Embed Size (px)
Citation preview

Terr
itoria
l Dia
gnos
is H
andb
ook Francisco Sarmento, José Ferreira
and Adolfo Hurtado

Territorial Diagnosis Handbook
Project idea and supervision: Francisco Sarmento
Authors: Francisco Sarmento, José Ferreira and Adolfo Hurtado
The authors acknowledge the contributions from:
Adriano Campolina; Alejandra Scampini; Amade Sucá; Fábio Ramos;
Frederic Bazin; Mariano Iossa; Pablo Sidersky; Paolo Groppo and Valerio
Tranchida.

3
CONTENTS
Contents .................................................................................................................. 3
List of figures................................................................................................................... 4
List of boxes .................................................................................................................... 4
Introduction............................................................................................................. 5
Overview of the tools and some basic concepts ............................................................... 6
An introduction to the quality matrix ................................................................................. 8
Part I – Territorial Diagnosis Step by Step............................................................ 13
1: Preparation & field mission ........................................................................................ 14
2: Initial appraisal .......................................................................................................... 17
3: Comparative analysis of production systems ............................................................. 27
4: Strategic plan (quality matrix) .................................................................................... 35
Part II Toolbox ....................................................................................................... 42
Conclusion ............................................................................................................ 63
Bibliography.......................................................................................................... 64

4
List of figures
Figure 1 – Components of territorial systems .................................................................................. 6
Figure 2 – Quality matrix ................................................................................................................ 9
Figure 3 - Expected outputs from community participation ............................................................ 16
Figure 4 – Table of indicators to map during the landscape analysis. ............................................ 18
Figure 5 – Transect of Manhiça (Mozambique) ............................................................................. 19
Figure 6 – Simplified time table of Manhiça (Mozambique) ........................................................... 22
Figure 7 - Driving forces matrix for Manhiça (Mozambique) .......................................................... 23
Figure 8 - Territorial Venn diagram of Manhiça (Mozambique) ...................................................... 24
Figure 9 - Matrix for actor analysis, based on experience in Manhiça (Mozambique) ..................... 26
Figure 10 – 3Rs Matrix: Rights, Responsibilities and Revenues .................................................... 26
Figure 11 – Scenario mapping exercise based on the experience of Manhiça (Mozambique) ........ 37
Figure 12 - Scenario description format ........................................................................................ 38
Figure 13 – Strategy quality matrix of Manhiça (Mozambique) ...................................................... 40
List of boxes
Box 1 – Using hypotheses to link previous results with further analysis in Coatepeque (Guatemala) 8
Box 2 – Strategy to revise diagnosis in Coatepeque (Guatemala) ................................................. 15
Box 3 – Explain the diversity of farmers in Niamina East District (The Gambia) ............................. 20
Box 4 – Construct a typology of farmers in Manhiça, Mozambique ................................................ 29
Box 5 – Subsystems of the family system ..................................................................................... 31
Box 6 – Gender bargaining theory ................................................................................................ 33

5
INTRODUCTION
Rights Based Territorial Development is a methodology to improve quality in rural development
programs. The approach combines a systemic understanding of current conditions in a given
territory, which gives a holistic view of the territory and focuses on the few key aspects which are
driving the history of a specific territory), using a concept of development as the expansion of
entitlements.
In 2007, ActionAid’s Right to Food Theme launched the Territorial Development Initiative (TDI) with
the goal of improving quality in the Right to Food program at local level. The initial document
defined quality as the level of coherence of Right to Food work among levels (local, national and
global) and with other themes. In summary, quality was the level of integration of the work across
levels and sectors.
In this handbook, we work with an abroad concept of territorial development. In this methodology
we do not understand territorial development as setting up a regional forum to drive the
development process in its area of influence. For us, territorial development is any process driving
development based on negotiation and influence. The method of diagnosis that we present here is
designed to draw up a work plan considering the different roles of various organisations in an
implementing partnership and to identify the organisations that the implementing partners need to
work with (building alliances or influencing) outside the partnership in order to achieve
development. In fact, one of the best ways this approach can be used is by a single organisation
intending to engage better in the regional forums that are resulting from decentralisation processes.
This handbook provides concepts and practical guidance on the methodology for conducting the
initial diagnosis for Rights-Based Territorial Development (RBTD). The method has four phases:
preparation of the diagnosis and field mission to define a team with diversified skills and
knowledge and to involve local communities and relevant actors; initial appraisal to build a
common understanding of the local socio-economic trends and power dynamics, including the
rights that are denied to the powerless; comparative analysis of farming systems to identify the
distinct groups among poor farmers and understand how their farming systems contribute to local
food security and are affected by internal and external trends; and strategic planning to identify
multi-level and inter-thematic priorities and the respective action plan.

6
Overview of the tools and some basic concepts
Territory is usually defined as a geographical space with its resources, which is controlled and
reproduced over time by different actors unequally inserted within a network of social relations
Figure 1
. This
definition emphasises that the territory has two main components or subsystems ( ). The
first are its resources: natural resources and production resources. The second are the processes
of bargaining to control and use these resources. Consider that decisions on the use of each of
these resources are influenced at different levels.
Figure 1 – Components of territorial systems
We introduce the concept of territory as a building block to move forward from the discussion
between the area approach and the actor’s approach to development. As territory comprises these
two dimensions, this approach can join together the immaterial issues of social and power relations
with the material distribution of resources. It is crucial to take account of the two dimensions,
because the distribution of material resources in a territory cannot be explained without considering
the power relations that control them, nor we can understand power relations without considering
the assets that the actors are bargaining for.
The initial appraisal, as described later, assembles these different components of territory. It starts
by identifying roughly how resources are distributed spatially and discusses the historical
development of each component of the territory. More than describing the status of each
component, the initial appraisal will focus on the relations between them.
It is important first to identify the driving forces in the territory. Following Dufumier, we consider
these driving forces to be a set of interconnected events that result in a change of the current
reality. In other words, they are social processes that explain how the territory became what it is
today, and from which the future can be forecast. Some examples of “driving forces” are the

7
expansion of a new crop or the emergence of a new market; climate change; environmental
degradation or other environmental processes and so on.
Analysis of the most important driving forces will require the team to gather information and reflect
about governance mechanisms in place in the territory. These processes will have different impacts
on different actors (women and men, young people, indigenous people etc.) and actors will act to
reinforce or constrain them. The analysis of these processes will bring to light power relations and
the past history of cooperation and conflict among actors.
In short, the initial appraisal should give a simple, but comprehensive, picture of how the driving
forces impact on actors and how actors act to change these driving forces.
The next phase is a comparative analysis of farming systems1
To conclude, there is a high risk of losing focus in holistic diagnosis. Instead of collecting a large
amount of data, the team should focus from the outset on the key elements that can give a good
understanding of the territory. The team should focus on diversity. In that regard, the team will look
for and explain the diversity of strategies among actors, taking account of differences in gender,
ethnic group, age and sex. Even critics and possible opponents of the chosen right-holder should
. Comparative analysis of right-
holders’ farming systems has a clear goal: to understand in depth the impact of internal or external
constraints – driving forces – on powerless groups and their farming systems. It explains how
families adapt to previously identified external constraints (for example; international market
liberalisation, climate change or national agri-policies).
Comparative analysis of farming systems can add information to the initial appraisal, but may also
refute some of its hypotheses. This is one of the important challenges: systems diagnosis is
essentially a process of constantly improving the analysis and should be adapted to the information
needs and time available in each case. The diagnosis can take from two weeks to two months to
complete depending, as already said, on the needs and goals.
The final step in the diagnosis is strategic planning. This step starts with a scenario exercise that
will help to identify what must be done in order to achieve the rights of the powerless. The
corresponding activities will then be arranged by spatial level and sector to give the picture of all
recommendations. The quality matrix is a tool used to identify and analyse the coherence of the
building block issues for a concrete strategic plan.
Participatory use of the matrix can help the implementing organisation and its partners to clarify the
role of each organisation (or organisation team) in putting the plan into practice.
1 This step was built with concepts from gender bargaining theory (Agarwal, 1997) and the agrarian systems
approach (Mazoyer, 1992).

8
be interviewed to get a more complete picture of the territory. Without their point of view, part of the
knowledge about the region cannot be captured.
The team should gather qualitative information rather than quantitative data. Semi-structured
interviews and focus groups often give a better – and quicker – understanding of the territory’s
recent history than other methods. Bibliographical research and statistical data are recommended
for confirming and clarifying the information from interviews. Maps also are very important to
organise this information.
Informants should be chosen in view of the research goals. Here, key informant interviews are more
useful than random interviews. The team is more likely to find the information it needs in key
people, such as technical staff of local organisations and local leaders.
Lastly, the research should be hypothesis driven. Hypotheses will identify what information is
needed and what is irrelevant. Confirming hypotheses demands more than just describing the facts;
it means formulating relations between facts – explaining rather than simply describing. In fact,
hypotheses show the research route (see Box 1).
Box 1 – Using hypotheses to link previous results with further analysis in Coatepeque (Guatemala)
In Coatepeque, Guatemala (Development Area 9 of ActionAid’s National Programme), there is considerable interest in switching from conventional agriculture to agro-ecology. In interviews, some farmers seem uninterested in changing and invest time and effort in land they do not own.
The diagnosis (Ferreira and Marcatto, 2007) shows they depend on leasing plots from larger landowners to cultivate their most important crop: corn. In the most cases, after cultivating the plot for 2 years, the owner will request the land for pasture. This normal situation jeopardises the medium- or long-term investment required by agro-ecology.
Nevertheless, further information will be required to understand better what margins of flexibility are available for peasants to start to adopt agro-ecology practices. While it is true that they cannot replace chemical fertilizer with manure (because manure takes 6 months to a year to start to nourish the plants), would it be possible for them to reduce pesticide use by sowing local seeds?
One hypothesis is that there are no local seeds. The communities interviewed were established by immigrants in the first half of the 20th century. They came from other regions with their own varieties of corn. However, the plants are very tall and could not withstand the strong local winds. In fact, some peasants said that one reason for using hybrid seeds is that the plants are smaller and, thus, so is the risk of losing the crop.
This is just one example of how hypotheses are important to move the diagnosis forward, by
showing the team what information is needed. We will now describe in greater detail the various
steps set out above.
An introduction to the quality matrix
The quality matrix (see Figure 2) is a tool developed by Hurtado (2005) and Dietsh et al (2007) to
emphasise that development demands coordinated decisions across different levels and sectors.

9
ActionAid (2007) has defined quality as the increase in coherence of work between levels – local,
national and international – and between themes. The quality matrix is used to capture key
information during the diagnosis that will work as a mental map for the diagnosis team.
Figure 2 – Quality matrix
Source: Adapted from on Dietsh and others (2006).
On page 6 we introduced a concept of territory that was represented in Figure 1. In the planning
phase we are concerned with the second component of the territory: the process of bargaining to
control and use resources. Now, we can define territoriality as multiple, hierarchically organised
bargaining arenas2
Because there are a large number of arenas, the matrix clusters them by level and sector, reducing
the number of arenas to be taken into account (sixteen in the case of the
where policies are defined. In each arena there are different actors and different
political bargaining processes.
Figure 2). While the
number of spatial levels can be easily adjusted to each study3
2 Arenas are the various universes of social relations. Their boundaries are constructed intellectually according
to research needs and do not exist in the real world. At the community level, the municipal council can be
considered an arena as, at the national level, can the ‘social space’ occupied by all actors engaged in food
security politics.
3 There is only one limitation to the spatial levels typology – it can easily lead to using the “levels of
government” structure to define the typology. In some cases, administrative boundaries are not the most
relevant to planning or discussing development. In any case, it is always possible to adapt spatial references
other than government spatial references (watersheds, for example).
, the other dimensions (the number of
sectors and the types of problems involved) are harder to understand and to use, and even more so

10
to adapt. For that reason we will explain more fully why we propose this typology and how we have
defined the types.
The nature of the issues at stake gives complexity to the political relations, because discussing the
issues calls for a certain degree of knowledge which is not scientific, but knowledge of the past and
of roles in the bargaining process. More importantly, the actors need to know what they can
rightfully bargain for. There are “general values” that are used in bargaining. We identify four:
legitimacy, efficiency, equity and sustainability. Every demand or proposal is made as a step in
pursuit of one of these values. We are aware that the content of these “general values” is also open
to bargaining, but we want to underline that bargaining on the various issues tends to be
concentrated around these “general values”. A land reform proposal is made to promote equity; the
agro-ecological approach to agriculture is proposed in the name of sustainability; the gender
approach in projects is proposed to promote equity and so on.
These general values are the base for our typology. We link each value to a sector: we link
governance issues to legitimacy, economic issues are defined as those that pursue efficiency, the
social sector aims for equity and the environmental sector for sustainability. Using the
sector/general value double-check will help to classify the issues to bargain for on the horizontal
axis of the matrix.

11
THE 4 STEPS OF THE DIAGNOSIS
Steps Expected results Excise PRA tools Days
1. Preparation & field mission
Identify the territory and gather background information/documents Identify a research team Prepare the communities for the mission
n.a. n.a.
2. Initial appraisal
2.1 Landscape analysis
A transect of the region Definition of the various different zones in the region
1 Transect Village map
1
2.2 Historical analysis
Historical transects of the region Identify the main driving forces
2 3
Time line Trend lines Historical transects
2
2.3 Actor analysis
List of all actors in the region Analysis of the main actors in the region
4 5
Actor matrix Venn diagram
2
3. Comparative analysis of productive systems
3.1 PS typology A typology of PS 1 0,5
3.2 PS Analysis Identification of the components of the family system. Description of the behaviour of each family system.
2 3 4 5
Production systems diagram Seasonal calendar Cost benefit matrix Timeline
2
3.3 PS Comparison
Qualitative analysis of global trends’ impact on peasants
6 0,5
4. Strategic plan (quality matrix)
4.1 Scenario building
Two to five prospective scenarios 6 1
4.1 Quality matrix
Identification of projects and partnerships 1 2

12

13
PART I – TERRITORIAL DIAGNOSIS
STEP BY STEP

14
1: Preparation & field mission
Aim: To prepare the diagnosis and organise the field mission
Activity 1: Choosing the area and forming the diagnosis team
We have prepared this handbook to help NGO’s and Civil Society Organisations to perform
systemic diagnosis in the areas where they are intending to work. The diagnosis is designed to
inform strategic planning and should be performed when the implementing organisation starts to
work in a new area or intends to review the strategic plan for an “old” area.
A good team to perform the diagnosis comprises a small number of people with several different
expertises. As this method takes a holistic approach, the team should have knowledge of different
sectors (see page 8 et seq.), combine local and technical knowledge, and be aware of national and
global politics that may have an impact on the area studied.
To address right to food and/or food security issues the diagnosis can be carried out by a small
team of three technicians connected with a network of local leaders that will participate as key
informants. An ideal team will be constituted by:
An expert in agrarian systems with knowledge of environmental/agro-ecological issues
An expert in gender and education issues
An expert in health and nutrition issues
One of the team members should act as a team coordinator who should guide the other members
through the methodology, maintain the focus between the various different activities and, in each
phase of the diagnosis, decide when the team should research further or move on. It is
recommended that the team coordinator have participated previously in a similar diagnosis.
An alternative approach to setting up a team is to make the diagnosis a capacity-building activity.

15
Box 2 – Strategy to revise diagnosis in Coatepeque (Guatemala)
In March 2009 we decided to revise the diagnosis made a year and half earlier in Guatemala. On this occasion the exercise had two objectives: to revise the diagnosis and build capacities in the partner organisations to perform this kind of the diagnosis.
The strategy chosen was to organise capacity building for ten people to perform the exercise. Participants in the capacity building were local leaders, local and national level partner organisation staff, the ActionAid Guatemala Food Rights coordinator and a professor from a Guatemalan national university.
This approach has several advantages:
• It reinforces ownership of the diagnosis. The people who are going to use the results understand clearly how the team achieved those results.
• The team members already have a lot of information about the territory and this reduces the number of interviews and focal groups needed. On the other hand, the team is larger than usual. That makes more information available in less time.
• Capacities are being built and dependence on external expertise reduced. The participants can do similar diagnoses in other areas without – or with little – support from outside consultants.
There are two disadvantages to this approach:
• It is difficult to achieve two objectives in one exercise, particularly if only a few days are available. The exercise should be prepared carefully so as to balance the goal of building a diagnosis with the goal of building capacities in the participants.
• It may be difficult to mobilise people to participate for capacity building lasting ten days. Sometimes staff are not available to take part in the exercise.
Activity 2: Gathering prior information
Another important preparatory step is to gather prior information. Information always available about
a territory includes (in order of importance):
Maps of the territory (topography, soil, rainfall, roads etc.) and aerial photos.
Statistical data or diagnoses of the region that are already condensed and offer
interpretations of this data.
Summary of implementing organisation’s work, current plans and evaluations.
Zoning studies and characterisation of these zones at the national or local level.
Diagnoses, plans, studies and dissertations about the area.
In preparing such materials, team members should focus on a few key items. Maps first! Maps are
very useful to guide the diagnosis. The materials should be selected and sent to the team at least
ten days in advance. Key information available in electronic format is easiest to send.
In many cases, the authors of the materials are from local NGOs or research centres and are
available for interview during the diagnosis. Check the possibility of using them as key informants.
16
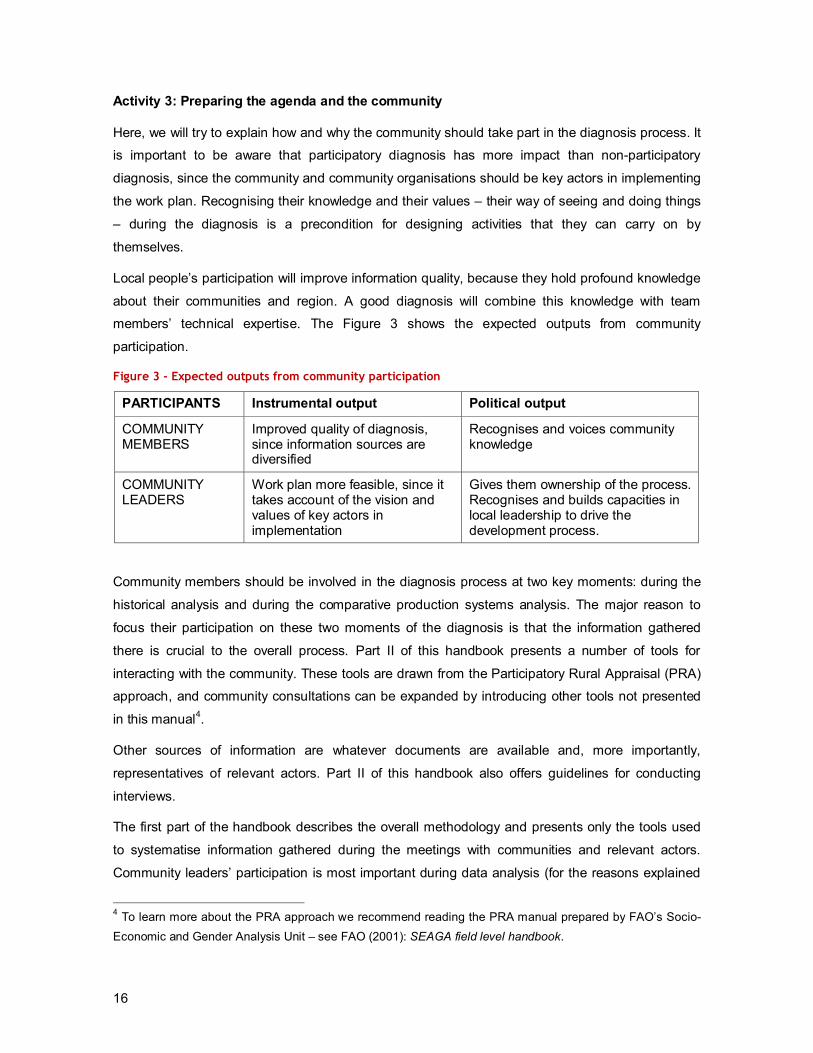
Activity 3: Preparing the agenda and the community
Here, we will try to explain how and why the community should take part in the diagnosis process. It
is important to be aware that participatory diagnosis has more impact than non-participatory
diagnosis, since the community and community organisations should be key actors in implementing
the work plan. Recognising their knowledge and their values – their way of seeing and doing things
– during the diagnosis is a precondition for designing activities that they can carry on by
themselves.
Local people’s participation will improve information quality, because they hold profound knowledge
about their communities and region. A good diagnosis will combine this knowledge with team
members’ technical expertise. The Figure 3 shows the expected outputs from community
participation.
Figure 3 - Expected outputs from community participation
PARTICIPANTS Instrumental output Political output
COMMUNITY MEMBERS
Improved quality of diagnosis, since information sources are diversified
Recognises and voices community knowledge
COMMUNITY LEADERS
Work plan more feasible, since it takes account of the vision and values of key actors in implementation
Gives them ownership of the process. Recognises and builds capacities in local leadership to drive the development process.
Community members should be involved in the diagnosis process at two key moments: during the
historical analysis and during the comparative production systems analysis. The major reason to
focus their participation on these two moments of the diagnosis is that the information gathered
there is crucial to the overall process. Part II of this handbook presents a number of tools for
interacting with the community. These tools are drawn from the Participatory Rural Appraisal (PRA)
approach, and community consultations can be expanded by introducing other tools not presented
in this manual4
The first part of the handbook describes the overall methodology and presents only the tools used
to systematise information gathered during the meetings with communities and relevant actors.
Community leaders’ participation is most important during data analysis (for the reasons explained
.
Other sources of information are whatever documents are available and, more importantly,
representatives of relevant actors. Part II of this handbook also offers guidelines for conducting
interviews.
4 To learn more about the PRA approach we recommend reading the PRA manual prepared by FAO’s Socio-Economic and Gender Analysis Unit – see FAO (2001): SEAGA field level handbook.

17
in Figure 3). To include the participation of the community leaders, can be used one of three
proposals
Add two community leaders (a man and a woman) to the diagnosis team.
Set up a forum of community leaders to validate the diagnosis. In this case, the forum will
meet at the following key moments: at the end of the landscape analysis, to validate the
zoning and the research hypothesis; at the end of the initial appraisal, to validate the overall
appraisal; and at the end of comparative farming systems analysis, to validate its results
and carry out the strategic plan. Note that, on this approach, the final step of the diagnosis
(scenarios and planning analysis) should be performed by the community leaders’ forum,
with the diagnosis team acting only as facilitators.
As capacity building, by including community leaders among the participants (see Box 2).
2: Initial appraisal
Aim: To build a comprehensive picture of the social dynamics in the territory
This appraisal comprises four activities to facilitate the understanding of a specific territory. The
methodology proposed below uses concepts from agrarian systems diagnosis and actor analysis to
give a better understanding of local communities. Three steps are involved: landscape analysis,
historical analysis and actor analysis.
Activity 1: Landscape analysis. What are the different zones within the territory?
Landscape analysis is the entry point of the appraisal. Landscape analysis is done mainly by
observing the landscape and analysing maps of the area. It will help the team formulate the
questions for historical analysis. It will also help in understanding the spatial distribution of
resources and identifying the different zones in the territory.
With the help of topographic and other thematic maps, the team will start to identify the spatial
distribution of resources in the territory. Using these maps, the team should identify whether or not
and how the various different material resources (see Figure 1 on page 6) are associated with one
another. For instance, population settlements and economic infrastructure are usually concentrated;
agriculture production types change with several environmental factors.

18
Figure 4 – Table of indicators to map during the landscape analysis.
SECTOR Indicators
ENVIRONMENTAL - Topography: altitude and relief - Temperature and water variability - Plant coverage and soil types
ECONOMIC - Distribution of agricultural crops - Visible economic structures: factories - Economic infra-structure: roads, electricity
SOCIAL - Population distribution and settlements - Social services: schools, hospital …
Analysis of the maps should enable the team to make a tentative zoning of the region. To structure
this data in a drawing, the team could perform the “Region resources map” as a first template (see
also Part II of this Handbook).
Exercise 1: Region resources map (see page 44)
Build a map of the region and identify on it the location of major natural resources, infrastructure, urban areas, fields etc. If you have an official map you can draw the sector indicators (see Figure 4) on it.
After the office analysis, a field visit will complement the landscape analysis. During the field visit
the team will confirm and gather detailed information about the spatial distribution of resources.
Using the maps, a small number of trajectories to be walked or traversed by car can be chosen to
cover the diversity of situations in the territory.
During the field visits, the team should also do some comparative evaluation of the state of the
resources under analysis. What condition are the houses, buildings, etc. in? Where are the newer
buildings, plantations, etc.? Where are the older ones? Choosing the line of greatest diversity, the
information from the field visits can be organised and systematised in a transect, as shown in Figure
5.

19
Figure 5 – Transect of Manhiça (Mozambique)
Source: Hurtado, A. (2007): Territorial development initiative: Manhiça – Mozambique (final report).
Consultant report for ActionAid International.
The transect will represent spatial relations among factors: some factors – a road, for instance –
may explain the greater importance of non-agricultural activities. Also decisive are factors that are
very complex to identify in a diagnosis when the time is short. In agricultural regions, as can be
seen in Figure 5, these decisive factors are normally altitude, availability of water and roads.
Relations between resources are very important, because they enable the different zones in the
territory to be identified – and that is one of the major outputs of this activity. For example, in the
diagnosis of Manhiça (Mozambique), the landscape analysis identified three zones: savannah to
the left of the road, upper floodplain zones (where most of the houses are) and the lower floodplain
zones (where sugar cane and food crops are grown).
Exercise 2: Transect (see page 45)
Build a transect of the territory, choosing the line of greatest diversity. Then discuss what zones there are and how the different zones interact.
Although if this activity should be carried out by the team itself, because its major aim is to afford
the team its first contact with the territory, some community input may be added. For instance, the
maps from exercises 1 and 2 (especially the latter) can be validated in a forum with local leaders.
Note that, if the team chooses to hold a forum of local leaders to validate the landscape analysis,
the drawings should not be very detailed: the team must present a simple sketch of the territorial
transect to which the forum participants can add their views of the territory.

20
Activity 2: Historical analysis. What are the driving forces in the territory?
Historical analysis is a fundamental piece of the overall methodology. From the historical analysis
the team will identify the “driving forces” that determine the territory. As already said, the driving
forces are a set of interconnected events that result in a change of the current reality. In other
words, they are social processes that explain how the territory became what it is today and give the
basis for prospective analysis. Examples of “driving forces” are the expansion of a new crop or the
emergence of a new market; as well as climate change, environmental degradation or other
environmental process and so on. Box 3 shows how historical analysis gives a better understanding
of the territory.
The driving forces will be used in the activities to follow. They make it possible to understand actors’
positions and levels of power. Driving forces are also the external constraints that the team
evaluates in the comparative analysis of production systems. Also, driving forces will give the
elements for input to the quality matrix. For that reason, this step is fundamental to the process.
As driving forces are inter-related events, the team will start to assemble the historical events of the
territory. Timetables or timelines can be used to record the facts. We recommend that the team
construct a timeline on a wall and record the facts on cards to stick on the wall. Once the most
important facts are recorded, the team will start to find the connections between them. These
connections will identify the driving forces.
Box 3 – Explain the diversity of farmers in Niamina East District (The Gambia)
During the 2005 Development Area identification process, ActionAid commissioned a study to evaluate the widespread poverty in the Niamina East District. “This study reveals that 53% of the 867 households in the villages sampled are very poor, 32% are poor and only 15% are classified as non-poor”. This classification used indicators such as number of meals the family eats each day; months in which the family has food from their own farm; level of agricultural inputs; sources of agricultural income; quality of house-building materials and livestock.
Using historical analysis, which is part of the territorial system analysis carried out in 2007, it was possible to understand the roots of the region’s inequalities: “The access to workforce has been a historically important factor in the labour-intensive farming system and a powerful factor of differentiation among farmers: first with slavery; then with the “strange farmers” and more recently with access to draft animals and equipment”. When, in the seventies, the State-led cooperatives started to provide credit for access to draft animals and equipment, some small farmers were able to expand their production areas.
But “not all farmers could be members of the cooperatives and have access to loans for equipment and inputs. Thus, the production capacity of the farmers with draft animals and equipment became much greater than the production capacity of the farmers using just manual labour”. This explains the different situations found among the farmers in the first study.
When the cooperatives and farmers’ incentives were dismantled under structural adjustment and trade liberalisation policies in the 90s, many family farmers lost the opportunity to improve their own situation.
Source: Based on Bazin, F (2007): Territorial development initiative: agrarian diagnosis of Niamina East
District. Consultant report for ActionAid International.

21
This step demands major interaction with local communities. Landscape analysis gives the team a
considerable amount of information about the territory. From this follow ideas on how natural
resources, infrastructure, urban concentration and other variables influence the living patterns of the
people in the region. These “ideas” should be seen as hypotheses to be confirmed in the historical
analysis phase.
For instance, when one zone in the territory experiences greater urban growth than others, the
team can expect this to be accompanied by greater growth in economic activity. The team should
ask: When did this start? Why did it start? How has it developed? This kind of question will guide
the historical research.
Workshops with communities can be used to collect information. The advantage of already having a
validated territorial zoning is that the team can interview at least one community per zone and can
enlist the help of the community forum that validated the zoning to facilitate the logistics of the
community meetings.
Exercise 3: Historical interviews with communities
Interviews with the community are the most important step of the overall methodology. The objective is to understand the dynamics of the territory. Here history about the region is the most relevant information for the diagnosis. To produce this information, the team can use the tools presented in Part II of the manual, such as:
• Timeline or timetables to gather history of the community or region (see pages 46 and 47)
• Trend lines to analyse key aspects in the history in greater depth (see page 48)
• Historical transects to systematise the information gathered with the previous tools (see page 49)
Once the team collect all data from community interviews, the information must be put together on
one timeline. For this, the timetable shown in the Figure 6 should be used. The timetable pushes
the team to think in terms of sectors, because it asks the team to classify the various events that
they collect into sectors.
Another important issue in filling out the timetable is to define key moments in history that changed
the pattern of social relations in the territory, and the intervals between these moments. In Manhiça,
as shown in Figure 6, the team recognised three key moments and three periods. The key moments
were: the first foreign investment in 1950; independence and beginning of the civil war in 1975-
1976; and the peace agreement in 1992. Then, we have three periods: colonial rule; civil war; and
peace and development.

22
Figure 6 – Simplified time table of Manhiça (Mozambique)
Time Governance issues
Economic issues
Social issues
Environmental issues
1950 First foreign investments
“Col
onia
l ru
les”
Links with inter-national market
(sugarcane sector)
1975 Independence
1976
War Migrations
Forest degradation
(war)
War
Land
refo
rm
coop
erat
ives
Immigrants working in the cooperatives
1992 Return of the migrants
Pea
ce a
nd
deve
lopm
ent
Traditional chiefs lose power
+ decentralisation
New investments
(sugar cane vs.
food crops)
HIV AIDS
Flooding
Water management
conflicts
The timetable should not show all the data collected in the interviews. At this point the team should
formulate some hypotheses on what social processes or driving forces are operating in the territory.
Remember that driving forces are a set of interconnect events that result in a change of the reality
or, in other words, the set of events that explain how, and how much, the situation changed at the
key moment identified and what the consequences were.
When the team agrees on what driving forces are the most important, they can simplify the table to
present only the key events that show clearly those driving forces.
After this, the team should identify the aspects of the driving forces that are most relevant in the
current period and cluster them by sector and level (see Figure 7). For instance, the matrix
presented below was produced by the participants in a capacity-building activity in territorial
diagnosis in Mozambique.

23
The team identified four driving forces: the increase in flooding in the region; the rise of HIV
prevalence; the expansion of sugar cane; and changes in local governance systems. The driving
forces were split into components and these components were distributed by territorial level and
sector. The matrix is the mental model on which further steps are taken.
Figure 7 - Driving forces matrix for Manhiça (Mozambique)
Political sector (governance)
Economic sector
Social sector
Environmental sector
Global Direct foreign investment in sugar cane
Climate change
Regional HIV infections at
SA gold mines Incomati river management
National
Dec
entra
lisa
tion
proc
ess
(reso
urce
s)
District/ Municipal
HIV spread due to customary
practices
Community Erosion of the legitimacy of
traditional chiefs
Land use conflicts (sugar cane vs.
food crops)
Water management
practices
The red lines represent some of the connections identified between driving forces. For instance, the
pressing need for employment for men, who usually emigrate to the South African gold mines,
bringing AIDS back home, influenced municipal politicians to support foreign investments in sugar
cane. At the same time, the expansion of sugar cane is intensifying challenges to the land
distribution system that, in the past, were relayed in traditional chiefs and, today, is a matter of
conflict between municipal and district officers and communities. Note that different components of
the same driving force (for instance, climate change and the practices of Incomati watershed
management) obviously have direct impacts on each other, and there is no need to represent that
in the matrix.
Activity 3: Institutional analysis. What are the interests at stake?
Power relations were already implicit in the historical analysis. But, as power relations are crucial to
planning territorial development, the team should analyse them in detail. First we need to identify
the actors with a stake in the territory; then analyse the most important.
From the historical information, and having the driving forces matrix as a reference, we can identify
the actors in play. In fact, each component of the driving forces has interests and agents behind it.
Because of this, during the Mozambique capacity-building activity mentioned above, we were able
to produce a territorial Venn diagram (Figure 8).

24
Figure 8 - Territorial Venn diagram of Manhiça (Mozambique)
A common mistake we found is the attempt to list all actors in the territory. This is difficult, time-
consuming and useless. To focus the brainstorming the tip is to keep the driving forces matrix in
mind. If you interlink the two exercises, it should be possible to recognise actors when looking at the
driving forces matrix and to recognise the driving forces when looking for the actor relationships
represented in the territorial Venn.
Remember that actors may be a social group (peasants, traders, landowners etc.), an organisation
(NGO, union, state agency, enterprise) or an important individual. Actors are also defined as
whoever has an interest in the issue being analysed or, in other words, who can influence or be
influenced by a social process. The driving forces give the entry point to identifying actors. Who can
influence the most important driving forces? Who are being constrained by the most important
driving forces? The answers to these two questions give the first list of actors.
Exercise 4: Analysis of the community interviews
This is a crucial moment of the process: the timetable, driving forces matrix and territorial Venn give the mental map that will guide the team during the diagnosis. Further research is only to confirm and detail the data already gathered. The steps are explained in the text, but can be summarised as follows:
• List all events collected during community interviews in a timetable.
• Simplify the timetable, building hypotheses about what driving forces are most relevant.
• Identify the components of the present driving forces in a quality matrix.
• Specify explicitly the actors behind each driving force in a territorial Venn diagram.

25
From the Venn diagram, the team should prioritise actors for further research. Some information is
already given by the historical analysis, and the tables below can be filled in without further
research. Actors that are important to development in the region should be interviewed. In
Mozambique, for instance, in order to understand better the process of sugar cane expansion and
land management, we interviewed representatives of the sugar cane factory; the traditional chiefs;
the municipality and the farmers union (see Figure 8).
Each interview should focus on the history of the actor interviewed. This entry point has three
advantages: it leads the conversation to issues that the person interviewed is more comfortable
with; it gives the team new information to cross-check the historical analysis; and it helps the team
to understand the actor’s objectives, power and interests without asking directly.
Exercise 5: Key informant interviews
The interviews are intended primarily to fill gaps and triangulate the information given by the communities. Accordingly, the mains question will be the same as appear in Part II of this handbook. We recommend the team take the following steps to prepare the interviews:
1. Chose the most relevant actors from the territorial transect and schedule an appointment with one or two representatives.
2. Identify the information most needed and what information the interviewee can provide.
3. Prepare a few interview questions using some of the driving questions from the tools in Part II of this handbook and others that the team considers relevant.
4. Choose a team member to lead the interview and to put the main questions. Interventions by other team members should be careful not to intimidate the person interviewed.
As can be seen from the foregoing, the first task after interviewing the representatives of the most
relevant actors and other key informants is to revise Exercise 4. Only then can the team go on to
describe each actor. Of course, the team has enough information to describe not only the actors
interviewed, but also other actors that could not be interviewed.
Actors are usually analysed in two dimensions: power and interest. Often, the implementing
organisation will be supporting powerless groups. However all groups, including the implementing
organisation, must be analysed, because they are potential allies or potential antagonists of
powerless groups. It may be crucial to build alliances among groups in order to challenge current
power distribution. Figure 9 will focus on actors’ power and interests, and how their interests are
affected by the trends identified in the historical analysis.

26
Figure 9 - Matrix for actor analysis, based on experience in Manhiça (Mozambique)
Level of power: classify from 1 to 4; Interest affected: very negatively affected (- -); negatively affected (-); not affected (0);
positively affected (+); very positively affected (++).
The team should also list the rights and duties of each actor. The 3Rs matrix is a tool that may help
summarise this information. Poverty is denial of rights. Stating these rights explicitly, and also the
actors whose duty it is to fulfil these rights, gives the basis for a rights-based empowerment
approach.
Figure 10 – 3Rs Matrix: Rights, Responsibilities and Revenues
Actors Rights Responsibilities Revenues
Rights and duties come from diverse sources: customary practices, national law and the
international human rights framework. The analysis may find conflicting rights; in Manhiça
(Mozambique), for instance, we found that the women have the same right as the men to inherit
land, but customary practice does not recognise women’s right to own land. Analysis of rights and
responsibilities/duties must consider all three levels: customary practices, national law and the
international human rights framework.
As this document is oriented to food security and right to food organisations, we are particularly
concerned to understand the Right to Food. It may be necessary to discover whether the country is
a signatory to the main international covenants and agreements and, also, how this is reflected in
national law. Moreover, it is important to understand whether relevant actors, especially right-
holders, are aware of the rights and duties that apply to them.
Power inequity is usually accepted by the disadvantaged, because they believe in the norms and
values that justify it. The discussion of the 3R’s matrix is a good time to raise questions to

27
understand the current cultural pattern justifying inequities. Lastly, the team should note that
practices are reinforced by a system of revenues. Just as a private company needs to make profit in
order to keep working, all actors need some return from their activities. For instance, a charity
foundation needs to be recognised in order for donors to pay for its work; a political leader will
demand recognition and political support; a peasant organisation will need the support of its
members etc.
Exercise 6: Power and rights analysis
From the data collected in the historical analysis and key informant interviews, identify the power and interests, rights, duties and revenues of the relevant actors. Then discuss how different driving forces are impacting on actors. The discussion can be captured in the matrix in Figure 9 and Figure 10.
3: Comparative analysis of production systems
Aim: To identify and characterise different production systems and how different households respond to external trends.
The comparative analysis of production systems will help to unpack this major actor called
community. Because, in rural areas, family farmers are often the largest powerless group, we will
use this method that makes it possible to identify different types of farmers and to understand the
differences between them.
This analysis has multiple uses in the diagnosis: to increase the quality of solidarity support being
given to communities by local implementing organisations; to identify concrete proposals to be
negotiated with other actors; and to mobilise smallholder farmers.
What to compare? Why compare?
Political and other external factors constrain farmers in different ways; it is widely known that
peasants and capitalist farmers respond differently to trade liberalisation, but even among peasants
there is great diversity. Peasants near a city may already be producing horticulture and other
labour-intensive or perishable crops, while peasants farther from the city have never had a large
enough market to switch their production and are still mainly harvesting cereals, which are more
vulnerable to market liberalisation.
There are also internal factors that impact production systems, such as weak internal social capital,
and weak organisational capacity. This also provides the opportunity to get more insight about the
behaviour of the family system. The information collected can also serve to cross check the data
collected during the historical analysis (see page 20). This will help to understand why families and
28
communities behave the way they do – it provides the underlying reasons for their behaviour and its
impacts.
Comparing different types of farm is also useful to evaluate the impact of a policy or social dynamic,
especially recent social dynamics. During a territorial diagnosis in Manhiça (Mozambique), we could
see that large factories with difficulties in accessing land were starting to integrate smallholder
farmers into their supply chain. To evaluate the impact of that strategy we compared peasants
outside the sugarcane supply chain with those already inside it.
Activity 1: Set the research question – clarify the context
The first step in the analysis is to build a typology of farmers. Some context information is valuable
to learn the socio-economic conditions the farmers work under. Moreover, context analysis
highlights a diversity of actors, already reflecting at least some of the differences between farmers.
Hopefully, we have already performed the initial appraisal, which gives us the context analysis to
build a tentative typology (see Box 3 on page 20). Nevertheless, further research may be needed.
To build a typology of farmers we will use three criteria: issues relating to the location of the farm;
social condition and availability of resources; and technical-economic options. Lets see what each
one means.
Farmers in different zones will have different access to natural resources, such as water for
irrigation or quality soil, different access to markets, due to the distance to a city or the conditions of
roads and other economic infrastructure etc. During landscape analysis, the team has already split
the region into different zones. Now, it should work with the hypothesis that the farmers in different
zones have different farming strategies and constraints.
The social condition and availability of resources, including capital, is another major factor
differentiating farmers. The most common example is the distinction between big farmers and small
farmers, but other, less visible differences, are also important. An example of this is shown in Box 3
on page 20.
Third, farmers in the same zone and with similar access to resources can produce different things,
apparently depending on their choices. For instance, in the same region, small-scale farmers can
produce cassava, corn and vegetables for self-consumption and sell some to buy things they
cannot produce, such as salt; or they may focus their activity on vegetable produce, thus making
more income, but buying corn and cassava from their neighbours. Nevertheless, very often different
technical-economic choices mask small differences between farmers that will only be captured
through analysis and comparisons between types.
Box 4 explains how we built the typology of farmers in the territorial diagnosis in Manhiça
(Mozambique).

29
Too much detail in constructing the typology will lead to a large number of types. Be careful not to
produce too much information that you cannot use. Team members should be guided by the
principal of optimal ignorance. In Manhiça, there is great diversity in how polyculture plots are
organised. In fact, not all grow vegetables and the ratio of corn to cassava changes from farmer to
farmer. This means that it is always possible to define a large number of types, but having more
than three or four types is useless. Small variations between types can be discarded.
The typology is constructed in the back office, based on the initial appraisal or at least on the
landscape and historical analysis. The typology is often adjusted during the field work, however, as
pointed out in Box 4. The initial appraisal may have overlooked aspects of context or the team may
find exceptional cases that are not covered by the typology. Whatever the case, the typology should
include these new types.
Box 4 – Construct a typology of farmers in Manhiça, Mozambique
To evaluate the impact of sugar cane in Mozambique we made a comparative analysis of production systems, using detailed information on the production, consumption and revenues of different farmers. The initial appraisal made beforehand suggested that, in most of the cases, sugar cane was an investment by capitalist investors, but some farmers were starting to switch from traditional polyculture to sugar cane production, through associative production. Because sugar cane production is only possible in the lowlands of the valley, we used only two criteria: social conditions and technical-economic choices.
With this background we already expected three kinds of farmer: capitalist sugar cane producers; peasants producing sugar cane; and peasants with traditional polyculture. The first interviews with capitalist farmers revealed that there were two different kinds of farmer in this group: factories owned by foreign investors, with more than 1000 ha under sugar cane and other capitalist farmers with 100 to 300 ha plantations.
The same occurred when we interviewed polyculture peasants: we found one case of a farmer specialising in horticulture. Obviously he was no longer a traditional farmer, but nor was he a sugar cane producer. Another type had to be built to contemplate this case. Although the latter case was an exception, analysing this kind of exception is often the best way to find alternative routes to escape from poverty.
The figure shows how different criteria were combined to form distinct types of farmers. But why are capitalist farmers distinguished by social criteria and peasants by technical-economic criteria? Meanwhile the two types of capitalist farmers are from different social origins (even from different countries) and have differential access to production resources (capital); the different types of peasants all have the same social background, but different farm practices.
If the fieldwork produces information suggesting further types (not exceptional cases), there is no
need for the team to review their initial appraisal to include any new information that appears at this
stage. However, it is certainly important to consider types resulting from new information. Now, such
information will probably mean revising the results and recommendations of the initial appraisal.

30
But, why include special cases in the analysis anyway? There may probably be only one family with
such a strategy. Special cases are nearly always innovator families who find themselves better
placed than their neighbours. Understanding their innovation can help the team to propose
development plans suited to the territory.
Exercise 7: Define the different types of farmers
Review the initial appraisal and interview some key informants to define different types of farmers in the region. In building the typology consider the three criteria mentioned: location; availability of resources and social condition; and technical-economic choices.
Activity 2: Understanding system structure
To understand the structure and behaviour of each family system type we need to do three different
things: first, we need to identify the different subsystems in the family household; second, we need
to understand the connections among subsystems; and third, we need to evaluate the economic
results of each subsystem and the whole system. The next two activities propose three exercises to
perform each of these tasks.
There are also two different techniques for gathering information from the families. Using these
depends on the time available and, more importantly, on the cultural practices of the territory and
the group. Focus groups can be held with three or four families of the same type – the team will
need one focus group for each type. Alternatively, individual families can be visited and interviewed.
The latter option will require at least three interviews for each type. It will be more appropriate to use
one approach or the other; it varies from type to type. It is easy to plan a focus group with small
farmers, but may be difficult with large-scale capitalist farmers.
Women’s participation in the focus groups/interviews must be planned carefully to reduce the men’s
dominance. Whether to interview family members jointly or disaggregated by gender is a choice the
team should consider carefully in preparing the field research. Local-level technical staff can help
decide whether or not facilitation will be able to reduce male dominance.
The first task in the focus groups or interviews is to ask for the history of each family present. In the
second part of this handbook we present a timeline were families’ major decisions were recorded.
The family history will show whether the family does in fact represent the type under analysis – its
history must relate to the context history gathered in the initial appraisal. Conversely, the family
history is also used to confirm or question the historical analysis. In the end, the team will be seeing
the driving forces identified in the initial appraisal through the peasants’ eyes.
A second use of family history is to identify how the family decisions are taken. The team should
identify the important events and decisions in the family history (marriage, birth of a child etc) and to
discuss their consequences. The next task in the focus group will be to discuss how the family

31
organises itself at present. Looking at the present organisation and history will facilitate a discussion
of why the family takes such decisions and will give the team the rationality of each family type.
Exercise 8: Timeline for family-farm analysis (see page 54)
Draw up a timeline of the history of each family in the focus group. Discuss the major differences and resemblances of each timeline.
The second task is to identify the different subsystems in the family system. The family organises
itself into distinct components, including farming and non-farming components. Box 5 shows a list of
possible subsystems in the family system.
In this box we try to cover all the possibilities encountered in the research, but it is always possible
that the research teams will find subsystems in the field that are not considered here. In other
words, the teams should keep an open mind to capture all subsystems and adapt this framework to
each family.
Box 5 – Subsystems of the family system
DOMESTIC COMPONENT
Domestic system: All activity relating to the family reproductive work: cooking, cleaning etc.
FARMING COMPONENTS
Crop systems: Activities relating to plant production: ploughing, sowing, harvesting etc.
Livestock systems: Activities relating to animal husbandry: feeding, care etc.
NON-FARMING COMPONENTS
Processing systems: Activities directed to adding value to the farm product: cheese making etc.
Others: Other activities not directly related to farming, such as handicrafts.
OFF-FARM COMPONENTS
Salaried work: Family member’s employment positions.
Community work: All activities in the community organisations: political organisations, women’s or peasant organisations etc.
Social protection schemes: Revenues from government programmes, such as minimum income programmes.
The subsystems are related and, in the same farmer type, are combined in similar proportions from
farm to farm. There is always a reason for this and finding it reveals how the system functions. For
example, in Guatemala we found a production system with two subsystems: one, the owned home
garden, called “sitio”, where the peasant grows fruit trees and raises small animals like chicken and
pigs; the other, the rented field, called “milpa”, where the peasant grows corn, sesame and other
crops. The area rented for corn depends on the area available for small animals, because they

32
need to sell their animals to buy the agrochemicals required by corn and sesame (Ferreira &
Marcato, 2007).
One pattern found very often is where the crop system provides the food for the animals, while the
livestock system furnishes the manure needed to nourish the plants. The two systems are
proportional in size: if the livestock system is larger on one farm than another, the crop system will
also be bigger on the first farm (Dufumier, 1996). Experience shows that, when the typology is well
done, the differences within each type are very small and this kind of pattern can be identified with
three family interviews. In other words, with only three cases per type we have a good analysis of
farming systems (FAO, 1999).
The relations between the various components of the family can be gathered from a farming
systems diagram (see Part II of the handbook).
Exercise 9: Farming systems diagram (see page 55)
Identify and describe the components or structure of each production system. Draw a farming systems diagram, including all subsystems, that represents the type under analysis (not each family).
After the systems diagram is done, it is important to look at the timeline again. The participants
should be invited to discuss how the system was affected by major events in the family cycle: the
birth of a child; the marriage of a son or daughter; or the death of an elder.
Activity 3: Understand how the system works
System behaviour is analysed in the same focus groups/interviews as are used to identify system
structure. In other words, Activities 2 and 3 go together. We separate them into two activities in
order to explain better all the tasks in these activities. At the end of Activity 2 we have identified the
various different subsystems and have started to analyse the relations between subsystems. Now
we will get data about the work required and the cash flow of each subsystem, so as to understand
better the role each plays in the family.
Daily activity clocks and seasonal calendars (see Part II of this handbook) are tools that show how
the labour available in the family is allocated to the different subsystems. These two tools should be
used to gather gender-disaggregated data. The focus group should be divided into two subgroups,
women and men, and the team should use the two tools with the two subgroups separately.
Time allocation helps in discussing roles and responsibilities. As shown in Box 6, there are separate
spheres in the family were men and women have different degrees of control: some spheres are
controlled by women, some by men and others are disputed by the two. These separate spheres
are a concept in gender bargaining theory which is very close to the concept of subsystems in
farming systems theory. We propose using the two together, one enriching the other.

33
Box 6 – Gender bargaining theory
Gender bargaining theory or intra-household bargaining theory is an analytical framework that helps explain the intra-household dynamics, while taking account of the extra-household context. The concept of separate spheres is central: family members will cooperate in some spheres, conflict over others and decide and manage others individually. This heterogeneity of relations is a result of socially-constructed gender roles which assign different tasks to men and to women.
Control over a separate sphere will give the family member the control over the assets associated with that sphere. Power is linked to the assets that each family member brings to the family. This dynamic is clear when a woman loses her job: she also loses her bargaining power inside the family. Another example is that social support given to a woman improves her position in the family.
But, as seen in that last example, the value of each separate sphere is influenced by the extra-household context. Green revolution extension projects focus mainly on the men, reinforcing their power inside the family. If, on the other hand, market value is given to the food crops grown, and products processed, by women, this can improve their power inside the family.
Source: Based AGARWAL, Bina (1997): “Bargaining” and gender relations: within and beyond the household”.
Feminist Economics. N.º 3 Vol. 1.
After identifying who manages the various subsystems or spheres, we propose a discussion with
each subgroup on how decisions are taken. The man tends to be legitimated as responsible for all
family decisions, but his decisions are taken only after lengthy bargaining with his wife. It is
important to understand the bargaining process from both men’s and women’s points of view. Both
the timeline and the systems diagram can enrich this debate.
Exercises 10 and 11: Daily activity clock (see page 56) and Seasonal calendar (see page 57)
Analyse how the time available inside the family – to women, men and children – is allocated to the various family subsystems. Draw a seasonal calendar by gender and a daily activity clock by gender and season. After the exercise discuss how decisions are taken on managing each subsystem.
Where the market is important, an economic analysis of the system should be made. A consultant
in farm systems diagnosis will have strong tools to analyse labour allocation and economic
performance of the farming system5
This tool is presented in Part II of this manual. But remember that we do not need an analysis of
each family, only of each type. In the focus groups, facilitators should always try to input information
. However, we will present a simple tool which can help the
team to collect some data to make a simple economic appraisal of family systems.
The Expenditure & Income Matrix is to be applied to each subsystem in the family system. To use it
you need to have already applied the farming systems diagram. The Seasonal Calendar and Daily
Activity Clocks can also give important information to facilitate use of this tool. In fact, we are not
interested only in gathering economic information about the family type, but also in reviewing all the
information gathered by the previous tools.
5 See FAO (1999), Agrarian systems diagnosis.

34
that is not exactly the case of any one of the families present, but is an arrangement of the
information from all families in the focus group.
After the economic analysis is done, the team should facilitate a discussion of the economic security
(including food security) situation and strategies of the types of farming under analysis. What are
the main sources of cash? What are the main sources of food? The team should discuss the
rationality underlying decisions between self-consumption and market production and between in-
farm and off-farm labour.
It is also important to understand how income variations during the year are counterbalanced. For
example, we saw that at harvesting time some peasants bought small ruminants as savings. In the
course of the year these animals are sold to earn money to buy the inputs needed for agricultural
production (Bazin, 2008).
Exercise 12: Expenditure & income matrix (see page 58)
Identify and quantify the main sources of expenditure and income by family type. Once the various sources are identified, discuss: the level of economic security of the family; the importance of different economic strategies; and how intra-annual variations are addressed.
Activity 4: Compare production systems
At this point the team has a description of the structure and function of each family type and some
data about time allocation and economic results. The aim now is to put together the information of
all system types. When the team produces the typology of farmers, it already has an idea of the
different constraints that impact on right-holders. But it is only now that the team has sufficient
information to understand how these constraints impact on the strategy of each group.
For instance, at the beginning of the comparative analysis of farming systems, the team already
know that two peasants located in two different zones are different, but only at the end of this
analysis can the team understand how different localisation factors, such as ecological conditions or
proximity to a city, constrain the practices of each one.
This leads us to the first group of questions: how do different living conditions – those used to build
the typology – impact on the strategies of the family? How does living in different zones lead to
different living standards? How does differing availability of resources (e.g. land) or differing social
conditions (e.g. better access to school) lead to a different strategies for producing food and
income? What are the results of different production choices between farmers under the same
conditions and in the same zone?
The second group of questions can be summarised as: why are the families different? The data
from the family history is very useful in answering the question.
35
The last question is very useful, because it highlights several constraints on the poorest farmers.
Lets return to Manhiça for an example. As already explained, in the Manhiça exercise we found
several types of farmers. The difference between peasants and national farmers (see Box 4) was
very interesting (see Box 4): although the second group has a lot more land than the first, they
started from very similar conditions. When we looked at the history of the national farmers, they
seemed to have started from the same poverty level as the peasants were currently. But, while the
national farmers were able to capitalise during civil war period (working in the city or producing food
crops), the peasants’ level of financial capital held steady or declined. When the sugar cane sector
started expanding, the national farmers had money to invest and developed very fast, while only a
few peasants were able to change their conditions. As result, we found a huge difference between
the two groups.
4: Strategic plan (quality matrix)
Aim: To identify development priorities for the territory and synergies among potential partners for implementing them.
The final step has the clear goal of putting the information together and making recommendations.
There are two main steps to the methodology. First the team will build future development scenarios
for the territory. Scenarios should be thought-provoking for team members. This discussion should
have the help of the community leader workshop. The aim is to propose strategies for the right-
holders and implementing agency to cope with the challenges identified. The quality matrix6
Activity 1: Scenario building. What are the possible routes for the territory?
will be
used to discuss and map the major actions by level (local, national and international) and sector
(political, economic, environmental and social), showing the coherence and synergies between
actions to be implemented.
Scenarios tools are developed with two major objectives. A more technical approach to the
scenarios exercise is designed to determine the range of possible futures and analyse the impact of 6 By definition, quality has always been measured and calibrated in terms of the expectations of the
“beneficiaries”. That is why there are several levels of quality based on a specific set of prior expectations. To
increase the present level of quality of our work on food rights means to be able effectively to promote social
change and decrease present levels of hunger. This means that we should: increase coherence – the work
done at all levels (particularly our programme work) must be politically coherent with our strategy and each
level must reinforce the potential of the others; increase inter-thematic partnerships – our intervention should
be carried out in collaboration with other themes; increase local livelihoods – short- and medium-term results in
specific livelihoods should be achieved through political change, but also through the adoption of appropriate
innovative technologies (ActionAid, 2007).

36
each on the organisation strategy. Participatory approaches are intended to highlight assumptions
and mobilise actors around a strategic proposal. Nevertheless, these different objectives are more
or less present in all scenario exercises.
The scenarios exercise starts by analysing the driving forces identified in the historical analysis
made at the start of the diagnosis. Of course, all the data collected in the actor and farming system
analyses should add a considerable amount of information to the historical analysis. Now the team
should not only know what the main driving forces are, but also recognise how they are affecting
the main actors and, above all, these actors’ ability to modify each driving force.
Scenario building is also the moment when the team’s technical expertise is most important.
Sometimes communities are unable to change a driving force for lack of competences. For
instance, the expansion of sugar cane in Manhiça (Mozambique), which we identified during the
diagnosis, seems to the community to be the most profitable land use and, for that reason,
inevitable. They do not have enough experience of sugar cane production to know the crop’s long-
term effects: decreasing yields, declining soil fertility etc.
It is precisely at this point that scientific expertise should be added to the data collected in the
communities.
The first step is to define different possible futures. The team should start by defining the timeframe
for the scenarios. Then the team should consider different extreme combinations of the driving
forces captured in the historical analysis. For instance, once again using the Manhiça exercise, we
identified four driving forces: climate change; sugar cane expansion; local governance capacity and
HIV/AIDS prevalence.
The second step is to identify what driving forces show a definite trend: for instance, it is very
unlikely that climate change can be stopped and reversed – the team can consider it a driving force
with little degree of uncertainty. The others can be thought of in terms of extremes: strong local
governance vs weak very local governance. The same happens with sugar cane expansion (great
vs small) our HIV/AIDS prevalence (high vs low).
The second step is to prioritise the two most important driving forces. Two driving forces produce
four scenarios; with three driving forces, the number of scenarios rises to eight; with four, to sixteen.
As a result, although all driving forces do matter, we should prioritise only two. In Figure 11, local
governance and sugar cane expansion are prioritised and HIV/AIDS prevalence is momentarily
suspended.
Note that in this part of the process the objective is to choose the driving forces that the diagnosis
team believe involve greatest uncertainty and will have the greatest impact on the territory. Of
course this depends on what issues it is intended to work with.

37
Figure 11 – Scenario mapping exercise based on the experience of Manhiça (Mozambique)
As this exercise is very important, it should be conducted with the participation of local leaders.
Moreover, it will give the basis for planning, and the plan will be implemented by local organisations.
For these reasons, the leaders should participate in the scenarios and planning exercise.
In Figure 11 we consider three scenarios: less local governance with more sugar cane expansion
(scenario A); more local governance with more sugar cane expansion (scenario B); and more local
governance with more sugar cane expansion (scenario C). We do not consider less local
governance with less sugar cane expansion, because reduced sugar cane expansion entails finding
other economic alternatives through concerted action by local actors.
Exercise 13: Define the scenarios
Choose the two most important driving forces in terms of unpredictability and impact on the territory. Make a four-scenario matrix and arrange catchy names for each.
After scenarios have been defined, the team must focus on each one to analyse it. Figure 12 shows
a format for describing each scenario. Note that now all driving forces must be considered; for those
not considered important in the previous scenario, the team should assume that their behaviour will
remain steady in the time-frame in analysis.

38
Figure 12 - Scenario description format
The format in Figure 12 comprises four parts. The first gives the basic characteristics of the
scenario. For example, the basic characteristics of Scenario A are:
Sugar cane expansion will momentarily boost the revenues of all actors in the territory; nevertheless
periodical extreme events caused by climate change will cause the actors to return to poverty. Local
state bodies are weak and will be weakened when the land conflicts arise, and do not have the
capacity to take actions that will help the local actors to prepare themselves for climate change
impact.
Once the team agree on the basic characteristics of the scenario, they should discuss their impact
on the main actors, on the different zones of the territory and on gender issues. Here it is important
to remember the time-frame of the scenarios. The team should obviously review the information
from the actor and landscape analyses. Note that comparative farming systems analysis is no more
than a detailed actor analysis applied to the usual beneficiaries of food rights and agricultural
programmes.
A set of questions can help define the impact of the scenarios. How will actors’ strategies be
constrained by this scenario? How will actors react to these constraints? How will actors use the
different zones a few years from now (consider the timeframe)? How will these changes affect the
gender balance inside families? Etc.
The scenarios should then be presented to the whole team to evaluate their coherence.

39
Exercise 14: Describe each scenario identified.
Describe each scenario resulting from the matrix in the previous exercise.
Activity 2: From scenarios to planning
Presentations of the scenarios in the community leaders workshop lead to a discussion of the
development priorities for the territory. The quality matrix is, first of all, a tool for capturing and
organising these “ideas”. The bullet points of a strategy for the territory are clustered by spatial level
and sector, according to the discussion presented on pages 8 et seq.
The table in Figure 13 was used in the territorial diagnosis in Manhiça, Mozambique, to map the
various agenda bullets (here we have shown part of the agenda that was built up).
Taking into account the various scenarios that have been built, what are the relevant actions to be
carried out in the territory? From what levels and sectors should they be addressed? What
organisations in the workshop are best placed to pursue these actions? For example,
environmental organisations will direct their work to the environmental sector. Education and health
organisations tend to focus on the social sector. Women’s and food rights organisation tend to be
multi-thematic. If they recognise their aims in the actions in the matrix, that will help them to
recognise their role in the overall strategic plan.

40
Figure 13 – Strategy quality matrix of Manhiça (Mozambique)
Governmental Economic Social Environmental
Global
National Lobby the organisms responsible for state decentralisation for effective decentralisation of resources
Participate in SETSAN and lobby for the use of agro-ecology programmes as hunger reduction measures (an experimental programme in Manhiça can be proposed).
Province Start dialog with CSO, local state institutions and private sector to mitigate the impact on crops of diminishing water supply due to climate change.
Actions to build up the agro-ecological market chain in the province of Maputo (a market study is recommended).
Municipal and District
Propose an alternative plan and budget for using government decentralised resources to support ecological agriculture.
Municipal actions to build up ecological and agricultural market products.
Building capacities in women, in small business management and commercialisation of agricultural products.
Lobby state local institutions to promote a participatory management plan for the savanna region, particularly in wood gathering.
Community
Strengthen the political capacity of agricultural organisations, which
• Background in local leadership competences.
includes:
• Improve articulation between represented and representatives.
• Linkage with civil society actors at the national level (ROSA).
Strengthen the capacity of local associations to deliver technical support for their members. This may involve the international Farmer to Farmer programme, as well as setting up a local F2F programme.
Introduce into formal education
(schools) and informal education
(REFLECT circles) issues like:
• Diet and cooking practices • Agro-ecological production
techniques (school farming) • Sex education (HIV/SIDA)
Source: TDI work plan for Manhiça.
Work Plan 1 Work Plan 2 Work Plan 3 Work Plan 4

41
On the other hand, to the extent that participants identify themselves as connected with some
action, they recognise their place in the matrix. Participants focused at the same place in the matrix
will then make better coalitions. Capacity building in local development councils to strengthen their
ability to address food security or water management – two actions that are usually pursued by
different organisations – can be mutually reinforcing. In that sense, this exercise will help the
participants to build broader coalitions.
Strengthening civil society organisations and their networks at the local level and linking them at the
national (and international) level will allow them to engage critically with duty bearers.
Once the matrix is filled (after the first attempt), try to revise it by answering the following questions:
• To what degree will this strategy heighten the critical consciousness of rights-holders, and
strengthen their ability to define and claim their rights (agency)?
• To what degree will this strategy build the power (consciousness, capacity, resources) of
women and address power imbalances with regard to women?
• Does this response have the potential to result in a sustained, beneficial change in power
relations locally, nationally or globally?
• To what degree will this strategy create ongoing relationships of engagement between
rights holders and duty bearers (rather than just once-off consultation)?
• To what degree will this strategy empower rights-holders to demand meaningful
accountability from duty-bearers and the implementing organisation?
Once finished, the items of the matrix can be grouped into work plans. According to the
implementing organisation’s and its partners’ capacities and current work, the team should split the
issues in the matrix and define work plans. In fact, the matrix is filled with strategic objectives that
can be used in a logical framework matrix.
If objectives in the matrix are to be split into different work plans (or LogFrames), we strongly
recommend that the objectives in the same matrix cell should be kept together in the same work
plan. If two objectives are to be addressed at the same level with the same type of “expertise”,
synergies can probably be found between them and both be addressed by the same implementing
team.
Exercise 15: Quality matrix
Fill in the matrix, helping participants (partners) to position themselves in the strategy. Identify objectives by levels, indicators and structural activities in order to build a logical framework and action plan.

42
PART II TOOLBOX

43
1: Initial appraisal
Main aim: To build a comprehensive picture of the territory
The Initial Appraisal is a participatory tool used to describe and analyse a given territory together with all the local actors involved (men, women, young and old, to draw the big picture of its development opportunities and constraints. The research intends to put together information from various sources, including interviews, focus groups facilitated with PRA tools, literature review and team members’ experience. The aim is to make a comprehensive, rather than descriptive, analysis of the territory. It is important to identify the main political, eco-systemic, geographical and social issues that constrain or deny the rights of the powerless, especially the Right to Food.
This step is divided into three activities: landscape analysis; historical analysis and power analysis. The landscape analysis is the main entry point to the territory: it will enable the team to arrive at a first evaluation of the territory in order to engage in dialogue with local actors. The historical analysis is the information collection phase and gives the basis for further steps. Actor analysis is the step where the power relations between the different actors are analysed. This should also provide the basic information on differential access to, and control of, land, natural resources by women and men, old and young. This information is the basis for planning.
The tools presented here are designed to facilitate focus groups (for men and women separately) or to record the information gathered from other sources by team members. For example, the matrix of powers and interests can be covered in a few focus grups, after which the team members put together the information gathered in those workshops, and include it with the information from other sources.
Although we describe here how to use this technique in participatory workshops, the team should always do a final diagram putting together the information from field observations, focus groups and interviews.
Main outputs: Technological • Identification of the homogeneous zones in the territory, for purposes of development
planning • Identification of the most important trends in the development of this territory • Tentative typology of actors and their description in terms of power, rationality, rights and
duties, and relationships according to age and sex
Tools: Landscape analysis: Village resources map; Transect. Historical analysis: Timeline; Timetable; Trend lines; Historical transect. Power analysis: Venn diagram; Matrix of power and interests; Matrix of rights, responsibilities and revenues.

44
Landscape analysis: Region resources map
Aim: To identify the location and evolution of the most important production and social resources in the community or region by socio-economic group, sex and age. Important to record the group’s perception of major constraints and strengths and also their spatial distribution.
Process: Split the group by socio-economic group, sex and age. On a flipchart or on the floor, start by having one of the group members draw a known place (for example an important road, a church or the market). Then ask to the participants to continue by drawing boundaries. You can use the questions below to prompt the debate that will help to draw the map and will feed the analysis.
.
Driving questions: • Where are the assets of the territory: the various fields, the market, the roads, etc.? • What are the oldest parts of the village and how has the village grown? • What resources are abundant and what are scarce? • What has changed for the better in the past five or ten years? • What has changed for the worse in the past five to ten years?
Notes: When a map is available from a government office or other source, the group can represent the assets on it. This will help save time.

45
Landscape analysis: Transect
Aim: To extend the information on the village resources map in greater depth and to organise and represent special information. It helps identify how actors use different parts of the territory, considering ecological and infrastructure conditions.
Process: With input from the village resources map and/or cartographic maps, choose a line of greatest diversity and draw altitude variation. Then together with the men and women of the community draw key environmental elements: humidity; water sources; etc. Then add key economic and social elements, such as urban and agricultural land uses (including schools, health centres, churches, social halls etc). When the map is finished discuss the different zones that could be identified in the territory.
Driving questions: • What are the most important factors that cause spatial differences in the region? • What are the various zones in the region? • What are the natural strengths and constraints of each zone? Who takes advantage of them?
Who has access and control over them? • What are the most important activities carried on in the zone? By whom? • What are the services available in each zone? • Who has access to those services?
Notes: A final transect representing the various zones in the territory must be constructed by the team, based on their interviews and on transects made by the community focal groups.

46
Historical analysis: Timeline
Aim: To identify the important historical facts that have influenced the territory. To search for cause-and-effect relations between them. How these historical events affected men and women, young and old people differently.
Process: Put an arrow – a large paper arrow, for example – on a wall and write some dates (years) on it. Alternatively draw a line on ground. Brainstorm and list the important events that determine the region’s history. Start by asking when the community was founded and then follow events after that. Glue cards (15×21 cm) on the wall, as in the example. Discuss how these events are related. Sometimes you will have to work with focus groups of older men and women who have long-term memory of the territory and changes that have occurred socially, politically, environmentally etc.
Driving questions: • How has the community changed in recent years? • What are the important events in these changes? • How they are related? • What are the trends/driving forces (chains of events that produce visible changes) to be seen
in the territory?
Notes: It is important to disaggregate the facts by level (global, national and local) and by sector (political, environmental, social and economic). Arranging the cards vertically can help meet the first need – put the global issues higher and local issues lower – and use colours to distinguish sectors, for example, red for political, green for environmental, yellow for social and blue for economic.
1950 Coffee
expansion
1984 Drop in
prices
1980 Soil losing capacity
1990
Emigration

47
Historical analysis: Time table
Aim: To identify the important historical facts that have influenced the territory. To search for cause-and-effect relations between them. How these historical events affected men and women, young and old people differently.
Process: Draw a table with five columns: date; environmental facts; economic facts; social facts and political facts. Brainstorm and list the important facts which are determining the history of the region. Start by asking when the community was funded and then follow events after that.
Then, discuss how these events are related.
Driving questions: • How has the community changed in recent years? • What are the important events in these changes? • How they are related? • What are the trends/driving forces (chains of events that produce visible changes) to be seen
in the territory?
Notes: The timetable is a better tool for recording key informant interviews than for facilitating participatory workshops.

48
Historical analysis: Trend lines
Aim: Explore an important issue in the history of the territory. From the actors’ perceptions, identify how important factors are changing in the territory and discuss how this is affecting other issues there.
Process: Identify a trend that is very important to the community. Draw a Cartesian graph (XY) and put the time span on the horizontal axis. Discuss how the trend has changed over time and represent it by a line. Discuss the causes of this behaviour and try to find other related trends to analyse with this same tool.
Agriculture Industry Population
Today1900 1950 Today1900 1950 Today1900 1950
Driving questions: • What are the most important trends (environment, economic, social and political)?
• What has their behaviour been over time?
• What are the most important reasons for this?
• How has this trend affected the community? The men? The women?
• What trends are related? And how?
Notes: The graph is less important than the discussion. Take notes of the discussion and use the discussion as an input for more complex exercises: timetables, timelines and special, historical transects.

49
Historical analysis: Historical transects
Aim: To visualise how the various trends in history have transformed the territory being analysed. To define different phases in history and highlight the differences between them. And to understand the different perspectives of community members in terms of these historical phases.
Process: Do a transect of the current situation. Then discuss the historical information and define different periods in it. Next redraw the first transect to adapt it to each period. Ensure that different transects highlight the most important trends/driving forces in the region and their impact on the landscape.
Driving questions: • What are the different periods in the territory’s recent history? • How have the various zones in the territory been used over time? • How have different actors been engaged in this process? How has the process affected them? • What was been changing? How does this affect the territory? • What is the probable future of this territory?
Notes: This tool combines the information from some of the tools presented above (the transect with the timeline). It helps in discussing the information from those tools further and in greater detail, but also requires that the other exercises are done beforehand.

50
Power analysis: Venn diagram
Aim: To understand the role and importance of groups and organisations in the territory. To analyse their relations and how decisions are taken.
Process: Prepare paper circles of at least four different sizes. With the focus groups described in previous activities, start by listing the names of groups and organisations. Agree with the participants that the largest circles are for powerful actors and the smallest for powerless. Finally arrange the circles on a wall, considering the following:
circles separate = no contact circles touching = flow of information between organisations small overlap = some cooperation between organisations large overlap = strong cooperation
Driving questions: • What are the organisations around different issues in the community? • Which groups (women, youth, peasants…) are represented in these organisations? Which are
excluded? • What are the links between local and external organisations?
Notes: Remember to divide the groups by sex, age and socio-economic group in order to get the different perceptions. From this Venn diagram the team and focus group participants should identify the most relevant actors for further research and for using the next tools.

51
Power analysis: Matrix of power and interests
Aim: To understand how the important trends in the territory are impacting on the actors and their capacity to resist and modify those trends. To link the historical process of the region with the ability of each actor in the territory to take action.
Process: Draw the matrix below. List the important actors in the territory (you can copy from the first matrix). Classify them by power and brainstorm their interests. Then identify the various impacts of the driving forces (captured in the historical analysis) on the actors’ interests.
Legend Power: classify from 0 (powerless) to 4 (powerful)
Affected: + + (very positive); + (some positive); 0 (not affected) – (some negative); – – (very negative)
Driving questions: • Who are the most relevant actors in the region? • What is their level of power? What are the sources of their power? • What are each actor’s main interests? • What are the most important trends in the territory? How does each trend impact on each
actor? • How has this trend affected men and women, young and old people differently? How may it
affect them in the future?
Notes: The trends should already have been identified in the historical analysis. Go back to the timeline and historical transects to identify them.

52
Power analysis: 3Rs matrix
Aim: To identify the rights of the powerless and the duties of those responsible for ensuring them. Gives a preliminary description of the actors in the territory. This work should be carried out with different socio-economic groups to get the broadest perspective.
Process: Draw four columns on a flip chart or a board and name the columns as follows: actors, rights, responsibilities and revenues. Start by listing the actors in the first column (you can copy from the first matrix) and fill in the matrix as shown below.
Driving questions: • Who are the most relevant actors in the territory? • What are their rights, considering customary practices, national law and international
framework? • Are these rights ensured? Who is responsible for ensuring them? • What are main revenues and returns for each actor? Who decides the use of these revenues?
How are they used? How will actors’ practices be rewarded and reinforced?
Notes:

53
2: Comparative PS
analysis Main aim: To analyse in detail how the different households respond to external changes
The comparative analysis of production systems aims to highlight how differences between powerless will generate different demands. This method will also help identify what technical shortcomings in their production unit can be addressed in order to improve their conditions of life and afford them the leeway (more free time and better health) to engage in political activity. Finally, it can be used to document the impact of the major external trends on the powerless farmers and these findings can be used to advocate with duty-bearers.
This step demands a review of the information gathered in the initial appraisal to identify the focus of the analysis. It will then be conducted by interviewing farmer families in groups (focus groups) or individually. Although the method is designed to understand peasant families, with a little adaptation it could fit the analysis of other powerless families or large-scale farmers.
The tools presented here are for use to facilitate focus groups or to record the information gathered by team members from other sources. For example, the matrix of powers and interests can be covered in a few workshops, after which the team members put together the information gathered in those workshops and add in the information from other sources.
Main outputs: • Identify the different sources of diversity among powerless farmers and organise them by
type. • Describe each type and explain their behaviour/rationality. • Analyse the role of each family member: women/men, children/adults/elderly etc. • Understand the different impacts of the external trends on each type and family member.
Tools: Timeline (for family-farm analysis); Farming system diagram; Daily activity clock; Seasonal calendar; Expenditure & income matrix.

54
Timeline for family-farm analysis
Aim: To learn how external constraints have affected the farming family and how the reproduction pattern (marriages and inheritance) posed challenges to them. To identify whether the family’s standard of living is improving or declining and identify the main causes.
Process: Choose a family or a small group of peasant families of the same type. It is important to have both women and men at the meeting. Draw an arrow on flipchart paper or on the ground. Explain that the line represents time and that we want to know their family history. Start by asking when the family started its own farm. Then ask for important changes like births, purchase of a tractor, construction of a new building etc. and write them on the line in chronological order. Now, discuss the importance of these key events and how they have impacted on the family’s livelihood. New important events may appear and will enrich the line.
Driving questions: • When was the family settled? • What important events have occurred since then on the farm? When? • What were the consequences of those events in the family and on the farm? • What have been the major challenges facing the family over this time? How have they met
them? What innovations introduced by this family may be useful to their neighbours?
• Does this family correspond to the type we are analysing? Should the typology be revised? For the research team
Notes: The history is very important to see if the peasant family interviewed is a good example of the type or not. If not, we should also examine whether this family is an exception or the typology should be improved.

55
Farming systems diagram
Aim: This tool helps understand how a peasant family organises and uses its production capacity, inside and outside the farm. Identify the farm subsystems.
Process: Choose a family or a small group of peasant families of the same type. It is important to have both women and men at the meeting. Start the discussion of farm organisation with the questions below. Then capture the information with a diagram as in the example. The facilitator can do the drawing with input from the participants or ask the participants to finish the drawing.
Driving questions: • What are the major activities inside the farm? Crops? Livestock production? Etc. • What are the major activities outside the farm? Fishing? Collecting water? Paid work?
Market? • How are the products of each part of the farm used? • Who is responsible for what?
Notes: Use colours to draw the lines or use symbols in order to clarify the gender roles, as the example above shows.

56
Daily activity clock
Aim: To learn how family members allocate their time. Helps to identify the different components of the system and who is responsible for what.
Process: Interview men, woman and children of the same family separately or do three different focus groups disaggregated by gender and age. Draw a circle on a flipchart and explain that we want to know what they do at different times of day. Also explain that the circle represents a 24-hour clock and that we are going to mark on it the various activities they do in the course of the day. Then start the exercise by asking what time they wake up and what they do next. And after that? And so on. Record these activities as in the example below.
Driving questions: • How do men and women use their time? How much time do they spend on production
activities, domestic activities, community work, leisure and sleep? • Is their allocation of time concentrated in a few activities or is it fragmented? • Comparing separate diagrams for men, women and children, who does what? • Who has more free time available and who does not?
Notes: Pay attention to the fact that agricultural activities change in the course of the year, as does the time allocation pattern. It is probably useful to do more than one diagram for each gender and generation group, one for each specific phase of the seasonal calendar (see below).

57
Seasonal calendar
Aim: To understand the distribution of work over the year: the seasonal distribution of work (which months have heavy workloads and in what months labour is available) and the seasonality of financial capacity. It can also show the seasonality of other important aspects in the family.
Process: Discuss what month the agricultural year starts in (for example, the family may plan their farm activities from the first rain after summer). Draw a table as in the example below. Then ask about rainfall patterns. This will facilitate later discussions, because agricultural practices depend on rainfall. Use a line for each part of the farm and off-farm process/component (the subsystems) and list the activities pursued to carry out each process in the corresponding month.
Driving questions: • How do men’s and women’s workloads change over the year? What months are busiest? • When is most of the work done by men? And by women? • When is food scarce? In what months does the family have financial resources? • When is forage scarce?
Notes: It is better to have two different calendars, one for men and one for women (divided by social class if possible).

58
Expenditure & income matrix
Aim: To conduct a simple economic analysis of farming systems. By quantifying the main sources of income and expense, we will get a deeper understanding of the priorities and constraints of the family farm.
Process: Looking at the farming systems diagram, identify the different subsystems. On a flipchart draw a worksheet with four columns: source of expenditure, amount, source of income, amount (see example). Define the time span. The time span will be different for each subsystem: for example, weekly for domestic expenses, monthly for off-farm income and annually for farming income. The time span needs to be adapted to each subsystem. Then fill in a matrix for each subsystem. Lastly confirm annual income and expenditure to discover whether any information is missing.
Weekly domestic expenditure of a peasant family
Layout of an expenditure and income matrix
Driving questions: • How long are the cycles of each type of important subsystem (e.g. a year for agricultural
production or a week for domestic labour)? • What are the major sources of expenditure? How much does the family spend on them? • What are the major sources of income? How much does the family earn from them? • Who decides to spend or save earnings, the man or the woman?
Notes: This process is usually difficult and may take a few hours to finish. The focus group should split into small groups to make it easier.
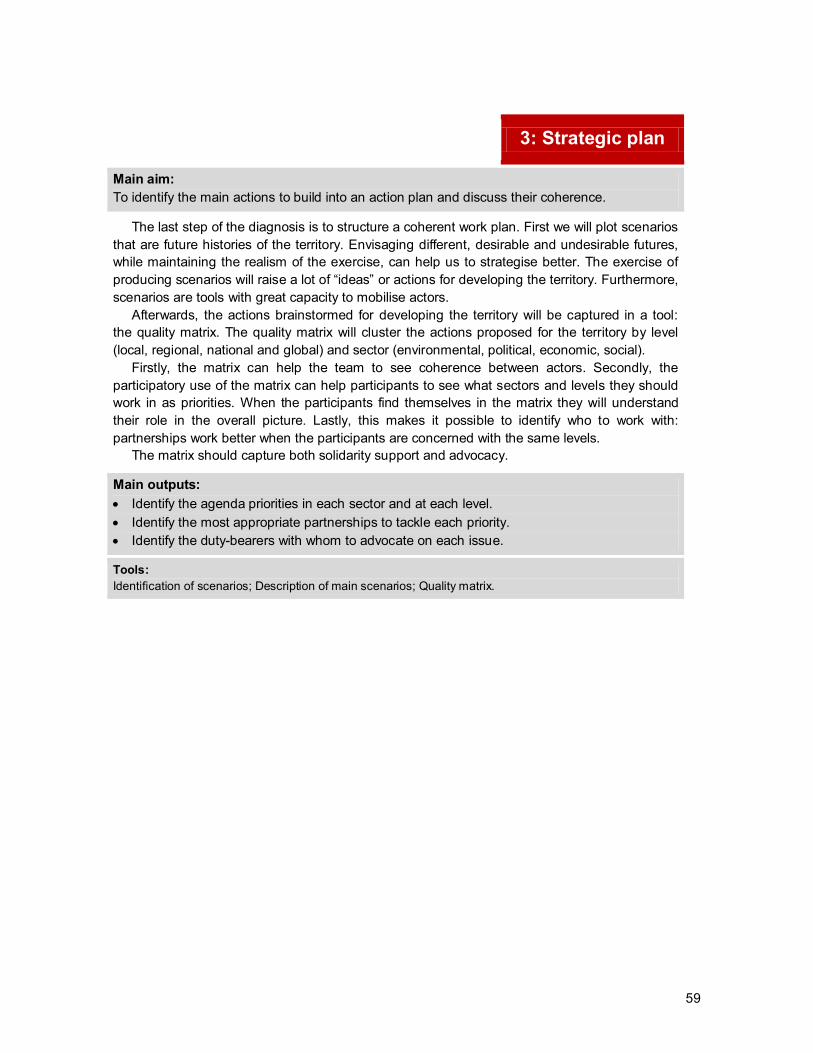
59
3: Strategic plan
Main aim: To identify the main actions to build into an action plan and discuss their coherence.
The last step of the diagnosis is to structure a coherent work plan. First we will plot scenarios that are future histories of the territory. Envisaging different, desirable and undesirable futures, while maintaining the realism of the exercise, can help us to strategise better. The exercise of producing scenarios will raise a lot of “ideas” or actions for developing the territory. Furthermore, scenarios are tools with great capacity to mobilise actors.
Afterwards, the actions brainstormed for developing the territory will be captured in a tool: the quality matrix. The quality matrix will cluster the actions proposed for the territory by level (local, regional, national and global) and sector (environmental, political, economic, social).
Firstly, the matrix can help the team to see coherence between actors. Secondly, the participatory use of the matrix can help participants to see what sectors and levels they should work in as priorities. When the participants find themselves in the matrix they will understand their role in the overall picture. Lastly, this makes it possible to identify who to work with: partnerships work better when the participants are concerned with the same levels.
The matrix should capture both solidarity support and advocacy.
Main outputs: • Identify the agenda priorities in each sector and at each level. • Identify the most appropriate partnerships to tackle each priority. • Identify the duty-bearers with whom to advocate on each issue.
Tools: Identification of scenarios; Description of main scenarios; Quality matrix.

60
Scenario building: indentifying the scenarios
Aim: Explore the assumptions made during the diagnosis. This exercise helps the participants to analyse the implications of their assumptions. Requires discussing the importance of each trend (driving force) that affects the territory.
Process: After revising all information captured during the previous phases of the diagnosis, define the driving forces of the territory. Then divide the driving forces in two groups: those with little or no uncertainty and those with considerable uncertainty. Then order the second group according to the importance/impact of each driving force in the territory, choosing the two most important to build the scenarios matrix (see below). Then, choose catchy names for each scenario.
Driving questions: • What will the timeframe be for the scenario building? • How many years will it take before we see results from working in the territory? • What are the important driving forces that constrain the territory’s development?
Notes:

61
Scenario building: Description of each scenario
Aim: To explore the assumptions made during the diagnosis. This exercise helps the participants to analyse the implications of their assumptions. Requires discussing the importance of each trend (driving force) that affects the territory.
Process (for each scenario): Define the timeframe. Then write two paragraphs describing the basic behaviour of the scenario, considering all driving forces (see notes below). Then analyse the impact of each scenario on the most relevant actors, zones and gender issues. It is recommended to use the form below.
Driving questions: • What will be the impact of each scenario on actors, zones and gender issues?
Notes: Although driving forces with little or no uncertainty cannot lead to different scenarios (and were therefore suspended in the previous exercise), they can have greater impact on the future and should be considered in all scenarios.
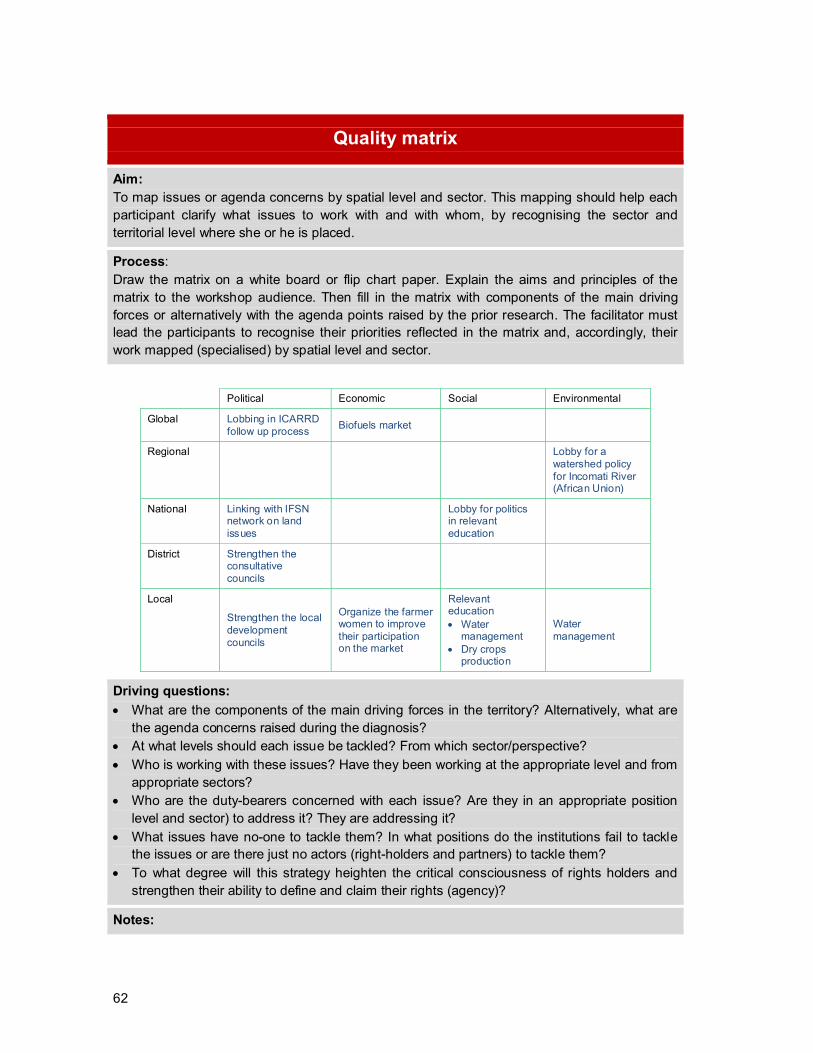
62
Quality matrix
Aim: To map issues or agenda concerns by spatial level and sector. This mapping should help each participant clarify what issues to work with and with whom, by recognising the sector and territorial level where she or he is placed.
Process: Draw the matrix on a white board or flip chart paper. Explain the aims and principles of the matrix to the workshop audience. Then fill in the matrix with components of the main driving forces or alternatively with the agenda points raised by the prior research. The facilitator must lead the participants to recognise their priorities reflected in the matrix and, accordingly, their work mapped (specialised) by spatial level and sector.
Political Economic Social Environmental
Global Lobbing in ICARRD follow up process Biofuels market
Regional
Lobby for a watershed policy for Incomati River (African Union)
National Linking with IFSN network on land issues
Lobby for politics in relevant education
District Strengthen the consultative councils
Local
Strengthen the local development councils
Organize the farmer women to improve their participation on the market
Relevant education • Water
management • Dry crops
production
Water management
Driving questions: • What are the components of the main driving forces in the territory? Alternatively, what are
the agenda concerns raised during the diagnosis? • At what levels should each issue be tackled? From which sector/perspective? • Who is working with these issues? Have they been working at the appropriate level and from
appropriate sectors? • Who are the duty-bearers concerned with each issue? Are they in an appropriate position
level and sector) to address it? They are addressing it? • What issues have no-one to tackle them? In what positions do the institutions fail to tackle
the issues or are there just no actors (right-holders and partners) to tackle them? • To what degree will this strategy heighten the critical consciousness of rights holders and
strengthen their ability to define and claim their rights (agency)?
Notes:

63
CONCLUSION
In classic previous approaches we used an “area-based” methodology for programming, in which
we examined an area to identify what was lacking and then focused on the people in it. Now, our
current food rights programme approach introduces a different hierarchy into planning: we consider
territory as a historically constructed arena for struggle and negotiation, and focus directly on the
different groups in the territory and the power relations among them.
We start this process with a concrete diagnosis designed to support the formulation of a specific
LogFrame and action plan for the implementation of specific actions (farmer-to-farmer exchanges,
lobbying, advocacy, campaigning and negotiation) directed to building local, national and
international Right to Food frameworks (policies and institutions).
As said at the outset, this manual is a living document which will be updated as more experiences
are reported to us.

64
BIBLIOGRAPHY
ABARCA, Pedro and Adolfo Hurtado (2006): El plan educativo para el desarrollo local: guía
metodología. Nicaragua: Ministerio de Educación, Cultura y Deportes.
ACTION AID (2007): Pilot Initiative on negotiated agricultural development: rights based approach
to our agricultural work. Action Aid Food Rights Team Working Paper.
AGARWAL, Bina (1997): “Bargaining” and gender relations: within and beyond the household
Available at
.
Feminist Economics. No. 3 Vol. 1.
ARCHER, David and Kate Newman (2003): Reflect: communication and power. UK: ActionAid.
http://www.reflec-action.org
BAZIN, Frederic (2007a): Participatory territorial development: what is it and how does it work?.
ActionAid Food Rights Team Working Paper.
BAZIN, Frederic (2007b): Territorial development initiative: agrarian diagnosis of Niamina East
District. Consultant report for ActionAid International.
BAZIN, Frederic (2008): Territorial development initiative: agrarian diagnosis and actor analysis of
Niamina East District. Consultant report for ActionAid International.
BIANCALANI, Riccardo (2004): Participatory land use development in municipalities of Bosnia and
Herzegovina: guidelines. Sarajevo: FAO.
Available at http://www.plud.ba/index.aspx?PID=14
CHIWAKA, Ethlet and Roger Yates (n.d.): Participatory vulnerability analysis: step by step guide for
field staff. ActionAid International.
Available at:
http://www.actionaid.org.uk/doc_lib/108_1_participatory_vulnerability_analysis_guide.pdf
ARCHER, D and S. Cottingham (1996). The Reflect Mother Manual. UK. ActionAid.
Available at http://www.reflect-action.org
CUÉLLAR, Nelson and Susan Kandel (2007): Gestión territorial rural: enfoque para fortalecer
estrategias de las comunidades rurales pobres. San Salvador: PRISMA.
Available at http://www.prisma.org.sv

65
DIETSH, Laurent; Edwin Novoa and Claudia Picado (2006): Diagnóstico Territorial Integral:
Municipio de la Ciudad de Darío. Managua: Universidad Centroamericana. M.Sc.
dissertation.
DUFUMIER, Marc (1996): Les projets de développement agricole – manuel d’expertise. France.
CTA-Karthala.
FAO (1999): Guidelines for agrarian systems diagnosis Rome: FAO.
Available at ftp://ftp.fao.org/sd/sda/sdaa/asd.zip
FAO (2001): SEAGA: field level handbook. Rome: FAO.
Available at http://www.fao.org/sd/SEAGA
FAO (2003): SEAGA: macro level handbook. Rome: FAO.
Available at http://www.fao.org/sd/SEAGA
FAO (2005): An approach to rural development: participatory and negotiated territorial
development. Rome: FAO.
Available at http://www.fao.org/sd/dim_pe2/docs/pe2_050402d1_en.pdf
FAO (2007): Comunicação, diálogo e conciliação: DTPN, mais que um método, uma estratégia de
integração e interação. Rome: FAO.
FERREIRA, José (2006): Memoria del taller “Curso básico de diagnóstico de sistemas agrários”.
Guatemala, REDSSAG (working paper).
FERREIRA, José and Celso Marcatto (2007): Territorial analysis of the municipality of Coatepeque.
Consultant report for ActionAid International.
FELDSTEIN, Hilary Sims (2000): Gender analysis: making women visible and improving social
analysis
Available at
. In M. Collinson (ed.) A History of farming systems research. UK: CABI Publisher.
GUERRA, Isabel (2006): Participação e acção colectiva – interesses, conflitos e consensos.
Oeiras, Princípia.
GEILFUS, Frans (1997): 80 herramientas para el desarrollo participativo: diagnóstico, planificación,
monitoreo y evaluación. IICA, El Salvador.
http://www.catie.ac.cr/econegociosagricolas/BancoMedios/Documentos%20PDF/
rde_oe_80_herramientas_metodos_iica_parte1.pdf
GODET, Michel (2006): Strategic foresight: problems and methods. Paris: LIPSOR.
Available at http://www.cnam.fr/lipsor/lips/conferences/outils.php
HILDEBRAND, Peter E. (2000): A personal history in FSR. In M. Collinson (ed.) A History of
farming systems research. UK: CABI Publisher.

66
HURTADO, Adolfo (2005): Memoria del ‘Taller introductoria para el ordenamiento de las agendas
de incidencia de los movimientos y representaciones sociales del departamento de Nueva
Segovia’. Nicaragua, Consejo Regional de Alcaldes de las Segovias (working paper)
HURTADO, Adolfo (2007a): Propuesta metodológica para la planificación estratégica para el
desarrollo de SSAN. Managua: PESA/FAO (working paper).
HURTADO, Adolfo (2007b): Territorial development initiative: Manhiça – Mozambique (final report):
Consultant report for ActionAid International.
MAZOYER, Marcel (1992): Pour des projets légitimes et efficaces
Available at
. Land reform. Rome, FAO.
OGILVY, Jay and Peter Schwartz (2004): Plotting your scenarios. USA: Global Business Network
http://www.gbn.com/ArticleDisplayServlet.srv?aid=34550
RAVERA, Federica (2005): Sistematización de un proceso de participación y concertación para el
desarrollo territorial en áreas de montaña: la experiencia de la Zona Centro de la Provincia
de Huancavelica (Perú). Peru: CEPES & FAO.
Available at http://www.fao.org/sard/common/ecg/2532/es/Cepes4pagesSP55.pdf
SCHEJTMAN, Alexander and Julio A. Berdegué (2004): Desarrollo territorial rural. Chile, RIMISP.
Available at http://www.rimisp.org/getdoc.php?docid=870
SCARCE, Diana and Katherine Fulton (2004): What if? The art of scenario thinking for nonprofits.
USA: Global Business Network.
Available at http://www.gbn.com/ArticleDisplayServlet.srv?aid=32655
SHELL Global Business Environment (2003): Scenarios: an exploring guide. London, Shell
International.
Available at http://www-static.shell.com/static/aboutshell/downloads/our_strategy/shell_global_
scenarios/scenario_explorersguide.pdf
SIDERSKY, Pablo (2007): A territorial assessment in Morang District – Eastern Terai, Nepal.
Consultant report for ActionAid International.


