Embed Size (px)
Citation preview
“A STUDY ON CONSUMER BEHAVIOUR
TOWARDS REALME SMARTPHONES”
Project Report submitted to
UNIVERSITY OF CALICUT
In partial fulfillment of the requirement for the award of the degree of
BACHELOR OF COMMERCE
Submitted by
JOM JOSE
(CCASBCM218)
Under the supervision of
Mr. ASLAM P.S
DEPARTMENT OF COMMERCE
CHRIST COLLEGE (AUTONOMOUS), IRINJALAKUDA
MARCH 2021
CHRIST COLLEGE (AUTONOMOUS), IRINJALAKUDA
UNIVERSITY OF CALICUT
DEPARTMENT OF COMMERCE
CERTIFICATE
This is to certify that the project report entitled “A STUDY ON CONSUMER
BEHAVIOUR TOWARDS REALME SMARTPHONES” is a bonafide record of project
done by JOM JOSE, Reg. No. CCASBCM218, under my guidance and supervision in
partial fulfillment of the requirement for the award of the degree of BACHELOR OF
COMMERCE and it has not previously formed the basis for any Degree, Diploma and
Associateship or Fellowship.
Prof. K.J.JOSEPH Mr. ASLAM P.S
Co-ordinator Project Guide
DECLARATION
I, JOM JOSE, hereby declare that the project work entitled “A STUDY ON
CONSUMER BEHAVIOUR TOWARDS REALME SMARTPHONES” is a record of
independent and bonafide project work carried out by me under the supervision and guidance
of Mr. Aslam P.S, Assistant Professor, Department of Commerce, Christ College,
Irinjalakuda.
The information and data given in the report is authentic to the best of my knowledge.
The report has not been previously submitted for the award of any Degree, Diploma,
Associateship or other similar title of any other university or institute.
Place: Irinjalakuda Jom Jose
Date: CCASBCM218
ACKNOWLEDGEMENT
I would like to take the opportunity to express my sincere gratitude to all people who have
helped me with sound advice and able guidance.
Above all, I express my eternal gratitude to the Lord Almighty under whose divine guidance;
I have been able to complete this work successfully.
I would like to express my sincere gratitude to Rev.Dr. Jolly Andrews, Principal-in-Charge,
Christ college Irinjalakuda for providing various facilities.
I am thankful to Prof. K.J.Joseph, Co-ordinator of B.Com (Finance), for providing proper
help and encouragement in the preparation of this report.
I am thankful to Ms. Prassy Viswambharan, Class teacher for her cordial support, valuable
information and guidance, which helped me in completing this task through various stages.
I express my sincere gratitude to Mr. Aslam P.S, Assistant Professor, whose guidance and
support throughout the training period helped me to complete this work successfully.
I would like to express my gratitude to all the faculties of the Department for their interest
and cooperation in this regard.
I extend my hearty gratitude to the librarian and other library staffs of my college for their
wholehearted cooperation.
I express my sincere thanks to my friends and family for their support in completing this
report successfully.
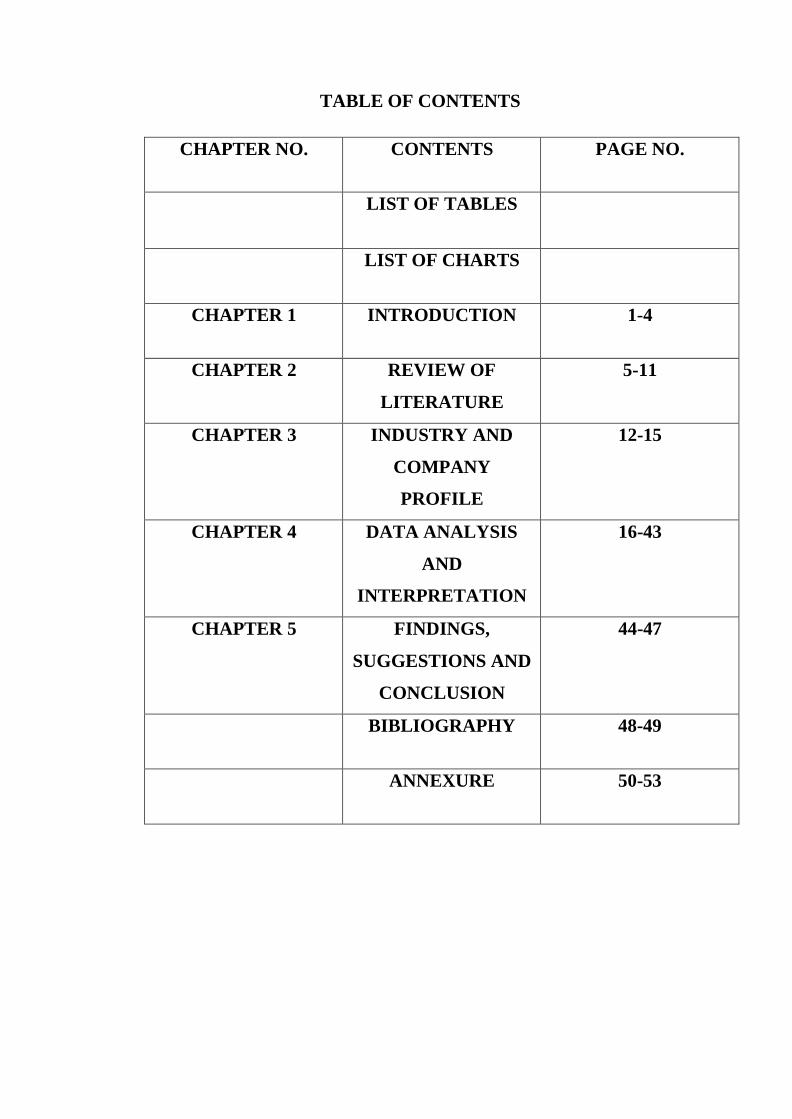
TABLE OF CONTENTS
CHAPTER NO. CONTENTS PAGE NO.
LIST OF TABLES
LIST OF CHARTS
CHAPTER 1 INTRODUCTION 1-4
CHAPTER 2 REVIEW OF
LITERATURE
5-11
CHAPTER 3 INDUSTRY AND
COMPANY
PROFILE
12-15
CHAPTER 4 DATA ANALYSIS
AND
INTERPRETATION
16-43
CHAPTER 5 FINDINGS,
SUGGESTIONS AND
CONCLUSION
44-47
BIBLIOGRAPHY 48-49
ANNEXURE 50-53

LIST OF TABLES
TABLE NO: TITLE PAGE NO:
4.1 Showing gender wise classification 16
4.2 Showing age wise classification 17
4.3 Showing educational qualification
wise classification
18
4.4 Showing occupation wise
classification
19
4.5 Showing income wise classification 20
4.6 Showing source of information 21
4.7 Showing price range consider 22
4.8 Showing promotional offer which is
more attractive
23
4.9 Showing media of advertisement
influence in purchase
24
4.10 Showing response on special features 25
4.11 Showing response of features
influence purchase
26
4.12 Showing response of easy availability
of accessories
28
4.13 Showing response of purchasing the
same brand in near future
29
4.14 Showing response of loyalty 30
4.15 Showing response of recommendation
to friends and relatives
31
4.16 Showing response of price 32
4.17 Showing response of color 33
4.18 Showing response of camera 34
4.19 Showing response of design 35
4.20 Showing response of battery 36
4.21 Showing response of display 37
4.22 Showing response of accessories 38

4.23 Showing response of storage space 39
4.24 Showing response of warranty
assurance
40
4.25 Showing response of overall
satisfaction
41
4.26 Showing satisfaction 42

LIST OF CHARTS
FIGURE NO: TITLE PAGE NO:
4.1 Showing gender wise classification 16
4.2 Showing age wise classification 17
4.3 Showing educational qualification wise
classification
18
4.4 Showing occupation wise classification 19
4.5 Showing income wise classification 20
4.6 Showing source of information 21
4.7 Showing price range consider 22
4.8 Showing promotional offer which is more
attractive
23
4.9 Showing media of advertisement influence
in purchase
24
4.10 Showing data on special features 25
4.11 Showing data of features influence
purchase
27
4.12 Showing data on easy availability of
accessories
28
4.13 Showing data of purchasing the same
brand in near future
29
4.14 Showing data of type of loyalty 30
4.15 Showing data of recommendation to
friends and relatives
31
4.16 Showing response of price 32
4.17 Showing response of color 33
4.18 Showing response of camera 34
4.19 Showing response of design 35
4.20 Showing response of battery 36
4.21 Showing response of display 37
4.22 Showing response of accessories 38
4.23 Showing response of storage space 39

9
4.24 Showing response of warranty assurance 40
4.25 Showing response of overall satisfaction 41
4.26 Showing data of satisfaction 42

10
CHAPTER 1
INTRODUCTION

11
1.1 INTRODUCTION
The Rapidly growing demand of smartphone has created a buzz around the world.
Nowadays most of the consumers opt to have a smartphone. The Increasing innovation
in Mobile phone industries has brought this craze among the people on smartphone. A
Smartphone is a mobile device that combines cellular and mobile computing functions
into one unit. They are distinguished from feature phones by their stronger hardware
capabilities and extensive mobile operating systems, which facilitate wider software,
internet and multimedia functionality alongside core phone functions such as voice calls
and text messaging. Smartphones typically contain a number of metal oxide semi-
conductor integrated circuit chips, include various sensors that can be leveraged by their
software and support wireless communications protocols.
Smartphones in the present scenario have penetrated everywhere and raised the
comfort level of the individuals in their everyday life. Smartphones are proliferating at
a very fast pace in India mainly due to the younger demographic and rapidly expanding
economy. The way a individual deals with things is eased through the smartphones. The
market of smartphone has been escalating every year with Increasing innovations.
Irrespective of the high price of the smart phone, still the demand is increasing. It is
true that Hi-Tech technology has played a vital role in attracting the people towards
Smartphones. Brand is a factor that drives people to buy smartphone. Besides,
technology and brand there could be other so many marketing and stimuli factors that
could influence the consumer behavior of smartphone buyers. Moreover, the
characteristics of the buyer itself also affect the buying behavior.
There are several brands and smartphone companies in the market for consumers
to choose from. Among the various brands of smartphones available in the market,
realme smartphones are far-reaching one. Realme is a technology brand officially
established on May 4, 2018 by Sky Li. The aspiration of realme is to provide products
with a comprehensive superior experience for the young and realme is committed to be
a trendsetting technology brand. Within a year of establishment realme has already
entered the markets of India, Vietnam, Thailand, Philippines, Malaysia, Singapore,
Myanmar, Pakistan, Nepal, Bangladesh, United Arab Emirates, Egypt, ltaly, Spain,
France, England, Russia, and China. As the world’s fastest growing smartphone brand
12
realme stands firmly among the mainstream smartphone brands. In this study we
analysis consumers buying behavior towards Realme Smartphones company with
reference to Thrissur district.
1.2 STATEMENT OF THE PROBLEM
There are many factors that people consider while making smartphone purchase
decision. There are now many companies offering smartphones in the market. This
study is conducted to know customers behavior towards realme smartphones, that is
how satisfied they are with the realme and areas not satisfied and need improvements
are being found out.
1.3 OBJECTIVES OF THE STUDY
• To measure the satisfaction level of customers towards realme smart phones.
• To analyze the factors influencing the customers to choose realme smart phones.
1.4 SIGNIFICANCE OF THE STUDY
The study is significant in the current scenario as there has been increase in the
number of smartphone users. And there has been increase in smartphones brands and
loyalty among the customers and increase in technology and other factors that can lead
to change in the preferences and perceptions of the customers. Especially during and
after the time of covid-19 pandemic the education sector also started using smartphones
for their study purposes, so there have been changes in the preferences and satisfaction
level of the customers towards a particular smartphone brand. So, the study conducted
is relevant in the current conditions.
1.5 RESEARCH DESIGN
People of Thrissur district were selected for the study. The study is conducted with
the help of both primary and secondary data. Primary data collected with the help of
questionnaire, the secondary data collected from websites, articles and books.
1.5.1 Nature of the study
Nature of the study is Descriptive cum Analytical in nature
1.5.2 Nature of Data
The Data required for the study is collected through both primary data and secondary
data.
13
1.5.3 Sources of Data
Primary data and secondary data are being used for study. Primary data are those
which are collected for the first time and thus happened to be original in character. This
data is collected through questionnaires. Secondary data is which have already being
collected by someone else and which have been passed through the statistical process.
Secondary data are collected from the websites, books and articles.
1.6 SAMPLE DESIGN
A sample design is a definite plan for obtaining a sample from a given population.
It refers to the technique or the procedure the researcher would adopt in selecting items
for sample. It is an important part of Research design.
1.6.1 Nature of Population
The population of this study includes all users of realme smartphones in Thrissur
district.
1.6.2 Sample Unit
All users of realme smartphones in Thrissur district is taken as the sample unit.
1.6.3 Method of Sampling
The sampling method that is used for taking the sample unit is the snow ball sampling
method.
1.6.4 Size of Sample
The sample size that is taken for the study is 102 respondents from Thrissur district.
1.7 TOOLS FOR ANALYSIS
Percentage analysis and average are used for analyzing the data that were collected.
Tools like column charts, tables, bar diagram and funnel charts are used for presenting
the data.
1.8 LIMITATION
• Sample size was not large enough which effects the reliability of surveys results
and may leads to bias.
14
• It is difficult to know whether the respondent’s response was genuine as they
invested in minimum time in filling questionnaire.
1.9 CHAPTERIZATION
Chapter 1 Introduction
Chapter 2 Review of literature
Chapter 3 Industry and company profile
Chapter 4 Data analysis and interpretation
Chapter 5 Findings, suggestions and conclusion
15
CHAPTER 2
REVIEW OF LITERATURE
16
2.1 INTRODUCTION
This chapter contains review of literature. It is divided into two parts. First part contains
empirical review about this topic and second part contains conceptual review about the
topic consumer behavior, it includes meaning, definition, process and types of
consumer behavior.
2.2 EMPERICAL REVIEW
Kotler and Armstrong (2001) in their book have written that the main factors, which
discriminate from one customer to the other, are age, salary, perception and adaptation.
This demographical diversification leads the marketers to assess the impact of their
products in the mind of the customers the customers are segmented accordingly.
Kushagra et al (2017) stated that the modern generation customers who are young and
dynamic are very tech-savvy and adventurous as far as adaptability to a new product is
concerned. They give very much emphasis on the attributes of a mobile like camera
quality, processor speed for gaming, battery power etc.
Ibrahim, Kassim, & Mohamood (2013) have deduced that while purchasing mobile
phones the young customers in the society are more influenced by celebrity
endorsement, frequency of advertisement, discount offers, word of mouth publicity
spread through friends, family and relatives.
Pigato (2001) explored that the proliferation of mobile phones in an unexpected rate in
developing countries since the 1990s. Even poor and remotest countries from sub-
Saharan Africa and South Asia are also catching up rapidly in mobile access.
Mokhlis, Yakkop (2012) when experimented buyers behavior towards smart phones
in Malaysian University reached the resolution that seven components depict smart
phone buying behavior – inventive and innovative highlighted features , picture,
quality, value for money, durable , solidness and compatibility , media impact and post
sales services. The most significant among them was imaginative highlights followed
by proposal and cost.
17
Chu-Mei Liu (2002). A good brand imaging is imperative to producers and all the
intermediaries of marketing process. High brand valued items have higher acceptability
which leads to high sales. The rapid growth of portable smart phone subscriptions is
extensively quicker in the Philippines. Now a day’s mobile phone manufactures and
service providers are collaborating with different advertising and promotions.
Jaakko et al (2007) Found from their research that MCRM is a portable client
relationship conceptualization were the interaction between the client and the customer
is fourfold. They are acceptance of Advertising messages, by passing the sales
messages, filtering the messages and the trust between the client and the customer based
on which the products are accepted.
Fred Robins (2003) inferred that there is a blending of technology and imagination to
build a product, whose innovation is based on the personalization, advancement of
different generations of mobile handsets to be aligned with the internet speed and
technology.
Lynda Andrews et al (2012) Examined that customers' impression of the worth value
they get from the ordinary day to day utilization of smart phones and how portable
advertising (m-promoting) can possibly improve these worth recognitions. The
discoveries feature approaches to tailor m-showcasing procedures to supplement
purchasers view of the worth value offered through their smart phones.
Osman et al (2012) in their investigation found that customers made buying decision
based on design availability and brand image.

18
2.3 CONCEPTUAL REVIEW
In this section we discuss about topic Consumer behavior, it includes Meaning,
Definition, Process and types of consumer behavior.
2.3.1 Meaning
Consumer behavior is the study of individuals, groups, or organizations and all
the activities associated with purchase, use and disposal of goods and services, and
how the consumer's emotions, attitudes and preferences affect buying behavior. The
study of consumer behavior formally investigates individual qualities such as
demographics, personality lifestyles and behavioral variables, in an attempt to
understand people’s wants and consumption. Also investigated are the influences on
the consumer from groups such as family, friends, sports and reference groups to
society in general including brand influencers and opinion leaders. Consumer is the
pivotal point in marketing. Consumer behavior is very complex and is influenced by
various factors. All the consumers have different tastes and preferences, likes and
dislikes and they adopt different behavior patterns while purchasing goods. A detailed
knowledge about the consumer, his behavior, buying motives and habits provide us
with reasons why consumer differ from one to another in buying and using product and
services.
2.3.2 Definition
Prof. Philip Kotler defines Consumer behavior as “the study of how individual,
groups and organization select, buy, use and dispose of goods and services, ideas or
experiences to satisfy their needs and wants.” The term Consumer behavior is the
behavior shown by the consumer at the time of searching, purchasing, using, and
disposing of product and services which satisfy his needs and wants. It is concerned
with the activities of individuals in buying and using the goods and services.
It includes the decision-making process that precedes his actual purchase. The
study of behavior is the study of individuals i.e., how they take decisions to spend their
available resources i.e., time, money and effort on buying goods and services.
19
American Marketing Association defines Consumer behavior as “the dynamic
interaction of affect and cognition, behavior and environmental events by which human
being conduct the exchange aspect of their lives.” Consumer behavior thus, relates to
all social, psychological and physical behavior of potential customers as they become
aware of the product, evaluate its features, purchase the goods, consume it and tell
others about the product and services.
2.3.3 Consumer Buying Process
To understand consumer behavior, it important to first understands consumer
buying process. Buying process represent different stages through which the consumer
goes through when he has to purchase something. Consumer has a bundle of desires,
needs, out of which the pressing needs move to the top. This is known as need
recognition. After this consumer searches relevant information related to product on the
basis of which decision is taken and purchase is made. After consuming the product the
post purchase behavior is evaluated and a dissatisfied customer again has an unsatisfied
need, and the process starts again. Each stage in the consumer buying process is a
challenge to the marketer, for which he must have a careful understanding of behavior
before he develops the marketing program.
2.3.3.1 Need Recognition
The starting point of the buying process is an unsatisfied need. It is the perceived
want or desire that paves the way for next stage. As we know every customer has bundle
of desire or needs, many of which are not satisfied. When such unfulfilled needs are
identified, the buying process starts. It is important to note that need recognition should
be of those needs without whose satisfaction, consumer is restless and under tension.
He should feel that he has desire or need which has arisen and which needs to be
satisfied. Dissatisfaction from the existing product or service may also give rise to
restlessness and again a need to satisfy the urge. Need or wants arise due to internal or
external situations. A person may be having deep rooted desires which may suddenly
become dominant and pressing under conducive environment.
Needs may also arise due to external situations where consumer is exposed to
different advertisements and people. It is the intensity or urgency of wants which
decides the speed at which it has to be satisfied. The pressing or urgent wants are first
satisfied as resources are limited.
20
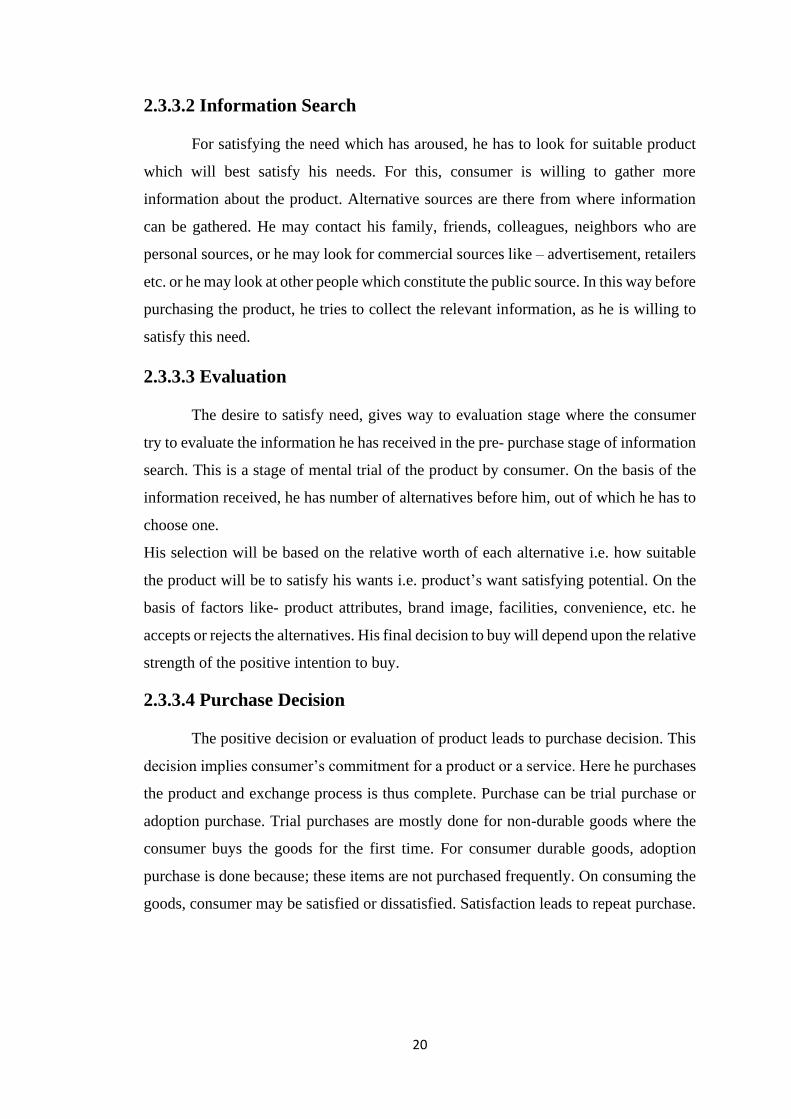
2.3.3.2 Information Search
For satisfying the need which has aroused, he has to look for suitable product
which will best satisfy his needs. For this, consumer is willing to gather more
information about the product. Alternative sources are there from where information
can be gathered. He may contact his family, friends, colleagues, neighbors who are
personal sources, or he may look for commercial sources like – advertisement, retailers
etc. or he may look at other people which constitute the public source. In this way before
purchasing the product, he tries to collect the relevant information, as he is willing to
satisfy this need.
2.3.3.3 Evaluation
The desire to satisfy need, gives way to evaluation stage where the consumer
try to evaluate the information he has received in the pre- purchase stage of information
search. This is a stage of mental trial of the product by consumer. On the basis of the
information received, he has number of alternatives before him, out of which he has to
choose one.
His selection will be based on the relative worth of each alternative i.e. how suitable
the product will be to satisfy his wants i.e. product’s want satisfying potential. On the
basis of factors like- product attributes, brand image, facilities, convenience, etc. he
accepts or rejects the alternatives. His final decision to buy will depend upon the relative
strength of the positive intention to buy.
2.3.3.4 Purchase Decision
The positive decision or evaluation of product leads to purchase decision. This
decision implies consumer’s commitment for a product or a service. Here he purchases
the product and exchange process is thus complete. Purchase can be trial purchase or
adoption purchase. Trial purchases are mostly done for non-durable goods where the
consumer buys the goods for the first time. For consumer durable goods, adoption
purchase is done because; these items are not purchased frequently. On consuming the
goods, consumer may be satisfied or dissatisfied. Satisfaction leads to repeat purchase.

21
2.3.3.5 Post Purchase Reaction
This stage is concerned with the behavior of the consumer after he consumes
the product. This post-purchase reaction may be positive or negative. If consumer is
satisfied, repeat purchase may be there or he may recommend the product to other
people. Dissatisfaction leads to anxiety and makes a person restless. He has a problem
before him and again he tries to solve it by going for other alternative products or
services. A marketer help the buyer feel good about the product purchased. In order to
reduce his anxiety about the product, the after-sale services are very important as it
develops loyalty, increases sales and profit.
2.3.4 Type of Consumer Behavior
Consumer decision making varies with the type of buying decision. The more
complex and expensive decisions are likely to involve more buyer deliberation and
more buying participants. The four type of Consumer Behavior are :
2.3.4.1 Complex Buying Behavior
Consumer go through complex buying behavior when they are highly involved
in a purchase and are aware of significant differences existing among brands.
Consumers are highly involved in a purchase when it is expensive, bought infrequently.
This buyer will pass through a cognitive learning process. It is characterized by first
developing beliefs about the product, then moving towards attitudes towards the
product, and finally making a deliberate purchase choice, the marketer of high-
involvement product has to understand the information-gathering and evaluation
behavior of high-involvement consumers.
2.3.4.2 Buying Behavior Reducing Dissonance
Sometimes the consumer who is highly involved in a purchase sees little
difference in the brands. His high involvement is based on the fact that the purchase is
expensive, in-frequent and risky. The buyer will shop around to learn what is available
but he will buy fairly quickly because brand differences are not pronounced. In this
situation pricing, good location and effective sales personnel are important influences
of brand choice. The major role of market communication is to supply beliefs and
evaluations that help the consumer feel good about his or her choice after the purchase.
22
2.3.4.3 Buying Behavior Based on Habits
Many products are purchased under conditions of low consumer involvement
and the absence of significant brand differences. For example- in purchase category.
They go to store and reach for the brand, having no strong brand loyalty. They have
low involvement with most low cost, frequently purchased products. Their behavior in
these cases does pass through the normal belief/attitude/behavior sequences. They do
not search extensive information about the brands. After purchase, they may not
evaluate it because they are not involved with the product. So in the buying process,
brand beliefs are formed by passive learning and followed by purchase behavior, which
may be or may not be followed by evaluation.
2.3.4.4 Variety – Seeking Buying Behavior
Some buying situation depicts low consumer involvement but significant brand
differences. Consumers are often observed to do a lot of brand switching. For example
– in purchasing cookies the consumer has some beliefs, chooses a brand of cookies
without much evaluation and evaluates it during consumption. In future, the consumer
may reach for another brand out of boredom or a wish to experiment. Here brand
switching occurs for the sake of variety rather than dissatisfaction.

23
CHAPTER 3
INDUSTRIAL AND COMPANY PROFILE

24
3.1 INTRODUCTION
Third chapter is about technology and telecommunications industry and about the
company profile of realme phones.
3.2 INDUSTRY PROFILE
One of the most marked developments in the field of telecommunications and
technology in the last few decades has been enabling people to get in touch with one
another quickly, through numerous means, while on the go. Communications and its
ever-strengthening connection to mobility has become the most significant
telecommunications development of recent years; allowing people to juggle daily
schedules, home life and work. Major tech companies like Apple, manufacture such
devices and constantly develop them so that they continue to meet new organisational
challenges presented during the course of everyday life. Statistics dealing with the
telecommunication industry display many current and exciting trends in this field.
Wireless telecommunication was first achieved with the invention of the radio
at the beginning of the 20th century. This revolutionized and significantly speed up
communication over long distances, as a new, quick way of sending and receiving
information. Telecommunications, in its most basic, simple form consist of a
transmitter, a transmission medium or channel and a receiver. Nowadays, however, this
lucrative, complex and secretive industry is an ever raging battle for intellectual
property, patents, court cases and injunctions. All deemed necessary to retain an edge
in the market.
The smartphone industry, creating phones with more advanced computing
capabilities and connectivity than regular mobile phones, has been part of the mobile
phone industry since late 90s, gaining mainstream popularity with the introduction of
Apple’s iPhone in 2007. The iPhone revolutionized the smartphone industry by offering
customer friendly features such as a touch screen interface and a virtual keyboard. The
first smartphone running on android was introduced to the consumer market in late
2008.The smartphone industry has been steadily developing and growing since then,
both in market size, as well as in models and suppliers.
25
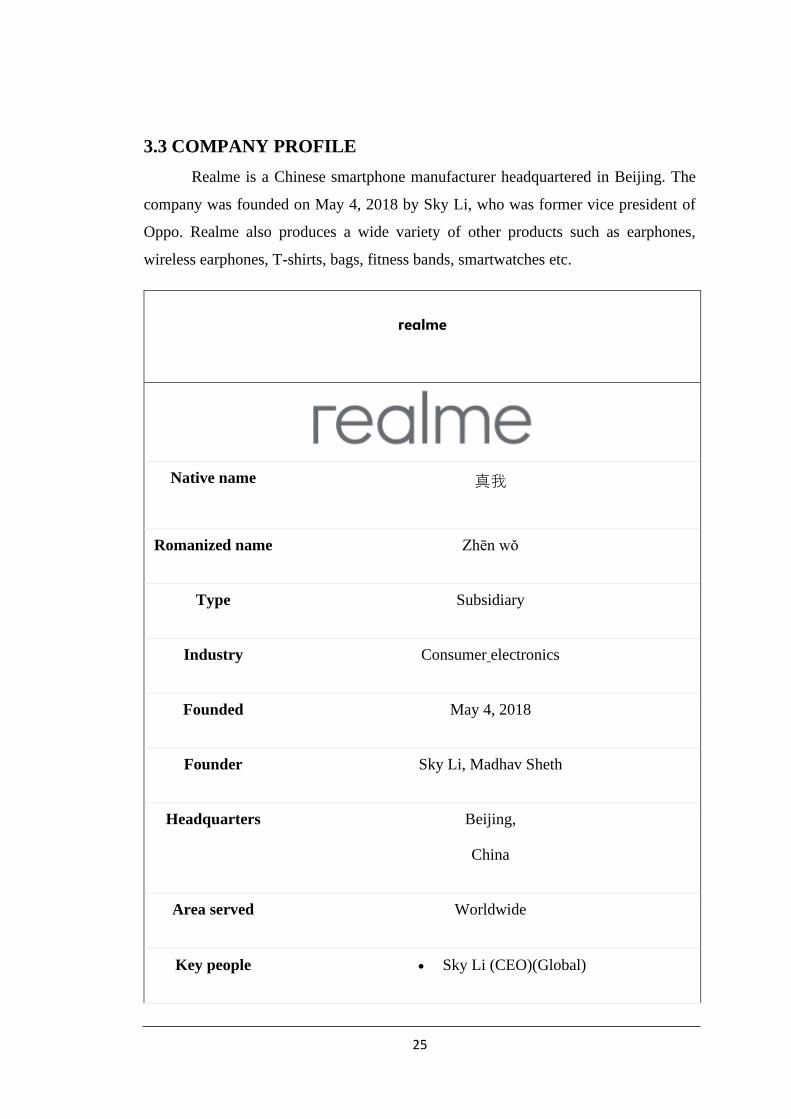
3.3 COMPANY PROFILE
Realme is a Chinese smartphone manufacturer headquartered in Beijing. The
company was founded on May 4, 2018 by Sky Li, who was former vice president of
Oppo. Realme also produces a wide variety of other products such as earphones,
wireless earphones, T-shirts, bags, fitness bands, smartwatches etc.
гeɑlme
Native name 真我
Romanized name Zhēn wǒ
Type Subsidiary
Industry Consumer electronics
Founded May 4, 2018
Founder Sky Li, Madhav Sheth
Headquarters Beijing,
China
Area served Worldwide
Key people • Sky Li (CEO)(Global)

26
• Madhav Sheth (SVP) (CE0) (realme India and Europe)
• Xu Qi (徐起) (CMO)
• Yao Kun (姚坤) (CTO)
• Wang Wei (王伟) (CPO)
Products Smartphones
Earphones
Power banks
RealmeUI
Phone Cases
AIoTproducts
Bags
Smart TVs
Parent Oppo ,BBK Electronics
Realme is a technology brand officially established on May 4, 2018 by Sky Li.
The aspiration of realme is to provide products with a comprehensive superior
experience for the young, and realme is committed to be a trendsetting technology
brand.
Due to the abilities in cutting-edge technologies of smartphones and IoT, realme
brings consumers products with trendsetting technologies, features and trendsetting
experiences that are first applied in the price segment.
At the beginning of 2020, realme announced its dual driven strategy of
“Smartphone + AIoT”. In June of 2020, realme's global users of smartphone reached
35 million and its sales volume of AIoT audio products broke the record of 1 million.
According to the statistics of counterpoint global smartphone shipments in Q1 of 2020,
the emerging smartphone brand realme still ranks 7th with year-over-year growth rate
of 157% which ranks the first in the world as well. As the world's fastest-growing
smartphone brand, realme stands firmly among the mainstream smartphone brand.
27
Realme is a brand that started with the intention to offer trendy yet affordable
smartphones for youths and it captured its audience perfectly. According to the Q3 2020
global smartphone shipment report by counterpoint, realme users have now surpassed
50 million globally. By achieving cumulative sales of 50 million in just nine quarters,
realme has become the world's fastest growing smartphone brand.
Despite being a young company, realme is far ahead of its years in the industry
and broke multiple records across Asia during the recent sales season. Mr. Li shared
the recent performance in the open letter that: In India, realme smart watch became the
highest shipped product of the year; In Southeast Asia, it emerged as one of the top 3
best-selling brands on leading online e-commerce platforms; In Russia, it has achieved
the top 5 market share within one year; In China, it broke last year's all-day sales records
on e-commerce sites within 30 minutes. Realme's CEO attributes their milestones to
their users. realme's open secret to their success is their relationship with and ability to
listen to their young users.
In order to sustain a strong relationship with their young clientele, realme's
CEO, Sky Li, mentioned in an open letter that the brand will continue to innovate and
connect with their audience further: "In two years, realme has never stopped interacting
and co-creating with young users. We hope to be the brand that knows young users
best". Realme even held a launch event with users as keynote speakers and their views
were the focal point of the event.
28
CHAPTER 4
DATA ANALYSIS & INTERPRETATION
29
4.1 Introduction
This chapter deals with data analysis and interpretation. Data has been collected
through using questionnaire conducted among realme smartphone users. The data is
first sorted, tabulated and analyzed. Here the collected was analyzed using percentage
analysis method, average, bar diagram, column chart, funnel graph is used to get a clear
picture and an analytical interpretation is given using figures. This chapter helps to finds
out the satisfaction level of customers towards realme smartphone and also analyze the
factors influencing the customers to buy realme smartphones.
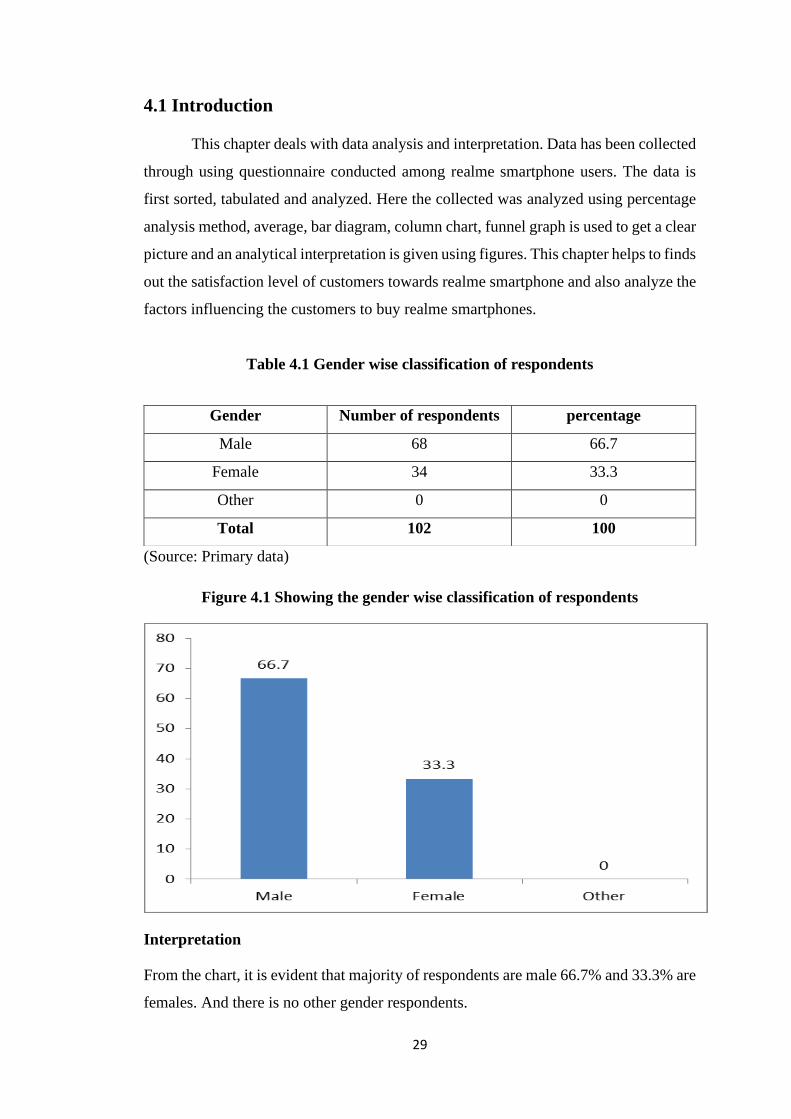
Table 4.1 Gender wise classification of respondents
(Source: Primary data)
Figure 4.1 Showing the gender wise classification of respondents
Interpretation
From the chart, it is evident that majority of respondents are male 66.7% and 33.3% are
females. And there is no other gender respondents.
Gender Number of respondents percentage
Male 68 66.7
Female 34 33.3
Other 0 0
Total 102 100
30
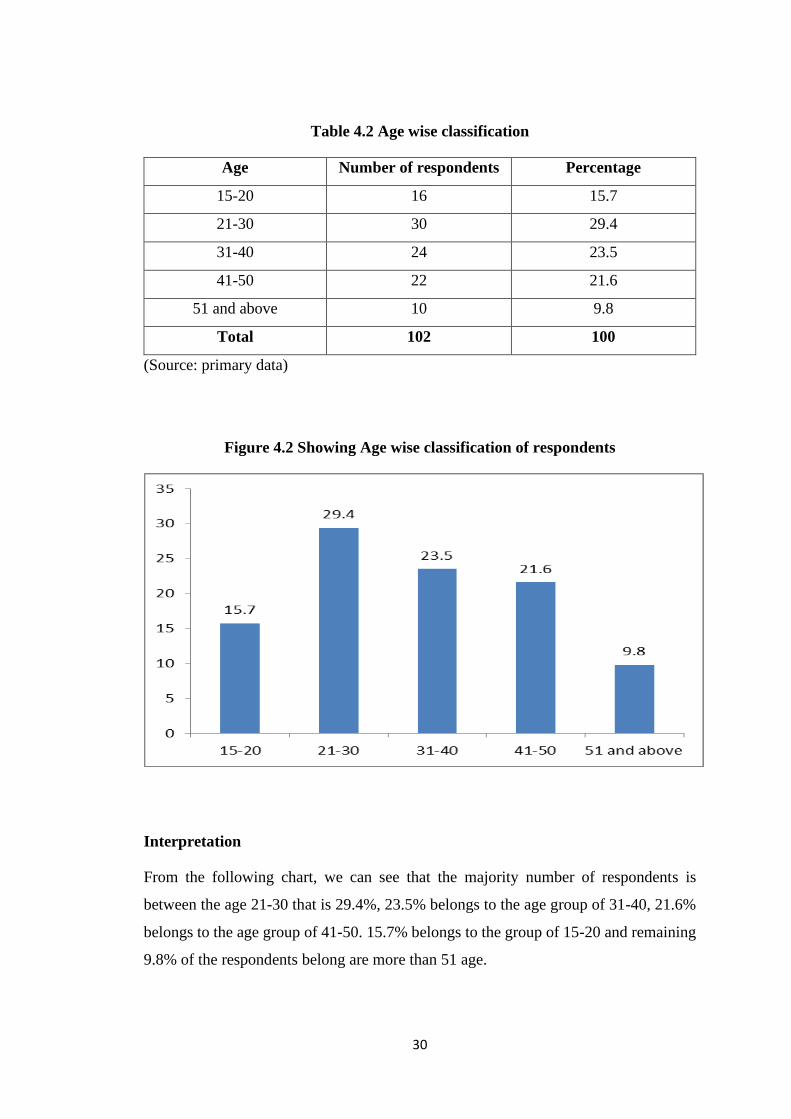
Table 4.2 Age wise classification
Age Number of respondents Percentage
15-20 16 15.7
21-30 30 29.4
31-40 24 23.5
41-50 22 21.6
51 and above 10 9.8
Total 102 100
(Source: primary data)
Figure 4.2 Showing Age wise classification of respondents
Interpretation
From the following chart, we can see that the majority number of respondents is
between the age 21-30 that is 29.4%, 23.5% belongs to the age group of 31-40, 21.6%
belongs to the age group of 41-50. 15.7% belongs to the group of 15-20 and remaining
9.8% of the respondents belong are more than 51 age.

31
Table 4.3 Educational qualification wise classification
Educational
qualification
Number of respondents Percentage
Matriculation 1 1
Higher secondary 19 18.6
Graduate 54 52.9
Post graduate 28 27.5
Total 102 100
(Source: primary data)
Figure 4.3 Showing educational qualification wise classification
Interpretation
From the chart, we can see that majority of the respondents were graduates i.e., 52.9%,
27.5% of the respondents were post graduates. 18.6% of them completed their higher
secondary education and 1% of the respondents were matriculate.
32
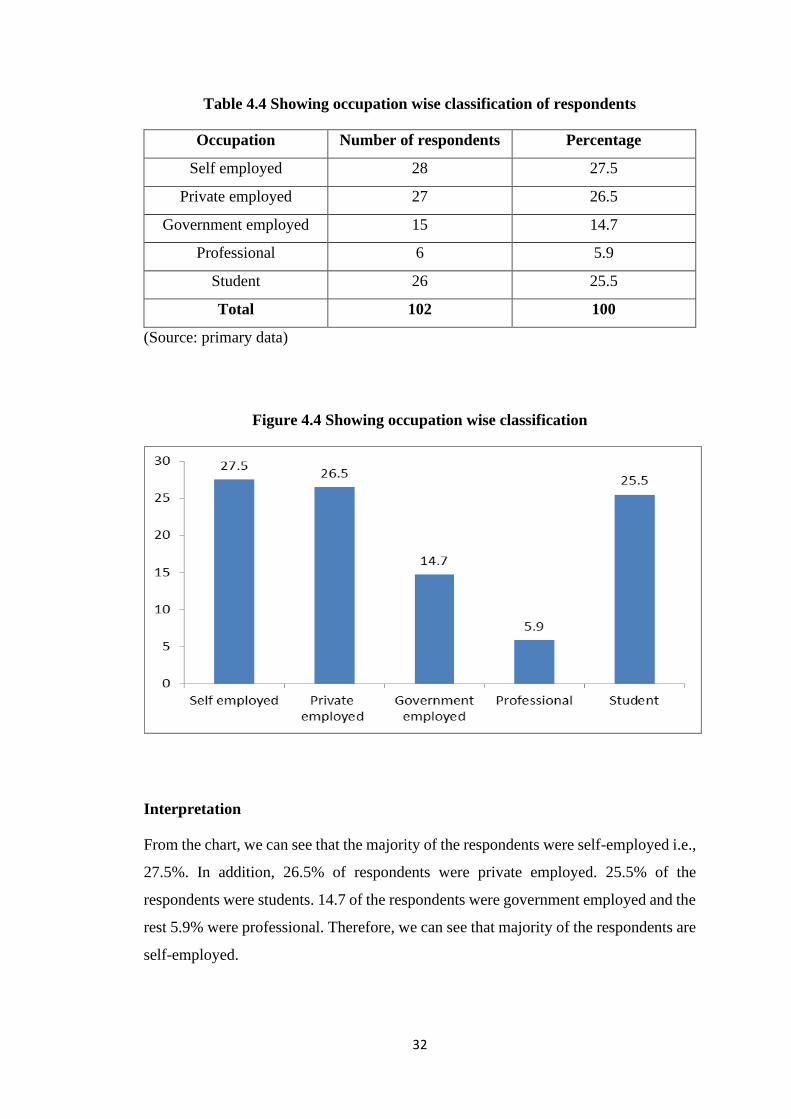
Table 4.4 Showing occupation wise classification of respondents
Occupation Number of respondents Percentage
Self employed 28 27.5
Private employed 27 26.5
Government employed 15 14.7
Professional 6 5.9
Student 26 25.5
Total 102 100
(Source: primary data)
Figure 4.4 Showing occupation wise classification
Interpretation
From the chart, we can see that the majority of the respondents were self-employed i.e.,
27.5%. In addition, 26.5% of respondents were private employed. 25.5% of the
respondents were students. 14.7 of the respondents were government employed and the
rest 5.9% were professional. Therefore, we can see that majority of the respondents are
self-employed.
33
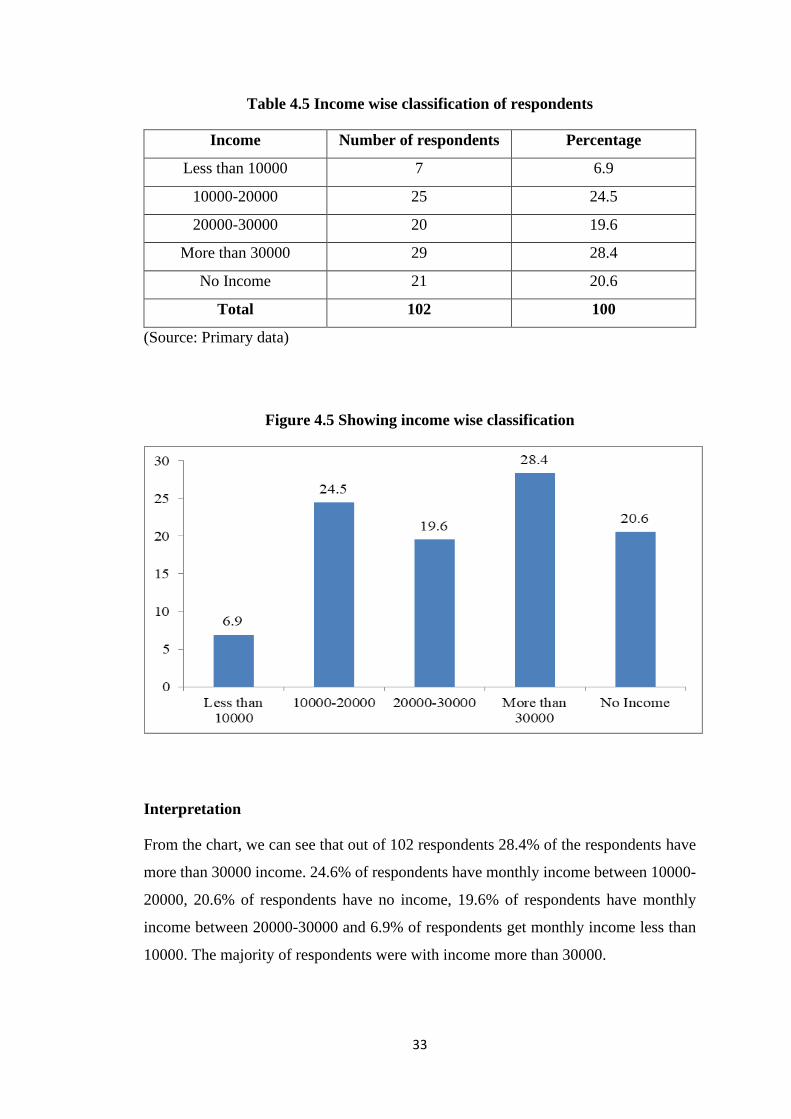
Table 4.5 Income wise classification of respondents
Income Number of respondents Percentage
Less than 10000 7 6.9
10000-20000 25 24.5
20000-30000 20 19.6
More than 30000 29 28.4
No Income 21 20.6
Total 102 100
(Source: Primary data)
Figure 4.5 Showing income wise classification
Interpretation
From the chart, we can see that out of 102 respondents 28.4% of the respondents have
more than 30000 income. 24.6% of respondents have monthly income between 10000-
20000, 20.6% of respondents have no income, 19.6% of respondents have monthly
income between 20000-30000 and 6.9% of respondents get monthly income less than
10000. The majority of respondents were with income more than 30000.

34
Table 4.6 Showing source of information about realme smartphones
Source Number of respondents Percentage
Advertisement 26 25.5
Family and friends 35 34.3
Sale representative 14 13.7
Social media 27 26.5
Total 102 100
(Source: Primary data)
Figure 4.6 Showing the data of source of information about realme
Interpretation
As we can see in the chart that out of 102 respondents 34.3% of respondents come to
know about realme through family and friends, 26.5% of respondents through social
media, 25.5% of respondents through advertisement and 13.7% of the respondents
through sales representative.

35
Table 4.7 Showing price range consider while purchasing realme smartphone
Price range Number of respondents Percentage
Below 10000 7 6.9
10000-15000 47 46.1
15000-20000 44 43.1
20000-25000 2 2
Above 25000 2 2
Total 102 100
(Source: primary data)
Figure 4.7 Showing the data of price range consider while purchasing realme
Interpretation
As we can see from the chart out of 102 respondents 46.1% prefer to buy at 10000-
15000 price level, 43.1% of respondents prefer to purchase at 15000-20000, 6.9% of
respondents prefer to purchase at below 10000 price range. 2% of the respondents
prefer to purchase realme phones with price range of 20000-25000. 2% of the
respondents prefer to purchase realme phones at price above 25000.
36
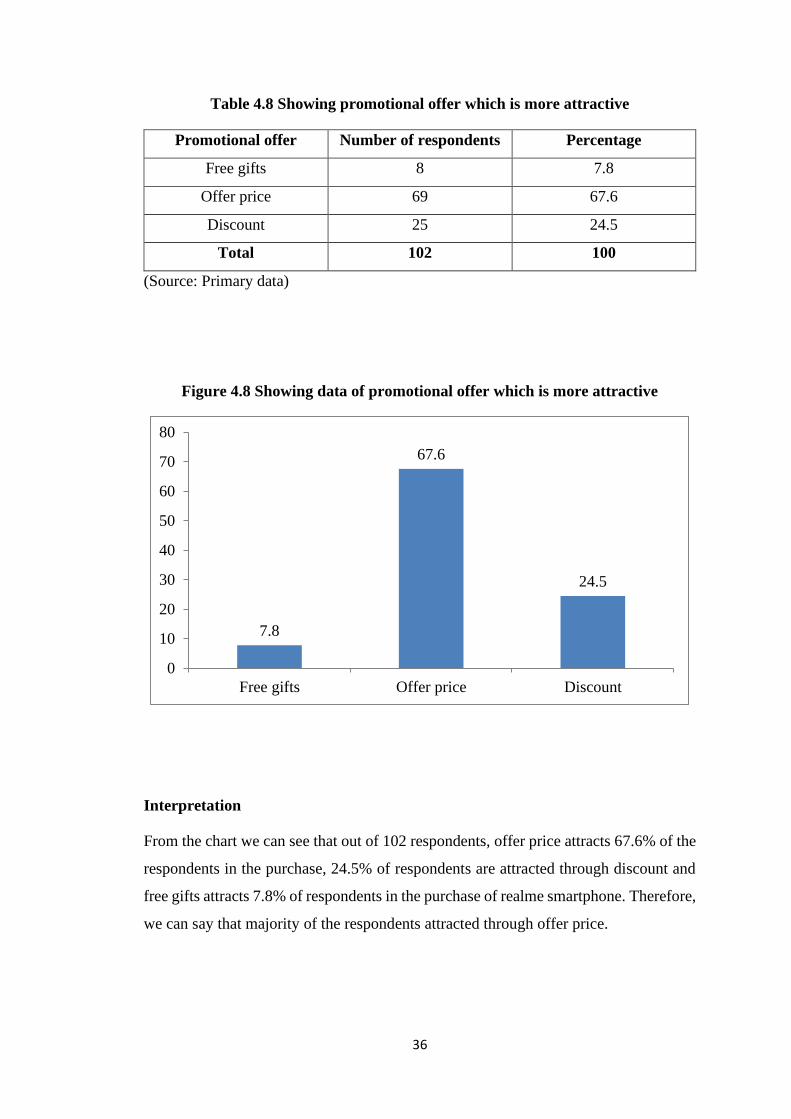
Table 4.8 Showing promotional offer which is more attractive
Promotional offer Number of respondents Percentage
Free gifts 8 7.8
Offer price 69 67.6
Discount 25 24.5
Total 102 100
(Source: Primary data)
Figure 4.8 Showing data of promotional offer which is more attractive
Interpretation
From the chart we can see that out of 102 respondents, offer price attracts 67.6% of the
respondents in the purchase, 24.5% of respondents are attracted through discount and
free gifts attracts 7.8% of respondents in the purchase of realme smartphone. Therefore,
we can say that majority of the respondents attracted through offer price.
7.8
67.6
24.5
0
10
20
30
40
50
60
70
80
Free gifts Offer price Discount
37
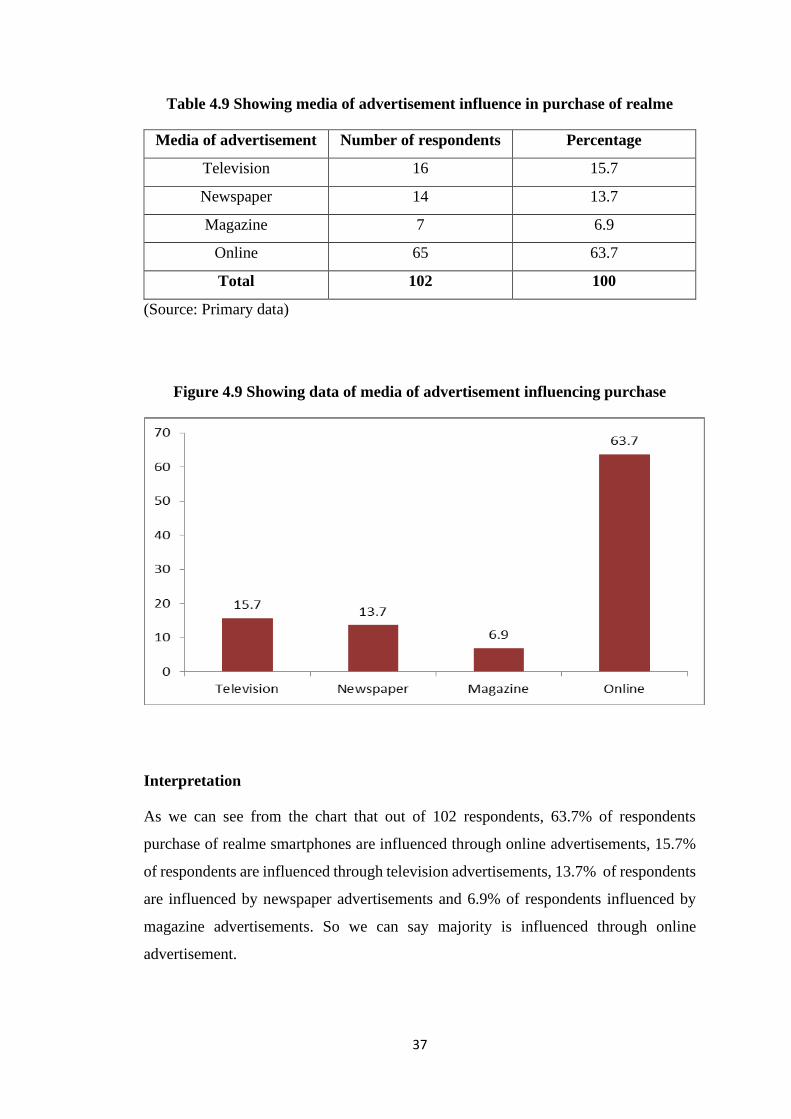
Table 4.9 Showing media of advertisement influence in purchase of realme
Media of advertisement Number of respondents Percentage
Television 16 15.7
Newspaper 14 13.7
Magazine 7 6.9
Online 65 63.7
Total 102 100
(Source: Primary data)
Figure 4.9 Showing data of media of advertisement influencing purchase
Interpretation
As we can see from the chart that out of 102 respondents, 63.7% of respondents
purchase of realme smartphones are influenced through online advertisements, 15.7%
of respondents are influenced through television advertisements, 13.7% of respondents
are influenced by newspaper advertisements and 6.9% of respondents influenced by
magazine advertisements. So we can say majority is influenced through online
advertisement.
38
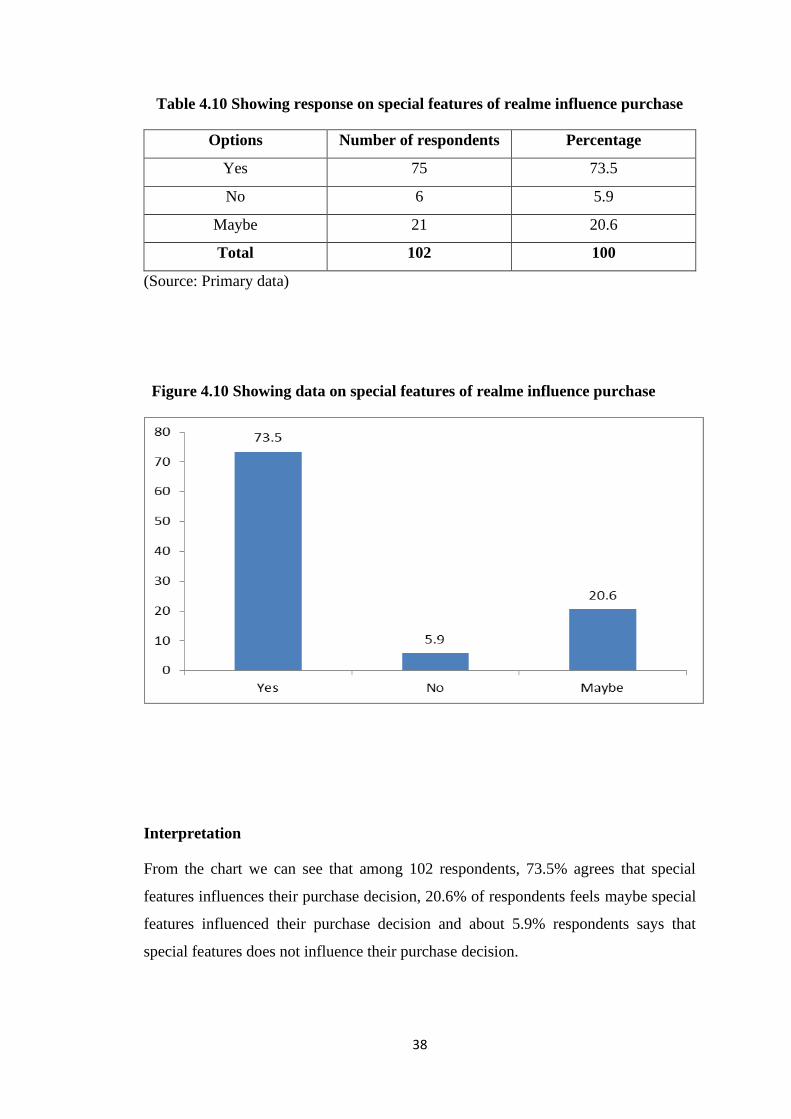
Table 4.10 Showing response on special features of realme influence purchase
Options Number of respondents Percentage
Yes 75 73.5
No 6 5.9
Maybe 21 20.6
Total 102 100
(Source: Primary data)
Figure 4.10 Showing data on special features of realme influence purchase
Interpretation
From the chart we can see that among 102 respondents, 73.5% agrees that special
features influences their purchase decision, 20.6% of respondents feels maybe special
features influenced their purchase decision and about 5.9% respondents says that
special features does not influence their purchase decision.
39
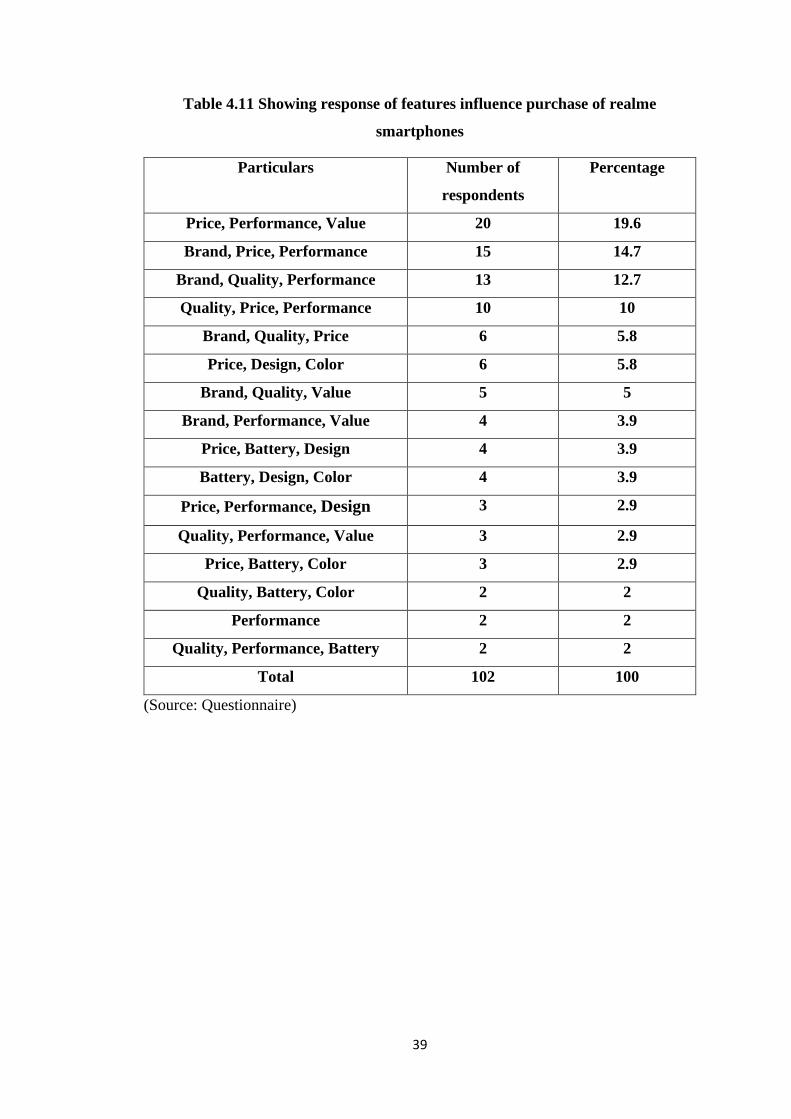
Table 4.11 Showing response of features influence purchase of realme
smartphones
Particulars Number of
respondents
Percentage
Price, Performance, Value 20 19.6
Brand, Price, Performance 15 14.7
Brand, Quality, Performance 13 12.7
Quality, Price, Performance 10 10
Brand, Quality, Price 6 5.8
Price, Design, Color 6 5.8
Brand, Quality, Value 5 5
Brand, Performance, Value 4 3.9
Price, Battery, Design 4 3.9
Battery, Design, Color 4 3.9
Price, Performance, Design 3 2.9
Quality, Performance, Value 3 2.9
Price, Battery, Color 3 2.9
Quality, Battery, Color 2 2
Performance 2 2
Quality, Performance, Battery 2 2
Total 102 100
(Source: Questionnaire)
40
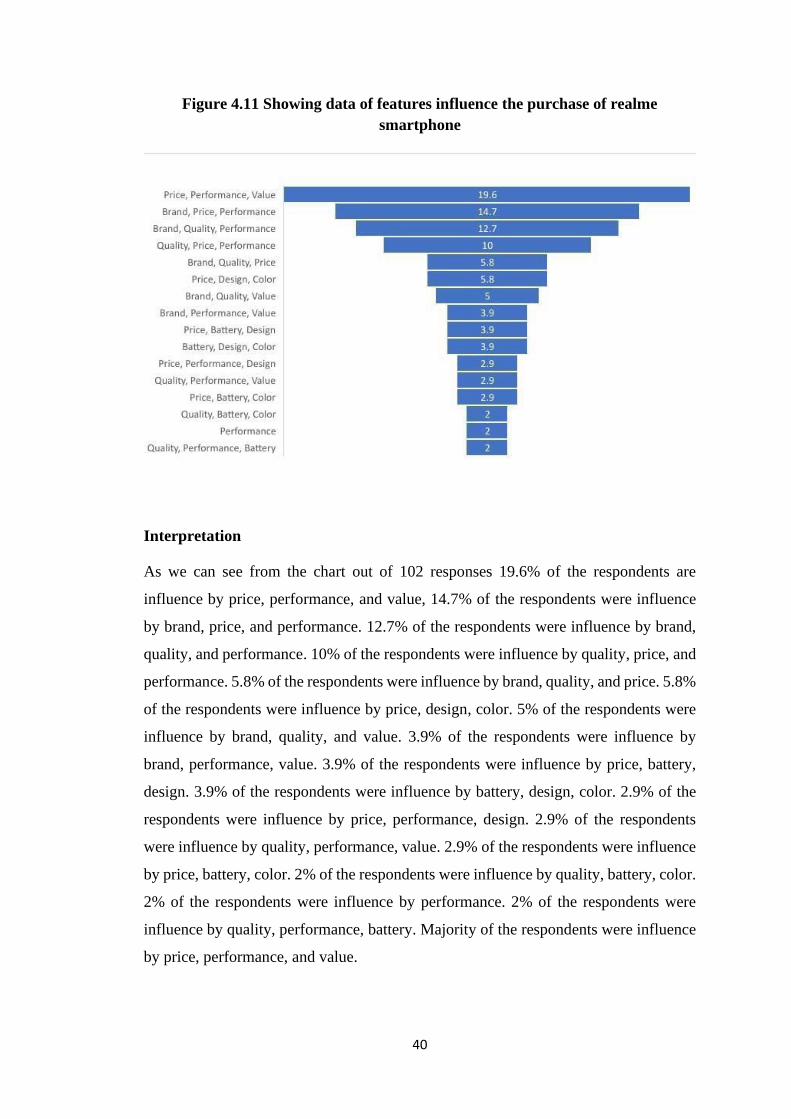
Figure 4.11 Showing data of features influence the purchase of realme
smartphone
Interpretation
As we can see from the chart out of 102 responses 19.6% of the respondents are
influence by price, performance, and value, 14.7% of the respondents were influence
by brand, price, and performance. 12.7% of the respondents were influence by brand,
quality, and performance. 10% of the respondents were influence by quality, price, and
performance. 5.8% of the respondents were influence by brand, quality, and price. 5.8%
of the respondents were influence by price, design, color. 5% of the respondents were
influence by brand, quality, and value. 3.9% of the respondents were influence by
brand, performance, value. 3.9% of the respondents were influence by price, battery,
design. 3.9% of the respondents were influence by battery, design, color. 2.9% of the
respondents were influence by price, performance, design. 2.9% of the respondents
were influence by quality, performance, value. 2.9% of the respondents were influence
by price, battery, color. 2% of the respondents were influence by quality, battery, color.
2% of the respondents were influence by performance. 2% of the respondents were
influence by quality, performance, battery. Majority of the respondents were influence
by price, performance, and value.
41
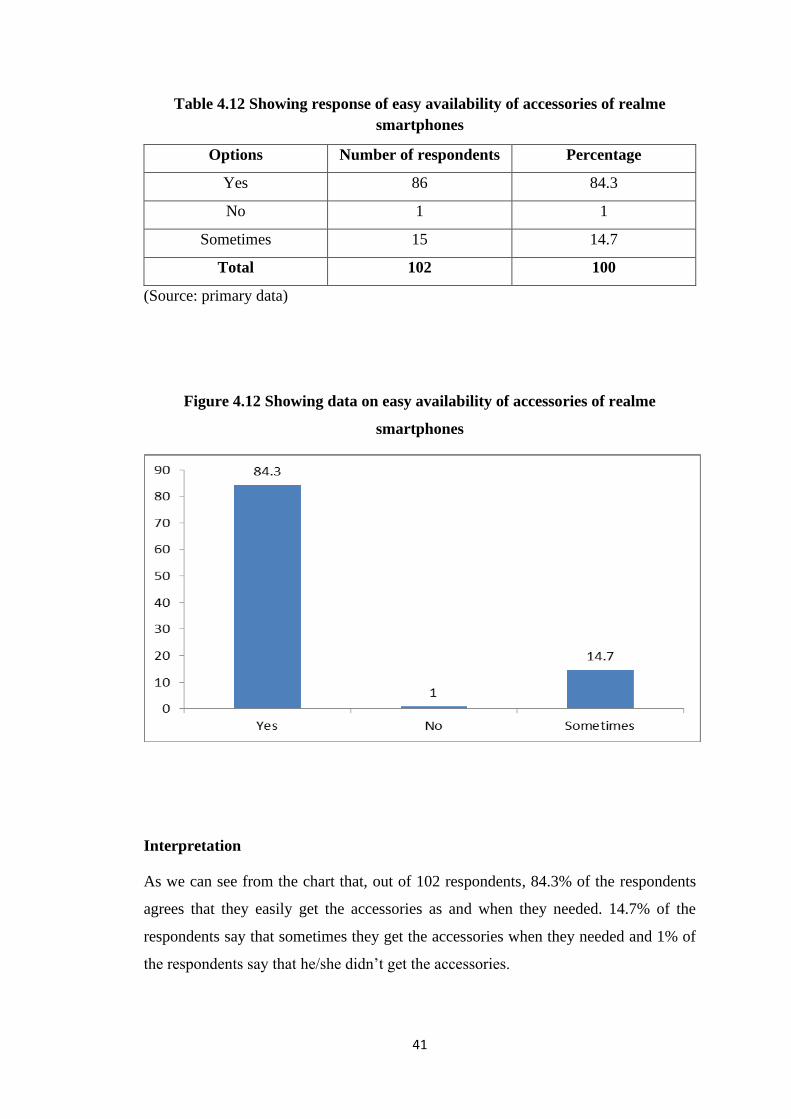
Table 4.12 Showing response of easy availability of accessories of realme
smartphones
Options Number of respondents Percentage
Yes 86 84.3
No 1 1
Sometimes 15 14.7
Total 102 100
(Source: primary data)
Figure 4.12 Showing data on easy availability of accessories of realme
smartphones
Interpretation
As we can see from the chart that, out of 102 respondents, 84.3% of the respondents
agrees that they easily get the accessories as and when they needed. 14.7% of the
respondents say that sometimes they get the accessories when they needed and 1% of
the respondents say that he/she didn’t get the accessories.

42
Table 4.13 Showing response of purchasing the same brand in the near future
Options Number of respondents Percentage
Yes 49 48
No 8 7.8
Maybe 45 44.1
Total 102 100
(Source: Primary data)
Figure 4.13 Showing data of respondents purchasing the same brand in near
future
Interpretation
As we can see from the chart that 48% of respondents agree that they buy the same in
near future, 44.1% of respondents says maybe they buy it and 7.8 % of respondents
says that they not prefer to buy the realme brand in near future. Therefore, majority of
the respondents prefer to buy it in the near future.
43
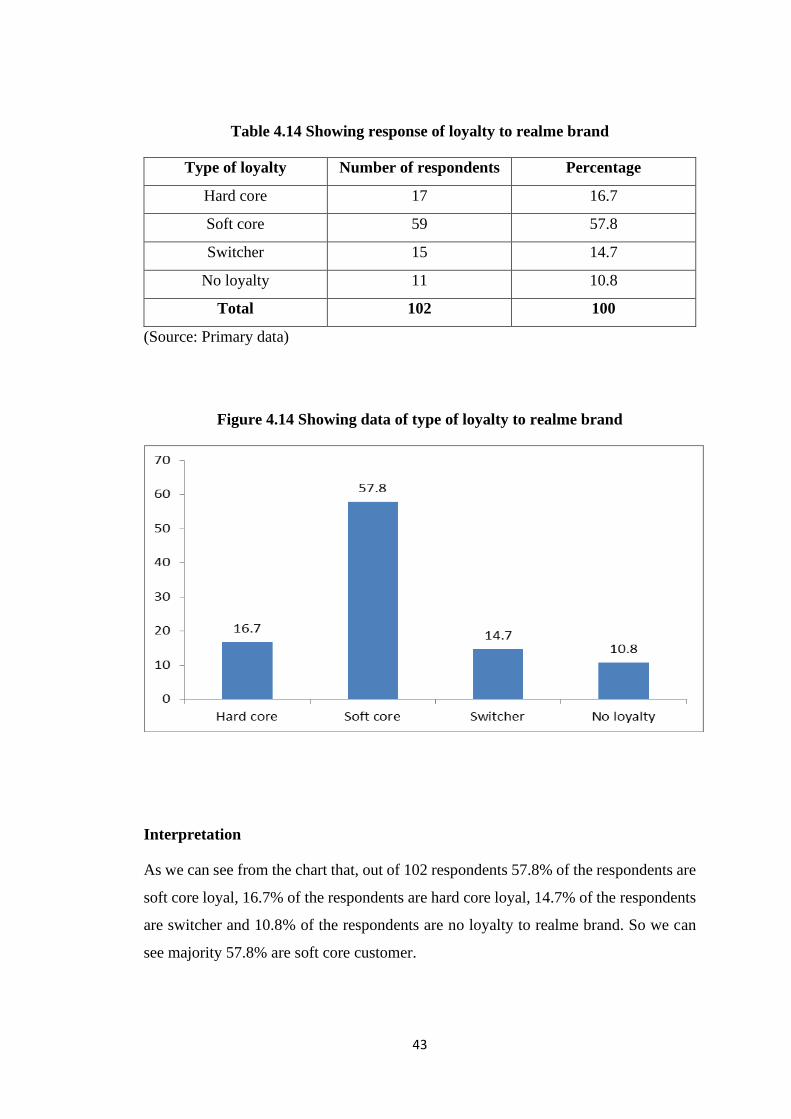
Table 4.14 Showing response of loyalty to realme brand
Type of loyalty Number of respondents Percentage
Hard core 17 16.7
Soft core 59 57.8
Switcher 15 14.7
No loyalty 11 10.8
Total 102 100
(Source: Primary data)
Figure 4.14 Showing data of type of loyalty to realme brand
Interpretation
As we can see from the chart that, out of 102 respondents 57.8% of the respondents are
soft core loyal, 16.7% of the respondents are hard core loyal, 14.7% of the respondents
are switcher and 10.8% of the respondents are no loyalty to realme brand. So we can
see majority 57.8% are soft core customer.

44
Table 4.15 Showing response of recommendation to friends and relatives
Options Number of respondents Percentage
Yes 77 75.5
No 3 2.9
Sometimes 22 21.6
Total 102 100
(Source: Primary data)
Figure 4.15 Showing data of respondents recommending realme to friends and
relatives
Interpretation
From the chart, we can see out of 102 respondents, 75.5% of the respondents agree to
that they will recommend the realme brand to their family and friends, 21.6% of the
respondents sometimes agree to the statement and 2.9% of the respondents disagreed
to the statement. As we can see majority of the respondents 75.5% agree to the
statement.
45
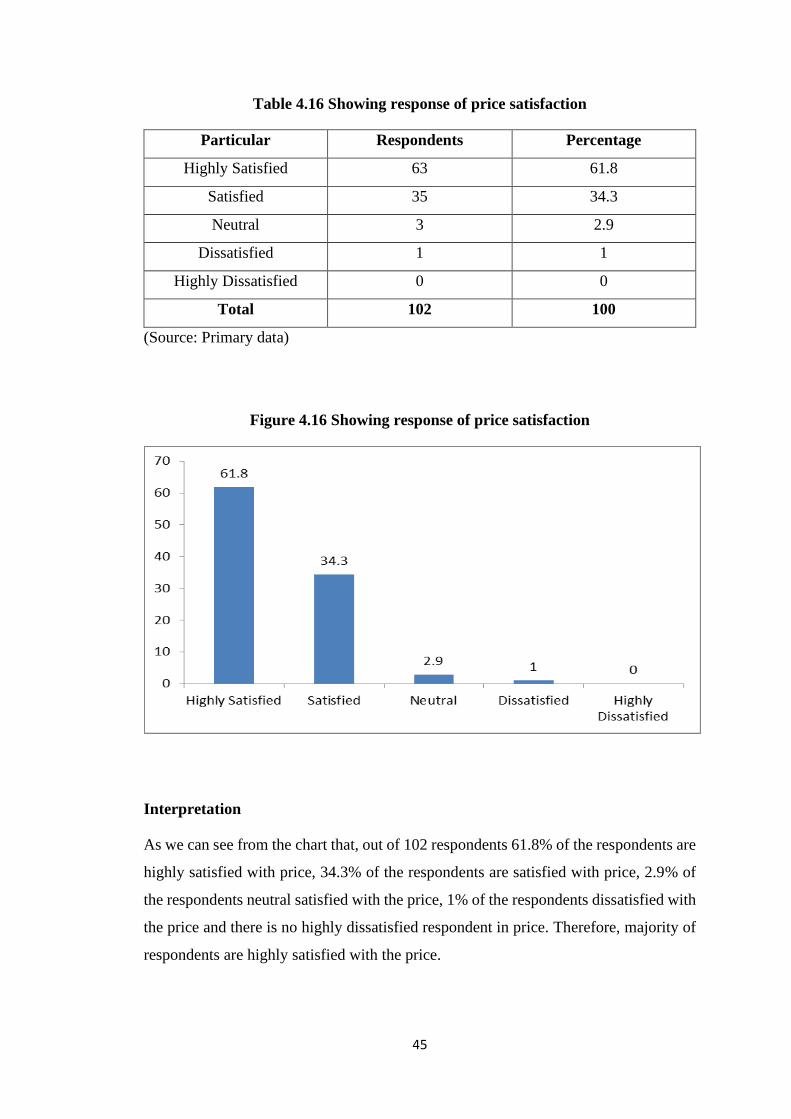
Table 4.16 Showing response of price satisfaction
Particular Respondents Percentage
Highly Satisfied 63 61.8
Satisfied 35 34.3
Neutral 3 2.9
Dissatisfied 1 1
Highly Dissatisfied 0 0
Total 102 100
(Source: Primary data)
Figure 4.16 Showing response of price satisfaction
Interpretation
As we can see from the chart that, out of 102 respondents 61.8% of the respondents are
highly satisfied with price, 34.3% of the respondents are satisfied with price, 2.9% of
the respondents neutral satisfied with the price, 1% of the respondents dissatisfied with
the price and there is no highly dissatisfied respondent in price. Therefore, majority of
respondents are highly satisfied with the price.

46
Table 4.17 Showing response of color satisfaction
Particular Respondents Percentage
Highly Satisfied 39 38.2
Satisfied 54 52.9
Neutral 9 8.8
Dissatisfied 0 0
Highly Dissatisfied 0 0
Total 102 100
(Source: Primary data)
Figure 4.17 Showing response of color satisfaction
Interpretation
As we can from the chart that out of 102 respondents, 52.9% of the respondents are
satisfied with color, 38.2% of the respondents are highly satisfied with color, 8.8% of
the respondents are neutral satisfied with color and there is no respondent dissatisfied
and highly dissatisfied with the color. Therefore, majority of the respondents are
satisfied with the color.
47
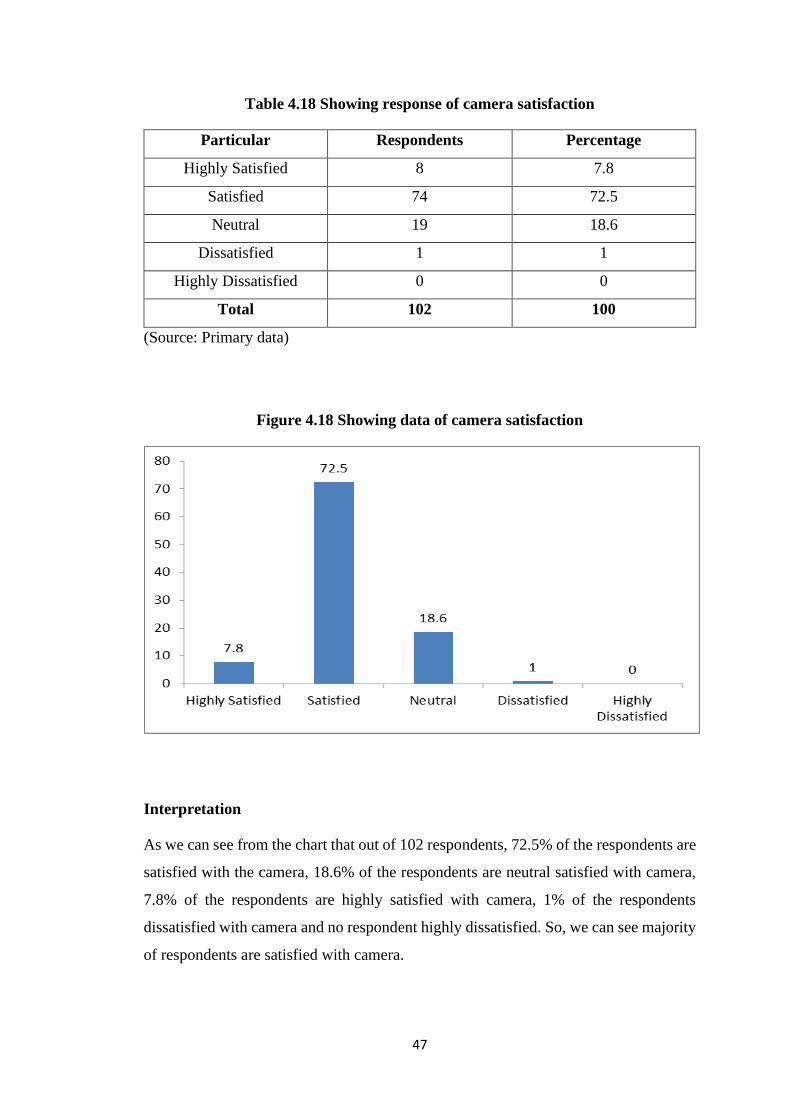
Table 4.18 Showing response of camera satisfaction
Particular Respondents Percentage
Highly Satisfied 8 7.8
Satisfied 74 72.5
Neutral 19 18.6
Dissatisfied 1 1
Highly Dissatisfied 0 0
Total 102 100
(Source: Primary data)
Figure 4.18 Showing data of camera satisfaction
Interpretation
As we can see from the chart that out of 102 respondents, 72.5% of the respondents are
satisfied with the camera, 18.6% of the respondents are neutral satisfied with camera,
7.8% of the respondents are highly satisfied with camera, 1% of the respondents
dissatisfied with camera and no respondent highly dissatisfied. So, we can see majority
of respondents are satisfied with camera.
48
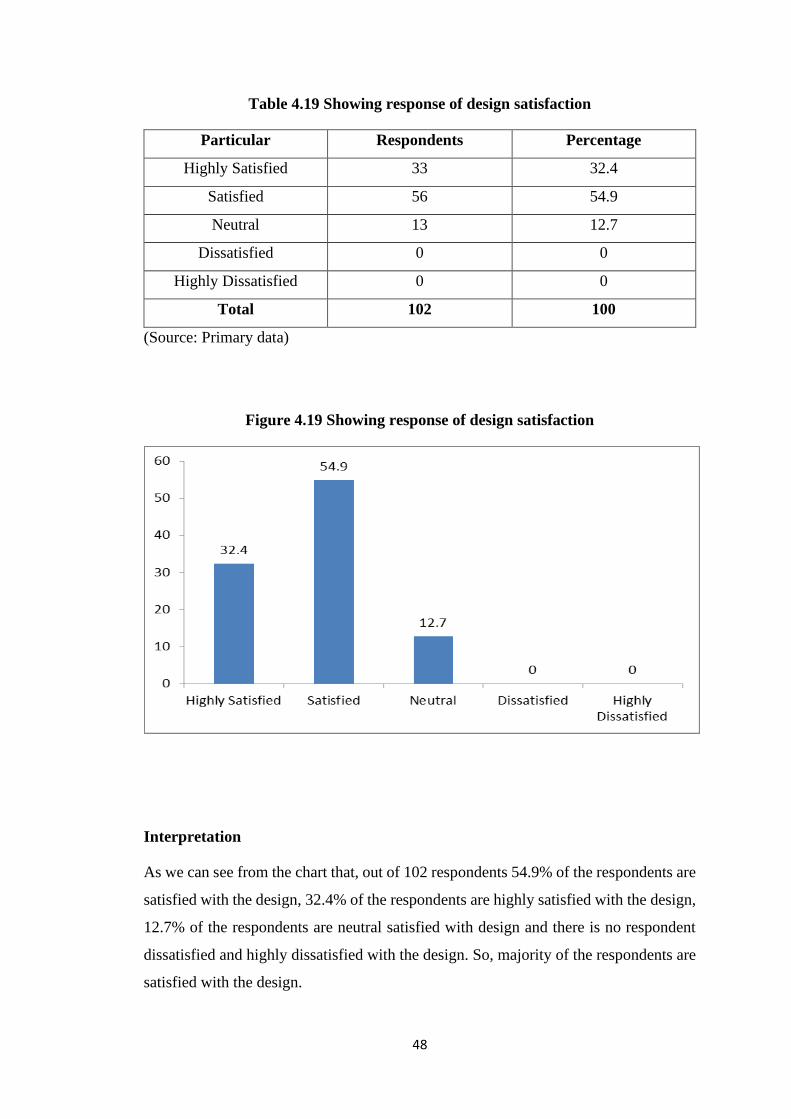
Table 4.19 Showing response of design satisfaction
Particular Respondents Percentage
Highly Satisfied 33 32.4
Satisfied 56 54.9
Neutral 13 12.7
Dissatisfied 0 0
Highly Dissatisfied 0 0
Total 102 100
(Source: Primary data)
Figure 4.19 Showing response of design satisfaction
Interpretation
As we can see from the chart that, out of 102 respondents 54.9% of the respondents are
satisfied with the design, 32.4% of the respondents are highly satisfied with the design,
12.7% of the respondents are neutral satisfied with design and there is no respondent
dissatisfied and highly dissatisfied with the design. So, majority of the respondents are
satisfied with the design.
49
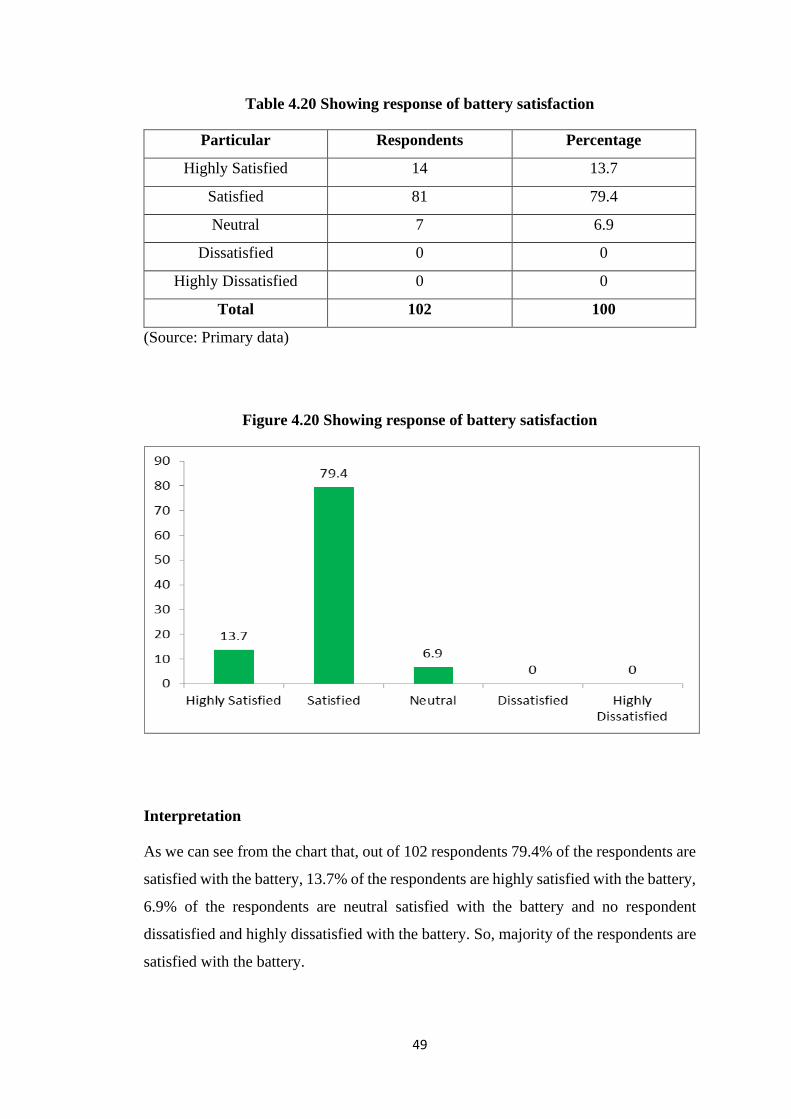
Table 4.20 Showing response of battery satisfaction
Particular Respondents Percentage
Highly Satisfied 14 13.7
Satisfied 81 79.4
Neutral 7 6.9
Dissatisfied 0 0
Highly Dissatisfied 0 0
Total 102 100
(Source: Primary data)
Figure 4.20 Showing response of battery satisfaction
Interpretation
As we can see from the chart that, out of 102 respondents 79.4% of the respondents are
satisfied with the battery, 13.7% of the respondents are highly satisfied with the battery,
6.9% of the respondents are neutral satisfied with the battery and no respondent
dissatisfied and highly dissatisfied with the battery. So, majority of the respondents are
satisfied with the battery.
50
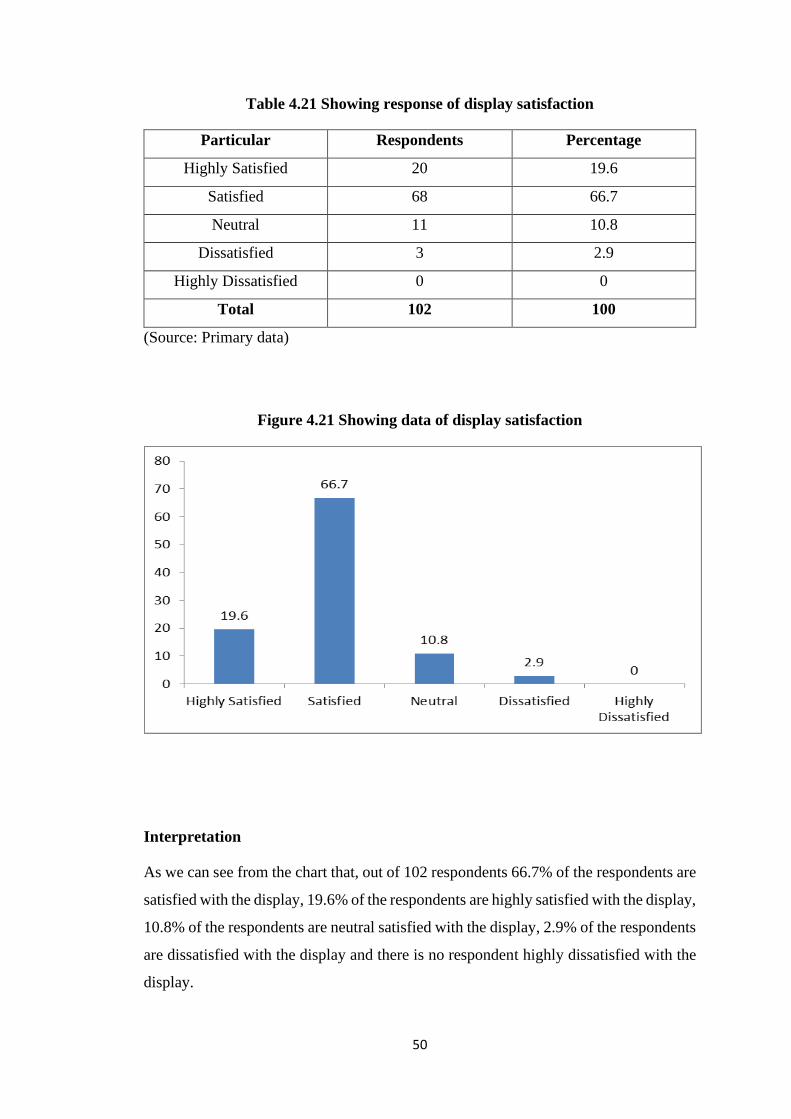
Table 4.21 Showing response of display satisfaction
Particular Respondents Percentage
Highly Satisfied 20 19.6
Satisfied 68 66.7
Neutral 11 10.8
Dissatisfied 3 2.9
Highly Dissatisfied 0 0
Total 102 100
(Source: Primary data)
Figure 4.21 Showing data of display satisfaction
Interpretation
As we can see from the chart that, out of 102 respondents 66.7% of the respondents are
satisfied with the display, 19.6% of the respondents are highly satisfied with the display,
10.8% of the respondents are neutral satisfied with the display, 2.9% of the respondents
are dissatisfied with the display and there is no respondent highly dissatisfied with the
display.
51
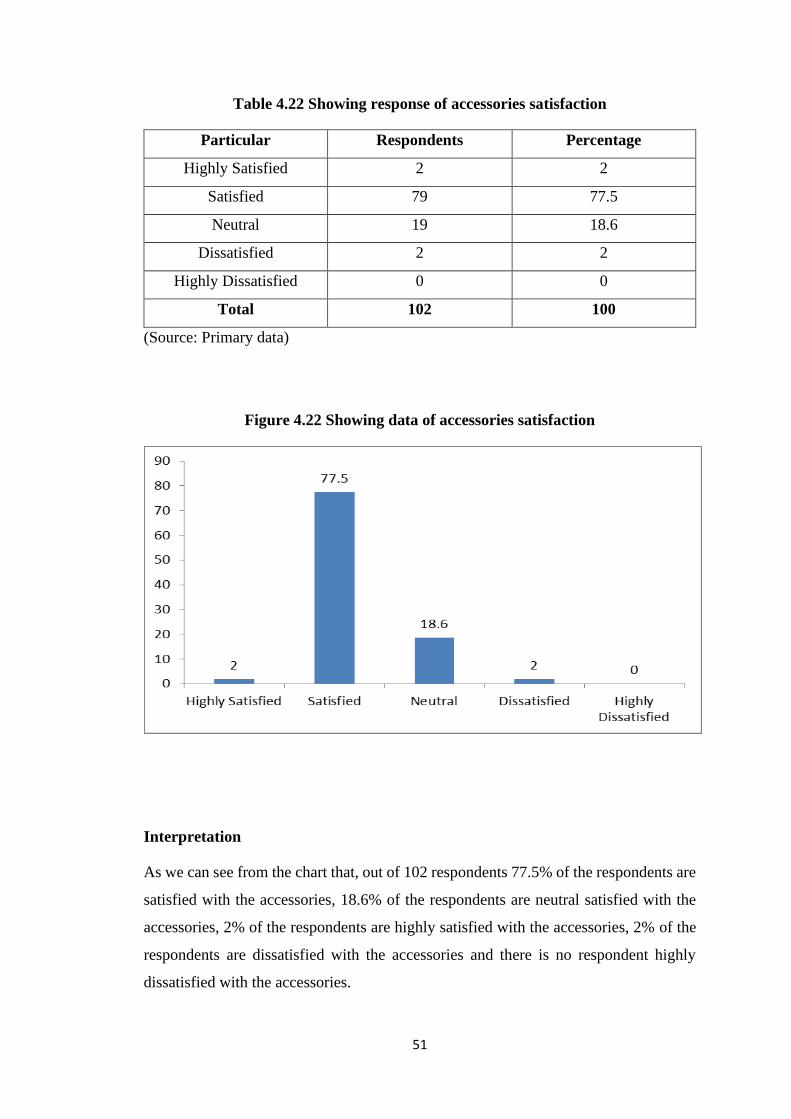
Table 4.22 Showing response of accessories satisfaction
Particular Respondents Percentage
Highly Satisfied 2 2
Satisfied 79 77.5
Neutral 19 18.6
Dissatisfied 2 2
Highly Dissatisfied 0 0
Total 102 100
(Source: Primary data)
Figure 4.22 Showing data of accessories satisfaction
Interpretation
As we can see from the chart that, out of 102 respondents 77.5% of the respondents are
satisfied with the accessories, 18.6% of the respondents are neutral satisfied with the
accessories, 2% of the respondents are highly satisfied with the accessories, 2% of the
respondents are dissatisfied with the accessories and there is no respondent highly
dissatisfied with the accessories.
52
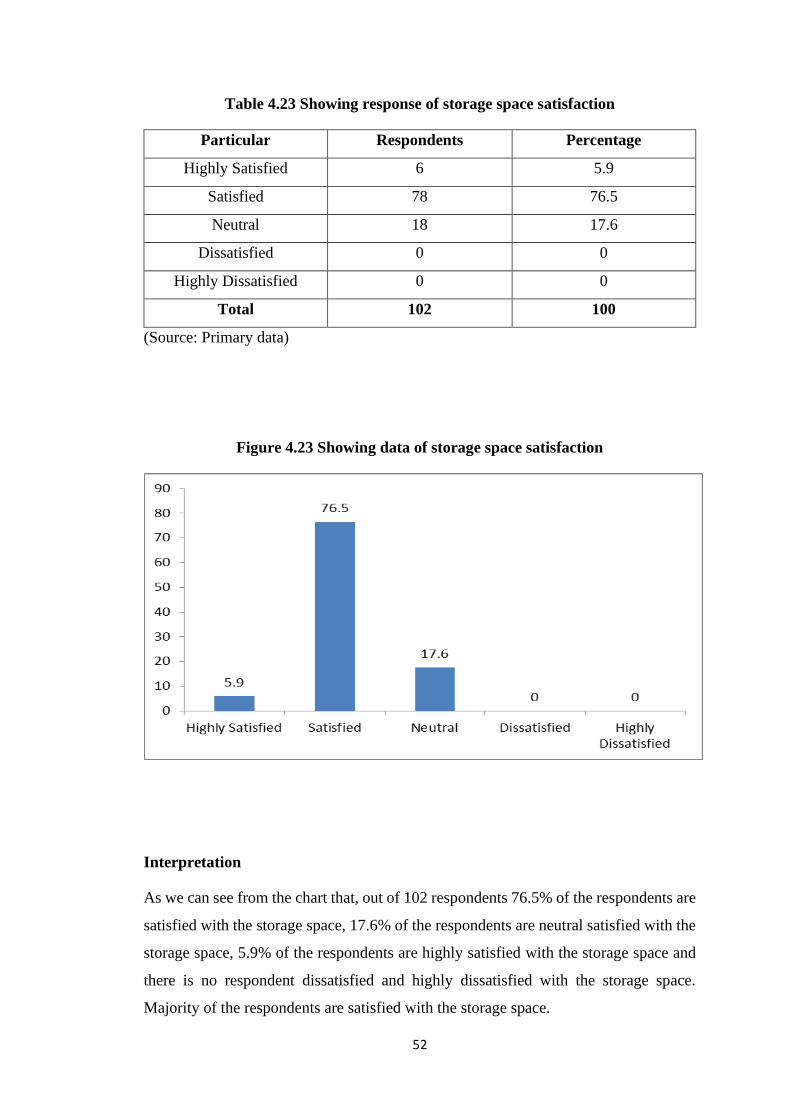
Table 4.23 Showing response of storage space satisfaction
Particular Respondents Percentage
Highly Satisfied 6 5.9
Satisfied 78 76.5
Neutral 18 17.6
Dissatisfied 0 0
Highly Dissatisfied 0 0
Total 102 100
(Source: Primary data)
Figure 4.23 Showing data of storage space satisfaction
Interpretation
As we can see from the chart that, out of 102 respondents 76.5% of the respondents are
satisfied with the storage space, 17.6% of the respondents are neutral satisfied with the
storage space, 5.9% of the respondents are highly satisfied with the storage space and
there is no respondent dissatisfied and highly dissatisfied with the storage space.
Majority of the respondents are satisfied with the storage space.

53
Table 4.24 Showing response of warranty assurance satisfaction
Particular Respondents Percentage
Highly Satisfied 2 2
Satisfied 85 83.3
Neutral 14 13.7
Dissatisfied 1 1
Highly Dissatisfied 0 0
Total 102 100
(Source: Primary data)
Figure 4.24 Showing data of warranty assurance satisfaction
Interpretation
As we can see from the chart that, out of 102 respondents 83.3% of the respondents are
satisfied with the warranty assurance, 13.7% of the respondents are neutral satisfied
with the warranty assurance, 2% of the respondents are highly satisfied with the
warranty assurance, 1% of the respondents are dissatisfied and no respondent is highly
dissatisfied with the warranty assurance.

54
Table 4.25 Showing response of overall satisfaction
Particular Respondents Percentage
Scale 1 1 1
Scale 2 1 1
Scale 3 12 11.8
Scale 4 64 62.7
Scale 5 24 23.5
Total 102 100
(Source: Primary data)
Figure 4.25 Showing data of overall satisfaction
Interpretation
From the chart we can see that, out of 102 respondents 62.7% of the respondents prefer
to give scale 4 for overall satisfaction on realme, 23.5% of the respondents prefer to
give scale 5 for overall satisfaction, 11.8% of the respondents prefer to give scale 3 for
overall satisfaction, 1% of the respondents prefer to give scale 2 and 1% of the
respondents prefer to give scale 1 for overall satisfaction.
55
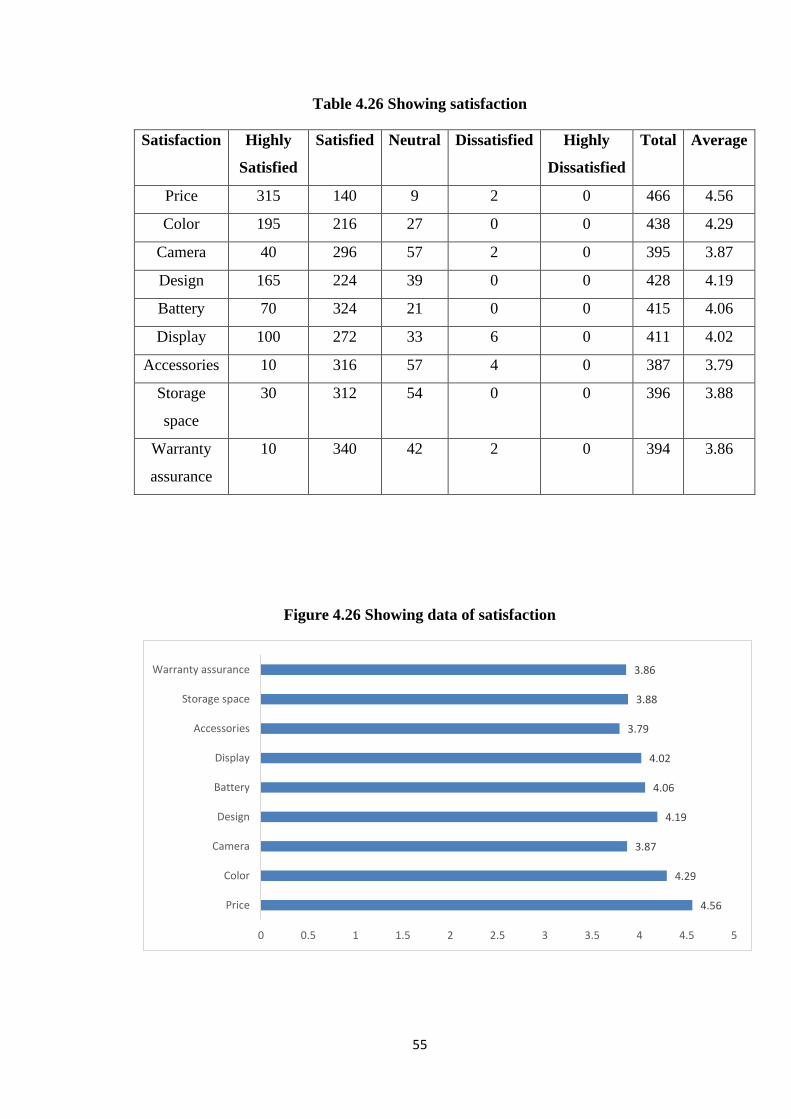
Table 4.26 Showing satisfaction
Satisfaction Highly
Satisfied
Satisfied Neutral Dissatisfied Highly
Dissatisfied
Total Average
Price 315 140 9 2 0 466 4.56
Color 195 216 27 0 0 438 4.29
Camera 40 296 57 2 0 395 3.87
Design 165 224 39 0 0 428 4.19
Battery 70 324 21 0 0 415 4.06
Display 100 272 33 6 0 411 4.02
Accessories 10 316 57 4 0 387 3.79
Storage
space
30 312 54 0 0 396 3.88
Warranty
assurance
10 340 42 2 0 394 3.86
Figure 4.26 Showing data of satisfaction
4.56
4.29
3.87
4.19
4.06
4.02
3.79
3.88
3.86
0 0.5 1 1.5 2 2.5 3 3.5 4 4.5 5
Price
Color
Camera
Design
Battery
Display
Accessories
Storage space
Warranty assurance
56
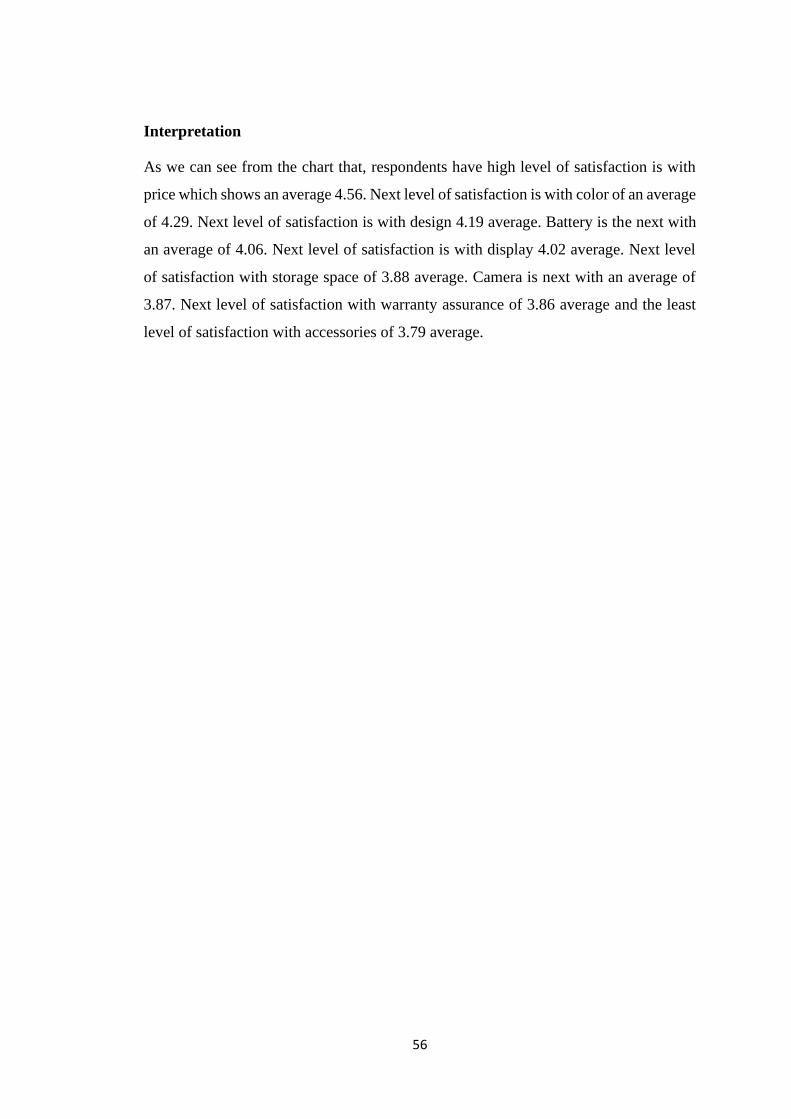
Interpretation
As we can see from the chart that, respondents have high level of satisfaction is with
price which shows an average 4.56. Next level of satisfaction is with color of an average
of 4.29. Next level of satisfaction is with design 4.19 average. Battery is the next with
an average of 4.06. Next level of satisfaction is with display 4.02 average. Next level
of satisfaction with storage space of 3.88 average. Camera is next with an average of
3.87. Next level of satisfaction with warranty assurance of 3.86 average and the least
level of satisfaction with accessories of 3.79 average.

57
CHAPTER 5
FINDINGS SUGGESTIONS AND CONCLUSION
58
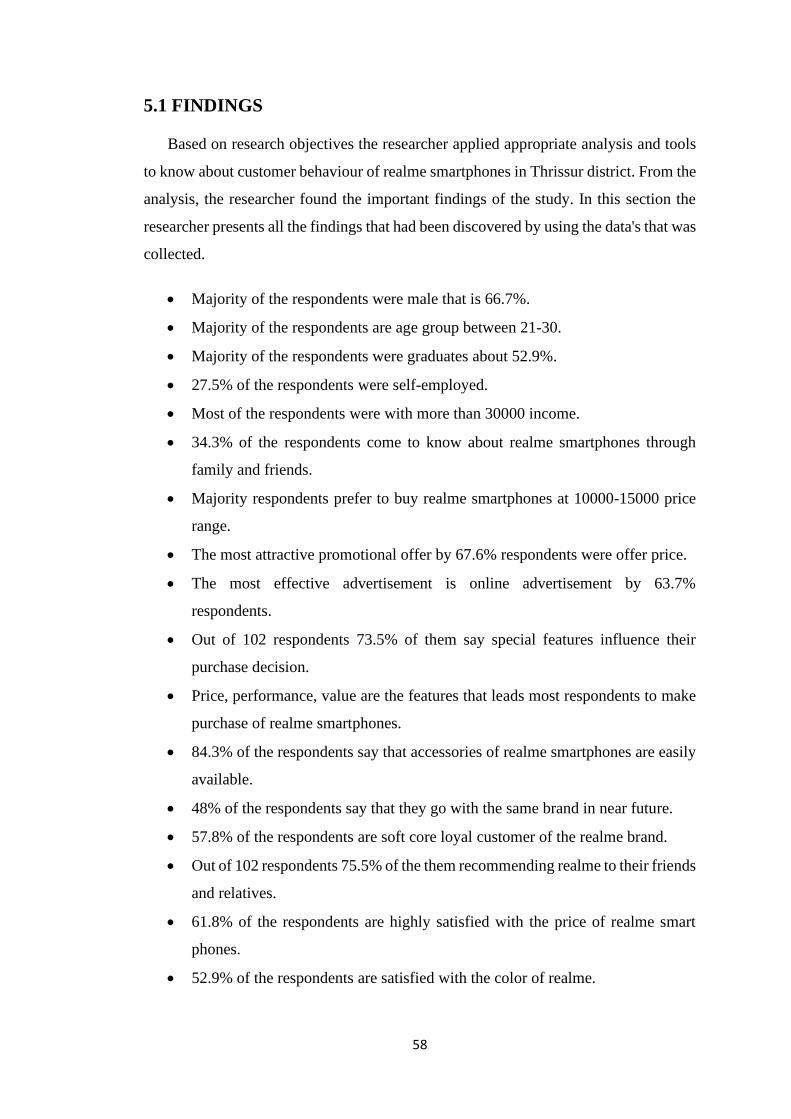
5.1 FINDINGS
Based on research objectives the researcher applied appropriate analysis and tools
to know about customer behaviour of realme smartphones in Thrissur district. From the
analysis, the researcher found the important findings of the study. In this section the
researcher presents all the findings that had been discovered by using the data's that was
collected.
• Majority of the respondents were male that is 66.7%.
• Majority of the respondents are age group between 21-30.
• Majority of the respondents were graduates about 52.9%.
• 27.5% of the respondents were self-employed.
• Most of the respondents were with more than 30000 income.
• 34.3% of the respondents come to know about realme smartphones through
family and friends.
• Majority respondents prefer to buy realme smartphones at 10000-15000 price
range.
• The most attractive promotional offer by 67.6% respondents were offer price.
• The most effective advertisement is online advertisement by 63.7%
respondents.
• Out of 102 respondents 73.5% of them say special features influence their
purchase decision.
• Price, performance, value are the features that leads most respondents to make
purchase of realme smartphones.
• 84.3% of the respondents say that accessories of realme smartphones are easily
available.
• 48% of the respondents say that they go with the same brand in near future.
• 57.8% of the respondents are soft core loyal customer of the realme brand.
• Out of 102 respondents 75.5% of the them recommending realme to their friends
and relatives.
• 61.8% of the respondents are highly satisfied with the price of realme smart
phones.
• 52.9% of the respondents are satisfied with the color of realme.
59
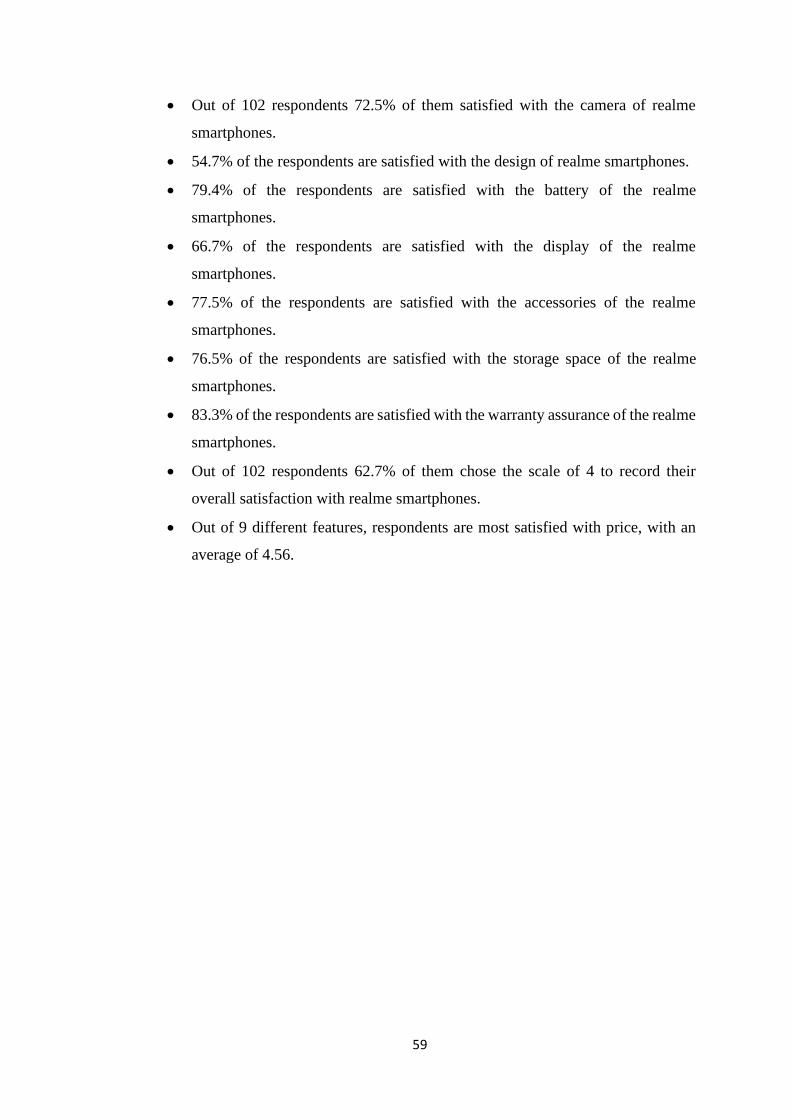
• Out of 102 respondents 72.5% of them satisfied with the camera of realme
smartphones.
• 54.7% of the respondents are satisfied with the design of realme smartphones.
• 79.4% of the respondents are satisfied with the battery of the realme
smartphones.
• 66.7% of the respondents are satisfied with the display of the realme
smartphones.
• 77.5% of the respondents are satisfied with the accessories of the realme
smartphones.
• 76.5% of the respondents are satisfied with the storage space of the realme
smartphones.
• 83.3% of the respondents are satisfied with the warranty assurance of the realme
smartphones.
• Out of 102 respondents 62.7% of them chose the scale of 4 to record their
overall satisfaction with realme smartphones.
• Out of 9 different features, respondents are most satisfied with price, with an
average of 4.56.
60
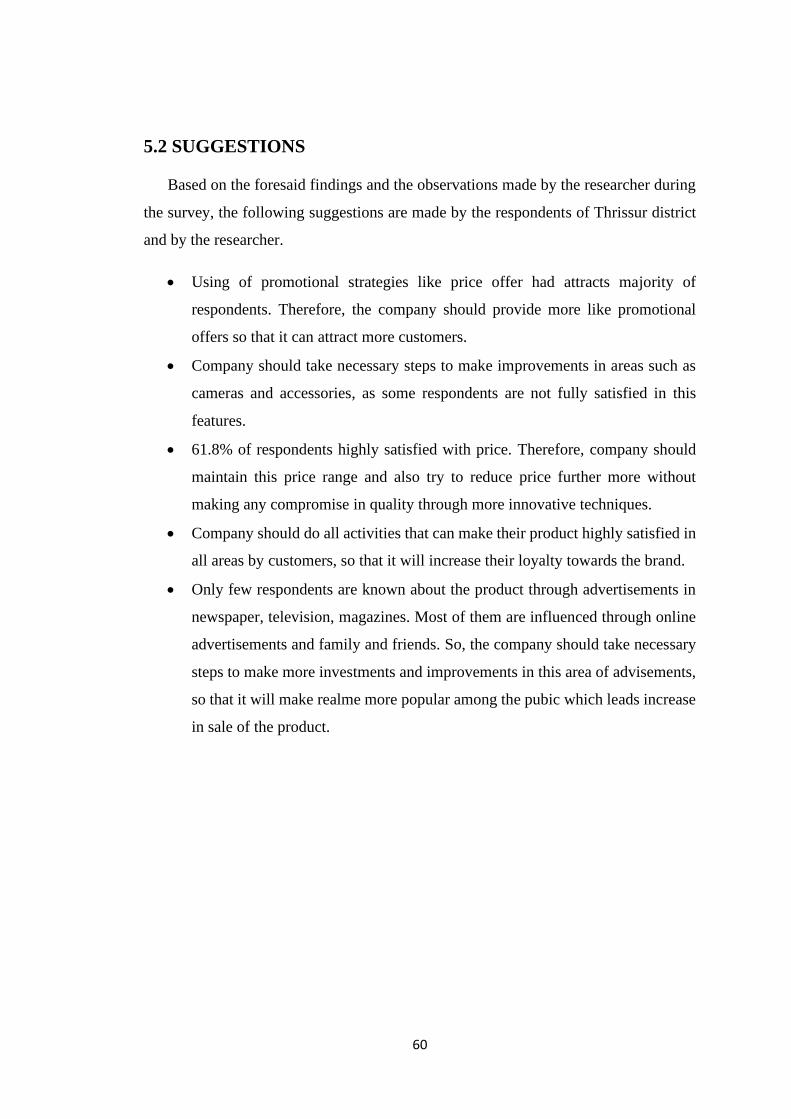
5.2 SUGGESTIONS
Based on the foresaid findings and the observations made by the researcher during
the survey, the following suggestions are made by the respondents of Thrissur district
and by the researcher.
• Using of promotional strategies like price offer had attracts majority of
respondents. Therefore, the company should provide more like promotional
offers so that it can attract more customers.
• Company should take necessary steps to make improvements in areas such as
cameras and accessories, as some respondents are not fully satisfied in this
features.
• 61.8% of respondents highly satisfied with price. Therefore, company should
maintain this price range and also try to reduce price further more without
making any compromise in quality through more innovative techniques.
• Company should do all activities that can make their product highly satisfied in
all areas by customers, so that it will increase their loyalty towards the brand.
• Only few respondents are known about the product through advertisements in
newspaper, television, magazines. Most of them are influenced through online
advertisements and family and friends. So, the company should take necessary
steps to make more investments and improvements in this area of advisements,
so that it will make realme more popular among the pubic which leads increase
in sale of the product.
61
5.3 CONCLUSION
This research is done for academic purpose and the study is conducted to know about
customer behaviour towards Realme Smartphones with special references to Thrissur
District. From the sample of 102 respondents, it is found that customer were satisfied
in almost every areas of the Smartphone and customer showing well behaviour towards
the realme smartphones. The objectives of the study are accomplished that factors
influencing the customer to choose realme smartphones have been identified and also
get to know the satisfaction level of customers towards realme.
Majority of the respondents are satisfied with almost all features of realme smartphones.
People are attracted towards realme smartphones are mainly due to its lower price,
higher performance, value for money and easy availability of accessories. Along with
this special features, promotional strategies like price offer and discount have a great
impact on sale of realme. Also, family and friends and online advertisements made
realme smartphones well known among the people.
In a short glance, this study shows majority of respondents are satisfied with almost all
areas of the realme smartphones. And its higher performance and lower price and value
for money, along with promotions through social media and online advertisements
make more customers to make chose for realme smartphones.

62
BIBLIOGRAPHY
63
REFERENCES
1. Amrit Mohan, “Consumer Behaviour towards Smartphone Industry in Indian
Market”, PhD. Dissertation, Department of Business Management, Dublin Business
School, pp. 1-85, 2014.
2. Chia-ling Eunice Liu, Rudolf R. Sinkovics, Noemi Sinkovics (2012), Determinants
of Consumer Perceptions toward Mobile Advertising - A Comparison between Japan
and Austria, February 2012, Journal of Interactive Marketing 26(1):21-32.
3. Debasish Rout, Dr Somabhusan Janakiballav Mishra, Rahul Gupta. (2020), A Study
on Perception of Mobile Phone users of Bhubaneswar Towards Chinese Mobile
Phone’s Quality, SSRG International Journal of Economics and Management Studies
(SSRG-IJEMS, ISSN: 2393- 9125) – Volume 7 Issue 3–March 2020, pp. 93-99.
4. Jaakko et al (2007), Conference: System Sciences, 2006. HICSS '06. Proceedings of
the 39th Annual Hawaii International Conference on system sciences, Volume: 6.
5. Fred Robins, The marketing of 3G (November 2003), Marketing Intelligence &
Planning 21(6):370-378
6. Lynda Andrews, Judy Drennan, Rebekah Russell-Bennett, (2012), Linking perceived
value of mobile marketing with the experiential consumption of mobile phones, March
2012, European Journal of Marketing 46(3/4):357-386.
7. Kushagra et al (2017), Consumer preference for electronic consumer durable goods
in India: a conjoint analysis approach, January 2017, International Journal of Business
Forecasting and Marketing Intelligence 3(1):13
8. Kotler & Armstrong. (2010). Principle of marketing (3rd ed.). Boston: Pearson
Education; 2010.
9. Philip Kotler (2008) "Marketing Management" (Eleventh Edition), Pearson
Education Inc., Singapore.
64
10. S.Mokhlis and A.Y.Yakoop, “Consumer Choice criteria in Mobile Phone selection:
An investigation of Malaysian University student”, International review of Social
Science & Humanities, 2(2), 2012, 203-212.
11. Dr S J Mishra, Debasish Rout, Neeraj K Jena (2020), “An analysis of Online
Shopping of customers with special reference to Bhubaneswar”. Mukt Shabd Journal
(UGC CARE), Vol-IX, Issue-V, ISSN NO: 2347-3150.
12. MohdAzam Osman, Tan Shiang-Yen, Abdullah Sani Alwi, “Trend of Smartphone
and its Usage behaviour in Malaysia”, International Journal on New Computer
Architectures, Vol. 2, No. 1, pp. 275-286, 2012.
13. Chu-Mei Liu, (2002) "The effects of promotional activities on brand decision in the
cellular – 51 telephone industry", Journal of Product & Brand Management, Vol. 11
Issue: 1, pp.42
14. Ibrahim et al (2013). Antecedent Stirring Purchase Intention of Smartphone among
adolescents in Perlis International Journal of Academic Research in Business and
Social Sciences December 2013, Vol. 3, No. 12, 84-97.
WEBSITES
https://www.realme.com/in/
https://en.m.wikipedia.org/wiki/Smartphone
https://clootrack.com/knowledge_base/types-of-consumer-behavior/?amp
https://www.counterpointresearch.com/global-smartphone-share/
https://www.counterpointresearch.com/india-smartphone-share/
https://www.mordorintelligence.com/industry-reports/smartphones-market
https://www.realme.com/in/brand#aboutpp
BOOKS
Research Methodology – methods and techniques, C R Kothari

65
APPENDIX

66
QUESTIONNAIRE
1. Gender:
• Male
• Female
• Others
2. Age:
• 15 - 20
• 21 – 30
• 31 – 40
• 41 – 50
• 51 & above
3. Education qualification:
• Matriculation
• Higher secondary
• Graduate
• Post graduate
• Others
4. Occupation:
• Self employed
• Private employed
• Government employed
• Professional
• Student
5. Income:
• Less than 10000
• 10000 - 20000
• 20000 – 30000
• More than 30000
• No income
67
6. How do you come to know about realme smart phones?
• Advertisement
• Family and friends
• Sale representative
• Social media
• Others
7. What price do you consider while you purchase a realme smart phone?
• Below 10000
• 10000 - 15000
• 15000 – 20000
• 20000 – 25000
• Above 25000
8. Which promotional offer attracts you most in purchase of realme?
• Free gifts
• Price offer
• Discount
• Others
9. Which Media of advertisement influence your purchase?
• Television
• Newspaper
• Magazine
• Internet
10. Does the Special features of the realme smart phones influence on your purchase
decision?
• Yes
• No
68
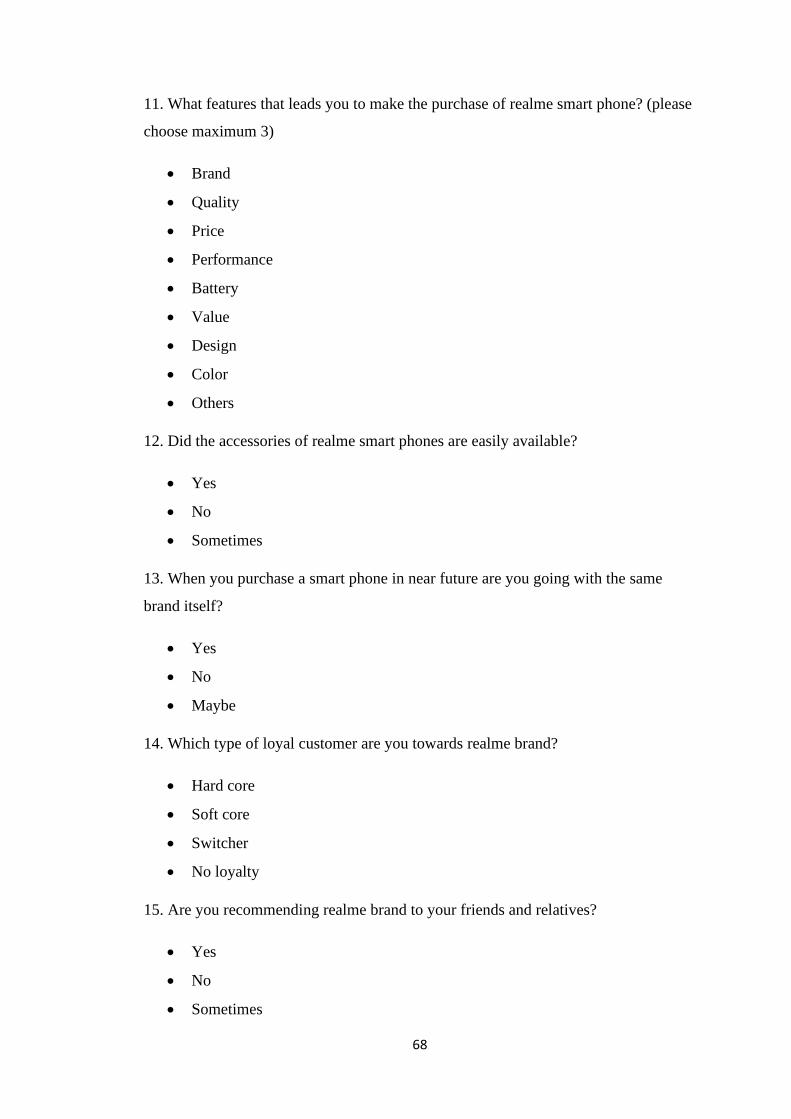
11. What features that leads you to make the purchase of realme smart phone? (please
choose maximum 3)
• Brand
• Quality
• Price
• Performance
• Battery
• Value
• Design
• Color
• Others
12. Did the accessories of realme smart phones are easily available?
• Yes
• No
• Sometimes
13. When you purchase a smart phone in near future are you going with the same
brand itself?
• Yes
• No
• Maybe
14. Which type of loyal customer are you towards realme brand?
• Hard core
• Soft core
• Switcher
• No loyalty
15. Are you recommending realme brand to your friends and relatives?
• Yes
• No
• Sometimes
69
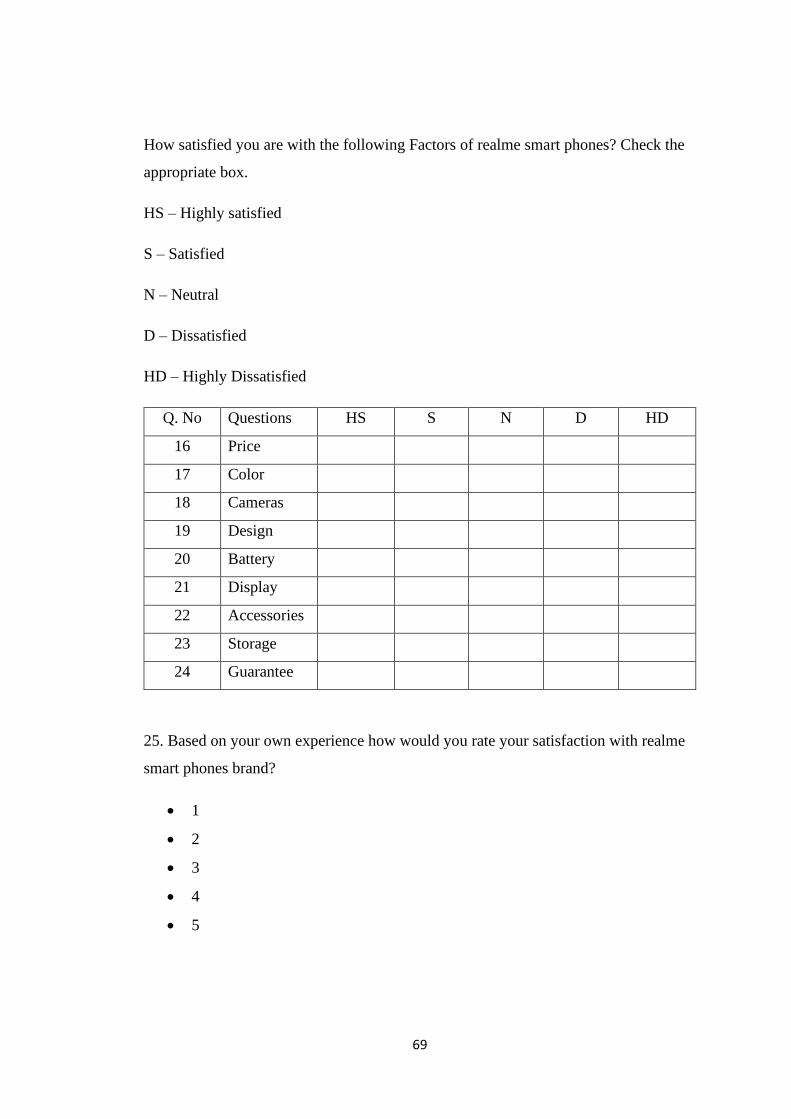
How satisfied you are with the following Factors of realme smart phones? Check the
appropriate box.
HS – Highly satisfied
S – Satisfied
N – Neutral
D – Dissatisfied
HD – Highly Dissatisfied
Q. No Questions HS S N D HD
16 Price
17 Color
18 Cameras
19 Design
20 Battery
21 Display
22 Accessories
23 Storage
24 Guarantee
25. Based on your own experience how would you rate your satisfaction with realme
smart phones brand?
• 1
• 2
• 3
• 4
• 5


