Embed Size (px)
Citation preview

Seediscussions,stats,andauthorprofilesforthispublicationat:https://www.researchgate.net/publication/255787027
Asocial–ecologicalassessmentofvacantlotsinNewYorkCity
ARTICLEinLANDSCAPEANDURBANPLANNING·JULY2013
ImpactFactor:3.04·DOI:10.1016/j.landurbplan.2013.05.003
CITATIONS
13
READS
415
3AUTHORS:
PelegKremer
VillanovaUniversity
17PUBLICATIONS180CITATIONS
SEEPROFILE
ZoeHamstead
TheNewSchool
12PUBLICATIONS130CITATIONS
SEEPROFILE
TimonMcPhearson
TheNewSchool
41PUBLICATIONS785CITATIONS
SEEPROFILE
Allin-textreferencesunderlinedinbluearelinkedtopublicationsonResearchGate,
lettingyouaccessandreadthemimmediately.
Availablefrom:TimonMcPhearson
Retrievedon:05February2016

G
L
A
Pa
b
N
h
•••••
ARRAA
KVGUSUN
1
csramaa2m
(m
0h
ARTICLE IN PRESS Model
AND-2382; No. of Pages 16
Landscape and Urban Planning xxx (2013) xxx– xxx
Contents lists available at SciVerse ScienceDirect
Landscape and Urban Planning
jou rn al hom ep age: www.elsev ier .com/ locate / landurbplan
social–ecological assessment of vacant lots in New York City
eleg Kremera,∗, Zoé A. Hamsteadb, Timon McPhearsona
Tishman Environment and Design Center, The New School, 79 Fifth Avenue, 16th Floor, New York, NY 10003, USAEnvironmental Policy and Sustainability Management, Milano School of International Affairs, Management and Urban Policy, The New School, 72 Fifth Avenue, 5th Floor, New York,Y 10011, USA
i g h l i g h t s
Sixty-seven percent of surveyed vacant lots are used for public, private or commercial purposes.Surveyed lots which are unused are largely located in areas of high population density and low income.Sixty-two percent of surveyed vacant lots are covered by trees and other herbaceous vegetation.Vegetated vacant lots are spatially clustered and correlated with neighborhood green space.Fine-scale classification can support planning for vacant lot management and development.
a r t i c l e i n f o
rticle history:eceived 10 July 2012eceived in revised form 11 May 2013ccepted 14 May 2013vailable online xxx
eywords:
a b s t r a c t
Land vacancy is a persistent phenomenon in urban landscapes in the United States, yet little is knownabout the ways vacant lots are used in practice and the functions they serve in local communities. Here,we offer insight into the composition, uses and neighborhood context of vacant lots in New York City.Using ArcGIS and Google Earth, we conducted a visual survey of 5% of vacant lots in each New York Cityborough, collecting land cover and actual use data. Results indicate that many vacant lots in New York Cityare used as community gardens, residential yards, parks, parking areas and sports fields. Neighborhood
acant lotsreen infrastructurerban land use\land coverocial–ecological systemsrban ecosystem servicesew York City
income and lot vegetation are significantly associated with most of the ways that vacant lots are usedin practice. In particular, lots which are actually unused (33%) tend to be located in neighborhoods withrelatively high population density and low median household income levels. We suggest that by assessingvacant lot uses, ecological characteristics and the social characteristics of neighborhoods in which vacantlots are located, planners may be able to more effectively address urban land vacancy while supportingurban sustainability and resilience.
© 2013 Elsevier B.V. All rights reserved.
. Introduction
Urban vacant land comes about through a variety of urban pro-esses, including demographic and preference-based residentialhifts, suburban expansion, de-industrialization and work forceelocation. Vacant lots are often viewed as a problem in urbanreas. Associated with crime, underutilization of land, abandon-ent, depressed real estate values, trash, overgrown weeds, vermin
nd general economic and social failure, they are thought to have
Please cite this article in press as: Kremer, P., et al. A social–ecological assehttp://dx.doi.org/10.1016/j.landurbplan.2013.05.003
negative impact on community vitality (Accordino & Johnson,000; Goldstein, Jensen, & Reiskin, 2001). However, vacant lotsay also be viewed as places in the urban landscape that serve
∗ Corresponding author. Tel.: +1 212 229 5100x3958; fax: +1 212 229 5404.E-mail addresses: [email protected], [email protected]
P. Kremer), [email protected] (Z.A. Hamstead),[email protected] (T. McPhearson).
169-2046/$ – see front matter © 2013 Elsevier B.V. All rights reserved.ttp://dx.doi.org/10.1016/j.landurbplan.2013.05.003
community needs or hold opportunity for land use transforma-tions which can contribute to community development and provideecosystem services that support the health and wellbeing of peo-ple (Burkholder, 2012; Little, 2008). The cumulative experience ofmany United States cities suggests that vacant lots are a common,lasting phenomenon which represent a substantial proportion ofthe urban landscape and can be strategically used in urban devel-opment policy (Bowman & Pagano, 2004). To inform planning anddecision-making processes addressing urban land vacancy, it isimperative that we build a knowledge base about the characteris-tics of vacant lots, the types of uses they serve and their potential forsocial–ecological transformation through strategic urban planningand development.
In New York City (NYC), while some information is available
ssment of vacant lots in New York City. Landscape Urban Plan. (2013),
about administrative aspects of vacant lots – such as zoning, loca-tion, and ownership – little is known about their landcover or howthey are used. In this paper, we assess characteristics of NYC vacantlots to understand how they contribute to ecological processes, how

ARTICLE IN PRESSG Model
LAND-2382; No. of Pages 16
2 P. Kremer et al. / Landscape and Urban Planning xxx (2013) xxx– xxx
Table 1Review of vacant lot census data collected between 1955 and 1997.
Number of cities sampled City population size Land vacancy (%) Source
12 >100,000 >20% Bartholomew (1955)48 ∼20% Niedercorn and Hearle (1964)86 >100,000 20% National Commission on Urban Problems (1968)37 >250,000a 12.5% National Commission on Urban Problems (1968)86 >100,000 20–25% Northam (1971)99 >100,000 19% Bowman and Pagano (2000)
15%
popu
ttoacm
1
h2lalbBwssutvtai2ivup(dewctpcdtledcbob5rsvr1
20 >250,000a
a Gray highlights indicate surveys that were conducted in cities of similarly large
hey are actually used by communities currently, and the social con-ext in which they are located. We posit that vacant lots are partf the infrastructure for social and ecological processes in the citynd can be utilized for the co-improvement of social and ecologicalonditions in communities through green infrastructure develop-ent.
.1. Vacant lots in large cities
The persistent existence of vacant lots in the urban landscapeas been a reality in American cities for many decades (Schukoske,000). There is no single, broadly recognized definition of vacant
and, but typically included in this category are bare soil, agriculturet the edge of an urbanized area or uncultivated land, recently razedand, derelict land, land with abandoned buildings and structures,rownfields, and greenfields (Bowman & Pagano, 2004; Pagano &owman, 2000). Northam (1971) offers a typology of vacant landhich includes (1) remnant parcels, having small size or irregular
hape; (2) land having physical limitations to development (steeplopes, flood hazards); (3) land in corporate reserve (e.g. owned bytility companies for future expansion); (4) land held for specula-ion and (5) land in institutional reserve. In practice, definitions ofacant land are established by cities, and so vary among jurisdic-ions. The classification may be influenced by a city’s tax structurend development plan, to include parcels with zero-dollar build-ng value or city-owned surface parking lots (Bowman & Pagano,004). The American Planning Association (APA) provides two def-
nitions of vacant land. Citing the California Planning Roundtable,acant land is defined as “lands or buildings that are not activelysed for any purpose,” or, cited from Leesburg, Virginia, “a lot orarcel of land on which no improvements have been constructed”Davidson & Dolnick, 2004). In NYC, the Department of Financeefines a vacant lot as a parcel of land “on which no lawful structurexists and which is not otherwise being used for any purpose forhich it may lawfully be used” (City of New York, 2010), combining
oncepts from both APA definitions. These descriptions provide lit-le information about how vacant land might be incorporated intolanning strategies. For instance, land on which no structure existsould be held in corporate reserve or have physical limitations toevelopment. The former is awaiting development, while the lat-er may not be able to support building structures; yet, the vacantand class encompasses both meanings. There is relatively little lit-rature on vacant land in United States cities; systematic censusata, tracking supply of vacant land at the national level, was firstollected in the mid-1950s during suburban expansion, and haseen infrequently updated. The most recent comprehensive studyf vacant lots in U.S. cities was conducted between 1997 and 1998,y surveying planning directors in U.S. cities with populations of0,000 or more (Bowman & Pagano, 2004). The survey responseate was 35%, suggesting that in many places, vacant land supply is
Please cite this article in press as: Kremer, P., et al. A social–ecological assehttp://dx.doi.org/10.1016/j.landurbplan.2013.05.003
ystematically tracked at the city-level. The average percentage ofacant land in cities of comparable population sizes has remainedelatively constant over time. Vacant land in cities of more than00,000 people has varied between 19 and 25% of total land area,
Bowman and Pagano (2000)
lation size (>250,000 people).
while for cities with populations greater than 250,000, vacant landhas comprised between 12.5 and 15% of total land area. Table 1summarizes vacant lot census data collected between 1955 and1997.
Bowman and Pagano (2004) found that cities which gained pop-ulation reported more vacant land area than cities experiencingpopulation loss. On its face, this evidence appears at odds withrecent experiences of some post-industrial U.S. cities, where popu-lation decline has occurred alongside vast land abandonment at theurban core. In cities such as Detroit, Michigan, Youngstown, Ohioand Buffalo, NY, vacancy has come at the heels of population shrink-age (Popper & Popper, 2010). One explanation for this apparentdiscrepancy is that vacant land in growing cities is acquired throughannexation at urban peripheries, while shrinking cities experiencevacancy at their core. Indeed, Bowman and Pagano (2004) foundthat a city’s ability to expand its territory was a significant predic-tor of that city’s proportion of vacant land, implying that annexationis being used to maintain a supply of vacant land for future devel-opment. Their survey data also suggests that size, shape, and theassembly of land are the conditions that most limit vacant landredevelopment. To avoid a blighting influence on the surroundingcommunity, undevelopable vacant land and vacant land awaitingdevelopment could serve long-term or interim beneficial uses suchas community gardens, wildlife gardens, public plantings and recre-ational areas (Bonham, Spilka, & Rastorfer, 2002).
Historically, strategies to green vacant land for neighborhoodimprovement purposes have been enacted through a variety ofpolicy mechanisms. Gardening on vacant lots has been facili-tated through Vacant Lot Cultivation Associations encouragingthe poor to grow food for sale and self-consumption (Lawson,2005), land trust lease and acquisition programs enabling com-munities to maintain gardens (Bonham et al., 2002), CooperativeExtension support for food production in underserved neighbor-hoods (Lawson, 2005), side-lot or “abutter” programs enablingresidents to manage land between buildings that would otherwisestand vacant, as well as a more recent integration of commu-nity gardening and urban agriculture into sustainability planningprocesses (City of Philadelphia, 2010; Colasanti & Hamm, 2010;Seattle Department of Neighborhoods, n.d.). Vacant land con-version projects that have been components of city or urbancommunity comprehensive plans have also included waterfrontpark development, the development of greenways used as bikeor pedestrian paths along railroads or abandoned industrial sites,and the creation of city gateways (Bonham et al., 2002; City ofPittsburgh, 2012; The Greening of Detroit, 2012). At the federallevel, funds from the Community Development Block Grant pro-gram and the Neighborhood Stabilization Program are occasionallyused to create public spaces on vacant land, in addition to rehabili-tating housing structures and enabling homeowners to purchasevacant homes (DeGategno, Kasper, Kremer, Lampton, & Quinn,
ssment of vacant lots in New York City. Landscape Urban Plan. (2013),
2010; US HUD, n.d., 2009). Cities that have been significantlyaffected by land abandonment, such as Baltimore, Maryland, Cleve-land, Ohio St. Louis, and Flint, Michigan, have used government orquasi-governmental land banks to address vacancy by aggregating

ING Model
L
Urba
vsHaacscmv
1e
(uiSdfigan1vt&tgim
spisn2issslfot(2ceatmlte2
sr(cisr
ARTICLEAND-2382; No. of Pages 16
P. Kremer et al. / Landscape and
acant lots to be put into productive use or to create open and greenpaces (Alexander, 2005; US HUD, 2009; Wachter, Scruggs, Voith, &uang, 2010). Still, many social and political barriers prevent widedoption of such strategies. Challenges include the lack of clear andccurate data about the nature and extent of the phenomena, theomplexity of handling properties under private ownership, con-traints and restrictions regarding the use and sale of public lands,apital and maintenance costs of greening projects, and the involve-ent of multiple agencies and stakeholders with often conflicting
isions and goals (Alexander, 2005; Bonham et al., 2002).
.2. Urban vacant lots, ecosystems, and the provision ofcosystem services
While the ecology of urban vacant lots is not widely understoodBurkholder, 2012), ecological processes do take place in vacantrban lots (Bradshaw, 2003). Ecological succession has been exam-
ned in urban landscapes including vacant land (Alberti, 2008).uccessional dynamics are often governed by the history of localisturbance, making future ecosystem structure and function dif-cult to predict (Trepl, 1995) for particular restoration or planningoals. For example, ecological studies of vacant lots in Baltimorend Chicago found inconsistent relationships between species rich-ess and variables such as lot age, size and level of isolation (Crowe,979; Tauzer, 2009). From an ecological perspective, urban landacancy offers the potential for integrated urban natural systems inhe forms of agriculture, forested areas and open streams (Zipperer
Pickett, 2012). The development of different types of ecosys-ems on vacant land and the ecosystem services they could providereatly depend on environmental conditions of the land, surround-ng natural habitats, current and historic uses of the lot and the
anagement practices utilized (Burkholder, 2012).Ecosystem services are defined generally as the benefits human
ociety accrues from ecosystems and include four major types –rovisioning services (e.g. food production, water supply), regulat-
ng services (e.g. climate regulation, air pollution removal), culturalervices (e.g. recreation, education), and supporting services (e.g.utrient cycling, soil building) (Millennium Ecosystem Assessment,005). A major driver of the type and quantity of ecosystem services
n urban areas is landcover. Land covered by vegetation and bareoil is generally more productive in the generation, regulation andupport of ecosystem services than non-vegetated and imperviousurfaces. Research assessing ecosystem services in urban vacantots is beginning to emerge. Studies suggest that vacant lots per-orm similarly or better than other urban land uses such as gardensr lawns in the supply of many ecosystem services such as biocon-rol (Yadav, Duckworth, & Grewal, 2012), soil food web productivityGrewal et al., 2011), stormwater retention services (Shuster et al.,011), habitat provision services, climate regulation and carbonapture (Robinson & Lundholm, 2012). Food production is anothercosystem service garnering increasing interest as an importantspect of social–ecological urban systems. Recent studies suggestshat in cities impacted by shrinking populations and land abandon-
ent such as Detroit, Cleveland and Philadelphia, utilizing vacantand for urban agriculture has significant potential to contribute tohe provisioning of food needs of local populations, help build localconomies, and strengthen social resilience (Colasanti & Hamm,010; Grewal & Grewal, 2012; Kremer, 2011).
Community gardens, open spaces and other urban greeningites provide not only ecological amenities such as food, climateegulation and stormwater mitigation, but also cultural valueSaldivar-Tanaka & Krasny, 2004). Ecological and cultural value
Please cite this article in press as: Kremer, P., et al. A social–ecological assehttp://dx.doi.org/10.1016/j.landurbplan.2013.05.003
an be intertwined; as communities transform unsafe and esthet-cally displeasing landscapes into community gardens or otherites of community engagement, opportunities for enhancing theesilience of coupled social–ecological systems may emerge (Folke,
PRESSn Planning xxx (2013) xxx– xxx 3
2006; Tidball & Krasny, 2009). A general conclusion from the lit-erature on ecosystem services in vacant lots is that although lotsdiffer widely by environmental conditions, uses and managementpractices, where natural systems establish through ecological suc-cession or intentional human intervention, ecosystem services areproduced. Much remains to be studied about the relationshipsbetween social and environmental conditions, uses and manage-ment practices and the type, quantity and quality of ecosystemsthat form on vacant land.
1.3. Vacant lots in New York City
In 1970, vacant land comprised an estimated 13% of NYC’stotal land area. This equated to approximately 25,656 acres ofvacant land, 90% of which was considered appropriate for develop-ment (Northam, 1971). By 1995, this estimate decreased to 20,000acres, accounting for 9.7% of the city’s land (Pagano & Bowman,2000). General information about how community members, localbusinesses, and public entities use vacant lots on a regular basisis not systematically collected. However, the use of vacant lotsfor community gardening in NYC is well-known due to contro-versies in the late 1990s in which community gardening waspitted against affordable housing opportunities in vacant lots (fora review of the NYC community gardens controversy see Saldivar-Tanaka & Krasny, 2004; Trust for Public Land, 2012), and a morerecent increasing interest in local food production in NYC (Cohen,Reynolds, & Sanghvi, 2012; Smith & Kurtz, 2003).
Under the provisions of New York State Law and the Admin-istrative Code of New York City, the Department of Finance isresponsible for valuing all real properties on an annual basis fortax purposes. Vacant lots are included in the portfolio of proper-ties to be inspected and valued. The NYC Department of Financedefines vacant lots as land having no improvement or constructiveuse (City of New York, 2010; NYC Department of Finance, 2012).In the last six years, a number of New York City Council actionsregarding vacant lots were introduced or adopted. These actionsaddress the use of vacant lots as community gardens, the role theycan play in affordable housing and revitalization through tempo-rary art installations, as well as the fundamental need to track cityvacancy so that business owners, residents and community groupsmay become aware of underutilized land. Appendix 1 provides alist of recent resolutions, introductions and a local law pertainingto NYC land vacancy. This city legislative activity points to a grow-ing interest in creative approaches to managing underused land ina way that meets community needs and minimizes deteriorationthat can occur in areas of the city that are unused and uncared for.
Data about land use in NYC is collected and maintained by theNYC Department of City Planning (DCP) through MapPLUTO, whichis a database created by merging the Primary Land Use Tax LotOutput (PLUTO) database and geographic boundaries of tax lotfeatures from the Department of Finance’s Digital Tax Map. It isavailable to the public by license. Lot land uses are derived frombuilding class, as determined by New York City Department ofFinance assessors, combined with data layers of parks and otheropen and public spaces. Because MapPLUTO is a compilation ofdifferent data sources, there are some known discrepancies andinaccuracies associated with the data; yet it is the primary wayinformation about land use in the city is maintained and publicized.MapPLUTO is used by different stakeholders in the city for a vari-ety of purposes including research on urban agriculture (Ackerman,2011) and activities by civic organizations. For example, the OasisNYC network uses MapPLUTO data along with other data layers
ssment of vacant lots in New York City. Landscape Urban Plan. (2013),
to provide community members and organizations free access tocommunity-related information (Oasis NYC, n.d.). The Brooklynbased organization 596 Acres, which advocates repurposing vacantlots, identifies publically owned vacant lots through the MapPLUTO
ARTICLE IN PRESSG Model
LAND-2382; No. of Pages 16
4 P. Kremer et al. / Landscape and Urban Planning xxx (2013) xxx– xxx
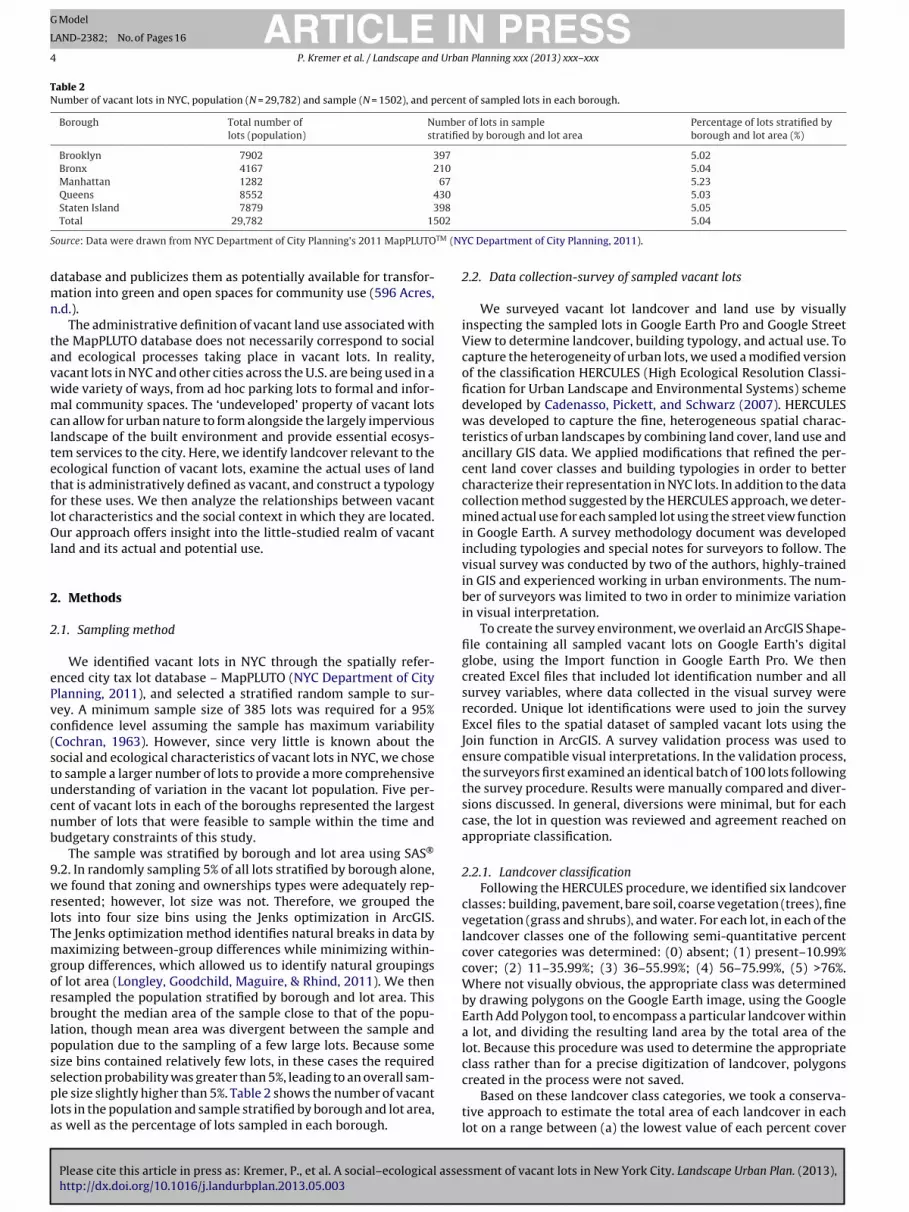
Table 2Number of vacant lots in NYC, population (N = 29,782) and sample (N = 1502), and percent of sampled lots in each borough.
Borough Total number oflots (population)
Number of lots in samplestratified by borough and lot area
Percentage of lots stratified byborough and lot area (%)
Brooklyn 7902 397 5.02Bronx 4167 210 5.04Manhattan 1282 67 5.23Queens 8552 430 5.03Staten Island 7879 398 5.05
02
S TM (NY
dmn
tavwmcltetflOl
2
2
ePvc(stucnb
9wrlTmgorblpsspla
Total 29,782 15
ource: Data were drawn from NYC Department of City Planning’s 2011 MapPLUTO
atabase and publicizes them as potentially available for transfor-ation into green and open spaces for community use (596 Acres,
.d.).The administrative definition of vacant land use associated with
he MapPLUTO database does not necessarily correspond to socialnd ecological processes taking place in vacant lots. In reality,acant lots in NYC and other cities across the U.S. are being used in aide variety of ways, from ad hoc parking lots to formal and infor-al community spaces. The ‘undeveloped’ property of vacant lots
an allow for urban nature to form alongside the largely imperviousandscape of the built environment and provide essential ecosys-em services to the city. Here, we identify landcover relevant to thecological function of vacant lots, examine the actual uses of landhat is administratively defined as vacant, and construct a typologyor these uses. We then analyze the relationships between vacantot characteristics and the social context in which they are located.ur approach offers insight into the little-studied realm of vacant
and and its actual and potential use.
. Methods
.1. Sampling method
We identified vacant lots in NYC through the spatially refer-nced city tax lot database – MapPLUTO (NYC Department of Citylanning, 2011), and selected a stratified random sample to sur-ey. A minimum sample size of 385 lots was required for a 95%onfidence level assuming the sample has maximum variabilityCochran, 1963). However, since very little is known about theocial and ecological characteristics of vacant lots in NYC, we choseo sample a larger number of lots to provide a more comprehensivenderstanding of variation in the vacant lot population. Five per-ent of vacant lots in each of the boroughs represented the largestumber of lots that were feasible to sample within the time andudgetary constraints of this study.
The sample was stratified by borough and lot area using SAS®
.2. In randomly sampling 5% of all lots stratified by borough alone,e found that zoning and ownerships types were adequately rep-
esented; however, lot size was not. Therefore, we grouped theots into four size bins using the Jenks optimization in ArcGIS.he Jenks optimization method identifies natural breaks in data byaximizing between-group differences while minimizing within-
roup differences, which allowed us to identify natural groupingsf lot area (Longley, Goodchild, Maguire, & Rhind, 2011). We thenesampled the population stratified by borough and lot area. Thisrought the median area of the sample close to that of the popu-
ation, though mean area was divergent between the sample andopulation due to the sampling of a few large lots. Because someize bins contained relatively few lots, in these cases the required
Please cite this article in press as: Kremer, P., et al. A social–ecological assehttp://dx.doi.org/10.1016/j.landurbplan.2013.05.003
election probability was greater than 5%, leading to an overall sam-le size slightly higher than 5%. Table 2 shows the number of vacant
ots in the population and sample stratified by borough and lot area,s well as the percentage of lots sampled in each borough.
5.04
C Department of City Planning, 2011).
2.2. Data collection-survey of sampled vacant lots
We surveyed vacant lot landcover and land use by visuallyinspecting the sampled lots in Google Earth Pro and Google StreetView to determine landcover, building typology, and actual use. Tocapture the heterogeneity of urban lots, we used a modified versionof the classification HERCULES (High Ecological Resolution Classi-fication for Urban Landscape and Environmental Systems) schemedeveloped by Cadenasso, Pickett, and Schwarz (2007). HERCULESwas developed to capture the fine, heterogeneous spatial charac-teristics of urban landscapes by combining land cover, land use andancillary GIS data. We applied modifications that refined the per-cent land cover classes and building typologies in order to bettercharacterize their representation in NYC lots. In addition to the datacollection method suggested by the HERCULES approach, we deter-mined actual use for each sampled lot using the street view functionin Google Earth. A survey methodology document was developedincluding typologies and special notes for surveyors to follow. Thevisual survey was conducted by two of the authors, highly-trainedin GIS and experienced working in urban environments. The num-ber of surveyors was limited to two in order to minimize variationin visual interpretation.
To create the survey environment, we overlaid an ArcGIS Shape-file containing all sampled vacant lots on Google Earth’s digitalglobe, using the Import function in Google Earth Pro. We thencreated Excel files that included lot identification number and allsurvey variables, where data collected in the visual survey wererecorded. Unique lot identifications were used to join the surveyExcel files to the spatial dataset of sampled vacant lots using theJoin function in ArcGIS. A survey validation process was used toensure compatible visual interpretations. In the validation process,the surveyors first examined an identical batch of 100 lots followingthe survey procedure. Results were manually compared and diver-sions discussed. In general, diversions were minimal, but for eachcase, the lot in question was reviewed and agreement reached onappropriate classification.
2.2.1. Landcover classificationFollowing the HERCULES procedure, we identified six landcover
classes: building, pavement, bare soil, coarse vegetation (trees), finevegetation (grass and shrubs), and water. For each lot, in each of thelandcover classes one of the following semi-quantitative percentcover categories was determined: (0) absent; (1) present–10.99%cover; (2) 11–35.99%; (3) 36–55.99%; (4) 56–75.99%, (5) >76%.Where not visually obvious, the appropriate class was determinedby drawing polygons on the Google Earth image, using the GoogleEarth Add Polygon tool, to encompass a particular landcover withina lot, and dividing the resulting land area by the total area of thelot. Because this procedure was used to determine the appropriateclass rather than for a precise digitization of landcover, polygons
ssment of vacant lots in New York City. Landscape Urban Plan. (2013),
created in the process were not saved.Based on these landcover class categories, we took a conserva-
tive approach to estimate the total area of each landcover in eachlot on a range between (a) the lowest value of each percent cover

ARTICLE IN PRESSG Model
LAND-2382; No. of Pages 16
P. Kremer et al. / Landscape and Urban Planning xxx (2013) xxx– xxx 5
Table 3Classification of actual uses of vacant lots and visual markers used to identify them.
Class Description Visual markers
(0) Unused land (There is no apparent use of the lot; lot does notappear to be actively managed.)
Boarded entry; overgrown vegetation
(1) Private house (The lot appears to be part of a house or used asa backyard.)
Manicured yard; attached to a private home or included withinthe fence of a private home
(2) Commercial\industrial (The lot appears to be in use by acommercial or industrial entity.)
Shipping containers; tractor trailers; warehouses; signage
(3) Community garden Community garden sign (e.g. New York Restoration Projectsite); raised garden beds
(4) Park (forested or paved) Park sign; athletic facilities (e.g. basketball court), forested lotswithin larger forest context
(5) Tree cover in residential street Tree cover between housing units in residential zoning(6) Sport fields Baseball diamond, running track(7) Road, roadside pavement or sidewalk(8) Junk yard Junk(9) Parking lot Sign at entry; fee collector(10) Non-commercial parking Alleyway between buildings with parked cars
cwmbt1
2
mvi(ug(Dsv
2
shmnbRahcttlrptbtodNuyp
(11) Other
lass (e.g. for class (2) the lowest value is 11%) and (b) the midpointithin the class (e.g. the midpoint for class (2) is 23.5%). We thenultiplied these minimum and midpoint land cover percentages
y total lot area to obtain area in each land cover class. One excep-ion was lots covered by only one landcover class. In these cases,00% of the lot area was assigned to a single landcover class.
.2.2. Building typologyTo identify the different types of structures on vacant lots we
odified the HERCULES building typology to accommodate theariation in building types common in NYC. We developed a build-ng typology including the following seven classes: (0) no building;1) single family structures; (2) multiple occupancy structuresnder 4 stories; (3) high-rises between 4 and 10 stories; (4) towersreater than 10 stories; (5) commercial and industrial structures;6) accessory structures (pools, gazebos, decks, sheds, and garages).uring the visual survey, whenever a structure was visible on the
urveyed lot, a class number was noted under the building typologyariable column in the survey Excel file.
.2.3. Actual useThe actual use category is not part of the HERCULES classification
cheme and was developed in order to provide information aboutow vacant lots in NYC are being used in practice. The develop-ent of the actual use classification was possible due to a relatively
ew function in Google Earth – Google Street View – which has noteen utilized comprehensively in research to date (Rundle, Bader,ichards, Neckerman, & Teitler, 2011). While Google Street View isvailable only partially in many parts of the world, in NYC compre-ensive and up-to-date street photography is available for mostity streets. At the time of data collection, available imagery wasaken in the summer of 2011, matching the MapPLUTO data used inhis study. Actual use was determined by visually assessing vacantots in Google Street View and classifying into use categories thatepresented recurring uses observed during the survey verificationrocedure. Because the purpose of this part of the research waso develop an understanding of the different ways vacant lots areeing used and because classifications based on Google street pho-ography are not yet developed, the classification here is basedn the researchers’ observations. Although a number of spatialatabases, including the NYC Parks Department’s parks layer and
Please cite this article in press as: Kremer, P., et al. A social–ecological assehttp://dx.doi.org/10.1016/j.landurbplan.2013.05.003
YC Green Thumb Community Gardens layer indicate some actualses, these databases are collected and published during differentears and can be incomplete or inconsistent. Since we wanted torovide a snapshot of vacant lot uses for a point in time and compare
these results with publically available data, we relied solely onvisual inspection to determine actual use. Table 3 describes thedifferent actual use classes and visual markers used to identifythem. A limitation of this study is the lack of verification procedureto assess the accuracy of survey observation.
2.3. Analysis
Analysis was conducted using data from the NYC Map-PLUTO tax lot database in conjunction with results of the actualuse and land cover survey, as well as a city green layer filedeveloped by merging available GIS green infrastructure layersincluding federal and state recreation and non-recreation openspace, NYS Department of Conservation land, and NYC parksand other open space. GIS green layers were obtained from theNYS GIS Clearinghouse (http://gis.ny.gov/) and the NYC OpenData(https://nycopendata.socrata.com/) websites. We mapped vacantlots and performed cluster analysis on the spatial proximity of lotsand lot characteristics, prepared descriptive statistics on vacant lotcharacteristics, and analyzed correlations among these characteris-tics. We also analyzed spatial density of the vacant lots population,as well as the green density within and in the neighborhood ofsampled vacant lots. The lot green density variable was created byadding the percent area of the coarse and fine vegetation landcovercategories; it describes the percentage of total green landcover areawithin the lot. Cluster analysis was performed on the green den-sity variable using the Hot Spot Analysis tool in ESRI ArcGIS 10.Using a randomization null hypothesis, the analysis locates andmaps statistically significant adjacency of high and low variablevalues (results are reported as GiZ scores). Descriptive statistics onownership, zoning and land area were developed for the popula-tion of vacant lots. For the sample, we also explored the distributionof actual use types across the five boroughs, as well as the distri-bution of ownership type (e.g. public), zoning classification, and lotsize across actual use types.
In order to examine how actual use of the lot relates tothe social characteristics of the neighborhood in which it islocated, we generated neighborhood income and neighbor-hood population density variables by creating a 500-m bufferfrom the centroid of each lot and intersected the buffers withU.S. Census median household income and population density
ssment of vacant lots in New York City. Landscape Urban Plan. (2013),
data at the census block level. Where the buffer encompassedmore than one census block, the variables were generated byaveraging median household incomes and population densitiesof all census blocks within the buffer. To explore how actual

ARTICLE ING Model
LAND-2382; No. of Pages 16
6 P. Kremer et al. / Landscape and Urba
F(l
uidncptowbpa11aptudgCtS
ig. 1. (A) Spatial distribution of vacant lots population (N = 29,782) and sampleN = 1502) in NYC. (B) Percentage of census block group area classified as vacantand.
se relates to the “greenness” of the neighborhood in whicht is located, we generated neighborhood green density andistance to green variables from the city green layer. For theeighborhood green density variable, we intersected this greenity layer with the 500-m vacant lot buffers and computed theercent green within each 500-m buffer. To generate the distanceo green variable, we computed the distance between the centroidf the lot and nearest green polygon edge. All spatial variablesere created using ESRI ArcGIS 10. We then analyzed correlations
etween the actual use of the lot and the neighborhood income,opulation density, neighborhood green density, distance to greennd lot green density variables using logistic regression in Stata2.1. Each actual use was recoded to a dummy variable where
represents the presence of an actual use and 0 represents itsbsence. Neighborhood income was recoded to units of $1000,opulation density to units of 1000 people/km2, and distanceo green to units of 100 m. Associations between each actualse type and neighborhood income, neighborhood populationensity, neighborhood green density, distance to green and lot
Please cite this article in press as: Kremer, P., et al. A social–ecological assehttp://dx.doi.org/10.1016/j.landurbplan.2013.05.003
reen density were then explored using simple logistic regression.orrelations were also explored among population density, dis-ance to green, and income and neighborhood green density usingpearman correlation in Stata 12.1.
PRESSn Planning xxx (2013) xxx– xxx
3. Results
3.1. The population of vacant lots in NYC
MapPLUTO (edition 11v1), classifies a total of 29,782 city lotsas vacant. These lots encompass over 7000 acres and range insize from almost 0 to over 900,000 m2, averaging 996 m2. Sixteenpercent of the lots are smaller than 100 m2, 46% range between100 and 300, 17% between 300 and 500, and 21% are larger than500 m2. Since the City assumes that lots with an ownership classi-fication of “unknown” are privately-held (NYC Department of CityPlanning, 2011), we combined unknown ownership and privateownership categories. The majority of vacant lots are privately-held (77%); of these, ownership is not known for 14,881 or 50%of the total number of vacant lots. With respect to vacant lotarea, the distribution between public and private is more even– with 44% of the total land area of vacant lots held by pub-lic entities, indicating that on average, publicly owned lots arelarger.
Fig. 1 presents the spatial distribution of the population andsample of vacant lots and the density of the population of vacantlots measured as percent of area of each census block group clas-sified as vacant. Variation across the five boroughs of the city withrespect to number of lots, total area they occupy and ownershiptype is presented in Fig. 2. While 26% of vacant lots in the city arelocated in Staten Island, these lots represent 57% of the total vacantland area due to a small number (4) of very large (>100,000 m2) lots.These four lots account for 50% of all of the land area in vacant landand therefore, heavily skew land area estimates for the actual usetypes that they represent. In general, Staten Island are larger thanvacant lots in other boroughs, with the average size of a StatenIsland vacant lot more than triple the average of the other fourboroughs.
Based on an overlay of city park and other green infrastructuredata layers with the vacant lot layer, we determined that there are2136 vacant lots occupying 2635 acres located within open spaceand green infrastructure in the city, accounting for 7% of all vacantlots and 37% of the total land area in vacant lots. These lots includecity owned parks and open spaces (30% of total vacant lot land area),state and federal park and forest land (1% of total vacant lot landarea), wetlands (2% of total vacant lot land area) and other openspace, such as cemeteries, owned privately or by not for profit orga-nizations (4% of total vacant lot land area). Two of the lots in oursurvey were cross-listed in two databases – one in the City Parkslayer and as a “unique area,” and the other in the City Parks layerand as a National Recreational Area. This suggests that in some casesgovernment entities may have overlapping ownership of conservedlands identified as vacant.
Overlaying the population of vacant lots with a city database ofcommunity gardens reveals that 672 lots (2%) are community gar-dens. Most community gardens on vacant lots (530) are included inthe city owned park and open space database and the remaining areowned by a mix of other city entities including private and not forprofit owners. As mentioned above, although the NYC Parks Depart-ment’s parks layer, NYC Green Thumb Community Gardens andother green space layers indicate some actual uses, we did not usethese databases to determine the actual use results in our survey,since they are collected and published during different years andcan be incomplete or inconsistent. Rather, we relied on our surveyto determine the current actual use of vacant lots.
Roughly half of all vacant lots are found in low-density residen-tial areas and held by private owners, implying that private owner
ssment of vacant lots in New York City. Landscape Urban Plan. (2013),
land management is an important determinant of how vacant lotsare used. High-density residentially zoned lots held by privateowners are the second most frequent zoning/ownership categoryof vacant lots (14.6%), followed by low-density residentially zoned,

Please cite this article in press as: Kremer, P., et al. A social–ecological assehttp://dx.doi.org/10.1016/j.landurbplan.2013.05.003
ARTICLE IN PRESSG Model
LAND-2382; No. of Pages 16
P. Kremer et al. / Landscape and Urban Planning xxx (2013) xxx– xxx 7
Tab
le
4N
um
ber
and
area
of
the
pop
ula
tion
(N
=
29,7
82)
of
vaca
nt
lots
in
NY
C
by
typ
e
of
own
ersh
ip
and
zon
ing
des
ign
atio
n.
Priv
ate
Publ
ic
Mix
ed
own
ersh
ipTo
tal
#
of
lots
Tota
l are
a
(m2)
#
of
lots
Tota
l are
a
(m2)
#
of
lots
Tota
l are
a
(m2)
#
of
lots
Tota
l are
a
(m2)
Com
mer
cial
900
(3.0
%)
630,
735
(2.1
%)
230
(0.8
%)
641,
223
(2.2
%)
64
(0.2
%)
63,0
96
(0.2
%)
1194
4.0%
1,33
5,05
4
4.5%
Man
ufa
ctu
rin
g
2095
(7.0
%)
5,78
6,04
5
(19.
5%)
624
(2.1
%)
4,22
9,63
0
(14.
3%)
125
(0.4
%)
665,
367
(2.2
%)
2844
(9.5
%)
10,6
81,0
42
(36.
0%)
Mix
ed
use
251
(0.8
%)
131,
500
(0.4
%)
40
(0.1
%)
26,5
04
(0.1
%)
7
(0.0
%)
3133
(0.0
%)
298
(1.0
%)
161,
138
(0.5
%)
R1–
515
,488
(52.
0%)
8,45
3,95
4
(28.
5%)
3203
(10.
8%)
4,33
7,38
2
(14.
6%)
476
(1.6
%)
995,
185
(3.4
%)
19,1
67
(64.
4%)
13,7
86,5
21
(46.
5%)
R6–
10
4340
(14.
6%)
1,56
5,35
4
(5.3
%)
1749
(5.9
%)
1,33
2,60
5
(4.5
%)
188
(0.6
%)
173,
350
(0.6
%)
6277
(21.
1%)
3,07
1,30
9
(10.
4%)
Park
s
1
(0.0
%)
1196
(0.0
%)
0
(0.0
%)
0
(0.0
%)
1
(0.0
%)
636,
843
(2.1
%)
2
(0.0
%)
638,
038
(2.2
%)
Tota
l
23,0
75
(77.
5%)
16,5
68,7
85
(55.
84%
)
5846
(19.
6%)
10,5
67,3
44
(35.
6%)
861
(2.9
%)
2,53
6,97
4
(8.5
5%)
29,7
82
(100
%)
29,6
73,1
03
(100
%)
Sour
ce:
Dat
a
for
own
ersh
ip
and
zon
ing
stat
us
of
lots
wer
e
dra
wn
from
NY
C
Dep
artm
ent
of
Cit
y
Plan
nin
g’s
2011
Map
PLU
TOTM
(NY
C
Dep
artm
ent
of
Cit
y
Plan
nin
g,
2011
).
Fig. 2. Number of vacant lots and the total area they occupy by borough and owner-ship type in the population (N = 29,782) of vacant lots in NYC.
publicly-owned lots (10.8%). Fewer vacant lots are located in com-mercial (4%) or manufacturing (9.5%) zones, and almost none arelocated within mixed use districts. Table 4 shows cross-categorypercentages of vacant lots by zoning district and ownership fornumber of lots and lot area.
3.2. Surveyed vacant lots
With the exception of mean lot size, the summary statistics ofthe sampled vacant lots closely match those of the population. Dueto the area stratification sampling strategy which sampled at least
ssment of vacant lots in New York City. Landscape Urban Plan. (2013),
one lot from the upper area bin per borough, mean area of the sam-ple (2694 m2) was considerably higher than that of the population(996 m2), though median areas closely match. Table 5 compares
Table 5Summary statistics, including number, mean and median area, ownership and zon-ing district, for all vacant lots (N = 29,782) and a random, stratified sample of vacantlots (N = 1502) in New York City.
Population Sample
Total number of lots 29,782 1502Mean area (m2) 996 2694Median area (m2) 235 233% publicly-owned 23% 22%% privately-owned 77% 78%% lots in low-density residential districts 64% 66%% lots in high-density residential districts 21% 20%% lots in commercial districts 4% 4%% lots in manufacturing districts 10% 9%% lots in mixed residential/commercial districts 1% 1%
Source: Data for area, ownership and zoning status of lots were drawn from NYCDepartment of City Planning’s 2011 MapPLUTOTM (NYC Department of City Planning,2011).

ARTICLE IN PRESSG Model
LAND-2382; No. of Pages 16
8 P. Kremer et al. / Landscape and Urban Planning xxx (2013) xxx– xxx
F arth vs aroun
sp
b
ig. 3. Examples of vacant lots with different actual uses as surveyed in a Google Eocioeconomic characteristics of the lot’s neighborhood, defined by a 500-m radius
Please cite this article in press as: Kremer, P., et al. A social–ecological assehttp://dx.doi.org/10.1016/j.landurbplan.2013.05.003
ize, ownership and zoning descriptive statistics of the vacant lotopulation with the sample.
Roughly 11% of surveyed vacant lots have some type of visi-le building structure. Seven percent were accessory structures,
isual survey. Details include the surrounding urban context and demographic andd the centroid of the lot.
ssment of vacant lots in New York City. Landscape Urban Plan. (2013),
2% single occupancy structures, 1% multiple occupancy structuresunder four stories and 1% industrial buildings. The identificationof single and multiple occupancy structures, as well as industrialbuildings on a small number of vacant lots may be due to the time

ARTICLE IN PRESSG Model
LAND-2382; No. of Pages 16
P. Kremer et al. / Landscape and Urban Planning xxx (2013) xxx– xxx 9
Fts
ddeN
epwttiiabsteSlcTabttnsbAa(a
3
NlpwFacv
3
vvm
Fig. 5. (A) Map representing the spatial distribution of the results of a Google Earthvisual survey (N = 1502) of actual uses of vacant lots in NYC. (B) Spatial cluster anal-ysis of green density of vacant lots. Reported GiZ scores represent the standard
ig. 4. Survey results of landcover in sampled vacant lots (N = 1502). Results presenthe distribution of different landcover types (coarse vegetation, fine vegetation, bareoil, water, building and paved) for the five boroughs of NYC.
iscrepancy between Google Earth photography and MapPLUTOata collection, or could be indicative of lot misalignment or datarrors, since lack of a structure is a defining characteristic of theYC Department of Finance’s vacant lot class.
Fig. 3 shows visual examples of common actual use typesncountered in the survey. Lots are presented from a street viewerspective using the Street View function in Google Earth togetherith a Google Earth aerial image at about 1:300 m scale, showing
he urban context of each lot. Also presented in Fig. 3 are charac-erizing features such as size, ownership and median householdncome (Census 2000) of the block group in which the vacant lots located. As a measure of the availability of and access to greennd open spaces in the neighborhood of each vacant lot, neigh-orhood green density represents the percent of green and openpace in a 500-m radius of the lot. Distance to green describeshe distance to the nearest public green or open space. As Fig. 3xemplifies, vacant lots are located in multiple urban contexts.ome are small lots, located in the middle of rows of low rise andow density residential streets. Others, as in the example of theommunity garden, are part of a larger land unit bordered by roads.he lot representing tree cover within a residential context servess an example of the importance of the location and spatial distri-ution of vacant lots. In this case, the lot is immediately adjacento a large public open space (a cemetery) and provides a connec-ion between open space to the south-east and street trees to theorth-west. Such connections are crucial in the maintenance andupport of ecosystem provisioning, as well as the maintenance ofiodiversity that supports ecosystem services in cities (Elmqvist,lfsen, & Colding, 2008). Depending on the management practicespplied, vacant lots used as private yards and unused vacant lotswith no apparent use) have similar potential to serve as corridorsnd connectors between fragmented urban green spaces.
.2.1. Landcover in surveyed vacant lotsWe find that the landcover of vacant lots varies widely across
YC boroughs. The dominant landcover type in sampled vacantots was fine vegetation (38%), followed by coarse vegetation (24%),aved surfaces (17%), bare soil (15%) and building cover (6%), withater accounting for only 1% of total area of the sampled vacant lots.
ig. 4 presents the results of the landcover survey by landcover type,nd variation across boroughs. As shown in Fig. 4, most buildingover is found in Brooklyn and the majority of tree cover and fineegetation is concentrated in Staten Island and Queens.
.2.2. Actual uses in surveyed vacant lots
Please cite this article in press as: Kremer, P., et al. A social–ecological assehttp://dx.doi.org/10.1016/j.landurbplan.2013.05.003
Results of the survey of actual uses show that 33% of sampledacant lots appear to be unused. In our survey, we define unusedacant lots as those lots having no apparent actual use or manage-ent. Other vacant lots are used as private yards, for commercial
deviations associated with the statistical significance of the null hypothesis rejec-tion. Red indicates clustering of high green density and blue indicates clustering oflow green density.
and non-commercial parking, commercial spaces (such as a storagearea of a lumber company or a sanitary equipment company), sportfields, playgrounds, and community gardens. Fig. 5(A) presents thespatial distribution of actual uses of vacant lots, and Fig. 6 illustratesthe distribution of actual uses within and among vacant lots acrossthe five boroughs.
Vacant lot land use composition varies widely across the fiveboroughs of NYC. One example of this variation is the high pro-portion of vacant lots that are used as community gardens inManhattan (18%) versus the other boroughs (0–5%). This is partlydue to the highly visible public campaign in the 1990s to pro-tect community gardens that were established through the GreenThumb Program (Schmelzkopf, 2002), and provides insight intodifferences in land use priorities across boroughs. The generaltypology of the built landscape is also evident in this sample, withQueens – a borough characterized by a relatively high density ofsingle family housing units – having the largest percentage ofvacant lots used as private yards. Another interesting finding is that
ssment of vacant lots in New York City. Landscape Urban Plan. (2013),
overall, 12% of vacant lots in the city can be characterized as treecover within residential streets. This finding suggests that in urbanareas, discontinuous land patches may hold significant ecologicalvalue characteristic of urban forests, providing local temperature

ARTICLE IN PRESSG Model
LAND-2382; No. of Pages 16
10 P. Kremer et al. / Landscape and Urban Planning xxx (2013) xxx– xxx
cross
rentIct
oe8pElmc
Fig. 6. Actual uses of surveyed vacant lots (N = 1502) a
egulation, storm water runoff mitigation and human health ben-fits (Nowak et al., 2007). Notably, this finding is driven by a largeumber of lots in Staten Island (92 out of 176) that in general main-ain the highest tree cover density in the city. Excluding Statensland, only 6% of total lots in the sample can be characterized as treeover within residential streets, implying that local-scale access tohis amenity is not evenly distributed across the city.
Vacant lots are by and large privately-held. With the exceptionf community gardens, the proportion of lots owned by privatentities in each actual land use category ranges between 66 and8%. Low-density residential zoning districts hold the greatestroportion of vacant lots for most actual land use categories.
Please cite this article in press as: Kremer, P., et al. A social–ecological assehttp://dx.doi.org/10.1016/j.landurbplan.2013.05.003
xceptions to this are community gardens, commercially usedots, industrially used lots and junkyards. Community gardens are
ore commonly found in high-density residential districts, whileommercially used lots, industrially used lots and junkyards are
NYC’s five boroughs as determined by a visual survey.
primarily found in manufacturing zones. The “unused land” and“park” categories each contain more land area, by a factor of morethan three, than every other actual use type combined. However, asmentioned in Section 3.1 above, four lots in Staten Island accountfor 50% of all vacant land and therefore skew area proportions forthe actual uses they represent. Of these four lots, we classifiedtwo as unused, one as a park and one as commercial/industrialuse. One is listed as City-owned, one privately-owned and twohave unknown ownership. The lot classified as privately-ownedby the MapPLUTO database was identified as a park in our sur-vey, and is listed as a state-protected “unique area” in the NewYork State Department of Environmental Conservation protected
ssment of vacant lots in New York City. Landscape Urban Plan. (2013),
land database, as well as a National Recreation Area (New YorkState Department of Environmental Conservation, 2011). Althoughthe ownership type is listed as private in MapPLUTO, the owner islisted as “People of the State of New York.” This lot is 414,795 m2,

ARTICLE ING Model
LAND-2382; No. of Pages 16
P. Kremer et al. / Landscape and Urba
Table 6Descriptive statistics for lot and neighborhood characteristics.
Mean Median St Dev Range
Neighborhood income ($1000) 42.58 41.26 15.58 11.88–90.62Neighborhood population
density (1000 people/km2)12.98 9.41 10.38 0.01–57.86
Neighborhood green density (%) 0.11 0.05 0.14 0–0.89Distance to green (100 m) 1.74 1.42 1.48 0–10.10Lot green density (%) 0.51 0.67 0.36 0–1
Sources: Data for population density and income variables were drawn from the2000 U.S. Census; Data for lot green density, distance to green and neighborhoodgreen density variables were drawn from New York City Parks layer (2011) and NewYork City open space layer (2011) available at https://nycopendata.socrata.com/;aWa
adta
3
icstpbbocd
gtidtrr
Andtpal
TC
S2gYaWa
the strongest associations with parks (+) and junkyard (−), thoughthe association between junkyards and neighborhood green den-sity was non-significant. For detailed results of odds ratio rangessee the table in Appendix 3.
nd New York State Department of Conservation (DEC) DEC Lands layer (2011),ater Inventory (2011), Park Boundary (2011) and Tidal Wetlands (1974) available
t http://gis.ny.gov/gisdata/inventories.
ccounting for 10% of total land area of the sampled lots. For aetailed description of the variation in ownership type, zoning dis-rict type and land area across actual use types see Appendices 2And 2B.
.3. Land use, landcover and the social context of vacant lots
To begin to understand the relationships between lot character-stics, neighborhood characteristics and land cover, we examinedorrelations among actual use, neighborhood income (average cen-us block median household income within a 500-m buffer ofhe lot), neighborhood population density (average census blockopulation density within a 500-m buffer around the lot), neigh-orhood green density (percentage green space within a 500-muffer around the lot), distance to green (distance from the lot tother green spaces), and lot green density (percentage of the lotovered by trees, shrubs and herbaceous vegetation). Table 6 showsescriptive statistics for the neighborhood and lot variables.
Population density is negatively correlated with distance toreen, income and neighborhood green density, though the nega-ive correlation between population density and distance to greens weak. Distance to green is negatively correlated with populationensity and neighborhood green density, and has a weak posi-ive correlation with income. In general, greener lots are located inelatively greener neighborhoods with higher income levels. Cor-elation results are summarized in Table 7.
Results of the simple logistic regression analysis, listed inppendix 3, indicate that income is significantly associated withine of the 12 actual land use categories, neighborhood populationensity with six categories, and lot green density with eight. Dis-
Please cite this article in press as: Kremer, P., et al. A social–ecological assehttp://dx.doi.org/10.1016/j.landurbplan.2013.05.003
ance to green and neighborhood green density are, overall, poorredictors of actual use, as both are associated with only threectual use categories. Among actual use types that imply greenand cover, including community garden, park and residential tree
able 7orrelation matrix for lot and neighborhood characteristics.
Lot greendensity
Populationdensity
Distanceto green
Income
Population density −0.26Distance to green 0.01 −0.09***
Income 0.25*** −0.66*** 0.17***
Neighborhood green density 0.10*** −0.32*** −0.48*** 0.12***
ources: Data for population density and income variables were drawn from the000 U.S. Census; Data for lot green density, distance to green and neighborhoodreen density variables were drawn from New York City Parks layer (2011) and Nework City open space layer (2011) available at https://nycopendata.socrata.com/;nd New York State Department of Conservation (DEC) DEC Lands layer (2011),ater Inventory (2011), Park Boundary (2011) and Tidal Wetlands (1974) available
t http://gis.ny.gov/gisdata/inventories.*** Results are significant at p ≤ 0.001.
PRESSn Planning xxx (2013) xxx– xxx 11
cover, at least one green metric was associated with each of them.Community gardens tend to be closer to other green space thanvacant lots that are not used as community gardens; however, theytend to have a smaller neighborhood green density than the otheruses. Parks also tend to be closer to other green space, and areassociated with a much higher neighborhood green density. Eachpercent increase in neighborhood green density increases the oddsthat a vacant lot will be a park by 446%, within a 95% confidenceinterval of 92–2164%. Residential tree cover, though not signifi-cantly associated with distance to green or neighborhood greendensity was highly associated with lot green density. Althoughcommunity gardens may imply green space, they were not signif-icantly associated with higher lot green density (likely due to thepresence of bare soil), whereas unused lots were. Each additionalpercent of green on a vacant lot increases the odds of it being in theunused category by 2.4–4.5%. Unused land was also associated withlower-income neighborhoods and higher population density,implying that unused land may serve as an important ecologicalresource in low-income, high population density neighborhoods,but are currently underserving as a social resource that other kindsof spaces such as parks may provide. Fig. 7 shows the results ofthe odds ratio analysis on a logarithmic scale. From this figure, itis apparent that of all the actual use categories, community gar-dens had the strongest association with neighborhood income (−),neighborhood population density (+), as well as distance to green(−). Lot green density was most strongly associated with parkinglots (−) and tree cover (+), while neighborhood green density had
ssment of vacant lots in New York City. Landscape Urban Plan. (2013),
Fig. 7. Odds ratio analysis (on logarithmic scale) of the association between sur-veyed actual uses on vacant lots and social characteristics in vacant lots’ 500 mneighborhood. Variable analyzed include median household income, populationdensity, neighborhood green density, distance to green, and lot green density.

ARTICLE ING Model
LAND-2382; No. of Pages 16
12 P. Kremer et al. / Landscape and Urba
Fvl
tiumstsroitpocpviiaylIpdg
4
lsiefuvac2tsi
ig. 8. Distribution of lot green density (calculated as percent green cover) for sur-eyed actual uses. Outliers are indicated by “*” and dark bars represent the medianot green density for each actual use.
An important consideration for management of vacant land inhe city is the interplay between the various land uses taking placen vacant lots and the land cover that accompanies them. Of partic-lar relevance is the possibility of utilizing vacant lots in the short,edium and long terms, as urban nature sites that provide and
upport ecosystem services generation in the city. Fig. 8 showshe distribution of lot green density (as percent green cover) forurveyed actual uses. Outliers are indicated by “*” and dark barsepresent the median lot green density for each actual use. Resultsf logistic regression analysis (Fig. 7) indicate that actual use des-gnations, which imply green land cover, such as parks, residentialree cover and community gardens, do in fact have relatively highercentages of green cover. Lots that are used as parking lots and forther commercial purposes tend to have low green coverage. Greenoverage in other uses of vacant land, such as sports fields andrivate yards, is more widely spread, indicating more land coverariability in these actual use categories. Land identified as unusedn our survey also shows variability in percent green coverage buts skewed toward the upper percentages with a range between 35nd 85% and a median of 70%. As presented in Fig. 5(B), cluster anal-sis of lot green density indicates a high level of spatial clustering ofots with high green density. These are located primarily in Statensland, where prevalent actual uses include residential tree cover,rivate yards, and unused land. Clustering of lots with low greenensity in Brooklyn, Queens and Manhattan is co-located with areater mix of actual uses.
. Discussion
A growing realization in the planning community that vacantand is a permanent, though dynamic, feature of urban centers ishifting the focus from understanding and evaluating the adversempacts of land vacancy on neighborhoods and communities toxamining how economic and planning mechanisms can trans-orm these lots into more productive uses. In addition, a growingnderstanding that not all vacant land has the potential to be rede-eloped through market mechanisms has led to an effort to developlternative programs and mechanisms through which vacant lotsan provide public use and community enhancement (Alexander,
Please cite this article in press as: Kremer, P., et al. A social–ecological assehttp://dx.doi.org/10.1016/j.landurbplan.2013.05.003
005; Bonham et al., 2002; Wachter et al., 2010), even if for shorterm use. Many of these programs target urban green and openpaces, suggesting there is positive social and ecological potentialn these types of transformation. Here we discuss major findings
PRESSn Planning xxx (2013) xxx– xxx
of the survey of landcover and actual uses of vacant lots in NYCand analyze these findings with respect to the social and ecologicalcontext of the neighborhoods around them.
Findings of this study support the early evidence that manyvacant lots already have vegetative landcover, which fosters eco-logical processes and supports the provisioning of ecosystemservices to the city. We find that the majority (62%) of land definedas vacant in NYC is covered by trees, herbaceous vegetation andgrass. Vacant lots that tend to have green cover vary in their use– from parks, community gardens and private yards to vegetatedand tree-covered unused lots concentrated in residential areas.Moreover, we find strong positive correlation between the levelof green cover in a lot and the level of green cover in the neigh-borhood around the lot, as well as strong spatial clustering of lotsthat share similar levels of green density. This finding suggests thatwhere lots with high green density are clustered, they are part of aconnected, urban green matrix. Taken together, these findings sug-gest that at their present state, vacant lots already provide manytypes of ecosystem services associated with the presence of greenlandcover such as food production, runoff mitigation, and recre-ation. In some cases, unused vacant lots with a high proportion ofgreen coverage may be important to protect from development. Atthe same time, lots that are truly unused may have the most poten-tial for transformation into even more productive urban sites forincreasing the generation of ecosystem services.
Currently, community gardens appear to be a successful strat-egy for utilizing vacant spaces in NYC. Community gardens in oursurvey are relatively green spaces which, as literature suggests, aresupporting the production of a multitude of ecosystem servicessuch as food production and recreation (Burkholder, 2012; Grewal& Grewal, 2012; Grewal et al., 2011; Zipperer & Pickett, 2012).Given that their locations are positively correlated with populationdensity and negatively correlated with income and neighborhoodgreen density, our findings suggest that they provide these servicesin communities of high social need and limited access to other typesof open or green spaces.
Our study also suggests that the City’s method for identifyingand classifying vacant lots, though meaningful for property tax pur-poses, is not necessarily useful for planning purposes. Many lotsdefined as vacant are sites for a multitude of social and ecologi-cal processes, and require a finer classification if they are to be fullyconsidered in planning processes. Moreover, the high proportion ofvacant lots whose ownership is unknown (50%) may present a chal-lenge for community groups or other organizations and individualswishing to more fully utilize under-utilized vacant lots. A numberof vacant lots are located within areas that are under conservationor other forms of protection by federal, state and municipal entitiesand should not be considered developable, while others are unused,unmanaged sites which may be contributing to urban blight. How-ever, the lack of groundtruthing in our study is a limitation, andmay constrain our ability to characterize the full array of actual useof vacant lots in the city. A census of vacant lots using our method-ology could be conducted by the City and periodically updated, inorder to provide useful data for community groups who wish toadvocate for development and transformation of vacant lots intomore beneficial space, or who are engaged in participatory plan-ning processes involving vacant land utilization, especially sincemany of the lots are located in residential areas. Our methodology isdesigned to be flexible and could potentially be applied in multipleurban contexts, including postindustrial cities, such as Chicago orDetroit, with declining populations and vacant land that is unevenlydistributed and concentrated in disinvested, often minority neigh-
ssment of vacant lots in New York City. Landscape Urban Plan. (2013),
borhoods. Understanding the social conditions in neighborhoodswhere vacant lots are located may be of even greater relevance inthese contexts because vacancy which comes about as a result ofdisinvestment can influence further disinvestment.

ING Model
L
Urba
cit1wwotaiiauO(fut3lpciaacvfat
lagn
acesTaigmpcw
ARTICLEAND-2382; No. of Pages 16
P. Kremer et al. / Landscape and
Of the 91 lots included within both the City Parks database andlassified as vacant in the MapPLUTO database, our visual surveydentified 26 as unused, 10 as parks, 27 as community gardens andhe remainder fell into a variety of actual use classes. In addition,9 vacant lots fell within state parks, national recreation areas,etland and other state and federally protected areas. Two tidaletland lots were classified as unused in our survey, and three
f the 5 state and federal parks were classified as parks, whilehe remaining two were classified as commercial and parking. Inll, 26 lots or 5% of lots classified as unused fell within a greennfrastructure layer. This points to possible limitations of our visualnspection methodology, errors in the green infrastructure layersnd/or inconsistencies within the MapPLUTO database. Eleven landse classes are listed within the MapPLUTO database, includingpen Space and Outdoor Recreation (class 09) and Vacant Land
class 11). As Open Space and Outdoor Recreation is a distinct classrom Vacant Land, it is unclear how a park is classified as vacant,nless there are errors within MapPLUTO or time lags in data collec-ion between the two datasets. To illustrate this problem, in section.1 above, we describe a lot in Staten Island that is a state-protected
and in conservation, but is listed as a vacant lot in MapPLUTO underrivate ownership. Data collection coordination among City agen-ies responsible for maintaining land use and urban green spacenformation may help to resolve inconsistencies and provide moreccurate information to the public regarding which lots are actuallyvailable for transformation. Identifying lots that are truly unusedan serve as a first step in the process of prioritizing the rede-elopment of vacant lots for public and community purposes, oror conservation if unused vacant land is significantly green andlready providing ecosystem services valued by the community orhe city.
Our findings show that unused lots are relatively green, andocated in residential neighborhoods of high population densitynd low income. Targeting such lots for redevelopment as publicreen spaces can benefit local community members and enhanceeighborhood vitality.
More generally, we argue that a fine scale classification, suchs we undertook in this survey, can support decision making pro-esses in planning for vacant lot management and development. Forxample, residential tree covered lots already serving as importantources of green connectivity may be designated for conservation.he large number of lots being used as private yards might merit
consideration of mechanisms to allow such use while requir-ng certain management strategies supporting ecosystem servicesoals. Lots which are small in size or otherwise make develop-
Please cite this article in press as: Kremer, P., et al. A social–ecological assehttp://dx.doi.org/10.1016/j.landurbplan.2013.05.003
ent challenging present opportunities to develop, enhance orreserve urban green infrastructure. Land that is topographicallyhallenging, for example, may be well-suited as nature preserves,hile accessible, but oddly shaped lots may serve as greenways or
PRESSn Planning xxx (2013) xxx– xxx 13
small pocket parks with public access. Land near existing rail orother transportation corridors where other types of developmentare unlikely may serve as portions of greenways with pedes-trian and bike access. Urban design interventions such as thesecould facilitate development of vacant land into enhanced publicamenities, yet appropriate transformation depends on the socialcontext and actual use of the land. However, deciding the mostappropriate transformation of unused vacant land to best meetsocial need for ecosystem services is a complex process involvingstakeholders from local residents and community groups to citygovernment agencies. These processes are political in nature, attimes involving contested claims over who has a right to accesscommunity resources and who is empowered to make decisionsregarding those resources. We argue that providing public infor-mation regarding vacant land at a greater level of detail is one stepCity agencies can take toward engaging with community membersin visioning how unused land may be transformed.
5. Conclusion
In this paper we used ArcGIS, Google Earth, and Google StreetView technologies to survey and assess 5% of New York City’sadministratively-defined vacant lots and analyze survey findingsin relation to social and ecological characteristics of the neigh-borhoods where vacant lots are located. The goal of this study isto support emerging research and planning of urban vacant lots.We conclude that vacant lots are sites for social and ecologicalprocesses in the city. The social context of vacant lots, often res-idential areas or neighborhoods with high population density andlow household income, offers potential to develop landscapes thatare more socially and ecologically beneficial. Unused lots withinhigh social need contexts can be prioritized for redevelopment ofpublic green infrastructure. A first step toward appropriate devel-opment of vacant land for urban green infrastructure is the creationof a mechanism for identifying and classifying social and ecologicalcharacteristics of vacant lots at the city scale. The survey method-ology we use offers one way to combine new technologies andpublicly available data to extract spatially explicit, detailed infor-mation at a fine scale. While the tools used in this study are mostlypublicly available and could be easily reproduced in other cities,limitations of the methodology include a time consuming surveyprocess, a dependence on accurately identifying lot use, and poten-tial time discrepancies between different datasets. Further researchis necessary on the typology of vacant lots. However, by combiningan assessment of actual uses, ecological characteristics and physi-
ssment of vacant lots in New York City. Landscape Urban Plan. (2013),
cal indicators such as size, location and shape, planners may be ableto more effectively address urban land vacancy while supportingurban sustainability and resilience through enhanced productionof urban ecosystem services.

Please cite this article in press as: Kremer, P., et al. A social–ecological assessment of vacant lots in New York City. Landscape Urban Plan. (2013),http://dx.doi.org/10.1016/j.landurbplan.2013.05.003
ARTICLE IN PRESSG Model
LAND-2382; No. of Pages 16
14 P. Kremer et al. / Landscape and Urban Planning xxx (2013) xxx– xxx
Appendix 1.
Review of New York City legislation related to vacant land.
File no. & date Name Description
Resolutiona
1033-2007Preserve the existing Green ThumbCommunity Gardens
Requires the Mayor to preserve existing Green Thumb Community Gardens and set aside moreparkland, open space and vacant lots to be developed as permanent Green Thumb CommunityGardens
Introductionb
0048-2010Annual census of vacant properties To require that a list of every vacant building and vacant lot in the city is made available to the
public on an annual basisResolutiona
0009-2010Creating a Mitchell-Lama-type program for the21st Century for buildings to be built on vacantlots owned by NYC and for vacant City-ownedbuildings
Encourages affordable housing development on City-owned vacant lots and in vacantCity-owned buildings, requiring that some units be reserved for residents who werepreviously displaced
T2011-3626 Oversight – The Impact of Pop-Up ArtInstallations in Vacant Spaces
Oversight hearing was held on the role of the Department of Cultural Affairs in supportingpop-up art in vacant spaces.
Introductionb
0652-2011Requiring the registration of owners of vacantproperty
To require that owners of property which is vacant for one year register owner contactinformation with the City
Local Lawc No.48-2011
Establishing reporting requirements for thedepartment of citywide administrative serviceson the status of city-owned real property
Requires that information about all City-owned property be available to the public, includingthe use (or vacancy) of lots
Introductionb
0809-2012Identifying all vacant and underutilizedmunicipally owned sites that would be suitablefor the development of renewable energy
To require that a solar and wind energy feasibility study be conducted every three years onvacant and underutilized municipally owned sites
Introductionb
0776-2012Creating a land bank To establish the New York City Land Corporation to encourage construction and development
of affordable housing. . . fresh food stores and public and open spaces by conductinginventories of vacant property and conveying them for productive uses
a Resolutions are non-binding policy statements.b Introductions are proposed laws in the legislative process.c Local Laws are enforceable municipal legislation (New York State, 1998).
Appendix 2A.
Variation in ownership type and zoning district of each actual use class with margins of error for a 95% confidence level.
Actual use type Ownership Zoning
Public Private Residential(low density)
Residential(high density)
Commercial Manufacturing Mixed use Park
Unused 114 (23% ± 4%) 383 (77% ± 4%) 290 (58% ± 4%) 126 (25% ± 4%) 34 (7% ± 2%) 42 (8% ± 2%) 5 (1% ± 0.8%) 0 (0%)Private residence 93 (23% ± 4%) 315 (77% ± 4%) 353 (87% ± 3%) 44 (11% ± 3%) 3 (1% ± 0.8%) 8 (2% ± 1%) 0 (0%) 0 (0%)Commercial/industrial 22 (29% ± 10%) 53 (71% ± 10%) 15 (20% ± 9%) 9 (12% ± 7%) 6 (8% ± 6%) 42 (56% ± 11%) 3 (4% ± 4%) 0 (0%)Community garden 21 (50% ± 15%) 21 (50% ± 15%) 5 (12% ± 10%) 36 (86% ± 10%) 1 (2% ± 5%) 0 (0%) 0 (0%) 0 (0%)Park 3 (10% ± 11%) 27 (90% ± 11%) 21 (70% ± 16%) 5 (17% ± 13%) 1 (3% ± 9%) 2 (7% ± 9%) 0 (0%) 1 (3% ± 6%)Residential tree cover 24 (14% ± 5%) 152 (86% ± 5%) 157 (89% ± 5%) 15 (9% ± 10%) 1 (1% ± 1%) 3 (2% ± 2%) 0 (0%) 0 (0%)Sports fields 1 (13% ± 23%) 7 (88% ± 23%) 5 (63% ± 34%) 3 (38% ± 34%) 0 (0%) 0 (0%) 0 (0%) 0 (0%)Road 10 (15% ± 9%) 57 (85% ± 9%) 52 (78% ± 10%) 7 (10% ± 7%) 1 (1% ± 3%) 7 (10% ± 7%) 0 (0%) 0 (0%)Junkyard 3 (21% ± 21%) 11 (79% ± 21%) 2 (14% ± 18%) 5 (36% ± 25%) 0 (0%) 6 (43% ± 23%) 1 (7% ± 13%) 0 (0%)Parking lot 21 (34% ± 12%) 40 (66% ± 12%) 22 (36% ± 12%) 17 (28% ± 11%) 3 (5% ± 5%) 18 (30% ± 11%) 1 (2% ± 3%) 0 (0%)Noncommercial
parking24 (24% ± 8%) 77 (76% ± 8%) 55 (54% ± 10%) 35 (35% ± 9%) 5 (5% ± 4%) 5 (5% ± 4%) 1 (1% ± 2%) 0 (0%)
Other 4 (17% ± 16%) 19 (83% ± 16%) 17 (74% ± 18%) 5 (22% ± 17%) 0 (0% ± 0%) 1 (4% ± 8%) 0 (0%) 0 (0%)Total 340 (23%) 1162 (77%) 994 (66%) 307 (20%) 55 (4%) 134 (9%) 11 (1%) 1 (0%)
Source: Data for ownership and zoning status of lots were drawn from NYC Department of City Planning’s 2011 MapPLUTOTM (NYC Department of City Planning, 2011).
Appendix 2B.
Variation in mean, median and total area of each actual use type with margins of error for a 95% confidence level for mean estimates.
Actual use type Area (m2)
Mean Median Total
Unused 3860 ± 4170 259 1,918,300Private residence 247 ± 31 184 100,918Commercial/industrial 3885 ± 5064 469 291,405Community garden 318 ± 91 231 13,349Park 44,856 ± 49,067 689 1,345,687Residential tree cover 748 ± 453 260 131,638Sports fields 412 ± 299 238 3293Road 1802 ± 2081 228 120,716Junkyard 304 ± 106 250 4258Parking lot 1182 ± 612 396 72,083Noncommercial parking 207 ± 30 191 20,930Other 1019 ± 1419 218 23,432
Total 4,046,009 (100%)
Source: Data for area of lots were drawn from NYC Department of City Planning’s 2011 MapPLUTOTM (NYC Department of City Planning, 2011).

ARTICLE IN PRESSG Model
LAND-2382; No. of Pages 16
P. Kremer et al. / Landscape and Urban Planning xxx (2013) xxx– xxx 15
Appendix 3.
Relationship between actual uses and neighborhood and lot characteristics, reported as odds ratio ranges for a 95% confidence interval.Independent variables are listed in column headings and dependent variables, each of which represents a dummy variable (where 1 = the actual use listed and 0 = all actualuses except the one listed), are listed in row headings. Values represent the odds of a lot having an actual use given a one unit change in the independent variable, within a95% confidence interval. For example, for every 1000 people/km2 increase in neighborhood population density, ceteris paribus, we expect an 8–13% increase in the odds of alot being a community garden.
Actual use type Neighborhood income($1000)
Neighborhoodpopulation density(1000 people/km2)
Distance to green(100 m)
Neighborhood greendensity (%)
Lot green density(%)
Unused 0.97–0.99*** 1.00–1.02* 0.87–1.01 0.60–2.80 2.41–4.55***
Private residence 1.01–1.03*** 0.97–0.99*** 1.13–1.31*** 0.26–1.43 0.73–1.38Commercial/industrial 0.97–1.0* 0.97–1.02 0.80–1.1 0.04–2.08 0.00–0.03***
Community Garden 0.87–0.93*** 1.08–1.13*** 0.10–0.34*** 0.00–0.79* 0.71–4.19Park 0.96–1.01 0.91–1.00 0.23–0.61*** 91.93–2163.62*** 0.92–8.18Residential tree cover 1.04–1.06*** 0.92–0.96*** 0.97–1.19 0.32–3.10 115.35–860.10***
Sports fields 0.95–1.04 0.95–1.08 0.20–1.06 0.06–238.61 0.09–4.18Road 1.02–1.05*** 0.94–0.99* 0.81–1.14 0.42–10.46 0.01–0.08***
Junkyard 0.89–0.98** 0.98–1.07 0.69–1.42 1.97e−06–7.55 0.04–0.89*
Parking lot 0.94–0.98*** 0.99–1.04 0.78–1.12 0.15–6.2 0.00–0.02***
Noncommercial parking 0.94–0.97*** 1.02–1.05*** 0.92–1.20 0.01–0.60** 0.03–0.11***
Other 0.97–1.02 0.97–1.05 0.78–1.34 0.10–26.4 0.08–0.90*
Sources: Data for population density and income variables were drawn from the 2000 U.S. Census; Data for lot green density, distance to green and neighborhoodgreen density variables were drawn from New York City Parks layer (2011) and New York City open space layer (2011) available at https://nycopendata.socrata.com/;and New York State Department of Conservation (DEC) DEC Lands layer (2011), Water Inventory (2011), Park Boundary (2011) and Tidal Wetlands (1974) available athttp://gis.ny.gov/gisdata/inventories.
R
5A
A
A
A
B
B
B
B
B
B
C
CC
C
C
C
C
C
D
D
* Results are significant at p ≤ 0.05.** Results are significant at p ≤ 0.01.
*** Results are significant at p ≤ 0.001.
eferences
96 Acres. (n.d.). 596 Acres: Home. Retrieved from http://596acres.org/ccordino, J., & Johnson, G. T. (2000). Addressing the vacant and abandoned property
problem. Journal of Urban Affairs, 22(3), 301–315.ckerman, K. (2011). The potential for urban agriculture in New York City: Grow-
ing capacity, food security, & green infrastructure. Retrieved from. http://www.urbandesignlab.columbia.edu/?pid=nyc-urban-agriculture
lberti, M. (2008). Advances in urban ecology – Integrating humans and ecologicalprocesses in urban ecosystems. Seattle, WA: Springer.
lexander, F. S. (2005). Land bank authoroties a guide for the creation and operationof local land banks.
artholomew, H. (1955). Land uses in American cities. Cambridge: Harvard UniversityPress.
onham, J. B., Spilka, G., & Rastorfer, D. (2002). Old cities/green cities: Planning advisoryservice report number 506/507. Chicago, IL.
owman, A. Om., & Pagano, M. A. (2000). Transforming America’s cities: Poli-cies and conditions of vacant land. Urban Affairs Review, 35(4), 559–581.http://dx.doi.org/10.1177/10780870022184534
owman, Ann O’M., & Pagano, M. A. (2004). . Terra incognita: Vacant land and urbanstrategies. Urban public economics review (103) Washington, DC: GeorgetownUniversity Press.
radshaw, A. D. (2003). Natural ecosystems in cities: A model for cities as ecosys-tems. In A. R. Berkowitz, C. H. Nilon, & K. S. Hollweg (Eds.), Understanding urbanecosystems: A new frontier for science and education (pp. 77–97). New York:Springer-Verlag. Incorporated.
urkholder, S. (2012). The new ecology of vacancy: Rethinking land use in shrinkingcities. Sustainability, 4(12), 1154–1172. http://dx.doi.org/10.3390/su4061154
adenasso, M. L., Pickett, S. T. A., & Schwarz, K. (2007). Spatial heterogeneity in urbanecosystems: Reconceptualizing land cover and a framework for classification.Frontiers in Ecology and the Environment, 5(2), 80–88, doi:10.1890/1540-9295(2007)5[80:SHIUER]2.0.CO;2.
ity of New York. (2010). Intro 48: A citywide census of vacant properties.ity of Philadelphia. (2010). Greenworks Philadelphia: 2010 Progress Report. Philadel-
phia.ity of Pittsburgh. (2012). Greening resources. Retrieved from. http://www.
pittsburghpa.gov/neighborhoodinitiatives/greenup/resources.htmochran, W. G. (1963). Sampling techniques (2nd ed.). New York, NY: John Wiley and
Sons Inc.ohen, N., Reynolds, K., & Sanghvi, R. (2012). Five borough farm: Seeding the future of
urban agriculture in New York City. New York, NY: Design Trust for Public Space.olasanti, K., & Hamm, M. W. (2010). Assessing the local food supply capacity of
detroit, Michigan. Journal of Agriculture, Food Systems, and Community Develop-ment, 1(2).
rowe, T. M. (1979). Lots of weeds: Insular phytogeography of vacant lots. Journal of
Please cite this article in press as: Kremer, P., et al. A social–ecological assehttp://dx.doi.org/10.1016/j.landurbplan.2013.05.003
Biogeography, 6(2), 169–181.avidson, M., & Dolnick, F. (2004). A planners dictionary. Planning Advisory Service
Report Number 521/522. Chicago, IL: American Planning Association.eGategno, K., Kasper, D., Kremer, P., Lampton, C., & Quinn, J. C. (2010). Supporting
community gardening and home gardening. Newark: DE.
Elmqvist, T., Alfsen, C., & Colding, J. (2008). Urban systems. In J. S. Erik, & B. D. Fath(Eds.), Ecosystems (pp. 3665–3672). Oxford: Elsevier.
Folke, C. (2006). Resilience: The emergence of a perspective for social–ecologicalsystems analyses. Global Environmental Change, 16(3), 253–267.http://dx.doi.org/10.1016/j.gloenvcha.2006.04.002
Goldstein, J., Jensen, M., & Reiskin, E. (2001). Urban vacant land redevelopment: Chal-lenges and progress.
Grewal, S. S., Cheng, Z., Masih, S., Wolboldt, M., Huda, N., Knight, A., et al. (2011).An assessment of soil nematode food webs and nutrient pools in communitygardens and vacant lots in two post-industrial American cities. Urban Ecosystems,14(2), 181–194. http://dx.doi.org/10.1007/s11252-010-0146-3
Grewal, S. S., & Grewal, P. S. (2012). Can cities become self-reliant in food? Cities,29(1), 1–11. http://dx.doi.org/10.1016/j.cities.2011.06.003
Kremer, P. (2011). Local food systems as a strategy for sustainability: Analysis of a scaledependent sustainable urban food system a case study in Philadelphia. Universityof Delaware. Retrieved from. http://gradworks.umi.com/34/65/3465799.html
Lawson, L. J. (2005). City bountiful: A century of community gardening in America.Berkeley: University of California Press.
Little, G. M. (2008). 692 Main Street – A revisioning of an urban void: An exploration intochallenging cultural perceptions of an urban vacant lot. The University of Manitoba.
Longley, P. A., Goodchild, M. F., Maguire, D. J., & Rhind, D. W. (2011). Geographicinformation systems and science 3e. In P. A. Longley, M. F. Goodchild, D. J.Maguire, & D. We. Rhind (Eds.), Information systems journal (Vol. 20) (p. 560).Wiley.
Millennium Ecosystem Assessment. (2005). Ecosystems and human well-being: Syn-thesis. World health. Washington, DC: Island Press.
National Commission on Urban Problems. (1968). Land use in 106 large cities. Wash-ington, DC: Three Land Research Studies.
New York State. (1998). Adopting local laws in New York State: James A. Coon localgovernment technical series. Albany, NY.
New York State Department of Environmental Conservation. (2011). DECLands. Retrieved from NYSGIS Clearinghouse: http://gis.ny.gov/gisdata/inventories/details.cfm?DSID=1114
Niedercorn, J. H., & Hearle, E. F. R. (1964). Recent land-use trends in forty-eight largeAmerican cities. Land Economics, 40(1), 105–110.
Northam, R. M. (1971). Vacant urban land in the American city. Land Economics,47(4), 345–355.
Nowak, D. J., Hoehn, R. E., Crane, D. E., Stevens, J. C., Walton, J. T., et al. (2007). Assessingurban forest effects and values: New York City’s urban forest. Newtown Square, PA:U.S. Department of Agriculture, Forest Service, Northern Research Station.
NYC Department of City Planning. (2011). MapPLUTOTM.NYC Department of Finance. (2012). Data dictionary for the RPAD master file. New
York City.Oasis NYC. (n.d.). NYC Open Accessible Space Information System (OASIS). Retrieved
from http://www.oasisnyc.net/pages/mission.aspxPagano, M. A., & Bowman, A. O. (2000). Vacant land in cities: An urban resource. The
ssment of vacant lots in New York City. Landscape Urban Plan. (2013),
Brookings Institution Survey Series, (December), 1–9.Popper, D., & Popper, F. (2010). Smart decline in post-carbon cities: The buffalo
commons meets buffalo, New York. In R. Heinberg, & D. Lerch (Eds.), The postcarbon reader: Managing the 21st century’s sustainability crises. CA: Santa Rosa.

ING Model
L
1 Urba
R
R
S
S
S
S
S
S
T
gardens and vacant lots. Landscape and Urban Planning, 104(2), 238–244.
ARTICLEAND-2382; No. of Pages 16
6 P. Kremer et al. / Landscape and
obinson, S. L., & Lundholm, J. T. (2012). Ecosystem services providedby urban spontaneous vegetation. Urban Ecosystems, 15(3), 545–557.http://dx.doi.org/10.1007/s11252-012-0225-8
undle, A. G., Bader, M. D. M., Richards, C. A., Neckerman, K. M., & Teitler, J.O. (2011). Using Google Street View to audit neighborhood environments.American Journal of Preventive Medicine, 40(1), 94–100. Retrieved from.http://www.pubmedcentral.nih.gov/articlerender.fcgi?artid=3031144&tool=pmcentrez&rendertype=Abstract
aldivar-Tanaka, L., & Krasny, M. E. (2004). Culturing community development,neighborhood open space, and civic agriculture: The case of Latino commu-nity gardens in New York City. Agriculture and Human Values, 21(4), 399–412.http://dx.doi.org/10.1023/B:AHUM.0000047207.57128.a5
chmelzkopf, K. (2002). Incommensurability, land use, and the right to space: Com-munity gardens in New York City. Urban Geography, 23(4), 323–343.
chukoske, J. E. (2000). Community development through gardening: State andlocal policies transforming urban open space. Legislation and Public Policy, 3(2),351–392.
eattle Department of Neighborhoods. (n.d.). P-patch community garden-ing program. Retrieved from http://www.seattle.gov/neighborhoods/ppatch/gardening.htm
huster, W. D., Barkasi, A., Clark, P., Dadio, S., Gerber, T., Houser, T., et al. (2011).Vacant lots – Potential for serious ecosystem services. Soil Survey Horizons, 52(1),
Please cite this article in press as: Kremer, P., et al. A social–ecological assehttp://dx.doi.org/10.1016/j.landurbplan.2013.05.003
1–30.mith, C. M., & Kurtz, H. E. (2003). Community gardens and politics of scale in New
York City. American Geographical Society, 93(2), 193–212.auzer, E. (2009). The phytogeography of vacant lots in Baltimore, MD, USA: A test
of Island Biogeography. The Cary Institute of Ecosystem Studies, 1–17.
PRESSn Planning xxx (2013) xxx– xxx
The Greening of Detroit. (2012). Urban agriculture and open space. Retrieved from.http://detroitagriculture.net/open-space-stories/
Tidball, K. G., & Krasny, M. E. (2009). From risk to resilience: What role for communitygreening and civic ecology in cities? In A. E. J. Wals (Ed.), Social learning towardsa sustainable world (pp. 149–164). Wageningen, The Netherlands: WageningenAcademic Publishers.
Trepl, L. (1995). Towards a theory of urban biocoenoses. In A. H. H. Sukopp, & M.Numata (Eds.), Urban ecology as the basis for urban planning (pp. 3–21). TheHague, The Netherlands: SPB Academic.
Trust for Public Land. (2012). Community gardens. Retrieved from.http://www.tpl.org/what-we-do/where-we-work/new-york/community-gardens.html
US HUD. (n.d.). Neighborhood stabilization program grants. Retrieved fromhttp://portal.hud.gov/hudportal/HUD?src=/program offices/comm planning/communitydevelopment/programs/neighborhoodspg
US HUD. (2009). Revitalizing foreclosed properties with land banks.Wachter, S., Scruggs, G., Voith, R., & Huang, L. (2010). Redevelopment authority of the
City of Philadelphia land use and policy study. Philadelphia, PA: Penn Institute forUrban Research, Econsult Corporation.
Yadav, P., Duckworth, K., & Grewal, P. S. (2012). Habitat structure influ-ences below ground biocontrol services: A comparison between urban
ssment of vacant lots in New York City. Landscape Urban Plan. (2013),
http://dx.doi.org/10.1016/j.landurbplan.2011.10.018Zipperer, W. C., & Pickett, S. T. A. (2012). Urban ecology: Patterns of
population growth and ecological effects. eLS, 1–8. http://dx.doi.org/10.1002/9780470015902.a0003246.pub2


