Embed Size (px)
Citation preview

Reprinted from
Adsorption Science & Technology2007 Volume 25 Number 6
Multi-Science Publishing Co. Ltd.5 Wates Way, Brentwood, Essex CM15 9TB, United Kingdom
A Simulation Study of Alkanes in Linde Type
A Zeolites
Almudena García-Sánchez, Elena García-Pérez,
David Dubbeldam, Rajamani Krishna and Sofía
Calero
417
*Author to whom all correspondence should be addressed. E-mail: [email protected].
A Contribution on the Occasion of the 65th Birthday of Professor Wladyslaw Rudzinski
A Simulation Study of Alkanes in Linde Type A Zeolites
Almudena García-Sánchez1,2, Elena García-Pérez1, David Dubbeldam3, Rajamani Krishna2
and Sofía Calero1* (1) Department of Physical, Chemical and Natural Systems, University Pablo de Olavide, Ctra.
Utrera km. 1, 41013 Seville, Spain. (2) van’t Hoff Institute for Molecular Sciences, University of Amsterdam, Nieuwe
Achtergracht 166, 1018 WV Amsterdam, The Netherlands. (3) Chemical & Biological Engineering Department,
Northwestern University, Evanston, IL 60208, U.S.A.
ABSTRACT: Monte Carlo simulations were performed to study the adsorptionand diffusion of small hydrocarbons in Linde Type A zeolites as a function oftheir calcium/sodium ratio. The diffusion studies were focused on methanewhereas the adsorption simulations were performed from methane up topentane. The results obtained showed that an increase in the number of cationsin the structure (exchange of univalent sodium ions by divalent calcium ions) ledto an increase in the adsorption of linear alkanes at low and medium pressure,but caused a decrease in adsorption at the highest pressures. An increase in theamount of cations favours molecular attraction and hence results in lowermobility. At higher cation loading the ions block the windows interconnectingthe LTA cages, leading to a further decrease in diffusion. Methane self-diffusioncoefficients obtained from our simulations were twice as high for the Linde Type5A zeolite as for the Linde Type 4A zeolite. These results are consistent withprevious experimental studies and provide a molecular picture of the influenceof the zeolite type, the amount of cations contained and their location in thestructure.
1. INTRODUCTION
Zeolites are crystalline aluminosilicates based on frameworks with well-defined channels andcavities. The structure consists of TO4 (T = Si, Al) primary building units linked together bycorner-sharing to form bent oxygen bridges (Meier et al. 1996). The presence of Al atoms inducesan electrical imbalance, leading to the generation of a negatively charged framework that iscompensated by additional cations. The inner surface of the zeolite can act as a catalyst. Zeolitesare also widely used as water softeners (by exchanging non-framework cations with those of anearby solution), as drying agents (anhydrous activated zeolites with a high affinity for water), forenvironmental clean-up and as molecular sieves in industrial separation processes (Guisnet andGilson 2002).
Zeolites A (LTA, Linde Type A) are well-known representatives. They can crack chain paraffinscatalytically and selectively to single straight-chain products and were the first zeolites used inshape-selective catalysis in 1960 (Chen et al. 1996). They are also used as water softeners indetergents and in horticulture, as drying agents, and as adsorbents for air and hydrocarbon
separations. Zeolite A was first prepared by Breck and co-workers in 1956 (Breck et al. 1956;Reed and Breck 1956). The high silica LTA (ITQ-29) has only recently been synthesized (Cormaet al. 2004). LTA zeolites are often synthesized in their sodium form and obey Loewenstein’s rule(Loewenstein 1954). The sodium form has the chemical composition Na96Al96Si96O384, with a unitcell parameter of 24.555 Å and the Fm3c space group (Pluth and Smith 1980).
The structure of LTA consists of a cubic array of α-cages (diameter ≈ 11.2 Å), interconnectedthrough eight-membered oxygen windows with a free effective diameter of ca. 4.1 Å (althoughthis may be reduced by the presence of an exchangeable cation). The LTA unit cell is formed byeight α-cages, with each cage having 12 negative charges which must be compensated byexchangeable cations. The effective size of the windows in zeolite A can be modified by thecorrect choice of cations which partially block the pore windows. In such a way, pore cross-sections of 3 Å (K+-exchanged form), 4 Å (Na+-exchanged form) or 5 Å (Ca2+/Na+ form) can beproduced. The Na+/Ca2+ form (zeolite 5A) is obtained by replacing the sodium with calciumcations via a post-synthesis exchange. Although the names LTA 3A, 4A and 5A originatedindependently, they fortuitously coincide with windows sizes of ca. 3, 4 and 5 Å, respectively.
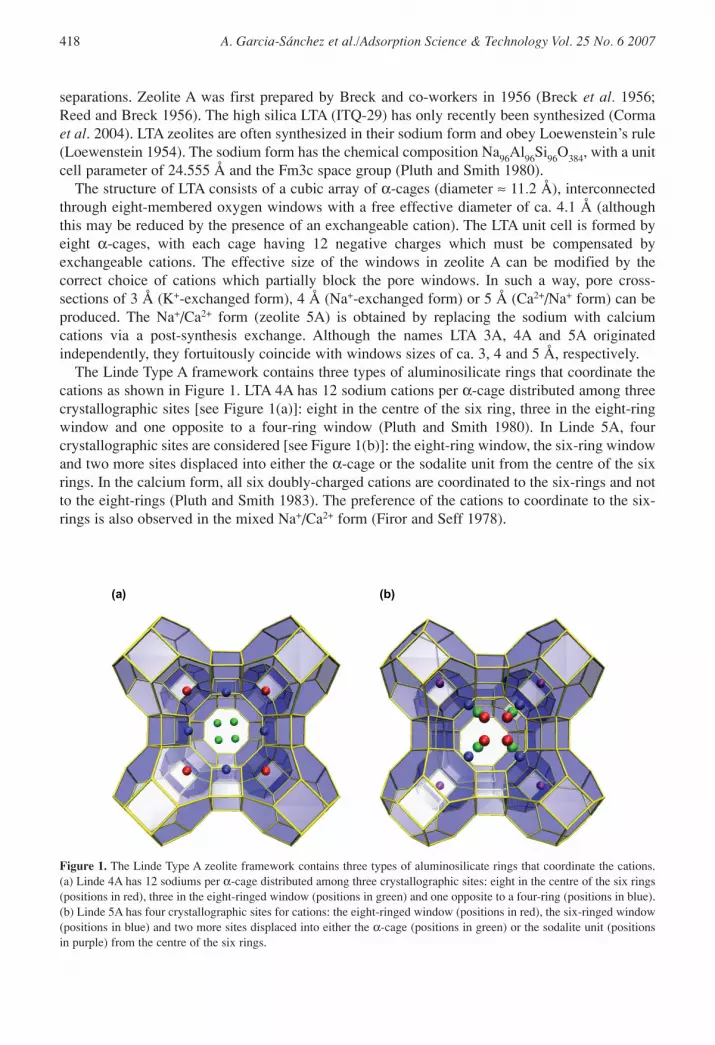
The Linde Type A framework contains three types of aluminosilicate rings that coordinate thecations as shown in Figure 1. LTA 4A has 12 sodium cations per α-cage distributed among threecrystallographic sites [see Figure 1(a)]: eight in the centre of the six ring, three in the eight-ringwindow and one opposite to a four-ring window (Pluth and Smith 1980). In Linde 5A, fourcrystallographic sites are considered [see Figure 1(b)]: the eight-ring window, the six-ring windowand two more sites displaced into either the α-cage or the sodalite unit from the centre of the sixrings. In the calcium form, all six doubly-charged cations are coordinated to the six-rings and notto the eight-rings (Pluth and Smith 1983). The preference of the cations to coordinate to the six-rings is also observed in the mixed Na+/Ca2+ form (Firor and Seff 1978).
418 A. Garcia-Sánchez et al./Adsorption Science & Technology Vol. 25 No. 6 2007
(a) (b)
Figure 1. The Linde Type A zeolite framework contains three types of aluminosilicate rings that coordinate the cations.(a) Linde 4A has 12 sodiums per α-cage distributed among three crystallographic sites: eight in the centre of the six rings(positions in red), three in the eight-ringed window (positions in green) and one opposite to a four-ring (positions in blue).(b) Linde 5A has four crystallographic sites for cations: the eight-ringed window (positions in red), the six-ringed window(positions in blue) and two more sites displaced into either the α-cage (positions in green) or the sodalite unit (positionsin purple) from the centre of the six rings.

The distribution of the cations has a significant influence on the adsorption and diffusionproperties of zeolite A. Simulation studies on these systems can provide a better understanding ofthe effect of the Na+/Ca2+ ratio, thereby leading to the control of molecular adsorption anddiffusion in LTA zeolites through tuning the Na+/Ca2+ ratio. A variety of simulation studies hasbeen undertaken for the pure silica structure on adsorption and diffusion (Bates et al. 1996;Beerdsen et al. 2004, 2006a,b; Dubbeldam et al. 2006; Dubbeldam and Smit 2003; Fritzsche et al.1994, 1996, 1998, 2000; Maesen et al. 2006; Schuring et al. 2002, 2004; Tunca and Ford 2003),but only a few papers have reported simulations of adsorption in LTA 4A and 5A with sodium andcalcium cations (Daems et al. 2007; García-Pérez et al. 2006; Jaramillo and Chandross 2004) andwe are not aware of simulation studies of diffusion in these systems.
In the present work, we provide new insights into the effect that the Na+/Ca2+ ratio exerts on theadsorption and diffusion of hydrocarbons in LTA 4A and 5A. The remainder of the paper isorganized as follows. In Section 2, we present our simulation methods including descriptions ofthe force fields used in this work. In Section 3, we continue with the simulation results and finallyin Section 4 we provide some concluding remarks.
2. METHODS
2.1. Zeolite model
The Linde Type A framework was constructed from silicon, aluminium and oxygen atoms using thecrystallographic positions of Pluth and Smith (1980). The Si/Al ratio is exactly one, leading to analternating arrangement of Si and Al atoms (the Loewenstein rule forbids Al–O–Al linkages).Simulations were performed for 10 structures by varying the cation ratio: 96Na+/0Ca2+,80Na+/8Ca2+, 72Na+/12Ca2+, 56Na+/20Ca2+, 48Na+/24Ca2+, 38Na+/29Ca2+, 32Na+/32Ca2+,24Na+/36Ca2+, 4Na+/46Ca2+, together with the pure silica structure with 0Na+/0Ca2+. The Na–O andCa–O interactions were calibrated to reproduce the experimentally known positions in LTA 4A andLTA5A (Figure 1) employing the charges qNa = +1 and qCa = +2. In addition, the crystallographiclocations of the sites obtained through molecular simulations were within 0.2 Å from those obtainedvia X-ray diffraction studies (Calero et al. 2004; García-Pérez et al. 2006). The charge distributionon the oxygen framework was considered to be static, i.e. polarization of oxygen by nearby cationswas neglected. We use a model that explicitly distinguishes silicon from aluminium with a differenceof 0.3e– between qSi and qAl (Jaramillo and Auerbach 1999), considering different charges for oxygenatoms bridging two silicon atoms, qOSi, and oxygen atoms bridging one silicon and one aluminiumatom, qOAl. All partial charges are listed in Table 1. The exchangeable cation density was adjusted tomatch the framework aluminium density, and the density of the zeolite was determined by theframework atoms (aluminium, silicon and oxygen) and the cations (sodium and calcium). In ourmodel, the cations can move freely and adjust their positions depending on their interactions withthe framework atoms, other cations and alkane molecules. The simulations were performed usingone unit cell with eight α-cages. Test simulations using eight unit cells gave identical results but weredeemed too computational expensive to use with the Ewald summation for all the simulations.
2.2. Interatomic potentials
A realistic description of the interaction between the sodium and calcium cations, the zeoliteframework and the alkanes is employed in this work. The interactions between guest molecules
A Simulation Study of Alkanes in Linde Type A Zeolites 419
420 A. Garcia-Sánchez et al./Adsorption Science & Technology Vol. 25 No. 6 2007
TA
BL
E 1
.Len
nard
-Jon
es P
aram
eter
sa,b
OSi
OA
lSi
Al
Na+
Ca2+
CH
4C
H3
CH
2
CH
411
511
5–
–58
259
015
8.5
130.
8494
.21
3.47
3.47
2.72
2.56
3.72
3.74
3.38
CH
393
.293
.2–
–44
340
013
0.84
108.
077
.73.
483.
482.
652.
63.
743.
763.
86C
H2
60.5
60.5
––
310
440
94.2
177
.756
.03.
583.
582.
952.
83.
843.
863.
96N
a+23
.023
.0–
––
–58
244
331
03.
43.
42.
722.
652.
95C
a2+18
.018
.0–
––
–59
040
044
03.
453.
452.
562.
62.
8C
harg
e [e
- ]q
= –
1.0
25q
= –
1.2
q =
+2.
05q
= +
1.75
q =
+1.
0q
= +
2.0
––
–
a ε/k
B(K
) in
the
top
left
cor
ner,
σ(Å
) in
the
botto
m-r
ight
cor
ner
of e
ach
fiel
d, p
artia
l cha
rges
(e– )
of
the
fram
ewor
k so
dium
and
cal
cium
ions
are
als
o in
clud
ed. b A
ll va
lues
take
nfr
om p
revi
ous
publ
icat
ions
(B
eerd
sen
et a
l.20
04; C
aler
o et
al.
2004
; Dub
beld
am e
t al
.200
4b; G
arcí
a-Pé
rez
et a
l. 20
06).

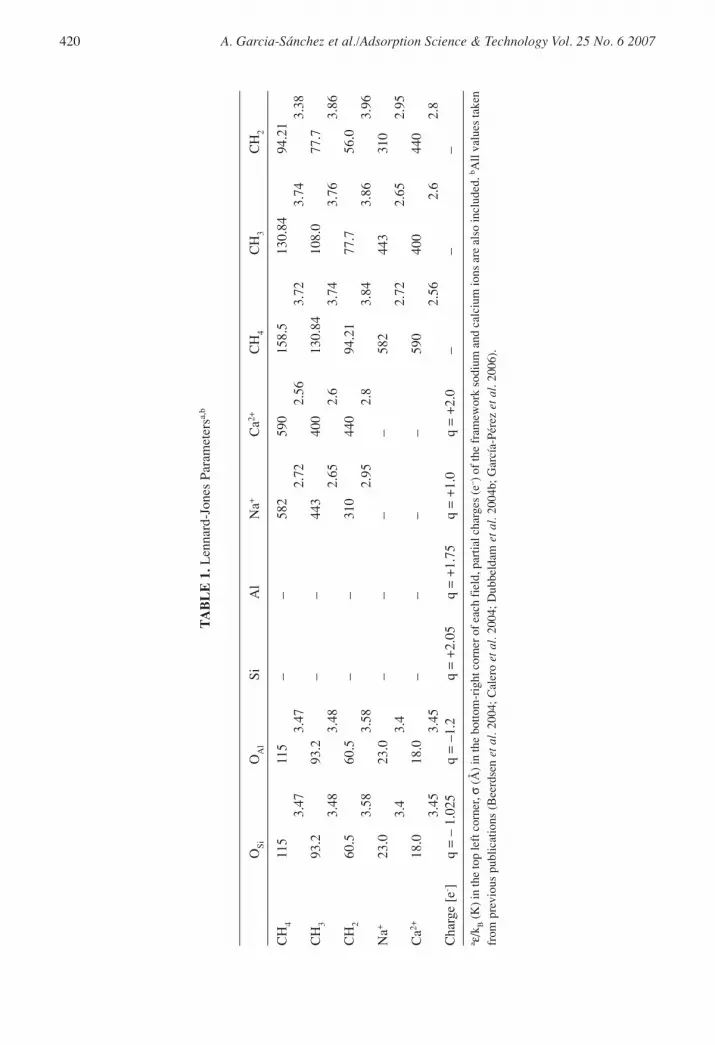
(alkanes and cations) with the zeolite host framework were modelled by Lennard-Jones andCoulombic potentials (Calero et al. 2004; Dubbeldam et al. 2004a,b; García-Pérez et al. 2006).All the used parameters are listed in Table 1. The Coulombic interactions in the system werecalculated using Ewald summations (Frenkel and Smit 2002). In our simulations, the convergenceparameter was chosen as 0.3 with k = 9 wave vectors for high accuracy. The alkanes weredescribed with a united atom model in which CHx groups were considered as single interactioncentres with their own effective potentials (Ryckaert and Bellemans 1978). The beads in the chainwere connected by harmonic bonding potentials. The bond-bending between three neighbouringbeads was modelled by a harmonic cosine bending potential, and changes in the torsional anglewere controlled by a Ryckaert–Bellemans potential. The beads in a chain separated by more thanthree bonds interacted with each other through a Lennard-Jones potential. The van der Waalsinteractions between silicon atoms were taken into account through an effective potential withonly the oxygen atoms of the zeolite (Bezus et al. 1978; Kiselev et al. 1985; Vlugt et al. 1999)and an “average” polarization was included implicitly in the parameterization by means of thepolarization induced by the cation on the zeolite and by the cation on the alkanes (Calero et al.2004). It should be noted that effective Lennard-Jones potentials implicitly include, in an averagesense, many-body interactions (polarization), the contributions arising from instantaneousdipole–quadrupole and quadrupole–quadrupole interactions, flexibility of the framework, etc. Theflexibility of the framework has a minor effect on the adsorption of small alkanes (Vlugt andSchenk 2002).
2.3. Simulation techniques
The adsorption isotherms of alkanes were computed using Configurational Bias Monte Carlo(CBMC) simulations in the Grand Canonical ensemble (Frenkel and Smit 2002). In CBMCsimulations, molecules are grown segment by segment, avoiding overlap. For each segment, a setof trial orientations is generated. One of the trial positions is selected according to the Boltzmannweight of the external energy, and this selected trial orientation is added to the chain. Theprocedure is repeated until the entire molecule has been grown. The rules for acceptance orrejection of a grown molecule are chosen in such a way that they exactly remove the bias causedby this growing scheme. Simulations are performed in cycles and in each cycle one move ischosen at random with a fixed probability of performing a molecule displacement (0.15), rotationaround the centre of mass (0.15), exchange with the reservoir (0.55) and partial re-growth of amolecule (0.15). The maximum translational and rotational displacements are adjusted to achievean acceptance probability of 50%. The number of cycles for methane and ethane was 2 × 10⁷ andat least 3 × 10⁷ for propane, butane and pentane. The total number of cations remains constantduring simulations. To sample cation motions, we used displacements and insertions at newrandomly selected positions that bypass energy barriers.
Self-diffusion coefficients were computed using MD simulations. In such simulations,successive configurations of the system are generated by integrating Newton’s laws of motion,which then yields a trajectory that describes the positions, velocities and accelerations of theparticles as they vary with time. The Verlet integration scheme with a time-step of 0.5 fs was used,providing a relative energy drift smaller than 10–4. Simulations were performed using the NVTensemble. Simulations using the NVE ensemble gave equivalent results. More details can befound in Dubbeldam et al. (2005a). The self-diffusion coefficients are computed by taking theslope of the mean-squared displacement at extended times (Dubbeldam et al. 2005b, 2006).
A Simulation Study of Alkanes in Linde Type A Zeolites 421
3. RESULTS AND DISCUSSION
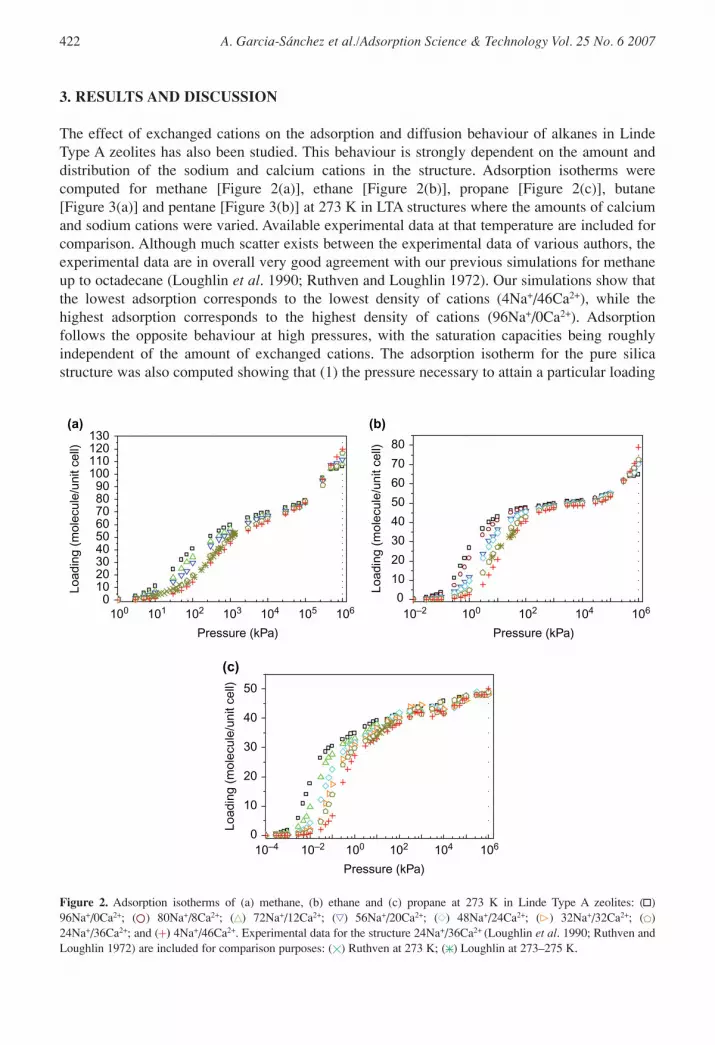
The effect of exchanged cations on the adsorption and diffusion behaviour of alkanes in LindeType A zeolites has also been studied. This behaviour is strongly dependent on the amount anddistribution of the sodium and calcium cations in the structure. Adsorption isotherms werecomputed for methane [Figure 2(a)], ethane [Figure 2(b)], propane [Figure 2(c)], butane[Figure 3(a)] and pentane [Figure 3(b)] at 273 K in LTA structures where the amounts of calciumand sodium cations were varied. Available experimental data at that temperature are included forcomparison. Although much scatter exists between the experimental data of various authors, theexperimental data are in overall very good agreement with our previous simulations for methaneup to octadecane (Loughlin et al. 1990; Ruthven and Loughlin 1972). Our simulations show thatthe lowest adsorption corresponds to the lowest density of cations (4Na+/46Ca2+), while thehighest adsorption corresponds to the highest density of cations (96Na+/0Ca2+). Adsorptionfollows the opposite behaviour at high pressures, with the saturation capacities being roughlyindependent of the amount of exchanged cations. The adsorption isotherm for the pure silicastructure was also computed showing that (1) the pressure necessary to attain a particular loading
422 A. Garcia-Sánchez et al./Adsorption Science & Technology Vol. 25 No. 6 2007
100 10010–2101 102 102103 104 104105 106 1060
102030405060708090
100110120130
(a) (b)
Load
ing
(mol
ecul
e/un
it ce
ll)
Load
ing
(mol
ecul
e/un
it ce
ll)
Pressure (kPa) Pressure (kPa)
0
10
20
30
40
50
60
70
80
10010–210–4 102 104 106
(c)
Load
ing
(mol
ecul
e/un
it ce
ll)
Pressure (kPa)
0
10
20
30
40
50
Figure 2. Adsorption isotherms of (a) methane, (b) ethane and (c) propane at 273 K in Linde Type A zeolites: ( )96Na+/0Ca2+; ( ) 80Na+/8Ca2+; ( ) 72Na+/12Ca2+; ( ) 56Na+/20Ca2+; ( ) 48Na+/24Ca2+; ( ) 32Na+/32Ca2+; ( )24Na+/36Ca2+; and ( ) 4Na+/46Ca2+. Experimental data for the structure 24Na+/36Ca2+ (Loughlin et al. 1990; Ruthven andLoughlin 1972) are included for comparison purposes: ( ) Ruthven at 273 K; ( ) Loughlin at 273–275 K.
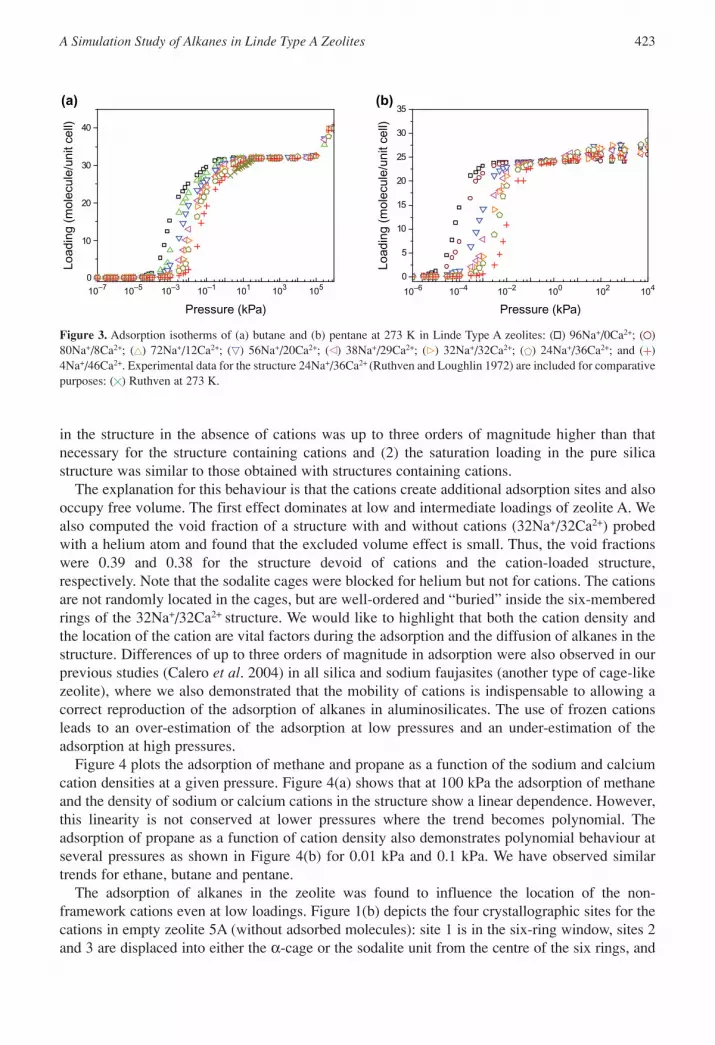
in the structure in the absence of cations was up to three orders of magnitude higher than thatnecessary for the structure containing cations and (2) the saturation loading in the pure silicastructure was similar to those obtained with structures containing cations.
The explanation for this behaviour is that the cations create additional adsorption sites and alsooccupy free volume. The first effect dominates at low and intermediate loadings of zeolite A. Wealso computed the void fraction of a structure with and without cations (32Na+/32Ca2+) probedwith a helium atom and found that the excluded volume effect is small. Thus, the void fractionswere 0.39 and 0.38 for the structure devoid of cations and the cation-loaded structure,respectively. Note that the sodalite cages were blocked for helium but not for cations. The cationsare not randomly located in the cages, but are well-ordered and “buried” inside the six-memberedrings of the 32Na+/32Ca2+ structure. We would like to highlight that both the cation density andthe location of the cation are vital factors during the adsorption and the diffusion of alkanes in thestructure. Differences of up to three orders of magnitude in adsorption were also observed in ourprevious studies (Calero et al. 2004) in all silica and sodium faujasites (another type of cage-likezeolite), where we also demonstrated that the mobility of cations is indispensable to allowing acorrect reproduction of the adsorption of alkanes in aluminosilicates. The use of frozen cationsleads to an over-estimation of the adsorption at low pressures and an under-estimation of theadsorption at high pressures.
Figure 4 plots the adsorption of methane and propane as a function of the sodium and calciumcation densities at a given pressure. Figure 4(a) shows that at 100 kPa the adsorption of methaneand the density of sodium or calcium cations in the structure show a linear dependence. However,this linearity is not conserved at lower pressures where the trend becomes polynomial. Theadsorption of propane as a function of cation density also demonstrates polynomial behaviour atseveral pressures as shown in Figure 4(b) for 0.01 kPa and 0.1 kPa. We have observed similartrends for ethane, butane and pentane.
The adsorption of alkanes in the zeolite was found to influence the location of the non-framework cations even at low loadings. Figure 1(b) depicts the four crystallographic sites for thecations in empty zeolite 5A (without adsorbed molecules): site 1 is in the six-ring window, sites 2and 3 are displaced into either the α-cage or the sodalite unit from the centre of the six rings, and
A Simulation Study of Alkanes in Linde Type A Zeolites 423
10010–210–4 102 10410–6
(a) (b)
Load
ing
(mol
ecul
e/un
it ce
ll)
Load
ing
(mol
ecul
e/un
it ce
ll)
Pressure (kPa)
10110–110–3 103 10510–510–7
Pressure (kPa)
0
10
20
30
40
0
5
10
15
20
25
30
35
Figure 3. Adsorption isotherms of (a) butane and (b) pentane at 273 K in Linde Type A zeolites: ( ) 96Na+/0Ca2+; ( )80Na+/8Ca2+; ( ) 72Na+/12Ca2+; ( ) 56Na+/20Ca2+; ( ) 38Na+/29Ca2+; ( ) 32Na+/32Ca2+; ( ) 24Na+/36Ca2+; and ( )4Na+/46Ca2+. Experimental data for the structure 24Na+/36Ca2+ (Ruthven and Loughlin 1972) are included for comparativepurposes: ( ) Ruthven at 273 K.

site 4 is in the eight-ring window. Crystallographic studies indicate that the cations in zeolite 5Aare only near to the six-ring windows (sites 1, 2 and 3) and not to the eight-ring window (Pluth andSmith 1983). This is in agreement with our simulations that yield occupations of 87.7% (site 1),3.3% (site 2) and 9% (site 3). Figure 5 shows some snapshots of pentane in 48Na+/24Ca2+ zeolite5A taken from our simulations at 1, 103 and 106 kPa. The presence of alkanes in the zeoliteincreases the number of positions where the cations can be located (undefined sites) and even verysmall amount of alkanes have a pronounced effect on the location of the cations. Hence, cationoccupations during the adsorption of pentane in 48Na+/24Ca2+ zeolite 5A zeolite are 48.6% (site 1),20.8% (site 3) and 30.6% (undefined sites) for 1 kPa, 79.1% (site 1), 8.3% (site 3) and 12.5%(undefined sites) for 103 kPa, and 80.2% (site 1), 14.3% (site 3) and 5.5% (undefined sites) for 106 kPa.
The adsorption isotherms of methane, ethane, propane, butane and pentane have also beencompared, and the resulting simulation data for 48Na+/24Ca2+ 5A zeolite are shown in Figure 6.Adsorption of two molecules per α-cage (16 molecules/unit cell) requires a pressure of 0.002 kPafor pentane, 0.01 kPa for butane, 0.05 kPa for propane, 2 kPa for ethane and 50 kPa for methane,At around 103 kPa, every α-cage adsorbs on average 3, 4, 5, 6 and 7 molecules of C5, C4, C3, C2and C1, respectively.
The diffusion coefficients of methane have been computed from the slope of the mean-squareddisplacement at long times in silica, LTA 5A (32Na+/32Ca2+) and LTA 4A (96Na+/0Ca2+). The96 molecules of methane per unit cell at 500 K and the cations in zeolites 5A and 4A wereconsidered as being initially located in the crystallographic positions (Pluth and Smith 1980,1983). The computed values for the diffusion coefficients were 2.9 × 10⁻¹¹ m2/s for the pure silicastructure, 2.4 × 10⁻¹¹ m2/s for 32Na+/32Ca2+ zeolite 5A and ca. 3 × 10–14 m2/s for 96Na+/0Ca2+
zeolite 4A. Diffusion coefficients are much lower in zeolite 4A than in 5A due to the distributionof the cations. Diffusive hopping processes take place through the eight-ringed windows. Inzeolite 5A none of the windows are blocked by a cation, with a free diameter for the window of5 Å. Zeolite 4A contains 12 sodium cations per α-cage and all the windows are occupied with acation, reducing the effective size to 4 Å. To show the influence of the cations, we performedadditional simulations by placing the sodium and calcium cations at random starting positionsin the 32Na+/32Ca2+ zeolite 5A. These simulations provided a diffusion coefficient of
424 A. Garcia-Sánchez et al./Adsorption Science & Technology Vol. 25 No. 6 2007
10 20 30 40 50 60 70 80 9010
15
20
25
30
35
40
4545 40 35 30 25 20 15 10 5 0
Met
hane
load
ing
(mol
ecul
e/un
it ce
ll)
Pro
pane
load
ing
(mol
ecul
e/un
it ce
ll)
10 20 30 40 50 60 70 80 90
10
15
20
25
30
3545 40 35 30 25 20 15 10 5 0
5
0
Ca2+ cations/unit cell
Na+ cations/unit cell Na+ cations/unit cell
Ca2+ cations/unit cell
Figure 4. Amount of alkane adsorbed as a function of the sodium and calcium ion densities: (a) methane at 102 kPa, (b) propane at 10–2 kPa (×) and 10–1 kPa ( ).

A Simulation Study of Alkanes in Linde Type A Zeolites 425
(a) (b)
(c)
Figure 5. Snapshots of the adsorption of pentane in 48Na+/24Ca2+ 5A zeolite at 273 K and (a) 1 kPa, (b) 103 kPa and 106 kPa.
0
10
20
30
40
50
60
70
80
10010–110–4 10–3 10–210–5 102101 103 104 10510–6
Load
ing
(mol
ecul
e/un
it ce
ll)
Pressure, P (kPa)
Figure 6. Adsorption isotherms of ( ) methane, ( ) ethane, ( ) propane, ( ) butane and ( ) pentane in 48Na+/24Ca2+
5A zeolite at 273 K.

1.1 × 10⁻¹¹ m2/s, which is a clear indication that part of the windows were blocked by the randomlylocated cations.
4. CONCLUSIONS
We have performed a computational study of the effect of exchanged sodium and calcium cationson the adsorption and diffusion of alkanes in Linde Type A zeolites. We have demonstrated thatthe density and the location of cations induce marked variations in the alkane adsorptionproperties, and also that the adsorption of alkanes in the zeolite induces re-locations of the cationsin the structure even at low loadings. During adsorption, the increase in the number of exchangedcations leads to higher loadings at low pressures and to lower loadings at high pressures. Diffusionis mostly influenced by the spatial distribution of the cation. It is slower in LTA zeolite 4A than inLTA zeolite 5A since the eight-ringed windows are partially blocked in the former and unoccupiedin the later.
ACKNOWLEDGEMENTS
This work is supported by the Spanish “Ministerio de Educación y Ciencia” (CTQ2007-63229/BQU) and the National Science Foundation (CTS-0507013). The authors gratefullyacknowledge the computer resources, technical expertise and assistance provided by theBarcelona Supercomputing Centre — Centro Nacional de Supercomputación. E. García-Pérez,and A. García-Sanchez wish to thank the MEC and the Netherlands Foundation for FundamentalResearch (NWO-CW) for their pre-doctoral fellowships. The authors wish to thank J.M. vanBaten for his useful scripts.
REFERENCES
Bates, S.P., van Well, W.J.M., van Santen, R.A. and Smit, B. (1996) J. Am. Chem. Soc. 118, 6753.Beerdsen, E., Dubbeldam, D. and Smit, B. (2006a) J. Phys. Chem. B 110, 22 754.Beerdsen, E., Dubbeldam, D. and Smit, B. (2006b) Phys. Rev. Lett. 96, 44 501.Beerdsen, E., Smit, B. and Dubbeldam, D. (2004) Phys. Rev. Lett. 93, 248 301.Bezus, A.G., Kiselev, A.V., Lopatkin, A.A. and Du, P.Q. (1978) J. Chem. Soc., Faraday Trans. II 74, 367.Breck, D.W., Eversole, W.G., Milton, R.M., Reed, T.B. and Thomas, T.L. (1956) J. Am. Chem. Soc. 78, 5963.Calero, S., Dubbeldam, D., Krishna, R., Smit, B., Vlugt, T.J.H., Denayer, J.F.M., Martens, J.A. and Maesen,
T.L.M. (2004) J. Am. Chem. Soc. 126, 11377.Chen, N.Y., Garwood, W.E. and Dwyer, F.G. (1996) Shape Selective Catalysis in Industrial Applications,
Marcel Dekker, New York.Corma, A., Rey, F., Rius, J., Sabater, M.J. and Valencia, S. (2004) Nature (London) 431, 287.Daems, I., Baron, G.V., Punnathanam, S., Snurr, R.Q. and Denayer, J.F.M. (2007) J. Phys. Chem. C 111, 2191.Dubbeldam, D. and Smit, B. (2003) J. Phys. Chem. B 107, 12 138.Dubbeldam, D., Beerdsen, E., Calero, S. and Smit, B. (2005a) Proc. Nat. Acad. Sci. U.S.A. 102, 12 317.Dubbeldam, D., Beerdsen, E., Calero, S. and Smit, B. (2006) J. Phys. Chem. B 110, 3164.Dubbeldam, D., Beerdsen, E., Vlugt, T.J.H. and Smit, B. (2005b) J. Chem. Phys. 122, 224 712.Dubbeldam, D., Calero, S., Vlugt, T.J.H., Krishna, R., Maesen, T.L.M., Beerdsen, E. and Smit, B. (2004a)
Phys. Rev. Lett. 93, 088 302.
426 A. Garcia-Sánchez et al./Adsorption Science & Technology Vol. 25 No. 6 2007
Dubbeldam, D., Calero, S., Vlugt, T.J.H., Krishna, R., Maesen, T.L.M. and Smit, B. (2004b) J. Phys. Chem. B108, 12 301.
Firor, R.L. and Seff, K. (1978) J. Am. Chem. Soc. 100, 3091.Frenkel, D. and Smit, B. (2002) Understanding Molecular Simulations: From Algorithms to Applications,
Academic Press, San Diego, CA, U.S.A.Fritzsche, S., Haberlandt, R. and Wolfsberg, M. (2000) Chem. Phys. 253, 283.Fritzsche, S., Gaub, M., Haberlandt, R. and Hofmann, G. (1996) J. Mol. Model. 2, 286.Fritzsche, S., Haberlandt, R., Karger, J., Pfeifer, H. and Waldherrteschner, M. (1994) Stud. Surf. Sci. Catal.
84, 2139.Fritzsche, S., Wolfsberg, M., Haberlandt, R., Demontis, P., Suffritti, G.B. and Tilocca, A. (1998) Chem. Phys.
Lett. 296, 253.García-Pérez, E., Dubbeldam, D., Maesen, T.L.M. and Calero, S. (2006) J. Phys. Chem. B 110, 23 968.Guisnet, M. and Gilson, J.-P. (2002) Zeolites for Cleaner Technologies, Vol. 3 in Catalytic Science Series,
Imperial College Press, London.Jaramillo, E. and Auerbach, S.M. (1999) J. Phys. Chem. B 103, 9589.Jaramillo, E. and Chandross, M. (2004) J. Phys. Chem. B 108, 20 155.Kiselev, A.V., Lopatkin, A.A. and Shulga, A.A. (1985) Zeolites 5, 261.Loewenstein, W. (1954) Am. Mineral. 39, 92.Loughlin, K.F., Hasanain, M.A. and Abdulrehman, H.B. (1990) Ind. Eng. Chem., Res. 29, 1535.Maesen, T.L.M., Beerdsen, E., Calero, S., Dubbeldam, D. and Smit, B. (2006), J. Catal. 237, 278.Meier, W.M., Olson, D.H. and Baerlocher, C. (1996) Zeolites 17, 1.Pluth, J.J. and Smith, J.V. (1980) J. Am. Chem. Soc. 102, 4704.Pluth, J.J. and Smith, J.V. (1983) J. Am. Chem. Soc. 105, 1192.Reed, T.B. and Breck, D.W. (1956) J. Am. Chem. Soc. 78, 5972.Ruthven, D.M. and Loughlin, K.F. (1972) J. Chem. Soc., Faraday Trans. I 68, 696.Ryckaert, J.P. and Bellemans, A. (1978) Discuss. Faraday Soc. 66, 95.Schuring, A., Auerbach, S.M., Fritzsche, S. and Haberlandt, R. (2002) J. Chem. Phys. 116, 10 890.Schuring, A., Auerbach, S.M., Fritzsche, S. and Haberlandt, R. (2004) Stud. Surf. Sci. Catal. 154, 2110.Tunca, C. and Ford, D.M. (2003) Chem. Eng. Sci. 58, 3373.Vlugt, T.J.H. and Schenk, M. (2002) J. Phys. Chem. B 106, 12 757.Vlugt, R.J.H., Krishna, R. and Smit, B. (1999) J. Phys. Chem. B 103, 1102.
A Simulation Study of Alkanes in Linde Type A Zeolites 427


![Site-selective fragmentation in core-excited bromo-chloro-alkanes [Br(CH2)nCl]](https://img.dokumen.tips/doc/110x75/635abf55cbcde0bb73071572/site-selective-fragmentation-in-core-excited-bromo-chloro-alkanes-brch2ncl.jpg)


