Embed Size (px)
Citation preview

Environ Monit Assess (2011) 181:335–345DOI 10.1007/s10661-010-1832-6
A regional inventory and monitoring setup to evaluatebark peeling damage by red deer (Cervus elaphus)in coniferous plantations in Southern Belgium
Thibaut Gheysen · Yves Brostaux ·Jacques Hébert · Gauthier Ligot ·Jacques Rondeux · Philippe Lejeune
Received: 18 June 2010 / Accepted: 2 December 2010 / Published online: 29 December 2010© Springer Science+Business Media B.V. 2010
Abstract Bark peeling by red deer (Cervuselaphus L.) has become a serious issue for pro-ductive forests in western Europe. The damage isparticularly severe on species such as spruce, asthese become vulnerable to fungus attacks thatresult in considerably depreciated timber. Thisarticle presents a monitoring setup for recent barkpeeling damage in spruce plantings in Wallonia(southern part of Belgium). This setup implies tocollect data annually from a survey involving clus-ter sampling. It has been employed since 2004 inconiferous stands amounting to 165,000 ha of land,where Norway spruce is the predominant species.The study area was divided into blocks delineatedalong features preventing deer migrations. A setof indicators was computed either at the wholestudy area level or at block level. The resultingset of indicators enabled forest managers to fol-low up debarking intensity in productive forests.Additional analyses were carried out in order toassess the relationship between the social positionof trees in the stand and the debarking probabilityon the one hand, and the relationship between thevariation in damage magnitude and seasonality,namely summer versus winter, on the other hand.
T. Gheysen · Y. Brostaux · J. Hébert · G. Ligot ·J. Rondeux · P. Lejeune (B)Gembloux Agro-Bio Tech, University of Liege,Passage des Déportés 2, 5030 Gembloux, Belgiume-mail: [email protected]
Keywords Deer · Bark peeling · Inventory ·Norway spruce · Wallonia
Introduction
Bark peeling by red deer (Cervus elaphus L.) inconiferous stands is a serious problem in manyEuropean forests managed for production pur-poses (Reimoser 2003; Verheyden et al. 2006).The adverse impacts of bark peeling in thoseplantations are described abundantly in the lit-erature (Gill 1992a; Putman and Moore 1998).Wood decay is caused by fungi developing intree trunks, sometimes over a length of severalmeters, and it induces a severe loss in timbervalue (Gironpaire and Ballon 1992; Vasiliauskas2001; Cermák et al. 2004; Welch and Scott 2008).However, the vulnerability of tree species tofungi development varies widely, and Norwayspruce (Picea abies (L.) Karst) stands among themost sensitive species (Gill 1992b; Gironpaire andBallon 1992; Welch et al. 1997; Vospernik 2006).Most national or regional forest inventories in-clude observatory schemes for bark peeling bylarge mammals (Rondeux and Lecomte 1997;Ministry of environnent of the Czech Republic2009; Stierlin et al. 1994; Vospernik 2006). Thestatistics obtained from these schemes outline ma-jor trends but cannot serve as basis for monitor-ing damage dynamics accurately, mainly because

336 Environ Monit Assess (2011) 181:335–345
of the inadequate sampling design (low samplingrate and frequency). Consequently, such statisticsare of limited interest for managing game.
Specific assessment methods have been tailoredto these types of damage in several Europeancountries, such as in Germany, where a wide rangeof methodologies have been employed (Simonand Petrak 1998; Trisl et al. 1999; Schmitz et al.2006; Moog 2008). All these methodologies in-volve surveying recent bark peeling through ob-servations from sampling schemes and comparingbark peeling intensity with a minimum thresholdvalue. The sampling plots used in these method-ologies differ in terms of shape (e.g. linear orcircular sampling units) and design (e.g. randomor semi-oriented sampling grid).
For instance, the British State Forest Authorityadvocates an approach involving sampling at com-partment level (Pepper 1998). They use samplingplots with a fixed number of trees (e.g., the stems),set up at regular intervals along parallel lines.The intervals depend on the degree of accuracyexpected and the compartment area. The result-ing interpretation mainly consists in comparingthe number of trees suffering from recent barkpeeling damage with the total number of trees inthe stand (Rennolls et al. 1984). Although alsobased upon a sampling scheme—either plots orzigzag lines following the planting pattern—theapproach developed in France to assess bark peel-ing magnitude differs slightly (Hamard and Ballon2003). Indeed, it compares the numbers of healthystems, i.e., damage-free or showing minor damageonly, with the numbers of stems pre-determinedby silvicultural standards. This scheme was setup between 1999 and 2001 in five departments,namely Landes, Oise, Sarthe, Tarn, and Vosgesby the National Observatory for damage causedby red deer in forest areas. The pursued objectivewas to assess the effect of different game manage-ment practices in France. For each department,homogeneous areas—in terms of forest cover anddeer distribution—were identified, inside which10 to 20 plots prone to bark peeling were sur-veyed.
This article presents a method to assess reddeer pressure on forest ecosystem, which is basedon estimates of annual bark peeling intensityin coniferous stands. Only Norway spruce and
Douglas fir plantations, which together accountfor over 90% of coniferous forests in the area,are addressed in this study. This approach is un-precedented since it uses a sampling surveyingscheme implemented annually by the local StateForest Service. Moreover, the method descriptionis supported by a set of results derived from obser-vations and measures made from 2004 until 2008.
The lessons learned in the course of this 5-yearpilot phase allow us both to refine the approachand to suggest some recommendations useful toforest managers.
Study area
Wallonia covers the southern part of Belgiumand is 17,500 km2 in area. Forest covers 32% ofWallonia, and forested areas can even reach upto 50% in certain provinces. The Wallonia for-est consists of almost even shares of deciduousstands (53.4%) and coniferous stands (46.6%),the latter being mostly composed of even-agedspruce stands (73.2%). The regional forest in-ventory indicates that 28.9% of coniferous standssuffer from bark peeling damage with a meanproportion of damaged stems of 35.8% (Rondeuxand Lecomte 1997).
Noticeably, the game population—the red deerone in particular—has steadily increased over thelast 15 years (Licoppe 2006). However, this trendis based on rough estimates of unknown accuracy.
Methodology
Sampling methodology
The sampling methodology used to assess barkpeeling damage is inspired from the methodologydeveloped in Germany by Trisl et al. (1999). Itis based upon a segmented cluster sampling witha grid of 200 m × 200 m. Within this grid, first-degree plots located in so-called sensitive standsare identified (see below). Each unit consists ofthree sub-plots oriented south–north and located20 m apart. Within each sub-plot, observations aremade on the six trees closest to the plot centre.The maximum radius of sub-plots is set at 10 m,
Environ Monit Assess (2011) 181:335–345 337
and the total number of trees in a sampling plot istherefore lower or equal to 18.
The concept of sensitive stands relates to even-aged spruce or Douglas fir stands. Spruce standsare particularly vulnerable between 8 and 30 ofage while Douglas fir stands are particularly vul-nerable between 8 and 36 years old. These ageranges were obtained from field investigationscarried out in the course of the methodology test-ing phase (Rondeux et al. 2000). The rationalefor defining sensitive development stages is to fo-cus sampling efforts on the most sensitive stands.However, it also restricts the validity of the resultsto these particular conditions. Concretely, the listof sampling plots was updated annually using aGIS to combine the stand maps provided by theState Forest Service with the sampling grid layer.This scheme is thus semi-permanent. As a result,a sampling plot was observed annually as long asthe stand where this plot was located was reportedas sensitive to bark peeling.
Data were collected between mid-April andmid-May. This time window proved useful to con-trast recent bark peeling damage, i.e., caused overthe last 12 months, to that caused over the previ-ous season (Lejeune et al. 2002).
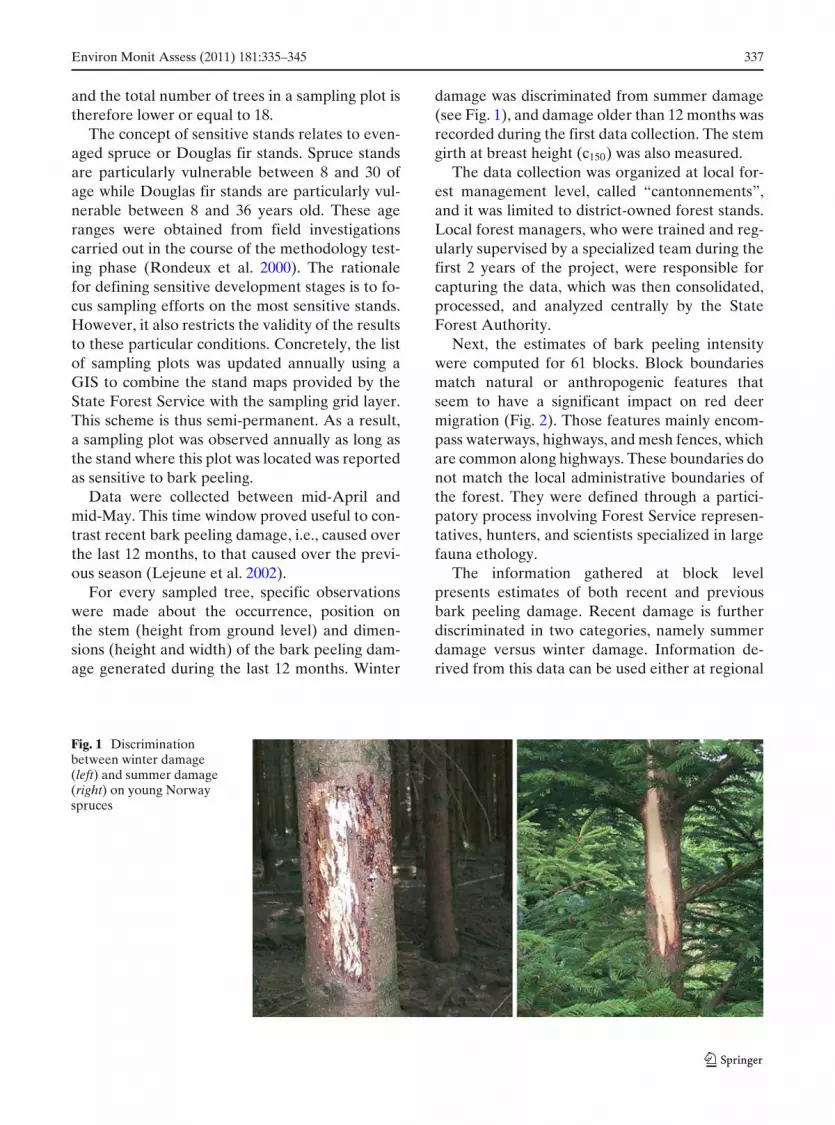
For every sampled tree, specific observationswere made about the occurrence, position onthe stem (height from ground level) and dimen-sions (height and width) of the bark peeling dam-age generated during the last 12 months. Winter
damage was discriminated from summer damage(see Fig. 1), and damage older than 12 months wasrecorded during the first data collection. The stemgirth at breast height (c150) was also measured.
The data collection was organized at local for-est management level, called “cantonnements”,and it was limited to district-owned forest stands.Local forest managers, who were trained and reg-ularly supervised by a specialized team during thefirst 2 years of the project, were responsible forcapturing the data, which was then consolidated,processed, and analyzed centrally by the StateForest Authority.
Next, the estimates of bark peeling intensitywere computed for 61 blocks. Block boundariesmatch natural or anthropogenic features thatseem to have a significant impact on red deermigration (Fig. 2). Those features mainly encom-pass waterways, highways, and mesh fences, whichare common along highways. These boundaries donot match the local administrative boundaries ofthe forest. They were defined through a partici-patory process involving Forest Service represen-tatives, hunters, and scientists specialized in largefauna ethology.
The information gathered at block levelpresents estimates of both recent and previousbark peeling damage. Recent damage is furtherdiscriminated in two categories, namely summerdamage versus winter damage. Information de-rived from this data can be used either at regional
Fig. 1 Discriminationbetween winter damage(left) and summer damage(right) on young Norwayspruces

338 Environ Monit Assess (2011) 181:335–345
Fig. 2 Delineation of the study area into 61 blocks based on natural or anthropogenic features that seem to have a significantimpact on red deer movement
Environ Monit Assess (2011) 181:335–345 339
or at block level, assuming that the latter levelrelates to blocks with a high-enough number ofsampling plots. The minimum number of samplingplots per block has been fixed to 50 in orderto obtain accurate estimates that are significantlydifferent from zero.
Recent bark peeling rate and sampling error
The general expression of recent bark peeling rate(RBPR) is the ratio of damaged trees to the totalnumber of sampled trees Eq. 1. Different RBPRcan be computed depending on the definition ofthe damage type under investigation (recent dam-age, winter damage, summer damage).
p =
n∑
i=1yi
n∑
i=1mi
(1)
Where p is the estimate rate of barked-strippedtrees, n is the number of clusters, yi is the num-ber of trees showing damage of a given category(recent damage, winter damage, summer dam-age), mi is the number of trees under observationin the ith cluster.
Then, sampling errors are computed with theapproximation of the variance estimate σ 2
p sug-gested by Trisl et al. (1999) Eq. 2.
σ 2p ≈
⎛
⎜⎜⎜⎝
(1−f)
n(
1n
n∑
i=1mi
)2
n∑
i=1y 2
i −2pn∑
i=1mi.yi+p2
n∑
i=1m 2
i
(n − 1)
⎞
⎟⎟⎟⎠
1/2
(2)
Where f is the sampling rate.
Secondary indicators
Bark peeling rate increment
We also estimated the ratio of recent damagerate to the total damage rate (recent damage +previous damage; Eq. 3) because this measure is
particularly useful to highlight new cases of heavydebarking or cases of increasing debarking bydeer and related impacts on the forest ecosystem.
BPRI = RBPRTBPR
=
n∑
i=1yi
n∑
i=1mi
n∑
i=1yti
n∑
i=1mi
(3)
Where BPRI is the bark peeling rate increment,RBPR is the recent bark peeling rate, TBPR is thetotal bark peeling rate, yti is the number of treeswith recent or older bark peeling, mi the numberof trees in the ith cluster.
One may consider this indicator as a proportionderived from a cluster sampling of variable size yti
and further adapt the previous formula regardingvariance estimates.
σ(BPRI)
≈
⎛
⎜⎜⎜⎝
(1 − f ′)
n′(
1n′
n′∑
i=1yti
)2
n′∑
i=1y 2
i −2 pr
n′∑
i=1yti.yi+ p 2
r
n′∑
i=1yt 2
i
(n′ − 1)
⎞
⎟⎟⎟⎠
1/2
(4)
Where pr is an estimate of BPRI, n′ is the numberof clusters where at least one tree suffers frombark peeling (yti > 0), and f ′ the intensity of thesample based solely on the clusters where damagehas occurred.
Inf luence of the social position of trees on barkpeeling occurrence probability
Measuring individual trees’ stem size at breastheight while setting up sampling plots in the field(2004) enabled us to test the influence of the trees’social position on bark peeling occurrence prob-ability and to identify a preference for stems oflarger dimensions. For this purpose, we comparedthe distribution of a tree social position index inrespect with two groups of trees, namely bark-stripped and bark peeling free. The tree social po-sition index is defined as the quotient of individual

340 Environ Monit Assess (2011) 181:335–345
girth to mean girth in the sampling plot where thetree is located Eq. 5.
creli = c150i
c150(5)
Where
creli is the social position index of tree i;c150i is the girth at breast height of tree i;c150 is the arithmetic mean girth of trees in-
cluded in the sampling plot comprisingtree i.
Both distributions were compared using a t test.Moreover, plots were sorted according to theirmean girth into four classes, and then a similaranalysis was performed.
Damage dimension
The damage dimension is also important to studysince it strongly relates to the probability of fungusto attack bark-stripped trees, causing trunk decay(Gill 1992b; Welch et al. 1988; Gregory 1986). Thevarying damage dimension was studied in relationwith the season when the damage occurred. Thepurpose of this analysis was to verify whethersummer bark peeling by red deer causes largerpieces of bark to be removed than in the winter.
All the statistical tests were performed with theopen source software R version 2.9.0 (R Develop-ment Core Team 2007).
Results
Survey network
Following a testing phase in one local adminis-trative forest unit in 2000–2001 (Lejeune et al.2002), the surveying network was progressively setup in 24 local administrative forest units, whichwere further subdivided into 61 blocks for analysispurposes. Table 1 summarizes the key statisticsregarding these blocks.
Table 1 Key statistics about the size and the forest compo-sition of the blocks delineated inside the study area
Variable Mean Min Max CV (%)
Total area (ha) 8,578.1 1,007.4 33,787.8 78.8Forest rate (%) 58.7 0.7 93.8 35.4Private forest area (%) 33.7 0.0 90.1 66.2Conifers area (ha) 2,711.5 1.1 9,950.5 76.4Sensitive stands (ha) 272.7 12 924 68.0
The year of reference for these statistics is 2007
Recent bark peeling rate
Table 2 gives the mean bark-stripping rate for thewhole study area on the basis of data collectedbetween 2004 and 2008. Regarding local analyses,only blocks including at least 50 sampling plotswere taken into account.
Overall bark peeling rate significantly variedfrom year to year (4.54% in 2006 vs. 1.98% in2007). Local data analyses point out even greatervariations, and annual bark peeling rates mayrange from 0 to 12% depending on place and year!
Figure 3 provides a synoptic summary of re-sults, i.e. overall mean bark peeling rate and asso-ciated confidence intervals per block in 2006. Thisgraph can be used to identify blocks where barkpeeling rate is greater than a given reference rate,i.e., a threshold value beyond which the situationis alarming.
Given today’s state of knowledge, the ForestService has arbitrarily set this threshold at 4%.Alarming situations occur whenever the meanvalues of the bark peeling rate computed for agiven block are greater than 4%. Alternatively,situations are said to be alarming whenever theupper limit of the confidence interval associatedwith this mean rate is greater than 4%, this secondcase being more conservative. For instance, resultsfor year 2006 indicate that the mean bark peelingrate was >4% in 21 of the 39 blocks. This numberwould increase to 24 blocks out of 39 if the upperlimit of the confidence interval was used instead.
Bark peeling rate increment
Analyzing the bark peeling rate increment is a wayto identify blocks where damage had been unim-portant for some time but suddenly became sig-

Environ Monit Assess (2011) 181:335–345 341
Table 2 Evolution of keyindicators pertaining torecent bark peeling rates(total, during winter andsummer period) reportedin the five-year study
Year
2004 2005 2006 2007 2008
Number of sampling units 4,286 4,971 5,214 5,029 7,317Number of observed trees 64,395 74,746 78,598 75,424 70,177Number of surveyed blocks 55 60 61 61 61Number of blocks with n ≥ 50 35 39 41 40 40Total recent bark peeling rate (%) 3.35% 2.60% 4.54% 1.98% 3.47%Total recent damage rate 241.7 261.4 227.9 318.7 257.9
coefficient of variation (%)Recent bark peeling rate for winter 2.74% 2.05% 3.94% 1.46% 2.74%
period (%)Recent bark peeling rate for summer 0.67% 0.59% 0.66% 0.54% 0.79%
period (%)Total bark peeling rate: maximum value 9.57% 7.82% 12.62% 7.51% 12.27%
at block level (%)Recent bark peeling rate for winter period: 7.10% 6.84% 9.17% 4.73% 9.01%
maximum value at block level (%)Recent bark peeling rate for summer period: 3.26% 3.11% 4.32% 3.42% 4.54%
maximum value at block level (%)
nificant and acute. For instance, block #14 showeda BPRI of 48% in 2008, which means that vir-tually half the trees belonging to sensitive standshad been damaged in the 2007–2008 season (seeFig. 4).
Bark peeling—tree social position
Generally the “healthy trees” (n0 = 49,210) and“damaged trees” (n1 = 3,297) groups present
significantly different (p = 0.052) mean valuesof crel, although this difference is slight (crel0 =1.001, crel1 = 0.991). If one organizes the data asper mean tree stem size (c150), one can observethe phenomenon dynamics (Fig. 5): In youngstands (c150 < 20 cm), bark-stripped trees showa crel greater than the crel for healthy trees (p =0.00). In the stem size class where 20 cm ≤ c150 <
40 cm, no significant difference is observed (p =0.418). The trend then reverses itself in the case of
Fig. 3 Results per blockin 2006: mean recentbark peeling rate andconfidence interval

342 Environ Monit Assess (2011) 181:335–345
Fig. 4 Bark peeling rateincrement by block for2008 (dots representestimated BPRI whilevertical line segmentsrepresent confidenceinterval where1 − α = 95%)
Fig. 5 Boxplot showingcrel in relation to absenceversus presence ofdamage (0 vs 1) andmean tree stem size inthe stand (c150 in cm)
Fig. 6 Boxplot for width(in cm) and length (in cm)of bark peeling damagedisplayed by season(winter vs. summer).The p values correspondto t test

Environ Monit Assess (2011) 181:335–345 343
bigger trees, with a clearer discrimination between“healthy trees” and “bark-stripped trees” (p =0.023 and p = 0.00, respectively, for both stem sizeclasses where 40 cm ≤ c150 < 60 cm and 60 cm≤ c150).
In young stands (0–19 cm) with trees of smalldimensions, deer tend to choose the biggest stems.In the case of intermediate stem size categories(20–39 cm), the animals’ choice is random, inother words they do not choose. Beyond 40 cm ingirth, the trend reverses itself, and the deer peeloff smaller trees preferentially as they avoid largertrees, whose bark is less palatable.
Damage dimensions
The dimensions of bark peeling damage (widthand length) were studied on 10,298 trees ob-served between 2004 and 2007. When consider-ing these dimensions, seasonal differences, i.e.,the dimensions of winter damage versus summerdamage, are significant (see Fig. 6). However, thedifference in damage length (xSUMMER = 30.2 cm,xWINTER = 15.6 cm) between seasons is clearlymore important than the difference in damagewidth (xSUMMER = 6.6 cm, xWINTER = 6.3 cm).
Discussion and conclusions
Monitoring bark peeling by red deer in conifer-ous plantations offers two advantages. Firstly, itcovers sensitive stands included in a 560,000 haterritory (with a forest cover of 58.7% of the totalarea). Secondly, it offers an annual data collectionwith a high sampling rate of one plot per 4 ha insensitive stands (±7,300 plots).
Implementing a standardized observatoryscheme provides solid, up-to-date informationand a valuable database that can be used byforest managers. Various indicators with reliablestatistical value can thus be inferred in order toquantify bark peeling damage objectively, at bothregional and block level.
Forest managers can combine this informationwith other data from the Forest Authority—for in-stance, the game population census derived fromnight counting (Casaer and Licoppe 2010) as wellas shooting statistics—for the purpose of assisting
an objective decision-making process aimed atmanaging game hunting.
Nevertheless, this method is not free of weak-nesses. It lacks accuracy, which directly relates toa very high variation in the bark peeling phenom-enon (coefficient of variation >200%) and to thelow sampling intensity, which is mainly dictated bybudget constraints. Consequently, only two blocksout of three could be subject to individual report-ing. One third of the blocks under investigationwere either too small in area or did not includeenough coniferous stands and therefore did notinclude at least 50 sampling plots. In case of blocksincluding too few plots, one could possibly com-bine two consecutive data collection campaignsin order to provide bi-annual estimates of barkpeeling rate.
Another issue lies in the forest ownership: ob-servations are limited to forest that is state-owned.The proportion of private forests inside blocksaverages 33.5% but can reach up to 90%. It isnot clear how representative estimates are as thesilvicultural and game management practices mayvary widely from owner to owner.
Moreover, the quality control of field measure-ment still has to be improved. In the present case,10% to 15% of sampling units should be measuredagain by an independent team of field workers.However this has not been implemented yet andis under discussion with the State Forest Service.
Analyzing the social position of trees sufferingfrom bark peeling leads to expected results. Deerusually damage the largest trees in young stands.This trend fades out as the stand develops, andthe mean tree diameter increases. Eventually, thetrend reverses itself along with an increase inmean stem diameter because coarser and thickerbark tends to become less and less palatable.
Results show that damage caused during sum-mer is bigger than that caused during winter, inparticular the damage length. Shorter winter barkpeeling damage is explained by a stronger adher-ence of bark to the trunk outside the growingvegetation period. Red deer cannot peel off longstrips of bark during winter, thus it rubs the stembark with its front teeth, resulting in damage ofsmaller dimensions. In the case of damage width,the main factor explaining the size of the damageis the morphology of the deer’s jaws. Although

344 Environ Monit Assess (2011) 181:335–345
summer damage has a greater impact on the prop-agation of infectious agents, it is less frequent thanwinter damage (0.79% vs 2.74% for 2008).
Following on this first analysis of results pro-vided by the monitoring setup, we find it interest-ing to identify two development axes:
– An attempt to identify environmental vari-ables presumably impacting bark peeling rate,
– The financial impact of the damage caused toplantations should be valued. Up to now, dam-age rates are considered acceptable as long asthey remain below a certain threshold, whichis determined in a rather arbitrary manner. Inaddition, forest managers need a more consis-tent approach to better interpret the resultsprovided by annual surveys of bark peelingdamage.
On the basis of these results, one may considerthat the Forest Authority ought to maintain themonitoring setup as described in this article. Thisstudy is also an example of genuine collaborationbetween scientists and forest managers to the endof managing soundly large ungulates in multi-purpose forests in Europe.
Acknowledgements This research was funded by theWalloon Region Ministry (“Accord-Cadre Recherche etVulgarisation Forestières”). The authors would also like toacknowledge the reviewers for their constructive remarks.
References
Casaer, J., & Licoppe, A. (2010). Ungulates and their man-agement in Belgium. In M. Apollonio, et al. (Ed.),European ungulates and their management in the 21stcentury (pp. 184–200).
Cermák, P., Glogar, J., & Jankovský, L. (2004). Damageby deer barking and browsing and subsequent rotsin Norway spruce stands of Forest Range Morkov,Forest District Frenštá p.R. (the Beskids ProtectedLandscape Area). Journal of Forest Science, 50(1),24–30.
Gill, R. (1992a). A review of damage by mammals in northtemperate forests: 1. Deer. Forestry, 65(2), 145–169.
Gill, R. (1992b). A review of damage by mammals innorth temperate forests: 3. Impact on trees and forests.Forestry, 65(4), 363–388.
Gironpaire, L., & Ballon, P. (1992). Conséquences del’écorcage du cerf élaphe dans le massif des Vosgesalsaciennes. Revue Forestière Française, 44, 501–511.
Gregory, S. C. (1986). The development of stain inwounded Sitka spruce stems. Forestry, 59(2), 1999–208. doi:10.1093/forestry/59.2.199.
Hamard, J. P., & Ballon, Ph. (2003). Appréciation desdégâts de cervidés en milieu forestier (3ème tranche):Synthèse des résultats. CEMAGREF—Groupementde Nogent: UR “Ecosystèmes Forestiers et Paysages”.
Lejeune, P., Rotheudt, H., & Verrue, V. (2002). Proposi-tion d’une méthode d’inventaire des dégâts frais decervidés applicable en Région wallonne. Forêt Wal-lonne, 60, 4–10.
Licoppe, A. (2006). The diurnal habitat used by red deer(Cervus elaphus L.) in the Haute Ardenne. EuropeanJournal of Wildlife Research, 52, 164–170.
Ministry of environnent of Czech Republic (2009). Fourthnational report of the Czech Republic to the conven-tion on biological diversity (see http://www.cbd.int/doc/world/cz/cz-nr-04-p1-en.pdf).
Moog, M. (2008). Bewertung von Wildschäden imWald. Modelle—Methoden—Bewertung. Neumann-Neudamm, Melsungen. ISBN 978-3-7888-1189-1.
Pepper, H. (1998). Nearest neighbour method for quanti-fying wildlife damage to trees in woodland. ForestryCommission Practice Note, 1. ISSN 1460-3810. ISBN0-85538-371-2.
Putman, R. J., & Moore, N. P. (1998). Impact of deer inlowland Britain on agriculture, forestry and conserva-tion habitats.
R Development Core Team (2007). R: A language andenvironment for statistical computing. R Foundationfor Statistical Computing, Vienna (see http://www.r-project.org/).
Reimoser, F. (2003). Steering the impacts of ungulates ontemperate forests. Journal of Nature Conservation, 10,243–252.
Rennolls, K., Tee, L., Tee, V. & Melville, R. (1984). Anempirical trial of a deer damage assessment method.Forestry, 57(1), 17–33. doi:10.1093/forestry/57.1.17.
Rondeux, J., & Lecomte, H. (1997). Estimation des dégâtsde cervidés en pessière wallonne. Une applicationciblée de l’inventaire régional. Forêt Wallonne, 31, 6–9.
Rondeux, J., Rotheudt, H., & Lejeune, P. (2000).Accord-Cadre—Recherche forestière. Action 1.3.2.Développement de techniques d’inventaire appliquéesaux différentes facettes de la gestion forestière inté-grée. Rapport annuel d’avancement, mai 2000, 1–14.
Schmitz, W., Bücking, M., Moshammer, R., Jochum,M., & Roeder, A. (2006). Einfaches Verfahrenzur Bewertung von Verbissschäden in den Wäldernvon Rheinland-Pfalz-Ein Verfahrensvorschlag für diePraxis. Forst und Holz, 61(5), 182–184.
Simon, O., & Petrak, M. (1998). Methodik der Lin-ientaxation bei der Erhebung von Schälereignissen.Zeitschrift für Jagdwissenschaften, 44(3), 113–200.
Stierlin, H.-R., Brändli, U.-B., Herold, A., & Zinggeler,J. (1994). Schweizerisches Landesforstinventar. An-leitung für di Feldaufnahment des Erhebung 1993–1995. Birmensdorf, Eidgenössische Foprschungsanstaltfur Wald, Schnee und Landschaft, 204 p.
Trisl, O., Wode, L., & Akça, A. (1999). Sechs JahreSchälschadeninventuren im Niedersächsischen

Environ Monit Assess (2011) 181:335–345 345
Forstamt Winnefeld. Forst und Holz, 54(14), 425–428.
Vasiliauskas, R. (2001). Damage to trees due to forestryoperations and its pathological significance in temper-ate forests: A literature review. Forestry, 74(4), 319–336.
Verheyden, H., Ballon, P., Berbard, V., & Saint-Andrieux,C. (2006). Variations in bark-stripping by red deerCervus elaphus across Europe. Mammal Review,36(3), 217–234.
Vospernik, S. (2006). Probability of bark stripping damageby red deer (Cervus elaphus) in Austria. Silva Fennica,40(4), 589–601.
Welch, D., & Scott, D. (2008). An estimate of timberdegrade in Sitka spruce due to bark stripping bydeer in a Scottish plantation. Forestry, 81(4), 489–497.doi:10.1093/forestry/cpn016.
Welch, D., Staines, B., Scott, D., & Catt, D. (1988). Barkstripping damage by red deer in a Sitka spruce for-est in Western Scotland. II. Wound size and position.Forestry, 61(3), 245–254.
Welch, D., Staines, B., Scott, D., & Catt, D. (1997). Barkstripping damage by red deer in a sitka spruce forestin western Scotland. III. Trends in wound condition.Forestry, 70(2), 113–120.


