Embed Size (px)
Citation preview
A Normal-Distribution Based Reputation Model
Ahmad Abdel-Hafez1, Yue Xu1 and Audun Jøsang2
1 Queensland University of Technology, Brisbane, Australia{a.abdelhafez, yue.xu}@qut.edu.au
2 University of Oslo, Oslo, [email protected]
Abstract. Rating systems are used by many websites, which allow cus-tomers to rate available items according to their own experience. Sub-sequently, reputation models are used to aggregate available ratings inorder to generate reputation scores for items. A problem with currentreputation models is that they provide solutions to enhance accuracyof sparse datasets not thinking of their models performance over densedatasets. In this paper, we propose a novel reputation model to generatemore accurate reputation scores for items using any dataset; whetherit is dense or sparse. Our proposed model is described as a weightedaverage method, where the weights are generated using the normal dis-tribution. Experiments show promising results for the proposed modelover state-of-the-art ones on sparse and dense datasets.
Keywords: Reputation Model, Ratings Aggregation, Uncertainty.
1 Introduction
People are increasingly dependent on information online in order to decidewhether to trust a specific object or not. Therefore, reputation systems are anessential part of any e-commerce or product reviews websites, where they pro-vide methods for collecting and aggregating users’ ratings in order to calculatethe overall reputation scores for products, users, or services [1]. The existenceof reputation scores in these websites helps people in making decisions aboutwhether to buy a product, or to use a service, etc. Reputation systems play asignificant role in users’ decision making process.
Many of the existing reputation models did not mention how good they arewith different sparsity datasets, Lauw et.al [2] mentioned that the simple averagemethod would be adequate with dense dataset supported by the law of largenumbers [3]. Other models focused on robustness of the reputation score, i.e., thevalue is not easy to be affected by malicious reviews [4]. In general, the majorityof the recently proposed reputation systems involved other factors, besides theratings, such as the time when the rating was given or the reputation of the userwho gave that rating. Usually, this data is incorporated with ratings as weightsduring the aggregation process, performing the weighted average method. Thesefactors can be easily combined into our proposed methods.
One of the challenges that face any reputation model is its ability to workwith different datasets, sparse or dense ones. Within any dataset some itemsmay have rich rating data, while others, especially new ones, have low numberof ratings. Sparse datasets are the ones that contain higher percentage of itemswhich do not have many ratings or users who didn’t rate many items. However,with the increased popularity of rating systems on the web particularly, sparsedatasets become denser by time as ratings build up on the dataset. Most of thecurrent reputation models did not mentioned if they work well with dense orsparse datasets or both, others focused on sparse dataset only assuming they arethe ones require attention only [2].
On the other hand, most of the existing reputation models don’t considerthe distribution of ratings for an item, which should influence its reputation.In this paper, we propose to consider the frequency of ratings in the ratingaggregation process in order to generate reputation scores. The purpose is toenhance accuracy of reputation scores using any dataset no matter whether itis dense or sparse. The proposed methods are weighted average methods, wherethe weights are assumed to reflect the distribution of ratings in the overall score.An important contribution of this paper is a method to generate the weightsbased on the normal distribution of the ratings. We evaluate the accuracy ofour results using ratings prediction system, and we compare with state-of-the-art methods. Our methods show promising results dealing with any dataset nomatter whether it is dense or sparse.
In the rest of this paper, we will first introduce existing product reputationmodels briefly in Section 2, and then we will explain the proposed methods inSections 3. We will also provide detailed experiments and results evaluation inSection 4 in order to prove the significance of our proposed method. Finally inSection 5 we conclude the paper.
2 Related Works
Reputation systems are used with many objects, such as webpages, products,services, users, and also in peer-to-peer networks, where they reflect what isgenerally said or believed about the target object [5]. Item’s reputation is calcu-lated based on ratings given by many users using a specific aggregation method.Many methods used weighted average as an aggregator for the ratings, where theweight can represent user’s reputation, time when the rating was given, or thedistance between the current reputation score and the received rating. Shapiro[6] proved that time is important in calculating reputation scores; hence, thetime decay factor has been widely used in reputation systems [6–9]. For exam-ple, Leberknight et al. [9] discussed the volatility of online ratings, where theauthors aimed to reflect the current trend of users’ ratings. They used weightedaverage where old ratings have less weight than current ones. On the other hand,Riggs and Wilensky [10] performed collaborative quality filtering, based on theprinciple of finding the most reliable users. One of the baseline methods we usein this paper is proposed by Lauw et al., which is called the Leniency-Aware
Quality (LQ) Model [2]. This model is a weighted average model that uses users’ratings tendency as weights. The authors classified users into lenient or strictusers based on the leniency value which is used as a weight for the user’s ratings.
Another baseline model that we use was introduced by Jøsang and Haller,which is a multinomial Bayesian probability distribution reputation system basedon Dirichlet probability distribution [8]. This model is probably the most relevantmethod to our proposed method because this method also takes into consider-ation the count of ratings. The model introduced in [8] is a generalization totheir previously introduced binomial Beta reputation system [11]. The authorsindicated that Bayesian reputation systems provide a statistically sound basisfor computing reputation scores. This model provides more accurate reputationvalues when the number of ratings per item is small because the uncertainty inthese cases is high. Using fuzzy models are also popular in calculating reputationscores because fuzzy logic provides rules for reasoning with fuzzy measures, suchas trustworthy, which are usually used to describe reputation. Sabater & Sierraproposed REGRET reputation system [12] , which defines a reputation measurethat takes into account the individual dimension, the social dimension and theontological dimension. Bharadwaj and Al-Shamri [13] proposed a fuzzy compu-tational model for trust and reputation. According to them, the reputation of auser is defined as the accuracy of his prediction to other user’s ratings towardsdifferent items. Authors also introduced reliability metric, which represent howreliable is the computed score.
In general, some of the proposed reputation systems compute reputationscores based on the reputation of the user or reviewer, or they normalize theratings by the behavior of the reviewer. Other works suggested adding volatilityfeatures to ratings. According to our knowledge, most of the currently usedaggregating methods in the reputation systems do not reflect the distribution ofratings towards an object. Besides, there are no general methods that are robustwith any dataset and always generate accurate results no matter whether thedataset is dense or sparse, for example, LQ model [2] is good with sparse datasetsonly and Jøsang and Haller model [8] generates more accurate reputation scoresfor items with low frequent ratings.
3 Normal Distribution Based Reputation Model (NDR)
In this section we will introduce a new aggregation method to generate productreputation scores. Before we start explaining the method in details, we wantto present some definitions. First of all, in this paper we use arithmetic meanmethod as the Naıve method. Secondly, the term “rating levels” is used to repre-sent the number of possible rating values that can be assigned to a specific itemby a user. For example, considering the well-known five stars rating system withpossible rating values of {1, 2, 3, 4, 5}, we say that we have five rating levels; onefor each possible rating value.
As mentioned previously, the weighted average is the most currently usedmethod for ratings aggregation, while the weights usually represent the time
when the rating was given, or the reviewer reputation. In the simplest case,where we don’t consider other factors such as time and user credibility, theweight for each rating is 1
n , if there are n ratings to an item. No matter forthe simplest average method or the weighted average methods that take time orother user related factors into consideration, the frequency of each rating levelis not explicitly considered. For example, assume that an item receives a set ofratings < 2, 2, 2, 2, 3, 5, 5 >, for the simplest average method, the weight for eachof the ratings is 1
7 even the rating level 2 has higher frequency than the other tworating levels. For other weighted average methods, the weights are only relatedto time or some user related factors but not rating frequency.
In the following discussion, we will use the Naıve method as an example toexplain the strength of our proposed method since the other factors can be easilycombined into our methods to make the weights related to other factors such astime or user credibility.
Our initial intuition is that rating weights should relate to the frequency ofrating levels, because the frequency represents the popularity of users’ opinionstowards an item. Another important fact that we would like to take into consid-eration in deriving the rating weights is the distribution of ratings. Not losinggenerality, like many “natural” phenomena, we can assume that the ratings fallin normal distribution. Usually the middle rating levels such as 3 in a ratingscale [1− 5] system is the most frequent rating level (we call these rating levels“Popular Rating Levels” ) and 1 and 5 are the least frequent levels (we call theselevels “Rare Rating Levels” ). By taking both the rating frequency and the nor-mal distribution into consideration, we propose to ‘award’ higher frequent ratinglevels, especially popular rating levels, and ‘punish’ lower frequent rating levels,especially rare rating levels.
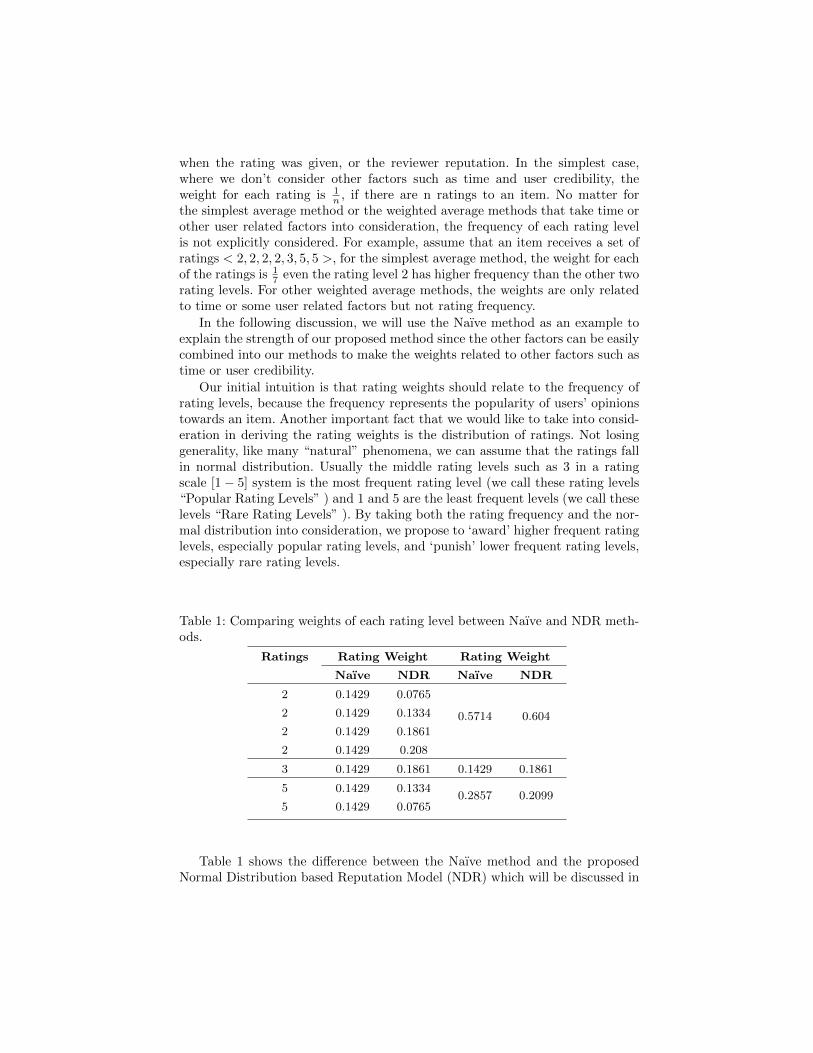
Table 1: Comparing weights of each rating level between Naıve and NDR meth-ods.
Ratings Rating Weight Rating Weight
Naıve NDR Naıve NDR
2 0.1429 0.0765
0.5714 0.6042 0.1429 0.1334
2 0.1429 0.1861
2 0.1429 0.208
3 0.1429 0.1861 0.1429 0.1861
5 0.1429 0.13340.2857 0.2099
5 0.1429 0.0765
Table 1 shows the difference between the Naıve method and the proposedNormal Distribution based Reputation Model (NDR) which will be discussed in
Section 3.1. From the second column in Table 1 (i.e., Weight per rating), we cannotice that using the Naıve method the weight for each rating is fixed whichis 1
7 = 0.1429. Different from the Naıve method, the NDR method generatesdifferent weights for different ratings, especially, the weights from rare ratingssuch as 2 and 5 to popular ratings such as 3 are increase and the increment isnon-linear. This non-linear increase in weights for repeated ratings of the samelevel will result in a higher aggregated weight for that rating level. For example,rating level 2 is the most frequent level, in comparison, the aggregated weightgenerated by the Naıve method for rating level 2 is 0.5714, where the NDR modelgenerates a higher value 0.604 which reflects the contribution from the frequencyof rating level 2. On the other hand, rating level 3 gets a higher weight 0.186 inthe NDR method than the Naıve method which generates a weight value 0.1429,however, this is not because level 3 is more frequent, but because it is a popularrating level. In contrast, rating Level 5 gets a lower weight in the NDR methodbecause it is a rare rating level and not very frequent in this example.
3.1 Weighting Based on a Normal Distribution
Our method can be described as weighted average where the weights are gener-ated based on both rating distribution and rating frequency. As mentioned above,we use a normal distribution because it represents many “natural” phenomena.In our case, it will provide different weights for ratings, where the more frequentthe rating level is, the higher the weight the level will get. In other words, us-ing this weighting method we can assign higher weights to the highly repeatedratings, which we believe will reflect more accurate reputation tendency.
Suppose that we have n ratings for a specific product P , represented as avector RP = {r0, r1, r2, . . . , rn−1} where r0 is the smallest rating and rn is thelargest rating, i.e., r0 ≤ r1 ≤ r2 ≤ . . . ≤ rn−1 . In order to aggregate the ratings,we need to compute the associated weights with each rating, which is also rep-resented as a vector WP = {w0, w1, w2, . . . , wn−1}. As we discussed previously,the weights to the ratings will be calculated using the normal distribution den-sity function given in Equation 1, where ai is the weight for the rating at indexi, i = 0, . . . , n−1, µ is the mean, σ is the standard deviation, and xi is supposedto be the value at index i; the basic idea is to evenly deploy the values between 1and k for the rating scale [1, k] over the indexes from 0 to n−1. k is the numberof levels in the rating system, in this paper we use the popular 5-star system,then k = 5.
ai =1
σ√
2πe−
(xi−µ)2
2σ2 (1)
xi =(k − 1)× in− 1
+ 1 (2)
Equation 2 is used to evenly deploy the values of xi between 1 and k, wherex0 = 1 and xn−1 = k. In Equation 1, the value of the mean is fixed, i.e.,
µ = (k+1)2 . However, the value of is the actual standard deviation value extracted
from the ratings to this item; hence, each item in the dataset will have differentflatness for its normal distribution curve.
The purpose of using such these values for x, µ and σ is to produce normallydistributed weights associated with the k-levels rating system. The generatedweights in Equation 1 is then normalized so the summation of all weights is equalto 1, hence, we create the normalized weights vectorWP = {w0, w1, w2, . . . , wn−1}using Equation 3.
wi =ai∑n−1
j=0 aj, where
n−1∑i=0
wi = 1 (3)
In order to calculate the final reputation score, which is affected by the ratingsand the weights, we need to sum the weights of each level separately. To this end,we partition all ratings into groups based on levels,Rl = {rl0, rl1, rl2, . . . , rl|Rl|−1}, l =
1, 2, . . . , k, for each rating r ∈ Rl, r = l. The set of all ratings to item p isRP =
⋃kl=1R
l. The corresponding weights for the ratings in Rl are representedas W l = {wl
0, wl1, w
l2, . . . , w
l|Rl|−1}
The final reputation score is calculated as weighted average for each ratinglevel using Equation 4, where LW l is called level weight which is calculated inEquation 5
NDRp =
k∑l=1
(l × LW l
)(4)
LW l =
|Rl|−1∑j=0
wlj (5)
Equation 5 calculates level weights LW l as a summation of the weights ofevery rating belonging to that level.
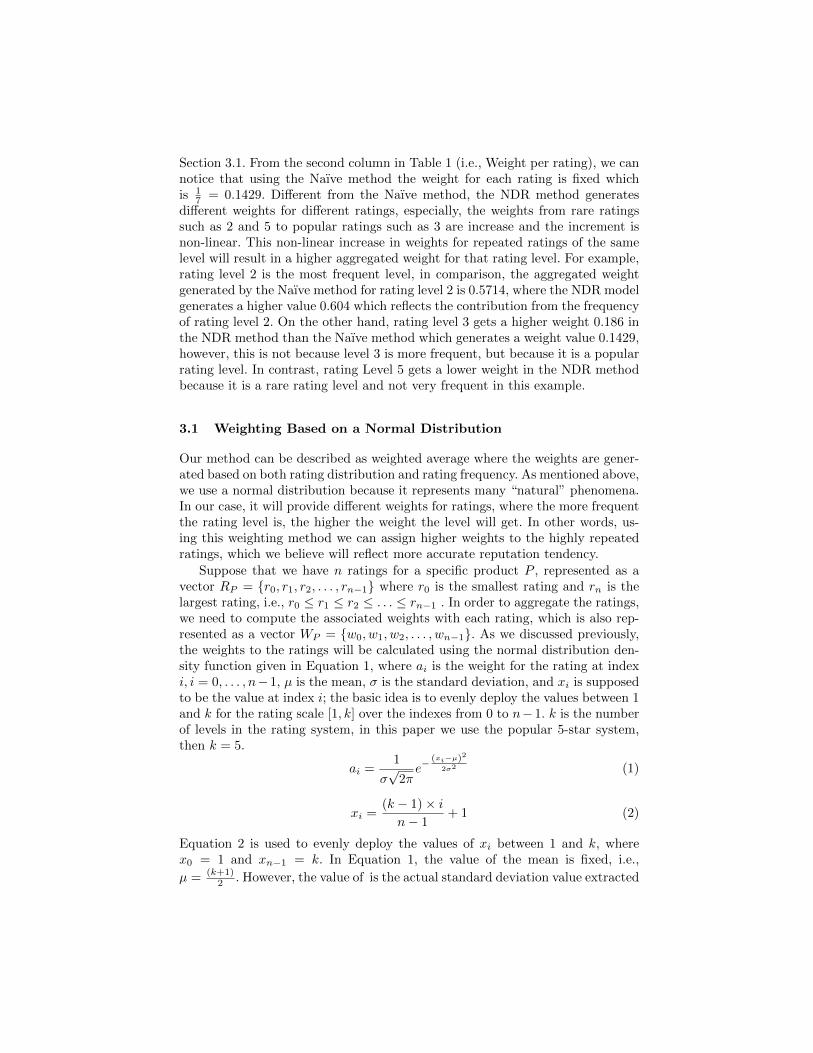
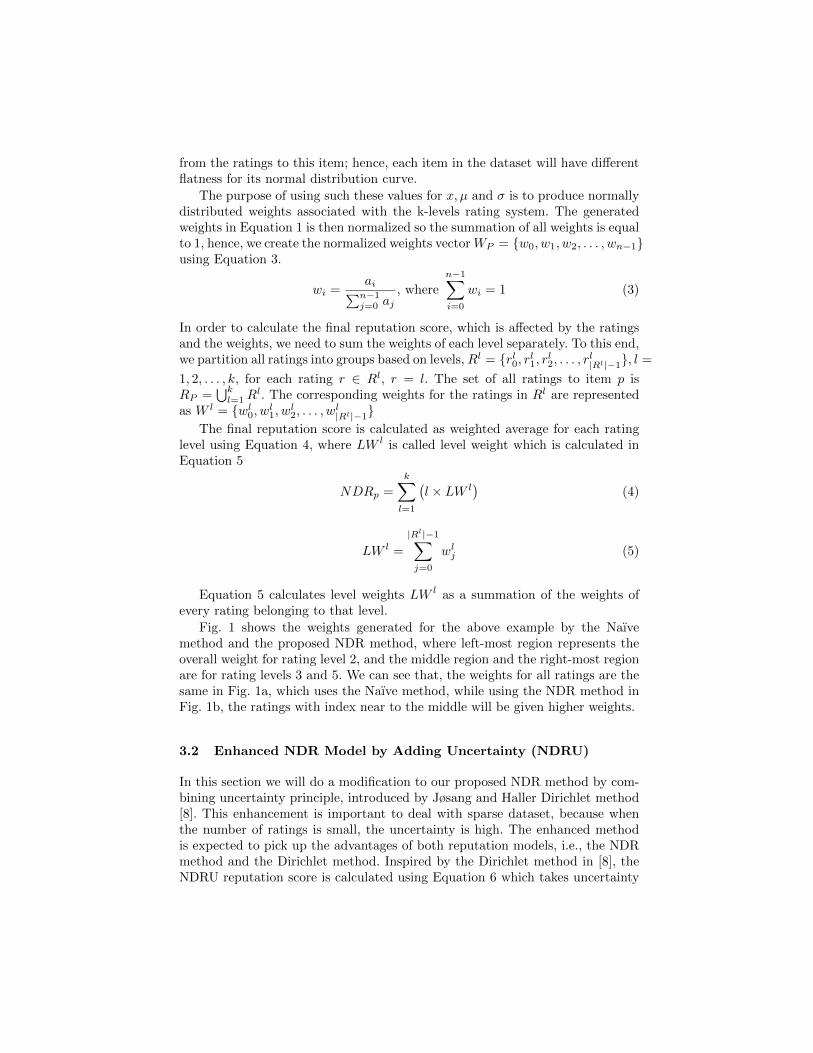
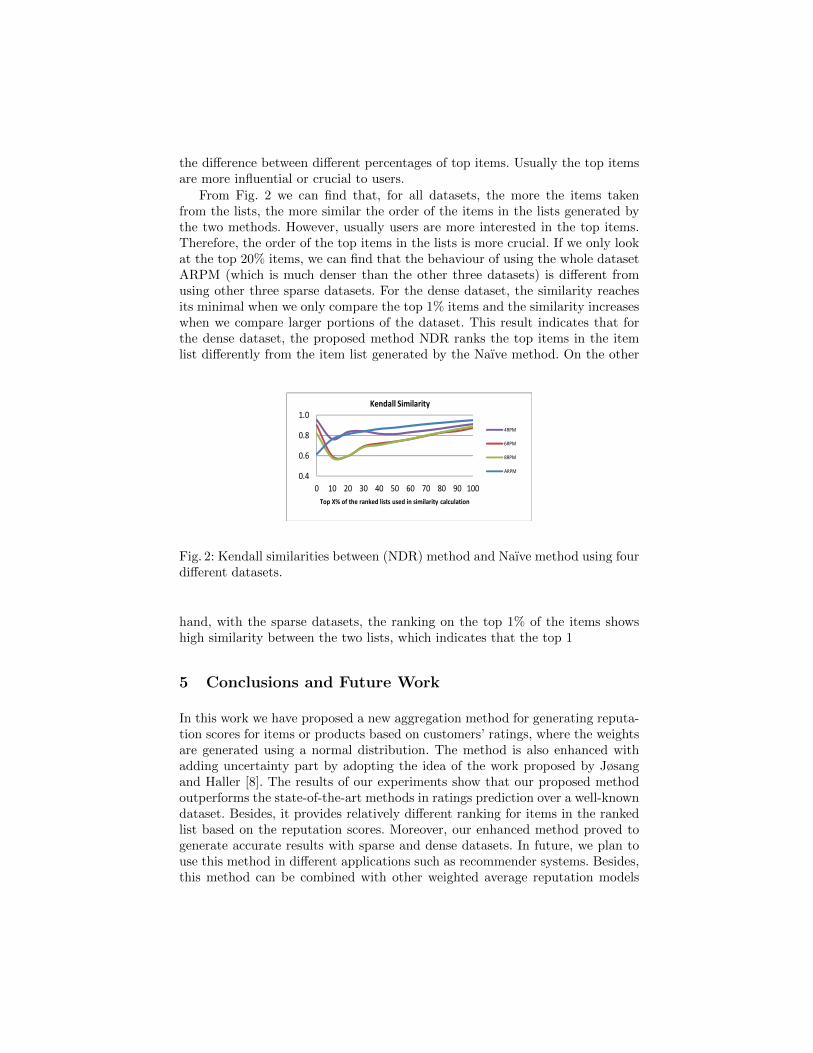
Fig. 1 shows the weights generated for the above example by the Naıvemethod and the proposed NDR method, where left-most region represents theoverall weight for rating level 2, and the middle region and the right-most regionare for rating levels 3 and 5. We can see that, the weights for all ratings are thesame in Fig. 1a, which uses the Naıve method, while using the NDR method inFig. 1b, the ratings with index near to the middle will be given higher weights.
3.2 Enhanced NDR Model by Adding Uncertainty (NDRU)
In this section we will do a modification to our proposed NDR method by com-bining uncertainty principle, introduced by Jøsang and Haller Dirichlet method[8]. This enhancement is important to deal with sparse dataset, because whenthe number of ratings is small, the uncertainty is high. The enhanced methodis expected to pick up the advantages of both reputation models, i.e., the NDRmethod and the Dirichlet method. Inspired by the Dirichlet method in [8], theNDRU reputation score is calculated using Equation 6 which takes uncertainty
(a) Average method weights for the 7ratings example.
(b) NDR normalised weights for the 7 rat-ings example.
Fig. 1: Weights generated using Naıve and NDR methods
into consideration:
NDRUp1 =
k∑l=1
(l ×(n× LW l + C × b
C + n
))(6)
C is a priori constant which is set to 2 in our experiments, and b = 1k is a
base rate for any of the k rating values.The NDRU method will reduce the effect of praising popular rating levels
and depreciating rare rating levels process done by the NDR model. We cansay that in all cases if the NDR method provides higher reputation scores thanthe Naıve method, then the NDRU method will also provide higher reputationscores but marginally less than the NDR ones and vice versa. However, as wehave mentioned before, in the case of having a small number of ratings peritem, the uncertainty will be higher because the base rate b is divided by thenumber of ratings plus a priori constant n + C in Equation 6. In this case, thedifference between the final reputation scores of the NDR and NDRU methodsis noticeable. This advantage of the Dirichlet method to deal with sparse data isadopted by the NDRU method. Yet, when we use dense dataset, the differencebetween the final reputation scores of the NDR and NDRU methods will be verysmall, which allow the NDRU to behave similarly to the NDR method.
4 Experiment
In the beginning we want to say that there are no globally acknowledged eval-uation methods that appraise the accuracy of reputation models. However, wechoose to assess the proposed model in regards to the accuracy of the gener-ated reputation scores, and how the items are ranked. Hence, we conducted twoexperiments in this research. The first experiment is to predict an item ratingusing the item reputation score generated by reputation models. The hypothesisis that the more accurate the reputation model the closer the scores it generatesto actual users’ ratings. For one item, we will use the same reputation score to
predict the item’s rating for different users. The second experiment is to provethat the proposed method produces different results than the Naıve method interms of the final ranked list of items based on the item reputations. If the orderof the items in the two ranked lists generated by the Naıve and NDR methodsis not the same, we say that our method is significant.
4.1 Datasets
The dataset used in this experiment is the MovieLens dataset obtained fromwww.grouplens.org, which is publicly available and widely used in the area ofrecommender systems. The dataset contains about one million anonymous rat-ings of approximately 3,706 movies. In this dataset each user has evaluated atleast 20 movies, and each movie is evaluated by at least 1 user. In our experimentwe split the dataset into training and testing datasets with 80% of the users usedto build the training dataset and the rest are used for testing.
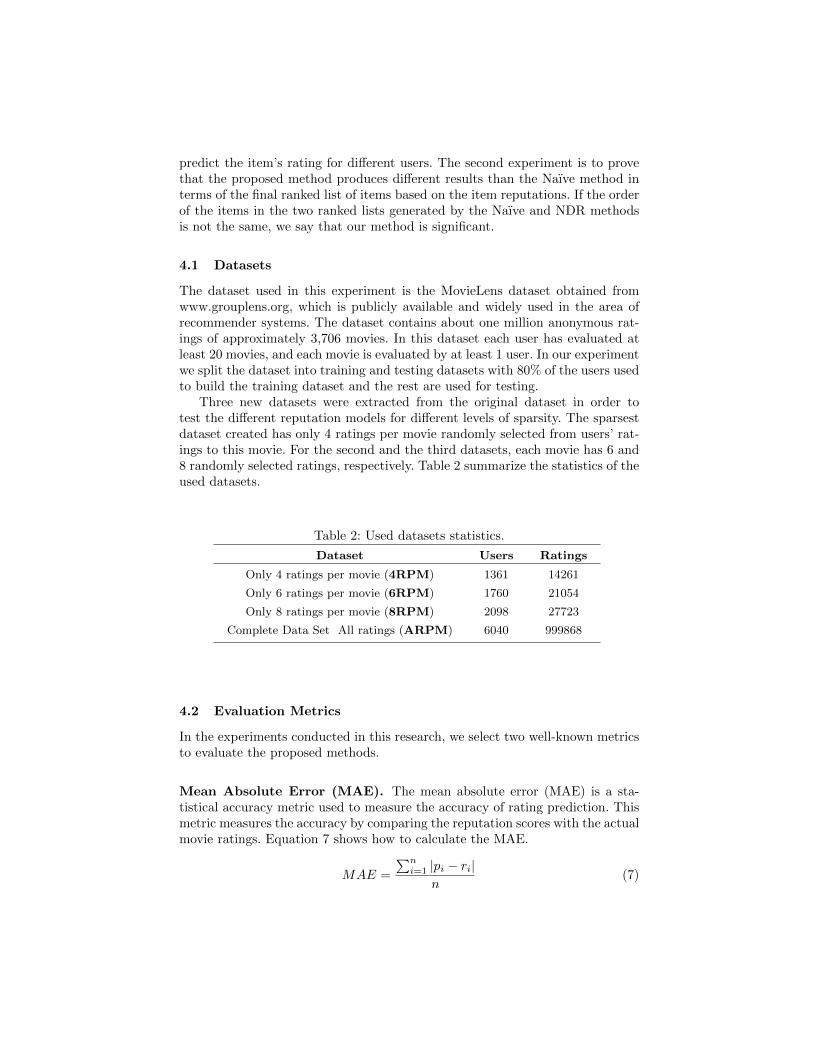
Three new datasets were extracted from the original dataset in order totest the different reputation models for different levels of sparsity. The sparsestdataset created has only 4 ratings per movie randomly selected from users’ rat-ings to this movie. For the second and the third datasets, each movie has 6 and8 randomly selected ratings, respectively. Table 2 summarize the statistics of theused datasets.
Table 2: Used datasets statistics.
Dataset Users Ratings
Only 4 ratings per movie (4RPM) 1361 14261
Only 6 ratings per movie (6RPM) 1760 21054
Only 8 ratings per movie (8RPM) 2098 27723
Complete Data Set All ratings (ARPM) 6040 999868
4.2 Evaluation Metrics
In the experiments conducted in this research, we select two well-known metricsto evaluate the proposed methods.
Mean Absolute Error (MAE). The mean absolute error (MAE) is a sta-tistical accuracy metric used to measure the accuracy of rating prediction. Thismetric measures the accuracy by comparing the reputation scores with the actualmovie ratings. Equation 7 shows how to calculate the MAE.
MAE =
∑ni=1 |pi − ri|
n(7)
pi is the predicted value (i.e., a reputation score) for a movie i, ri is theactual rating given by a user for the movie i, and n is the number of ratingsin the testing dataset. The lower the MAE, the more accurately the reputationmodel generates scores.
Kendall Tau Coefficient. Kendall tau coefficient is a statistic used to mea-sure the association between two ranked lists. In other words, it evaluates thesimilarity of the orderings of the two lists. Equation 8 shows how to calculateKendall Tau coefficient, where it divides the difference between concordant and
discordant pairs in the two lists by the total number of pairs n(n−1)2 . The coef-
ficient must be in the range of −1 ≤ τ ≤ 1, where the value of τ = −1 indicatescomplete disagreement between two lists, and the value of τ = 1 indicates com-plete agreement. In addition, the value of τ = 0 identify that the two lists areindependent.
τ =nc − nd
12n (n− 1)
(8)
nd = |{(i, j)|A(i) < A(j), NDR(i) > NDR(j)}|nc = |{(i, j)|A(i) < A(j), NDR(i) < NDR(j)}|
nd is the number of discordant pairs between the two lists, while nc is thenumber of concordant ones, NDR(i) is the reputation score for the movie igenerated using the NDR method, while A(i) is the reputation score generatedusing the Naıve method, n is the number of items and i and j are items. The aimof using the Kendall tau coefficient method is to compute the ordering differencebetween the two ranked item lists generated based on the reputations computedusing two different reputation models. The higher the value of τ , the more similarthe two ranked lists.
4.3 Ratings Prediction
In this experiment we use the training dataset to calculate a reputation score forevery movie. Secondly we will use these reputation scores as rating predictionvalues for all the movies in the testing dataset and will compare these reputationvalues with users’ actual ratings in the testing dataset. The theory is that areputation value to an item that is closer to the users’ actual ratings to the itemis considered more accurate. The Baseline methods we will compare with includethe Naıve method, Dirichlet reputation system proposed by Jøsang and Haller[8], and the Leniency-aware Quality (LQ) model proposed by Lauw et al. [2].
The experiment is done as a five-fold cross validation, where every time adifferent 20% of the dataset is used for testing. This method ensures that eachuser’s data has been used five times; four times in training and one time intesting. We record the MAE in each round for all the implemented methods,and at the end we calculate the average of the five MAE values recorded foreach reputation model. We have tested the ratings prediction accuracy usingthe four previously described datasets and the results are shown in Table 3.
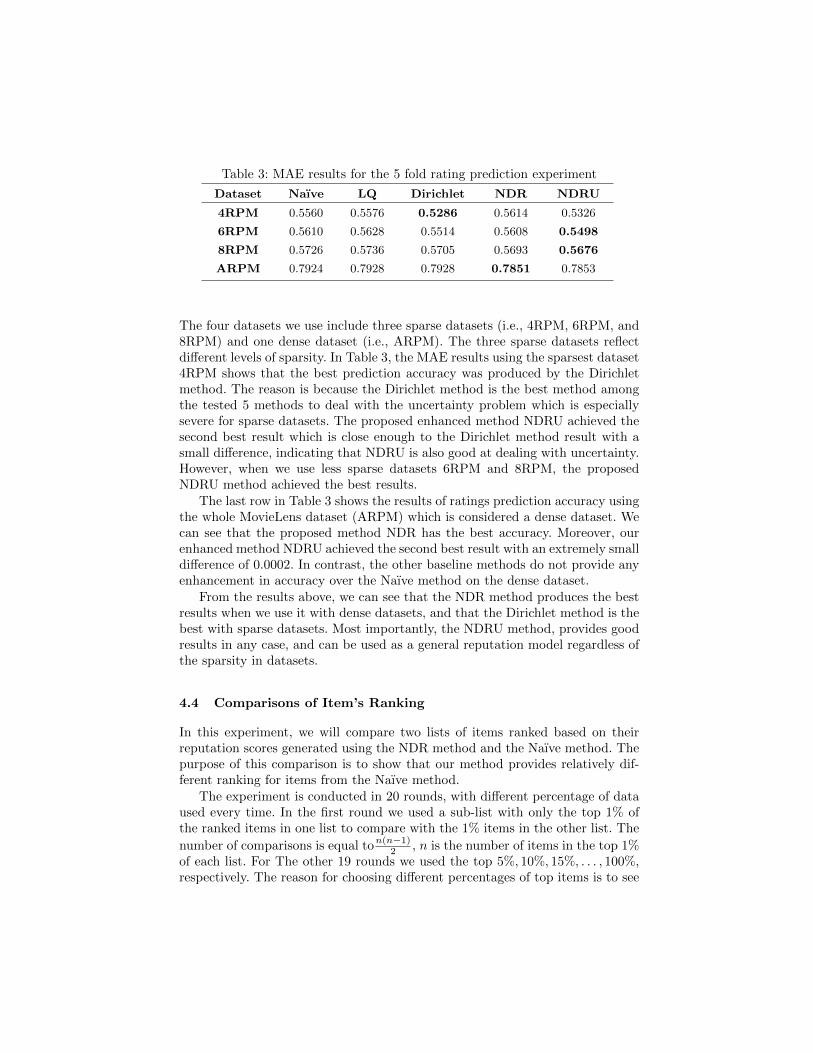
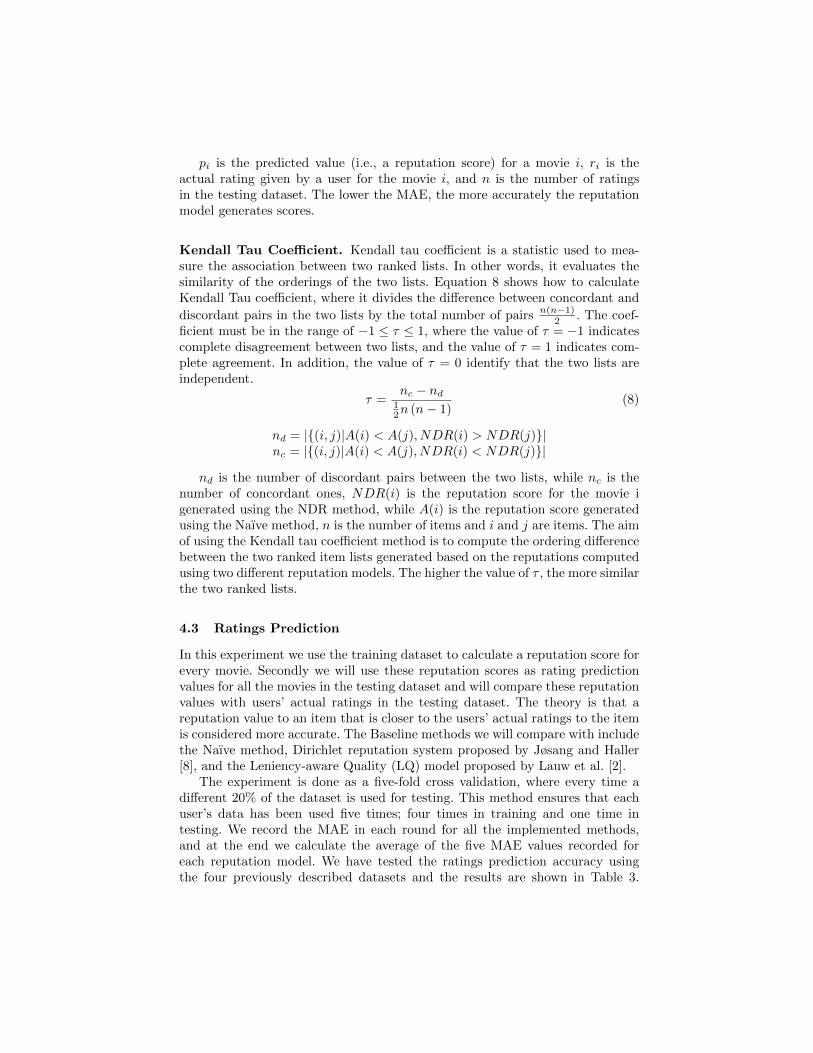
Table 3: MAE results for the 5 fold rating prediction experiment
Dataset Naıve LQ Dirichlet NDR NDRU
4RPM 0.5560 0.5576 0.5286 0.5614 0.5326
6RPM 0.5610 0.5628 0.5514 0.5608 0.5498
8RPM 0.5726 0.5736 0.5705 0.5693 0.5676
ARPM 0.7924 0.7928 0.7928 0.7851 0.7853
The four datasets we use include three sparse datasets (i.e., 4RPM, 6RPM, and8RPM) and one dense dataset (i.e., ARPM). The three sparse datasets reflectdifferent levels of sparsity. In Table 3, the MAE results using the sparsest dataset4RPM shows that the best prediction accuracy was produced by the Dirichletmethod. The reason is because the Dirichlet method is the best method amongthe tested 5 methods to deal with the uncertainty problem which is especiallysevere for sparse datasets. The proposed enhanced method NDRU achieved thesecond best result which is close enough to the Dirichlet method result with asmall difference, indicating that NDRU is also good at dealing with uncertainty.However, when we use less sparse datasets 6RPM and 8RPM, the proposedNDRU method achieved the best results.
The last row in Table 3 shows the results of ratings prediction accuracy usingthe whole MovieLens dataset (ARPM) which is considered a dense dataset. Wecan see that the proposed method NDR has the best accuracy. Moreover, ourenhanced method NDRU achieved the second best result with an extremely smalldifference of 0.0002. In contrast, the other baseline methods do not provide anyenhancement in accuracy over the Naıve method on the dense dataset.
From the results above, we can see that the NDR method produces the bestresults when we use it with dense datasets, and that the Dirichlet method is thebest with sparse datasets. Most importantly, the NDRU method, provides goodresults in any case, and can be used as a general reputation model regardless ofthe sparsity in datasets.
4.4 Comparisons of Item’s Ranking
In this experiment, we will compare two lists of items ranked based on theirreputation scores generated using the NDR method and the Naıve method. Thepurpose of this comparison is to show that our method provides relatively dif-ferent ranking for items from the Naıve method.
The experiment is conducted in 20 rounds, with different percentage of dataused every time. In the first round we used a sub-list with only the top 1% ofthe ranked items in one list to compare with the 1% items in the other list. The
number of comparisons is equal ton(n−1)2 , n is the number of items in the top 1%
of each list. For The other 19 rounds we used the top 5%, 10%, 15%, . . . , 100%,respectively. The reason for choosing different percentages of top items is to see
the difference between different percentages of top items. Usually the top itemsare more influential or crucial to users.
From Fig. 2 we can find that, for all datasets, the more the items takenfrom the lists, the more similar the order of the items in the lists generated bythe two methods. However, usually users are more interested in the top items.Therefore, the order of the top items in the lists is more crucial. If we only lookat the top 20% items, we can find that the behaviour of using the whole datasetARPM (which is much denser than the other three datasets) is different fromusing other three sparse datasets. For the dense dataset, the similarity reachesits minimal when we only compare the top 1% items and the similarity increaseswhen we compare larger portions of the dataset. This result indicates that forthe dense dataset, the proposed method NDR ranks the top items in the itemlist differently from the item list generated by the Naıve method. On the other
0.4
0.6
0.8
1.0
0 10 20 30 40 50 60 70 80 90 100
Top X% of the ranked lists used in similarity calculation
Kendall Similarity
4RPM
6RPM
8RPM
ARPM
Fig. 2: Kendall similarities between (NDR) method and Naıve method using fourdifferent datasets.
hand, with the sparse datasets, the ranking on the top 1% of the items showshigh similarity between the two lists, which indicates that the top 1
5 Conclusions and Future Work
In this work we have proposed a new aggregation method for generating reputa-tion scores for items or products based on customers’ ratings, where the weightsare generated using a normal distribution. The method is also enhanced withadding uncertainty part by adopting the idea of the work proposed by Jøsangand Haller [8]. The results of our experiments show that our proposed methodoutperforms the state-of-the-art methods in ratings prediction over a well-knowndataset. Besides, it provides relatively different ranking for items in the rankedlist based on the reputation scores. Moreover, our enhanced method proved togenerate accurate results with sparse and dense datasets. In future, we plan touse this method in different applications such as recommender systems. Besides,this method can be combined with other weighted average reputation models
that use time or user reputation in order to improve the accuracy of their re-sults.
References
1. Resnick, P., Kuwabara, K., Zeckhauser, R. Friedman, E.: Reputation Systems.Communi-cations of the ACM, 43(12), pp. 45-48. (2000).
2. Lauw, H. W., Lim, E. P., Wang, K.: Quality and Leniency in Online CollaborativeRating Systems. ACM Transactions on the Web (TWEB), 6(1), 4. (2012).
3. Grimmett, G., Stirzaker, D.: Probability and random processes. Oxford universitypress.(2001).
4. Garcin, F., Faltings, B., Jurca, R.: Aggregating Reputation Feedback. Proceedingsof the First International Conference on Reputation: Theory and Technology, pp.62-74. (2009).
5. Jøsang, A., Ismail, R., Boyd, C.: A Survey Of Trust And Reputation Systems ForOnline Service Provision. Decision Support Systems, 43(2), pp. 618-644. Elsevier.(2007).
6. Shapiro, C.: Consumer Information, Product Quality, And Seller Reputation. TheBell Journal of Economics,13(1), pp. 20-35. RAND. (1982).
7. Ayday, E., Lee, H., Fekri, F.: An Iterative Algorithm For Trust And ReputationManagement. Proceedings of the International Symposium on Information Theory,pp. 2051-2055. IEEE. (2009).
8. Jøsang, A. and Haller, J.: Dirichlet Reputation Systems. Proceedings of the Sec-ond International Conference on Availability, Reliability and Security, pp. 112-119.IEEE. (2007).
9. Leberknight, C. S., Sen, S., Chiang, M.: On The Volatility Of Online Ratings: AnEmpirical Study. E-Life: Web-Enabled Convergence of Commerce, Work, and SocialLife, pp. 77-86. Springer Berlin Heidelberg. (2012).
10. Riggs, T., Wilensky, R.: An Algorithm For Automated Rating Of Reviewers. Pro-ceedings of the First ACM/IEEE-CS joint conference on Digital libraries, pp. 381-387. ACM.. (2001).
11. Jøsang, A., Ismail, R.: The Beta Reputation System. Proceedings of the 15th bledelectronic commerce conference, pp. 41-55. (2002).
12. Sabater, J., Sierra, C.: Reputation And Social Network Analysis In Multi-AgentSystems. in Proceedings of the first international joint conference on Autonomousagents and multiagent systems. pp. 475-482. (2002).
13. Bharadwaj, K. K., Al-Shamri, M. Y. H.: Fuzzy Computational Models For TrustAnd Reputation Systems. Electronic Commerce Research and Applications, 8(1),pp. 37-47, (2009).