Embed Size (px)
Citation preview

NeuroImage 63 (2012) 179–193
Contents lists available at SciVerse ScienceDirect
NeuroImage
j ourna l homepage: www.e lsev ie r .com/ locate /yn img
A NIRS–fMRI study of resting state network
Shuntaro Sasai a,b,⁎, Fumitaka Homae c, Hama Watanabe a, Akihiro T. Sasaki b,d,e, Hiroki C. Tanabe d,e,Norihiro Sadato d,e,f, Gentaro Taga a
a Graduate School of Education, The University of Tokyo, Tokyo, 7‐3‐1 Hongo, Bunkyo‐ku, Tokyo 113-0033, Japanb Japan Society for the Promotion of Science, Sumitomo‐Ichibancho FS Bldg., 8 Ichibancho, Chiyoda-ku, Tokyo 102-8472, Japanc Department of Language Sciences, Tokyo Metropolitan University, 1-1 Minami Osawa, Hachioji, Tokyo 192-0397, Japand Division of Cerebral Integration, Department of Cerebral Research, National Institute for Physiological Sciences, 38, Nishigo‐naka, Myodaiji, Okazaki, Aichi 444‐8585, Japane Department of Physiological Sciences, The Graduate University for Advanced Studies (Sokendai), 38, Nishigo-naka, Myodaiji, Okazaki, Aichi 444-8585, Japanf Japan Science and Technology Agency/Research Institute of Science and Technology for Society, K's Gobancho Bldg, 7, Gobancho, Chiyoda‐ku, Tokyo 102-0076, Japan
⁎ Corresponding author at: Division of Physical anschool of Education, University of Tokyo, 7‐3‐1, HongoJapan. Fax: +81 3 5841 1396.
E-mail address: [email protected] (S. Sasai).
1053-8119/$ – see front matter © 2012 Elsevier Inc. Alldoi:10.1016/j.neuroimage.2012.06.011
a b s t r a c t
a r t i c l e i n f oArticle history:Accepted 8 June 2012Available online 17 June 2012
Keywords:Resting stateFunctional connectivityResting state networkDefault mode networkSimultaneous NIRS–fMRI recordingSpontaneous hemodynamic fluctuation
Resting state functional connectivity, which is defined as temporal correlation of spontaneous activity be-tween diverse brain regions, has been reported to form resting state networks (RSNs), consisting of a specificset of brain regions, based on functional magnetic resonance imaging (fMRI). Recently, studies using near‐infrared spectroscopy (NIRS) reported that NIRS signals also show temporal correlation between differentbrain regions. The local relationship between NIRS and fMRI signals has been examined by simultaneouslyrecording these signals when participants perform tasks or respond to stimuli. However, the NIRS–fMRI signalrelationship during the resting state has been reported only between NIRS signals obtained within limitedregions and whole brain fMRI signals. Therefore, it remains unclear whether NIRS signals obtained at diverseregions correlate with regional fMRI signals close to the NIRS measurement channels, especially in relationto the RSNs. In this study, we tested whether the signals measured by these different modalities during theresting state have the consistent characteristics of the RSNs. Specifically, NIRS signals during the restingstate were acquired over the frontal, temporal, and occipital cortices while whole brain fMRI data was simul-taneously recorded. First, by projecting the NIRS channel positions over the cerebral cortical surface, we iden-tified the most likely anatomical locations of all NIRS channels used in the study. Next, to investigate theregional signal relationship between NIRS and fMRI, we calculated the cross‐correlation between NIRS signalsand fMRI signals in the brain regions adjacent to each NIRS channel. For each NIRS channel, we observed thelocal maxima of correlation coefficients between NIRS and fMRI signals within a radius of 2 voxels from theprojection point. Furthermore, we also found that highly correlated voxels with the NIRS signal were mainlylocalized within brain tissues for all NIRS channels, with the exception of 2 frontal channels. Finally, by calcu-lating the correlation between NIRS signals at a channel and whole brain fMRI signals, we observed that NIRSsignals correlatewith fMRI signals not onlywithin brain regions adjacent toNIRS channels but alsowithin distantbrain regions constituting RSNs, such as the dorsal attention, fronto-parietal control, and defaultmode networks.These results support the idea that NIRS signals obtained at several cortical regions during the resting statemainly reflect regional spontaneous hemodynamicfluctuations that originate from spontaneous cortical activity,and include information that characterizes the RSNs. Because NIRS is relatively easy to use and a less physicallydemanding neuroimaging technique, our findings should facilitate a broad application of this technique toexamine RSNs, especially for clinical populations and conditions unsuitable for fMRI.
© 2012 Elsevier Inc. All rights reserved.
Introduction
The brain typically operates in a coordinated manner even duringthe resting state. Functional magnetic resonance imaging (fMRI)
d Health Education, Graduate, Bunkyo‐ku, Tokyo 113-0033,
rights reserved.
demonstrates that there is a strong correlation among blood oxygen-ation level-dependent (BOLD) signal fluctuations of distinct regionsof the brain in the low‐frequency range (b0.1 Hz) in the restingstate (Biswal et al., 1995). This correlation, termed resting state func-tional connectivity, has often been observed between functionallyrelated brain regions, including sensory, motor, sensory association,attention, and task-negative regions (Fox and Raichle, 2007). Whenwe regard this connectivity as the “edge” and the brain regions linkedby the connectivity as the “node,” the spontaneous brain activity con-stitutes unique network architectures, termed resting state networks

180 S. Sasai et al. / NeuroImage 63 (2012) 179–193
(RSNs) (De Luca et al., 2006; Fox and Raichle, 2007; Lowe et al.,1998). These network architectures are consistent across healthyindividuals (Damoiseaux et al., 2006), and are suggested to reflectintrinsic functional architecture of the brain (Fox and Raichle, 2007).
Near‐infrared spectroscopy (NIRS) is a technique for measuringchanges in local oxygenated and deoxygenated hemoglobin (oxy-Hband deoxy-Hb) concentrations. Studies using NIRS have successfullyobserved functional connectivity during the resting state in bothadult and infant participants (Homae et al., 2010, 2011; Lu et al.,2010; Mesquita et al., 2010; White et al., 2009; Zhang et al., 2010).One NIRS study also demonstrated that functional connectivity esti-mated using oxy-Hb and deoxy-Hb signals obtained during the restingstate has different frequency characteristics (Sasai et al., 2011). More-over, higher temporal resolution of NIRS has revealed a temporal rela-tionship of signals obtained at different brain regions in combinationwith analysis of phase synchronization (Taga et al., 2000, 2011). Theseresults support that NIRS is a useful neuroimaging technique for acqui-sition of information about functional connectivity. Considering thatNIRS is less physically demanding and relatively easy to use comparedto other neuroimaging techniques, application of NIRS may allow easyRSN data collection even in cases where fMRI would be difficult to use.
Because both fMRI and NIRS signals measured during the restingstate may reflect spontaneous brain activity, NIRS signals in diverseregions of the cortex during the resting state should show a highcorrelation with BOLD signals in regions adjacent to each of the NIRSmeasurement positions. Furthermore, despite the fact that NIRS candetect cortical activity only in superficial cortical regions, we canhypothesize that the NIRS signals measured in separate regions ofthe cortex can capture information reflecting different RSNs thatinclude not only superficial regions, but also deep brain regions suchas the default mode network (Buckner et al., 2008; Raichle et al.,2001). However, although the simultaneous use of these techniquesduring stimulation or task execution has shown a high correlationbetween the 2 different signals in the corresponding cortical regions(Cui et al., 2011; Hoge et al., 2005; Kleinschmidt et al., 1996; Schroeteret al., 2006; Strangman et al., 2002; Toronov et al., 2001; Toyoda et al.,2008), it is not well understood whether this relationship is also trueduring the resting state. Moreover, although previous studies havesimultaneously recorded NIRS signals within limited regions and BOLDsignals of the whole brain during the resting state (Duan et al., 2012;Tong and Frederick, 2010), the investigators did not compare the NIRSsignals in diverse regions of the cortex and the BOLD signals. Thus, theaim of this study was to establish the NIRS–fMRI relationship to studyfunctional connectivity with special focus on the RSNs.
To solve the above-mentioned issue, we designed and conductedstep-by-step analyses. First, we had to determine the relative loca-tions of NIRS measurement channels on the participant's brain to de-termine the brain regions where NIRS acquires its signals. However,we could obtain only the probabilistic anatomical cranio-cerebral cor-relation to represent the anatomical location of NIRS measurementchannels (Okamoto et al., 2004), because NIRS probes are located out-side of the head. Thus, we obtained structural MRI of all participantswhile they were wearing NIRS probes and determined the accuratepositional relationships between their brain regions and the NIRSprobes, which constituted 14 channels and were located on bilateralfrontal, temporal, and occipital cortices.
Second, we aimed to confirm that NIRS signals obtained at a channelduring the resting state reflected the spontaneous hemodynamic fluc-tuations within the adjacent brain regions. Previous studies of simulta-neous recording of NIRS and fMRI have revealed that NIRS signalsinduced by several stimuli show high correlation with the BOLD signalsobtained from adjacent brain regions to the NIRS measurementchannels (Cui et al., 2011; Hoge et al., 2005; Kleinschmidt et al., 1996;Schroeter et al., 2006; Strangman et al., 2002; Toronov et al., 2001;Toyoda et al., 2008). In theory, with or without tasks, NIRS signalsshould reflect the concentration changes of oxy-Hb and deoxy-Hb
within close regions to NIRS channels. However, this theoretical deduc-tion has not been confirmed forNIRS signals obtained during the restingstate. To test this, we investigated whether we could find the localmaximum of correlation coefficients between NIRS and BOLD signalssimultaneously obtained during the resting state in the brain regionclose to each NIRS channel. However, because photons travel in a“banana shape” between the emitter and the detector (Okada et al.,1997; van der Zee et al., 1990), NIRS signals can be affected not onlyby changes in hemoglobin concentration within adjacent brain regionsbut also by those changes within non-brain regions such as skin andlarge pial veins (Gagnon et al., 2012a, 2012b; Kohno et al., 2007; Obriget al., 2000; Saager and Berger, 2008; Tachtsidis et al., 2008; Takahashiet al., 2011; Tonorov et al., 2000; Yamada et al., 2009; Zhang et al.,2007). Therefore, to evaluate whether the concentration changes ofoxy-Hb and deoxy-Hb in the brain tissues are major substitutes of theNIRS signals obtained during the resting state, we sorted highly corre-lating voxels with NIRS signals by tissue types of the voxels (graymatter, white matter, cerebrospinal fluid [CSF], skull and skin), andcalculated the proportion of the voxels within brain tissues (gray andwhite matter) against those within non-brain tissues (skull and skin).
Finally, we aimed to clarify whether RSNs estimated using fMRIdata sets could be reproduced using NIRS signals. One of the tech-niques to estimate RSNs in the fMRI data sets is based on the calcula-tion of cross-correlation between a BOLD time-course extracted froma region of interest (ROI) as a seed and those of whole brain voxels. IfNIRS signals include information characterizing RSNs contained in theseed BOLD signals, RSNs estimated using the BOLD signals extractedfrom ROIs should be reproduced using NIRS signals obtained fromthe ROIs. Thus, we investigated this issue by calculating correlationmaps using BOLD and corresponding NIRS signals as seed signals.
If NIRS signals obtained from diverse regions of the cortex are pro-bed to reflect the time-series characterizing the major RSNs obtainedby fMRI, it becomes possible to acquire the time-series that repre-sents RSNs solely by conducting NIRS measurement of the selectedregions of the brain. By taking advantage of the high temporal resolu-tion, we can address the temporal relationship between different RSNs(Chang and Glover, 2010; Kang et al., 2011; Majeed et al., 2011) usingNIRS. Considering that NIRS measurement is relatively easy to use anda less physically demanding neuroimaging technique, application ofNIRS would facilitate collection of data on the RSNs not only in normalexperimental environments but also in other situations such as thoseinvolving a whole sleep period or social interaction, and in particularpopulations such as infants and patients. Thus, using the above‐mentioned step-by-step analyses, we investigated whether sparseNIRS signals obtained from diverse regions of the cortex can representthe time-series for major RSNs obtained by fMRI.
Materials and methods
The outline of the analysis conducted in this study is shown inFig. 1.
Participants
Twenty-eight healthy adults (15 men and 13 women; age range,22–44 years) participated in this study. All participants were awakewith their eyes closed during the measurement. The protocol wasapproved by the ethical committee of the National Institute forPhysiological Sciences, Okazaki, Japan. Informed consentwas obtainedfrom all participants prior to initiation of the experiments.
Data acquisition
NIRSWe used a near-infrared optical topography instrument (ETG-
4000; Hitachi Medical Corporation, Tokyo, Japan) to measure the

Population-based Z-score maps calculation Spatial correlation between correlation maps
NIRS channel registration in sMRI. projecting vitamin tablets attached on probe holder onto the brain surface in the structural image
NIRS-ROI mask making . making masks of regions of interest defined as the NIRS measurement areas (NIRS-ROI)
Seed-based correlation maps calculation. calculating cross-correlation between BOLD signals of whole brain voxels and1. NIRS signals (oxy-Hb [oxy-map] and deoxy-Hb [deoxy-map])2. seed BOLD signals extracted from ROIs corresponding to NIRS measurement regions (cBOLD-map)3. seed BOLD signals extracted from predifined ROIs of resting state networks (DA-map, FPC-map and DM-map)
Seed signal extraction from NIRS-ROI. making seed signals by averaging BOLD signals within NIRS-ROIs
NIRS data acquisition. simultaneously acquiring with fMRI data
Structural data acquisition. acquiring structural images (sMRI) with attaching NIRS probes
Downsampling. from 10Hz to 0.5Hz
Band-pass filtering . 0.009–0.08 Hz
Regional correlating voxels distribution investigation. calculating cross-correlation between NIRS signals and BOLD signals within areas near the projection points
fMRI data normalization. normalizing fMRI data sets to MNI space
Data preprocessing. slice timing correction. motion correction
fMRI data acquisition. simultaneously acquiring with NIRS data
Band-pass filtering . 0.009–0.08 Hz
NIRS-ROI mask normalization. normalizing NIRS-ROI masks to MNI
fMRI data correction. performing linear regression against1. 6 motion correction parameters 2. white matter signals3. ventricular system signals 4. soft tissue signals
Seed signal extraction from predefined ROI. making seed signals by averaging BOLD signals within predifined ROIs of resting state networks
NIRS fMRI sMRI
Fig. 1. Outline of all analyses conducted in the current study.
181S. Sasai et al. / NeuroImage 63 (2012) 179–193
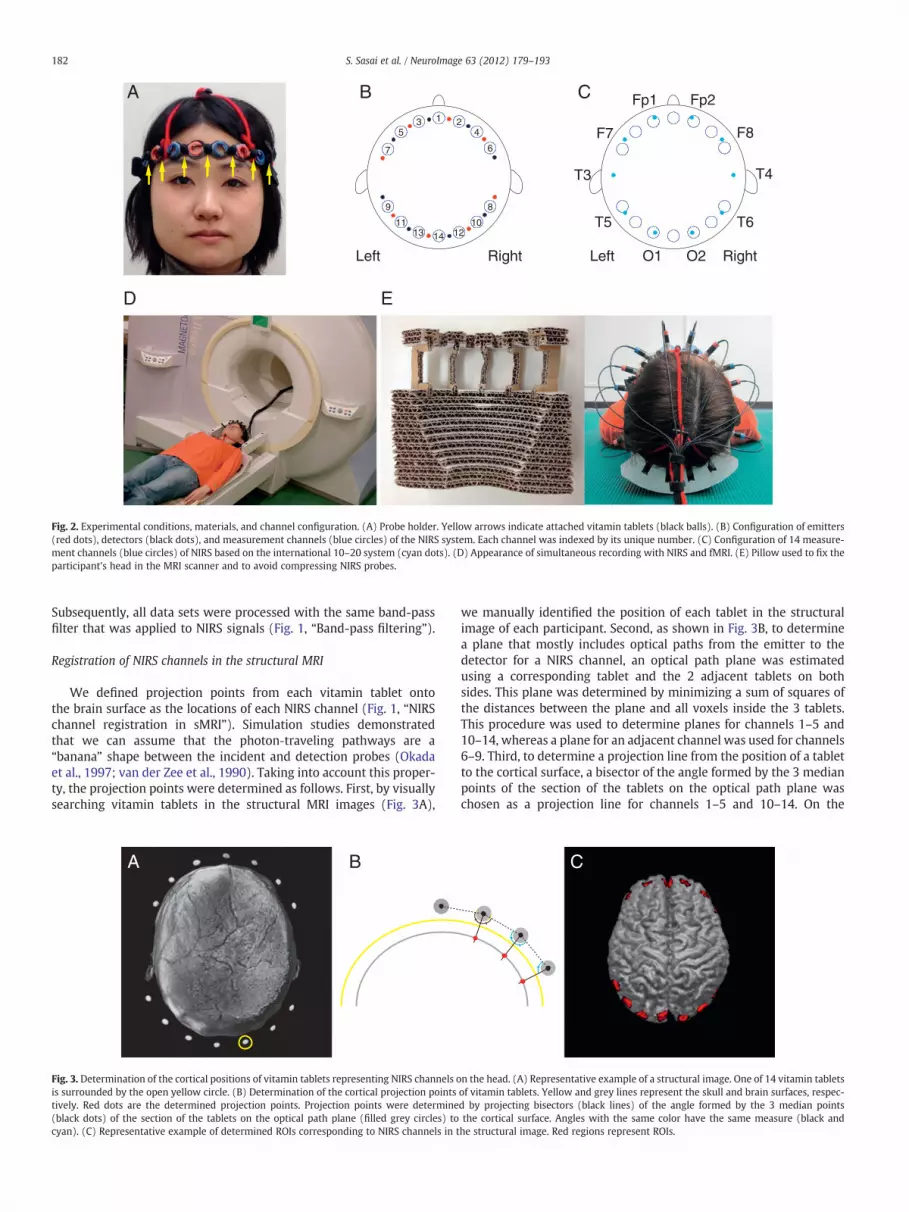
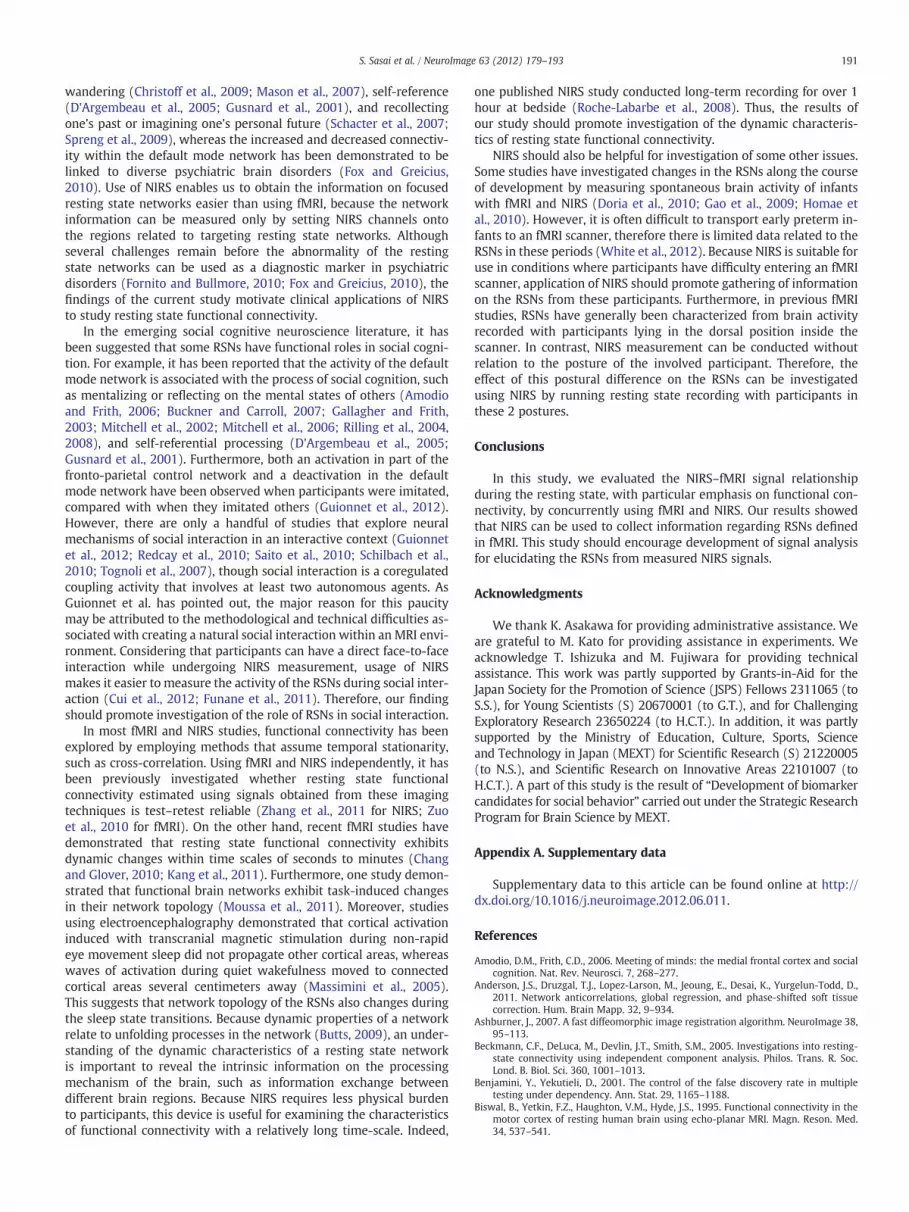
time-courses of spontaneous changes in oxy-Hb and deoxy-Hb duringa 20-min period with 0.1-s time resolution (Fig. 1, “NIRS data acquisi-tion”). The instrument generated 2 wavelengths of near-infrared light(695 nm and 830 nm). We evaluated relative changes in the oxy-Hband deoxy-Hb signals from an arbitrary baseline (set to 0) at the be-ginning of the measurement period based on the Lambert–Beer law.The unit used to measure these values was molar concentration mul-tiplied by length (mM·mm). The distance between the incident andthe detection fibers was 3 cm. The 8 emitters and 8 detectors wereplugged into a holder, on which vitamin tablets were attached toidentify the positions of NIRS channels in MRI images (Fig. 2A), andwere arranged into two 1×8 arrays, resulting in 14 measurementchannels (Fig. 2B). Arrays were positioned over the bilateral frontal,temporal and occipital regions by referring to the international10–20 System of Electrode Placement (Fig. 2C). NIRS data were simul-taneously obtained with functional MRI imaging for all participants,with each participant lying supine in an MRI scanner. The appearanceof simultaneous recording with NIRS and fMRI is shown in Fig. 2D. Apillow was placed under the occiput to fix the participant's head andto avoid compressing the NIRS probes (Fig. 2E).
MRIFunctional and structural MRI images were acquired using a
3-Tesla MR scanner (Allegra; Siemens; Fig. 1, “fMRI data acquisition”and “Structural data acquisition”). First, a time-series of 610 volumeswas acquired for each session using T2*-weighted gradient-echoecho-planar imaging (EPI) sequence. Each volume consisted of 34 slices,each of which was 3.5 mm thick, with a 17% gap. The time intervalbetween 2 successive acquisitions of the same slice (TR) was 2000 ms
with a flip angle (FA) of 76° and an echo time (TE) of 30 ms. The fieldof view (FoV) was 192×192 mm and the in-plane matrix size was64×64 pixels. Additionally, to acquire a fine structural whole brainimage, magnetization-prepared rapid-acquisition gradient-echo (MP-RAGE) images were obtained (TR=2500 ms; TE=4.38 ms; FA=8°;FoV=230×230 mm; one slab; number of slices per slab=192; voxeldimensions=0.9×0.9×1.0 mm).
Data preprocessing
NIRSBoth oxy-Hb and deoxy-Hb signals were downsampled to the fMRI
acquisition frequency of 0.5 Hz by applying an anti-aliasing (lowpass)FIR filter inMATLAB (MathWorks, Inc., Natick, MA, USA) because thesesignals were measured with a 20-times higher sampling rate an fMRIdata sets (10 Hz; Fig. 1, “Downsampling”). Spontaneous low-frequency fluctuations are contaminated by various other signalsoriginating mainly from non-neural sources. To remove the long-term trends, respiratory and cardiac noises that are generally includedoutside the frequency band, we used a Butterworth band-passfilter (0.009–0.08 Hz) and performed zero-phase digital filtering byprocessing the data in both the forward and reverse directions inMATLAB (Fig. 1, “Band-pass filtering”).
fMRIFunctional MRI volumes were motion-corrected and slice-timing
corrected using the SPM8 package (Wellcome Department of ImagingNeuroscience, London, UK) (Fig. 1, “Data preprocessing”). Thesefunctional volumes were not spatially smoothed nor normalized.
D
Fp1 Fp2
F7 F8
T3 T4
T5 T6
O1 O2Left Right
CA
6
8
7
9
4
10
5
11
2
12
3
13
1
14
Left Right
B
E
Fig. 2. Experimental conditions, materials, and channel configuration. (A) Probe holder. Yellow arrows indicate attached vitamin tablets (black balls). (B) Configuration of emitters(red dots), detectors (black dots), and measurement channels (blue circles) of the NIRS system. Each channel was indexed by its unique number. (C) Configuration of 14 measure-ment channels (blue circles) of NIRS based on the international 10–20 system (cyan dots). (D) Appearance of simultaneous recording with NIRS and fMRI. (E) Pillow used to fix theparticipant's head in the MRI scanner and to avoid compressing NIRS probes.
182 S. Sasai et al. / NeuroImage 63 (2012) 179–193
Subsequently, all data sets were processed with the same band-passfilter that was applied to NIRS signals (Fig. 1, “Band-pass filtering”).
Registration of NIRS channels in the structural MRI
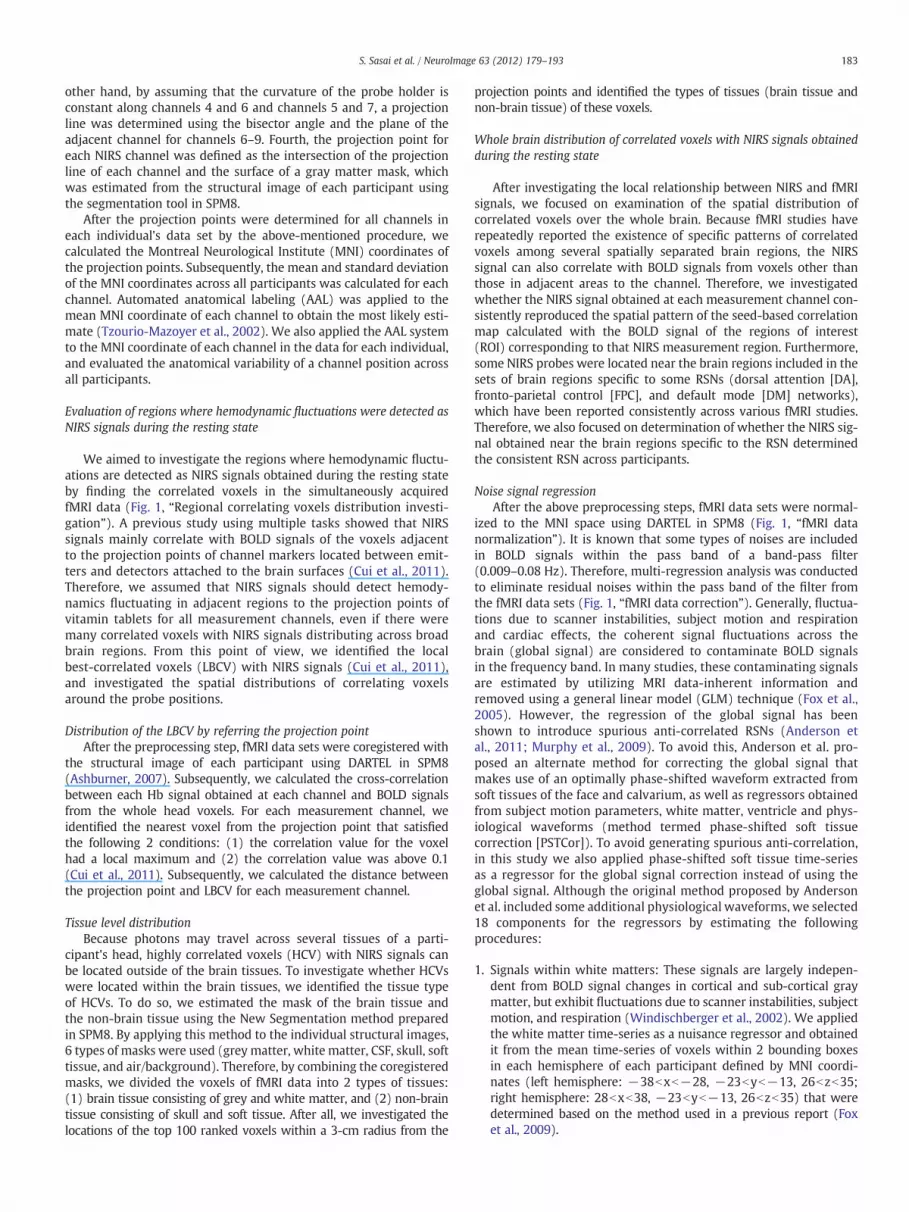
We defined projection points from each vitamin tablet ontothe brain surface as the locations of each NIRS channel (Fig. 1, “NIRSchannel registration in sMRI”). Simulation studies demonstratedthat we can assume that the photon‐traveling pathways are a“banana” shape between the incident and detection probes (Okadaet al., 1997; van der Zee et al., 1990). Taking into account this proper-ty, the projection points were determined as follows. First, by visuallysearching vitamin tablets in the structural MRI images (Fig. 3A),
BA
Fig. 3. Determination of the cortical positions of vitamin tablets representing NIRS channels ois surrounded by the open yellow circle. (B) Determination of the cortical projection pointstively. Red dots are the determined projection points. Projection points were determine(black dots) of the section of the tablets on the optical path plane (filled grey circles) tocyan). (C) Representative example of determined ROIs corresponding to NIRS channels in t
we manually identified the position of each tablet in the structuralimage of each participant. Second, as shown in Fig. 3B, to determinea plane that mostly includes optical paths from the emitter to thedetector for a NIRS channel, an optical path plane was estimatedusing a corresponding tablet and the 2 adjacent tablets on bothsides. This plane was determined by minimizing a sum of squares ofthe distances between the plane and all voxels inside the 3 tablets.This procedure was used to determine planes for channels 1–5 and10–14, whereas a plane for an adjacent channel was used for channels6–9. Third, to determine a projection line from the position of a tabletto the cortical surface, a bisector of the angle formed by the 3 medianpoints of the section of the tablets on the optical path plane waschosen as a projection line for channels 1–5 and 10–14. On the
C
n the head. (A) Representative example of a structural image. One of 14 vitamin tabletsof vitamin tablets. Yellow and grey lines represent the skull and brain surfaces, respec-d by projecting bisectors (black lines) of the angle formed by the 3 median pointsthe cortical surface. Angles with the same color have the same measure (black andhe structural image. Red regions represent ROIs.
183S. Sasai et al. / NeuroImage 63 (2012) 179–193
other hand, by assuming that the curvature of the probe holder isconstant along channels 4 and 6 and channels 5 and 7, a projectionline was determined using the bisector angle and the plane of theadjacent channel for channels 6–9. Fourth, the projection point foreach NIRS channel was defined as the intersection of the projectionline of each channel and the surface of a gray matter mask, whichwas estimated from the structural image of each participant usingthe segmentation tool in SPM8.
After the projection points were determined for all channels ineach individual's data set by the above-mentioned procedure, wecalculated the Montreal Neurological Institute (MNI) coordinates ofthe projection points. Subsequently, the mean and standard deviationof the MNI coordinates across all participants was calculated for eachchannel. Automated anatomical labeling (AAL) was applied to themean MNI coordinate of each channel to obtain the most likely esti-mate (Tzourio-Mazoyer et al., 2002). We also applied the AAL systemto the MNI coordinate of each channel in the data for each individual,and evaluated the anatomical variability of a channel position acrossall participants.
Evaluation of regions where hemodynamic fluctuations were detected asNIRS signals during the resting state
We aimed to investigate the regions where hemodynamic fluctu-ations are detected as NIRS signals obtained during the resting stateby finding the correlated voxels in the simultaneously acquiredfMRI data (Fig. 1, “Regional correlating voxels distribution investi-gation”). A previous study using multiple tasks showed that NIRSsignals mainly correlate with BOLD signals of the voxels adjacentto the projection points of channel markers located between emit-ters and detectors attached to the brain surfaces (Cui et al., 2011).Therefore, we assumed that NIRS signals should detect hemody-namics fluctuating in adjacent regions to the projection points ofvitamin tablets for all measurement channels, even if there weremany correlated voxels with NIRS signals distributing across broadbrain regions. From this point of view, we identified the localbest-correlated voxels (LBCV) with NIRS signals (Cui et al., 2011),and investigated the spatial distributions of correlating voxelsaround the probe positions.
Distribution of the LBCV by referring the projection pointAfter the preprocessing step, fMRI data sets were coregistered with
the structural image of each participant using DARTEL in SPM8(Ashburner, 2007). Subsequently, we calculated the cross-correlationbetween each Hb signal obtained at each channel and BOLD signalsfrom the whole head voxels. For each measurement channel, weidentified the nearest voxel from the projection point that satisfiedthe following 2 conditions: (1) the correlation value for the voxelhad a local maximum and (2) the correlation value was above 0.1(Cui et al., 2011). Subsequently, we calculated the distance betweenthe projection point and LBCV for each measurement channel.
Tissue level distributionBecause photons may travel across several tissues of a parti-
cipant's head, highly correlated voxels (HCV) with NIRS signals canbe located outside of the brain tissues. To investigate whether HCVswere located within the brain tissues, we identified the tissue typeof HCVs. To do so, we estimated the mask of the brain tissue andthe non-brain tissue using the New Segmentation method preparedin SPM8. By applying this method to the individual structural images,6 types of masks were used (grey matter, white matter, CSF, skull, softtissue, and air/background). Therefore, by combining the coregisteredmasks, we divided the voxels of fMRI data into 2 types of tissues:(1) brain tissue consisting of grey and white matter, and (2) non-braintissue consisting of skull and soft tissue. After all, we investigated thelocations of the top 100 ranked voxels within a 3-cm radius from the
projection points and identified the types of tissues (brain tissue andnon-brain tissue) of these voxels.
Whole brain distribution of correlated voxels with NIRS signals obtainedduring the resting state
After investigating the local relationship between NIRS and fMRIsignals, we focused on examination of the spatial distribution ofcorrelated voxels over the whole brain. Because fMRI studies haverepeatedly reported the existence of specific patterns of correlatedvoxels among several spatially separated brain regions, the NIRSsignal can also correlate with BOLD signals from voxels other thanthose in adjacent areas to the channel. Therefore, we investigatedwhether the NIRS signal obtained at each measurement channel con-sistently reproduced the spatial pattern of the seed-based correlationmap calculated with the BOLD signal of the regions of interest(ROI) corresponding to that NIRS measurement region. Furthermore,some NIRS probes were located near the brain regions included in thesets of brain regions specific to some RSNs (dorsal attention [DA],fronto-parietal control [FPC], and default mode [DM] networks),which have been reported consistently across various fMRI studies.Therefore, we also focused on determination of whether the NIRS sig-nal obtained near the brain regions specific to the RSN determinedthe consistent RSN across participants.
Noise signal regressionAfter the above preprocessing steps, fMRI data sets were normal-
ized to the MNI space using DARTEL in SPM8 (Fig. 1, “fMRI datanormalization”). It is known that some types of noises are includedin BOLD signals within the pass band of a band-pass filter(0.009–0.08 Hz). Therefore, multi-regression analysis was conductedto eliminate residual noises within the pass band of the filter fromthe fMRI data sets (Fig. 1, “fMRI data correction”). Generally, fluctua-tions due to scanner instabilities, subject motion and respirationand cardiac effects, the coherent signal fluctuations across thebrain (global signal) are considered to contaminate BOLD signalsin the frequency band. In many studies, these contaminating signalsare estimated by utilizing MRI data-inherent information andremoved using a general linear model (GLM) technique (Fox et al.,2005). However, the regression of the global signal has beenshown to introduce spurious anti-correlated RSNs (Anderson etal., 2011; Murphy et al., 2009). To avoid this, Anderson et al. pro-posed an alternate method for correcting the global signal thatmakes use of an optimally phase-shifted waveform extracted fromsoft tissues of the face and calvarium, as well as regressors obtainedfrom subject motion parameters, white matter, ventricle and phys-iological waveforms (method termed phase-shifted soft tissuecorrection [PSTCor]). To avoid generating spurious anti-correlation,in this study we also applied phase-shifted soft tissue time-seriesas a regressor for the global signal correction instead of using theglobal signal. Although the original method proposed by Andersonet al. included some additional physiological waveforms, we selected18 components for the regressors by estimating the followingprocedures:
1. Signals within white matters: These signals are largely indepen-dent from BOLD signal changes in cortical and sub-cortical graymatter, but exhibit fluctuations due to scanner instabilities, subjectmotion, and respiration (Windischberger et al., 2002). We appliedthe white matter time-series as a nuisance regressor and obtainedit from the mean time-series of voxels within 2 bounding boxesin each hemisphere of each participant defined by MNI coordi-nates (left hemisphere: −38bxb−28, −23byb−13, 26bzb35;right hemisphere: 28bxb38, −23byb−13, 26bzb35) that weredetermined based on the method used in a previous report (Foxet al., 2009).

Table 1Locations of predefined ROIs of 3 resting state networks.
Network Name of ROI used inthe previous study
Correspondingname in the AAL
MNI coordinates
x y z
Dorsal attention lMT+ Occipital_Mid_L −45 −69 −2Fronto-parietal raPFC Frontal_Mid_R 34 52 10Default vmPFC Frontal_Med_Orb_L 0 51 −7
All MNI coordinates have been reported in the previous studies (Fox et al., 2005;Vincent et al., 2008). Abbreviations: r/R = right, l/L = left, MT+ = middle temporalarea, aPFC = anterior prefrontal cortex, vmPFC = ventromedial prefrontal cortex,Mid = middle, Med = medial part, Orb = orbital part.
Table 2Locations of gravity points of normalized ROIs corresponding to NIRS channels.
Number ofchannel
Anatomical locationof gravity point
MNI coordinates
Position SD
x y z
1 Frontal_Sup_Medial_L −1.9 59.3 5.4 8.42 Frontal_Sup_R 20.1 64.5 5.4 5.93 Frontal_Sup_L −24.5 61.3 4.1 5.84 Frontal_Mid_R 40.6 53.2 2.4 6.95 Frontal_Mid_Orb_L −43.4 47.4 −6.9 5.46 Frontal_Inf_Tri_R 51.4 32.7 1.2 7.47 Frontal_Inf_Orb_L −47.9 23.7 −14.2 9.38 Temporal_Mid_R 54.0 −64.0 −0.5 10.49 Temporal_Mid_L −56.1 −62.2 6.7 10.010 Occipital_Mid_R 41.2 −81.5 5.5 10.211 Occipital_Mid_Ant_L −43.4 −82.0 9.1 10.512 Occipital_Sup_R 20.3 −94.9 6.2 12.613 Occipital_Mid_Post_L −24.5 −95.1 9.8 11.214 Calcarine_L −3.0 −93.6 8.8 12.2
The most likely anatomical labels are shown. Anatomical labels were determined byusing the Automated Anatomical Labeling (AAL) (Tzourio-Mazoyer et al., 2002). Allvalues are in millimeters. ‘SD’ stands for standard deviation. Abbreviations: L = Lefthemisphere, R = Right hemisphere, Sup = Superior, Mid = Middle, Inf = Inferior,Ant = Anterior, Post = posterior, Orb = Orbital part, Tri = Triangular part.
184 S. Sasai et al. / NeuroImage 63 (2012) 179–193
2. Signals within ventricle: Physiological artifacts including res-piration and cardiac effects are also present in the CSF (Dagliet al., 1999; Windischberger et al., 2002). After normalizingthe functional images of all participants into the MNI space,we identified voxels commonly contained in CSF-segmentedimages made by SPM8 for all participants. Among thesevoxels, we selected those within the anterior horn of thelateral ventricle, and extracted the regressor as the meantime-series within the selected voxels.
3. Signals within soft tissues: Soft tissue time-series was appliedas a regressor to correct the coherent signal fluctuations acrossthe brain. The soft tissue restriction mask was created for eachparticipant to contain voxels within the face and calvarium.
4–9. Time-series of motion correction parameters: In addition tothe 3 aforementioned regressors, we also applied the time-series of motion parameters from the automated realignmentprocedure (realign step from preprocessing described above)as nuisance regressors. Three of 6 correspond to parametersof x, y and z translation, whereas the other 3 correspond tothose of x, y and z rotation.
10–18. The temporal derivatives of the upper 9 components were used.
Before processing functional data sets with these 18 regressors,the first 3 time-series of regressors were phase shifted to achieve op-timal correlation with the mean gray matter signal (Anderson et al.,2011). After these 3 signals were phase shifted, temporal derivativesof 1–3 were also prepared to achieve optimal correlation with themean gray matter signal. No phase shifting was performed for motionparameters because these were measured at zero lag from image dataand showed the highest correlation coefficients at the lag. Finally,these 18 parameters were regressed out from filtered BOLD time-series of all voxels using a GLM technique.
Estimation of correlation mapsWe estimated the 3 types of seed-based correlation maps calculat-
ed with different seed signals:
1. NIRS (oxy-Hb and deoxy-Hb) time-series: Both preprocessed oxy-Hb and deoxy-Hb signals of all channels were used.
2. BOLD time-series extracted from the brain regions selected ascorresponding voxels to NIRS measurement regions in each parti-cipant's structural image: We estimated 14 ROIs corresponding tothe NIRS measurement channels in each participant's structuralimage to obtain the corresponding BOLD time-series to the NIRSsignals (Fig. 1, “NIRS-ROI mask making”). Because NIRS signals,in theory, are generated by changes in the amount of photonstraveling from an emitter to a detector, the corresponding fMRIsignal to the NIRS signal can be related to the average BOLD signalin all voxels along the photon-traveling pathway. However, be-cause the exact shape of the pathway was unknown, we used aspherical region underneath each channel marker (vitamin tabletsattached on a probe holder, see Fig. 2B) as an approximation of anROI, which was determined using the following processes with theanatomical image of each participant before normalizing the MNIspace. First, the spherical region around the projection point ofeach channel was determined, which showed the radius of thesphere was 7.5 mm. Second, by removing any portion of the spherethat fell outside the gray matter mask and keeping only the voxelsinside the gray matter, we determined 14 ROIs in the structuralimage of each participant (Fig. 3C). Subsequently, by normalizingthese ROIs to the MNI space and identifying commonly includedvoxels between these ROIs and the functional volumes (Fig. 1,“NIRS-ROI mask normalization”), we extracted and averaged fMRIsignals inside these voxels (Fig. 1, “Seed signal extraction fromNIRS-ROI”). Thus, for each NIRS time-course, we obtained acorresponding BOLD time-course. The anatomical name of each ROIwas determined in the MNI space by referring to the anatomical
location of the centroid that was calculated as the centroid of allcentroids of the ROIs estimated in individual data sets.
3. BOLD time-series used to produce each predefined RSN: Seedregions of BOLD time-series used to estimate the predefinedRSNs were extracted from ROIs in the MNI space (Fig. 1, “Seedsignal extraction from predefined ROI”). The MNI coordinatesreported by previous reports (Fox et al., 2005; Vincent et al.,2008; Table 1) were used to define the dorsal attention, thefronto-parietal control, and the default mode networks.
By calculating the cross-correlation at lag 0 between the BOLD time-series of voxels from the whole brain and the above‐mentioned seedtime-series, we obtained 3 types of correlation maps (maps calculatedwith NIRS signals [oxy-map and deoxy-map], corresponding BOLD sig-nals [cBOLD-map], and RSNs [DA-map, FPC-map, and DM-map])for each participant's data (Fig. 1, “Seed-based correction mapscalculation”). All maps were processed using Fisher's Z transformation.Subsequently, a Student's t-statistic map (random effects analysis;uncorrected) was computed for each data set (Fig. 1, “Population-based Z-score maps calculation”). Because distributions of p-valueswere different between maps calculated with seed signals acquiredwith different devices, we thresholded each map based on the distribu-tion of p-values.
Similarity of correlation mapsTo evaluate the similarity of spatial distribution between the oxy-
map, deoxy-map, and cBOLD-map for each measurement channel, wecomputed the standard Pearson correlation coefficient over all graymatter voxels within the cerebral cortex in each participant (Foxet al., 2006; Vincent et al., 2007; Fig. 1, “Spatial correlation betweencorrelation maps”). Statistical significance was tested using a two-
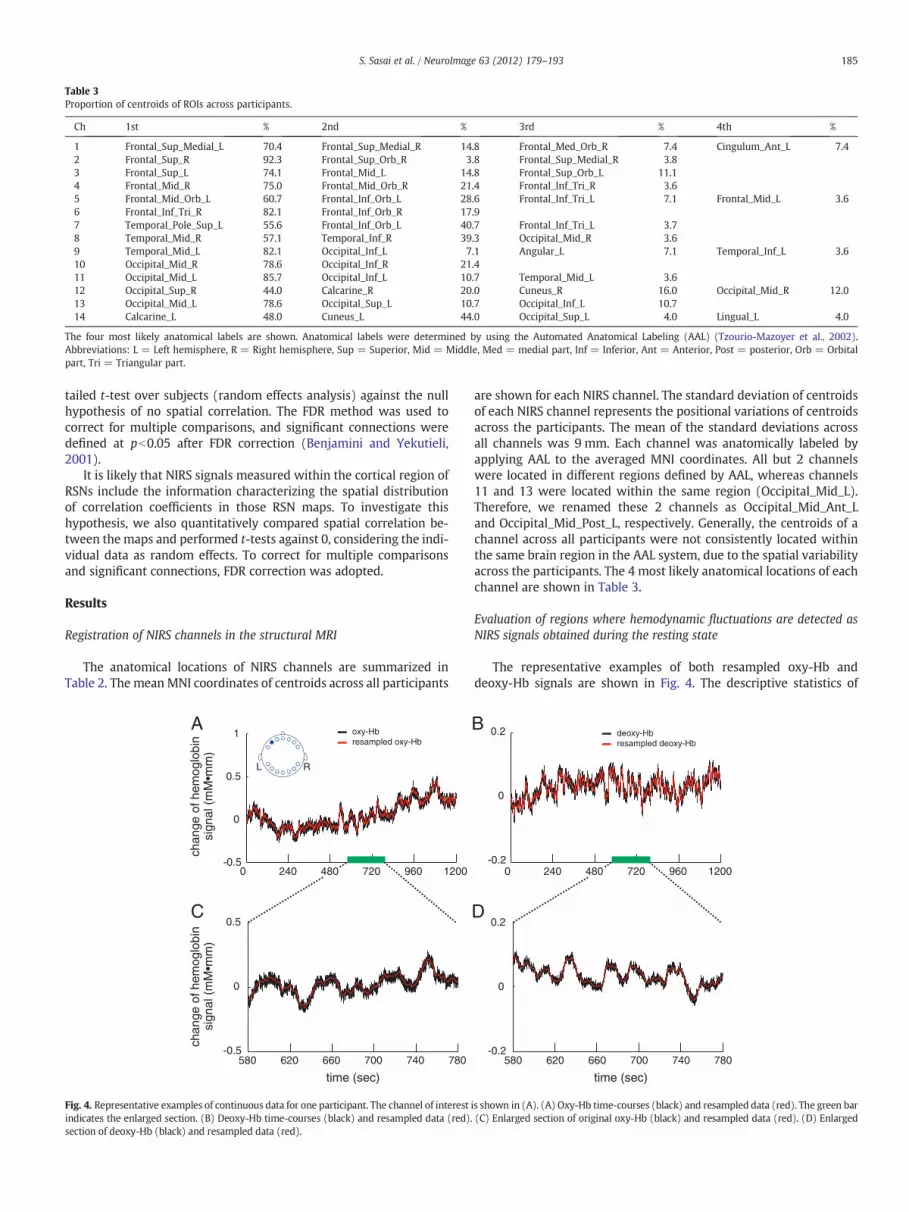
Table 3Proportion of centroids of ROIs across participants.
Ch 1st % 2nd % 3rd % 4th %
1 Frontal_Sup_Medial_L 70.4 Frontal_Sup_Medial_R 14.8 Frontal_Med_Orb_R 7.4 Cingulum_Ant_L 7.42 Frontal_Sup_R 92.3 Frontal_Sup_Orb_R 3.8 Frontal_Sup_Medial_R 3.83 Frontal_Sup_L 74.1 Frontal_Mid_L 14.8 Frontal_Sup_Orb_L 11.14 Frontal_Mid_R 75.0 Frontal_Mid_Orb_R 21.4 Frontal_Inf_Tri_R 3.65 Frontal_Mid_Orb_L 60.7 Frontal_Inf_Orb_L 28.6 Frontal_Inf_Tri_L 7.1 Frontal_Mid_L 3.66 Frontal_Inf_Tri_R 82.1 Frontal_Inf_Orb_R 17.97 Temporal_Pole_Sup_L 55.6 Frontal_Inf_Orb_L 40.7 Frontal_Inf_Tri_L 3.78 Temporal_Mid_R 57.1 Temporal_Inf_R 39.3 Occipital_Mid_R 3.69 Temporal_Mid_L 82.1 Occipital_Inf_L 7.1 Angular_L 7.1 Temporal_Inf_L 3.610 Occipital_Mid_R 78.6 Occipital_Inf_R 21.411 Occipital_Mid_L 85.7 Occipital_Inf_L 10.7 Temporal_Mid_L 3.612 Occipital_Sup_R 44.0 Calcarine_R 20.0 Cuneus_R 16.0 Occipital_Mid_R 12.013 Occipital_Mid_L 78.6 Occipital_Sup_L 10.7 Occipital_Inf_L 10.714 Calcarine_L 48.0 Cuneus_L 44.0 Occipital_Sup_L 4.0 Lingual_L 4.0
The four most likely anatomical labels are shown. Anatomical labels were determined by using the Automated Anatomical Labeling (AAL) (Tzourio-Mazoyer et al., 2002).Abbreviations: L = Left hemisphere, R = Right hemisphere, Sup = Superior, Mid = Middle, Med = medial part, Inf = Inferior, Ant = Anterior, Post = posterior, Orb = Orbitalpart, Tri = Triangular part.
185S. Sasai et al. / NeuroImage 63 (2012) 179–193
tailed t-test over subjects (random effects analysis) against the nullhypothesis of no spatial correlation. The FDR method was used tocorrect for multiple comparisons, and significant connections weredefined at pb0.05 after FDR correction (Benjamini and Yekutieli,2001).
It is likely that NIRS signals measured within the cortical region ofRSNs include the information characterizing the spatial distributionof correlation coefficients in those RSN maps. To investigate thishypothesis, we also quantitatively compared spatial correlation be-tween the maps and performed t-tests against 0, considering the indi-vidual data as random effects. To correct for multiple comparisonsand significant connections, FDR correction was adopted.
Results
Registration of NIRS channels in the structural MRI
The anatomical locations of NIRS channels are summarized inTable 2. The mean MNI coordinates of centroids across all participants
chan
ge o
f hem
oglo
bin
sig
nal (
mM
•mm
)
time (sec)
580 620 660 700 740 780-0.5
0
0.5C
0 240 480 720 960 1200-0.5
0
0.5
1 oxy-Hbresampled oxy-Hb
A
RL
chan
ge o
f hem
oglo
bin
sig
nal (
mM
•mm
)
Fig. 4. Representative examples of continuous data for one participant. The channel of interestindicates the enlarged section. (B) Deoxy-Hb time-courses (black) and resampled data (red).section of deoxy-Hb (black) and resampled data (red).
are shown for each NIRS channel. The standard deviation of centroidsof each NIRS channel represents the positional variations of centroidsacross the participants. The mean of the standard deviations acrossall channels was 9 mm. Each channel was anatomically labeled byapplying AAL to the averaged MNI coordinates. All but 2 channelswere located in different regions defined by AAL, whereas channels11 and 13 were located within the same region (Occipital_Mid_L).Therefore, we renamed these 2 channels as Occipital_Mid_Ant_Land Occipital_Mid_Post_L, respectively. Generally, the centroids of achannel across all participants were not consistently located withinthe same brain region in the AAL system, due to the spatial variabilityacross the participants. The 4 most likely anatomical locations of eachchannel are shown in Table 3.
Evaluation of regions where hemodynamic fluctuations are detected asNIRS signals obtained during the resting state
The representative examples of both resampled oxy-Hb anddeoxy-Hb signals are shown in Fig. 4. The descriptive statistics of
0 240 480 720 960 1200-0.2
0
0.2 deoxy-Hbresampled deoxy-Hb
B
580 620 660 700 740 780-0.2
0
0.2D
time (sec)
is shown in (A). (A) Oxy-Hb time-courses (black) and resampled data (red). The green bar(C) Enlarged section of original oxy-Hb (black) and resampled data (red). (D) Enlarged

Table 4Descriptive statistics of LBCV.
Ch Anatomical locationof channel
oxy-Hbaverageddistance
SD Averagedr value
deoxy-Hbaverageddistance
SD Averagedr value
1 Frontal_Sup_Medial_L 4.6 1.8 0.39 5.4 1.7 −0.372 Frontal_Sup_R 5.2 1.7 0.49 5.4 1.7 −0.463 Frontal_Sup_L 5.8 2.3 0.48 5.1 2.0 −0.494 Frontal_Mid_R 4.9 1.9 0.42 6.0 2.4 −0.435 Frontal_Mid_Orb_L 5.2 1.5 0.33 5.7 1.9 −0.396 Frontal_Inf_Tri_R 5.4 1.8 0.29 5.8 1.5 −0.297 Frontal_Inf_Orb_L 5.0 1.4 0.26 5.6 1.7 −0.288 Temporal_Mid_R 4.9 2.3 0.47 5.4 2.0 −0.419 Temporal_Mid_L 5.2 1.8 0.43 5.2 2.1 −0.3810 Occipital_Mid_R 5.3 1.8 0.52 5.3 1.6 −0.4611 Occipital_Mid_Ant_L 6.6 2.0 0.45 5.4 1.8 −0.3812 Occipital_Sup_R 6.3 1.6 0.55 6.4 1.7 −0.5213 Occipital_Mid_Post_L 5.4 1.9 0.55 6.0 2.3 −0.5014 Calcarine_L 5.0 1.7 0.51 5.4 1.5 −0.38
Anatomical labels were determined by using the Automated Anatomical Labeling(AAL) (Tzourio-Mazoyer et al., 2002). Values in the columns indicated as ‘averageddistance’ and ‘SD’ are in millimeters, while those in the columns indicated as‘averaged r value’ are correlation coefficients. ‘averaged distance’, ‘SD’ and ‘averaged rvalue’ stands for averaged distance of the LBCV from the projection point across allparticipants, standard deviation and averaged correlation coefficients of the LBCVacross all participants. Abbreviations: L = Left hemisphere, R = Right hemisphere,Sup = Superior, Mid = Middle, Inf = Inferior, Ant = Anterior, Post = posterior,Orb = Orbital part, Tri = Triangular part.
186 S. Sasai et al. / NeuroImage 63 (2012) 179–193
LBCVs are shown in Table 4. Based on these data, the average distanceacross all channels was 5.3 mm for oxy-Hb and 5.6 mm for deoxy-Hb,whereas the standard deviation was 0.6 and 0.4, respectively. Thisresult demonstrates that most of the LBCVs were located within theradius of 2 voxels from the projection point. Although most of theaveraged correlation coefficients were higher than 0.3 for oxy-Hb andlower than ‐0.3 for deoxy-Hb, the absolute values in Frontal_Inf_Tri_Rand Frontal_Inf_Orb_L were slightly lower than those in the otherbrain regions (Table 4).
To investigate the distribution of regions where hemodynamicchanges affect the obtained NIRS signals at the brain tissue level, wesorted HCVs (top 100 ranked voxels within a 3-cm radius from theprojection point) by the tissue type. Most of the HCVs with both Hbsignals were located within the brain tissue, whereas the HCVs in 2brain regions (Frontal_Inf_Tri_R, Frontal_Inf_Orb_L) were locatedequally in the brain and non-brain tissues (Table 5). By picking upmore than 100 voxels as HCVs and sorting by tissue types, the robust-ness of the result shown in Table 5 was confirmed (Table S1). Theseresults show that NIRS signals obtained with all but 2 channels
Table 5Distributions of HCVs with NIRS signals.
Ch Anatomical locationof channel
oxy-Hb braintissue (%)
Skull (%) Skin (%) r valrank
1 Frontal_Sup_Medial_L 92 6 2 0.332 Frontal_Sup_R 95 3 2 0.413 Frontal_Sup_L 93 4 3 0.404 Frontal_Mid_R 85 5 10 0.325 Frontal_Mid_Orb_L 70 9 21 0.296 Frontal_Inf_Tri_R 51 10 39 0.257 Frontal_Inf_Orb_L 37 9 54 0.258 Temporal_Mid_R 94 3 3 0.419 Temporal_Mid_L 91 5 4 0.3610 Occipital_Mid_R 95 2 3 0.4911 Occipital_Mid_Ant_L 94 4 2 0.4512 Occipital_Sup_R 96 2 2 0.5413 Occipital_Mid_Post_L 94 4 2 0.5014 Calcarine_L 92 5 3 0.46
Anatomical labels were determined by using the Automated Anatomical Labeling (AAL) (Tzovoxels’ are correlation coefficients. ‘r value of 100th-ranked voxels’ stands for averaged 10L = Left hemisphere, R = Right hemisphere, Sup = Superior, Mid = Middle, Inf = Inferio
mainly reflect changes in the Hb concentration that occur in thebrain regions adjacent to the channels during the resting state.
Whole brain distribution of correlated voxels with NIRS signals obtainedduring the resting state
To calculate group-averaged statistical maps of cross-correlation,we used oxy-Hb signals, deoxy-Hb signals, and BOLD signals extractedfrom the ROIs corresponding to the NIRSmeasurement regions as seedsignals (Fig. 5). Because of the inconsistency between participantsin the tissue type where hemodynamics were reflected in NIRSsignals, we did not use signals from Frontal_Inf_Tri_R (channel 6)or Frontal_Inf_Orb_L (channel 7) for calculating the map. For eachchannel, oxy-maps and cBOLD-maps provided closely resemblingspatial distributions, whereas deoxy-maps were clearly similar tothe inversed patterns of both oxy-maps and cBOLD-maps. Spatialcorrelation analyses demonstrated that the oxy-maps and cBOLD-maps had a significant positive correlation for all brain regions(Fig. 5, bar graphs). Significant negative correlation was observedbetween deoxy-maps and cBOLD-maps for all brain regions. These re-sults demonstrate that using NIRS signals measured at various brainregions as seed signals can reproduce the specific distribution patternsof correlation maps generated using BOLD signals extracted from thecorresponding seed brain regions.
To identify the non-brain tissue regions that correlated with NIRSsignals obtained at Frontal_Inf_Tri_R and Frontal_Inf_Orb_L, weexamined the correlation maps using NIRS signals obtained in theseregions as seed signals in individual data. We focused examinationon 2 participants whose data showed that over half of all correlatingvoxels with NIRS signals obtained in these 2 regions were locatedwithin the non-brain tissue regions. The correlation map estimatedfor each individual's data is shown in Supplemental Figure S1. Wefound that the correlating voxels mainly localized not within thebrain regions but rather within the bilateral temporal muscles and/or in the tissues near the eyes. Furthermore, an overlap was observedbetween most of the voxels correlating with the NIRS signal obtainedat the Frontal_Inf_Tri_R and the Frontal_Inf_Orb_L.
The effect of noise regression in BOLD signals on the correlationbetween NIRS and BOLD signals was examined (Fig. S2). When nowaveform was regressed from the BOLD signals, both the Hb signalscorrelated not only with the cortical regions but also with cerebralvasculatures such as the superior sagittal sinus and the transversesinus. Conversely, when all physiological waveforms (see “Noisesignal regression” in the Materials and methods section) wereregressed from the BOLD signals, no correlation over threshold wasobserved in these cerebral vasculature areas.
ue of 100thed voxel
deoxy-Hb braintissue (%)
Skull (%) Skin (%) r value of 100thranked voxel
89 8 3 −0.3093 4 3 −0.3794 4 2 −0.4081 7 12 −0.3172 8 20 −0.3255 10 35 −0.2451 8 41 −0.2690 5 5 −0.3485 7 8 −0.3188 5 7 −0.4185 8 7 −0.3688 6 6 −0.4789 6 5 −0.4481 10 9 −0.35
urio-Mazoyer et al., 2002). Values in the columns indicated as ‘r value of 100th-ranked0th -ranked correlation coefficients of the HCVs across all participants. Abbreviations:r, Ant = Anterior, Post = posterior, Orb = Orbital part, Tri = Triangular part.

oxy-Hb deoxy-Hb cBOLD Z value
oxy-
Hb
- B
OLD
deox
y-H
b -
BO
LD
***p < 0.001** p < 0.005* p < 0.05
-1.5-1
-0.50
0.51
1.5
-1.5-1
-0.50
0.51
1.5
-1.5-1
-0.50
0.51
1.5
-1.5-1
-0.50
0.51
1.5
-1.5-1
-0.50
0.51
1.5
-1.5-1
-0.50
0.51
1.5
-1.5-1
-0.50
0.51
1.5
-1.5-1
-0.50
0.51
1.5
-1.5-1
-0.50
0.51
1.5
-1.5-1
-0.50
0.51
1.5
-1.5-1
-0.50
0.51
1.5
-1.5-1
-0.50
0.51
1.5
*
**
***
***
***
***
***
***
***
***
***
***
*
***
***
***
***
***
***
***
***
***
***
***
channel: 1Frontal_Sup_Medial_L
2Frontal_Sup_R
3Frontal_Sup_L
4Frontal_Mid_R
5Frontal_Mid_Orb_L
8Temporal_Mid_R
9Temporal_Mid_L
10Occipital_Mid_R
11Occipital_Mid_Ant_L
12Occipital_Sup_R
13Occipital_Mid_Post_L
14Calcarine_L
negative positive
percentile10 5 1 0.510510.5
Z=8
Z=8
Z=8
Z=4
Z=-4
Z=0
Z=8
Z=4
Z=8
Z=4
Z=8
Z=8
187S. Sasai et al. / NeuroImage 63 (2012) 179–193
We also calculated group-averaged statistical maps with BOLDsignals extracted from predefined ROIs (DA-map, FPC-map, andDM-map) so that we could determine whether NIRS signals obtainedin these areas were correlated with the specific brain regions of theseRSNs. The nearest NIRS channels from the predefined ROIs of the dor-sal attention and fronto-parietal control networks were located with-in the same anatomical regions as these ROIs (Occipital_Mid_Ant_Land Frontal_Mid_R), whereas the nearest channel to the ROI of thedefault mode network was located in the next regions, based onAAL (NIRS channel: Frontal_Sup_Medial_L, ROI: Frontal_Med_Orb_L).The regions positively correlated with oxy-Hb signals and negativelycorrelated with deoxy-Hb signals in the Occipital_Mid_Ant_L regionwere mainly localized within the bilateral inferior temporal gyri,bilateral lingual gyri, right inferior precentral gyrus, and bilateral su-perior parietal lobule. These brain regions correspond to the regionsthat have been repeatedly reported as the “dorsal attention network.”The DA-map calculated using BOLD signals extracted from the leftMT+ region, which corresponds to the Occipital_Mid_L in the AAL,as seed signals also showed positive correlation in these regions(Figs. 6A, B). The regions positively correlated with oxy-Hb signalsand negatively correlated with deoxy-Hb signals in the Frontal_Mid_Rwere mainly localized within the bilateral dorsolateral prefrontal cor-tices, right dorsomedial prefrontal cortex/anterior cingulated, andright anterior inferior parietal lobule. These brain regions correspondto the regions that have been repeatedly reported as the “fronto-parietal control network.” The FPC-map calculated using BOLDsignals extracted from the right aPFC region, corresponding to theFrontal_Mid_R in the AAL, as seed signals also showed positive corre-lation in these regions (Figs. 6C, D). The regions positively correlatedwith oxy-Hb signals and negatively correlated with deoxy-Hb signalsin the Frontal_Sup_Medial_L weremainly localized within the ventro-medial prefrontal cortex, bilateral lateral parietal cortices, bilateralsuperior frontal cortices, and posterior cingulate. These brain regionscorrespond to the regions also known as the “default mode network.”The DM-map calculated using BOLD signals extracted from rightvmPFC, corresponding to the Frontal_Med_Orb_L in the AAL, as seedsignals also showed positive correlation in these regions (Figs. 6E, F).Spatial correlation analysis revealed that the spatial distributions ofcorrelation coefficients in the oxy-maps and deoxy-maps calculatedwith signals obtained from the Occipital_Mid_Ant_L, Frontal_Mid_R,and Frontal_Sup_Medial_L were correlated positively and negatively,respectively, with those of the DA-map, FPC-map, and DM-map(Figs. 6G–I). These results demonstrate that NIRS signals obtainedat the brain regions of dorsal attention, fronto-parietal control, anddefault mode networks correlated with spontaneous hemodynamicfluctuation determining the spatial patterns of those RSNs.
A previous study demonstrated that the regions within the fronto-parietal control network are spatially interposed between regionswithin the dorsal attention and default mode networks, especially
Fig. 5. Group-average statistical maps of correlation corresponding to varied seedlocations and different seed signals. Each row corresponds to the location of the seedrepresented by NIRS measurement channels and their projected locations on thecortex. The left, middle, and right maps in each row represent those calculated usingdifferent seed signals: oxy-Hb signal, deoxy-Hb signal, and BOLD signal extractedfrom the ROI around the projection point (Fig. 3), respectively. The voxels with upper10% of p-value are colored. The dots indicated by arrowheads (green dots in theleft and right maps and pink dots in the middle map) show the cortical projectionpoint of the vitamin tablet representing the NIRS measurement channel. The redand blue bar graphs on the right side of the images represent the spatial correlationsbetween the maps calculated using oxy-Hb signals as seed signals and that calculatedwith seed BOLD signals, and those between the maps calculated using deoxy-Hbsignals as seed signals and that calculated with seed BOLD signals, respectively.The error bars indicate standard deviations. Significant spatial correlation coefficientsagainst 0 are shown (*pb0.05, **pb0.01, ***pb0.001).

188 S. Sasai et al. / NeuroImage 63 (2012) 179–193
within the parietal cortex (Vincent et al., 2008). To determinewhetherNIRS signals obtained in brain regions near these 3 RSNs could charac-terize this spatial relation among the RSNs, we investigated thedistributions of the superficial cortical regions correlated with NIRSsignals obtained from the Occipital_Mid_Ant_L, Frontal_Mid_R, andFrontal_Sup_Medial_L. We found that there was very little overlapof regions positively correlated with oxy-Hb signals and negativelycorrelated with deoxy-Hb signals obtained for these 3 regions(Figs. 7A, B). In particular, regions positively correlated with oxy-Hbsignals and negatively correlated with deoxy-Hb signals in theFrontal_Mid_R and Frontal_Sup_Medial_L were anteroposteriorly sepa-rately localized within the inferior parietal regions (Parietal_Inf_R,SupraMarginal_R, Parietal_Inf_L, and SupraMarginal_L for Frontal_Mid_R;Angular_R and Angular_L for Frontal_Sup_Medial_L), whereas thosepositively correlated with oxy-Hb signals and negatively correlatedwith deoxy-Hb signals in the Occipital_Mid_Ant_L were localized inmore superior cortical regions (Parietal_Sup_R and Parietal_Sup_L).For each channel, non-overlapping voxels were more than 89% of allvoxels positively correlated with oxy-Hb signals of the channel, andwere more than 93% of all voxels negatively correlated with deoxy-Hb signals of the channel. These results demonstrate that NIRS signalsobtained within brain regions of these RSNs estimated in previousfMRI studies include adequate information to localize those RSNswithin plausibly separate anatomical regions. By comparing the spatialpatterns of the DA-map, FPC-map, and DM-map in superficial brainregions, we confirmed this positional relationship between these3 networks within the fMRI data set (Fig. 7C).
Discussion
The purpose of this study was to investigate and establish the re-lationship between NIRS and fMRI during the resting state to studyfunctional connectivity with special focus on the RSNs. To do so,we conducted simultaneous recording of NIRS and fMRI and thefollowing analyses. First, we identified the positions of NIRS channelsin the cortical regions using individual data sets and investigated thedistribution of these positions across participants in the MNI space.Second, we tried to find the local maximum of the correlation coeffi-cient between NIRS and fMRI signals in the regions close to the NIRSchannel. Third, we classified the highly correlated voxels with NIRSsignals that resided in the adjacent regions to NIRS channels intobrain and non-brain voxels. Finally, we investigated whether NIRSsignals correlated with BOLD signals not only within the adjacentbrain regions to NIRS channels but also within distant brain regionsconstituting RSNs. Accordingly, there are 4 corresponding findingsin this study. First, we successfully projected all NIRS measurementchannels onto the cortical surface with an average standard deviationof 9 mm (Table 2), which is similar to a previously reported value byOkamoto et al. (2004). Second, we found single voxels, which cor-responded to the local maxima of correlation coefficients betweenNIRS and fMRI signals, within a radius of 2 voxels from the projectionpoint independent of the channel location (Table 4). Third, weobserved that highly correlated voxels with the NIRS signal weremainly localized within brain tissues for all NIRS channels, exceptfor 2 bilateral inferior frontal channels (Frontal_Inf_Tri_R andFrontal_Inf_Orb_L) (Table 5). Finally, we observed cortical regionscorrelating with the NIRS signals not only within areas adjacent tothe channels but also in areas distant from the channels (Fig. 5). Inparticular, we successfully reproduced the correlation maps of 3RSNs (dorsal attention, fronto-parietal control, and default modenetworks) using NIRS signals as seed signals (Figs. 6, 7). Collectively,these findings support the idea that NIRS signals obtained at severalcortical regions during the resting state mainly reflect regional spon-taneous hemodynamic fluctuations that originate from spontaneouscortical activity and include information characterizing cortico-corticalresting state functional connectivity.
Registration of NIRS channels in the structural MRI
In the current study, we assumed that obtainedNIRS signals shouldmainly reflect hemodynamics of regions along the optical path plane,because it has previously been reported that the photon‐travelingpathways have a “banana” shape between the incident and detectionprobes (Okada et al., 1997; van der Zee et al., 1990) (see Materialsand methods). Therefore, we applied a different procedure for regis-tration of NIRS channel positions on the cortical regions that theprevious study that examined cranio-cerebral correlation using mag-netic resonance imaging (MRI), via the guidance of the international10–20 system for electrode placement (Okamoto et al., 2004). To con-firm the reliability of the registration process, we examined whetherchanges in the projection point of the NIRS channel produced byrotation of the optical path plane affected the resultant correlationbetween NIRS signals (oxy-Hb and deoxy-Hb) and BOLD signalsextracted from spherical ROIs around the projection point (seesupplementary materials for detailed account of the procedure). Thebest correlation was found between NIRS signals and BOLD signalsextracted from the ROI around the projection point without rotation(Fig. S3), indicating that the process can reliably register the channellocation on the cortical surface. All channels were projected on thecortical surface with similar accuracy to that previously reported. Cuiet al. (2011) projected the channel marker from the scalp to thebrain surface by finding the point on the brain surface that was closestto themarker, which is similar to the procedure used by Okamoto et al.(2004). Furthermore, Cui et al. (2011) reported that themean value ofthe distances between the LBCVs and projection points was 18 mm foroxy-Hb signals and 21 mm for deoxy-Hb signals. In the current study,we found the LBCVs were within a radius of 2 voxels (~6 mm) fromthe projection point, suggesting that the method of registrationapplied in our study is also useful in addition to those methods usedin the aforementioned previous studies.
Regions where hemodynamic fluctuations were reflected by NIRS signalsobtained during the resting state
The fact that LBCVs were found within a radius of 2 voxels from theprojection point supports that both oxy-Hb and deoxy-Hb signals re-flect hemodynamic fluctuations in regions adjacent to the measure-ment channels. Furthermore, highly correlated voxels with each of theHb signals were found within brain tissues regardless of which of theHb signal was used to calculate correlation (Table 5). Therefore, correla-tion between fMRI signals within cortical regions and NIRS signalsreported in the current study mainly reflects coherence of hemody-namic changes due to spontaneous cortical activity. On the otherhand, NIRS signals obtained at the 2 frontal regions (Frontal_Inf_Tri_Rand Frontal_Inf_Orb_L) showed correlation not only with BOLD signalsfrom brain tissues but also with those from non-brain tissues (Table 5).Among these signals, we found a strong correlation between theNIRS signals obtained at the 2 frontal channels (Frontal_Inf_Tri_Rand Frontal_Inf_Orb_L) and the whole head BOLD signals in the softtissue, such as bilateral temporal muscles and/or tissues near the eyes(Fig. S1). This finding indicates that NIRS signals obtained at theseareas mainly reflect Hb concentration changes in the soft tissue, asshown in the lower proportions of brain tissues in the highly correlatedvoxels in Table 5. Also of note, Cui et al. (2011) demonstrated that thescalp-brain distance affects the NIRS–fMRI correlation. However, thedistance between these 2 channels and brain surfaces did not have astrong effect on the results of the current study. Although it is unclearwhy NIRS signals in only 2 frontal regions showed correlation withthose outside of the brain tissue, it is likely that signals in these regionsaremore strongly affected by global changes of Hb concentrations, suchas skin blood flow, than the other regions (Gagnon et al., 2012a, 2012b;Kohno et al., 2007; Obrig et al., 2000; Saager and Berger, 2008;Tachtsidis et al., 2008; Takahashi et al., 2011; Toronov et al., 2001;

oxy-Hb
deoxy-Hb
BOLD
A C E
B D F
negative positivepercentile
10 5 1 0.510510.5
channel: 9Occipital_Mid_Ant_L
channel: 4Frontal_Mid_R
channel: 1Frontal_Sup_Medial_L
predefined ROI for DA-map Occipital_Mid_L
predefined ROI for FPC-mapFrontal_Mid_R
predefined ROI for DM-mapFrontal_Med_Orb_L
G
-1.2-0.9-0.6-0.3
00.30.60.91.2 ***
***
Z v
alue
oxy-
Hb
- B
OLD
deox
y-H
b -
BO
LD
I
-1.2-0.9-0.6-0.3
00.30.60.91.2
**
***
Z v
alue
H
0
-1.2-0.9-0.6-0.3
0.30.60.91.2
**
***
Z v
alue
BOLD + oxy-HbBOLD + deoxy-Hb
BOLD + oxy-Hb + deoxy-Hb
Fig. 6. RSNs revealed using NIRS signals and BOLD signals as seeds. Group-average statistical maps calculated using Hb signals and BOLD signals extracted from predefined ROIsas seed signals. The top and middle rows show oxy-maps and deoxy-maps calculated using Hb signals obtained at (A) Occipital_Mid_Ant_L, (C) Frontal_Mid_R, and(E) Frontal_Sup_Medial_L. The bottom row shows maps calculated using BOLD signals extracted from predefined ROIs (Table 1) located within (A) Occipital_Mid_L, (C) Frontal_Mid_R,and (E) Frontal_Med_Orb_L areas. BOLD signals extracted from these areas have been reported to correlate with brain regions of (A) dorsal attention, (C) fronto-parietal control, and(E) default mode networks. (B), (D) and (F) correspond to the conjunction maps of (A), (C), and (E), respectively. Yellow, magenta, and cyan regions were colored as brain regionscorrelating with BOLD signals and both Hb signals used as seed signals; with BOLD signals and oxy-Hb signals; and with BOLD signals and deoxy-Hb signals, respectively. In (A–F), wethresholded each map at the value of the top 10% of the distribution of p-values of all brain voxels, because the distributions of p-values were different between maps calculated withseed signals acquired with different devices. (G–I) Spatial correlation between the map calculated using Hb signals as seed signals and that calculated with BOLD signals. The errorbars indicate standard deviations. The significant spatial correlation coefficients against 0 are shown (**pb0.01, ***pb0.001).
189S. Sasai et al. / NeuroImage 63 (2012) 179–193
Yamada et al., 2009; Zhang et al., 2007). In particular, Gagnon et al.(2012b) showed that systemic interference occurring in the superficiallayers of the human head is inhomogeneous across the surface of thescalp. To clarify the issue, it would be helpful to investigate the effectof the motion of the cephalic muscles and blood stanching on theNIRS signals obtained at these regions. In addition, the effect of theposture of participants during measurement on the results must beclarified. Although we measured NIRS signals with individuals in theface-up position, NIRS measurements are generally conducted with
A B
oxy-Hb deoxy-
Fig. 7. Anatomical separation of RSNs. (A) Positively correlated regions with oxy-Hb seed sigcortical voxels that were positively correlated with oxy-Hb signals obtained at Occipital_Milated regions with deoxy-Hb seed signals. Blue, green, and red represents the voxels with pdeoxy-Hb signals obtained at Occipital_Mid_Ant_L, Frontal_Mid_R, and Frontal_Sup_Mediared represents the voxels with p-values within the upper 5% of all cortical voxels that weat Occipital_Mid_L, Frontal_Mid_R, and Frontal_Med_Orb_L, respectively. In this figure, we
participants sitting. Because this positional difference of the participantscan affect their blood flow circulation, it would useful for future studiesto focus on the relevance of participant's posture to functional connec-tivity. Whatever the case, the present study demonstrated that NIRScan detect regional changes in cortical blood oxygenation during theresting state, though we must be very careful about taking measure-ments at some restricted head positions, such as the inferior frontalgyrus where changes in signals are dominated by those originatedfrom non-brain tissues.
C
Hb BOLD
nals. Blue, green, and red represents the voxels with p-values within the upper 5% of alld_Ant_L, Frontal_Mid_R, and Frontal_Sup_Medial_L, respectively. (B) Negatively corre--values within the upper 5% of all cortical voxels that were negatively correlated withl_L, respectively. (C) Positively correlated regions with BOLD signals. Blue, green, andre positively correlated with BOLD signals extracted from predefined ROIs (Table 1)defined cortical voxels as those classified into cortical regions with AAL.

190 S. Sasai et al. / NeuroImage 63 (2012) 179–193
Whole brain distribution of correlated voxels with NIRS signals obtainedduring the resting state
By calculating the cross-correlation, we observed that spatialpatterns of correlating brain regions with NIRS signals were similarto those of correlating regions with BOLD signals extracted fromareas close to NIRS channels (Fig. 5). RSNs have been reported inmany fMRI studies using seed-based correlation analysis (Biswal etal., 1995; Damoiseaux et al., 2006; Fox et al., 2005; Fransson, 2005;Greicius et al., 2003; Vincent et al., 2008) and independent compo-nent analysis (Beckmann et al., 2005; Calhoun et al., 2001; De Lucaet al., 2006; van de Ven et al., 2004). Despite the different methodsused to characterize the RSNs, specific brain regions have been con-sistently reported as the RSNs across studies (van den Heuvel andHulshoff, 2010). In the present study, we used NIRS and fMRI simulta-neously to successfully reproduce 3 RSNs (dorsal attention, fronto-parietal control, and default mode networks), using NIRS signalsinstead of fMRI signals as seed signals (Beckmann et al., 2005;Damoiseaux et al., 2006; De Luca et al., 2006; Fox et al., 2005;Fransson, 2005; Greicius et al., 2003; van den Heuvel et al., 2008;Vincent et al., 2008) (Fig. 6). It should be noted that the voxels thatdid not satisfy the significance level (pb0.05, corrected) could beincluded in the correlation maps thresholded with our method.However, considering that the spatial patterns of previously reportedRSNs could be successfully reproduced using both NIRS and BOLDsignals, our results strongly support the theory that both oxy-Hband deoxy-Hb signals can detect the information necessary for deter-mining RSNs included in the fMRI data sets. On the other hand, theBOLD response theoretically results from local concentration changesin paramagnetic deoxy-Hb (Ogawa et al., 1990). Previous studies onfunctional activation revealed a strong temporal and spatial correla-tion of the BOLD signal with deoxy-Hb, rather than oxy-Hb (Huppertet al., 2006a, 2006b). In contrast, the current study showed that bothoxy-Hb and deoxy-Hb produced consistent results in terms of the spa-tial patterns of the correlation maps. Although the relationshipsbetween each of the Hb signals and the BOLD signals are not fully un-derstood (Chen et al., 2011; Devor et al., 2007; Steinbrink et al., 2006),our results suggest that resting state functional connectivity may ariseat least in part from the coupling of spontaneous neural activity that iscommonly reflected in cerebral hemodynamic changes in differentblood vessels such as arterioles, capillaries, and venules.
Conversely, a previous study indicated that the low‐frequencycomponents (0.01–0.1 Hz) of NIRS signals obtained during the restingstate were affected by fluctuations in the blood flow and hemoglobinoxygenation at a global circulatory system level (Tong and Frederick,2010). In this previous study, the authors showed that the spatiotem-poral patterns of regions correlating with NIRS signals obtained at theright prefrontal area resembled the spatial patterns of the cerebral ve-nous system. In the current study, when the preprocessing step of thefMRI data similar to the one used in the previous study was adopted,we also observed a correlation over threshold within the cerebral ve-nous regions (Fig. S2). This finding suggests that both NIRS and BOLDsignals may include the correlating information of physiologicalnoises originating from non-brain tissue even after being processedwith the band-pass filter (0.009–0.1 Hz). However, the correlationwithin vasculature areas was not found in the correlation maps calcu-lated with the current preprocessing step, which fully regresses outthe noises in fMRI data. Furthermore, some RSNs can be successfullyreproduced using NIRS instead of fMRI signals as seed signals(Figs. 5, 6). This result supports the theory that, although NIRS signalsobtained during the resting state may be contaminated with physio-logical noises, they evidently also contain information representingthe spontaneous cortical activity that characterizes RSNs.
Recently, another study showed that simultaneously measuredNIRS and fMRI signals produce similar resting state functionalconnectivity between the bilateral primary motor areas (Duan et al.,
2012). In that study, the authors transformed the fMRI data into theNIRS measurement space and estimated the functional connectivityin that space. Generally, NIRS-based functional connectivity is esti-mated by calculating the cross-correlation of signals obtained fromdifferent channels. In our previous NIRS study, we calculated thecross-correlation between all pairs of NIRS signals obtained from di-verse brain regions and observed the functional connectivity betweenbilateral homologous brain regions (Sasai et al., 2011). This findingwas reproduced using the same analysis with the NIRS signals mea-sured in the current study (data not shown). Thus, accumulated evi-dence shows that NIRS-based functional connectivity is consistentwith fMRI-based functional connectivity.
The dorsal attention and default mode networks have beensuggested to have competing functions, that is, information process-ing from the external world versus internal mentation (Buckner andVincent, 2007; Buckner et al., 2008; Corbetta and Shulman, 2002;Gusnard et al., 2001; Mason et al., 2007). Recent fMRI studies focusedon switching between these RSNs (depending on the experimentalconditions) demonstrated that the interaction of the dorsal attentionand default mode networks is causally regulated by the fronto-parietal control network (Gao and Lin, 2012; Sridharan et al., 2008).The fronto-parietal control network is anatomically interposed be-tween the dorsal attention and default mode networks (Vincent etal., 2008). The results of the current study successfully reproducedthe same anatomical relationship among these RSNs using NIRS(Fig. 6), which supports that use of NIRS can detect the cortical activ-ity correlated only within the anatomically specific regions of theseRSNs, This suggests that we can evaluate the relationship of theseRSNs using NIRS signals obtained at cortical regions of these RSNs. Al-though we must establish the method to extract only the informationdetermining RSNs from raw NIRS signals, the findings of our studypromote the application of NIRS to prove the signal relationshipamong these RSNs.
Regarding the temporal relationship among the RSNs, many fMRIstudies have reported a negative correlation between the dorsal at-tention and default mode networks (Fox et al., 2005, 2009;Fransson, 2005; Greicius et al., 2003; Kelly et al., 2008). To accuratelyestimate functional connectivity, a general linear model (GLM) tech-nique has previously been used to remove fluctuations due to scannerinstabilities, subject motion and respiration and cardiac effects, andthe coherent signal fluctuations across the brain (global signal) (Foxet al., 2005, 2009). However, the regression of the global signal hasalso been shown to introduce spurious anti-correlated RSNs(Anderson et al., 2011; Murphy et al., 2009). Thus, it is still unclearwhether anti-correlation between RSNs observed in fMRI studies re-flects the negatively correlating patterns of spontaneous brain activi-ty. On the other hand, although NIRS measurement was conducted onthe diverse cortical regions, we could not found negative correlationamong any pairs of NIRS channels in our previous NIRS study (Sasaiet al., 2011) and the current study (data not shown). Although the re-sults of the current study indicated that the signals acquired usingboth NIRS and fMRI represent the spontaneous neural activity charac-terizing RSNs, the attributes of noises included in these signals mightbe different. Considering this difference between fMRI and NIRSand the higher temporal resolution of NIRS, NIRS provides additionalinformation on the temporal relationship between these RSNs. Thisfinding supports the theory that NIRS is a valuable tool that can beused to measure the signals characterizing RSNs and to investigatethe intrinsic dynamics of the human brain.
Issues for future studies
Recent studies have demonstrated the relationship betweenresting state networks and cognitive function and dysfunction.For example, the default mode network is suggested to take thecentral role in internally focused cognitive processes, such as mind
191S. Sasai et al. / NeuroImage 63 (2012) 179–193
wandering (Christoff et al., 2009; Mason et al., 2007), self-reference(D'Argembeau et al., 2005; Gusnard et al., 2001), and recollectingone's past or imagining one's personal future (Schacter et al., 2007;Spreng et al., 2009), whereas the increased and decreased connectiv-ity within the default mode network has been demonstrated to belinked to diverse psychiatric brain disorders (Fox and Greicius,2010). Use of NIRS enables us to obtain the information on focusedresting state networks easier than using fMRI, because the networkinformation can be measured only by setting NIRS channels ontothe regions related to targeting resting state networks. Althoughseveral challenges remain before the abnormality of the restingstate networks can be used as a diagnostic marker in psychiatricdisorders (Fornito and Bullmore, 2010; Fox and Greicius, 2010), thefindings of the current study motivate clinical applications of NIRSto study resting state functional connectivity.
In the emerging social cognitive neuroscience literature, it hasbeen suggested that some RSNs have functional roles in social cogni-tion. For example, it has been reported that the activity of the defaultmode network is associated with the process of social cognition, suchas mentalizing or reflecting on the mental states of others (Amodioand Frith, 2006; Buckner and Carroll, 2007; Gallagher and Frith,2003; Mitchell et al., 2002; Mitchell et al., 2006; Rilling et al., 2004,2008), and self-referential processing (D'Argembeau et al., 2005;Gusnard et al., 2001). Furthermore, both an activation in part of thefronto-parietal control network and a deactivation in the defaultmode network have been observed when participants were imitated,compared with when they imitated others (Guionnet et al., 2012).However, there are only a handful of studies that explore neuralmechanisms of social interaction in an interactive context (Guionnetet al., 2012; Redcay et al., 2010; Saito et al., 2010; Schilbach et al.,2010; Tognoli et al., 2007), though social interaction is a coregulatedcoupling activity that involves at least two autonomous agents. AsGuionnet et al. has pointed out, the major reason for this paucitymay be attributed to the methodological and technical difficulties as-sociated with creating a natural social interaction within an MRI envi-ronment. Considering that participants can have a direct face-to-faceinteraction while undergoing NIRS measurement, usage of NIRSmakes it easier to measure the activity of the RSNs during social inter-action (Cui et al., 2012; Funane et al., 2011). Therefore, our findingshould promote investigation of the role of RSNs in social interaction.
In most fMRI and NIRS studies, functional connectivity has beenexplored by employing methods that assume temporal stationarity,such as cross-correlation. Using fMRI and NIRS independently, it hasbeen previously investigated whether resting state functionalconnectivity estimated using signals obtained from these imagingtechniques is test–retest reliable (Zhang et al., 2011 for NIRS; Zuoet al., 2010 for fMRI). On the other hand, recent fMRI studies havedemonstrated that resting state functional connectivity exhibitsdynamic changes within time scales of seconds to minutes (Changand Glover, 2010; Kang et al., 2011). Furthermore, one study demon-strated that functional brain networks exhibit task-induced changesin their network topology (Moussa et al., 2011). Moreover, studiesusing electroencephalography demonstrated that cortical activationinduced with transcranial magnetic stimulation during non-rapideye movement sleep did not propagate other cortical areas, whereaswaves of activation during quiet wakefulness moved to connectedcortical areas several centimeters away (Massimini et al., 2005).This suggests that network topology of the RSNs also changes duringthe sleep state transitions. Because dynamic properties of a networkrelate to unfolding processes in the network (Butts, 2009), an under-standing of the dynamic characteristics of a resting state networkis important to reveal the intrinsic information on the processingmechanism of the brain, such as information exchange betweendifferent brain regions. Because NIRS requires less physical burdento participants, this device is useful for examining the characteristicsof functional connectivity with a relatively long time-scale. Indeed,
one published NIRS study conducted long-term recording for over 1hour at bedside (Roche-Labarbe et al., 2008). Thus, the results ofour study should promote investigation of the dynamic characteris-tics of resting state functional connectivity.
NIRS should also be helpful for investigation of some other issues.Some studies have investigated changes in the RSNs along the courseof development by measuring spontaneous brain activity of infantswith fMRI and NIRS (Doria et al., 2010; Gao et al., 2009; Homae etal., 2010). However, it is often difficult to transport early preterm in-fants to an fMRI scanner, therefore there is limited data related to theRSNs in these periods (White et al., 2012). Because NIRS is suitable foruse in conditions where participants have difficulty entering an fMRIscanner, application of NIRS should promote gathering of informationon the RSNs from these participants. Furthermore, in previous fMRIstudies, RSNs have generally been characterized from brain activityrecorded with participants lying in the dorsal position inside thescanner. In contrast, NIRS measurement can be conducted withoutrelation to the posture of the involved participant. Therefore, theeffect of this postural difference on the RSNs can be investigatedusing NIRS by running resting state recording with participants inthese 2 postures.
Conclusions
In this study, we evaluated the NIRS–fMRI signal relationshipduring the resting state, with particular emphasis on functional con-nectivity, by concurrently using fMRI and NIRS. Our results showedthat NIRS can be used to collect information regarding RSNs definedin fMRI. This study should encourage development of signal analysisfor elucidating the RSNs from measured NIRS signals.
Acknowledgments
We thank K. Asakawa for providing administrative assistance. Weare grateful to M. Kato for providing assistance in experiments. Weacknowledge T. Ishizuka and M. Fujiwara for providing technicalassistance. This work was partly supported by Grants-in-Aid for theJapan Society for the Promotion of Science (JSPS) Fellows 2311065 (toS.S.), for Young Scientists (S) 20670001 (to G.T.), and for ChallengingExploratory Research 23650224 (to H.C.T.). In addition, it was partlysupported by the Ministry of Education, Culture, Sports, Scienceand Technology in Japan (MEXT) for Scientific Research (S) 21220005(to N.S.), and Scientific Research on Innovative Areas 22101007 (toH.C.T.). A part of this study is the result of “Development of biomarkercandidates for social behavior” carried out under the Strategic ResearchProgram for Brain Science by MEXT.
Appendix A. Supplementary data
Supplementary data to this article can be found online at http://dx.doi.org/10.1016/j.neuroimage.2012.06.011.
References
Amodio, D.M., Frith, C.D., 2006. Meeting of minds: the medial frontal cortex and socialcognition. Nat. Rev. Neurosci. 7, 268–277.
Anderson, J.S., Druzgal, T.J., Lopez-Larson, M., Jeoung, E., Desai, K., Yurgelun-Todd, D.,2011. Network anticorrelations, global regression, and phase-shifted soft tissuecorrection. Hum. Brain Mapp. 32, 9–934.
Ashburner, J., 2007. A fast diffeomorphic image registration algorithm. NeuroImage 38,95–113.
Beckmann, C.F., DeLuca, M., Devlin, J.T., Smith, S.M., 2005. Investigations into resting-state connectivity using independent component analysis. Philos. Trans. R. Soc.Lond. B. Biol. Sci. 360, 1001–1013.
Benjamini, Y., Yekutieli, D., 2001. The control of the false discovery rate in multipletesting under dependency. Ann. Stat. 29, 1165–1188.
Biswal, B., Yetkin, F.Z., Haughton, V.M., Hyde, J.S., 1995. Functional connectivity in themotor cortex of resting human brain using echo-planar MRI. Magn. Reson. Med.34, 537–541.
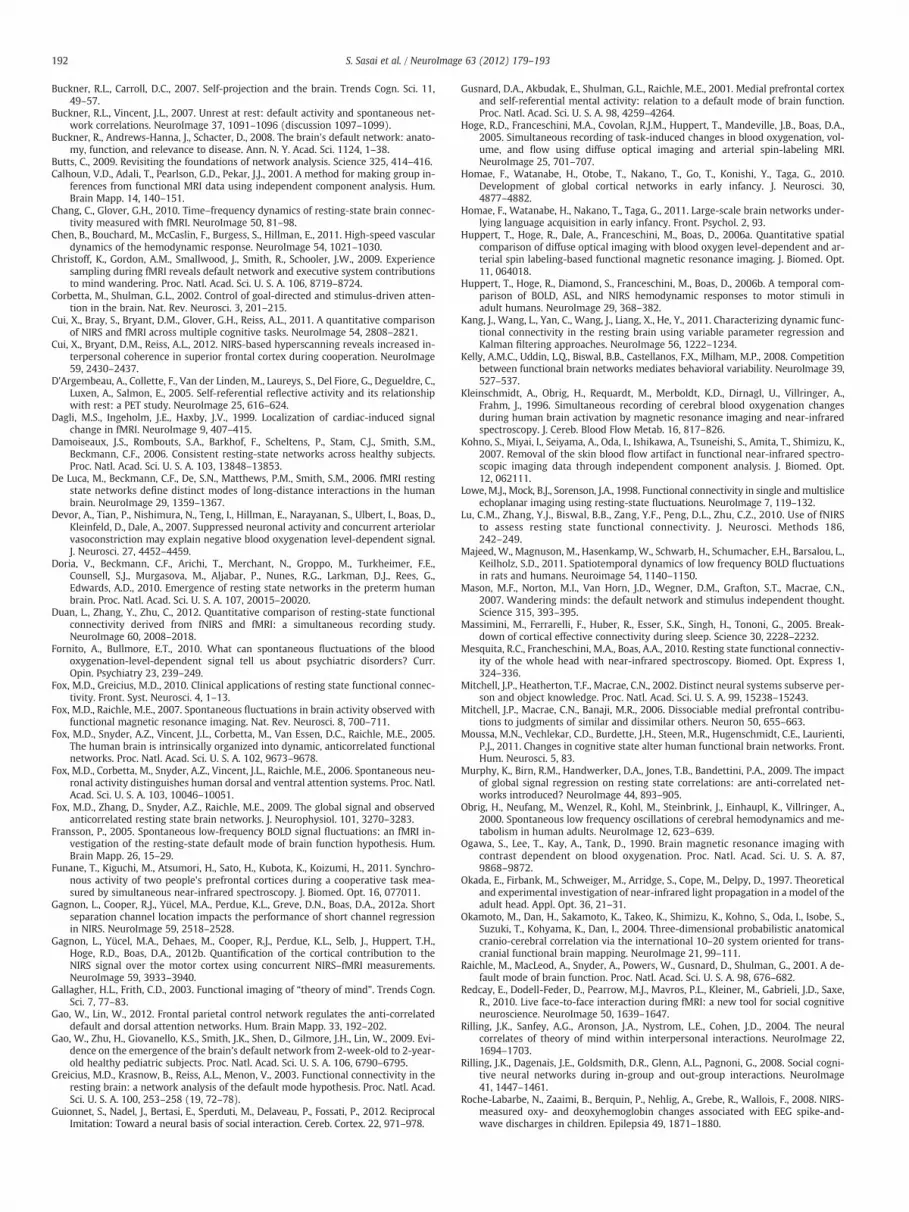
192 S. Sasai et al. / NeuroImage 63 (2012) 179–193
Buckner, R.L., Carroll, D.C., 2007. Self-projection and the brain. Trends Cogn. Sci. 11,49–57.
Buckner, R.L., Vincent, J.L., 2007. Unrest at rest: default activity and spontaneous net-work correlations. NeuroImage 37, 1091–1096 (discussion 1097–1099).
Buckner, R., Andrews-Hanna, J., Schacter, D., 2008. The brain's default network: anato-my, function, and relevance to disease. Ann. N. Y. Acad. Sci. 1124, 1–38.
Butts, C., 2009. Revisiting the foundations of network analysis. Science 325, 414–416.Calhoun, V.D., Adali, T., Pearlson, G.D., Pekar, J.J., 2001. A method for making group in-
ferences from functional MRI data using independent component analysis. Hum.Brain Mapp. 14, 140–151.
Chang, C., Glover, G.H., 2010. Time–frequency dynamics of resting-state brain connec-tivity measured with fMRI. NeuroImage 50, 81–98.
Chen, B., Bouchard, M., McCaslin, F., Burgess, S., Hillman, E., 2011. High-speed vasculardynamics of the hemodynamic response. NeuroImage 54, 1021–1030.
Christoff, K., Gordon, A.M., Smallwood, J., Smith, R., Schooler, J.W., 2009. Experiencesampling during fMRI reveals default network and executive system contributionsto mind wandering. Proc. Natl. Acad. Sci. U. S. A. 106, 8719–8724.
Corbetta, M., Shulman, G.L., 2002. Control of goal-directed and stimulus-driven atten-tion in the brain. Nat. Rev. Neurosci. 3, 201–215.
Cui, X., Bray, S., Bryant, D.M., Glover, G.H., Reiss, A.L., 2011. A quantitative comparisonof NIRS and fMRI across multiple cognitive tasks. NeuroImage 54, 2808–2821.
Cui, X., Bryant, D.M., Reiss, A.L., 2012. NIRS-based hyperscanning reveals increased in-terpersonal coherence in superior frontal cortex during cooperation. NeuroImage59, 2430–2437.
D'Argembeau, A., Collette, F., Van der Linden, M., Laureys, S., Del Fiore, G., Degueldre, C.,Luxen, A., Salmon, E., 2005. Self-referential reflective activity and its relationshipwith rest: a PET study. NeuroImage 25, 616–624.
Dagli, M.S., Ingeholm, J.E., Haxby, J.V., 1999. Localization of cardiac-induced signalchange in fMRI. NeuroImage 9, 407–415.
Damoiseaux, J.S., Rombouts, S.A., Barkhof, F., Scheltens, P., Stam, C.J., Smith, S.M.,Beckmann, C.F., 2006. Consistent resting-state networks across healthy subjects.Proc. Natl. Acad. Sci. U. S. A. 103, 13848–13853.
De Luca, M., Beckmann, C.F., De, S.N., Matthews, P.M., Smith, S.M., 2006. fMRI restingstate networks define distinct modes of long-distance interactions in the humanbrain. NeuroImage 29, 1359–1367.
Devor, A., Tian, P., Nishimura, N., Teng, I., Hillman, E., Narayanan, S., Ulbert, I., Boas, D.,Kleinfeld, D., Dale, A., 2007. Suppressed neuronal activity and concurrent arteriolarvasoconstriction may explain negative blood oxygenation level-dependent signal.J. Neurosci. 27, 4452–4459.
Doria, V., Beckmann, C.F., Arichi, T., Merchant, N., Groppo, M., Turkheimer, F.E.,Counsell, S.J., Murgasova, M., Aljabar, P., Nunes, R.G., Larkman, D.J., Rees, G.,Edwards, A.D., 2010. Emergence of resting state networks in the preterm humanbrain. Proc. Natl. Acad. Sci. U. S. A. 107, 20015–20020.
Duan, L., Zhang, Y., Zhu, C., 2012. Quantitative comparison of resting-state functionalconnectivity derived from fNIRS and fMRI: a simultaneous recording study.NeuroImage 60, 2008–2018.
Fornito, A., Bullmore, E.T., 2010. What can spontaneous fluctuations of the bloodoxygenation-level-dependent signal tell us about psychiatric disorders? Curr.Opin. Psychiatry 23, 239–249.
Fox, M.D., Greicius, M.D., 2010. Clinical applications of resting state functional connec-tivity. Front. Syst. Neurosci. 4, 1–13.
Fox, M.D., Raichle, M.E., 2007. Spontaneous fluctuations in brain activity observed withfunctional magnetic resonance imaging. Nat. Rev. Neurosci. 8, 700–711.
Fox, M.D., Snyder, A.Z., Vincent, J.L., Corbetta, M., Van Essen, D.C., Raichle, M.E., 2005.The human brain is intrinsically organized into dynamic, anticorrelated functionalnetworks. Proc. Natl. Acad. Sci. U. S. A. 102, 9673–9678.
Fox, M.D., Corbetta, M., Snyder, A.Z., Vincent, J.L., Raichle, M.E., 2006. Spontaneous neu-ronal activity distinguishes human dorsal and ventral attention systems. Proc. Natl.Acad. Sci. U. S. A. 103, 10046–10051.
Fox, M.D., Zhang, D., Snyder, A.Z., Raichle, M.E., 2009. The global signal and observedanticorrelated resting state brain networks. J. Neurophysiol. 101, 3270–3283.
Fransson, P., 2005. Spontaneous low-frequency BOLD signal fluctuations: an fMRI in-vestigation of the resting-state default mode of brain function hypothesis. Hum.Brain Mapp. 26, 15–29.
Funane, T., Kiguchi, M., Atsumori, H., Sato, H., Kubota, K., Koizumi, H., 2011. Synchro-nous activity of two people's prefrontal cortices during a cooperative task mea-sured by simultaneous near-infrared spectroscopy. J. Biomed. Opt. 16, 077011.
Gagnon, L., Cooper, R.J., Yücel, M.A., Perdue, K.L., Greve, D.N., Boas, D.A., 2012a. Shortseparation channel location impacts the performance of short channel regressionin NIRS. NeuroImage 59, 2518–2528.
Gagnon, L., Yücel, M.A., Dehaes, M., Cooper, R.J., Perdue, K.L., Selb, J., Huppert, T.H.,Hoge, R.D., Boas, D.A., 2012b. Quantification of the cortical contribution to theNIRS signal over the motor cortex using concurrent NIRS–fMRI measurements.NeuroImage 59, 3933–3940.
Gallagher, H.L., Frith, C.D., 2003. Functional imaging of “theory of mind”. Trends Cogn.Sci. 7, 77–83.
Gao, W., Lin, W., 2012. Frontal parietal control network regulates the anti-correlateddefault and dorsal attention networks. Hum. Brain Mapp. 33, 192–202.
Gao, W., Zhu, H., Giovanello, K.S., Smith, J.K., Shen, D., Gilmore, J.H., Lin, W., 2009. Evi-dence on the emergence of the brain's default network from 2-week-old to 2-year-old healthy pediatric subjects. Proc. Natl. Acad. Sci. U. S. A. 106, 6790–6795.
Greicius, M.D., Krasnow, B., Reiss, A.L., Menon, V., 2003. Functional connectivity in theresting brain: a network analysis of the default mode hypothesis. Proc. Natl. Acad.Sci. U. S. A. 100, 253–258 (19, 72–78).
Guionnet, S., Nadel, J., Bertasi, E., Sperduti, M., Delaveau, P., Fossati, P., 2012. ReciprocalImitation: Toward a neural basis of social interaction. Cereb. Cortex. 22, 971–978.
Gusnard, D.A., Akbudak, E., Shulman, G.L., Raichle, M.E., 2001. Medial prefrontal cortexand self-referential mental activity: relation to a default mode of brain function.Proc. Natl. Acad. Sci. U. S. A. 98, 4259–4264.
Hoge, R.D., Franceschini, M.A., Covolan, R.J.M., Huppert, T., Mandeville, J.B., Boas, D.A.,2005. Simultaneous recording of task-induced changes in blood oxygenation, vol-ume, and flow using diffuse optical imaging and arterial spin-labeling MRI.NeuroImage 25, 701–707.
Homae, F., Watanabe, H., Otobe, T., Nakano, T., Go, T., Konishi, Y., Taga, G., 2010.Development of global cortical networks in early infancy. J. Neurosci. 30,4877–4882.
Homae, F., Watanabe, H., Nakano, T., Taga, G., 2011. Large-scale brain networks under-lying language acquisition in early infancy. Front. Psychol. 2, 93.
Huppert, T., Hoge, R., Dale, A., Franceschini, M., Boas, D., 2006a. Quantitative spatialcomparison of diffuse optical imaging with blood oxygen level-dependent and ar-terial spin labeling-based functional magnetic resonance imaging. J. Biomed. Opt.11, 064018.
Huppert, T., Hoge, R., Diamond, S., Franceschini, M., Boas, D., 2006b. A temporal com-parison of BOLD, ASL, and NIRS hemodynamic responses to motor stimuli inadult humans. NeuroImage 29, 368–382.
Kang, J., Wang, L., Yan, C., Wang, J., Liang, X., He, Y., 2011. Characterizing dynamic func-tional connectivity in the resting brain using variable parameter regression andKalman filtering approaches. NeuroImage 56, 1222–1234.
Kelly, A.M.C., Uddin, L.Q., Biswal, B.B., Castellanos, F.X., Milham, M.P., 2008. Competitionbetween functional brain networks mediates behavioral variability. NeuroImage 39,527–537.
Kleinschmidt, A., Obrig, H., Requardt, M., Merboldt, K.D., Dirnagl, U., Villringer, A.,Frahm, J., 1996. Simultaneous recording of cerebral blood oxygenation changesduring human brain activation by magnetic resonance imaging and near-infraredspectroscopy. J. Cereb. Blood Flow Metab. 16, 817–826.
Kohno, S., Miyai, I., Seiyama, A., Oda, I., Ishikawa, A., Tsuneishi, S., Amita, T., Shimizu, K.,2007. Removal of the skin blood flow artifact in functional near-infrared spectro-scopic imaging data through independent component analysis. J. Biomed. Opt.12, 062111.
Lowe, M.J., Mock, B.J., Sorenson, J.A., 1998. Functional connectivity in single andmultisliceechoplanar imaging using resting-state fluctuations. NeuroImage 7, 119–132.
Lu, C.M., Zhang, Y.J., Biswal, B.B., Zang, Y.F., Peng, D.L., Zhu, C.Z., 2010. Use of fNIRSto assess resting state functional connectivity. J. Neurosci. Methods 186,242–249.
Majeed, W., Magnuson, M., Hasenkamp,W., Schwarb, H., Schumacher, E.H., Barsalou, L.,Keilholz, S.D., 2011. Spatiotemporal dynamics of low frequency BOLD fluctuationsin rats and humans. Neuroimage 54, 1140–1150.
Mason, M.F., Norton, M.I., Van Horn, J.D., Wegner, D.M., Grafton, S.T., Macrae, C.N.,2007. Wandering minds: the default network and stimulus independent thought.Science 315, 393–395.
Massimini, M., Ferrarelli, F., Huber, R., Esser, S.K., Singh, H., Tononi, G., 2005. Break-down of cortical effective connectivity during sleep. Science 30, 2228–2232.
Mesquita, R.C., Francheschini, M.A., Boas, A.A., 2010. Resting state functional connectiv-ity of the whole head with near-infrared spectroscopy. Biomed. Opt. Express 1,324–336.
Mitchell, J.P., Heatherton, T.F., Macrae, C.N., 2002. Distinct neural systems subserve per-son and object knowledge. Proc. Natl. Acad. Sci. U. S. A. 99, 15238–15243.
Mitchell, J.P., Macrae, C.N., Banaji, M.R., 2006. Dissociable medial prefrontal contribu-tions to judgments of similar and dissimilar others. Neuron 50, 655–663.
Moussa, M.N., Vechlekar, C.D., Burdette, J.H., Steen, M.R., Hugenschmidt, C.E., Laurienti,P.J., 2011. Changes in cognitive state alter human functional brain networks. Front.Hum. Neurosci. 5, 83.
Murphy, K., Birn, R.M., Handwerker, D.A., Jones, T.B., Bandettini, P.A., 2009. The impactof global signal regression on resting state correlations: are anti-correlated net-works introduced? NeuroImage 44, 893–905.
Obrig, H., Neufang, M., Wenzel, R., Kohl, M., Steinbrink, J., Einhaupl, K., Villringer, A.,2000. Spontaneous low frequency oscillations of cerebral hemodynamics and me-tabolism in human adults. NeuroImage 12, 623–639.
Ogawa, S., Lee, T., Kay, A., Tank, D., 1990. Brain magnetic resonance imaging withcontrast dependent on blood oxygenation. Proc. Natl. Acad. Sci. U. S. A. 87,9868–9872.
Okada, E., Firbank, M., Schweiger, M., Arridge, S., Cope, M., Delpy, D., 1997. Theoreticaland experimental investigation of near-infrared light propagation in a model of theadult head. Appl. Opt. 36, 21–31.
Okamoto, M., Dan, H., Sakamoto, K., Takeo, K., Shimizu, K., Kohno, S., Oda, I., Isobe, S.,Suzuki, T., Kohyama, K., Dan, I., 2004. Three-dimensional probabilistic anatomicalcranio-cerebral correlation via the international 10–20 system oriented for trans-cranial functional brain mapping. NeuroImage 21, 99–111.
Raichle, M., MacLeod, A., Snyder, A., Powers, W., Gusnard, D., Shulman, G., 2001. A de-fault mode of brain function. Proc. Natl. Acad. Sci. U. S. A. 98, 676–682.
Redcay, E., Dodell-Feder, D., Pearrow, M.J., Mavros, P.L., Kleiner, M., Gabrieli, J.D., Saxe,R., 2010. Live face-to-face interaction during fMRI: a new tool for social cognitiveneuroscience. NeuroImage 50, 1639–1647.
Rilling, J.K., Sanfey, A.G., Aronson, J.A., Nystrom, L.E., Cohen, J.D., 2004. The neuralcorrelates of theory of mind within interpersonal interactions. NeuroImage 22,1694–1703.
Rilling, J.K., Dagenais, J.E., Goldsmith, D.R., Glenn, A.L., Pagnoni, G., 2008. Social cogni-tive neural networks during in-group and out-group interactions. NeuroImage41, 1447–1461.
Roche-Labarbe, N., Zaaimi, B., Berquin, P., Nehlig, A., Grebe, R., Wallois, F., 2008. NIRS-measured oxy- and deoxyhemoglobin changes associated with EEG spike-and-wave discharges in children. Epilepsia 49, 1871–1880.

193S. Sasai et al. / NeuroImage 63 (2012) 179–193
Saager, R.B., Berger, A.J., 2008. Measurement of layer-like hemodynamic trends in scalpand cortex: implications for physiological baseline suppression in functional nearinfrared spectroscopy. J. Biomed. Opt. 13, 034017.
Saito, D.N., Tanabe, H.C., Izuma, K., Hayashi, M.J., Morito, Y., Komeda, H., Uchiyama, H.,Kosaka, H., Okazawa, H., Fujibayashi, Y., Sadato, N., 2010. “Stay tuned”: inter-individual neural synchronization during mutual gaze and joint attention. Front.Integr. Neurosci. 4, 127.
Sasai, S., Homae, F., Watanabe, H., Taga, G., 2011. Frequency-specific functionalconnectivity in the brain during resting state revealed by NIRS. NeuroImage 56,252–257.
Schacter, D.L., Addis, D.R., Buckner, R.L., 2007. Remembering the past to imagine thefuture: the prospective brain. Nat. Rev. Neurosci. 8, 657–661.
Schilbach, L., Wilms, M., Eickhoff, S.B., Romanzetti, S., Tepest, R., Bente, G., Shah, N.J.,Fink, G.R., Vogeley, K., 2010. Minds made for sharing: initiating joint attention re-cruits reward-related neurocircuitry. J. Cogn. Neurosci. 22, 2702–2715.
Schroeter, M.L., Kupka, T., Mildner, T., Uludag, K., von Cramon, D.Y., 2006. Investigatingthe post-stimulus undershoot of the BOLD signal—a simultaneous fMRI and fNIRSstudy. NeuroImage 30, 349–358.
Spreng, R.N., Mar, R.A., Kim, A.S., 2009. The common neural basis of autobiographicalmemory, prospection, navigation, theory of mind, and the default mode: a quanti-tative meta-analysis. J. Cogn. Neurosci. 21, 489–510.
Sridharan, D., Levitin, D.J., Menon, V., 2008. A critical role for the right fronto-insularcortex in switching between central-executive and default-mode networks. Proc.Natl. Acad. Sci. U. S. A. 105, 12569–12574.
Steinbrink, J., Villringer, A., Kempf, F., Haux, D., Boden, S., Obrig, H., 2006. Illuminatingthe BOLD signal: combined fMRI–fNIRS studies. Magn. Res. Imaging 24, 495–505.
Strangman, G., Culver, J., Thompson, J., Boas, D., 2002. A quantitative comparison of si-multaneous BOLD fMRI and NIRS recordings during functional brain activation.NeuroImage 17, 719–731.
Tachtsidis, I., Leung, T., Tisdall, M., Devendra, P., Smith, M., Delpy, D., Elwell, C., 2008.Investigation of frontal cortex, motor cortex and systemic haemodynamic changesduring anagram solving. Adv. Exp. Biol. 614, 21–28.
Taga, G., Konishi, Y., Maki, A., Tachibana, T., Fujiwara, M., Koizumi, H., 2000. Spontane-ous oscillation of oxy- and deoxy-hemoglobin changes with a phase differencethroughout the occipital cortex of newborn infants observed using noninvasive op-tical topography. Neurosci. Lett. 282, 101–104.
Taga, G., Watanabe, H., Homae, F., 2011. Spatiotemporal properties of cortical hemody-namic response to auditory stimuli in sleeping infants revealed by multi-channelNIRS. Phil. Trans. R. Soc. A 369, 4495–4511.
Takahashi, T., Takikawa, Y., Kawagoe, R., Shibuya, S., Iwano, T., 2011. Influence of skinblood flow on near-infrared spectroscopy signals measured on the forehead duringa verbal fluency task. NeuroImage 57, 991–1002.
Tognoli, E., Lagarde, J., DeGuzman, G.C., Kelso, J.A., 2007. The phi complex as a neuromarkerof human social coordination. Proc. Natl. Acad. Sci. U. S. A. 104, 8190–8195.
Tong, Y., Frederick, B., 2010. Time lag dependent multimodal processing of concurrentfMRI and near-infrared spectroscopy (NIRS) data suggests a global circulatoryorigin for low-frequency oscillation signals in human brain. NeuroImage 53,553–564.
Tonorov, V., Franceschini, M., Filiaci, M., Fantini, S., Wolf, M., Michalos, A., Gratton, E., 2000.Near-infrared study of fluctuations in cerebral hemodynamics during rest and motorstimulation: temporal analysis and spatial mapping. Med. Phys. 27 (4), 801–815.
Toronov, V., Webb, A., Choi, J., 2001. Investigation of human brain hemodynamics bysimultaneous near-infrared spectroscopy and functional magnetic resonance im-aging. Med. Phys. 28, 521–527.
Toyoda, H., Kashikura, K., Ikada, T., Nakashita, S., Honda, M., Yonekura, Y., Kawaguchi,H., Maki, A., Sadato, N., 2008. Source of nonlinearity of the BOLD response revealedby simultaneous fMRI and NIRS. NeuroImage 39, 997–1013.
Tzourio-Mazoyer, N., Landeau, B., Papathanassiou, D., Crivello, F., Etard, O., Delcroix, N.,Mazoyer, B., Joliot, M., 2002. Automated anatomical labeling of activations in SPMusing a macroscopic anatomical parcellation of the MNI MRI single-subject brain.NeuroImage 15, 273–289.
van de Ven, V.G., Formisano, E., Prvulovic, D., Roeder, C.H., Linden, D.E., 2004. Function-al connectivity as revealed by spatial independent component analysis of fMRImeasurements during rest. Hum. Brain Mapp. 22, 165–178.
van den Heuvel, M.P., Hulshoff, H.E., 2010. Exploring the brain network: a review onresting-state fMRI functional connectivity. Eur. Neuropsychopharmacol. 20,519–534.
van den Heuvel, M.P., Mandl, R.C., Hulshoff Pol, H.E., 2008. Normalized group clusteringof resting-state fMRI data. PLoS One 3, e2001.
van der Zee, P., Arridge, S., Cope, M., Delpy, D., 1990. The effect of optode positioning onoptical pathlength in near infrared spectroscopy of brain. Adv. Exp. Med. Biol. 277,79–84.
Vincent, J., Patel, G., Fox, M., Snyder, A., Baker, J., van Essen, D., Zempel, J., Snyder, L.,Corbetta, M., Raichle,M., 2007. Intrinsic functional architecture in the anaesthetizedmonkey brain. Nature 447, 83–86.
Vincent, J., Kahn, I., Snyder, A., Raichle, M., Buckner, R., 2008. Evidence for a frontoparietalcontrol system revealed by intrinsic functional connectivity. J. Neurophysiol. 100,3328–3342.
White, B., Snyder, A., Cohen, A., Petersen, S., Raichle, M., Schlaggar, B., Culver, J., 2009.Resting-state functional connectivity in the human brain revealed with diffuseoptical tomography. NeuroImage 47, 148–156.
White, B.R., Liao, S.M., Ferradal, S.L., Inder, T.E., Culver, J.P., 2012. Bedside opticalimaging of occipital resting-state functional connectivity in neonates. NeuroImage59, 2529–2538.
Windischberger, C., Langenberger, H., Sycha, T., Tschernko, E., Fuchsjager-Mayerl, G.,Schmetterer, L., Moser, E., 2002. On the origin of respiratory artifacts in BOLD-EPIof the human brain. Magn. Reson. Imaging 20, 575–582.
Yamada, T., Umeyama, S., Matsuda, K., 2009. Multidistance probe arrangement toeliminate artifacts in functional near-infrared spectroscopy. J. Biomed. Opt. 16(4), 06434.
Zhang, Q., Brown, E.N., Strangman, G.E., 2007. Adaptive filtering to reduce global inter-ference in evoked brain activity detection: a human subject case study. J. Biomed.Opt. 12, 064009.
Zhang, H., Zhang, Y., Lu, C., Ma, S., Zang, Y., Zhu, C., 2010. Functional connectivity asrevealed by independent component analysis of resting-state fNIRS measurements.NeuroImage 51, 1150–1161.
Zhang, H., Duan, L., Zhang, Y., Lu, C., Liu, H., Zhu, C., 2011. Test–retest assessment ofindependent component analysis-derived resting-state functional connectivitybased on functional near-infrared spectroscopy. NeuroImage 55, 607–615.
Zuo, X.N., Kelly, C., Adelstein, J.S., Klein, D.F., Castellanos, F.X., Milham, M.P., 2010. Reliableintrinsic connectivity networks: test–retest evaluation using ICA and dual regressionapproach. NeuroImage 49, 2163–2177.


