Embed Size (px)
Citation preview
arX
iv:a
stro
-ph/
0608
709v
1 3
1 A
ug 2
006
1
The aim of this paper is to characterise the star formationactivity in the poorly studied embedded cluster Serpens/G3-G6, located∼ 45′ (3 pc) to the south of the Serpens Cloud Core,and to determine the luminosity and mass functions of its pop-ulation of Young Stellar Objects (YSOs). Multi-wavelengthbroadband photometry was obtained to sample the near andmid-IR spectral energy distributions to separate YSOs fromfield stars and classify the YSO evolutionary stage. ISOCAMmapping in the two filters LW2 (5-8.5µm) and LW3 (12-18 µm) of a 19′ × 16′ field was combined with JHKS datafrom 2MASS, KS data from Arnica/NOT, and L′ data fromSIRCA/NOT. Continuum emission at 1.3 mm (IRAM) and3.6 cm (VLA) was mapped to study the cloud structure andthe coldest/youngest sources. Deep narrow band imaging at the2.12µm S(1) line of H2 from NOTCam/NOT was obtained tosearch for signs of bipolar outflows. We have strong evidencefor a stellar population of 31 Class II sources, 5 flat-spectrumsources, 5 Class I sources, and two Class 0 sources. Our methoddoes not sample the Class III sources. The cloud is composedof two main dense clumps aligned along a ridge over∼ 0.5 pcplus a starless core coinciding with absorption features seen inthe ISOCAM maps. We find two S-shaped bipolar collimatedflows embedded in the NE clump, and propose the two driv-ing sources to be a Class 0 candidate (MMS3) and a doubleClass I (MMS2). For the Class II population we find a best ageof∼ 2 Myr and compatibility with recent Initial Mass Functions(IMFs) by comparing the observed Class II luminosity function(LF), which is complete to 0.08L⊙, to various model LFs withdifferent star formation scenarios and input IMFs.
Key words. Stars: formation, Stars: pre-main-sequence, Stars:luminosity function, mass function, Stars: low-mass
Astronomy & Astrophysicsmanuscript no. 5533 February 5, 2008(DOI: will be inserted by hand later)
A multi-wavelength census of star formation activity in the youngembedded cluster around Serpens/G3-G6 ⋆ ⋆⋆
A.A. Djupvik1, Ph. Andre2,5, S. Bontemps3, F. Motte2,5, G. Olofsson4, M. Gålfalk4, and H.-G. Floren4
1 Nordic Optical Telescope, Apdo 474, 38700 Santa Cruz de La Palma, Spain2 CEA/DSM/DAPNIA, Service d’Astrophysique, C.E. Saclay, Orme des Merisiers, 91191 Gif-sur-Yvette, France3 Observatoire de Bordeaux, BP 89, 33270 Floirac, France4 Stockholm Observatory, Roslagstullsbacken 21, 10691 Stockholm, Sweden5 AIM – Unite Mixte de Recherche CEA – CNRS – Universite ParisVII – UMR 7158, France
Received 3 May 2006/ Accepted 6 July 2006
Abstract.
1. Introduction
The Serpens Cauda Clouds are among the darkest regions in acomplex of clouds called the Aquila Rift (Dame & Thaddeus1985). The young embedded cluster in the Serpens CloudCore has been well studied at most wavelengths, seeEiroa, Djupvik & Casali (2006) for a recent review. About 45’to the south there is also a region with active star formation.Cohen & Kuhi (1979) found 4 optical T Tauri stars in a 30′′
field and named them Ser/G3- G6. Clark (1990, 1991) mappedthe area surrounding Ser/G3- G6 in the ammonia 1,1 emissionline and found two NH3 cores, one on each side of the opti-cally visible stellar group: Ser/G3- 6NE and Ser/G3- G6SW.Ziener & Eisloffel (1999) surveyed 3.14 square degrees in theoptical lines of [S II] and found the Herbig-Haro object HH 476close to the Ser/G3-G6SW core. The energy source of HH 476was identified by Wu et al. (2002) to be IRAS18265+0028. Atthis position Persi, Palagi, & Felli (1994) found a H2O maser.Recently, Harvey et al. (2006) found 24 YSO candidates in a12’ × 12’ area in this region (which they refer to as Cluster B)from a mid-IR survey with Spitzer.
When preparing theISOCAM star formation survey,1 thisregion was defined based on the ammonia maps of Clark(1990) and namedSerpens NH3. The field is relatively opaque
Send offprint requests to: A.A. Djupvik (before: A.A. Kaas)⋆ Based on observations with ISO, an ESA project with instruments
funded by ESA Member States (especially the PI countries: France,Germany, the Netherlands, and the United Kingdom) and with the par-ticipation of ISAS and NASA.⋆⋆ Tables 1, 2, and 3 are only available in electronic form at theCDS via anonymous ftp to cdsarc.u-strasbg.fr (130.79.128.5) or viahttp://cdsweb.u-strasbg.fr/cgi-bin/qcat?J/A+A/Correspondence to: [email protected]
1 One of the guaranteed time programs with the camera aboard theInfrared Space Observatory (ISO).
at optical wavelengths and has a peak brightness at 60µm(Zhang et al. 1988).
We will use the distance of 225± 55 pc to the SerpensCauda Clouds according to Straizys,Cernis, & Bartasi ute(2003), keeping in mind the caveat of the same authors thatthe cloud complex is possibly 80 pc deep.
Preliminary ISOCAM results from this region were pre-sented in Kaas et al. (1999) and Kaas (1999b). In this paperwe present the full results of a 17’× 19’ ISOCAM survey inLW2 (6.7 µm) and LW3 (14.3µm), cross-correlated with the2MASS point source catalogue. In addition we present deepfollow-up H2 line (2.122µm), KS band (2.15µm), andL′ band(3.8 µm) imaging from the Nordic Optical Telescope, as wellas IRAM 1.3 mm continuum and VLA 3.6 cm mapping of themost active part of the region.
We describe the various observation sets with reductionsand results in Sect. 2, the use of IR excesses to extract YSOcandidates in Sect. 3, the classification of the YSO populationin Sect. 4, the luminosity and mass function in Sect. 5, and thecloud structure and the outflow sources in Sect. 6.
2. Observations and reductions
2.1. ISOCAM
This paper is based on observations obtained with ISOCAM,the camera aboard the Infrared Space Observatory (ISO; seeKessler et al. 1996; Cesarsky et al. 1996), and is part of theLNORDH.SURVEY 1 star formation survey conducted in thetwo broadband filters LW2 (5-8.5µm) and LW3(12-18µm),see, e.g., Kaas & Bontemps (2000) for a review. In the re-gion called Serp-NH3 about 0.09 square degrees were sur-veyed in LW2 and LW3 in 1996. The pixel field of view(PFOV) was 6′′ and the unit integration time 0.28 seconds.The region was mapped by rastering along right ascension with
Djupvik et al.: The young embedded cluster around Serpens/G3-G6 3
about half a frame (90′′) overlap inα and 24′′ overlap inδ,producing a 12 by 6 mosaic. Each position in the sky wasobserved for about 15 seconds. Image reductions were per-formed using CIA2 and a set of our own programs for pointsource detection and photometry. We refer to Kaas et al. (2004)for a detailed description of the data reduction. The fluxesin ADU/s in LW2 and LW3 are converted to mJy throughthe relations 2.32 and 1.96 ADU/gain/s/mJy for LW2 andLW3, respectively (Blommaert et al. 2000). These are strictlyvalid only for Fν ∝ ν−1 sources and a small colour correc-tion has been applied to the “blue” sources, which have sig-nificantly different spectra (Fν ∝ ν−3). The reference wave-lengths are defined at 6.7 and 14.3µm for LW2 and LW3,respectively. Conversion from flux density to magnitude isdefined as m6.7 = −2.5 log(Fν(6.7µm)/82.8) and m14.3µm =
−2.5 log(Fν(14.3µm)/18.9), whereFν is given in Jy. The∼ 5 %responsivity decrease throughout orbit has not been correctedfor. The ISOCAM astrometry was based on the ISO point-ing only. We manually cross-correlated bright sources with2MASS positions and found a bulk offset of 7” in DEC and1.4” in RA. Correcting for this, the mean deviation betweenISOCAM and 2MASS positions (for these bright sources) be-came 2.5± 1.4”.
ISOCAM point source extraction and photometry gave atotal of 186 detections (see Table 1) of which 160 have reliable3
fluxes in the 6.7µm band (LW2) and 74 in the 14.3µm band(LW3). For the 14.3µm band we estimate a completeness limitof 8 mJy and a limiting sensitivity of 3 mJy, while for the 6.7µm band the survey is complete to 6 mJy and reaches 1 mJy.At these levels the sample is not contaminated by galaxies. Seethe discussion in Kaas et al. (2004) for details.
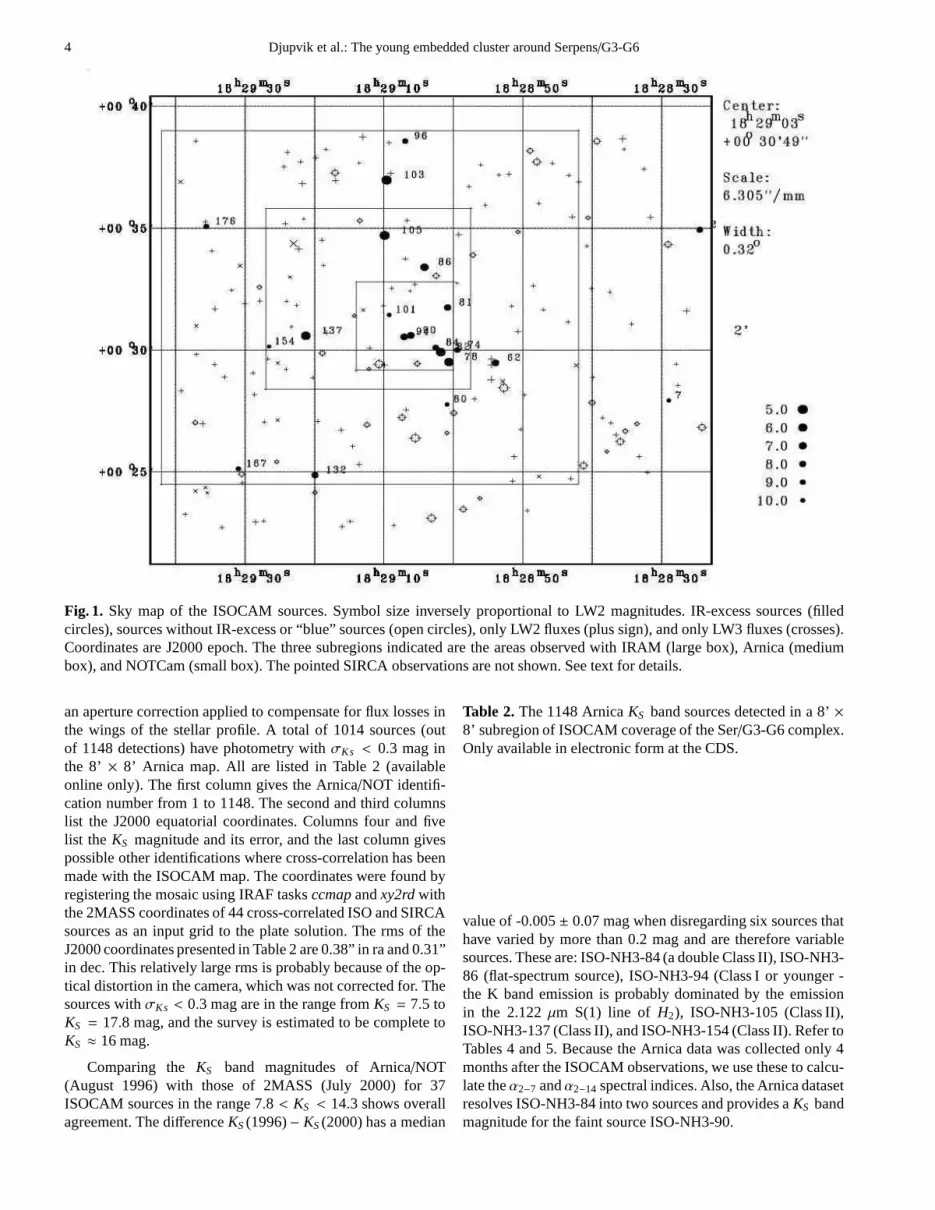
Table 1, which is available in electronic form at the CDS,lists all the 186 ISOCAM detections with fluxes and uncertain-ties for each band (see Sect. 3 for a description of the columns).Flux measurements have been obtained in both bands for a to-tal of 57 sources. These belong to either of two colour pop-ulations, one group of 36 “blue” sources that have colour in-dices like normal photospheres, and another group of 21 “red”sources that have excess emission at 14.3µm (see Fig. 4 andSect. 3 in general for details). Figure 1 is a sky map of theISOCAM sources. The locations of the IR-excess sources, thatare also labelled, are shown together with those of the “blue”(no IR-excess) sources, as well as sources with either LW2 orLW3 fluxes only. The subregions marked in this map show thelocation and extent of various follow-up observations: IRAM1.3mm map (large box), Arnica deep Ks imaging (mediumbox), and NOTCam H2 line imaging (small box). The SIRCApointed observations are not indicated in the figure.
2 CAM Interactive Analysis, a joint development by the ESAAstrophysics Division and the ISOCAM Consortium led by theISOCAM PI, C. Cesarsky, Direction des Sciences de la Matiere,C.E.A., France.
3 Detections without reliable flux measurements are generallysources observed on the edge of the detector.
Table 1.The 186 ISOCAM detections in the Ser/G3-G6 com-plex. Only available in electronic form at the CDS.
2.2. 2MASS
In the region mapped by ISOCAM a total of 1803 sources wasfound in the 2MASS All-Sky Release Point Source Catalog(Cutri et al. 2003). TheJ (1.24µm), H (1.66µm), andKs (2.16µm) photometry of all these has been used in this paper.
We cross-correlated the 186 ISOCAM sources with the2MASS PSC using a search radius of 7.5” (i.e., 3 times themean positional deviation between ISOCAM and 2MASS forbright sources after the global recentering, see Sect. 2.1). Only19 ISOCAM detections had no 2MASS counterpart, and ofthese, three are very red and faint in the near-IR, while the re-maining had been detected in only one of the two ISOCAMbands. In 29 cases we found multiple 2MASS objects withinthe search radius. Disregarding these, the mean positionalde-viation of all cross-correlations is 3.1± 1.5” and the maximumis 6.5”, and this is a measure of the accuracy of the ISOCAMpositions. None of the 29 ISOCAM sources that are associatedwith multiple 2MASS sources within a 7.5” radius are YSOcandidates with excess emission at 14.3µm, although ISO-132might be a Class II to Class III transition object (cf. Sect. 4). Inthe 28 cases of two 2MASS sources within the search radius,we have discarded one of them as “probably not an ISOCAMcounterpart”, based on separation, color, and quality flags. Inone case of a quadruple (ISO-NH3-118), we have discarded 3objects.
2.3. Ks band imaging with Arnica at the NOT
In August 1996, about 4 months after the ISOCAM observa-tions, the Arcetri Near-Infrared Camera (A) was used atthe Nordic Optical Telescope (NOT), La Palma, to obtain deepKs band (2.15µm) imaging in the most active 8′ × 8′ subre-gion of the ISOCAM field. A 4 by 4 raster mode (256× 256array and 0.54”/pix) was scanned repeatedly (dithering eachscan), staring at the same position only 1 minute at a time witha unit integration time of 1 second, until a total on-source in-tegration time of 5 minutes was obtained for the whole map.In this way the program images themselves were used to sub-tract the thermal sky level. Flat fields were calibrated on thedecreasing/increasing twilight sky, removing thermal and straylight contributions by taking difference images. Standard starstaken from the UKIRT Faint standard list (Casali & Hawarden1992) and from the A list (Hunt et al. 1998) were observedthroughout the night. Observation and reduction methods arethe same as those described in Kaas (1999a).
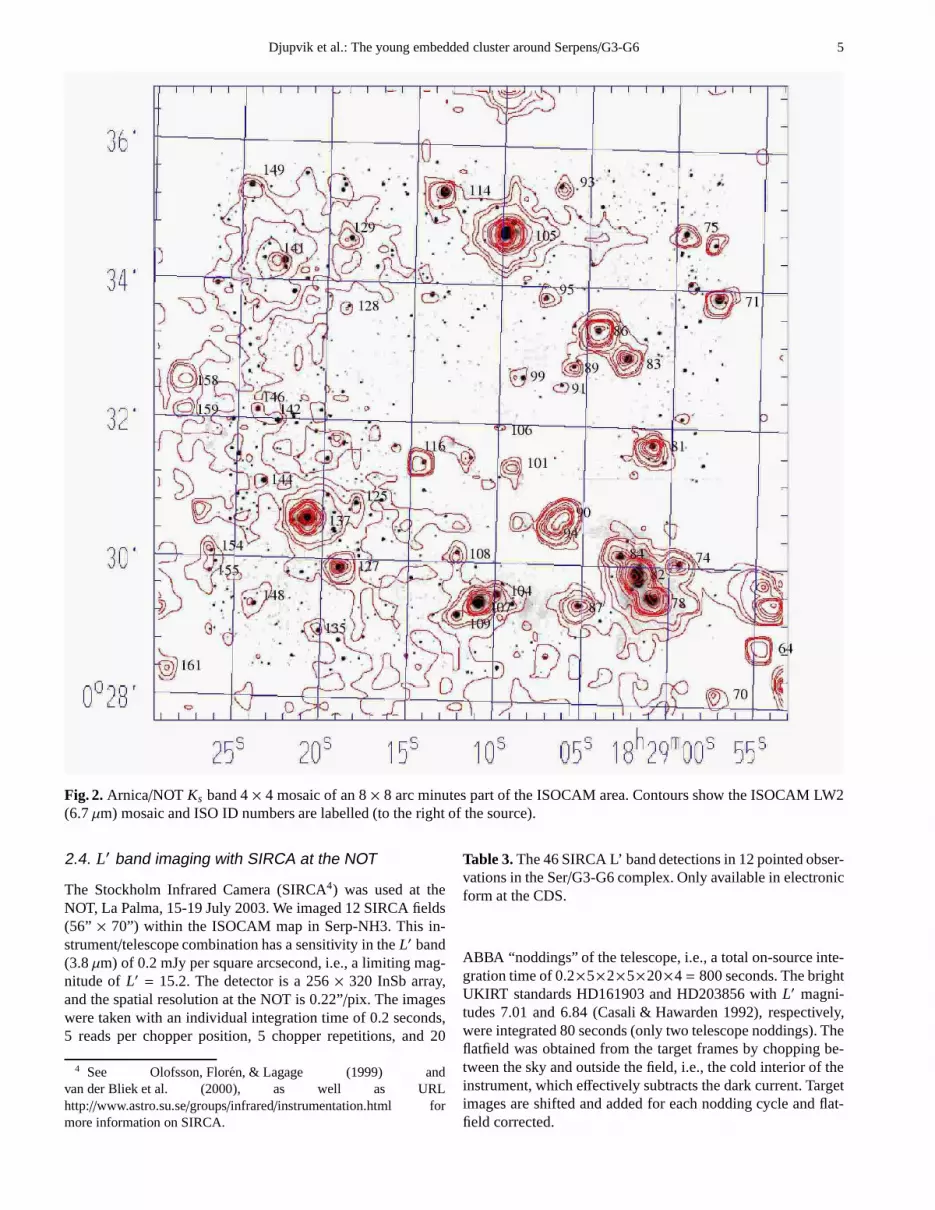
Figure 2 shows the deepKS band imaging with Arnica of an8× 8 arc minutes sub-region (i.e., 18 %) of the ISOCAM area,and contours of the LW2 band (6.7µm) image are overlaid.This area covers the Ser/G3-G6NE ammonia core (Clark 1991)well, and a high extinction region is outlined by the drop in thesurface density of stars in theKS band.
Point sources were detected with daofind (threshold at 5σ),and aperture photometry was made using a small aperture with
4 Djupvik et al.: The young embedded cluster around Serpens/G3-G6
Fig. 1. Sky map of the ISOCAM sources. Symbol size inversely proportional to LW2 magnitudes. IR-excess sources (filledcircles), sources without IR-excess or “blue” sources (open circles), only LW2 fluxes (plus sign), and only LW3 fluxes (crosses).Coordinates are J2000 epoch. The three subregions indicated are the areas observed with IRAM (large box), Arnica (mediumbox), and NOTCam (small box). The pointed SIRCA observations are not shown. See text for details.
an aperture correction applied to compensate for flux lossesinthe wings of the stellar profile. A total of 1014 sources (outof 1148 detections) have photometry withσKs < 0.3 mag inthe 8’ × 8’ Arnica map. All are listed in Table 2 (availableonline only). The first column gives the Arnica/NOT identifi-cation number from 1 to 1148. The second and third columnslist the J2000 equatorial coordinates. Columns four and fivelist the KS magnitude and its error, and the last column givespossible other identifications where cross-correlation has beenmade with the ISOCAM map. The coordinates were found byregistering the mosaic using IRAF tasksccmap andxy2rd withthe 2MASS coordinates of 44 cross-correlated ISO and SIRCAsources as an input grid to the plate solution. The rms of theJ2000 coordinates presented in Table 2 are 0.38” in ra and 0.31”in dec. This relatively large rms is probably because of the op-tical distortion in the camera, which was not corrected for.Thesources withσKs < 0.3 mag are in the range fromKS = 7.5 toKS = 17.8 mag, and the survey is estimated to be complete toKS ≈ 16 mag.
Comparing the KS band magnitudes of Arnica/NOT(August 1996) with those of 2MASS (July 2000) for 37ISOCAM sources in the range 7.8 < KS < 14.3 shows overallagreement. The differenceKS (1996)− KS (2000) has a median
Table 2. The 1148 ArnicaKS band sources detected in a 8’×8’ subregion of ISOCAM coverage of the Ser/G3-G6 complex.Only available in electronic form at the CDS.
value of -0.005± 0.07 mag when disregarding six sources thathave varied by more than 0.2 mag and are therefore variablesources. These are: ISO-NH3-84 (a double Class II), ISO-NH3-86 (flat-spectrum source), ISO-NH3-94 (Class I or younger -the K band emission is probably dominated by the emissionin the 2.122µm S(1) line of H2), ISO-NH3-105 (Class II),ISO-NH3-137 (Class II), and ISO-NH3-154 (Class II). Refer toTables 4 and 5. Because the Arnica data was collected only 4months after the ISOCAM observations, we use these to calcu-late theα2−7 andα2−14 spectral indices. Also, the Arnica datasetresolves ISO-NH3-84 into two sources and provides aKS bandmagnitude for the faint source ISO-NH3-90.
Djupvik et al.: The young embedded cluster around Serpens/G3-G6 5
Fig. 2.Arnica/NOT Ks band 4× 4 mosaic of an 8× 8 arc minutes part of the ISOCAM area. Contours show the ISOCAM LW2(6.7µm) mosaic and ISO ID numbers are labelled (to the right of the source).
2.4. L′ band imaging with SIRCA at the NOT
The Stockholm Infrared Camera (SIRCA4) was used at theNOT, La Palma, 15-19 July 2003. We imaged 12 SIRCA fields(56” × 70”) within the ISOCAM map in Serp-NH3. This in-strument/telescope combination has a sensitivity in theL′ band(3.8µm) of 0.2 mJy per square arcsecond, i.e., a limiting mag-nitude of L′ = 15.2. The detector is a 256× 320 InSb array,and the spatial resolution at the NOT is 0.22”/pix. The imageswere taken with an individual integration time of 0.2 seconds,5 reads per chopper position, 5 chopper repetitions, and 20
4 See Olofsson, Floren, & Lagage (1999) andvan der Bliek et al. (2000), as well as URLhttp://www.astro.su.se/groups/infrared/instrumentation.html formore information on SIRCA.
Table 3.The 46 SIRCA L’ band detections in 12 pointed obser-vations in the Ser/G3-G6 complex. Only available in electronicform at the CDS.
ABBA “noddings” of the telescope, i.e., a total on-source inte-gration time of 0.2×5×2×5×20×4= 800 seconds. The brightUKIRT standards HD161903 and HD203856 withL′ magni-tudes 7.01 and 6.84 (Casali & Hawarden 1992), respectively,were integrated 80 seconds (only two telescope noddings). Theflatfield was obtained from the target frames by chopping be-tween the sky and outside the field, i.e., the cold interior oftheinstrument, which effectively subtracts the dark current. Targetimages are shifted and added for each nodding cycle and flat-field corrected.
6 Djupvik et al.: The young embedded cluster around Serpens/G3-G6
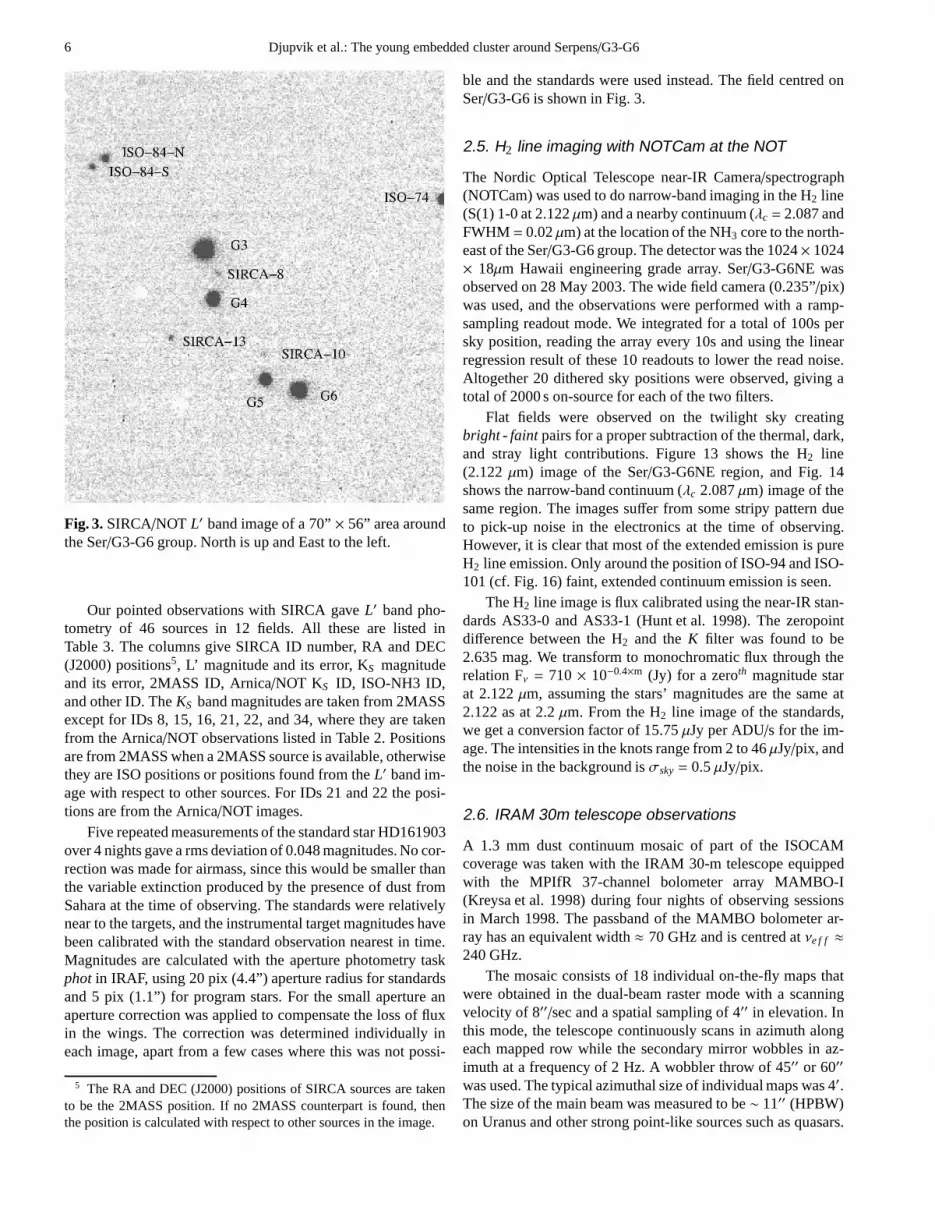
Fig. 3.SIRCA/NOT L′ band image of a 70”× 56” area aroundthe Ser/G3-G6 group. North is up and East to the left.
Our pointed observations with SIRCA gaveL′ band pho-tometry of 46 sources in 12 fields. All these are listed inTable 3. The columns give SIRCA ID number, RA and DEC(J2000) positions5, L’ magnitude and its error, KS magnitudeand its error, 2MASS ID, Arnica/NOT KS ID, ISO-NH3 ID,and other ID. TheKS band magnitudes are taken from 2MASSexcept for IDs 8, 15, 16, 21, 22, and 34, where they are takenfrom the Arnica/NOT observations listed in Table 2. Positionsare from 2MASS when a 2MASS source is available, otherwisethey are ISO positions or positions found from theL′ band im-age with respect to other sources. For IDs 21 and 22 the posi-tions are from the Arnica/NOT images.
Five repeated measurements of the standard star HD161903over 4 nights gave a rms deviation of 0.048 magnitudes. No cor-rection was made for airmass, since this would be smaller thanthe variable extinction produced by the presence of dust fromSahara at the time of observing. The standards were relativelynear to the targets, and the instrumental target magnitudeshavebeen calibrated with the standard observation nearest in time.Magnitudes are calculated with the aperture photometry taskphot in IRAF, using 20 pix (4.4”) aperture radius for standardsand 5 pix (1.1”) for program stars. For the small aperture anaperture correction was applied to compensate the loss of fluxin the wings. The correction was determined individually ineach image, apart from a few cases where this was not possi-
5 The RA and DEC (J2000) positions of SIRCA sources are takento be the 2MASS position. If no 2MASS counterpart is found, thenthe position is calculated with respect to other sources in the image.
ble and the standards were used instead. The field centred onSer/G3-G6 is shown in Fig. 3.
2.5. H2 line imaging with NOTCam at the NOT
The Nordic Optical Telescope near-IR Camera/spectrograph(NOTCam) was used to do narrow-band imaging in the H2 line(S(1) 1-0 at 2.122µm) and a nearby continuum (λc = 2.087 andFWHM = 0.02µm) at the location of the NH3 core to the north-east of the Ser/G3-G6 group. The detector was the 1024× 1024× 18µm Hawaii engineering grade array. Ser/G3-G6NE wasobserved on 28 May 2003. The wide field camera (0.235”/pix)was used, and the observations were performed with a ramp-sampling readout mode. We integrated for a total of 100s persky position, reading the array every 10s and using the linearregression result of these 10 readouts to lower the read noise.Altogether 20 dithered sky positions were observed, givingatotal of 2000 s on-source for each of the two filters.
Flat fields were observed on the twilight sky creatingbright - faint pairs for a proper subtraction of the thermal, dark,and stray light contributions. Figure 13 shows the H2 line(2.122µm) image of the Ser/G3-G6NE region, and Fig. 14shows the narrow-band continuum (λc 2.087µm) image of thesame region. The images suffer from some stripy pattern dueto pick-up noise in the electronics at the time of observing.However, it is clear that most of the extended emission is pureH2 line emission. Only around the position of ISO-94 and ISO-101 (cf. Fig. 16) faint, extended continuum emission is seen.
The H2 line image is flux calibrated using the near-IR stan-dards AS33-0 and AS33-1 (Hunt et al. 1998). The zeropointdifference between the H2 and theK filter was found to be2.635 mag. We transform to monochromatic flux through therelation Fν = 710× 10−0.4×m (Jy) for a zeroth magnitude starat 2.122µm, assuming the stars’ magnitudes are the same at2.122 as at 2.2µm. From the H2 line image of the standards,we get a conversion factor of 15.75µJy per ADU/s for the im-age. The intensities in the knots range from 2 to 46µJy/pix, andthe noise in the background isσsky = 0.5µJy/pix.
2.6. IRAM 30m telescope observations
A 1.3 mm dust continuum mosaic of part of the ISOCAMcoverage was taken with the IRAM 30-m telescope equippedwith the MPIfR 37-channel bolometer array MAMBO-I(Kreysa et al. 1998) during four nights of observing sessionsin March 1998. The passband of the MAMBO bolometer ar-ray has an equivalent width≈ 70 GHz and is centred atνe f f ≈
240 GHz.The mosaic consists of 18 individual on-the-fly maps that
were obtained in the dual-beam raster mode with a scanningvelocity of 8′′/sec and a spatial sampling of 4′′ in elevation. Inthis mode, the telescope continuously scans in azimuth alongeach mapped row while the secondary mirror wobbles in az-imuth at a frequency of 2 Hz. A wobbler throw of 45′′ or 60′′
was used. The typical azimuthal size of individual maps was 4′.The size of the main beam was measured to be∼ 11′′ (HPBW)on Uranus and other strong point-like sources such as quasars.
Djupvik et al.: The young embedded cluster around Serpens/G3-G6 7
The pointing of the telescope was checked every∼ 1 hr usingthe VLA position of the strong, compact Class 0 source FIRS1in the Serpens Cloud Core (good to∼ 0.1′′, Curiel et al. 1993);it was found to be accurate to better than∼ 3′′. The zenith atmo-spheric optical depth, monitored by ‘skydips’ every∼ 2 hr, wasbetween∼ 0.2 and∼ 0.4. Calibration was achieved through on-the-fly mapping and on-off observations of the primary calibra-tor Uranus (e.g., Griffin & Orton 1993, and references therein).In addition, the Serpens secondary calibrator FIRS1, whichhasa 1.3 mm peak flux density∼ 2.4 Jy in an 11′′ beam, was ob-served before and after each map. The relative calibration wasfound to be good to within∼ 10% by comparing the individualcoverages of each field, while the overall absolute calibrationuncertainty is estimated to be∼ 20%.
The dual-beam maps were reduced and combined withthe IRAM software for bolometer-array data (“NIC”; cf.Broguiere, Neri & Sievers 1995), which uses the EKH restora-tion algorithm (Emerson, Klein & Haslam 1979).
Figure 12 shows the IRAM data contour map with fourbright sources labelled (MMS1, MMS2, MMS3, and MMS4),and Table 7 lists the individual sources with fluxes and posi-tions.
2.7. VLA 3.6 cm observations
Radio continuum observations of three fields covering all fourmillimeter sources (MMS1-4) were made at 3.6 cm (central fre-quency 8.46 GHz, total bandwidth 100 MHz) with the NRAO6
Very Large Array (VLA) in a mixed B/C configuration on22 June 2001. The on-source integration time per field was∼ 75 min. The amplitude calibrator was 3C286 and the phasecalibrator was 1801+010. The data were edited and calibratedusing standard VLA procedures and the corresponding mapcleaned using the AIPS task IMAGR with natural weighting.The synthesised beam size was 2.8′′ × 2.3′′ (HPBW) and theprimary beam (or field of view) of each observation was 5.3′
(FWHM). The rms noise in each field was∼ 16µJy/beam, im-plying a 5σ detection threshold of∼ 0.08 mJy/beam in the in-ner parts of the fields. A total of eight point-like radio sourceswere detected above the 5σ level within the primary beamsof the three observed VLA fields. Table 8 lists their positions(accurate to±0.5′′) and their 3.6 cm flux densities correctedfor primary beam attenuation. Five VLA sources appear to beclosely associated with infrared and/or millimeter sources (cf.Table 8). The other sources are probably background extra-galactic sources. In addition to these robust VLA detections,we have also included a weak, tentative (∼ 3.3σ) radio sourcein Table 8 as it coincides within 1.5′′ with the 1.3 mm contin-uum source MMS1-c.
3. IR-excess sources
The results from the different datasets on the ISOCAM se-lected sample are summarised in Table 1, which is available
6 The National Radio Astronomy Observatory is operated byAssociated Universities, Inc., under a cooperative agreement with theNational Science Foundation.
at the CDS in electronic form only. Its first column lists theISO identification number (ISO-nh3-#), then the ISOCAM po-sitions (RA and DEC in J2000 epoch) in columns two andthree. Columns four and five give the Arnica KS band mag-nitude and error (KS (96) andσK). Columns six to nine listthe ISOCAM fluxes with uncertainties in mJy (Fν(6.7µ), σ6.7,Fν(14.3µ),σ14.3). Columns 10 to 13 show the ISOCAM detec-tion and photometry flag, the name of the 2MASS counterpart,the id of the NOT (Arnica KS (96)) counterpart, and at last a col-umn with possible other identification. We refer to the 2MASScatalogue for further information on the 2MASS counterparts.
In the following subsections we will use various colour-magnitude and colour-colour diagrams to extract YSO candi-dates based on IR excess. The strategy is as follows:
– select IR-excess sources from the ISOCAM data– compare with theJ −H/H−KS diagram from 2MASS and
search for more candidates– combine bands of ISOCAM and 2MASS to search for ad-
ditional IR-excess sources in theH − KS /KS −m7 diagram– combine SIRCA L’ band with 2MASSH andKS to search
for more candidates
3.1. The ISOCAM colour-magnitude diagram
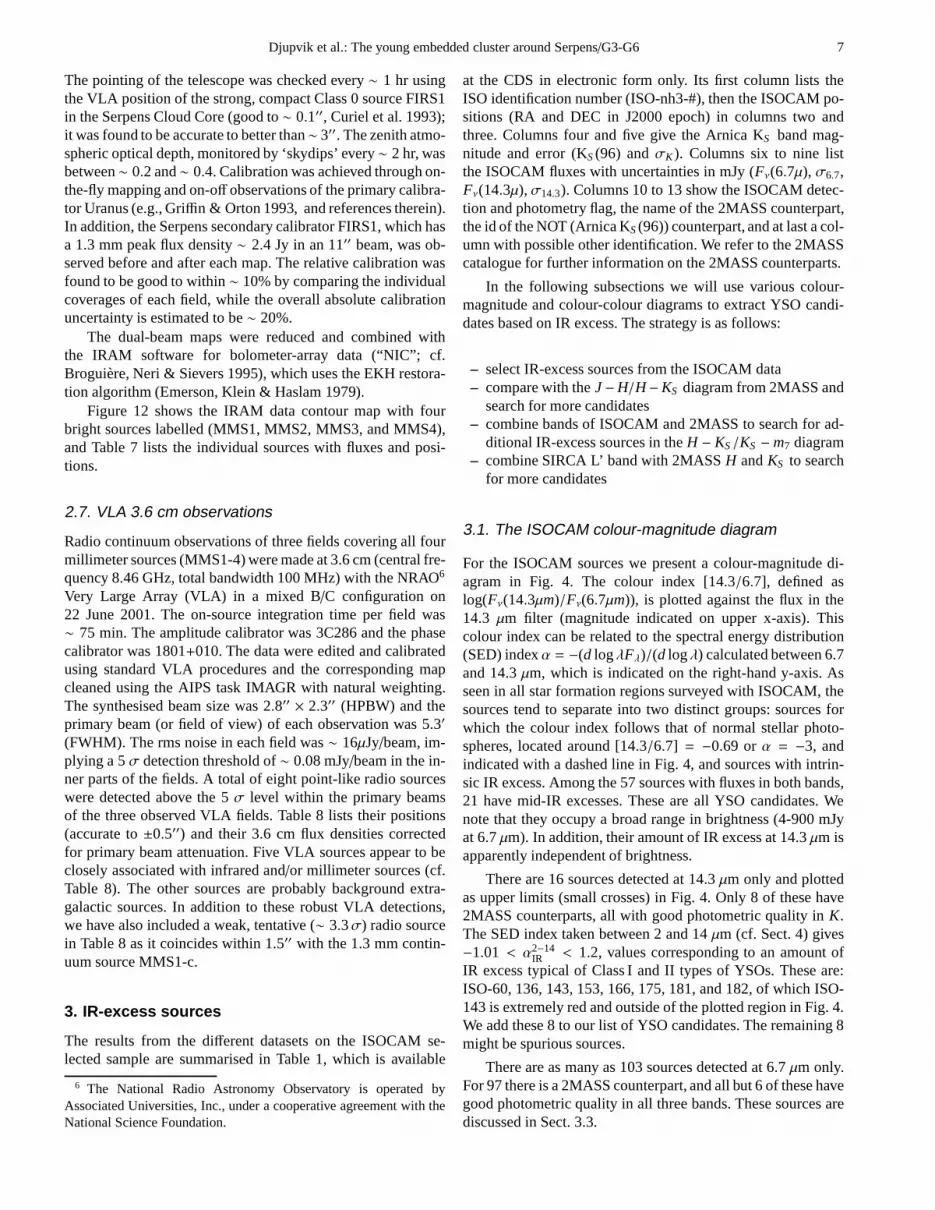
For the ISOCAM sources we present a colour-magnitude di-agram in Fig. 4. The colour index [14.3/6.7], defined aslog(Fν(14.3µm)/Fν(6.7µm)), is plotted against the flux in the14.3 µm filter (magnitude indicated on upper x-axis). Thiscolour index can be related to the spectral energy distribution(SED) indexα = −(d logλFλ)/(d logλ) calculated between 6.7and 14.3µm, which is indicated on the right-hand y-axis. Asseen in all star formation regions surveyed with ISOCAM, thesources tend to separate into two distinct groups: sources forwhich the colour index follows that of normal stellar photo-spheres, located around [14.3/6.7] = −0.69 or α = −3, andindicated with a dashed line in Fig. 4, and sources with intrin-sic IR excess. Among the 57 sources with fluxes in both bands,21 have mid-IR excesses. These are all YSO candidates. Wenote that they occupy a broad range in brightness (4-900 mJyat 6.7µm). In addition, their amount of IR excess at 14.3µm isapparently independent of brightness.
There are 16 sources detected at 14.3µm only and plottedas upper limits (small crosses) in Fig. 4. Only 8 of these have2MASS counterparts, all with good photometric quality inK.The SED index taken between 2 and 14µm (cf. Sect. 4) gives−1.01 < α2−14
IR < 1.2, values corresponding to an amount ofIR excess typical of Class I and II types of YSOs. These are:ISO-60, 136, 143, 153, 166, 175, 181, and 182, of which ISO-143 is extremely red and outside of the plotted region in Fig.4.We add these 8 to our list of YSO candidates. The remaining 8might be spurious sources.
There are as many as 103 sources detected at 6.7µm only.For 97 there is a 2MASS counterpart, and all but 6 of these havegood photometric quality in all three bands. These sources arediscussed in Sect. 3.3.
8 Djupvik et al.: The young embedded cluster around Serpens/G3-G6
Fig. 4. The colour index [14.3/6.7], defined aslog((Fν(14.3µ)/Fν(6.7µ)), is shown on the y-axis and theflux at 14.3µm (in Jy) is shown on the x-axis. Sources withoutIR excess tend to line up around [14.3/6.7] = −0.66 orα = −3(dashed line). The 21 sources with mid-IR excesses (circles)are spread out over a large range in brightness. These are allYSOs. Lower limits on colour are given for sources detected at14.3µm only (small crosses).
Fig. 5.TheJ−H/H−KS diagram for the ISOCAM sources with2MASS counterparts (dots). The red ISOCAM sources (opencircles) merge together with the blue ISOCAM sources (opentriangles) along the reddening band of normal stars. SevenISOCAM sources appear to have excess emission in theH−KS
index (open squares), but they are all flagged 2MASS sources.Twenty faint 2MASS sources (crosses) with apparent IR ex-cesses are discussed in the text.
3.2. The 2MASS J − H/H − KS diagram
Figure 5 shows theJ −H/H−KS diagram for all the ISOCAMsources with 2MASS counterparts (dots). The blue ISOCAMsources are marked with open triangles. The red ISOCAMsources found to be YSO candidates in the previous sectionare marked with open circles. The loci of giant, supergiant,andmain-sequence stars (Koornneef 1983) are indicated with boldcurves. We have calculated the slope outlined by the ISOCAMblue sources to be 1.82±0.05. This should be a good indica-tor of the cloud extinction in this diagram, and the redden-
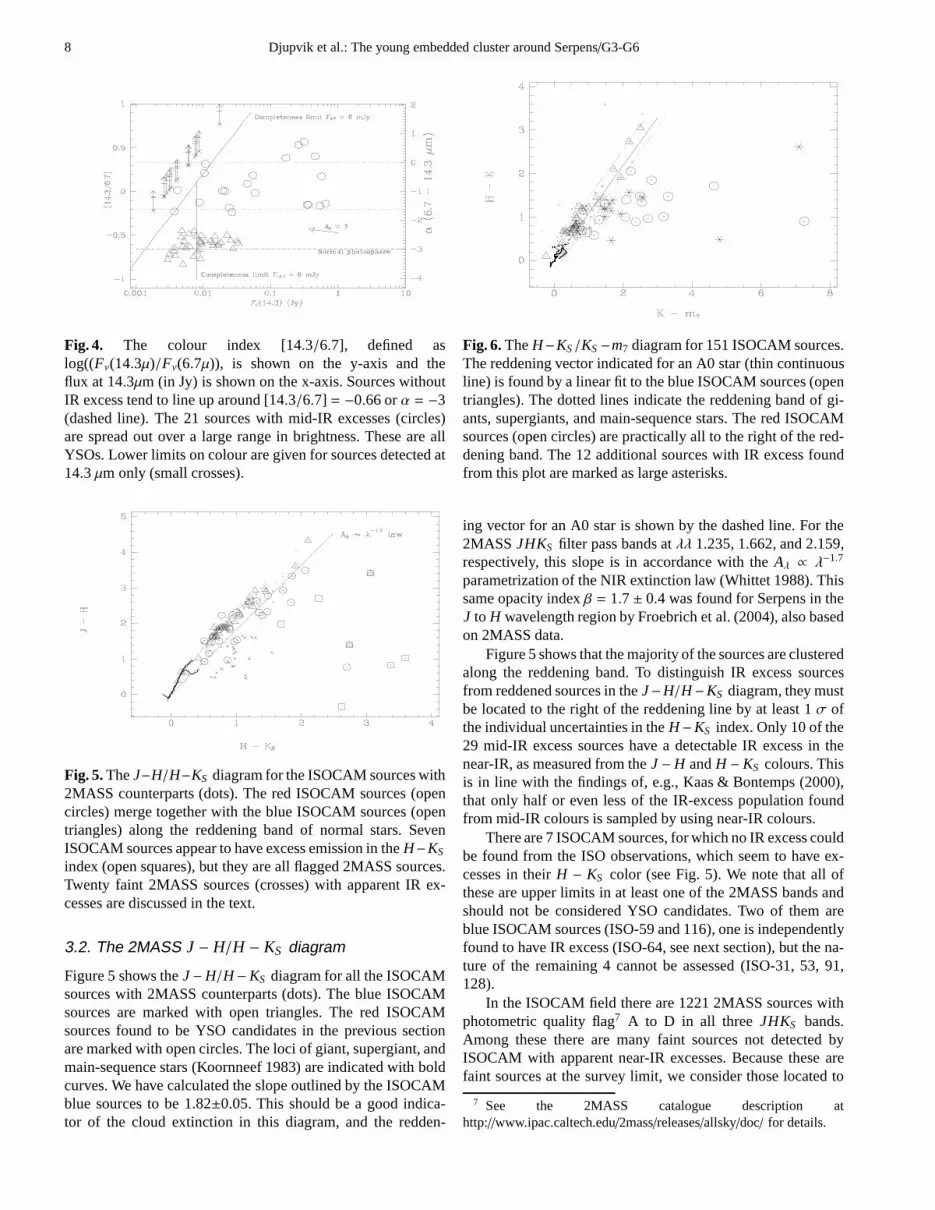
Fig. 6.TheH−KS /KS −m7 diagram for 151 ISOCAM sources.The reddening vector indicated for an A0 star (thin continuousline) is found by a linear fit to the blue ISOCAM sources (opentriangles). The dotted lines indicate the reddening band ofgi-ants, supergiants, and main-sequence stars. The red ISOCAMsources (open circles) are practically all to the right of the red-dening band. The 12 additional sources with IR excess foundfrom this plot are marked as large asterisks.
ing vector for an A0 star is shown by the dashed line. For the2MASS JHKS filter pass bands atλλ 1.235, 1.662, and 2.159,respectively, this slope is in accordance with theAλ ∝ λ−1.7
parametrization of the NIR extinction law (Whittet 1988). Thissame opacity indexβ = 1.7± 0.4 was found for Serpens in theJ to H wavelength region by Froebrich et al. (2004), also basedon 2MASS data.
Figure 5 shows that the majority of the sources are clusteredalong the reddening band. To distinguish IR excess sourcesfrom reddened sources in theJ−H/H−KS diagram, they mustbe located to the right of the reddening line by at least 1σ ofthe individual uncertainties in theH−KS index. Only 10 of the29 mid-IR excess sources have a detectable IR excess in thenear-IR, as measured from theJ −H andH − KS colours. Thisis in line with the findings of, e.g., Kaas & Bontemps (2000),that only half or even less of the IR-excess population foundfrom mid-IR colours is sampled by using near-IR colours.
There are 7 ISOCAM sources, for which no IR excess couldbe found from the ISO observations, which seem to have ex-cesses in theirH − KS color (see Fig. 5). We note that all ofthese are upper limits in at least one of the 2MASS bands andshould not be considered YSO candidates. Two of them areblue ISOCAM sources (ISO-59 and 116), one is independentlyfound to have IR excess (ISO-64, see next section), but the na-ture of the remaining 4 cannot be assessed (ISO-31, 53, 91,128).
In the ISOCAM field there are 1221 2MASS sources withphotometric quality flag7 A to D in all three JHKS bands.Among these there are many faint sources not detected byISOCAM with apparent near-IR excesses. Because these arefaint sources at the survey limit, we consider those locatedto
7 See the 2MASS catalogue description athttp://www.ipac.caltech.edu/2mass/releases/allsky/doc/ for details.
Djupvik et al.: The young embedded cluster around Serpens/G3-G6 9
the right of the reddening band by at least 2σ of the individ-ual uncertainties in theH − KS index. The resulting 20 sources(see Fig. 5) occupy a range ofJ − H andH − KS colours typi-cal of pre-main sequence stars. As suggested by the referee,wecross-correlated these with the on-line c2d Spitzer photometrytable for Serpens, and found IRAC counterparts for 19 sources.None of these have IR excess in any of the Spitzer IRAC bands,however, and therefore they cannot be proposed as bona-fide IRexcess YSO candidates. The apparent excesses inH − KS arenot understood and may mostly be the result of statistical fluc-tuations in the 2MASS data, since none of the 20 sources islocated to the right of the reddening band by more than 5σ ofthe individual errors in theH − KS index. More data is neededto establish the near-IR colours of these sources.
3.3. The H − KS /KS − m7 diagram
As seen in Fig. 5, theJ − H/H − KS diagram does not extractnearly half of the IR-excess sources identified with ISOCAM.The IR excess does not separate well from the reddening inthe J − H andH − KS colours, and the blue and red ISOCAMsources tend to merge together along the reddening band. Asshown in, e.g., Kaas et al. (2004), theH − KS /KS − m7 dia-gram better distinguishes IR excess from reddening. By usingthis diagram we can study the 103 ISOCAM sources for whichthere are 6.7µm fluxes only (see Fig. 6). The reddening vectorindicated is empirically found from this dataset. The slope1.09± 0.01 is found by a linear fit to the blue ISOCAM sources.For comparison, the slope was 1.23 for the Serpens CloudCore (Kaas et al. 2004). The width of the reddening band ofgiants, super giants and main-sequence stars, whose intrinsiccolours are outlined by the bold face curves, is indicated. Thered ISOCAM sources are all, except two (132 and 167), foundto the right of the reddening band. We find a total of 26 IR-excess objects from theH − KS /KS − m7 diagram, i.e., thosewho are located to the right of the reddening band of normalstars by more than 1σ in the KS − m7 colour index. Twelveof these are new, i.e., not selected in the colour diagrams dis-cussed above.
3.4. The H − KS /KS − L diagram
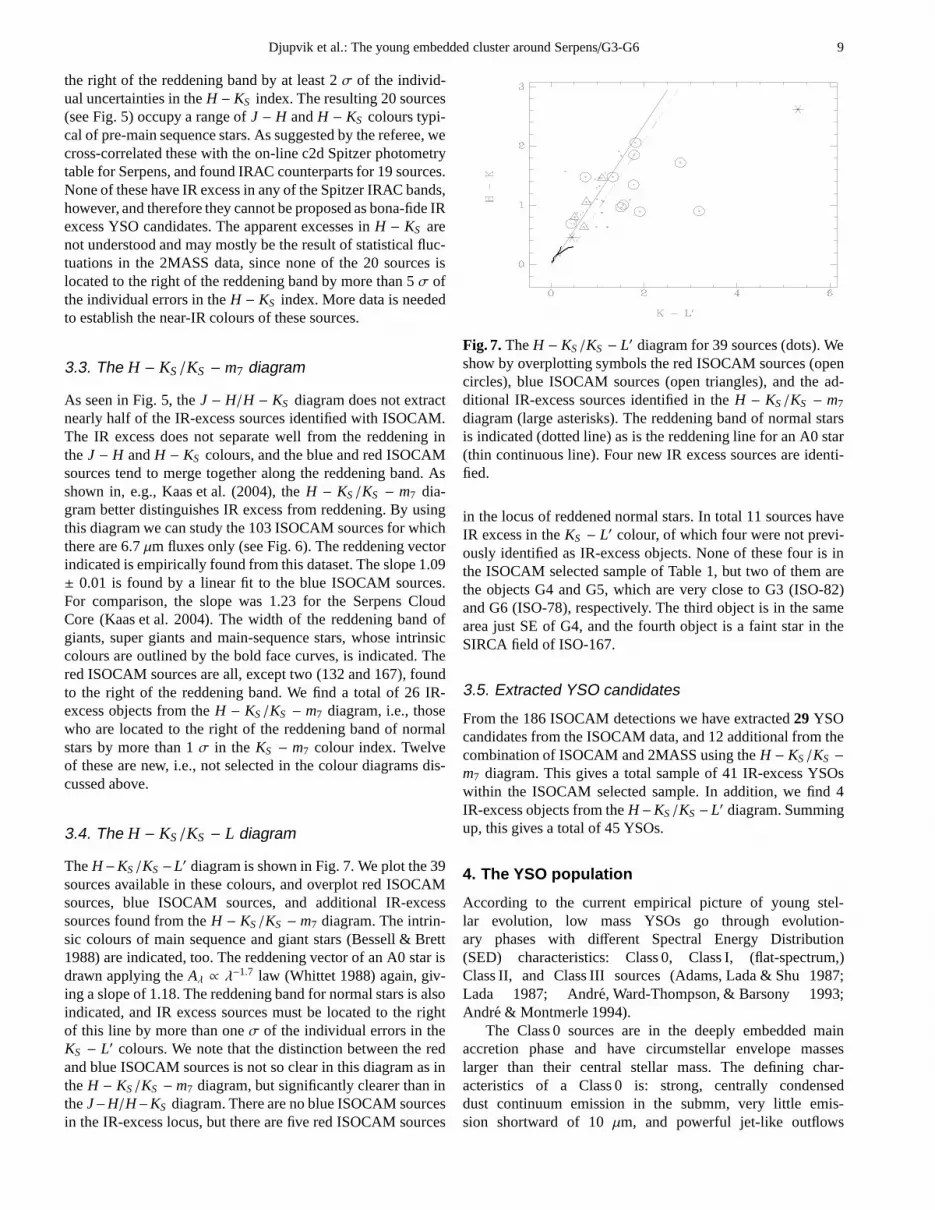
TheH−KS /KS −L′ diagram is shown in Fig. 7. We plot the 39sources available in these colours, and overplot red ISOCAMsources, blue ISOCAM sources, and additional IR-excesssources found from theH − KS /KS − m7 diagram. The intrin-sic colours of main sequence and giant stars (Bessell & Brett1988) are indicated, too. The reddening vector of an A0 star isdrawn applying theAλ ∝ λ−1.7 law (Whittet 1988) again, giv-ing a slope of 1.18. The reddening band for normal stars is alsoindicated, and IR excess sources must be located to the rightof this line by more than oneσ of the individual errors in theKS − L′ colours. We note that the distinction between the redand blue ISOCAM sources is not so clear in this diagram as intheH − KS /KS − m7 diagram, but significantly clearer than intheJ−H/H−KS diagram. There are no blue ISOCAM sourcesin the IR-excess locus, but there are five red ISOCAM sources
Fig. 7.TheH − KS /KS − L′ diagram for 39 sources (dots). Weshow by overplotting symbols the red ISOCAM sources (opencircles), blue ISOCAM sources (open triangles), and the ad-ditional IR-excess sources identified in theH − KS /KS − m7
diagram (large asterisks). The reddening band of normal starsis indicated (dotted line) as is the reddening line for an A0 star(thin continuous line). Four new IR excess sources are identi-fied.
in the locus of reddened normal stars. In total 11 sources haveIR excess in theKS − L′ colour, of which four were not previ-ously identified as IR-excess objects. None of these four is inthe ISOCAM selected sample of Table 1, but two of them arethe objects G4 and G5, which are very close to G3 (ISO-82)and G6 (ISO-78), respectively. The third object is in the samearea just SE of G4, and the fourth object is a faint star in theSIRCA field of ISO-167.
3.5. Extracted YSO candidates
From the 186 ISOCAM detections we have extracted29 YSOcandidates from the ISOCAM data, and 12 additional from thecombination of ISOCAM and 2MASS using theH − KS /KS −
m7 diagram. This gives a total sample of 41 IR-excess YSOswithin the ISOCAM selected sample. In addition, we find 4IR-excess objects from theH−KS /KS −L′ diagram. Summingup, this gives a total of 45 YSOs.
4. The YSO population
According to the current empirical picture of young stel-lar evolution, low mass YSOs go through evolution-ary phases with different Spectral Energy Distribution(SED) characteristics: Class 0, Class I, (flat-spectrum,)Class II, and Class III sources (Adams, Lada & Shu 1987;Lada 1987; Andre, Ward-Thompson, & Barsony 1993;Andre & Montmerle 1994).
The Class 0 sources are in the deeply embedded mainaccretion phase and have circumstellar envelope masseslarger than their central stellar mass. The defining char-acteristics of a Class 0 is: strong, centrally condenseddust continuum emission in the submm, very little emis-sion shortward of 10µm, and powerful jet-like outflows
10 Djupvik et al.: The young embedded cluster around Serpens/G3-G6
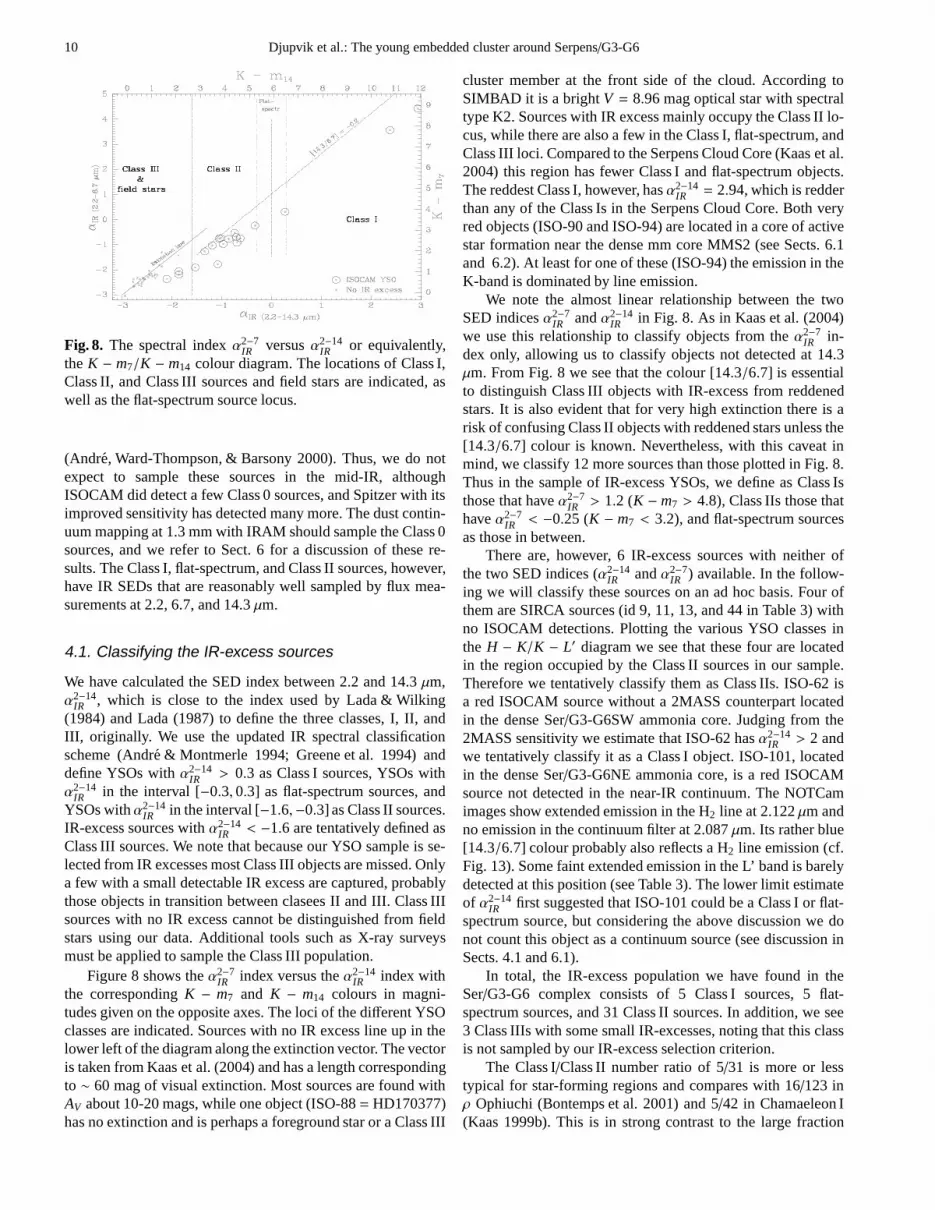
Fig. 8. The spectral indexα2−7IR versusα2−14
IR or equivalently,the K − m7/K − m14 colour diagram. The locations of Class I,Class II, and Class III sources and field stars are indicated,aswell as the flat-spectrum source locus.
(Andre, Ward-Thompson, & Barsony 2000). Thus, we do notexpect to sample these sources in the mid-IR, althoughISOCAM did detect a few Class 0 sources, and Spitzer with itsimproved sensitivity has detected many more. The dust contin-uum mapping at 1.3 mm with IRAM should sample the Class 0sources, and we refer to Sect. 6 for a discussion of these re-sults. The Class I, flat-spectrum, and Class II sources, however,have IR SEDs that are reasonably well sampled by flux mea-surements at 2.2, 6.7, and 14.3µm.
4.1. Classifying the IR-excess sources
We have calculated the SED index between 2.2 and 14.3µm,α2−14
IR , which is close to the index used by Lada & Wilking(1984) and Lada (1987) to define the three classes, I, II, andIII, originally. We use the updated IR spectral classificationscheme (Andre & Montmerle 1994; Greene et al. 1994) anddefine YSOs withα2−14
IR > 0.3 as Class I sources, YSOs withα2−14
IR in the interval [−0.3, 0.3] as flat-spectrum sources, andYSOs withα2−14
IR in the interval [−1.6,−0.3] as Class II sources.IR-excess sources withα2−14
IR < −1.6 are tentatively defined asClass III sources. We note that because our YSO sample is se-lected from IR excesses most Class III objects are missed. Onlya few with a small detectable IR excess are captured, probablythose objects in transition between clasees II and III. Class IIIsources with no IR excess cannot be distinguished from fieldstars using our data. Additional tools such as X-ray surveysmust be applied to sample the Class III population.
Figure 8 shows theα2−7IR index versus theα2−14
IR index withthe correspondingK − m7 and K − m14 colours in magni-tudes given on the opposite axes. The loci of the different YSOclasses are indicated. Sources with no IR excess line up in thelower left of the diagram along the extinction vector. The vectoris taken from Kaas et al. (2004) and has a length correspondingto ∼ 60 mag of visual extinction. Most sources are found withAV about 10-20 mags, while one object (ISO-88= HD170377)has no extinction and is perhaps a foreground star or a Class III
cluster member at the front side of the cloud. According toSIMBAD it is a brightV = 8.96 mag optical star with spectraltype K2. Sources with IR excess mainly occupy the Class II lo-cus, while there are also a few in the Class I, flat-spectrum, andClass III loci. Compared to the Serpens Cloud Core (Kaas et al.2004) this region has fewer Class I and flat-spectrum objects.The reddest Class I, however, hasα2−14
IR = 2.94, which is redderthan any of the Class Is in the Serpens Cloud Core. Both veryred objects (ISO-90 and ISO-94) are located in a core of activestar formation near the dense mm core MMS2 (see Sects. 6.1and 6.2). At least for one of these (ISO-94) the emission in theK-band is dominated by line emission.
We note the almost linear relationship between the twoSED indicesα2−7
IR andα2−14IR in Fig. 8. As in Kaas et al. (2004)
we use this relationship to classify objects from theα2−7IR in-
dex only, allowing us to classify objects not detected at 14.3µm. From Fig. 8 we see that the colour [14.3/6.7] is essentialto distinguish Class III objects with IR-excess from reddenedstars. It is also evident that for very high extinction thereis arisk of confusing Class II objects with reddened stars unless the[14.3/6.7] colour is known. Nevertheless, with this caveat inmind, we classify 12 more sources than those plotted in Fig. 8.Thus in the sample of IR-excess YSOs, we define as Class Isthose that haveα2−7
IR > 1.2 (K − m7 > 4.8), Class IIs those thathaveα2−7
IR < −0.25 (K − m7 < 3.2), and flat-spectrum sourcesas those in between.
There are, however, 6 IR-excess sources with neither ofthe two SED indices (α2−14
IR andα2−7IR ) available. In the follow-
ing we will classify these sources on an ad hoc basis. Four ofthem are SIRCA sources (id 9, 11, 13, and 44 in Table 3) withno ISOCAM detections. Plotting the various YSO classes inthe H − K/K − L′ diagram we see that these four are locatedin the region occupied by the Class II sources in our sample.Therefore we tentatively classify them as Class IIs. ISO-62isa red ISOCAM source without a 2MASS counterpart locatedin the dense Ser/G3-G6SW ammonia core. Judging from the2MASS sensitivity we estimate that ISO-62 hasα2−14
IR > 2 andwe tentatively classify it as a Class I object. ISO-101, locatedin the dense Ser/G3-G6NE ammonia core, is a red ISOCAMsource not detected in the near-IR continuum. The NOTCamimages show extended emission in the H2 line at 2.122µm andno emission in the continuum filter at 2.087µm. Its rather blue[14.3/6.7] colour probably also reflects a H2 line emission (cf.Fig. 13). Some faint extended emission in the L’ band is barelydetected at this position (see Table 3). The lower limit estimateof α2−14
IR first suggested that ISO-101 could be a Class I or flat-spectrum source, but considering the above discussion we donot count this object as a continuum source (see discussion inSects. 4.1 and 6.1).
In total, the IR-excess population we have found in theSer/G3-G6 complex consists of 5 Class I sources, 5 flat-spectrum sources, and 31 Class II sources. In addition, we see3 Class IIIs with some small IR-excesses, noting that this classis not sampled by our IR-excess selection criterion.
The Class I/Class II number ratio of 5/31 is more or lesstypical for star-forming regions and compares with 16/123 inρ Ophiuchi (Bontemps et al. 2001) and 5/42 in Chamaeleon I(Kaas 1999b). This is in strong contrast to the large fraction
Djupvik et al.: The young embedded cluster around Serpens/G3-G6 11
Table 4. The 5 Class I and the 5 flat-spectrum sources. Cross-correlated with Spitzer YSO candidates from Harvey et al.(2006).
ISO Other ID α2−7IR α2−14
IR ∆K
90 IRAS 18265+0028, Spitzer-16 4.42 2.94 n.a.941 Spitzer-17 3.56 2.38 0.64622 >3 >2 n.a.
1433 1.20 n.a.64 Spitzer-5 2.93 n.a.86 0.31 0.27 -0.7460 Spitzer-3 0.02 n.a.
182 -0.04 n.a.153 -0.14 n.a.121 1.06 n.a.
1 H2 line emission probably dominates the K band flux.2 Lower limits onα2−14
IR , butα4−14IR = 1.54 .
3 Not located within the 1.3 mm emission, and its Class I natureisquestionable.
of Class I sources found in the Serpens Cloud Core (Kaas et al.2004).
4.2. Class I and flat-spectrum candidates
There is a total of 10 IR-excess protostar candidates listedinTable 4: 5 Class Is and 5 flat-spectrum sources. We note thatthe classification is tentative in the sense that only lower limitson the SED indices can be given in the case of ISO-62. Also,the indices of ISO-94 are lower limits since the K-band fluxis dominated by H2 line emission. These sources may be evenyounger than we have indicated. Nevertheless, in the followingwe will use our tentative classification.
Two of the Class Is are located in the ammonia core Ser/G3-G6NE (ISO-90 and 94), and another two (ISO-62 and 64) in thecore Ser/G3-G6SW. As shown in the IRAM 1.3 mm continuummap in Fig 12, all but one Class Is are located in the high den-sity regions outlined by the 1.3 mm continuum emission. Theexception, ISO-143, lies to the NE of the two ammonia coresin the vicinity of ISO-141, It is extended in both ISO bands andnot detected as a point source at 6.7µm (therefore not visiblein Fig. 2). Its Class I nature might be questionable. The flat-spectrum sources are partly located inside the cores and partlyoutside.
4.3. The Class II and Class III sources
Our sample of pre-main sequence stars in the Ser/G3-G6 com-plex comprises the Class II objects listed in Table 5 and the fewClass IIIs our selection method is capable of seeing, listedinTable 6. As emphasized in Sect. 4.1, our YSO selection crite-rion is IR excess, and therefore we do not sample the Class IIIpopulation except for occasional transition objects betweenClass II and III.
As shown in Fig. 12 the spatial distribution of the Class IIsources is relatively scattered, apart from the small cluster ofClass IIs at the location of CoKu-Ser/G3-G6. We note that
Table 5. The 31 Class II sources. The cross-correlated SpitzerYSO candidates from Harvey et al. (2006) are indicated in thelast column.
ISO MJ AJ ∆K Other ID
7 4.72 3.51 n.a.26 5.67 4.44 n.a.74 3.50 4.88 0.1878 3.06 1.74 0.05 CoKu-Ser-G6, NOT-15880 6.06 2.58 n.a. SIRCA-5,Spitzer-1081 2.80 6.28 0.04 SIRCA-7,NOT-162,Spitzer-1182 2.31 1.63 -0.11 CoKu Ser G3, NOT-201
841 5.03 3.74 -0.72 SIRCA-15 & 16, Spitzer-1496 4.76 3.68 n.a. SIRCA-23
100 3.90 5.73 n.a. SIRCA-28102 5.67 3.64 n.a.103 -0.76 6.70 n.a. SIRCA-30105 0.55 3.47 0.50122 3.41 4.03 n.a.136 7.00 4.39 n.a.137 -0.28 4.51 0.49 Spitzer-21139 2.42 5.41 n.a.140 4.28 4.49 n.a.141 4.43 0.22 -0.07 SIRCA-41,NOT-898147 3.80 4.55 n.a.154 5.70 3.72 0.25 Spitzer-23156 4.78 3.94 n.a.166 6.53 3.48 n.a. Spitzer-24175 9.54 0.19 n.a.176 4.46 0.78 n.a.178 3.40 5.18 n.a.181 6.32 2.49 n.a.
- 4.26 2.04 -0.28 CoKu Ser G5, Spitzer-12- 3.23 1.18 -0.10 CoKu Ser G4- 7.10 0.79 -0.14 SIRCA-13- 5.40 3.97 n.a. SIRCA-44
1 Double source resolved by SIRCA and NOT/Arnica (NOT-239 &247), but not resolved by ISO and 2MASS.
all four objects CoKu-Ser/G3-G6, earlier found to be T Taurisources with strong Hα emission (Cohen & Kuhi 1979) are in-dependently classified here as Class II sources. For the Class IIsample we presentMJ and AJ as calculated in Sect. 5.1in Table 5. The fourth column represents the variation inthe KS magnitude between the 2MASS data (Jul-2000) andthe Arnica/NOT (Aug-1996) dataset in the senseKS (1996)−KS (2000). Among the 12 Class IIs whereKS band photometryis available for both epochs, as many as 6 (or 50 %) have variedby more than∆K = 0.2 mag.
4.4. Comparison with recent Spitzer results
At the finalization of this paper we became aware of the re-cent publication of Harvey et al. (2006) who list Spitzer mid-IR fluxes for 24 YSO candidates found in a 12’× 12’ area cen-tred on the Ser/G3-G6 complex, which they refer to as SerpensCluster B. We have cross-correlated these with our results andfind that we have 4 Class I and 7 Class II sources in common,
12 Djupvik et al.: The young embedded cluster around Serpens/G3-G6
Table 6.The 3 Class III sources with some IR-excess. Note thatour study does not sample the Class III sources.
ISO α2−7IR α2−14
IR J − H H − K K − L′ ∆K
2 -2.06 -1.86 1.619 0.638 n.a. n.a.132 -2.36 -2.10 1.511 0.735 n.a. n.a.167 -2.19 -1.86 1.628 0.691 0.435 n.a.
while Harvey et al. (2006) classify one blue ISOCAM sourceas a Class II and find 11 YSO candidates that go undetected byISOCAM. The Spitzer source number is added underOther IDin both Tables 4 and 5. Comparing the SED indices with theSpitzer results, the classification is in agreement for all but onesource, ISO-64 (Spitzer-5), where the Spitzer data suggests itis a Class II. The ISOCAM 6.7µm flux is about twice as highas the interpolated value between the Spitzer bands at 5.8 and8.0µm. This could be due to strong H2 line emission in the 6.7µm band or also to source variability.
We also note that both ISO-62 and ISO-101 are clearly de-tected in the IRAC images, but not listed among the SpitzerYSO candidates of Harvey et al. (2006), probably because oftheir extended nature.
5. Luminosity and mass function
5.1. Stellar luminosities
We do not attempt to estimate luminosities and masses for theprotostar candidates (flat-spectrum and Class I sources). In thissection we concentrate on the Class II sources. It is probablyjustified to assume that our Class II sample in Table 5 is dom-inated by Classical T Tauri Stars (CTTS), since there are onlyvery few examples of weak-lined T Tauri Stars (WTTS) withthe amount of IR excess compatible with a Class II designation.
To estimate the reddening of each object we assumean intrinsic colour of (J − H)0 = 0.85, i.e., the me-dian value found for CTTS (Strom, Strom & Merrill 1993;Meyer, Calvet, & Hillenbrand 1997). The extinction in theJ-band is then found from the relationAJ = 2.53× [(J − H) −(J − H)0], obtained from theAλ ∝ λ−1.7 extinction law (cf.Sect. 3.2). The absoluteJ-band magnitudes areMJ = mJ−AJ−
DM, where the distance modulus isDM = 6.76 for the distanceof 225 pc (Straizys,Cernis, & Bartasi ute 2003). Table 5 liststhe Class II YSOs with extinction and absoluteJ-band magni-tudes.
Apart from the photometric uncertainty inJ, which is±0.05 mag on the average, the uncertainties introduced inMJ
arise from 1) the spread in the intrinsic (J − H)0 colour ofour targets, 2) the uncertainty in the distance estimate, and3) the amount of veiling in theJ-band. The spread aroundthe median value of (J − H)0 for CTTS is of the order of±0.15, which translates directly into±0.38 mag in the esti-mate of AJ. The quoted uncertainty in the distance of±55pc (Straizys,Cernis, & Bartasi ute 2003) gives an error in thedistance modulus of+0.48
−0.61 magnitudes. The average amount ofJ-band veiling for 22 CTTS in Taurus-Auriga was found byFolha & Emerson (1999) to be as high asr = 0.57. About
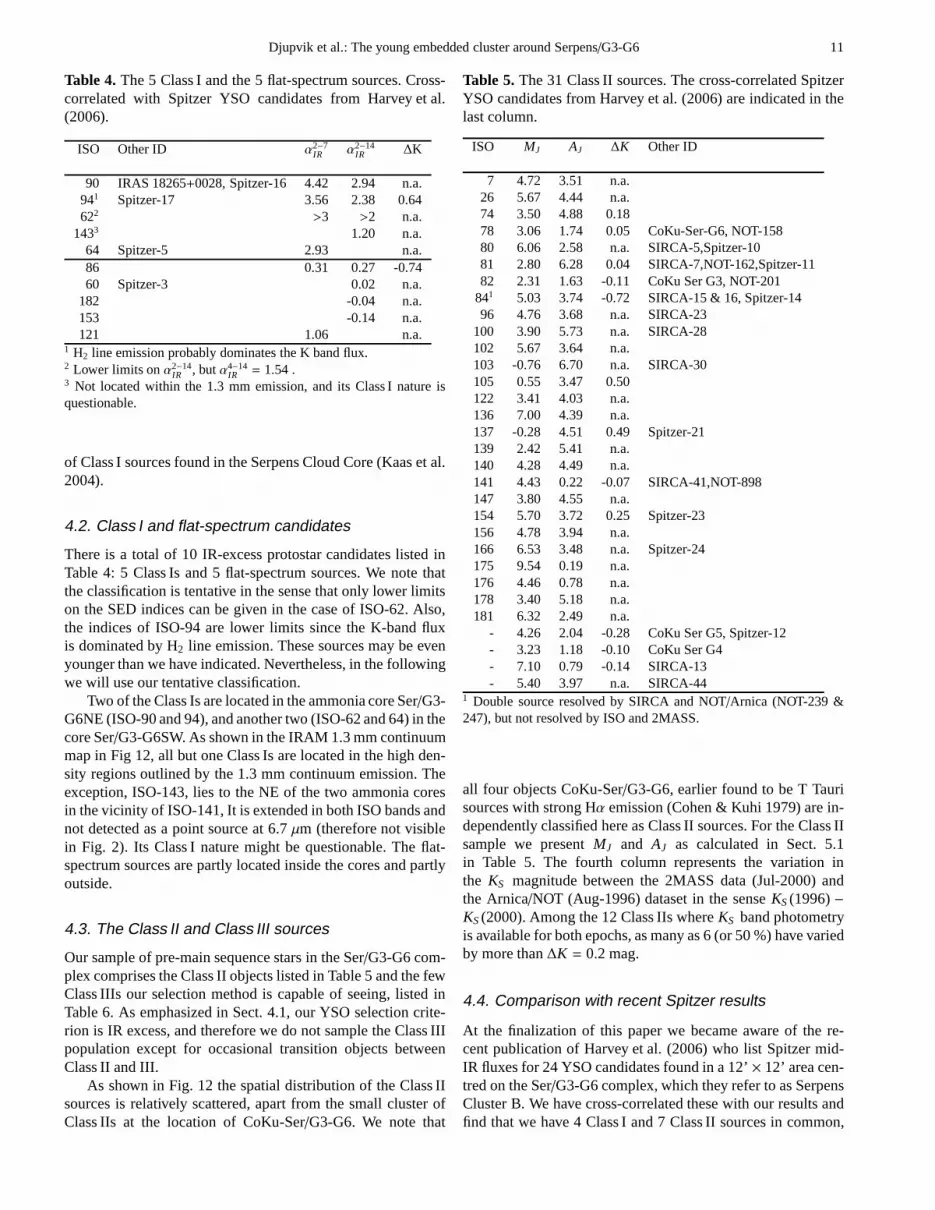
Fig. 9.TheMJ luminosity function for the Class II sources Therange of young BDs and young stars is indicated by the sub-stellar limits (vertical lines) for the two ages 1 and 10 Myr.
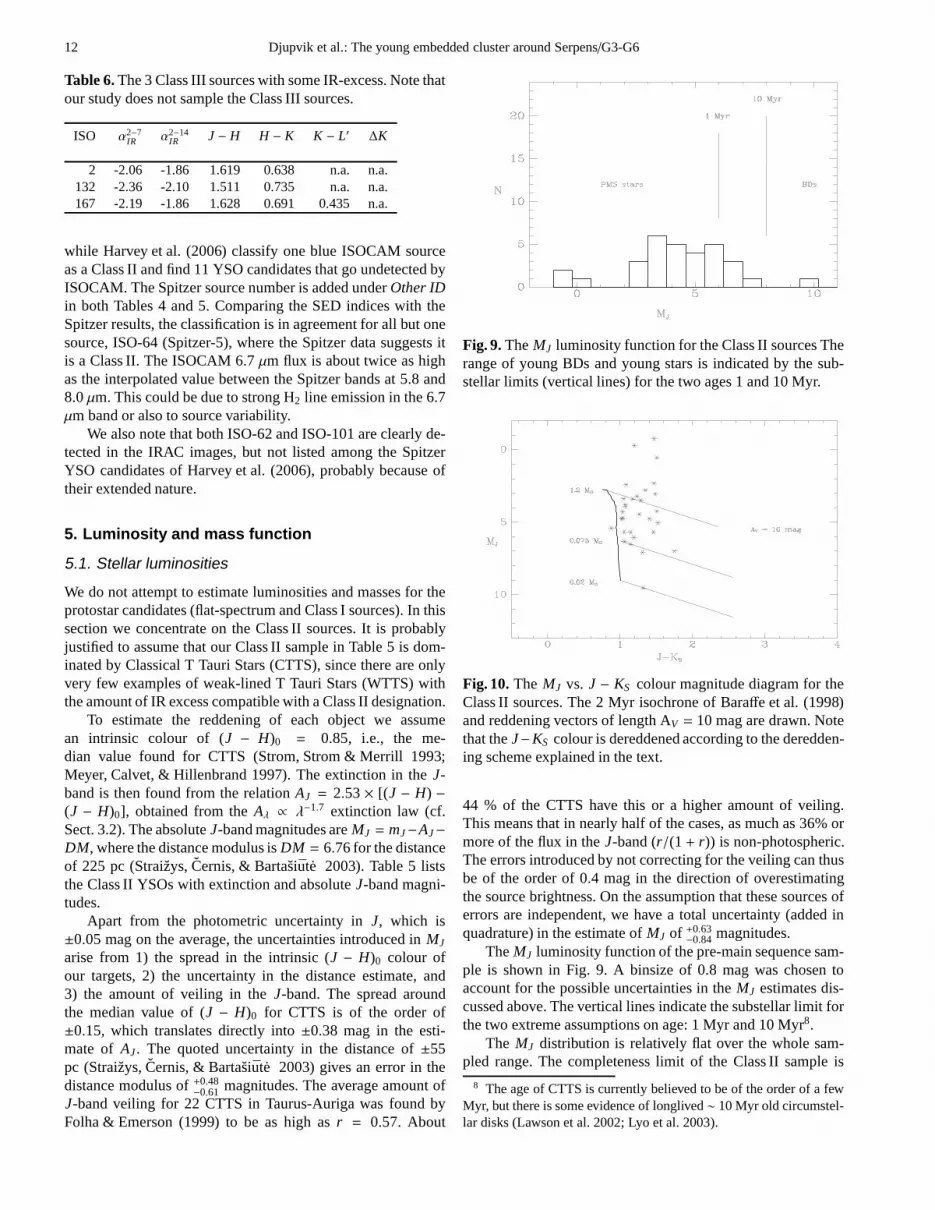
Fig. 10.The MJ vs. J − KS colour magnitude diagram for theClass II sources. The 2 Myr isochrone of Baraffe et al. (1998)and reddening vectors of length AV = 10 mag are drawn. Notethat theJ−KS colour is dereddened according to the deredden-ing scheme explained in the text.
44 % of the CTTS have this or a higher amount of veiling.This means that in nearly half of the cases, as much as 36% ormore of the flux in theJ-band (r/(1+ r)) is non-photospheric.The errors introduced by not correcting for the veiling can thusbe of the order of 0.4 mag in the direction of overestimatingthe source brightness. On the assumption that these sourcesoferrors are independent, we have a total uncertainty (added inquadrature) in the estimate ofMJ of +0.63
−0.84 magnitudes.TheMJ luminosity function of the pre-main sequence sam-
ple is shown in Fig. 9. A binsize of 0.8 mag was chosen toaccount for the possible uncertainties in theMJ estimates dis-cussed above. The vertical lines indicate the substellar limit forthe two extreme assumptions on age: 1 Myr and 10 Myr8.
The MJ distribution is relatively flat over the whole sam-pled range. The completeness limit of the Class II sample is
8 The age of CTTS is currently believed to be of the order of a fewMyr, but there is some evidence of longlived∼ 10 Myr old circumstel-lar disks (Lawson et al. 2002; Lyo et al. 2003).
Djupvik et al.: The young embedded cluster around Serpens/G3-G6 13
based on the completeness limit of the mid-IR survey, whichis 6 mJy for the 6.7µm band (cf. Sect. 2.1). We have made alinear fit between the 6.7µm flux andMJ for the 23 Class IIsources that have both values. The 6 mJy completeness limitwas found to correspond toMJ = 5.6± 0.2 mag.
In Fig. 10 we plotMJ versusJ − KS for the 31 Class IIsources. The 2 Myr isochrone from the evolutionary models ofBaraffe et al. (1998) is drawn with the reddening vectors indi-cated for the lowest and highest mass included in the model, aswell as the substellar mass limit at 0.075 M⊙.
TheJ − KS colour has been corrected for reddening as dis-cussed above. Because of intrinsic IR-excess and possibly alsoinsufficient dereddening in some cases, practically all sourcesfall to the right of the 2 Myr isochrone. The sample comprisesobjects in the mass range from above 1.2 M⊙ to 0.07 M⊙ (oneobject reaching to 0.02 M⊙), assuming an age of 2 Myr.
5.2. Candidate young brown dwarfs with disks
The border between stars and brown dwarfs (at∼ 0.075M⊙)is indicated both in Figs. 9 and 10. We note that between 1and 5 of the 31 Class II sources in Table 5 have substellarmasses, judging from Fig. 9 and the age range 1-10 Myr. Thissame fraction of BDs among ISOCAM selected Class II ob-jects (i.e.,∼ 20 % for ages of a few Myr) was also found in theChamaeleon I cloud (Olofsson et al. 1998; Persi et al. 2000),theρ Ophiuchi cloud (Bontemps et al. 2001), and the SerpensCloud Core (Kaas et al. 2004).
All the sources in our YSO samples have IR-excess, ofwhich 31 sources are designated Class II objects. Class IIs havea mid-IR SED compatible with circumstellar dust distributedin a disk. The substellar objects in our study are therefore mostprobably young BDs with circumstellar disks. We note thatsince the selection criteria in our study is IR excess, we do notsample any BDs without disks.
5.3. The Serpens Class II mass function
The 31 Class II sources from this paper are added to the sampleof 43 Class II sources in the Serpens Cloud Core region fromKaas et al. (2004) to improve the small number of statistics forthe Serpens Class II luminosity function (LF). The two samplesare from two different embedded young clusters separated bya projected distance of 45 arc minutes (∼ 3 pc), but probablylocated in the same cloud system and at the same distance (225pc adopted from Straizys,Cernis, & Bartasi ute 2003).
For the 31 Class II sources of this paper (cf. Table 5) wehave calculated the stellar luminosityL⋆ from MJ using the re-lation logL⋆ = 1.49− 0.466∗ MJ found by Bontemps et al.(2001). The total Serpens sample now consists of 74 Class IIsources. Figure 11 shows the observed luminosity function(LF) of the combined sample of Class II sources together withmodel LFs calculated for co-eval formation for a set of fourages: 0.5, 1, 2, and 5 Myr.
We assume as a first approximation co-eval formation ofthe Class II sources. Though admittedly a simplification, thisassumption may be viable as we are treating a subset of cluster
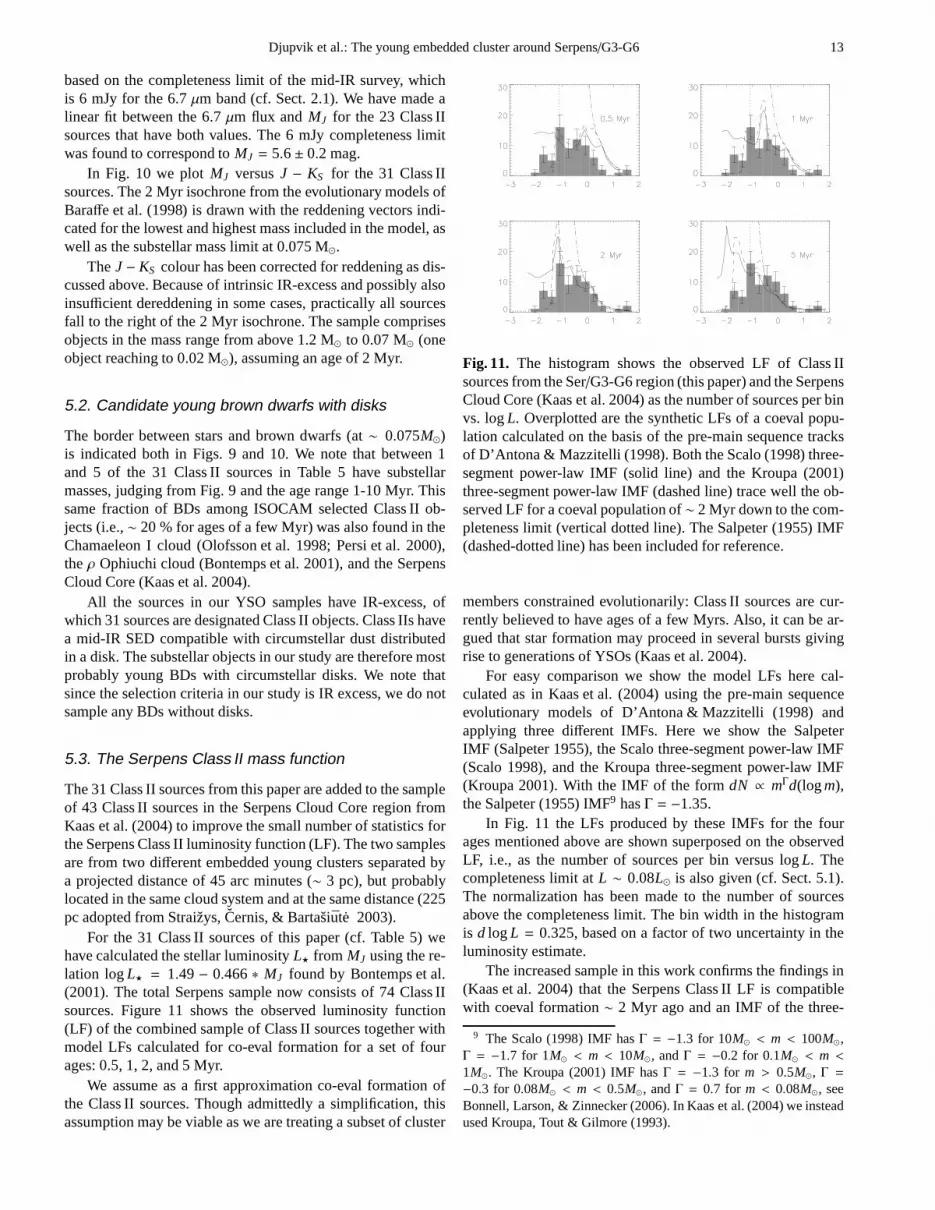
Fig. 11. The histogram shows the observed LF of Class IIsources from the Ser/G3-G6 region (this paper) and the SerpensCloud Core (Kaas et al. 2004) as the number of sources per binvs. logL. Overplotted are the synthetic LFs of a coeval popu-lation calculated on the basis of the pre-main sequence tracksof D’Antona & Mazzitelli (1998). Both the Scalo (1998) three-segment power-law IMF (solid line) and the Kroupa (2001)three-segment power-law IMF (dashed line) trace well the ob-served LF for a coeval population of∼ 2 Myr down to the com-pleteness limit (vertical dotted line). The Salpeter (1955) IMF(dashed-dotted line) has been included for reference.
members constrained evolutionarily: Class II sources are cur-rently believed to have ages of a few Myrs. Also, it can be ar-gued that star formation may proceed in several bursts givingrise to generations of YSOs (Kaas et al. 2004).
For easy comparison we show the model LFs here cal-culated as in Kaas et al. (2004) using the pre-main sequenceevolutionary models of D’Antona & Mazzitelli (1998) andapplying three different IMFs. Here we show the SalpeterIMF (Salpeter 1955), the Scalo three-segment power-law IMF(Scalo 1998), and the Kroupa three-segment power-law IMF(Kroupa 2001). With the IMF of the formdN ∝ mΓd(logm),the Salpeter (1955) IMF9 hasΓ = −1.35.
In Fig. 11 the LFs produced by these IMFs for the fourages mentioned above are shown superposed on the observedLF, i.e., as the number of sources per bin versus logL. Thecompleteness limit atL ∼ 0.08L⊙ is also given (cf. Sect. 5.1).The normalization has been made to the number of sourcesabove the completeness limit. The bin width in the histogramis d logL = 0.325, based on a factor of two uncertainty in theluminosity estimate.
The increased sample in this work confirms the findings in(Kaas et al. 2004) that the Serpens Class II LF is compatiblewith coeval formation∼ 2 Myr ago and an IMF of the three-
9 The Scalo (1998) IMF hasΓ = −1.3 for 10M⊙ < m < 100M⊙,Γ = −1.7 for 1M⊙ < m < 10M⊙, andΓ = −0.2 for 0.1M⊙ < m <1M⊙. The Kroupa (2001) IMF hasΓ = −1.3 for m > 0.5M⊙, Γ =−0.3 for 0.08M⊙ < m < 0.5M⊙, andΓ = 0.7 for m < 0.08M⊙, seeBonnell, Larson, & Zinnecker (2006). In Kaas et al. (2004) weinsteadused Kroupa, Tout & Gilmore (1993).
14 Djupvik et al.: The young embedded cluster around Serpens/G3-G6
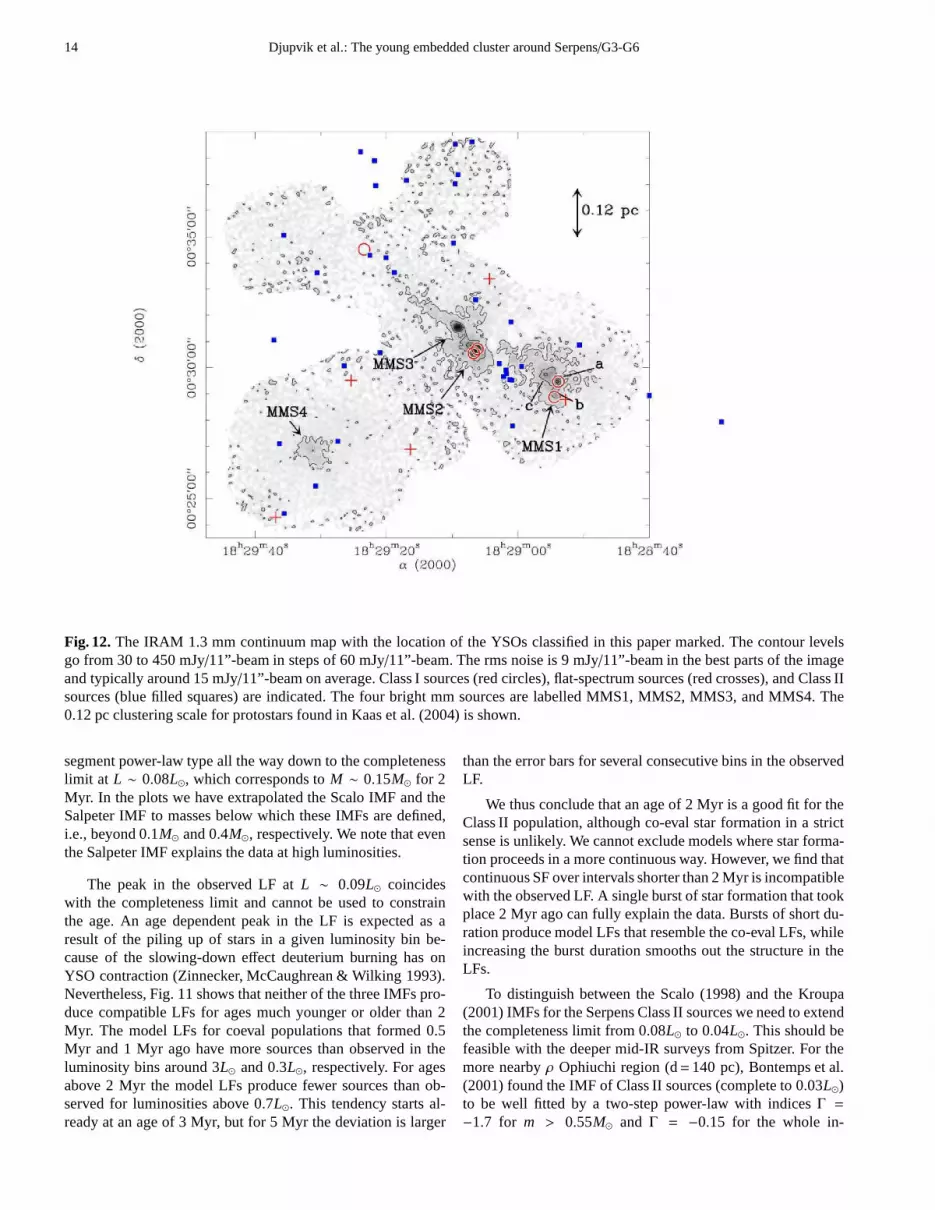
Fig. 12.The IRAM 1.3 mm continuum map with the location of the YSOs classified in this paper marked. The contour levelsgo from 30 to 450 mJy/11”-beam in steps of 60 mJy/11”-beam. The rms noise is 9 mJy/11”-beam in the best parts of the imageand typically around 15 mJy/11”-beam on average. Class I sources (red circles), flat-spectrum sources (red crosses), and Class IIsources (blue filled squares) are indicated. The four brightmm sources are labelled MMS1, MMS2, MMS3, and MMS4. The0.12 pc clustering scale for protostars found in Kaas et al. (2004) is shown.
segment power-law type all the way down to the completenesslimit at L ∼ 0.08L⊙, which corresponds toM ∼ 0.15M⊙ for 2Myr. In the plots we have extrapolated the Scalo IMF and theSalpeter IMF to masses below which these IMFs are defined,i.e., beyond 0.1M⊙ and 0.4M⊙, respectively. We note that eventhe Salpeter IMF explains the data at high luminosities.
The peak in the observed LF atL ∼ 0.09L⊙ coincideswith the completeness limit and cannot be used to constrainthe age. An age dependent peak in the LF is expected as aresult of the piling up of stars in a given luminosity bin be-cause of the slowing-down effect deuterium burning has onYSO contraction (Zinnecker, McCaughrean & Wilking 1993).Nevertheless, Fig. 11 shows that neither of the three IMFs pro-duce compatible LFs for ages much younger or older than 2Myr. The model LFs for coeval populations that formed 0.5Myr and 1 Myr ago have more sources than observed in theluminosity bins around 3L⊙ and 0.3L⊙, respectively. For agesabove 2 Myr the model LFs produce fewer sources than ob-served for luminosities above 0.7L⊙. This tendency starts al-ready at an age of 3 Myr, but for 5 Myr the deviation is larger
than the error bars for several consecutive bins in the observedLF.
We thus conclude that an age of 2 Myr is a good fit for theClass II population, although co-eval star formation in a strictsense is unlikely. We cannot exclude models where star forma-tion proceeds in a more continuous way. However, we find thatcontinuous SF over intervals shorter than 2 Myr is incompatiblewith the observed LF. A single burst of star formation that tookplace 2 Myr ago can fully explain the data. Bursts of short du-ration produce model LFs that resemble the co-eval LFs, whileincreasing the burst duration smooths out the structure in theLFs.
To distinguish between the Scalo (1998) and the Kroupa(2001) IMFs for the Serpens Class II sources we need to extendthe completeness limit from 0.08L⊙ to 0.04L⊙. This should befeasible with the deeper mid-IR surveys from Spitzer. For themore nearbyρ Ophiuchi region (d=140 pc), Bontemps et al.(2001) found the IMF of Class II sources (complete to 0.03L⊙)to be well fitted by a two-step power-law with indicesΓ =−1.7 for m > 0.55M⊙ and Γ = −0.15 for the whole in-

Djupvik et al.: The young embedded cluster around Serpens/G3-G6 15
101
9490
+MMS3
+MMS2
Fig. 13.NOTCamH2 line image (2.122µm) of Ser/G3-G6NE.Pure line emission features are arrowed (cf. the continuum im-age in Fig. 14). The locations of the two bright mm sourcesMMS2 and MMS3 are marked with plus signs. The Class I can-didates ISO-90 and 94, as well as ISO-101, probably a hot spotin the jetlike emission, are encircled.
terval 0.055M⊙ < m < 0.55M⊙ (accounting for unresolvedbinaries givesΓ = −0.35). Thus, there are indications thatthe Class II IMFs are better described by the Scalo (1998) orthe Kroupa, Tout & Gilmore (1993) than by the more recentKroupa (2001).
6. Cloud structure deduced from 1.3 mm and3.6 cm observations
Figure 12 shows the IRAM 1.3 mm continuum mapping ofa major part of the ISOCAM field. Four strong continuumsources are labelled in the figure. One is a multiple of threeand another is elongated - all listed with coordinates and fluxesin Table 7. The protostar clustering scale of 0.12 pc found inthe Serpens Cloud Core (Kaas et al. 2004) is drawn in the mapfor size reference. Also shown are the positions of YSO can-didates found in Sect. 4: Class I sources, flat-spectrum sources,and Class II sources.
The contour plot of the 1.3 mm continuum emission out-lines the position of the two ammonia cores found by Clark(1991) on each side of the optically visible stellar groupSer/G3-G6 quite well. MMS4 is a starless core coinciding withan absorption core seen in both ISOCAM filters. It is a candi-date prestellar core similar to the cores studied in absorptionwith ISOCAM by Bacmann et al. (2000). MMS1 is locatedin the Ser/G3-G6SW ammonia core and is a multiple source
Fig. 14. NOTCam 2.087µm continuum image of Ser/G3-G6NE. The same field as Fig. 13.
whose brightest components we have denoted as a, b, and c.Both MMS2, which is extended, and MMS3 are located in theSer/G3-G6NE ammonia core.
Morphologically, the 1.3 mm map is quite similar to theIRAM map of the Serpens Cloud Core (Kaas et al. 2004),showing two separate clumps of which one has an elongatedtail in the direction of the alignment of the clumps along anelongated density structure or a cloud filament. Here the elon-gated density structure oriented NE-SW is also well traced intheK-band image of Fig. 2 as a pronounced drop in the surfacedensity of faint stars. In the case of the Serpens Cloud Core,the NW-SE oriented ridge was described in, e.g., Kaas (1999a).Each clump contains a sub-structure. This region differs fromthe Cloud Core, however, in that the number of protostars islower, and the 1.3 mm emission is in general less intense. Theimmediate interpretation is that we see no such intense burstof star formation here as in the Cloud Core, which is also inagreement with the Class I/Class II number fraction discussedat the end of Sect. 4.1.
6.1. Individual 1.3 mm and 3.6 cm sources
The fluxes and positions of the IRAM 1.3 mm and VLA 3.6 cmsources are given in Tables 7 and 8. Taking into account theuncertainties in the ISOCAM positions (estimated in Sect. 2.2)and the IRAM positions (∼ 3′′ on the average and 5′′ at most),here we compare the mm and cm source positions with thoseof ISOCAM.
16 Djupvik et al.: The young embedded cluster around Serpens/G3-G6
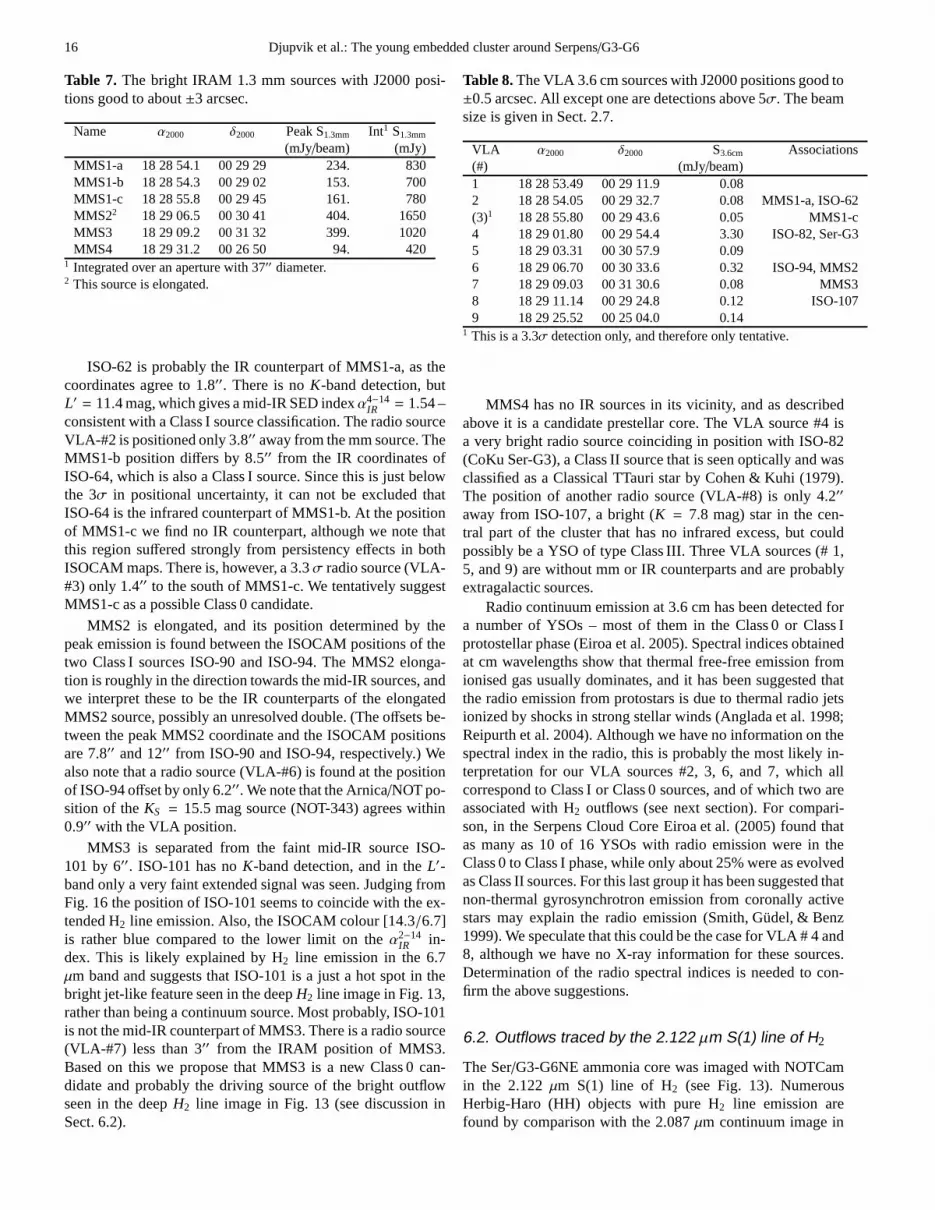
Table 7. The bright IRAM 1.3 mm sources with J2000 posi-tions good to about±3 arcsec.
Name α2000 δ2000 Peak S1.3mm Int1 S1.3mm
(mJy/beam) (mJy)MMS1-a 18 28 54.1 00 29 29 234. 830MMS1-b 18 28 54.3 00 29 02 153. 700MMS1-c 18 28 55.8 00 29 45 161. 780MMS22 18 29 06.5 00 30 41 404. 1650MMS3 18 29 09.2 00 31 32 399. 1020MMS4 18 29 31.2 00 26 50 94. 420
1 Integrated over an aperture with 37′′ diameter.2 This source is elongated.
ISO-62 is probably the IR counterpart of MMS1-a, as thecoordinates agree to 1.8′′. There is noK-band detection, butL′ = 11.4 mag, which gives a mid-IR SED indexα4−14
IR = 1.54 –consistent with a Class I source classification. The radio sourceVLA-#2 is positioned only 3.8′′ away from the mm source. TheMMS1-b position differs by 8.5′′ from the IR coordinates ofISO-64, which is also a Class I source. Since this is just belowthe 3σ in positional uncertainty, it can not be excluded thatISO-64 is the infrared counterpart of MMS1-b. At the positionof MMS1-c we find no IR counterpart, although we note thatthis region suffered strongly from persistency effects in bothISOCAM maps. There is, however, a 3.3σ radio source (VLA-#3) only 1.4′′ to the south of MMS1-c. We tentatively suggestMMS1-c as a possible Class 0 candidate.
MMS2 is elongated, and its position determined by thepeak emission is found between the ISOCAM positions of thetwo Class I sources ISO-90 and ISO-94. The MMS2 elonga-tion is roughly in the direction towards the mid-IR sources,andwe interpret these to be the IR counterparts of the elongatedMMS2 source, possibly an unresolved double. (The offsets be-tween the peak MMS2 coordinate and the ISOCAM positionsare 7.8′′ and 12′′ from ISO-90 and ISO-94, respectively.) Wealso note that a radio source (VLA-#6) is found at the positionof ISO-94 offset by only 6.2′′. We note that the Arnica/NOT po-sition of theKS = 15.5 mag source (NOT-343) agrees within0.9′′ with the VLA position.
MMS3 is separated from the faint mid-IR source ISO-101 by 6′′. ISO-101 has noK-band detection, and in theL′-band only a very faint extended signal was seen. Judging fromFig. 16 the position of ISO-101 seems to coincide with the ex-tended H2 line emission. Also, the ISOCAM colour [14.3/6.7]is rather blue compared to the lower limit on theα2−14
IR in-dex. This is likely explained by H2 line emission in the 6.7µm band and suggests that ISO-101 is a just a hot spot in thebright jet-like feature seen in the deepH2 line image in Fig. 13,rather than being a continuum source. Most probably, ISO-101is not the mid-IR counterpart of MMS3. There is a radio source(VLA-#7) less than 3′′ from the IRAM position of MMS3.Based on this we propose that MMS3 is a new Class 0 can-didate and probably the driving source of the bright outflowseen in the deepH2 line image in Fig. 13 (see discussion inSect. 6.2).
Table 8.The VLA 3.6 cm sources with J2000 positions good to±0.5 arcsec. All except one are detections above 5σ. The beamsize is given in Sect. 2.7.
VLA α2000 δ2000 S3.6cm Associations(#) (mJy/beam)1 18 28 53.49 00 29 11.9 0.082 18 28 54.05 00 29 32.7 0.08 MMS1-a, ISO-62(3)1 18 28 55.80 00 29 43.6 0.05 MMS1-c4 18 29 01.80 00 29 54.4 3.30 ISO-82, Ser-G35 18 29 03.31 00 30 57.9 0.096 18 29 06.70 00 30 33.6 0.32 ISO-94, MMS27 18 29 09.03 00 31 30.6 0.08 MMS38 18 29 11.14 00 29 24.8 0.12 ISO-1079 18 29 25.52 00 25 04.0 0.14
1 This is a 3.3σ detection only, and therefore only tentative.
MMS4 has no IR sources in its vicinity, and as describedabove it is a candidate prestellar core. The VLA source #4 isa very bright radio source coinciding in position with ISO-82(CoKu Ser-G3), a Class II source that is seen optically and wasclassified as a Classical TTauri star by Cohen & Kuhi (1979).The position of another radio source (VLA-#8) is only 4.2′′
away from ISO-107, a bright (K = 7.8 mag) star in the cen-tral part of the cluster that has no infrared excess, but couldpossibly be a YSO of type Class III. Three VLA sources (# 1,5, and 9) are without mm or IR counterparts and are probablyextragalactic sources.
Radio continuum emission at 3.6 cm has been detected fora number of YSOs – most of them in the Class 0 or Class Iprotostellar phase (Eiroa et al. 2005). Spectral indices obtainedat cm wavelengths show that thermal free-free emission fromionised gas usually dominates, and it has been suggested thatthe radio emission from protostars is due to thermal radio jetsionized by shocks in strong stellar winds (Anglada et al. 1998;Reipurth et al. 2004). Although we have no information on thespectral index in the radio, this is probably the most likelyin-terpretation for our VLA sources #2, 3, 6, and 7, which allcorrespond to Class I or Class 0 sources, and of which two areassociated with H2 outflows (see next section). For compari-son, in the Serpens Cloud Core Eiroa et al. (2005) found thatas many as 10 of 16 YSOs with radio emission were in theClass 0 to Class I phase, while only about 25% were as evolvedas Class II sources. For this last group it has been suggestedthatnon-thermal gyrosynchrotron emission from coronally activestars may explain the radio emission (Smith, Gudel, & Benz1999). We speculate that this could be the case for VLA # 4 and8, although we have no X-ray information for these sources.Determination of the radio spectral indices is needed to con-firm the above suggestions.
6.2. Outflows traced by the 2.122 µm S(1) line of H2
The Ser/G3-G6NE ammonia core was imaged with NOTCamin the 2.122µm S(1) line of H2 (see Fig. 13). NumerousHerbig-Haro (HH) objects with pure H2 line emission arefound by comparison with the 2.087µm continuum image in
Djupvik et al.: The young embedded cluster around Serpens/G3-G6 17
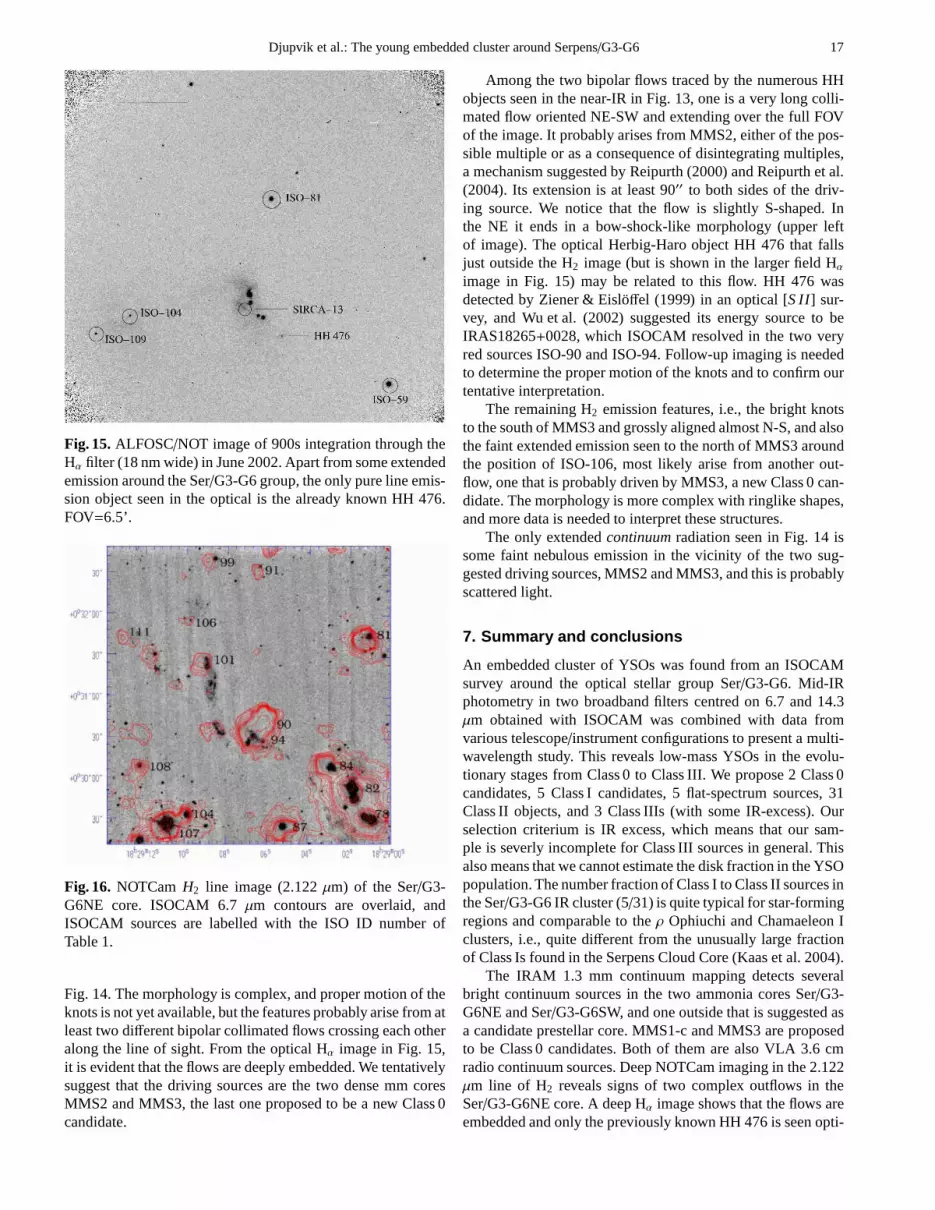
Fig. 15.ALFOSC/NOT image of 900s integration through theHα filter (18 nm wide) in June 2002. Apart from some extendedemission around the Ser/G3-G6 group, the only pure line emis-sion object seen in the optical is the already known HH 476.FOV=6.5’.
Fig. 16. NOTCam H2 line image (2.122µm) of the Ser/G3-G6NE core. ISOCAM 6.7µm contours are overlaid, andISOCAM sources are labelled with the ISO ID number ofTable 1.
Fig. 14. The morphology is complex, and proper motion of theknots is not yet available, but the features probably arise from atleast two different bipolar collimated flows crossing each otheralong the line of sight. From the optical Hα image in Fig. 15,it is evident that the flows are deeply embedded. We tentativelysuggest that the driving sources are the two dense mm coresMMS2 and MMS3, the last one proposed to be a new Class 0candidate.
Among the two bipolar flows traced by the numerous HHobjects seen in the near-IR in Fig. 13, one is a very long colli-mated flow oriented NE-SW and extending over the full FOVof the image. It probably arises from MMS2, either of the pos-sible multiple or as a consequence of disintegrating multiples,a mechanism suggested by Reipurth (2000) and Reipurth et al.(2004). Its extension is at least 90′′ to both sides of the driv-ing source. We notice that the flow is slightly S-shaped. Inthe NE it ends in a bow-shock-like morphology (upper leftof image). The optical Herbig-Haro object HH 476 that fallsjust outside the H2 image (but is shown in the larger field Hαimage in Fig. 15) may be related to this flow. HH 476 wasdetected by Ziener & Eisloffel (1999) in an optical [S II] sur-vey, and Wu et al. (2002) suggested its energy source to beIRAS18265+0028, which ISOCAM resolved in the two veryred sources ISO-90 and ISO-94. Follow-up imaging is neededto determine the proper motion of the knots and to confirm ourtentative interpretation.
The remaining H2 emission features, i.e., the bright knotsto the south of MMS3 and grossly aligned almost N-S, and alsothe faint extended emission seen to the north of MMS3 aroundthe position of ISO-106, most likely arise from another out-flow, one that is probably driven by MMS3, a new Class 0 can-didate. The morphology is more complex with ringlike shapes,and more data is needed to interpret these structures.
The only extendedcontinuum radiation seen in Fig. 14 issome faint nebulous emission in the vicinity of the two sug-gested driving sources, MMS2 and MMS3, and this is probablyscattered light.
7. Summary and conclusions
An embedded cluster of YSOs was found from an ISOCAMsurvey around the optical stellar group Ser/G3-G6. Mid-IRphotometry in two broadband filters centred on 6.7 and 14.3µm obtained with ISOCAM was combined with data fromvarious telescope/instrument configurations to present a multi-wavelength study. This reveals low-mass YSOs in the evolu-tionary stages from Class 0 to Class III. We propose 2 Class 0candidates, 5 Class I candidates, 5 flat-spectrum sources, 31Class II objects, and 3 Class IIIs (with some IR-excess). Ourselection criterium is IR excess, which means that our sam-ple is severly incomplete for Class III sources in general. Thisalso means that we cannot estimate the disk fraction in the YSOpopulation. The number fraction of Class I to Class II sources inthe Ser/G3-G6 IR cluster (5/31) is quite typical for star-formingregions and comparable to theρ Ophiuchi and Chamaeleon Iclusters, i.e., quite different from the unusually large fractionof Class Is found in the Serpens Cloud Core (Kaas et al. 2004).
The IRAM 1.3 mm continuum mapping detects severalbright continuum sources in the two ammonia cores Ser/G3-G6NE and Ser/G3-G6SW, and one outside that is suggested asa candidate prestellar core. MMS1-c and MMS3 are proposedto be Class 0 candidates. Both of them are also VLA 3.6 cmradio continuum sources. Deep NOTCam imaging in the 2.122µm line of H2 reveals signs of two complex outflows in theSer/G3-G6NE core. A deep Hα image shows that the flows areembedded and only the previously known HH 476 is seen opti-
18 Djupvik et al.: The young embedded cluster around Serpens/G3-G6
cally. We suggest that the driving sources of these two outflowsare MMS2 and MMS3.
Comparing with existing pre-main sequence evolutionarymodels, we find that for any reasonable assumptions on age forthe Class II sources, our sample extends well into the BD massregime. The Class II sample was joined with the Class II samplefrom the Serpens Cloud Core to improve statistics. Model LFscalculated for a set of ages and IMFs give a best age of 2 Myrfor which both the Scalo (1998) and Kroupa (2001) IMFs arecompatible with the observed LF down to the completenesslimit at 0.08 L⊙. The Class II LF can be described by co-evalstar formation∼ 2 Myr ago, continuous star formation over thelast 2 Myr, or a burst of star formation of various duration thattook place 2 Myr ago. There is a peak in the observed LF thatcannot be used to constrain the age because it coincides withthe completeness limit. Nevertheless, the general shape oftheLF does not permit a much younger or older population. Thecompleteness limit must be shifted to 0.04 L⊙ to possibly dis-tinguish between different IMFs and star formation scenarios.This should be feasible with the deeper mid-IR surveys nowavailable from Spitzer.
Acknowledgements. We thank the referee, Dr Paul Harvey, for sug-gestions that led to substantial improvements of the paper.We ac-knowledge Dr. F.O. Clark for presenting his unpublished NH3 map-ping to us before planning the ISOCAM observations. The ISOCAMdata presented in this paper was reduced using ”CIA”, a jointdevelop-ment by the ESA Astrophysics Division and the ISOCAM Consortiumled by the ISOCAM PI, C. Cesarsky, Direction des Sciences dela Matiere, C.E.A., France. This work is partly based on obser-vations made with the NOT, operated on the island of La Palmajointly by Denmark, Finland, Iceland, Norway, and Sweden, in theSpanish Observatorio del Roque de los Muchachos of the Institutode Astrofisica de Canarias. One image presented here has beentaken using ALFOSC, which is owned by the Instituto de Astrofisicade Andalucia (IAA) and operated at the NOT under an agreementbetween IAA and the NBIfAFG of the Astronomical Observatoryof Copenhagen. This publication makes use of data products fromthe Two Micron All Sky Survey, which is a joint project of theUniversity of Massachusetts and the Infrared Processing and AnalysisCenter/California Institute of Technology, funded by the NationalAeronautics and Space Administration and the National ScienceFoundation. This research has made use of the SIMBAD database,operated at CDS, Strasbourg, France, as well as SAOImage DS9, de-veloped by the Smithsonian Astrophysical Observatory.
References
Adams, F.C., Lada, C.J., & Shu, F.H. 1987, ApJ 312, 788Anglada, G., Villuendas, E., Estalella, R., et al. 1998, AJ 116,
2953Andre, P., Ward-Thompson, D., & Barsony, M. 1993 ApJ 406,
122Andre, P., Ward-Thompson, D., & Barsony, M. 2000, in
Protostars and Planets IV, ed. V. Mannings, A.P. Boss, & S.S.Russell (Tucson: University of Arizona Press), p. 59
Andre, P. & Montmerle, T. 1994, ApJ 420, 837Bacmann, A., Andre, P., Puget, J.-L., et al. 2000, A&A 361,
555
Baraffe, I., Chabrier, G., Allard, F., & Hauschildt, P.H. 1998,A&A 337, 403
Bessell, M.S., & Brett, J.M. 1988, PASP 100, 1134Blommaert, J., Metcalfe, L., Altieri, B., et al. 2000,
Experimental Astronomy, 10, 241Bonnell, I.A., Larson, R.B., & Zinnecker, H. 2006, in
Protostars and Planets V, ed. B. Reipurth, D. Jewitt, & K.Keil, in press, astro-ph/0603447
Bontemps, S., Andre, P., Kaas, A.A., et al. 2001, A&A 372,173
Broguiere, D., Neri, R., & Sievers, A. 1995, NIC bolometerusers guide (IRAM internal report)
Casali, M.M., & Hawarden, T.G. 1992, UKIRT Newsletter 4,33
Clark, F.O. 1990, private communicationClark, F.O. 1991, ApJS 75, 611Cesarsky C.J., Abergel, A., Agnese, P., et al. 1996, A&A 315,
L32Cohen, M., & Kuhi, L.V. 1979, ApJS 41, 743Curiel, S., Rodriguez, L.F., Moran, J.M., & Canto, J. 1993, ApJ
415, 191Cutri, R.M., Skrutskie, M.F., Van Dyk, S., et al. 2003,
Explanatory Supplement to the 2MASS All Sky DataRelease,http://www.ipac.caltech.edu/2mass/releases/allsky/doc/explsup.html
Dame, T.M., & Thaddeus, P. 1985, ApJ 297, 751D’Antona F., & Mazzitelli I. 1998, in Brown Dwarfs and
Extrasolar Planets, ed. R. Rebolo, E.L. Martin, & M.R.Zapatero Osorio, ASP Conf. Proc. 134, p. 442
Emerson, D.T., Klein, U., & Haslam, C.G.T. 1979, A&A, 76,92
Eiroa, C., Torrelles, J.M., Curiel, S., & Djupvik, A.A. 2005, AJ130, 643
Eiroa, C., Djupvik, A.A., & Casali, M.M. 2006, in “Handbookof star formation regions”, ed. B. Reipurth, in press
Folha, D.F.M., & Emerson, J.P. 1999, A&A 352, 517Froebrich, D., Ray, T.P., Murphy, G.C., & Scholz, A. 2004
A&A 432, L67Greene, T.P., Wilking, B.A., Andre, P., Young, E.T., & Lada,
C.J. 1994, ApJ 434, 614Griffin, M.J., & Orton, G.S. 1993, Icarus, 105, 337Harvey, P.M., Chapman, N., Lai, S.-P., et al. 2006, ApJ, in pressHunt, L., Mannucci, F., Testi, L., et al. 1998, AJ 115, 2594Kaas, A.A. 1999a, AJ, 118, 558Kaas, A.A. 1999b, PhD Thesis, Stockholm University,
Akademitryck AB, Edsbruk, ISBN 91-7153-923-9Kaas, A.A., Olofsson, G., Bontemps, S., et al. 1999, in The
Universe as seen by ISO, ed. P. Cox & M.F. Kessler, ESASP–427, p. 493
Kaas, A.A., & Bontemps, S. 2000, in From Darkness toLight: Origin and Evolution of Young Stellar Clusters, ed.T. Montmerle & P. Andre, ASP Conf. Proc. 243, p. 367
Kaas, A.A., Olofsson, G., Bontemps, S., et al. 2004, A&A 421,623
Kessler, M.F., Steinz, J.A., Anderegg, et al. 1996, A&A, 315,L27
Koornneef, J. 1983, A&A, 128, 84
Djupvik et al.: The young embedded cluster around Serpens/G3-G6 19
Kreysa, E., Gemund, H.-P., Gromke, et al. 1998, in AdvancedTechnology MMW, Radio, and Terahertz Telescopes, Ed.T.G. Phillips, Proc. SPIE, 3357, 319
Kroupa, P., Tout, C., & Gilmore, G.F. 1993, MNRAS 262, 545Kroupa, P. 2001, MNRAS 322, 231Lada, C.J. 1987, in IAU Symp. 115, Star Forming Regions, ed.
M. Peimbert & J. Jugaku (Dordrecht: D. Reidel PublishingCo.), p. 1–17
Lada, C.J., & Wilking, B.A. 1984, ApJ 287, 610Lawson, W.A., Crause, L.A., Mamajek, E.E., & Feigelson,
E.D. 2002, MNRAS 329, L29Lyo, A.-Ran, Lawson, W.A., Mamajek, et al. 2003, MNRAS
338, 616Meyer, M.R., Calvet, N., & Hillenbrand, L.A. 1997, ApJ 114,
288Olofsson, G., Kaas, A.A., Nordh, L., et al. 1998, in Brown
Dwarfs and Extrasolar Planets, ed. R. Rebolo, E.L. Martin,& M.R. Zapatero Osorio, ASP Conf. Proc. 134, p. 81
Olofsson, G., Floren, H.-G., & Lagage, P.O. 1999, Imaging inthe Thermal Infrared, in Astrophysics with the NOT, ed. H.Karttunen, & V. Piirola (University of Turku), p. 37
Persi, P., Palagi, F., & Felli, M. 1994, A&A 291, 577Persi, P., Marenzi, A.R., Olofsson, G., et al. 2000, A&A 357,
219Reipurth, B. 2000, AJ 120, 3177Reipurth, B., Rodriguez, L.F., Anglada, & G., Bally, J. 2004,
AJ 127, 1736Salpeter, E. 1955, ApJ 121, 161Scalo, J. 1998, in The Stellar Initial Mass Function, ed. G.
Gilmore, D. Howell, Astronomical Society of the Pacific vol142, p. 201
Smith, K., Gudel, & M., Benz, A.O. 1999, A&A 349, 475Straizys, V.,Cernis, K, & Bartasi ute, S. 2003, A&A 405, 585Strom, K.M., Strom, S.E., & Merrill, K.M. 1993, ApJ 412, 233van der Bliek, N., Olofsson, G., Floren, H.-G., et al. 2000,
SIRCA, The Stockholm Infrared Camera, in The NOT in the2000’s, ed. N. Bergvall, L. Takalo, & V. Piirola (Universityof Turku), p. 151
Whittet, D.C.B. 1988, The observed properties of interstellardust in the infrared, in Dust in the Universe, ed. M.E. Bailey& D.A. Williams (New York: Cambridge University Press),p. 25–53
Wu, J.W., Wu, Y.F., Wang, J.Z., & Cai, K. 2002, Chin. J.Astron. Astrophys. Vol 2, No 1, 33–42
Zhang C.Y., Laureijs R.J., Clark F.O., & Wesselius P.R. 1988,A&A 199, 170
Ziener, R., & Eisloffel, J. 1999, A&A 347, 565Zinnecker, H., McCaughrean, M.J., & Wilking, B.A. 1993,
in Protostars and Planets III, ed. E. Levy, & J.I. Lunine,(Tucson: University of Arizona Press), p. 429


