Embed Size (px)
Citation preview
Journal of Colloid and Interface Science 249, 152–161 (2002)doi:10.1006/jcis.2001.8149, available online at http://www.idealibrary.com on
A Molecular Modeling Study of Pentanol Solubilizedin a Sodium Octanoate Micelle
Hubert Kuhn,1 Burkhard Breitzke, and Heinz Rehage
Department of Physical Chemistry, University of Essen, Schuetzenbahn 70, D-45117 Essen, Germany
Received March 15, 1999; accepted December 10, 2001
In order to study the structural and dynamical aspects of thesolubilization process of pentanol within a sodium octanoate mi-celle a molecular dynamics simulation is presented. In this initialstudy we discuss the results and detailed insights into the inter-actions between sodium octanoate, pentanol, and water. The totalmicellar radius and the hydrophobic core radius were determined.The calculated values are in fairly good agreement with experi-mental results. In contrast to pure sodium octanoate micelles theaggregate with dissolved pentanol attained a more spherical shaperelated to the time interval of the simulation. It is clear that theresults of a molecular dynamics computer simulation are alwayslimited by its total length and the total time used for data analysis.Nevertheless, from our simulation study it turned out that a partof the pentanol hydroxyl groups were located within the micellarcore and some alcohol molecules were also observed at the sur-face region of the micelle. The corresponding partition coefficientwas calculated and agreed well with the experiment. The evalu-ated radial distribution functions of the sodium ions, the octanoateoxygens, and the hydroxyl hydrogens reveal details of the interfaceregion of the micelle and the bulk phase. Additionally, it was pos-sible to calculate the trans-to-gauche ratios of the alkyl chains andto compare these results with the simulation of a pure octanoatemicelle. C© 2002 Elsevier Science (USA)
Key Words: micelles; solubilization; molecular dynamics simula-tion; molecular structure.
1. INTRODUCTION
Ternary systems which consist of surfactants, cosurfactants,and solvent have numerous applications in household and in-dustry. Due to their important role they have been the subject ofmany experimental and theoretical studies. Most of these inves-tigations are based on thermodynamical data or macroscopicproperties. To study the molecular structure, micellar shape,and water penetration into the micellar core, one of the mostadvanced techniques is small-angle neutron scattering (SANS).Results obtained from scattering experiments are usually basedon a theoretical model which is used for data analysis.
1 To whom correspondence should be addressed. Fax: +49 (0)201/183-2826.E-mail: [email protected].
150021-9797/02 $35.00C© 2002 Elsevier Science (USA)All rights reserved.
With molecular dynamics (MD) computer simulations themolecular structure obtained by scattering experiments can berefined. It is possible to get a detailed microscopic understandingof micellar aggregates.
Recent literature reports computer simulations of micellarsystems using different methods, approximation levels, and sta-tistical ensembles (1–9). Sodium octanoate was frequently usedfor MD simulation studies (1–5) due to the small aggregationnumber of sodium octanoate micelles. Since only a small numberof atoms are involved in a MD simulation of such micelles, MDsimulations of this system are easy to perform with a reasonableamount of computational effort. A MD simulation of a sodiumdodecyl sulfate (SDS) micelle consisting of 60 monomers hasalso recently been published (6). A spherical structure with aradius of gyration in accordance with experimental results anda micellar core was found which appears to be less fluid thanpure alkane.
Previously, the solubilization process within micelles wasalso investigated with computer simulations using a four-particlemodel (7–9). These investigations were based on an oil particle,a water particle, and additional hydrophilic and hydrophobiccompounds. Each particle represented a group of atoms. Theinteractions between these particles were calculated using dif-ferent potential functions. In this model a surfactant moleculeconsists of at least one hydrophilic particle which is connectedto a chain of hydrophobic spheres by a harmonic potential. Theadvantage of this approach is the capability to simulate largesystems at long time scales due to the relatively low compu-tational effort. Additionally, these procedures are not sensitiveto the starting configurations because forming, merging, or thebreaking process of micelles can be directly observed. On theother hand it is difficult to compare the simulated properties ofsuch models with the molecular structures of surfactants.
On the atomic level the process of solubilization and the struc-tures of aggregated surfactants are still poorly understood. Ad-ditional MD simulations would help to obtain a more detailedpicture of these structures. These investigations are useful tounderstand phenomena like the washing process or the solu-bilzation and mobilization of contaminants.
Octanoate/pentanol/water systems have been studied byRaman spectroscopy (10) and SANS experiments (11). Further-more, octane-1,8-diol as the alcohol component was investigated
2
PENTANOL SOLUBILIZATION IN AN OCTANOATE MICELLE 153
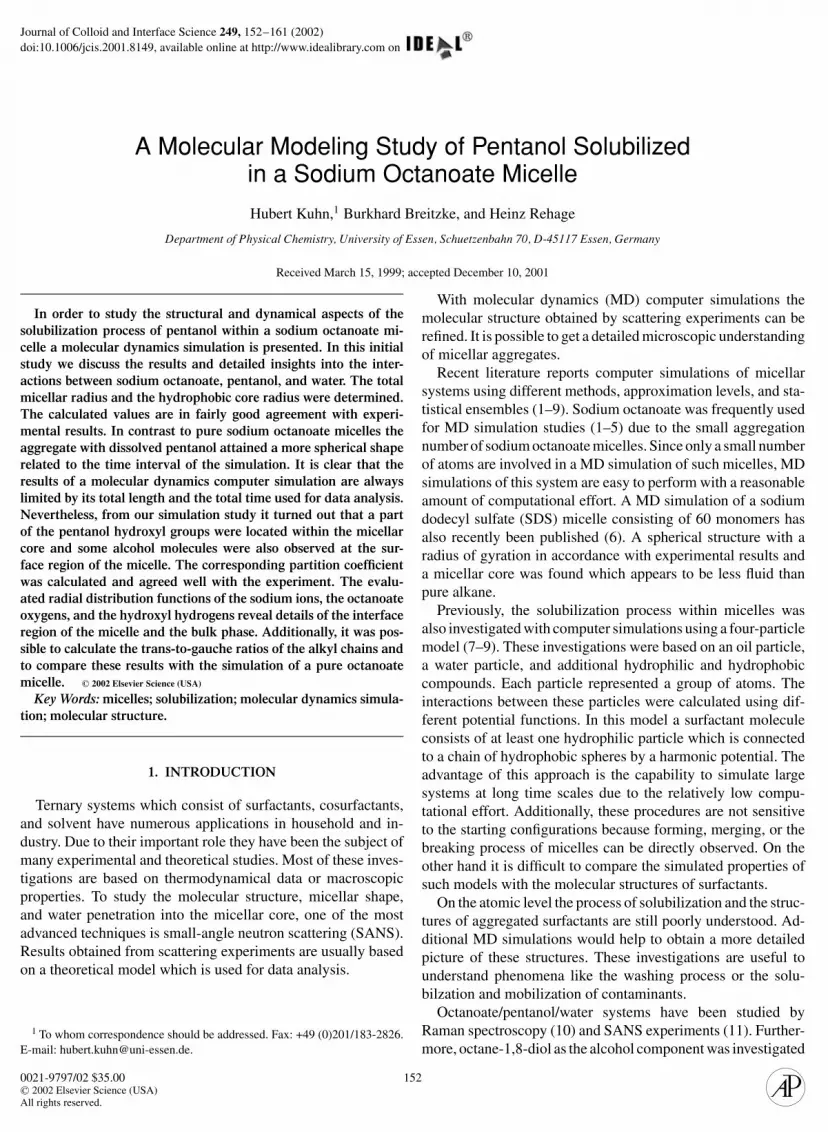
FIG. 1. Schematic drawing of a two-shell micellar model (11). The core radius R1 denotes the dimension of the sphere not containing an octanoate headgroup. The micellar radius R2 corresponds to the sphere containing the whole micelle. The partition coefficient Pe represents the distribution of alcohol molecules
between bulk water and the micellar aggregate. Pi is the partition coefficient defining the distribution of pentanol in the micellar core and in the interface region of the micelle.using X-ray scattering techniques (12). A two-shell model ofthe micelle was developed for the interpretation of these SANSand X-ray scattering data (Fig. 1). The SANS results lead tothe conclusion that the aggregation number of pure octanoatemicelles at a surfactant concentration of 1.2 mol/dm3 is about24 and almost independent of the actual pentanol concentration(11). Within the core radius R1 no carboxylate head groups werefound. The polar head groups and the sodium counterions arelocated in the interface region between the core radius R1 andthe total micellar radius R2. Head groups and counterions are indirect contact with the surrounding water molecules.
Both radii R1 and R2 are very sensitive to the amount ofadded pentanol. A core radius R1 = 1.09 nm and a total micellarradius R2 = 1.53 nm were found by the SANS experiments. Theprobability of finding a –CH2OH group of solubilized pentanolin the interface region is about 0.8.
With small-angle X-ray scattering investigations the size andstructure of sodium octanoate micelles interacting with solubi-lizates like p-xylene, N ,N -dimethylaniline, and decanol wereinvestigated by Svens and Rosenholm (13). The authors found
that solubilized decanol appears to be located in the polar re-gion of the micelle, and the micellar radius increases markedlywith increasing decanol concentrations. The radius of the paraf-fin chain region which is comparable to the R1 value in (11) wasmeasured to be 0.65 nm up to 1.00 nm depending to the amountof added decanol. The radius which indicates the thickness of thepolar layer (R2) increases from 2.8 nm to 4.05 nm with increas-ing decanol concentrations. In contrast to the results of (11), in(13) the R2 value was found to be much larger than the R1 value.The reason for the large R2 value could be the uncertainty of theX-ray scattering measurements to determine the rough micellarstructure of sodium octanoate micelles precisely (13).
The focus of this work is directed to the comparison of theexperimental SANS values in Ref. (11) with results calculatedby a molecular dynamics simulation of the system sodiumoctanoate/pentanol/water. In this context it is of special interestto study the penetration of water into the micellar aggregate.
2. METHODS
The interatomic interactions require the calculation of the po-tential energy. The interatomic forces were calculated according
to the parameters and potential functions of the AMBER95 forcefield (14). The TIP3P potential functions (15) were assigned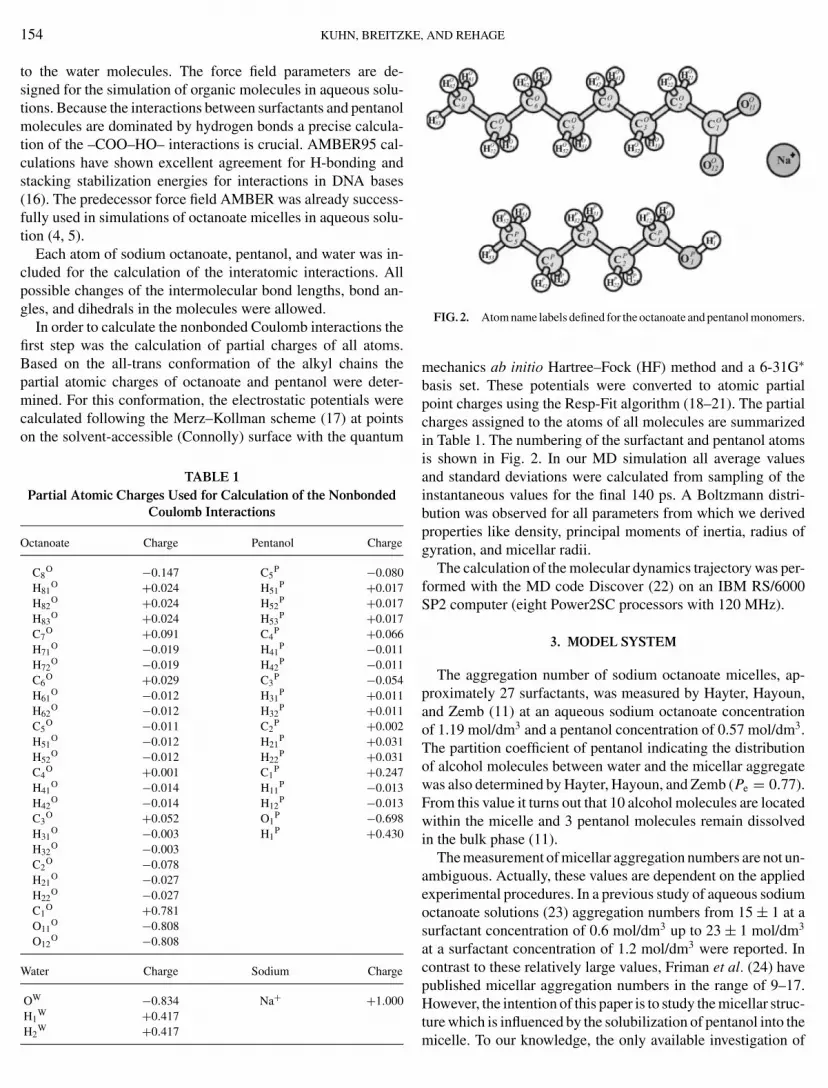
E
154 KUHN, BREITZKto the water molecules. The force field parameters are de-signed for the simulation of organic molecules in aqueous solu-tions. Because the interactions between surfactants and pentanolmolecules are dominated by hydrogen bonds a precise calcula-tion of the –COO–HO– interactions is crucial. AMBER95 cal-culations have shown excellent agreement for H-bonding andstacking stabilization energies for interactions in DNA bases(16). The predecessor force field AMBER was already success-fully used in simulations of octanoate micelles in aqueous solu-tion (4, 5).
Each atom of sodium octanoate, pentanol, and water was in-cluded for the calculation of the interatomic interactions. Allpossible changes of the intermolecular bond lengths, bond an-gles, and dihedrals in the molecules were allowed.
In order to calculate the nonbonded Coulomb interactions thefirst step was the calculation of partial charges of all atoms.Based on the all-trans conformation of the alkyl chains thepartial atomic charges of octanoate and pentanol were deter-mined. For this conformation, the electrostatic potentials werecalculated following the Merz–Kollman scheme (17) at pointson the solvent-accessible (Connolly) surface with the quantum
TABLE 1Partial Atomic Charges Used for Calculation of the Nonbonded
Coulomb Interactions
Octanoate Charge Pentanol Charge
C8O −0.147 C5
P −0.080H81
O +0.024 H51P +0.017
H82O +0.024 H52
P +0.017H83
O +0.024 H53P +0.017
C7O +0.091 C4
P +0.066H71
O −0.019 H41P −0.011
H72O −0.019 H42
P −0.011C6
O +0.029 C3P −0.054
H61O −0.012 H31
P +0.011H62
O −0.012 H32P +0.011
C5O −0.011 C2
P +0.002H51
O −0.012 H21P +0.031
H52O −0.012 H22
P +0.031C4
O +0.001 C1P +0.247
H41O −0.014 H11
P −0.013H42
O −0.014 H12P −0.013
C3O +0.052 O1
P −0.698H31
O −0.003 H1P +0.430
H32O −0.003
C2O −0.078
H21O −0.027
H22O −0.027
C1O +0.781
O11O −0.808
O12O −0.808
Water Charge Sodium Charge
OW −0.834 Na+ +1.000H1
W +0.417
H2W +0.417
, AND REHAGE
FIG. 2. Atom name labels defined for the octanoate and pentanol monomers.
mechanics ab initio Hartree–Fock (HF) method and a 6-31G∗
basis set. These potentials were converted to atomic partialpoint charges using the Resp-Fit algorithm (18–21). The partialcharges assigned to the atoms of all molecules are summarizedin Table 1. The numbering of the surfactant and pentanol atomsis shown in Fig. 2. In our MD simulation all average valuesand standard deviations were calculated from sampling of theinstantaneous values for the final 140 ps. A Boltzmann distri-bution was observed for all parameters from which we derivedproperties like density, principal moments of inertia, radius ofgyration, and micellar radii.
The calculation of the molecular dynamics trajectory was per-formed with the MD code Discover (22) on an IBM RS/6000SP2 computer (eight Power2SC processors with 120 MHz).
3. MODEL SYSTEM
The aggregation number of sodium octanoate micelles, ap-proximately 27 surfactants, was measured by Hayter, Hayoun,and Zemb (11) at an aqueous sodium octanoate concentrationof 1.19 mol/dm3 and a pentanol concentration of 0.57 mol/dm3.The partition coefficient of pentanol indicating the distributionof alcohol molecules between water and the micellar aggregatewas also determined by Hayter, Hayoun, and Zemb (Pe = 0.77).From this value it turns out that 10 alcohol molecules are locatedwithin the micelle and 3 pentanol molecules remain dissolvedin the bulk phase (11).
The measurement of micellar aggregation numbers are not un-ambiguous. Actually, these values are dependent on the appliedexperimental procedures. In a previous study of aqueous sodiumoctanoate solutions (23) aggregation numbers from 15 ± 1 at asurfactant concentration of 0.6 mol/dm3 up to 23 ± 1 mol/dm3
at a surfactant concentration of 1.2 mol/dm3 were reported. Incontrast to these relatively large values, Friman et al. (24) havepublished micellar aggregation numbers in the range of 9–17.However, the intention of this paper is to study the micellar struc-
ture which is influenced by the solubilization of pentanol into themicelle. To our knowledge, the only available investigation of
PENTANOL SOLUBILIZATION
the ternary system sodium octanoate/pentanol/water is the small-angle neutron scattering study of Ref. (11). The authors foundthat at a pentanol concentration of 5% the aggregation number is27, so our simulation model containing 4.1% pentanol (percentby weight) is a reasonable approximation to the SANS results.It can be assumed that the micellar aggregation number remainsfairly constant by addition of pentanol since the micelles growwithout a variation of the aggregation number (11).
One can expect a regular distribution of charged head groupson the surface of the micelle. In order to obtain a well-definedstarting structure the best-known solution for the problem ofdistributing n equal point charges on a sphere (25, 26) was em-ployed to distribute systematically the carboxylate head groups(n = 27) on the surface of the micelle. This approach is in accor-dance with geometric distributions in the canonical cases (e.g.,icosahedron or bucky-ball). Using this procedure it is possibleto generate reasonable initial structures for micellar aggregatesconsisting of up to 132 head groups. The 10 pentanol moleculesin the interior of the micelle were also distributed by locatingthe oxygens on a spherical surface. The molecules were then ad-justed in such a way that the hydrogen bond distances betweenthe pentanol hydroxyl hydrogens and the nearest-neighbor oxy-gen atoms of the surfactant molecules were equal to 0.16 nm.Consequently, in the initial structure all pentanol molecules arebound to octanoate molecules by hydrogen bonds. The last threepentanol molecules were placed arbitrarily in the bulk phase.The sodium ions were set in the vicinity of the head groups us-ing the minimum potential energy structure of a single sodiumoctanoate molecule in vacuum. This means that all sodium coun-terions were in direct contact with the head groups.
In contrast to compact micelles with large aggregation num-bers (6), the number of van der Waals (VDW) contacts withinloosely packed micelles is quite small due to their open structure.In order to obtain sufficient VDW contacts of the initial structure,the radius from the center of mass (COM) to all of the C1
O atomswas set to 1.15 nm. This value is only slightly above the experi-mental core radius of 1.09 nm. At the beginning of the simulationthe spherical micelle including the solvated pentanol moleculeswas centered in a box with dimensions Lx = L y = Lz = 3.61 nm.Periodic boundary conditions were used for the MD simulation.The micelle was surrounded by water molecules with the resultthat the box was completely filled with water. The initial coreand interface region of the micellar aggregate (R1) remainedfree of water molecules. Water molecules were located aroundthe micelle on the micellar surface and in the simulation box.To ensure that the water molecules represent the equilibriumwater structure close to a density of 1 kg/dm3 the positions ofthe solvent molecules in the box were extracted from a previousequilibrium molecular dynamics simulation of a water box atconstant pressure (105 Pa) and temperature (298 K). This initialstructure generation procedure resulted in an idealized micellewhich approximately matches the experimental size of the mi-
celle. The final system representing the starting structure of theMD simulation consists of 27 surfactant molecules, 27 sodiumIN AN OCTANOATE MICELLE 155
counterions, and 13 pentanol molecules surrounded by 1249water molecules.
4. CALCULATION PROCEDURE
The potential energy of the whole system was minimized, fol-lowed by gradually heating from 1 to 298 K with a step size of1 K over a period of 10 ps and a relaxation of the temperature foranother 10 ps. During the initial heating and the relaxation pro-cedure, the temperature was set by direct velocity scaling. Thefinal simulation was performed at a constant pressure of 105 Paand a constant temperature of 298 K. The total simulation timewas 780 ps. The temperature was controlled by the Andersenmethod (27) and the pressure was controlled by the Berendsenalgorithm (28) with a decay constant of 0.1. Newton’s equationsof motion for all atoms were integrated using the Verlet velocityalgorithm (29) using a time step of 1 fs. For the calculation of theCoulomb potentials a charge group approximation scheme wasused to retain the dipole–dipole interactions. The cutoff radiuswas set to 1.6 nm for the Coulomb and 1.0 nm for the VDWinteractions, both including a 0.1-nm spline switching function.Statistical analysis was applied to the trajectory frames for thefinal 140 ps. During the MD simulation the trajectory frameswere stored every 100 fs.
The quality of the results and the amount of information ob-tained by a MD computer simulation are limited with respectto the total simulation time length and the related data analy-sis. However, the simulation time of this work exceeds the timeranges of previous works on comparable systems (1–5).
5. EQUILIBRATION
The initial structure of the micelle was built according to themodel of Hartley with the hydrophobic chains oriented towardthe center of the aggregate. The polar head groups are directed to-ward the water phase. This idealized micellar structure generatedas the starting configuration of the simulation needs some timeto relax to the thermodynamic equilibrium. The use of all-transconformations for the surfactant and the pentanol molecules,as well as the somewhat arbitrary placement of the pentanolmolecules within the micelle, requires a careful gradual heat-ing procedure prior to the production run. This method leads toequilibrated trans/gauche distributions of the aliphatic dihedralsand reliable VDW contacts.
The relaxation of the total potential energy of the systemas a function of the simulation time is plotted in Fig. 3. Therelaxation of the total potential energy to a constant fluctuationcan be observed at about 250 ps followed by fluctuation arounda potential energy value of approximately −65 kJ/mol. The con-stant total potential energy fluctuations indicate the thermody-namic equilibrium of the system. The development of the totalpotential energy as a function of time is reflected by all inter-
and intramolecular energy terms. A detailed analysis of the inter-and intramolecular potential energy contributions showed that
E
156 KUHN, BREITZKFIG. 3. Convergence of the total potential energy Epot as a function of thesimulation time t after the initial 20-ps heating and relaxation step.
the equilibration process is mainly determined by the relaxationof the Coulomb interactions.
6. EXPERIMENTS
In order to ensure that the MD simulation matches the realisticmacrocopic density of the octanoate/pentanol/water system, thedensity was experimentally determined. These measurementswere performed on a Kruess processor tensiometer K121 bydetermination of the buoyancy of a standard glass probe in thesolution. The sodium salt of n-octanoic acid and the pentanolwere 99%, both purchased from Sigma and used without furtherpurification.
7. RESULTS AND DISCUSSION
All experimentally determined structures (SANS, X ray) arebased on an average of micellar configurations in aqueous solu-tion. Conversely, the MD simulation provides information aboutthe evolution of a single micelle starting from an initial config-uration. The equivalence between time and ensemble averageallows the comparison of calculated and experimental quanti-ties (30) in the limit of the investigated time scale. A successfulverification of experimental and simulated data allows a fur-ther analysis of the calculation results to understand moleculardetails of the micellar structure and its molecular dynamics.
7.1. Density of the Aqueous Solution
The density of the system is a macroscopic property which caneasily be obtained. The simulated average mass density of themicellar solution was calculated to be 1.017 ± 0.004 kg/dm3.This value is slightly lower than the value of 1.019 g/cm3 de-termined by the experiment but the agreement is quite good. It
can be assumed that the MD simulation reflects the macroscopicdensity of the micellar solution., AND REHAGE
7.2. Micellar Structure
In Fig. 4 a snapshot of the micellar structure correspondingto a simulation time of 500 ps is presented. In contrast to thetextbook pictures of the Hartley micelle model (Fig. 1) the oc-tanoate micelle in Fig. 4 is more disordered with strong tiltedhydrophobic alkyl chains. This makes it clear that the molecularstructure of the hydrophobic chains is determined by dynamicrotations around the alkyl C–C bonds.
7.3. Micellar Shape and Radius
In order to check the assumption of a spherical aggregatewhich was indicated by experimental results the principal mo-ments of inertia I1, I2, and I3 were calculated and their ratioswere analyzed. For the I1/I3, I2/I3, and I1/I2 ratios, values of1.03 ± 0.01, 1.05 ± 0.01, and 1.09 ± 0.01 were obtained. Thisfact indicates an almost spherical structure of the micelle.
For the octanoate molecules a radius of gyration of rgO =
1.18 ± 0.06 nm was found. The radius of gyration of the ninepentanol molecules solved in the micelle was also calculated asrg
P = 1.18 ± 0.26 nm. For the carboxylate oxygen positions anaverage distance from the center of mass of the surfactant mole-cules (COM) was calculated to be rCOM−OO = 1.34 ± 0.19 nm.The average distance from COM to the C1
O atoms of the oc-tanoate head groups was found to be rCOM−C1
O =1.31±0.18 nm.The radius rCOM−C2
O was evaluated to be 1.13 ± 0.18 nm.The sum of rCOM−OO and the standard deviation of 0.19 nm
is equal to 1.53 nm. This value is in agreement with the exper-imental result for the total radius R2 = 1.53 nm of the micelle(11). The calculated value of rCOM−C2
O = 1.13 nm is just slightlyabove the experimental result for the core radius R1 of 1.09 nm(11). The results of the micellar radii are summarized in Table 2.
7.4. Counterion Distribution
In order to get a more detailed picture of the sodium coun-terion distribution, radial distribution functions (RDFs) werecalculated for various atom pairs using the equation
gab(r ) = d〈Nab(r )〉ρbdV (r )
, [1]
where d〈Nab(r )〉 is the average number of type b atoms at thedistance between r and r + dr measured from a type a atom.The RDFs are normalized with the average local density ρb ofthe component b atoms in the shell volume dV (r ) between rand r + dr . By integrating d〈Nab(r )〉 from rs to re the averagenumber of type b atoms within the specific shell was obtained.
〈Nab(rs − re)〉 =re∫
rs
d〈Nab(r )〉 dr. [2]
By normalization with the total number of type b atoms in the
system or within the micelle the results could be expressed inpercent.
PENTANOL SOLUBILIZATION IN AN OCTANOATE MICELLE 157
FIG. 4. Solvent-accessible (Conolly) surface and stick-model presentation o500 ps: oxygens (red), octanoate carbons (green), pentanol carbons (blue), and so
In Fig. 5 the RDFs of sodium ions with the oxygen atomsof octanoate, pentanol, and water are plotted. The RDF betweensodium and octanoate oxygen has a very pronounced first neigh-bor peak and also a sharp second-order maximum: 22.2% of the
TABLE 2Calculated Micellar Radii of the Sodium
Octanoate/Pentanol/Water System
Average radius (nm) Reference
rgO 1.18 ± 0.06 This work
rgP 1.16 ± 0.06 This work
rCOM−OO 1.34 ± 0.19 This workrCOM−C1
O 1.31 ± 0.18 This workrCOM−C2
O 1.13 ± 0.18 This work
R1 1.09 (11)R2 1.53 (11)f the micellar aggregate extracted from the trajectory at a simulation time step ofdium ions (purple).
sodium ions are bound to oxygen atoms at a distance of about0.235 nm. The remaining sodium ions are building a second shellaround the carboxylate oxygens at a distance of 0.435 nm. Theobserved close contact of 22.2% of the sodium counterions iscertainly a result of the starting configuration of the simulationwhere all sodium ions were bound to carboxylate oxygens.
The RDF between sodium and water oxygen has a pronouncedfirst-order maximum, but a more diffuse second-order peak. Onthe average the sodium ions are surrounded by 5.46 water oxy-gen atoms within the first hydration shell. The RDF betweenpentanol oxygens and sodium counterions reveals that 7.7% ofthe sodium ions are in contact with pentanol oxygen atoms.
The RDFs between the oxygen atoms of the surfactantmolecules (OO–OO) and between the sodium counterions(Na–Na) are plotted in Fig. 6. From Fig. 6 it becomes clear
that the high structure peak at approximately 1.6 nm is causedby a wrong distribution of sodium ions in the solution which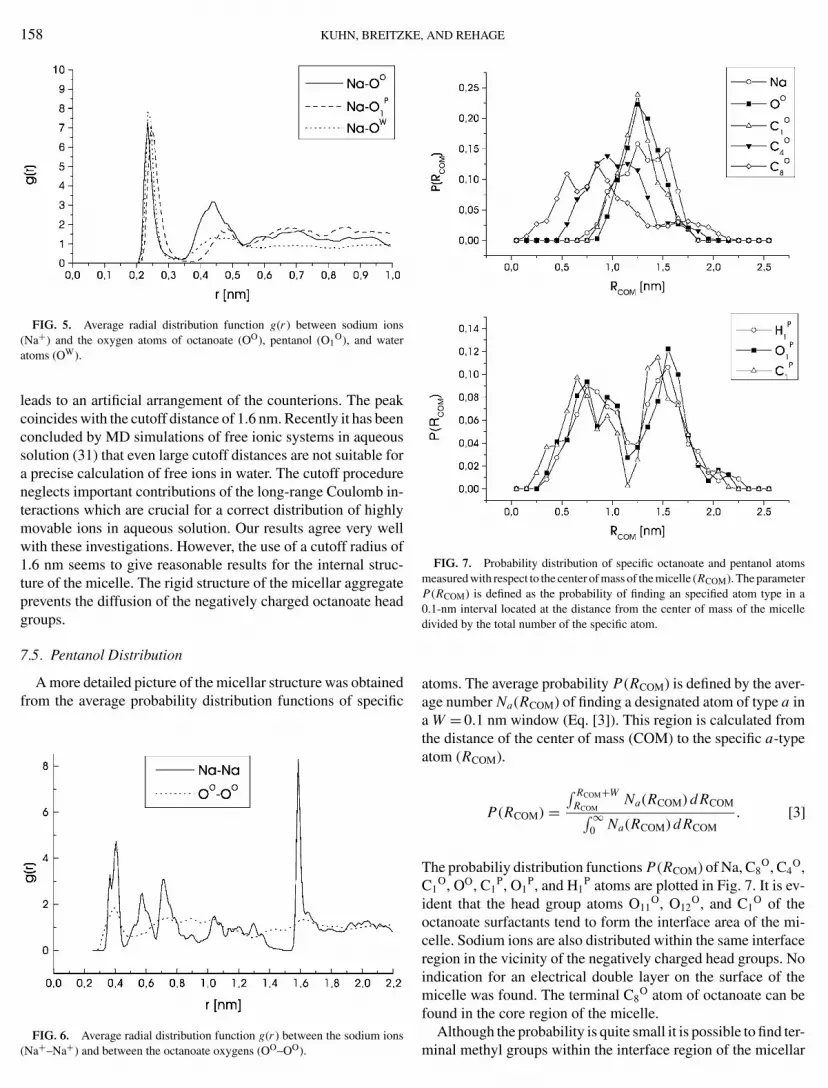
Although the probability is quite small it is possible to find ter-
158 KUHN, BREITZKE
FIG. 5. Average radial distribution function g(r ) between sodium ions(Na+) and the oxygen atoms of octanoate (OO), pentanol (O1
O), and wateratoms (OW).
leads to an artificial arrangement of the counterions. The peakcoincides with the cutoff distance of 1.6 nm. Recently it has beenconcluded by MD simulations of free ionic systems in aqueoussolution (31) that even large cutoff distances are not suitable fora precise calculation of free ions in water. The cutoff procedureneglects important contributions of the long-range Coulomb in-teractions which are crucial for a correct distribution of highlymovable ions in aqueous solution. Our results agree very wellwith these investigations. However, the use of a cutoff radius of1.6 nm seems to give reasonable results for the internal struc-ture of the micelle. The rigid structure of the micellar aggregateprevents the diffusion of the negatively charged octanoate headgroups.
7.5. Pentanol Distribution
A more detailed picture of the micellar structure was obtainedfrom the average probability distribution functions of specific
FIG. 6. Average radial distribution function g(r ) between the sodium ions(Na+–Na+) and between the octanoate oxygens (OO–OO).
, AND REHAGE
FIG. 7. Probability distribution of specific octanoate and pentanol atomsmeasured with respect to the center of mass of the micelle (RCOM). The parameterP(RCOM) is defined as the probability of finding an specified atom type in a0.1-nm interval located at the distance from the center of mass of the micelledivided by the total number of the specific atom.
atoms. The average probability P(RCOM) is defined by the aver-age number Na(RCOM) of finding a designated atom of type a ina W = 0.1 nm window (Eq. [3]). This region is calculated fromthe distance of the center of mass (COM) to the specific a-typeatom (RCOM).
P(RCOM) =∫ RCOM+W
RCOMNa(RCOM) d RCOM
∫ ∞0 Na(RCOM) d RCOM
. [3]
The probabiliy distribution functions P(RCOM) of Na, C8O, C4
O,C1
O, OO, C1P, O1
P, and H1P atoms are plotted in Fig. 7. It is ev-
ident that the head group atoms O11O, O12
O, and C1O of the
octanoate surfactants tend to form the interface area of the mi-celle. Sodium ions are also distributed within the same interfaceregion in the vicinity of the negatively charged head groups. Noindication for an electrical double layer on the surface of themicelle was found. The terminal C8
O atom of octanoate can befound in the core region of the micelle.
minal methyl groups within the interface region of the micellar
I
PENTANOL SOLUBILIZATIONaggregate. The reason for this behavior of terminal alkyl chaingroups is that an octanoate chain with one or more gauche con-formations can be bent outwards toward the interface region.The octanoate micelle with an aggregation number of 27 is rel-atively loosely packed with a result of large fluctuations of thealkyl chains. The movement of terminal methyl groups into theinterface region can be observed.
For the pentanol head groups a significant partition into differ-ent regions was found. This is in accordance with experimentalresults (11). The analysis of the average probability functionwith respect to the C1
P, O1P, and H1
P atoms reveals that fivepentanol hydroxyl groups are located in the micellar core. Theother four hydroxyl groups are located in the interface region.
This picture of the interface region is in accordance with asimulation of a smectic liquid crystal bilayer of sodium de-canoate/decanol/water (32). In this publication a large interfaceregion of about 0.8 nm (0.4 nm this work) thickness was alsofound due to a substantial overlap of the distributions of counte-rions and decanoate head groups. The decanol OH groups werelocated about 0.5 nm more inward with respect to the carboxy-late groups. In our simulation this is observed for the pentanolOH groups located within the micellar core. In contrast to thebilayer simulation, pentanol molecules adsorbed at the micellarinterface were observed in the SANS experiments and in thiswork. The difference can be a natural consequence of the spher-ical micellar structure as opposed to the plane interface and thepacking effects in the bilayer.
The partition coefficient Pi was calculated from the ratio ofpentanol OH groups within the interface NP
I and the total num-ber of pentanol molecules NP
T solubilizated within the micellaraggregate.
Pi = NPI
NPT . [4]
Pi has a value of 0.44 which is below the experimental valueof 0.8 but near the range of 0.5 ≤ Pi ≤ 0.8 observed for higherpentanol concentrations (11). This result of our simulation indi-cates a significantly larger amount of pentanol molecules withinthe core region than in the micellar interface region. This couldbe induced by the initial structure of the micelle in which allpentanol molecules were arranged in equal distances. However,it can be expected that during a 10-ps heating step and a subse-quent 780-ps MD simulation at 298 K, the resulting moleculararrangements are independent of the initial starting conforma-tions. We have observed that the partition coefficient Pi remainedalmost constant over the last 280 ps of the simulation. This is anindication of a convergence of the pentanol partition coefficient.Nevertheless, this statement has to be proven by performing sev-eral MD simulations starting from different inital configurationswhich is at the moment beyond our computational capabilities.Probably, a longer simulation time scale is required to observe
the diffusion process that leads to the correct thermodynamicalequilibrated distribution of pentanol into the micelle.N AN OCTANOATE MICELLE 159
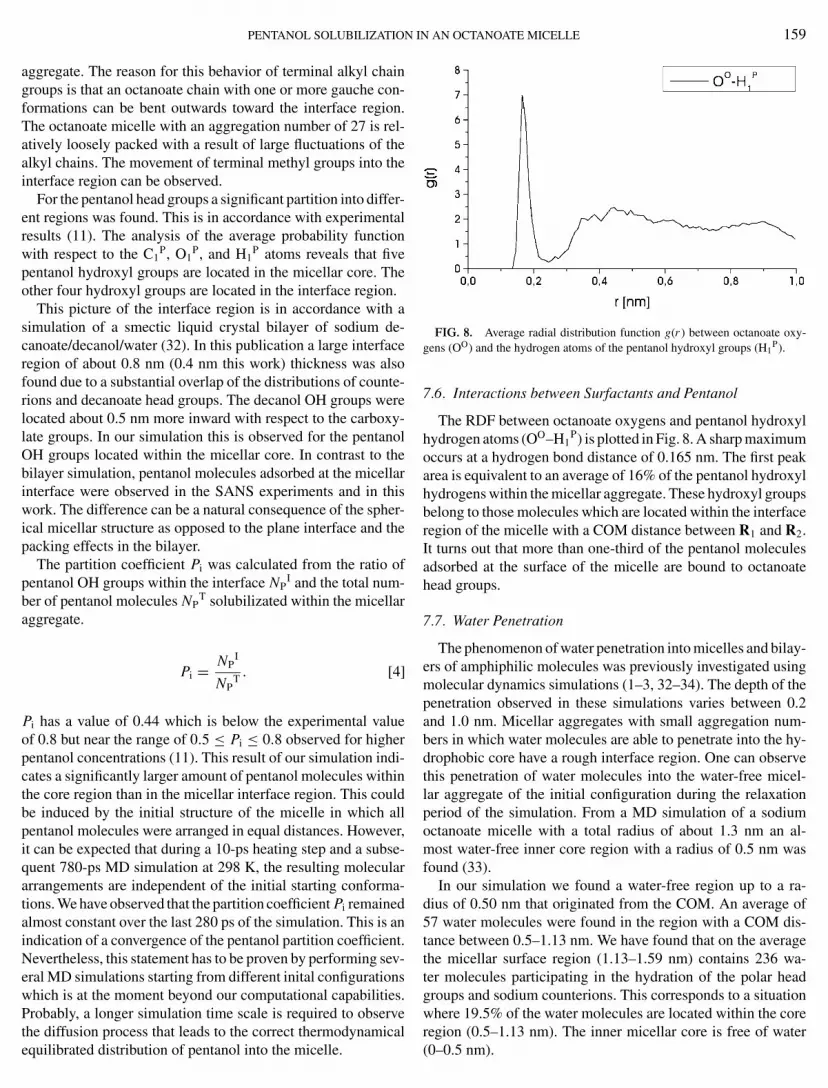
FIG. 8. Average radial distribution function g(r ) between octanoate oxy-gens (OO) and the hydrogen atoms of the pentanol hydroxyl groups (H1
P).
7.6. Interactions between Surfactants and Pentanol
The RDF between octanoate oxygens and pentanol hydroxylhydrogen atoms (OO–H1
P) is plotted in Fig. 8. A sharp maximumoccurs at a hydrogen bond distance of 0.165 nm. The first peakarea is equivalent to an average of 16% of the pentanol hydroxylhydrogens within the micellar aggregate. These hydroxyl groupsbelong to those molecules which are located within the interfaceregion of the micelle with a COM distance between R1 and R2.It turns out that more than one-third of the pentanol moleculesadsorbed at the surface of the micelle are bound to octanoatehead groups.
7.7. Water Penetration
The phenomenon of water penetration into micelles and bilay-ers of amphiphilic molecules was previously investigated usingmolecular dynamics simulations (1–3, 32–34). The depth of thepenetration observed in these simulations varies between 0.2and 1.0 nm. Micellar aggregates with small aggregation num-bers in which water molecules are able to penetrate into the hy-drophobic core have a rough interface region. One can observethis penetration of water molecules into the water-free micel-lar aggregate of the initial configuration during the relaxationperiod of the simulation. From a MD simulation of a sodiumoctanoate micelle with a total radius of about 1.3 nm an al-most water-free inner core region with a radius of 0.5 nm wasfound (33).
In our simulation we found a water-free region up to a ra-dius of 0.50 nm that originated from the COM. An average of57 water molecules were found in the region with a COM dis-tance between 0.5–1.13 nm. We have found that on the averagethe micellar surface region (1.13–1.59 nm) contains 236 wa-ter molecules participating in the hydration of the polar headgroups and sodium counterions. This corresponds to a situationwhere 19.5% of the water molecules are located within the core
region (0.5–1.13 nm). The inner micellar core is free of water(0–0.5 nm).
160 KUHN, BREITZKE
FIG. 9. Average radial distribution functions between octanoate oxygens(OO) and the water hydrogen atoms (HW). The RDF between octanoate C1
O
atoms and the oxygen atoms of water (OW) has also been plotted.
For a pure octanoate micelle an average value of 10% of watermolecules within the micelle was found (33). The increase ofthe water concentration within the core region for the systemoctanoate/pentanol/water can be explained by the existence ofthe polar hydroxyl groups of the pentanol molecules solubilizedwithin the micellar core. Due to hydrogen-bonding effects, thehydroxyl groups will tend to keep the water molecules even inthe apolar hydrophobic environment. The same effect seems tobe responsible for ion transport through membranes (35).
7.8. Hydration of Surfactants and Pentanol
The interactions of the octanoate head groups with watermolecules are mainly characterized by hydrogen bonds. TheRDFs between the octanoate oxygen atoms (OO) and water hy-drogens (HW) and also between the octanoate C1
O atoms andwater oxygens (OW) are shown in Fig. 9. The RDF(OO–HW)has a pronounced maximum corresponding to the first hydrationshell with an average hydrogen bond distance of about 0.17 nm.A second maximum at 0.3 nm is distinctive. Even a small peak at0.38 nm corresponding to a third hydration shell can be noticed.Integration of the RDF(OO–HW) leads to an average number of3 hydrogen bonds formed by water molecules and octanoate oxy-gens. By integration of the RDF(C1
O–OW) an average value of6.2 water molecules was found within the first hydration shell.This result is in agreement with SANS studies of sodium oc-tanoate micelles (33). From this work an average micellar hy-dration of between 6 and 7 solvent molecules per monomer couldbe concluded. A Monte Carlo simulation study of the hydrationof –COOH groups arranged on a flat surface (36) has foundan average number of 4 nearest-neighbor water molecules. TheMD simulation of a pure octanoate micelle with 15 monomers(5) gave a result of 8 water molecules within the first hydrationshell. Although different potentials and different treatments of
electrostatic interactions have been used, all results are in fairlygood agreement. In comparison to Ref. (34), surface hydration, AND REHAGE
and the hydration of micellar head groups could differ due to aneffect of curvature. A distinctive curvature of the surface leadsto more exposed head groups with respect to water moleculeswith the effect of an increased number of hydrogen bonds.
7.9. Conformations of the Hydrophobic Alkyl Chains
The ratio of trans to gauche conformations should be dif-ferent for single octanoate molecules solved in water or formonomers arranged in a micelle. Certainly, the addition of pen-tanol molecules to the micellar structure should affect the trans-to-gauche ratios in the hydrophobic alkyl chains of the surfac-tant molecules. In order to examine these effects in more detailthe average distribution of dihedrals in the hydrophobic alkylchains was examined. By integration of the dihedral distribu-tion in intervals between 0–120, 120–240, and 240–360◦, thepercentage distributions of the trans and gauche conformationswere calculated. The results were compared with a MD simula-tion of a single octanoate monomer dissolved in octane and inwater. Comparisons of dihedral distributions from a single oc-tanoate monomer in the vacuum phase and of a pure octanoatemicelle (4) were also performed. These results are summarizedin Table 3. It is striking that in all cases the energetically pre-ferred trans conformation of the alkyl chains is predominant.The highest ratio of gauche configurations is observed in a vac-uum. Without intermolecular interactions the frequency of rota-tions in the alkyl chains is large. Intermolecular interactions tendto decrease the number of alkyl chain rotations. According toTable 3 apolar/polar contacts as in the case of a single octanoatemolecule in aqueous solution have smaller effects than the apo-lar/apolar contacts as in the case of a single octanoate monomerdissolved in octane. The micellar aggregation of the monomersleads to a decrease of the gauche conformations due to pack-ing effects (4, 37). The MD simulation of the ternary systemoctanoate/pentanol/water also shows an increase of trans con-formations within the micellar aggregate but this effect is lesspronounced than for the pure octanoate micelle. Due to thelarge number of pentanol hydroxyl groups and water moleculesincluded in the micellar core region, more polar contacts of
TABLE 3Percentage Distribution of the Trans/Gauche Ratios of Octanoate
and Pentanol in the Ternary System in Comparison to the Resultsof a Simulation of a Pure Sodium Octanoate Micellea
System Trans (%) Gauche (%) Reference
Pentanol in octanoate micelle/water 80 20 This workOctanoate micelle/water 77 23 (4)Octanoate micelle with pentanol/water 66 34 This workOctanoate monomer in octane 65 35 (4)Octanoate monomer in water 62 38 (4)Octanoate monomer in a vacuum 60 40 (4)
a The values for a single octanoate monomer dissolved in octane and in water
are given. The results for an isolated monomer in the vacuum phase are alsopresented.
I
PENTANOL SOLUBILIZATIONthe alkyl chains with pentanol and water can be assumed. Thisphenomenon leads to an increasing number of gauche configu-rations. Hayter et al. (11) have observed an increase of pentanolhydroxyl groups within the micellar core and a fairly constantaggregation number by adding more pentanol to an aqueous so-lution of sodium octanoate. The addition of pentanol could leadto an increased number of polar/apolar contacts. Nevertheless,our conclusions are in contrast to investigations of Rosenholmet al. (10). With Raman spectroscopy the authors have found anincreasing degree of transconformation in the octanoate alkylchains by adding pentanol. An opposite effect was recognizedby adding decanol. One reason for this discrepancy could bethe application of perdeuterated octanoate and water which wasused for the experimental investigations. However, a carbon-13 NMR shielding study of ternery sodium octanoate/water/pentanol and sodium octanoate/water/decanol systems revealedthat micelle formation and alcohol solubilization lead to anincreased fraction of trans conformers in the sodium oc-tanoate alkyl chains (38). This result is in agreement with ourstudy.
8. CONCLUSIONS
This molecular dynamics computer simulation provides in-sights into atomic details which are in accordance with exper-imental results. With the MD simulation at constant pressureand temperature the macroscopic density of the aqueous solu-tion was reproduced. Micellar geometry parameters like the coreand the total radius of the micellar aggregate were found to be infairly good agreement with the experimental values. The shapeof the micelle with solubilizated pentanol is more spherical thanin the pure octanoate micelle. Hydrated octanoate head groupsand sodium ions were found at the surface of the micelle. Itturned out that even large cutoffs of the nonbonded electrostaticinteractions are inadequate to calculate surface charges or freecounterion distributions related to ionic surfactants. The num-ber of pentanol molecules located within the core region waslarger than expected. Pentanol molecules adsorbed at the in-terface region in the micelle have a high probability to be incontact with an octanoate head group. The trans-to-gauche ra-tio was a sensitive indicator for polar/apolar contacts within themicelle.
ACKNOWLEDGMENTS
Financial support from the Deutsche Forschungsgemeinschaft (DFG-GRK153/2) and the Forschungspool of the University of Essen is greatefully
acknowledged. We also thank the computer center of the University of Essenfor providing the computer resources.N AN OCTANOATE MICELLE 161
REFERENCES
1. Watanabe, K., Ferrario, M., and Klein, M. L., J. Phys. Chem. 92, 819 (1988).2. Laaksonen, L., and Rosenholm, J. B., Chem. Phys. Lett. 216, 429 (1993).3. Shelley, J. C., Sprik, M., and Klein, M. L., Langmuir 9, 916 (1993).4. Kuhn, H., and Rehage, H., Ber. Bunsenges. Phys. Chem. 101, 1485 (1997).5. Kuhn, H., and Rehage, H., Ber. Bunsenges. Phys. Chem. 101, 1493 (1997).6. MacKerell, A. D., J. Phys. Chem. 99, 1846 (1995).7. Karaborni, S., van Os, N. M., Esselink, K., and Hilbers, P. A. J., Langmuir
9, 1175 (1993).8. Esselink, K., Hilbers, P. A. J., van Os, N., Smit, B., and Karaborni, S.,
Colloids Surf. A 91, 155 (1994).9. Smit, B., Hilbers, P. A. J., Esselink, K., Rupert, L. A. M., and van Os, N. M.,
J. Phys. Chem. 95, 6361 (1991).10. Rosenholm, J. B., Larsson, K., and Dinh-Nguyen, N., Colloid Polym. Sci.
255, 1098 (1977).11. Hayter, B., Hayoun, M., and Zemb, T., Colloid Polym. Sci. 262, 798 (1984).12. Friman, R., and Rosenholm, J. B., Colloid Polym. Sci. 260, 545 (1982).13. Svens, B., and Rosenholm, B., J. Colloid Interface Sci. 44, 495 (1973).14. Cornell, W. D., Cieplak, P., Bayly, C. I., Gould, I. R., Merz, K. M., Ferguson,
D. M., Spellmeyer, D. C., Fox, T., Caldwell, J. W., and Kollman, P. A.,J. Am. Chem. Soc. 117, 5179 (1995).
15. Jorgensen, W. L., Chandrasekhar, J., Madura, J. D., Impey, R. W., and Klein,M. L., J. Chem. Phys. 79, 926 (1983).
16. Hobza, M. B., Sponer, J., Mejzlik, P., and Vondrasek, J., J. Comput. Chem.18, 1136 (1997).
17. Besler, B. H., Merz, K. M., and Kollman, P. A., J. Comput. Chem. 11, 431(1990).
18. Singh, U. C., and Kollman, P. A., J. Comput. Chem. 5, 129 (1983).19. Reynolds, C. A., Essex, J. W., and Richards, W. G., J. Am. Chem. Soc. 114,
9075 (1992).20. Baylay, C. I., Cieplak, P., Cornell, W. D., and Kollman, P. A., J. Phys. Chem.
97, 10269 (1993).21. Cornell, W. D., Cieplak, P., Bayly, C., and Kollman, P. A., J. Am. Chem.
Soc. 115, 9620 (1993).22. “DISCOVER, Ver. 4.0.0,” Molecular Simulation Inc., San Diego, CA, 1997.23. Hayter, J. B., and Zemb, T., Chem. Phys. Lett. 93, 91 (1982).24. Friman, R., Petterson, K., and Stenius, P., J. Colloid Interface Sci. 53, 90
(1975).25. Hardin, R. H., Sloane, N. J. A., and Smith, W. D., Spherical codes,
http://www.research.att.com/∼njas/, 1997.26. Kottwitz, D. A., Acta Crystallogr. A 47, 158 (1991).27. Andersen, H. C., J. Chem. Phys. 72, 2384 (1980).28. Berendsen, H. J. C., Postma, J. P. M., van Gunsteren, W. F., DiNola, A.,
and Haak, J., J. Chem. Phys. 81, 3684 (1984).29. Verlet, L., Phys. Rev. 159, 98 (1967).30. Allen, M. P., and Tildesley, D. J., “Computer Simulation of Liquids,” Oxford
Univ. Press, Oxford, 1989.31. van Gunsteren, W. F., and Mark, A. E., J. Chem. Phys. 108, 6109 (1998).32. Egberts, E., and Berendsen, H. J. C., J. Chem. Phys. 89, 3717 (1988).33. Kuhn, H., Breitzke, B., and Rehage, H., Prog. Colloid Polym. Sci. 276, 824
(1998).34. Tieleman, D. P., and Berendsen, H. J. C., J. Chem. Phys. 105, 4871 (1996).35. Tieleman, D. P., Marrink, S. J., and Berendsen, H. J. C., Biochim. Biophys.
Acta 1331, 235 (1997).36. Makovsky, N. N., Mol. Phys. 72, 235 (1991).37. Gruen, D. W. R., J. Colloid Interface Sci. 84, 281 (1981).
38. Rosenholm, J. B., Drakenberg, T., and Lindman B., J. Colloid Interface Sci.63, 538 (1978).


