Embed Size (px)
Citation preview
JOURNAL OF GEOPHYSICAL RESEARCH, VOL. 106, NO. A6, PAGES 10,905-10,921, JUNE 1, 2001
A model for the diurnal universal time variation of the index
J. Takalo and K. Mursula
Department of Physical Sciences, University of Oulu, Oulu, Finland
Abstract. Using a simple model for the asymmetric ring current, we show that the main reason for the diurnal universal time (UT) variation of Dst index is the uneven distribution of the Dst network stations. The model takes into account
the four Dst stations and the strong disturbance due to the partial ring current in the 1800 LT sector. In agreement with the equinoctial theory the diurnal variation is found to be larger in local summer than winter for Hermanus (HER). However, while Hermanus is the only Southern Hemisphere Dst station, this leads to a larger UT variation in the Dst index in the Northern Hemisphere summer. Moreover, we find evidence that the diurnal LT minimum is shifted by a couple of hours closer to the mid•ght during local winter, supporting the Malin-Isikm'a effect. We also note that the Russell-McPherron (RMP) effect is in phase (out of phase) with the modeled diurnal variation of the Dst index around vernal (autumnal) equinox, thus increasing (decreasing) the diurnal variation in the Dst index in spring (fall) by 20-30%. However, the RMP effect is not responsible for the overall dim'hal UT variation of the Dst index.
1. Introduction
The Dst index is intended to describe the evolution of
the ring current, although there is some influence from other current systems as well [Campbell, 1996]. It is cal- culated from the horizontal component of the magnetic field measured at four low- to midlatitude observato-
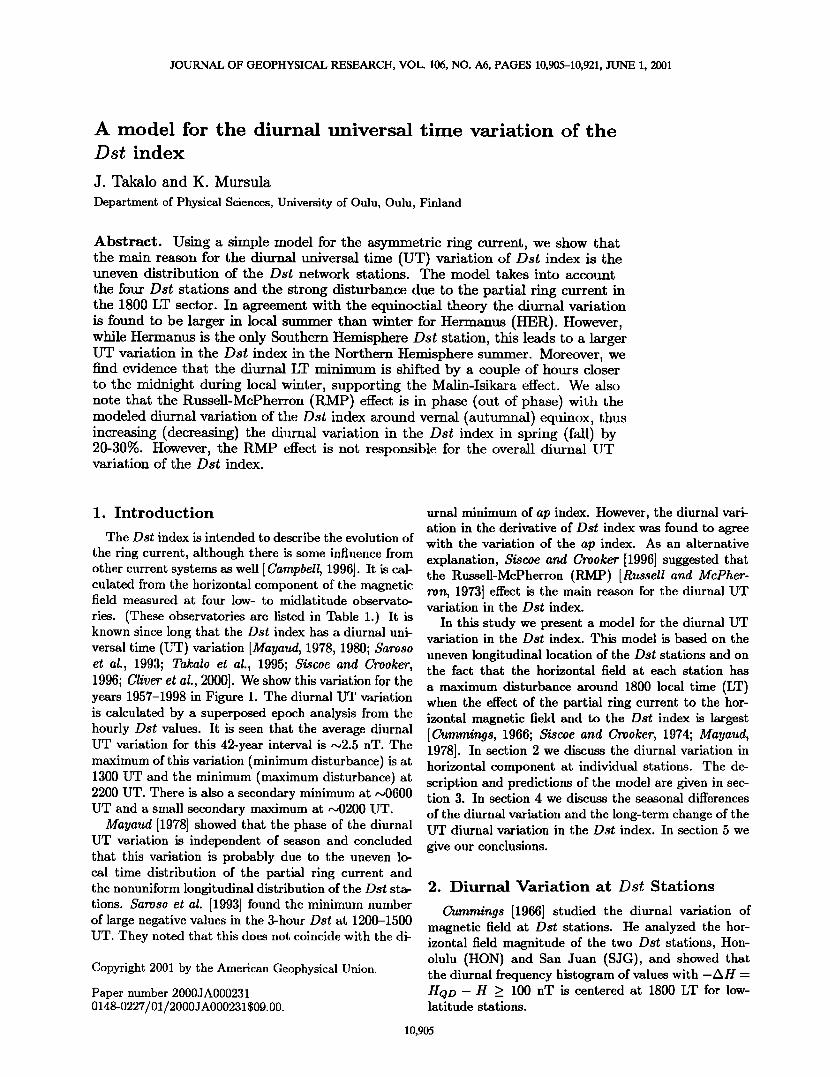
ries. (These observatories are listed in Table 1.) It is known since long that the Dst index has a diurnal uni- versal time (UT) variation [Mayaud, 1978, 1980; $aroso et al., 1993; Takalo et al., 1995; $iscoe and Crooker, 1996; Cliver et al., 2000]. We show this variation for the years 1957-1998 in Figure 1. The diurnal UT variation is calculated by a superposed epoch analysis from the hourly Dst values. It is seen that the average diurnal UT variation for this 42-year interval is 002.5 nT. The maximum of this variation (minimum disturbance) is at 1300 UT and the minimum (maximum disturbance) at 2200 UT. There is also a secondary minimum at 000600 UT and a small secondary maximum at 000200 UT.
Mayaud [1978] showed that the phase of the diurnal UT variation is independent of season and concluded that this variation is probably due to the uneven lo- cal time distribution of the partial ring current and the nonuniform longitudinal distribution of the Dst sta- tions. Samso et al. I1993] found the minimum number of large negative values in the 3-hour Dst at 1200-1500 UT. They noted that this does not coincide with the di-
Copyright 2001 by the American Geophysical Union.
Paper number 2000JA000231 0148-0227 / 01 / 2000J A000231 $09.00.
urnal minimum of ap index. However, the diurnal vari- ation in the derivative of Dst index was found to agree with the variation of the ap index. As an alternative explanation, $iscoe and Crooker [1996] suggested that the Russell-McPherron (•MP) [Russell and McPher- r0n, 1973] effect is the main reason for the diurnal UT variation in the Dst index.
In this study we present a model for the diurnal UT variation in the Dst index. This model is based on the
uneven longitudinal location of the Dst stations and on the fact that the horizontal field at each station has
a maximum disturbance around 1800 local time (LT) when the effect of the partial ring current to the hor- izontal magnetic field and to the Dst index is largest [Cummings, 1966; $iscoe and Crooker, 1974; Mayaud, 1978]. In section 2 we discuss the diurnal variation in horizontal component at individual stations. The de- scription and predictions of the model are given in sec- tion 3. In section 4 we discuss the seasonal differences
of the diurnal variation and the long-term change of the UT diurnal variation in the Dst index. In section 5 we
give our conclusions.
2. Diurnal Variation at Dst Stations
Cummings [1966] studied the diurnal variation of magnetic field at Dst stations. He analyzed the hor- izontal field magnitude of the two Dst stations, Hon- olulu (HON) and San Juan (SJ(•), and showed that the diurnal frequency histogram of values with -AH -- HQD- H _• 100 nT is centered at 1800 LT for low- latitude stations.
10,905
10,906 TAKALO AND MURSULA: DIURNAL UT VARIATION
-15
-15.5
-16
x
.c:_ _ 16.5
-17
-17.5
i i i i i i i i ß
ß i
-18 , i , , , , , , , , 0 2 4 6 8 10 12 14 16 18 20 22 24
UT
Figure 1. The diurnal UT variation of the Dst index in 1957-1998.
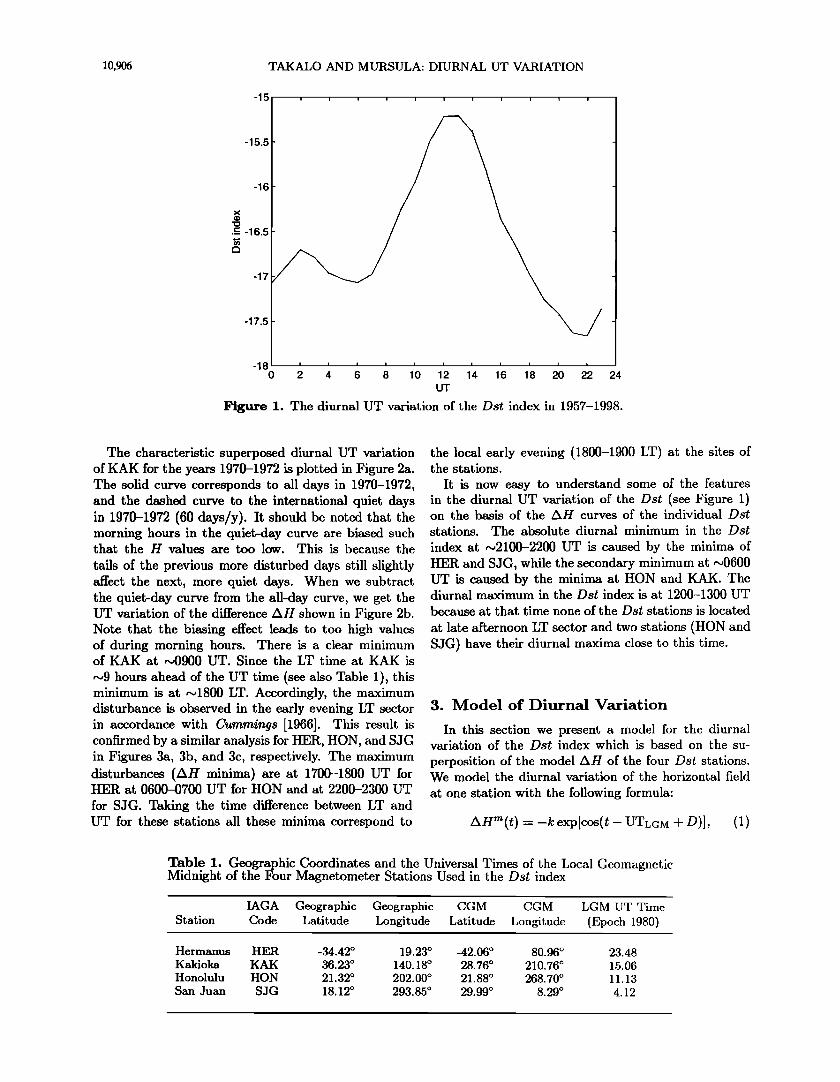
The characteristic superposed diurnal UT variation of KAK for the years 1970-1972 is plotted in Figure 2a. The solid curve corresponds to all days in 1970-1972, and the dashed curve to the international quiet days in 1970-1972 (60 days/y). It should be noted that the morning hours in the quiet-day curve are biased such that the H values are too low. This is because the
tails of the previous more disturbed days still slightly affect the next, more quiet days. When we subtract the quiet-day curve from the all-day curve, we get the UT variation of the difference AH shown in Figure 2b. Note that the biasing effect leads to too high values of during morning hours. There is a clear minimum of KAK at •0900 UT. Since the LT time at KAK is
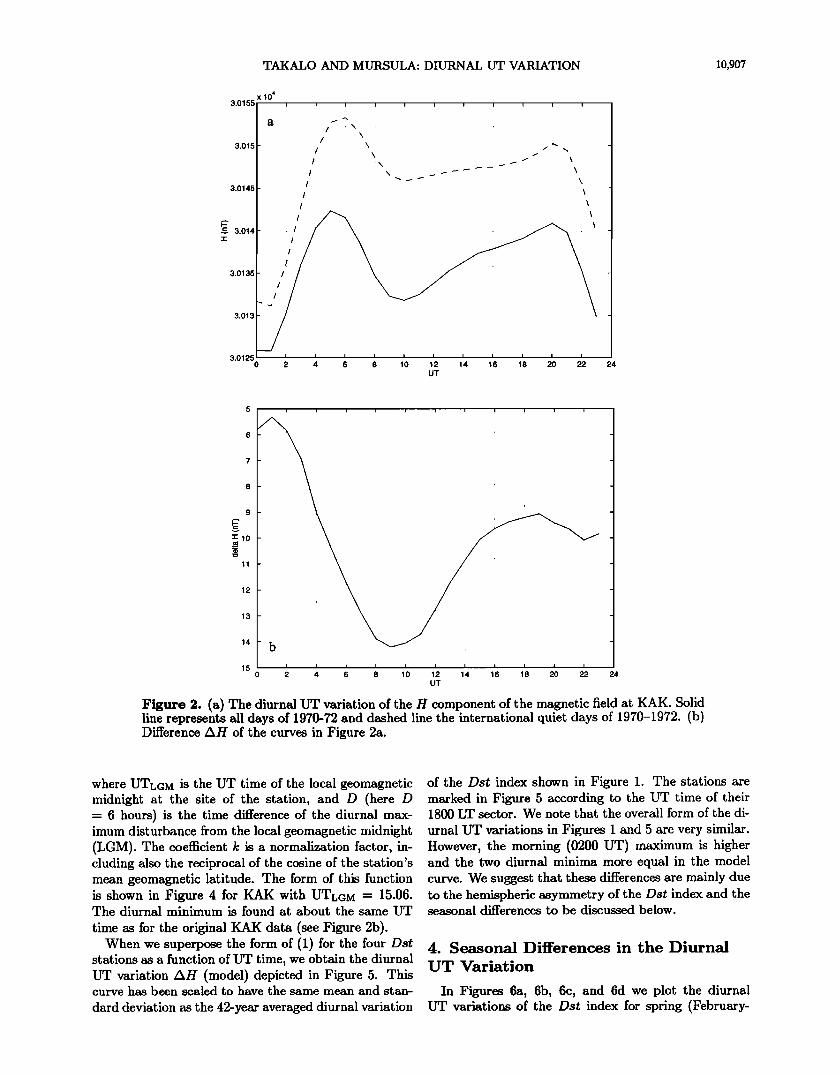
~9 hours ahead of the UT time (see also Table 1), this minimum is at ~1800 LT. Accordingly, the maximum disturbance is observed in the early evening LT sector in accordance with Cummings [1966]. This result is confirmed by a similar analysis for HER, HON, and SJG in Figures 3a, 3b, and 3c, respectively. The maximum
disturbances (AH minima) are at 1700-1800 UT for HER at 0600-0700 UT for HON and at 2200-2300 UT
for SJG. Taking the time difference between LT and UT for these stations all these minima correspond to
the local early evening (1800-1900 LT) at the sites of the stations.
It is now easy to understand some of the features in the diurnal UT variation of the Dst (see Figure 1) on the basis of the AH curves of the individual Dst stations. The absolute diurnal minimum in the Dst
index at •2100-2200 UT is caused by the minima of HER and SJG, while the secondary minimum at •0600 UT is caused by the minima at HON and KAK. The diurnal maximum in the Dst index is at 1200-1300 UT because at that time none of the Dst stations is located
at late afternoon LT sector and two stations (HON and SJG) have their diurnal maxima close to this time.
3. Model of Diurnal Variation
In this section we present a model for the diurnal variation of the Dst index which is based on the su-
perposition of the model AH of the four Dst stations. We model the diurnal variation of the horizontal field
at one station with the following formula:
AHm(t) = -k exp[cos(t- UTLGM + D)], (1)
Table 1. Geographic Coordinates and the Universal Times of the Local Geomagnetic Midnight of the Four Magnetometer Stations Used in the Dst index
IAGA Geographic Geographic CGM CGM LGM UT Time Station Code Latitude Longitude Latitude Longitude (Epoch 1980)
Hermanus HER -34.42 ø 19.23 ø -42.06 ø 80.96 ø 23.48 Kakioka KAK 36.23 ø 140.18 ø 28.76 ø 210.76 ø 15.06 Honolulu HON 21.32 ø 202.00 ø 21.88 ø 268.70 ø 11.13 San Juan SJG 18.12 ø 293.85 ø 29.99 ø 8.29 ø 4.12
TAKALO AND MURSULA: DIURNAL UT VARIATION 10,907
3.0155
3.015
3.0145
3.014
3.0135
3.013
x 104 i i i i i i i i i i i
a \
/
/
/
/
/
/
/
3.0125 0 24
/ \ \
//
UT
5 i i ' i i i i i
6 -
7 -
8 -
9 -
-r 10 - _
11 -
12 -
13 -
14 - b -
15 • • i • i 0 2 4 6 8 1•0 1• 1'4 1• 1• 20 •2 24 UT
Figure 2. (a) The diurnal UT variation of the H component of the magnetic field at KAK. Solid line represents all days of 1970-72 and dashed line the international quiet days of 1970-1972. (b) Difference AH of the curves in Figure 2a.
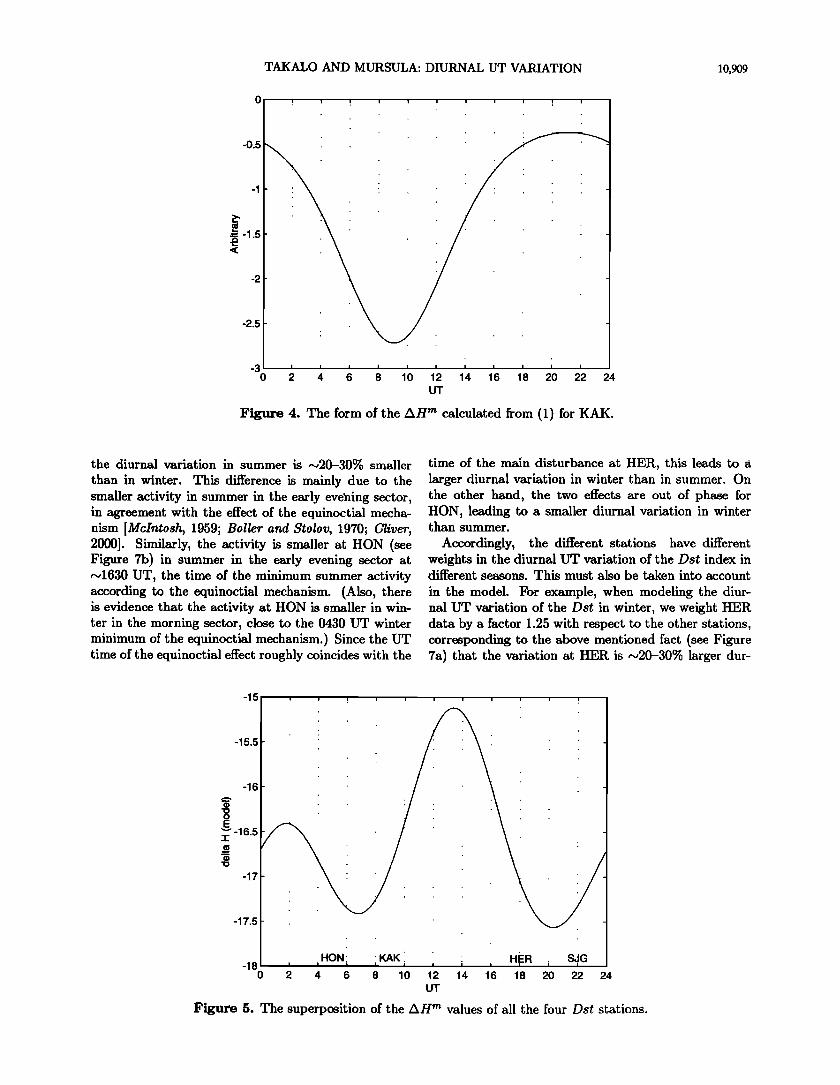
where UTLcM is the UT time of the local geomagnetic midnight at the site of the station, and D (here D = 6 hours) is the time difference of the diurnal max- imum disturbance from the local geomagnetic midnight (LGM). The coefficient k is a normalization factor, in- cluding also the reciprocal of the cosine of the station's mean geomagnetic latitude. The form of this function is shown in Figure 4 for KAK with UTt. cM = 15.06. The diurnal minimum is found at about the same UT
time as for the original KAK data (see Figure 2b). When we superpose the form of (1) for the four Dst
stations as a function of UT time, we obtain the diurnal UT variation AH (model) depicted in Figure 5. This curve has been scaled to have the same mean and stan-
dard deviation as the 42-year averaged diurnal variation
of the Dst index shown in Figure 1. The stations are marked in Figure 5 according to the UT time of their 1800 LT sector. We note that the overall form of the di-
urnal UT variations in Figures 1 and 5 are very similar. However, the morning (0200 UT) maximum is higher and the two diurnal minima more equal in the model curve. We suggest that these differences are mainly due to the hemispheric asymmetry of the Dst index and the seasonal differences to be discussed below.
4. Seasonal Differences in the Diurnal UT Variation
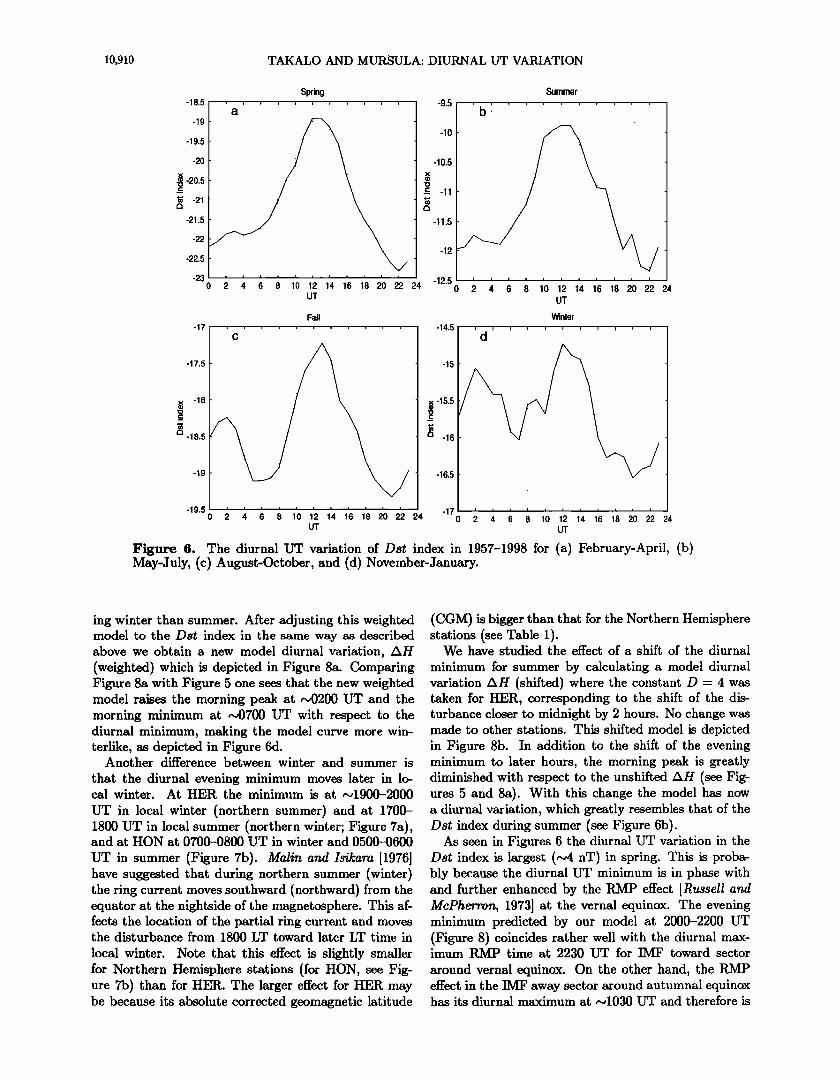
In Figures 6a, 6b, 6c, and 6d we plot the diurnal UT variations of the Dst index for spring (February-
10,908 TAKALO AND MURSULA: DIURNAL UT VARIATION
April), summer (May-July), fall (August-September), and winter (November-January) months of 1957-1998, respectively. (Thus the seasons refer to the Northern Hemisphere unless otherwise stated.) We analyze these differences with the help of the above presented model. Note first that the overall diurnal variations in all the
four seasons have roughly similar shape in agreement
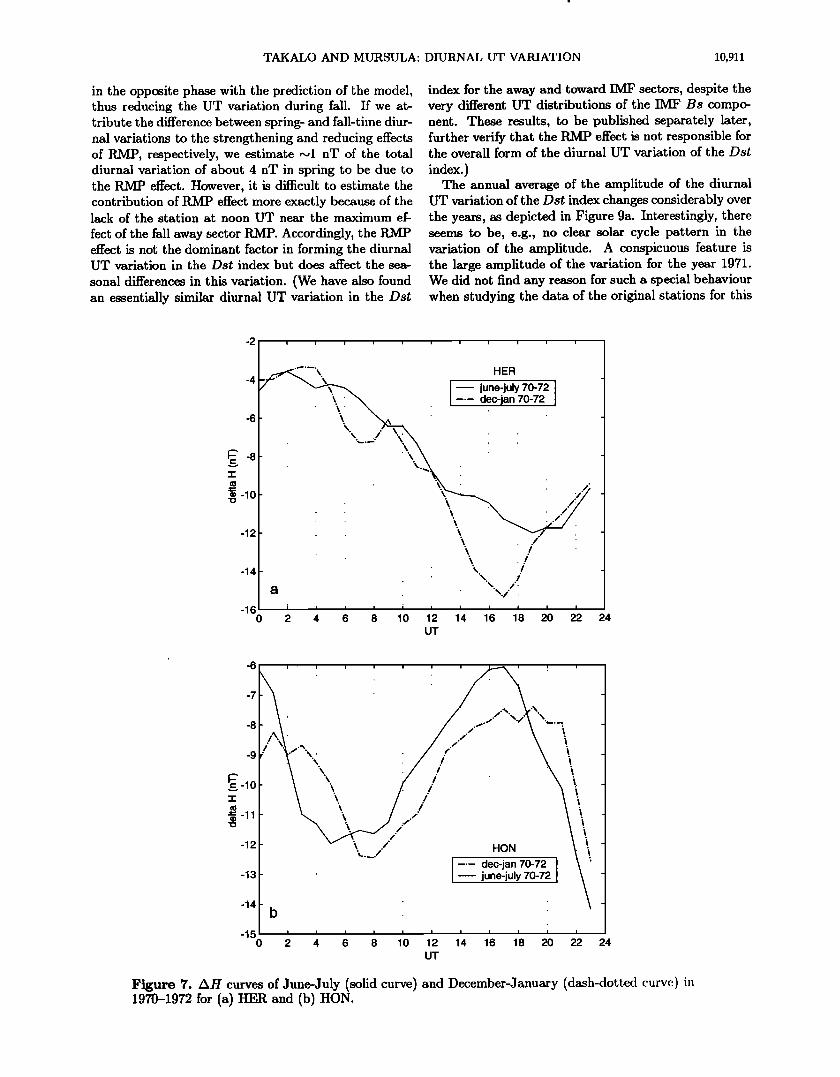
with Mayaud [1978]. However, the diurnal variation is smaller (~1.8 nT) in winter than in summer (• 2.4 nT). Summer-winter differences are also found at in- dividual stations. Figure 7a shows the diurnal varia- tion of Hermanus (HER) during the summer (June-July only, solid curve) and winter (December-January only, dash-dotted curve) for the years 1970-1972. At HER
•- 25
-o 30
- a'
HER
• i • , i i i 0 • 4 6 8 ,iO 12 1•4 ' ' 18 20 22 16
UT
11
[ [ ! i ! ] ! , !
_
_
- ,
_
- b
i i
9
0 2 4 6 I 24 UT
Figure 3. The same difference AH as in Figure 2b for (a)Hermanus (HER), (b) Honolulu HON, and (c) San Juan (SJG).
TAKALO AND MURSULA: DIURNAL UT VARIATION 10,909
! i
-0.5
-2-
-2.5
ß
ß
ß .
i i i i i i , i i i
2 4 6 8 10 12 14 16 18
UT
-3 ' • 0 20 22 24
Figure 4. The form of the AH m calculated from (1) for KAK.
the diurnal variation in summer is '•2()-30% smaller
than in winter. This difference is mainly due to the smaller activity in summer in the early evehing sector, in agreement with the effect of the equinoctial mecha- nism [Mcintosh, 1959; Boller and Stolov, 1970i Cliver, 2000]. Similarly, the activity is smaller at HON (see Figure 7b) in summer in the early evening sector at ~1630 UT, the time of the minimum summer activity according to the equinoctial mechanism. (Also, there is evidence that the activity at HON is smaller in win- ter in the morning sector, close to the 0430 UT winter minimum of the equinoctial mechanism.) Since the UT time of the equinoctial effect roughly coincides with the
time of the main disturbance at HER, this leads to a larger diurnal variation in winter than in summer. On the other hand, the two effects are out of phase for HON, leading to a smaller diurnal variation in winter than summer.
Accordingly, the different stations have different weights in the diurnal UT variation of the Dst index in different seasons. This must also be taken into account
in the model. For example, when modeling the diur- nal UT variation of the Dst in winter, we weight HER data by a factor 1.25 with respect to the other stations, corresponding to the above mentioned fact (see Figure 7a) that the variation at HER is ~20-30% larger dur-
-15
-15.5
-16
-16.5
-17
-17.5
-18 0
HON' i
'KAK I
6 8 10 12 20 22 24
UT
i
, ,, H,ER , SJG 14 16 18
Figure 5. The superposition of the AH'" values of all the four Dst stations.
10,910 TAKALO AND MURSULA: DIURNAL UT VARIATION
-18.5
-19
-19.5
-20
-20.5
-21
-21.5
-22
-22.5
-23 0
-17
-17.5
x -18
-18.5
-19
-19.5
!
Spring ! ! ! -9.5
-10
10.5
-11
11.5
-12
-12.5
Summer , ,
b
UT
Fall
c -lz..5
-15
ex -1,",.5
•3 -16
-1{;.5
-17
Winter
, ! ! • ! , , , ! , ,
d
i
UT UT
Figure õ. The diurnal UT variation of Dst index in 1957-1998 for (a) February-April, (b) May-July, (c) August-October, and (d) November-January.
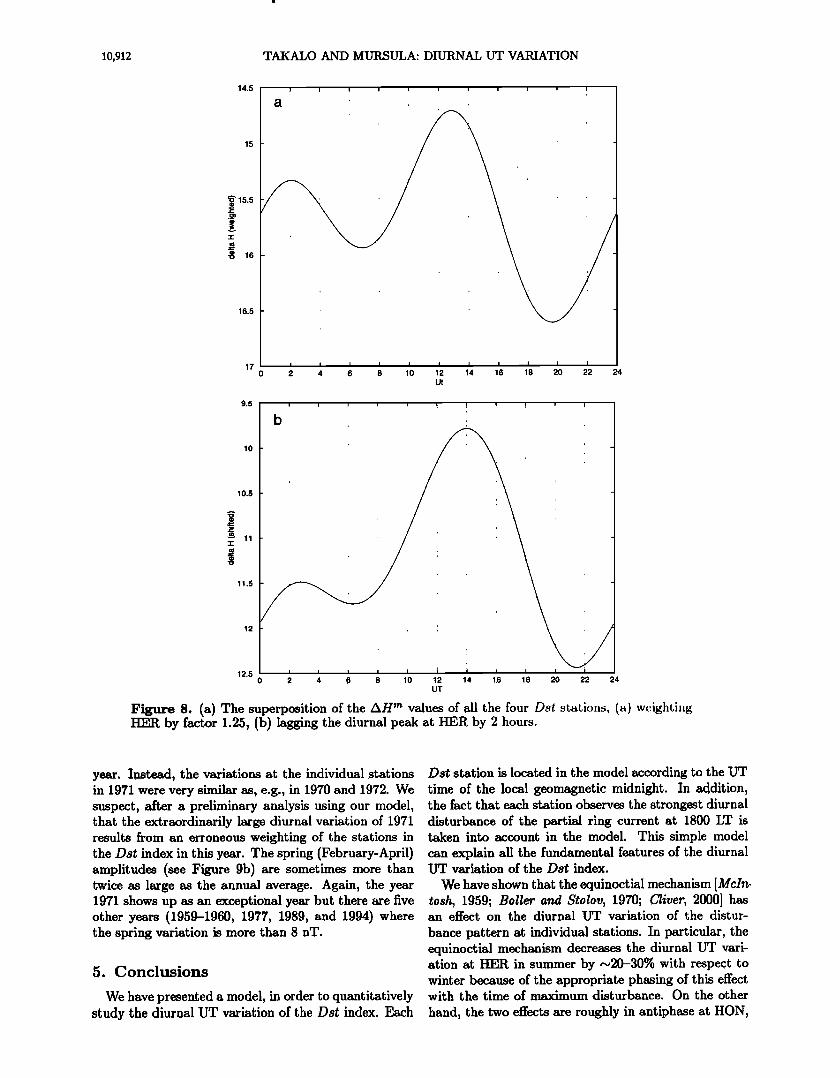
ing winter than summer. After adjusting this weighted model to the Dst index in the same way as described above we obtain a new model diurnal variation, AH (weighted) which is depicted in Figure 8a. Comparing Figure 8a with Figure 5 one sees that the new weighted model raises the morning peak at •0200 UT and the morning minimum at •d)700 UT with respect to the diurnal minimum, making the model curve more win- terlike, as depicted in Figure 6d.
Another difference between winter and summer is
that the diurnal evening minimum moves later in lo- cal winter. At HER the minimum is at •1900-2000
UT in local winter (northern summer) and at 1700- 1800 UT in local summer (northern winter; Figure 7a), and at HON at 0700-0800 UT in winter and 0500-0600
UT in summer (Figure 7b). Malin and Isikara [1976] have suggested that during northern summer (winter) the ring current moves southward (northward) from the equator at the nightside of the magnetosphere. This af- fects the location of the partial ring current and moves the disturbance from 1800 LT toward later LT time in
local winter. Note that this effect is slightly smaller for Northern Hemisphere stations (for HON, see Fig- ure 7b) than for HER. The larger effect for HER may be because its absolute corrected geomagnetic latitude
(CGM) is bigger than that for the Northern Hemisphere stations (see Table 1).
We have studied the effect of a shift of the diurnal
minimum for summer by calculating a model diurnal variation AH (shifted) where the constant D = 4 was taken for HER, corresponding to the shift of the dis- turbance closer to midnight by 2 hours. No change was made to other stations. This shifted model is depicted in Figure 8b. In addition to the shift of the evening minimum to later hours, the morning peak is greatly diminished with respect to the unshifted AH (see Fig- ures 5 and 8a). With this change the model has now a diurnal variation, which greatly resembles that of the Dst index during summer (see Figure 6b).
As seen in Figures 6 the diurnal UT variation in the Dst index is largest (•4 nT) in spring. This is proba- bly because the diurnal UT minimum is in phase with and further enhanced by the RMP effect [Russell and McPherron, 1973] at the vernal equinox. The evening minimum predicted by our model at 2000-2200 UT (Figure 8) coincides rather well with the diurnal max- imum RMP time at 2230 UT for IMF toward sector
around vernal equinox. On the other hand, the RMP effect in the IMF away sector around autumnal equinox has its diurnal maximum at •1030 UT and therefore is
TAKALO AND MURSULA: DIURNAL [IT VARIATION 10,911
in the opposite phase with the prediction of the model, thus reducing the UT variation during fall. If we at- tribute the difference between spring- and fall-time diur- nal variations to the strengthening and reducing effects of RMP, respectively, we estimate •1 nT of the total diurnal variation of about 4 nT in spring to be due to the RMP effect. However, it is difficult to estimate the contribution of RMP effect more exactly because of the lack of the station at noon UT near the maximum ef-
fect of the fall away sector RMP. Accordingly, the RMP effect is not the dominant factor in forming the diurnal UT variation in the Dst index but does affect the sea-
sonal differences in this variation. (We have also found an essentially similar diurnal UT variation in the Dst
index for the away and toward IMF sectors, despite the very different UT distributions of the IMF B s compo- nent. These results, to be published separately later, further verify that the RMP effect is not responsible for the overall form of the diurnal UT variation of the Dst
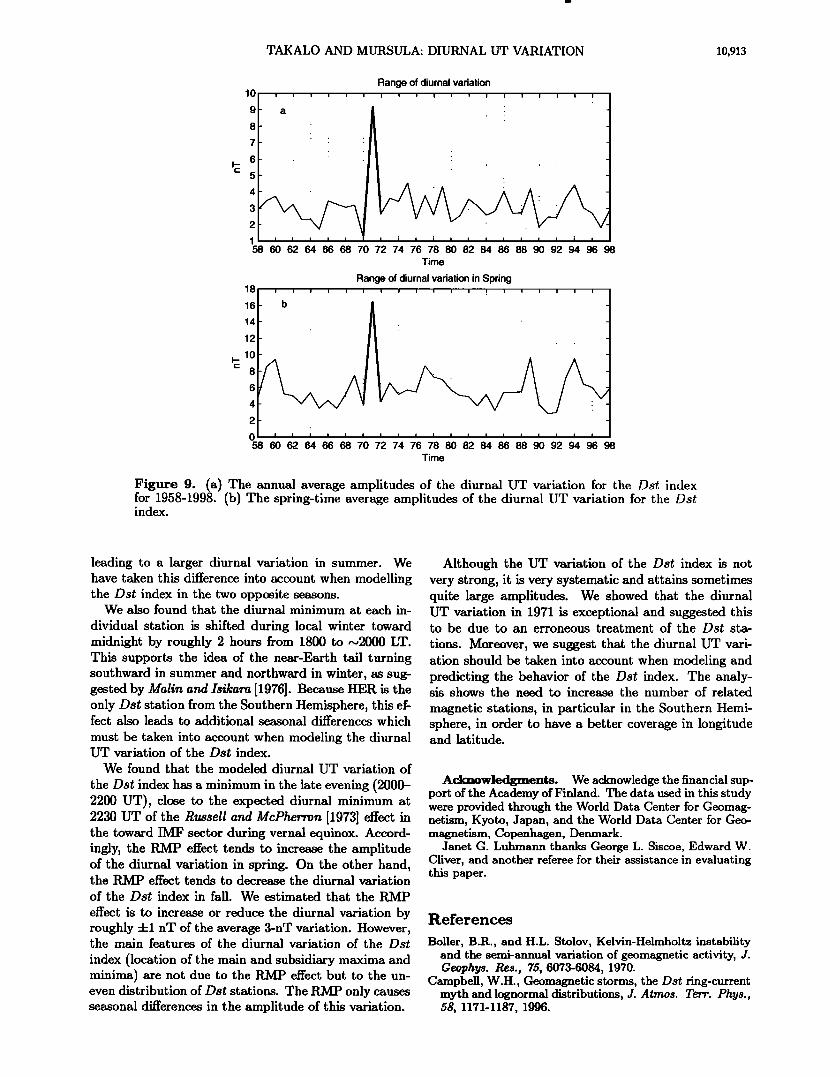
index.) The annual average of the amplitude of the diurnal
UT variation of the Dst index changes considerably over the years, as depicted in Figure 9a. Interestingly, there seems to be, e.g., no clear solar cycle pattern in the variation of the amplitude. A conspicuous feature is the large amplitude of the variation for the year 1971. We did not find any reason for such a special behaviour when studying the data of the original stations for this
-12
-14
-16 0
_•'"'-!\ : HER : -/" ' ' I - june-july 70-72 I
ß : \ : • [-.- dec-jan 70-72 I
ß ß . x '• x 'X ' ' : : :
_ : • ' . : : /.),/ ; , : vz?"""• ß . •
ß i ß 'N ' !
ß . \. ! ß . .
a '•,. ß \,? ß ß
• i i • • i i
2 4 6 8 14 16 18 20 22 i
10 12
UT
24
-6
-7
-8
-9
.•-11 -12
-13
-14
-15 0
i , i i i i ....
L.." ,/:....'"i • i/ ! ' !HONi
'-':' ' I-'- •ø-J•" 7o-72 ' . [ - june-july 70-72
i
2
I I I I I
4 6 8 10 12 14 16 18 20 22 24
UT
Figure 7. AH curves of June-July (solid curve) and December-January (dash-dotted curve) 1970-1972 for (a) HER and (b) HON.
10,912 TAKALO AND MURSULA: DIURNAL UT VARIATION
14.5
•' 15.5
._o)
'o 16
16.5
I I I I I I I ....
a ß
ut
9.5
10.5
11.5
12.5 0 2 4 6 8 10 12 14 16 18 20 22 24
UT
Figure 8. (a) The superposition of the AH m values of all the four Dst stations, (a) wcight, iz•g HER by factor 1.25, (b) lagging the diurnal peak at HER by 2 hours.
year. Instead, the variations at the individual stations in 1971 were very similar as, e.g., in 1970 and 1972. We suspect, after a preliminary analysis using our model, that the extraordinarily large diurnal variation of 1971 results from an erroneous weighting of the stations in the Dst index in this year. The spring (February-April) amplitudes (see Figure 9b) are sometimes more than twice as large as the annual average. Again, the year 1971 shows up as an exceptional year but there are five other years (1959-1960, 1977, 1989, and 1994) where the spring variation is more than 8 nT.
5. Conclusions
We have presented a model, in order to quantitatively study the diurnal UT variation of the Dst index. Each
Dst station is located in the model according to the UT time of the local geomagnetic midnight. In addition, the fact that each station observes the strongest diurnal disturbance of the partial ring current at 1800 LT is taken into account in the model. This simple model can explain all the fundamental features of the diurnal UT variation of the Dst index.
We have shown that the equinoctial mechanism [McIn. tosh, 1959; Boller and Stolov, 1970; Cliver, 2000] has an effect on the diurnal UT variation of the distur-
bance pattern at individual stations. In particular, the equinoctial mechanism decreases the diurnal UT vari- ation at HER in summer by ~20-30% with respect to winter because of the appropriate phasing of this effect with the time of maximum disturbance. On the other
hand, the two effects are roughly in antiphase at HON,
TAKALO AND MURSULA: DIURNAL UT VARIATION 10,913
Range of diurnal variation 10
9
8
7
6
5
4
3
2 ß . ,
1 ;06121 ' i I ' ' ' i;O I i I I I I ' i 58 64 66 68 70 72 74 76 78 82 84 86 88 90 92 94 96 98
Time
Range of diurnal variation in Spring
18 / • • ! ' , • ........ 16
14
12
• 10 8
6
4 t ...... 2
0 J i , i i i i i i i i i i i i i 58 60 62 64 66 68 70 72 74 76 78 80 82 84 86 88 90 92 94 96 98
Time
Figure 9. (a) The annual average amplitudes of the diurnal UT variation for the Dst index for 1958-1998. (b) The spring-time average amplitudes of the diurnal UT variation for the Dst index.
leading to a larger diurnal variation in summer. We have taken this difference into account when modelling the Dst index in the two opposite seasons.
We also found that the diurnal minimum at each in-
dividual station is shifted during local winter toward midnight by roughly 2 hours from 1800 to ~2000 LT. This supports the idea of the near-Earth tail turning southward in summer and northward in winter, as sug- gested by Malin and Isikara [1976]. Because HER is the only Dst station from the Southern Hemisphere, this ef- fect also leads to additional seasonal differences which
must be taken into account when modeling the diurnal UT variation of the Dst index.
We found that the modeled diurnal UT variation of
the Dst index has a minimum in the late evening (2000- 2200 UT), close to the expected diurnal minimum at 2230 UT of the Russell and McPherron [1973] effect in the toward IMF sector during vernal equinox. Accord- ingly, the RMP effect tends to increase the amplitude of the diurnal variation in spring. On the other hand, the RMP effect tends to decrease the diurnal variation
of the Dst index in fall. We estimated that the RMP
effect is to increase or reduce the diurnal variation by roughly :1:1 nT of the average 3-nT variation. However, the main features of the diurnal variation of the Dst
index (location of the main and subsidiary maxima and minima) are not due to the RMP effect but to the un- even distribution of Dst stations. The RMP only causes seasonal differences in the amplitude of this variation.
Although the UT variation of the Dst index is not very strong, it is very systematic and attains sometimes quite large amplitudes. We showed that the diurnal UT variation in 1971 is exceptional and suggested this to be due to an erroneous treatment of the Dst sta-
tions. Moreover, we suggest that the diurnal UT vari- ation should be taken into account when modeling and predicting the behavior of the Dst index. The analy- sis shows the need to increase the number of related
magnetic stations, in particular in the Southern Hemi- sphere, in order to have a better coverage in longitude and latitude.
Acknowled•ents. We acknowledge the financial sup- port of the Academy of Finland. The data used in this study were provided through the World Data Center for Geomag- netism, Kyoto, Japan, and the World Data Center for Geo- magnetism, Copenhagen, Denmark.
Janet G. Luhmann thanks George L. Siscoe, Edward W. Cliver, and another referee for their assistance in evaluating this paper.
References
Boiler, B.R., and H.L. Stolov, Kelvin-Helmholtz instability and the semi-annual variation of geomagnetic activity, J. Geophys. Res., 75, 6073-6084, 1970.
Campbell, W.H., Geomagnetic storms, the D st ring-current myth and lognormal distributions, J. Atmos. Terr. Phys., 58, 1171-1187, 1996.
10,914 TAKALO AND MURSULA: DIURNAL UT VARIATION
Cliver, E.W., Mountains versus valleys: Semiannual varia- tion of geomagnetic activity, J. Geophys. Res., 105, 2413- 2424, 2000.
Cummings, W.D., Asymmetric ring current and low-latitude disturbance daily variation, J. Geophys. Res., 71, 4495- 4503, 1966.
Malin, S.R.C., and A.M. Isikara, Annual variation of the geomagnetic field, Ceophys. J. R. Astron. $oc., • 7, 445- 457, 1976.
Mayaud, P.N., The annual and daily variation of the Dst index, Ceophys. J. R. Astron. $oc., 55, 193-201, 1978.
Mayaud. P.N., Derivation, Meaning and Use of Geomag- netic Indices, Geophys. Monogr. Set., vol. 22, AGU, Washington, D.C., 1980.
Mcintosh, D.H., On the annual variation of magnetic dis- turbance, Philos. Trans. R. Soc. London, Set. A, 251, 525-552, 1959.
Russell, C.T., and R.L. McPherron, Semiannual variation of geomagnetic acti•ty, J. Geophys. Res., 78, 92-108, 1973.
Saroso, S., T. Iyemori, and M. Sugiura, Universal tirne vari- ations in the ap and Dst indices and their possible cause, J. Geomagn. Geoelectr., -45,563-572, 1993.
Siscoe, G., and N. Crooker, On the partial ring current con- tribution to Dst, J. Geophys. Res., 79, 1110-1112, 1974.
Siscoe, G., and N. Crooker, Diurnal oscillation of Dst: A manifestation of the Russell-McPherron effect, J. Geo- phys. Res., 101, 24,985-24,989, 1996.
Takalo, J., R. Lohikoski, and J. Timonen, Structure function as a tool in AE and Dst time series analysis, Geophys. Res. Lett., 22, 635-638, 1995.
K. Mursula and J. Takalo, Department of Physical Sci- ences, University of Oulu, P.O. Box 3000, FIN-90014 Uni- versity of Oulu, Finland. (email: [email protected]; Jouni. [email protected])
(Received June 13, 2000; revised November 14, 2000; accepted December 5, 2000.)


