Embed Size (px)
Citation preview

INSTITUTE OF PHYSICS PUBLISHING JOURNAL OF PHYSICS: CONDENSED MATTER
J. Phys.: Condens. Matter 17 (2005) 737–753 doi:10.1088/0953-8984/17/4/016
A model for non-monotonic dose dependence ofthermoluminescence (TL)
J L Lawless1, R Chen2,5, D Lo3 and V Pagonis4
1 Redwood Scientific Incorporated, Pacifica, CA, USA2 School of Physics and Astronomy, Raymond and Beverly Sackler Faculty of Exact Sciences,Tel-Aviv University, Tel-Aviv 69978, Israel3 Physics Department, The Chinese University of Hong Kong, Hong Kong, People’s Republic ofChina4 Physics Department, McDaniel College, Westminster, MD 21157, USA
Received 5 October 2004, in final form 25 November 2004Published 14 January 2005Online at stacks.iop.org/JPhysCM/17/737
AbstractIn the applications of thermoluminescence (TL) in dosimetry and archaeologicaland geological dating, a desirable dose dependence of TL intensity is amonotonically increasing function, preferably linear. It is well known thatin many dosimetric materials, nonlinear dependence is observed. This mayinclude a superlinear dependence at low doses and/or sublinear dose dependenceat higher doses, where the TL intensity approaches saturation. In quite a numberof materials, non-monotonic dose dependence has been observed, namely, theTL intensity reached a maximum value at a certain dose and decreased at higherdoses. This effect is sometimes ascribed to ‘radiation damage’ in the literature.In the present work we show, both quasi-analytically and by using numericalsimulation, that such dose dependence may result from a simple energy levelscheme of at least one kind of trapping state and two kinds of recombinationcentres. One does not necessarily have to assume a destruction of trapping statesor recombination centres at high doses. Instead, the main concept involved isthat of competition which takes place both at the excitation stage and the read-out stage during the heating of the sample. This may explain the fact that thephenomenon in question, although very often ignored, is rather common. Casesare identified in which competition during excitation dominates, and others inwhich competition during read-out dominates.
1. Introduction
The dose dependence of thermoluminescence (TL) is usually an increasing function that,ideally, starts linearly and then goes sublinear when the TL intensity approaches a saturationvalue. For applications in dosimetry and archaeological and geological dating,one usually tries
5 Author to whom any correspondence should be addressed.
0953-8984/05/040737+17$30.00 © 2005 IOP Publishing Ltd Printed in the UK 737

738 J L Lawless et al
to exploit the linear dose range in order to determine the unknown dose imparted on the sample.In several materials, superlinear dose dependence has been reported (see e.g. chapter 4 in [1]),and it was usually explained to result from competition between transitions into trapping statesor to recombination centres, either during the excitation by irradiation or during the heatingof the sample or both. At high doses of excitation, the usually expected behaviour is that thedose dependence function goes sublinear while approaching saturation. The usual explanationfor this is that trapping states and/or recombination centres are being filled to capacity so thatfurther irradiation does not contribute to any further increase in the emitted TL.
In quite a number of publications, it is seen that for some TL peaks in different materials,the maximum TL intensity measured as a function of the excitation dose reaches a maximumand then decreases at higher doses. In some cases, the authors consider this as an unimportantfluctuation, and still term this rather unusual effect ‘saturation’. In fact, quite often the set ofmeasurements was terminated following one point of the decrease, and therefore it is hard totell to what extent this reduction can go. In other cases, however, it is seen clearly that theintensity goes down quite significantly after having reached a maximum at a certain dose.
In the present work, we present a rather general model, without assuming a radiationdamage of destruction of trapping states and/or recombination centres. This follows arecent work by Chen et al [2] in which non-monotonic behaviour was demonstrated byusing numerical simulation of the excitation and read-out stages of TL. The main elementsof the present model are the existence of (at least) one trapping state and two kinds ofrecombination centres. These seem to occur in practically any dosimetric material in use. Thecompetition over charge carriers during both excitation and heating is considered using intuitiveconsiderations, analytical derivation and more numerical simulation. Cases are identified inwhich either the competition during excitation or during heating dominates in being the reasonfor the non-monotonic dose dependence.
2. Experimental evidence
In the present section we give a brief account of the vast number of experimental results reportedin the literature. It is interesting to note that this effect of a decrease in the TL intensity at highdoses takes place in several materials including the most often used TL dosimetric materials,namely LiF and Al2O3, routinely used for dosimetry, and quartz, which is the main TL datingmaterial. First reports on the effect are found in publications from the 1960s. Cameron et al[3] give a graph (previously presented by Schulman et al, 1967, in an unpublished report)of the dose dependence of TL in LiF (TLD-100) as a function of 60Co γ -rays. They reporton a rather broad range of linear dependence followed by a superlinear range after which amaximum value and a slight decline are seen. Similar results in LiF:Mg were given by Claffyet al [4]. Crittenden et al [5] describe the effect of TL decline in LiF:Mg,Ti irradiated by x-rays.Piesch et al [6] report on the γ -ray dose dependence of LiF ribbons and LiF–Teflon dosimetersof different thicknesses, and show in some of their samples a decrease in the intensity with thedose at relatively high doses. Jain et al [7] describe a significant decrease of the TL output ofpeak V in LiF, by a factor of ∼2.5 from the maximum, and ascribe it to ‘radiation damage’, aterm which is later used by other investigators to describe the effect. They speculate that, atvery high exposures, luminescence centres aggregate to form complex centres. Their graphsshow that at very high doses, the dose-dependence curves tend to level off following a rangeof decrease in TL intensity. Kithara et al [8] also report on a quite significant decrease effectin γ -irradiated and thermal neutron irradiated LiF powder. Waligorski and Katz [9] show thatin TLD-700 (7LiF), peak 5 decreases at high doses of 60Co γ -exposure by a factor of ∼20between 103 and 105 Gy. Moscovitch and Horowitz [10] show the effect in x-ray and α-particle

Non-monotonic dose dependence of TL 739
irradiated LiF:Mg, Ti for doses above 104 Gy. Similar results are shown by Horowitz [11] forx-ray excitation. Mische and McKeever [12] report on the decline effect as of ∼103 Gy in α,γ and proton irradiated LiF samples. Piters and Bos [13] also discuss the effect in β-irradiatedLiF:Mg, Ti. The measured quantity here is the integrated area of peaks 4 + 5, which reaches amaximum at ∼20 Gy.
The first report on non-monotonic dose dependence in quartz was also given in the 1960sby Ichikawa [14]. He found that out of four peaks in γ -irradiated natural quartz, the peaktermed B1, occurring at ∼200 ◦C, reached a maximum at ∼6×10⁴ Gy and decreased at higherdoses by at least a factor of 2.5. Durrani et al [15] reported on a significant decrease of theTL response as well as the TL sensitivity at doses >107 Gy in natural Brazilian quartz. Inanother paper, Durrani et al [16] reported such a decline above 4 × 10⁴ Gy of γ -radiationinduced TL in natural quartz. David et al [17] showed the dose dependence of some TL peaksin γ -irradiated pink quartz, which revealed a decline following a maximum at 103–104 Gy.Morris and McKeever [18] describe a model of three electron traps and two hole traps in quartzwhich explains a somewhat similar effect of the residual TL (following a given bleaching) asa function of the applied dose. In a recent paper, Yazici and Topaksu [19] report on thenon-monotonic effect in ‘peak 1’ out of a series of four peaks in β-irradiated synthetic quartz.
Another material which exhibits non-monotonic behaviour is CaSO4, nominally pure ordoped with different impurities. Lakshmanan et al [20] and Srivastava and Supe [21] show adecline in the TL intensity at high γ -doses >104 Gy in CaSO4:Dy. Natarajan et al [22] reporton a decline of the peak intensity of a TL peak at 406 K following >70 h of self-irradiation inCaSO4:241Am, the excitation being equivalent to ∼400 Gy h−1 of α-particles. Seshagiri et al[23] report TL peaks at 375, 400 and 440 K in γ -irradiated CaSO4:U2+
2 . They suggest that theeffect of self-irradiation is negligible, and show that the maximum takes place at ∼4 ×10³ Gy,after which the intensity reduces by a factor of ∼2 and levels off at higher doses, reachinga constant equilibrium value. Lewandowski and Mathur [24] give an account of the TL ofγ -irradiated CaSO4, CaSO4:Dy and CaSO4:Tm. They measure the TL intensity integratedover a temperature range and get a maximum followed by a slight decline. They refer tothis situation as ‘saturation’ and do not pursue the behaviour at higher doses. Yaskolko [25]describes the TL light sum in CaSO4 excited by UV light with photon energy significantlylower than the band gap. Yaskolko presents a model of two-stage photoexcitation, which canexplain the slight decline following the maximum in this specific situation. Mathur et al [26]report on the dependence of TL in CaSO4:Dy irradiated by protons. The maximum intensity ofa TL peak at 335 ◦C occurs at ∼104 Gy, and the intensity decreases by a factor ∼7 at ∼106 Gy.For a peak at 475 ◦C, the maximum occurs at ∼105 Gy, and the following decline is by far lessdramatic.
The same effect has also been discovered in the important dosimetric material Al2O3. Asmall effect was found by Wayne Cooke et al [27] in a UV excited TL peak at 270 K. A similareffect has been reported by a number of researchers in the more sensitive Al2O3:C material. Ak-selrod et al [28] reported a decrease in the TL output of Al2O3:C thin layer detector at >15 Gyof β-irradiation. Agersap Larsen et al [29] gave an account of a similar effect of a TL peak at∼430 K in γ -irradiated Al2O3:C. An effect of the same nature though smaller was reportedfor a thermally stimulated conductivity (TSC) peak at ∼480 K. The same effect is describedby Papin et al [30] for x-ray excited Al2O3:C, where the maximum is reached at ∼10 Gy. Chi-tambo et al [31] reported a very strong effect in which the main dosimetric peak at ∼130 ◦C inα-Al2O3:C reaches a maximum at ∼100 Gy of γ -irradiation and decreases by a factor of ∼4at ∼450 Gy. Further evidence for the non-monotonic effect dose dependence has been givenby Bloom et al [32], who presented similar results of a maximum at ∼15 Gy of β-irradiation;the authors report on results of the same nature at about the same doses for optically stimulated
740 J L Lawless et al
luminescence (OSL). Yukihara et al [33] gave an account on the dose dependence of samples ofAl2O3:C from different batches. Whereas at lower β doses some superlinearity was observed,at doses of ∼30 Gy, the intensity of the 450 K peak reached a maximum and then declined athigher doses. These authors distinguish between the ‘real’ dose dependence and the sensitivitychanges which are measured as the response to a small test-dose following a relatively highdose irradiation and annealing at ∼500 ◦C. In both, the effect of reduction of the measured TLwith β-dose is reported. The authors present a model which explains the observed effects inAl2O3:C, and is based on the occurrence of F/F+ centres known to exist in this material, as wellas other traps/centres in Al2O3:C. The initial situation described is that of existing F+ centres.A number of reports are found in the literature on the non-monotonic dose dependence of otherinorganic materials. The earliest one is by Halperin and Chen [34], who gave an account of theUV excited TL in semiconducting diamonds. Whereas for the main peak at ∼250 K lower thanband-gap photon energies of the excitation light (300–400 nm) caused strong superlinear dosedependence followed by an approach to saturation, the secondary peak at ∼150 K increased lin-early, reached a maximum and decreased at higher doses. Similar non-monotonic dependenceof the same peak was found with 225 nm light excitation, which corresponds to band-to-bandphoton energy (5.5 eV), although the dose dependence of the main peak was different. Pradhanet al [35] report a similar γ -dose dependence in Li2B4O7:Mn. Jain and Mitra [36] describe arather strong decrease following the maximum of ‘peak I’ (out of four peaks) in natural andfired fluorites. Las and Stoebe [36] show the same kind of effect in UV excited MgO. Seshagiriet al [37] report on the dependence on the dose of three TL peaks in SrSO4:239Pu. In two outof the three, the TL intensity reached a maximum at ∼5×10⁴ Gy of γ -irradiation and reducedquite significantly at higher doses, reaching a constant equilibrium value.
Finally, in a small number of works, the non-monotonic dependence of TL intensity onthe excitation dose in organic materials has been described. Charlesby and Partridge [38]report on the effect starting at ∼104 Gy in γ -irradiated polyethylene. They show that themaximum intensity behaviour differs from peak to peak, and for each peak it is differentbetween the visible and UV components of the luminescence. In a later paper, Charlesbyand Partridge [39] discuss a similar effect in UV-irradiated polyethylene. Wintle [40] gives atheoretical account for the effect for this specific material and irradiation, postulating that here,indeed, one can speak about ‘radiation damage’. He assumes that ionized centres are destroyedat a rate proportional to the dose-rate, and allows for the destruction of the un-ionized butexcited centres by a separate bimolecular reaction. Further work on the effect in UV-irradiatedpolyethylene has been given by Partridge [41]. He explains the non-monotonic behaviour bya model of a double excitation mechanism followed by competition for the ejected electronsbetween shallow traps and radiation-produced alkyl radicals, with electrons in shallow trapsalso being untrapped by the incident radiation. Hama et al [42] give an account of TL inelectron beam irradiated polycarbonate. The α and β peaks are shown to reach a maximum at∼2 × 10⁴ Gy and then decrease at higher doses. The authors suggest that this indicates thatluminescence centres are destroyed by the irradiation. Pietrzak and Leszczynski [43] report onthe γ -irradiated TL in aliphatic–aromatic polyamides. They show that a maximum is reachedat ∼2.4×10⁴ Gy, and the TL intensity decreases significantly to ∼20% of the maximum valueat ∼3 × 10⁵ Gy. Vanderschueren et al [44] describe a smaller effect following a maximum inUV-irradiated polycarbonate doped with triphenil methane and xanthene dyes.
3. The model and analytical considerations
Chen et al [2] demonstrated that by using the two-trap, two-centre model and choosingappropriate sets of trapping parameters, two main kinds of non-monotonic behaviour could

Non-monotonic dose dependence of TL 741
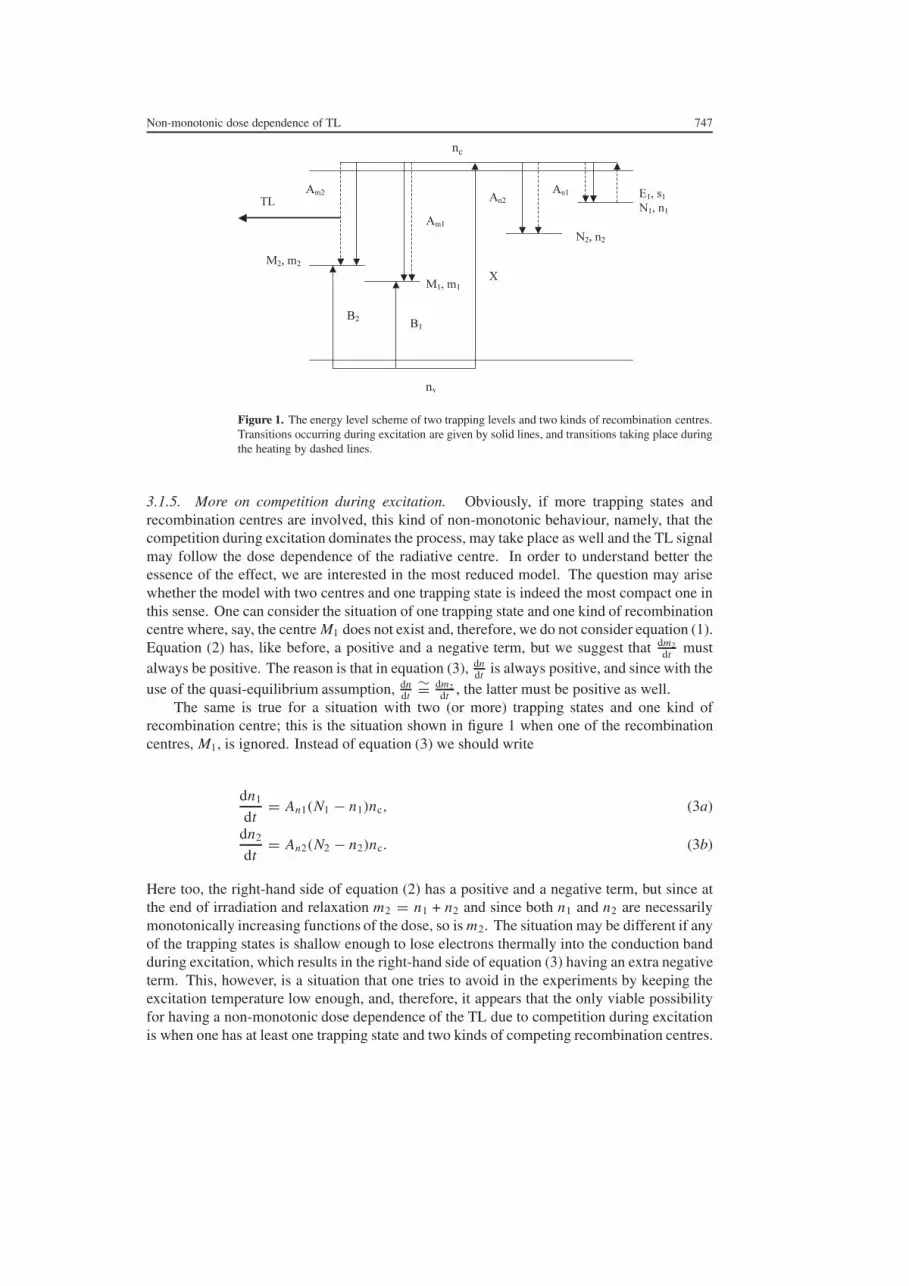
be observed in numerical simulations. One kind of behaviour is where the maximum TLincreases with the applied dose up to a maximum intensity and then declines to a certainintermediate intensity where it levels off and then remains constant. The relevant radiativerecombination centre population at the end of the irradiation, denoted below by m2, behavesin practically the same way, namely, reaching a maximum at the same dose and decreasing toa plateau level. The similarity between the two curves indicates that the TL intensity followsthe occupancy of the radiative centre. Obviously, the latter results from competition duringexcitation, and thus, the non-monotonic dose behaviour of TL results from competition duringexcitation, and competition during heating has only minor influence on the dose dependenceunder these circumstances. In the present work, we demonstrate that rather similar resultscan be reached in the system with two kinds of recombination centres, but only one kind oftrapping state. Figure 1 depicts an energy level system with two trapping states and two kindsof recombination centres. Although some of the relevant results may be reached with only onetrapping state, in other cases the effect of competition with another trapping state is also ofimportance, and therefore, the more general situation of having two trapping states is shown.Transitions taking place during the excitation are shown in the figure by solid lines, whereasthose that occur during heating by dashed lines.
3.1. Competition during excitation
3.1.1. Governing equations. The set of simultaneous differential equations governing theprocess during excitation in the case where two kinds of centres but only one trapping stateexist is
dm1
dt= −Am1m1nc + B1(M1 − m1)nv, (1)
dm2
dt= −Am2m2nc + B2(M2 − m2)nv, (2)
dn
dt= An(N − n)nc, (3)
dnc
dt= X − Am1m1nc − Am2m2nc − An(N − n)nc, (4)
dnv
dt= X − B2(M2 − m2)nv − B1(M1 − m1)nv. (5)
Here, M2 (m−3) is the concentration of the radiative hole centres with instantaneous occupancyof m2 (m−3), M1 (m−3) is the concentration of non-radiative hole centres with instantaneousoccupancy of m1 (m−3), and N (m−3) is the concentration of the electron trapping state withinstantaneous occupancy of n (m−3). nc and nv are the concentrations (m−3) of electrons andholes in the conduction and valence bands respectively. X (m−3 s−1) is the rate of production ofelectron–hole pairs, which is proportional to the excitation dose-rate, and B1 and B2 (m3 s−1)are the trapping coefficients of free holes in centres 1 and 2 respectively. Am1 and Am2
(m3 s−1) are the recombination coefficients for free electrons with holes in centres 1 and 2, andAn (m3 s−1) is the retrapping coefficient of free electrons into the trapping state N . It shouldbe noted that, in some instances, the occurrence of a competing trapping state is of importancewith regard to the non-monotonic dose dependence, in which case equation (3) is replacedby two similar equations, one with n1, N1 and An1 and the other with n2, N2 and An2 [2](see also the next subsection). If we denote the time of excitation by tD , D = XtD is the totalconcentration of electrons and holes produced, which is proportional to the total dose imparted.It should be mentioned that, at the end of the excitation, free electrons and holes remain in the

742 J L Lawless et al
conduction and valence bands, respectively. In order to simulate the experimental situationproperly, one has to consider a relaxation time following the excitation and prior to the heatingstage, during which practically all the free carriers relax and end up in the traps and centres.It should be noted that the relaxation process is important because the carriers can build upto significant levels during excitation, and relaxation is needed to provide the time necessaryfor them to decay back toward zero. The analytical model to be presented here, however, isfor slow excitation rates, X (with high doses achieved by long exposure times). Because Xis small, the free carrier concentrations are always small (see equations (12) and (13) below),and there is no need for considering the relaxation process (see also the discussion concerningthe numerical results at the end of section 4).
It is quite obvious from equation (3) that n is an increasing function of time, and thereforeof dose D, which approaches saturation, n → N , at large doses. The behaviour of the centres ismore complex. If M1 + M2 < N , then, in general, it is found that both m1 and m2 will approachsaturation at large doses, m1 → M1 and m2 → M2. For the other case of M1 + M2 > N ,however, it is generally found that neither centre becomes full regardless of dose. Further, inthis case, at large dose, it is found that the sum (m1 +m2) monotonically increases with dose andapproaches a limiting value of m1 + m2 → N . The main point in this respect, however, is thatalthough m1 +m2 is an increasing function of the dose, approaching saturation, this may not bethe case with m1 and m2 separately. Due to the rather complex competition processes takingplace during excitation, which involve the transitions of holes from the valence band into M1
and M2, the recombination of electrons with these holes and the retrapping of electrons into N ,the distribution of holes between m1 and m2 at the end of relaxation may be such that one ofthem will increase, say, superlinearly with the dose whereas the other will reach a maximumand decrease at higher doses. If the latter happens to be the radiative centre, the measured TLintensity may follow this behaviour, reach a maximum at a certain dose and then decrease athigher doses.
3.1.2. Centre kinetics: qualitative considerations. The reason that the population of a centremay decline with dose at high doses can be understood by examining the two competingprocesses which fill and deplete a centre. Considering for specificity centre m2, hole capture,represented by the term B2(M2 − m2)nv on the right-hand side of equation (2), always acts toincrease the population of m2. By contrast, electron capture, represented by the term Am2m2nc,always acts to decrease m2. The usual initial condition is that the centre is empty: m2 = 0.In this case, electron capture is initially zero and, initially, therefore m2 increases due to holecapture. Suppose the alternate case happens and, for some reason, m2 is initially large, say:m2 → M2. In this case, the hole capture becomes small as (M2−m2) → 0 and electron capturewill dominate over hole capture and m2 will consequently decrease. This is the key differencebetween centres and traps. While trap populations may approach saturation, n → N , at largedoses, centre populations may not. Electron capture by centres prevents this from happening.Furthermore, as we discuss in more detail below, it is possible, at high doses, for electroncapture to become stronger relative to hole capture and actually drive m2 down as the doseincreases.
To clarify the nature of the competition between filling the centre by hole capture anddepleting it by electron capture, we can rearrange equation (2) as follows:
dm2
dt= nc
(Am2 + B2
nv
nc
)[B2 M2
nvnc
Am2 + B2nvnc
− m2
]. (6)

Non-monotonic dose dependence of TL 743
This can be rewritten asdm2
dt= m2QS − m2
τ2(7)
where we have defined two useful abbreviations:
m2QS = B2 M2nvnc
Am2 + B2nvnc
, (8)
τ2 = 1
nc(Am2 + B2nvnc
). (9)
It is important to note that equations (6) and (7) are equivalent to equation (2). The termshave merely been rearranged to make qualitative discussion easier. For simplicity, supposethat the ratio of free holes to free electrons, nv
nc, remains constant in time during the excitation
dose. In this case, the quantity m2QS is also a constant in time, and equation (7) shows thatthe centre population m2 will asymptotically approach the constant quantity m2QS . Note thatthis conclusion is independent of the initial condition: it does not matter whether the centre isinitially empty, m2 = 0, or initially full, m2 = M2. In either case, equation (7) shows that, astime progresses, m2 will approach m2QS . This approach occurs over the timescale τ2.
In general, as excitation progresses, the ratio nvnc
is not constant. Suppose nvnc
happens toincrease with time as the excitation progresses. From equation (8), it follows that m2QS willalso be increasing with time. Inspection of equation (7) leads to the conclusion that at longtimes (high doses), m2 will also increase. In the usual case with centre m2 initially empty,m2 = 0, m2 will increase over the entire excitation period from beginning to end as long as nv
nc
(and hence m2QS) is increasing.An increase in the ratio nv
ncmeans that free holes are becoming more plentiful relative to
free electrons. This means that hole capture, B2(M2 − m2)nv, which attempts to increase m2,becomes stronger relative to electron capture, Am2m2nc, which attempts to decrease m2. Thusit is not surprising that an increasing nv
ncdrives m2 to increase.
The opposite case, with nvnc
decreasing with time (dose), is far more interesting here. Inthe usual case with m2 initially empty, equation (7) shows that m2 will initially increase. Withnvnc
decreasing with time, m2QS will decrease while m2 is increasing until these two meet.
At the instant that m2QS drops to the level of m2, m2 stops increasing and dm2dt = 0, as per
equation (7). If m2QS continues to decrease, it will drop below the value of m2, and equation (7)shows that m2 will then start dropping. This is just the effect that is of interest to explain theexcitation-driven form of the non-monotonic dose effect. A decreasing ratio nv
ncmeans that free
electrons are becoming more plentiful relative to free holes, and this increases the importanceof electron capture relative to hole capture. Electron capture decreases m2, and this is whatmakes possible a decreasing m2 at high doses.
If m2 is starting from the usual initially empty state, m2 = 0, it follows from the abovediscussion that two conditions are necessary for m2 to decrease with increasing excitation time(dose). They are:
(1) The excitation must last long enough that m2 grows to equal m2QS . This likely takes anexcitation time of at least the order of τ2.
(2) The ratio nvnc
continues to decrease after the instant of time when m2 = m2QS .
Unless specified otherwise, the following discussion will assume the usual initial condition ofm2 = 0.
The above conclusions raise the immediate question: when can we expect nvnc
to decreasewith increasing dose? A simple answer that applies to the case of most interest to us will bederived in the next subsection.

744 J L Lawless et al
3.1.3. Necessary condition for excitation-driven decline in m2. The discussion above foundtwo necessary conditions for the centre population m2 to decline at high dose, which can causean excitation-driven non-monotonic effect. In this subsection, we reduce the second conditionto a simple quantitative form for the case of most interest to us. As discussed in a previoussection, for a two-centre problem, m1 + m2 = n is strictly increasing with time (or dose). Ifm2 � m1, then m2 will likely have to increase so that the sum m1 + m2 is increasing. Since weare studying the non-monotonic effect, this case would not be interesting. So, let us considerthe case m2 � m1. We can reach this case by assuming M2 and its associated rate constants, B2
and Am2, are small so that M2 � M1, Am2m2 � Am1m1, and B2(M2 − m2) � B1(M1 − m1).Under this assumption of small m2, the conservation conditions for free electrons, equation (4),and free holes, equation (5), become
dnc
dt= X − Am1m1nc − An(N − n)nc, (10)
dnv
dt= X − B1(M1 − m1)nv. (11)
For slow enough excitation, the usual quasi-steady assumption applies. This can be statedas |dnc/dt| � nc/τc and |dnv/dt| � nv/τv, where τc = 1/(Am1m1 + An(N − n)) andτv = 1/(B1(M1 − m1)). Equations (10) and (11) yield
nc = X
Am1m1 + An(N − n), (12)
nv = X
B1(M1 − m1). (13)
It follows that the ratio of interest isnv
nc= Am1m1 + An(N − n)
B1(M1 − m1). (14)
For the case m2 � m1, it follows from conservation of charge that n ∼= m1, so
nv
nc= Am1n + An(N − n)
B1(M1 − n), (15)
or, after slight rearrangement,
nv
nc= An N
B1 M1
1 − (1 − Am1An
) nN
1 − NM1
nN
. (16)
The only variable with time in the above equation is n, and n always increases with dose. Thus,it is clear from equation (16) that the ratio nv
ncwill only decrease with increasing dose if
1 − Am1
An>
N
M1, (17)
orAm1
An+
N
M1< 1. (18)
If the parameters of the problem satisfy equation (18), then it is possible for m2 to decrease withdose, providing a non-monotonic effect. If equation (18) is not satisfied, then nv
ncwill increase
with dose and the excitation-driven non-monotonic effect will not occur. This discussionapplies to the case of m2 � m1 with the initial condition m2 = 0.
Equation (18) can be provided with an intuitive interpretation. Equation (18) requiresthat Am1/An < 1. Referring back to the conservation of free electrons, equation (4), this

Non-monotonic dose dependence of TL 745
means that, as n increases, and remembering n ≈ m1, the drop in the free electron capturecoefficient by the trap, An(N − n), is stronger than the increase in electron capture coefficientby the centre, Am1m1. Thus, as the dose increases, the free electron density, nc, increases asindicated by equation (13). Equation (18) further requires that N/M1 < 1. This means that,with increasing dose, the electron trap, n, approaches saturation faster than the recombinationcentre, m1. This means that nc increases with dose faster than nv increases. The result isa declining ratio nv
nc, which means that the small centre m2 is depopulated due to a relative
increase in electron capture over hole capture.The model above is for the excitation stage. Because this model assumed slow excitation
(X small), the free carrier concentrations, nc and nv, remain small throughout the excitationstage (see equations (12) and (13)). A consequence of this is that the analytical model has noneed to consider a relaxation stage. In contrast, our numerical solutions are capable of solvingproblems with rapid excitation (large X), which leave significant populations of free carriersat the end of excitation, necessitating a relaxation stage. To verify the analytical model and thecomputer codes, numerical solutions were performed for slow excitation, and the numericaland analytical results were found to be in good agreement.
The above considerations showed that the excitation-driven non-monotonic effect occurswhen the non-radiative centre is stronger than the radiative centre. This indicates that this typeof non-monotonic dose dependence only occurs in TL materials with low radiative efficiency.Many TL materials are quite inefficient in absolute terms, as can be seen in a review paper byBos [45]. Here, efficiencies of 0.03%–0.04% are reported for LiF:Mg, Ti (TLD-100), 0.44%for CaF2:Tm, 0.84% for Al2O3:C and values in the same range for other dosimetric materials.It can be expected that in natural materials like quartz, the absolute efficiencies are even lower.
In sum, we have examined the conditions required to see a non-monotonic effect in theradiative centre population, m2, in a two-centre system. If the radiative centre is the dominantcentre, i.e. m2 � m1, there can be no significant non-monotonic effect. In the oppositecase, m2 � m1 as detailed above, a necessary requirement to see the non-monotonic effectis equation (18). This reflects the conditions needed for electron capture by m2 to dominateover hole capture, resulting in a net decrease in m2 with increasing dose. In other words, thebehaviour of the radiative centre m2 is due to competition between free electron capture by m2
and free hole capture by m2. m2 can decrease with increasing dose if the ratio nvnc
decreases sothat electron capture becomes stronger relative to hole capture. Equation (18) agrees with thenumerical solution for two centres and one trap presented later.
As an additional note, several of the experimental results showed that, as the dose increased,a maximum intensity was observed followed by a decline and then a levelling off of intensity.This is consistent with equations (16) and (8), which show that as saturation is approached,n → N , the ratio nv
ncapproaches a constant and therefore m2 should asymptotically approach
a constant m2QS .
3.1.4. Bounding the decline in m2. As we have discussed, there are two types of non-monotonic effect: one due to competition during excitation and one due to competition duringheating. A distinctive feature is that the intensity levels off at high doses for the competition-during-excitation effect but generally not for the competition-during-heating effect. We willexamine here how much of a decline can be expected for the competition-during-excitationeffect. For small M2, the behaviour of m2 is described by equation (7): we have previouslyfound that m2QS changes monotonically as time (or dose) increases and that the excitation-driven non-monotonic effect only occurs if m2QS is decreasing. For the decreasing case, wecan conclude:
746 J L Lawless et al
(1) The peak in m2 occurs at the time t when m2 = m2QS . Therefore, the maximum value ofm2 is less than the initial (maximum) value of m2QS .
(2) If a maximum in m2 occurs, then, as per equation (7), after the maximum, m2 will alwaysbe greater than m2QS . So, the minimum value of m2 after the peak will always be greaterthan the final (minimum) value of m2QS. From the above two considerations, the maximumpossible fractional drop in m2 is (m2QS)final/(m2QS)initial. Thus, we can bind the drop inm2 by
1 � (m2)min
(m2)peak� (m2QS)final
(m2QS)initial. (19)
To quantify the drop in m2QS , remember the definition of m2QS in equation (8) and the previousresult for nv
ncin equation (16). The initial value of m2QS which, if m2QS is declining, is also the
maximum is found by setting n = 0 in equation (16) and substituting into equation (8). Theresult is
(m2QS)initial = M2
1 + Am2 B1 M1An B2 N
. (20)
To find the final value of m2QS , we need the final value of n. Since our model requires thatN < M1, n will approach N at high dose, and the final value of m2QS is found to be
(m2QS)final = M2
1 + Am2 B1(M1−N)
Am1 B2 N
. (21)
Substituting equations (20) and (21) into (19) gives us our bound on the drop in m2:
(m2)min
(m2)peak�
[1 +
(1 − Am1
An− N
M1
)An Am2 B1 M1
Am1 Am2 B1M1 + An Am1 B2 N
]−1
, (22)
or, equivalently,
(m2)min
(m2)peak�
[1 +
1 − Am1An
− NM1
Am1An
+ Am1 B2 NB1 Am2 M1
]−1
. (23)
Note that the sign of the numerator of the fraction inside the square brackets is determined byequation (18). If equation (18) is satisfied, the numerator is positive and equation (23) will bebetween 0 and 1, as it should be if m2 is declining.
An interesting question is how much of a decline in m2 is possible. Examination ofequation (23) shows that conditions for which Am1/An and (N/M1) and (Am1/B1)(B2/Am2)
are all much smaller than 1 will lead to large declines. If all three are small, then equation (23)can be approximated by
(m2)min
(m2)peak� max
(Am1
An,
Am1 B2 N
B1 Am2 M1
). (24)
The reader may find equation (24) to be an aid in understanding the bounds on large declines.For quantitative work, equation (23) is both more accurate and more general.
Note the rate constants for m2 enter into equation (23) only through the ratio B2/Am2.This is because m2QS depends only on this ratio, and equation (23) was derived from m2QS .The magnitudes of B2 and Am2 do affect the timescale τ2. Keeping their ratio fixed, largervalues of B2 and Am2 lead to shorter times τ2. If τ2 is short, then m2 more closely followsm2QS and equation (23) approaches an equality. Again holding the ratio constant, small valuesof B2 and Am2 lead to long τ2, and for long enough τ2, m2 will not decline at all.
Non-monotonic dose dependence of TL 747
c
Figure 1. The energy level scheme of two trapping levels and two kinds of recombination centres.Transitions occurring during excitation are given by solid lines, and transitions taking place duringthe heating by dashed lines.
3.1.5. More on competition during excitation. Obviously, if more trapping states andrecombination centres are involved, this kind of non-monotonic behaviour, namely, that thecompetition during excitation dominates the process, may take place as well and the TL signalmay follow the dose dependence of the radiative centre. In order to understand better theessence of the effect, we are interested in the most reduced model. The question may arisewhether the model with two centres and one trapping state is indeed the most compact one inthis sense. One can consider the situation of one trapping state and one kind of recombinationcentre where, say, the centre M1 does not exist and, therefore, we do not consider equation (1).Equation (2) has, like before, a positive and a negative term, but we suggest that dm2
dt mustalways be positive. The reason is that in equation (3), dn
dt is always positive, and since with theuse of the quasi-equilibrium assumption, dn
dt∼= dm2
dt , the latter must be positive as well.The same is true for a situation with two (or more) trapping states and one kind of
recombination centre; this is the situation shown in figure 1 when one of the recombinationcentres, M1, is ignored. Instead of equation (3) we should write
dn1
dt= An1(N1 − n1)nc, (3a)
dn2
dt= An2(N2 − n2)nc. (3b)
Here too, the right-hand side of equation (2) has a positive and a negative term, but since atthe end of irradiation and relaxation m2 = n1 + n2 and since both n1 and n2 are necessarilymonotonically increasing functions of the dose, so is m2. The situation may be different if anyof the trapping states is shallow enough to lose electrons thermally into the conduction bandduring excitation, which results in the right-hand side of equation (3) having an extra negativeterm. This, however, is a situation that one tries to avoid in the experiments by keeping theexcitation temperature low enough, and, therefore, it appears that the only viable possibilityfor having a non-monotonic dose dependence of the TL due to competition during excitationis when one has at least one trapping state and two kinds of competing recombination centres.

748 J L Lawless et al
3.2. Competition during heating
We have concentrated in the previous subsections on cases in which the dependence of theoccupancy of the radiative centre following excitation and prior to the read-out stage duringheating was non-monotonic, and suggested that the TL dependence may follow, more or less,the same pattern. As shown by Chen et al [2], the non-monotonic dose behaviour can alsobe observed in situations where all the relevant occupancy functions n1, n2, m1 and m2 areincreasing functions of the dose. The general idea is that if in the relevant dose range theoccupancy of the non-radiative centre increases with the dose faster than that of the radiativeone, the measured TL signal may be reaching a maximum and then decrease due to competitionduring heating. We will discuss later the question of whether all four levels shown in figure 1are necessary to yield the non-monotonic dose dependence of TL. Let us write, however, thesimultaneous differential equations governing the flow of carriers during heating:
dn1
dt= −s1n1 exp(−E1/kT ) + An1(N1 − n1)nc, (25)
dn2
dt= An2(N2 − n2)nc, (26)
dm1
dt= −Am1m1nc, (27)
dm2
dt= −Am2m2nc, (28)
dn1
dt+
dn2
dt+
dnc
dt= dm1
dt+
dm2
dt. (29)
In principle, the right-hand side of equation (26) should include the term−s2n2 exp(−E2/kT ),but it is assumed that the trap is deep enough not to be able to release electrons in the relevanttemperature range. We have to specify the heating function which we conventionally chooseto be linear, namely, T = T0 + βt , where β is the constant heating rate. The TL intensity isassociated with the recombination into m2, therefore the intensity I (T ) is
I (T ) = Am2m2nc. (30)
The set of equations (25)–(29) obviously includes all the competing processes occurringduring heating. The magnitude nc couples all these equations, and since it appears to be ratherdifficult to predict analytically its time dependence (or temperature dependence), it is very hardto give an intuitive explanation to the dose dependence associated with the competition duringheating. In the next section, we give some examples of simulations of the non-monotonic dosedependence dominated by competition during heating. As opposed to the non-monotonicbehaviour discussed in the previous subsection, dominated by competition during excitation,here the occupancy of the luminescence centre at the end of irradiation is a monotonicallyincreasing function of the dose. The non-monotonic dose dependence of TL is ascribed hereto the increasing competition of the non-radiative centre m1 during heating, which must beassociated with m1 being a much faster increasing function of the dose than m2, the radiativecentre. As shown below, we record in the simulation the TL maximum intensity as well asthe values of m2 and m2/m1, all as a function of the excitation dose. Generally speaking, wefound two kinds of behaviour that lead to non-monotonicity related to the competition duringthe heating stage. We found sets of parameters that yielded an increasing m2 with dose anda curve of m2/m1, which had a peak shape, with the function of TL versus dose reaching amaximum at about the same simulated dose. We also found cases where m2(D) was again anincreasing function whereas m2/m1 was a decreasing function of the dose. The maximum TL

Non-monotonic dose dependence of TL 749
as a function of the dose displayed a peak shape, which resulted from the combined effect of theincrease of m2 and the decrease of m2/m1, which in other words means that m1 is increasingwith the dose significantly faster than m2. An important point to mention is that, as opposedto the non-monotonic dose dependence dominated by competition during excitation, we couldnot find appropriate sets of parameters that yielded non-monotonic dose dependence due tocompetition during heating in three-level systems (two traps and one centre or two centres andone trap).
In fact, for the case of one trap and two centres, this can be explained as follows. Assume,as is conventional, that all levels are empty before excitation,namely, n = m1 = m2 = 0. Afterexcitation and relaxation, the levels will have nonzero populations subject to the requirementof conservation of charge, n = m1 = m2. After heating, the trap is emptied, i.e., n = 0,and due to conservation of charge, both centres will also be empty again. Thus, m1 electronswill have non-radiatively recombined while m2 electrons will have radiatively recombined.The integrated intensity is thus m2, where m2 refers here to the population of m2 followingradiation and relaxation and before heating. The conclusion is that, for one-trap systems withall levels initially empty, the intensity is determined entirely by the excitation process, and nocompetition-during-heating effect is possible. We do not have a similar proof for the case oftwo trapping states and one kind of recombination centre. Therefore, at present, we cannotprove or refute the assertion that, for the occurrence of non-monotonicbehaviour, the minimumrequirement is a system with two traps and two kinds of recombination centres, although ourpresent results indicate that this is the case. The question of whether this kind of non-monotonicdose dependence is possible in a three-level system appears to be of only theoretical significancefor two reasons. One is that most of the systems used for TL measurements include severaltrapping states and recombination centres. The other reason is that, as explained above, non-monotonic dose dependence can be seen in a three-level system (one trap and two centres) dueto competition during excitation.
4. Numerical results
In order to get the numerical results, sets of trapping parameters have been chosen, and therelevant sets of equations solved numerically. The Matlab odes23 solver has been used aswell as the Mathematica solver; the results reached by these parallel models were in excellentagreement. For the case of one trap and two centres, equations (1)–(5) were first solved for acertain value of the dose-rate X and for a certain length of the excitation time tD , which togetherdetermine the dose D = XtD . (As explained above, X and D are not really the dose-rate andthe dose, but are proportional to these quantities.) The solution of the same set of equations,but with X = 0, is continued for a further period of relaxation time. Finally, the coupledequations for the heating stage, (25) and (27)–(29) were solved, and along with equation (30)gave the TL intensity as a function of time and, through the heating function, of temperature.In the case of two trapping states, equation (3) is replaced by equations (3a) and (3b) in thefirst stages of excitation and relaxation. For the read-out stage, equations (25)–(29) are solved,and again, equation (30) gives the TL intensity.
In figure 2, an example of the dose dependence of TL and the occupancy of the radiativecentre in a situation where competition during excitation causes the non-monotonic dosedependence is shown within the framework of a model with one trapping level and two kinds ofrecombination centres. The parameters chosen are: M1 = 3×10²¹ m−3; M2 = 1×10¹⁸ m−3;Am1 = 1 × 10⁻¹⁷ m3 s−1; Am2 = 1 × 10⁻¹⁶ m3 s−1; An = 3 × 10⁻¹⁷ m3 s−1; E = 1.0 eV;s = 1 × 10¹² s−1; N = 1 × 10²¹ m−3; B1 = 1.5 × 10⁻¹⁷ m3 s−1; B2 = 10−17 m3 s−1. Theheating rate for all the simulated curves was β = 1 ◦C s−1. The results show an increase of

750 J L Lawless et al
Figure 2. Simulated dose dependence of the maximum TL (solid curve), and the radiative centre,m2 (dotted curve), in a system with one trapping state and two kinds of recombination centres,when competition during excitation dominates. The relevant set of parameters is given in the text.
the TL maximum (solid curve) with the dose up to a maximum at a ‘dose’ of ∼7 × 10²⁰ m−3,followed by a decrease of ∼35%, after which the maximum TL intensity levels off at higherdoses. This behaviour is very similar to experimental results reported in some materials(see e.g. [7]). Similar behaviour is seen in the plot of m2, the radiative centre occupancyat the end of the relaxation period as a function of the dose (dotted curve). It is noted thatthese parameters satisfy equation (18), which was shown to be a necessary condition for non-monotonic dependence of TL.
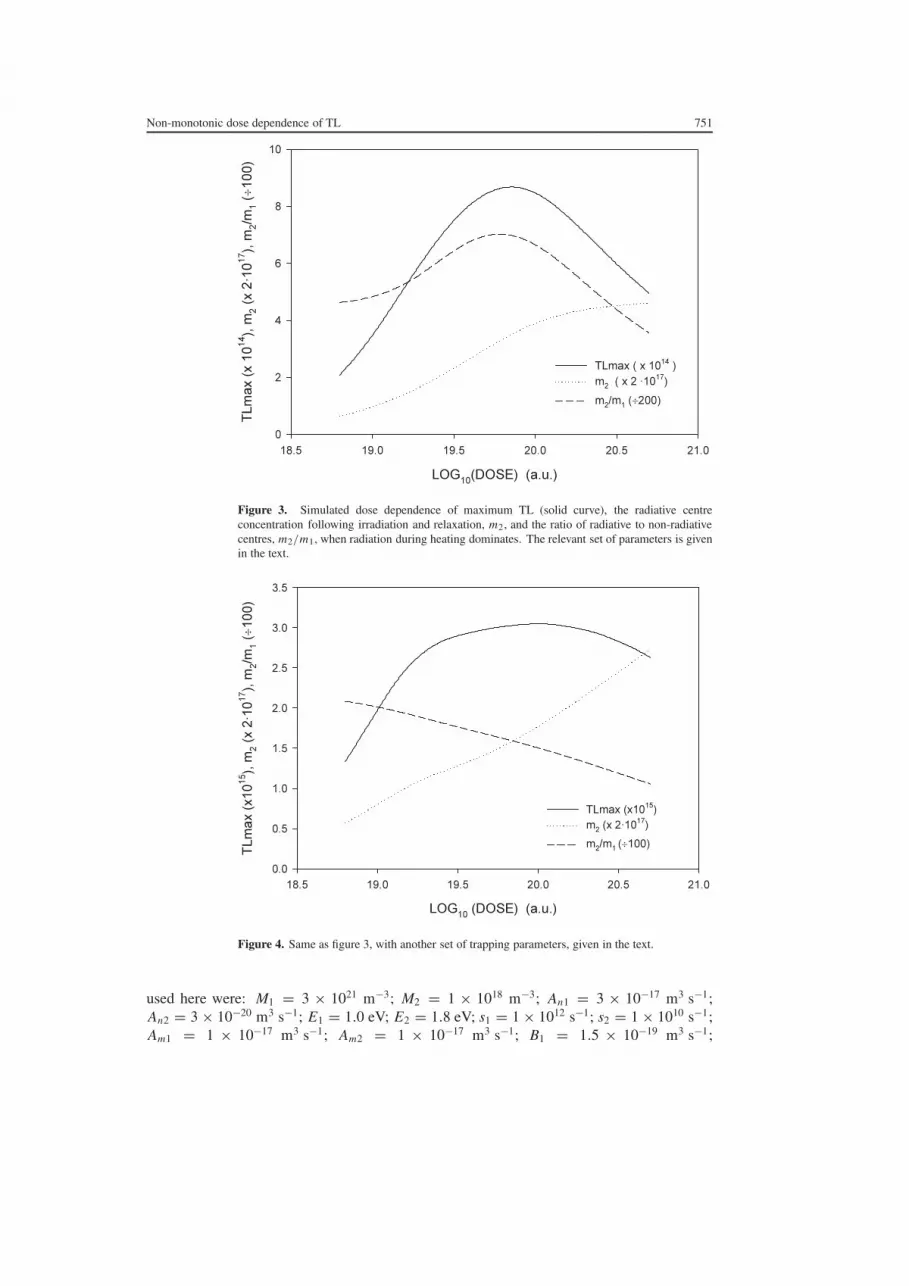
Two examples of non-monotonic dose dependence governed mainly by competition duringheating are also shown. Here, the model involves two electron-trapping states and two kindsof recombination centres as shown in figure 1. The trapping parameters chosen for figure 3are: M1 = 3 × 10²¹ m−3; M2 = 1 × 10¹⁸ m−3; An1 = 3 × 10⁻²⁰ m3 s−1; E1 = 1.0 eV;An2 = 3 × 10⁻¹⁷ m3 s−1, E2 = 1.8 eV; s1 = 1 × 10¹² s−1; s2 = 1 × 10¹⁰ s−1; Am1 =1×10⁻¹⁷ m3 s−1; Am2 = 1×10⁻¹⁸ m3 s−1; B1 = 1.5×10⁻¹⁹ m3 s−1; B2 = 1×10⁻¹⁷ m3 s−1;N1 = 1×10¹⁹ m−3; N2 = 1×10²¹ m−3. The solid curve shows the dependence of the TL signal(defined as the maximum intensity) on the excitation dose. The curve reaches a maximum anddecreases at higher doses. As opposed to the previous case, this does not reflect the behaviourof the occupancy of the radiative centre m2 shown by the dotted curve; this curve is seen to be anincreasing function of the dose. However, as pointed out above, the non-radiative competitor,m1, grows faster with the dose, and its effect seems to be the reason for the non-monotonicdosedependence of the TL signal. The dependence of the ratio m2/m1 is depicted by the dashedcurve, which reaches a maximum and declines at higher doses. The TL dose dependence curvehas a non-monotonic peak shape, the maximum of which occurs at a somewhat higher dosethan that of the m2/m1 curve.
Yet another kind of non-monotonic dose dependence is shown in figure 4. Here, too, themodel includes two trapping states and two kinds of recombination centres. The parameters
Non-monotonic dose dependence of TL 751
Figure 3. Simulated dose dependence of maximum TL (solid curve), the radiative centreconcentration following irradiation and relaxation, m2, and the ratio of radiative to non-radiativecentres, m2/m1, when radiation during heating dominates. The relevant set of parameters is givenin the text.
Figure 4. Same as figure 3, with another set of trapping parameters, given in the text.
used here were: M1 = 3 × 10²¹ m−3; M2 = 1 × 10¹⁸ m−3; An1 = 3 × 10⁻¹⁷ m3 s−1;An2 = 3 × 10⁻²⁰ m3 s−1; E1 = 1.0 eV; E2 = 1.8 eV; s1 = 1 × 10¹² s−1; s2 = 1 × 10¹⁰ s−1;Am1 = 1 × 10⁻¹⁷ m3 s−1; Am2 = 1 × 10⁻¹⁷ m3 s−1; B1 = 1.5 × 10⁻¹⁹ m3 s−1;

752 J L Lawless et al
B2 = 1 × 10⁻¹⁷ m3 s−1; N1 = 1 × 10¹⁹ m−3; N2 = 1 × 10²¹ m−3. In this case, m2 isa monotonically increasing function of the applied dose. The ratio of the occupancies of theradiative to non-radiative centres following excitation, m2/m1, is a continuously decreasingfunction. The TL signal exhibits a broad maximum, which appears to result from the combinedeffect of the increasing function of the concentration of the radiative centre, m2, and thedecreasing function m2/m1. In other words, the peak shape of the TL signal results herefrom the fact that, although the radiative centre population m2 increases with the dose, thenon-radiative competing centre m1 decreases at a faster rate, and the combination of thesebehaviours results in the non-monotonic dose dependence.
As explained above, the contribution of the relaxation period to the final results is ofimportance only for large values of the dose-rate X . In order to check the size of the effect inthe simulations shown in figures 2–4, we have checked the contribution of this period to thevalues of the relevant concentrations n1, n2, m1, and m2. With the given sets of parameters,the changes were of the order of 0.001%–0.1%, which can be considered negligible as far asthe conclusions are concerned. Of course, with different sets of parameters, and, in particular,if X is very large, the effect of the relaxation time cannot be ignored.
5. Conclusion
In the present work, we have presented a model which can explain the quite common effect ofnon-monotonic dose dependence of TL. We show that ‘radiation damage’, mentioned in theliterature as the reason for this effect, is not necessarily the governing process, and the effectmay simply be the result of different kinds of competition between radiative and non-radiativecentres, and sometimes between different kinds of trapping centres as well. This competitionmay take place during the excitation stage or during the read-out (heating) stage.
We distinguish between cases where the non-monotonic behaviour results mainly fromcompetition during excitation and during heating. In the former case, which is characterizedby the fact that the TL curve resembles the m2 dose dependence, we show analytically, usingthe well-established quasi-equilibrium assumption, that the possibility of non-monotonic dosedependence exists. We show that the minimum requirement for this kind of the effect to occur isa system with two kinds of recombination centre and one kind of trapping state. The analyticalmodel found a necessary condition (equation (17)) for the excitation-stage non-monotoniceffect to occur and then bound the drop in radiative centre population with equation (23).This is accompanied by a numerical simulation demonstrating the non-monotonic behaviourwith such a three-level system. We also show analytically that the mirror image systemof two trapping states and one kind of recombination centre cannot yield a non-monotonicdose dependence of TL. As for the heating-competition-dominated non-monotonic dosedependence, characterized by the TL reaching a peak when the m2 function is monotonicallyincreasing, we can demonstrate the effect by numerical simulations and using the two-trap andtwo-centre model. We cannot show at present whether a reduced three-level system may resultin this kind of non-monotonic dependence. We can only state that in our attempts so far wecould not find a set of parameters that yield this behaviour within the three-level system.
Finally, it should be noted that although we ascribe the ‘competition-during-heating’effect mainly to the relative growth of the radiative centres, we should remember that theoverall situation is more complicated and, in fact, the growth of the occupancy of the trappingstate(s) with the dose also has an effect on the final dose dependence curve. Also, despitethe distinction between cases governed by competition during excitation and during heating,which helps in the intuitive understanding of the processes involved, one should rememberthat, in fact, both kinds of competition have an effect on the final results.

Non-monotonic dose dependence of TL 753
References
[1] Chen R and McKeever S W S 1997 Theory of Thermoluminescence and Related Phenomena (Singapore:World Scientific)
[2] Chen R, Lo D and Lawless J L 2005 14th Int. Conf. on Solid State Dosimetry (Yale University, July 2004);Radiat. Prot. Dosim. at press
[3] Cameron J R, Suntharalingam N and Kenney G N 1968 Thermoluminescent Dosimetry (Madison, WI:The University of Wisconsin Press) p 60
[4] Claffy E W, Klick C C and Attix F H 1968 Proc. Gatlinburg Conf. USAEC Conf 680920 pp 302–9[5] Crittenden C C, Townsend P D, Gilkes J and Wintersgill M C 1974 J. Phys. D: Appl. Phys. 7 2410–21[6] Piesch E, Burgkhardt B and Kabadjova S 1975 Nucl. Instrum. Methods 126 563–72[7] Jain V K, Kathuria S P and Ganguly A K 1975 J. Phys. C: Solid State Phys. 8 2191–7[8] Kitahara A, Saitoh M and Harasawa S 1976 Health Phys. 31 41–6[9] Waligorski M P R and Katz R 1980 Nucl. Instrum. Methods 172 463–70
[10] Moscovitch M and Horowitz Y S 1988 J. Phys. D: Appl. Phys. 21 804–14[11] Horowitz Y S 1990 Radiat. Prot. Dosim. 33 75–81[12] Mische E F and McKeever S W S 1989 Radiat. Prot. Dosim. 29 159–75[13] Piters T M and Bos A J J 1995 Radiat. Prot. Dosim. 24 431–4[14] Ichikawa Y 1968 Japan. J. Appl. Phys. 7 220–6[15] Durrani S A, Khazal K A R, McKeever S W S and Riley R J 1977 Radiat. Eff. 33 237–44[16] Durrani S A, Groom P J, Khazal K A R and McKeever S W S 1977 J. Phys. D: Appl. Phys. 10 1351–61[17] David M, Sunta C M and Ganguly A K 1977 Indian J. Pure Appl. Phys. 15 277–80[18] Morris M F and McKeever S W S 1993 Radiat. Prot. Dosim. 47 637–41[19] Yazici A N and Topaksu M 2003 J. Phys. D: Appl. Phys. 36 620–7[20] Lakshmanan A R, Chandra B and Bhatt R C 1978 Nucl. Instrum. Methods 153 581–8[21] Srivastava J K and Supe S J 1979 Radiat. Eff. 45 13–8[22] Natarajan V, Dalvi A G I and Sastry M D 1988 J. Phys. C: Solid State Phys. 21 5913–22[23] Seshagiri T K, Natarajan V, Dalvi A G I and Sastry M D 1989 Pramana—J. Phys. 33 685–95[24] Lewandowski A C and Mathur V K 1996 Radiat. Prot. Dosim. 66 213–6[25] Yaskolko V Ya 1996 Phys. Status Solidi 157 507–14[26] Mathur V K, Lewandowski A C, Guardala N A and Price J L 1999 Radiat. Meas. 30 735–8[27] Wayne Cooke D, Roberts H E and Alexander C Jr 1978 J. Appl. Phys. 49 3451–7[28] Akselrod M S, McKeever S W S, Moscovitch M, Emfitzoglou D, Durham J S and Soares C G 1996 Radiat.
Prot. Dosim. 66 105–10[29] Agersap Larsen N, Bøtter-Jensen L and McKeever S W S 1999 Radiat. Prot. Dosim. 84 87–90[30] Papin E, Grosseau P, Guilhot B, Benabdessalam M and Iacconi P 1999 Radiat. Prot. Dosim. 84 91–4[31] Chitambo M L, Sendezera E J and Davidson A T 2002 Radiat. Prot. Dosim. 100 269–72[32] Bloom D, Evans D R, Holmstrom S A, Polf J C, McKeever S W S and Whitley V 2003 Radiat. Meas. 37 141–9[33] Yukihara E G, Whitley V H, Polf J C, Klein D M, McKeever S W S, Akselrod A E and Akselrod M S 2003
Radiat. Meas. 37 627–38[34] Halperin A and Chen R 1966 Phys. Rev. 148 839–45[35] Pradhan A S, Bhatt R C and Supe S J 1980 Int. J. Appl. Radiat. Isot. 31 671–4[36] Las W C and Stoebe T G 1982 J. Mater. Sci. 17 1585–93[37] Seshagiri T K, Dalvi A G I and Sastry M D 1988 J. Phys. C: Solid State Phys. 21 5891–912[38] Charlesby A and Partridge R H 1963 Proc. R. Soc. A 271 170–87[39] Charlesby A and Partridge R H 1965 Proc. R. Soc. A 283 329–36[40] Wintle H J 1974 Polymer 15 425–8[41] Partridge R H 1982 Polymer 23 1461–6[42] Hama Y, Nishi K, Watanabe K and Shinohara K 1974 J. Polym. Sci. 12 1109–15[43] Pietrzak M and Leszczynski R 1979 Radiochem. Radioanal. Lett. 41 349–54[44] Vanderschueren J, Linkens A and Niezette J 1987 J. Polym. Sci. 25 1537–48[45] Bos A J J 2001 Radiat. Prot. Meas. 33 737–44


