Embed Size (px)
Citation preview

A Methodology for the Evaluation of MultiprocessorNon-Preemptive Allocation PoliciesE. Smirni�, E. Rostiy, L.W. Dowdyz, G. SerazzixAbstractIn this paper a methodology for the evaluation of non-preemptive adaptive policies for mul-tiprogramming multiprocessor systems is proposed. An evaluation criterion is derived, based onthe systematic and consistent comparison of several allocation policies in a common framework.The comparison of the policies identi�es the characteristic performance behavior of this typeof policies. It suggests that equipartitioning strategies are an e�ective solution to the alloca-tion problem when the workload components are statistically similar. The envelope of staticequipartitioning policies is proposed as an evaluation criterion for non-preemptive adaptive poli-cies. This criterion o�ers a guideline for the design of new policies and is useful in assessing theperformance of existing ones. Analytical validation of the proposed criterion is presented for asimple case.1 IntroductionThe increasing power of hardware coupled with inherent limitations on software parallelism sug-gest the use of multiprogramming to provide better utilization of multiprocessor systems. Withmultiprogramming, various parallel applications are allowed to execute simultaneously on a set ofprocessors. Since the late 80's several processor allocation strategies have been developed to imple-ment multiprogramming. A convenient classi�cation of processor allocation strategies distinguishesthem as preemptive and non-preemptive.�Department of Computer Science - University of Illinois, Urbana, Illinois, USAyDipartimento di Scienze dell'Informazione - Universit�a di Milano, ItalyzDepartment of Computer Science - Vanderbilt University - Tennessee, USA.xDipartimento di Elettronica e Informazione - Politecnico di Milano - Italy.This work was partially supported by Italian M.U.R.S.T. 40% and 60% projects and by sub-contract 19X-SL131Vfrom the Oak Ridge National Laboratory managed by Martin Marietta Energy Systems, Inc. for the U.S. Departmentof Energy under contract no. DE-AC05-84OR21400. 1

Non-preemptive policies do not permit processor preemption during application execution. Byde�nition, non-preemptive policies space share the multiprocessor among the applications, i.e.,partition the system into disjoint subsets of processing elements called partitions, each assigned toa di�erent application. Non-preemptive policies can be further classi�ed as static or adaptive. Withstatic non-preemptive policies, the number and size of partitions is �xed for the system's lifetime[Sevc89, GST91, MEB91]. When an application is submitted for execution, it is assigned one of thepartitions. With adaptive non-preemptive policies, the partition size assigned to an application iscomputed before the application starts execution and may vary in successive application executionsdepending upon the current state of the system and possibly other parameters [Sevc89, ZM90,NSS93, Sevc94, RSDSC94].With preemptive policies, an executing application may be interrupted and part of its processorsmay be assigned to another application. Time sharing policies, by de�nition, are preemptive astasks of various applications may be assigned to each processor. Processors may service their tasksin a round robin or priority based scheme [Oust82, LV90]. Space sharing policies may be preemptiveif the partition allocated to an application is allowed to change during its execution. The numberof processors assigned to an application changes depending on the system load [TG89, MZ94] or onchanges in the applications' parallelism [ZM90]. Preemptive space sharing policies are also knownas dynamic policies [TG89, DCDP90, ZM90]. Hybrid partitioning schemes are also preemptive,where the multiprocessor is divided into possibly non disjoint partitions. In each partition, tasksof di�erent applications execute in time sharing mode [ZB91, SST93].The focus of this paper is on non-preemptive policies as they represent a viable solution formultiprogramming parallel systems. Non-preemptive policies are a simple on-line alternative too�-line allocation policies based on users' requests exclusively [Int93]. O�-line allocations, eitherin batch or interactive mode, are often the strategy used on actual parallel machines that operatein production mode. By assigning the number of processors requested by the user, the applica-tion's execution time is guaranteed but not the waiting time. Non-preemptive policies are easyto implement and their run-time overhead is minimum as they do not context switch processorsamong di�erent applications. Non-preemptive policies are not sensitive to the underlying hardwareplatform, therefore their implementation overhead is independent of the speci�c architecture. Non-preemptive adaptive policies are interesting for medium size parallel systems where applicationperformance and system throughput are equally important targets.In this paper a methodology for the evaluation of non-preemptive adaptive policies is proposed.The methodology results from the systematic and consistent comparison in a common framework ofselected representative policies that have appeared in the literature. The comparison demonstratesthe characteristic behavior of this type of policies. It shows that the various policies considered2
achieve comparable performance when the allocation algorithm tends to divide the system intopartitions of equal size. Such a result suggests that equipartitioning strategies may be an e�ectivesolution to the allocation problem under given circumstances. Based upon these considerations, aperformance evaluation criterion is derived for the design of new policies and the assessment of theperformance of existing ones. Such a criterion is based upon the envelope of the performance curvesof the static equipartitioning policies, i.e., the policies that partition the system into a �xed numberof equally sized partitions at system con�guration time. Depending on the workload characteris-tics and intensity, such a multiprogramming scheme may yield dramatically di�erent performance.However, by tuning the number and size of partitions to the system load and the workload char-acteristics, good performance is achieved on a limited system load subrange. Analytical validationof the proposed criterion is presented.This paper is organized as follows. Section 2 describes the policies considered. The comparisonframework used for the comparison of the various policies is described in Section 3 and resultsof the comparison are presented in Section 4. The evaluation methodology and the performanceevaluation criterion are presented in Section 5. Section 6 concludes the paper.2 The PoliciesIn order to investigate the existence of a common performance behavior for non-preemptive adaptivepolicies and the in uence of the parameters used, a set of policies of such a class are presented andcompared. Among the several policies proposed in the literature, the more representative of thevarious classes of strategies have been selected.The design philosophy of non-preemptive adaptive policies assumes that the partition size as-signed to an application (job) is determined based on the current state of the system and possiblyother parameters (e.g., the application average parallelism). It is decided before the job startsexecution and does not change during the entire job's execution. Policies may require input pa-rameters either of con�guration type (i.e., those that depend upon system hardware or workloadcharacteristics) or of run-time type (i.e., those that depend upon the current run-time state of thesystem). In the following sections, emphasis is placed on the required input parameters since theydirectly a�ect the cost and feasibility of policy implementation.2.1 The AlgorithmsIn this section, the selected non-preemptive adaptive policies are presented. Before describingthe policies, the de�nitions of the performance indices used by the policies are recalled. Averageparallelism A of an application is the average number of processors utilized by the application3
assuming that an unlimited number of processors is available. Maximum (minimum) parallelismM (m) of an application is the maximum (minimum) number of processors that are simultaneouslybusy when a su�ciently large number of processors is available. Processor working set PWS of anapplication is the minimum number of processors that maximizes the e�cacy, which is de�ned asS2p=p, where Sp is the job speedup when p processors are assigned to the job [GST91]. P is thetotal number of processors in the system.The policies considered are: A+ [Sevc89]; run-to-completion (RTC) [ZM90]; processor workingset (PWS) [GST91]; threshold (THR) [MEB91]; robust adaptive (RA) [RSDSC94]. The policydescription follows.A+The A+ policy [Sevc89] is based on the application's average parallelism. In the lack of preciseinformation, the policy assumes that the application minimum and maximum parallelism are 1and P , respectively. It also assumes knowledge of the variance V in the application's parallelism.When the variance V is not known, then it is drawn from a uniform distribution over the interval[0, (P � A) � (A � 1)]. At each system load level, de�ned as � = ��T (1)P , where T (1) is equalto the sequential execution time of the application when only one processor is allocated, all jobsare allocated the minimum between the available processors and an equal number of processors p,which is given by: p = A+ V(P �A)(A� 1)[h(1; P )� A] (1)where h(1; P ) is the function that adjusts the assignment depending upon the system load �:h(x; y) = 8<: y � �� y�A� ; if � � �x+ (1� �)� A�x1�� ; if � � � (2)In the de�nition of h(x; y), � is a parameter that roughly indicates the load level beyond whichassigning A processors is no longer the optimal allocation. Following the rule of thumb indicated in[Sevc89], � can be set to .25. The minimum required parameters for the A+ policy are the workloadarrival rate �, the sequential execution time of the workload T (1), and the average parallelism A.Run-to-CompletionThe run-to-completion (RTC) policy [ZM90] requires that the maximum parallelism of each ap-plication is known. The policy also assumes that the execution rate of the application when it isassigned p processors is known, for any p. Upon arrival to the system, a job is assigned the min-imum between its maximum parallelism and the number of free processors. When a job �nishes,4

the released processors are distributed one at a time to the waiting job i whose current assignmentof processors, pi, is less than its maximum parallelism and for which the expected improvement inelapsed execution time T (pi)� T (pi+1) is the largest. No job is assigned more than one processorif there are jobs that have not been allocated any processor yet. When all the released processorshave been assigned, jobs begin execution.Processor Working SetThe concept of processor working set is used as a con�guration parameter for several adaptivepolicies [GST91]. Of the several possible variations, only the overall best policy is described here.This policy aims to assign to each job a number of processors that is equal to the job's PWS. Thesystem waiting queue is searched for the �rst job whose PWS is less than or equal to the number offree processors. This job is allocated its PWS. When no job is found whose PWS can be satis�ed,then the currently free processors are allocated to the �rst job in the waiting queue.Threshold PolicyPartitioning policies that dynamically switch between di�erent partition sizes chosen within aprede�ned set as a function of the number of jobs in the system are called threshold policies(THR) [MEB91]. A threshold policy is de�ned by the set of threshold queue length values H =fh0; h1; : : : ; hn+1g and the corresponding set of partition sizes P = fp0; p1; : : : ; png. If the numberof jobs in the system is between hi and hi+1, then the partition size is pi. To guarantee good perfor-mance, the threshold-partition pairs must be tuned to the workload's characteristics. In the limit,as the di�erence hi+1�hi becomes 1 for all i's, with P = fP; bP2 c; bP3 c; bP4 c; : : :g the correspondingset of partition sizes, the THR policy converges to the equipartitioning dynamic policy. In theoriginal version such policies are preemptive. Here, the non-preemptive version is considered. Inthis case, when a threshold is crossed, the partition size is adjusted for the jobs yet to be scheduled.When a running job completes execution, the released processors are assigned to the waiting jobsaccording to the (possibly new) partition size.Robust AdaptiveOf the several policies studied in [RSDSC94], a robust adaptive policy (RA) that computes the par-tition size based only on run-time parameters is described here. A state dependent equipartitioningscheme that adapts to transient workload behavior without requiring any a priori knowledge aboutthe workload characteristics is realized. The system is in an ideal state when the number of par-titions is the same as the number of jobs in the waiting queue. The equally sized partitions areobtained as the total number of processors divided by the number of partitions. If the number of5

waiting jobs surpasses the number of partitions, the number of partitions is adjusted to the numberof jobs waiting in the queue. On the contrary, if several jobs depart the system while fewer newjobs have arrived, the number of partions is decreased by 1 at each scheduling round, as long asthe number of jobs waiting in the queue remains smaller than the number of partitions and thereare at least two idle partitions of the current partition size.2.2 Policy CharacterizationPolicies can be characterized based on the parameters they require. Such parameters contributeto the policy implementation costs. The A+ policy requires the maximum, minimum, and averageparallelism, the variance in the applications' parallelism, and the workload arrival rate. However,the maximum and minimum parallelism, as well as the variance in the parallelism, can be guessedfrom system con�guration parameters (i.e., P and 1 for maximum and minimum parallelism respec-tively) or from prede�ned distributions (e.g., the variance). The RTC policy requires the knowledgeof the application's entire execution signature and maximum parallelism, and uses the number ofidle processors and the queue length to compute the actual allocation size. The PWS policy basesits decisions only upon the application pws, as long as there are enough idle processors. The THRpolicy requires the threshold-partition sets, which de�ne the partition sizes for all number of jobsin the system. The RA computes the partition size based on the queue length only.The various parameters are illustrated in Figure 1 together with the policy that uses them.Parameters such as the number of idle processors and the queue length are measured at run-time.All policies, except for the RTC poplicy, use the number of idle processors to ensure the feasibilityof the computed partition (i.e., verify that there are enough processors available for allocation).Therefore their name is not associated with it. Parameters such as average parallelism and jobarrival rate are con�guration and workload parameters, whose derivation require speci�c knowledgeof the workload and of the system.Processor
(PWS)
ArrivalRate
(A+)
Execution Rate
(RTC)
ParallelismAverage
(A+)
Threshold-PartitionPairs Processors
IdleWorking Set
(RTC) (RA, RTC)
LengthQueue
Policy Parameters
(RTC)
MaximumParallelism
(THR)Figure 1: Characteristic policy parameters.6

Unlike run-time parameters, which can be easily estimated, parameters that require speci�c knowl-edge of the workload and of the system are not always available in real environments, or theyare di�cult to acquire. In order to obtain the applications' execution times, the average paral-lelism, the maximum parallelism, and the processor working set, prior executions of the applica-tions on various numbers of processors are required. Estimates of the execution times may beavailable, although precise evaluations are not possible without executing the applications. Tuningthe threshold-partition pairs to the workload characteristics requires experimentation with variouspotential pairs. Using only run-time parameters, such as the queue length and the number of freeprocessors, provides for low policy implementation costs in actual systems.3 The Evaluation FrameworkIn order to compare the performance of the selected allocation policies, a common frameworkfor comparisonis established such that the policies can be evaluated under the same workloadconditions. The multiprocessor system is modeled as an open queueing network with one multipleserver station (the multiprocessor) with a single queue. Arriving jobs join the waiting queue fromwhich they are scheduled according to the speci�c allocation algorithm. Jobs arrive in a Poissonprocess and are served in �rst-come �rst-served order. Jobs are considered statistically identicaland receive an exponentially distributed service time1, whose mean value depends upon the numberof allocated processors. The scheduler is activated every time a job arrives or departs. It determinesthe current partition size, as speci�ed by the scheduling policy. Since only non-preemptive adaptivepolicies are considered, the scheduler overhead is neglected.The workload is described by the average execution rates of each job for all possible processorassignments. The execution rates indicate job scalability as a function of the number of processorsassigned. The e�ects of di�erent architectural features are incorporated in the workload model. Noexplicit assumptions about the architecture are made.A functional form is used to express the workload execution rates. Let �p be the execution rateof a job with p processors. Then,�p = 1T (p) = �1 � 1� �p1� � p � 1; 0 � � < 1 (3)Eq. 3 characterizes a curve where, at each step, the increment is a constant fraction of the incrementat the previous step, that is, (�p+1��p)=(�p��p�1) = � . When � is approximately 0, the executionrate (hence the speedup curve) is at (i.e., the job is intrinsecally sequential). At the other extreme,1Experiments with various interarrival and service time distributions were also run, but are not reported heresince the relative performance of the policies remains the same [Smi95].7
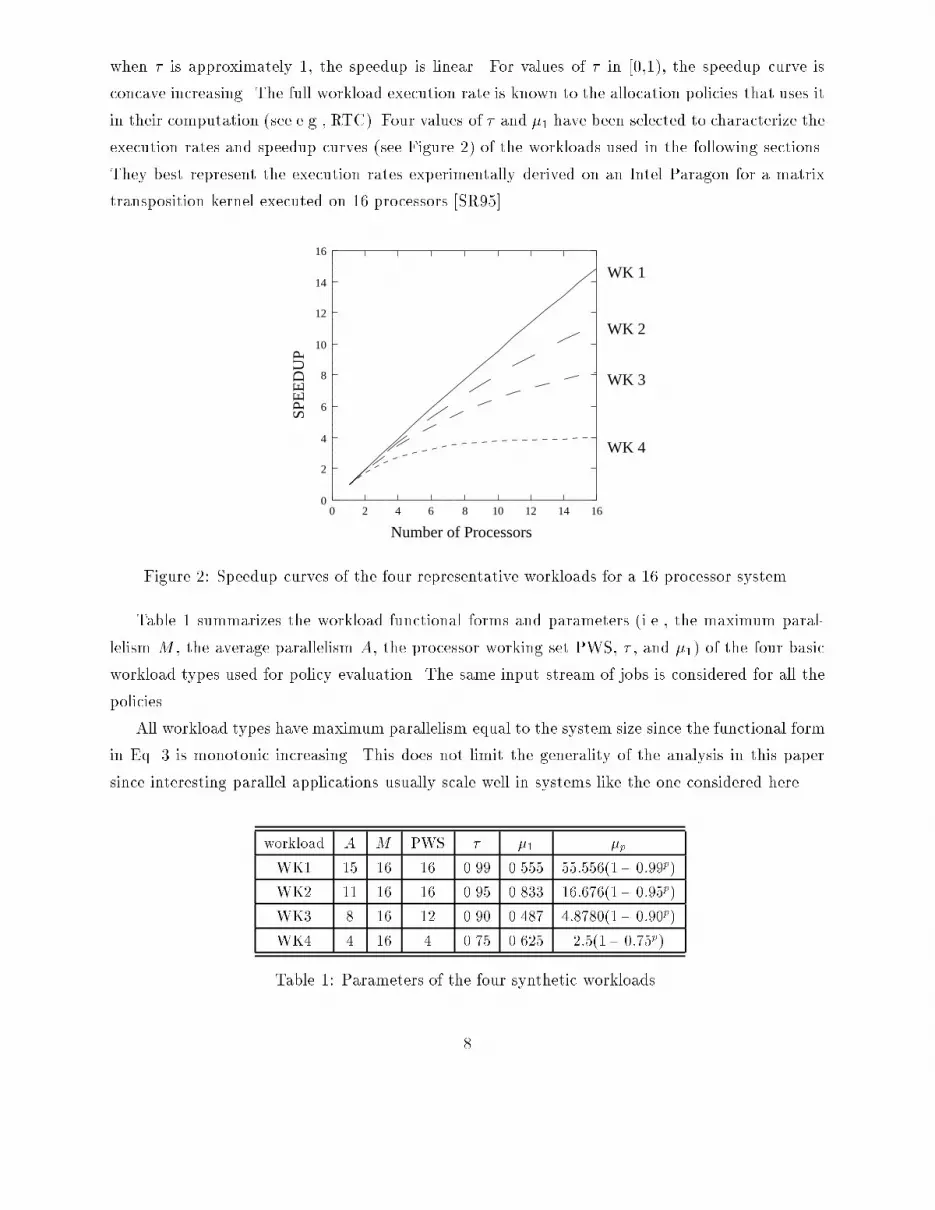
when � is approximately 1, the speedup is linear. For values of � in [0,1), the speedup curve isconcave increasing. The full workload execution rate is known to the allocation policies that uses itin their computation (see e.g., RTC). Four values of � and �1 have been selected to characterize theexecution rates and speedup curves (see Figure 2) of the workloads used in the following sections.They best represent the execution rates experimentally derived on an Intel Paragon for a matrixtransposition kernel executed on 16 processors [SR95].0
2
4
6
8
10
12
14
16
0 2 4 6 8 10 12 14 16
Number of Processors
SPE
ED
UP
WK 1
WK 2
WK 3
WK 4Figure 2: Speedup curves of the four representative workloads for a 16 processor system.Table 1 summarizes the workload functional forms and parameters (i.e., the maximum paral-lelism M , the average parallelism A, the processor working set PWS, � , and �1) of the four basicworkload types used for policy evaluation. The same input stream of jobs is considered for all thepolicies.All workload types have maximum parallelism equal to the system size since the functional formin Eq. 3 is monotonic increasing. This does not limit the generality of the analysis in this papersince interesting parallel applications usually scale well in systems like the one considered here.workload A M PWS � �1 �pWK1 15 16 16 0.99 0.555 55:556(1� 0:99p)WK2 11 16 16 0.95 0.833 16:676(1� 0:95p)WK3 8 16 12 0.90 0.487 4:8780(1� 0:90p)WK4 4 16 4 0.75 0.625 2:5(1� 0:75p)Table 1: Parameters of the four synthetic workloads.8

To compare the policies, single class and multiclass workloads are considered. Six workloadmixes are selected (see Table 2), four of which represent single class workloads (MIX1 � MIX4) andtwo represent multiclass workloads (MIX5 and MIX6). Multiclass workloads have been consideredas they re ect actual system workloads and they adequately model execution time variability.WK1 WK2 WK3 WK4MIX1 100% { { {MIX2 { 100% { {MIX3 { { 100% {MIX4 { { { 100%MIX5 25% 25% 25% 25%MIX6 { 50% 50% {Table 2: Workload mixes used for policy evaluation.4 Policy ComparisonThe �ve allocation policies are compared on the six workload mixes across the range of system loadsvia simulation. The parameters each policy requires are those reported in Table 1 or derived fromit. The objective function used is system power, de�ned as the ratio of the system throughput tothe average job response time [?]. Power is selected because it balances two con icting but equallyimportant performance metrics, i.e., throughput and response time. Throughput is maximized whenthe system is fully utilized, which typically leads to poor response time. Alternatively, responsetime is minimized when jobs are executed alone in the system, which implies poor throughput.Maximizing power balances these e�ects.The entire range of system load, de�ned as � = ��T (1)P , is simulated and results are reported asa function of �. All simulations are run with 95% con�dence intervals. The con�dence intervals arenot indicated in the �gures for the sake of clarity.The policy comparisons are illustrated in Figure 3. The relative policy performance variesdepending on the system load and on the workload mix. Each policy was implemented assumingthat the parameters it requires are available. Speci�c observations are possible regarding eachpolicy. The focus here is on the common performance behavior.When the policy allows for smaller partitions as the system load increases, performance issustained across the entire range of system load. Policies like PWS and THR that do not allow forpartition fragmentation at high load levels may reach high power values but saturate before theload has reached 100% of system capacity. With THR, adding smaller partitions to P , the partition9

size set, accounted for a signi�cant reduction in power. Therefore partition sizes that yielded betterperformance on a limited range of system load were preferred. With PWS, fragmentation is possibleonly if the jobs comprising the workload have widely di�erent PWS's (see Figure 3 for MIX5).Using workload characteristics in scheduling decisions does not provide for better performance.Policies that use only run-time parameters, such as RA, perform as good, if not better, thanpolicies that base their decisions upon workload parameters such as average parallelism or executionsignature.Except for speci�c cases, such as A+ on MIX1, PWS on all mixes but MIX1, THR on MIX2,MIX4, and MIX5, all policies exhibit similar behavior. The range of maximum power de�ned bythe policies is reasonably narrow to associate a common performance behavior to all of them.Table 3 qualitatively summarizes the results of the policy comparison from a performancepoint of view for the six workload mixes, based on the graphs plotted in Figure 3. The relativeperformance of each policy on the six examined workloads is characterized as \good", \average",or \poor" according to the following criteria.� Policies that achieve high power values (i.e., within 10% of the maximum power among allpolicies) over all system loads are characterized as \good".� Policies that reach reasonable power values (i.e., within 25% of the maximum power amongall policies) for a broad subrange of the potential system loads (i.e., at least 75% of systemload range), are considered \average".� Policies that perform well only over a limited subrange of the load (i.e., less than 75% of systemload range), or achieve low power values (i.e., below 25% of the maximum) are classi�ed as\poor". MIX1 MIX2 MIX3 MIX4 MIX5 MIX6PWS good poor poor poor average poorRTC average good good good average averageA+ poor average good good good averageTHR good good average average average averageRA average good good good good goodTable 3: Summary of policy performance for the six workload mixes.10

0
1
2
3
4
5
6
7
0
2
4
6
8
10
12
14
16
18
60%40%20% 80% 100%0%
Sys
tem
Pow
er
System Load
RTC
RA
PWS
MIX 1 MIX 2
0
5
10
15
20
25
30
PWS
0% 20% 40% 60% 80% 100%
Sys
tem
Pow
er
System Load
THR
RTC
RA
0% 20% 40% 60% 80% 100%0
1
2
3
4
5
6
7
0% 20% 40% 60% 80% 100%
MIX 4MIX 3
Sys
tem
Pow
er
System Load System Load
Sys
tem
Pow
erA+
PWS
PWSTHR
RTC
RARA
RTCTHR
A+
THR
A+
0
1
2
3
4
5
6
7
0
2
4
6
8
10
12
14
16
18
60%40%20% 80% 100%0%
Sys
tem
Pow
er
System Load
RTC
RA
PWS
MIX 1 MIX 2
0
5
10
15
20
25
30
PWS
0% 20% 40% 60% 80% 100%
Sys
tem
Pow
er
System Load
THR
RTC
RA
0% 20% 40% 60% 80% 100%0
1
2
3
4
5
6
7
0% 20% 40% 60% 80% 100%
MIX 4MIX 3
Sys
tem
Pow
er
System Load System Load
Sys
tem
Pow
erA+
PWS
PWSTHR
RTC
RARA
RTCTHR
A+
THR
A+
A+
0
1
2
3
4
5
6
7
0
2
4
6
8
10
12
14
16
18
60%40%20% 80% 100%0%
Sys
tem
Pow
er
System Load
RTC
RA
PWS
MIX 1 MIX 2
0
5
10
15
20
25
30
PWS
0% 20% 40% 60% 80% 100%
Sys
tem
Pow
er
System Load
THR
RTC
RA
0% 20% 40% 60% 80% 100%0
1
2
3
4
5
6
7
0% 20% 40% 60% 80% 100%
MIX 4MIX 3
Sys
tem
Pow
er
System Load System Load
Sys
tem
Pow
erPWS
PWSTHR
RTC
RARA
RTCTHR
A+
THR
A+
0
1
2
3
4
5
6
7
0
2
4
6
8
10
12
14
16
18
60%40%20% 80% 100%0%
Sys
tem
Pow
er
System Load
RTC
RA
PWS
MIX 1 MIX 2
0
5
10
15
20
25
30
PWS
0% 20% 40% 60% 80% 100%
Sys
tem
Pow
er
System Load
THR
RTC
RA
0% 20% 40% 60% 80% 100%0
1
2
3
4
5
6
7
0% 20% 40% 60% 80% 100%
MIX 4MIX 3
Sys
tem
Pow
er
System Load System Load
Sys
tem
Pow
erPWS
PWSTHR
RTC
RARA
RTCTHR
A+
THR
A+
A+
A+
Sys
tem
Pow
er
System Load
0
2
4
6
8
10
12
0% 20% 40% 60% 80% 100%
PWS
RTC
MIX 6
THR
RA
0
2
4
6
8
10
0% 20% 40% 60% 80% 100%System Load
Sys
tem
Pow
er
MIX 5
RTC
RA
PWSTHR A+ A+
Figure 3: System power for the six workload mixes as a function of the system load.11

Table 3 and Figure 3 con�rm expected results:� knowing workload parameters such as maximum and average parallelism or the executionrate does not signi�cantly improve the performance of non-preemptive adaptive policies;� policies based on run-time parameters (e.g., RA) generally give good performance;� adaptive equipartitioning schemes are an overall good choice also when the workload charac-teristics are ignored (e.g., RA compared to RTC or A+)The results of the comparison suggest that the ideal policy would be one whose power is acollection of the highest values of all power curves across all policies for all workload mixes and forall system loads (see Figure 3). In the next section a characterization of the performance of such apolicy is presented and derived in terms of simple components. This gives a criterion for evaluatingthe e�ectiveness of any newly proposed policy.5 Evaluation MethodologyThe uniform comparison of non-preemptive adaptive policies presented in the previous sectionsuggests that it may be possible to identify a common performance target that characterizes themaximum power achievable by this type of allocation policies. Such a target would be an evaluationcriterion for guiding the design of new policies and assessing the performance of existing ones. In thissection the performance achievable with static equipartitioning policies is identi�ed as characterizingthe common behavior observed in the previous section. The performance of the dynamic spacesharing policy is also identi�ed as the optimal performance bound.The proposed evaluation methodology consists of four steps:1. characterization of the system workload using the speedup curve of its parallel applications;2. identi�cation of the adaptive policy performance target by constructing the envelope of thepower curves of the static equipartitioning policies;3. identi�cation of the dynamic policy performance bound by deriving the power curve for thedynamic space sharing policy;4. evaluation of the performance of the scheduling policy of interest.A good non-preemptive adaptive policy would achieve power values in the range of the envelopecurve, or possibly above it, in the area between it and the curve of the dynamic policy.12

In what follows the envelope curve is derived and it is shown that, although e�ective, it isnot a strict upper bound for the performance of all non-preemptive adaptive policies. However,the exhaustive search of the policy space of a limited system con�rms the quality of the proposedcriterion.5.1 The Envelope CriterionThe common philosophy of the policies investigated in Section 4 suggests that an equipartitioningstrategy tuned for the speci�c workload intensity and characteristics performs well. In order toderive the performance target in an easy to reproduce way, the family of non-preemptive staticequipartitioning policies (SEP) is considered. These policies [Sevc89, EZL89, ZM90, GST91], par-tition the multiprocessor into disjoint subsets of processors of equal size at system con�gurationtime. For a �xed number of partitions, n, and a single class workload, the system is modeled as anM=M=n queue. It is well known that for each number of partitions (i.e., for each policy) and for agiven workload, there is a limited subrange of the system load where the policy performs well. Thesize and location of the optimal subrange of each policy depend upon the partition size, the systemload, and the characteristics of the workload. As an example, the power curves for the possible SEPpolicies for a 16 processor system (i.e., namely SEP16, SEP8, SEP4, SEP2, and SEP1 for partitionsof 16, 8, 4, 2, and 1 processor, respectively) are reported in Figures 4(a) and 4(b) for WK1 andWK3, respectively. Each curve in the �gure is analytically derived, by solving the M=M=n modelcorresponding to the speci�c SEPp policy, where n = 16=p is the number of partitions.As observed in Figure 4, no single SEP policy is optimal, nor e�ective, over the entire system loadrange. However, the collection of the pieces where each curve is best exhibits good overall behavior.The coarse granularity of the discrete partitions sizes accounts for possibly jagged behavior of sucha strict envelope that simply connects the optimal portions of each curve. Larger systems where thevariety of partition sizes of the SEP policies is greater present smoother strict envelopes. Thereforethe envelope assumed as a performance target for non-preemptive adaptive policies is the oneobtained as though a continuum of partition sizes were possible. It is the concave curve associatedwith the outermost points of the collection of all SEP power curves across the range of system load.Figure 5 shows the envelope (bold line) added to Figures 3(a) and 3(c). As seen, the envelopecaptures the best features of the policies compared in the previous section.Figure 5 also includes the power curve of the dynamic equal partitioning policy with no reparti-tioning overhead. The dynamic policy is preemptive and assumes that it is possible to redistributeprocessors to jobs during execution at no cost. Upon job arrival or departure, the processors aredynamically redistributed among all jobs in the system to enforce partitions of equal size. Thedynamic curve is derived analytically by solving the corresponding Markov chain with arival rate13
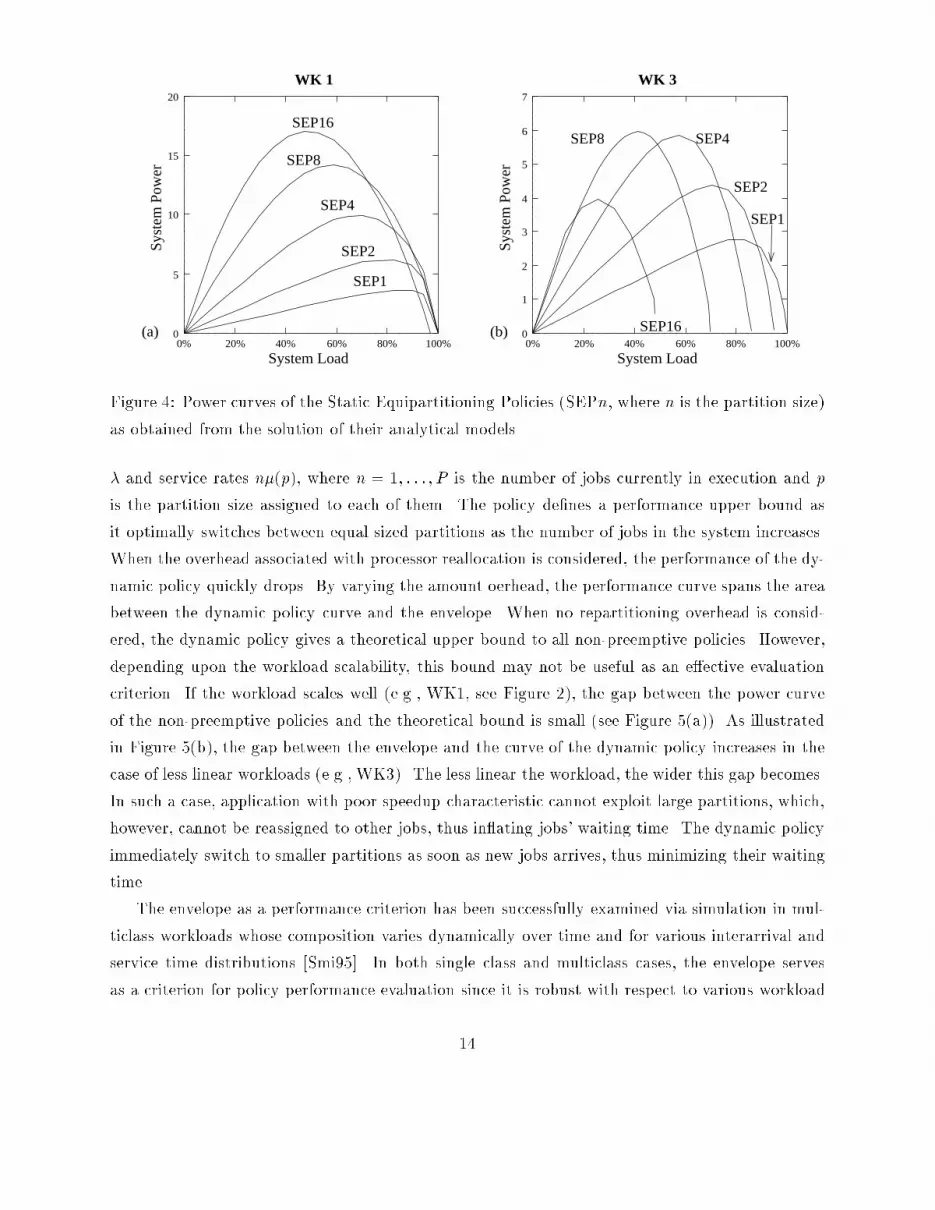
0
5
10
15
20
0% 20% 40% 60% 80% 100%
System Load
Syst
em P
ower
(a) 0
1
2
3
4
5
6
7
0% 20% 40% 60% 80% 100%
System Load
Syst
em P
ower
(b)
WK 1 WK 3
SEP16
SEP1
SEP4
SEP16
SEP8
SEP2
SEP8 SEP4
SEP2
SEP1Figure 4: Power curves of the Static Equipartitioning Policies (SEPn, where n is the partition size)as obtained from the solution of their analytical models.� and service rates n�(p), where n = 1; : : : ; P is the number of jobs currently in execution and pis the partition size assigned to each of them. The policy de�nes a performance upper bound asit optimally switches between equal sized partitions as the number of jobs in the system increases.When the overhead associated with processor reallocation is considered, the performance of the dy-namic policy quickly drops. By varying the amount oerhead, the performance curve spans the areabetween the dynamic policy curve and the envelope. When no repartitioning overhead is consid-ered, the dynamic policy gives a theoretical upper bound to all non-preemptive policies. However,depending upon the workload scalability, this bound may not be useful as an e�ective evaluationcriterion. If the workload scales well (e.g., WK1, see Figure 2), the gap between the power curveof the non-preemptive policies and the theoretical bound is small (see Figure 5(a)). As illustratedin Figure 5(b), the gap between the envelope and the curve of the dynamic policy increases in thecase of less linear workloads (e.g., WK3). The less linear the workload, the wider this gap becomes.In such a case, application with poor speedup characteristic cannot exploit large partitions, which,however, cannot be reassigned to other jobs, thus in ating jobs' waiting time. The dynamic policyimmediately switch to smaller partitions as soon as new jobs arrives, thus minimizing their waitingtime.The envelope as a performance criterion has been successfully examined via simulation in mul-ticlass workloads whose composition varies dynamically over time and for various interarrival andservice time distributions [Smi95]. In both single class and multiclass cases, the envelope servesas a criterion for policy performance evaluation since it is robust with respect to various workload14

0
2
4
6
8
10
12
14
16
18
20
0% 20% 40% 60% 80% 100%
System Load
A+
RTC
RA
dynamic
PWS
THR
Syst
em P
ower
WK 1
0
1
2
3
4
5
6
7
8
9
0% 20% 40% 60% 80% 100%
dynamic
THR
RA
Syst
em P
ower
System Load
WK 3
A+
PWS
RTC
Figure 5: Envelope of the SEP policies (bold line) compared to the power of the non-preemptiveadaptive policies and to the power of the preemptive dynamic policy.types and across the range of system loads. Allocation policies whose performance closely matchesthat of the envelope would be very e�ective policies. Whether the envelope could set a performancebound such as the dynamic policy is the subject of the following section.5.2 Bound AnalysisIn this section, Markovian models of non-preemptive policies are used to investigate the existenceof non-preemptive policies whose power curves exceed the envelope and approach the bound of thedynamic policy. From all possible non-preemptive policies, the threshold policy is selected as agood candidate since its behavior closely resembles the behavior of both the SEP and the dynamicpolicies. The dynamic policy can be approximated to any degree of accuracy, up to convergence,by the preemptive threshold policies (see Section 2.1). Since the focus of the paper is on non-preemptive adaptive policies, the non-preemptive version is investigated here, using Markoviananalysis.Assuming exponential interarrival and service times, with mean 1=� and 1=� respectively, thesystem behavior under the allocation policy is described by a Continuous Time Markov Chain(CTMC). In order to keep the analysis tractable from a computational point of view, the simplecase of policies with only one threshold, THR1, is analyzed. Let (qp00 qp11 : : : qpnn ) denote the systemstate when there are qk jobs executing on pk processors each. qpkk will only appear in the statedescription if it is non-zero. (�) indicates the idle state. When pk = 0, jobs are waiting for service15

in the queue. As an example, state (1028) indicates that there is 1 job whose partition size is zero(i.e., waiting in the queue), two jobs executing on 8 processors each, and no job executing on 16processors (the component is missing).With a single threshold, two partition sizes are possible. With the single threshold set at1, the two partitions are selected as the whole system (i.e., 16 processors) and half the system(i.e., 8 processors). If the number of jobs in the system q = Pi=ni=0 qpii becomes greater than thethreshold, then the smaller partition size (half the system in this case) is used for scheduling newjobs. Likewise, if q is less than or equal to one (i.e., the threshold) then the larger target partitionsize (the entire system) is used for scheduling jobs.When the exponential service times for both partition sizes have average 1=�16 and 1=�8,respectively, the CTMC describing the system behavior under THR1 policy is shown in Figure 6.If the threshold policy has h threshold values, then the corresponding CTMC has h+ 1 horizontalchains. Each horizontal chain is associated with a partition size. As the number of chains increases,the complexity of the analytical solution increases dramatically. Due to this complexity, the focusis on a single threshold policy, THR1.16
10116 11620 11603
18 82 82 8220
2µ8 2µ8 2µ8
µ16 µ16 µ16µ16
1
0
λ λ λλ
λ λ λ
. . .
. . .
_
µ8
1Figure 6: Continuous Time Markov Chain of the THR1 policy.The Markov chain of Figures 6 is solved analytically using standard techniques (see Appendix A)and the system power is derived. Figure 7 shows the power achieved by THR1 in comparison withthe dynamic policy and the envelope (dashed line) for the case of a linear (WK1) and a non-linearworkload (WK2). When the workload is linear (see Figure 7(a)), the THR1 policy achieves highervalues than the envelope when the system load ranges between 70% to 90% of the system loadcapacity. In the case of WK2 (see Figure 7(b)) the load range where THR1 exceeds the envelopeis between 30% to 60% of system load capacity. As the workload scalability decreases (e.g., WK3and WK4), THR1 exceeds the envelope at lower system load levels. The possibility of switching16

to smaller partitions when the workload has poor speedup characteristics improves performance asapplications cannot take advantage of large partitionsenvelope
0
2
4
6
8
10
12
14
16
18
20
0% 20% 40% 60% 80% 100%
dynamicSy
stem
Pow
er
System Load
(a)
WK 1
envelope
THR1
0
5
10
15
20
25
30
35
0% 20% 40% 60% 80% 100%
dynamic
System Load
Syst
em P
ower
(b)
THR1
WK 2
Figure 7: Power curves of the envelope (dashed line), THR1 (dotted line), and dynamic policy(solid line).In all situations, the envelope is not a strict upper bound. However, it is not exceeded signi�-cantly by other non-preemptive policies considered. Thus, according to all experimental evidences,the envelope is a good evaluation criterion for the set of all non-preemptive policies.As evidence to the quality of the envelope, the state space of all possible policies of a limitedsystem has been explored. A system of limited size with �nite capacity (i.e., where the total numberof jobs allowed in the system is �nite) is used to exhaustively search for the best non-preemptivepolicy. To show the existence, or the lack thereof, of policies that perform better than the envelope,an exhaustive enumeration of all possible non-preemptive policies is performed. The results of theexhaustive search are illustrated in Figure 8, which plots the power curves of the 511 policiesfound for the system considered. The graph con�rms that the envelope of the SEP policies for thesystem considered achieves the best power values. However, there is a point where another policy,a threshold policy, performs as good as the envelope. (See Appendix B for the details.)As the counterexample to the 16 processor system shows, the theoretical results obtained forthe exhaustive search of the closed system do not generalize to systems with in�nite capacity.However, this example supports the quality of the envelope as the power of an overall good policyfor systems where arrivals are not discouraged beyond a given limit. Furthermore, it seems unlikelythat policies that perform better than the curve enveloping the SEP curves and exhibit comparablerobustness exist. Such a characteristic and its simple derivation based on the SEP curves make the17
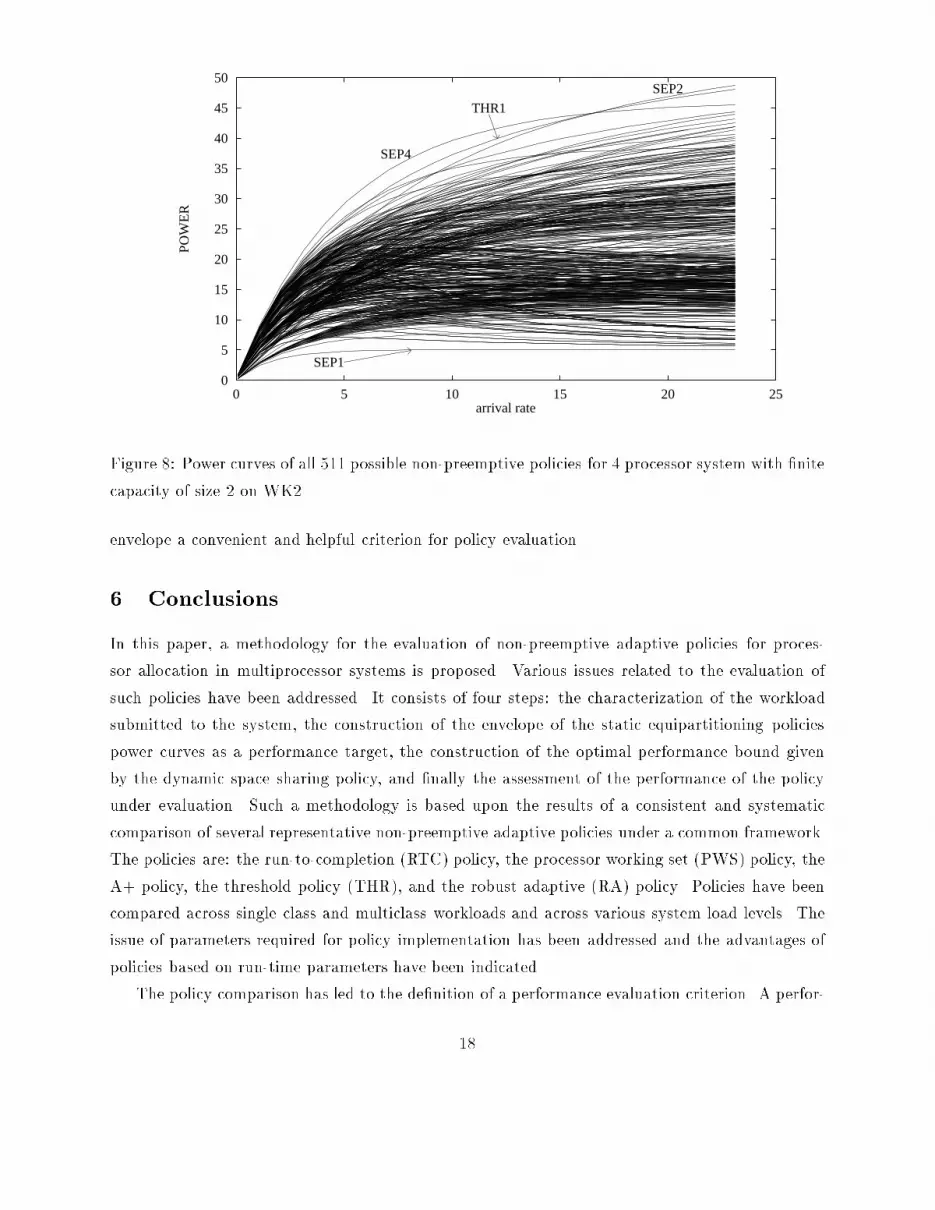
0
5
10
15
20
25
30
35
40
45
50
0 5 10 15 20 25
POW
ER
arrival rate
SEP2
SEP4
THR1
SEP1Figure 8: Power curves of all 511 possible non-preemptive policies for 4 processor system with �nitecapacity of size 2 on WK2.envelope a convenient and helpful criterion for policy evaluation.6 ConclusionsIn this paper, a methodology for the evaluation of non-preemptive adaptive policies for proces-sor allocation in multiprocessor systems is proposed. Various issues related to the evaluation ofsuch policies have been addressed. It consists of four steps: the characterization of the workloadsubmitted to the system, the construction of the envelope of the static equipartitioning policiespower curves as a performance target, the construction of the optimal performance bound givenby the dynamic space sharing policy, and �nally the assessment of the performance of the policyunder evaluation. Such a methodology is based upon the results of a consistent and systematiccomparison of several representative non-preemptive adaptive policies under a common framework.The policies are: the run-to-completion (RTC) policy, the processor working set (PWS) policy, theA+ policy, the threshold policy (THR), and the robust adaptive (RA) policy. Policies have beencompared across single class and multiclass workloads and across various system load levels. Theissue of parameters required for policy implementation has been addressed and the advantages ofpolicies based on run-time parameters have been indicated.The policy comparison has led to the de�nition of a performance evaluation criterion. A perfor-18
mance evaluation criterion for non-preemptive policies, the envelope of the power curves of staticequipartitioning policies, has been proposed. The envelope provides a uniform criterion of com-parison against which all non-preemptive policies can be evaluated. The envelope is easy to derivesince the basic components, the static equipartitioning policies, admit analytical models that canbe solved with little e�ort. Although it is not a strict upper bound, no policy that performs con-siderably better than the envelope is known. The exhaustive search of all possible policies for asmall system with limited capacity supports the quality of the envelope as a performance target ofnon-preemptive policies.References[EZL89] D. L. Eager, J. Zahorjan, and E. D. Lazowska, \Speedup versus e�ciency," IEEETransaction on Software Engineering, Vol 38(3), 1989, pp. 408-423.[DCDP90] K. Dussa, B. M. Carlson, L. W. Dowdy, and K.-H. Park, \Dynamic partitioning in atransputer environment," Proc. ACM SIGMETRICS, 1990, pp. 203-213.[GST91] D. Ghosal, G. Serazzi, and S. K. Tripathi, \Processor working set and its use inscheduling multiprocessor systems," IEEE Trans. Software Eng., Vol 17(5), 1991, pp.443-453.[Int93] Intel Corporation, Paragon OSF/1 User's Guide, 1993.[LV90] S. T. Leutenegger and M. K. Vernon, \The performance of multiprogrammed multi-processor scheduling policies," Proc. ACM SIGMETRICS, 1990, pp. 226-236.[MEB91] S. Majumdar, D. L. Eager, and R. Bunt, \Characterization of programs for schedulingin multiprogrammed parallel systems," Performance Evaluation, Vol 13(2), 1991, pp.109-130.[MVZ93] C. McCann, R. Vaswani, and J. Zahorjan, \A dynamic processor allocation policy formultiprogrammed shared memory multiprocessors," ACM Trans. Comput. Syst., Vol11(2), 1993, pp. 146-178.[MZ94] C. McCann, J. Zahorjan, \Processor allocation policies for message-passing parallelcomputers," Proc. ACM SIGMETRICS, 1994, pp. 19-32.[NSS93] V.K. Naik, S.K. Setia, M.S. Squillante, \Performance analysis of job scheduling poli-cies in parallel supercomputing environments," Proc. of Supercomputing 93, 1993, pp.824-833. 19
[Oust82] J. Ousterhout, \Scheduling techniques for concurrent systems," Proc. 3rd Interna-tional Conference on Distributed Computing Systems, 1982, pp. 22-30.[RSDSC94] E. Rosti, E. Smirni, L. W. Dowdy, G. Serazzi, and B. M. Carlson, \Robust partitioningpolicies for multiprocessor systems," Performance Evaluation, Vol 19(2-3), March1994, pp. 141-165.[SST93] S. K. Setia, M. S. Squillante, and S. K. Tripathi, \Processor scheduling in multipro-grammed, distributed memory parallel computers," Proc. ACM SIGMETRICS, 1993,pp. 158-170.[Sevc89] K. C. Sevcik, \Characterization of parallelism in applications and their use in schedul-ing," Proc. ACM SIGMETRICS, 1989, pp. 171-180.[Sevc94] K. C. Sevcik, \Application scheduling and processor allocation in multiprogrammedmultiprocessors," Performance Evaluation, Vol 19(2-3), March 1994, pp. 107-140.[Smi95] Smirni E., \Processor allocation and thread placement policies in parallel multipro-cessor systems," Ph.D. Dissertation, CS-Dept. Vanderbilt University, TN, May 1995.[SR95] Smirni E., Rosti E., \Modeling speedup of SPMD applications on the Intel Paragon:a case study," Proc. of High-Performance Computing and Networking 95 Europe, B.Hertzberger, G. Serazzi Eds., Lecture Notes in Computer Science 919, pp 94-101,Italy, May 1995.[TG89] A. Tucker and A. Gupta, \Process control and scheduling issues for multiprogrammedshared-memory multiprocessors," Proc. of the 12th ACM Symposium on OperatingSystems Principles, 1989, pp. 159-166.[ZM90] J. Zahorjan and C. McCann, \Processor scheduling in shared memory multiproces-sors," Proc. ACM SIGMETRICS, 1990, pp. 214-225.[ZB91] S. Zhou and T. Brecht, \Processor pool-based scheduling for large-scale NUMA mul-tiprocessors," Proc. ACM SIGMETRICS, 1991, pp. 133-142.A Appendix AThe steady state probabilities P(qp00 qp11 ) for the THR1 policy are derived in this appendix. Let f(�),(0018), (i0116) for i � 0, (j028) for j � 0g be the set of all system states under the THR1 threshold20

policy as described by the Markov chain in Figure 6. By solving the global balance equations ofthe system, the steady state probabilities are given by:�� = �16(�+ �16)(2�8 � �)2�8�2 + 4��8�16 � ��216 + 2�8�216 (4)�18 = �2�8(�+ �16)�� (5)�i0116 = � ��+ �16�i+1 �� for i � 0 (6)�i028 = i+1Xk=1� �2�8�k � ��+ �16�i+3�k �� +�2�8(�+ �16) � �2�8�i+1 �� for i � 0 (7)Using the state probabilities, the closed form expression for the system power can be computed.B Appendix BThis appendix illustrates the details of the exhaustive search of all possible non-preemptive policiesfor a small case. A system of limited size (4 processors) with �nite capacity (i.e., where thetotal number of jobs allowed in the system is �nite) is used to exhaustively search for the best non-preemptive policy. When the capacity is in�nite, the number of policies is in�nite and an exhaustivesearch is not feasible. By limiting the capacity, an exhaustive enumeration of all possible non-preemptive policies is performed to show the existence, or the lack thereof, of policies that performbetter than the envelope.The system is modeled as a queueing system with �nite capacity of size 2. Jobs arriving whenthere are already two jobs in the system are ignored. The system state is described, as before, bythe vector of queue lengths for all possible assignments, (qp00 qp11 : : : qpnn ), for non-zero queue lengths.The possible assignments are 0, 1, 2, 3, and 4 processors, respectively. The set of feasible statesis: f(�), (11); (12), (13); (14); (1011), (1012); (1013); (1014), (1112); (1113); (21); (22)g. States wherethe multiprocessor is idle and there are jobs waiting for service are excluded from the state space.A policy is de�ned as a set of states and a set of deterministic transition rules that specify thesuccessor state for each state of the set. As an illustration, Figure 9 represents the entire statespace and three possible non-preemptive policies, SEP2 (dotted line), SEP4 (dashed line), andTHR1 (solid line). THR1 is a threshold policy with 1 threshold set at 1. If the multiprocessoris idle, the whole system (4 processors) is assigned to the incoming job (i.e., a transition to state(14)). If a second job arrives, it waits in the queue (i.e., transition to state (1014)). When thesecond job arrives, the threshold is corssed and the system switches to a di�erent partition size, 221
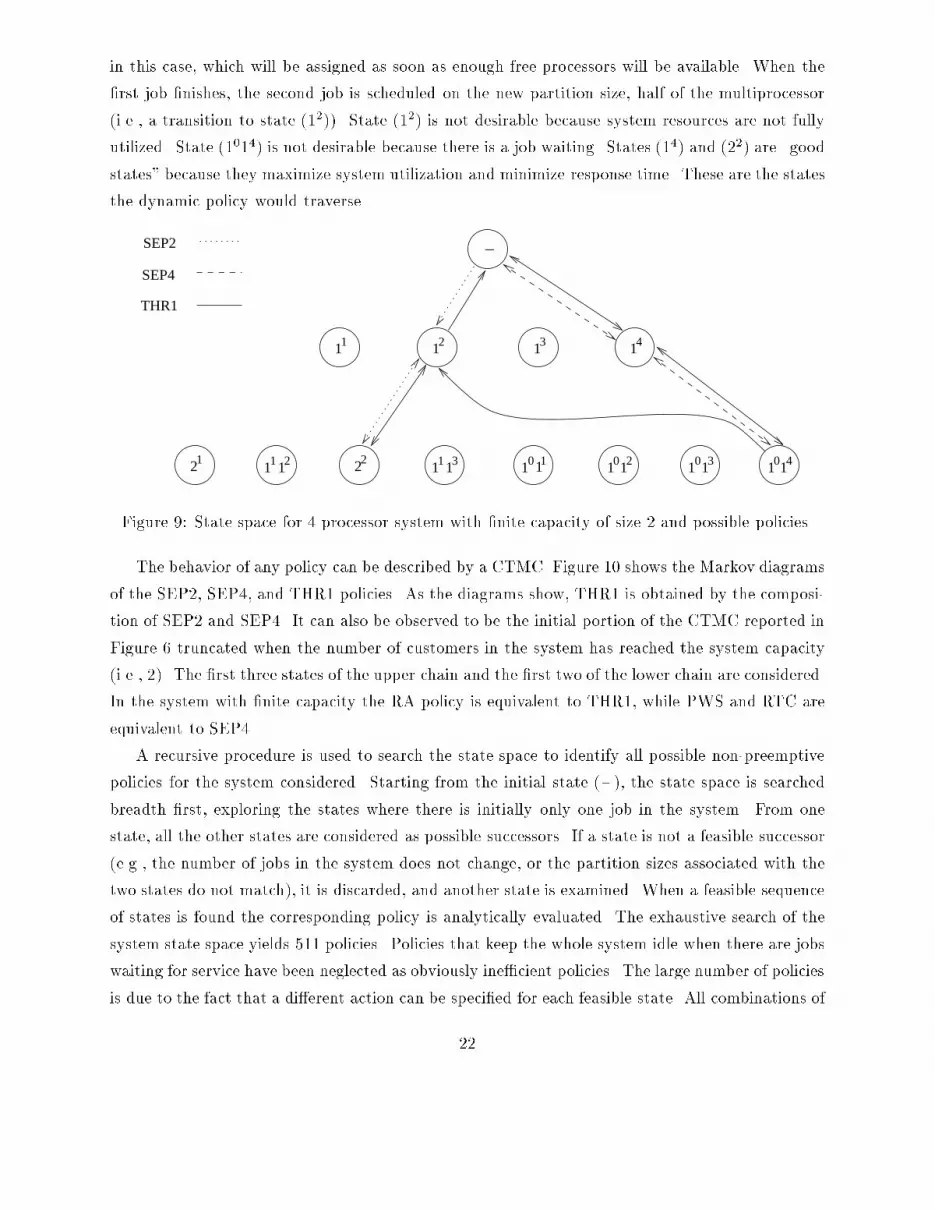
in this case, which will be assigned as soon as enough free processors will be available. When the�rst job �nishes, the second job is scheduled on the new partition size, half of the multiprocessor(i.e., a transition to state (12)). State (12) is not desirable because system resources are not fullyutilized. State (1014) is not desirable because there is a job waiting. States (14) and (22) are \goodstates" because they maximize system utilization and minimize response time. These are the statesthe dynamic policy would traverse._
1211 1311 12 1413
1 1 1 11 2 3 4
21 221 11 11 10 0 0 0
THR1
SEP4
SEP2
Figure 9: State space for 4 processor system with �nite capacity of size 2 and possible policies.The behavior of any policy can be described by a CTMC. Figure 10 shows the Markov diagramsof the SEP2, SEP4, and THR1 policies. As the diagrams show, THR1 is obtained by the composi-tion of SEP2 and SEP4. It can also be observed to be the initial portion of the CTMC reported inFigure 6 truncated when the number of customers in the system has reached the system capacity(i.e., 2). The �rst three states of the upper chain and the �rst two of the lower chain are considered.In the system with �nite capacity the RA policy is equivalent to THR1, while PWS and RTC areequivalent to SEP4.A recursive procedure is used to search the state space to identify all possible non-preemptivepolicies for the system considered. Starting from the initial state (�), the state space is searchedbreadth �rst, exploring the states where there is initially only one job in the system. From onestate, all the other states are considered as possible successors. If a state is not a feasible successor(e.g., the number of jobs in the system does not change, or the partition sizes associated with thetwo states do not match), it is discarded, and another state is examined. When a feasible sequenceof states is found the corresponding policy is analytically evaluated. The exhaustive search of thesystem state space yields 511 policies. Policies that keep the whole system idle when there are jobswaiting for service have been neglected as obviously ine�cient policies. The large number of policiesis due to the fact that a di�erent action can be speci�ed for each feasible state. All combinations of22
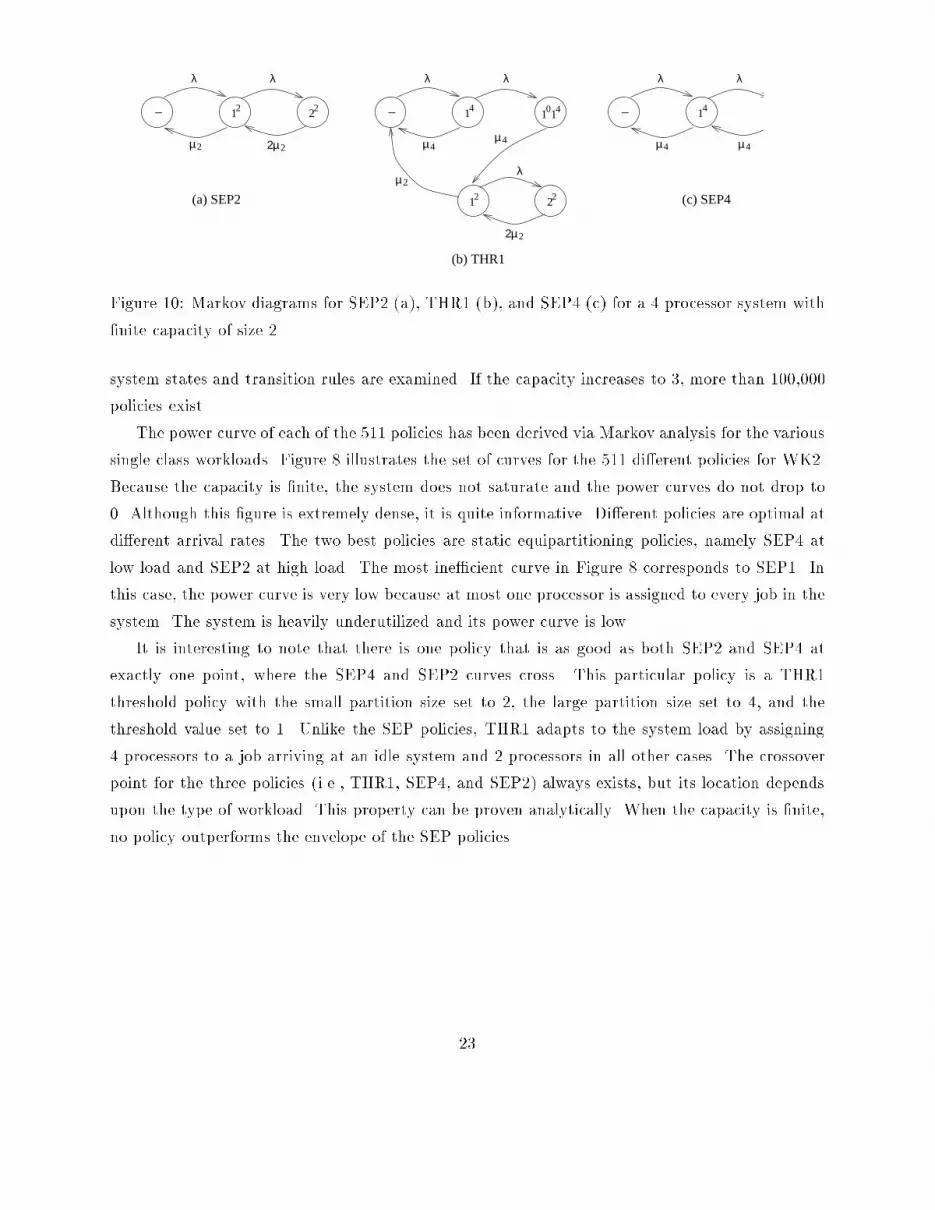
_ 12 22
λ
2µ2µ2
_
µ4
12 22
2µ2
λ
µ4
µ2
_
µ4 µ4
λ λ
14
λ λ λ
141 140
(b) THR1
(a) SEP2 (c) SEP4Figure 10: Markov diagrams for SEP2 (a), THR1 (b), and SEP4 (c) for a 4 processor system with�nite capacity of size 2.system states and transition rules are examined. If the capacity increases to 3, more than 100,000policies exist.The power curve of each of the 511 policies has been derived via Markov analysis for the varioussingle class workloads. Figure 8 illustrates the set of curves for the 511 di�erent policies for WK2.Because the capacity is �nite, the system does not saturate and the power curves do not drop to0. Although this �gure is extremely dense, it is quite informative. Di�erent policies are optimal atdi�erent arrival rates. The two best policies are static equipartitioning policies, namely SEP4 atlow load and SEP2 at high load. The most ine�cient curve in Figure 8 corresponds to SEP1. Inthis case, the power curve is very low because at most one processor is assigned to every job in thesystem. The system is heavily underutilized and its power curve is low.It is interesting to note that there is one policy that is as good as both SEP2 and SEP4 atexactly one point, where the SEP4 and SEP2 curves cross. This particular policy is a THR1threshold policy with the small partition size set to 2, the large partition size set to 4, and thethreshold value set to 1. Unlike the SEP policies, THR1 adapts to the system load by assigning4 processors to a job arriving at an idle system and 2 processors in all other cases. The crossoverpoint for the three policies (i.e., THR1, SEP4, and SEP2) always exists, but its location dependsupon the type of workload. This property can be proven analytically. When the capacity is �nite,no policy outperforms the envelope of the SEP policies.23


