Embed Size (px)
Citation preview
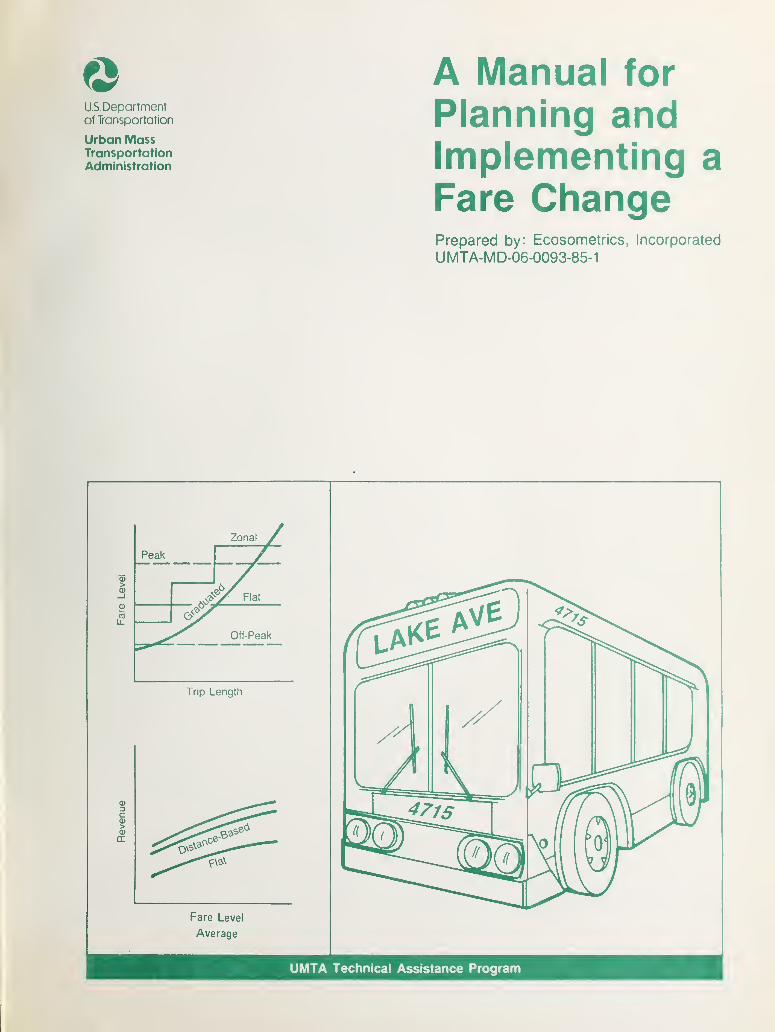
A Manual for
Planning andImplementing aFare ChangePrepared by: Ecosometrics, Incorporated
UMTA-MD-06-0093-85-1
Fare Level
Average
U.S. Departmentof Transportation
Urban MassTransportationAdministration
UMTA Technical Assistance Program

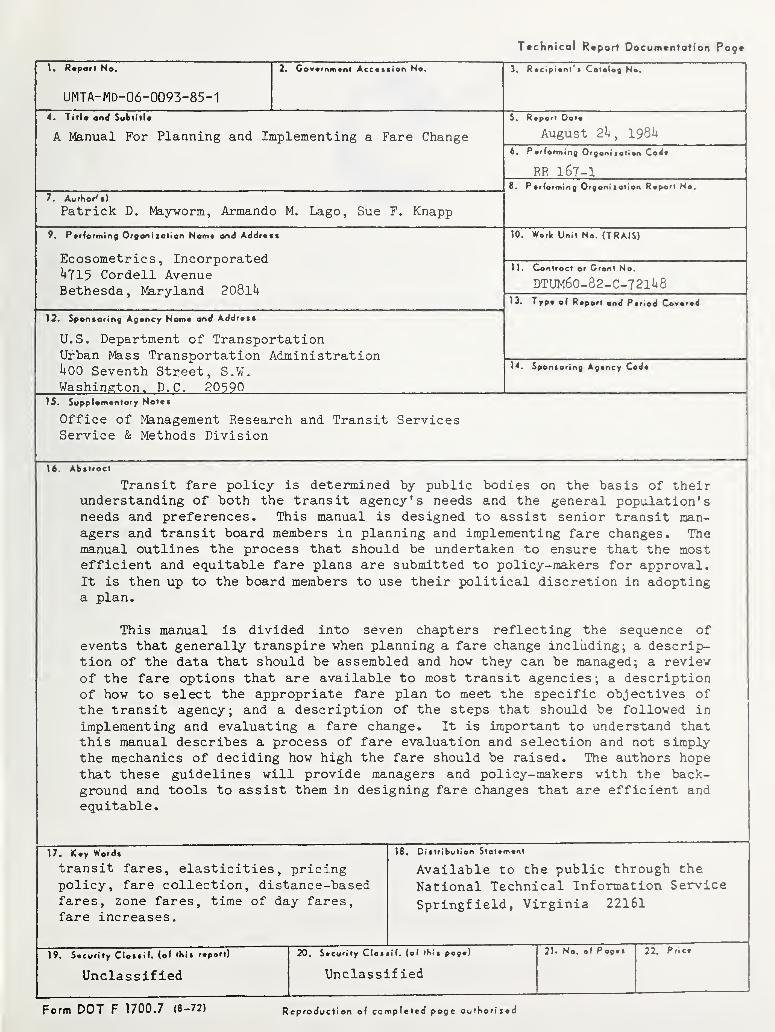
Ttchnical Report Docum«ntotion Poge
I. Raporl No.
UlviTA-MD-06-0093-85-1
2. Gov«rnm«nf Accession No. 3. R»cipi«nt't CotaloQ Ho.
4. 1 III* ond Subtitle
A Manual For Planning and Implementing a Fare Change August 2U, 198I4
6. Parformmg Orgoniiotion Cod*
RR I6T-I8. Porforming Orgoniiotion Rapert Ho.
7 AiitKnr^ < J
Patrick D. Mayvorm, Armando M. Lago, Sue F. Knapp
9. Porforming Orgonitotion Nom* ond Addrctt
Ecosometrics , Incorporated^+715 Cordell AvenueBethesda, Maryland 208li+
10. Work Unit No. (TRAIS)
)1. Controct or Cront No.
DTUM6O-82-C-T2II4813. Typ* of Report ond Period Corered
12. Sponsoring Agoncy Nemo and Addrot*
U.S. Department of TransportationUrban Mass Transportation Administration1+00 Seventh Street, S.W.Washington. D.C. 20590
14. Sponioring Agency Cod*
15. Supplomontory Notes
Office of Management Research and Transit ServicesService & Methods Division
16. Abstroet
Transit fare policy is determined by public bodies on the basis of theirunderstanding of both the transit agency's needs and the general population'sneeds and preferences. This manual is designed to assist senior transit man-
agers and transit board members in planning and implementing fare changes. Themanual outlines the process that should be undertaken to ensure that the mostefficient and equitable fare plans are submitted to policy-makers for approval.
It is then up to the board members to use their political discretion in adoptinga plan.
This manual is divided into seven chapters reflecting the sequence ofevents that generally transpire when planning a fare change including; a descrip-tion of the data that should be assembled and how they can be managed; a review
of the fare options that are available to most transit agencies; a descriptionof how to select the appropriate fare plan to meet the specific objectives of
the transit agency; and a description of the steps that should be followed in
implementing and evaluating a fare change. It is important to understand thatthis manual describes a process of fare evaluation and selection and not simplythe mechanics of deciding how high the fare should be raised. The authors hope
that these guidelines will provide managers and policy-makers with the back-ground and tools to assist them in designing fare changes that are efficient andequitable.
17. iCoy Words
transit fares, elasticities, pricingpolicy, fare collection, distance-basedfares, zone fares, time of day fares,fare increases.
IS. Dittrlbution Slolerrient
Available to the public through the
National Technical Information Service
Springfield, Virginia 22161
19. Security Clossif. (of iKis report)
Unclassified
20. Security Cloifif. (of (hit poge)
Unclassified
21. No. of Pego 22. Pr.c*
Form DOT F 1700.7 (e-72) R eproduction of completed pOQc outhorized

Research Report I67-I
A MANUAL FOR PLANNING AND IMPLEMENTING A FARE CHANGE
Service and Methods DivisionOffice of Management Research and Transit Services
Urban Mass Transportation AdministrationU.S. Department of Transportation
Contract DTUM60-82-C-T21U8
4715 COROELL AVENUE • BETHESDA. MARYLAND 20814 30vfi52 2414
by
Patrick D, MaywormArmando M. Lago
Sue F. Knapp
August 2h, I98U
for

PREFACE
Transit fare policy is determined by public bodies on the basis of theirunderstanding of both the transit agency's needs and the general population'sneeds and preferences. Since one location will have different needs and aspira-tions than another, transit fare policies are seldom the same. Moreover, farepolicies will change from time to time even within the seune area as public at-titudes and priorities change. In light of these conditions, the establishmentof fare policy must be based on economic and technical issues, as well as polit-ical issues, since the main purpose of fare policy in these times of budgetaryrestraint is to generate passenger revenues in the most efficient and equitablemanner.
This manual is designed to assist senior transit managers and transit boardmembers in planning and implementing fare changes. The manual outlines theprocess that should be undertaken to ensure that the most efficient and equitablefare plans are submitted to policy-makers for approval. It is then up to theboard members to use their political discretion in adopting a plan.
This manual is divided into seven chapters, reflecting the sequence ofevents that generally transpire when planning a fare change. Chapter 1 describesthe role of fare policy in financing public transportation services. Chapters
2 and 3 describe the fare planning process and the basic organizational require-ments for carrying the process from conception to implementation. The fourthchapter describes the data that should be assembled and how they can be managed.
Chapter 5 provides a review of the fare options that are available to most tran-sit agencies. In particular, the chapter reviews alternative fare structures,fare collection methods, and promotional fare policies. With this background,the sixth chapter describes how to select the appropriate fare plan to meet thespecific objectives of the transit agency. Finally, Chapter T describes the
steps that should be followed in Junplementing and evaluating a fare change.
It is important to understand that this manual describes a process of fare
evaluation and selection and not simply the mechanics of deciding how high the
fare should be raised. The authors hope that these guidelines will providemanagers and policy-makers with the background and tools to assist them in
designing fare changes that are efficient and equitable.

TABLE OF CONTENTS
Page
1 ~ THE ROLE OF FARE POLICY IN PUBLIC TRANSIT FINANCING 1
How Much Should Users Pay? 2
Balancing Fare and Service Levels 3
2 — PLANNING FOR A FARE CHANGE 5
The Basic Idea 5
3 — PREPARING YOUR ORGANIZATION FOR FARE PLANNING 11
Defining an Organizational Structure and Staff Responsibility 11Setting Overall Fare Policy 13Setting Fare Policy Objectives 15
k — GATHERING AND MANAGING FARE PLANNING DATA IT
Gathering Fare Planning Data 17Managing Fare Planning Data 21Analyzing Fare Planning Data 21
5 ~ REVIEW OF FARE OPTIONS 27
Fare Structure Options 27Fare Collection Methods 3^
Promotional Fare Policies 39
6 — SELECTING THE APPROPRIATE FARE PLAN hi
Step 1: Evaluate Existing Fare Policies Ul
Step 2: Establish Evaluation Criteria for Analyzing Options U3
Step 3: Select Fare Options U7
Step U: Evaluate Fare Options 55
Step 5: Recommend Fare Plan to Transit Board 6l
7 — IMPLEMENTING AND EVALUATING THE FARE CHANGE c... 63
Involving Citizens in the Fare Planning Process 63
Establishing The Fare Evaluation Process 65Dealing with the Logistics of Fare Implementation 70
BIBLIOGRAPHY 71
APPENDIX: An Example of Selecting Fare Options


THE ROLE OF FARE POLICY

1
THE ROLE OF FAKE POLICY IN PUBLIC TRMSIT FINANCING
Passenger fares vere the predominant, if not the only, source of funds for
most public transportation systems until the 1960s. As it became more difficult
to finance public transportation solely from the farebox, municipalities and
other public authorities assvimed the ownership and responsibility for what had
previously been privately owned companies. The Federal government began to
provide greater assistance to meet the deficits created by increasing costs and
declining revenues.
Problems revolving around fares as the major source of income included:
• a major decline in transit ridership since the period of greatest usageduring World War II,
• a reluctance to raise fares by those responsible for regulating theoperations of the then privately owned companies,
• the perception of public transit as an "inferior good" that needed tobe priced substantially below other modes to attract riders, and
• the recognition that a substantial portion of transit riders was a
"captive market" that could afford no other option (meaning that any
fare increases would constitute a special economic hardship).
A number of these problems were explicitly recognized in the UMTA legisla-
tion of 197^ that, for the first time, provided Federal funds to subsidize
operating losses incurred by transit authorities in urban areas. This assist-
ance was explicitly provided so localities could maintain the lowest possible
fares and thus attract more riders.
-1-
These issues have now changed. Until recently, transit ridership had been
increasing. Further, the new equipment and services operated by many properties
have dispelled much of the negative image associated with transit riding. But
a large captive or transit-dependent submarket still exists, and this is one of
the considerations that continues to make fare increases politically sensitive
and difficult.
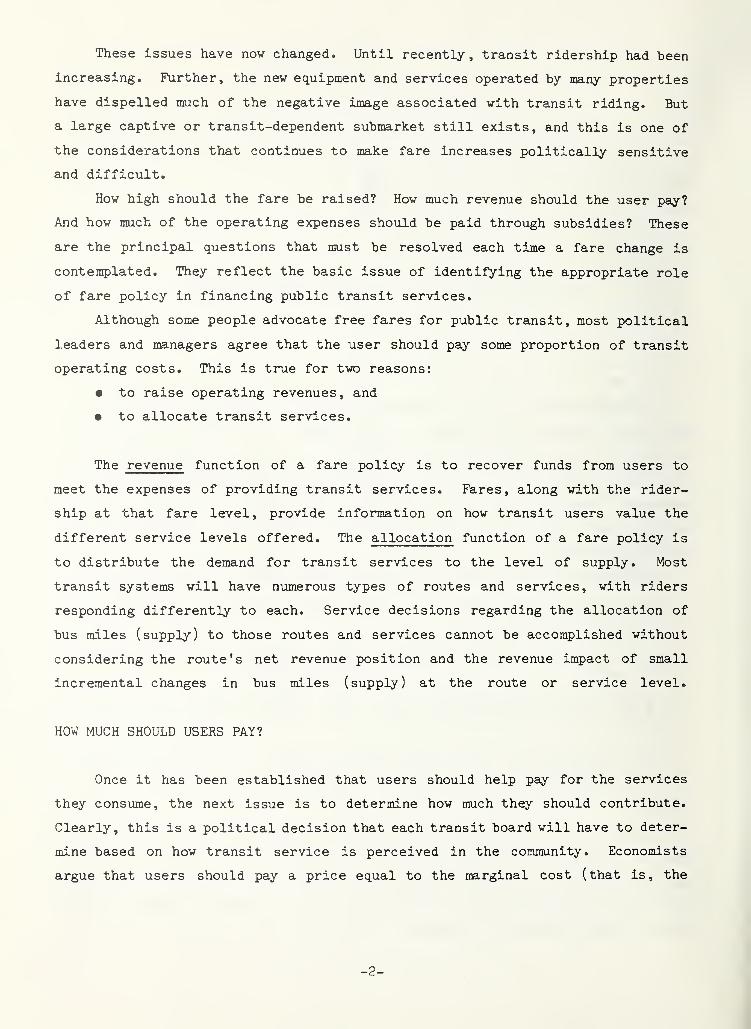
How high should the fare be raised? How much revenue should the user pay?
And how much of the operating expenses should be paid through subsidies? These
are the principal questions that must be resolved each time a fare change is
contemplated. They reflect the basic issue of identifying the appropriate role
of fare policy in financing public transit services.
Although some people advocate free fares for public transit, most political
leaders and managers agree that the user should pay some proportion of transit
operating costs. This is true for two reasons:
• to raise operating revenues, and
• to allocate transit services.
The revenue function of a fare policy is to recover funds from users to
meet the expenses of providing transit services. Fares, along with the rider-
ship at that fare level, provide information on how transit users value the
different service levels offered. The allocation function of a fare policy is
to distribute the demand for transit services to the level of supply. Most
transit systems will have numerous types of routes and services, with riders
responding differently to each. Service decisions regarding the allocation of
bus miles (supply) to those routes and services cannot be accomplished without
considering the route's net revenue position and the revenue impact of small
incremental changes in bus miles (supply) at the route or service level.
HOW MUCH SHOULD USERS PAY?
Once it has been established that users should help pay for the services
they consume, the next issue is to determine how much they should contribute.
Clearly, this is a political decision that each transit board will have to deter-
mine based on how transit service is perceived in the community. Economists
argue that users should pay a price equal to the marginal cost (that is, the
-2-
additional cost of transporting one more rider) . While this is the most effi-
cient price, it may also be too high to be politically feasible. Moreover,
many politiced. leaders feel that the cominunity as a whole benefits from the
existence of transit service, and thus, some government subsidization is Jus-
tifiable, Reduced traffic congestion, improved air quality, and to a lesser
extent, increased economic activity in the central business districts (CBDs) of
our cities have all been identified as benefits of transit service. The argu-
ments in support of these claims are rather complex and the evidence on which
to test them is not always strong. Consequently, it is difficult to establish
a standard level for all communities at which operating subsidies should be
provided
,
Traditionally, fares have been kept low to benefit low-income users. Re-
search has shown, however, that most transit subsidies financed by state and
local taxes are relatively inefficient mechanisms for channeling assistance to
low-income or other disadvantaged groups because of the inability to target the
subsidy. The benefits of low fares go to riders of all income classes, high
and middle, as well as low. Another approach to subsidizing low-income users
might be to maintain an established farebox recovery rate and to target specific
users by such means as transportation vouchers or coupons valid for transit
services.
How much users shoxild pay and how much should come from government subsi-
dies should be determined based on an understanding of all these issues. But
clearly, if Federal operating assistance is curtailed without the infusion of
new operating subsidies, farebox revenues will have to represent a larger share
of operating expenses than they do today,
BALANCING FARE AND SERVICE LEVELS
There is a tendency to think of the fare level only in terms of what it
will do to the financial condition of the transit agency. Seldom, if ever, do
transit managers plan fare changes in conjunction with service changes to meet
ridership needs. For example, there is a basic question of whether financial
resources, generated either internally or externally, should be used to support
fares or services. Money spent holding fares down might produce more ridership
and revenues if it were spent maintaining or increasing services.
-3-
To illustrate this point, consider the relationship that exists among
farebox revenues, outside subsidy support, and the cost of transit services. As
shown below, costs must be equal to subsidy plus revenue:
COST = SUBSIDY + REVENUE
If, for example, subsidy support diminishes, one or both of the remaining
components in the equation must be adjusted to maintain the betlance between cost
(outputs) and subsidy plus revenue (inputs). Typically, in the wake of subsidy
shortfalls, fares are increased and sei^ice levels are reduced so that available
revenues cover the operating expenses remaining after all outside subsidies have
been committed. But are such decisions always the best answers, or are they
only temporary solutions? Fares can play a more important role in supporting
new services.
The principal problem with transit planning today is that fare and service-
level decisions are seldom jointly planned, even though fares and service levels
are intrinsically related. In addition, less traditional fare and service
concepts are seldom given serious consideration when major policy changes are
under review. Some of these interesting concepts include conversion from con-
ventional service to paratransit (vanpools and taxi feeders), conversion of some
services to quality-based services with truly premium fares, and developing
private sector assistance and support (through merchant validation, business
support of specific services, and employer-subsidized pass programs).
This manual takes the position that fares do play an important role in
transit financing. They indicate the value of transit service since riders are
clearly willing to pay different prices for different levels of service. More
important, however, transit service benefits most those who use the service. A
user fee, therefore, is appropriate.
-U-

PLANNING FOR A FARE CHANGE

2PLANNING FOR A FARE CHANGE: THE BASIC IDEA
Transit managers and policy-makers have long advocated establishing fare
levels that would not change over several years. However, with rising costs
and uncertainties about the level of operating subsidies available, fare changes
have been occurring more frequently. Fare changes should, in fact, be considered
at least annually since the demand for transit service is constantly changing.
Moreover, new fare policies must be set as new service concepts are developed
and implemented.
Planning a fare change, therefore, is not an occasional event, but rather a
process that may involve all personnel levels within the organization and may
also affect the services provided, the level of patronage, arid the financial
position of the agency. This manual presents a structured fare planning process
that involves developing a detailed strategy for meeting your agency's goal for
providing service. As an exaunple, the fare planning process can yield a fare
plan that, when implemented, maximizes ridership while meeting the revenue re-
quirements not met by other sources.
THE BASIC IDEA
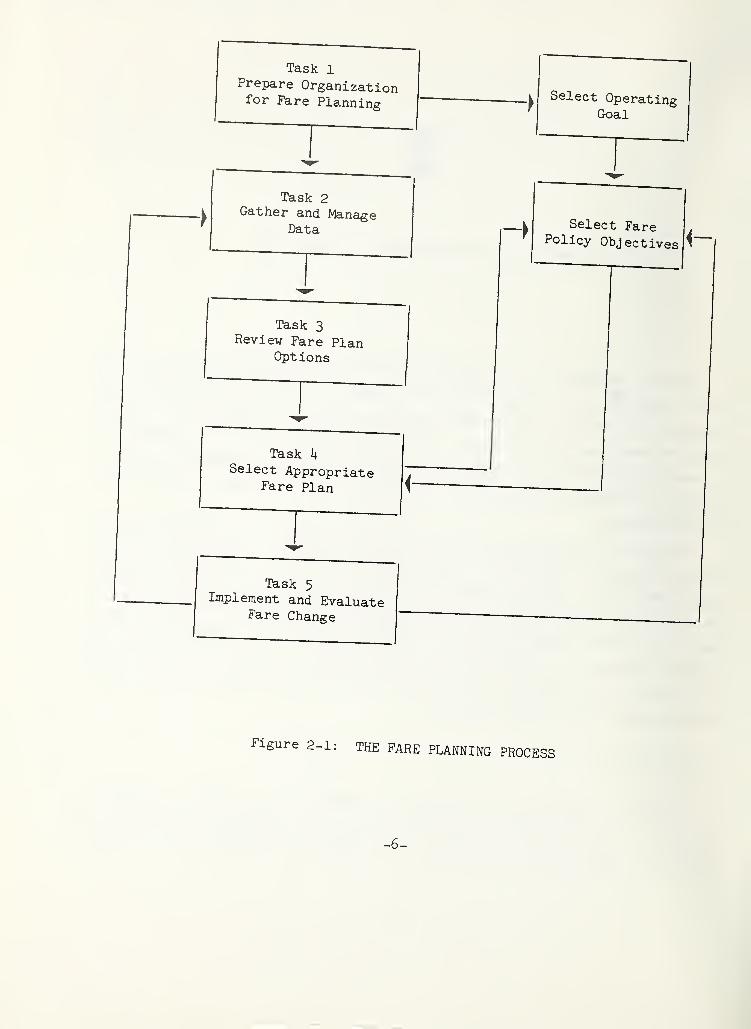
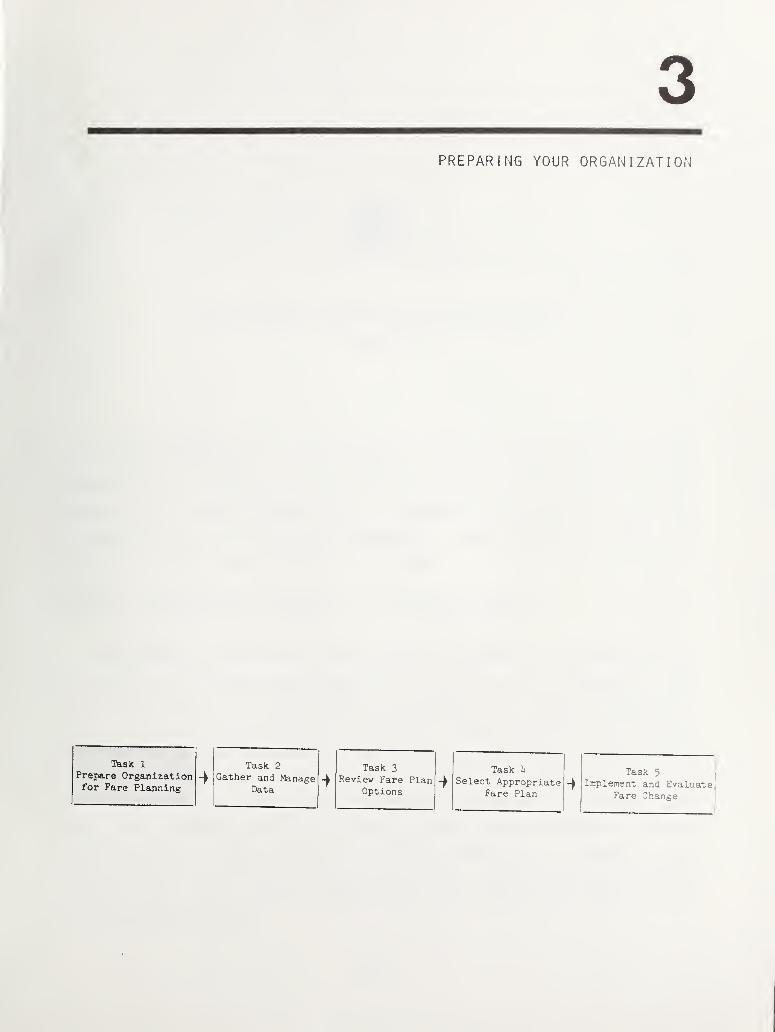
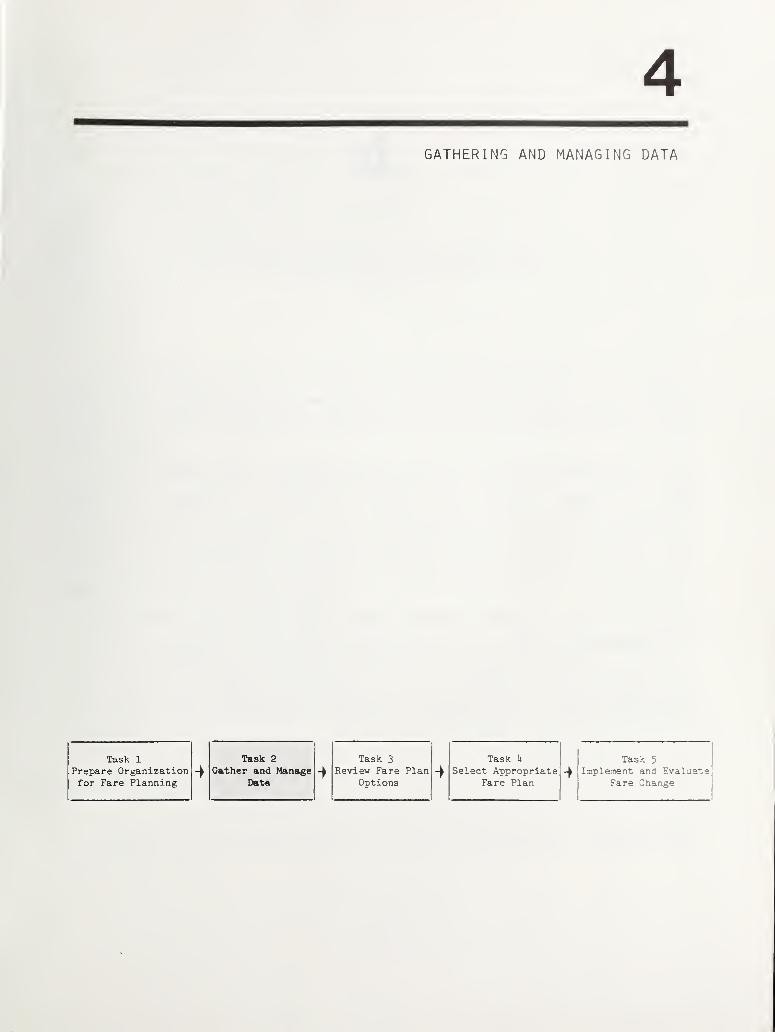
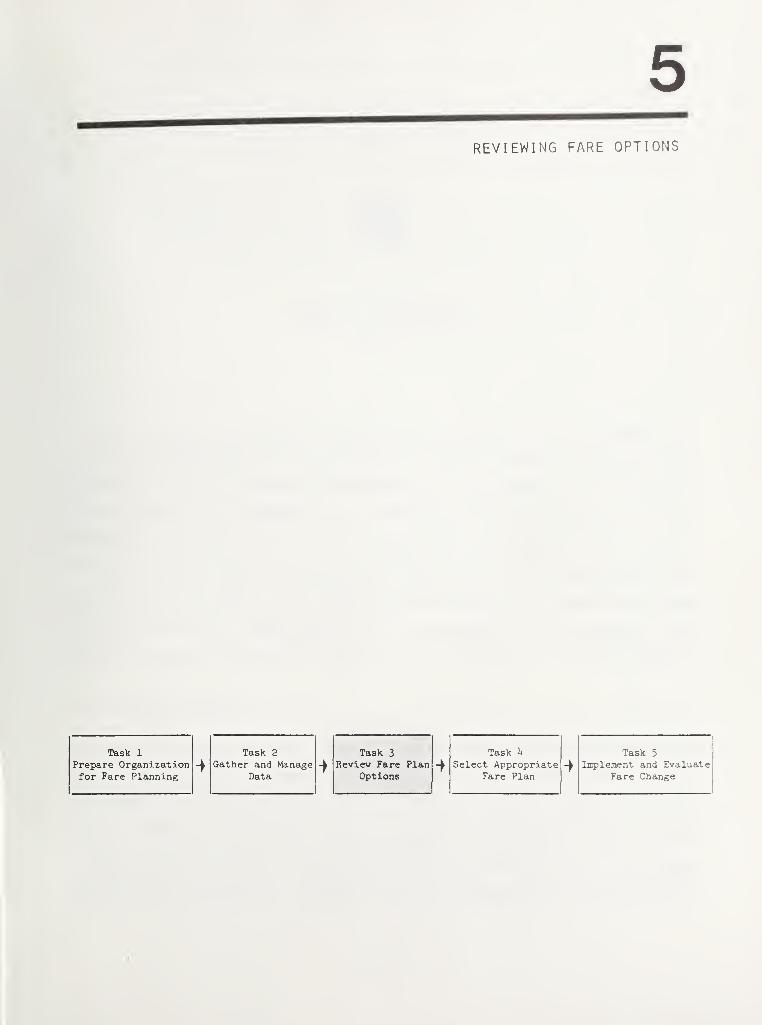
The fare planning process involves a series of five tasks, as shown in
Figure 2-1. The method outlined here follows the basic format of a management by
objectives (MBO) approach to planning. The tasks are implemented in an orderly
-5-
Task 1Prepare Organizationfor Fare Planning
Task 2Gather and Manage
Data
Task 3Review Fare Plan
Options
Task k
Select AppropriateFare Plan
Select OperatingGoal
SelectPolicy Ot
' Fare -
Jectives ^
Task 5Implement and Evaluate
Fare Change
Figure 2-1: THE FARE PLANNING PROCESS
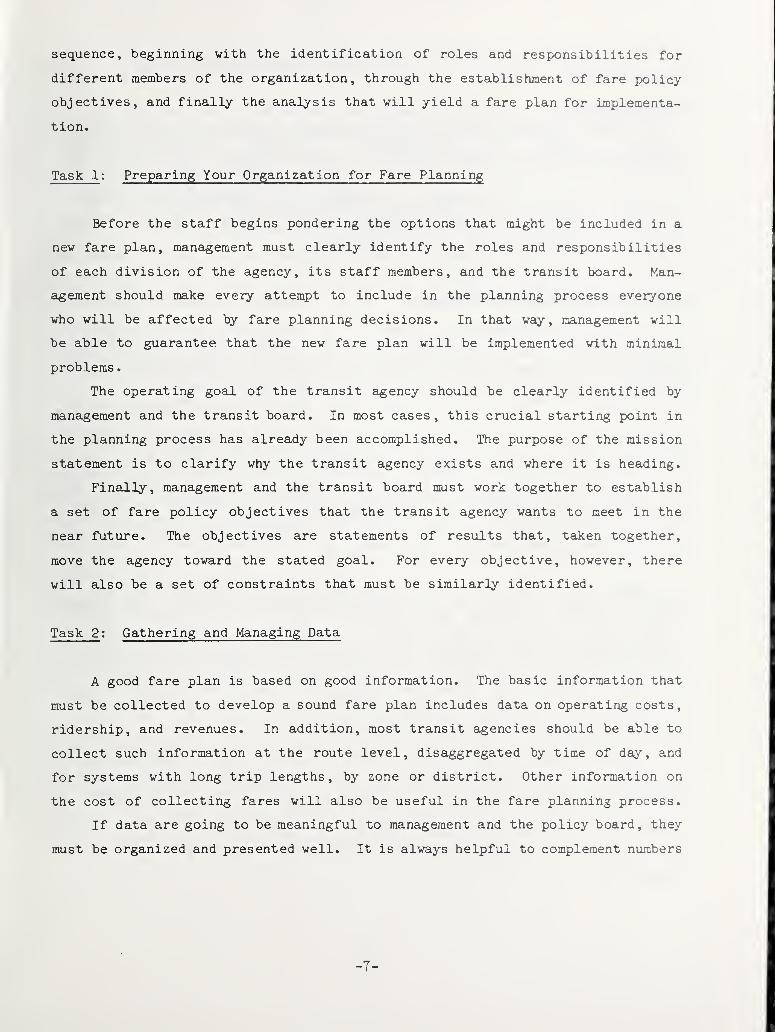
sequence, beginning vith the identification of roles and responsibilities for
different members of the organization, through the establishment of fare policy
objectives, and fineilly the analysis that will yield a fare plan for implementa-
tion.
Task 1 : Preparing Your Organization for Fare Planning
Before the staff begins pondering the options that might be included in a
new fare plan, management must clearly identify the roles and responsibilities
of each division of the agency, its staff members, and the transit board. Man-
agement should make every attempt to include in the planning process everyone
who will be affected by fare planning decisions. In that way, management will
be able to guarantee that the new fare plan will be implemented with minimal
problems
.
The operating goal of the transit agency should be clearly identified by
management and the transit board. In most cases, this crucial starting point in
the planning process has already been accomplished. The purpose of the mission
statement is to clarify why the transit agency exists and where it is heading.
Finally, management and the transit board must work together to establish
a set of fare policy objectives that the transit agency wants to meet in the
near future. The objectives are statements of results that, taken together,
move the agency toward the stated goal. For every objective, however, there
will also be a set of constraints that must be similarly identified.
Task 2 : Gathering and Managing Data
A good fare plan is based on good information. The basic information that
must be collected to develop a sound fare plan includes data on operating costs,
ridership, and revenues. In addition, most transit agencies should be able to
collect such information at the route level, disaggregated by time of day, and
for systems with long trip lengths, by zone or district. Other information on
the cost of collecting fares will also be useful in the fare planning process.
If data are going to be meaningful to management and the policy board, they
must be organized and presented well. It is always helpful to complement numbers
-T-
on costs, ridership, and revenues with graphics. Bar and line charts showing
trends are useful management tools because they communicate information quickly
and efficiently.
The information employed to analyze alternative fare options may not always
be readily available. Demand elasticities, for example, are needed to test the
ridership and revenue impacts of fare changes. Although demand elasticities
from other systems can be used, it is advised that elasticities be estimated
from historical data collected from your own transit agency. Thus, the manage-
ment of information may also require data analysis.
Task 3 : Reviewing Fare Options
To develop a fare plan appropriate for your transit system, you should be
aware of the advantages and disadvantages of alternative fare structures, fare
collection methods, and policies on the use of promotional fares.
The fare structure refers to the relative prices charged for different tran-
sit sei-vices. In a flat fare structure, all riders are charged the same fare
for all services during all periods of the day. A flat fare structure, conse-
quently, is the easiest system to apply. Alternative fare structures include
distance-based, time-based, and quality-based fares, special fares for different
user groups, and transfer charges. Each fare structure can be applied uniquely
or in conjunction with another fare structure.
It is important to consider how the fare is collected when a change in fares
is contemplated. As fare levels approach and exceed one dollar, cash payment
— the dominant method of fare payment — becomes more burdensome on both the
operator and the user. Alternative fare collection methods that can be analyzed
for their ridership, cost, and operational impacts include fare prepayment, fare
postpayment, and self-service fare collection. The latter method of payment
has only recently been applied in this country.
Finally, every transit system will at one time or another experiment with
promotional fares as a marketing tool to generate ridership. The experience of
using price to generate rides without having a negative impact on revenues is
mixed. Fortunately, a significant amount of research has been done on price
promotion, to help managers select the method that will best reach their target
populations.
-8-
Task k : Selecting the Appropriate Fare Plan
The most Important task In the fare planning process is selecting the fare
plan that will be submitted to the transit board for approval. This phase,
which requires the greatest ajnount of technical work involving many staff
levels, constitutes five separate steps.
First, the staff should provide a detailed inventory of the existing con-
ditions in the transit system. The existing fare levels and policies, ridership
and revenue levels by fare paying category, operating cost information, and
issues related to the fare collection process should be clearly identified.
Second, board members, management, and staff must decide what evaluation
criteria to select, and how they will be used to evaluate the alternative fare
structures, fare collection methods, promotional fares, and fare levels under
review. The evaluation criteria should include at least the following concepts;
revenue production, ridership generation, operational simplicity and cost, and
user equity.
The third step involves selecting the fare options to test. Numerous
options could be tested because of the many combinations of fare structures and
fare collection methods available. Consequently, management and staff must be
able to combine their knowledge of the current system with the range of options
available, to develop a short list of three or four options that can be evaluated
in more detail.
The actual evaluation process takes place in the fourth step. Here, a
technical analysis of each option is performed, as well as a subjective review
by operations and planning staff to determine the workability of each option.
The result of this analysis will be a ranking of each option according to how
well it meets specific criteria established earlier in the process.
The final step is recommending a fare plan to the transit board for approv-
al. Here, the staff presents the options to the board, describing why the
recommended plan is the preferred choice. If the board members are aware of
the selection process described in this manual and have participated in defining
the objectives and evaluation criteria, the approval process should flow smooth-
ly. It is imperative that the board members contribute to the fare planning
process before a fare plan is presented to them for approval.
-9-
Task_5 : Implementing and Evaluating the Fare Change
Nov that a fare plan has been adopted by the transit board, management and
staff must come up with a schedule for its implementation. This requires the
concerted effort of the planning, marketing, and operations departments of the
transit agency. While some fare changes can be made at one time, most complex
fare changes require implementation in sequence to minimize confusion and cost.
The marketing department is usually given the role of selling the new fare plan
to the public.
Because of funding shortages, many transit agencies do not monitor and eval-
uate the impacts of fare changes. Since fare planning is a process that should
recur at least annually, data on the effect of fare changes on ridership, costs,
and revenues are important for future fare planning. If an efficient system for
collecting data is in place, evaluating the impacts of fare changes can be an
inexpensive endeavor.
-10-
3PREPARING YOUR ORGANIZATION
Task 1
Prepare Organizationfor Fare Planning
Task 2
Gather and ManageData
Task 3
Review Fare PlanOptions
Task U
Select AppropriateFare Plan
Ias.< T
Implement and Evaluate
|
Fare Chani;e

3PREPARING YOUR ORGANIZATION FOR FARE PLANNING
(TASK 1)
If fare planning is to be an efficient process vith a minimum of delays
and problems, management must be prepared to clearly identify the roles and
responsibilities of individuals vithin the organization. In addition, it must
be able to work with the transit board to establish an overall fare policy for
the agency and a set of fare policy objectives. Only with these in place can
the transit agency begin to develop a fare plan.
DEFINING AN ORGANIZATIONAL STRUCTURE AND STAFF RESPONSIBILITY
The purpose of defining an organizational structure at the outset is to
identify who in the organization should be involved in fare planning and what
their roles should be. Several levels of personnel are involved in fare plan-
ning. At the top, senior management and transit board members set the policies
and establish the goals and objectives of the organization. They are responsible
for the fare plan that finally emerges from the process outlined in this manual.
Staff members, on the other hand, are responsible for data collection and man-
agement, data analysis, and other technical issues in fare planning. In many
organizations, the staff provides the planning process with knowledge of the
state-of-the-art in fare practices and of day-to-day operational issues. Table
3-1 shows which groups have the responsibility for accomplishing each task in
the fare planning process.
-11-
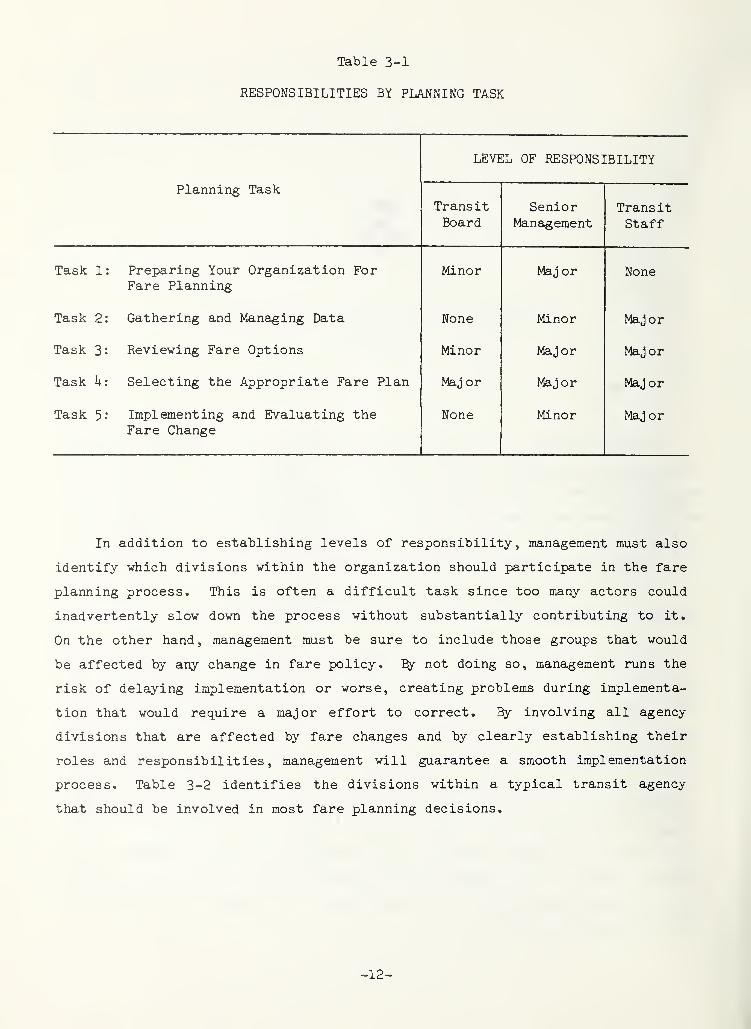
Table 3-1
RESPONSIBILITIES BY PLANNING TASK
LEVEL OF RESPONSIBILITY
Planning TaskTransitBoard
SeniorManagement
TransitStaff
Task 1: Preparing Your Organization ForFare Planning
Minor MaJ or None
Task 2: Gathering and Managing Data None Minor Major
Task 3: Reviewing Fare Options Minor Major Maj or
Task k: Selecting the Appropriate Fare Plan Maj or Maj or Maj or
Task 5: Implementing and Evaluating theFare Change
None Minor Maj or
'. In addition to establishing levels of responsibility, management must also
identify which divisions within the organization should participate in the fare
planning process. This is often a difficult task since too many actors could
inadvertently slow down the process without substantially contributing to it.
On the other hand, management must be sure to include those groups that would
be affected by any change in fare policy. Ey not doing so, management runs the
risk of delaying implementation or worse, creating problems during implementa-
tion that would require a major effort to correct. By involving all agency
divisions that are affected by fare changes and by clearly establishing their
roles and responsibilities, management will guarantee a smooth implementation
process. Table 3-2 identifies the divisions within a typical transit agency
that should be involved in most fare planning decisions.
-12-
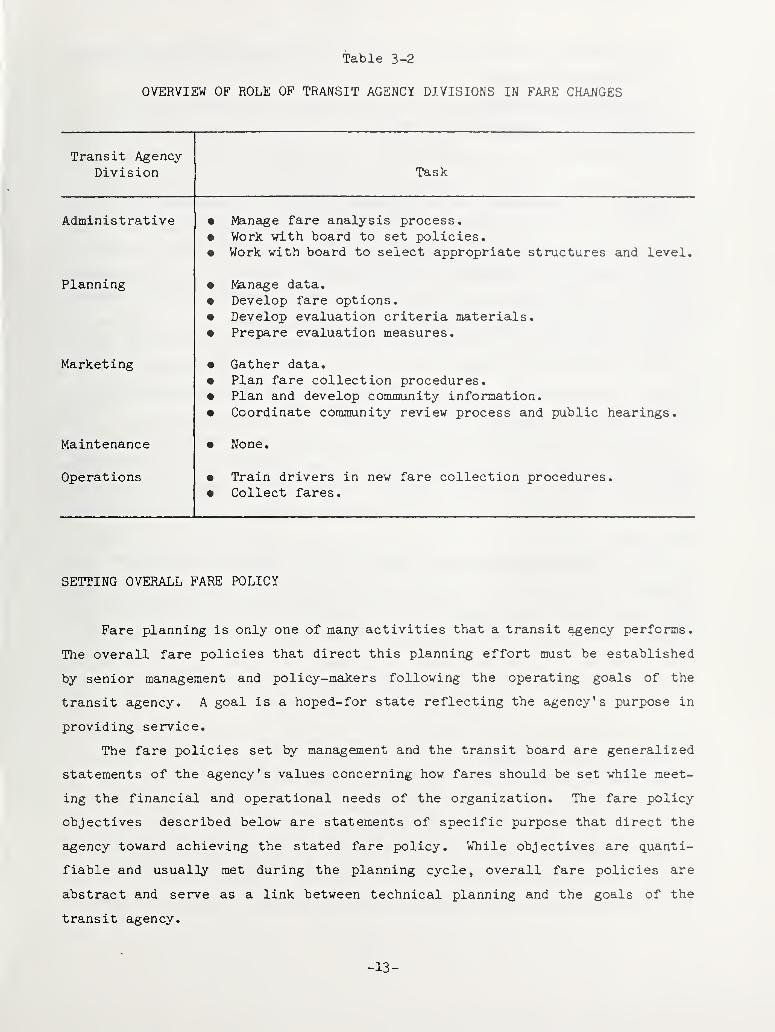
Table 3-2
OVERVIEW OF ROLE OF TRANSIT AGENCY DIVISIONS IN FARE CHANGES
Transit AgencyDivision Task
Administrative • Manaige fare analysis process.• Work with board to set policies.• Work with board to select appropriate structures and level.
Planning • Manage data.
• Develop fare options.• Develop evaluation criteria materials.• Prepare evaluation measures.
Marketing • Gather data.
• Plan fare collection procedures.• Plan and develop community information.• Coordinate community review process and public hearings.
Maintenance • None.
Operations • Train drivers in new fare collection procedures.• Collect fares.
SETTING OVERALL FARE POLICY
Fare planning is only one of many activities that a transit agency performs.
The overall fare policies that direct this planning effort must be established
by senior management and policy-makers following the operating goals of the
transit agency. A goal is a hoped-for state reflecting the agency's purpose in
providing service.
The fare policies set by management and the transit board are generalized
statements of the agency's values concerning how fares should be set while meet-
ing the financial and operational needs of the organization. The fare policy
objectives described below are statements of specific purpose that direct the
agency toward achieving the stated fare policy. While objectives are quanti-
fiable and usually met during the planning cycle, overall fare policies are
abstract and serve as a link between technical planning and the goals of the
transit agency.
-13-
Transit fare policies can usually be categorized into one of four groups:
• revenue production,
• ridership generation,
• operational needs and costs , and
• user equity.
Revenue production policies are those that identify the importance of fare-
box revenues. If subsidy sources are plentiful, revenue production policies may
not be as important as ridership or equity policies. However, as transit operat-
ing costs rise without a similar increase in operating subsidies, most transit
agencies will be setting fare policies whose main objective will be revenue
generation from changes in fare levels and fare structures.
Ridership generation policies have usually become less important as fare-
box revenues have become a major source of funds for financing transit service.
Very often transit boards will set policies that determine a minimiim loss of
ridership that can result from a fare change.
Policies are usually also established to promote fare structure simplicity,
operational feasibility, and cost-effectiveness. Simplicity and understand-
ability have become increasingly important as fare structure designs have become
more complex. These fare policies are designed to maintain passenger commitment
and low cost.
Fare policies promoting user equity are often vague simply because few
policy-makers have defined the term "equity." Recent definitions used in form-
ulating policy objectives include equivalent fare per mile and equivalent cost
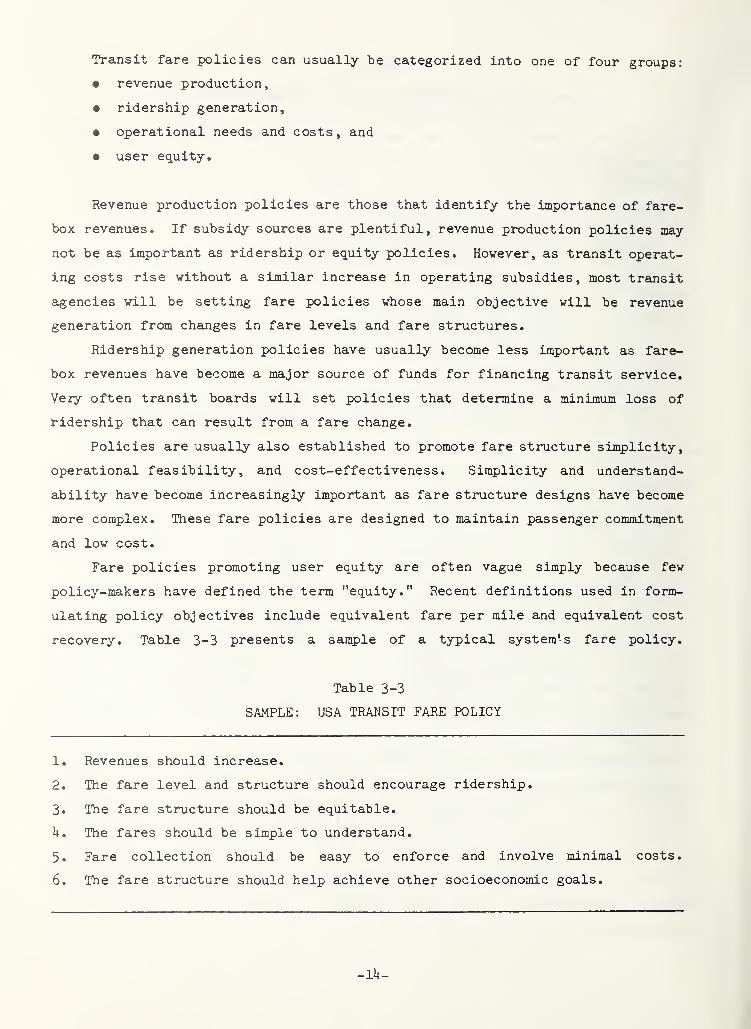
recovery. Table 3-3 presents a sample of a typical system's fare policy.
Table 3-3
• SAMPLE: USA TRANSIT FARE POLICY
1. Revenues should increase.
2. The fare level and structure should encourage ridership.
3. The fare structure should be equitable.
h. The fares should be simple to understand.
5. Fare collection should be easy to enforce and involve minimal costs.
6. The fare structure should help achieve other socioeconomic goals.
-lU-
SETTING FARE POLICY OB.JECTIVES
Once board members have decided on the fare policies for the transit agency,
management must plot a strategy for meeting them. Specific fare policy objec-
tives are established for this purpose. The objectives are used in the planning
process to clearly define the position of the transit agency once the fare plan
has become operational. The fare planning process, therefore, is designed to
meet those objectives.
In selecting the objectives, management must be certain that it develops a
comprehensive list covering all aspects of a given fare policy. The policy
objectives, moreover, should be measurable whenever possible. "Increasing fare-
box revenues" is not a measurable quantity. "Increasing farebox revenues by $1
million per year" is a specific objective that can be used to evaluate alterna-
tive fare plans.
Occasionally, however, fare policy objectives cannot be measured or fore-
casted in precise quantitative units. Professional Judgmental ratings or rank-
ings should then be used. Such measures are often as important as the quantifi-
able objectives in an evaluation. As described in Chapter 6, the evaluation
and selection process involves both the qualitative and the quantitative
impacts.
Fare policy objectives, like the policies they hope to achieve, are not
static. They are subject to continuous review and can be modified as conditions
change. What is important to remember, however, is that they provide a means
of initiating a fare planning process. Without clearly stated objectives that
can be realisticaJLly reached during the planning cycle, the fare planning
process would be without the direction and yardsticks needed to evaluate fare
plans. Table 3-U presents a sample of fare objectives for a typical system.
-15-
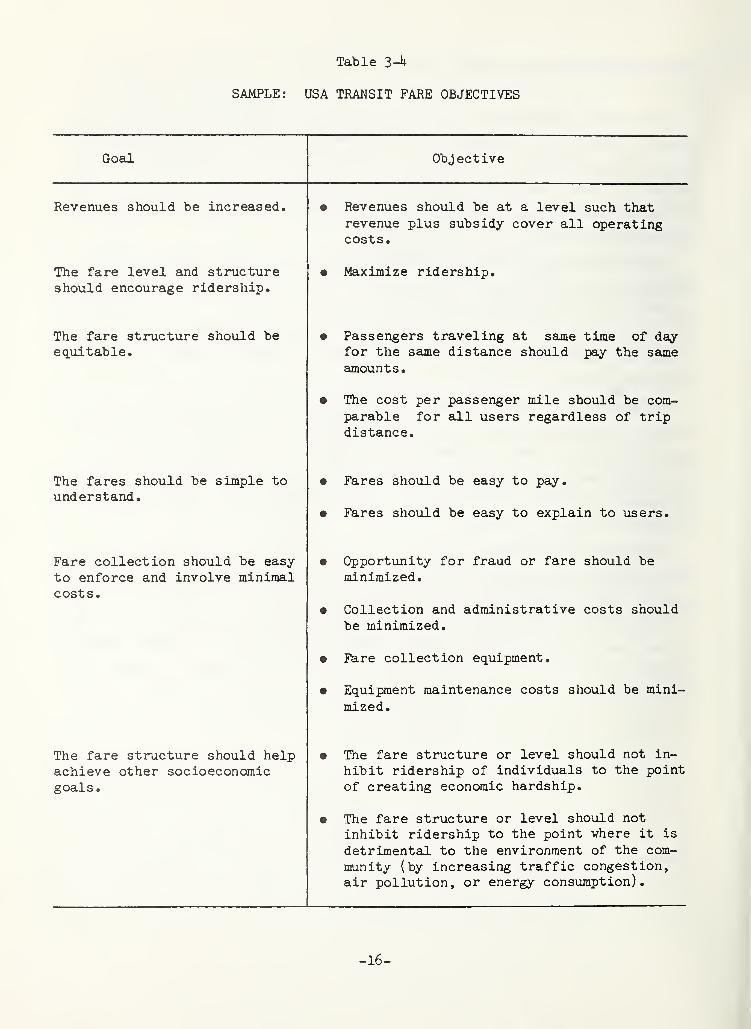
Table 3-^
SAMPLE: USA TRANSIT FARE OBJECTIVES
Goal Obj ective
Revenues should be increased. • Revenues should be at a level such thatrevenue plus subsidy cover all operatingcosts.
The fare level ajid structureshould encourage ridership.
w ITkXA JJUX ZiCT I XU, CI oiiX^ •
The fare structure should beequitable.
• Passengers traveling at same time of dayfor the saine distancf* shoiil d tviv tVip ^am^
amounts.
• The cost per passenger mile should be com-parable for all users regardless of tripdistance.
The fares should be simple tounderstand.
•
•
Fares should be easy to pay.
Fares should be easy to explain to users.
Fare collection should be easyto enforce and involve minimalcosts
•
•
•
Opportunity for fraud or fare should beminimized.
Collection and administrative costs shouldbe minimized.
• Fare collection equipment.
• Equipment maintenance costs should be mini-
mized.
The fare structure should helpachieve other socioeconomicgoals.
• The fare structure or level should not in-
hibit ridership of individuals to the point
of creating economic hardship.
• The fare structure or level should not
inhibit ridership to the point where it is
detrimental to the environment of the com-
munity (by increasing traffic congestion,air pollution, or energy consumption).
-16-
4GATHERING AND MANAGING DATA
Task 1
Prepare Organizationfor Fare Planning
Task 2
Gather and ManageData
Task 3
Review Fare PlanOptions
Task 1*
Select AppropriateFare Plan
Task 5
Implement and EvaluateFare Change

4GATHERING AND MANAGING FARE PLANNING DATA
(TASK 2)
Fare planning is only as good as the information on which it is based.
Consequently, management must be certain that accurate, timely, and relevant
data are collected and managed to support the fare planning activities outlined
in this manual.
Fare planning is not independent from service or financial planning. Rid-
ership, for example, is affected by travel time, service reliability, walk
time, and comfort, as well as by price. The amount of service miles provided,
in fact, will be determined indirectly from the level of fares charged. The
data collected and managed to support fare planning, therefore, are used for
several levels of decision-making.
This chapter describes the information necessary for fare planning and how
it should be managed. In addition, some data used in the evaluation must be
derived or estimated from available information. Demand elasticities, for ex-
ample, should be estimated from historical data on past ridership response to
fare changes. The most popular methods for doing this are briefly described
below.
GATHERING FARE PLANNING DATA
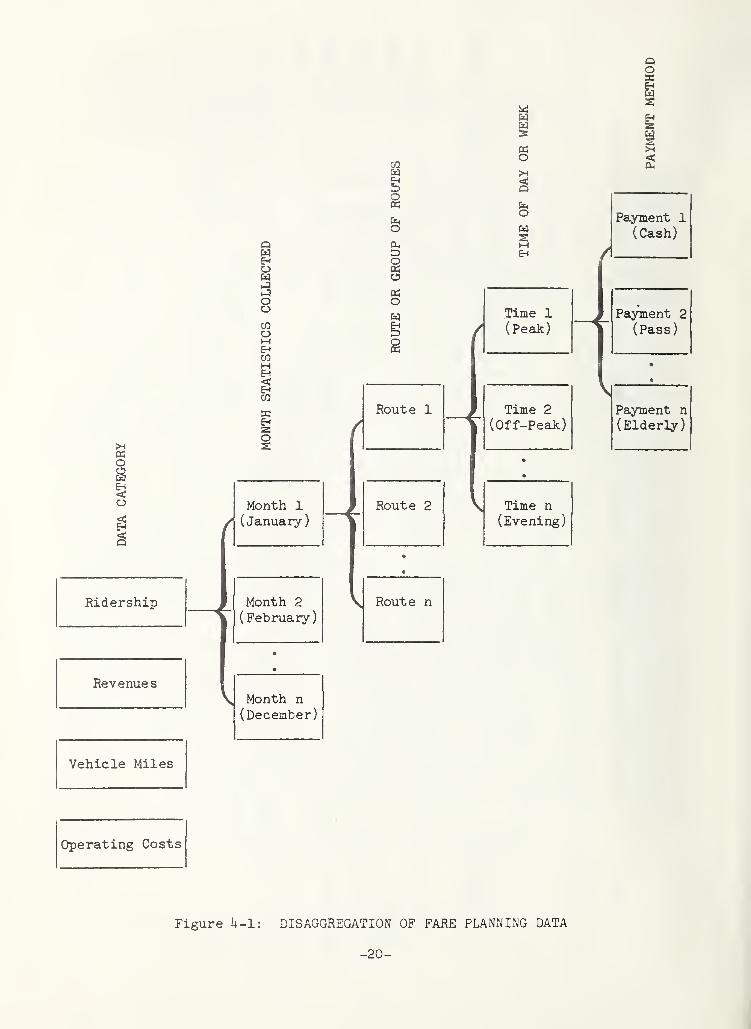
For most fare planning activities, transit managers need to collect only
four types of data:
-IT-
• ridership,
• revenues
,
• vehicle miles, and
• operating costs.
If relatively accurate and timely statistics can be easily obtained, most of the
fare plan options described in this manual can be evaluated with these data.
Since the fare planning process is interested in adapting the fare structure
to on-going changes , each of the data types mentioned above must be viewed over
time. Statistics on each of the variables should be collected periodiceilly (in
other words, time-series data are required). Very frequent tabulations 'made by
the day or week are perhaps useful for day-to-day operations, but are not neces-
sary for fare planning. Data tabulated on a monthly basis are most appropriate.
In addition to time-series data, each data type should be disaggregated on
at least three dimensions: route type, time of day, and payment method. The
geographic dimension will allow management to analyze fare options by route
type and by trip length. Although providing revenue, ridership, vehicle miles,
and operating costs by route type is not particularly difficult, most transit
agencies will have problems disaggregating revenues and ridership by trip
length. Occasional surveys of passengers is the only way to maintain timely
information on trip-length distributions.
It is also important to collect data along the temporal dimension since
fare structures can be designed to consider differences in travel demand and
marginal costs. Data should be disaggregated into a.m. and p.m. peaks, midday,
evening, and late night. Data on weekend service should also be provided.
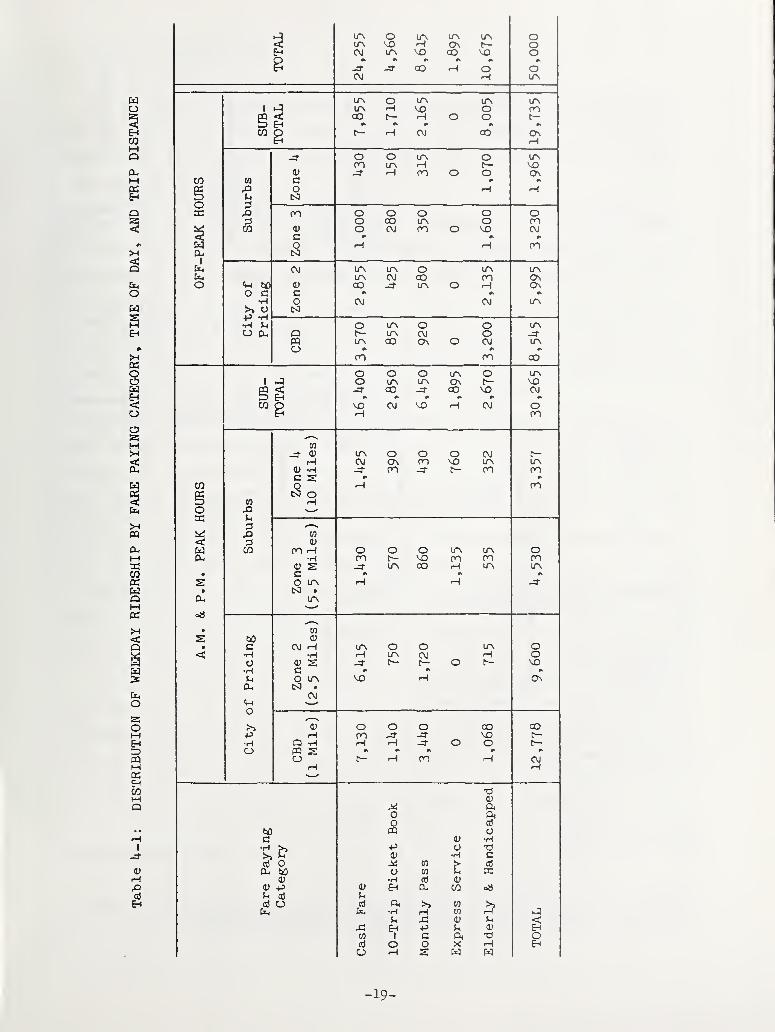
Finally, revenue and ridership statistics should be disaggregated according
to payment method and fare paying group. Cash fares, for example, should be
divided according to the type of cash fares available (adult, student, senior
citizen, etc.). Fare prepayment methods should be similarly disaggregated.
Table h-1 presents an example of the distribution of weekday ridership by
fare category, time of day, and trip distance. Figure k-1 presents a schematic
of the data types to be collected for fare planning, along with the various
characteristics upon which those data should be disaggregated.
-18-
:^o O
LP> vo C7\ t-— oOJ VD vo o-J- ^ QO -H o oCM r-i
u\ o u\ LTN,1 M i
'"I VO o CIOcc\ c h-^
**
UJ 2 r
—
OJ GO«H
O o oPO H
0) H on o o\JJ CO
^ oi—
>
CsJ
CO o O o o Oo CY"! fOUJ o r\ 1 CM
cO J J
Pu11
(in CM LTN ITN o ltx
L/\ OJ OO on CTn
^ 1 t\\H/ C?\f-*
O CM OJ LTN
S O•P O o o L/\O Oi CM o -3"
PQ OO C7\ O OJ
Cm on OO
O o o LPs o LP\
1 O C7\ t
—
Vi3
s 00 OO vo CM
s om
u> o O O OJ1 /-»
1 ON on ltn LTN
1) 'H 1 C 1 00>^ ^_O 1
1—
1
roo
Q
CO
UJ Cm r-1 ^—
/
/—
\
o LPs ot-U 'H CO t"
—
on on c^OD i-H LPv LTN
o —1
• CSI •A
*- ^
CO
00 (11
• C OJ iH Lrx o o LP\ o<; CM
C"
—
_j oO fs
L vo
OCL, tS] .
CM«M ^ "
o
>> O o O CO OOiH on J" VO
•H (—
1
_J \^O m so _J Cm i—
J
CMr-(
d)
-*« n.riVJ Qj>-Hvj cu
Oc•H o rr^
aJ o CO aCu O CO C X
0) •H 05 <p
OJ +J OJ E-i Dh cn o803 u
ct) U 05 !>> W >^•H H CO
x: (D (h
EH -pCO 1 C ft o O
O o X rHo w W
-19-
QO
KO
O
ooCOoMEHCOMEH
CO
KEHSo
Ridership
Revenues
Month 1
(January)
Month 2
(February)
V Month n
(December)
Vehicle Miles
COw
o
o
P3Ow
Route 1
Route 2
\ Route n
w
«o
EHIS
>H
EC4
o Payment 1(Cash)
Eh /
Time 1 Payment 2(Peak) (Pass)
Time 2
(Off-Peak)Payment n
(Elderly)
Time n(Evening)
Operating Costs
Figure h-1: DISAGGREGATION OF FARE PLANNING DATA
-20-
MANAGING FARE PLANNING DATA
The purpose of collecting data is to assist managers in mstking decisions.
Pages of computer printouts, therefore, must be organized and presented to
management in such a way as to facilitate the decision-making process. Infor-
mation is processed data.
The first point about processing data is that all figures should be pre-
sented in chronological order. Since most of the data are collected periodical-
ly, management should be viewing the figures as the events took place. It is
also advisable that entire reporting periods should be displayed at the same
time.
Frequently, data can be more meaningful if they are combined with other data
in the form of ratios or sums. The revenue-to-cost ratio, for example, is an
extremely important and useful piece of information. Other indicators include
passengers per vehicle mile and operating cost per employee.
The performance of a route is usually analyzed by comparing indicators over
time. Comparisons are extremely important since they indicate when ridership,
revenues, or other factors change. For time-series data, management should
always compare current data with what occurred during the saane month a year ago.
Monthly fluctuations occur naturally and comparisons with recent months can
cloud the actual trend that is occurring. One way to correct for the fluctua-
tions is to apply any number of smoothing techniques.
Management and staff may also use data to test the accuracy of previous
projections. Comparing what actually occurred with what was projected will
indicate major differences. Trying to understand why the forecasted values were
off is important in improving the forecasting techniques used by the agency.
Finally, fare planning data can be presented graphically. The monthly
ridership levels on different routes over the past 12 months can be clearly
portrayed with line charts. Bar charts provide a similar resource for plotting
one or two items over time. Very often, management will find that a graphic
presentation of data will communicate information in much less time than tabula-
tions of data. This resource is clearly applicable in fare planning.
ANALYZING FARE PLANNING DATA
Some data that must be used in the fare planning process are not readily
available. The two most important categories of required data are elasticities
-21-
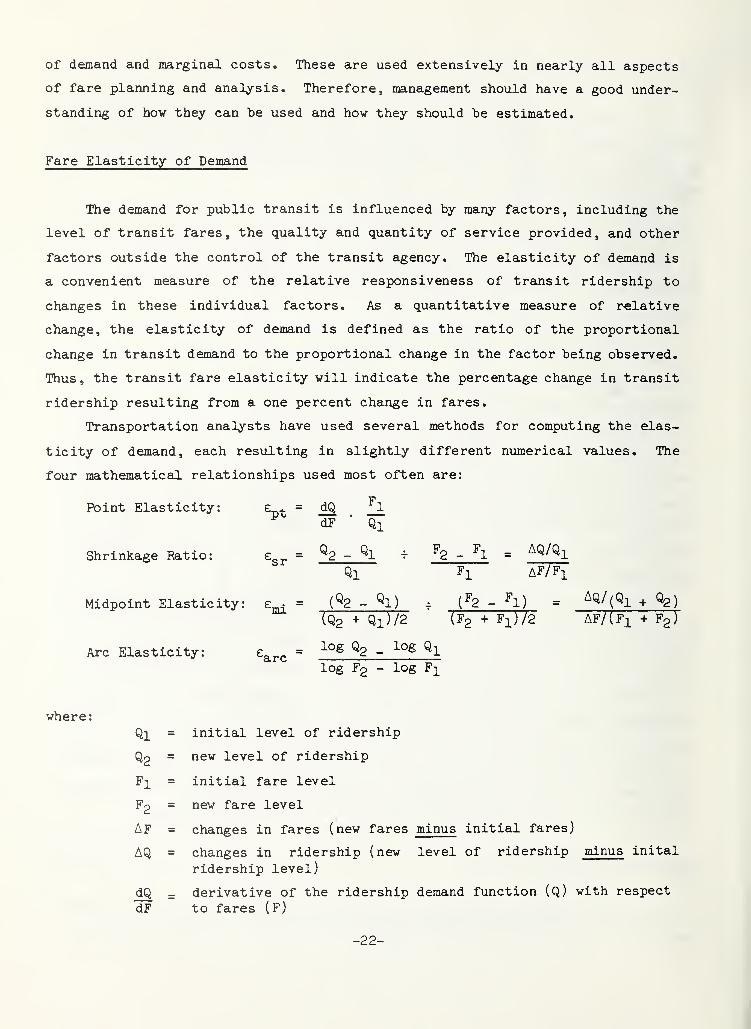
of demand and marginal costs. These are used extensively in nearly all aspects
of fare planning and analysis. Therefore, management should have a good under-
standing of how they can be used and how they shoxild be estimated.
Fare Elasticity of Demand
The demand for public transit is influenced by many factors, including the
level of transit fares, the quality and quantity of service provided, and other
factors outside the control of the transit agency. The elasticity of demand is
a convenient measure of the relative responsiveness of transit ridership to
changes in these individual factors. As a quantitative measure of relative
change, the elasticity of demand is defined as the ratio of the proportional
change in transit demand to the proportional change in the factor being observed.
Thus, the transit fare elasticity will indicate the percentage change in transit
ridership resulting from a one percent change in fares.
Transportation analysts have used several methods for computing the elas-
ticity of demand, each resulting in slightly different numerical values. The
four mathematical relationships used most often are:
Point Elasticity: z^^ = dQ ^1
dF •
Qi
Shrinkage Ratio: = ^2 - ^1 - ^2 - ^1 = ^^/"^l
Ql Fi AF/Fi
Midpoint Elasticity: = (^2 - ^1) . - ^l) = ^^/j^l ^ ^)(Q2 + Ql)/2 (F2 + Fi)/2 AF/(Fj_ + Fg)
Arc Elasticity: e^^^ = ^og Q2 - ^1
log F2 - log Fi
where
;
Q]_ = initial level of ridership
Q2 = new level of ridership
Fi = initial fare level
F2 = new fare level
AF = changes in fares (new fares minus initial fares)
AQ = changes in ridership (new level of ridership minus inital
ridership level)
dQ = derivative of the ridership demand function (q) with respect
dF to fares (F)
-22-

J5 -H M oa -w o -H*3 t» C 3 -C tt. JZ
H S ^
J3 « 5 =
- S - oo o
CO u
got!
o ooV 4J
o <-> s
,5 oe
^ <w t, o o
rj 03 *> <S »)
C 1) *> £ 00
Id 5 9- f 5 i
D< t» OJ
,3 O >< u (D
V ^ n a, a)
U O I. 0) tl o -Hwajaju C-- o
O. OJ
o *J a) 0) O ^aj-'cujrxt. W^ O *J 4J
cvi cc-uoiaoJ-^^ O al c j;p o «) o •»-> —
<
2 -Heoci-wtJtn u (u
i: *" ^
o -a
2 >.
V it
a) *»
8,-
o -* ^
O ^ «j
a oa a)
« *; <n a)
, alO C
£ o U 4J 4)
.ii ^
+5 1) ^a) c O
O a) " c
^u cz4Un<Jato3C010)4) Otl-C4)-<-^ o
t-<0<"a, 4J z -r^ ^ "O O *J
C I'
3) a]
E c
V V 01 41 cu 0) o « ua) a) o <-> 0
«j 41 a «-i 4)L. u u 3
c O 0 s:V (-1 4) 71 41 a]
T3 a, L. >a V >. 4<
V —
(
«j -o >>
asa) 5
41
ua
11 41 41 413 o
01 41 «J 01 c 0O u 3 O Vc 4> C > >. a:
> V a 01 01 n a!
c > 4J 4J
0 4J <10 4)
u o I. ui c
a) 01 a) O0] u >. Vc 41 09 o t~i
0) a U <-> <jI. 0 w 1. <j O
-< -< 4) aj
2 1a, t a) -3 ^^ T3 1) n 1
J U l; O 01° 41 U I
-o a) 4) a„ - E 3
5 11 *> "o" u ao--' 4)
3 ?
1) Si
0! > C
01 aJ°
00 4) a -3-< > 3 C _j: a) o OJ
ai ac a)
4JtDC4j4.3:>4ia3ai C 4) £ -H I
a! aJ > «j 3 >,
4) jJ O X "
-I *J U 41 >.
^oi"o-^>^- n4JCali) 4)*>J3
34JI.«50U1 l'3'^-<
500 O c > al
0] 41 U 41
(_> I. *> -o
<l
-23-
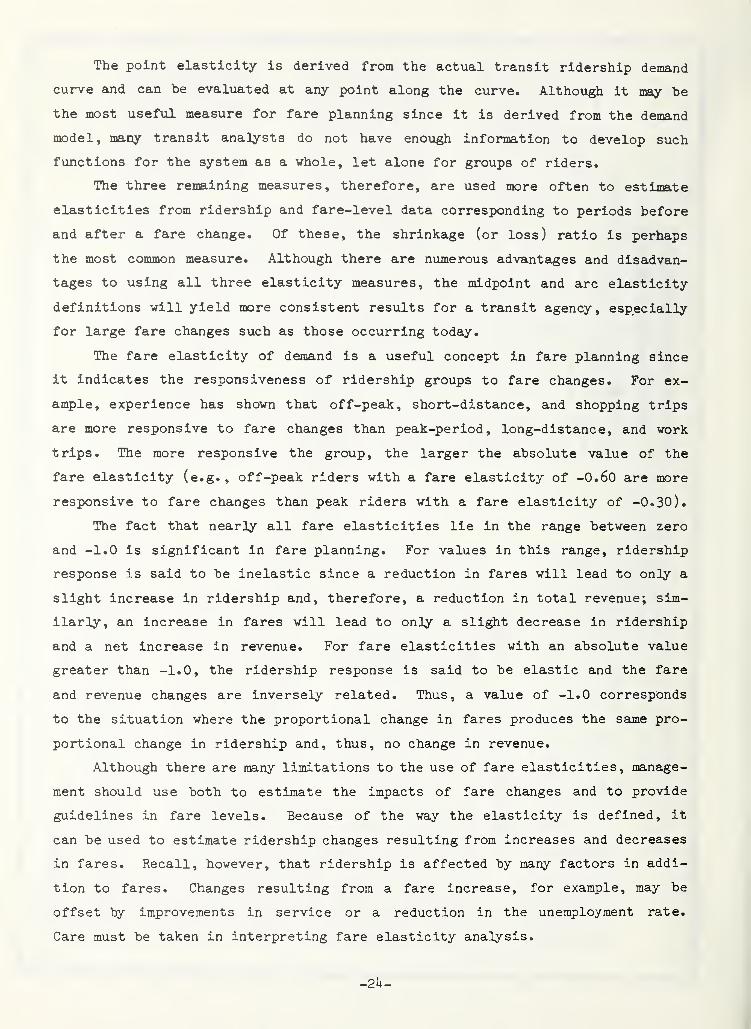
The point elasticity is derived from the actual transit ridership demand
curve and can be evaluated at any point along the curve. Although it may be
the most usefiil measure for fare planning since it is derived from the demand
model, many transit analysts do not have enough information to develop such
functions for the system as a whole, let alone for groups of riders.
The three remaining measures, therefore, are used more often to estimate
elasticities from ridership and fare-level data corresponding to periods before
and after a fare change. Of these, the shrinkage (or loss) ratio is perhaps
the most common measure. Although there are numerous advantages and disadvan-
tages to using all three elasticity measures, the midpoint and arc elasticity
definitions will yield more consistent results for a transit agency, especially
for large fare changes such as those occurring today.
The fare elasticity of demand is a useful concept in fare planning since
it indicates the responsiveness of ridership groups to fare changes. For ex-
ample, experience has shown that off-peak, short-distance, and shopping trips
are more responsive to fare changes than peak-period, long-distance, and work
trips. The more responsive the group, the larger the absolute value of the
fare elasticity (e.g., off-peak riders with a fare elasticity of -O.60 are more
responsive to fare changes than peak riders with a fare elasticity of -0.30).
The fact that nearly all fare elasticities lie in the range between zero
and -1.0 is significant in fare planning. For values in this range, ridership
response is said to be inelastic since a reduction in fares will lead to only a
slight increase in ridership and, therefore, a reduction in total revenue; sim-
ilarly, an increase in fares will lead to only a slight decrease in ridership
and a net increase in revenue. For fare elasticities with an absolute value
greater than -1.0, the ridership response is said to be elastic and the fare
and revenue changes are inversely related. Thus, a value of -1.0 corresponds
to the situation where the proportional change in fares produces the saiae pro-
portional change in ridership and, thus, no change in revenue.
Although there are many limitations to the use of fare elasticities, manage-
ment should use both to estimate the impacts of fare changes and to provide
guidelines in fare levels. Because of the way the elasticity is defined, it
can be used to estimate ridership changes resulting from increases and decreases
in fares. Recall, however, that ridership is affected by many factors in addi-
tion to fares. Changes resulting from a fare increase, for example, may be
offset by improvements in service or a reduction in the unemployment rate.
Care must be taken in interpreting fare elasticity analysis.
-2k-
Fare elasticities should also provide management and board lasmbers with
guidelines on fare levels. As a basic policy, transit services should be priced
taJclng into consideration both the costs of providing transit service and the
responsiveness of ridership to fare changes. If your basic goal Is to maximize
revenue and ridership and costs are equivalent among ridership groups, transit
service shoxild be priced higher for ridership groups exhibiting small fare
elasticities (i.e., from 0 to -0.30) and lower for those exhibiting high fare
elasticities (i.e., from -0.30 to -1.0).^
Cost Considerations
Knowledge of transit operating costs is important for reasons other than
the conventional financial accounting purposes of determining profits and tax
liabilities. Not only is the knowledge of operating costs important for estab-
lishing cost reduction and productivity programs, but they are also of paramount
importance in pricing decisions.
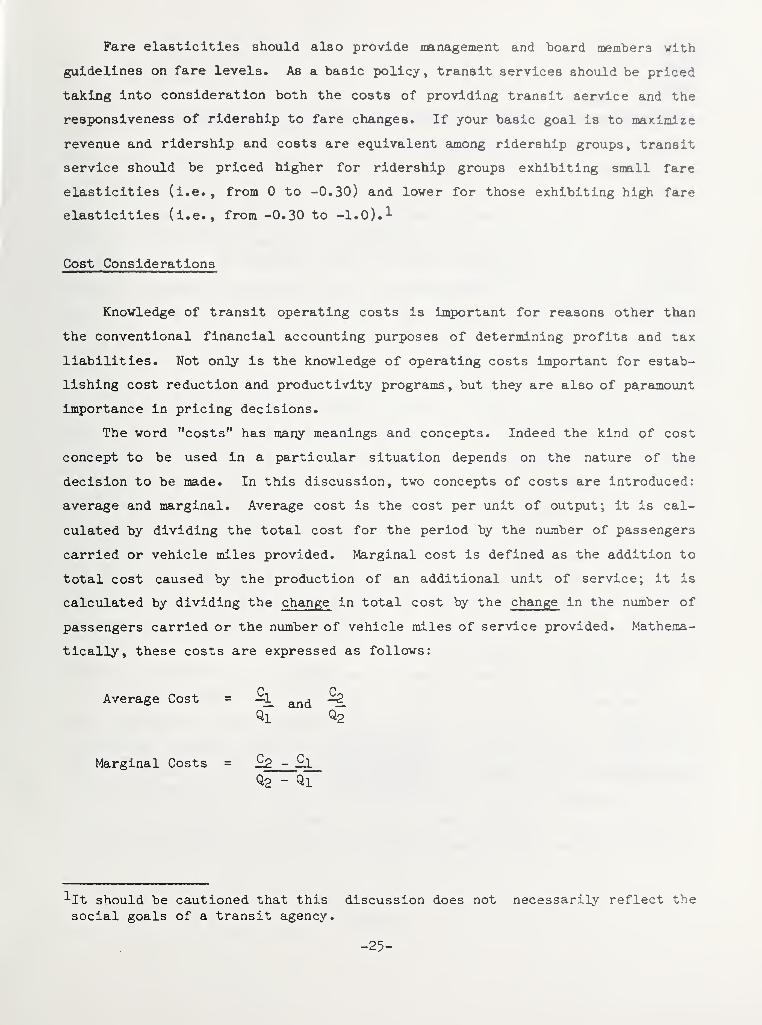
The word "costs" has many meanings and concepts. Indeed the kind of cost
concept to be used in a particular situation depends on the nature of the
decision to be made. In this discussion, two concepts of costs are introduced:
average and marginal. Average cost is the cost per unit of output; it is cal-
culated by dividing the total cost for the period by the number of passengers
carried or vehicle miles provided. Marginal cost is defined as the addition to
total cost caused by the production of an additional unit of service; it is
calculated by dividing the change in total cost by the change in the number of
passengers carried or the number of vehicle miles of service provided. Mathema-
tically, these costs are expressed as follows:
Average Cost "i and
Marginal Costs = i:i2 - !:a
Q2 - Ql
It should be cautioned that this discussion does not necessarily reflect the
social goals of a transit agency.
-25-
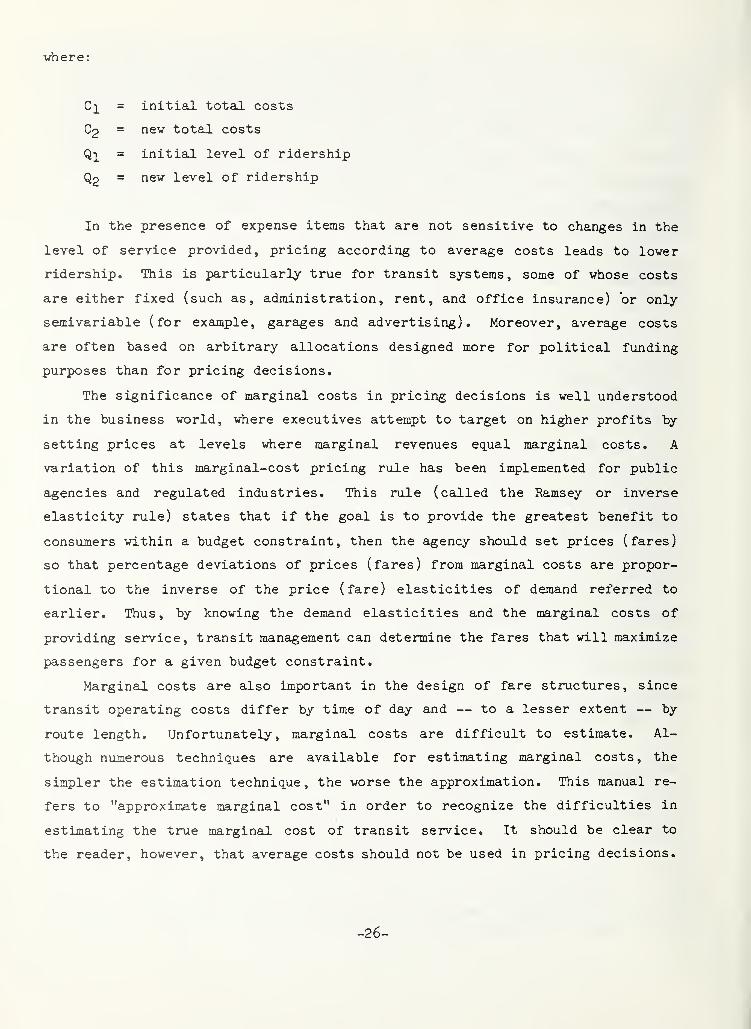
where:
C]_ = initial total costs
C2 = nev total costs
Q]_ = initiaJ. level of ridership
Q2 = nev level of ridership
In the presence of expense items that are not sensitive to changes in the
level of service provided, pricing according to average costs leads to lower
ridership. This is particularly true for transit systems, some of whose costs
are either fixed (such as, administration, rent, and office insurance) or only
semivariable (for example, garages and advertising). Moreover, average costs
are often based on arbitrary allocations designed more for political funding
purposes than for pricing decisions.
The significance of marginal costs in pricing decisions is well understood
in the business world, where executives attempt to target on higher profits by
setting prices at levels where marginal revenues equal marginal costs. A
variation of this marginal-cost pricing rule has been implemented for public
agencies and regulated industries. This rule (called the Ramsey or inverse
elasticity rule) states that if the goal is to provide the greatest benefit to
consumers within a budget constraint, then the agency should set prices (fares)
so that percentage deviations of prices (fares) from marginal costs are propor-
tional to the inverse of the price (fare) elasticities of demand referred to
earlier. Thus, by knowing the demand elasticities and the marginal costs of
providing service, transit manaLgement can determine the fares that will maximize
passengers for a given budget constraint.
Marginal costs are also important in the design of fare structures, since
transit operating costs differ by time of day and — to a lesser extent — by
route length. Unfortunately, marginal costs are difficult to estimate. Al-
though numerous techniques are available for estimating marginal costs, the
simpler the estimation technique, the worse the approximation. This manual re-
fers to "approximate marginal cost" in order to recognize the difficulties in
estimating the time marginal cost of transit service. It should be clear to
the reader, however, that average costs should not be used in pricing decisions.
-26-
REVIEWING FARE OPTIONS
Task 1
Prepare Organizationfor Fare Planning
Task 2
Gather and ManageData
Task 3Review Fare Plan
Options
Task h
Select AppropriateFare Plan
Task 5
Implement and EvaluateFare Change

5REVIEW OF FARE OPTIONS
(TASK 3)
Fare planning in the past has been constrained by the technology for
collecting passenger fares. The design of a fare structure, for exeanple, was
limited by the type of fareboxes installed on the bus, regardless of the merits
of distance-based or time-based fare concepts. During the past few years,
however, more attention has been paid to new methods of fare collection — both
hardware and operations — and the varied fare structures they permit.
This chapter reviews fare structure options, fare collection methods, and
promotional fare policies. The purpose of this review is to identify the range
of options available, highlighting their advantages and disadvantages. The
process of actually selecting a new fare plan is covered in the next chapter.
FARE STRUCTURE OPTIONS
Clearly, the most complex element in fare planning is deciding the structure
of the fare system. For simplicity and low cost, most transit agencies have
traditionally relied on a single fare for all users. For revenue and equity
reasons, however, reliance on a flat fare structure in some cities may not be in
the best interest of either the transit agency or its patrons. This section
describes the advantages and disadvantages of flat fares and the most common
fare structure alternatives. Included in this discussion are the folloving:
-27-
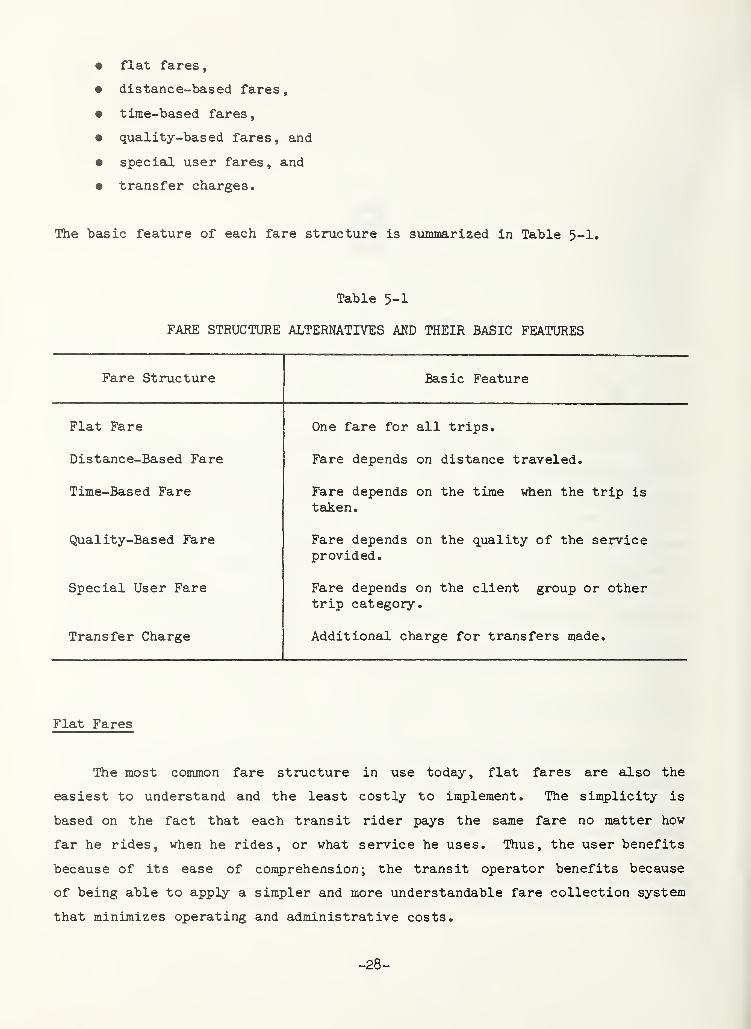
• flat fares
,
• distance-based fares,
• time-based fares,
• quality-based fares, and
• special user fares, and
• transfer charges.
The basic feature of each fare structure is summarized in Table 5-1.
Table 5-1
FARE STRUCTURE ALTERNATIVES AND THEIR BASIC FEATURES
Fare Structure Basic Feature
Flat Fare One fare for all trips.
Distance-Based Fare Fare depends on distance traveled.
Time-Based Fare Fare depends on the time when the trip is
tsdten.
Quality-Based Fare Fare depends on the quality of the serviceprovided.
Special User Fare Fare depends on the client group or othertrip category.
Transfer Charge Additional charge for transfers made.
Flat Fares
The most common fare structure in use today, flat fares are also the
easiest to understand and the least costly to implement. The simplicity is
based on the fact that each transit rider pays the same fare no matter how
far he rides, when he rides, or what service he uses. Thus, the user benefits
because of its ease of comprehension; the transit operator benefits because
of being able to apply a simpler and more understandable fare collection system
that minimizes operating and administrative costs.
-28-
Unfortunately, flat fare structures have their disadvantages. First, they
reduce management's ability to maximize farebox revenues. Since in most loca-
tions short-distance and off-peak riders are more responsive to fare changes
than long-distance and peak-period riders, management would be able to generate
more revenues with no loss in ridership by requiring different fares from each
of the two groups.
In systems where there are significant differences in the marginal costs
per mile for different categories of trips, flat fare structures are also
inequitable. For example, it is often difficult to set a fare level that is
simultaneously acceptable to the short-distance rider, yet high enough to cover
a reasonable portion of the operating costs. Long-distance riders gain an
unfair advantage over short-distance riders because they are able to ride at a
lower cost per mile.
Distance-Based Fares
Perhaps the most common alternative to flat fares, and one that is popular
in large transit systems, is to charge users in some proportion to the distance
traveled. This can be rationalized on the grounds that the marginal cost of
servicing long trips is greater than the marginal cost of servicing short
trips. In addition, long-distance riders tend to be less responsive to fare
changes than short-distance riders.
There are essentially two ways of charging users according to the distance
traveled. The first is to identify the rate at which riders should pay for
each mile or group of miles traveled. This method, known as graduated fares,
is very difficult to administer without the aid of computerized fare collection
equipment. Graduated fares are most common on modern commuter railroad and
rapid rail systems.
The more common method of charging fares by distance traveled is to super-
impose a zone structure on the transit network. The price of a trip will
therefore depend on the number of zones crossed. Such a zone structure can be
designed in any number of ways, as shown in Figure 5-l« The most common approach
in large cities is to design a series of concentric zones, with the center zone
incorporating the entire city. Since, in most large urban areas, over 75
percent of public transit trips take place within the city limits, this type of
zone system is more akin to a flat fare structure and should not be adopted if
a true distance-based fare structure is desired. It follows that, the finer
the zone structure, the more equitable the fare structure will be to the rider.
-29-
The strength of the concentric zone structure lies in its application to
a bus system where the route pattern is largely radial. If, however, there
are a significant number of crosstown routes, users on such routes are likely
to pay less for a given distance traveled than those who use the radial ser-
vices. An additional weakness of the concentric zone system is that riders
who take short trips across zone boundaries will pay for trips at a much
higher rate per mile than those traveling comparable distances wholly within
the limits of a zone. This problem can be alleviated by creating minimum fares
good for at least two zones of travel.
Because of its ease of administration and its pricing peculiarities, the
concentric zone system adopted by the Dallas Transit System (DTS) may be of
interest to some transit agencies. Transit fares in the Dallais three-zone system
are based on where the passenger boards and alights and not specifically on the
distance traveled. Thus, a passenger boarding in the outermost zone pays the
highest fare, regardless of whether the patron travels to the center city, the
second zone» or only within the third zone. A passenger boarding in the center
zone pays the fare applicable to the zone where he disembarks. The Dallas fare
structure is therefore easy for passengers to understand and drivers to enforce.
The structure is based on the premise that service to outlying areas is most
costly to provide, trip lengths are the longest for third-zone patrons, and
third-zone riders exhibit the lowest elasticities of demand (that is, they are
least sensitive to fare changes).
An alternative to the concentric zone concept is to superimpose a grid
system over the transit network. A series of concentric zones can be maintained
if the predominant route structure is radial, or the zone can be rectangular in
shape. The strength of either grid arrangement is to produce a fare structure
that is more equitable for all trip distances, irrespective of whether the
rider is using a radial or crosstown service. The grid zone concept's greatest
weakness is its complexity and its difficulty in administration and enforcement.
Moreover, the grid system will still result in a high cost of travel for short
trips across zone boundaries unless the fare scale allows at least two zones'
worth of travel for the minimum fare.
Finally, it is possible to design a zone fare structure for individual
routes, provided there is little transferring from one route to another. The
strength of a system of individually tailored zones for different routes is that
-30-
each route's zones can be designed to achieve a high degree of cost equity
aunong users and a maximization of revenue-earning miles. Unfortunately, a
system of unique zone boundaries is both difficult to enforce and to understand.
Time-Based Fares
A time-based fare structure is one in which the fare paid depends on the
time the trip is taken rather than on the distance traveled. As with a dis-
tance-based fare structure, the rationale for time-based pricing involves both
cost and market considerations. During peak periods, for example, the cost of
providing a transit trip is approximately 50 percent higher than during off-
peak hours. Peak riders also tend to be much less sensitive to price changes
than off-peak riders.
Although time-based fare structures are operationally easier to Implement
than distance-based fares, time-based fares do create a problem of enforcement
for the bus driver. Often, passengers will argue with the bus driver over the
correct fare when the boarding takes place at or near the time the fare changes.
Small transit agencies can get around this by identifying specific runs as
either peak or off-peak runs.
In addition to charging a different fare depending on the time of day,
some transit agencies have implemented reduced-fare programs during the evening
hours and on weekends since riders during these periods are sensitive to price
changes. The net effect of those programs, however, has been to reduce farebox
revenues, given that fare elasticities of demand during these periods are still
lower than one.
Quality-Based Fares
Research has repeatedly shown that transit riders, especially commuters
and high-income users, are more sensitive to service changes than they are to
price changes. This suggests that a ten percent increase in service or service
quality would attract more riders than would be lost by a ten percent increase
in fares. Reliability, comfort, and travel time are the attributes most riders
would like to improve and for which they are willing to pay. For this reason,
many transit agencies offer special, high-quality services, such as express and
subscription services.
-31-
A quality-based fare structure is one in vhich several levels of service are
provided and separate fares are charged for each level. The fares established
for each service are based on the cost of providing the service and the relative
elasticities of demand for each service group. For a quality-based fare struc-
ture to be successful, it is imperative that the express or premium service be
substantially superior to local service. Too often, transit agencies attach a
premium price to services that do not significantly improve riding comfort or
running time.
Special User Fares
In addition to one of the fare structures already discussed, most transit
agencies adopt separate fare levels for specific user groups. Off-peak half
fares have been implemented for the elderly and handicapped, for example.
Special rates are generally also provided for children and students.
It is important to note that these fare structures are often not Justified
on the grounds of equity or cost, but rather are adopted in response to specific
subsidies (e.g., school board) or political policies. Care must be taken that
transit fare-reduction policies be targeted specifically toward the group in
question. This subject is discussed more in the next chapter.
Transfer Charges
Few transit agencies are able to design a route structure such that no
transit trips would require a transfer. The origins and destination of urban
travel are so diverse that management's only hope is to minimize the number of
transfers and the time in transferring. How management handles the transfer is
a key element in fare structure design.
No Transfer Policy
In a system without transfers, the transfer charge, in effect, is the full
fare. This policy is used in very few transit agencies because it reduces
ridership and is viewed as inequitable. Most transit managers question the
equity of charging one rider two fares for a single trip simply because the
-32-
rider's travel pattern does not coincide with the route structure. A no-
transfer policy, however, is simple to understand and enforce, reduces cost,
and eliminates transfer abuse.
Free Transfer Policy
With a free transfer policy, a transit rider is given a transfer on demand
at no cost to the user. Depending on the regulations regarding transfer use
and the level of driver enforcement, transfer abuse can be a problem. The most
common form of abuse occurs when passengers obtain a free transfer and sell it
or give it to a friend who is then able to ride free. A free transfer policy
has the advantage of being easy to understand and more equitable than a no-trans-
fer policy.
Reduced-Fare Transfer Policy
Most transit agencies use transfer slips to provide a reduced-fare trans-
fer. The most common method is requiring passengers to pay for transfers when
the slip is received on the first bus. As an attempt to reduce the transfer
abuse mentioned above, some agencies require payment of the transfer charge on
the second bus. The effect of this policy, however, is to create two separate
monetary transactions. This arrangement does eliminate user dissatisfaction
caused by purchasing transfers and then possibly not using them.
Temporal and Directional Transfer Policies
In addition to determining how the transfer charge is going to be collected,
transit mnagement must identify the temporal and directional policies governing
transfer usage. Most transit agencies provide the user with 30 to 60 minutes
during which the transfer must be made. Some agencies provide as much as three
hours of transfer time and actually encourage users to make intermediate stops.
A few systems do not issue transfers, but do sell day passes for twice the base
fare, allowing unlimited riding for the entire day. For the purpose of trans-
ferring, day passes function much like free transfer slips with no directional
or temporal limitations.
The directional limitations generally placed on transfers are designed to
eliminate multiple trip taking. For this reason, most transit agencies do not
-33-
allow the transfer to be used for backtracking. Thus, only buses moving in
certain route directions can be boarded with a specific transfer. To encourage
downtown shopping and other activities, transfers can be used as CBD-zone
passes, particularly during the midday,
FARE COLLECTION METHODS
An integral, part of fare planning is deciding how transit riders will pay
the fare. Decisions of this nature must be made in conjunction with establish-
ing a fare structure since certain fare structures preclude the use of severed
payment methods. As a resource in identifying the range of fare payment methods
available to transit management, this section of the chapter reviews the prin-
cipal fare payment options, highlighting selected features. Note that a transit
agency's fare payment policies might rely on a single fare method (for example,
cash fare payment only) or, more often, on a combination of methods.
Cash Payment
The basic method of fare payment by nearly all the transit agencies operat-
ing in the U.S, is cash, both with coins and dollar bills. Although the cost
of collecting, sorting, and counting coins is relatively low, the cost of
handling dollar bills is very high. Accommodating the dollar bill has increased
both labor and capital (through dollar-bill accepting fareboxee) requirements.
Currently, transit agencies spend between one and three percent of total operat-
ing costs on fare collection, 80 percent of which is labor.
As fares increase beyond the one dollar level, alternatives to cash fare
payment must be adopted to minimize fare collection costs and fare abuse. The
most popular alternative to cash fare collection is the prepayment of fares.
Fare Prepayment
Generally referred to as prepaid passes, commuter tickets, and flash
passes, transit fare prepayment is defined as any method of advance fare pay-
ment. Thus, fare prepayment involves purchasing evidence that can later be
verified as a substitute for cash payment for transit rides.
-3U-
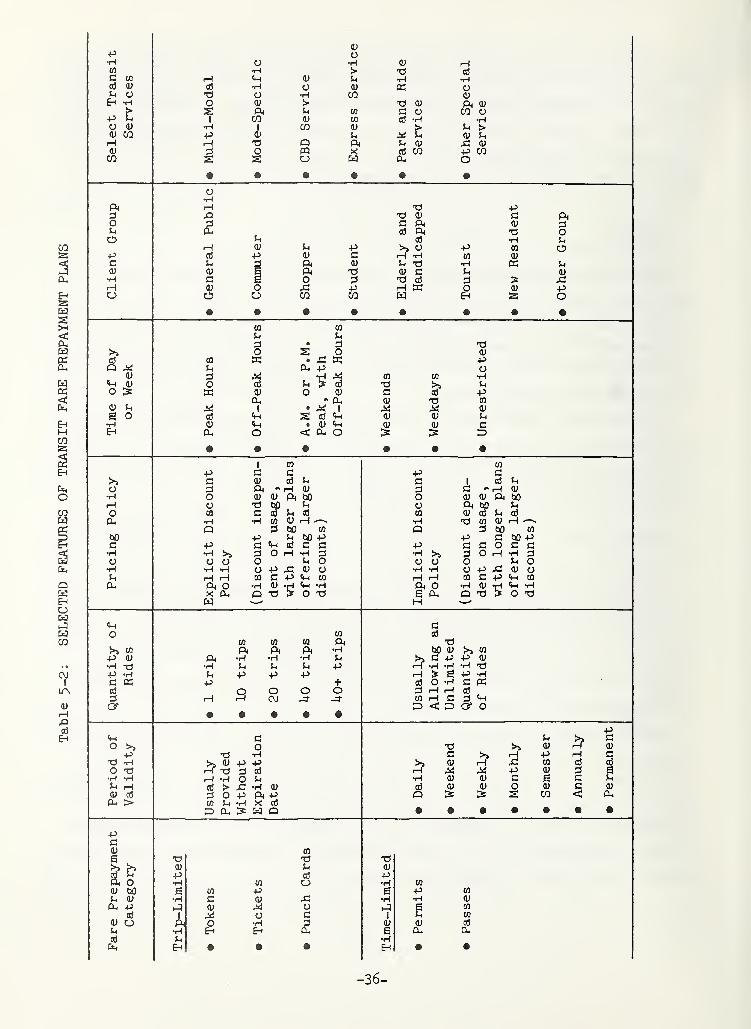
The most common categories of fare prepayment in use today include tokens,
tickets, punch cards, permits, and passes. These categories vary primarily
according to boarding procedure and period of validity. As shovn in Table
5-2, tokens, tickets, and punch cards can be used for a limited number of rides.
Permits and passes generally do not have trip limitations, but are time limited.
Other selected features of fare prepayment plans are shovn in the table.
Tokens
Tokens are metal, coin-like disks dropped into a turnstile at the entrance
to a rapid transit station or into a farebox on a transit vehicle. They 'are the
fare prepayment form most similar to cash since they resemble coins. Tokens are
also the only form of fare prepayment that must be minted instead of printed.
Generally made of brass or less expensive aluminum, tokens range in size from
0.65 to 1.51 inches in diameter.
Unlike other forms of fare prepayment, tokens are reusable and can last for
an indefinite period of time. They usually do not expire unless a fare change
necessitates replacing all tokens in the system. This is done primarily to
avoid hoarding of tokens before a fare change.
Tickets
Tickets are cards or pieces of paper given to the conductor or dropped into
the farebox when a trip is taken. In self-service systems, tickets are validated
at wayside locations or on-board the transit vehicle by the passenger. The
validated ticket is kept by the passenger and then shown to the inspector on
request. Some tickets have stubs that are torn off by the driver and returned
to the passenger as a receipt.
Each ticket is usually good for one ride or for each zone in which a trip
is taken. In systems with multiple fare categories, tickets are often available
in a variety of denominations. In addition, tickets are usually sold in books
of 10, 20, ho i or U5 tickets, in strips of 10 or 12, or individually from a
ticket roll. Tickets usually do not carry expiration dates. One problem with
tickets is that they may Jam farebox machines that are not specifically^ designed
to handle this type of fare prepayment plan.
-35-
wC CO
ci V
Eh -H
^ tO 0)
<U COH<UCO
oo •H 0) r-(
•H > T3 q3H tM a; •H •Ho3 •H o 1) Ph
o •H CO <Uo >• Qj D
ft ^ w c o CO y1 CO CO CCJ -H •H
•HI
CO (h >P V UH Q ft (-1 d) x; i)
o m X ctS CO COo w (X, o# #
H 4»
C ft0) ft
•H<D 43 4^ CO
OJ -P (U C H -H CO o;J-. ft (U t3 K
ft T3 <D CC o 73 03 ><0 o XI p H K oCJ o CO CO W EH
ft
o
C5
Pc(U•H(HO
ft
ou
po
Cm 0)
O >
e o
CO
u
o
a.
CO
o
c«
(U
Dl,
I
«wCmO
CO
U:3
oA WPtr 03
o;' CL,
>i I
03 «MOJ <MOh O
CO
T3c
0)
CO
73
13(U
O•H
PCO
4J
UC
1 CQ CO
p C GC CD G 03
o " (1) G H•H o 0) 0) ft 8 (U 0) ft (JOH o 73 M 0 ft W)O ca C d 08 CO o3 U 03
(X,Di
•H CO OJ
(50
H —CO
Di 73US
ge HCO
bO P,
Li taO P P G to +3c p" C <M 03 G G p> G G 0 G G•H •H d 0 •H d •H d 0 rH •H 3O o o 0 Jh 0 0 0 0•H •H •H 0 p 0) 0 •H •H 0 P A <D 0U H CQ C Cm CO CO G p Cm CQ
CL,
ExpPo
•H 0)
Q 73Cm -H0 73
ImpPo (Di de
Cm -H0 73
Cm GO
CO CO CO
CO
ft03
73S CO ft ft ft •H (50 (U CO
+> a; ft •rl •rH •H Sh G P p•H T3 •H Jh u Jh P •rH •H •H 73+3 -H (h P p P
sP •H
C K P> + 03 •H G K03 0 0 0 H H 03H s OJ J- CO H G «M
< ^ 0
pCm c u GO i.. 0 73 <u o;
P 73 •H G >. H H-> H G73 -H (U +S ^ <U rH X CO 03
O 73 73 oJ ^ P 0) dBH •H o u •H (I) QJ C s G
^. ^ ctf >• 4:; •H <U o3 0 0 G OJ
OJ 03 3 O p ft P :s :2 S CO <:CL, >
Us Pr Wi X 08W Q
pGOJ
73CO
73 73
lbft O
0) u <U
P 03 P•H CO CD •H CO
s CO P H p CO
0) •H c <U J3 •H •H 0)
Oh P (U 0 CO
03 1 0 G 1 CO
<U CJ ft o •H (L) o3
•H Eh Eh s CL, CL,
cc! •HEH • • • Eh • •
-36-
Punch Cards
Punch cards are cards or slips of paper with areas in which holes are
punched by the driver or conductor — an operation that increases dwell time
and thereby operating costs. Printed usually in the size of a credit card,
punch cards are functionally equivalent to most tickets and tokens. One hole
is punched per ride or zone in which a trip is taken. When the specified
number of holes has been punched, the card no longer has any value. Punch
cards have often been called "punch tickets," "multiple- ride tickets," "commu-
tation tickets," and "punch passes."
A variation of the punch card — and for that matter any multiple-ride
ticket format — is the magnetic farecard. Implemented in several modern rapid
rail systems in this country and in Europe, the magnetic farecard requires
sophisticated technology that is not yet practical for use on bus systems (one
company will begin production of card readers for use on buses very soon)
.
With the magnetic card, a passenger purchases a certain value that is recorded
on the magnetic tape portion of the card. To take a trip, the rider places the
farecard into the card reader, which identifies the origin of the trip. When
exiting, the farecard is again inserted into the reader, which computes the
fare for the trip, deducts the value from the card, and returns the card to the
user. Although card readers would have to be placed in both the front and back
of the bus in systems with distance-based fares, the system would only require
one unit per bus if flat, time-based, or quality-based fares are used. The
system could also incorporate unlimited-ride passes or permits as described
below.
Permits
Permits are wallet-size cards that passengers display at the time of board-
ing. The permit allows the individual to travel at a reduced rate until the
permit expires. A photograph or another method of identification on the permit
is usually used to limit use of the card to the intended person. Since permits
are usually used for long periods of time, the cards are often made of heavy
paper stock and coated in plastic.
Permits are ideal for targeting lower fares to special groups, such as
students, the elderly, and the handicapped. For these groups, the permit is
provided for a nominal fee or free of charge and is valid for one year or longer.
-3T-
However, recently there has been a renewed interest in monthly permits for the
general population as an alternative to the monthly pass because of their
revenue potential.
Passes
Passes are similar to permits in appearance, but generally do not include
the photograph of the user because of the cost. Like permits, passes must be
displayed to the driver when boarding. However, passes differ from permits in
that the passenger rides as many times as desired without paying any additional
fee until the pass expires. This affords the user the convenience of not having
to carry cash to make a trip. Pass validity periods can vary considerably, the
most common being daily, weekly, monthly, semester, and annual. In some cases,
passes for privileged users have no expiration dates.
In transit companies with zone fare structures, passes specific to zones
can be made available. However, since most passengers travel in the central
zone of zone fare systems, a central zone pass can be used as a permit for trips
into the outer zones. Thus, differential fares can be charged with only one
version of the prepayment instrument.
Fare Postpayment
Postpayment methods have been used only in demonstration projects sponsored
by the U.S. Department of Transportation. This method of payment has several
serious drawbacks. First, buses would have to be equipped with credit card
readers, which have yet to be proven effective on a systemwide basis. The cost
to the agency would be high, cash flow would be impaired, and the opportunities
for fraud and misuse are great. In addition, the system would require an
elaborate data processing and billing system.
Self-Service Fare Collection
Used extensively in Europe, self-service fare collection is now operating
in Portland, Oregon, and on the light-rail line in San Diego. Under this system
of fare collection, riders purchase prepaid tickets or passes from agents,
vending machines, or for a premima price, from the bus driver. Once on the bus,
-38-
the passenger must validate the ticket, thereby ensuring that a ticket (or
pass) of sufficient value has been purchased. To guard against fraud, these
systems employ a series of roving inspectors vho check for valid tickets and
passes. Those with invalid tickets or passes are fined.
Although an additional capital cost for validators and vendors (optional)
is incurred, the benefits of self-service fare collection may be great.
Differential pricing policies may be instituted to increase passenger revenues
and dwell times can be significajitly reduced, especially if both doors are used
for boarding as well as alighting.
PROMOTIONAL FARE POLICIES
In addition to developing fare policies for collecting passenger revenues,
transit managers can use fares as promotional tools for specific marketing
purposes. Promotional fare policies are generally provided as temporary fare
reductions during the promotional period for the purpose of increasing transit
patronage over the long term.
Free- or reduced-fare promotions are often undertaken in cooperation with
local businesses or radio stations. The promotions may take several forms and
can be targeted to increase certain types of ridership. The incentive may
vary from a slight fare reduction to total fare removal and may be presented
in several different ways: on one specific bus, on all buses or alternating
buses, and for periods ranging from one hour to a year or longer.
Promotional fare incentives provide excellent tools for engaging private
sector support for transit services by soliciting their assistance in marketing
or financial subsidization. In addition, when prcxnotional fare incentives are
used strategically, they can aid in maintaining and managing transit ridership.
Managers must be aware, however, that, if promotional fares are not underwritten
by the business community or by specific public organizations, revenue losses
will result. As a general rule, the ridership generated during promotional
fare periods is not retained sufficiently after the fares are reinstated at
their normal level to offset lost revenue during the promotional period.
-39-

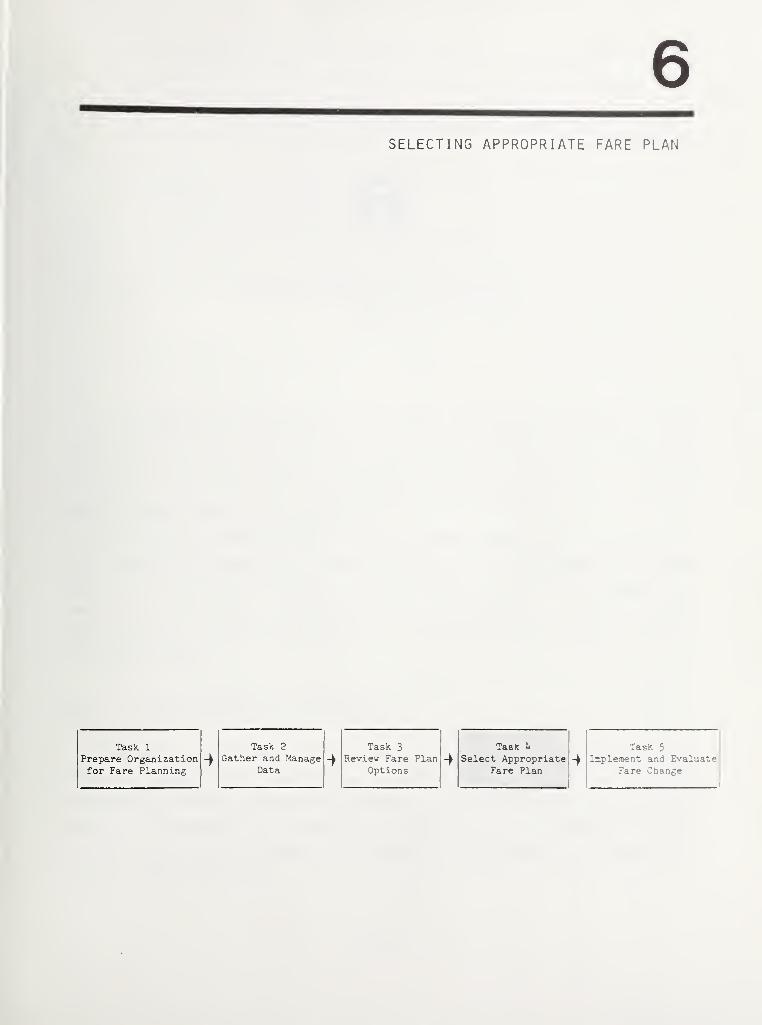
6SELECTING APPROPRIATE FARE PLAN
Task 1
Prepare Organizationfor Fare Planning
Task 2
Gather and ManageData
Task 3j
Review Fare PlanOptions

6SELECTING THE APPROPRIATE FARE PLAN
(TASK k)
The purpose of fare planning is to identify what is wrong and what is right
about the fare policies that currently exist and to suggest how those policies
can be improved. The outcome of the planning process, therefore, is a proposal
outlining a series of fare changes that, when implemented, would move the
transit company toward its stated goal.
This chapter presents a sequence of five steps that identify the specific
fare changes that should be recommended to the transit board for approval. These
tasks include evaluating existing fare policies, establishing appropriate
evaluation criteria for analyzing options, selecting fare options to test,
evaluating four or five fare options, and recommending a specific fare pleui to
the transit board.
STEP 1: EVALUATE EXISTING FARE POLICIES
The best place to start in developing appropriate fare options to test
is with an evaluation of current fare policies. This should be done by first
defining the problems that currently exist with the fare structure. Why, for
example, is management interested in changing the fare? Are passenger revenues
too low? Is the fare structure too complex to understand? Has there been
excessive fraud and theft?
-hi-
The most frequent answers to these questions involve the need to raise
farebox revenues, create a more equitable fare structure, and simplify the
operational complexity and cost of the fare collection system. Answers to the
above questions will flow from an analysis of what is wrong with existing fare
policies.
An inventory of existing conditions should be performed to assist in that
determination. The inventory should include at least the following six areas.
• Existing Fare Structure and Fare Levels ; The staff should conduct aninventory and provide a description of the existing fare structure andthe fare levels for each fare-paying group. Special fare categories —such as park-and-ride services, downtown services, elderly and handicap-ped reduced fares, and student reduced fares — must also be inventoriedand their fare levels recorded for analysis.
• Existing Ridership and Revenue Levels by Fare Category : After the farestructure and the fare levels have been reviewed, the next step is toprovide ridership and revenue data for each fare category in a mannerthat can support the development of fare options. Ridership and revenuedata should be developed for weekdays and weekends, and disaggregatedby zone or distance and by time of day to facilitate considerationof alternative fare structures. The average fare paid by each type ofpassenger should also be noted.
• Transfer Levels and Transfer Policies : Given the adverse effects oftransfers on transit ridership, the level of transferring should bemonitored. Ridership is affected by transferring because of the waittime required for the transfer. In addition, the price of transfershas an important revenue and ridership effect. A problem in sometransit properties is transfer abuse. When the operator does notphysically take possession of the transfer to inspect it, punch it, orvalidate it, the opportunity for abuse is great.
• Fare Collection Equipment and Processing : Fare collection equipmentis intimately tied to the fare structure. If the fare collectionequipment is subject to significant equipment failure or if the pro-cessing of fare collection revenue results in appreciable theft, thenthe fare collection system, including its closely linked fare structure,needs to be reconsidered. The problem of equipment failure occursoften in automatic fare collection systems.
• Amount of Fraud and Error : Error in paying the correct fare occursmost often when the fare structure is not easily understandable by the
rider. It is important to determine through on-board surveys how manyriders are paying the correct fare and if there are any complaintsregarding fare complexity. Fraud — voluntary or involuntary — will
always be present. However, when revenue losses due to fraud, error,
and theft exceed three to five percent of total passenger revenue, a
reevaluation of the fare collection policies should be undertaken.
-h2-
• Existing Costs of Providing Different Services : TTie costs of providingtransit services for each fare category must be identified to the extentpossible. These costs should be marginal (or quasi-marginal) costsrather than average costs since, as discussed earlier, marginal costsare the pertinent figures to use in planning fare changes. Averagecosts should also be made available if the cost recovery ratios fordifferent market groups are going to be compared.
An inventory of the existing fare collection system and performing the
analysis Just suggested will provide management and staff with two immediate
resources. First, the important numbers and figures concerning existing condi-
tions will be available for comparison with new options that might be tested.
The value of any fare change can be measured by how well it improves the current
situation.
The second benefit of this analytic effort is that it will help identify
what is right and what is wrong with existing fare policies. I*lany problems are
often difficult to detect until such an analysis has been performed. Thus, the
list of problems identified at the beginning of this exercise can be augmented
with new problems that may have been discovered.
Understanding the issues relating to existing fare policies provides the
basis for the steps that follow. The criteria used for evaluating alternative
fare options will be selected based on those issues. Management and staff will
also be in a better position to identify fare options that are reasonable and
worthy of being tested. Thus, the foundation for the detailed anal;,'ses that
follow will be set.
STEP 2: ESTABLISH EVALUATION CRITERIA FOR ANALYZING OPTIONS
Before alternative fare plans can be evaluated, a set of criteria mast be
established that will determine how each plan will be judged. Evaluation
criteria are the yardsticks against which the relative value of one plan versus
another can be measured. Which evaluation criteria to use will depend on the
results of the analysis undertaken in the previous step and the specific fare
policy objectives of the transit company.
For major fare changes, at least five classes of evaluation criteria have
been used, including:
• revenue-generation criteria,
• ridership-generation criteria,
• fare equity criteria,
• operational feasibility criteria, and
• socioeconomic and environmental criteria.
The purpose of this step is first to decide which criteria should be used
in evaluating alternative fare plans. Each criterion should then be quantified
by setting established targets with minimum and maximim values identifying ac-
ceptable ranges.
Revenue-Generation Criteria
Perhaps the most important reason for a fare change is to generate ad-
ditional passenger revenues. As operating costs rise and subsidies fall, a
greater share of the financial support of transit operations comes from the
farebox.
Revenue requirements are usually determined annually as part of the budget
and financial planning review process. In this context, it is useful to select
the farebox revenue requirement by recalling the triangular relationship that
exists among farebox revenues, outside subsidy support, and the cost of transit
service. As subsidy support diminishes, fares or service levels must be adjusted
to maintain the balance between revenue and cost.
The first task in identifying the revenue-generation criteria is to fore-
cast the level of external subsidy support that will be available from local,
state, and Federal sources, as well as other sources, such as dedicated taxes.
Forecasts should be made quarterly over one to two years. Once such forecasts
have been made, the next task is to project the costs of running the transit
system for a projected level of service. However, the costs and service levels
should not be decided in isolation from fare decisions, since these decisions
have some degree of interdependence. What emerges from this analysis is the
development of a few options combining levels of service, cost, and farebox
revenues that are compatible with the external subsidy level available. A
specific revenue-generation target can now be set, as well as an acceptable
range that may be quite narrow. This range of acceptable levels of revenue
generation becomes one of the criteria used to judge fare plan options.
-kk-
Ridership-Generation Criteria
Intrinslceilly linked to the revenue criteria Just set are ridership-
generation criteria. The higher the target set for additional revenue, the
lover the acceptable ridership target. In light of a revenue growth target of
10 percent, for example, it will be quite difficult for a transit agency to meet
a similar growth rate for ridership. Management, therefore, should establish
ridership targets that can be met given the revenue target already established.
The only way to diminish the importance of the revenue target is to reduce
service costs or increase outside subsidy levels,
Ridership-generation criteria can be established for the system as a whole
and by market group. If management has clear policy objectives with respect
to the ridership levels on specific routes, time periods, or service areas, these
objectives can be used to help establish ridership criteria. The criteria should
specify a target and an acceptable range.
Fare Equity Criteria
The concept of equity is central to developing a rational. Just, and accept-
able fare policy. Two alternative views of equity are usually discussed: the
ability-to-pay principle and the benefit principle . In its application to
transit fare policy, the ability-to-pay principle claims that transit is a
social service and its fares should be set to favor those least able to pay.
On the other hand, the benefit principle claims that fares should be paid in
proportion to the benefits received. Following this latter view, equitable
fares result when all users have the same ratio of fares per trip mile to cost
per trip mile. A simpler approximation would be to equalize fares per trip
mile. Because of the different subsidy levels provided by different political
Jurisdictions — with suburban localities contributing more subsidy per trip
mile than central cities — the equity argument is sometimes extended to cover
the incidence of all taxes (income, sales, property) levied to defray the costs
of transit.
While each transit agency should follow its defined goals and objectives
regarding fare subsidization, this manual follows the benefit principle in the
analysis of equity. Fare policy has been found to be an inefficient tool for
distributing income to the needy. This is because fare policy is too general
in scope and cannot usually be targeted solely to the needy. Consequently,
fare discounts are often extended to the non-needy who have the resources to
pay the full fare. In general, fare policy should not be used to redistribute
income except for groups favored by law, such as the elderly and handicapped.
From the analysis of the existing fare structure, management should be able
to create a series of tables comparing the ratio of fares per trip mile to cost
per trip mile (or simply fares per trip mile) for different transit markets.
Passengers of different trip lengths, traveling in different service areas, and
traveling during different time periods are the suggested market groups for
this comparison. These tables will indicate which market groups are paying a
larger share of transit costs. Specific criteria can then be established with
the objective of reducing any inequities. As with other evaluation criteria,
management should establish a target equity ratio and an acceptable range
aroiind this target value.
Operational Feasibility Criteria
If the fare is going to be changed, the new fare structure must meet some
basic operational criteria. First, the fare structure must be convenient for
passengers. That is, the fare structure should be easily understood, the number
of coins required for a typical transaction should be small, the transfer mech-
anism should be simple, and the number of prepaid fare plans should be small,
with each plan readily available through outlets and ticket machines.
Second, fare collection costs should be minimized. As a general rule, fare
collection costs should not exceed five cents per passenger trip. Fare policies
that lead to higher costs than this rule should be closely examined for stream-
lining. To help minimize operating costs, fare policies should not delay
passenger boarding and alighting.
Third, the fare structure should support the collection of passenger data,
particularly in view of UMTA's Section 15 reporting requirements. Although no
major problems arise in flat fare systems, it is difficult to estimate ridership
levels in other fare structures and for pass programs unless on-board surveys
are conducted, registering fareboxes are used, or automatic passenger counters
are employed.
Finally, the fare plan finally adopted should minimize fraud, theft, and
fare abuse. Fraud and fare abuse can be reduced by simplifying the fare struc-
ture. Theft is usually avoided by limiting the number of cash transactions.
Each operationaJ. criterion should be specified as clearly as possible.
Pare collection costs, fare abuse, and theft can be quantified and targets can
be set based on current conditions. The criteria should identify vhat is
acceptable and what is not acceptable from an operational standpoint. A ranking
system may also be used to score the various plan options eilong each of the
criteria mentioned above.
Socioeconomic and Environmental Criteria
In addition to the above criteria, fare plans are sometimes designed to
meet a variety of other goals. Exetmples include providing reduced fares for
the elderly and handicapped during off-peak hours, meeting clean air standards
and energy conservation goals by encouraging shifts from auto use, promoting
the use of idle capacity during off-peak hours, and fostering the development
of the central business district. It is safe to say that, with respect to fare
policy, most of these goals are of secondary importance. Transit fare policies
generally have small leverage on the achievement of these socioeconomic goals.
STEP 3: SELECT FARE OPTIONS
Once the background work has been performed, the transit agency will be
ready to select different fare options that can be analyzed and evaluated. The
four specific decisions that have to be made are:
• which fare structures to test,
• which fare collection methods to use,
• which fare prepayment plans to offer, and
• which promotional fare programs to implement.
Selecting Fare Structures
If a major fare change is being considered, several fare structures should
be tested. Unfortunately, no simple rules exist for selecting fare structures.
Creativity is required along with a clear understanding of what is wrong with
the current fare structure, what is applicable in the region, and what is
politically feasible. Most of these aspects of the current transit system
should be understood at this point in the fare planning process.
The basic fare options that can be tested iTiclude flat fares, time-of-day
fares, zone- or distance-based fares, and other options including quality-based
fares. Each fare structvire has its own benefits and disbenefits. As a general
rule, the more complex fare structures Ctime-of-day and distance-based fares)
produce more revenue with a smaller loss of ridership and are most equitable.
However, they can be confusing to users and more costly to implement.
The present practice of approaching fare design from the political view-
point of defining fares in terms of the lowest common demoninator of what the
average passenger is willing to pay is myopic, since it fails to tap the poten-
tial for pricing according to the perceived value of the transit service.
Consumer research on transit has consistently shown the rider' s perception that
transit service does have a value and that the clientele is willing to pay for
clean, fast , and convenient service. Consvimer research results also show that
improving service is perhaps more important than maintaining low fares for
attracting or maintaining ridership. These findings suggest a need for differ-
ent services and different prices to take advantage of riders' perception of
service need and value. The few communities that provide scant service to a
homogeneous group of riders are the only ones that do not have to worry about
multiple sei*vice options and, thus, differential pricing. However, if other
systems are truly in the business of providing the most service to the most
people for a given level of subsidy, then those systems should opt for differen-
tial pricing policies.
Development of differential pricing structures requires an active market
research prograim to identify segments of the transit market and their response
to fare and service changes. In addition, an entrepreneurial approach to the
development of transit services has to be combined with political flexibility,
objectivity, and freedom to vary fares in response to changing economic con-
ditions.
It is conventionally understood that transit markets vary in their respon-
siveness to fare changes. Short-distance and off-peak riders are generally more
responsive to fare changes than long-distance and peak-period riders. There-
fore, by designing fare structures that consider different traveler reponses to
fares, it is possible to raise revenues with less sacrifice of trips lost.
Critics of flat fare structures claim that flat fares, by ignoring differ-
ences in elasticities of traveler responses to fare changes, raise less revenue
with greater sacrifice of trips lost than would be the case with distance-based
-1+8-
or time-of-day fare structures. Flat fares are also less equitable if trip
lengths vary considerably.
On the positive side, however, flat fare structures are easier to adminis-
ter. Time-of-day and distance-based fares require driver training and a more
conscious effort on the driver's part to supervise the payment of correct fares.
Flat fare systems also result in faster boardings than do more complex fare
systems.
A fined, factor not usually highlighted in the discussion of alternative
fare structures is the issue of fraud. Fare experiments involving changes
frOTi distance-based fares to flat fares have uncovered a significant element of
fraud (both Involuntary and voluntary) in distance-based fares, as well as other
significant costs, such as increases in dwell time, driver time, and adminis-
trative costs. For distance-based and time-of-day fares to overcome their
greater administrative costs, significant differences must be present in the
elasticities found for short vs. long trips and peak vs. off-peak trips. Only
when appreciable elasticity differences are present will enough revenue be
raised to cover administrative costs.
Based on this discussion, it is possible to make the following generali-
zations concerning each fare structure alternative:
• Flat fares ; While easy to apply and administer, they suffer from theiradverse effects on eqxiity and revenue generation.
• Time-of-day fares ; This fare policy involves a surcharge for peak ser-vice, a surcharge Justified by the greater costs and lower elasticityof demand during the peak period. These fare structures are superiorto flat fares in terms of equity and revenue potential, but they areslightly more expensive to administer.
• Distance-based fares : Transit fares graduated by distance provide thebest features in terms of equity and revenue-generation potential in
those transit systems with appreciable differences in elasticities be-tween short and long trips. However, these fare structures are incon-venient to users and lead to fraud and to higher operating costs due
to slower boarding times.
• Quality-based fares : There is evidence that transit riders, especiallyhigh-income transit riders, are willing to pay considerably greaterfares for high-quality services, such as express or subscription ser-
vice. Evidence of the opportunities offered by these fare structures
is provided by several companies providing profitable long-haul expresscommuter service in large metropolitan areas in the East and Midwest.
Ey charging higher fares to the long-distance high-income commuter,
quality-based fare policies remove some of the inequities of flat fare
systems, while having high revenue-generation potential.
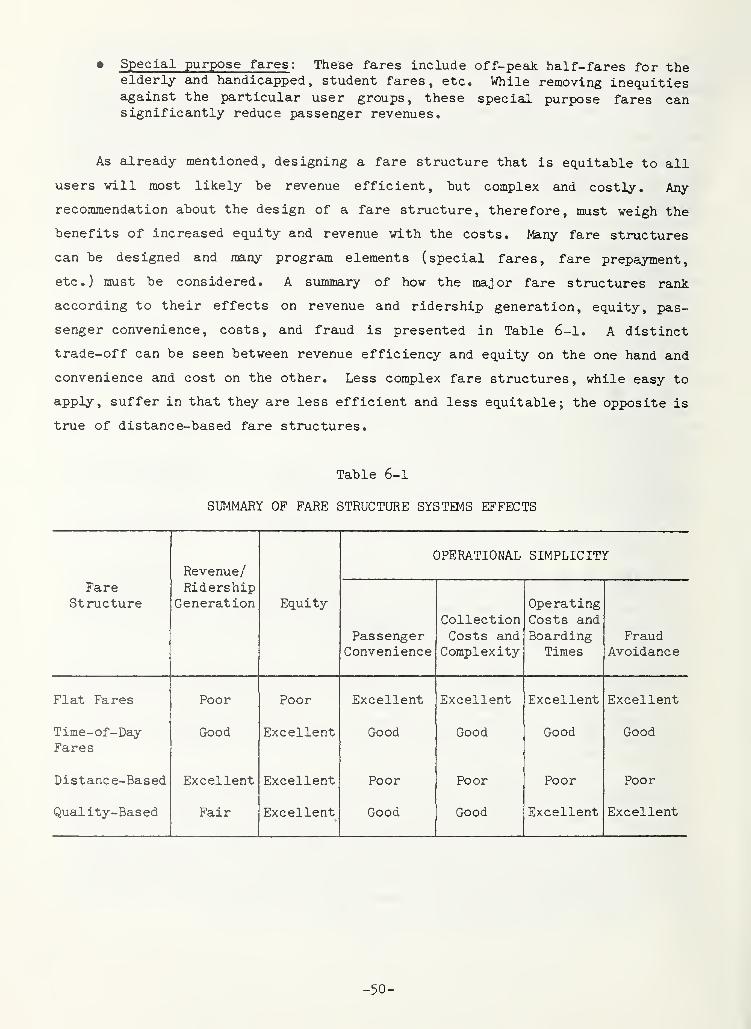
• Special purpose fares : These fares include off-peai half-fares for theelderly and handicapped, student fares, etc. While removing inequitiesagainst the particular user groups, these special purpose fares cansignificantly reduce passenger revenues.
As already mentioned, designing a fare structure that is equitable to all
users vill most likely be revenue efficient, but complex and costly. Any
recommendation about the design of a fare structure, therefore, must weigh the
benefits of increased equity and revenue with the costs. Many fare structures
can be designed and many program elements (special fares, fare prepayment,
etc.) must be considered. A summary of how the major fare structures rank
according to their effects on revenue and ridership generation, equity, pas-
senger convenience, costs, and fraud is presented in Table 6-1. A distinct
trade-off can be seen between revenue efficiency and equity on the one hand and
convenience and cost on the other. Less complex fare structures, while easy to
apply, suffer in that they are less efficient and less equitable; the opposite is
true of distance-based fare structures.
Table 6-1
SUMMARY OF FARE STRUCTURE SYSTEMS EFFECTS
Revenue/OPERATIONAL SIMPLICITY
FareStructure
RidershipGeneration Equity
PassengerConvenience
CollectionCosts and
Complexity
OperatingCosts andBoarding
TimesFraud
Avoidance
Flat Fares Poor Poor Excellent Excellent Excellent Excellent
Time-of-DayFares
Good Excellent Good Good Good Good
Distance-Based Excellent Excellent Poor Poor Poor Poor
Quality-Based Fair Excellent Good Good Excellent Excellent
-50-
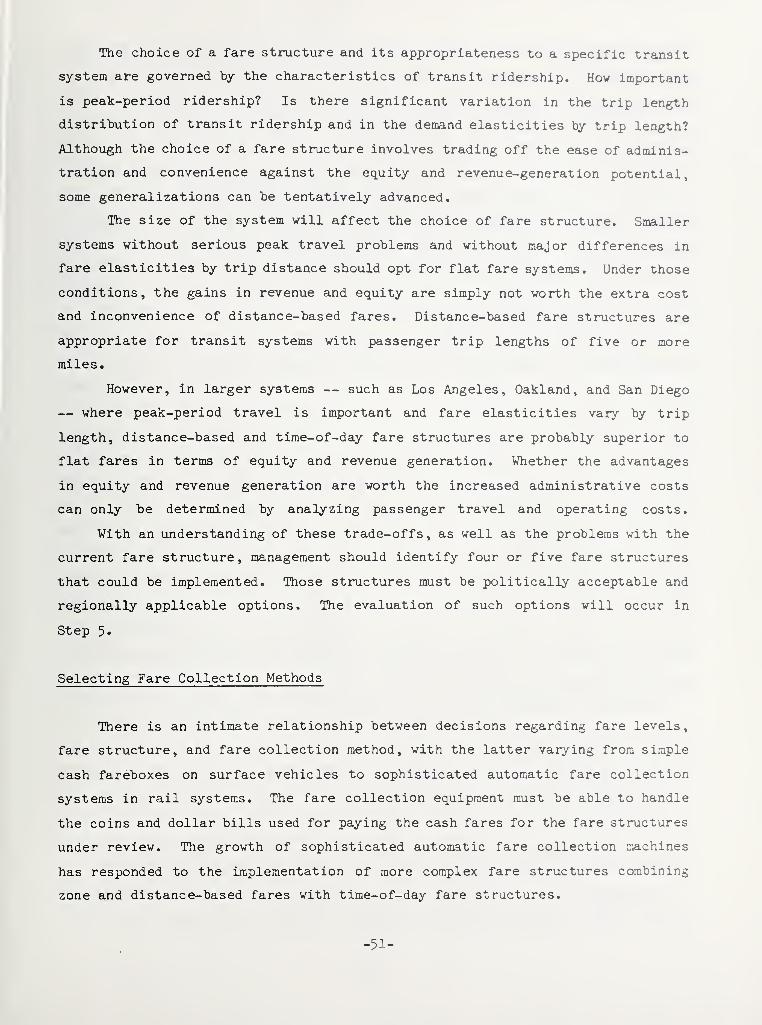
The choice of a fare structure and its appropriateness to a specific transit
system are governed by the characteristics of transit ridership. How important
is peak-period ridership? Is there significant variation in the trip length
distribution of transit ridership and in the demand elasticities by trip length?
Although the choice of a fare structure involves trading off the ease of adminis-
tration and convenience against the equity and revenue-generation potential,
some generalizations can be tentatively advanced.
The size of the system vill affect the choice of fare structure. Smaller
systems without serious peak travel problems and without major differences in
fare elasticities by trip distance should opt for flat fare systems. Under those
conditions, the gains in revenue and equity are simply not worth the extra cost
and inconvenience of distance-based fares. Distance-based fare structures are
appropriate for transit systems with passenger trip lengths of five or more
miles.
However, in larger systems — such as Los Angeles, Oakland, and San Diego
— where peak-period travel is important and fare elasticities vary by trip
length, distance-based and time-of-day fare structures are probably superior to
flat fares in terms of equity and revenue generation. Whether the advantages
in equity and revenue generation are worth the increased administrative costs
can only be determined by analyzing passenger travel and operating costs.
With an understanding of these trade-offs, as well as the problems with the
current fare structure, management should identify four or five fare structures
that could be implemented. Those structures must be politically acceptable and
regionally applicable options. The evaluation of such options will occur in
Step 5.
Selecting Fare Collection Methods
There is an intimate relationship between decisions regarding fare levels,
fare structure, and fare collection method, with the latter varying from simple
cash fareboxes on surface vehicles to sophisticated automatic fare collection
systems in rail systems. The fare collection equipment must be able to handle
the coins and dollar bills used for paying the cash fares for the fare structures
under review. The growth of sophisticated automatic fare collection machines
has responded to the implementation of more complex fare structures combining
zone and distance-based fares with time-of-day fare structures.
-51-
The objective of a fare collection system is to collect the exact fare
while minimizing costs and detrimental effects on boarding times/vehicle speeds,
driver/passenger interface, machine/passenger interface, and fraud and theft.
That is, the fare collection system should be selected to minimize costs and
passenger time and inconvenience.
The off-vehicle purchase of fare instruments and passenger self-service
fare collection methods result in faster boardings. The nature of the driver/
passenger interface depends on provisions in the labor relations agreements.
In some systems, the driver handles the money, checks whether the correct fare
is paid, and issues, collects, and inspects tickets and transfers. In more
restricted labor agreements, drivers may only check that some coins and instru-
ments are dropped in the farebox.
Fraud and theft are important problems to consider. Fraud can take the form
of not paying the correct fare or paying in illegal coins (such as slugs, half
dollar bills, foreign currency, etc.) Revenue losses from fraud usually amount
to two to five percent of the cash fare revenue and are greater under zone- and
distance-based fare structures because of the difficulties of supervising pay-
ment of the correct fare in the absence of machines or on-board checkers. A
rule of thumb used in passenger self-service systems is that every rider should
be checked every i+0 to 50 rides to keep fraud at tolerable levels.
Theft can take place at several steps in the coin collection process. The
greater the number of coin handling operations, the greater the probability of
theft. Ticket-issuing machines are very sensitive to theft because they inter-
face with riders, coin collecting staff, and maintenance personnel. To reduce
problems of theft and fraud, prepayment instruments such as tickets and passes
are being advocated. But even in those instances, there is the need for precau-
tion by numbering the tickets and passes to check those issued against receipts.
The fare collection system can provide data on passenger movements, a
feature significant in view of UMTA's Section I5 reporting requirements.
Some of the sophisticated fare collection systems in place — with their magnetic
features, microprocessors, and computers — can satisfy some of the requirements
of management information system reports.
Selecting Fare Prepayment Plans
If the new fare plan will include prepaid fare instruments, how does a
transit agency determine which fare prepayment plans to use and what restrictions
-52-
should be placed on their usage? The general approach has been to survey users
and ask them what type of plan they would like. Unfortunately, people do not
always react the way they say they will.
The first task in selecting the appropriate fare prepayment plan is to
identify the target group the transit manager is most interested in reaching.
Usually, this group shows a high potential for new or increased ridership.
Many operators, however, simply want to provide some groups with a convenient,
yet cost-effective alternative to cash payment. The target group may be identi-
fied either by trip purpose or client group (commuter, shopper, elderly, youth;
or by the specific transit services they use (off-peak, CBD, or park-and-ride
service)
.
Commuters usually choose their payment method on cost considerations alone.
Their ability to predict the number of rides they will make enables them to
select the most economical payment method. In addition, except for low-income
riders, commuters are usually able to handle a Iximp-sum payment in advance.
Thus, long-term or large-quantity plans — such as annual or monthly passes, or
UO-trip ticket books — are appropriate for commuters. A variation of the
monthly pass attracting considerable attention is the monthly commuter pass,
which, by restricting its use to peak hours only, limits the usual revenue loss
experienced in pass programs. Monthly permits are also appropriate and can
preserve more peak-period revenues. However, in cities where a large proportion
of the commuters are low-income riders, short-term plans (such as 10-trip ticket
books and weekly passes) should also be offered because of the difficulties
experienced by many low-income riders in financing the front-end costs of
long-term plans.
Day passes and tickets, usually with off-peak-only restrictions, are most
appropriate for shoppers. Tokens and punch cards are less useful than tickets,
but may be used to encourage transit use for shopping. In general, small-quan-
tity plans should be used and marked for off-peak use only.
College communities seem to have been first in experimenting with annual
passes and other long-term fare prepayment methods. In one university community,
high parking rates and an annual bus pass have encouraged many non-captive riders
to use the bus system. As a general rule, students should be offered plans
similar to those used during off-peak hours.
Fare prepayment programs designed for the transit-dependent should empha-
size low cost. Low-quantity tickets can be provided since the front-end cost
-53-
is usually a problem. It may be found that, because the transit-dependent use
transit frequently, passes or permits are most appropriate. Day passes may
prove successful for low-income transit users.
Once a transit manager has identified a set of alternative plans that
would be appropriate for the target group under consideration, it is important
to select the plan that not only fits with other plans in operation, but also
minimizes operating costs. Monthly and weekly passes, for example, may be
appropriate for the same group, but their costs are significantly different.
Consequently, knowing how much more (or less) it will cost each month to pro-
duce and sell one type of fare prepayment plan over another would be useful
for planning purposes.
Attention must also be given to balancing the combination of plans offered.
In some cases, fare prepayment plans can duplicate one another and lead to higher
than necessary administrative costs. For most transit systems, two or three
basic fare prepayment options will cover the range of consumer needs if the
plans are properly priced relative to one another. A program with too many
plans may prove difficult to administer and confusing to the public.
The possible combinations of fare prepayment plans are endless, and no one
set or combination can be recommended for general use. However, the analysis
of recent experience with transit fare prepayment does suggest that plans
should be offered to cover both the frequent and infrequent ridership markets.
Specifically, the following guidelines for establishing a balanced set of fare
prepayment plans are recommended
:
• A relatively low-priced, short-duration option should be made available
to meet the needs of low-income people, the transit-dependent, and
occasional riders. Day passes or lO-trip ticket books may be appropri-
ate. Punch cards should be probably avoided because of their adverse
effects on dwell time.
• Weekly or monthly passes or permits should be provided for frequent
riders, complemented by a multiple-trip format, such as strip tickets
or ticket books.
• The plans and their respective discount rates should be determined by
their ability to encourage greater transit usage at minimum cost to the
system. The plans should stimulate off-peak transit use where the
marginal cost of providing increased service is low. Low-quantity plans
should not be discounted, whereas long-duration plans that encourage
regular transit usage, such as monthly passes, can be slightly dis-
counted. Caution should be taken not to extend to peak-period users
other than nominal discounts because of their inelastic demand response
and because of the higher cost of peak-period service.
-5U-
Selecting Promotional Fare Programs
The design of promotional fares progreuns has to be approached vith care
because of the danger of revenue losses. Successful promotional fare programs
have certain elements in common, namely:
• they are of short duration,
• they are targeted on new riders,
• they use excess capacity during off-peak hours, and
• they include continuous monitoring and evaluation activities.
Most promotional fare programs have a short duration period. The duration
period should be long enough to enable the rider to assess the quality of the
service and to feel comfortable with its use. A one- or two-week period is
probably enough for most programs. The short duration is designed to minimize
revenue losses.
Promotional fare programs must be targeted to new riders and not to frequent
riders. Obviously, giving fare discounts to persons who would ride transit
anyway is self-defeating. Promotional fare programs -- such as "Fare-Free
Days" or "Bargain Fare Day" — that fail to target promotions to non-transit
riders should be avoided.
Some promotional fare policies promote travel during periods of excess
capacity, such as on weekends and during off-peak shopping hours. These pro-
grams, if properly designed by avoiding frequent riders, can be cost-effective.
Downtown businesses should be encouraged to help offset the cost .of implementing
promotional fare programs.
Few promotional fare programs are monitored closely for their short-term
and long-term ridership and revenue impacts. Yet the need for continuous
evaluation and monitoring of these programs is evident. Successful programs
are those that lead to the highest number of new transit trips per dollar of
revenue foregone in the promotion.
STEP h: EVALUATE FARE OPTIONS
The initial step in evaluating each of the fare options identified above
is to forecast changes in the existing conditions, assuming fares will remain
-55-
constant. Cost, ridership, and revenues will change over the period under in-
vestigation even if fares do not. Labor and fuel costs are rising, and rider-
ship may grow simply because the economy and the population are growing. These
forecasts will provide management and staff with the new base conditions for
comparing each fare plan.
Look at each of the fare plans selected in the preceding section and iden-
tify each of the fare paying groups for which data must be provided. The total
number of \inique fare paying groups that can be combined to meet any of the
market groups under investigation will become the level of analysis. For
example, assume that five fare structures are being considered by management: a
revised flat fare, two time-of-day fare structures, and two zone fare structures.
For each fare structure, define the fare paying categories, such as:
• cash fare patrons, by zone and/or time-of-day,
• prepayment patrons (tickets and monthly pass riders),
• express service,
• elderly and handicapped,
• etc
.
Each of the ridership-based evaluation criteria for each fare structure
option must be evaluated at this disaggregate level. ^ Consequently, ridership,
costs, and fare elasticities of demand must be available for each group. Disag-
gregate ridership levels should be easy to obtain from existing data collection
sources and recent on-board surveys. Costs for each group should be obtained
using the system's cost allocation model. Elasticities should be computed from
past fare changes. If disaggregate elasticities are not available, estimates
(default values) can be obtained from the elasticity table provided in Table
6-2.
With the data available for each fare option, the staff must now select fare
levels for each fare option so that the evaluation criteria established in Step
2 are met. Although this is the generally accepted approach to pricing, it is
not theoretically correct. If the purpose of the transit agency is to maximize
the benefits provided to transit users while meeting the budget requirements,
management should select fare levels so that the mark-up, or percent deviation
of fares from marginal cost, is inversely proportional to the fare elasticities.
-'In the example presented in the appendix to this manual, there are kO uniquefare-paying groups.
-56-
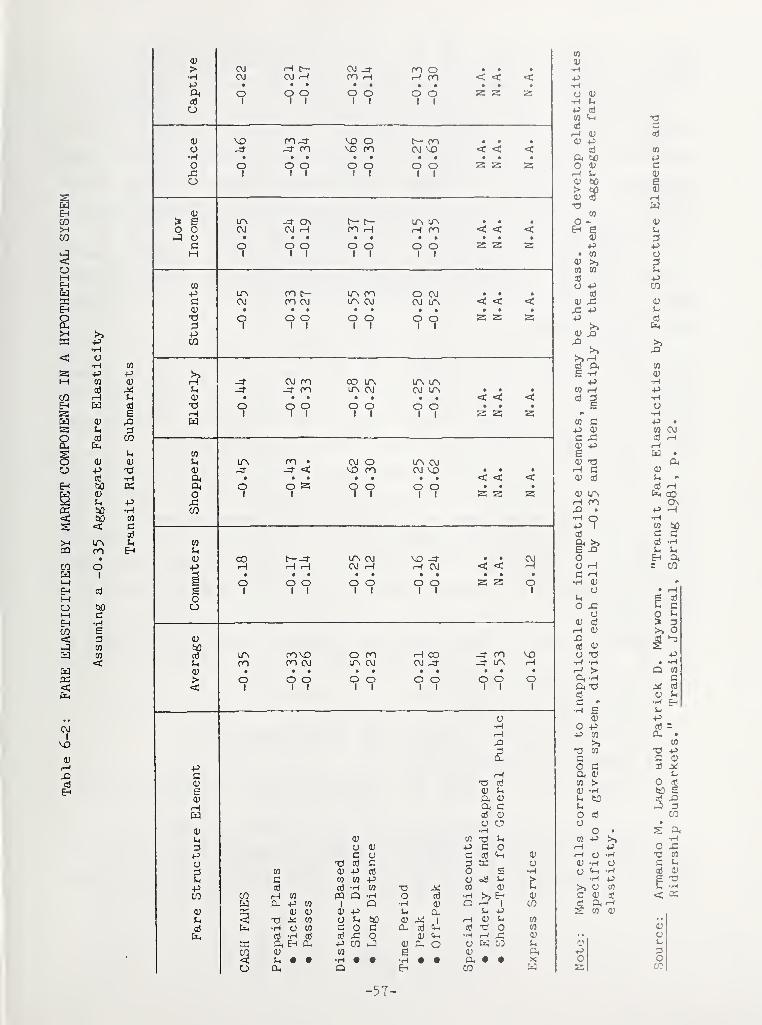
m
OJ
cn
0)
•H
OJ
c
Eh
1)
>• oo o • • •
H C\J CM iH < <• • • • • • • • • •
P< o o o o o o o zcS 1 1 1 1 1 1 1o
0) MD o t— m • • •
o -J- on CM \D < < <•H • • • • • • •
o O1
9 91 1
9 9 o o1 1
zo
0)
> 0 UA -3" 0\ • • •
o O CM CM H H 00 <; < <o • • • • • • • • • •
cM O1
o o1 1
o o1 1
o o1 1
M•P Lr\ ro LTN m O CM • • •
G CM 00 CM LTN CM CM U\ < < <1) • • • • • • •
t3 o o o o o O O z13 1 1 1 1 1 1 1
PCO
J- CM OO CO u> uA ir\LTN CM CM LTN • • •
OJ • • • • • • • < < <XJ o o o o o o o • • •
H 1 1 1 1 1 1 1W
WIn LPv CM O UA CMOJ OJ \o •
• • • • • • t < < <O 1Z5 o o o o • • •
o 1 1 1 1 1 zCO
W
<v CO LTN CM \0 J" CM+J CM t-t H CM < < rH
• • • • • • • • • •
O o o o o o o s zE 1 1 1 1 1 1 1 9oCD
LTN O 00 rH OO J- OOcn CM ir\ CM CM -3-
• • • • • • • • • •
o o o o o o o o o o< 1 1 1 1 1 1 1 1 1 1
o
H
pOh
c H<D T3 03
S CJ Si
0) ft 0^
iH Q< CW 03 1)
o ov •H
<u to t3 l-i
n o <v P c op c o C oJ ^ i)
op
T3 o3 C ow (U P o5 0c (0 CO P o
p o3 o3 -H CO T3 ^ to MCO CO iH (/J pa Q -H O cd fH QJ
w p 1 Q •r-l D ^ 1 COOJ 0) 0) OJ 4J (X, S-i 4-3
u <: -c( -iii CO O ^ bD (U ^ 1fH a; i-( CO
o3 •H O CO c o c a. 0) Cm 0? -c o CO
o3 -H oJ o! -C O OJ Cm r-t r-H j:: a;
Eh P CO 0) D-, O O u0) CO e 0.' ft
Xo Q-, Q en CO
a;
Vp03
ft bOO
4)
>0)
T3
OEh
PCO
>»CO
p03
P
0)
CO
03
o
0)
P0)
>>
03 ftS -Hp
CO rH0) 3
E
C
CO
V
u
•P
epCO
0)
GO
4)•HP•HO
cc c P •
P OJ CO CMc x: Oj rHOJ +J iHs W •
ftrH C OJ
0) Oi t.
03 rH<u ir\ Ct, COf—1 ro C^XI . P -H•H o •Hp 1 CO bOo3 c c9^ >^ o3 r-t
S -Q u uO &H ftO rH COC r-l
f-i a>
o rHc 03
o x: c co o (h
0) o3 ? 3rH (U >> O
03 o;
U 13 p•H -H • •HrH > Q 03
ft -H Cft T3 0)
03 oC •> H Eh•H S IH
PO P 03P CO ft •
MT3 CO T3 Pc C 0)
c =ft a;
03
Cto > 0
ia; -H toI- w
30 o3 00o •
o • ftCO P >>rH ^ o x:rH O -H •o CO
(T -H O cO <M 03 0)
•rH p -a>> o to r-l
c 0) 03 <a> ftrHS CO (U
po
0)
u
3oCO
-57-
That is, the mark-up should be smaller in more elastic markets, such as for
off-peak travelers or for short-distance trips, than in inelastic markets.
In practice, however, this pricing rule runs into problems due to the in-
ability of present-day costing methodologies to properly estimate marginal
costs for different transit services. In addition, political realities some-
times make it difficult to implement pure economic solutions to fare design
problems. For that reason, this manual follows the more conventional approach
of selecting fares based solely on fare elasticity of demand.
To compare fare plan options, the fare levels selected for each should meet
the most important evaluation criterion. With the most important criterion
met, each fare plan option can then be evaluated according to how well it meets
the remaining criteria.
Suppose, for example, that the revenue target for the new fare structure is
$33,000 per weekday, up from $28,000. If the existing flat fare of $0.65 were
changed to meet this revenue target under four fare structure alternatives , the
figures presented in Table 6-3 would result. The new revenue levels for each
fare plan option meet the revenue target, plus or minus one percent.
Using these fare levels, the staff's next step is to evaluate each fare
option with respect to each of the remaining evaluation criteria. How closely
has the ridership target been met? Are there still large differences in the
revenue/cost ratios for each ridership group? Do the new fare structure propos-
als meet the operational and social needs of the transit system and community?
Table 6-h summarizes the evaluation results for the five fare plans used in the
above example.
Each fare option is evaluated according to the criteria established in
Step 2. In this example, the following five evaluation criteria were chosen:
• daily revenue production,
• daily ridership level,
• equity considerations based on the revenue/cost ratio,
• operational feasibility, and
• socioeconomic in terms of encouraging CBD travel and development.
The forecasted base conditions are shown in the first row of the table,
followed by the target conditions set for each criterion. The evaluation re-
sults for the five fare options used in this example are presented at the bottom
-58-
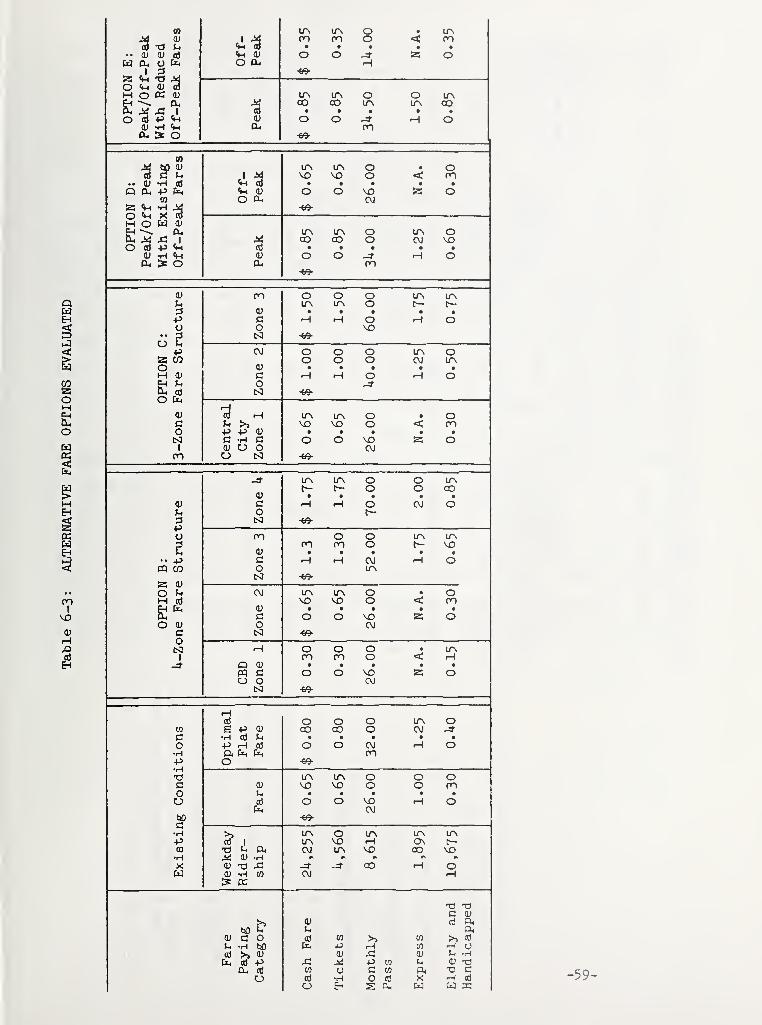
^ t3.. <u a>
I ::>» <M 13O tt)M O CC
a.
00
0)
O
LTN o •
1 OO o < OO• • • • •
v< <u o o -It o0-1
LTv o o LfNoo OO LTN CO
a • • • • •
0) o o o
S5OH
o
Ou, 4-> Ct,
0}
X
o
MctJ
a;
a.
o69-
oo
CM
ITSOO
o
ITSOO
Oo
<2;
cvj
oCO
o
0)
u:3po
o
oM
o
•pCO
(U
<D
GOIS]
I
OO
OO
co
coCO
C -H C0)0 0U tS3
o o ooo
oo
oo
ooo
LA
o69-
oo
OJ
<
o
o
oOO
0)
o
m CO
o uM bJ
O Vco
I
J- o oc- o o OO
0) • • • • •
c H H o CM oo c-to
00 O o ITS
00 OO od) • • • • •
c H H OJ ooCO -ee-
CVJ LTN o • oVD o < 00
0) • • • • •
c o o VO oo CMCO -ee-
o o o •
00 OO o <Q a; • • • • •
PQ c o o OO oCO
CO
cO•HP•HacOo
C•H-PCO
•H
w
•H ttf
P .HPL| (x<
o
(L)
a; a;
:2 KCO
oOO
O-ee-
oCO
ooCMOO
oo
CO
OJ
oVDLTN
LPvrH
J- CO
LTN
CM
OO
LTV
CO
O-J-
oOO
UAc-
o
C O
^03 PCL, cd
CD
0)
a)
x:(0
a)
CJ)
CO
p0)
o•HEH
P CO
C CO
Os a.
CO
CO
<v
u!^Xw
T3C 0)
n3
^ O
TD CrH CC)
X
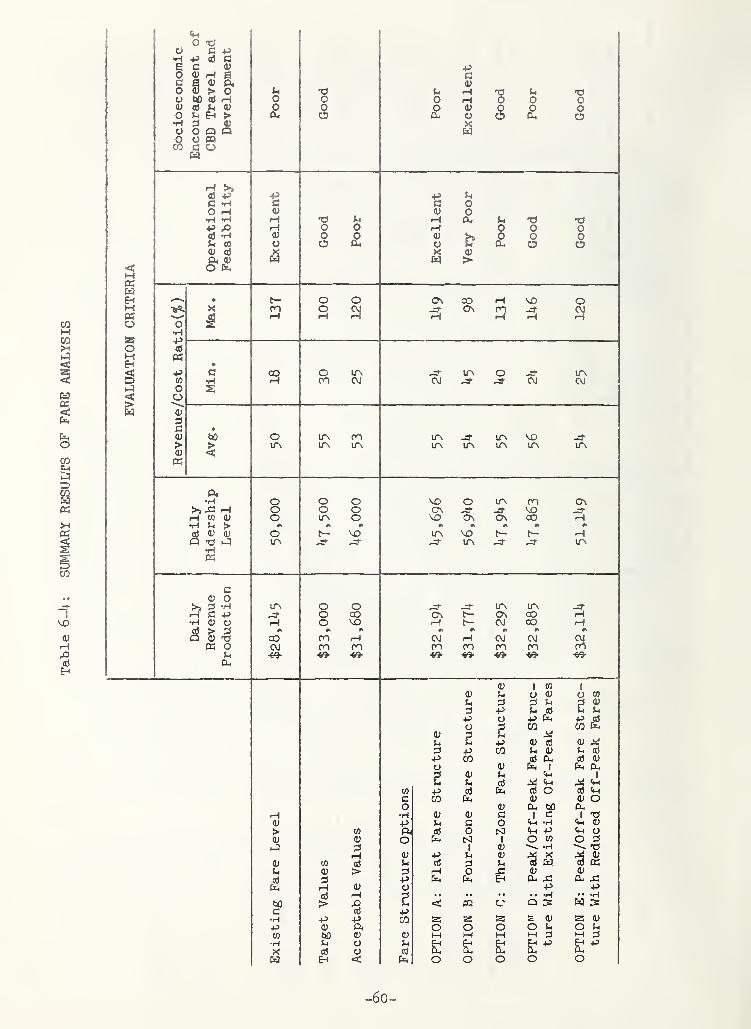
COMCQ
wEHMKO
oM
I
CO
CO
I
0)HaEH
f i
(rt C+^
Q r*KMCo V > o M
o w J
M fljW M M/ o r\w d) \J Or\\J «, Phi i> 0< §. f \
•HO Q QO
O O PQCQ c o
i~j
wo -t-^
C "H c wO ^ V•H *H+» 1*-' H Q Oi\J£0 "H <u o 4) O o o
00 O Cu oV a) M w >
\ / no >H
fH00 -if
w s•HP(ri
•P c o ir\ LA o -3- mCQ •H H m CJ CM -=r OJ CMr\\Jr \\ '
d)
j3 O irs 00 ir\ ITS vo> >; LTN ir\ lA LTN LA
lA rv-vI
rO (—
)
Q \—
/
—
^
VA>4^r—1 CO <U Q LTN o \Q On On CO
d <D a> O LTN H(3 73 LTN J- LA lA
•H
Co
*H (U O
_J" LA LA
\ o\ no\Q rvi OO
(Tf *V HW ^ .-J
C3 QJ co" oo H cvT H oT C\J
« o OJ on on on on on-69- -ee- -ee- -69- 69-
f\
1 CA1
0) o a; O COf.>H
«^»—
'
>-> M a)
p i3 M CD 2
w* t
W torn &j
ss pp CO ^ CIS
ruct
UJ
(U are kFa
1
1—
r
k
Fa
I—
re
p CD fe a o c(3 «HCO 0) (U o
/-\w CL. tjD fer~i *rH c 1 c 1 X}/tl\u o Cm -H <M 0)
>-
V-/ CSJ «M -P (iH Oo tt/ O roCvl I O CO o dt—
J
I (U -H•P
<u co cd a Kf .M <u r> rH OJ
CD »-J fe XIPr1^ 1—
1
Mf \ P
Q(J < M-i ^- Q De M >w •p S 0)C/J is z £ Q}
fl) o o o oCO tiD i) 0) 1—
t
t—
1
(-H d•H VX oJ o nJ
w Eh < o o o O o
-60-
of Table 6-k, Note that Options C and E meet all five criteria. A more de-
tailed exeunple of how to identify and evaluate fare structure options is pre-
sented in the appendix to this manual.
STEP 5: RECOMMEND FARE PLAN TO TRANSIT BOARD
Although the process outlined in this manual will lead to a staff-recom-
mended fare plan, it should be clear that, with Just minor changes to the evalua-
tion criteria established in Step 2, a different fare plan could have resulted.
This has strengthened the movement toward fares being political policy decisions
derived from public attitudes, general economic and fiscal conditions, and the
influence of vested interests. For these decisions to remain in the hands of
transit management, the transit board must be involved throughout the process
described here. Thus, the reasons used by management and staff for selecting a
particular fare plan must, in part, be generated by the group of people who
vill eventually make the final decision about which fare plan to adopt.
In obtaining board approval for implementation of a particular fare plan,
management must clearly present the advantages and disadvantages of the recom-
mended plan. In addition, alternative fare plans must also be discussed. If
an alternative is only slightly inferior to the recommended plan, but may be
politically easier to implement, then the board may opt for the alternative.
The job of the transit board, after all, is to make political decisions that are
in the best interest of the transit system and its patrons. These decisions
are based on operational facts and political insights. The results of the
process outlined in this manual should provide policy-makers with the facts.
-61-

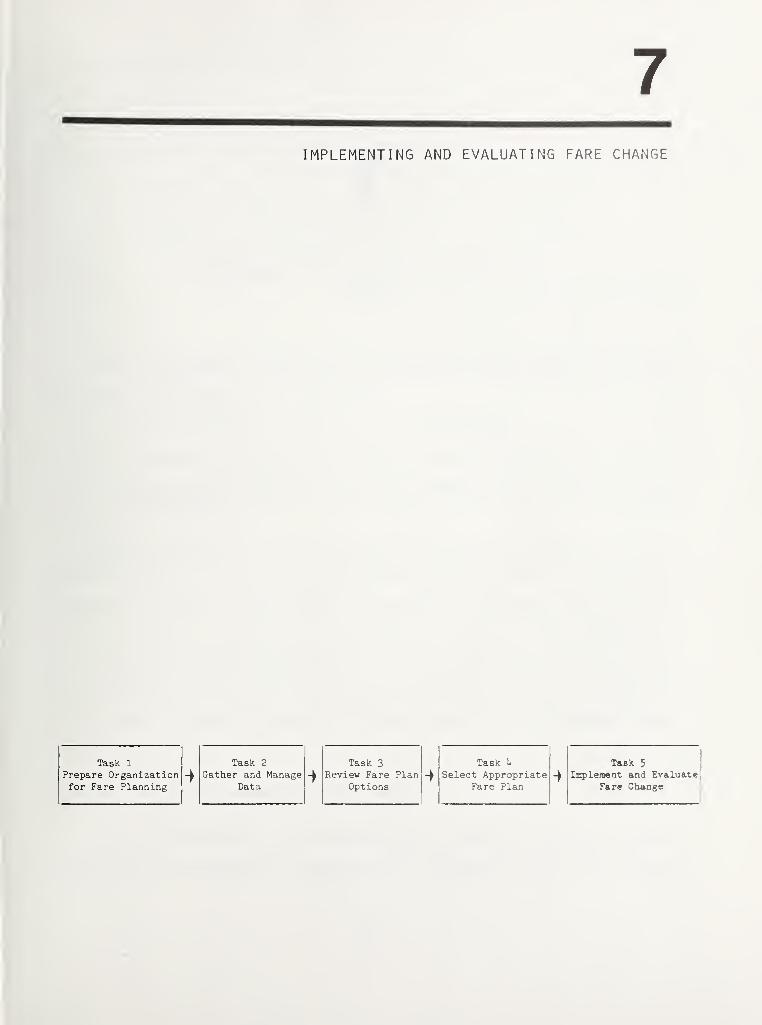
7IMPLEMENTING AND EVALUATING FARE CHANGE
Task 1
Prepare Organizationfor Fare Planning
Task 2
Gather and ManageData
Task 3
Review Fare PlanOptions
Ta.8K 5
In^ilement and EvaluateFare Change

7IMPLEMENTING AND EVALUATING THE FARE CHANGE
(TASK 5)
Once an appropriate fare plan has been selected, three steps remain before
the actual fare change can go into effect:
1. Citizen involvement activities must be undertaken.
2. An on-going fare monitoring process should be established.
3. Any logistical activities involved in changing the fare structure mustbe completed.
Citizen involvement includes notifying the affected population of the
proposed change, conducting formal public hearings on the issue, and responding
to community comments on the change. Monitoring and evaluating of the effect
of the fare change on ridership is accomplished by instituting an on-going data
collection and data management process (described in Chapter ky Task 2). Finally,
activities aimed at the smooth transition from one fare level and structure to
another must be carried out. These logistical activities include public adver-
tising, driver training, and dealing with any changes in the mechanics of fare
collection.
INVOLVING CITIZENS IN THE FARE PLANNING PROCESS
A major consideration in implementing a fare change is involving citizens
in the process. Most transit agencies have an approved plan for how and when
-63-
citizens will be involved in transportation planning activities.^ Among other
things, such plans cover:
• Key issues and decision points where citizen involvement will be sought,
• Mechanisms for involving citizens and the timing of such efforts, in-cluding:— notifying the public, and— disseminating information materials.
• Procedures for considering and responding to public comments.
Notifying the Public
Federal laws authorizing UMTA operating and capital grant programs require
the applicant to certify adequate public notice of projects affecting the com-
munity. 2 The public should be notified well in advance of the fare change so
it has a chance to respond. Background information should be made available on
why the fare policy is being changed. In particular, public information materi-
als should address fare equity for different user groups (e.g., suburban com-
muters vs. inner city residents) to forestall potential charges that the fare
change is unfair. It is also important to keep public information materials as
non-technical as possible. In addition, all public information documents or
announcements should identify someone to contact for further information.
Possible mechanisms for informing the public of a fare change include:
• Public service announcements on radio or television.
• Newspapers
.
• Announcements on public vehicles and at transit stops.
• Community bulletin boards.
• Flyers.
Involving the Public
Once the public has been inforaed about the proposed change in fare policy,
a number of mechanisms can be used to solicit public input. The most common is
-^The DOT Guidelines on Citizen Participation in Local Transportation Planning ,
issued in the Federal Register on January 19, I98I, require a plan for citizen
participation.
^Public Law 88-365, as amended.
-61;-
the public hearing. In fact, the law authorizing capital and operating assist-
ance through UMTA programs requires that recipients hold public hearings con-
cerning projects that will substantially affect the conununity . -' And an UI^TA
regiilation implements that statutory requirement .2
Another formal mechanism to involve the public might be setting up an ad
hoc or on-going citizen advisory group on fare planning. Other, less formal,
involvement mechanisms include:
• Community or neighborhood association meetings.
• Town meetings.
• Telephone hotlines.
• Citizen advocates.
Regardless of the mechanisms, any plans for public participation should
consider times and places convenient and accessible to the public.
Considering Public Comments
Citizen comments on the proposed fare change should be tabulated and
summarized for review by the transit agency staff, management, and board. Those
comments should be considered and responded to before a final decision is made
regarding implementation. Such comments provide a valuable tool for decision-
making in that they often predict user response to the proposed change.
ESTABLISHING THE FARE EVALUATION PROCESS
As stressed earlier, the fare planning process is a continuing effort, not
one performed intermittently or when a crisis arises. Fare policies should be
reviewed at least annually. To make the best decisions, now and in the future,
it is essential to have first-hand, system-specific information on the impacts
of the proposed fare change on ridership, revenue, and cost. This data gathering
process should be designed and in place before the fare change is implemented.
Once implemented, the fare change should be monitored and evaluated in
terms of how well it meets the goals set by the transit operator as part of the
^Public Law 88-365, as amended.
2li9 CFR 635.
-65-
planning process. Those goals can include: (l) ridership generation, (2) rev-
enue generation, (3) fare equity, {k) operational simplicity, and (5) social
and environmental considerations.
Thus, the purpose of evaluating fare change impacts on ridership is to:
1. Gain insights to the effect on ridership and revenue,
2. Analyze the effect on fare equity,
3. Detemine the effect on operational simplicity.
k. Measure the effect on socioeconomic and environmental goals.
As explained in the following sections, the appropriate level of evaluation
will vary depending on the type of fare change. If the change is a simple
increase in fare level, then data may be collected and analyzed on an aggregate
basis across all time frsunes and for all users. If, however, the change involves
the fare structure or fare collection procedures, data must be collected and
analyzed in a disaggregate manner that allows the transit agency to make an
in-depth evaluation.
Managing Fare Monitoring Data
Four basic types of data can be used in the fare impact evaluation:
1. System operational data (ridership, fare level, service, cost),
2. User survey data.
3. Information on administrative costs and procedures.
k. Information on fare collection costs and procedures.
These data will have been collected and analyzed during the fare planning
process described in Chapter k (Task 2). They are used as descriptors of the
"before" situation and should include at least the six-month period prior to
the fare change. To perform the evaluation, similar data for the "after" period
should be collected. The "after" period begins as soon as the fare change has
been made. Data should be collected from that time, even though the effect of
the fare change will not have stabilized for at least 5-9 months. Data collec-
tion should continue for at least six months after the fare change effect has
stabilized. When comparing "before" and "after" data, extraneous influences on
ridership and revenue (for example, seasonal variations, bus miles supplied,
central city employment, gas prices, etc.) must be minimized. To the extent
-66-
possible, "before" data should be examined for the same months as "after" data.
(Some methods of calculating elasticities do control for extraneous effects;
see Chapter k. )
A primary purpose of the fare impact evaluation is to gain insights to the
sensitivity of users (and specific user subgroups) to the fare change so that,
when the transit agency makes future fare decisions, the benefits of lessons
learned can be taken into account. A good measure of user sensitivity is fare
elasticities (see Chapter k for a full review of fare elasticities). To the
extent needed, such elasticities should be developed for disaggregate market
groups.
If the proposed change involves the fare structure, then ridership, rev-
enue, and cost data should be disaggregated for:
1. Time of Day:
• peak• off-peak
2. Day of Week:
• weekday• weekend
3. Payment Method:• cash• pass• ticket/token
k. Route Type:
• CBD
• radial• suburban
5. User Characteristics:• adult• student
• senior citizens• disabled• income level
User surveys may also be helpful to ascertain how and why riders are re-
acting to the fare change. This method is particularly useful in evaluating
the effect of new fare structures (e.g., distance-based fares where trip dis-
tances can only be gathered through surveys) or new fare collection methods.
Data on changes in administrative costs and procedures resulting from the fare
change and data on changes in fare collection procedures and costs should also
be kept.
-67-
Analyzing the Effect of the Fare Change on Ridershlp and Revenue
Because rider response to fare changes is inelastic, increases in fare
levels will reduce ridership and increase revenue. Conversely, decreases in
fare levels will increase ridership and decrease revenues. When making a change
in fare level (even if only for one user group), it is extremely important to
monitor rider response. The relative sensitivity of riders to fare increases or
decreases is often measured using fare elasticities.
The first step is to collect and analyze raw data on ridership and revenue
both "before" and "after" the fare change. This should be done first on an ag-
gregate system level and then disaggregated by user group, (it may be necessary
to employ some user survey data to disaggregate ridership and revenue totals.)
A second step would be to supplement this review with user survey data to help
explain the rider response.
Analyzing the Effect of the Fare Change on Fare Equity
Fare equity is defined as how equitable the fare structure and fare level
are to the various groups that ride the system: Do user groups pay comparable
amounts for the same trip distance and service quality? Fare equity is often
defined in terms of the relative fare paid per passenger mile for various route
types and user groups. Another way fare equity is measured is as the ratio of
fare paid per passenger mile divided by the cost incurred to provide a mile of
service.
r^uch of the information needed to evaluate fare equity will come from a
user survey using the fare level, trip distances, and service levels on various
routes and the resulting cost per passenger mile. Once these data are available,
a judgement must still be made as to what is "equitable". This is fairly
subjective especially with regard to how much more users should pay for premium
or peak hour service.
Analyzing the Effect of Fare Change on Operational Simplicity
Operational simplicity includes how convenient it is for passengers to pay
and the system to collect fares. It also includes how easy it is for the system
to control for fraud and fare evasion.
-68-
The first, user convenience, is fairly subjective. However, some assess-
ment of the convenience and effect of the fare collection procedures on users
can be ascertained from the user survey.
The second consideration, the cost of fare collection, should also be
monitored when making a fare change since the introduction of a new fare struc-
ture may involve a change in fare collection procedures. Changing to or from a
more complex fare structure could involve an increase or decrease in admin-
istrative costs, driver training costs, marketing costs, and fare collection
costs. (The increased costs of new fare policies are often the result of new,
more complicated and cumbersome fare collection procedures.) Vhen planning for
the fare change, administration and fare collection functions should be identi-
fied which will change as the result of the revision to fare policy. These may
include items such as record keeping functions, administering a transfer pro-
gram, and other special fare collection procedures. Once the fare change is
made, data should be collected on how these functions change and the resulting
increase or decrease in costs.
A final evaluation issue to consider when implementing a fare change is
whether the new fare structure or level results in more or less fare evasion.
This is fairly difficult to measure and analyze, but in general, the more com-
plicated the fare structure, the greater the possibility of fare evasion. One
of the most common responses to fare evasion worries is to impose more rigorous
(and complex) fare collection procedures. However, more rigorous procedures
will usually cost more money. It may be necessary to make tradeoffs between
additional fare collection costs versus what can be saved through fare evasion
measures
.
Analyzing the Effect of the Fare Change on Socioeconomic and EnvironmentalGoals
The final category of goals which must be considered are socioeconomic and
environmental goals such as increasing the mobility of special user groups
(elderly and disabled persons), meeting air pollution or auto congestion goals
and fostering economic development. Achievement of this type of goal is ex-
tremely hard to measure. However, some attempts to consider them in a quanti-
tative or even qualitative fashion should be made.
Increasing the mobility of special user groups is subjective but you can
state that lower fares or special programs increase ridership. Progress toward
meeting environmental goals may be measured using the results of the user survey
-69-
to estimate the amount of persons svitching to transit and their trip length and
then project the total auto emissions not released into the environment as a
result of decreased auto usage. Reduction in traffic congestion can be measured
in a similar way. Fostering downtown development may be more difficult to
measure since the downtown effects are sometimes partially offset by development
effects somewhere else in the metropolitan area.
DEALING WITH THE LOGISTICS OF FARE IMPLEMENTATION
Changes to fare level, fare structure, and fare collection methodologies
bring with them a number of logistical problems which must be addressed before
the change can be implemented. Riders must be notified of fare change when
the change goes into effect. Depending upon the extent of the change, this
may require some educational and media promotion, particularly where a change
in fare structure is involved. Riders must be able to understand the new
fare structure and promotional materials must present this information in a
clear and concise manner.
Again, depending upon the extent of the changes, drivers may have to be
trained in how to calculate and collect fares and the actual fare collection
mechanism and procedures must be designed.
-TO-
BIBLIOGRAPHY
Barton-Aschman Associates, Inc. Recommendations to Improve the Fare Structure .
Prepared for Port Authority of Allegheny County in association with MichaelBaker, Jr., Inc. Evanston, Illinois, May I982.
William J. Baumol and David F. Bradford. "Optimal Departures from MarginalCost Pricing." American Economic Review , June 1970, pp. 265-283.
Robert Cervero. Evidence of Time—of—Day Transit Pricing in the United States .
Prepared for the Technical Assistance Prograjn. Prepared by the Urban fAass
Transportation Administration, U.S. Department of Transportation, University ofCalifornia, Berkeley, California, May 198U.
Charles River Associates, Incorporated. State of the Art of Current Practicesfor Transit Transfers . Prepared for U.S. Deparmtent of Transportation, UrbanMass Transportation Administration, July 1981.
Charles River Associates, Atlanta Transit Pricing Study . Prepared for Transpor-tation Systems Center, U.S. Department of Transportation, October I98O.
Walter Cherwony, Grey Gleichman and Ben Porter. Bus Route Costing Procedures .
Prepared by Simpson and Curtin Unit of Booz Allen & Hamilton, Inc. Preparedfor U.S. Department of Transportation, Urban Mass Transportation Administration,May 1981.
Walter Cherwony and Subhash Mundle. Peak-Base Cost Allocation Models , Transpor-tation Research Record, No. 663, 1978, pp. 52-56.
R. Cooter and G. Topakian. "Political Economy of a Public Corporation: PricingObjectives of BART." Journal of Public Economics , Vol. 13, I98O, pp. 299-318.
Thomas A. Domencich and Daniel McFadden. Urban Travel Demand : A BehavioralAnalysis . American Elsevier Publishing Company, Inc., New York 1975*
Paul Dygert, James Holec and Donald Hill. Public Transportation Fare Policy .
Prepared for the U.S. Department of Transportation, Office of the Secretary
Report No. DOT-TPI-lO-77-19 , Peak, Marwick, Mitchell & Co., Washington, D.C.,May 1977.
Frederic Fravel, Helen Tauchers and Gorman Gilbert. Economies of Scale in the
U.S. Intercity Bus Industry . Prepared for the Office of University Research,
U.S. Department of Transportation, July I98O.
Phillip Habib, et al. Fare Policy and Structure . Report No. UMTA-NY-ll-OOlU-
78-I. Prepared for the Urban Mass Transportation Administration, Polytechnic
Institute of New York, New York, New York, September 1978.
Michael Kemp. Planning For Fare Changes: a Guide for Interpreting and Using
Fare Elasticity Information for Transit Planners . Urban Institute Working
Paper 1^28-05, December 1930.
-71-
Armando M. Lago and Patrick D. Mayworm. "Economics of Transit Fare Prepayment:Passes." Transportation Research Record . No. 857, I982, pp. 52-57.
Armando M. Lago and Patrick D. Mayworm. "Transit Fare Elasticities by FareStructure Elements and Ridership Submarkets." Transit Journal , Vol. 7, Spring1981, pp. ^-lU,
Armando M, Lago and Patrick Mayworm. "Transit Means Business: A Corporate Plan-ning Approach to Transit Fare and Service Planning." Transportation Quarterly ,
July 1982, pp. 335-3U9.
Armando M. Lago, Patrick Mayworm, and J. Matthew McEnroe. "Transit RidershipResponsiveness to Fare Changes." Traffic Quarterly , January I98I, p. 13U.
Armando M. Lago, Patrick Mayworm, and J. Matthew McEnroe. "Transit ServiceElasticites." Journal of Transport Economics and Policy , May 198I.
Cyril M. Logan, et al. A Study of Pricing Structures and Fare Collection Sys-tems for Integrated Local Transit Systems . Prepared for the University Researchand Training Program of the Urban Mass Transportation Administration, WestVirginia University, Morgantown, West Virginia, February I983.
Patrick D. Mayworm and Armando M. Lago. Transit Fare Prepayment : A Guide forTransit Managers . Prepared for the Office of Service and Management Demonstra-tions of the Urban Mass Transportation Administration, Ecosometrics , Inc.,Bethesda, Maryland, January I983.
Patrick Mayworm, Armando M. Lago and J. Matthew McEnroe. Patronage Impacts ofChanges in Transit Fares and Services. Prepared for the Office of Service andMethods Demonstration of the Urban Mass Transportation Administration, Ecoso-metrics, Inc., Bethesda, Maryland, September I98O,
C.A. Nash. "Management Objectives, Fares and Service Levels in Bus Transport."Journal of Transport Economics and Policy , January I978, pp. 7O-85.
Precursor, Ltd. A Study of Transit Fare Policies, Fare Structure and FareCollection Methods . Prepared for the Canadian Surface Transportation Adminis-tration, August 1978.
David A. Quarmby. "Choice of Investment Priorities: Practical Aspects."Topic 3, The Contribution of Economic Research to Transport Policy Decisions ,
Seventh International Symposium on the Theory and Practice in TransportEconomics, 1977, p. 75.
Simpson and Curtin Division of Booz , Allen & Hamilton, Inc.. Dallas TransitSystem Fare Structure Study . Prepared for North Central Texas Council ofGovernments, July 1977.
Kenneth Train. "Optimal Transit Prices Under Increasing Returns to Scale and aLoss Constraint." Journal of Transport Economics and Policy , May 1977, pp.185-19^+.
Martin Wachs. "Pricing Policies and Alternative Fare Structures." Prepared as
background paper for the American Public Transit Association Position Paper in
Fare Structure and Policy , September I982.
Wilbur Smith & Associates. Regional Fare Study : Final Report . Prepared for
Southeastern Michigan Transportation Authority, February 1978.
-72-

APPENDIX

APPENDIX
AN EXAMPLE OF SELECTING FARE OPTIONS
INTRODUCTION
The process of selecting an appropriate fare plan as outlined in this
manual can be complex. To illustrate how one transit system might approach
this problem, the authors have prepared a case study example. This example
takes the reader through the five steps described in Chapter 6, beginning with
an evaluation of the existing fare policy to the recommendation of a fare plan.
BACKGROUND
The site for this case study is the hypothetical Midwestern city. Pricing,
Missouri. Pricing is an agro-business and industry-based city situated on the
Mississippi. Pricing has a strong center city, where two universities, the
coimty government, and major financial institutions are located. In I98O
,
Pricing and the surrounding urbanized area had 700,000 inhabitants.
Since 1970, public transportation in Pricing has been provided by USA
Transit. USA Transit replaced an ailing private company when voters created a
regional transit district with taxing authority. During the past decade, the
ridership decline has been reversed and USA Transit now carries over 15 million
passengers each year. Some of the statistics on USA Transit's operations are
shown in Table A-1.
A-1
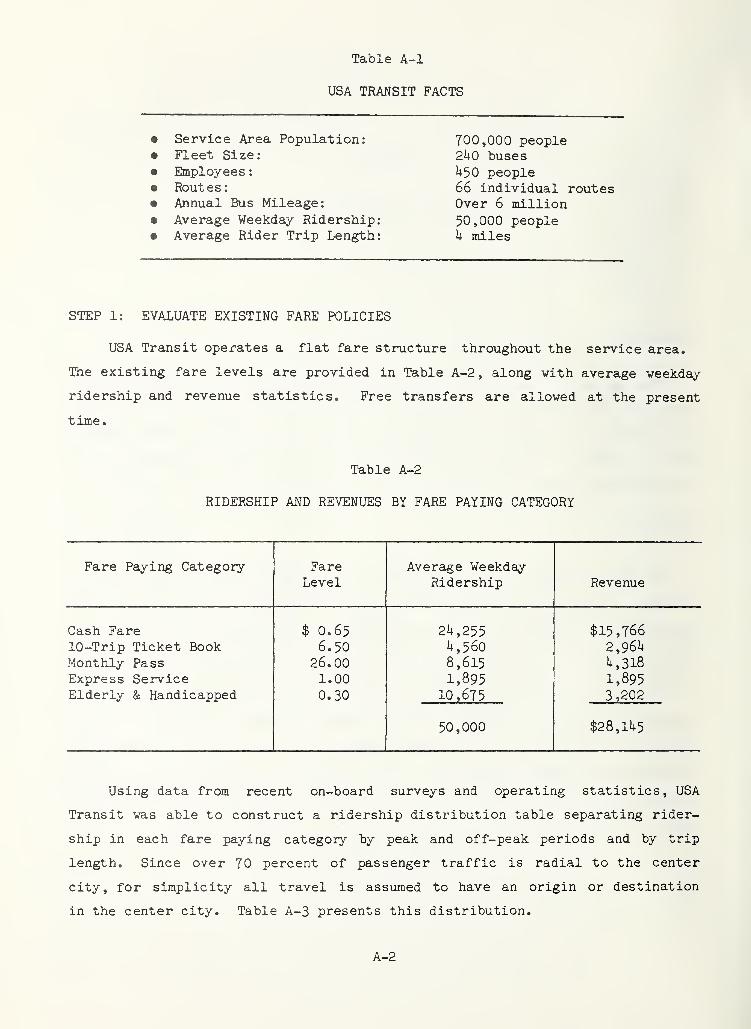
Table A-1
USA TRANSIT FACTS
• Service Area Population: 700,000 people• Fleet Size: 2U0 buses• Employees
:
U50 people• Routes
:
66 individual routes• Annual Bus Mileage: Over 6 million• Average Weekday Ridership: 50,000 people• Average Rider Trip Length: k miles
STEP 1: EVALUATE EXISTING FARE POLICIES
USA Transit operates a flat fare structure throughout the service area.
The existing fare levels are provided in Table A-2, along vith average weekday
ridership and revenue statistics. Free transfers are allowed at the present
time.
Table A-2
RIDERSHIP AND REVENUES BY FARE PAYING CATEGORY
Fare Paying Category Fare AversLge WeekdayLevel Ridership Revenue
Cash Fare $ 0.65 2U,255 $15,76610-Trip Ticket Book 6.50 i+,560 2,96i+
Monthly Pass 26.00 8,615 4,318Express Service 1.00 1,895 1,895Elderly & Handicapped 0.30 10,675 3,202
50,000 $28,11+5
Using data from recent on-board surveys and operating statistics, USA
Transit was able to construct a ridership distribution table separating rider-
ship in each fare paying category by peak and off-peak periods and by trip
length. Since over 70 percent of passenger traffic is radial to the center
city, for simplicity all travel is assumed to have an origin or destination
in the center city. Table A-3 presents this distribution.
A-2
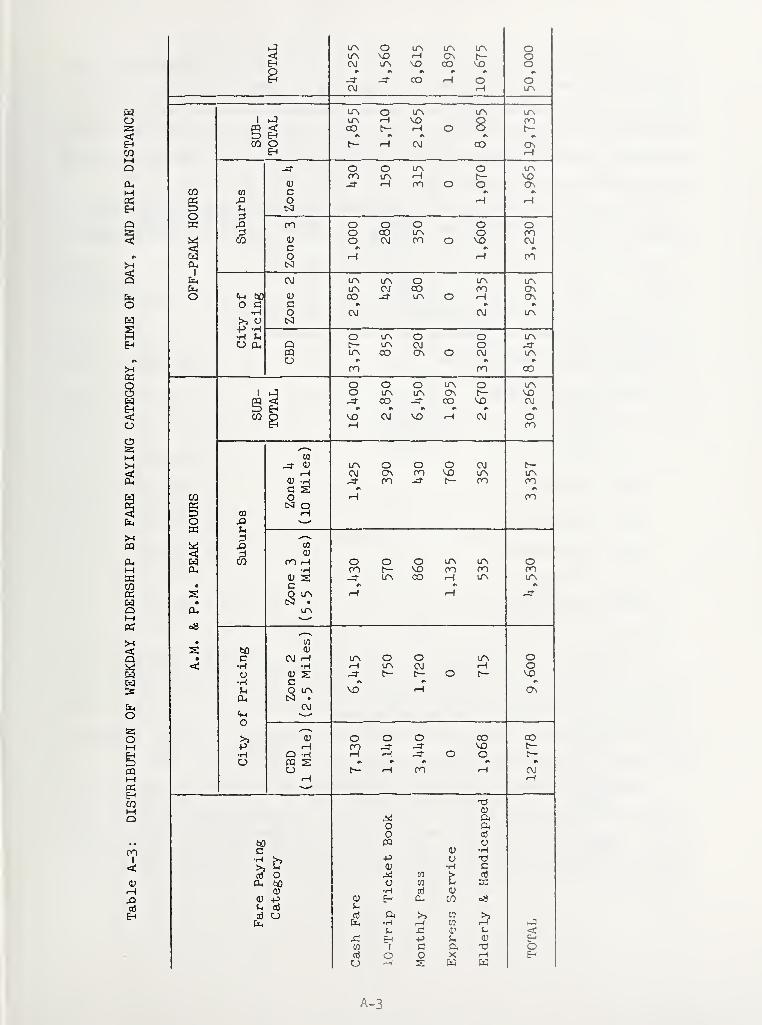
EHCOMQa.M«EH
o
oM
CPMOSE-t
03
I<
H
I
o UA LTN OrH 0\ t— o
pi CM UA VD GO VD o-3- J- CO rH O oCM H
LPv LP^
1 1-5 LTN VD Qe < CO O O t~-5 E-i
CO O H CM CO OvE-i rH
/ \ f—
\
LTNm LTN VD0) -J- -H on O o 0\
CO co rH
o ;3
W 1 N / \^o CO LTV o m
CO o CM on O VD CMc
(jq o rH onOu,
1
to1
C\J ir\ LPv oLTN CJ CO on
o <D CO LTN O rH C7\
o c c•H o CM LTN
S o
LTN LTN
o cu Q L/A CM oPQ ir\ CO O CM USo •>
on CO
o O O L/N o1 o UA US C?N t— VDe < J- CO CO VD CVi
5 EH r
CO p \D VD H CM oon
'—
^
tr\ o O O CMCM ON on VD US UA
(1) -H on J- t— on onC S
CO O onCs3 O
CO Ho
-—
s
wp 0)
cn iH O o o U~\ UA o•H on VD on on on
CO H us us• c n
O Lr\ rH• cs] •
LTN
• CO
(D
• C CM r-i UA o O us o< •H •H H OJ H o
O <u s t— O c— VD•H Cf
,
M O VD rH o\[S] .
CM
o'—
^
v O O O CO COon J- VD
•H o C t-o m s r> r r
o m rH CMrH
13Vft
o fto (xS
CO oc •H
p o 13
o ^ CO ccJ
a, V CO X0) •H CT?
(U -p Cu CO oi!
Ih aoj CD erf ft l>> CJ >5H CO r-l
a' t- <^ E-I p o;
CO 1 c ft T5 oO o X rH C-l
CJ w
A-3
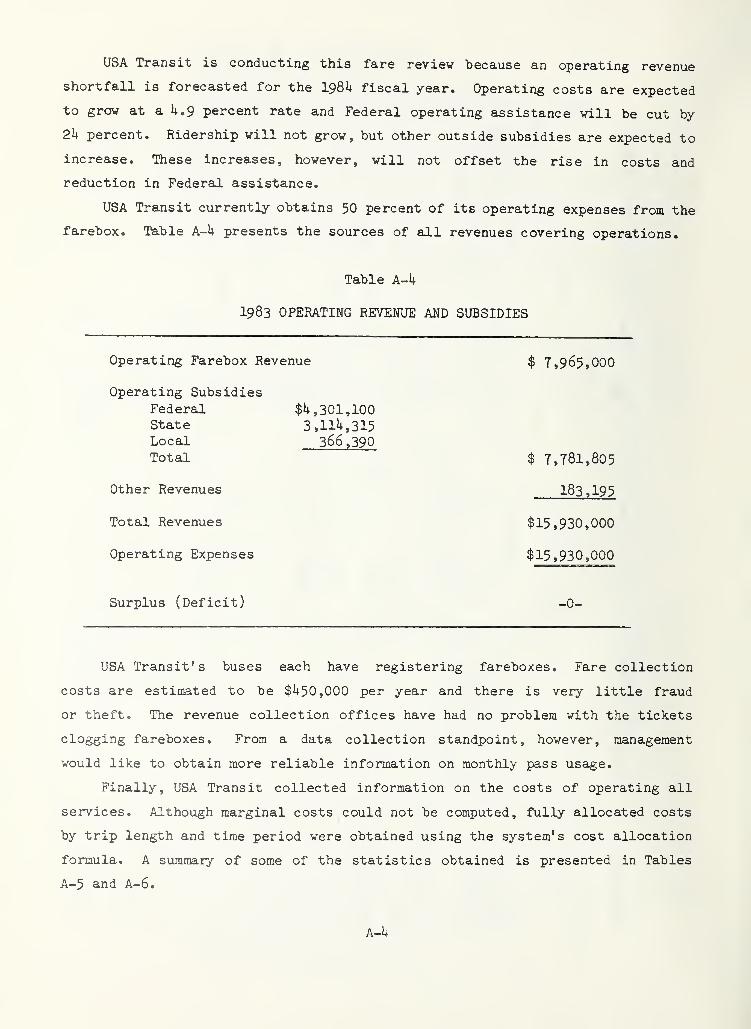
USA Transit is conducting this fare reviev because an operating revenue
shortfall is forecasted for the I98U fiscal year. Operating costs are expected
to grow at a U.9 percent rate and Federal operating assistance vill be cut by
2k percent. Ridership will not grow, but other outside subsidies are expected to
increase. These increases, however, will not offset the rise in costs and
reduction in FederaJ. assistance.
USA Transit currently obtains 50 percent of its operating expenses from the
farebox. Table A-k presents the sources of all revenues covering operations.
Table A-h
1983 OPERATING REVENUE AND SUBSIDIES
Operating Farebox Revenue $ 7,965,000
Operating SubsidiesFederal $1+, 301,100State 3,llU,315Local 366,390Total $ 7,781,805
Other Revenues 183,195
Total Revenues $15,930,000
Operating Expenses $15,930,000
Surplus (Deficit) -0-
USA Transit's buses each have registering fareboxes. Fare collection
costs are estimated to be $i+50,000 per year and there is very little fraud
or theft. The revenue collection offices have had no problem with the tickets
clogging fareboxes. From a data collection standpoint, however, management
would like to obtain more reliable information on monthly pass usage.
Finally, USA Transit collected information on the costs of operating all
services. Although marginal costs could not be computed, fully allocated costs
by trip length and time period were obtained using the system's cost allocation
formula. A summary of some of the statistics obtained is presented in Tables
A-5 and A-6.
A-i^
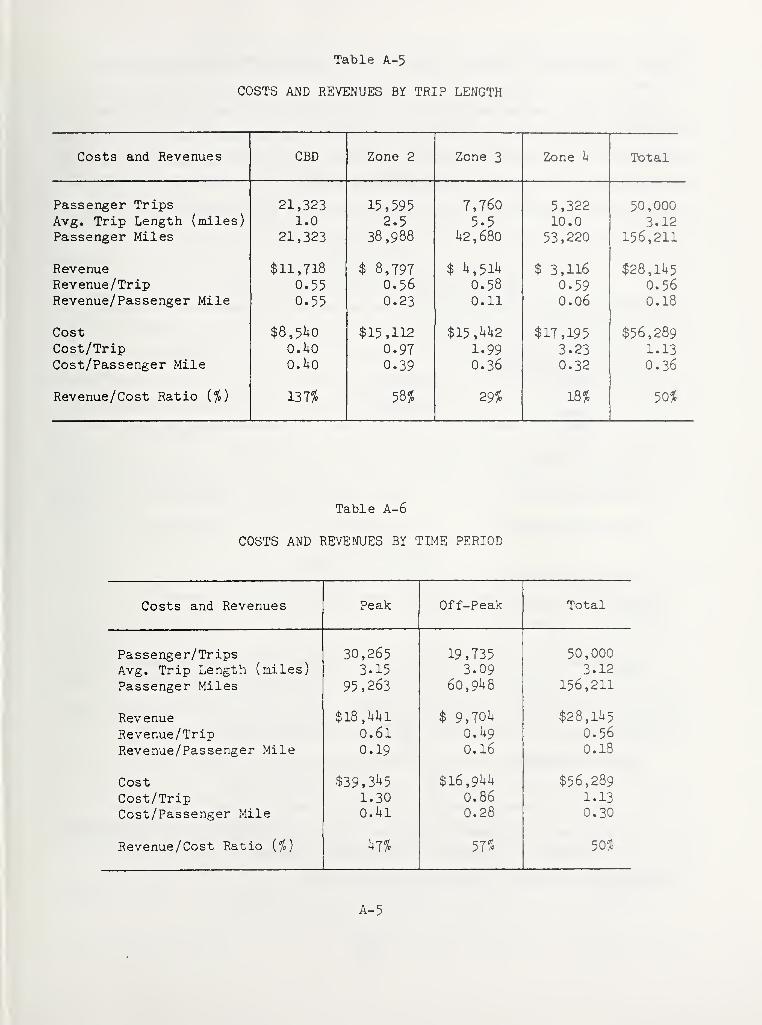
Table A-5
COSTS AND REVENUES BY TRIP LENGTH
Costs and Revenues CBD Zone 2 Zone 3 Zone k Total
Passenger TripsAvg. Trip Length (miles)Passenger Miles
21,3231.0
21,323
15,5952.5
38,988
7,7605.5
42,680
5,32210.0
53,220
50,0003.12
156,211
RevenueRevenue/TripRevenue/Passenger Mile
$11,7180.550.55
$ 8,7970.560.23
$ i4,5lU
0.580.11
$ 3,1160.590.06
$28,1U50.560.18
CostCost/TripCost/Passenger Mile
$8,5i^0
o.UoO.UO
$15,1120.970.39
$15 ,UU2
1.990.36
$17,1953.230.32
$56,2891.13
0.36
Revenue/Cost Ratio {$) 137% 29I0 18% 50%
Table A-6
COSTS AND REVENUES BY TII-lE PERIOD
Costs and Revenues Peak Off-Peak Total
Passenger/ TripsAvg. Trip Length (miles)
Passenger Miles
30,2653.15
95,263
19,7353.09
60,91+8
50,0003.12
156,211
RevenueRevenue/TripRevenue/Passenger Mile
$l8,Ui;l
0.610.19
$ 9,70li
O.I19
0.16
$28,1145
0.560.18
CostCost/TripCost/Passenger Mile
$39,31+5
1.30O.I4I
$16,9^4!+
0.860.28
$56,2891.130.30
Revenue/Cost Ratio [%) kn 57% 50%
A-5
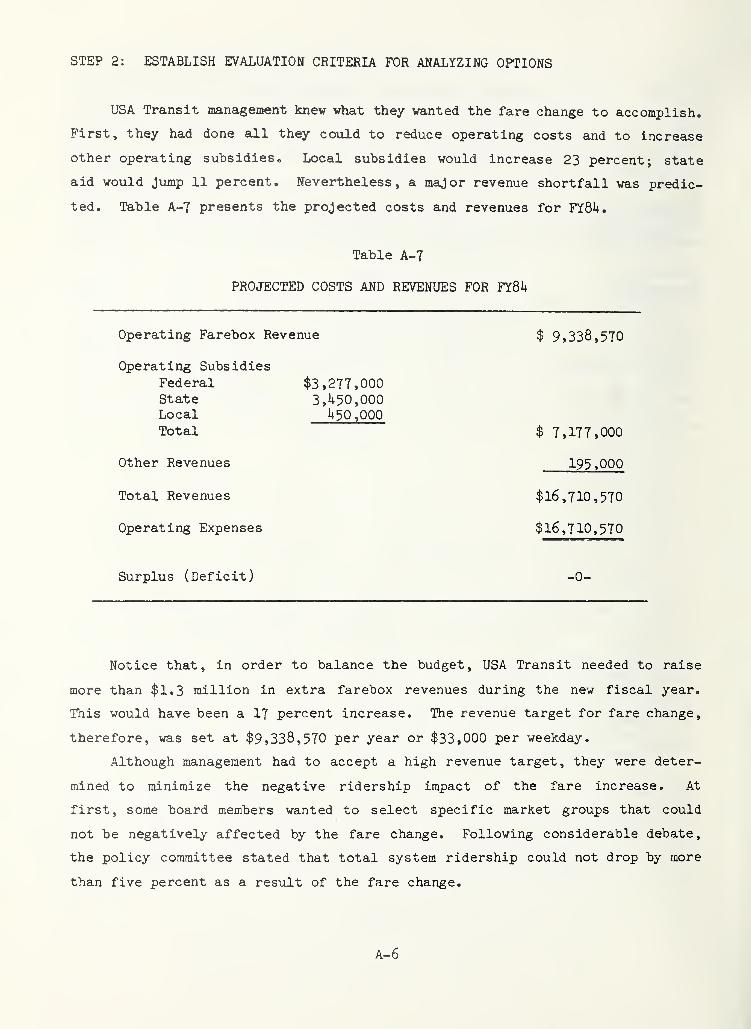
STEP 2: ESTABLISH EVALUATION CRITERIA FOR ANALYZING OPTIONS
USA Transit management knew what they wanted the fare change to accomplish.
First, they had done all they could to reduce operating costs and to increase
other operating subsidies. Local subsidies would increase 23 percent; state
aid would Jump 11 percent. Nevertheless, a major revenue shortfall was predic-
ted. Table A-T presents the projected costs and revenues for YXQh.
Table A-T
PROJECTED COSTS AND REVENUES FOR FY8U
Operating Farebox Revenue $ 9,338,570
Operating SubsidiesFederal $3,277,000State 3,U50,000Local U50 ,000
Total $ 7,177,000
Other Revenues 195,000
Total Revenues $16,710,570
Operating Expenses $16,710,570
Surplus (Deficit) -0-
Notice that, in order to balance the budget, USA Transit needed to raise
more than $1.3 million in extra farebox revenues during the new fiscal year.
This would have been a 17 percent increase. The revenue target for fare change,
therefore, was set at $9,338,570 per year or $33,000 per weekday.
Although management had to accept a high revenue target, they were deter-
mined to minimize the negative ridership impact of the fare increase. At
first, some board members wanted to select specific market groups that could
not be negatively affected by the fare change. Following considerable debate,
the policy committee stated that total system ridership could not drop by more
than five percent as a result of the fare change.
A-6
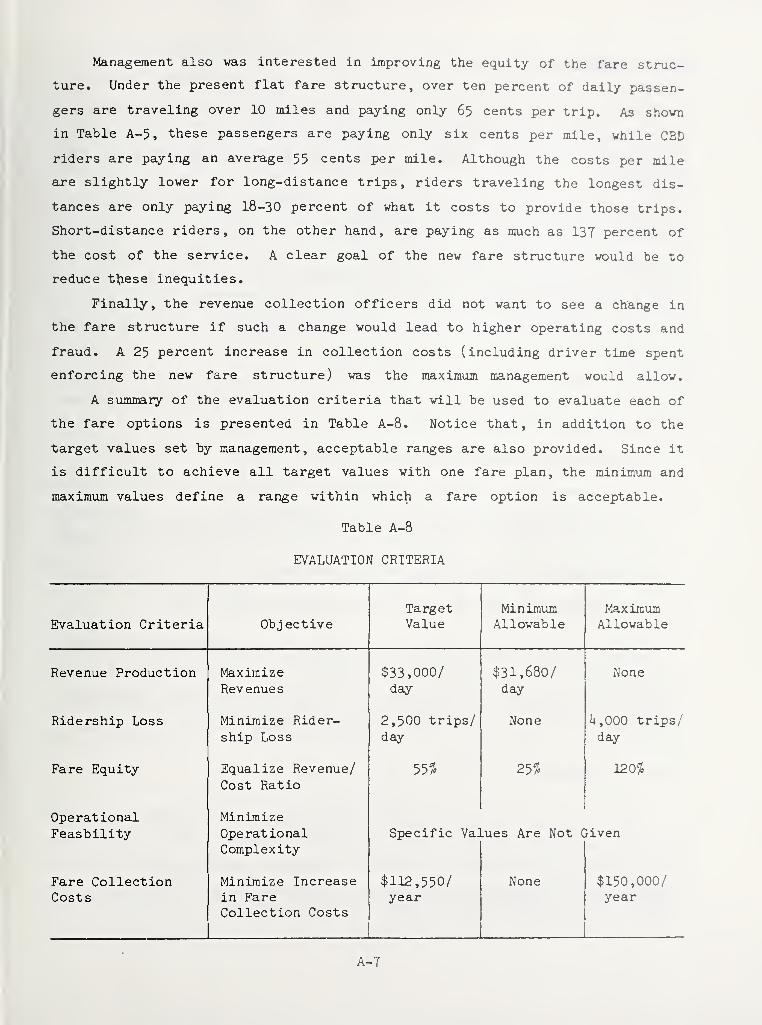
Management also was interested in improving the equity of the fare struc-
ture. Under the present flat fare structure, over ten percent of daily passen-
gers are traveling over 10 miles and paying only 65 cents per trip. As shown
in Table A-5, these passengers are paying only six cents per mile, while CBD
riders are paying an average 55 cents per mile. Although the costs per mile
are slightly lower for long-distance trips, riders traveling the longest dis-
tances are only paying 18-30 percent of what it costs to provide those trips.
Short-distance riders, on the other hand, are paying as much as 137 percent of
the cost of the service, A clear goal of the new fare structure would be to
reduce ttiese inequities.
Finally, the revenue collection officers did not want to see a change in
the fare structure if such a change would lead to higher operating costs and
fraud. A 25 percent increase in collection costs (including driver time spent
enforcing the new fare structure) was the maximum management would allow.
A summary of the evaluation criteria that will be used to evaluate each of
the fare options is presented in Table A-8. Notice that, in addition to the
target values set by management, acceptable ranges are also provided. Since it
is difficult to achieve all target values with one fare plan, the minimum and
maximum values define a range within which a fare option is acceptable.
Table A-8
EVALUATION CRITERIA
Target Minimum MaximumEvaluation Criteria Obj ective Value Allowable Allowable
Revenue Production Maximize $33,000/ $31,680/ None
Revenues day day
Ridership Loss Minimize Rider- 2,500 trips/ None U,000 trips/ship Loss day day
Fare Equity Equalize Revenue/ 55f« 25% 120%
Cost Ratio
Operational MinimizeFeasbility Operational Specific Values Are Not Given
Complexity
Fare Collection Minimize Increase $112,550/ None $150,000/Costs in Fare year year
Collection Costs
A-T
STEP 3: SELECT FARE OPTIONS
The analysis of the current fare structure identified two major deficien-
cies. First, not enough revenue is generated from the farebox. As a percen-
tage of operating costs, farebox revenues have been declining over the past
decade.
The second major deficiency concerns the distribution of the revenue-to-
cost ratio among different ridership groups. Over kO percent of the riders on
USA Transit travel on average only one mile and pay over 130 percent of what it
costs to serve those trips. Long-distance riders, on the other hand, pay less
than 20 percent of what it costs to provide service to the outer suburbs.
As a result of this analysis, USA Transit management agreed to explore
alternatives to the present flat fare structure with the goal of increasing
revenues and minimizing the inequities. After reviewing the regional applica-
bility and operational feasibility of numerous fare structure designs, manage-
ment identified five options to test:
0 flat fare structure with higher fares
,
• four-zone fare structure with a reduced CBD fare,
• three-zone fare structure with the center zone incorporating all of thecity of Pricing, holding the price for the first zone at 65 cents,
• peak/off-peak fare structure with off-peak fare held at 65 cents, and
• peak/off-peak fare structure with reduced off-peak fare.
From our operational viewpoint, it appeared that each of the five options
was feasible at a minimal cost to the system. Boundaries for zones were easily
determined, as were the pestk-period hours. The drivers' union had concerns about
enforcement, but did not immediately reject the options.
STEP k: EVALUATE FARE OPTIONS
The first step in evaluating the fare options is to forecast changes in
the base conditions, assTiming the fares remain constant. Cost, for example,
will increase by U.9 percent, as already indicated. Ridership would normally
increase as well due to secular trends in ridership levels. However, because
A-8
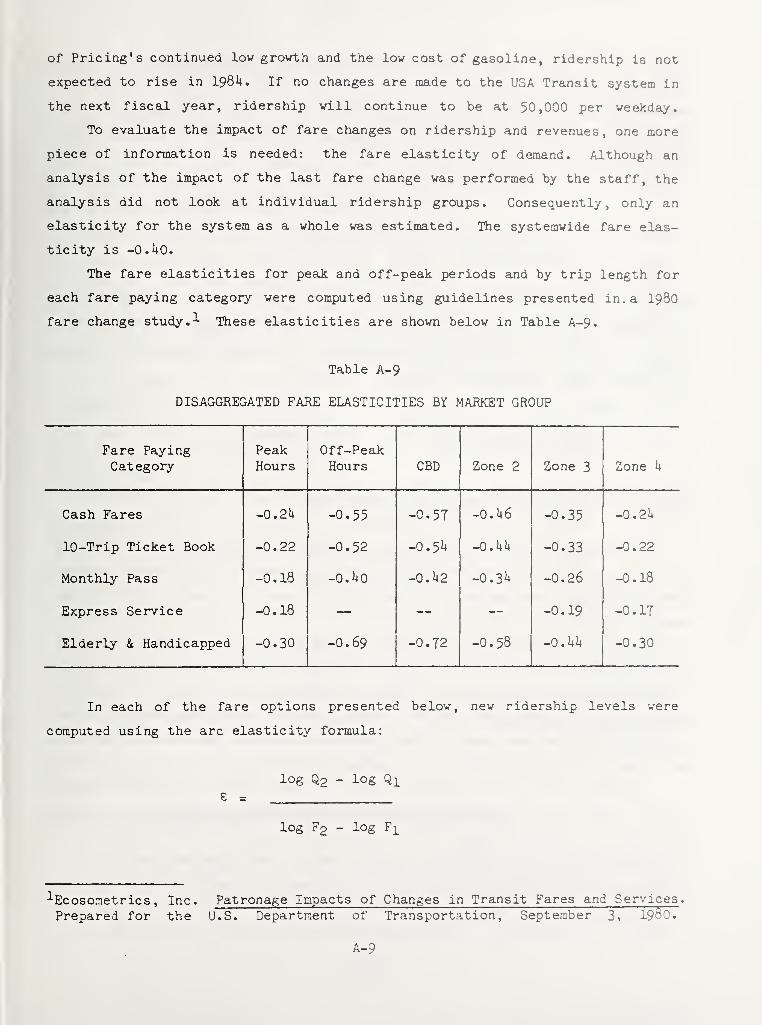
of Pricing's continued low growth and the low cost of gasoline, ridership is not
expected to rise in igQk, If no changes are made to the USA Transit system in
the next fiscaJ. year, ridership will continue to be at 50,000 per weekday.
To evaluate the impact of fare changes on ridership and revenues, one more
piece of information is needed: the fare elasticity of demand. Although an
analysis of the impact of the last fare change was performed by the staff, the
analysis did not look at individual ridership groups. Consequently, only an
elasticity for the system as a whole was estimated. The systemwide fare elas-
ticity is -0.^40.
The fare elasticities for peak and off-peak periods and by trip length for
each fare paying category were computed using guidelines presented in. a 1930
fare change study. ^ These elasticities are shown below in Table A-9.
Table A-9
DISAGGREGATED FARE ELASTICITIES BY MARKET GROUP
Fare Paying Peak Off-PeakCategory Hours Hours CBD Zone 2 Zone 3 Zone I4
Cash Fares -0.2U -0.55 -0.57 -0.U6 -0.35 -0.2i+
10-Trip Ticket Book -0.22 -0.52 -0.5^ -o.ku -0.33 -0.22
Monthly Pass -0.18 -O.UO -0,h2 -0.3h -0.26 -0.18
Express Service -0.18 -0.19 -0.17
Elderly & Handicapped -0.30 -0.69 -0.72 -0.58 -O.UU -0.30
In each of the fare options presented below, new ridership levels were
computed using the arc elasticity formula:
log Q2 - log Qie =
log F2 - log F]_
Ecosometrics , Inc. Patronage Impacts of Changes in Transit Fares and Services .
Prepared for the U.S. Department of Transportation, Septe:cber 3, I90O.
A-9
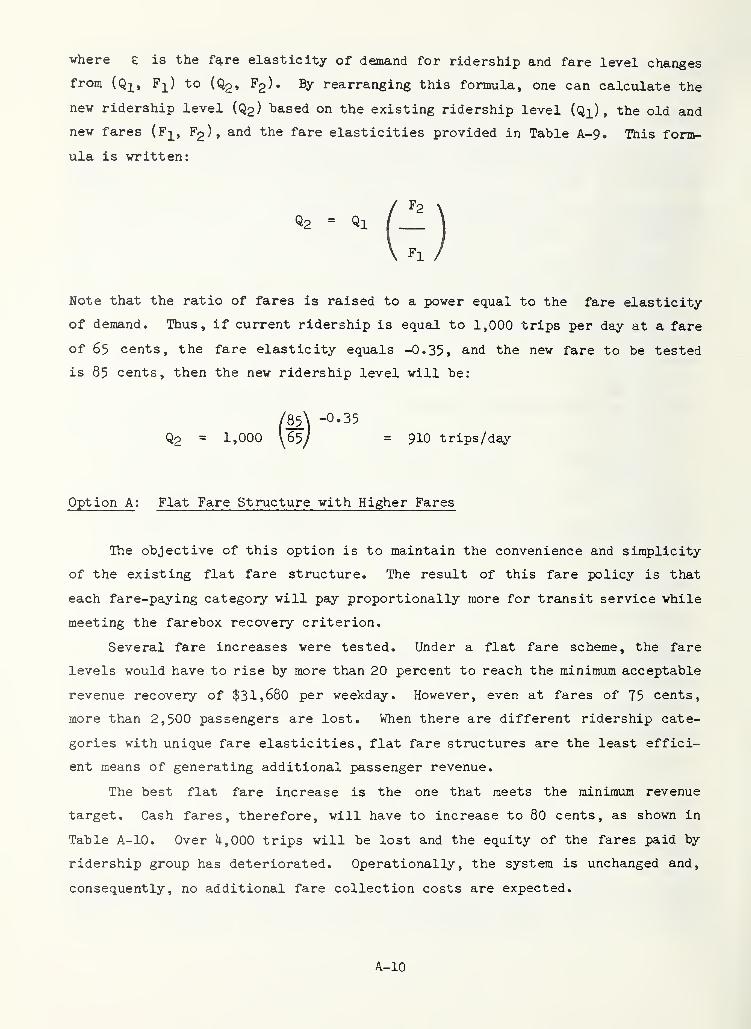
where e is the fare elasticity of demand for ridership and fare level changes
from (Q]^, F^) to (Q2, Fg). By rearranging this formula, one can calculate the
new ridership level (Q2) based on the existing ridership level (Qi) , the old and
new fares (Fj^, F2), and the fare elasticities provided in Table A-9. This form-
ula is written:
Note that the ratio of fares is raised to a power equal to the fare elasticity
of demand. Thus, if current ridership is equal to 1,000 trips per day at a fare
of 65 cents, the fare elasticity equals -0.35, and the new fare to be tested
is 85 cents, then the new ridership level will be:
/85\ -0-35
Q2 = 1,000 y65/ = 910 trips/day
Option A : Flat Fare Structure with Higher Fares
The objective of this option is to maintain the convenience and simplicity
of the existing flat fare structure. The result of this fare policy is that
each fare-paying category will pay proportionally more for transit service while
meeting the farebox recovery criterion.
Several fare increases were tested. Under a flat fare scheme, the fare
levels would have to rise by more than 20 percent to reach the minimum acceptable
revenue recovery of $31,680 per weekday. However, even at fares of 75 cents,
more than 2,500 passengers are lost. When there are different ridership cate-
gories with unique fare elasticities, flat fare structures are the least effici-
ent means of generating additional passenger revenue.
The best flat fare increase is the one that meets the minimum revenue
target. Cash fares, therefore, will have to increase to 80 cents, as shown in
Table A-10. Over U,000 trips will be lost and the equity of the fares paid by
ridership group has deteriorated. Operationally, the system is unchanged and,
consequently, no additional fare collection costs are expected.
A-10

Option B : Four-Zone Fare Structure with Reduced CBD Fares
An alternative method of raising farebox revenues is to charge riders in
some proportion to the distance traveled. A distance-based fare structure is
also designed to take advantage of the different elasticities of demand.
Unfortunately, distance-based charges are difficult to operate and understand,
and may lead to consumer fraud.
Three four-zone fare structures were tested in this option. In all three
tests, the second zone charges were not changed from the current fare level,
the CBD-zone fares were reduced, and the fares for the two outer zones were
raised. All three options resulted in both Increased revenue and ridershlp.
This is possible because of the different elasticities. However, only the
second and third tests met the revenue criterion.
By charging a fare according to distance, USA Transit hoped that the
revenue-to-cost ratios would be closer together for each fare category. Al-
though a distance-based fare structure does reduce the inequities of a flat
fare structure, there remain significant differences in the revenue/cost ratios
by trip length.
A four-zone fare structure is the most complex and expensive option under
investigation in this fare study. Management estimates that the four-zone
structure would cost between $150,000 and $200,000. These figures include
driver time allocated to enforcing and explaining the fare structure, the in-
creased cost of fare prepayment printing and distribution, and the higher cost
of dollar bill collection.
As a result of this analysis, the management team identified the second
test as the best set of fare levels for this fare option. The results of this
analysis are shown in Table A-11. The minimum revenue production level is met
and the new ridershlp levels exceed present levels. The fare collection costs
are expected to increase by as much as $150,000. Operationally, however, this
option is the most difficult to implement.
Option C : Three-Zone Fare Structure with Large Center Zone
The four-zone fare structure can be made less expensive if the first two
zones are combined into one large zone incorporating the city of Pricing. This
option has the advantage of not only reducing fare collection costs, but also
of being less confusing and less difficult to operate than the four-zone option.
A-11
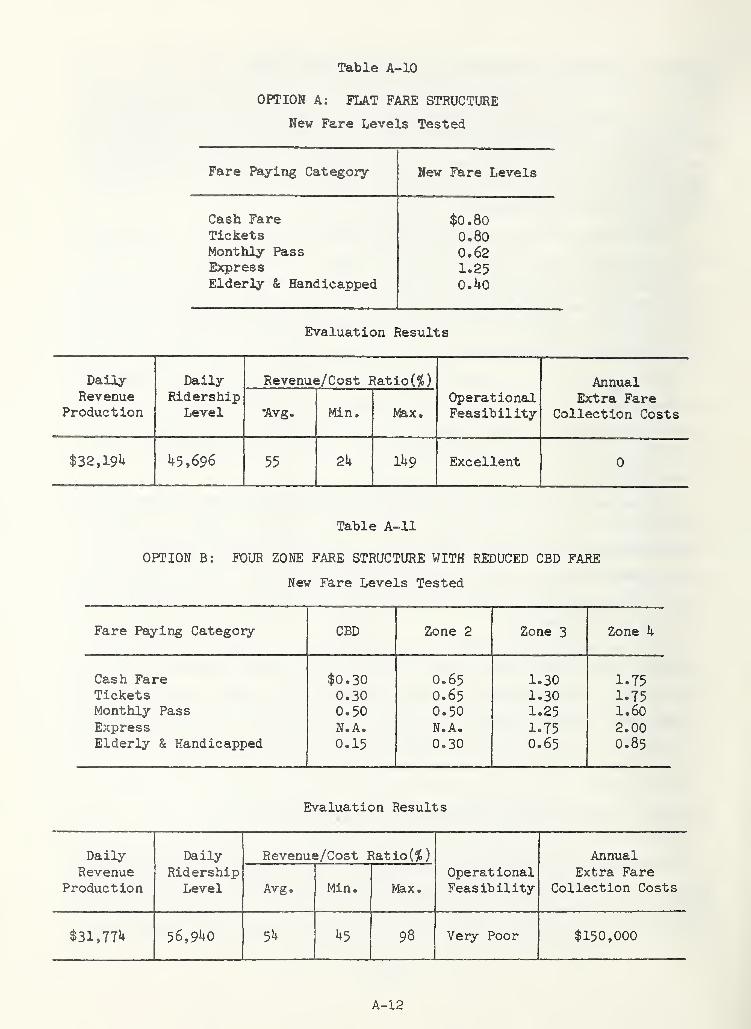
Table A-10
OPTION A: FLAT FARE STRUCTURE
New Fare Levels Tested
Fare Paying Category New Fare Levels
Cash Fare $0.80Tickets 0,80Monthly Pass 0.62Express 1.25Elderly & Handicapped o,ko
Evaluation Results
Daily Daily Revenue/Cost Ratio (^) AnnualRevenue Eldership Operational Extra Fare
Production Level •Avg. Min. Feasibility Collection Costs
$32,191+ ^5,696 55 2h IU9 Excellent 0
Table A-11
OPTION B: FOUR ZONE FARE STRUCTURE WITH REDUCED CBD FARE
Nev Fare Levels Tested
Fare Paying Category CBD Zone 2 Zone 3 Zone k
Cash Fare $0.30 0.65 1.30 1.75Tickets 0.30 0.65 1.30 1.75Monthly Pass 0.50 0.50 1.25 1.60Express N.A. N.A. 1.75 2.00Elderly & Handicapped 0.15 0.30 0.65 0.85
Evaluation Results
Daily Daily Revenue/Cost Ratio(^) AnnualRevenue Ridership Operational Extra Fare
Production Level Avg. Min. Max, Feasibility Collection Costs
$31,77^+ 56,9^+0 5h h3 98 Very Poor $150,000
A-12
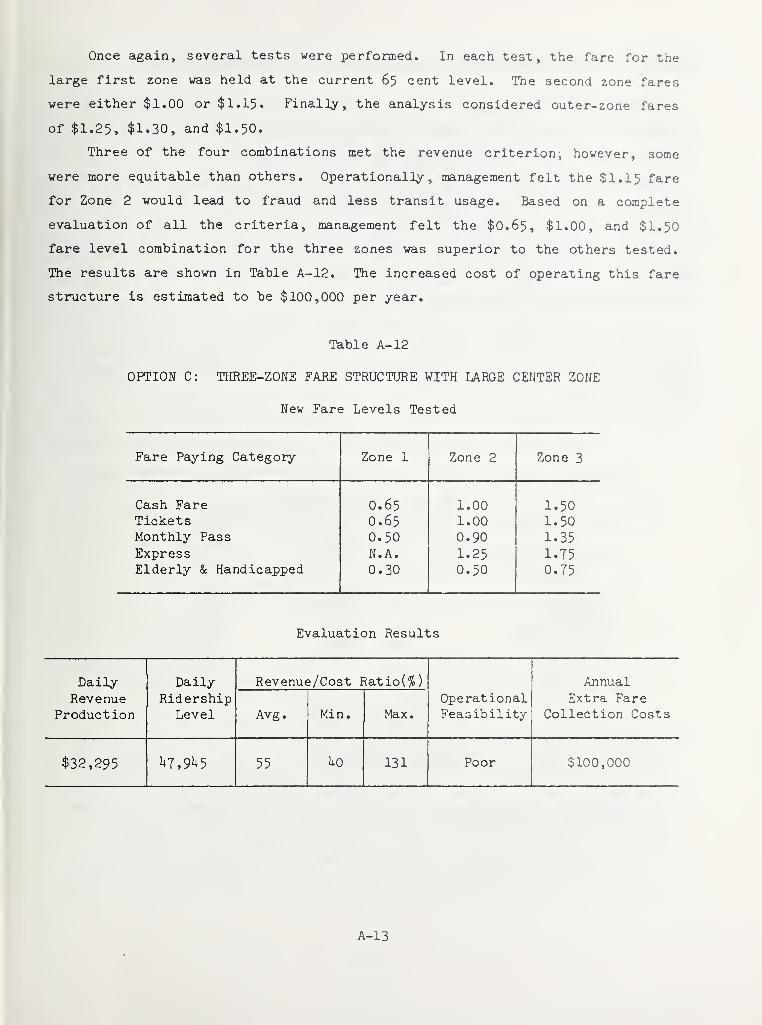
Once again, several tests were performed. In each test, the fare for the
large first zone was held at the current 65 cent level. The second zone fares
were either $1.00 or $1.15. Finally, the analysis considered outer-zone fares
of $1.25, $1.30, and $1.50.
Three of the four combinations met the revenue criterionjhowever, some
were more equitable than others. Operationally, management felt the $1.15 fare
for Zone 2 would lead to fraud and less transit usage. Based on a complete
evaluation of all the criteria, management felt the $0.65, $1.00, and $1.50
fare level combination for the three zones was superior to the others tested.
The results are shown in Table A- 12. The increased cost of operating this fare
structure is estimated to be $100,000 per year.
Table A- 12
OPTION C: THREE-ZONE FARE STRUCTURE WITH LARGE CENTER ZONE
New Fare Levels Tested
Fare Paying Category Zone 1 Zone 2 Zone 3
Cash Fare 0.65 1.00 1.50Tickets 0.65 1.00 1.50Monthly Pass 0.50 0.90 1.35Express N.A. 1.25 1.T5Elderly & Handicapped 0.30 0.50 0.75
Evaluation Results
Daily Daily Revenue/Cost Ratio(%) AnnualRevenue Ridersbip Operational Extra Fare
Production Level Avg. Min. Max
.
Feasibility Collection Costs
$32,295 55 ho 131 Poor $100,000
A-13
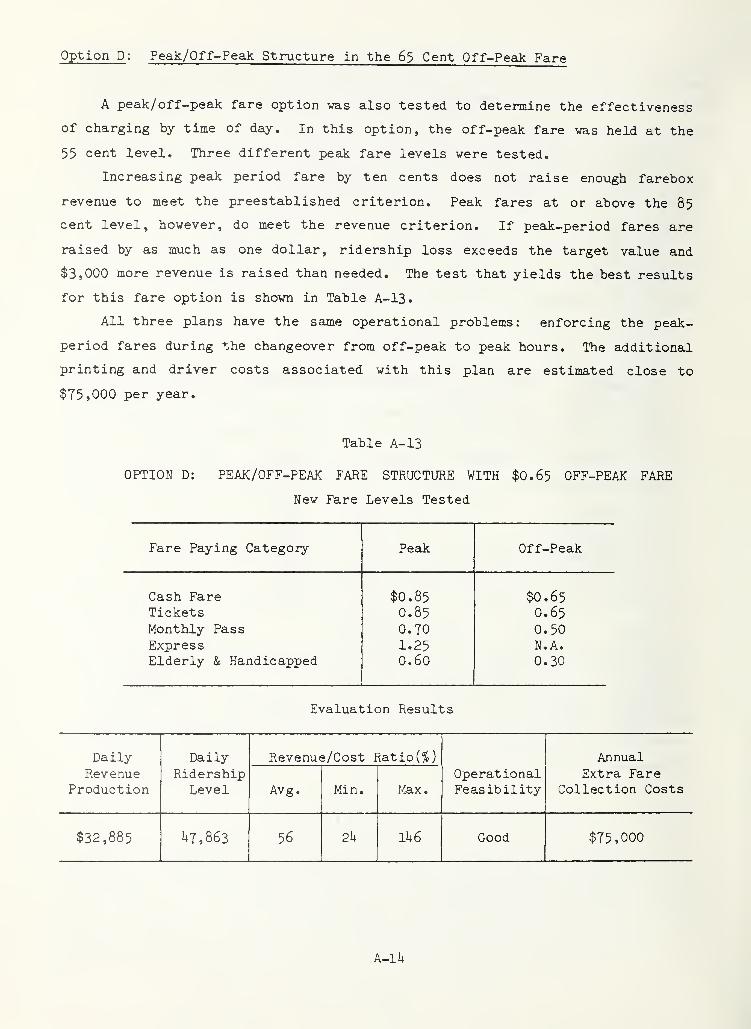
Option D : Peak/Off-Peak Structure in the 63 Cent Off-Peak Fare
A peak/off-peak fare option was also tested to determine the effectiveness
of charging by time of day. In this option, the off-peak fare was held at the
55 cent level. Three different peak fare levels were tested.
Increasing peak period fare by ten cents does not raise enough farebox
revenue to meet the preestablished criterion. Peak fares at or above the 85
cent level, however, do meet the revenue criterion. If peak-period fares are
raised by as much as one dollar, ridership loss exceeds the target value and
$3,000 more revenue is raised than needed. The test that yields the best results
for this fare option is shown in Table A-13.
All three plans have the same operational problems: enforcing the peak-
period fares during the changeover from off-peak to peak hours. The additioneJ.
printing and driver costs associated with this plan are estimated close to
$75,000 per year.
Table A- 13
OPTION D: PEAK/OFF-PEAK FARE STRUCTURE WITH $0.65 OFF-PEAK FARE
New Fare Levels Tested
Fare Paying Category Peak Off-Peak
Cash Fare $0.85 $0.65Tickets 0.85 0.65Monthly Pass 0.70 0.50Express 1.25 N.A.
Elderly & Handicapped 0.60 0.30
Evaluation Results
Daily Daily Revenue/Cost Ratio (^) AnnualRevenue Ridership Operational Extra Fare
Production Level Avg. Min. Max
.
Feasibility Collection Costs
$32,885 U7,863 56 2U IU6 Good $75,000
A-lU
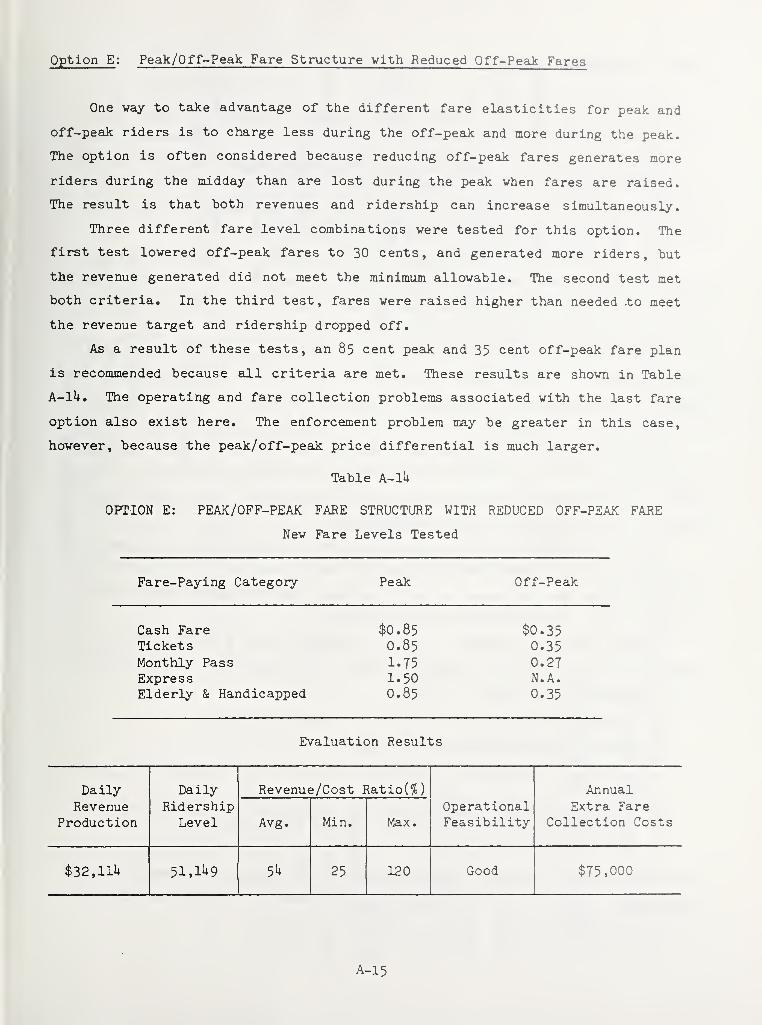
Option E : Peak/Off-Peak Fare Structure with Reduced Off-Peak Fares
One way to take advantage of the different fare elasticities for peak and
off-peak riders is to charge less during the off-peak and more during the peak.
The option is often considered because reducing off-peak fares generates more
riders during the midday than are lost during the peak when fares are raised.
The result is that both revenues and ridership can increase simultaneously.
Three different fare level combinations were tested for this option. The
first test lowered off-peak fares to 30 cents, and generated more riders, but
the revenue generated did not meet the minimum allowable. The second test met
both criteria. In the third test, fares were raised higher than needed -to meet
the revenue target and ridership dropped off.
As a result of these tests, an 85 cent peak and 35 cent off-peak fare plan
is recommended because all criteria are met. These results are shown in Table
A-lU, The operating and fare collection problems associated with the last fare
option also exist here. The enforcement problem may be greater in this case,
however, because the peak/off-peak price differential is much larger.
Table A-lU
OPTION E: PEAK/OFF-PEAK FARE STRUCTURE WITH REDUCED OFF-PEAK FARE
New Fare Levels Tested
Fare-Paying Category Peak Off-Peak
Cash Fare $0.85 $0.35Tickets 0.85 0.35Monthly Pass 1.75 0.27Express 1.50 N.A.
Elderly 8e Handicapped 0.85 0.35
Evaluation Results
Daily Daily Revenue/Cost Ratio(^) AnnualRevenue Ridership Operational Extra Fare
Production Level Avg. Min. Max. Feasibility Collection Costs
$32,llU 51,1U9 5i4 25 120 Good $75,000
A-15
STEP 5: RECOMMEND A FARE PLAN TO TRANSIT BOARD
A best fare level plan for each fare structure option has now been deter-
mined. One of the five options must now be selected as the recommended plan.
USA Transit management agreed not to weight each plan, but rather to present
the analysis results for each fare option to the transit board. The presentation
will include each of the evaluation criteria and the rationale for recommending
the fare plan selected as the best for the transit system.
Table A-I5 presents the results of the fare analysis. The best fare plan
under each fare structure option is presented, along with the existing condi-
tions. Each option can be Judged according to how well it meets each of the
evaluation criteria established at the beginning of the study.
The flat fare option will only meet the revenue target with a large sacri-
fice in ridership. Management is convinced that such a large fare increase
would not be acceptable to the transit board. Moreover, the flat fare option
does not improve the equitable distribution of fares among ridership groups.
The four-zone fare structure, while clearly the best in terms of ridership
and revenue generation, is unacceptable from an operational perspective at this
time. The three-zone option is an acceptable improvement. The revenue, rider-
ship, and fare collection criteria are all met.
Of the two time-differential pricing policies, the last option is superior.
The revenue target is nearly met and ridership is increased due to the lower off-
peak fare. The fare structure is more equitable and the operational and fare
collection costs are within the acceptable range.
Options C and E, therefore, are the best two options of the five under
review. The management team selected Option E (the peak/off-peak option) as
the recommended plan for four reasons:
• ridership is expected to increase as revenues increase,
• the cost of fare collection is lower,
• the drivers preferred a peak/off-peak plan over a distance-based plan,
and
• the marketing group felt it would be easier to sell a fare plan that
includes a fare reduction for one segment of the population.
For these reasons, the staff and management of USA Transit recommended to the
policy board that the peak/off-peak pricing scheme be adopted as the new
fare plan for FXQk.
A-16
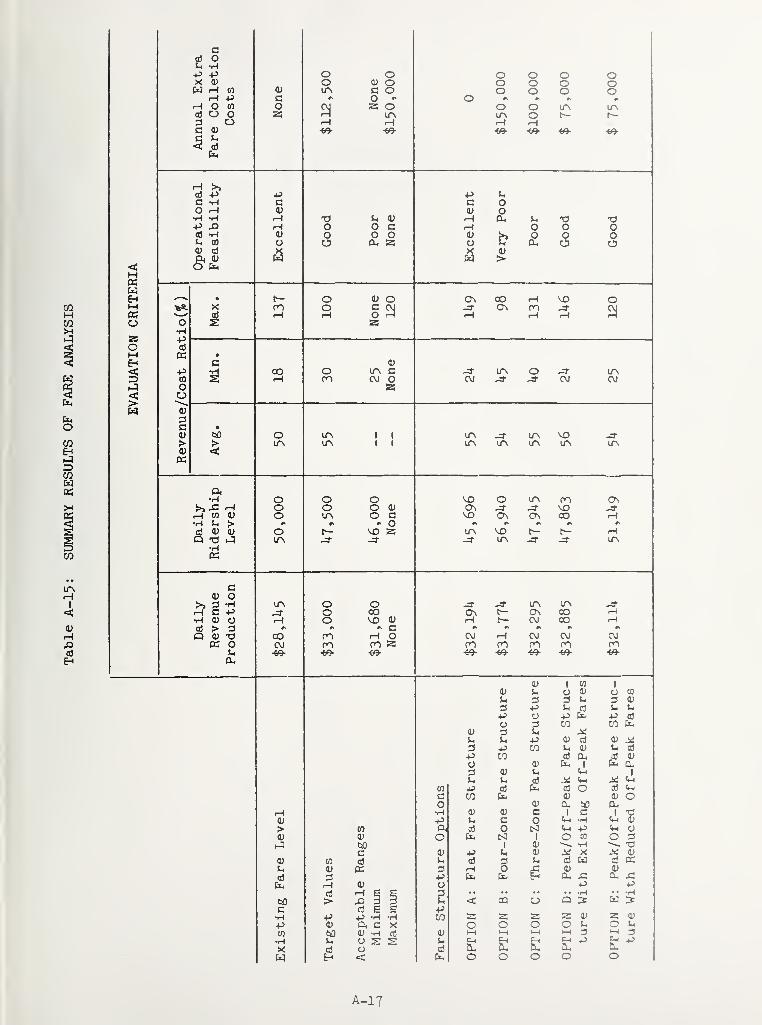
COMCO»
COEH
COw03
CO
HI
«WEhM«O
oMEh
ctJ OJh -h+-' V—' 0 0X (U O D O 0 0
ir\ C O 0w **
»-H O CO f\i
H (&i \^ 0 LTN LTNM rCU \J 5^^-i LTN 0^ r 'i —1
• 1 r-H __j
-€e- <^5
r-
1
00i_5+-
'
CO rH QJ 0•H *H CU Tl
v-/1 pj\J
/-\W /Svj
<u o o o i> 000 o nu z 0 5 0
w w t>
^t"
—
(^) Q Onw< I ' 1
rHQ tvJ on
rHCM»—
1
Q•H
CD
+> CO o 1^ c 0 l/N
CO s H on CM O CM CM CMw
a; 00 O ir\ 1 1 ir\ VD -3-
>; l/^ 1 t L/N LA<
i rK —
^
—
^
r—( CO On ^'H i~t ^a) oj 0) CD \oQ T3 (-^3 J- -3- -3-
•HK
c2
-— w\
—
J/—
\
—
/
—*..—
J
t/N LP^
r—T C 4^ CO On ON CO*H (L) O VD 1* r-l OJ CO rHM ^UJ r> -J •> CQ a; CO ro H 0 OJ H CM CM CMK o CVJ cn no S m on ro ro m
-69- w- e9- 69- -69-ftM-i
11 CO 1
1
OJ CO—<—J OJt t
fe CD*^(J J rnu J
+^ rH i>
UJ fi)u./
+-* rn COftUL* M
\J 11
r-4 1
1
Co Mc rn Q»\J d; cu fe
_J "r-i d) (L) 1 1
A) ij•t—' j_ C Cm *H
?* rriCD/-^ rO
(11 1 CO \^, T1—
J
11 M/ *H
(-< v<
<u w 03 03 05 a CCt>H
—
<
(-•
M <-* fe j:^
r_ t
MCuV-/
•r4
J_, a feit( C C3ro fcr c
•H 4^ 4^ -H -H CO 2: z Z CJ
^-^ d
)
Q Qn 0) M 1—
1
1—
t
l-H
•HX
OSS0 a
C-<
Cu-p
W Eh < fe 0 0 0 0 0
A-lT


DOT LIBRARY
00399624


