Embed Size (px)
Citation preview

REVIEW
A la carte proteomics with an emphasis on gel-free
techniques
Kris Gevaert1, 2, Petra Van Damme1, 2, Bart Ghesquière1, 2, Francis Impens1, 2,Lennart Martens3, Kenny Helsens1, 2 and Joël Vandekerckhove1, 2
1 Department of Medical Protein Research, VIB, Ghent, Belgium2 Department of Biochemistry, Ghent University, Ghent, Belgium3 EMBL Outstation, European Bioinformatics Institute, Wellcome Trust Genome Campus,
Hinxton, Cambridge, UK
Since the introduction of the proteome term somewhat more than a decade ago the field of pro-teomics witnessed a rapid growth mainly fueled by instrumental analytical improvements. Ofparticular notice is the advent of a diverse set of gel-free proteomics techniques. In this review, wediscuss several of these gel-free techniques both for monitoring protein concentration changesand protein modifications, in particular protein phosphorylation, glycosylation, and proteinprocessing. Furthermore, different approaches for (multiplexed) gel-free proteome analysis arediscussed.
Received: February 2, 2007Revised: April 2, 2007
Accepted: April 2, 2007
Keywords:
Gel-free proteomics / Peptide-centric proteomics / Post-translational modifications /Protein processing
2698 Proteomics 2007, 7, 2698–2718
1 Introduction
2D-PAGE [1–3] is still the sole technology able to visualizeand quantify as many individual protein forms in a proteomeas possible. It has been around for more than 30 years andwas successfully used for biomarker discovery studies (e.g.,[4, 5]). One of the most notable improvements of the 2D-PAGE technique was the introduction of IPG gels [6] that
overcame the cathodic drift problem [7] and have led tostandardized procedures for 2-DE, which in turn paved theway for interlab comparisons of 2-DE results [8, 9]. A morerecent enhancement was the introduction of DIGE [10]which reduced most of the reproducibility issues when com-paring analogous 2-D gel patterns of similar samples.Nevertheless, and like any other analytical technique, someproteins often remain unseen by the 2D-PAGE approach.Often this “dark side of the proteome” is reported to consistsof hydrophobic, integral membrane proteins that are notreadily extracted from their lipidic background [11] and lowcopy number proteins (typically less than about 1000 copiesper cell) of which, without any preenrichment step (e.g., byfractionating cells into organelles), insufficient numbers canbe loaded on a 2D-gel [12, 13].
Over the past decade the overall sensitivity, accuracy, anddynamic range of mass spectrometers have improved drasti-cally [14]. In combination with the ever increasing publicavailability of completely sequenced genomes (e.g., theEntrez Genome Project [15]) this has led to a new researcharea in proteomics: gel-free, nongel, shotgun or rather pep-tide-centric proteomics. Here, instead of analyzing the pro-
Correspondence: Professor Dr. Kris Gevaert, Department of Bio-chemistry, Faculty of Medicine and Health Sciences, Ghent Uni-versity, A. Baertsoenkaai 3, B-9000 Ghent, BelgiumE-mail: [email protected]: 132-92649496
Abbreviations: AMT, accurate mass tag; CDG, congenital disor-ders of glycosylation; COFRADIC, combined fractional diagonalchromatography; ICAT, isotope-coded affinity tag; IMAC, immo-bilized metal ion affinity chromatography; iTRAQ™, isobaric tagsfor relative and absolute quantification; MudPIT, multidimen-sional protein identification technology; O-GlcNAc, O-linkedbeta N-acetylglucosamine; SCX, strong cation exchange; SILAC,
stable isotope labeling by amino acids in cell culture; TNBS,
2,4,6-trinitrobenzenesulfonic acid
DOI 10.1002/pmic.200700114
© 2007 WILEY-VCH Verlag GmbH & Co. KGaA, Weinheim www.proteomics-journal.com

Proteomics 2007, 7, 2698–2718 Technology 2699
tein directly, its peptides are analyzed. The latter are gen-erally more soluble than their precursors and are readilyprobed by mass spectrometers.
We here discuss different approaches in contemporaryproteome research and tried to focus on peptide-centricmethods. Since recent proteome-wide analyses using state-of-the-art mass spectrometers [16, 17] as well as intelligentblind searching and comparing of large datasets [18, 19] haveshown that only a small part of the tens of already knownprotein modifications [20] have been biologically assessed,we also discuss approaches for mapping a number of inter-esting protein modifications, emphasizing on phosphoryla-tion, glycosylation, and protein processing. Some of thetechniques discussed below can be considered “classic” pro-teomics approaches as they rely on gels to separate and ana-lyze (specific) proteins. A link to gel-free analytical tech-niques readily pops up in these, however. Finally, differentapproaches for differential and quantitative proteome analy-sis are discussed.
2 Multidimensional or orthogonal LCapproaches in gel-free proteome studies
In gel-free proteomics, following isolation of a proteome, thegeneral starting point is an enzymatic digestion step con-verting the proteins into peptides. Trypsin is the enzyme-of-choice for such studies as it cleaves C-terminal to arginineand lysine and the sequences of tryptic peptides may thus beeasily predicted, and, furthermore, peptide MS/MS frag-mentation rules are largely based on analyzing tryptic pep-tides. Since tryptic peptides have been sequenced for overdecades, the behavior of trypsin on a protein is well knownand it was recently shown that this plethora of informationcan be used to more accurately predict missed tryptic cleav-age sites, leading to more correct protein identifications [21].
Clearly, when digesting an already complex mixture ofproteins with an enzyme that, on average, is expected tohydrolyze a peptide bond every ten amino acids the gener-ated peptide mixture will be even more complex. Let us takethe Escherichia coli proteome as an example. The E. coli K12genome was predicted to encode for 4288 ORFs [22]. If all ofthese were expressed and their corresponding proteins gotefficiently cleaved by trypsin, a mixture of 109 934 peptideswould be generated. One typical LC-MS/MS analysis usingcontemporary mass spectrometers on average results in theacquisition of about 10 000 MS/MS spectra [23]. Given thefact that a major part of these spectra will be redundant andonly a small percentage of all spectra would be of sufficientquality for unambiguous identification, clearly for a rathersimple organism like E. coli one such LC-MS/MS analysiswould result in identifying only a very small part of the wholeproteome.
One way to reduce this complexity and increase pro-teome coverage is including a different (orthogonal) chro-matographic separation step prior to nano-RP-HPLC. Yates
and coworkers introduced strong cation exchange (SCX)chromatography prior to RP for studying protein complexes(yeast ribosomes [24]) and complete proteomes (the yeastproteome [25]) and called their technology multi-dimensional protein identification technology (MudPIT)[26]. The MudPIT technology has matured rather quicklyand is very often used in contemporary proteomics labora-tories. Selected recent studies include subtractive proteom-ics characterizing the integral membrane proteins of thenuclear envelope [27], a detailed analysis of proteomicchanges upon differentiation of mouse myoblasts [28], or-ganelle proteomics of a breast cancer cell line [29] and theformidable identification of more than 7792 proteins inmouse brain using an enrichment of cysteinyl peptidescombined with MudPIT [30].
One of the major pitfalls of the MudPIT technology is theunder-sampling or random sampling of analytes [31]. Thisimplies that due to the complexity of the sample, too manypeptides are delivered to the mass spectrometer which thenrandomly picks ions for MS/MS analysis. Reanalyzing thesame sample will only give a small overlap with the previousanalysis, indicating that all SCX-fractions should be reana-lyzed several times before ample proteome coverage will beachieved. One way to reduce under-sampling is to select a setof so-called representative peptides [32]: these peptides carryamino acids that are sufficiently rare, yet remain well-dis-tributed over a proteome such that the chance that all pre-cursor proteins are finally represented by at least one peptideis very high.
To illustrate the effects of under-sampling, a thoughtexperiment can be conceived (Fig. 1). In this scenario, weassume an organism is expressing 5000 different proteins,yielding 100 000 different peptides upon tryptic digest (notethat these numbers correlate well with the data given abovefor the E. coli K12 proteome). We further uphold the above-mentioned analytical capacity of a mass spectrometer at10 000 MS/MS spectra per analysis. We will make a leap offaith and assume 80% of these are identifiable and can bereliably assigned to a peptide sequence. A first MudPITiteration thus samples 8% (8000 out of 100 000) of the pep-tides in the mixture (i.e., a sampling rate of 8%). For thesecond iteration, we calculate that the number of novelidentifications is the sampling rate times the number of asyet unidentified peptides: 0.08 times (100 000–8000). Thisworks out to an optimistic estimate of 7360 novel identifica-tions in the second iteration (and, correspondingly, to only640 redundant identifications). As the number of replicatesincreases, the chances of finding novel identificationsdetoriate quickly however, and the curve levels off.
In comparison, a peptide selection technique employsthe same high-performance instrument, but reduces theinitial sample size, with the net effect of increasing the sam-pling rate (as is evident from the first iterations). In the caseof isotope-coded affinity tag (ICAT) [33] and methionine orcysteine combined fractional diagonal chromatography(COFRADIC) [34, 35], the sample complexity is reduced by a
© 2007 WILEY-VCH Verlag GmbH & Co. KGaA, Weinheim www.proteomics-journal.com

2700 K. Gevaert et al. Proteomics 2007, 7, 2698–2718
Figure 1. Thought experimentto illustrate the effects of under-sampling of peptide ions. Thechart shows the proteome cov-erage as the percentage of iden-tified peptides for a simplethought experiment (see maintext for details). Peptide-selec-tion strategies achieve high pro-teome coverage more quicklydue to a decreased initial sam-ple complexity.
factor of four in this example (thus starting with 25 000 pep-tides in the mixture). This figure roughly corresponds to theactual prevalence of identifiable cysteinyl and methionylpeptides in the human proteome. The N-terminal COFRA-DIC approach [36] reduces the sample complexity even fur-ther, in this case to one-tenth of the original sample com-plexity (a reduction achieved by allowing one additional, non-N-terminal peptide – e.g., an internal peptide blocked by anN-terminal pyroglutamic acid residue – to pass the selectionprocedure per protein), theoretically achieving 80% proteomecoverage in a single run.
Note that several optimistic assumptions are made inthis thought experiment, including the absence of differ-ences in abundance. It is clear however, that all approacheswould be equally affected by these ignored problems, andthat the trend in the results will remain identical, althoughthe absolute coverages reported will decrease. This thoughtexperiment, graphically illustrated in Fig. 1, clearly illustrat-ing the advantages of peptide selection techniques when itcomes to rapidly achieving high proteome coverage.
Such targeted gel-free approaches are discussed in thefollowing section and listed in Table 1.
Table 1. List of gel-free techniques isolating peptides carrying specific amino acids or the protein’s N-terminus
Procedure Brief description of the procedure Key reference(s)
Cys peptides
ICAT Biotinylation of cysteine residues and affinity isolation [33, 38]Covalent trapping Covalent coupling of activated cysteines on thiopropyl resin [39–41]SCX Performic acid oxidation to sulfonic acid residues [42]COFRADIC Reversible labeling with Elman’s reagent [35]
His peptides
IMAC Affinity of His for IMAC resins [44]Covalent trapping 1 IMAC Isolation of peptides containing Cys and His [45]
Met peptides
Covalent trapping Binding to bromoacetyl groups [46]COFRADIC Sorting following hydrogen peroxide treatment [34]
Trp peptides
Hydrophobic interaction NBSCl labeling and trapping on LH-20 resins [47, 48]
Ser/Thr-starting peptides
Affinity labeling Introducing N-terminal aldehyde and reaction with affinity-labeled hydrazine [49]
N-terminal peptides
COFRADIC Sorting following TNBS treatment [36]PST Biotinylation of N-terminal peptides [168]Positional proteomics Biotinylation of internal peptides [169]
© 2007 WILEY-VCH Verlag GmbH & Co. KGaA, Weinheim www.proteomics-journal.com

Proteomics 2007, 7, 2698–2718 Technology 2701
3 Targeted approaches for gel-freeproteome analysis
3.1 Isolation of cysteinyl peptides
The exemplary chemical tagging strategy for gel-free pro-teome analysis is the ICAT introduced by Aebersold andcoworkers [33]. In brief, these molecules hold three parts – athiol-reactive group, a linker that holds different stable iso-topes, and an affinity label (biotin) – and thus such tags areused to isolate cysteinyl peptides. The original ICAT mole-cule underwent several improvements since its introduction.It was for example loaded with carbon-13 isotopes instead ofdeuterium to reduce the “isotope dispersion” effect observedduring RP-HPLC [37]. Furthermore, an altered version of theICAT molecule was covalently attached to a solid phase sup-port and following capture of cysteinyl peptides, a photo-cleavable linker can be activated to release peptides for fur-ther analysis [38]. Since its introduction in 1999, the ICATtechnology has been applied to a multitude of proteomesfrom all kinds of organisms and a Medline survey indicatedthat already more than 100 papers on the use of ICAT havebeen published in the field of proteomics.
Cysteinyl peptides may however be targeted by otherapproaches as well. For instance, following reduction of dis-ulfide bridges and reaction of free cysteines with dipyridyldisulfide, such activated cysteines can be captured on a thio-propyl resin (covalent chromatography) as shown by Wangand Regnier [39]. A somewhat similar strategy for covalentenrichment of cysteinyl peptides was developed by Smithand coworkers [30, 40, 41] who demonstrated rather unpar-alleled numbers of protein identification and quantificationusing a FT-ICR mass spectrometer. Recently, anotherenrichment procedure for cysteinyl peptides was describedbased upon the introduction of a negative charge oncysteines. Here, prior to digestion, cysteines were oxidized byperformic acid which converts cysteines to their sulfonic acidcounterparts. The hereby-introduced negative charge is usedto enrich cysteinyl peptides in the flow-through fraction of anSCX run. Interestingly, mass spectrometers may also takeadvantage of this negative charge: cysteinyl peptides can bemore easily detected in negative mode and are then frag-mented in positive mode. Although this technique was onlyused on a relatively uncomplicated peptide mixture (a BSAdigest) [42], because of its simplicity it holds potential for gel-free proteomics studies.
3.2 Isolation of histidinyl peptides
Another infrequently occurring amino acid is histidine: fol-lowing tryptophan and cysteine, it is the least frequentamino acid (see http://www.expasy.ch/sprot/relnotes/) how-ever, it is very well distributed over proteomes, with almostall proteins containing at least one tryptic histidinyl peptide[32, 43]. A typical strategy for isolating histidine-containingpeptides makes use of their affinity for immobilized metal
ion affinity chromatography (IMAC) resins [44]. Further-more, by combining covalent chromatography to first selectfor cysteinyl peptides with a subsequent IMAC step, onlypeptides containing both cysteine and histidine could beisolated, thereby significantly reducing the analyte complex-ity [45].
3.3 Peptides containing methionine or tryptophan
Both methionine and tryptophan are encoded by a singlecodon, making them infrequent amino acids. Several strate-gies have been described for isolating peptides containingthese amino acids. Methionyl peptides can be bound toreactive bromoacetyl groups presented on glass beads. Fol-lowing extensive washing to remove nonmethionyl peptides,trapped methionyl peptides are reduced by beta-mercap-toethanol and analyzed by MS [46]. In 2003, Kuyama et al.[47] introduced a technique for specific labeling of trypto-phans in peptides followed by enriching tryptophan-con-taining peptides on a LH-20 Sephadex resin. Tryptophanlabeling was done by 2-nitrobenzenesulfenyl chloride(NBSCl) – which may contain six carbon-13 atoms for differ-ential proteome analysis – and advantage was taken from theincreased interaction between NBS-tryptophan containingpeptides and the dual hydrophilic and lipophilic LH-20 resin[47]. In one of their follow-up papers, an improvement of theoriginal procedure was described, amongst others, bychanging to a phenyl-based resin that allowed more specificenrichment of tryptophan peptides [48].
3.4 Peptides starting with serine or threonine
Another way to reduce the complexity of an analyte mixturewas described by Chelius and Shaler in 2003 [49]. In theirapproach, peptides starting with either a serine or threonineresidue are isolated for further analysis. Briefly, a periodateoxidation reaction is used to introduce an aldehyde group at apeptide’s N-terminus. This aldehyde is then reacted with ahydrazine molecule containing an affinity label (e.g., biotin)which is then used to extract peptides containing an N-ter-minal serine or threonine from a complex mixture.
3.5 Isolating classes of peptides based on their
intrinsic charge
Recently, the group of Gabriel Padrón introduced proceduresexploiting the net charge of peptides for selective isolation ofpeptide classes. In their first application, reversible acylationof alpha- and epsilon-amino groups by maleic anhydride wasused to isolate peptides devoid of histidine and arginine(nHnR peptides) in the nonbinding SCX fraction (SCX wasperformed in 0.01% of formic acid) [50]. Acylation of aminogroups was then reverted by treatment in 0.01% of formicacid for 1 h at 907C after which peptides were sampled forLC-MS/MS analysis. Their so-called SCAPE (selective cap-ture of peptides) technology was modified – or rather rever-
© 2007 WILEY-VCH Verlag GmbH & Co. KGaA, Weinheim www.proteomics-journal.com

2702 K. Gevaert et al. Proteomics 2007, 7, 2698–2718
ted – to allow the enrichment of multiply charged arginineand histidine containing peptides (RH peptides) [51]. Here,proteins are digested with a combination of endoproteinaseLys-C and trypsin after which primary amino groups areblocked with acetic anhydride. This modification takes awaypositive charges from alpha- and epsilon-amino groups andnow the SCX flow-through (SCX was performed in 0.05%TFA) and poorly binding fraction is discarded, while multi-ply charged RH peptides are retained by the SCX column,eluted and analyzed by LC-MS/MS. In a “spin-off” applica-tion, lysine-free tryptic peptides restricted by arginines(RRnK peptides) were suggested for proteome analysis [52].Here, proteins were digested with endoproteinase Lys-C andall free amines were then blocked by biotinylation. Next, thepeptide mixture was further digested with trypsin and, fol-lowing affinity removal of biotinylated peptides, lysine-freepeptides restricted by arginines remain in the analyte mix-ture and these RRnK peptides are used for protein identifi-cation and quantification. Using such SCAPE techniquesbetween 80 and 90% of all proteins are amenable for proteinidentification, each protein typically generating three to fourdifferent peptides [50–52].
3.6 COFRADIC techniques sorting methionyl,
cysteinyl, or N-terminal peptides
Over the past few years our group exploited the principle ofdiagonal electrophoresis introduced in 1966 by Brown andHartley [53] for gel-free proteome analysis (reviewed in [32,
54]). The central principle of the techniques we have devel-oped is straightforward: it essentially consists of two con-secutive, identical peptide separation steps (using RP-HPLC) with a sorting reaction in between them. This sort-ing reaction alters the structure of a selected class of pep-tides such that these altered peptides obtain different col-umn retention characteristics. During a series of secondary,identical peptide separation steps such altered peptidesundergo a hydrophilic or hydrophobic shift relative to theirprimary elution interval and are thereby separated from thebulk of nonaltered peptides. Based on the parallel with thetechniques of diagonal electrophoresis and diagonal chro-matography [55] and since several primary fractions may becombined per secondary separation, we termed our tech-nique COFRADIC.
In our original publication dated from 2002 we describedhow methionyl peptides are isolated. In brief, a proteomedigest is fractionated a first time by RP-HPLC after whichcombined primary fractions are oxidized with hydrogen per-oxide (i.e., the sorting reaction, Fig. 2). Hereby, only methio-nine residues are oxidized and only to their methionine-sulfoxide derivatives. Since a dipole is now introduced, suchaltered methionyl peptides are more hydrophilic and elute infront of their primary elution interval during the secondaryRP-HPLC runs. We applied this technology to anunfractionated proteome preparation of E. coli and identifiedmore than 800 different proteins, which was about an orderof magnitude higher as compared to the traditional, gel-based proteomics techniques [34].
Figure 2. Overview of the different COFRADIC procedures. The first row sketches the different reactions leading to the isolation of theindicated peptides (the actual sorting agent is indicated in a bold type face). The second row indicates how these peptides chromato-graphically shift between the primary and secondary RP separations. The third row depicts how the sorting agent affects the side-chain ofthe sorted peptides. Note that for the sorting of N-terminal peptides the reaction of internal peptides carrying a free a-amine with TNBS isdepicted since these are thrown out of the primary collection interval.
© 2007 WILEY-VCH Verlag GmbH & Co. KGaA, Weinheim www.proteomics-journal.com

Proteomics 2007, 7, 2698–2718 Technology 2703
One of the key features of COFRADIC is its versatility: bysimply changing the sorting reaction virtually any type ofpeptide that can be specifically modified can be isolated.Hence, we showed that cysteinyl peptides can also be sortedby COFRADIC in a reversible labeling approach [35]. Basi-cally, prior to protein digestion all disulfide bridges arereduced and free cysteines are reacted with Ellman’s reagentplacing a hydrophobic entity (nitrobenzoic acid) via a hetero-disulfide link on the side-chain of cysteine. Following a pri-mary separation of the proteome digest, this hydrophobicmoiety is removed by a reducing step with TCEP. In this way,reduced cysteinyl peptides undergo a hydrophilic shift rela-tive to their original elution interval and segregate fromnoncysteinyl peptides (Fig. 2). We applied this cysteineCOFRADIC technology to human serum depleted fromserum albumin and antibodies and showed that proteins ofwhich the concentration spanned four to five orders of mag-nitude, were identified [35].
Isolating either methionyl or cysteinyl peptides leads to areduction of the sample’s complexity by about a factor four tofive [32, 43]. Especially for tryptic digests of proteomes fromhigher eukaryotes such a complexity reduction might not yetbe optimal since the flux of peptides to mass spectrometers isstill very high resulting in significant under-sampling. Oneway to overcome this is by combining different techniques,for instance as described for SCX and methionine COFRA-DIC, resulting in a “four dimensional” separation of peptides[56] and ICAT to MudPIT enhancing identification of lowabundant proteins [57]. A different option is to isolate onesingle peptide for each protein since this maximally reducesthe complexity. We showed that COFRADIC can be tuned tospecifically isolate N-terminal peptides of proteins [36]. Here,each protein is finally represented by a single peptide, its N-terminal one which furthermore monitors protein proces-sing events and N-terminal modifications (see below). TheCOFRADIC sorting scheme is now based on the differencebetween the alpha-amino group of an N-terminal peptideand an internal peptide. Either in vivo or in vitro, the protein’salpha-N-terminus is blocked by an acetyl group or by a pyr-rolidone carboxylic acid. Following trypsin digestion, twotypes of peptides are formed: blocked, N-terminal ones andinternal peptides carrying a free alpha-amino group. Theselatter peptides react specifically and uniformly with 2,4,6-tri-nitrobenzenesulfonic acid (TNBS), thereby placing a hydro-phobic trinitrophenyl group on such internal peptides(Fig. 2). Thus, in a series of secondary COFRADIC runs,internal peptides undergo a hydrophobic shift when com-pared to their primary elution interval and segregate fromthe N-terminal peptides that are not affected by TNBS. Inthis way, N-terminal peptides are isolated leading to a com-plexity reduction by a factor of about 20 [32].
This N-terminal COFRADIC technology has been usedto monitor protein processing ([58] and see below) and in“xenoproteomics” studies [59]. In these latter studies, N-ter-minal peptides are used to distinguish between homologousproteins from different species that are simultaneously
present in one proteome sample. In particular, we identifieda number of human proteins in unfractionated serum of aSCID mouse overexpressing the urokinase plasminogenactivator (uPA) in its liver [59]. This normally leads to a lethalphenotype but can be rescued by transplanting humanhepatocytes via the spleen into the mouse liver. In this study,N-terminal COFRADIC was used to show that the chimericliver was functionally active and produced human proteinsthat were released in the serum. Given the increasing use ofxenograft models for studying diverse aspects of tumorigen-esis and biomarker discovery (e.g., [60–63]), it is conceivablethat N-terminal COFRADIC will start to play an importantrole in these types of studies.
It should be clear by now that no single technique willlead to the ultimate coverage of a proteome and that ideally,and time and sample permitting, one needs to combine dif-ferent (orthogonal) strategies for methodical proteomics.Indeed, we recently showed that only a combination of threedifferent COFRADIC techniques – those for isolatingmethionyl, cysteinyl, and N-terminal peptides – leads to adetailed analysis of the proteome of human platelets, identi-fying at that time more than 400 novel platelet proteins [64].
4 Protein phosphorylation
One of the most studied protein modifications is proteinphosphorylation. Given that more than 500 human genesencode the human kinome [65] and that on average one thirdof all eukaryotic proteins can exist in a phosphorylated state,protein phosphorylation truly is a common protein mod-ification. In 2D-PAGE studies, phosphorylation may bespecifically detected by 32P-autoradiography (e.g., [66]), usingantibodies (especially for tyrosine phosphorylation, e.g., [67])or by fluorescent staining [68].
Over the past few years, a number of gel-free techniquesfor phosphoproteome analysis have been introduced. Oneoverall advantage such techniques hold over gel-based anal-yses is the fact that the peptide carrying the modification(phosphorylated amino acid) is directly isolated and ana-lyzed. Although not all phosphorylation events will ever becovered by such techniques, the overall likelihood of char-acterizing protein phosphorylations is much higher for gel-free techniques as compared to gel-based techniques.Indeed, if for instance a 2-DE separated protein is expected tobe phosphorylated, an in-gel digest of this protein spot isperformed followed by multiple rounds of mass spectromet-ric analyses in trying to sequence phosphorylated peptides.Furthermore, to reach ample coverage of the sequence of theinvestigated protein different proteases are often used. Al-though this will result in a detailed map of the proteinsequence, the cost one has to pay in terms of the amount ofanalysis time is very high, especially since phosphopeptidesare often poorly detected in a mixture of nonphosphorylatedpeptides when analysis is done in the positive ion mode as isroutine [69].
© 2007 WILEY-VCH Verlag GmbH & Co. KGaA, Weinheim www.proteomics-journal.com

2704 K. Gevaert et al. Proteomics 2007, 7, 2698–2718
4.1 Immobilized metal ion chromatography
techniques for isolating phosphopeptides
Phosphopeptides may be isolated by IMAC [70]. However, forroutine use in proteomics laboratories one of the majorproblems used to be the coisolation of nonphosphorylated,mainly highly acidic peptides. This was addressed in a paperby Hunt and coworkers [71] who esterified all carboxylgroups prior to IMAC and characterized 383 phosphoryla-tion sites in the Saccharomyces cerivisiae proteome. Some-what improved IMAC technologies have since then beenused in various proteome studies – e.g., esterification usingthionyl chloride and methanol instead of acetyl chloride andmethanol leading to the characterization of 238 phosphoryl-ation sites in the human HT-29 colon adenocarcinoma cellline [72] – and comprehensive protocols [73] and compar-isons of different commercially available IMAC resins [74]were also published.
Another way to reduce the number of IMAC-isolatednonphosphopeptides was introduced in a paper by Bone-nfant et al. [75] who eluted IMAC-retained phosphopeptidesusing phosphatases thereby reducing the background ofcoenriched acidic nonphosphorylated peptides. In an appli-cation that was published last year, the use of gel-free IEF ofpeptides was presented as a preenrichment step of phos-phopeptides. Here, phosphorylated peptides were pre-ferentially found in the low pH fractions and were then fur-ther isolated by IMAC [76].
Increased coverage of a phosphoproteome can beachieved by combining phosphoprotein and phosphopeptideIMAC as was shown by the characterization of 331 phos-phorylated sites in mouse synaptic proteins [77]. One way toovercome the inherent suppression of MALD ionization ofphosphopeptides over nonphosphopeptides is by removingthe phosphate group using broad-range phosphatases. Al-though any information on the actual site of modification isdiscarded, a “before and after” comparison of treated peptidemixtures often pinpoints phosphopeptides which may thenbe fragmented both in their phosphorylated and depho-sphorylated state, enabling the characterization of the actualphosphorylated site [78, 79].
4.2 Segregating phosphopeptides from
nonphosphoylated peptides by SCX
In 2004 Gygi and coworkers [80] showed that phosphorylatedpeptides can be enriched by SCX. When performing SCX atpH 2.7, all carboxyl groups are protonated and thus neutral.Basic groups at the alpha-amino terminus and on arginine,lysine, and histidine are also protonated and thus carry asingle positive charge. Tryptic nonphosphorylated peptidesending on an arginine or lysine will thus carry at least onepositive charge. If such peptides are phosphorylated, thephosphate moiety is deprotonated at pH 2.7 and, comparedto their nonphosphorylated peptides, these peptides thushold one less positive charge. This difference in net charge at
pH 2.7 forms the basis for enriching phosphorylated trypticpeptides by SCX since these will elute in front of nonphos-phorylated peptides [80]. Clearly, some phosphorylated pep-tides will be more difficult to enrich as they elute similarly tononphosphorylated peptides (e.g., those carrying a histidineresidue and thus holding an extra positive charge). However,this technique is often combined with an IMAC step for fur-ther enrichment of phosphopeptides and has led to thecharacterization of hundreds of phosphorylation sites in dif-ferent proteomics samples [80–82].
4.3 Titanium dioxide as an alternative method
enriching phosphopeptides
Several research groups recently reported the use of titaniumdioxide (TiO2) for specific retention of phosphorylated pep-tides [83, 84]. The highest level of selectivity and sensitivitywas reported when a peptide mixture containing phospho-rylated and nonphosphorylated peptides was loaded in acidicsolutions containing 2,5-dihydroxybenzoic acid whichreduced background binding of nonphosphorylated peptides[85]. Titanium dioxide columns are typically used in a multi-dimensional setup (combined with RP-HPLC columns [86])allowing rather automated enrichment and subsequentanalysis of phosphorylated peptides. Because of thisstraightforward coupling, it may be anticipated that suchdual column systems become important tools for phospho-proteomic analysis in the future.
4.4 Chemical approaches for isolating
phosphorylated peptides
Phosphorylated amino acids have also been the target fordifferent kinds of chemical reactions aiming at modifyingthem for specific isolation prior to MS/MS analysis. Phos-phorylated serines and threonines may be targeted by beta-elimination at high pH introducing reactive alkene bondsthat serve as Michael acceptors for nucleophilic moleculessuch as ethanedithiol. In turn, such newly introduced thiolgroups may be targeted by ICAT-like molecules therebyintroducing an affinity anchor (biotin) for further isolation[87]. One of the major unwanted side-reactions reported wasthe dehydration of nonmodified serine residues leading tofalse positive identifications of phosphopeptides. Since then,improved protocols for beta-elimination reactions have beenproposed (e.g., [88]) and most notably was the introduction ofsolid-phase Michael addition allowing a capture-and-releaseapproach for phosphoproteomics [89, 90].
A different approach was suggested by Aebersold andcoworkers [91]. In their original paper a rather complex, six-step chemical reaction procedure was presented. In brief,following digestion of a reduced and alkylated protein (orprotein mixture), all amino groups are protected by tBoc(step 1). Then, a carbodiimide-based condensation reactionintroduces amides and phosphoramidates at peptide car-boxyl and phosphate groups respectively (step 2). In the third
© 2007 WILEY-VCH Verlag GmbH & Co. KGaA, Weinheim www.proteomics-journal.com

Proteomics 2007, 7, 2698–2718 Technology 2705
step, phosphate groups are regenerated following acidhydrolysis and, again using carbodiimide, cystamine is cou-pled to phosphate groups and following reduction, free thiolgroups are now introduced at each in vivo phosphorylatedamino acid (step 4). Using iodoacetyl groups covalentattached to glass beads, peptides containing such free thiolgroups are retained on a solid phase (step 5) and finally,phosphopeptides are recovered by cleaving the phosphor-amidate bonds with TFA simultaneously releasing the pro-tective tBoc groups (step 6) [91]. Most probably because of thecomplex scheme of interactions, this method has not (yet)been introduced into many proteomics laboratories. A dif-ferent and more simple three-step capture-and-release strat-egy was proposed in 2005 [92]. Here, peptides are firstmethylated by methanolic HCl protecting all carboxylgroups. Phosphopeptides are then captured on a solubledendrimer support by a conjugation reaction catalyzed byEDC and imidazole and nonphosphorylated peptides areremoved following extensive washing. Finally, conjugatedphosphopeptides are released by treatment with 10% TFAand analyzed by LC-MS/MS [92]. One advantage both meth-ods hold over the beta-elimination methods described aboveis that they are equally applicable to phosphorylated serine,threonine, and tyrosine residues, whereas the beta-elimina-tion methods cannot target phosphotyrosines. However,specific antiphosphotyrosine antibodies for immunoprecipi-tation have been around for a long time and several groupsreported on their use in phosphotyrosine studies (e.g., [93,94]).
4.5 COFRADIC and the phosphoproteome
Our COFRADIC technology was also tuned for phosphopro-teome analysis [95]. Here, the COFRADIC sorting step con-sisted of an enzymatic dephosphorylation of phosphorylatedpeptides using a cocktail of broad-range phosphatases. In thesecondary COFRADIC separations, dephosphorylated pep-tides undergo a hydrophobic shift and are thereby isolatedfrom in vivo nonphosphorylated peptides (Fig. 2). Onepotential drawback of this method is that the actual infor-mation on the site that was in vivo phosphorylated is lost. Infact, this resulted in two different concerns that needed to beembarked upon. First, artificially and unwanted shiftingpeptides – for instance by deamidation of Asn-Gly and Asn-Ser residues [96] or by formation of N-terminal pyrrolidonecarboxylic acid – need to be distinguished from dephos-phorylated peptides. In fact, this was tackled by splitting thesample in two equal parts and labeling these differently withoxygen-18 isotopes [95, 97]. One part was then depho-sphorylated prior to the first COFRADIC separation step andfollowing the whole COFRADIC procedure, artificially shift-ing peptides are readily recognized as oxygen-16/oxygen-18couples, whereas dephosphorylated peptides only containedone type of oxygen isotopes. The second concern is findingout which residue was phosphorylated when a sorted peptidecontained more than one serine, threonine, and/or tyrosine.
Although this included a repetitive analysis, we showed thatone may create m/z inclusion lists based on the sequence ofidentified dephosphorylated peptides and use these to rea-nalyze the primary COFRADIC fractions in a data-depend-ent manner [95].
5 Protein glycosylation
Protein glycosylation is a widespread modification as it isreckoned that about half of all proteins are glycosylated [98].Alterations in protein glycosylation are frequently associatedwith physiological disorders (e.g., congenital disorders ofglycosylation (CDGs), reviewed in [99–101]) and over the pastfew years a “renewed” interest in protein glycosylation hasbecome apparent in the proteome analytical world. Glycosy-lation typically occurs on asparagines (N-glycosylation) or onserines and threonines (O-glycosylation), although glycosy-lation of other amino acids, e.g., hydroxyproline [102], hasbeen described. One feature of N-glycosylation in particularis the microheterogeneity of conjugated glycan structures(e.g., [103, 104]) leading to a scattered migration profile of thesame “base protein” on 2-D gels [105]. Differences in the2-DE migration pattern of particular glycoproteins can effec-tively be used to monitor CDGs: e.g., like recently monitoredfor a-1-acid glycoprotein and transferrin in the serum ofCDG patients [106]. Prior to further analysis, glycosylatedproteins may be specifically detected using fluorescenthydrazide dyes, e.g., Pro-Q-Emerald [107] or by lectin blotanalysis (e.g., [108, 109]). However, over the past few yearsgel-free methods for glycoprotein research have emerged.
5.1 Lectin-affinity chromatographic techniques
Regnier and coworkers [110] showed that immobilized lec-tins may be used to isolate so-called “signature peptides”(here: glycosylated peptides) from digests of complex proteinmixtures prior to mass spectrometric analysis. Dependingupon the choice of the lectin, a broad range of glycopeptides(e.g., using Con A targeting N-glycopeptides/N-glycoproteins[111, 112]) or a rather specific set of glycopeptides (e.g., usingthe Bandeiraea simplicifolia lectin BS-II particularly recog-nizing O-linked beta N-acetylglucosamine (O-GlcNAc) con-taining oligosaccharides [113]) can be isolated. One recentinteresting application involved the use of lectin weak affini-ty chromatography (LWAC) to enrich for peptides containingO-GlcNAc using wheat germ agglutinin (WGA) leading tothe identification of 63 unique O-GlcNAc modified peptidesin a postsynaptic density preparation using electron capturedissociation (ECD, reviewed in [114]) for peptide sequencing[115].
One of the major advantages lectin affinity chromatogra-phy holds over chemical trapping of glycopeptides (seebelow) is its simplicity of operation: essentially no chemicalreactions are required before or during the chromatographicisolation whereby these techniques are readily put into prac-
© 2007 WILEY-VCH Verlag GmbH & Co. KGaA, Weinheim www.proteomics-journal.com

2706 K. Gevaert et al. Proteomics 2007, 7, 2698–2718
tice in any proteomics laboratory. However, if one wants tostudy the whole set of glycosylated proteins in a sample – theglycoproteome [116] – the sometimes limited specificity ofcommonly used lectins hinders ample glycoproteome cover-age. Combining different lectins recognizing different gly-can structures – multilectin affinity chromatography (M-LAC) [117] – opened up the analysis of a broader range of lowabundant proteins in biomarker screens [118]. On the otherhand, the specificity of lectins may also be used in a serialmode enriching for a specific set of glycopeptides. An exam-ple of such serial lectin affinity chromatography (SLAC) isthe use of Con A trapping high-mannose N-glycans prior toJacalin which then preferentially binds O-glycosylated pep-tides [119].
Hydrophilic interaction LC (HILIC) was recently appliedto enrich glycosylated peptides [120, 121]. In one application,trapped N-glycosylated peptides were specifically eluted fromthe HILIC resin using a partial deglycosylation of N-glycosy-lated peptides by a mixture of endo-beta-N-acetyl-glucosaminidases, leaving a single N-GlcNAc residue on theeluted peptide. This glycan remnant then elegantly served asa mass signature and was used to exactly determine the siteof modification [120].
5.2 Chemical trapping of N-glycosylated peptides
In 2003, Aebersold and coworkers [122] developed a tech-nique that chemically traps N-glycosylated peptides prior toLC-MS/MS based on hydrazide chemistry. In essence, a pro-teome containing N-glycosylated proteins (e.g., serum orenriched plasma membrane preparations) is oxidized byperiodate, thereby changing cis-diol groups in carbohydratesinto aldehydes. These aldehydes are then coupled to sup-ports by covalent binding to immobilized hydrazide groups.This coupling step already removes the nonglycosylated pro-teins and following a tryptic digestion of immobilized glyco-proteins, nonglycosylated peptides can also be washed off.Using PNGaseF, immobilized N-glycosylated peptides arerecovered from the support and may then be analyzed by LC-MS/MS. This “chemical trapping/release” technique hasbeen applied to various proteome samples (e.g., [123–126])and boosted the characterization of N-glycosylation sites overthe past few years. The latter is also evident from the recentintroduction of the UniPep database (http://www.unipep.org/, [127]) holding a vast amount of experimentally verifiedN-glycosylation sites.
5.3 Analysis of O-glycosylated peptides
Next to the lectin affinity chromatography proceduresdescribed above, “chemoenzymatic” [128, 129] or “tagging-via-substrate” [130, 131] strategies were recently shown toenrich O-GlcNAc peptides in complex mixtures. Central inthese approaches is an unnatural carbohydrate analog (aketone-containing galactose analog [128, 129] or a per-acetylated azido-GlcNAc [130, 131]) that is tolerated by the
engineered [128, 129] or natural enzymes [130, 131] in the O-GlcNAc pathway. In the tagging-via-substrate strategy, anazido-GlcNAc derivative is taken up by cells which then con-vert it to UDP-azido-GlcNAc. The latter is recognized by O-GlcNAc transferases that modify protein substrates. Usingbiotinylated phosphines, an affinity tag is specifically placedon O-GlcNAc modified proteins by the Staudinger reactionwhich serves as a handle to further isolate and analyze O-GlcNAc modified peptides. In one study, 199 different O-GlcNAc modified proteins were identified in HeLa cellsusing this tagging-by-substrate approach in combinationwith SDS-PAGE and LC-MS/MS analysis [131].
Another approach for characterizing O-glycosylated pep-tides is based upon a mild alkaline beta-elimination followedby a Michael-type of condensation reaction. In this approach,glycosylated serine and threonine residues are altered toform dehydroalanine and 2-aminodehydrobutyric acidrespectively which react with nucleophiles and are thereby“mass tagged” (e.g., methylated in ref. [132]). One elegantapplication introduced a biotin anchor by Michael addition,allowing further isolation of O-glycosylation sites [133].
5.4 Profiling N-glycosylation by diagonal RP
chromatography
We recently published a procedure for the isolation of N-gly-cosylated peptides using the COFRADIC technology de-scribed above. Here, the sorting agent is PNGaseF, cleavingconjugated glycans from asparagines between the twoCOFRADIC RP-HPLC runs (Fig. 2). Interestingly and deter-mined by the composition of the glycan structure, the thusevoked chromatographic shifts may be either hydrophilic orhydrophobic. The former appears to occur when the glycandoes not contain any charged carbohydrates, whereas thelatter is seen when charged carbohydrates such as sialic acidare present in the glycan structure [134]. As such, ourCOFRADIC technique has some advantages over most of theabove described strategies analyzing glycoproteomes since itstill keeps some information on the nature of the glycansthat were attached to the identified proteins.
6 Protein processing
Proteases constitute about 2% of all human genes however,as can be judged from browsing the MEROPS database(release 7.70, http://merops.sanger.ac.uk/, [135]) most of the612 known or putative peptidases or proteases have no oronly very few known in vivo substrates. Nevertheless, pro-teases are extremely important in embryogenesis [136], anti-gen presentation [137], programmed cell death [138], etc. andboth endogenous as well as exogenous (e.g., viral and bacte-rial) proteases are considered as major drug targets [139–141]. Unraveling the in vivo substrates that are cleaved by aparticular protease not only provides profound insights intothe molecular processes that are governed by this protease
© 2007 WILEY-VCH Verlag GmbH & Co. KGaA, Weinheim www.proteomics-journal.com

Proteomics 2007, 7, 2698–2718 Technology 2707
but may also steer development of more specific proteaseinhibitors by integrating structural data drawn from thecharacterized substrates and knowledge of downstream pro-cesses that may potentially be disturbed upon perturbing theactivity of the protease.
So, what techniques can be used to characterize proteasesubstrates? Nonproteomic techniques typically use eitheryeast-2-hybrid and derived screenings (e.g., [142, 143]) orphages displaying a wide collection of potential substrates(e.g., [144, 145]). However, such analyses are done in ratherartificial in vitro conditions and might not reflect in vivosituations. Using yeast-2-hybrid analyses, most often theprimary information is simply a collection of possible pro-tein interaction partners of the bait protease and does notdirectly point to substrate processing. Miniaturized arrays of(fluorogenic) peptides have been used in the past to charac-terize the substrate specificity of proteases (e.g., [146–150]).Although such “peptide chips” rather swiftly characterizestructural constraints of proteases, their complexity in termsof the number of different peptides might be inadequate toallow a thorough examination of the structural confinementsof the protease. Granzymes A and B for example are knownto recognize at least six subsites on their substrates [151, 152]and this would imply that a peptide chip covering all possible6-mer substrates would need to consist of 64 million differ-ent peptides. This kind of sample complexity remains tech-nically very challenging for many laboratories.
Clearly, selected processing of a protease substrate createsnovel fragments, which, if their structures remain stablyintact, are at least theoretically analyzable by gel-based pro-teome analytical techniques. Indeed, if a sufficiently largepiece of a protein is cleaved off, following 1-D or 2-D PAGEtwo novel protein spots should appear. Furthermore, whencompared to a control setup in which no protease was active,the number of copies of nonprocessed protein substrates isexpected to drop in a setup in which a protease (or proteasecascade (e.g., during apoptosis)) was activated. However, thiseffect is only observed if a substantial amount of the precursoris affected. These two characteristics of protein processinghave been exploited in the past in 2D-PAGE studies to point toproteins that were in vivo processed by various proteases (e.g.,[153–155]). Recently, gel-free techniques have also been usedto monitor protein levels changing as a result of proteolyticactivity. In one study, ICAT labeling of cysteines and multi-dimensional LC coupled to MS/MS were used to characterizeextracellular substrates and shedding activity of the MT-1matrix metalloprotease in a breast carcinoma cell line and thisled to the identification of a number of previously unchar-acterized MT1-MMP substrates [143, 156]. In another study,stable isotope labeling by amino acids in cell culture (SILAC)[157, 158] (see below) of E. coli was performed to identifypotential substrates that were trapped on the ClpXP bacterialprotease complex following DNA damage [159].
In both these gel-based and gel-free studies, potentialprotease substrates may clearly be identified however, theactual characterization of the processed site is of crucial
importance before it can be unambiguously concluded thatan identified protein was indeed processed and moreover itallows the characterization of the protease specificity. There-fore, more targeted approaches should be used for char-acterizing protease substrates.
Considering the fact that upon protein processing twonovel protein termini are formed – a novel C-terminal end onthe N-terminal protein fragment and a novel N-terminal endon the C-terminal protein fragment – techniques that speci-fically isolate protein terminal parts should be well suited foridentifying and characterizing protein processing. Anhydro-trypsin columns [160], pentafluoropropionic acid and hepta-fluorobutyric acid sequencing [161], C-terminal Edman se-quencing [162, 163], and C-terminal MS/MS sequencing[164] have all been suggested to specifically analyze C-termi-nal ends of proteins and peptides. However, until now thesemethods have not been used in proteome-wide processing ordegradomics [165] studies.
The N-terminal parts of proteins may be analyzed by N-terminal Edman sequencing [166], protein sequence tags(PST) [167, 168], so-called positional proteomics [169] andour N-terminal COFRADIC procedure [36]. Only the N-ter-minal COFRADIC technique has thus far been used tomonitor in vivo protein processing on a proteomic scale [58].In this project, Fas-induced apoptosis in human Jurkat T-lymphocytes was monitored following differential isotopelabeling of tryptic proteome digests of living and apoptoticcells. Here, postmetabolic incorporation of two oxygen-18atoms at the C-terminal ends of all tryptic peptides was used[97], although whenever possible we now prefer SILAClabeling [157] both because of the increased spacing betweenthe isotopic envelopes of the light and heavy peptide variantsand the stability of the isotopic label. We found 92 proteinsproteolytically processed in apoptotic Jurkat cells and, moreimportantly, the overall majority of the identified processingsites were unknown pointing to one of the most importantadvantages of N-terminal COFRADIC in degradomics stud-ies: not only the protease substrate is identified, the actualsite of processing is also characterized thus providing sub-stantial evidence of a protein processing event. In anotherstudy, the same approach was used to characterize 50 cleav-age sites in 15 proteins in a Jurkat T-cell proteome that werein vitro processed by the OMI protease which is releasedfrom mitochondria upon induction of apoptosis (VandeWalle, Van Damme, in press; and [170]).
7 A selection of other proteinmodifications
It would simply be impossible to review all other proteinmodifications for which targeted strategies are available fortheir characterization. Therefore, this section is best seen asa particular flavor of proteomic technologies that have beendesigned for a selected set of protein modifications (hereubiquitination and oxidative stress).
© 2007 WILEY-VCH Verlag GmbH & Co. KGaA, Weinheim www.proteomics-journal.com

2708 K. Gevaert et al. Proteomics 2007, 7, 2698–2718
7.1 Ubiquitin and ubiquitin-like modifiers
One protein modification that received a lot of interest overthe past few years is protein ubiquitination [171]. Ubiquitin isa highly conserved 76 amino acid long protein that is cova-lently attached to proteins via an isopeptidyl bond between itsC-terminal glycine and a target protein lysine residue. Once aprotein is monoubiquitinated, polyubiquitination may occurand, historically, polyubiquitination was considered as thesignal for protein degradation by the proteasome system[172]. However, recent studies indicate that ubiquitin andubiquitin-like modifiers play essential roles in various cellularprocesses such as transcription, endocytosis, DNA repair,activation of kinases and ribosomes, etc. (reviewed in [173]).Several strategies have been used to identify ubiquitinatedproteins and helped to unravel the biochemistry of ubiquitin.Since ubiquitin and ubiquitin-like modifiers are small pro-teins, tagging them with affinity tags and thereby allowingtheir isolation seems a logical approach. Indeed, using hexa-histidine-Myc tagged ubiquitin, Peng et al. [174] identified1075 possibly ubiquitinated proteins and 110 ubiquitinatedsites in Saccharomyces cerevisiae by a MudPIT approach. Ana-logous strategies were used to identify sumoylated proteins inyeast [175] and in mammalian cells (e.g., [176]).
7.2 Protein modifications associated with oxidative
stress
Protein modifications that are linked to cellular oxidative ornitrosative stress are increasingly studied by shotgun prote-omic approaches. Oxidative stress is best described as a con-dition in which an imbalance between oxidants and reducingagents exists, favoring an increase in reactive oxygen andnitrogen species. Conditions of oxidative stress lead to ahighly diverse set of protein modifications [177], some ofwhich have been studied by protein chemical techniques.
Cysteine nitrosylation is a reversible modification affect-ing the activity, localization and stability of an increasingnumber of proteins (reviewed in [178]). The biotin-switchmethod was introduced in 2001 by Jaffrey et al. [179] forstudying cysteine nitrosylation. Here, free cysteines are firstblocked by methylthiolation and nitrosylated cysteines arespecifically denitrosylated using a reduction with vitamin C.Free thiol groups are then affinity tagged with a biotin mole-cule allowing their isolation and identification. In 2006, Haoet al. [180] published a modification of the biotin-switchmethod in which the biotin anchor was used to affinity iso-late biotinylated peptides following in solution trypsindigestion of affinity-isolated proteins. This way, 68 nitrosyla-tion sites in 56 different proteins in S-nitrosoglutathionetreated rat cerebellum lysates were characterized. Later on,an analogous method was used to map 20 S-nitrosylationsites in human vascular smooth muscle cells [181].
The ICAT technology has been applied to characterizeoxidant-sensitive cysteine thiols in proteomes [182]. Thegeneral idea is that upon oxidative stress some cysteine thiol
groups are no longer open to modification by the ICATreagents. When thus used in a differential analysis – controlversus oxidative state – peptide couples with deviating ratiospoint to cysteines that are specifically modified in conditionsof oxidative stress. This approach was applied to a rabbitheart membrane fraction exposed to hydrogen peroxide andled to the characterization of several cysteines that were oxi-dized for more than 50% [179].
Protein carbonylation (introduction of aldehydes andketones) is another modification associated with oxidativestress and is considered a hallmark for oxidative stress.Typically, protein carbonyls are detected following reactionwith 2,4-dinitrophenylhydrazine followed by UV [183] orantibody detection [184]. A rather small number of carbony-lated amino acids have thus far been mapped onto proteins.Last year, Fred Regnier suggested using the Girard P reagentfor enriching carbonylated peptides. This reagent reacts withcarbonyl groups via its hydrazide group and since it carries aquaternary amine, it places an extra positive charge of suchmodified carbonylated peptides thus allowing their enrich-ment via SCX. Using this approach, the authors identifiednine carbonylation sites in in vitro oxidized apotransferrinand 26 naturally oxidized protein in a yeast proteome prepa-ration [184] and thus prove that their approach might beexploited for future “carbonyl proteome studies”.
8 Protein quantification methods ingel-free proteomics
The most interesting aspect of proteomics is the ability tocompare the composition of different proteomes and indi-cate proteins of which the concentration and/or the degreeand nature of modifications differ. Since MS is at the endstage of gel-free proteomics, intuitively, comparison of pep-tide and corresponding protein levels is done followinglabeling of peptides or proteins with stable isotopes sincethese introduce predictable peptide mass differences that arestraightaway recognizable in MS and MS/MS spectra.
In general, two different isotope labeling approaches canbe distinguished: metabolic and postmetabolic labeling.Metabolic labeling introduces stable, heavy isotopes (typi-cally D, 13C, and 15N) into newly synthesized proteins in cul-tured cells and even whole organisms by replacing naturalsources with heavy labeled variants. One drawback is thatmetabolic labeling is only applicable in systems in whichthere is a sufficiently high protein turnover and protein syn-thesis rate. This means that several samples that are impor-tant for biomarker discovery – for example human blood andurine samples – cannot be marked by metabolic labeling.Here, postmetabolic labeling, both by chemicals and en-zyme-based, will mainly be used for differential proteomics.Several aspects need to be considered when a choice betweenmetabolic or postmetabolic labeling is to be made. Oneintrinsic advantage of metabolic labeling is that, in principle,proteome samples are mixed together in an early stage of the
© 2007 WILEY-VCH Verlag GmbH & Co. KGaA, Weinheim www.proteomics-journal.com

Proteomics 2007, 7, 2698–2718 Technology 2709
overall analytical process and hence the reproducibility ofmeasurements is expected to be rather high (low variability).On the other hand and, as will be discussed below, recentadvancements allow for multiplexing of samples with post-metabolic labeling strategies. This increases the speed ofanalysis and positively influences the biomarker discoveryrate.
8.1 Metabolic labeling methods
One of the earliest applications of metabolic labeling for dif-ferential proteome analysis was introduced by Chait andcoworkers in 1999 [185]. In their study, S. cerevisiae wasgrown in natural medium or in medium enriched for morethan 96% for 15N. Following 1-D or 2D-PAGE proteins ofinterest were excised, digested and analyzed by MS. All pep-tides are now present as couples of light and heavy peptides.The mass values of the light peptides can be used to identifythe corresponding protein by PMF, while the ratio of theintensities of the light and heavy peptide variants reflectsconcentration differences of the precursor protein in the twosamples and point to proteins with significantly differentconcentrations. Later on, similar strategies were used to labelproteins in the fruit fly Drosophila melanogaster and thenematode Caenorhabditis elegans by feeding them with 15N-labeled E. coli and yeast, respectively [186] and even rats wereshown to survive 15N-rich diets and are thus open to meta-bolic labeling [187].
In 2002, Mann and coworkers [157, 158] introduced theSILAC technology designed for metabolic labeling of cellcultures. SILAC builds in heavy, stable variants of essentialamino acids in proteins of cells or organisms (e.g., yeast[188]) that can be cultured in growth media. For highereukaryotic cells, heavy variants of arginine, lysine, tyrosine,and leucine/isoleucine are mainly used [189] and we wouldhere like to refer to an excellent recent review by Mann [158]on the potential of SILAC in several proteome studies.
8.2 Postmetabolic labeling methods
Postmetabolic labeling comes in two flavors: stable isotopesare either incorporated following a chemical reaction or byenzymes. Different chemical isotope tagging methods areavailable and a few selected examples include labeling of freeamino groups using nicotinoyl-N-hydroxysuccinimide indual modus [190] and in triplex modus (isotope-coded pro-tein labeling (ICPL) [191]) and trideuteroacetylation [110].
Recently, isobaric tags for relative and absolute quantifi-cation (iTRAQ™ reagents) were introduced [192]. Thesereagents contain an amino-reactive group that labels all freeamines (alpha and epsilon), a balancing group and a reportergroup. All iTRAQ labels are isobaric but hold a different dis-tribution of isotopes between the balancing and reportergroups. This implies that when a given peptide, produced indifferent proteome digests is marked with different iTRAQlabels, the different peptide forms are indistinguishable in
MS mode. However, upon fragmentation the reporter groupis released and pops up as a series of singly charged frag-ment ions with nominal mass values at 114, 115, 116, and117 Da, respectively [192]. Each of these values correspondsto the labeled peptide that was present in one proteomedigest. Thus, the relative intensity ratios of these reporterions reflect the protein abundances in the proteomes andallows for differential analysis. The multiplexing aspect ofiTRAQ is of particular interest as it allows higher samplethroughput (according to the manufacturer, 8-plexing shouldbe available in 2007) and more precise measurements byusing internal standards (mix of proteome digests).
The explicatory example of enzyme-based isotope label-ing is the incorporation of two oxygen-18 isotopes by trypsinat the C-terminal carboxyl group of tryptic peptides [193]. Adiverse set of protocols has been published as recentlyreviewed in [194]. Typical problems encountered with tryp-sin-mediated peptide labeling include inadequate labeling ofsome peptides and back-exchange of oxygen isotopes leadingto “isotope dilution”. In 2004 our laboratory developed a two-step protocol for stably labeling tryptic peptides with twooxygen-18 isotopes [97] and applied it to differential gel-freeproteome analysis using the COFRADIC techniques for iso-lating N-terminal peptides [58] and phosphopeptides [95].The two main problems mentioned above were cir-cumvented by decoupling proteome digestion from peptidelabeling and by irreversible inactivation of trypsin. In ourapproach, proteins are first digested in a volatile buffer atpH 8 at which trypsin efficiently hydrolyzes peptide bonds.The peptide mixture is then vacuum dried and redissolved ina solution containing nonvolatile buffer components atpH 4–5. The peptide mixture is redried and then enriched18O-water is added. At this acidic pH trypsin no longerhydrolyzes peptide bonds but it is still capable of esterifyingthe C-terminal carboxyl group of tryptic peptides and regen-erating it. In this way, following prolonged incubation, twooxygen-18 atoms are incorporated in all tryptic peptidesending on lysine or arginine. If in all subsequent analysesthe pH is not shifted to very strong acidic or basic conditions,oxygen-18 incorporation is stable and allows differentialproteomics [97].
The isotopic spacing achieved by enzymatic 18O-labelingis 4 amu and for most peptide ions this is sufficient to dis-tinguish and weigh the isotopic envelopes of the light andheavy peptides ions as shown in Fig. 3. When possible wecurrently prefer SILAC labeling over 18O-labeling as theenvelope spacing (Fig. 3), label stability and the “degrees offreedom of labeling” (i.e., the choice of the SILAC amino acidcan depend on the COFRADIC method that is used:methionine for methionine COFRADIC [34] and argininefor N-terminal COFRADIC [36]) increase. Nevertheless,since the overall majority of ions generated by MALDI aresingly charged, the 4 Da spacing with 18O-labeling is mostlysufficient to determine peptide ratios. This is evident fromFig. 4 which shows the dispersion of measured ratios oftryptic peptides from BSA differentially labeled with oxygen-
© 2007 WILEY-VCH Verlag GmbH & Co. KGaA, Weinheim www.proteomics-journal.com

2710 K. Gevaert et al. Proteomics 2007, 7, 2698–2718
Figure 3. Illustration of the differencebetween oxygen-18 and 13C6-Arg SILAClabeling. The N-terminal peptide of thehuman glyceraldehyde-3-phosphatedehydrogenase (sequence acetyl-GKVKVGVDGFGR) was isolated by N-terminal COFRADIC. The top spectrumshows the doubly charged precursorlabeled with oxygen-18 isotopes,whereas the same peptide ion was alsoisolated following SILAC labeling of cellswith 13C6-Arg (bottom spectrum).Clearly, SILAC labeling introduces a big-ger spacing between the light and heavypeptide ions and is therefore betteramenable for differential proteomeanalysis.
Figure 4. Diagram showing the spreading of oxygen-16/oxygen-18 ratios measured by MALDI-MS. BSA wasdigested with trypsin and part of it was labeled with oxygen-18 atoms. Light and heavy digests were mixed intodifferent ratios as indicated and analyzed by LC-MALDI (for technical details see [97]). In the y-axis the measuredratios are given with error flags corresponding to one SD. The expected ratios are indicated in the x-axis. Whenmixing labeled peptides together in largely deviating ratios, it can clearly be observed that the ratio measurementsbecome less accurate.
16 or oxygen-18. Clearly, a linear trend is observed howeverwith larger spreading of measured ratios when light andheavy peptides were mixed in more than four-fold excessagainst each other. In practice, this means that oxygen-18labeling can be used for differential proteome analysis andwill pinpoint peptides that have significantly deviating ratiosfrom the expected ratio, which is normally reached by mixingthe same amount of peptide material from two sources to-gether [58]. However, exactly determining the extent of theconcentration change of a peptide (and protein) is almostimpossible with this kind of labeling strategy.
8.3 Absolute peptide (and protein) quantification
Absolute quantification implies synthesizing heavy variantsof peptides one wants to quantify and adding these pref-erentially as early as possible in the analytical process; e.g.,the AQUA (absolute quantification of proteins) suggested byGygi and coworkers [195]. Multiplexing for absolute quanti-fication can be achieved by constructing an artificial patch-work gene holding the different tryptic peptides to be quan-tified. This patchwork protein is then expressed in E. coligrown in 15N-media, isolated via affinity tags and digested
© 2007 WILEY-VCH Verlag GmbH & Co. KGaA, Weinheim www.proteomics-journal.com

Proteomics 2007, 7, 2698–2718 Technology 2711
with trypsin thereby creating a set of stably labeled heavypeptides that can be used as internal standards for proteomestudies [196]. One question that immediately pops up iswhich peptide(s) should be chosen for absolute quantifica-tion studies? Ideally, each internal standard peptide shouldonly be present in one protein (isoform) such that only oneprotein is quantified. Proteotypic peptides – i.e., peptides thatfrequently have been identified in gel-free proteome studiesand can only be derived from one particular protein in aproteome digest – seem to be the peptides-of-choice forfuture studies for absolute protein quantification [197–199].
9 Gel-free proteomics challengesbioinformatics
Gel-free proteomics puts high demands on bioinformatics.One needs to cope with the vast amounts of data that aregenerated by mass spectrometers, link these data to peptideand protein sequences stored in databases, provide meta-information allowing systematic assessment of proteomictrends (e.g., pathway mapping, linking to gene ontologydatabases, etc. ) and make data publicly available to the sci-entific community [200–202]. Two issues pertaining to gel-free proteomics are (i) defining the smallest but most com-prehensible set of identified proteins (i.e., the protein infer-ence problem [203]) since identified peptides often point tomultiple protein sequences stored in databases, and (ii) howto deal with one-hit wonders (linked to the false positiveproblem) [204]?
Both these problems are illustrated using a N-terminalCOFRADIC analysis [36] of a proteome preparation from thehuman epithelial A431 carcinoma cell line. A total of 10 287MS/MS spectra were generated with a Q-TOF Premier ESImass spectrometer (Waters Corporation, Manchester, UK),
1532 of which were identified in the UniProtKB/Swiss-Protdatabase, version 51.1 (restricted to human proteins) usingMASCOT set at the 95% confidence level. Database search-ing and evaluation of the results were done as describedpreviously [36, 58]. From the 807 different peptides identi-fied, we further analyzed 450 that were “true N-terminalpeptides” (peptides starting at amino acids 1 or 2 of the par-ent protein). We therefore did not consider acetylated inter-nal peptides pointing to in vivo (e.g., mitochondrial import)or in vitro processing events [36]. Interestingly, the vastmajority of these peptides, 435 out of 450 (96.6%), point toonly one protein in the UniProtKB/Swiss-Prot database andonly 15 N-terminal peptides are associated with more thanone protein entry in this database (Fig. 5). Importantly, thelatter peptides always pointed to closely related proteins. Forexample, the peptide ASTSTTIR constitutes the N-terminusof the epithelia-expressed cytokeratins 6A, 6B, 6C, and 6E ofwhich at least six isoforms may be expressed.
These figures illustrate the discriminative power of theN-terminal COFRADIC technique and clearly indicate thatN-terminal peptides are among the best candidate “proteo-typic” peptides [198, 199] one can envision as they directlyalleviate many of the protein inference problems.
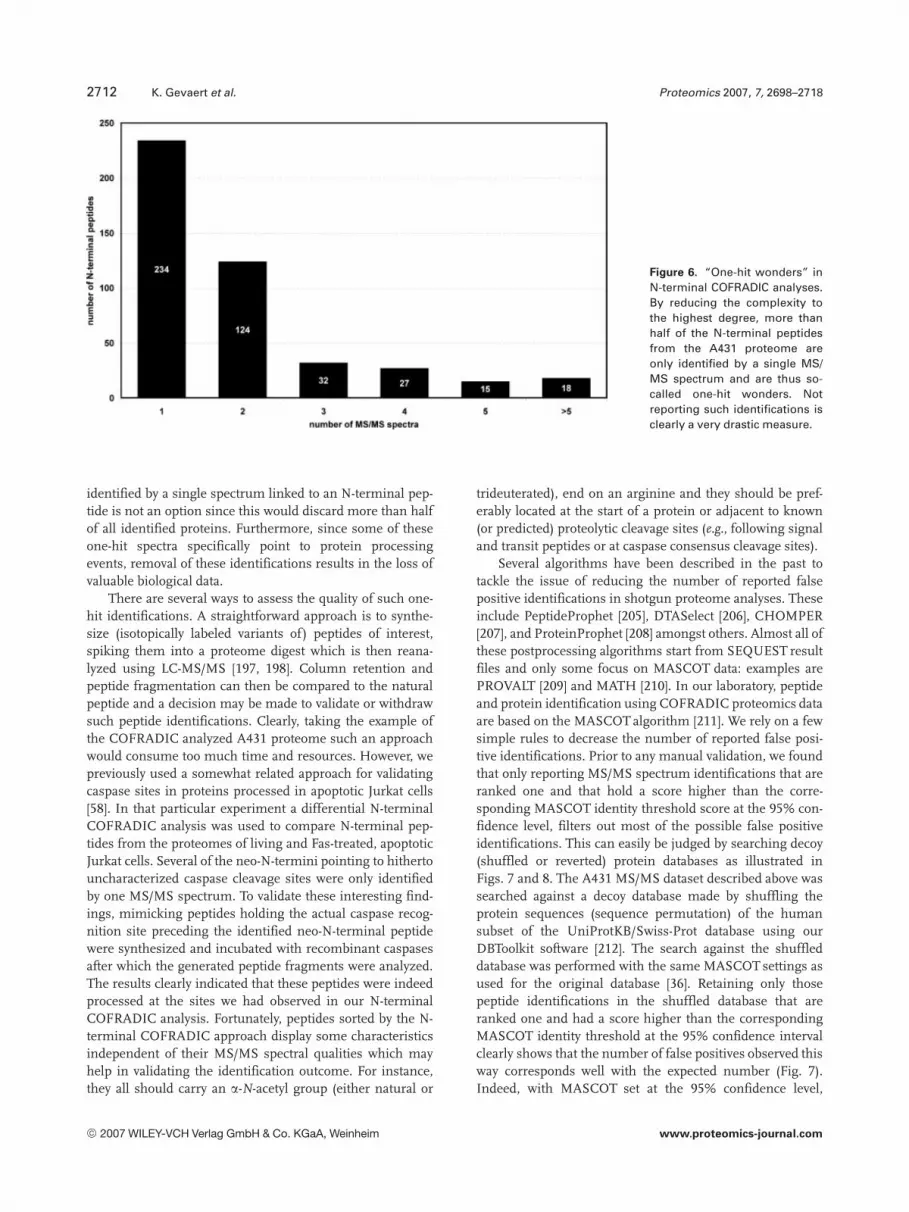
Our N-terminal COFRADIC approach was especiallydesigned to maximally reduce the analyte complexity [36].Unfortunately, this reduction also comes with a price: manyproteins are only identified by a single MS/MS spectrum andthus constitute one-hit wonders. Plotting the N-terminalpeptides from the A431 proteome versus the number of MS/MS spectra associated with each peptide indicates that234 N-terminal peptides were identified by only one frag-mentation spectrum (Fig. 6). Such figures illustrate both thevery high reduction of the sample’s complexity as well as theefficiency of the mass spectrometer working in a data-de-pendent manner [36]. Clearly, simply not reporting proteins
Figure 5. N-terminal COFRADICreduces the protein inferenceproblem. The overall majority ofN-terminal peptides isolatedfrom the A431 proteome digestonly point to one protein entrystored in the human UniProtKB/Swiss-Prot database.
© 2007 WILEY-VCH Verlag GmbH & Co. KGaA, Weinheim www.proteomics-journal.com
2712 K. Gevaert et al. Proteomics 2007, 7, 2698–2718
Figure 6. “One-hit wonders” inN-terminal COFRADIC analyses.By reducing the complexity tothe highest degree, more thanhalf of the N-terminal peptidesfrom the A431 proteome areonly identified by a single MS/MS spectrum and are thus so-called one-hit wonders. Notreporting such identifications isclearly a very drastic measure.
identified by a single spectrum linked to an N-terminal pep-tide is not an option since this would discard more than halfof all identified proteins. Furthermore, since some of theseone-hit spectra specifically point to protein processingevents, removal of these identifications results in the loss ofvaluable biological data.
There are several ways to assess the quality of such one-hit identifications. A straightforward approach is to synthe-size (isotopically labeled variants of) peptides of interest,spiking them into a proteome digest which is then reana-lyzed using LC-MS/MS [197, 198]. Column retention andpeptide fragmentation can then be compared to the naturalpeptide and a decision may be made to validate or withdrawsuch peptide identifications. Clearly, taking the example ofthe COFRADIC analyzed A431 proteome such an approachwould consume too much time and resources. However, wepreviously used a somewhat related approach for validatingcaspase sites in proteins processed in apoptotic Jurkat cells[58]. In that particular experiment a differential N-terminalCOFRADIC analysis was used to compare N-terminal pep-tides from the proteomes of living and Fas-treated, apoptoticJurkat cells. Several of the neo-N-termini pointing to hithertouncharacterized caspase cleavage sites were only identifiedby one MS/MS spectrum. To validate these interesting find-ings, mimicking peptides holding the actual caspase recog-nition site preceding the identified neo-N-terminal peptidewere synthesized and incubated with recombinant caspasesafter which the generated peptide fragments were analyzed.The results clearly indicated that these peptides were indeedprocessed at the sites we had observed in our N-terminalCOFRADIC analysis. Fortunately, peptides sorted by the N-terminal COFRADIC approach display some characteristicsindependent of their MS/MS spectral qualities which mayhelp in validating the identification outcome. For instance,they all should carry an a-N-acetyl group (either natural or
trideuterated), end on an arginine and they should be pref-erably located at the start of a protein or adjacent to known(or predicted) proteolytic cleavage sites (e.g., following signaland transit peptides or at caspase consensus cleavage sites).
Several algorithms have been described in the past totackle the issue of reducing the number of reported falsepositive identifications in shotgun proteome analyses. Theseinclude PeptideProphet [205], DTASelect [206], CHOMPER[207], and ProteinProphet [208] amongst others. Almost all ofthese postprocessing algorithms start from SEQUEST resultfiles and only some focus on MASCOT data: examples arePROVALT [209] and MATH [210]. In our laboratory, peptideand protein identification using COFRADIC proteomics dataare based on the MASCOT algorithm [211]. We rely on a fewsimple rules to decrease the number of reported false posi-tive identifications. Prior to any manual validation, we foundthat only reporting MS/MS spectrum identifications that areranked one and that hold a score higher than the corre-sponding MASCOT identity threshold score at the 95% con-fidence level, filters out most of the possible false positiveidentifications. This can easily be judged by searching decoy(shuffled or reverted) protein databases as illustrated inFigs. 7 and 8. The A431 MS/MS dataset described above wassearched against a decoy database made by shuffling theprotein sequences (sequence permutation) of the humansubset of the UniProtKB/Swiss-Prot database using ourDBToolkit software [212]. The search against the shuffleddatabase was performed with the same MASCOT settings asused for the original database [36]. Retaining only thosepeptide identifications in the shuffled database that areranked one and had a score higher than the correspondingMASCOT identity threshold at the 95% confidence intervalclearly shows that the number of false positives observed thisway corresponds well with the expected number (Fig. 7).Indeed, with MASCOT set at the 95% confidence level,
© 2007 WILEY-VCH Verlag GmbH & Co. KGaA, Weinheim www.proteomics-journal.com
Proteomics 2007, 7, 2698–2718 Technology 2713
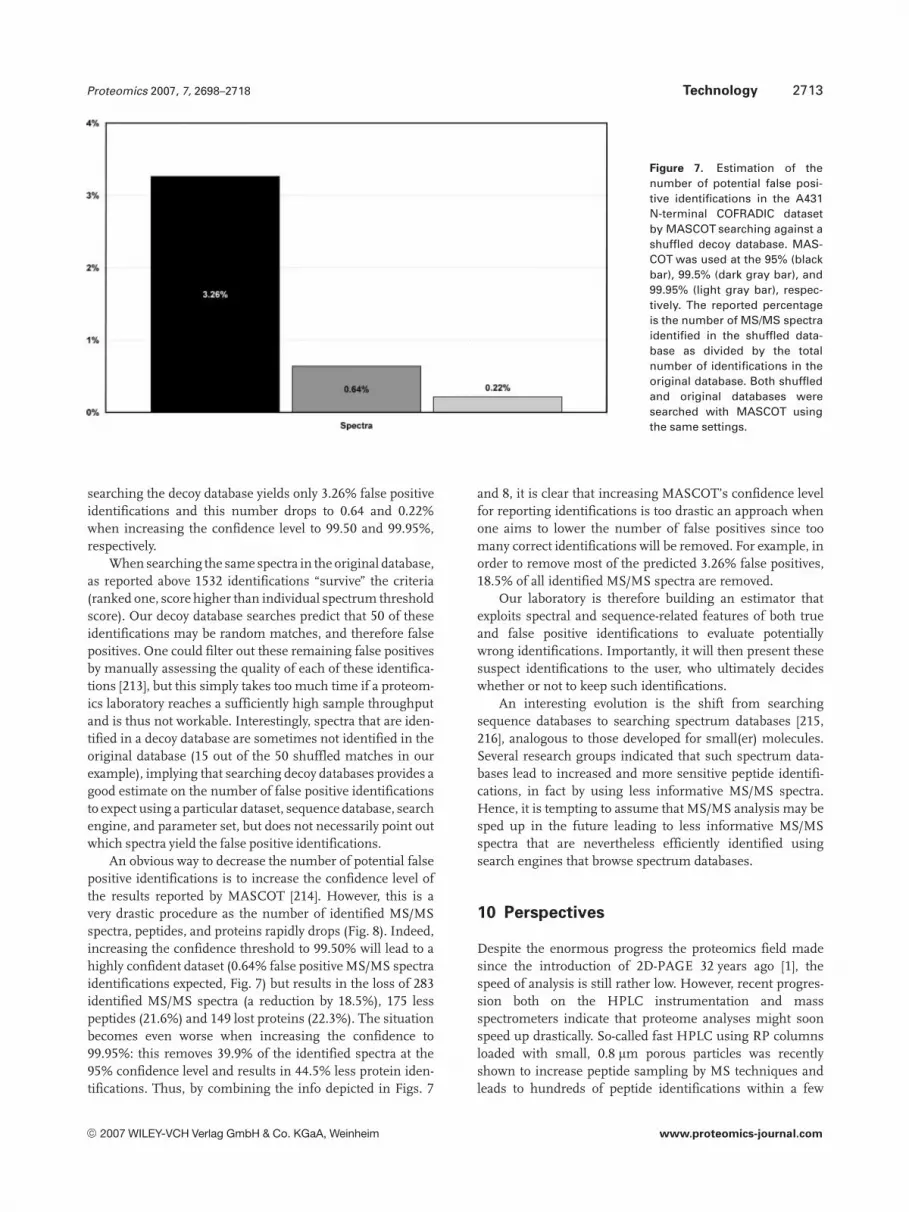
Figure 7. Estimation of thenumber of potential false posi-tive identifications in the A431N-terminal COFRADIC datasetby MASCOT searching against ashuffled decoy database. MAS-COT was used at the 95% (blackbar), 99.5% (dark gray bar), and99.95% (light gray bar), respec-tively. The reported percentageis the number of MS/MS spectraidentified in the shuffled data-base as divided by the totalnumber of identifications in theoriginal database. Both shuffledand original databases weresearched with MASCOT usingthe same settings.
searching the decoy database yields only 3.26% false positiveidentifications and this number drops to 0.64 and 0.22%when increasing the confidence level to 99.50 and 99.95%,respectively.
When searching the same spectra in the original database,as reported above 1532 identifications “survive” the criteria(ranked one, score higher than individual spectrum thresholdscore). Our decoy database searches predict that 50 of theseidentifications may be random matches, and therefore falsepositives. One could filter out these remaining false positivesby manually assessing the quality of each of these identifica-tions [213], but this simply takes too much time if a proteom-ics laboratory reaches a sufficiently high sample throughputand is thus not workable. Interestingly, spectra that are iden-tified in a decoy database are sometimes not identified in theoriginal database (15 out of the 50 shuffled matches in ourexample), implying that searching decoy databases provides agood estimate on the number of false positive identificationsto expect using a particular dataset, sequence database, searchengine, and parameter set, but does not necessarily point outwhich spectra yield the false positive identifications.
An obvious way to decrease the number of potential falsepositive identifications is to increase the confidence level ofthe results reported by MASCOT [214]. However, this is avery drastic procedure as the number of identified MS/MSspectra, peptides, and proteins rapidly drops (Fig. 8). Indeed,increasing the confidence threshold to 99.50% will lead to ahighly confident dataset (0.64% false positive MS/MS spectraidentifications expected, Fig. 7) but results in the loss of 283identified MS/MS spectra (a reduction by 18.5%), 175 lesspeptides (21.6%) and 149 lost proteins (22.3%). The situationbecomes even worse when increasing the confidence to99.95%: this removes 39.9% of the identified spectra at the95% confidence level and results in 44.5% less protein iden-tifications. Thus, by combining the info depicted in Figs. 7
and 8, it is clear that increasing MASCOT’s confidence levelfor reporting identifications is too drastic an approach whenone aims to lower the number of false positives since toomany correct identifications will be removed. For example, inorder to remove most of the predicted 3.26% false positives,18.5% of all identified MS/MS spectra are removed.
Our laboratory is therefore building an estimator thatexploits spectral and sequence-related features of both trueand false positive identifications to evaluate potentiallywrong identifications. Importantly, it will then present thesesuspect identifications to the user, who ultimately decideswhether or not to keep such identifications.
An interesting evolution is the shift from searchingsequence databases to searching spectrum databases [215,216], analogous to those developed for small(er) molecules.Several research groups indicated that such spectrum data-bases lead to increased and more sensitive peptide identifi-cations, in fact by using less informative MS/MS spectra.Hence, it is tempting to assume that MS/MS analysis may besped up in the future leading to less informative MS/MSspectra that are nevertheless efficiently identified usingsearch engines that browse spectrum databases.
10 Perspectives
Despite the enormous progress the proteomics field madesince the introduction of 2D-PAGE 32 years ago [1], thespeed of analysis is still rather low. However, recent progres-sion both on the HPLC instrumentation and massspectrometers indicate that proteome analyses might soonspeed up drastically. So-called fast HPLC using RP columnsloaded with small, 0.8 mm porous particles was recentlyshown to increase peptide sampling by MS techniques andleads to hundreds of peptide identifications within a few
© 2007 WILEY-VCH Verlag GmbH & Co. KGaA, Weinheim www.proteomics-journal.com

2714 K. Gevaert et al. Proteomics 2007, 7, 2698–2718
Figure 8. Influence of the MAS-COT confidence interval on thenumber of identified MS/MSspectra, peptides, and proteins.Clearly, increasing the con-fidence level (color codes as inFig. 7) has too drastic an influ-ence on the number of identifiedpeptides and proteins.
minutes [217, 218]. The accurate mass tag (AMT) approachpioneered by the group of Smith [219] might be especiallyuseful for biomarker discovery as it avoids time-consumingMS/MS analyses and thus increases sample throughput.AMTs were shown practical useful for simple organismssuch as Deinococcus radiodurans [220] as well as when com-plex eukaryotic proteomes were analyzed [221]. When sam-ple preparation methods, especially for isolating a wide vari-ety of PTMs, would be highly reproducible, AMTs wouldallow fast monitoring of diverse aspects of dynamic pro-teomes.
Another interesting development is top-down proteom-ics [222]. In contrast to bottom-up approaches, the completeprotein is targeted by mass spectrometric approaches.Recently, top-down sequencing of proteins bigger than200 kDa was realized [223]. Especially for modificationsoccurring at the protein termini, top-down proteomics seemsto hold interesting potential. However, this technology iscurrently only applicable to well-soluble and rather abundantproteins. Furthermore, these proteins should be delivered ina rather pure form to mass spectrometers and without anyaffinity tags this approach seems rather complicated if onewants to monitor one protein in a complex whole proteomebackground, let alone that top-down proteomics wouldalready be applicable for monitoring complex protein mix-tures.
F. I. is a research assistant of the Fund for Scientific Research– Flanders (Belgium) and K. H. is supported by a Ph. D. grant ofthe Institute for the Promotion of Innovation through Scienceand Technology in Flanders (IWT-Vlaanderen). The laboratoryis supported by research grants from the Fund for Scientific Re-search – Flanders (Belgium), the Concerted Research Actions(GOA) from the Ghent University, the Inter University Attrac-
tion Poles (IUAP05) and the European Union Interaction Pro-teome (6th Framework Program). L. M. would like to thankHenning Hermjakob and Rolf Apweiler for their support.
11 References
[1] O’Farrell, P. H., J. Biol. Chem. 1975, 250, 4007–4021.
[2] Klose, J., Humangenetik 1975, 26, 231–243.
[3] Scheele, G. A., J. Biol. Chem. 1975, 250, 5375–5385.
[4] Celis, J. E., Wolf, H., Ostergaard, M., Electrophoresis 2000,21, 2115–2121.
[5] Celis, J. E., Gromov, P., Ostergaard, M., Madsen, P. et al.,FEBS Lett. 1996, 398, 129–134.
[6] Bjellqvist, B., Ek, K., Righetti, P. G., Gianazza, E. et al., J. Bio-chem. Biophys. Methods 1982, 6, 317–339.
[7] O’Farrell, P. Z., Goodman, H. M., O’Farrell, P. H., Cell 1977, 12,1133–1141.
[8] Corbett, J. M., Dunn, M. J., Posch, A., Gorg, A., Electropho-resis 1994, 15, 1205–1211.
[9] Blomberg, A., Blomberg, L., Norbeck, J., Fey, S. J. et al.,Electrophoresis 1995, 16, 1935–1945.
[10] Unlu, M., Morgan, M. E., Minden, J. S., Electrophoresis1997, 18, 2071–2077.
[11] Santoni, V., Molloy, M., Rabilloud, T., Electrophoresis 2000,21, 1054–1070.
[12] Wilkins, M. R., Gasteiger, E., Sanchez, J. C., Bairoch, A.,Hochstrasser, D. F., Electrophoresis 1998, 19, 1501–1505.
[13] Gygi, S. P., Corthals, G. L., Zhang, Y., Rochon, Y., Aebersold,R., Proc. Natl. Acad. Sci. USA 2000, 97, 9390–9395.
[14] Aebersold, R., Mann, M., Nature 2003, 422, 198–207.
[15] Wheeler, D. L., Barrett, T., Benson, D. A., Bryant, S. H. et al.,Nucleic Acids Res. 2007, 35, D5–D12.
[16] Nielsen, M. L., Savitski, M. M., Zubarev, R. A., Mol. Cell.Proteomics 2006, 5, 2384–2391.
© 2007 WILEY-VCH Verlag GmbH & Co. KGaA, Weinheim www.proteomics-journal.com

Proteomics 2007, 7, 2698–2718 Technology 2715
[17] Savitski, M. M., Nielsen, M. L., Zubarev, R. A., Mol. Cell.Proteomics 2006, 5, 935–948.
[18] Tsur, D., Tanner, S., Zandi, E., Bafna, V., Pevzner, P. A., Nat.Biotechnol. 2005, 23, 1562–1567.
[19] Tsur, D., Tanner, S., Zandi, E., Bafna, V., Pevzner, P. A., Proc.IEEE Comput. Syst. Bioinform. Conf. 2005, 157–166.
[20] Walsh, C. T., Garneau-Tsodikova, S., Gatto, G. J., Jr., Angew.Chem. Int. Ed. Engl. 2005, 44, 7342–7372.
[21] Siepen, J. A., Keevil, E. J., Knight, D., Hubbard, S. J., J. Pro-teome Res. 2007, 6, 399–408.
[22] Blattner, F. R., Plunkett, G., 3rd, Bloch, C. A., Perna, N. T. etal., Science 1997, 277, 1453–1474.
[23] de Godoy, L. M., Olsen, J. V., de Souza, G. A., Li, G. et al.,Genome Biol. 2006, 7, R50.
[24] Link, A. J., Eng, J., Schieltz, D. M., Carmack, E. et al., Nat.Biotechnol. 1999, 17, 676–682.
[25] Washburn, M. P., Wolters, D., Yates, J. R., 3rd, Nat. Bio-technol. 2001, 19, 242–247.
[26] Liu, H., Lin, D., Yates, J. R., 3rd, BioTechniques 2002, 32, 898,900, 902 passim.
[27] Schirmer, E. C., Florens, L., Guan, T., Yates, J. R., 3rd, Gerace,L., Science 2003, 301, 1380–1382.
[28] Kislinger, T., Gramolini, A. O., Pan, Y., Rahman, K. et al., Mol.Cell. Proteomics 2005, 4, 887–901.
[29] Chen, E. I., Hewel, J., Felding-Habermann, B., Yates, J. R.,3rd, Mol. Cell. Proteomics 2006, 5, 53–56.
[30] Wang, H., Qian, W. J., Chin, M. H., Petyuk, V. A. et al., J. Pro-teome Res. 2006, 5, 361–369.
[31] Liu, H., Sadygov, R. G., Yates, J. R., 3rd, Anal. Chem. 2004,76, 4193–4201.
[32] Gevaert, K., Van Damme, P., Martens, L., Vandekerckhove, J.,Anal. Biochem. 2005, 345, 18–29.
[33] Gygi, S. P., Rist, B., Gerber, S. A., Turecek, F. et al., Nat. Bio-technol. 1999, 17, 994–999.
[34] Gevaert, K., Van Damme, J., Goethals, M., Thomas, G. R. etal., Mol. Cell. Proteomics 2002, 1, 896–903.
[35] Gevaert, K., Ghesquiere, B., Staes, A., Martens, L. et al.,Proteomics 2004, 4, 897–908.
[36] Gevaert, K., Goethals, M., Martens, L., Van Damme, J. et al.,Nat. Biotechnol. 2003, 21, 566–569.
[37] Zhang, R., Sioma, C. S., Wang, S., Regnier, F. E., Anal. Chem.2001, 73, 5142–5149.
[38] Zhou, H., Ranish, J. A., Watts, J. D., Aebersold, R., Nat. Bio-technol. 2002, 20, 512–515.
[39] Wang, S., Regnier, F. E., J. Chromatogr. 2001, 924, 345–357.
[40] Liu, T., Qian, W. J., Strittmatter, E. F., Camp, D. G., 2nd et al.,Anal. Chem. 2004, 76, 5345–5353.
[41] Liu, T., Qian, W. J., Chen, W. N., Jacobs, J. M. et al., Prote-omics 2005, 5, 1263–1273.
[42] Dai, J., Wang, J., Zhang, Y., Lu, Z. et al., Anal. Chem. 2005,77, 7594–7604.
[43] Zhang, H., Yan, W., Aebersold, R., Curr. Opin. Chem. Biol.2004, 8, 66–75.
[44] Ji, J., Chakraborty, A., Geng, M., Zhang, X. et al., J. Chro-matogr. B Biomed. Sci. Appl. 2000, 745, 197–210.
[45] Wang, S., Zhang, X., Regnier, F. E., J. Chromatogr. 2002, 949,153–162.
[46] Weinberger, S. R., Viner, R. I., Ho, P., Electrophoresis 2002,23, 3182–3192.
[47] Kuyama, H., Watanabe, M., Toda, C., Ando, E. et al., Rapid.Commun. Mass Spectrom. 2003, 17, 1642–1650.
[48] Matsuo, E., Toda, C., Watanabe, M., Iida, T. et al., RapidCommun. Mass Spectrom. 2006, 20, 31–38.
[49] Chelius, D., Shaler, T. A., Bioconjug. Chem. 2003, 14, 205–211.
[50] Betancourt, L., Gil, J., Besada, V., Gonzalez, L. J. et al., J.Proteome Res. 2005, 4, 491–496.
[51] Sanchez, A., Gonzalez, L. J., Betancourt, L., Gil, J. et al., Pro-teomics 2006, 6, 4444–4455.
[52] Sanchez, A., Gonzalez, L. J., Ramos, Y., Betancourt, L. et al.,J. Proteome Res. 2006, 5, 1204–1213.
[53] Brown, J. R., Hartley, B. S., Biochem. J. 1966, 101, 214–228.
[54] Gevaert, K., Van Damme, P., Ghesquiere, B., Vandekerc-khove, J., Biochim. Biophys. Acta 2006, 1764, 1801–1810.
[55] Cruickshank, W. H., Malchy, B. L., Kaplan, H., Can. J. Bio-chem. 1974, 52, 1013–1017.
[56] Gevaert, K., Pinxteren, J., Demol, H., Hugelier, K. et al., J.Proteome Res. 2006, 5, 1415–1428.
[57] Gygi, S. P., Rist, B., Griffin, T. J., Eng, J., Aebersold, R., J.Proteome Res. 2002, 1, 47–54.
[58] Van Damme, P., Martens, L., Van Damme, J., Hugelier, K. etal., Nat. Methods 2005, 2, 771–777.
[59] Meuleman, P., Libbrecht, L., De Vos, R., de Hemptinne, B. etal., Hepatology (Baltimore, Md) 2005, 41, 847–856.
[60] Jessani, N., Humphrey, M., McDonald, W. H., Niessen, S. etal., Proc. Natl. Acad. Sci. USA 2004, 101, 13756–13761.
[61] Hood, B. L., Lucas, D. A., Kim, G., Chan, K. C. et al., J. Am.Soc. Mass Spectrom. 2005, 16, 1221–1230.
[62] Besada, V., Diaz, M., Becker, M., Ramos, Y. et al., Proteomics2006, 6, 1038–1048.
[63] van den Bemd, G. J., Krijgsveld, J., Luider, T. M., van Rijs-wijk, A. L. et al., Mol. Cell. Proteomics 2006, 5, 1830–1839.
[64] Martens, L., Van Damme, P., Van Damme, J., Staes, A. et al.,Proteomics 2005, 5, 3193–3204.
[65] Manning, G., Whyte, D. B., Martinez, R., Hunter, T., Sudarsa-nam, S., Science 2002, 298, 1912–1934.
[66] Chu, G., Egnaczyk, G. F., Zhao, W., Jo, S. H. et al., Circ. Res.2004, 94, 184–193.
[67] Maguire, P. B., Wynne, K. J., Harney, D. F., O’Donoghue, N.M. et al., Proteomics 2002, 2, 642–648.
[68] Martin, K., Steinberg, T. H., Goodman, T., Schulenberg, B. etal., Comb. Chem. High Throughput Screen. 2003, 6, 331–339.
[69] Annan, R. S., Huddleston, M. J., Verma, R., Deshaies, R. J.,Carr, S. A., Anal. Chem. 2001, 73, 393–404.
[70] Andersson, L., Porath, J., Anal. Biochem. 1986, 154, 250–254.
[71] Ficarro, S. B., McCleland, M. L., Stukenberg, P. T., Burke, D. J.et al., Nat. Biotechnol. 2002, 20, 301–305.
[72] Kim, J. E., Tannenbaum, S. R., White, F. M., J. Proteome Res.2005, 4, 1339–1346.
[73] Collins, M. O., Yu, L., Husi, H., Blackstock, W. P. et al., Sci.STKE 2005, 2005, pl6.
[74] Kange, R., Selditz, U., Granberg, M., Lindberg, U. et al., J.Biomol. Tech. 2005, 16, 91–103.
[75] Bonenfant, D., Schmelzle, T., Jacinto, E., Crespo, J. L. et al.,Proc. Natl. Acad. Sci. USA 2003, 100, 880–885.
© 2007 WILEY-VCH Verlag GmbH & Co. KGaA, Weinheim www.proteomics-journal.com

2716 K. Gevaert et al. Proteomics 2007, 7, 2698–2718
[76] Cantin, G. T., Venable, J. D., Cociorva, D., Yates, J. R., 3rd, J.Proteome Res. 2006, 5, 127–134.
[77] Collins, M. O., Yu, L., Coba, M. P., Husi, H. et al., J. Biol.Chem. 2005, 280, 5972–5982.
[78] Larsen, M. R., Sorensen, G. L., Fey, S. J., Larsen, P. M.,Roepstorff, P., Proteomics 2001, 1, 223–238.
[79] Torres, M. P., Thapar, R., Marzluff, W. F., Borchers, C. H., J.Proteome Res. 2005, 4, 1628–1635.
[80] Beausoleil, S. A., Jedrychowski, M., Schwartz, D., Elias, J.E. et al., Proc. Natl. Acad. Sci. USA 2004, 101, 12130–12135.
[81] Ballif, B. A., Villen, J., Beausoleil, S. A., Schwartz, D., Gygi,S. P., Mol. Cell. Proteomics 2004, 3, 1093–1101.
[82] Villen, J., Beausoleil, S. A., Gerber, S. A., Gygi, S. P., Proc.Natl. Acad. Sci. USA 2007, 104, 1488–1493.
[83] Pinkse, M. W., Uitto, P. M., Hilhorst, M. J., Ooms, B., Heck,A. J., Anal. Chem. 2004, 76, 3935–3943.
[84] Kuroda, I., Shintani, Y., Motokawa, M., Abe, S., Furuno, M.,Anal. Sci. 2004, 20, 1313–1319.
[85] Larsen, M. R., Thingholm, T. E., Jensen, O. N., Roepstorff,P., Jorgensen, T. J., Mol. Cell. Proteomics 2005, 4, 873–886.
[86] Hata, K., Morisaka, H., Hara, K., Mima, J. et al., Anal. Bio-chem. 2006, 350, 292–297.
[87] Oda, Y., Nagasu, T., Chait, B. T., Nat. Biotechnol. 2001, 19,379–382.
[88] Reinders, J., Meyer, H. E., Sickmann, A., Proteomics 2006,6, 2647–2649.
[89] McLachlin, D. T., Chait, B. T., Anal. Chem. 2003, 75, 6826–6836.
[90] Tseng, H. C., Ovaa, H., Wei, N. J., Ploegh, H., Tsai, L. H.,Chem. Biol. 2005, 12, 769–777.
[91] Zhou, H., Watts, J. D., Aebersold, R., Nat. Biotechnol. 2001,19, 375–378.
[92] Tao, W. A., Wollscheid, B., O’Brien, R., Eng, J. K. et al., Nat.Methods 2005, 2, 591–598.
[93] Conrads, T. P., Veenstra, T. D., Nat. Biotechnol. 2005, 23, 36–37.
[94] Zheng, H., Hu, P., Quinn, D. F., Wang, Y. K., Mol. Cell. Prote-omics 2005, 4, 721–730.
[95] Gevaert, K., Staes, A., Van Damme, J., De Groot, S. et al.,Proteomics 2005, 5, 3589–3599.
[96] Krokhin, O. V., Antonovici, M., Ens, W., Wilkins, J. A.,Standing, K. G., Anal. Chem. 2006, 78, 6645–6650.
[97] Staes, A., Demol, H., Van Damme, J., Martens, L. et al., J.Proteome Res. 2004, 3, 786–791.
[98] Apweiler, R., Hermjakob, H., Sharon, N., Biochim. Biophys.Acta 1999, 1473, 4–8.
[99] Jaeken, J., Matthijs, G., Annu. Rev. Genomics Hum. Genet.2001, 2, 129–151.
[100] Freeze, H. H., Aebi, M., Curr. Opin. Struct. Biol. 2005, 15,490–498.
[101] Freeze, H. H., Biochim. Biophys. Acta 2002, 1573, 388–393.
[102] Teng-umnuay, P., Morris, H. R., Dell, A., Panico, M. et al., J.Biol. Chem. 1998, 273, 18242–18249.
[103] Yoshima, H., Matsumoto, A., Mizuochi, T., Kawasaki, T.,Kobata, A., J. Biol. Chem. 1981, 256, 8476–8484.
[104] Flahaut, C., Capon, C., Balduyck, M., Ricart, G. et al., Bio-chem. J. 1998, 333 (Pt 3), 749–756.
[105] Mills, P. B., Mills, K., Johnson, A. W., Clayton, P. T.,Winchester, B. G., Proteomics 2001, 1, 778–786.
[106] Kleinert, P., Kuster, T., Arnold, D., Jaeken, J. et al., Prote-omics 2007, 7, 15–22.
[107] Steinberg, T. H., Pretty On Top, K., Berggren, K. N., Kemper,C. et al., Proteomics 2001, 1, 841–855.
[108] Bruin, T., Sturk, A., ten Cate, J. W., Cath, M., Eur. J. Bio-chem./FEBS 1987, 170, 305–310.
[109] Dai, Z., Liu, Y. K., Cui, J. F., Shen, H. L. et al., Proteomics2006, 6, 5857–5867.
[110] Geng, M., Ji, J., Regnier, F. E., J. Chromatogr. 2000, 870,295–313.
[111] Wang, L., Li, F., Sun, W., Wu, S. et al., Mol. Cell. Proteomics2006, 5, 560–562.
[112] Fan, X., She, Y. M., Bagshaw, R. D., Callahan, J. W. et al.,Anal. Biochem. 2004, 332, 178–186.
[113] Geng, M., Zhang, X., Bina, M., Regnier, F., J. Chromatogr. BBiomed. Sci. Appl. 2001, 752, 293–306.
[114] Zubarev, R. A., Curr. Opin. Biotechnol. 2004, 15, 12–16.
[115] Vosseller, K., Trinidad, J. C., Chalkley, R. J., Specht, C. G. etal., Mol. Cell. Proteomics 2006, 5, 923–934.
[116] Manning, J. C., Seyrek, K., Kaltner, H., Andre, S. et al., His-tol. Histopathol. 2004, 19, 1043–1060.
[117] Yang, Z., Hancock, W. S., J. Chromatogr. 2004, 1053, 79–88.
[118] Yang, Z., Harris, L. E., Palmer-Toy, D. E., Hancock, W. S.,Clin. Chem. 2006, 52, 1897–1905.
[119] Durham, M., Regnier, F. E., J. Chromatogr. 2006, 1132, 165–173.
[120] Hagglund, P., Bunkenborg, J., Elortza, F., Jensen, O. N.,Roepstorff, P., J. Proteome Res. 2004, 3, 556–566.
[121] Yu, Y. Q., Gilar, M., Kaska, J., Gebler, J. C., Rapid Commun.Mass Spectrom. 2005, 19, 2331–2336.
[122] Zhang, H., Li, X. J., Martin, D. B., Aebersold, R., Nat. Bio-technol. 2003, 21, 660–666.
[123] Zhang, H., Yi, E. C., Li, X. J., Mallick, P. et al., Mol. Cell. Pro-teomics 2005, 4, 144–155.
[124] Liu, T., Qian, W. J., Gritsenko, M. A., Camp, D. G., 2nd et al.,J. Proteome Res. 2005, 4, 2070–2080.
[125] Lewandrowski, U., Moebius, J., Walter, U., Sickmann, A.,Mol. Cell. Proteomics 2006, 5, 226–233.
[126] Pan, S., Zhang, H., Rush, J., Eng, J. et al., Mol. Cell. Prote-omics 2005, 4, 182–190.
[127] Zhang, H., Loriaux, P., Eng, J., Campbell, D. et al., GenomeBiol. 2006, 7, R73.
[128] Khidekel, N., Arndt, S., Lamarre-Vincent, N., Lippert, A. etal., J. Am. Chem. Soc. 2003, 125, 16162–16163.
[129] Khidekel, N., Ficarro, S. B., Peters, E. C., Hsieh-Wilson, L. C.,Proc. Natl. Acad. Sci. USA 2004, 101, 13132–13137.
[130] Sprung, R., Nandi, A., Chen, Y., Kim, S. C. et al., J. ProteomeRes. 2005, 4, 950–957.
[131] Nandi, A., Sprung, R., Barma, D. K., Zhao, Y. et al., Anal.Chem. 2006, 78, 452–458.
[132] Mirgorodskaya, E., Hassan, H., Clausen, H., Roepstorff, P.,Anal. Chem. 2001, 73, 1263–1269.
[133] Wells, L., Vosseller, K., Cole, R. N., Cronshaw, J. M. et al.,Mol. Cell. Proteomics 2002, 1, 791–804.
[134] Ghesquiere, B., Van Damme, J., Martens, L., Vandekerc-khove, J., Gevaert, K., J. Proteome Res. 2006, 5, 2438–2447.
© 2007 WILEY-VCH Verlag GmbH & Co. KGaA, Weinheim www.proteomics-journal.com

Proteomics 2007, 7, 2698–2718 Technology 2717
[135] Rawlings, N. D., Morton, F. R., Barrett, A. J., Nucleic AcidsRes. 2006, 34, D270–D272.
[136] Bowerman, B., Kurz, T., Development (Cambridge, Eng-land) 2006, 133, 773–784.
[137] Liu, W., Spero, D. M., Drug News Perspect. 2004, 17, 357–363.
[138] Riedl, S. J., Shi, Y., Nat. Rev. 2004, 5, 897–907.
[139] Maass, N., Hojo, T., Zhang, M., Sager, R. et al., Acta Oncol.(Stockholm, Sweden) 2000, 39, 931–934.
[140] King, J. R., Acosta, E. P., Clin. Pharm. 2006, 45, 665–682.
[141] Lin, K., Perni, R. B., Kwong, A. D., Lin, C., Antimicrob.Agents Chemother. 2006, 50, 1813–1822.
[142] Van Criekinge, W., van Gurp, M., Decoster, E., Schotte, P. etal., Anal. Biochem. 1998, 263, 62–66.
[143] Overall, C. M., Tam, E. M., Kappelhoff, R., Connor, A. et al.,Biol. Chem. 2004, 385, 493–504.
[144] Sedlacek, R., Chen, E., Combinat. Chem. High ThroughputScreen. 2005, 8, 197–203.
[145] Scholle, M. D., Kriplani, U., Pabon, A., Sishtla, K. et al.,Chembiochem 2006, 7, 834–838.
[146] Duan, Y., Laursen, R. A., Anal. Biochem. 1994, 216, 431–438.
[147] St Hilaire, P. M., Alves, L. C., Sanderson, S. J., Mottram, J.C. et al., Chembiochem. 2000, 1, 115–122.
[148] Gosalia, D. N., Salisbury, C. M., Maly, D. J., Ellman, J. A.,Diamond, S. L., Proteomics 2005, 5, 1292–1298.
[149] Gosalia, D. N., Salisbury, C. M., Ellman, J. A., Diamond, S.L., Mol. Cell. Proteomics 2005, 4, 626–636.
[150] Thomas, D. A., Francis, P., Smith, C., Ratcliffe, S. et al., Pro-teomics 2006, 6, 2112–2120.
[151] Bell, J. K., Goetz, D. H., Mahrus, S., Harris, J. L. et al., Nat.Struct. Biol. 2003, 10, 527–534.
[152] Waugh, S. M., Harris, J. L., Fletterick, R., Craik, C. S., Nat.Struct. Biol. 2000, 7, 762–765.
[153] Honer, B., Shoeman, R. L., Traub, P., Cell Biol. Int. Rep. 1992,16, 603–612.
[154] Thiede, B., Dimmler, C., Siejak, F., Rudel, T., J. Biol. Chem.2001, 276, 26044–26050.
[155] Bredemeyer, A. J., Lewis, R. M., Malone, J. P., Davis, A. E. etal., Proc. Natl. Acad. Sci. USA 2004, 101, 11785–11790.
[156] Tam, E. M., Morrison, C. J., Wu, Y. I., Stack, M. S., Overall, C.M., Proc. Natl. Acad. Sci. USA 2004, 101, 6917–6922.
[157] Ong, S. E., Blagoev, B., Kratchmarova, I., Kristensen, D. B.et al., Mol. Cell. Proteomics 2002, 1, 376–386.
[158] Mann, M., Nat. Rev. 2006, 7, 952–958.
[159] Neher, S. B., Villen, J., Oakes, E. C., Bakalarski, C. E. et al.,Mol. Cell. 2006, 22, 193–204.
[160] Kumazaki, T., Nakako, T., Arisaka, F., Ishii, S., Proteins 1986,1, 100–107.
[161] Tsugita, A., Takamoto, K., Kamo, M., Iwadate, H., Euro. J.Biochem./FEBS 1992, 206, 691–696.
[162] Samyn, B., Hardeman, K., Van der Eycken, J., Van Beeu-men, J., Anal. Chem. 2000, 72, 1389–1399.
[163] Boyd, V. L., Bozzini, M., Zon, G., Noble, R. L., Mattaliano, R.J., Anal. Biochem. 1992, 206, 344–352.
[164] Samyn, B., Sergeant, K., Castanheira, P., Faro, C., VanBeeumen, J., Nat. Methods 2005, 2, 193–200.
[165] Lopez-Otin, C., Overall, C. M., Nat. Rev. 2002, 3, 509–519.
[166] Edman, P., Begg, G., Eur. J. Biochem./FEBS 1967, 1, 80–91.
[167] Kuhn, K., Thompson, A., Prinz, T., Muller, J. et al., J. Pro-teome Res. 2003, 2, 598–609.
[168] Kuhn, K., Prinz, T., Schafer, J., Baumann, C. et al., Prote-omics 2005, 5, 2364–2368.
[169] McDonald, L., Robertson, D. H., Hurst, J. L., Beynon, R. J.,Nat. Methods 2005, 2, 955–957.
[170] van Loo, G., van Gurp, M., Depuydt, B., Srinivasula, S. M. etal., Cell Death Differ. 2002, 9, 20–26.
[171] Kirkpatrick, D. S., Denison, C., Gygi, S. P., Nat. Cell Biol.2005, 7, 750–757.
[172] Wilkinson, K. D., Urban, M. K., Haas, A. L., J. Biol. Chem.1980, 255, 7529–7532.
[173] Denison, C., Kirkpatrick, D. S., Gygi, S. P., Curr. Opin. Chem.Biol. 2005, 9, 69–75.
[174] Peng, J., Schwartz, D., Elias, J. E., Thoreen, C. C. et al., Nat.Biotechnol. 2003, 21, 921–926.
[175] Wohlschlegel, J. A., Johnson, E. S., Reed, S. I., Yates, J. R.,3rd, J. Biol. Chem. 2004, 279, 45662–45668.
[176] Vertegaal, A. C., Andersen, J. S., Ogg, S. C., Hay, R. T. et al.,Mol. Cell. Proteomics 2006, 5, 2298–2310.
[177] Davies, M. J., Biochim. Biophys. Acta 2005, 1703, 93–109.
[178] Hess, D. T., Matsumoto, A., Kim, S. O., Marshall, H. E.,Stamler, J. S., Nature Rev. 2005, 6, 150–166.
[179] Jaffrey, S. R., Erdjument-Bromage, H., Ferris, C. D., Tempst,P., Snyder, S. H., Nat. Cell Biol. 2001, 3, 193–197.
[180] Hao, G., Derakhshan, B., Shi, L., Campagne, F., Gross, S. S.,Proc. Natl. Acad. Sci. USA 2006, 103, 1012–1017.
[181] Greco, T. M., Hodara, R., Parastatidis, I., Heijnen, H. F. et al.,Proc. Natl. Acad. Sci. USA 2006, 103, 7420–7425.
[182] Sethuraman, M., McComb, M. E., Huang, H., Huang, S. etal., J. Proteome Res. 2004, 3, 1228–1233.
[183] Levine, R. L., J. Biol. Chem. 1983, 258, 11823–11827.
[184] Robinson, C. E., Keshavarzian, A., Pasco, D. S., Frommel, T.O. et al., Anal. Biochem. 1999, 266, 48–57.
[185] Oda, Y., Huang, K., Cross, F. R., Cowburn, D., Chait, B. T.,Proc. Natl. Acad. Sci. USA 1999, 96, 6591–6596.
[186] Krijgsveld, J., Ketting, R. F., Mahmoudi, T., Johansen, J. etal., Nat. Biotechnol. 2003, 21, 927–931.
[187] Wu, C. C., MacCoss, M. J., Howell, K. E., Matthews, D. E.,Yates, J. R., 3rd, Anal. Chem. 2004, 76, 4951–4959.
[188] Gruhler, A., Olsen, J. V., Mohammed, S., Mortensen, P. etal., Mol. Cell. Proteomics 2005, 4, 310–327.
[189] Beynon, R. J., Pratt, J. M., Mol. Cell. Proteomics 2005, 4,857–872.
[190] Munchbach, M., Quadroni, M., Miotto, G., James, P., Anal.Chem. 2000, 72, 4047–4057.
[191] Schmidt, A., Kellermann, J., Lottspeich, F., Proteomics2005, 5, 4–15.
[192] Ross, P. L., Huang, Y. N., Marchese, J. N., Williamson, B. etal., Mol. Cell. Proteomics 2004, 3, 1154–1169.
[193] Desiderio, D. M., Kai, M., Biomed. Mass Spectrom. 1983,10, 471–479.
[194] Miyagi, M., Rao, K. C., Mass Spectrom. Rev. 2007, 26, 121–136.
[195] Gerber, S. A., Rush, J., Stemman, O., Kirschner, M. W.,Gygi, S. P., Proc. Natl. Acad. Sci. USA 2003, 100, 6940–6945.
© 2007 WILEY-VCH Verlag GmbH & Co. KGaA, Weinheim www.proteomics-journal.com

2718 K. Gevaert et al. Proteomics 2007, 7, 2698–2718
[196] Beynon, R. J., Doherty, M. K., Pratt, J. M., Gaskell, S. J., Nat.Methods 2005, 2, 587–589.
[197] Craig, R., Cortens, J. P., Beavis, R. C., Rapid Commun. MassSpectrom. 2005, 19, 1844–1850.
[198] Kuster, B., Schirle, M., Mallick, P., Aebersold, R., Nat. Rev.2005, 6, 577–583.
[199] Mallick, P., Schirle, M., Chen, S. S., Flory, M. R. et al., Nat.Biotechnol. 2007, 25, 125–131.
[200] Martens, L., Hermjakob, H., Jones, P., Adamski, M. et al.,Proteomics 2005, 5, 3537–3545.
[201] Deutsch, E. W., Eng, J. K., Zhang, H., King, N. L. et al., Pro-teomics 2005, 5, 3497–3500.
[202] Desiere, F., Deutsch, E. W., King, N. L., Nesvizhskii, A. I. etal., Nucleic Acids Res. 2006, 34, D655–D658.
[203] Nesvizhskii, A. I., Aebersold, R., Mol. Cell. Proteomics 2005,4, 1419–1440.
[204] Veenstra, T. D., Conrads, T. P., Issaq, H. J., Electrophoresis2004, 25, 1278–1279.
[205] Keller, A., Nesvizhskii, A. I., Kolker, E., Aebersold, R., Anal.Chem. 2002, 74, 5383–5392.
[206] Tabb, D. L., McDonald, W. H., Yates, J. R., 3rd, J. ProteomeRes. 2002, 1, 21–26.
[207] Eddes, J. S., Kapp, E. A., Frecklington, D. F., Connolly, L. M.et al., Proteomics 2002, 2, 1097–1103.
[208] Nesvizhskii, A. I., Keller, A., Kolker, E., Aebersold, R., Anal.Chem. 2003, 75, 4646–4658.
[209] Weatherly, D. B., Astwood, J. A., 3rd, Minning, T. A.,Cavola, C. et al., Mol. Cell. Proteomics 2005, 4, 762–772.
[210] Rudnick, P. A., Wang, Y., Evans, E., Lee, C. S., Balgley, B. M.,J. Proteome Res. 2005, 4, 1353–1360.
[211] Perkins, D. N., Pappin, D. J., Creasy, D. M., Cottrell, J. S.,Electrophoresis 1999, 20, 3551–3567.
[212] Martens, L., Vandekerckhove, J., Gevaert, K., Bioinfor-matics (Oxford, England) 2005, 21, 3584–3585.
[213] Chen, Y., Kwon, S. W., Kim, S. C., Zhao, Y., J. Proteome Res.2005, 4, 998–1005.
[214] Tebbe, A., Klein, C., Bisle, B., Siedler, F. et al., Proteomics2005, 5, 168–179.
[215] Frewen, B. E., Merrihew, G. E., Wu, C. C., Noble, W. S.,MacCoss, M. J., Anal. Chem. 2006, 78, 5678–5684.
[216] Craig, R., Cortens, J. C., Fenyo, D., Beavis, R. C., J. Pro-teome Res. 2006, 5, 1843–1849.
[217] Shen, Y., Smith, R. D., Unger, K. K., Kumar, D., Lubda, D.,Anal. Chem. 2005, 77, 6692–6701.
[218] Shen, Y., Strittmatter, E. F., Zhang, R., Metz, T. O. et al., Anal.Chem. 2005, 77, 7763–7773.
[219] Conrads, T. P., Anderson, G. A., Veenstra, T. D., Pasa-Tolic,L., Smith, R. D., Anal. Chem. 2000, 72, 3349–3354.
[220] Smith, R. D., Anderson, G. A., Lipton, M. S., Pasa-Tolic, L. etal., Proteomics 2002, 2, 513–523.
[221] Qian, W. J., Monroe, M. E., Liu, T., Jacobs, J. M. et al., Mol.Cell. Proteomics 2005, 4, 700–709.
[222] Ge, Y., Lawhorn, B. G., ElNaggar, M., Strauss, E. et al., J.Am. Chem. Soc. 2002, 124, 672–678.
[223] Han, X., Jin, M., Breuker, K., McLafferty, F. W., Science 2006,314, 109–112.
© 2007 WILEY-VCH Verlag GmbH & Co. KGaA, Weinheim www.proteomics-journal.com


