Embed Size (px)
Citation preview
A Karyopherin a2 Nuclear Transport Pathway isRegulated by Glucose in Hepatic and Pancreatic Cells
Aurelia Cassany1, Ghislaine Guillemain1,Christophe Klein2, Veronique Dalet1, EdithBrot-Laroche1 and Armelle Leturque1,
*
1 Inserm U505, UPMC and2 Service commun d’imagerie cellulaire IFR58,15 rue del’Ecole de Medecine, F-75006 Paris, France* Corresponding author: Armelle Leturque,[email protected]
We studied the role of the karyopherin a2 nuclear importcarrier (also known as importin a2) in glucose signaling.In mhAT3F hepatoma cells, GFP-karyopherin a2 accumu-lated massively in the cytoplasm within minutes of glu-cose extracellular addition and returned to the nucleusafter glucose removal. In contrast, GFP-karyopherina1 distribution was unaffected regardless of glucoseconcentration. Glucose increased GFP-karyopherin a2nuclear efflux by a factor 80 and its shuttling by a factor4. These glucose-induced movements were not due toglycolytic ATP production. The mechanism involved wasleptomycin B-insensitive, but phosphatase- and energy-dependent. HepG2 and COS-7 cells displayed no glucose-induced GFP-karyopherin a2 movements. In pancreaticMIN-6 cells, the glucose-induced movements of karyo-pherin a2 and the stimulation of glucose-induced genetranscription were simultaneously lost between pas-sages 28 and 33. Thus, extracellular glucose regulates anuclear transport pathway by increasing the nuclearefflux and shuttling of karyopherin a2 in cells in whichglucose can stimulate the transcription of sugar-responsivegenes.
Key words: glucose signal transduction, importin a2,nucleocytoplasmic transports, nutrient regulation ofgene expression, protein nuclear efflux, protein shuttling
Received 6 August 2003, revised and accepted for pub-lication 23 September 2003
Gene expression in cells can be modulated by extracellular
signals. This requires the transfer of information from the
plasma membrane to the nucleus by the transport of
molecules. Small molecules can diffuse freely through
the nuclear pore, but larger proteins (>40–50 kDa) require
karyopherin receptors, localization signals and a RanGTP
gradient (1,2). There are at least 20 different karyopherin
receptors in humans (3), resulting in considerable diversity
in nucleocytoplasmic transport pathways. The import
machinery therefore constitutes a potential target for the
regulation of gene transcription (4).
Glucose repression of gene transcription is present in all
cells (5). In contrast, the stimulation of gene transcription
by glucose is restricted to cells that can detect high extra-
cellular glucose concentration. The mechanism by which
sugars stimulate gene transcription is less well understood
in mammals (6) than in yeast (7). GLUT2, a member of
the mammalian facilitative glucose transporters family
(8) may be involved in glucose detection in hepatic cells.
Indeed, we have shown that the GLUT2 protein, via an
intracytoplasmic domain, transduces the activation signal
for glucose-sensitive gene transcription (9). Moreover,
karyopherin a2 interacts transiently with this specific
intracytoplasmic domain of GLUT2 and a truncated isoform
of this import receptor, that cannot migrate into the
nucleus, blocks the stimulation of glucose-sensitive gene
transcription (10).
Nuclear import receptors are thought to be involved in
diabetic nephropathy because hyperglycemic rats have
abnormally large amounts of several isoforms of karyo-
pherin alpha proteins in the kidney (11). This feature may
be involved in the changes in gene expression associated
with diabetes in tissues that express GLUT2, such as the
liver, pancreas, kidney and intestine.
We investigated the role of karyopherin a2 in a glucose
signaling pathway, by studying the location of karyopherin
a2 in mhAT3F, a hepatoma cell line that expressed GLUT2
(12). We followed the intracellular movements of fluores-
cent-karyopherin a2 protein, in living cells in response to
glucose. To elucidate the mechanism involved in this pro-
cess, we analyzed some of the molecular and biochemical
prerequisites necessary for the response to sugars of
karyopherin a2, in several recipient cells.
Results
Changes in GFP-karyopherin a2 location in mhAT3F
cells, in response to glucose
No clear distribution of GFP-karyopherin a2 was identified
in mhAT3F hepatoma cells cultured for 24 h in medium
with or without glucose. Indeed, depending on the cell,
fluorescence was observed either mainly in the nucleus, or
mainly in the cytoplasm. We therefore incubated mhAT3F
cells for short periods of time (15min) in PBS with various
supplements and recorded GFP- karyopherin a2 movements
in real time by confocal microscopy. The fluorescence
intensity in the nucleus and the cytoplasm was quantified
(Figure 1).
Traffic 2004; 5: 10–19Copyright # Blackwell Munksgaard 2004
Blackwell Munksgaard doi: 10.1046/j.1600-0854.2003.00143.x
10
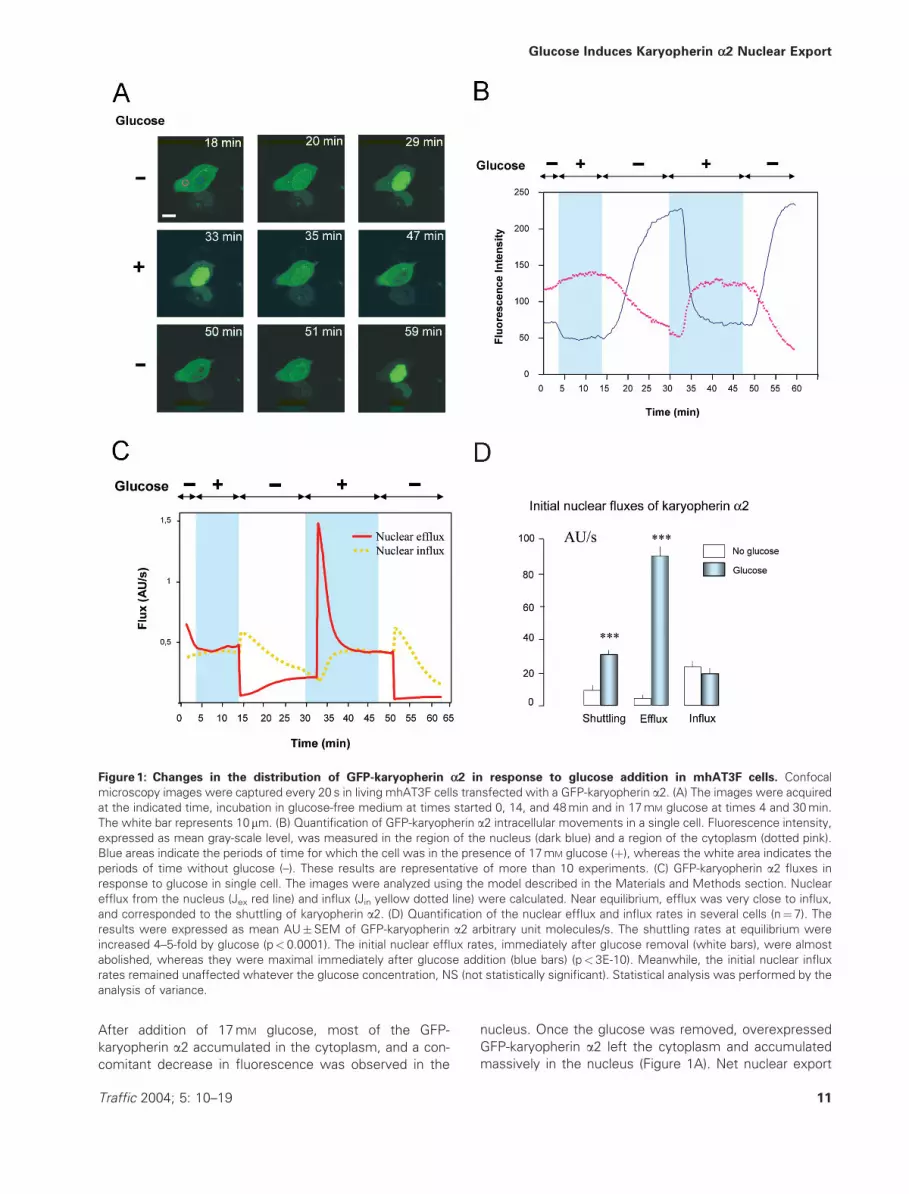
After addition of 17mM glucose, most of the GFP-
karyopherin a2 accumulated in the cytoplasm, and a con-
comitant decrease in fluorescence was observed in the
nucleus. Once the glucose was removed, overexpressed
GFP-karyopherin a2 left the cytoplasm and accumulated
massively in the nucleus (Figure 1A). Net nuclear export
Figure 1: Changes in the distribution of GFP-karyopherin a2 in response to glucose addition in mhAT3F cells. Confocal
microscopy images were captured every 20 s in living mhAT3F cells transfected with a GFP-karyopherin a2. (A) The images were acquired
at the indicated time, incubation in glucose-free medium at times started 0, 14, and 48min and in 17mM glucose at times 4 and 30min.
The white bar represents 10mm. (B) Quantification of GFP-karyopherin a2 intracellular movements in a single cell. Fluorescence intensity,
expressed as mean gray-scale level, was measured in the region of the nucleus (dark blue) and a region of the cytoplasm (dotted pink).
Blue areas indicate the periods of time for which the cell was in the presence of 17mM glucose (þ), whereas the white area indicates the
periods of time without glucose (–). These results are representative of more than 10 experiments. (C) GFP-karyopherin a2 fluxes in
response to glucose in single cell. The images were analyzed using the model described in the Materials and Methods section. Nuclear
efflux from the nucleus (Jex red line) and influx (Jin yellow dotted line) were calculated. Near equilibrium, efflux was very close to influx,
and corresponded to the shuttling of karyopherin a2. (D) Quantification of the nuclear efflux and influx rates in several cells (n¼7). The
results were expressed as mean AU�SEM of GFP-karyopherin a2 arbitrary unit molecules/s. The shuttling rates at equilibrium were
increased 4–5-fold by glucose (p< 0.0001). The initial nuclear efflux rates, immediately after glucose removal (white bars), were almost
abolished, whereas they were maximal immediately after glucose addition (blue bars) (p< 3E-10). Meanwhile, the initial nuclear influx
rates remained unaffected whatever the glucose concentration, NS (not statistically significant). Statistical analysis was performed by the
analysis of variance.
Glucose Induces Karyopherin a2 Nuclear Export
Traffic 2004; 5: 10–19 11
was faster (5min) than net nuclear import (10min). We
were able to induce several successive changes in GFP-
karyopherin a2 location of similar magnitude, and following
a similar time-course, in the same cell (Figure 1B). In all
cases, an increase in fluorescence intensity in one com-
partment was accompanied by a reciprocal decrease in the
other (Figure 1B). The movement of GFP-karyopherin a2was not detected at room temperature (not shown). This
process required a minimal temperature of 28 �C, suggest-ing the involvement of an active mechanism. Transient
labeling of the nuclear membrane was observed during
both the influx and the efflux of GFP-karyopherin a2,presumably due to the physiological bottleneck of the
pore (Figure 1A) (see the movie in the video gallery at
www.traffic.dk). Thus, extracellular addition of glucose
seems to regulate a nuclear transport pathway mediated
by the net nuclear entry and exit of karyopherin a2.
Computational analysis of glucose-induced
karyopherin a2 movements in cells
We investigated whether the glucose-induced accumula-
tion of GFP-karyopherin a2 in the cytoplasm was due to an
increase in nuclear efflux, a decrease in nuclear influx or
some other process. Nuclear and cytoplasmic fluores-
cence intensities were recorded over time. Considering
that the fluorescence levels are directly related to GFP
concentrations, we fitted the experimental curves of fluor-
escence intensity to the equations of a simple two-
compartment model. From this fit, we estimated the
kinetic constants of nuclear efflux kex or influx kin in the
presence or absence of glucose. We then calculated, from
these kinetic constants and the GFP-karyopherin a2 con-
centrations, the nuclear influx and efflux rates as the num-
ber of GFP-karyopherin a2 molecules that enter or exit the
nucleus per second.
A steady-state was approached after more than 10min in
the presence or absence of glucose, at which time the net
flux of GFP-karyopherin a2 (Jnet¼ Jin� Jex) was almost
abolished. At that time, nuclear efflux (Jex) was therefore
very close to nuclear influx (Jin). These values corres-
ponded to the shuttling of GFP-karyopherin a2, in and out
of the nucleus when no net flux can be observed (Figure
1C).
In the absence of glucose, when fluorescence levels
in the nucleus remained stable, Jex and Jin remained low
(Figure 1C). In the presence of glucose, when fluores-
cence levels remained stable in the cytoplasm, Jex and
Jin increased the shuttling of karyopherin a2 by a factor
of 3–4.
Immediately after glucose addition, initial efflux (Jex) was
increased by a factor of 7, whereas influx was only slightly
affected (Jin). Immediately after glucose removal, efflux
was blocked whereas influx increased slightly. Glucose
caused Jex to vary by a factor of almost 80.
Similar analysis was conducted on 7 cells in which the high-
est flux values were taken to be 100. The shuttling rates
were increased 4–5-fold by glucose. Nuclear influx [26� 4
arbitrary units (AU) of GFP-karyopherin a2/s] remained
unaffected whatever the glucose concentration, whereas
nuclear efflux rates were increased dramatically by glucose
(87� 8 AU/s) and almost abolished in the absence of glu-
cose (4� 2 AU/s) (Figure 1D).
Thus, glucose increases the rate of karyopherin a2 shut-
tling at equilibrium. This is achieved by means of a major
effect of glucose on efflux that differed considerably
between the two experimental conditions.
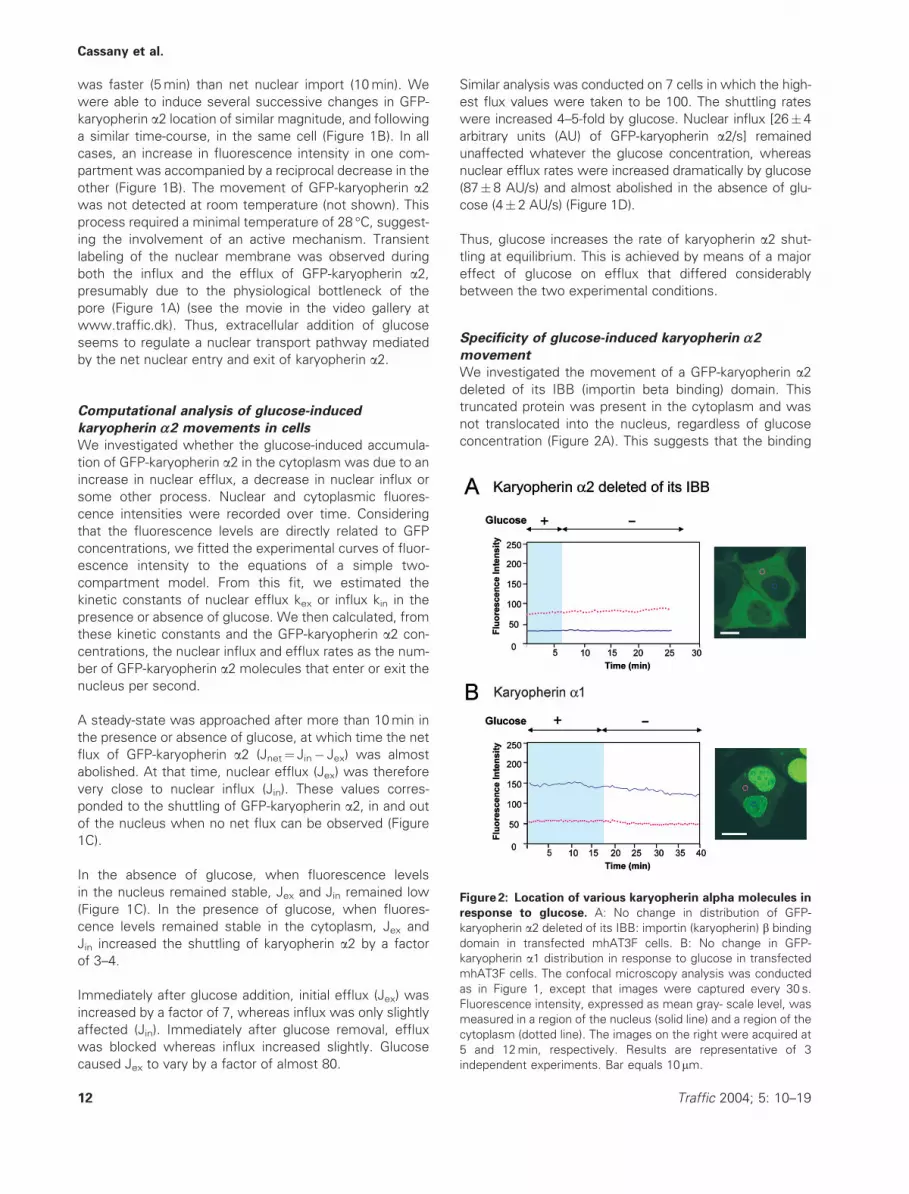
Specificity of glucose-induced karyopherin a2movement
We investigated the movement of a GFP-karyopherin a2deleted of its IBB (importin beta binding) domain. This
truncated protein was present in the cytoplasm and was
not translocated into the nucleus, regardless of glucose
concentration (Figure 2A). This suggests that the binding
Figure 2: Location of various karyopherin alpha molecules in
response to glucose. A: No change in distribution of GFP-
karyopherin a2 deleted of its IBB: importin (karyopherin) b binding
domain in transfected mhAT3F cells. B: No change in GFP-
karyopherin a1 distribution in response to glucose in transfected
mhAT3F cells. The confocal microscopy analysis was conducted
as in Figure 1, except that images were captured every 30 s.
Fluorescence intensity, expressed as mean gray- scale level, was
measured in a region of the nucleus (solid line) and a region of the
cytoplasm (dotted line). The images on the right were acquired at
5 and 12min, respectively. Results are representative of 3
independent experiments. Bar equals 10 mm.
Cassany et al.
12 Traffic 2004; 5: 10–19

to karyopherin b (importin b) is required during transloca-
tion, as in a classical import pathway.
We investigated the distribution of GFP-karyopherin a1following the addition of glucose, in mhAT3F (Figure 2B),
COS-7 and HepG2 cells (not shown). The a1 isoform
had a similar cellular distribution to the a2 isoform after
24 h in medium with or without glucose. No significant
change in the cellular distribution of GFP-karyopherin a1was observed in any of these cells at any glucose concen-
tration (Figure 2B). The glucose effect therefore targets a
transport pathway that uses karyopherin a2 as an adaptor
and karyopherin b as a second partner.
Substrates triggering changes in the distribution
of GFP-karyopherin a2We analyzed some of the biochemical requirements for
changes of karyopherin a2 distribution. A concentration
of 5mM glucose, corresponding to physiological blood
glucose levels, was able to produce an accumulation in
the cytoplasm of GFP-karyopherin a2 (Table 1). Fructose,
another specific substrate of GLUT2, induced the accumu-
lation of fluorescence in the cytoplasm, whereas xylose, a
pentose not transported by GLUT2, induced no net nuclear
export of GFP-karyopherin a2 (Table 1). Furthermore, GFP-
karyopherin a2 did not accumulate in the cytoplasm after
the addition of a glucose analog, 3-O-methylglucose
(3-OMG) (Table 1). As this glucose analog does not provide
energy to the cells, we investigated the role of energy
provision in glucose-induced protein movement. We sup-
plied the cells with lactate/pyruvate, substrates that feed
into the final steps of glycolysis. Lactate/pyruvate did not
promote cytoplasmic accumulation of GFP-karyopherin a2,suggesting that energy provision through glycolysis did not
drive glucose-induced karyopherin a2 movement (Table 1).
The GFP-karyopherin a2 movements, induced by glucose
were not affected by an inhibitor of glucose metabolism
(N-acetylglucosamine, a hexokinase inhibitor) (Table 2).
Thus, the glucose-induced movements of karyopherin a2seem to involve neither a metabolite nor energy provided
by glucose metabolism.
It is known that energy from GTP hydrolysis by Ran is
required for the recycling in the cytoplasm of most import
carriers. Profound ATP depletion has been shown to
induce RanGTP depletion. The addition of sodium azide
(10mM) was used to deprive the cells of ATP by inhibiting
oxidative phosphorylation. This inhibitor of mitochondrial
phosphorylation induced the sequestration of GFP-
karyopherin a2 in the nucleus, despite the presence of
glucose (Table 2). This suggests that glucose-induced
movements of karyopherin a2 involve an energy-dependent
step.
Mechanisms of changes in the distribution
of GFP-karyopherin a2We investigated the effects of an inhibitor of GLUT activity
(phloretin), together with glucose. Glucose transport inhib-
ition blocked the net efflux of GFP-karyopherin a2 from the
Table 1: Effect of various substrates on GFP-karyopherin a2redistribution in mhAT3F cells. After 15min of incubation, GFP-
karyopherin a2 accumulated in the cell compartment. The results
are expressed as the ratio of fluorescence intensities in nucleus vs.
cytoplasm, which is arbitrarily taken as 1 in the absence of glucose,
before the addition of the effector. A ratio close to 1 indicates that
the effector is inefficient in altering karyopherin a2 location,
whereas a ratio lower than 1 indicates cytoplasmic accumulation
of GFP-karyopherin a2. Several effectors were tested: no glucose
corresponds to 17mM mannitol to keep osmolarity constant,
3-OMG stands for 3-O-methylglucose. Each experimentwas carried
out at least four times. Results are expressed as mean�SEM
Effectors GFP-karyopherin a2nucleus/cytoplasm ratio
No glucose 1.08� 0.07 (n¼ 49)
Glucose (17mM) 0.43� 0.03 (n¼ 21) ***
Glucose (5mM) 0.44� 0.04 (n¼ 9) ***
Fructose (17mM) 0.53� 0.08 (n¼ 5) *
Xylose (17mM) 1.09� 0.20 (n¼ 5) NS
3-OMG (17mM) 1.10� 0.20 (n¼ 4) NS
Lactate/pyruvate (10/1mM) 1.05� 0.08 (n¼ 4) NS
Statistical significance was tested using Student’s t-test: NS not
statistically different; * p<0.05; *** p<0.001 when compared to
the ratios obtained in the absence of glucose.
Table 2: Effect of various inhibitors on glucose-induced GFP-
karyopherin a2 redistribution in mhAT3F cells. Inhibitors were
tested in the presence or absence of glucose. Fluorescence inten-
sities nucleocytoplasmic ratio N/C was arbitrarily taken as 1
(1.08�0.07, n¼49) in the absence of glucose. A ratio close to
1=indicates that the effector is altering karyopherin a2 movement
in response to glucose, whereas a ratio lower than 1 indicates that
the effector is inefficient, since GFP-karyopherin a2 cytoplasmic
accumulation is observed like in the presence of glucose alone.
We used N-acetylglucosamine as a hexokinase inhibitor, sodium
azide as an oxidative phosphorylation inhibitor, phloretin as a
glucose transport inhibitor, leptomycin B as an inhibitor of Crm1-
mediated export, wortmannin as a PI3kinase inhibitor, staurospor-
ine as a protein kinase A, G, and C inhibitor. Each experiment was
carried out independently at least 3 times. The results are
expressed as mean�SEM
Inhibitors�glucose Pre-incubation GFP-karyopherin a2nucleus/cytoplasm ratio
N-acetylglucosamine
(50mM)
30min 0.50�0.05 (n¼11) **
Sodium azide (10mM) 20min 0.97�0.12 (n¼5) NS
Phloretin (50mM) no 1.80�0.10 (n¼3) *
Leptomycin B (100nM) 2 h 0.50�0.06 (n¼4) *
Wortmannin (100nM) 20min 0.33�0.02 (n¼4) **
Staurosporine (20 nM) 30min 0.48�0.15 (n¼3) *
The statistical significance was tested using Student’s t-test: NS
not statistically different; * p<0.05; ** p<0.01; *** p< 0.001
when compared to the ratios obtained in the absence of glucose.
Glucose Induces Karyopherin a2 Nuclear Export
Traffic 2004; 5: 10–19 13

nucleus (Table 2). Glucose transport through the plasma
membrane is therefore necessary.
The net nuclear efflux of GFP-karyopherin a2, observed in
response to glucose, was not blocked by an inhibitor of
protein export, leptomycin B (Table 2). Thus, the glucose-
regulated export does not involve the exportin CRM1.
Kinases and phosphatases are involved in numerous
cellular signaling pathways, including protein trafficking.
Neither the addition of wortmannin (a PI3 kinase inhibitor),
nor that of staurosporine (a Protein Kinase A and C inhibi-
tor), modified the glucose-induced movements of GFP-
karyopherin a2 (Table 2). Finally, we showed that okadaic
acid (a phosphatase inhibitor) prevented nuclear import of
GFP-karyopherin a2 in the absence of glucose, suggesting
a phosphatase-dependent mechanism (Figure 3).
Glucose-induced movements of GFP-karyopherin a2in several cell lines
The GLUT2 hexose transporter was shown to be required.
The location of GFP-karyopherin a2 was not affected by
glucose in COS-7 cells (Figure 4) or in hepatoma HepG2
cells (Figure 4); both cell lines are devoid of GLUT2, and
display no stimulation of glucose-sensitive gene expres-
sion (not shown). A GLUT2 expressing cell line, MIN-6
pancreatic cells, at passage 28, displayed glucose-induced
GFP-karyopherin a2 movements similar to mhAT3F cells
(Figure 5A). This suggests that GLUT2 is required to medi-
ate karyopherin a2 movement, in response to glucose in
MIN-6 pancreatic cells. However, when we used MIN-6
pancreatic cells at a later passage (33 vs. 28), GLUT2
mRNA (measured to assess the presence of the GLUT2)
was constitutively and abundantly expressed (Figure 5B).
Nevertheless, the cells were no longer sensitive to the
effect of glucose on karyopherin a2 movement (Figure
5A) or on the stimulation of gene transcription (Figure
5C). Thus, the presence of GLUT2 is necessary, but not
sufficient for glucose-induced protein translocation. Intra-
cellular proteins from the host cells may therefore be
crucial.
Discussion
Karyopherins a have been described as adaptor-receptors
of the machinery that imports cytoplasmic proteins bearing
an NLS (nuclear localization signal) into the nucleus. We
showed that GFP-karyopherin a2 and a1 were located in
the nucleus, but also to some extent in the cytoplasm in
mhAT3F, MIN-6, HepG2 and COS-7 cells. These receptors
are known to shuttle in and out of the nucleus, but the
regulation of this translocation has not been described.
Most of the overexpressed GFP-karyopherin a2 seemed
to be subject to such regulation. We found that extracel-
lular addition of nutrient sugars regulated the efflux of GFP-
karyopherin a2 within seconds and increase the shuttling
of the import carrier within minutes. This suggests that
glucose regulates a karyopherin a2-specific pathway of the
nucleocytoplasmic transport machinery, together with
translocation of karyopherin a2 protein cargoes.
This process displayed several characteristics of a classical
nuclear import pathway. Since the process was not
observed with a karyopherin a2 deleted of its IBB, the
binding to karyopherin b was required as in most import
pathways (13). The glucose-regulated export of karyo-
pherin a2 was not inhibited by leptomycin B, suggesting
that this processwasCRM1-independent (14). Ran-dependent
Figure 3: Effect of okadaic acid as a PP1, PP2A phosphatase inhibitor on GFP-karyopherin a2 import in mhAT3F. The first image
shows GFP-karyopherin a2 nuclear accumulation in mhATF cells incubated for 20min in the presence of okadaic acid but without glucose.
In the second image, acquired 3min after glucose addition, the presence of okadaic acid did not prevent GFP-karyopherin a2 cytoplasmic
accumulation, suggesting that the inhibitor was inefficient in controlling glucose-induced nuclear efflux of GFP-karyopherin a2. The cells
were then placed in a medium containing okadaic acid but without any glucose, and in the third image acquired after 15min of incubation,
the GFP-karyopherin a2 remained in the cytoplasm suggesting that the inhibitor was blocking GFP-karyopherin a2 nuclear import. The last
image, acquired 15min after inhibitor removal, is presented to show that these cells were still able to accumulate GFP-karyopherin a2 in
the nucleus. The inhibitory effect of okadaic acid was thus reversible.
Cassany et al.
14 Traffic 2004; 5: 10–19

nuclear transport requires energy provided by the
hydrolysis of GTP, for the recycling of import carriers
(15–17). Profound ATP depletion has been reported to
cause the depletion of free GTP, and thus of RanGTP,
and can lead to the inhibition in vivo of Ran-dependent
nuclear transport (18). The use of sodium azide inhibits
ATP production and blocks export of several carriers
(18,19). Here, the sequestration of the carrier into the
nucleus following treatment with sodium azide shows
that glucose-induced export of karyopherin a2 depends
on energy, probably from free GTP, and might be
mediated by a Ran-dependent step.
Okadaic acid blocked the nuclear accumulation of karyo-
pherin a2 induced by glucose removal. Consistent with
this, okadaic acid has been reported to inhibit nucleocyto-
plasmic import in vitro, suggesting that a phosphatase-
dependent step is involved in nuclear import (20). Recently,
a serine/threonine phosphatase PP2A, inhibited by okadaic
acid, was implicated in nucleocytoplasmic transport on the
basis of its binding to karyopherin b (21). Interestingly,
okadaic acid efficiently controlled the nuclear efflux of
karyopherin a2 in response to the glucose addition. Glucose,
via one of its metabolite, xylulose 5- phosphate, has been
shown to activate a protein phosphatase of the PP2A family
(22). This xylulose-activated phosphatase was recovered
from both the cytoplasm and nucleus of liver cells (22). It
is currently unclear whether this xylulose-activated phos-
phatase is the target of okadaic acid involved in the glu-
cose-sensitive redistribution of karyopherin a2.
Glucose specifically regulates not only the efflux of karyo-
pherin a2, but also its nucleocytoplasmic shuttling. Karyo-
pherin a2 fluxes in nucleocytoplasmic transport are currently
thought to be conditioned by numerous factors. Those
include the number of protein complexes that can pass
through nuclear pores and the permeability of the nuclear
envelope to these complexes (pore property and number)
(23). The differences in kinetic constants obtained in this
study probably reflect changes in the formation of these
import and export complexes. The nuclear availability of
Ran GTP has also been reported to limit the formation of
complexes that can cross the nuclear envelope (24). As the
composition of import and export complexes is not entirely
clear (25), we did not introduce these factors into our model.
A simple two-compartment model was used to calculate
GFP protein fluxes. The increased nuclear efflux in response
to glucose leading to the massive cytoplasmic accumulation
of karyopherin a2 is a specific feature of this process.
The existence of numerous isoforms of import receptors
suggests that highly selective nucleocytoplasmic transport
process may occur (26). Indeed, we report here that glu-
cose induced redistribution of the karyopherin a2 isoform
but not of another isoform, karyopherin a1. We have
shown that the GLUT2 glucose transporter binds specific-
ally and transiently to karyopherin a2, but not to karyo-
pherin a1 (10). Thus, the GLUT2 binding capacity appears
to be related to the induction of karyopherin a2 move-
ments in response to glucose.
The metabolism of glucose generates energy, but the glu-
cose-induced movement of karyopherin a2 seemed to be
independent of glycolysis. Indeed, the redistribution of pro-
tein was induced by glucose or fructose addition, but was
not blocked by an inhibitor of hexose metabolism or stimu-
lated by insulin, a hormone that accelerates metabolism
(not shown). The protein movement seems also to be inde-
pendent of the ATP produced during glucose metabolism,
since lactate/pyruvate that provides ATP in the Krebs cycle,
did not induce the translocation. Hepatoma cells possess
intracellular stores of energy providing substrates that are
mobilized in the absence of glucose, which could fulfill the
energy requirement of the import machinery. We therefore
suggest that glucose or fructose triggers a non-metabolic
signal leading to the nuclear efflux of karyopherin a2. Pro-tein signals generated by glucose in yeast are initiated by
plasma membrane sensors (5,7,27).
GLUT2 is required to promote the process of GFP-
karyopherin a2 accumulation in the cytoplasm after glucose
addition. This conclusion is supported by arguments based
on the substrate specificity of this isoform of glucose
Figure 4: Location of GFP-karyopherin a2 in response to
glucose in transfected COS-7 cells (A) and HepG2 cells (B).
The confocal microscopy analysis was conducted as in Figure 2.
Fluorescence intensity, expressed as mean gray-scale level,
was measured in a region of the nucleus (blue solid line) and a
region of the cytoplasm (pink dotted line). The images on the right
were acquired at 10min. These results are representative of 4
experiments. Bar equals 10mm.
Glucose Induces Karyopherin a2 Nuclear Export
Traffic 2004; 5: 10–19 15

transporters (28), and on the use of cell lines that do or do
not express endogenous GLUT2 (8,12). GLUT2 is also
required for the stimulation of glucose-sensitive gene
expression in hepatoma cell lines (12). This highlights the
possibility of a functional relationship between glucose-
induced karyopherin a2 movements and GLUT2 expression
in cells.
However, although GLUT2 expression is required, it is
not sufficient for karyopherin a2 movements in response
to extracellular glucose. Indeed, a glucose analog trans-
ported by GLUT2 did not induce karyopherin a2 redistribu-
tion, suggesting that stereospecificity may be involved
in this process. Moreover, a late passage of MIN-6 cells,
that constitutively express GLUT2 mRNA (29) but dis-
played no glucose-sensitive gene transcription, showed
no glucose-induced karyopherin a2 redistribution. Two
sublines of insulin-secreting MIN-6 cells from two pas-
sages have been studied using high-density microarrays;
one that has retained glucose-induced secretion, and
one that has not. A long list of genes involved in metabo-
lism, intracellular signaling, and cell architecture were sig-
nificantly affected by cell passage, but none of the
candidate genes involved in glucose sensing in the pan-
creas was modified (30). Therefore, intracellular effectors,
present in mhAT3F and MIN-6 passage 28, and absent in
HepG2, in COS-7 cells and MIN-6 passage 33, may be
required to mediate glucose-induced cytoplasmic accumu-
lation of karyopherin a2.
The cargoes that bind specifically to karyopherin a2, may
constitute a set of factors involved in a glucose signaling
pathway downstream from GLUT2. Glucose has been
reported to induce nuclear accumulation of several
gene-regulating factors. Factors stimulating the tran-
scription of glucose-sensitive genes, such as an AMP-
kinase subunit in yeast (31), and ChREBP in mammalian
liver cells (32), and a factor inhibiting the transcription
of genes repressed by glucose, Mig1, a yeast repressor
(33), have been recovered in the nucleus after glucose
addition. As glucose increases the rate of karyopherin
a2 shuttling, we suggest that karyopherin a2 increases
the import of glucose- sensitive transcription activators.
However, if the main action of glucose is to stimulate the
massive translocation of karyopherin a2 into the
cytoplasm, then karyopherin a2 may mediate an inhibitory
process that is relieved by glucose. To address this
point, we are now investigating the partners of karyo-
pherin a2.
In conclusion, extracellular addition of glucose increases
the nuclear efflux and the shuttling rate of GFP-karyopherin
a2 in cells displaying stimulation of glucose-sensitive gene
transcription. Glucose may induce the transcription of
sugar-responsive genes, via karyopherin a2 nuclear efflux
or shuttling.
Materials and Methods
Cell culture
The mhAT3F hepatoma cell line was derived from trans-
genic mice expressing the SV40 large T and small t
Figure 5: Redistribution of GFP-
karyopherin a2 in transfected
MIN-6 pancreatic cells. (A) The
experiment was conducted as in
Figure 2. In MIN-6 cells at passage
28 (early) or 33 (late), fluorescence
intensity, expressed as mean gray-
scale level, was measured in a
region of the nucleus (blue solid
line) and a region of the cytoplasm
(pink dotted line). (B) The ratio
GLUT2/L19 mRNA abundance was
estimated by RT-PCR in MIN-6 at
passage 28 (early) and 33 (late) and
compared to that in mhAT3F. (C)
Human GLUT2 promoter activity
was assessed by measuring lucif-
erase activity, as a reporter gene, in
cells cultured in media with high
and low glucose concentrations.
We determined the statistical sig-
nificance (p<0.05) of differences
from values obtained at high and
low glucose concentrations. These
data are representative of 3–4 inde-
pendent experiments.
Cassany et al.
16 Traffic 2004; 5: 10–19

antigens under the control of the antithrombin III promoter.
The mhAT3F cells (34) were generously provided by B.
Antoine (INSERM U129, Paris, France). Cells were cul-
tured in Dulbecco’s modified Eagle’s medium/Ham-F12,
Glutamax I, with 17mM glucose (Life Technologies,
InVitrogen, Cergy Pontoise, France), supplemented with
penicillin, streptomycin, 0.1mM insulin, 1mM dexamethasone,
1mM triiodothyronine, 0.03 mM selenium and 5% fetal
calf serum. The COS-7 and HepG2 cell lines were
cultured in Dulbecco’s modified Eagle’s medium/-
Ham-F12, Glutamax I (Life Technologies) supplemented
with penicillin, streptomycin and 10% fetal calf serum.
It should be noted that fetal calf serum adds about
1mM glucose to the medium. MIN-6 cells were
generously provided by Philippe Ravassard (CNRS
UMR 9923, Paris, France). MIN-6 at passages 28–33
were cultured in Dulbecco’s modified Eagle’s medium,
with 25mM glucose, Glutamax I (Life Technologies) sup-
plemented with penicillin, streptomycin, 0.25 ml/100ml b-mercaptoethanol and 15% decomplemented fetal calf
serum.
Transfection
We plated 2� 105 cells in single-chambered Labtek
coverslips (Nunc, Merck Strasbourg, France). The follow-
ing day, cells were transiently transfected with 7 mg of
the rat full-length karyopherin a2 cDNA in frame in
the pEGFPn1 and pEGFPc3 vectors (Clontech, Ozyme,
Saint-Quentin en Yvelines, France) (10). The position
of the tag, at the N- or C-terminus of karyopherin a2 had
no effect on protein redistribution in response to
glucose. We therefore chose arbitrarily to use the GFP-N-
karyopherin a2 in this study. The pEGFPc2-karyopherin
a1 was constructed from pGEX3X-karyopherin a1vector which was supplied by M. Prieve (35). The
mhAT3F, HepG2 and COS-7 cells were transfected
with 5 mg of pEGFPc3-karyopherin a1. We also deleted
the importin b binding domain of GFP-karyopherin a2 (10)
to prevent nuclear translocation of the truncated protein
(36). Transfections were performed with Lipofectin (Life
Technologies).
Confocal microscopy on living cells
One day after transfection, cells were transferred in glu-
cose-containing or glucose-free medium for 24 h and then
placed at 28 �C in circulating PBS (137mM NaCl, 2.7mM
KCl, 4.3mM Na2HPO4 7H2O, 1.4mM KH2PO4). The PBS
was continually renewed by gravitational flow, ensuring
the total replacement of the medium in the culture cham-
ber within 1min. Mannitol was added to the PBS, to a
concentration of up to 17mM to keep osmolarity constant.
Substrates were added at the indicated concentration
in PBS. We used a Zeiss LSM510 confocal microscope
equipped with a C-Apochromat� 63 objective lens. Green
cells were selected for their unsaturated fluorescence
intensities. Images were acquired every 20 or 30 s. For
each image in the time series, the green fluorescence
intensity was measured in two areas of identical size,
one within the nucleus and the other within the cytoplasm.
Fluorescence intensities are expressed as mean gray-
scale level/pixel.
Computational analysis of the images
At steady-state, the GFP-karyopherin a2 influx into the
nucleus (Jin, influx, molecules/s) and its efflux out of the
nucleus (Jex, efflux) are equal, and correspond to the shut-
tling rate of karyopherin a2. The resulting net flux is equal
to zero (Jnet¼ Jin� Jex¼ 0).
The following system of kinetic equations was used to
model nuclear influx and efflux:
Jin ¼ kin � GFP Ka2CJex ¼ kex � GFP Ka2NJnet ¼ Jin � Jex ¼ kin � GFP Ka2� kex � GFP Ka2
When the glucose concentration of the medium is chan-
ged, influx, efflux or both may be modified and the net flux
will vary (J net 6¼ 0) until a new-steady state (Jnet¼ 0) is
reached. A change in fluorescence is caused by changes
in the amounts of GFP-karyopherin a2 in the nucleus and
cytoplasm over time. This can be described by the follow-
ing differential equations:
J ¼ � dGFP Ka2C ðtÞdt
¼ kin � GFP Ka2C ðtÞ
� kex � GFP Ka2NðtÞ
�J ¼ � dGFP Ka2NðtÞdt
¼ kex � GFP K�2NðtÞ
� kin � GFP Ka2C ðtÞ
Finally, the total amount of GFP-karyopherin a2 is con-
served throughout the experiment:
GFP Ka2Nðt0Þ þ GFP Ka2C ðt0Þ ¼ GFP Ka2NðtÞþ GFP Ka2CðtÞ
We measured fluorescence intensities (mean gray-
scale level/pixel), which are related to concentration,
whereas fluxes are expressed in molecules/s. We mod-
eled variations in concentration to obtain kinetic cons-
tants (kin and kex) and to calculate fluxes (Jin and Jex).
The previous equations were rewritten in term of concen-
trations, with VN the nuclear and VC the cytoplasmic
volumes:
Glucose Induces Karyopherin a2 Nuclear Export
Traffic 2004; 5: 10–19 17

� d ½GFP Ka2C �ðtÞdt
¼ kin � ½GFP Ka2C �ðtÞ � kex �VN
VC
½GFP Ka2N �ðtÞ
� d ½GFP Ka2N �ðtÞdt
¼ kex � ½GFP Ka2N �ðtÞ � kin �VC
VN
½GFP Ka2C �ðtÞ1
VC
½GFP Ka2N �ðt0Þ þ1
VN
½GFP Ka2C �ðt0Þ ¼1
VC
½GFP Ka2N �ðtÞ þ1
VN
½GFP Ka2C �ðtÞ
From this set of equations, analytical solutions can be
found for [GFP Ka2C](t) and [GFP Ka2N](t)
½GFP K�2C �ðtÞ ¼ ½GFP Ka2C �ðt0Þexp�ðkinþkex Þt
þ kex
kin þ kex
½GFP Ka2N �ðt0ÞR
þ�
½GFP Ka2C �ðt0Þ�
1� exp�ðkinþkex Þt� �
½GFP Ka2N �ðtÞ ¼ ½GFP Ka2N �ðt0Þexp�ðkinþkex Þt
þ kin
kin þ kex
�½GFP Ka2N �ðt0Þ
þR � ½GFP Ka2C �ðt0Þ�
1� exp�ðkinþkex Þt� �
with:
R ¼ VC
VN
The experimental plots of fluorescence levels were used
to fit simultaneously these two functions to give us kin, kexand R. Data were fitted with the solver function of Excel
software (Microsoft) by minimizing the sum of squared
differences between experimental and calculated points,
with kin, kex, [GFP Ka2N](t0), [GFP Ka2C](t0), and R as
variables. If we arbitrarily set nuclear volume to 1, fluxes
can be calculated as:
JinðtÞ ¼ kin � R � ½GFP Ka2C �ðtÞJexðtÞ ¼ kex � ½GFP Ka2N �ðtÞ
Moreover, the extrapolation of the fits allowed us to
estimate Jin and Jex at equilibrium and to provide a shut-
tling value. Assuming that cytoplasmic and nuclear volumes
(rather than just their ratio) are constant throughout the
experiment, we can compare fluxes for different conditions
in one cell. However, to compare the variation in fluxes from
cell to cell, the highest value of fluxes was taken to be 100
for each cell. In fact, the absolute values of fluxes varied
from 0.667 to 2.524 (n¼ 7) due to the transient transfection
protocol used to express the GFP-protein.
Quantitative RT-PCR
We cultured mhAT3F andMIN-6 cells in a medium contain-
ing a high glucose concentration. Levels of mRNA for
GLUT2 and L19 were determined by real-time PCR (Light
Cycler system, Roche, Meylan, France). The ribosomal
L19 mRNA was used as a control for RNA extraction.
Thus, the results are expressed in an arbitrary unit as the
ratio GLUT2/L19 mRNA abundance (10).
Promoter activity
The �1100/þ300 region of the human GLUT2 promoter
was inserted into the episomal replicative p205-luc plas-
mid driving the luciferase reporter gene. Luciferase activ-
ities were measured in homogenates of cells cultured in
the presence or absence of glucose, using the Luciferase
Assay System (Promega, Madison, USA) in a Lumat
LB9501 luminometer (Berthold). The human GLUT2 gene
was kindly provided by G.I. Bell (Howard Hughes Institute,
Chicago, USA) (37). The results, in an arbitrary unit of
luciferase activity/mg protein of cells cultured at high glu-
cose concentration, are expressed as a fraction of those
cultured at low glucose concentration, which was taken as
1. Protein content was determined by a BCA assay
(Ultima, Interchim, Montlucon, France).
Statistical analysis
Student’s t-test and two-way analysis of variance were
performed using Prism Software.
Acknowledgments
We thank Jean Chambaz, Alain Ktorza and members of U505 for helpful
discussions and Adrien Klapisz for the film.
A.C. received a grant from La Ligue Contre Le Cancer (France); G.G.
received a grant from the Ministere de la Recherche et de la Technologie
(France); A.L. is supported by grants n�9303 and n�5531 from ARC (Asso-
ciation pour la Recherche contre le Cancer, France).
References
1. Nigg EA. Nucleocytoplasmic transport: signals, mechanisms and regu-
lation. Nature 1997;386:779–787.
2. Mattaj IW, Englmeier L. Nucleocytoplasmic transport: the soluble
phase. Annu Rev Biochem 1998;67:265–306.
3. Conti E, Izaurralde E. Nucleocytoplasmic transport enters the atomic
age. Curr Opin Cell Biol 2001;13:310–319.
4. Komeili A, O’Shea EK. Nuclear transport and transcription. Curr Opin
Cell Biol 2000;12:355–360.
5. Johnston M. Feasting, fasting and fermenting. Glucose sensing in
yeast and other cells. Trends Genet 1999;15:29–33.
6. Vaulont S, Vasseur-Cognet M, Kahn A. Glucose regulation of gene
transcription. J Biol Chem 2000;275:31555–31558.
7. Rolland F, Winderickx J, Thevelein JM. Glucose-sensing mechanisms
in eukaryotic cells. Trends Biochem Sci 2001;26:310–317.
8. Thorens B, Sarkar HK, Kaback HR, Lodish HF. Cloning and functional
expression in bacteria of a novel glucose transporter present in liver,
intestine, kidney, and beta-pancreatic islet cells. Cell 1988;55:281–290.
9. Guillemain G, Loizeau M, Pincon-Raymond M, Girard J, Leturque A.
The large intracytoplasmic loop of the glucose transporter GLUT2 is
involved in glucose signaling in hepatic cells. J Cell Sci 2000;113:
841–847.
Cassany et al.
18 Traffic 2004; 5: 10–19

10. Guillemain G, Munoz-Alonzo MJ, Cassany A, Loizeau M, Faussat A-M,
Burnol A-F, Leturque A. Karyopherin alpha 2. a control step of glucose
sensitive gene expression in hepatic cells. Biochem J 2002;364:
201–209.
11. Kohler M, Buchwalow IB, Alexander G, ChristiansenM, Shagdarsuren E,
Samoilova V, Hartmann E, Mervaala EM, Haller H. Increased importin
alpha protein expression in diabetic nephropathy. Kidney Int
2001;60:2263–2273.
12. Antoine B, Lefrancois-Martinez AM, Le Guillou G, Leturque A,
Vandewalle A, Kahn A. Role of the GLUT 2 glucose transporter in the
response of the L-type pyruvate kinase gene to glucose in liver-derived
cells. J Biol Chem 1997;272:17937–17943.
13. Gorlich D, Kutay U. Transport between the cell nucleus and the cyto-
plasm. Annu Rev Cell Dev Biol 1999;15:607–660.
14. Ossareh-Nazari B, Gwizdek C, Dargemont C. Protein export from the
nucleus. Traffic 2001;2:684–689.
15. Fornerod M, Ohno M, Yoshida M, Mattaj IW. CRM1 is an export recep-
tor for leucine-rich nuclear export signals. Cell 1997;90:1051–1060.
16. Kutay U, Bischoff FR, Kostka S, Kraft R, Gorlich D. Export of importin
alpha from the nucleus is mediated by a specific nuclear transport
factor. Cell 1997;90:1061–1071.
17. Nachury MV, Weis K. The direction of transport through the nuclear
pore can be inverted. Proc Natl Acad Sci USA 1999;96:9622–9627.
18. Schwoebel ED, Ho TH, Moore MS. The mechanism of inhibition of
Ran-dependent nuclear transport by cellular ATP depletion. J Cell Biol
2002;157:963–974.
19. Kose S, Imamoto N, Yoneda Y. Distinct energy requirement for nuclear
import and export of importin beta in living cells. FEBS Lett
1999;463:327–330.
20. Kehlenbach RH, Gerace L. Phosphorylation of the nuclear transport
machinery down-regulates nuclear protein import in vitro. J Biol
Chem 2000;275:17848–17856.
21. Lubert EJ, Sarge KD. Interaction between protein phosphatase 2A and
members of the importin beta superfamily. Biochem Biophys Res
Commun 2003;303:908–913.
22. Kabashima T, Kawaguchi T, Wadzinski BE, Uyeda K. Xylulose 5-
phosphate mediates glucose-induced lipogenesis by xylulose 5-
phosphate-activated protein phosphatase in rat liver. Proc Natl Acad
Sci USA 2003;100:5107–5112.
23. Ribbeck K, Gorlich D. The permeability barrier of nuclear pore com-
plexes appears to operate via hydrophobic exclusion. EMBO J
2002;21:2664–2671.
24. Gorlich D, Seewald MJ, Ribbeck K. Characterization of Ran-driven
cargo transport and the RanGTPase system by kinetic measurements
and computer simulation. EMBO J 2003;22:1088–1100.
25. Lindsay ME, Plafker K, Smith AE, Clurman BE, Macara IG. Npap60/
Nup50 is a tri-stable switch that stimulates importin-alpha: beta-
mediated nuclear protein import. Cell 2002;110:349–360.
26. Jakel S, Mingot JM, Schwarzmaier P, Hartmann E, Gorlich D. Impor-
tins fulfil a dual function as nuclear import receptors and cytoplasmic
chaperones for exposed basic domains. EMBO J 2002;21:377–386.
27. Ozcan S, Dover J, Rosenwald AG, Wolfl S, Johnston M. Two glucose
transporters in Saccharomyces cerevisiae are glucose sensors that
generate a signal for induction of gene expression. Proc Natl Acad Sci
USA 1996;93:12428–12432.
28. Gould GW, Thomas HM, Jess TJ, Bell GI. Expression of human glucose
transporters in Xenopus oocytes: kinetic characterization and substrate
specificities of the erythrocyte, liver, and brain isoforms. Biochemistry
1991;30:5139–5145.
29. Miyazaki J, Araki K, Yamato E, Ikegami H, Asano T, Shibasaki Y, Oka Y,
Yamamura K. Establishment of a pancreatic beta cell line that retains
glucose-inducible insulin secretion: special reference to expression of
glucose transporter isoforms. Endocrinology 1990;127: 126–132.
30. Lilla V, Webb G, Rickenbach K, Maturana A, Steiner DF, Halban PA,
Irmenger JC. Differential gene expression in well-regulated and dys-
regulated pancreatic beta-cell (MIN6) sublines. Endocrinology
2003;144:1368–1379.
31. VincentO, TownleyR, KuchinS, CarlsonM.Subcellular localization of the
Snf1 kinase is regulated by specific beta subunits and a novel glucose
signaling mechanism. Genes Dev 2001;15: 1104–1114.
32. Kawaguchi T, Takenoshita M, Kabashima T, Uyeda K. Glucose and
cAMP regulate the L-type pyruvate kinase gene by phosphorylation/
dephosphorylation of the carbohydrate response element binding pro-
tein. Proc Natl Acad Sci USA 2001;98:13710–13715.
33. De Vit MJ, Waddle JA, Johnston M. Regulated nuclear translocation of
the Mig1 glucose repressor. Mol Biol Cell 1997;8:1603–1618.
34. Lefrancois-Martinez AM, Diaz-Guerra MJ, Vallet V, Kahn A, Antoine B.
Glucose-dependent regulation of the L-pyruvate kinase gene in a hepa-
toma cell line is independent of insulin and cyclic AMP. FASEB J 1994;
8:89–96.
35. Prieve MG, Guttridge KL, Munguia J, Waterman ML. Differential
importin-alpha recognition and nuclear transport by nuclear localization
signals within the high-mobility-group DNA binding domains of lymphoid
enhancer factor 1 and T-cell factor 1. Mol Cell Biol 1998;18: 4819–4832.
36. Gorlich D, Henklein P, Laskey RA, Hartmann E. A 41 amino acid motif in
importin-alpha confers binding to importin-beta and hence transit into
the nucleus. EMBO J 1996;15:1810–1817.
37. Takeda J, Kayano T, Fukomoto H, Bell GI. Organization of the human
GLUT2 (pancreatic beta-cell and hepatocyte) glucose transporter gene.
Diabetes 1993;42:773–777.
Glucose Induces Karyopherin a2 Nuclear Export
Traffic 2004; 5: 10–19 19


