Embed Size (px)
Citation preview
Corrosion Science 51 (2009) 1115–1127
Contents lists available at ScienceDirect
Corrosion Science
journal homepage: www.elsevier .com/locate /corsc i
A first quantitative XPS study of the surface films formed, by exposure to water,on Mg and on the Mg–Al intermetallics: Al3Mg2 and Mg17Al12
Ming Liu a,b,c, Sandrine Zanna c, Helene Ardelean c, Isabelle Frateur c, Patrik Schmutz b, Guangling Song a,Andrej Atrens a,b,c,*, Philippe Marcus c
a The University of Queensland, Division of Materials, St. Lucia, Brisbane, Qld 4072, Australiab EMPA, Swiss Federal Laboratories for Materials Testing and Research, Ueberlandstrasse 129, CH-8600 Dubendorf, Switzerlandc Laboratoire de Physico-Chimie des Surfaces, CNRS-ENSCP (UMR 7045), Ecole Nationale Supérieure de Chimie de Paris (ENSCP), 11 rue Pierre et Marie Curie, 75005 Paris, France
a r t i c l e i n f o a b s t r a c t
Article history:Received 14 November 2008Accepted 18 February 2009Available online 27 February 2009
Keywords:A. MagnesiumA. IntermetallicsB. XPSC. Surface filmsC. Dealloying
0010-938X/$ - see front matter � 2009 Elsevier Ltd. Adoi:10.1016/j.corsci.2009.02.017
* Corresponding author. Address: The UniversityMaterials, St. Lucia, Brisbane, Qld 4072, Australia. Te733653888.
E-mail address: [email protected] (A. Atre
An XPS investigation was carried out of the surface films, formed by exposure to ultrapure water, onmechanically ground Mg and the two Mg–Al intermetallic compounds: Al3Mg2 and Mg17Al12. Themechanically ground Mg surface had a film of MgO at the Mg metal surface covered by a Mg(OH)2 layer,formed by the reaction of the MgO with water vapour in the air. Upon immersion in ultrapure water, thisfilm converted to a duplex film with an inner MgO layer next to the Mg metal and an external poroushydroxide layer. For both intermetallics, the XPS data is consistent with (i) preferential dissolution ofMg and (ii) a 10 nm thick film on the surface after immersion in ultrapure water; the film compositionon Al3Mg2 was AlMg1:4O0:2ðOHÞ5:4 whilst on Mg17Al12 the composition was AlMg2:5ðOHÞ8.
� 2009 Elsevier Ltd. All rights reserved.
1. Introduction
Mg alloys are gaining in interest in different fields of technolog-ical application. They have low density, adequate strength, goodcastability and high damping capacity. They are good candidatesfor structural components in automotive and aerospace applica-tions. They are also gaining popularity for handheld products suchas sporting equipment and electronic products. Their biocompati-bility and biodegradability is interesting for medical implantsand their hydrogen storage capability also needs to be mentioned.The potential advantages are however counteracted by poor corro-sion resistance, due to the high chemical reactivity of Mg and dueto poorly protective nature of the surface films [1–5]. The low sol-ubility limit of many alloying elements means that Mg alloys areoften multiphase with a complex microstructure, consisting of aMg-rich matrix and intermetallic particles.
Although the corrosion behaviour of Mg alloys has been studiedextensively during the last few years [1–27], the role of the micro-scale intermetallic particles is still poorly understood. This is partlythe result of the difficulty of isolating microscale phases for inves-tigation of electrochemical surface reactivity. Depending on theintermetallic composition and their arrangement in the micro-
ll rights reserved.
of Queensland, Division ofl.: +61 733653748; fax: +61
ns).
structure, they play a significant role in accelerating the corrosionof the Mg-rich matrix by galvanic coupling or can play a barrierrole and decrease corrosion. An understanding of the surface prop-erties of the intermetallics will help all the fields of technologicalapplication of Mg alloys and will allow the development of tailorednew alloys with predictable reactivity.
The corrosion of Mg alloys is also related to their surface films[1,2,5], which need to be understood in order to optimize corro-sion/oxidation resistance. A fundamental study of oxides/hydrox-ides forming on Mg alloys needs to be based on knowledge ofthe structure and properties of the surface film on pure Mg andthe Mg-intermetallic phases that form as a result of alloying. Thesurface film on Mg and Mg alloys has been studied for some years.By use of ion beam analysis, Bradford et al. [28] found that thehydroxide film forming on a Mg–Al alloy on exposure to waterwas highly permeable to water, such that the hydration of the me-tal occurred at or close to the metal surface. By using plan-viewobservation, Vermilyea and Kirk [29] suggested a platelet-like mor-phology for the film forming on pure Mg on immersion in distilledwater. In a first paper, Nordlien et al. [30] showed that the filmformed in water exhibited a three-layered morphology: the outermost layer had a platelet-like morphology; there was an innermostrelatively-dense hydrated layer and an apparently dehydratedintermediate layer. In the following paper, Nordlien et al. [31] usedTEM and found pure Mg is protected by a stable air-formed oxidein dry environments and, in aqueous environments, the air-formedfilm is undermined by the formation of a less stable, hydrated
1116 M. Liu et al. / Corrosion Science 51 (2009) 1115–1127
oxide resulting from electrochemical metal oxidation. Splinter andco-workers [32,33] studied Mg and Al surfaces exposed to watervapour and humid air; they found that both surfaces formed par-tially hydrated oxides, which became progressively more hydratedwith longer exposures. Hara et al. [34] found that the surface filmswere mainly composed of Mg(OH)2 for pure Mg and AZ91 exposedto 0.1 M NaCl and 0.1 M Na2SO4. For AZ91 in 0.1 M Na2SO4, Chen etal. [35–37] found that the films were Mg and Al hydroxides andsulfates.
X-ray photoelectron spectroscopy (XPS) is a powerful techniquefor quantitative analysis of time-dependent chemical changesoccurring at the sample surface. For example, Yao et al. [38] re-vealed that the film on pure Mg formed in distilled water wasmainly a mixture of Mg(OH)2 and MgO; Mg(OH)2 was predomi-nantly in the top layer and decreased gradually with depth whilstMgO exhibit the opposite behaviour. Mixed oxy-hydroxide layerswere also reported on scratched Mg after air exposure [39]. Re-cently, Santamaria et al. [40] found that the films formed afterimmersion in an aqueous electrolyte had a bi-layer structure, con-sisting of a thin MgO inner layer and a Mg(OH)2 external layer.They found that quite thick films formed reasonably quickly afterexposure to water, so they adopted a procedure of dry grindingin laboratory air without water and without lubricant to allowstudy of the early stages of film formation after solution exposure.
The present work aims to understand the nature of surface lay-ers on Mg and the two Mg–Al intermetallics Al3Mg2 and Mg17Al12.The focus is on the characterization by XPS of films formed duringinitial solution exposure. The films on Mg were formed under con-ditions similar to those in the work of Santamaria et al. [40] andwere analyzed with a similar approach so that the results of thepresent investigation could be compared directly with the priorstudy. The same approach was then taken in the study of thetwo intermetallics.
2. Experiment
2.1. Materials
Pure Mg was obtained from Goodfellow Cambridge Limited(99.9% purity). The specimens were discs, �11 mm in diameter,2 mm in thickness. Two Mg–Al intermetallics were analyzed.Mg17Al12 was provided by ENSCP; it was produced by meltingthe pure elements by CAST CRC. Al3Mg2 was supplied by EMPA;it is a model Complex Metallic Alloy (CMA) grown by M. Feuerb-acher of the Jülich Research Center GMBH in Germany as part ofthe European Network of excellence NOE CMA (project financed
Table 1Curve fitting parameters.
Inelastic mean free path (nm)
Mg Al3Mg2 Mg17Al12 MgO Mg(OH)2
Mg 3.50 3.40 3.82 3.10 3.28Al 3.36 3.77O 2.09 2.38
Table 2Binding energies (after calibration) of the Mg 2p and O 1s peaks for Mg after different im
Immersion time (s) Metallic Mg 2p Oxidized Mg 2p Carbonate Mg 2p
0 50.0 50.830 49.9 50.3 51.060 50.0 50.4 51.3
120 49.9 50.3 51.2420 50.3 51.2
by the European Commission under contract no. NMP3-CT-2005-500140). The composition of each intermetallic was confirmed byEPMA. Specimens were carefully dry mechanically ground to1200 grit SiC paper in laboratory air, with no lubricant and withno water. A stream of air was used to blow away any surface par-ticles. This specimen condition is designated as MG (mechanicallyground). The specimen grinding was carried out dry, in laboratoryair, with no lubricant and with no water. The specimen was thinand was hand held during grinding; the experimenter could feelno temperature increase during the polishing. The sample wasground to 1000 grit while the XPS apparatus was made ready,the sample was ground to 1200 grit (this took several minutes),immediately introduced into XPS chamber and vacuum pumpingstarted immediately; the pressure reached 6 � 10�2 Pa in about10 min, then the sample was transferred into the high vacuum sys-tem. Removal of the SiC particles was effective as evidenced by thefact that there was only sometimes a weak Si peak and such a Sipeak quickly disappeared after a slight sputter.
2.2. Solutions
The mechanically ground specimen was immersed at roomtemperature in ultrapure (Millipore) water or de-aerated ultrapurewater saturated with Mg(OH)2 which has a pH about 10.5. For de-aerated immersion, the solution was de-aerated by sparging withnitrogen for 45 min before introducing the specimen, the nitrogensparging was continued during specimen exposure to the solutionand a nitrogen atmosphere was maintained above the solution. Allsolutions were made with reagent grade chemicals and ultrapure(Millipore) water. Clean oil-free compressed air was used to dryand clean the sample surface.
2.3. XPS analysis
The Thermo Electron Escalab 250 spectrometer at ENSCP (Paris,France) used monochromatic Al Ka radiation (1486.6 eV). The ana-lyzer pass energy was 100 eV for survey spectra and 20 eV for high-resolution spectra. The spectrometer was calibrated using Au 4f7/2
at 84.1 eV. The following core levels were analyzed: Mg 2p, Al 2p, O1s and C 1s. The photoelectron take-off angle (the angle of the sur-face with the direction in which the photoelectrons are analyzed)was 90�. The X-rays were incident normal at 45� to the specimensurface and the electron detector was normal to the specimen sur-face so that the electrons detected were those that were emittednormal to the specimen surface or close to normal. This approachwas considered to provide acceptable XPS data despite the 1200
Number density (mol/cm3) r T
Mg MgO Mg(OH)2
0.0725 0.0895 0.041 0.3335 33490.537 3381
0.0895 0.083 2.93 3435
mersion time.
Oxide O 1s Hydroxide O 1s Carbonate O 1s Carbonate C 1s
531.0 532.8530.5 532.4 534.0 290.3530.5 532.5 534.2 290.4530.3 532.4 533.9 290.6
532.4 533.7 290.7
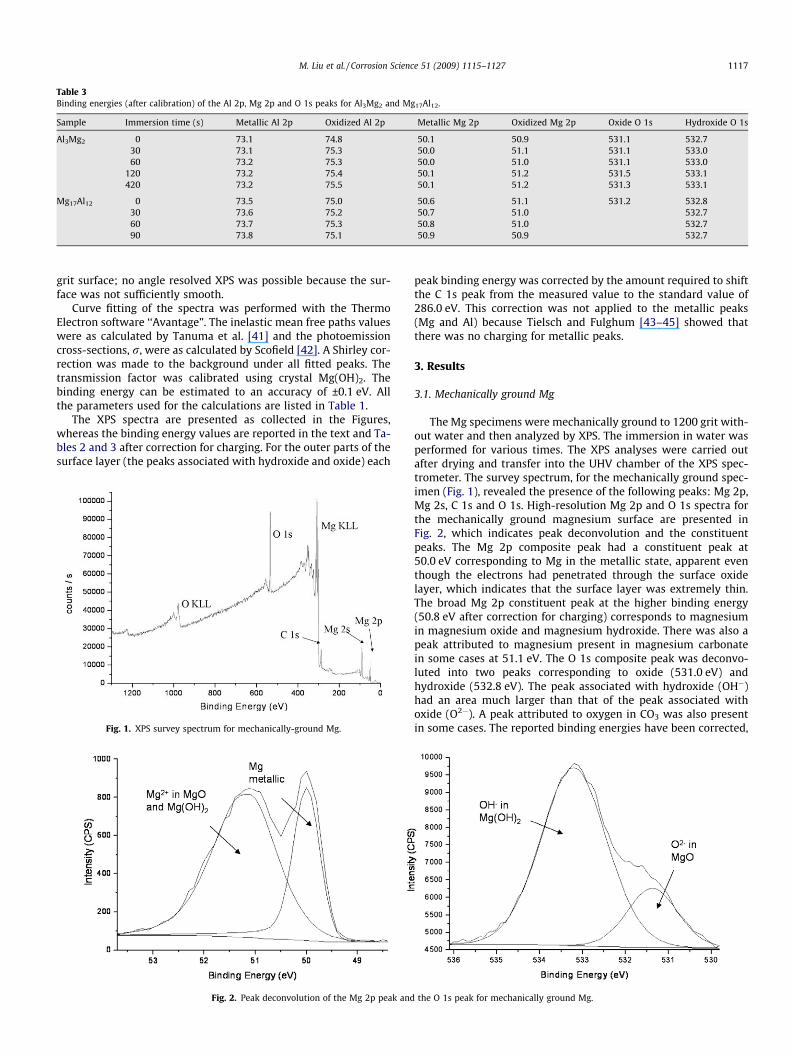
Table 3Binding energies (after calibration) of the Al 2p, Mg 2p and O 1s peaks for Al3Mg2 and Mg17Al12.
Sample Immersion time (s) Metallic Al 2p Oxidized Al 2p Metallic Mg 2p Oxidized Mg 2p Oxide O 1s Hydroxide O 1s
Al3Mg2 0 73.1 74.8 50.1 50.9 531.1 532.730 73.1 75.3 50.0 51.1 531.1 533.060 73.2 75.3 50.0 51.0 531.1 533.0
120 73.2 75.4 50.1 51.2 531.5 533.1420 73.2 75.5 50.1 51.2 531.3 533.1
Mg17Al12 0 73.5 75.0 50.6 51.1 531.2 532.830 73.6 75.2 50.7 51.0 532.760 73.7 75.3 50.8 51.0 532.790 73.8 75.1 50.9 50.9 532.7
M. Liu et al. / Corrosion Science 51 (2009) 1115–1127 1117
grit surface; no angle resolved XPS was possible because the sur-face was not sufficiently smooth.
Curve fitting of the spectra was performed with the ThermoElectron software ‘‘Avantage”. The inelastic mean free paths valueswere as calculated by Tanuma et al. [41] and the photoemissioncross-sections, r, were as calculated by Scofield [42]. A Shirley cor-rection was made to the background under all fitted peaks. Thetransmission factor was calibrated using crystal Mg(OH)2. Thebinding energy can be estimated to an accuracy of ±0.1 eV. Allthe parameters used for the calculations are listed in Table 1.
The XPS spectra are presented as collected in the Figures,whereas the binding energy values are reported in the text and Ta-bles 2 and 3 after correction for charging. For the outer parts of thesurface layer (the peaks associated with hydroxide and oxide) each
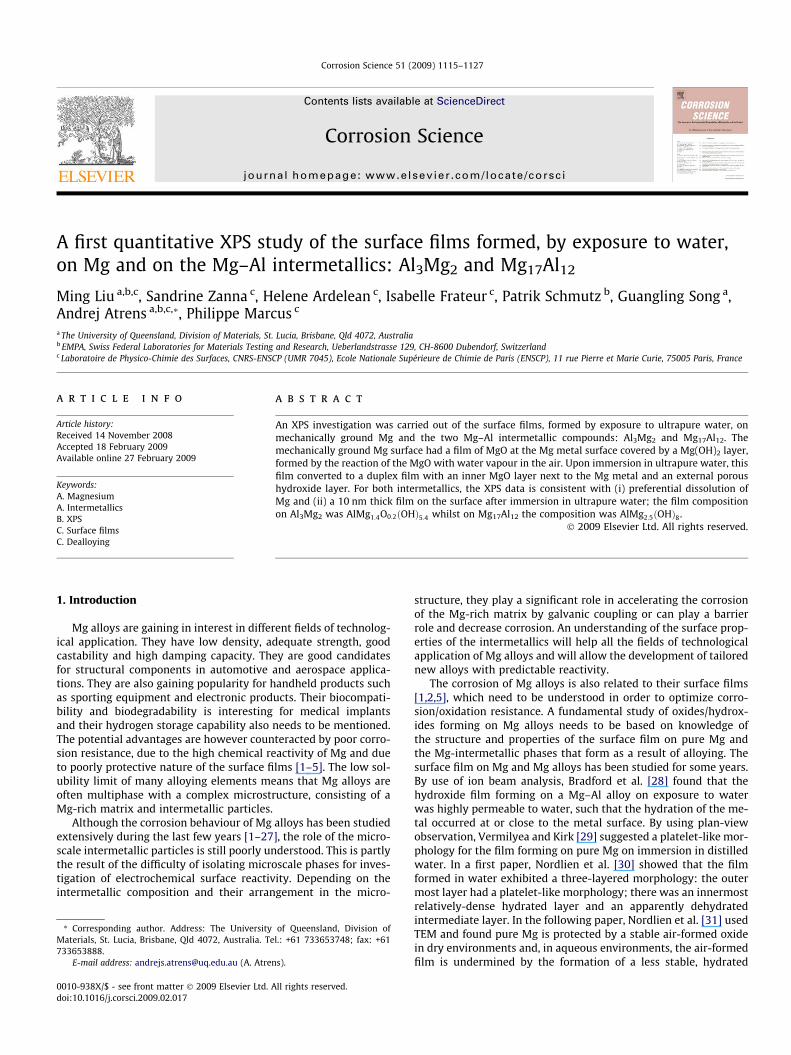
Fig. 1. XPS survey spectrum for mechanically-ground Mg.
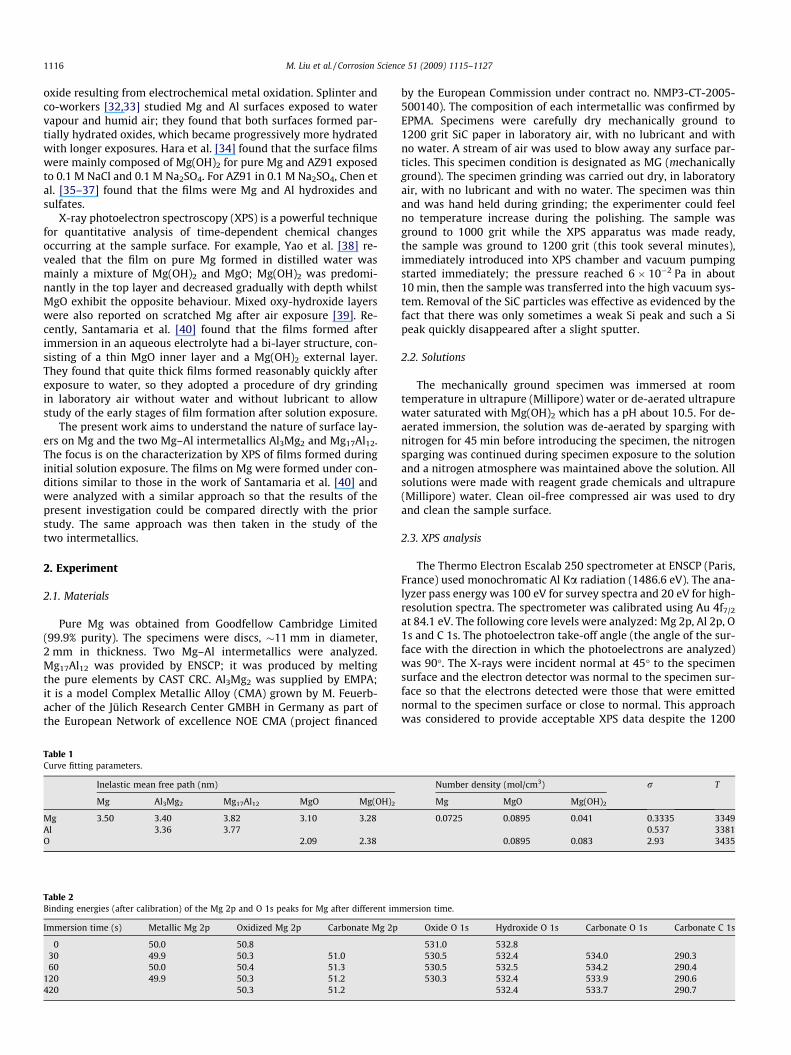
Fig. 2. Peak deconvolution of the Mg 2p peak and
peak binding energy was corrected by the amount required to shiftthe C 1s peak from the measured value to the standard value of286.0 eV. This correction was not applied to the metallic peaks(Mg and Al) because Tielsch and Fulghum [43–45] showed thatthere was no charging for metallic peaks.
3. Results
3.1. Mechanically ground Mg
The Mg specimens were mechanically ground to 1200 grit with-out water and then analyzed by XPS. The immersion in water wasperformed for various times. The XPS analyses were carried outafter drying and transfer into the UHV chamber of the XPS spec-trometer. The survey spectrum, for the mechanically ground spec-imen (Fig. 1), revealed the presence of the following peaks: Mg 2p,Mg 2s, C 1s and O 1s. High-resolution Mg 2p and O 1s spectra forthe mechanically ground magnesium surface are presented inFig. 2, which indicates peak deconvolution and the constituentpeaks. The Mg 2p composite peak had a constituent peak at50.0 eV corresponding to Mg in the metallic state, apparent eventhough the electrons had penetrated through the surface oxidelayer, which indicates that the surface layer was extremely thin.The broad Mg 2p constituent peak at the higher binding energy(50.8 eV after correction for charging) corresponds to magnesiumin magnesium oxide and magnesium hydroxide. There was also apeak attributed to magnesium present in magnesium carbonatein some cases at 51.1 eV. The O 1s composite peak was deconvo-luted into two peaks corresponding to oxide (531.0 eV) andhydroxide (532.8 eV). The peak associated with hydroxide (OH�)had an area much larger than that of the peak associated withoxide (O2�). A peak attributed to oxygen in CO3 was also presentin some cases. The reported binding energies have been corrected,
the O 1s peak for mechanically ground Mg.
1118 M. Liu et al. / Corrosion Science 51 (2009) 1115–1127
using the position of the C 1s signal (286 eV) from the inevitablesurface hydrocarbon contamination. The C 1s composite peak(not shown) also contained a constituent peak, attributed to mag-nesium carbonate, at 290.5 eV whenever the carbonate peak waspresent in the composite oxygen peak.
3.2. First quantitative model – film on Mg
For a first quantitative analysis of the surface layer, the simplestpossible model for the surface layer (SL) was adopted. This modelsimply assumed that an homogeneous oxide/hydroxide surface
Fig. 3. (a–d) Curve fitting of the Mg 2p peak for the mechanically ground Mg surface aftcharging). (e) Mg 2p core level spectra for the mechanically ground Mg surface and aftecharging).
layer covered the whole surface. This model was fitted to the threemeasured peak areas: IMg for the metallic peak, IMg2þ for the Mg2+
peak and IO for the oxygen peak. These peak areas are given bythe following three equations:
IMg ¼ KAðhÞrMgkPureMgMg TMgDPureMg
Mg sin h exp � d
kSLMg sin h
!ð1:1Þ
IMg2þ ¼ KAðhÞrMgkSLMgTMgDSL
Mg sin h 1� exp � d
kSLMg sin h
! !ð1:2Þ
er immersion in ultrapure water for 30 s, 60 s 120 s, 420 s (spectra not corrected forr immersion in ultrapure water for 30 s, 60 s, 120 s, 420 s (spectra not corrected for
M. Liu et al. / Corrosion Science 51 (2009) 1115–1127 1119
IO ¼ KAðhÞrOkSLO TODSL
O sin h 1� exp � d
kSLO sin h
! !ð1:3Þ
In the above equations, K is a constant specific to the partic-ular XPS apparatus; A is the area analyzed; h is the take-off an-gle for the analyzed electrons, h = 90� in this work; rE is thecross-section of photo-ionization for each element E, where Eis Mg or O; kPureMg
Mg , kSLMg and kSL
O correspond to the inelastic meanfree path (IMFP) of Mg 2p or O 1s photoelectrons in metallic Mgand in the surface layer (SL) (as a first approximation the valueused for the IMFP in the surface layer was as for MgO from the
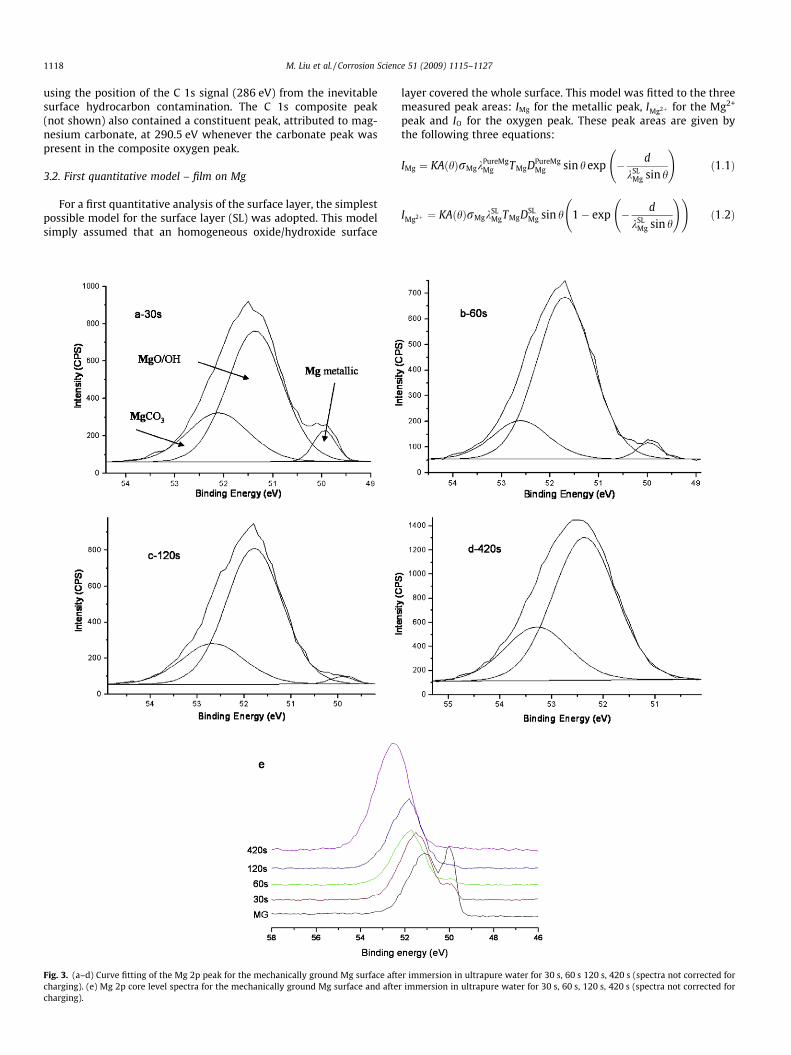
Fig. 4. (a–d) Curve fitting of the O 1s peak for the mechanically ground Mg surface aftercharging). (e) O 1s core level spectra for the mechanically ground Mg surface and aftercharging).
calculations of Tanuma et al. [41]; the choice of this value doesnot have a significant influence on the calculated results); TE isthe transmission factor for each element E; DPureMg
E and DSLE cor-
respond to the number density of the element E in metallicMg and the surface layer (SL), respectively (DSL
E ), was calculatedas in MgO as a first approximation as the surface layer was as-sumed to consist of stoichiometric MgO); and d is the thicknessof the surface layer.
The thickness of the surface layer was calculated, from themetallic peak IMg and the oxidized Mg 2p peak IMg2þ , by rearrangingEq. (1.1) and Eq. (1.2) to give:
immersion in ultrapure water for 30 s, 60 s, 120 s, 420 s (spectra not corrected forimmersion in ultrapure water for 30 s, 60 s, 120 s, 420 s (spectra not corrected for
1120 M. Liu et al. / Corrosion Science 51 (2009) 1115–1127
d ¼ kMgOMg sin h ln
kPureMgMg DPureMg
Mg IMg2þ
kSLMgDSL
MgIMgþ 1
!ð1:4Þ
The thickness of the surface layer was calculated to be �5 nm(based on the assumption that the surface layer was MgO) andwas calculated to be �6 nm (based on the assumption that the sur-face layer was Mg(OH)2). For a mixture containing a preponderanceof hydroxide, the thickness would be calculated to be betweenthese two values and to be closer to �6 nm, that is to be closer tothe value calculated on the basis of Mg(OH)2.
The composition of the surface layer was determined in twosteps. The initial step was to calculate the ratio, RO
Mg2þ , of the num-ber of O atoms to Mg2+ ions in the surface layer, from the oxidizedMg 2p and O 1s peaks from the surface layer; Eq. (1.2) is divided byEq. (1.3) and the resulting equation is rearranged to give an expres-sion for the ratio as follows:
ROMg2þ ¼
DSLO
DSLMg
¼kSL
MgTMgrMgIPO
kSLO TOrOIP
Mg2þ
1� exp � dkSL
Mg sin h
� �
1� exp � dkSL
O sin h
� � ð1:5Þ
The O/Mg2+ ratio was calculated to be 1.30 based on the assumptionthat the surface layer was MgO. Once the amount of oxygen relativeto the magnesium in the surface layer had been determined, the rel-ative number of O2� and OH� ions could be calculated based on thepeak area ratio from the deconvolution of the oxide peak into theconstituent O2� peak and OH� peaks. The composition of the sur-face layer was evaluated as Mg1:0O0:3ðOHÞ1:0. Alternatively, the O/Mg2+ ratio was calculated to be 1.26 based on the assumption thatthe surface layer was Mg(OH)2 and the composition of the surfacelayer was evaluated to be Mg1:0O0:29ðOHÞ0:97, which is essentiallythe same as Mg1:0O0:3ðOHÞ1:0.
This means the surface layer on the Mg after mechanicallygrinding without water is a mixture of MgO and Mg(OH)2, withthe concentration of Mg(OH)2 being significantly greater than thatof MgO, in agreement with the peak areas, Fig. 2. The Mg(OH)2 isexpected to have been formed by a reaction of MgO with water va-pour in the air.
3.3. Mg after immersion in water
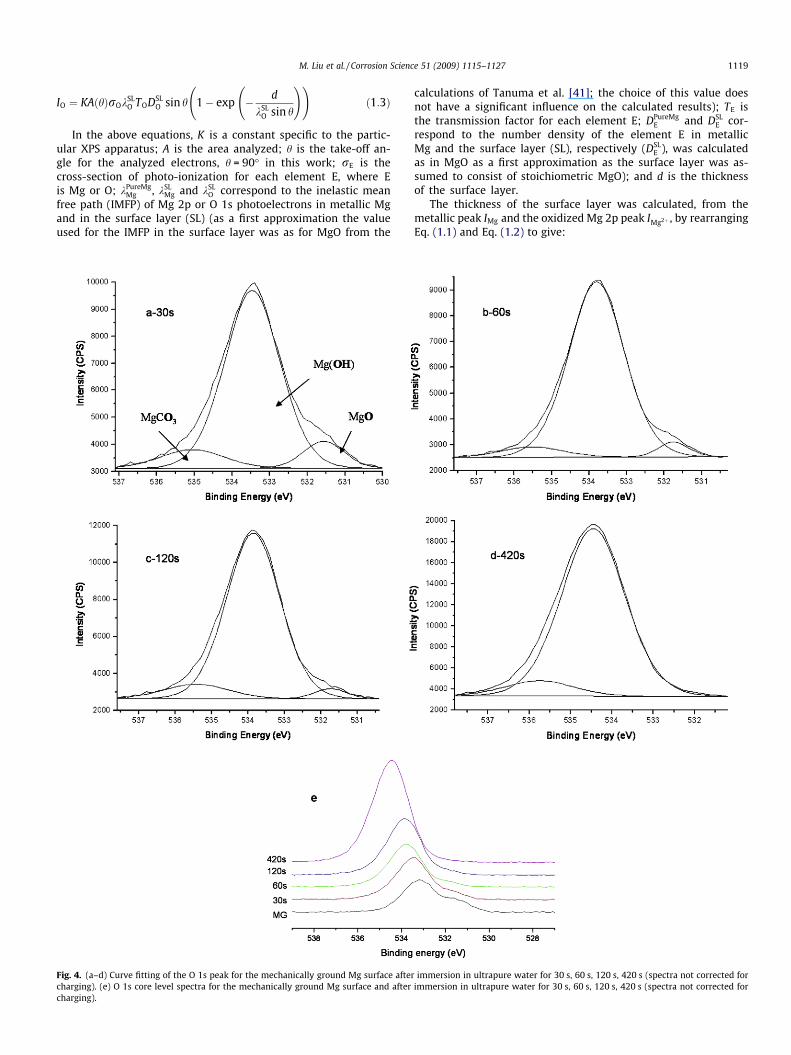
Figs. 3 and 4 present the Mg 2p and O 1s peaks after exposure ofthe mechanically ground Mg to ultrapure (Millipore) water. Table 2
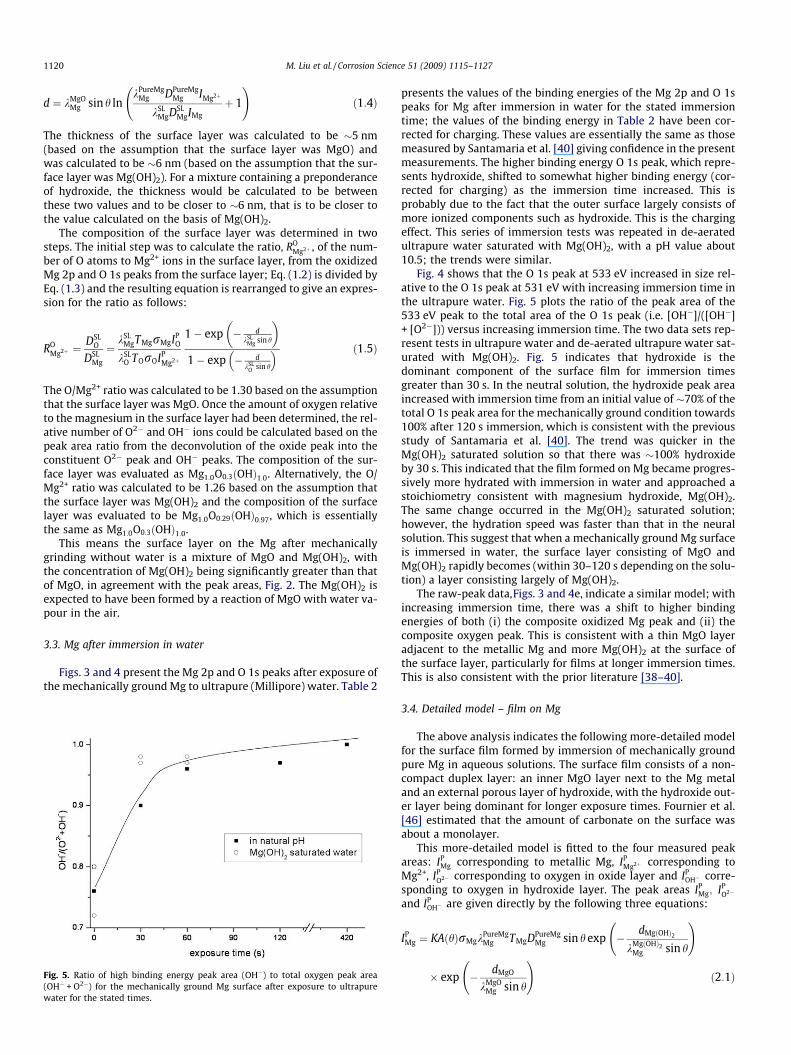
Fig. 5. Ratio of high binding energy peak area (OH�) to total oxygen peak area(OH� + O2�) for the mechanically ground Mg surface after exposure to ultrapurewater for the stated times.
presents the values of the binding energies of the Mg 2p and O 1speaks for Mg after immersion in water for the stated immersiontime; the values of the binding energy in Table 2 have been cor-rected for charging. These values are essentially the same as thosemeasured by Santamaria et al. [40] giving confidence in the presentmeasurements. The higher binding energy O 1s peak, which repre-sents hydroxide, shifted to somewhat higher binding energy (cor-rected for charging) as the immersion time increased. This isprobably due to the fact that the outer surface largely consists ofmore ionized components such as hydroxide. This is the chargingeffect. This series of immersion tests was repeated in de-aeratedultrapure water saturated with Mg(OH)2, with a pH value about10.5; the trends were similar.
Fig. 4 shows that the O 1s peak at 533 eV increased in size rel-ative to the O 1s peak at 531 eV with increasing immersion time inthe ultrapure water. Fig. 5 plots the ratio of the peak area of the533 eV peak to the total area of the O 1s peak (i.e. [OH�]/([OH�]+ [O2�])) versus increasing immersion time. The two data sets rep-resent tests in ultrapure water and de-aerated ultrapure water sat-urated with Mg(OH)2. Fig. 5 indicates that hydroxide is thedominant component of the surface film for immersion timesgreater than 30 s. In the neutral solution, the hydroxide peak areaincreased with immersion time from an initial value of �70% of thetotal O 1s peak area for the mechanically ground condition towards100% after 120 s immersion, which is consistent with the previousstudy of Santamaria et al. [40]. The trend was quicker in theMg(OH)2 saturated solution so that there was �100% hydroxideby 30 s. This indicated that the film formed on Mg became progres-sively more hydrated with immersion in water and approached astoichiometry consistent with magnesium hydroxide, Mg(OH)2.The same change occurred in the Mg(OH)2 saturated solution;however, the hydration speed was faster than that in the neuralsolution. This suggest that when a mechanically ground Mg surfaceis immersed in water, the surface layer consisting of MgO andMg(OH)2 rapidly becomes (within 30–120 s depending on the solu-tion) a layer consisting largely of Mg(OH)2.
The raw-peak data,Figs. 3 and 4e, indicate a similar model; withincreasing immersion time, there was a shift to higher bindingenergies of both (i) the composite oxidized Mg peak and (ii) thecomposite oxygen peak. This is consistent with a thin MgO layeradjacent to the metallic Mg and more Mg(OH)2 at the surface ofthe surface layer, particularly for films at longer immersion times.This is also consistent with the prior literature [38–40].
3.4. Detailed model – film on Mg
The above analysis indicates the following more-detailed modelfor the surface film formed by immersion of mechanically groundpure Mg in aqueous solutions. The surface film consists of a non-compact duplex layer: an inner MgO layer next to the Mg metaland an external porous layer of hydroxide, with the hydroxide out-er layer being dominant for longer exposure times. Fournier et al.[46] estimated that the amount of carbonate on the surface wasabout a monolayer.
This more-detailed model is fitted to the four measured peakareas: IP
Mg corresponding to metallic Mg, IPMg2þ corresponding to
Mg2+, IPO2� corresponding to oxygen in oxide layer and IP
OH� corre-sponding to oxygen in hydroxide layer. The peak areas IP
Mg; IPO2�
and IPOH� are given directly by the following three equations:
IPMg ¼ KAðhÞrMgk
PureMgMg TMgDPureMg
Mg sin h exp �dMgðOHÞ2
kMgðOHÞ2Mg sin h
!
� exp � dMgO
kMgOMg sin h
!ð2:1Þ
M. Liu et al. / Corrosion Science 51 (2009) 1115–1127 1121
IPO2� ¼ KAðhÞrOkMgO
O TODMgOO sin h exp �
dMgðOHÞ2
kMgðOHÞ2O sin h
!
� 1� exp � dMgO
kMgOO sin h
! !ð2:2Þ
IPOH� ¼ KAðhÞrOkMgðOHÞ2
O TODMgðOHÞ2O
� sin h 1� exp �dMgðOHÞ2
kMgðOHÞ2O sin h
! !ð2:3Þ
The parameters have the same meaning as in Eq. (1.1)–(1.3). Thepeak area corresponding to IP
Mg2þ has contributions from both theoxide layer and from the hydroxide layer. Separate equations canbe written for each of these contributions as follows:
IPMgO�Mg2þ ¼ KAðhÞrMgk
MgOMg TMgDMgO
Mg
� sin h exp �dMgðOHÞ2
kMgðOHÞ2Mg sin h
!1� exp � dMgO
kMgOMg sin h
! !
ð2:4Þ
IPMgðOHÞ2�Mg2þ ¼ KAðhÞrMgk
MgðOHÞ2Mg TMgDMgðOHÞ2
Mg
� sin h 1� exp �dMgðOHÞ2
kMgðOHÞ2Mg sin h
! !ð2:5Þ
An expression for IPMg2þ can be written, as the sum of these two con-
tributions (from the oxide layer and from the hydroxide layer) asfollows:
IPMg2þ ¼ IP
MgO�Mg2þ þ IPMgðOHÞ2�Mg2þ ð2:6Þ
In the above equations, kMgOMg , kMgO
O , kMgðOHÞ2Mg and kMgðOHÞ2
O correspond tothe inelastic mean free path (IMFP) of Mg 2p or O 1s photoelectronsin MgO and Mg(OH)2; DMgO
E and DMgðOHÞ2E correspond to the mole
density of the element E (E is Mg or O) in MgO or Mg(OH)2; anddMgO and dMgðOHÞ2 correspond to the thickness of the surface layersof MgO and Mg(OH)2.
If a value is assumed for the quantity of Mg2+ in the oxide layer,i.e. of IP
MgO�Mg2þ ; then the amount of Mg2+ in the hydroxide layer canbe evaluated, by rearranging Eq. (2.6), as follows:
IPMgðOHÞ2�Mg2þ ¼ IP
Mg2þ � IPMgO�Mg2þ ð2:7Þ
Fig. 6. Surface oxide and total layer thickness as determined by XPS as function ofthe immersion time of Mg in ultrapure water. The full symbols are from the presentstudy; the open symbols are from Santamaria et al. [40].
The metallic peak area, IPMg, can be used to provide independent esti-
mates of the thickness of the inner MgO layer, and the outerMg(OH)2 layer, by rearranging Eqs. (2.1), (2.4), (2.5) as follows:
dMgO ¼ kMgOMg sin h ln
kPureMgMg DPureMg
Mg IPMgO�Mg2þ
kMgOMg DMgO
Mg IPMg
þ 1
!ð2:8Þ
dMgðOHÞ2 ¼ kMgðOHÞ2Mg sin h ln
kPureMgMg DPureMg
Mg IPMgðOHÞ2�Mg2þ
kMgðOHÞ2Mg DMgðOHÞ2
Mg IPMg
þ 1
!
� exp � dMgO
kMgOMg sin h
!ð2:9Þ
To fit the model, an optimized value of IPMgO�Mg2þ should be esti-
mated, so that the stoichiometry ratio RO2�inMgOMg2þinMgO
between O2� andMg2+ in the inner oxide layer is equal to the expected value of1.0, which is the theoretical ratio for MgO. Eq. (2.2) is divided byEq. (2.4) and the resulting equation is rearranged to give an expres-sion for the ratio RO2� inMgO
Mg2þinMgOas follows:
RO2�inMgOMg2þinMgO
¼DMgO�O2�
DMgO�Mg2þ¼
kMgOMg TMgrMgIP
O2�
kMgOO TOrOIP
MgO�Mg2þ
�1� exp � dMgO
kMgOMg sin h
� �
1� exp � dMgO
kMgOO sin h
� � exp � dMgðOHÞ2
kMgðOHÞ2Mg sin h
� �
exp � dMgðOHÞ2
kMgðOHÞ2O sin h
� � ð2:10Þ
To confirm the self-consistency of this more-detailed model, thestoichiometry RO2� inMgðOHÞ2
Mg2þ inMgðOHÞ2between O2� and Mg2+ in the outer
hydroxide layer was estimated. If the model is self-consistent, thenthis ratio should have a value close to 2.0, which is the theoreticalratio for Mg(OH)2. The ratio RO2�inMgðOHÞ2
Mg2þ inMgðOHÞ2was evaluated by dividing
Eq. (2.3) by Eq. (2.5) and rearranging as follows:
RO2�inMgðOHÞ2Mg2þinMgðOHÞ2
¼DMgðOHÞ2�OH�
DMgðOHÞ2�Mg2þ¼
kMgðOHÞ2Mg TMgrMgIP
OH�
kMgðOHÞ2O TOrOIP
MgðOHÞ2�Mg2þ
�1� exp � dMgðOHÞ2
kMgðOHÞ2Mg sin h
� �
1� exp � dMgðOHÞ2
kMgðOHÞ2O sin h
� � ð2:11Þ
An average value of �2.07 was calculated for the OH�/Mg2+ ratio, inreasonable agreement with the stoichiometry of Mg(OH)2, indicat-ing that the more-detailed model is indeed self-consistent.
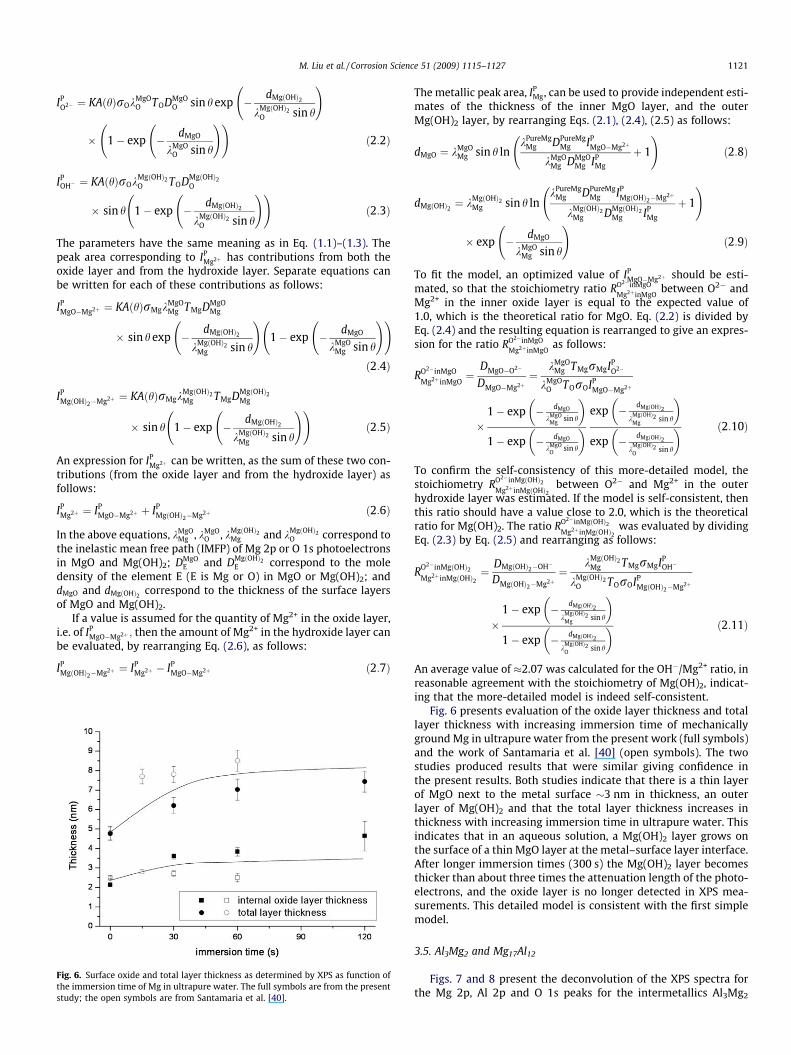
Fig. 6 presents evaluation of the oxide layer thickness and totallayer thickness with increasing immersion time of mechanicallyground Mg in ultrapure water from the present work (full symbols)and the work of Santamaria et al. [40] (open symbols). The twostudies produced results that were similar giving confidence inthe present results. Both studies indicate that there is a thin layerof MgO next to the metal surface �3 nm in thickness, an outerlayer of Mg(OH)2 and that the total layer thickness increases inthickness with increasing immersion time in ultrapure water. Thisindicates that in an aqueous solution, a Mg(OH)2 layer grows onthe surface of a thin MgO layer at the metal–surface layer interface.After longer immersion times (300 s) the Mg(OH)2 layer becomesthicker than about three times the attenuation length of the photo-electrons, and the oxide layer is no longer detected in XPS mea-surements. This detailed model is consistent with the first simplemodel.
3.5. Al3Mg2 and Mg17Al12
Figs. 7 and 8 present the deconvolution of the XPS spectra forthe Mg 2p, Al 2p and O 1s peaks for the intermetallics Al3Mg2
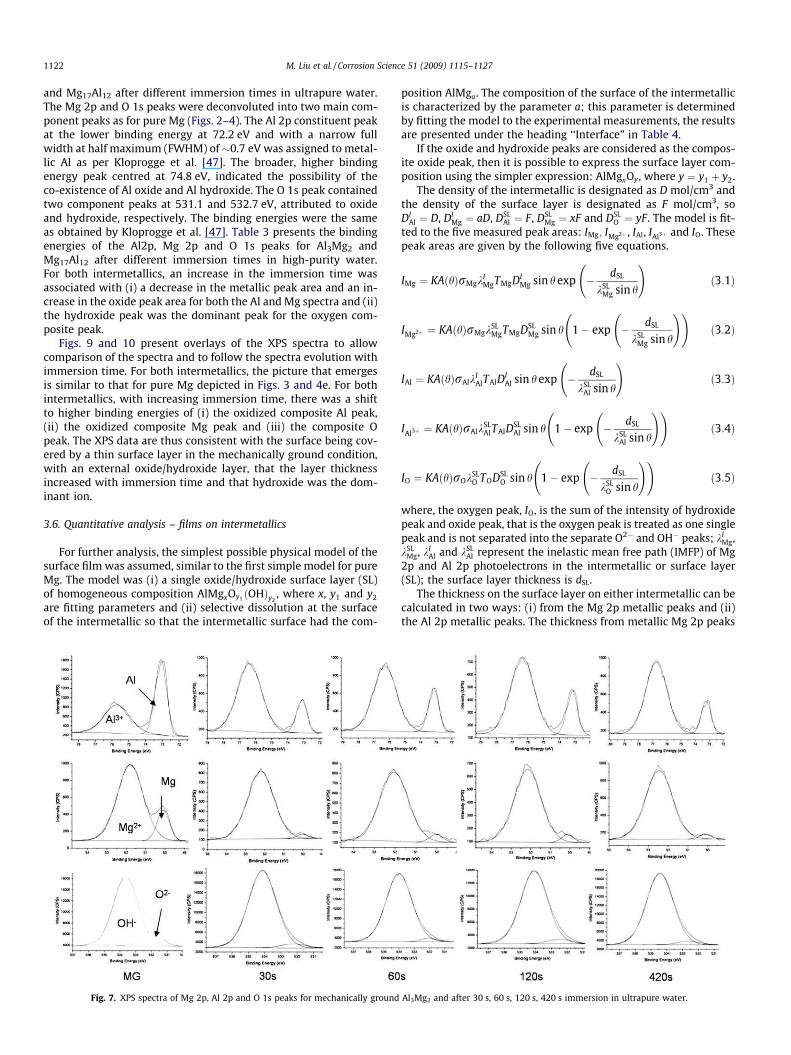
1122 M. Liu et al. / Corrosion Science 51 (2009) 1115–1127
and Mg17Al12 after different immersion times in ultrapure water.The Mg 2p and O 1s peaks were deconvoluted into two main com-ponent peaks as for pure Mg (Figs. 2–4). The Al 2p constituent peakat the lower binding energy at 72.2 eV and with a narrow fullwidth at half maximum (FWHM) of�0.7 eV was assigned to metal-lic Al as per Kloprogge et al. [47]. The broader, higher bindingenergy peak centred at 74.8 eV, indicated the possibility of theco-existence of Al oxide and Al hydroxide. The O 1s peak containedtwo component peaks at 531.1 and 532.7 eV, attributed to oxideand hydroxide, respectively. The binding energies were the sameas obtained by Kloprogge et al. [47]. Table 3 presents the bindingenergies of the Al2p, Mg 2p and O 1s peaks for Al3Mg2 andMg17Al12 after different immersion times in high-purity water.For both intermetallics, an increase in the immersion time wasassociated with (i) a decrease in the metallic peak area and an in-crease in the oxide peak area for both the Al and Mg spectra and (ii)the hydroxide peak was the dominant peak for the oxygen com-posite peak.
Figs. 9 and 10 present overlays of the XPS spectra to allowcomparison of the spectra and to follow the spectra evolution withimmersion time. For both intermetallics, the picture that emergesis similar to that for pure Mg depicted in Figs. 3 and 4e. For bothintermetallics, with increasing immersion time, there was a shiftto higher binding energies of (i) the oxidized composite Al peak,(ii) the oxidized composite Mg peak and (iii) the composite Opeak. The XPS data are thus consistent with the surface being cov-ered by a thin surface layer in the mechanically ground condition,with an external oxide/hydroxide layer, that the layer thicknessincreased with immersion time and that hydroxide was the dom-inant ion.
3.6. Quantitative analysis – films on intermetallics
For further analysis, the simplest possible physical model of thesurface film was assumed, similar to the first simple model for pureMg. The model was (i) a single oxide/hydroxide surface layer (SL)of homogeneous composition AlMgxOy1
ðOHÞy2, where x, y1 and y2
are fitting parameters and (ii) selective dissolution at the surfaceof the intermetallic so that the intermetallic surface had the com-
Fig. 7. XPS spectra of Mg 2p, Al 2p and O 1s peaks for mechanically ground
position AlMga. The composition of the surface of the intermetallicis characterized by the parameter a; this parameter is determinedby fitting the model to the experimental measurements, the resultsare presented under the heading ‘‘Interface” in Table 4.
If the oxide and hydroxide peaks are considered as the compos-ite oxide peak, then it is possible to express the surface layer com-position using the simpler expression: AlMgxOy, where y ¼ y1 þ y2.
The density of the intermetallic is designated as D mol/cm3 andthe density of the surface layer is designated as F mol/cm3, soDI
Al ¼ D, DIMg ¼ aD, DSL
Al ¼ F, DSLMg ¼ xF and DSL
O ¼ yF. The model is fit-ted to the five measured peak areas: IMg; IMg2þ , IAl, IAl3þ and IO. Thesepeak areas are given by the following five equations.
IMg ¼ KAðhÞrMgkIMgTMgDI
Mg sin h exp � dSL
kSLMg sin h
!ð3:1Þ
IMg2þ ¼ KAðhÞrMgkSLMgTMgDSL
Mg sin h 1� exp � dSL
kSLMg sin h
! !ð3:2Þ
IAl ¼ KAðhÞrAlkIAlTAlD
IAl sin h exp � dSL
kSLAl sin h
!ð3:3Þ
IAl3þ ¼ KAðhÞrAlkSLAlTAlD
SLAl sin h 1� exp � dSL
kSLAl sin h
! !ð3:4Þ
IO ¼ KAðhÞrOkSLO TODSL
O sin h 1� exp � dSL
kSLO sin h
! !ð3:5Þ
where, the oxygen peak, IO, is the sum of the intensity of hydroxidepeak and oxide peak, that is the oxygen peak is treated as one singlepeak and is not separated into the separate O2� and OH� peaks; kI
Mg,kSL
Mg, kIAl and kSL
Al represent the inelastic mean free path (IMFP) of Mg2p and Al 2p photoelectrons in the intermetallic or surface layer(SL); the surface layer thickness is dSL.
The thickness on the surface layer on either intermetallic can becalculated in two ways: (i) from the Mg 2p metallic peaks and (ii)the Al 2p metallic peaks. The thickness from metallic Mg 2p peaks
Al3Mg2 and after 30 s, 60 s, 120 s, 420 s immersion in ultrapure water.
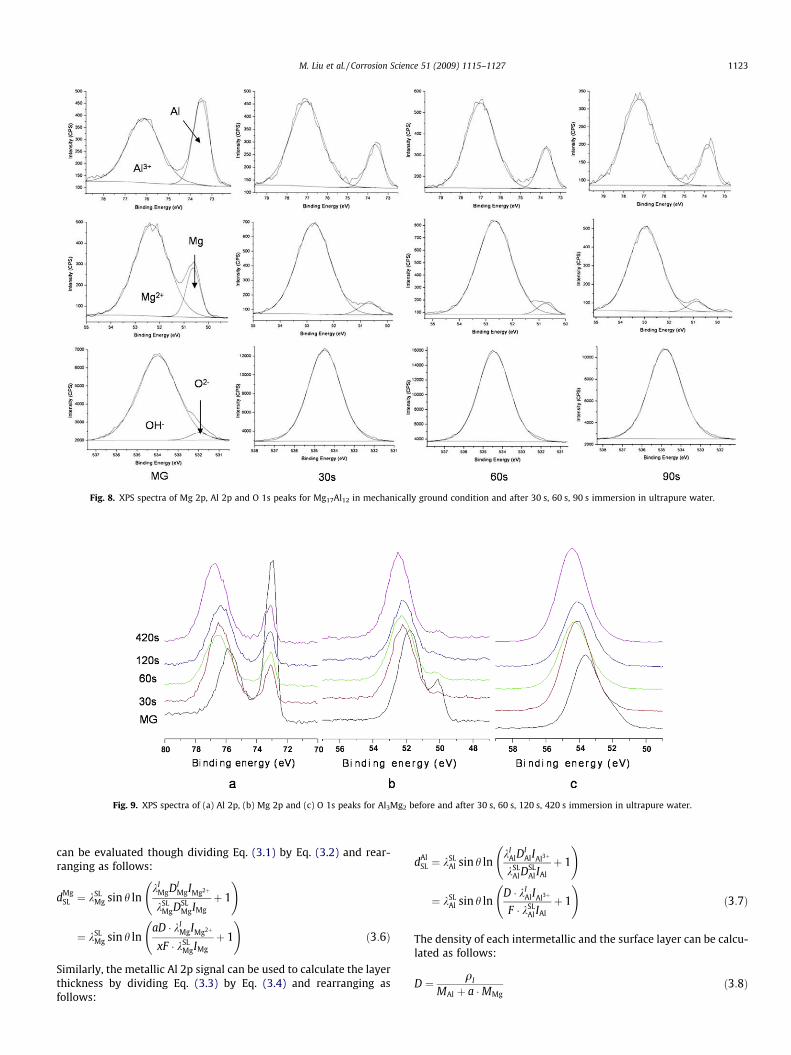
Fig. 8. XPS spectra of Mg 2p, Al 2p and O 1s peaks for Mg17Al12 in mechanically ground condition and after 30 s, 60 s, 90 s immersion in ultrapure water.
Fig. 9. XPS spectra of (a) Al 2p, (b) Mg 2p and (c) O 1s peaks for Al3Mg2 before and after 30 s, 60 s, 120 s, 420 s immersion in ultrapure water.
M. Liu et al. / Corrosion Science 51 (2009) 1115–1127 1123
can be evaluated though dividing Eq. (3.1) by Eq. (3.2) and rear-ranging as follows:
dMgSL ¼ kSL
Mg sin h lnkI
MgDIMgIMg2þ
kSLMgDSL
MgIMgþ 1
!
¼ kSLMg sin h ln
aD � kIMgIMg2þ
xF � kSLMgIMg
þ 1
!ð3:6Þ
Similarly, the metallic Al 2p signal can be used to calculate the layerthickness by dividing Eq. (3.3) by Eq. (3.4) and rearranging asfollows:
dAlSL ¼ kSL
Al sin h lnkI
AlDIAlIAl3þ
kSLAl D
SLAl IAl
þ 1
!
¼ kSLAl sin h ln
D � kIAlIAl3þ
F � kSLAl IAl
þ 1
!ð3:7Þ
The density of each intermetallic and the surface layer can be calcu-lated as follows:
D ¼ qI
MAl þ a �MMgð3:8Þ
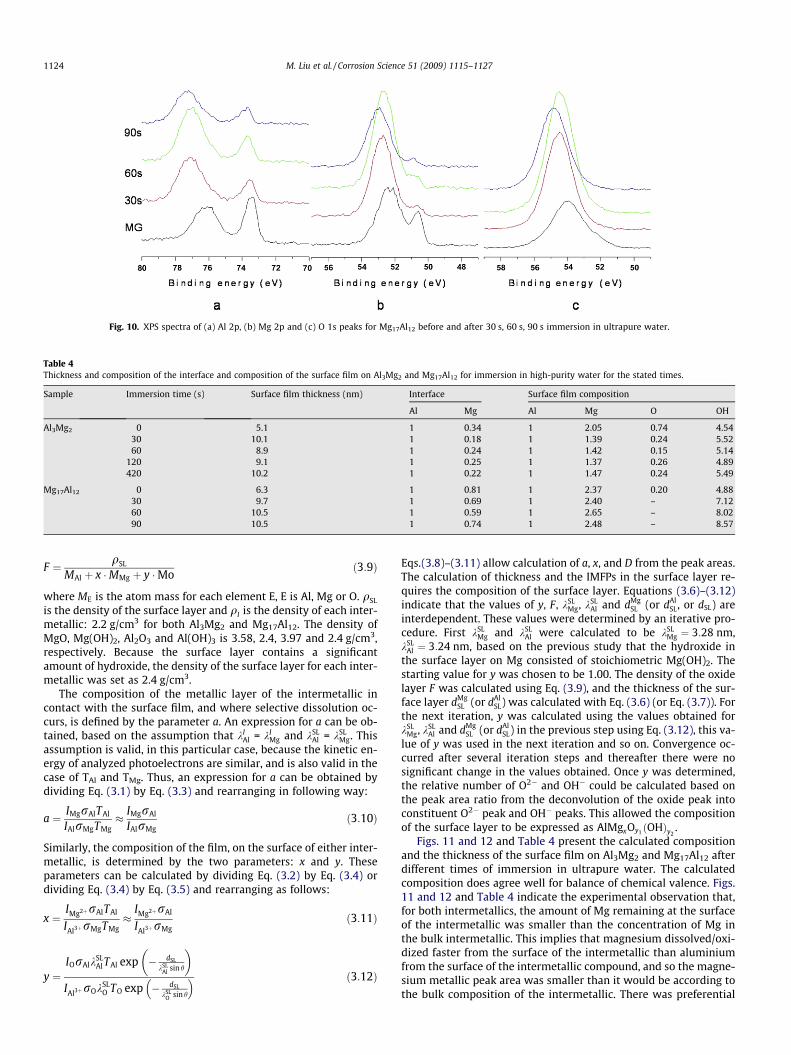
Fig. 10. XPS spectra of (a) Al 2p, (b) Mg 2p and (c) O 1s peaks for Mg17Al12 before and after 30 s, 60 s, 90 s immersion in ultrapure water.
Table 4Thickness and composition of the interface and composition of the surface film on Al3Mg2 and Mg17Al12 for immersion in high-purity water for the stated times.
Sample Immersion time (s) Surface film thickness (nm) Interface Surface film composition
Al Mg Al Mg O OH
Al3Mg2 0 5.1 1 0.34 1 2.05 0.74 4.5430 10.1 1 0.18 1 1.39 0.24 5.5260 8.9 1 0.24 1 1.42 0.15 5.14
120 9.1 1 0.25 1 1.37 0.26 4.89420 10.2 1 0.22 1 1.47 0.24 5.49
Mg17Al12 0 6.3 1 0.81 1 2.37 0.20 4.8830 9.7 1 0.69 1 2.40 – 7.1260 10.5 1 0.59 1 2.65 – 8.0290 10.5 1 0.74 1 2.48 – 8.57
1124 M. Liu et al. / Corrosion Science 51 (2009) 1115–1127
F ¼ qSL
MAl þ x �MMg þ y �Moð3:9Þ
where ME is the atom mass for each element E, E is Al, Mg or O. qSL
is the density of the surface layer and qI is the density of each inter-metallic: 2.2 g/cm3 for both Al3Mg2 and Mg17Al12. The density ofMgO, Mg(OH)2, Al2O3 and Al(OH)3 is 3.58, 2.4, 3.97 and 2.4 g/cm3,respectively. Because the surface layer contains a significantamount of hydroxide, the density of the surface layer for each inter-metallic was set as 2.4 g/cm3.
The composition of the metallic layer of the intermetallic incontact with the surface film, and where selective dissolution oc-curs, is defined by the parameter a. An expression for a can be ob-tained, based on the assumption that kI
Al = kIMg and kSL
Al = kSLMg. This
assumption is valid, in this particular case, because the kinetic en-ergy of analyzed photoelectrons are similar, and is also valid in thecase of TAl and TMg. Thus, an expression for a can be obtained bydividing Eq. (3.1) by Eq. (3.3) and rearranging in following way:
a ¼ IMgrAlTAl
IAlrMgTMg� IMgrAl
IAlrMgð3:10Þ
Similarly, the composition of the film, on the surface of either inter-metallic, is determined by the two parameters: x and y. Theseparameters can be calculated by dividing Eq. (3.2) by Eq. (3.4) ordividing Eq. (3.4) by Eq. (3.5) and rearranging as follows:
x ¼IMg2þrAlTAl
IAl3þrMgTMg�
IMg2þrAl
IAl3þrMgð3:11Þ
y ¼IOrAlk
SLAlTAl exp � dSL
kSLAl sin h
� �
IAl3þrOkSLO TO exp � dSL
kSLO sin h
� � ð3:12Þ
Eqs.(3.8)–(3.11) allow calculation of a, x, and D from the peak areas.The calculation of thickness and the IMFPs in the surface layer re-quires the composition of the surface layer. Equations (3.6)–(3.12)indicate that the values of y, F, kSL
Mg, kSLAl and dMg
SL (or dAlSL, or dSL) are
interdependent. These values were determined by an iterative pro-cedure. First kSL
Mg and kSLAl were calculated to be kSL
Mg ¼ 3:28 nm,kSL
Al ¼ 3:24 nm, based on the previous study that the hydroxide inthe surface layer on Mg consisted of stoichiometric Mg(OH)2. Thestarting value for y was chosen to be 1.00. The density of the oxidelayer F was calculated using Eq. (3.9), and the thickness of the sur-face layer dMg
SL (or dAlSL) was calculated with Eq. (3.6) (or Eq. (3.7)). For
the next iteration, y was calculated using the values obtained forkSL
Mg, kSLAl and dMg
SL (or dAlSL) in the previous step using Eq. (3.12), this va-
lue of y was used in the next iteration and so on. Convergence oc-curred after several iteration steps and thereafter there were nosignificant change in the values obtained. Once y was determined,the relative number of O2� and OH� could be calculated based onthe peak area ratio from the deconvolution of the oxide peak intoconstituent O2� peak and OH� peaks. This allowed the compositionof the surface layer to be expressed as AlMgxOy1 ðOHÞy2
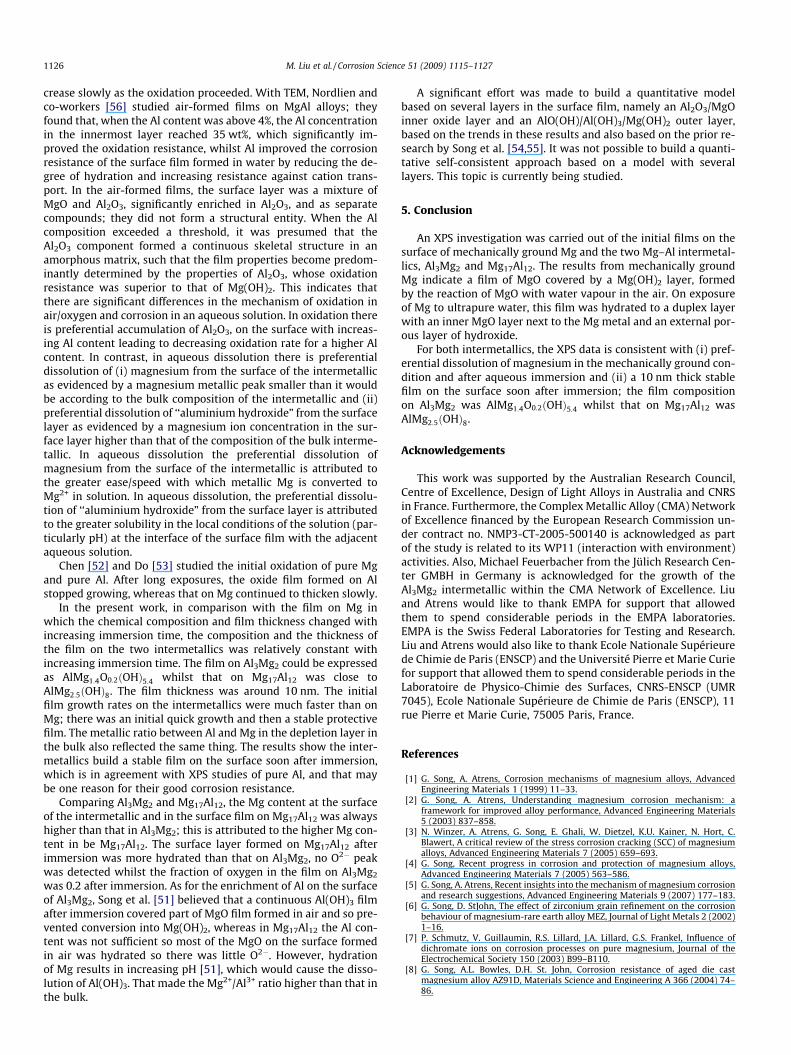
.Figs. 11 and 12 and Table 4 present the calculated composition
and the thickness of the surface film on Al3Mg2 and Mg17Al12 afterdifferent times of immersion in ultrapure water. The calculatedcomposition does agree well for balance of chemical valence. Figs.11 and 12 and Table 4 indicate the experimental observation that,for both intermetallics, the amount of Mg remaining at the surfaceof the intermetallic was smaller than the concentration of Mg inthe bulk intermetallic. This implies that magnesium dissolved/oxi-dized faster from the surface of the intermetallic than aluminiumfrom the surface of the intermetallic compound, and so the magne-sium metallic peak area was smaller than it would be according tothe bulk composition of the intermetallic. There was preferential
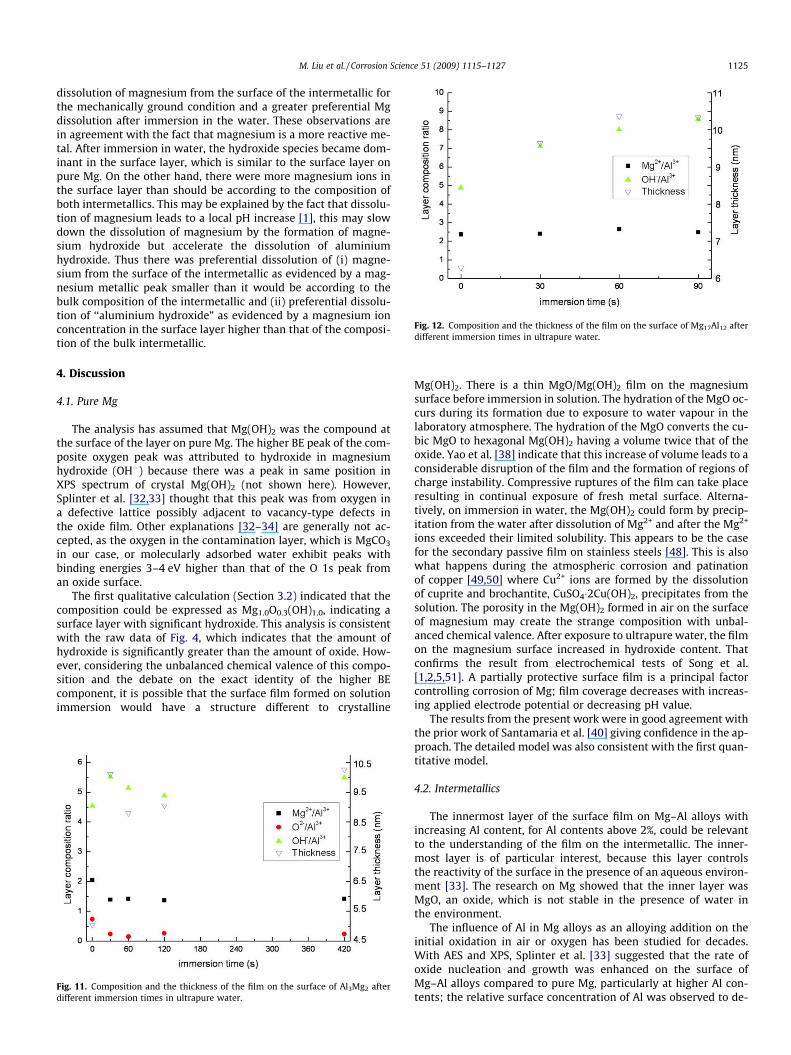
Fig. 12. Composition and the thickness of the film on the surface of Mg17Al12 afterdifferent immersion times in ultrapure water.
M. Liu et al. / Corrosion Science 51 (2009) 1115–1127 1125
dissolution of magnesium from the surface of the intermetallic forthe mechanically ground condition and a greater preferential Mgdissolution after immersion in the water. These observations arein agreement with the fact that magnesium is a more reactive me-tal. After immersion in water, the hydroxide species became dom-inant in the surface layer, which is similar to the surface layer onpure Mg. On the other hand, there were more magnesium ions inthe surface layer than should be according to the composition ofboth intermetallics. This may be explained by the fact that dissolu-tion of magnesium leads to a local pH increase [1], this may slowdown the dissolution of magnesium by the formation of magne-sium hydroxide but accelerate the dissolution of aluminiumhydroxide. Thus there was preferential dissolution of (i) magne-sium from the surface of the intermetallic as evidenced by a mag-nesium metallic peak smaller than it would be according to thebulk composition of the intermetallic and (ii) preferential dissolu-tion of ‘‘aluminium hydroxide” as evidenced by a magnesium ionconcentration in the surface layer higher than that of the composi-tion of the bulk intermetallic.
4. Discussion
4.1. Pure Mg
The analysis has assumed that Mg(OH)2 was the compound atthe surface of the layer on pure Mg. The higher BE peak of the com-posite oxygen peak was attributed to hydroxide in magnesiumhydroxide (OH�) because there was a peak in same position inXPS spectrum of crystal Mg(OH)2 (not shown here). However,Splinter et al. [32,33] thought that this peak was from oxygen ina defective lattice possibly adjacent to vacancy-type defects inthe oxide film. Other explanations [32–34] are generally not ac-cepted, as the oxygen in the contamination layer, which is MgCO3
in our case, or molecularly adsorbed water exhibit peaks withbinding energies 3–4 eV higher than that of the O 1s peak froman oxide surface.
The first qualitative calculation (Section 3.2) indicated that thecomposition could be expressed as Mg1.0O0.3(OH)1.0, indicating asurface layer with significant hydroxide. This analysis is consistentwith the raw data of Fig. 4, which indicates that the amount ofhydroxide is significantly greater than the amount of oxide. How-ever, considering the unbalanced chemical valence of this compo-sition and the debate on the exact identity of the higher BEcomponent, it is possible that the surface film formed on solutionimmersion would have a structure different to crystalline
Fig. 11. Composition and the thickness of the film on the surface of Al3Mg2 afterdifferent immersion times in ultrapure water.
Mg(OH)2. There is a thin MgO/Mg(OH)2 film on the magnesiumsurface before immersion in solution. The hydration of the MgO oc-curs during its formation due to exposure to water vapour in thelaboratory atmosphere. The hydration of the MgO converts the cu-bic MgO to hexagonal Mg(OH)2 having a volume twice that of theoxide. Yao et al. [38] indicate that this increase of volume leads to aconsiderable disruption of the film and the formation of regions ofcharge instability. Compressive ruptures of the film can take placeresulting in continual exposure of fresh metal surface. Alterna-tively, on immersion in water, the Mg(OH)2 could form by precip-itation from the water after dissolution of Mg2+ and after the Mg2+
ions exceeded their limited solubility. This appears to be the casefor the secondary passive film on stainless steels [48]. This is alsowhat happens during the atmospheric corrosion and patinationof copper [49,50] where Cu2+ ions are formed by the dissolutionof cuprite and brochantite, CuSO4�2Cu(OH)2, precipitates from thesolution. The porosity in the Mg(OH)2 formed in air on the surfaceof magnesium may create the strange composition with unbal-anced chemical valence. After exposure to ultrapure water, the filmon the magnesium surface increased in hydroxide content. Thatconfirms the result from electrochemical tests of Song et al.[1,2,5,51]. A partially protective surface film is a principal factorcontrolling corrosion of Mg; film coverage decreases with increas-ing applied electrode potential or decreasing pH value.
The results from the present work were in good agreement withthe prior work of Santamaria et al. [40] giving confidence in the ap-proach. The detailed model was also consistent with the first quan-titative model.
4.2. Intermetallics
The innermost layer of the surface film on Mg–Al alloys withincreasing Al content, for Al contents above 2%, could be relevantto the understanding of the film on the intermetallic. The inner-most layer is of particular interest, because this layer controlsthe reactivity of the surface in the presence of an aqueous environ-ment [33]. The research on Mg showed that the inner layer wasMgO, an oxide, which is not stable in the presence of water inthe environment.
The influence of Al in Mg alloys as an alloying addition on theinitial oxidation in air or oxygen has been studied for decades.With AES and XPS, Splinter et al. [33] suggested that the rate ofoxide nucleation and growth was enhanced on the surface ofMg–Al alloys compared to pure Mg, particularly at higher Al con-tents; the relative surface concentration of Al was observed to de-
1126 M. Liu et al. / Corrosion Science 51 (2009) 1115–1127
crease slowly as the oxidation proceeded. With TEM, Nordlien andco-workers [56] studied air-formed films on MgAl alloys; theyfound that, when the Al content was above 4%, the Al concentrationin the innermost layer reached 35 wt%, which significantly im-proved the oxidation resistance, whilst Al improved the corrosionresistance of the surface film formed in water by reducing the de-gree of hydration and increasing resistance against cation trans-port. In the air-formed films, the surface layer was a mixture ofMgO and Al2O3, significantly enriched in Al2O3, and as separatecompounds; they did not form a structural entity. When the Alcomposition exceeded a threshold, it was presumed that theAl2O3 component formed a continuous skeletal structure in anamorphous matrix, such that the film properties become predom-inantly determined by the properties of Al2O3, whose oxidationresistance was superior to that of Mg(OH)2. This indicates thatthere are significant differences in the mechanism of oxidation inair/oxygen and corrosion in an aqueous solution. In oxidation thereis preferential accumulation of Al2O3, on the surface with increas-ing Al content leading to decreasing oxidation rate for a higher Alcontent. In contrast, in aqueous dissolution there is preferentialdissolution of (i) magnesium from the surface of the intermetallicas evidenced by a magnesium metallic peak smaller than it wouldbe according to the bulk composition of the intermetallic and (ii)preferential dissolution of ‘‘aluminium hydroxide” from the surfacelayer as evidenced by a magnesium ion concentration in the sur-face layer higher than that of the composition of the bulk interme-tallic. In aqueous dissolution the preferential dissolution ofmagnesium from the surface of the intermetallic is attributed tothe greater ease/speed with which metallic Mg is converted toMg2+ in solution. In aqueous dissolution, the preferential dissolu-tion of ‘‘aluminium hydroxide” from the surface layer is attributedto the greater solubility in the local conditions of the solution (par-ticularly pH) at the interface of the surface film with the adjacentaqueous solution.
Chen [52] and Do [53] studied the initial oxidation of pure Mgand pure Al. After long exposures, the oxide film formed on Alstopped growing, whereas that on Mg continued to thicken slowly.
In the present work, in comparison with the film on Mg inwhich the chemical composition and film thickness changed withincreasing immersion time, the composition and the thickness ofthe film on the two intermetallics was relatively constant withincreasing immersion time. The film on Al3Mg2 could be expressedas AlMg1:4O0:2ðOHÞ5:4 whilst that on Mg17Al12 was close toAlMg2:5ðOHÞ8. The film thickness was around 10 nm. The initialfilm growth rates on the intermetallics were much faster than onMg; there was an initial quick growth and then a stable protectivefilm. The metallic ratio between Al and Mg in the depletion layer inthe bulk also reflected the same thing. The results show the inter-metallics build a stable film on the surface soon after immersion,which is in agreement with XPS studies of pure Al, and that maybe one reason for their good corrosion resistance.
Comparing Al3Mg2 and Mg17Al12, the Mg content at the surfaceof the intermetallic and in the surface film on Mg17Al12 was alwayshigher than that in Al3Mg2; this is attributed to the higher Mg con-tent in be Mg17Al12. The surface layer formed on Mg17Al12 afterimmersion was more hydrated than that on Al3Mg2, no O2� peakwas detected whilst the fraction of oxygen in the film on Al3Mg2
was 0.2 after immersion. As for the enrichment of Al on the surfaceof Al3Mg2, Song et al. [51] believed that a continuous Al(OH)3 filmafter immersion covered part of MgO film formed in air and so pre-vented conversion into Mg(OH)2, whereas in Mg17Al12 the Al con-tent was not sufficient so most of the MgO on the surface formedin air was hydrated so there was little O2�. However, hydrationof Mg results in increasing pH [51], which would cause the disso-lution of Al(OH)3. That made the Mg2+/Al3+ ratio higher than that inthe bulk.
A significant effort was made to build a quantitative modelbased on several layers in the surface film, namely an Al2O3/MgOinner oxide layer and an AlO(OH)/Al(OH)3/Mg(OH)2 outer layer,based on the trends in these results and also based on the prior re-search by Song et al. [54,55]. It was not possible to build a quanti-tative self-consistent approach based on a model with severallayers. This topic is currently being studied.
5. Conclusion
An XPS investigation was carried out of the initial films on thesurface of mechanically ground Mg and the two Mg–Al intermetal-lics, Al3Mg2 and Mg17Al12. The results from mechanically groundMg indicate a film of MgO covered by a Mg(OH)2 layer, formedby the reaction of MgO with water vapour in the air. On exposureof Mg to ultrapure water, this film was hydrated to a duplex layerwith an inner MgO layer next to the Mg metal and an external por-ous layer of hydroxide.
For both intermetallics, the XPS data is consistent with (i) pref-erential dissolution of magnesium in the mechanically ground con-dition and after aqueous immersion and (ii) a 10 nm thick stablefilm on the surface soon after immersion; the film compositionon Al3Mg2 was AlMg1:4O0:2ðOHÞ5:4 whilst that on Mg17Al12 wasAlMg2:5ðOHÞ8.
Acknowledgements
This work was supported by the Australian Research Council,Centre of Excellence, Design of Light Alloys in Australia and CNRSin France. Furthermore, the Complex Metallic Alloy (CMA) Networkof Excellence financed by the European Research Commission un-der contract no. NMP3-CT-2005-500140 is acknowledged as partof the study is related to its WP11 (interaction with environment)activities. Also, Michael Feuerbacher from the Jülich Research Cen-ter GMBH in Germany is acknowledged for the growth of theAl3Mg2 intermetallic within the CMA Network of Excellence. Liuand Atrens would like to thank EMPA for support that allowedthem to spend considerable periods in the EMPA laboratories.EMPA is the Swiss Federal Laboratories for Testing and Research.Liu and Atrens would also like to thank Ecole Nationale Supérieurede Chimie de Paris (ENSCP) and the Université Pierre et Marie Curiefor support that allowed them to spend considerable periods in theLaboratoire de Physico-Chimie des Surfaces, CNRS-ENSCP (UMR7045), Ecole Nationale Supérieure de Chimie de Paris (ENSCP), 11rue Pierre et Marie Curie, 75005 Paris, France.
References
[1] G. Song, A. Atrens, Corrosion mechanisms of magnesium alloys, AdvancedEngineering Materials 1 (1999) 11–33.
[2] G. Song, A. Atrens, Understanding magnesium corrosion mechanism: aframework for improved alloy performance, Advanced Engineering Materials5 (2003) 837–858.
[3] N. Winzer, A. Atrens, G. Song, E. Ghali, W. Dietzel, K.U. Kainer, N. Hort, C.Blawert, A critical review of the stress corrosion cracking (SCC) of magnesiumalloys, Advanced Engineering Materials 7 (2005) 659–693.
[4] G. Song, Recent progress in corrosion and protection of magnesium alloys,Advanced Engineering Materials 7 (2005) 563–586.
[5] G. Song, A. Atrens, Recent insights into the mechanism of magnesium corrosionand research suggestions, Advanced Engineering Materials 9 (2007) 177–183.
[6] G. Song, D. StJohn, The effect of zirconium grain refinement on the corrosionbehaviour of magnesium-rare earth alloy MEZ, Journal of Light Metals 2 (2002)1–16.
[7] P. Schmutz, V. Guillaumin, R.S. Lillard, J.A. Lillard, G.S. Frankel, Influence ofdichromate ions on corrosion processes on pure magnesium, Journal of theElectrochemical Society 150 (2003) B99–B110.
[8] G. Song, A.L. Bowles, D.H. St. John, Corrosion resistance of aged die castmagnesium alloy AZ91D, Materials Science and Engineering A 366 (2004) 74–86.
M. Liu et al. / Corrosion Science 51 (2009) 1115–1127 1127
[9] G. Song, D. St. John, Corrosion behaviour of magnesium in ethylene glycol,Corrosion Science 46 (2004) 1381–1399.
[10] A. Atrens, W. Dietzel, The negative difference effect and unipositive Mg+,Advanced Engineering Materials 9 (2007) 292–297.
[11] M.C. Zhao, M. Liu, G. Song, A. Atrens, Influence of homogenization annealing ofAZ91 on mechanical properties and corrosion behavior, Advanced EngineeringMaterials 10 (2008) 93–103.
[12] M.C. Zhao, M. Liu, G. Song, A. Atrens, Influence of microstructure on corrosionof as-cast ZE41, Advanced Engineering Materials 10 (2008) 104–111.
[13] M.C. Zhao, M. Liu, G. Song, A. Atrens, Influence of the b-phase morphology onthe corrosion of the Mg alloy AZ91, Corrosion Science 50 (2008) 1939–1953.
[14] M.C. Zhao, M. Liu, G. Song, A. Atrens, Influence of pH and chloride ionconcentration on the corrosion of Mg alloy ZE41, Corrosion Science 50 (2008)3168–3178.
[15] S. Bender, J. Goellner, A. Atrens, A study of the corrosion of AZ91 in 1 N NaCland the mechanism of magnesium corrosion, Advanced Engineering Materials10 (2008) 583–587.
[16] M. Liu, D. Qiu, M.C. Zhao, G. Song, A. Atrens, The effect of crystallographicorientation on the active corrosion of pure magnesium, Scripta Materialia 58(2008) 421–424.
[17] J.W. Chang, X.W. Guo, P.H. Fu, A. Atrens, L.M. Peng, W.J. Ding, X.S. Wang, Acomparison of the corrosion behaviour in 5% NaCl solution of Mg alloys NZ30Kand AZ91D, Journal of Applied Electrochemistry 38 (2008) 207.
[18] G. Wu, Y. Fan, A. Atrens, C. Zhai, W. Ding, Electrochemical behavior ofmagnesium alloys AZ91D, AZCe2, and AZLa1 in chloride and sulfate solutions,Journal of Applied Electrochemistry 38 (2008) 251–257.
[19] N. Winzer, A. Atrens, W. Dietzel, G. Song, K.U. Kainer, The fractography ofstress corrosion cracking (SCC) of Mg–Al alloys, Metallurgical and MaterialsTransactions A 39 (2008) 1157.
[20] N. Winzer, A. Atrens, W. Dietzel, V.S. Raja, G. Song, K.U. Kainer,Characterisation of stress corrosion cracking (SCC) of Mg–Al alloys, MaterialsScience and Engineering A 488 (2008) 339–351.
[21] M.B. Haroush, C.B. Hamu, D. Eliezer, L. Wagner, The relation betweenmicrostructure and corrosion behavior of AZ80 Mg alloy following differentextrusion temperatures, Corrosion Science 50 (2008) 1766.
[22] Z. Xuehua, H. Yuanwei, W. Zhongling, C. Qiurong, G. Fuxing, Improvement ofcorrosion resistance of AZ91D magnesium alloy by holmium addition,Corrosion Science 48 (2006) 4223.
[23] J.X. Jia, G.L. Song, A. Atrens, Influence of geometry on galvanic corrosion ofAZ91D coupled to steel, Corrosion Science 48 (2006) 2133–2153.
[24] J.X. Jia, A. Atrens, G. Song, T. Muster, Simulation of galvanic corrosion ofmagnesium coupled to a steel fastener in NaCl solution, Materials andCorrosion 56 (2005) 468–474.
[25] J. Chen, J. Dong, J. Wang, E. Han, W. Ke, Effect of magnesium hydride on thecorrosion behavior of an AZ91 magnesium alloy in sodium chloride solution,Corrosion Science 50 (2008) 3610–3614.
[26] J. Chen, J. Wang, E. Han, W. Ke, Effects of dust and salt particles on theformation and spreading of micro-droplets on AZ91 magnesium alloy,Corrosion Science 50 (2008) 1449–1459.
[27] J. Chen, J. Wang, E. Han, W. Ke, In situ observation of crack initiation andpropagation of the charged magnesium alloy under cyclic wet–dry conditions,Corrosion Science 50 (2008) 2338–2341.
[28] P.M. Bradford, B. Case, G. Dearnaley, J.F. Turner, I.S. Woolsey, Ion beam analysisof corrosion films on a high magnesium alloy (Magnox Al 80), CorrosionScience 16 (1976) 747–766.
[29] D.A. Vermilyea, C.F. Kirk, Studies of inhibition of magnesium corrosion, Journalof the Electrochemical Society 116 (1969) 1487–1492.
[30] J.H. Nordlien, O. Sachiko, M. Noburo, N. Kemal, Morphology and structure ofoxide-films formed on magnesium by exposure to air water, The Journal of theElectrochemical Society 142 (1995) 3320–3322.
[31] J.H. Nordlien, S. Ono, N. Masuko, K. Nisancioglu, A TEM investigation ofnaturally formed oxide films on pure magnesium, Corrosion Science 39 (1997)1397–1414.
[32] S.J. Splinter, An AES and XPS study of the initial oxidation of polycrystallinemagnesium with water vapour at room température, Surface Science 292(1993) 130–144.
[33] S.J. Splinter, The initial interaction of water vapour with Mg–Al alloy surfacesat room température, Surface Science 314 (1994) 157–171.
[34] N. Hara, Y. Kobayashi, D. Kagaya, N. Akao, Formation and breakdown of surfacefilms on magnesium and its alloys in aqueous solutions, Corrosion Science 49(2007) 166–175.
[35] J. Chen, J. Wang, E. Han, J. Dong, W. Ke, AC impedance spectroscopy study ofthe corrosion behavior of an AZ91 magnesium alloy in 0.1 M sodium sulfatesolution, Electrochimica Acta 52 (2007) 3299–3309.
[36] J. Chen, J. Wang, E. Han, W. Ke, In situ observation of formation and spreadingof micro-droplets on magnesium and its alloy under cyclic wet–dry conditions,Corrosion Science 49 (2007) 1625–1634.
[37] J. Chen, J. Wang, E. Han, J. Dong, W. Ke, States and transport of hydrogen in thecorrosion process of an AZ91 magnesium alloy in aqueous solution, CorrosionScience 50 (2008) 1292–1305.
[38] H.B. Yao, Y. Li, A.T.S. Wee, An XPS investigation of the oxidation/corrosion ofmelt-spun Mg, Applied Surface Science 158 (2000) 112–119.
[39] K. Asami, S. Ono, Quantitative X-ray photoelectron spectroscopycharacterization of magnesium oxidized in air, Journal of theElectrochemical Society 147 (2000) 1408–1413.
[40] M. Santamaria, F. Di Quarto, S. Zanna, P. Marcus, Initial surface film onmagnesium metal: a characterization by X-ray photoelectron spectroscopy(XPS) and photocurrent spectroscopy (PCS), Electrochimica Acta 53 (2007)1314–1324.
[41] S. Tanuma, C.J. Powell, D.R. Penn, Calculations of electron inelastic mean freepaths. II. Data for 27 elements over the 50–2000 eV range, Surface andInterface Analysis 17 (1991) 911–926.
[42] J.H. Scofield, Hartree-Slater subshell photoionization cross-sections at 1254and 1487 eV, Journal of Electron Spectroscopy and Related Phenomena 8(1976) 129–137.
[43] B.J. Tielsch, J.E. Fulghun, Differential charging in XPS. Part I: demonstration oflateral charging in a bulk insulator using imaging XPS, Surface and InterfaceAnalysis 24 (1996) 422.
[44] B.J. Tielsch, J.E. Fulghun, Differential charging in XPS. Part II: sample mountingand X-ray flux effects on heterogeneous samples, Surface and InterfaceAnalysis 24 (1996) 459.
[45] B.J. Tielsch, J.E. Fulghun, Differential charging in XPS. Part III: a comparison ofcharging in thin polymer overlayers on conducting and non-conductingsubstrates, Surface and Interface Analysis 25 (1997) 904.
[46] V. Fournier, P. Marcus, I. Olefjord, Oxidation of magnesium, Surface andInterface Analysis 34 (2002) 494–497.
[47] J.T. Kloprogge, L.V. Duong, B.J. Wood, R.L. Frost, XPS study of the majorminerals in bauxite: Gibbsite, bayerite and (pseudo-) boehmite, Journal ofColloid and Interface Science 296 (2006) 572–576.
[48] A. Atrens, B. Baroux, M. Mantel, The secondary passive film for type 304stainless steel in 0.5 M H2SO4, Journal of the Electrochemical Society 144(1997) 3697–3704.
[49] K.P. FitzGerald, J. Nairn, A. Atrens, The chemistry of copper patination,Corrosion Science 40 (1998) 2029–2050.
[50] K.P. FitzGerald, J. Nairn, G. Skennerton, A. Atrens, Atmospheric corrosion andthe colour, structure and composition of natural patinas on copper, CorrosionScience 48 (2006) 2480–2509.
[51] G.L. Song, A. Atrens, D.H. St. John, J. Nairn, Y. Lang, Electrochemical corrosion ofpure magnesium in 1 N NaCl, Corrosion Science 39 (1997) 855–875.
[52] C. Chen, S.J. Splinter, T. Do, N.S. Mclntyre, Measurement of oxide film growthon Mg and Al surfaces over extended periods using XPS, Surface Science 382(1997) L652–L657.
[53] T. Do, S.J. Splinter, C. Chen, N.S. Mclntyre, The oxidation kinetics of Mg and Alsurfaces studied by AES and XPS, Surface Science 387 (1997) 192–198.
[54] G. Song, A. Atrens, X. Wu, B. Zhang, Corrosion behaviour of AZ21, AZ501 andAZ91 in sodium chloride, Corrosion Science 40 (1998) 1769–1791.
[55] G. Song, A. Atrens, M. Dargusch, Influence of microstructure on the corrosion ofdiecast AZ91D, Corrosion Science 41 (1998) 249–273.
[56] J.H. Nordlien, Morphology and structure of oxide films formed on MgAl alloysby exposure to air and water, Journal of the Electrochemical Society 143(1996) 2564–2572.


