Embed Size (px)
Citation preview
Air Force Institute of TechnologyAFIT Scholar
Theses and Dissertations Student Graduate Works
6-17-2010
A Dynamically Configurable Log-basedDistributed Security Event DetectionMethodology using Simple Event CorrelatorJustin M. Myers
Follow this and additional works at: https://scholar.afit.edu/etd
Part of the Computer and Systems Architecture Commons
This Thesis is brought to you for free and open access by the Student Graduate Works at AFIT Scholar. It has been accepted for inclusion in Theses andDissertations by an authorized administrator of AFIT Scholar. For more information, please contact [email protected].
Recommended CitationMyers, Justin M., "A Dynamically Configurable Log-based Distributed Security Event Detection Methodology using Simple EventCorrelator" (2010). Theses and Dissertations. 2111.https://scholar.afit.edu/etd/2111
brought to you by COREView metadata, citation and similar papers at core.ac.uk
provided by AFTI Scholar (Air Force Institute of Technology)

A Dynamically Configurable Log-based
Distributed Security Event Detection Methodology
using Simple Event Correlator
THESIS
Justin Myers
AFIT/GCO/ENV/10-J02
DEPARTMENT OF THE AIR FORCEAIR UNIVERSITY
AIR FORCE INSTITUTE OF TECHNOLOGY
Wright-Patterson Air Force Base, Ohio
APPROVED FOR PUBLIC RELEASE; DISTRIBUTION UNLIMITED.

The views expressed in this thesis are those of the author and do not reflect the offi-cial policy or position of the United States Air Force, Department of Defense, or theUnited States Government.
This material is declared a work of the U.S. Government and is not subject to copy-right protection in the United States.

AFIT/GCO/ENV/10-J02
A Dynamically Configurable Log-based
Distributed Security Event Detection Methodology
using Simple Event Correlator
THESIS
Presented to the Faculty
Department of Electrical and Computer Engineering
Graduate School of Engineering and Management
Air Force Institute of Technology
Air University
Air Education and Training Command
In Partial Fulfillment of the Requirements for the
Degree of Master of Science in Cyber Operations
Justin Myers, B.S.
June 2010
APPROVED FOR PUBLIC RELEASE; DISTRIBUTION UNLIMITED.
AFIT/GCO/ENV/10-J02
A Dynamically Configurable Log-based
Distributed Security Event Detection Methodology
using Simple Event Correlator
Justin Myers, B.S.
Approved:
/signed/ 09 June 2010
Dr. Michael R. Grimaila (Chairman) date
/signed/ 09 June 2010
Dr. Robert F. Mills (Member) date
/signed/ 09 June 2010
Dr. Gilbert L. Peterson (Member) date

AFIT/GCO/ENV/10-J02
Abstract
Log event correlation is an effective means of detecting system faults and se-
curity breaches encountered in information technology environments. Centralized,
database-driven log event correlation is common, but suffers from flaws such as high
network bandwidth utilization, significant requirements for system resources, and dif-
ficulty in detecting certain suspicious behaviors. This research presents a distributed
event correlation system which performs security event detection, and compares it
with a centralized alternative. The comparison measures the value in distributed
event correlation by considering network bandwidth utilization, detection capability
and database query efficiency, as well as through the implementation of remote con-
figuration scripts and correlation of multiple log sources. These capabilities produce
a configuration which allows a 99% reduction of network syslog traffic in the low-
accountability case, and a significant decrease in database execution time through
context-addition in the high-accountability case. In addition, the system detects ev-
ery implemented malicious use case, with a low false positive rate.
iv

Acknowledgements
I would like to thank my advisor, Dr. Michael Grimaila, not only for helping me de-
velop a vision for this thesis but also for the personal interest he took in the research
effort, his insistence that I get the work published, and his mentoring me towards suc-
cess as a researcher, government employee, and lifelong student of computer security.
I would like to thank my committee for their guidance and support. I would also like
to thank Adam, Steve and Chad at Pacific Northwest National Laboratory for the
internship opportunity and their enthusiastic support as I used their product in my
research. Finally, I would like to thank Daniel, Mitch, Curt and others who patiently
listened in the lab while I used them as a sounding board (and/or as a distraction)
to help me think through what I was doing.
Justin Myers
v
Table of ContentsPage
Abstract . . . . . . . . . . . . . . . . . . . . . . . . . . . . . . . . . . . . . iv
Acknowledgements . . . . . . . . . . . . . . . . . . . . . . . . . . . . . . . v
List of Figures . . . . . . . . . . . . . . . . . . . . . . . . . . . . . . . . . xi
List of Tables . . . . . . . . . . . . . . . . . . . . . . . . . . . . . . . . . . xii
I. Introduction . . . . . . . . . . . . . . . . . . . . . . . . . . . . . 11.1 Problem Statement . . . . . . . . . . . . . . . . . . . . . 11.2 Assumptions and Limitations . . . . . . . . . . . . . . . 2
1.3 Research Goals . . . . . . . . . . . . . . . . . . . . . . . 31.4 Contributions . . . . . . . . . . . . . . . . . . . . . . . . 31.5 Thesis Overview . . . . . . . . . . . . . . . . . . . . . . 4
II. Literature Review . . . . . . . . . . . . . . . . . . . . . . . . . . 52.1 Log Monitoring and Analysis . . . . . . . . . . . . . . . 5
2.1.1 Log Monitoring Trends . . . . . . . . . . . . . . 6
2.1.2 Related Research . . . . . . . . . . . . . . . . . 92.2 Event Correlation . . . . . . . . . . . . . . . . . . . . . . 10
2.2.1 Usage Trends . . . . . . . . . . . . . . . . . . . 11
2.2.2 Comparing Centralized and Distributed Event Cor-relation . . . . . . . . . . . . . . . . . . . . . . 13
2.3 Security Information and Event Management . . . . . . 14
2.4 Insider Threat Detection . . . . . . . . . . . . . . . . . . 152.4.1 Insider Threat Trends . . . . . . . . . . . . . . 152.4.2 Insider Threat Scenarios as Use Cases . . . . . . 16
2.5 Web Server Logfile Overview . . . . . . . . . . . . . . . 17
2.5.1 Apache log files . . . . . . . . . . . . . . . . . . 17
2.5.2 IIS log files . . . . . . . . . . . . . . . . . . . . 20
2.6 Simple Event Correlator . . . . . . . . . . . . . . . . . . 21
2.7 Summary . . . . . . . . . . . . . . . . . . . . . . . . . . 25
III. Concept Development . . . . . . . . . . . . . . . . . . . . . . . . 26
3.1 Approach . . . . . . . . . . . . . . . . . . . . . . . . . . 26
3.2 Network Design Rationale . . . . . . . . . . . . . . . . . 27
3.2.1 Realism and Scope Limitation . . . . . . . . . . 27
3.2.2 The Base Rate . . . . . . . . . . . . . . . . . . 28
vi
Page
3.3 Use Case Selection . . . . . . . . . . . . . . . . . . . . . 293.3.1 The OWASP Top Ten . . . . . . . . . . . . . . 29
3.3.2 Relevance . . . . . . . . . . . . . . . . . . . . . 303.3.3 Policy vs. Threat-based events . . . . . . . . . . 30
3.3.4 Understanding and Limiting Observables . . . . 31
3.4 Introspection . . . . . . . . . . . . . . . . . . . . . . . . 32
3.5 Adjustable Logging Modes . . . . . . . . . . . . . . . . . 33
3.6 Implications of Remote Configuration . . . . . . . . . . . 33
3.7 Summary . . . . . . . . . . . . . . . . . . . . . . . . . . 34
IV. Experimental Implementation and Methodology . . . . . . . . . . 35
4.1 Use Case Detail . . . . . . . . . . . . . . . . . . . . . . . 354.1.1 Injection . . . . . . . . . . . . . . . . . . . . . . 36
4.1.2 Cross Site Scripting . . . . . . . . . . . . . . . . 37
4.1.3 Broken Authentication and Session Management 37
4.1.4 Insecure Direct Object References . . . . . . . . 38
4.1.5 Cross Site Request Forgery . . . . . . . . . . . . 38
4.1.6 Security Misconfiguration . . . . . . . . . . . . 39
4.1.7 Failure to Restrict URL Access . . . . . . . . . 394.1.8 Unvalidated Redirects and Forwards . . . . . . 404.1.9 Insecure Cryptographic Storage . . . . . . . . . 40
4.1.10 Insufficient Transport Layer Protection . . . . . 40
4.1.11 Naıve Web Crawler . . . . . . . . . . . . . . . . 424.1.12 Delayed Web Crawler . . . . . . . . . . . . . . . 42
4.1.13 Excessive Downloads . . . . . . . . . . . . . . . 424.1.14 Excessive Access Attempts . . . . . . . . . . . . 43
4.1.15 Injection Sequence . . . . . . . . . . . . . . . . 44
4.2 Metrics Selection . . . . . . . . . . . . . . . . . . . . . . 444.3 Implementation . . . . . . . . . . . . . . . . . . . . . . . 46
4.3.1 Hardware Configuration . . . . . . . . . . . . . 46
4.3.2 Software Configuration . . . . . . . . . . . . . . 48
4.3.3 Sensor Instrumentation . . . . . . . . . . . . . . 564.4 Experimental Procedure . . . . . . . . . . . . . . . . . . 58
4.4.1 Experimental Run Detail . . . . . . . . . . . . . 58
4.4.2 Protocols . . . . . . . . . . . . . . . . . . . . . 594.4.3 Experiment Execution . . . . . . . . . . . . . . 60
vii
Page
V. Results . . . . . . . . . . . . . . . . . . . . . . . . . . . . . . . . 625.1 Results . . . . . . . . . . . . . . . . . . . . . . . . . . . 62
5.1.1 Use Case Detectability . . . . . . . . . . . . . . 62
5.1.2 Network Composition . . . . . . . . . . . . . . . 64
5.1.3 Query Efficiency . . . . . . . . . . . . . . . . . 65
5.2 Capability of the Experimental Design . . . . . . . . . . 66
5.2.1 Remote Configurability . . . . . . . . . . . . . . 66
5.2.2 Log Source Flexibility . . . . . . . . . . . . . . 68
5.3 Analysis . . . . . . . . . . . . . . . . . . . . . . . . . . . 68
5.3.1 Use Case Detectability . . . . . . . . . . . . . . 68
5.3.2 Network Composition . . . . . . . . . . . . . . . 69
5.3.3 Query Efficiency . . . . . . . . . . . . . . . . . 71
5.4 Summary . . . . . . . . . . . . . . . . . . . . . . . . . . 75
VI. Conclusions . . . . . . . . . . . . . . . . . . . . . . . . . . . . . . 766.1 Significance of Research . . . . . . . . . . . . . . . . . . 76
6.2 Recommendations for Future Research . . . . . . . . . . 766.3 Conclusions of Research . . . . . . . . . . . . . . . . . . 77
Appendix A. Web Server Logging Configuration . . . . . . . . . . . . 79
A.1 Available Format Strings in Apache . . . . . . . . . . . . 79
A.2 IIS Configuration Dialogs . . . . . . . . . . . . . . . . . 82
A.3 Available Log Elements in IIS . . . . . . . . . . . . . . . 84
Appendix B. SEC Configuration Files . . . . . . . . . . . . . . . . . . 86
B.1 Injection . . . . . . . . . . . . . . . . . . . . . . . . . . . 86
B.2 Cross Site Scripting . . . . . . . . . . . . . . . . . . . . 91
B.3 Broken Authentication and Session Management . . . . 95
B.4 Insecure Direct Object References . . . . . . . . . . . . . 98
B.5 Cross Site Request Forgery . . . . . . . . . . . . . . . . 101
B.6 Failure to Restrict URL Access . . . . . . . . . . . . . . 103B.7 Unvalidated Redirects and Forwards . . . . . . . . . . . 105B.8 Insufficient Transport Layer Protection . . . . . . . . . . 107
B.9 Naıve Webcrawler . . . . . . . . . . . . . . . . . . . . . 108B.10 Delayed Webcrawler . . . . . . . . . . . . . . . . . . . . 111
B.11 Excessive Downloads . . . . . . . . . . . . . . . . . . . . 115B.12 Excessive Access Attempts . . . . . . . . . . . . . . . . . 117
B.13 Injection Sequence . . . . . . . . . . . . . . . . . . . . . 120
B.14 All Events . . . . . . . . . . . . . . . . . . . . . . . . . . 123B.15 Hybrid Context . . . . . . . . . . . . . . . . . . . . . . . 124
viii
Page
Appendix C. Attack Script Source Code . . . . . . . . . . . . . . . . . 126
C.1 Injection . . . . . . . . . . . . . . . . . . . . . . . . . . . 126
C.2 Cross Site Scripting . . . . . . . . . . . . . . . . . . . . 127
C.3 Broken Authentication and Session Management . . . . 129
C.4 Insecure Direct Object References . . . . . . . . . . . . . 130
C.5 Cross Site Request Forgery . . . . . . . . . . . . . . . . 131
C.6 Failure to Restrict URL Access . . . . . . . . . . . . . . 132C.7 Unvalidated Redirects and Forwards . . . . . . . . . . . 133C.8 Excessive Downloads . . . . . . . . . . . . . . . . . . . . 134C.9 Excessive Access Attempts . . . . . . . . . . . . . . . . . 135
C.10 Injection Sequence . . . . . . . . . . . . . . . . . . . . . 137
Appendix D. Database Queries and Scripts . . . . . . . . . . . . . . . 139
D.1 Injection (non-normalized) . . . . . . . . . . . . . . . . . 139
D.2 Injection (normalized) . . . . . . . . . . . . . . . . . . . 139
D.3 Cross Site Scripting (non-normalized . . . . . . . . . . . 140
D.4 Cross Site Scripting (normalized) . . . . . . . . . . . . . 141
D.5 Authentication/Session Mgmt. (non-normalized) . . . . 142
D.6 Authentication/Session Mgmt. (normalized) . . . . . . . 143
D.7 Object References (non-normalized) . . . . . . . . . . . . 143
D.8 Object References (normalized) . . . . . . . . . . . . . . 144
D.9 Cross Site Request Forgery (non-normalized) . . . . . . 145
D.10 Cross Site Request Forgery (normalized) . . . . . . . . . 146
D.11 URL Access (non-normalized) . . . . . . . . . . . . . . . 146
D.12 URL Access (normalized) . . . . . . . . . . . . . . . . . 147
D.13 Redirects and Forwards non-normalized) . . . . . . . . . 148
D.14 Redirects and Forwards (normalized) . . . . . . . . . . . 149
D.15 Transport Layer Protection (non-normalized) . . . . . . 149
D.16 Transport Layer Protection (normalized) . . . . . . . . . 150
D.17 Naıve Webcrawler (non-normalized) . . . . . . . . . . . . 151
D.18 Naıve Webcrawler (normalized) . . . . . . . . . . . . . . 155
D.19 Excessive Downloads (non-normalized) . . . . . . . . . . 157
D.20 Excessive Downloads (normalized, Mode 3) . . . . . . . 160
D.21 Excessive Downloads (normalized, Mode 4) . . . . . . . 161
D.22 Excessive Downloads (normalized, Mode 4) . . . . . . . 163
D.23 Excessive Downloads (normalized, Mode 3 with relatedlogs) . . . . . . . . . . . . . . . . . . . . . . . . . . . . . 164
ix
Page
D.24 Excessive Downloads (normalized, Mode 4 with relatedlogs) . . . . . . . . . . . . . . . . . . . . . . . . . . . . . 166
D.25 Excessive Access Attempts (normalized) . . . . . . . . . 169
D.26 Excessive Access Attempts (non-normalized) . . . . . . . 171
Appendix E. Miscellaneous Supporting Source Code . . . . . . . . . . 176
E.1 Generic Syslog client for Linux . . . . . . . . . . . . . . 176
E.2 Hybrid Syslog client for Linux . . . . . . . . . . . . . . . 176
E.3 Remote Configuration Bash script . . . . . . . . . . . . . 177
E.4 FindDelayedRobot Library . . . . . . . . . . . . . . . . . 179
E.5 Aggregate Log sender for Windows . . . . . . . . . . . . 184
E.6 Log Normalizer for Oracle Database . . . . . . . . . . . 185
Appendix F. Sliding Window Implementation Flowcharts . . . . . . . 192
F.1 Naıve Webcrawler Normalized . . . . . . . . . . . . . . . 192F.2 Naıve Webcrawler Non-Normalized . . . . . . . . . . . . 193F.3 Excessive Downloads Normalized . . . . . . . . . . . . . 194F.4 Excessive Downloads Non-Normalized . . . . . . . . . . 195
Bibliography . . . . . . . . . . . . . . . . . . . . . . . . . . . . . . . . . . 196
x
List of FiguresFigure Page
2.1. Verizon Data Breach Report: Detective Controls by percent of
breach victims. [11] . . . . . . . . . . . . . . . . . . . . . . . . 7
2.2. Sample log configuration in Apache 2. [1] . . . . . . . . . . . . 18
2.3. Sample CLF access log entry in Apache 2. [1] . . . . . . . . . . 18
2.4. Example SEC Ruleset. [27] . . . . . . . . . . . . . . . . . . . . 22
4.1. Experimental Network Design. . . . . . . . . . . . . . . . . . . 47
4.2. Configuring SAST. . . . . . . . . . . . . . . . . . . . . . . . . . 50
4.3. Original Apache Configuration. . . . . . . . . . . . . . . . . . . 53
5.1. Total Syslog Traffic per mode in Kilobytes (KB). . . . . . . . . 70
5.2. Normalized and Non-normalized queries for OWASP use cases. 72
5.3. Normalized and Non-normalized queries for insider threat use
cases. . . . . . . . . . . . . . . . . . . . . . . . . . . . . . . . . 73
A.1. IIS 6.0 Log Format Configuration [2] . . . . . . . . . . . . . . . 82
A.2. IIS 6.0 Log Element Selection Dialog [2] . . . . . . . . . . . . . 83
F.1. Naıve Webcrawler Normalized Sliding Window Implementation 192
F.2. Naıve Webcrawler Non-Normalized Sliding Window Implemen-
tation . . . . . . . . . . . . . . . . . . . . . . . . . . . . . . . . 193
F.3. Excessive Downloads Normalized Sliding Window Implementation 194
F.4. Excessive Downloads Non-Normalized Sliding Window Imple-
mentation . . . . . . . . . . . . . . . . . . . . . . . . . . . . . . 195
xi
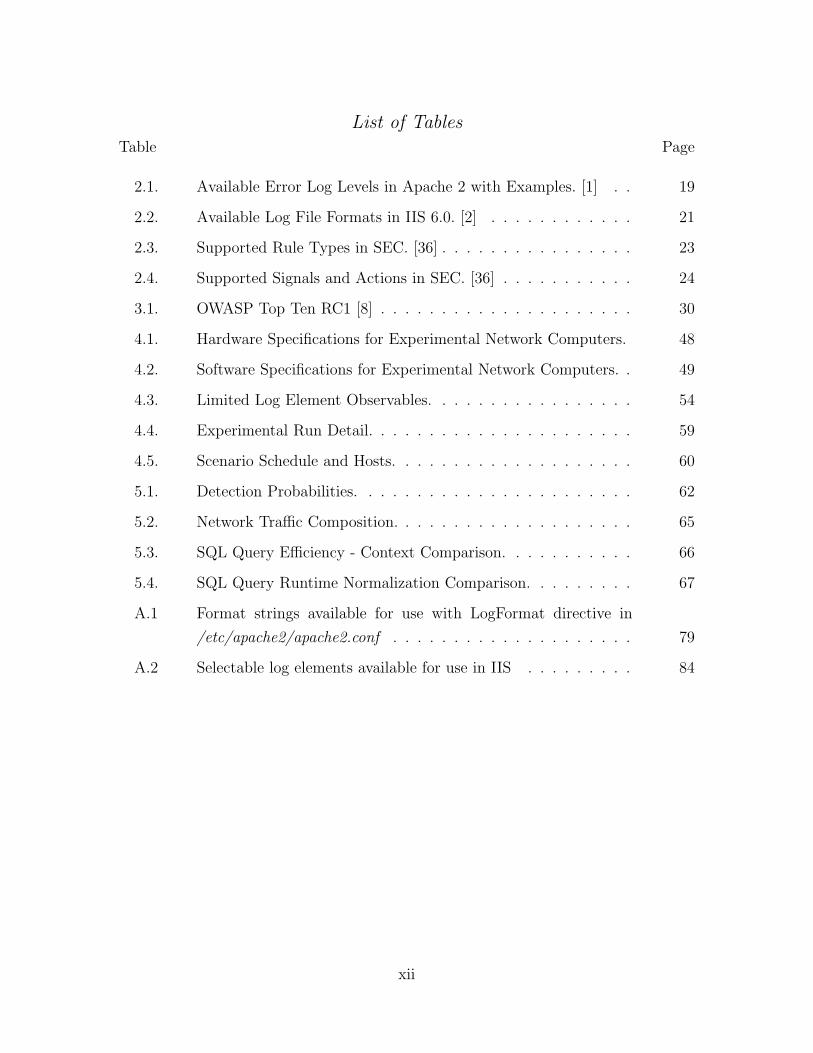
List of TablesTable Page
2.1. Available Error Log Levels in Apache 2 with Examples. [1] . . 19
2.2. Available Log File Formats in IIS 6.0. [2] . . . . . . . . . . . . 21
2.3. Supported Rule Types in SEC. [36] . . . . . . . . . . . . . . . . 23
2.4. Supported Signals and Actions in SEC. [36] . . . . . . . . . . . 24
3.1. OWASP Top Ten RC1 [8] . . . . . . . . . . . . . . . . . . . . . 30
4.1. Hardware Specifications for Experimental Network Computers. 48
4.2. Software Specifications for Experimental Network Computers. . 49
4.3. Limited Log Element Observables. . . . . . . . . . . . . . . . . 54
4.4. Experimental Run Detail. . . . . . . . . . . . . . . . . . . . . . 59
4.5. Scenario Schedule and Hosts. . . . . . . . . . . . . . . . . . . . 60
5.1. Detection Probabilities. . . . . . . . . . . . . . . . . . . . . . . 62
5.2. Network Traffic Composition. . . . . . . . . . . . . . . . . . . . 65
5.3. SQL Query Efficiency - Context Comparison. . . . . . . . . . . 66
5.4. SQL Query Runtime Normalization Comparison. . . . . . . . . 67
A.1 Format strings available for use with LogFormat directive in
/etc/apache2/apache2.conf . . . . . . . . . . . . . . . . . . . . 79
A.2 Selectable log elements available for use in IIS . . . . . . . . . 84
xii
A Dynamically Configurable Log-based
Distributed Security Event Detection Methodology
using Simple Event Correlator
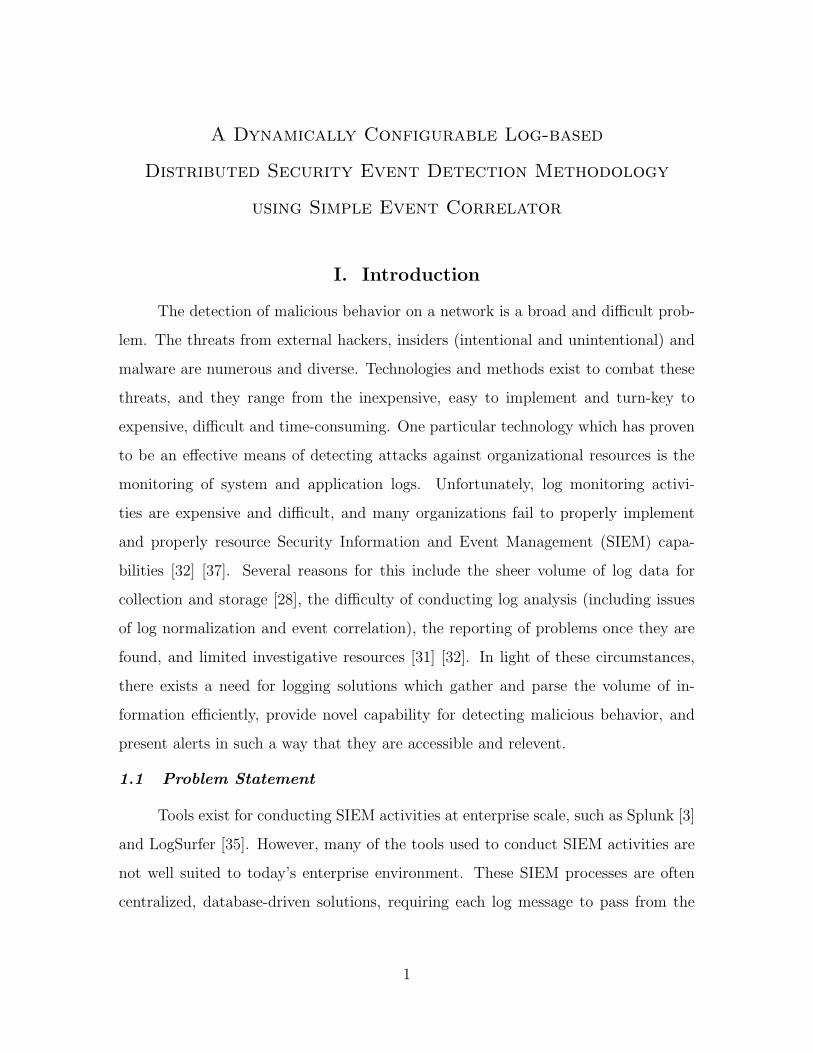
I. Introduction
The detection of malicious behavior on a network is a broad and difficult prob-
lem. The threats from external hackers, insiders (intentional and unintentional) and
malware are numerous and diverse. Technologies and methods exist to combat these
threats, and they range from the inexpensive, easy to implement and turn-key to
expensive, difficult and time-consuming. One particular technology which has proven
to be an effective means of detecting attacks against organizational resources is the
monitoring of system and application logs. Unfortunately, log monitoring activi-
ties are expensive and difficult, and many organizations fail to properly implement
and properly resource Security Information and Event Management (SIEM) capa-
bilities [32] [37]. Several reasons for this include the sheer volume of log data for
collection and storage [28], the difficulty of conducting log analysis (including issues
of log normalization and event correlation), the reporting of problems once they are
found, and limited investigative resources [31] [32]. In light of these circumstances,
there exists a need for logging solutions which gather and parse the volume of in-
formation efficiently, provide novel capability for detecting malicious behavior, and
present alerts in such a way that they are accessible and relevent.
1.1 Problem Statement
Tools exist for conducting SIEM activities at enterprise scale, such as Splunk [3]
and LogSurfer [35]. However, many of the tools used to conduct SIEM activities are
not well suited to today’s enterprise environment. These SIEM processes are often
centralized, database-driven solutions, requiring each log message to pass from the
1

log producer to the central log server through the network. The aggregated messages
are then correlated at one time on the central log server.
In terms of an enterprise SIEM solution, this approach presents several chal-
lenges. First, the sending of all log messages over the network incurs a bandwidth
performance cost, which increases significantly with each appliance, application server
or workstation on the network. Second, a heavyweight database-driven solution con-
sumes a significant amount of resources (processor time, memory, storage space) to be
able to accomplish the event correlation. It may even do it in stages, or may require
several physical machines to accomplish the task. Third, a relational database ex-
cels at describing relationships between data, but is awkward for detecting scenarios
involving the computation of sliding time windows and aggregation of individual log
elements. These situations are common in web server log analysis: for instance, one
might want to know if a user accesses a resource at a certain frequency in a specific
time frame.
These challenges usually produce one of two outcomes [28] [11]. First, the
enterprise experiences the increased expense of building, using and maintaining such
a system. Second, a management decides not to spend resources to collect and analyze
logs, with the significant impact of missing a security incident or compromise. This
scenario can lead to lost information on network performance or security incidents,
along with their associated costs [11] [5].
1.2 Assumptions and Limitations
This research assumes that there is previously acquired knowledge about the
value of information located on each log-producing server. This knowledge is not
necessary for the research to be effective, but it is a prerequisite for the higher-level
correlation activities.
The research is also limited in terms of the realism of the environment. While
efforts were made to mimic the characteristics of a real environment, the experimental
2

environment was contrained in the number of systems, total volume of traffic and
composition of that traffic.
1.3 Research Goals
This research presents a distributed log event correlation methodology which
provides value over centralized alternatives, based on novel metrics for quantifying
that value. In addition, this research aims to provide a configuration which can be
customized remotely to the circumstances and logging requirements of individual log
producers. The research will use as examples malicious behavior scenarios which
relate to web server logs, but the goal is to develop a methodology which is applicable
to logs from any log-producing system or application.
1.4 Contributions
This research contributes a quantitative analysis of the value inherent in dis-
tributed event correlation, as opposed to a centralized model. The nature of this value
depends on the environment in which the techniques are being implemented. As such,
it defines a continuum of accountability requirements. In a low accountability envi-
ronment where not everything must be logged centrally (or at all), a distributed event
correlation methodology offers the benefit of decreased network bandwidth use while
still maintaining a robust event detection capability. In a high accountability environ-
ment where everything must be logged, a distributed event correlation methodology
can add context to centralized correlation activities by injecting real-time synthetic
events into the event stream. Furthermore, this research contributes the analysis and
validation of a dynamically configurable log collection architecture. The ability to
dynamically configure the log collection activities allows more flexibility in the detec-
tion configuration and contributes to overall ease of maintenance. Lastly, this research
contributes scalability with regard to multiple log sources and formats for increased
event detection capability.
3

1.5 Thesis Overview
This chapter describes the goals of this research and the circumstances which
motivate the development of a distributed log event correlation methodology. Back-
ground literature in the areas of log management, event correlation and insider threat,
as well as technologies being used to conduct the research are reviewed in Chapter
2. Next, Chapter 3 presents the development of the concepts, ideas and thought pro-
cesses used in developing this research. Chapter 4 presents the experimental design
and the methodology used for conducting analysis of that design. Chapter 5 describes
the results of the experiment and provides an analysis of those results. Finally, Chap-
ter 6 draws conclusions from the results of the research and recommends avenues for
further research in this area.
4
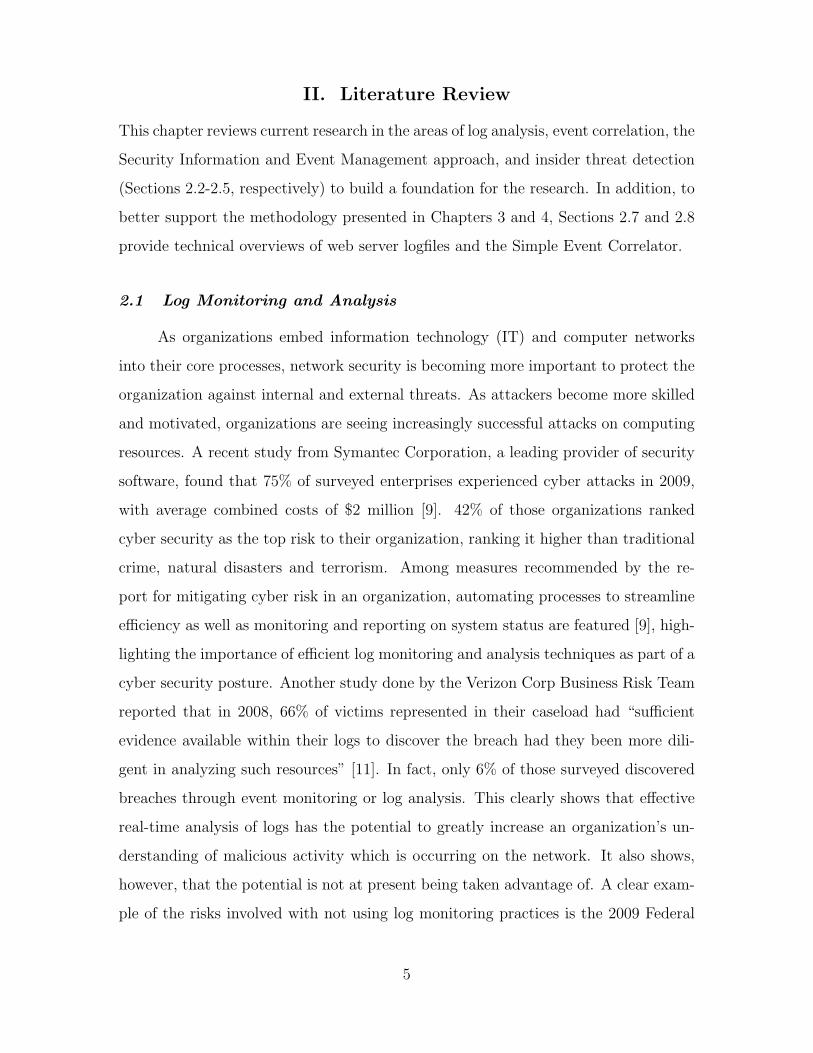
II. Literature Review
This chapter reviews current research in the areas of log analysis, event correlation, the
Security Information and Event Management approach, and insider threat detection
(Sections 2.2-2.5, respectively) to build a foundation for the research. In addition, to
better support the methodology presented in Chapters 3 and 4, Sections 2.7 and 2.8
provide technical overviews of web server logfiles and the Simple Event Correlator.
2.1 Log Monitoring and Analysis
As organizations embed information technology (IT) and computer networks
into their core processes, network security is becoming more important to protect the
organization against internal and external threats. As attackers become more skilled
and motivated, organizations are seeing increasingly successful attacks on computing
resources. A recent study from Symantec Corporation, a leading provider of security
software, found that 75% of surveyed enterprises experienced cyber attacks in 2009,
with average combined costs of $2 million [9]. 42% of those organizations ranked
cyber security as the top risk to their organization, ranking it higher than traditional
crime, natural disasters and terrorism. Among measures recommended by the re-
port for mitigating cyber risk in an organization, automating processes to streamline
efficiency as well as monitoring and reporting on system status are featured [9], high-
lighting the importance of efficient log monitoring and analysis techniques as part of a
cyber security posture. Another study done by the Verizon Corp Business Risk Team
reported that in 2008, 66% of victims represented in their caseload had “sufficient
evidence available within their logs to discover the breach had they been more dili-
gent in analyzing such resources” [11]. In fact, only 6% of those surveyed discovered
breaches through event monitoring or log analysis. This clearly shows that effective
real-time analysis of logs has the potential to greatly increase an organization’s un-
derstanding of malicious activity which is occurring on the network. It also shows,
however, that the potential is not at present being taken advantage of. A clear exam-
ple of the risks involved with not using log monitoring practices is the 2009 Federal
5
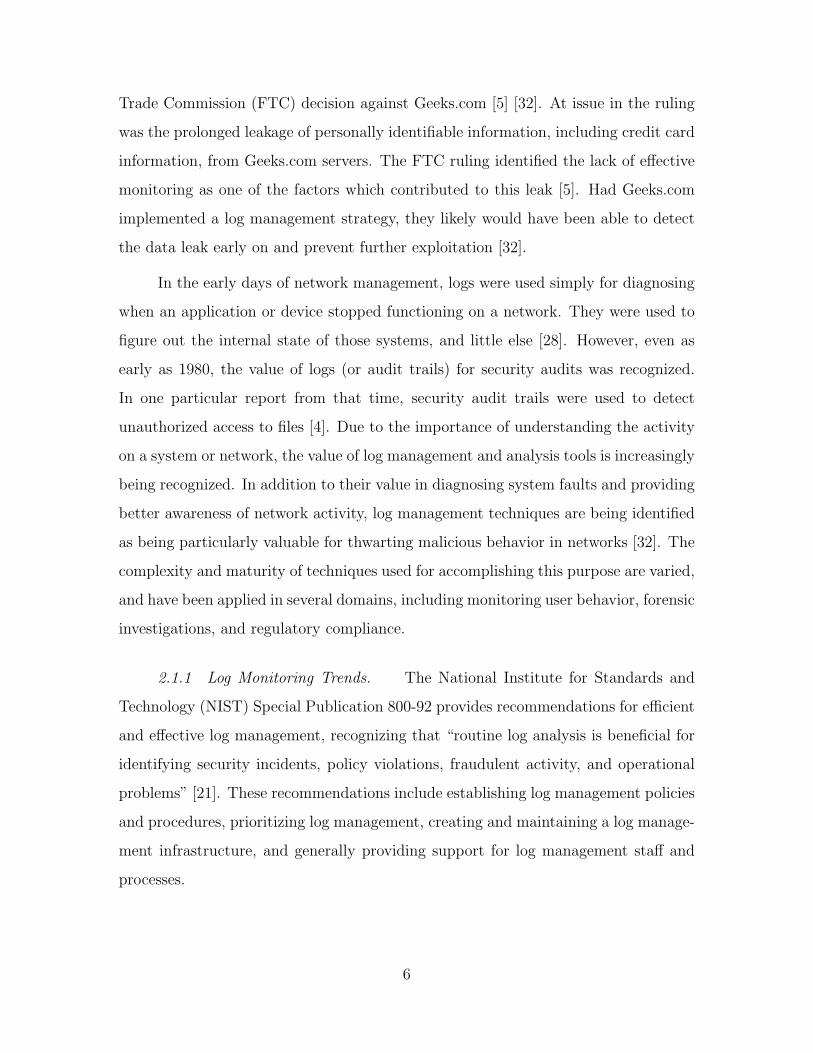
Trade Commission (FTC) decision against Geeks.com [5] [32]. At issue in the ruling
was the prolonged leakage of personally identifiable information, including credit card
information, from Geeks.com servers. The FTC ruling identified the lack of effective
monitoring as one of the factors which contributed to this leak [5]. Had Geeks.com
implemented a log management strategy, they likely would have been able to detect
the data leak early on and prevent further exploitation [32].
In the early days of network management, logs were used simply for diagnosing
when an application or device stopped functioning on a network. They were used to
figure out the internal state of those systems, and little else [28]. However, even as
early as 1980, the value of logs (or audit trails) for security audits was recognized.
In one particular report from that time, security audit trails were used to detect
unauthorized access to files [4]. Due to the importance of understanding the activity
on a system or network, the value of log management and analysis tools is increasingly
being recognized. In addition to their value in diagnosing system faults and providing
better awareness of network activity, log management techniques are being identified
as being particularly valuable for thwarting malicious behavior in networks [32]. The
complexity and maturity of techniques used for accomplishing this purpose are varied,
and have been applied in several domains, including monitoring user behavior, forensic
investigations, and regulatory compliance.
2.1.1 Log Monitoring Trends. The National Institute for Standards and
Technology (NIST) Special Publication 800-92 provides recommendations for efficient
and effective log management, recognizing that “routine log analysis is beneficial for
identifying security incidents, policy violations, fraudulent activity, and operational
problems” [21]. These recommendations include establishing log management policies
and procedures, prioritizing log management, creating and maintaining a log manage-
ment infrastructure, and generally providing support for log management staff and
processes.
6
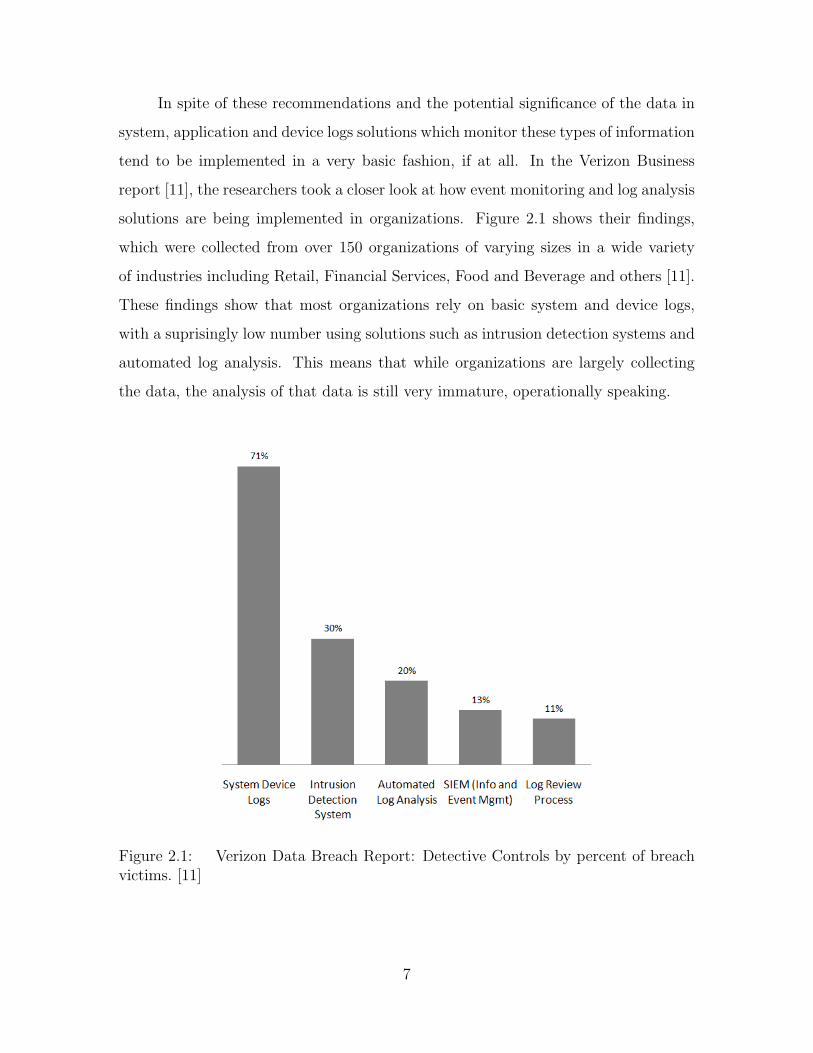
In spite of these recommendations and the potential significance of the data in
system, application and device logs solutions which monitor these types of information
tend to be implemented in a very basic fashion, if at all. In the Verizon Business
report [11], the researchers took a closer look at how event monitoring and log analysis
solutions are being implemented in organizations. Figure 2.1 shows their findings,
which were collected from over 150 organizations of varying sizes in a wide variety
of industries including Retail, Financial Services, Food and Beverage and others [11].
These findings show that most organizations rely on basic system and device logs,
with a suprisingly low number using solutions such as intrusion detection systems and
automated log analysis. This means that while organizations are largely collecting
the data, the analysis of that data is still very immature, operationally speaking.
Figure 2.1: Verizon Data Breach Report: Detective Controls by percent of breachvictims. [11]
7
The 2008 CSI Computer Crime and Security Survey produced similar results,
showing that failure in the area of system and transaction log monitoring was a
significant factor in the success of attacks. The survey also showed that security log
management is far from widely implemented, with 51% of respondents reporting that
they have such a system in place [26].
A closer look at the way log management is being done sheds more light on the
situation. The SANS Annual 2009 Log Management Survey focuses excusively on the
topic of log management, and provides finer-grained detail on how log management
activities are being done in organizations [32]. Their data, more current than that
used by the CSI survey by about a year, shows that 87% of respondents collect
logs in some fashion, with an additional 12% planning to implement log collection
at some point in the future. The same survey conducted in 2007 showed that 44%
of respondents did not collect log data - a significant increase which indicates the
increasing awareness in organizations about the importance of data in log files [32].
The reasons for collecting log data were weighted toward security-based issues, a move
away from the traditional use of log data for diagnosing system faults. The survey
respondents chose as the top three reasons, respectively, “Tracking suspicious behavior
and user activity monitoring,” “Forensic analysis and correlation,” and “Day-to-day
IT operations/process control compliance” [32]. This shows that while logs are still
being used for their traditional purpose, their value in security-oriented activities
is being increasingly recognized and exploited. Another area of interest addressed
by this survey is the type of applications and devices from which organizations are
collecting logs. The most common source of log data is the operating system; 92% of
respondents collected operating system logs. This was followed by switch, router and
firewall data at 90% [32]. Other significant sources of logs included databases and
virtual machines, while log collection from mainframes is in decline. There did not
appear to be any data on collection from application logs such as web servers.
Another area of emerging importance in log management is normalization.
Nearly every application and appliance out there has the capability to generate log
8
messages, and those log messages are in a wide variety of formats. This presents a dif-
ficulty for log analysis, since the analysis engine must be configured to understand logs
from every expected source. Since this can be an expensive undertaking for an organi-
zation with logs in many different formats, normalization is an attractive alternative.
Log normalization can be succinctly defined as converting each log data field to a par-
ticular data representation and categorizing the resulting fields consistently [21]. This
activity significantly aids log analysis activities, but incurs a high performance cost.
Another way to achieve this result without the performance overhead is through the
use of standard data representations by the individual log producers themselves, so
that the log messages are initially produced in normalized form. This is an intended
result of MITRE’s Common Event Expression (CEE) project [7]. This approach
naturally depends on vendor adoption, but shows promise in mitigating the issues
associated with differing log formats.
2.1.2 Related Research. The focus of this research is on web server applica-
tion logs, since they contain relevant data on the use of web resources from inside and
outside an organization. Two of the surveys mentioned in this section speak directly
to the importance of web servers as an area of concern or avenue for attack. In the
Verizon Business Data Breach survey, six out of the ten types of hacking used in
their data set are primarily or commonly web-application hacks. Most significantly,
SQL injection was second in prevalence and first in number of records compromised,
involved in the compromise of 79% of the 285 million records [11]. In addition, the
Verizon survey also noted that web applications were the second most common at-
tack vector (21 of 57 breaches) and again were involved in the compromise of 79% of
records in their data set.
The CSI Computer Crime and Security Survey asked what respondents thought
the most critical security issues their organizations would face over the next two years.
Among a wide variety of reponses, concerns about web application security appeared
frequently [26]. While the CSI survey showed web application misuse and website
9
defacement comprising only 16% of incidents, this is an area in which continued
vigilance seems to be valuable to survey respondents.
2.2 Event Correlation
Event correlation is an increasingly important and accepted tool in managing
complexity in enterprise networks today [18]. It has also been recognized as being
a powerful tool for understanding real-time events in the military battlespace [20].
One good definition of event correlation is those activities which analyze individual
pieces of information in aggregate to diagnose the root causes of problems on the
network and filter the alarms generated as a result of those problems into a single
composite event [16]. In any large scale network, event and alarm-producing systems
are distributed across the entire network, comprising some (and possibly all) of the
computing and infrastructure systems in the network. In common configurations this
virtually guarantees a volume of data, in the form of log messages, which is infeasible
for a human operator to manage efficiently [36] [21]. In the early days of fault manage-
ment, alarms were sent over the network using a facility such as syslog to a central log
server, which most likely simply stored the events, allowing a human analyst to exam-
ine them after the fact. Syslog has some filtering capabilities and is often paired with
a utility to do further regular expression matching, but both techniques are limited by
an inability to capture time and state, and are therefore unable to detect potentially
interesting event patterns [12]. The potential consequences of this situation are signif-
icant - the analyst might fail to discern the actual internal state of the system which
failed or was compromised [19]. Furthermore, time and volume-based events might
go unnoticed or get lost in the large volume of events. Event correlation activities
allow this volume of messages to be reduced to a set of alarms that is manageable for
an analyst. While these techniques were initially applied to network fault manage-
ment, event correlation activities have begun to be recognized as useful for security
management activities, among other applications [36] [18]. The need for more robust,
always-on event correlation solutions for both fault and intrusion detection has been
10
met in various ways. While syslog by itself lacks event correlation capabilities and
is therefore best suited for a centralized architecture, event correlation solutions vary
between centralized and distributed architectures, with some combining aspects from
both and some working well in either architecture. This section explores various ap-
plications of event correlation techniques in a variety or architectures, and the nature
of their benefit to network and security management.
2.2.1 Usage Trends. Several tools, described below, perform centralized
event correlation. These tools can be further broken down by the class of algorithm
used to conduct the correlation activities. The first is a simple rule-based algorithm,
which is employed by the Zurich Correlation Engine (ZCE), which accepts input events
as name value pairs and compares them against simple rules in a hash table [15]. Later
adaptations of ZCE were upgraded to allow for more complex event processing. An
alternative approach is the use of coding techniques [22] [38], which defines a code as
a series of “problem” events which cause a“symptom” event, and “decodes” the set of
observed symptom events to determine what the underlying problem or problems must
have been. Lastly, centralized event correlation can be done using techniques from the
domain of artificial intelligence, including the use of belief networks and probabilistic
reasoning. An example application of these techniques to event correlation is XUNET
[17], which uses probabilistic networks and a non-deterministic network model to
automate fault diagnosis and identify issues in spite of missing or delayed information.
Due to shortcomings in centralized architectures, several event correlation tools
distribute the task over a number of computers in the network. The actual archi-
tecture varies significantly from implementation to implementation, but the common
factor is that event correlation activities are primarily done on multiple computers,
rather than on one central server. A good example of the distributed approach is pre-
sented by Tai, et. al. [34], where a subscription scheme is used to arrange independent
Fault Management Servers (FMS) into a hierarchical model where the FMS further
up the hierarchy subscribes to all subsidiary FMS alerts, and includes those alerts
11

in its correlation activities. While this scheme has each FMS doing similar activi-
ties, other schemes such as the Global Real-time Advanced Correlation Environment
(GRACE) [18] distribute distinct correlation components according to a pre-defined
model. In GRACE, there are three components: Event Correlation, Knowledge Man-
agement, Event Explanation, as well as a Supervisor component. Each is distributed
across a potentially global network, using XML to facilitate communication and data
flow between components. Another approach, taken by the Madeira project [39],
incorporates peer-to-peer technologies into a system which is distributed and self
managing. Madeira is interesting because it combines this distributed idea of self-
management with more centralized correlation ideas at the level of network domains
or geographical locations [34]. This combination of centralized and distributed, usu-
ally resulting in a distributed network of smaller centralized event correlation nodes,
is quite common. Depending on the configuration, these combined implementations
share positive and negative aspects of both major architectures. Another example
of this combined centralized-distributed model is the Distributed Event Correlation
System (DECS), which is build of many Domain Managers (DM), each of which does
centralized event correlation on a single domain arbitrarily partitioned off from the
global networked system domain [38]. Similar to the FMS solution described above,
DECS allows a subscription-based system to allow communication - but instead of
arranging DMs hierarchically, DECS clients subscribe to DMs to receive notifications
of particular problems. Thus this distributed system is organized by problem type,
rather than by geographical or network proximity. Finally, one research effort presents
the idea of a Distributed Security Operations Center (DSOC), which collects logs from
any log-producing device and distributes the event correlation activities over a number
of clusters, which may be connected physically or by wireless links [29]. The actual
event correlation and intrusion detection activities, as organized by the DSOC, are
essentially a context-aware signature-based scheme.
Some event correlation tools are general enough to be considered architecture
agnostic. Examples of these architecture agnostic tools include the Syslog Heuristic
12

Analysis and Response Program (SHARP), which extends an existing syslog infras-
tructure with event correlation capabilities [12], and the Simple Event Correlator
(SEC), an open source, Perl-based tool that is lightweight enough to run in a dis-
tributed environment and robust enough to do centralized correlation as well [36].
Incidentally, SEC is the event correlation engine which was chosen for this research,
and will be treated in more detail in Section 2.7.
2.2.2 Comparing Centralized and Distributed Event Correlation. There are
positive and negative aspects to both centralized and distributed event correlation.
In a centralized architecture, the event-producing computers send the events over
the network to a central server, where correlation activities are performed. In large
networks, this configuration presents a likely risk that the event correlation engines
will be flooded by events - even when the centralized activity is distributed across
network domains [34]. In addition, a centralized architecture requires that any events
which are to be included in correlation activities be sent over the network to the
correlation server. This intuitively incurs a network performance cost, which increases
significantly with each event-producing computer on the network. Challenges are also
presented by the central correlation server itself. Since all the correlation activities
must be performed over all events in one location, significant resources (processor
time, memory, storage space) are required to store the information and perform the
event correlation. A database-driven centralized solution is also likely unable to do
real-time analysis, since all facets of the event to be detected must be present before
database queries are run. Thus this kind of approach is forensic in nature, while
distributed solutions are better suited to real-time analysis.
Centralized event correlation is not without its advantages over distributed or
hybrid approaches. The most significant drawback to a distributed approach is the
up-front configuration effort that is needed to make certain distributed correlation
approaches operational [34]. This is especially true for hybrid approaches, since “pure”
distributed systems often have a self-organizing mechanism which automates some
13
of the configuration activities. In addition, should an adversary target the event
correlation infrastructure in a network, a centralized architecture provides a smaller
number of computers, which makes it potentially easier to defend. The log producers,
however, are equally numerous in either architecture, so their vulnerability would not
depend as much on the event correlation architecture.
In the final analysis, the choice of event correlation tools and specific needs of
the operational environment will make these advantages and disadvantages more or
less significant.
2.3 Security Information and Event Management
Security Information and Event Management (SIEM) systems are an emerging
class of tool which combine the functional areas of log consolidation, threat correlation,
incident management, and reporting into one solution [33]. A primary focus is on
automating correlation techniques to increase the effectiveness at identifying incidents
in progress. The growing popularity of SIEM systems is part of an anticipated logical
progression in industry, and in fact the SANS Log Management Survey indicated that
32% of respondents are actively incorporating their log management activities with
an SIEM, while 26% intend to do so in the future [32].
The goals of a SIEM tool are similar to those of event correlation - to automate
analysis of large quantities of information and reduce the overall number of events
to a manageable level [33]. A particularly significant benefit of an SIEM tool is the
ability to see events from a whole-network perspective. For instance, a single attack
may generate logs indicating a port scan at the firewall, a signature match at an IDS,
and a suspicious series of web server logs. At each stage, the SIEM tool is “connecting
the dots,” and categorizing them as elements of the same alert, increasing the severity
level at each stage [33].
As SIEM tools are increasingly deployed, the concepts of log management and
event correlation will become even more important, as an SIEM system must have the
14
best data from log-producers across the network, as well as efficient event correlation
algorithms for effective detection of incidents as they are occurring. The areas of
management and reporting, while not discussed in this chapter, will also become
increasingly important. The value of accurate detection of incidents is diminished if
those incidents are not reported quickly, accurately and concisely to the right people,
so that the right action may be taken in response to the incident.
2.4 Insider Threat Detection
Insider threat detection is a difficult domain to effectively characterize, due to
the lack of a consistent definition of an insider and a reluctance on the part of industry
to release data on real insider damage [13]. Several definitions of an insider have been
proposed, each capturing a different aspect of the highly diverse domain. For example,
Bishop [13] defines an insider as “a trusted entity that is given the power to violate
one or more rules in a given security policy”: in this case “the insider threat occurs
when a trusted entity abuses that power.” Another definition characterizes an insider
more generally, as any entity which possesses knowledge not available to the general
public [25]. Other definitions separate malicious insiders into two classes: traitors and
masqueraders, the former being those insiders who intentionally violate trust placed
in them, and the latter being an attacker who steals a legitimate insider’s identity
and uses it to carry out the attack [30].
2.4.1 Insider Threat Trends. The threat from malicious insiders is an in-
creasingly significant source of financial and data loss for enterprises. The 2010 Cyber
Security Watch Survey from CSO magazine, the U.S. Secret Service, Software Engi-
neering Institute Computer Emergency Response Team (CERT) Program at Carnegie
Mellon University and Deloitte provides recent evidence of this trend. The survey in-
dicates that 51% of respondents who experienced a cyber security event were victims
of an insider attack, despite the fact that most of the top 15 policies and procedures
in the survey were aimed at insider attack prevention [6]. In addition, 67% of re-
15

spondents agreed that insider incidents were more costly than external breaches. The
insider threat was at one time much more common than the threat from external
forces, since the major barrier to entry was physical access to a machine [4]. How-
ever, with the advent of the Internet and a complex environment of network devices
and services, external penetration overall has become more common than exploita-
tion by insiders. Insider attack, considered equally with other types of attacks, is still
a common type of attack. Insider attacks (malicious or otherwise) briefly overtook
virus and worm attacks in 2007 as the most commonly reported security incidents in
the CSI/FBI Computer Crime and Security Survey, and remained the second most
common (44%) in subsequent surveys [26].
2.4.2 Insider Threat Scenarios as Use Cases. The use of system and appli-
cation logs for insider threat detection is a natural pairing, since they provide insight
into the status of individual systems which must be considered in certain insider threat
scenarios. As early as 1980, the value of system audit logs for detecting insiders was
recognized. In a report on computer monitoring and surveillance, the James Anderson
company used simple definitions of abnormal user behavior to detect insider attacks
using system audit logs [4]. In addition, a study from the Carnegie Mellon CERT
determined that a majority of insider attacks were detected using system logs; this
included remote access logs, file access logs, database logs, application logs, and e-mail
logs [14]. In addition, the same study includes “log, monitor, and audit employee on-
line actions” as a recommended practice for preventing insider attacks, arguing that
those activities “can lead to early discovery and investigation of suspicious insider
actions” [14]. Furthermore, research is now only beginning to emerge which addresses
the insider threat in a real-time fashion - the majority of techniques are driven by a
forensic analysis approach after an attack. Consequently, there is a need for network
and log monitoring techniques which provide real-time insight into user behaviors,
and allow the prevention, detection and deterrence of insider attacks [30].
16
2.5 Web Server Logfile Overview
This research uses web server log files as the basic input into the event correlation
system. While log files from any log-producing system or application can be and are
used in event correlation activities, this research will show the effectiveness of the
distributed event correlation technique within the limited scope of web server logs,
and extrapolate the results to logs in other formats and from other systems and
applications.
At the most basic level, a log file is composed of individual log entries, which
are composed of (or, in the case of Windows, Snort or other logs, may be converted
to) a single line of text. Apache [1] and Microsoft’s Internet Information Services
(IIS) [2], the two most popular web server applications, both store their logfiles in
plain-text format, with each log entry contained in a single line of text. In addition,
both applications generate two types of log files - the access log and the error log.
Both Apache and IIS store the same types of information in each log file. The access
log contains details about each request for data to be served from the web server.
The error log contains information about errors that were encountered by the web
server application itself or by helper applications connected to the web server. The
remainder of this section describes the structure, configuration and content of the
access and error log files in Apache and IIS web servers.
2.5.1 Apache log files. The Apache web server is a widely used, open source
HTTP web server application available as a free download from the Apache Software
Foundation web site [1]. This section applies to Apache version 2.2, installed on an
Ubuntu Linux operating system. In a default installation, Apache stores both the ac-
cess and error logs in /var/log/apache2 as access.log and error.log. This location and
naming convention is specified in Apache’s main configuration file, which is located
by default at /etc/apache2/apache2.conf.
17

2.5.1.1 Apache Access Log. One of the functions of the configuration
file located by default at /etc/apache2/apache2.conf is to define the format for entries
in the access log using a standard set of format strings. Figure 2.2 shows a sample
access log configuration that might be found in Apache’s main configuration file.
This sample configuration uses a log format known as Common Log Format (CLF),
a standardized format for log entries from web servers. A sample log entry in CLF
format that might appear in the access log is shown in Figure 2.3.
LogFormat "%h %l %u %t \"%r\" %>s %b " common
CustomLog logs/access log common
Figure 2.2: Sample log configuration in Apache 2. [1]
127.0.0.1 - frank [10/Oct/2000:13:55:36 -0700] "GET /apache pb.gif
HTTP/1.0" 200 2326
Figure 2.3: Sample CLF access log entry in Apache 2. [1]
The number of available format strings for Apache access logs leads to high
configurability. Table A.1 shows the defined format strings in Apache and the data
they represent. [Table A.1 should be turned into an appendix when everything’s
put together] As evidenced in Figure 2.2 and Figure 2.3, normal characters may be
escaped to be included in the log entry along with automatically generated log data.
In the example shown, double quotes are shown escaped around the %r format string,
so that the HTTP request text is surrounted by double quotes when written to the
access log. Apache’s configuration options allow the access log to capture a wide array
of information about individual requests to the web server, while also providing the
capability for formatting the log entries in a fashion appropriate for subsequent event
correlation activities.
2.5.1.2 Apache Error Log. The Apache error log is the record of di-
agnostic and error messages encountered by Apache in the process of serving web
requests. These messages may originate from the Apache application itself, or from
18
any Common Gateway Interface (CGI) scripts which report their errors by printing
them to stderr [1]. The error log location and customization options are specified in
Apache’s main configuration file. However, the error log is significantly less customiz-
able than the access log. There are two primary means of customization, namely the
use of the ErrorLog and LogLevel directives in apache.conf.
The ErrorLog directive is used to direct the error-log entries to a user-specified
directory or process. The destination of these log entries can be a plain text file (the
default), a command that will process the log, or a syslog facility to transmit the log
entry over the network.
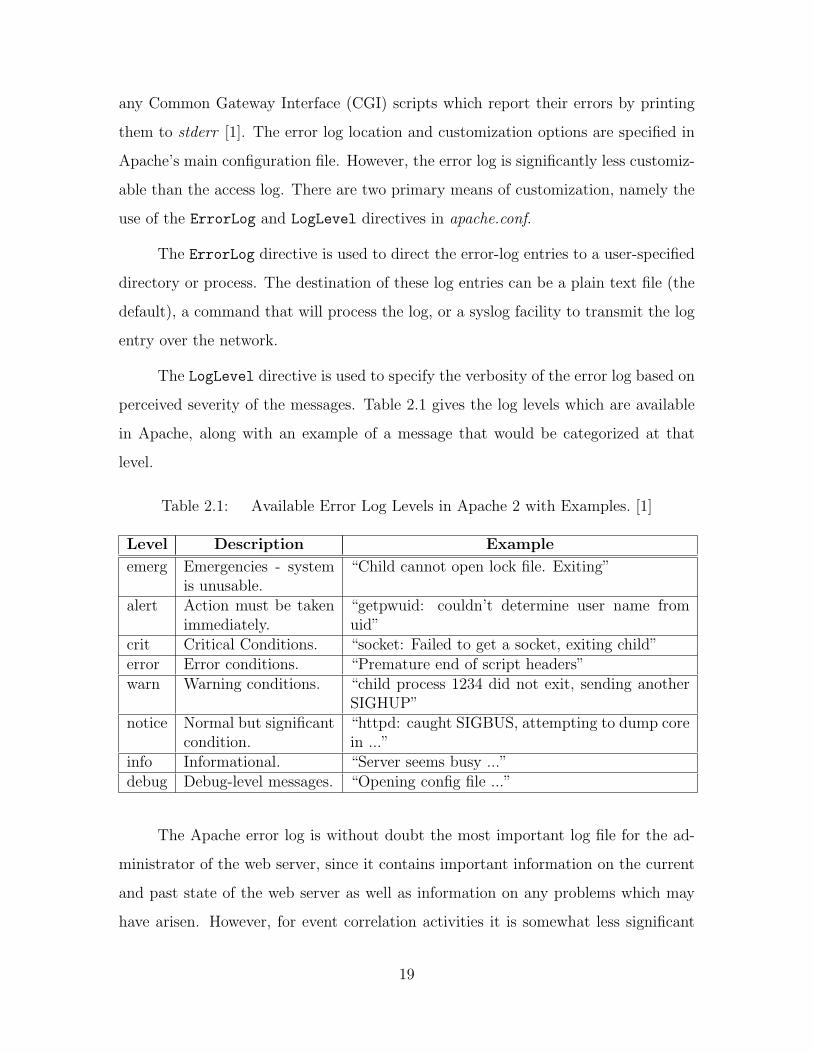
The LogLevel directive is used to specify the verbosity of the error log based on
perceived severity of the messages. Table 2.1 gives the log levels which are available
in Apache, along with an example of a message that would be categorized at that
level.
Table 2.1: Available Error Log Levels in Apache 2 with Examples. [1]
Level Description Example
emerg Emergencies - systemis unusable.
“Child cannot open lock file. Exiting”
alert Action must be takenimmediately.
“getpwuid: couldn’t determine user name fromuid”
crit Critical Conditions. “socket: Failed to get a socket, exiting child”error Error conditions. “Premature end of script headers”warn Warning conditions. “child process 1234 did not exit, sending another
SIGHUP”notice Normal but significant
condition.“httpd: caught SIGBUS, attempting to dump corein ...”
info Informational. “Server seems busy ...”debug Debug-level messages. “Opening config file ...”
The Apache error log is without doubt the most important log file for the ad-
ministrator of the web server, since it contains important information on the current
and past state of the web server as well as information on any problems which may
have arisen. However, for event correlation activities it is somewhat less significant
19
than the access log, since the format is less rigid and the potential messages not as well
documented. Still, the use of the error log might provide useful clues about specific
anticipated malicious behaviors which would not necessarily be present in the access
log.
2.5.2 IIS log files. Microsoft’s Internet Information Services (IIS) is a pop-
ular commercial web server which is included as part of a Windows Server operating
system install [2]. As such, it is only supported in the Windows environment. This
section applies to IIS 6.0 as a component of a Windows Server 2003 installation. In
addition to the access and error log, IIS 6.0 also generates a cluster log and a shutdown
log. The cluster log stores messages that are related to high availability configuration
options in IIS 6.0 [2], while the shutdown log stores system information relating to the
last shutdown. This document does not address these log files as their relevance to
event correlation activities is marginal, and depends highly on the local configuration
of IIS.
2.5.2.1 IIS Access Log. The access log in IIS captures the same sort of
information as the Apache access log, although fewer log elements are available. Unlike
Apache, the logging characteristics of an IIS web server are configured in a graphical
menu. Figure A.1 shows the property dialog used for configuring logging options,
accessible by opening the Application Server Management Console, navigating to
“IIS Manager − > Local Computer − > Web Sites” and selecting properties from
the right-click menu on the default web site. The actual elements to be logged in the
IIS access log are selected in the dialog shown in Figure A.2, which can be accessed
by clicking the“Properties” button in the logging section at the bottom of the dialog
in Figure A.1. It is important to note that the ability to select individual log elements
is only present when “W3C Extended Log Format” is selected as the logging format.
If it is selected, the advanced tab with log elements is shown; otherwise it is absent.
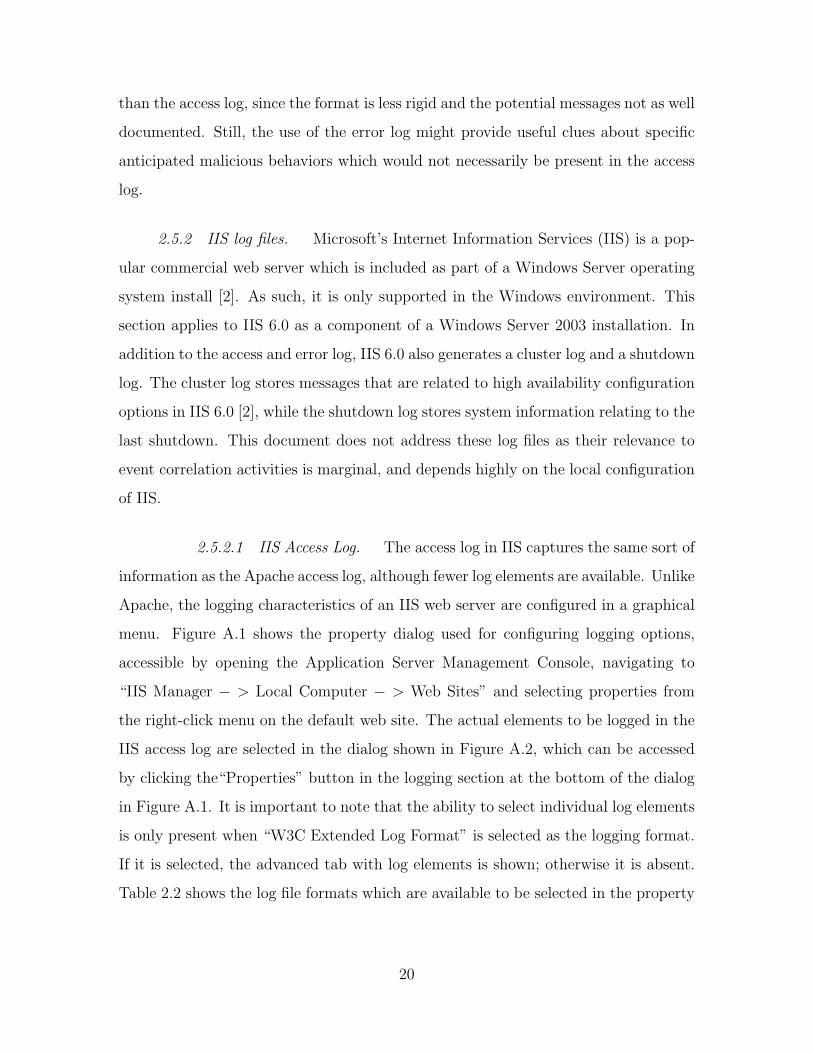
Table 2.2 shows the log file formats which are available to be selected in the property
20
dialog, and Table A.2 shows the individual available log elements and descriptions of
each.
Table 2.2: Available Log File Formats in IIS 6.0. [2]
Log File Format Description
W3C Extended LogFile Format
Text-based, customizable format for a single site. Thisis the default format.
W3C Centralized Log-ging
All data from all Web sites is recorded in a single logfile in the W3C log file format.
NCSA Common LogFile Format
Text-based, fixed format for a single site.
IIS Log File Format Text-based, fixed format for a single site.ODBC Logging Fixed format for a single site. Data is recorded in an
ODBC-compliant database.Centralized BinaryLogging
Binary-based, unformatted data that is not customiz-able. Data is recorded from multiple Web sites and sentto a single log file. To interpret the data, you need aspecial parser.
HTTP.sys Error LogFiles
Fixed format for HTTP.sys-generated errors.
2.5.2.2 IIS Error Log. The IIS error log is very similar in nature to the
error log in Apache. It serves as a single point of reference for all error logs generated
by IIS and the Dynamic Linked Libraries (DLLs) that support it. Unfortunately,
there is no comprehensive reference as to the format or possible content of log entries
in this file. This means that the IIS error log is not especially useful for general event
correlation activities, but may be of some value when looking for a specific anticipated
error.
2.6 Simple Event Correlator
The Simple Event Correlator (SEC) is a lightweight, open-source, and platform-
independent tool for rule-based event correlation [36]. SEC is used worldwide by
organizations in industries such as banking, telecommunications, retail, and soft-
ware development, with cited benefits including low cost, flexibility, efficiency and
21
ease of configuration [36]. SEC is written in Perl, has a very small footprint (less
than 250 KB) and utilizes tools and concepts which are familiar to system and net-
work administrators such as regular expressions, file streams, and named pipes. It
is available for free download from http://kodu.neti.ee/risto/sec/ or http://simple-
evcorr.sourceforge.net/.
Configuration files in SEC are plain text files, created and modified with any text
editor. These configuration files may contain one or more rules, which are evaluated in
the order in which they appear in the file. These rules may be one of nine supported
rule types. While each rule type has a few unique parameters, they all follow the
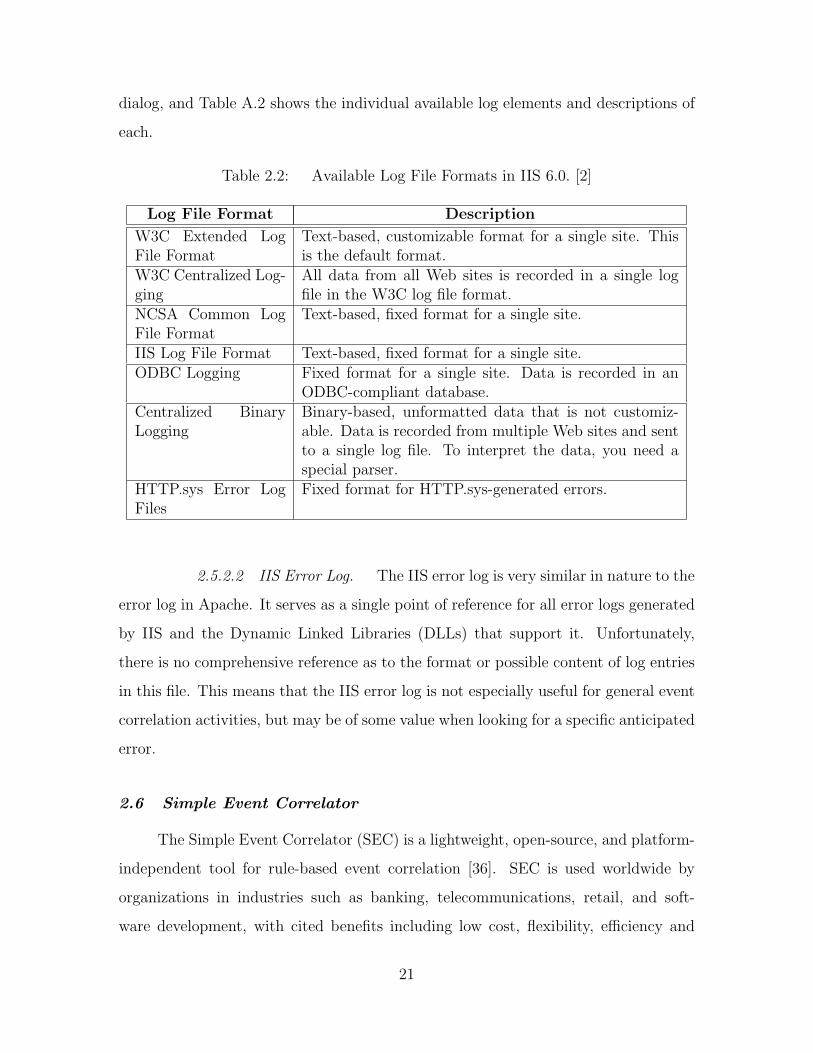
same basic format. Figure 2.4 shows an example ruleset which detects a “file system
full” error and suppress further messages for 60 minutes, while Table 2.3 describes all
available SEC rule types.
#Example:# Apr 13 15:08:52 host4.example.org ufs: [ID 845546 \# kern.notice] NOTICE: alloc: /mount/sd0f: file system fulltype=SingleWithSuppressdesc=Full filesystem $2 on $1ptype=regexppattern=([\w. -]+) ufs: \[.* NOTICE: alloc: ([\w. -]+): file system fullaction= write - filesystem $2 on host $1 fullwindow=3600
Figure 2.4: Example SEC Ruleset. [27]
The example rule in Figure 2.4 includes several elements which are common to
any SEC rule. The type keyword identifies the rule type, which defines how SEC
will interpret the other keywords. In this example, the type is SingleWithSuppress.
The desc keyword is a name for the event which will be used internally to group sim-
ilar events together. This description is generated with the temporary variables $1
and $2, which correspond to the host and filesystem in the message, respectively. In
this example, additional messages regarding /mount/sd0f on host4.example.org will
be suppressed, but an error concerning another filesystem will be displayed, since a
different description would be generated for that event. The ptype keyword indicates
the type of pattern which will be evaluated; the most common value is regexp, signi-
22
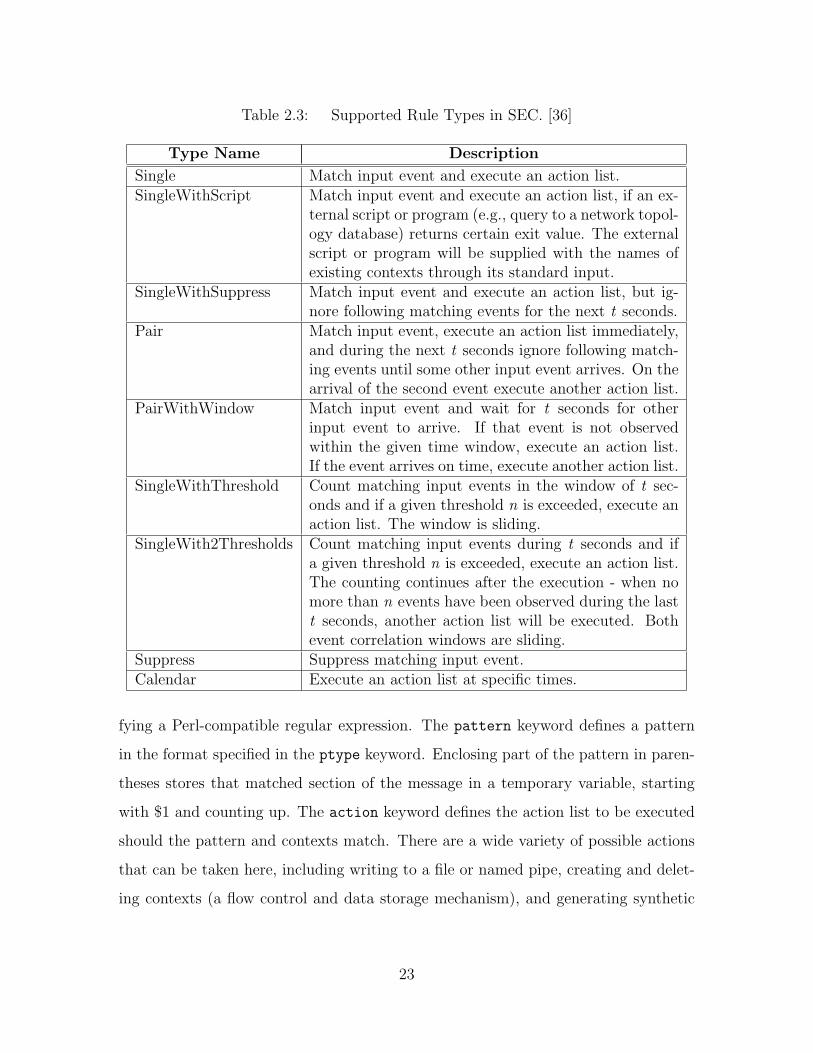
Table 2.3: Supported Rule Types in SEC. [36]
Type Name Description
Single Match input event and execute an action list.SingleWithScript Match input event and execute an action list, if an ex-
ternal script or program (e.g., query to a network topol-ogy database) returns certain exit value. The externalscript or program will be supplied with the names ofexisting contexts through its standard input.
SingleWithSuppress Match input event and execute an action list, but ig-nore following matching events for the next t seconds.
Pair Match input event, execute an action list immediately,and during the next t seconds ignore following match-ing events until some other input event arrives. On thearrival of the second event execute another action list.
PairWithWindow Match input event and wait for t seconds for otherinput event to arrive. If that event is not observedwithin the given time window, execute an action list.If the event arrives on time, execute another action list.
SingleWithThreshold Count matching input events in the window of t sec-onds and if a given threshold n is exceeded, execute anaction list. The window is sliding.
SingleWith2Thresholds Count matching input events during t seconds and ifa given threshold n is exceeded, execute an action list.The counting continues after the execution - when nomore than n events have been observed during the lastt seconds, another action list will be executed. Bothevent correlation windows are sliding.
Suppress Suppress matching input event.Calendar Execute an action list at specific times.
fying a Perl-compatible regular expression. The pattern keyword defines a pattern
in the format specified in the ptype keyword. Enclosing part of the pattern in paren-
theses stores that matched section of the message in a temporary variable, starting
with $1 and counting up. The action keyword defines the action list to be executed
should the pattern and contexts match. There are a wide variety of possible actions
that can be taken here, including writing to a file or named pipe, creating and delet-
ing contexts (a flow control and data storage mechanism), and generating synthetic
23
events [27]. Finally, the window keyword defines the length of time over which the
rule will suppress further matching messages with the same description.
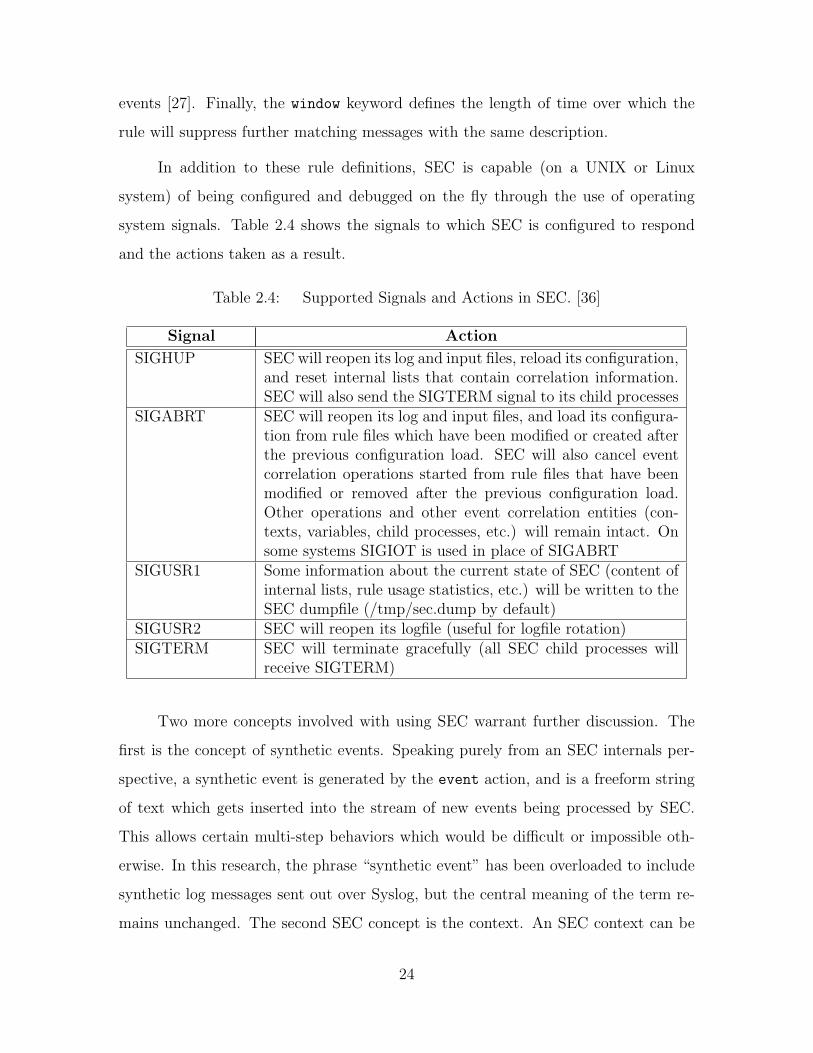
In addition to these rule definitions, SEC is capable (on a UNIX or Linux
system) of being configured and debugged on the fly through the use of operating
system signals. Table 2.4 shows the signals to which SEC is configured to respond
and the actions taken as a result.
Table 2.4: Supported Signals and Actions in SEC. [36]
Signal Action
SIGHUP SEC will reopen its log and input files, reload its configuration,and reset internal lists that contain correlation information.SEC will also send the SIGTERM signal to its child processes
SIGABRT SEC will reopen its log and input files, and load its configura-tion from rule files which have been modified or created afterthe previous configuration load. SEC will also cancel eventcorrelation operations started from rule files that have beenmodified or removed after the previous configuration load.Other operations and other event correlation entities (con-texts, variables, child processes, etc.) will remain intact. Onsome systems SIGIOT is used in place of SIGABRT
SIGUSR1 Some information about the current state of SEC (content ofinternal lists, rule usage statistics, etc.) will be written to theSEC dumpfile (/tmp/sec.dump by default)
SIGUSR2 SEC will reopen its logfile (useful for logfile rotation)SIGTERM SEC will terminate gracefully (all SEC child processes will
receive SIGTERM)
Two more concepts involved with using SEC warrant further discussion. The
first is the concept of synthetic events. Speaking purely from an SEC internals per-
spective, a synthetic event is generated by the event action, and is a freeform string
of text which gets inserted into the stream of new events being processed by SEC.
This allows certain multi-step behaviors which would be difficult or impossible oth-
erwise. In this research, the phrase “synthetic event” has been overloaded to include
synthetic log messages sent out over Syslog, but the central meaning of the term re-
mains unchanged. The second SEC concept is the context. An SEC context can be
24

though of as a flag which can be set and unset, and as a bucket which can be filled
with events and emptied. Adding a context keyword to an SEC rule provides the
capability to only execute the action list if certain other conditions are met. It also
allows information to be stored in such a way as to be retrievable later.
There are many excellent references on using SEC and sample rulesets available
for free download online and in academic publications [36] [27].
2.7 Summary
This chapter has covered the current state of research in the areas of log man-
agement and event correlation, discussed SIEM tools and the concept of insider threat
detection, and given a technical overview of technologies which are leveraged in this
research, including web server logging mechanisms and the Simple Event Correlator.
25

III. Concept Development
As presented in Chapter 1, SIEM activities are often ill-suited to today’s enterprise
environment, and if SIEM activities are conducted at all, the scope of those activities is
limited and the design centralized in nature. This research develops and demonstrates
a tool which addresses these limitations, but also reasons about the factors which play
into the real world implementation of SIEM activities. This reasoning strengthens the
resulting methodology by increasing the relevance of recommendations to real-world
networks and by increasing the body of knowledge on the subject.
This chapter revisits the goals of this research, namely present a distributed
event correlation methodology, provide a remotely configurable and customizable con-
figuration and enable the incorporation of logs from multiple sources and locations
into the methodology. In addition, a viewport into the thought processes involved
fulfilling those goals is presented. The general approach to conducting this research is
presented first, followed by a section explaining the thought process for designing an
experimental network to validate the assertions in Chapter 1. Following this section
is a discussion of the principles applied in selecting use cases, as well as some lessons
learned from that selection process and a summary of the chapter.
3.1 Approach
Following the reasoning phase discussed in this chapter, a physical experimental
network is set up, and a test implementation of the methodology is built. This imple-
mentation is based on the conclusions and lessons learned discussed in this chapter.
A set of 15 malicious web-based scenarios are simulated amidst a background of be-
nign user traffic. The logs from both classes of traffic are collected and analyzed in
four runs of the experimental network, each run corresponding to one of four logging
modes presented in Section 3.5. The specific implementation details of the experimen-
tal network are discussed in Chapter 4. Remote configurability is achieved by taking
advantage of real-time configuration capabilities of the Simple Event Correlator. The
26

end result is a flexible, context aware distributed event correlation methodology which
can be tailored to an individual organization’s perceived needs and vulnerabilities.
3.2 Network Design Rationale
To design a theoretical methodology for efficient and effective event correlation is
one thing; building an experimental network to measure its properties is quite another.
This section discusses decisions which must be made when building an experimental
network, and the thought process involved in making those decisions for this research.
3.2.1 Realism and Scope Limitation. Research conducted on a system which
bears little resemblance to real-world, operational systems is of limited value. How-
ever, it is infeasible to build a multi-million dollar enterprise network to implement and
measure a single tool or methodology. Therefore a balance must be struck between
the time and budgetary constraints of research, and the need for the experimental
network to be similar enough to an operational network that the conclusions drawn
from the experiments hold true for both.
In the experimental network built for this research, this tension has been recog-
nized and attempts made to strike such a balance. Scope limitations made included
the overall size of the network and the single class of log-producer, namely web servers.
These limitations have a clear impact on the results of the research. In the case of
network size, the methodology must be shown to be scalable and the composition of
the network must closely approximate a full-sized network. In the case of the single
log-producer, the argument must be made that web server logs are fundamentally
similar to logs from other sources so that the results of analysis on web server logs
will apply to other sorts of logs as well. The analysis in Chapter 5 discusses each of
these points as they pertain to the data gathered during the experimental phase of
the research.
Balancing these scope limitations are efforts which were made to make the
network more realistic and applicable to operational configurations. These efforts
27
include the choice of platforms and tools such as Microsoft Windows XP, Apache and
IIS web servers, Kiwi Log Server, Oracle Database 10g and the addition of the SAST
traffic generation engine. These platforms and tools are popular operating systems,
web servers and databases, chosen so that the experimental results were derived from
an environment with a realistic composition, if not a realistic size. In addition, claims
of detectability are strengthened when the attacks are hidden amongst innocent traffic.
Chapter 4 describes the implementation of these design decisions in further detail.
3.2.2 The Base Rate. To implement the traffic generation in such a way
that the traffic is realistic, it is important to consider the basic rate of incidence of
malicious traffic. The immediately intuitive benefit to this consideration is the realism
in the traffic, that is that the proportion of malicious traffic in comparison to benign
traffic should at least be realistic. The other important benefits are the ability to
address the base-rate fallacy when drawing conclusions about the detection rate.
Axelsson describes the base rate fallacy at length in [10]. In essence, the concept
is that the basic rate of incidence of a malicious behavior is not intuitively taken into
account when calculating probabilities such as the false-positive rate, detection rate,
and others. In fact, the probability that there was an intrusion given that there was
an alarm is dominated by the false positive rate, or the probability that an alarm is
raised when there was no intrusion. This makes it critical that the false positive rate
be as low as possible. The benefit of detecting specific policy violations (which largely
describes the use cases in the next section) as opposed to general malicious behavior
is that a more precise signature can be created, making the false positive rate quite
low.
A brief statement of the base rate fallacy in mathematical terms (from Axelsson)
follows:
Since Bayes theorem (used for calculating conditional probabilities) is the main
equation used in this type of analysis, Equation 3.1 presents a generally useful form.
28

P (A)B =P (A) · P (B|A)∑n
i=1 P (Ai) · P (B|Ai)(3.1)
Using Axelsson’s conventions, we define I and ¬ I as intrusive and nonintrusive
behavior, and A and ¬ A as the presence or absence of an intrusion alarm. Thus
P(A|I) is the probability that an alarm is raised if there is intrusive behavior (true
positive), P(A|¬ I) is the probability that an alarm is raised when there is no in-
trusive bahavior (false positive), and so on. As Axelsson identifies, the really useful
probabilities are P(I|A) (the probability that intrusive behavior has happened given
that an alarm was raised), and P(¬ I|¬ A) (the probability that there is no intrusive
behavior in the absence of an alarm). Since an intrusion detection or event correlation
scheme aims to produce trustworthy alarms, these last two probabilities ought to be
as high as possible.
Bayes’ theorem can be used to calculate these two probabilities (and will be
used to do so in Chapter 5) as shown in Equation 3.2 and Equation 3.3.
P (I|A) =P (I) · P (A|I)
P (I) · P (A|I) + P (¬I) · P (A|¬I)(3.2)
P (¬I|¬A) =P (¬I) · P (¬A|¬I)
P (¬I) · P (¬A|¬I) + P (I) · P (¬A|I)(3.3)
3.3 Use Case Selection
The proper selection of use cases is a critical component contributing to the
relevance of the research. This section discusses some concepts behind the selection
of use cases and uses the OWASP Top Ten as a positive example of a set of use cases.
3.3.1 The OWASP Top Ten. The Open Web Application Security Project
(OWASP) is an organization focused on improving the security of web applications
worldwide. To this end, they compile a list of what they perceive as the “Top Ten”
web application security risks every three years to help organizations combat the most
29
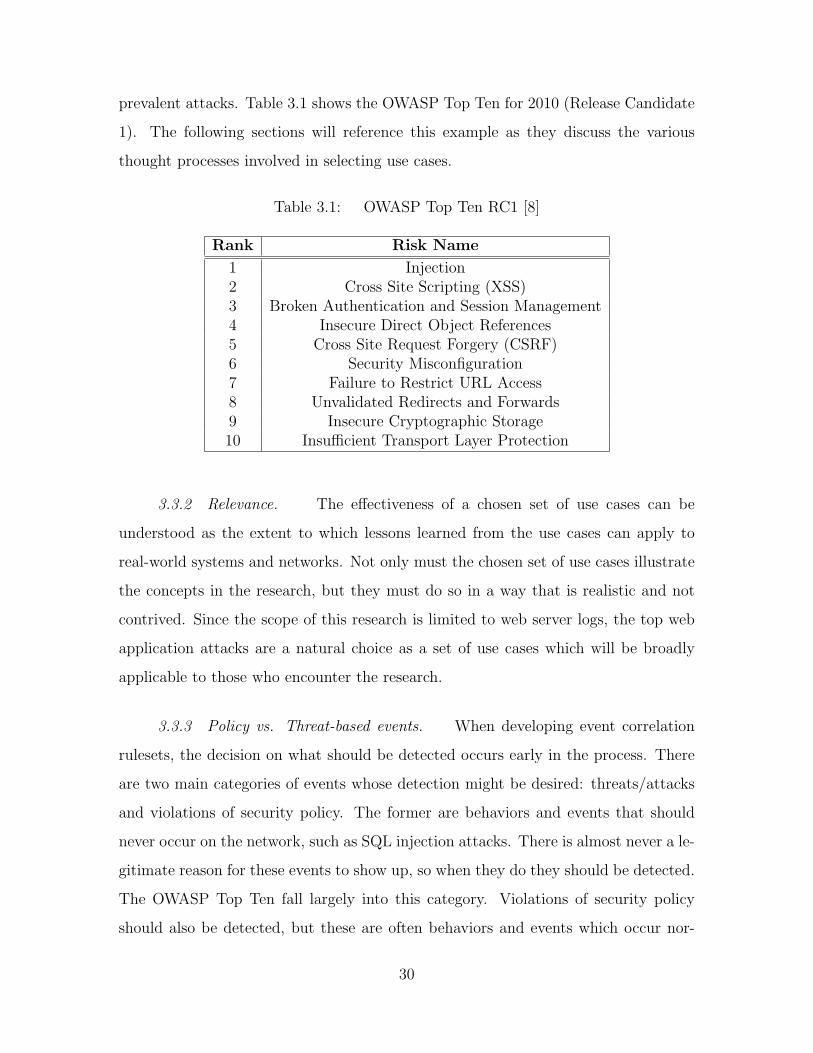
prevalent attacks. Table 3.1 shows the OWASP Top Ten for 2010 (Release Candidate
1). The following sections will reference this example as they discuss the various
thought processes involved in selecting use cases.
Table 3.1: OWASP Top Ten RC1 [8]
Rank Risk Name
1 Injection2 Cross Site Scripting (XSS)3 Broken Authentication and Session Management4 Insecure Direct Object References5 Cross Site Request Forgery (CSRF)6 Security Misconfiguration7 Failure to Restrict URL Access8 Unvalidated Redirects and Forwards9 Insecure Cryptographic Storage10 Insufficient Transport Layer Protection
3.3.2 Relevance. The effectiveness of a chosen set of use cases can be
understood as the extent to which lessons learned from the use cases can apply to
real-world systems and networks. Not only must the chosen set of use cases illustrate
the concepts in the research, but they must do so in a way that is realistic and not
contrived. Since the scope of this research is limited to web server logs, the top web
application attacks are a natural choice as a set of use cases which will be broadly
applicable to those who encounter the research.
3.3.3 Policy vs. Threat-based events. When developing event correlation
rulesets, the decision on what should be detected occurs early in the process. There
are two main categories of events whose detection might be desired: threats/attacks
and violations of security policy. The former are behaviors and events that should
never occur on the network, such as SQL injection attacks. There is almost never a le-
gitimate reason for these events to show up, so when they do they should be detected.
The OWASP Top Ten fall largely into this category. Violations of security policy
should also be detected, but these are often behaviors and events which occur nor-
30
mally, but constitute a policy violation when certain parameters occur. For example,
a policy might exist that says that no employee should be accessing a given resource
during non-work hours, say 5pm - 8am. Access to that resource is a legitimate action,
but when the “access time” parameter has a certain value, that legitimate action
becomes a policy violation.
To ensure that both event classes are covered in this research, five additional
use cases were added. These use cases represent combinations of legitimate activities
which, taken together, are regarded as policy violations in the experimental network.
These use cases are:
• Naıve Web Crawler
• Delayed Web Crawler
• Excessive Downloads
• Excessive HTTP Errors
• Injection Sequence
3.3.4 Understanding and Limiting Observables. An observable is simply
a piece of information which can be observed to give insight into a given event or
behavior. In the case of web application attacks, the log elements generated as a
result of the attack are a significant set of observables. To most effectively monitor
and react to events and behaviors as they are occurring, a thorough understanding
of the available observable information is key. To understand the universe of infor-
mation provided by Apache and IIS, research was done to identify the individual log
elements supported by each application. The results of this research can be found in
Appendix A.1 and Appendix A.2. In addition, initial detection work was done with
all log elements turned on, to more easily identify which log elements were relevant
to detecting the chosen use cases.
It is important to execute this process for several reasons. First, it deepened
the understanding of Apache’s and IIS’ capabilities. Second, it allowed later stages
31

to configure each web server with a smaller set of log elements, since those elements
had been guaranteed to retain the ability to detect the desired malicious activity.
Lastly, the reduced size and complexity of resulting log files means more efficient
use of storage space and network bandwidth, as well as increased efficiency in event
correlation activities involving those log files.
The results of this process of “paring down” the observable log elements would
vary depending on the events and behaviors to be detected. For the fourteen use cases
chosen for this research, the specific log elements identified are discussed in Chapter
4.
3.4 Introspection
A brief study of the OWASP Top Ten will show that several, such as “Unvali-
dated Redirects and Forwards” and “Failure to Restrict URL Access” describe attacks
which are easy to detect, but whose vulnerabilities would be easily fixed if discovered.
While there is value in looking for attacks on as-yet undiscovered vulnerabilities, the
situation begs the question, “Why not just fix the vulnerability instead of detecting
when it gets exploited?” It’s a fair question, and highlights the importance of intro-
spection as a security posture. Introspection can be defined as the ability to critically
evaluate internal systems, applications and processes from a security point of view.
The processes of identifying events and behaviors to detect and understanding and
limiting observables affords an organization the opportunity to turn a critical eye
toward their applications and policies. In addition, it highlights a common problem
- those with the prerogative to evaluate an organization’s systems for vulnerabilities
may not have the ability or authority to fix them. In this case, those conducting log
monitoring activities may want to monitor identified vulnerabilities for breaches until
the problem can be resolved.
32
3.5 Adjustable Logging Modes
In Chapter 1, one of the goals of the research was explained as the ability to
configure the event correlators. The nature of this configuration is an important con-
cept in the research, since the configuration options must facilitate the other research
goals while representing real-world issues in log management. To that end, the con-
figuration of the event correlation engines has been designed to be adjustable in two
ways. First, the behaviors to be detected can be adjusted; that is to say new specifi-
cations for behaviors can be added and old ones can be deleted. Second, the output
of the event correlation engines can be set to one of three logging modes. In Mode 1,
only synthetic event messages are produced, and all raw log messages are suppressed.
In Mode 2, synthetic event messages are produced along with the raw logs which
caused the synthetic event to be generated. This way, all possible information about
each attack is available to an analyst watching the output. In Mode 3, all raw log
messages are included, as well as synthetic event messages. This mode is designed
to provide context in high accountability environments, where all raw log messages
must be collected and/or stored centrally. Lastly, Mode 4 includes only raw logs for
use as a control and to model the traditional, centralized approach.
Another logical logging mode can be envisioned - a “Mode 0” where nothing is
logged over the network. This mode might still write synthetic and raw log messages
to the local machine, but would either queue them up for later delivery or not send
them at all. While Mode 0 is not implemented in this research, it could be useful in
situations where there is reason to believe that the log server had been compromised
by an insider, or that it was unsafe or undesirable for log messages to be sent over
the network for a certain period of time.
3.6 Implications of Remote Configuration
In addition to the ability to configure the event correlation engines, Chapter 1
identified as a goal that the capability should exist to do the configuration remotely.
In designing and implementing the capability to perform the configurations discussed
33
in the previous section remotely, it must be recognized that this introduces certain
security risks. If a malicious entity wanted to execute some malicious behavior and
go undetected, they would be motivated to find a way to remotely configure the event
correlation and log collection activities so that their behavior was not reported. To
mitigate this risk, the experimental network accomplishes the remote configuration
through SSH. This way, only a user with an account on the log-producer would be
able to remotely configure that node of the event correlator. Of course, this still leaves
open the possibility for insider attack, the mitigation of which is outside the scope of
the research.
3.7 Summary
This chapter has discussed the thought processes that occurred during the
decision-making process and design phase of this research. Specifically, the chap-
ter considered the general approach of the research, points to consider in the network
design and use case selection activities, a model for configurability, the value of intro-
spection and an acknowledgement of the risk associated with remote configuration.
34
IV. Experimental Implementation and Methodology
This chapter delves into the technical details of the research, describing how the
principles in Chapter 3 were implemented in policy, software and hardware. The
first section goes into detail about each selected use case, including a description of
the attack and the simulated scenario. The next several sections go into detail on the
design of the test network, and the chapter concludes with the policy for administering
each scenario.
4.1 Use Case Detail
This section discusses the use case scenarios which were used in each run of the
experiment. Each use case represents an interesting attack on web servers. Some of
the implementations of these use cases are broadly detectable, such as the “Exces-
sive Downloads” and “Injection” use cases. This simply means that most malicious
behaviors described by the use case are detectable in a general implementation. The
other implementations are narrowly detectable, which means that there is no intuitive,
general implementation which will detect most malicious behaviors. For example, the
“Failure to Restrict URL Access” use case describes the failure on an organization’s
part to properly restrict access to a resource through typing in the path to that
resource in a URL. Since every legitimate or illegitimate access of web resources fun-
damentally involves typing in the path to that resource in a URL, a general rule to
detect this behavior would not provide any value. However, in the case of directory
traversal a user is accessing resources using a method which is never necessary and
often malicious. This can be detected in an implementation of this use case, but does
not cover all of the malicious behavior contained therein.
The following subsections provide more detail on each use case, and describe
how they are expected to demonstrate the ideas set forth in Chapter 1. The first
ten use cases are taken from the Open Web application Security Project (OWASP)
Top Ten List, a well-respected compilation of top web application attacks which was
discussed in the previous chapter. The next four are insider threat-oriented use cases
35
identified in previous research as interesting web application attack scenarios [24].
The final use case, the Injection Sequence, utilizes two distinct log sources to detect a
possible SQL injection without the use of regular expressions. In addition, the scripts
written to carry out the attack are characterized, and the reader is referred to the
source code of those scripts.
4.1.1 Injection. The injection use case refers both to SQL and command
injection. In injection attacks, user inputs are not sanitized by the web application
before being sent to the database or operating system for execution. These inputs
could potentially contain special characters which would change the meaning of queries
made or actions taken using those inputs. This potentially allows an attacker the
opportunity to craft an input which performs some malicious action in the database
or on the host operating system.
To detect SQL and command injection, a rule has been written (found in Ap-
pendix B.1 and Appendix B.2) which looks for quote marks, the word “or,” the equals
sign, a double dash or a semicolon, along with their ASCII and hex encoded equiv-
alents. In addition, the rule looks for some common SQL keywords and command
injection keywords.
This rule will be used to evaluate logs from multiple sources, in this case web
server, database, and system logs to show that the method being used for web server
logs is easily adaptable to include logs from other sources.
The Python script which implements this attack executes five injections. The
first injection is the classic “’ or 1=1”. The second is the same as the first, but
URL encoded. The third is an injection specifically targeted at the PHPNuke Ap-
plication; the actual injection code is taken from the Honeynet project’s website
(http://www.honeynet.org). The fourth injection includes SQL keywords in the query
string, and the last injection includes keywords indicative of attempted execution of
system commands. The source code for this script is located in Appendix C.1.
36
4.1.2 Cross Site Scripting. This use case demonstrates the detection of
cross-site scripting (XSS), one of the most common web application attacks [23].
In XSS attacks, scripting tags are embedded in HTTP requests and automatically
generated page content in such a way that users are enticed to execute the script,
which would happen on the user’s local machine. Commonly, these scripts are used
to deliver malware to user workstations.
To detect XSS, a rule has been written (found in Appendix B.3 and Ap-
pendix B.4) which looks for image tags (one of the more popular vectors for the
malicious scripts), javascript keywords, and general HTML tags. It is worth noting
that in some web applications which allow posting of HTML content (such as web
forums), this may produce a large volume of false positives.
The Python script which implements this attack executes four requests. The
first contains an image tag carrying a javascript alert. The second and third simply
contain script tags, and the fourth contains script content disguised as a normal
comment submission. The source code for this script is located in Appendix C.2.
4.1.3 Broken Authentication and Session Management. This use case demon-
strates the detection of a scenario where an attacker is either fuzzing the login func-
tions of a web application or exploiting a discovered vulnerability. In the scenario, a
web server is misconfigured to accept login or session information from cleartext GET
parameters, which leaves the application vulnerable to session rewriting and sniffing
attacks. The detection ruleset (found in Appendix B.5 and Appendix B.6) looks for
indicators in the GET parameters such as login page names and parameter names
dealing with username and password transmission, as well as session information.
The Python script which implements this attack executes two requests. The first
request contains login credentials in the query string, and the second contains a session
id in the query string. The source code for this script is located in Appendix C.3.
37
4.1.4 Insecure Direct Object References. This use case demonstrates the
detection of attacks which exploit internal objects which have been inadvertently
exposed to the public. This attack often exploits application-specific resources for
which it would be impossible to write a general rule. However, there are some common
attacks that fall into this category which are broadly detectable. The first attack is
directory traversal, where a web server is configured to interpret command line path
strings such as “../” and return files from other locations in the filesystem. The second
is related, where an attacker specifically goes after command shells and password
stores.
The rule (found in Appendix B.7 and Appendix B.8) to detect insecure direct
object reference attacks looks for both of these vectors, including ASCII and hex-
encoded versions of the attacks.
The Python script which implements this attack executes three requests. The
first two are directory traversal attacks, with various encodings. The third request
simply contains a suspicious filename (/etc/shadow). The source code for this script
is located in Appendix C.4.
4.1.5 Cross Site Request Forgery. Cross Site Request Forgery (CSRF) at-
tacks take advantage of web applications which allow state-changing requests to be
made without the inclusion of anything secret. An example would be a bank which al-
lows funds to be transfered via a url such as http://www.bank.com/transferFunds.asp
?toAccount=123456789&amount=1000. An attacker conducts a CSRF attack by in-
cluding a similar link in an image tag or iframe on a website under his control, and
trying to get users of www.bank.com to view it. If they are logged in when they do
so, the request would be made, and the money would be transfered to the attacker’s
account.
To detect CSRF attacks, the ruleset (found in Appendix B.9 and Appendix B.10)
looks at the Referer HTTP header, which tells the web server what site a link was
38
followed from (or in this case, from which site the request was made). If the access to
the script is from another domain (i.e. not from www.bank.com), an alert is generated.
The Python script which implements this attack executes two requests. The
first request is good - it accesses transferFunds.asp from within www.bank.com, which
is allowed. The second request accesses the same page, but does so from
www.badguy.com/badscript.php. The source code for this script is located in Ap-
pendix C.5.
4.1.6 Security Misconfiguration. Security Misconfiguration is a term which
refers to failure to perform security hardening tasks across the entire application
stack [8]. This includes activities such as installing firewalls, keeping patches up to
date, disabling ports and services, and changing default passwords. Attackers might
be able to exploit published vulnerabilities or generally gain access more easily if
these activities are not performed. Unfortunately, none of these activities produce
predictable entries in web server logs. It is possible that the exploitation of an un-
patched third-party application might show up in the logs, but that appearance woudl
be highly specific to that application and vulnerability. Thus, while this scenario is
not reliably detectable in web server logs, it does illustrate well the principle of intro-
spection which was discussed in Chapter 3.
4.1.7 Failure to Restrict URL Access. A URL access vulnerability has two
primary characteristics; there is a resource accessible via URL that does some sort
of privileged action, and the web application fails to restrict access to that resource.
Thus anyone can perform the privileged action if they know how the application
works. The scenario here is a web application admin console at admin.php, that adds
an account via addaccount.php. In the scenario, admin.php validates that a user is
logged on, but addaccount.php does not. The security team wants to know when
addaccount.php is accessed directly, or from a location other than admin.php. In
reality, there would rarely (if ever) be a good reason to have a web application set up
this way. This again highlights the value of introspection.
39
The Python script which implements this attack executes two requests. The first
request is from www.goodguy.com/admin.php, and is considered a normal and permit-
ted access. The second request accesses the same page, but comes from www.badguy.com.
The source code for this script is located in Appendix C.6, and the SEC ruleset which
detects this scenario is found in Appendix B.11 and Appendix B.12.
4.1.8 Unvalidated Redirects and Forwards. This use case covers the common
behavior of using GET parameters to forward users to other parts of the site or redirect
them when a transaction is successful. This situation could be used as part of a
phishing scam, where users are presented with a valid-looking link which redirects
them to a malicious site. In this scenario, www.goodguy.com has an open redirect
page to their banking site. The ruleset (found in Appendix B.13 and Appendix B.14)
checks to make sure that the provided URL parameter actually points to a resource
located at www.goodguy.com.
The Python script which implements this attack executes two requests. The
first is a permitted use of the redirect. The second is a redirect to www.badguy.com’s
phishing site. The source code for this script is located in Appendix C.7.
4.1.9 Insecure Cryptographic Storage. This use case refers to situations
where personal or sensitive information is stored in an insecure manner, whether in
long-term storage or in a live database. If an attacker gained access to such data, the
disclosure of personal information could occur or sensitive information could fall into
the wrong hands. Unfortunately, while the attacks which disclose the information may
show up in the web server logs, the fact that information is being stored insecurely is
not an area applicable to web server logs. Thus this use case is not detectable in web
server logs.
4.1.10 Insufficient Transport Layer Protection. This use case is largely a
configuration issue. It deals with whether or not a web application has SSL installed
and properly configured, to prevent sniffing and phishing attacks which take advantage
40
of browser warnings or unencrypted connections. Thus, this is a difficult case to detect,
as sniffing and phishing attacks don’t reliably show up in web server logs. However,
it is possible to detect when a user encounters an error while browsing to a secure
site. In addition, Apache can be configured to log errors encountered when processing
requests using SSL.
To enable detection of this behavior (and SSL in general), an additional Apache
module (mod ssl) must be installed. Fortunately, Apache provides an easy mechanism
to do this - the a2enmod command. Simply running sudo a2enmod ssl sets up Apache
to be able to handle SSL traffic. After running this command, one need only copy
the configuration file from /etc/apache2/sites-available to /etc/apache2/sites-enabled,
adjust the configuration to match the logging characteristics of the unencrypted server,
and restart Apache.
The rule (found in Appendix B.15) to detect this behavior looks at both the
access log and error log. When a client using Firefox receives a certificate error, an
“SSL Library Error” is generated in error.log, even though nothing shows up in the
access log. Internet Explorer and other browsers generate different errors, for which
a rule could be written as well. This particular entry is at the info-level, so it is
necessary to modify the SSL site configuration in Apache so that the LogLevel is
info. In the access log, mod ssl adds four additional log elements - the TLS/SSL
version, the cipher used, the error code, and the error string. If SSL is not used, the
first two will be displayed as dashes. The second pair of elements will be displayed as
dashes unless an error occurs - so if anything aside from dashes is detected, an alert is
generated. To demonstrate this use case, alerts are generated when the bad-certificate
error appears in error.log or if any other error shows up in access.log.
This attack is conducted simply by manually attempting to access (using Fire-
fox) the Apache server with SSL enabled. Since the certificate on that server is
self-signed, an error will be generated.
41

4.1.11 Naıve Web Crawler. This use case demonstrates the detection of
a web crawler such as GNU Wget (http://www.gnu.org/software/wget) which is not
attempting to avoid detection. The idea behind this scenario is that an insider would
be trying to exfiltrate data from an organization’s intranet as quickly as possible by
using a web crawler to download all the content to some removable media, which can
then be hand-carried out of the establishment.
The rule (found in Appendix B.16 and Appendix B.17) to detect this use case
involves a sliding time window and an event threshold, calculated for each IP address
represented in the log. If the event threshold is exceeded inside the time window, an
alert is generated identifying that IP as potentially having a web crawler.
Instead of using a Python script to implement this attack, GNU Wget will be
used, since it is one of the most popular web crawling software packages.
4.1.12 Delayed Web Crawler. This use case is similar in motivation to
the previous, except in this use case the perpetrator is circumventing the window
and threshold technique by delaying each access by the web crawler so that it only
downloads a page every several seconds.
To detect this use case, an SEC rule (found in Appendix B.18 and Appendix B.19)
was written which keeps a tally of the access times for each IP, and sends them to
an external utility which measures the standard deviation of the access times. If the
standard deviation is too small an alert is generated, since a small standard deviation
may indicate that the accesses are automated, rather than generated by a human
being.
This attack is also implemented with GNU Wget, using the wait (-w) option to
delay each request by some number of seconds.
4.1.13 Excessive Downloads. This use case involves a malicious insider
with a similar motive as the previous two use cases, but in this case the insider is
downloading large amounts of data either by hand or using a tool which evades the
42

other two rules. In this scenario, an organizational threshold for excessive download
volume in a given time frame is set, and any download totals exceeding that threshold
generate an alert.
The rule (found in Appendix B.20 and Appendix B.21) to detect this use case
involves keeping a tally of total bytes consumed in a temporary array indexed by IP.
When the download total for an IP exceeds the threshold, an alert is generated and
further events are suppressed for a given time period (like 60 minutes). This way, if
the threshold is exceeded, further alerts will be generated every hour, rather than on
every additional access.
This use case will be used to demonstrate the value of injecting synthetic events
into the event stream in a high-accountability environment where every log entry must
be sent to a central log server for correlation.
The Python script which implements this attack downloads two large files five
times each, waiting a random amount of time (from 0 to 10 seconds) between each
access to simulate downloading the files by hand. The source code for this script is
located in Appendix C.8.
4.1.14 Excessive Access Attempts. In this scenario, an attacker is repeatedly
attempting to access resources which he is not permitted to view, or resources which
have been moved or gone missing. It also includes the situation where an attacker
has found useful information in an error message, and is loading it repeatedly to gain
additional information about the underlying system.
The rule (found in Appendix B.22 and Appendix B.23) to detect this use case
again uses a sliding time window and threshold. It counts up the number of HTTP
errors generated per IP, and generates an alert when an IP has encountered too many
of a specific type of error.
The Python script which implements this attack accesses a nonexistent page in
rapid succession. The source code for this script is located in Appendix C.9.
43
4.1.15 Injection Sequence. In this scenario, an attacker visits a comments
page which is vulnerable to SQL injection. The database behind the application has
two tables: a comments table for use by the web application, and a users table for
access on other parts of the site. The attacker injects a query to insert himself as a
user.
The rule (found in Appendix B.24) to detect this use case detects four events,
and only alerts when all four have taken place. The four events are as follows:
• (MySQL query log) A user (or script) connects to the database.
• (MySQL query log) An insert is performed on the comments table.
• (MySQL query log) An insert is performed on the users table.
• (Apache access log) An access to comments.php is detected.
When these happen simultaneously, a user is presumed to have used SQL injec-
tion to insert an entry into the users table.
The Python script which implements this attack accesses comments.php with
injection code in the query string. The source code for this script is located in Ap-
pendix C.10.
4.2 Metrics Selection
To facilitate the observation of the experimental network, specific metrics were
selected for their value in demonstrating and validating the claims made in Chapter
1. In summary, those claims were that the methodology presented in this research:
• Adds value in low accountability environments through decreased resource con-
sumption
• Adds value in high accountability environments by providing context with syn-
thetic events
• Provides remote configurability
44

• Has the ability to scale to multiple log formats
To demonstrate and validate these claims, five metrics have been chosen. They
are detection rate, false positive rate, network load and database query execution
time. The remainder of this section discusses each metric and the reason for choosing
it.
The first metric chosen is the detection rate. In order to add value to log event
correlation activities, the methodology must be able to fulfill a basic requirement of
event correlation - detecting suspicious behavior. The detection rate measures the
methodology’s ability to detect the selected use cases, which were presented in detail
in the previous section. This measurement will be taken by monitoring at the log
server alerts produced by SEC instances at each web server. If an alert is generated
when the attack is executed, the scenario is said to have been detected.
The second metric chosen is the false positive rate. Even if every scenario is
detected correctly, a high false positive rate would decrease the credibility of alerts,
as well as increase the expense associated with investigating alerts (in an operational
environment). Thus, it is important that false positive rates be kept as low as possible.
This measurement will be taken by monitoring SEC alerts at the log server. If an alert
is generated but no attack was executed, a false alarm is said to have been detected
and this is factored into the overall false positive rate.
The third metric chosen addresses the value added through decreased resource
consumption by monitoring the composition of network traffic. This metric is com-
posed of two components. First, the overall proportion of benign and known malicious
traffic will be monitored to ensure that the base rate of malicious traffic is somewhat
realistic. For the purposes of this set of experiments, malicious traffic is defined as
malicious requests - any responses to the attack are not taken into account. The
second component is the amount of Syslog traffic - specifically, the difference in the
volume of Syslog traffic between various logging configurations. This measurement is
45
taken by monitoring all traffic via a SPAN port on the switch, using Ntop to generate
statistics on the data.
The fourth metric addresses the value of providing context with synthetic events
by monitoring the execution times of database queries. With the addition of synthetic
events, the database should be able to more efficiently identify a particular attack than
if it had to find them without assistance. The magnitude of this boost in efficiency will
be measured by recording execution times of queries with and without synthetic event
context in the database. This metric will also measure the impact of normalization
on query execution time.
4.3 Implementation
This section discusses the configuration of hardware and software to create an
experimental environment where observation of the metrics discussed in the previous
section is possible. To that end, the first two sub-sections discuss the specific hardware
and software configurations used, as well as lessons learned and difficulties encountered
in setting up the systems. The final sub-section discusses the specific sensors which
were put in place to observe the selected metrics.
4.3.1 Hardware Configuration. The experimental hardware configuration is
designed to facilitate a realistic logging infrastructure to support testing of the use
cases described in the previous section. Figure 4.1 shows the overall configuration of
the network, including IP addresses and functions.
The nine non-infrastructure machines in the network, with two exceptions, are
all AOpen miniPC Duo mini computers. The two exceptions are the SAST controller
and log server. Table 4.1 gives the hardware specifications for these machines.
In addition to these computers, there are two infrastructure devices on the
network, namely a Cisco Catalyst 3550 switch with IOS version 12.1(22)EA4 and a
LaCie network storage disk (1 TB capacity) running Windows XP.
46
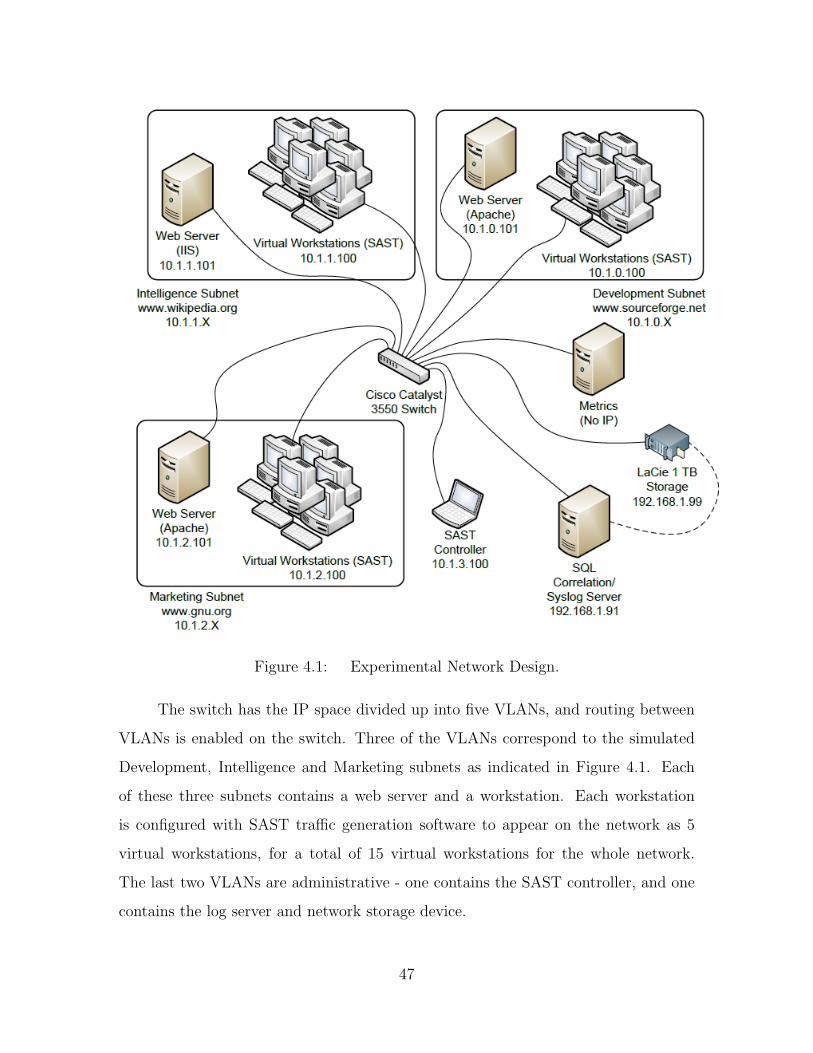
Figure 4.1: Experimental Network Design.
The switch has the IP space divided up into five VLANs, and routing between
VLANs is enabled on the switch. Three of the VLANs correspond to the simulated
Development, Intelligence and Marketing subnets as indicated in Figure 4.1. Each
of these three subnets contains a web server and a workstation. Each workstation
is configured with SAST traffic generation software to appear on the network as 5
virtual workstations, for a total of 15 virtual workstations for the whole network.
The last two VLANs are administrative - one contains the SAST controller, and one
contains the log server and network storage device.
47
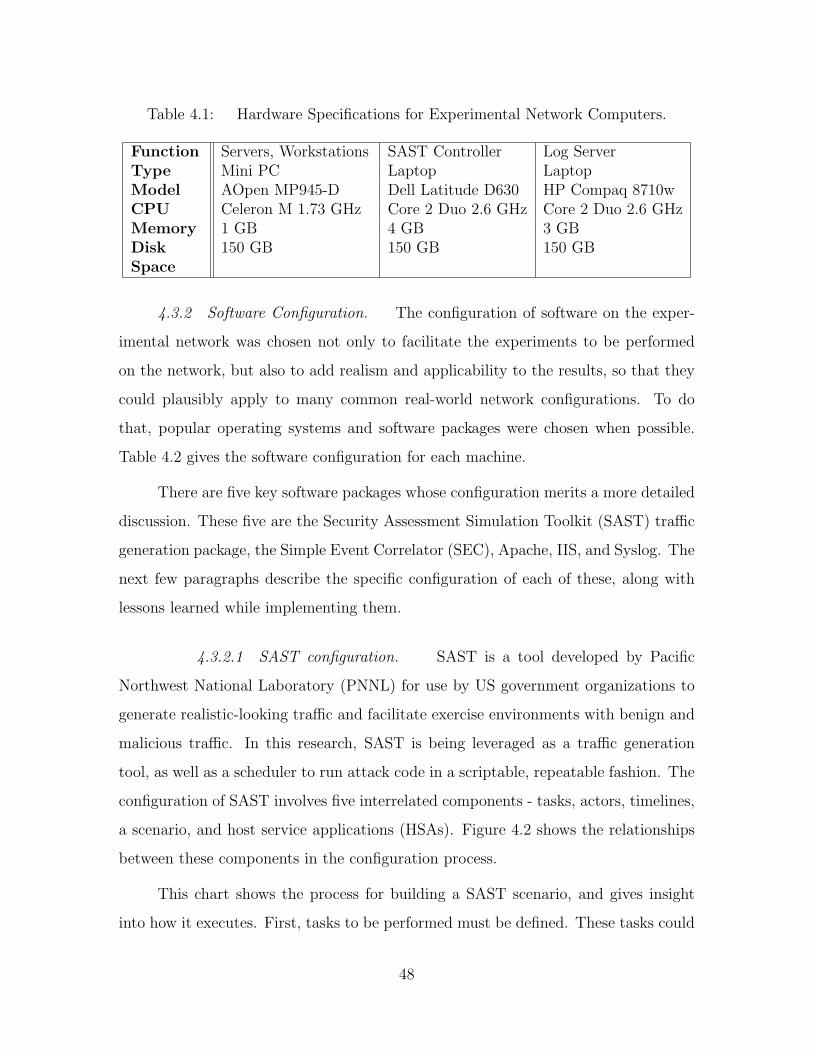
Table 4.1: Hardware Specifications for Experimental Network Computers.
Function Servers, Workstations SAST Controller Log ServerType Mini PC Laptop LaptopModel AOpen MP945-D Dell Latitude D630 HP Compaq 8710wCPU Celeron M 1.73 GHz Core 2 Duo 2.6 GHz Core 2 Duo 2.6 GHzMemory 1 GB 4 GB 3 GBDiskSpace
150 GB 150 GB 150 GB
4.3.2 Software Configuration. The configuration of software on the exper-
imental network was chosen not only to facilitate the experiments to be performed
on the network, but also to add realism and applicability to the results, so that they
could plausibly apply to many common real-world network configurations. To do
that, popular operating systems and software packages were chosen when possible.
Table 4.2 gives the software configuration for each machine.
There are five key software packages whose configuration merits a more detailed
discussion. These five are the Security Assessment Simulation Toolkit (SAST) traffic
generation package, the Simple Event Correlator (SEC), Apache, IIS, and Syslog. The
next few paragraphs describe the specific configuration of each of these, along with
lessons learned while implementing them.
4.3.2.1 SAST configuration. SAST is a tool developed by Pacific
Northwest National Laboratory (PNNL) for use by US government organizations to
generate realistic-looking traffic and facilitate exercise environments with benign and
malicious traffic. In this research, SAST is being leveraged as a traffic generation
tool, as well as a scheduler to run attack code in a scriptable, repeatable fashion. The
configuration of SAST involves five interrelated components - tasks, actors, timelines,
a scenario, and host service applications (HSAs). Figure 4.2 shows the relationships
between these components in the configuration process.
This chart shows the process for building a SAST scenario, and gives insight
into how it executes. First, tasks to be performed must be defined. These tasks could
48
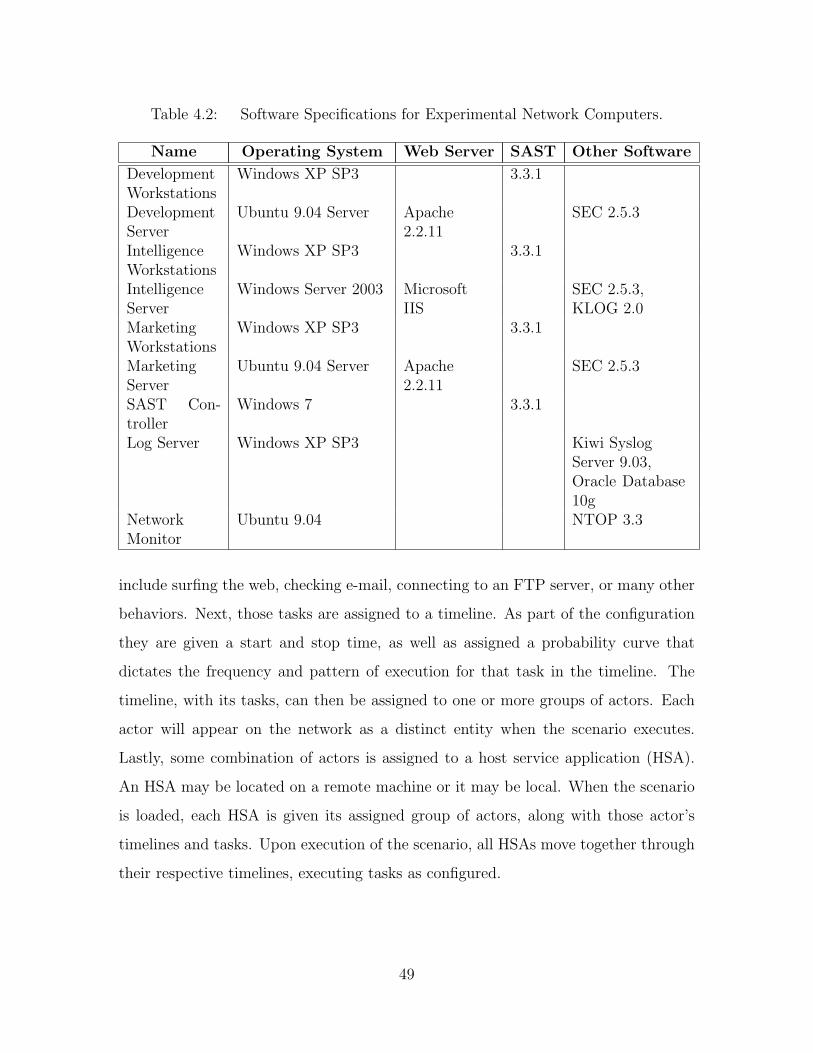
Table 4.2: Software Specifications for Experimental Network Computers.
Name Operating System Web Server SAST Other Software
DevelopmentWorkstations
Windows XP SP3 3.3.1
DevelopmentServer
Ubuntu 9.04 Server Apache2.2.11
SEC 2.5.3
IntelligenceWorkstations
Windows XP SP3 3.3.1
IntelligenceServer
Windows Server 2003 MicrosoftIIS
SEC 2.5.3,KLOG 2.0
MarketingWorkstations
Windows XP SP3 3.3.1
MarketingServer
Ubuntu 9.04 Server Apache2.2.11
SEC 2.5.3
SAST Con-troller
Windows 7 3.3.1
Log Server Windows XP SP3 Kiwi SyslogServer 9.03,Oracle Database10g
NetworkMonitor
Ubuntu 9.04 NTOP 3.3
include surfing the web, checking e-mail, connecting to an FTP server, or many other
behaviors. Next, those tasks are assigned to a timeline. As part of the configuration
they are given a start and stop time, as well as assigned a probability curve that
dictates the frequency and pattern of execution for that task in the timeline. The
timeline, with its tasks, can then be assigned to one or more groups of actors. Each
actor will appear on the network as a distinct entity when the scenario executes.
Lastly, some combination of actors is assigned to a host service application (HSA).
An HSA may be located on a remote machine or it may be local. When the scenario
is loaded, each HSA is given its assigned group of actors, along with those actor’s
timelines and tasks. Upon execution of the scenario, all HSAs move together through
their respective timelines, executing tasks as configured.
49
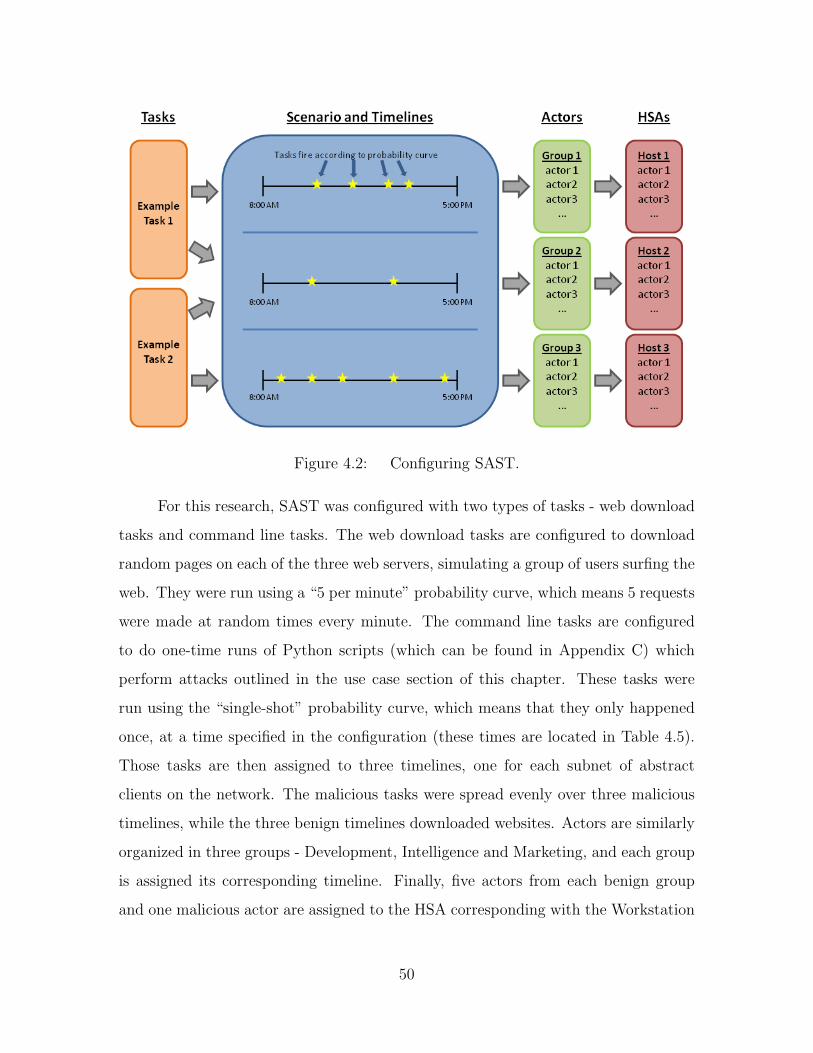
Figure 4.2: Configuring SAST.
For this research, SAST was configured with two types of tasks - web download
tasks and command line tasks. The web download tasks are configured to download
random pages on each of the three web servers, simulating a group of users surfing the
web. They were run using a “5 per minute” probability curve, which means 5 requests
were made at random times every minute. The command line tasks are configured
to do one-time runs of Python scripts (which can be found in Appendix C) which
perform attacks outlined in the use case section of this chapter. These tasks were
run using the “single-shot” probability curve, which means that they only happened
once, at a time specified in the configuration (these times are located in Table 4.5).
Those tasks are then assigned to three timelines, one for each subnet of abstract
clients on the network. The malicious tasks were spread evenly over three malicious
timelines, while the three benign timelines downloaded websites. Actors are similarly
organized in three groups - Development, Intelligence and Marketing, and each group
is assigned its corresponding timeline. Finally, five actors from each benign group
and one malicious actor are assigned to the HSA corresponding with the Workstation
50
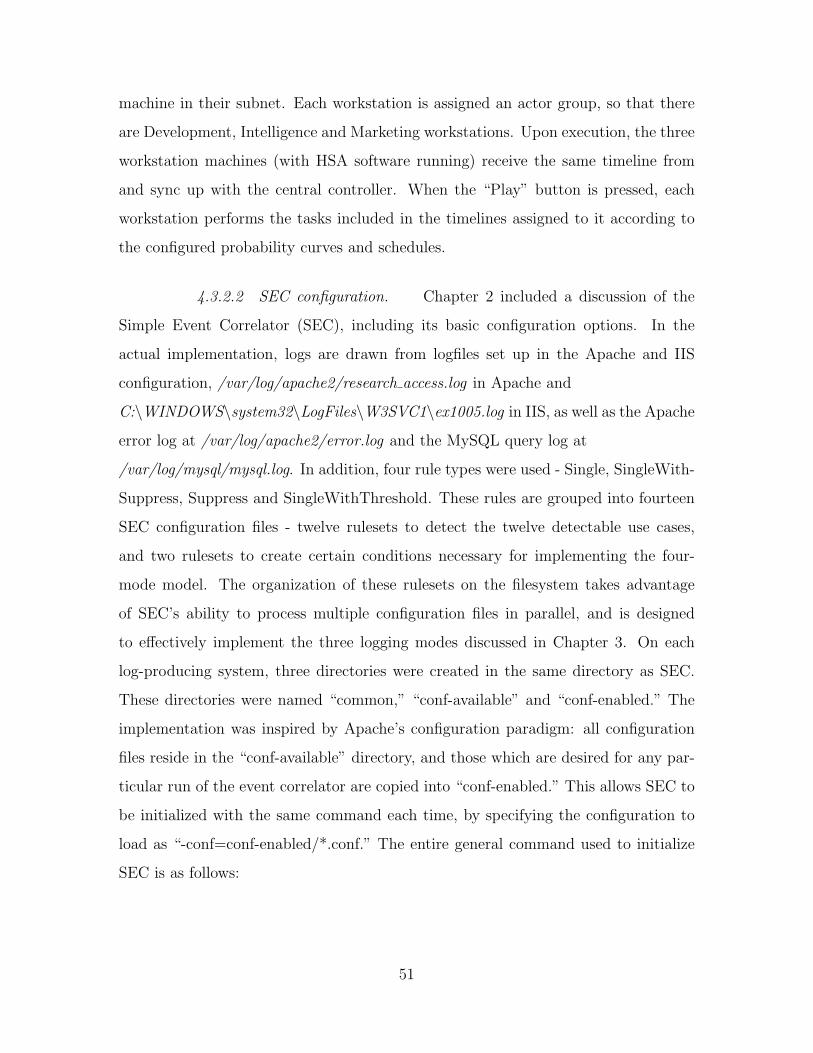
machine in their subnet. Each workstation is assigned an actor group, so that there
are Development, Intelligence and Marketing workstations. Upon execution, the three
workstation machines (with HSA software running) receive the same timeline from
and sync up with the central controller. When the “Play” button is pressed, each
workstation performs the tasks included in the timelines assigned to it according to
the configured probability curves and schedules.
4.3.2.2 SEC configuration. Chapter 2 included a discussion of the
Simple Event Correlator (SEC), including its basic configuration options. In the
actual implementation, logs are drawn from logfiles set up in the Apache and IIS
configuration, /var/log/apache2/research access.log in Apache and
C:\WINDOWS\system32\LogFiles\W3SVC1\ex1005.log in IIS, as well as the Apache
error log at /var/log/apache2/error.log and the MySQL query log at
/var/log/mysql/mysql.log. In addition, four rule types were used - Single, SingleWith-
Suppress, Suppress and SingleWithThreshold. These rules are grouped into fourteen
SEC configuration files - twelve rulesets to detect the twelve detectable use cases,
and two rulesets to create certain conditions necessary for implementing the four-
mode model. The organization of these rulesets on the filesystem takes advantage
of SEC’s ability to process multiple configuration files in parallel, and is designed
to effectively implement the three logging modes discussed in Chapter 3. On each
log-producing system, three directories were created in the same directory as SEC.
These directories were named “common,” “conf-available” and “conf-enabled.” The
implementation was inspired by Apache’s configuration paradigm: all configuration
files reside in the “conf-available” directory, and those which are desired for any par-
ticular run of the event correlator are copied into “conf-enabled.” This allows SEC to
be initialized with the same command each time, by specifying the configuration to
load as “-conf=conf-enabled/*.conf.” The entire general command used to initialize
SEC is as follows:
51
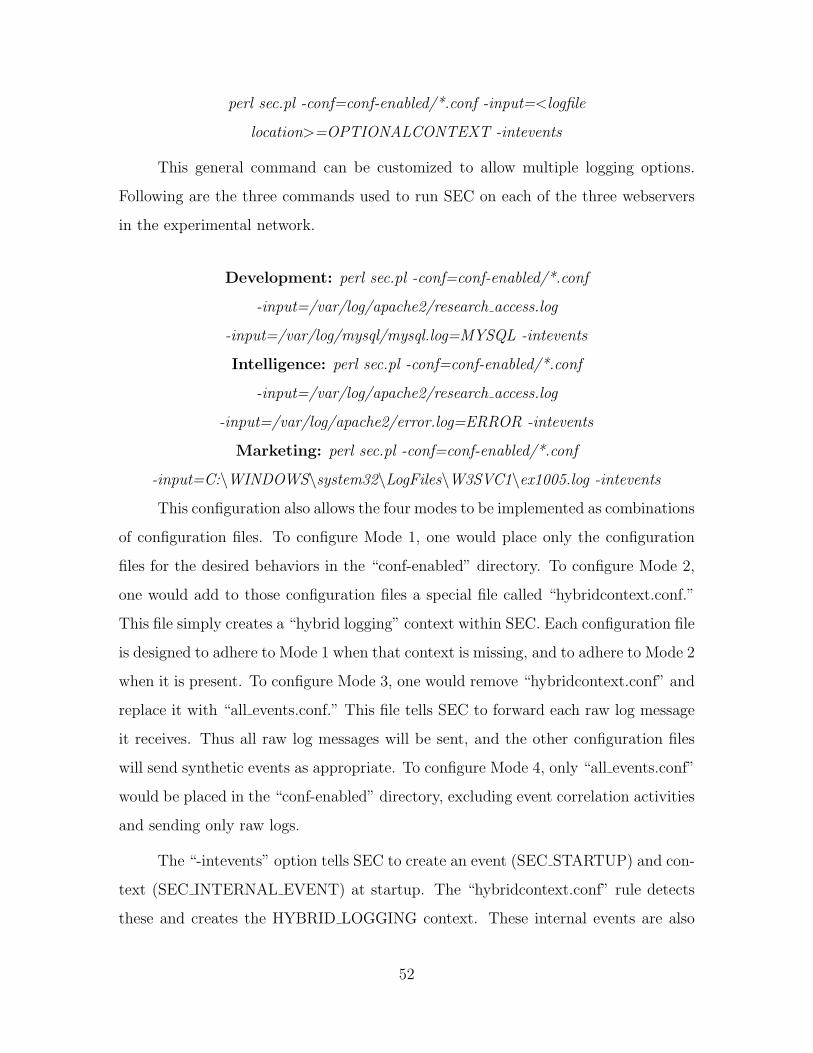
perl sec.pl -conf=conf-enabled/*.conf -input=<logfile
location>=OPTIONALCONTEXT -intevents
This general command can be customized to allow multiple logging options.
Following are the three commands used to run SEC on each of the three webservers
in the experimental network.
Development: perl sec.pl -conf=conf-enabled/*.conf
-input=/var/log/apache2/research access.log
-input=/var/log/mysql/mysql.log=MYSQL -intevents
Intelligence: perl sec.pl -conf=conf-enabled/*.conf
-input=/var/log/apache2/research access.log
-input=/var/log/apache2/error.log=ERROR -intevents
Marketing: perl sec.pl -conf=conf-enabled/*.conf
-input=C:\WINDOWS\system32\LogFiles\W3SVC1\ex1005.log -intevents
This configuration also allows the four modes to be implemented as combinations
of configuration files. To configure Mode 1, one would place only the configuration
files for the desired behaviors in the “conf-enabled” directory. To configure Mode 2,
one would add to those configuration files a special file called “hybridcontext.conf.”
This file simply creates a “hybrid logging” context within SEC. Each configuration file
is designed to adhere to Mode 1 when that context is missing, and to adhere to Mode 2
when it is present. To configure Mode 3, one would remove “hybridcontext.conf” and
replace it with “all events.conf.” This file tells SEC to forward each raw log message
it receives. Thus all raw log messages will be sent, and the other configuration files
will send synthetic events as appropriate. To configure Mode 4, only “all events.conf”
would be placed in the “conf-enabled” directory, excluding event correlation activities
and sending only raw logs.
The “-intevents” option tells SEC to create an event (SEC STARTUP) and con-
text (SEC INTERNAL EVENT) at startup. The “hybridcontext.conf” rule detects
these and creates the HYBRID LOGGING context. These internal events are also
52
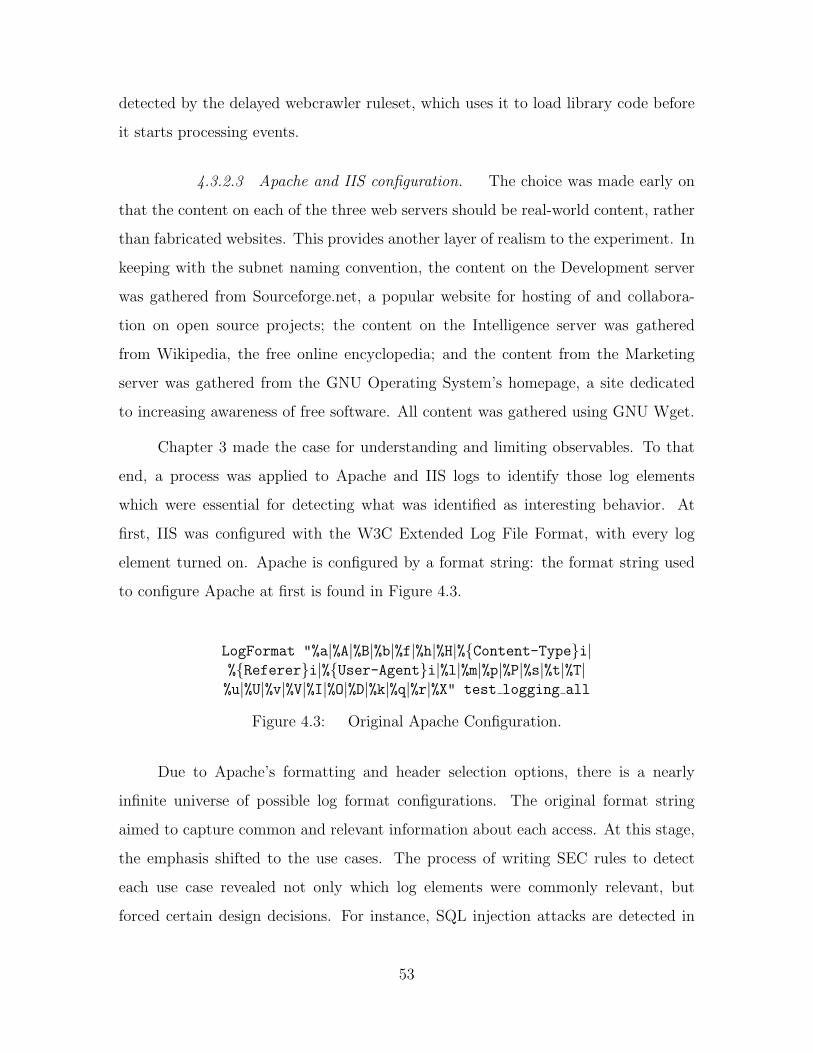
detected by the delayed webcrawler ruleset, which uses it to load library code before
it starts processing events.
4.3.2.3 Apache and IIS configuration. The choice was made early on
that the content on each of the three web servers should be real-world content, rather
than fabricated websites. This provides another layer of realism to the experiment. In
keeping with the subnet naming convention, the content on the Development server
was gathered from Sourceforge.net, a popular website for hosting of and collabora-
tion on open source projects; the content on the Intelligence server was gathered
from Wikipedia, the free online encyclopedia; and the content from the Marketing
server was gathered from the GNU Operating System’s homepage, a site dedicated
to increasing awareness of free software. All content was gathered using GNU Wget.
Chapter 3 made the case for understanding and limiting observables. To that
end, a process was applied to Apache and IIS logs to identify those log elements
which were essential for detecting what was identified as interesting behavior. At
first, IIS was configured with the W3C Extended Log File Format, with every log
element turned on. Apache is configured by a format string: the format string used
to configure Apache at first is found in Figure 4.3.
LogFormat "%a|%A|%B|%b|%f|%h|%H|%{Content-Type}i|%{Referer}i|%{User-Agent}i|%l|%m|%p|%P|%s|%t|%T|%u|%U|%v|%V|%I|%O|%D|%k|%q|%r|%X" test logging all
Figure 4.3: Original Apache Configuration.
Due to Apache’s formatting and header selection options, there is a nearly
infinite universe of possible log format configurations. The original format string
aimed to capture common and relevant information about each access. At this stage,
the emphasis shifted to the use cases. The process of writing SEC rules to detect
each use case revealed not only which log elements were commonly relevant, but
forced certain design decisions. For instance, SQL injection attacks are detected in
53
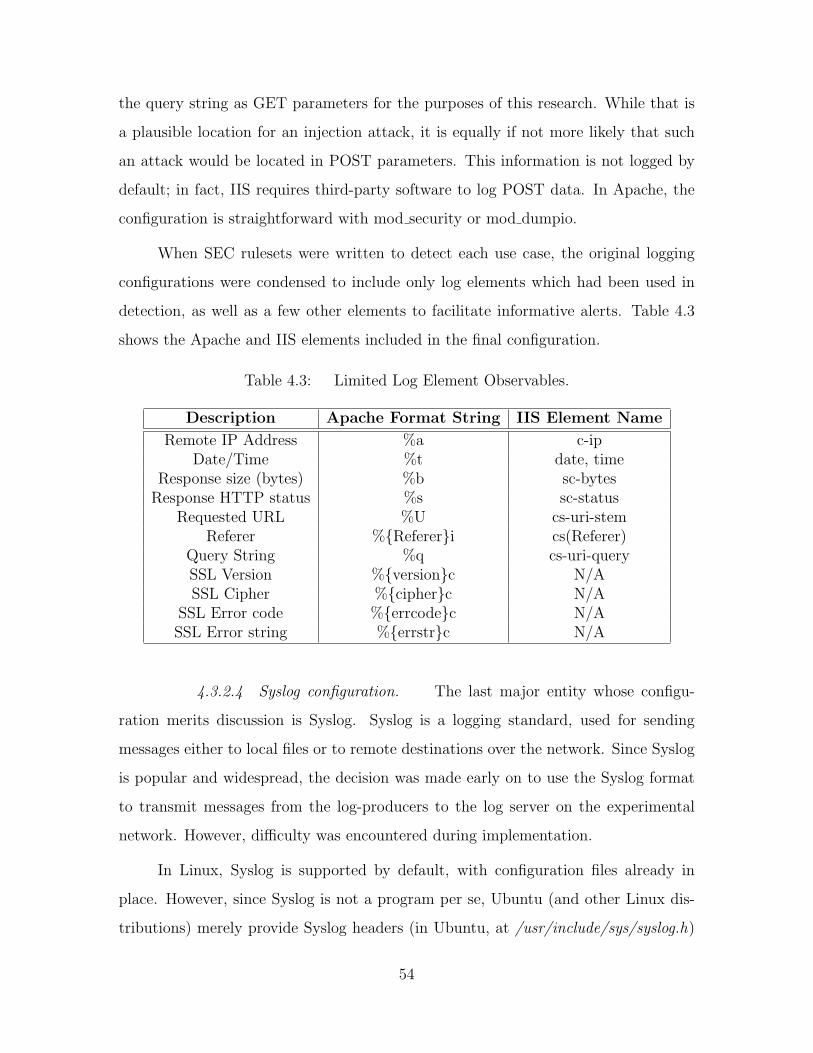
the query string as GET parameters for the purposes of this research. While that is
a plausible location for an injection attack, it is equally if not more likely that such
an attack would be located in POST parameters. This information is not logged by
default; in fact, IIS requires third-party software to log POST data. In Apache, the
configuration is straightforward with mod security or mod dumpio.
When SEC rulesets were written to detect each use case, the original logging
configurations were condensed to include only log elements which had been used in
detection, as well as a few other elements to facilitate informative alerts. Table 4.3
shows the Apache and IIS elements included in the final configuration.
Table 4.3: Limited Log Element Observables.
Description Apache Format String IIS Element Name
Remote IP Address %a c-ipDate/Time %t date, time
Response size (bytes) %b sc-bytesResponse HTTP status %s sc-status
Requested URL %U cs-uri-stemReferer %{Referer}i cs(Referer)
Query String %q cs-uri-querySSL Version %{version}c N/ASSL Cipher %{cipher}c N/A
SSL Error code %{errcode}c N/ASSL Error string %{errstr}c N/A
4.3.2.4 Syslog configuration. The last major entity whose configu-
ration merits discussion is Syslog. Syslog is a logging standard, used for sending
messages either to local files or to remote destinations over the network. Since Syslog
is popular and widespread, the decision was made early on to use the Syslog format
to transmit messages from the log-producers to the log server on the experimental
network. However, difficulty was encountered during implementation.
In Linux, Syslog is supported by default, with configuration files already in
place. However, since Syslog is not a program per se, Ubuntu (and other Linux dis-
tributions) merely provide Syslog headers (in Ubuntu, at /usr/include/sys/syslog.h)
54
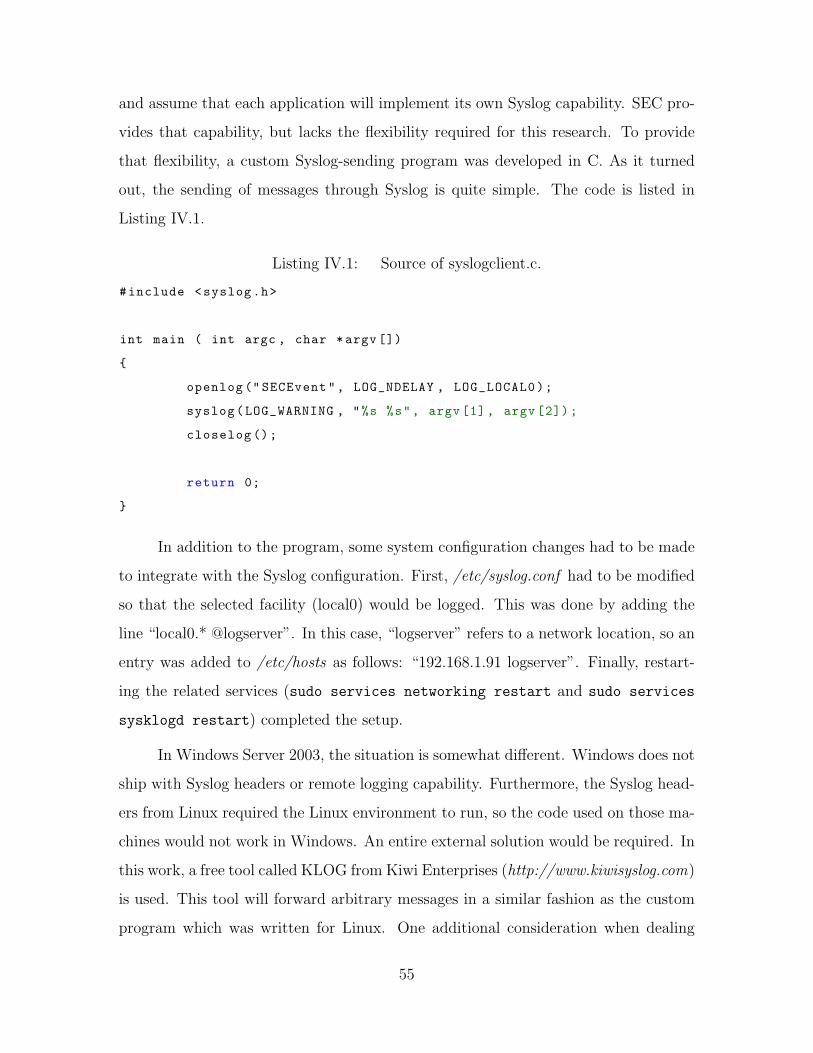
and assume that each application will implement its own Syslog capability. SEC pro-
vides that capability, but lacks the flexibility required for this research. To provide
that flexibility, a custom Syslog-sending program was developed in C. As it turned
out, the sending of messages through Syslog is quite simple. The code is listed in
Listing IV.1.
Listing IV.1: Source of syslogclient.c.
#include <syslog.h>
int main ( int argc , char *argv [])
{
openlog (" SECEvent", LOG_NDELAY , LOG_LOCAL0);
syslog(LOG_WARNING , "%s %s", argv [1], argv [2]);
closelog ();
return 0;
}
In addition to the program, some system configuration changes had to be made
to integrate with the Syslog configuration. First, /etc/syslog.conf had to be modified
so that the selected facility (local0) would be logged. This was done by adding the
line “local0.* @logserver”. In this case, “logserver” refers to a network location, so an
entry was added to /etc/hosts as follows: “192.168.1.91 logserver”. Finally, restart-
ing the related services (sudo services networking restart and sudo services
sysklogd restart) completed the setup.
In Windows Server 2003, the situation is somewhat different. Windows does not
ship with Syslog headers or remote logging capability. Furthermore, the Syslog head-
ers from Linux required the Linux environment to run, so the code used on those ma-
chines would not work in Windows. An entire external solution would be required. In
this work, a free tool called KLOG from Kiwi Enterprises (http://www.kiwisyslog.com)
is used. This tool will forward arbitrary messages in a similar fashion as the custom
program which was written for Linux. One additional consideration when dealing
55
with logs from IIS is the timing of events produced by SEC. Since SEC is configured
to watch for changes to text files, it is only able to process the events when they
are written to the file. IIS caches log files, only writing them to file once or twice a
minute. Thus the composition of log files at the log server seems odd, because the logs
from IIS come in bursts. This has not been observed to affect correlation activities,
but does produce a discrepancy between the Syslog timestamp and the timestamp in
the log message itself.
At the log server, the configuration was somewhat more straightforward. Kiwi
Syslog Server was chosen, and by default it listens for Syslog messages directed to
itself and writes them to a file. Additional configuration options enabled logging to
a database. However, database logging is a premium feature in Kiwi Syslog Server,
and it was disabled with the free trial period expired. An alternate configuration was
designed, which uses SEC to watch the Kiwi-generated syslog catchall file, and writes
each message to the database as it is observed. This accomplishes the same results
as logging to the database directly.
As for the database itself, the results are stored in four sets of tables. Initially,
log messages are written to an unnormalized table with the name “syslogd modeX,”
where X is the logging mode in use for the experimental run. After all results are
collected, a normalizing perl script (found in Appendix E.6) is run on the “sys-
logd mode3” and“syslogd mode4” tables, which normalizes the data and produces a
new set of four normalized tables. These four tables are named “syslogd modeX norm
raw,” “syslogd modeX norm synth,” “syslogd modeX norm mysql” and “syslogd
modeX norm error,” one for each type of log message which could be received.
4.3.3 Sensor Instrumentation. Earlier in this chapter, a set of five metrics
were established as the five specific ways this research validates the claims in Chapter
1. To measure each of those metrics, sensors were instrumented to collect data and
report on each run of the experiment. In total, three sensors are used to observe
these metrics. They are central log server analysis, Ntop network usage monitor, and
56

custom-written scripts. The remainder of this section describes these sensors and
their configuration in more detail.
4.3.3.1 Log Server Analysis. Log server observation is used to evaluate
three of the metrics: detection rate, false positive rate and specific demonstrations.
With regard to the detection and false positive rates, knowledge of the SAST scenario
configurations allow the comparison of the actual attacks and the alerts produced
in the log file. This facilitates the collection of the number of true positives, false
positives and false negatives. These numbers can then be evaluated using a process
similar to that in Chapter 2 to find the detection rate and false positive rate. With
regard to the specific demonstrations, the log server will be observed to determine
whether remote configuration and multiple log analysis demonstrations produced the
expected results. These observations are taken by an instance of SEC with a fixed
ruleset, to ensure that each run of the experiment is evaluated accurately.
4.3.3.2 Ntop. Ntop is a popular open source network packet ana-
lyzer. It allows the monitoring of traffic over a SPAN port, and produces statistics
on network load and the composition of the traffic. This will be used to measure the
network load metric by providing statistics on overall network load during the exper-
iment, as well as specific details about the composition of the traffic on the network.
In particular, the volume of Syslog traffic in each logging mode will help evaluate that
mode’s effectiveness. Ntop is easy to install - in Ubuntu it was installed via a simple
sudo apt-get install ntop command. However, certain aspects of its configuration were
somewhat troublesome. To make sure that the statistics were meaningful, a reliable
way to clear previous results was needed. However, the built-in option (Admin >
Configure > Reset Stats) in Ntop did not reliably clear all of the statistics. In partic-
ular, the network load statistics never seemed to be deleted. To ensure that each run
of the experiment would include only statistics from that run, a shell script (reset-
Stats.sh) was written to delete the database files. The script is shown in Listing IV.2.
57
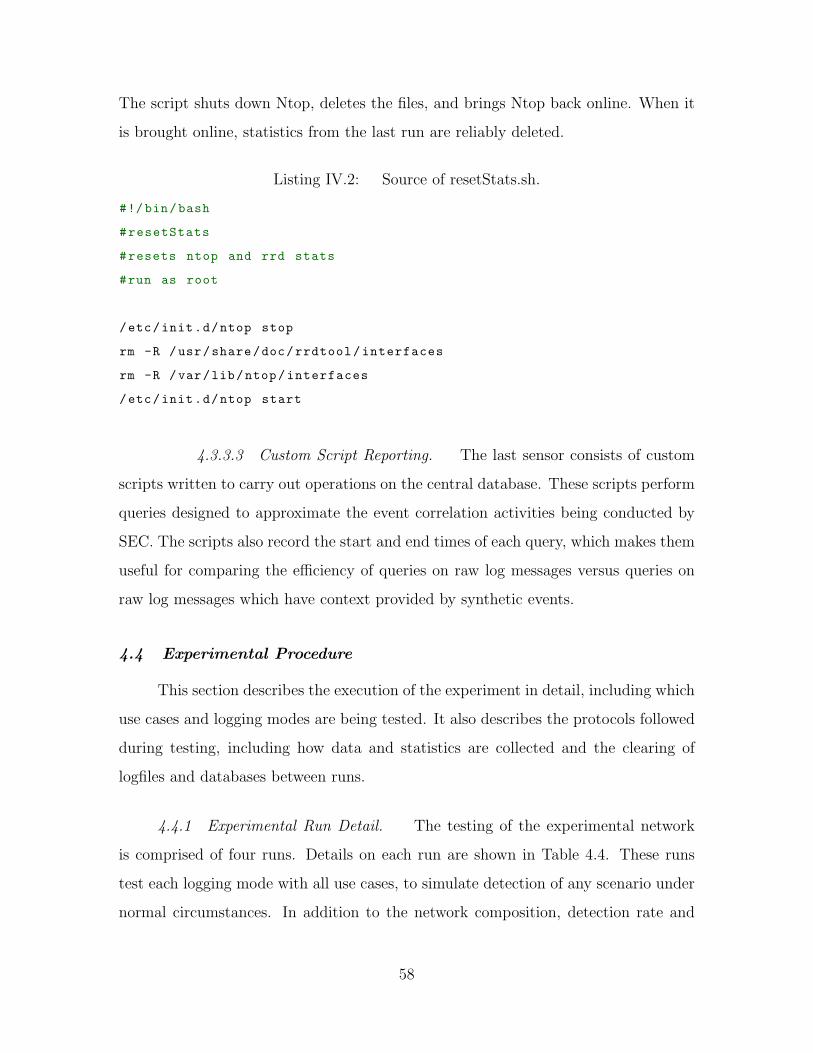
The script shuts down Ntop, deletes the files, and brings Ntop back online. When it
is brought online, statistics from the last run are reliably deleted.
Listing IV.2: Source of resetStats.sh.
#!/bin/bash
#resetStats
#resets ntop and rrd stats
#run as root
/etc/init.d/ntop stop
rm -R /usr/share/doc/rrdtool/interfaces
rm -R /var/lib/ntop/interfaces
/etc/init.d/ntop start
4.3.3.3 Custom Script Reporting. The last sensor consists of custom
scripts written to carry out operations on the central database. These scripts perform
queries designed to approximate the event correlation activities being conducted by
SEC. The scripts also record the start and end times of each query, which makes them
useful for comparing the efficiency of queries on raw log messages versus queries on
raw log messages which have context provided by synthetic events.
4.4 Experimental Procedure
This section describes the execution of the experiment in detail, including which
use cases and logging modes are being tested. It also describes the protocols followed
during testing, including how data and statistics are collected and the clearing of
logfiles and databases between runs.
4.4.1 Experimental Run Detail. The testing of the experimental network
is comprised of four runs. Details on each run are shown in Table 4.4. These runs
test each logging mode with all use cases, to simulate detection of any scenario under
normal circumstances. In addition to the network composition, detection rate and
58
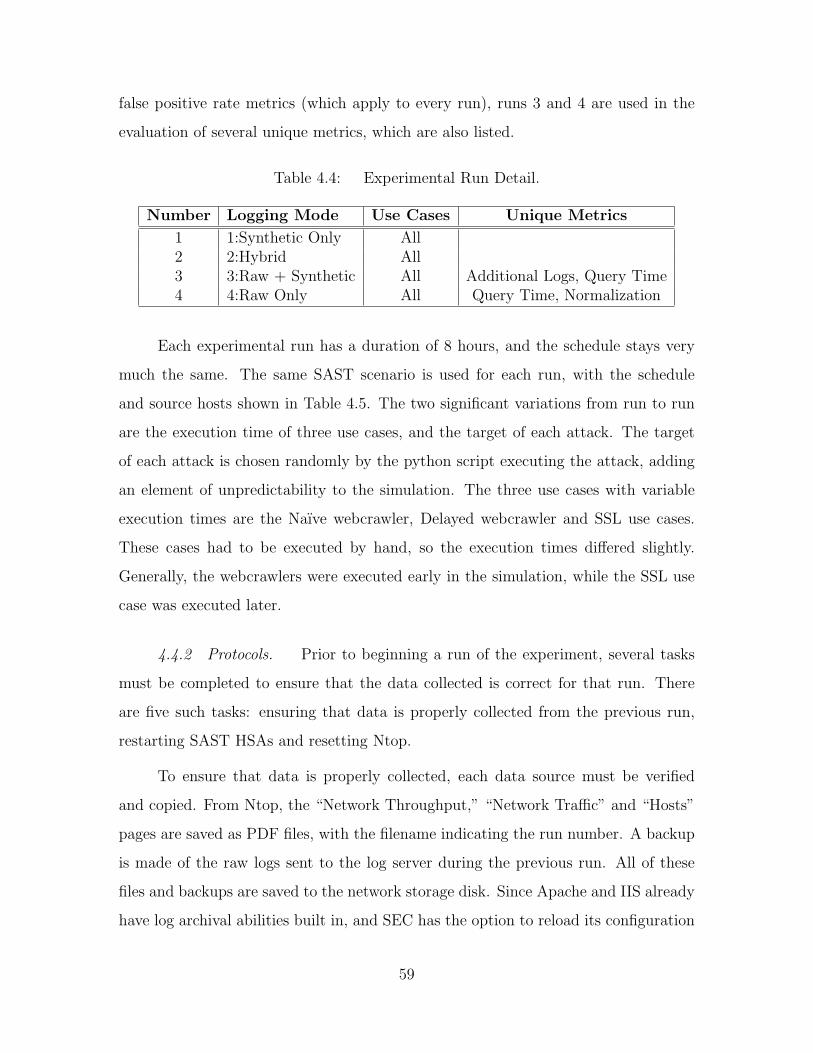
false positive rate metrics (which apply to every run), runs 3 and 4 are used in the
evaluation of several unique metrics, which are also listed.
Table 4.4: Experimental Run Detail.
Number Logging Mode Use Cases Unique Metrics
1 1:Synthetic Only All2 2:Hybrid All3 3:Raw + Synthetic All Additional Logs, Query Time4 4:Raw Only All Query Time, Normalization
Each experimental run has a duration of 8 hours, and the schedule stays very
much the same. The same SAST scenario is used for each run, with the schedule
and source hosts shown in Table 4.5. The two significant variations from run to run
are the execution time of three use cases, and the target of each attack. The target
of each attack is chosen randomly by the python script executing the attack, adding
an element of unpredictability to the simulation. The three use cases with variable
execution times are the Naıve webcrawler, Delayed webcrawler and SSL use cases.
These cases had to be executed by hand, so the execution times differed slightly.
Generally, the webcrawlers were executed early in the simulation, while the SSL use
case was executed later.
4.4.2 Protocols. Prior to beginning a run of the experiment, several tasks
must be completed to ensure that the data collected is correct for that run. There
are five such tasks: ensuring that data is properly collected from the previous run,
restarting SAST HSAs and resetting Ntop.
To ensure that data is properly collected, each data source must be verified
and copied. From Ntop, the “Network Throughput,” “Network Traffic” and “Hosts”
pages are saved as PDF files, with the filename indicating the run number. A backup
is made of the raw logs sent to the log server during the previous run. All of these
files and backups are saved to the network storage disk. Since Apache and IIS already
have log archival abilities built in, and SEC has the option to reload its configuration
59
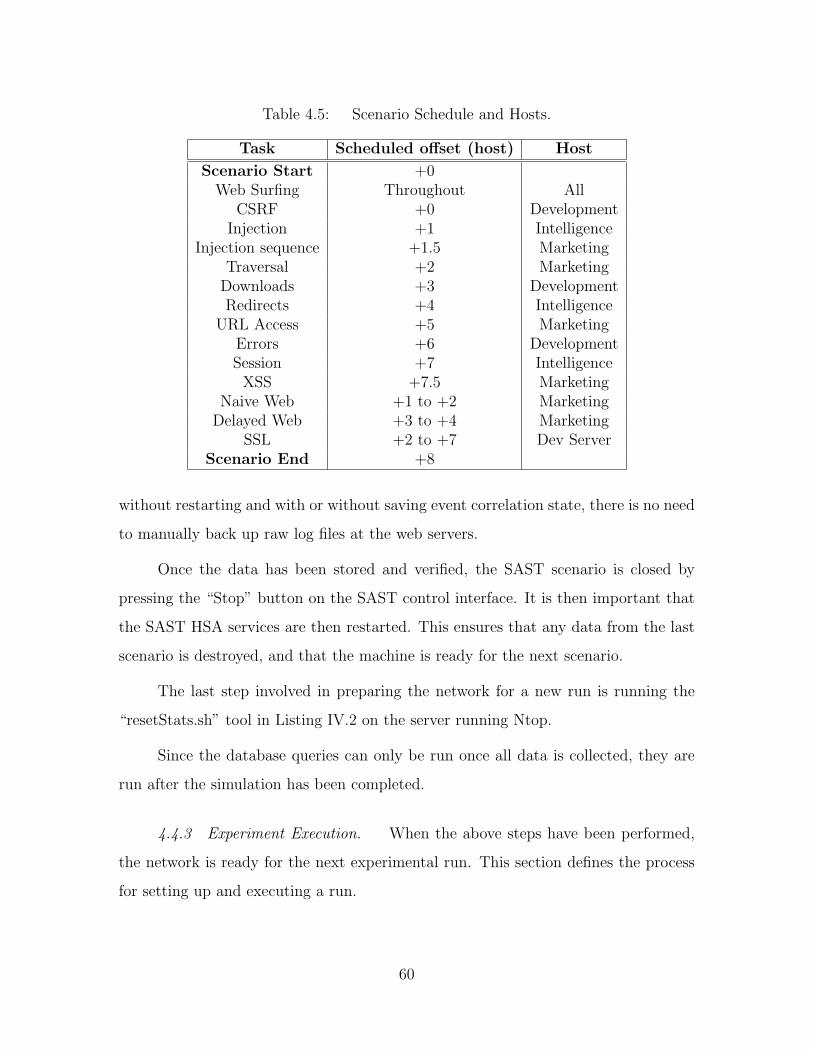
Table 4.5: Scenario Schedule and Hosts.
Task Scheduled offset (host) Host
Scenario Start +0Web Surfing Throughout All
CSRF +0 DevelopmentInjection +1 Intelligence
Injection sequence +1.5 MarketingTraversal +2 Marketing
Downloads +3 DevelopmentRedirects +4 Intelligence
URL Access +5 MarketingErrors +6 DevelopmentSession +7 IntelligenceXSS +7.5 Marketing
Naive Web +1 to +2 MarketingDelayed Web +3 to +4 Marketing
SSL +2 to +7 Dev ServerScenario End +8
without restarting and with or without saving event correlation state, there is no need
to manually back up raw log files at the web servers.
Once the data has been stored and verified, the SAST scenario is closed by
pressing the “Stop” button on the SAST control interface. It is then important that
the SAST HSA services are then restarted. This ensures that any data from the last
scenario is destroyed, and that the machine is ready for the next scenario.
The last step involved in preparing the network for a new run is running the
“resetStats.sh” tool in Listing IV.2 on the server running Ntop.
Since the database queries can only be run once all data is collected, they are
run after the simulation has been completed.
4.4.3 Experiment Execution. When the above steps have been performed,
the network is ready for the next experimental run. This section defines the process
for setting up and executing a run.
60
Three configuration steps are needed to prepare the network for a run. First,
the SEC instances on each web server must be configured. This can be done locally
or remotely through the remote configuration shell script written for this purpose.
This script can be found in Appendix E.3. Once SEC has been configured, the SAST
scenario must be loaded at the controller. Lastly, the database which will store log
messages from this run must be created, Kiwi must be configured to write to a new
catchall text file, and the log server SEC instance must be configured with the correct
source file and destination database.
Once these tasks are complete, the system is ready for the experimental run.
Loading and playing the SAST scenario will initiate both benign traffic and scheduled
attacks. The scenario runs for eight hours, then stop. At that time, the data collection
process described earlier can be initiated.
61

V. Results
This chapter presents the results of the experimental runs according to the proce-
dure laid out in Chapter 4. Specifically, the detectability of each use case, statistics
on network traffic load and composition, analysis of query efficiency and the specific
capabilities of the design are discussed. The first section presents observed empir-
ical results, the second describes the additional capabilities of the system, and the
final section analyzes these results and capabilities in the context of the goals of the
research.
5.1 Results
This section reports the recorded results for each of the metrics identified in
Chapter four. Each subsection describes a particular analysis which was performed,
any background information necessary to provide context for the data, and the data
itself.
5.1.1 Use Case Detectability. To verify the detectability metric, each alert
generated was mapped and compared with scheduled attacks to determine whether
or not that alert represented an actual attack. Table 5.1 shows the total number of
alerts for each logging mode and the number of true and false positives. For Modes
1-3, alerts are defined as synthetic log events produced by SEC instances. For Mode
4, the output of database queries against the normalized database were used.
Table 5.1: Detection Probabilities.
LoggingMode
TotalAlerts
TruePositives
FalsePositives
FalseNegatives
P (I|A) P (¬I|¬A)
Mode 1 46 45 1 0 0.12276 0.99993Mode 2 42 40 2 0 0.05855 0.99984Mode 3 48 47 1 0 0.12752 0.99993Mode 4 28 26 2 0 0.03886 0.99976
In addition to the detection probabilities in Table 5.1, the discussion in Chapter
3 identified three other important statistics to aid understanding of the detection
62
capabilities of the experimental system. These are the base rate of malicious traffic,
the conditional probability that malicious behavior occurred given that an alert was
generated, and the conditional probability that there was no malicious behavior given
that there was no alert.
The base rate is important to discuss because, as Section 3.2.2 pointed out,
the rate of incidence of malicious behavior is not intuitively taken into account when
considering the detection rate of a system such as the one in this research. In addition,
the effort to maintain a reasonable rate of incidence in the traffic being analyzed
ensures that the detection mechanism is being exercised in a realistic manner.
The rate of incidence of malicious behavior in this research can be calculated
several ways. The most accurate method would be to calculate the rate of incidence
of suspicious log messages. The total number of log messages generated was 49,770,
and Mode 2 identified 157 which were related to attacks. This gives a rate of inci-
dence of malicious log messages of 157/49, 770 = 0.00315. An alternative method
would be to do the same calculation based on the number of packets involved in each
malicious behavior as compared to the overall network throughput in packets. Since
this experimental design did not include a sensor for measuring this information, the
rate of incidence could not be calculated using this method.
The conditional probabilities are important because they allow a realistic con-
sideration of the performance of the system by recognizing that the false alarm rate
is the limiting factor on the effectiveness of the system in detecting suspicious be-
havior [10]. These results include the calculation of both conditional probabilities to
emphasize the impact of the rate of incidence of malicious traffic and the false positive
rate on the detection effectiveness of the system.
To calculate P (I|A) (the probability that an alert really indicates an attack) and
P (¬I|¬A) (the probability that the absence of an alarm really indicates that there is
no attack), the equations presented in Chapter 3, Equation 3.2 and Equation 3.3 can
be evaluated. To do this, some preliminary values must be calculated.
63

Overall, there were 49,770 log messages generated. Of those, the run of Mode
2 identified 157 messages which were related to attacks. Thus P (I), the probability
of an intrusion, and P (¬I), its inverse, can be calculated as
P (I) = 1/49770
157= 3.1 × 10⁻³ (5.1)
P (¬I) = 1 − P (I) = 0.996845 (5.2)
The calculations for P (I|A) and P (¬I|¬A) are now straightforward. Equa-
tion 5.3 and Equation 5.4 shows the calculation for Mode 1 as an example.
P (I|A) =3.1 × 10−3 · 45/46
3.1 × 10−3 · 45/46 + 0.996845 · 1/46= 0.12276 (5.3)
P (¬I|¬A) =0.996845 · 45/46
0.996845 · 45/46 + 3.1 × 10−3 · 1/46= 0.99993 (5.4)
5.1.2 Network Composition. In measuring network composition, nine es-
sential components were identified. These components were the overall number of
abstract host workstations (benign or malicious), total and average network through-
put, SAST control traffic (absolute and as a percentage), HTTP traffic (absolute and
as a percentage) and Syslog traffic (absolute and as a percentage). These amounts
and proportions are shown in Table 5.2. Note that the number of hosts includes only
the abstract workstations, not the three webservers, SAST controller and logserver.
64
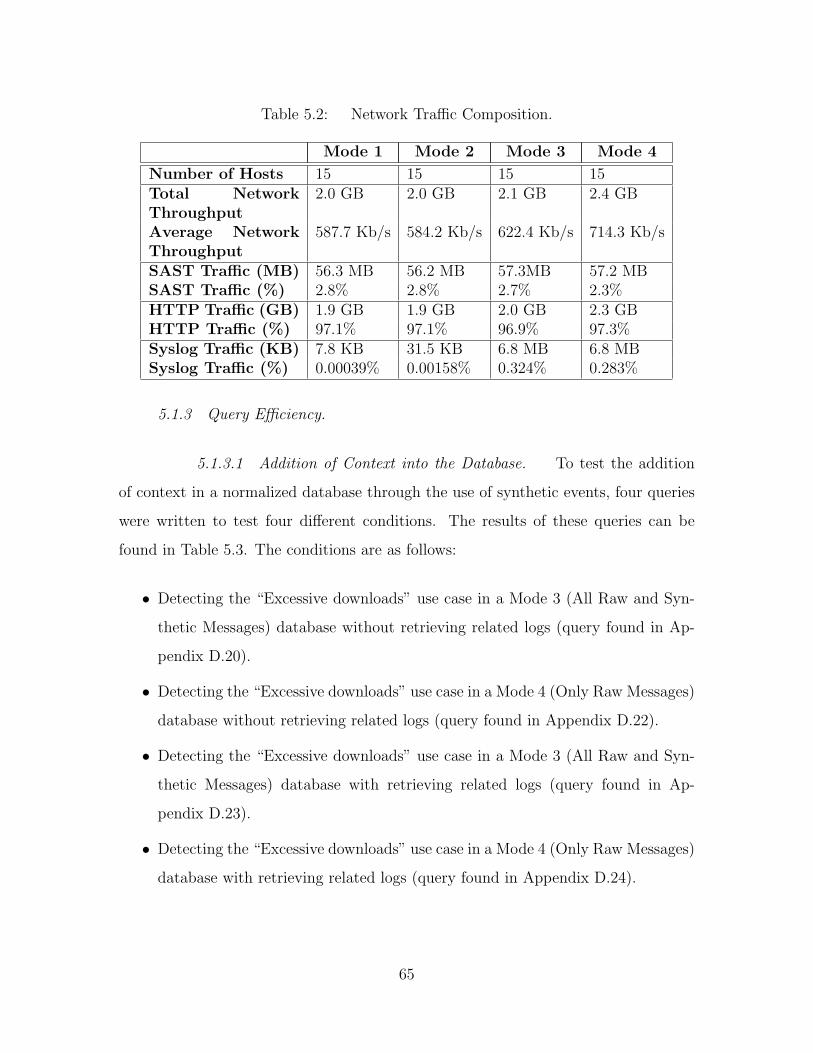
Table 5.2: Network Traffic Composition.
Mode 1 Mode 2 Mode 3 Mode 4
Number of Hosts 15 15 15 15Total NetworkThroughput
2.0 GB 2.0 GB 2.1 GB 2.4 GB
Average NetworkThroughput
587.7 Kb/s 584.2 Kb/s 622.4 Kb/s 714.3 Kb/s
SAST Traffic (MB) 56.3 MB 56.2 MB 57.3MB 57.2 MBSAST Traffic (%) 2.8% 2.8% 2.7% 2.3%HTTP Traffic (GB) 1.9 GB 1.9 GB 2.0 GB 2.3 GBHTTP Traffic (%) 97.1% 97.1% 96.9% 97.3%Syslog Traffic (KB) 7.8 KB 31.5 KB 6.8 MB 6.8 MBSyslog Traffic (%) 0.00039% 0.00158% 0.324% 0.283%
5.1.3 Query Efficiency.
5.1.3.1 Addition of Context into the Database. To test the addition
of context in a normalized database through the use of synthetic events, four queries
were written to test four different conditions. The results of these queries can be
found in Table 5.3. The conditions are as follows:
• Detecting the “Excessive downloads” use case in a Mode 3 (All Raw and Syn-
thetic Messages) database without retrieving related logs (query found in Ap-
pendix D.20).
• Detecting the “Excessive downloads” use case in a Mode 4 (Only Raw Messages)
database without retrieving related logs (query found in Appendix D.22).
• Detecting the “Excessive downloads” use case in a Mode 3 (All Raw and Syn-
thetic Messages) database with retrieving related logs (query found in Ap-
pendix D.23).
• Detecting the “Excessive downloads” use case in a Mode 4 (Only Raw Messages)
database with retrieving related logs (query found in Appendix D.24).
65

Table 5.3: SQL Query Efficiency - Context Comparison.
Logging Mode Related Logs Number of Records Execution Time
Mode 3 No 257 0.086sMode 4 No 49,770 120.915sMode 3 Yes 38,700 1.0sMode 4 Yes 49,770 289.4s
These queries were run on the Log Server using Oracle Database 10g, Strawberry
Perl 5.10.1.1 and Windows XP SP3 on an Intel Core 2 Duo 2.6 GHz with 3GB of
RAM.
5.1.3.2 Impact of Normalization. In addition to the context compari-
son, the impact of normalization on query execution times was evaluated. Table 5.4
shows the normalized and non-normalized runtime of queries which detect their re-
spective use cases. All queries were run on a Logging Mode 4 (Raw Messages only)
database. Each query was run 10 times and the results averaged due to a high amount
of variability in the runtimes of some queries. All queries were written in PL/SQL
with the exception of the Naıve Web Crawler, Excessive Downloads, and Excessive
Access Attempts queries. Due to the complex nature of these use cases, these behav-
iors were detected in the database using Perl scripts. All queries and scripts used in
this analysis are located in Appendix D.
5.2 Capability of the Experimental Design
In addition to the empirical results in the previous section, the research goals
included pursuit of certain capabilities in the experimental network. These capabil-
ities demonstrate the potential flexibility of distributed event correlation and help
validate the value it provides. This section discusses two such capabilities - remote
configurability and log source flexibility.
5.2.1 Remote Configurability. In a small experimental network, it is fea-
sible to manually configure each machine in a network. Indeed, a centralized event
66
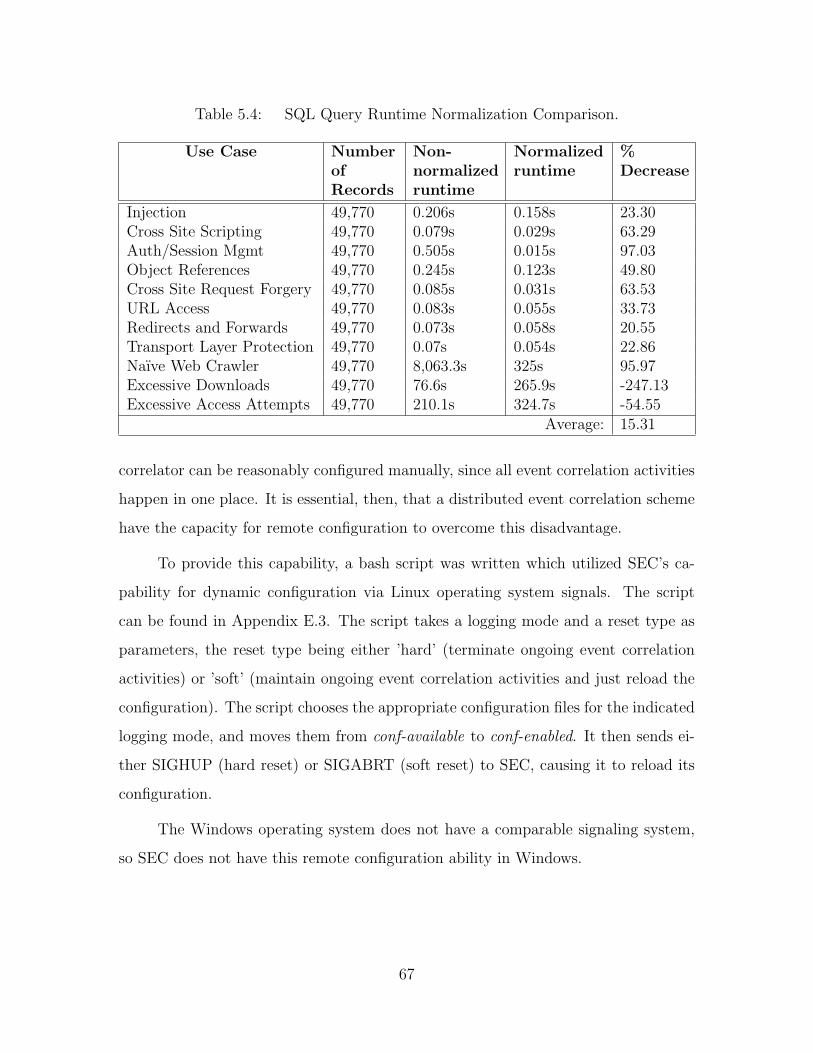
Table 5.4: SQL Query Runtime Normalization Comparison.
Use Case NumberofRecords
Non-normalizedruntime
Normalizedruntime
%Decrease
Injection 49,770 0.206s 0.158s 23.30Cross Site Scripting 49,770 0.079s 0.029s 63.29Auth/Session Mgmt 49,770 0.505s 0.015s 97.03Object References 49,770 0.245s 0.123s 49.80Cross Site Request Forgery 49,770 0.085s 0.031s 63.53URL Access 49,770 0.083s 0.055s 33.73Redirects and Forwards 49,770 0.073s 0.058s 20.55Transport Layer Protection 49,770 0.07s 0.054s 22.86Naıve Web Crawler 49,770 8,063.3s 325s 95.97Excessive Downloads 49,770 76.6s 265.9s -247.13Excessive Access Attempts 49,770 210.1s 324.7s -54.55
Average: 15.31
correlator can be reasonably configured manually, since all event correlation activities
happen in one place. It is essential, then, that a distributed event correlation scheme
have the capacity for remote configuration to overcome this disadvantage.
To provide this capability, a bash script was written which utilized SEC’s ca-
pability for dynamic configuration via Linux operating system signals. The script
can be found in Appendix E.3. The script takes a logging mode and a reset type as
parameters, the reset type being either ’hard’ (terminate ongoing event correlation
activities) or ’soft’ (maintain ongoing event correlation activities and just reload the
configuration). The script chooses the appropriate configuration files for the indicated
logging mode, and moves them from conf-available to conf-enabled. It then sends ei-
ther SIGHUP (hard reset) or SIGABRT (soft reset) to SEC, causing it to reload its
configuration.
The Windows operating system does not have a comparable signaling system,
so SEC does not have this remote configuration ability in Windows.
67

5.2.2 Log Source Flexibility. This research focused on web server logs and
attacks. However, there are many more log sources and log formats available to an
enterprise. To show that this method works for other log sources in combination
with web server logs, an “Injection Sequence” use case was added. This use case,
described in detail in Chapter 4, uses the query log from MySQL in conjunction with
the Apache access log to discern suspicious behavior without the use of a regular
expression signature.
In addition, the “Insufficient Transport Layer Protection” use case used the
Apache error log, which does not have the rigid format of the access log, to detect
accesses by the Firefox web browser to an SSL-enabled page with an invalid certificate.
5.3 Analysis
This section looks at the empirical results from the beginning of the chapter
and evaluates each group of data in the context of the overall goals of the research.
5.3.1 Use Case Detectability. The first thing worth noting about this section
is that the false positive rate is relatively very low, given the small number of total
alerts generated. The true positive tally includes a few alerts which were out of
sync with their attack - these alerts happened when attack behavior happened as a
by-product of another attack. For instance, when the “Excessive Access Attempts”
attack executes, over a dozen requests are made from the same client to the same
server in rapid succession. This is exactly the sort of behavior meant to be caught
by the webcrawler rulesets, and so the “Excessive Access Attempts” attack was often
alerted upon by the “Naıve Webcrawler” ruleset. Since a genuine attack was being
detected, the alert was regarded as a true positive. This illustrates the difficulty of
coding rulesets to detect even policy violations - the policies must specifically define
suspicious or disallowed behavior, and that specificity must translate to the detection
mechanism (in this case, SEC rulesets).
68
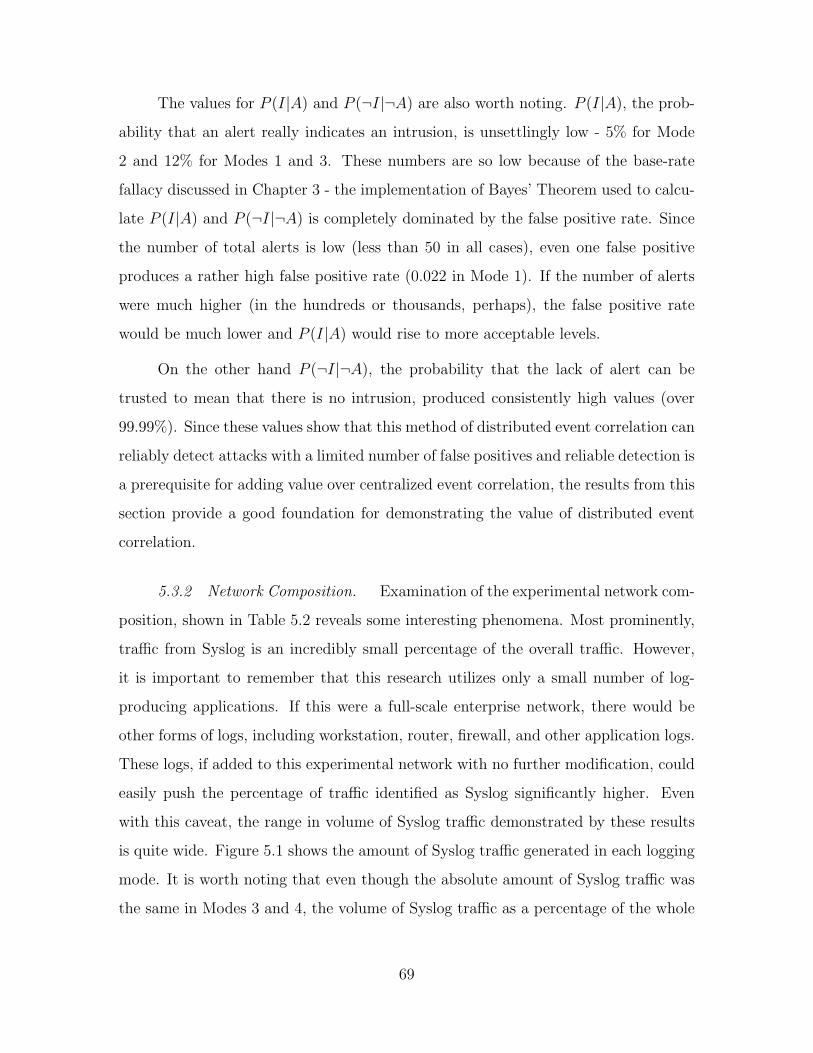
The values for P (I|A) and P (¬I|¬A) are also worth noting. P (I|A), the prob-
ability that an alert really indicates an intrusion, is unsettlingly low - 5% for Mode
2 and 12% for Modes 1 and 3. These numbers are so low because of the base-rate
fallacy discussed in Chapter 3 - the implementation of Bayes’ Theorem used to calcu-
late P (I|A) and P (¬I|¬A) is completely dominated by the false positive rate. Since
the number of total alerts is low (less than 50 in all cases), even one false positive
produces a rather high false positive rate (0.022 in Mode 1). If the number of alerts
were much higher (in the hundreds or thousands, perhaps), the false positive rate
would be much lower and P (I|A) would rise to more acceptable levels.
On the other hand P (¬I|¬A), the probability that the lack of alert can be
trusted to mean that there is no intrusion, produced consistently high values (over
99.99%). Since these values show that this method of distributed event correlation can
reliably detect attacks with a limited number of false positives and reliable detection is
a prerequisite for adding value over centralized event correlation, the results from this
section provide a good foundation for demonstrating the value of distributed event
correlation.
5.3.2 Network Composition. Examination of the experimental network com-
position, shown in Table 5.2 reveals some interesting phenomena. Most prominently,
traffic from Syslog is an incredibly small percentage of the overall traffic. However,
it is important to remember that this research utilizes only a small number of log-
producing applications. If this were a full-scale enterprise network, there would be
other forms of logs, including workstation, router, firewall, and other application logs.
These logs, if added to this experimental network with no further modification, could
easily push the percentage of traffic identified as Syslog significantly higher. Even
with this caveat, the range in volume of Syslog traffic demonstrated by these results
is quite wide. Figure 5.1 shows the amount of Syslog traffic generated in each logging
mode. It is worth noting that even though the absolute amount of Syslog traffic was
the same in Modes 3 and 4, the volume of Syslog traffic as a percentage of the whole
69
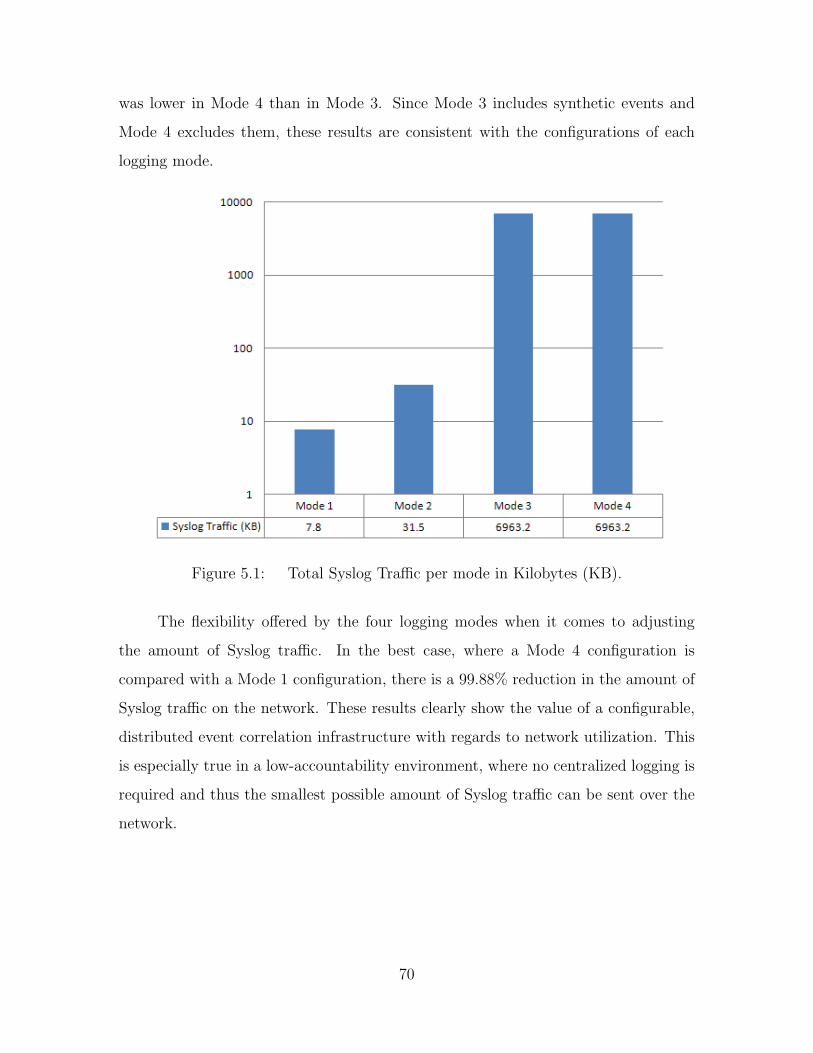
was lower in Mode 4 than in Mode 3. Since Mode 3 includes synthetic events and
Mode 4 excludes them, these results are consistent with the configurations of each
logging mode.
Figure 5.1: Total Syslog Traffic per mode in Kilobytes (KB).
The flexibility offered by the four logging modes when it comes to adjusting
the amount of Syslog traffic. In the best case, where a Mode 4 configuration is
compared with a Mode 1 configuration, there is a 99.88% reduction in the amount of
Syslog traffic on the network. These results clearly show the value of a configurable,
distributed event correlation infrastructure with regards to network utilization. This
is especially true in a low-accountability environment, where no centralized logging is
required and thus the smallest possible amount of Syslog traffic can be sent over the
network.
70
5.3.3 Query Efficiency.
5.3.3.1 Addition of context. Initially, only the first two queries in
Table 5.3 were planned (those without the related logs). The results from that analysis
were so striking that the second set with related logs was added to provide more data
on the value of adding context to a database. In either case, the scenario in this
analysis is a high-accountability environment where every message (for legal or policy
reasons) must be logged centrally. Synthetic events are used in this case to provide
context, to enable quicker identification of suspicious activity in the database. When
the database is normalized, the synthetic events are placed in their own table, making
it trivially easier to find an already-stored synthetic event than to find the activity
from scratch in the database. Thus, the addition of the related logs was added, to see
if adding context to the database still helps in the case where related log messages are
desired as well. Our results clearly show that even when related logs are collected, the
time required in the context-aware case is several orders of magnitude smaller than in
the context-less case. This is an intuitive result - in the context-aware case, the hard
work of actually correlating individual log-based events was done in real-time as they
happened, allowing the context-aware script to merely query the database for related
logs. The context-less case had to do both the task of correlating individual events
and the task of searching for related logs. In this experimental high-accountability
environment the raw logs are still accessible at the centralized log server, but these
results demonstrate that the addition of context in real time through distributed event
correlation can foster a remarkable decrease in the amount of time it takes to interact
with those raw logs.
5.3.3.2 Impact of Normalization. The results from the normalization
queries, shown in Table 5.4, clearly demonstrated the value of normalizing a database
for increasing the efficiency of queries made on that database, with an average re-
duction in query time of 15.31%. This benefit is even clearer when the OWASP Top
Ten use cases are considered on their own. Altogether, these queries experienced an
71
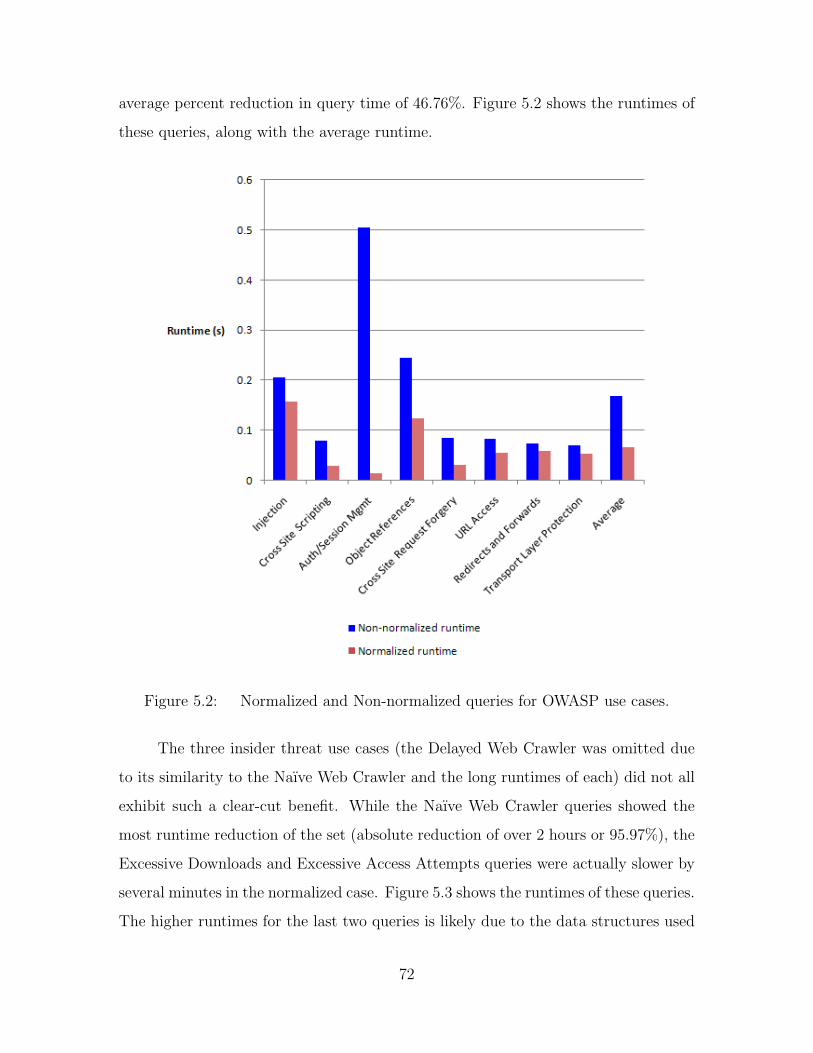
average percent reduction in query time of 46.76%. Figure 5.2 shows the runtimes of
these queries, along with the average runtime.
Figure 5.2: Normalized and Non-normalized queries for OWASP use cases.
The three insider threat use cases (the Delayed Web Crawler was omitted due
to its similarity to the Naıve Web Crawler and the long runtimes of each) did not all
exhibit such a clear-cut benefit. While the Naıve Web Crawler queries showed the
most runtime reduction of the set (absolute reduction of over 2 hours or 95.97%), the
Excessive Downloads and Excessive Access Attempts queries were actually slower by
several minutes in the normalized case. Figure 5.3 shows the runtimes of these queries.
The higher runtimes for the last two queries is likely due to the data structures used
72
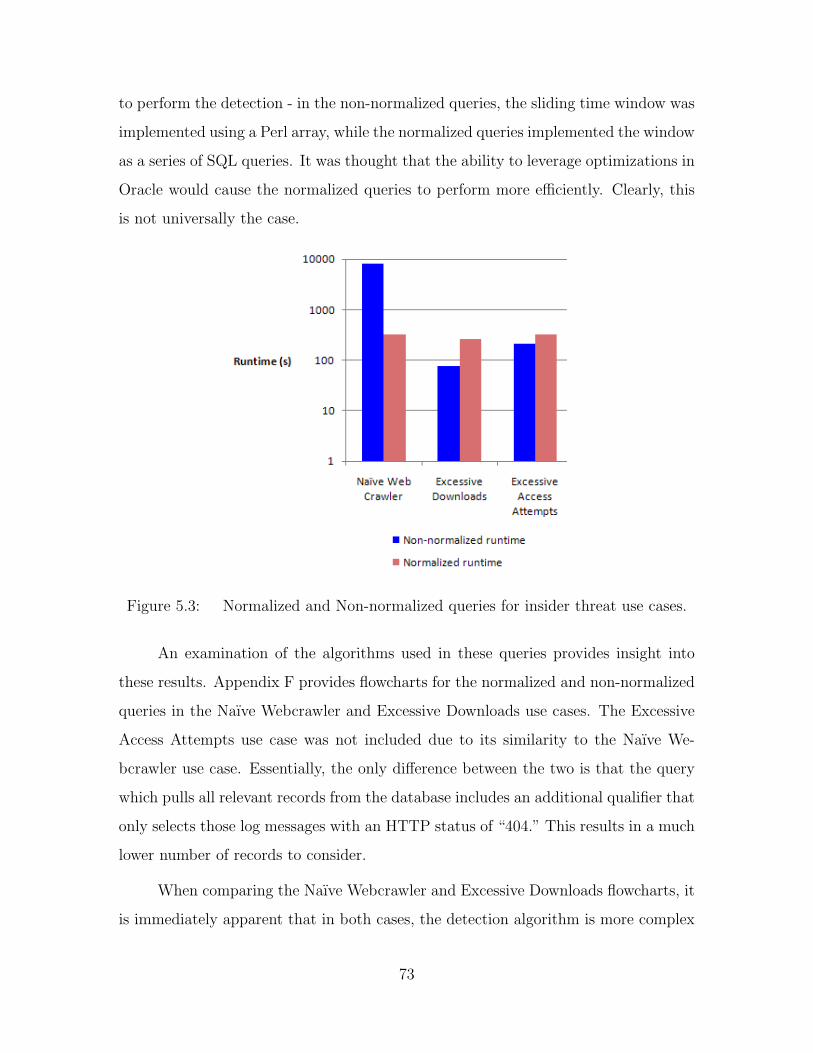
to perform the detection - in the non-normalized queries, the sliding time window was
implemented using a Perl array, while the normalized queries implemented the window
as a series of SQL queries. It was thought that the ability to leverage optimizations in
Oracle would cause the normalized queries to perform more efficiently. Clearly, this
is not universally the case.
Figure 5.3: Normalized and Non-normalized queries for insider threat use cases.
An examination of the algorithms used in these queries provides insight into
these results. Appendix F provides flowcharts for the normalized and non-normalized
queries in the Naıve Webcrawler and Excessive Downloads use cases. The Excessive
Access Attempts use case was not included due to its similarity to the Naıve We-
bcrawler use case. Essentially, the only difference between the two is that the query
which pulls all relevant records from the database includes an additional qualifier that
only selects those log messages with an HTTP status of “404.” This results in a much
lower number of records to consider.
When comparing the Naıve Webcrawler and Excessive Downloads flowcharts, it
is immediately apparent that in both cases, the detection algorithm is more complex
73
in the non-normalized case. However, the non-normalized algorithm for the Naıve
Webcrawler is even more complex than the Excessive Downloads algorithm - the
worst case complexity of the window is n2 for the former, as opposed to n for the
latter. This is necessary because to detect the Naıve Webcrawler, both the beginning
and the end of the time window slide - that is to say that the length of the time
window is constant. By contrast, detection of the Excessive downloads requires an
expanding time window to detect the sum of downloads since the first observed access.
This difference in complexity exposes the underlying mechanisms used to con-
duct the detection. In the non-normalized cases, a Perl array was used to store the
relevant information parsed out of the log messages. These Perl arrays were then used
to implement the sliding time windows. In the normalized queries, no such reliance
on arrays was necessary, since the sliding time window could be implemented entirely
in SQL queries. It seems, therefore, that the implementation of sliding time windows
in Perl arrays is more efficient than their implementation in SQL queries. The rela-
tively lower complexity of the Excessive Downloads and Excessive Access Attempts
algorithms allows that difference to manifest itself.
These results make two points about database normalization of log messages.
First, they show that in many cases there can be a distinct efficiency advantage in
doing event correlation using a normalized database. Second, these results illustrate
the fact that normalization by itself is unlikely to solve the major issues with central-
ized log management. In the Excessive Downloads and Excessive Access Attempts
queries, a more efficient detection implementation actually outweighed any benefit
presented by the use of a normalized database.
The ability to perform analysis on a normalized dataset comes at a price -
the data must first be analyzed and processed. In this research, the normalization
was done with a Perl script after all data had been collected. This script (included
in Appendix E.6) demonstrates just how difficult normalization can be. Separate
database tables must be created for each log type, and those log types must then be
74
analyzed to construct a table which can hold all possible types of data that might be
contained in that log. For a fixed-format log like Apache and IIS web server logs, this
process is somewhat painless. For more freeform log types (such as the Apache error
log), this could be a very difficult task.
5.4 Summary
This chapter presented the data collected through four runs of the experimental
network, offering context and analysis as to how this data should be interpreted and
how it met the research goals.
75

VI. Conclusions
This chapter identifies the significance of the research and make recommendations for
future research, summarizing and drawing conclusions based on the results presented
in Chapter 5.
6.1 Significance of Research
The significance of this research lies not in its development of a tool, although
software was developed and configured. Neither does it lie in the assertion that
distributed event correlation provides benefits over centralized, database-driven event
correlation - as the research in Chapter 2 showed, the popularity of event correlation
is growing, and distributed techniques are being explored and embraced as their value
is experienced. Rather, the primary significance of this research lies in the methodical
identification, measurement and analysis of specific areas where distributing the event
correlation activities adds value to the exercises of log management, log analysis
and event correlation. In addition, the characteristics of remote configurability and
scalability with regard to multiple log sources address specific difficult problems in
the field of log analysis. The thought processes, analysis and results provided in this
research address current issues in the field, and therefore offer a valuable contribution
to the academic and professional communities to expand upon and use to improve
event correlation and log monitoring capabilities.
6.2 Recommendations for Future Research
There are several areas for future research. First, this research effort focused
on web server access logs, and to a lesser extent web server error logs and MySQL
logs. Expansion of this methodology to include other types of logs, such as router
logs, workstation logs, firewall and intrusion detection logs, and other application logs
would add an understanding of what is detectable in those areas.
In addition, further research is recommended in the area of emerging common
log event description standards such as Mitre’s Common Event Expression. This
76
area provides great potential for log normalization and event correlation, and parallel
research efforts would benefit all concerned communities.
Another area for further research is in the presentation of the alerts generated.
As noted in the discussion in Chapter 2, SIEM tools are focused not only on col-
lecting logs and detecting behavior, but also on incident management, reporting and
visualization. This research did not meaningfully address the reporting of events once
they were generated, or the organizational processes which would be necessary to
respond to incidents once they were reported. Further research in this area would
give the log collection and incident detection components of this research additional
organizational relevance.
6.3 Conclusions of Research
The goal of this research had two components, namely developing a distributed
log event correlation methodology and quantifying the value provided by that method-
ology over a centralized alternative. That two-part goal is met when the chosen
metrics for measuring the value of a methodology demonstrate that the distributed
methodology does in fact outperform the centralized methodology.
The secondary goal of this research was to demonstrate additional advantages
of a distributed approach which provide useful, if not quantifiable, value. This goal
is met when a plausible implementation of the identified advantages is demonstrated
and shown to provide the anticipated value.
The primary goal of this research was met in part by the measurement of network
utilization, showing a best-case reduction in Syslog traffic of 99.88% between a raw-
log only and synthetic-event only configuration. The goal was further met by the
measurement of query efficiencies, showing that adding context to the database has
a dramatic effect in reducing the time necessary to detect suspicious behavior by
querying the database.
77
The secondary goal of the research was met through the implementation of sev-
eral techniques which take advantage of the distributed architecture to add additional
value. Those techniques were remote configuration, inclusion of multiple log sources
and analysis of the differences between normalized and unnormalized databases. The
remote configuration showed that distributed event correlation architectures can be
easily managed remotely, making it much more practical at a larger scale. The in-
clusion of multiple log sources showed that the methodology can correlate sources
with different formats and information, even combining information from multiple
sources to detect behavior that is not evident in only one or the other. Lastly, the
value of normalizing a database was shown through analysis that revealed that as
the complexity of detection algorithms increase, the reduction in query time becomes
even more pronounced. Therefore, this research effort succesfully accomplished the
objectives set out in Chapter 1.
78
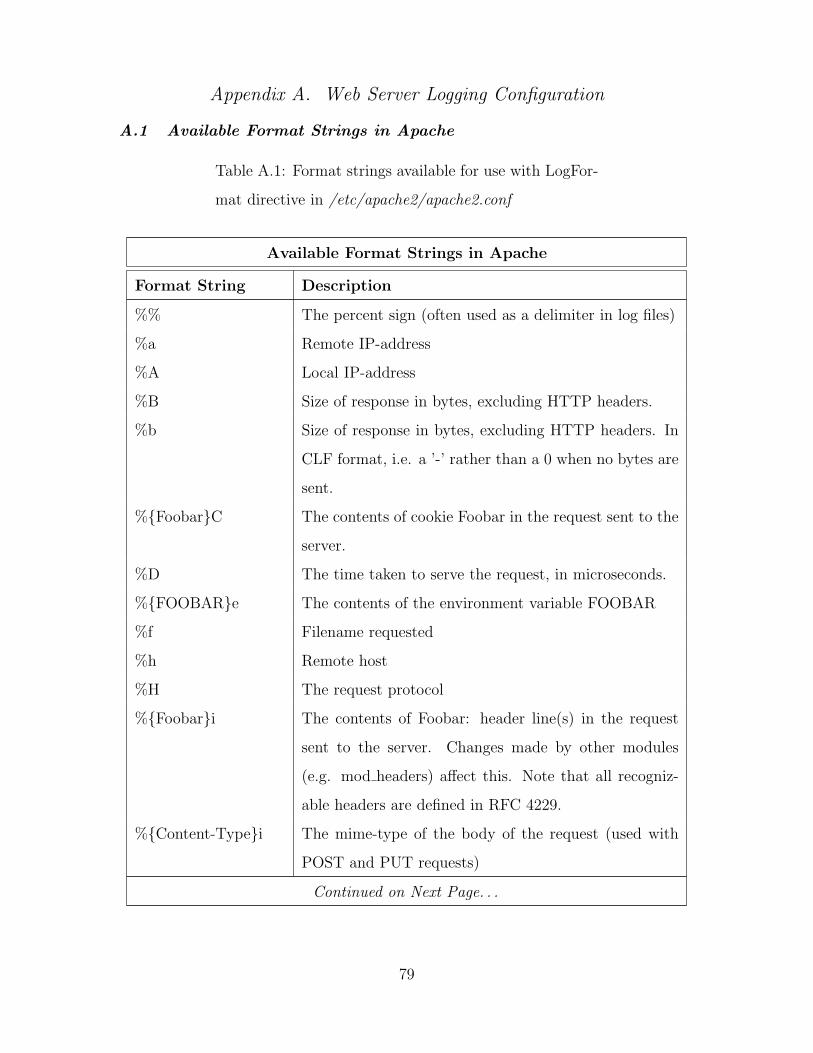
Appendix A. Web Server Logging Configuration
A.1 Available Format Strings in Apache
Table A.1: Format strings available for use with LogFor-
mat directive in /etc/apache2/apache2.conf
Available Format Strings in Apache
Format String Description
%% The percent sign (often used as a delimiter in log files)
%a Remote IP-address
%A Local IP-address
%B Size of response in bytes, excluding HTTP headers.
%b Size of response in bytes, excluding HTTP headers. In
CLF format, i.e. a ’-’ rather than a 0 when no bytes are
sent.
%{Foobar}C The contents of cookie Foobar in the request sent to the
server.
%D The time taken to serve the request, in microseconds.
%{FOOBAR}e The contents of the environment variable FOOBAR
%f Filename requested
%h Remote host
%H The request protocol
%{Foobar}i The contents of Foobar: header line(s) in the request
sent to the server. Changes made by other modules
(e.g. mod headers) affect this. Note that all recogniz-
able headers are defined in RFC 4229.
%{Content-Type}i The mime-type of the body of the request (used with
POST and PUT requests)
Continued on Next Page. . .
79
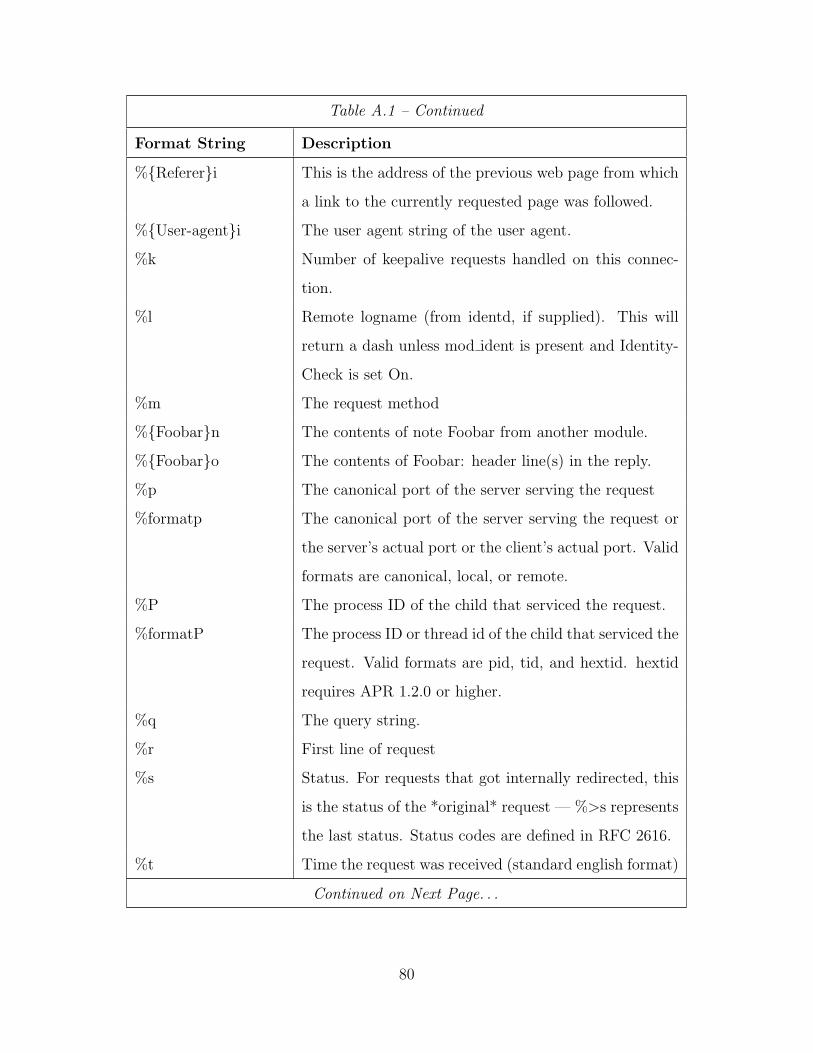
Table A.1 – Continued
Format String Description
%{Referer}i This is the address of the previous web page from which
a link to the currently requested page was followed.
%{User-agent}i The user agent string of the user agent.
%k Number of keepalive requests handled on this connec-
tion.
%l Remote logname (from identd, if supplied). This will
return a dash unless mod ident is present and Identity-
Check is set On.
%m The request method
%{Foobar}n The contents of note Foobar from another module.
%{Foobar}o The contents of Foobar: header line(s) in the reply.
%p The canonical port of the server serving the request
%formatp The canonical port of the server serving the request or
the server’s actual port or the client’s actual port. Valid
formats are canonical, local, or remote.
%P The process ID of the child that serviced the request.
%formatP The process ID or thread id of the child that serviced the
request. Valid formats are pid, tid, and hextid. hextid
requires APR 1.2.0 or higher.
%q The query string.
%r First line of request
%s Status. For requests that got internally redirected, this
is the status of the *original* request — %>s represents
the last status. Status codes are defined in RFC 2616.
%t Time the request was received (standard english format)
Continued on Next Page. . .
80
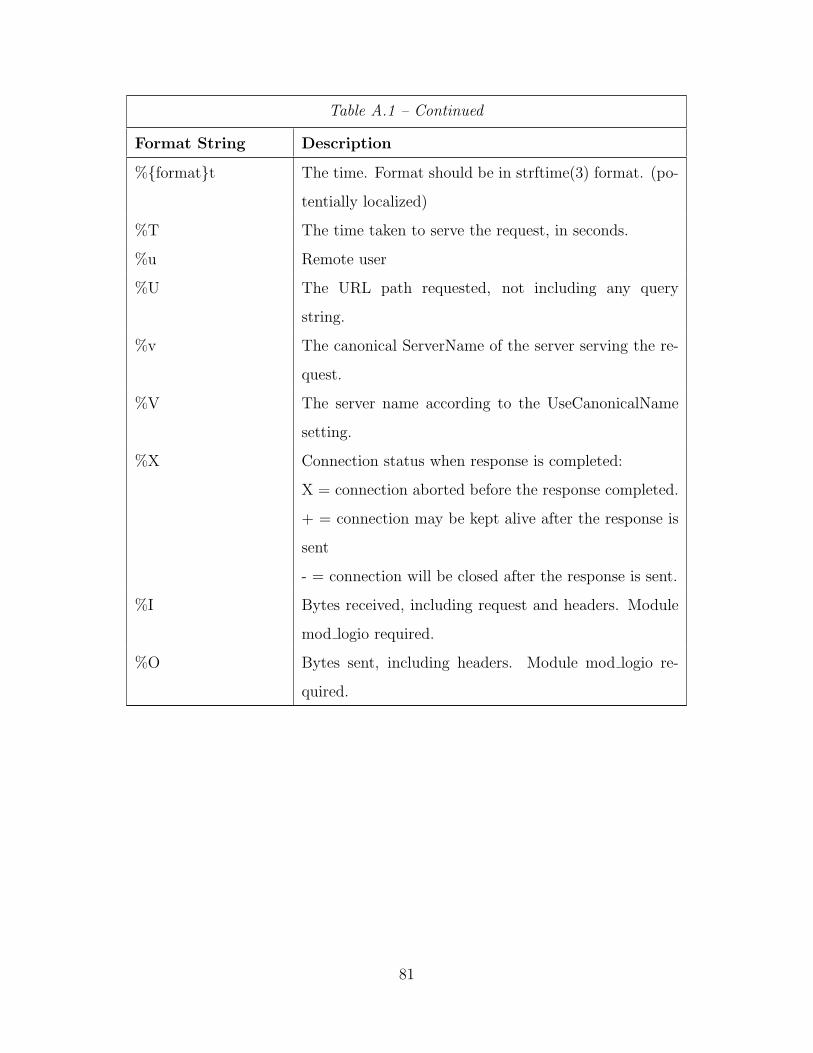
Table A.1 – Continued
Format String Description
%{format}t The time. Format should be in strftime(3) format. (po-
tentially localized)
%T The time taken to serve the request, in seconds.
%u Remote user
%U The URL path requested, not including any query
string.
%v The canonical ServerName of the server serving the re-
quest.
%V The server name according to the UseCanonicalName
setting.
%X Connection status when response is completed:
X = connection aborted before the response completed.
+ = connection may be kept alive after the response is
sent
- = connection will be closed after the response is sent.
%I Bytes received, including request and headers. Module
mod logio required.
%O Bytes sent, including headers. Module mod logio re-
quired.
81
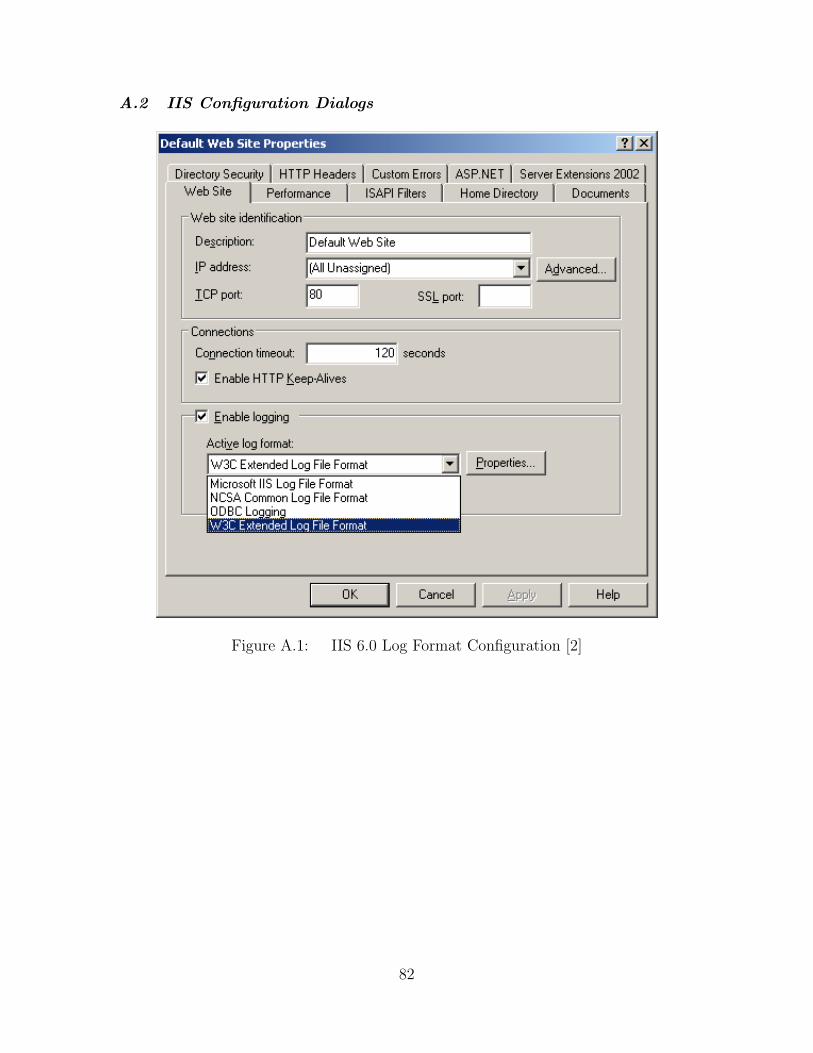
A.2 IIS Configuration Dialogs
Figure A.1: IIS 6.0 Log Format Configuration [2]
82
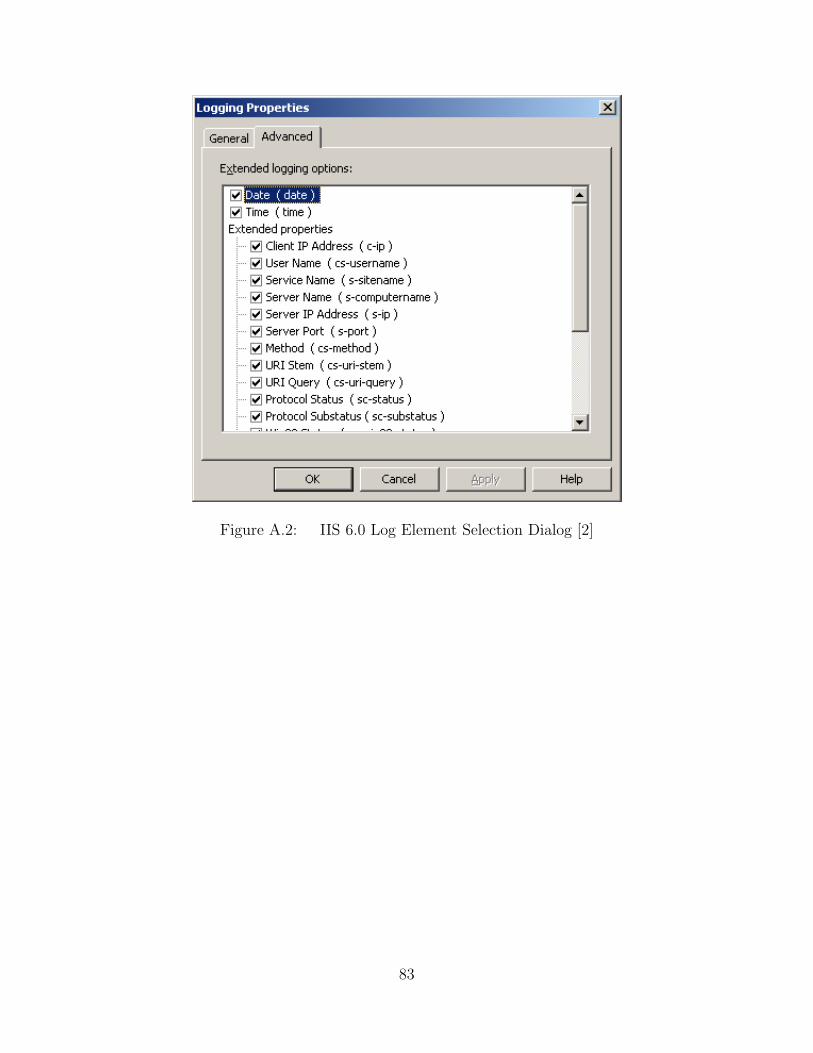
Figure A.2: IIS 6.0 Log Element Selection Dialog [2]
83
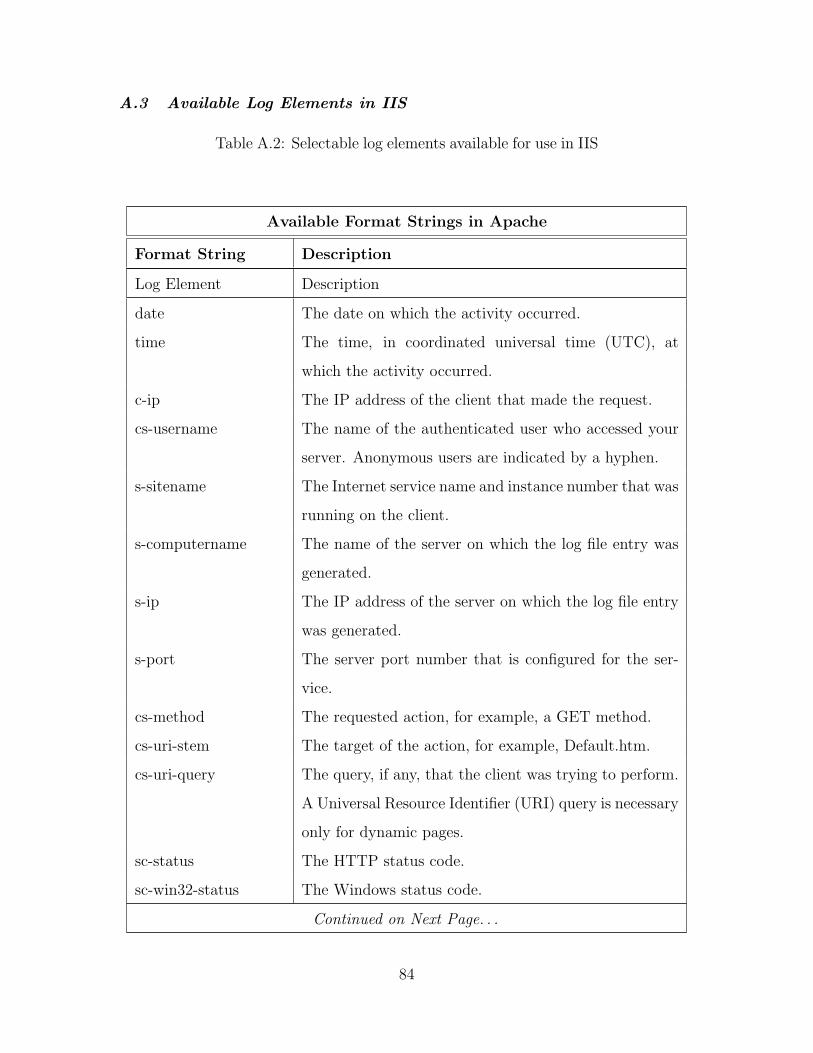
A.3 Available Log Elements in IIS
Table A.2: Selectable log elements available for use in IIS
Available Format Strings in Apache
Format String Description
Log Element Description
date The date on which the activity occurred.
time The time, in coordinated universal time (UTC), at
which the activity occurred.
c-ip The IP address of the client that made the request.
cs-username The name of the authenticated user who accessed your
server. Anonymous users are indicated by a hyphen.
s-sitename The Internet service name and instance number that was
running on the client.
s-computername The name of the server on which the log file entry was
generated.
s-ip The IP address of the server on which the log file entry
was generated.
s-port The server port number that is configured for the ser-
vice.
cs-method The requested action, for example, a GET method.
cs-uri-stem The target of the action, for example, Default.htm.
cs-uri-query The query, if any, that the client was trying to perform.
A Universal Resource Identifier (URI) query is necessary
only for dynamic pages.
sc-status The HTTP status code.
sc-win32-status The Windows status code.
Continued on Next Page. . .
84
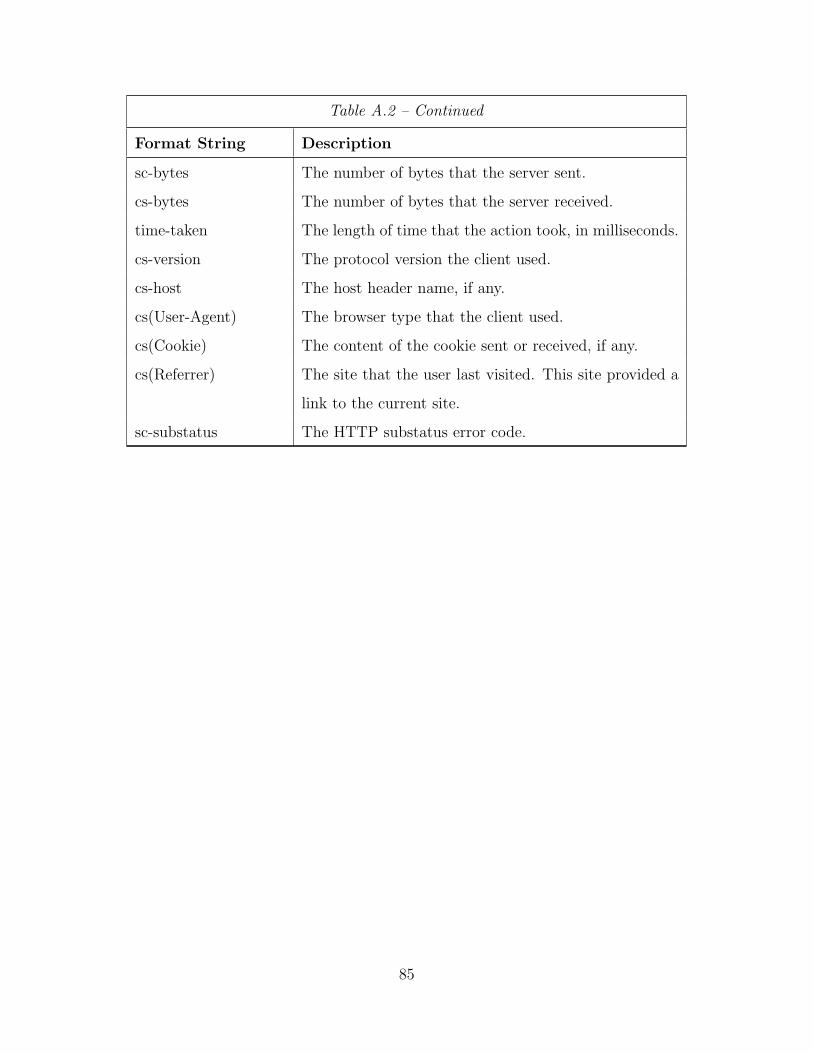
Table A.2 – Continued
Format String Description
sc-bytes The number of bytes that the server sent.
cs-bytes The number of bytes that the server received.
time-taken The length of time that the action took, in milliseconds.
cs-version The protocol version the client used.
cs-host The host header name, if any.
cs(User-Agent) The browser type that the client used.
cs(Cookie) The content of the cookie sent or received, if any.
cs(Referrer) The site that the user last visited. This site provided a
link to the current site.
sc-substatus The HTTP substatus error code.
85
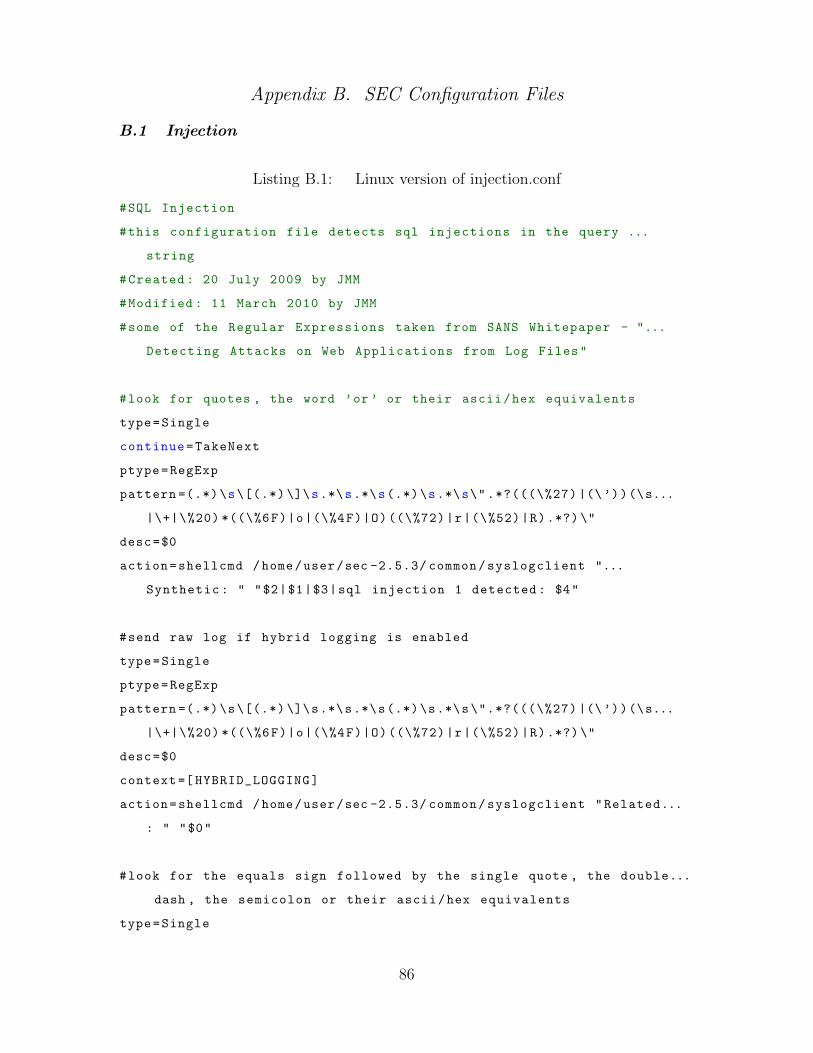
Appendix B. SEC Configuration Files
B.1 Injection
Listing B.1: Linux version of injection.conf
#SQL Injection
#this configuration file detects sql injections in the query ...
string
#Created : 20 July 2009 by JMM
#Modified : 11 March 2010 by JMM
#some of the Regular Expressions taken from SANS Whitepaper - "...
Detecting Attacks on Web Applications from Log Files"
#look for quotes , the word ’or ’ or their ascii/hex equivalents
type=Single
continue=TakeNext
ptype=RegExp
pattern =(.*)\s\[(.*) \]\s.*\s.*\s(.*)\s.*\s\".*?(((\%27) |(\’))(\s...
|\+|\%20) *((\%6F)|o|(\%4F)|O)((\%72)|r|(\%52)|R).*?)\"
desc=$0
action=shellcmd /home/user/sec -2.5.3/ common/syslogclient "...
Synthetic : " "$2|$1|$3|sql injection 1 detected : $4"
#send raw log if hybrid logging is enabled
type=Single
ptype=RegExp
pattern =(.*)\s\[(.*) \]\s.*\s.*\s(.*)\s.*\s\".*?(((\%27) |(\’))(\s...
|\+|\%20) *((\%6F)|o|(\%4F)|O)((\%72)|r|(\%52)|R).*?)\"
desc=$0
context =[ HYBRID_LOGGING]
action=shellcmd /home/user/sec -2.5.3/ common/syslogclient "Related...
: " "$0"
#look for the equals sign followed by the single quote , the double...
dash , the semicolon or their ascii/hex equivalents
type=Single
86
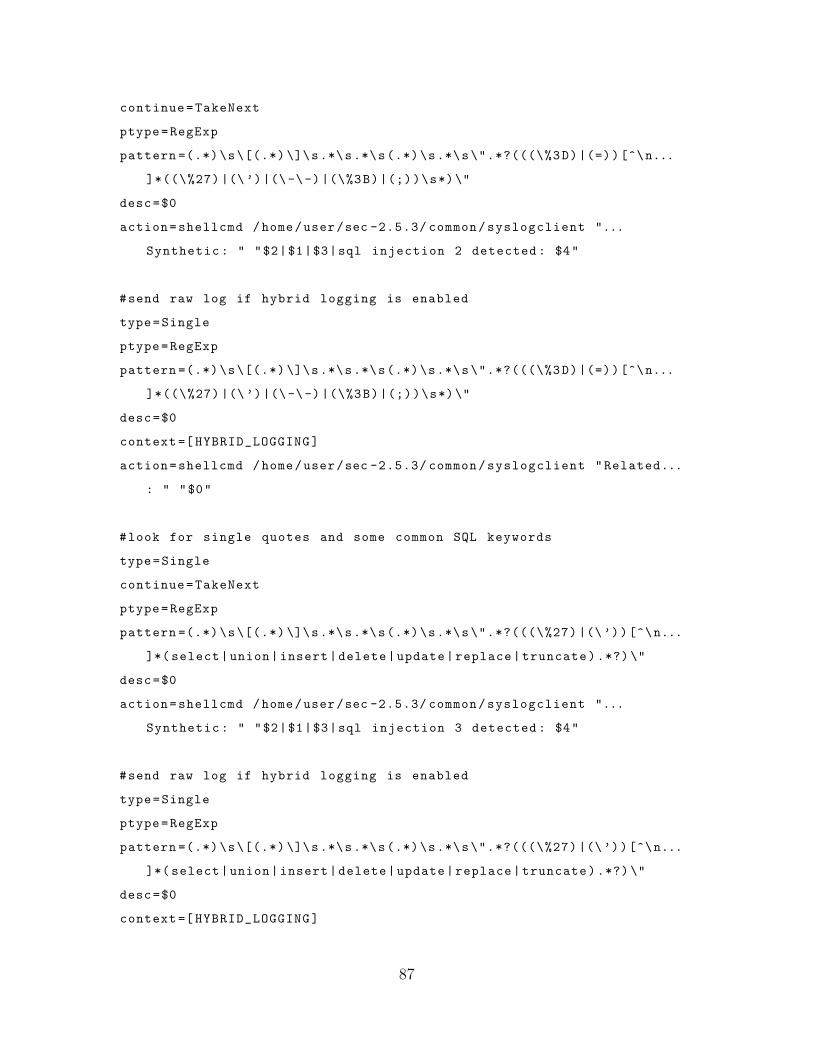
continue=TakeNext
ptype=RegExp
pattern =(.*)\s\[(.*) \]\s.*\s.*\s(.*)\s.*\s\".*?(((\%3D)|(=))[^\n...
]*((\%27) |(\’)|(\-\-) |(\%3B)|(;))\s*)\"
desc=$0
action=shellcmd /home/user/sec -2.5.3/ common/syslogclient "...
Synthetic : " "$2|$1|$3|sql injection 2 detected : $4"
#send raw log if hybrid logging is enabled
type=Single
ptype=RegExp
pattern =(.*)\s\[(.*) \]\s.*\s.*\s(.*)\s.*\s\".*?(((\%3D)|(=))[^\n...
]*((\%27) |(\’)|(\-\-) |(\%3B)|(;))\s*)\"
desc=$0
context =[ HYBRID_LOGGING]
action=shellcmd /home/user/sec -2.5.3/ common/syslogclient "Related...
: " "$0"
#look for single quotes and some common SQL keywords
type=Single
continue=TakeNext
ptype=RegExp
pattern =(.*)\s\[(.*) \]\s.*\s.*\s(.*)\s.*\s\".*?(((\%27) |(\’))[^\n...
]*( select|union|insert|delete|update|replace|truncate).*?)\"
desc=$0
action=shellcmd /home/user/sec -2.5.3/ common/syslogclient "...
Synthetic : " "$2|$1|$3|sql injection 3 detected : $4"
#send raw log if hybrid logging is enabled
type=Single
ptype=RegExp
pattern =(.*)\s\[(.*) \]\s.*\s.*\s(.*)\s.*\s\".*?(((\%27) |(\’))[^\n...
]*( select|union|insert|delete|update|replace|truncate).*?)\"
desc=$0
context =[ HYBRID_LOGGING]
87
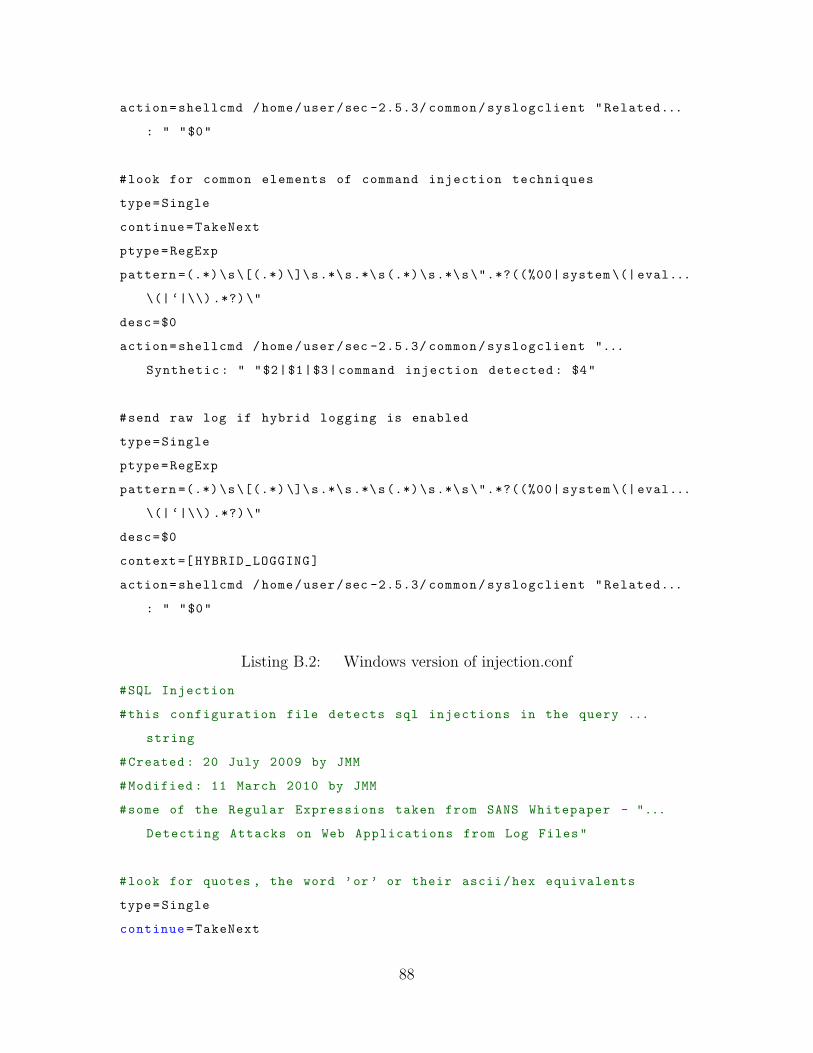
action=shellcmd /home/user/sec -2.5.3/ common/syslogclient "Related...
: " "$0"
#look for common elements of command injection techniques
type=Single
continue=TakeNext
ptype=RegExp
pattern =(.*)\s\[(.*) \]\s.*\s.*\s(.*)\s.*\s\".*?((%00| system \(| eval...
\(| ‘|\\) .*?)\"
desc=$0
action=shellcmd /home/user/sec -2.5.3/ common/syslogclient "...
Synthetic : " "$2|$1|$3|command injection detected : $4"
#send raw log if hybrid logging is enabled
type=Single
ptype=RegExp
pattern =(.*)\s\[(.*) \]\s.*\s.*\s(.*)\s.*\s\".*?((%00| system \(| eval...
\(| ‘|\\) .*?)\"
desc=$0
context =[ HYBRID_LOGGING]
action=shellcmd /home/user/sec -2.5.3/ common/syslogclient "Related...
: " "$0"
Listing B.2: Windows version of injection.conf
#SQL Injection
#this configuration file detects sql injections in the query ...
string
#Created : 20 July 2009 by JMM
#Modified : 11 March 2010 by JMM
#some of the Regular Expressions taken from SANS Whitepaper - "...
Detecting Attacks on Web Applications from Log Files"
#look for quotes , the word ’or ’ or their ascii/hex equivalents
type=Single
continue=TakeNext
88
ptype=RegExp
pattern =(.*)\s(.*)\s(.*)\s(.*?((\%27) |(\’))(\s|\+|\%20) *((\%6F)|o...
|(\%4F)|O)((\%72)|r|(\%52)|R).*?)\s(.*)\s.*\s.*\s.*\s.*
desc=$0
action=shellcmd C:\sec -2.5.3\ common\klogclient.bat " SECEvent : ...
Synthetic : $1 $2|$15|$3|sql injection 1 detected : $4"
#send raw log if hybrid logging is enabled
type=Single
ptype=RegExp
pattern =(.*)\s(.*)\s(.*)\s(.*?((\%27) |(\’))(\s|\+|\%20) *((\%6F)|o...
|(\%4F)|O)((\%72)|r|(\%52)|R).*?)\s(.*)\s.*\s.*\s.*\s.*
desc=$0
context =[ HYBRID_LOGGING]
action=shellcmd C:\sec -2.5.3\ common\klogclient.bat " SECEvent : ...
Related : $0"
#look for the equals sign followed by the single quote , the double...
dash , the semicolon or their ascii/hex equivalents
type=Single
continue=TakeNext
ptype=RegExp
pattern =(.*)\s(.*)\s(.*)\s.*?(((\%3D)|(=))[^\n]*((\%27) |(\’)...
|(\-\-) |(\%3B)|(;))\s*)\s(.*)\s.*\s.*\s.*\s.*
desc=$0
action=shellcmd C:\sec -2.5.3\ common\klogclient.bat " SECEvent : ...
Synthetic : $1 $2|$14|$3|sql injection 2 detected : $4"
#send raw log if hybrid logging is enabled
type=Single
ptype=RegExp
pattern =(.*)\s(.*)\s(.*)\s.*?(((\%3D)|(=))[^\n]*((\%27) |(\’)...
|(\-\-) |(\%3B)|(;))\s*)\s(.*)\s.*\s.*\s.*\s.*
desc=$0
context =[ HYBRID_LOGGING]
89
action=shellcmd C:\sec -2.5.3\ common\klogclient.bat " SECEvent : ...
Related : $0"
#look for single quotes and some common SQL keywords
type=Single
continue=TakeNext
ptype=RegExp
pattern =(.*)\s(.*)\s(.*)\s.*?(((\%27) |(\’))[^\n]*( select|union|...
insert|delete|update|replace|truncate).*?)\s(.*)\s.*\s.*\s.*\s...
.*
desc=$0
action=shellcmd C:\sec -2.5.3\ common\klogclient.bat " SECEvent : ...
Synthetic : $1 $2|$9|$3|sql injection 3 detected : $4"
#send raw log if hybrid logging is enabled
type=Single
ptype=RegExp
pattern =(.*)\s(.*)\s(.*)\s.*?(((\%27) |(\’))[^\n]*( select|union|...
insert|delete|update|replace|truncate).*?)\s(.*)\s.*\s.*\s.*\s...
.*
desc=$0
context =[ HYBRID_LOGGING]
action=shellcmd C:\sec -2.5.3\ common\klogclient.bat " SECEvent : ...
Related : $0"
#look for common elements of command injection techniques
type=Single
continue=TakeNext
ptype=RegExp
pattern =(.*)\s(.*)\s(.*)\s.*?((%00| system \(| eval \(| ‘|\\) .*?)\s(.*)...
\s.*\s.*\s.*\s.*
desc=$0
action=shellcmd C:\sec -2.5.3\ common\klogclient.bat " SECEvent : ...
Synthetic : $1 $2|$6|$3|command injection detected : $4"
90
#send raw log if hybrid logging is enabled
type=Single
ptype=RegExp
pattern =(.*)\s(.*)\s(.*)\s.*?((%00| system \(| eval \(| ‘|\\) .*?)\s(.*)...
\s.*\s.*\s.*\s.*
desc=$0
context =[ HYBRID_LOGGING]
action=shellcmd C:\sec -2.5.3\ common\klogclient.bat " SECEvent : ...
Related : $0"
B.2 Cross Site Scripting
Listing B.3: Linux version of xss.conf
#Cross Site Scripting detection
#this configuration file detects cross site scripting attacks
#Created : 8 March 2010 by JMM
#Modified:
#some of the Regular Expressions taken from SANS Whitepaper - "...
Detecting Attacks on Web Applications from Log Files"
#look for image tags
type=Single
continue=TakeNext
ptype=RegExp
pattern =(.*)\s\[(.*) \]\s.*\s.*\s.*\s.*\s\".*(((\%3C)|<)((\%69)|i...
|(\%49))((\%6D)|m|(\%4D))((\%67)|g|(\%47))[^\n]+((\%3E)|>).*)\"
desc=$0
action=shellcmd /home/user/sec -2.5.3/ common/syslogclient "...
Synthetic : " "$2|$1|xss detected in image tag: $3"
#send the raw log
type=Single
ptype=RegExp
pattern =(.*)\s\[(.*) \]\s.*\s.*\s.*\s.*\s\".*(((\%3C)|<)((\%69)|i...
|(\%49))((\%6D)|m|(\%4D))((\%67)|g|(\%47))[^\n]+((\%3E)|>).*)\"
91
desc=$0
context =[ HYBRID_LOGGING]
action=shellcmd /home/user/sec -2.5.3/ common/syslogclient "Related...
: " "$0"
#look for look for javascript keywords
type=Single
continue=TakeNext
ptype=RegExp
pattern =(.*)\s\[(.*) \]\s.*\s.*\s.*\s.*\s\"(.*( javascript|vbscript|...
expression|applet|script|embed|object|iframe|frame|frameset).*)...
\"
desc=$0
action=shellcmd /home/user/sec -2.5.3/ common/syslogclient "...
Synthetic : " "$2|$1|xss detected with javascript tag: $3"
#send the raw log
type=Single
ptype=RegExp
pattern =(.*)\s\[(.*) \]\s.*\s.*\s.*\s.*\s\"(.*( javascript|vbscript|...
expression|applet|script|embed|object|iframe|frame|frameset).*)...
\"
desc=$0
context =[ HYBRID_LOGGING]
action=shellcmd /home/user/sec -2.5.3/ common/syslogclient "Related...
: " "$0"
#look for any HTML tag
type=Single
continue=TakeNext
ptype=RegExp
pattern =(.*)\s\[(.*) \]\s.*\s.*\s.*\s.*\s\".*(((\%3C)|<)[a-z0 -9\=\s...
\%\/]+((\%3E)|>).*)\"
desc=$0
92
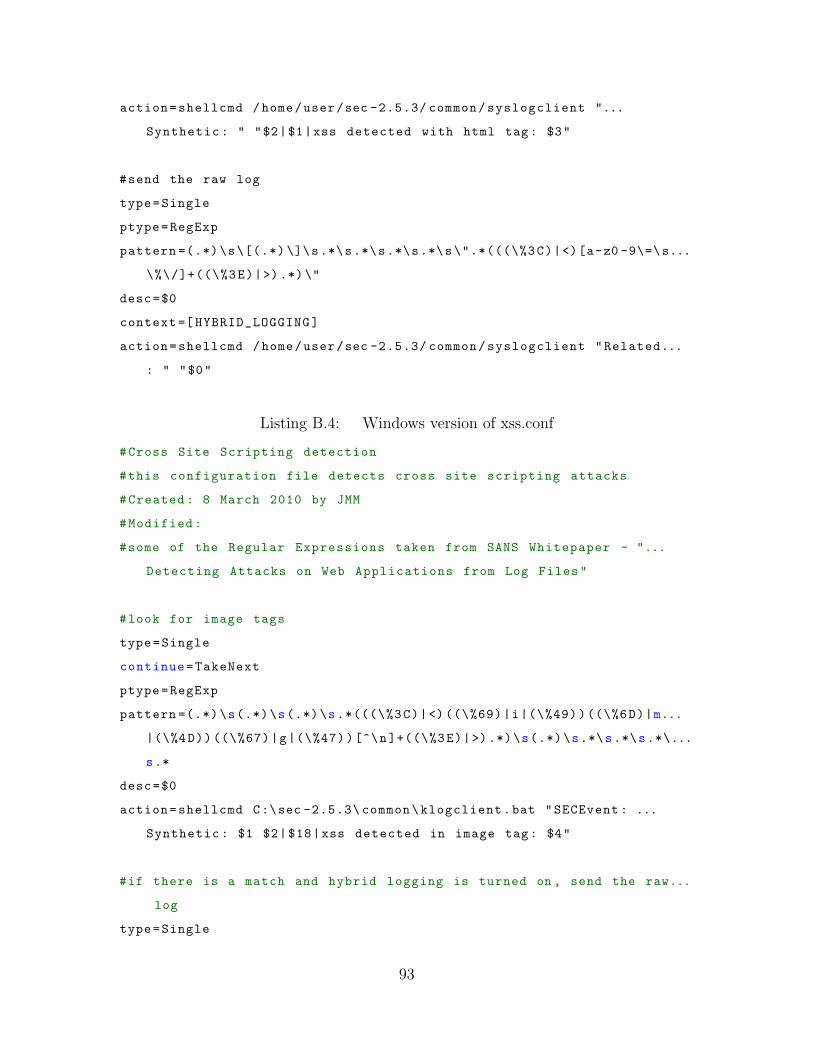
action=shellcmd /home/user/sec -2.5.3/ common/syslogclient "...
Synthetic : " "$2|$1|xss detected with html tag: $3"
#send the raw log
type=Single
ptype=RegExp
pattern =(.*)\s\[(.*) \]\s.*\s.*\s.*\s.*\s\".*(((\%3C)|<)[a-z0 -9\=\s...
\%\/]+((\%3E)|>).*)\"
desc=$0
context =[ HYBRID_LOGGING]
action=shellcmd /home/user/sec -2.5.3/ common/syslogclient "Related...
: " "$0"
Listing B.4: Windows version of xss.conf
#Cross Site Scripting detection
#this configuration file detects cross site scripting attacks
#Created : 8 March 2010 by JMM
#Modified:
#some of the Regular Expressions taken from SANS Whitepaper - "...
Detecting Attacks on Web Applications from Log Files"
#look for image tags
type=Single
continue=TakeNext
ptype=RegExp
pattern =(.*)\s(.*)\s(.*)\s.*(((\%3C)|<)((\%69)|i|(\%49))((\%6D)|m...
|(\%4D))((\%67)|g|(\%47))[^\n]+((\%3E)|>).*)\s(.*)\s.*\s.*\s.*\...
s.*
desc=$0
action=shellcmd C:\sec -2.5.3\ common\klogclient.bat "SECEvent : ...
Synthetic : $1 $2|$18|xss detected in image tag: $4"
#if there is a match and hybrid logging is turned on , send the raw...
log
type=Single
93
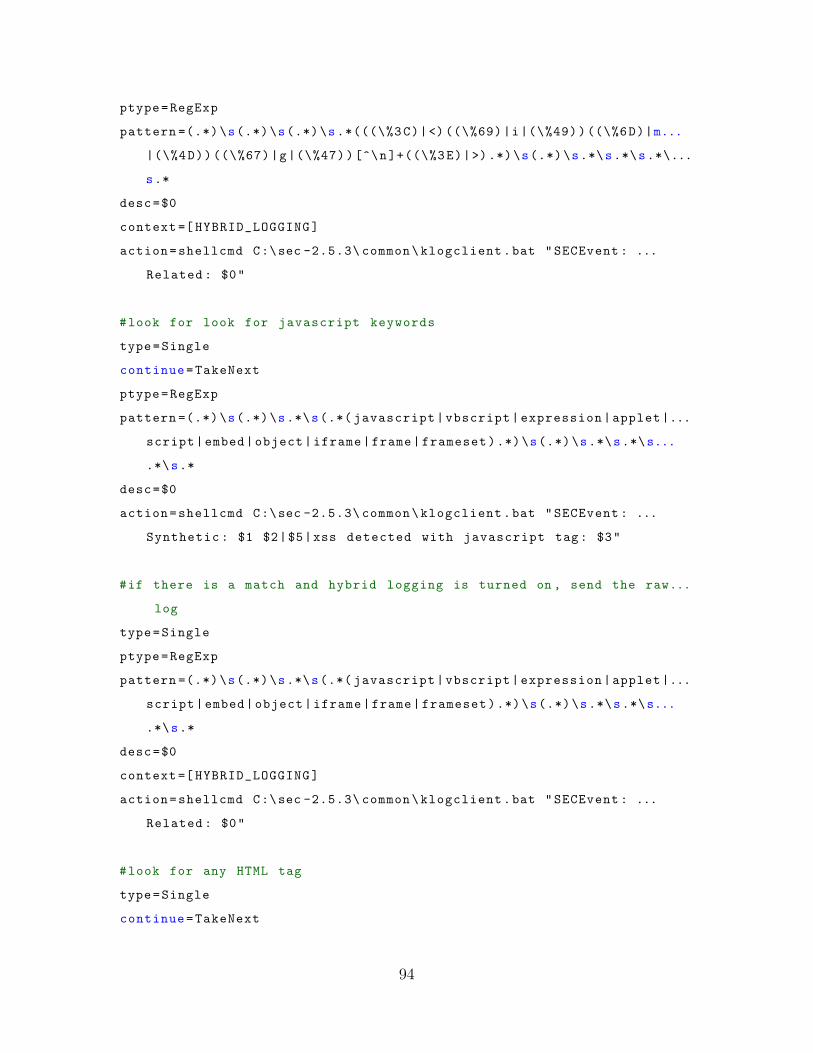
ptype=RegExp
pattern =(.*)\s(.*)\s(.*)\s.*(((\%3C)|<)((\%69)|i|(\%49))((\%6D)|m...
|(\%4D))((\%67)|g|(\%47))[^\n]+((\%3E)|>).*)\s(.*)\s.*\s.*\s.*\...
s.*
desc=$0
context =[ HYBRID_LOGGING]
action=shellcmd C:\sec -2.5.3\ common\klogclient.bat "SECEvent : ...
Related : $0"
#look for look for javascript keywords
type=Single
continue=TakeNext
ptype=RegExp
pattern =(.*)\s(.*)\s.*\s(.*( javascript|vbscript|expression|applet|...
script|embed|object|iframe|frame|frameset).*)\s(.*)\s.*\s.*\s...
.*\s.*
desc=$0
action=shellcmd C:\sec -2.5.3\ common\klogclient.bat "SECEvent : ...
Synthetic : $1 $2|$5|xss detected with javascript tag: $3"
#if there is a match and hybrid logging is turned on , send the raw...
log
type=Single
ptype=RegExp
pattern =(.*)\s(.*)\s.*\s(.*( javascript|vbscript|expression|applet|...
script|embed|object|iframe|frame|frameset).*)\s(.*)\s.*\s.*\s...
.*\s.*
desc=$0
context =[ HYBRID_LOGGING]
action=shellcmd C:\sec -2.5.3\ common\klogclient.bat "SECEvent : ...
Related : $0"
#look for any HTML tag
type=Single
continue=TakeNext
94
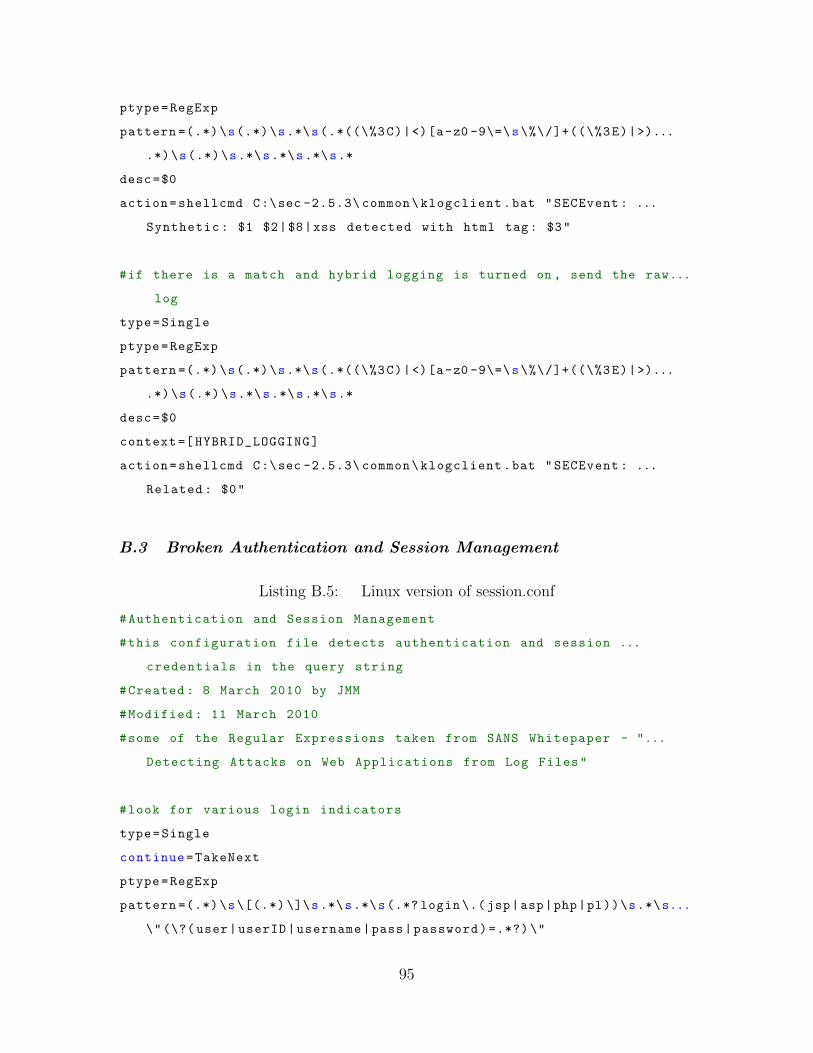
ptype=RegExp
pattern =(.*)\s(.*)\s.*\s(.*((\%3C)|<)[a-z0 -9\=\s\%\/]+((\%3E)|>)...
.*)\s(.*)\s.*\s.*\s.*\s.*
desc=$0
action=shellcmd C:\sec -2.5.3\ common\klogclient.bat "SECEvent : ...
Synthetic : $1 $2|$8|xss detected with html tag: $3"
#if there is a match and hybrid logging is turned on , send the raw...
log
type=Single
ptype=RegExp
pattern =(.*)\s(.*)\s.*\s(.*((\%3C)|<)[a-z0 -9\=\s\%\/]+((\%3E)|>)...
.*)\s(.*)\s.*\s.*\s.*\s.*
desc=$0
context =[ HYBRID_LOGGING]
action=shellcmd C:\sec -2.5.3\ common\klogclient.bat "SECEvent : ...
Related : $0"
B.3 Broken Authentication and Session Management
Listing B.5: Linux version of session.conf
#Authentication and Session Management
#this configuration file detects authentication and session ...
credentials in the query string
#Created : 8 March 2010 by JMM
#Modified : 11 March 2010
#some of the Regular Expressions taken from SANS Whitepaper - "...
Detecting Attacks on Web Applications from Log Files"
#look for various login indicators
type=Single
continue=TakeNext
ptype=RegExp
pattern =(.*)\s\[(.*) \]\s.*\s.*\s(.*? login \.(jsp|asp|php|pl))\s.*\s...
\"(\?( user|userID|username|pass|password)=.*?)\"
95
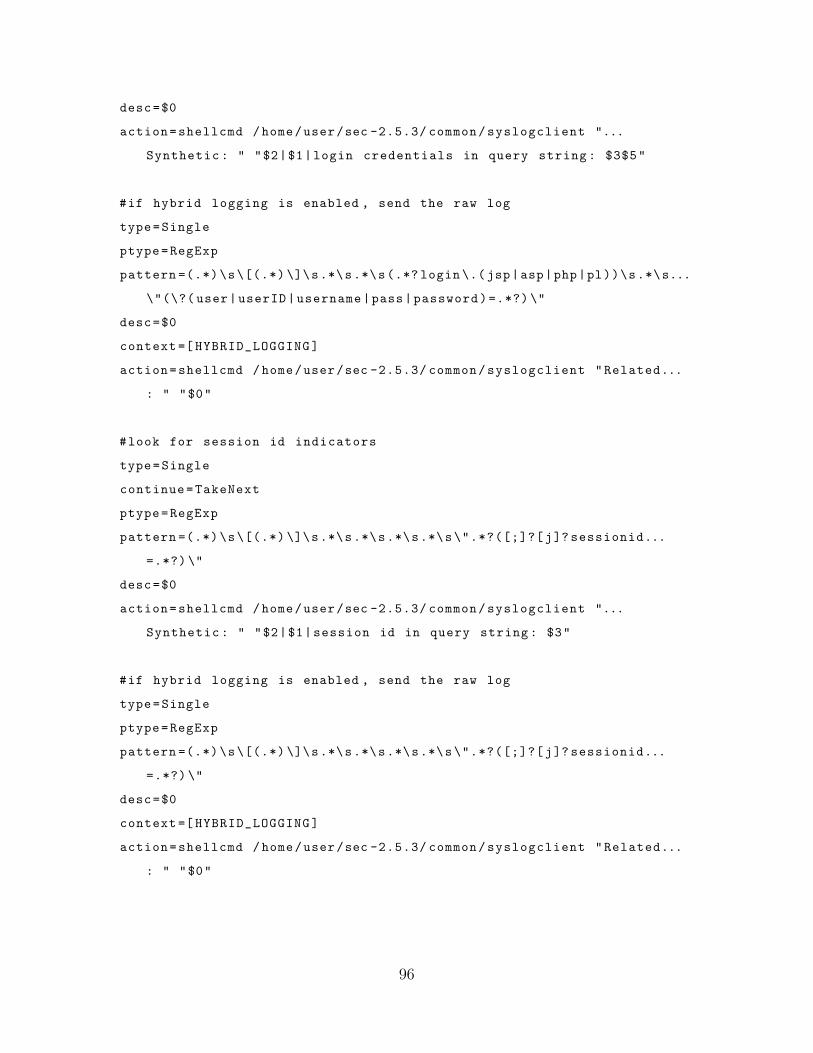
desc=$0
action=shellcmd /home/user/sec -2.5.3/ common/syslogclient "...
Synthetic : " "$2|$1|login credentials in query string : $3$5"
#if hybrid logging is enabled , send the raw log
type=Single
ptype=RegExp
pattern =(.*)\s\[(.*) \]\s.*\s.*\s(.*? login \.( jsp|asp|php|pl))\s.*\s...
\"(\?( user|userID|username|pass|password)=.*?) \"
desc=$0
context =[ HYBRID_LOGGING]
action=shellcmd /home/user/sec -2.5.3/ common/syslogclient "Related...
: " "$0"
#look for session id indicators
type=Single
continue=TakeNext
ptype=RegExp
pattern =(.*)\s\[(.*) \]\s.*\s.*\s.*\s.*\s\".*?([;]?[j]? sessionid...
=.*?)\"
desc=$0
action=shellcmd /home/user/sec -2.5.3/ common/syslogclient "...
Synthetic : " "$2|$1|session id in query string : $3"
#if hybrid logging is enabled , send the raw log
type=Single
ptype=RegExp
pattern =(.*)\s\[(.*) \]\s.*\s.*\s.*\s.*\s\".*?([;]?[j]? sessionid...
=.*?)\"
desc=$0
context =[ HYBRID_LOGGING]
action=shellcmd /home/user/sec -2.5.3/ common/syslogclient "Related...
: " "$0"
96
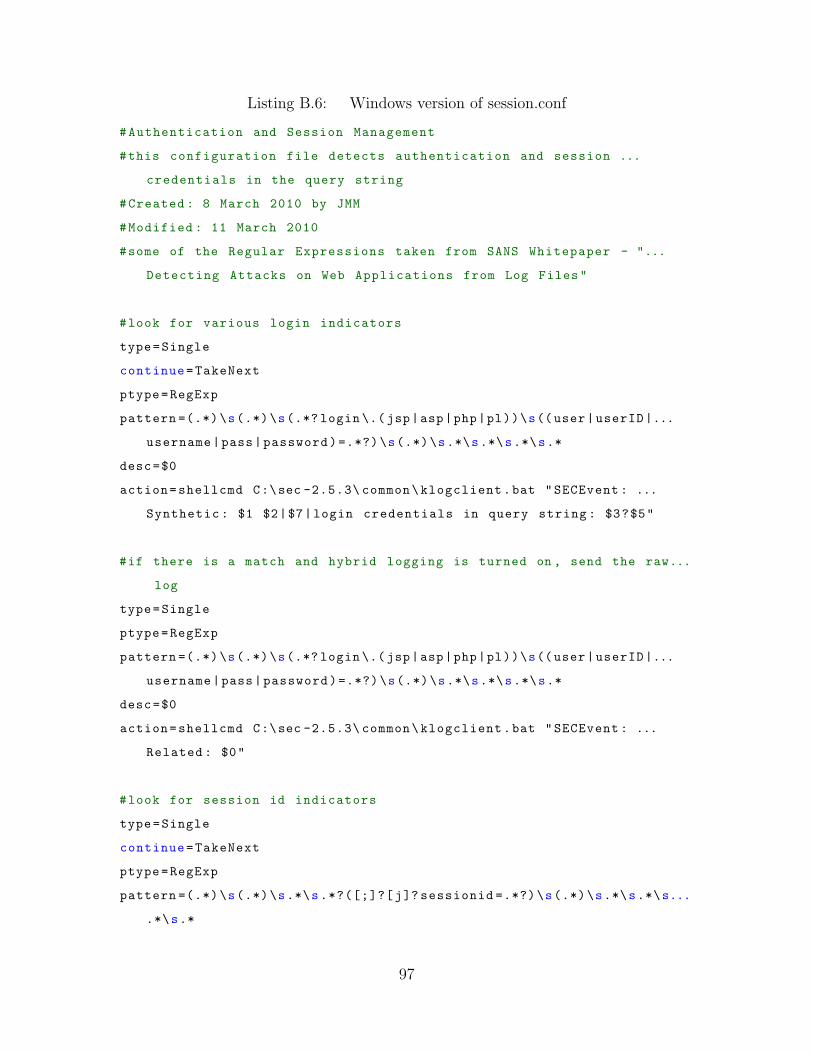
Listing B.6: Windows version of session.conf
#Authentication and Session Management
#this configuration file detects authentication and session ...
credentials in the query string
#Created : 8 March 2010 by JMM
#Modified : 11 March 2010
#some of the Regular Expressions taken from SANS Whitepaper - "...
Detecting Attacks on Web Applications from Log Files"
#look for various login indicators
type=Single
continue=TakeNext
ptype=RegExp
pattern =(.*)\s(.*)\s(.*? login \.(jsp|asp|php|pl))\s((user|userID|...
username|pass|password)=.*?)\s(.*)\s.*\s.*\s.*\s.*
desc=$0
action=shellcmd C:\sec -2.5.3\ common\klogclient.bat "SECEvent : ...
Synthetic : $1 $2|$7|login credentials in query string : $3?$5"
#if there is a match and hybrid logging is turned on , send the raw...
log
type=Single
ptype=RegExp
pattern =(.*)\s(.*)\s(.*? login \.(jsp|asp|php|pl))\s((user|userID|...
username|pass|password)=.*?)\s(.*)\s.*\s.*\s.*\s.*
desc=$0
action=shellcmd C:\sec -2.5.3\ common\klogclient.bat "SECEvent : ...
Related : $0"
#look for session id indicators
type=Single
continue=TakeNext
ptype=RegExp
pattern =(.*)\s(.*)\s.*\s.*?([;]?[j]? sessionid =.*?)\s(.*)\s.*\s.*\s...
.*\s.*
97
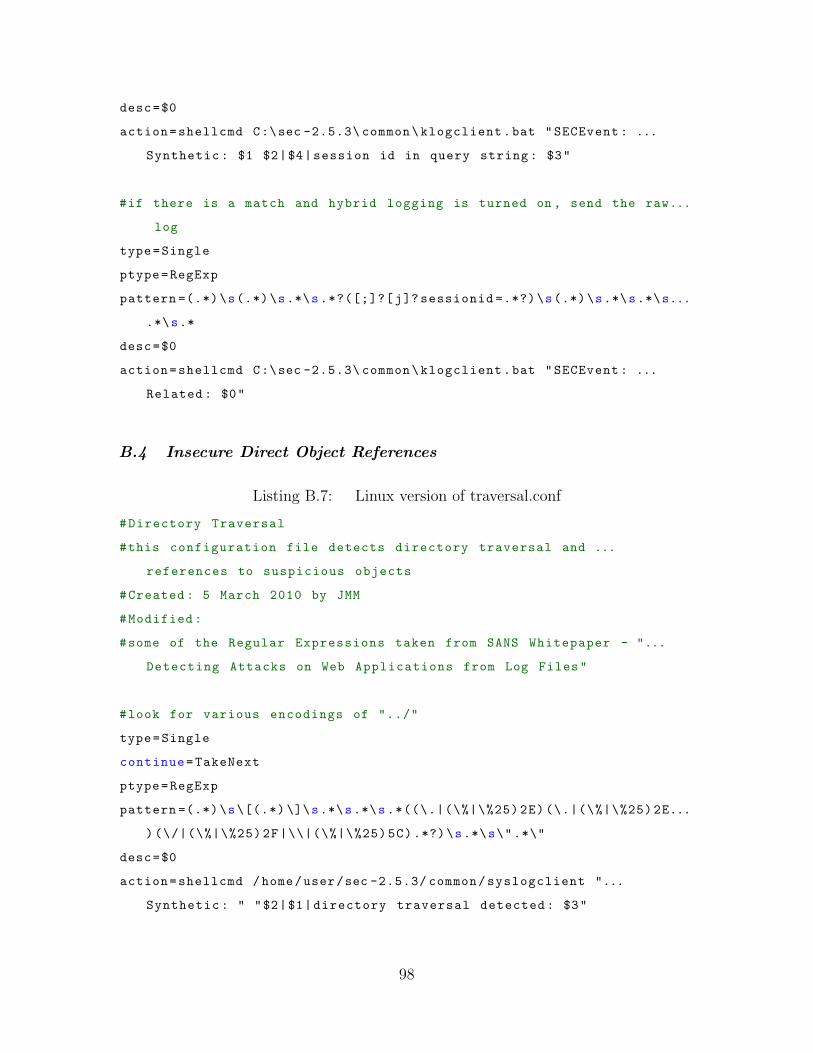
desc=$0
action=shellcmd C:\sec -2.5.3\ common\klogclient.bat "SECEvent : ...
Synthetic : $1 $2|$4|session id in query string : $3"
#if there is a match and hybrid logging is turned on , send the raw...
log
type=Single
ptype=RegExp
pattern =(.*)\s(.*)\s.*\s.*?([;]?[j]? sessionid =.*?)\s(.*)\s.*\s.*\s...
.*\s.*
desc=$0
action=shellcmd C:\sec -2.5.3\ common\klogclient.bat "SECEvent : ...
Related : $0"
B.4 Insecure Direct Object References
Listing B.7: Linux version of traversal.conf
#Directory Traversal
#this configuration file detects directory traversal and ...
references to suspicious objects
#Created : 5 March 2010 by JMM
#Modified:
#some of the Regular Expressions taken from SANS Whitepaper - "...
Detecting Attacks on Web Applications from Log Files"
#look for various encodings of "../"
type=Single
continue=TakeNext
ptype=RegExp
pattern =(.*)\s\[(.*) \]\s.*\s.*\s.*((\.|(\%|\%25)2E)(\.|(\%|\%25)2E...
)(\/|(\%|\%25)2F|\\|(\%|\%25)5C).*?)\s.*\s\".*\"
desc=$0
action=shellcmd /home/user/sec -2.5.3/ common/syslogclient "...
Synthetic : " "$2|$1|directory traversal detected : $3"
98
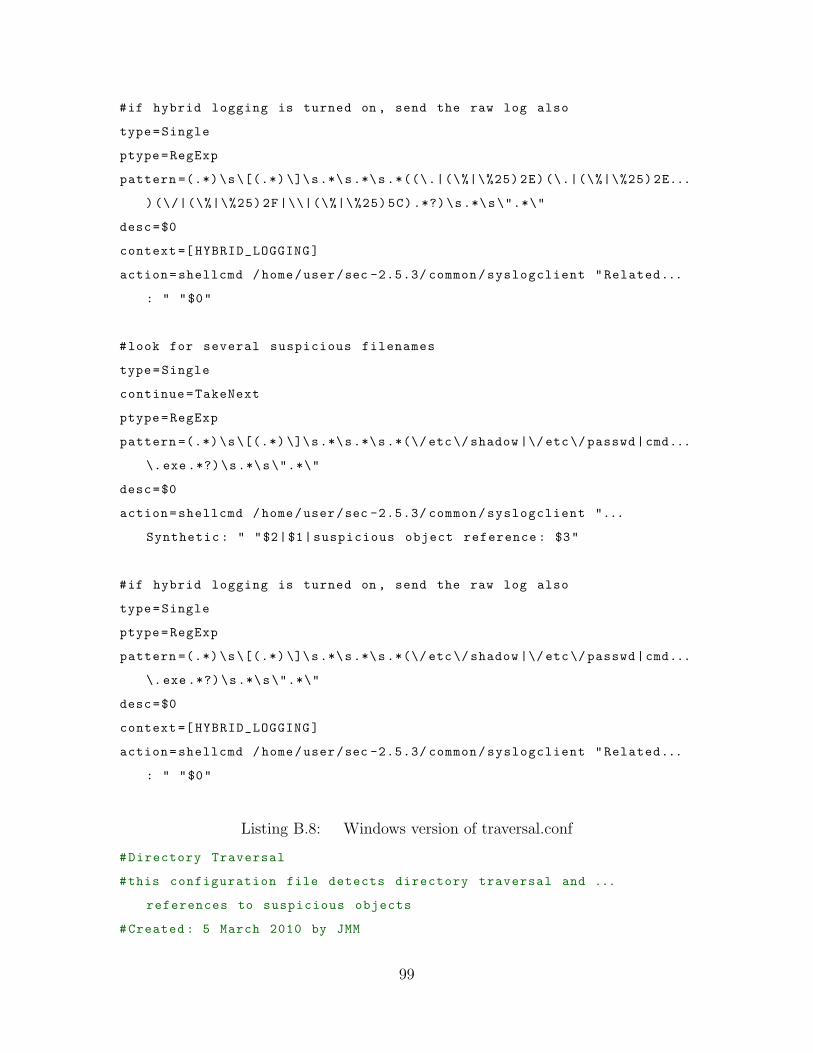
#if hybrid logging is turned on , send the raw log also
type=Single
ptype=RegExp
pattern =(.*)\s\[(.*) \]\s.*\s.*\s.*((\.|(\%|\%25)2E)(\.|(\%|\%25)2E...
)(\/|(\%|\%25)2F|\\|(\%|\%25)5C).*?)\s.*\s\".*\"
desc=$0
context =[ HYBRID_LOGGING]
action=shellcmd /home/user/sec -2.5.3/ common/syslogclient "Related...
: " "$0"
#look for several suspicious filenames
type=Single
continue=TakeNext
ptype=RegExp
pattern =(.*)\s\[(.*) \]\s.*\s.*\s.*(\/ etc\/ shadow |\/ etc\/ passwd|cmd...
\.exe .*?)\s.*\s\".*\"
desc=$0
action=shellcmd /home/user/sec -2.5.3/ common/syslogclient "...
Synthetic : " "$2|$1|suspicious object reference : $3"
#if hybrid logging is turned on , send the raw log also
type=Single
ptype=RegExp
pattern =(.*)\s\[(.*) \]\s.*\s.*\s.*(\/ etc\/ shadow |\/ etc\/ passwd|cmd...
\.exe .*?)\s.*\s\".*\"
desc=$0
context =[ HYBRID_LOGGING]
action=shellcmd /home/user/sec -2.5.3/ common/syslogclient "Related...
: " "$0"
Listing B.8: Windows version of traversal.conf
#Directory Traversal
#this configuration file detects directory traversal and ...
references to suspicious objects
#Created : 5 March 2010 by JMM
99
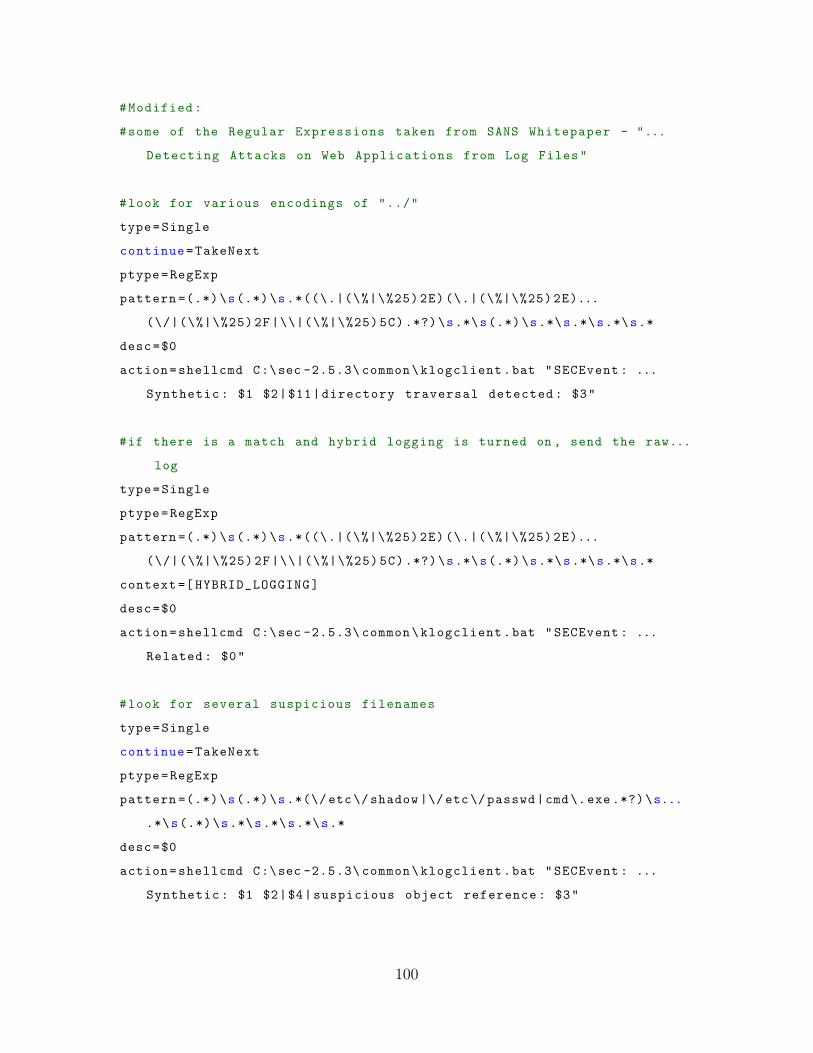
#Modified:
#some of the Regular Expressions taken from SANS Whitepaper - "...
Detecting Attacks on Web Applications from Log Files"
#look for various encodings of "../"
type=Single
continue=TakeNext
ptype=RegExp
pattern =(.*)\s(.*)\s.*((\.|(\%|\%25)2E)(\.|(\%|\%25)2E)...
(\/|(\%|\%25)2F|\\|(\%|\%25)5C).*?)\s.*\s(.*)\s.*\s.*\s.*\s.*
desc=$0
action=shellcmd C:\sec -2.5.3\ common\klogclient.bat "SECEvent : ...
Synthetic : $1 $2|$11|directory traversal detected : $3"
#if there is a match and hybrid logging is turned on , send the raw...
log
type=Single
ptype=RegExp
pattern =(.*)\s(.*)\s.*((\.|(\%|\%25)2E)(\.|(\%|\%25)2E)...
(\/|(\%|\%25)2F|\\|(\%|\%25)5C).*?)\s.*\s(.*)\s.*\s.*\s.*\s.*
context =[ HYBRID_LOGGING]
desc=$0
action=shellcmd C:\sec -2.5.3\ common\klogclient.bat "SECEvent : ...
Related : $0"
#look for several suspicious filenames
type=Single
continue=TakeNext
ptype=RegExp
pattern =(.*)\s(.*)\s.*(\/ etc\/ shadow |\/ etc\/ passwd|cmd\.exe .*?)\s...
.*\s(.*)\s.*\s.*\s.*\s.*
desc=$0
action=shellcmd C:\sec -2.5.3\ common\klogclient.bat "SECEvent : ...
Synthetic : $1 $2|$4|suspicious object reference : $3"
100
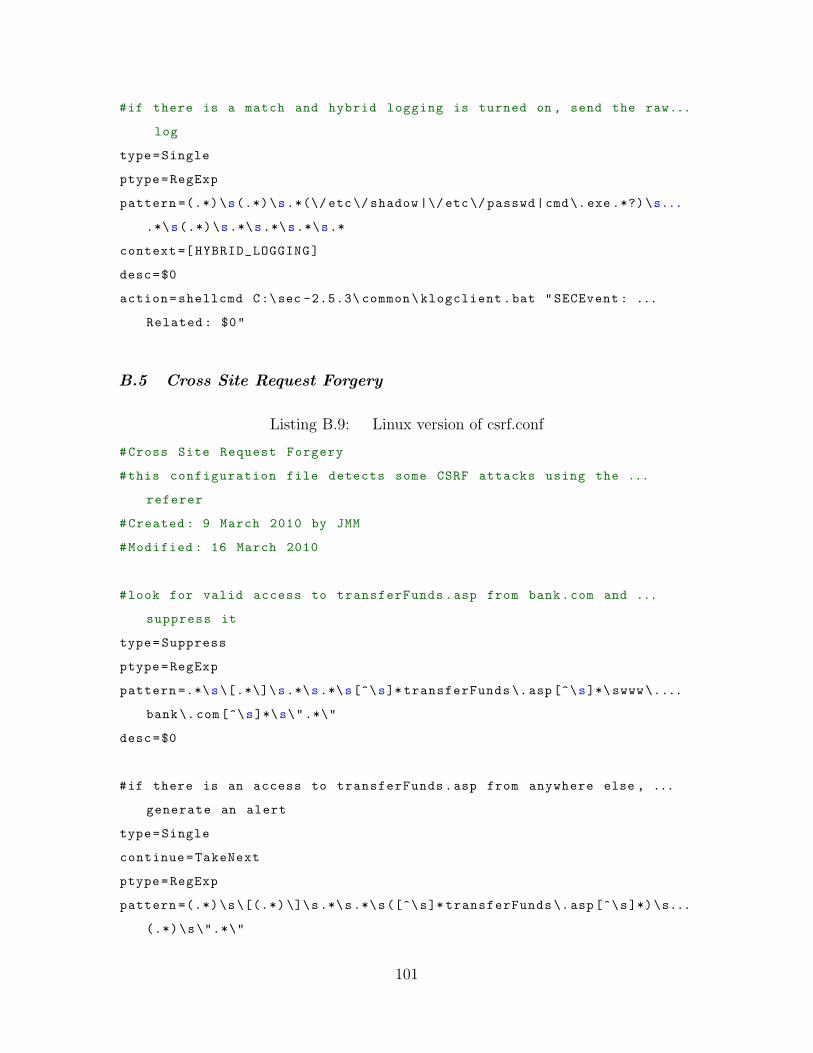
#if there is a match and hybrid logging is turned on , send the raw...
log
type=Single
ptype=RegExp
pattern =(.*)\s(.*)\s.*(\/ etc\/ shadow |\/ etc\/ passwd|cmd\.exe .*?)\s...
.*\s(.*)\s.*\s.*\s.*\s.*
context =[ HYBRID_LOGGING]
desc=$0
action=shellcmd C:\sec -2.5.3\ common\klogclient.bat "SECEvent : ...
Related : $0"
B.5 Cross Site Request Forgery
Listing B.9: Linux version of csrf.conf
#Cross Site Request Forgery
#this configuration file detects some CSRF attacks using the ...
referer
#Created : 9 March 2010 by JMM
#Modified : 16 March 2010
#look for valid access to transferFunds.asp from bank.com and ...
suppress it
type=Suppress
ptype=RegExp
pattern =.*\s\[.*\]\s.*\s.*\s[^\s]* transferFunds \.asp[^\s]*\ swww\....
bank\.com[^\s]*\s\".*\"
desc=$0
#if there is an access to transferFunds.asp from anywhere else , ...
generate an alert
type=Single
continue=TakeNext
ptype=RegExp
pattern =(.*)\s\[(.*) \]\s.*\s.*\s([^\s]* transferFunds \.asp [^\s]*)\s...
(.*)\s\".*\"
101
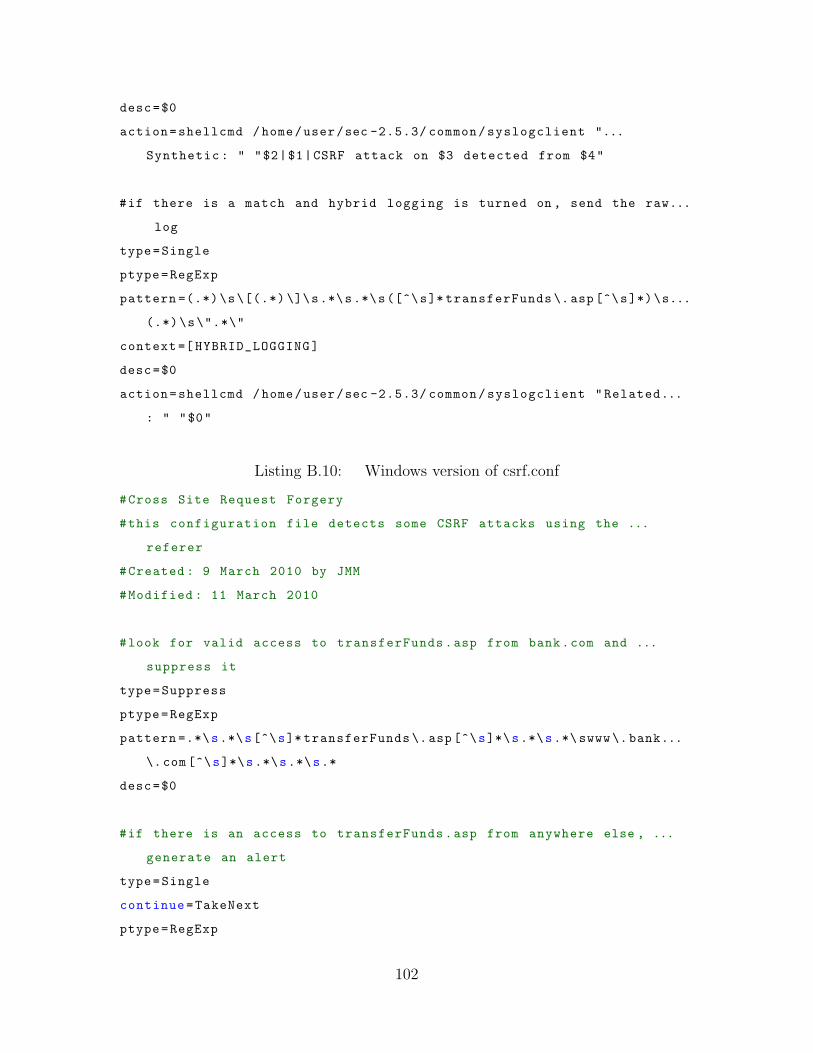
desc=$0
action=shellcmd /home/user/sec -2.5.3/ common/syslogclient "...
Synthetic : " "$2|$1|CSRF attack on $3 detected from $4"
#if there is a match and hybrid logging is turned on , send the raw...
log
type=Single
ptype=RegExp
pattern =(.*)\s\[(.*) \]\s.*\s.*\s([^\s]* transferFunds \.asp [^\s]*)\s...
(.*)\s\".*\"
context =[ HYBRID_LOGGING]
desc=$0
action=shellcmd /home/user/sec -2.5.3/ common/syslogclient "Related...
: " "$0"
Listing B.10: Windows version of csrf.conf
#Cross Site Request Forgery
#this configuration file detects some CSRF attacks using the ...
referer
#Created : 9 March 2010 by JMM
#Modified : 11 March 2010
#look for valid access to transferFunds.asp from bank.com and ...
suppress it
type=Suppress
ptype=RegExp
pattern =.*\s.*\s[^\s]* transferFunds \.asp[^\s]*\s.*\s.*\ swww\.bank...
\.com [^\s]*\s.*\s.*\s.*
desc=$0
#if there is an access to transferFunds.asp from anywhere else , ...
generate an alert
type=Single
continue=TakeNext
ptype=RegExp
102
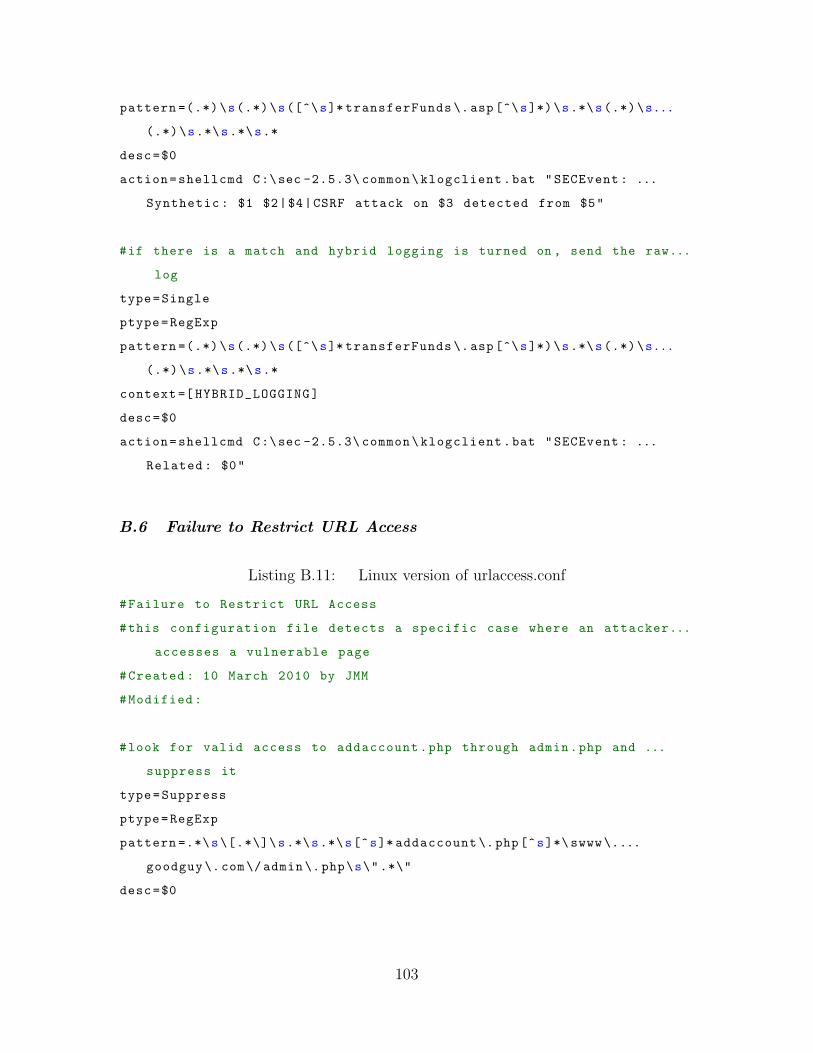
pattern =(.*)\s(.*)\s([^\s]* transferFunds \.asp[^\s]*)\s.*\s(.*)\s...
(.*)\s.*\s.*\s.*
desc=$0
action=shellcmd C:\sec -2.5.3\ common\klogclient.bat "SECEvent : ...
Synthetic : $1 $2|$4|CSRF attack on $3 detected from $5"
#if there is a match and hybrid logging is turned on , send the raw...
log
type=Single
ptype=RegExp
pattern =(.*)\s(.*)\s([^\s]* transferFunds \.asp[^\s]*)\s.*\s(.*)\s...
(.*)\s.*\s.*\s.*
context =[ HYBRID_LOGGING]
desc=$0
action=shellcmd C:\sec -2.5.3\ common\klogclient.bat "SECEvent : ...
Related : $0"
B.6 Failure to Restrict URL Access
Listing B.11: Linux version of urlaccess.conf
#Failure to Restrict URL Access
#this configuration file detects a specific case where an attacker...
accesses a vulnerable page
#Created : 10 March 2010 by JMM
#Modified:
#look for valid access to addaccount.php through admin.php and ...
suppress it
type=Suppress
ptype=RegExp
pattern =.*\s\[.*\]\s.*\s.*\s[^s]* addaccount \.php[^s]*\ swww\....
goodguy \.com\/admin \.php\s\".*\"
desc=$0
103
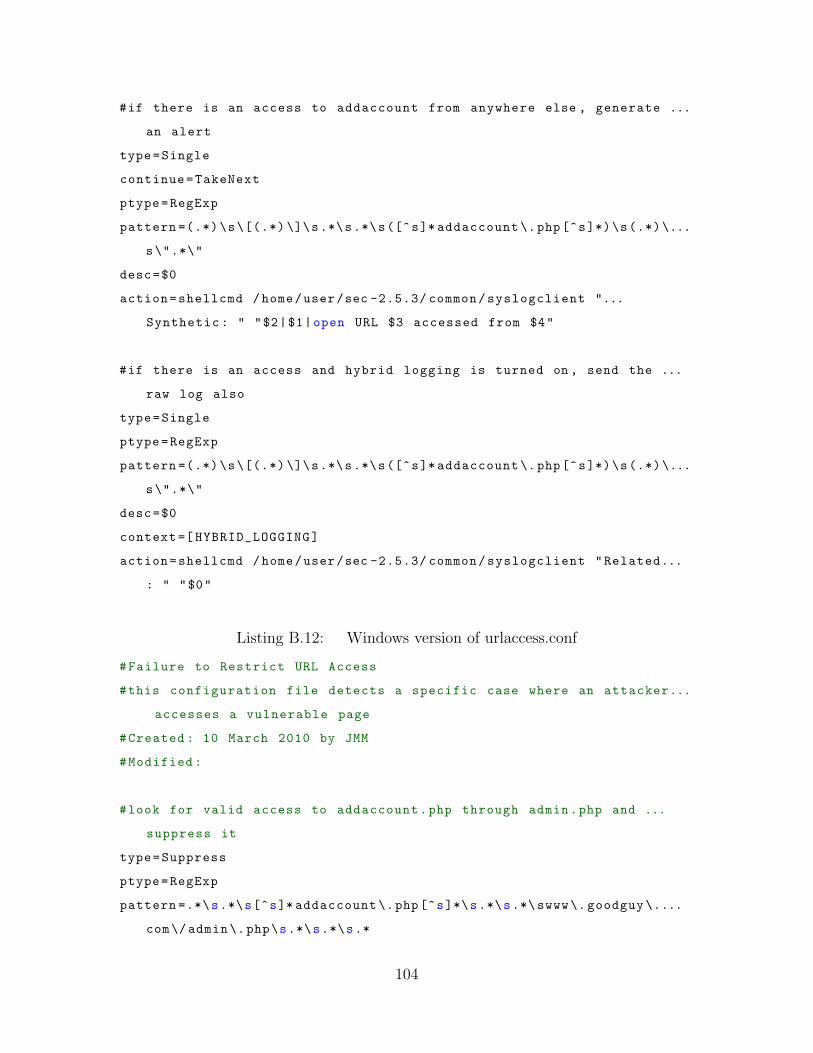
#if there is an access to addaccount from anywhere else , generate ...
an alert
type=Single
continue=TakeNext
ptype=RegExp
pattern =(.*)\s\[(.*) \]\s.*\s.*\s([^s]* addaccount \.php[^s]*)\s(.*)\...
s\".*\"
desc=$0
action=shellcmd /home/user/sec -2.5.3/ common/syslogclient "...
Synthetic : " "$2|$1|open URL $3 accessed from $4"
#if there is an access and hybrid logging is turned on , send the ...
raw log also
type=Single
ptype=RegExp
pattern =(.*)\s\[(.*) \]\s.*\s.*\s([^s]* addaccount \.php[^s]*)\s(.*)\...
s\".*\"
desc=$0
context =[ HYBRID_LOGGING]
action=shellcmd /home/user/sec -2.5.3/ common/syslogclient "Related...
: " "$0"
Listing B.12: Windows version of urlaccess.conf
#Failure to Restrict URL Access
#this configuration file detects a specific case where an attacker...
accesses a vulnerable page
#Created : 10 March 2010 by JMM
#Modified:
#look for valid access to addaccount.php through admin.php and ...
suppress it
type=Suppress
ptype=RegExp
pattern =.*\s.*\s[^s]* addaccount \.php[^s]*\s.*\s.*\ swww\. goodguy \....
com\/ admin\.php\s.*\s.*\s.*
104
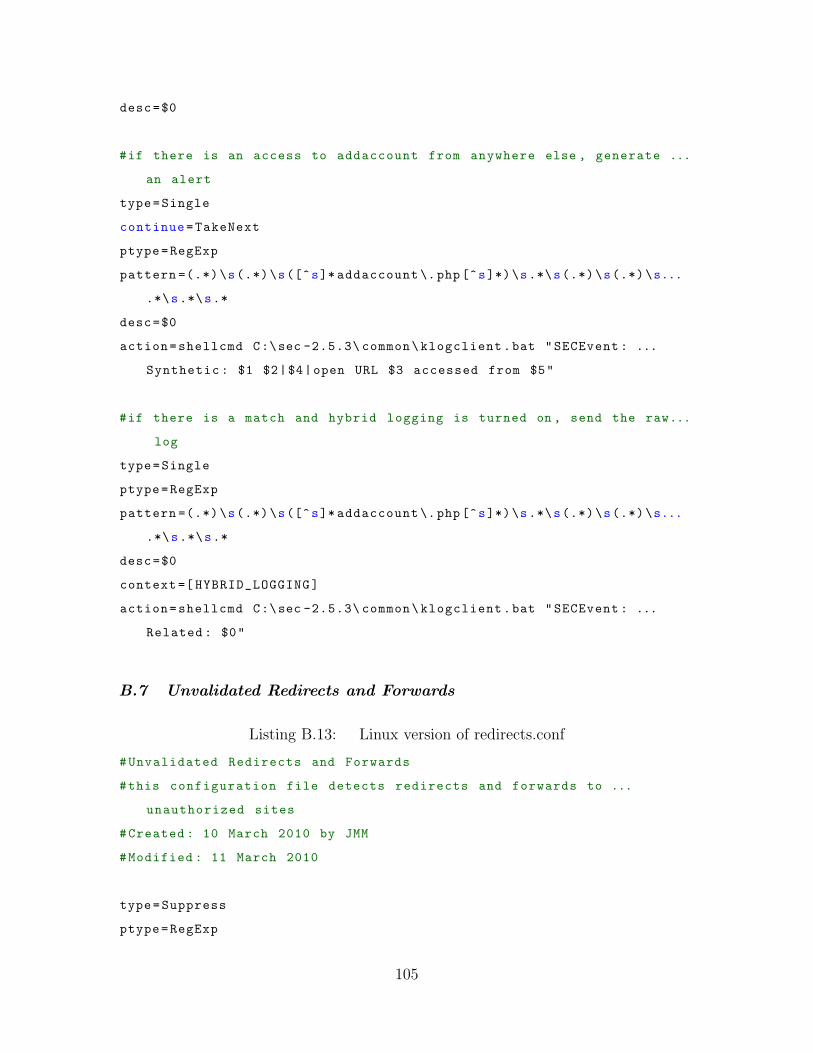
desc=$0
#if there is an access to addaccount from anywhere else , generate ...
an alert
type=Single
continue=TakeNext
ptype=RegExp
pattern =(.*)\s(.*)\s([^s]* addaccount \.php[^s]*)\s.*\s(.*)\s(.*)\s...
.*\s.*\s.*
desc=$0
action=shellcmd C:\sec -2.5.3\ common\klogclient.bat "SECEvent : ...
Synthetic : $1 $2|$4|open URL $3 accessed from $5"
#if there is a match and hybrid logging is turned on , send the raw...
log
type=Single
ptype=RegExp
pattern =(.*)\s(.*)\s([^s]* addaccount \.php[^s]*)\s.*\s(.*)\s(.*)\s...
.*\s.*\s.*
desc=$0
context =[ HYBRID_LOGGING]
action=shellcmd C:\sec -2.5.3\ common\klogclient.bat "SECEvent : ...
Related : $0"
B.7 Unvalidated Redirects and Forwards
Listing B.13: Linux version of redirects.conf
#Unvalidated Redirects and Forwards
#this configuration file detects redirects and forwards to ...
unauthorized sites
#Created : 10 March 2010 by JMM
#Modified : 11 March 2010
type=Suppress
ptype=RegExp
105
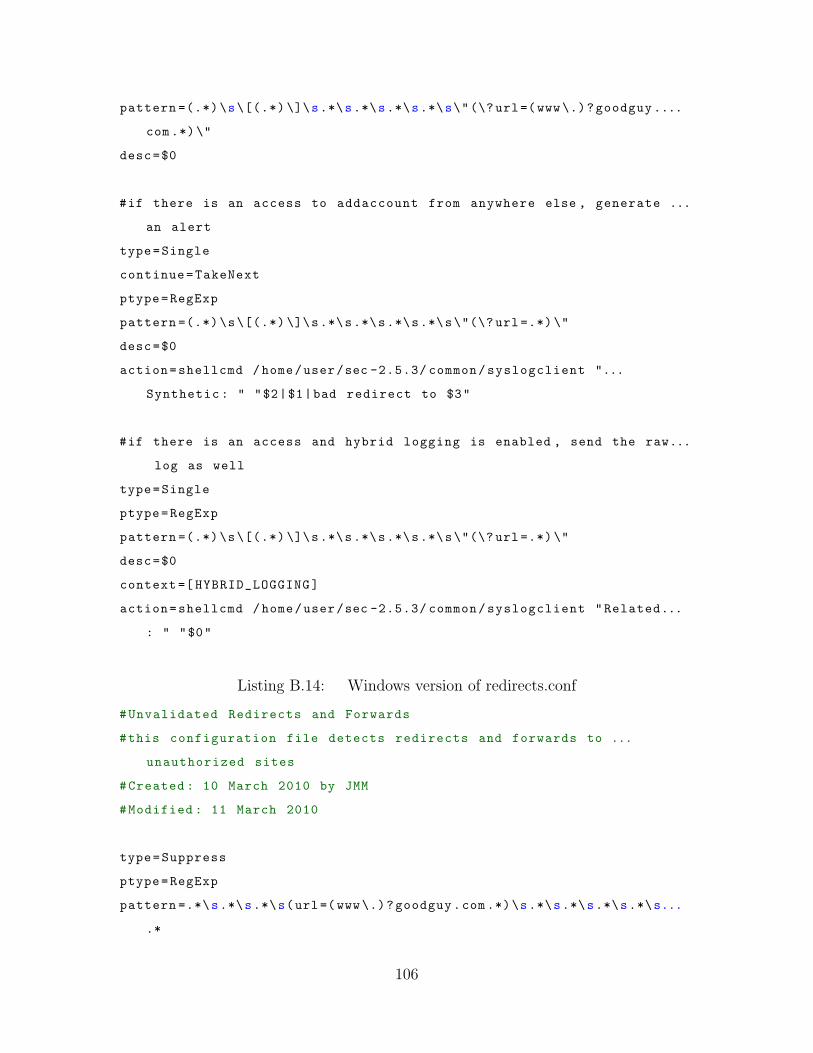
pattern =(.*)\s\[(.*) \]\s.*\s.*\s.*\s.*\s\"(\?url=(www\.)?goodguy....
com .*)\"
desc=$0
#if there is an access to addaccount from anywhere else , generate ...
an alert
type=Single
continue=TakeNext
ptype=RegExp
pattern =(.*)\s\[(.*) \]\s.*\s.*\s.*\s.*\s\"(\? url =.*)\"
desc=$0
action=shellcmd /home/user/sec -2.5.3/ common/syslogclient "...
Synthetic : " "$2|$1|bad redirect to $3"
#if there is an access and hybrid logging is enabled , send the raw...
log as well
type=Single
ptype=RegExp
pattern =(.*)\s\[(.*) \]\s.*\s.*\s.*\s.*\s\"(\? url =.*)\"
desc=$0
context =[ HYBRID_LOGGING]
action=shellcmd /home/user/sec -2.5.3/ common/syslogclient "Related...
: " "$0"
Listing B.14: Windows version of redirects.conf
#Unvalidated Redirects and Forwards
#this configuration file detects redirects and forwards to ...
unauthorized sites
#Created : 10 March 2010 by JMM
#Modified : 11 March 2010
type=Suppress
ptype=RegExp
pattern =.*\s.*\s.*\s(url=(www\.)?goodguy.com .*)\s.*\s.*\s.*\s.*\s...
.*
106
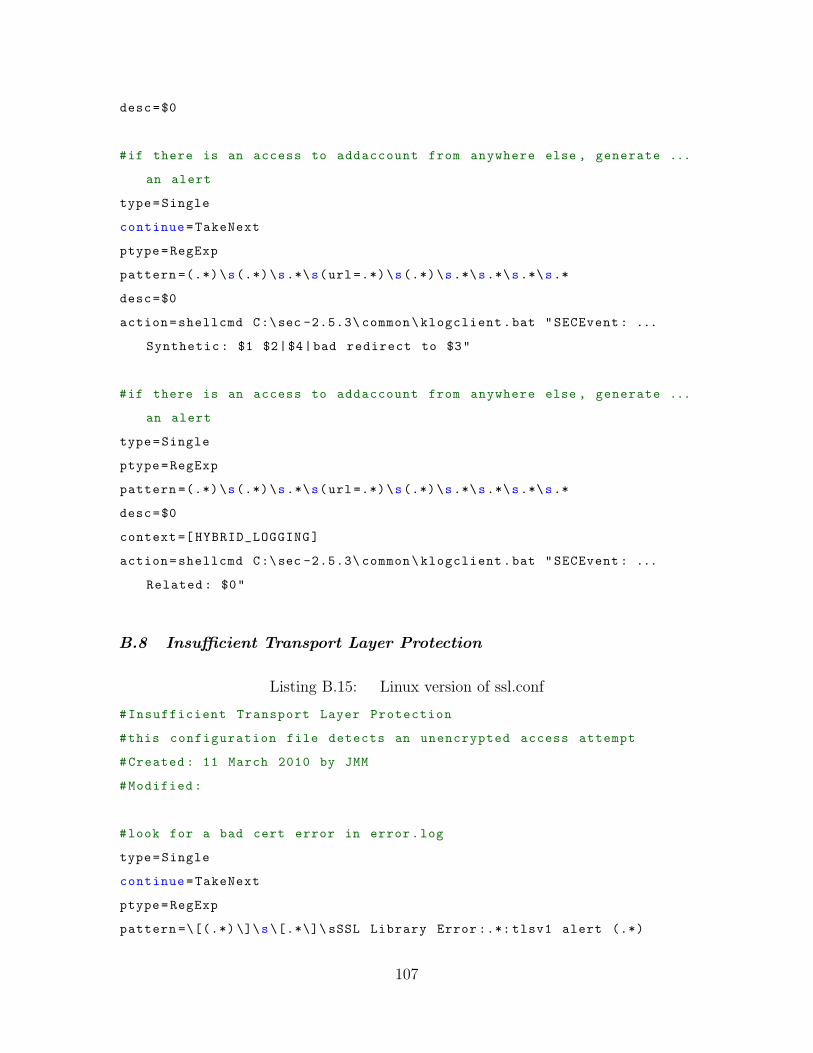
desc=$0
#if there is an access to addaccount from anywhere else , generate ...
an alert
type=Single
continue=TakeNext
ptype=RegExp
pattern =(.*)\s(.*)\s.*\s(url =.*)\s(.*)\s.*\s.*\s.*\s.*
desc=$0
action=shellcmd C:\sec -2.5.3\ common\klogclient.bat "SECEvent : ...
Synthetic : $1 $2|$4|bad redirect to $3"
#if there is an access to addaccount from anywhere else , generate ...
an alert
type=Single
ptype=RegExp
pattern =(.*)\s(.*)\s.*\s(url =.*)\s(.*)\s.*\s.*\s.*\s.*
desc=$0
context =[ HYBRID_LOGGING]
action=shellcmd C:\sec -2.5.3\ common\klogclient.bat "SECEvent : ...
Related : $0"
B.8 Insufficient Transport Layer Protection
Listing B.15: Linux version of ssl.conf
#Insufficient Transport Layer Protection
#this configuration file detects an unencrypted access attempt
#Created : 11 March 2010 by JMM
#Modified:
#look for a bad cert error in error.log
type=Single
continue=TakeNext
ptype=RegExp
pattern =\[(.*) \]\s\[.*\]\ sSSL Library Error :.*: tlsv1 alert (.*)
107
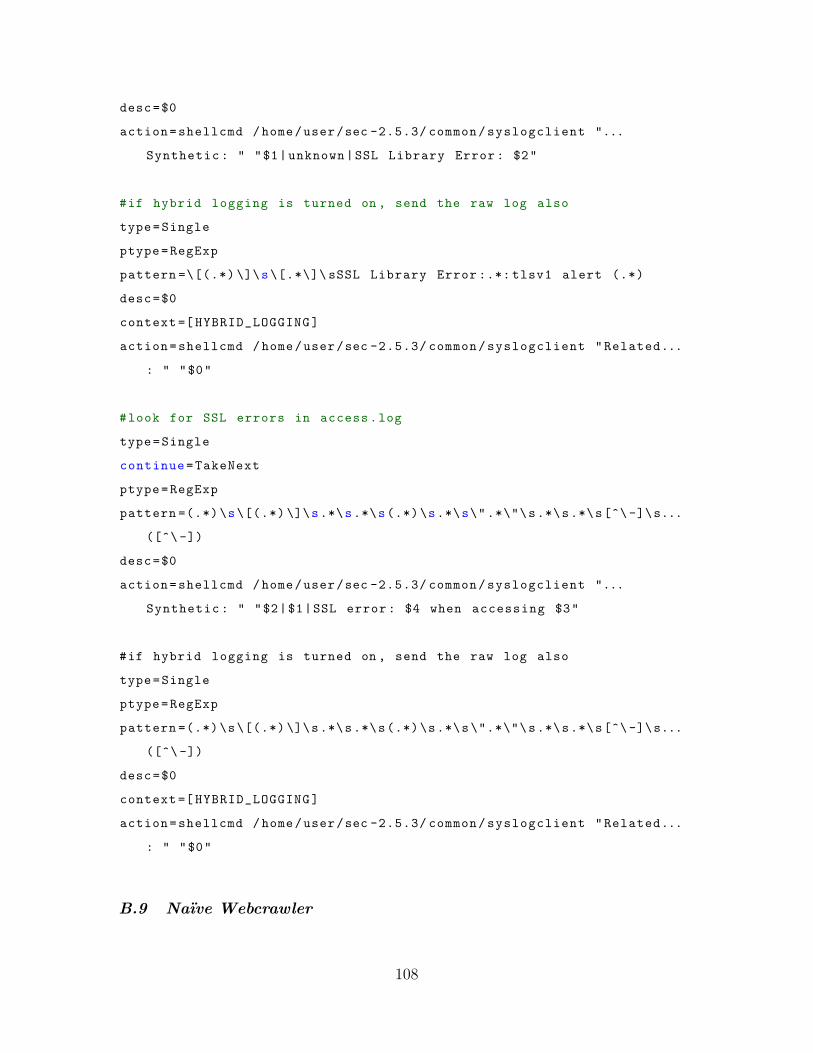
desc=$0
action=shellcmd /home/user/sec -2.5.3/ common/syslogclient "...
Synthetic : " "$1|unknown|SSL Library Error : $2"
#if hybrid logging is turned on , send the raw log also
type=Single
ptype=RegExp
pattern =\[(.*) \]\s\[.*\]\ sSSL Library Error :.*: tlsv1 alert (.*)
desc=$0
context =[ HYBRID_LOGGING]
action=shellcmd /home/user/sec -2.5.3/ common/syslogclient "Related...
: " "$0"
#look for SSL errors in access.log
type=Single
continue=TakeNext
ptype=RegExp
pattern =(.*)\s\[(.*) \]\s.*\s.*\s(.*)\s.*\s\".*\"\s.*\s.*\s[^\ -]\s...
([^\ -])
desc=$0
action=shellcmd /home/user/sec -2.5.3/ common/syslogclient "...
Synthetic : " "$2|$1|SSL error : $4 when accessing $3"
#if hybrid logging is turned on , send the raw log also
type=Single
ptype=RegExp
pattern =(.*)\s\[(.*) \]\s.*\s.*\s(.*)\s.*\s\".*\"\s.*\s.*\s[^\-]\s...
([^\ -])
desc=$0
context =[ HYBRID_LOGGING]
action=shellcmd /home/user/sec -2.5.3/ common/syslogclient "Related...
: " "$0"
B.9 Naıve Webcrawler
108
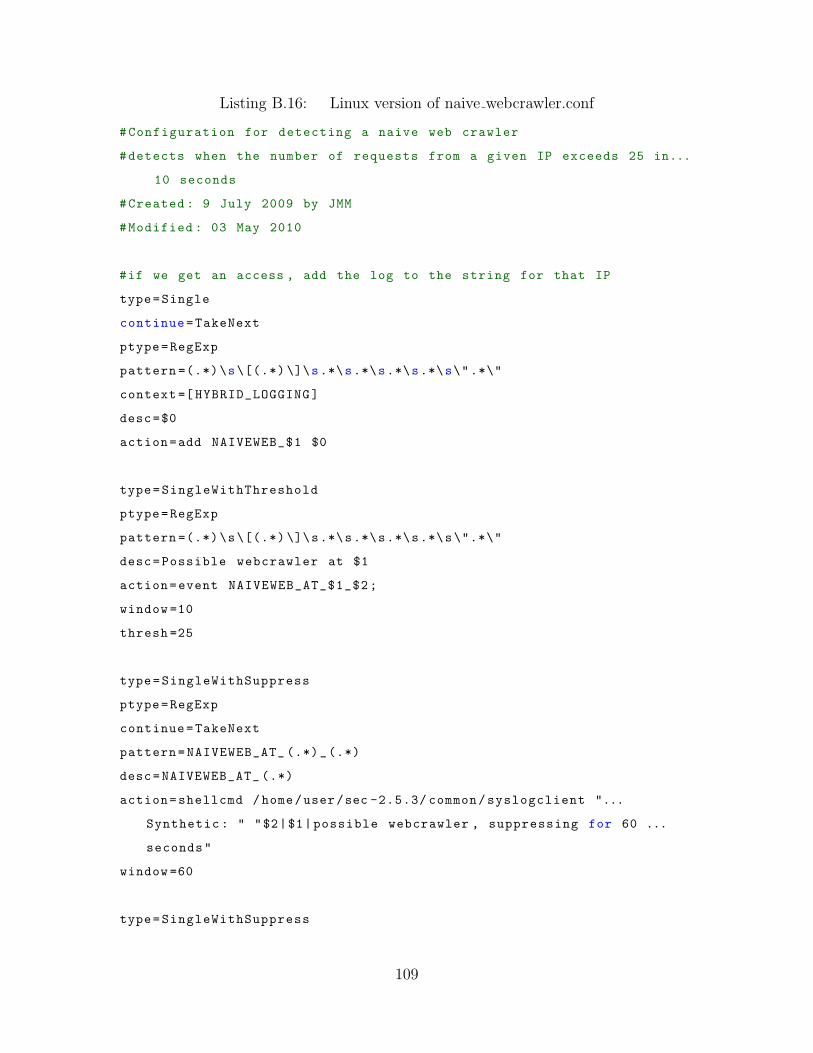
Listing B.16: Linux version of naive webcrawler.conf
#Configuration for detecting a naive web crawler
#detects when the number of requests from a given IP exceeds 25 in...
10 seconds
#Created : 9 July 2009 by JMM
#Modified : 03 May 2010
#if we get an access , add the log to the string for that IP
type=Single
continue=TakeNext
ptype=RegExp
pattern =(.*)\s\[(.*) \]\s.*\s.*\s.*\s.*\s\".*\"
context =[ HYBRID_LOGGING]
desc=$0
action=add NAIVEWEB_$1 $0
type=SingleWithThreshold
ptype=RegExp
pattern =(.*)\s\[(.*) \]\s.*\s.*\s.*\s.*\s\".*\"
desc=Possible webcrawler at $1
action=event NAIVEWEB_AT_$1_$2;
window =10
thresh =25
type=SingleWithSuppress
ptype=RegExp
continue=TakeNext
pattern=NAIVEWEB_AT_ (.*)_(.*)
desc=NAIVEWEB_AT_ (.*)
action=shellcmd /home/user/sec -2.5.3/ common/syslogclient "...
Synthetic : " "$2|$1|possible webcrawler , suppressing for 60 ...
seconds"
window =60
type=SingleWithSuppress
109
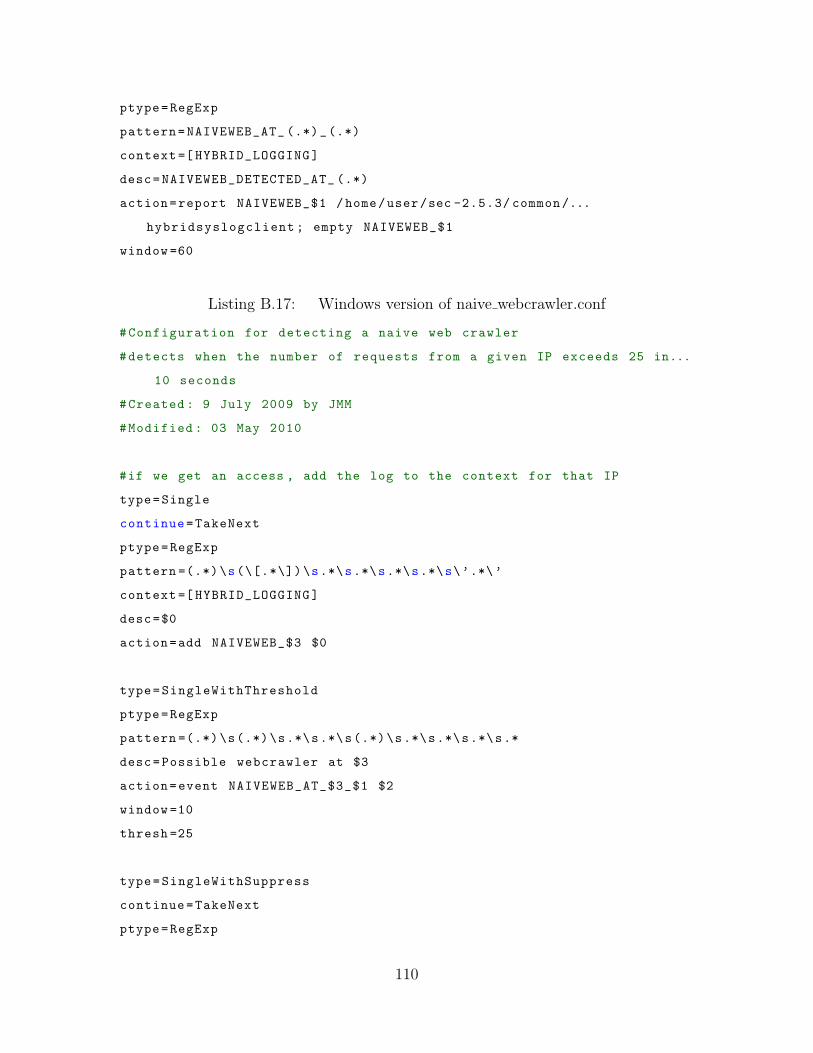
ptype=RegExp
pattern=NAIVEWEB_AT_ (.*)_(.*)
context =[ HYBRID_LOGGING]
desc=NAIVEWEB_DETECTED_AT_ (.*)
action=report NAIVEWEB_$1 /home/user/sec -2.5.3/ common/...
hybridsyslogclient ; empty NAIVEWEB_$1
window =60
Listing B.17: Windows version of naive webcrawler.conf
#Configuration for detecting a naive web crawler
#detects when the number of requests from a given IP exceeds 25 in...
10 seconds
#Created : 9 July 2009 by JMM
#Modified : 03 May 2010
#if we get an access , add the log to the context for that IP
type=Single
continue=TakeNext
ptype=RegExp
pattern =(.*)\s(\[.*\])\s.*\s.*\s.*\s.*\s\’.*\’
context =[ HYBRID_LOGGING]
desc=$0
action=add NAIVEWEB_$3 $0
type=SingleWithThreshold
ptype=RegExp
pattern =(.*)\s(.*)\s.*\s.*\s(.*)\s.*\s.*\s.*\s.*
desc=Possible webcrawler at $3
action=event NAIVEWEB_AT_$3_$1 $2
window =10
thresh =25
type=SingleWithSuppress
continue=TakeNext
ptype=RegExp
110
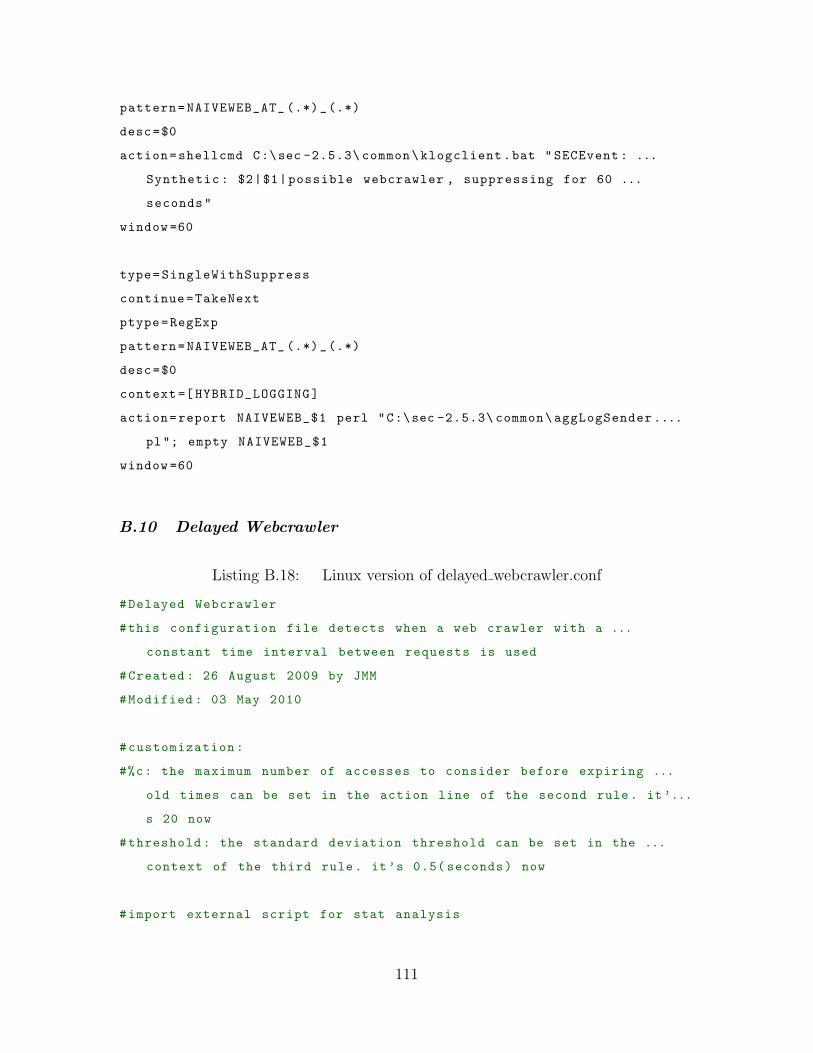
pattern=NAIVEWEB_AT_ (.*)_(.*)
desc=$0
action=shellcmd C:\sec -2.5.3\ common\klogclient.bat " SECEvent : ...
Synthetic : $2|$1|possible webcrawler , suppressing for 60 ...
seconds"
window =60
type=SingleWithSuppress
continue=TakeNext
ptype=RegExp
pattern=NAIVEWEB_AT_ (.*)_(.*)
desc=$0
context =[ HYBRID_LOGGING]
action=report NAIVEWEB_$1 perl "C:\sec -2.5.3\ common\aggLogSender....
pl"; empty NAIVEWEB_$1
window =60
B.10 Delayed Webcrawler
Listing B.18: Linux version of delayed webcrawler.conf
#Delayed Webcrawler
#this configuration file detects when a web crawler with a ...
constant time interval between requests is used
#Created : 26 August 2009 by JMM
#Modified : 03 May 2010
#customization:
#%c: the maximum number of accesses to consider before expiring ...
old times can be set in the action line of the second rule. it’...
s 20 now
#threshold : the standard deviation threshold can be set in the ...
context of the third rule. it’s 0.5( seconds) now
#import external script for stat analysis
111
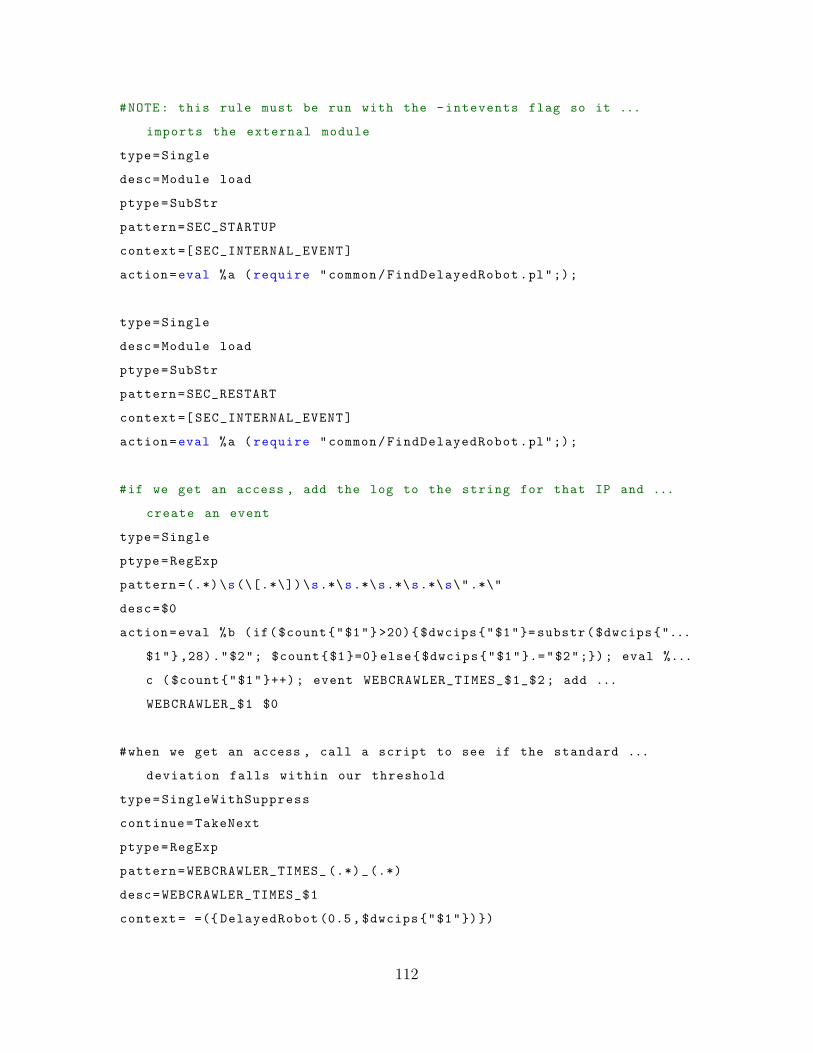
#NOTE: this rule must be run with the -intevents flag so it ...
imports the external module
type=Single
desc=Module load
ptype=SubStr
pattern=SEC_STARTUP
context =[ SEC_INTERNAL_EVENT]
action=eval %a ( require "common/FindDelayedRobot.pl";);
type=Single
desc=Module load
ptype=SubStr
pattern=SEC_RESTART
context =[ SEC_INTERNAL_EVENT]
action=eval %a ( require "common/FindDelayedRobot.pl";);
#if we get an access , add the log to the string for that IP and ...
create an event
type=Single
ptype=RegExp
pattern =(.*)\s(\[.*\])\s.*\s.*\s.*\s.*\s\".*\"
desc=$0
action=eval %b (if($count{"$1"}>20){$dwcips{"$1"}= substr($dwcips{"...
$1"},28)."$2"; $count{$1}=0} else{$dwcips{"$1"}.="$2";}); eval %...
c ( $count{"$1"}++); event WEBCRAWLER_TIMES_$1_$2 ; add ...
WEBCRAWLER_$1 $0
#when we get an access , call a script to see if the standard ...
deviation falls within our threshold
type=SingleWithSuppress
continue=TakeNext
ptype=RegExp
pattern=WEBCRAWLER_TIMES_ (.*)_(.*)
desc=WEBCRAWLER_TIMES_$1
context = =({ DelayedRobot (0.5, $dwcips{"$1"})})
112
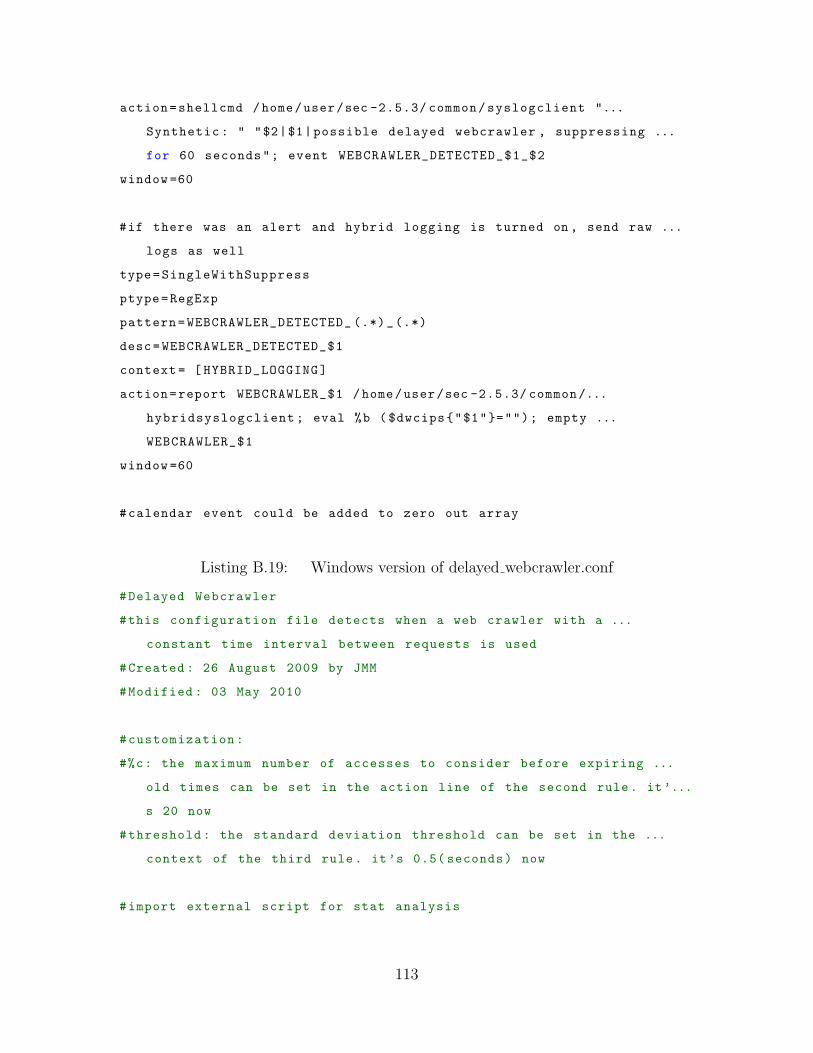
action=shellcmd /home/user/sec -2.5.3/ common/syslogclient "...
Synthetic : " "$2|$1|possible delayed webcrawler , suppressing ...
for 60 seconds"; event WEBCRAWLER_DETECTED_$1_$2
window =60
#if there was an alert and hybrid logging is turned on , send raw ...
logs as well
type=SingleWithSuppress
ptype=RegExp
pattern=WEBCRAWLER_DETECTED_ (.*)_(.*)
desc=WEBCRAWLER_DETECTED_$1
context = [ HYBRID_LOGGING]
action=report WEBCRAWLER_$1 /home/user/sec -2.5.3/ common/...
hybridsyslogclient ; eval %b ( $dwcips{"$1"}=""); empty ...
WEBCRAWLER_$1
window =60
#calendar event could be added to zero out array
Listing B.19: Windows version of delayed webcrawler.conf
#Delayed Webcrawler
#this configuration file detects when a web crawler with a ...
constant time interval between requests is used
#Created : 26 August 2009 by JMM
#Modified : 03 May 2010
#customization:
#%c: the maximum number of accesses to consider before expiring ...
old times can be set in the action line of the second rule. it’...
s 20 now
#threshold : the standard deviation threshold can be set in the ...
context of the third rule. it’s 0.5( seconds) now
#import external script for stat analysis
113
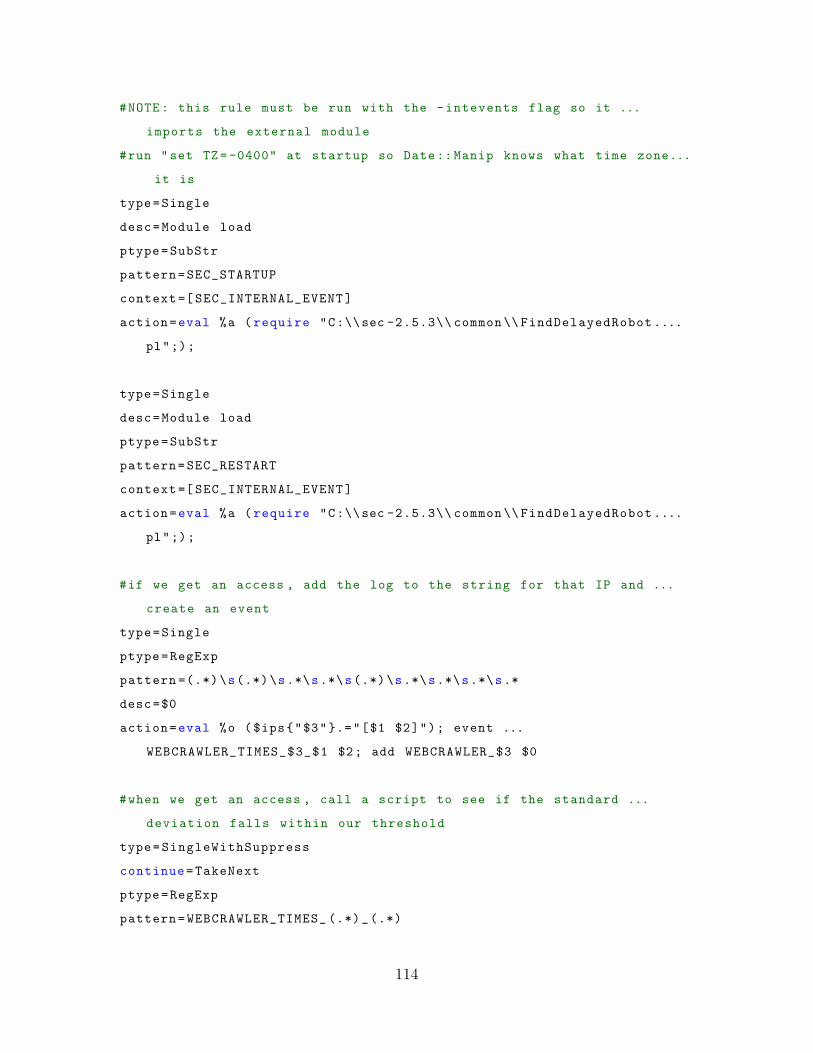
#NOTE: this rule must be run with the -intevents flag so it ...
imports the external module
#run "set TZ= -0400" at startup so Date::Manip knows what time zone...
it is
type=Single
desc=Module load
ptype=SubStr
pattern=SEC_STARTUP
context =[ SEC_INTERNAL_EVENT]
action=eval %a ( require "C:\\sec -2.5.3\\ common \\ FindDelayedRobot....
pl";);
type=Single
desc=Module load
ptype=SubStr
pattern=SEC_RESTART
context =[ SEC_INTERNAL_EVENT]
action=eval %a ( require "C:\\sec -2.5.3\\ common \\ FindDelayedRobot....
pl";);
#if we get an access , add the log to the string for that IP and ...
create an event
type=Single
ptype=RegExp
pattern =(.*)\s(.*)\s.*\s.*\s(.*)\s.*\s.*\s.*\s.*
desc=$0
action=eval %o ($ips{"$3"}.="[$1 $2]"); event ...
WEBCRAWLER_TIMES_$3_$1 $2; add WEBCRAWLER_$3 $0
#when we get an access , call a script to see if the standard ...
deviation falls within our threshold
type=SingleWithSuppress
continue=TakeNext
ptype=RegExp
pattern=WEBCRAWLER_TIMES_ (.*)_(.*)
114
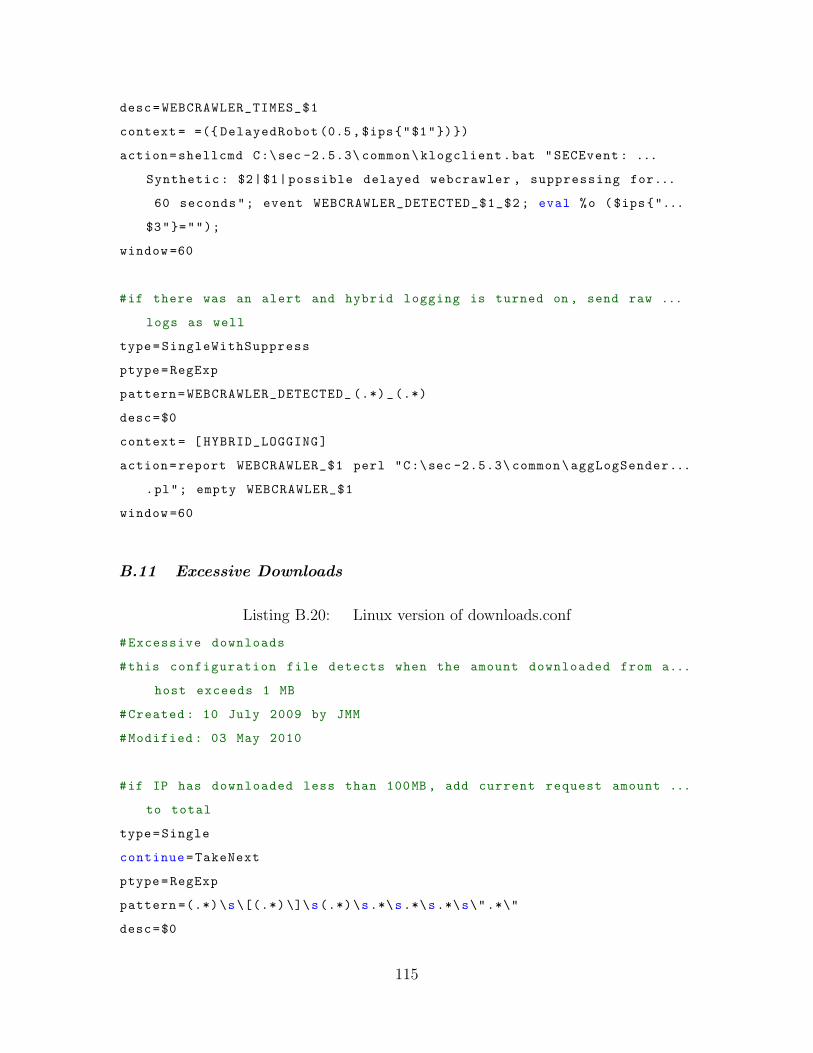
desc=WEBCRAWLER_TIMES_$1
context = =({ DelayedRobot (0.5, $ips{"$1"})})
action=shellcmd C:\sec -2.5.3\ common\klogclient.bat "SECEvent : ...
Synthetic : $2|$1|possible delayed webcrawler , suppressing for...
60 seconds"; event WEBCRAWLER_DETECTED_$1_$2 ; eval %o ($ips{"...
$3"}="");
window =60
#if there was an alert and hybrid logging is turned on , send raw ...
logs as well
type=SingleWithSuppress
ptype=RegExp
pattern=WEBCRAWLER_DETECTED_ (.*)_(.*)
desc=$0
context = [ HYBRID_LOGGING]
action=report WEBCRAWLER_$1 perl "C:\sec -2.5.3\ common\aggLogSender...
.pl"; empty WEBCRAWLER_$1
window =60
B.11 Excessive Downloads
Listing B.20: Linux version of downloads.conf
#Excessive downloads
#this configuration file detects when the amount downloaded from a...
host exceeds 1 MB
#Created : 10 July 2009 by JMM
#Modified : 03 May 2010
#if IP has downloaded less than 100MB , add current request amount ...
to total
type=Single
continue=TakeNext
ptype=RegExp
pattern =(.*)\s\[(.*) \]\s(.*)\s.*\s.*\s.*\s\".*\"
desc=$0
115
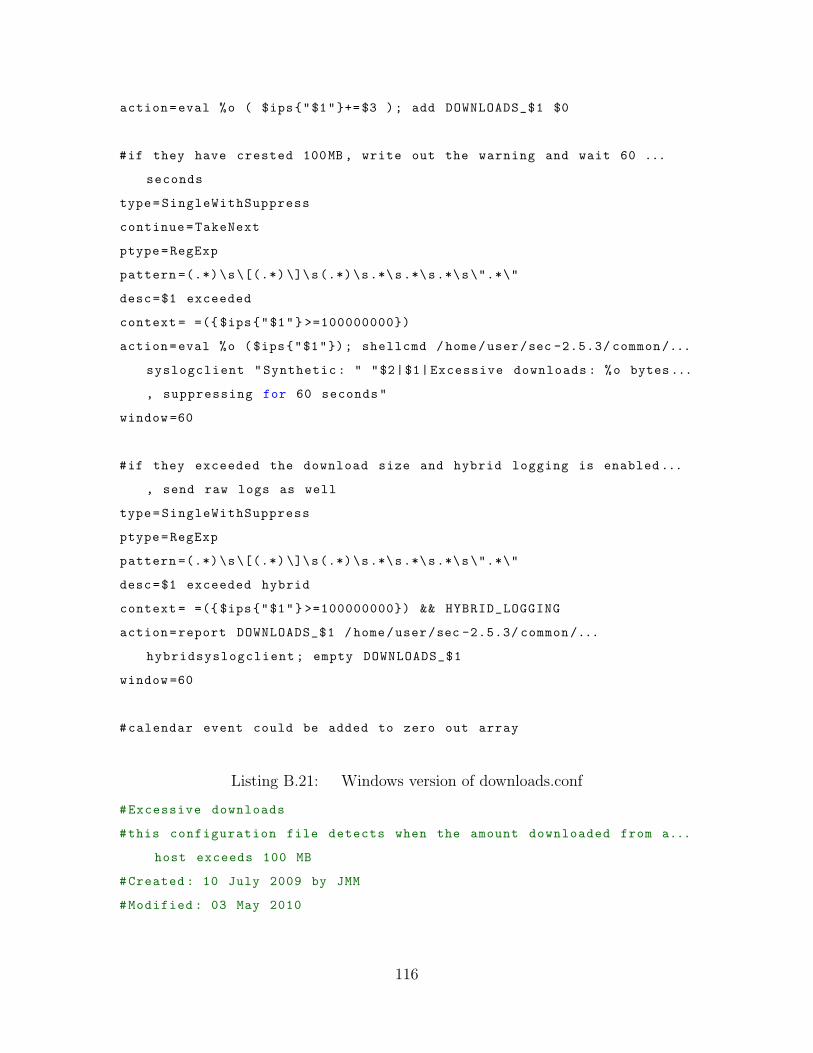
action=eval %o ( $ips{"$1"}+=$3 ); add DOWNLOADS_$1 $0
#if they have crested 100MB , write out the warning and wait 60 ...
seconds
type=SingleWithSuppress
continue=TakeNext
ptype=RegExp
pattern =(.*)\s\[(.*) \]\s(.*)\s.*\s.*\s.*\s\".*\"
desc=$1 exceeded
context = =({ $ips{"$1"} >=100000000})
action=eval %o ($ips{"$1"}); shellcmd /home/user/sec -2.5.3/ common/...
syslogclient "Synthetic : " "$2|$1|Excessive downloads : %o bytes...
, suppressing for 60 seconds"
window =60
#if they exceeded the download size and hybrid logging is enabled ...
, send raw logs as well
type=SingleWithSuppress
ptype=RegExp
pattern =(.*)\s\[(.*) \]\s(.*)\s.*\s.*\s.*\s\".*\"
desc=$1 exceeded hybrid
context = =({ $ips{"$1"} >=100000000}) && HYBRID_LOGGING
action=report DOWNLOADS_$1 /home/user/sec -2.5.3/ common/...
hybridsyslogclient ; empty DOWNLOADS_$1
window =60
#calendar event could be added to zero out array
Listing B.21: Windows version of downloads.conf
#Excessive downloads
#this configuration file detects when the amount downloaded from a...
host exceeds 100 MB
#Created : 10 July 2009 by JMM
#Modified : 03 May 2010
116
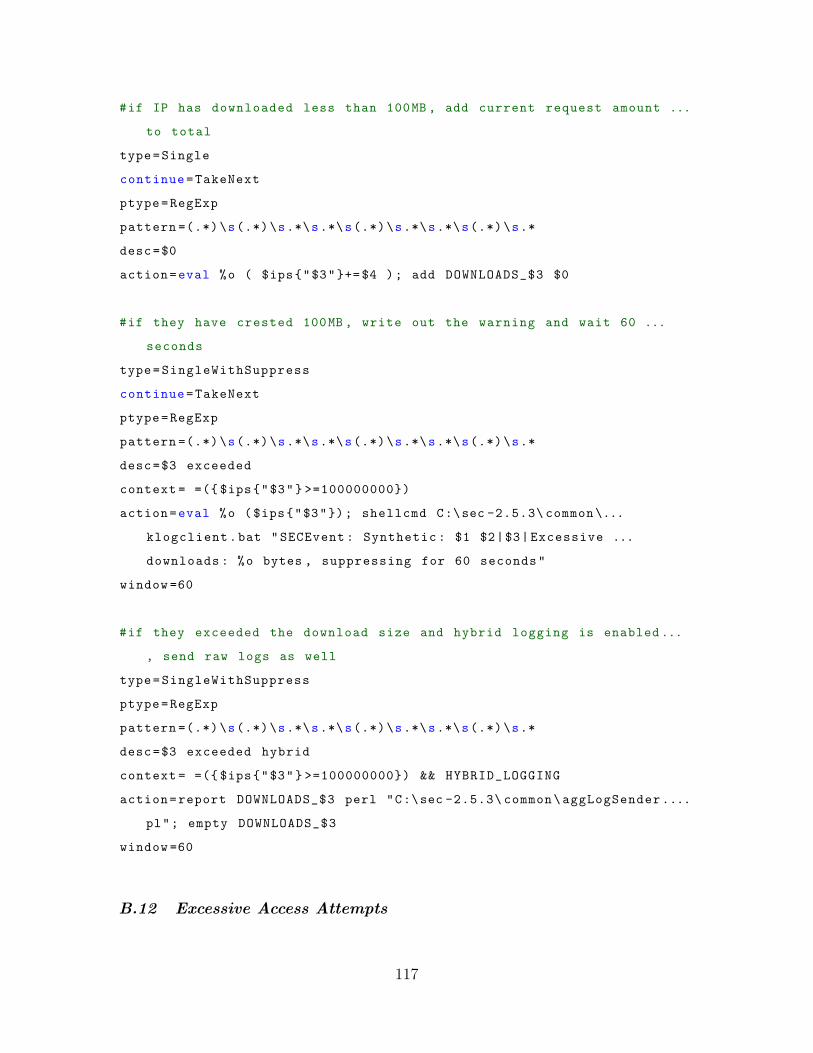
#if IP has downloaded less than 100MB , add current request amount ...
to total
type=Single
continue=TakeNext
ptype=RegExp
pattern =(.*)\s(.*)\s.*\s.*\s(.*)\s.*\s.*\s(.*)\s.*
desc=$0
action=eval %o ( $ips{"$3"}+=$4 ); add DOWNLOADS_$3 $0
#if they have crested 100MB , write out the warning and wait 60 ...
seconds
type=SingleWithSuppress
continue=TakeNext
ptype=RegExp
pattern =(.*)\s(.*)\s.*\s.*\s(.*)\s.*\s.*\s(.*)\s.*
desc=$3 exceeded
context = =({ $ips{"$3"} >=100000000})
action=eval %o ($ips{"$3"}); shellcmd C:\sec -2.5.3\ common\...
klogclient.bat "SECEvent : Synthetic : $1 $2|$3|Excessive ...
downloads : %o bytes , suppressing for 60 seconds"
window =60
#if they exceeded the download size and hybrid logging is enabled ...
, send raw logs as well
type=SingleWithSuppress
ptype=RegExp
pattern =(.*)\s(.*)\s.*\s.*\s(.*)\s.*\s.*\s(.*)\s.*
desc=$3 exceeded hybrid
context = =({ $ips{"$3"} >=100000000}) && HYBRID_LOGGING
action=report DOWNLOADS_$3 perl "C:\sec -2.5.3\ common\aggLogSender....
pl"; empty DOWNLOADS_$3
window =60
B.12 Excessive Access Attempts
117
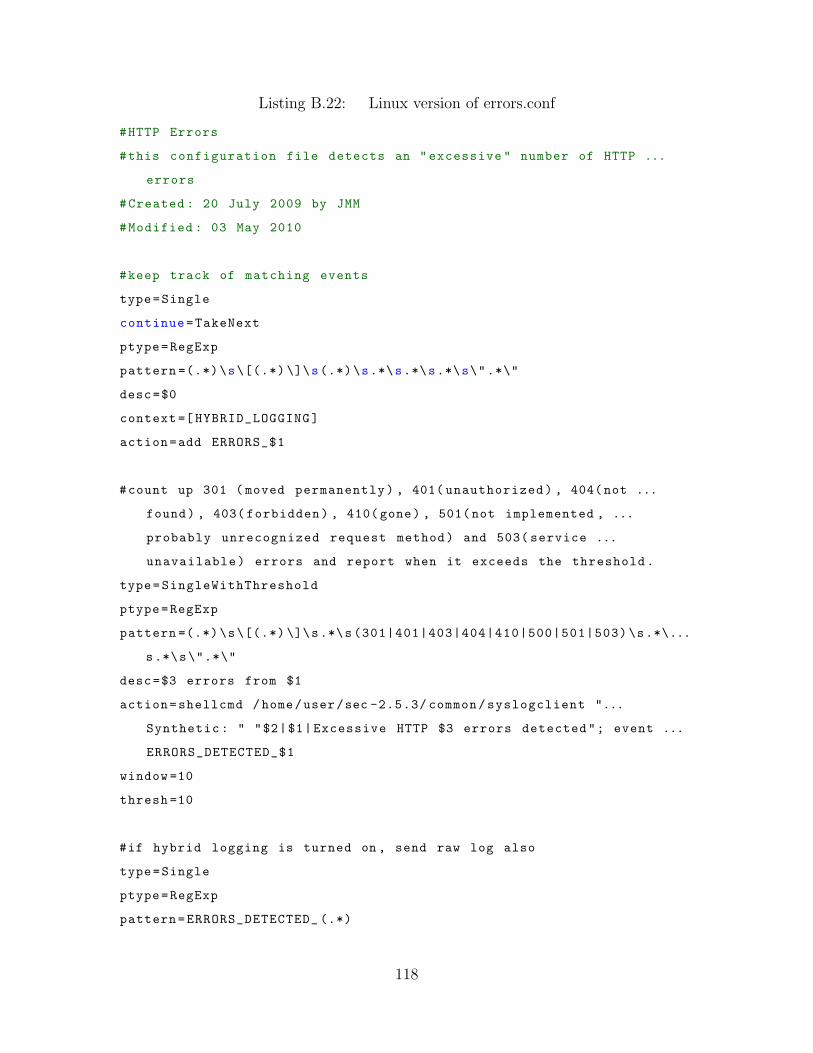
Listing B.22: Linux version of errors.conf
#HTTP Errors
#this configuration file detects an " excessive " number of HTTP ...
errors
#Created : 20 July 2009 by JMM
#Modified : 03 May 2010
#keep track of matching events
type=Single
continue=TakeNext
ptype=RegExp
pattern =(.*)\s\[(.*) \]\s(.*)\s.*\s.*\s.*\s\".*\"
desc=$0
context =[ HYBRID_LOGGING]
action=add ERRORS_$1
#count up 301 ( moved permanently) , 401( unauthorized) , 404( not ...
found) , 403( forbidden) , 410( gone) , 501(not implemented , ...
probably unrecognized request method) and 503( service ...
unavailable) errors and report when it exceeds the threshold.
type=SingleWithThreshold
ptype=RegExp
pattern =(.*)\s\[(.*) \]\s.*\s(301|401|403|404|410|500|501|503)\s.*\...
s.*\s\".*\"
desc=$3 errors from $1
action=shellcmd /home/user/sec -2.5.3/ common/syslogclient "...
Synthetic : " "$2|$1|Excessive HTTP $3 errors detected"; event ...
ERRORS_DETECTED_$1
window =10
thresh =10
#if hybrid logging is turned on , send raw log also
type=Single
ptype=RegExp
pattern=ERRORS_DETECTED_ (.*)
118
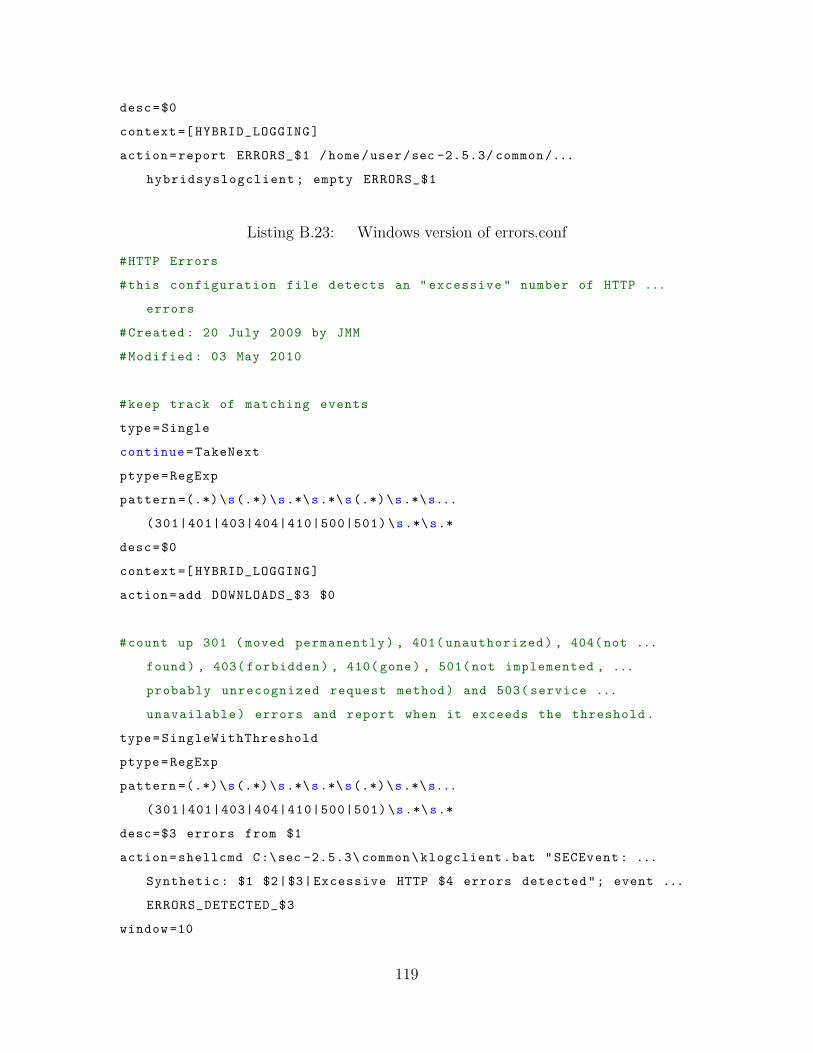
desc=$0
context =[ HYBRID_LOGGING]
action=report ERRORS_$1 /home/user/sec -2.5.3/ common/...
hybridsyslogclient ; empty ERRORS_$1
Listing B.23: Windows version of errors.conf
#HTTP Errors
#this configuration file detects an " excessive " number of HTTP ...
errors
#Created : 20 July 2009 by JMM
#Modified : 03 May 2010
#keep track of matching events
type=Single
continue=TakeNext
ptype=RegExp
pattern =(.*)\s(.*)\s.*\s.*\s(.*)\s.*\s...
(301|401|403|404|410|500|501)\s.*\s.*
desc=$0
context =[ HYBRID_LOGGING]
action=add DOWNLOADS_$3 $0
#count up 301 ( moved permanently) , 401( unauthorized) , 404(not ...
found) , 403( forbidden) , 410( gone) , 501(not implemented , ...
probably unrecognized request method) and 503( service ...
unavailable) errors and report when it exceeds the threshold.
type=SingleWithThreshold
ptype=RegExp
pattern =(.*)\s(.*)\s.*\s.*\s(.*)\s.*\s...
(301|401|403|404|410|500|501)\s.*\s.*
desc=$3 errors from $1
action=shellcmd C:\sec -2.5.3\ common\klogclient.bat "SECEvent : ...
Synthetic : $1 $2|$3|Excessive HTTP $4 errors detected"; event ...
ERRORS_DETECTED_$3
window =10
119
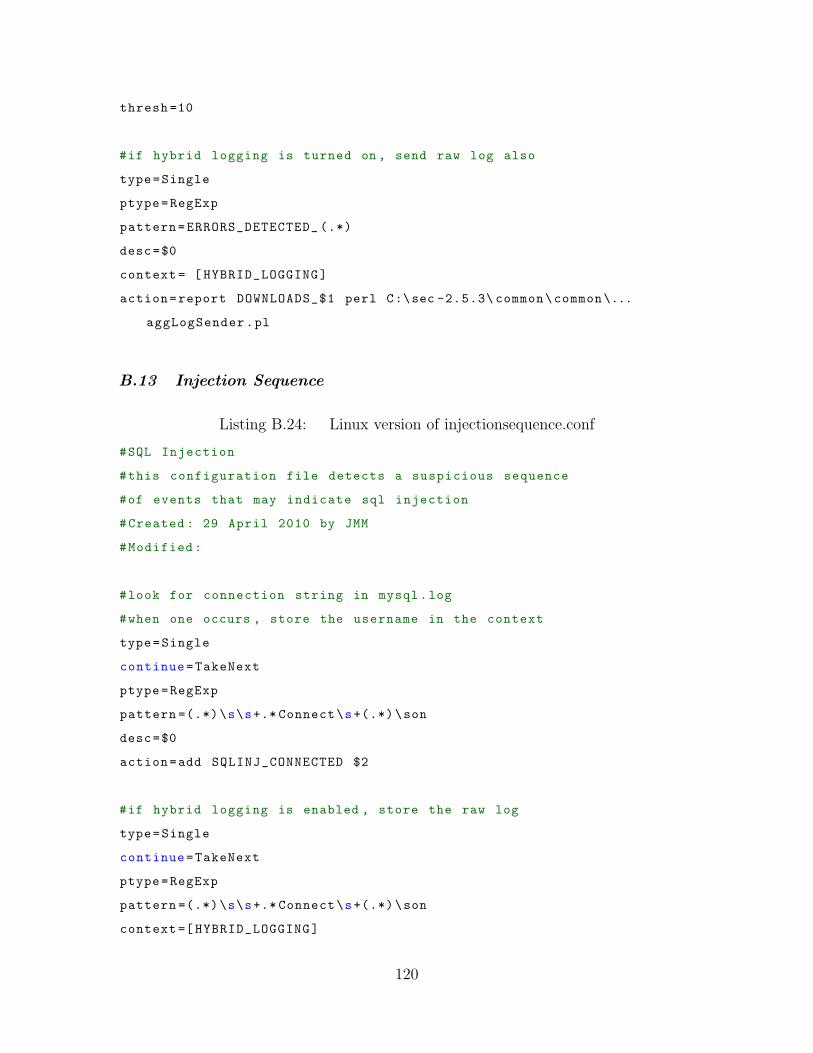
thresh =10
#if hybrid logging is turned on , send raw log also
type=Single
ptype=RegExp
pattern=ERRORS_DETECTED_ (.*)
desc=$0
context = [ HYBRID_LOGGING]
action=report DOWNLOADS_$1 perl C:\sec -2.5.3\ common\common\...
aggLogSender.pl
B.13 Injection Sequence
Listing B.24: Linux version of injectionsequence.conf
#SQL Injection
#this configuration file detects a suspicious sequence
#of events that may indicate sql injection
#Created : 29 April 2010 by JMM
#Modified:
#look for connection string in mysql.log
#when one occurs , store the username in the context
type=Single
continue=TakeNext
ptype=RegExp
pattern =(.*)\s\s+.* Connect\s+(.*)\son
desc=$0
action=add SQLINJ_CONNECTED $2
#if hybrid logging is enabled , store the raw log
type=Single
continue=TakeNext
ptype=RegExp
pattern =(.*)\s\s+.* Connect\s+(.*)\son
context =[ HYBRID_LOGGING]
120
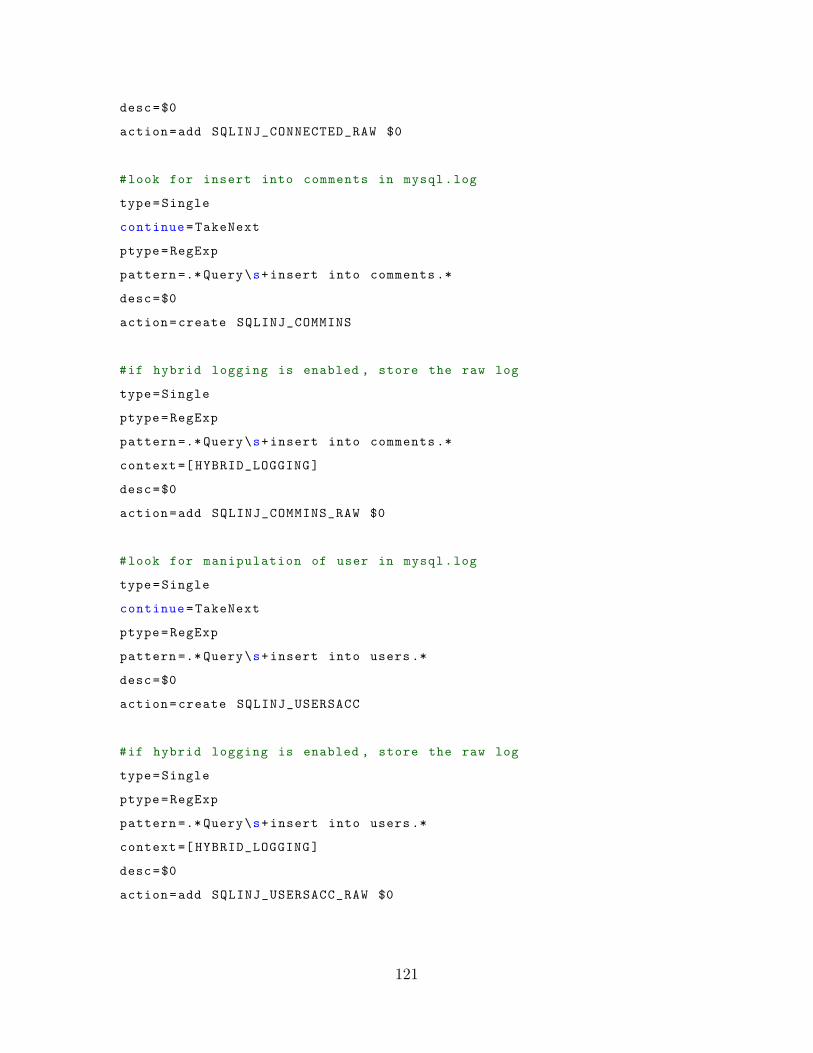
desc=$0
action=add SQLINJ_CONNECTED_RAW $0
#look for insert into comments in mysql.log
type=Single
continue=TakeNext
ptype=RegExp
pattern =.* Query\s+insert into comments .*
desc=$0
action=create SQLINJ_COMMINS
#if hybrid logging is enabled , store the raw log
type=Single
ptype=RegExp
pattern =.* Query\s+insert into comments .*
context =[ HYBRID_LOGGING]
desc=$0
action=add SQLINJ_COMMINS_RAW $0
#look for manipulation of user in mysql.log
type=Single
continue=TakeNext
ptype=RegExp
pattern =.* Query\s+insert into users.*
desc=$0
action=create SQLINJ_USERSACC
#if hybrid logging is enabled , store the raw log
type=Single
ptype=RegExp
pattern =.* Query\s+insert into users.*
context =[ HYBRID_LOGGING]
desc=$0
action=add SQLINJ_USERSACC_RAW $0
121
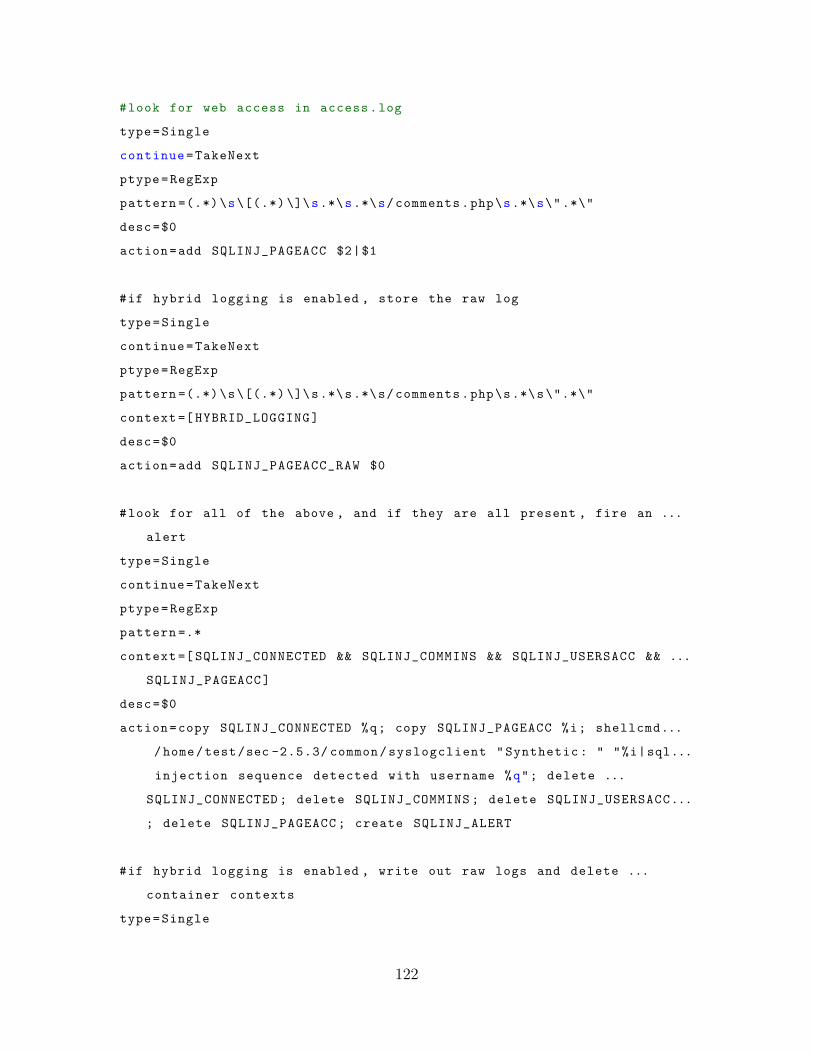
#look for web access in access.log
type=Single
continue=TakeNext
ptype=RegExp
pattern =(.*)\s\[(.*) \]\s.*\s.*\s/comments.php\s.*\s\".*\"
desc=$0
action=add SQLINJ_PAGEACC $2|$1
#if hybrid logging is enabled , store the raw log
type=Single
continue=TakeNext
ptype=RegExp
pattern =(.*)\s\[(.*) \]\s.*\s.*\s/comments.php\s.*\s\".*\"
context =[ HYBRID_LOGGING]
desc=$0
action=add SQLINJ_PAGEACC_RAW $0
#look for all of the above , and if they are all present , fire an ...
alert
type=Single
continue=TakeNext
ptype=RegExp
pattern =.*
context =[ SQLINJ_CONNECTED && SQLINJ_COMMINS && SQLINJ_USERSACC && ...
SQLINJ_PAGEACC]
desc=$0
action=copy SQLINJ_CONNECTED %q; copy SQLINJ_PAGEACC %i; shellcmd...
/home/test/sec -2.5.3/ common/syslogclient "Synthetic : " "%i|sql...
injection sequence detected with username %q"; delete ...
SQLINJ_CONNECTED ; delete SQLINJ_COMMINS ; delete SQLINJ_USERSACC...
; delete SQLINJ_PAGEACC ; create SQLINJ_ALERT
#if hybrid logging is enabled , write out raw logs and delete ...
container contexts
type=Single
122
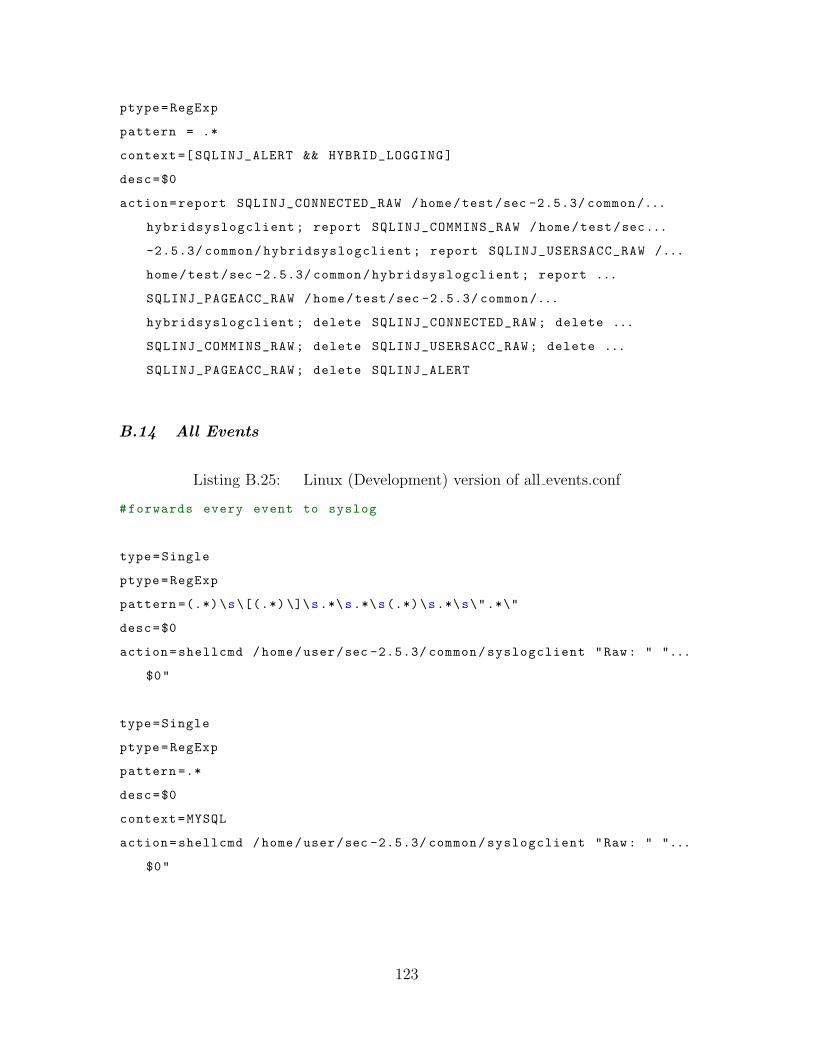
ptype=RegExp
pattern = .*
context =[ SQLINJ_ALERT && HYBRID_LOGGING]
desc=$0
action=report SQLINJ_CONNECTED_RAW /home/test/sec -2.5.3/ common/...
hybridsyslogclient ; report SQLINJ_COMMINS_RAW /home/test/sec...
-2.5.3/ common/hybridsyslogclient ; report SQLINJ_USERSACC_RAW /...
home/test/sec -2.5.3/ common/hybridsyslogclient ; report ...
SQLINJ_PAGEACC_RAW /home/test/sec -2.5.3/ common/...
hybridsyslogclient ; delete SQLINJ_CONNECTED_RAW ; delete ...
SQLINJ_COMMINS_RAW ; delete SQLINJ_USERSACC_RAW ; delete ...
SQLINJ_PAGEACC_RAW ; delete SQLINJ_ALERT
B.14 All Events
Listing B.25: Linux (Development) version of all events.conf
#forwards every event to syslog
type=Single
ptype=RegExp
pattern =(.*)\s\[(.*) \]\s.*\s.*\s(.*)\s.*\s\".*\"
desc=$0
action=shellcmd /home/user/sec -2.5.3/ common/syslogclient "Raw: " "...
$0"
type=Single
ptype=RegExp
pattern =.*
desc=$0
context=MYSQL
action=shellcmd /home/user/sec -2.5.3/ common/syslogclient "Raw: " "...
$0"
123
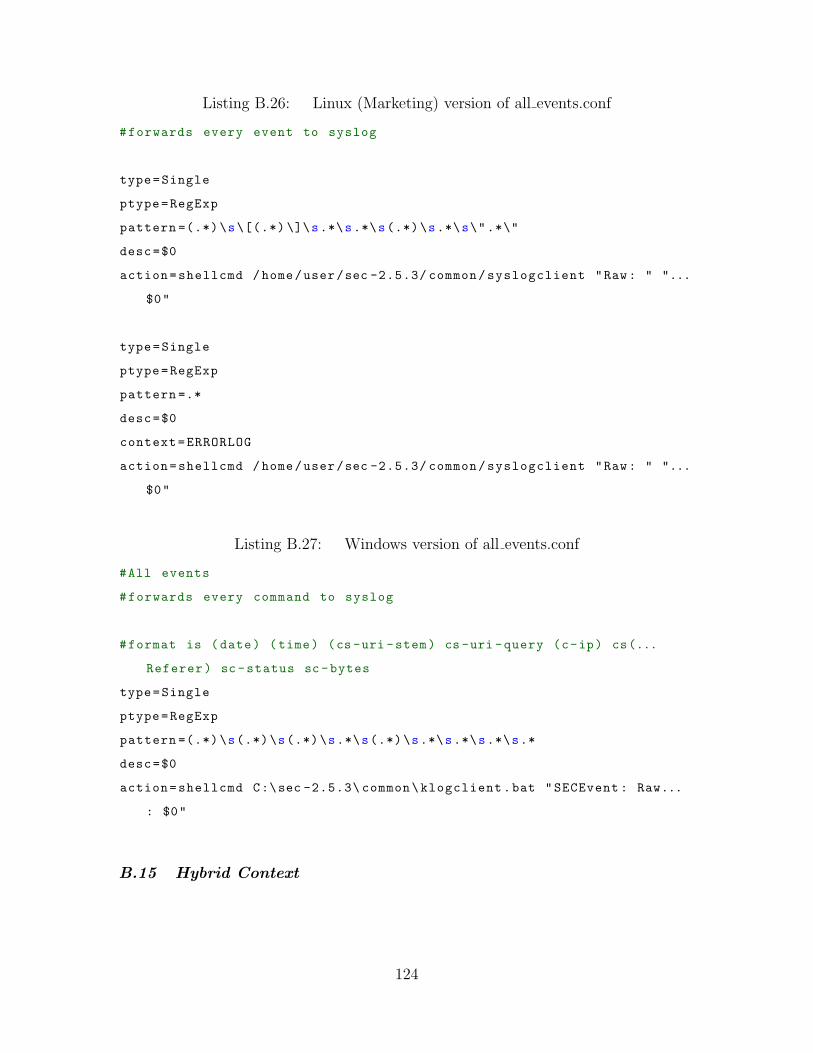
Listing B.26: Linux (Marketing) version of all events.conf
#forwards every event to syslog
type=Single
ptype=RegExp
pattern =(.*)\s\[(.*) \]\s.*\s.*\s(.*)\s.*\s\".*\"
desc=$0
action=shellcmd /home/user/sec -2.5.3/ common/syslogclient "Raw: " "...
$0"
type=Single
ptype=RegExp
pattern =.*
desc=$0
context=ERRORLOG
action=shellcmd /home/user/sec -2.5.3/ common/syslogclient "Raw: " "...
$0"
Listing B.27: Windows version of all events.conf
#All events
#forwards every command to syslog
#format is (date) (time) (cs -uri -stem) cs -uri -query (c-ip) cs(...
Referer) sc -status sc-bytes
type=Single
ptype=RegExp
pattern =(.*)\s(.*)\s(.*)\s.*\s(.*)\s.*\s.*\s.*\s.*
desc=$0
action=shellcmd C:\sec -2.5.3\ common\klogclient.bat "SECEvent : Raw...
: $0"
B.15 Hybrid Context
124
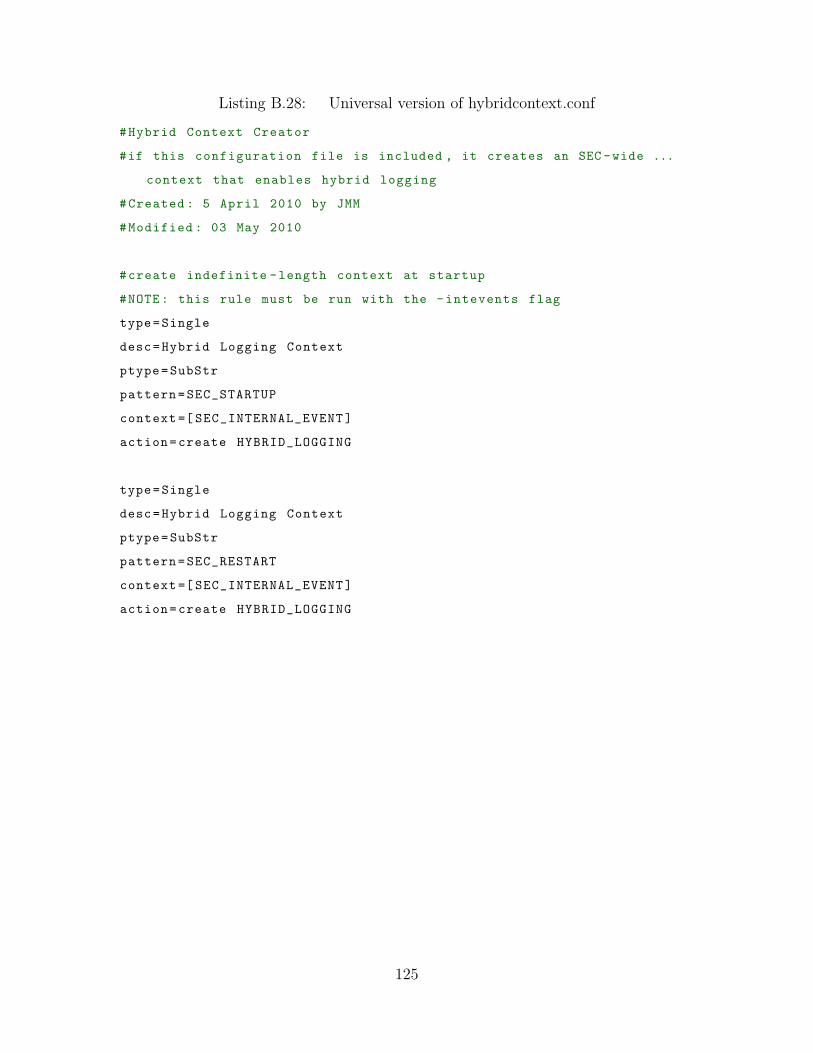
Listing B.28: Universal version of hybridcontext.conf
#Hybrid Context Creator
#if this configuration file is included , it creates an SEC -wide ...
context that enables hybrid logging
#Created : 5 April 2010 by JMM
#Modified : 03 May 2010
#create indefinite -length context at startup
#NOTE: this rule must be run with the -intevents flag
type=Single
desc=Hybrid Logging Context
ptype=SubStr
pattern=SEC_STARTUP
context =[ SEC_INTERNAL_EVENT]
action=create HYBRID_LOGGING
type=Single
desc=Hybrid Logging Context
ptype=SubStr
pattern=SEC_RESTART
context =[ SEC_INTERNAL_EVENT]
action=create HYBRID_LOGGING
125
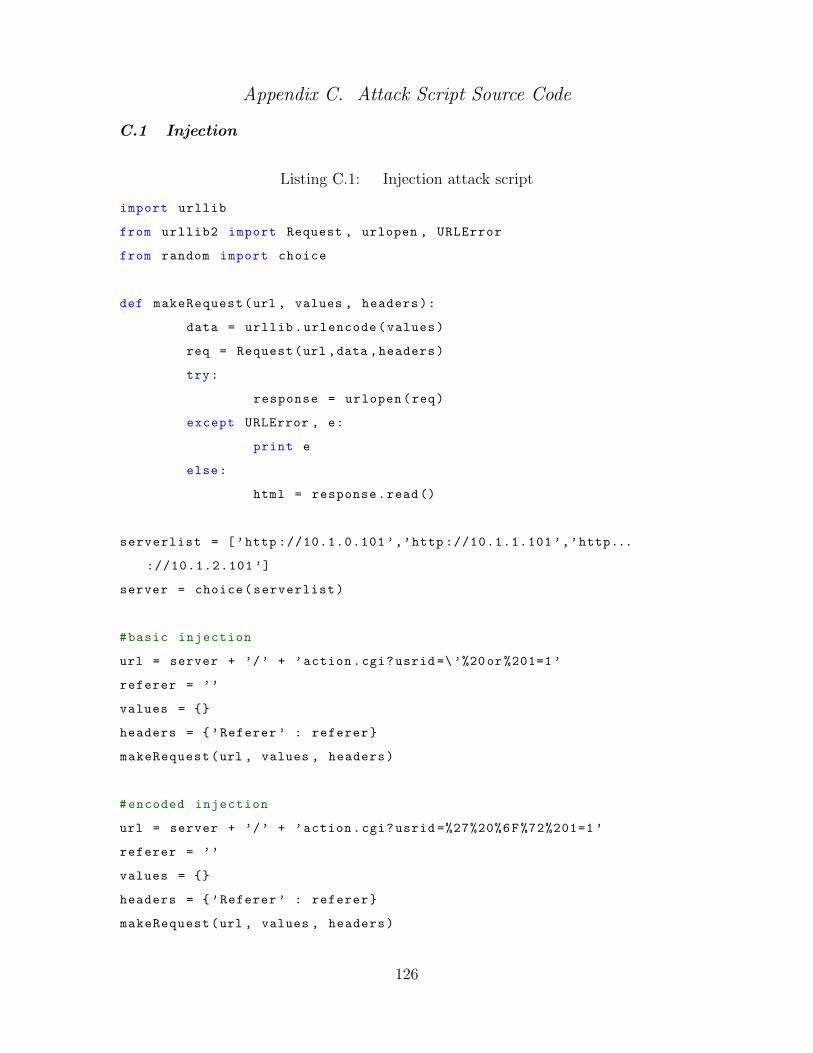
Appendix C. Attack Script Source Code
C.1 Injection
Listing C.1: Injection attack script
import urllib
from urllib2 import Request , urlopen , URLError
from random import choice
def makeRequest(url , values , headers):
data = urllib.urlencode(values)
req = Request(url ,data ,headers)
try:
response = urlopen(req)
except URLError , e:
print e
else:
html = response.read()
serverlist = [’http ://10.1.0.101 ’,’http ://10.1.1.101 ’,’http...
://10.1.2.101 ’]
server = choice(serverlist)
#basic injection
url = server + ’/’ + ’action.cgi?usrid =\’%20or %201=1 ’
referer = ’’
values = {}
headers = {’Referer ’ : referer}
makeRequest(url , values , headers)
#encoded injection
url = server + ’/’ + ’action.cgi?usrid =%27%20%6F%72%201=1 ’
referer = ’’
values = {}
headers = {’Referer ’ : referer}
makeRequest(url , values , headers)
126
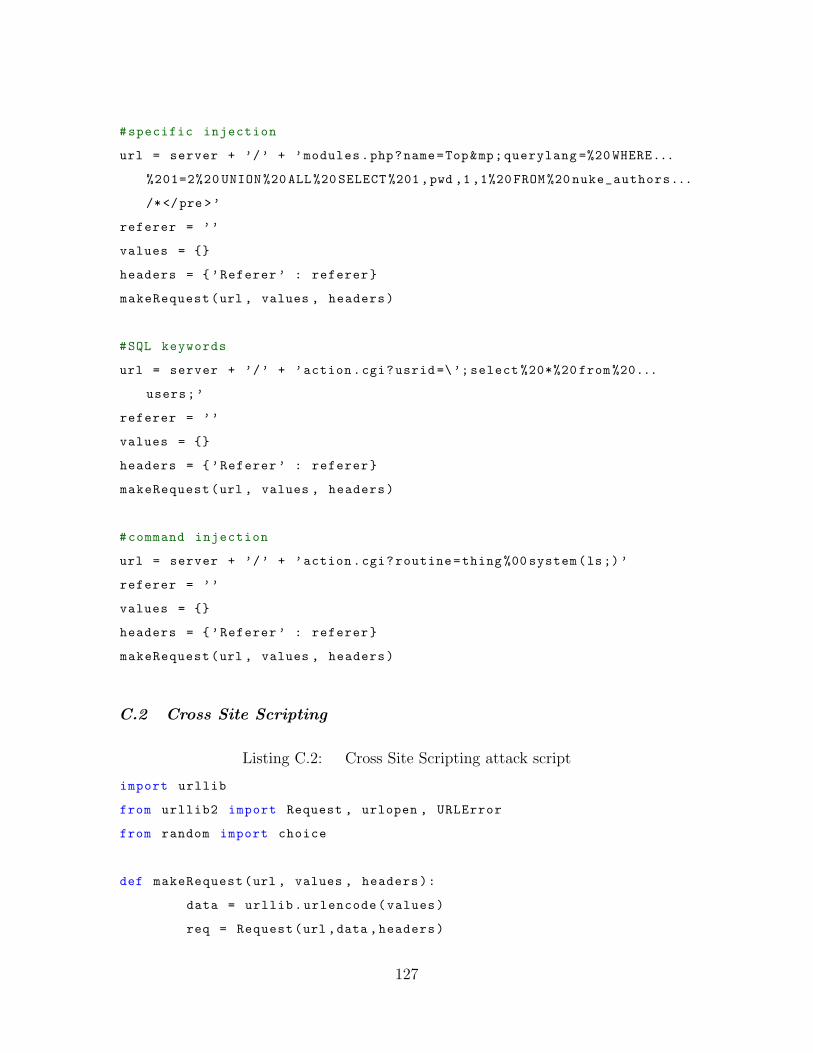
#specific injection
url = server + ’/’ + ’modules.php?name=Top∓querylang =%20 WHERE...
%201=2%20 UNION %20 ALL %20 SELECT %201,pwd ,1 ,1%20 FROM %20 nuke_authors...
/*</pre >’
referer = ’’
values = {}
headers = {’Referer ’ : referer}
makeRequest(url , values , headers)
#SQL keywords
url = server + ’/’ + ’action.cgi?usrid=\’; select %20*%20 from %20...
users;’
referer = ’’
values = {}
headers = {’Referer ’ : referer}
makeRequest(url , values , headers)
#command injection
url = server + ’/’ + ’action.cgi?routine=thing %00 system(ls;)’
referer = ’’
values = {}
headers = {’Referer ’ : referer}
makeRequest(url , values , headers)
C.2 Cross Site Scripting
Listing C.2: Cross Site Scripting attack script
import urllib
from urllib2 import Request , urlopen , URLError
from random import choice
def makeRequest(url , values , headers):
data = urllib.urlencode(values)
req = Request(url ,data ,headers)
127
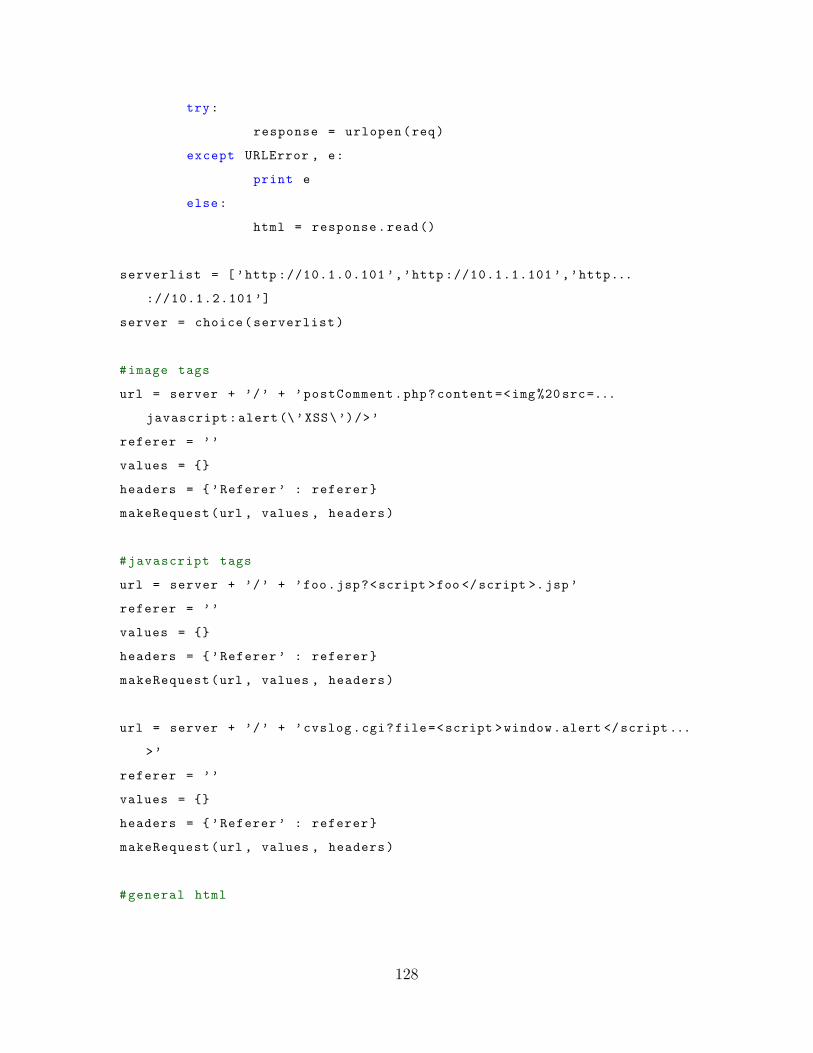
try:
response = urlopen(req)
except URLError , e:
print e
else:
html = response.read()
serverlist = [’http ://10.1.0.101 ’,’http ://10.1.1.101 ’,’http...
://10.1.2.101 ’]
server = choice(serverlist)
#image tags
url = server + ’/’ + ’postComment.php?content=<img %20 src=...
javascript:alert(\’XSS\’)/>’
referer = ’’
values = {}
headers = {’Referer ’ : referer}
makeRequest(url , values , headers)
#javascript tags
url = server + ’/’ + ’foo.jsp?<script >foo </script >.jsp’
referer = ’’
values = {}
headers = {’Referer ’ : referer}
makeRequest(url , values , headers)
url = server + ’/’ + ’cvslog.cgi?file=<script >window.alert </script ...
>’
referer = ’’
values = {}
headers = {’Referer ’ : referer}
makeRequest(url , values , headers)
#general html
128
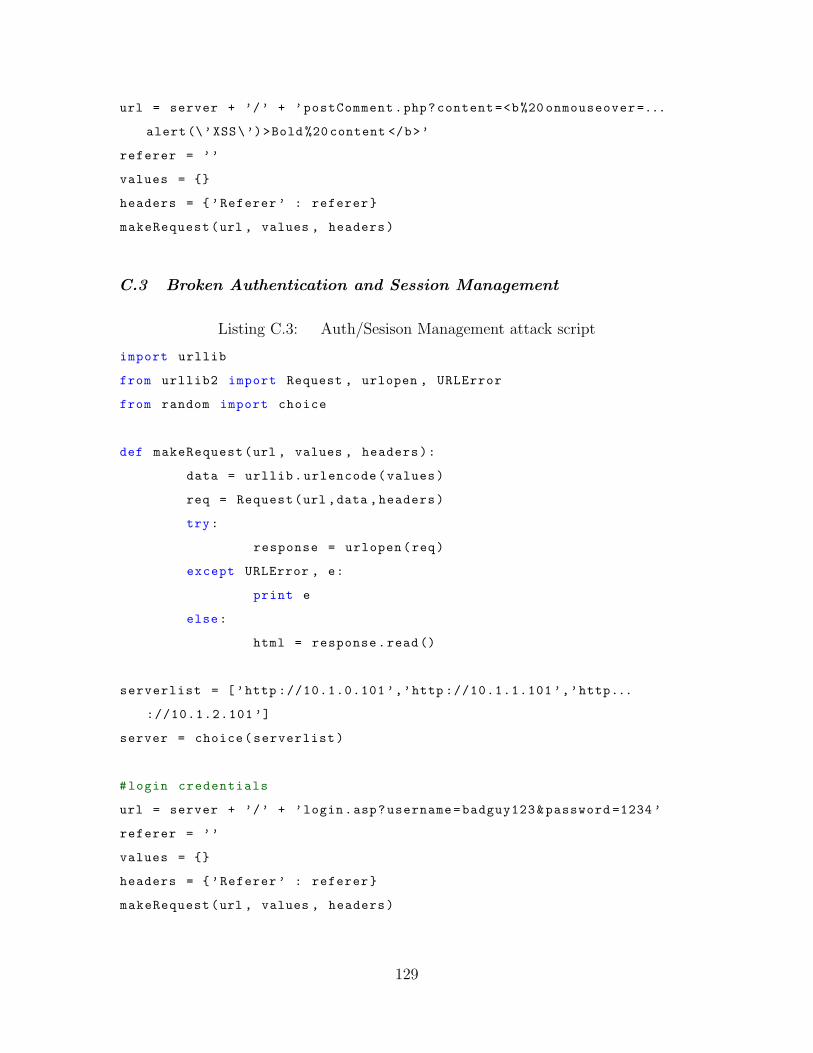
url = server + ’/’ + ’postComment.php?content=<b%20 onmouseover=...
alert(\’XSS\’)>Bold %20 content </b>’
referer = ’’
values = {}
headers = {’Referer ’ : referer}
makeRequest(url , values , headers)
C.3 Broken Authentication and Session Management
Listing C.3: Auth/Sesison Management attack script
import urllib
from urllib2 import Request , urlopen , URLError
from random import choice
def makeRequest(url , values , headers):
data = urllib.urlencode(values)
req = Request(url ,data ,headers)
try:
response = urlopen(req)
except URLError , e:
print e
else:
html = response.read()
serverlist = [’http ://10.1.0.101 ’,’http ://10.1.1.101 ’,’http...
://10.1.2.101 ’]
server = choice(serverlist)
#login credentials
url = server + ’/’ + ’login.asp?username=badguy123&password =1234 ’
referer = ’’
values = {}
headers = {’Referer ’ : referer}
makeRequest(url , values , headers)
129
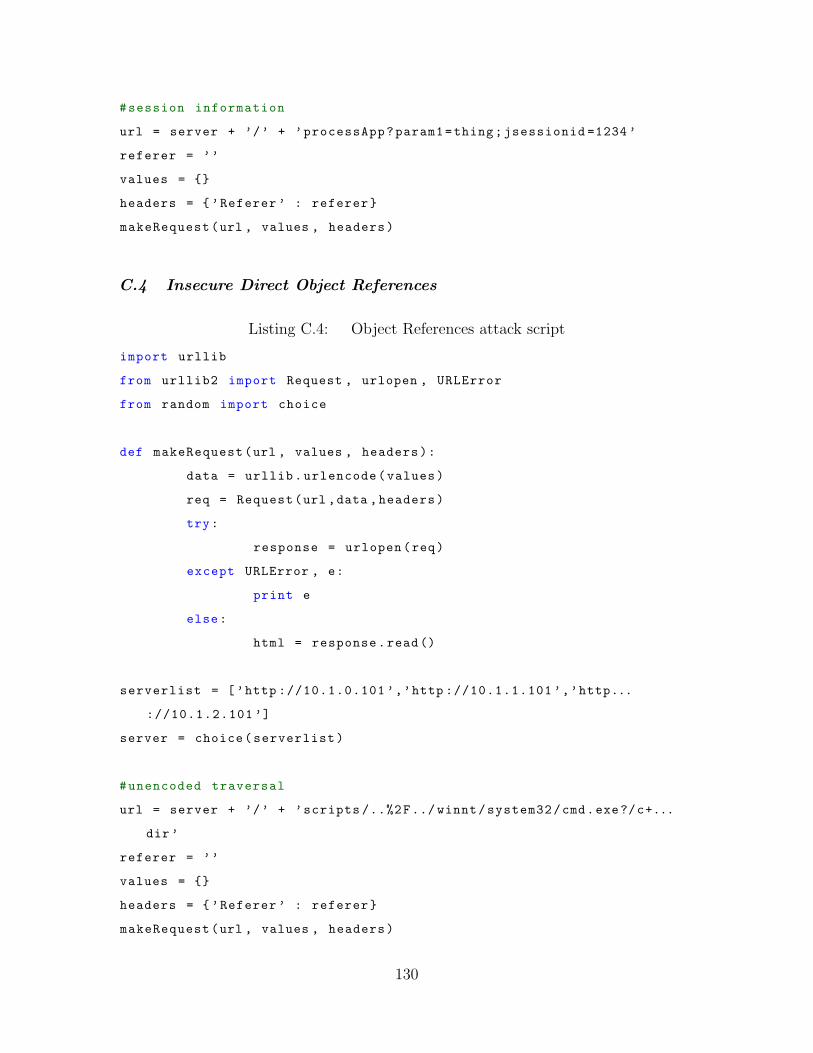
#session information
url = server + ’/’ + ’processApp?param1=thing;jsessionid =1234 ’
referer = ’’
values = {}
headers = {’Referer ’ : referer}
makeRequest(url , values , headers)
C.4 Insecure Direct Object References
Listing C.4: Object References attack script
import urllib
from urllib2 import Request , urlopen , URLError
from random import choice
def makeRequest(url , values , headers):
data = urllib.urlencode(values)
req = Request(url ,data ,headers)
try:
response = urlopen(req)
except URLError , e:
print e
else:
html = response.read()
serverlist = [’http ://10.1.0.101 ’,’http ://10.1.1.101 ’,’http...
://10.1.2.101 ’]
server = choice(serverlist)
#unencoded traversal
url = server + ’/’ + ’scripts /..%2F../ winnt/system32/cmd.exe?/c+...
dir’
referer = ’’
values = {}
headers = {’Referer ’ : referer}
makeRequest(url , values , headers)
130
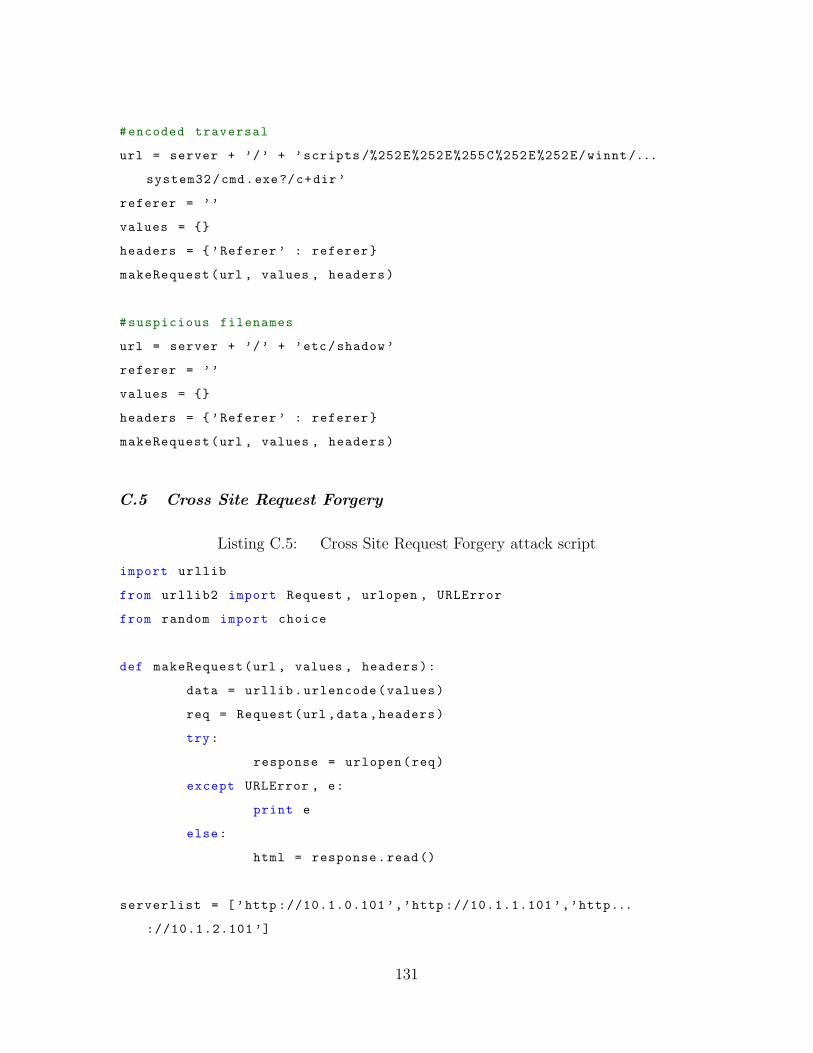
#encoded traversal
url = server + ’/’ + ’scripts /%252E%252E%255C%252E%252E/winnt/...
system32/cmd.exe?/c+dir’
referer = ’’
values = {}
headers = {’Referer ’ : referer}
makeRequest(url , values , headers)
#suspicious filenames
url = server + ’/’ + ’etc/shadow ’
referer = ’’
values = {}
headers = {’Referer ’ : referer}
makeRequest(url , values , headers)
C.5 Cross Site Request Forgery
Listing C.5: Cross Site Request Forgery attack script
import urllib
from urllib2 import Request , urlopen , URLError
from random import choice
def makeRequest(url , values , headers):
data = urllib.urlencode(values)
req = Request(url ,data ,headers)
try:
response = urlopen(req)
except URLError , e:
print e
else:
html = response.read()
serverlist = [’http ://10.1.0.101 ’,’http ://10.1.1.101 ’,’http...
://10.1.2.101 ’]
131
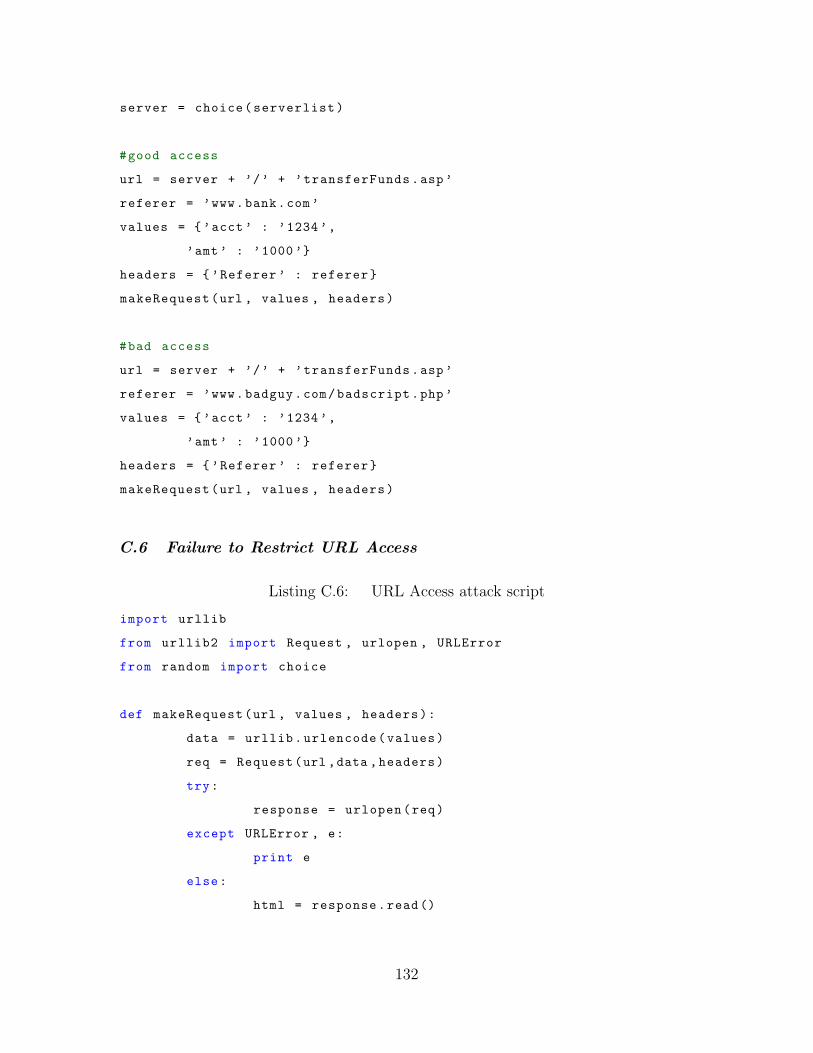
server = choice(serverlist)
#good access
url = server + ’/’ + ’transferFunds.asp’
referer = ’www.bank.com’
values = {’acct’ : ’1234’,
’amt’ : ’1000’}
headers = {’Referer ’ : referer}
makeRequest(url , values , headers)
#bad access
url = server + ’/’ + ’transferFunds.asp’
referer = ’www.badguy.com/badscript.php’
values = {’acct’ : ’1234’,
’amt’ : ’1000’}
headers = {’Referer ’ : referer}
makeRequest(url , values , headers)
C.6 Failure to Restrict URL Access
Listing C.6: URL Access attack script
import urllib
from urllib2 import Request , urlopen , URLError
from random import choice
def makeRequest(url , values , headers):
data = urllib.urlencode(values)
req = Request(url ,data ,headers)
try:
response = urlopen(req)
except URLError , e:
print e
else:
html = response.read()
132
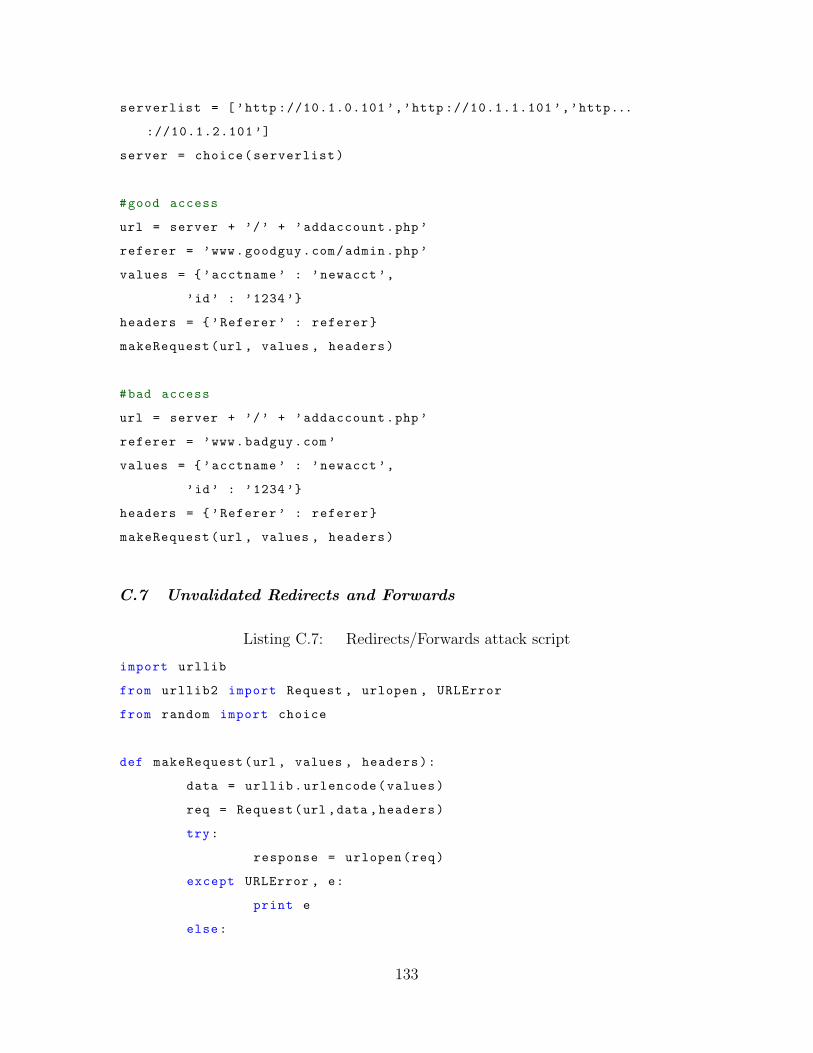
serverlist = [’http ://10.1.0.101 ’,’http ://10.1.1.101 ’,’http...
://10.1.2.101 ’]
server = choice(serverlist)
#good access
url = server + ’/’ + ’addaccount.php’
referer = ’www.goodguy.com/admin.php’
values = {’acctname ’ : ’newacct ’,
’id’ : ’1234’}
headers = {’Referer ’ : referer}
makeRequest(url , values , headers)
#bad access
url = server + ’/’ + ’addaccount.php’
referer = ’www.badguy.com’
values = {’acctname ’ : ’newacct ’,
’id’ : ’1234’}
headers = {’Referer ’ : referer}
makeRequest(url , values , headers)
C.7 Unvalidated Redirects and Forwards
Listing C.7: Redirects/Forwards attack script
import urllib
from urllib2 import Request , urlopen , URLError
from random import choice
def makeRequest(url , values , headers):
data = urllib.urlencode(values)
req = Request(url ,data ,headers)
try:
response = urlopen(req)
except URLError , e:
print e
else:
133
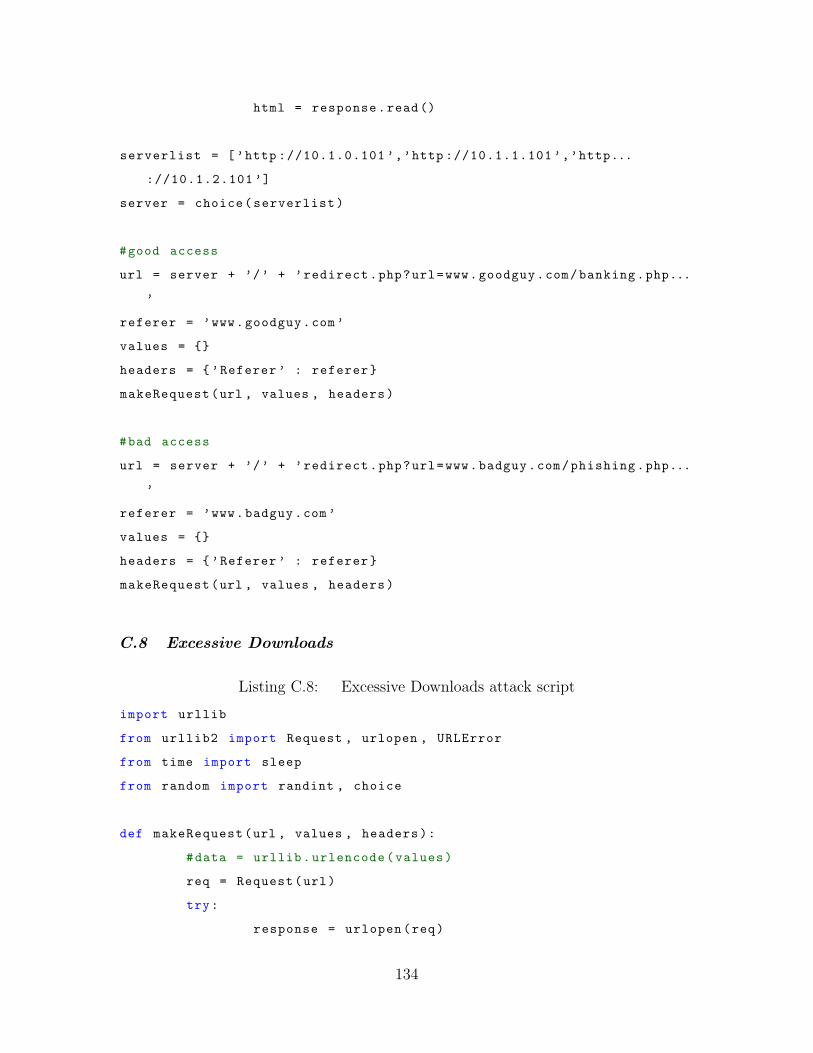
html = response.read()
serverlist = [’http ://10.1.0.101 ’,’http ://10.1.1.101 ’,’http...
://10.1.2.101 ’]
server = choice(serverlist)
#good access
url = server + ’/’ + ’redirect.php?url=www.goodguy.com/banking.php...
’
referer = ’www.goodguy.com’
values = {}
headers = {’Referer ’ : referer}
makeRequest(url , values , headers)
#bad access
url = server + ’/’ + ’redirect.php?url=www.badguy.com/phishing.php...
’
referer = ’www.badguy.com’
values = {}
headers = {’Referer ’ : referer}
makeRequest(url , values , headers)
C.8 Excessive Downloads
Listing C.8: Excessive Downloads attack script
import urllib
from urllib2 import Request , urlopen , URLError
from time import sleep
from random import randint , choice
def makeRequest(url , values , headers):
#data = urllib.urlencode(values)
req = Request(url)
try:
response = urlopen(req)
134
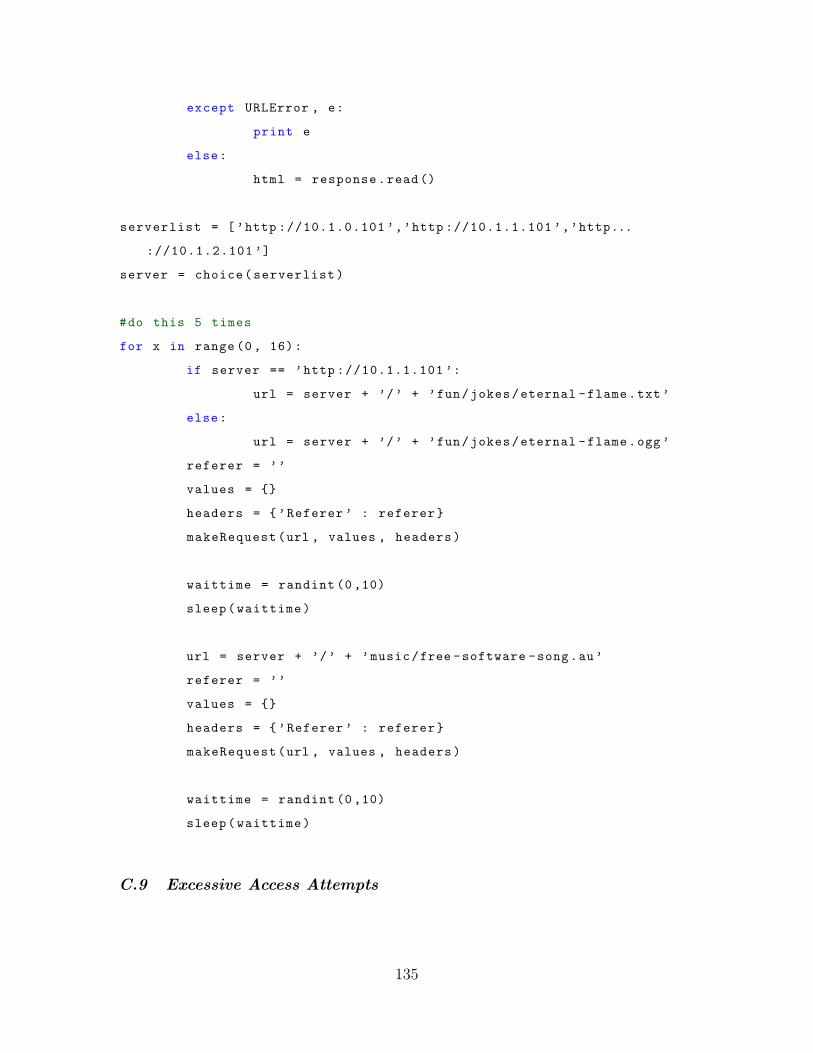
except URLError , e:
print e
else:
html = response.read()
serverlist = [’http ://10.1.0.101 ’,’http ://10.1.1.101 ’,’http...
://10.1.2.101 ’]
server = choice(serverlist)
#do this 5 times
for x in range (0 , 16):
if server == ’http ://10.1.1.101 ’:
url = server + ’/’ + ’fun/jokes/eternal -flame.txt’
else:
url = server + ’/’ + ’fun/jokes/eternal -flame.ogg’
referer = ’’
values = {}
headers = {’Referer ’ : referer}
makeRequest(url , values , headers)
waittime = randint (0,10)
sleep(waittime)
url = server + ’/’ + ’music/free -software -song.au’
referer = ’’
values = {}
headers = {’Referer ’ : referer}
makeRequest(url , values , headers)
waittime = randint (0,10)
sleep(waittime)
C.9 Excessive Access Attempts
135
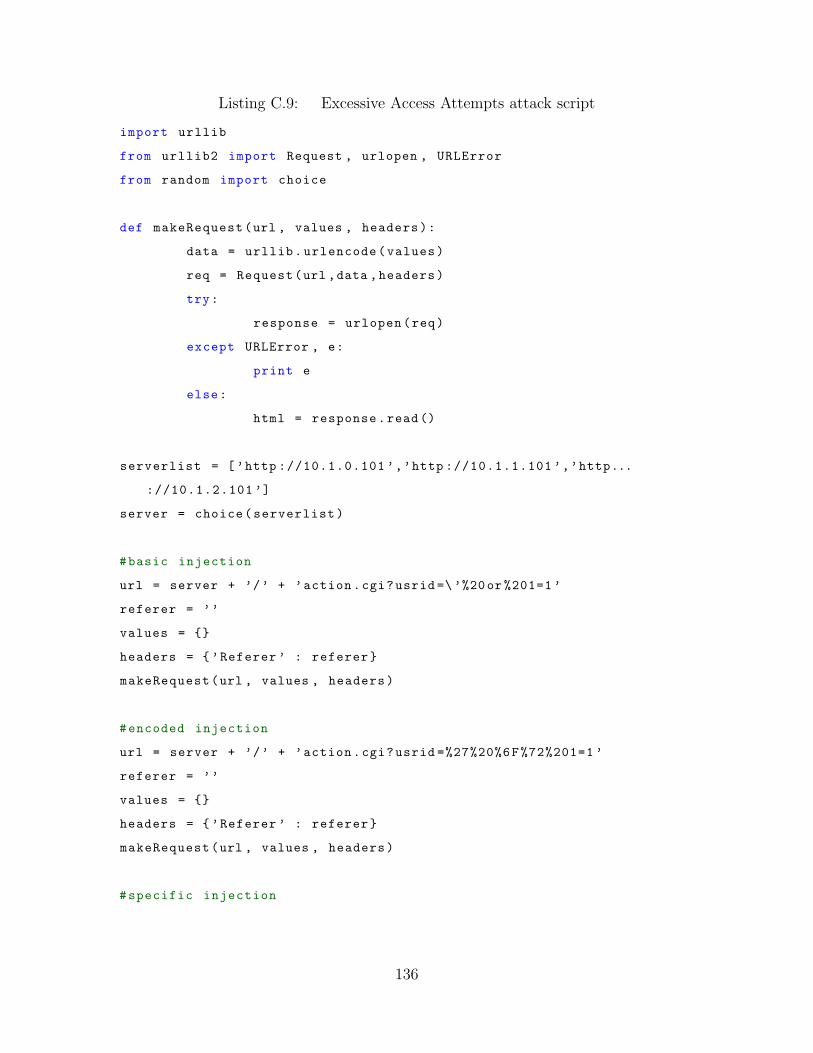
Listing C.9: Excessive Access Attempts attack script
import urllib
from urllib2 import Request , urlopen , URLError
from random import choice
def makeRequest(url , values , headers):
data = urllib.urlencode(values)
req = Request(url ,data ,headers)
try:
response = urlopen(req)
except URLError , e:
print e
else:
html = response.read()
serverlist = [’http ://10.1.0.101 ’,’http ://10.1.1.101 ’,’http...
://10.1.2.101 ’]
server = choice(serverlist)
#basic injection
url = server + ’/’ + ’action.cgi?usrid =\’%20or %201=1 ’
referer = ’’
values = {}
headers = {’Referer ’ : referer}
makeRequest(url , values , headers)
#encoded injection
url = server + ’/’ + ’action.cgi?usrid =%27%20%6F%72%201=1 ’
referer = ’’
values = {}
headers = {’Referer ’ : referer}
makeRequest(url , values , headers)
#specific injection
136
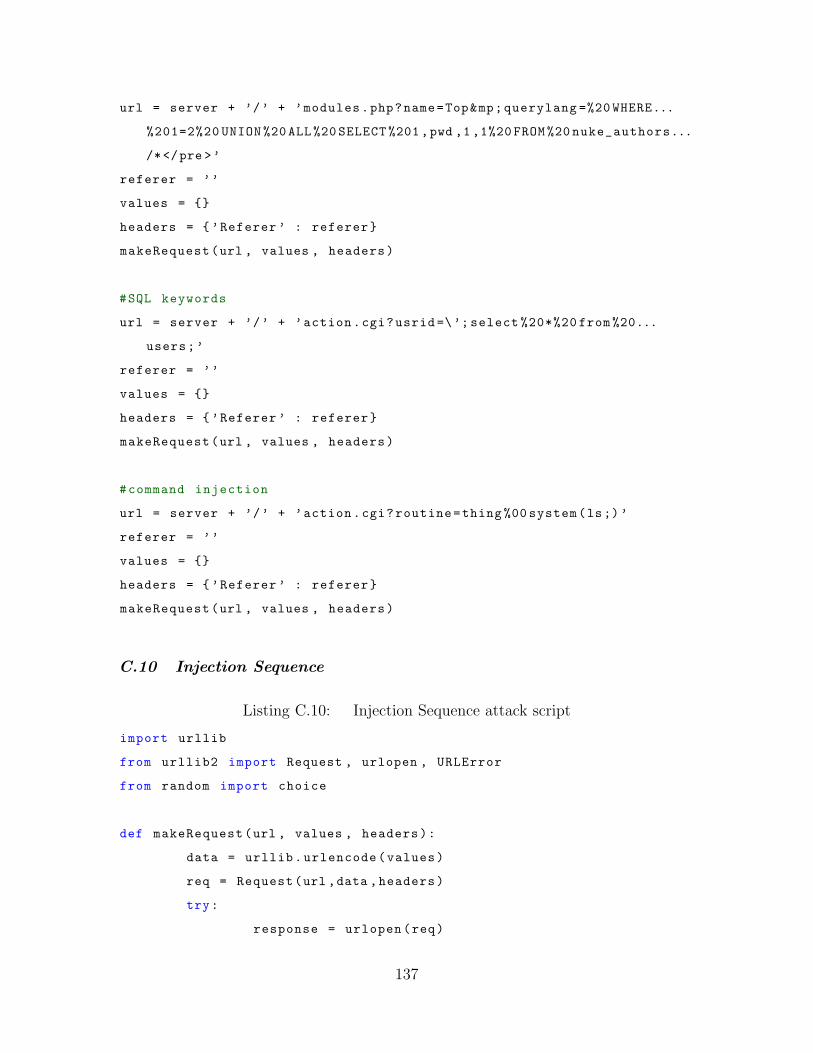
url = server + ’/’ + ’modules.php?name=Top∓querylang =%20 WHERE...
%201=2%20 UNION %20 ALL %20 SELECT %201,pwd ,1 ,1%20 FROM %20 nuke_authors...
/*</pre >’
referer = ’’
values = {}
headers = {’Referer ’ : referer}
makeRequest(url , values , headers)
#SQL keywords
url = server + ’/’ + ’action.cgi?usrid=\’; select %20*%20 from %20...
users;’
referer = ’’
values = {}
headers = {’Referer ’ : referer}
makeRequest(url , values , headers)
#command injection
url = server + ’/’ + ’action.cgi?routine=thing %00 system(ls;)’
referer = ’’
values = {}
headers = {’Referer ’ : referer}
makeRequest(url , values , headers)
C.10 Injection Sequence
Listing C.10: Injection Sequence attack script
import urllib
from urllib2 import Request , urlopen , URLError
from random import choice
def makeRequest(url , values , headers):
data = urllib.urlencode(values)
req = Request(url ,data ,headers)
try:
response = urlopen(req)
137
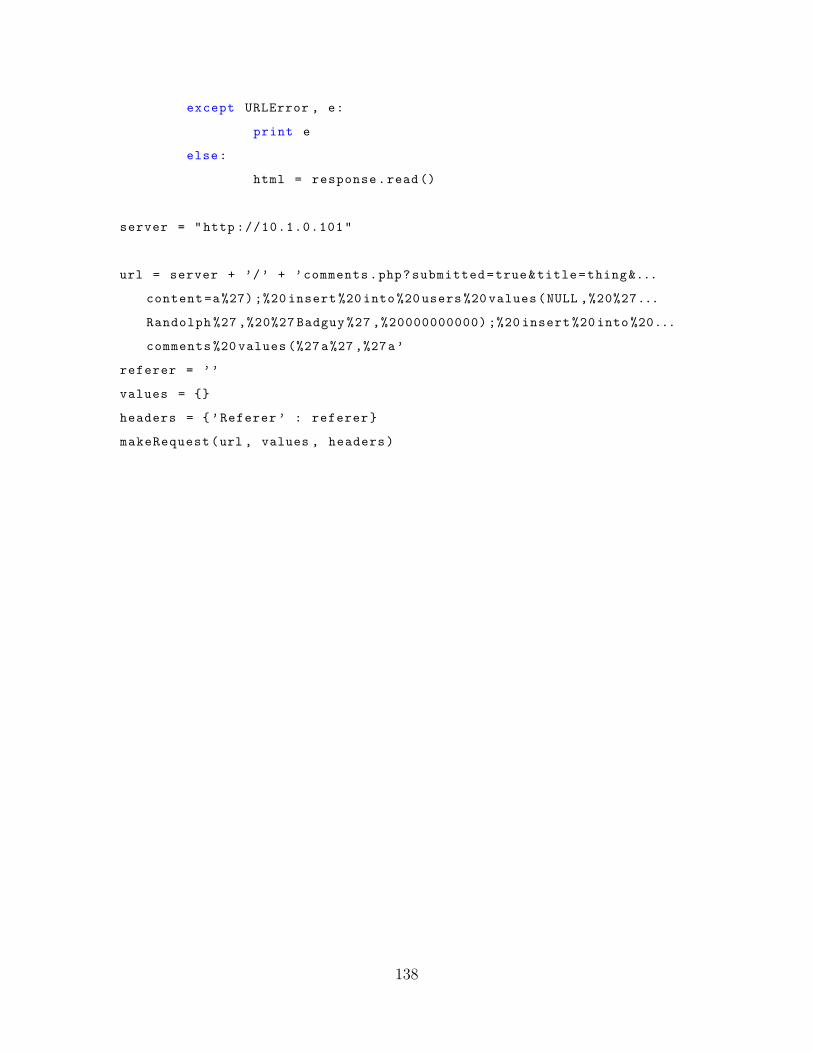
except URLError , e:
print e
else:
html = response.read()
server = "http ://10.1.0.101"
url = server + ’/’ + ’comments.php?submitted=true&title=thing&...
content=a%27) ;%20 insert %20 into %20 users %20 values(NULL ,%20%27...
Randolph %27 ,%20%27 Badguy %27 ,%20000000000) ;%20 insert %20 into %20...
comments %20 values (%27a%27 ,%27a’
referer = ’’
values = {}
headers = {’Referer ’ : referer}
makeRequest(url , values , headers)
138
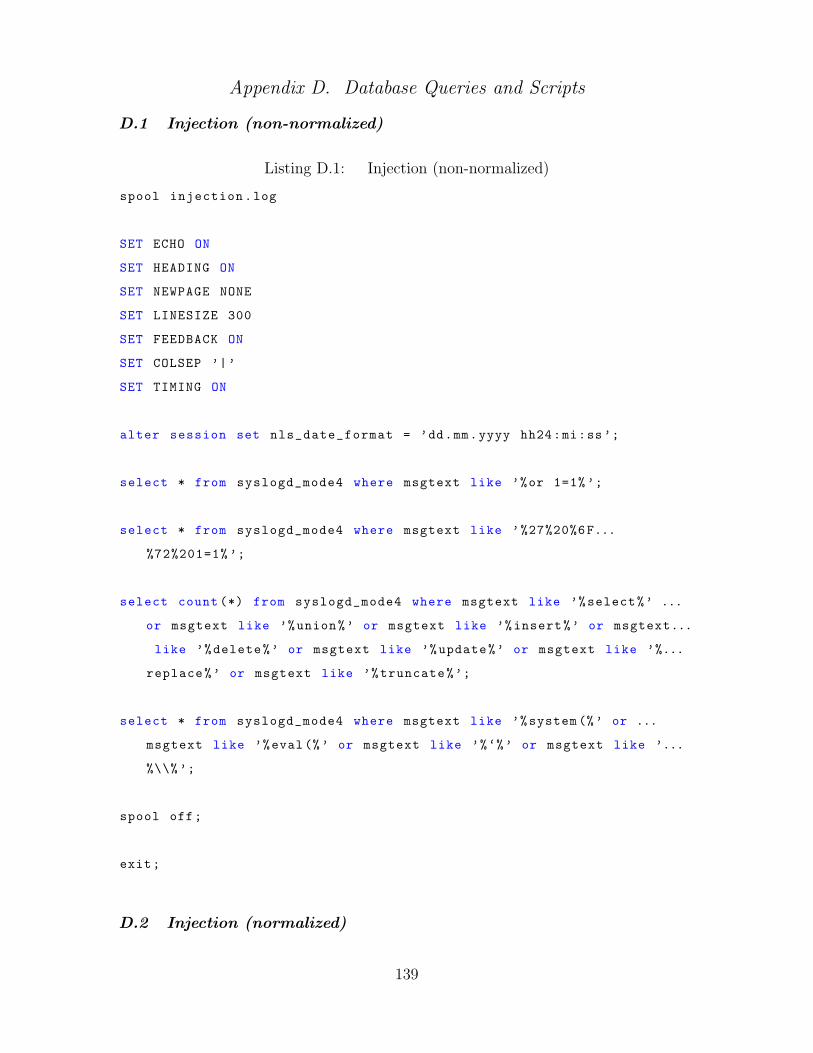
Appendix D. Database Queries and Scripts
D.1 Injection (non-normalized)
Listing D.1: Injection (non-normalized)
spool injection.log
SET ECHO ON
SET HEADING ON
SET NEWPAGE NONE
SET LINESIZE 300
SET FEEDBACK ON
SET COLSEP ’|’
SET TIMING ON
alter session set nls_date_format = ’dd.mm.yyyy hh24:mi:ss’;
select * from syslogd_mode4 where msgtext like ’%or 1=1% ’;
select * from syslogd_mode4 where msgtext like ’%27%20%6F...
%72%201=1% ’;
select count (*) from syslogd_mode4 where msgtext like ’%select%’ ...
or msgtext like ’%union%’ or msgtext like ’%insert%’ or msgtext...
like ’%delete%’ or msgtext like ’%update%’ or msgtext like ’%...
replace%’ or msgtext like ’%truncate%’;
select * from syslogd_mode4 where msgtext like ’%system (%’ or ...
msgtext like ’%eval(%’ or msgtext like ’%‘%’ or msgtext like ’...
%\\%’;
spool off;
exit;
D.2 Injection (normalized)
139
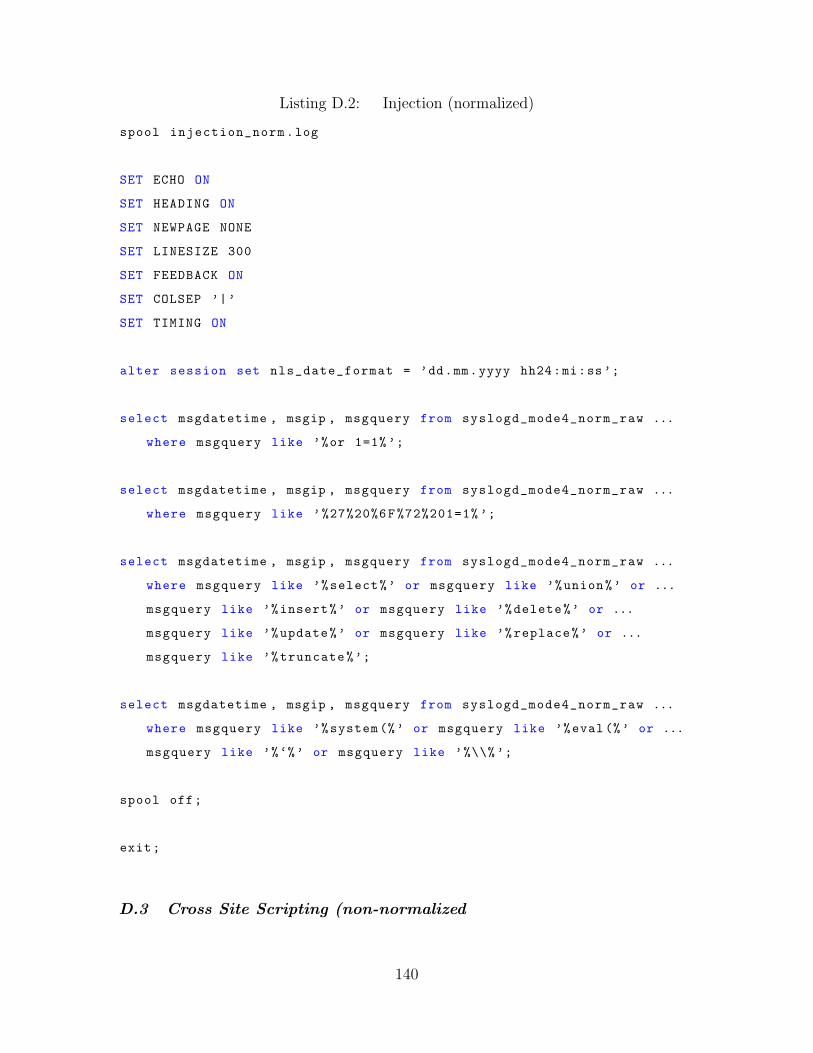
Listing D.2: Injection (normalized)
spool injection_norm.log
SET ECHO ON
SET HEADING ON
SET NEWPAGE NONE
SET LINESIZE 300
SET FEEDBACK ON
SET COLSEP ’|’
SET TIMING ON
alter session set nls_date_format = ’dd.mm.yyyy hh24:mi:ss’;
select msgdatetime , msgip , msgquery from syslogd_mode4_norm_raw ...
where msgquery like ’%or 1=1% ’;
select msgdatetime , msgip , msgquery from syslogd_mode4_norm_raw ...
where msgquery like ’%27%20%6F%72%201=1% ’;
select msgdatetime , msgip , msgquery from syslogd_mode4_norm_raw ...
where msgquery like ’%select%’ or msgquery like ’%union%’ or ...
msgquery like ’%insert%’ or msgquery like ’%delete%’ or ...
msgquery like ’%update%’ or msgquery like ’%replace%’ or ...
msgquery like ’%truncate%’;
select msgdatetime , msgip , msgquery from syslogd_mode4_norm_raw ...
where msgquery like ’%system (%’ or msgquery like ’%eval(%’ or ...
msgquery like ’%‘%’ or msgquery like ’%\\%’;
spool off;
exit;
D.3 Cross Site Scripting (non-normalized
140
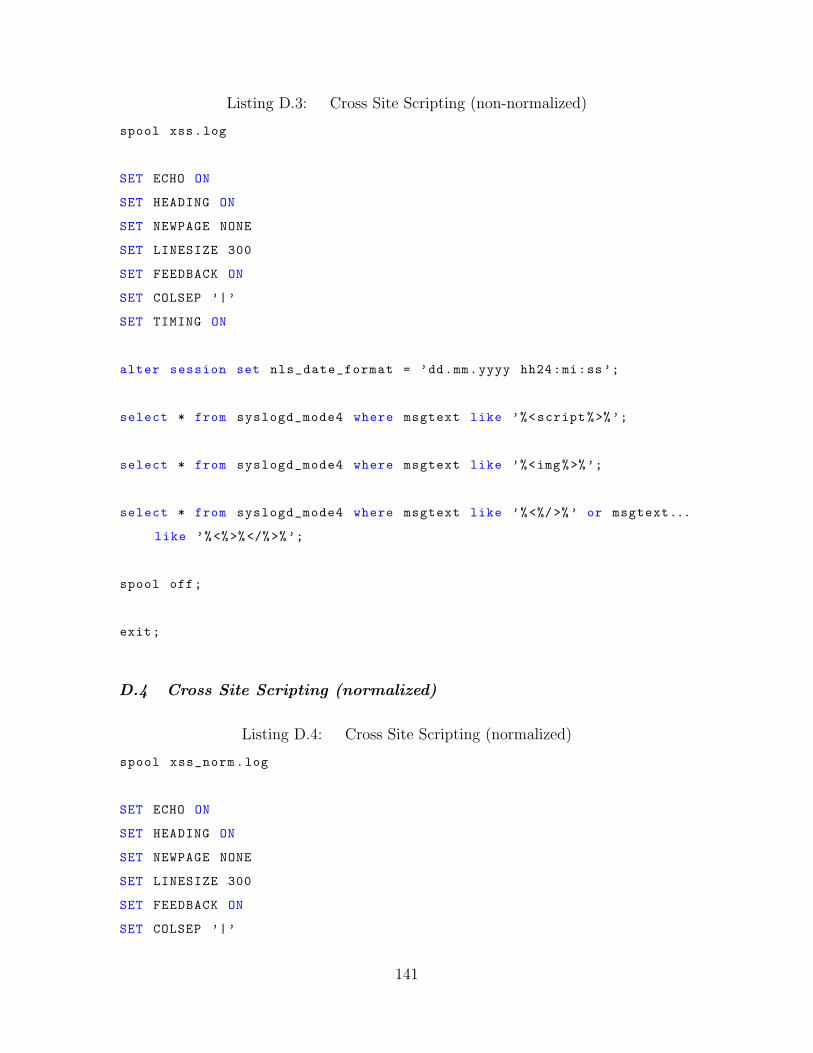
Listing D.3: Cross Site Scripting (non-normalized)
spool xss.log
SET ECHO ON
SET HEADING ON
SET NEWPAGE NONE
SET LINESIZE 300
SET FEEDBACK ON
SET COLSEP ’|’
SET TIMING ON
alter session set nls_date_format = ’dd.mm.yyyy hh24:mi:ss’;
select * from syslogd_mode4 where msgtext like ’%<script%>%’;
select * from syslogd_mode4 where msgtext like ’%<img%>%’;
select * from syslogd_mode4 where msgtext like ’%<%/>%’ or msgtext...
like ’%<%>%</%>%’;
spool off;
exit;
D.4 Cross Site Scripting (normalized)
Listing D.4: Cross Site Scripting (normalized)
spool xss_norm.log
SET ECHO ON
SET HEADING ON
SET NEWPAGE NONE
SET LINESIZE 300
SET FEEDBACK ON
SET COLSEP ’|’
141
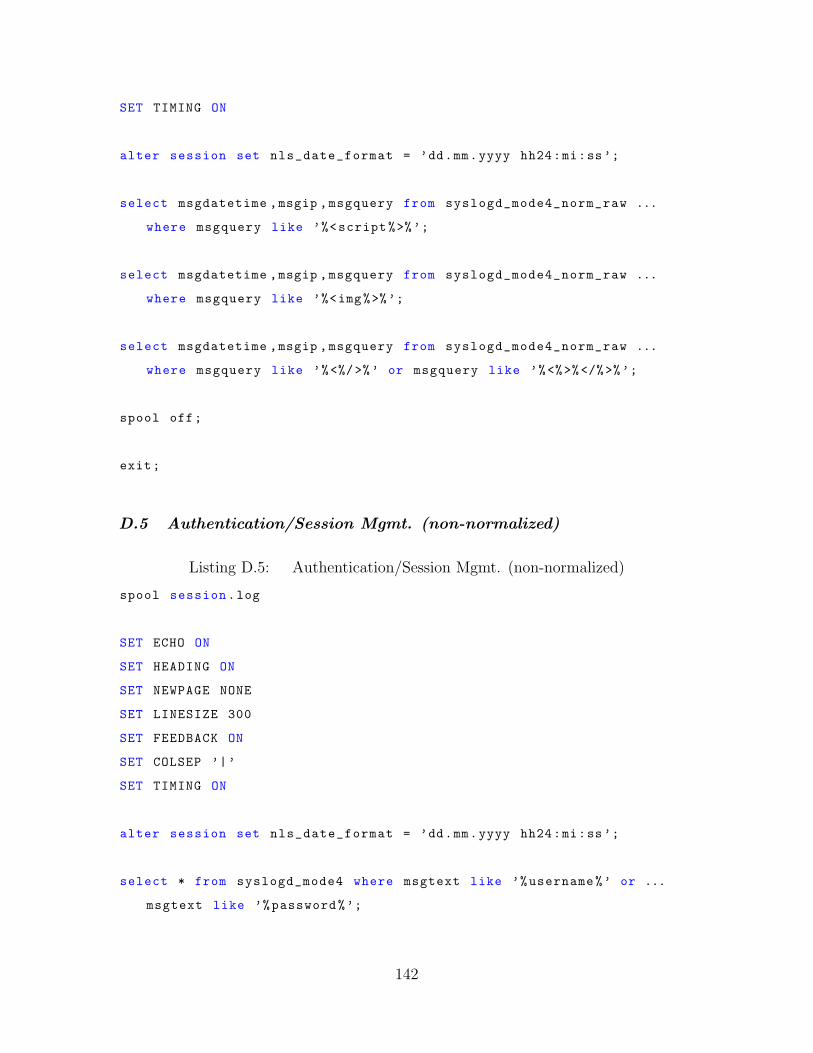
SET TIMING ON
alter session set nls_date_format = ’dd.mm.yyyy hh24:mi:ss’;
select msgdatetime ,msgip ,msgquery from syslogd_mode4_norm_raw ...
where msgquery like ’%<script%>%’;
select msgdatetime ,msgip ,msgquery from syslogd_mode4_norm_raw ...
where msgquery like ’%<img%>%’;
select msgdatetime ,msgip ,msgquery from syslogd_mode4_norm_raw ...
where msgquery like ’%<%/>%’ or msgquery like ’%<%>%</%>%’;
spool off;
exit;
D.5 Authentication/Session Mgmt. (non-normalized)
Listing D.5: Authentication/Session Mgmt. (non-normalized)
spool session.log
SET ECHO ON
SET HEADING ON
SET NEWPAGE NONE
SET LINESIZE 300
SET FEEDBACK ON
SET COLSEP ’|’
SET TIMING ON
alter session set nls_date_format = ’dd.mm.yyyy hh24:mi:ss’;
select * from syslogd_mode4 where msgtext like ’%username%’ or ...
msgtext like ’%password%’;
142
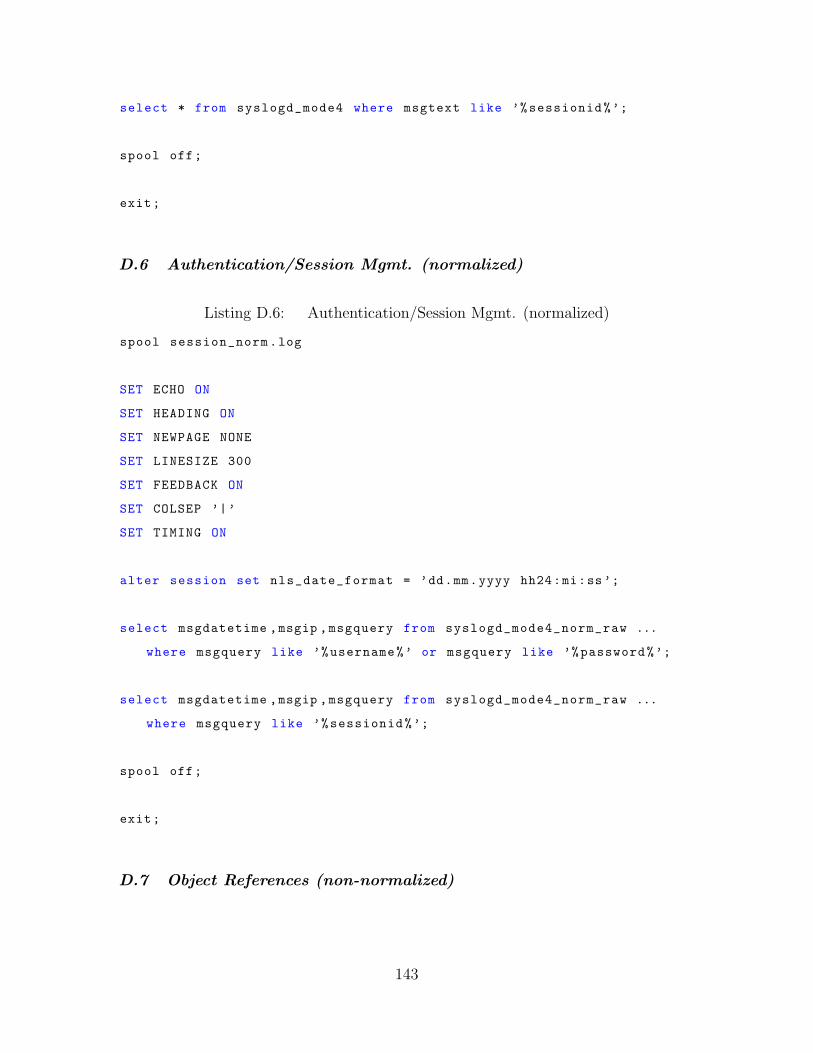
select * from syslogd_mode4 where msgtext like ’%sessionid%’;
spool off;
exit;
D.6 Authentication/Session Mgmt. (normalized)
Listing D.6: Authentication/Session Mgmt. (normalized)
spool session_norm.log
SET ECHO ON
SET HEADING ON
SET NEWPAGE NONE
SET LINESIZE 300
SET FEEDBACK ON
SET COLSEP ’|’
SET TIMING ON
alter session set nls_date_format = ’dd.mm.yyyy hh24:mi:ss’;
select msgdatetime ,msgip ,msgquery from syslogd_mode4_norm_raw ...
where msgquery like ’%username%’ or msgquery like ’%password%’;
select msgdatetime ,msgip ,msgquery from syslogd_mode4_norm_raw ...
where msgquery like ’%sessionid%’;
spool off;
exit;
D.7 Object References (non-normalized)
143
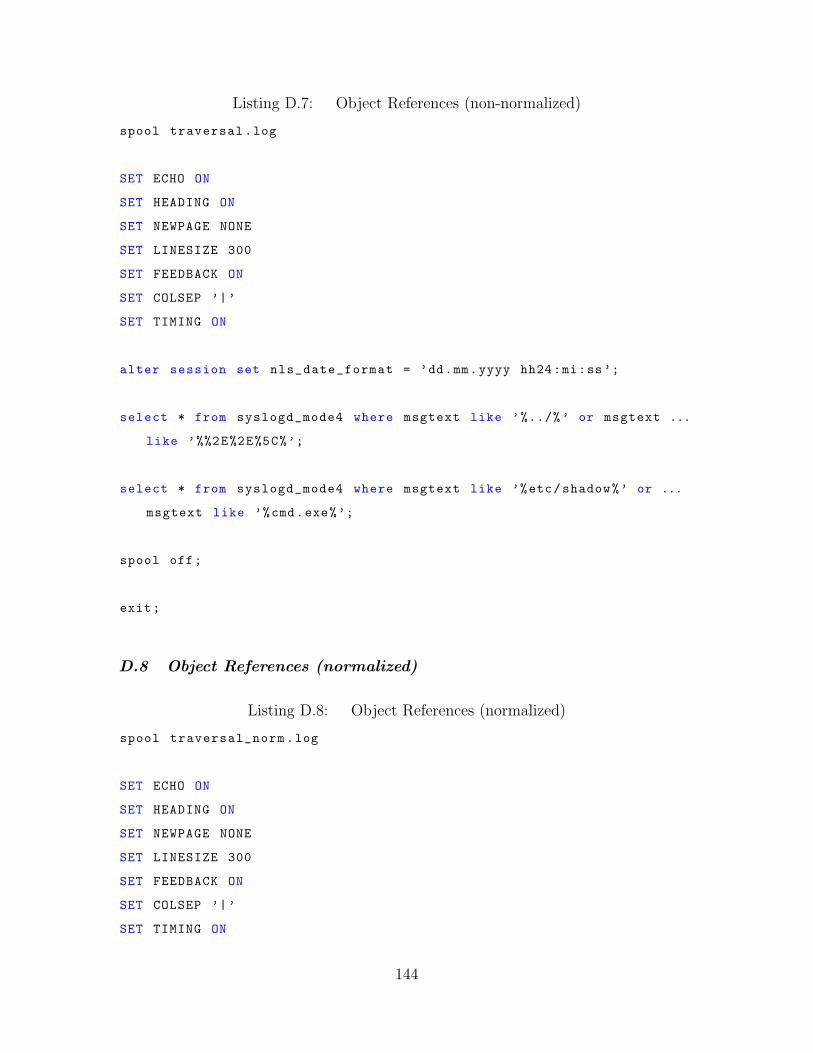
Listing D.7: Object References (non-normalized)
spool traversal.log
SET ECHO ON
SET HEADING ON
SET NEWPAGE NONE
SET LINESIZE 300
SET FEEDBACK ON
SET COLSEP ’|’
SET TIMING ON
alter session set nls_date_format = ’dd.mm.yyyy hh24:mi:ss’;
select * from syslogd_mode4 where msgtext like ’%../% ’ or msgtext ...
like ’%%2E%2E%5C%’;
select * from syslogd_mode4 where msgtext like ’%etc/shadow%’ or ...
msgtext like ’%cmd.exe%’;
spool off;
exit;
D.8 Object References (normalized)
Listing D.8: Object References (normalized)
spool traversal_norm.log
SET ECHO ON
SET HEADING ON
SET NEWPAGE NONE
SET LINESIZE 300
SET FEEDBACK ON
SET COLSEP ’|’
SET TIMING ON
144
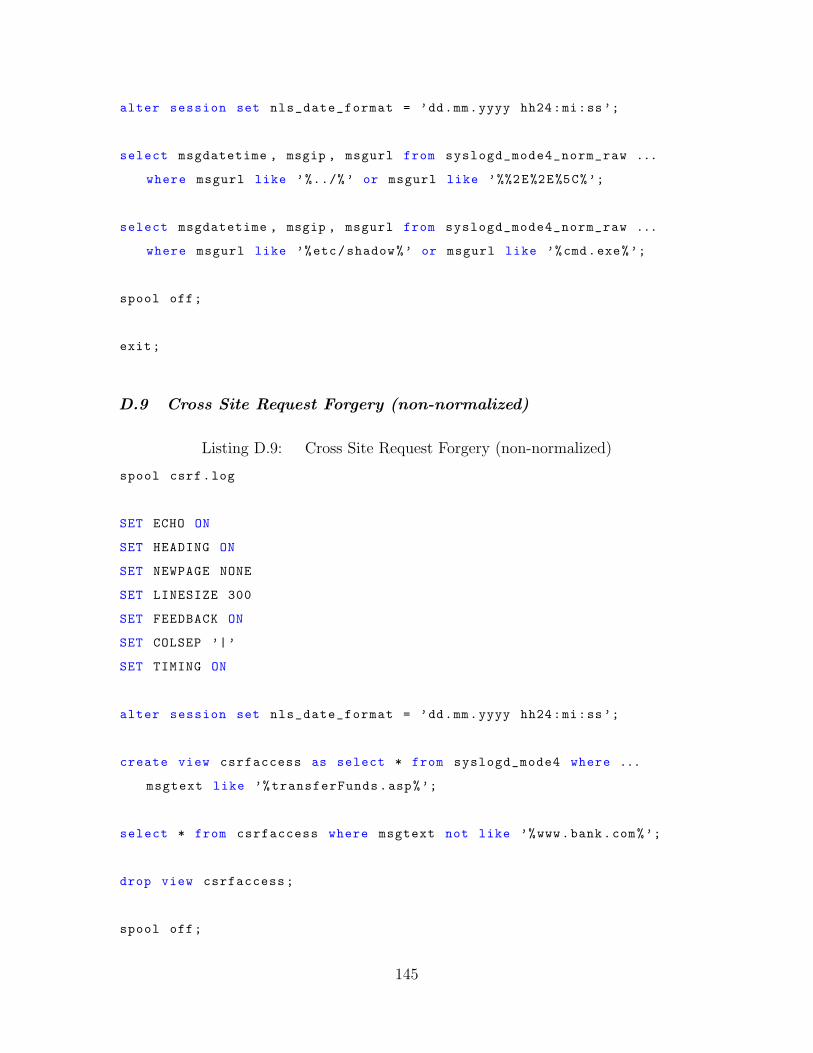
alter session set nls_date_format = ’dd.mm.yyyy hh24:mi:ss’;
select msgdatetime , msgip , msgurl from syslogd_mode4_norm_raw ...
where msgurl like ’%../% ’ or msgurl like ’%%2E%2E%5C%’;
select msgdatetime , msgip , msgurl from syslogd_mode4_norm_raw ...
where msgurl like ’%etc/shadow%’ or msgurl like ’%cmd.exe%’;
spool off;
exit;
D.9 Cross Site Request Forgery (non-normalized)
Listing D.9: Cross Site Request Forgery (non-normalized)
spool csrf.log
SET ECHO ON
SET HEADING ON
SET NEWPAGE NONE
SET LINESIZE 300
SET FEEDBACK ON
SET COLSEP ’|’
SET TIMING ON
alter session set nls_date_format = ’dd.mm.yyyy hh24:mi:ss’;
create view csrfaccess as select * from syslogd_mode4 where ...
msgtext like ’%transferFunds.asp%’;
select * from csrfaccess where msgtext not like ’%www.bank.com%’;
drop view csrfaccess;
spool off;
145
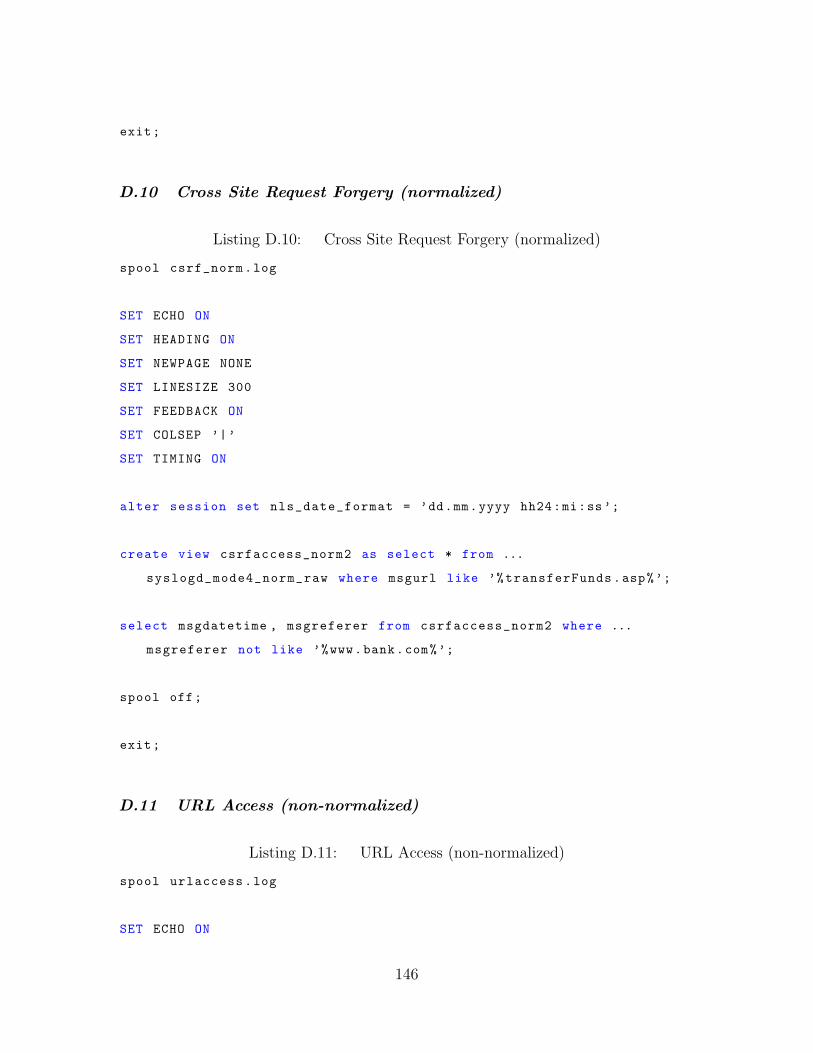
exit;
D.10 Cross Site Request Forgery (normalized)
Listing D.10: Cross Site Request Forgery (normalized)
spool csrf_norm.log
SET ECHO ON
SET HEADING ON
SET NEWPAGE NONE
SET LINESIZE 300
SET FEEDBACK ON
SET COLSEP ’|’
SET TIMING ON
alter session set nls_date_format = ’dd.mm.yyyy hh24:mi:ss’;
create view csrfaccess_norm2 as select * from ...
syslogd_mode4_norm_raw where msgurl like ’%transferFunds.asp%’;
select msgdatetime , msgreferer from csrfaccess_norm2 where ...
msgreferer not like ’%www.bank.com%’;
spool off;
exit;
D.11 URL Access (non-normalized)
Listing D.11: URL Access (non-normalized)
spool urlaccess.log
SET ECHO ON
146
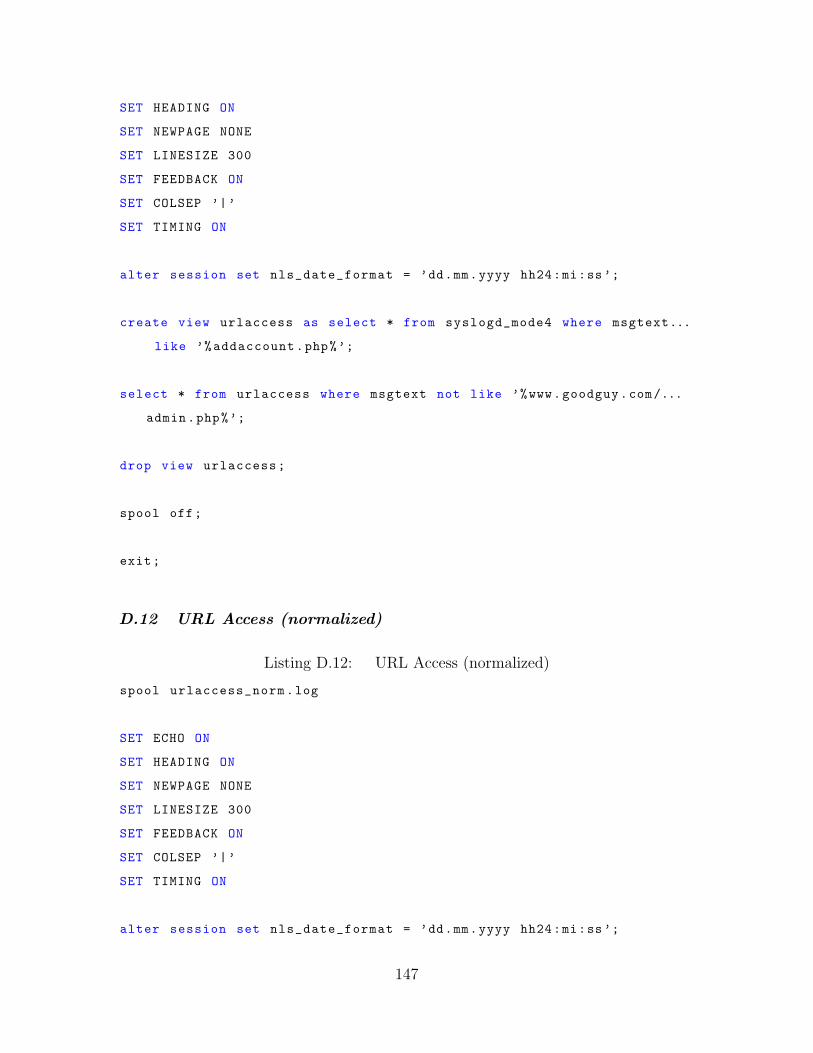
SET HEADING ON
SET NEWPAGE NONE
SET LINESIZE 300
SET FEEDBACK ON
SET COLSEP ’|’
SET TIMING ON
alter session set nls_date_format = ’dd.mm.yyyy hh24:mi:ss’;
create view urlaccess as select * from syslogd_mode4 where msgtext...
like ’%addaccount.php%’;
select * from urlaccess where msgtext not like ’%www.goodguy.com/...
admin.php%’;
drop view urlaccess;
spool off;
exit;
D.12 URL Access (normalized)
Listing D.12: URL Access (normalized)
spool urlaccess_norm.log
SET ECHO ON
SET HEADING ON
SET NEWPAGE NONE
SET LINESIZE 300
SET FEEDBACK ON
SET COLSEP ’|’
SET TIMING ON
alter session set nls_date_format = ’dd.mm.yyyy hh24:mi:ss’;
147
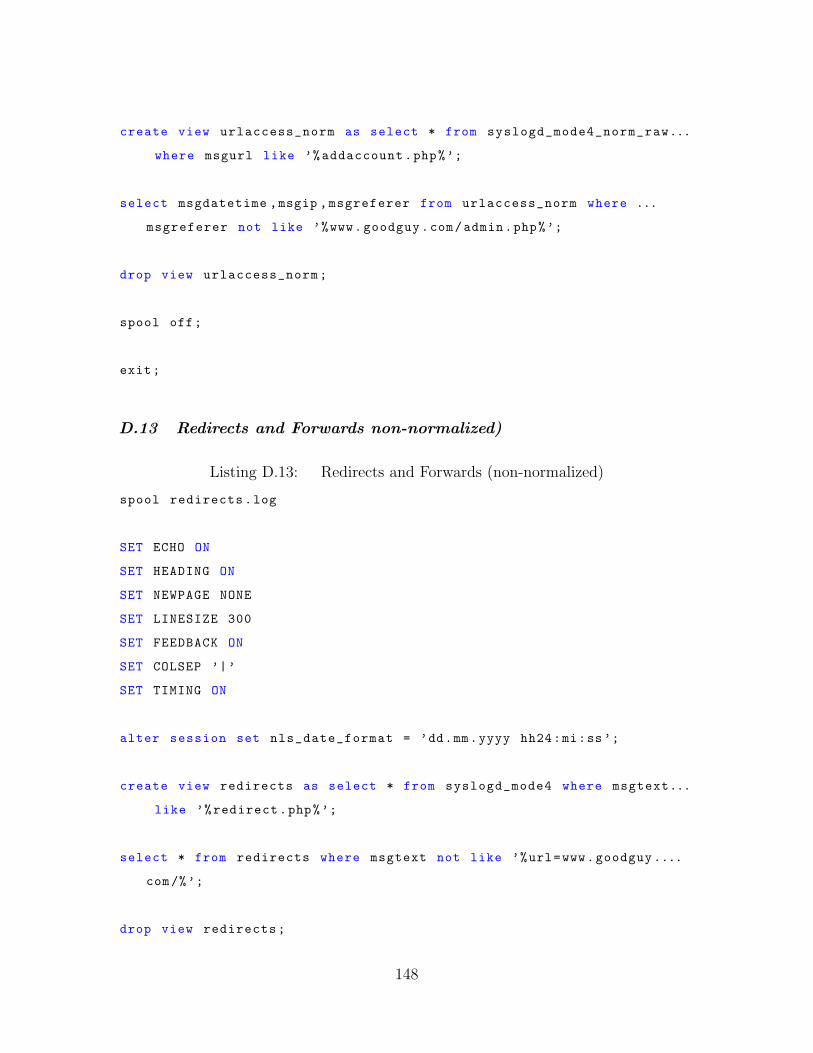
create view urlaccess_norm as select * from syslogd_mode4_norm_raw...
where msgurl like ’%addaccount.php%’;
select msgdatetime ,msgip ,msgreferer from urlaccess_norm where ...
msgreferer not like ’%www.goodguy.com/admin.php%’;
drop view urlaccess_norm;
spool off;
exit;
D.13 Redirects and Forwards non-normalized)
Listing D.13: Redirects and Forwards (non-normalized)
spool redirects.log
SET ECHO ON
SET HEADING ON
SET NEWPAGE NONE
SET LINESIZE 300
SET FEEDBACK ON
SET COLSEP ’|’
SET TIMING ON
alter session set nls_date_format = ’dd.mm.yyyy hh24:mi:ss’;
create view redirects as select * from syslogd_mode4 where msgtext...
like ’%redirect.php%’;
select * from redirects where msgtext not like ’%url=www.goodguy....
com/%’;
drop view redirects;
148
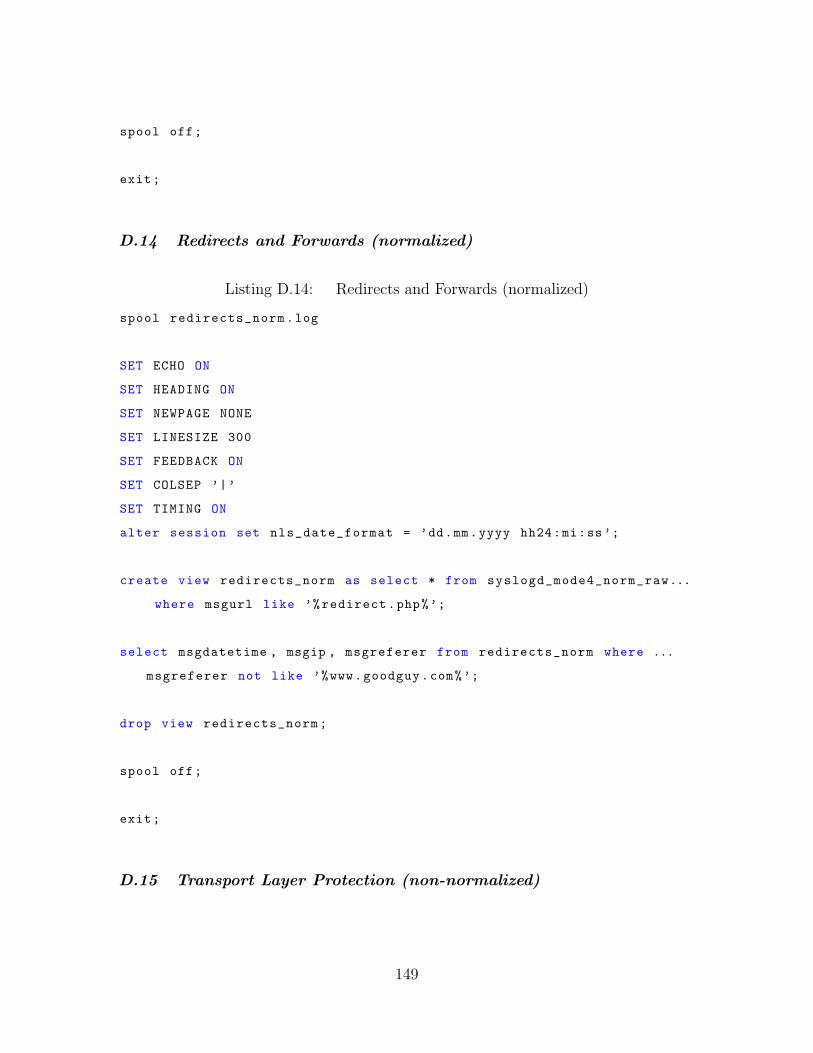
spool off;
exit;
D.14 Redirects and Forwards (normalized)
Listing D.14: Redirects and Forwards (normalized)
spool redirects_norm.log
SET ECHO ON
SET HEADING ON
SET NEWPAGE NONE
SET LINESIZE 300
SET FEEDBACK ON
SET COLSEP ’|’
SET TIMING ON
alter session set nls_date_format = ’dd.mm.yyyy hh24:mi:ss’;
create view redirects_norm as select * from syslogd_mode4_norm_raw...
where msgurl like ’%redirect.php%’;
select msgdatetime , msgip , msgreferer from redirects_norm where ...
msgreferer not like ’%www.goodguy.com%’;
drop view redirects_norm;
spool off;
exit;
D.15 Transport Layer Protection (non-normalized)
149
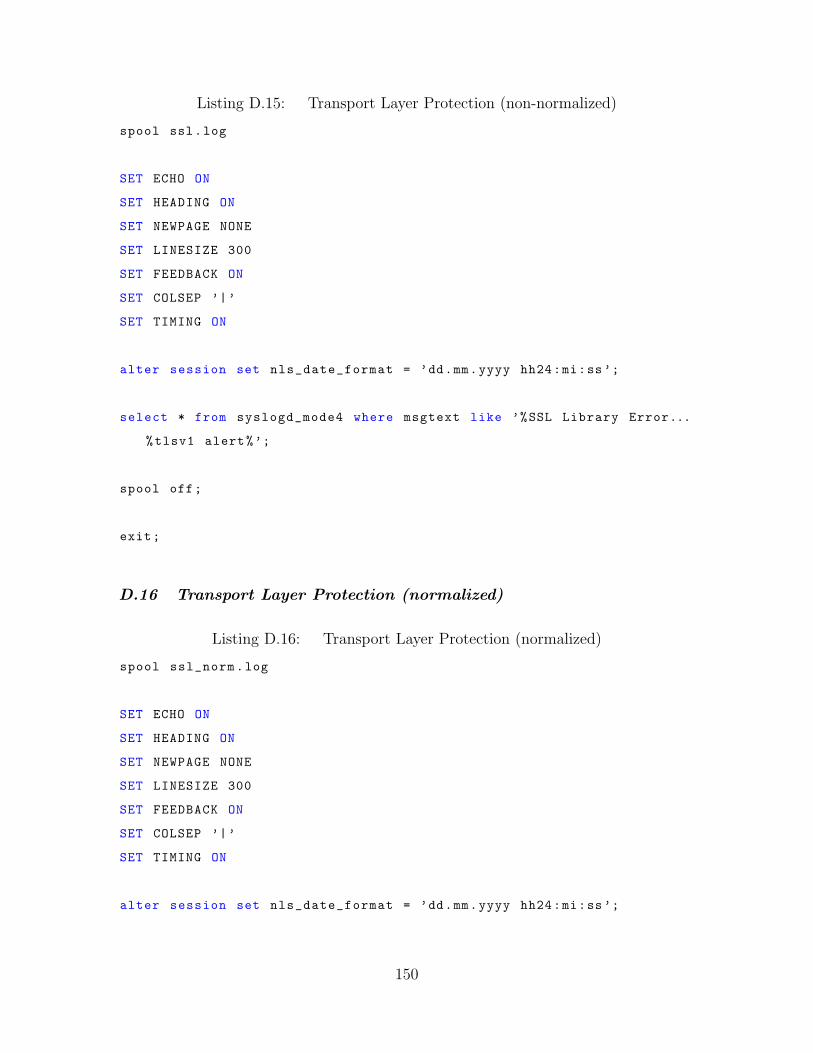
Listing D.15: Transport Layer Protection (non-normalized)
spool ssl.log
SET ECHO ON
SET HEADING ON
SET NEWPAGE NONE
SET LINESIZE 300
SET FEEDBACK ON
SET COLSEP ’|’
SET TIMING ON
alter session set nls_date_format = ’dd.mm.yyyy hh24:mi:ss’;
select * from syslogd_mode4 where msgtext like ’%SSL Library Error...
%tlsv1 alert%’;
spool off;
exit;
D.16 Transport Layer Protection (normalized)
Listing D.16: Transport Layer Protection (normalized)
spool ssl_norm.log
SET ECHO ON
SET HEADING ON
SET NEWPAGE NONE
SET LINESIZE 300
SET FEEDBACK ON
SET COLSEP ’|’
SET TIMING ON
alter session set nls_date_format = ’dd.mm.yyyy hh24:mi:ss’;
150
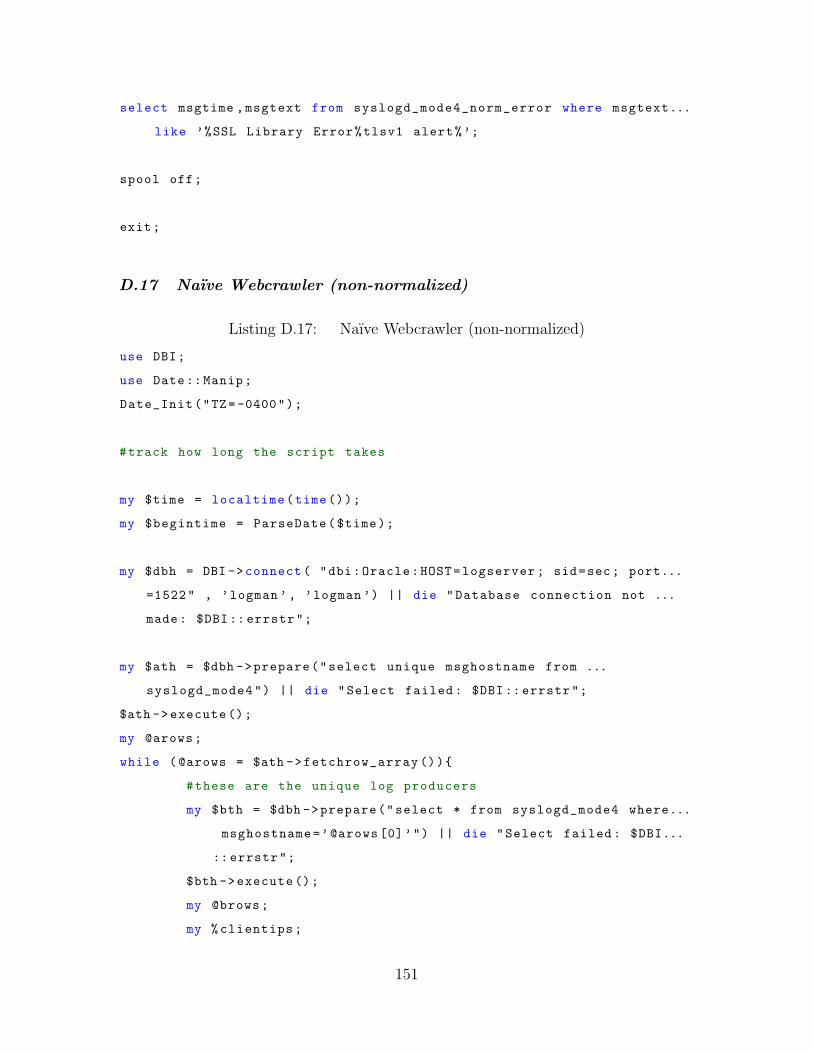
select msgtime ,msgtext from syslogd_mode4_norm_error where msgtext...
like ’%SSL Library Error%tlsv1 alert%’;
spool off;
exit;
D.17 Naıve Webcrawler (non-normalized)
Listing D.17: Naıve Webcrawler (non-normalized)
use DBI;
use Date::Manip;
Date_Init("TZ=-0400");
#track how long the script takes
my $time = localtime(time());
my $begintime = ParseDate($time);
my $dbh = DBI ->connect ( "dbi:Oracle:HOST=logserver ; sid=sec; port...
=1522" , ’logman ’, ’logman ’) || die "Database connection not ...
made: $DBI:: errstr";
my $ath = $dbh ->prepare("select unique msghostname from ...
syslogd_mode4") || die "Select failed : $DBI:: errstr";
$ath ->execute ();
my @arows;
while ( @arows = $ath ->fetchrow_array ()){
#these are the unique log producers
my $bth = $dbh ->prepare("select * from syslogd_mode4 where...
msghostname=’@arows [0]’") || die "Select failed : $DBI...
:: errstr";
$bth ->execute ();
my @brows;
my % clientips;
151
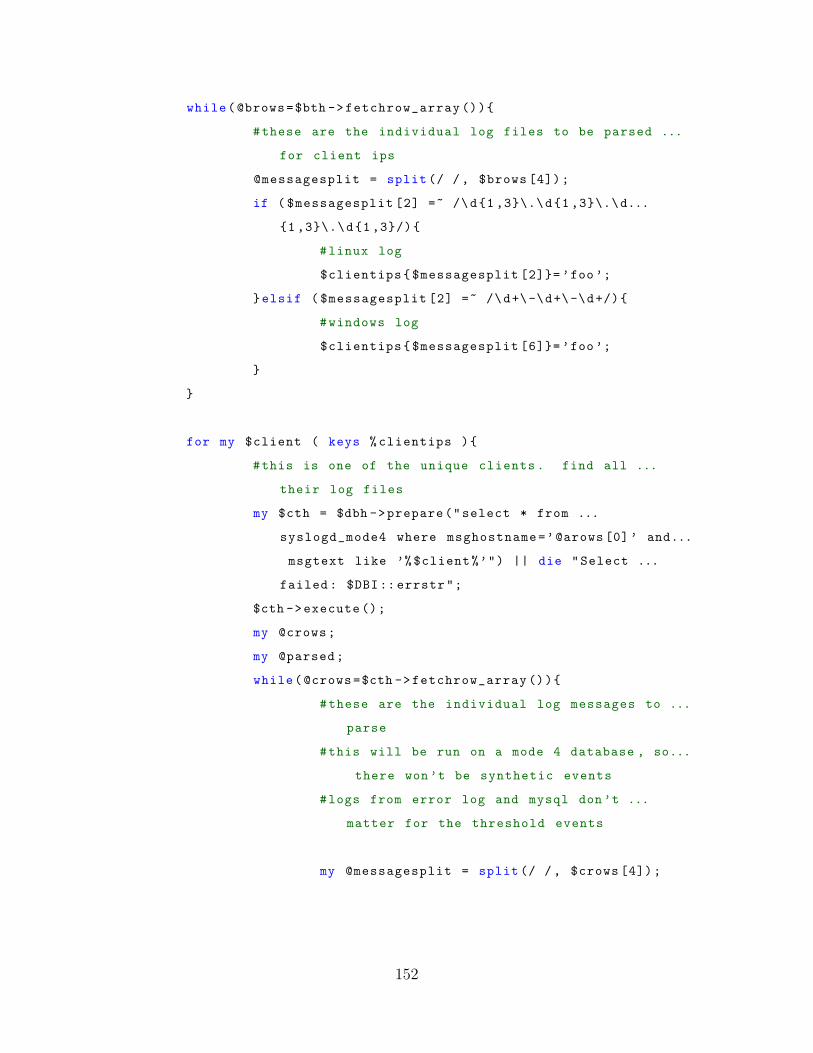
while(@brows=$bth ->fetchrow_array ()){
#these are the individual log files to be parsed ...
for client ips
@messagesplit = split (/ / , $brows [4]);
if ( $messagesplit [2] =~ /\d{1 ,3}\.\d{1 ,3}\.\d...
{1 ,3}\.\d{1 ,3}/){
#linux log
$clientips{$messagesplit [2]}= ’foo’;
}elsif ( $messagesplit [2] =~ /\d+\-\d+\-\d+/){
#windows log
$clientips{$messagesplit [6]}= ’foo’;
}
}
for my $client ( keys % clientips ){
#this is one of the unique clients . find all ...
their log files
my $cth = $dbh ->prepare("select * from ...
syslogd_mode4 where msghostname=’@arows [0]’ and...
msgtext like ’%$client%’") || die "Select ...
failed : $DBI:: errstr";
$cth ->execute ();
my @crows;
my @parsed;
while(@crows=$cth ->fetchrow_array ()){
#these are the individual log messages to ...
parse
#this will be run on a mode 4 database , so...
there won’t be synthetic events
#logs from error log and mysql don’t ...
matter for the threshold events
my @messagesplit = split (/ / , $crows [4]);
152
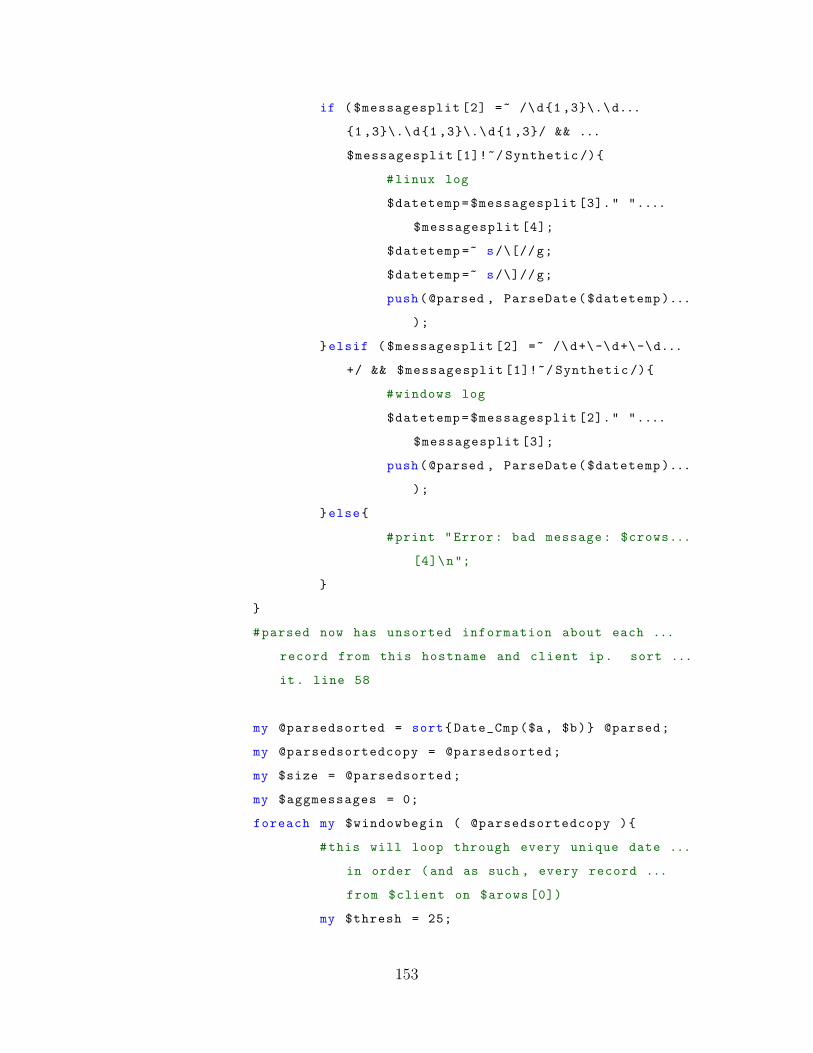
if ( $messagesplit [2] =~ /\d{1 ,3}\.\d...
{1 ,3}\.\d{1 ,3}\.\d{1 ,3}/ && ...
$messagesplit [1]!~/ Synthetic /){
#linux log
$datetemp=$messagesplit [3]." "....
$messagesplit [4];
$datetemp =~ s/\[//g;
$datetemp =~ s/\]//g;
push(@parsed , ParseDate($datetemp)...
);
}elsif ( $messagesplit [2] =~ /\d+\-\d+\-\d...
+/ && $messagesplit [1]!~/ Synthetic /){
#windows log
$datetemp=$messagesplit [2]." "....
$messagesplit [3];
push(@parsed , ParseDate($datetemp)...
);
}else{
#print "Error: bad message : $crows...
[4]\n";
}
}
#parsed now has unsorted information about each ...
record from this hostname and client ip. sort ...
it. line 58
my @parsedsorted = sort{Date_Cmp($a , $b)} @parsed;
my @parsedsortedcopy = @parsedsorted;
my $size = @parsedsorted;
my $aggmessages = 0;
foreach my $windowbegin ( @parsedsortedcopy ){
#this will loop through every unique date ...
in order (and as such , every record ...
from $client on $arows [0])
my $thresh = 25;
153
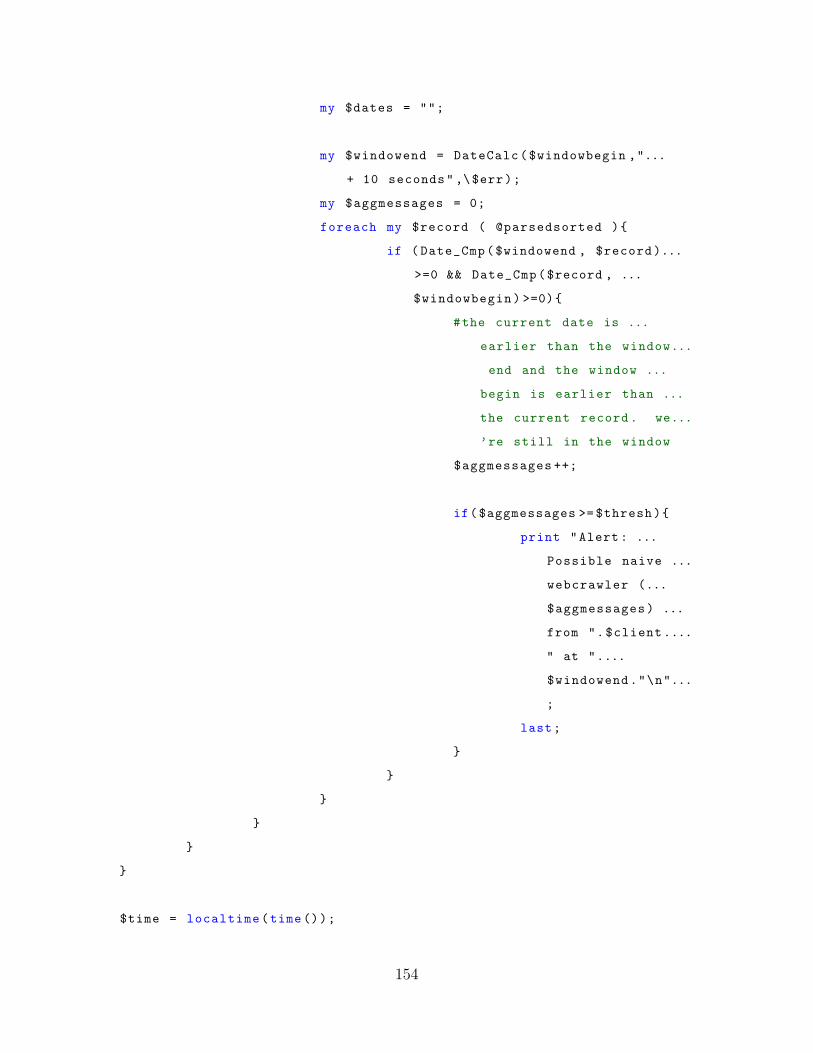
my $dates = "";
my $windowend = DateCalc($windowbegin ,"...
+ 10 seconds",\$err);
my $aggmessages = 0;
foreach my $record ( @parsedsorted ){
if ( Date_Cmp($windowend , $record)...
>=0 && Date_Cmp($record , ...
$windowbegin) >=0){
#the current date is ...
earlier than the window...
end and the window ...
begin is earlier than ...
the current record . we...
’re still in the window
$aggmessages ++;
if($aggmessages >= $thresh){
print "Alert: ...
Possible naive ...
webcrawler (...
$aggmessages) ...
from ".$client....
" at "....
$windowend."\n"...
;
last;
}
}
}
}
}
}
$time = localtime(time());
154
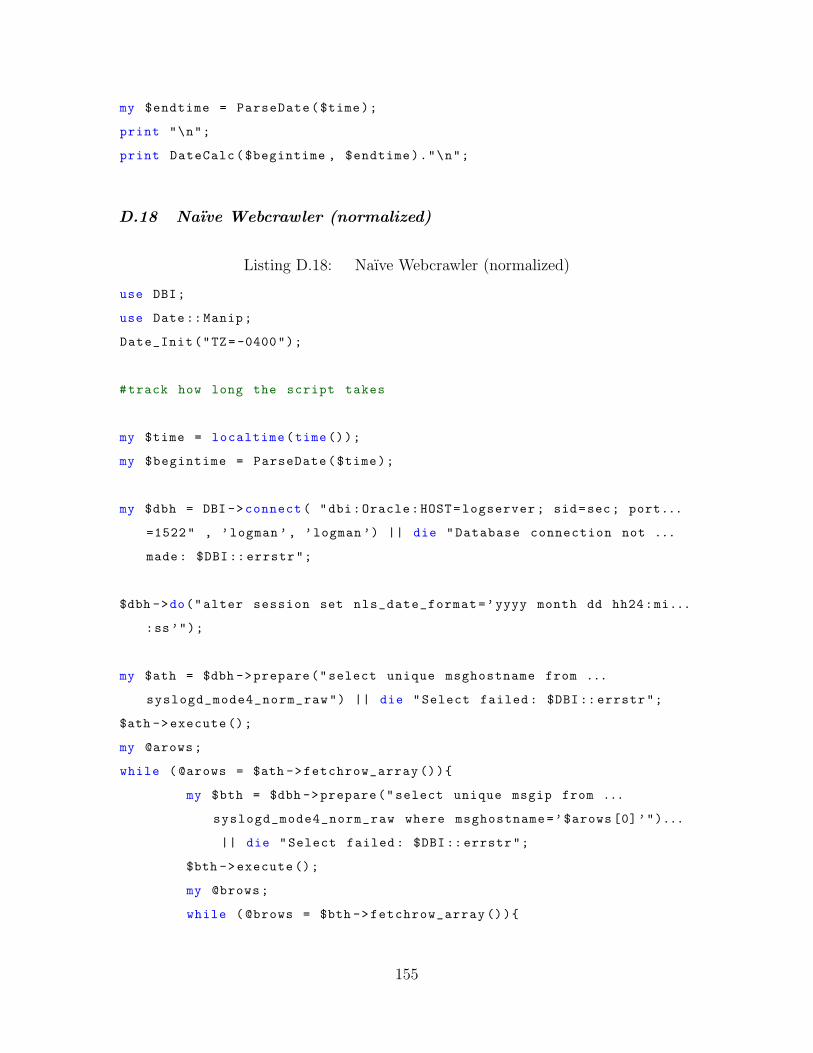
my $endtime = ParseDate($time);
print "\n";
print DateCalc($begintime , $endtime)."\n";
D.18 Naıve Webcrawler (normalized)
Listing D.18: Naıve Webcrawler (normalized)
use DBI;
use Date::Manip;
Date_Init("TZ=-0400");
#track how long the script takes
my $time = localtime(time());
my $begintime = ParseDate($time);
my $dbh = DBI ->connect ( "dbi:Oracle:HOST=logserver ; sid=sec; port...
=1522" , ’logman ’, ’logman ’) || die "Database connection not ...
made: $DBI:: errstr";
$dbh ->do("alter session set nls_date_format=’yyyy month dd hh24:mi...
:ss’");
my $ath = $dbh ->prepare("select unique msghostname from ...
syslogd_mode4_norm_raw") || die "Select failed : $DBI:: errstr";
$ath ->execute ();
my @arows;
while ( @arows = $ath ->fetchrow_array ()){
my $bth = $dbh ->prepare("select unique msgip from ...
syslogd_mode4_norm_raw where msghostname=’$arows [0]’")...
|| die "Select failed : $DBI:: errstr";
$bth ->execute ();
my @brows;
while ( @brows = $bth ->fetchrow_array ()){
155
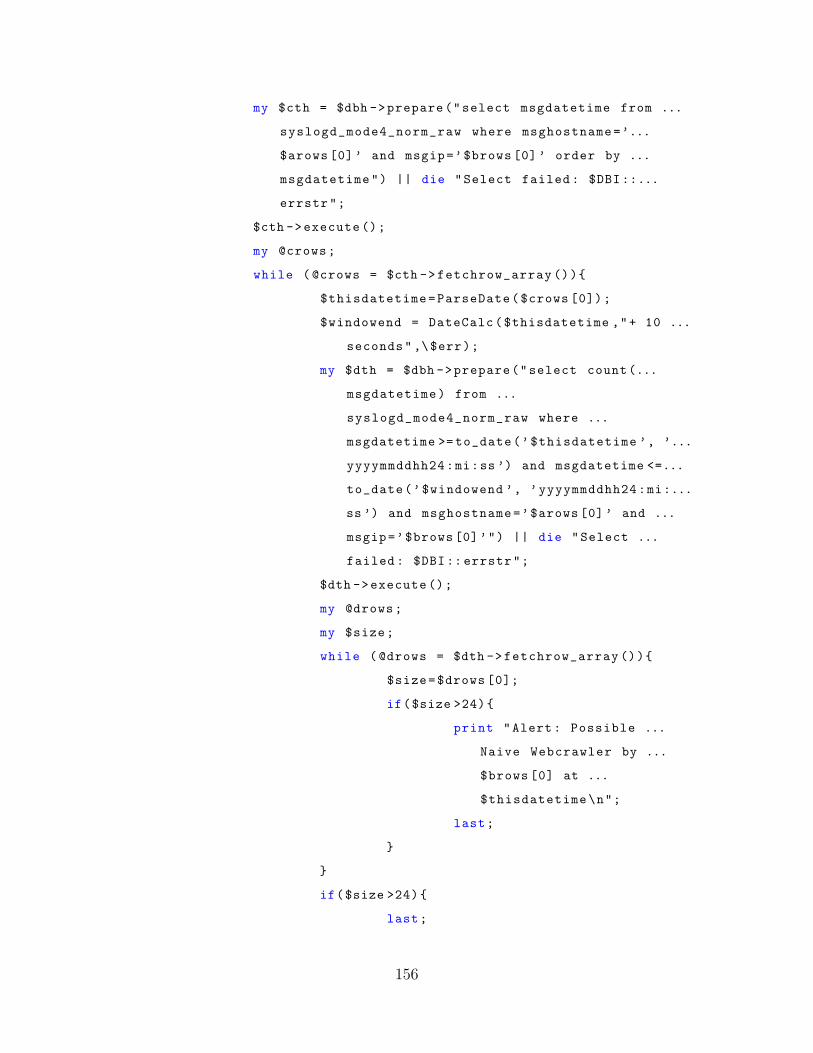
my $cth = $dbh ->prepare("select msgdatetime from ...
syslogd_mode4_norm_raw where msghostname=’...
$arows [0]’ and msgip=’$brows [0]’ order by ...
msgdatetime") || die "Select failed : $DBI::...
errstr";
$cth ->execute ();
my @crows;
while ( @crows = $cth ->fetchrow_array ()){
$thisdatetime=ParseDate($crows [0]);
$windowend = DateCalc($thisdatetime ,"+ 10 ...
seconds" ,\$err);
my $dth = $dbh ->prepare("select count(...
msgdatetime) from ...
syslogd_mode4_norm_raw where ...
msgdatetime >= to_date(’$thisdatetime ’, ’...
yyyymmddhh24:mi:ss ’) and msgdatetime <=...
to_date(’$windowend ’, ’yyyymmddhh24:mi:...
ss ’) and msghostname=’$arows [0]’ and ...
msgip=’$brows [0]’") || die "Select ...
failed : $DBI:: errstr";
$dth ->execute ();
my @drows;
my $size;
while ( @drows = $dth ->fetchrow_array ()){
$size=$drows [0];
if($size >24){
print "Alert: Possible ...
Naive Webcrawler by ...
$brows [0] at ...
$thisdatetime\n";
last;
}
}
if($size >24){
last;
156
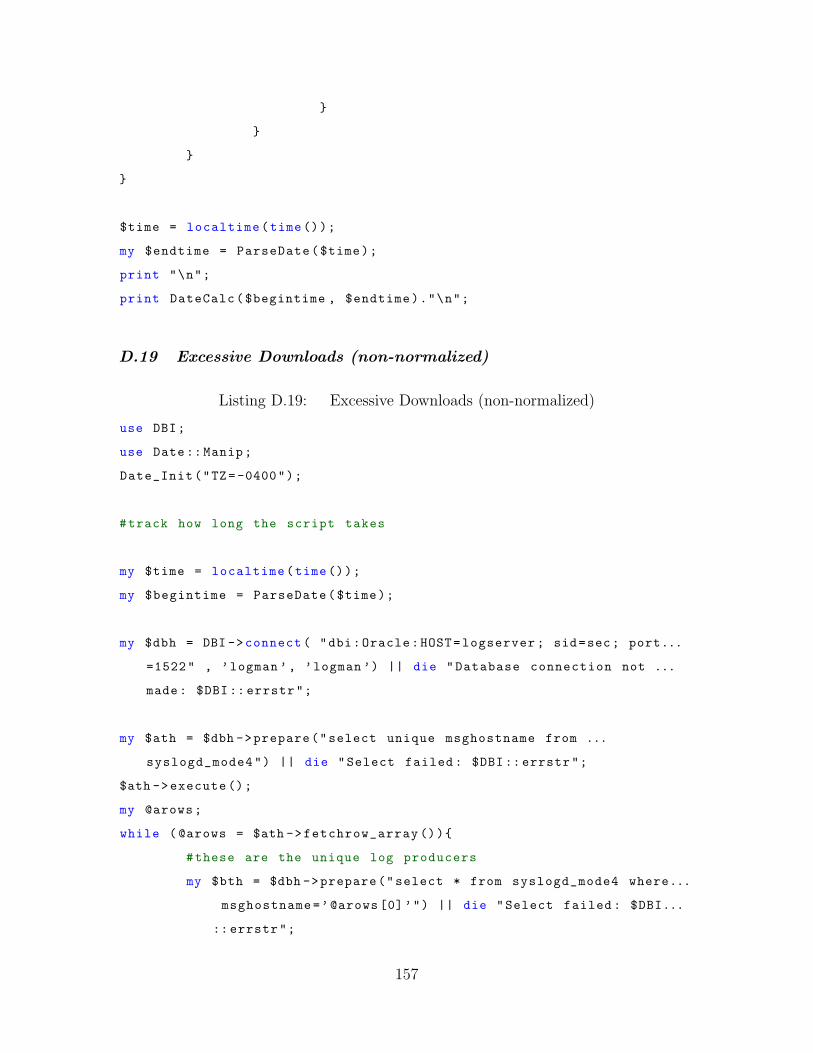
}
}
}
}
$time = localtime(time());
my $endtime = ParseDate($time);
print "\n";
print DateCalc($begintime , $endtime)."\n";
D.19 Excessive Downloads (non-normalized)
Listing D.19: Excessive Downloads (non-normalized)
use DBI;
use Date::Manip;
Date_Init("TZ=-0400");
#track how long the script takes
my $time = localtime(time());
my $begintime = ParseDate($time);
my $dbh = DBI ->connect ( "dbi:Oracle:HOST=logserver ; sid=sec; port...
=1522" , ’logman ’, ’logman ’) || die "Database connection not ...
made: $DBI:: errstr";
my $ath = $dbh ->prepare("select unique msghostname from ...
syslogd_mode4") || die "Select failed : $DBI:: errstr";
$ath ->execute ();
my @arows;
while ( @arows = $ath ->fetchrow_array ()){
#these are the unique log producers
my $bth = $dbh ->prepare("select * from syslogd_mode4 where...
msghostname=’@arows [0]’") || die "Select failed : $DBI...
:: errstr";
157
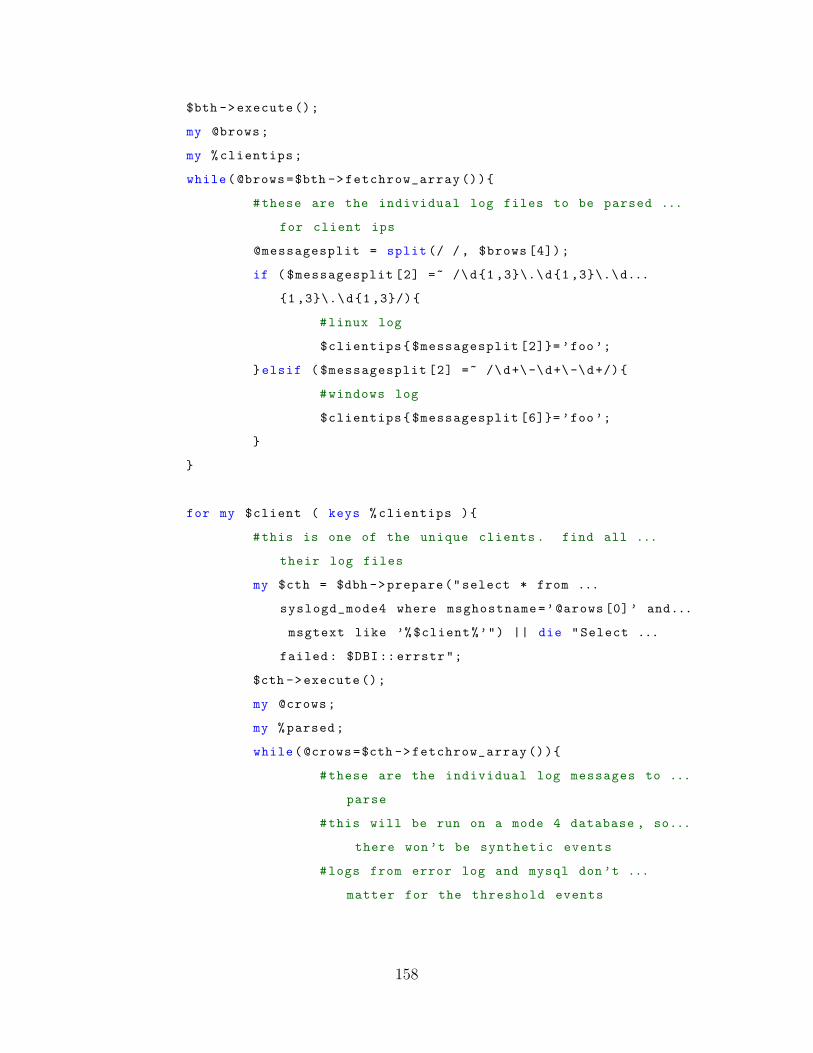
$bth ->execute ();
my @brows;
my % clientips;
while(@brows=$bth ->fetchrow_array ()){
#these are the individual log files to be parsed ...
for client ips
@messagesplit = split (/ / , $brows [4]);
if ( $messagesplit [2] =~ /\d{1 ,3}\.\d{1 ,3}\.\d...
{1 ,3}\.\d{1 ,3}/){
#linux log
$clientips{$messagesplit [2]}= ’foo’;
}elsif ( $messagesplit [2] =~ /\d+\-\d+\-\d+/){
#windows log
$clientips{$messagesplit [6]}= ’foo’;
}
}
for my $client ( keys % clientips ){
#this is one of the unique clients . find all ...
their log files
my $cth = $dbh ->prepare("select * from ...
syslogd_mode4 where msghostname=’@arows [0]’ and...
msgtext like ’%$client%’") || die "Select ...
failed : $DBI:: errstr";
$cth ->execute ();
my @crows;
my % parsed;
while(@crows=$cth ->fetchrow_array ()){
#these are the individual log messages to ...
parse
#this will be run on a mode 4 database , so...
there won’t be synthetic events
#logs from error log and mysql don’t ...
matter for the threshold events
158
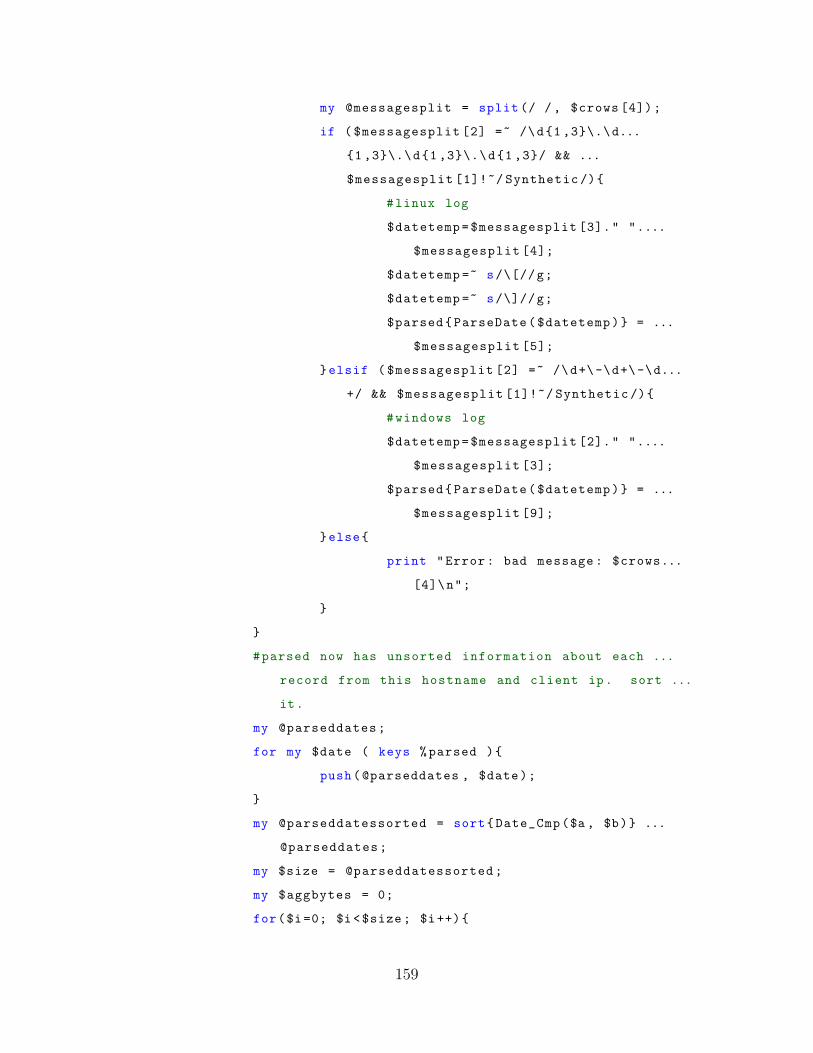
my @messagesplit = split (/ / , $crows [4]);
if ( $messagesplit [2] =~ /\d{1 ,3}\.\d...
{1 ,3}\.\d{1 ,3}\.\d{1 ,3}/ && ...
$messagesplit [1]!~/ Synthetic /){
#linux log
$datetemp=$messagesplit [3]." "....
$messagesplit [4];
$datetemp =~ s/\[//g;
$datetemp =~ s/\]//g;
$parsed{ParseDate($datetemp)} = ...
$messagesplit [5];
}elsif ( $messagesplit [2] =~ /\d+\-\d+\-\d...
+/ && $messagesplit [1]!~/ Synthetic /){
#windows log
$datetemp=$messagesplit [2]." "....
$messagesplit [3];
$parsed{ParseDate($datetemp)} = ...
$messagesplit [9];
}else{
print "Error: bad message : $crows...
[4]\n";
}
}
#parsed now has unsorted information about each ...
record from this hostname and client ip. sort ...
it.
my @parseddates;
for my $date ( keys % parsed ){
push(@parseddates , $date);
}
my @parseddatessorted = sort{Date_Cmp($a , $b)} ...
@parseddates;
my $size = @parseddatessorted;
my $aggbytes = 0;
for($i=0; $i <$size; $i++){
159
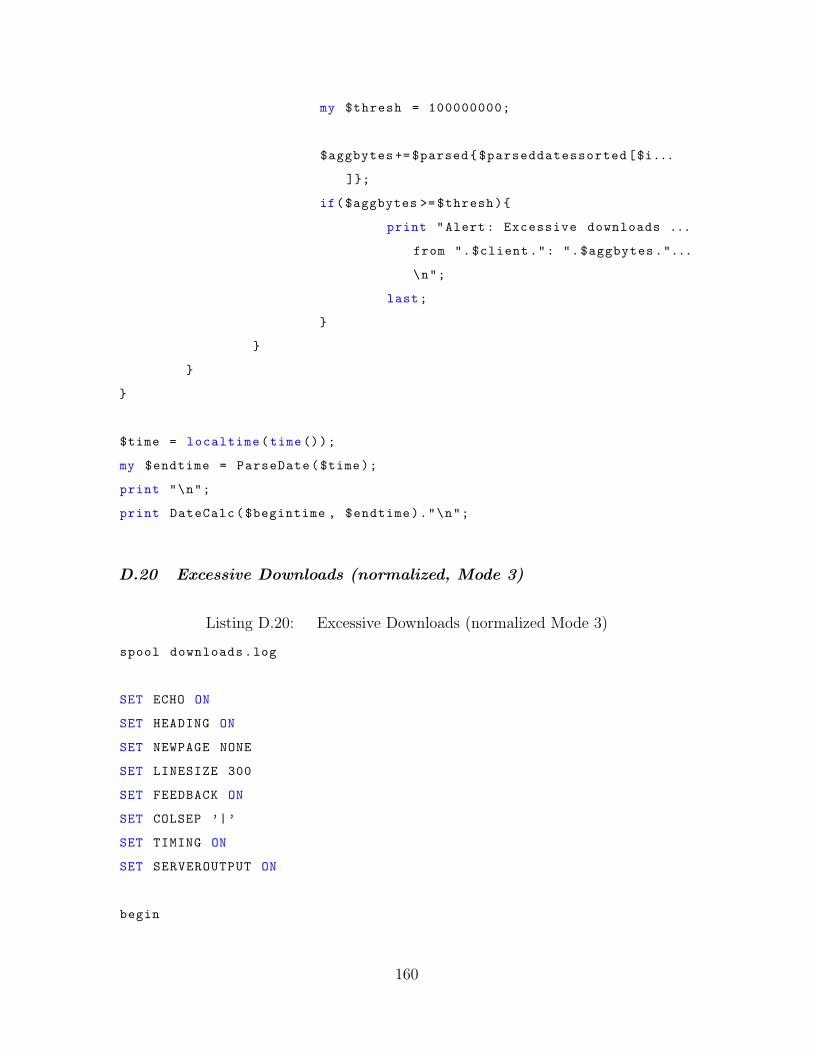
my $thresh = 100000000;
$aggbytes += $parsed{$parseddatessorted[$i...
]};
if($aggbytes >= $thresh){
print "Alert: Excessive downloads ...
from ".$client.": ".$aggbytes."...
\n";
last;
}
}
}
}
$time = localtime(time());
my $endtime = ParseDate($time);
print "\n";
print DateCalc($begintime , $endtime)."\n";
D.20 Excessive Downloads (normalized, Mode 3)
Listing D.20: Excessive Downloads (normalized Mode 3)
spool downloads.log
SET ECHO ON
SET HEADING ON
SET NEWPAGE NONE
SET LINESIZE 300
SET FEEDBACK ON
SET COLSEP ’|’
SET TIMING ON
SET SERVEROUTPUT ON
begin
160
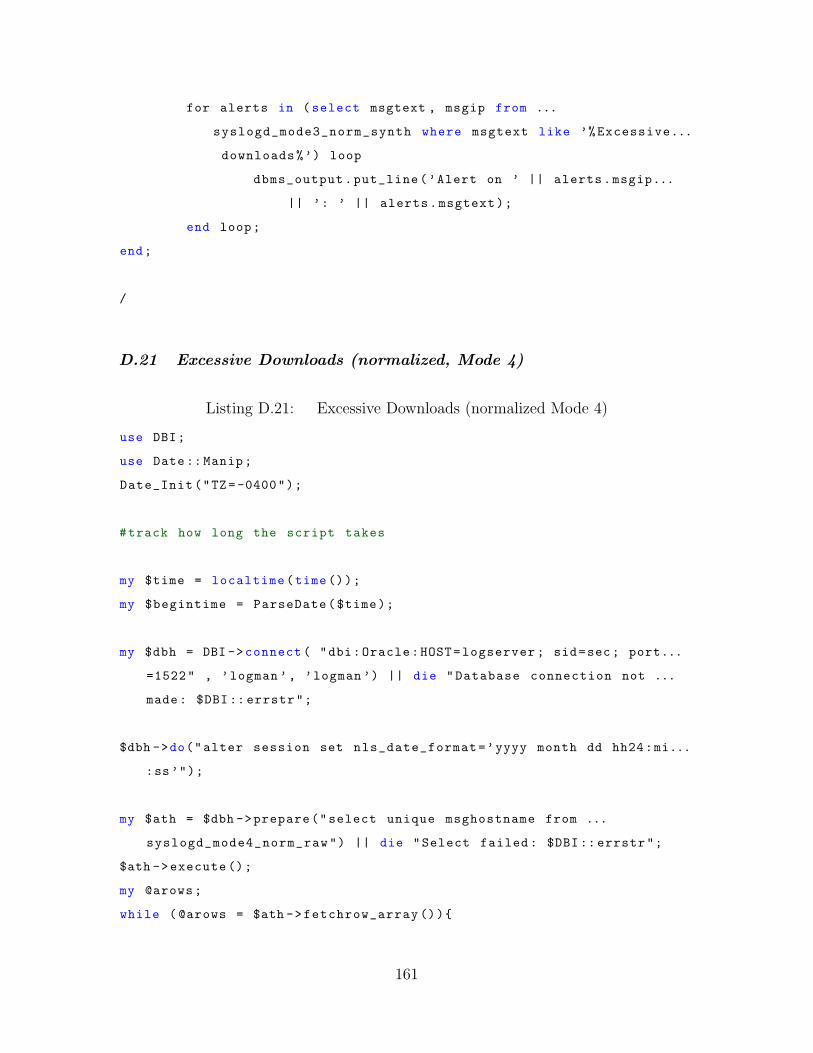
for alerts in ( select msgtext , msgip from ...
syslogd_mode3_norm_synth where msgtext like ’%Excessive...
downloads%’) loop
dbms_output.put_line(’Alert on ’ || alerts.msgip...
|| ’: ’ || alerts.msgtext);
end loop;
end;
/
D.21 Excessive Downloads (normalized, Mode 4)
Listing D.21: Excessive Downloads (normalized Mode 4)
use DBI;
use Date::Manip;
Date_Init("TZ=-0400");
#track how long the script takes
my $time = localtime(time());
my $begintime = ParseDate($time);
my $dbh = DBI ->connect ( "dbi:Oracle:HOST=logserver ; sid=sec; port...
=1522" , ’logman ’, ’logman ’) || die "Database connection not ...
made: $DBI:: errstr";
$dbh ->do("alter session set nls_date_format=’yyyy month dd hh24:mi...
:ss’");
my $ath = $dbh ->prepare("select unique msghostname from ...
syslogd_mode4_norm_raw") || die "Select failed : $DBI:: errstr";
$ath ->execute ();
my @arows;
while ( @arows = $ath ->fetchrow_array ()){
161
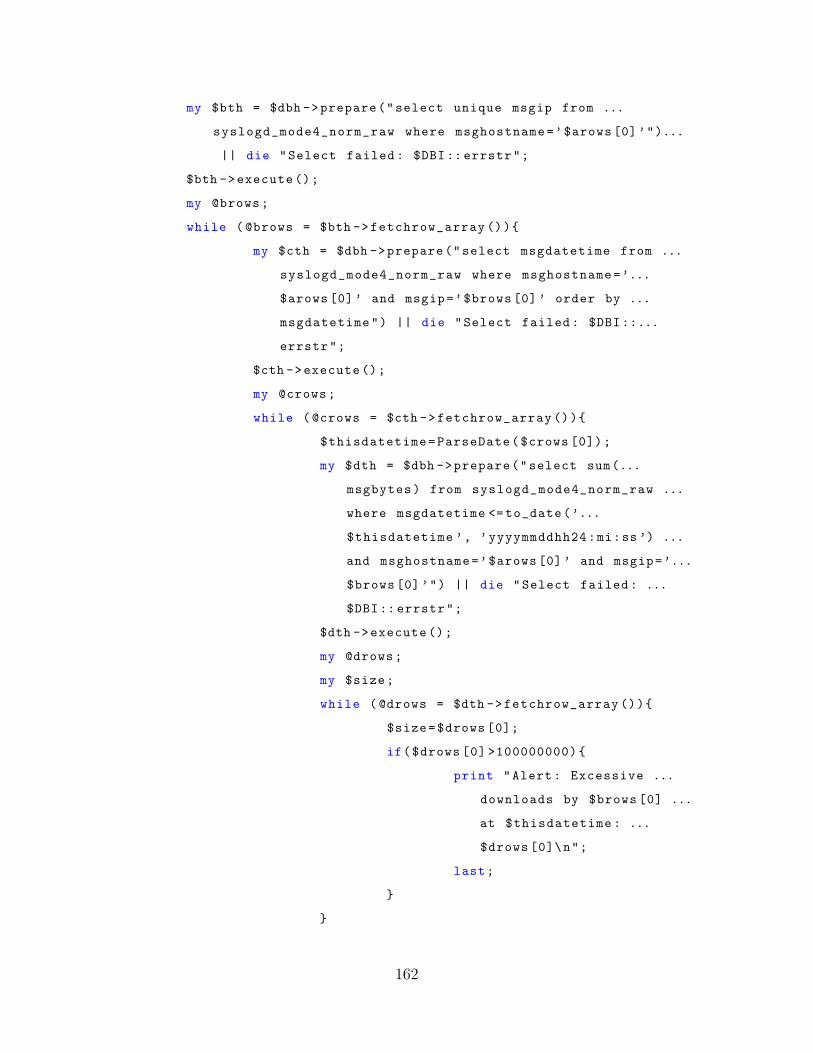
my $bth = $dbh ->prepare("select unique msgip from ...
syslogd_mode4_norm_raw where msghostname=’$arows [0]’")...
|| die "Select failed : $DBI:: errstr";
$bth ->execute ();
my @brows;
while ( @brows = $bth ->fetchrow_array ()){
my $cth = $dbh ->prepare("select msgdatetime from ...
syslogd_mode4_norm_raw where msghostname=’...
$arows [0]’ and msgip=’$brows [0]’ order by ...
msgdatetime") || die "Select failed : $DBI::...
errstr";
$cth ->execute ();
my @crows;
while ( @crows = $cth ->fetchrow_array ()){
$thisdatetime=ParseDate($crows [0]);
my $dth = $dbh ->prepare("select sum(...
msgbytes) from syslogd_mode4_norm_raw ...
where msgdatetime <= to_date(’...
$thisdatetime ’, ’yyyymmddhh24:mi:ss ’) ...
and msghostname=’$arows [0]’ and msgip=’...
$brows [0]’") || die "Select failed : ...
$DBI:: errstr";
$dth ->execute ();
my @drows;
my $size;
while ( @drows = $dth ->fetchrow_array ()){
$size=$drows [0];
if($drows [0] >100000000){
print "Alert: Excessive ...
downloads by $brows [0] ...
at $thisdatetime : ...
$drows [0]\n";
last;
}
}
162
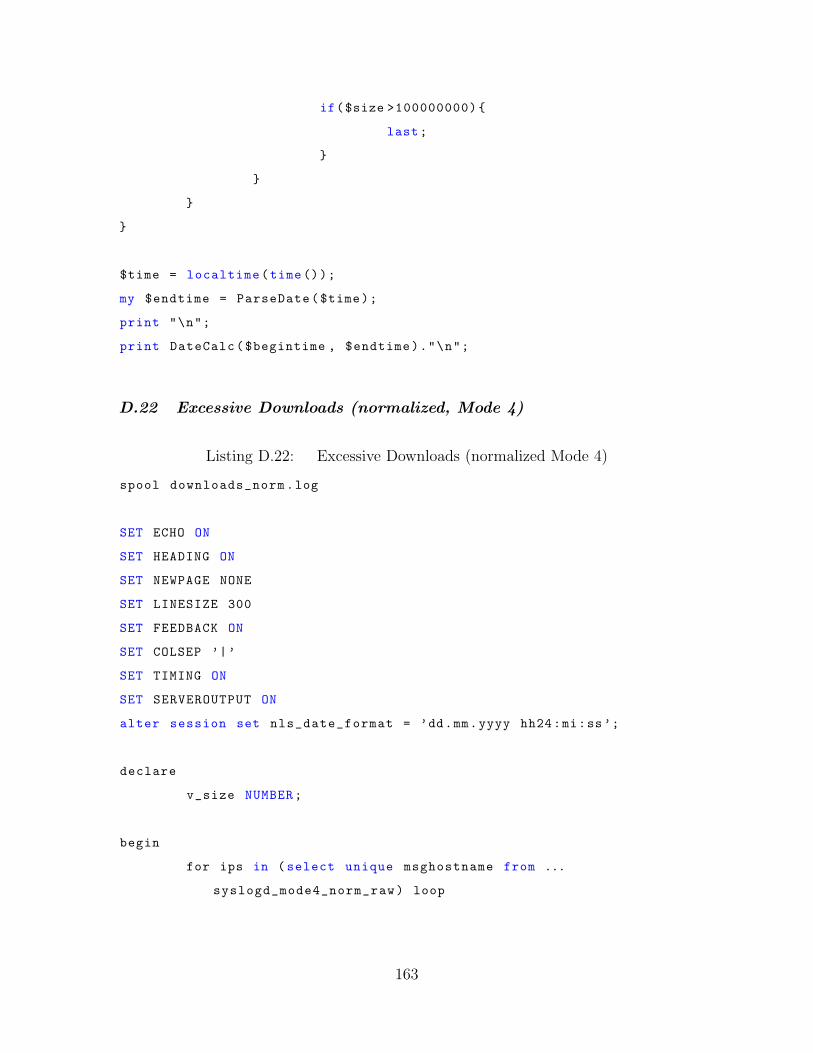
if($size >100000000){
last;
}
}
}
}
$time = localtime(time());
my $endtime = ParseDate($time);
print "\n";
print DateCalc($begintime , $endtime)."\n";
D.22 Excessive Downloads (normalized, Mode 4)
Listing D.22: Excessive Downloads (normalized Mode 4)
spool downloads_norm.log
SET ECHO ON
SET HEADING ON
SET NEWPAGE NONE
SET LINESIZE 300
SET FEEDBACK ON
SET COLSEP ’|’
SET TIMING ON
SET SERVEROUTPUT ON
alter session set nls_date_format = ’dd.mm.yyyy hh24:mi:ss’;
declare
v_size NUMBER;
begin
for ips in ( select unique msghostname from ...
syslogd_mode4_norm_raw) loop
163
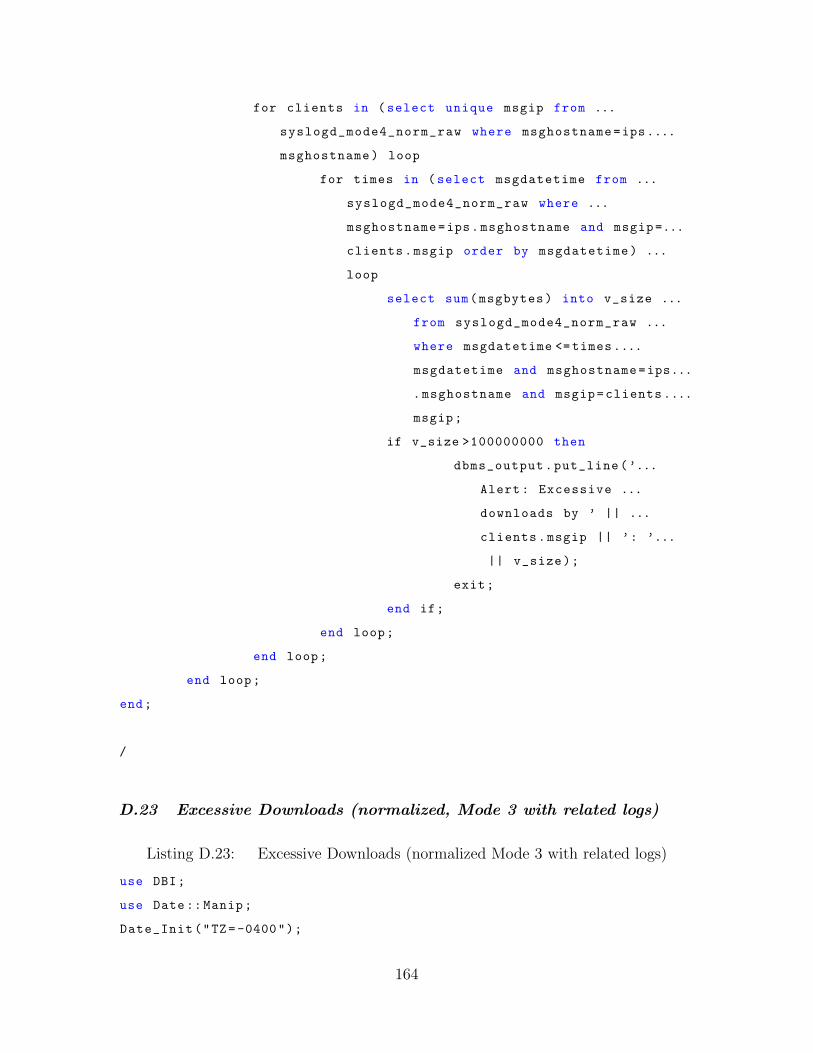
for clients in ( select unique msgip from ...
syslogd_mode4_norm_raw where msghostname=ips....
msghostname) loop
for times in ( select msgdatetime from ...
syslogd_mode4_norm_raw where ...
msghostname=ips.msghostname and msgip=...
clients.msgip order by msgdatetime) ...
loop
select sum(msgbytes) into v_size ...
from syslogd_mode4_norm_raw ...
where msgdatetime <=times....
msgdatetime and msghostname=ips...
.msghostname and msgip=clients....
msgip;
if v_size >100000000 then
dbms_output.put_line(’...
Alert: Excessive ...
downloads by ’ || ...
clients.msgip || ’: ’...
|| v_size);
exit;
end if;
end loop;
end loop;
end loop;
end;
/
D.23 Excessive Downloads (normalized, Mode 3 with related logs)
Listing D.23: Excessive Downloads (normalized Mode 3 with related logs)
use DBI;
use Date::Manip;
Date_Init("TZ=-0400");
164
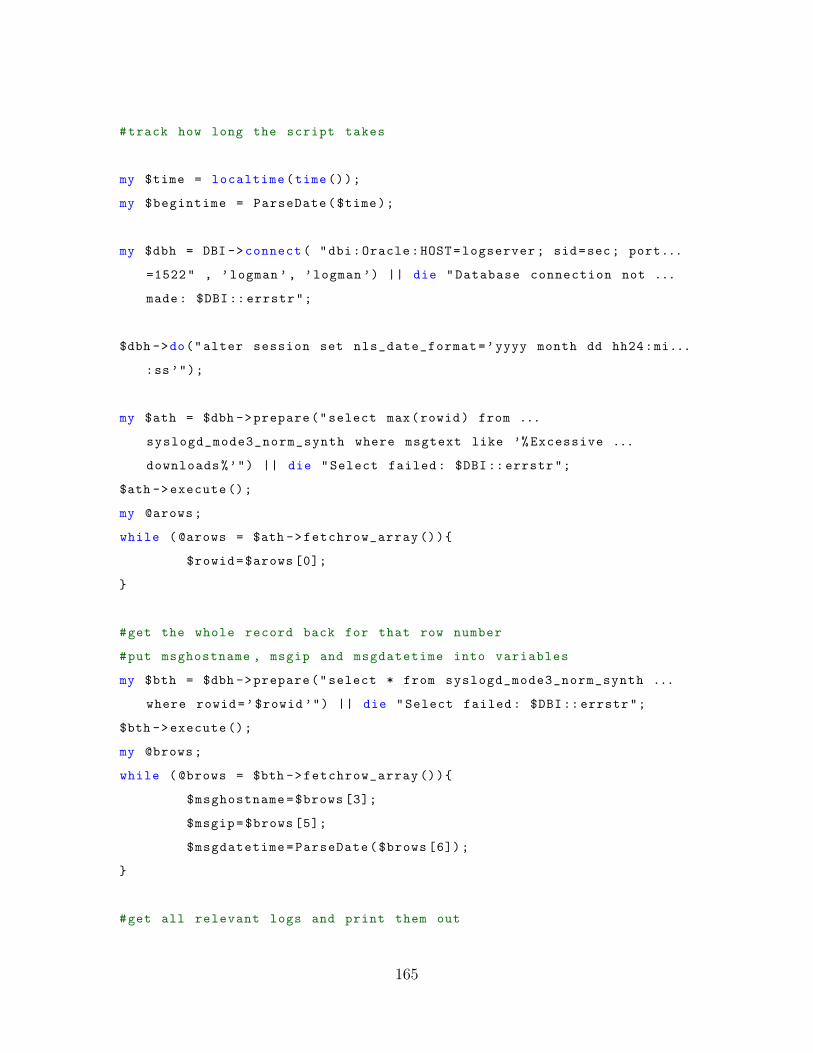
#track how long the script takes
my $time = localtime(time());
my $begintime = ParseDate($time);
my $dbh = DBI ->connect ( "dbi:Oracle:HOST=logserver ; sid=sec; port...
=1522" , ’logman ’, ’logman ’) || die "Database connection not ...
made: $DBI:: errstr";
$dbh ->do("alter session set nls_date_format=’yyyy month dd hh24:mi...
:ss’");
my $ath = $dbh ->prepare("select max(rowid) from ...
syslogd_mode3_norm_synth where msgtext like ’% Excessive ...
downloads%’") || die "Select failed : $DBI:: errstr";
$ath ->execute ();
my @arows;
while ( @arows = $ath ->fetchrow_array ()){
$rowid=$arows [0];
}
#get the whole record back for that row number
#put msghostname , msgip and msgdatetime into variables
my $bth = $dbh ->prepare("select * from syslogd_mode3_norm_synth ...
where rowid=’$rowid ’") || die "Select failed : $DBI:: errstr";
$bth ->execute ();
my @brows;
while ( @brows = $bth ->fetchrow_array ()){
$msghostname=$brows [3];
$msgip=$brows [5];
$msgdatetime=ParseDate($brows [6]);
}
#get all relevant logs and print them out
165
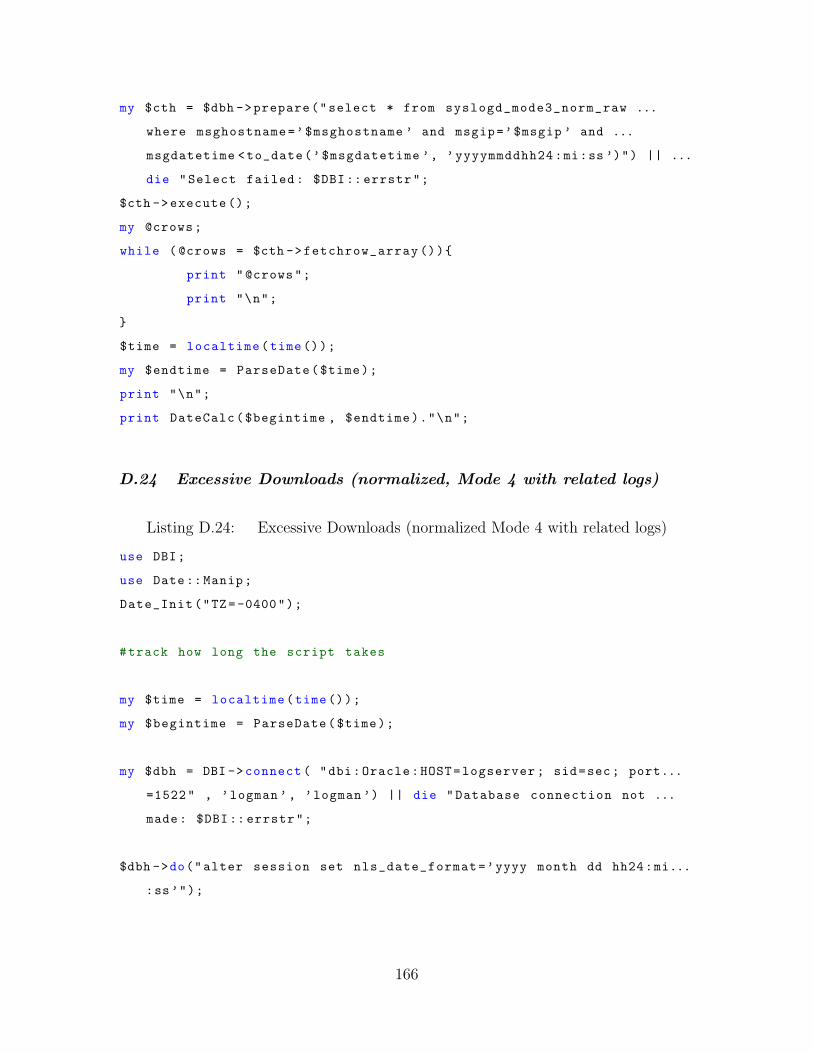
my $cth = $dbh ->prepare("select * from syslogd_mode3_norm_raw ...
where msghostname=’$msghostname ’ and msgip=’$msgip ’ and ...
msgdatetime <to_date(’$msgdatetime ’, ’yyyymmddhh24:mi:ss ’)") || ...
die "Select failed : $DBI:: errstr";
$cth ->execute ();
my @crows;
while ( @crows = $cth ->fetchrow_array ()){
print "@crows";
print "\n";
}
$time = localtime(time());
my $endtime = ParseDate($time);
print "\n";
print DateCalc($begintime , $endtime)."\n";
D.24 Excessive Downloads (normalized, Mode 4 with related logs)
Listing D.24: Excessive Downloads (normalized Mode 4 with related logs)
use DBI;
use Date::Manip;
Date_Init("TZ=-0400");
#track how long the script takes
my $time = localtime(time());
my $begintime = ParseDate($time);
my $dbh = DBI ->connect ( "dbi:Oracle:HOST=logserver ; sid=sec; port...
=1522" , ’logman ’, ’logman ’) || die "Database connection not ...
made: $DBI:: errstr";
$dbh ->do("alter session set nls_date_format=’yyyy month dd hh24:mi...
:ss’");
166
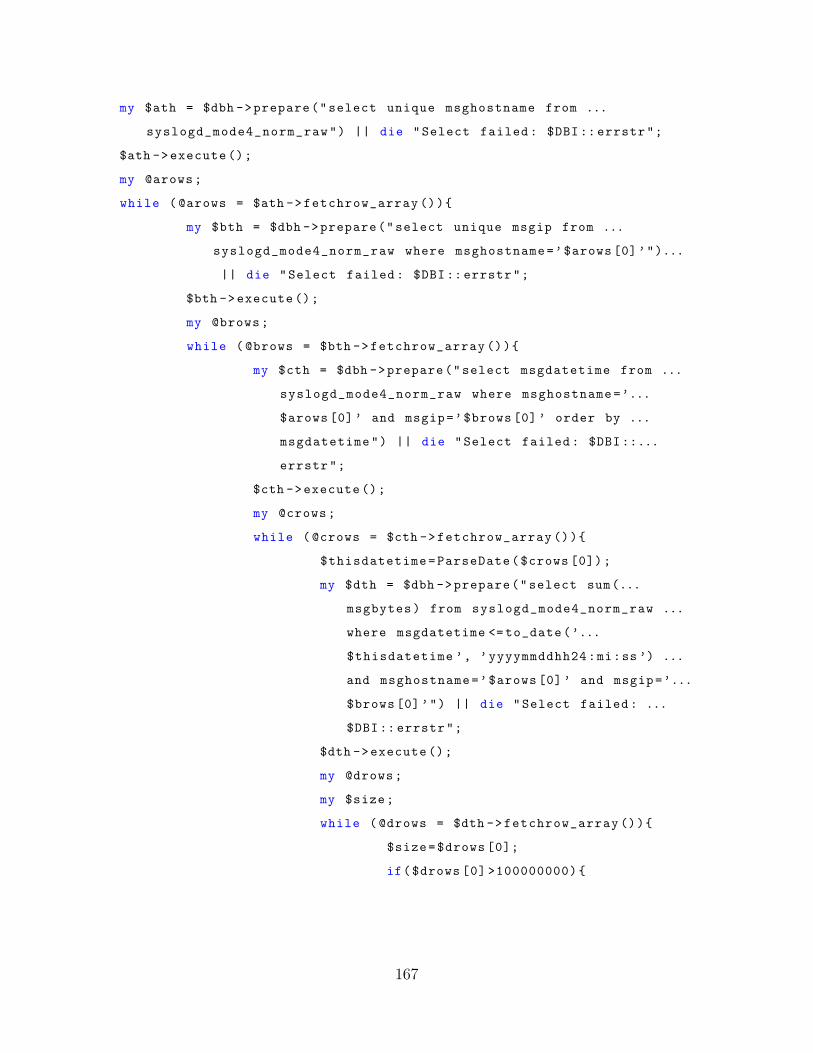
my $ath = $dbh ->prepare("select unique msghostname from ...
syslogd_mode4_norm_raw") || die "Select failed : $DBI:: errstr";
$ath ->execute ();
my @arows;
while ( @arows = $ath ->fetchrow_array ()){
my $bth = $dbh ->prepare("select unique msgip from ...
syslogd_mode4_norm_raw where msghostname=’$arows [0]’")...
|| die "Select failed : $DBI:: errstr";
$bth ->execute ();
my @brows;
while ( @brows = $bth ->fetchrow_array ()){
my $cth = $dbh ->prepare("select msgdatetime from ...
syslogd_mode4_norm_raw where msghostname=’...
$arows [0]’ and msgip=’$brows [0]’ order by ...
msgdatetime") || die "Select failed : $DBI::...
errstr";
$cth ->execute ();
my @crows;
while ( @crows = $cth ->fetchrow_array ()){
$thisdatetime=ParseDate($crows [0]);
my $dth = $dbh ->prepare("select sum(...
msgbytes) from syslogd_mode4_norm_raw ...
where msgdatetime <= to_date(’...
$thisdatetime ’, ’yyyymmddhh24:mi:ss ’) ...
and msghostname=’$arows [0]’ and msgip=’...
$brows [0]’") || die "Select failed : ...
$DBI:: errstr";
$dth ->execute ();
my @drows;
my $size;
while ( @drows = $dth ->fetchrow_array ()){
$size=$drows [0];
if($drows [0] >100000000){
167
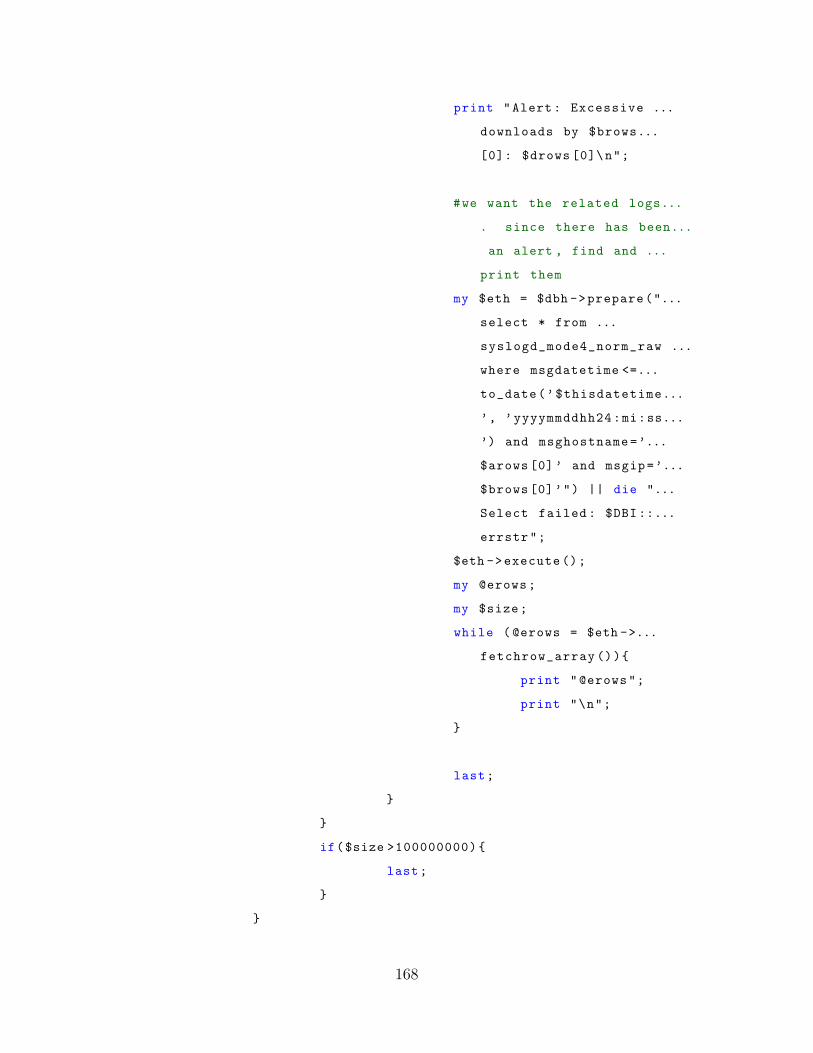
print "Alert: Excessive ...
downloads by $brows...
[0]: $drows [0]\n";
#we want the related logs...
. since there has been...
an alert , find and ...
print them
my $eth = $dbh ->prepare("...
select * from ...
syslogd_mode4_norm_raw ...
where msgdatetime <=...
to_date(’$thisdatetime...
’, ’yyyymmddhh24:mi:ss...
’) and msghostname=’...
$arows [0]’ and msgip=’...
$brows [0]’") || die "...
Select failed : $DBI::...
errstr";
$eth ->execute ();
my @erows;
my $size;
while ( @erows = $eth ->...
fetchrow_array ()){
print "@erows";
print "\n";
}
last;
}
}
if($size >100000000){
last;
}
}
168
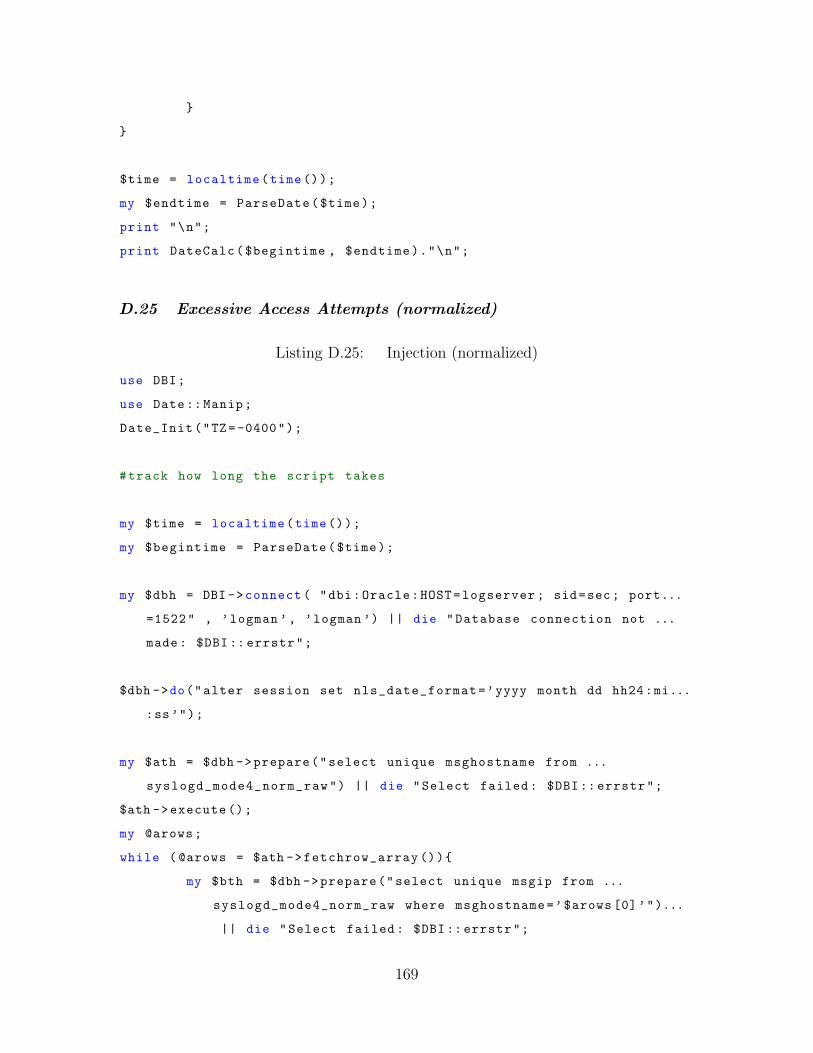
}
}
$time = localtime(time());
my $endtime = ParseDate($time);
print "\n";
print DateCalc($begintime , $endtime)."\n";
D.25 Excessive Access Attempts (normalized)
Listing D.25: Injection (normalized)
use DBI;
use Date::Manip;
Date_Init("TZ=-0400");
#track how long the script takes
my $time = localtime(time());
my $begintime = ParseDate($time);
my $dbh = DBI ->connect ( "dbi:Oracle:HOST=logserver ; sid=sec; port...
=1522" , ’logman ’, ’logman ’) || die "Database connection not ...
made: $DBI:: errstr";
$dbh ->do("alter session set nls_date_format=’yyyy month dd hh24:mi...
:ss’");
my $ath = $dbh ->prepare("select unique msghostname from ...
syslogd_mode4_norm_raw") || die "Select failed : $DBI:: errstr";
$ath ->execute ();
my @arows;
while ( @arows = $ath ->fetchrow_array ()){
my $bth = $dbh ->prepare("select unique msgip from ...
syslogd_mode4_norm_raw where msghostname=’$arows [0]’")...
|| die "Select failed : $DBI:: errstr";
169
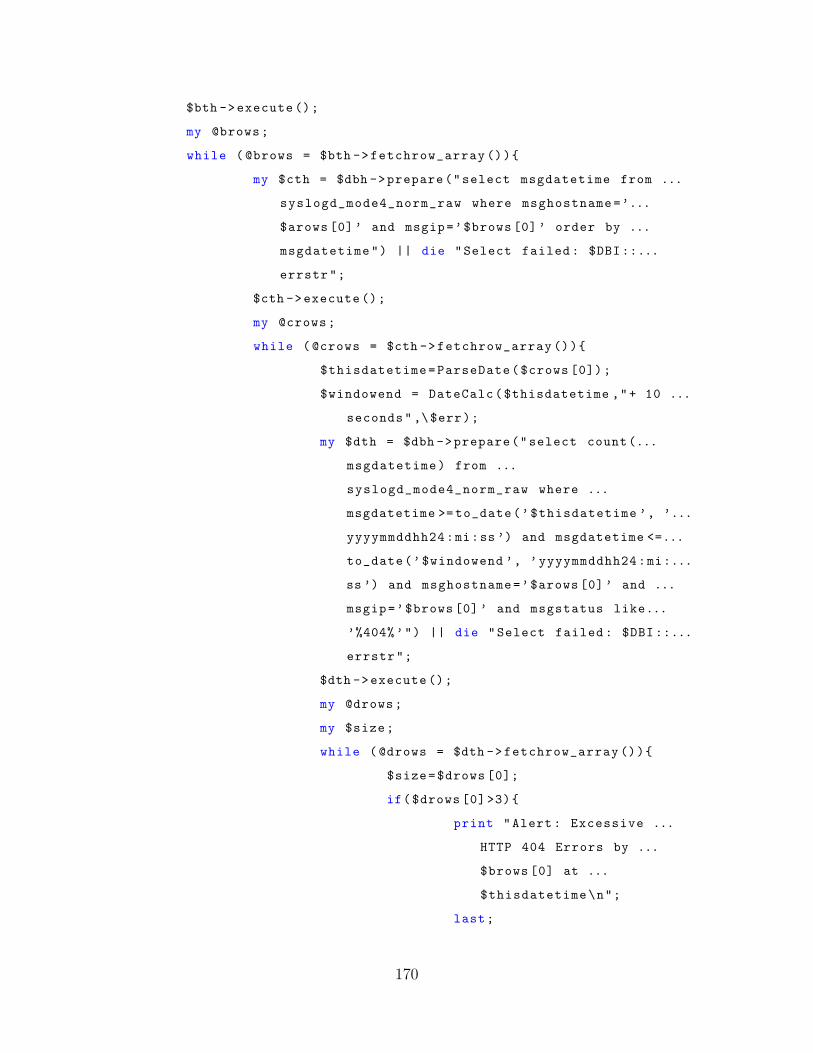
$bth ->execute ();
my @brows;
while ( @brows = $bth ->fetchrow_array ()){
my $cth = $dbh ->prepare("select msgdatetime from ...
syslogd_mode4_norm_raw where msghostname=’...
$arows [0]’ and msgip=’$brows [0]’ order by ...
msgdatetime") || die "Select failed : $DBI::...
errstr";
$cth ->execute ();
my @crows;
while ( @crows = $cth ->fetchrow_array ()){
$thisdatetime=ParseDate($crows [0]);
$windowend = DateCalc($thisdatetime ,"+ 10 ...
seconds" ,\$err);
my $dth = $dbh ->prepare("select count(...
msgdatetime) from ...
syslogd_mode4_norm_raw where ...
msgdatetime >= to_date(’$thisdatetime ’, ’...
yyyymmddhh24:mi:ss ’) and msgdatetime <=...
to_date(’$windowend ’, ’yyyymmddhh24:mi:...
ss ’) and msghostname=’$arows [0]’ and ...
msgip=’$brows [0]’ and msgstatus like...
’%404%’") || die "Select failed : $DBI::...
errstr";
$dth ->execute ();
my @drows;
my $size;
while ( @drows = $dth ->fetchrow_array ()){
$size=$drows [0];
if($drows [0]>3){
print "Alert: Excessive ...
HTTP 404 Errors by ...
$brows [0] at ...
$thisdatetime\n";
last;
170
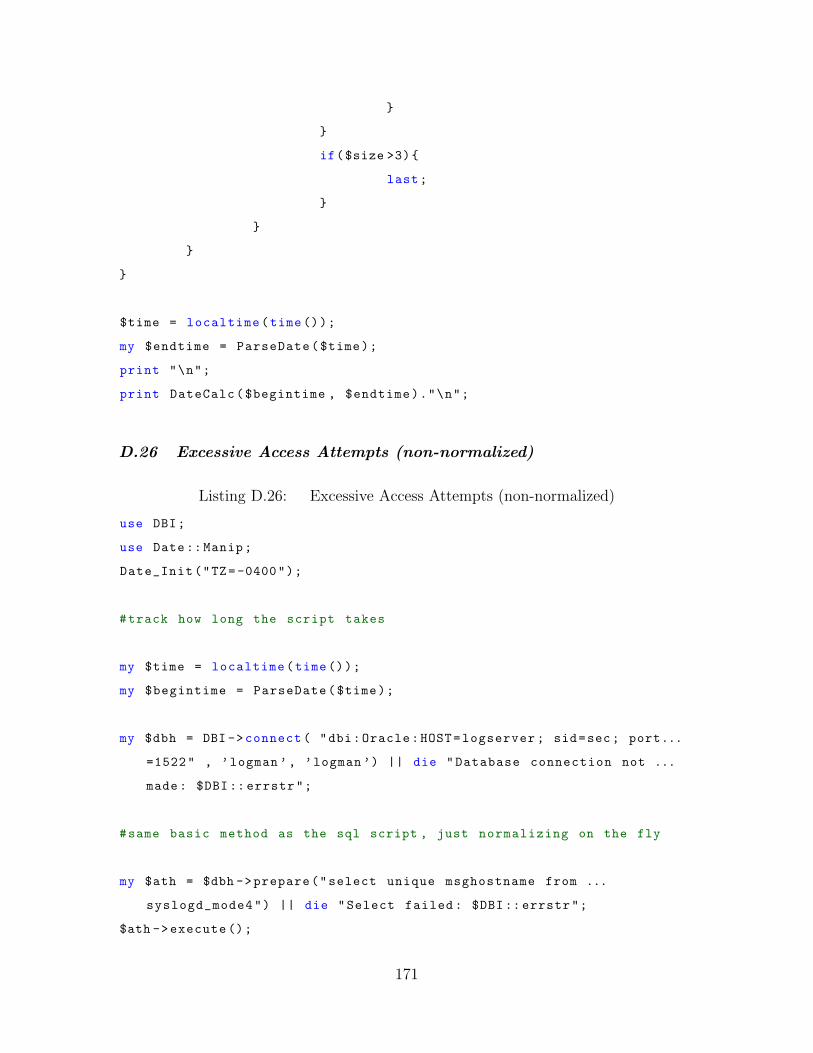
}
}
if($size >3){
last;
}
}
}
}
$time = localtime(time());
my $endtime = ParseDate($time);
print "\n";
print DateCalc($begintime , $endtime)."\n";
D.26 Excessive Access Attempts (non-normalized)
Listing D.26: Excessive Access Attempts (non-normalized)
use DBI;
use Date::Manip;
Date_Init("TZ=-0400");
#track how long the script takes
my $time = localtime(time());
my $begintime = ParseDate($time);
my $dbh = DBI ->connect ( "dbi:Oracle:HOST=logserver ; sid=sec; port...
=1522" , ’logman ’, ’logman ’) || die "Database connection not ...
made: $DBI:: errstr";
#same basic method as the sql script , just normalizing on the fly
my $ath = $dbh ->prepare("select unique msghostname from ...
syslogd_mode4") || die "Select failed : $DBI:: errstr";
$ath ->execute ();
171
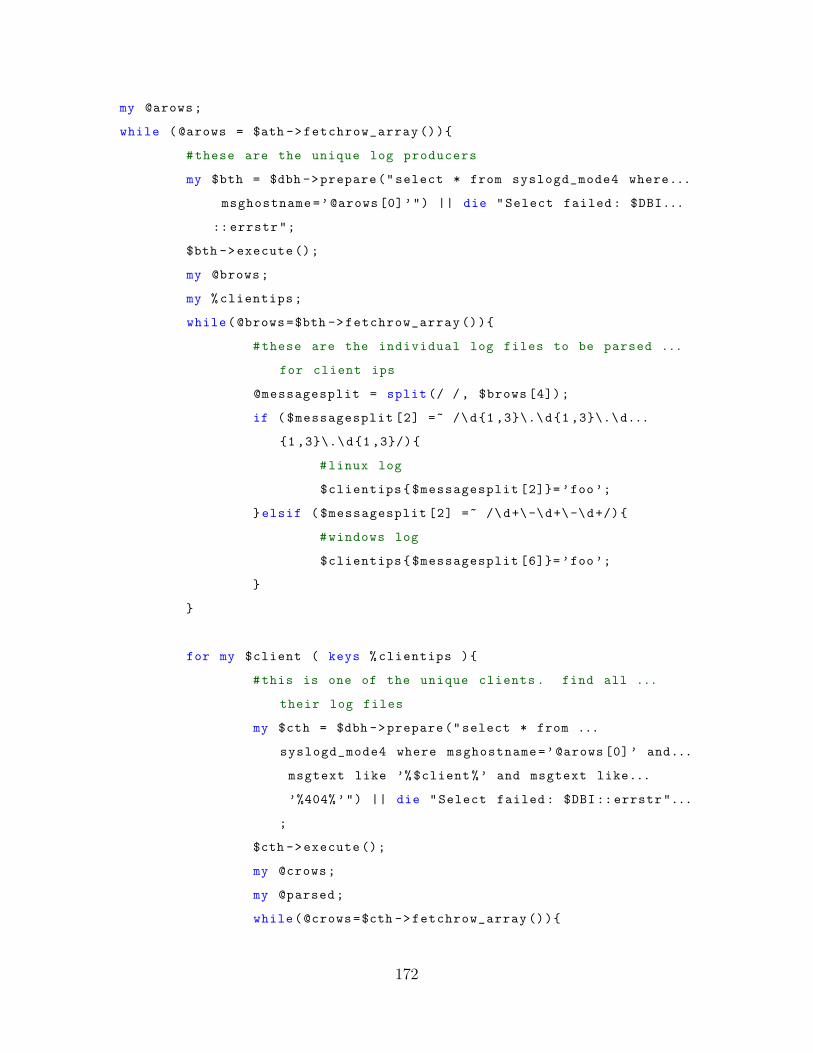
my @arows;
while ( @arows = $ath ->fetchrow_array ()){
#these are the unique log producers
my $bth = $dbh ->prepare("select * from syslogd_mode4 where...
msghostname=’@arows [0]’") || die "Select failed : $DBI...
:: errstr";
$bth ->execute ();
my @brows;
my % clientips;
while(@brows=$bth ->fetchrow_array ()){
#these are the individual log files to be parsed ...
for client ips
@messagesplit = split (/ / , $brows [4]);
if ( $messagesplit [2] =~ /\d{1 ,3}\.\d{1 ,3}\.\d...
{1 ,3}\.\d{1 ,3}/){
#linux log
$clientips{$messagesplit [2]}= ’foo’;
}elsif ( $messagesplit [2] =~ /\d+\-\d+\-\d+/){
#windows log
$clientips{$messagesplit [6]}= ’foo’;
}
}
for my $client ( keys % clientips ){
#this is one of the unique clients . find all ...
their log files
my $cth = $dbh ->prepare("select * from ...
syslogd_mode4 where msghostname=’@arows [0]’ and...
msgtext like ’%$client%’ and msgtext like...
’%404%’") || die "Select failed : $DBI:: errstr"...
;
$cth ->execute ();
my @crows;
my @parsed;
while(@crows=$cth ->fetchrow_array ()){
172
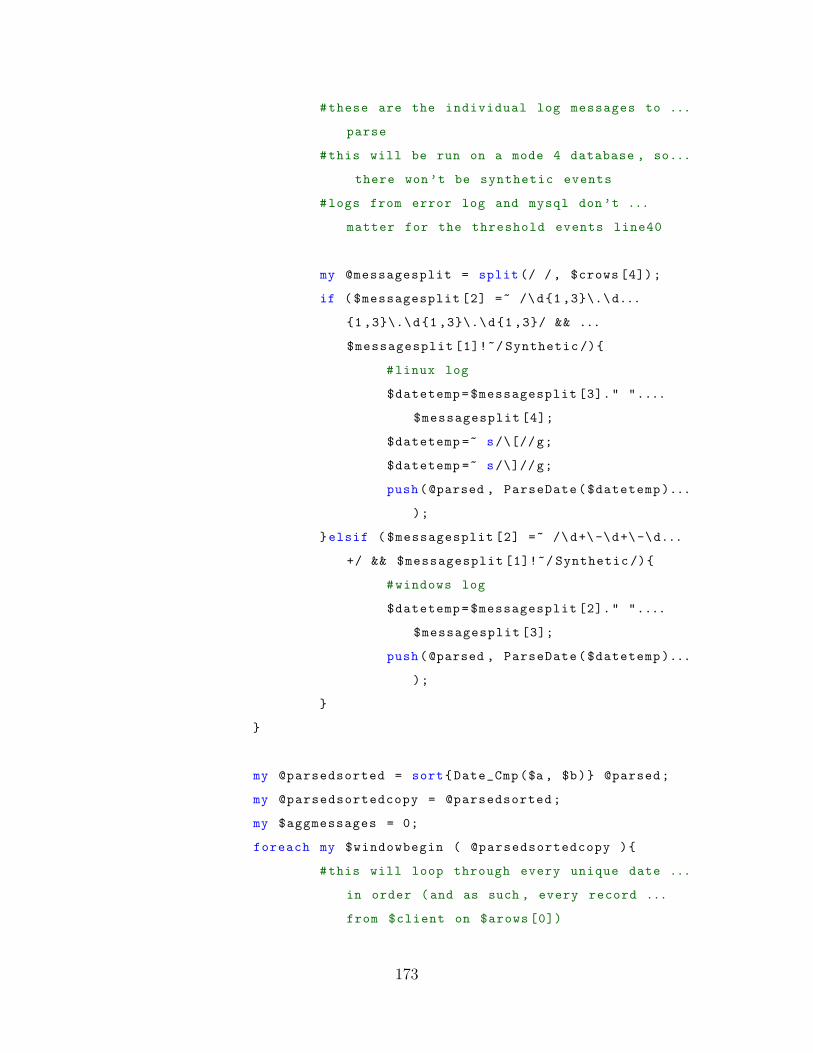
#these are the individual log messages to ...
parse
#this will be run on a mode 4 database , so...
there won’t be synthetic events
#logs from error log and mysql don’t ...
matter for the threshold events line40
my @messagesplit = split (/ / , $crows [4]);
if ( $messagesplit [2] =~ /\d{1 ,3}\.\d...
{1 ,3}\.\d{1 ,3}\.\d{1 ,3}/ && ...
$messagesplit [1]!~/ Synthetic /){
#linux log
$datetemp=$messagesplit [3]." "....
$messagesplit [4];
$datetemp =~ s/\[//g;
$datetemp =~ s/\]//g;
push(@parsed , ParseDate($datetemp)...
);
}elsif ( $messagesplit [2] =~ /\d+\-\d+\-\d...
+/ && $messagesplit [1]!~/ Synthetic /){
#windows log
$datetemp=$messagesplit [2]." "....
$messagesplit [3];
push(@parsed , ParseDate($datetemp)...
);
}
}
my @parsedsorted = sort{Date_Cmp($a , $b)} @parsed;
my @parsedsortedcopy = @parsedsorted;
my $aggmessages = 0;
foreach my $windowbegin ( @parsedsortedcopy ){
#this will loop through every unique date ...
in order (and as such , every record ...
from $client on $arows [0])
173
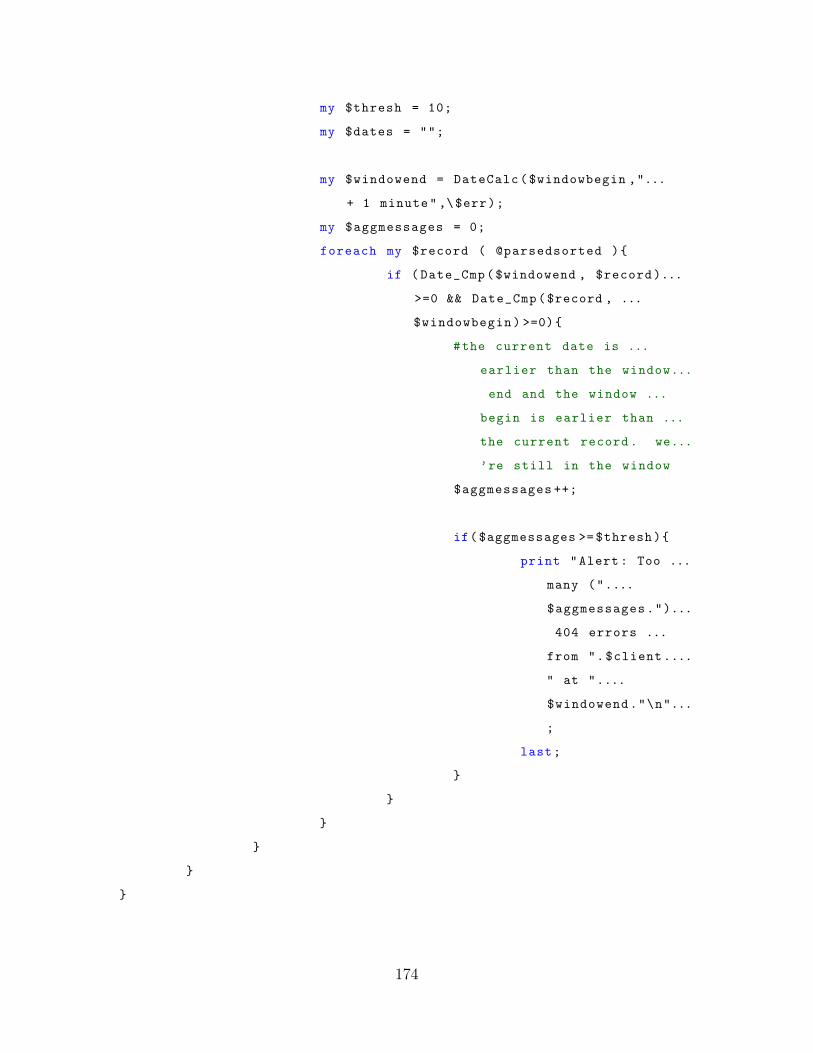
my $thresh = 10;
my $dates = "";
my $windowend = DateCalc($windowbegin ,"...
+ 1 minute" ,\$err);
my $aggmessages = 0;
foreach my $record ( @parsedsorted ){
if ( Date_Cmp($windowend , $record)...
>=0 && Date_Cmp($record , ...
$windowbegin) >=0){
#the current date is ...
earlier than the window...
end and the window ...
begin is earlier than ...
the current record . we...
’re still in the window
$aggmessages ++;
if($aggmessages >= $thresh){
print "Alert: Too ...
many ("....
$aggmessages.")...
404 errors ...
from ".$client....
" at "....
$windowend."\n"...
;
last;
}
}
}
}
}
}
174

$time = localtime(time());
my $endtime = ParseDate($time);
print "\n";
print DateCalc($begintime , $endtime)."\n";
175
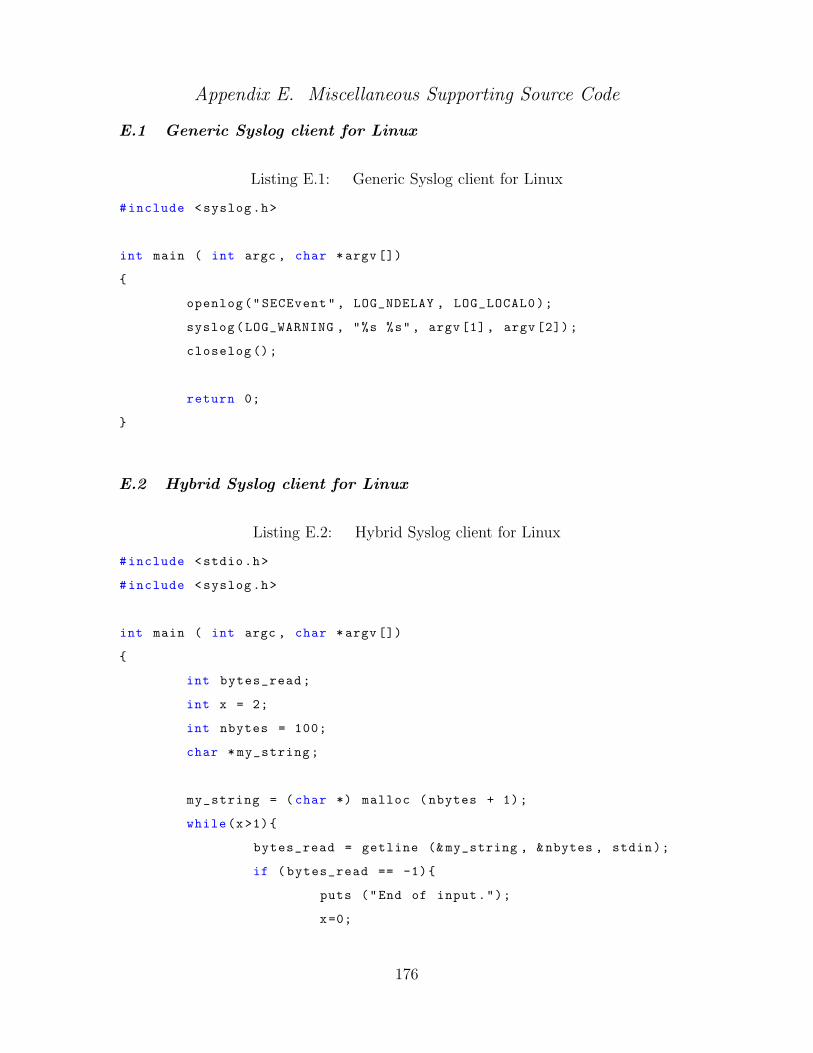
Appendix E. Miscellaneous Supporting Source Code
E.1 Generic Syslog client for Linux
Listing E.1: Generic Syslog client for Linux
#include <syslog.h>
int main ( int argc , char *argv [])
{
openlog("SECEvent" , LOG_NDELAY , LOG_LOCAL0);
syslog(LOG_WARNING , "%s %s", argv [1], argv [2]);
closelog ();
return 0;
}
E.2 Hybrid Syslog client for Linux
Listing E.2: Hybrid Syslog client for Linux
#include <stdio.h>
#include <syslog.h>
int main ( int argc , char *argv [])
{
int bytes_read;
int x = 2;
int nbytes = 100;
char * my_string;
my_string = ( char *) malloc ( nbytes + 1);
while(x>1){
bytes_read = getline (& my_string , &nbytes , stdin);
if ( bytes_read == -1){
puts ("End of input.");
x=0;
176
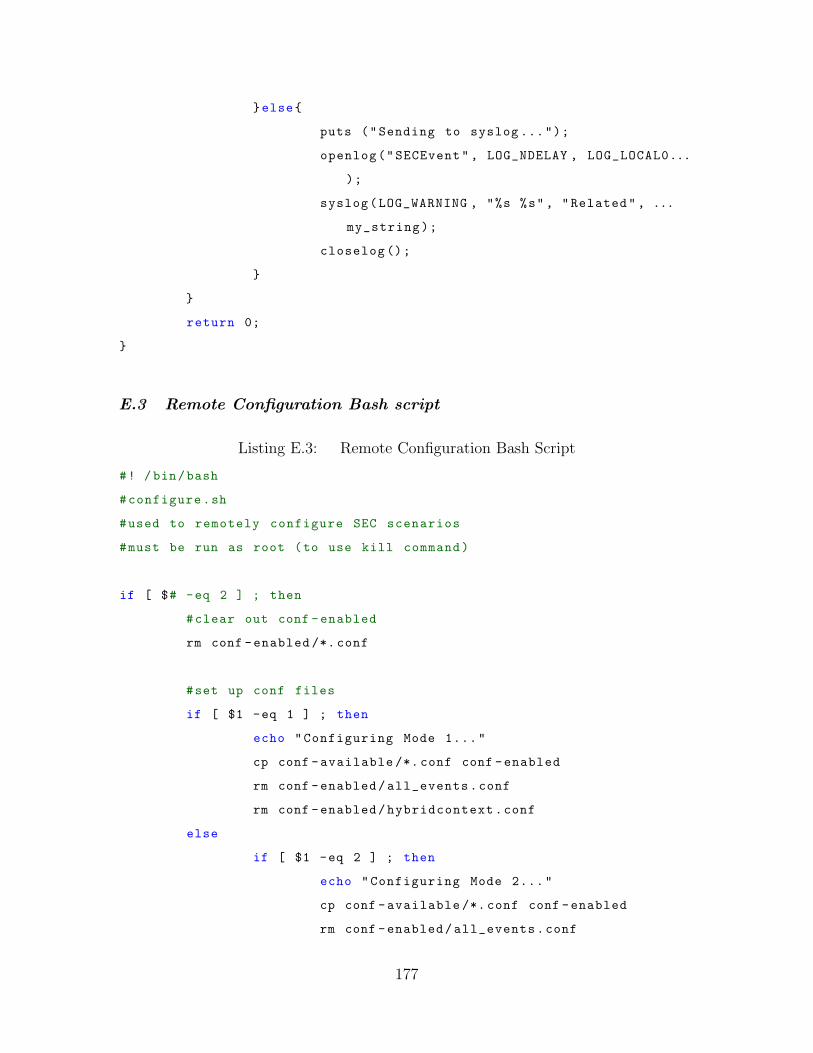
}else{
puts ("Sending to syslog ...");
openlog("SECEvent" , LOG_NDELAY , LOG_LOCAL0...
);
syslog(LOG_WARNING , "%s %s", "Related", ...
my_string);
closelog ();
}
}
return 0;
}
E.3 Remote Configuration Bash script
Listing E.3: Remote Configuration Bash Script
#! / bin/bash
#configure.sh
#used to remotely configure SEC scenarios
#must be run as root (to use kill command)
if [ $# -eq 2 ] ; then
#clear out conf -enabled
rm conf -enabled /*. conf
#set up conf files
if [ $1 -eq 1 ] ; then
echo "Configuring Mode 1..."
cp conf -available /*. conf conf -enabled
rm conf -enabled/all_events.conf
rm conf -enabled/hybridcontext.conf
else
if [ $1 -eq 2 ] ; then
echo "Configuring Mode 2..."
cp conf -available /*. conf conf -enabled
rm conf -enabled/all_events.conf
177
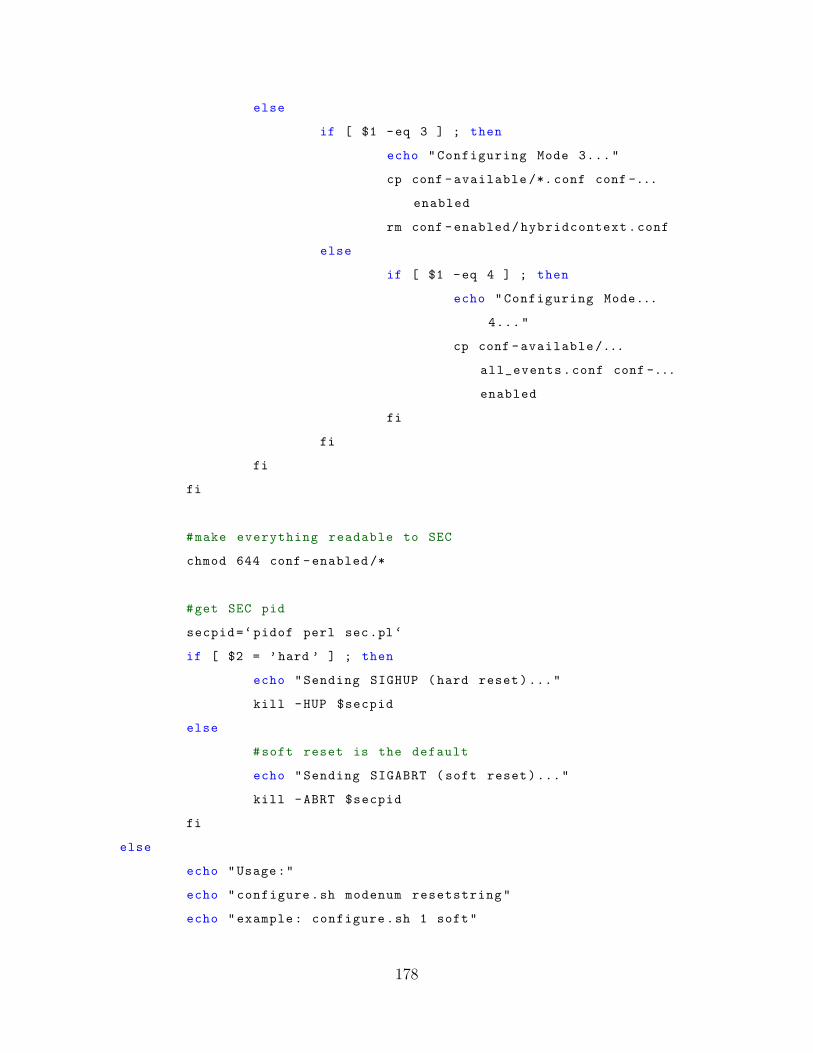
else
if [ $1 -eq 3 ] ; then
echo "Configuring Mode 3..."
cp conf -available /*. conf conf -...
enabled
rm conf -enabled/hybridcontext.conf
else
if [ $1 -eq 4 ] ; then
echo "Configuring Mode...
4..."
cp conf -available/...
all_events.conf conf -...
enabled
fi
fi
fi
fi
#make everything readable to SEC
chmod 644 conf -enabled /*
#get SEC pid
secpid=‘pidof perl sec.pl ‘
if [ $2 = ’hard ’ ] ; then
echo "Sending SIGHUP (hard reset)..."
kill -HUP $secpid
else
#soft reset is the default
echo "Sending SIGABRT (soft reset)..."
kill -ABRT $secpid
fi
else
echo "Usage:"
echo "configure.sh modenum resetstring"
echo "example : configure.sh 1 soft"
178
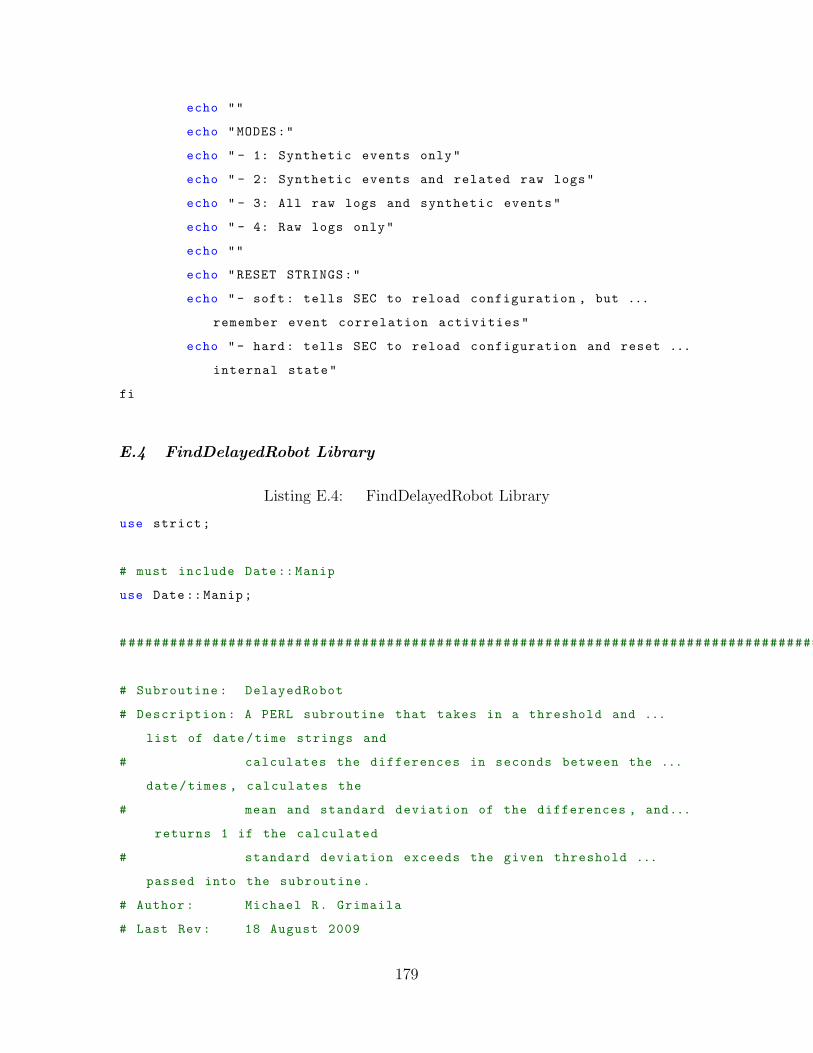
echo ""
echo "MODES:"
echo " - 1: Synthetic events only"
echo " - 2: Synthetic events and related raw logs"
echo " - 3: All raw logs and synthetic events"
echo " - 4: Raw logs only"
echo ""
echo "RESET STRINGS:"
echo " - soft: tells SEC to reload configuration , but ...
remember event correlation activities"
echo " - hard: tells SEC to reload configuration and reset ...
internal state"
fi
E.4 FindDelayedRobot Library
Listing E.4: FindDelayedRobot Library
use strict;
# must include Date:: Manip
use Date::Manip;
#################################################################################################...
# Subroutine : DelayedRobot
# Description : A PERL subroutine that takes in a threshold and ...
list of date/time strings and
# calculates the differences in seconds between the ...
date/times , calculates the
# mean and standard deviation of the differences , and...
returns 1 if the calculated
# standard deviation exceeds the given threshold ...
passed into the subroutine.
# Author : Michael R. Grimaila
# Last Rev: 18 August 2009
179
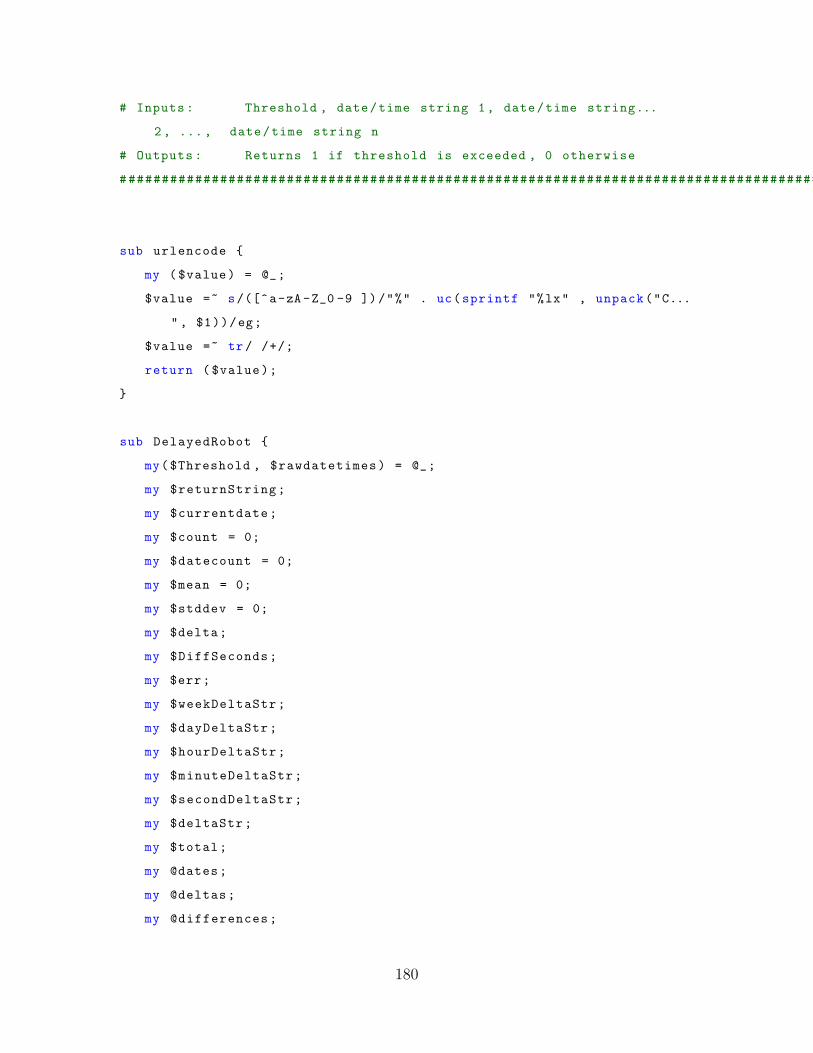
# Inputs : Threshold , date/time string 1, date/time string...
2, ... , date/time string n
# Outputs : Returns 1 if threshold is exceeded , 0 otherwise
#################################################################################################...
sub urlencode {
my ( $value) = @_;
$value =~ s/([^a-zA-Z_0 -9 ])/"%" . uc(sprintf "%lx" , unpack("C...
", $1))/eg;
$value =~ tr / /+/;
return ( $value);
}
sub DelayedRobot {
my($Threshold , $rawdatetimes) = @_;
my $returnString;
my $currentdate;
my $count = 0;
my $datecount = 0;
my $mean = 0;
my $stddev = 0;
my $delta;
my $DiffSeconds;
my $err;
my $weekDeltaStr;
my $dayDeltaStr;
my $hourDeltaStr;
my $minuteDeltaStr;
my $secondDeltaStr;
my $deltaStr;
my $total;
my @dates;
my @deltas;
my @differences;
180
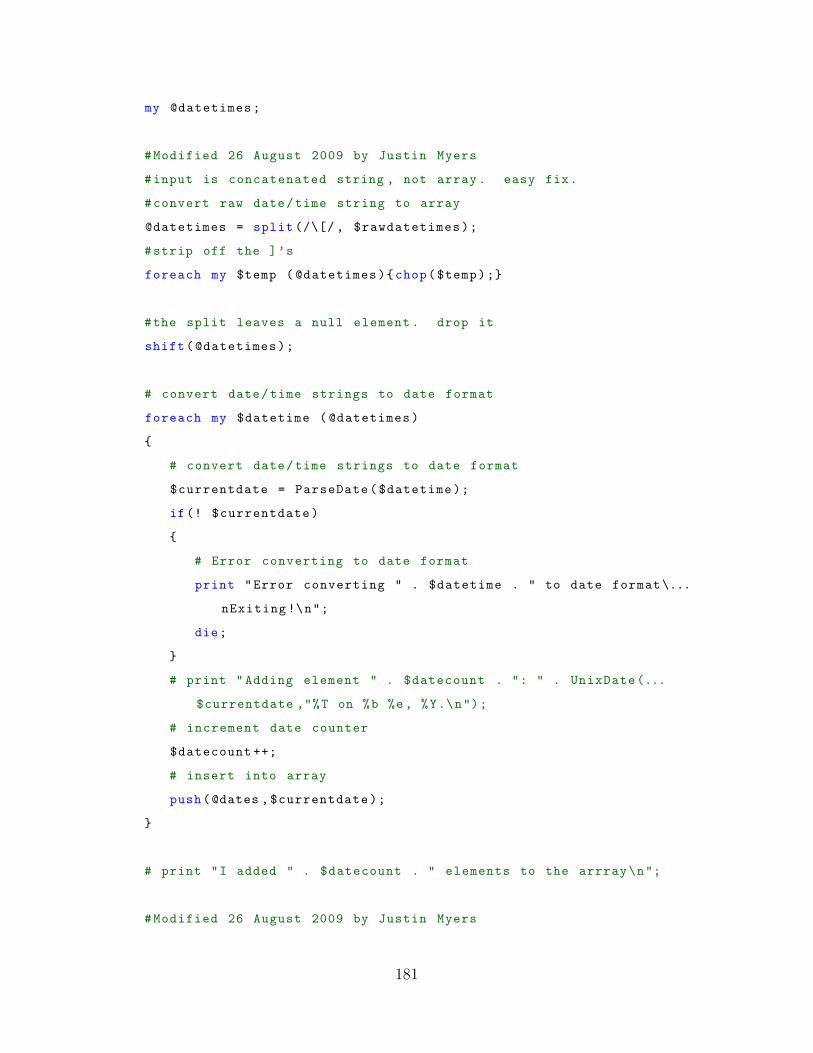
my @datetimes;
#Modified 26 August 2009 by Justin Myers
#input is concatenated string , not array. easy fix.
#convert raw date/time string to array
@datetimes = split (/\[/ , $rawdatetimes);
#strip off the ]’s
foreach my $temp ( @datetimes){chop($temp);}
#the split leaves a null element . drop it
shift(@datetimes);
# convert date/time strings to date format
foreach my $datetime ( @datetimes)
{
# convert date/time strings to date format
$currentdate = ParseDate($datetime);
if(! $currentdate)
{
# Error converting to date format
print "Error converting " . $datetime . " to date format\...
nExiting !\n";
die;
}
# print " Adding element " . $datecount . ": " . UnixDate(...
$currentdate ,"%T on %b %e, %Y.\n");
# increment date counter
$datecount ++;
# insert into array
push(@dates ,$currentdate);
}
# print "I added " . $datecount . " elements to the arrray\n";
#Modified 26 August 2009 by Justin Myers
181
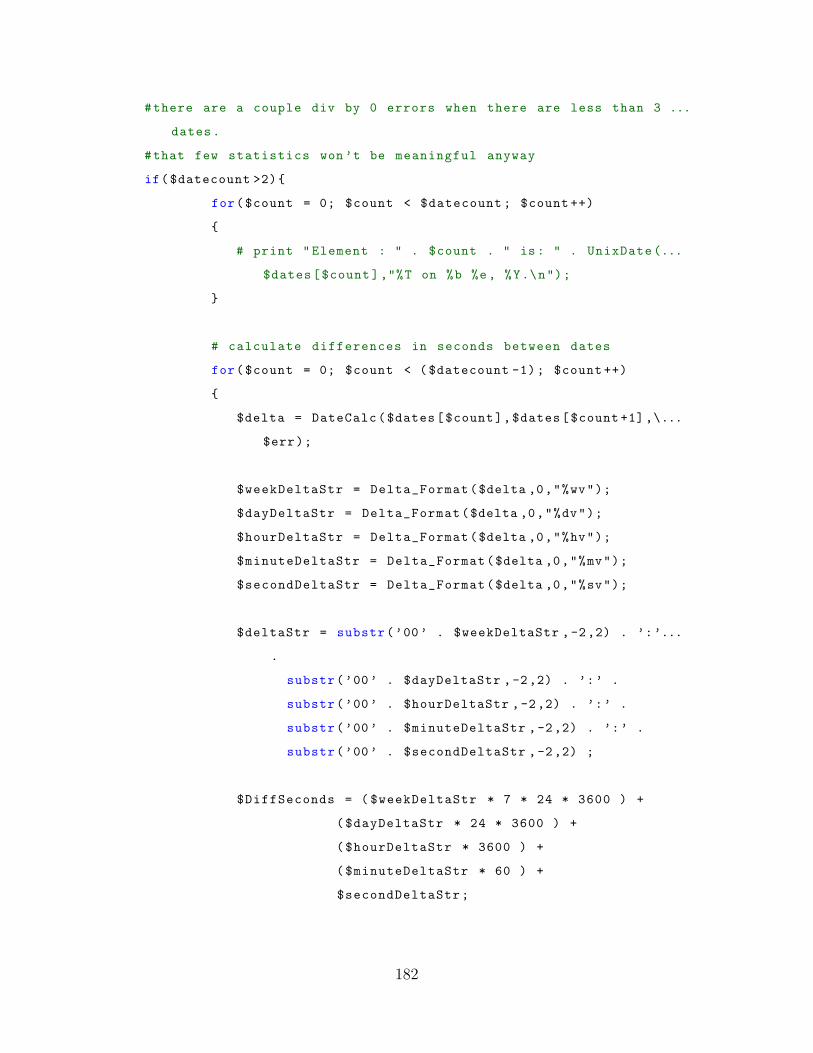
#there are a couple div by 0 errors when there are less than 3 ...
dates.
#that few statistics won’t be meaningful anyway
if($datecount >2){
for($count = 0; $count < $datecount ; $count ++)
{
# print " Element : " . $count . " is : " . UnixDate(...
$dates[$count ],"%T on %b %e, %Y.\n");
}
# calculate differences in seconds between dates
for($count = 0; $count < ($datecount -1); $count ++)
{
$delta = DateCalc($dates[$count],$dates[$count +1],\...
$err);
$weekDeltaStr = Delta_Format($delta ,0,"%wv");
$dayDeltaStr = Delta_Format($delta ,0,"%dv");
$hourDeltaStr = Delta_Format($delta ,0,"%hv");
$minuteDeltaStr = Delta_Format($delta ,0,"%mv");
$secondDeltaStr = Delta_Format($delta ,0,"%sv");
$deltaStr = substr(’00’ . $weekDeltaStr ,-2,2) . ’:’...
.
substr(’00’ . $dayDeltaStr ,-2,2) . ’:’ .
substr(’00’ . $hourDeltaStr ,-2,2) . ’:’ .
substr(’00’ . $minuteDeltaStr ,-2,2) . ’:’ .
substr(’00’ . $secondDeltaStr ,-2,2) ;
$DiffSeconds = ( $weekDeltaStr * 7 * 24 * 3600 ) +
($dayDeltaStr * 24 * 3600 ) +
($hourDeltaStr * 3600 ) +
($minuteDeltaStr * 60 ) +
$secondDeltaStr;
182
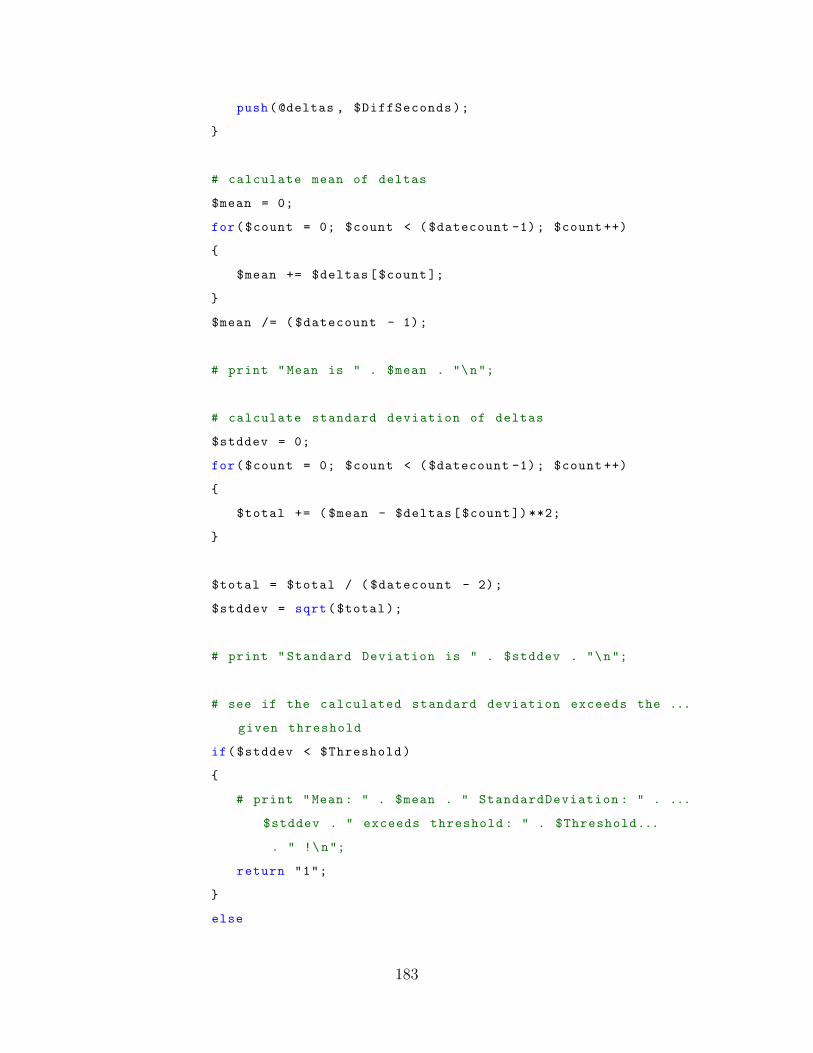
push(@deltas , $DiffSeconds);
}
# calculate mean of deltas
$mean = 0;
for($count = 0; $count < ($datecount -1); $count ++)
{
$mean += $deltas[$count ];
}
$mean /= ( $datecount - 1);
# print "Mean is " . $mean . "\n";
# calculate standard deviation of deltas
$stddev = 0;
for($count = 0; $count < ($datecount -1); $count ++)
{
$total += ( $mean - $deltas[$count ])**2;
}
$total = $total / ( $datecount - 2);
$stddev = sqrt($total);
# print " Standard Deviation is " . $stddev . "\n";
# see if the calculated standard deviation exceeds the ...
given threshold
if($stddev < $Threshold)
{
# print "Mean : " . $mean . " StandardDeviation : " . ...
$stddev . " exceeds threshold : " . $Threshold...
. " !\n";
return "1";
}
else
183
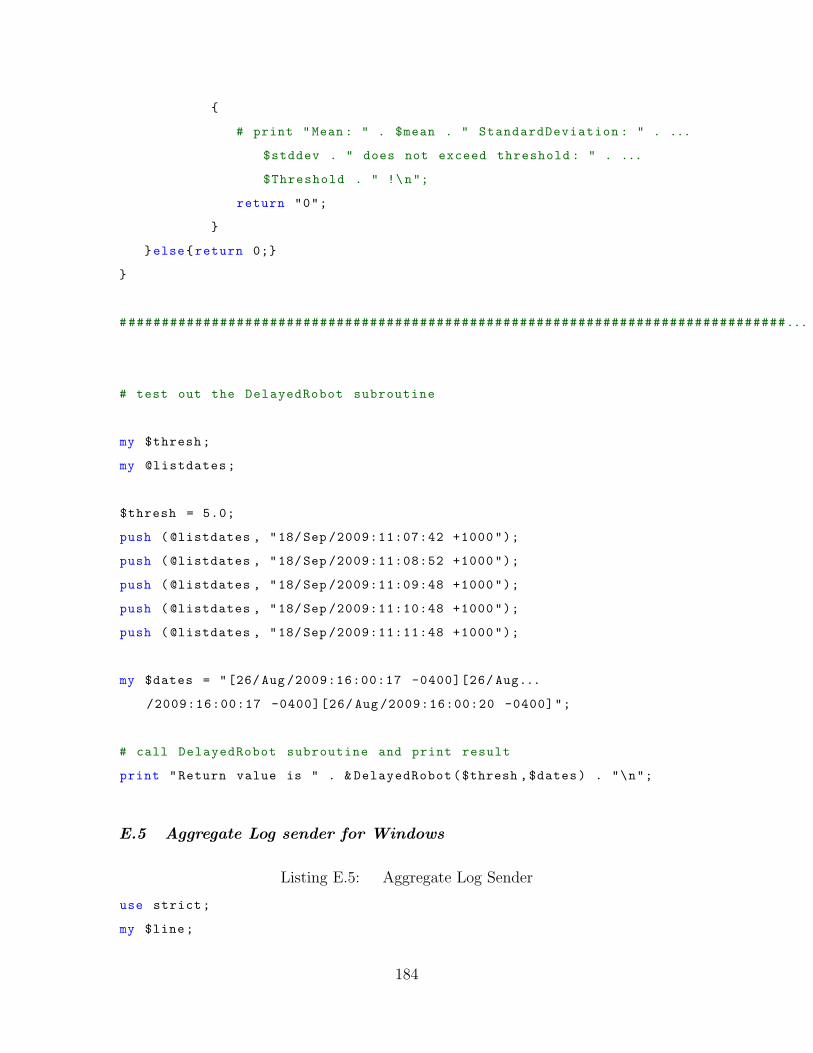
{
# print "Mean : " . $mean . " StandardDeviation : " . ...
$stddev . " does not exceed threshold : " . ...
$Threshold . " !\n";
return "0";
}
}else{return 0;}
}
################################################################################...
# test out the DelayedRobot subroutine
my $thresh;
my @listdates;
$thresh = 5.0;
push ( @listdates , "18/Sep /2009:11:07:42 +1000");
push ( @listdates , "18/Sep /2009:11:08:52 +1000");
push ( @listdates , "18/Sep /2009:11:09:48 +1000");
push ( @listdates , "18/Sep /2009:11:10:48 +1000");
push ( @listdates , "18/Sep /2009:11:11:48 +1000");
my $dates = "[26/ Aug /2009:16:00:17 -0400][26/ Aug...
/2009:16:00:17 -0400][26/ Aug /2009:16:00:20 -0400]";
# call DelayedRobot subroutine and print result
print "Return value is " . & DelayedRobot($thresh ,$dates) . "\n";
E.5 Aggregate Log sender for Windows
Listing E.5: Aggregate Log Sender
use strict;
my $line;
184
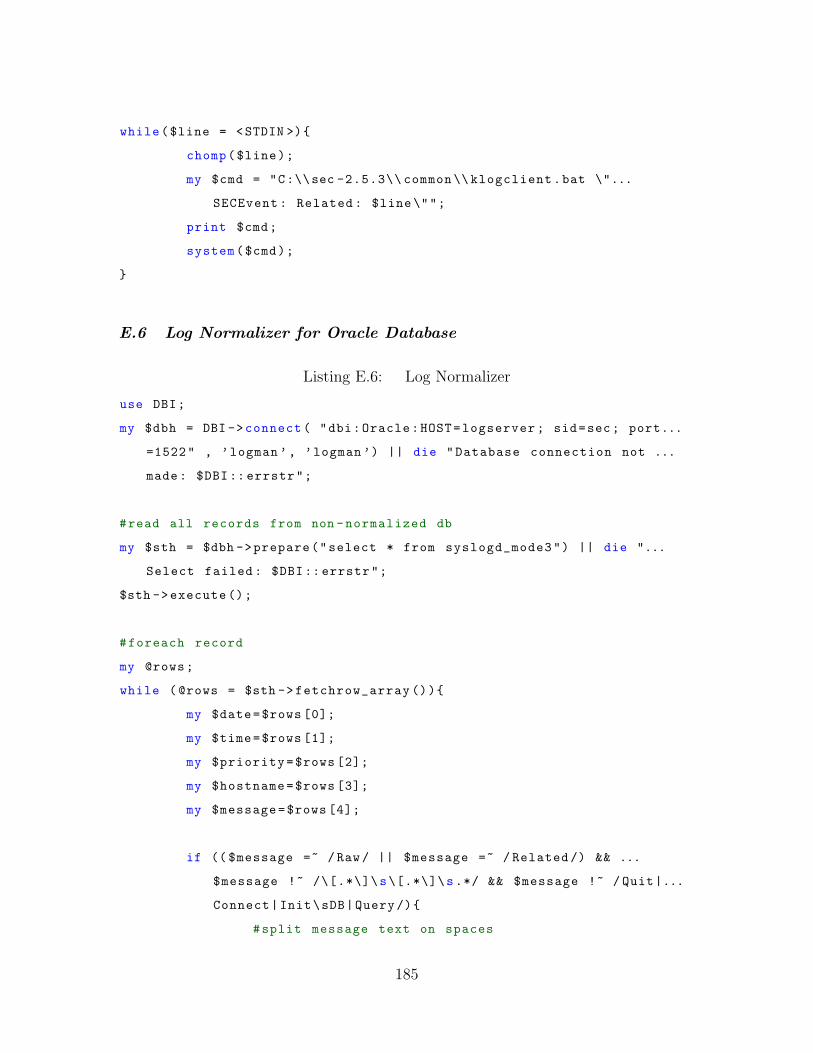
while($line = <STDIN >){
chomp($line);
my $cmd = "C:\\sec -2.5.3\\ common \\ klogclient.bat \"...
SECEvent : Related : $line\"";
print $cmd;
system($cmd);
}
E.6 Log Normalizer for Oracle Database
Listing E.6: Log Normalizer
use DBI;
my $dbh = DBI ->connect ( "dbi:Oracle:HOST=logserver ; sid=sec; port...
=1522" , ’logman ’, ’logman ’) || die "Database connection not ...
made: $DBI:: errstr";
#read all records from non -normalized db
my $sth = $dbh ->prepare("select * from syslogd_mode3") || die "...
Select failed : $DBI:: errstr";
$sth ->execute ();
#foreach record
my @rows;
while (@rows = $sth ->fetchrow_array ()){
my $date=$rows [0];
my $time=$rows [1];
my $priority=$rows [2];
my $hostname=$rows [3];
my $message=$rows [4];
if (( $message =~ / Raw / || $message =~ / Related /) && ...
$message !~ /\[.*\]\s\[.*\]\s.*/ && $message !~ / Quit|...
Connect|Init\sDB|Query /){
#split message text on spaces
185
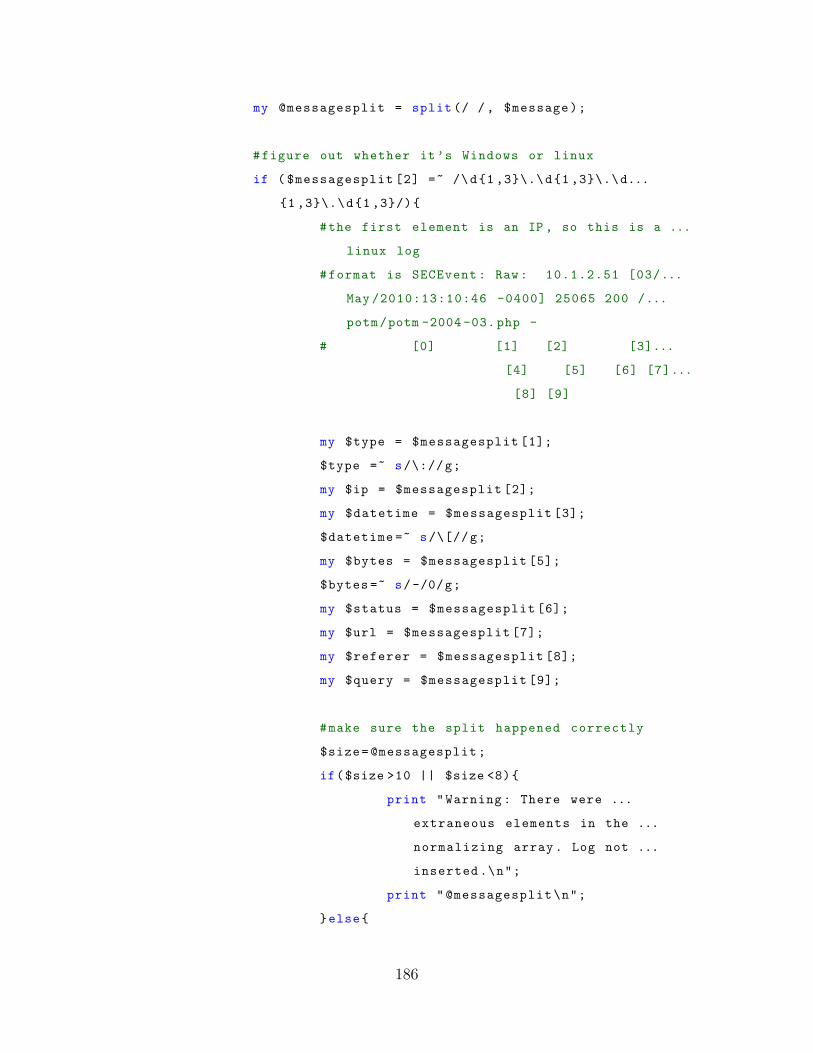
my @messagesplit = split (/ / , $message);
#figure out whether it’s Windows or linux
if ( $messagesplit [2] =~ /\d{1 ,3}\.\d{1 ,3}\.\d...
{1 ,3}\.\d{1 ,3}/){
#the first element is an IP , so this is a ...
linux log
#format is SECEvent : Raw: 10.1.2.51 [03/...
May /2010:13:10:46 -0400] 25065 200 /...
potm/potm -2004 -03. php -
# [0] [1] [2] [3]...
[4] [5] [6] [7]...
[8] [9]
my $type = $messagesplit [1];
$type =~ s/\://g;
my $ip = $messagesplit [2];
my $datetime = $messagesplit [3];
$datetime =~ s/\[//g;
my $bytes = $messagesplit [5];
$bytes =~ s/-/0/g;
my $status = $messagesplit [6];
my $url = $messagesplit [7];
my $referer = $messagesplit [8];
my $query = $messagesplit [9];
#make sure the split happened correctly
$size=@messagesplit;
if($size >10 || $size <8){
print "Warning : There were ...
extraneous elements in the ...
normalizing array. Log not ...
inserted .\n";
print "@messagesplit\n";
}else{
186
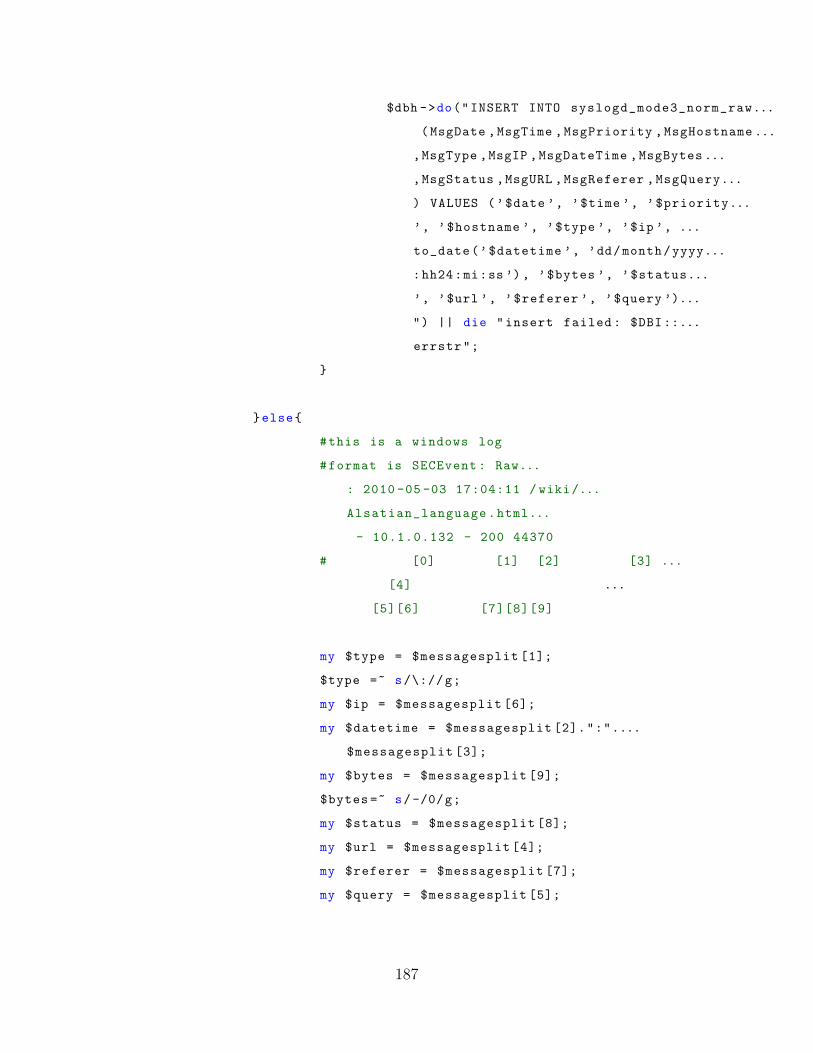
$dbh ->do("INSERT INTO syslogd_mode3_norm_raw...
(MsgDate ,MsgTime ,MsgPriority ,MsgHostname ...
,MsgType ,MsgIP ,MsgDateTime ,MsgBytes ...
,MsgStatus ,MsgURL ,MsgReferer ,MsgQuery...
) VALUES (’$date ’, ’$time ’, ’$priority...
’, ’$hostname ’, ’$type ’, ’$ip ’, ...
to_date(’$datetime ’, ’dd/month/yyyy...
:hh24:mi:ss ’), ’$bytes ’, ’$status...
’, ’$url ’, ’$referer ’, ’$query ’)...
") || die "insert failed : $DBI::...
errstr";
}
}else{
#this is a windows log
#format is SECEvent : Raw...
: 2010 -05 -03 17:04:11 / wiki/...
Alsatian_language.html...
- 10.1.0.132 - 200 44370
# [0] [1] [2] [3] ...
[4] ...
[5][6] [7][8][9]
my $type = $messagesplit [1];
$type =~ s/\://g;
my $ip = $messagesplit [6];
my $datetime = $messagesplit [2].":"....
$messagesplit [3];
my $bytes = $messagesplit [9];
$bytes =~ s/-/0/g;
my $status = $messagesplit [8];
my $url = $messagesplit [4];
my $referer = $messagesplit [7];
my $query = $messagesplit [5];
187
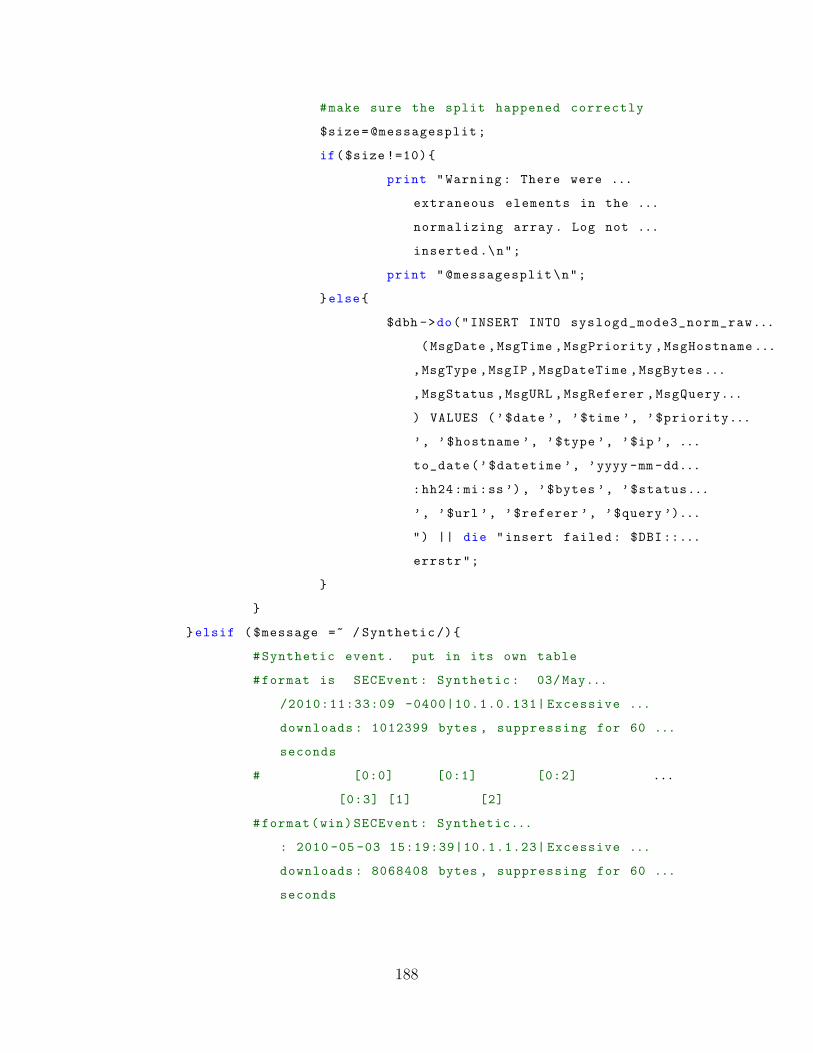
#make sure the split happened correctly
$size=@messagesplit;
if($size !=10){
print "Warning : There were ...
extraneous elements in the ...
normalizing array. Log not ...
inserted .\n";
print "@messagesplit\n";
}else{
$dbh ->do("INSERT INTO syslogd_mode3_norm_raw...
(MsgDate ,MsgTime ,MsgPriority ,MsgHostname ...
,MsgType ,MsgIP ,MsgDateTime ,MsgBytes ...
,MsgStatus ,MsgURL ,MsgReferer ,MsgQuery...
) VALUES (’$date ’, ’$time ’, ’$priority...
’, ’$hostname ’, ’$type ’, ’$ip ’, ...
to_date(’$datetime ’, ’yyyy -mm-dd...
:hh24:mi:ss ’), ’$bytes ’, ’$status...
’, ’$url ’, ’$referer ’, ’$query ’)...
") || die "insert failed : $DBI::...
errstr";
}
}
}elsif ( $message =~ / Synthetic /){
#Synthetic event. put in its own table
#format is SECEvent : Synthetic : 03/ May...
/2010:11:33:09 -0400|10.1.0.131| Excessive ...
downloads : 1012399 bytes , suppressing for 60 ...
seconds
# [0:0] [0:1] [0:2] ...
[0:3] [1] [2]
#format(win)SECEvent : Synthetic...
: 2010 -05 -03 15:19:39|10.1.1.23| Excessive ...
downloads : 8068408 bytes , suppressing for 60 ...
seconds
188
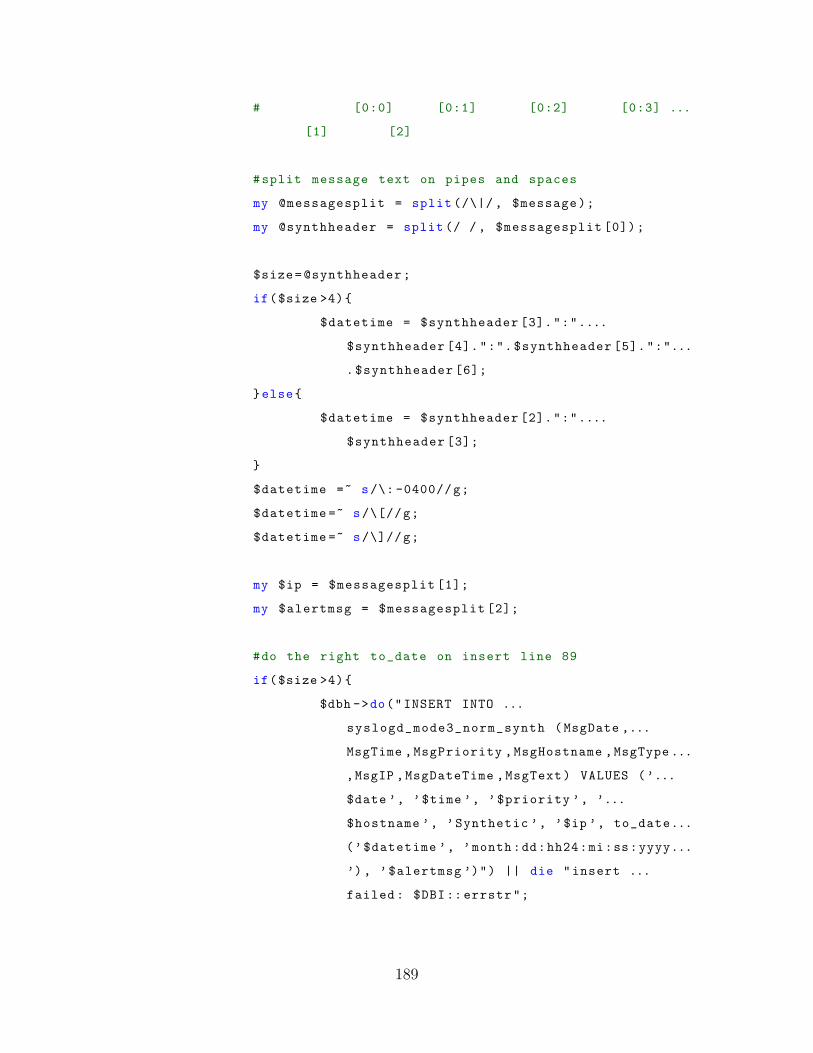
# [0:0] [0:1] [0:2] [0:3] ...
[1] [2]
#split message text on pipes and spaces
my @messagesplit = split (/\|/ , $message);
my @synthheader = split (/ / , $messagesplit [0]);
$size=@synthheader;
if($size >4){
$datetime = $synthheader [3].":"....
$synthheader [4].":".$synthheader [5].":"...
.$synthheader [6];
}else{
$datetime = $synthheader [2].":"....
$synthheader [3];
}
$datetime =~ s/\: -0400//g;
$datetime =~ s/\[//g;
$datetime =~ s/\]//g;
my $ip = $messagesplit [1];
my $alertmsg = $messagesplit [2];
#do the right to_date on insert line 89
if($size >4){
$dbh ->do("INSERT INTO ...
syslogd_mode3_norm_synth (MsgDate ,...
MsgTime ,MsgPriority ,MsgHostname ,MsgType ...
,MsgIP ,MsgDateTime ,MsgText) VALUES (’...
$date ’, ’$time ’, ’$priority ’, ’...
$hostname ’, ’Synthetic ’, ’$ip ’, to_date...
(’$datetime ’, ’month:dd:hh24:mi:ss:yyyy...
’) , ’$alertmsg ’)") || die "insert ...
failed : $DBI:: errstr";
189
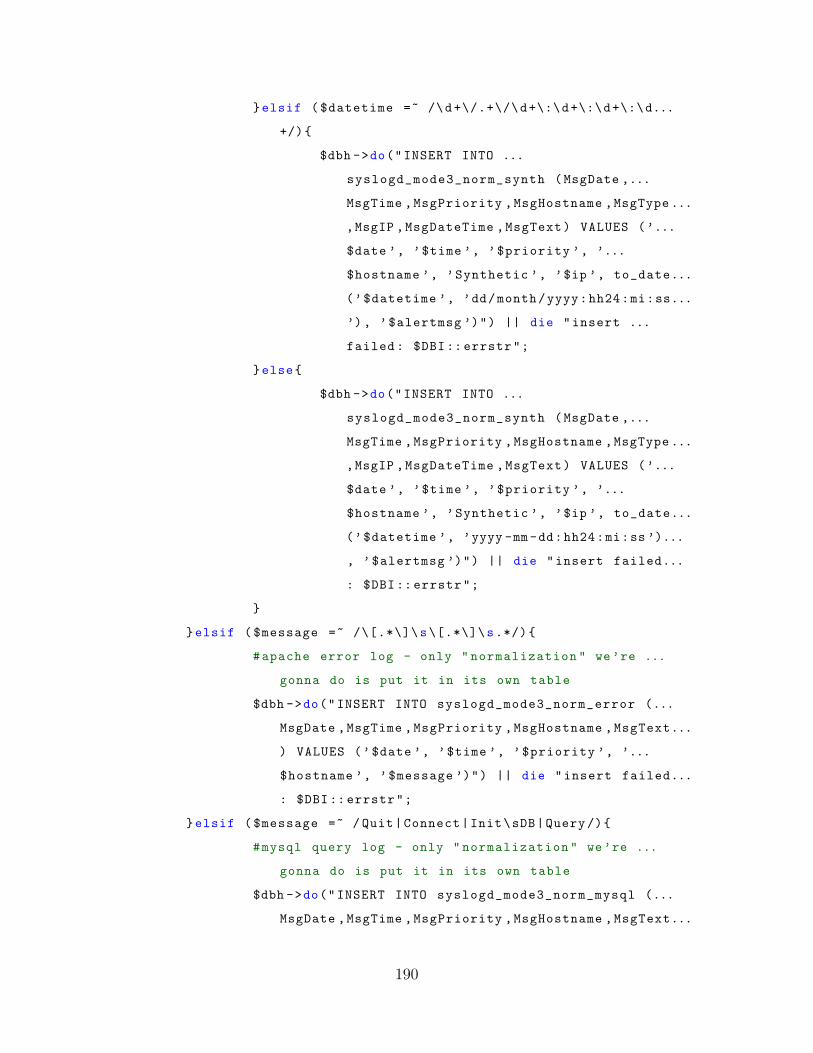
}elsif ( $datetime =~ /\d+\/.+\/\d+\:\d+\:\d+\:\d...
+/){
$dbh ->do("INSERT INTO ...
syslogd_mode3_norm_synth (MsgDate ,...
MsgTime ,MsgPriority ,MsgHostname ,MsgType ...
,MsgIP ,MsgDateTime ,MsgText) VALUES (’...
$date ’, ’$time ’, ’$priority ’, ’...
$hostname ’, ’Synthetic ’, ’$ip ’, to_date...
(’$datetime ’, ’dd/month/yyyy:hh24:mi:ss...
’) , ’$alertmsg ’)") || die "insert ...
failed : $DBI:: errstr";
}else{
$dbh ->do("INSERT INTO ...
syslogd_mode3_norm_synth (MsgDate ,...
MsgTime ,MsgPriority ,MsgHostname ,MsgType ...
,MsgIP ,MsgDateTime ,MsgText) VALUES (’...
$date ’, ’$time ’, ’$priority ’, ’...
$hostname ’, ’Synthetic ’, ’$ip ’, to_date...
(’$datetime ’, ’yyyy -mm-dd:hh24:mi:ss ’)...
, ’$alertmsg ’)") || die "insert failed...
: $DBI:: errstr";
}
}elsif ( $message =~ /\[.*\]\s\[.*\]\s.*/){
#apache error log - only " normalization " we’re ...
gonna do is put it in its own table
$dbh ->do("INSERT INTO syslogd_mode3_norm_error (...
MsgDate ,MsgTime ,MsgPriority ,MsgHostname ,MsgText...
) VALUES (’$date ’, ’$time ’, ’$priority ’, ’...
$hostname ’, ’$message ’)") || die "insert failed...
: $DBI:: errstr";
}elsif ( $message =~ / Quit|Connect|Init\sDB|Query/){
#mysql query log - only " normalization " we’re ...
gonna do is put it in its own table
$dbh ->do("INSERT INTO syslogd_mode3_norm_mysql (...
MsgDate ,MsgTime ,MsgPriority ,MsgHostname ,MsgText...
190

) VALUES (’$date ’, ’$time ’, ’$priority ’, ’...
$hostname ’, ’$message ’)") || die "insert failed...
: $DBI:: errstr";
}else{
print "Log didn’t match any of the patterns\n ...
$message\n";
}
}
191
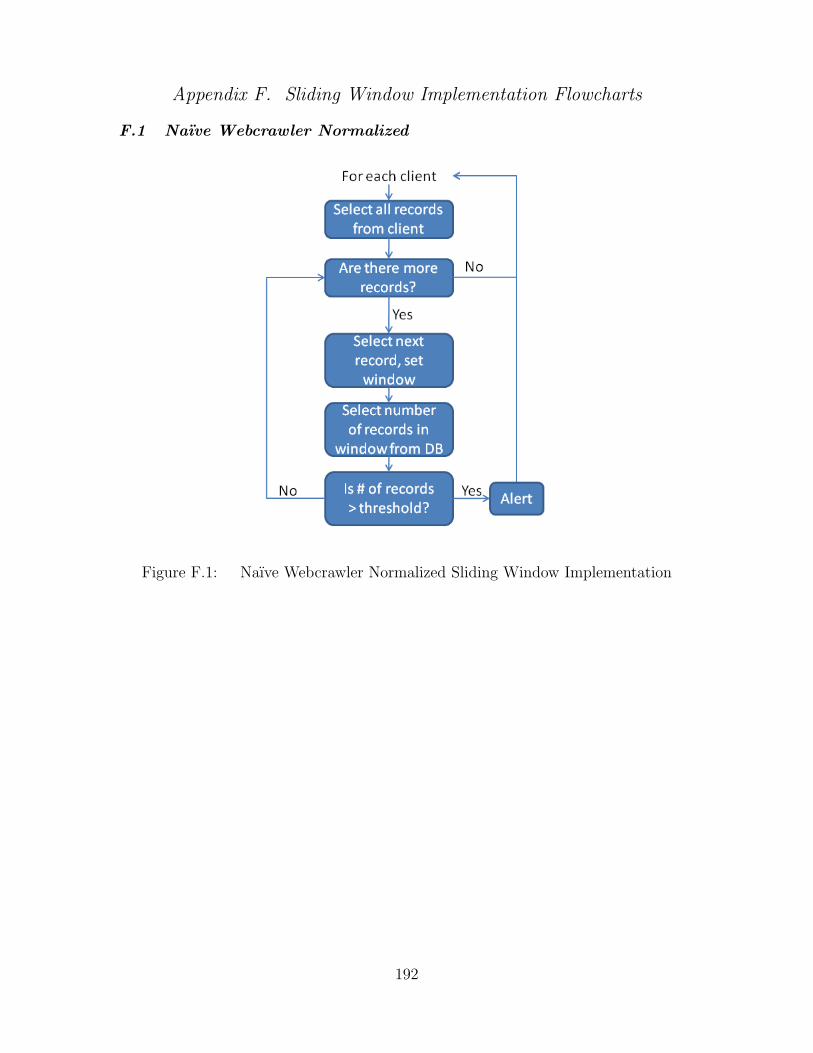
Appendix F. Sliding Window Implementation Flowcharts
F.1 Naıve Webcrawler Normalized
Figure F.1: Naıve Webcrawler Normalized Sliding Window Implementation
192
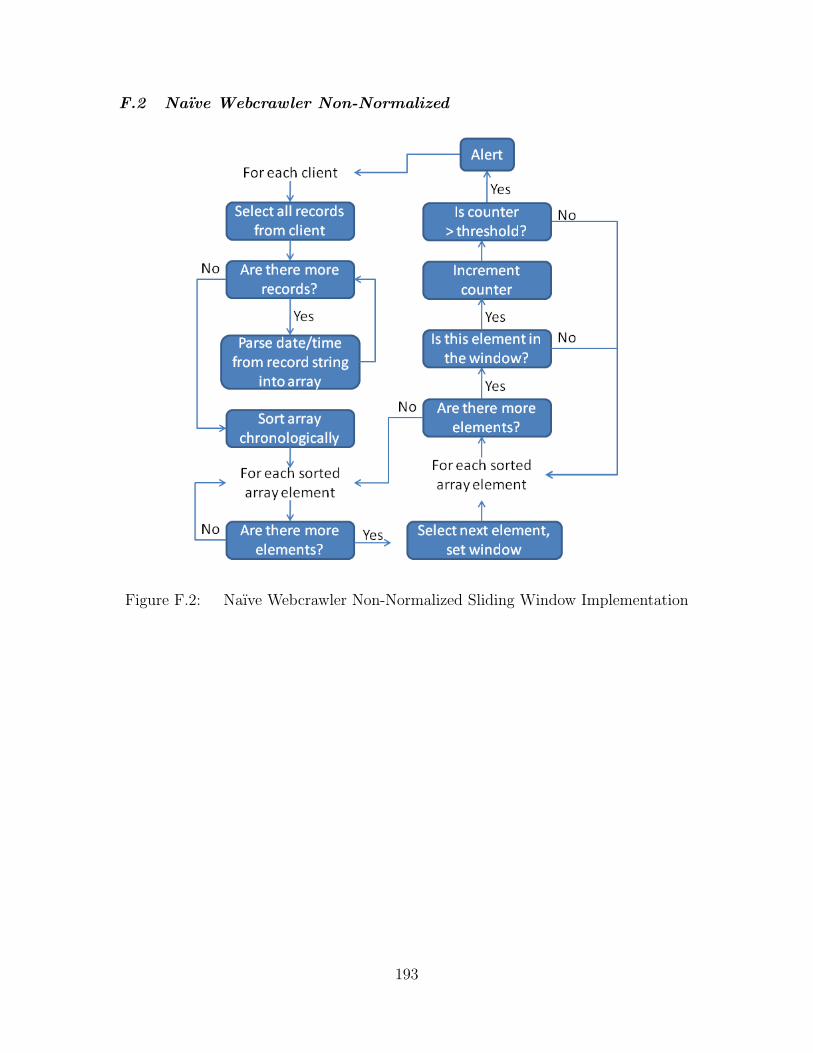
F.2 Naıve Webcrawler Non-Normalized
Figure F.2: Naıve Webcrawler Non-Normalized Sliding Window Implementation
193
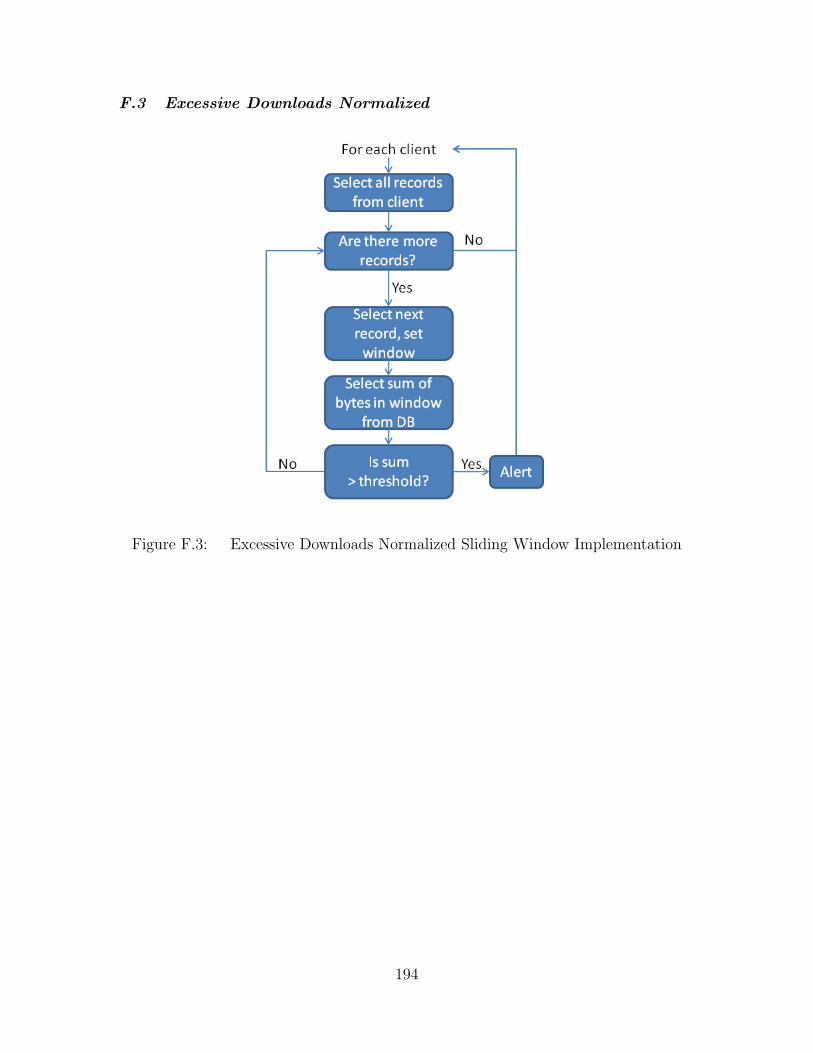
F.3 Excessive Downloads Normalized
Figure F.3: Excessive Downloads Normalized Sliding Window Implementation
194
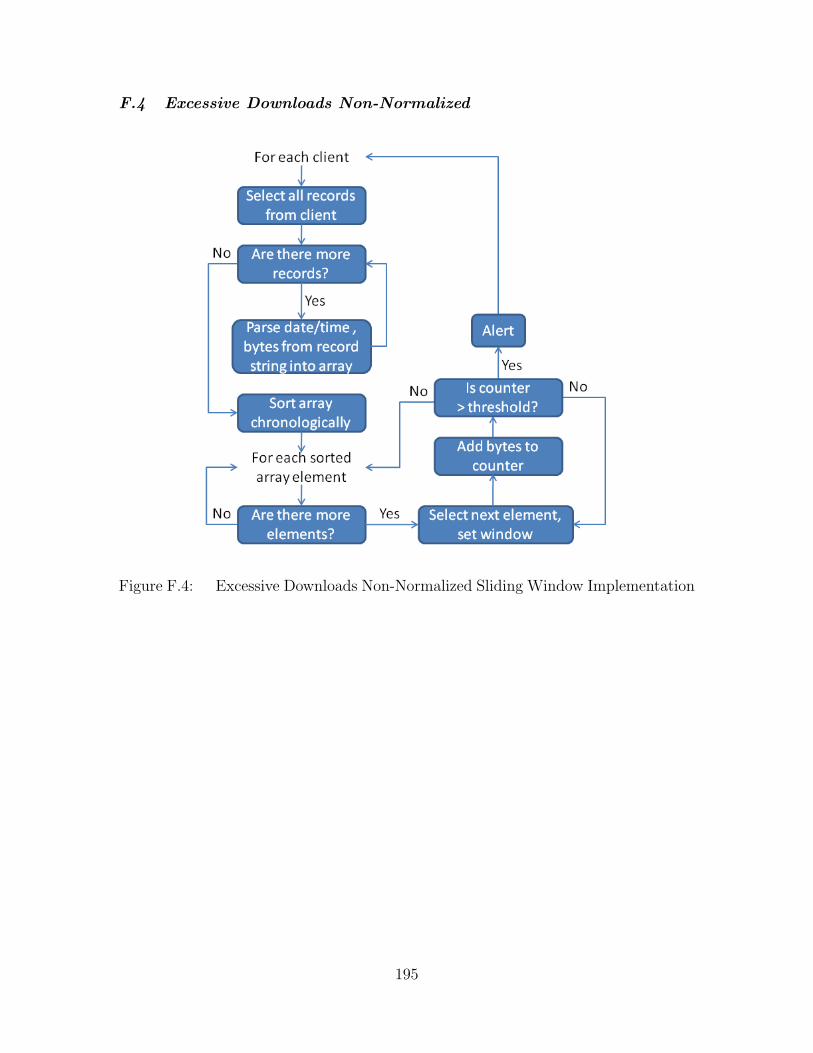
F.4 Excessive Downloads Non-Normalized
Figure F.4: Excessive Downloads Non-Normalized Sliding Window Implementation
195
Bibliography
1. “Apache HTTP Server Version 2.2 Documentation”. URLhttp://httpd.apache.org/docs/2.2/.
2. “IIS 6.0 Technical Reference”. URL http://technet.microsoft.com
/en-us/library/cc775635(WS.10).aspx.
3. “Splunk”. URL http://www.splunk.com.
4. Computer Security Threat Monitoring and Surveillance. Technical report, JamesP. Anderson Co., 1980.
5. “In the Matter of Genica Corporation, a corporation, and Compgeeks.com, alsodoing business as Computer Geeks Discount Outlet and Geeks.com, a corpora-tion.”, 2009. URL http://www2.ftc.gov/os/caselist/0823113/index.shtm.FTC File No. 082 3113.
6. 2010 CyberSecurity Watch Survey. Technical report, CSO magazine, U.S. Se-cret Service, Software Engineering Institute CERT Program at Carnegie MellonUniversity and Deloitte, 2010.
7. “Common Event Expression: A Standard Log Language for Event Interoperabil-ity in Electronic Systems”, May 2010. URL http://cee.mitre.org/.
8. OWASP Top 10 - 2010 RC1. Technical report, The OWASP Foundation, 2010.
9. State of Enterprise Security. Technical report, Symantec Corporation, 2010.
10. Axelsson, Stefan. “The base-rate fallacy and the difficulty of intrusion detection”.ACM Trans. Inf. Syst. Secur., 3(3):186–205, 2000.
11. Baker, Wade, Alex Hutton, C. David Hylender, Christopher Novak, ChristopherPorter, Bryan Sartin, Peter Tippett, and J. Andrew Valentine. Data BreachInvestigations Report. Technical report, Verizon Business RISK Team, 2009.
12. Bing, Matthew and Carl Erickson. “Extending UNIX System Logging withSHARP”. LISA ’00: Proceedings of the 14th USENIX conference on Systemadministration, 101–108. USENIX Association, Berkeley, CA, USA, 2000.
13. Bishop, Matt and Carrie Gates. “Defining the Insider Threat”. CSIIRW ’08:Proceedings of the 4th Annual Workshop on Cyber Security and Information In-telligence Research, 2008.
14. Cappelli, Dawn, Andrew Moore, Randall Trzeciak, and Timothy J. Shimeall.Common Sense Guide to Prevention and Detection of Insider Threats. CarnegieMellon University Software Engineering Institute, 3rd edition, 2009.
15. Chen, Shyh-Kwei, Jun-Jang Jeng, and H. Chang. “Complex Event Processingusing Simple Rule-based Event Correlation Engines for Business PerformanceManagement”. E-Commerce Technology, 26–29, 2006.
196
16. Hasan, Masum, Binay Sugla, and Ramesh Viswanathan. “A Conceptual Frame-work for Network Management Event Correlation and Filtering Systems”. Inte-grated Network Management, 233–246, 1999.
17. Huard, Jean-Francois. Probabilistic Reasoning for Fault Management on XUNET.Technical report, AT&T Bell Labs, 1994.
18. Jakobson, G., M. Weissman, L. Brenner, C. Lafond, and C. Matheus. “GRACE:building next generation event correlation services”. Network Operations andManagement Symposium, 2000., 701 –714, 2000.
19. Jakobson, Gabriel. “The Technology and Practice of Integrated Multi-AgentEvent Correlation Systems”. International Conference on Integration of Knowl-edge Intensive Multi-Agent Systems., 568–573, 2003.
20. Jakobson, Gabriel, Lundy Lewis, John Buford, and Ed Sherman. “Battlespacesituation analysis: the dynamic CBR approach”. Military Communications Con-ference. IEEE, volume 2, 941 – 947. 2004.
21. Kent, Karen and Murugiah Souppaya. “NIST Special Publication 800-92 Guideto Computer Security Log Management”, 2006.
22. Klinger, S., S. Yemini, Y. Yemini, D. Ohsie, and S. Stolfo. “A coding approachto event correlation”. Proceedings of the Fourth International Symposium onIntegrated Network Management IV, 266–277. Chapman & Hall, Ltd., London,UK, UK, 1995.
23. Meyer, Roger. Detecting Attacks on Web Applications from Log Files. Technicalreport, SANS Institute, 2008.
24. Myers, Justin, Michael R. Grimaila, and Robert F. Mills. “Insider Threat De-tection using Distributed Event Correlation of Web Server Logs”. ICIW 2010:Proceedings of the 5th International Conference on i-Warfare & Security. 2009.
25. Myers, Justin, Michael R. Grimaila, and Robert F. Mills. “Towards insider threatdetection using web server logs”. CSIIRW ’09: Proceedings of the 5th AnnualWorkshop on Cyber Security and Information Intelligence Research, 1–4. ACM,New York, NY, USA, 2009. ISBN 978-1-60558-518-5.
26. Richardson, R. CSI/FBI Computer Crime and Security Survey. Technical report,2008.
27. Rouillard, John P. “Real-time Logfile Analysis Using the Simple Event Correlator(SEC)”. Proceedings of 18th USENIX System Administration Conference (LISA’04), 133–149, 2004.
28. Sah, Adam. “A New Architecture for Managing Enterprise Log Data”. LISA,121–132, 2002.
29. Sailhan, Francoise and Julien Bourgeois. “Log-based Distributed Intrusion De-tection for Hybrid Networks”. CSIIRW, 2008.
197
30. Salem, Malek Ben, Shlomo Hershkop, and Salvatore J. Stolfo. A Survey of In-sider Attack Detection Research, volume 39 of Advances in Information Security.Springer US, 2008.
31. Shenk, Jerry. Demanding More from Log Management Systems. Technical report,SANS, 2008.
32. Shenk, Jerry. SANS Annual 2009 Log Management Survey. Technical report,SANS, 2009.
33. Swift, David. A Practical Application of SIM/SEM/SIEM Automating ThreatIdentification. Technical report, SANS Institute, 2007.
34. Tai, Wei, Declan O’Sullivan, and John Keeney. “Distributed fault correlationscheme using a semantic publish/subscribe system.” NOMS, 835–838. IEEE,2008.
35. Thompson, Kerry. “LogSurfer”. URL http://www.crypt.gen.nz/logsurfer/.
36. Vaarandi, Risto. “SEC a Lightweight Event Correlation Tool”. 2002.
37. Wilshusen, Gregory and David Powner. “CYBERSECURITY: Continued EffortsAre Needed to Protect Information Systems from Evolving Threats”, 2009. URLhttp://www.gao.gov/new.items/d10230t.pdf.
38. Yemini, Shaula Alexander, Shmuel Kliger, Eyal Mozes, Yechiam Yemini, andDavid Ohsie. “High speed and robust event correlation”. Communications Mag-azine, IEEE, 34(5):82 –90, 1996.
39. Zach, Martin, Daryl Parker, Liam Fallon, Christian Unfried, Miguel Ponce DeLeon, Sven Van Der Meer, Nektarios Georgalas, and Johan Nielsen. “CELTICInitiative Project Madeira: A P2P Approach to Network Management”. Proceed-ings of EURESCOM Summit 2005, 149–158. 2005.
198
REPORT DOCUMENTATION PAGE Form ApprovedOMB No. 0704–0188
The public reporting burden for this collection of information is estimated to average 1 hour per response, including the time for reviewing instructions, searching existing data sources, gathering andmaintaining the data needed, and completing and reviewing the collection of information. Send comments regarding this burden estimate or any other aspect of this collection of information, includingsuggestions for reducing this burden to Department of Defense, Washington Headquarters Services, Directorate for Information Operations and Reports (0704–0188), 1215 Jefferson Davis Highway,Suite 1204, Arlington, VA 22202–4302. Respondents should be aware that notwithstanding any other provision of law, no person shall be subject to any penalty for failing to comply with a collectionof information if it does not display a currently valid OMB control number. PLEASE DO NOT RETURN YOUR FORM TO THE ABOVE ADDRESS.
1. REPORT DATE (DD–MM–YYYY) 2. REPORT TYPE 3. DATES COVERED (From — To)
4. TITLE AND SUBTITLE 5a. CONTRACT NUMBER
5b. GRANT NUMBER
5c. PROGRAM ELEMENT NUMBER
5d. PROJECT NUMBER
5e. TASK NUMBER
5f. WORK UNIT NUMBER
6. AUTHOR(S)
7. PERFORMING ORGANIZATION NAME(S) AND ADDRESS(ES) 8. PERFORMING ORGANIZATION REPORTNUMBER
9. SPONSORING / MONITORING AGENCY NAME(S) AND ADDRESS(ES) 10. SPONSOR/MONITOR’S ACRONYM(S)
11. SPONSOR/MONITOR’S REPORTNUMBER(S)
12. DISTRIBUTION / AVAILABILITY STATEMENT
13. SUPPLEMENTARY NOTES
14. ABSTRACT
15. SUBJECT TERMS
16. SECURITY CLASSIFICATION OF:
a. REPORT b. ABSTRACT c. THIS PAGE
17. LIMITATION OFABSTRACT
18. NUMBEROFPAGES
19a. NAME OF RESPONSIBLE PERSON
19b. TELEPHONE NUMBER (include area code)
Standard Form 298 (Rev. 8–98)Prescribed by ANSI Std. Z39.18
17–06–2010 Master’s Thesis Oct 2008 — June 2010
A Dynamically Configurable Log-basedDistributed Security Event Detection Methodology
using Simple Event Correlator
JON 09ENV326
Justin Myers
Air Force Institute of TechnologyGraduate School of Engineering and Management2950 Hobson WayWPAFB OH 45433-7765
AFIT/GCO/ENV/10-J02
Mr. Michael BlaumDoD Enterprise Security PMONational Security Agency9800 Savage RoadFort Meade, Maryland 20755(240) 373-5745
NSA
Approval for public release; distribution is unlimited.
This research effort identifies attributes of distributed event correlation which make it desirable for security eventdetection, and evaluates those attributes in a comparison with a centralized alternative. Event correlation is an effectivemeans of detecting complex situations encountered in information technology environments. Centralized, database-drivenlog event correlation is more commonly implemented, but suffers from flaws such as high network bandwidth utilization,significant requirements for system resources, and difficulty in detecting certain suspicious behaviors. This analysismeasures the value in distributed event correlation by considering network bandwidth utilization, detection capabilityand database query efficiency, as well as through the implementation of remote configuration scripts and correlation ofmultiple log sources. These capabilities produce a configuration which allows a 99% reduction of network syslog traffic inthe low-accountability case, and a significant decrease in database execution time through context-addition in thehigh-accountability case.
event correlation, log management, log infrastructure
U U U UU 212
Dr. Michael Grimaila
(937) 255–3636, ext 4800


