Embed Size (px)
Citation preview

Hindawi Publishing CorporationEURASIP Journal on Advances in Signal ProcessingVolume 2007, Article ID 29125, 10 pagesdoi:10.1155/2007/29125
Research ArticleA Discrete Model for Color Naming
G. Menegaz,1 A. Le Troter,2 J. Sequeira,2 and J. M. Boi2
1 Department of Information Engineering, Faculty of Telecommunications, University of Siena, Siena 53100, Rome, Italy2 Systems and Information Sciences Laboratory, UMR CNRS 6168, 13397 Marseille, France
Received 3 January 2006; Revised 2 June 2006; Accepted 29 June 2006
Recommended by Maria Concetta Morrone
The ability to associate labels to colors is very natural for human beings. Though, this apparently simple task hides very complex andstill unsolved problems, spreading over many different disciplines ranging from neurophysiology to psychology and imaging. Inthis paper, we propose a discrete model for computational color categorization and naming. Starting from the 424 color specimensof the OSA-UCS set, we propose a fuzzy partitioning of the color space. Each of the 11 basic color categories identified by Berlinand Kay is modeled as a fuzzy set whose membership function is implicitly defined by fitting the model to the results of an ad hocpsychophysical experiment (Experiment 1). Each OSA-UCS sample is represented by a feature vector whose components are thememberships to the different categories. The discrete model consists of a three-dimensional Delaunay triangulation of the CIELABcolor space which associates each OSA-UCS sample to a vertex of a 3D tetrahedron. Linear interpolation is used to estimate themembership values of any other point in the color space. Model validation is performed both directly, through the comparison ofthe predicted membership values to the subjective counterparts, as evaluated via another psychophysical test (Experiment 2), andindirectly, through the investigation of its exploitability for image segmentation. The model has proved to be successful in bothcases, providing an estimation of the membership values in good agreement with the subjective measures as well as a semanticallymeaningful color-based segmentation map.
Copyright © 2007 Hindawi Publishing Corporation. All rights reserved.
1. INTRODUCTION
Color is a complex issue. Color research is intrinsically inter-disciplinary, and as such gathers the efforts of many differentresearch communities, ranging from the medical and psy-chological fields (neurophysiology, cognitive sciences) to theengineering fields (image and signal processing, robotics).Color naming implies a further level of abstraction, goingbeyond the field of vision-related sciences. The strong depen-dency on the development of the language implies a progres-sive evolution of the mechanisms responsible for color cate-gorization and naming [1–3]. Accordingly, the definition ofa computational model must account for the dynamics of thephenomenon, in the form of an updating of the labels usedto describe a given color as well as of the location of the cor-responding colors in the considered color space.
Color categorization is intrinsically related to color nam-ing, which lies at the boundary between different fields ofcognitive sciences: visual perception and linguistics. Colornaming is about the labelling of a given set of color stimuliaccording to their appearance in a given observation condi-tion. Pioneering this field, the work of Berlin and Kay [4]traces back to the early 1970’s, and has settled the ground for
the proliferation of the next wave of cognitive studies, likethose of Sturges and Whitfield [5, 6] and Lammens [7]. Inparticular, Berlin and Kay found that there are semantic uni-versals in the domain of color naming, especially in the ex-tension of what they call basic color terms.
The cornerstones of such a vast investigation can be sum-marized as follows:
(i) the best examples of basic color categories are the samewithin small tolerances of speakers, in any language,that has the equivalent of the basic color terms in ques-tion;
(ii) there is a hierarchy of languages with respect to howmany and which basic color terms they possess (i.e., alanguage that has i+ 1 basic color terms features all thebasic terms of any language with i color terms, and anylanguage with i basic color terms has the same ones);
(iii) basic color categories are characterized by gradedmembership functions.
A corollary of such findings is that a set of color foci can beidentified and, what is most important for image processing,measured, as being the best representative of the naming cat-egory they pertain according to psychophysical scaling. In

2 EURASIP Journal on Advances in Signal Processing
other terms, color foci represent the best examples of a namedcolor out of a set of color samples.
As very well pointed out in [7], the color naming processconsists in a mapping N from the color representation do-main to a multidimensional naming space which associatesto a given color stimulus (i) a color name; (ii) a confidencemeasure, and (iii) a goodness or typicality measure.
The set of color terms that can be considered as universalconstants (among the languages that have at least the neces-sary number of color terms) are the following: white, black,red, green, yellow, blue, brown, pink, purple, orange, gray.
Based on this, it is possible to derive the same number ofequivalent classes, while keeping into account the fuzzynessof the categorical membership.
The interest of color categorization in the image process-ing framework is that it enables the identification of “colornaming fuzzy clusters” in any color space, establishing a di-rect link between the name given to a color and its location inthe color space. This goes beyond the classical partitioning ofthe color space by clustering techniques based on color ap-pearance models, because the color descriptors are no moreuniquely dependent on the (suitably defined) tristimulus val-ues and colorimetric model.
Linking semantic features with numerical descriptors isone of challenges of the multimedia technology. Computa-tional models of color naming naturally lead to the design ofautomatic agents able to predict and reproduce the perfor-mance of human observers in sensing (through cameras orother kind of equipments), identifying, and classifying colors,as pertaining to one out of a set of predefined classes with acertain degree of confidence and in a reproducible manner.
The potential of color naming models has triggered aconsiderable amount of research in recent years follow-ing the way opened by Lammens [7]. Among the morerecent contributions are those of Belpaeme [1, 2], Bleys[8], and Mojsilovic [9]. Designing a color naming systemhides very difficult problems. The many possible choicesfor the set of control parameters (color naming system,reference color space, standard illuminant, model features)make it difficult to gather all this knowledge into a uni-fied framework. Different color naming systems often re-fer to different uniform color spaces, for which a closedform or exact transformation to a “usable” color space (likeXYZ, Lab, LMS) is usually not available. Roughly speak-ing, there is a great deal of uncertainty in managing colors,which makes it difficult to gain a clear and unified perspec-tive.
The extraction of high-level color descriptors is gainingan increasing interest in the image processing field due to itsintrinsic link to the representation of the image content. Se-mantic annotations for indexing, image segmentation, objectrecognition, and tracking are only few of the many examplesof applications that would take advantage of an automaticcolor naming engine. When the exploitability of the modelfor image processing is an issue, the outcomes of the modelmust be some measurable quantities suitable for feature ex-traction and analysis, and, as such, eligible as image descrip-tors.
In this paper, we propose a discrete computational modelfor color categorization. Given the tristimulus value of acolor randomly picked in the CIELAB space, the so-definedideal observer provides the estimation of the probability ofthat color being classified as pertaining to each of the 11predefined categories. This corresponds to a smooth parti-tioning of the color space, where the membership functionsof each category are shaped on the data collected by an adhoc psychophysical experiment (Experiment 1). The modelis subsequently validated by comparing the estimated mem-bership values of a color sample with the corresponding rel-ative frequencies measured via another subjective test (Ex-periment 2). The model exploitability for image processingis assessed by the characterization of its performance for se-mantic color-based segmentation.
This paper is organized as follows. Section 2 describesthe subjective experiments; Section 3 illustrates the dis-crete model. The performance is discussed in Section 4, andSection 5 derives conclusions.
2. METHODS
2.1. Color system
In this study, we used the OSA-UCS color system as in Boyn-ton and Olson [10]. The data obtained by Boynton and Ol-son cannot be directly applied to our purpose because of tworeasons. First, only the centroids and foci are provided foreach color category and for each subject, while the whole setof subjective data is needed for fitting our model. Second, inthat study the samples were observed in completely differentconditions, namely, they were mounted on 5-inch squares ofacid free Bristol board seen by the subject through a 3.8 cm-square aperture in a table slanted 20◦ upwards from horizon-tal. The source of illumination was a 200 Watts photofloodlamp at 3200 K mounted above the subject’s head [10].
The OSA-UCS is a color appearance system that has beendeveloped by the Optical Society of America (OSA) [11].Color samples are arranged in a regular rhombohedral lat-tice in which each color is surrounded by twelve neighbor-ing colors, all perceptually equidistant from the consideredone. Figure 1 shows the solid centered at a point in the L, g,j space.
The color chips illustrated in the atlas closely reproducethe appearance of a set of colors of given CIE 1964 coordi-nates when viewed under the daylight (D65) illumination ona middle gray surround (30% reflectance). The CIE 1964 andOSA-UCS L, g, j coordinates are related by a nonlinear trans-formation [11].
The OSA-UCS system has the unique advantage of equalperceptual spacing among the color samples. Such a supra-threshold uniform perceptual spacing is the main reason be-hind the choice of using the OSA-UCS space instead of an-other color dataset more suitable for the applications to beused as reference. The main inconvenience of this choice isthat the volume of the color space corresponding to the OSAsamples fails to extend to highly saturated regions. In conse-quence, this constrains the applicability of the model only to

G. Menegaz et al. 3
the region of the color space that is represented by the OSAsamples, of course limiting its exploitability from the imageprocessing perspective. Accordingly, after having verified thepotential of the proposed approach in the current prototyp-ing phase, the next step of our work will be to extend the setof color samples to adequately represent the entire region ofthe color space that is concerned with the foreseen applica-tions by designing a suitable color sampling scheme.
2.2. Color naming model
After choosing the color system, the color naming modelmust be specified. Attributing a label to a color requiresa color vocabulary that is expression of both the culturalbackground (implicitly) of the speakers and the applicationframework. For instance, the Munsell color order system [11]is extensively used in the production of textiles and paint-ings, allowing a highly detailed specification of colors. TheISCC-NBS [12] dictionary was developed by the NBS fol-lowing a recommendation of the Inter-Society Council. Itconsists of 267 terms obtained by combining five descrip-tors for lightness (very dark, dark, medium, light, very light),four for saturation (grayish, moderate, strong, vivid), three forbrightness and saturation (brilliant, pale, deep), and twenty-eight for hues constructed from a basic set (red, orange, yel-low, green, blue, violet, purple, pink, brown, olive, black, white,gray).
However, as pointed out in [9], such dictionaries oftensuffer from many disadvantages like the lack of both a well-defined color vocabulary and an exact transform to a differ-ent color space. This is the case for the Munsell system for in-stance, and to a certain extent also of the ISCC-NBS one. As itis usually the case, colors are described in terms of hue, light-ness, and saturation. Noteworthy, since the language evolvesin time, many terms of the dictionary become obsolete andas such are not adequate for color description.
In our work, we constrain the choice of the color namesto the 11 basic terms of Berlin and Kay. The reasons istwofold. First, we want to set up a framework as simple aspossible in order to design and characterize a prototype sys-tem and check its usefulness in a given set of applications(like image segmentation and indexing). It is worth men-tioning that the more names are allowed, the more subjec-tive data are needed for both model fitting and validation,in order to have an acceptable estimation of the categoriza-tion probabilities of each data sample. Second, we foreseeto follow a multiresolution approach, allowing for a progres-sively refinable description of the color features generatinga nested partitioning of the color volume. Accordingly, thecolor space will be initially split into a set of 11 regions cor-responding to the 11 basic colors. Such regions will overlapdue to the intrinsic fuzzyness of the categorization processand will serve for the automatic naming of color samples atthe first coarser level. Next step will be the definition of a setof descriptors for each color attribute (as exemplified abovereferring to the ISSC-NBS color naming system) jointly witha syntax allowing to combine them in a structured way, asin [9]. Again, we will follow the multiscale approach and
L
g j
Figure 1: In the OSA color system, color samples are arranged ina regular rhombohedral lattice in which each point is surroundedby twelve neighboring colors, all perceptually equidistant from thecentral one.
y
x
Figure 2: The 424 OSA-UCS samples represented in the xy space.
allow for a progressive refinement of the granularity in thedescription of the color features. This will end up with a se-quence of nested subvolumes that will result in the descrip-tion of a color in the form 80% light bluish green and 20%light blue.
Though, this is left for future work and goes beyond thescope of this paper.
2.3. Experiment 1
As mentioned above, the first experiment aimed at the cate-gorization of the 424 OSA-UCS color samples. Figures 2 and3 illustrate the positions of the OSA samples in the xy andCIELAB spaces, respectively.
2.3.1. Subjects
Six subjects aged between 25 and 35 years participated in thisexperiment (5 males and 1 female). Two of them were famil-iar with color imaging and the others were naives. All of themwere volunteers. They were screened for normal color vision

4 EURASIP Journal on Advances in Signal Processing
through the Ishihara test. Each subject repeated the test threetimes.
2.3.2. Procedure
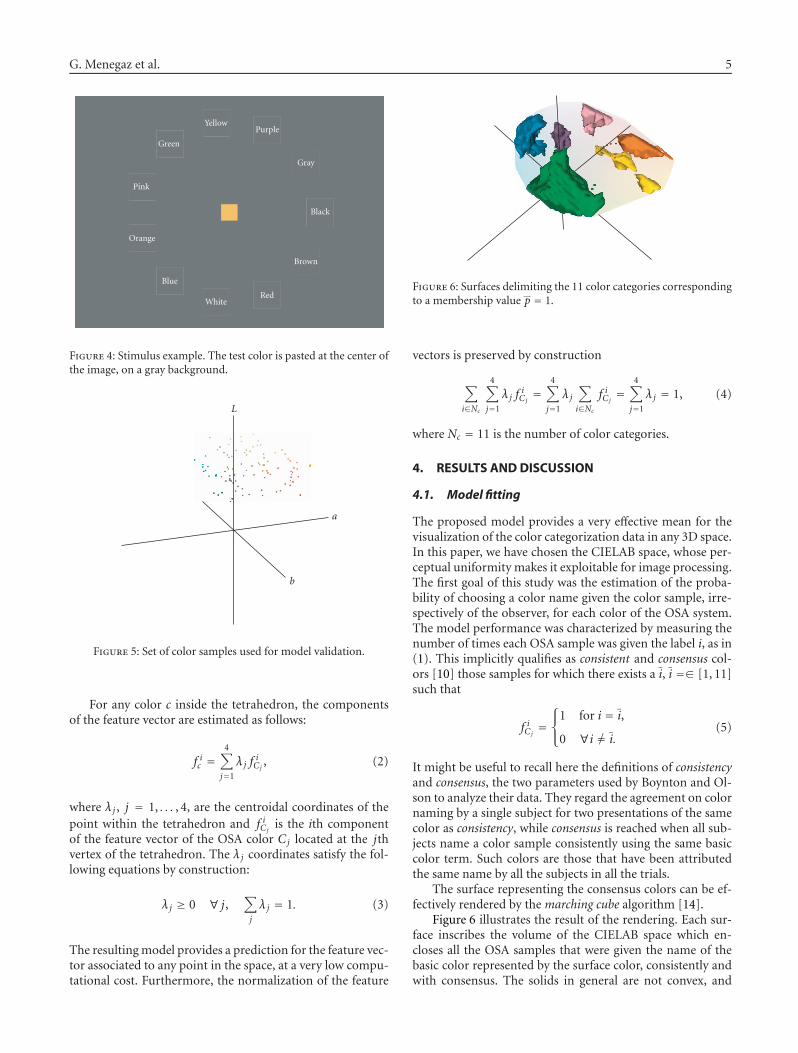
The 424 OSA samples were displayed on a CRT calibratedmonitor in a completely dark room. Each color sample wasshown in a square window of size 2 × 2 cm2 in a mid lu-minance gray background. The visual angle subtended bythe stimulus was about 2 degrees in order to avoid the in-terference of rod mechanisms. The viewing distance wasof 57 cm. The OSA samples were presented one at a timein random order. The order was different for each blockof trials (three for each subject) and within trials for thesame subject. Standard instructions were provided in writ-ten form in the center of the screen using white charac-ters on the same gray background used for the experi-ment. The task consisted in naming each color sample us-ing one of the 11 basic terms. To this purpose, the labelswere shown using the corresponding string of characters en-closed in a square of the same size of the sample. Both thecharacters and the square sides were light-gray. The squareswere arranged along a circle centered on the sample loca-tion. The ray of the circle was such that the average dis-tance of the squares resulted in about 2 cm. The locationof the squares along the circle was randomized, in order toavoid bias effects on the judgement related to the relativedistance of the squares from the starting gaze direction. Notime constraints were given. When ready, the subject madeher/his choice by clicking on the corresponding square withthe mouse. Figure 4 shows an example of the test stimu-lus.
2.4. Experiment 2
The second experiment was aimed at the model validation.The same experimental setting as in Experiment 1 was used,the difference being in the set of color samples the subjectwas asked to classify.
2.4.1. Subjects
The same six subjects that participated in Experiment 1 alsotook part to Experiment 2. This allows limiting the fluctua-tions in color categorization due to intersubject variability. Alarger number of subjects would be needed for a more precisefitting, or, equivalently, model training.
2.4.2. Procedure
A total of Nc = 100 colors were randomly sampled from thevolume enclosed by the OSA outer (more saturated) sam-ples at each luminance level following a uniform probabilitydistribution. Figure 5 illustrates the resulting color set. Thesame paradigm as in Experiment 1 was followed: the sub-jects were shown each color sample and asked to name it byclicking on the corresponding square. The same set of colorswas shown three times to each observer in random order to
Figure 3: The 424 OSA-UCS samples represented in the CIELABspace.
estimate its probability of classification within each of the 11categories.
The outcome of this experiment is the estimation of thecategory membership of each color sample.
3. THE DISCRETE MODEL
In our model, each point in the color space is representedby an 11-component feature vector. Each component rep-resents the estimated membership value of the sample toone category. For points corresponding an OSA-UCS samplesuch values coincide with the measured relative frequenciesof classification of the point in the different categories. Themembership values for the rest of the colors are estimated bylinear interpolation. The discrete model consists of a three-dimensional Delaunay triangulation [13] of the color spacewhich associates each OSA sample to a vertex of a 3D tetrahe-dron. The Delaunay triangulation is particularly suitable forour purpose because it provides a well-balanced partitioningof the space, according to a predefined criterion.
The membership value of any color lying inside of thetetrahedron is estimated as a linearly weighted sum of theanalogous values of the four vertexes of the enclosing tetra-hedron.
Let fC(−→x ) be the feature vector associated to color C atposition −→x , −→x = {L, a, b} in the CIELAB space. For thepoints corresponding to the OSA samples, the ith compo-nent of the feature vector represents the relative frequency ofclassification of color C in the category i:
f iC(−→x ) = NiC
N, (1)
where NiC is the number of times C has been classified as per-
taining to class i evaluated over the whole set of subjects andblocks, and N is the total number of times that the color wasdisplayed (number of subjects×3). Setting such membershipvalues amounts to fitting the model to the actual data gath-ered by the subjective experiment.
G. Menegaz et al. 5
Blue
WhiteRed
Brown
Black
Gray
PurpleYellow
Green
Pink
Orange
Figure 4: Stimulus example. The test color is pasted at the center ofthe image, on a gray background.
L
a
b
Figure 5: Set of color samples used for model validation.
For any color c inside the tetrahedron, the componentsof the feature vector are estimated as follows:
f ic =4∑
j=1
λj fiCj
, (2)
where λj , j = 1, . . . , 4, are the centroidal coordinates of thepoint within the tetrahedron and f iCj
is the ith componentof the feature vector of the OSA color Cj located at the jthvertex of the tetrahedron. The λj coordinates satisfy the fol-lowing equations by construction:
λj ≥ 0 ∀ j,∑
j
λ j = 1. (3)
The resulting model provides a prediction for the feature vec-tor associated to any point in the space, at a very low compu-tational cost. Furthermore, the normalization of the feature
Figure 6: Surfaces delimiting the 11 color categories correspondingto a membership value p = 1.
vectors is preserved by construction
∑
i∈Nc
4∑
j=1
λj fiCj=
4∑
j=1
λj
∑
i∈Nc
f iCj=
4∑
j=1
λj = 1, (4)
where Nc = 11 is the number of color categories.
4. RESULTS AND DISCUSSION
4.1. Model fitting
The proposed model provides a very effective mean for thevisualization of the color categorization data in any 3D space.In this paper, we have chosen the CIELAB space, whose per-ceptual uniformity makes it exploitable for image processing.The first goal of this study was the estimation of the proba-bility of choosing a color name given the color sample, irre-spectively of the observer, for each color of the OSA system.The model performance was characterized by measuring thenumber of times each OSA sample was given the label i, as in(1). This implicitly qualifies as consistent and consensus col-ors [10] those samples for which there exists a i, i =∈ [1, 11]such that
f iCj=⎧⎨⎩
1 for i = i,
0 ∀i �= i.(5)
It might be useful to recall here the definitions of consistencyand consensus, the two parameters used by Boynton and Ol-son to analyze their data. They regard the agreement on colornaming by a single subject for two presentations of the samecolor as consistency, while consensus is reached when all sub-jects name a color sample consistently using the same basiccolor term. Such colors are those that have been attributedthe same name by all the subjects in all the trials.
The surface representing the consensus colors can be ef-fectively rendered by the marching cube algorithm [14].
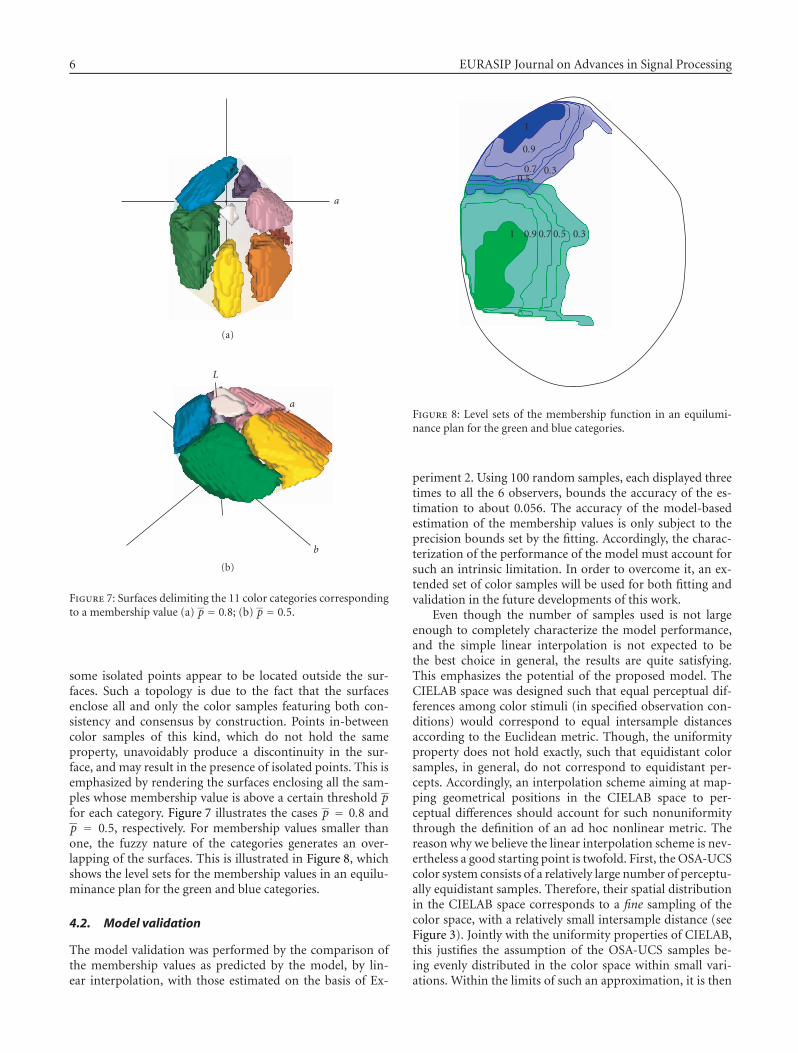
Figure 6 illustrates the result of the rendering. Each sur-face inscribes the volume of the CIELAB space which en-closes all the OSA samples that were given the name of thebasic color represented by the surface color, consistently andwith consensus. The solids in general are not convex, and
6 EURASIP Journal on Advances in Signal Processing
a
(a)
a
L
b
(b)
Figure 7: Surfaces delimiting the 11 color categories correspondingto a membership value (a) p = 0.8; (b) p = 0.5.
some isolated points appear to be located outside the sur-faces. Such a topology is due to the fact that the surfacesenclose all and only the color samples featuring both con-sistency and consensus by construction. Points in-betweencolor samples of this kind, which do not hold the sameproperty, unavoidably produce a discontinuity in the sur-face, and may result in the presence of isolated points. This isemphasized by rendering the surfaces enclosing all the sam-ples whose membership value is above a certain threshold pfor each category. Figure 7 illustrates the cases p = 0.8 andp = 0.5, respectively. For membership values smaller thanone, the fuzzy nature of the categories generates an over-lapping of the surfaces. This is illustrated in Figure 8, whichshows the level sets for the membership values in an equilu-minance plan for the green and blue categories.
4.2. Model validation
The model validation was performed by the comparison ofthe membership values as predicted by the model, by lin-ear interpolation, with those estimated on the basis of Ex-
1
0.9
0.70.5
0.3
1 0.9 0.7 0.5 0.3
Figure 8: Level sets of the membership function in an equilumi-nance plan for the green and blue categories.
periment 2. Using 100 random samples, each displayed threetimes to all the 6 observers, bounds the accuracy of the es-timation to about 0.056. The accuracy of the model-basedestimation of the membership values is only subject to theprecision bounds set by the fitting. Accordingly, the charac-terization of the performance of the model must account forsuch an intrinsic limitation. In order to overcome it, an ex-tended set of color samples will be used for both fitting andvalidation in the future developments of this work.
Even though the number of samples used is not largeenough to completely characterize the model performance,and the simple linear interpolation is not expected to bethe best choice in general, the results are quite satisfying.This emphasizes the potential of the proposed model. TheCIELAB space was designed such that equal perceptual dif-ferences among color stimuli (in specified observation con-ditions) would correspond to equal intersample distancesaccording to the Euclidean metric. Though, the uniformityproperty does not hold exactly, such that equidistant colorsamples, in general, do not correspond to equidistant per-cepts. Accordingly, an interpolation scheme aiming at map-ping geometrical positions in the CIELAB space to per-ceptual differences should account for such nonuniformitythrough the definition of an ad hoc nonlinear metric. Thereason why we believe the linear interpolation scheme is nev-ertheless a good starting point is twofold. First, the OSA-UCScolor system consists of a relatively large number of perceptu-ally equidistant samples. Therefore, their spatial distributionin the CIELAB space corresponds to a fine sampling of thecolor space, with a relatively small intersample distance (seeFigure 3). Jointly with the uniformity properties of CIELAB,this justifies the assumption of the OSA-UCS samples be-ing evenly distributed in the color space within small vari-ations. Within the limits of such an approximation, it is then
G. Menegaz et al. 7
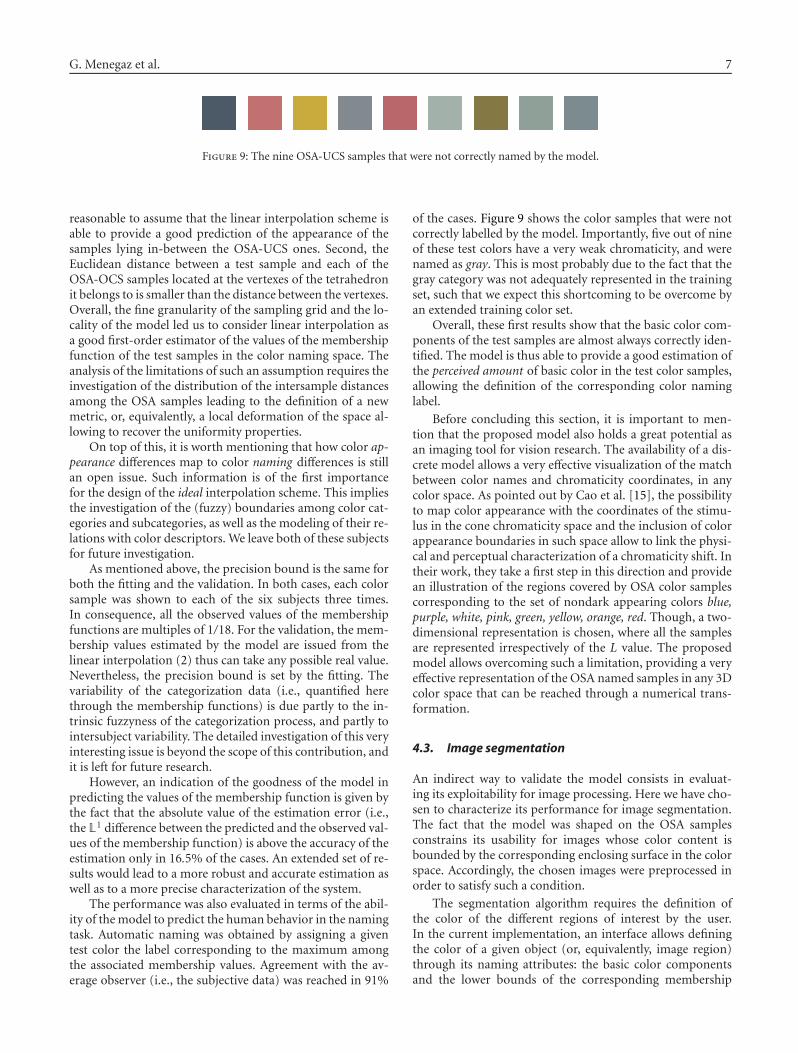
Figure 9: The nine OSA-UCS samples that were not correctly named by the model.
reasonable to assume that the linear interpolation scheme isable to provide a good prediction of the appearance of thesamples lying in-between the OSA-UCS ones. Second, theEuclidean distance between a test sample and each of theOSA-OCS samples located at the vertexes of the tetrahedronit belongs to is smaller than the distance between the vertexes.Overall, the fine granularity of the sampling grid and the lo-cality of the model led us to consider linear interpolation asa good first-order estimator of the values of the membershipfunction of the test samples in the color naming space. Theanalysis of the limitations of such an assumption requires theinvestigation of the distribution of the intersample distancesamong the OSA samples leading to the definition of a newmetric, or, equivalently, a local deformation of the space al-lowing to recover the uniformity properties.
On top of this, it is worth mentioning that how color ap-pearance differences map to color naming differences is stillan open issue. Such information is of the first importancefor the design of the ideal interpolation scheme. This impliesthe investigation of the (fuzzy) boundaries among color cat-egories and subcategories, as well as the modeling of their re-lations with color descriptors. We leave both of these subjectsfor future investigation.
As mentioned above, the precision bound is the same forboth the fitting and the validation. In both cases, each colorsample was shown to each of the six subjects three times.In consequence, all the observed values of the membershipfunctions are multiples of 1/18. For the validation, the mem-bership values estimated by the model are issued from thelinear interpolation (2) thus can take any possible real value.Nevertheless, the precision bound is set by the fitting. Thevariability of the categorization data (i.e., quantified herethrough the membership functions) is due partly to the in-trinsic fuzzyness of the categorization process, and partly tointersubject variability. The detailed investigation of this veryinteresting issue is beyond the scope of this contribution, andit is left for future research.
However, an indication of the goodness of the model inpredicting the values of the membership function is given bythe fact that the absolute value of the estimation error (i.e.,the L1 difference between the predicted and the observed val-ues of the membership function) is above the accuracy of theestimation only in 16.5% of the cases. An extended set of re-sults would lead to a more robust and accurate estimation aswell as to a more precise characterization of the system.
The performance was also evaluated in terms of the abil-ity of the model to predict the human behavior in the namingtask. Automatic naming was obtained by assigning a giventest color the label corresponding to the maximum amongthe associated membership values. Agreement with the av-erage observer (i.e., the subjective data) was reached in 91%
of the cases. Figure 9 shows the color samples that were notcorrectly labelled by the model. Importantly, five out of nineof these test colors have a very weak chromaticity, and werenamed as gray. This is most probably due to the fact that thegray category was not adequately represented in the trainingset, such that we expect this shortcoming to be overcome byan extended training color set.
Overall, these first results show that the basic color com-ponents of the test samples are almost always correctly iden-tified. The model is thus able to provide a good estimation ofthe perceived amount of basic color in the test color samples,allowing the definition of the corresponding color naminglabel.
Before concluding this section, it is important to men-tion that the proposed model also holds a great potential asan imaging tool for vision research. The availability of a dis-crete model allows a very effective visualization of the matchbetween color names and chromaticity coordinates, in anycolor space. As pointed out by Cao et al. [15], the possibilityto map color appearance with the coordinates of the stimu-lus in the cone chromaticity space and the inclusion of colorappearance boundaries in such space allow to link the physi-cal and perceptual characterization of a chromaticity shift. Intheir work, they take a first step in this direction and providean illustration of the regions covered by OSA color samplescorresponding to the set of nondark appearing colors blue,purple, white, pink, green, yellow, orange, red. Though, a two-dimensional representation is chosen, where all the samplesare represented irrespectively of the L value. The proposedmodel allows overcoming such a limitation, providing a veryeffective representation of the OSA named samples in any 3Dcolor space that can be reached through a numerical trans-formation.
4.3. Image segmentation
An indirect way to validate the model consists in evaluat-ing its exploitability for image processing. Here we have cho-sen to characterize its performance for image segmentation.The fact that the model was shaped on the OSA samplesconstrains its usability for images whose color content isbounded by the corresponding enclosing surface in the colorspace. Accordingly, the chosen images were preprocessed inorder to satisfy such a condition.
The segmentation algorithm requires the definition ofthe color of the different regions of interest by the user.In the current implementation, an interface allows definingthe color of a given object (or, equivalently, image region)through its naming attributes: the basic color componentsand the lower bounds of the corresponding membership
8 EURASIP Journal on Advances in Signal Processing
(a) (b)
(c) (d)
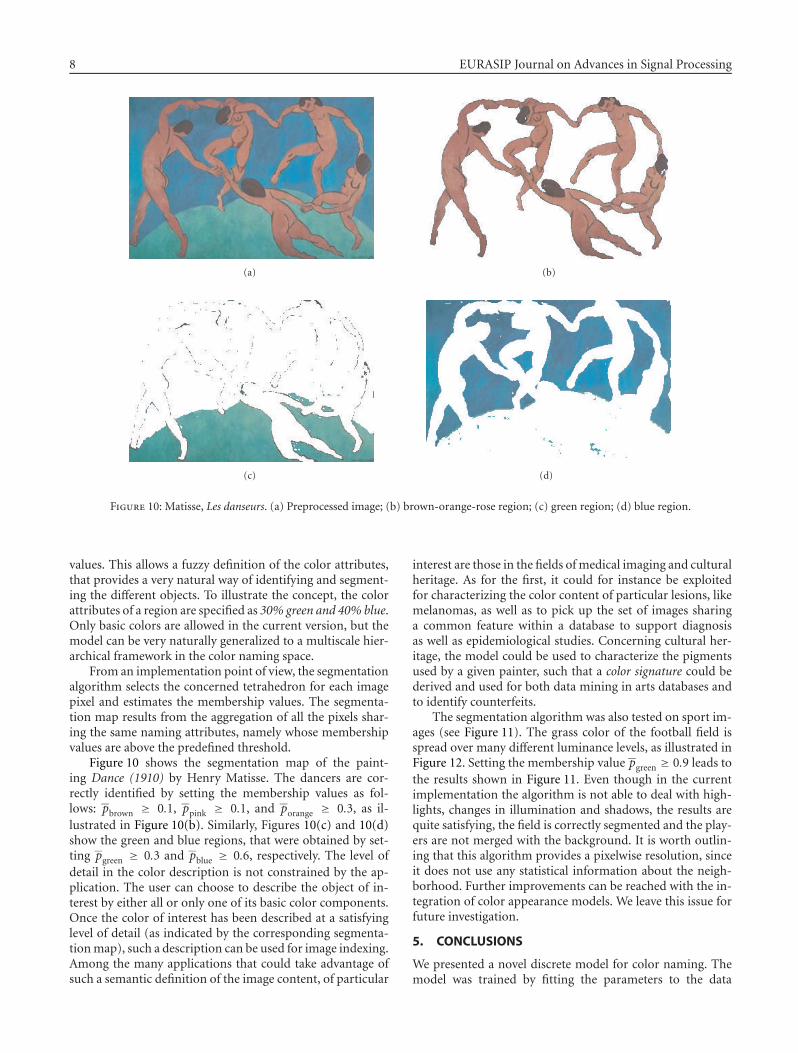
Figure 10: Matisse, Les danseurs. (a) Preprocessed image; (b) brown-orange-rose region; (c) green region; (d) blue region.
values. This allows a fuzzy definition of the color attributes,that provides a very natural way of identifying and segment-ing the different objects. To illustrate the concept, the colorattributes of a region are specified as 30% green and 40% blue.Only basic colors are allowed in the current version, but themodel can be very naturally generalized to a multiscale hier-archical framework in the color naming space.
From an implementation point of view, the segmentationalgorithm selects the concerned tetrahedron for each imagepixel and estimates the membership values. The segmenta-tion map results from the aggregation of all the pixels shar-ing the same naming attributes, namely whose membershipvalues are above the predefined threshold.
Figure 10 shows the segmentation map of the paint-ing Dance (1910) by Henry Matisse. The dancers are cor-rectly identified by setting the membership values as fol-lows: pbrown ≥ 0.1, ppink ≥ 0.1, and porange ≥ 0.3, as il-lustrated in Figure 10(b). Similarly, Figures 10(c) and 10(d)show the green and blue regions, that were obtained by set-ting pgreen ≥ 0.3 and pblue ≥ 0.6, respectively. The level ofdetail in the color description is not constrained by the ap-plication. The user can choose to describe the object of in-terest by either all or only one of its basic color components.Once the color of interest has been described at a satisfyinglevel of detail (as indicated by the corresponding segmenta-tion map), such a description can be used for image indexing.Among the many applications that could take advantage ofsuch a semantic definition of the image content, of particular
interest are those in the fields of medical imaging and culturalheritage. As for the first, it could for instance be exploitedfor characterizing the color content of particular lesions, likemelanomas, as well as to pick up the set of images sharinga common feature within a database to support diagnosisas well as epidemiological studies. Concerning cultural her-itage, the model could be used to characterize the pigmentsused by a given painter, such that a color signature could bederived and used for both data mining in arts databases andto identify counterfeits.
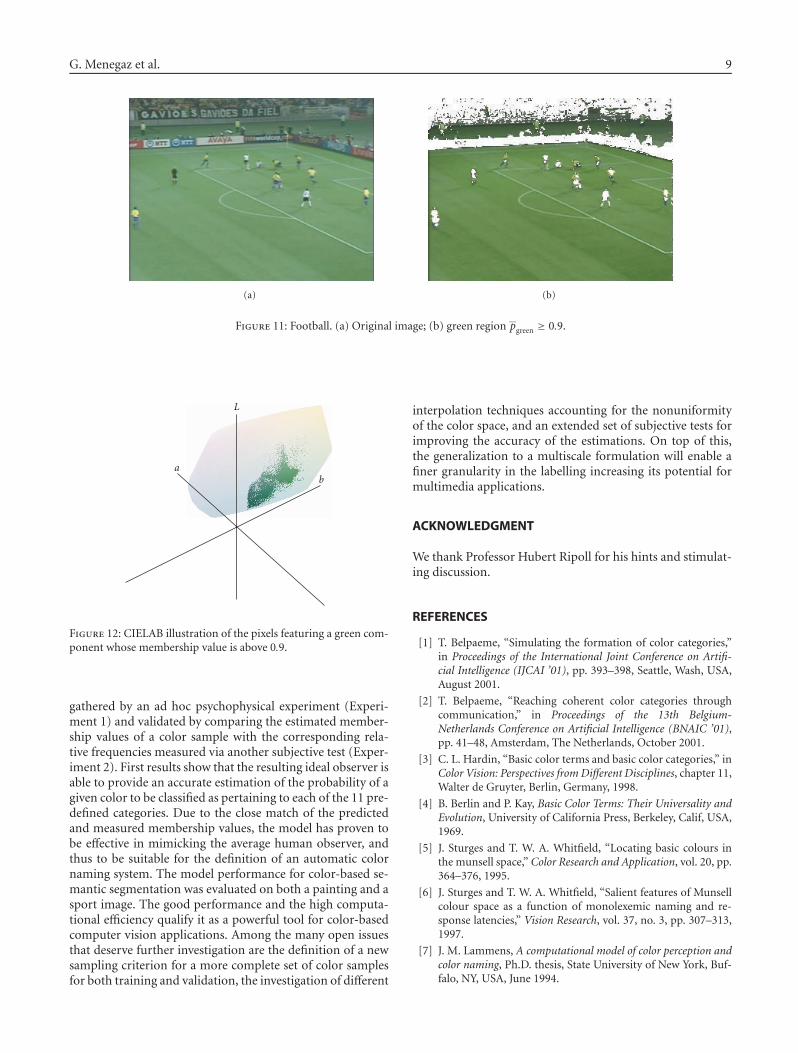
The segmentation algorithm was also tested on sport im-ages (see Figure 11). The grass color of the football field isspread over many different luminance levels, as illustrated inFigure 12. Setting the membership value pgreen ≥ 0.9 leads tothe results shown in Figure 11. Even though in the currentimplementation the algorithm is not able to deal with high-lights, changes in illumination and shadows, the results arequite satisfying, the field is correctly segmented and the play-ers are not merged with the background. It is worth outlin-ing that this algorithm provides a pixelwise resolution, sinceit does not use any statistical information about the neigh-borhood. Further improvements can be reached with the in-tegration of color appearance models. We leave this issue forfuture investigation.
5. CONCLUSIONS
We presented a novel discrete model for color naming. Themodel was trained by fitting the parameters to the data
G. Menegaz et al. 9
(a) (b)
Figure 11: Football. (a) Original image; (b) green region pgreen ≥ 0.9.
L
ab
Figure 12: CIELAB illustration of the pixels featuring a green com-ponent whose membership value is above 0.9.
gathered by an ad hoc psychophysical experiment (Experi-ment 1) and validated by comparing the estimated member-ship values of a color sample with the corresponding rela-tive frequencies measured via another subjective test (Exper-iment 2). First results show that the resulting ideal observer isable to provide an accurate estimation of the probability of agiven color to be classified as pertaining to each of the 11 pre-defined categories. Due to the close match of the predictedand measured membership values, the model has proven tobe effective in mimicking the average human observer, andthus to be suitable for the definition of an automatic colornaming system. The model performance for color-based se-mantic segmentation was evaluated on both a painting and asport image. The good performance and the high computa-tional efficiency qualify it as a powerful tool for color-basedcomputer vision applications. Among the many open issuesthat deserve further investigation are the definition of a newsampling criterion for a more complete set of color samplesfor both training and validation, the investigation of different
interpolation techniques accounting for the nonuniformityof the color space, and an extended set of subjective tests forimproving the accuracy of the estimations. On top of this,the generalization to a multiscale formulation will enable afiner granularity in the labelling increasing its potential formultimedia applications.
ACKNOWLEDGMENT
We thank Professor Hubert Ripoll for his hints and stimulat-ing discussion.
REFERENCES
[1] T. Belpaeme, “Simulating the formation of color categories,”in Proceedings of the International Joint Conference on Artifi-cial Intelligence (IJCAI ’01), pp. 393–398, Seattle, Wash, USA,August 2001.
[2] T. Belpaeme, “Reaching coherent color categories throughcommunication,” in Proceedings of the 13th Belgium-Netherlands Conference on Artificial Intelligence (BNAIC ’01),pp. 41–48, Amsterdam, The Netherlands, October 2001.
[3] C. L. Hardin, “Basic color terms and basic color categories,” inColor Vision: Perspectives from Different Disciplines, chapter 11,Walter de Gruyter, Berlin, Germany, 1998.
[4] B. Berlin and P. Kay, Basic Color Terms: Their Universality andEvolution, University of California Press, Berkeley, Calif, USA,1969.
[5] J. Sturges and T. W. A. Whitfield, “Locating basic colours inthe munsell space,” Color Research and Application, vol. 20, pp.364–376, 1995.
[6] J. Sturges and T. W. A. Whitfield, “Salient features of Munsellcolour space as a function of monolexemic naming and re-sponse latencies,” Vision Research, vol. 37, no. 3, pp. 307–313,1997.
[7] J. M. Lammens, A computational model of color perception andcolor naming, Ph.D. thesis, State University of New York, Buf-falo, NY, USA, June 1994.

10 EURASIP Journal on Advances in Signal Processing
[8] J. Bleys, The cultural propagation of color categories: insightsfrom computational modeling, Ph.D. thesis, Vrjie UniversityBrussel, Brussels, Belgium, 2004.
[9] A. Mojsilovic, “A computational model for color naming anddescribing color composition of images,” IEEE Transactions onImage Processing, vol. 14, no. 5, pp. 690–699, 2005.
[10] R. M. Boynton and C. X. Olson, “Locating basic colors in theOSA space,” Color Research and Application, vol. 12, no. 2, pp.94–105, 1987.
[11] G. Wyszecki and W. S. Stiles, Color Science: Concepts and Meth-ods, Quantitative Data and Formulae, John Wiley & Sons, NewYork, NY, USA, 1982.
[12] K. Kelly and D. Judd, “The ISCC-NBS color names dictionaryand the universal color language (the ISCC-NBS method ofdesignating colors and a dictionary for color names),” Tech.Rep. Circular 553, National Bureau of Standards, Washington,DC, USA, November 1955.
[13] B. Delaunay, “Sur la sphere vide,” Bulletin of the Academy ofSciences of the USSR, Classe des Sciences Mathematiques et Na-turelles, vol. 7, no. 6, pp. 793–800, 1934.
[14] W. E. Lorensen and H. E. Cline, “Marching cubes: a high res-olution 3D surface construction algorithm,” in Proceedings ofthe 14th Annual Conference on Computer Graphics and Inter-active Techniques (SIGGRAPH ’87), vol. 21, pp. 163–169, NewYork, NY, USA, 1987.
[15] D. Cao, J. Pokorny, and V. C. Smith, “Associating color ap-pearance with the cone chromaticity space,” Vision Research,vol. 45, no. 15, pp. 1929–1934, 2005.
G. Menegaz was born in Verbania, Italy.She obtained an M.S. in electronic engi-neering and an M.S. in information tech-nology from the Polytechnic University ofMilan in 1993 and 1995, respectively. In2000 she got the Ph.D. degree in applied sci-ences from the Signal Processing Instituteof the Swiss Federal Institute of Technology(EPFL). From 2000 to 2002 she was a Re-search Associate at the Audiovisual Com-munications Laboratory of EPFL, and from 2002 to 2004 she was anAssistant Professor at the Department of Computer Science of theUniversity of Fribourg (Switzerland). Since 2004 she is an AdjunctProfessor at the Information Engineering Department of the Uni-versity of Siena (Italy), thanks to a grant funded by the Italian Min-istry of University and Research. Her research field is perception-based image processing for multimedia applications. Among themain themes are color perception and categorization, medical im-age processing and perception, texture vision and modeling, andmultidimensional model-based coding.
A. Le Troter was born in Aix-en-Provence(France) in 1978. He obtained his Master ofSciences degree from the University of Aix-Marseille II in 2002. He is currently pur-suing his Ph.D. degree at the Systems andInformation Engineering Laboratory of thesame University. His research activity is inthe field of color imaging, image segmenta-tion, registration, and 3D scene reconstruc-tion from multiple views.
J. Sequeira was born in Marseilles (France)in 1953. He graduated from Ecole Polytech-nique of Paris in 1977 and from Ecole Na-tionale Superieure des Telecommunicationsin 1979, respectively. Then, he taught com-puter science from 1979 to 1981 in an en-gineering school of Ivory Coast (at the Ya-moussoukro “Ecole Nationale Superieuredes Travaux Public”). From 1981 to 1991, hewas Project Manager at the IBM Paris Scien-tific Center. During this period, he obtained a “Docteur Ingenieur”degree (Ph.D.) in 1982 and a “Doctorat d’Etat” degree in 1987. Hehas been a Full Professor at the University of Marseilles since 1991(he has a “First Class Professor” since 2001). In 1994, he foundedthe Research Group on Image Analysis and Computer Graphicsat the Systems and Information Engineering Laboratory, which hecurrently leads. He published more than 90 papers, 27 of them injournals and 40 in international conferences, he organized interna-tional conferences, he is in the scientific committee of many jour-nals and international conferences, and he was the Scientific Direc-tor of 16 Ph.D. research works.
J. M. Boi was born in Ouenza (Algeria)in 1956. He obtained the Master of Sci-ences degree at the University of Grenoblein 1982, and his Ph.D. at the University ofAix-Marseille II in 1988. He had been anAssistant Professor at the University of Avi-gnon from 1989 to 1999. Since 1999 he isan Associate Professor at the University ofAix-Marseilles II, where he is a Member ofthe Image Analysis and Computer Graph-ics Group of the Systems and Information Engineering Laboratory.His fields of interest include image analysis, 3D scene reconstruc-tion, and computer graphics.