Embed Size (px)
Citation preview
Colloids and Surfaces
!i!koms SURFACES A
ELSEVIER A: Physicochemical and Engineering Aspects 89 ( 1994) 117-l 3 1
A computer model for wetting hysteresis 1. A virtual wetting balance
Anant D. Mahalea*b, Sheldon P. Wessonb**
‘Department of Chemical Engineering, Princeton University, Princeton, NJ, USA bTRI/Princeton, 601 Prospect Avenue, POB 625, Princeton, NJ 08542, USA
Received 22 November 1993; accepted 8 December 1993
Abstract
The modified Wilhelmy plate method is widely used to determine the wettability of solid surfaces by probe liquids. This is accomplished by monitoring the wetting force experienced by a solid suspended from a microbalance during immersion into and emersion from the fluid. In the absence of surface roughness, fluctuations in force observed as the liquid slides over the solid and hysteresis between the advancing and receding modes of measurement are caused by surface chemical heterogeneity. An independent analysis based upon the fundamental rules of stick-slip behavior of the moving contact line is developed to explain these effects quantitatively and to predict the hysteresis loop for a known surface. The extent of hysteresis and the amplitude and frequency of force fluctuations are shown to depend upon the nature of the heterogeneity and its spatial distribution. A detailed description of the model is given, followed by results of computer simulations performed on model surfaces. The results agree well with previous experimental work.
Keywords: Contact angle; Hysteresis; Surface heterogeneity; Wetting; Wilhelmy method
1. Modeling the wetting force scanning experiment
1 .I. Introduction
The acquisition of meaningful results by wetting
experiments has been complicated by physical irregularities and the presence of chemical contami- nants that are invariably found on the surface of a solid. The presence of surface heterogeneities affects the apparent contact angle measured during the experiments, and hysteresis observed between the advancing and receding measurement modes has been attributed largely to these heterogeneities
[ 1,2]. From a thermodynamic standpoint, contact angle hysteresis should not exist if the surface being
*Corresponding author.
studied is completely smooth and chemically homogeneous, provided that the advancing and receding measurements are done at a sufficiently slow velocity so as to remain as close to equilibrium as possible.
Characteristics of wetting such as hysteresis and the kinetics of spreading could be used to advan- tage in characterizing surfaces once their measure- ment is well controlled and their interpretation understood. Traditional spectroscopic methods (e.g. X-ray photoelectron spectroscopy, polarized infrared external reflectance spectroscopy and optical ellipsometry) might then be replaced by measurements of surface wetting properties using standard probe liquids. The wetting experiment has the twofold advantage of being a simple and comparatively inexpensive measurement and of being broadly relevant technologically. Recent
0927-7757/94/$07.00 0 1994 Elsevier Science B.V. All rights reserved SSDI 0927-7757(94)02805-3
118 A. D. Mahale, S. P. WessonlColloids Surfaces A: Physicochem. Eng. Aspects 89 (I 994) I 17-131
research in this field, however, leaves a lot to be rules of stick-slip behavior of the moving contact understood [ 3,4]. line and the laws of mechanics.
A theoretical analysis of the Wilhelmy plate scanning experiment has been attempted here. It explains the mechanism of motion of a three-phase interface over a chemically heterogeneous surface based upon an extension of the well-understood stick-slip behavior. A thermodynamic treatment of the problem along with the application of basic laws of mechanics enables the prediction of the force that is measured in a Wilhelmy measurement. On the basis of the ideas developed here, it should be possible to generate an accurate representation of a surface from wetting measurements using known probe liquids. We have done some prelimi- nary experiments to illustrate interesting features of wetting measurements that are indicative of solid surface characteristics. Further quantitative examinations of such features are needed to verify the theory.
1.3. Definitions
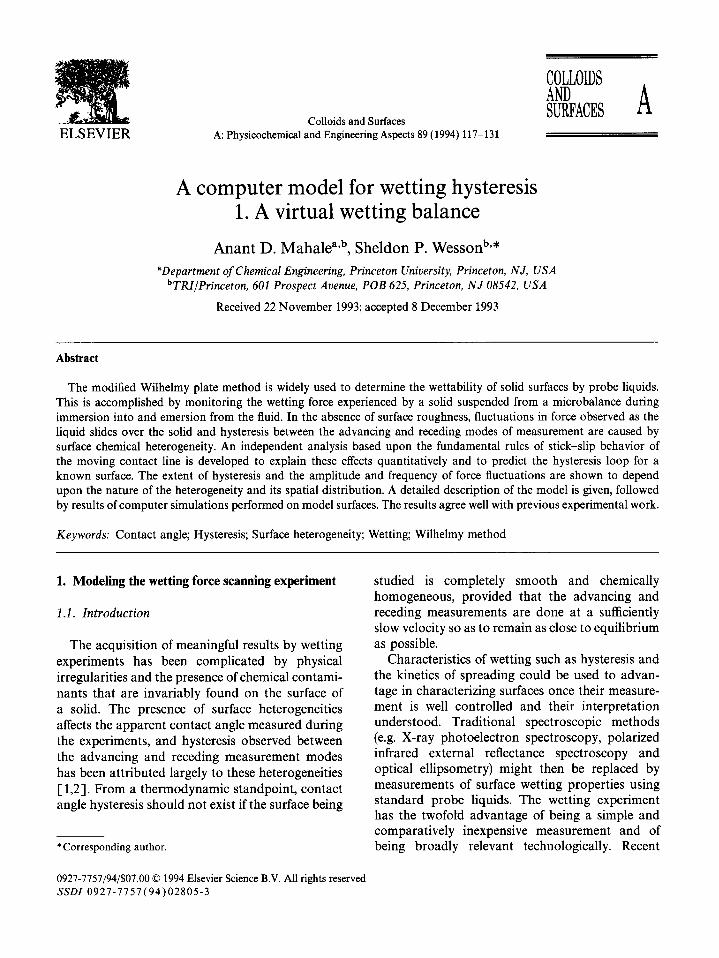
Some terms that will occur frequently in this analysis are defined here and in Fig. 1.
(1) Classijication of heterogeneities based on their surface energies
W high energy surface or a more wettable zone; nw low energy surface or a less wettable (non-
wetting) zone; t boundary separating the two types of site
(2) Length scales of interest on the surface of the Wilhelmy plate
1.2. Theory
A modified Wilhelmy plate approach is com- monly adopted to evaluate the wettability of films by probe liquids [ 51. This is done by monitoring the wetting force experienced by a film which is suspended from a microbalance while being immersed into or pulled out of a liquid. Two important features of a typical experiment are the continuous fluctuations in force observed as the liquid slides over the film, and the hysteresis between the advancing and receding modes of measurement. These are a result of one or several perturbing factors of a physical nature, such as surface roughness [ 63, molecular orientation [ 71, chemical heterogeneity of the solid surface, or swelling of the solid by diffusion of the wetting liquid.
L wx width of a high energy site measured in a direction perpendicular to the direction of motion of the surface
L nwx width of a low energy site measured in a direction perpendicular to the direction of motion of the surface
L wy length of a high energy site measured in the direction of motion of the surface
L nwy length of a low energy site measured in the direction of motion of the surface
L tx total length of surface perpendicular to the direction of motion
Lt, total length of film in the direction of motion
(3) Length scales based on the equilibrium shape of the meniscus formed by a probe liquid on the surface
The work reported here deals with surface chem- ical heterogeneities. If the effects of such heteroge- neities were understood, a quantitative estimate of the degree, type and distribution of surface perturb- ations could be obtained from wetting force scans. Since previous work is not sufficient in its applica- tion to real surfaces, we have attempted an inde- pendent approach based upon the fundamental
H, height of contact line relative to the free surface of the liquid (fs) in the case of a w zone (H, < 0 if 0, > 90”) where 0 is the contact
angle) H nw height of contact line relative to the free
surface of the liquid in the case of an nw zone (H,,<O if 8,,>90”)
J the “jump span”, equal to the absolute differ- ence between H, and H,,
A. D. Mahale, S. P. WessonlCoiloids Surfaces A: Physicochem. Eng. Aspects 89 (1994) I1 7-131 119
Lnwy
LWY
nw
Fig. 1. Definitions of some terms used in our analysis of the wetting force scanning experiment. FS denotes free surface.
(4) System constant aficting the values of H, and H nw
Ho = (2rlpg)“2
where p is the density of the probe liquid, y is the surface tension of the probe liquid, and g is the gravitational constant, taken as 981.0 cm sp2.
(5) Relevant surface forces used in the analysis
fw force per unit distance along the contact line exhibited by the w zone
f nw force per unit distance along the contact line exhibited by the nw zone
F, total surface force
(6) Diflerent mechanisms of motion of the contact line and the free surface of the liquid
Stick/Pin (p) the contact line remains stationary, and the free surface moves
Slip (sp) the contact line rapidly traverses a certain distance, and the free sur- face remains stationary
Slide (sd) the contact line and the free surface move together
1.4. Thermodynamic derivation: force during a Wilhelmy experiment
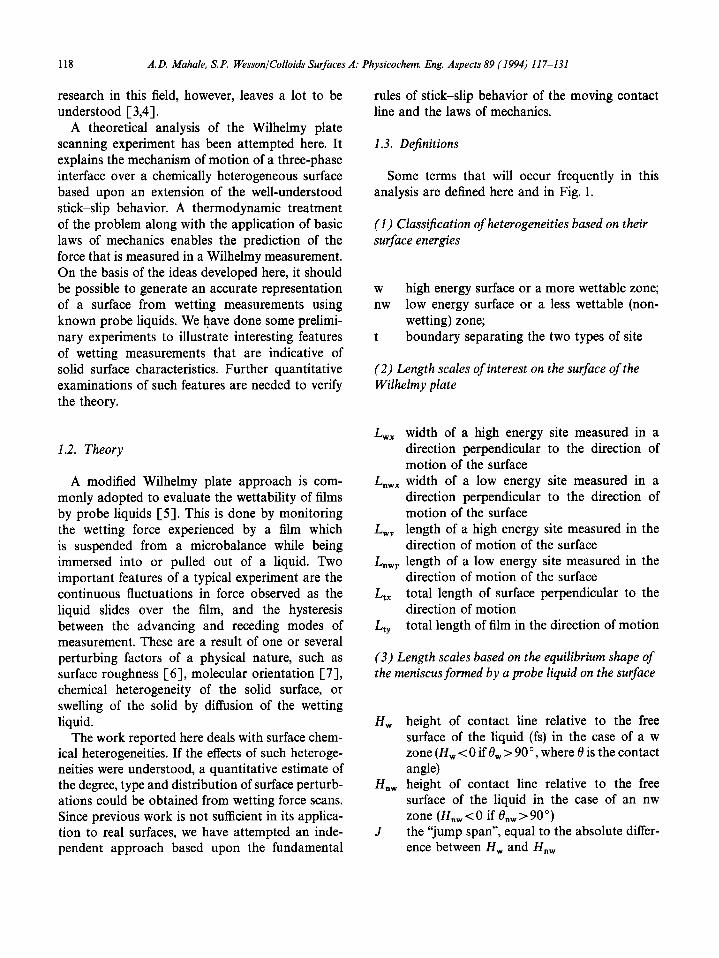
Consider a system which includes a solid(s), a liquid(l) and its container (c), as shown in Fig. 2. Using the definition of surface tension y for a process at constant temperature and pressure, the work done by the system minus the volumetric
;
Fig. 2. Arrangement for the Wilhelmy experiment.
120 A. D. Mahale, S. P. WessonlColloidr Surfaces A: Physicochem. Eng. Aspects 89 (1994) 117-131
work P dV is given by [S]
-6W=y6A (1)
Now imagine a process in which the solid is vertically displaced a distance dy from y as shown in Fig. 2. The free surface moves by the same amount. In this case
6 W = F dy - m,g dy + ApgA,y dy (2)
where A, is the cross-sectional area of the solid, Ap = (p, - p,) is the difference between the densities of the liquid and vapor (v) phases, and m,g = (p, - p,)A,hg is the weight of solid in the vapor phase. The total surface energy change occurring in this step is given by
Y dA = ~1s dA,, + ysv dA,, + ~1” dA1,
+ yci d&i + ycv dA,, (3)
Since the cross-sectional area of the solid is much smaller than that of the container
dA,, = dA,, = 0
For a solid with constant perimeter, the liquid- vapor surface area does not change as the solid is immersed in the liquid, i.e.
dA,, = 0
so that
Y dA = ~1s dAi, + 7s” dA,, (4)
Applying Young’s force balance for equilibrium
Y dA = (~1, - ysv) dA,, = - (riv cos 0) d&
Combining Eqs. (l), (2) and (5) gives
(5)
F = m,g - ApgA,y + (ylv cos B)P (6)
where P is the perimeter of the solid. The microbalance reading during a Wilhelmy
plate experiment measures the sum of the vertical component of the surface force and the weight of the plate corrected for buoyancy. In Eq. (6) the total surface force is given by
F, = (~1, COS 8)P = CfiLix (7)
wherefi is the zonal force per unit distance along the contact line due to zone i, ylV is the surface tension of the liquid with respect to the vapor, 8i is the equilibrium contact angle made by the liquid with the solid surface i, L, is the width of zone i, and the summation is over all zones along the contact line at any position of the free surface of the liquid.
During a wetting experiment on a strip, the contact line follows one of the following three states of motion.
(1) Slip mode. In this case, the free surface is stationary, but the contact line travels rapidly over the surface. The meniscus changes shape, the observed contact angle thus changing continu- ously, as does the measured force, from its initial value to the next stable value. The force measured by the microbalance is given by Eq. (6), and the wetting force is obtained after subtracting the weight of the plate and correcting for buoyancy effects.
(2) Stick/pin mode. In this case, the contact line does not move but the free surface moves. The wetting force contribution is calculated from Eq. (6). Here again, there is a change in the shape of the meniscus caused by the motion of the free surface.
(3) Sliding mode. This involves motion of both the contact line and the free surface. The wetting force can be obtained from Eq. (6) after subtracting the weight of the plate from the total force and correcting for buoyancy effects.
1.5. Wetting force analysis for a heterogeneous strip - one-dimensional model
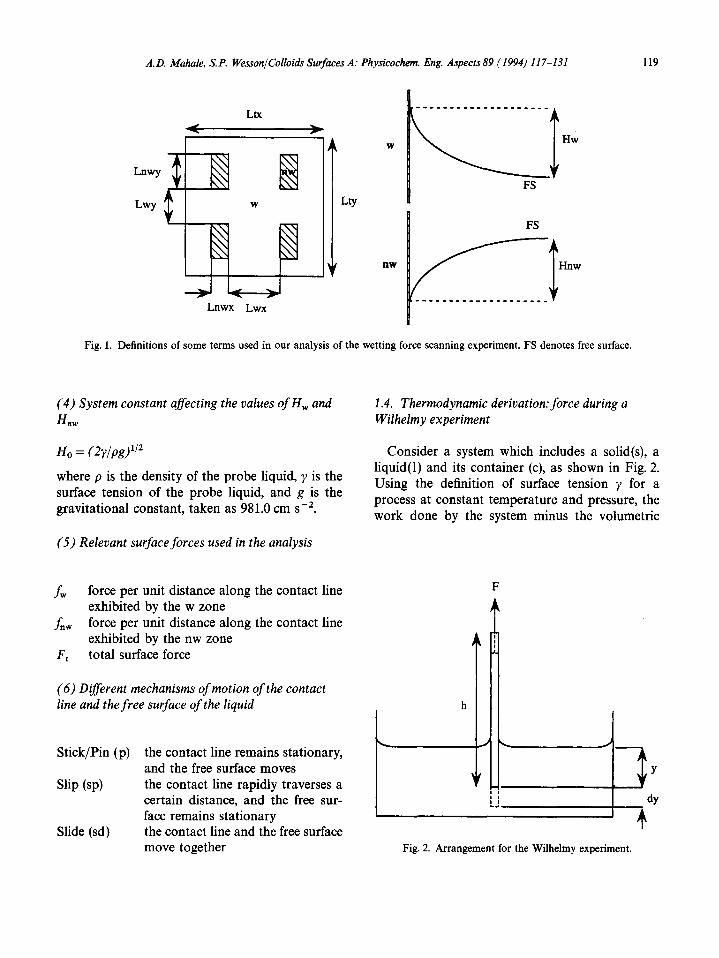
The object under consideration here is shown in Fig. 3(a). If, as in the case of a typical dynamic Wilhelmy experiment, the advancing and receding modes are carried out sufficiently slowly, any stable meniscus shape observed is an equilibrium shape. The motion of the liquid contact line on the surface occurs in jumps; this has been referred to as the stick-slip mechanism.
During liquid advance, the following set of events occurs.
A. D. Mahale, S. P. WessonlColloids Surfaces A: Physicochem. Eng. Aspects 89 (1994) I1 7-131 121
(a) F - weight
9 Advancing mode Receding mode
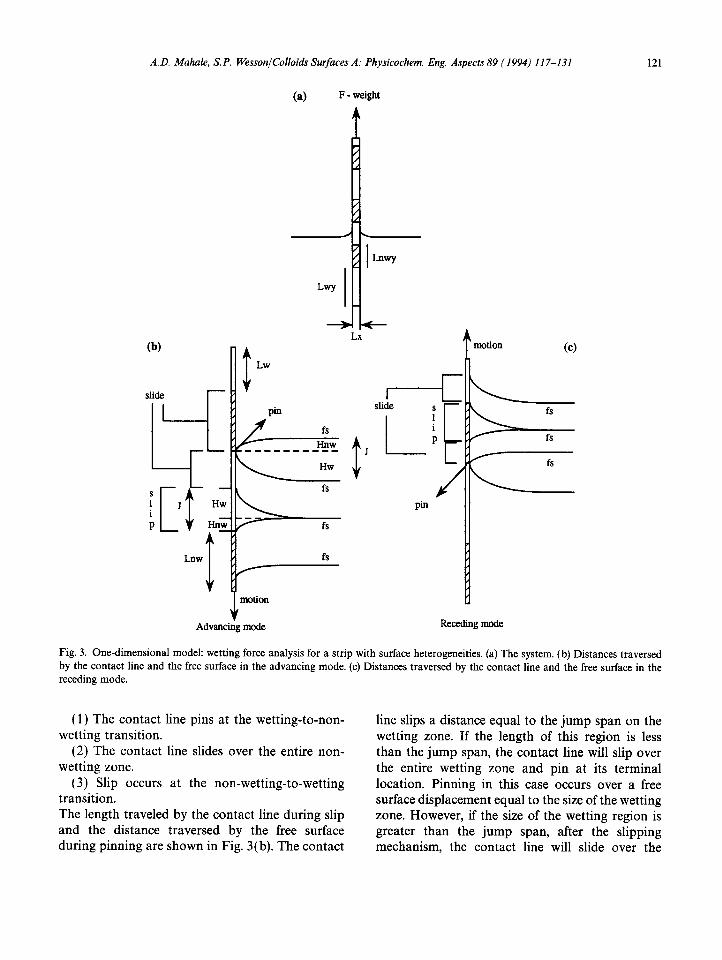
Fig. 3. One-dimensional model: wetting force analysis for a strip with surface heterogeneities. (a) The system. (b) Distances traversed by the contact line and the free surface in the advancing mode. (c) Distances traversed by the contact line and the free surface in the receding mode.
(1) The contact line pins at the wetting-to-non- wetting transition.
(2) The contact line slides over the entire non- wetting zone.
(3) Slip occurs at the non-wetting-to-wetting transition. The length traveled by the contact line during slip and the distance traversed by the free surface during pinning are shown in Fig. 3(b). The contact
line slips a distance equal to the jump span on the wetting zone. If the length of this region is less than the jump span, the contact line will slip over the entire wetting zone and pin at its terminal location. Pinning in this case occurs over a free surface displacement equal to the size of the wetting zone. However, if the size of the wetting region is greater than the jump span, after the slipping mechanism, the contact line will slide over the
122 A. D. Mahale, S. P. WessonlColloids Surfaces A: Physicochem. Eng. Aspects 89 (1994) 117-131
remaining portion. Pinning occurs over a distance over a free surface displacement of J units, during equal to the jump span. which the contact line remains stationary.
In the receding mode, the mechanism is different. (1) The contact line pins at the non-wetting-to-
wetting transition. (2) The contact line slides over the entire wet-
ting zone.
(3) If the size of the low energy site is smaller than J, then the entire site is slipped over. In this case pinning occurs over a free surface displace- ment equal to the length of the low energy site.
(3) Slip occurs at the wetting-to-non-wetting transition.
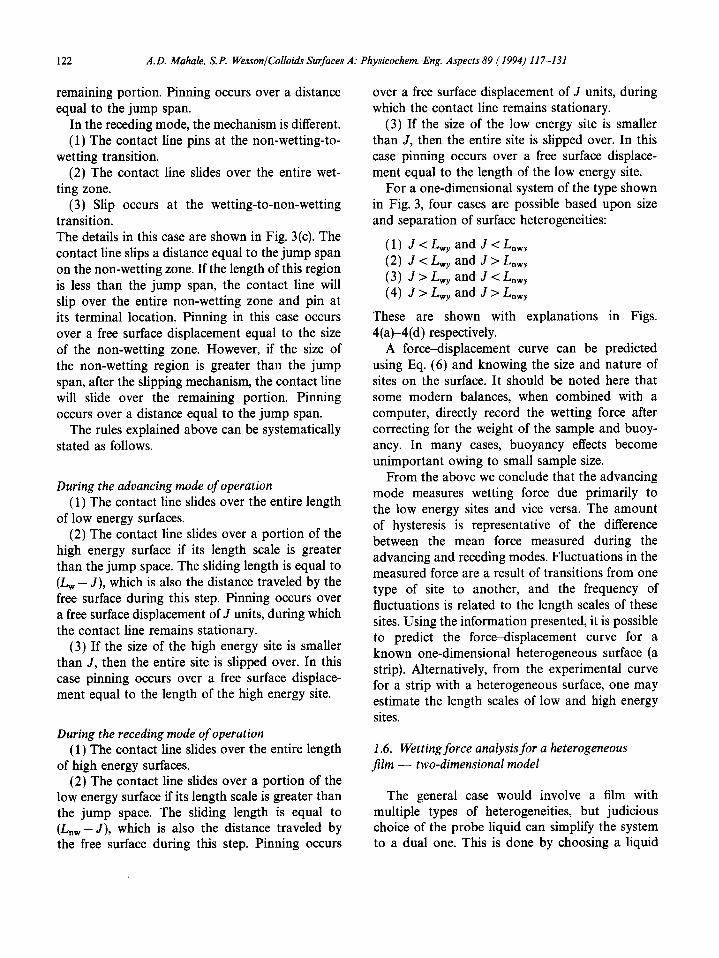
For a one-dimensional system of the type shown in Fig. 3, four cases are possible based upon size and separation of surface heterogeneities:
The details in this case are shown in Fig. 3(c). The contact line slips a distance equal to the jump span on the non-wetting zone. If the length of this region is less than the jump span, the contact line will slip over the entire non-wetting zone and pin at its terminal location. Pinning in this case occurs over a free surface displacement equal to the size of the non-wetting zone. However, if the size of the non-wetting region is greater than the jump span, after the slipping mechanism, the contact line will slide over the remaining portion. Pinning occurs over a distance equal to the jump span.
(1) JCL,, and JCL,,, (2) J < L,, and J > L,,, (3) J > L,, and J < Lnwy (4) J > L,, and J > L,,,,,,,
These are shown with explanations in Figs. 4(a)-4(d) respectively.
The rules explained above can be systematically stated as follows.
A force-displacement curve can be predicted using Eq. (6) and knowing the size and nature of sites on the surface. It should be noted here that some modern balances, when combined with a computer, directly record the wetting force after correcting for the weight of the sample and buoy- ancy. In many cases, buoyancy effects become unimportant owing to small sample size.
During the advancing mode of operation (1) The contact line slides over the entire length
of low energy surfaces. (2) The contact line slides over a portion of the
high energy surface if its length scale is greater than the jump space. The sliding length is equal to (L, - J), which is also the distance traveled by the free surface during this step. Pinning occurs over a free surface displacement of J units, during which the contact line remains stationary.
(3) If the size of the high energy site is smaller than J, then the entire site is slipped over. In this case pinning occurs over a free surface displace- ment equal to the length of the high energy site.
From the above we conclude that the advancing mode measures wetting force due primarily to the low energy sites and vice versa. The amount of hysteresis is representative of the difference between the mean force measured during the advancing and receding modes. Fluctuations in the measured force are a result of transitions from one type of site to another, and the frequency of fluctuations is related to the length scales of these sites. Using the information presented, it is possible to predict the forcedisplacement curve for a known one-dimensional heterogeneous surface (a strip). Alternatively, from the experimental curve for a strip with a heterogeneous surface, one may estimate the length scales of low and high energy sites.
During the receding mode of operation (1) The contact line slides over the entire length
of high energy surfaces. 1.6. Wetting force analysis for a heterogeneous
film - two-dimensional model (2) The contact line slides over a portion of the
low energy surface if its length scale is greater than the jump space. The sliding length is equal to (L,, - J), which is also the distance traveled by the free surface during this step. Pinning occurs
The general case would involve a film with multiple types of heterogeneities, but judicious choice of the probe liquid can simplify the system to a dual one. This is done by choosing a liquid
Advancing Receding Advancing Receding
1 slide
slip
Lnw
I J
pin e I J slip C
Lw
sequence: II
sequence: I
1 sd/n~+sd/w+p/t-j ( (sd/w-_+sdlnw+plt7j
(a) J<Lwy and J<Lnwy
Advancing Advancing Receding
.I
slide II
C
pin slip Slide c
slip 6 pin l-u
~~
sequence: sequence: sequence: II
sequence:
sdlnwe pit *dlnw 711 P
sdlw~ sdlnw -9 p/t--J
(c) J > Lwy and J c Lnwy (d) J > Lwy and J > Lnwy
Fig. 4. Four possible cases for the size and separation of surface heterogeneities on a one-dimensional strip.
A. D. Mahale, S. P. WessonJColloiak Surfaces A: Physicochem. Eng. Aspects 89 (I 994) 117-l 31 123
pgfczqp1 (b) JcLwy andJ>Lnwy
that is selectively sensitive to the type of hetero- geneity of interest and shows very similar wetting behavior to the rest of the surface.
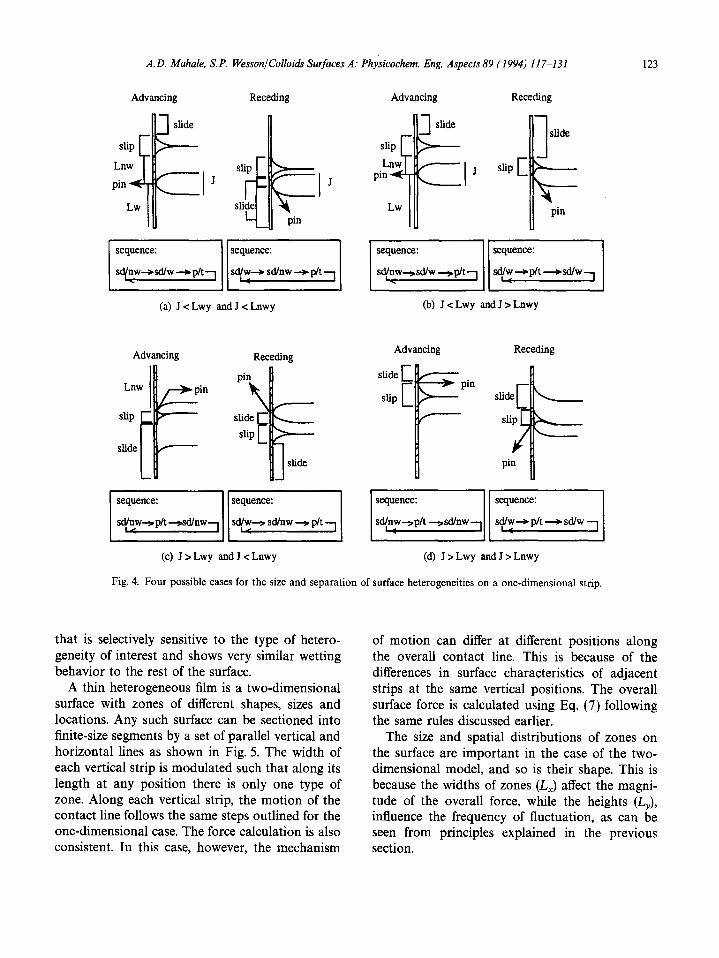
A thin heterogeneous film is a two-dimensional surface with zones of different shapes, sizes and locations. Any such surface can be sectioned into finite-size segments by a set of parallel vertical and horizontal lines as shown in Fig. 5. The width of each vertical strip is modulated such that along its length at any position there is only one type of zone. Along each vertical strip, the motion of the contact line follows the same steps outlined for the one-dimensional case. The force calculation is also consistent. In this case, however, the mechanism
of motion can differ at different positions along the overall contact line. This is because of the differences in surface characteristics of adjacent strips at the same vertical positions. The overall surface force is calculated using Eq. (7) following the same rules discussed earlier.
The size and spatial distributions of zones on the surface are important in the case of the two- dimensional model, and so is their shape. This is because the widths of zones (L,) affect the magni- tude of the overall force, while the heights (LJ, influence the frequency of fluctuation, as can be seen from principles explained in the previous section.
124 A. D. Mahale. S. P. WessonjColloi& Surfaces A: Physicochem. Eng. Aspects 89 (1994) II 7-131
\/ leas wetting Zones
more wetting zones U
Fig. 5. Two-dimensional surface with more and less wettable zones of various shapes, sectioned so that each strip encom- passes only one type of zone at any position.
2. A virtual wetting balance
2.1. Introduction
Monolayer gas adsorption and wetting are sim- ilar experiments in principle: the nature and extent of interaction with a fluid of known properties are used to deduce properties of a solid surface. Vapor molecules have the mobility to cover high energy sites preferentially: the process of increasing the vapor pressure over the substrate is a process of promoting interactions with progressively weaker surface sites. The monolayer isotherm can therefore be deconvoluted to deliver a spectrum of adsorp- tion energies. Probe molecules in a liquid meniscus, however, are constrained to interact simultane- ously with all the site energies encountered at the three-phase boundary. Quantitative analysis of the wetting trace is often impossible in principle because there can be many more variables (site energies) than equations (advancing and receding wetting values). Deductions are usually limited to determining whether the surface is energetically uniform on an atomic scale, as evinced by hystere- sis in the wetting trace, and whether the surface is
uniform on a macroscale, as deduced from chatter in the advancing and receding wetting traces.
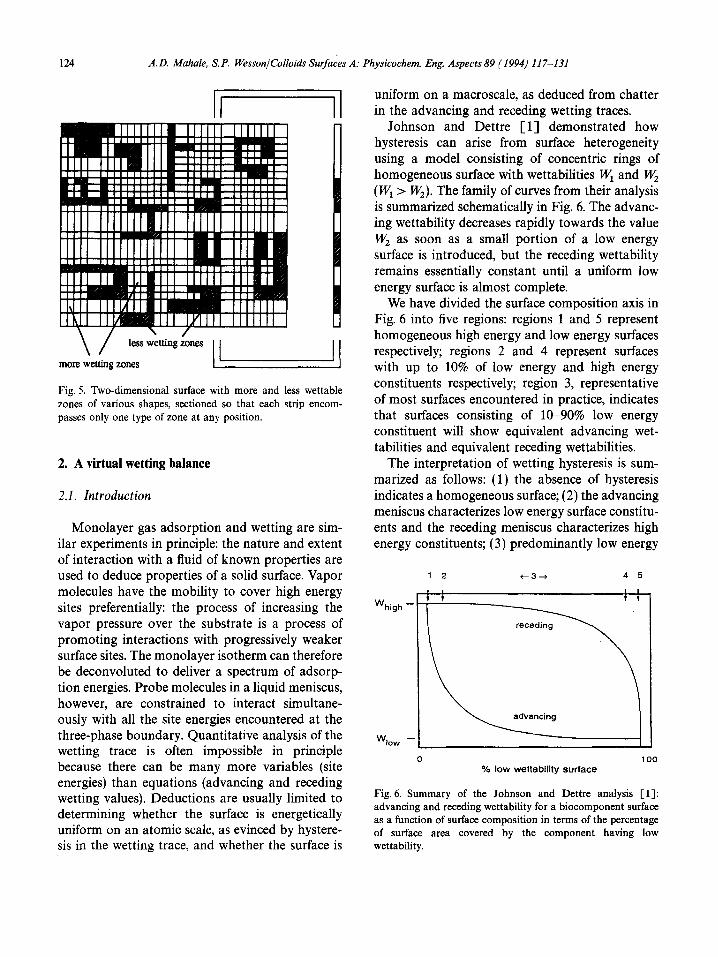
Johnson and Dettre [l] demonstrated how hysteresis can arise from surface heterogeneity using a model consisting of concentric rings of homogeneous surface with wettabilities WI and W, (WI > W,). The family of curves from their analysis is summarized schematically in Fig. 6. The advanc- ing wettability decreases rapidly towards the value W, as soon as a small portion of a low energy surface is introduced, but the receding wettability remains essentially constant until a uniform low energy surface is almost complete.
We have divided the surface composition axis in Fig. 6 into five regions: regions 1 and 5 represent homogeneous high energy and low energy surfaces respectively; regions 2 and 4 represent surfaces with up to 10% of low energy and high energy constituents respectively; region 3, representative of most surfaces encountered in practice, indicates that surfaces consisting of lo-90% low energy constituent will show equivalent advancing wet- tabilities and equivalent receding wettabilities.
The interpretation of wetting hysteresis is sum- marized as follows: (1) the absence of hysteresis indicates a homogeneous surface; (2) the advancing meniscus characterizes low energy surface constitu- ents and the receding meniscus characterizes high energy constituents; (3) predominantly low energy
1 2 e-3+ 4 5
.
0
% low wettability surface
Fig. 6. Summary of the Johnson and Dettre analysis [l]: advancing and receding wettability for a biocomponent surface as a function of surface composition in terms of the percentage of surface area covered by the component having low wettability.
A. D. Mahale, S. P. Wessonlcolloids Surfaces A: Physicochem. Eng. Aspects 89 (1994) II 7-131 125
surfaces show poor reproducibility of the receding wettability, while scatter in values for advancing wettability indicates a predominantly high energy surface.
We implemented the analysis of the wetting hysteresis described in the preceding section using a computer program named VIRTUAL WETTING
BALANCE (vB). This program presents the Wilhelmy wetting process schematically, using mathematical descriptions of homogeneous and heterogeneous surfaces as input, and delivering hysteresis loops as output. This section consists of a description of the computer program, followed by analyses of a group of selected virtual surfaces.
2.2. Computer program for the virtual balance
Program VB was writted in NDP C-486 (Microway Inc., POB 79, Kingston, MA, 02364) using the 32-bit protected mode extended graphics library LIBHPGL produced by Gary Olhoeft (POB 10870 Edgemont, Golden, CO 80401). Object modules were linked and run with the 386DOS Extender (Phar Lap Software Inc., 60 Aberdeen Avenue, Cambridge, MA 02138).
The hardware required to run program vn con- sists of an MS-DOS computer with a 80386/387 or 80486 processor and 4 Mb of RAM. The video card must feature 1 Mb RAM to display 256 colors, and must be one of the following: AT1 Wonder, STB EM + , IBM 8415 compatible, or a Hercules Graphics Station Card. The video moni- tor must be able to display 1024 x 768 pixels.
Program vu resides in a directory with subdirec- tory \DATA and a conformation file VB.CNF. The conformation file consists of ASCII text that pro- vides all the parameters required for vn to con- struct the solid surface and select tables for the desired liquid. Program vn is executed with the command line
run386 vb nl n2 n3 n4 > vb.txt
where RUN386 is a utility that runs vn in protected mode, nl (0 or 1) toggles output of diagnostics, n2 toggles interactive mode operation, n3 toggles graphics animation, and n4 is a seed for the pseudo- random number generator in va. The remainder
of the command line redirects diagnostics from screen to disk.
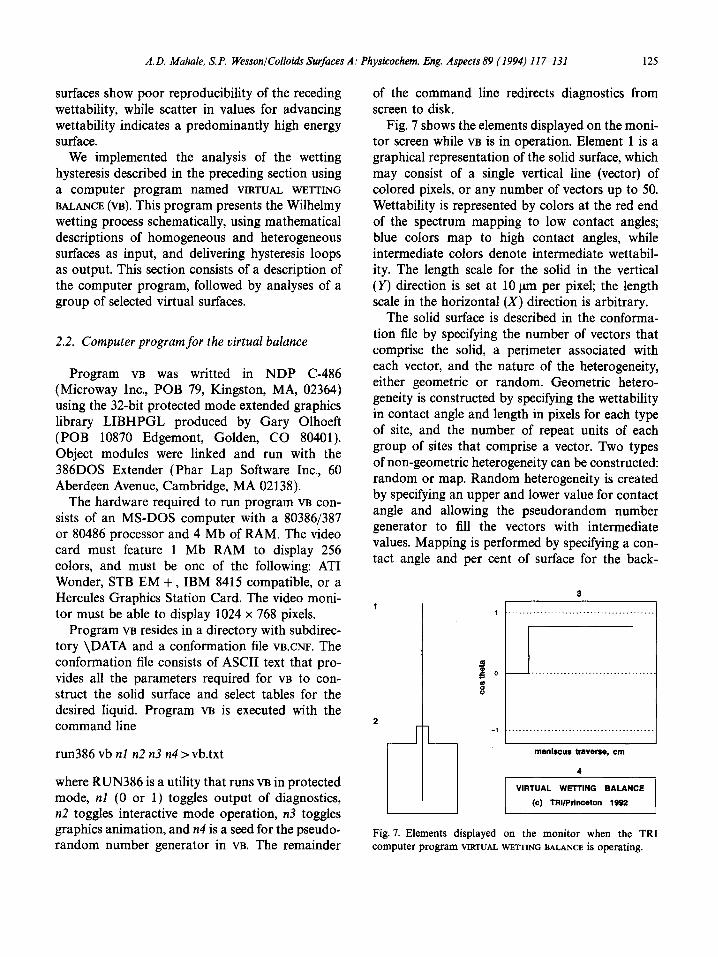
Fig. 7 shows the elements displayed on the moni- tor screen while VB is in operation. Element 1 is a graphical representation of the solid surface, which may consist of a single vertical line (vector) of colored pixels, or any number of vectors up to 50. Wettability is represented by colors at the red end of the spectrum mapping to low contact angles; blue colors map to high contact angles, while intermediate colors denote intermediate wettabil- ity. The length scale for the solid in the vertical (Y) direction is set at 10 urn per pixel; the length scale in the horizontal (X) direction is arbitrary.
The solid surface is described in the conforma- tion file by specifying the number of vectors that comprise the solid, a perimeter associated with each vector, and the nature of the heterogeneity, either geometric or random. Geometric hetero- geneity is constructed by specifying the wettability in contact angle and length in pixels for each type of site, and the number of repeat units of each group of sites that comprise a vector. Two types of non-geometric heterogeneity can be constructed: random or map. Random heterogeneity is created by specifying an upper and lower value for contact angle and allowing the pseudorandom number generator to fill the vectors with intermediate values. Mapping is performed by specifying a con- tact angle and per cent of surface for the back-
1 1 , I................... .” . . . . ] I I r I
d 2 0 . . . . . . . . . . . %
2 L -1 K--l . . . . . . . . . . . . . . . . . . . . . . . . . . . . . . . . . . . . . . . . .
meniscus traverse, cm
-1
Fig. 7. Elements displayed on the monitor when the TRI computer program VIRTUAL WETmNG BALANCE is operating.
126 A.D. Mahale, S.P. WessonlColloids Surfaces A: Physicochem. Eng. Aspects 89 (1994) 117-131
ground wettability, and a contact angle value for the heterogeneous sites. The random number generator then determines where in the vector(s) to place the specified percentage of heterogeneous sites.
Element 2 in Fig. 7 is the liquid meniscus. Program vn incorporates look-up tables based on the properties of six liquids shown in Table 1. The first look-up table gives meniscus height in pixels vs. contact angle, computed from H(cm) = H,( 1 -sin @l/2 [ 93. This table is used to establish the meniscus height sustainable by the wettability (the contact angle associated with the pixel) that is currently in contact with the meniscus, for each vector that makes up the solid. Tables for water were used to compute all the hysteresis loops below. Fig. 7 shows one meniscus supported by contact with a uniform, high energy, one-vector surface as the solid penetrates the liquid.
The processes of sliding, slipping and pinning that are defined in the preceding section are imple- mented by an algorithm that looks up the meniscus height that is sustainable by the contact angle associated with the pixel currently in contact with the liquid surface. If that meniscus height is higher than the current value, the actual meniscus height increases by 1 pixel, and the maximum meniscus height associated with the next pixel in the vector is found. This process (slipping) is repeated until the meniscus height is at the maximum possible for the liquid, or until a pixel with a lower wettabil- ity (lower maximum meniscus height) is encoun- tered. The meniscus then travels with the solid (pinning) until the meniscus height is equal to that sustainable by the contact angle associated with the pixel. The meniscus slides if a homogen-
Table 1 Liquid properties
Liquid
Water Formamide Ethylene glycol Hexadecane FC129 Methylene iodide
Y H0 rg ml-‘) (mN m-l) (cm)
1.000 12.5 0.3844585 1.134 58.2 0.3234711 1.113 47.1 0.2955916 0.776 26.4 0.2633611 1.000 16.2 0.1817348 3.325 50.8 0.1764885
eous region longer than the meniscus height is encountered.
Element 3 in Fig. 7 is a schematic representation of an XY recorder showing the hysteresis loop (cos 8 vs. meniscus traverse in centimeters) that is generated as the virtual solid submerges in the virtual liquid. The second look-up table, obtained by solving iteratively for 8 for each value of menis- cus height in pixels, is used to compute cos 6’ from the average value of meniscus height sustained by the pixel contacting the meniscus, for each vector in the solid. Each value of meniscus height is divided by the perimeter associated with its vector.
Element 4 is the interface that prompts for input and describes the activities in progress. Operating the program thus consists of editing the conforma- tion file to specify the solid and liquid properties, executing the command line, and observing the animated display of the solid advancing into and receding from the liquid while the hysteresis loop is generated on the virtual XY recorder. When the hysteresis loop is complete, program VB writes an ASCII file in the \DATA directory that contains all the information in the conformation file, together with vectors of wetting force (milligrams) vs. position (centimeters).
2.3. Analyses of virtual surfaces
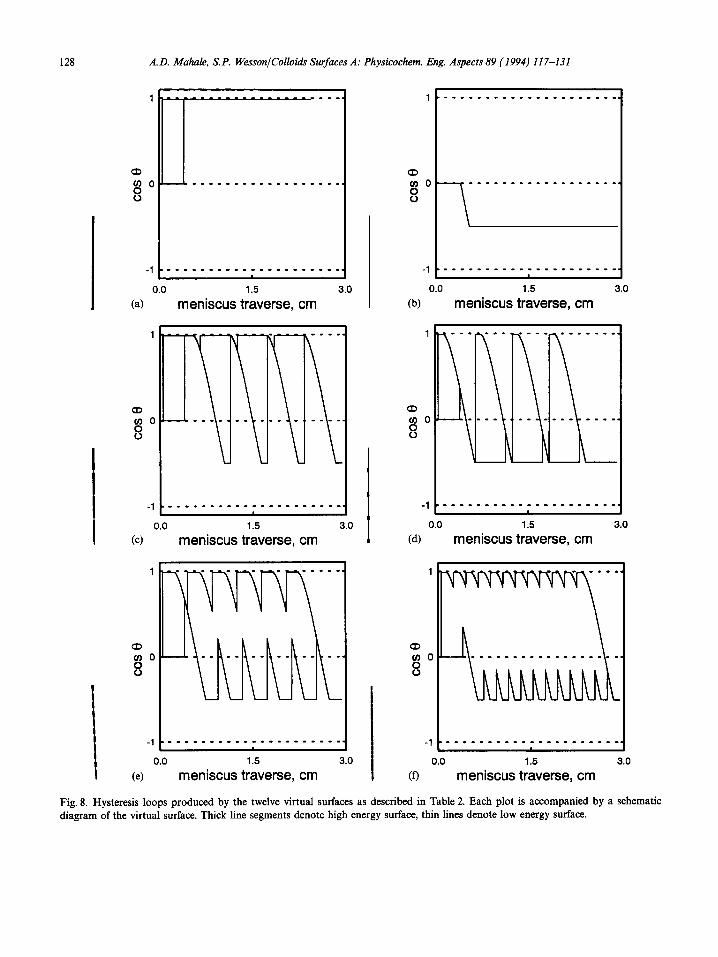
Table 2 lists parameters used to create a variety of uniform and heterogeneous virtual surfaces, together with mean and standard deviation values for advancing and receding wettability computed from the hysteresis loops shown in Figs. 8(a)-(l). Properties of water used to compute meniscus heights and contact angles on each surface. Vector perimeters were identical throughout.
Fig. 8(a) shows the hysteresis loop produced by wetting a uniform high energy surface. The advanc- ing and receding wettabilities are exactly the same, and the loop shows no hysteresis. This situation should not be confused with a very similar loop that would result if the liquid spread on the surface in both modes; the contact angle in this example is lo”, which is small but finite. Fig. 8(b) displays the wetting trace produced by immersing a uniform non-wetting surface with contact angle set at 120”. This system also exhibits no hysteresis. These high
A. D. Mahale, S. P. WessonlColloids Surfaces A: Physicochem. Eng. Aspects 89 (1994) I1 7-131
Table 2 Virtual solid properties and water wettabilities computed from hysteresis loops
121
Figure No. of IlO. vectors
8(a) 1
8(b) 1
8(c) 1
8(d) 1
8(e) 1
8(f) 1 8(g) 1
8(h) 1 8(i) 50
8(j) 1 8(k) 5 8(l) 50
Surface description cos 8, calculated”
Contact angle/length of domain Advancing Receding
10”/2.4 cm 120”/2.4 cm
(lO”/OS cm+ 120”/0.1 cm) x 4 _
( 10°/O.l cm+ 120”/0.5 cm) x 4 _ _
( loo/O.2 cm+ 120”/0.2 cm) x 6 _
(loo/O.1 cm+ 120”/0.1 cm) x 12 (lO”/O.OOl cm+ 120”/0.001 cm) x 1200 - _
lo”-120” random - 0.418 k 0.049 0.960 k 0.018 lo“-120” random - 0.414 L- 0.009 0.962 f 0.002
30” or 70” random -0.385 + 0.032 0.840 f 0.018 30” or 70” random -0.387 f 0.013 0.840 f 0.009 30” or 70” random -0.388 + 0.004 0.839 f 0.003
* + Standard deviation.
and low energy surfaces are characteristic of regions 1 and 5, respectively, in the Johnson and Dettre plot (Fig. 6).
We should note that although the diagrams show one-vector surfaces as “fibers”, these are platonic surfaces, i.e. there is no geometry associ- ated with them other than a perimeter. Single- vector surfaces can show heterogeneity in the Y direction and homogeneity in the X direction, or one-dimensional heterogeneity. Multivector sur- faces can display heterogeneity in either or both dimensions.
A simple example of one-dimensional hetero- geneity is shown in Fig. 8(c), which consists of relatively long domains of high energy alternating with short domains of low energy. The low energy sites have a profound effect on the advancing wettability, pinning the meniscus and causing major excursions in the hysteresis loop. The menis- cus slips over these low energy sites in the receding mode, however, and the effect on the receding trace is minor. It is interesting to notice that, in the case of one-dimensional heterogeneity, the minima in the excursions in the advancing trace give an exact value for the low energy site wettability, which is not the case for two-dimensional heterogeneity.
Fig. 8(d) shows the trace obtained from the reverse situation - short, high energy domains on a background of low energy surface. The advancing trace characterizes low energy site wet- tability exactly, and the maxima in the receding trace show the exact wettability of high energy sites. Figs. 8(c) and 8(d) are characteristic of traces produced from regions 2 and 4 of the Johnson and Dettre plot.
Figs. 8(e)-8(g) demonstrate the effect of dimin- ishing the domain size of alternating high and low energy sites. Excursions in the advancing and receding branches diminish with shortening domain size, so that, at the limit of 1 pixel domain size, the surface appears to be uniformly low energy in the advancing mode and uniformly high energy in the receding mode (see Fig. 8(g)). These plots are characteristic of traces produced from region 3 of the Johnson and Dettre plot.
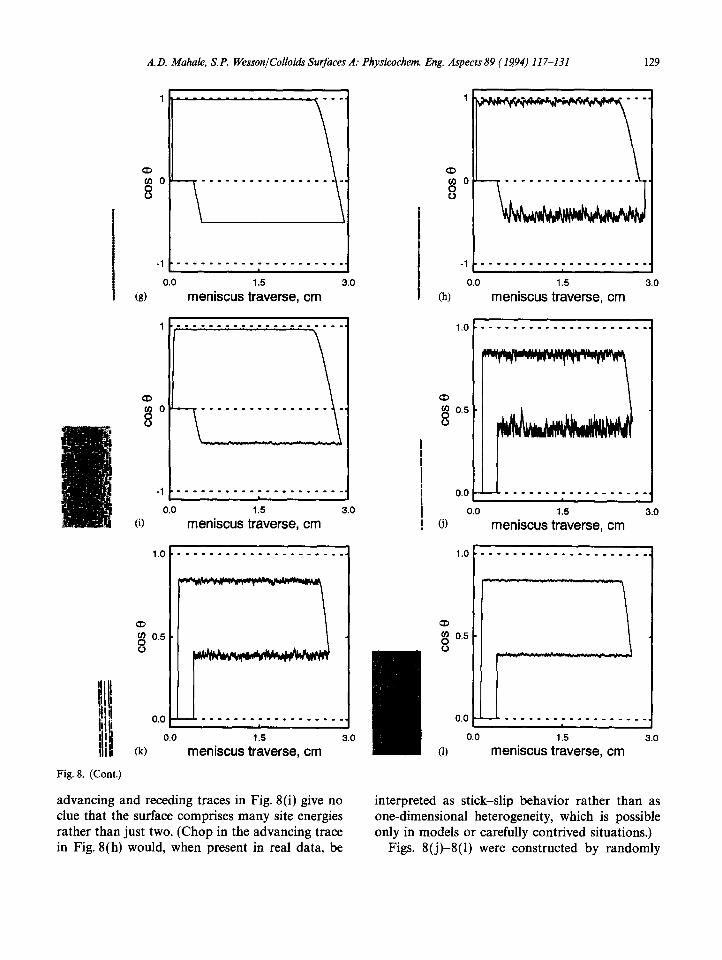
Fig. 8(h) shows a one-vector surface with contact angles between 10” and 120” randomly distributed. The choppy advancing trace is contrasted with that in Fig. 8(i), the result of wetting a multivector surface with the same random heterogeneity speci- fications. Both surfaces yield good estimates of the highest and lowest wettabilities. The smooth
128 A.D. Mahale, S. P. Wesson/Colloiak Surfaces A: Physicochem. Eng. Aspects 89 (1994) 117-131
1
-1
(4
I---- s.-
__________________
1
a u)O
8
1 (4
-1 i
meniscus traverse, cm I W
1
f/DO 8
-1
1
CD v)O 8
-1
0.0 1.5 3.0
meniscus traverse, cm
1
0.0 1.5 3.0
meniscus traverse, cm I (4 meniscus traverse, cm
I 0.0 1.5 3.0
(e) meniscus traverse, cm
1
_1t_____________________
0.0 1.5 3.0
Kl meniscus traverse, cm
Fig. 8. Hysteresis loops produced by the twelve virtual surfaces as described in Table 2. Each plot is accompanied by a schematic diagram of the virtual surface. Thick line segments denote high energy surface, thin lines denote low energy surface.
A.D. Mahale, S. P. Wesson/Colloids Surfaces A: Physicochem. Eng. Aspects 89 (1994) II 7-131 129
L _, ____._.__*___*__.____ .I -1 _.__.___.______-____.
0.0 1.5 3.0
meniscus traverse, cm 3.0 i 0.0 1.5
(8) 1 (h)
1.0
meniscus traverse, cm
1 I i 0.0
I 0.
-1 u....*_.._..___*_.. 0.0 1.5 3.0
meniscus traverse, cm 0 1.5
meniscus traverse, cm 3.0
6)
1.0 f 1.0
a ,..r -._--_1--_-___-__._
--7 6
0.0 c 0.0 1.5 3.0
(0 meniscus traverse, cm
a 8 0.5
u
0.c
0.0 1.5 3.0
(W meniscus traverse, cm
Fig. 8. (Cont.)
advancing and receding traces in Fig. 8(i) give no clue that the surface comprises many site energies rather than just two. (Chop in the advancing trace in Fig. 8(h) would, when present in real data, be
interpreted as stick-slip behavior rather than as one-dimensional heterogeneity, which is possible only in models or carefully contrived situations.)
. Figs. 8(j)-8(l) were constructed by randomly
130 A. D. Mahale, S. P. WessonlColloids Surfaces A: Physicochem Eng. Aspects 89 ( 1994) I1 7-131
distributing two wettability values (30” and 70”) on surfaces consisting of 1 vector, 5 vectors and 50 vectors respectively. The mean values from the hysteresis loops are all good estimates, and the standard deviation decreases as the number of vectors increases, as expected. These traces are extremely realistic; Figs. 8(j) and 8(k) resemble traces obtained by wetting small perimeter fibers, and Fig. 8(k) resembles traces obtained by wetting strips of polymer film.
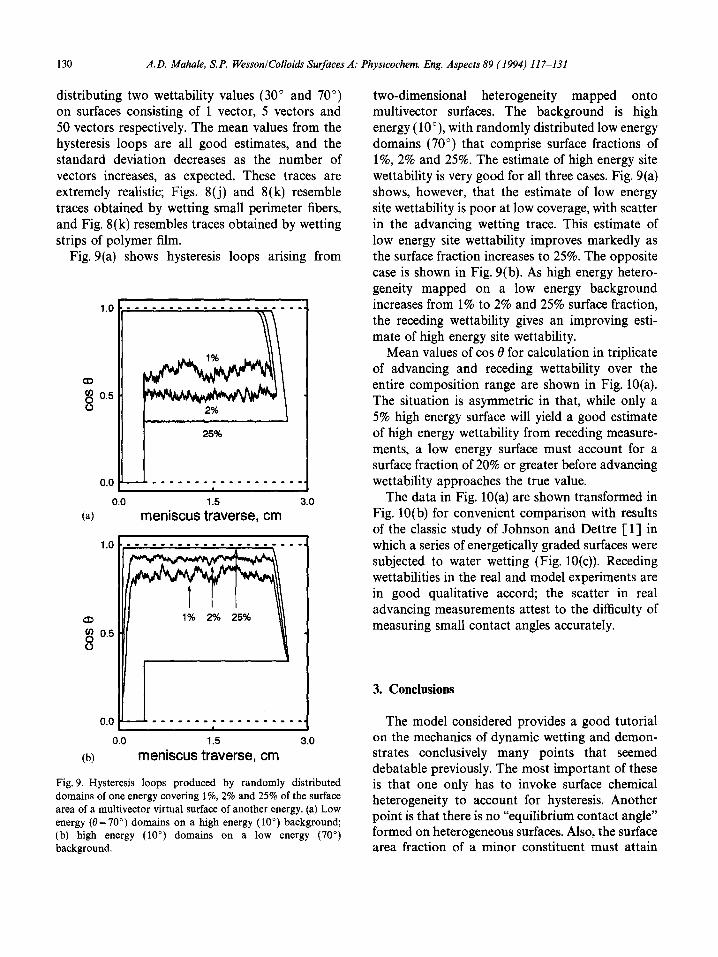
Fig. 9(a) shows hysteresis loops arising from
1.0
a 8 0.5 0
0.0 1.5 3.0
(a) meniscus traverse, cm
0.0 1.5 3.0
@I meniscus traverse, cm
Fig. 9. Hysteresis loops produced by randomly distributed domains of one energy covering l%, 2% and 25% of the surface area of a multivector virtual surface of another energy. (a) Low energy (0=70”) domains on a high energy (10”) background, (b) high energy (10”) domains on a low energy (70”) background.
two-dimensional heterogeneity mapped onto multivector surfaces. The background is high energy (lo’), with randomly distributed low energy domains (70”) that comprise surface fractions of l%, 2% and 25%. The estimate of high energy site wettability is very good for all three cases. Fig. 9(a) shows, however, that the estimate of low energy site wettability is poor at low coverage, with scatter in the advancing wetting trace. This estimate of low energy site wettability improves markedly as the surface fraction increases to 25%. The opposite case is shown in Fig. 9(b). As high energy hetero- geneity mapped on a low energy background increases from 1% to 2% and 25% surface fraction, the receding wettability gives an improving esti- mate of high energy site wettability.
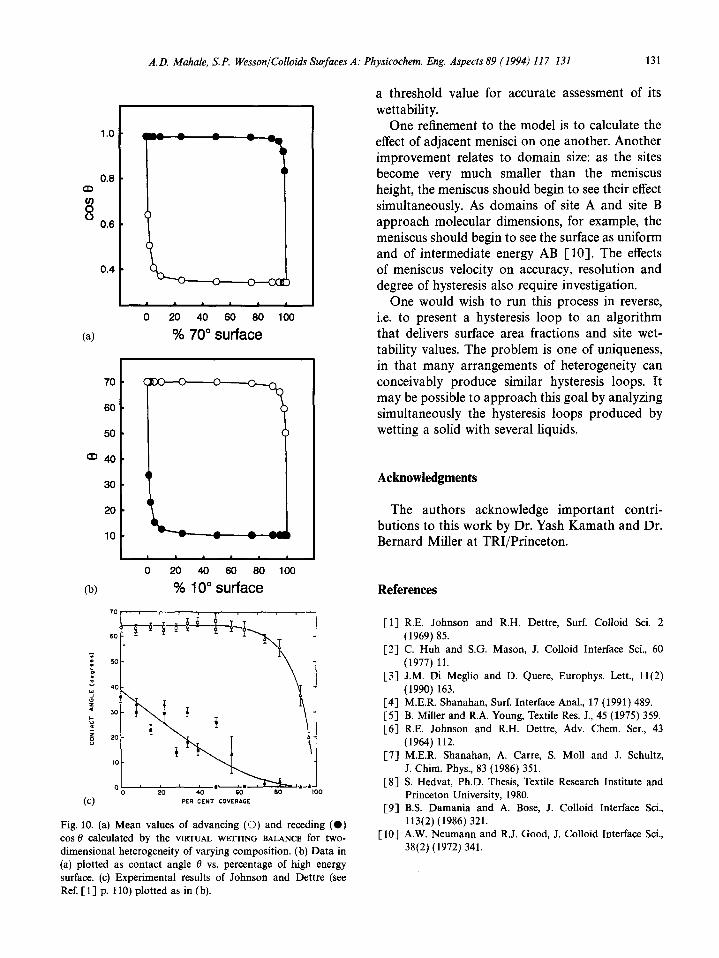
Mean values of cos 8 for calculation in triplicate of advancing and receding wettability over the entire composition range are shown in Fig. 10(a). The situation is asymmetric in that, while only a 5% high energy surface will yield a good estimate of high energy wettability from receding measure- ments, a low energy surface must account for a surface fraction of 20% or greater before advancing wettability approaches the true value.
The data in Fig. 10(a) are shown transformed in Fig. 10(b) for convenient comparison with results of the classic study of Johnson and Dettre [l] in which a series of energetically graded surfaces were subjected to water wetting (Fig. 10(c)). Receding wettabilities in the real and model experiments are in good qualitative accord; the scatter in real advancing measurements attest to the difficulty of measuring small contact angles accurately.
3. Conclusions
The model considered provides a good tutorial on the mechanics of dynamic wetting and demon- strates conclusively many points that seemed debatable previously. The most important of these is that one only has to invoke surface chemical heterogeneity to account for hysteresis. Another point is that there is no “equilibrium contact angle” formed on heterogeneous surfaces. Also, the surface area fraction of a minor constituent must attain
A. D. Mahale. S. P. WessonlColloids Surfaces A: Physicochem. Eng. Aspecfs 89 (1994) I1 7-131 131
1 .o
0.8 a
8
0 0.6
0.4
(a)
0 20 40 60 80 100
% 70"sufface
60 -
50 -
a40-
30 -
20 -
10 -
I I 0 20 40 60 80 100
(b) % lOosurface
(cl PER CENT COVERAGE
Fig. 10. (a) Mean values of advancing (0) and receding (0) cos 0 calculated by the VIRTUAL WETTING BALANCE for two- dimensional heterogeneity of varying composition. (b) Data in (a) plotted as contact angle f3 vs. percentage of high energy surface. (c) Experimental results of Johnson and Dettre (see Ref. Cl] p. 110) plotted as in (b).
a threshold value for accurate assessment of its wettability.
One refinement to the model is to calculate the effect of adjacent menisci on one another. Another improvement relates to domain size: as the sites become very much smaller than the meniscus height, the meniscus should begin to see their effect simultaneously. As domains of site A and site B approach molecular dimensions, for example, the meniscus should begin to see the surface as uniform and of intermediate energy AB [lo]. The effects of meniscus velocity on accuracy, resolution and degree of hysteresis also require investigation.
One would wish to run this process in reverse, i.e. to present a hysteresis loop to an algorithm that delivers surface area fractions and site wet- tability values. The problem is one of uniqueness, in that many arrangements of heterogeneity can conceivably produce similar hysteresis loops. It may be possible to approach this goal by analyzing simultaneously the hysteresis loops produced by wetting a solid with several liquids.
Acknowledgments
The authors acknowledge important contri- butions to this work by Dr. Yash Kamath and Dr. Bernard Miller at TRI/Princeton.
References
[l] R.E. Johnson and R.H. Dettre, Surf. Colloid Sci. 2 (1969) 85.
[Z] C. Huh and S.G. Mason, J. Colloid Interface Sci., 60 (1977) 11.
[3] J.M. Di Meglio and D. Quere, Europhys. Lett., ll(2) (1990) 163.
[4] M.E.R. Shanahan, Surf. Interface Anal., 17 (1991) 489. [S] B. Miller and R.A. Young, Textile Res. J., 45 (1975) 359. [6] R.E. Johnson and R.H. Dettre, Adv. Chem. Ser., 43
(1964) 112. [7] M.E.R. Shanahan, A. Carre, S. Mall and J. Schultz,
J. Chim. Phys., 83 (1986) 351. [S] S. Hedvat, Ph.D. Thesis, Textile Research Institute and
Princeton University, 1980. [9] B.S. Damania and A. Bose, J. Colloid Interface Sci.,
113(2) (1986) 321. [lo] A.W. Neumann and R.J. Good, J. Colloid Interface Sci.,
38(2) (1972) 341.


