Embed Size (px)
Citation preview
A computational modelling approach toinvestigate alpha rhythm slowing associated withAlzheimer’s Disease
Basabdatta Sen Bhattacharya, Damien Coyle and Liam Maguire
Abstract Attenuation of power in the alpha band (8–13 Hz) of Electroencephalo-grahy (EEG) is identified as a hallmark symptom of Alzheimer’s Disease (AD).There is general agreement in existing literature that the thalamocortical circuitryplay a key role in generation of alpha rhythms. Our research is to gain a better un-derstanding of the cause of alpha rhythm slowing in the thalamocortical circuitry,which in turn might help in early detection of Alzheimer’s Disease. We adopt acomputational approach and base our work on a classic computational model of thethalamocortical circuitry associated with the generation of alpha rhythms proposedby Lopes Da Silva. In this work, we use the model to do a preliminary study on thepower spectrum of the alpha rhythms by varying model parameters corresponding toinhibitory and excitatory synaptic activity. We observe that an increased inhibitorysynaptic activity in the network leads to a decrease in the power of the upper al-pha frequency band (11–13 Hz) and an increase in that of the lower alpha frequencyband (8–10 Hz). Thus we observe an overall slowing of alpha rhythm correspondingto an increase in the inhibitory synaptic activity in the thalamocortical circuitry.
1 Introduction
One of the major challenges in the current treatment of Alzheimer’s Disease (AD)is its early diagnosis. Pathological changes in the brain associated with AD are nowwell known as are the cognitive and behavioural changes in patients affected withAD. Yet, there is little therapeutic success in these cases. One of the main reasons
Basabdatta Sen BhattacharyaUniversity of Ulster, ISRC, Magee e-mail: [email protected]
Damien CoyleUniversity of Ulster, ISRC, Magee e-mail: [email protected]
Liam MaguireUniversity of Ulster, ISRC, Magee e-mail: [email protected]
1
2 B. Sen Bhattacharya, D. Coyle, L. Maguire
for this is that early clinical symptoms of AD cannot be distinguished from otherforms of mental dementia related to advancing age. Moreover, such symptoms areoften also associated with ageing of normal adults [17]. Distinct clinical symptomsspecific to AD appear only when the brain has already undergone a major patho-logical degradation corresponding to an advanced state of the disease [7]. Therapiescurrently used are mainly to delay symptomatic degradation. It is strongly believedthat early detection of AD might help in specifying drugs to delay the onset of thedisease by even a decade, so much so that even possibilities of curing the diseaseare not completely ruled out [5, 7].
Diminished power in the alpha frequency band (8–13 Hz), commonly referredto in literature as ‘slowing’ of alpha rhythms, is identified as a definite marker inthe EEG of AD patients [16, 4, 20]. Although such slowing of alpha rhythms are anindicator of underlying pathological aberration related with many neurological aswell as psychological disorders [8, 14], early stage AD patients are ‘fairly’ distin-guishable from a set of control patients and patients affected with mental depressionwith a correct classification rate of 77% and 72% respectively, albeit in a clinicallyrestrained environment [16, 20]. Alpha rhythm slowing is also a distinct marker forpatients with Mild Cognitive Impairment (MCI)1 [1]—28.2% of MCI patients weredetected with AD during a clinical follow-up after 14.8 months [19]. These find-ings provide support to the speculation that MCI may be a precursor to AD [1, 19].The only significant difference observed between untreated AD patients and thosetreated with cholinesterase inhibitor is in the alpha frequency band [2]. Thus, a goodunderstanding of the underlying cause of the diminishing power in the alpha bandwith MCI or AD may elucidate future therapeutic techniques as well as early diag-nosis of AD.
There is now a general agreement in literature that the thalamocortical circuitryplay a key role in the generation of alpha rhythms [3, 8, 10, 11]. In his seminalwork on alpha rhythms in thalamocortical network of awake dogs, Lopes da Silvaproposed that alpha rhythms are filter-like treatment of stochastic signals by groupsof similar neuronal networks existing in different areas of the thalamus and thecortex [12]. To test this hypothesis, he proposed a computational model based onhistological data obtained by Tombol during her Golgi studies on the thalamus ofan adult cat [24]. He showed that the output of the model indeed oscillates at alpharhythmic frequencies when stimulated with a random input [12]. A linear systemanalysis of the model was also presented as a platform for further investigation ofthe effects on the output rhythmic activity by varying the model parameters.
We start by validating the linear system representation of the computationalmodel proposed in [12]. This is with a goal of studying the changes in alpha rhythmcharacteristics of the output voltage effected by varying the free parameters of themodel and the significance and relation of the effects of such variation in under-standing AD and its early diagnosis. In this work we present preliminary results byvarying parameters related to inhibitory and excitatory synapses in the model. Weobserve that an increase in inhibitory synaptic activity diminishes the average power
1 a clinical state between normal old age and mental dementia
Alpha rhythm slowing in AD—a modelling approach 3
in the upper alpha band (11–13 Hz) while power in the lower alpha band (8–10 Hz)is increased. Thus there is an overall slowing of alpha rhythms. Furthermore, weobserve that variation in the excitatory synaptic activity does not affect this slowing.From this observation we speculate that the inhibitory thalamocortical pathway hasan important functional role in slowing of alpha rhythms.
In Sect. 2, we present our validation of Lopes da Silva’s Alpha Rhythm model(ARm). In Sect. 3, we present our work based on the model and the results obtainedthereof. We conclude by a discussion of our results in the context of AD and futuredirections in Sect. 4.
2 Validation of Alpha Rhythm model
In this section, we present a very brief biological background from Tombol’swork [24] which is the basis of the biological parameters used to design theARm [12]. This is followed by a description of the model and our validation ofthe simulation results and the linear representation as was done by Lopes da Silva.It is worth mentioning here that the distributed-model of alpha rhythm was pro-posed and validated by Lopes da Silva with experimental results obtained from thethalamic and cortical areas of a dog in a relaxed-awake state [12]. In this paper wepresent validation of simulation results from the lumped-model version of the ARm.
2.1 A brief biological background
Based on Golgi studies on the thalamus of a well developed cat, Tombol observedthat two typical kinds of nerve cell generally occur in all areas of the thalamus: thethalamocortical relay (TCR) neurons with large axons and internuncial (IN) neuronswith short axons [24]. It is estimated that more than ten afferents from outside thethalamus project on to the dendrites of one TCR cell. Furthermore, these afferentsmake strong excitatory synapses on both TCRs and INs. The axons of the IN popula-tion also make strong synaptic contacts with the TCR dendrites. At a short distancefrom the axon hillock of many of the TCR cells, collaterals are seen to branch offfrom the axon.
Based on this biological data, Lopes da Silva considers two types of neuronalpopulation in his model viz. the TCR and IN cells. The TCR is assumed to exciteone or more IN neurons via a recurrent collateral of its axon. This is the feed-forwardpath of the model. The IN neurons in turn make inhibitory synaptic contacts withone or more TCR neurons, thus forming a negative feedback. As there are thought tobe approximately 10 afferents converging on one TCR cell and assuming an actionpotential frequency of 20 pps (pulses per second) per fibre of the afferent connec-tions to the TCR (based on relevant literature), it is assumed in the model that eachTCR cell receives a 200 pps input. From the physiological dimensions provided by
4 B. Sen Bhattacharya, D. Coyle, L. Maguire
Tombol, each TCR neuron in the model is designed to receive inhibitory input from3 IN neurons. Due to a lack of available data, each IN neuron was assumed to re-ceive input from 32 TCR neurons. The validation of the model simulation results inour work is discussed below.
2.2 Alpha Rhythm model
Sigmoidfunction C1
SigmoidfunctionC2
Sum
Output
V(t) E(t)
White GaussianNoise inupt
I(t)
hi(t)
he(t)
he(t)
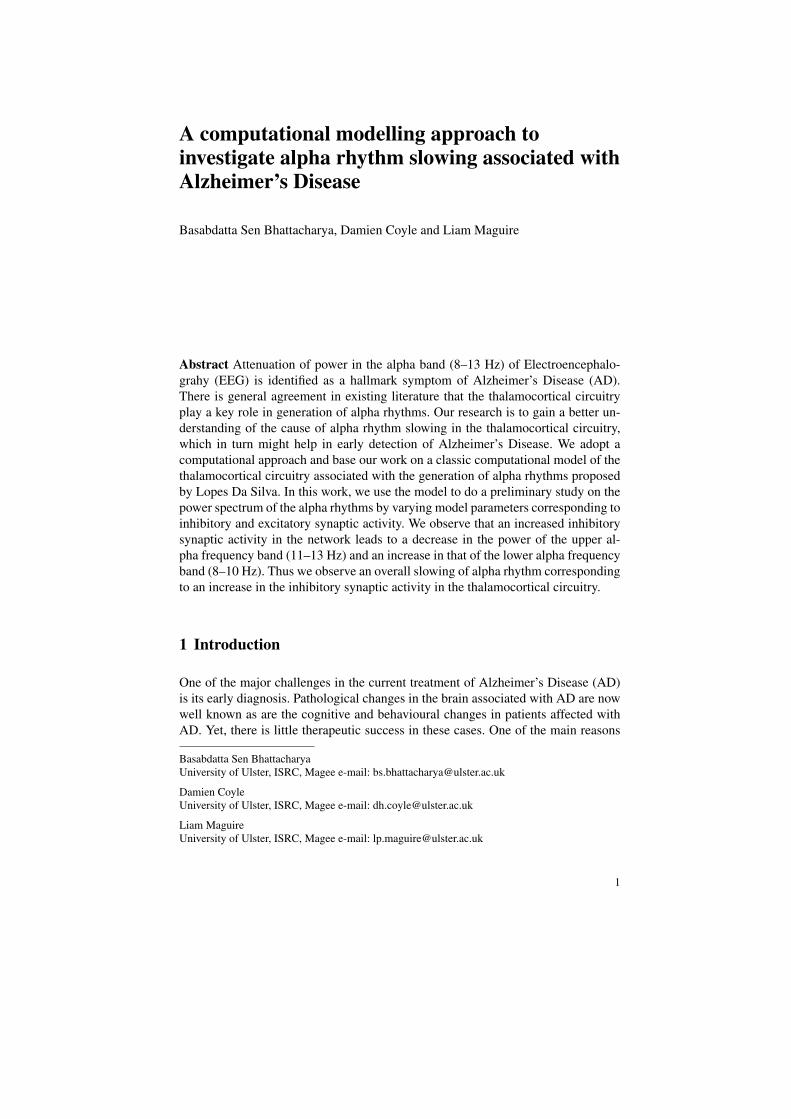
Fig. 1 The block diagram of Lopes Da Silva’s lumped circuit model of alpha rhythm [12]. In thiswork, we have implemented the model using Simulink in Matlab as was done by Suffczinsky [23](p. 26).
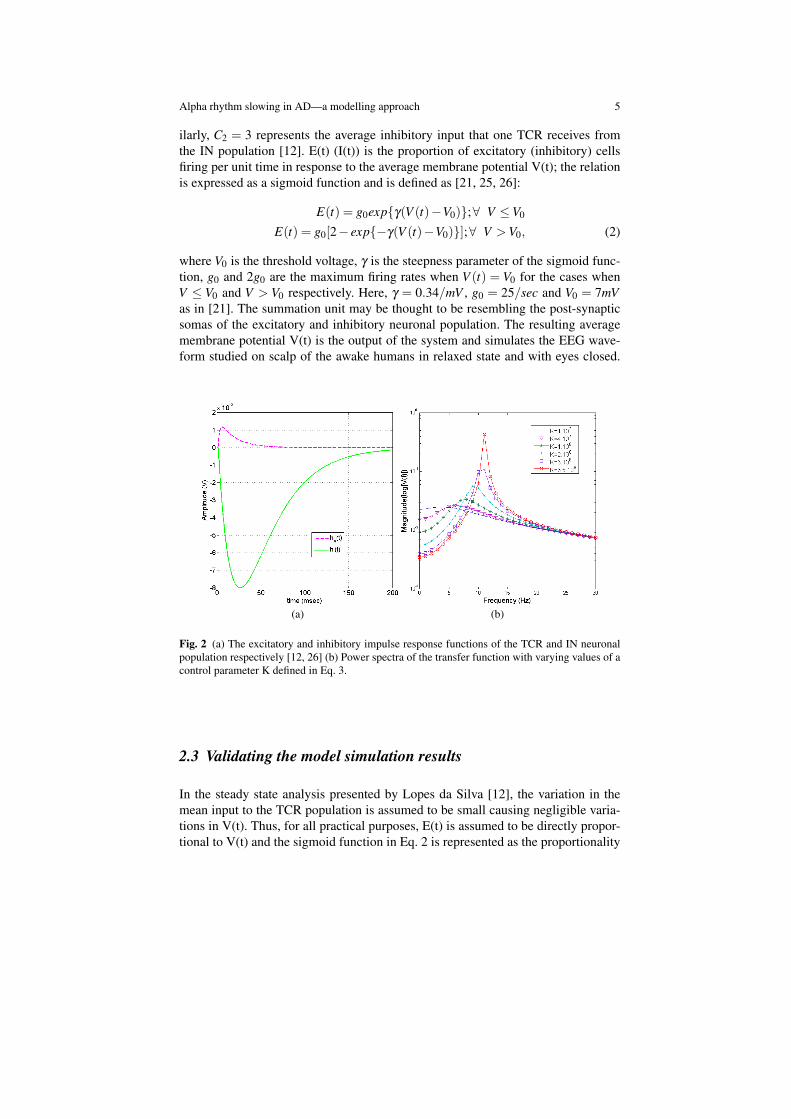
The functional block diagram of the ARm is shown in Fig. 1 [23]. The populationof each type of neuron viz. TCR and IN are represented as single entities. Sucha representation, termed as a ‘lumped circuit model’ by Freeman [6], is inspiredby the pioneering works of Freeman in [6] and Wilson and Cowan in [25]. Theinput to the model is simulated by a Gaussian white noise having a mean P and astandard deviation of 1, the standard deviation representing the variation in the inputspike frequency [23]. The excitatory post synaptic potential (EPSP) generated by aTCR neuron when depolarised by afferent signals is simulated by convolution of theinput to the model by a positive wave function he(t) shown in Fig. 2(a). Similarly,hi(t) corresponds to the inhibitory post synaptic potential (IPSP) generated by a INneuron. Thus each TCR and IN neuron act as ‘filters’ of their respective inputs,the impulse function of the excitatory and inhibitory filters being he(t) and hi(t)respectively and are defined in Eq. 1 [12]:
he(t) = A[exp(−a1t)− exp(−a2t)]
hi(t) = B[exp(−b1t)− exp(−b2t)], (1)
where A = 1.65mV and B = 32mV represent the strength of the respective impulsefunctions while a1 = 55/sec, a2 = 605/sec, b1 = 27.5/sec, b2 = 55/sec are the re-spective time constants [12, 23, 26]. C1 in Fig. 1 represents the average excitatoryinput to one IN from the TCR population and is 32 as described in Sect. 2.1. Sim-
Alpha rhythm slowing in AD—a modelling approach 5
ilarly, C2 = 3 represents the average inhibitory input that one TCR receives fromthe IN population [12]. E(t) (I(t)) is the proportion of excitatory (inhibitory) cellsfiring per unit time in response to the average membrane potential V(t); the relationis expressed as a sigmoid function and is defined as [21, 25, 26]:
E(t) = g0exp{γ(V (t)−V0)};∀ V ≤V0
E(t) = g0[2− exp{−γ(V (t)−V0)}];∀ V >V0, (2)
where V0 is the threshold voltage, γ is the steepness parameter of the sigmoid func-tion, g0 and 2g0 are the maximum firing rates when V (t) = V0 for the cases whenV ≤ V0 and V > V0 respectively. Here, γ = 0.34/mV , g0 = 25/sec and V0 = 7mVas in [21]. The summation unit may be thought to be resembling the post-synapticsomas of the excitatory and inhibitory neuronal population. The resulting averagemembrane potential V(t) is the output of the system and simulates the EEG wave-form studied on scalp of the awake humans in relaxed state and with eyes closed.
(a) (b)
Fig. 2 (a) The excitatory and inhibitory impulse response functions of the TCR and IN neuronalpopulation respectively [12, 26] (b) Power spectra of the transfer function with varying values of acontrol parameter K defined in Eq. 3.
2.3 Validating the model simulation results
In the steady state analysis presented by Lopes da Silva [12], the variation in themean input to the TCR population is assumed to be small causing negligible varia-tions in V(t). Thus, for all practical purposes, E(t) is assumed to be directly propor-tional to V(t) and the sigmoid function in Eq. 2 is represented as the proportionality
6 B. Sen Bhattacharya, D. Coyle, L. Maguire
constant q where q = 12130 . The transfer function of the linear analysis is:
V (s)P(s)
=A(a2 −a1)(s+b1)(s+b2)
(s+a1)(s+a2)(s+b1)(s+b2)+K,
where K =C1C2q2(a2 −a1)(b2 −b1)AB (3)
The power spectra of the transfer function is therefore independent of the mean in-put P. Furthermore, the spectrum is tuned to be alpha frequency selective with anarrow bandwidth by adjusting a control parameter K, which in turn is dependenton the impulse response as well as synaptic input parameters. We reproduce thepower spectra of the transfer function as presented in Lopes da Silva’s work [12]in Fig. 2(b). Observing the spectral characteristics of the transfer function, Lopesda Silva hypothesised that the evolution of posterior EEG with age from a predom-inantly low frequency signal to a signal having a high and narrow peak at around10 Hz may depend on the number of synaptic inputs (C1 and C2) as well as on theamplitude of the synaptic potentials (A and B). Based on the simulation criteria, thechange in the other parameters in K are assumed to be negligible.
3 Model set-up, analysis and results
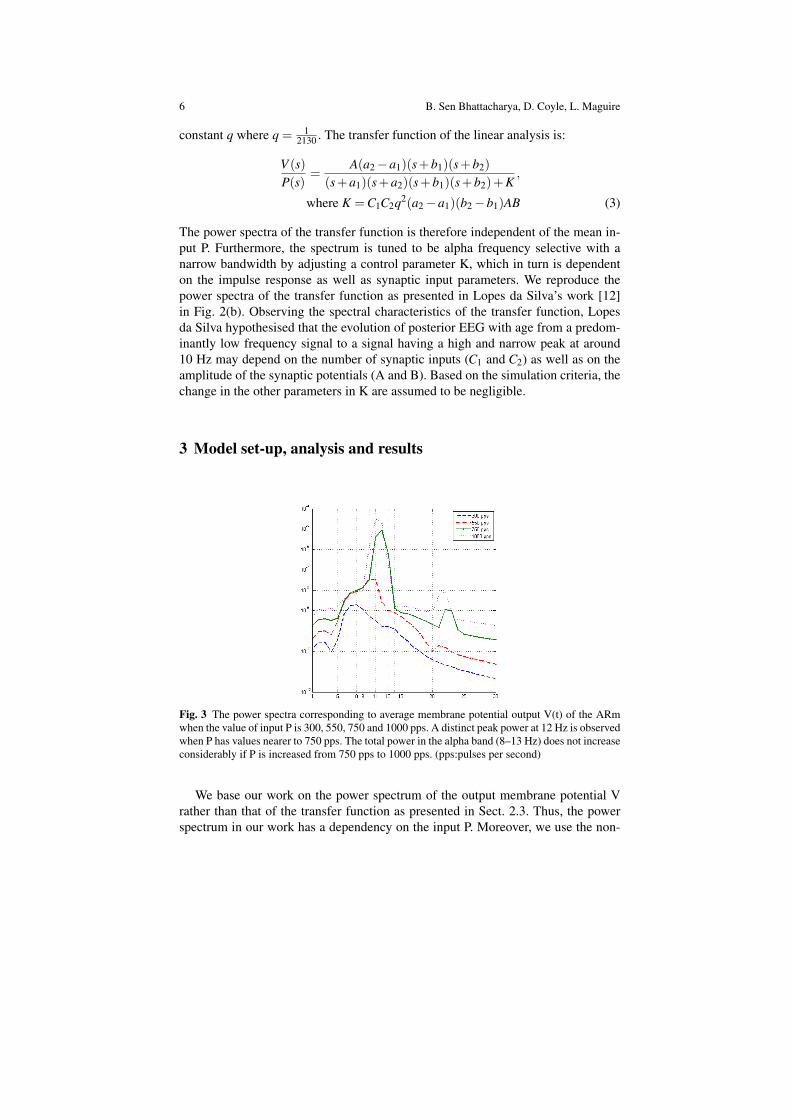
Fig. 3 The power spectra corresponding to average membrane potential output V(t) of the ARmwhen the value of input P is 300, 550, 750 and 1000 pps. A distinct peak power at 12 Hz is observedwhen P has values nearer to 750 pps. The total power in the alpha band (8–13 Hz) does not increaseconsiderably if P is increased from 750 pps to 1000 pps. (pps:pulses per second)
We base our work on the power spectrum of the output membrane potential Vrather than that of the transfer function as presented in Sect. 2.3. Thus, the powerspectrum in our work has a dependency on the input P. Moreover, we use the non-
Alpha rhythm slowing in AD—a modelling approach 7
linear sigmoid function as defined in Eq. 2. This is a different treatment of the modelthan in Lopes da Silva’s work [12].
Figure 3 presents the power spectra of V(t) corresponding to values of P=300,550, 750 and 1000 pps chosen randomly at approximately equal intervals. Thisrange of values for P is similar to those considered by Stam et al for a nonlineardynamical analysis of the model [21]. We observe that at P=750 pps, the outputvoltage spectrum has a peak at 12 Hz and a narrow bandwidth spanning the alphaband (8–13 Hz). The overall power in the alpha band is considerably increased thanthose at P=300 and 500 pps. Furthermore, there is no remarkable change in the peakpower or the bandwidth with P=1000 pps. In this work, we take the mean of ournoisy input as P=750 pps. All the simulations are run on Simulink in Matlab andthe output voltage is generated in real time. The total simulation time is 4 sec witha discrete time-step of 4 msec.
3.1 Results
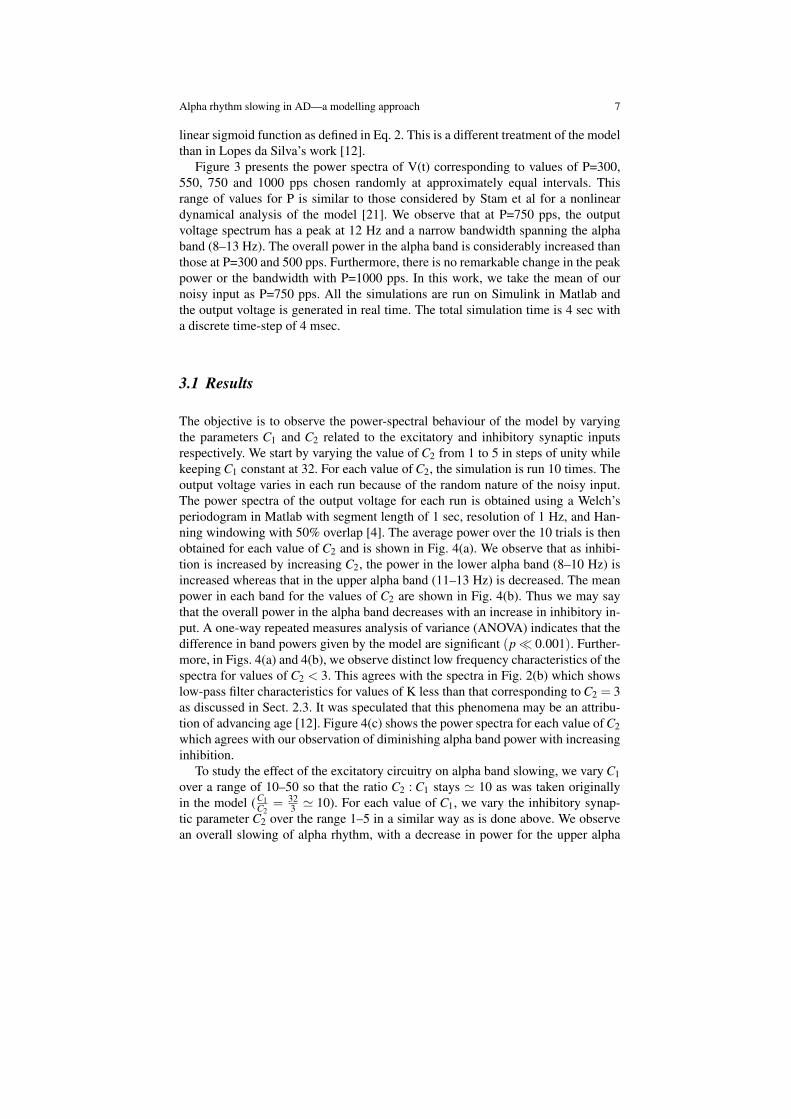
The objective is to observe the power-spectral behaviour of the model by varyingthe parameters C1 and C2 related to the excitatory and inhibitory synaptic inputsrespectively. We start by varying the value of C2 from 1 to 5 in steps of unity whilekeeping C1 constant at 32. For each value of C2, the simulation is run 10 times. Theoutput voltage varies in each run because of the random nature of the noisy input.The power spectra of the output voltage for each run is obtained using a Welch’speriodogram in Matlab with segment length of 1 sec, resolution of 1 Hz, and Han-ning windowing with 50% overlap [4]. The average power over the 10 trials is thenobtained for each value of C2 and is shown in Fig. 4(a). We observe that as inhibi-tion is increased by increasing C2, the power in the lower alpha band (8–10 Hz) isincreased whereas that in the upper alpha band (11–13 Hz) is decreased. The meanpower in each band for the values of C2 are shown in Fig. 4(b). Thus we may saythat the overall power in the alpha band decreases with an increase in inhibitory in-put. A one-way repeated measures analysis of variance (ANOVA) indicates that thedifference in band powers given by the model are significant (p ≪ 0.001). Further-more, in Figs. 4(a) and 4(b), we observe distinct low frequency characteristics of thespectra for values of C2 < 3. This agrees with the spectra in Fig. 2(b) which showslow-pass filter characteristics for values of K less than that corresponding to C2 = 3as discussed in Sect. 2.3. It was speculated that this phenomena may be an attribu-tion of advancing age [12]. Figure 4(c) shows the power spectra for each value of C2which agrees with our observation of diminishing alpha band power with increasinginhibition.
To study the effect of the excitatory circuitry on alpha band slowing, we vary C1over a range of 10–50 so that the ratio C2 : C1 stays ≃ 10 as was taken originallyin the model (C1
C2= 32
3 ≃ 10). For each value of C1, we vary the inhibitory synap-tic parameter C2 over the range 1–5 in a similar way as is done above. We observean overall slowing of alpha rhythm, with a decrease in power for the upper alpha
8 B. Sen Bhattacharya, D. Coyle, L. Maguire
(a) (b)
(c)
Fig. 4 (a) Average power of individual frequencies within the alpha band for different values ofC2 representing variations in inhibitory synaptic activity in the feedback path of the ARm. Theexcitatory synaptic activity parameter C1 is kept constant at 32. (b) Average power in the loweralpha band (8–10 Hz) and upper alpha band (11–13 Hz) with varying values of C2 when C1 =32.(c) Power spectrum of the output of the model corresponding to a constant value of C1 = 32 andtaking C2 =1, 2, 3, 4 and 5.
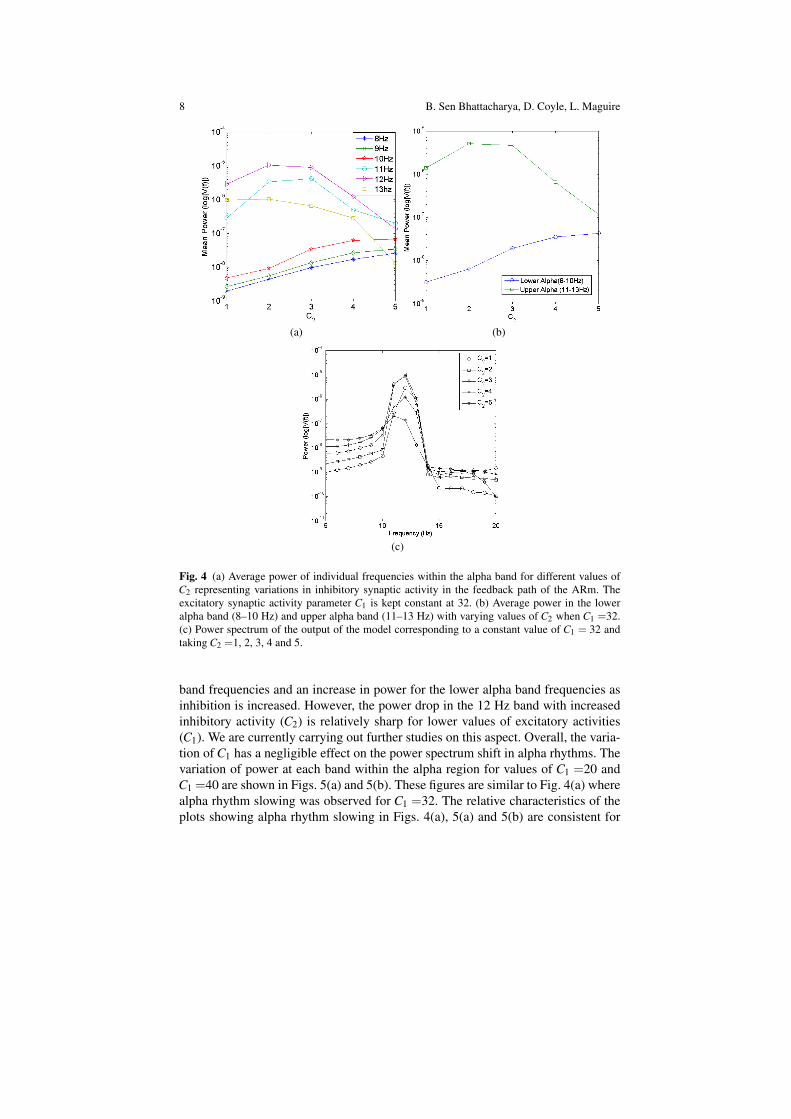
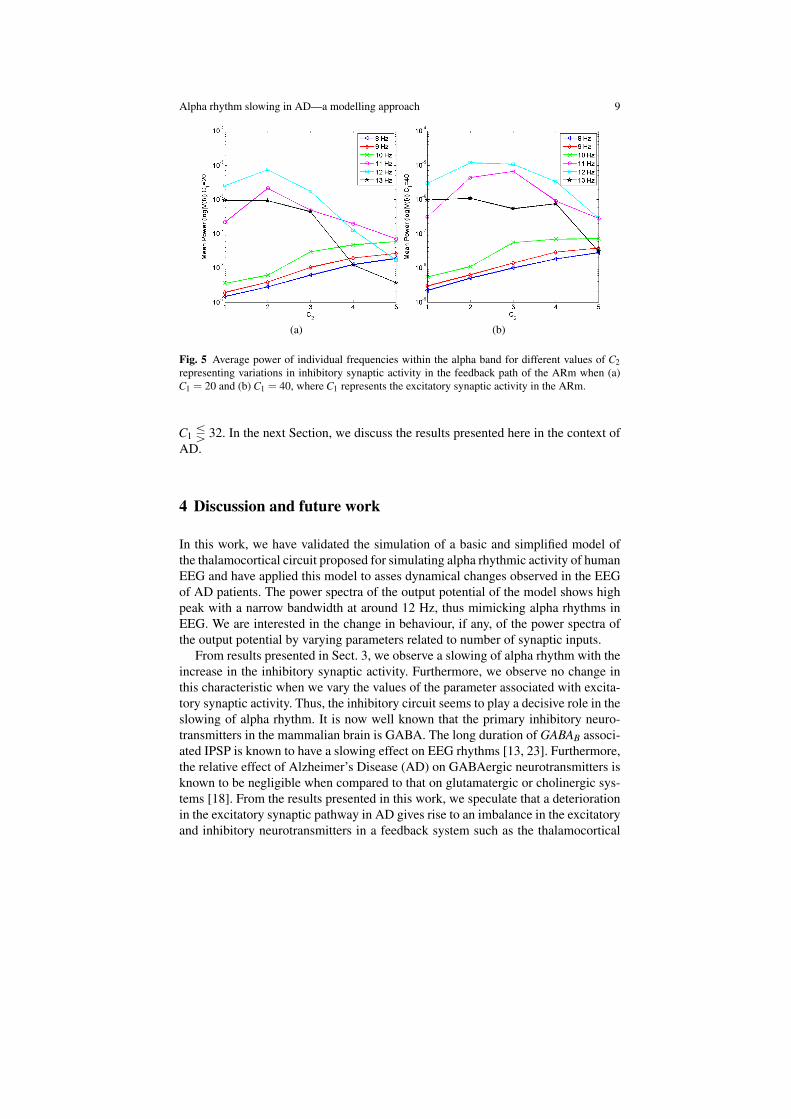
band frequencies and an increase in power for the lower alpha band frequencies asinhibition is increased. However, the power drop in the 12 Hz band with increasedinhibitory activity (C2) is relatively sharp for lower values of excitatory activities(C1). We are currently carrying out further studies on this aspect. Overall, the varia-tion of C1 has a negligible effect on the power spectrum shift in alpha rhythms. Thevariation of power at each band within the alpha region for values of C1 =20 andC1 =40 are shown in Figs. 5(a) and 5(b). These figures are similar to Fig. 4(a) wherealpha rhythm slowing was observed for C1 =32. The relative characteristics of theplots showing alpha rhythm slowing in Figs. 4(a), 5(a) and 5(b) are consistent for
Alpha rhythm slowing in AD—a modelling approach 9
(a) (b)
Fig. 5 Average power of individual frequencies within the alpha band for different values of C2representing variations in inhibitory synaptic activity in the feedback path of the ARm when (a)C1 = 20 and (b) C1 = 40, where C1 represents the excitatory synaptic activity in the ARm.
C1 Q 32. In the next Section, we discuss the results presented here in the context ofAD.
4 Discussion and future work
In this work, we have validated the simulation of a basic and simplified model ofthe thalamocortical circuit proposed for simulating alpha rhythmic activity of humanEEG and have applied this model to asses dynamical changes observed in the EEGof AD patients. The power spectra of the output potential of the model shows highpeak with a narrow bandwidth at around 12 Hz, thus mimicking alpha rhythms inEEG. We are interested in the change in behaviour, if any, of the power spectra ofthe output potential by varying parameters related to number of synaptic inputs.
From results presented in Sect. 3, we observe a slowing of alpha rhythm with theincrease in the inhibitory synaptic activity. Furthermore, we observe no change inthis characteristic when we vary the values of the parameter associated with excita-tory synaptic activity. Thus, the inhibitory circuit seems to play a decisive role in theslowing of alpha rhythm. It is now well known that the primary inhibitory neuro-transmitters in the mammalian brain is GABA. The long duration of GABAB associ-ated IPSP is known to have a slowing effect on EEG rhythms [13, 23]. Furthermore,the relative effect of Alzheimer’s Disease (AD) on GABAergic neurotransmitters isknown to be negligible when compared to that on glutamatergic or cholinergic sys-tems [18]. From the results presented in this work, we speculate that a deteriorationin the excitatory synaptic pathway in AD gives rise to an imbalance in the excitatoryand inhibitory neurotransmitters in a feedback system such as the thalamocortical
10 B. Sen Bhattacharya, D. Coyle, L. Maguire
circuitry. This would provide a bias in the system towards an increased inhibitoryactivity, which in turn would affect the alpha rhythmic activity. Recent research oneffects of AD on hippocampal inhibitory circuit speculates that the relative sparingof GABAergic systems by AD progression may be due to the increased synthesis ofGABAA neurotransmitters in hippocampal neurons as a compensatory mechanismand adaptation against deterioration of the hippocampal inhibitory circuitry [18].Such an argument may also be part of the inhibitory changes in the thalamocorticalcircuitry. Until recently, there was no definite evidence of physiological deteriora-tion and effects of AD on the thalamus. However atrophy in thalamus related to(Mild Cognitive Impairment) MCI and AD has now been reported [9]. It is thuspossible that a compensatory mechanism involving adaptations in the GABAergicsystem is also in play in the thalamocortical circuitry in AD whereby synthesis ofGABA neurotransmitters by surviving cells is increased. Our findings presented inthis work provide evidence to support this hypothesis.
The Alpha Rhythm model (ARm) validated and presented in this work providesa useful ‘starting point’ in our endeavour to understand the pathological origins ofthe changes in alpha rhythm as well as other brain rhythms associated with AD. Thesimplicity of the model makes it a popular basis for computational approaches inthe study of EEG changes related to neurological disorders like Epilepsy and non-linear neuronal dynamics in thalamocortical circuitry [15, 21, 23, 26]; subsequently,the model was further developed in these works for enhanced biological plausibil-ity. Indeed, the biological relevance of the model in current research seems to beits primary limitation. More recent research has revealed that Tombol’s Golgi studyand the assumptions thereafter regarding the feedback mechanism of the internun-cial (IN) neurons on the thalamocortical relay (TCR) neurons are flawed; however,it is demonstrated that IN neurons are indeed GABAergic in nature [22]. Thus theinherent inhibitory property of the feedback loop used in the model is not affectedby these new findings. It is now believed that there is strong involvement of circuitrycomprising of the thalamocortical, corticocortical and reticular nucleus (RE) in thegeneration of the different categories of brain rhythm [11, 13]. Although cells foundin the RE do not resemble the IN neurons, they are GABAergic. Again, if the simpli-fied single loop feedback circuit of the model is thought to comprise of RE neuronalpopulations, the nature of the connection would still be inhibitory. This justifies us-ing the model for preliminary work on computational approaches to alpha rhythmsin EEG.
Currently, we are investigating further into the behaviour of the excitatory tha-lamocortical circuitry to alpha rhythm slowing and its implications in the contextof AD. As future work, we propose to extend the model on the lines of those pre-sented in Suffczinsky’s work [23] for investigating event related synchronisation(ERS) and desynchronisation (ERD) observed in the alpha band rhythm and the as-sociation with AD. We also plan to investigate theta rhythms in AD using a similarcomputational approach.
Alpha rhythm slowing in AD—a modelling approach 11
References
1. Babiloni C et al (2009) Hippocampal volume and cortical sources of EEG alpha rhythms inmild cognitive impairment and Alzheimer disease. Neuroim 44:123–135
2. Basar E, Guntekin B (2008) A review of brain oscillations in cognitive disorders and the roleof neurotransmitters. Brain Res 1235:172–193
3. Basar E et al (1997) Alpha oscillations in brain functioning: an integrative theory. Int JourPsychophysiol 26:5–29
4. Canterro JL et al (2009) Functional integrity of thalamocortical circuits differentiates normalaging from Mild Cognitive Impairment. Hum Br Map 30:3944–3957
5. Cummings JL et al (1998) Alzheimer’s disease:Etiologies, pathophysiology, cognitive re-serve, and treatment opportunities. Neurol 51(Suppl 1):S2–S17
6. Freeman WJ (1975) Mass action in the nervous system. Academic Press, New York7. Geula C (1998) Abnormalities of neural circuitry in Alzheimer’s disease. Neurol 51(Suppl
1):S18–S298. Hughes SW, Crunelli V (2005) Thalamic mechanisms of EEG alpha rhythms and their patho-
logical implications. Neurosctst, doi: 10.1177/1073858405277459. Jong LW et al (2008) Strongly reduced volumes of putamen and thalamus in Alzheimer’s
disease: an MRI study. Brain 131:3277–328510. Llinas RR (1988) The intrinsic electrophysiological properties of mammalian neurons: in-
sights into central nervous system function. Science 242:1654–166411. Lopes da Silva FH (1991) Neural mechanisms underlying brain waves: from neural mem-
branes to networks. Elec Clin Neurophysiol 79:81–9312. Lopes da Silva FH et al (1973) Model of brain rhythmic activity. Kybernetic 15:27–3713. McCormick DA, Bal T (1997) Sleep and arousal: thalamocortical mechanisms. Ann Rev
Neurosci 20:185–21514. Niedermeyer E (1997) Alpha rhythms as physiological and abnormal phenomena. Int Jour
Psychophysiol 26:31–4915. Niedermeyer E, Lopes da Silva FH (1999) Electroencephalography: basic principles, clinical
applications and related fields. Williams and Wilkins, Baltimore16. Prinz PN, Vitiello MV (1989) Dominant occipital (alpha) rhythm frequency in early stage
Alzheimer’s disease and depression. Elec Clin Neurophysiol 73:427–43217. Raji CA et al (2009) Age, Alzheimer disease, and brain structure. Neurol 73:1899–190518. Rissman RA et al (2007) GABAA receptors in aging and Alzheimer’s disease. J Neurochem
103:1285–129219. Rossini PM et al (2006) Conversion from mild cognitive impairment to Alzheimer’s disease
is predicted by sources and coherence of brain electroencephalography rhythms. Neurosci143:793–803
20. Soininen H et al (1992) Slowing of electroencephalogram and choline acetyltransferase ac-tivity in post mortem frontal cortex in definite Alzheimer’s disease. Neurosci 49(3):529–535
21. Stam CJ et al (1999) Dynamics of the human alpha rhythm:evidence for non-linearity? ClinNeurophysiol 110:1801–1813
22. Steriade M, Deschenes M (1984) The thalamus as a neuronal oscillator. Brain Res Rev 8:1–6323. Suffczinsky P (2000) Neural dynamics underlying brain thalamic oscillations investigated
with computational models. Inst Exp Phys, Uni Warsaw24. Tombol T (1967) Short neurons and their synaptic relations in the specific thalamic nuclei.
Brain Res 3:307–32625. Wilson HR, Cowan JD (1972) Excitatory and inhibitory interaction in localized populations
of model neurons. Jour Biophy 12:1–2326. Zetterberg LH et al (1978) Performance of a model for a local neuron population. Biol Cyber
31:15–26


