Embed Size (px)
Citation preview
A COMPARISON OF RELATIONSHIPS OF
CERTAIN FACTORS TO THE READIHESS
ABILITIES OF TWO GROUPS
OF FIRST GRADE PUPILS
A THESIS
SUBMITTED TO THE FACULTY OF THE SCHOOL OF EDUCATION, ATLANTA UNIVERSITY
IN PARTIAL FULFILLMENT OF T1-E REQUIREMENTS
FOR THE DEGREE OF MASTER OF ARTS
BY
DOROTHY T. WOOD
SCHOOL OF EDUCATION
ATLANTA, GEORGIA
AUGUST, 1966
DEDICATI ON
To My Devoted Husband
Joseph L. Wood
For His Continuous Inspiration, Interest
and Encouragement Throughout the
Writing of This Thesis
and
To My Loving Children
Joseph and LaVentris Wood
D. T. W.
1]~
ACK~NLEDGNE NT
The writer wishes to express appreciationto the Troy City Board of Education in Troy,Alabama: Mr. Charles W. Thomas, Principal ofSouthside Elementary School, Troy, Alabama:Mrs. Minnie Cogborn and Mrs. Loretta Matthews,first grade teachers, parents, pupils and allwho assisted in the development of this research.Special laurels to DR. LYNETTE S. GAINES, Adviser,arid DR. R. L. SNOTHERS, Co-Adviser, who were untiringly patient and understanding and whosesuggestions and constructive criticism were mostinvaluable. The pleasurable experience will neverbe forgotten.
The writer is also grateful to her husband andtwo children for their patience, understanding andencouragement shown throughout the research.
11].
TABLE OF CONTENTS
Chapter Page
I. INTRODUCTION ••a•••••,••••,.~~~ 1
Rationale .............e............. 1EvolutionofthePrOblem.............”.. .. 3Contribution to Educational Research .............. 4StatementofthePrOblem..........~”~ 4Purpose of the Study ..................•e••~•• 4Definition of Terms . .. . . . . . . . . . . . . . . . . . . . . . . . . . . . . 5LimitatiOnoftheStudy.........0~~ 6Locale of the Study .....~••••••*•••••~•••••••• 6Method of Research •. . . , . . . . . . . . . . . ... . . . .. . . . . . . . . 7SubjectsandMaterialS.............”~ 7DescriptionofMaterialS..........~~ 8Research Procedure . . . . . . . . . . . . . . . . . . . . . . . . . . . . .. . . 12Survey of Related Literature •...................•• 13Description of Research Findings •................. 30Summary of Pertinent Literature ..................‘ 33
II. PRESENTATION AND ANALYSIS OF DATA .................... 36
Introductory Statement •.,......................... 36Results of Performances on the Ji!etropolitan
Readiness Test . . . . . . . . . . . . . . . . . . . . . . . . . . — . . . . . . 37Results of Performances on the Kuhlmann-AndersOn
Intelligence Test . . . . . . . . . . . . . . . . . . .. . . . . . . . . . . 40Results on the Measures of Physcial Factors ....... 43Results on the Personal Adjustment Section of the~~ljforniaTestofPerSOnality................”~ 43Results on the Social Adjustment Section of the
California Test of Personality •................ 52Results on the Total Adjustment Section of the
California Test of Personality ................. 57Results Obtained from Study of Socio-EconomiC
Factors •~~~••••_••..e.._.____,_..___._ 61
III. SUMMARYANDCONCLUSIONS.............—..—....~”” 74
Findings •.•.••~••••—•••••••*....•••••• ‘14Conclusions . . . . . . . . . . . . . . . . . . . . . . . . . . . . . . . . . . . . . . . 81Implications . . . . . . . . . . . . . . . . . . . . . . . . . . .. . . . . . . . . . . 82Recommendations • . . •. . •. . . . . . . . . . .. .. . . . . . . . . . . . . . . 83
iv
Page
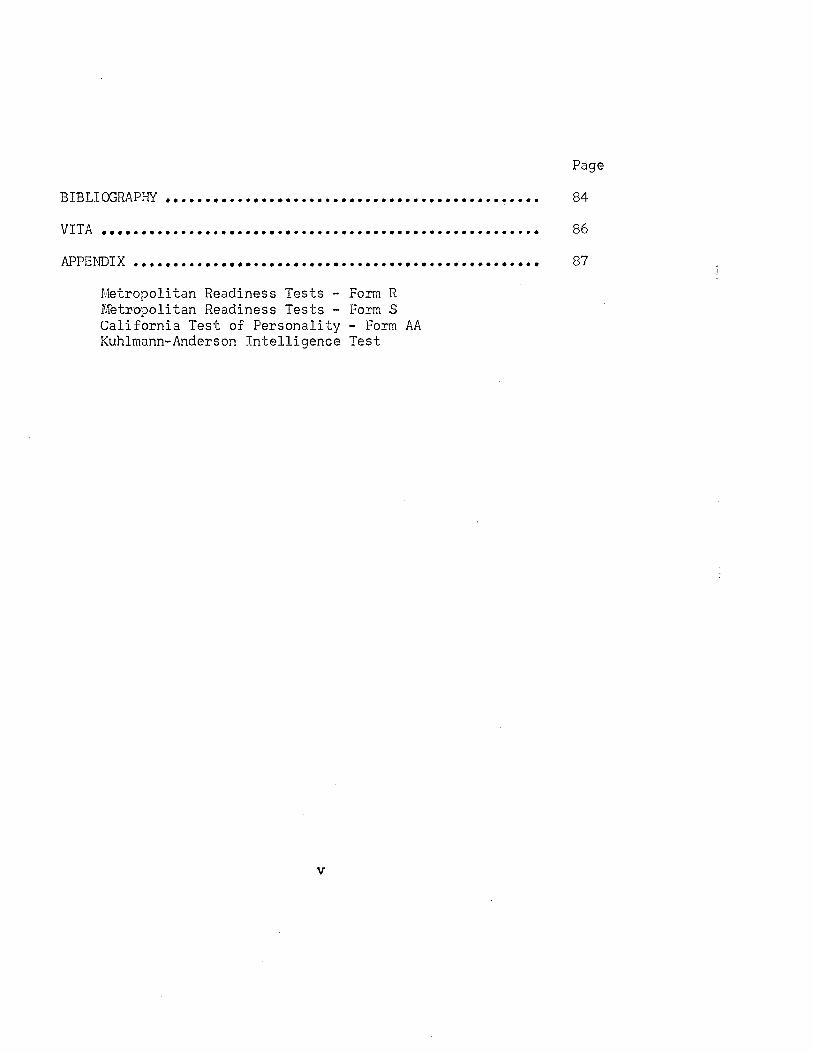
BIBLIOGRAPHY ............................................... 84
VITA ....................................................... 86
APPENDIX •.,..................................e............. 87
Metropolitan Readiness Tests — Form RMetropolitan Readiness Tests - Form SCalifornia Test of Personality - Form AAKuhimarin-Anderson Intelligence Test
V
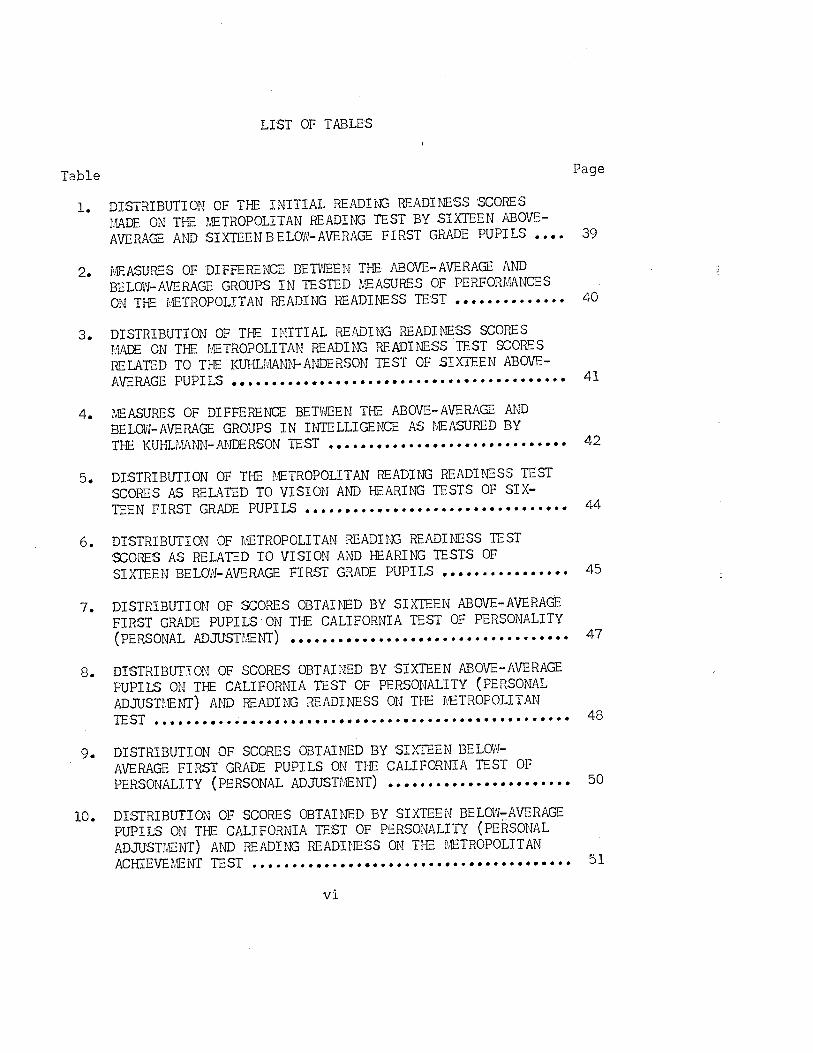
LIST OF TABLES
Table Page
1. DISTRIBUTION OF THE INITIAL READING READINESS SCORESMADE ON THE METROPOLITAN READING TEST BY SIXTEEN ABOVE-AVERAGE AND SIXTEEN B ELOW-AVERAGE FIRST GRADE PUPILS •... 39
2. MEASURES OF DIFFERENCE BETWEEN THE ABOVE-AVERAGE ANDBELOW-AVERAGE GROUPS IN TESTED MEASURES OF PERFORMANCESON THE METROPOLITAN READING READINESS TEST •............. 40
3. DISTRIBUTION OF THE INITIAL READING READINESS SCORESMADE ON THE METROPOLITAN READING READINESS TEST SCORESRELATED TO THE KUHLMANN-ANDERSON TEST OF SIXTEEN ABOVE-AVERAGE PUPILS~ 41
4. MEASURES OF DIFFERENCE BETWEEN THE ABOVE-AVERAGE ANDBELOW-AVERAGE GROUPS IN INTELLIGENCE AS MEASURED BYTHEKUHLMANN—ANDERSONTEST......................~’’~ 42
5. DISTRIBUTION OF THE METROPOLITAN READING READINESS TESTSCORES AS RELATED TO VISION AND HEARING TESTS OF SIXTEEN FIRST GRADE PUPILS .....................•.•.•••.•••. 44
6. DISTRIBUTION OF METROPOLITAN READING READINESS TESTSCORES AS RELATED TO VISION AND HEARING TESTS OFSIXTEEN BE LOW- AVERAGE FIRST GRADE PUPILS ....... . ........ 45
7. DISTRIBUTION OF SCORES OBTAINED BY SIXTEEN ABOVE-AVERAGEFIRST GRADE PUPILS ON THE CALIFORNIA TEST OF PERSONALITY(PERSONAL AD,J1JSTI~ENT) . . . . . . . . . . . . . . . . . .. . . . . . . . . . . . . . . . . 47
8. DISTRIBUTION OF SCORES OBTAINED BY SIXTEEN ABOVE-AVERAGEPUPILS ON THE CALIFORNIA TEST OF PERSONALITY (PERSONALADJUSTMENT) AND READING READINESS ON THE METROPOLITANTEST •.....••..•ee•*e••••••e*••~ •..........•,.••••~ 48
9. DISTRIBUTION OF SCORES OBTAINED BY SIXTEEN BELOW-AVERAGE FIRST GRADE PUPILS ON THE CALIFORNIA TEST OFPERSONALITY (PERSONALADJUSTHENT) ....................... SO
10. DISTRIBUTION OF SCORES OBTAINED BY SIXTEEN BELOW-AVERAGEPUPILS ON THE CALIFORNIA TEST OF PERSONALITY (PERSONALADJUSTMENT) AND READING READINESS ON THE METROPOLITANA(T~Tm~1~\fl’ TCfT r
4 VU-. fl 1. Ji •....e•e••••••e•••sseI•~•e••e•e•••••
vi
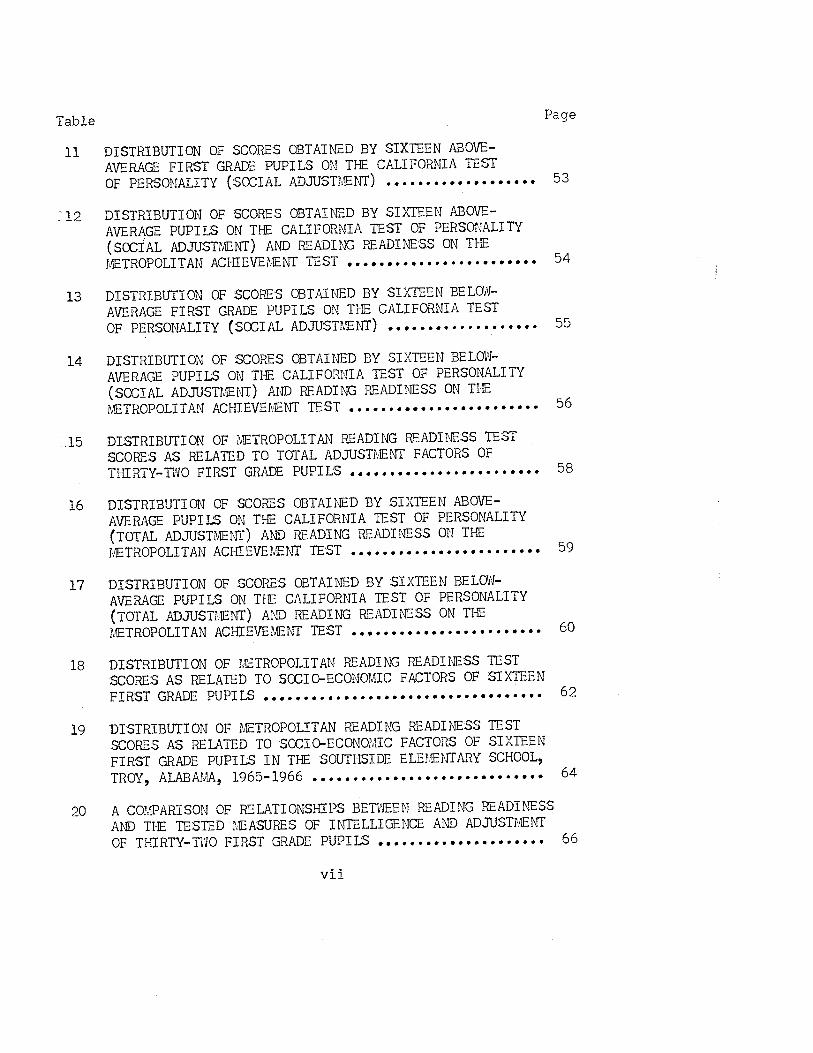
Table Page
11 DISTRIBUTION OF SCORES OBTAINED BY SIXTEEN ABOVE-AVERAGE FIRST GRADE PUPILS ON THE CALIFORNIA TESTOF PERSONALITY (sOCIAL ADJUSTMENT) ................... 53
12 DISTRIBUTION OF SCORES OBTAINED BY SIXTEEN ABOVE-AVERAGE PUPILS ON THE CALIFORNIA TEST OF PERSONALITY(soCfAL ADJUSTMENT) AND READING READINESS ON THEMETROPOLITANACHIEVEMENTTEST.....................~ 54
13 DISTRIBUTION OF SCORES OBTAINED BY SIXTEEN BELOW-AVERAGE FIRST GRADE PUPILS ON THE CALIFORNIA TESTOF PERSONALITY (SOCIAL ADJUSTMENT) ................... 55
14 DISTRIBUTION OF SCORES OBTAINED BY SIXTEEN BELOW-AVERAGE PUPILS ON THE CALIFORNIA TEST OF PERSONALITY(SOCIAL ADJUSTMENT) AND READING READINESS ON THEMETROPOLITAN ACHIEVEMENT TEST •....................... 56
.15 DISTRIBUTION OF METROPOLITAN READING READINESS TESTSCORES AS RELATED TO TOTAL ADJUSTMENT FACTORS OFTHIRTY-TWOFIRSTGRADEPUPILS..........~...........~ 58
16 DISTRIBUTION OF SCORES OBTAINED BY SIXTEEN ABOVE-AVERAGE PUPILS ON THE CALIFORNIA TEST OF PERSONALITY(TOTAL ADJUSTMENT) AND READING READINESS ON THEMETROPOLITANACHIEVE1~’ENT TEST ................“...... 59
17 DISTRIBUTION OF SCORES OBTAINED BY SIXTEEN BELOW-AVERAGE PUPILS ON THE CALIFORNIA TEST OF PERSONALITY(TOTAL ADJUSTMENT) AND READING READINESS ON THEMETROPOLITANACHIEVEMENTTEST.,...................’~ 60
18 DISTRIBUTION OF METROPOLITAN READING READINESS TESTSCORES AS RELATED TO SOCIO-ECONOMIC FACTORS OF SIXTEENFIRST GRADE PUPILS . . . . . . . . . . . . . . . . . . . . . . . . . . . . . . . . . . . 62
19 DISTRIBUTION OF METROPOLITAN READING READINESS TESTSCORES AS RELATED TO SOCIO-ECONOMIC FACTORS OF SIXTEENFIRST GRADE PUPILS IN THE SOUTHSIDE ELEMENTARY SCHOOL,TROY, ALABAMA, 1965—1966 . . . . . . . . . . . . . . . . . . . . . . . . . . . . . 64
20 A COMPARISON OF RELATIONSHIPS BETWEEN READING READINESSAND THE TESTED~~ OF INTELLIGENCE AND ADJUSTMENTOF THIRTY—TWO FIRST GRADE PUPILS •.................... 66
vii
CHAPTER I
INTRODUCTI ON
Rationale
Reading is of great importance in today’s world. In the
modern elementary school, reading is organized as a broad program
in which everything a school does to promote growth in and through
reading is considered an integral part. The child is seldom out of
sight of printed materials challenging him to read. There are many
situations in which he must read to protect himself from danger or
destruction. Few, if any, vocations are open to the non reader.
Reading is essential to good citizenship.
Success in school depends upon the child’s being able to read.
Teaching a child to read is the most important contribution to his
development that a teacher can make. It is, therefore, the desire of
all teachers to create a classroom environment rich in experiences
which will contribute to effective learning.
Reading is the real “magic carpet” that carries boys and girls
toward exciting new worlds of enjoyment and knowledge. The sooner
pupils learn to read independently, the sooner they can find enjoyment
in reading and make real progress in every phase of school work.1
The concept of readiness for learning is basic to all instruc
tion. A sensible and realistic approach includes a recognition of
learning as continuous and of reading as having its own sequence.
1Helen Huus, ‘Developing Reading Readiness,” The Instructor,LXXIV (March, 1965), p. 61.
1
2
Since each child progresses at a pace that is his own, the first
grade teacher can accept these children arid adjust her readiness
program to fit their individual needs.
Readiness for development of various reading skills taught
in the first grade is a significant aspect of training. Many slow
learners are penalized by teachers looking at the chronological age
and assuming that it is time for them to learn to read. Others are
handicapped by teachers who permit one intelligence test score to
become the sole dictator of the time for beginning reading.1
Many reading difficulties can be prevented if adequate
attention can be given to reading in the first grade. As early as
1925, the National Committee on Reading gave explicit recognition to
the fact that not all pupils who enter first grade are equally ready
to read.2
Since the publication on the committee’s report, intensive
studies have been made of many issues relating to reading readiness.
Readiness is a continuous factor. It is generally apparent in groups
of children that some of them will have distinct differences, mentally,
physically, socially and educationally. Individual differences in
readiness for reading demand diff-erentiated guidance activities.3
1-Lynette Sain~ “The Slow Learner,” The Instructor, LXXIV(March, 1965), p. 81.
2Walter Monroe, Encyclopedia of Education Research (New York:The Macmillan Company, 1950), p. 97.
3Mary M. Scobey and Wesley C. Souard, The Changing Curriculumand the Elementary Teachers (San Francisco: Wadsworth PublishingCompany, 1961), pp. 228-229.
3
Many things determine readiness for systematic reading instruc
tion. It is not a matter of age nor IQ. It is not mental maturity
alone but the major characteristics are:
1. Biological, personal, social and socio—economicfactors
2. Visual and auditory perception
3. Physical health and maturity
4. Freedom from directional confusion
5. Background experiences
6. Good listening and speaking habits
7. An interest in reading
In order to meet the educational challenge of today effective
ly, the writer feels that the teacher should have a wider knowledge
of children, the way they grow, their interests, personality and
social traits, and the way they learn. Once these developmental and
underlying factors have been recognized, and she knows the sequence
of teaching reading she can adjust her reading program to fit their
individual needs.
Evolution of the Problem
The problem grew out of the writer’s deep interest in the read
ing situation in the light of the large percentage of pupils who had
reading difficulties. The principal and teachers were aware that there
were too many children who were reading below their capacity. Concerned
over this situation the writer sought to determine to what extent develop
mental factors, such as general intelligence, personal, physical, social
4
adjustment and socio-economic factors relate to the initial reading
reading abilities of two groups of first grade pupils in her school.
She hoped to present evidence of relationship in which understanding
needed to be extended and deepened by further research.
Contribution to Educational Research
The writer hoped that the information contained in this study
would prove ~a1uable for those who were concerned with improving and
guiding the adjustment of the first grade child’s pre-reading activi
ties. The findings in this study might also be used as an aid to the
new teacher in making a better classification of the pupils in the
first grade before (formal) reading is begun.
Statement of the Problem
The problem involved in this study was to compare the extent
to which intellectual, physical, personal, social adjustment and socio
economic factors relate to the initial reading readiness abilities of
two groups of first grade pupils with above-average and below-average
academic performances respectively at the end of the school year 1965-
1966.
Purpose of the Study
The major purpose of this research was to compare the relation
ship of reading ability to intellectual, physical, personal, social
adjustment and socio-economic factors of a group of high and low
achievers. ~ ~
More specifically, the purposes of this research were:
1. To determine the general reading status of these twogroups and differences, if any, which might exist.
5
2. To ascertain to what extent intellectual factors relateto initial reading abilities of above—average and below—average pupils.
3. To ascertain to what extent physical factors relate toinitial reading readiness abilities of above-averageand below-average pupils.
4. To ascertain to what extent social adjustment factorsrelate to reading readiness abilities of above—averageand below—average pupils.
5. To ascertain to what extent socio—economic factors relateto initial reading readiness abilities of above-averageand below-average pupils.
6. To formulate implications and recommendations which maybe derived from analysis and interpretation of data.
Definition of Terms
The subsequent terms used for the purposes of clarity and con
sistency of this study are defined below.
1. The term, “intellectual factors,” refers to the levelof mental development which was measured by the KuhlmannAnderson Intelligence Test.1
2. The term, “physical factors,” refers to the good generalhealth, visual and auditory efficiency.
3. The term, “reading readiness,” refers to the developmentalstage at which constitutional and environmental factorshave prepared the child for reading instructions asmeasured by the Metropolitan Readiness Test.
4. The term, “personal and social adjustment factors,” refersto the total complex patterns of feeling, thinking andacting, as measured by the California Test of Personality.
5. The term, “socio-economic~ factors,” refers to the background of parents and siblings, economic status, homeatmosphere and achievement of the individual or group.
lp• Kuhlmann and R. G. Anderson, Kuhlmann-Anderson Testg SixthEdition (Princeton, New Jersey: Personnel Press, Inc., 1964).

6
6. The term, “above average,” refers to those pupils whofall above the mean of a distribution of scores derivedfrom averaging of pupils respective performances.
7. The term, “below-average,” refers to those pupils whofall above the mean of a distribution of scores derivedfrom averaging of pupils respective performances~on theMetropolitan Readiness Test.
Limitatior~ of the Study
Significant limitations of this study were as follows:
1. The proposed study was limited to two groups of firstgrade pupils in Southside Elementary School, Troy,Alabama.
2. In an effort to determine the extent that intellectual,physical, personal, social adjustment and socio-economicfactors influence or contribute to reading readinessabilities, no attempt was made to establish the socioeconomic status, but rather to point out some of thefactors that were involved in the reading readiness process.
Locale of the Study
This study was conducted at Southside Elementary School during
the school year 1965-1966. Southside Elementary School is located on
the south side of Troy, Alabama. The school has an enrollment of ap
proximately 300 pupils, a principal, one secretary, 13 teachers, a
cafeteria, 11 classrooms and a library.
Southside Elementary School, built in 1957, was designed
with a dual purpose in mind. It was built to meet the needs of the
present enrollment with foresight for enlargement for future increase
in enrollment. The building comprises a multi—purpose room (which
serves for a cafeteria, physical education, and numerous other activ
ities), a teacher’s lounge, a principal’s office and secretary com
bined, classrooms, one that can be used for special education or
7
board room and other purposes. Most of the children’s parents have
low incomes. There are a few home owners. There are few families
in the community with home libraries, and many homes contain no books.
In general, books of any sort are not discussed in the home. Member
ship and attendance in the school’s P.T.A. are good. Through;the P.T.A.
the parents are striving to improve the standards of the cor~munity.
Method of Research
The Description Survey Method of research employing the spe
cific techniques of standardized tests, questionnaires, analyses of
school records, and sta~istical analysis was used to gather the neces
sary data for the completion of this study.
Subjects and Materials
The subjects involved in this study were thirty-two first grade
pupils of Southside Elementary School, Troy, Alabama. The chronologi
cal age range for the thirty—two pupils tested was 6 years 2 months
to 7 years 9 months.
Materials and instruments used in this study were:
1. Survey tests
a. i~etropolitan Readiness Test Form “R” and 1t517
b. The California Test of Personalityc. Kuhlmann-Anderson Intelligence Test
2. Q~estionnaires
3. School Records
4. An Audiometer Test
5. Snellen and “E” Chart
8
Description of Materials
All the tests used for the purposes of this study were valid
and reliable for the desired results of this writer. They are dis
cussed below.
The Metropolitan Readiness Tests. Forms “R” and “5” were
devised to measure the traits and achievements of school beginners
that contribute to their readiness for first grade instruction. These
tests are contained in a sixteen—page booklet comprising six separa’~e
tests: Word Meaning, Sentences, Information, Matching, Numbers, and
Copying. The validity of the Metropolitan Readiness Tests--the extent
to which the tests actually measure readiness for the first grade--
may be judged in terms of the content of the test and of the corre
lation of Readiness scores with first—grade achievement.’
The California Test of Personality was administered in order
to measure emotional and social adjustment. The components of this
test yielded 13 scores identified with evaluating the more intangible
elements of the total complex patterns of (i) Personal Adjustment:
(a) Self—reliance, (b) Sense of Personal Worth, (c) Sense of Personal
Freedom, (d) Feeling of Belonging, (e) Withdrawing Tendencies, (f)
Nervous Symptoms; (2) Social Adjustment: (a) Social Standards,
(b) Social Skills, (c) Anti—social Tendencies, (d) Family Relations,
(e) School Relations, and (f) Community Relations. The test is orga
nized around the concept of life adjustment as a balance het~een
personal and social adjustment.
1G. H. Hilbreth and N. L. Griffiths, Metropolitan ReadinessTest (New York: Harcourt, Brace and World, Inc., 1950), pp. 1-30.
9
Since this test is primarily concerned with an individual’s
feelings, convictions and modes of behavior which are changing in
accordance with his experiences, the statistical reliability will
sometimes appear to be somewhat lower than of good tests of ability
and achievement. The items on Form AA and Fö~ñ~ BB have been matched
for equivalency as to difficulty, discriminative power, and internal
consistency. The means and standard deviations are identical and
the reliability data apply equally to both forms.’
Several reviews concerning the validity of the California Test
of Personality, Syracuse University2 found that this test correlated
more closely with clinical findings than any other petsonality test.
Taylor and Combs3 writing in the Journal of Consulting Psy
chology, provided additional evidence on the validity of the Cali
fornia Test of Personality. They tested 168 sixth grade pupils with
the California Test of Personality and divided the children into two
groups, the upper 50 percent (better adjusted) and the lower 50 per
cent (poorer adjusted). The test revealed a statistically significant
difference in favor of the better adjusted group; that is the better
adjusted half of the class checked a statistically significant larger
number of self—damaging statements than the poorly adjusted half.
2-The California Test of Personality, 1953 Revision, L. P. Thorpe,Willis W. Clark, and Ernest W. Tiegs, Form M, Primary Tests. (LosAngeles, California Test Bureau, 1964), pp. 7-l5.~
2Summary of Investigations Number One, Enlarged, California Testof Personali~y (Los Angeles: California Test Bureau, 1949), p. 7.
3Charles Taylor and Arthur W. Combs, “Self-Acceptance andAdjustment,” Journal of Consulting Psychology, 16:89-91, April, 1952.
10
The Kuhlmann-Anderson Intelligence Test is designed to
measure the pupil’s intelligence and mental ability. It is divided
into nine booklets for use from the first grade to maturity. The
booklet used for this study contained eight tests, which measured
ability in numerical and verbal relationships, reasoning ability
and the ability to follow directions of various types. Bases are
provided for interpreting the results in terms of the intelligence
quotient (i.Q.) and also in terms of mental level age (M.A.). There
are clear instructions for marking and scoring.
The manual does not include validity coefficients, but
careful and accurate work was done on preliminary steps to insur~
validity and reliability of the test and the reliability of the norms.
The reviews1 made on the Kuhlrnann-Anderson Intelligence Test
show little criticism on the subject matter of the test. The reviewers
and critics state that on the whole, the tests are a reasonably good
set. It is believed that the tests will continue to be used widely
because of their brevity and relatively less depending upon skill
than that required of most other group tests.
The Audiometer Testis designed to make possible a very exact
and comprehensive determination of hearing acuity. Where facilities
for securing a hearing test by means of the audiometer examination
by a specialist are not readily available, the teacher can proceed
10scar K. Buros (ed.), The Sixth Mental Measurements Yearbook(Highland Park, New Jersey: The Grypon Press, 1965), pp. 101—103.
11
by testing one ear at a time, the subject receives the sound through
a headphone or receiver held against the ear. The intensity is in
creased until the subject can iust barely hear the sound, and it is
decreased until he can no longer hear it. The entire procedure is
repeated at several frequency levels in order to check for differen
tial hearing loss. The zero point on the audiometer dial represents
the intensity of sound which the normal ~eartt can just barely hear
on the audiometer.
When properly administered, audiometers have been found to
yield retest reliabilities ranging from .70 to .87.1
The handedness of each child was observed by using several
of Halfner tests. (i) Throwing tests — A rubber ball was placed on
a table or desk directly before the pupil and the pupil was asked to
throw it back to you. This was repeated three or four times with
the examiner standing ten or fifteen feet away, either before the
desk or behind it, so that the pupil hadto turnaround before throw
ing the ball. (2) Receiving tests - The examiner stood about three
feet in front of the pupil and held the ball in the hand, moved it
forward fairly rapidly directly toward the center of the body just
about the waistline after asking the child to take the object when
it was presented. This was repeatedthree or more times. (3) Other
tests of similar purpose were used, using a spoon to dip peanuts from
1Anne Anastasi, Psychological Testing (New York: MacmillanCompany, 1954), pp. 390-392.
12
a bag, using scissors to cut a piece of paper, using cloth to dust
a desk arid shooting marbles. It was apparent that there is really
rio such thing as handedness for all arts. Handedness was found to
be a matter of degree.
The Snellen Chart (distributed by American Optical Company,
Southb~idge, Massachusetts) was used because a more comprehensive
test was not available. It measured visual acuity at a distance of
20 feet and will detect nearsightedness. The “E” Chart was also
used, response was made from this test by having the child indicate
in which direction he ~aw the ‘tE” pointing. Failure on this test
and success on the Snellen Chart indicate farsightedness while suc
cess on this and failure on the Snellen Chart indicate nearsighted
ness. The children were referred to the school Health Clinic for
further testing.
Research Procedure -
The procedural steps used in this study were the following:
1. Permission to conduct the study was secured from theproper persons in authority.
2. A further study of related literature was made in orderto obtain more information about the factors involvedin the reading readiness process.
3. School cumulative record folders were used to securepertinent information relative to such factors ashealth, previous achievement (kir~dergarten) and background information.
4. The subjects for this study were selected as “aboveaverage” and ‘~helow—average” achievers on the basisof those pupils who fell above and below the mean ofa distribution of scores derived from the averagingof pupils performances on the Metropolitan AchievementTests.
13
5. QuestionnaireS were sent to parents. General informationwas obtained concerning the socio—ecOnOrfliC status ofthe family, education, travel, reading materials, socialadjustment and emotional stability.
6. The Snellen and “E~ Charts were used to test the visionof the pupils.
7. Data derived from the tests and questionnaires were tabulated in appropriate tables or charts and treated statistically as indicated by the purposes of the research.
8. The tests for comparison of the two groups were basedupon the computation and use of the following statisticalmeasures: mean, standard deviation, difference betweenthe means, and the “t” ratio for measuring significanceof differences, Pearson Product Moment Coefficient ofCorrelation, and “z” for purposes of comparing differencesbetween correlations.
9. The statements of findings, conclusions, implications,and recommendations derived from the comparison andinterpretation of the data were taken and formulatedin the finished thesis copy.
Survey of Related Literature
The following paragraphs under the general heading of survey
of related literature have been arranged to present developmental
factors which relate to the reading readiness abilities of first
grade pupils.
Introductory statements. -- Children show strong
developmental and personality differences at all ages, but in teaching
reading, there is the tendency to project the concept of a standar
dized beginner who will respond exactly as we would wish. Many
problems for the child and his adult well-wishers spring from this
common misconception. The teacher cannot sit back and wait for
children to attainreadiness for reading. Instead she must look for
14
the qualities that a child may acquire in early years to help him in
such a difficult job as learning to read.
She can determine when children are physically, mentally,
emotionally and socially mature enough for beginning reading by using
intelligence tests, reading and readiness tests and systematic obser
vations.
Quality and quantity of achievement are always influenced by
the general health status of the pupils. A child with low general
health is likely to be listless, to be readily fatigued, and to have
a much shortened attention span. Defects in vision may hinder a child
in learning to read. Faulty vision may cause strain and discomfort
for the child, making him nervous, and fatigue. The child who must
strain his eyes~to read is not likely to enjoy the process and will
usually try to avoid reading. If his vision is so poor that even
with considerable effort, it is difficult or impossible for him to
differentiate between the forms of letters, success in reading will
be delayed until he is given reading materials printed in type that
he can read comfortably.1
Description of physical factors. -- All teachers
should be alerted to signs of visual difficulties among their pupils.
Among these difficulties are: facial contortions, book held close to
face; tense during visual work, tilting head; head thrust forward,
1Ruth Strang, Constance McCullough and Arthur Traxler, TheImprovement of Reading (New York: McGraw Hill Book Company, l9~TY,p. 313.
15
body tense while looking at distant objects as blackboard and
charts; poor sitting position; rubbing eyes frequently; tending to
avoid close visual work and tending to lose place in reading. When
two or more of these persist, a child is more likely to need visual
attention.1
However, it must not be assumed that poor vision is generally
the chief cause of poor reading. Cases of near-sightedness, far
sightedness, astigmatism, muscular imbalance, and lack of fusion
are found among both good and poor readers. Nevertheless, in both
groups such conditions tend to result in fatigue and consequent loss
in reading ability. Quite probably nearly all readers who have
visual defects would improve in reading ability if their defects
were corrected.
Since most reading involves near-point vision, it is impor
tant for the teacher to recognize the differences between far-point
and near-point vision. A child whose vision tests normal when
looking at a distant object but who has great difficulty in seeing an
object singly and clearly at a distance of fourteen inches or less
is in need of attention. In such cases glasses or visual reduction
or both are needed.2
Auditory acuity may be an important factor in regarding read
ing readiness because the child first learns to attach meaning to
lGuy Bond and Miles A. Tinker, Reading Difficulties(Appleton-Century Crofts, Inc., 1962), pp. 91-92.
2Bond and Tinker, op. cit., p. 29.
16
printed symbols through the medium of spoken language. Since learning
to read under most methods depend to a degree upon speech, any ap
preciable speech retardation due to hearing impai±’ment may become
a contributing factor in reading disability. Hearing impairment
often leads to emotional maladjustment which may become tragic in its
effect upon a child’s personality.1
The alert teacher will note signs of hearing difficulty in
a child’s behavior. Hearing impairment may be suspected if a child
is inattentive and frequently asks to have statements repeated or
misunderstands simple directions. Other signs include reports of
ringing and buzzing in the head, tilting of the head, turning one
ear toward the speaker, cupping a hand behind the ear, sitting with
a blank expression on face, scowling plus strained posture in listen
ing, and turning radio or phonograph on unusually loud.
How seriously a hearing defect interferes with learning to
read depends in part on certain accidental factors such as the po
sition in the seating arrangement in the classroom, the tone of and
clarity of the teacher’s voice, and also upon the form of instruction
employed in the reading program. A child may be hard of hearing be
cause of some infection or other disease which proper medical treat
ment could remedy. Only a physician can discover the cause and give
the proper treatment.
1lbid.
17
Description of language factors. -- The teacher
should help the child with deficient hearing in every possi~le ad
vantage. She should change his seating position and give individual
or special attention in correction with oral work. There should be
unusual amounts of self-aids of a printed or visible sort and modi
fy to some extent word recognition and other phases of reading.
One of the objectives of first grade programs, before and
after reading instruction is begun, is to help the pupil express him
self well orally. The child who is unable to talk in short, simple
sentences is unable to anticipate the meaning of a sentence. Speech
is most important in the reading skills.
The following principles should govern the procedures for
promoting good speech development.
1. Most speech improvement comes about through informalclassroom activities.
2. Provision should be made for a large number of enrichingexperiences that give opportunity for improved oral expression.
3. Attention should be given to enunciation and pronunciation, adequate speaking vocabulary and aninterest in speaking with or to others.
4. Pupils who need help in speech should be given opportunity for special practice.
5. The teacher’s own speech habits should be a suitablemodel for the children.
6. The teacher should not do all the talking.
7. The atmosphere of the classroom should encouragechildren to converse freely at appropriate times.1
lMartha Dallmann and John Deboer, The Teaching of Readi~q(New York: Holt, Rinehart and ~.finston, Inc., 1960), pp. 61-62.
18
Certain defects in speech require the attention of a speech
specialist — cases of stuttering, cleft-palate speech, spastic speech,
aphonia, persistent hoarseness, and mutism, as well as the speech
accompanying hearing defects. The teacher cannot hope to diagnose
these difficulties properly, but it is important for her to identify
them and to distinguish them from less serious defects. The more
common speech faults can be recognized by the teacher and most of
them treated by her. Lisping and most forms of defective articu
lation, omission, transposition, and substitution of sounds; indi
stinct speech; foreign accent; stuttering; and various vocal diffi
culties, such as the nasal and denasal, the monotonous and high-pitched
voice, the teacher should learn to recognize these. Before remedial
work in speech is undertaken, it is important that the speech defect
or speech fault be carefully diagnosed. It would be wise for the
teacher to give a speech test at intervals during the year.
Description of personal adjustment factors. -- Gates states
that success in reading depends in no small measure upon the kind of
mental and emotional adjustment the pupil makes to the learning situ
ation. The pupil who desires to learn to read, whose emotional ad
justment is favorable — who finds satisfaction in his reading achieve
ments, and who realizes the importance of reading in his daily life
is more likely to read than one of similar equipment whose adjustment
is less favorable.
Inability to read may itself create emotional problems. There
are three principal ways of accounting for relationship between emotional
19
difficulties and reading problems.
1. In some cases unfavorable conditions produce readingfailure and consequent emotional problems.
2. The second situation is one in which emotional factorsmay lead to reading failure.
3. Reading disability and emotional problems usually havea reciprocal relation.’
Personality is a dynamic unity that embraces both emotional
factors and reading performance. The individual’s response to the
printed page is conditioned by his self-concept and by various other
aspects of his personality. Among the personality characteristics
that have been observed in reading cases are anxiety, fear, tension,
withdrawal of effort, lack of sustained attention, antagonism to
school, compensatory interests and general lack of emotional and
social responsiveness.2
Everything that is known about environmental forces in
personality development points to the assumption that the individual
who is emotionally capable of utilizing critical-mindedness and
reasonable judgment in attacking problems will have these powers
developed and made more effective by years of practice in situations
which may require them.3
1Arthur I. Gates, The Improvement of Reading (New York:Macmillan Company, 1954), p. 110.
2Ruth Strano, Constance McCullough and Arthur Traxier, TheImprovement of Readin~ (New York: McGraw Hill Book Company, l9~TY,p. 64.
3Lillian M. Logan and Virgil G. Logan, Teaching the ElementarySchool Child (Boston: Houghtori Miff lin Company, 1962), p. 194.
20
Each stage of development brings with it not only new prob
lems but new dangers, new anxieties, and new challenges. How the
child relates himself and his needs and drives to the world of
people, processes, and things determines the health of his emerg
ing personality. Growing up in society is not a simple matter.
Neither is developing a healthy personality. The child’s thoughts,
perceptions, actions and behavior differ from those of the mature
individual. As the child develops, he must learn to maintain a
fine balance between the organismic demands, the emerging self, and
the demands of society. By doing this he resolves the conflicts
that arise, he develops personality by building new strengths and
adding new components.1
The development of personality is subject to certain inner
laws, just as the biological organism develops according to a plan,
the various parts arising at a proper time until they are all func
tioning as an entirety. In the first grade the child needs to develop
a healthy personality. By this time the child should have gone a
long way toward developing self-reliance or adequacy.
Description of social adjustment factors. -- Aiding the
pupils in social adjustment is the chief task of the first grade and
an important function of any public school. It involves achievement
of the kinds of social skills which enable one to be liked by a wide
range of persons, to like them in turn, to mingle easily with them,
i-Ibid..
21
and to work smoothly with them. The primary goal of adjustment is
effective reworking of both one’s environment and one’s self so as
to achieve goals which are regarded as important.1
A certain amount of strain in the adjustment-b school is
inevitable for most children. The problem of the first grade child
is to cope with both home and school pressures. The expectations
of cultures the long school day, the physiological instability of
this age require that the first grade teacher be relaxed, friendly,
interested, and willing to give attention to six-year-old feelings,
comments, questions, drawings, paintings, stories, and problems —
and not of one child but of thirty. Flexibility and creativity
must be the keynote for the curriculum.2
All children have problems. They try to find ways to
satisfy their needs but for various reasons may be unsuccessful.
When the pattern of non-success becomes established they resort to
other means of satisfaction, or they withdraw from these symptoms
of behavior as lying, cheating, stealing and withdrawing or day
dreaming. It is important that the teacher be alert to all types
of behavior indicative of unsatisfied needs. He must try to dis
courage whatever causes the lack of satisfaction.
‘Morris L. Bigg and Maurice P. Hunt, Psychological Foundationsof Education. ~New York: Harper and Row Company, 1962), pp. 86-87.
2G. Orville Johnson, Education for the Slow Learners. (NewJersey: Prentice—Hall, Inc., 1963), p. 308.
22
Since behavior of a social nature is also learned, the
causes for observed behavioral differences can be explained for
slow learners on the same basis as for normal children. The major
deviation of both is in their general cultural and socio-eCOflOmic
background. Most slow learners come from deprived homes where they
receive relatively little psycho-social stimulation of a desirable
nature as compared to most children. Evidence indicates the environ
mental stimulation is inadequate both qualitatively and quantitative
ly. Many of them quite possibly would be able to operate at higher
intellectual levels if early stimulations were provided.1
Description of socio-economiC fact~~. -— Cultural con
ditions in the home may also be related to reading development. The
educational and professional status of the parents, the number of
books owned by the student and by his family contribute greatly to
the reading development of the learner. Many personal, social and
cultural factors combine to create a predisposition to reading in a
certain manner, critically, accurately, selectively, or otherwise.
Conditions in the home have an important effect upon a
child’s personality adjustment before he goes to school and during
the school years. A child is fortunate if the home environment pro
vides love, understanding, an opportunity to develop individuality,
and a feeling of security. On the other hand, a number of unfortunate
home conditions may bring about emotional maladjustment in the child.
Quarreling parents, broken homes, neglect of the child, overprotection
1lbid.
23
or domination or anxiety on the part of parents and unhealthy rivalry
among children in the family are likely to produce nervous tension
and develop feelings of insecurity.1
Any one or a combination of socio-economic factors may result
in unfortunate personality adjustment in the child. In general, the
gratifications achieved through reading may provide the child a way
of escape from trying environmental pressures. Unfavorable home con
ditions hinder rather than help reading progress.
Description of intellectual factors. —— Reading
achievement tends to be related to intelligence at all academic levels.
To a certain degree, less than normal intelligence places a limit on
attainment in learning to read. Even though dull children may become
reading disability cases, they can be taught to read up to the level
indicated by their mental capacity. Intelligence seems to play a
role in how well a pupil continues to gain in reading ability after
a short period of intensive clinical training.2
Some intellectual factors are brought about by training
and experience. From experimental data available, the single factor
which most accurately determines readiness to read is that of mental
age. When we find that a child has mental age for reading readiness,
that fact alone does not insure reading success as has been found by
various experiments done in this field. It is safe to state that a
a-Guy L. Bond and Miles A. Tinker, Reading Difficulties (NewYork: Appleton-Century Crofts, Inc., l96l~~p. 109.
____ p. 115.
24
mental age of at least six years must be reached before success will
be probable and we can be more certain if the child’s mental age is
six years and six months.1
Intellectual maturity plays a part in determining reading
readiness. The fact that there seems to be no specific mental age
that can be used as a determining factor in deciding when to start
beginning reading activities does not mean that pressure to learn to
read can safely be put indiscriminately on all first-graders. Other
things being equal, which they seldom are in situations involving
pupils, children with high I.Q.’s are more likely to learn rapidly
than children with low I.Q.’s. Correlations of scores on intelligence
tests with measures of reading progress tend to fall between .35 and
.65. Furthermore, certain pre-reading skills are closely related to
general intellectual ability.2
Description of reading readiness. —— In the average
first grade, the children’s attitudes toward learning to read may
range from disinclination to indifference and to anticipation. There
are many other respects, in first-grade children reveal great differ
ences. They differ in mental, physical, social, emotional, and
other educational or psychological factors which are discussed in
the preceding paragraphs. To determine when and how to begin syste
1M. Lucile Harrison, Reading Readiness (New York: Rivers dePress, 1960), p. 60.
2Margaret G. McKim and Helen Caskey, Guiding Growth inReading (New York: Macmillan Company, 1963), pp. 37-38.
25
matic work in reading, the teacher needs to know to what extent each
pupil possesses the essential elements. No one element of reading
readiness alone should be considered in determining when systematic
instruction in reading should begin. Children lacking in one readi
ness factor may possess others that will justify teaching them to
read.
Some pre-requisites for reading are common to all learning.
Among four which are most essential are: (1) an eagerness to be
independent rather than spoon-fed and coddled; (2) an unquenchable
zest to explore the new in the big, widening world about him; (3)
the courage to try himself out at new skills and to take success
and some defeats; (4) the enjoyment of being with others and learn
ing from them.1
iV~ch is made of waiting for ~life” to develop readiness
naturally. Some children are not well adjusted enough socially
and emotionally to succeed in reading. The reading teacher should
realize that it is not enough to know the factors that promote or
prohibit adequate reading performance. She must examine the composite
of factors and on the basis of them must identify each pupil’s spe
cific readiness for reading.
The reading programr~t be individualized for each pupil.
The child who is unhappy, who has poor relationship with his peers,
family, other adults and who lacks confidence in himself has a diffi-~
‘Roma Gans, Common Sense in Teaching Readinq (New York:Bobbs Merrill Company, Inc., 1963), p. 20.
26
cult time learning to read. These children must be identified and
helped in order to adjust to the necessary preliminaries in learning
to read.
Intelligence tests could be used by the teacher along with
systematic observations in order to determine when the child is
physically, mentally, emotionally and socially mature enough for
beginning reading,
McKim and Caskey state that the reading readiness test
should be chosen to meet the needs of a particular situation. They
are not essential fo an effective reading program but can be of value
in providing additional evidence against which a teacher can check
her judgment of the probable success of individuals and groups.
Therefore, the t~ype of test and the time at which the test is given
should both be planned with the needs of the teacher in mind.
Three main types of readiness tests are available, the first
of which is the Metropolitan Readiness Test. It is a test of edu
cational readiness that explores broadly the skills needed for
first—grade activities. The second type of readiness test measures
pre—reading skills specifically on the Gates Reading Readiness Tests
and the Lee—Clark Reading Readiness Test. The third test consists
of reading readiness material found in many of the present-day series
of basal readers. They are designed to measure specifically the childts
ability to progress into the beginning - reading materials to given
series. 1
a-Margaret G. McKim and Helen Caskey, Guiding Growth inReading (New York: The Macmillan Company, 1963), pp. 49-50.
27
The authors further state that the test should be given at a
time that will provide the most help in planning pre-reading experi
ences. After reading readiness tests are administered and results
recorded, the teacher can go further in determining to what extent
developmental factors influence reading-readiness abilities. She
can observe the ~hildren who lack reading for readiness in terms of
their language development and background experience. These pupils
should have a prolonged readiness program in school. These experi
ences should include:
1. Listening to stories read or told by the teacher.
2. Taking field trips to parks, farms, zoos, dairies,airports, fire stations and other points of ihterest.
3. Using and listening to tape.:recorders and listeningstations.
4. Hearing records.
5. Seeing movies and filmstrips.1
The concept of reading readiness is widely accepted as the
first level of development in reading. The readiness period isan
actual stage of growth and preparation for the complex task of inter
preting printed symbols and includes all the reading development that
precedes actual reading from a book. Readiness for reading involves
within a child a combination of certain stages of physical, emotional,
social, and mental maturity with certain understandings, skills,
purposes, attitudes, and information.
‘Warren C. Cutts, “Readiness Unreadiness in the Underprivileged,”NEA Journal, LII (April, 1963), p. 23.
28
Readiness can be determined when the child shows the follow
ing developments:
1. The eyes should be developed to the point where thechild is able to see well and focus exactly.
2. The ears should be developed to the point where thechild can hear distinctly, and can relate certainsounds to symbols or understandings.
3. The child should be able to speak correctly andaccurately. His vocabulary has reached approximately2,500 words and is constantly being enriched. Thelanguage facility is of great importance in readingreadiness.
4. The child who is ready to read is socially a relativelyhappy child. He is successful much of the time in hismanipulative efforts, and demonstrates emotional security in his relationship with others.
5. The mental development of the child who is ready toread indicates that he has a good understanding anduse of concepts and word meanings, and the abilityto organize and classify ideas.
6. To begin to learn to read, the child should have anadequate background of experience.
7. Finally, the child who is ready to read must have areal interest in learning to read.’
It is important that all the personnel of a school system
have an understanding of the problems of readiness.
Elementary school educators know that many of the pupils
who are not promoted have failed because of the inability to read.
This outcome suggests that many children might have succeeded from
‘Wesley G. Sowards and Mary Scobey, The Changing Curriculumand the Elementary Teacher, (San Francisco: Wadsworth PublishingCompany, Inc., 1961), pp. 229-230.
29
the beginning had their instruction been as well adjusted to their
needs as the remedial teaching.1
Educational psychologists list these significant principles
of readiness:
1. Children generally become ready for specific learningtasks at different ages.
2. The child develops skills most readily if they arebuilt upon the natural foundation of maturationaldevelopment.
3. Children should net be forced into readiness trainingbefore maturational development is adequate.
4. Generally, the more mature the child is the less training is needed to develop a given proficiency.
5. The teacher can promote the child’s readiness byproviding for gaps in his experience.2
On the basis of these principles, Harris states that,
“Without maturation the child cannot learn; without experience he
has nothing to learn.” Readiness programs are not useless. Children
need appropriate environmental stimulation if maturational develop
ment is to progress at an appropriate rate. In many instances, the
child benefits greatly from readiness experiences. The teacher can
not overemphasize either maturation or experience learning.
Too much emphasis on maturation may lead to useless post
poning of wh~it could be learned; too much emphasis on learning or
1Lillian Orme, “Building Reading in First Grade ChildrenThrough Special Instruction,” Reading on Reading Instructions, Thirty-fourth Yearbook of the National Elementary Principal, XXXV (New York:David McKay Company, September, 1955), p. 83.
2Emerald V. Dechant, Improving the Teaching of Reading (NewJersey: Prentice Hall, Inc., 1964), pp. 127-129.
30
experiences may lead to futile attempts at teaching that for which
the child is riot ready.1
The teacher can determine when children are physically,
mentally, emotionally and socially mature enough for beginning
reading by using intelligence tests, reading and readiness tests
and by systematic observations. These observations should be re
corded on readiness inventories, a good means for identifying who
is ready for reading.
Description of research findings. -- Smith and
Dechant indicate that scores on reading readiness tests are not
completely accurate predictors of reading achievement. Perhaps their
greatest value is in the diagnosis of the pupil’s deficiencies. They
further indicate areas of strength and weakness arid help the teacher
in making adequate provisions for individual needs.2
Kottmeyer states that the use of readiness tests to determine
the child’s readiness to read is highly warranted. However, tests
alone are not always highly reliable in predicting a child’s success
in learning to read; when coupled with teacher judgment they are
highly useful. He also found that neither teacher judgment alone nor
tests were as useful as the two used together.3
‘Albert J. Harris, Effective Teaching of Reading (New York:David McKay Company, Inc., 1962), p. 3.
2Henry P. Smith and Emerald V. Dechant, Psychology in TeachingReading (New Jersey: Prentice Hall, Inc., 1961), pp. 416—419.
3william Kottmeyer and Others, “Reading Readiness in St. LouisPublic Schools,” The St. Louis Schools Journal, I (April, 1961), p. 24.
31
One study made in St. Louis showed more than a third of
the 4,000 pupils tested as unready for systematic reading instruc
tions at the outset of the school term.’
As a result of the study of school provisions for beginners
in California, Russell and Hill concluded that 30 percent of the
children needed to be in smaller classes and required more indi
vidual attention if they were to achieve satisfactory growth in
the first grade.2
At all times the reading program in the first grade should
be planned for the continued development of the skills necessary
for reading progress. If this is done properly by presenting a
varied and rich reading readiness prograrr~ the first grade teacher
is assured of guiding a maximum number of pupils to success in read
ing. Success in learning depends greatly upon the stage of all-
around development which the child achieved. Reading disability
is frequently caused by starting a child in a standard reading
program before he has acquired the necessary readiness which will
assure success in the reading program.3
~-Nila P. Smith, “Readiness for Reading and Related LanguageArts,” Research Bulletin of the National Conference on Research inEnglish (April, 1950), p. 5.
2David Russell and Ruby L. Hill, “Provisions for ImmatureFive and Six-Year Olds in California Schools,” California Journalof Elementary Education, XVII (May, 1948), p. 220.
3Guy L. Bond and Miles A. Tinker, Reading Difficulties(New York: Appleton-Century Crofts, Inc., 1961), p. 115.
32
Ma:r~y C. Petty found in her study, (“An Experimental Study
of Certain Factors Influencing Reading Readiness”), that variations
in home conditions, or the existence of social, health, disciplinary,
or personality problems might outweigh the influence of certain other
factors that correlate highly in general with success in learning
to read.1
Studies, conducted at Atlanta University during the past
years, concerning reading readiness have brought out interesting and
revealing findings. Some of the findings that the writer found
interesting to her study are viewed in the following paragraphs.
Hoover found in her study of reading readiness, using fifty—
two children from Spelman College Nursery School, that reading readi
ness to a marked degree is influenced to the extent to which children
are accelerated in mental age.2
Wall made the following reference to the significant impor
tance of developmental factors which influence reading readiness
factors among first grade pupils, despite the quantity of experimental
and developmental data, the wealth of ingenious teaching devices.
The range of interesting children’s material that the readiness pro—
gram is uneven and the extent of readiness is depepdent upon factors
~l~arcy C. Petty, “An Experimental Study of Certain FactorsInfluencing Reading Readiness,” Journal of Educational Psycholoqy,XXX (June, 1939).
2Annele Hoover, “A Study of Reading Readiness in Fifty-twoChildren of Spelman College Nursery School,” Atlanta, Georgia,(unpublished master’s thesis, School of Education, Atlanta University,1943).
33
which may require additional activities or extended experiences.
She also found that no one factor can determine the extent of read
ing readiness. Teachers should take under advisement the use of
teachers’ ratings as a method of predicting readiness for reading
along with the standardized instruments.’
In making a study on the “Predictive Validity of Two Methods
of Determining Reading Readiness,” Thurman concluded that more time
should be given to determine the reading readiness of the first
grade child. She also stated that further study should be made to
determine the extent of experiences needed for pupils in the com
munity who are below average. She suggested that further studies
be made to determine where improved pre-school activities are needed
to heighten readiness and beginning reading success.2
The writer believes that provisions of interesting experiences
during the readiness period in bridging the gap for not only providing
children with content of what to say, but she hopes that it will build
the vocabulary with which to say it.
Summary of Pertinent Points fromthe Review of Related Literature
The many studies just reviewed have attempted to enumerate
the various capacities and function upon which learning to read
‘Ruth Lyles Wall, “Analysis of Some Developmental FactorsInfluencing Reading Readiness P~ong First Grade Pupils,’1 1961-1963,(unpublished master’s thesis, School of Education, Atlanta University,1953).
2Margaret Morton Thurman, “The Predictive Validity of TwoMethods of Determining Readiness for Reading,” (unpublished master’sthesis, School of Education, Atlanta University, 1963).
34
de~~en~s. The authorities agreed that a pupil’s general intelligence,
his language aptitude, his vision and hearing, his general health
and vigor, his emotional balance, and various other fundamental
characteristics affect his ability to learn to read at every stage,
from the first lesson to adult life. Retardation or serious defici
encies in any one of these components of a pupil’s equipment may
seriously interfere with his progress in reading and may limit the
level of attainments in reading ability.
Finally, authorities all agreed on the following obs~r
vations:
1. Reading disabilities result from failure to identifyall possible handicaps and to arrange instruction insuch a way that they are directly or indirectly surmounted. The causes of reading disability are rriany;they are not caused by any one single factor, but acombination of factors may be involved; the remedieslie in improved, especially highly individualized,instruction.
2. The child is seldom out of sight of printed materialschallenging him to read. There are many situationsin which he must read to protect himself from dangeror destruction. Few, if any, vocations are open tothe non-reader. Reading is essential to good citizenship; a child must be able to read in order to thinkthrough clearly and evaluate suffifiently.
3. When a personality adjustment is truly a cause ofthe reading difficulty, it is not e~asy to tell whethera symptom is cause, effect, or concomitant, but it isadvisable to use every reasonable means of discoveringthe role of the maladjustment. Personal factors interfere with satisfactory reading growth or the inabilityto make adequate gains caused by dissatisfaction.
4. Social adjustment and socio—economic factors were foundto be contributing factors in reading readiness ability.The pupil who recognizes desirable social standards isthe one who has come to understand the rights of others
35
and~ who appreciates the necessity of subordinatingcertain desires to the needs of the group. Withoutthis kind of social adjustment, the pupil may developmental adjustment which may produce emotional resistanceto learning to read. The pupil who exhibits desirablefamily relationships is the one who feels that heisloved and well-treated as home, and who has a sense ofsecurity and self respect in connection with the variousmembers of his family. On the other hand, a number ofunfortunate home conditions may bring about emotionalmaladjustment in the child.
5. Auditory acuity may be an important factor in regardingreading readiness because the pupil first learns toattach meaning to printed symbols through the mediumof spoken language. Hearing impairment often l~adstoemotional maladjustment which may become tragic in itseffect upon a child’s personality. Poor vision orhearing, physical disabilities, and unfavorable environmental conditions are also contributing factors in reaching readiness abilities.
6. Cultural conditions in the home were found to be relatedto reading development. The educational and professionalstatus of the parents, the number of books owned by thepupil and his family contribute greatly to the readingreadiness abilities.
Finally, the authorities all agreed that there can be little
doubt that other things being equal, the wider and richer a child’s
experiences and greater his range of information, the better he is
equipped to learn to read.
CHAPTER II
PRESENTATION AND ANALYSIS OF DATA
Introductory Statement
Data recorded in this section of the thesis provide infor
mation of a comparative nature which fulfills the objective of
comparing the extent, if any, to which certain factors relate to
the reading readiness abilities of two groups of first grade pupils
with above-average and below-average performances. These are pre
sented in such a manner as to answer questions relative to the
hypothesis as posed in the statement of the problem.
Information is provided in the description of the pupils’
performances on the Ci) Metropolitan Reading Readiness Tests used
as a basis for determining the reliability of reading readiness,
(2) the Kuhlmann—Anderson Test which was used as a basis for de
termining the reliability of the intelligence quotient in predicting
readiness for reading, (3) the California Test of Personality was
used as a basis for identifying and revealing the status of certain
highly important factors in personality and social adjustment in
predicting readiness for reading of the two groups, (4) question
naires from parents and pupils were recorded to provide data about
socio—economic factors in predicting readiness for reading. These
data were treated with respect to the purposes of the study. The
main statistical measures were the mean, the standard error of the
mean, standard deviation, standard error of the difference between
36
37
the means, the “t11 ratio for measuring significance of differences,
Pearson Product Moment Coefficient of Correlation, and “z” for
purposes of comparing differences between correlations. In other
instances certain factors were treated by means of percentages and
observation for evidence of comparisons and relationships.
The subjects for this study were chosen during the school
year, 1965-1966. The first grade of Southside Elementary ‘School,
Troy, Alabama was chosen for the study.
The Metropolitan Reading Readiness Tests, forms “R” and
“5”, were administered. The Kuhlmann-Anderson Intelligence Test was
administered in April and May 1966, and the California Test of
Personality was administered in April and May 1966.
Health data were gathered from school records. Vision and
hearing tests results were recorded for the two groups of subjects
studied. Questionnaires were used to gather information concerning
social adjustment and emotional stability and to gain insight into
the general background of the family, education, travel, pupils’
interest, reading materials, mass media found in the home, and the
attitude of parents toward education.
Results of Performances on theMetropolitan Reading Readiness Test
The data on the Metropolitan Reading: ‘Readiness Test obtained
by sixteen above-average and sixteen below-average pupils in the
Southside Ele~nentary School, Troy, Alabama, 1965-1966, (September
38
1965) presented in Table 1, page 39 and are analyzed and interpreted
in the separate paragraphs below.
Above-average pupils. -- For the sixteen above-average pupils,
the scores ranged from a low of 53 to a high of 61, with a mean of
57.0. The standard deviation was 2.3, and the standard error of
the mean was .575. There was one pupil who scored “superior”, eleven
scored ~high normal”, and four: Scored “average.”
Below-average pupils. -- For the sixteen below—average pupils
the scores ranged from a low of 19 to a high of 46, with a mean of
37.25. The standard deviation was 2.1, with a standard error of the
mean of .568. There were ten pupils who scored “1ow-norma1~ and
six scored “poor-risk.”
The “t” ratio of comparative data. —- Table 2 shows the scores
for the difference between the two groups as follows: The mean was
57.0 and 37.25 for the above-average and below-average groups, re
spectively. The difference between the two means was 19.75 with a
standard error of 1.09. This indicated a “t” of 2.5 which was more
than 2.04 at the (.05) percent level of confidence with 30 degrees
of freedom. Therefore, the difference in reading readiness test of
performances between the above-average pupils and the below-average
pupils was significant.
Interpretation. -- A sumary of the data analyzed and com
pared above would appear to indicate that the Reading Readiness status
obtained by the above-average pupils was much higher than the Reading
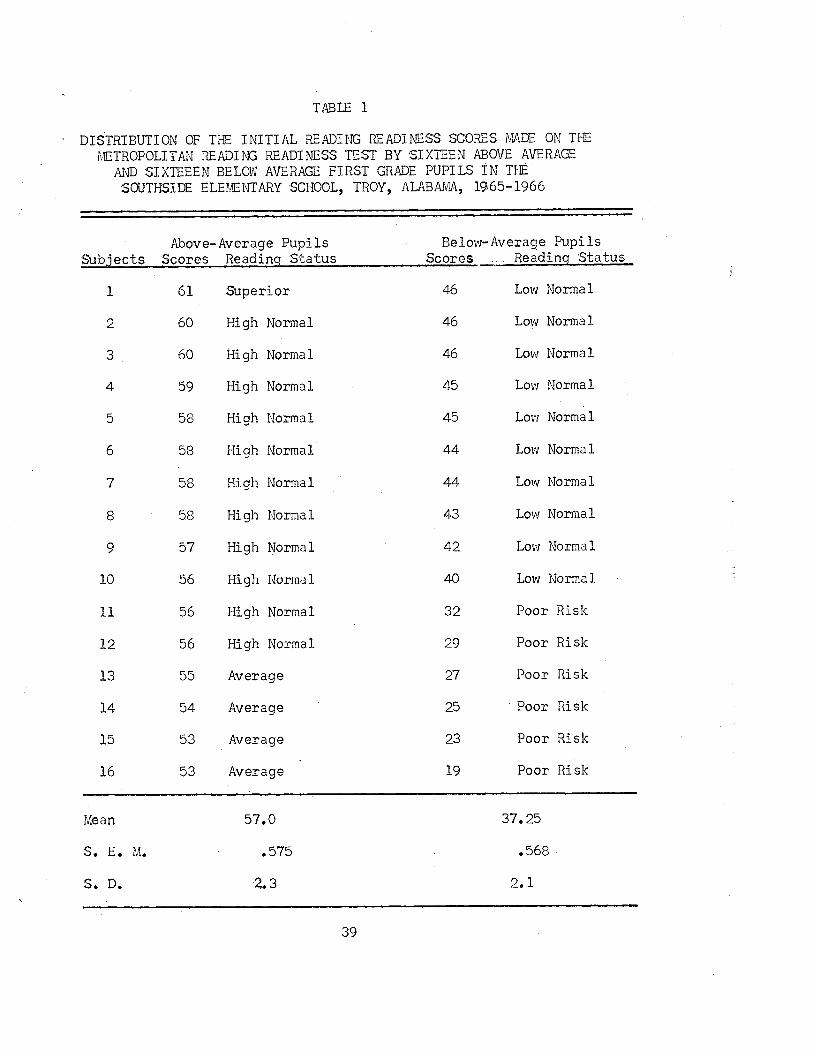
TABLE 1
DISTRIBUTION OF THE INITIAL READING READINESS SCORES MADE ON THEMETROPOLITAN READING READINESS TEST BY SIXTEEN ABOVE AVERAGE
AND SIXTEEEN BELOW AVERAGE FIRST GRADE PUPILS IN THESOUTHSIDE ELEMENTARY SCHOOL, TROY, ALABAMA, 1965-1966
. Above-Average Pupils Below-Average PupilsSubjects Scores Reading Status Scores~ Reading Status
1 61 Superior 46 Low Normal
2 60 High Normal 46 Low Normal
3 60 High Normal 46 Low Normal
4 59 High Normal 45 Low Normal
5 58 High Normal 45 Low Normal
6 58 High Normal 44 Low Normal
7 58 High Normal 44 Low Normal
8 58 High Normal 43 Low Normal
9 57 High Normal 42 Low Normal
10 56 High Normal 40 Low Normal
11 56 High Normal 32 Poor Risk
12 56 High Normal 29 Poor Risk
13 55 Average 27 Poor Risk
14 54 Average 25 Poor Risk
15 53 Average 23 Poor Risk
16 53 Average 19 Poor Risk
Mean 57.0 37.25
S. E. M. .575 .568
S. D. 2.3 2.1
39
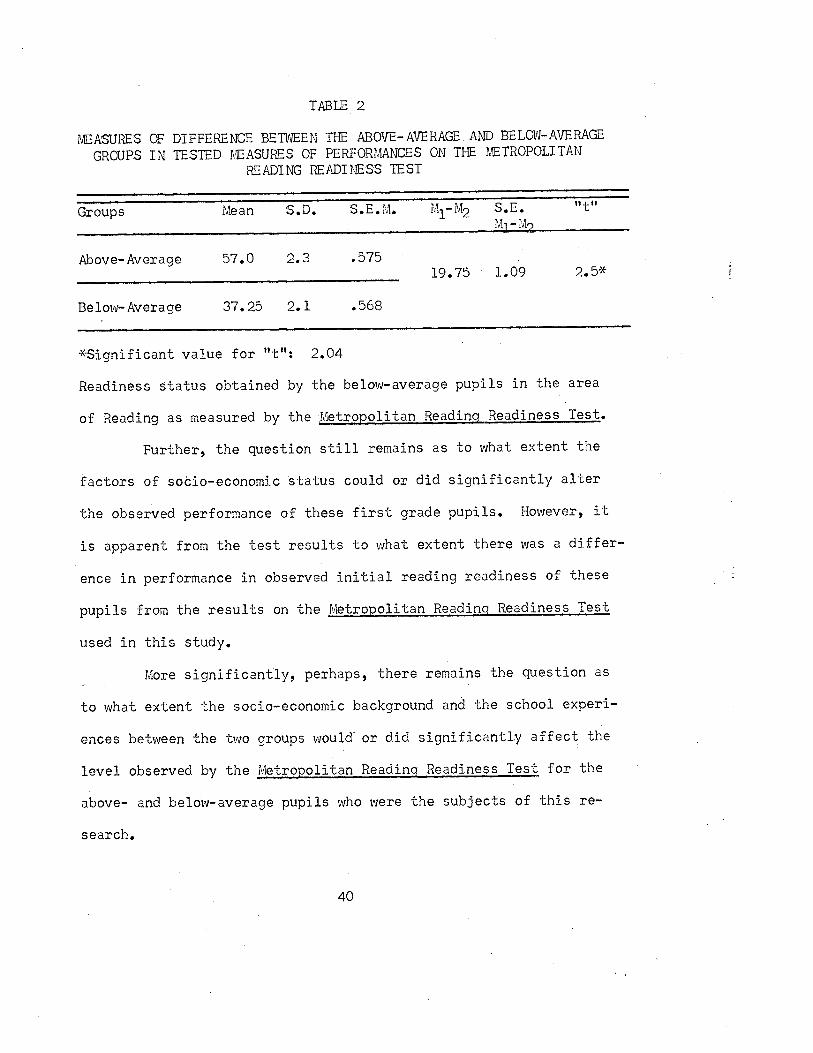
TABLE 2
MEASURES OF DIFFERENCE BETWEEN THE ABOVE-AVERAGE AND BELOW-AVERAGEGROUPS IN TESTED MEASURES OF PERFORMANCES ON THE METROPOLITAN
READING READINESS TEST
Groups Mean S.D. S.E.M. M1—M2 S~M1— M2
Above-Average 57.0 2.3 .57519.75 1.09 2.5*
Below-Average 37.25 2.1 .568
*Significant value for “t”: 2.04
Readiness status obtained by the below-average pupils in the area
of Reading as measured by the jvletropolitan Reading Readiness Test.
Further, the question still remains as to what extent the
factors of socio-economic status could or did significantly alter
the observed performance of these first grade pupils. However, it
is apparent from the test results to what extent there was a differ
ence in performance in observed initial reading readiness of these
pupils from the results on the Metropolitan Reading Readiness Test
used in this study.
- More significantly, perhaps, there remains the question as
to what extent the socio-economic background and the school experi
ences between the two groups would or did significantly affect the
level observed by the Metropolitan Reading Readiness Test for the
above— and below-average pupils who were the subjects of this re
search.
40
41
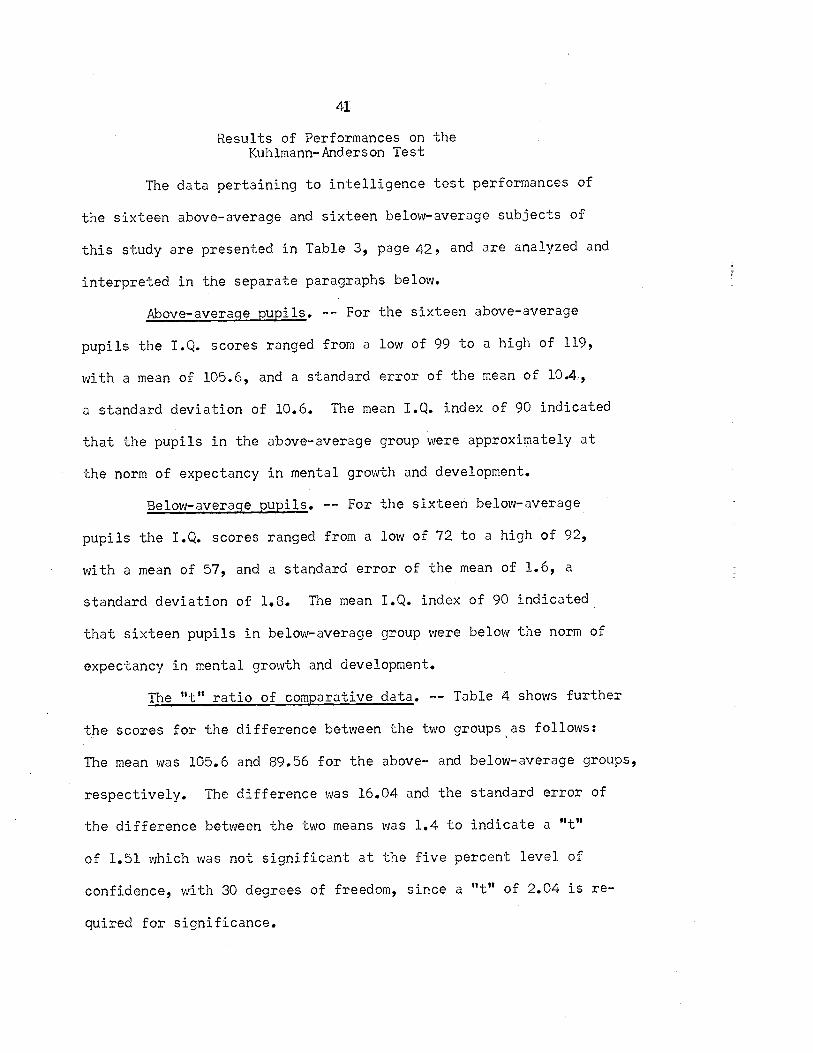
Results of Performances on theKuhlmann-Anderson Test
The data pertaining to intelligence test performances of
the sixteen above-average and sixteen below-average subjects of
this study are presented in Table 3, page 42, and are analyzed and
interpreted in the separate paragraphs below.
Above-average pupils. -- For the sixteen above-average
pupils the T.Q. scores ranged from a low of 99 to a high of 119,
with a mean of 105.6, and a standard error of the mean of 10.4,
a standard deviation of 10.6. The mean I.Q. index of 90 indicated
that the pupils in the above-average group were approximately at
the norm of expectancy in mental growth and development.
Below—average pupils. -— For the sixteen below-average
pupils the I.Q. scores ranged from a low of 72 to a high of 92,
with a mean of 57, and a standard error of the mean of 1.6, a
standard deviation of 1.8. The mean I.Q. index of 90 indicated
that sixteen pupils in below-average group were below the norm of
expectancy in mental growth and development.
The ‘it” ratio of comparative data. -- Table 4 shows further
the scores for the difference between the two groups as follows:
The mean was 105.6 and 89.56 for the above- and below-average groups,
respectively. The difference was 16.04 and the standard error of
the difference between the two means was 1.4 to indicate a “t”
of 1.51 which was not significant at the five percent level of
confidence, with 30 degrees of freedom, since a “t” of 2.04 is re
quired for significance.
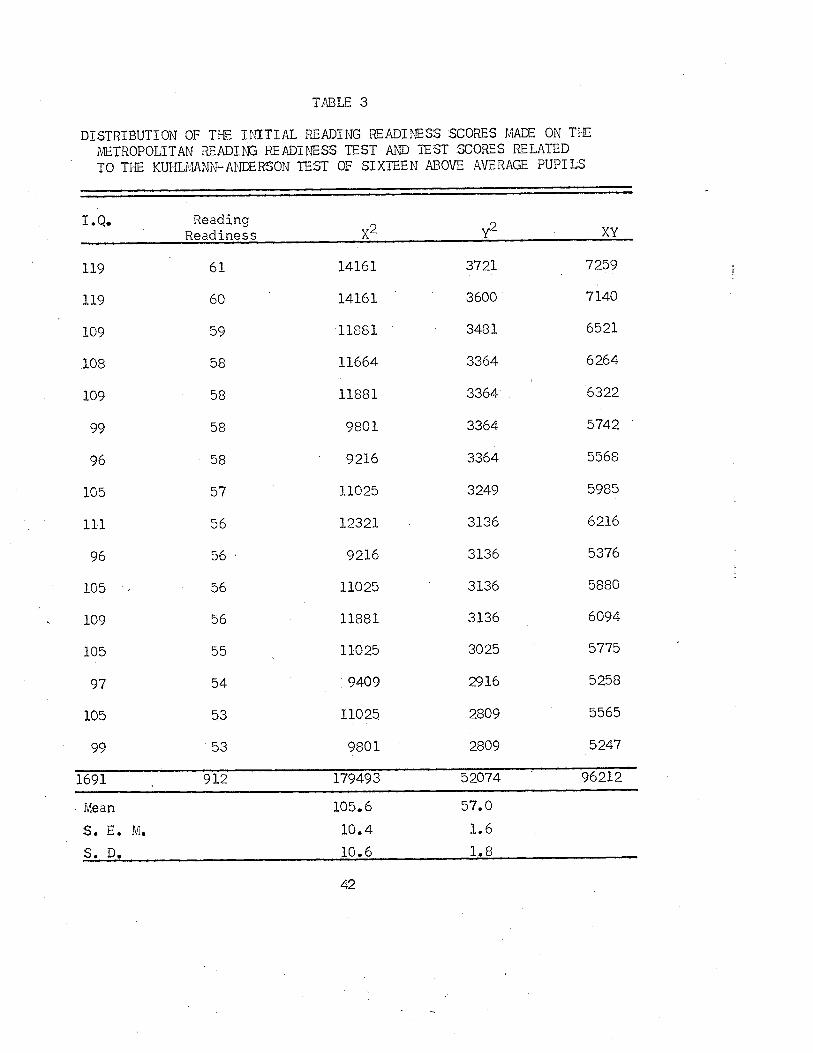
TABLE 3
DISTRIBUTION OF THE INITIAL READING READINESS SCORES MADE ON THEMETROPOLITAN READING READINESS TEST AND TEST SCORES RELATEDTO THE KUHLMANN-ANDERSON TEST OF SIXTEEN ABOVE AVERAGE PUPILS
I.Q. Reading 2Readiness X2 ‘1 XY
119 61 14161 3721 7259
119 60 14161 3600 7140
109 59 11881 3481 6521
108 58 11664 3364 6264
109 58 11881 3364 6322
99 58 9801 3364 5742
96 58 9216 3364 5568
105 57 11025 3249 5985
111 56 12321 3136 6216
96 56 9216 3136 5376
105 56 11025 3136 5880
109 56 11881 3136 6094
105 55 11025 3025 5775
97 54 9409 2916 5258
105 53 11025 2809 5565
99 53 9801 2809 5247
1691 912 179493 52074 96212
~ Mean 105.6 57.0
3. E. M. 10.4 1.6
S. D. 10.6 1.8
42
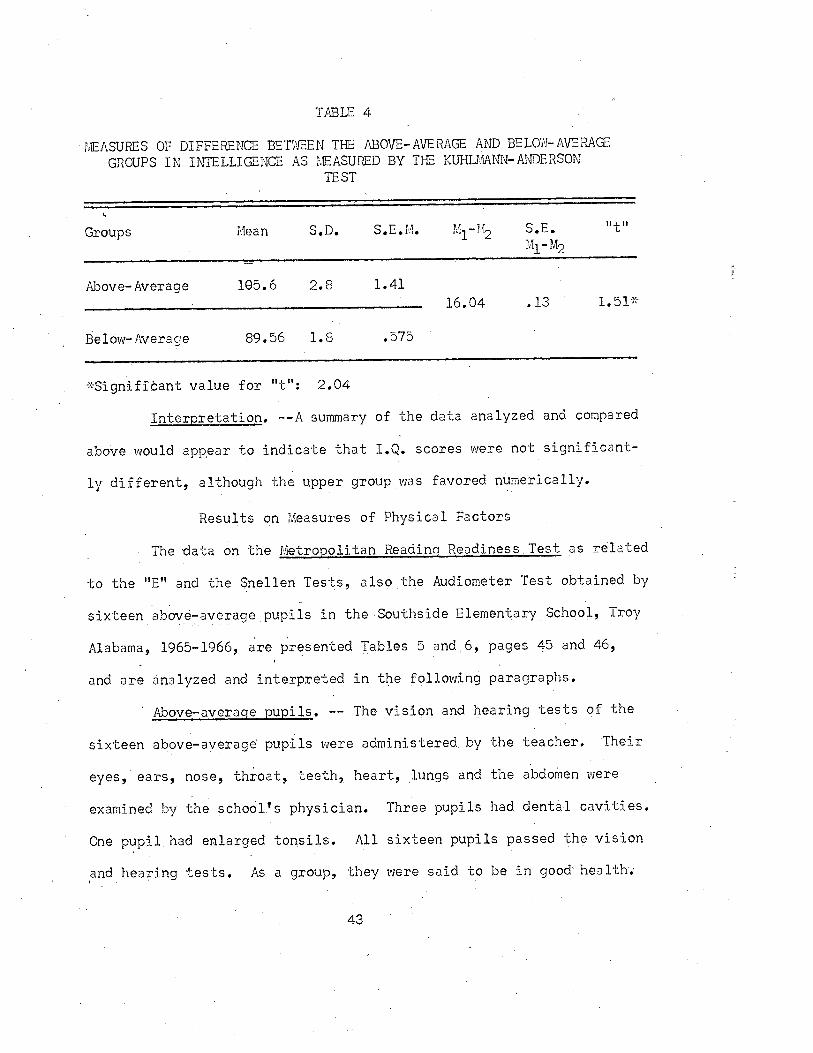
TABLE4 -
T~EASURES OF DIFFERENCE BETWEEN THE ABOVE- AVERAGE AND BELOW- AVERAGEGROUPS IN INTELLIGENOE AS ~EASURED BY THE KUHLMANN-ANDERSON
TEST
Groups Mean S.D. S.E.M. M1—M2 S.E.M1 M2
Above-Average 105.6 2.8 1.4116.04 .13 1.51*
Below-Average 89.56 1.8 .575
*Sjgnifi~ant value for “t”: 2.04
Interpretation. --A summary of the data analyzed and compared
ab&ie would appear to indicate that I.Q. scores were not significant
ly different, although the upper group was favored numerically.
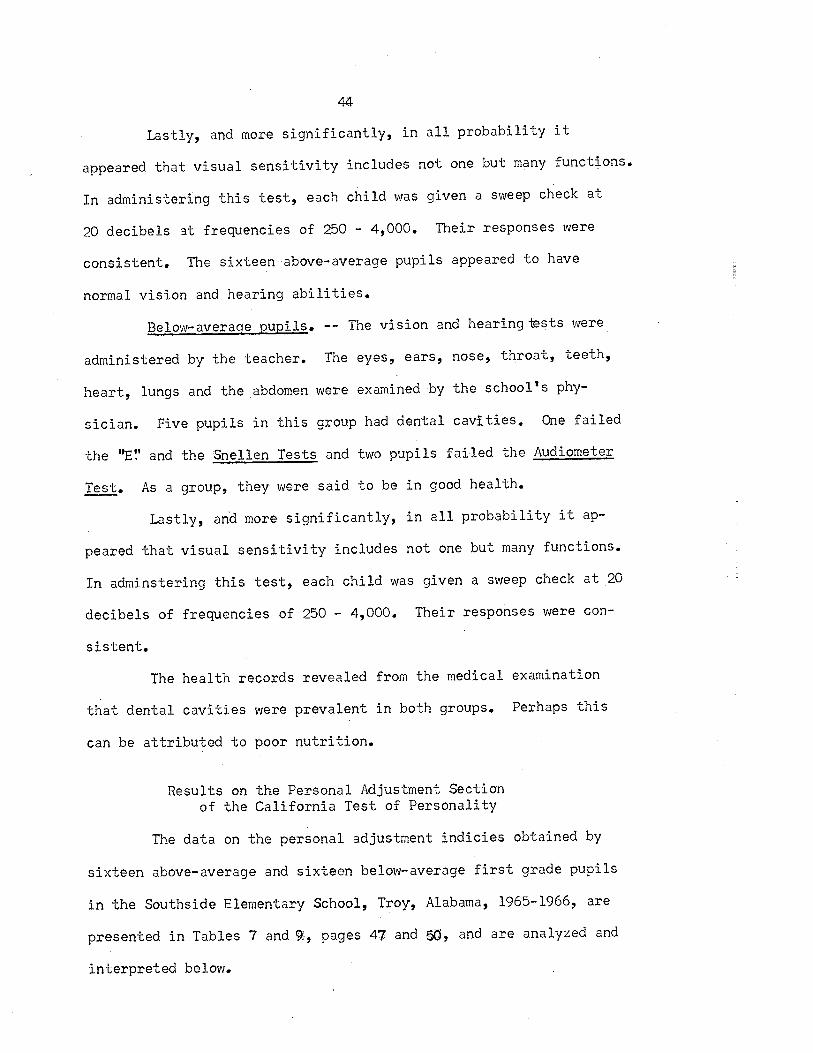
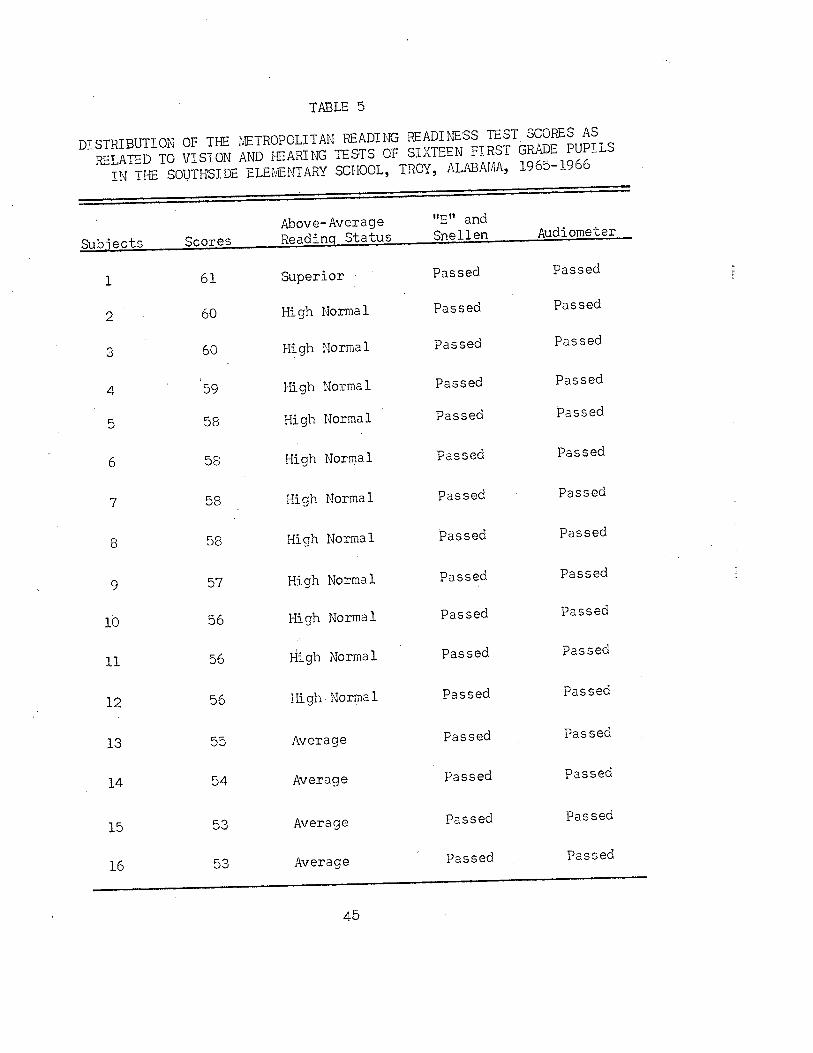
Results on Measures of Physical Factors
- The data on the Metropolitan Reading Readiness.Testas related
to the “Et’ and the Snellen Tests, also the Audiometer Test obtained by
sixteen above-average pupils in the •Southside Elementary School, Troy
Alabama, 1965—1966, are presented Tables 5 and6, pages 45 and 46,
and are analyzed and interpreted in the following paragraphs.
Above—average pupils. -- The vision and hearing tests of the
sixteen above-average pupils were administered, by the teacher. Their
eyes,’ ears, nose, throat, teeth, heart, lungs and the abdoinen were
examined by the school’s physician. Three pupils had der~t~l cavities.
One pupil had enlarged tonsils. All sixteen pupils passed the vision
and hearing tests. As a group, they were said to be in good health.
43
44
Lastly, and more significantly, in all probability it
appeared that visual sensitivity includes not one but many functions.
In administer5~ng this test, each child was given a sweep check at
20 decibels at frequencies of 250 - 4,000. Their responses were
consistent. The sixteen~ above-average pupils appeared to have
normal vision and hearing abilities.
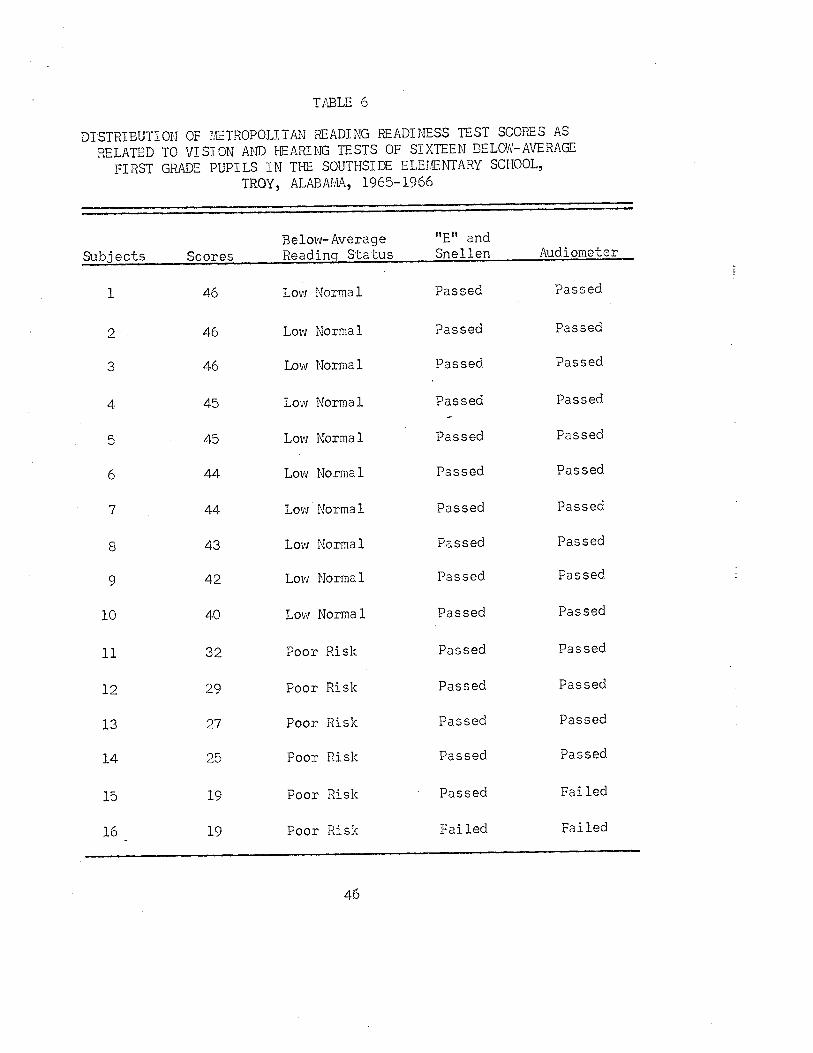
Below-average pupils. -- The vision and hearing ts were
administered by the teacher. The eyes, ears, nose, throat, teeth,
heart, lungs and the abdomen were examined by the school’s phy
sician. Five pupils in this group had dental cavities. One failed
the “B” and the Snellen Tests and two pupils failed the Audiometer
Test. As a group, they were said to be in good health.
Lastly, arid more significantly, in all probability it ap
peared that visual sensitivity includes not one but many functions.
In adminstering this test, each child was given a sweep check at 20
decibels of frequencies of 250 — 4,000. Their responses were con
sistent.
The health records revealed from the medical examination
that dental cavities were prevalent in both groups. Perhaps this
can be attributed to poor nutrition.
Results on the Personal Adjustment Sectionof the California Test of Personality
The data on the personal adjustment indicies obtained by
sixteen above—average and sixteen below-average first grade pupils
in the Southside Elementary School, Troy, Alabama, 1965-1966, are
presented in Tables 7 and 9~, pages 47 and ~, and are analyzed and
interpreted below.
TP1BLE5
DISTRIBUTION OF THE METROPOLITAN READING READINESS TEST SCORES ASRELATED TO VISION AND NEARING TESTS OF SIXTEEN FIRST GRADE PUPILS
IN THE SOUTHSIDE ELEMENTARY SCHOOL, TROY, ALADAMA, 1965-1966
Above-Average 11E” andSublects Scores Reading Status Snellen Audiometer —
1 61 Superior Passed Passed
2 60 High Normal Passed Passed
3 60 High Normal Passed Passed
4 59 High Normal Passed Passed
5 58 High Normal Passed Passed
6 58 High Normal Passed Passed
7 58 High Normal Passed Passed
8 58 High Normal Passed Passed
9 57 High Normal Passed Passed
10 56 High Normal Passed Passed
11 56 I-~igh Normal Passed Passed
12 56 1-ugh Normal Passed Passed
13 55 Average Passed Passed
14 54 Average Passed Passed
15 53 Average Passed Passed
16 53 Average Passed Passed
45
TPBLE 6
DISTRIBUTION OF METROPOLITAN READING READINESS TEST SCORES ASRELATED TO VISION AND REARING TESTS OF SIXTEEN BELOW-AVERAGE
FIRST GRADE PUPILS IN THE SOUTHSIDE ELEMENTARY SCHOOL,TROY, ALABAMA, 1965-1966
Below—Average “E11 andSubjects Scores Reading Status Snellen Audiometer
1 46 Low Normal Passed Passed
2 46 Low Normal Passed Pa.ssed
3 46 Low Normal Passed Passed
4 45 Low Normal Passed Passed
5 45 Low Normal Passed Passed
6 44 Low Normal Passed Passed
7 44 Low Normal Passed Passed
8 43 Low Normal Passed Passed
9 42 Low Normal Passed Passed
10 40 Low Normal Passed Passed
11 32 Poor Risk Passed Passed
12 29 Poor Risk Passed Passed
13 27 Poor Risk Passed Passed
14 25 Poor Risk Passed Passed
15 19 Poor Risk Passed Failed
16 19 Poor Risk Failed Failed
46
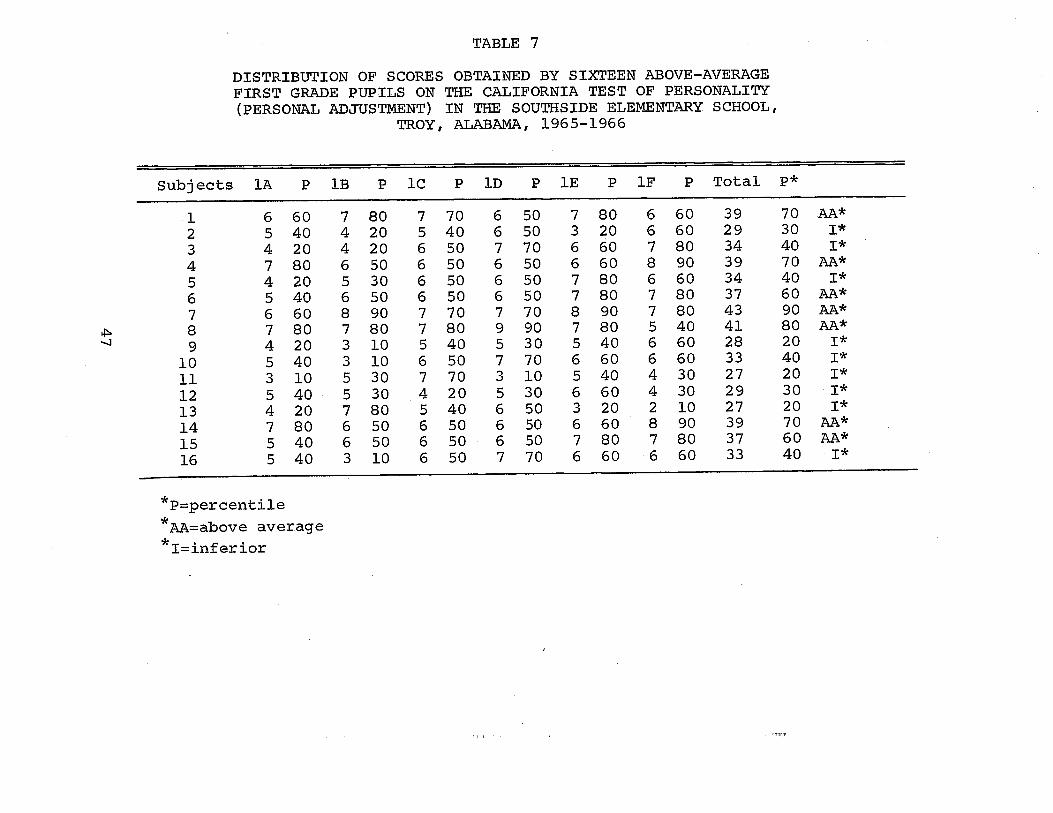
TABLE 7
DISTRIBUTION OF SCORES OBTAINED BY SIXTEEN ABOVE-AVERAGEFIRST GRADE PUPILS ON THE CALIFORNIA TEST OF PERSONALITY(PERSONAL ADJUSTMENT) IN THE SOUTHSIDE ELEMENTARY SCHOOL,
TROY, ALABAMA, 1965-1966
Subj ects
123456789
10111213141516
6 60 7 805 40 4 204 20 4 207 80 6 504 20 5 305 40 6 506 60 8 907 80 7 804 20 3 105 40 3 103 10 5 305 40 5 304 20 7 807 80 6 505 40 6 505 40 3 10
7 70 6 505 40 6 506 50 7 706 50 6 506 50 6 506 50 6 507 70 7 707 80 9 905 40 5 306 50 7 707 70 3 104 20 5 305 40 6 506 50 6 506 50 6 506 50 7 70
7 80 6 603 20 6 606 60 7 806 60 8 907 80 6 607 80 7 808 90 7 807 80 5 405 40 6 606 60 6 605 40 4 306 60 4 303 20 2 106 60 8 907 80 7 806 60 6 60
70 AA*30 1*40 1*70 ~*
40 1*60 AA*90 AA*80 AA*20 1*40 1*20 1*30 ~I*20 1*70 AA*60 i~a~*40 1*
*P_percentile
*~A above average
1A P lB P 1C P 1D P 1E P iF P Total P~
-.1
39293439343743412833272927393733
*Iifi
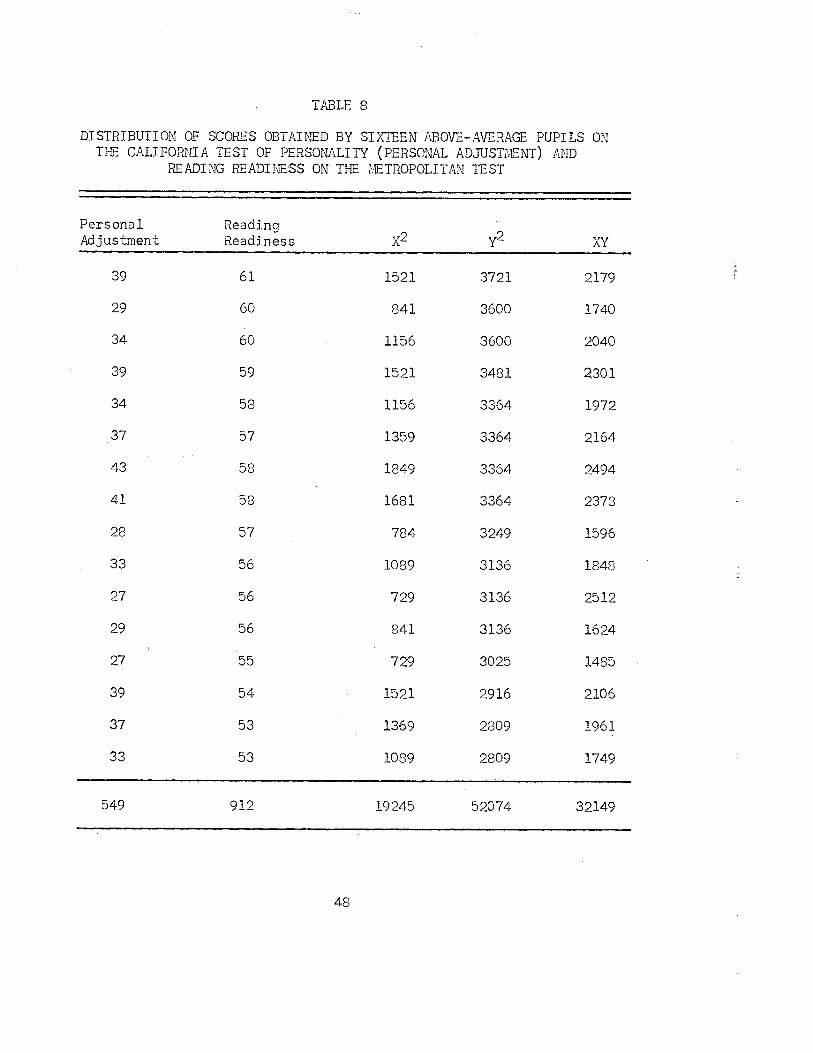
TABLE 8
DISTRIBUTION OF SCORES OBTAINED BY SIXTEEN ABO’~-AVERAGE PUPILS ONTHE CALIFORNIA TEST OF PERSONALITY (PERSONAL ADJUSTT~NT) AND
READING READINESS ON THE I!ETROPOLITAN TEST
Personal ReadingAdjustment Readiness X2 Y2 XY
39 61 1521 3721 2179
29 60 841 3600 1740
34 60 1156 3600 2040
39 59 1521 3481 2301
34 58 1156 3364 1972
37 57 1359 3364 2164
43 58 1849 3364 2494
41 58 1681 3364 2378
28 57 784 3249 1596
33 56 1089 3136 1848
27 56 729 3136 2512
29 56 841 3136 1624
27 55 729 3025 1485
39 54 1521 2916 2106
37 53 1369 2809 1961
33 53 1089 2809 1749
549 912 19245 52074 32149
48
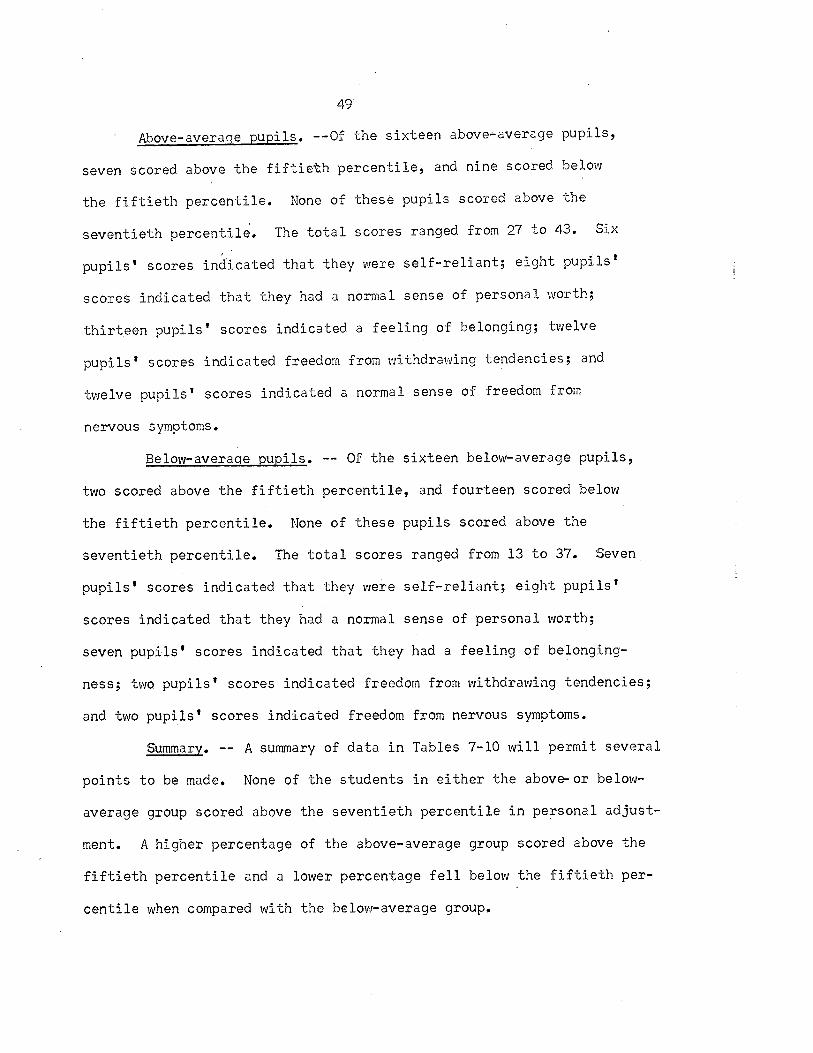
49
Above—average pupils. ——Of the sixteen above-average pupils,
seven scored above the fiftieth percentile, and nine scored below
the fiftieth percentile. None of these pupils scored above the
seventieth percentile. The total scores ranged from 27 to 43. Six
pupils’ scores indIcated that they were self-reliant; eight pupils’
scores indicated that they had a normal sense of personal worth;
thirteen pupils’ scores indicated a feeling of belonging; twelve
pupils’ scores indicated freedom from withdrawing tendencies; and
twelve pupils’ scores indicated a normal sense of freedom from
nervous symptoms.
Below-average pupils. -- Of the sixteen below-average pupils,
two scored above the fiftieth percentile, and fourteen scored below
the fiftieth percentile. None of these pupils scored above the
seventieth percentile. The total scores ranged from 13 to 37. Seven
pupils’ scores indicated that they were self-reliant; eight pupils’
scores indicated that they had a normal sense of personal worth;
seven pupils’ scores indicated that they had a feeling of belonging-
ness; two pupils’ scores indicated freedom from withdrawing tendencies;
and two pupils’ scores indicated freedom from nervous symptoms.
Summary. -- A summary of data in Tables 7-10 will permit several
points to be made. None of the students in either the above-or below
average group scored above the seventieth percentile in personal adjust
ment. A higher percentage of the above-average group scored above the
fiftieth percentile and a lower percentage fell below the fiftieth per
centile when compared with the below-average group.
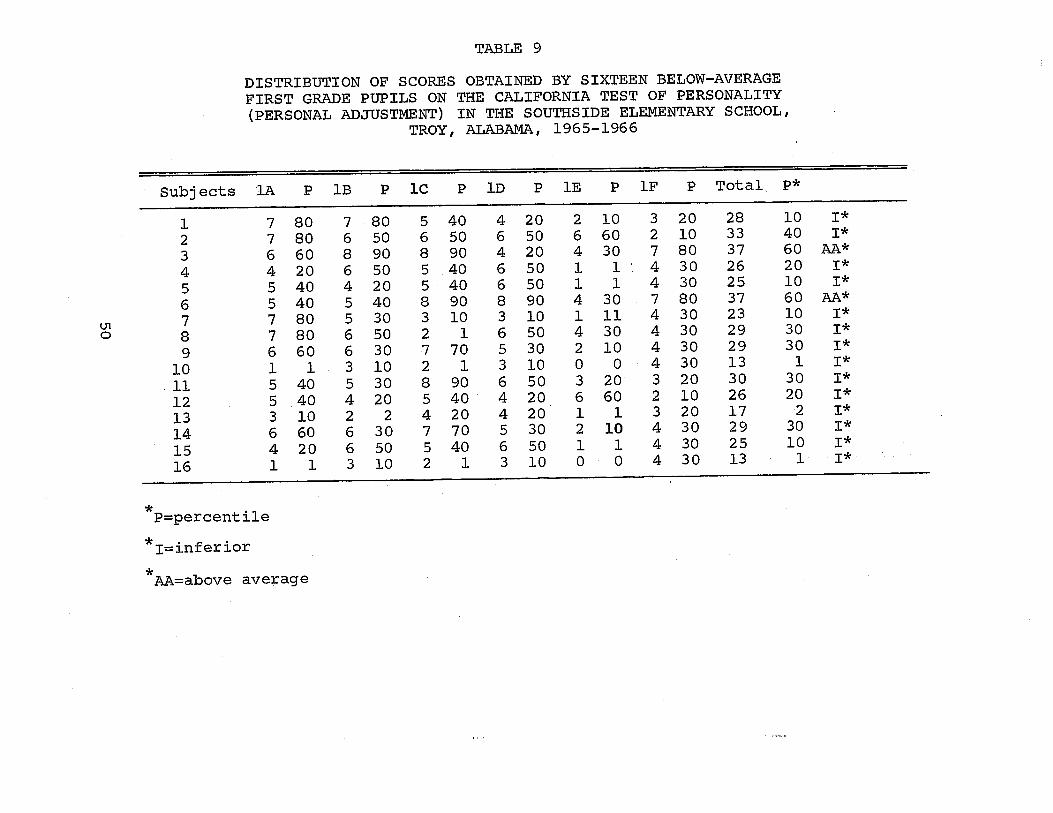
TABLE 9
*
DISTRIBUTION OF SCORES OBTAINED BY SIXTEEN BELOW-AVERAGEFIRST GR7~DE PUPILS ON THE CALIFORNIA TEST OF PERSONALITY(PERSONAL ADJUSTMENT) IN THE SOUTHSIDE ELEMENTARY SCHOOL,
TROY, ALABAMA, 1965-1966
Subjects 1A P lB P 1C P 1D P 1E P iF P Total. P*
P=percent ile
*Iinferior
*
010
1 7 80 7 80 5 40 4 20 2 10 3 20 28 10 1*2 7 80 6 50 6 50 6 50 6 60 2 10 33 40 1*3 6 60 8 90 8 90 4 20 4 30 7 80 37 60 AA*4 420 650 540 650 1 1430 26 20 1*5 540 420 540 650 1 1 430 25 10 1*6 5 40 5 40 8 90 8 90 4 30 7 80 37 60 AA*7 7 80 5 30 3 10 3 10 1 11 4 30 23 10 1*8 780 650 2 1 650 430 430 29 30 1*9 6 60 6 30 7 70 5 30 2 10 4 30 29 30 1*
10 1 1 310 2 1 310 0 0 430 13 1 1*~ 11 5 40 5 30 8 90 6 50 3 20 3 20 30 30 1*
12 5 40 4 20 5 40 4 20 6 60 2 10 26 20 1*13 310 2 2 420 4201 1 320 17 2 1*14 660 630 770 530 210 430 29 30 1*15 4 20 6 50 5 40 6 50 1 1 4 30 25 10 1*16 1 1 310 2 1 310 0 0 430 13 1 1*
AA~above average
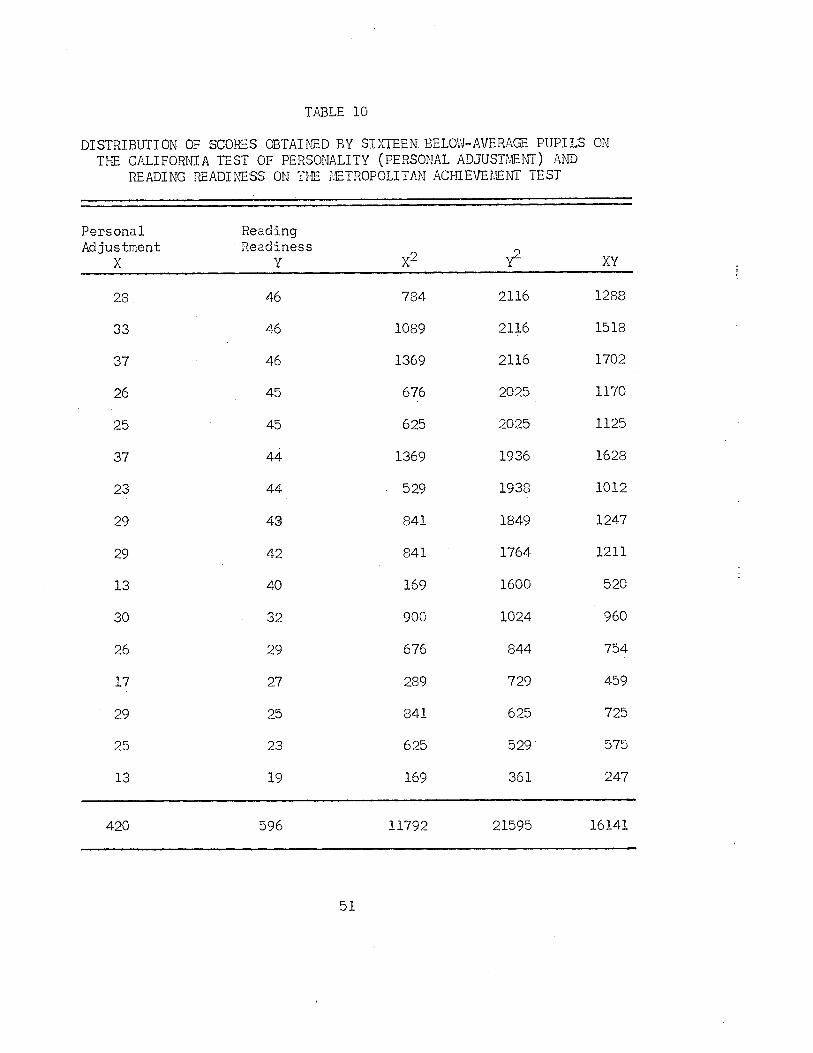
TABLE 10
DISTRIBUTION OF SCORES OBTAI NED BY SI XTEE N. BELOW- AVE RAGE PUPI LS ONThE CALIFORNIA TEST OF PERSONALITY (PERSONAL ADJUSTMENT) AND
READING READINESS ON TNE METROPOLITAN ACHIEVEMENT TEST
Personal ReadingAdjustment Readiness 2
x x2 xy
28 46 784 2116 1288
33 46 1089 2116 1518
37 46 1369 2116 1702
26 45 676 2025 1170
25 45 625 2025 1125
37 44 1369 1936 1628
23 44 529 1938 1012
29 4. 841 1849 1247
29 42 841 1764 1211
13 40 169 1600 520
30 32 900 1024 960
26 29 676 844 754
17 27 289 729 459
29 25 841 625 725
25 23 625 529 575
13 19 169 361 247
420 596 11792 21595 16141
51
52
Results on the Social Ad5ustrnent Sectionof the California Test of Personality
The data on the social adjustment indicies obtained by sixteen
above- and sixteen below-average pupils in the Southside Elementary
School, Troy, Alabama, 1965-1966, are presented in Tables 11-14, and
are analyzed and interpreted below.
Above-average pupils. -- Of the sixteen above-average pupils,
two were at the fiftieth percentile in social adjustment, eight scored
above the 50 percentile and six scored below the 50 ~ercentile. Four
of the pupils in this group scored at the seventieth percentile and
two at the nintieth percentile. Th~ total scores ranged from 27 to
45. Nine pupils’ scores indicated that they recognized desirable
social standards. Eleven pupils’ scores indicated that they were
socially skillful; eight pupils’ scores indicated that they werereasbn
ably free from anti-social tendencies; twelve pupils’ scores indicated
that they exhibit desirable family relationships; thirteen pupils’
scores indicated that they were satisfactorily adjusted to their
school; and twelve of the pupils’ scores indicated that they were mak
ing agood adjustment in their community.
In evaluat~.ng the scores for the group, the writer concluded
that on the percentile scale ten pupils scored on or above the fiftieth
percentile. The remaining pupils were rated as being inferior.
Below-~veraqe pupils. -- Of the sixteen below-average pupils,
none scored above the fiftieth percentile; two scored at the fiftieth
percentile and 14 scored below the fiftieth percentile. None of these
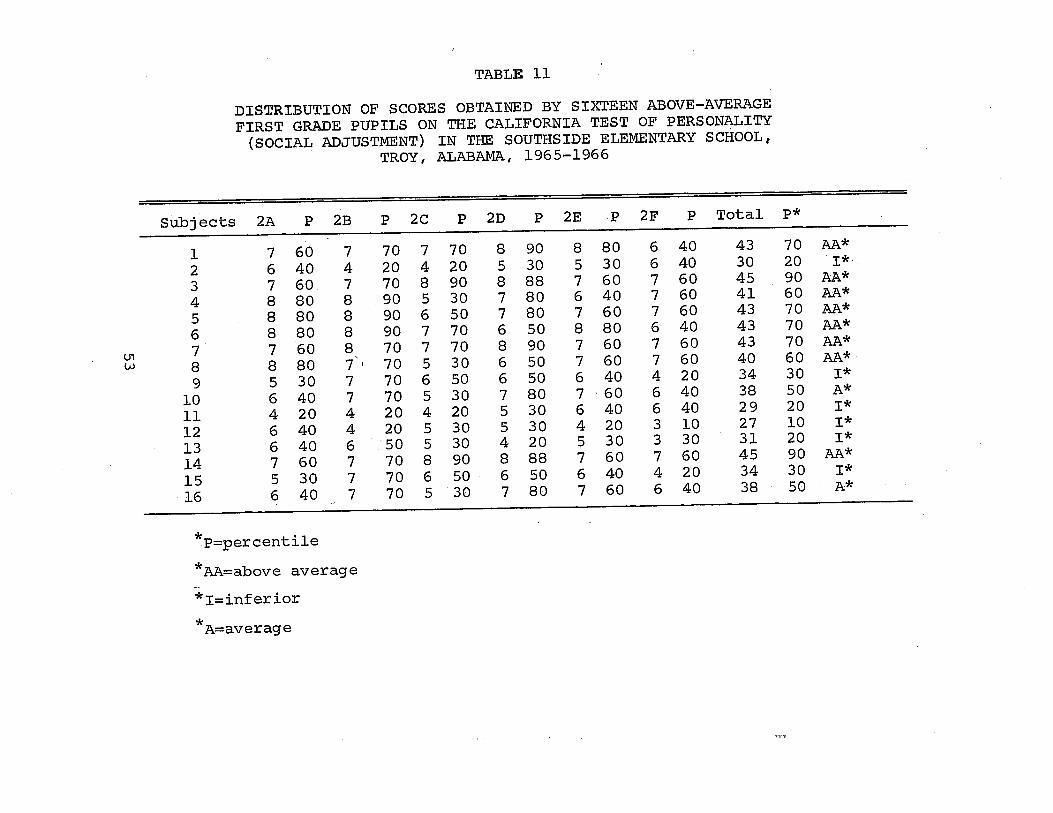
TABLE 11
DISTRIBUTION OF SCORES OBTAINED BY SIXTEEN ABOVE-AVERAGEFIRST GRADE PUPILS ON THE CALIFORNIA TEST OF PERSONALITY
(SOCIAL ADJUSTMENT) IN THE SOUTHSIDE ELEMENTARY SCHOOL,TROY, ALABAMA, 1965-1966
Subjects 2A P 2B P 2C P 2D P 2E P 2F P Total P*
1 7 60 7 70 7 70 8 90 8 80 6 40 43 70 AA*2 6 40 4 20 4 20 5 30 5 30 6 40 30 20 1*.3 7 60 7 70 8 90 8 88 7 60 7 60 45 90 AA*4 8 80 8 90 5 30 7 80 6 40 7 60 41 60 AA*5 8 80 8 90 6 50 7 80 7 60 7 60 43 70 AA*6 8 80 8 90 7 70 6 50 8 80 6 40 43 70 JX~*
7 7 60 8 70 7 70 8 90 7 60 7 60 43 70 ~&~*
8 8 80 7’ 70 5 30 6 50 7 60 7 60 40 60 AA*~9 5 30 7 70 6 50 6 50 6 40 4 20 34 30 1*
10 6 40 7 70 5 30 7 80 7 60 6 40 38 50 A*11 420 4 20420 530 640 640 29 20 1*12 6 40 4 20 5 30 5 30 4 20 3 10 27 10 1*13 6 40 6 50 5 30 4 20 5 30 3 30 31 20 1*14 7 60 7 70 8 90 8 88 7 60 7 60 45 90 AA*15 530 7 70650 650 640 420 34 30 1*16 6 40 7 70 5 30 7 80 7 60 6 40 38 50 A*
*Percentile
*2~J3~above average
* 1= inferior
01
* A=average
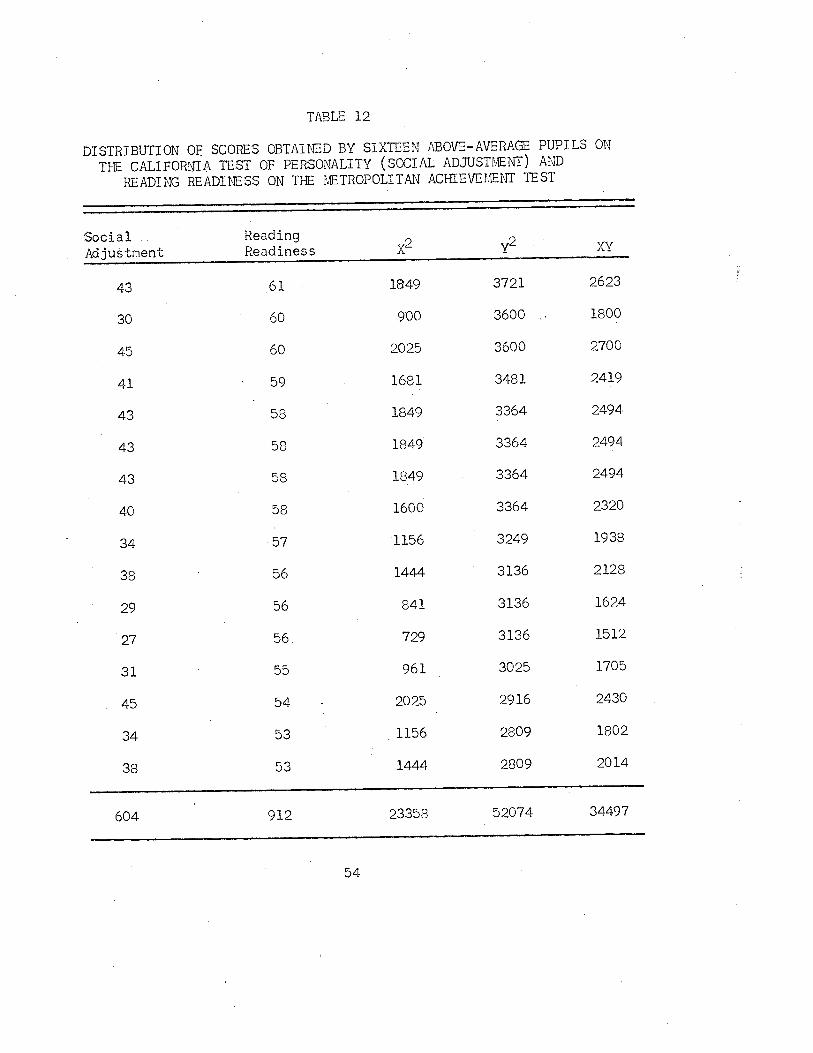
TABLE 12
DISTRIBUTION OE SCORES OBTAINED BY SIXTEEN ~BOVE-AVERA~ PUPILS ONTI-E CALIFORNIA TEST OF PERSONALITY (soCIAL ADJUSTMENT) AND
READING RE ADI NESS ON THE METROPOLI TAN ACHIEVE MENT TEST
Social ReadingAdjustment Readiness XY
43 61 1849 3721 2623
30 60 900 3600 1800
45 60 2025 3600 2700
41 59 1681 3481 2419
43 58 1849 3364 2494
43 58 1849 3364 2494
43 58 1849 3364 2494
40 58 1600 3364 2320
34 57 1156 3249 1938
38 56 1444 3136 2128
29 56 841 3136 1624
27 56~ 729 3136 1512
31 55 961 3025 1705
45 54 2025 2916 2430
34 53 1156 2809 1802
38 53 1444 2809 2014
604 912 23358 52074 34497
54
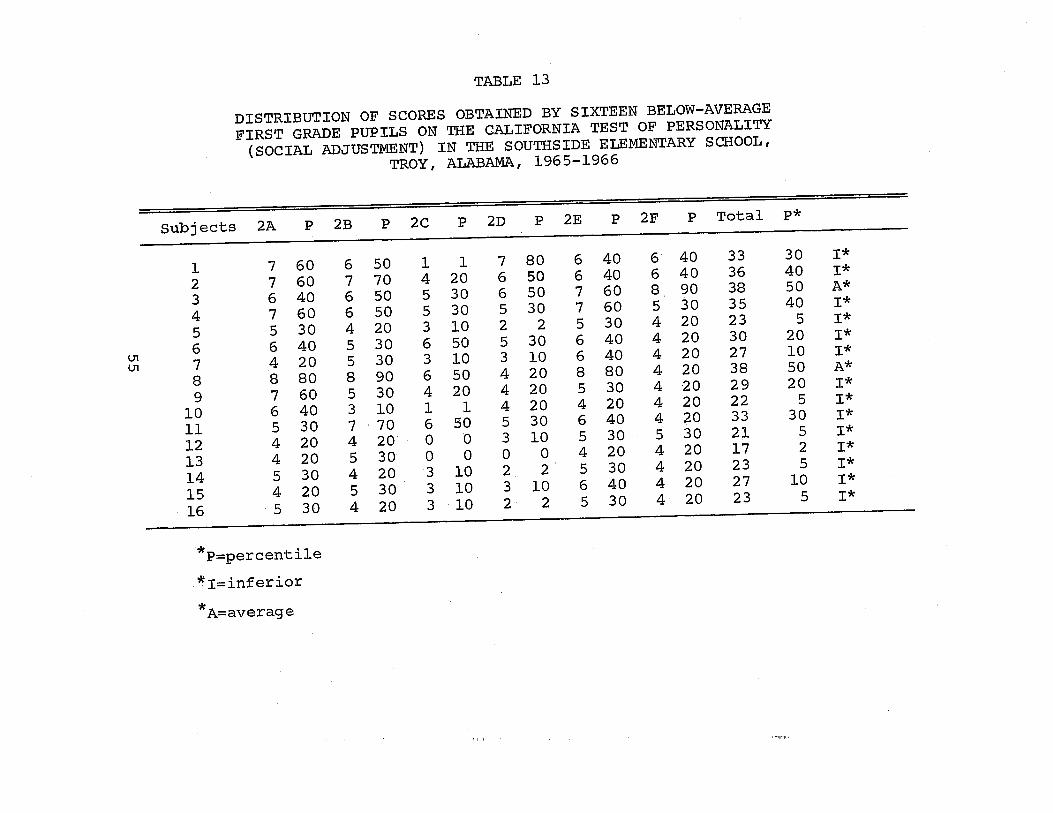
TABLE 13
DISTRIBUTION OF SCORES OBTAINED BY SIXTEEN BELOW-AVERAGEFIRST GRADE PUPILS ON THE CALIFORNIA TEST OF PERSONALITY
(SOCIAL M)JUSTMENT) IN THE SOUTHSIDE ELEMENTARY SCHOOL,TROY, ALABAMA, 1965-1966
SubjectS 2A P 2B P 2C P 2D P 2E P 2F P Total
6 50 1 1 7 80 6 40 6 407 70 4 20 6 50 6 40 6 406 50 5 30 6 50 7 60 8 906 50 5 30 5 30 7 60 5 304 20 3 10 2 2 5 30 4 205 30 6 50 5 30 6 40 4 205 30 3 10 3 10 6 40 4 208 90 6 50 4 20 8 80 4 205 30 4 20 4 20 5 30 4 203 10 1 1 4 20 4 20 4 207 70 6 50 5 30 6 40 4 204 20 0 0 3 10 5 30 5 305 30 0 0 0 0 4 20 4 204 20 3 10 2 2 5 30 4 205 30 3 10 3 10 6 40 4 204 20 3 10 2 2 5 30 4 20
33 30 1*36 40 1*38 50 A*35 40 1*23 5 1*30 20 1*27 10 1*38 50 A*29 20 1*22 5 1*33 30 1*21 5 1*17 2 1*23 5 1*27 10 1*23 5 1*
*Ppercentile
~“ I~inferior
*A=average
123456
(I’U’
89
10111213141516
7 607 606 407 605 306 40.4 208 807 606 405 304 204 205 304 20
~5 30
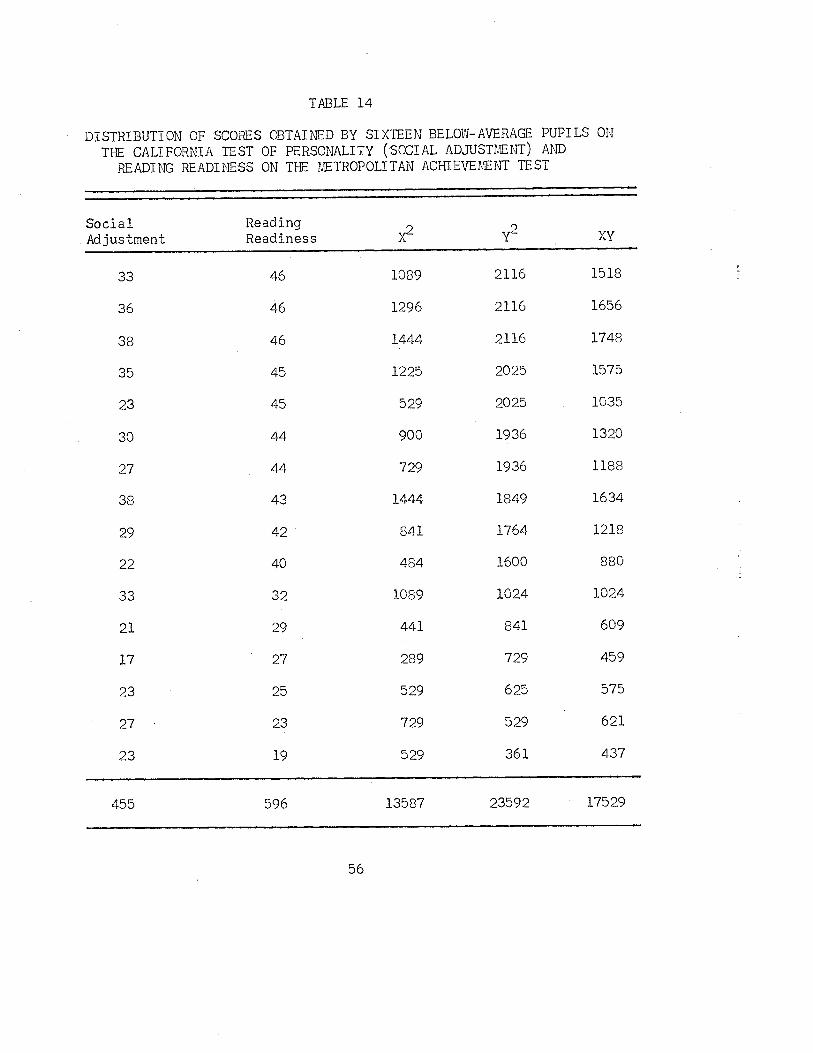
TABLE 14
DISTRIBUTION OF SCORES OBTAINED BY SIXTEEN BELOW-AVERAGE PUPILS ONTI-IE CALIFORNIA TEST OF PERSONALITY (sccIAL ADJUSTHENT) AND
REAM NC RE ADI NESS ON THE METROP DLI TAN ACI-E EVE MENT TEST
Social Reading 2 2. Adjustment Readiness X Y XY
33 46 1089 2116 1518
36 46 1296 2116 1656
38 46 1444 2116 1748
35 45 1225 2025 1575
23 45 529 2025 1035
30 44 900 1936 1320
27 44 729 1936 1188
38 43 1444 1849 1634
29 42 841 1764 1218
22 40 484 1600 880
33 32 1089 1024 1024
21 29 441 841 609
17 27 289 729 459
23 25 529 625 575
27 23 729 529 621
23 19 529 361 437
455 596 13587 23592 17529
56
57
pupils scored above the seventieth percentile. The total scores ranged
from 17 to 38. Eight pupils’ scores indicated that they recognized
desirable social standards; six of the pupils’ scores indicated tha~t
they were socially skillful; three pupils’ scores indicated that they
were reasonably free from anti—social tendencies; three pupils’ scores
indicated that they exhibit desirable family relationships; nine pupils’
scores indicated that they were satisfactorily adjusted to their school;
three pupils’ scores indicated that they were making good adjustment
in their community.
Evaluating the scores for the group, it was indicated by the
percentile scale that only two pupils scored at the fiftieth percentile.
The other pupils were rated inferior in social adjustment.
Summai~y. -— From the data in Tables 11-14, it is clear that
in terms of social adjustment more of the pupils in the below-average
group fell below the fiftieth percentile than did those in the above-
average group. A higher percentage of the latter group scored above
the fiftieth percentile. None of the below-average pupils scored above
the fiftieth percentile. Two of the above-average pupils scored at
the nintieth percentile.
Results on Total California Test of Personality
The data on the total adjustment indicies obtained by sixteen
above- and sixteen below—average pupils in the Southside Elementary
School, Troy, Alabama, 1965-1966, are presented in Tables 15-17, pages
58-60, and are interpreted and summarized below.
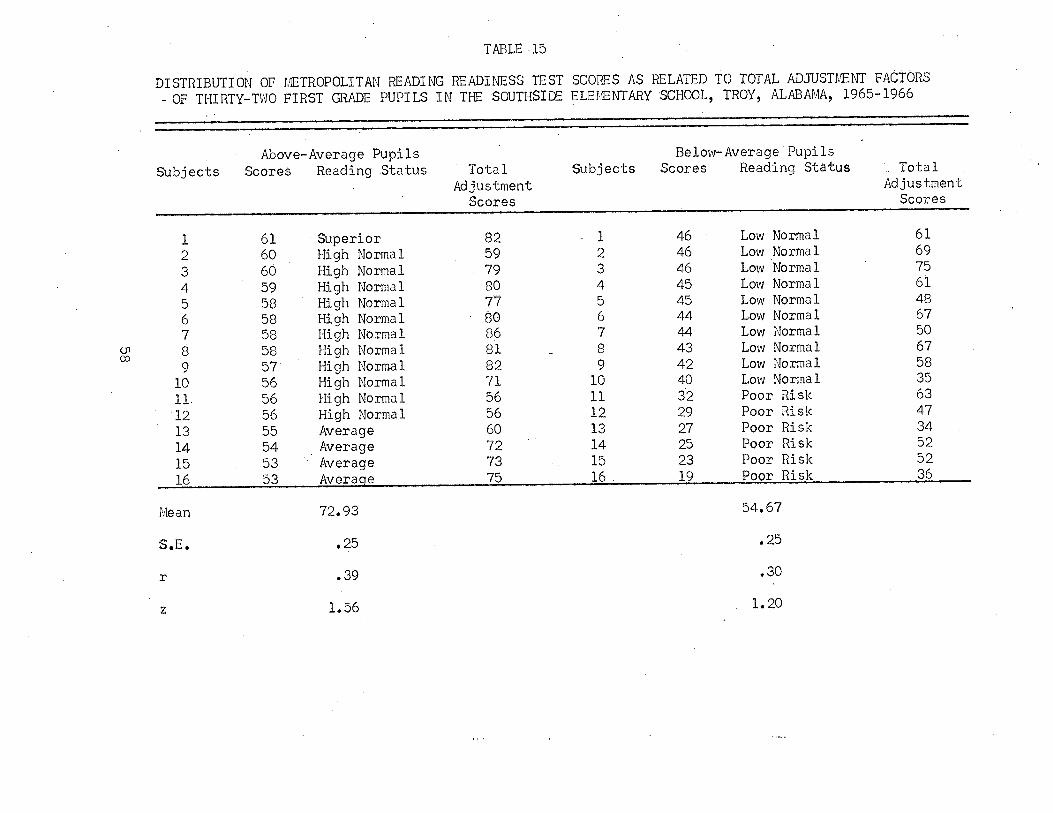
TABLE 15
DISTRIBUTION OF METROPOLITAN READING READINESS TEST-. OF THIRTY-TWO FIRST GRADE PUPILS IN TI-E SOUTHSIDE
SCORES AS RELATED TO TOTAL ADJUSTME~ FACTORSELEMENTARY SCHOOL, TROY, ALABAMA, 1965-1966
(pOD
Above-Average Pupils Below-Average PupilsSubjects Scores Reading Status Total Subjects Scores Reading Status Total
• Adjustment AdjustmentScores Scores
1 61 Superior 82 1 46 Low Normal 612 60 High Normal 59 2 46 Low Normal 693 60 High Normal 79 3 46 Low Normal 754 59 High Normal 80 4 45 Low Normal 615 58 High Normal 77 5 45 Low Normal 486 58 High Normal ~O 6 44 Low Normal 677 58 High Normal 86 7 44 Low Normal 508 58 High Normal 81 8 43 Low Normal 679 ST High Normal 82 9 42 Low Normal 58
10 56 High Normal 71 10 40 Low Normal 3511. 56 High Normal 56 11 32 Poor Risk 6312 56 High Normal 56 12 29 Poor Risk 4713 55 Average 60 13 27 Poor Risk 3414 54 Average 72 14 25 Poor Risk 5215 53 Average 73 15 23 Poor Risk 5216 53 Average 75 16 19 Poor Risk 36
Mean 72.93
S.E. .25
r .39
54.67
.25
.30
z 1.56 1.20
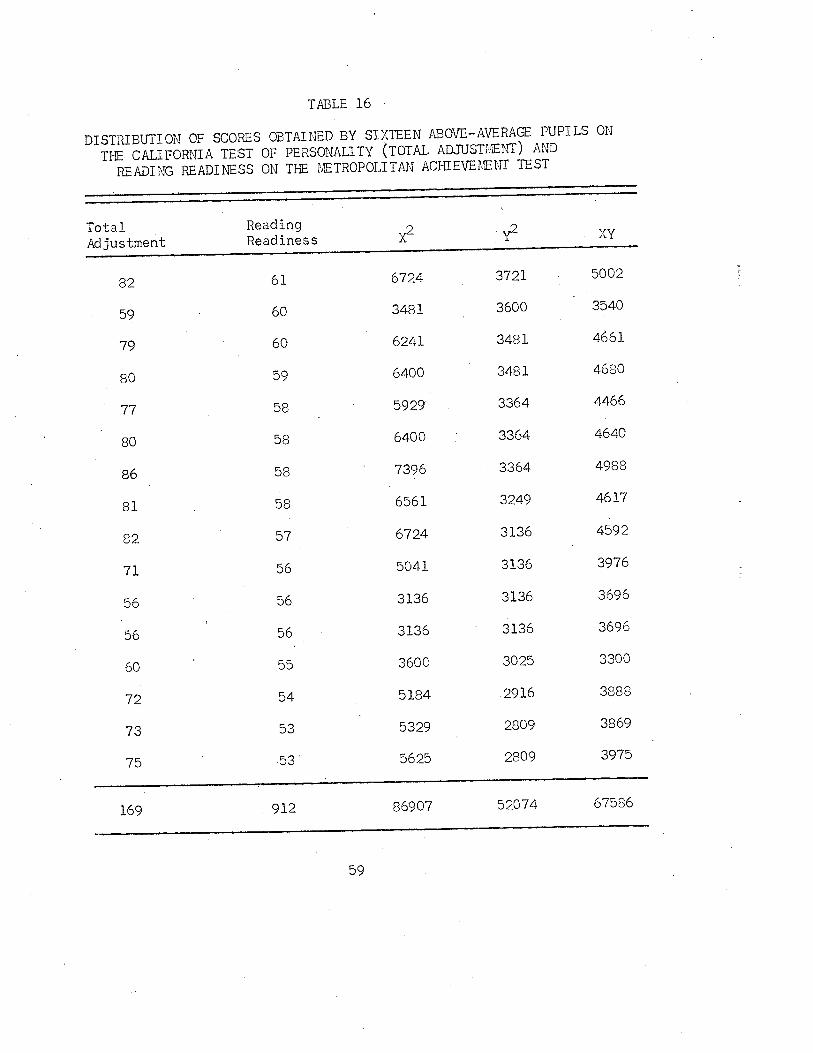
TABLE 16
DISTRIBUTI ON OF SCORES OBTAI NED BY SIXTEEN ABOVE- AVERAGE PUPILS ONTHE CALIFORNIA TEST OF PERSONALITY (TOTAL AD~flJSTMENT) AND
READING READINESS ON THE METROPOLITAN ACHIEvEME~rr TEST
Total ReadingAdjustment Readiness XY
82 61 6724 3721 5002
59 60 3481 3600 3540
79 60 6241 3481 4661
80 59 6400 3481 4680
77 58 5929 3364 4466
80 58 6400 3364 4640
86 58 7396 3364 4988
81 58 6561 3249 4617
82 57 6724 3136 4592
71 56 5041 3136 3976
56 56 3136 3136 3696
56 56 3136 3136 3696
60 55 3600 3025 3300
72 54 5184 2916 3888
73 53 5329 2809 3869
75 53 5625 2809 3975
52074169 912 86907 67586
59
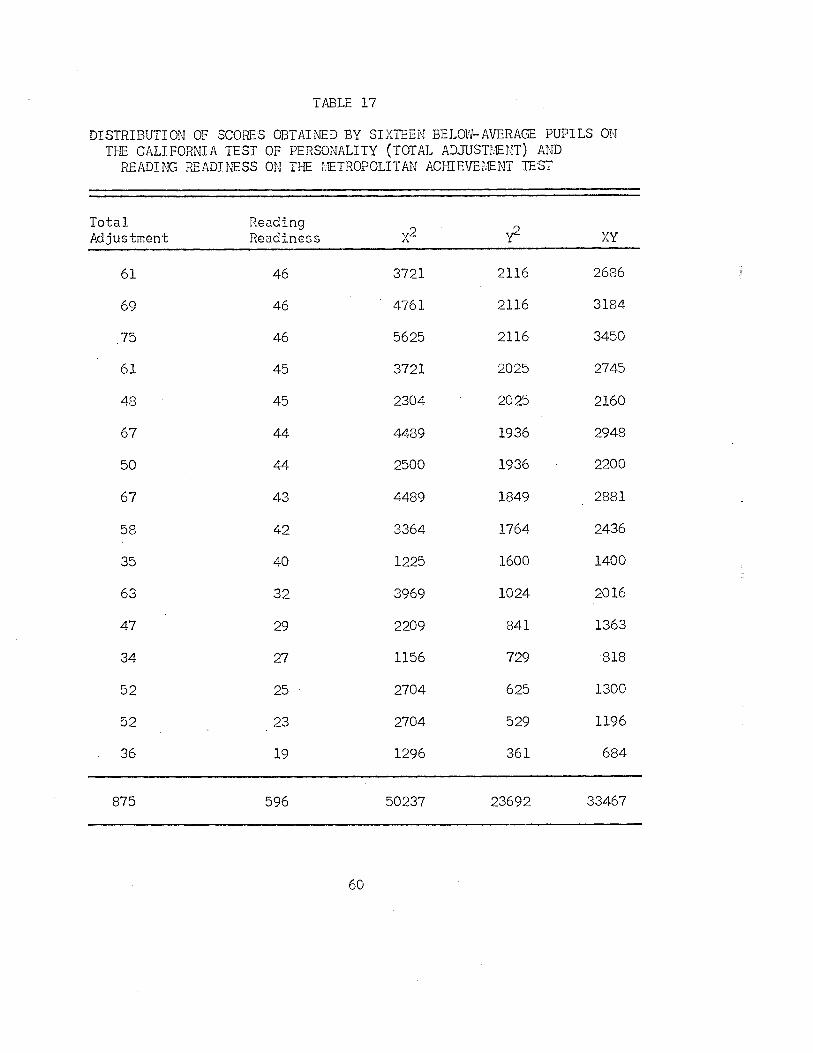
TABLE 17
DISTRIBUTION OF SCORES OBTAINED BY SIXTEEN BELOW-AVERAGE PUPILS ONTHE CALIFORNIA TEST OF PERSONALITY (TOTAL ADJUSTIENT) AND
READING READINESS ON THE 1~ETROPOLITAN ACI-JIEVEMENT TEST
Total ReadingAdjustment Readiness X2 Y2 XY
61 46 3721 2116 2686
69 46 4761 2116 3184
.75 46 5625 2116 3450
61 45 3721 2025 2745
48 45 2304 2025 2160
67 44 4489 1936 2948
50 44 2500 1936 2200
67 43 4489 1849 2881
58 42 3364 1764 2436
35 40 1225 1600 1400
63 32 3969 1024 2016
47 29 2209 841 1363
34 27 1156 729 818
52 25 2704 625 . 1300
52 23 2704 529 1196
36 19 1296 361 684
875 596 50237 23692 33467
60
61
Interpretation. -- From the data in Tables 15-17, a summary
of the total adjustment factors as related to the Metropolitan
Reading Readiness Test status of sixteen above— and sixteen below-
average first grade pupils respectively was an indication that each
of the two groups w~s markedly retarded in the development in its
total personality adjustment patterns as measured by the California
Test of Personality.
Results Obtained from Study ofSocio-Economic Factors
The data on the socio-econornic factors obtained by sixteen above-
average first grade pupils in the Southside Elementary School, Troy,
Alabama, 1965-1966, as related to the Metropolitan Reading Readiness
Test scores are presented in Table 18, page 62, are are analyzed and
interpreted below in the following paragraphs.
Above-average pupils. -- Of the sixteen above-average pupils,
there were eleven working fathers; five were not working; three of
the five not working fathers were on welfare. There were six working
mothers; seven were not working; and three mothers were on welfare.
Two parents had attended college; twenty-one had attended
high school and nine had attended elementary school. There were four
parents who owned their homes.
It appeared that there were only two parents whose attitudes
toward reading were indifferent; there were fourteen with acceptable
attitudes.
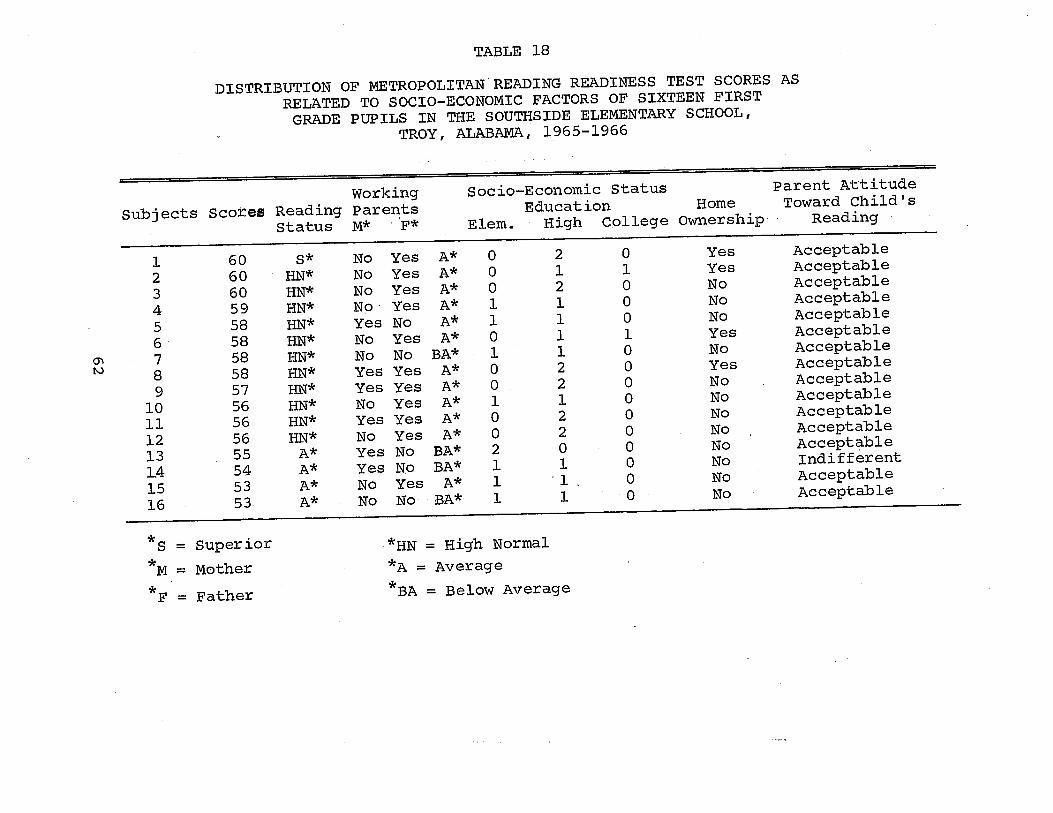
TABLE 18
DISTRIBUTION OF METROPOLITAN READING READINESS TEST SCORES ASRELATED TO SOCIO-ECONOMIC FACTORS OF SIXTEEN FIRST
GRADE PUPILS IN THE SOUTHSIDE ELEMENTARY SCHOOL,TROY, ALABAMA, 1965- 1966
M
Working Socio-Economic Status parent AttitudeSubjects Scores Reading Parents Education Home Toward Child’s
Status M* F* Elem. High College Ownership Reading
1 60 No Yes A* 0 2 0 Yes Acceptable2 60 HN* No Yes A* 0 1 1 Yes Acceptable3 60 HN* No Yes A* 0 2 0 No Acceptable4 59 HN* No Yes A* 1 1 0 No Acceptable5 58 HN* Yes No A* 1 1 0 No Acceptable6 58 HN* No Yes A* 0 1 1 Yes Acceptable7 58 No No BA* 1 1 0 No Acceptable8 58 HN* Yes Yes A* 0 2 0 Yes Acceptable9 57 Yes Yes A* 0 2 0 No Acceptable
10 56 HN* No Yes A* 1 1 0 No Acceptable11 56 HN* Yes Yes A* 0 2 0 No Acceptable12 56 HN* No Yes A* 0 2 0 No Acceptable13 55 A* Yes No BA* 2 0 0 No Acceptable14 54 A* Yes No BA* 1 1 0 No Indifferent15 53 A* No Yes A* 1 1 0 No Acceptable16 53 A* No No BA* 1 1 0 No Acceptable
*s Superior *HN = High Normal
*M = Mother *A = Average
*F Father *BA Below Average
63
The results from the questionnaires indicated that in all
probability, it appeared that the cultural levels of these pupils’
homes were the most important determiness of the adequacy of their
background of knowledge and experiences.
Below-average pupils. -- The data on the socio—economic
factors obtained by sixteen below—average first grade pupils in the
Southside Elementary School, Troy, Alabama, 1965-1966, as related
to the Metropolitan Reading Readiness Test scores are presented in
Table 19, page 64, and are analyzed and interpreted in the following
paragraphs.
There were nine working fathers; six were not working; three
of •the seven were on welfare. There were eight working mothers;
three were on welfare, and five who were not working.
None of the parents in this group had attended college; eight
had attended high school, and twenty-four had attended elementary
school. There were three parents who owned their homes; seven paren1~.s
showed acceptable attitudes toward reading, and nine were indifferent
toward reading.
Evaluation of the results from the questionnaires indicated
that in all probability it appeared that the cultural levels of these
pupils’ homes were the most important determiness of the adequacy of
their background of knowledge and experiences.
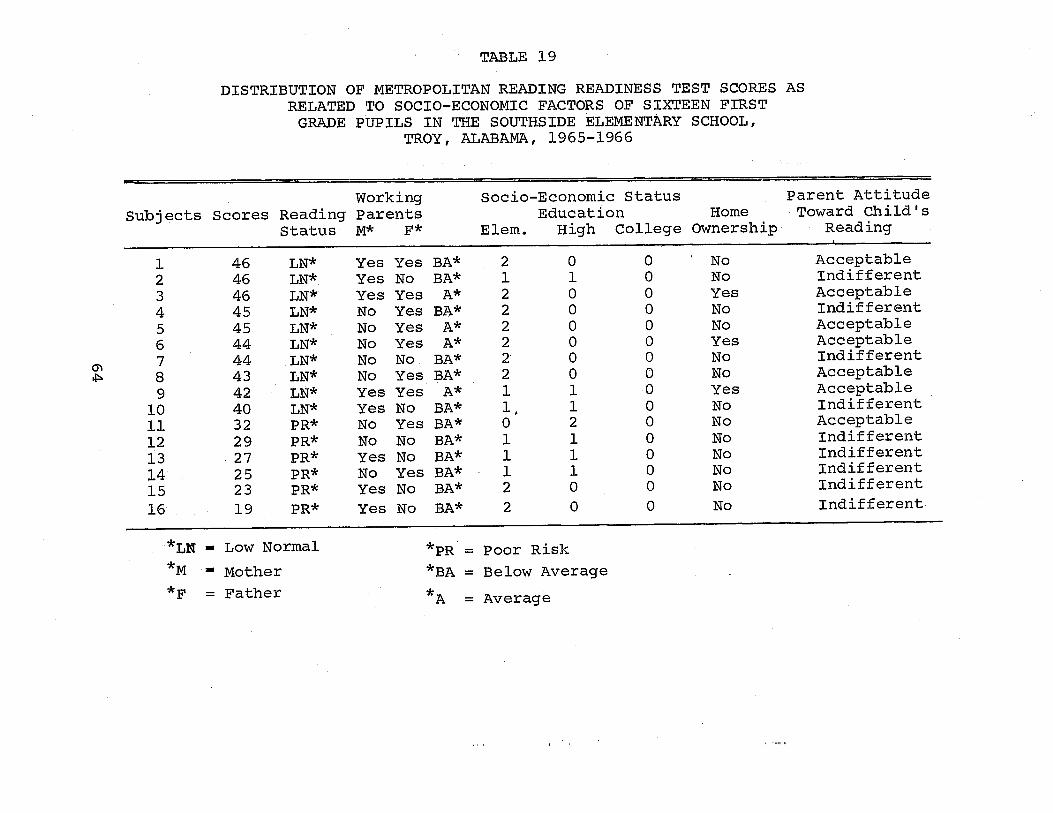
TABLE 19
DISTRIBUTION OF METROPOLITAN READING READINESS TEST SCORES ASRELATED TO SOCIO-ECONOMIC FACTORS OF SIXTEEN FIRST
GRADE PUPILS IN THE SOUTHSIDE ELEMENTARY SCHOOL,TROY, ALABAMA, 1965-1966
Working Socio-Economic Status Parent AttitudeSubjects Scores Reading Parents Education Home Toward Child’s
Status M* F* Elem. High College Ownership Reading
1 46 LN* Yes Yes BA* 2 0 0 No Acceptable2 46 LN*. Yes No BA* 1 1 0 No Indifferent3 46 LN* Yes Yes A* 2 0 0 Yes Acceptable4 45 LN* No Yes BA* 2 0 0 No Indifferent5 45 LN* No Yes A* 2 0 0 No Acceptable6 44 LN* No Yes A* 2 0 0 Yes Acceptable7 44 LN* No No~ BA* 2 0 0 No Indifferent8 43 LN* No Yes BA* 2 0 0 No Acceptable9 42 LN* Yes Yes A* 1 1 0 Yes Acceptable
10 40 LN* Yes No BA* 1, 1 0 No Indifferent11 32 PR* No Yes BA* 0 2 0 No Acceptable12 29 PR* No No BA* 1 1 0 No Indifferent13 27 PR* Yes No BA* 1 1 0 No Indifferent14 25 PR* No Yes BA* 1 1 0 No Indifferent15 23 PR* Yes No BA* 2 0 0 No Indifferent16 19 PR* Yes No BA* 2 0 0 No Indifferent
*LN — Low Normal *PR = Poor Risk
Mother *BA = Below Average
= Father *A = Average
65
Relationships and Respective Comparisons of CertainFactors to the Reading Readiness Abilities of
the Above-Average and Below-Average Groups
Introductory statement. -- The preceding section of this
chapter has dealt mainly with the presentation of status of the
above-average and below—average groups in reading readiness, intelli
gence, personality adjustment, certain physical factors, and socio
economic status. This section fulfills a major aim of the study,
namely, the relating of these factors to reading readiness in order
to compare the extent to which they might have contributed to the
above-average and below-average status of the pupils once they had
begun reading. The sections which follow present this information,
either through statistical computations or systematic observation.
The latter procedures became necessary when the results could not
be easily handled on a purely quantitative basis.
Relationships and respective comparisons of intelligence and
reading readiness. —- Table 20 presents the results of correlation
intelligence and reading readiness test performances of the two groups.
For the above-average group the value of ‘1r” was .39 and for the below-
average group it was .26. In terms of the Table of Values of “r” at
the .05 level of confidence, with 30 degrees of freedom, the first
value was significant, in that an “r” of .349 is required, but obvious
ly this was not true with the below—average group. In both instances,
however, it could be said that relationship was “slightly existent”
for the above—average group, but negligible for the below—average
group. When these “r’s” were converted to “z’s” it was noted that
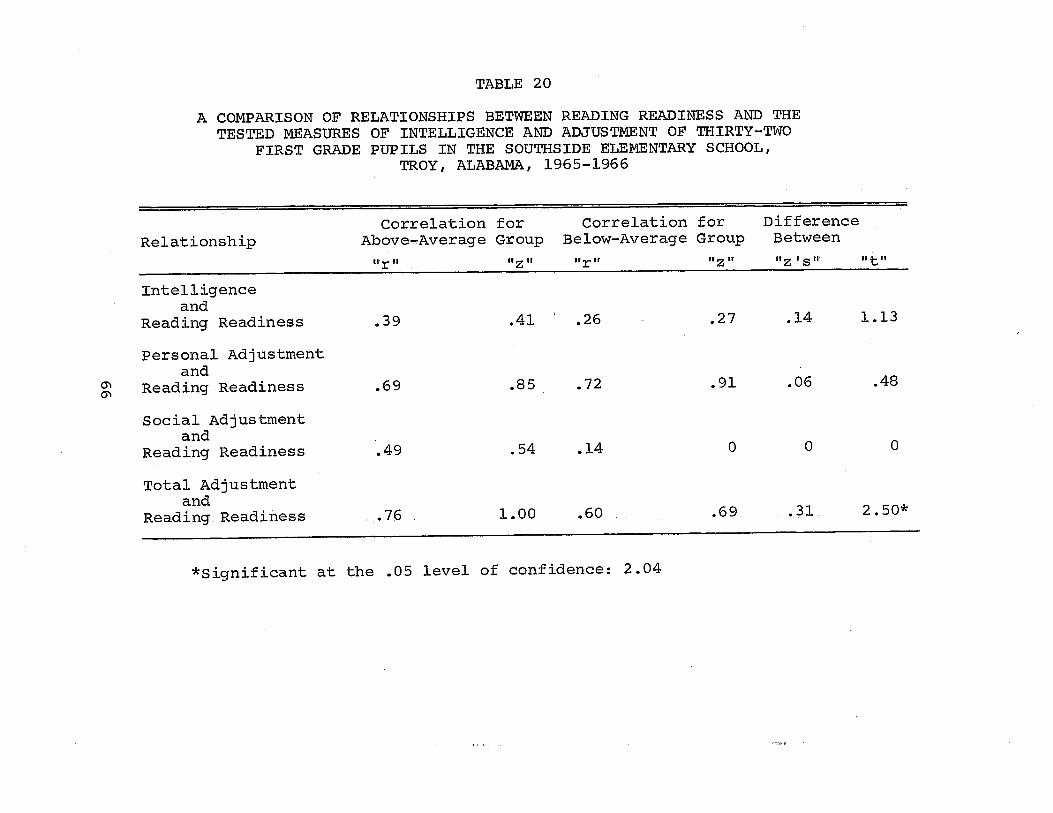
TABLE 20
A COMPARISON OF RELATIONSHIPS BETWEEN READING READINESS AND THETESTED MEASURES OF INTELLIGENCE AND ADJUSTMENT OF THIRTY-TWO
FIRST GRADE PUPILS IN THE SOUTHSIDE ELEMENTARY SCHOOL,TROY, ALABAMA, 1965-1966
Correlation for Correlation for DifferenceRelationship Above-Average Group Below—Average Group Between
ur H ‘‘r II • ti
Intelligenceand
Reading Readiness .39 .41 .26 - .27 .14 1.13
Personal Adjustmentand
Reading Readiness .69 .85 .72 .91 .06 .48
Social Adjustmentand
Reading Readiness .49 .54 .14 0 0 0
Total Adjustmentand
Reading Readiness .76 1.00 .60 .69. .31 2.50*
*5ignificant at the .05 level of confidence: 2.04
67
there was not a significant difference between the correlations.
In this measuring and comparing of relationships, however, it was
concluded by this writer that for the above-average group, there was
a slight tendency for intelligence to influence readiness for reading,
and hence, there was the possibility that possession of certain factors
inherent in the intelligence measure might have been responsible for
higher performances in reading. On the other hand, no such claims
could be assumed regarding the below-average group.
Relationships and respective comparisons of adjustment and
reading readiness. -- Table 20 carries the data pertaining to corre
lations of these two variables. There, it may be noted that personal
adjustment is considered from the standpoints of total adjustment,
persnnal adjustment and social adjustment. First of all, the above-
average group had an “r” of .76 between reading readiness and total
adjustment, while the below-average group had an “r” of .60 between
these variables. In both instances the readiness status of the two
groups could be said to have reflected significant relationships be
tween readiness and total personal adjustment, for these values are
appreciably higher than the “r” of .349 required for significance at
the .05 level of confidence, with 30 degrees of freedom. When corre
lations were converted to “z” scores and comparisons were made, it
was found that there was a significant difference between the corre
lations. The ratio of 2.50’was larger than the value of 2.04 required
for significance at the 5 percent level of confidence.
68
Secondly, the relationship between reading readiness and
personal adjustment was determined. As is shown in Table 20, the
correlations were again relatively “high.” For the above—average
group the coefficient was .69, and for the below-average group, it
was .72. Again, it was assumed that the two variables were related
in both instances, forthe values were far above the “r” .349 required
for significance at the .5 percent level of confidence. When these
correlations were converted to “z” scores and the difference corn—
putec3, there was rio significance.
Thirdly, the relationship between reading readiness and social
adjustment was determined. Unlike the preceding values the relation
ships differed appreciably. For the above—average group the coeffic
ient was .49 and for the below-average group it was .14. Obviously,
these values indicated vihat might be “fair” relationship between read
ing readiness and social adjustment for the above-average group and
none for the below-average group. Comparison could be made by in
spection, and it seemed justifiable to conclude that the groups
differed significantly in this area and that a favorable relationship
between the factors might have contributed to the higher reading
status of the upper group.
In all probability social adjustment factors cannot be sepa
rated from the initial reading readiness status obtained by the two
groups on the Metropolitan Reading Readiness Test.
Finally, and more significantly, there is the question as to
what extent the social patterns and the opportunity and encouragement
69
for participation in all types of person-to—Person and group relation
ships in the home and community of these pupils provided an environment
conducive to the personality growth and development of the first grade
pupils in the Southside Elementary School, Troy, Alabama.
Generai~pn~cIU~ipfl5, drawn re9~ nrei~nshiP~S which we~e
determined by systematic observat~~~. -- The first area for such
consideration is the relationship between visual and readiness factors.
Table 5, page 45, presents data basic to this discussion. The second,
presented in the same table, is between hearing and reading readiness.
In both observations it was noted that all pupils passed on both the
tests administered. It was concluded, therefore, that since these
satisfactory ratings persisted for both groups, there had been no
definite relationships between these physical factors and success or
failures on tests of reading readiness and reading achievement. The
writer would make the observation, however, that the test used for
vision gave no real insig1~it into how well the pupils functioned on
materials at reading distance. This, then, becomes a limitation in
the determining of true relationship between reading readiness and
visual efficiency.
With regard to socio-econom5-c status it was concluded that
there were reasons to believe that this factor contributed to the
levels of reading achievement, but, again these generalizations are
based on systematic observation of data summarized in Tables 12 and
13. From compilation of information and analysis of questionnaires
70
and interviews, it seemed to be reasonable to make the specific
summaries which follow regarding upper and lower reading level
groups, respectively.
A summary of the relationship of the initial reading readiness
abilities as related to the socio-economic status would indicate
that neither can be separated. The home experiences of the pupils
are especially important in the reading readiness program. The
above-average pupils were observed to come from homes where books,
magazines and newspapers were plentiful, where parents read to the
pupils, and used good English daily, and required them to use good
English.
A summary of the relationship of the initial reading readiness
abilities as related to the socio-economic status indicated that pre
existing conditions in the home were the dominant factors among many
of these pupils.
The home experiences of the pupils were especially important
in the reading readiness program. The below-average pupils were ob
served to come from homes where there were few books, magazines, and
newspapers. Communication between parent and child might have been
lacking. Unhappy experiences in the home might, in all probability,
have resulted in their emotional and social maladjustment as indi
cated by the California Test of Personality.
Emotional maturity, according to the research findings, is
most likely to be developed by loving care along with a democratic
approach, which takes into account all members of the family. Parental
71
patterns which research reveals to be conducive to a child’s aca
demic success include giving the child freedom within consistent
limits to explore and experiment, much verbal communication, and
emphasis on both speaking and listening. Each of these factors
appeared to be a need in the above- and below-average groups in
this study.
Interpretive summary with regard to relationships and
respective comparisons. -- The relationships may be summarized ac
cording to above-average and below-average groups in the following
manner.
For the below-average-in-reading group:
1. There was no appreciable relationship between readingreadiness and intelligence.
2. There were no relationships drawn between reading readiness and the factors of visual and auditory acuity. Allsubjects were at a satisfactory level of efficiency and,hence, benefitted from whatever values accrued from suchsatisfactory conditions.
3. There was no relationship found between reading readinessand social adjustment.
4. There were relatively high relationships between readingreadiness and personal and total adjustment.
5. There seemed to be a trend toward a kind of positiverelationship between socio-economic status and readingreadiness which reflected that those pupils who werelimited in readiness factors tended to be low in socioeconomic conditions.
For the above-average group:
1. There was slight relationship between intelligence andreading readiness.
2. There was high relationship between reading readiness andtotal adjustment as well as personal adjustment.
72
3. There was a fair relationship between social adjustmentand reading readiness.
4. Since all pupils passed in tests of auditory and visualacuity, it was assumed that all subjects profited fromthis favorable physical status and could benefit fromwhatever reading skills are facilitated through theseareas.
5. There seemed to be a tendency for any advantage in socioeconomic status to rest with the above-average group.
In comparison of relationships:
1. In only one relationship of a statistical nature couldit be said that the correlations of the “x” respectivegroups were significantly different, and this was between reading readiness and total adjustment. Bothgroups revealed an appreciable relationship between thetwo variables, but the above-average group held a favorable ascendence in this area.
2. All other relationships were not significantly differentand indicated that although the two groups differed inrange of reading abilities, the trend in respectivevariables tended to be similar.
3. The latter seemed to obtain, also, in the relationshipsbetween reading readiness and socio-economiC ~tatus ofthe above- and below-average readers.
In general, then, this w~riter concluded that all of the factors studied
made some contribution to readiness for reading, whether in terms of
their lack or presence. This is particularly true, for example, of
reading readiness and social adjustment. In this area the above
average group seemed to be significantly favored and the below-average
group just the opposite. It is highly probable that this factor could
have been definitely inoperative in the below-average group and thus
representative of a real need, particularly in situations where read
ing is taught on a group rather than an individualized basis. Similarly,
73
seeming lacks in socio-economic status seemed to accompany limitations
in reading achievement.
Other implications will be drawn in the latter sections of the
chapter which follows.
CHAPTER III
SUMMARY OF BASIC FRAHEWORK OF THE STUDY, FINDINGS, CONCLUSIONS,I MPLI CATI ONS AND RECOMMENDATI ONS
Summary and Research Design of the Study .
Success in school dep~nds upon a child’s being able to read.
Teaching a child to read is the most important contribution to his
development that the teacher can make. It is, therefore, the desire
of all teachers to create a classroom environment rich in experiences
which will contribute to effective learning. In initiating a reading
program with any group or groups, it is essential to ascertain the
reading status of the students involved. In this way the first grade
teacher will be able to determine the reading ability of each child.
Hence, any studies on a comparison of relationships of certain factors
to the initial reading readiness abilities of two groups of first
grade pupils would represent a contribution to instructional procedures.
The writer sought, therefore, to conduct such a study and to
provide firsthand data about factors important to growth in reading
such as (1) mental, (2) physical, (3) personal, and social adjustment
and socio—economic which might be used as an appraisal in aiding the
teacher to see the interrelationship of these factors and their sig
nificance in child growth.
The problem involved in this study was to compare the extent
to which intellectual, physical, personal and social adjustment and
socio—economic factors related to the initial reading readiness abili—
74
75
ties of two groups of first grade pupils with above-average and
below—average academic performances, respectively, at the end of
the school year 1965-1966.
The major purpose of this study was to ascertain the relation
ships of certain factors to the initial reading readiness abilities
of two groups of first grade pupils.
More specifically, the purposes of this research, with
reference to the sixteen above-average and sixteen below-average
first grade pupils of Southside Elementary School, Troy, Alabama,
were to determine:
1. The general reading status of these two groups anddifferences, if any, which might exist.
2. The extent which intellectual factors relate to initialreading readiness abilities of above— and below-averagepupils.
3. The extent which physical factors relate to the initialreading readiness abilities of above- and below—averagepupils.
4. The extent adjustment factors relate to initial readingreadiness abilities of above— and below—average pupils.
5. The extent socio—economic factors relate to initialreading readiness abilities of above- and below—averagepupils.
6. The findings, implications and recommendations derivedfroni an analysis and interpretation of the data whichmay be useful and helpful to pupils in an initial readingreadiness program.
The subsequent terms in this study carried these described
meanings:
1. The term, “intellectual factors,” refers to the group- behavioral consistency of pupils.
76
2. The term, “physical factors,” refers to good generalhealth, visual and auditory efficiency.
3. The term, “reading readiness,” refers to the developmental stage at which constitutional and environmentalfactors have prepared the child for reading instructionas measured by the MetropQlitan Reading Readiness Test.
4. The term, “personal and social adjustment factors,”refers to the intangible elements of the total complex patterns of feeling, thinking and acting, asmeasured by the California Test of Personality.
5. The term, “socio—economic factors,” refers to the background of parents and siblings, economic status, homeatmosphere, and achievement of the individual or group.
6. The term, “above-average,” refers to those pupils whofall above the means of a distribution of scores derivedfrom averaging of pupils’ performances on the MetropolitaflAchievement Tests.
7. The term, “below-average,” refers to those pupils whofall below the “means” of a distribution of scores derivedfrom an averaging of the pupils’ respective performanceson the Metropolitan Achievement Tests.
Unfortunately, this study was limited to two groups of first
grade pupils in the Southside Elementary School, Troy, Alabama, 1965-
1966. Further, the major limitation to this research inheres in the
fact that in an effort to determine the extent that intellectual,
physical, personal, social adjustment and socio-economic factors
influence or contribute to reading readiness abilities, no attempt
was made to establish the socio-economic status, but rather to point
out some of the factors that are involved in the reading readiness
process.
Further details of the basic design are enumerated below:
1. The locale and period of study. --This study was conductedat Southside Elementary School, Troy, Alabama, during theschool year, 1965-1966.
77
2. Method of research. -- The Descriptive survey methodof research, employing the specific techniques ofStandardized Tests, Questionnaires and School Recordswas used to gather the necessary data for the completion of this study.
3. Subjects and materials. -- The subjects and materials(instruments) used in this study were characterizedunder the separate captions below:
A. Instruments - The instruments were:
(1) Metropolitan Reading Readiness Tests — Forms“R” and tI5~
(2) California Test of Personality(3) Kuhlrnann-Anderson Intelligence Test(4) QuestionnaireS(5) Audiometer Test(6) “E” and Snellen Tests
B. Subjects - The subjects involved in this study werethirty-two first grade pupils of the Southside Elementary School in Troy, Alabama.
4. Criterion of Reliability. —- The “criterion of reliability”for the significance of difference was established asFisher’s “t” of 2.04 at the .05 level of confidence,with 30 degrees of freedom, together with the test forms.
Procedural steps. -- The procedural steps used in this study
were the following:
(a) Permission to conduct this study was secured from theproper persons in authority.
(b) A further study of related literature was reviewed,summarized and presented in the finished thesis copy.
Cc) School cumulative recors were examined for the purposeof securing pertinent information relative to suchfactors as health, previous achievement (kindergarten)and background information.
(d) Questionnaires were sent to parents. General informationwas obtained concerning the socio-economic status of thefamily, education, travel, reading materials, socialadjustment and emotional stability.
78
Ce) The Snellen and “E” Charts were used to test the visionof the pupils.
(f) The Metropolitan Reading Readiness Test and the KuhlmannAnderson Intelligence Test were administered to allpupils.
(g) Data derived from the tests and questionnaires were tabulated in appropriate tables and treated by comparing therelationships of certain factors as indicated by thepurposes of the research.
(h) The statements of conclusions, implications and recommendations derived from the comparison and interpretation of the data ~etaken and formulated in thefinished thesis copy.
Summary of the Reviewof Related Literature
The many studies reviewed have attempted to enumerate the
various capacities and functions upon which learning to rad depends.
The authorities agreed that a pupil’s general intelligence, his lin
guistic aptitude, his vision and hearing, his general~ health and
vigor, his emotional balance, and various other characteristics affect
his ability to learn to read at every stage grom the first lesson to
adult life.
Authorities all agreed on the following:
1. That there are certain factors which influence readingreadiness, such as intellectual, physical, personal andsocial adjustment, and soclo—economic.
2. That teachers can determine when children are physically,mentally, emotionally and socially mature enough forbeginning reading by using intelligence tests, readingand readiness tests and systematic observations.
3. That certain factors of personality are related toreading achievement. Personal factors can interferewith reading growth or the inability to succeed maycause dissatisfaction.
79
4. That social adjustment and socio—economic factors werefound to be contributing factors in reading readinessabilities. Maladjusted homes, inter—family relationships and the social adjustment of the pupils may developmental adjustment which may produce emotional resistanceto learning to read.
5. The poor vision or hearing physical disabilities andunfavorable environmental conditions are also contributing factors in reading readiness abilities.
6. That some pupils may be under-achieving. That is, thatthey may not be achieving according to their intellectualpotentialities. There appears to be a definite relationship between reading achievement and intelligence.
7. That pupils can achieve in reading, if given efficientand systematic instruction in a pleasant and secureenvironment at a level commensur~’te with their mentalage. Reading achievement is closely related to intelligence. Correlations as high as from .50 to .80 havebeen found.
Summary of Data
The devices used in obtaining the necessary information in
this study were Survey Tests, Questionnaires, School Records, Audi-
- ometer Test and Vision Tests.
The findings were as follows:
1. Analysis of the above—average group’s performance onthe Metropolitan Reading Readiness Test indicated aa range of 9 with a low score of 53 and a high scoreof 61. The mean score was 57.0. The range indicatedfor the below-average group was 28, with a low scoreof 19 and a high score of 46. The mean score was 37.0.These findings indicated that there was a significantdifference in the reading readiness abilities of thetwo groups.
2. The relationship between intelligence and reading readiness of the above-average pupils revealed that therewas a slight positive relationship of .39 between reading
80
readiness and intelligence. The I.Q. scores of thisgroup as obtained by the Kuhlmann-Anderson IntelligenceTest ranged from a low of 99 to a high of 119 with arange of 21.
3. The correlation between intelligence and reading readiness among the below-average pupils revealed that therewas no relationship between reading readiness and intelligence. The I.Q. scores of this group as obtainedby the Kuhlmann-Anderson Intelligence Test ranged froma low of 72 to a high of 92 with a range of 21. Thecorrelation of .22 was below the “r” of .349 requiredfor significance at the .05 level of confidence.
4. The general health status of both groups was good, withthe exception of numerous cavities in the teeth of bothgroups. One pupil failed the hearing test and passedthe vision test in the below-average group. The above-average pupils passed both tests. Therefore, it appearedthat in this study the achievement of both groups wasnot retarded by their general physical conditions, butrather facilitated.
5. Seven above—average pupils were above-average in personaladjustment. Two below-average pupils were above-averagein personal adjustment.
6. Ten above-average pupils were adjusted socially. Twobelow-average pupils were well adjusted sociallye
7. For the total adjustment, nine above-average pupilsscored above the fiftieth percentile. Two below—averagepupils scored at the fiftieth percentile.
8. Relationships between reading readiness and adjustmentwere:
a. For the above-average-in-reading group: personaladjustment and readiness, .69; social adjustmentand readiness, .49; and total adjustment and readiness, .76.
b. For below-average: personal adjustment and readiness,.72; social adjustment and readiness, .14; and totaladjustment and readiness, .60.
81
9. Cultural conditions in the home were related to readingdevelopment. The educational and professional statusof the parents, the number of books owned by the studentsand families see~m3d to contribute greatly to the readingdevelopment of the above— and below—average pupils.
Conclusions
The analysis and interpretation of the data would appear to
warrant the following conclusions:
1. Examination of the initial reading readiness status ofthe two groups indicated that the above-average pupilswere reading at a stage comparable to the first gradelevel, while the below-average pupils needed to remainin the pre-reading stage longer.
2. Since there was a positive relationship between intelligence and reading readiness for the above-average groupand none for the below-average group, it was concludedthat the above-average pupils might have been achievingbecause of their intelligence levels, and that the below-average ones might be retarded and delayed because ofcertain limitations in potential and failure of readinessand intelligence to contribute to each other in a positivevariation.
3. The findings of the relationship between reading readinessand intelligence led to the conclusion that when intellectual factors do relate to the reading readiness processthey may in turn facilitate reading achievement.
4. Physical conditions seemed to follow no particular patternin cases of above- or below-aver~ge pupils. The twophysical factors did not appear to be present any markeddifferences in the reading readiness process. Most ofthe cases were satisfactory in vision and hearing.
5. ~1ore of the above-average pupils scored above average inpersonal adjustment than did the below-average group.
6. The above-average pupils had better social adjustmentthan did the below-average pupils, and a positive relationship indicated that this factor might have accounted fora measure of their superiority in reading.
82
7. The above-average group had higher total adjustmentscores.
8. Favorable economic conditions and unfavorable homeexperiences of the pupils were especially importantfactors in the reading readiness process of theabove- and below-average pupils and in all probabilityinfluenced reading achievement.
Implications
The followings are implications which have been based on the
findings and conclusions of this study:
1. The fact that the above-average pupils indicated averageachie~’ements would seem to indicate a need for continuedeffort to help them improve and maintain their level ofachievement and to motivate individual pupils who mayshow promise of attainment beyond their grade level.
2. The very low reading achievement of the below—averagepupils may indicate a need for more enriched prereading program, also a need for finding the causativefactors responsible for poor readers.
3. On the basis of the statistical findings it was impliedthat mental ability is an important factor in readingachievement or lack of it among the above- and below-average pupils.
4. Because the above- and below-average pupils had limitations of total adjustment factors, it would indicatethat the personal and social adjustment factors neededto be improved.
~. There seemed to be a relationship between socio-econom5~clevel and reading readiness abilities of the above- andbelow-average pupils. Home environment appeared to beconducive to wholesome attitudes toward school.
6. Physical status seemed to have been a significant factorrelated to reading readiness abilities in both groups.It appeared that the physical status was not the onefactor responsible for the low—normal reading statusof the below-average pupils.
83
Recommendations
The findings of this study appeared to justify the recom
mendations that follow:
1. Much emphasis and stress should be centered on the needfor better understanding of what reading readiness testsmeasure. It is apparent that there is a need for developing valid instruments which schools can use to evaluatethe readiness levels that have been ac1~eved by theirpupils.
2. It is recommended that a special in-service program onreading readiness abilities be initiated at the beginningof the school year in all elementary schools.
3. It is recommended that there be more activities whichwould aid in the development of the pupils’ personal,social and emotional adjustment.
4. A sound reading program should be established givingdue consideration to school, community, and the generalreading status of all pupils.
Bibliography
Anastasi, Anne. Psychological Testing. New York: Macmillan Company,1964.
Biggs, Morris L. and Hunt, Maurice P. Psychological Foundationsof Education. New York: Harper and Rowe, Inc., 1963
Bonds, Guy L., and Tinker, Miles A. Reading Difficulties. NewYork: Appleton-Century Crofts, Inc., 1962.
Buros, The Sixth Mental Measurements Yearbook. New Jersey: GryponPress, 1965.
Daliman, Martha, and Deboer, John J. The Teaching of Readinq. NewYork: Holt, Rinehart and Winston, Inc., 1961.
Dechant, Emerald V. Improving the Teaching of Reading. New Jersey:Prentice—Hall, Inc., 1964.
Gans, Roma. Common Sense in Teaching Reading. New York: BobbsMenu Company, Inc., 1963.
Gates, Arthur I. The Improvement of Reading. New York: The MacmillanCompany, 1954.
Harris, Albert J. Effective Teaching of Readi~q. New York: DavidMcKay Company, Inc., 1962.
Johnson, Orville G. Education for the Slow Learner. New Jersey:Prentice-Hall, Inc., 1963.
Logan, Lillian and Logan, Virgil G. Teaching the Elementary SchoolChild. Boston: Houghton Miff lin Company, 1962.
McKim, Margaret G., and Caskey, Helen. Guiding Growth in Reading.New York: The Macmillan Company, 1963.
Monroe, Walter. Encyclopedia of Education Research. The MacmillanCompany, New York: 1950.
Smith, Henry P. and Dechant, Emerald V. Psychology in Teaching Readip~.Englewood Cliffs, New Jersey: Prentice—Hall, Inc., 1961
Strang, Ruth, McCullough, Constance and Traxier, Arthur. ~Improvement of Reading. New York: McGraw Hill Book Company,1961.
84
85
Articles and Periodicals
Cutts, Warren G. “Reading Unreadiness in the Underprivileged’ NEAJournal, LII (April, 1963).
Gaines, Lynette S. “The Slow Learner,” The Instructor, LXXIV(March, 1965).
Orme, Lillian, “Developing Reading Readiness in First Grade ChildrenThrough Special Instruction,” Reading on Reading Instructions,”Thirty-fourth Yearbook of the National Elementary Principal,(September, 1955).
Petty, Marcy C. “An Experimental Study of Certain Factors InfluencingReading Readiness,” Journal of Educational Psychol~gy, XXX(June, 1939).
Russell and Hill, Ruby L. “Provisions for Immature Five and SixYear Olds in California Schools,” California Journal ofElementary Education, XVI (May, 1948).
Smith, Nila P. “Readiness for Reading and Related Language Arts,”Research Bulletin of the National Conference on Research inEnglish, (April, 1950).
Sowards, Wesley C., and Scobey, Mary A. The Changing Curriculumand the Elementary Teacher, (San Francisco: Wadsworth PublishingCompany, Inc., 1961.
Unpublished Materials
Hoover, Annele. “A Study of Reading Readiness of Fifty-two Childrenin the Spelman College Nursery School.” (unpublished master’sthesis, School of Education, Atlanta University, 1945).
Thurman, Margaret Morton. “The Predictive Validity of Two Methodsof Determining Readiness for Reading.” (unpublished master’sthesis, School of Education, Atlanta University, Atlanta, Georgia,1963).
Wall, Ruth Lyles, “An Analysis of Some Developmental Factors InfluencingReading Readiness Among First Grade Pupils.” (unpublished master’sthesis, School of Education, Atlanta University, Atlanta, Georgia,1963).
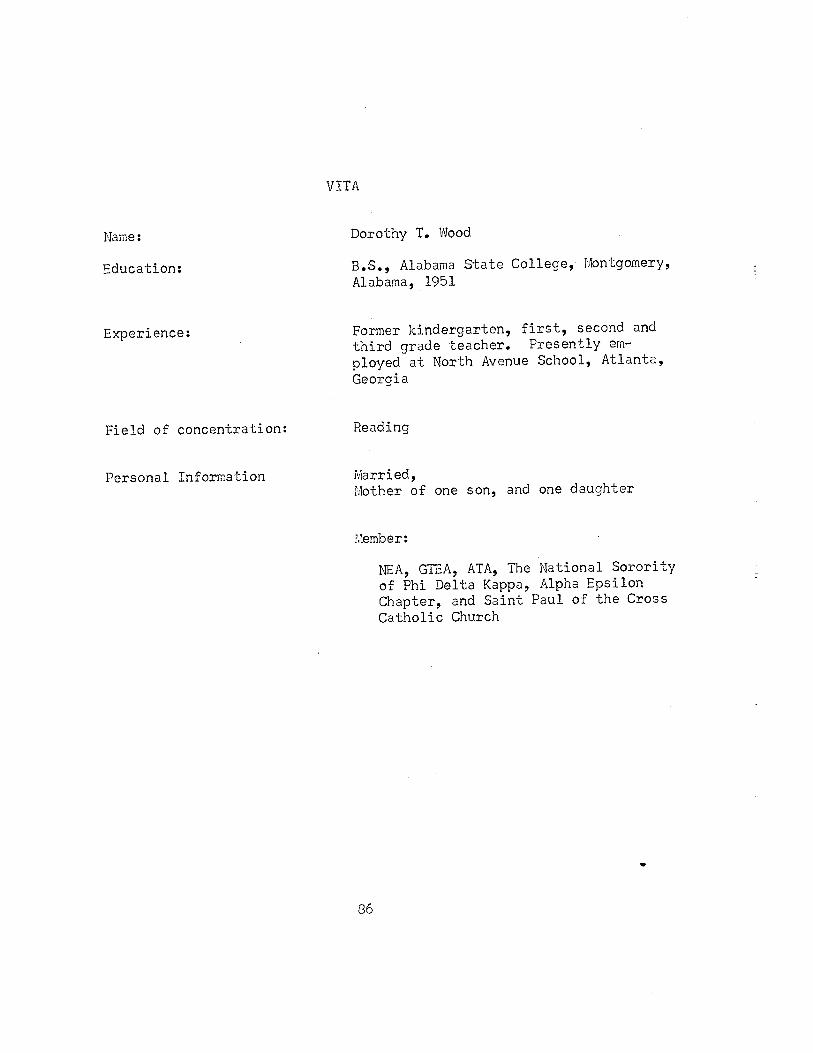
VITA
Name: Dorothy T. Wood
Education: B.S., Alabama State College, Montgomery,Alabama, 1951
Experience: Former kindergarten, first, second andthird grade teacher. Presently employed at North Avenue School, Atlanta,Georgi a
Field of concentration: Reading
Personal Information Married,Mother of one son, and one daughter
Member:
NEA, GTEA, ATA, The National Sororityof Phi Delta Kappa, Alpha Epsilonchapter, and Saint Paul of the CrossCatholic Church
86

1-li e H
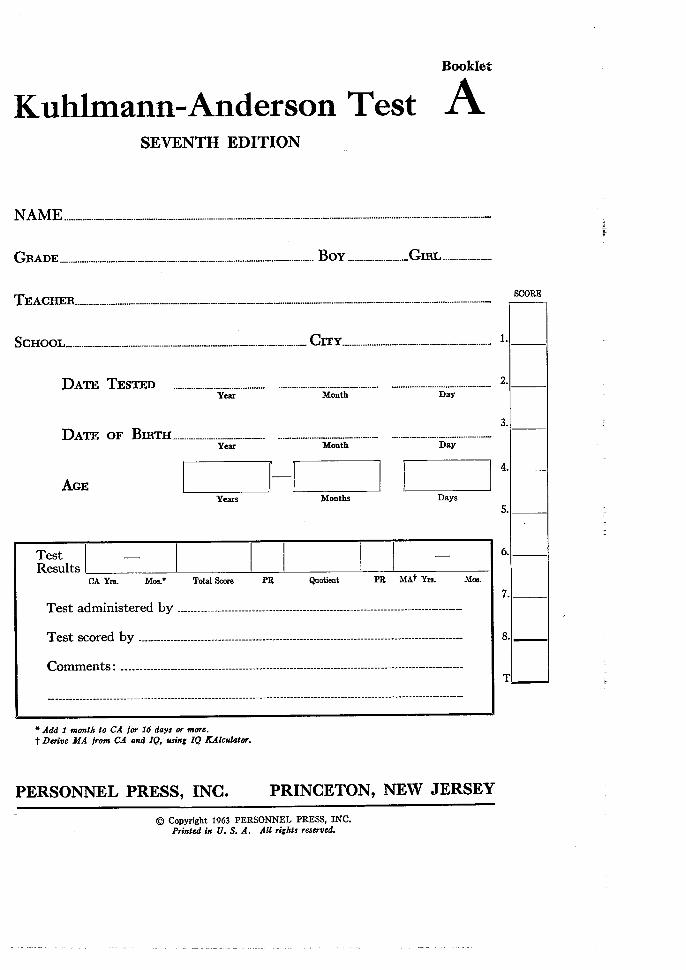
Booklet
Kuhlmann-Anderson Test A
SEVENTH EDITION
NAME .. ~ -
G.DE... - ~ Boy .~ ~
TEAcHER - ~ ~ ~ -
ScHooL_ ~ .._.~ CITY 1. ____
DArI~ TEs’rJ~D ~ .. .. ......._ - 2. ____
Year Month Day
DA’rJ~ OF Bmm . ........ .. .. - .~
Year Month Day
4. ______
AGE ________ ________ _______
Years Months Days5. _______
Test — — 6. _____
ResultsCA Yre. Moo Total Score PR Quotient PR MA? Yr~. Moe.
7. _______
Test administered by
Test scored by 8. _____
CommentsT____
* Add 1 month to CA for 16 days or more.
t Derive MA from CA and IQ, using IQ KAiculator.
PERSONNEL PRESS, INC. PRINCETON, NEW JERSEY
0 Copyright 1963 PERSONNEL PRESS, INC.Printed in U. S. A. All rights reserved.
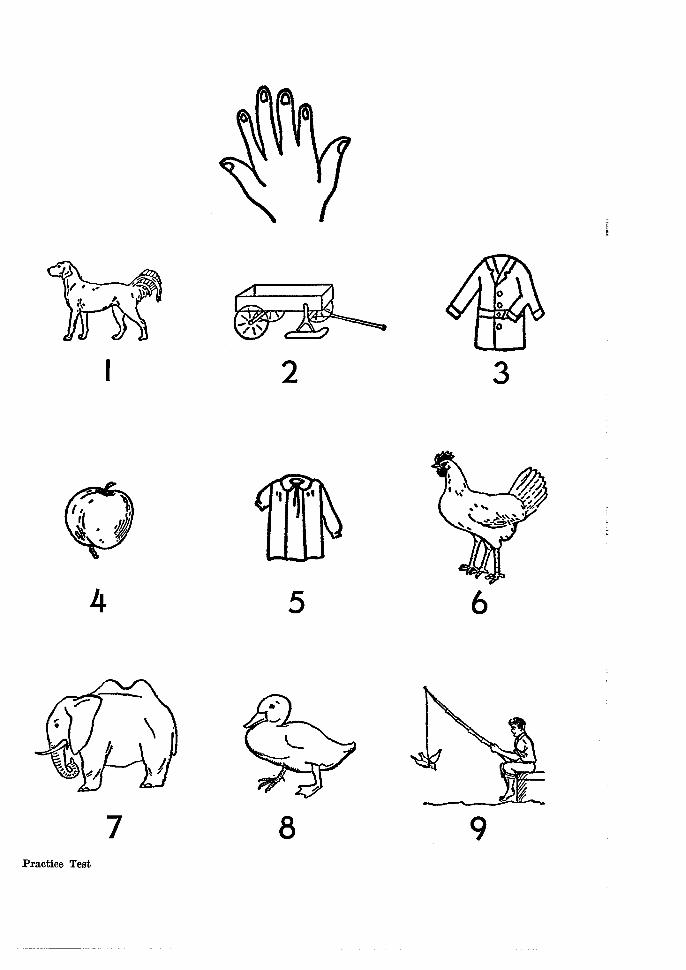
CD C..
CD CD I-~ CD
00
— I4
J~
(~)
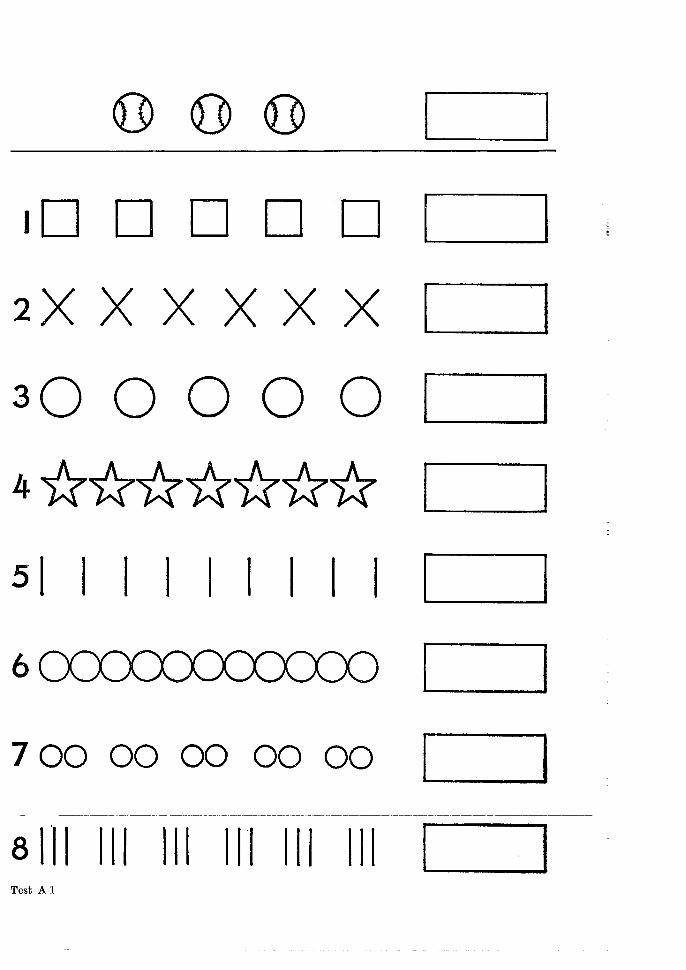
c~)_
o~
.oxII
0 0Z
~Q
Xri
©0
_0 o
*O
~ii©
0*
0*oxII
©0 0
*O
XH
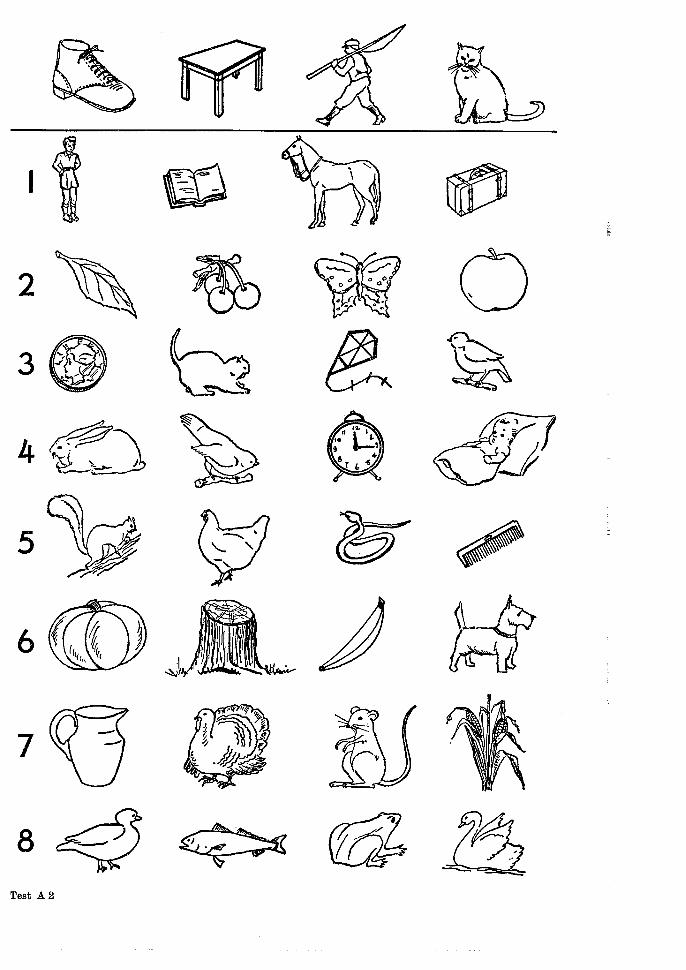
~1
‘1. 0
Test A 2
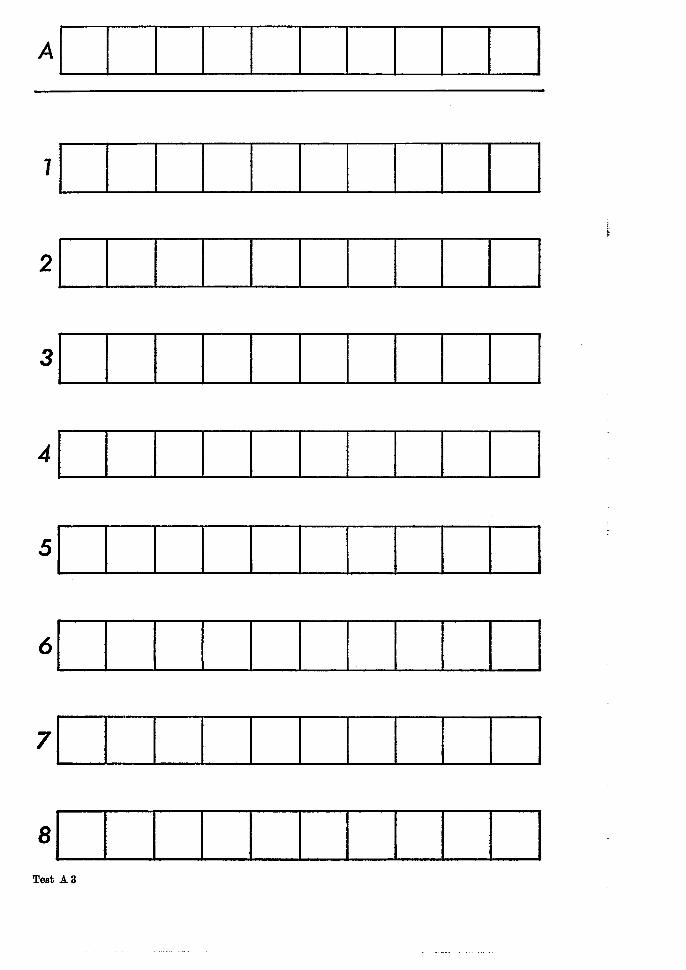
CoN
0%CA
)
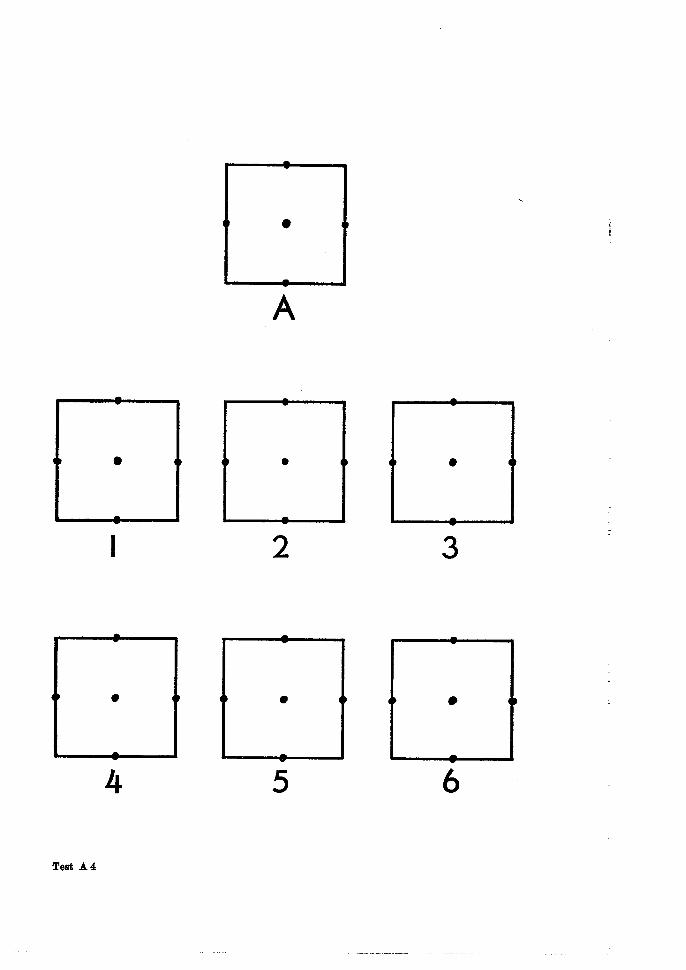
.fr
S B
S I
. S
.
S p
(~)
S I
S
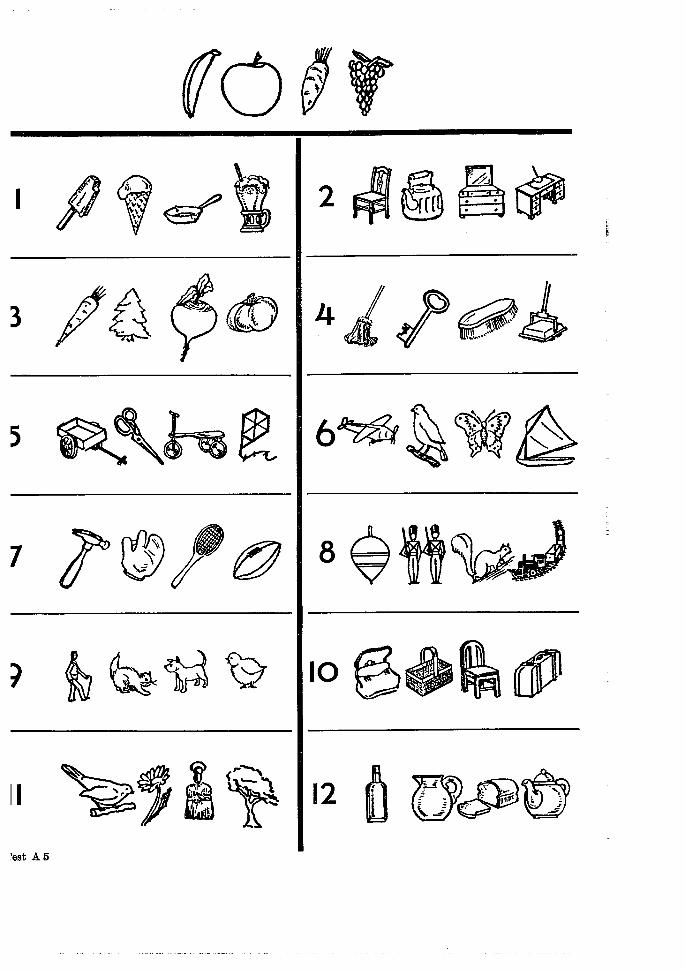
vJ
0 01
w0
00 2t1
I~
S
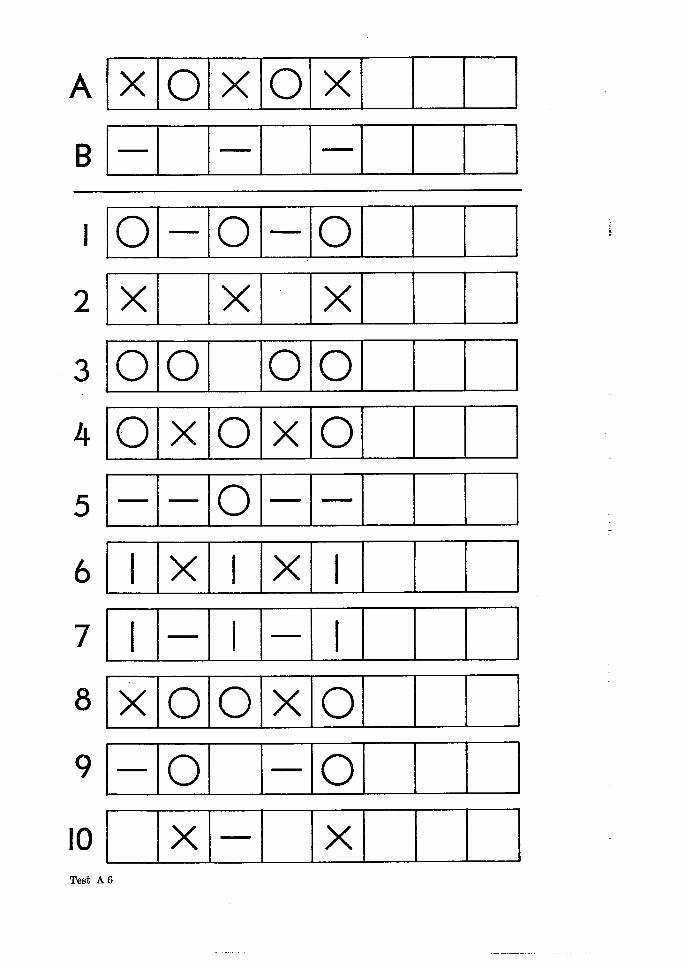
00C~
)k)
w
_Ix
—I
OO
xO
I_
xooI
ixo
_I
__
I_
0-
_0
0_
x0Ix
~_
IX
IX
IX
O_
I_
0x0
0~
--
IC
DX
CI
x
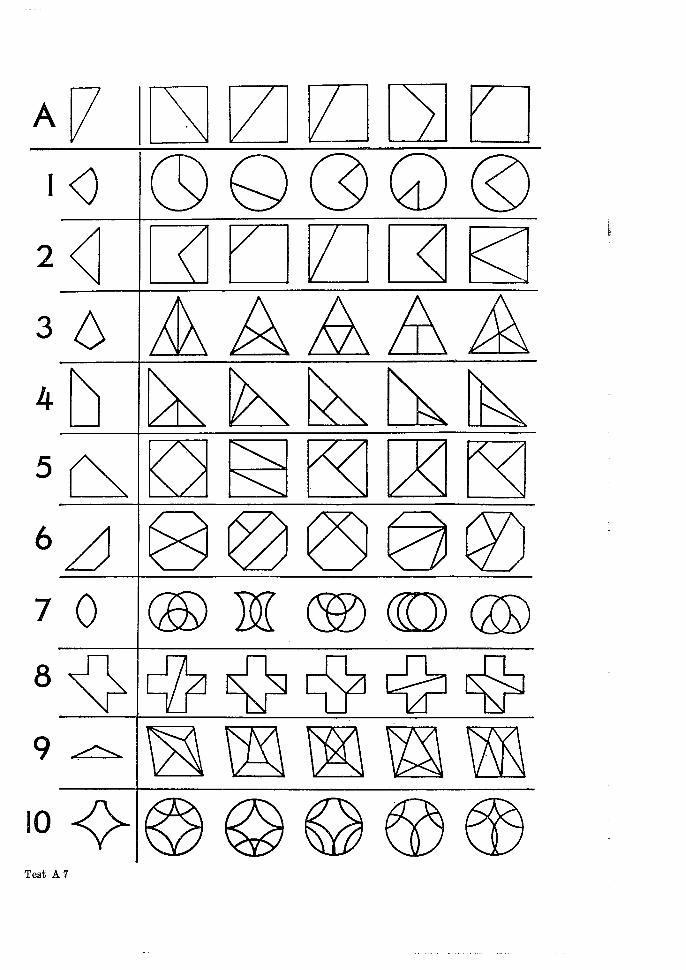
NVJVH~K~oo~©H<K
~AAA~
K>P~dV<<L/<N
A
2<
4
6/
708~
Test A 7
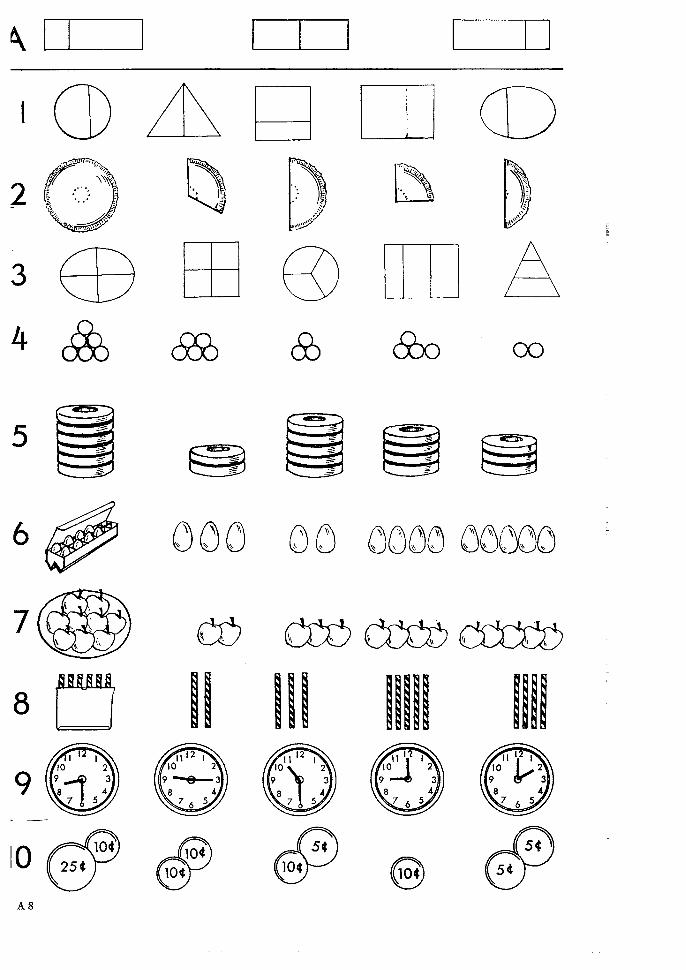
Co(~
)1%
)0 ~cE
~_
8>
C
EEl
ra
n.
rF~
J,
~%c~D
~e‘0
~~
SDH]
H
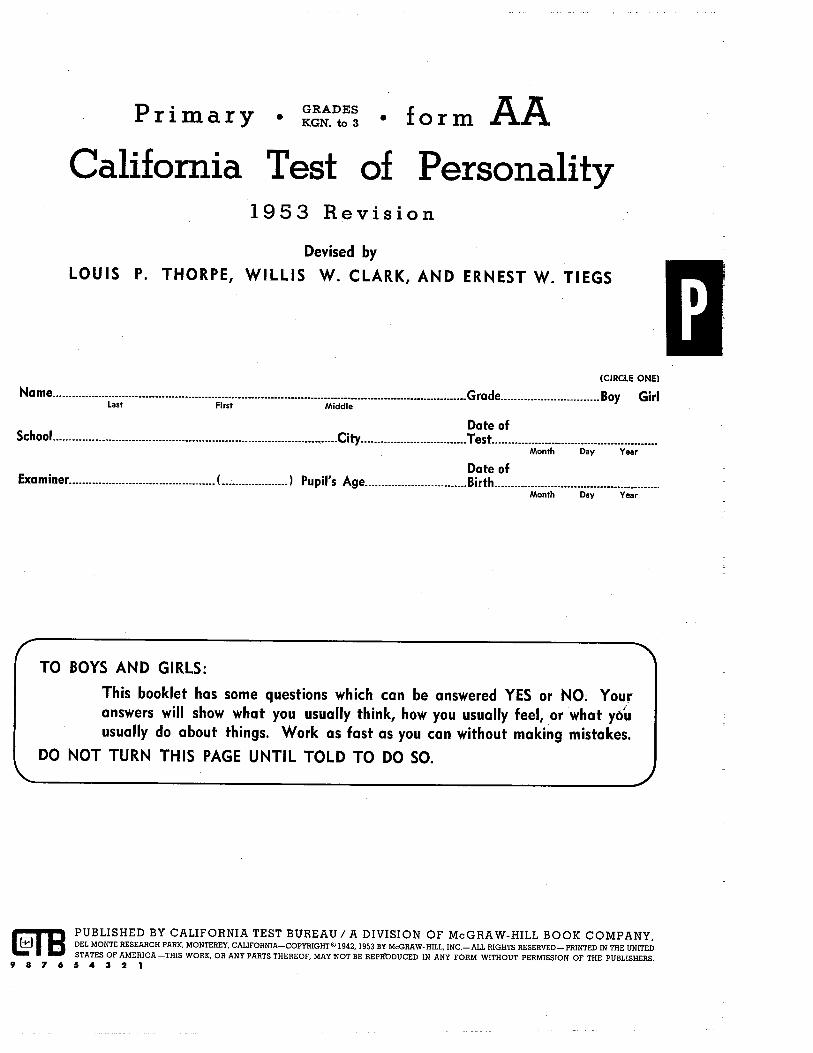
Primary GRADESKGN. to 3 form AA
California Test of Personality1953 Revision
Devised byLOUIS P. THORPE, WILLIS W. CLARK, AND ERNEST W. TIEGS
(CIRCLE ONE)
Grade Boy Girl
Date ofTest
PUBLISHED BY CALIFORNIA TEST BUREAU/A DIVISION OF McGRAW-HILL BOOK COMPANY,DEL MONTE RESEARCH PARK, MONTEREY. CALIFORNIA—COPYNIGIjT5~ 1942, 1953 BY McGRAW-HILL, INC—ALL RIGHTS RESERVED—PRINTED IN THE UNITEDSTATES OF AMERICA —THIS WORK, OR ANY PARTS THEREOF, MAY NOT BE REPI1GDUCED IN ANY FORM WITHOUT PERMISSION OF THE PUBLISHERS.
987654321
Nn m~
crk~J
Last First Middle
Date ofRrfk
Month Day Year
Examiner ( ) Pupil’s Age.Month Day Year
TO BOYS AND GIRLS:
This booklet has some questions which can be answered YES or NO. Youranswers will show what you usually think, how you usually feel, or what you
usually do about things. Work as fast as you can without making mistakes.DO NOT TURN THIS PAGE UNTIL TOLD TO DO SO.
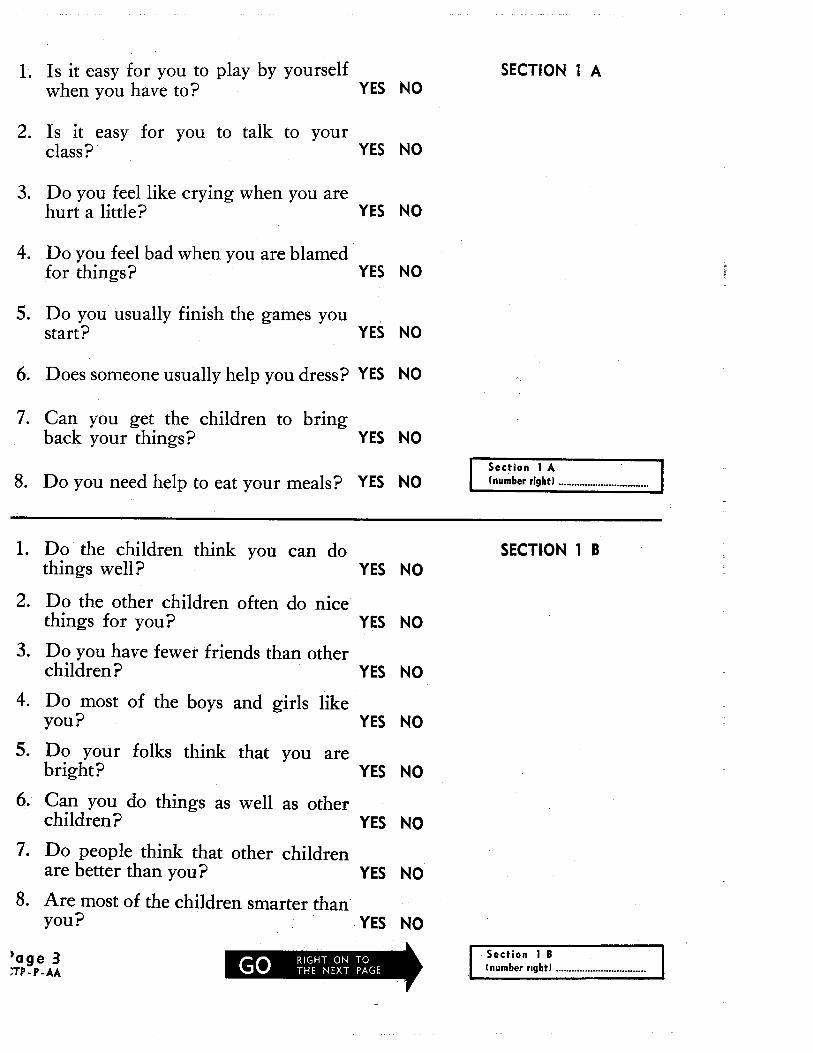
1. Is it easy for you to play by yourself SECTION 1 Awhen you have to? YES NO
2. Is it easy for you to talk to yourclass? YES NO
3. Do you feel like crying when you arehurt a little? YES NO
4. Do you feel bad when you are blamedfor things? YES NO
5. Do you usually finish the games youstart? YES NO
6. Does someone usually help you dress? YES NO
7. Can you get the children to bringback your things? YES NO
I Section 1 A8. Do you need help to eat your meals? YES NO (number right) ......
1. Do the children think you can do SECTION 1 Bthings well? YES NO
2. Do the other children often do nicethings for you? YES NO
3. Do you have fewer friends than otherchildren? YES NO
4. Do most of the boys and girls likeyou? YES NO
5. Do your folks think that you arebright? YES NO
6. Can you do things as well as otherchildren? YES NO
7. Do people think that other childrenare better than you? YES NO
8. Are most of the children smarter thanyou? YES NO
e 3 Section 1 B~TP-P-AA (number right)
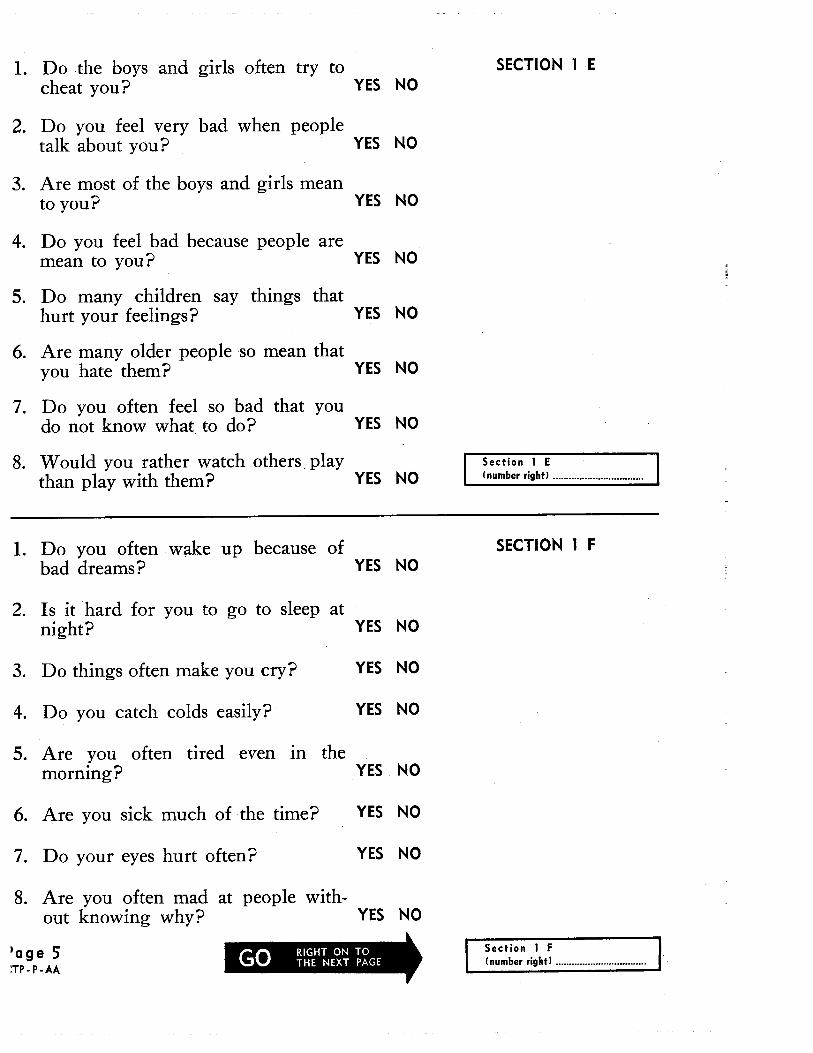
1. Do the boys and girls often try to SECTION 1 Echeat you? YES NO
2. Do you feel very bad when peopletalk about you? YES NO
3. Are most of the boys and girls meanto you? YES NO
4. Do you feel bad because people aremean to you? YES NO
5. Do many children say things thathurt your feelings? YES NO
6. Are many older people so mean thatyou hate them? YES NO
7. Do you often feel so bad that youdo not know what to do? YES NO
8. Would you rather watch others, play ‘ Section 1 E
than play with them? YES NO (number right) . . -
1. Do you often wake up because of SECTION 1 Fbad dreams? YES NO
2. Is it hard for you to go to sleep atnight? YES NO
3. Do things often make you cry? YES NO
4. Do you catch colds easily? YES NO
5. Are you often tired even in themorning? YES NO
6. Are you sick much of the time? YES NO
7. Do your eyes hurt often? YES NO
8. Are you often mad at people without knowing why? YES NO
page 5TP-P-AA GO RIGHT ON TOTHE NEXT PAGE
Section 1 F(number right)
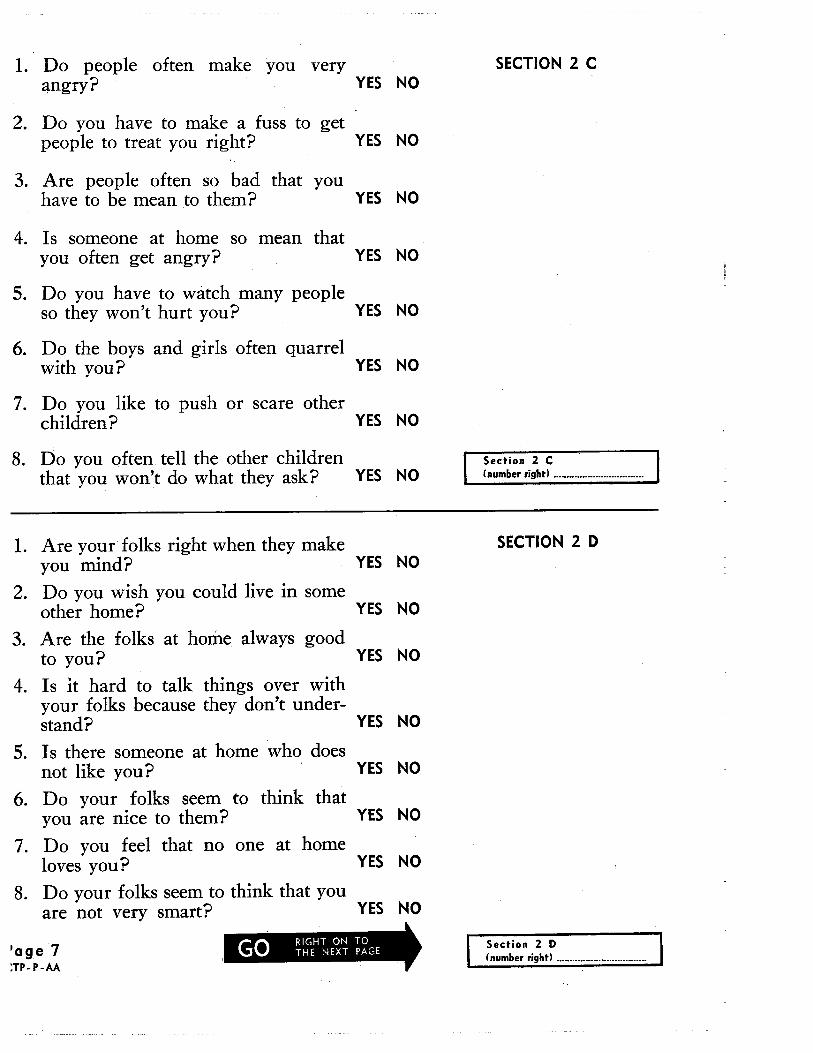
1. Do people often make you very SECTION 2 Cangry? YES NO
2. Do you have to make a fuss to get -
people to treat you right? YES NO
3. Are people often so bad that youhave to be mean to them? YES NO
4. Is someone at home so mean thatyou often get angry? YES NO
5. Do you have to watch many peopleso they won’t hurt you? YES NO
6. Do the boys and girls often quarrelwith you? YES NO
7. Do you like to push or scare otherchildren? YES NO
8. Do you often tell the other children Section 2 C
that you won’t do what they ask? YES NO (number right) ..
1. Are your folks right when they make SECTION 2 Dyou mind? YES NO
2. Do you wish you could live in someother home? YES NO
3. Are the folks at home always goodto you? YES NO
4. Is it hard to talk things over withyour folks because they don’t understand? YES NO
5. Is there someone at home who doesnot like you? YES NO
6. Do your folks seem to think thatyou are nice to them? YES NO
7. Do you feel that no one at homeloves you? YES NO
8. Do your folks seem to think that youare not very smart? YES NO
age 7TP - P - AA
Go RIGHT ON TOTHE NEXT PAGE[~ection 2 D
(number tight) —
V
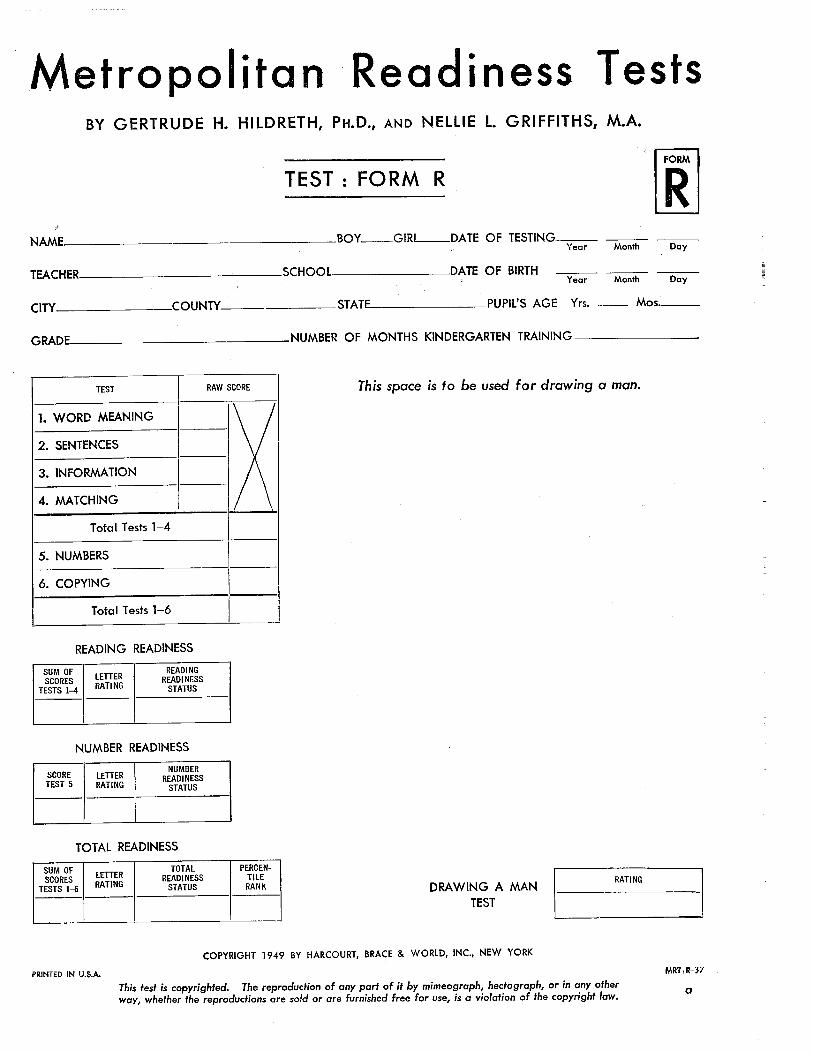
Metropolitan - Readiness TestsBY GERTRUDE H. HILDRETH, PH.D., AND NELLIE 1. GRIFFITHS, M.A.
TEST: FORM RFORM
NAME .BOY GIRl DATE OF TESTING______Year Month Day
TEACHER
_______SCHOOL
DATE OF BIRTHYear Month Day
CITY COUNTY. CT A T~ PUPIL’S AGE Yrs._____ Mos.______
f~D A r~~_nnL,_
~ TEST RAW SCORE
1. WORD MEANING
2. SENTENCES
3. INFORMATION
4. MATCHING
Total Tests 1—4
5. NUMBERS
6. COPYING
Total Tests 1—6
READING READINESS
~NUMBER OF MONTHS KINDERGARTEN TRAINING
This space is to be used for drawing a man.
SUM OF READINGSCORES LETFER READINESSRATINGTESTS 1—4 STATUS
NUMBER READINESS
SCORE LETtER 1 NUMBER~ READINESSTEST 5 RATING STATUS
DRAWING A MANTEST
RATING
COPYRIGHT 1949 BY HARCOURT, BRACE & WORLD, INC., NEW YORK
PRINTED IN U.S.A.
This test is copyrighted. The reproduction of any part of it by mimeograph, hectograph, or in any otherway, whether the reproductions are sold or are furnished free for use, is a violation of the copyright low.
MRT R-37
TOTAL READINESS
a
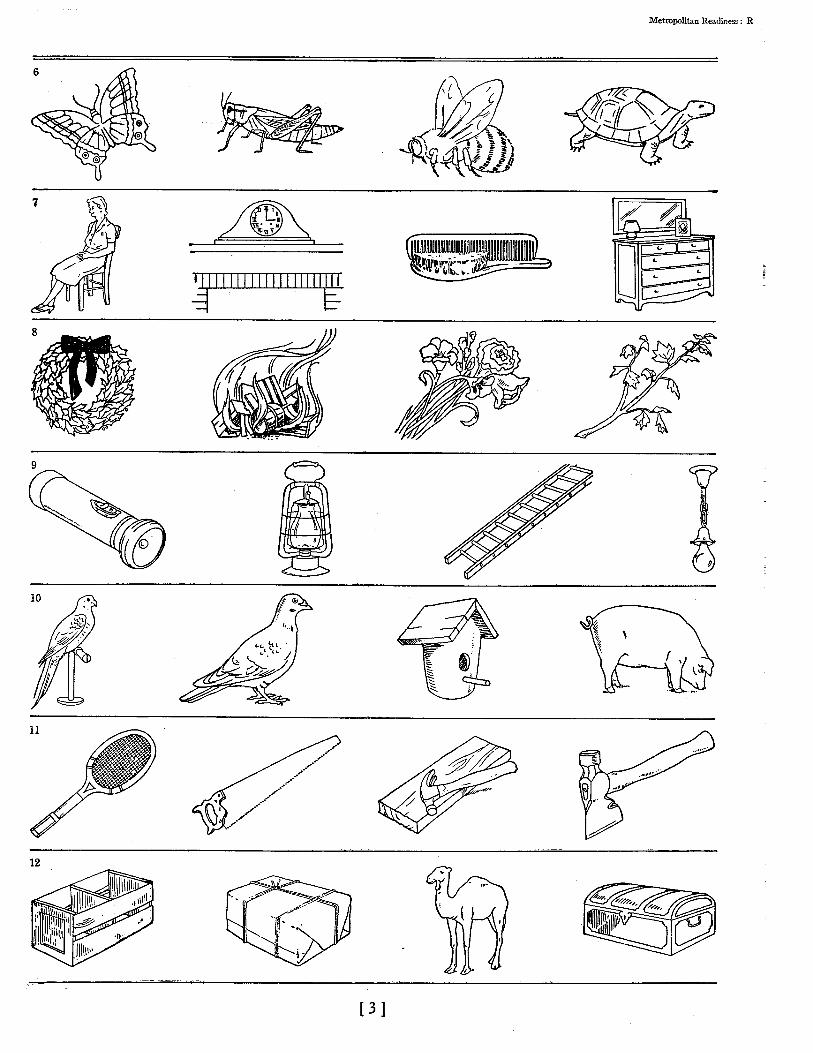
I~]
9 .II111111111Ii—
9
I
~s~urp~u~~odo.qoJ41
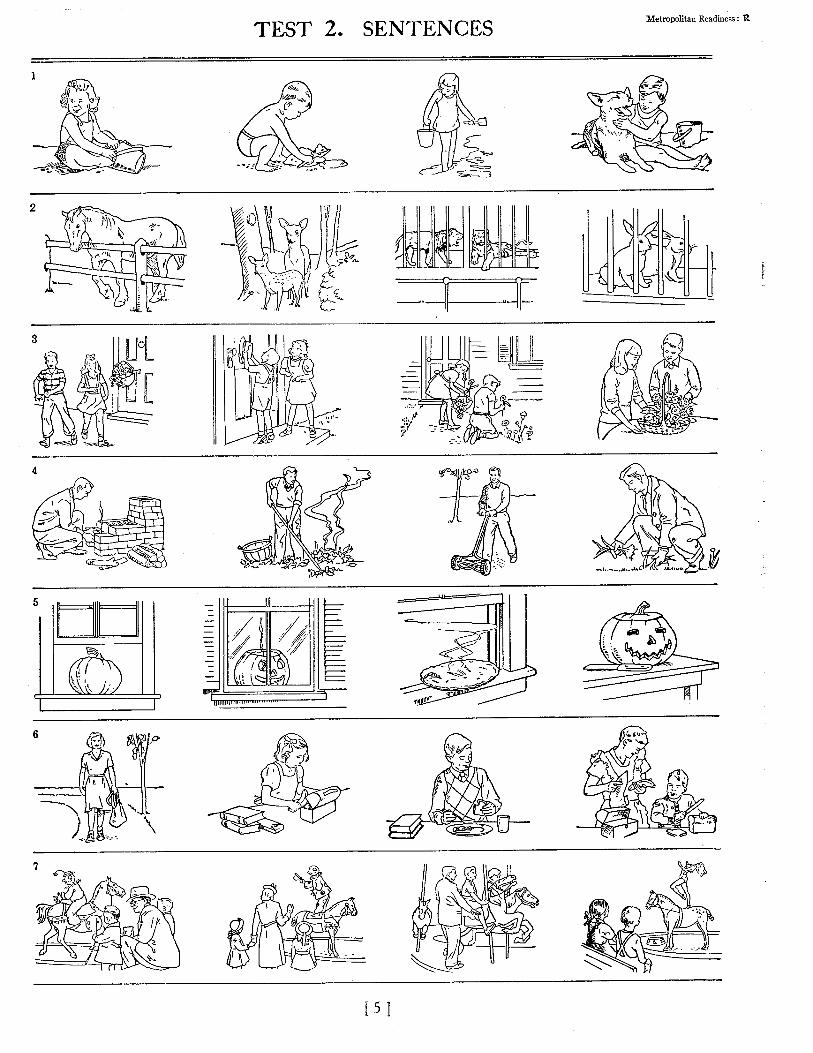
[ci
cz
Hr19
SS~UTp~)JudO1~p~S~ON3J~N~1S.ZJ~S~II
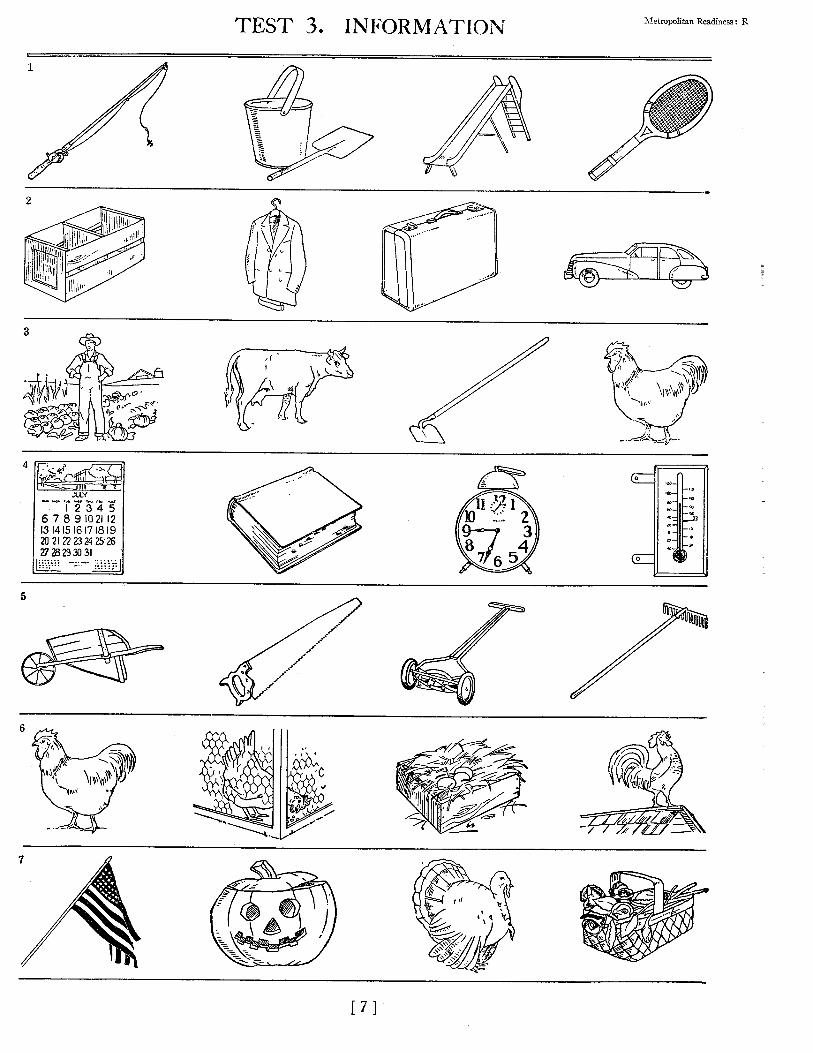
TEST 3. INFORMATION I~etropoiitan Readiness: R
4~
JJLV
~ 23456789102112131415161718192021222324252627~23303I~ Zll~
5
[71
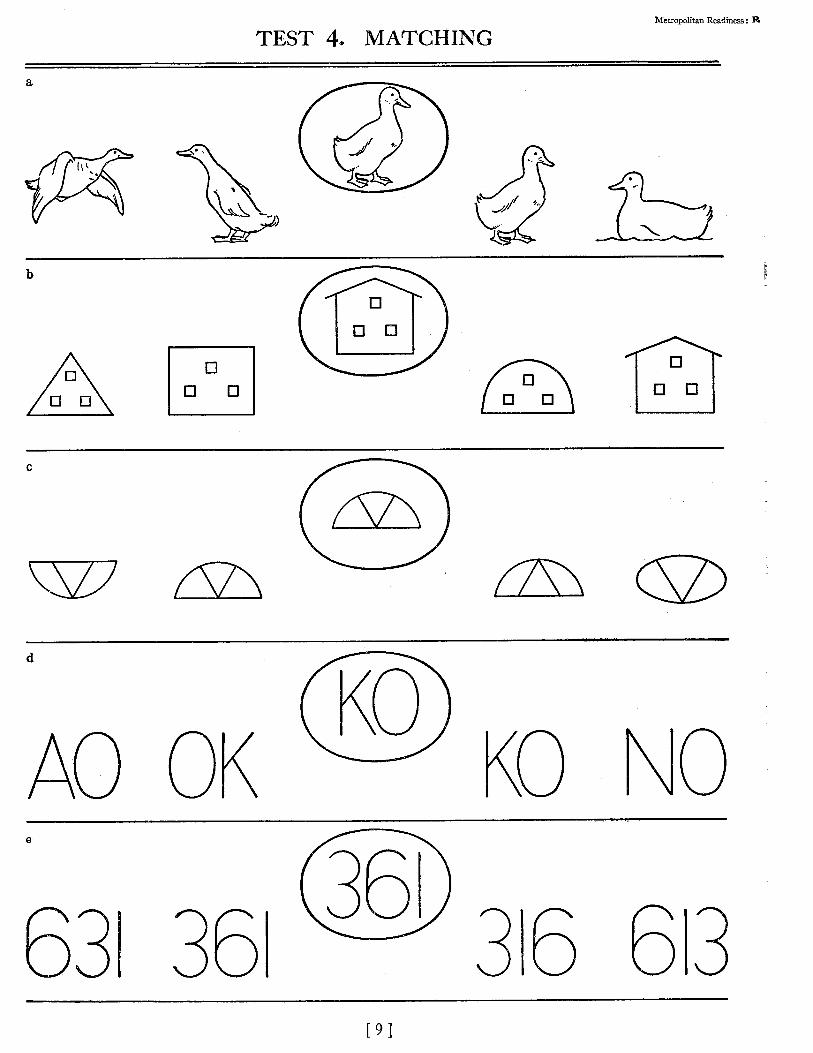
TEST 4. MATCHINGMetropoiitan Readiness:
C
~D OK KO NO
63~ 36~ 3~6 6~3[9]

[IL]
6
\~lw~
~
31
ss~tItp~)JU~!LOdOi4~JA~
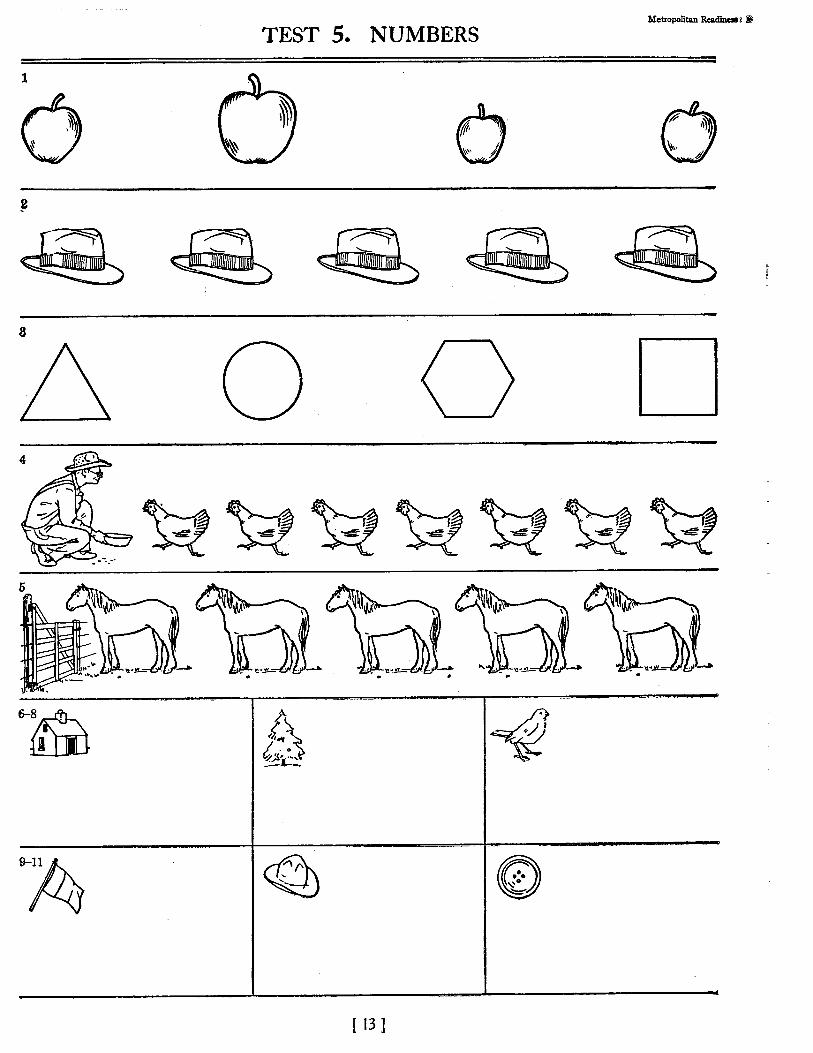
[~II~-
,~
~V9
3
r~~,.40
I
S~MHJAIflN.s~LS~LL u~1jodo1~~
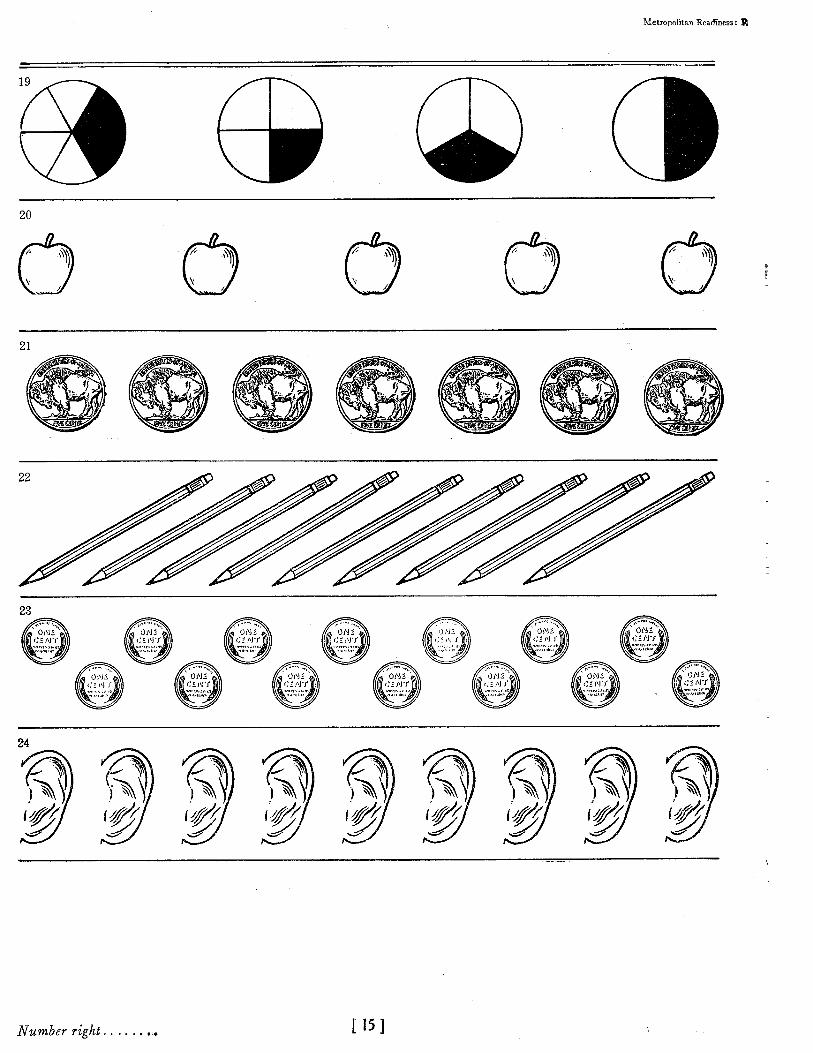
[ci]~[~i.1~
c~)~1J03
0C
ss~ujp~~U~[(X~o.L1~p~
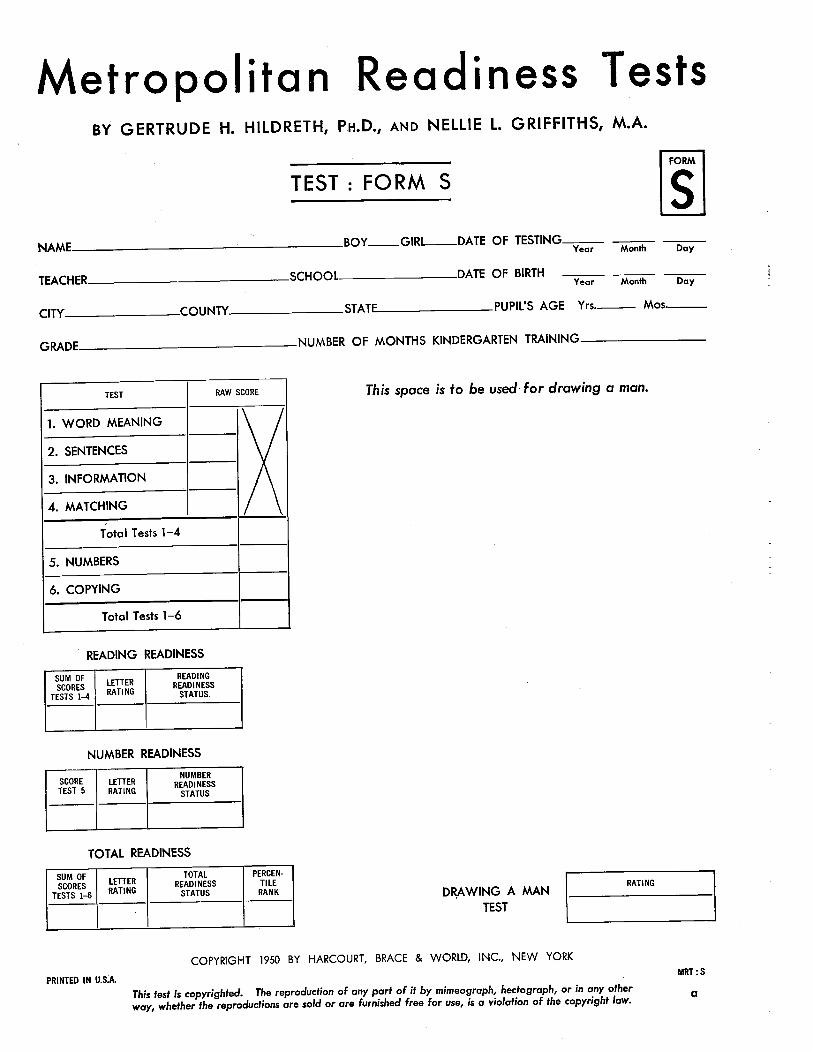
Metropolitan Readiness TestsBY GERTRUDE H. HILDRETH, PH.D., AND NELLIE L. GRIFFITHS, M.A.
TEST: FORM S
NAME BOY GIRl DATE OF TESTING Year Month Day
TEACHER
CITY COUNTY STATE.
_DATE OF BIRTHYear Month Day
________PUPIL’S AGE Yrs._____ Mos______
GRADE—
READING READINESS
NUMBER OF MONTHS KINDERGARTEN TRAINING.
This space is to be used for drawing a man.
SUM OF READINGSCORES LETTER READINESSRATINGTESTS 1—4 STATUS.
NUMBER READINESS
SCORE LETTER NUMBERTEST 5 RATING READINESSSTATUS
TOTAl. READINESS
SUM OF TOTAL PERCEN- iSCORES LETFER READINESS TILERATINGTESTS 1—6 STATUS RANK
I jDRAWING A MAN
TEST r RATING
PRINTED IN U.S.A.
COPYRIGHT 1950 BY HARCOURT, BRACE & WORLD, INC., NEW YORK
This test is copyrighted. The reproduction of any part of it by mimeograph, hectograph, or in any otherway, whether the reproductions are sold or ore furnished free for use, is a violation of the copyright tow.
MRT:S
a
FORMsi
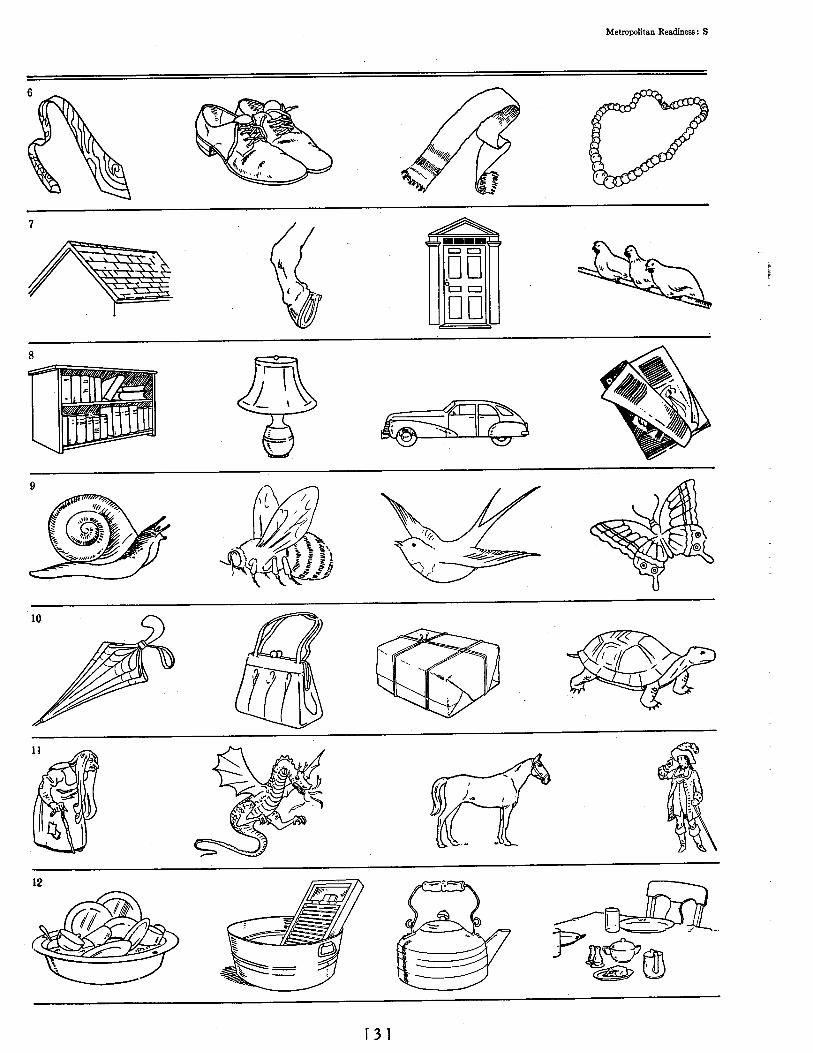
o~
U~
I1~~Iz1o
~uy
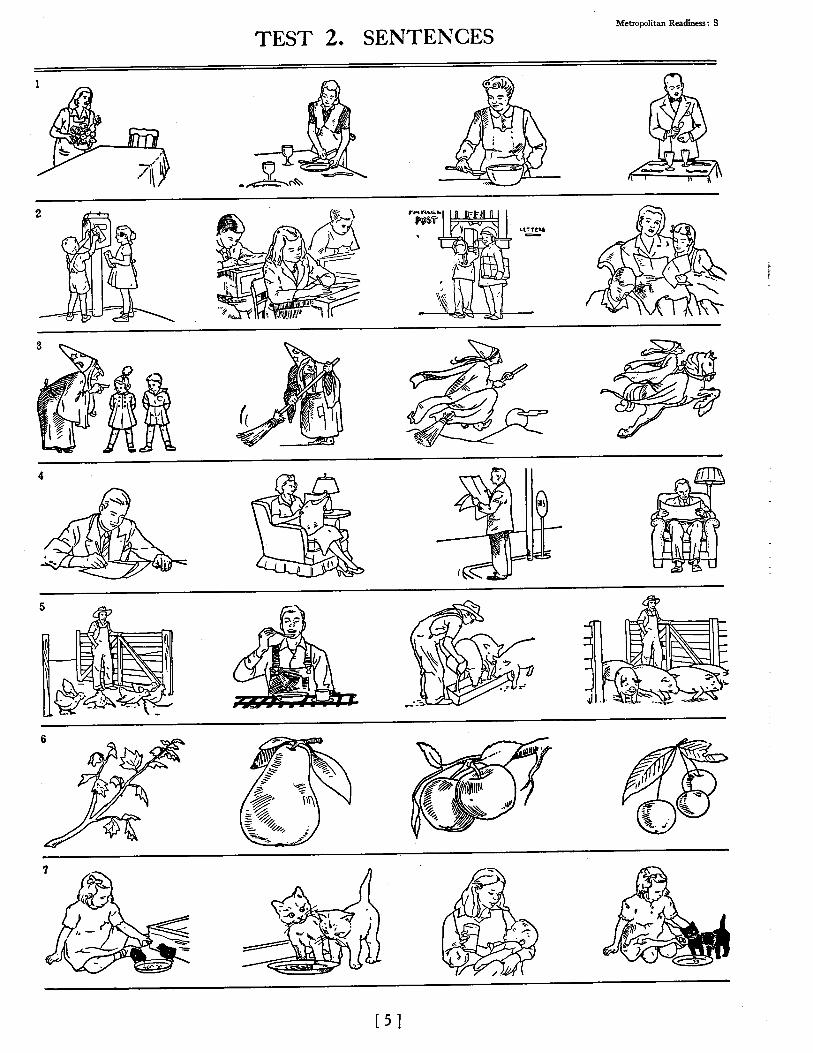
tc]
t
ss~uipea~U!1OdO1~WS~ON~LLN~S.ZJ~S3J.~
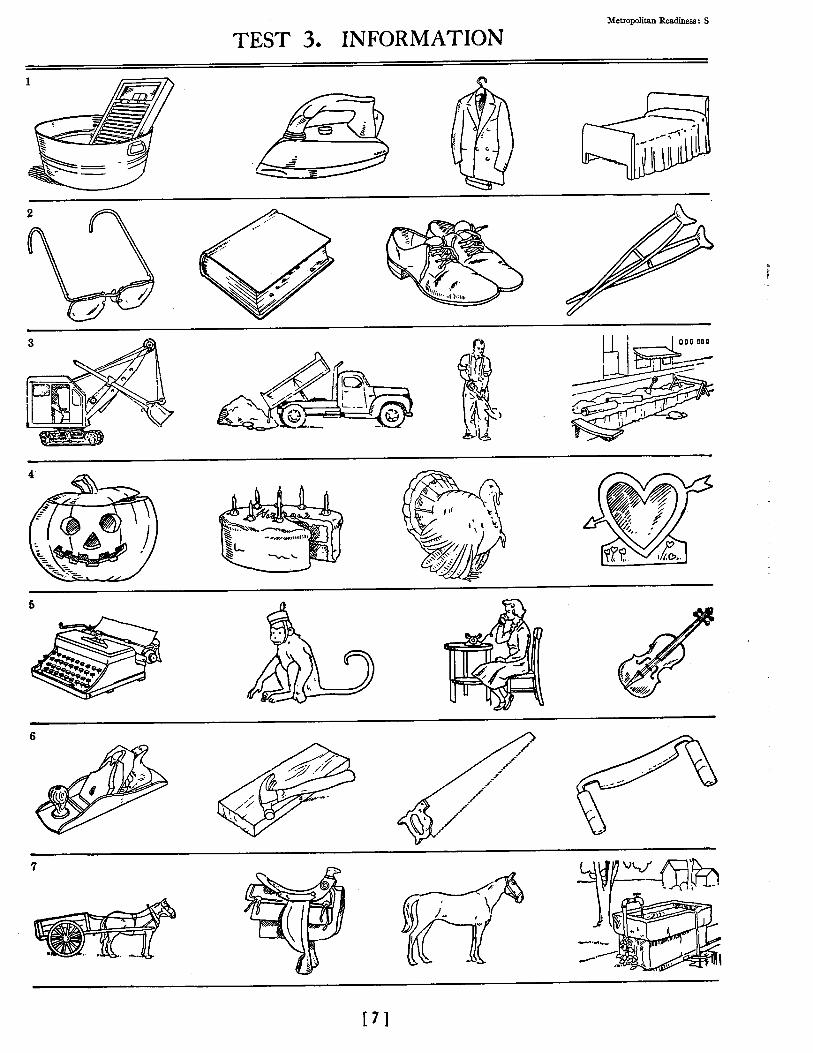
Cl)
.
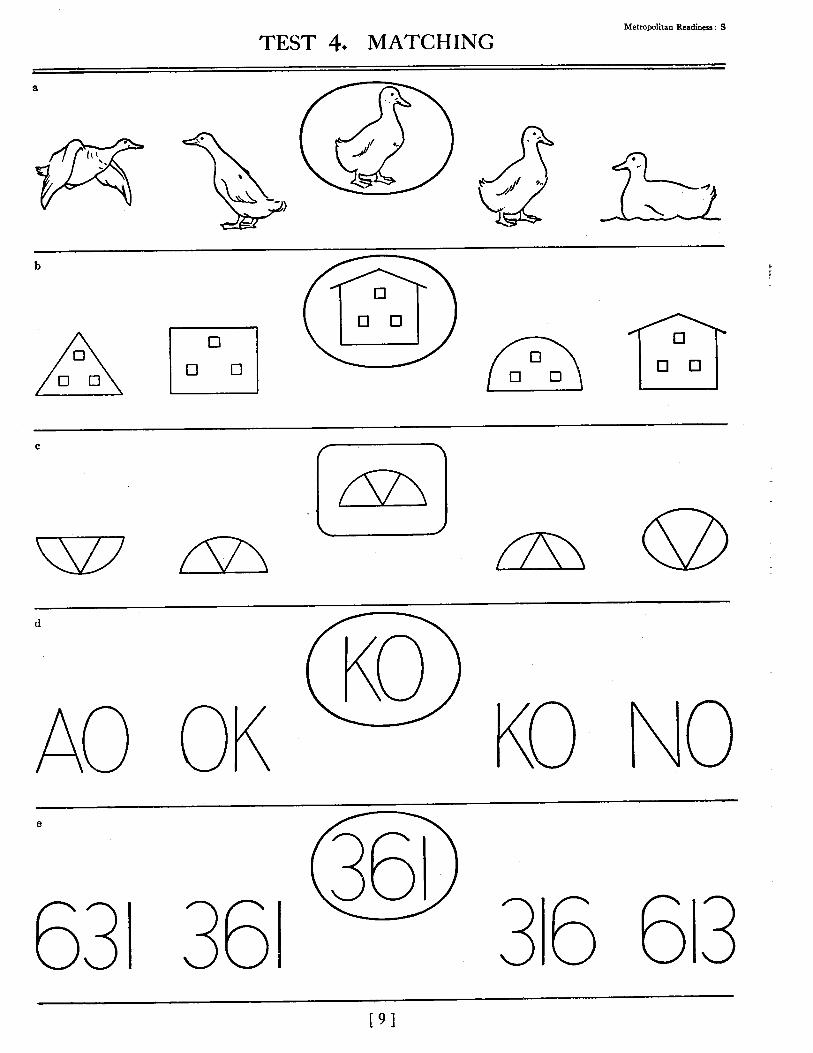
TEST 4. MATCHINGMetropolitan Readiness: S
b
~
C
~
d DAOOK KONO
6a 36~ 3~6 6~3[91

[Li~
©
0t
)(X)~(6
S
L
s~S~U!P~IU~!LOdO1~J~1
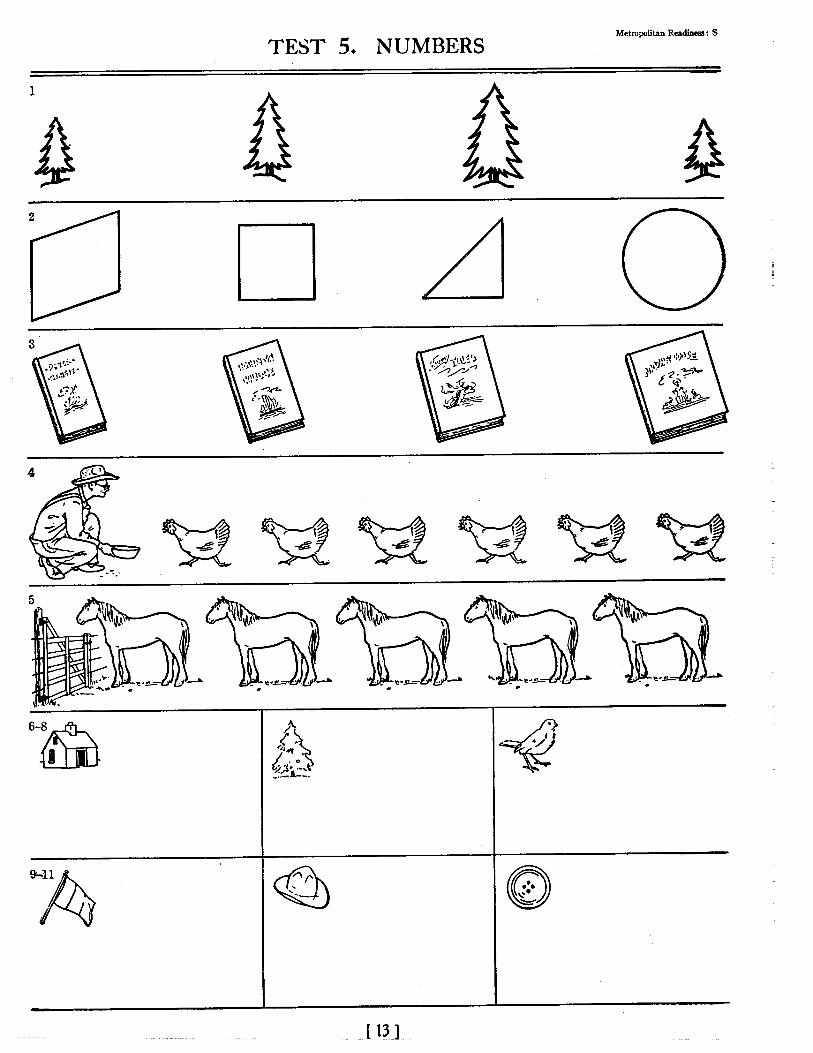
Metropolitan Readiness S
TEST 5. NUMBERS
[13]
A 4
. 
-~ s:fz: -~ -~ -~
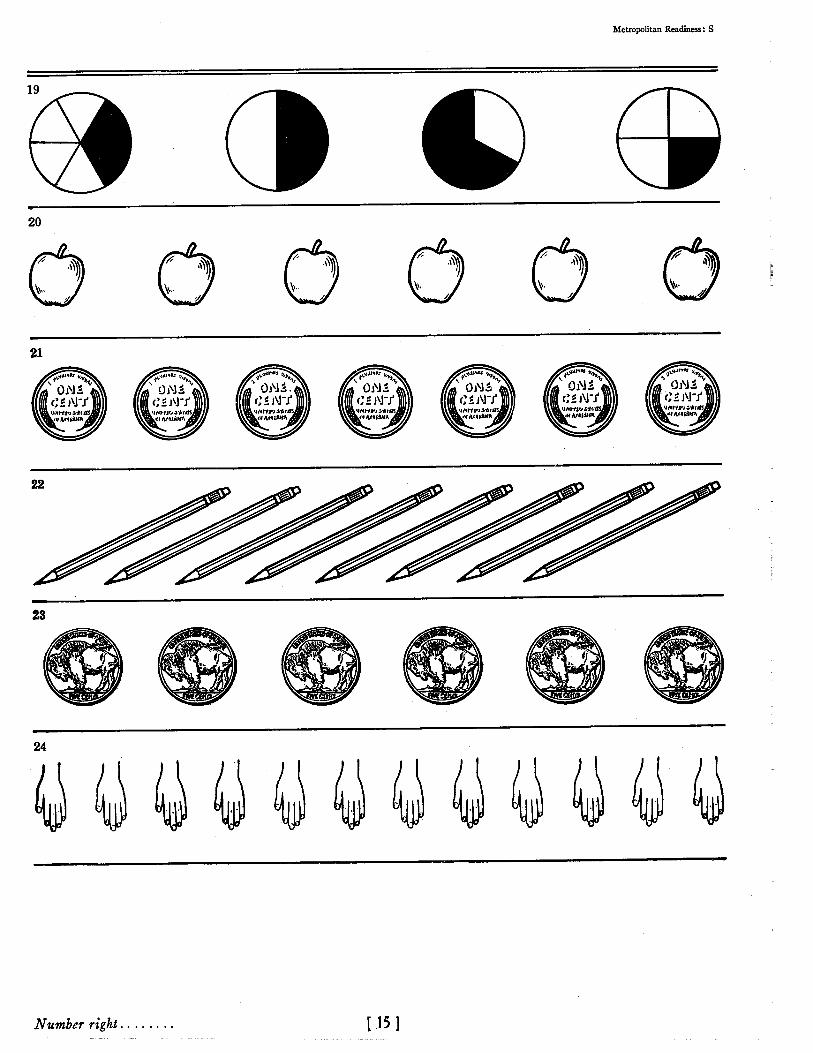
IcII71f2~.1~
0
s:ss~uTp~U~!1OdOi1~N


