Embed Size (px)
Citation preview
sustainability
Article
A Comparison of Motorcycle Helmet WearingIntention and Behavior between Urban andRural Areas
Sajjakaj Jomnonkwao 1,*, Duangdao Watthanaklang 2, Onanong Sangphong 2,Thanapong Champahom 1 , Napat Laddawan 1 , Savalee Uttra 1
and Vatanavongs Ratanavaraha 1
1 School of Transportation Engineering, Institute of Engineering, Suranaree University of Technology,Nakhon Ratchasima 30000, Thailand; [email protected] (T.C.); [email protected] (N.L.);[email protected] (S.U.); [email protected] (V.R.)
2 Department of Construction Technology, Faculty of Industrial Technology,Nakhon Ratchasima Rajabhat University, Nakhon Ratchasima 30000, Thailand;[email protected] (D.W.); [email protected] (O.S.)
* Correspondence: [email protected]; Tel.: +66-4422-4238
Received: 4 September 2020; Accepted: 10 October 2020; Published: 12 October 2020�����������������
Abstract: The motorcycle is one of the important modes of transport for Thai people in all provincesdue to its convenience and ability to access all areas and cover short distances, which is especiallyconvenient for rural people. However, according to the accident record, it was found that themotorcycle was the vehicle causing the highest amount of accidents, and helmet wearing could savelives and reduce the level of severe injuries. In this regard, the objective of this study was to studyand develop a model of factors that affected helmet use behavior using structural equation modeling(SEM) based on the Health Belief Model (HBM). Further, this study compared urban and rural models,so as to suggest suitable guidelines for the promotion of helmet use in the study areas. The samplecomprised 801 motorcycle users divided into 401 urban residents and 400 rural residents. From theparameter invariance testing in the two areas, a chi-square difference test found differences in thefactor loading, intercepts, and structural paths between urban and rural societies.
Keywords: helmet wearing intention and behavior; health belief model; structural equation modeling;multigroup analysis; promotion of helmet use
1. Introduction
1.1. Background
In general, the rate of motorcycle use in developing countries has continued to increase annually [1,2],including Thailand, where usage rates over the past decade have increased up to 38.44%. The numberof motorcycles in Thailand increased from 14.5 million vehicles in 2005 to 20.5 million vehicles in2017 [3]. The widespread use of motorcycles is because they are easy to ride, can access all areas, and aresuitable for short-distance travel. They are especially popular among rural residents, often being thefirst vehicle for new employees [4] who usually have lower wages [5]. Aspects of urban and the ruralsocieties are different towards health behavior. In the past, researchers investigated the differencebetween urban and rural areas for determining the policies in each area. For example, the role ofsocial support associated with individual psychological well-being [6]. Prudential value influencedhappiness and life satisfaction [7]. In Thailand, non-helmeted drivers are illegal. There were somedifferences between the urban and rural areas, such as in urban areas there is a strict law enforcement
Sustainability 2020, 12, 8395; doi:10.3390/su12208395 www.mdpi.com/journal/sustainability
Sustainability 2020, 12, 8395 2 of 16
more than in rural areas. The promoted helmet wearing in rural was less than urban areas, making thetwo societies different in terms of health perception.
In reference to the total number of road accidents classified by vehicle type, trends indicate thatmotorcycle crash rates have increased by 24.31% [8]. The parts of the body that are most susceptible toserious and fatal injuries are the head and face [9,10]. Evidence based on reviews indicated that wearinga helmet could prevent death and reduce the severity of injuries [11–13]. Moreover, non-helmeted ridersare three times more likely to die than helmeted riders [14]. The use of helmets significantly reduceshead and neck injuries and the probability of consequent deaths by 53% and 72%, respectively [15].Jou et al. [16] found that motorcyclists are 3.81 times more likely to die in an accident if they are notwearing a helmet. In this regard, the types, standard, and durability of materials used for helmetproduction also affect the effectiveness of the helmet’s defense against impact forces [17,18].
Although it is proven that helmets can prevent and diminish the magnitude of crash severity,and there has been a continuing campaign regarding helmet advantages coupled with the regulationsissued by government, helmet use rates have not yet reached 100% [19]. There have been many studiesthat have investigated measures to increase helmet use, such as increased law enforcement [20,21]and the participation of communities [22]. Likewise, knowledge provision, awareness creation,and community collaboration may contribute to developing a good attitude toward helmet use.From the results of such studies, helmet use rates have increased from 13.23% to 44.69%, which hasreduced the percentage of fatalities by 6.4% [22].
From the previous research studying the factors affecting helmet use in motorcycle riders, most ofthem have studied personal factor, time factor, and law enforcement. For data analysis, they used basicstatistical methods. Differently, this study additionally considered social psychological factors andanalyzed data by Structural Equation Modeling (SEM) which is an advanced statistic in order to bemore accurate in hypothesis testing, prediction, and forecast. The present study aims to determinethe factors that influence helmet use in both urban and rural society in Thailand, on the basis of theHealth Belief Model. The aim was to discern what factors influence the wearing of helmets in eacharea, which could assist in identifying the policies required to encourage the wearing of helmets.
1.2. Health Belief Model
The Health Belief Model (HBM) has been widely used to explain the factors that influenceindividual health behavior with an early agreement that individuals will look for and follow healthprevention practices such as health inspections or rehabilitation.
According to Rosenstock [23], the HBM consists of four factors: perceived susceptibility todisease, perceived severity of disease, perceived benefits of preventive action, and perceived barriersto preventive action. Maiman and Becker [24] extended these factors and added more details, as theearlier HBM had only been able to predict preventive disease behavior. The HBM of Maiman andBecker [24] has the following factors:
1. Perceived susceptibility to disease means a person’s direct beliefs about their behavior. They believeor predict that the risk of contracting diseases or having some level of health problems is relatedto their sickness avoidance actions. The perception of susceptibility to disease is accepted as themain factor in people’s behavior toward good health.
2. Perceived severity of disease means the belief that people have towards their ability to assess theseverity of diseases or health problems themselves, which includes such elements as the causesof disabilities, death, difficulties, time-consuming cures, complicated diseases, or the effects ontheir social roles. The perception of susceptibility to disease (1) accompanied with the perceivedseverity of disease, (2) allow people to recognize the perceived threat of disease and thereforeavoid it.
3. Perceived benefits of preventive action refers to how people search for methods to maintainthemselves or to recover from or prevent diseases. The practice must be recognized as good,beneficial, and suitable to prevent susceptibility to disease. The decision to follow suggestions
Sustainability 2020, 12, 8395 3 of 16
depends on comparisons between the advantages and disadvantages of such behavior andchoosing that which offers greater advantages.
4. Perceived barriers to preventive action means the beliefs a person has in the possible problemsand obstacles that prevent practical behavior and that are connected to the person’s negativehygienic health behavior, such as the expense involved and illness. Those people who believethere are many problems create barriers that make behavioral change more difficult.
5. Cue to action means the events that bring about a person’s required behavior. Completing theHBM requires a consideration of two sides: internal cues such as the acknowledgement theirown body condition, and the symptoms of diseases and sickness, and external cues such asobtaining information through mass media or warnings from loved ones or respected peoplesuch as husbands, wives, fathers, and mothers.
6. Modifying factors are factors that do not directly affect health behavior but affectacknowledgement and practice, such as population factors including age and level of education,and sociopsychological factors including health motivation, which could modify an individual’sdecision to use a helmet.
1.3. HBM in Transportation Safety Studies
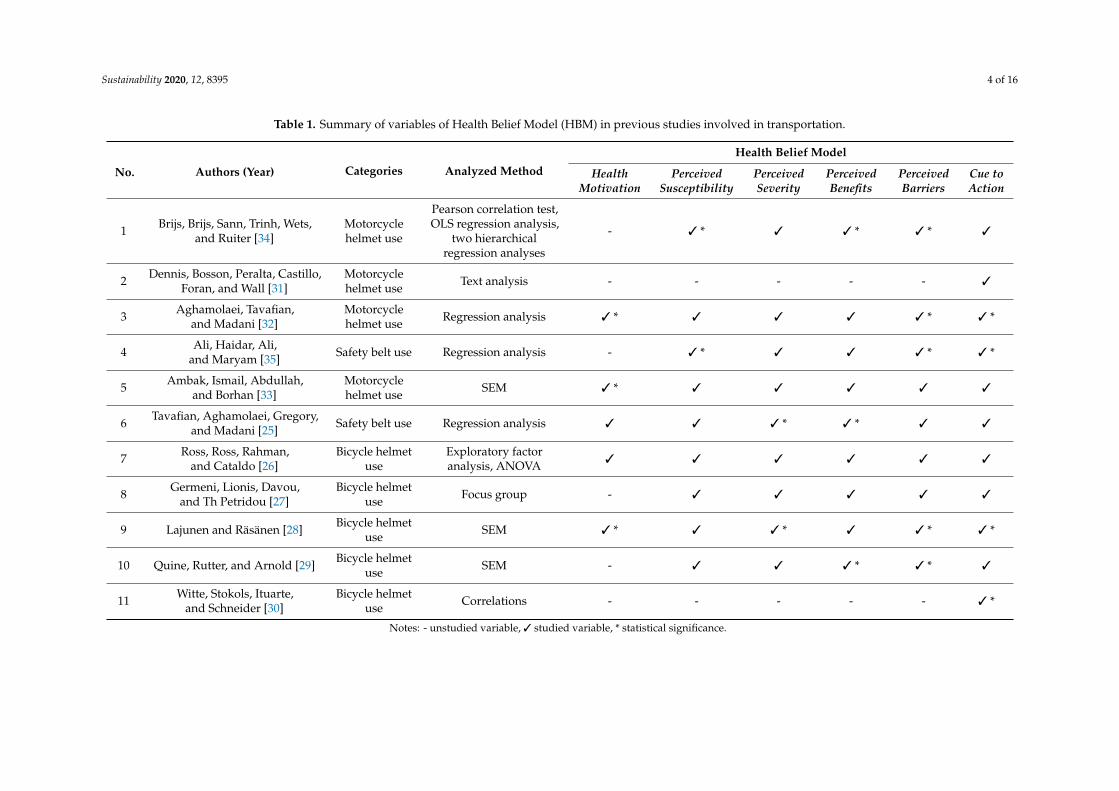
Table 1 summarizes 11 previous research papers that employed the HMB in transportation safetystudies. These include five studies on bicycle helmet use [25–30], four studies on motorcycle helmetuse [31–34], and two studies on safety belt use [25,35].
From Table 1, it was found that five studies of which six factors, considered according to HBM,including health motivation, perceived susceptibility, perceived severity, perceived benefits, perceivedbarriers, and cue to action [25,26,28,32,33]. The results of each study were different. Moreover, it wasalso found that four studies consider the factors according to HBM frame with five factors withoutconsidering health motivation [27,29,34,35] of which the results were different. It was also found thatfour studies considering HBM frame had only one factor which was cue to action [30,31]. Consideringthe method of data analysis, it was found that there were different methods including Pearsoncorrelation test, OLS regression analysis, two hierarchical regression analyses, text analysis, regressionanalysis, SEM, exploratory factor analysis, ANOVA, focus group.
From 11 research articles, the factors used in each study generally followed the HBM framework.The levels of statistical significance for these factors are summarized in Table 1, which presents thedifferent findings based on the application of the HBM for bicycles and motorcycle helmet use, safetybelt use, or the specified context in each country.
Sustainability 2020, 12, 8395 4 of 16
Table 1. Summary of variables of Health Belief Model (HBM) in previous studies involved in transportation.
No. Authors (Year) Categories Analyzed Method
Health Belief Model
HealthMotivation
PerceivedSusceptibility
PerceivedSeverity
PerceivedBenefits
PerceivedBarriers
Cue toAction
1 Brijs, Brijs, Sann, Trinh, Wets,and Ruiter [34]
Motorcyclehelmet use
Pearson correlation test,OLS regression analysis,
two hierarchicalregression analyses
- 3 * 3 3 * 3 * 3
2 Dennis, Bosson, Peralta, Castillo,Foran, and Wall [31]
Motorcyclehelmet use Text analysis - - - - - 3
3 Aghamolaei, Tavafian,and Madani [32]
Motorcyclehelmet use Regression analysis 3 * 3 3 3 3 * 3 *
4 Ali, Haidar, Ali,and Maryam [35] Safety belt use Regression analysis - 3 * 3 3 3 * 3 *
5 Ambak, Ismail, Abdullah,and Borhan [33]
Motorcyclehelmet use SEM 3 * 3 3 3 3 3
6 Tavafian, Aghamolaei, Gregory,and Madani [25] Safety belt use Regression analysis 3 3 3 * 3 * 3 3
7 Ross, Ross, Rahman,and Cataldo [26]
Bicycle helmetuse
Exploratory factoranalysis, ANOVA 3 3 3 3 3 3
8 Germeni, Lionis, Davou,and Th Petridou [27]
Bicycle helmetuse Focus group - 3 3 3 3 3
9 Lajunen and Räsänen [28] Bicycle helmetuse SEM 3 * 3 3 * 3 3 * 3 *
10 Quine, Rutter, and Arnold [29] Bicycle helmetuse SEM - 3 3 3 * 3 * 3
11 Witte, Stokols, Ituarte,and Schneider [30]
Bicycle helmetuse Correlations - - - - - 3 *
Notes: - unstudied variable, 3 studied variable, * statistical significance.
Sustainability 2020, 12, 8395 5 of 16
2. Materials and Methods
2.1. Sample Characteristics
This study was conducted nationwide using simple random sampling. The samples in this studywere 801 people (female 53% and male 47%), who rode a motorcycle to study or regular work (71%)and for other reasons (29%), consisted of motorcycle riders (67%), and motorcycle passengers (33%).Types of roads were classified as city streets (50.06%) and outside city roads (49.94%).
2.2. Survey Design
For the structural equation model, Golob [36] has proposed four methods of sampling. This studychose one of methods by considering that the sample size used to estimate maximum likelihood shouldbe at least 15 times the observable variables [37]. From these suggestions, the minimum sample sizefor this study was 15 × 20 = 300 for each urban and rural group.
The research tool used to collect data was a questionnaire that the researcher constructed usingthe frameworks of different theories, related research, and the research objectives. The data collectionin the field consisted of interviews using questionnaires with two sections. The first section collectedgeneral information and traveling behavior data (i.e., gender, trip purpose, road classification, etc.).The second section collected information regarding the attitudes of the motorcycle riders. The attitudetoward helmet wearing was studied using the internal relationship of the HBM, the variables for whichwere perceived susceptibility (i.e., I do not ride a motorcycle at high speed so I need not wear a helmet),perceived benefits (i.e., Wearing a helmet when riding a motorcycle helps me feel safer), perceivedseverity (i.e., If an accident happens when I am riding a motorcycle without wearing a helmet), cue toaction (i.e., I have a lot of friends who regularly wear helmets when riding a motorcycle), perceivedbarriers (i.e., When wearing a helmet, I feel uncomfortable) and health motivation (i.e., I mostly giveimportance to safety when riding a motorcycle).
In this study, the samples included motorcycle riders and passengers in urban and rural areas. In theprocess of data collection, we collected data according to the Thailand’s four regions, which includedthe north region, northeast region, central region, and south region, comprising Chiangrai, NakhonRatchasima, Bangkok, and Songkla, respectively, by drawing 200 samples from each province(100 samples from urban society and 100 samples from rural society) with face-to-face interviewsconducted in a petrol station.
2.3. Multigroup Structural Equation Modeling
The data analysis applied the structural equation model (SEM), which is formulated on the basis ofa theory that focuses on the relationship between the latent variables and the observed variables. For theSEM, there is a measurement model and a structural model used to indicate the causal relationshipbetween the variables [38,39]. For the SEM methodology, various statistical techniques including factoranalysis, path analysis, and regression models were used to analyze the data.
Brown [40] and Koh and Zumbo [41] indicated that multigroup analysis was a popular methodfor measuring the validity of a structural equation model. The objective is to examine the similaritiesof population parameters between group A and group B. Byrne [38] and Teo, et al. [42] described amultigroup SEM as a series of consecutive steps. First, the model is fitted and tested separately ineach group to determine the consistency of the model results. When the consistency is determined,multigroup testing then proceeds. Second, a chi-square value for a fitted baseline model is computedfor the pooled samples in all groups. Third, the constraints, which include loadings, intercepts,and structural paths held equally across groups, are added to the model. The constrained model isfitted, and the chi-square value determined. Finally, a chi-square difference test is applied. The valuerelated to this test represents the difference between the chi-square values for the baseline and othermodels in which equality constraints have been imposed on particular parameters. This differencevalue is distributed as a chi-square with the degrees of freedom equal to the difference in the degrees
Sustainability 2020, 12, 8395 6 of 16
of freedom. If this chi-square difference value is statistically significant, evidence of non-invarianceis claimed.
3. Results
3.1. Descriptive Statistics
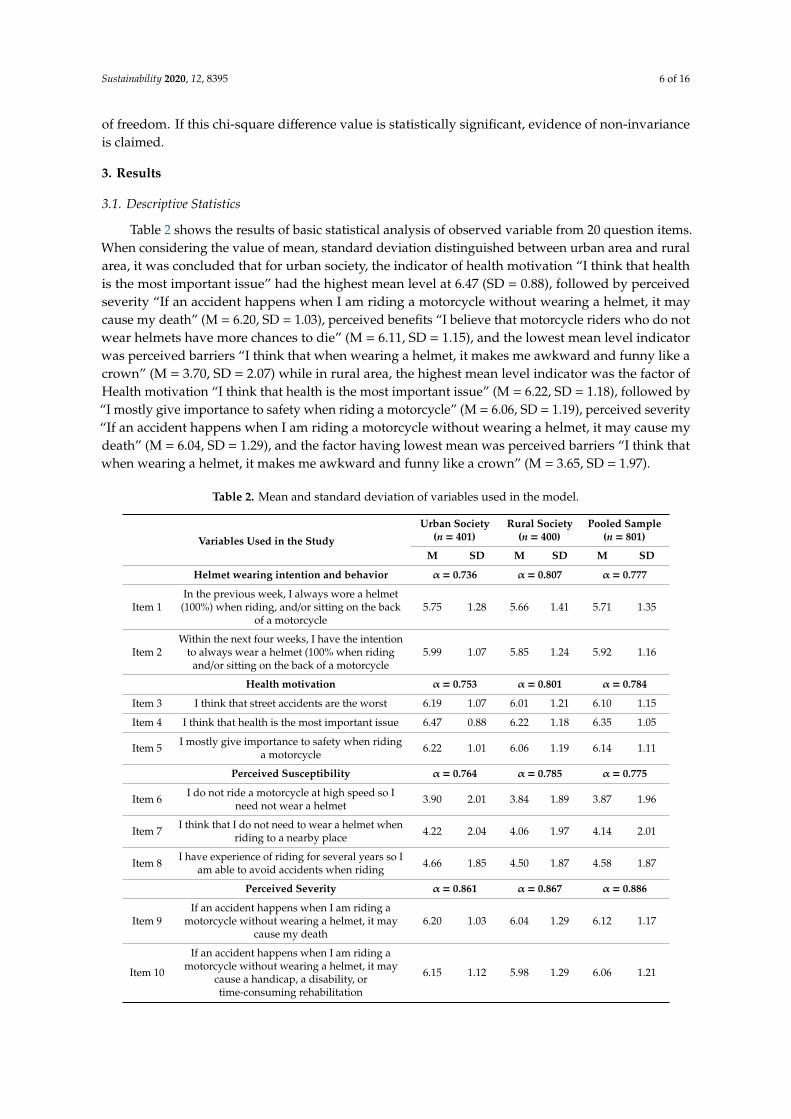
Table 2 shows the results of basic statistical analysis of observed variable from 20 question items.When considering the value of mean, standard deviation distinguished between urban area and ruralarea, it was concluded that for urban society, the indicator of health motivation “I think that healthis the most important issue” had the highest mean level at 6.47 (SD = 0.88), followed by perceivedseverity “If an accident happens when I am riding a motorcycle without wearing a helmet, it maycause my death” (M = 6.20, SD = 1.03), perceived benefits “I believe that motorcycle riders who do notwear helmets have more chances to die” (M = 6.11, SD = 1.15), and the lowest mean level indicatorwas perceived barriers “I think that when wearing a helmet, it makes me awkward and funny like acrown” (M = 3.70, SD = 2.07) while in rural area, the highest mean level indicator was the factor ofHealth motivation “I think that health is the most important issue” (M = 6.22, SD = 1.18), followed by“I mostly give importance to safety when riding a motorcycle” (M = 6.06, SD = 1.19), perceived severity“If an accident happens when I am riding a motorcycle without wearing a helmet, it may cause mydeath” (M = 6.04, SD = 1.29), and the factor having lowest mean was perceived barriers “I think thatwhen wearing a helmet, it makes me awkward and funny like a crown” (M = 3.65, SD = 1.97).
Table 2. Mean and standard deviation of variables used in the model.
Variables Used in the Study
Urban Society(n = 401)
Rural Society(n = 400)
Pooled Sample(n = 801)
M SD M SD M SD
Helmet wearing intention and behavior α = 0.736 α = 0.807 α = 0.777
Item 1In the previous week, I always wore a helmet(100%) when riding, and/or sitting on the back
of a motorcycle5.75 1.28 5.66 1.41 5.71 1.35
Item 2Within the next four weeks, I have the intention
to always wear a helmet (100% when ridingand/or sitting on the back of a motorcycle
5.99 1.07 5.85 1.24 5.92 1.16
Health motivation α = 0.753 α = 0.801 α = 0.784
Item 3 I think that street accidents are the worst 6.19 1.07 6.01 1.21 6.10 1.15
Item 4 I think that health is the most important issue 6.47 0.88 6.22 1.18 6.35 1.05
Item 5 I mostly give importance to safety when ridinga motorcycle 6.22 1.01 6.06 1.19 6.14 1.11
Perceived Susceptibility α = 0.764 α = 0.785 α = 0.775
Item 6 I do not ride a motorcycle at high speed so Ineed not wear a helmet 3.90 2.01 3.84 1.89 3.87 1.96
Item 7 I think that I do not need to wear a helmet whenriding to a nearby place 4.22 2.04 4.06 1.97 4.14 2.01
Item 8 I have experience of riding for several years so Iam able to avoid accidents when riding 4.66 1.85 4.50 1.87 4.58 1.87
Perceived Severity α = 0.861 α = 0.867 α = 0.886
Item 9If an accident happens when I am riding a
motorcycle without wearing a helmet, it maycause my death
6.20 1.03 6.04 1.29 6.12 1.17
Item 10
If an accident happens when I am riding amotorcycle without wearing a helmet, it may
cause a handicap, a disability, ortime-consuming rehabilitation
6.15 1.12 5.98 1.29 6.06 1.21
Sustainability 2020, 12, 8395 7 of 16
Table 2. Cont.
Variables Used in the Study
Urban Society(n = 401)
Rural Society(n = 400)
Pooled Sample(n = 801)
M SD M SD M SD
Item 11If an accident happens when I am riding a
motorcycle without wearing a helmet, it willgreatly affect my study or my work
6.14 1.13 5.92 1.36 6.03 1.26
Perceived Benefits α = 0.740 α = 0.808 α = 0.785
Item 12 Wearing a helmet when riding a motorcyclehelps me feel safer 6.08 1.08 5.88 1.33 5.98 1.22
Item 13 A helmet is an efficient accessory for reducingthe severity of injuries when accidents happen 6.06 1.09 5.76 1.32 5.91 1.22
Item 14 I believe that motorcycle riders who do notwear helmets have more chances to die 6.11 1.15 5.88 1.32 6.00 1.25
Perceived Barriers α = 0.861 α = 0.843 α = 0.853
Item 15 When wearing a helmet, I feel uncomfortable 4.41 1.85 4.36 1.84 4.38 1.85
Item 16 I think that when wearing a helmet, it makes meawkward and funny like a crown 3.70 2.07 3.65 1.97 3.67 2.03
Item 17 I think that helmets are too expensive for theirreal value or benefits 3.78 2.01 3.74 1.99 3.76 2.00
Cue to action α = 0.701 α = 0.643 A = 0.636
Item 18 I have a lot of friends who regularly wearhelmets when riding a motorcycle 5.76 1.20 5.49 1.35 5.62 1.29
Item 19 My parents told me to wear a helmet when Iwas young 5.53 1.43 5.29 1.65 5.30 1.57
Item 20I have seen advertisements on television, signs,or posters about the importance of wearing a
helmet when riding a motorcycle5.88 1.22 5.69 1.28 5.43 1.44
Denote: The response scale for each question was from 1 (strongly disagree) to 7 (strongly agree).
The skewness value and kurtosis for the observed variables was at an acceptable level since thevalue of the skewedness was not over 2 and that of Kurtosis was not over 7. This showed a normaldata distribution. According to data analysis, it was found that every question item was according tothe determined requirements.
The reliability of the questionnaires in this study was tested using the Cronbach’s Alpha Coefficientof which the accepted criterion was over 0.7 [43], and every latent variable had a Cronbach’s Alphavalue of more than 0.7. This demonstrated that the construct reliability of the latent variables andcould be used to analyze the structural equation modeling (SEM).
From the statistical results of Bartlett’s test of sphericity of urban area, which was the statisticaltesting hypothesis used to test the correlation matrix, the value of χ2 = 3548.427 (df = 190, p < 0.001)was found, which was different from 0 at a statistical significance of 0.01 and relevant to the results ofthe index value for the Kaiser–Meyer–Olkin (KMO) at 0.866, which meant the value approached 1.With regard to rural society, the statistical results of the Bartlett’s test of sphericity for the identity matrix,it was found that the value was χ2 = 3853.991 (df = 190, p < 0.001), which was different from 0 at astatistical significance of 0.01, and relevant to the results of the index value for the Kaiser–Meyer–Olkin(KMO) of 0.887, which meant the value approached 1. This showed that the correlation matrix ofobserved variables was not an identity matrix and had a sufficient relationship between the variablesto analyze the factors using the structural equation model.
3.2. Multigroup SEM
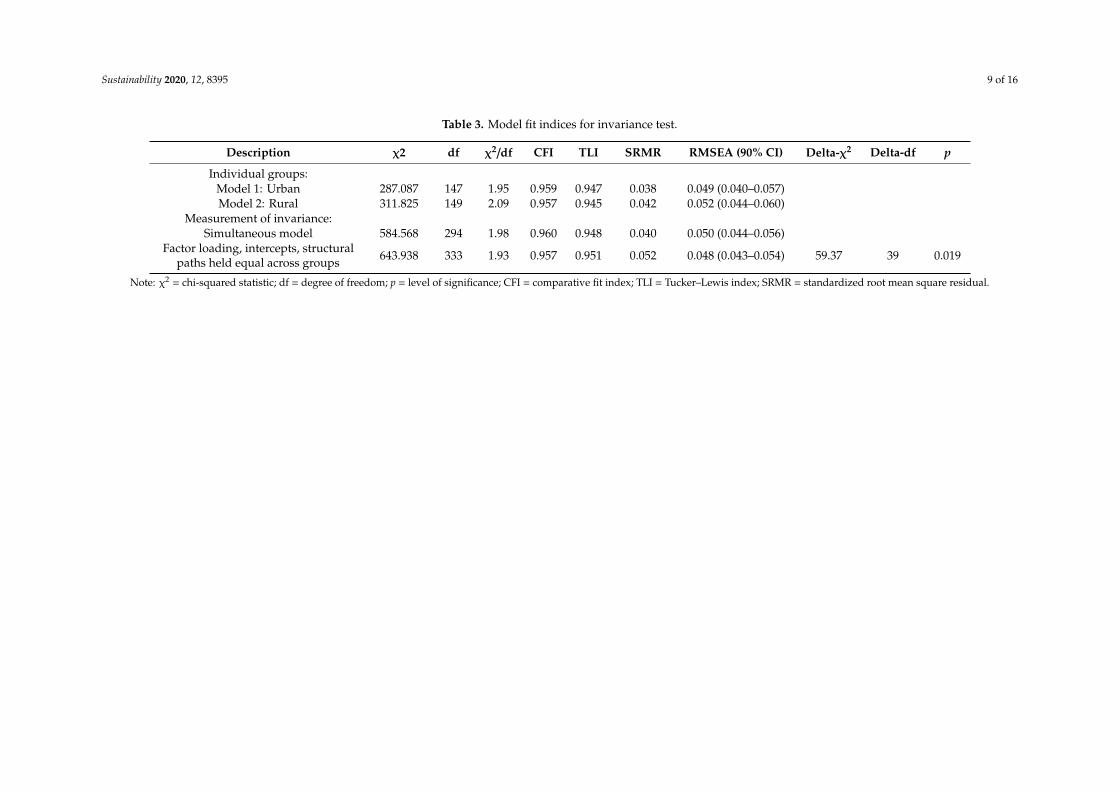
The invariance of the parameters was analyzed for urban and rural society models (Table 3).The results for the testing of urban society harmony showed the proportion between the chi-square andthe degree of freedom was 1.95 (χ2 = 287.087, df = 147), while rural society had a proportion between
Sustainability 2020, 12, 8395 8 of 16
the chi-square and the degree of freedom of (χ2/df) 2.09 (χ2 = 311.825, df = 149). The assessment of theinvariance in the measurement model for the hypothesis testing included factor loading, intercepts,structural paths having no different value using a different value between chi-square and the degree offreedom between the simultaneous model and the strict model. It was found that the different valuebetween the chi-square in the assessment was 59.37, the degree of freedom was 39, and the p-valuewas 0.019, so the hypothesis could not be accepted. This indicated that the factor loading, intercepts,and structural paths were different between urban and rural societies.
3.3. Urban Area HBM
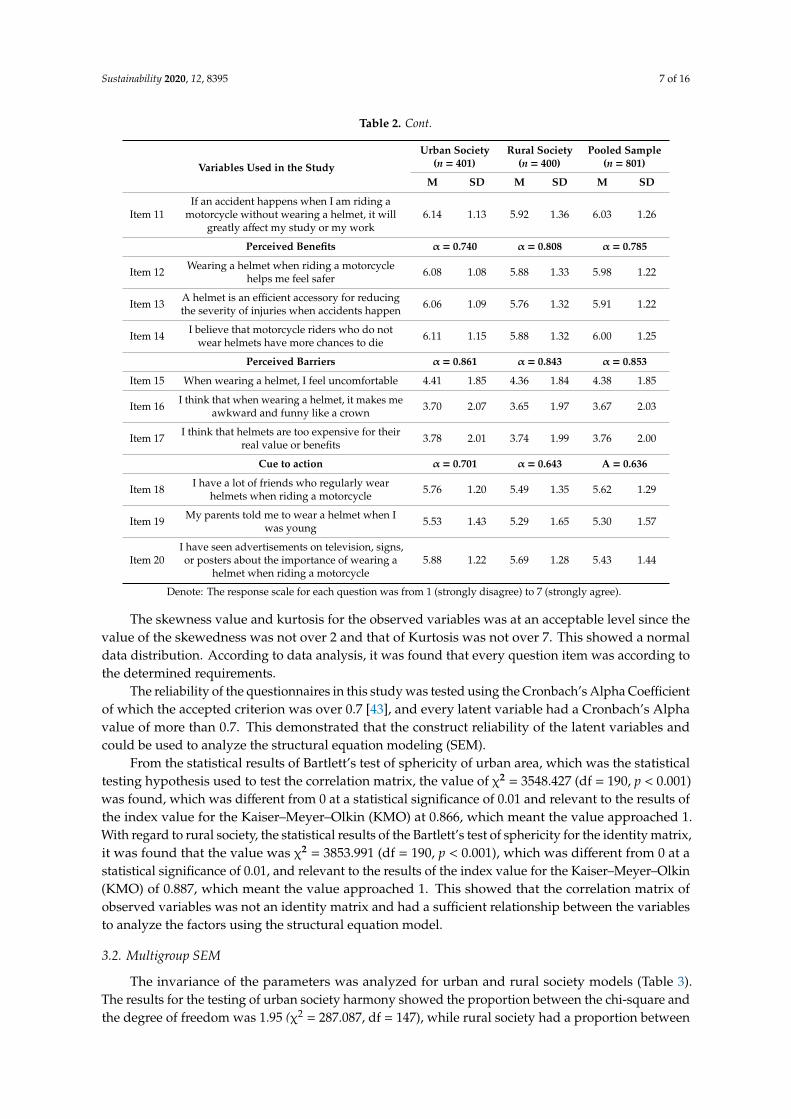
The analysis to determine the factors that affected helmet wearing intention and behavior wasconducted using the structural equation model. For urban society, the values were χ2 = 287.087,df = 147, p < 0.001, CFI = 0.959, TLI = 0.947, SRMR = 0.038, and RMSEA = 0.049, as shown inFigure 1. When compared with the statistical value using the recommended criteria, χ2 (df) should bep > 0.05 [44], the RMSEA should be 0.06 or less, the CFI should be 0.95 or above, the TLI value shouldbe 0.95 or above, and the SRMR should be 0.08 or less [45]. It was found that every statistical value inthe model was measured according to the mentioned criteria except for the chi-square testing as χ2
was found to be sensitive to sample size. For a larger sample size (n > 200), the χ2 test tended to rejectthe hypothesis [44,46]. For the previously mentioned reasons and because of the large sample size(n = 400), it was concluded that the structural equation modeling had adequate construct validity (fit).
Sustainability 2020, 12, x FOR PEER REVIEW 10 of 17
3.3. Urban Area HBM
The analysis to determine the factors that affected helmet wearing intention and behavior was conducted using the structural equation model. For urban society, the values were χ2 = 287.087, df = 147, p < 0.001, CFI = 0.959, TLI = 0.947, SRMR = 0.038, and RMSEA = 0.049, as shown in Figure 1. When compared with the statistical value using the recommended criteria, χ2 (df) should be p > 0.05 [44], the RMSEA should be 0.06 or less, the CFI should be 0.95 or above, the TLI value should be 0.95 or above, and the SRMR should be 0.08 or less [45]. It was found that every statistical value in the model was measured according to the mentioned criteria except for the chi-square testing as χ2 was found to be sensitive to sample size. For a larger sample size (n > 200), the χ2 test tended to reject the hypothesis [44,46]. For the previously mentioned reasons and because of the large sample size (n = 400), it was concluded that the structural equation modeling had adequate construct validity (fit).
Figure 1. Structural equation modeling of wearing helmets in motorcycle riding for urban society. χ2 = 287.087, df = 147, χ2/df = 1.95, CFI = 0.959, TLI = 0.947 SRMR = 0.038 RMSEA = 0.049. * p < 0.05, ** p < 0.01 (Mplus 7.12 standardized estimates).
When considering the seven measurement models, 20 indicators, all with positive weights, were confirmed as being factors for each latent variable at a statistical significance (p < 0.001). This meant that all observed variables had a positive correlation, as shown in Table 4.
Considering the factors that affect helmet wearing intention and behavior based on the HBM for urban area (see Table 5), the results showed that health motivation (β = 0.454) was the only factor that directly affected helmet wearing intention and behavior at a statistical significance of 0.05. In other words, if the importance of health and safety for riding was stressed, it would encourage an increase in helmet use for people in urban society. The other five factors—perceived susceptibility, perceived severity, perceived benefits, perceived barriers, and cue to action—did not affect helmet wearing intention and behavior at a statistical significance nor support the HBM framework.
Figure 1. Structural equation modeling of wearing helmets in motorcycle riding for urban society.χ2 = 287.087, df = 147, χ2/df = 1.95, CFI = 0.959, TLI = 0.947 SRMR = 0.038 RMSEA = 0.049. * p < 0.05,** p < 0.01 (Mplus 7.12 standardized estimates).
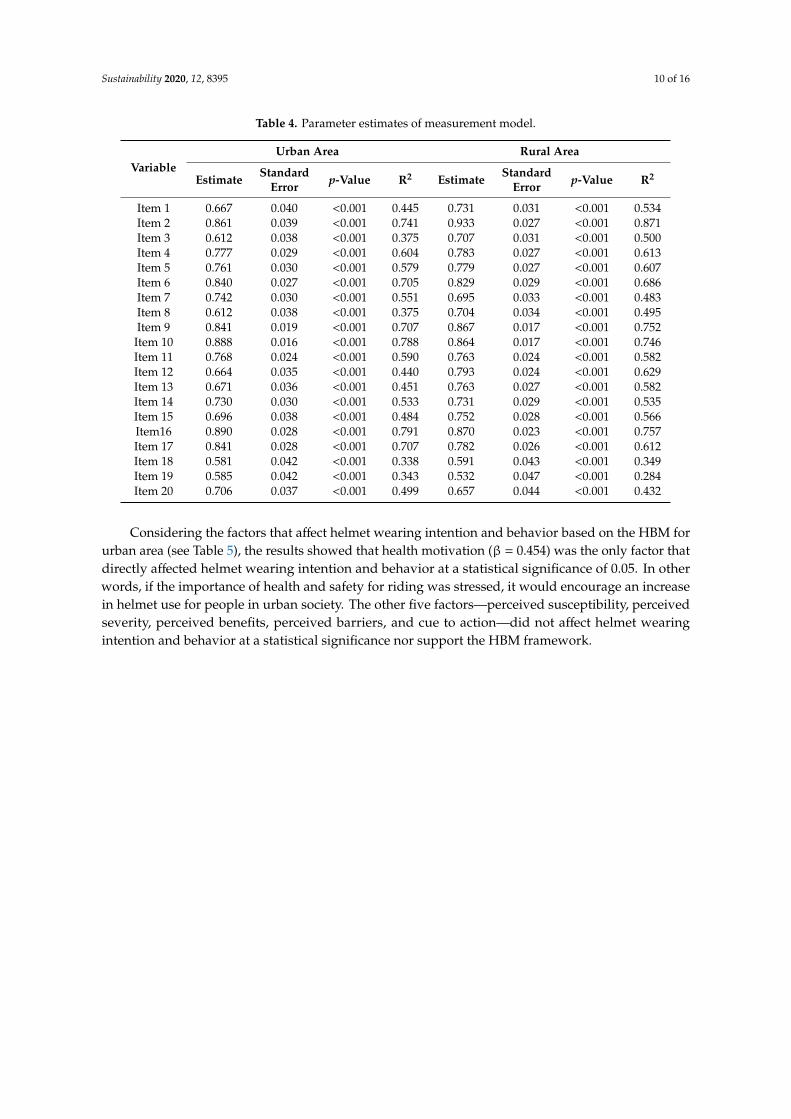
When considering the seven measurement models, 20 indicators, all with positive weights,were confirmed as being factors for each latent variable at a statistical significance (p < 0.001).This meant that all observed variables had a positive correlation, as shown in Table 4.
Sustainability 2020, 12, 8395 9 of 16
Table 3. Model fit indices for invariance test.
Description χ2 df χ2/df CFI TLI SRMR RMSEA (90% CI) Delta-χ2 Delta-df p
Individual groups:Model 1: Urban 287.087 147 1.95 0.959 0.947 0.038 0.049 (0.040–0.057)Model 2: Rural 311.825 149 2.09 0.957 0.945 0.042 0.052 (0.044–0.060)
Measurement of invariance:Simultaneous model 584.568 294 1.98 0.960 0.948 0.040 0.050 (0.044–0.056)
Factor loading, intercepts, structuralpaths held equal across groups 643.938 333 1.93 0.957 0.951 0.052 0.048 (0.043–0.054) 59.37 39 0.019
Note: χ2 = chi-squared statistic; df = degree of freedom; p = level of significance; CFI = comparative fit index; TLI = Tucker–Lewis index; SRMR = standardized root mean square residual.
Sustainability 2020, 12, 8395 10 of 16
Table 4. Parameter estimates of measurement model.
VariableUrban Area Rural Area
Estimate StandardError p-Value R2 Estimate Standard
Error p-Value R2
Item 1 0.667 0.040 <0.001 0.445 0.731 0.031 <0.001 0.534Item 2 0.861 0.039 <0.001 0.741 0.933 0.027 <0.001 0.871Item 3 0.612 0.038 <0.001 0.375 0.707 0.031 <0.001 0.500Item 4 0.777 0.029 <0.001 0.604 0.783 0.027 <0.001 0.613Item 5 0.761 0.030 <0.001 0.579 0.779 0.027 <0.001 0.607Item 6 0.840 0.027 <0.001 0.705 0.829 0.029 <0.001 0.686Item 7 0.742 0.030 <0.001 0.551 0.695 0.033 <0.001 0.483Item 8 0.612 0.038 <0.001 0.375 0.704 0.034 <0.001 0.495Item 9 0.841 0.019 <0.001 0.707 0.867 0.017 <0.001 0.752Item 10 0.888 0.016 <0.001 0.788 0.864 0.017 <0.001 0.746Item 11 0.768 0.024 <0.001 0.590 0.763 0.024 <0.001 0.582Item 12 0.664 0.035 <0.001 0.440 0.793 0.024 <0.001 0.629Item 13 0.671 0.036 <0.001 0.451 0.763 0.027 <0.001 0.582Item 14 0.730 0.030 <0.001 0.533 0.731 0.029 <0.001 0.535Item 15 0.696 0.038 <0.001 0.484 0.752 0.028 <0.001 0.566Item16 0.890 0.028 <0.001 0.791 0.870 0.023 <0.001 0.757Item 17 0.841 0.028 <0.001 0.707 0.782 0.026 <0.001 0.612Item 18 0.581 0.042 <0.001 0.338 0.591 0.043 <0.001 0.349Item 19 0.585 0.042 <0.001 0.343 0.532 0.047 <0.001 0.284Item 20 0.706 0.037 <0.001 0.499 0.657 0.044 <0.001 0.432
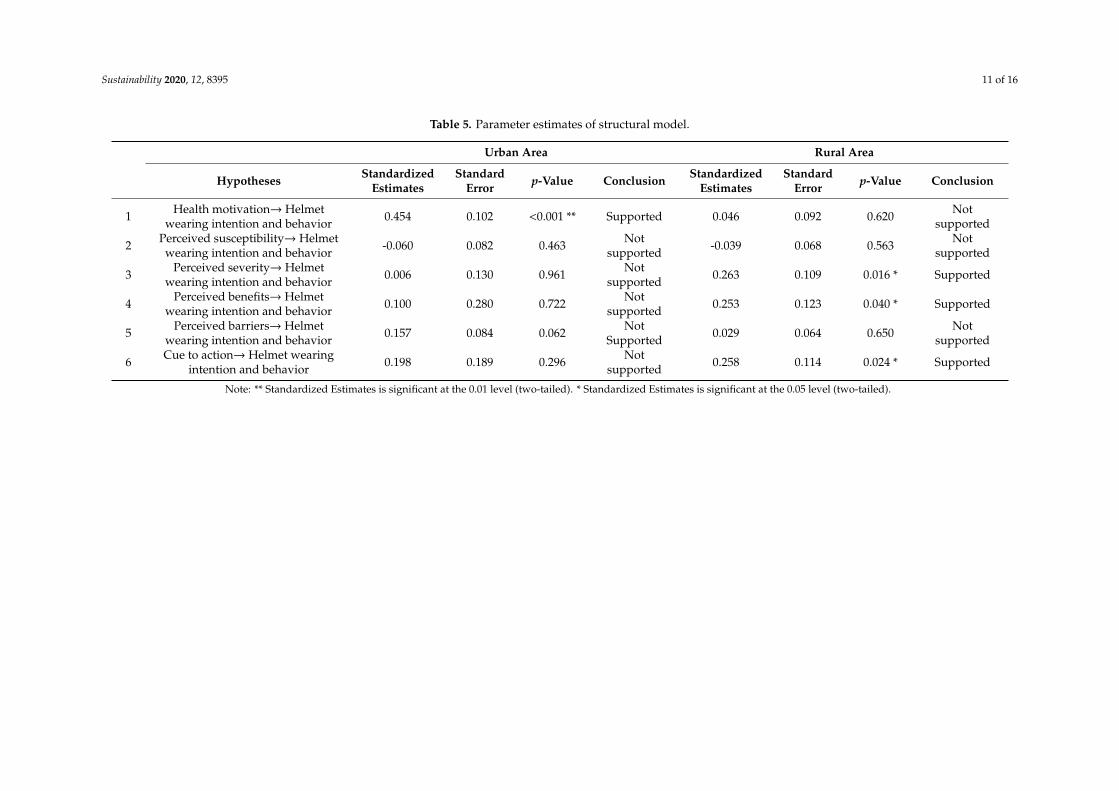
Considering the factors that affect helmet wearing intention and behavior based on the HBM forurban area (see Table 5), the results showed that health motivation (β = 0.454) was the only factor thatdirectly affected helmet wearing intention and behavior at a statistical significance of 0.05. In otherwords, if the importance of health and safety for riding was stressed, it would encourage an increasein helmet use for people in urban society. The other five factors—perceived susceptibility, perceivedseverity, perceived benefits, perceived barriers, and cue to action—did not affect helmet wearingintention and behavior at a statistical significance nor support the HBM framework.
Sustainability 2020, 12, 8395 11 of 16
Table 5. Parameter estimates of structural model.
Urban Area Rural Area
Hypotheses StandardizedEstimates
StandardError p-Value Conclusion Standardized
EstimatesStandard
Error p-Value Conclusion
1 Health motivation→ Helmetwearing intention and behavior 0.454 0.102 <0.001 ** Supported 0.046 0.092 0.620 Not
supported
2 Perceived susceptibility→ Helmetwearing intention and behavior -0.060 0.082 0.463 Not
supported -0.039 0.068 0.563 Notsupported
3 Perceived severity→ Helmetwearing intention and behavior 0.006 0.130 0.961 Not
supported 0.263 0.109 0.016 * Supported
4 Perceived benefits→ Helmetwearing intention and behavior 0.100 0.280 0.722 Not
supported 0.253 0.123 0.040 * Supported
5 Perceived barriers→ Helmetwearing intention and behavior 0.157 0.084 0.062 Not
Supported 0.029 0.064 0.650 Notsupported
6 Cue to action→ Helmet wearingintention and behavior 0.198 0.189 0.296 Not
supported 0.258 0.114 0.024 * Supported
Note: ** Standardized Estimates is significant at the 0.01 level (two-tailed). * Standardized Estimates is significant at the 0.05 level (two-tailed).
Sustainability 2020, 12, 8395 12 of 16
3.4. Rural Area HBM
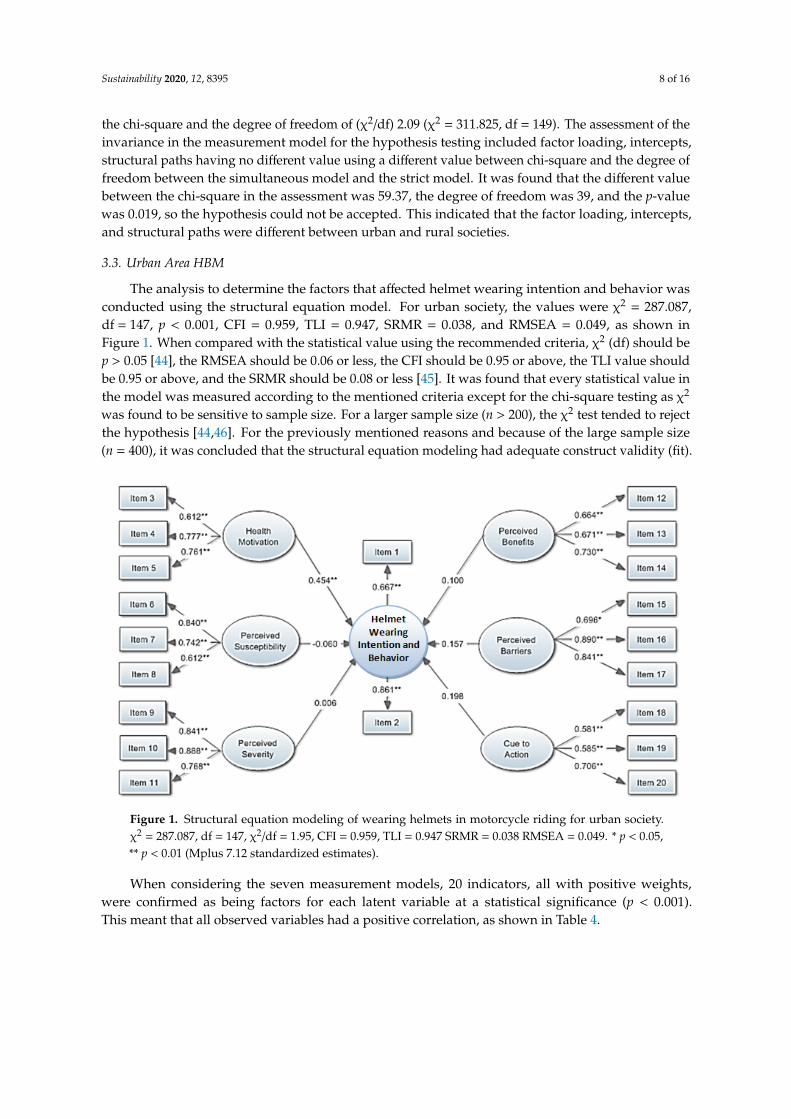
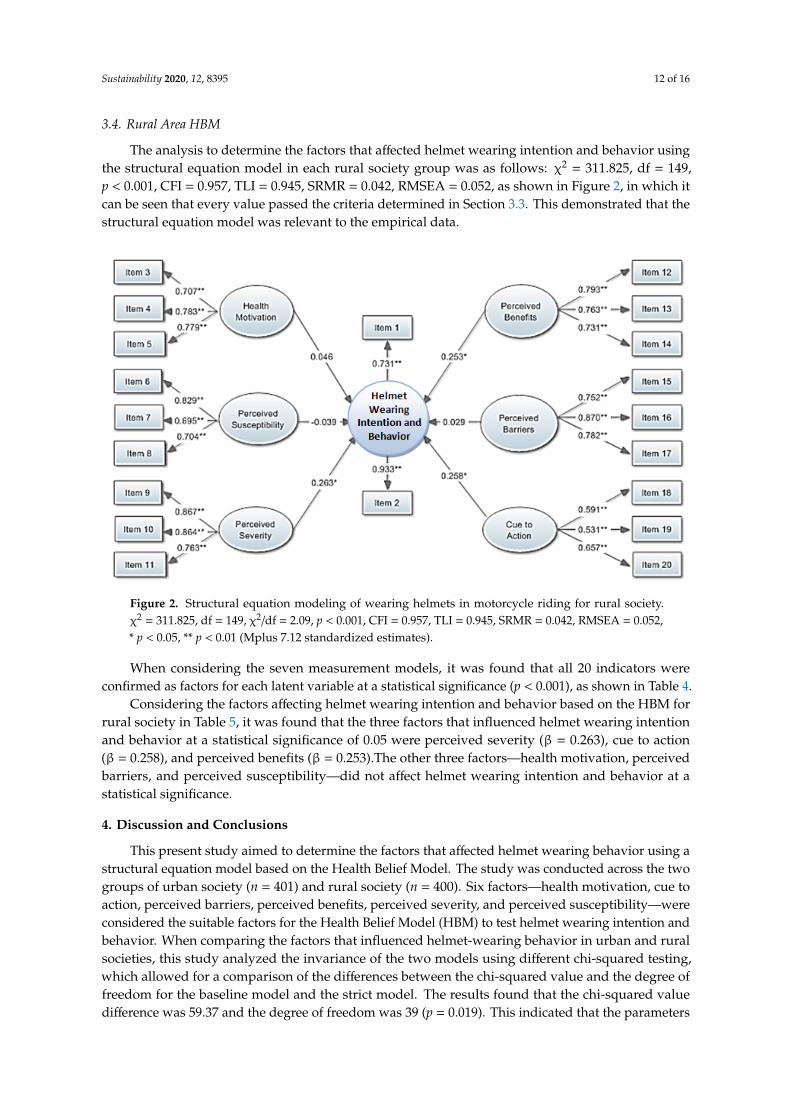
The analysis to determine the factors that affected helmet wearing intention and behavior usingthe structural equation model in each rural society group was as follows: χ2 = 311.825, df = 149,p < 0.001, CFI = 0.957, TLI = 0.945, SRMR = 0.042, RMSEA = 0.052, as shown in Figure 2, in which itcan be seen that every value passed the criteria determined in Section 3.3. This demonstrated that thestructural equation model was relevant to the empirical data.
Sustainability 2020, 12, x FOR PEER REVIEW 13 of 17
3.4. Rural Area HBM
The analysis to determine the factors that affected helmet wearing intention and behavior using the structural equation model in each rural society group was as follows: χ2 = 311.825, df = 149, p < 0.001, CFI = 0.957, TLI = 0.945, SRMR = 0.042, RMSEA = 0.052, as shown in Figure 2, in which it can be seen that every value passed the criteria determined in Section 3.3. This demonstrated that the structural equation model was relevant to the empirical data.
Figure 2. Structural equation modeling of wearing helmets in motorcycle riding for rural society. χ2 = 311.825, df = 149, χ2/df = 2.09, p < 0.001, CFI = 0.957, TLI = 0.945, SRMR = 0.042, RMSEA = 0.052, * p < 0.05, ** p < 0.01 (Mplus 7.12 standardized estimates).
When considering the seven measurement models, it was found that all 20 indicators were confirmed as factors for each latent variable at a statistical significance (p < 0.001), as shown in Table 4.
Considering the factors affecting helmet wearing intention and behavior based on the HBM for rural society in Table 5, it was found that the three factors that influenced helmet wearing intention and behavior at a statistical significance of 0.05 were perceived severity (β = 0.263), cue to action (β = 0.258), and perceived benefits (β = 0.253).The other three factors—health motivation, perceived barriers, and perceived susceptibility—did not affect helmet wearing intention and behavior at a statistical significance.
4. Discussion and Conclusions
This present study aimed to determine the factors that affected helmet wearing behavior using a structural equation model based on the Health Belief Model. The study was conducted across the two groups of urban society (n = 401) and rural society (n = 400). Six factors—health motivation, cue to action, perceived barriers, perceived benefits, perceived severity, and perceived susceptibility—were considered the suitable factors for the Health Belief Model (HBM) to test helmet wearing intention and behavior. When comparing the factors that influenced helmet-wearing behavior in urban and rural societies, this study analyzed the invariance of the two models using different chi-squared testing, which allowed for a comparison of the differences between the chi-squared value and the degree of freedom for the baseline model and the strict model. The results found that the chi-
Figure 2. Structural equation modeling of wearing helmets in motorcycle riding for rural society.χ2 = 311.825, df = 149, χ2/df = 2.09, p < 0.001, CFI = 0.957, TLI = 0.945, SRMR = 0.042, RMSEA = 0.052,* p < 0.05, ** p < 0.01 (Mplus 7.12 standardized estimates).
When considering the seven measurement models, it was found that all 20 indicators wereconfirmed as factors for each latent variable at a statistical significance (p < 0.001), as shown in Table 4.
Considering the factors affecting helmet wearing intention and behavior based on the HBM forrural society in Table 5, it was found that the three factors that influenced helmet wearing intentionand behavior at a statistical significance of 0.05 were perceived severity (β = 0.263), cue to action(β = 0.258), and perceived benefits (β = 0.253).The other three factors—health motivation, perceivedbarriers, and perceived susceptibility—did not affect helmet wearing intention and behavior at astatistical significance.
4. Discussion and Conclusions
This present study aimed to determine the factors that affected helmet wearing behavior using astructural equation model based on the Health Belief Model. The study was conducted across the twogroups of urban society (n = 401) and rural society (n = 400). Six factors—health motivation, cue toaction, perceived barriers, perceived benefits, perceived severity, and perceived susceptibility—wereconsidered the suitable factors for the Health Belief Model (HBM) to test helmet wearing intention andbehavior. When comparing the factors that influenced helmet-wearing behavior in urban and ruralsocieties, this study analyzed the invariance of the two models using different chi-squared testing,which allowed for a comparison of the differences between the chi-squared value and the degree offreedom for the baseline model and the strict model. The results found that the chi-squared valuedifference was 59.37 and the degree of freedom was 39 (p = 0.019). This indicated that the parameters
Sustainability 2020, 12, 8395 13 of 16
of the models for urban society and rural society were different at a statistical significance of 0.05.From these results, it can be concluded that it is necessary to develop separate helmet use models forurban society and rural society.
According to the SEM, it was found that health motivation was the only factor influencing helmetwearing intention and behavior in urban areas at a statistical significance of 0.05, which was in linewith the studies of Aghamolaei, Tavafian and Madani [32], Ambak, Ismail, Abdullah, and Borhan [33],and Lajunen and Räsänen [28]. When considering the latent variables in the measurement model,it was found that Item 4, “I think that health is the most important issue,” had the highest standardizedfactor loading value (0.783). This indicated that the government sector should give primary importanceto developing policies that focus on the perceived importance of health in urban society, which couldencourage greater helmet use. However, the policy implications of Item 3 and Item 5 must not be ignored,as both indicators were also confirmed as being health motivation factors at a statistical significance.
For rural society, three factors—perceived severity, cue to action, and perceived benefits—werefound to influence helmet wearing intention and behavior at a statistical significance of 0.05. Perceivedseverity was in line with the studies of Lajunen and Räsänen [28] and Item 9, “If the accident happenswhen I ride a motorcycle without wearing a helmet, it may cause mortality,” was the indicator with thehighest standardized factor loading value (0.867) in the measurement model. Therefore, with this inmind, policy makers must build a course of action that encourages those in rural society to perceivethe severe dangers and possible mortality of riding without a helmet.
The cue to action finding was in line with the results of the studies of Aghamolaei, Tavafian,and Madani [32], Tavafian, Aghamolaei, Gregory, and Madani [25], Lajunen and Räsänen [28], and Witte,Stokols, Ituarte, and Schneider [30]. In the measurement model, it was found that Item 20, “I seeadvertisements on televisions, signs, [and] posters about the importance of wearing helmets whenriding a motorcycle during the past time period,” was the indicator with the highest standardizedfactor loading value (0.657). This indicated that promoting the wearing of helmets was very importantto encourage increased helmet use in rural areas.
The perceived benefits finding was in line with the results of the studies of Brijs, Brijs, Sann, Trinh,Wets, and Ruiter [34] and Quine, Rutter, and Arnold [29]. In the measurement model, it was foundthat Item 12, “Wearing a helmet when riding a motorcycle helps me feel safer,” was the indicator withthe highest standardized factor loading value. Therefore, policies need to be developed that encouragepeople to perceive the benefits of wearing helmets when riding.
The helmet use model in urban society was found to be significantly different from that of ruralsociety. Therefore, the focused policies also need to be different. For urban society, the promotion ofthe health benefits must be emphasized, whereas for rural society, people who do not wear helmetsmust be warned about the risks of disability and death from accidents and how the wearing of helmetscan reduce the severity of accidents. It was also found that the motivation for putting helmet wearinginto practice comes from friends, families, and mass media. Friends or families’ regular helmet use andencouragement regarding the importance of wearing a helmet would encourage greater helmet use.
5. Limitations and Future Research Studies
The limitations of this study were the other unstudied factors, such as the regional variables,as Thailand has different geographical, climatic, and traffic profiles, all of which could affect thedifferent models in each region. These variables are a focus for future studies. The surveying of thisstudy was conducted only in the gas station; the future study could add other places, such as schools,shopping malls, and market areas, with various samples. This present study was not able to analyzethe regional differences as the samples were too small for each region. Further, studying the factors thatinfluence helmet wearing using the Theory of Planned Behavior (TPB) is also an interesting issue forfurther study. Moreover, the differences between the riders and the passengers should be additionallystudied in order to propose the suitable policy promoting helmet wearing.
Sustainability 2020, 12, 8395 14 of 16
Author Contributions: Conceptualization, S.J.; Data curation, S.J., D.W. and O.S.; Formal analysis, T.C., N.L.and S.U.; Funding acquisition, S.J.; Methodology, S.J. and T.C.; Supervision, V.R.; Writing—original draft,S.J. and D.W.; Writing—review and editing, V.R. All authors have read and agreed to the published version ofthe manuscript.
Funding: This research was funded by the Suranaree University of Technology Research and Development Fund,grant number RU7-706-59-03 and APC was funded by the Suranaree University of Technology.
Acknowledgments: The authors would like to thank the Suranaree University of Technology Research andDevelopment Fund.
Conflicts of Interest: On behalf of all authors, the corresponding author states that there is no conflict of interest.
References
1. Sheikh Abdul Kadir, I. Modeling Mode Choice Behavior of Motorcyclists in Malaysia. Ph.D. Thesis, UniversitiPutra Malaysia, Putra, Malaysia, 2006.
2. Yuen, C.W.; Karim, M.R.; Saifizul, A. Investigation on motorcyclist riding behaviour at curve entry in thedown slope terrain. KSCE J. Civ. Eng. 2015, 19, 749–755. [CrossRef]
3. Department of Land Transport. Transport Statistics. Available online: http://apps.dlt.go.th/statistics_web/
statistics.html (accessed on 19 January 2019). (In Thai)4. Hsu, T.-P.; Sadullah, A.F.M.; Dao, N.X. A Comparison Study on Motorcycle Traffic Development in Some Asian
Countries—Case of Taiwan, Malaysia and Vietnam; The Eastern Asia Society for Transportation Studies (EASTS):Tokyo, Japan, 2003.
5. Chen, C.-F.; Lai, W.-T. The effects of rational and habitual factors on mode choice behaviors in a motorcycle-dependent region: Evidence from Taiwan. Transp. Policy 2011, 18, 711–718. [CrossRef]
6. Liu, H.; Li, S.; Xiao, Q.; Feldman, M.W. Social Support and Psychological Well-Being Under Social Change inUrban and Rural China. Soc. Indic. Res. 2013, 119, 979–996. [CrossRef]
7. Liang, Y.; Wang, P. Influence of Prudential Value on the Subjective Well-Being of Chinese Urban–RuralResidents. Soc. Indic. Res. 2013, 118, 1249–1267. [CrossRef]
8. Bureau of Highway Safety. Road Accident Statistics. Available online: http://bhs.doh.go.th/statistic/type(accessed on 19 January 2019). (In Thai)
9. Eid, H.O.; Barss, P.; Adam, S.H.; Torab, F.C.; Lunsjo, K.; Grivna, M.; Abu-Zidan, F.M. Factors affectinganatomical region of injury, severity, and mortality for road trauma in a high-income developing country:Lessons for prevention. Injury 2009, 40, 703–707. [CrossRef]
10. Buckley, L.; Bingham, C.R.; Flannagan, C.A.; Carter, P.M.; Almani, F.; Cicchino, J.B. Observation of motorcyclehelmet use rates in Michigan after partial repeal of the universal motorcycle helmet law. Accid. Anal. Prev.2016, 95, 178–186. [CrossRef]
11. Rice, T.M.; Troszak, L.; Ouellet, J.V.; Erhardt, T.; Smith, G.S.; Tsai, B.-W. Motorcycle helmet use and the risk ofhead, neck, and fatal injury: Revisiting the Hurt Study. Accid. Anal. Prev. 2016, 91, 200–207. [CrossRef]
12. Ramli, R.; Oxley, J. Motorcycle helmet fixation status is more crucial than helmet type in providing protectionto the head. Injury 2016, 47, 2442–2449. [CrossRef]
13. Schnegg, M.; Massonnet, G.; Gueissaz, L. Motorcycle helmets: What about their coating? Forensic Sci. Int.2015, 252, 114–126. [CrossRef]
14. Ouellet, J.V.; Kasantikul, V. Motorcycle Helmet Effect on a Per-Crash Basis in Thailand and the United States.Traffic Inj. Prev. 2006, 7, 49–54. [CrossRef]
15. Keng, S.-H. Helmet use and motorcycle fatalities in Taiwan. Accid. Anal. Prev. 2005, 37, 349–355. [CrossRef][PubMed]
16. Jou, R.-C.; Yeh, T.-H.; Chen, R.-S. Risk Factors in Motorcyclist Fatalities in Taiwan. Traffic Inj. Prev. 2011, 13,155–162. [CrossRef] [PubMed]
17. DeMarco, A.L.; Chimich, D.D.; Gardiner, J.C.; Nightingale, R.W.; Siegmund, G.P. The impact responseof motorcycle helmets at different impact severities. Accid. Anal. Prev. 2010, 42, 1778–1784. [CrossRef][PubMed]
18. Fernandes, F.A.O.; Alves de Sousa, R.J. Motorcycle helmets—A state of the art review. Accid. Anal. Prev.2013, 56, 1–21. [CrossRef]
Sustainability 2020, 12, 8395 15 of 16
19. Nakahara, S.; Chadbunchachai, W.; Ichikawa, M.; Tipsuntornsak, N.; Wakai, S. Temporal distribution ofmotorcyclist injuries and risk of fatalities in relation to age, helmet use, and riding while intoxicated in KhonKaen, Thailand. Accid. Anal. Prev. 2005, 37, 833–842. [CrossRef]
20. Branas, C.C.; Knudson, M.M. Helmet laws and motorcycle rider death rates. Accid. Anal. Prev. 2001, 33,641–648. [CrossRef]
21. Houston, D.J.; Richardson, L.E. Motorcyclist fatality rates and mandatory helmet-use laws. Accid. Anal. Prev.2008, 40, 200–208. [CrossRef]
22. Ratanavaraha, V.; Jomnonkwao, S. Community participation and behavioral changes of helmet use inThailand. Transp. Policy 2013, 25, 111–118. [CrossRef]
23. Rosenstock, I.M. Historical Origins of the Health Belief Model. Health Educ. Behav. 1974, 2, 328–335.[CrossRef]
24. Maiman, L.A.; Becker, M.H. The Health Belief Model: Origins and Correlates in Psychological Theory.Health Educ. Behav. 1974, 2, 336–353. [CrossRef]
25. Tavafian, S.S.; Aghamolaei, T.; Gregory, D.; Madani, A. Prediction of Seat Belt Use among Iranian AutomobileDrivers: Application of the Theory of Planned Behavior and the Health Belief Model. Traffic Inj. Prev. 2011,12, 48–53. [CrossRef] [PubMed]
26. Ross, T.P.; Ross, L.T.; Rahman, A.; Cataldo, S. The Bicycle Helmet Attitudes Scale: Using the Health BeliefModel to Predict Helmet Use among Undergraduates. J. Am. Coll. Health 2010, 2010, 29–36. [CrossRef][PubMed]
27. Germeni, E.; Lionis, C.; Davou, B.; Th Petridou, E. Understanding reasons for non-compliance in motorcyclehelmet use among adolescents in Greece. Inj. Prev. 2009, 15, 19–23. [CrossRef] [PubMed]
28. Lajunen, T.; Räsänen, M. Can social psychological models be used to promote bicycle helmet use amongteenagers? A comparison of the Health Belief Model, Theory of Planned Behavior and the Locus of Control.J. Saf. Res. 2004, 35, 115–123. [CrossRef] [PubMed]
29. Quine, L.; Rutter, D.R.; Arnold, L. Predicting and understanding safety helmet use among schoolboy cyclists:A comparison of the theory of planned behaviour and the health belief model. Psychol. Health 1998, 13,251–269. [CrossRef]
30. Witte, K.; Stokols, D.; Ituarte, P.; Schneider, M. Testing the Health Belief Model in a Field Study to PromoteBicycle Safety Helmets. Commun. Res. 1993, 20, 564–586. [CrossRef]
31. Dennis, A.C.; Bosson, N.; Peralta, J.E.C.; Castillo, C.; Foran, M.; Wall, S.P. Determinants of helmet wearingbehavior among motorcyclists in the Dominican Republic. Int. J. Public Health Epidemiol. 2013, 2, 50–55.
32. Aghamolaei, T.; Tavafian, S.S.; Madani, A. Prediction of Helmet Use among Iranian Motorcycle Drivers:An Application of the Health Belief Model and the Theory of Planned Behavior. Traffic Inj. Prev. 2011, 12,239–243. [CrossRef]
33. Ambak, K.; Ismail, R.; Abdullah, R.A.; Borhan, M.N. Using structural equation modeling and the behavioralsciences theories in predicting helmet use. In Proceedings of the International Conference on AdvancedScience, Engineering and Information Technology, Putrajaya, Malaysia, 14–15 January 2011.
34. Brijs, K.; Brijs, T.; Sann, S.; Trinh, T.A.; Wets, G.; Ruiter, R.A.C. Psychological determinants of motorcyclehelmet use among young adults in Cambodia. Transp. Res. Part F Traffic Psychol. Behav. 2014, 26, 273–290.[CrossRef]
35. Ali, M.; Haidar, N.; Ali, M.M.; Maryam, A. Determinants of Seat Belt Use Among Drivers in Sabzevar,Iran: A Comparison of Theory of Planned Behavior and Health Belief Model. Traffic Inj. Prev. 2011, 12,104–109. [CrossRef]
36. Golob, T.F. Structural equation modeling for travel behavior research. Transp. Res. Part B Methodol. 2003, 37,1–25. [CrossRef]
37. Stevens, J. Applied Multivariate Statistics for the Social Sciences; Lawrence Erlbaum Associates: Mahwah, NJ,USA, 1996.
38. Byrne, B.M. Structural Equation Modeling with Mplus: Basic Concepts, Applications, and Programming; Taylorand Francis Group: Boca Raton, FL, USA, 2012.
39. Raykov, T.; Marcoulides, G.A. A First Course in Structural Equation Modeling; Lawrence Erlbaum Associates,Inc.: Mahwah, NJ, USA, 2006.
40. Brown, T.A. Confirmatory Factor Analysis for Applied Research; The Guilford Press: New York, NY, USA,2006; p. 475.
Sustainability 2020, 12, 8395 16 of 16
41. Koh, K.; Zumbo, B. Multi-Group Confirmatory Factor Analysis for Testing Measurement Invariance in MixedItem Format Data. J. Mod. Appl. Stat. Methods JMASM 2008, 7, 471–477. [CrossRef]
42. Teo, T.; Lee, C.B.; Chai, C.S.; Wong, S.L. Assessing the intention to use technology among pre-service teachersin Singapore and Malaysia: A multigroup invariance analysis of the Technology Acceptance Model (TAM).Comput. Educ. 2009, 53, 1000–1009. [CrossRef]
43. Nunnally, J.C. Psychometric Theory, 2nd ed.; McGraw-Hill: New York, NY, USA, 1978.44. Kline, R.B. Priciples and Practice of Structural Equation Modeling; Guilford Press: New York, NY, USA, 2011.45. Hu, L.T.; Bentler, P.M. Cutoff criteria for fit indexes in covariance structure analysis: Conventional criteria
versus new alternatives. Struct. Equ. Modeling A Multidiscip. J. 1999, 6, 1–55. [CrossRef]46. MacCallum, R.C.; Browne, M.W.; Sugawara, H.M. Power analysis and determination of sample size for
covariance structure modeling. Psychol. Methods 1996, 1, 130–149. [CrossRef]
© 2020 by the authors. Licensee MDPI, Basel, Switzerland. This article is an open accessarticle distributed under the terms and conditions of the Creative Commons Attribution(CC BY) license (http://creativecommons.org/licenses/by/4.0/).