Embed Size (px)
Citation preview
A comparative predictive analysis of neural networks (NNs), nonlinear
regression and classification and regression tree (CART) models
Muhammad A. Razi*, Kuriakose Athappilly
Department of Business Information Systems, Haworth College of Business, Western Michigan University, Kalamazoo, MI 49008-3821, USA
Abstract
Numerous articles comparing performances of statistical and Neural Networks (NNs) models are available in the literature, however, very
few involved Classification and Regression Tree (CART) models in their comparative studies. We perform a three-way comparison of
prediction accuracy involving nonlinear regression, NNs and CART models using a continuous dependent variable and a set of dichotomous
and categorical predictor variables. A large dataset on smokers is used to run these models. Different prediction accuracy measuring
procedures are used to compare performances of these models. The outcomes of predictions are discussed and the outcomes of this research
are compared with the results of similar studies.
q 2005 Elsevier Ltd. All rights reserved.
Keywords: Neural networks; Regression; Classification and regression tree
1. Introduction
Classical statistical methods have been applied in
industry for years. Recently, Neural Networks (NNs)
methods have become tools of choice for a wide variety
of applications across many disciplines. It has been
recognized in the literature that regression and neural
network methods have become competing model-building
methods (Smith & Mason, 1997). For a large class of
pattern-recognition processes, NNs is the preferred tech-
nique (Setyawati, Sahirman, & Creese, 2002). NNs methods
have also been used in the areas of prediction and
classification (Warner & Misra, 1996).
Since NNs was developed as generalizations of math-
ematical models of human cognition through biological
neurons, it is regarded as an information processing system
that has certain performance characteristics in common with
human neural biology. The characteristics include ability
for storing knowledge and making it available for use
whenever necessary, propensity to identify patterns, even in
0957-4174/$ - see front matter q 2005 Elsevier Ltd. All rights reserved.
doi:10.1016/j.eswa.2005.01.006
* Corresponding author. Tel.: C1 269 387 0950; fax: C1 269 387 5710.
E-mail address: [email protected] (M.A. Razi).
the presence of noise, aptitude for taking past experiences
into consideration and make inferences and judgments
about new situations.
Statistical methods such as regression analysis, multi-
variate analysis, Bayesian theory, pattern recognition and
least square approximation models have been applied to a
wide range of decisions in many disciplines (Buntine &
Weigend, 1991). These models are attractive to decision
makers because of their established methodology, long
history of application, availability of software and deep-
rooted acceptance among practitioners and academicians
alike. NNs are data dependent and therefore, their
performance improves with sample size. Statistical
methods, such as Regression perform better for extremely
small sample size, and also when theory or experience
indicates an underlying relationship between dependent and
predictor variables (Warner & Misra, 1996). Classification
and Regression Tree (CART) models use tree-building
algorithms, which are a set of if-then (split) conditions that
permit prediction or classification of cases. A CART model
that predicts the value of continuous variables from a set of
continuous and/or categorical predictor variables is referred
as regression-type model. For the prediction of the value of
categorical variable from a set of continuous and/or
categorical predictor variables, classification-type CART
model is used. One noticeable advantage of decision tree
Expert Systems with Applications 29 (2005) 65–74
www.elsevier.com/locate/eswa
M.A. Razi, K. Athappilly / Expert Systems with Applications 29 (2005) 65–7466
based models, such as CART, is that the decision tree based
models are scalable to large problems and can handle
smaller data set than NNs models (Marcham, Mathieu, &
Wray, 2000).
Despite the apparent substantive and applied advantages
of statistical models, Neural Networks (NNs) methods have
also gained popularity in recent years (Ripley, 1994). These
methods are particularly valuable when the functional
relationship between independent and dependent variables
are unknown and there are ample training and test data
available for the process. NNs models also have high
tolerance for noise in the data and complexity. Moreover,
the software technologies, such as, SPSS-Clementine, SAS-
Enterprise Minor and Brain Maker that deploy neural
networks algorithm have become extremely sophisticated
and user-friendly in recent years.
Our research objective was to compare the predictive
ability of multiple regression, NNs method and CART
model using a set of data on smokers that include mostly
categorical variables. Comparison of predictive abilities of
statistical and NNs models are plentiful in the literature. It is
also widely recognized that the effectiveness of any model is
largely dependent on the characteristics of data used to fit
the model. Goss and Vozikis (2002) compared NNs
methods with Binary Logit Regression (BLR) and con-
cluded that NNs model’s prediction accuracy was better
than that of BLR model. Shang, Lin, and Goetz (2000) also
concluded similarly. Feng and Wang (2002) compared
nonlinear regression with NNs methods in reverse engin-
eering application using all non-categorical variables in
their study. Both models provided comparably satisfactory
prediction, however, the regression model produced a
slightly better performance in model construction and
model verification. Brown, Corruble, and Pittard (1993)
show that NNs do better than CART models on multimodal
classification problems where data sets are large with few
attributes. The authors also concluded that the CART model
did better than the NNs model with smaller data sets and
with large numbers of irrelevant attributes. For non-linear
data sets, NNs and CART models outperform linear
discriminant analysis (Curram & Mingers, 1994). In our
research, a three-way comparison involving nonlinear
regression, NNs and CART models is performed. The
prediction errors of these three models are compared where
the dependent variable is continuous and predictor variables
are all categorical.
The rest of the paper is organized as follows: The Section
2 provides literature review on comparative analysis of NNs
and statistical models. Section 3 provides a brief description
and organization of data and the research model. Section 4
provides a brief discussion on NNs, regression and CART
models and presents test hypotheses. In Section 5, we
examine results of these three models and provide analysis.
Based on the analysis in Section 5, conclusions are drawn
and presented in Section 6.
2. Literature review
2.1. Classical statistical tools
Some of the widely used traditional Statistical tools
applied for prediction and diagnosis in many disciplines are
Discriminant analysis (Flury & Riedwyl, 1990; Press &
Wilson, 1978), Logistic regression (Hosmer & Lemeshow,
1989; Press & Wilson, 1978; Studenmund, 1992), Bayesian
approach (Buntine & Weigend, 1991; Duda & Hart, 1973),
and Multiple Regression (Menard, 1993; Myers, 1990;
Neter, Wasserman, & Kutner 1985; Snedecor & Cochran,
1980). These models have been proven to be very effective,
however, for solving relatively less complex problems.
2.2. Neural networks models
An overview of NNs models is provided by Lippmann
(1987). Fausett (1994); Freeman (1994); Hertz, Krogh, and
Palmer (1991); Lawrence (1994); Mehrotra, Mohan, and
Ranka (1996); Rumelhart, Hinton, and Williams (1986);
Smith (1993); Taylor (1999) and White (1992) conducted
research involving mathematical description of NNs
models, Neural Net architecture, training algorithms such
as supervised/unsupervised learning and backpropagation
algorithm. It is also evident from the literature involving
NNs models that the development and application of NNs is
not limited to a specific area. The applications of NNs range
from signal processing in telecommunications to pattern
recognition (Lippmann, 1987) in Medicine, Business and
Engineering. The following section provides a brief over-
view of the articles that applied Neural Networks in various
disciplines.
2.2.1. Health
Numerous articles involving applications of NNs in
medicine have been published over the years. NNs models
are applied in cardiovascular studies by Baxt (1990) and also
by Fujita, Katafuchi, Uehara, and Nishimura (1992). Fujita
et al. concluded that their feed-forward neural network with a
back-propagation algorithm performed better than radiology
residents but worse than experienced radiologists. Poli,
Cagnoni, Livi, Coppini, and Valli (1991) applied NNs
models in hypertension diagnosis. NNs models are used to
predict protein structures by Qian and Sejnowski (1988).
Shang et al. (2000) used NNs and Regression to detect
antibiotic-resistant pathogen infections in the US hospitals.
The results obtained by Shang et al. are mixed; Regression
model worked better for smaller test sets, however, NNs as a
whole, provided slightly better prediction and less variation
across different subgroups. Zhang and Berardi (1999)
applied NNs in thyroid function diagnosis.
2.2.2. Financial
Lee and Jung (2000) compared predictive ability of
Logistic regression and NNs to identify creditworthiness of
M.A. Razi, K. Athappilly / Expert Systems with Applications 29 (2005) 65–74 67
urban and rural customers. The results were mixed; for
urban customers, regression worked better and for rural
customers, NNs methods provided better prediction. Tam
and Kiang (1992) applied multivariate discriminant analysis
model and NNs to examine the failure of banks. The authors
concluded that NNs offered better predictive accuracy than
discriminant analysis model. Applicability of NNs for cost
estimation in building construction, is tested by Setyawati
et al. (2002). The authors concluded ‘Neural networks
outperform regression linear models given the same training
data and the same variables’. Other applications of NNs in
finance can be found in article by Kimoto, Asakawa, Yoda,
and Takeoka (1993). Applications of NNs models in Stock
market performance prediction are provided by Hutchinson
(1994) and Studenmund (1992).
2.2.3. Marketing and data minning
Numerous applications of NNs models in Marketing and
data mining are available in the literature (Ainslie & Dreze,
1996; Groth, 2000; Kumar, Rao, & Soni 1995; Westphal &
Blaxton, 1998). West, Brockett, and Golden (1997)
observed that NNs provides better prediction than discri-
minant analysis and logistic regression in brand choice
decision.
2.2.4. Business, manufacturing and engineering
Like other areas, applications of NNs in Business,
Manufacturing and Engineering are plentiful. Wong,
Bodnovich, and Selvi (1997) provided a comprehensive
review and analysis of the literature involving NNs
applications between 1988 and 1995. A survey by Zhang
and Huang (1995) provides applications of neural network
in manufacturing. Hurrion (1992) applied NNs metamodel
to find optimal number of Kanbans in manufacturing
systems. Liang, Markowitz, and Yih (1992) used NNs
metamodel in Operations Management, Hill and Remus
(1994) in Managerial Decision Making and Kaparthi and
Suresh (1994) in quality control. Feng and Wang (2002)
compared nonlinear regression and neural network models
in computer-aided reverse engineering and automatic
inspection applications. Coit, Jackson, and Smith (1998);
Martinez, Smith and Bidanda (1994); Moon and Na (1997);
Petri, Billo, and Bidanda (1998); Smith (1993) and
Yarlagadda (2000), among others, used NNs in manufactur-
ing processes and operations modeling. Yang and Lee
(2000) applied NNs for data processing in reverse
engineering. Zhou and Harrison (1999) used a fuzzy-neural
based hybrid approach for error compensation in on-line
inspection on a CNC machine tool. Smith et al. (1997)
compared the predictive capabilities of NNs and regression
methods in manufacturing cost estimation problems. Feng
and Pandey (2002), in an experiment with a coordinate-
measuring machine (CMM), used both regression and NNs
models to study the effect of digitizing parameters on
digitizing uncertainty. The authors concluded that the
‘multiple regression method produced a better prediction
in terms of both the root mean square error and the mean
relative error’.
2.3. Comparison of statistical and NNs models
Numerous authors have compared performance of
statistical and neural networks models on specific problems
(Sarle, 1994; Schumacher, Robner, & Vach 1999; Wu &
Yen, 1992). Hruschka (1993), for example, compared
econometric techniques with NNs models applied in market
response functions. The authors indicated that the back-
propagation NNs model that they used might lead to better
model fits than achieved by comparable econometric
models. However, they also cautioned that more studies
were necessary to establish general conclusion regarding the
strengths and weaknesses of neural networks. Lee and Jung
(2000) compared the forecasting ability of logistic
regression analysis with that of NNs model to predict
creditworthiness of urban customers. Werbos (1991)
discussed the link between Artificial Neural Networks
(ANNs) and Statistical models in pattern Recognition.
Warner and Misra (1996) compared the performance of
regression analysis with that of neural networks using
simulated data from known functions and also using real-
world data. The authors discussed the situations where it
would be advantageous to use NNs models in place of a
parametric regression model. They also discussed difficul-
ties related to implementation of NNs models. Zahedi
(1996) compared predictability of NNs with that of
discriminant analysis in financial applications. Ainslie and
Dreze (1996) compared predictability of logistic regression
with that of NNs model. The authors concluded that logistic
regression, in one case, outperformed NNs model, while
both performed equally in another.
2.4. Hybrid models (combination of choice and NNs models)
The idea behind combined (Hybrid) models is to derive
advantages of individual model’s best features to obtain the
best possible results in a given problem/situation (Papatla,
Zahedi, & Zezic-Susac, 2002; Mojirsheibani, 1999). The
practice of mixing models (classifiers) is not new, and have
also been suggested by Xu, Kryzak, and Suen (1992).
Larkey and Croft (1996) used combined (hybrid) classifiers
for handwriting recognition and text categorization. White-
cotton, Sanders, and Norris (1998) combined statistical
method with human judgment and argued that the
combination could provide better accuracy. Smith, Palanis-
wamy, and Krishnamoorthy (1996); Wolport (1992) and
Zhang and Beradi (2001) developed hybrid models by
combining different NNs architectures and showed that the
combinations provided improved performance compared to
standalone NNs models. Hybrid models by combining
statistical models (mixed regression models) were done by
Breiman (1996); LeBlanc and Tibshirani (1996); Mojir-
sheibani (1999) and Stone (1974), among others. Results
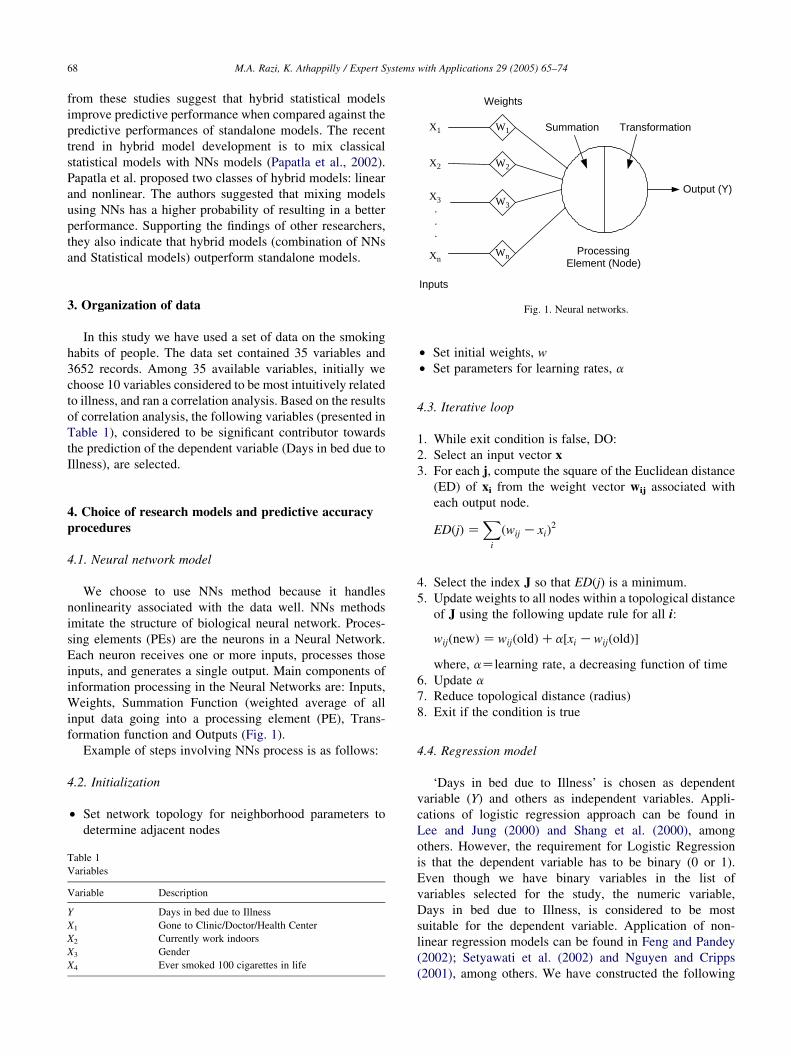
X1
X2
X3...
Xn
W1
W2
W3
Wn
Weights
Output (Y)
Summation Transformation
ProcessingElement (Node)
M.A. Razi, K. Athappilly / Expert Systems with Applications 29 (2005) 65–7468
from these studies suggest that hybrid statistical models
improve predictive performance when compared against the
predictive performances of standalone models. The recent
trend in hybrid model development is to mix classical
statistical models with NNs models (Papatla et al., 2002).
Papatla et al. proposed two classes of hybrid models: linear
and nonlinear. The authors suggested that mixing models
using NNs has a higher probability of resulting in a better
performance. Supporting the findings of other researchers,
they also indicate that hybrid models (combination of NNs
and Statistical models) outperform standalone models.
Inputs
Fig. 1. Neural networks.
3. Organization of dataIn this study we have used a set of data on the smoking
habits of people. The data set contained 35 variables and
3652 records. Among 35 available variables, initially we
choose 10 variables considered to be most intuitively related
to illness, and ran a correlation analysis. Based on the results
of correlation analysis, the following variables (presented in
Table 1), considered to be significant contributor towards
the prediction of the dependent variable (Days in bed due to
Illness), are selected.
4. Choice of research models and predictive accuracy
procedures
4.1. Neural network model
We choose to use NNs method because it handles
nonlinearity associated with the data well. NNs methods
imitate the structure of biological neural network. Proces-
sing elements (PEs) are the neurons in a Neural Network.
Each neuron receives one or more inputs, processes those
inputs, and generates a single output. Main components of
information processing in the Neural Networks are: Inputs,
Weights, Summation Function (weighted average of all
input data going into a processing element (PE), Trans-
formation function and Outputs (Fig. 1).
Example of steps involving NNs process is as follows:
4.2. Initialization
†
Tab
Var
Var
Y
X1
X2
X3
X4
Set network topology for neighborhood parameters to
determine adjacent nodes
le 1
iables
iable Description
Days in bed due to Illness
Gone to Clinic/Doctor/Health Center
Currently work indoors
Gender
Ever smoked 100 cigarettes in life
†
Set initial weights, w†
Set parameters for learning rates, a4.3. Iterative loop
1.
While exit condition is false, DO:2.
Select an input vector x3.
For each j, compute the square of the Euclidean distance(ED) of xi from the weight vector wij associated with
each output node.
EDðjÞ ZX
i
ðwij KxiÞ2
4.
Select the index J so that ED(j) is a minimum.5.
Update weights to all nodes within a topological distanceof J using the following update rule for all i:
wijðnewÞ Z wijðoldÞCa½xi KwijðoldÞ�
where, aZlearning rate, a decreasing function of time
6.
Update a7.
Reduce topological distance (radius)8.
Exit if the condition is true4.4. Regression model
‘Days in bed due to Illness’ is chosen as dependent
variable (Y) and others as independent variables. Appli-
cations of logistic regression approach can be found in
Lee and Jung (2000) and Shang et al. (2000), among
others. However, the requirement for Logistic Regression
is that the dependent variable has to be binary (0 or 1).
Even though we have binary variables in the list of
variables selected for the study, the numeric variable,
Days in bed due to Illness, is considered to be most
suitable for the dependent variable. Application of non-
linear regression models can be found in Feng and Pandey
(2002); Setyawati et al. (2002) and Nguyen and Cripps
(2001), among others. We have constructed the following
M.A. Razi, K. Athappilly / Expert Systems with Applications 29 (2005) 65–74 69
nonlinear multivariate regression model: YiZb0CP4
jZ1
bjXij CP10
kZ5 bkðXi1Xi2CXi1Xi3CXi1Xi4CXi2Xi3CXi2Xi4
CXi3Xi4Þ:
4.5. Classification and regression tree (CART) model
CART model is developed by Breiman, Freidman,
Olshen, and Stone (1984). Regression-type CART mode is
a non-parametric procedure for predicting continuous
dependent variable with categorical and/or continuous
predictor variables where the data is partitioned into nodes
on the basis of conditional binary responses to questions
involving the predictor variable, y. ‘CART models use a
binary tree to recursively partition the predictor space into
subsets in which the distribution of y is successively more
homogenous’ (Chipman, George, & McCulloch, 1998). For
example, CART procedure derives conditional distribution
of y given x, where x represents a vector of predictors ½xZðx1; x2; x3; .; xnÞ�. A decision tree P with t terminal nodes is
used for communicating the classification decision. A
parameter FZ ð41;42;43; .;4tÞ associates the parameter
value 4iðiZ1; 2; 3;.; tÞ with the ith terminal node. The
partitioning procedure searches through all values of
predictor variables (vector of predictors) to find the variable
x that provides best partition into child nodes. The best
partition is the one that minimizes the weighted variance. The
distribution f(yjfi) of yjx represents the situation that x lies in
the region corresponding to the ith terminal node. Although
numerous articles have compared NNs models with linear,
non-linear and hybrid Regression models, very few have
compared the predictive ability of CART model with NNs
and/or regression models. Brown et al. (1993) compared NNs
with CART model. Since CART is a non-parametric
procedure for predicting continuous dependent variable
with categorical predictor variables, we find this model a
natural fit for prediction with the variable set chosen for this
study. For a thorough discussion of CART model, readers are
referred to Breiman et al. (1984) and Chipman et al. (1998).
4.6. Predictive accuracy procedures
It has been identified by Watts and Leftwich (1977) and
Zhang, Cao, and Schniederjans (2004), among others, that a
model with a solid goodness-of-fit measure may not perform
as well in prediction. R2 is a common criterion for goodness-
of-fit for regression models, however, it does not work well
for all data. The problem with goodness-of-fit procedure has
been described by researchers as the ‘descriptive-predictive
paradox’ or ‘regression fallacy’ (Lorek & Willinger, 1996;
Zhang et al., 2004). In light of the above argument, instead
of fitting a model with fundamental variables and measuring
the goodness-of-fit, we estimate the predictive power of a
model by comparing the forecast error for a relatively large
sample of data.
A total of 3652 observations are used to forecast Days in
bed due to Illness (Y) values. Mean Absolute Error (MAE) is
used as one of the measurements of prediction accuracy. As
used by Zhang et al. (2004), we also compute following
three error metrics to measure prediction accuracy:
1.
Mean Absolute Percentage Error (MAPE)Z 13652P3652iZ1
jYiKYi=Yij P
2. Mean Squared Error (MSE) Z 136523652iZ1 ðYiKYi=YiÞ
2
where, Yi^ is the forecasted value of Days in bed due to
Illness (Y).
3.
Large Prediction Error (LPE): We set large forecast erroras one that exceeds 100% as used by Zhang et al. (2004).
4.7. Hypothesis
In order to establish statistical significance, we carry out
statistical tests to comparatively evaluate prediction accu-
racy between regression and NNs methods, between
regression and CART methods and between NNs and
CART methods on problems for the dataset of smokers.
Following hypotheses are proposed:
H01:
There is no prediction accuracy difference in regres-sion and NNs methods.
H02:
There is no prediction accuracy difference in regres-sion and CART methods.
H03:
There is no prediction accuracy difference in CARTand NNs methods.
Since regression models do not perform well with
categorical predictor variables, we expect that both NNs
and CART models will outperform the predictive ability of
regression model.
5. Results and analysis
5.1. Regression
A stepwise regression procedure was conducted using
SPSS. In the process, some of the variables and nonlinear
interactions were thrown away by the procedure due to lack
of significant contributions towards the prediction of the
value of the dependent variable, Y. Multicollinearity among
independent variables was also a factor in the final selection
of the model. The final nonlinear regression model is as
follows:
Y Z 1:474 C3:536X2 C5:856X4 K1:734X1X2
C1:505X1X3 K2:563X2X3 K3:438X3X4
The following table shows the regression results of the
prediction model. It shows that Current working conditions
(X2) and smoking intensity (X4) have a significant impact on
the Days in bed due to illness (Y) based on aZ0.05.
Table 2
Output of regression model
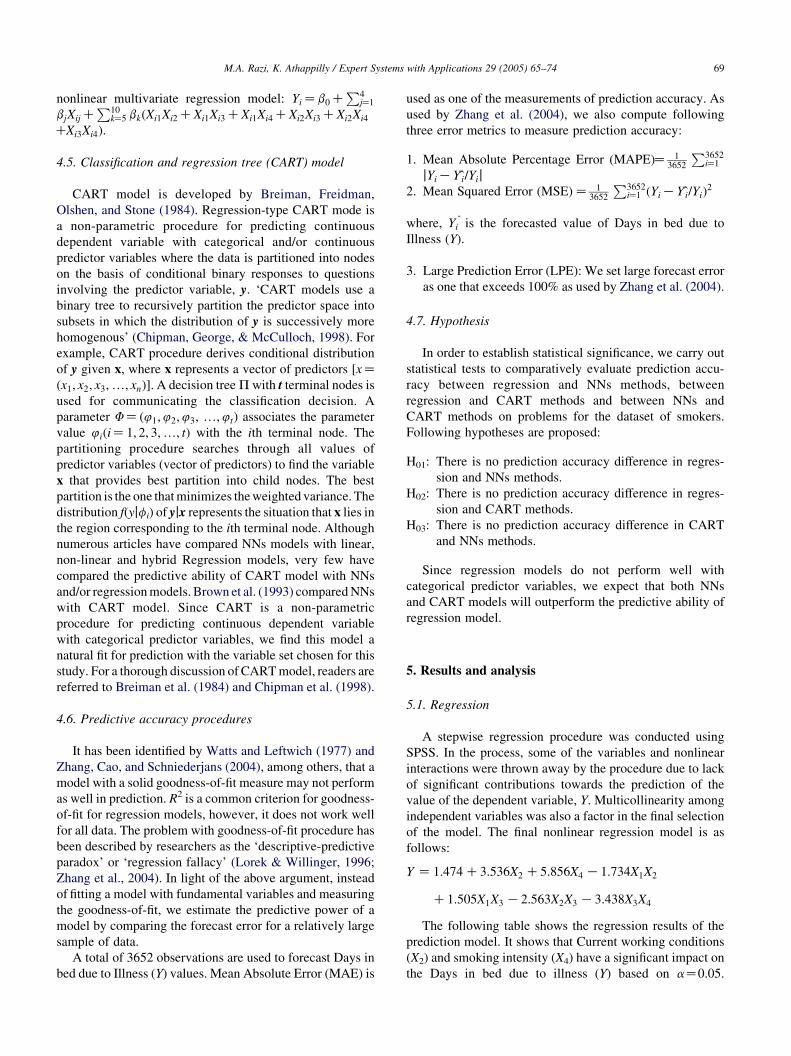
Predictor Coef (b) SE Coef T P
Constant 1.474 0.461 3.197 0.001
X2 3.536 0.532 11.007 0.000
X4 5.856 0.645 K5.330 0.000
X1X2 K1.734 0.645 5.479 0.000
X1X3 1.505 0.623 K4.112 0.000
X2X3 K2.563 0.530 K3.272 0.001
X3X4 K3.438 0.602 2.499 0.012
Table 4
Predictive accuracy procedures
MAE MAPE MSE LPE (%)
Regression 5.08 1.9 8.29 42.6
Neural Network 4.75 1.61 6.3 35.3
CART 4.79 1.62 6.8 32.5
M.A. Razi, K. Athappilly / Expert Systems with Applications 29 (2005) 65–7470
Four interactions X1X2, X1X3, X2X3, and X3X4 also
significantly affected Y for the same Alpha level (Table 2).
Analysis of variance
Source DF SS MS F P
Regression 32092.131 6 5348.827 46.283 0.000
Residual
Error
421241.6 3645 115.567
Total 453334.6 3651
Table 3
NNs factors us
Input layer:
Hidden layer
Output layer:
Relative impor
Gone to clini
Currently wo
Gender
Ever smoked
ed in predicti
tance of inpu
c/doctor/healt
rk indoors
100 cigarette
on and analys
ts:
h center
s in life
is
4 neuro
3 neuro
1 neuro
0.039
0.039
0.013
0.012
5.2. Neural network model
Neural networks, through a network of functions, provide
a non-linear mapping between dependent and independent
variables. The network is supported by a set of inter-
connected layers of processing elements. Table 3 provides
statistics of neural network factors used in prediction.
5.3. Predictive accuracy results
Descriptive statistics and the graphs of ðYi KYi^Þ for
Regression, NNs and CART models are provided in
Appendix A. All three models show almost same minimum
and maximum prediction error. Regression model, however,
shows lower standard deviation but higher mean of
prediction error. All three graphs show that each model
reacts similarly to outlier values of Y (please see graphs in
Appendix A). Each model generates similar number of
prediction errors where error is O40. However, upon close
observation of graphs of these three models, it is evident that
most errors for regression model are little higher than the
errors generated by the NNs and CART models. Obser-
vations in this section are also supported by the predictive
accuracy results explained below.
ns
ns
n
The results of MAE, MAPE, MSE, and LPE for
regression, Neural Networks and CART are provided in
Table 4. The Neural Network method yields the lowest
MAE, MAPE and MSE values (4.75, 1.61, and 6.3,
respectively). However, the values of MAE, MAPE and
MSE for CART model (4.79, 1.62, and 6.8, respectively) are
close behind those of NNs method. Regression seems to
provide consistently higher values of MAE, MAPE and
MSE (5.08, 1.9, and 8.29, respectively) compared to other
two procedures. It can be concluded that, across the three
models, MAE, MAPE and MSE exhibit the same pattern. It
was no surprise that the measure of large prediction error
(LPE) for regression (42.6%) is higher that that of other two
models. However, LPE shows opposite pattern between
Neural Network and CART models. LPE for CART (32.5%)
is significantly lower than that of Neural Networks model
(35.3%). The implication is that, even though, CART model
exhibit slightly higher values of MAE, MAPE and MSE,
than the NNs model, it produces significantly lower
percentage of large prediction error.
5.4. Hypothesis testing: regression vs NNs model
Since data used for prediction in all models are same, we
carried out paired t-test (two samples for mean) on
prediction accuracy ðYiKYi^Þ to test all hypotheses. The
results of paired t-tests are shown in Table 5. Detail results
are provided in Appendix B.
Since P!0.05, H01, H02 and H03 all are rejected. The
evidence indicate that the average prediction error of
regression model is significantly different from the average
prediction error of NNs model (reject H01). This conclusion,
however, also indicate that the prediction error of regression
model is higher than the NNs model. Similar conclusion can
be drawn for the regression versus CART test (reject H02) as
well as for the NNs versus CART test (reject H03). The
implications of rejecting H02 and H03 are that mean
Table 5
Results of paired t-tests
Tests df t-Stat P(T%t) Conclusion
H01: Regression vs
NNs
3651 21.24 0 mROmNN
H02: Regression vs
CART
3651 24.85 0 mROmCART
H03: NNs vs CART 3651 K3.61 0.000154 mNNOmCART
Where, mR, mNN and mCART are, mean prediction errors of Regression,
Neural Networks and Classification and Regression Tree (CART) models,
respectively.
M.A. Razi, K. Athappilly / Expert Systems with Applications 29 (2005) 65–74 71
prediction error produced by CART model is lower than that
of Regression model and the mean prediction error
generated by the NNs model is lower than that of CART
model. However, it should be noted that t-Statistics for H03
test is quite low (K3.61) compared to H01(21.24) and
H02(24.85).
6. Conclusion
In this research we perform a three-way comparison of
prediction accuracy involving nonlinear regression, NNs and
CART models. The prediction errors of these three models
are compared where the dependent variable is continuous and
predictor variables are all categorical. As mentioned before,
many comparative studies have been done in the past,
however, very few involved CART model in their studies.
NNs and CART models, in our study, produced better
prediction accuracy than non-linear regression model. Even
though NNs produced lower MAE, MAPE and MSE values
than the CART model, the later model generated fewer
LPEs than the former model. The advantage of decision tree
based models, however, is that the decision tree based
models are scalable to large problems and can handle
smaller data set than NNs models (Marcham et al., 2000).
Feng and Pandey (2002) compared nonlinear regression
with NNs methods in reverse engineering application.
However, variables used in their study were all non-
categorical. The authors pointed out that, even though both
models provided satisfactory prediction, the regression
model yielded a slightly better performance in model
construction and model verification. Brown et al. (1993)
show that NNs do better than CART models on multimodal
classification problems where data sets are large with few
attributes. However, the authors also point out that CART
outperform NNs models where data sets are smaller with
large numbers of irrelevant attributes. NNs and CART
models are shown to outperform linear discriminant
analysis on problems where the data is non-linear (Curram
& Mingers, 1994).
It is obvious from the study results that NNs and CART
models provide better prediction compared to regression
models when the predictor variables are binary or categorical
and the dependent variable continuous. However, neither
NNs nor CART model showed clear advantage of one over
the other. For application standpoint, either one of NNs and
CART models may be used for prediction and would provide
better predictability over regression. However, oweverH-
more studies and different scenarios/conditions need to be
explored in order to establish a clear distinction of
performance between CART and NNs models.
Appendix A
Descriptive statistics
N Minimum Maximum Mean Std. deviation
Diff-Reg 3652 0.01 86.72 5.0864 9.46036
Diff-NN 3652 0 87 4.75 9.663
Diff-CART 3652 0 87 4.80 9.613
Valid N
(listwise)
3652
1.
Graph of ðYiKYiÞ^ for the Regression model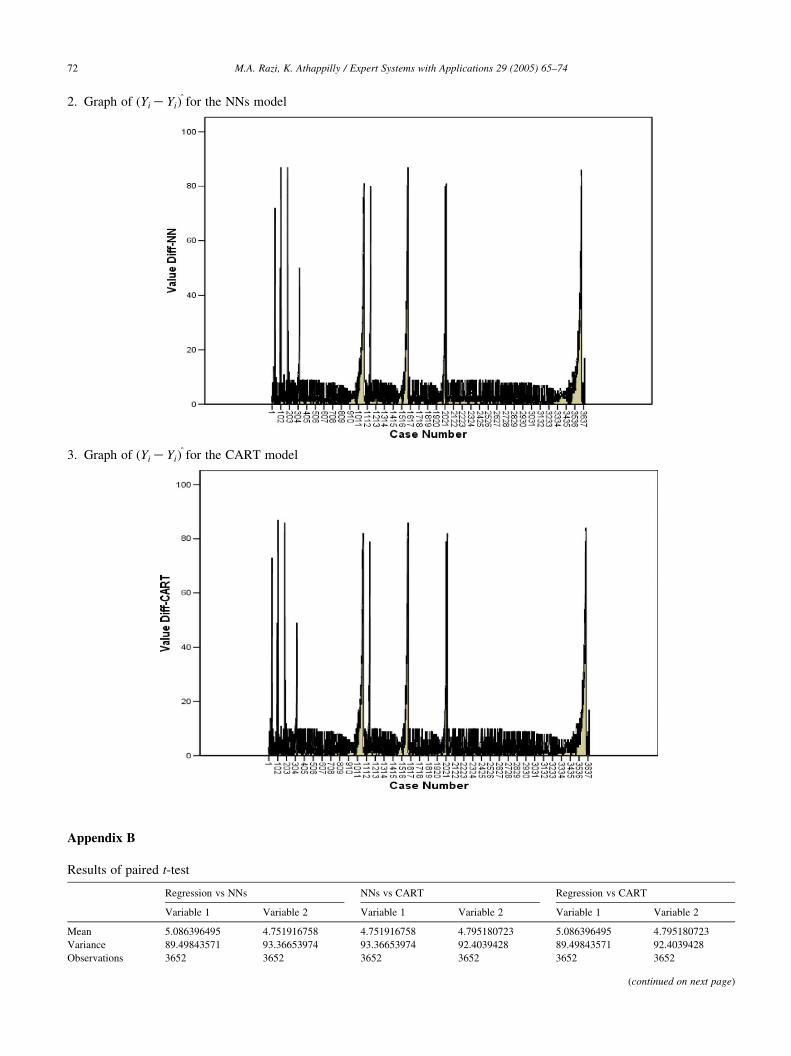
M.A. Razi, K. Athappilly / Expert Systems with Applications 29 (2005) 65–7472
2.
Graph of ðYi KYiÞ^ for the NNs model3.
Graph of ðYi KYiÞ^ for the CART modelAppendix B
Results of paired t-test
Regression vs NNs NNs vs CART Regression vs CART
Variable 1 Variable 2 Variable 1 Variable 2 Variable 1 Variable 2
Mean 5.086396495 4.751916758 4.751916758 4.795180723 5.086396495 4.795180723
Variance 89.49843571 93.36653974 93.36653974 92.4039428 89.49843571 92.4039428
Observations 3652 3652 3652 3652 3652 3652
(conti
nued on next page)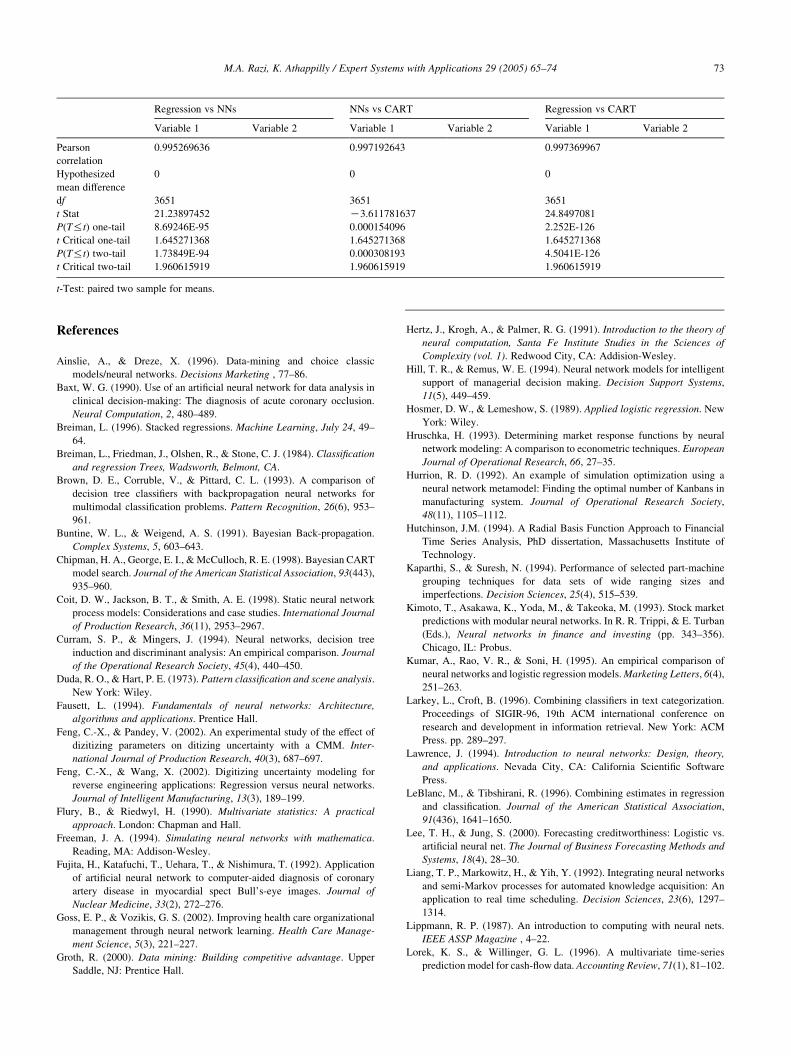
M.A. Razi, K. Athappilly / Expert Systems with Applications 29 (2005) 65–74 73
Regression vs NNs NNs vs CART Regression vs CART
Variable 1 Variable 2 Variable 1 Variable 2 Variable 1 Variable 2
Pearson
correlation
0.995269636 0.997192643 0.997369967
Hypothesized
mean difference
0 0 0
df 3651 3651 3651
t Stat 21.23897452 K3.611781637 24.8497081
P(T%t) one-tail 8.69246E-95 0.000154096 2.252E-126
t Critical one-tail 1.645271368 1.645271368 1.645271368
P(T%t) two-tail 1.73849E-94 0.000308193 4.5041E-126
t Critical two-tail 1.960615919 1.960615919 1.960615919
t-Test: paired two sample for means.
Hertz, J., Krogh, A., & Palmer, R. G. (1991). Introduction to the theory of
ReferencesAinslie, A., & Dreze, X. (1996). Data-mining and choice classic
models/neural networks. Decisions Marketing , 77–86.
Baxt, W. G. (1990). Use of an artificial neural network for data analysis in
clinical decision-making: The diagnosis of acute coronary occlusion.
Neural Computation, 2, 480–489.
Breiman, L. (1996). Stacked regressions. Machine Learning, July 24, 49–
64.
Breiman, L., Friedman, J., Olshen, R., & Stone, C. J. (1984). Classification
and regression Trees, Wadsworth, Belmont, CA.
Brown, D. E., Corruble, V., & Pittard, C. L. (1993). A comparison of
decision tree classifiers with backpropagation neural networks for
multimodal classification problems. Pattern Recognition, 26(6), 953–
961.
Buntine, W. L., & Weigend, A. S. (1991). Bayesian Back-propagation.
Complex Systems, 5, 603–643.
Chipman, H. A., George, E. I., & McCulloch, R. E. (1998). Bayesian CART
model search. Journal of the American Statistical Association, 93(443),
935–960.
Coit, D. W., Jackson, B. T., & Smith, A. E. (1998). Static neural network
process models: Considerations and case studies. International Journal
of Production Research, 36(11), 2953–2967.
Curram, S. P., & Mingers, J. (1994). Neural networks, decision tree
induction and discriminant analysis: An empirical comparison. Journal
of the Operational Research Society, 45(4), 440–450.
Duda, R. O., & Hart, P. E. (1973). Pattern classification and scene analysis.
New York: Wiley.
Fausett, L. (1994). Fundamentals of neural networks: Architecture,
algorithms and applications. Prentice Hall.
Feng, C.-X., & Pandey, V. (2002). An experimental study of the effect of
dizitizing parameters on ditizing uncertainty with a CMM. Inter-
national Journal of Production Research, 40(3), 687–697.
Feng, C.-X., & Wang, X. (2002). Digitizing uncertainty modeling for
reverse engineering applications: Regression versus neural networks.
Journal of Intelligent Manufacturing, 13(3), 189–199.
Flury, B., & Riedwyl, H. (1990). Multivariate statistics: A practical
approach. London: Chapman and Hall.
Freeman, J. A. (1994). Simulating neural networks with mathematica.
Reading, MA: Addison-Wesley.
Fujita, H., Katafuchi, T., Uehara, T., & Nishimura, T. (1992). Application
of artificial neural network to computer-aided diagnosis of coronary
artery disease in myocardial spect Bull’s-eye images. Journal of
Nuclear Medicine, 33(2), 272–276.
Goss, E. P., & Vozikis, G. S. (2002). Improving health care organizational
management through neural network learning. Health Care Manage-
ment Science, 5(3), 221–227.
Groth, R. (2000). Data mining: Building competitive advantage. Upper
Saddle, NJ: Prentice Hall.
neural computation, Santa Fe Institute Studies in the Sciences of
Complexity (vol. 1). Redwood City, CA: Addision-Wesley.
Hill, T. R., & Remus, W. E. (1994). Neural network models for intelligent
support of managerial decision making. Decision Support Systems,
11(5), 449–459.
Hosmer, D. W., & Lemeshow, S. (1989). Applied logistic regression. New
York: Wiley.
Hruschka, H. (1993). Determining market response functions by neural
network modeling: A comparison to econometric techniques. European
Journal of Operational Research, 66, 27–35.
Hurrion, R. D. (1992). An example of simulation optimization using a
neural network metamodel: Finding the optimal number of Kanbans in
manufacturing system. Journal of Operational Research Society,
48(11), 1105–1112.
Hutchinson, J.M. (1994). A Radial Basis Function Approach to Financial
Time Series Analysis, PhD dissertation, Massachusetts Institute of
Technology.
Kaparthi, S., & Suresh, N. (1994). Performance of selected part-machine
grouping techniques for data sets of wide ranging sizes and
imperfections. Decision Sciences, 25(4), 515–539.
Kimoto, T., Asakawa, K., Yoda, M., & Takeoka, M. (1993). Stock market
predictions with modular neural networks. In R. R. Trippi, & E. Turban
(Eds.), Neural networks in finance and investing (pp. 343–356).
Chicago, IL: Probus.
Kumar, A., Rao, V. R., & Soni, H. (1995). An empirical comparison of
neural networks and logistic regression models. Marketing Letters, 6(4),
251–263.
Larkey, L., Croft, B. (1996). Combining classifiers in text categorization.
Proceedings of SIGIR-96, 19th ACM international conference on
research and development in information retrieval. New York: ACM
Press. pp. 289–297.
Lawrence, J. (1994). Introduction to neural networks: Design, theory,
and applications. Nevada City, CA: California Scientific Software
Press.
LeBlanc, M., & Tibshirani, R. (1996). Combining estimates in regression
and classification. Journal of the American Statistical Association,
91(436), 1641–1650.
Lee, T. H., & Jung, S. (2000). Forecasting creditworthiness: Logistic vs.
artificial neural net. The Journal of Business Forecasting Methods and
Systems, 18(4), 28–30.
Liang, T. P., Markowitz, H., & Yih, Y. (1992). Integrating neural networks
and semi-Markov processes for automated knowledge acquisition: An
application to real time scheduling. Decision Sciences, 23(6), 1297–
1314.
Lippmann, R. P. (1987). An introduction to computing with neural nets.
IEEE ASSP Magazine , 4–22.
Lorek, K. S., & Willinger, G. L. (1996). A multivariate time-series
prediction model for cash-flow data. Accounting Review, 71(1), 81–102.
M.A. Razi, K. Athappilly / Expert Systems with Applications 29 (2005) 65–7474
Markham, I. S., Mathieu, R. G., & Wray, B. A. (2000). Kanban setting
through artificial intelligence: A comparative study of artificial neural
networks and decision threes. Integrated Manufacturing, 11(4), 239.
Martinez, S. E., Smith, A. E., & Bidanda, B. (1994). Reducing waste in
casting with a predictive neural model. Journal of Intelligent
Manufacturing, 5(4), 277–286.
Mehrotra, K., Mohan, C. K., & Ranka, S. (1996). Elements of artificial
neural networks. Cambridge, Massachusetts: The MIT Press.
Menard, S. (1993). Applied logistic regression analysis, series: Quantitat-
ive applications in the social sciences. Thousand Oaks, CA: Sage.
Mojirsheibani, M. (1999). Combining classifiers via discretization. Journal
of the American Statistical Association, 94(446), 600–609.
Moon, H.-S., & Na, S.-J. (1997). Optimum design based on mathematical
model and neural network to predict weld parameters for fillet joints.
Journal of Manufacturing Systems, 16(1), 13–23.
Myers, R. H. (1990). Classical and modern regression with applications
(2nd ed.). Boston, Massachusetts: PWS-KENT Publishing Company.
Neter, J., Wasserman, W., & Kutner, M. H. (1985). Applied linear
statistical models (2nd ed.). Homewood, IL: Richard D. Irwin, Inc.
Nguyen, N., & Cripps, A. (2001). Predicting housing value: A comparison
of multiple regression analysis and artificial neural networks. The
Journal of Real Estate Research, 22(3), 313–336.
Papatla, P., Zahedi, F., & Zezic-Susac, M. (2002). Leveraging the strengths
of choice models and neural networks: A multiproduct comparative
analysis. Decision Sciences, 33(3), 433–468.
Petri, K. L., Billo, R. E., & Bidanda, B. (1998). A neural network process
model for abrasive flow machining operations. Journal of Manufactur-
ing Systems, 17(1), 52–64.
Poli, R., Cagnoni, S., Livi, R., Coppini, G., & Valli, G. (1991). A neural
network expert system for diagnosing and treating hypertension.
Computer , 64–71.
Press, S. J., & Wilson, S. (1978). Choosing between logistic regression and
discriminant analysis. Journal of the American Statistical Association,
73, 699–705.
Qian, N., & Sejnowski, T. J. (1988). Predicting the secondary structure of
globular proteins using neural network models. Journal of Molecular
Biology, 202, 865–884.
Ripley, B. D. (1994). Neural networks and related methods for
classification. Journal of the Royal Statistical Society B, 56(3), 409–
456.
Rumelhart, D. E., Hinton, G. E., & Williams, R. J. (1986). Learning
representations by back-propagating error. Nature, 323, 533–536.
Reprinted in Anderson and Rosenfeld [1988], pp. 696–699.
Sarle, W.S. (1994). Neural networks and statistical methods, in Proceedings
of the 19th Annual SAS Users Group International Conference.
Schumacher, M., Robner, R., & Vach, W. (1999). Neural networks and
logistic regression: Part I, Computational statistics and data analysis
(vol. 21), 661–682.
Setyawati, B. R., Sahirman, S., & Creese, R. C. (2002). Neural networks for
cost estimation. AACE International Transactions EST13 , 13.1–13.8.
Shang, J. S., Lin, Y. E., & Goetz, A. M. (2000). Diagnosis of MRSA with
neural networks and logistic regression approach. Health Care
Management Science, 3(4), 287–297.
Smith, M. (1993). Neural networks for statistical modeling. New York: Van
Nostrand Reinhold.
Smith, A. E., & Mason, A. K. (1997). Cost estimation predictive modeling:
Regression versus neural network. The Engineering Economist, 42(2),
137–161.
Smith, K., Palaniswamy, M., & Krishnamoorthy, M. (1996). A hybrid
neural approach to combinatorial optimization. Computers and
Operations Research, 23(6), 597–610.
Snedecor, G. W., & Cochran, W. G. (1980). Statistical methods (7th ed.).
Ames, IA: The Iowa State University Press.
Stone, M. (1974). Cross-validation choice and assessment of statistical
predictions. Journal of the Royal Statistical Society, Series B, 36(2),
111–147.
Studenmund, A. H. (1992). Using econometrics: A practical guide. New
York: Harper Collins.
Tam, K. Y., & Kiang, M. Y. (1992). Managerial applications of neural
networks: The case of bank failure predictions. Management Science,
38(7), 926–947.
Taylor, J. G. (1999). Neural networks and their applications. Wiley.
Warner, B., & Misra, M. (1996). Understanding neural networks as
statistical tools. The American Statistician, 50(4), 284–293.
Watts, R. L., & Leftwich, R. W. (1977). The time series of annual
accounting EPS (in Research Reports). Journal of Accounting
Research, 15(2), 253–271.
Werbos, P. J. (1991). Links between artificial neural networks (ANNs) and
statistical pattern recognition. In I. Sethi, & A. Jain (Eds.), Artificial
neural networks and statistical pattern recognition: Old and new
connections (pp. 11–31). Amsterdam: Elsevier.
West, P., Brockett, P. L., & Golden, L. L. (1997). A comparative analysis of
neural networks and statistical methods for predicting consumer choice.
Marketing Science, 16(4), 370–391.
Westphal, C., & Blaxton, T. (1998). Data mining solution: Method and
tools for solving real-world problems. New York: Wiley.
White, H. (1992). Artificial neural networks: Approximation and learning
theory. Oxford: Basil Blackwell.
Whitecotton, S. M., Sanders, D. E., & Norris, K. B. (1998). Improving
predictive accuracy with a combination of human intuition and
mechanical decision aids. Organizational Behavior and Human
Decision Processes, 76(3), 325–348.
Wolport, D. (1992). Stacked generalization. Neural networks, 5(2), 241–
259.
Wong, B. K., Bodnovich, T. V., & Selvi, Y. (1997). Neural network
applications in business: A review and analysis of the literature (1988–
95). Decision Support Systems, 19(4), 301–320.
Wu, F.Y., Yen, K.K. (1992). Application of neural network in regression
analysis, in Proceedings of the 14th Annual Conference on Computers
and Industrial Engineering.
Xu, L., Kryzak, A., & Suen, C. Y. (1992). Methods for combining multiple
classifiers and their applications to handwriting recognition. IEEE
Transactions on Systems, Man and Cybernetics, 22(3), 418–435.
Yarlagadda, P. K. D. V. (2000). Prediction of die casting process
parameters by using an artificial neural network model for zinc alloy.
International Journal of Production research, 38(1), 119–139.
Yang, M., & Lee, E. (2000). Improved neural network models for reverse
engineering. International Journal of Production Research, 38(9),
2067–2078.
Zahedi, F. (1996). A meta-analysis of financial applications of neural
networks. International Journal of Computational Intelligence and
Organizations, 1(3), 164–178.
Zhang, G., & Berardi, V. (1999). An investigation of neural networks in
thyroid function diagnosis. Health Care Management Science, 1, 29–
37.
Zhang, G., & Berardi, V. (2001). Time series forecasting with neural
network ensembles: An application for exchange rate prediction.
Journal of the Operational Research Society, 52(6), 652–664.
Zhang, H.-C., & Huang, S. H. (1995). Applications of neural network
applications in manufacturing: A state-of-the-art survey. International
Journal of Production Research, 33, 705–728.
Zhou, E. P., & Harrison, D. K. (1999). Improving error compensation via a
fuzzy-neural hybrid model. Journal of Manufacturing Systems, 18(5),
335–344.
Zhang, W., Cao, Q., & Schniederjans, M. J. (2004). Neural networks
earning per share forecasting models: A comparative analysis of
alternative methods. Decision Sciences, 35(2), 205–237.


