Embed Size (px)
Citation preview
eScholarship provides open access, scholarly publishingservices to the University of California and delivers a dynamicresearch platform to scholars worldwide.
California Partners for AdvancedTransportation Technology
UC Berkeley
Title:A Combined Traveler Behavior And System Performance Model With ATIS
Author:Khattak, AsadAl-deek, HaithamThananjeyan, Paramsothy
Publication Date:01-01-1994
Series:Research Reports
Permalink:http://escholarship.org/uc/item/26m3r4s0
Keywords:Route choice--Mathematical models, Traffic congestion--Mathematical models, Queuing theory,Intelligent Vehicle Highway Systems, Travel bahavior
Abstract:The specific objective of this study is to assess traveler behavior impacts of Advanced TravelerInformation Systems (ATIS) technologies and the consequent system impacts at highwaybottlenecks caused by incidents and recurring congestion. This research is based on earlier workregarding impacts of congestion on traveler behavior and system performance in the presence ofinformation. In this paper, the authors enhance the previous work and develop a richer and morecomprehensive approach for evaluating ATIS technologies. The unique features of this study are:1) integration of traveler behavior and system performance in the context of ATIS. It is based upona dynamic network performance model (queuing) that incorporates a behavioral model responsiveto traffic information; 2) exploration of unsaturated and over-saturated conditions; and, 3) thepossibility of congesting alternate routes as well as the issue of user equilibrium.
Copyright Information:All rights reserved unless otherwise indicated. Contact the author or original publisher for anynecessary permissions. eScholarship is not the copyright owner for deposited works. Learn moreat http://www.escholarship.org/help_copyright.html#reuse

This paper has been mechanically scanned. Someerrors may have been inadvertently introduced.
CALIFORNIA PATH PROGRAMINSTITUTE OF TRANSPORTATION STUDIESUNIVERSITY OF CALIFORNIA, BERKELEY
A Combined Traveler Behavior andSystem Performance Model with ATIS
Asad KhattakHaitham Al-DeekParamsothy Thananjeyan
California PATH Research Paper
UCB-ITS-PRR-94-06
This work was performed as part of the California PATH Program ofthe University of California, in cooperation with the State of CaliforniaBusiness, Transportation, and Housing Agency, Department of Trans-portation; and the United States Department Transportation, FederalHighway Administration.
The contents of this report reflect the views of the authors who areresponsible for the facts and the accuracy of the data presented herein.The contents do not necessarily reflect the official views or policies ofthe State of California. This report does not constitute a standard,specification, or regulation.
March 1994
ISSN 1055-1425

A COMBINED TRAVELER BEHAVIOR AND SYSTEM PERFORMANCE MODEL
WITH ATIS
Asad Khattak
108 Naval Architecture BuildingInstitute of Transportation StudiesUniversity of California, Berkeley
Berkeley, California 94720
Haitham Al-Deek
Department of Civil and Environmental EngineeringP.O. Box 162450
University of Central FloridaOrlando, Florida 328 16
Paramsothy Thananjeyan
108 Naval Architecture BuildingInstitute of Transportation StudiesUniversity of California, Berkeley
Berkeley, California 94720
(5 10) 642-9208FAX (510) 643- 5456
Submitted to
California Department of Transportation
February 1994
Abstract
The goal of this study is to develop a framework for evaluating the effect of Advanced Traveler
Information Systems (ATIS). The framework uses a traveler behavior model of route diversion
imbedded in a queuing model to evaluate ATIS impacts in incident conditions. The unique feature of
our methodology is the integration of realistic traveler behavior with a system performance model while
accounting for the effect of real-time travel information.
To demonstrate the application of our methodology, we consider the evolution of queues on a
two-link network with an incident bottleneck during unsaturated (off-peak) and over-saturated (peak)
conditions. The assignment of traffic is based on a probabilistic reported behavior model of route
diversion and a deterministic full compliance model which assumes behavior.
The results indicate that overall system performance, measured by delay and travel times,
improves marginally with increased market penetration of ATIS with the reported behavior model. The
reasons for limited benefits are that in real-life situations (1) people observe incident queues and receive
incident information from radio reports, and (2) they place a relatively high value on avoiding queuing
delay; consequently, they divert--congesting alternate routes and limiting the potential for additional
benefits. The results also indicate that in certain situations, characterized by higher incident durations
and flow rates, ATIS may provide significant system benefits.

TABLE OF CONTENTS
INTRODUCTION
SYNTHESIS OF LITERATURE AND PROBLEM OVERVIEWSystem PerformanceTraveler BehaviorPrevious Models Considered as a Whole
CONCEPTUAL FRAMEWORK 6Strategies for Information Dissemination 6Traveler Decisions 7
METHODOLOGYTheoretical Models for System PerformanceMicroscopic Traffic Assignment and Simulation
SIMULATION OF SYSTEM PERFORMANCEDescription of the Simulation ExperimentSirnulation results
CONCLUSIONS 23
REFERENCES 26
Page1
88
13
151517
TABLES AND FIGURES 30
LIST OF TABLES AND FIGURES
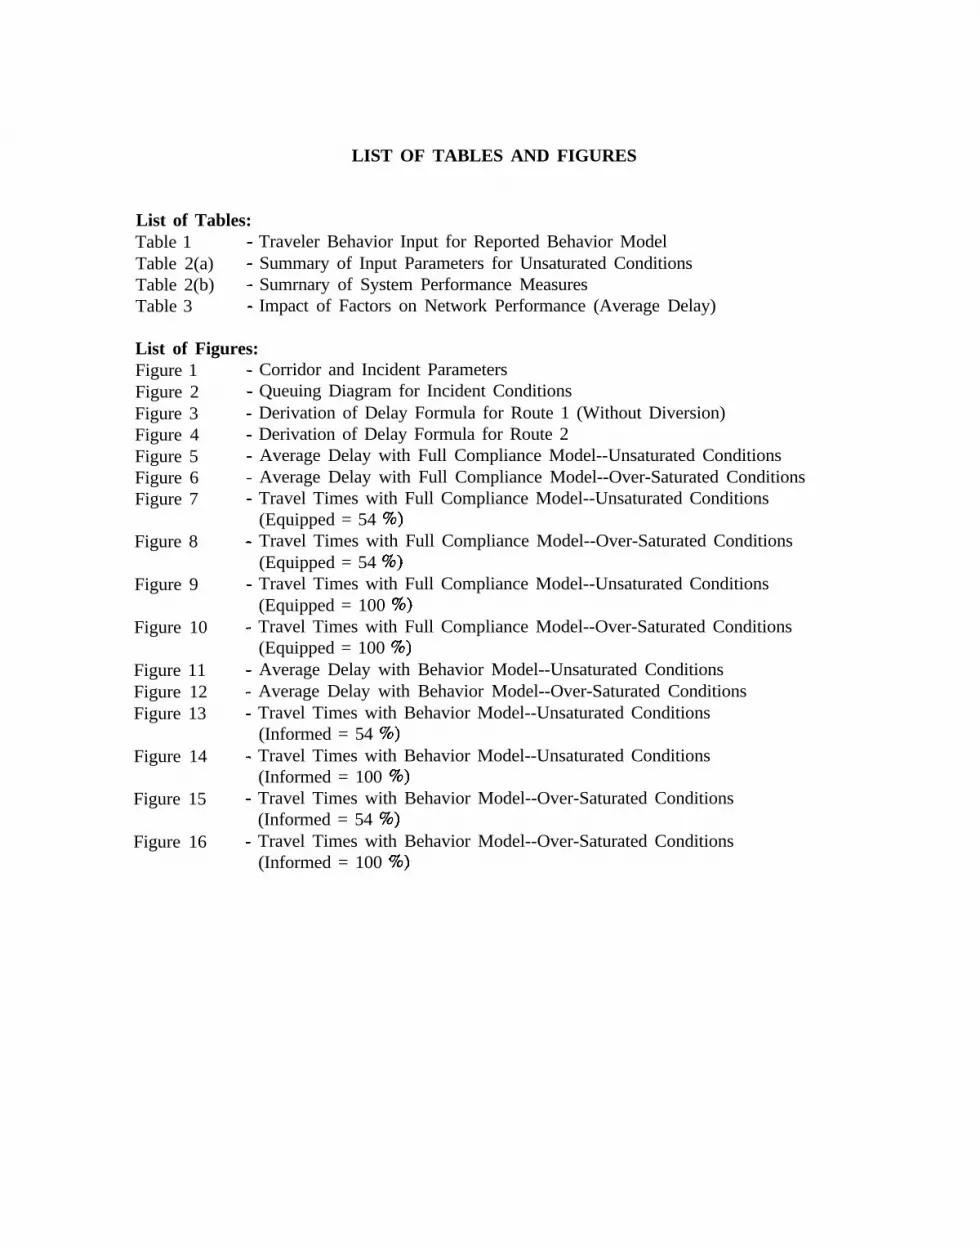
List of Tables:Table 1 - Traveler Behavior Input for Reported Behavior ModelTable 2(a) - Summary of Input Parameters for Unsaturated ConditionsTable 2(b) - Sumrnary of System Performance MeasuresTable 3 - Impact of Factors on Network Performance (Average Delay)
List of Figures:Figure 1Figure 2Figure 3Figure 4Figure 5Figure 6Figure 7
Figure 8
Figure 9
Figure 10
Figure 11Figure 12Figure 13
Figure 14
Figure 15
Figure 16
- Corridor and Incident Parameters- Queuing Diagram for Incident Conditions- Derivation of Delay Formula for Route 1 (Without Diversion)- Derivation of Delay Formula for Route 2- Average Delay with Full Compliance Model--Unsaturated Conditions- Average Delay with Full Compliance Model--Over-Saturated Conditions- Travel Times with Full Compliance Model--Unsaturated Conditions
(Equipped = 54 %)- Travel Times with Full Compliance Model--Over-Saturated Conditions
(Equipped = 54 %)- Travel Times with Full Compliance Model--Unsaturated Conditions
(Equipped = 100 %)- Travel Times with Full Compliance Model--Over-Saturated Conditions
(Equipped = 100 %)- Average Delay with Behavior Model--Unsaturated Conditions- Average Delay with Behavior Model--Over-Saturated Conditions- Travel Times with Behavior Model--Unsaturated Conditions
(Informed = 54 %)- Travel Times with Behavior Model--Unsaturated Conditions
(Informed = 100 %)- Travel Times with Behavior Model--Over-Saturated Conditions
(Informed = 54 %)- Travel Times with Behavior Model--Over-Saturated Conditions
(Informed = 100 %)
ACKNOWLEDGMENT
This research was funded by the California Department of Transportation under the PATH
Program, Institute of Transportation Studies, University of California at Berkeley. Mr. Robert
Ratcliff of the Califomia Department of Transportation was very supportive during the course of
the study. Professor Adib Kanafani provided very useful guidance and direction during all stages
of the research. Ms. Joy Dahlgren read the manuscript and gave us insightful comments which
resulted in the refinement of the paper.

INTRODUCTION
Advanced Traveler Information Systems (ATIS) may offer significant benefits in terms
of improving the travel experience of individuals and enhancing system performance. They may
be particularly useful in the context of incident-induced congestion and recurring congestion.
However, the true potential of these systems has yet to be evaluated. This study develops a
framework for assessing the impacts of auto-related ATIS technologies in both incident and
recurring congestion conditions. The framework can be used in addressing the key research
issues: how will ATIS impact individual travel choices and system performance, and what are
the benefits?
SYNTHESIS OF LITERATURE AND PROBLEM OVERVIEW
There have been worldwide efforts during the last decade to study various aspects of
ATIS, including the evaluation of their impacts on travelers and on the transportation system (see
conference proceedings of VNIS 1989 and 1991; TRB 1987-1993). But there remains a lack of
“connectivity” between behavioral and system performance models, and no clearly defined
mechanism exists for unifying them.
The impacts of ATIS technologies depend, to a large extent, on how travelers will respond
to such systems. Therefore, it is important to understand what factors influence travel decisions.
The existing behavioral choice models usually assume perfect information, that is, individuals
have knowledge of all alternatives. Clearly, such an assumption cannot be supported when
evaluating the effect of information. Similarly, a majority of network performance models do not
explicitly account for the effect of information, and assume unrealistic behavioral rules.
1
The specific objective of this study is to assess traveler behavior impacts of ATIS
technologies and the consequent system impacts at highway bottlenecks caused by incidents and
recurring congestion. This research is based on our earlier work regarding impacts of congestion
on traveler behavior and system performance in the presence of information (Al-Deek 1991;
Khattak 1991). In this paper we enhance our previous work and develop a richer and more
comprehensive approach for evaluating ATIS technologies. The unique features of this study are:
1) Integration of traveler behavior and system performance in the context of ATIS. It is
based upon a dynamic network performance model (queuing) that incorporates a
behavioral model responsive to traffic information.
2) Exploration of unsaturated and over-saturated conditions.
3) The possibility of congesting alternate routes as well as the issue of user equilibrium.
While ATIS is likely to influence travel decisions (e.g., mode, route, schedule, trip
chaining, parking) and activity participation decisions (e.g., work, recreation, shopping), this study
focuses on route diversions. Further, while ATIS may impact network performance in many
ways, we choose a two-route corridor with single origin and destination. The intention is to
describe our initial efforts and demonstrate the application of our methodology. Development of
a network model complete with realistic behavioral rules which can evaluate impacts of
information is an ambitious undertaking that would require extensive time. An ATIS-based
network model may be validated by using real-life data gathered from field operational tests to
be conducted in the future.
2

System Performance
Evaluation of system performance with ATIS requires the ability to model travel
conditions at bottlenecks caused by incidents. With ATIS, drivers will be able obtain detailed
information on travel conditions. Hence, traffic simulation models for ATIS purposes should
include queuing conditions and dynamic path assignment capabilities.
Recently, an exhaustive study of existing traffic models was conducted by Gardes et al.
(1990 and 1991), followed by some applications to model traveler information systems (Gardes
et al. 1993). They concluded that only three models had both assignment and queuing
capabilities: SATURN, CONTRAM, and INTEGRATION. Based on our review of these models,
it was found that none of them incorporate significant traveler behavior. INTEGRATION has
dynamic path selection capabilities based on user-specified vehicle types; SATURN and
CONTRAM do not have adequate dynamic path selection capabilities. A recent extension to
CONTRAM is reported by Smith et al. (1991), in which the model is extended to accommodate
a second route policy with minimum local marginal cost. However, the model assumes total
compliance and travel time optimizing behavior of drivers. DYNASMART (Chang et al. 1985;
Jayakrishnan and Mahmassani 1992; Chen and Mahmassani 1993) is a new macroscopic
simulation model and has the ability to track individual vehicles. The model also has path
selection capabilities, and appears to have route selection models based on bounded rational
behavior.
The traveler decision process is an intrinsic element in modeling traffic conditions with
traveler information systems. Consequently, several researchers have conducted simulation studies
and/or proposed theoretical frameworks to incorporate behavioral characteristics into the traffic
3
modeling process (Arnott et al. 1990 and 1991; Ben Akiva et al. 1986, and 1991; Mahmassani
et al. 1990; Mahmassani and Chen 1991; Mahmassani and Jayakrishnan 1991). The dynamic
network modeling framework proposed by Ben-Al&a et al. (1991) presents a detailed description
of the traveler decision process. Their research also explores deterministic user-equilibrium and
system-optimal conditions. More specific simulation results are presented by Mahmassani et al.
(1991) -- based on a three-route network. These studies address the impact of real-time
information on travelers, supplied at the origin or en route, and exhibit both route switching and
departure time decision capabilities. However, the studies by Mahmassani et al. do not explore
the actual benefits of information under different incident and network characteristics. Studies
by Arnott et al. (1990, 1991), and de Palma et al. (1991) have concentrated on the combined
impact of tolls, pricing, and traveler information systems for recurrent congestion during the
morning commute.
Several other researchers have also addressed the impact of information systems (Cascetta
et al. 1991; Hamerslag et al. 1991; Van Vuren et al. 1991; Papageorgiou et al. 1991; Bonsall et
al. 1991). However, these studies either assume total compliance of drivers, or do not incorporate
realistic traveler behavior adequately. Research studies in stochastic equilibrium (Akamatsu et
al. 1989; Horowitz 1984; Kawakama et al. 1989; Tsuji at al. 1985) also have not addressed the
research issues presented in this paper.
Traveler Behavior
Understanding traveler behavior is complicated by a lack of strong theoretical basis and
the fact that individuals change their responses over time. The important aspects of information
4
are its meaning and whether the information is (a) historical, real-time, or predictive, (b)
qualitative or quantitative, and (c) accurate, timely, relevant, reliable (Schafer et al. 1993). On
the issue of route diversion, researchers have found that travelers are more willing to divert in
response to prescriptive and descriptive traffic information and increasing delays and/or
congestion (Heathington 1969; Dudek et al. 1971; Dudek et al. 1983; Mannering 1989;
Mahmassani et al. 1990; Allen et al. 1991; Bonsall 1991). In addition, longer trip length, lower
number of traffic stops on alternate routes, and familiarity with the alternate route encourage
diversion. Further, younger, male, and unmarried travelers are more likely to divert. Studies on
diversion behavior provided useful insights, but indicated that the effect of information and other
contextual factors on traveler behavior has not been adequately quantified.
Previous Models Considered as a Whole
Until recently the simulation/assignment models and behavioral models have been
considered separately. A majority of the earlier traffic assignment models assume perfect
information and rational behavior of travelers. Further, most traffic simulation models did not
have route assignment capabilities. Under non-incident conditions, user equilibrium assumptions
were considered acceptable, as it was believed that travelers used trial and error to find
reasonable routes. However, this assumption is unrealistic when we wish to understand the effect
of information. With ATIS, under non-recurrent congestion, individuals will be informed of the
travel conditions on their routes, and sometimes may receive route guidance instructions.
Compliance with such instructions by ATIS-equipped travelers, and diversion because of direct
observation of the queue by travelers not equipped with ATIS, introduce additional complexities
5
to the problem. Moreover, the evaluation of benefits and their distribution is complicated because
diversion of equipped travelers can benefit unequipped travelers.
It appears that no model sufficiently addresses the issue of combining system performance
and traveler behavior in the presence of information. For instance, Mahmassani’s bounded
rational decision process and Ben-Akiva’s between-day decision processes have not yet been
confirmed by appropriate real-life empirical data. In addition, Van-Aerde’s INTEGRATION
program may not have the capabilities to represent accurate traveler behavior. These issues
remain to be studied in greater detail.
CONCEPTUAL FRAMEWORK
Travel conditions are created by the interaction of network supply and travel demand.
Congestion on urban area networks can be classified as incident-induced and recurring. Incidents
reduce the network supply by reducing capacities of the network links. They can also reduce
travel demand on certain routes, e.g., an automobile commuter may decide to change the usual
route due to unexpected congestion.
Strategies for Information Dissemination
Managers of the transportation system will use variable message signs, in-vehicle
information systems, and other ATIS technologies to optimize performance with either a user
equilibrium (i.e. optimize travel time for each user) or system optimal strategy (i.e. optimize the
total travel time for all users in the system). Each strategy will have a different effect on network
supply, traveler decisions, travel demand, and may result in different travel conditions (see
6
example presented by Ben-Akiva et al.(l991)). System performance can be evaluated for the
strategy implemented.
This research investigates impacts of various information dissemination strategies on
traveler behavior and system performance. Here we focus on strategies to produce user
equilibrium:
Providing Descriptive Information. ATIS provides travelers with a description of traffic
events such as incidents. This may support travelers’ choice of route. No specific advice is
given to travelers. Descriptive information may be qualitative or quantitative or both, An
example of qualitative information is the message: “There is an accident at - [location];” an
example of quantitative information is the message: “The accident will be cleared within one
hour.” Based on this strategy, travelers can be assigned according to how they would actually
make diversion decisions, e.g., based on a reported behavior model.
Providing Prescriptive Information. ATIS gives instructions or advice on travel choices.
Like descriptive information, prescriptive information can be qualitative or quantitative, or it can
be a mixture of both. An example of a mixture of qualitative and quantitative information is to
advise travelers to use a certain route and justify the advice by giving the expected time savings
if the suggested route is followed. Based on this strategy, travelers can be assigned to the
minimum time route if they are informed. In this strategy we assume full compliance by
travelers.
Traveler Decisions
We hypothesized that traveler decisions can be influenced by real-time travel information
7
such as traffic reports and ATIS devices as well as by the following factors:
l Incident characteristics such as length of delay,
. Trip characteristics such as trip origin and destination and availability of alternate
routes,
l Attributes of the preferred and alternate routes such as travel time and scenery,
l Environmental conditions such as weather,
l Traveler characteristics such as age, gender, and personality,
l Work rules such as flexibility in work arrival time and type of work, and
l Situational constraints such as remaining trip length.
During a trip travelers perceive information through direct and indirect contact with the
environment; in response they make en route decisions. When there is a major delay, and a
traveler perceives this, he or she may be motivated to change travel decisions, e.g., divert to an
alternate route, add or cancel intermediate stops, or take public transit (after parking the vehicle).
Travelers will change routes only if and when their delay thresholds are reached. While it is
difficult to measure a person’s thresholds, reported behavior can indicate whether the threshold
was reached; e.g., if a person diverts in response to delay, then his or her time threshold was
reached.
METHODOLOGY
Theoretical Models for System Performance
In the real world, traffic diversion during incidents can be complicated. Under normal
8

conditions, the hypothesis is that the transportation system is in equilibrium; i.e., no driver can
improve his/her travel time by switching routes (Wardrop 1952). Traffic incidents cause system
disequilibrium, and travelers may be able to reduce their travel time by diverting to alternate
routes. Actual diversions will depend on many factors, including incident, network, and traveler
behavior characteristics. The addition of ATIS increases the complexity of measurement, as the
travelers’ perception of the ATIS system and compliance to guidance instructions are also
essential factors in estimating the total system benefits. In the following sections we will describe
in detail the elements of our assumptions and models used in our research framework.
Idealized Corridor and Assumptions
The network analyzed in this paper is a simplified corridor which consists of two routes
connecting a single origin (point A) and a single destination (point B), as shown in Figure 1.
We have used a simplified corridor because we believe it is important to develop a
comprehensive model which integrates traveler behavior and queuing at bottlenecks in a simple
network before extending the model to simulate larger scale networks.
Route 1 is a freeway with capacity p, and free-flow travel time T,, and Route 2 is an
alternate route with free flow travel time T2 and capacity lu,, where cr, I lu,. The alternate route
may represent a collection of city streets with lower speeds and very large capacity, or it could
be a freeway with longer travel distance than Route 1. Furthermore, Tl < T2, and it is assumed
that travel times on Routes 1 and 2 are independent of flow except under queuing conditions.
This assumption has been empirically validated by Hurdle and Solomon (1986). The incident
occurs at point C and reduces the capacity of Route 1 from p1 to p*]. The incident occurs at time
9
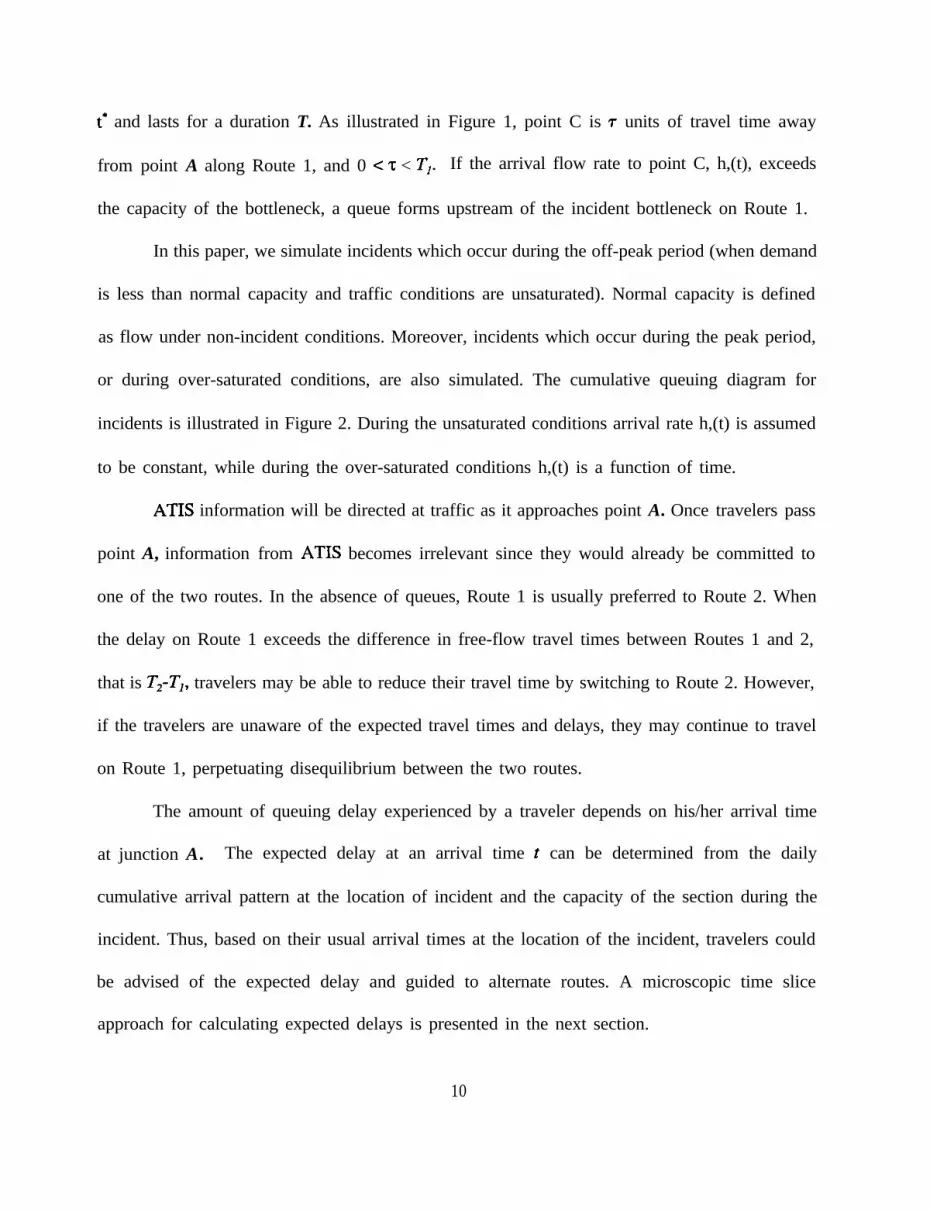
t* and lasts for a duration T. As illustrated in Figure 1, point C is r units of travel time away
from point A along Route 1, and 0 < ‘I: < Tl. If the arrival flow rate to point C, h,(t), exceeds
the capacity of the bottleneck, a queue forms upstream of the incident bottleneck on Route 1.
In this paper, we simulate incidents which occur during the off-peak period (when demand
is less than normal capacity and traffic conditions are unsaturated). Normal capacity is defined
as flow under non-incident conditions. Moreover, incidents which occur during the peak period,
or during over-saturated conditions, are also simulated. The cumulative queuing diagram for
incidents is illustrated in Figure 2. During the unsaturated conditions arrival rate h,(t) is assumed
to be constant, while during the over-saturated conditions h,(t) is a function of time.
ATIS information will be directed at traffic as it approaches point A. Once travelers pass
point A, information from ATIS becomes irrelevant since they would already be committed to
one of the two routes. In the absence of queues, Route 1 is usually preferred to Route 2. When
the delay on Route 1 exceeds the difference in free-flow travel times between Routes 1 and 2,
that is T,-T,, travelers may be able to reduce their travel time by switching to Route 2. However,
if the travelers are unaware of the expected travel times and delays, they may continue to travel
on Route 1, perpetuating disequilibrium between the two routes.
The amount of queuing delay experienced by a traveler depends on his/her arrival time
at junction A. The expected delay at an arrival time t can be determined from the daily
cumulative arrival pattern at the location of incident and the capacity of the section during the
incident. Thus, based on their usual arrival times at the location of the incident, travelers could
be advised of the expected delay and guided to alternate routes. A microscopic time slice
approach for calculating expected delays is presented in the next section.
10
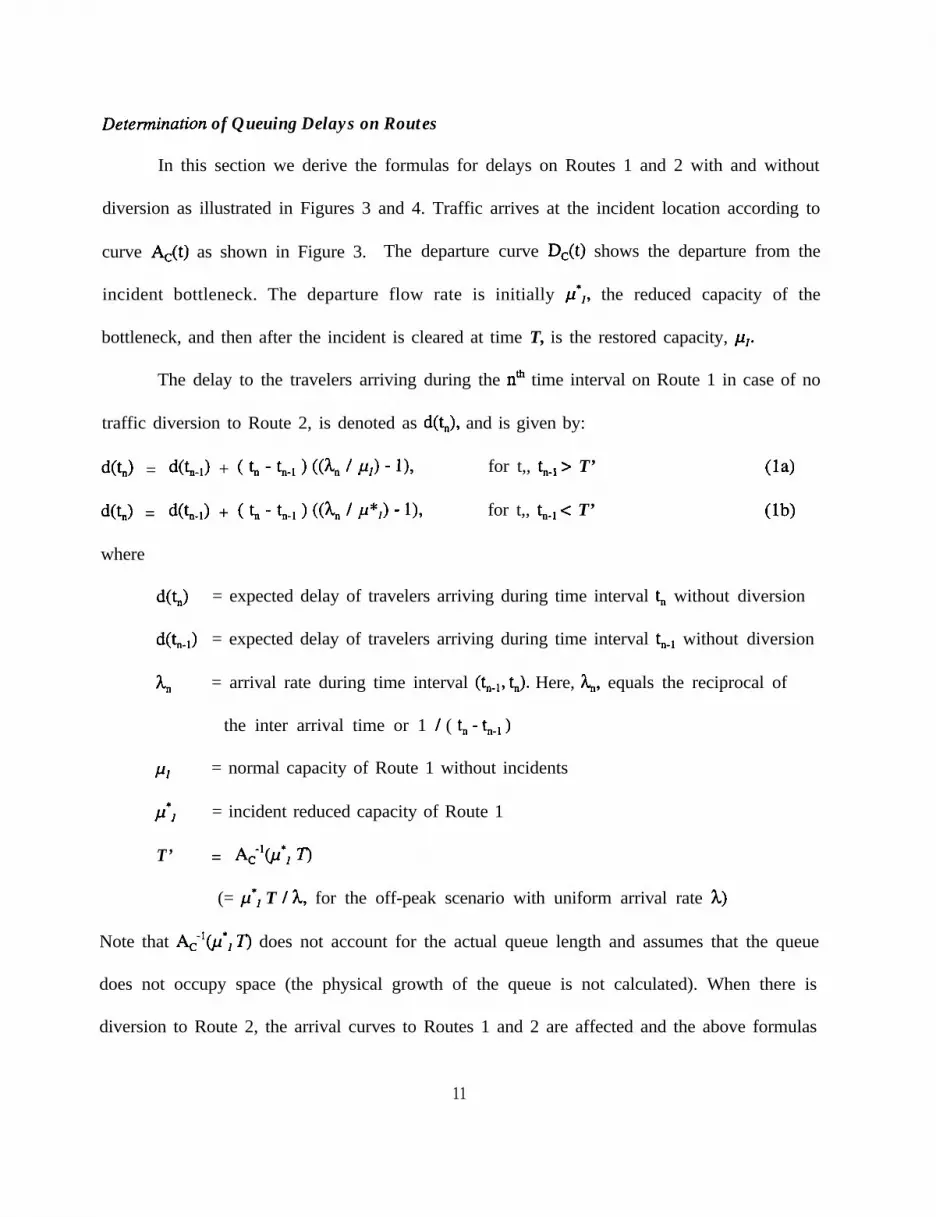
Determination of Queuing Delays on Routes
In this section we derive the formulas for delays on Routes 1 and 2 with and without
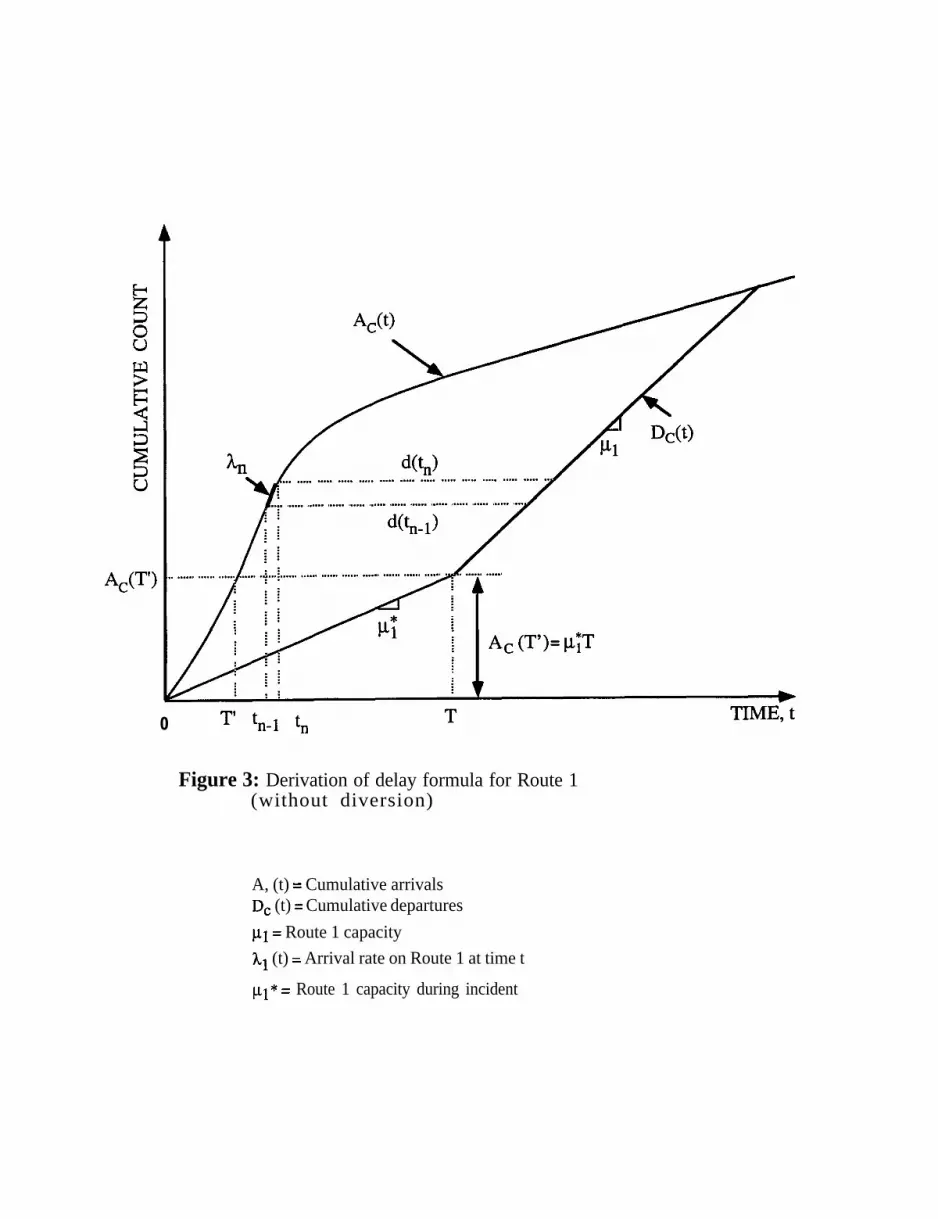
diversion as illustrated in Figures 3 and 4. Traffic arrives at the incident location according to
curve &(t) as shown in Figure 3. The departure curve De(t) shows the departure from the
incident bottleneck. The departure flow rate is initially pfl, the reduced capacity of the
bottleneck, and then after the incident is cleared at time T, is the restored capacity, p,.
The delay to the travelers arriving during the nth time interval on Route 1 in case of no
traffic diversion to Route 2, is denoted as d(t,,), and is given by:
d&J = d(h) + ( ?, - L-1 > (& / PI) - 11, for t,, t,-r > T’ (la>
d(t,) = Wn-1) + ( 6, - L-1 > (6, / ~“1) - 11, for t,, t,-, < T’ (lb)
where
d&J = expected delay of travelers arriving during time interval t, without diversion
Wn.1) = expected delay of travelers arriving during time interval t,-, without diversion
&I = arrival rate during time interval (t,.,-r, tJ. Here, &, equals the reciprocal of
the inter arrival time or 1 / ( t, - t,-, )
PI = normal capacity of Route 1 without incidents
A = incident reduced capacity of Route 1
T’ = 4-‘or*, r)
(= Pan T / h, for the off-peak scenario with uniform arrival rate A)
Note that 4“(p*, 2) does not account for the actual queue length and assumes that the queue
does not occupy space (the physical growth of the queue is not calculated). When there is
diversion to Route 2, the arrival curves to Routes 1 and 2 are affected and the above formulas
11

have to be modified. The modified delay formulas for Route 1 are:
4(L) = d(b-,) + ( t, - t,-, > I@, (1-r) /IQ> - 11, for t,, fel > T’ W
W,) = d&J + ( t, - fml > C (h, (l-r)/ Pan> - 11, for L Ll < T’ 0)
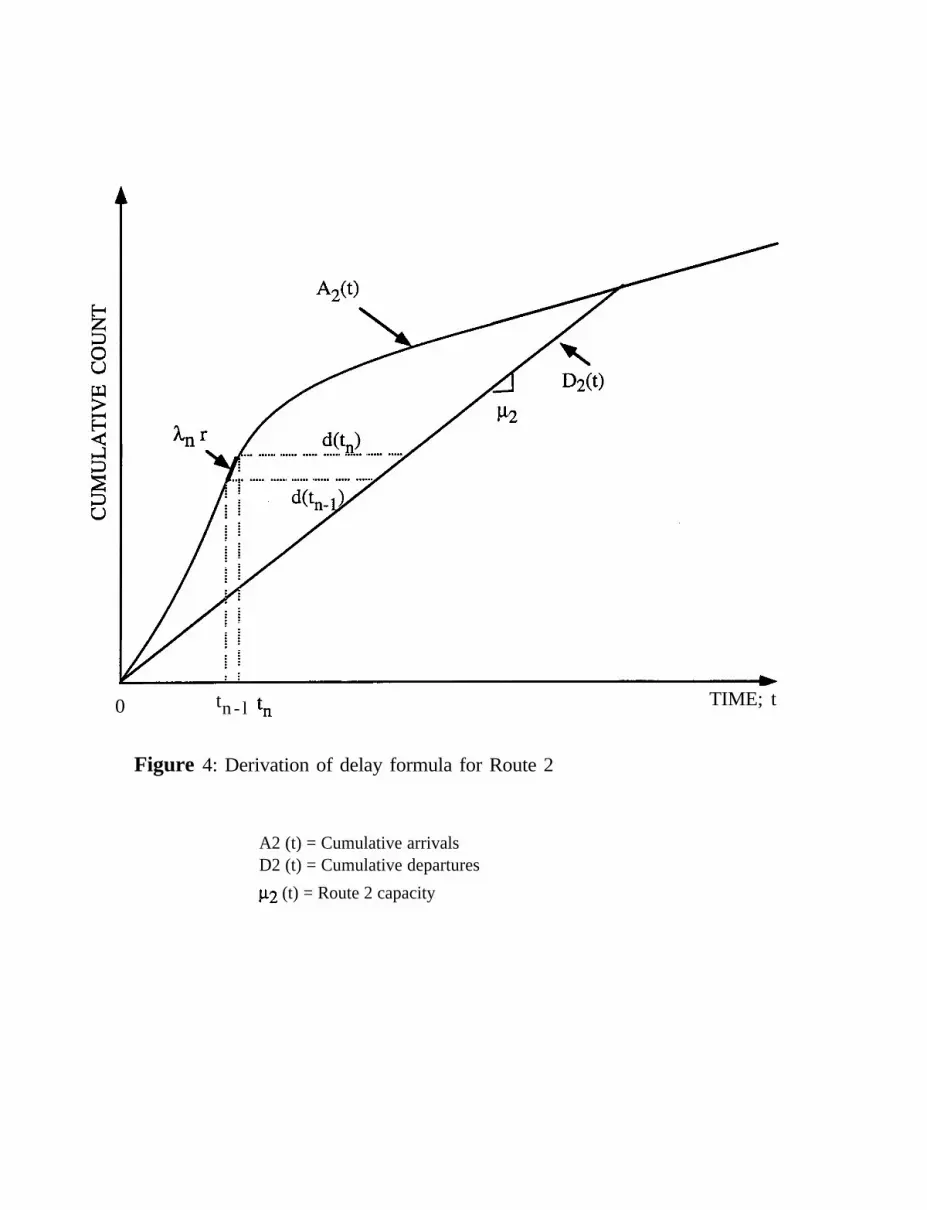
The formula for Route 2 is derived in a similar way as shown in Figure 4 and is given by:
4&J = d,<a-,> + ( t, - tnel > Kh r / p2) - 11 (3)
where d,(t,) = expected delay of travelers arriving during time interval t,, on Route 1 with
diversion
wrJ = expected delay of travelers arriving during time interval t, on Route 2 with
diversion
P2 = normal capacity of Route 2
r = the proportion of travelers diverting to Route 2 between time fi-r, and f.
Since the queue length at time when the incident occurs is zero, and the capacities and
the flow rate can be measured by traffic sensors (such as loop detectors) and are known at all
times, the delay at any time, t, can be determined using the above expression. The advantage of
this approach is that it can represent individual behavior microscopically by choosing the time
interval to be sufficiently small to reflect individual arrivals (we have used such an approach in
our simulation). Furthermore, the above queuing equations are independent of the shape of the
arrival and departure curves. Daily arrival patterns also can be simulated by approximating them
linearly for small time intervals.
In the previous paragraphs we presented a time slice approach for determining bottleneck
delays. Next, we discuss traffic assignment models used in conjunction with simulation of traffic
delays at bottlenecks.
12

Microscopic Traffic Assignment and Simulation
Two traffic assignment models were used to estimate the reduction in delay due to ATIS
in the simplified corridor. In the first model, travelers equipped with ATIS fully comply with
information, that is they follow diversion instructions to the alternate route. In the second model,
travelers are assigned randomly to routes with those informed through electronic media more
likely to divert under incident conditions than those who observe congestion. The probabilities
of diversion are based on travelers’ responses of a survey conducted in the Chicago area (Khattak
1991). Results of the two models are compared to show the difference in the estimated benefits
of ATIS between a model which assumes traveler behavior and another which explicitly considers
traveler behavior.
Full Compliance Model
This model assumes traveler behavior such that ATIS equipped travelers always follow
instructions by diverting to the shortest travel time route. Hence, whenever an equipped traveler
arrives at junction A and is informed that travel time (including delay) on Route 1 is larger than
travel time on Route 2, he or she uses Route 2 (r=l because the time interval was set to reflect
individual arrivals), The delay information is available only to equipped travelers. Unequipped
travelers continue to choose Route 1 even when Route 2 travel time is smaller (r=O).
Furthermore, the information regarding delay is updated for each time interval (every individual
arrival).
13

Reported Behavior Model
The methodology used to capture realistic response of travelers to existing real-time traffic
information uses a traveler behavior model based on a survey of travelers in Chicago.
Automobile travelers who made repeated trips during which quantitative real-time traffic
information broadcast by electronic media was available to them were asked via a mail-back
survey if they knew about a delay, and if so what was the context and did they divert to an
alternate route (see Khattak 1991).
A binary logit model of route choice was estimated using the responses of those who
knew about the traffic delays (N=382). The dependent variable was the decision to divert to an
alternate route or stay on the usual commute route. Table 1 shows a simple version of the
model. A positive sign indicates increased likelihood of diverting. Longer travel times on the
usual route and longer delay increase the probability of diversion. Travelers are more likely to
take alternate routes if they receive delay information through traffic reports as opposed to
observing congestion. This variable captures the effect of various attributes of information such
as accuracy and relevance. Furthermore the information given in Chicago are point-to-point travel
time and delay (quantitative and real-time).
The delay threshold in the model suggests that individuals are significantly more likely
to divert if the expected delay exceeds 20 minutes. The use of a threshold is justified because
travelers are expected to become sensitive to delay on their usual route only if it exceeds a
certain level. For the sake of simplicity driver attributes are currently not included in the model--
their inclusion is a logical extension of our framework. Also, the behavioral model does not
consider those who reported that they never divert (30% of the sample) and those who did not
14

know of a delay within the past six months.
To assign individuals between the routes, the probability of diversion is calculated. Then
a random number, n, is generated between 0 and 1. Suppose that P[diversion] = x, then
If ( n I x ), then r = 1, otherwise r = 0.
The assignment model assumes individuals can observe the queue at point A. Such an assumption
is restrictive, however in the simplified corridor this is the only decision point beyond which
diversion is not possible. The impacts of additional delays caused on Route 2 by diversion due
to incidents could not be quantified in the context of the survey due to limitations of survey
research. With ATIS, equipped travelers may be able to obtain delay information on their
alternate routes, and this additional information may also affect their diversion probability. Note
that Route 1 travelers may have different thresholds for Route 2 delays, i.e., they may perceive
stopped delays and free-flow travel times on Route 2 differently. However, in this behavioral
model it was assumed that for both informed and uninformed drivers, the expected travel time
on Route 2 was equal to the free-flow travel time.
In the following sections the reported behavior model (representing real-life situations)
is compared with the full compliance model (future ATIS scenarios) to explore how much
additional benefits would be achieved with ATIS.
SIMULATION OF SYSTEM PERFORMANCE
Description of the Simulation Experiment
The corridor performance was simulated using the full compliance and the reported
behavior models. Incident cases were generated from a pool of random incident parameters (e.g.,
15
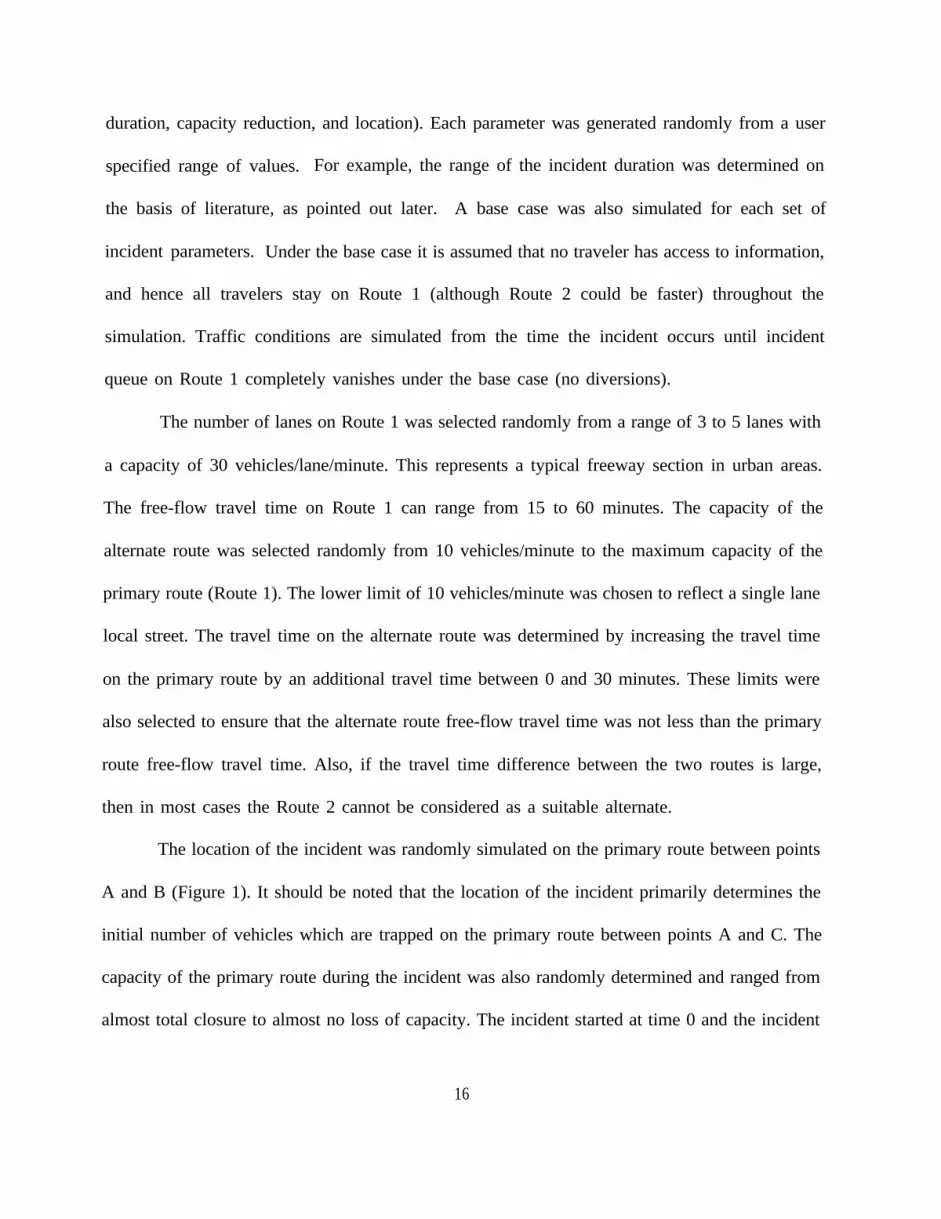
duration, capacity reduction, and location). Each parameter was generated randomly from a user
specified range of values. For example, the range of the incident duration was determined on
the basis of literature, as pointed out later. A base case was also simulated for each set of
incident parameters. Under the base case it is assumed that no traveler has access to information,
and hence all travelers stay on Route 1 (although Route 2 could be faster) throughout the
simulation. Traffic conditions are simulated from the time the incident occurs until incident
queue on Route 1 completely vanishes under the base case (no diversions).
The number of lanes on Route 1 was selected randomly from a range of 3 to 5 lanes with
a capacity of 30 vehicles/lane/minute. This represents a typical freeway section in urban areas.
The free-flow travel time on Route 1 can range from 15 to 60 minutes. The capacity of the
alternate route was selected randomly from 10 vehicles/minute to the maximum capacity of the
primary route (Route 1). The lower limit of 10 vehicles/minute was chosen to reflect a single lane
local street. The travel time on the alternate route was determined by increasing the travel time
on the primary route by an additional travel time between 0 and 30 minutes. These limits were
also selected to ensure that the alternate route free-flow travel time was not less than the primary
route free-flow travel time. Also, if the travel time difference between the two routes is large,
then in most cases the Route 2 cannot be considered as a suitable alternate.
The location of the incident was randomly simulated on the primary route between points
A and B (Figure 1). It should be noted that the location of the incident primarily determines the
initial number of vehicles which are trapped on the primary route between points A and C. The
capacity of the primary route during the incident was also randomly determined and ranged from
almost total closure to almost no loss of capacity. The incident started at time 0 and the incident
16
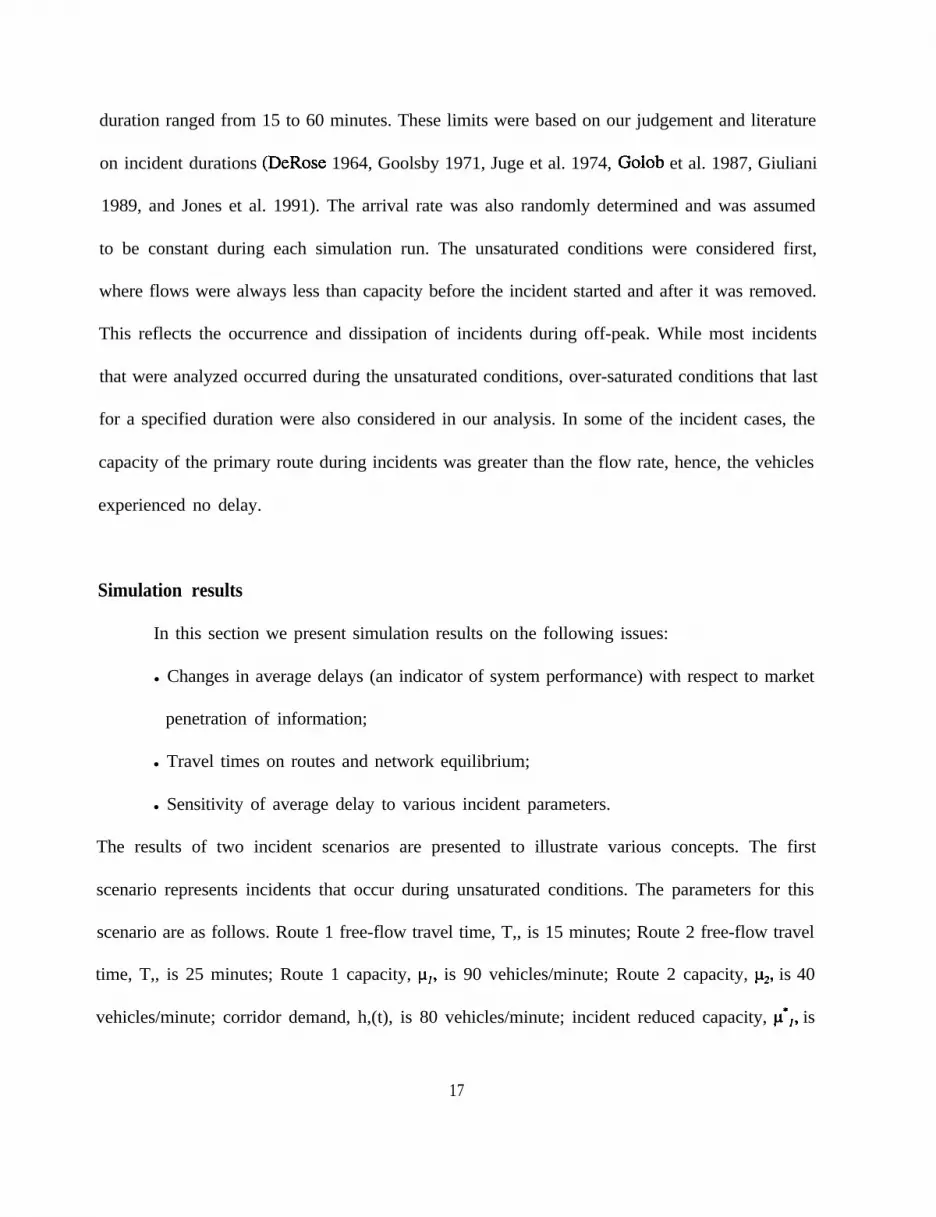
duration ranged from 15 to 60 minutes. These limits were based on our judgement and literature
on incident durations (DeRose 1964, Goolsby 1971, Juge et al. 1974, Golob et al. 1987, Giuliani
1989, and Jones et al. 1991). The arrival rate was also randomly determined and was assumed
to be constant during each simulation run. The unsaturated conditions were considered first,
where flows were always less than capacity before the incident started and after it was removed.
This reflects the occurrence and dissipation of incidents during off-peak. While most incidents
that were analyzed occurred during the unsaturated conditions, over-saturated conditions that last
for a specified duration were also considered in our analysis. In some of the incident cases, the
capacity of the primary route during incidents was greater than the flow rate, hence, the vehicles
experienced no delay.
Simulation results
In this section we present simulation results on the following issues:
l Changes in average delays (an indicator of system performance) with respect to market
penetration of information;
l Travel times on routes and network equilibrium;
l Sensitivity of average delay to various incident parameters.
The results of two incident scenarios are presented to illustrate various concepts. The first
scenario represents incidents that occur during unsaturated conditions. The parameters for this
scenario are as follows. Route 1 free-flow travel time, T,, is 15 minutes; Route 2 free-flow travel
time, T,, is 25 minutes; Route 1 capacity, ul, is 90 vehicles/minute; Route 2 capacity, u2, is 40
vehicles/minute; corridor demand, h,(t), is 80 vehicles/minute; incident reduced capacity, cl*,, is
17

22.5 vehicles/minute; the incident location, 2, is 10 minutes from point A; and the incident
duration, T, is 60 minutes. The second scenario represents incidents that occur during over-
saturated conditions. The parameters for the second scenario are the same as those for the first
scenario except that the corridor demand, h,(t), increases uniformly from 80 to 100
vehicles/minute during the fust hour and decreases at the same rate thereafter. Next, we present
the results of the full compliance and the reported behavior models under these two incident
scenarios.
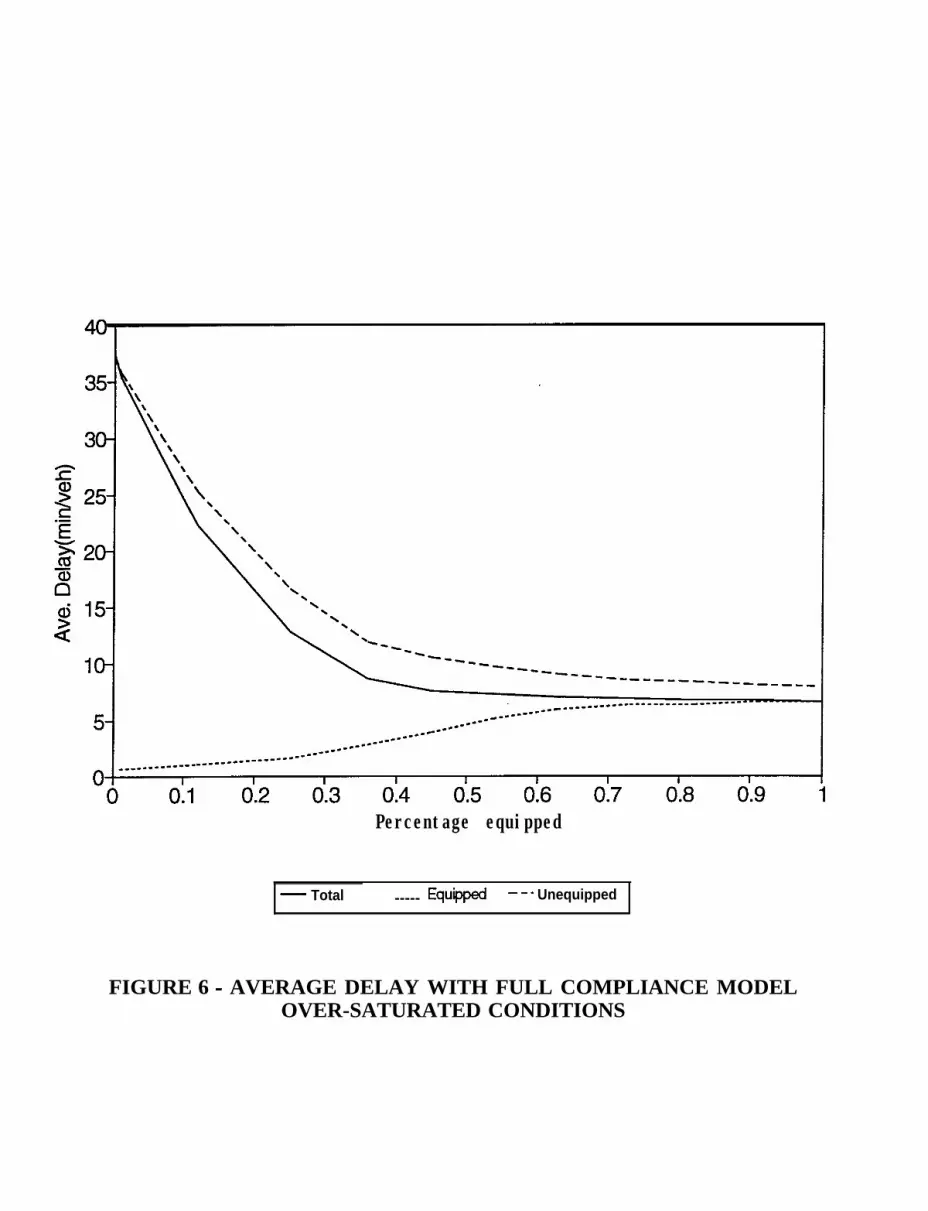
Results of the Full Compliance Model. The findings indicate that for both over-saturated
and unsaturated scenarios the average delay for ah traveIers decreases with an increase in market
penetration of equipped travelers (see Figures 5 and 6). This decrease continues up to a certain
penetration level, after which no further significant reduction in delay can be achieved. The
critical penetration level is around 50% (in this example), which is the level at which queues
form on Route 2 as a result of diversion. The effect of increase in market penetration on average
delay of equipped traffic depends on the particular incident scenario. For example, in case of
the unsaturated incident scenario, an increase in market penetration has no effect on average
delay as long as it is below 50%, the critical level above which Route 2 becomes congested.
When the penetration level exceeds 50%, equipped traffic is diverted to the congested Route 2,
and therefore, experiences increase in delay. In case of the over-saturated scenario, under the
assumptions of the full compliance model, once an incident occurs equipped traffic is diverted
to Route 2 (in this particular example). As a result Route 2 becomes more congested because
the corridor demand is higher than capacity. Hence, the benefits of equipped traffic in the over-
saturated conditions are reduced (average delay for equipped traffic increases sharply until the
18

50% penetration level is reached but increases marginally after that where conditions become
fully saturated). Another observation, in this particular example, is that the maximum reduction
in average delay is much larger in the over-saturated incident than it is in the unsaturated
scenario (e.g., around 30 minutes maximum reduction in average delay for the scenario of over-
saturated conditions, compared with 18 minutes for the unsaturated conditions).
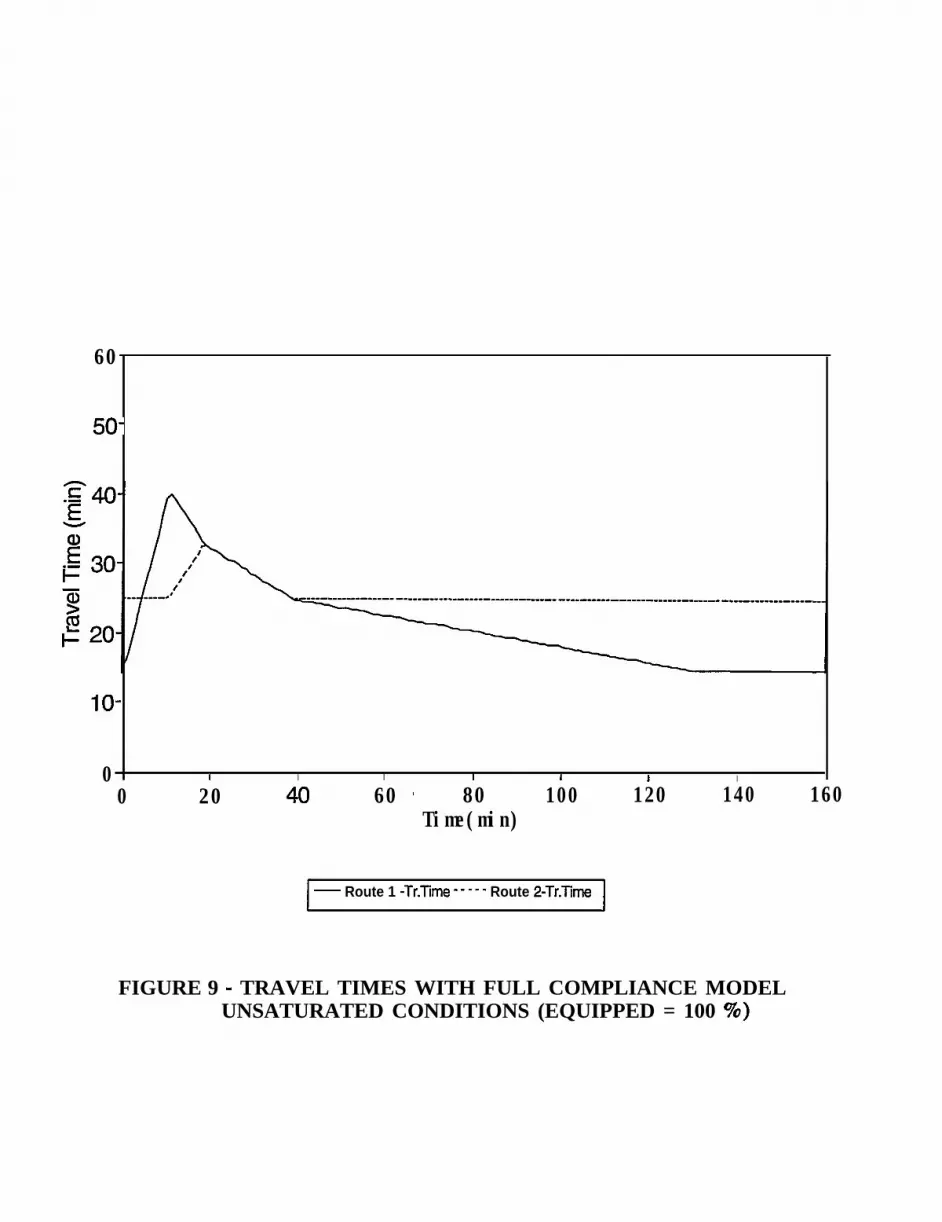
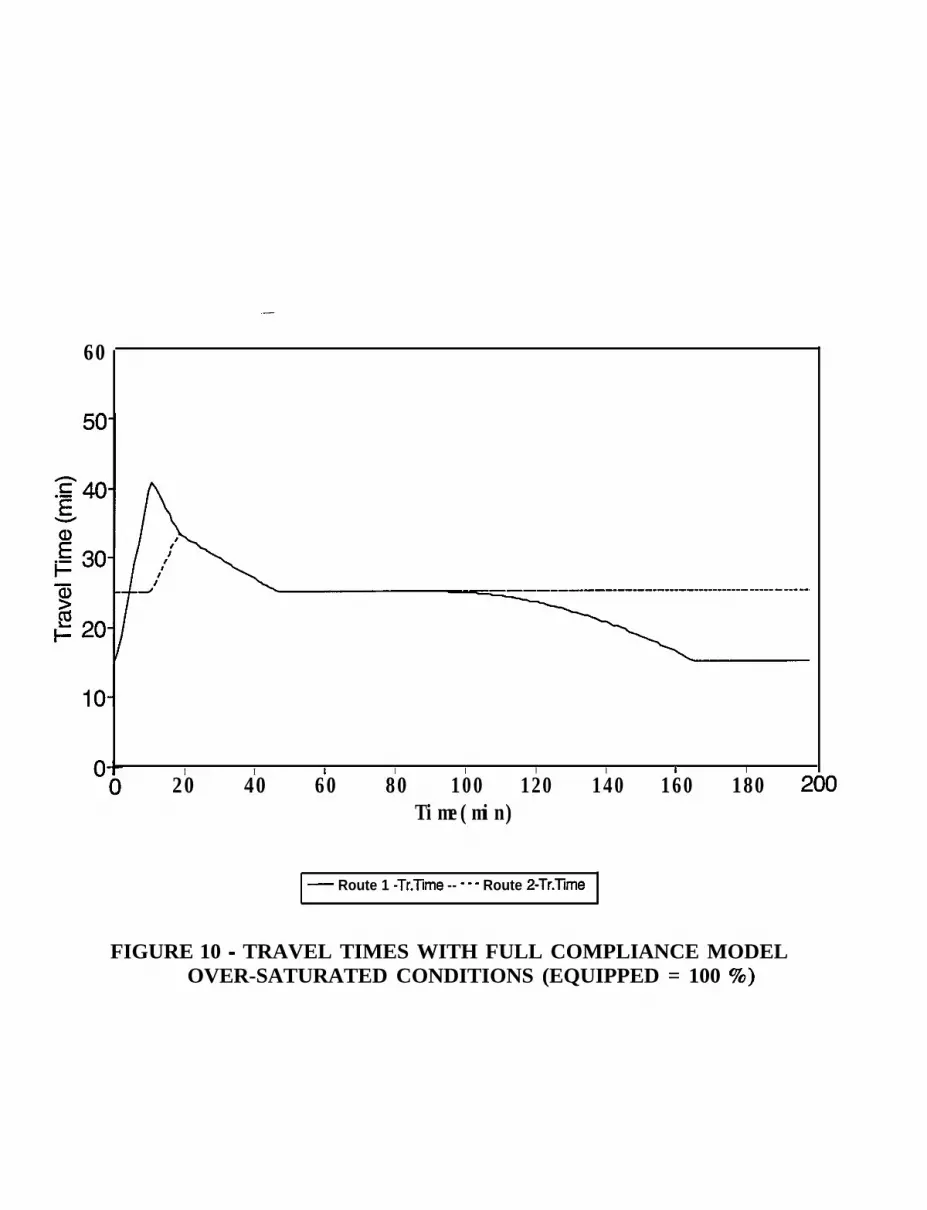
The travel times on Routes 1 and 2 for the two scenarios are depicted in Figures 7
through 10. These figures represent results for cases with 54% and 100% penetration of
information analyzed for both incident scenarios. As expected, the travel time on Route 1
increases initially due to the incident queuing delay while travel time on Route 2 starts to
increase later as more vehicles divert to it. In all of these graphs, there is a period during which
travel times on the two routes become equal (equilibrium duration). At the end of equilibrium,
travel time on the freeway becomes less than that on Route 2 and no more diversion occurs. The
increase in Route 2 travel time is due to the congestion caused by diversion. In the over-
saturated incident scenario, queues take longer to dissipate than with the unsaturated scenario.
This results in longer diversion and equilibrium durations for the same percentage of equipped
traffic. This is’obvious when comparing between Figures 7 and 8, and between Figures 9 and
10.
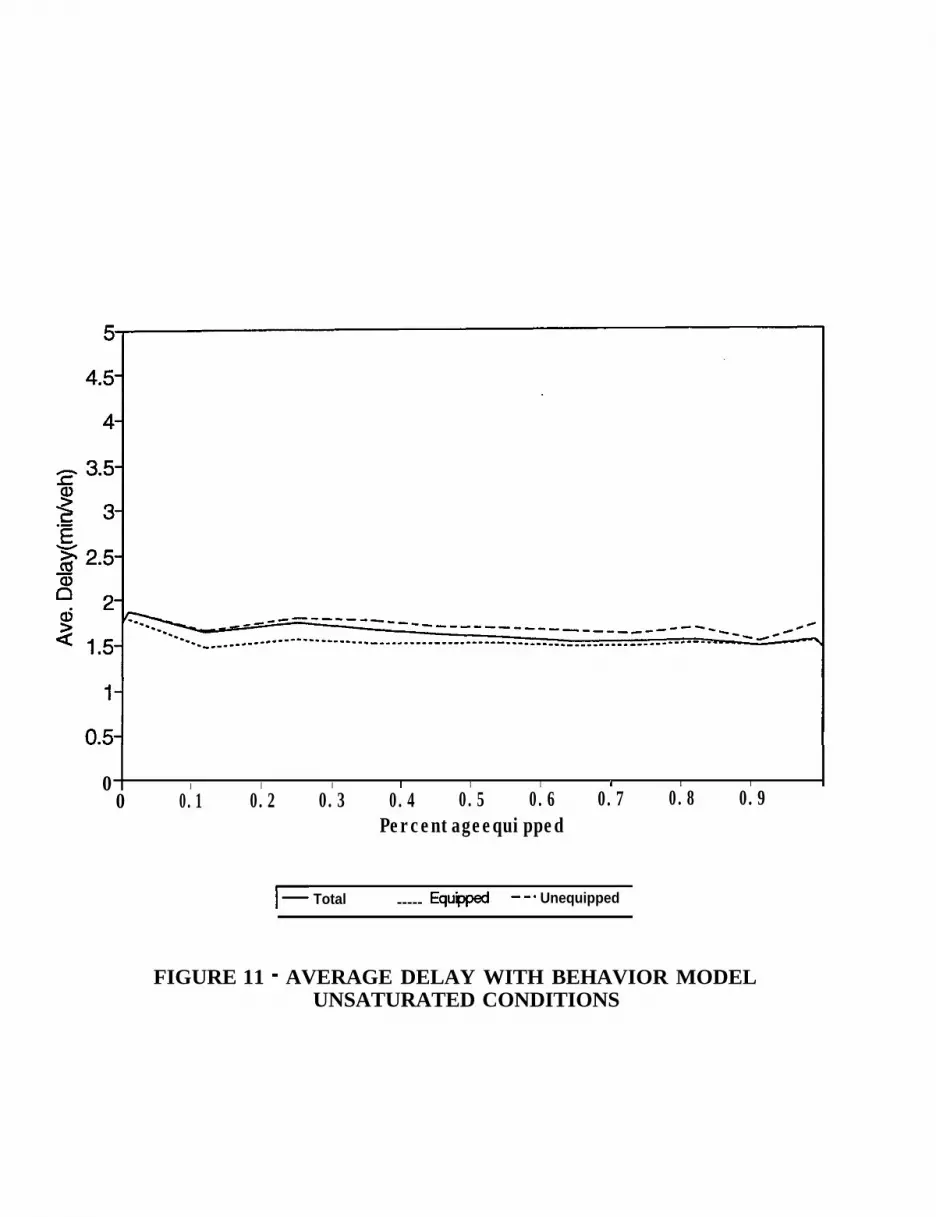
Results of the Reported Behavior Model. In this section we compare results of the same
numerical example using the reported behavior model. As opposed to the full compliance model,
the results do not show a clear trend of average delay with the increase in market penetration,
see Figures 11 and 12. Hence, the relationship between average delay and market penetration
of information will be investigated further using a regression model presented later. The average
19

delay in the reported behavior model is smaller than the full compliance model. Some informed
travelers may not necessarily divert to the shorter travel time route, while some uninformed
travelers observe the incident queue and divert to the shorter travel time route. The net effect
of increasing market penetration on reduction of average delay depends on the diversion behavior
of both informed and uninformed. Average delay may decrease with penetration in some cases
(as demonstrated in this numerical example) but it may increase in others. In any case, note that
the maximum reduction in average delay with increased market penetration of information for
the behavioral model is much less than that of the full compliance model.
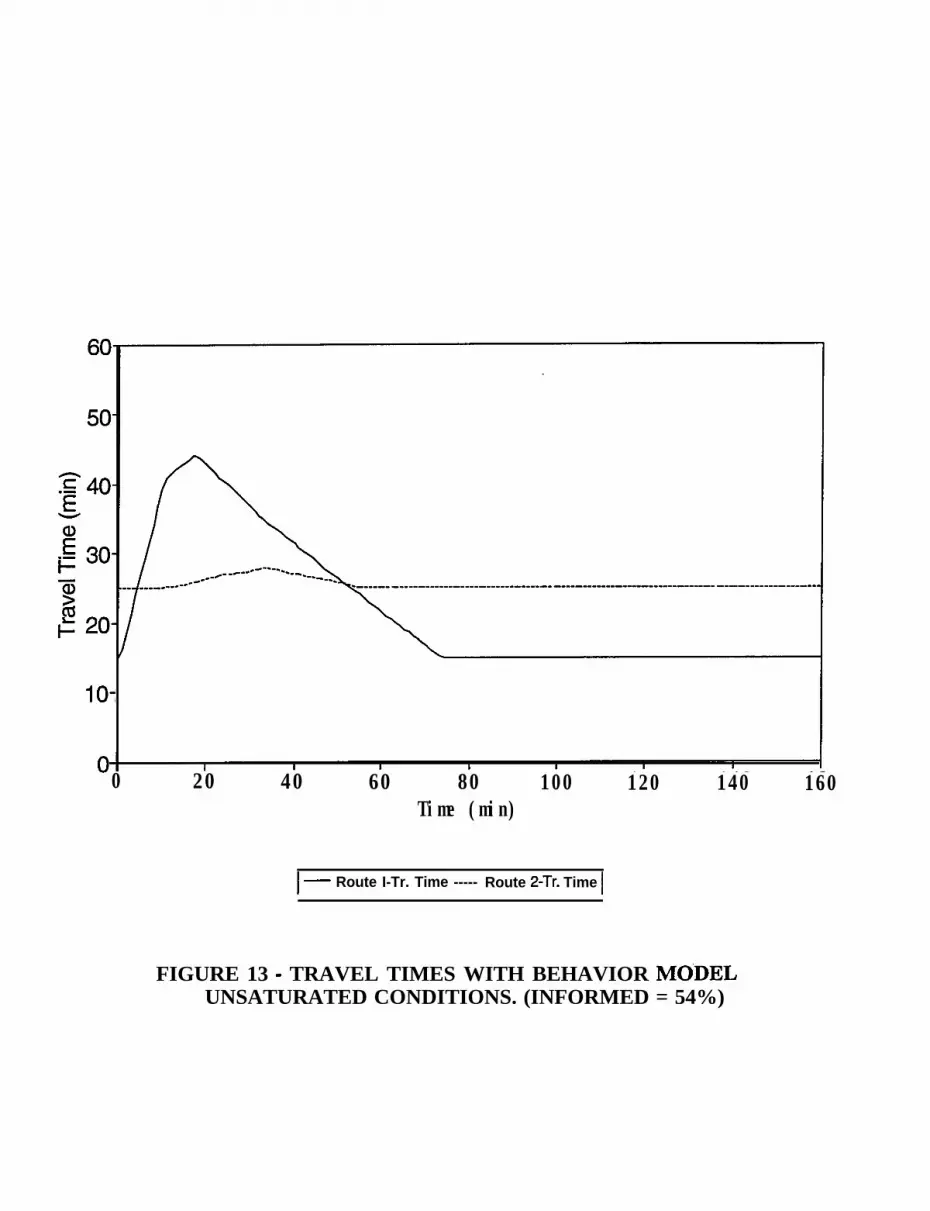
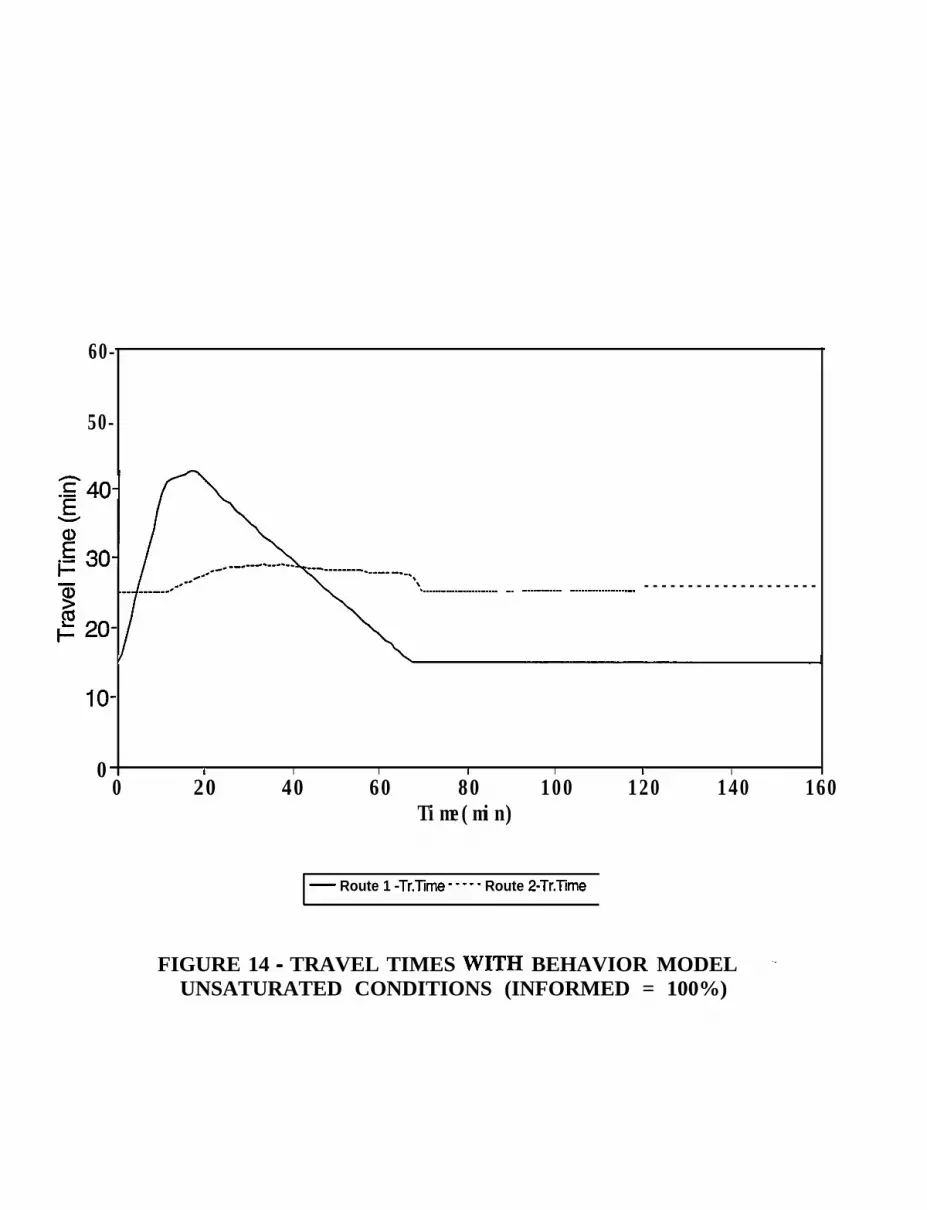
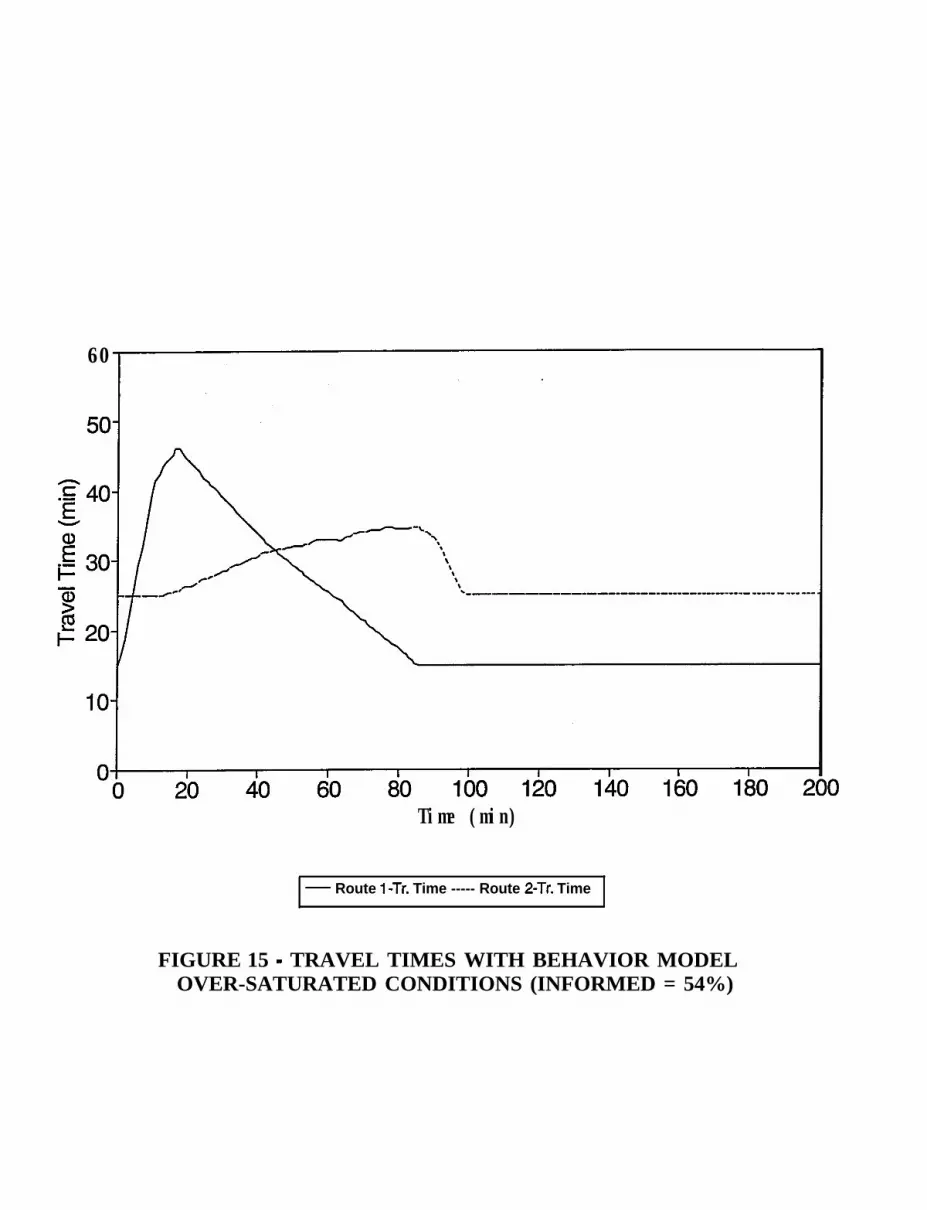
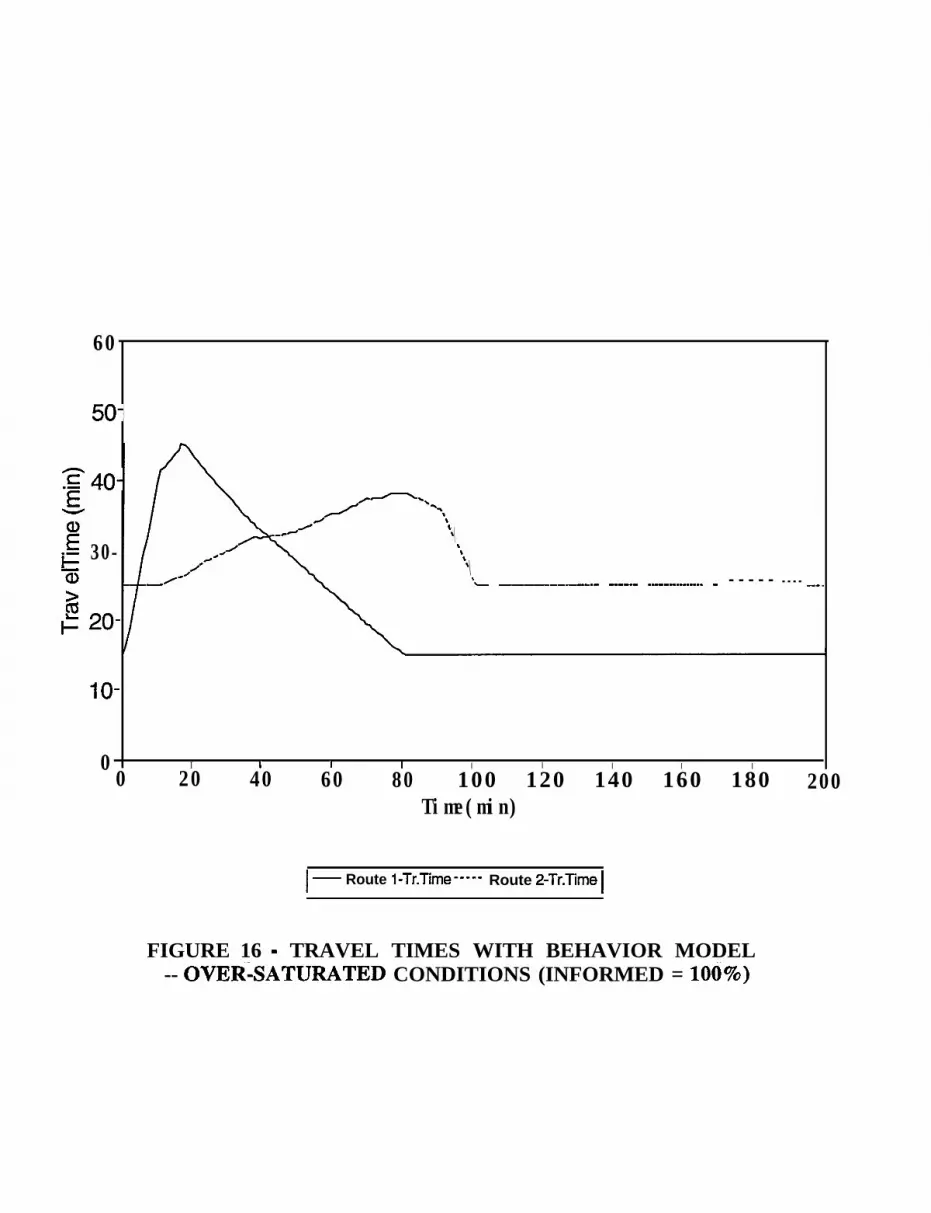
The results also illustrate the difference in travel times on both routes between the two
models, see Figures 13 through 16. Equilibrium of travel times between the two routes has not
been achieved in the behavior model because of insufficient diversion and/or because of
over-diversion to Route 2. As expected, for the unsaturated conditions, travelers (whether or not
they receive traffic information) are reluctant to divert for small savings in travel time to Route
2, see Figures 13 and 14. For incidents that occur in over-saturated conditions, both informed
and uninformed travelers may over-divert to Route 2 (i.e., they may over-react), see Figures 15
and 16. In this example, it has been shown that in both over-saturated and unsaturated
conditions, equilibrium between the two routes is not achieved. Also note that the queue on
Route 2 lasts longer than that on Route 1.
Summary of System Performance. The difference in benefits were further analyzed by
simulating a total of 1,167 random scenarios in the parameter ranges specified above. All
scenarios were for unsaturated conditions, and the number of scenarios were arbitrarily chosen
large enough to produce statistically significant results. For each run, the network was simulated
20

initially for the base case with no diversion, followed by the full compliance and reported
behavior models. The cases simulated included many where information about delay will not be
of benefit to travelers (from a system performance perspective). This occurs when the maximum
delay encountered on the primary route never exceeds the difference between the travel times on
both routes.
The averages of input parameters are presented in Table 2(a), and a comparison of
network performance measures is presented in Table 2(b). The measures were determined as
follows:
Average duration of queue = h#N
Average delay per vehicle = x(d)/N
Average percent of diversion = c ( Pdiv > ’ N
Average travel time = C(t)/N
where
N
T
d
Pdiv
t
= Total number of scenarios
= Total duration of queue in the corridor for each scenario
= Average delay per vehicle for each scenario
= Percent of vehicles diverted for each scenario
= Average travel time in the corridor (i.e., free-flow travel time plus delay) for
each scenario
The results show that the average queue duration on Route 1 and the average delay is shortest
for the reported behavior model. This is because in the behavioral model individuals can observe
21
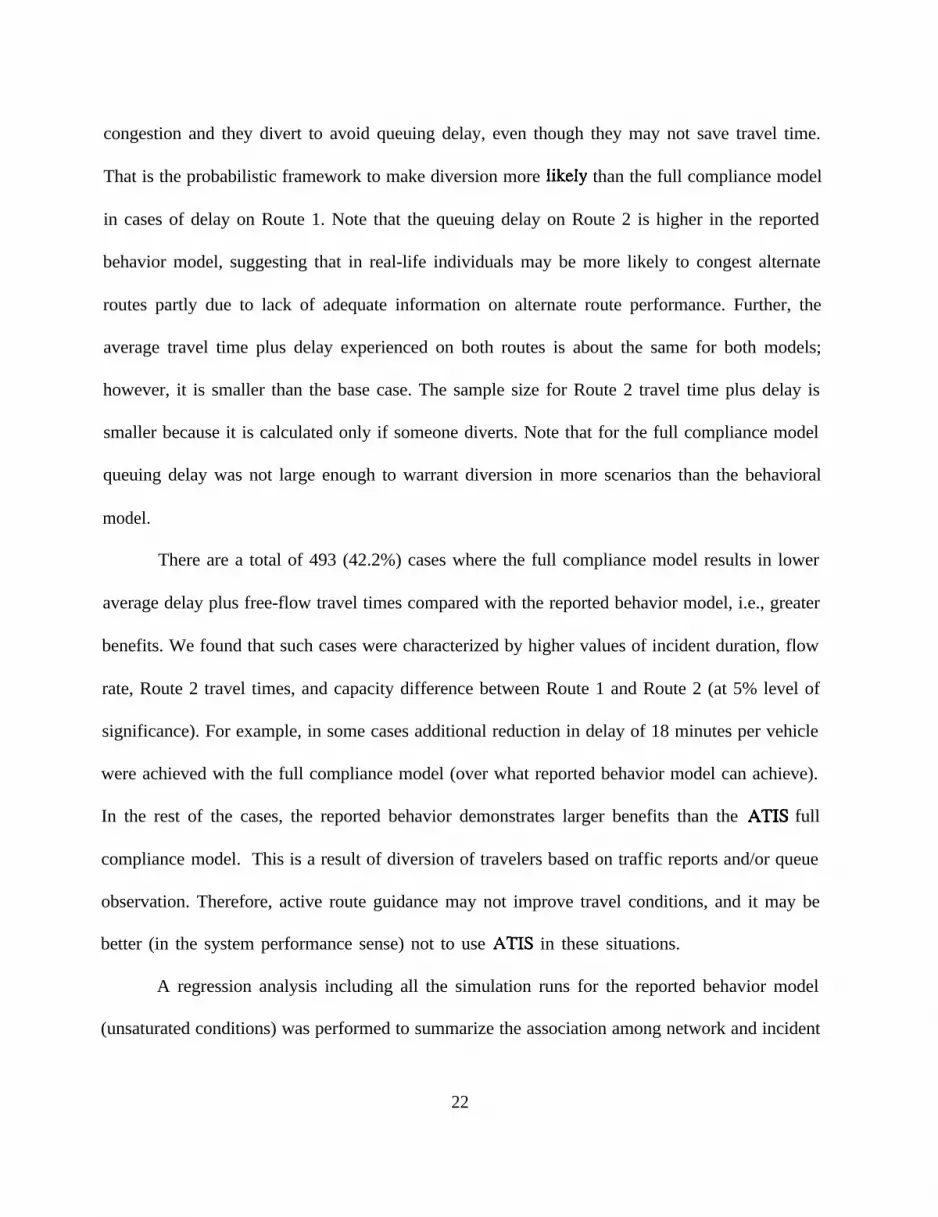
congestion and they divert to avoid queuing delay, even though they may not save travel time.
That is the probabilistic framework to make diversion more Iikely than the full compliance model
in cases of delay on Route 1. Note that the queuing delay on Route 2 is higher in the reported
behavior model, suggesting that in real-life individuals may be more likely to congest alternate
routes partly due to lack of adequate information on alternate route performance. Further, the
average travel time plus delay experienced on both routes is about the same for both models;
however, it is smaller than the base case. The sample size for Route 2 travel time plus delay is
smaller because it is calculated only if someone diverts. Note that for the full compliance model
queuing delay was not large enough to warrant diversion in more scenarios than the behavioral
model.
There are a total of 493 (42.2%) cases where the full compliance model results in lower
average delay plus free-flow travel times compared with the reported behavior model, i.e., greater
benefits. We found that such cases were characterized by higher values of incident duration, flow
rate, Route 2 travel times, and capacity difference between Route 1 and Route 2 (at 5% level of
significance). For example, in some cases additional reduction in delay of 18 minutes per vehicle
were achieved with the full compliance model (over what reported behavior model can achieve).
In the rest of the cases, the reported behavior demonstrates larger benefits than the ATIS full
compliance model. This is a result of diversion of travelers based on traffic reports and/or queue
observation. Therefore, active route guidance may not improve travel conditions, and it may be
better (in the system performance sense) not to use ATIS in these situations.
A regression analysis including all the simulation runs for the reported behavior model
(unsaturated conditions) was performed to summarize the association among network and incident
22
parameters and average delay. Note that the regression model is not causal, because the
simulation assumes some of these relationships to start with (there was, however, a realistic
chance of finding out that percent informed was not significant). The main value of regression
is in analyzing the relative impacts of variables on delay while considering many scenarios,
enhancing the generalizability of results.
The variables included in the regression analysis are shown in Table 3. The signs of the
variables are as expected. Lower average delay per vehicle is weakly associated with increase in
percent informed through radio traffic reports (as opposed to observation); lower delay is
associated with higher capacity of the alternate route; and average delay increases with increasing
incident duration and location (away from the decision point), higher capacity loss and higher
travel time difference between the two routes.
CONCLUSIONS
In this paper, we have reported two models to evaluate the benefits of information (the
benefit is measured in terms of travel times and delay due to information dissemination on traffic
incidents). In the first model (the full compliance model), travelers equipped with ATIS fully
comply with information; that is, they follow diversion instructions to the alternate route. In the
second model (the reported behavior model), travelers are assigned probabilistically to routes with
those receiving traffic information (e.g. radio reports) being more likely to divert under incident
conditions than those who observe traffic congestion. The probabilities of diversion are based
on travelers’ responses to a behavioral survey conducted in the Chicago area. Results of the two
models were compared to show the difference in estimated benefits of ATIS between a model
23
which assumes traveler behavior and another which explicitly considers traveler behavior. The
reported behavior model presented diversion benefits of an existing traffic reporting system
(and/or benefits because of diversion due to traveler’s observation of incident queues). On the
other hand, the full compliance model reflected the benefits that could be gained when ATIS is
implemented.
It was clear from the full compliance model that for the same level of market penetration
the maximum reduction in average delay was higher for incidents which occur during over-
saturated conditions than those which occur during off-peak (or unsaturated conditions). The net
effect of increasing market penetration on reduction of average delay depends on the diversion
behavior of both equipped and unequipped travelers. Average delay may decrease with
penetration in some cases (as was demonstrated in this paper) and it may not decrease in others.
Although the two models used entirely different set of assumptions and represented two
different information scenarios (one with ATIS and another with reported diversion behavior),
we found that the results of some system performance measures (e.g., average travel time in the
corridor) are close. Following the results of the survey, the probabilistic behavior model placed
high weight on the queuing delay and accounted for observation of congestion. This caused more
traffic (informed and uninformed) to divert to the alternate route. When the two models were
compared for the same market penetration level of information, smaller average delay per vehicle
and smaller duration of queues were achieved under the assumptions of the reported behavior
model. However, this benefit was offset by the longer free-flow travel time experienced by
diverted traffic on the alternate route. On regular commute trips individuals acquire experience
and update their knowledge of travel conditions by observation (and/or radio reports). They are
24
able to observe incident queues; some divert and consequently may benefit. Diverters may,
however, congest alternate routes and reduce the chance of travelers equipped with ATIS to
benefit by diversion. Although both models agreed in the sense that the benefits of an ATIS
under incident conditions are expected to be marginal (at least in the analyzed two-route
corridor), there are cases where active guidance can produce significant system benefits (e.g.,
incident cases with high demand rates, long incident durations). In such cases ATIS can be used
to provide prescriptive information along with descriptive information. However, in other cases,
it may be sufficient to listen to descriptive information (provided by traffic reports) and/or
observe incident queues and possibly divert. Finally, there is a need to investigate benefits from
diversion in larger-scale networks where several routes with surplus capacity are available for
traffic diversion.
25


REFERENCESAl-Deek, H., Martello M., Sanders W., and May A.D. (1990) “Potential Benefits of
In-Vehicle Information Systems in A Real Life Freeway Corridor,” Paper presented at1st International Conference on Applications of Advanced Technologies inTransportation Engineering, American Society of Civil Engineers, San Diego,California.
Al-Deek H.M. (1991) “The Role of Advanced Traveler Information Systems in IncidentManagement,” PhD Dissertation, Department of Civil Engineering, Institute ofTransportation Studies, University of California at Berkeley, UCB-ITS-DS-91-5.
Allen Wade R., Ziedman D, Rosenthal T., Stein A., Torres J., and Halati A. (1991)“Laboratory Assessment of Driver Route Diversion in Response to In-VehicleNavigation and Motorist Information Systems,” Preprint No. 910701, 70th AnnualMeeting of Transportation Research Board, Washington, D.C.
Akamatsu T., and Kuwahara M. (1989) “Optimal Toll Pattern on a Road Network UnderStochastic User Equilibrium With Elastic Demand,” World Conference on TransportResearch, Transport policy, management & Technology towards 2001. Vol. I.
Amott R., de Palma A., and Linsdey R. (1990) “Departure Time and Route Choice for theMorning Commute,” Transpn Res-B Vol. 24B, No. 3, pp. 209-228.
Amott R., de Palma A., and Linsdey R. (1991) “Does Providing Information to DriversReduce Traffic Congestion?,” Transpn Res-A Vol. 25A, No. 5, pp. 309-318.
Ben-Akiva M., de Palma A., and Kanaroglou P. (1986) “Dynamic Model of Peak PeriodTraffic Congestion with Elastic Arrival Rates,” Transportation Science, 20(2), pp. 164-181.
Ben-Akiva M., de Palma A., and Kaysi I. (1991) “Dynamic Network Models and DriverInformation Systems,” Transpn. Res-A, Vol. 25A, No. 5, pp. 251-266.
Ben-Akiva M.,Kroes E., Ruiter J., Smulders S., Whittaker J., and Lindveld. K. (1992) “Real-time Prediction of Traffic Congestion,” Paper presented at 6th World Conference onTransport Research, Lyon, France.
Bonsall P., and Parry T. (199 1) “Using an Interactive Route-Choice Simulator to InvestigateDrivers’ Compliance with Route Guidance Advice,” Transportation Research Record,1306.
Cascetta E., Cantarella G.E., and DiGangi M. (1991) “Evaluation of Control StrategiesThrough a Doubly Dynamic Assignment Model,” Transportation Research Record,1306.
26
Chang G. L., Mahmassani H.S., and Herman R. (1985) “A Macroparticle Traffic SimulationModel to Investigate Peak-Period Commuter Decision Dynamics,” Transpn. Res. Rec.,1005, pp.107-120.
Chen P. S., and Mahmassani H. (1993) “A Dynamic Interactive Simulator for the Study ofCommuter Behavior Under Real-Time Traffic Information Supply Strategies,”Transportation Research Board.
Churchill, G.( 1987) Marketing Research, Methodological Foundations, Fourth Edition, TheDryden Press.
de Palma A., and Linsdey R. (1992) “The Potential Benefits of a Combined Route Guidanceand Road Pricing System: An Economic Analysis,” Presented at TransportationResearch Record.
De Rose F. (1964) “An Analysis of Random Freeway Traffic Accidents and VehicleDisabilities,” Highway Research Board, HRR 59, Washington, D.C., pp. 53-65.
Dudek C., Friebele J., and Loutzenheizer R. (1971) “Evaluation of Commercial Radio forReal-Time Driver Communications on Urban Freeways,” Highway Research Record358, Highway Research Board, Washington, D. C.
Gardes Y., and May A.D. (1990) “Traffic Modeling to Evaluate the Potential Benefits ofAdvanced Traffic Management and In-Vehicle Information Systems in aFreeway/Arterial Corridor,” PATH Research Report UCB-ITS-PRR-90-3, University ofCalifornia, Berkeley.
Gardes Y., Haldors B., and May A.D. (199 1) “Model Selection and Initial Application of theCONTRAM Model for Evaluating In-Vehicle Systems,” PATH Research Report UCB-ITS-PRR-9 l- 11, University of California, Berkeley.
Gardes T., Lunsford M.E.,May A.D., and Van Aerde M. (1993) “Application of theINTEGRATION Model to Demonstrate the Simulation of Advanced TravellerInformation Systems,” Transpn. Res. Board.
Giuliano G. (1989) “Incident Characteristics, Frequency and Duration on a High VolumeUrban Freeway,” Transportation Res. A, Vol. 23A, No. 5, pp. 387-396.
Golob, Reeker T.W., and Leonard J. (1987) “An Analysis of the Severity and IncidentDuration of Truck Involved Freeway Incidents,” Accident Analysis and Prevention,Vol. 19, No. 5, pp. 375-395.
Goolsby M. (1971) “Influence of Incident on Freeway Quality of Service,” HighwayResearch Board, HRR 349, Washington, D.C., pp. 41-46.
27
Hall R. (1993) “Non-recurrent Congestion: How Big is the Problem ? Are TravelerInformation Systems the Solution?” Transpn Res.C Vol. lC, No. 1, pp. 89-103.
Hamerslag R., and Van Berkum, E.C. (1991) “Effectiveness of Information Systems inNetworks With and Without Congestion,” Transportation Research Record, 1306.
Heathington, K. (1969) “On the Development of a Freeway Driver Information System,”Unpublished PhD Dissertation, Civil Engineering Department, NorthwesternUniversity, Evanston, Illinois.
Horowitz J.L. (1984) “The Stability of Stochastic Equilibrium in a Two-Link TransportationNetwork,” Transpn. Res-B., Vol. 18, No. 1, pp. 13-28.
Hurdle V., and Solomon D. (1986) “Service Functions for Urban Freeways - An EmpiricalStudy,” Transpn. Sci., 20 (3), pp. 153 - 163.
Jayakrishnan R., and Mahmassani H.S. (1992) “DYNASMART-Dynamic NetworkAssignment-Simulation Model for Advanced Road Telematics,” Draft TechnicalWorking Paper.
Jones B., Janssen L., and Mannering F. (1991) “Analysis of the Frequency and Duration ofFreeway Accidents in Seattle,” Accident Analysis and Prevention, Vol. 23, No. 4, pp.239-255.
Juge, J., Kennedy K., and Wang T. (1974) “Early Detection and Rapid Removal of DisabledVehicles and other Hazards from the Freeway,” Final report to Caltfomia Departmentof Transportation and California Highway Patrol.
Kanafani, A., and Al-Deek H.M. (1991) “A Simple Model for Route Guidance Benefits,”Transpn. Research B, Vol 25 (3).
Kawakama S., Hirobata Y., and Xu Z. (1989) “A General Comparison of Stochastic andDeterministic Equilibrium Traffic Assignment Models,” World Conference onTransport Research. Transport policy, management & Technology towards 2001.Vol. 1.
Khattak, A. (1991) “Driver Response to Unexpected Travel Conditions: Effect of Informationand Other Factors,” Ph.D. Dissertation, Department of Civil Engineering, NorthwesternUniversity, Evanston, Illinois.
Mahmassani H.S., and Chen P.S. (1991) “Comparative Assessment of Origin-Based and Enroute Real-Time Information Under Alternative User Behavior Rules,” TransportationResearch Record. 1306.
28
Mahmassani H.S., and Jayakrishnan R. (1991) “System Performance and User ResponseUnder Real-Time Information in a Congested Traffic Corridor,” Transpn Res-A, Vol25A No. 5, pp. 293-307.
Mahmassani H., Caplice C., and Walton C. (1990) “Characteristics of Urban CommuterBehavior: Switching Propensity and Use of Information,” Preprint No. 890738, 69thAnnual Meeting of Transportation Research Board, Washington, D.C.
Mannering F.(1989) “Poisson Analysis of Commuter Flexibility in Changing Routes andDeparture Times,” Transportation Research, Vol. 23 B, No. 1, pp. 53-60.
Papageorgiou M., and Messmer A. (199 1) “Dynamic Network Traffic Assignment and RouteGuidance via Feedback Regulation,” Transportation Research Record, 1306.
Schafer J.L., Khattak A., and Koppleman F.S. (1993) “Behavioral Issues in the Design andEvaluation of Advanced Information Systems,” Transportation Research C, Vol. 1 No.2 pp. 107 - 117.
Smith M.J., and Ghali M.O. (1991) “New Dynamic Model to Evaluate the Urban Traffic andControl Systems and Route Guidance Strategies,” Transportation Research Record,1306.
Tsuji H., Takahashi R., Kawashima H., and Yamamoto Y. (1985) “A Stochastic Approach forEstimating the Effectiveness of a Route Guidance System and its Related Parameters,”Transportation Science, 19(4), pp. 333-35 1.
Van Aerde M., Krange M., and Case E.R. (1991) “Supporting Routines for Modelling theTraffic Responsive Features of the Travtek System using INTEGRATION,”Proceeding of VNIS’91 Society of Automotive Engineers Conference, Dearborn,Michigan.
Van Aerde A, et al., (1992) “INTEGRATION Model Users Guide for Version 1.4 d,”Transportation System Research Group, Department of Civil Engineering, QueensUniversity, Kingston, Canada.
Van Vuren T., and Watling D. (1991) “Multiple User Class Assignment for Route Guidance,”Transportation Research Record, 1306.
Wardrop J. G. (1952) “Some Theoretical Aspects of Road Traffic Research,” Proceedings ofthe Institute of Civil Engineering, Part II, pp. 325-378.
29

TABLES AND FIGURES
30
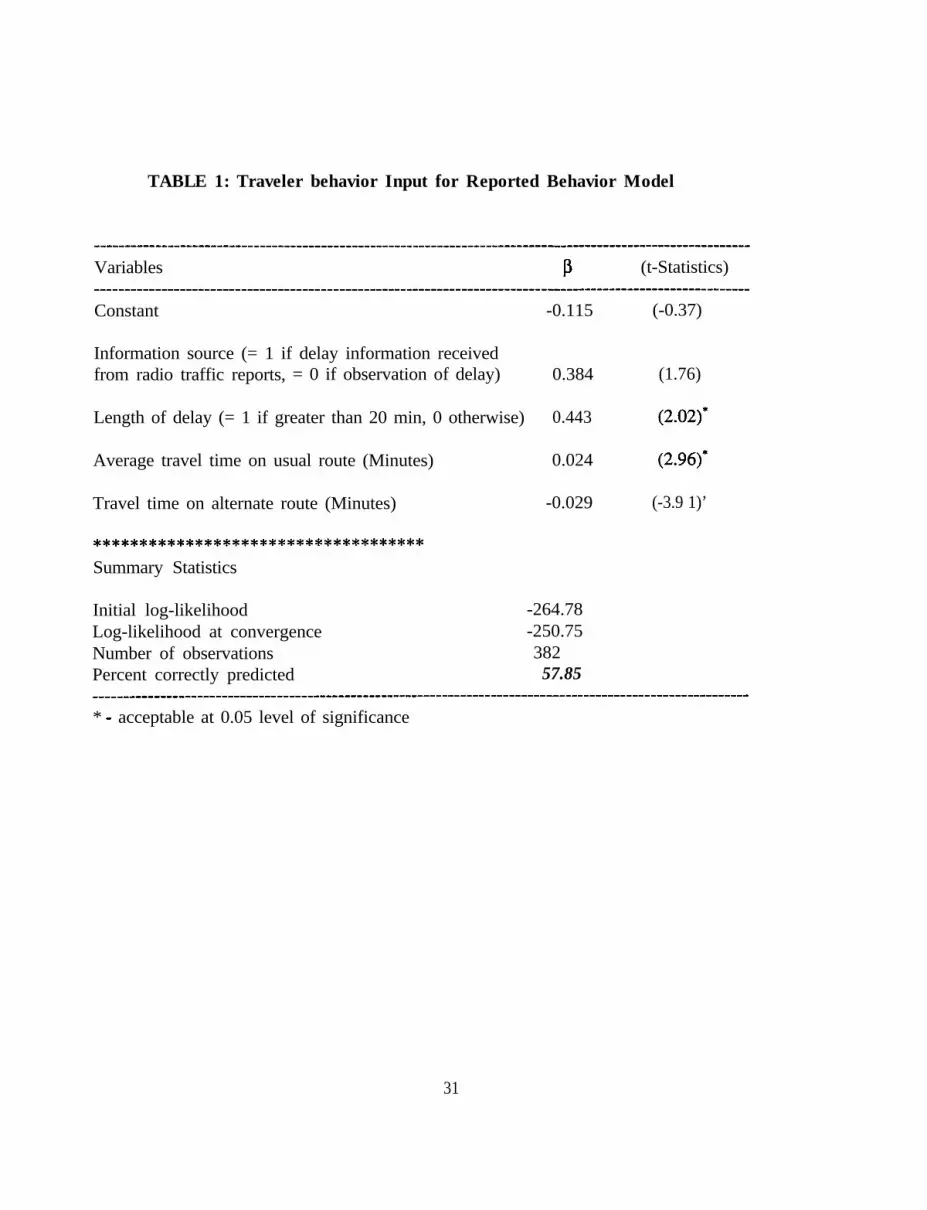
TABLE 1: Traveler behavior Input for Reported Behavior Model
-_-------------------------------------------------------------------------------------------------------
Variables P (t-Statistics)_________________-__------------------------------------------------------------------------------------Constant -0.115 (-0.37)
Information source (= 1 if delay information receivedfrom radio traffic reports, = 0 if observation of delay) 0.384 (1.76)
Length of delay (= 1 if greater than 20 min, 0 otherwise) 0.443 (2.02)*
Average travel time on usual route (Minutes) 0.024 (2.96)*
Travel time on alternate route (Minutes) -0.029 (-3.9 1)’
************************************
Summary Statistics
Initial log-likelihood -264.78Log-likelihood at convergence -250.75Number of observations 382Percent correctly predicted 57.85________________------------------------------------------------------------------------------------------* - acceptable at 0.05 level of significance
31

TABLE 2(a): Summary of Input Parameters for unsaturated conditions
TABLE 2(b): Summary of System Performance Measures
DESCRIPTION OF OUTPUT NODIVERSION(Base Case)AVERAGE
FULLCOMPLIANCE
AVERAGE
Average Duration of Queue on Route 1 (Minutes)
Average Duration of Queue on Route 2 (Minutes)
Average Delay per Vehicle (Minutes)
Average Percent of Diversion (%)
Average Free-flow Travel Time plus DelayExperienced on Route 1 (Minutes)
Average Free-flow Travel Time plus DelayExperienced on Route 2 (Minutes)
Average Free-flow Travel time plus DelayExperienced on Both Routes (Minutes)
105.1 81.2
0.0 3.3
9.0 6.5
0.0 3.7
41.1 38.8
0.0 41.7(N=588)’
41.10 38.8
REPORTED-1BEHAVIORAVERAGE
41.6 I
7.1 I
4.1 I
13.8 I
36.4
49.3(N=1097)’
38.1
l Travel times were calculated based on the actual travel times plus delay experienced due to diversions, so thesample size is smaller; for all the rest N = 1167.
32
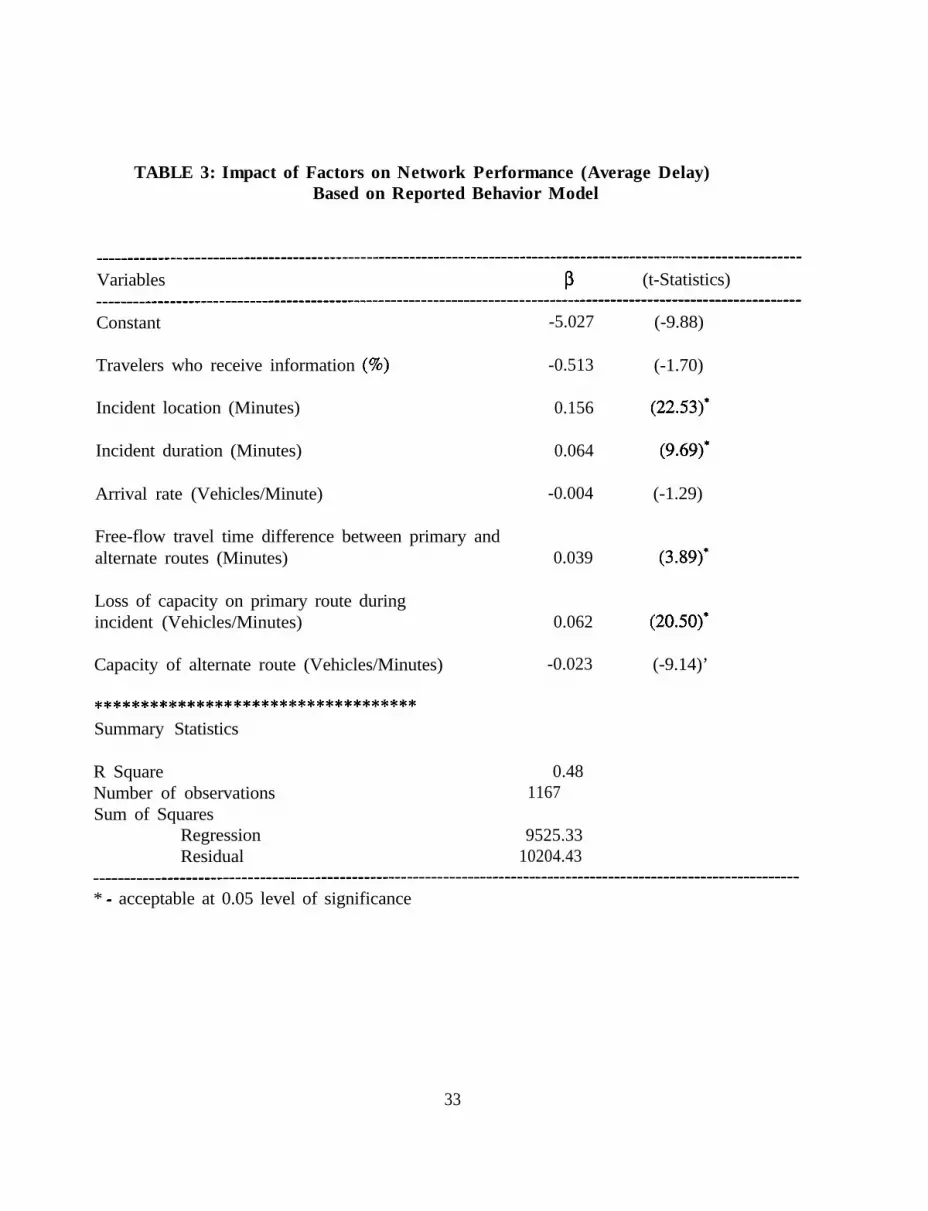
TABLE 3: Impact of Factors on Network Performance (Average Delay)Based on Reported Behavior Model
Variables P (t-Statistics)
Constant
Travelers who receive information (%)
Incident location (Minutes)
Incident duration (Minutes)
Arrival rate (Vehicles/Minute)
Free-flow travel time difference between primary andalternate routes (Minutes)
Loss of capacity on primary route duringincident (Vehicles/Minutes)
Capacity of alternate route (Vehicles/Minutes)
***********************************Summary Statistics
R SquareNumber of observationsSum of Squares
RegressionResidual
-5.027
-0.513
0.156
0.064
-0.004
0.039 (3.89)*
0.062 (20.50)*
-0.023 (-9.14)’
0.481167
9525.3310204.43
(-9.88)
(-1.70)
(22.53)*
(9.69).
(-1.29)
____________________-----------------------------------------------------------------------------------------------
* - acceptable at 0.05 level of significance
33
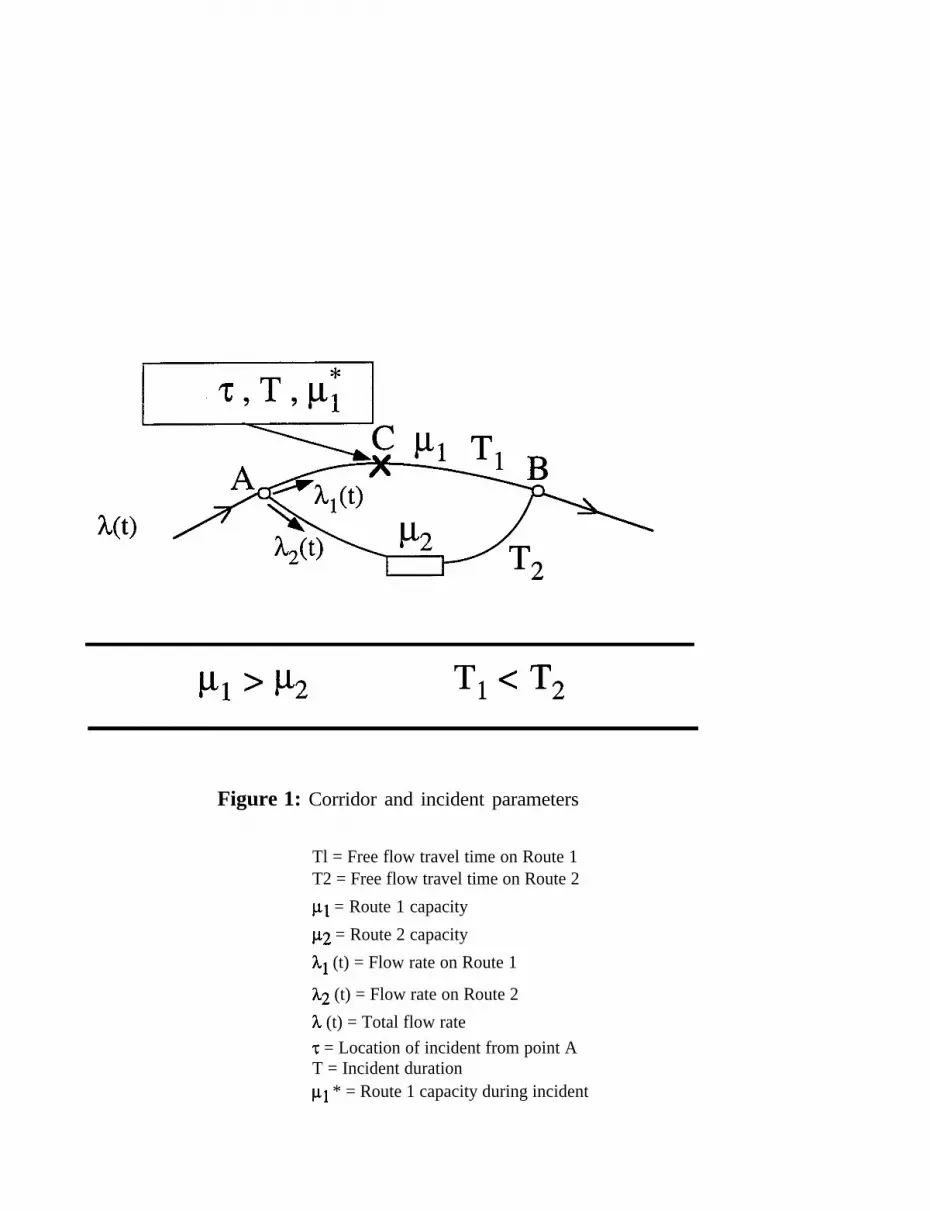
Figure 1: Corridor and incident parameters
Tl = Free flow travel time on Route 1T2 = Free flow travel time on Route 2pl = Route 1 capacity~2 = Route 2 capacityhl (t) = Flow rate on Route 1
h2 (t) = Flow rate on Route 2h (t) = Total flow rate7 = Location of incident from point AT = Incident duration~1 * = Route 1 capacity during incident

T TIME:t
Figure 2: Queueing diagram for incident conditions
A, (t) = Cumulative arrivalsDC (t) = Cumulative departures1-11 = Route 1 capacityhl (t) = Arrival rate on Route 1 at time t
Pl * = Route 1 capacity during incident
0 T’ &-l tn
Figure 3: Derivation of delay formula for Route 1(without diversion)
A, (t) = Cumulative arrivalsDC (t) = Cumulative departurespl = Route 1 capacityI.1 (t) = Arrival rate on Route 1 at time t
pl* = Route 1 capacity during incident
0 tn - l tn TIME; t
Figure 4: Derivation of delay formula for Route 2
A2 (t) = Cumulative arrivalsD2 (t) = Cumulative departures~2 (t) = Route 2 capacity

I I I I I I I I I
0.1 0.2 0.3 0.4 0.5 0.6 0.7 0.8 0.9Percentage equipped
- Total ----- Equipped - - - Unequipped
FIGURE 5 - AVERAGE DELAY WITH FULL COMPLIANCE MODELUNSATURATED CONDITIONS
Percentage equipped
- Total ----- Equipped - - - Unequipped
FIGURE 6 - AVERAGE DELAY WITH FULL COMPLIANCE MODELOVER-SATURATED CONDITIONS

/-
O--0 20 40 60 80 100 120 140 1Time (min)
- Route 1 -Tr. Time - - - - - Route 2-Tr. Time
FIGURE 7 - TRAVEL TIMES WITH FULL COMPLIANCE-MODELUNSATURATED CONDITIONS (EQUIPPED = 54 %)

60
0I I I I I I I I I20 40 60 80 100 120 140 160 180 2
Time(min)
- Route 1 -Tr. Time ----- Route 2-Tr. Time
10
FIGURE 8 - TRAVEL TIMES WITH FULL COMPLIANCE MODELOVER-SATURATED CONDITIONS (EQUIPPED = 54 %)
60
50-
IO-
0 I I I I I
0I
20I
40 60 1 80 100 120 140 160Time(min)
- Route 1 -Tr.Time - - - - - Route 2-Tr.Time
FIGURE 9 - TRAVEL TIMES WITH FULL COMPLIANCE MODELUNSATURATED CONDITIONS (EQUIPPED = 100 %)
60
I I 1 I I I I I I20 40 60 80 100 120 140 160 180 2
Time(min)
- Route 1 -Tr.Time -- - - - Route 2-Tr.Time
10
FIGURE 10 - TRAVEL TIMES WITH FULL COMPLIANCE MODELOVER-SATURATED CONDITIONS (EQUIPPED = 100 %)
0 I I I I I I I I I
0 0.1 0.2 0.3 0.4 0.5 0.6 0.7 0.8 0.9Percentageequipped
I- Total ----- EquW - -a Unequipped
FIGURE 11 - AVERAGE DELAY WITH BEHAVIOR MODELUNSATURATED CONDITIONS

1c
9
8
7
6
5
4
3
2
1,
0
I--
l-
I_,
I
0
-L----- _----_---e--- ---_---- -w--w___
-m-----c ----
___--- II----m___ I-----__m_-----mm_____ **_---
.s.-- -_____s__s_---------
O:l d.2 d.3 014 d.5 016 017 d.8 d.9Percentage equipped
- Total ----* Equipped - - * Unequippf3d
FIGURE 12 - AVERAGE DELAY WITH BEHAVIOR MODELOVER-SATURATED CONDITIONS
IO-
0 20 40 60 80 100 120 140 160Time (min)
I- Route I-Tr. Time ----- Route 2-Tr. Time 1
FIGURE 13 - TRAVEL TIMES WITH BEHAVIOR MODELUNSATURATED CONDITIONS. (INFORMED = 54%)
60-
50-
Iz40-gifj= 30-z5 ._______________________ -_ -___-_______ -------------_--_-- --------------------2g 20-
IO-
0 I I I I I I I0 20 40 60 80 100 120 140 160
Time(min)
- Route 1 -Tr.Time - - - - - Route 2-Tr.Time
FIGURE 14 - TRAVEL TIMES WITH BEHAVIOR MODEL ..UNSATURATED CONDITIONS (INFORMED = 100%)
60
Time (min)
- Route 1 -Tr. Time ----- Route 2-Tr. Time
FIGURE 15 - TRAVEL TIMES WITH BEHAVIOR MODELOVER-SATURATED CONDITIONS (INFORMED = 54%)
60
50-
z40-.5E"
\\\\F 30- \\\\55 'L ______-__--_- -_--_- ___--__________ - ----- ---- ---.5ip 20-
IO-
0 I I I I I I I I I0 20 40 60 80 100 120 140 160 180 200
Time(min)
I- Route l-Tr.Time----- Route 2-Tr.Time 1
FIGURE 16 - TRAVEL TIMES WITH BEHAVIOR MODEL-- OVERdATURATED CONDITIONS (INFORMED = 100%)


