Embed Size (px)
Citation preview

A Challenging Tornado Event on the Weather Event Simulator
Donald Moore WFO Billings, Montana
Introduction
On the afternoon of 25 July 2004 a small area of thunderstorms moved across south central Montana producing marginally severe sizedhail and sub severe wind gusts. The exception was one storm that intensified and became a right mover with supercell characteristics,including a hook. As the storm crossed a highway running through a rural area, a tornado (as indicated by storm surveys), developedcausing considerable damage to a few mobile homes that were not properly anchored to the ground. The tornado then apparentlydissipated as the storm continued to intensify. The storm maintained supercell characteristics for over 45 minutes, however additionaltornadoes or damage were not reported.
The meteorological environment in which the storm and tornado developed in was not typical of supercell tornadoes, as observational andmodel data suggest CAPE values were under 500 J/kg with minimal CAPE below 3 km and surface dewpoint spreads greater than 30 F(Rasmussen and Blanchard 1998; Rasmussen 2003; Thompson et al. 2003). Since this was such a challenging case due to rapidthunderstorm development and tornadogenesis in a somewhat benign environment for supercells, meteorologists at WFO Billings wentthrough this case on the WES. The simulation focused on gaining a grasp of the near storm environment by picking up on subtle clues tohelp anticipate rapid storm development and the tornado potential. This paper will briefly discuss some of the subtle clues that may haveled to the tornado.
Meteorological Conditions and Thunderstorm Evolution
An upper level high that was centered over Colorado on 2324 July 2003 shifted slightly east on the 25th (figure 1). In this environment,middle and upper level moisture wrapping around the high helped produced isolated, pulsing thunderstorms that brought a few reports ofmarginally severe sized hail on the 23rd and 24th. Late on the 24th a weak cold front pushed through the eastern half of Montana andWyoming, causing low level flow to become easterly. Meanwhile westerly flow continued aloft. The result was an increase in shear below700mb, however instability was low as a result of the low level cooler air behind the front. Some showers and thunderstorms movednortheast through northern Wyoming and southern Montana overnight on the 24th and through part of the morning on the 25th, possiblyproducing low level boundaries that lingered over the area through the afternoon. Weak short wave forcing moving north out of northwestWyoming, hinted at in the water vapor imagery, was the primary large scale lifting mechanism of the day (figure 1).
A modified ACARS sounding from 1926Z on the 25th indicated very little CAPE, with storm tops under 35 kft, although lifting from thehigher terrain does show greater instability. Figure 2 shows the sounding modified by surface observations from Billings (3570 feet) andPryor Mountain RAWS (6612 feet) just south of Billings as the convection was developing (the tornado occurred around 4000 feet). A RUCsounding initialized at 1800Z showed slightly cooler temperatures around 700mb and stronger shear than the ACARS sounding, but stillindicated low CAPE values (figure 3). The initialized 00Z RUC sounding, just prior to the greater storm development, maintained the fairlylow CAPE values but also kept the fairly strong shear (figure 4). Like the ACARS sounding, the KBLX 88D VAD Wind Profile indicated theRUC was likely excessive with the shear, but not considerably bad.
Radar analysis and surface observations between 2330Z and 0022Z, just prior to the strongest convection, shows several low levelboundaries present over south central Montana. The most obvious boundaries, as shown in figure 5, are fairly common terraininducedconvergent boundaries along the Yellowstone River near Billings (boundary A in figure 5) and along the Clarks Fork of the Yellowstone(boundary B in figure 5). Two additional nearly stationary boundaries may also be present south of Billings (boundary C and D in figure 5)due to convection earlier in the morning. These lines of enhanced returns could also be due to horizontal rolls. Either way, those linesappear to be regions of persistent enhanced lift and likely enhanced low level shear. Satellite imagery does not show these boundaries dueto cirrus cloud cover and very little visible cumulus underneath.
As the batch of thunderstorms west of Billings around 0022Z moved into boundary B, storm development took place on the southern flankwhere low level convergence appears to be most intense via surface and radar observations (figure 5). Around 0045Z, one storm took onsupercell characteristics with a pronounced rear flank downdraft (RFD) and storm top of 40 to 45 kft as it moved along boundary C (figure6). About the same time there appears to be a region of lower returns moving south just ahead of the storm (denoted by the black line infigure 6). This region could be a result of several factors such as subsidence and clearing ahead of the storm, a result of outflow fromconvection to the north, or from the forward flank downdraft.
Another important consideration for the tornado formation may be the lack of stability associated with the RFD. The Pryor Mountain RAWSshows a temperature of 65 with a dew point of 56 just after the RFD passage, which indicates neutral instability behind the RFD per theACARS sounding. It is possible the tornado was able to form in association with the RFD since there was not much stability behind theRFD (figure 6).
Between 0102Z and 0108Z, the tornado formed near the Yellowstone County line along boundary C. The time of the tornado coincidesclosely with the arrival of the southward moving boundary into the area shown in figure 6. Only weak rotation was indicated by the 8 bitvelocity and SRM with little to no gate to gate shear. Figure 7 shows the 0.5 and 1.5 SRM and 8 bit reflectivity around the time of thetornado. Point A in figure 7 denotes the location where storm surveys indicate tornado damage and point B in figure 7 shows wherestraight line wind damage appears to have occurred (figure 8).
Discussion
Providing ample lead time for a tornado warning in this type of event is especially difficult due to the rapid development of the storm andlack of significant velocity signatures. A first glance at the meteorological conditions prior to the convection did not reveal much of a severeweather threat other than pulse type storms due to low CAPE values and weak forcing. However, close scrutiny of the radar and surface

observations did reveal low level boundaries would provide increased forcing and locally stronger low level shear. This was particularly thecase just south of Billings where strong low level convergence was implied. Thus, when storms moved into that region, intensification withmore sustained updrafts were likely. Once the one storm began to intensify, the proximity of this storm to preexisting boundaries(boundary C in figure 4) and strong storm inflow suggested the storm would maintain its strength for an extended period of time, unlike allother storms earlier in the day.
Predicting the rapid change in storm characteristic and especially the tornado development was less obvious than predicting the stormintensification. However, numerous journal articles such as Atkins et al. (1999) and Markowski et al. (1998) have shown the importance oflow level boundaries in storm morphology and tornado occurrence. In most years, there are several storms a year in WFO Billings CWAthat take on supercell characteristics with a well defined RFD and hook that do not produce tornadoes. Issuing a tornado warning on everyone of those storms would lead to a high false alarm rate. However as this case shows, having a greater tendency to issue tornadowarnings on similar storms that are in more favorable environments as defined in the mesoanalysis severe weather guide by Pete Wolfand on storms intensifying along boundaries should help identify storms with the greatest potential of producing a tornado.
References
Atkins, Nolan T., Morris L. Weisman, Louis J. Wicker, 1999: The Influence of Preexisting Boundaries on Supercell Evolution. MonthlyWeather Review: Vol. 127, No. 12, pp. 29102927
Markowski, P. M, E. N. Rasmussen, and J. M. Straka, 1998: The occurrence of tornadoes in supercells interacting with boundaries duringVORTEX95. Wea. Forecasting, 13, 852859.
Rasmussen, E. N., and D. O. Blanchard, 1998: A baseline climatology of soundingderived supercell and tornado forecast parameters.Wea. Forecasting., 13, 11481164.
Rasmussen, Erik N. 2003: Refined Supercell and Tornado Forecast Parameters. Wea. Forecasting: Vol. 18, No. 3, pp. 530535.
Thompson, Richard L., Edwards, Roger, Hart, John A., Elmore, Kimberly L., Markowski, Paul. 2003: Close Proximity Soundings withinSupercell Environments Obtained from the Rapid Update Cycle. Wea. Forecasting: Vol. 18, No. 6, pp. 12431261
Wolf, Pete. Mesoanalysis Severe Weather Guide, http://www.meted.ucar.edu/resource/soo/MesoAnalyst.htm
Figure 1
Figure 2
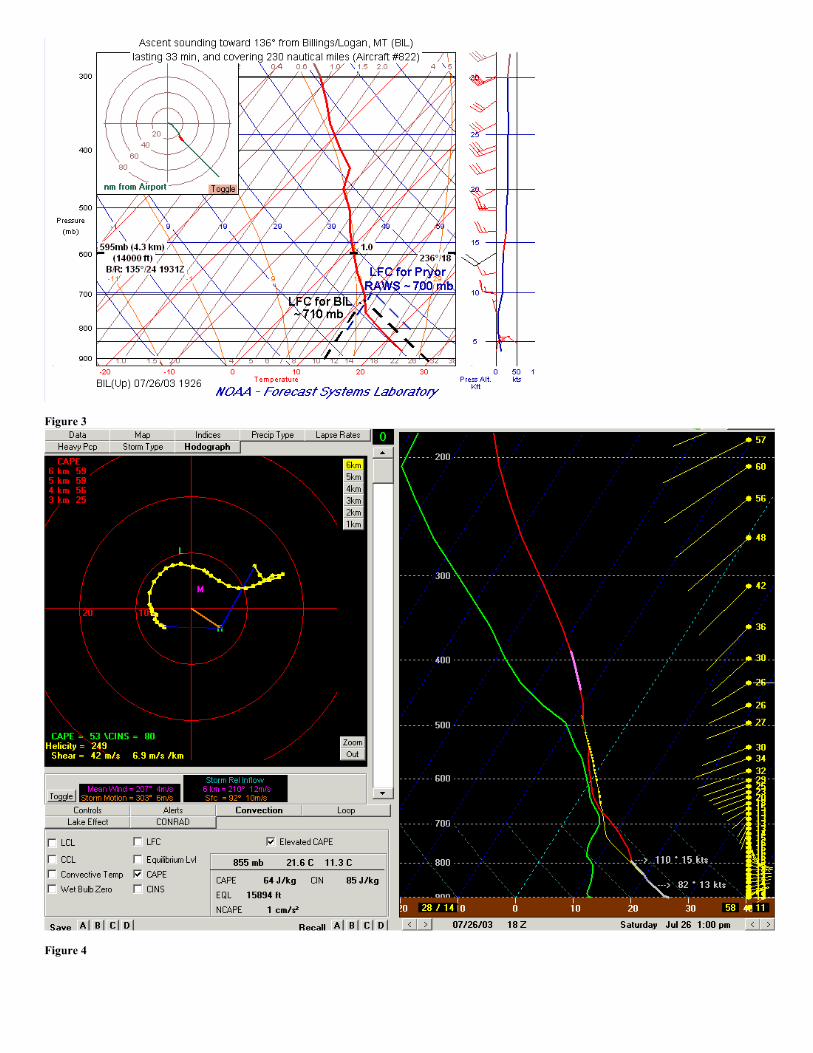
Figure 3
Figure 4

Figure 5
Figure 6

Figure 7

Figure 8


