Embed Size (px)
Citation preview
ASTRONOMY & ASTROPHYSICS MAY I 1998, PAGE 455
SUPPLEMENT SERIES
Astron. Astrophys. Suppl. Ser. 129, 455-462 (1998)
A catalogue of dwarf galaxy candidates around interactinggalaxies?
H.J. Deeg1, C. Munoz-Tunon1, G. Tenorio-Tagle2,3, E. Telles2,3,4, J.M. Vilchez1, J.M. Rodriguez-Espinosa1, P.A. Duc5, and I.F. Mirabel6
1 Instituto de Astrofısica de Canarias, E-38200 La Laguna, Tenerife, Spaine-mail: [email protected] Institute of Astronomy, Madingley Road, Cambridge, UK3 Royal Greenwich Observatory, Madingley Road, Cambridge, UK4 Observatorio Nacional, Rio de Janeiro, Brasil5 European Southern Observatory, Garching, Germany6 Service d’Astrophysique, Centre d’Etudes de Saclay, F-91191 Gif-sur-Yvette, France
Received May 30; accepted October 7, 1997
Abstract. We present results from the imaging of a sam-ple of 12 interacting galaxies for which we have catalogedall potential dwarf systems in the vicinity of these stronglyinteracting galaxies. After careful cleaning of the imagesand applying a restrictive S/N criterion we have identified,measured and cataloged all possible extended objects ineach field. On the frames, covering 11.4 × 10.5 arcmins,typically 100-200 non-stellar faint, extended objects werefound. The vast majority (> 98%) of these objects hadnot been previously identified. The number of expectedobjects in the magnitude range R = 18− 19.5 exceeds theexpected count of background galaxies. This supports thepossibility that a density enhancement of extended objectsaround some interacting galaxies results from the additionof a locally formed dwarf galaxy population.
Key words: galaxies: interactions — galaxies:statistics — galaxies: formation
1. Introduction
Active star formation taking place in gas condensationsejected during the merging of large galaxies is a pos-sible source of dwarf galaxy formation. This idea, firstproposed by Zwicky (1956), has received important re-cent observational support (Mirabel 1992; Mirabel et al.1992; Elmegreen et al. 1993; Duc & Mirabel 1994). Thestrongest evidence comes from the identification of blue
Send offprint requests to: C. Munoz-Tunon? Tables 4 to 15 only available in electronic form at CDSvia anonymous ftp to cdsarc.u-strasbg.fr (130.79.128.5) or viahttp://cdsweb.u-strasbg.fr/Abstract.html
condensations in the tips of ejected tails of ultralumi-nous mergers, with typical HI masses from 5 108 to6 109 M�. Objects similar to dwarf irregulars, HII galax-ies or Magellanic irregulars are indeed found in the ejectedtails of colliding galaxies, and some are likely to becomedetached systems, or isolated dwarf galaxies (Sanders &Mirabel 1996). A study of seven Hickson Compact Groupsof galaxies (Hickson 1982; Hunsberger et al. 1996) exhibit-ing tidal tails or debris also showed these objects, andHunsberger et al. estimate that a third to half of all dwarfsin compact galaxy groups may have formed during galaxy-galaxy encounters.
Our aim is to look for evidence either in favor oragainst the possible genesis of dwarf galaxies as a resultof strong galactic encounters. To this end we have con-ducted a search of small, although extended, nebulositiesaround a sample of luminous infrared galaxies (LIGs) withcompact nuclear starbursts. Twelve galaxies were selectedfrom the IRAS bright galaxy sample (Soifer et al. 1989)and from Condon et al. (1991). These galaxies display awide range in size and luminosity – the observations pre-sented here are not restricted to ultraluminous objects orto well defined merger systems with sharply designed tails.The sample covers a large variety of morphologies andstages in the merging process. It includes, for example,ellipticals with double peaked nuclei, galaxies in groups,and merging spirals that still show their individual spi-ral structure. Most sample galaxies are included in Arp’s(1966) Atlas of Peculiar Galaxies.
For the twelve sample galaxies, this catalogue lists allextended objects (EOs) found within a field of 11.4′×10.5′
size, centered at the central galaxy. An account of the ob-servations is given in Sect. 2. The procedure to identify theEOs in the CCD frames is described in Sect. 3. Section 4
456 H.J. Deeg et al.: A catalogue of dwarf galaxy candidates around interacting galaxies
All objects found by daofindon R frame
(typ. 5000 /frame)
define prelim star-psf on each frame
(≈ 10 obvious stars) → σa*, σb*
Amp > minimum for reliable psf-fit
noyes (typ 500 /frame)discard
raw fit of psf (ellipt. gaussian)
→Amp, σa, σb
σa > 0.8 σa* AND σb > 0.8 σb*
(psf sufficiently large for star)
AND
final fit of psf (ellipt. gaussian)
→ Posx, Posy, Amp, NSky, σa, σb, rot
Amp > min. for reliable psf-fit,photometry
Nsky < limiting surface brigthness of main galaxy
σa > 0.9 σa* and σb > 0.9 σb*
AND
AND
noyes
List of identifiedobjects
σa > 1.4 σa* OR σb > 1.4 σb*
yes
Scan by eye EO's missed by daofind with very large σa, σb
Close Binaries
no
Prelim. list of EO's
Final list of EO's
Final determination of from Histogram of σa, σb
a*, σb*σ
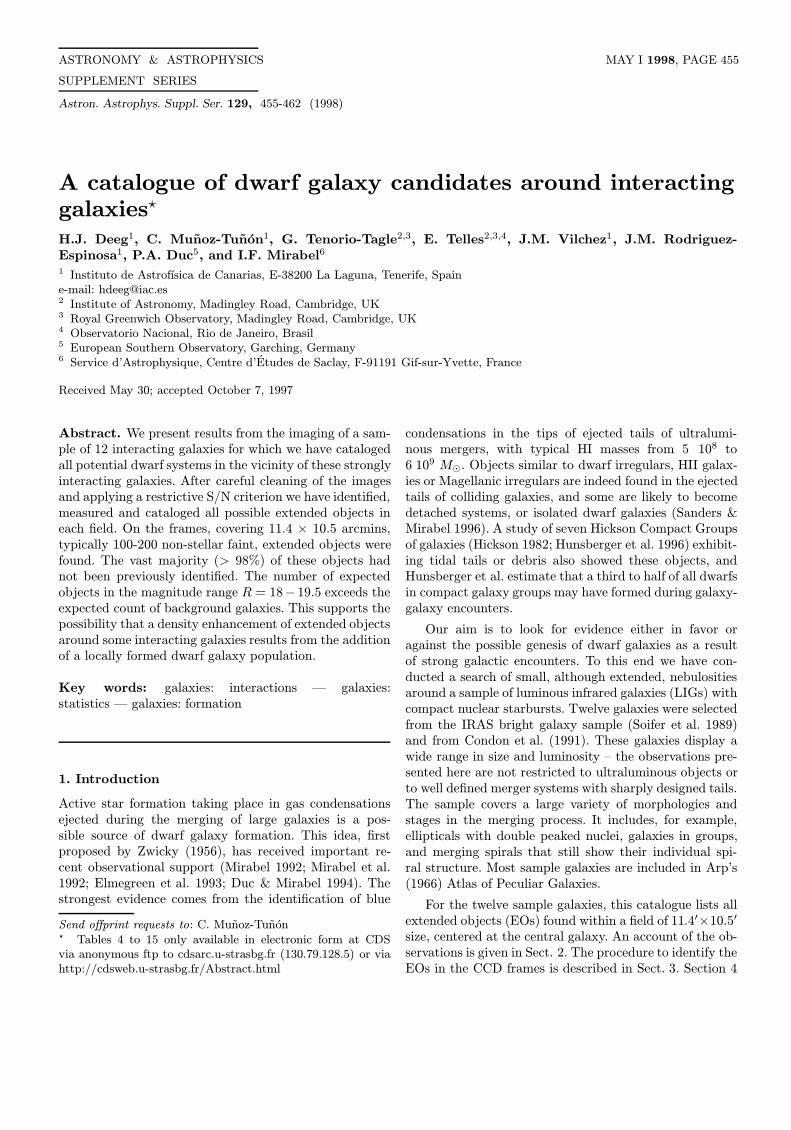
Fig. 1. Flow-diagram of the selection procedure used to iden-tify objects as EOs or stellar like
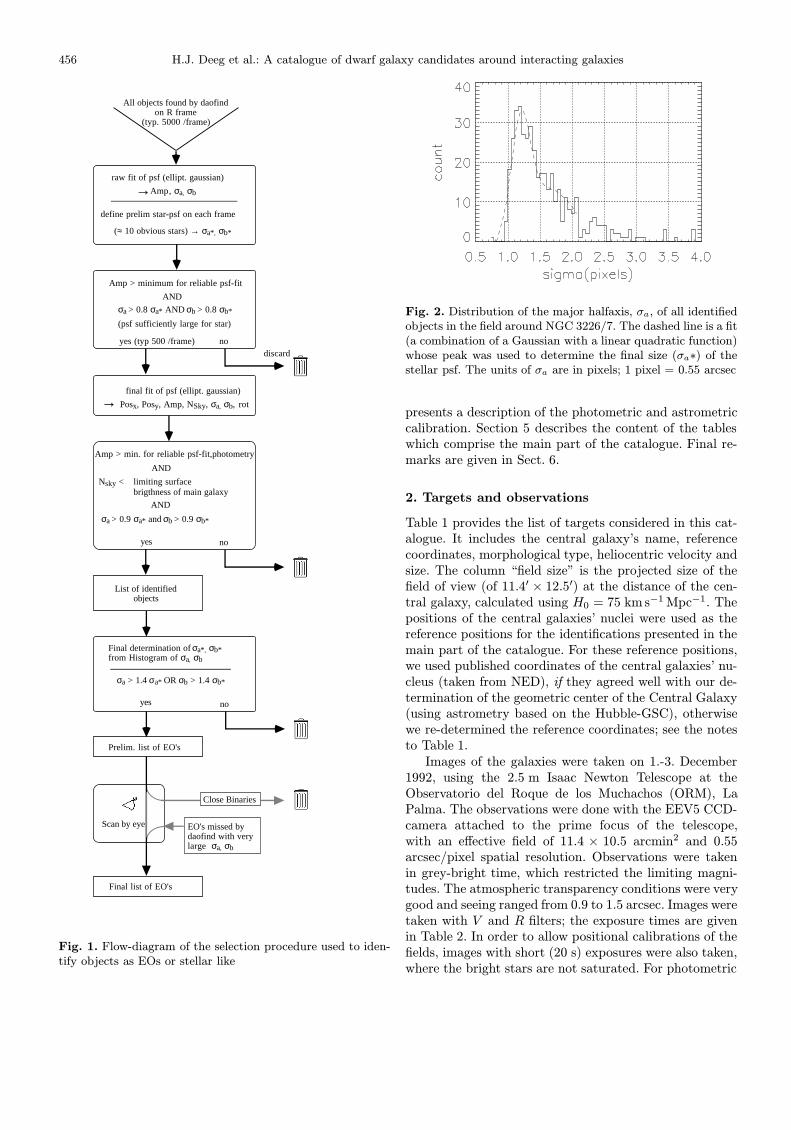
Fig. 2. Distribution of the major halfaxis, σa, of all identifiedobjects in the field around NGC 3226/7. The dashed line is a fit(a combination of a Gaussian with a linear quadratic function)whose peak was used to determine the final size (σa∗) of thestellar psf. The units of σa are in pixels; 1 pixel = 0.55 arcsec
presents a description of the photometric and astrometriccalibration. Section 5 describes the content of the tableswhich comprise the main part of the catalogue. Final re-marks are given in Sect. 6.
2. Targets and observations
Table 1 provides the list of targets considered in this cat-alogue. It includes the central galaxy’s name, referencecoordinates, morphological type, heliocentric velocity andsize. The column “field size” is the projected size of thefield of view (of 11.4′ × 12.5′) at the distance of the cen-tral galaxy, calculated using H0 = 75 km s−1 Mpc−1. Thepositions of the central galaxies’ nuclei were used as thereference positions for the identifications presented in themain part of the catalogue. For these reference positions,we used published coordinates of the central galaxies’ nu-cleus (taken from NED), if they agreed well with our de-termination of the geometric center of the Central Galaxy(using astrometry based on the Hubble-GSC), otherwisewe re-determined the reference coordinates; see the notesto Table 1.
Images of the galaxies were taken on 1.-3. December1992, using the 2.5 m Isaac Newton Telescope at theObservatorio del Roque de los Muchachos (ORM), LaPalma. The observations were done with the EEV5 CCD-camera attached to the prime focus of the telescope,with an effective field of 11.4 × 10.5 arcmin2 and 0.55arcsec/pixel spatial resolution. Observations were takenin grey-bright time, which restricted the limiting magni-tudes. The atmospheric transparency conditions were verygood and seeing ranged from 0.9 to 1.5 arcsec. Images weretaken with V and R filters; the exposure times are givenin Table 2. In order to allow positional calibrations of thefields, images with short (20 s) exposures were also taken,where the bright stars are not saturated. For photometric
H.J. Deeg et al.: A catalogue of dwarf galaxy candidates around interacting galaxies 457
Table 1. Parameters of central galaxies of the catalogue’s fields
Galaxy α(2000) δ(2000) morph.type velocity Galaxy Size Field Sizename h:mm:s ◦ ′ ′′ km/s arcmin2 Kpc2
NGC 520 01:24:35 3:47:37(4) S pec 2266 1.9× 0.7 9200(ARP157:VV231c)
NGC 772 01:59:20 19:00:28(2) SA(s)b 2472 7.2× 4.3 11000(ARP78)
NGC 1023 02:40:24 39:03:46(1) SB(rs)0 637 8.7× 3.0 730(ARP135)
NGC1253 03:14:09 −02:49:22(1) SB(s)m 1831 1.7× 1.0 6030(ARP279)
ARP 141 07:14:21 73:28:36(6) E 2735 - 13400
NGC2535/6 08:11:15 25:11:36(5) SB(rs)c pec 4142 0.9× 0.6 30800(ARP 82)
NGC 2623 08:38:24 25:45:17(1) - 5535 - 55000(ARP243)
NGC2782 09:14:05 40:06:49(1) SAB(rs)a pec 2562 3.5× 2.6 11800(ARP 215)
NGC 3226/7 10:23:29 19:52:54(3) E2:pec 1151 3.2× 2.8 2380(ARP94)
NGC 3656 11:23:38 53:50:31(1) (R)I0:pec 2860 1.6× 1.6 14700(ARP155)
NGC 3690 11:28:31.9 58:33:45(1) SBm pec 3132 1.2× 1.0 17600(ARP299)
NGC 3921 11:51:06.6 55:04:45(1) (R)SA(s)0/a pec 5838 2.1× 1.3 61300(ARP224)
Notes to Table: Source for reference coordinates: (1) position taken from NED; (2) position measured on CCD frame; (3) positionmeasured on CCD, midway between NGC 3226 and NGC 3227; (4) position listed for VV231c in NED (positions of otheridentifications do not correspond well with the geometric center); (5) position listed for Arp82 in NED (is midway betweenNGC 2535 and NGC 2536); (6) position measured on CCD, midway between the two major nuclei of Arp 141.
calibration, Landolt (1992) standards were observed at arange of airmasses.
Raw images were zero-subtracted and flatfielded in theusual manner. A “standard” flatfield was obtained by av-eraging the individual sky-flats taken at the entire observ-ing run. This was possible, since the stability of the flatsbetween nights was better than 1%.
3. Identification of dwarf galaxy candidates
A flow diagram of the procedure used to discriminate ex-tended objects (EOs) against objects with a stellar pointspread function (psf) in the CCD frames is shown inFig. 1. The R images, which are deeper, were used to iden-tify the EOs around the interacting galaxies. In each field,a stellar reference psf was defined using elliptical Gaussianfitting with the IRAF task “fitpsf” on 10-15 apparent star-like objects. This psf is characterized by the major andminor halfaxis widths (σa∗, σb∗), see Table 2. Then, anautomatic search for flux peaks was done with the IRAFroutine “daofind”, from the “daophot” package (Stetson1987; Stetson & Davies 1992). Daophot made typically
5000 detections on each frame, including the faintest ob-jects visible by eye on the CCD, but also many pixelswith random high counts from background noise. EllipticalGaussians were then fitted to all these detections, andthose with a psf significantly narrower then the stellar psfand below a minimum amplitude were discarded. The re-maining objects were fitted again with elliptical Gaussiansto a greater precision. The results of these fits were thenused to create a final list of objects (stellar and extended)which fulfilled the following requirements:
– sufficiently high amplitudes (typically 700 ADU) forreliable Gaussian fits and reliable photometry
– a psf at least 0.8 times the size of σa∗ and σb∗– a low background count, assuring that the object is not
a part of the central galaxy. This threshold was set tovalues in the outermost regions of the large centralgalaxy, typically at 23−24 mag/arcsec2.
For a secure final determination of the size of thestellar psf (σa∗, σb∗), histograms of the distributionsof σa (and σb) were plotted (Fig. 2, also Fig. 6a),where the stellar psf can be clearly seen as a peak.Objects identified as EO were only those which were not
458 H.J. Deeg et al.: A catalogue of dwarf galaxy candidates around interacting galaxies
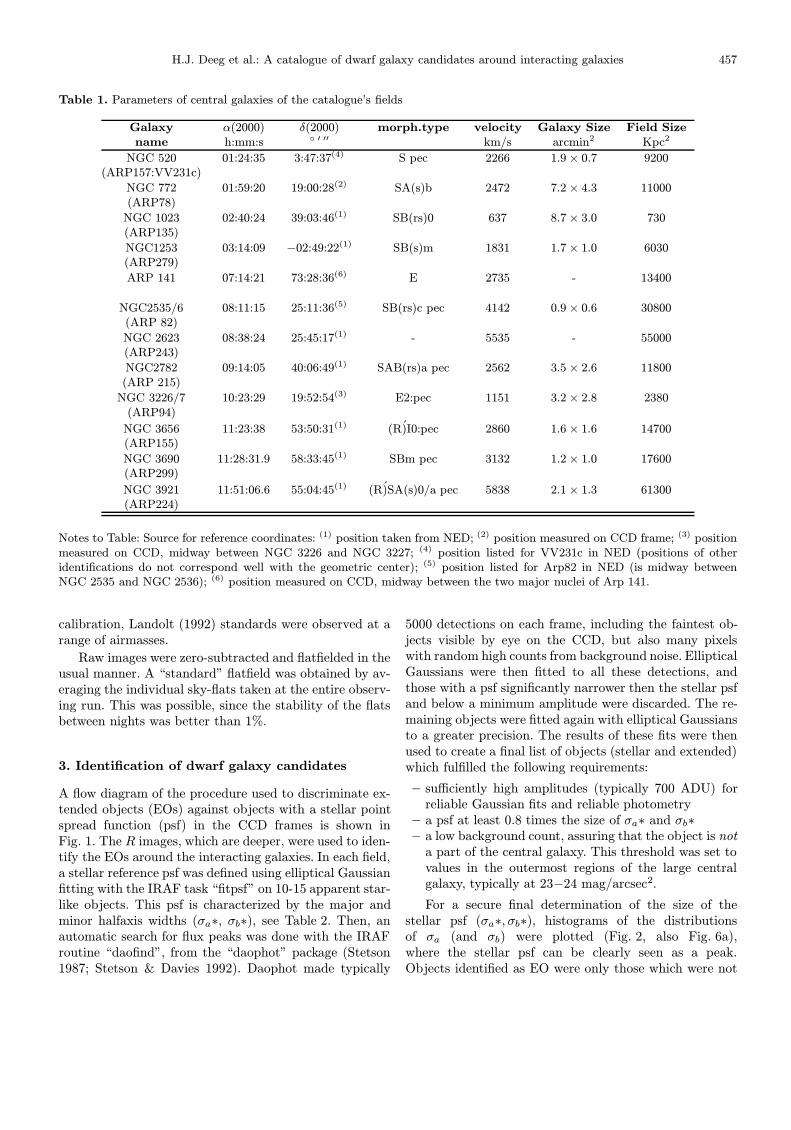
Fig. 3. R band CCD image of NGC 3226/7. Marked in rings are the objects identified as EOs. The big cross is the position ofthe reference coordinate of this field
oversaturated and have a psf at least 1.4 times larger thanσa∗ or σb∗. Both, the initial light source search (daofind)and the Gaussian fitting (fitpsf) work reliably only withina range of Gaussian widths, and some very extended galax-ies were missed. These galaxies can easily be seen on theframes and were added manually. Visual scanning was alsoperformed to remove those objects which were obviouslyclose double or multiple stellar systems. As an example ofour findings, the R band image of NGC 3226/7 is shownin Fig. 3. Marked in rings are the objects identified as ex-tended.
4. Photometry and astrometry
The CCD frames do have only moderate crowding, andamong the identified EOs, there is a wide range ofsizes and morphologies. Aperture photometry was testedagainst photometry based on the isophotal fitting of ellip-tical Gaussians, and gave more consistent results, as canbe expected from the small extent of most objects of afew CCD-pixels only. Circular aperture photometry wasthen performed within a diameter 2 times the size of theFWHM of the major halfaxis of each object. The FWHM
was measured on the R band frames, which were deeper.The photometry was performed with a specially writtenIRAF task, “fuzzphot” (available from H. Deeg) whichperforms aperture photometry on a large number of ob-jects on a CCD frame. Fuzzphot takes the positions andsizes of the apertures for each object from a list, whichhad previously been created with the point-spread fittingtask “fitpsf”. Same-sized apertures were then also used forthe V frames.
An absolute calibration has been made, based on theobservations of Landolt standards at different airmasses,with the following calibration relation:
mcalib = −a− kX − 2.5 log(count of object in ADU)
(exp. time in sec),(1)
where X is the airmass, a is the instrumental zero-point,and k the airmass dependence. As the uncertainty in thederivation of the calibration constants a and k was largerthan the night-to-night variation, average calibration con-stants were used in Eq. (1) for the entire observing run.We adopted:
a = 25.087, k = 0.204 for the V filter and (2)
H.J. Deeg et al.: A catalogue of dwarf galaxy candidates around interacting galaxies 459
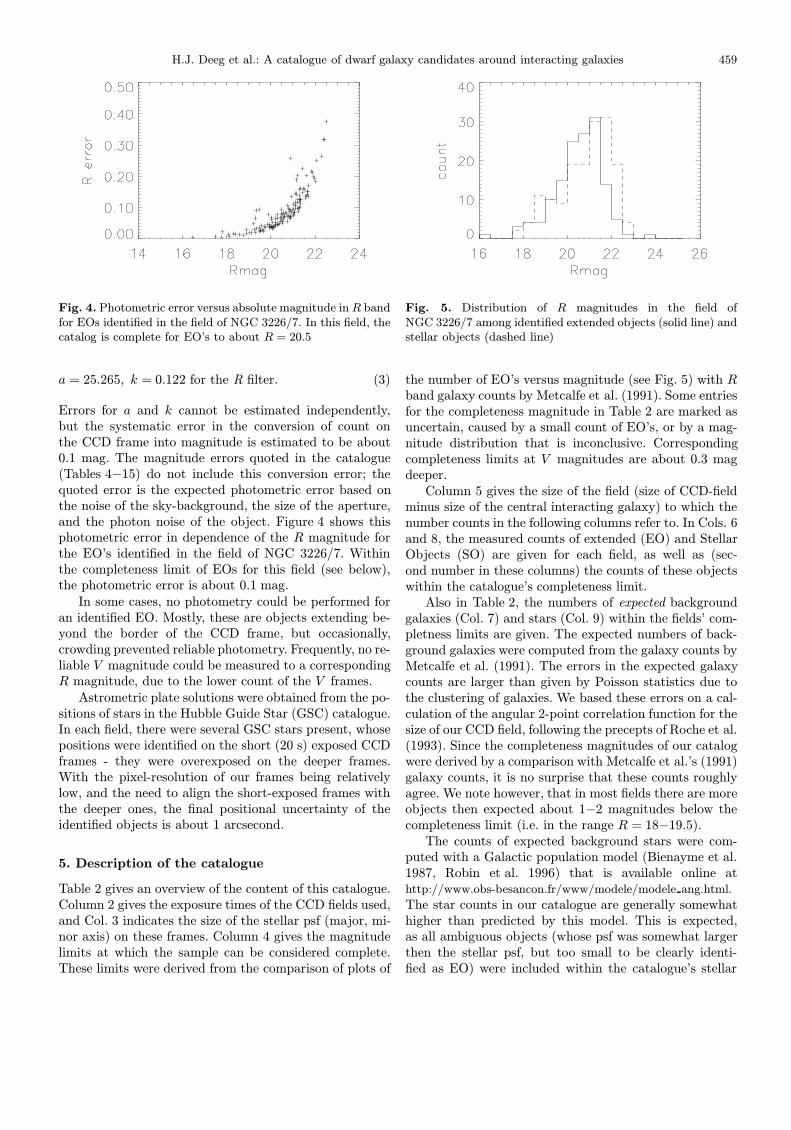
Fig. 4. Photometric error versus absolute magnitude inR bandfor EOs identified in the field of NGC 3226/7. In this field, thecatalog is complete for EO’s to about R = 20.5
a = 25.265, k = 0.122 for the R filter. (3)
Errors for a and k cannot be estimated independently,but the systematic error in the conversion of count onthe CCD frame into magnitude is estimated to be about0.1 mag. The magnitude errors quoted in the catalogue(Tables 4−15) do not include this conversion error; thequoted error is the expected photometric error based onthe noise of the sky-background, the size of the aperture,and the photon noise of the object. Figure 4 shows thisphotometric error in dependence of the R magnitude forthe EO’s identified in the field of NGC 3226/7. Withinthe completeness limit of EOs for this field (see below),the photometric error is about 0.1 mag.
In some cases, no photometry could be performed foran identified EO. Mostly, these are objects extending be-yond the border of the CCD frame, but occasionally,crowding prevented reliable photometry. Frequently, no re-liable V magnitude could be measured to a correspondingR magnitude, due to the lower count of the V frames.
Astrometric plate solutions were obtained from the po-sitions of stars in the Hubble Guide Star (GSC) catalogue.In each field, there were several GSC stars present, whosepositions were identified on the short (20 s) exposed CCDframes - they were overexposed on the deeper frames.With the pixel-resolution of our frames being relativelylow, and the need to align the short-exposed frames withthe deeper ones, the final positional uncertainty of theidentified objects is about 1 arcsecond.
5. Description of the catalogue
Table 2 gives an overview of the content of this catalogue.Column 2 gives the exposure times of the CCD fields used,and Col. 3 indicates the size of the stellar psf (major, mi-nor axis) on these frames. Column 4 gives the magnitudelimits at which the sample can be considered complete.These limits were derived from the comparison of plots of
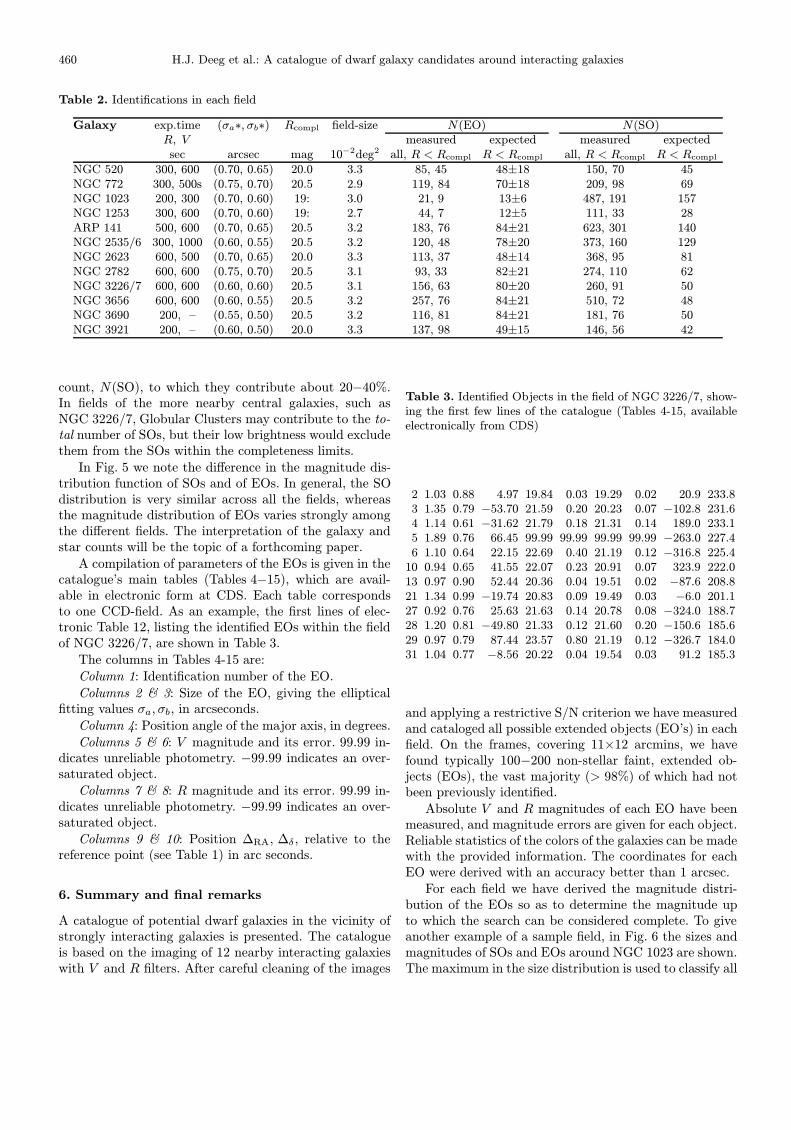
Fig. 5. Distribution of R magnitudes in the field ofNGC 3226/7 among identified extended objects (solid line) andstellar objects (dashed line)
the number of EO’s versus magnitude (see Fig. 5) with Rband galaxy counts by Metcalfe et al. (1991). Some entriesfor the completeness magnitude in Table 2 are marked asuncertain, caused by a small count of EO’s, or by a mag-nitude distribution that is inconclusive. Correspondingcompleteness limits at V magnitudes are about 0.3 magdeeper.
Column 5 gives the size of the field (size of CCD-fieldminus size of the central interacting galaxy) to which thenumber counts in the following columns refer to. In Cols. 6and 8, the measured counts of extended (EO) and StellarObjects (SO) are given for each field, as well as (sec-ond number in these columns) the counts of these objectswithin the catalogue’s completeness limit.
Also in Table 2, the numbers of expected backgroundgalaxies (Col. 7) and stars (Col. 9) within the fields’ com-pletness limits are given. The expected numbers of back-ground galaxies were computed from the galaxy counts byMetcalfe et al. (1991). The errors in the expected galaxycounts are larger than given by Poisson statistics due tothe clustering of galaxies. We based these errors on a cal-culation of the angular 2-point correlation function for thesize of our CCD field, following the precepts of Roche et al.(1993). Since the completeness magnitudes of our catalogwere derived by a comparison with Metcalfe et al.’s (1991)galaxy counts, it is no surprise that these counts roughlyagree. We note however, that in most fields there are moreobjects then expected about 1−2 magnitudes below thecompleteness limit (i.e. in the range R = 18−19.5).
The counts of expected background stars were com-puted with a Galactic population model (Bienayme et al.1987, Robin et al. 1996) that is available online athttp://www.obs-besancon.fr/www/modele/modele ang.html.
The star counts in our catalogue are generally somewhathigher than predicted by this model. This is expected,as all ambiguous objects (whose psf was somewhat largerthen the stellar psf, but too small to be clearly identi-fied as EO) were included within the catalogue’s stellar
460 H.J. Deeg et al.: A catalogue of dwarf galaxy candidates around interacting galaxies
Table 2. Identifications in each field
Galaxy exp.time (σa∗, σb∗) Rcompl field-size N(EO) N(SO)R, V measured expected measured expectedsec arcsec mag 10−2deg2 all, R < Rcompl R < Rcompl all, R < Rcompl R < Rcompl
NGC 520 300, 600 (0.70, 0.65) 20.0 3.3 85, 45 48±18 150, 70 45NGC 772 300, 500s (0.75, 0.70) 20.5 2.9 119, 84 70±18 209, 98 69NGC 1023 200, 300 (0.70, 0.60) 19: 3.0 21, 9 13±6 487, 191 157NGC 1253 300, 600 (0.70, 0.60) 19: 2.7 44, 7 12±5 111, 33 28ARP 141 500, 600 (0.70, 0.65) 20.5 3.2 183, 76 84±21 623, 301 140NGC 2535/6 300, 1000 (0.60, 0.55) 20.5 3.2 120, 48 78±20 373, 160 129NGC 2623 600, 500 (0.70, 0.65) 20.0 3.3 113, 37 48±14 368, 95 81NGC 2782 600, 600 (0.75, 0.70) 20.5 3.1 93, 33 82±21 274, 110 62NGC 3226/7 600, 600 (0.60, 0.60) 20.5 3.1 156, 63 80±20 260, 91 50NGC 3656 600, 600 (0.60, 0.55) 20.5 3.2 257, 76 84±21 510, 72 48NGC 3690 200, – (0.55, 0.50) 20.5 3.2 116, 81 84±21 181, 76 50NGC 3921 200, – (0.60, 0.50) 20.0 3.3 137, 98 49±15 146, 56 42
count, N(SO), to which they contribute about 20−40%.In fields of the more nearby central galaxies, such asNGC 3226/7, Globular Clusters may contribute to the to-tal number of SOs, but their low brightness would excludethem from the SOs within the completeness limits.
In Fig. 5 we note the difference in the magnitude dis-tribution function of SOs and of EOs. In general, the SOdistribution is very similar across all the fields, whereasthe magnitude distribution of EOs varies strongly amongthe different fields. The interpretation of the galaxy andstar counts will be the topic of a forthcoming paper.
A compilation of parameters of the EOs is given in thecatalogue’s main tables (Tables 4−15), which are avail-able in electronic form at CDS. Each table correspondsto one CCD-field. As an example, the first lines of elec-tronic Table 12, listing the identified EOs within the fieldof NGC 3226/7, are shown in Table 3.
The columns in Tables 4-15 are:Column 1: Identification number of the EO.
Columns 2 & 3: Size of the EO, giving the ellipticalfitting values σa, σb, in arcseconds.
Column 4: Position angle of the major axis, in degrees.Columns 5 & 6: V magnitude and its error. 99.99 in-
dicates unreliable photometry. −99.99 indicates an over-saturated object.
Columns 7 & 8: R magnitude and its error. 99.99 in-dicates unreliable photometry. −99.99 indicates an over-saturated object.
Columns 9 & 10: Position ∆RA, ∆δ, relative to thereference point (see Table 1) in arc seconds.
6. Summary and final remarks
A catalogue of potential dwarf galaxies in the vicinity ofstrongly interacting galaxies is presented. The catalogueis based on the imaging of 12 nearby interacting galaxieswith V and R filters. After careful cleaning of the images
Table 3. Identified Objects in the field of NGC 3226/7, show-ing the first few lines of the catalogue (Tables 4-15, availableelectronically from CDS)
2 1.03 0.88 4.97 19.84 0.03 19.29 0.02 20.9 233.83 1.35 0.79 −53.70 21.59 0.20 20.23 0.07 −102.8 231.64 1.14 0.61 −31.62 21.79 0.18 21.31 0.14 189.0 233.15 1.89 0.76 66.45 99.99 99.99 99.99 99.99 −263.0 227.46 1.10 0.64 22.15 22.69 0.40 21.19 0.12 −316.8 225.4
10 0.94 0.65 41.55 22.07 0.23 20.91 0.07 323.9 222.013 0.97 0.90 52.44 20.36 0.04 19.51 0.02 −87.6 208.821 1.34 0.99 −19.74 20.83 0.09 19.49 0.03 −6.0 201.127 0.92 0.76 25.63 21.63 0.14 20.78 0.08 −324.0 188.728 1.20 0.81 −49.80 21.33 0.12 21.60 0.20 −150.6 185.629 0.97 0.79 87.44 23.57 0.80 21.19 0.12 −326.7 184.031 1.04 0.77 −8.56 20.22 0.04 19.54 0.03 91.2 185.3
and applying a restrictive S/N criterion we have measuredand cataloged all possible extended objects (EO’s) in eachfield. On the frames, covering 11×12 arcmins, we havefound typically 100−200 non-stellar faint, extended ob-jects (EOs), the vast majority (> 98%) of which had notbeen previously identified.
Absolute V and R magnitudes of each EO have beenmeasured, and magnitude errors are given for each object.Reliable statistics of the colors of the galaxies can be madewith the provided information. The coordinates for eachEO were derived with an accuracy better than 1 arcsec.
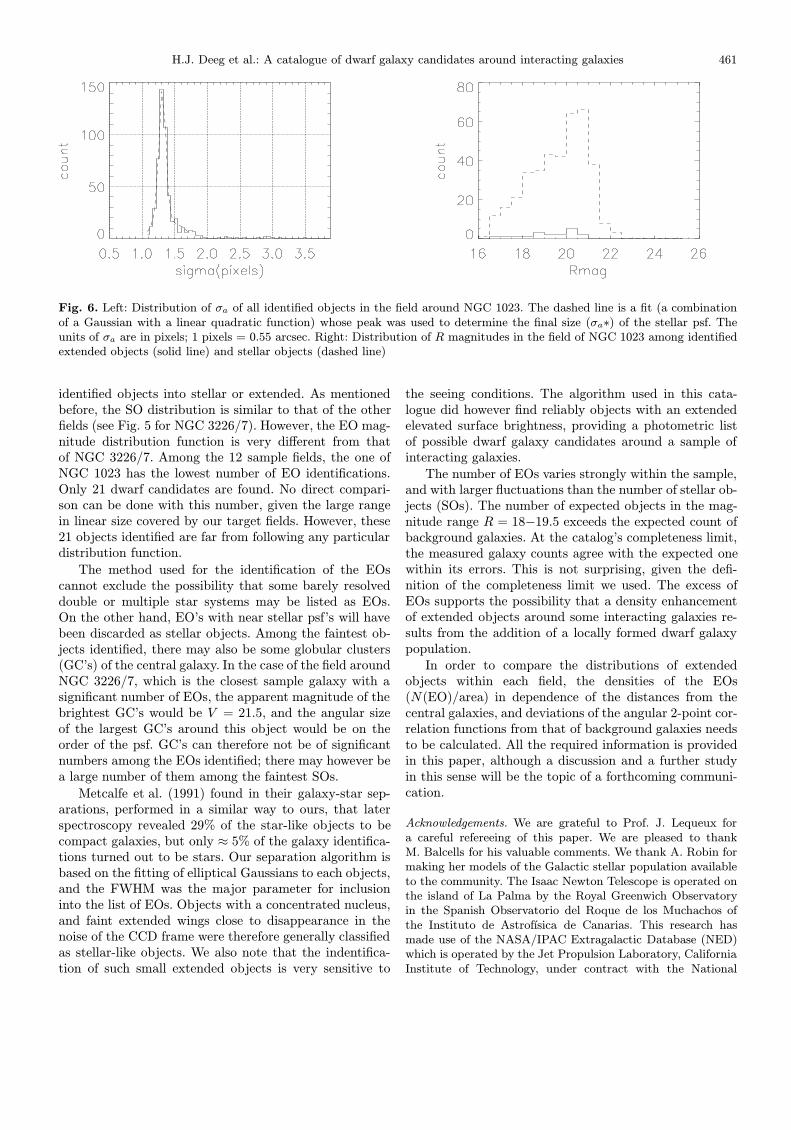
For each field we have derived the magnitude distri-bution of the EOs so as to determine the magnitude upto which the search can be considered complete. To giveanother example of a sample field, in Fig. 6 the sizes andmagnitudes of SOs and EOs around NGC 1023 are shown.The maximum in the size distribution is used to classify all
H.J. Deeg et al.: A catalogue of dwarf galaxy candidates around interacting galaxies 461
Fig. 6. Left: Distribution of σa of all identified objects in the field around NGC 1023. The dashed line is a fit (a combinationof a Gaussian with a linear quadratic function) whose peak was used to determine the final size (σa∗) of the stellar psf. Theunits of σa are in pixels; 1 pixels = 0.55 arcsec. Right: Distribution of R magnitudes in the field of NGC 1023 among identifiedextended objects (solid line) and stellar objects (dashed line)
identified objects into stellar or extended. As mentionedbefore, the SO distribution is similar to that of the otherfields (see Fig. 5 for NGC 3226/7). However, the EO mag-nitude distribution function is very different from thatof NGC 3226/7. Among the 12 sample fields, the one ofNGC 1023 has the lowest number of EO identifications.Only 21 dwarf candidates are found. No direct compari-son can be done with this number, given the large rangein linear size covered by our target fields. However, these21 objects identified are far from following any particulardistribution function.
The method used for the identification of the EOscannot exclude the possibility that some barely resolveddouble or multiple star systems may be listed as EOs.On the other hand, EO’s with near stellar psf’s will havebeen discarded as stellar objects. Among the faintest ob-jects identified, there may also be some globular clusters(GC’s) of the central galaxy. In the case of the field aroundNGC 3226/7, which is the closest sample galaxy with asignificant number of EOs, the apparent magnitude of thebrightest GC’s would be V = 21.5, and the angular sizeof the largest GC’s around this object would be on theorder of the psf. GC’s can therefore not be of significantnumbers among the EOs identified; there may however bea large number of them among the faintest SOs.
Metcalfe et al. (1991) found in their galaxy-star sep-arations, performed in a similar way to ours, that laterspectroscopy revealed 29% of the star-like objects to becompact galaxies, but only ≈ 5% of the galaxy identifica-tions turned out to be stars. Our separation algorithm isbased on the fitting of elliptical Gaussians to each objects,and the FWHM was the major parameter for inclusioninto the list of EOs. Objects with a concentrated nucleus,and faint extended wings close to disappearance in thenoise of the CCD frame were therefore generally classifiedas stellar-like objects. We also note that the indentifica-tion of such small extended objects is very sensitive to
the seeing conditions. The algorithm used in this cata-logue did however find reliably objects with an extendedelevated surface brightness, providing a photometric listof possible dwarf galaxy candidates around a sample ofinteracting galaxies.
The number of EOs varies strongly within the sample,and with larger fluctuations than the number of stellar ob-jects (SOs). The number of expected objects in the mag-nitude range R = 18−19.5 exceeds the expected count ofbackground galaxies. At the catalog’s completeness limit,the measured galaxy counts agree with the expected onewithin its errors. This is not surprising, given the defi-nition of the completeness limit we used. The excess ofEOs supports the possibility that a density enhancementof extended objects around some interacting galaxies re-sults from the addition of a locally formed dwarf galaxypopulation.
In order to compare the distributions of extendedobjects within each field, the densities of the EOs(N(EO)/area) in dependence of the distances from thecentral galaxies, and deviations of the angular 2-point cor-relation functions from that of background galaxies needsto be calculated. All the required information is providedin this paper, although a discussion and a further studyin this sense will be the topic of a forthcoming communi-cation.
Acknowledgements. We are grateful to Prof. J. Lequeux fora careful refereeing of this paper. We are pleased to thankM. Balcells for his valuable comments. We thank A. Robin formaking her models of the Galactic stellar population availableto the community. The Isaac Newton Telescope is operated onthe island of La Palma by the Royal Greenwich Observatoryin the Spanish Observatorio del Roque de los Muchachos ofthe Instituto de Astrofısica de Canarias. This research hasmade use of the NASA/IPAC Extragalactic Database (NED)which is operated by the Jet Propulsion Laboratory, CaliforniaInstitute of Technology, under contract with the National
462 H.J. Deeg et al.: A catalogue of dwarf galaxy candidates around interacting galaxies
Aeronautic and Space Administration. This work has been par-tially supported by the Spanish DGICYT (Direccion Generalde Investigacion Cientifıca y Tecnica) Grant No. PB94-1106. HJD acknowledges a fellowship (Programa Nacionalde Formacion de Personal Investigador) from the Ministeriode Educacion y Cultura of Spain. GTT gratefully acknowl-edges the BBV foundation for a visiting professorship at theUniversity of Cambridge
References
Arp H., 1966, ApJS 14, 1Barnes J.E., 1994, in: “The Formation and Evolution
of Galaxies”, Munoz-Tunon C. & Sanchez F. (eds.).Cambridge University Press, p. 399
Bienayme O., Robin A.C., Creze M., 1987, A&A 180, 94Condon J.J., Huang Z.P., Yin Q.F, Thuan T.X., 1991, ApJ
378, 65Duc P.A., Mirabel I.F., 1994, A&A 289, 83Elmegreen B.G., Kaufman M., Thomasson M., 1993, ApJ 412,
90Hickson P., 1982, ApJ 255, 382Hunsberger S.D., Charlton J.C., Zaritsky D., 1996, ApJ 462,
50
Landolt A.U., 1992, AJ 104, 340Metcalfe N., Shanks T., Fong R., Jones L.R., 1991, MNRAS
249, 498Mirabel F., 1992, in Star Formation in Stellar Systems,
Tenorio-Tagle G., Prieto M. and Sanchez F. (eds.).Cambridge University Press, p. 479
Mirabel I.F., Dottori H., Lutz D., 1992, A&A 256, L19Robin A.C., Haywood M., Creze M., Ojha D.K., Bienayme O.,
1996, A&A 305, 125Roche N., Shanks S., Metcalfe N., Fong F., 1993, MNRAS 263,
360Sanders D.B, Soifer B.T., Elias J.H., Madore B.F, Matthews
K., Neugebauer G., Scoville N.Z., 1988, ApJ 325, 74Sanders D.B., Mirabel I.F., 1996, ARA&A 34, 749Soifer B.T., Boehmer L., Neugebauer G., Sanders D.B., 1989,
AJ 98, 766Stetson P.B., 1987, PASP 99, 191Stetson P.B., Davies L.E., 1992, “A User’s Guide to Stellar
CCD Photometry”, NOAO, TucsonZwicky F., 1956, Ergebnisse der exakten Naturwissenschaften,
29, 34


