Embed Size (px)
Citation preview
1
REPORT ON
A Baseline Survey for Progressing the Retail Sector by Improving Decent Employment (PRIDE)
DECEMBER 2020
2
Contact Information
Rubaiyath Sarwar
Managing Director
Email: [email protected]
Innovision Consulting Private Limited
House 26 (Level 3 & 4), Road 6, Block J
Pragati Sarani, Baridhara, Dhaka - 1212
E-mail: [email protected]
Website: www. Innovision-bd.com
A Baseline Survey for Progressing the Retail sector by
Improving Decent Employment (PRIDE)
Study Team
Team Leader
Md. Rubaiyath Sarwar
HR & Skill Development Expert
Parveen S Huda
Skills and Disability Inclusion Expert
Albert Mollah
Senior Research Associate
Ittiba Bin Azha
Research Associate
Tanuva Aumia Khundkar
Statistical Expert & Analyst
Fahim S Chowdhury
Field Manager
Aftab Uddin
1
Acknowledgement
Innovision Consulting expresses gratitude to BRAC, for awarding this assignment and for trusting on
the capacity to undertake this Baseline Survey on Progressing the Retail sector by Improving Decent
Employment (PRIDE).
We specially thank Mr. Mohammad Sadique Hasan, Programme Manager, Skills Development
Program, Mr. Debangshu Kumar Ghosh, Operations Manager, and Mr. Md. Akhter Hossain, Technical
Manager, Skills Development Programme for explaining the contexts and purpose of the assignment,
and their technical direction on designing the methodology and field plan and for coordination and
management support.
The study team would also like express gratitude to Ms. Ferdousi Fatema, Deputy Manager, Monitoring
Evaluation & Learning, and Ms Nasifa Sefat Sultan, Knowledge Management and Communications
Specialist for their support in overall coordination and management, and providing feedback on this
assignment.
We finally acknowledge the wholehearted support rendered by the respondents of the survey, key-
informants despite restrictions in this Covid-19 pandemic situation. Without their time and cooperation,
the survey would not be complete and evidential. Their contribution helped us to undertake an
informative and rigorous study, which we believe will help support the project to reach to the intended
outcome.
2
Acronym
BDT Bangladesh Taka
POS Point of Sale
HSC Higher Secondary School Certificate
PWD People with Disability
NGO Non-Government Organizations
ILO The International Labour Organisation
CCTV Closed-circuit television
COVID 19 Coronavirus disease of 2019
SSC Secondary School Certificate
HR Human Resources
MD Managing Director
IDLC Industrial Development Leasing Company of Bangladesh Limited
USD United States Dollar
SSG Super Star Group
RMG Readymade garments
IDI In depth interview
IT Information technology
CSR Corporate Social Responsibility
NSDA National Skills Development Authority
ISC Industry Skills Council
BSOA Bangladesh Supermarket Owners Association
BWCCI Bangladesh Women Chamber of Commerce and Industry
SDP Skills Development Program
PPE Personal Protective Gear
SOP Standard Operating Procedure
GDP Gross Domestic Product
3
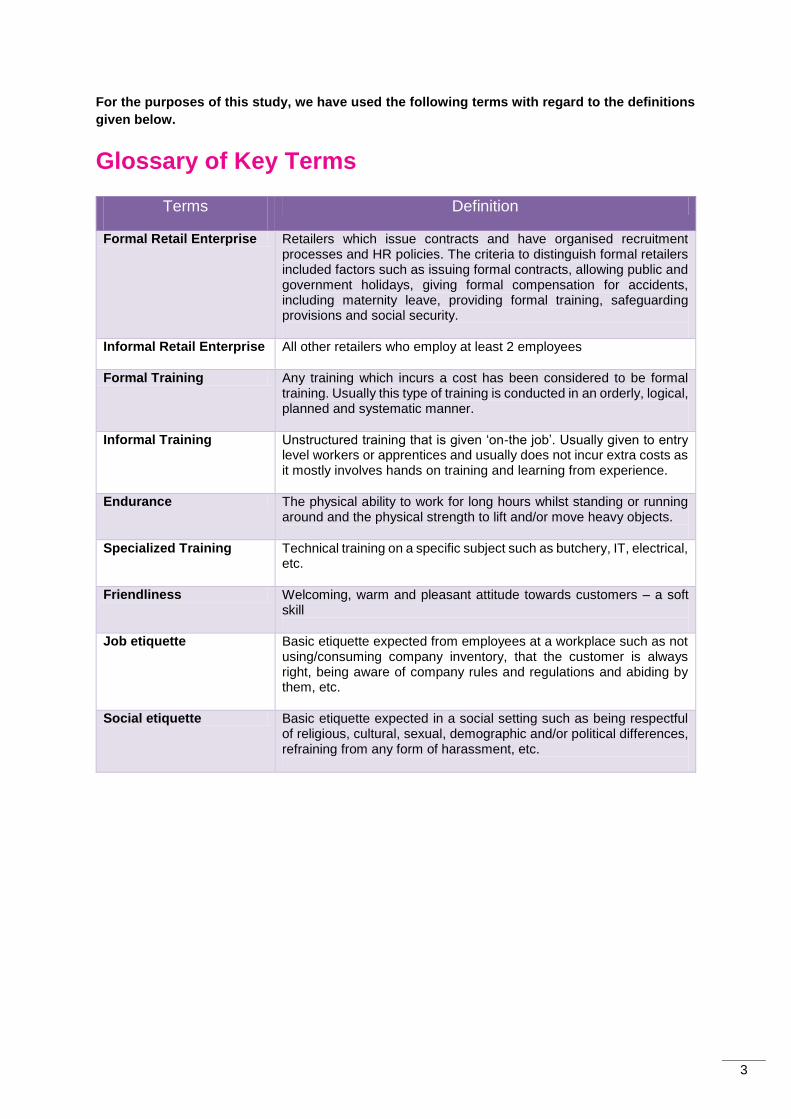
For the purposes of this study, we have used the following terms with regard to the definitions
given below.
Glossary of Key Terms
Terms
Definition
Formal Retail Enterprise Retailers which issue contracts and have organised recruitment processes and HR policies. The criteria to distinguish formal retailers included factors such as issuing formal contracts, allowing public and government holidays, giving formal compensation for accidents, including maternity leave, providing formal training, safeguarding provisions and social security.
Informal Retail Enterprise All other retailers who employ at least 2 employees
Formal Training Any training which incurs a cost has been considered to be formal training. Usually this type of training is conducted in an orderly, logical, planned and systematic manner.
Informal Training Unstructured training that is given ‘on-the job’. Usually given to entry level workers or apprentices and usually does not incur extra costs as it mostly involves hands on training and learning from experience.
Endurance The physical ability to work for long hours whilst standing or running around and the physical strength to lift and/or move heavy objects.
Specialized Training Technical training on a specific subject such as butchery, IT, electrical, etc.
Friendliness Welcoming, warm and pleasant attitude towards customers – a soft skill
Job etiquette Basic etiquette expected from employees at a workplace such as not using/consuming company inventory, that the customer is always right, being aware of company rules and regulations and abiding by them, etc.
Social etiquette Basic etiquette expected in a social setting such as being respectful of religious, cultural, sexual, demographic and/or political differences, refraining from any form of harassment, etc.
4
Executive Summary
Background and objective: This study was undertaken for the ‘Progressing the Retail sector by
Improving Decent Employment (PRIDE)’, a project to create a training model that can foster sustainable
livelihoods for urban youths in Bangladesh from the lower economic strata and other disadvantaged
groups in partnership with the retail sector and the Government of Bangladesh. The findings of this
study will enable the project to gather the necessary data to pilot the project. Therefore, this study was
undertaken to achieve the following key objectives:
Methodology: Four zones, Dhaka, Chattogram, Khulna and Sylhet were selected within the scope of
this study for the survey. Additionally, Gazipur district was also included in the Dhaka zone. At the
beginning of the data collection, the study team conducted 35 in-depth interviews (IDIs) with key retail
companies, early adopters and trade associations to gather information regarding the landscape and
employment practices of retail enterprises. The data from the IDIs was used to select the potential retail
industries and employers, and to develop the research tools according to the study’s objectives. The
findings presented in this report reflect the insights from a quantitative study of 720 employers, and a
qualitative study of 48 employees, from six retail industries, which was selected purposively by the study
team, in consultation with BRAC. The industries are:
1. Clothing and footwear 2. Supermarkets, hypermarkets, groceries and convenience stores 3. Electrical and electronics 4. Food products (Sweet, Confectionery, Bakery) 5. Mobile phone and mobile accessories 6. Furniture and furnishing
Retail stores with multiple outlets were purposefully selected as samples as they would require more
manpower, and have more possibility of having formal HR policies such as training, decent work
practices and benefits. The qualitative survey of employees purposively sampled employees only
working in entry or semi-midlevel positions. Moreover, women, people with disabilities and transgender
employees were also purposefully interviewed wherever possible.
Outline the landscape of the retail sector 1
2 Identify daily activities and job description in retail sector
3 Identify the eligibility criteria to get a job in the retail sector
4 Establish a baseline of the existing decent work practices employers in the
retail sector currently follow
5 List down the name and number of employers in retail willing to recruit trained youth, and people with disability, female and transgender.
6 List down the name and number of employers providing in-house formal
training.
7 List down the name and number of employers willing to share training
costs, especially retail sales
5
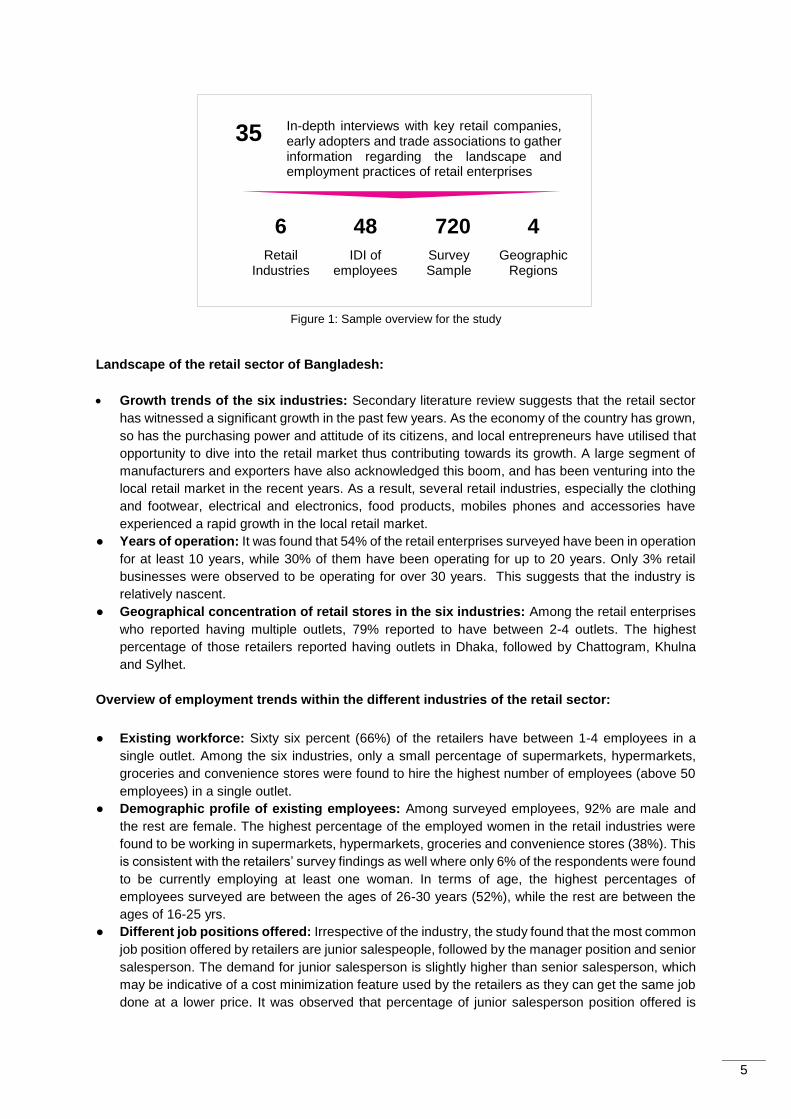
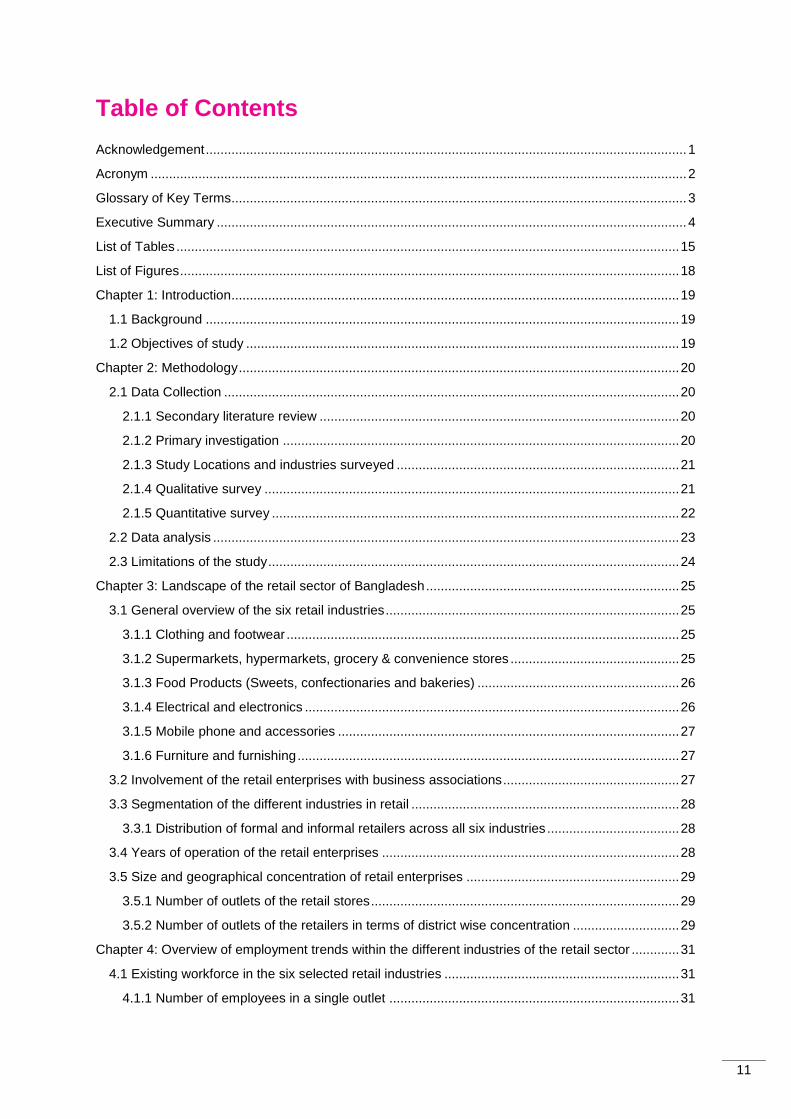
Figure 1: Sample overview for the study
Landscape of the retail sector of Bangladesh:
Growth trends of the six industries: Secondary literature review suggests that the retail sector
has witnessed a significant growth in the past few years. As the economy of the country has grown,
so has the purchasing power and attitude of its citizens, and local entrepreneurs have utilised that
opportunity to dive into the retail market thus contributing towards its growth. A large segment of
manufacturers and exporters have also acknowledged this boom, and has been venturing into the
local retail market in the recent years. As a result, several retail industries, especially the clothing
and footwear, electrical and electronics, food products, mobiles phones and accessories have
experienced a rapid growth in the local retail market.
● Years of operation: It was found that 54% of the retail enterprises surveyed have been in operation
for at least 10 years, while 30% of them have been operating for up to 20 years. Only 3% retail
businesses were observed to be operating for over 30 years. This suggests that the industry is
relatively nascent.
● Geographical concentration of retail stores in the six industries: Among the retail enterprises
who reported having multiple outlets, 79% reported to have between 2-4 outlets. The highest
percentage of those retailers reported having outlets in Dhaka, followed by Chattogram, Khulna
and Sylhet.
Overview of employment trends within the different industries of the retail sector:
● Existing workforce: Sixty six percent (66%) of the retailers have between 1-4 employees in a
single outlet. Among the six industries, only a small percentage of supermarkets, hypermarkets,
groceries and convenience stores were found to hire the highest number of employees (above 50
employees) in a single outlet.
● Demographic profile of existing employees: Among surveyed employees, 92% are male and
the rest are female. The highest percentage of the employed women in the retail industries were
found to be working in supermarkets, hypermarkets, groceries and convenience stores (38%). This
is consistent with the retailers’ survey findings as well where only 6% of the respondents were found
to be currently employing at least one woman. In terms of age, the highest percentages of
employees surveyed are between the ages of 26-30 years (52%), while the rest are between the
ages of 16-25 yrs.
● Different job positions offered: Irrespective of the industry, the study found that the most common
job position offered by retailers are junior salespeople, followed by the manager position and senior
salesperson. The demand for junior salesperson is slightly higher than senior salesperson, which
may be indicative of a cost minimization feature used by the retailers as they can get the same job
done at a lower price. It was observed that percentage of junior salesperson position offered is
35 In-depth interviews with key retail companies, early adopters and trade associations to gather information regarding the landscape and employment practices of retail enterprises
IDI of employees
48
Survey Sample
720
Retail Industries
6
Geographic Regions
4
6
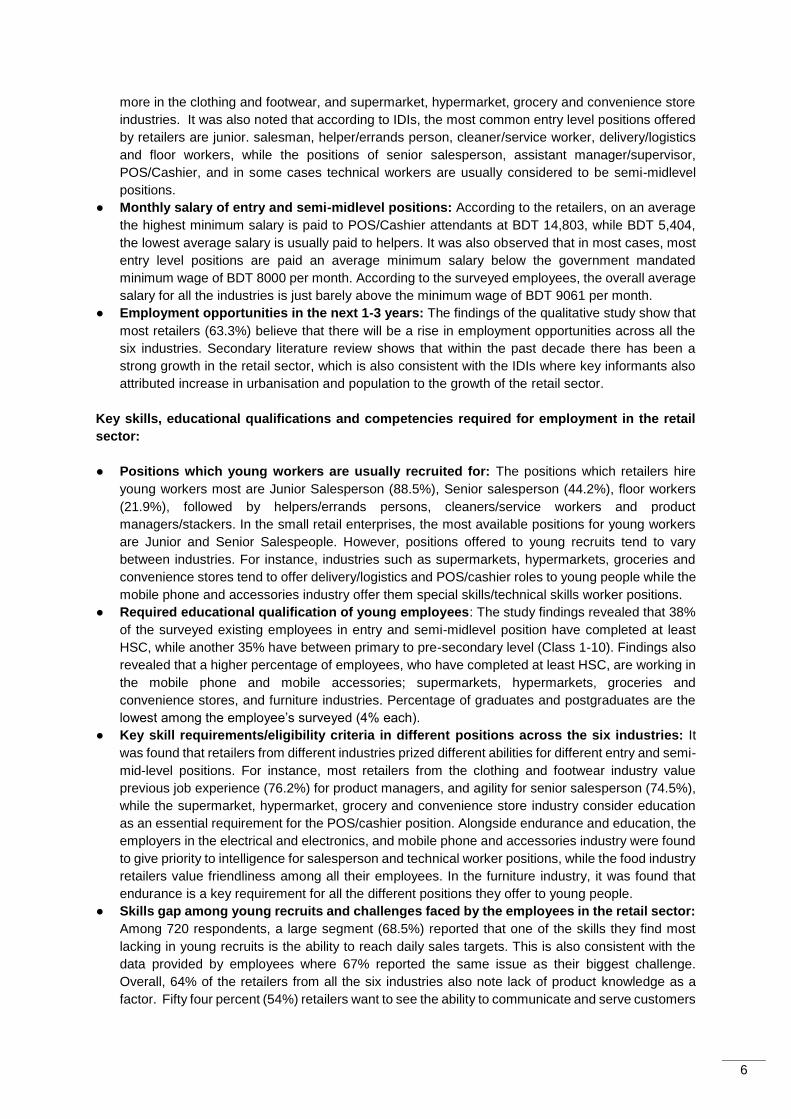
more in the clothing and footwear, and supermarket, hypermarket, grocery and convenience store
industries. It was also noted that according to IDIs, the most common entry level positions offered
by retailers are junior. salesman, helper/errands person, cleaner/service worker, delivery/logistics
and floor workers, while the positions of senior salesperson, assistant manager/supervisor,
POS/Cashier, and in some cases technical workers are usually considered to be semi-midlevel
positions.
● Monthly salary of entry and semi-midlevel positions: According to the retailers, on an average
the highest minimum salary is paid to POS/Cashier attendants at BDT 14,803, while BDT 5,404,
the lowest average salary is usually paid to helpers. It was also observed that in most cases, most
entry level positions are paid an average minimum salary below the government mandated
minimum wage of BDT 8000 per month. According to the surveyed employees, the overall average
salary for all the industries is just barely above the minimum wage of BDT 9061 per month.
● Employment opportunities in the next 1-3 years: The findings of the qualitative study show that
most retailers (63.3%) believe that there will be a rise in employment opportunities across all the
six industries. Secondary literature review shows that within the past decade there has been a
strong growth in the retail sector, which is also consistent with the IDIs where key informants also
attributed increase in urbanisation and population to the growth of the retail sector.
Key skills, educational qualifications and competencies required for employment in the retail
sector:
● Positions which young workers are usually recruited for: The positions which retailers hire
young workers most are Junior Salesperson (88.5%), Senior salesperson (44.2%), floor workers
(21.9%), followed by helpers/errands persons, cleaners/service workers and product
managers/stackers. In the small retail enterprises, the most available positions for young workers
are Junior and Senior Salespeople. However, positions offered to young recruits tend to vary
between industries. For instance, industries such as supermarkets, hypermarkets, groceries and
convenience stores tend to offer delivery/logistics and POS/cashier roles to young people while the
mobile phone and accessories industry offer them special skills/technical skills worker positions.
● Required educational qualification of young employees: The study findings revealed that 38%
of the surveyed existing employees in entry and semi-midlevel position have completed at least
HSC, while another 35% have between primary to pre-secondary level (Class 1-10). Findings also
revealed that a higher percentage of employees, who have completed at least HSC, are working in
the mobile phone and mobile accessories; supermarkets, hypermarkets, groceries and
convenience stores, and furniture industries. Percentage of graduates and postgraduates are the
lowest among the employee’s surveyed (4% each).
● Key skill requirements/eligibility criteria in different positions across the six industries: It
was found that retailers from different industries prized different abilities for different entry and semi-
mid-level positions. For instance, most retailers from the clothing and footwear industry value
previous job experience (76.2%) for product managers, and agility for senior salesperson (74.5%),
while the supermarket, hypermarket, grocery and convenience store industry consider education
as an essential requirement for the POS/cashier position. Alongside endurance and education, the
employers in the electrical and electronics, and mobile phone and accessories industry were found
to give priority to intelligence for salesperson and technical worker positions, while the food industry
retailers value friendliness among all their employees. In the furniture industry, it was found that
endurance is a key requirement for all the different positions they offer to young people.
● Skills gap among young recruits and challenges faced by the employees in the retail sector:
Among 720 respondents, a large segment (68.5%) reported that one of the skills they find most
lacking in young recruits is the ability to reach daily sales targets. This is also consistent with the
data provided by employees where 67% reported the same issue as their biggest challenge.
Overall, 64% of the retailers from all the six industries also note lack of product knowledge as a
factor. Fifty four percent (54%) retailers want to see the ability to communicate and serve customers
7
well among potential young recruits. Of the employees, 50% also reported difficulty in
communicating with customers as a challenge, which further validates the demand for improved
communication by employers. Also, a considerable portion of the respondents reported that they
look for efficiency and dedication in young workers (51.5%). Only a small percentage of employers
reported that technical skills or specialized skills are lacking among the young workers (6.4%).
Willingness of employers to recruit trained youth, people with disabilities, women and
transgender in the retail sector:
● Willingness to recruit skilled youth or graduates: Over 90% respondents reported preference
towards recruiting skilled labour. Among those retailers who preferred to recruit skilled labour and/or
graduates, 83.2% said that it was because skilled workers achieve their set targets more efficiently,
while 54.1% said that they prefer it as there is no need to train them further. On the other hand, out
of the retailers who did not prefer to recruit skilled labour/ graduates, more than 90% of them said
it is because the kind of work performed does not require skilled worker or graduates.
● Willingness to recruit women: Only six (6%) of the surveyed retailers were found to have at least
one female employee. Among those retailers, it was found that clothing and footwear, and
supermarket, hypermarket, groceries and convenience store retailers tend to hire more women on
an average (about 2 and 8 women respectively) compared to the rest of the industries. Sixty-nine
(69%) retailers said they are unwilling to hire women because of safety and security issues. Another
significant percentage (57%) said that their unwillingness is due to their perception that women
have limited capacity to endure physical strain. Fifty one percent (51%) retailers from the electrical
and electronics industry, and 60% from the food industry reported that they would hire women if
they possessed valuable skills needed for the job.
● Willingness to recruit people with disability: Only 2% of the respondents reported hiring people
with disabilities, and only retailers from food products and supermarkets, hypermarkets, groceries
and convenience store industry were found to employ them. The surveyed retailers who employ
people with disabilities mostly placed them in sales positions. Among the retailers who did not hire
people with disabilities, the highest percentage (69.3%) said they did not because the nature of
their business requires varied physical abilities such as mobility and endurance. Most retailers
(52%) reported that their willingness to hire people with disabilities will increase if an incentive from
the government is provided for retailers who fill a disability quota.
● Willingness to recruit transgender: The qualitative interviews with early adopters and prominent
members from the transgender community gave insight to some issues regarding the challenges
of the people from the transgender community which includes lack of designated toilet space,
harassment from co-workers and reluctance of employers to place transgender people in customer
centric positions. Most of the respondents (78.3%) of this study said the reason for not wanting to
recruit transgender is because they felt that customers will be uncomfortable or unaccepting.
Findings revealed that the willingness of employers to recruit people from the transgender
community seems to depend on the social acceptability of having a transgender employee as the
data shows that some retailers said they would be willing to hire transgender if everyone else was
doing it too.
● Facilities provided for people with disabilities, women and transgender communities by
employers in the retail sector: Findings showed that none of the retailers who reported to have
people with disabilities as employees provide accessible communication or assistive technology
such as braille, screens magnifier, sign language support, etc. to their employees with disabilities,
and only 4% of them provide wheelchair ramps. Of all the retailers, 94% respondents do not have
separate and/accessible bathrooms for women, persons with disabilities or transgender workers.
Moreover, among the 53 respondents who had recruited women and people with disabilities, 68%
of those retailers do not provide sensitization training. Those who do not provide it said that they
would consider if the cost was borne by a third party, or if it was not too high.
8
Employers who provide formal training and retail enterprises willing bear training costs:
● In-house training provided by employers: Retailers who provide in-house training are higher in
number in the electrical and electronics, mobile phones and accessories, and furniture and
furnishing industries (between 40-45%). The type of training most given by retailers is informal
(71.1%). Most retailers stated sales strategy as the type of training offered, followed by customer
management (71.5%) and inventory arrangement (69%). The trend of giving sales strategy training
to employees is highest among food product retailers than others (88.9%). Product knowledge
training (70.2%) is prioritized more by clothing and footwear stores, while supermarkets,
hypermarkets, groceries and convenience stores were observed to provide customer management
training (78.3%) more than any other training.
● Advantages and disadvantages of arranging training: Retailers who provide in-house training
to their employees reported to believe that these trainings improve product knowledge (82.6%),
help their employees understand sales strategies better (62.1%) and achieve their targets better
(51.9%). However, out of the retailers who do not provide any sort of training, more than half
(57.1%) believe that the type of work does not require any training.
● Financial sustainability and scalability of training programs: All respondents who said that the
training they provided incur a cost, reported that it was funded by themselves. These retailers are
also considered as those who provide formal training as qualitative findings revealed that informal
training did not incur any costs. Among the retailers who provide training, 82.6% said that their
training programs are scalable.
● Willingness of the employers to arrange and share the cost of training in future: About 44.3%
of employers who do not provide training for their employees, said that they would not be willing to
arrange or pay for training in the future because trained workers tend to seek better opportunities
or ask for raises. Thirty-three percent (33%) said that they would consider providing training but
only if the cost is shared with an NGO or the government.
Baseline of existing decent work practices followed by employers in the retail sector:
● Safeguarding policies and safe work environment: It was found that the highest percentage of
retailers (93%) providing safety training and/or safety gears to their employees is in Sylhet, followed
by 82% retailers in Chattogram. Forty seven percent (47%) of the surveyed retailers said that they
provide formal compensation for their employees in the event of an accident. About 27% retailers
from both the furniture and mobile phone and accessories industries were found to offer no
compensation in the event of an accident. In the case of policies protecting employees from sexual
harassment, it was found that, more than 50% retailers from all the six industries of retail reported
having such policies in place.
● Employee and workers representation and rights at work: The study found that 82% retailers
do not issue any formal job contracts for their employees. Out of the retailers who reported that they
ensure acceptable behaviour towards employees, most reported that they do so by maintaining
zero tolerance policy of verbal/physical abuse towards employees. On the other hand, 71.6% of
the retailers reported that they provide job etiquette training to implement acceptable behaviour,
while 59.6% reported that they ensure it through constant supervision.
● Equal opportunity and treatment in work: Only 30% of the retailers surveyed from all six
industries reported having policies that include provisions on gender equality. Of all the retailers
surveyed, 97% reported that their job circular does not encourage women, transgender people, or
people with disabilities. Only 3% retailers encourage the job applications from women, where the
tendency was higher among clothing and footwear, and supermarket, hypermarket, groceries and
convenience retail stores, and only 3% of retailers from the supermarket, hypermarket, grocery and
convenience store industry encourage job applications of people with disabilities.
9
● Decent working hours and conditions, work and life balance, and social security policies:
On an average, working hours for employees working in retail was found to be around 11hrs where
they mostly work in 1 shift. Most retailers reported that their employees have access to adequate
light, fresh drinking water and clean air at the workplace was in Chattogram (98%) and Dhaka
(89%). With regard to policies on inclusive worker’s rights, it was revealed that, about 77.6% of all
the surveyed retailers grant annual leave to their employees, while 55% grant public holidays.
Impact of COVID 19 on the employment sector of the retail industry
● Impact on business operations and disruption in supply chain: Regarding the changes in
their business operation during the lockdown, only 6% reported a reduction in outlets during
that time. Among them, most retailers reported that they had to reduce a single outlet (61%),
and the highest percentage of retail stores that reported downsizing was in Dhaka (7.8%). In
terms of industry, the highest percentage of reduction in operations was found to be in the
clothing and footwear sector. Majority of the respondents (60.4%) reported disruptions in the
supply chain at the beginning which have since returned to normal, while 37.9% reported on-
going disruptions in the supply chain.
● Change in demand of sales due to COVID-19: Among the retailers surveyed, a large
percentage (67.2%) claimed that demand has decreased due to COVID-19, while 30.7%
retailers said that demand had fallen initially but has returned to normal. Clothing and footwear,
electrical and electronics, and the furniture retailers were the ones who are mostly facing
decreased demand, while retailers from the rest of the industries mostly reported that they faced
an initial fall in demand that has picked up since then.
● Impact on employment: Due to the effects of COVID 19, on an average, retailers had to let
go of 6-7 employees. The electrical and electronics industry reported the highest amount of lay-
offs (19). Only 1.4%retailers said that they had to recruit more workers due to Covid-19, mostly
in junior salesperson positions.
● Plan of business expansion during COVID-19: In terms of business expansion plan, a large
segment of the sample (51%) stated that they did not know whether any new outlets will be
established in the next 1-3 years. Furthermore, 29% confirmed that no new outlets will be
launched in the next 1-3 years due to the pandemic. However, 20% of retailers were affirmative
about the possibility of launching new outlets within the next 3 years, in spite of the effects of
the pandemic.
Recommendations and conclusions
For the project to be sustainable, the issues of informal contracts, decent work practices, gender
equality in recruitment and management of the retail space need to be addressed. This would require
long term strategic endeavours, the seed for which can be laid by the pilot project. The project can take
a two staged strategy to have a long-term impact on skills development for the workers and to make
the workplace inclusive for women, people with disabilities and the transgender people.
In stage 1, the project should target providing specialised training to current junior and mid-level sales
employees. These trainings would be male dominated but will allow the project to have an entry. This
can be completed within 6 months of the pilot. Stage 1 should involve two types of trainings- (i) trainings
directly offered by the programme to willing employers and (ii) trainings offered by the programme
through partner associations. As such the project is advised to:
Target participants selectively to achieve productive results: It is advisable that the project first
targets and engages with retailers who are already providing in house training to their employees.
Moreover, given that the sales work is the most demanded type of job in the retail sector, findings
show that the programme will have more scalable results if it targets sales representatives at the
entry and mid-level positions.
10
Focus on developing sales-specific soft skills and having a mixed training curriculum: Being
the most universal indicator for measuring performance of the retail workforce, ability to achieve
sales target is recommended to be a part of any training on skills development. Soft skills training
on customer relationship, communications, agility, learning aptitude would have the highest impact
as this would also allow the workers to shift between different industries. The findings of the study
suggest that a mix of classroom-based training over the weekend, followed up by on-the-job
practical test and training will benefit the project.
Develop a training service delivery channel for scalable impact: For industries that have
organized associations, the project can leverage them as partners to deliver the training exclusively
to the members of the association. For the other industries, the project can first organize a training
on its own and then use it as an evidence to gather buy in of the associations to organize the follow-
up rounds.
In stage 2, it is recommended that the project utilises their experience with the employers who
participated in the first stage of the programme and plot the results to develop strong case studies on
the impact of the training on retail sales, employee satisfaction and attrition rate, which can then be
used to engage the second batch of employers who are currently not engaged in providing training
services. It is also advisable that the project organizes a residential orientation session for the
employers which will incentivize their participation in the programme activities. In this stage the project
should also engage some of the early adopters and work with them to develop HR policies that can
address the issues of recruitment of women, people with disabilities and the transgender people. HR
policies designed should also allow for rewards for loyalty as the employers are apprehensive that the
trained workers will leave after the training. The programme should also invest in a customer centric
promotion campaigns as positive response from the customers for recruitment of women, people with
disabilities and the transgender people will reinforce the employer’s incentive to sustain recruitment of
the marginalized communities in the retail workforce.
Building on the evidence from stage 2, the project should then scale the operations to involve more
employers from the different industries who can then be involved into two separate programmes- light
touch (stage 1) and long term (stage 2).
Advocacy with the government for policies that enable recruitment of women, people with
disabilities and the transgender people: As findings show that the employers will react positively to
a government mandate requiring retail enterprises to maintain a quota of employees from marginalised
communities, government policy can also help make the project’s impact more sustainable and
scalable. In this regard, the findings from the project can be used to create a national programme
anchored to government policies that aim for inclusive retail industry in Bangladesh.
11
Table of Contents
Acknowledgement ................................................................................................................................... 1
Acronym .................................................................................................................................................. 2
Glossary of Key Terms ............................................................................................................................ 3
Executive Summary ................................................................................................................................ 4
List of Tables ......................................................................................................................................... 15
List of Figures ........................................................................................................................................ 18
Chapter 1: Introduction .......................................................................................................................... 19
1.1 Background ................................................................................................................................. 19
1.2 Objectives of study ...................................................................................................................... 19
Chapter 2: Methodology ........................................................................................................................ 20
2.1 Data Collection ............................................................................................................................ 20
2.1.1 Secondary literature review .................................................................................................. 20
2.1.2 Primary investigation ............................................................................................................ 20
2.1.3 Study Locations and industries surveyed ............................................................................. 21
2.1.4 Qualitative survey ................................................................................................................. 21
2.1.5 Quantitative survey ............................................................................................................... 22
2.2 Data analysis ............................................................................................................................... 23
2.3 Limitations of the study ................................................................................................................ 24
Chapter 3: Landscape of the retail sector of Bangladesh ..................................................................... 25
3.1 General overview of the six retail industries ................................................................................ 25
3.1.1 Clothing and footwear ........................................................................................................... 25
3.1.2 Supermarkets, hypermarkets, grocery & convenience stores .............................................. 25
3.1.3 Food Products (Sweets, confectionaries and bakeries) ....................................................... 26
3.1.4 Electrical and electronics ...................................................................................................... 26
3.1.5 Mobile phone and accessories ............................................................................................. 27
3.1.6 Furniture and furnishing ........................................................................................................ 27
3.2 Involvement of the retail enterprises with business associations ................................................ 27
3.3 Segmentation of the different industries in retail ......................................................................... 28
3.3.1 Distribution of formal and informal retailers across all six industries .................................... 28
3.4 Years of operation of the retail enterprises ................................................................................. 28
3.5 Size and geographical concentration of retail enterprises .......................................................... 29
3.5.1 Number of outlets of the retail stores .................................................................................... 29
3.5.2 Number of outlets of the retailers in terms of district wise concentration ............................. 29
Chapter 4: Overview of employment trends within the different industries of the retail sector ............. 31
4.1 Existing workforce in the six selected retail industries ................................................................ 31
4.1.1 Number of employees in a single outlet ............................................................................... 31
12
4.1.2 Number of employees combining all outlets ......................................................................... 31
4.2 Demographic profile of the existing employees in the selected retail industries ......................... 32
4.2.1 Gender .................................................................................................................................. 32
4.2.2 Age ........................................................................................................................................ 32
4.3 Different job positions offered in the six different industries surveyed ........................................ 33
4.4 Monthly Salary ............................................................................................................................. 34
4.4.1 Average minimum salary of the employees as per their positions in the retail sector .......... 34
4.5 Employment opportunities in the next 1-3 years in the surveyed retail industries ...................... 35
Chapter 5: Key skills, educational qualifications and competencies required for employment in the retail
sector ..................................................................................................................................................... 37
5.1 Positions which young workers are usually recruited for ............................................................ 37
5.2 Required educational qualification of young employees for retail jobs ....................................... 38
5.3 Key skill requirements/eligibility criteria in different positions across the six industries .............. 39
5.3.1 Clothing and footwear industry ............................................................................................. 39
5.3.2 Supermarkets, hypermarkets, Groceries and convenience stores industry ......................... 39
5.3.3 Electrical and electronics industry ........................................................................................ 40
5.3.4 Food products (Sweet, Confectionery, Bakery) industry ...................................................... 40
5.3.5 Mobile phone and mobile accessories industry .................................................................... 41
5.3.6 Furniture and furnishing industry .......................................................................................... 42
5.4 Skills that employers seek but are unable to find among the recruits ......................................... 42
5.5 Challenges faced by the employees in the retail sector .............................................................. 43
Chapter 6: Willingness of employers to recruit trained youth, people with disabilities, women and
transgender in the retail sector ............................................................................................................. 45
6.1 Willingness of employers to recruit skilled youth or graduates ................................................... 45
6.1.1 Reason to prefer skilled /trained graduates .......................................................................... 45
6.1.2 Cost associated with hiring trained labour/graduates ........................................................... 47
6.2 Willingness of employers to recruit women ................................................................................. 48
6.2.1 Baseline status of recruitment of women .............................................................................. 48
6.2.2 Reasons for unwillingness to hire women ............................................................................ 48
6.2.3 Factors contributing to encourage future recruitment of women by the employers in the retail
sector ............................................................................................................................................. 49
6.3 Willingness of employers to recruit people with disabilities......................................................... 50
6.3.1 Baseline status of recruitment of people with disabilities ..................................................... 50
6.3.2 Reasons for unwillingness of the employers to recruit people with disabilities .................... 52
6.3.3 Factors contributing to encourage future recruitment of people with disabilities by the
employers in the retail sector ......................................................................................................... 53
6.4 Willingness to recruit people from the transgender community in the retail sector by the employers
........................................................................................................................................................... 55
6.4.1 Baseline status of recruitment of transgender employees ................................................... 55
6.4.2 Reasons for unwillingness of the employers to recruit transgender ..................................... 55
13
6.4.3 Factors that might encourage future recruitment of transgender community by the employers
in the retail sector ........................................................................................................................... 57
6.5 Status of facilities provided for people with disabilities, women and transgender communities by
employers in the retail sector............................................................................................................. 58
6.5.1 Status of available assistive technology and accessible facilities for people with disability,
women and transgender ................................................................................................................ 58
6.5.2 Sensitization and training provided by employers to employees in the retail sector ............ 59
6.5.3 Specialized orientation training and support provided to the people with disabilities and
transgender employees ................................................................................................................. 59
Chapter 7: Employers who provide formal trainings to their staff and are willing bear training costs .. 61
7.1 Baseline status of training provided by retailers .......................................................................... 61
7.1.1 Type of in-house training provided to the employees ........................................................... 61
7.1.2 Type of employees for whom the employers mostly arranged training for ........................... 62
7.1.3 Different type of training offered by the six industries........................................................... 62
7.1.4 Advantages of arranging/providing training for employees in retail sector ........................... 63
7.1.5 Unwillingness of the retailers for not arranging/providing training to employees ................. 64
7.2. Financial sustainability of trainings ............................................................................................. 65
7.2.1 Existing sources of funding for trainings ............................................................................... 65
7.2.2 Scalability of training programs ............................................................................................. 65
7.2.3 Willingness of the employers to share retail sales training costs ......................................... 66
7.2.4 Factors contributing to influence employers to provide training in future ............................. 67
Chapter 8: Baseline of existing decent work practices followed by employers in the retail sector ....... 68
8.1 Safeguarding policies and safe work environment ...................................................................... 68
8.1.1 Access to safety training/gears ............................................................................................. 68
8.1.2 Risk of accidents in all across six retail industries ................................................................ 69
8.1.3 Compensation provided to employees for accidents ............................................................ 70
8.1.4 Roles in job position requiring extra care or ability ............................................................... 70
8.2 Employee and workers’ representation and rights at work ......................................................... 71
8.2.1 Status of formal job contract of employees with the employers ........................................... 71
8.2.2 Measures of ensuring acceptable behaviour towards employees ........................................ 71
8.2.3 Policies protecting employees from sexual harassment ...................................................... 72
8.3 Equal opportunity and treatment in work ..................................................................................... 72
8.3.1 Provisions on gender equality within company policy .......................................................... 72
8.3.2 Measures of ensuring acceptable behaviour towards customers ........................................ 73
8.4 Decent working hours and conditions, work and life balance, and social security policies ........ 74
8.4.1 Status of operating hours in a day across retail sector......................................................... 74
8.4.2 Access to adequate light, fresh drinking water and clean air ............................................... 75
8.4.3 Policies inclusive of worker’s rights, adequate pay and maintaining work-life balance of
employees ...................................................................................................................................... 75
Chapter 9: Impact of COVID 19 on the employment of the retail sector .............................................. 77
14
9.1 Challenges since the start of the lockdown ................................................................................. 77
9.1.1 Types of challenges for the retail sector due to COVID-19 .................................................. 77
9.2 During and post lockdown scenario of the retail sector due to COVID-19 .................................. 78
9.2.1 Impact on business operations due to COVID-19 ................................................................ 78
9.2.2 Disruption in supply chain due to COVID-19 ........................................................................ 78
9.2.3 Change in demand of sales due to COVID-19 ..................................................................... 79
9.2.4 Change in online sales/ e-commerce due to COVID-19 ...................................................... 80
9.2.5 Impact on employment due to COVID-19 ............................................................................. 81
9.3 Safety measures undertaken by the retailers for their employees during COVID-19 ................. 82
9.4 Business expansion plan despite the effects of COVID-19......................................................... 83
Chapter 10: Recommendation and Conclusion .................................................................................... 84
15
List of Tables
Table 1: Sample distribution of employees for the qualitative survey ................................................... 22 Table 2: Gender distribution of employers surveyed for quantitative survey ........................................ 23 Table 3: Retailers involvement with business associations (Sample size n=30 for each industry in each
location) ................................................................................................................................................. 28 Table 4: Distribution of formal and informal retailers across all six industries (Total sample size n = 720)
.............................................................................................................................................................. 28 Table 5: Years of operation of retailers in retail sector (sample size n= 120 for each industry) ........... 29 Table 6: Percentage of retail stores (Total sample size n=720) ........................................................... 29 Table 7: Classification of retailers in terms of multiple outlets (Sample size n=656) ............................ 29 Table 8: Average number of outlets in each district (Sample size n=656) ........................................... 30 Table 9: Number of employees in a single outlet across all six industries (Total sample size n = 720)
.............................................................................................................................................................. 31 Table 10: Number of employees in all outlets for a retailer (Sample size n = 656) .............................. 31 Table 11: Gender Profile of employees (Total sample size n = 48) ...................................................... 32 Table 12: Age profile of employees (Total sample size n = 48) ............................................................ 32 Table 13: Different job positions offered in the six different industries surveyed (Sample size n =120 for
each industry) ........................................................................................................................................ 33 Table 14: Percentage of employees working in each job position out of total workforce (Sample size n
=120 for each industry) ......................................................................................................................... 34 Table 15: Average Minimum salary for different positions in the six industries according to employers
(BDT/month) .......................................................................................................................................... 35 Table 16: Monthly average salary in six industries according to employees (BDT/month) .................. 35 Table 17: Opportunities for employment in retail in the next 1-3 years (Total sample size n = 720) ... 36 Table 18: Positions which young workers are usually recruited for (Sample size n =120 for each
industry)................................................................................................................................................. 37 Table 19: Level of education of employees in the six different industries (Total sample size n = 48) .. 38 Table 20: Key skills/ requirements sought in young recruits in clothing and footwear retail industry ... 39 Table 21: Key skills/ requirements sought in young recruits in supermarkets, hypermarkets, groceries
retail industry ......................................................................................................................................... 39 Table 22: Key skills/ requirements sought in young recruits in electrical and electronics retails industry
.............................................................................................................................................................. 40 Table 23: Key skills/ requirements sought in young recruits in food products retail industry ............... 41 Table 24: Key skills/ requirements sought in young recruits in mobile phone and mobile accessories
retail industry ......................................................................................................................................... 41 Table 25: Key skills/ requirements sought in young recruits in furniture and furnishing industry ......... 42 Table 26: Skills/abilities sought by employers and found lacking among young workers (Sample size n=
120 for each industry) ........................................................................................................................... 43 Table 27: Challenges faced by the employees while fulfilling jobs in general (Total sample size n = 48)
.............................................................................................................................................................. 44 Table 28: Willingness of employers to recruit skilled labours and young graduates ............................ 45 Table 29: Reasons to prefer skilled labour/trained graduates .............................................................. 45 Table 30: Reasons behind not preferring skilled labour/trained graduates .......................................... 46 Table 31: Cost associated with hiring skilled labour/graduates ............................................................ 47 Table 32: Average cost associated with hiring skilled labour/graduates (BDT/Month) ........................ 47 Table 33: Cost sharing in hiring skilled labour/graduates ..................................................................... 47 Table 34: Average number of women working in retail across the six industries (Total sample size n =
720) ....................................................................................................................................................... 48 Table 35: Reasons for unwillingness to hire women ............................................................................ 48 Table 36: Factors that will make employers willing to hire women in future ......................................... 49 Table 37: Percentage of employers who recruited people with disability (Total sample size n = 720) 50
16
Table 38: Status of current employees with disabilities ........................................................................ 50 Table 39: Positions which people with disabilities were recruited in (Sample size n = 14) .................. 50 Table 40: Types of disability of people with disabilities who were recruited ......................................... 51 Table 41: Causes of turnover of employees with disabilities (Sample size n = 2) ................................ 51 Table 42: Challenges faced in the workplace by people with disabilities ............................................. 52 Table 43: Reasons for unwillingness of employers to hire people with disabilities (Sample size n = 706)
.............................................................................................................................................................. 53 Table 44: Factors that will make employers willing to recruit people with disabilities in future (sample
size n= 720) ........................................................................................................................................... 53 Table 45: Percentage of employees’ comfort level of working alongside people with disabilities ........ 54 Table 46: Reasons why employees are uncomfortable with working alongside people with disabilities
.............................................................................................................................................................. 54 Table 47: Factors that can be improved for people with disabilities in the workplace according to
employees ............................................................................................................................................. 55 Table 48: Percentage of employers who recruited transgender employees (Total sample size n = 720)
.............................................................................................................................................................. 55 Table 49: Reasons for unwillingness of the employers to recruit transgender ..................................... 56 Table 50: Level of comfort among employees regarding working with people from the transgender
community (Total sample size n = 48) .................................................................................................. 56 Table 51: Reasons for discomfort among employees regarding working with people from the
transgender community ......................................................................................................................... 57 Table 52: Future willingness of employers to recruit transgender ........................................................ 57 Table 53: Availability of assistive technology and accessible communication for people with disability
.............................................................................................................................................................. 58 Table 54: Availability of accessible/separate lavatory for people with disabilities and different genders
at the workplace (Total sample size n = 720) ....................................................................................... 58 Table 55: Availability of accessible/separate lodging for people with disability and different genders at
the workplace (Total sample size n = 720) ........................................................................................... 58 Table 56: Availability of wheelchair ramps/lifts at the workplace (Total sample size n = 720) ............. 59 Table 57: Retailers who provide sensitization and training ................................................................... 59 Table 58: Retailers who provide specialized orientation training and support ...................................... 60 Table 59: Factors that would make employers willing to provide sensitization training and orientation for
people with disability and different genders .......................................................................................... 60 Table 60: Percentage of retailers who provide in-house training (Sample size n = 30 for each industry
in each location) .................................................................................................................................... 61 Table 61: Form of in-house training provided by retailers in the six industries ..................................... 62 Table 62: Types of worker receive trainings by retailers ...................................................................... 62 Table 63: Different types of training offered in the six industries of retail ............................................. 63 Table 64: Benefits of arranging/providing trainings for workers............................................................ 63 Table 65: Reasons why employers do not arrange/provide trainings for workers ................................ 64 Table 66: Existing sources of funding for trainings of retail enterprises ............................................... 65 Table 67: Scalability of training programs provided by retailers ........................................................... 66 Table 68: Willingness of employers to bear costs for training .............................................................. 66 Table 69: Factors that could influence employers to provide training for employees in future ............. 67 Table 70: Percentage of retailers who provide safety training and/or gear in the workplace (Sample size
n = 30 for each industry in each location) ............................................................................................. 68 Table 71: Types of safety training/safety gear provided to employees by retailers .............................. 68 Table 72: Safety gear provided by retailers according to employees ................................................... 69 Table 73: Possibility of accidents in the workplace across all six industries (Total sample size n = 720)
.............................................................................................................................................................. 69 Table 74: Types of accidents that is a possibility in all six industries ................................................... 70
17
Table 75: Compensation provided to employees for accidents occurring in the workplace (Total sample
size n = 720) .......................................................................................................................................... 70 Table 76: Percentage of retail enterprises where duties requires extra care or ability (Total sample size
n = 720) ................................................................................................................................................. 71 Table 77: Types of activities in the workplace that involve extra care or ability across all the six industries
.............................................................................................................................................................. 71 Table 78: Employers who issue formal job contracts across all six industries ..................................... 71 Table 79: Measures of ensuring acceptable behaviour towards employees from customers, co-workers
and employer ........................................................................................................................................ 72 Table 80: Percentage of retailers which have policies protecting employees from sexual harassment
(Sample size n = 120 for each industry) ............................................................................................... 72 Table 81: Retail enterprises with provisions on gender equality within company policy (Total sample
size n = 720) .......................................................................................................................................... 73 Table 82: Retail enterprises that encourage job applications from women, people with disabilities, and
transgender workers (Total sample size n = 720) ................................................................................. 73 Table 83: Measures of ensuring acceptable behaviour from employees towards customers, co-workers
and employer ........................................................................................................................................ 73 Table 84: Average operating hours of retailers across six industries (Total sample size n =720) ....... 74 Table 85: Number of works shifts per day in different industries in different locations of the retail sector
(Total sample size n =720) .................................................................................................................... 74 Table 86: Percentage of retail workplaces that have access to adequate light, fresh drinking water and
clean air (Total sample size n =720) ..................................................................................................... 75 Table 87: Percentage of retail enterprises that have policies inclusive of worker’s rights, adequate pay
and maintaining work-life balance of employees (Total sample size n =720) ...................................... 76 Table 88: Percentage of retail enterprises that have policies inclusive of decent working hours and
conditions, work and life balance, and social security policies according to employees (Total sample
size n = 48) ............................................................................................................................................ 76 Table 89: Type of challenges faced due to COVID-19 (Sample size n = 120 for each industry) ......... 77 Table 90: Percentage of retail enterprises that had to reduce number of outlets due to the effects of
COVID-19 (Total sample size n = 720) ................................................................................................. 78 Table 91: Number of outlets retailers had to reduce due to the effects of COVID 19 .......................... 78 Table 92: Percentage of retail enterprises that had to reduce the number of outlets due to the effects of
COVID 19, disaggregated by six industries (Sample size n = 44) ........................................................ 78 Table 93: Disruption in supply chain due to COVID 19 (Sample size n = 30 for each industry in each
location) ................................................................................................................................................. 79 Table 94: Change in demand of sales due to COVID-19 (Total sample size n = 720) ......................... 80 Table 95: Change in online sales/e-commerce (Total sample size n = 720) ........................................ 80 Table 96: Average number of attrition/job cuts per industry due to COVID-19 .................................... 81 Table 97: Recruitment of more employees due to COVID-19 (Total sample size n = 720) ................. 81 Table 98: Positions in which employees were recruited due to COVID-19 .......................................... 81 Table 99: Safety measures taken to prevent the spread of COVID-19 ................................................ 82 Table 100: Percentage of retail enterprises with the possibility of business expansion in the next 1-3
years ...................................................................................................................................................... 83 Table 101: Percentage of retail enterprises with the possibility of business expansion in the next 1-3
years, disaggregated by the six industries ............................................................................................ 83 Table 102: Average Number of new outlets to be established within 1-3 years ................................... 83
18
List of Figures
Figure 1: Sample overview for the study ................................................................................................. 5
Figure 2: Methodological framework of the study ................................................................................. 20
Figure 3: Study locations in Bangladesh ............................................................................................... 21
Figure 4: Designation of all retailers surveyed across six industries .................................................... 23
19
Chapter 1: Introduction
1.1 Background
Since 1980, Bangladesh has been experiencing a demographic transition where the size of the working
age population has been growing steadily while the dependent age population has decreased. Currently
65% of the population of the country is of working age which means that Bangladesh is experiencing a
demographic dividend, a phenomenon that is predicted to end by 2040. There are many benefits to be
gained from this one-time opportunity if it is managed properly, such as improved labour supply, growth
of human capital and savings, and domestic market expansion. However, it is estimated that out of
106.1 million working age people, about 42.6 million people are unemployed (The Financial Express,
2020)1. Moreover, although around 2.2 million young people enter the workforce, the most
disadvantaged communities, such as youth from low-income households, women, transgender and
people with disabilities, are not able to secure decent and reliable employment (World Bank, 2016).
This study was designed to support ‘Progressing the Retail sector by Improving Decent Employment
(PRIDE)’, a project to create a training model intended to foster sustainable livelihoods for urban youths
in Bangladesh from the lower economic strata and other disadvantaged groups in partnership with the
retail sector and the Government of Bangladesh. The findings of this study will enable the project to
gather the necessary data to pilot the project. IKEA Foundation and UBS Optimus Foundation intend
to fund this project on a pilot basis. In partnership with the Government of Bangladesh and the retail
sector, BRAC will implement the project which is expected to run for 3 years.
1.2 Objectives of study
Based on the objectives set in the ToR, this study was conducted to achieve the following objectives:
1. Outline the landscape of the retail sector (key players in terms of industry and location, and their classification by type, revenue, size, etc.).
2. Identify the daily activities in a retail store, complete job descriptions and work details at entry level retail jobs, salary in entry and semi - mid level jobs in retail sales.
3. Identify skill competencies, educational qualification and any other eligibility that is required to get a job in the retail sector.
4. Establish a baseline of the existing decent work practices employers follow in the retail sector.
5. List down the name and number of employers in retail willing to recruit trained youth, and people with disability, female and transgender.
6. List down the name and number of employers willing to provide in-house formal training.
7. List down the name and number of employers willing to share training costs, especially retail sales.
1 Chowdhury, P S. (2020). Demographic dividend: A roadmap to progress, The Financial Express,
https://thefinancialexpress.com.bd/views/reviews/demographic-dividend-a-roadmap-to-progress-1600268169
20
Chapter 2: Methodology
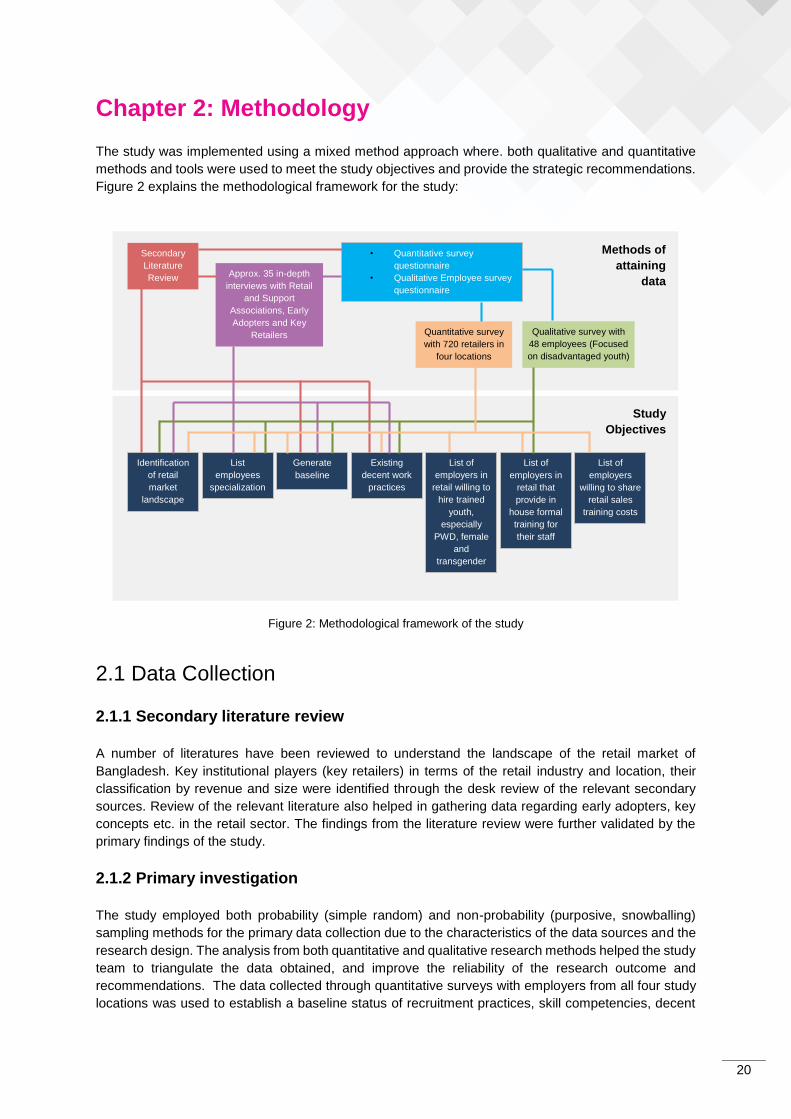
The study was implemented using a mixed method approach where. both qualitative and quantitative
methods and tools were used to meet the study objectives and provide the strategic recommendations.
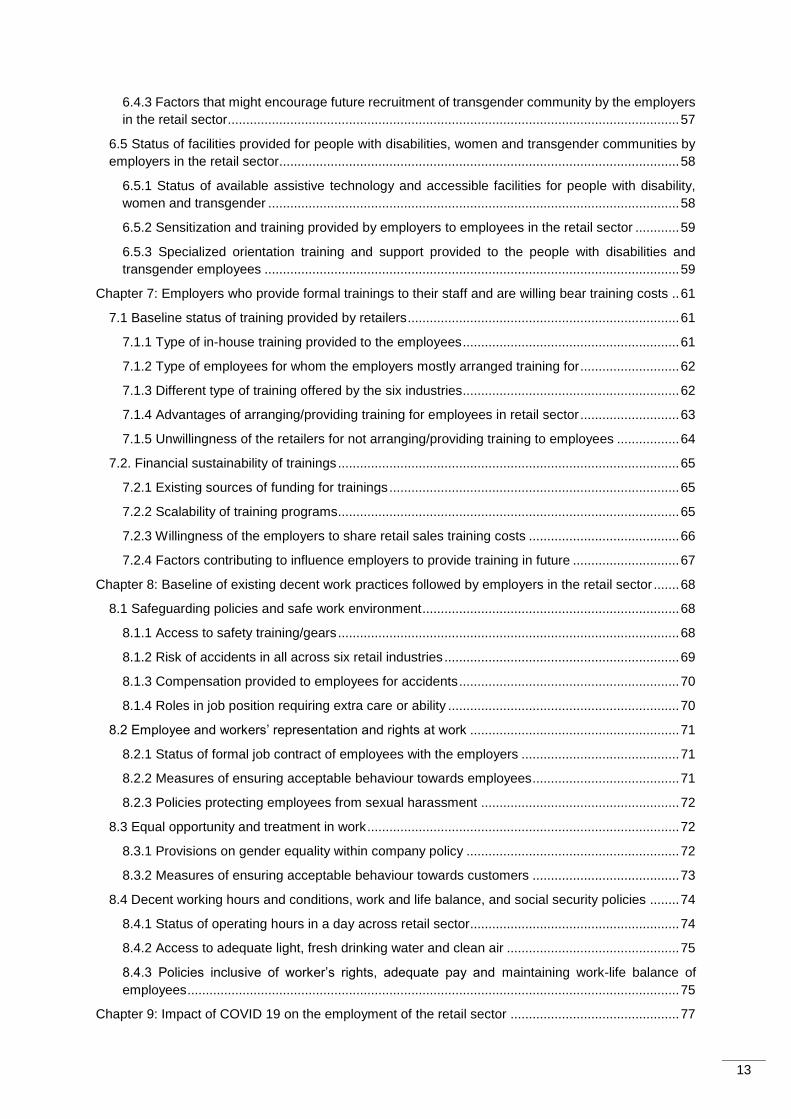
Figure 2 explains the methodological framework for the study:
Figure 2: Methodological framework of the study
2.1 Data Collection
2.1.1 Secondary literature review
A number of literatures have been reviewed to understand the landscape of the retail market of
Bangladesh. Key institutional players (key retailers) in terms of the retail industry and location, their
classification by revenue and size were identified through the desk review of the relevant secondary
sources. Review of the relevant literature also helped in gathering data regarding early adopters, key
concepts etc. in the retail sector. The findings from the literature review were further validated by the
primary findings of the study.
2.1.2 Primary investigation
The study employed both probability (simple random) and non-probability (purposive, snowballing)
sampling methods for the primary data collection due to the characteristics of the data sources and the
research design. The analysis from both quantitative and qualitative research methods helped the study
team to triangulate the data obtained, and improve the reliability of the research outcome and
recommendations. The data collected through quantitative surveys with employers from all four study
locations was used to establish a baseline status of recruitment practices, skill competencies, decent
Secondary
Literature
Review
• Quantitative survey
questionnaire
• Qualitative Employee survey
questionnaire
Quantitative survey
with 720 retailers in
four locations
Qualitative survey with
48 employees (Focused
on disadvantaged youth)
Methods of
attaining
data Approx. 35 in-depth
interviews with Retail
and Support
Associations, Early
Adopters and Key
Retailers
Study
Objectives
Identification
of retail
market
landscape
List
employees
specialization
Generate
baseline Existing
decent work
practices
List of
employers in
retail willing to
hire trained
youth,
especially
PWD, female
and
transgender
List of
employers in
retail that
provide in
house formal
training for
their staff
List of
employers
willing to share
retail sales
training costs
21
work practices, etc. in the retail sector. Qualitative survey with employees of the retail sector was also
conducted with the objective of cross checking and validating the responses from the employers.
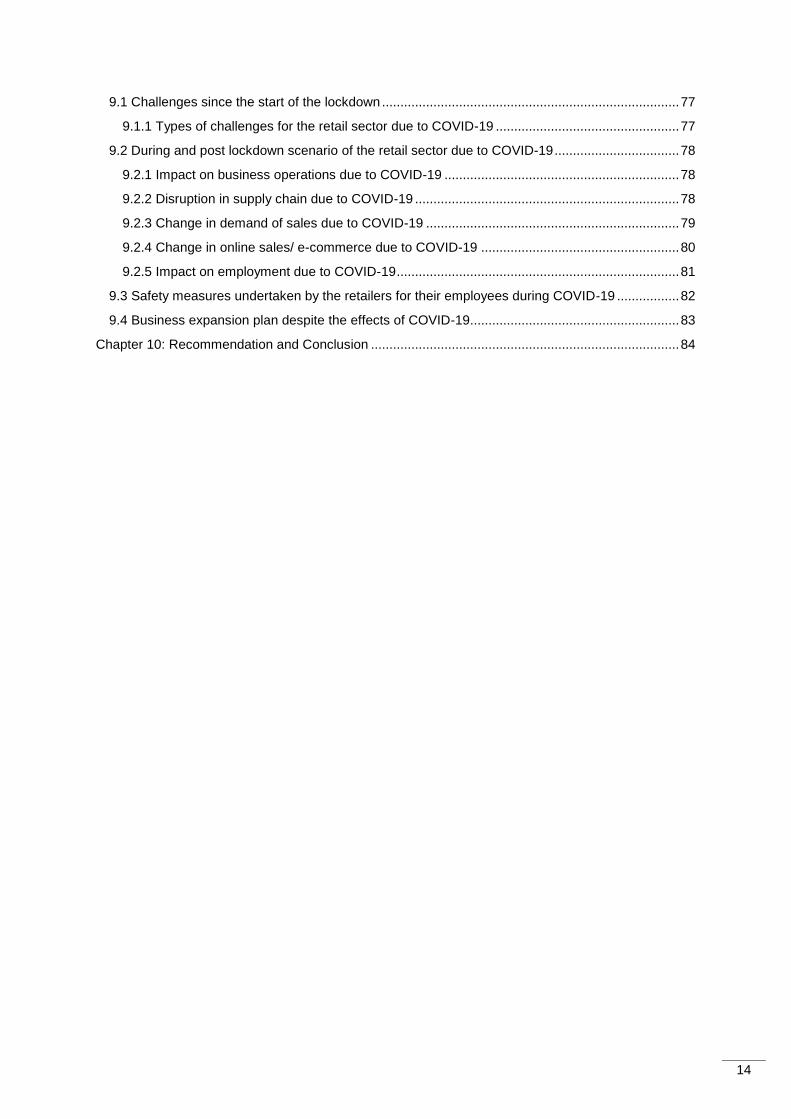
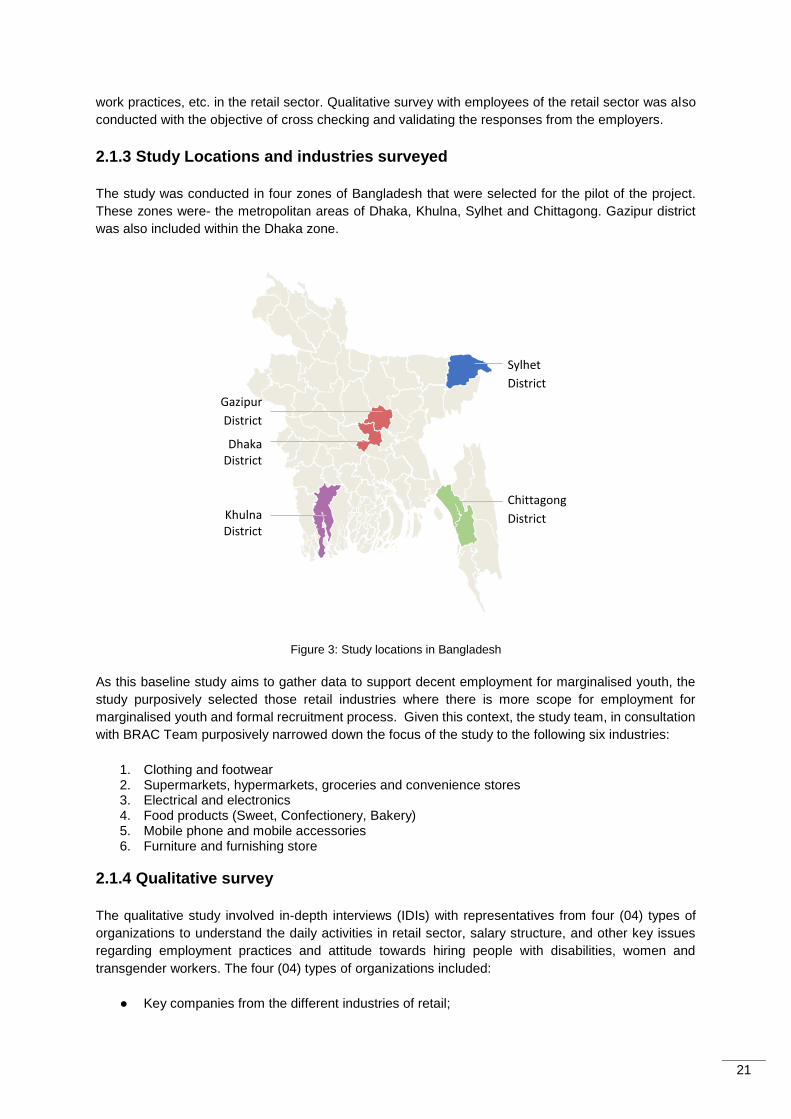
2.1.3 Study Locations and industries surveyed
The study was conducted in four zones of Bangladesh that were selected for the pilot of the project.
These zones were- the metropolitan areas of Dhaka, Khulna, Sylhet and Chittagong. Gazipur district
was also included within the Dhaka zone.
Figure 3: Study locations in Bangladesh
As this baseline study aims to gather data to support decent employment for marginalised youth, the
study purposively selected those retail industries where there is more scope for employment for
marginalised youth and formal recruitment process. Given this context, the study team, in consultation
with BRAC Team purposively narrowed down the focus of the study to the following six industries:
1. Clothing and footwear 2. Supermarkets, hypermarkets, groceries and convenience stores 3. Electrical and electronics 4. Food products (Sweet, Confectionery, Bakery) 5. Mobile phone and mobile accessories 6. Furniture and furnishing store
2.1.4 Qualitative survey
The qualitative study involved in-depth interviews (IDIs) with representatives from four (04) types of
organizations to understand the daily activities in retail sector, salary structure, and other key issues
regarding employment practices and attitude towards hiring people with disabilities, women and
transgender workers. The four (04) types of organizations included:
● Key companies from the different industries of retail;
Sylhet
District
Khulna District
Chittagong
District
Dhaka District
Gazipur
District
22
● Early adopters i.e., retailers who have already employed people with disability and transgender; ● Organizations working on engaging the people with disability and transgender to formal
economy; ● Representatives of associations of merchants/traders and disadvantaged communities.
The qualitative survey also involved IDIs with a total of 12 employees of the selected retail industries
from each study location to cross analyse, validate and qualify the findings from the employers. In total
48 employees were interviewed. The qualitative survey of employees purposively sampled employees
only working in entry or semi-mid level positions. Moreover, women, people with disabilities and
transgender employees were also purposefully interviewed wherever possible. The qualitative survey
with the employees was conducted simultaneously with the quantitative survey with the employers of
the selected six retail industries. The qualitative insights from the interviews with the employees indicate
the general trend and help to validate the findings from the employers.
Table 1: Sample distribution of employees for the qualitative survey
Location Respondent
Dhaka & Gazipur 12
Chattogram 12
Khulna 12
Sylhet 12
Total Sample 48
2.1.5 Quantitative survey
Based on the findings from the secondary literature and IDIs, the study team developed a questionnaire
inquiring about decent work practice guidelines in retail sector, information on job positions and
requirements of entry and semi-mid level retail jobs, salary structure, employers providing in house
formal training for their staffs and their willingness to share training costs, willingness to hire trained
youth, women, people with disabilities and transgender workers.
The final questionnaire was transformed into a computer aided survey instrument using KoBoToolbox.
This method of data collection allowed real time monitoring - as data were sent to the server after
collection, and the concerned team viewed and observed the data online for any inconsistencies, errors
and outliers and instantly provided feedback to the field team for correction and proper explanation. A
team of 24 data collectors collected the data from 13 October, 2020 to 22 October, 2020. Four teams
were formed with 5 data collectors per team, with each of the teams being led by a Field Supervisor.
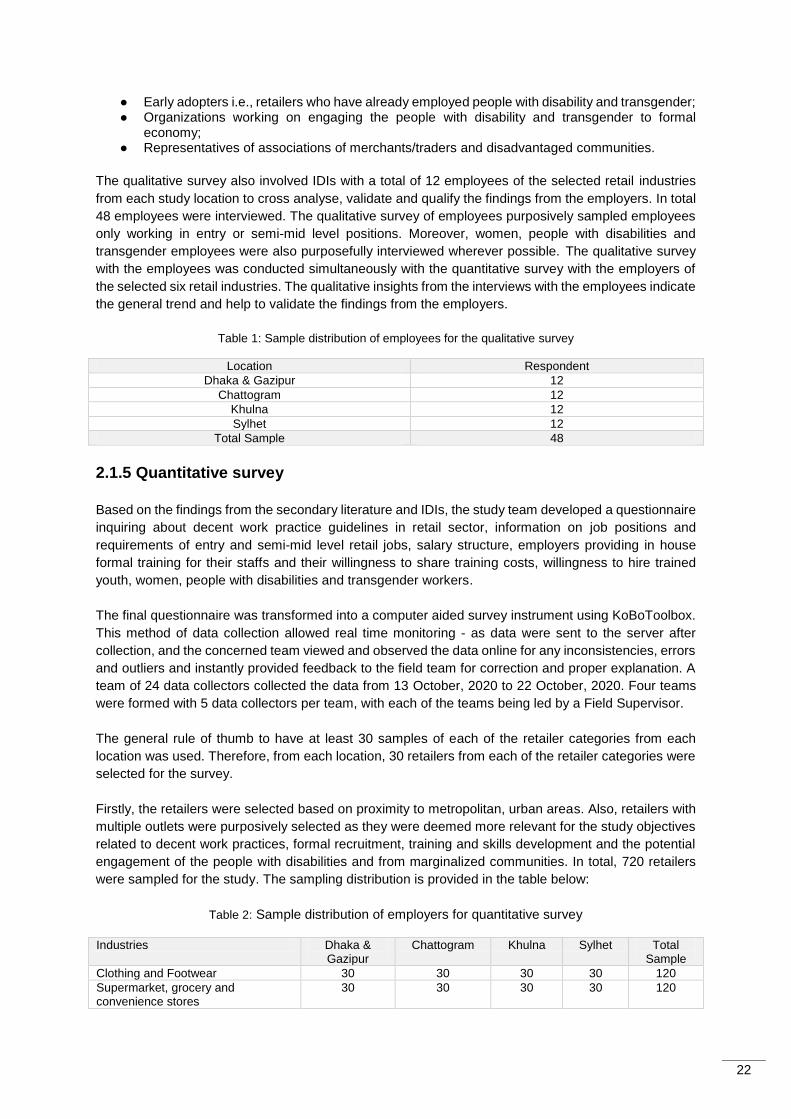
The general rule of thumb to have at least 30 samples of each of the retailer categories from each
location was used. Therefore, from each location, 30 retailers from each of the retailer categories were
selected for the survey.
Firstly, the retailers were selected based on proximity to metropolitan, urban areas. Also, retailers with
multiple outlets were purposively selected as they were deemed more relevant for the study objectives
related to decent work practices, formal recruitment, training and skills development and the potential
engagement of the people with disabilities and from marginalized communities. In total, 720 retailers
were sampled for the study. The sampling distribution is provided in the table below:
Table 2: Sample distribution of employers for quantitative survey
Industries Dhaka & Gazipur
Chattogram Khulna Sylhet Total Sample
Clothing and Footwear 30 30 30 30 120
Supermarket, grocery and convenience stores
30 30 30 30 120
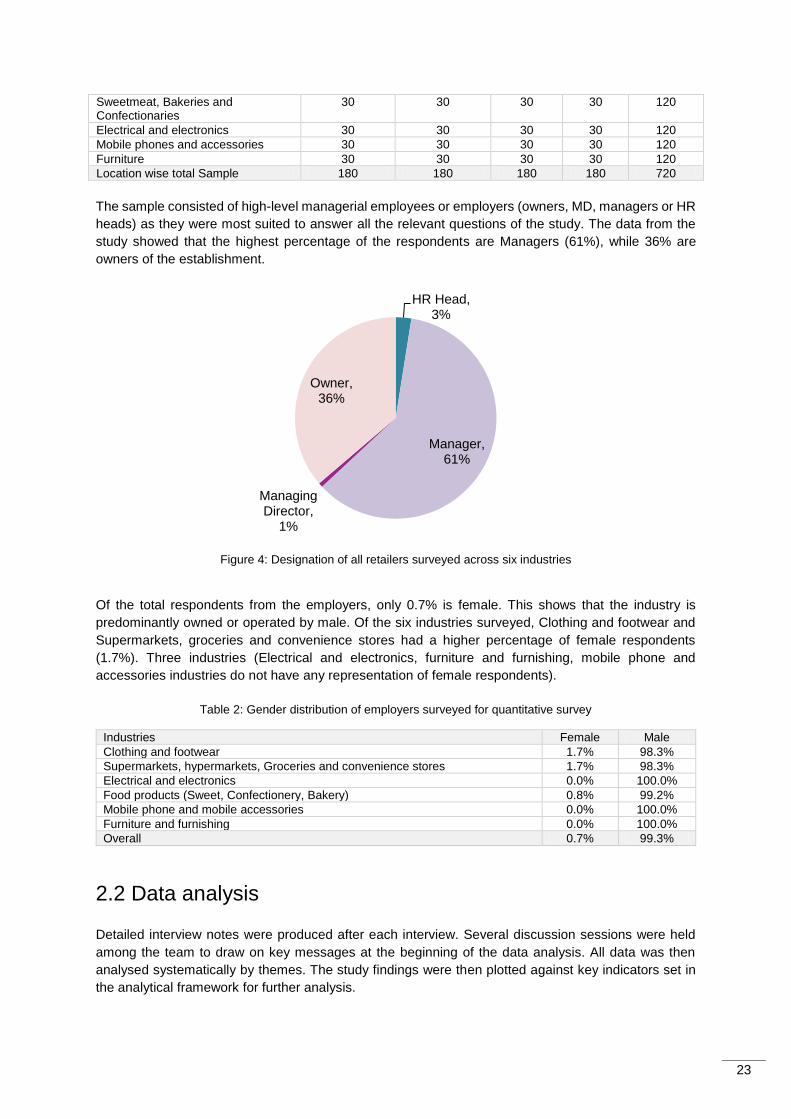
23
Sweetmeat, Bakeries and Confectionaries
30 30 30 30 120
Electrical and electronics 30 30 30 30 120
Mobile phones and accessories 30 30 30 30 120
Furniture 30 30 30 30 120
Location wise total Sample 180 180 180 180 720
The sample consisted of high-level managerial employees or employers (owners, MD, managers or HR
heads) as they were most suited to answer all the relevant questions of the study. The data from the
study showed that the highest percentage of the respondents are Managers (61%), while 36% are
owners of the establishment.
Figure 4: Designation of all retailers surveyed across six industries
Of the total respondents from the employers, only 0.7% is female. This shows that the industry is
predominantly owned or operated by male. Of the six industries surveyed, Clothing and footwear and
Supermarkets, groceries and convenience stores had a higher percentage of female respondents
(1.7%). Three industries (Electrical and electronics, furniture and furnishing, mobile phone and
accessories industries do not have any representation of female respondents).
Table 2: Gender distribution of employers surveyed for quantitative survey
Industries Female Male
Clothing and footwear 1.7% 98.3%
Supermarkets, hypermarkets, Groceries and convenience stores 1.7% 98.3%
Electrical and electronics 0.0% 100.0%
Food products (Sweet, Confectionery, Bakery) 0.8% 99.2%
Mobile phone and mobile accessories 0.0% 100.0%
Furniture and furnishing 0.0% 100.0%
Overall 0.7% 99.3%
2.2 Data analysis
Detailed interview notes were produced after each interview. Several discussion sessions were held
among the team to draw on key messages at the beginning of the data analysis. All data was then
analysed systematically by themes. The study findings were then plotted against key indicators set in
the analytical framework for further analysis.
HR Head, 3%
Manager, 61%
Managing Director,
1%
Owner, 36%
24
2.3 Limitations of the study
Some limitations of the study were noted:
● The initial phase of the study aimed to gather information regarding the landscape and
employment practices of retail enterprises through trade associations. However, due to the
pandemic, a lot of key informants were not in their offices and many could not be reached via
the contact information available. Furthermore, various key retailers who were contacted were
open to the idea of an interview, however they were unable to make time for it.
● A considerable number of key informants were only available for online interviews where some
had internet issues which interfered in obtaining a substantial interview, and in other cases
some were unable to provide specific information regarding the market size and therefore only
cited estimates of relevant information regarding the market. In some cases, the informants
were also hesitant in wanting to share too much information regarding the organisational
structure of their establishment and only provided a gist.
● Almost all the key informants were very reluctant to discuss or share financial data or business
size in terms of revenue, turnover, etc. As a result, certain information regarding the market
size and landscape of the retail industry was obtained from secondary literature, where
information regarding some industries of retail was sparse.
● In some cases, respondents were newly appointed and (or in the case of some officials of larger
retailers with a huge number of outlets) did not know the exact number of outlets and were
unable to share the information.
● As the quantitative survey of this study did not find any respondents from the transgender
community and had very little samples of people with disabilities, qualitative research was done
through several IDIs with early adopters who had hired people with disadvantages and
transgender workers
25
Chapter 3: Landscape of the retail sector of
Bangladesh
This section discusses the overview of overall market size in terms of growth, geographical
concentration, number of outlets, and years of operation, and segmentation of formal/informal of the six
retail industries. It must be noted that the study team faced a challenge while identifying information
regarding the revenue of the retail industries as the respondents were reluctant to disclose such
information. However, insight from secondary literature has been presented here in order to illustrate
the backdrop of each industry and give context to the study that was conducted.
3.1 General overview of the six retail industries
3.1.1 Clothing and footwear
As the economy continues to grow, rapidly turning Bangladesh into a middle-income country, the
fashion i.e., clothing retail industry has been steadily growing with it. With a vast number of local
consumers, and availability of raw materials and skilled manufacturers in hand, entrepreneurs, local
and foreign alike, are fast diving into the local fashion retail market and contributing towards that growth.
As a result, more and more of the country’s leading garment exporters including Beximco, Standard
Group, Epyllion Group, Sonotex Group, Giant Group of Companies, Evince Group, Saasco group, East-
West Industrial Park, Babylon Group and Millon Clothings have been venturing into the domestic retail
clothing market with brands such as Yellow (Beximco), Sailor (Epyllion Group), Amber Lifestyle
(Partex), etc. (Apparel Resources, 2020)2. Even though the industry is dominated by established
brands, there is no published account of the sales and growth trends. As a result, no reliable information
could be found regarding the overall market size of the clothing retail industry. This finding is also
consistent with the information provided by key informants who reported that there is barely any valid
data regarding this subject.
Bangladesh’s domestic footwear retail market also began to expand when several renowned footwear
exporters started to launch outlets locally. According to Orion, in 2016, the local footwear market was
worth Tk 16,000 crore and since then it has been growing steadily at a rate of 10 to 15% a year (The
Daily Star, 2017)3. Other industry insiders, however, valued the market at around Tk 7000-8000 crore.
The first footwear retailer in the country was the multinational company, Bata which opened its doors in
1962. In 2017 it had 240 stores and 500 dealers all over Bangladesh (The Daily Star, 2017). Apex
launched in the domestic market in 2006, and by 2017 it had about 250 stores (The Daily Star, 2017).
Similarly, a number of other footwear retailers have also entered the local market such as Jenny, Bay,
Leatherex, Lotto, Orion, etc., and are thriving. According to industry insiders, Bangladesh consumes 30
crore pairs of footwear annually (The Daily Star, 2017).
3.1.2 Supermarkets, hypermarkets, grocery & convenience stores
The supermarket industry of our country can be roughly divided into two categories, the traditional
grocery/convenience stores (mudir dokans) and organised retail markets, which began to take its place
in the domestic retail market in 2001. While the traditional grocery stores still dominate the market, the
organised or formal supermarket retailers have started to gain some traction in the field in the recent
years, with the rise of affluence among the middle-class population of Bangladesh. Although such
2 Apparel Resources. (2020), How the Bangladesh Industry is emerging in fashion retail, Apparel Resources, https://bd.apparelresources.com/business-news/retail/bangladesh-industry-emerging-fashion-retail/ 3 Parvez, S. (2017), Footwear market expands fast as demand rises, The Daily Star, https://www.thedailystar.net/business/footwear-market-expands-fast-demand-rises-1394254
26
formal retailers still only capture about 1.52% of the market share, in 2019 its market size was estimated
to be Tk 2,300 crore (The Daily Star, 2020)4. To put things into perspective, it is worth noting that the
IDLC report in 2017 valued the supermarket industry at Tk 1,500 crore and predicted that the market
size would multiply 15 times by 2021 (Databd.Co, 2019)5. Currently, there are about 40 organised
grocery retailers, Shwapno being the market leader with about 150 outlets all over Bangladesh, followed
by Meena Bazar (Databd.Co, 2019). Other players in the field include Agora, Carrefamily, Unimart, Pick
N Pay, Daily Super shop, etc.
3.1.3 Food Products (Sweets, confectionaries and bakeries)
The retail segment of food products in Bangladesh can be broken down into three categories, bakeries,
confectioneries and sweets. According to a key informant, the Bangladesh Bread Biscuit O
Confectionary Prostutkarok Samitee currently has 5000 members across the country. The bakery
business has expanded quite significantly where there has been a 15% growth in the market since
2008, bringing it to a current market size of BDT 6,000 crore approximately (The Financial Express,
2018)6
On the other hand, industry insiders have quoted that the market size of the sweetmeat is unofficially
estimated to yield BDT 300 crore annually. Bangladesh Sweets Manufacturers Association estimates
to have around 3,500 registered shops in the country among which 250 of them are in Dhaka (The Daily
Star, 2019)7.
Among the oldest retailers in this industry are Shumi’s Hot Cake, Banoful & Co., Muslim Sweets, Yousuf
Confectionary, Coopers. Since then, countless other brands have made their way into the mainstream
market such as Rosh, Premium Sweets, Bread and Beyond, Tasty Treats, Olympia Confectionary, etc.
3.1.4 Electrical and electronics
In 2018, the consumer electronics market was valued at approximately BDT 11,600 crore (Databd.Co,
2018)8. This growth is predicted based on the increasing affluence of the middle-class society and the
rising population of youth and women in the workforce. All that combined with the effects of increased
education and globalisation, the demand for consumer electronics has been observed to have
drastically grown over the last few years. Due to changing lifestyles and local conglomerates, even
those from low income households are opting to purchase consumer electronics as they can purchase
the cheaper locally produced ones which are also available in the market (Databd.Co, 2018). According
to industry insiders, the industry has grown at a pace of 15% on an average in the last 10 years (The
Daily Star, 2020)9. This growth in the market and the consumer trends in this industry therefore indicate
a thriving retail segment which can cater to a growing customer base of consumer electronics.
Some of the key retailers in the market for electrical and electronics retailers are Walton Group,
Transcom Electronics, Rangs Electronics, Rangs Toshiba, Best Electronics, MyOne Electronics
4 Parvez, S. (2020), Supermarkets turn knights in shining armour, The Daily Star,
https://www.thedailystar.net/business/news/supermarkets-turn-knights-shining-armour-1893385 5 LightCastle Analytics Wing. (2019), Retail industry in Bangladesh: A different shapeup story, Databd.Co,
https://databd.co/stories/organized-retail-industry-outlook-bangladesh-2077 6 Sakib, S M N. (2018), Baking business booms, The Financial Express, https://today.thefinancialexpress.com.bd/print/baking-
business-booms-1523554764 7 Chakma, J. (2019), A sweeter Pohela Baishakh, The Daily Star, https://www.thedailystar.net/business/news/sweeter-pahela-baishakh-1729756 8 Industries. (2018), Consumer Electronics, Databd.Co, https://databd.co/profiles/industries/profile-consumer-electronics 9 Chakma, J. (2020), Consumer electronic companies predict grim outlook for 2020, The Daily Star, https://www.thedailystar.net/business/news/consumer-electronics-companies-predict-grim-outlook-2020-1968177
27
Industries, Jamuna Electronics, PRAN RFL (Vision), Esquire Electronics, Electra International, and
Super Star Group (SSG), Ryan’s Computers, FLORA, etc.
3.1.5 Mobile phone and accessories
The mobile phone market announced a 4.1% annual growth rate in 2019 (Dhaka Tribune, 2020)10, and
estimated to be worth BDT10,000 crore and growing (The Daily Star, 2019)11. Meanwhile, the annual
market for accessories was quoted to be BDT 3,000 crore (The Daily Star, 2019). The accessories
market was also reported to have had a 50% annual growth in terms of value (The Daily Star, 2019).
Just like the electrical and electronics industry, the changing consumer trends of the young and digitally
savvy population are boosting the growth in this industry. The rise of mobile phone users, e-commerce
businesses, MFIs along with increased purchase power of consumers, and availability of mid to low-
cost products have opened the gates to a huge consumer base. With imported products dominating the
market, alongside a handful of local manufacturers of mobile phones, the potential for the retail segment
of this market is huge (The Independent, 2018)12. Key retailers in this industry are Samsung, Vivo,
Oppo, Walton, Symphony, Xiaomi, Gadget n Gear, Executive Machines, etc.
3.1.6 Furniture and furnishing
According to resources, the furniture industry is the second largest source of employment, after the
RMG sector (Databd.Co, 2019)13. In 2019 it was estimated that the industry employs about 2.5 million
people, and the domestic market was valued at BDT 6,700 crore (Databd.Co, 2019). There are currently
over 80,000 organisations involved in manufacturing furniture, including backward and forward chains
(Databd.Co, 2019).
IDI conducted with a key informant revealed that the Bangladesh Furniture Owners Association
presently has 13,000 members, of which over 3000 are official members and the rest are unofficial
members. According to the expert, about 0.5% of all the furniture retailers are large enterprises such
as Hatil, Partex, Navana, Akhter, Nadia, Legacy, Brothers, and these operate like franchises where the
company itself owns 10-20 stores and has about 600 stores operating separately as franchisees. The
medium sized enterprises which operate with approximately 5-7 employees take up about 25-30% of
the market while the rest are considered to be small or micro enterprises.
3.2 Involvement of the retail enterprises with business
associations
The study examined the number of retailers who were members of trade associations. It was found that
retailers in the areas of this study in general have a low involvement with associations where only 22.1%
were members of trade associations. Most of the associations are also very area-centric, meaning that
they tend to operate within a specific local market or bazaar. A few formal retailers reported involvement
with national level associations while the rest were observed to have weak linkage with trade
associations.
10 Tribune Desk. (2020), 4.1% growth in local mobile phone market in 2019, Dhaka Tribune,
https://www.dhakatribune.com/business/2020/02/24/4-1-growth-in-local-mobile-phone-market-in-2019 11 Islam, M Z. (2019), Smart accessories making life smarter, The Daily Star, https://www.thedailystar.net/business/smart-
mobile-accessories-making-life-smarter-1828111 12 Ahmed, S. (2018), Mobile accessories market booms, The Independent,
http://www.theindependentbd.com/arcprint/details/159848/2018-07-29 13 Industries. (2019), Timbee and Furniture, Databd.Co, https://databd.co/profiles/industries/profile-timber-and-
furniture#:~:text=Albeit%20around%2090%25%20of%20furniture,population%20has%20high%20disposable%20income
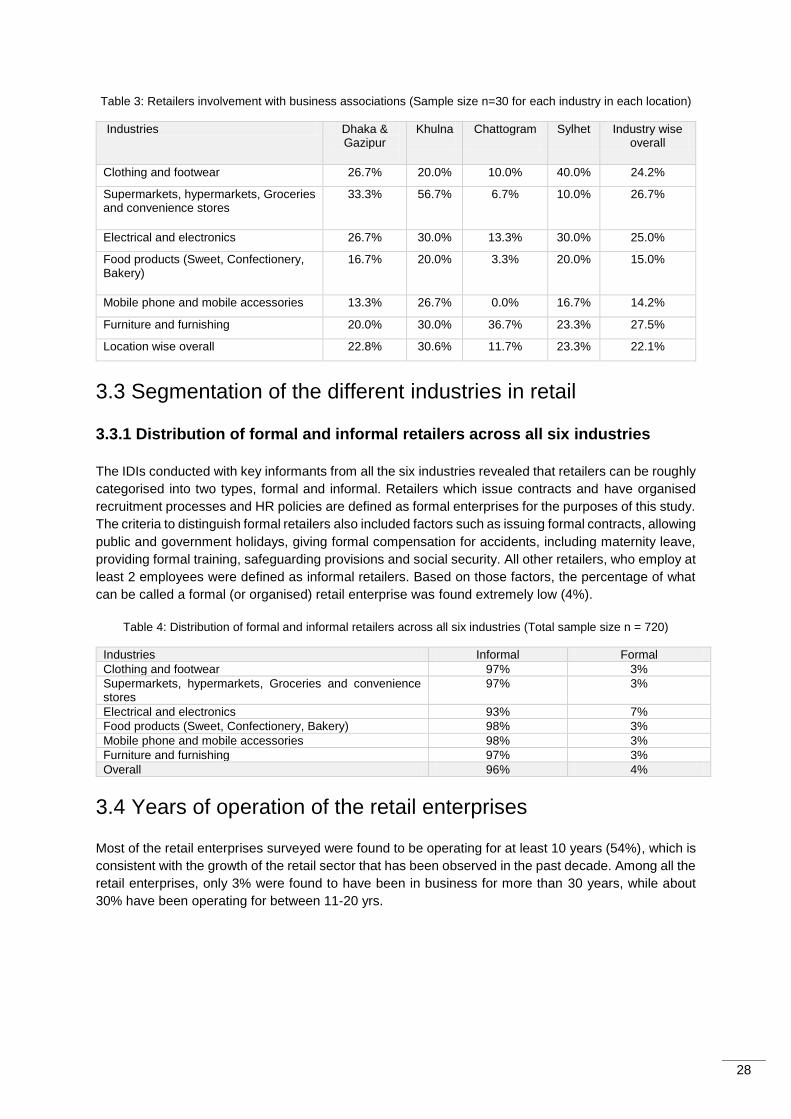
28
Table 3: Retailers involvement with business associations (Sample size n=30 for each industry in each location)
Industries Dhaka & Gazipur
Khulna
Chattogram
Sylhet
Industry wise overall
Clothing and footwear 26.7% 20.0% 10.0% 40.0% 24.2%
Supermarkets, hypermarkets, Groceries and convenience stores
33.3% 56.7% 6.7% 10.0% 26.7%
Electrical and electronics 26.7% 30.0% 13.3% 30.0% 25.0%
Food products (Sweet, Confectionery, Bakery)
16.7% 20.0% 3.3% 20.0% 15.0%
Mobile phone and mobile accessories 13.3% 26.7% 0.0% 16.7% 14.2%
Furniture and furnishing 20.0% 30.0% 36.7% 23.3% 27.5%
Location wise overall 22.8% 30.6% 11.7% 23.3% 22.1%
3.3 Segmentation of the different industries in retail
3.3.1 Distribution of formal and informal retailers across all six industries
The IDIs conducted with key informants from all the six industries revealed that retailers can be roughly
categorised into two types, formal and informal. Retailers which issue contracts and have organised
recruitment processes and HR policies are defined as formal enterprises for the purposes of this study.
The criteria to distinguish formal retailers also included factors such as issuing formal contracts, allowing
public and government holidays, giving formal compensation for accidents, including maternity leave,
providing formal training, safeguarding provisions and social security. All other retailers, who employ at
least 2 employees were defined as informal retailers. Based on those factors, the percentage of what
can be called a formal (or organised) retail enterprise was found extremely low (4%).
Table 4: Distribution of formal and informal retailers across all six industries (Total sample size n = 720)
Industries Informal Formal
Clothing and footwear 97% 3%
Supermarkets, hypermarkets, Groceries and convenience stores
97% 3%
Electrical and electronics 93% 7%
Food products (Sweet, Confectionery, Bakery) 98% 3%
Mobile phone and mobile accessories 98% 3%
Furniture and furnishing 97% 3%
Overall 96% 4%
3.4 Years of operation of the retail enterprises
Most of the retail enterprises surveyed were found to be operating for at least 10 years (54%), which is
consistent with the growth of the retail sector that has been observed in the past decade. Among all the
retail enterprises, only 3% were found to have been in business for more than 30 years, while about
30% have been operating for between 11-20 yrs.
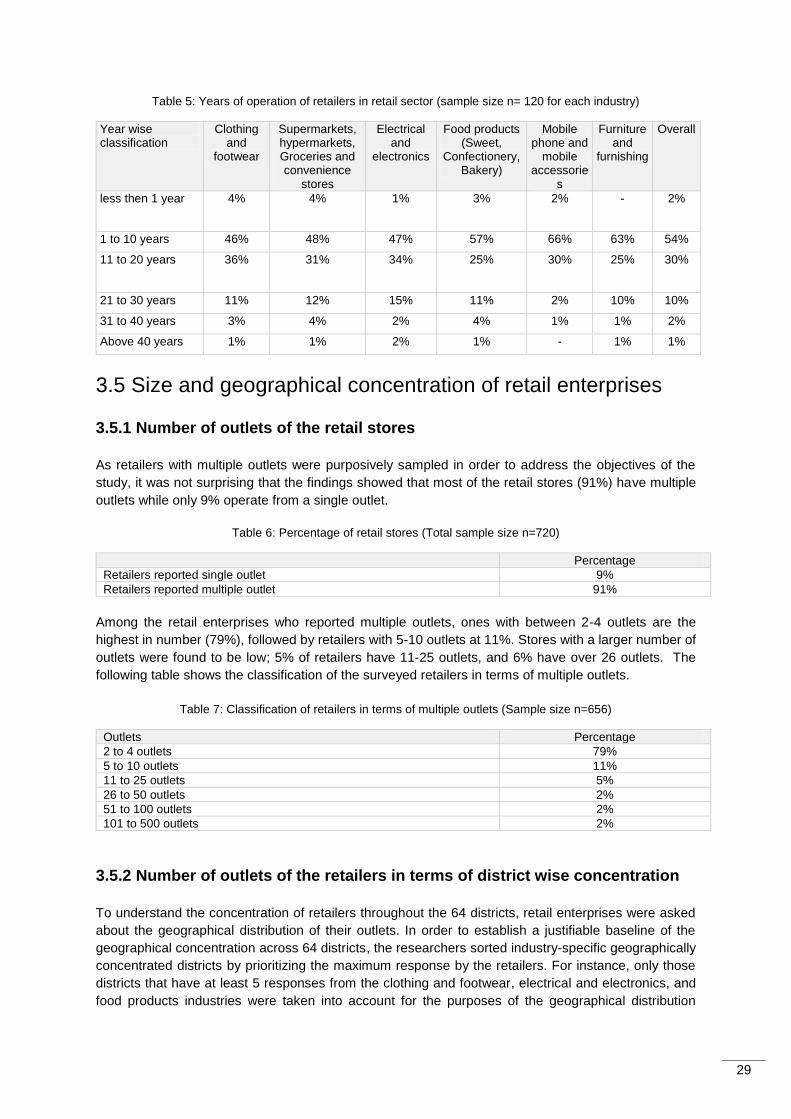
29
Table 5: Years of operation of retailers in retail sector (sample size n= 120 for each industry)
Year wise classification
Clothing and
footwear
Supermarkets, hypermarkets, Groceries and convenience
stores
Electrical and
electronics
Food products (Sweet,
Confectionery, Bakery)
Mobile phone and
mobile accessorie
s
Furniture and
furnishing
Overall
less then 1 year 4% 4% 1% 3% 2% - 2%
1 to 10 years 46% 48% 47% 57% 66% 63% 54%
11 to 20 years 36% 31% 34% 25% 30% 25% 30%
21 to 30 years 11% 12% 15% 11% 2% 10% 10%
31 to 40 years 3% 4% 2% 4% 1% 1% 2%
Above 40 years 1% 1% 2% 1% - 1% 1%
3.5 Size and geographical concentration of retail enterprises
3.5.1 Number of outlets of the retail stores
As retailers with multiple outlets were purposively sampled in order to address the objectives of the
study, it was not surprising that the findings showed that most of the retail stores (91%) have multiple
outlets while only 9% operate from a single outlet.
Table 6: Percentage of retail stores (Total sample size n=720)
Percentage
Retailers reported single outlet 9%
Retailers reported multiple outlet 91%
Among the retail enterprises who reported multiple outlets, ones with between 2-4 outlets are the
highest in number (79%), followed by retailers with 5-10 outlets at 11%. Stores with a larger number of
outlets were found to be low; 5% of retailers have 11-25 outlets, and 6% have over 26 outlets. The
following table shows the classification of the surveyed retailers in terms of multiple outlets.
Table 7: Classification of retailers in terms of multiple outlets (Sample size n=656)
Outlets Percentage
2 to 4 outlets 79%
5 to 10 outlets 11%
11 to 25 outlets 5%
26 to 50 outlets 2%
51 to 100 outlets 2%
101 to 500 outlets 2%
3.5.2 Number of outlets of the retailers in terms of district wise concentration
To understand the concentration of retailers throughout the 64 districts, retail enterprises were asked
about the geographical distribution of their outlets. In order to establish a justifiable baseline of the
geographical concentration across 64 districts, the researchers sorted industry-specific geographically
concentrated districts by prioritizing the maximum response by the retailers. For instance, only those
districts that have at least 5 responses from the clothing and footwear, electrical and electronics, and
food products industries were taken into account for the purposes of the geographical distribution
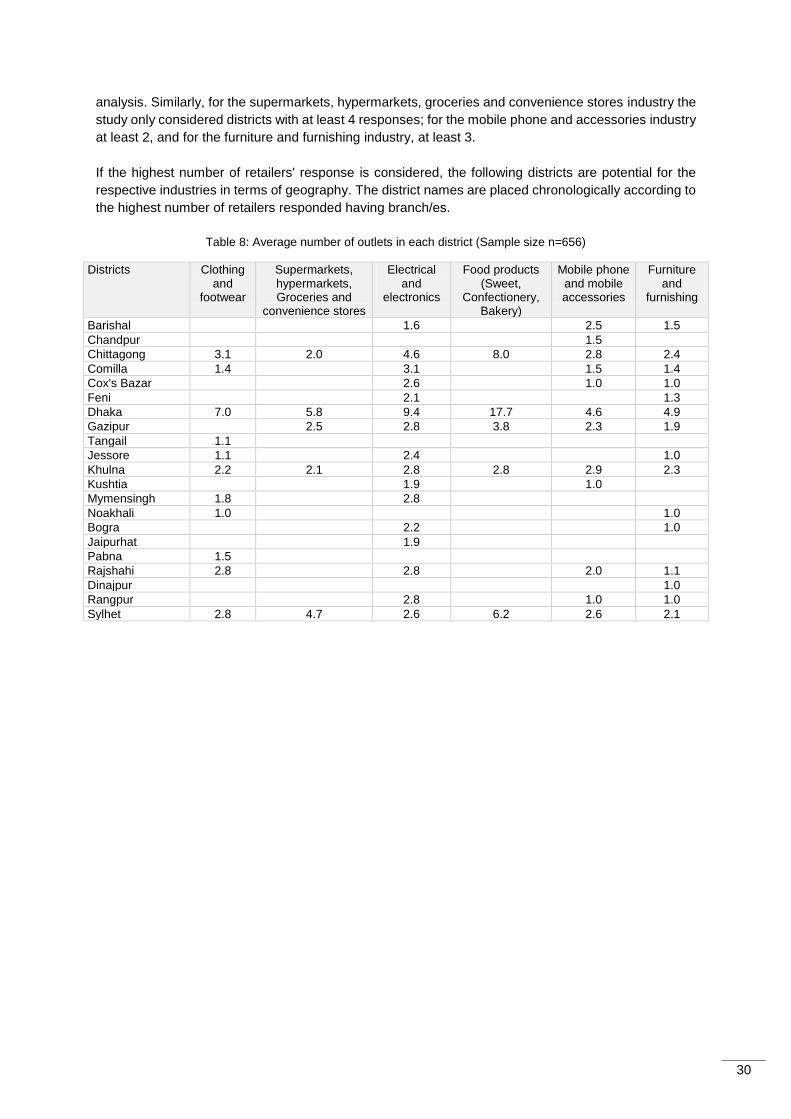
30
analysis. Similarly, for the supermarkets, hypermarkets, groceries and convenience stores industry the
study only considered districts with at least 4 responses; for the mobile phone and accessories industry
at least 2, and for the furniture and furnishing industry, at least 3.
If the highest number of retailers' response is considered, the following districts are potential for the
respective industries in terms of geography. The district names are placed chronologically according to
the highest number of retailers responded having branch/es.
Table 8: Average number of outlets in each district (Sample size n=656)
Districts Clothing and
footwear
Supermarkets, hypermarkets, Groceries and
convenience stores
Electrical and
electronics
Food products (Sweet,
Confectionery, Bakery)
Mobile phone and mobile accessories
Furniture and
furnishing
Barishal 1.6 2.5 1.5
Chandpur 1.5
Chittagong 3.1 2.0 4.6 8.0 2.8 2.4
Comilla 1.4 3.1 1.5 1.4
Cox's Bazar 2.6 1.0 1.0
Feni 2.1 1.3
Dhaka 7.0 5.8 9.4 17.7 4.6 4.9
Gazipur 2.5 2.8 3.8 2.3 1.9
Tangail 1.1
Jessore 1.1 2.4 1.0
Khulna 2.2 2.1 2.8 2.8 2.9 2.3
Kushtia 1.9 1.0
Mymensingh 1.8 2.8
Noakhali 1.0 1.0
Bogra 2.2 1.0
Jaipurhat 1.9
Pabna 1.5
Rajshahi 2.8 2.8 2.0 1.1
Dinajpur 1.0
Rangpur 2.8 1.0 1.0
Sylhet 2.8 4.7 2.6 6.2 2.6 2.1
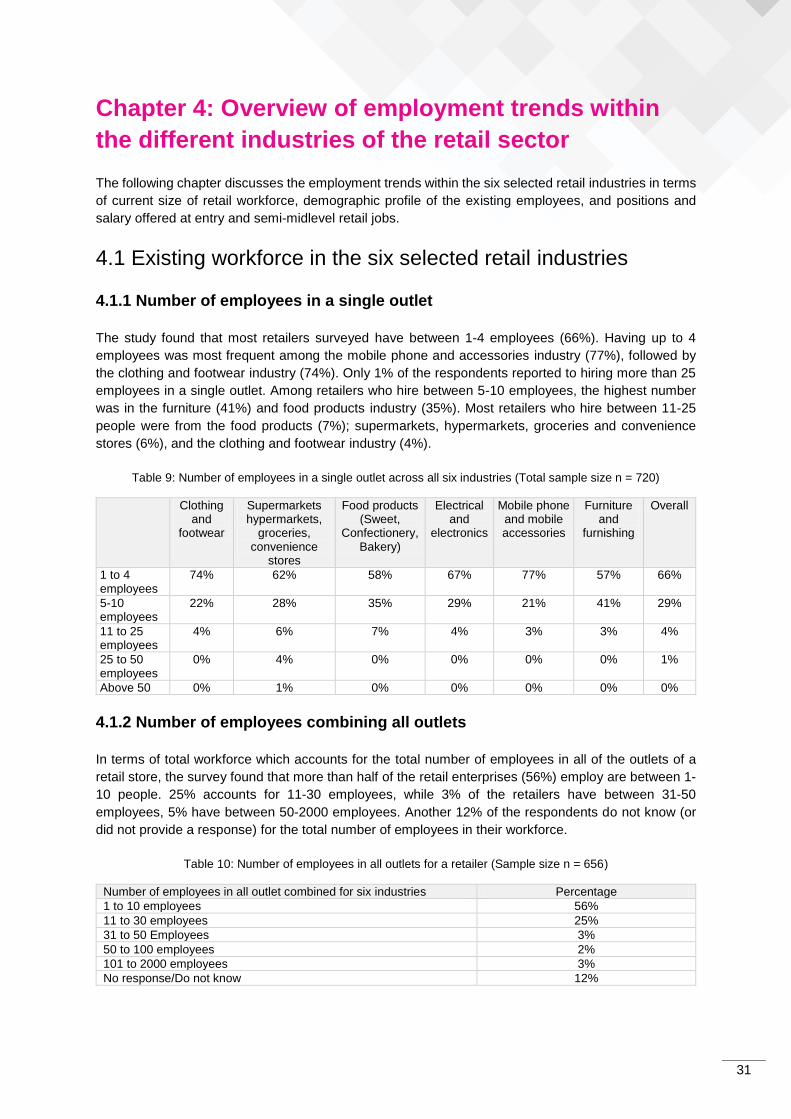
31
Chapter 4: Overview of employment trends within
the different industries of the retail sector
The following chapter discusses the employment trends within the six selected retail industries in terms
of current size of retail workforce, demographic profile of the existing employees, and positions and
salary offered at entry and semi-midlevel retail jobs.
4.1 Existing workforce in the six selected retail industries
4.1.1 Number of employees in a single outlet
The study found that most retailers surveyed have between 1-4 employees (66%). Having up to 4
employees was most frequent among the mobile phone and accessories industry (77%), followed by
the clothing and footwear industry (74%). Only 1% of the respondents reported to hiring more than 25
employees in a single outlet. Among retailers who hire between 5-10 employees, the highest number
was in the furniture (41%) and food products industry (35%). Most retailers who hire between 11-25
people were from the food products (7%); supermarkets, hypermarkets, groceries and convenience
stores (6%), and the clothing and footwear industry (4%).
Table 9: Number of employees in a single outlet across all six industries (Total sample size n = 720)
Clothing and
footwear
Supermarkets hypermarkets,
groceries, convenience
stores
Food products (Sweet,
Confectionery, Bakery)
Electrical and
electronics
Mobile phone and mobile accessories
Furniture and
furnishing
Overall
1 to 4 employees
74% 62% 58% 67% 77% 57% 66%
5-10 employees
22% 28% 35% 29% 21% 41% 29%
11 to 25 employees
4% 6% 7% 4% 3% 3% 4%
25 to 50 employees
0% 4% 0% 0% 0% 0% 1%
Above 50 0% 1% 0% 0% 0% 0% 0%
4.1.2 Number of employees combining all outlets
In terms of total workforce which accounts for the total number of employees in all of the outlets of a
retail store, the survey found that more than half of the retail enterprises (56%) employ are between 1-
10 people. 25% accounts for 11-30 employees, while 3% of the retailers have between 31-50
employees, 5% have between 50-2000 employees. Another 12% of the respondents do not know (or
did not provide a response) for the total number of employees in their workforce.
Table 10: Number of employees in all outlets for a retailer (Sample size n = 656)
Number of employees in all outlet combined for six industries Percentage
1 to 10 employees 56%
11 to 30 employees 25%
31 to 50 Employees 3%
50 to 100 employees 2%
101 to 2000 employees 3%
No response/Do not know 12%
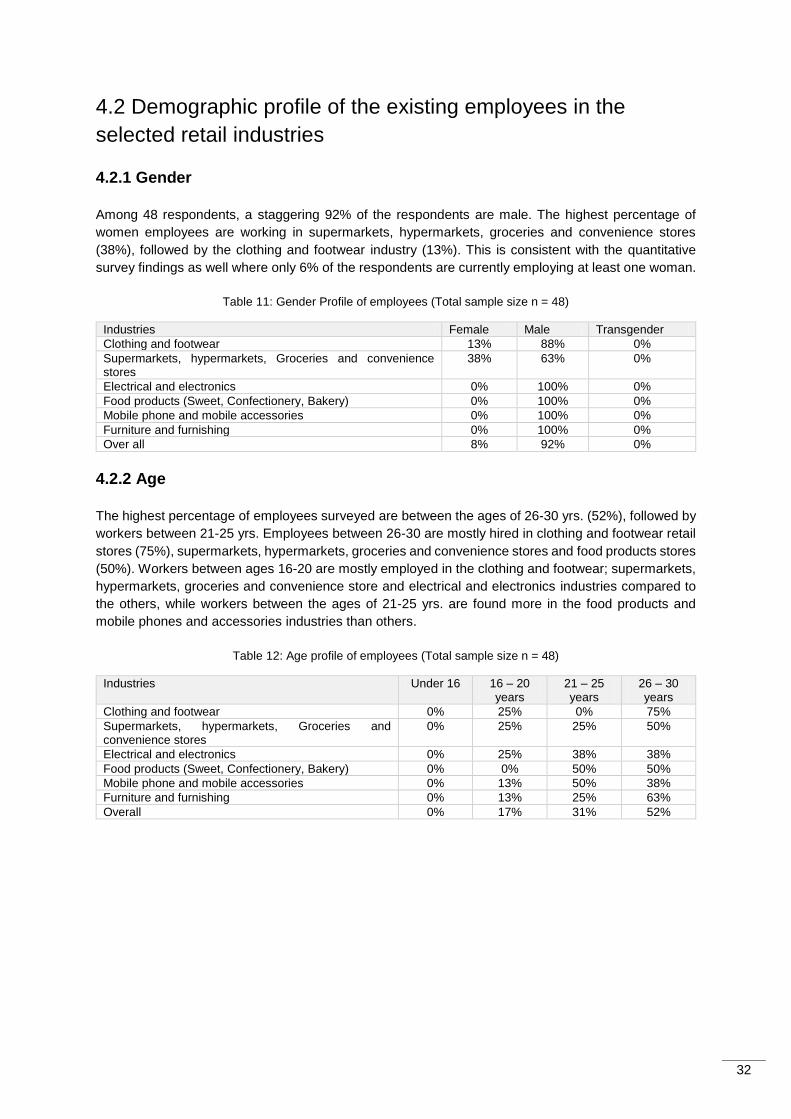
32
4.2 Demographic profile of the existing employees in the
selected retail industries
4.2.1 Gender
Among 48 respondents, a staggering 92% of the respondents are male. The highest percentage of
women employees are working in supermarkets, hypermarkets, groceries and convenience stores
(38%), followed by the clothing and footwear industry (13%). This is consistent with the quantitative
survey findings as well where only 6% of the respondents are currently employing at least one woman.
Table 11: Gender Profile of employees (Total sample size n = 48)
Industries Female Male Transgender
Clothing and footwear 13% 88% 0%
Supermarkets, hypermarkets, Groceries and convenience stores
38% 63% 0%
Electrical and electronics 0% 100% 0%
Food products (Sweet, Confectionery, Bakery) 0% 100% 0%
Mobile phone and mobile accessories 0% 100% 0%
Furniture and furnishing 0% 100% 0%
Over all 8% 92% 0%
4.2.2 Age
The highest percentage of employees surveyed are between the ages of 26-30 yrs. (52%), followed by
workers between 21-25 yrs. Employees between 26-30 are mostly hired in clothing and footwear retail
stores (75%), supermarkets, hypermarkets, groceries and convenience stores and food products stores
(50%). Workers between ages 16-20 are mostly employed in the clothing and footwear; supermarkets,
hypermarkets, groceries and convenience store and electrical and electronics industries compared to
the others, while workers between the ages of 21-25 yrs. are found more in the food products and
mobile phones and accessories industries than others.
Table 12: Age profile of employees (Total sample size n = 48)
Industries Under 16 16 – 20 years
21 – 25 years
26 – 30 years
Clothing and footwear 0% 25% 0% 75%
Supermarkets, hypermarkets, Groceries and convenience stores
0% 25% 25% 50%
Electrical and electronics 0% 25% 38% 38%
Food products (Sweet, Confectionery, Bakery) 0% 0% 50% 50%
Mobile phone and mobile accessories 0% 13% 50% 38%
Furniture and furnishing 0% 13% 25% 63%
Overall 0% 17% 31% 52%
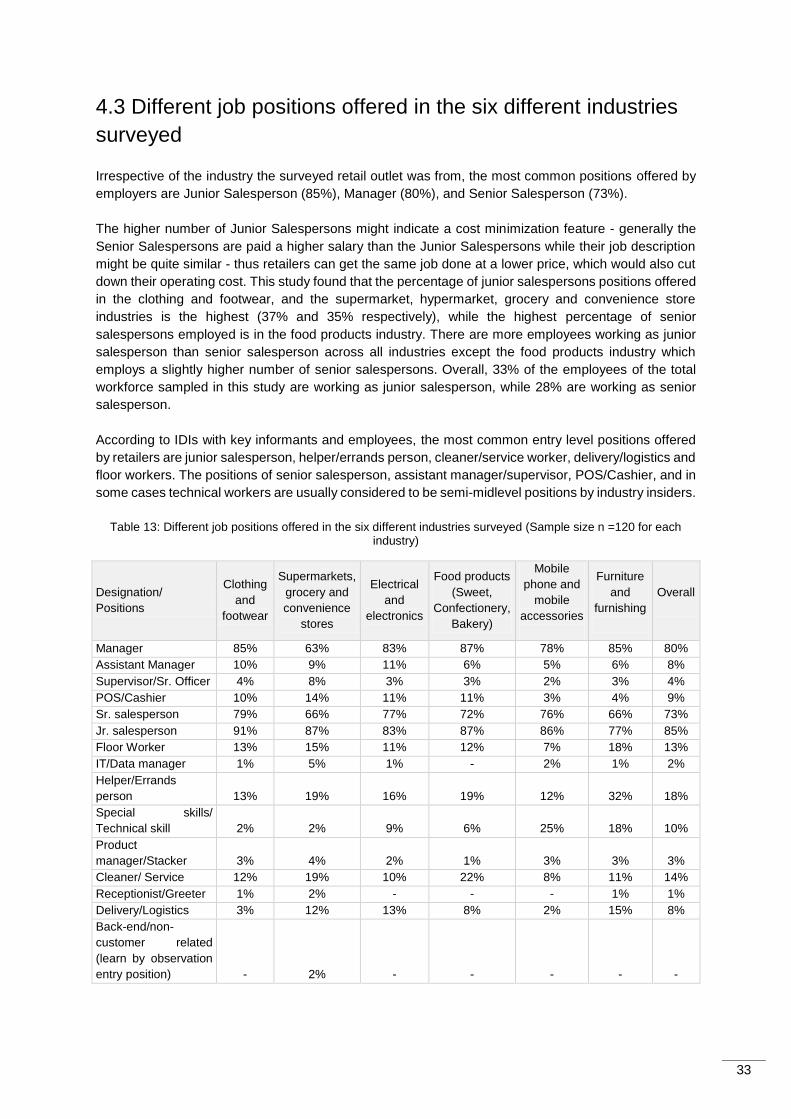
33
4.3 Different job positions offered in the six different industries
surveyed
Irrespective of the industry the surveyed retail outlet was from, the most common positions offered by
employers are Junior Salesperson (85%), Manager (80%), and Senior Salesperson (73%).
The higher number of Junior Salespersons might indicate a cost minimization feature - generally the
Senior Salespersons are paid a higher salary than the Junior Salespersons while their job description
might be quite similar - thus retailers can get the same job done at a lower price, which would also cut
down their operating cost. This study found that the percentage of junior salespersons positions offered
in the clothing and footwear, and the supermarket, hypermarket, grocery and convenience store
industries is the highest (37% and 35% respectively), while the highest percentage of senior
salespersons employed is in the food products industry. There are more employees working as junior
salesperson than senior salesperson across all industries except the food products industry which
employs a slightly higher number of senior salespersons. Overall, 33% of the employees of the total
workforce sampled in this study are working as junior salesperson, while 28% are working as senior
salesperson.
According to IDIs with key informants and employees, the most common entry level positions offered
by retailers are junior salesperson, helper/errands person, cleaner/service worker, delivery/logistics and
floor workers. The positions of senior salesperson, assistant manager/supervisor, POS/Cashier, and in
some cases technical workers are usually considered to be semi-midlevel positions by industry insiders.
Table 13: Different job positions offered in the six different industries surveyed (Sample size n =120 for each industry)
Designation/
Positions
Clothing
and
footwear
Supermarkets,
grocery and
convenience
stores
Electrical
and
electronics
Food products
(Sweet,
Confectionery,
Bakery)
Mobile
phone and
mobile
accessories
Furniture
and
furnishing
Overall
Manager 85% 63% 83% 87% 78% 85% 80%
Assistant Manager 10% 9% 11% 6% 5% 6% 8%
Supervisor/Sr. Officer 4% 8% 3% 3% 2% 3% 4%
POS/Cashier 10% 14% 11% 11% 3% 4% 9%
Sr. salesperson 79% 66% 77% 72% 76% 66% 73%
Jr. salesperson 91% 87% 83% 87% 86% 77% 85%
Floor Worker 13% 15% 11% 12% 7% 18% 13%
IT/Data manager 1% 5% 1% - 2% 1% 2%
Helper/Errands
person 13% 19% 16% 19% 12% 32% 18%
Special skills/
Technical skill 2% 2% 9% 6% 25% 18% 10%
Product
manager/Stacker 3% 4% 2% 1% 3% 3% 3%
Cleaner/ Service 12% 19% 10% 22% 8% 11% 14%
Receptionist/Greeter 1% 2% - - - 1% 1%
Delivery/Logistics 3% 12% 13% 8% 2% 15% 8%
Back-end/non-
customer related
(learn by observation
entry position) - 2% - - - - -
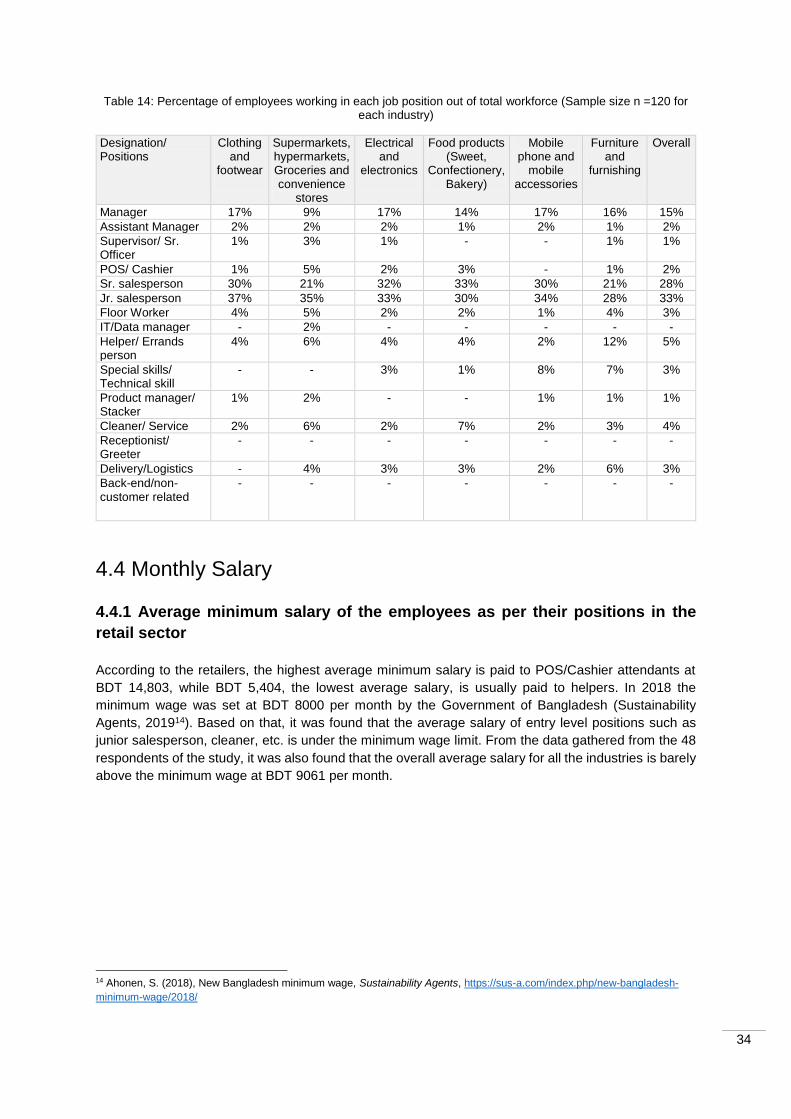
34
Table 14: Percentage of employees working in each job position out of total workforce (Sample size n =120 for each industry)
Designation/ Positions
Clothing and
footwear
Supermarkets, hypermarkets, Groceries and convenience
stores
Electrical and
electronics
Food products (Sweet,
Confectionery, Bakery)
Mobile phone and
mobile accessories
Furniture and
furnishing
Overall
Manager 17% 9% 17% 14% 17% 16% 15%
Assistant Manager 2% 2% 2% 1% 2% 1% 2%
Supervisor/ Sr. Officer
1% 3% 1% - - 1% 1%
POS/ Cashier 1% 5% 2% 3% - 1% 2%
Sr. salesperson 30% 21% 32% 33% 30% 21% 28%
Jr. salesperson 37% 35% 33% 30% 34% 28% 33%
Floor Worker 4% 5% 2% 2% 1% 4% 3%
IT/Data manager - 2% - - - - -
Helper/ Errands person
4% 6% 4% 4% 2% 12% 5%
Special skills/ Technical skill
- - 3% 1% 8% 7% 3%
Product manager/ Stacker
1% 2% - - 1% 1% 1%
Cleaner/ Service 2% 6% 2% 7% 2% 3% 4%
Receptionist/ Greeter
- - - - - - -
Delivery/Logistics - 4% 3% 3% 2% 6% 3%
Back-end/non-customer related
- - - - - - -
4.4 Monthly Salary
4.4.1 Average minimum salary of the employees as per their positions in the
retail sector
According to the retailers, the highest average minimum salary is paid to POS/Cashier attendants at
BDT 14,803, while BDT 5,404, the lowest average salary, is usually paid to helpers. In 2018 the
minimum wage was set at BDT 8000 per month by the Government of Bangladesh (Sustainability
Agents, 201914). Based on that, it was found that the average salary of entry level positions such as
junior salesperson, cleaner, etc. is under the minimum wage limit. From the data gathered from the 48
respondents of the study, it was also found that the overall average salary for all the industries is barely
above the minimum wage at BDT 9061 per month.
14 Ahonen, S. (2018), New Bangladesh minimum wage, Sustainability Agents, https://sus-a.com/index.php/new-bangladesh-
minimum-wage/2018/
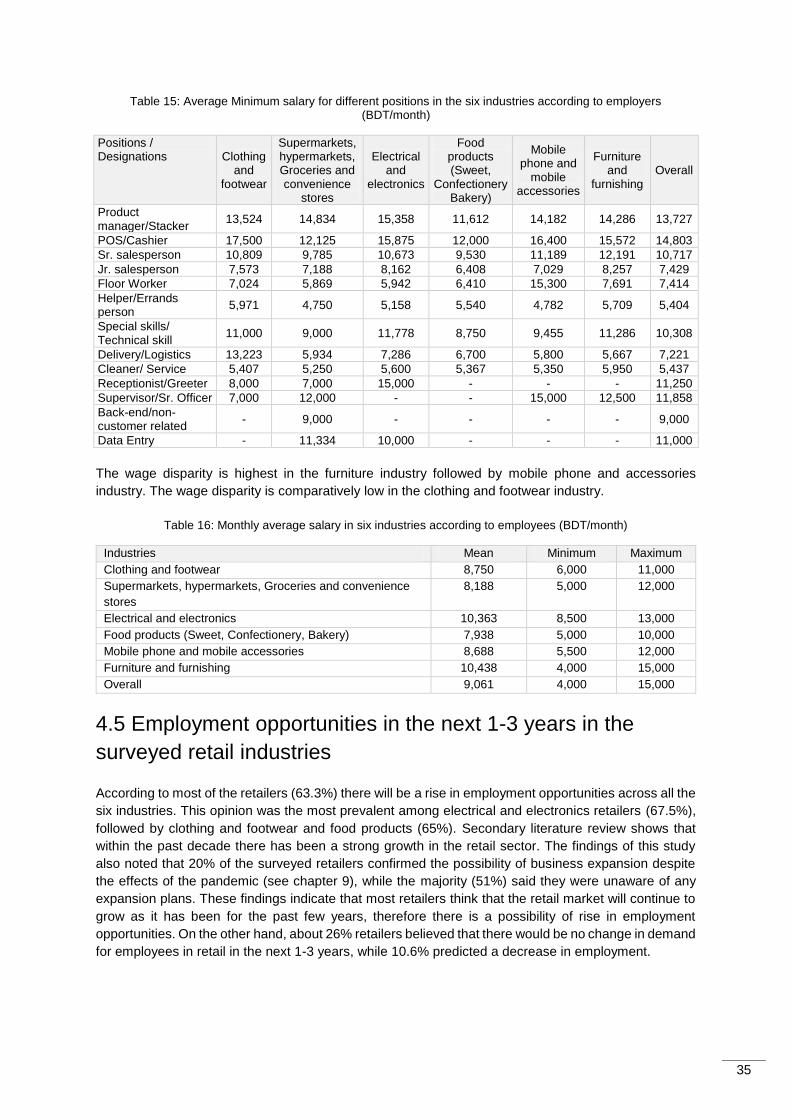
35
Table 15: Average Minimum salary for different positions in the six industries according to employers (BDT/month)
Positions / Designations Clothing
and footwear
Supermarkets, hypermarkets, Groceries and convenience
stores
Electrical and
electronics
Food products (Sweet,
ConfectioneryBakery)
Mobile phone and
mobile accessories
Furniture and
furnishing Overall
Product manager/Stacker
13,524 14,834 15,358 11,612 14,182 14,286 13,727
POS/Cashier 17,500 12,125 15,875 12,000 16,400 15,572 14,803
Sr. salesperson 10,809 9,785 10,673 9,530 11,189 12,191 10,717
Jr. salesperson 7,573 7,188 8,162 6,408 7,029 8,257 7,429
Floor Worker 7,024 5,869 5,942 6,410 15,300 7,691 7,414
Helper/Errands person
5,971 4,750 5,158 5,540 4,782 5,709 5,404
Special skills/ Technical skill
11,000 9,000 11,778 8,750 9,455 11,286 10,308
Delivery/Logistics 13,223 5,934 7,286 6,700 5,800 5,667 7,221
Cleaner/ Service 5,407 5,250 5,600 5,367 5,350 5,950 5,437
Receptionist/Greeter 8,000 7,000 15,000 - - - 11,250
Supervisor/Sr. Officer 7,000 12,000 - - 15,000 12,500 11,858
Back-end/non-customer related
- 9,000 - - - - 9,000
Data Entry - 11,334 10,000 - - - 11,000
The wage disparity is highest in the furniture industry followed by mobile phone and accessories
industry. The wage disparity is comparatively low in the clothing and footwear industry.
Table 16: Monthly average salary in six industries according to employees (BDT/month)
Industries Mean Minimum Maximum
Clothing and footwear 8,750 6,000 11,000
Supermarkets, hypermarkets, Groceries and convenience
stores
8,188 5,000 12,000
Electrical and electronics 10,363 8,500 13,000
Food products (Sweet, Confectionery, Bakery) 7,938 5,000 10,000
Mobile phone and mobile accessories 8,688 5,500 12,000
Furniture and furnishing 10,438 4,000 15,000
Overall 9,061 4,000 15,000
4.5 Employment opportunities in the next 1-3 years in the
surveyed retail industries
According to most of the retailers (63.3%) there will be a rise in employment opportunities across all the
six industries. This opinion was the most prevalent among electrical and electronics retailers (67.5%),
followed by clothing and footwear and food products (65%). Secondary literature review shows that
within the past decade there has been a strong growth in the retail sector. The findings of this study
also noted that 20% of the surveyed retailers confirmed the possibility of business expansion despite
the effects of the pandemic (see chapter 9), while the majority (51%) said they were unaware of any
expansion plans. These findings indicate that most retailers think that the retail market will continue to
grow as it has been for the past few years, therefore there is a possibility of rise in employment
opportunities. On the other hand, about 26% retailers believed that there would be no change in demand
for employees in retail in the next 1-3 years, while 10.6% predicted a decrease in employment.
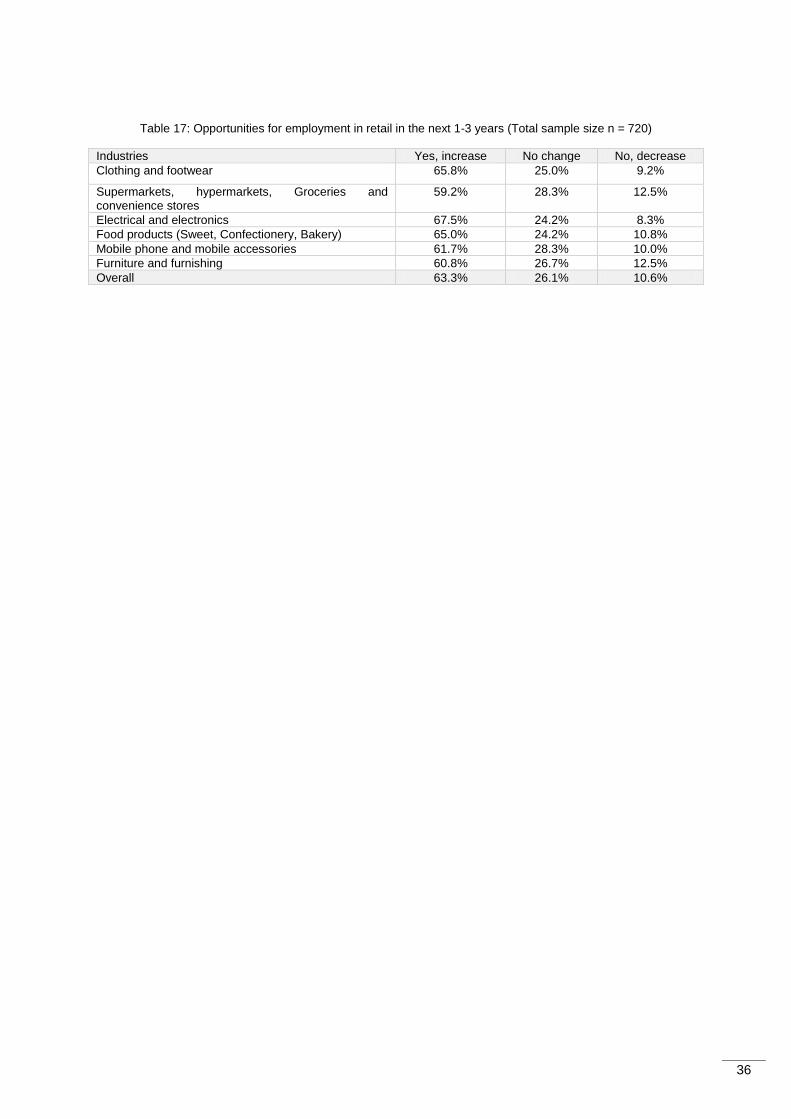
36
Table 17: Opportunities for employment in retail in the next 1-3 years (Total sample size n = 720)
Industries Yes, increase No change No, decrease
Clothing and footwear 65.8% 25.0% 9.2%
Supermarkets, hypermarkets, Groceries and convenience stores
59.2% 28.3% 12.5%
Electrical and electronics 67.5% 24.2% 8.3%
Food products (Sweet, Confectionery, Bakery) 65.0% 24.2% 10.8%
Mobile phone and mobile accessories 61.7% 28.3% 10.0%
Furniture and furnishing 60.8% 26.7% 12.5%
Overall 63.3% 26.1% 10.6%
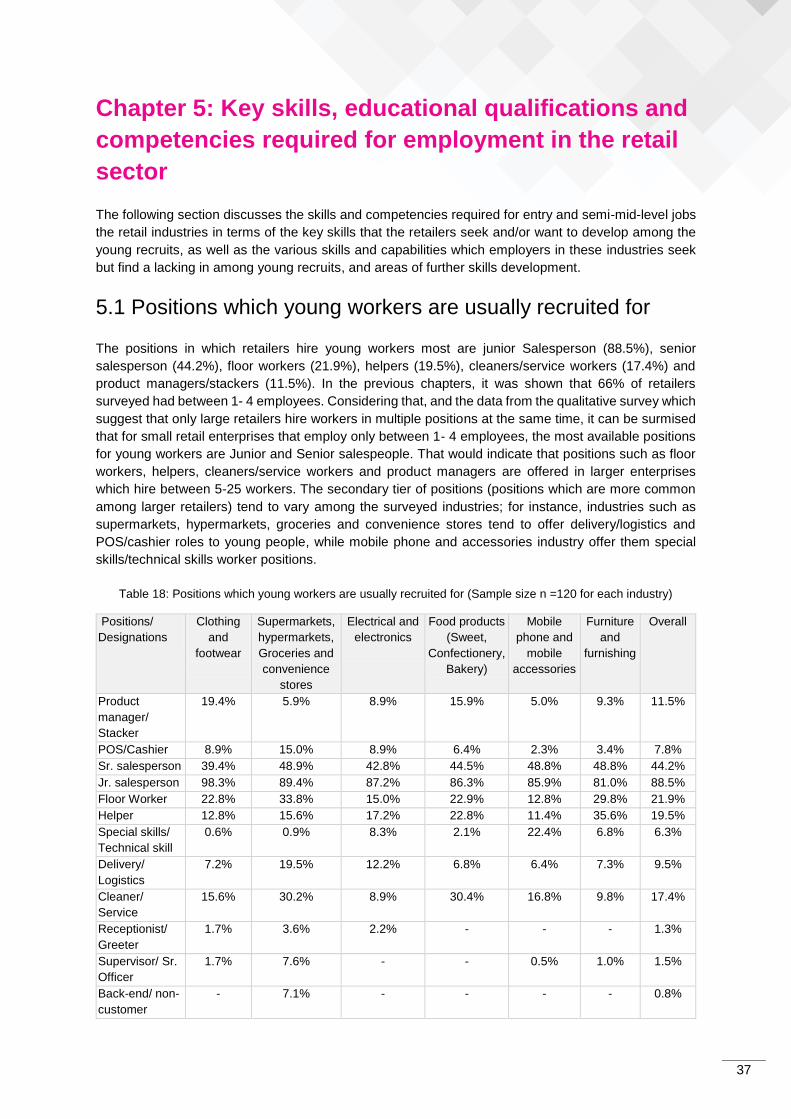
37
Chapter 5: Key skills, educational qualifications and
competencies required for employment in the retail
sector
The following section discusses the skills and competencies required for entry and semi-mid-level jobs
the retail industries in terms of the key skills that the retailers seek and/or want to develop among the
young recruits, as well as the various skills and capabilities which employers in these industries seek
but find a lacking in among young recruits, and areas of further skills development.
5.1 Positions which young workers are usually recruited for
The positions in which retailers hire young workers most are junior Salesperson (88.5%), senior
salesperson (44.2%), floor workers (21.9%), helpers (19.5%), cleaners/service workers (17.4%) and
product managers/stackers (11.5%). In the previous chapters, it was shown that 66% of retailers
surveyed had between 1- 4 employees. Considering that, and the data from the qualitative survey which
suggest that only large retailers hire workers in multiple positions at the same time, it can be surmised
that for small retail enterprises that employ only between 1- 4 employees, the most available positions
for young workers are Junior and Senior salespeople. That would indicate that positions such as floor
workers, helpers, cleaners/service workers and product managers are offered in larger enterprises
which hire between 5-25 workers. The secondary tier of positions (positions which are more common
among larger retailers) tend to vary among the surveyed industries; for instance, industries such as
supermarkets, hypermarkets, groceries and convenience stores tend to offer delivery/logistics and
POS/cashier roles to young people, while mobile phone and accessories industry offer them special
skills/technical skills worker positions.
Table 18: Positions which young workers are usually recruited for (Sample size n =120 for each industry)
Positions/
Designations
Clothing
and
footwear
Supermarkets,
hypermarkets,
Groceries and
convenience
stores
Electrical and
electronics
Food products
(Sweet,
Confectionery,
Bakery)
Mobile
phone and
mobile
accessories
Furniture
and
furnishing
Overall
Product
manager/
Stacker
19.4% 5.9% 8.9% 15.9% 5.0% 9.3% 11.5%
POS/Cashier 8.9% 15.0% 8.9% 6.4% 2.3% 3.4% 7.8%
Sr. salesperson 39.4% 48.9% 42.8% 44.5% 48.8% 48.8% 44.2%
Jr. salesperson 98.3% 89.4% 87.2% 86.3% 85.9% 81.0% 88.5%
Floor Worker 22.8% 33.8% 15.0% 22.9% 12.8% 29.8% 21.9%
Helper 12.8% 15.6% 17.2% 22.8% 11.4% 35.6% 19.5%
Special skills/
Technical skill
0.6% 0.9% 8.3% 2.1% 22.4% 6.8% 6.3%
Delivery/
Logistics
7.2% 19.5% 12.2% 6.8% 6.4% 7.3% 9.5%
Cleaner/
Service
15.6% 30.2% 8.9% 30.4% 16.8% 9.8% 17.4%
Receptionist/
Greeter
1.7% 3.6% 2.2% - - - 1.3%
Supervisor/ Sr.
Officer
1.7% 7.6% - - 0.5% 1.0% 1.5%
Back-end/ non-
customer
- 7.1% - - - - 0.8%
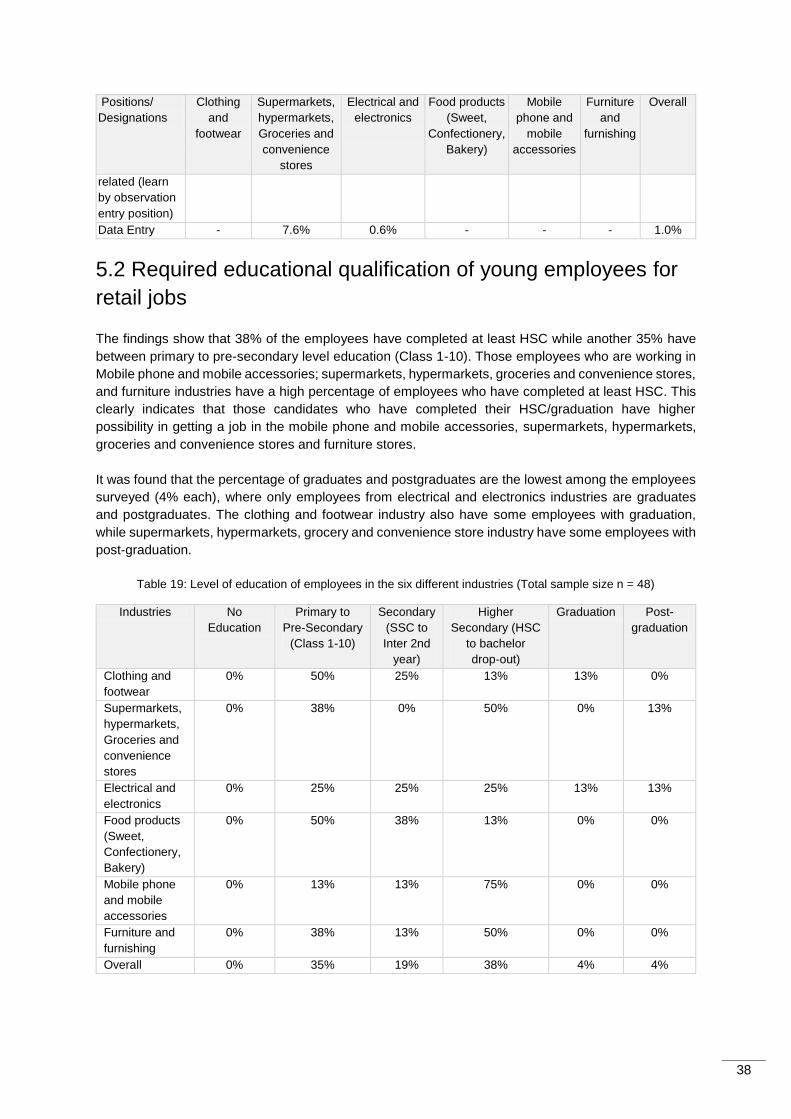
38
Positions/
Designations
Clothing
and
footwear
Supermarkets,
hypermarkets,
Groceries and
convenience
stores
Electrical and
electronics
Food products
(Sweet,
Confectionery,
Bakery)
Mobile
phone and
mobile
accessories
Furniture
and
furnishing
Overall
related (learn
by observation
entry position)
Data Entry - 7.6% 0.6% - - - 1.0%
5.2 Required educational qualification of young employees for
retail jobs
The findings show that 38% of the employees have completed at least HSC while another 35% have
between primary to pre-secondary level education (Class 1-10). Those employees who are working in
Mobile phone and mobile accessories; supermarkets, hypermarkets, groceries and convenience stores,
and furniture industries have a high percentage of employees who have completed at least HSC. This
clearly indicates that those candidates who have completed their HSC/graduation have higher
possibility in getting a job in the mobile phone and mobile accessories, supermarkets, hypermarkets,
groceries and convenience stores and furniture stores.
It was found that the percentage of graduates and postgraduates are the lowest among the employees
surveyed (4% each), where only employees from electrical and electronics industries are graduates
and postgraduates. The clothing and footwear industry also have some employees with graduation,
while supermarkets, hypermarkets, grocery and convenience store industry have some employees with
post-graduation.
Table 19: Level of education of employees in the six different industries (Total sample size n = 48)
Industries No
Education
Primary to
Pre-Secondary
(Class 1-10)
Secondary
(SSC to
Inter 2nd
year)
Higher
Secondary (HSC
to bachelor
drop-out)
Graduation Post-
graduation
Clothing and
footwear
0% 50% 25% 13% 13% 0%
Supermarkets,
hypermarkets,
Groceries and
convenience
stores
0% 38% 0% 50% 0% 13%
Electrical and
electronics
0% 25% 25% 25% 13% 13%
Food products
(Sweet,
Confectionery,
Bakery)
0% 50% 38% 13% 0% 0%
Mobile phone
and mobile
accessories
0% 13% 13% 75% 0% 0%
Furniture and
furnishing
0% 38% 13% 50% 0% 0%
Overall 0% 35% 19% 38% 4% 4%
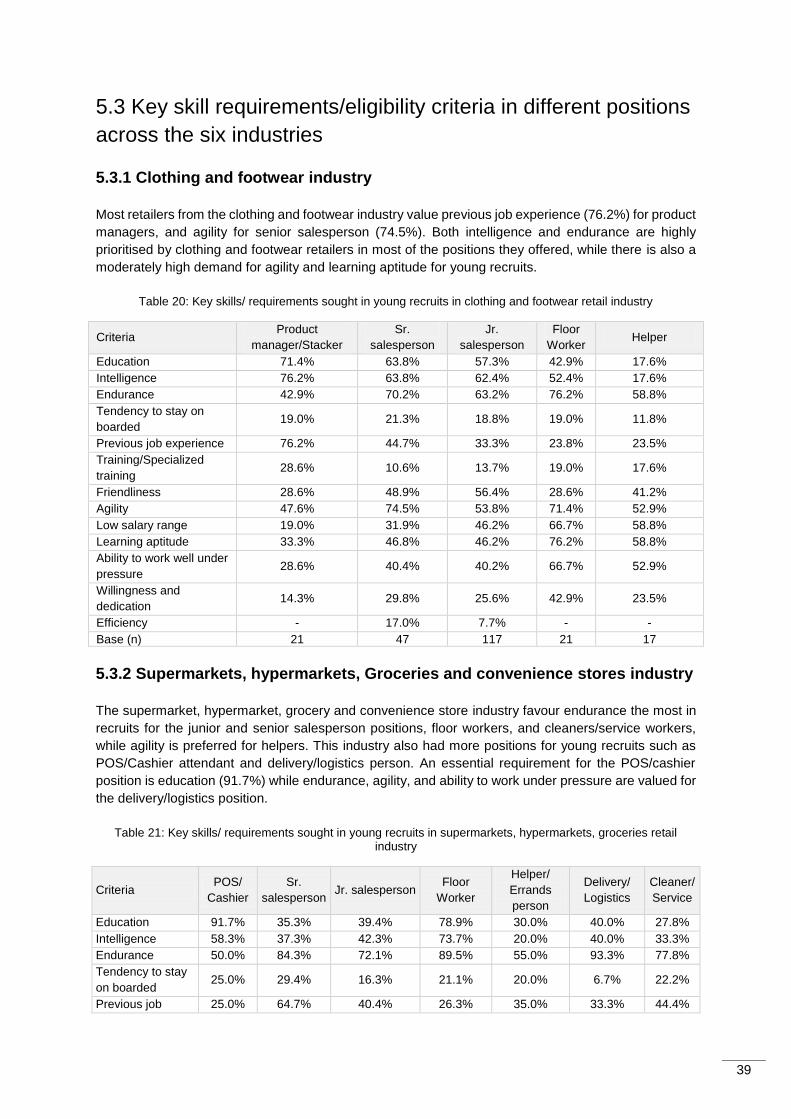
39
5.3 Key skill requirements/eligibility criteria in different positions
across the six industries
5.3.1 Clothing and footwear industry
Most retailers from the clothing and footwear industry value previous job experience (76.2%) for product
managers, and agility for senior salesperson (74.5%). Both intelligence and endurance are highly
prioritised by clothing and footwear retailers in most of the positions they offered, while there is also a
moderately high demand for agility and learning aptitude for young recruits.
Table 20: Key skills/ requirements sought in young recruits in clothing and footwear retail industry
Criteria Product
manager/Stacker
Sr.
salesperson
Jr.
salesperson
Floor
Worker Helper
Education 71.4% 63.8% 57.3% 42.9% 17.6%
Intelligence 76.2% 63.8% 62.4% 52.4% 17.6%
Endurance 42.9% 70.2% 63.2% 76.2% 58.8%
Tendency to stay on
boarded 19.0% 21.3% 18.8% 19.0% 11.8%
Previous job experience 76.2% 44.7% 33.3% 23.8% 23.5%
Training/Specialized
training 28.6% 10.6% 13.7% 19.0% 17.6%
Friendliness 28.6% 48.9% 56.4% 28.6% 41.2%
Agility 47.6% 74.5% 53.8% 71.4% 52.9%
Low salary range 19.0% 31.9% 46.2% 66.7% 58.8%
Learning aptitude 33.3% 46.8% 46.2% 76.2% 58.8%
Ability to work well under
pressure 28.6% 40.4% 40.2% 66.7% 52.9%
Willingness and
dedication 14.3% 29.8% 25.6% 42.9% 23.5%
Efficiency - 17.0% 7.7% - -
Base (n) 21 47 117 21 17
5.3.2 Supermarkets, hypermarkets, Groceries and convenience stores industry
The supermarket, hypermarket, grocery and convenience store industry favour endurance the most in
recruits for the junior and senior salesperson positions, floor workers, and cleaners/service workers,
while agility is preferred for helpers. This industry also had more positions for young recruits such as
POS/Cashier attendant and delivery/logistics person. An essential requirement for the POS/cashier
position is education (91.7%) while endurance, agility, and ability to work under pressure are valued for
the delivery/logistics position.
Table 21: Key skills/ requirements sought in young recruits in supermarkets, hypermarkets, groceries retail industry
Criteria POS/
Cashier
Sr.
salesperson Jr. salesperson
Floor
Worker
Helper/
Errands
person
Delivery/
Logistics
Cleaner/
Service
Education 91.7% 35.3% 39.4% 78.9% 30.0% 40.0% 27.8%
Intelligence 58.3% 37.3% 42.3% 73.7% 20.0% 40.0% 33.3%
Endurance 50.0% 84.3% 72.1% 89.5% 55.0% 93.3% 77.8%
Tendency to stay
on boarded 25.0% 29.4% 16.3% 21.1% 20.0% 6.7% 22.2%
Previous job 25.0% 64.7% 40.4% 26.3% 35.0% 33.3% 44.4%
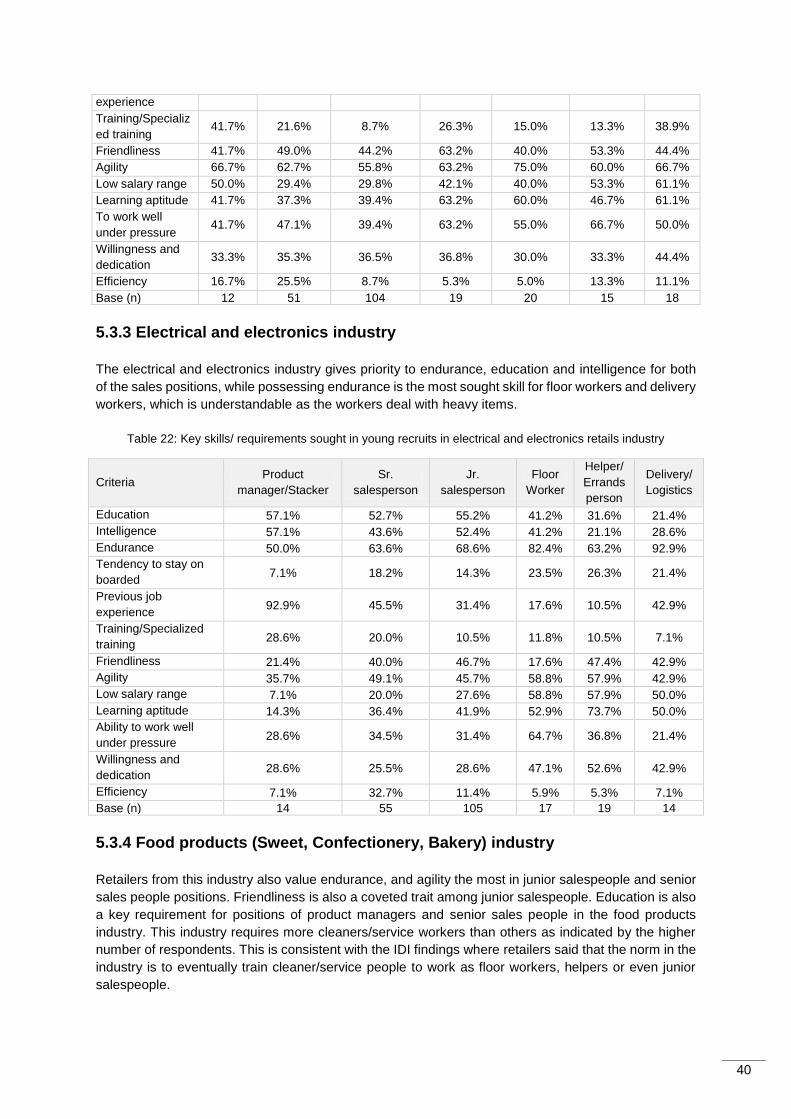
40
experience
Training/Specializ
ed training 41.7% 21.6% 8.7% 26.3% 15.0% 13.3% 38.9%
Friendliness 41.7% 49.0% 44.2% 63.2% 40.0% 53.3% 44.4%
Agility 66.7% 62.7% 55.8% 63.2% 75.0% 60.0% 66.7%
Low salary range 50.0% 29.4% 29.8% 42.1% 40.0% 53.3% 61.1%
Learning aptitude 41.7% 37.3% 39.4% 63.2% 60.0% 46.7% 61.1%
To work well
under pressure 41.7% 47.1% 39.4% 63.2% 55.0% 66.7% 50.0%
Willingness and
dedication 33.3% 35.3% 36.5% 36.8% 30.0% 33.3% 44.4%
Efficiency 16.7% 25.5% 8.7% 5.3% 5.0% 13.3% 11.1%
Base (n) 12 51 104 19 20 15 18
5.3.3 Electrical and electronics industry
The electrical and electronics industry gives priority to endurance, education and intelligence for both
of the sales positions, while possessing endurance is the most sought skill for floor workers and delivery
workers, which is understandable as the workers deal with heavy items.
Table 22: Key skills/ requirements sought in young recruits in electrical and electronics retails industry
Criteria Product
manager/Stacker
Sr.
salesperson
Jr.
salesperson
Floor
Worker
Helper/
Errands
person
Delivery/
Logistics
Education 57.1% 52.7% 55.2% 41.2% 31.6% 21.4%
Intelligence 57.1% 43.6% 52.4% 41.2% 21.1% 28.6%
Endurance 50.0% 63.6% 68.6% 82.4% 63.2% 92.9%
Tendency to stay on
boarded 7.1% 18.2% 14.3% 23.5% 26.3% 21.4%
Previous job
experience 92.9% 45.5% 31.4% 17.6% 10.5% 42.9%
Training/Specialized
training 28.6% 20.0% 10.5% 11.8% 10.5% 7.1%
Friendliness 21.4% 40.0% 46.7% 17.6% 47.4% 42.9%
Agility 35.7% 49.1% 45.7% 58.8% 57.9% 42.9%
Low salary range 7.1% 20.0% 27.6% 58.8% 57.9% 50.0%
Learning aptitude 14.3% 36.4% 41.9% 52.9% 73.7% 50.0%
Ability to work well
under pressure 28.6% 34.5% 31.4% 64.7% 36.8% 21.4%
Willingness and
dedication 28.6% 25.5% 28.6% 47.1% 52.6% 42.9%
Efficiency 7.1% 32.7% 11.4% 5.9% 5.3% 7.1%
Base (n) 14 55 105 17 19 14
5.3.4 Food products (Sweet, Confectionery, Bakery) industry
Retailers from this industry also value endurance, and agility the most in junior salespeople and senior
sales people positions. Friendliness is also a coveted trait among junior salespeople. Education is also
a key requirement for positions of product managers and senior sales people in the food products
industry. This industry requires more cleaners/service workers than others as indicated by the higher
number of respondents. This is consistent with the IDI findings where retailers said that the norm in the
industry is to eventually train cleaner/service people to work as floor workers, helpers or even junior
salespeople.
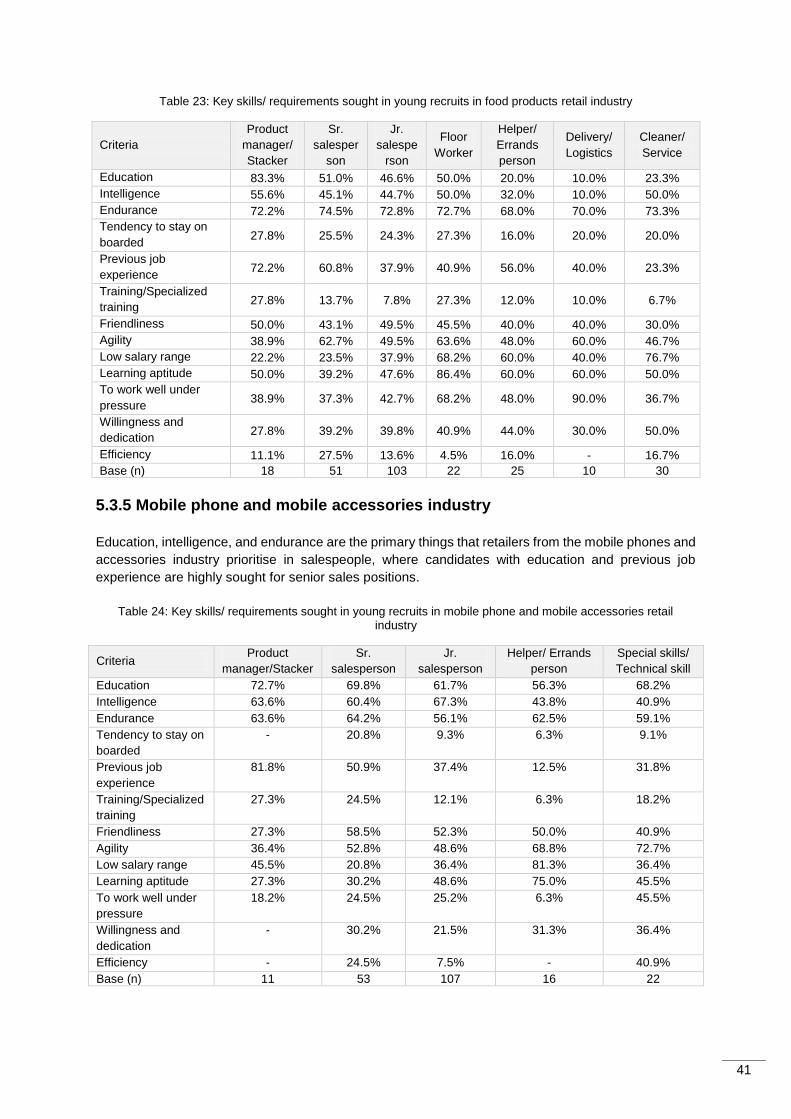
41
Table 23: Key skills/ requirements sought in young recruits in food products retail industry
Criteria
Product
manager/
Stacker
Sr.
salesper
son
Jr.
salespe
rson
Floor
Worker
Helper/
Errands
person
Delivery/
Logistics
Cleaner/
Service
Education 83.3% 51.0% 46.6% 50.0% 20.0% 10.0% 23.3%
Intelligence 55.6% 45.1% 44.7% 50.0% 32.0% 10.0% 50.0%
Endurance 72.2% 74.5% 72.8% 72.7% 68.0% 70.0% 73.3%
Tendency to stay on
boarded 27.8% 25.5% 24.3% 27.3% 16.0% 20.0% 20.0%
Previous job
experience 72.2% 60.8% 37.9% 40.9% 56.0% 40.0% 23.3%
Training/Specialized
training 27.8% 13.7% 7.8% 27.3% 12.0% 10.0% 6.7%
Friendliness 50.0% 43.1% 49.5% 45.5% 40.0% 40.0% 30.0%
Agility 38.9% 62.7% 49.5% 63.6% 48.0% 60.0% 46.7%
Low salary range 22.2% 23.5% 37.9% 68.2% 60.0% 40.0% 76.7%
Learning aptitude 50.0% 39.2% 47.6% 86.4% 60.0% 60.0% 50.0%
To work well under
pressure 38.9% 37.3% 42.7% 68.2% 48.0% 90.0% 36.7%
Willingness and
dedication 27.8% 39.2% 39.8% 40.9% 44.0% 30.0% 50.0%
Efficiency 11.1% 27.5% 13.6% 4.5% 16.0% - 16.7%
Base (n) 18 51 103 22 25 10 30
5.3.5 Mobile phone and mobile accessories industry
Education, intelligence, and endurance are the primary things that retailers from the mobile phones and
accessories industry prioritise in salespeople, where candidates with education and previous job
experience are highly sought for senior sales positions.
Table 24: Key skills/ requirements sought in young recruits in mobile phone and mobile accessories retail industry
Criteria Product
manager/Stacker
Sr.
salesperson
Jr.
salesperson
Helper/ Errands
person
Special skills/
Technical skill
Education 72.7% 69.8% 61.7% 56.3% 68.2%
Intelligence 63.6% 60.4% 67.3% 43.8% 40.9%
Endurance 63.6% 64.2% 56.1% 62.5% 59.1%
Tendency to stay on
boarded
- 20.8% 9.3% 6.3% 9.1%
Previous job
experience
81.8% 50.9% 37.4% 12.5% 31.8%
Training/Specialized
training
27.3% 24.5% 12.1% 6.3% 18.2%
Friendliness 27.3% 58.5% 52.3% 50.0% 40.9%
Agility 36.4% 52.8% 48.6% 68.8% 72.7%
Low salary range 45.5% 20.8% 36.4% 81.3% 36.4%
Learning aptitude 27.3% 30.2% 48.6% 75.0% 45.5%
To work well under
pressure
18.2% 24.5% 25.2% 6.3% 45.5%
Willingness and
dedication
- 30.2% 21.5% 31.3% 36.4%
Efficiency - 24.5% 7.5% - 40.9%
Base (n) 11 53 107 16 22
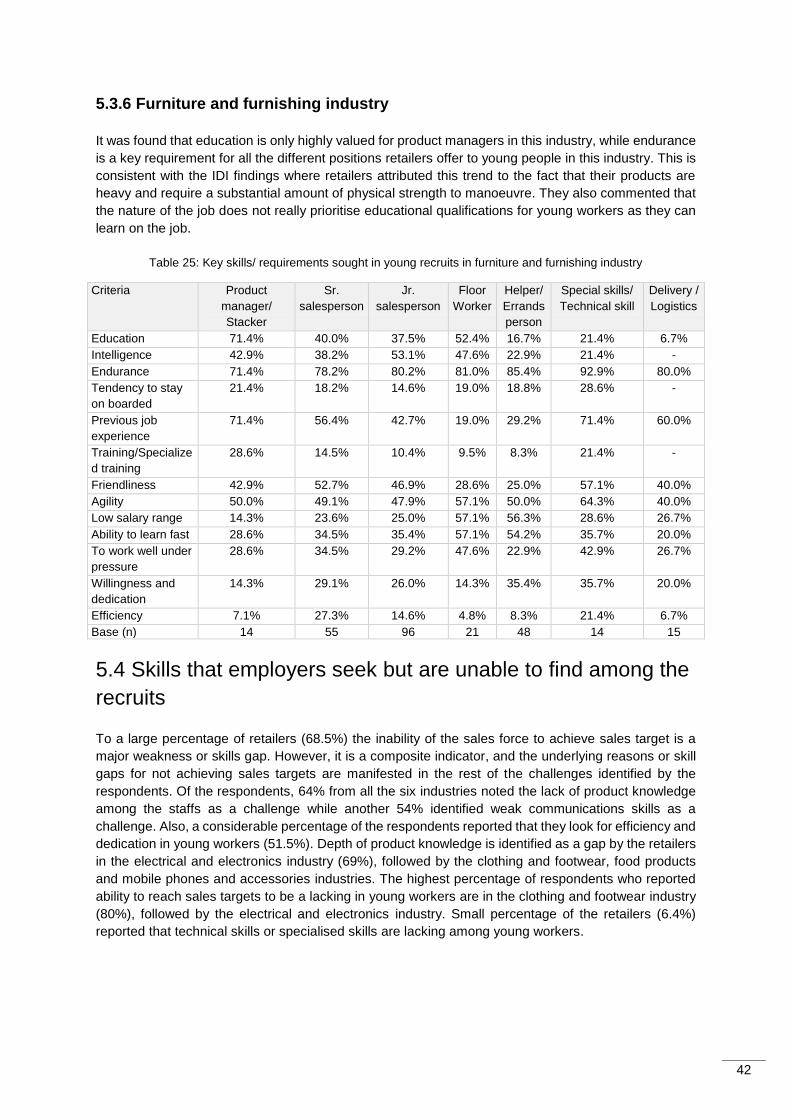
42
5.3.6 Furniture and furnishing industry
It was found that education is only highly valued for product managers in this industry, while endurance
is a key requirement for all the different positions retailers offer to young people in this industry. This is
consistent with the IDI findings where retailers attributed this trend to the fact that their products are
heavy and require a substantial amount of physical strength to manoeuvre. They also commented that
the nature of the job does not really prioritise educational qualifications for young workers as they can
learn on the job.
Table 25: Key skills/ requirements sought in young recruits in furniture and furnishing industry
Criteria Product
manager/
Stacker
Sr.
salesperson
Jr.
salesperson
Floor
Worker
Helper/
Errands
person
Special skills/
Technical skill
Delivery /
Logistics
Education 71.4% 40.0% 37.5% 52.4% 16.7% 21.4% 6.7%
Intelligence 42.9% 38.2% 53.1% 47.6% 22.9% 21.4% -
Endurance 71.4% 78.2% 80.2% 81.0% 85.4% 92.9% 80.0%
Tendency to stay
on boarded
21.4% 18.2% 14.6% 19.0% 18.8% 28.6% -
Previous job
experience
71.4% 56.4% 42.7% 19.0% 29.2% 71.4% 60.0%
Training/Specialize
d training
28.6% 14.5% 10.4% 9.5% 8.3% 21.4% -
Friendliness 42.9% 52.7% 46.9% 28.6% 25.0% 57.1% 40.0%
Agility 50.0% 49.1% 47.9% 57.1% 50.0% 64.3% 40.0%
Low salary range 14.3% 23.6% 25.0% 57.1% 56.3% 28.6% 26.7%
Ability to learn fast 28.6% 34.5% 35.4% 57.1% 54.2% 35.7% 20.0%
To work well under
pressure
28.6% 34.5% 29.2% 47.6% 22.9% 42.9% 26.7%
Willingness and
dedication
14.3% 29.1% 26.0% 14.3% 35.4% 35.7% 20.0%
Efficiency 7.1% 27.3% 14.6% 4.8% 8.3% 21.4% 6.7%
Base (n) 14 55 96 21 48 14 15
5.4 Skills that employers seek but are unable to find among the
recruits
To a large percentage of retailers (68.5%) the inability of the sales force to achieve sales target is a
major weakness or skills gap. However, it is a composite indicator, and the underlying reasons or skill
gaps for not achieving sales targets are manifested in the rest of the challenges identified by the
respondents. Of the respondents, 64% from all the six industries noted the lack of product knowledge
among the staffs as a challenge while another 54% identified weak communications skills as a
challenge. Also, a considerable percentage of the respondents reported that they look for efficiency and
dedication in young workers (51.5%). Depth of product knowledge is identified as a gap by the retailers
in the electrical and electronics industry (69%), followed by the clothing and footwear, food products
and mobile phones and accessories industries. The highest percentage of respondents who reported
ability to reach sales targets to be a lacking in young workers are in the clothing and footwear industry
(80%), followed by the electrical and electronics industry. Small percentage of the retailers (6.4%)
reported that technical skills or specialised skills are lacking among young workers.
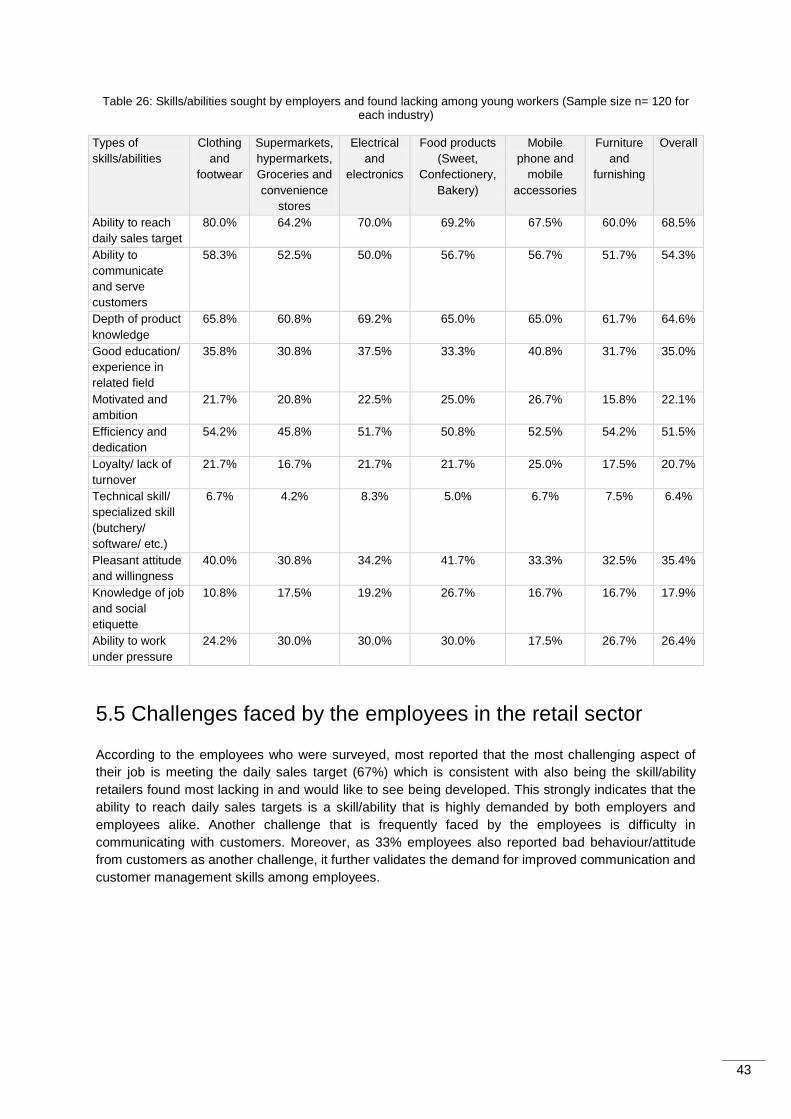
43
Table 26: Skills/abilities sought by employers and found lacking among young workers (Sample size n= 120 for each industry)
Types of
skills/abilities
Clothing
and
footwear
Supermarkets,
hypermarkets,
Groceries and
convenience
stores
Electrical
and
electronics
Food products
(Sweet,
Confectionery,
Bakery)
Mobile
phone and
mobile
accessories
Furniture
and
furnishing
Overall
Ability to reach
daily sales target
80.0% 64.2% 70.0% 69.2% 67.5% 60.0% 68.5%
Ability to
communicate
and serve
customers
58.3% 52.5% 50.0% 56.7% 56.7% 51.7% 54.3%
Depth of product
knowledge
65.8% 60.8% 69.2% 65.0% 65.0% 61.7% 64.6%
Good education/
experience in
related field
35.8% 30.8% 37.5% 33.3% 40.8% 31.7% 35.0%
Motivated and
ambition
21.7% 20.8% 22.5% 25.0% 26.7% 15.8% 22.1%
Efficiency and
dedication
54.2% 45.8% 51.7% 50.8% 52.5% 54.2% 51.5%
Loyalty/ lack of
turnover
21.7% 16.7% 21.7% 21.7% 25.0% 17.5% 20.7%
Technical skill/
specialized skill
(butchery/
software/ etc.)
6.7% 4.2% 8.3% 5.0% 6.7% 7.5% 6.4%
Pleasant attitude
and willingness
40.0% 30.8% 34.2% 41.7% 33.3% 32.5% 35.4%
Knowledge of job
and social
etiquette
10.8% 17.5% 19.2% 26.7% 16.7% 16.7% 17.9%
Ability to work
under pressure
24.2% 30.0% 30.0% 30.0% 17.5% 26.7% 26.4%
5.5 Challenges faced by the employees in the retail sector
According to the employees who were surveyed, most reported that the most challenging aspect of
their job is meeting the daily sales target (67%) which is consistent with also being the skill/ability
retailers found most lacking in and would like to see being developed. This strongly indicates that the
ability to reach daily sales targets is a skill/ability that is highly demanded by both employers and
employees alike. Another challenge that is frequently faced by the employees is difficulty in
communicating with customers. Moreover, as 33% employees also reported bad behaviour/attitude
from customers as another challenge, it further validates the demand for improved communication and
customer management skills among employees.
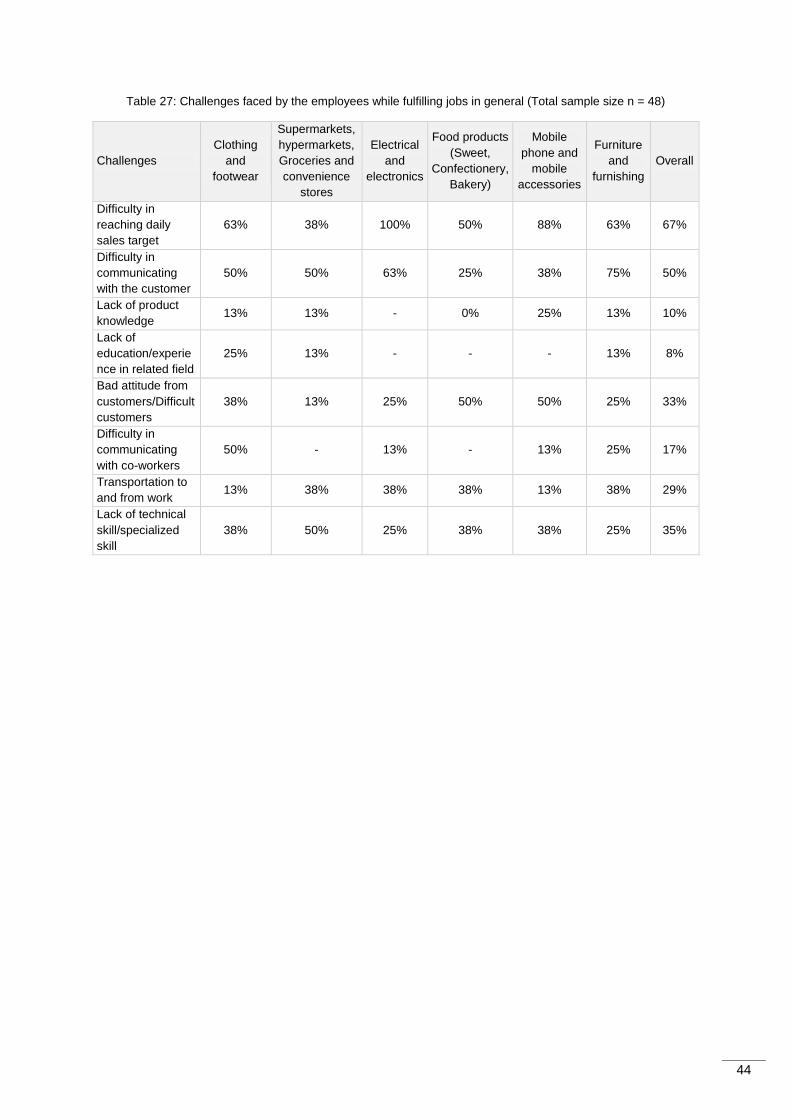
44
Table 27: Challenges faced by the employees while fulfilling jobs in general (Total sample size n = 48)
Challenges
Clothing
and
footwear
Supermarkets,
hypermarkets,
Groceries and
convenience
stores
Electrical
and
electronics
Food products
(Sweet,
Confectionery,
Bakery)
Mobile
phone and
mobile
accessories
Furniture
and
furnishing
Overall
Difficulty in
reaching daily
sales target
63% 38% 100% 50% 88% 63% 67%
Difficulty in
communicating
with the customer
50% 50% 63% 25% 38% 75% 50%
Lack of product
knowledge 13% 13% - 0% 25% 13% 10%
Lack of
education/experie
nce in related field
25% 13% - - - 13% 8%
Bad attitude from
customers/Difficult
customers
38% 13% 25% 50% 50% 25% 33%
Difficulty in
communicating
with co-workers
50% - 13% - 13% 25% 17%
Transportation to
and from work 13% 38% 38% 38% 13% 38% 29%
Lack of technical
skill/specialized
skill
38% 50% 25% 38% 38% 25% 35%
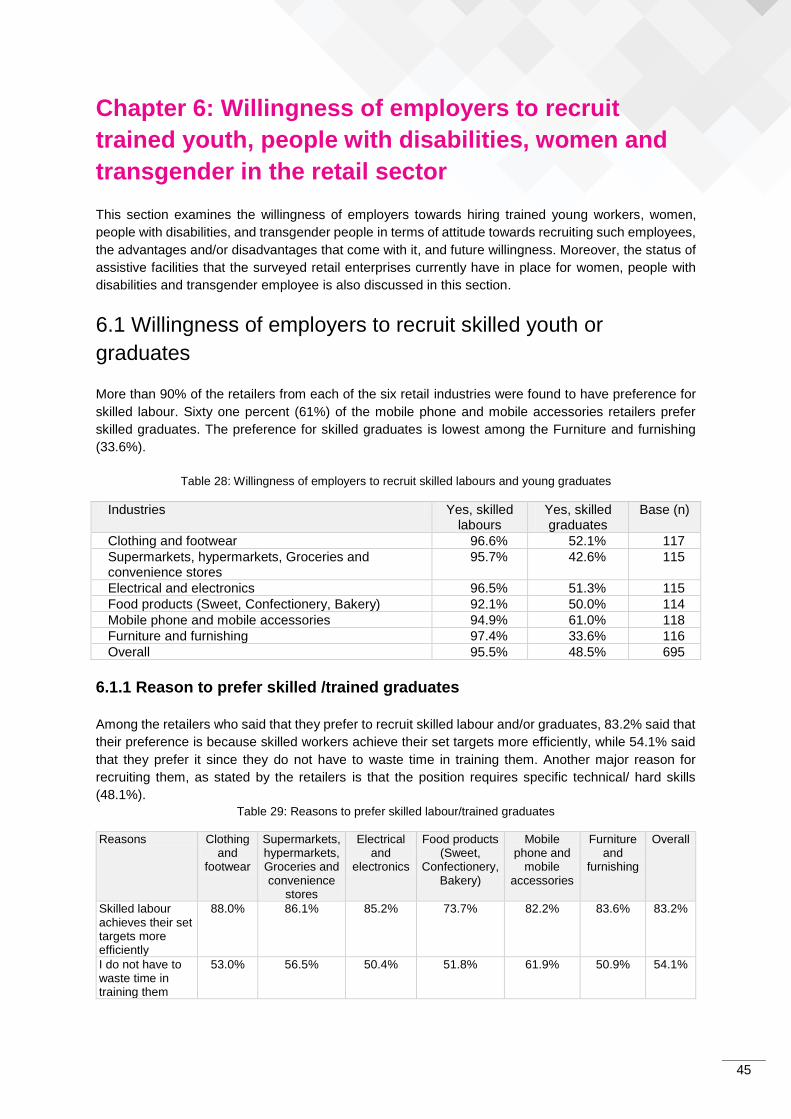
45
Chapter 6: Willingness of employers to recruit
trained youth, people with disabilities, women and
transgender in the retail sector
This section examines the willingness of employers towards hiring trained young workers, women,
people with disabilities, and transgender people in terms of attitude towards recruiting such employees,
the advantages and/or disadvantages that come with it, and future willingness. Moreover, the status of
assistive facilities that the surveyed retail enterprises currently have in place for women, people with
disabilities and transgender employee is also discussed in this section.
6.1 Willingness of employers to recruit skilled youth or
graduates
More than 90% of the retailers from each of the six retail industries were found to have preference for
skilled labour. Sixty one percent (61%) of the mobile phone and mobile accessories retailers prefer
skilled graduates. The preference for skilled graduates is lowest among the Furniture and furnishing
(33.6%).
Table 28: Willingness of employers to recruit skilled labours and young graduates
Industries Yes, skilled labours
Yes, skilled graduates
Base (n)
Clothing and footwear 96.6% 52.1% 117
Supermarkets, hypermarkets, Groceries and convenience stores
95.7% 42.6% 115
Electrical and electronics 96.5% 51.3% 115
Food products (Sweet, Confectionery, Bakery) 92.1% 50.0% 114
Mobile phone and mobile accessories 94.9% 61.0% 118
Furniture and furnishing 97.4% 33.6% 116
Overall 95.5% 48.5% 695
6.1.1 Reason to prefer skilled /trained graduates
Among the retailers who said that they prefer to recruit skilled labour and/or graduates, 83.2% said that
their preference is because skilled workers achieve their set targets more efficiently, while 54.1% said
that they prefer it since they do not have to waste time in training them. Another major reason for
recruiting them, as stated by the retailers is that the position requires specific technical/ hard skills
(48.1%).
Table 29: Reasons to prefer skilled labour/trained graduates
Reasons Clothing and
footwear
Supermarkets, hypermarkets, Groceries and convenience
stores
Electrical and
electronics
Food products (Sweet,
Confectionery, Bakery)
Mobile phone and
mobile accessories
Furniture and
furnishing
Overall
Skilled labour achieves their set targets more efficiently
88.0% 86.1% 85.2% 73.7% 82.2% 83.6% 83.2%
I do not have to waste time in training them
53.0% 56.5% 50.4% 51.8% 61.9% 50.9% 54.1%
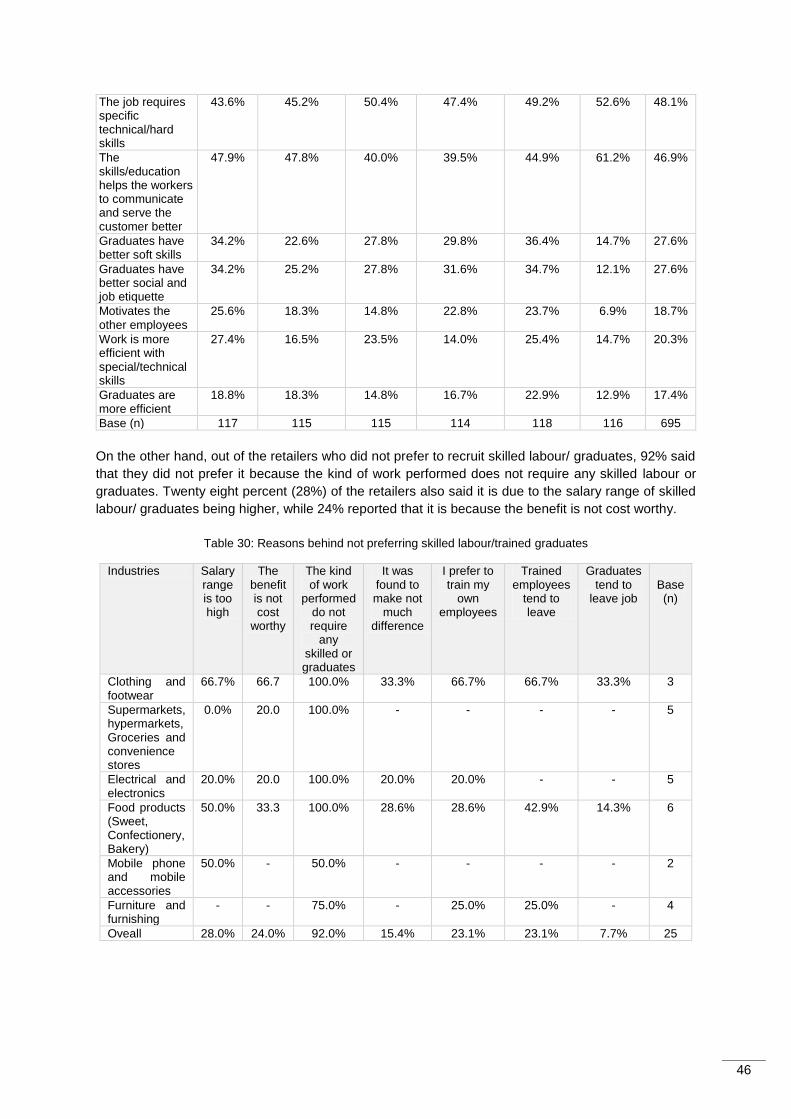
46
The job requires specific technical/hard skills
43.6% 45.2% 50.4% 47.4% 49.2% 52.6% 48.1%
The skills/education helps the workers to communicate and serve the customer better
47.9% 47.8% 40.0% 39.5% 44.9% 61.2% 46.9%
Graduates have better soft skills
34.2% 22.6% 27.8% 29.8% 36.4% 14.7% 27.6%
Graduates have better social and job etiquette
34.2% 25.2% 27.8% 31.6% 34.7% 12.1% 27.6%
Motivates the other employees
25.6% 18.3% 14.8% 22.8% 23.7% 6.9% 18.7%
Work is more efficient with special/technical skills
27.4% 16.5% 23.5% 14.0% 25.4% 14.7% 20.3%
Graduates are more efficient
18.8% 18.3% 14.8% 16.7% 22.9% 12.9% 17.4%
Base (n) 117 115 115 114 118 116 695
On the other hand, out of the retailers who did not prefer to recruit skilled labour/ graduates, 92% said
that they did not prefer it because the kind of work performed does not require any skilled labour or
graduates. Twenty eight percent (28%) of the retailers also said it is due to the salary range of skilled
labour/ graduates being higher, while 24% reported that it is because the benefit is not cost worthy.
Table 30: Reasons behind not preferring skilled labour/trained graduates
Industries Salary range is too high
The benefit is not cost
worthy
The kind of work
performed do not require
any skilled or graduates
It was found to make not
much difference
I prefer to train my
own employees
Trained employees
tend to leave
Graduates tend to
leave job
Base (n)
Clothing and footwear
66.7% 66.7 100.0% 33.3% 66.7% 66.7% 33.3% 3
Supermarkets, hypermarkets, Groceries and convenience stores
0.0% 20.0 100.0% - - - - 5
Electrical and electronics
20.0% 20.0 100.0% 20.0% 20.0% - - 5
Food products (Sweet, Confectionery, Bakery)
50.0% 33.3 100.0% 28.6% 28.6% 42.9% 14.3% 6
Mobile phone and mobile accessories
50.0% - 50.0% - - - - 2
Furniture and furnishing
- - 75.0% - 25.0% 25.0% - 4
Oveall 28.0% 24.0% 92.0% 15.4% 23.1% 23.1% 7.7% 25
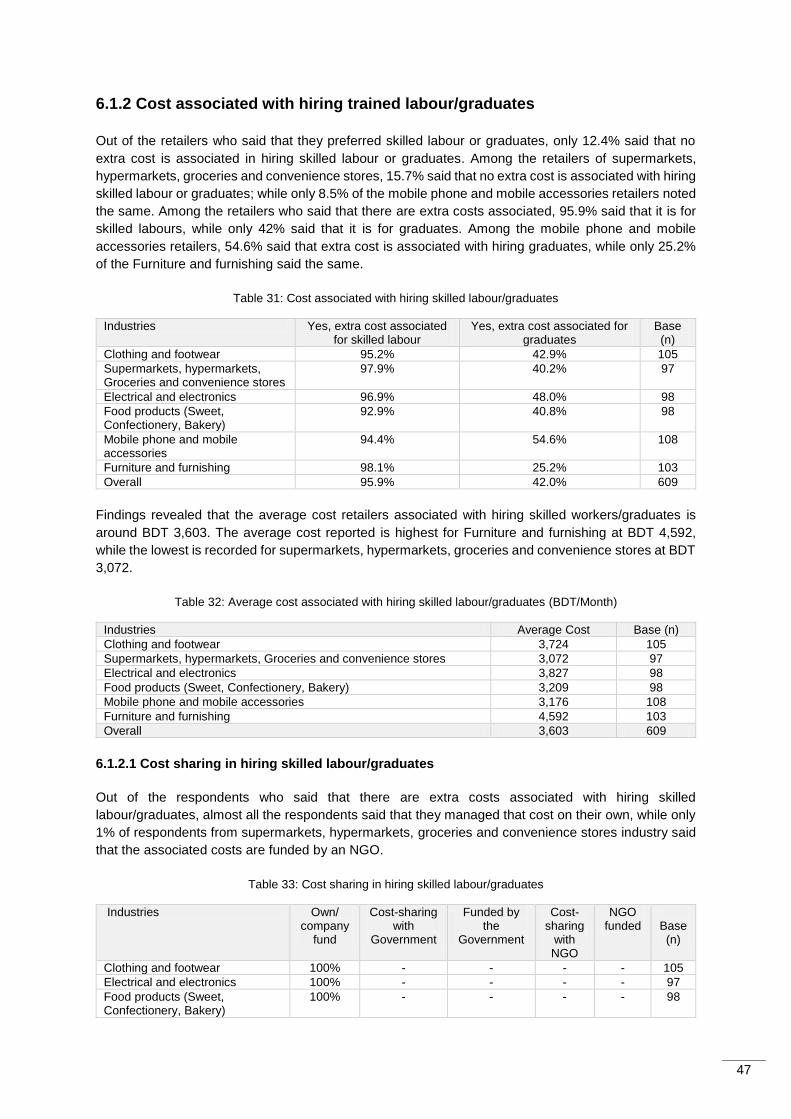
47
6.1.2 Cost associated with hiring trained labour/graduates
Out of the retailers who said that they preferred skilled labour or graduates, only 12.4% said that no
extra cost is associated in hiring skilled labour or graduates. Among the retailers of supermarkets,
hypermarkets, groceries and convenience stores, 15.7% said that no extra cost is associated with hiring
skilled labour or graduates; while only 8.5% of the mobile phone and mobile accessories retailers noted
the same. Among the retailers who said that there are extra costs associated, 95.9% said that it is for
skilled labours, while only 42% said that it is for graduates. Among the mobile phone and mobile
accessories retailers, 54.6% said that extra cost is associated with hiring graduates, while only 25.2%
of the Furniture and furnishing said the same.
Table 31: Cost associated with hiring skilled labour/graduates
Industries Yes, extra cost associated for skilled labour
Yes, extra cost associated for graduates
Base (n)
Clothing and footwear 95.2% 42.9% 105
Supermarkets, hypermarkets, Groceries and convenience stores
97.9% 40.2% 97
Electrical and electronics 96.9% 48.0% 98
Food products (Sweet, Confectionery, Bakery)
92.9% 40.8% 98
Mobile phone and mobile accessories
94.4% 54.6% 108
Furniture and furnishing 98.1% 25.2% 103
Overall 95.9% 42.0% 609
Findings revealed that the average cost retailers associated with hiring skilled workers/graduates is
around BDT 3,603. The average cost reported is highest for Furniture and furnishing at BDT 4,592,
while the lowest is recorded for supermarkets, hypermarkets, groceries and convenience stores at BDT
3,072.
Table 32: Average cost associated with hiring skilled labour/graduates (BDT/Month)
Industries Average Cost Base (n)
Clothing and footwear 3,724 105
Supermarkets, hypermarkets, Groceries and convenience stores 3,072 97
Electrical and electronics 3,827 98
Food products (Sweet, Confectionery, Bakery) 3,209 98
Mobile phone and mobile accessories 3,176 108
Furniture and furnishing 4,592 103
Overall 3,603 609
6.1.2.1 Cost sharing in hiring skilled labour/graduates
Out of the respondents who said that there are extra costs associated with hiring skilled
labour/graduates, almost all the respondents said that they managed that cost on their own, while only
1% of respondents from supermarkets, hypermarkets, groceries and convenience stores industry said
that the associated costs are funded by an NGO.
Table 33: Cost sharing in hiring skilled labour/graduates
Industries Own/ company
fund
Cost-sharing with
Government
Funded by the
Government
Cost-sharing
with NGO
NGO funded
Base (n)
Clothing and footwear 100% - - - - 105
Electrical and electronics 100% - - - - 97
Food products (Sweet, Confectionery, Bakery)
100% - - - - 98
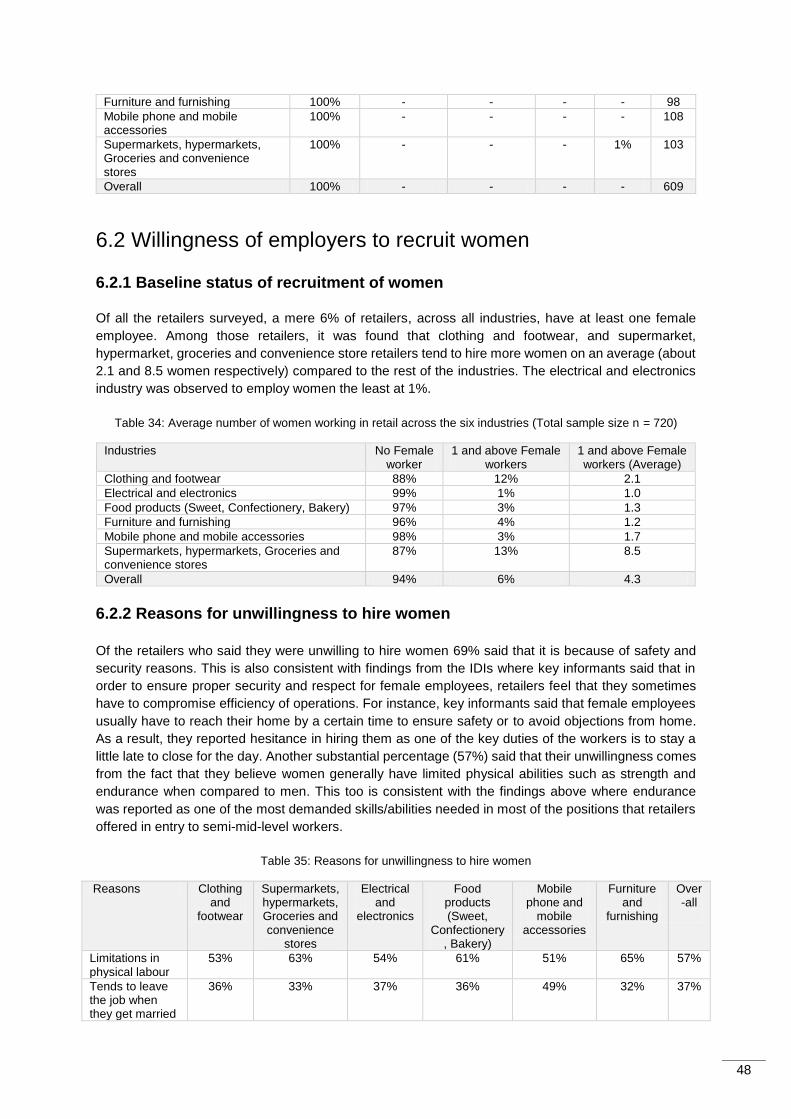
48
Furniture and furnishing 100% - - - - 98
Mobile phone and mobile accessories
100% - - - - 108
Supermarkets, hypermarkets, Groceries and convenience stores
100% - - - 1% 103
Overall 100% - - - - 609
6.2 Willingness of employers to recruit women
6.2.1 Baseline status of recruitment of women
Of all the retailers surveyed, a mere 6% of retailers, across all industries, have at least one female
employee. Among those retailers, it was found that clothing and footwear, and supermarket,
hypermarket, groceries and convenience store retailers tend to hire more women on an average (about
2.1 and 8.5 women respectively) compared to the rest of the industries. The electrical and electronics
industry was observed to employ women the least at 1%.
Table 34: Average number of women working in retail across the six industries (Total sample size n = 720)
Industries No Female worker
1 and above Female workers
1 and above Female workers (Average)
Clothing and footwear 88% 12% 2.1
Electrical and electronics 99% 1% 1.0
Food products (Sweet, Confectionery, Bakery) 97% 3% 1.3
Furniture and furnishing 96% 4% 1.2
Mobile phone and mobile accessories 98% 3% 1.7
Supermarkets, hypermarkets, Groceries and convenience stores
87% 13% 8.5
Overall 94% 6% 4.3
6.2.2 Reasons for unwillingness to hire women
Of the retailers who said they were unwilling to hire women 69% said that it is because of safety and
security reasons. This is also consistent with findings from the IDIs where key informants said that in
order to ensure proper security and respect for female employees, retailers feel that they sometimes
have to compromise efficiency of operations. For instance, key informants said that female employees
usually have to reach their home by a certain time to ensure safety or to avoid objections from home.
As a result, they reported hesitance in hiring them as one of the key duties of the workers is to stay a
little late to close for the day. Another substantial percentage (57%) said that their unwillingness comes
from the fact that they believe women generally have limited physical abilities such as strength and
endurance when compared to men. This too is consistent with the findings above where endurance
was reported as one of the most demanded skills/abilities needed in most of the positions that retailers
offered in entry to semi-mid-level workers.
Table 35: Reasons for unwillingness to hire women
Reasons Clothing and
footwear
Supermarkets, hypermarkets, Groceries and convenience
stores
Electrical and
electronics
Food products (Sweet,
Confectionery, Bakery)
Mobile phone and
mobile accessories
Furniture and
furnishing
Over-all
Limitations in physical labour
53% 63% 54% 61% 51% 65% 57%
Tends to leave the job when they get married
36% 33% 37% 36% 49% 32% 37%
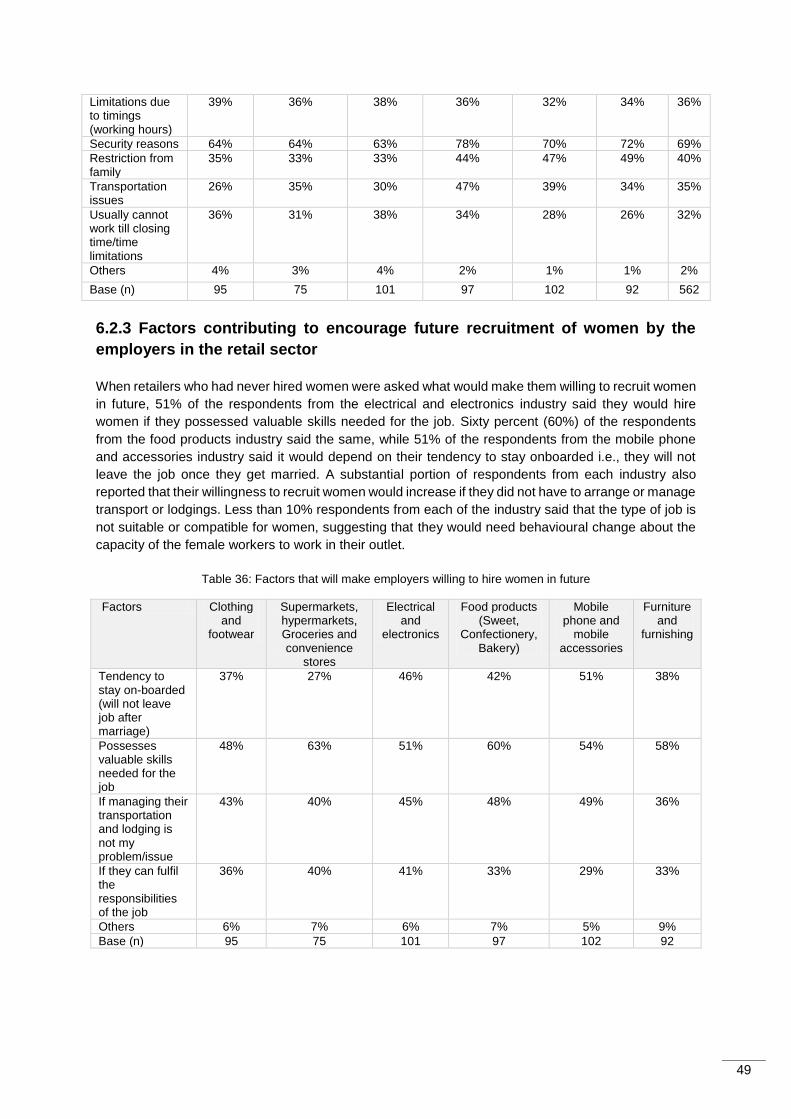
49
Limitations due to timings (working hours)
39% 36% 38% 36% 32% 34% 36%
Security reasons 64% 64% 63% 78% 70% 72% 69%
Restriction from family
35% 33% 33% 44% 47% 49% 40%
Transportation issues
26% 35% 30% 47% 39% 34% 35%
Usually cannot work till closing time/time limitations
36% 31% 38% 34% 28% 26% 32%
Others 4% 3% 4% 2% 1% 1% 2%
Base (n) 95 75 101 97 102 92 562
6.2.3 Factors contributing to encourage future recruitment of women by the
employers in the retail sector
When retailers who had never hired women were asked what would make them willing to recruit women
in future, 51% of the respondents from the electrical and electronics industry said they would hire
women if they possessed valuable skills needed for the job. Sixty percent (60%) of the respondents
from the food products industry said the same, while 51% of the respondents from the mobile phone
and accessories industry said it would depend on their tendency to stay onboarded i.e., they will not
leave the job once they get married. A substantial portion of respondents from each industry also
reported that their willingness to recruit women would increase if they did not have to arrange or manage
transport or lodgings. Less than 10% respondents from each of the industry said that the type of job is
not suitable or compatible for women, suggesting that they would need behavioural change about the
capacity of the female workers to work in their outlet.
Table 36: Factors that will make employers willing to hire women in future
Factors Clothing and
footwear
Supermarkets, hypermarkets, Groceries and convenience
stores
Electrical and
electronics
Food products (Sweet,
Confectionery, Bakery)
Mobile phone and
mobile accessories
Furniture and
furnishing
Tendency to stay on-boarded (will not leave job after marriage)
37% 27% 46% 42% 51% 38%
Possesses valuable skills needed for the job
48% 63% 51% 60% 54% 58%
If managing their transportation and lodging is not my problem/issue
43% 40% 45% 48% 49% 36%
If they can fulfil the responsibilities of the job
36% 40% 41% 33% 29% 33%
Others 6% 7% 6% 7% 5% 9%
Base (n) 95 75 101 97 102 92
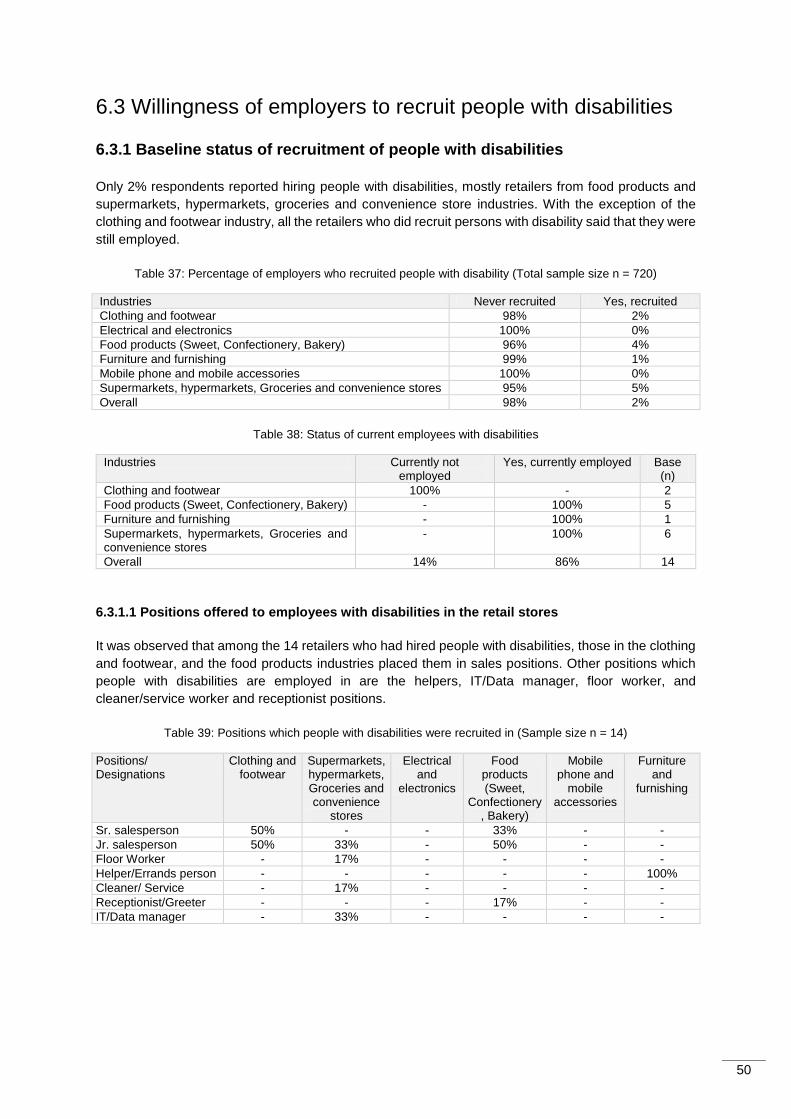
50
6.3 Willingness of employers to recruit people with disabilities
6.3.1 Baseline status of recruitment of people with disabilities
Only 2% respondents reported hiring people with disabilities, mostly retailers from food products and
supermarkets, hypermarkets, groceries and convenience store industries. With the exception of the
clothing and footwear industry, all the retailers who did recruit persons with disability said that they were
still employed.
Table 37: Percentage of employers who recruited people with disability (Total sample size n = 720)
Industries Never recruited Yes, recruited
Clothing and footwear 98% 2%
Electrical and electronics 100% 0%
Food products (Sweet, Confectionery, Bakery) 96% 4%
Furniture and furnishing 99% 1%
Mobile phone and mobile accessories 100% 0%
Supermarkets, hypermarkets, Groceries and convenience stores 95% 5%
Overall 98% 2%
Table 38: Status of current employees with disabilities
Industries Currently not employed
Yes, currently employed Base (n)
Clothing and footwear 100% - 2
Food products (Sweet, Confectionery, Bakery) - 100% 5
Furniture and furnishing - 100% 1
Supermarkets, hypermarkets, Groceries and convenience stores
- 100% 6
Overall 14% 86% 14
6.3.1.1 Positions offered to employees with disabilities in the retail stores
It was observed that among the 14 retailers who had hired people with disabilities, those in the clothing
and footwear, and the food products industries placed them in sales positions. Other positions which
people with disabilities are employed in are the helpers, IT/Data manager, floor worker, and
cleaner/service worker and receptionist positions.
Table 39: Positions which people with disabilities were recruited in (Sample size n = 14)
Positions/ Designations
Clothing and footwear
Supermarkets, hypermarkets, Groceries and convenience
stores
Electrical and
electronics
Food products (Sweet,
Confectionery, Bakery)
Mobile phone and
mobile accessories
Furniture and
furnishing
Sr. salesperson 50% - - 33% - -
Jr. salesperson 50% 33% - 50% - -
Floor Worker - 17% - - - -
Helper/Errands person - - - - - 100%
Cleaner/ Service - 17% - - - -
Receptionist/Greeter - - - 17% - -
IT/Data manager - 33% - - - -
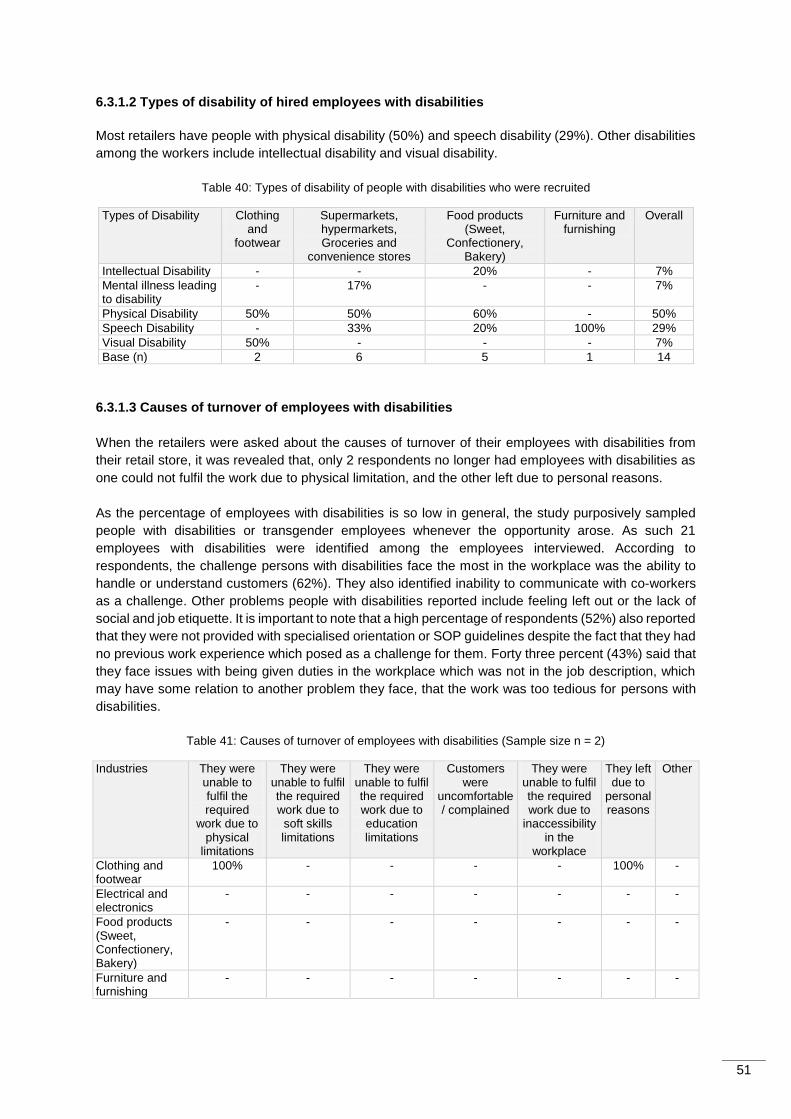
51
6.3.1.2 Types of disability of hired employees with disabilities
Most retailers have people with physical disability (50%) and speech disability (29%). Other disabilities
among the workers include intellectual disability and visual disability.
Table 40: Types of disability of people with disabilities who were recruited
Types of Disability Clothing and
footwear
Supermarkets, hypermarkets, Groceries and
convenience stores
Food products (Sweet,
Confectionery, Bakery)
Furniture and furnishing
Overall
Intellectual Disability - - 20% - 7%
Mental illness leading to disability
- 17% - - 7%
Physical Disability 50% 50% 60% - 50%
Speech Disability - 33% 20% 100% 29%
Visual Disability 50% - - - 7%
Base (n) 2 6 5 1 14
6.3.1.3 Causes of turnover of employees with disabilities
When the retailers were asked about the causes of turnover of their employees with disabilities from
their retail store, it was revealed that, only 2 respondents no longer had employees with disabilities as
one could not fulfil the work due to physical limitation, and the other left due to personal reasons.
As the percentage of employees with disabilities is so low in general, the study purposively sampled
people with disabilities or transgender employees whenever the opportunity arose. As such 21
employees with disabilities were identified among the employees interviewed. According to
respondents, the challenge persons with disabilities face the most in the workplace was the ability to
handle or understand customers (62%). They also identified inability to communicate with co-workers
as a challenge. Other problems people with disabilities reported include feeling left out or the lack of
social and job etiquette. It is important to note that a high percentage of respondents (52%) also reported
that they were not provided with specialised orientation or SOP guidelines despite the fact that they had
no previous work experience which posed as a challenge for them. Forty three percent (43%) said that
they face issues with being given duties in the workplace which was not in the job description, which
may have some relation to another problem they face, that the work was too tedious for persons with
disabilities.
Table 41: Causes of turnover of employees with disabilities (Sample size n = 2)
Industries They were unable to fulfil the required
work due to physical
limitations
They were unable to fulfil the required work due to
soft skills limitations
They were unable to fulfil the required work due to education limitations
Customers were
uncomfortable / complained
They were unable to fulfil the required work due to
inaccessibility in the
workplace
They left due to
personal reasons
Other
Clothing and footwear
100% - - - - 100% -
Electrical and electronics
- - - - - - -
Food products (Sweet, Confectionery, Bakery)
- - - - - - -
Furniture and furnishing
- - - - - - -
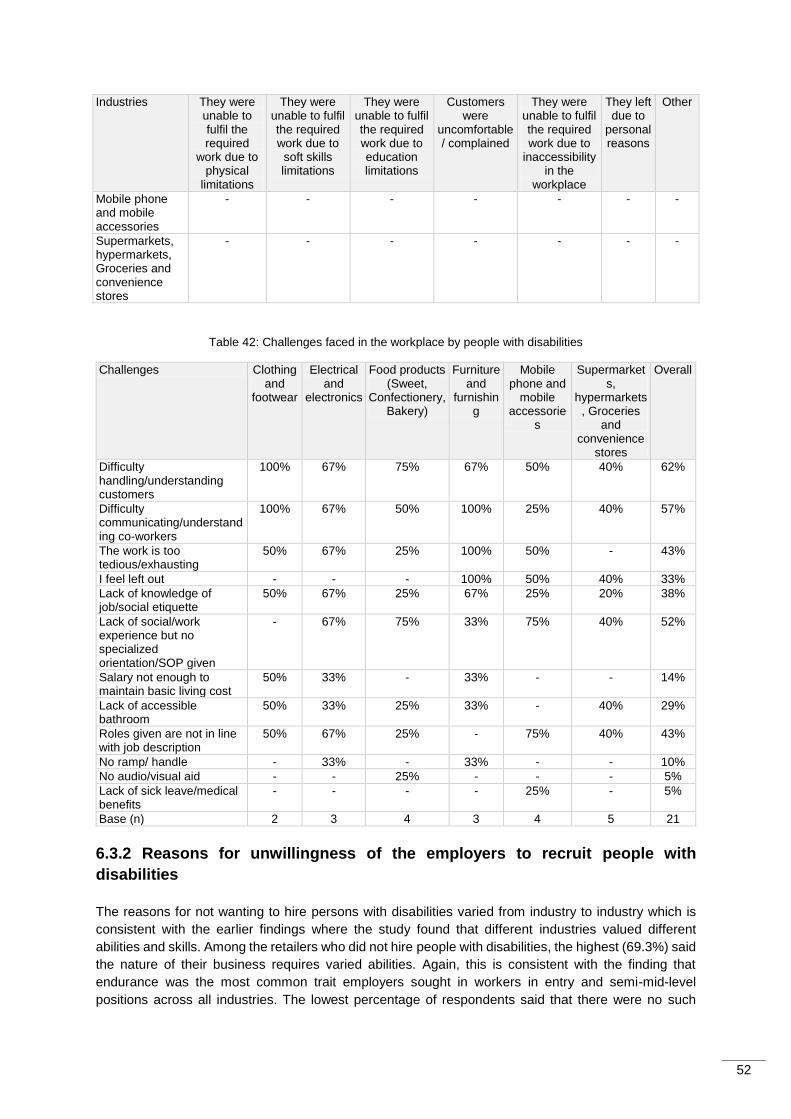
52
Industries They were unable to fulfil the required
work due to physical
limitations
They were unable to fulfil the required work due to
soft skills limitations
They were unable to fulfil the required work due to education limitations
Customers were
uncomfortable / complained
They were unable to fulfil the required work due to
inaccessibility in the
workplace
They left due to
personal reasons
Other
Mobile phone and mobile accessories
- - - - - - -
Supermarkets, hypermarkets, Groceries and convenience stores
- - - - - - -
Table 42: Challenges faced in the workplace by people with disabilities
Challenges Clothing and
footwear
Electrical and
electronics
Food products (Sweet,
Confectionery, Bakery)
Furniture and
furnishing
Mobile phone and
mobile accessorie
s
Supermarkets,
hypermarkets, Groceries
and convenience
stores
Overall
Difficulty handling/understanding customers
100% 67% 75% 67% 50% 40% 62%
Difficulty communicating/understanding co-workers
100% 67% 50% 100% 25% 40% 57%
The work is too tedious/exhausting
50% 67% 25% 100% 50% - 43%
I feel left out - - - 100% 50% 40% 33%
Lack of knowledge of job/social etiquette
50% 67% 25% 67% 25% 20% 38%
Lack of social/work experience but no specialized orientation/SOP given
- 67% 75% 33% 75% 40% 52%
Salary not enough to maintain basic living cost
50% 33% - 33% - - 14%
Lack of accessible bathroom
50% 33% 25% 33% - 40% 29%
Roles given are not in line with job description
50% 67% 25% - 75% 40% 43%
No ramp/ handle - 33% - 33% - - 10%
No audio/visual aid - - 25% - - - 5%
Lack of sick leave/medical benefits
- - - - 25% - 5%
Base (n) 2 3 4 3 4 5 21
6.3.2 Reasons for unwillingness of the employers to recruit people with
disabilities
The reasons for not wanting to hire persons with disabilities varied from industry to industry which is
consistent with the earlier findings where the study found that different industries valued different
abilities and skills. Among the retailers who did not hire people with disabilities, the highest (69.3%) said
the nature of their business requires varied abilities. Again, this is consistent with the finding that
endurance was the most common trait employers sought in workers in entry and semi-mid-level
positions across all industries. The lowest percentage of respondents said that there were no such
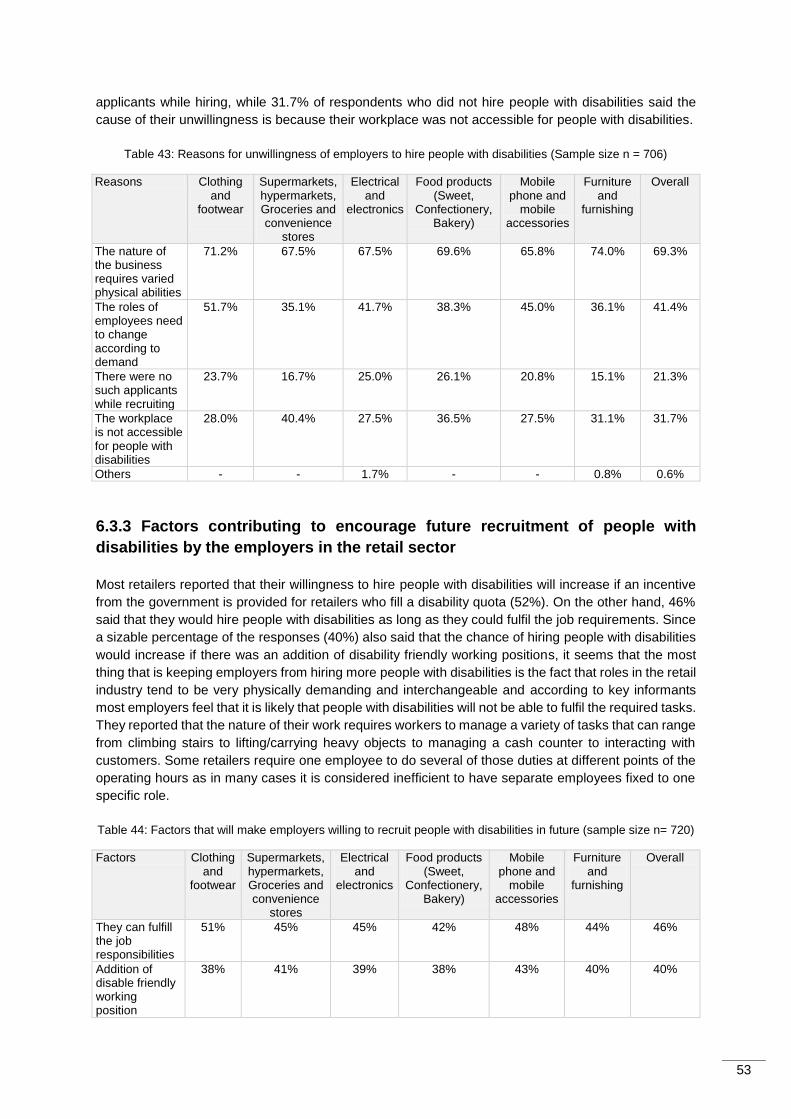
53
applicants while hiring, while 31.7% of respondents who did not hire people with disabilities said the
cause of their unwillingness is because their workplace was not accessible for people with disabilities.
Table 43: Reasons for unwillingness of employers to hire people with disabilities (Sample size n = 706)
Reasons Clothing and
footwear
Supermarkets, hypermarkets, Groceries and convenience
stores
Electrical and
electronics
Food products (Sweet,
Confectionery, Bakery)
Mobile phone and
mobile accessories
Furniture and
furnishing
Overall
The nature of the business requires varied physical abilities
71.2% 67.5% 67.5% 69.6% 65.8% 74.0% 69.3%
The roles of employees need to change according to demand
51.7% 35.1% 41.7% 38.3% 45.0% 36.1% 41.4%
There were no such applicants while recruiting
23.7% 16.7% 25.0% 26.1% 20.8% 15.1% 21.3%
The workplace is not accessible for people with disabilities
28.0% 40.4% 27.5% 36.5% 27.5% 31.1% 31.7%
Others - - 1.7% - - 0.8% 0.6%
6.3.3 Factors contributing to encourage future recruitment of people with
disabilities by the employers in the retail sector
Most retailers reported that their willingness to hire people with disabilities will increase if an incentive
from the government is provided for retailers who fill a disability quota (52%). On the other hand, 46%
said that they would hire people with disabilities as long as they could fulfil the job requirements. Since
a sizable percentage of the responses (40%) also said that the chance of hiring people with disabilities
would increase if there was an addition of disability friendly working positions, it seems that the most
thing that is keeping employers from hiring more people with disabilities is the fact that roles in the retail
industry tend to be very physically demanding and interchangeable and according to key informants
most employers feel that it is likely that people with disabilities will not be able to fulfil the required tasks.
They reported that the nature of their work requires workers to manage a variety of tasks that can range
from climbing stairs to lifting/carrying heavy objects to managing a cash counter to interacting with
customers. Some retailers require one employee to do several of those duties at different points of the
operating hours as in many cases it is considered inefficient to have separate employees fixed to one
specific role.
Table 44: Factors that will make employers willing to recruit people with disabilities in future (sample size n= 720)
Factors Clothing and
footwear
Supermarkets, hypermarkets, Groceries and convenience
stores
Electrical and
electronics
Food products (Sweet,
Confectionery, Bakery)
Mobile phone and
mobile accessories
Furniture and
furnishing
Overall
They can fulfill the job responsibilities
51% 45% 45% 42% 48% 44% 46%
Addition of disable friendly working position
38% 41% 39% 38% 43% 40% 40%
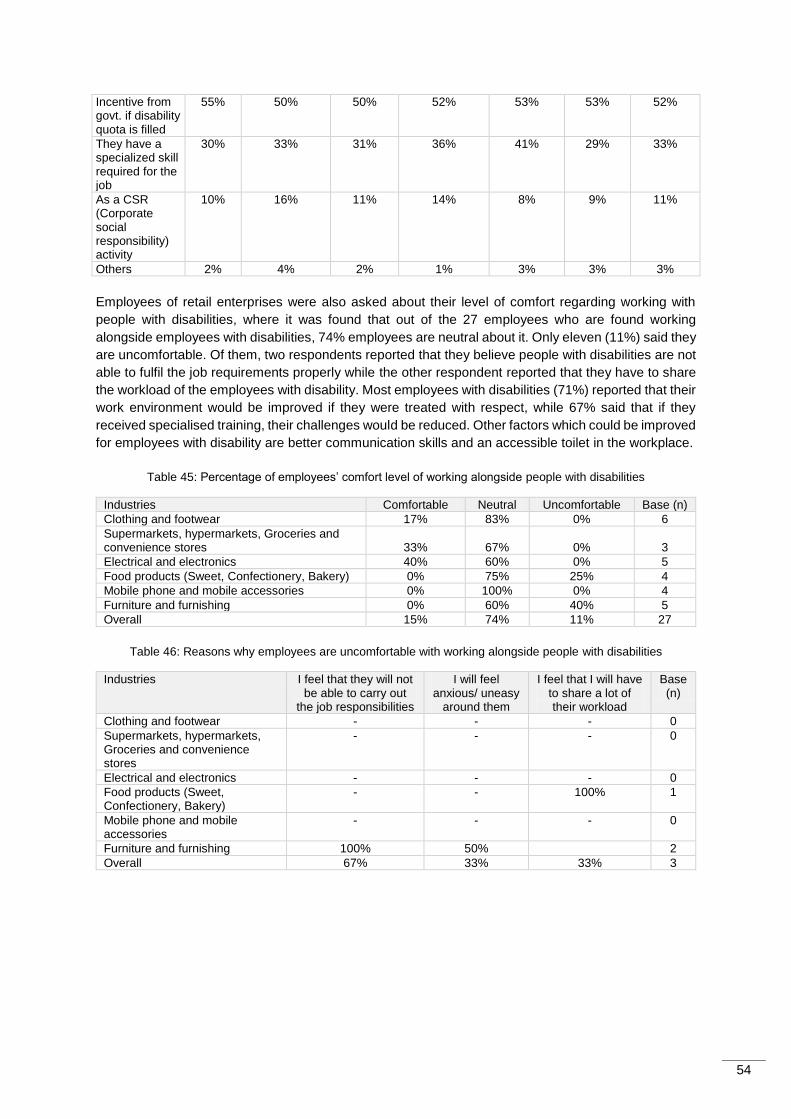
54
Incentive from govt. if disability quota is filled
55% 50% 50% 52% 53% 53% 52%
They have a specialized skill required for the job
30% 33% 31% 36% 41% 29% 33%
As a CSR (Corporate social responsibility) activity
10% 16% 11% 14% 8% 9% 11%
Others 2% 4% 2% 1% 3% 3% 3%
Employees of retail enterprises were also asked about their level of comfort regarding working with
people with disabilities, where it was found that out of the 27 employees who are found working
alongside employees with disabilities, 74% employees are neutral about it. Only eleven (11%) said they
are uncomfortable. Of them, two respondents reported that they believe people with disabilities are not
able to fulfil the job requirements properly while the other respondent reported that they have to share
the workload of the employees with disability. Most employees with disabilities (71%) reported that their
work environment would be improved if they were treated with respect, while 67% said that if they
received specialised training, their challenges would be reduced. Other factors which could be improved
for employees with disability are better communication skills and an accessible toilet in the workplace.
Table 45: Percentage of employees’ comfort level of working alongside people with disabilities
Industries Comfortable Neutral Uncomfortable Base (n)
Clothing and footwear 17% 83% 0% 6
Supermarkets, hypermarkets, Groceries and convenience stores 33% 67% 0% 3
Electrical and electronics 40% 60% 0% 5
Food products (Sweet, Confectionery, Bakery) 0% 75% 25% 4
Mobile phone and mobile accessories 0% 100% 0% 4
Furniture and furnishing 0% 60% 40% 5
Overall 15% 74% 11% 27
Table 46: Reasons why employees are uncomfortable with working alongside people with disabilities
Industries I feel that they will not be able to carry out
the job responsibilities
I will feel anxious/ uneasy
around them
I feel that I will have to share a lot of their workload
Base (n)
Clothing and footwear - - - 0
Supermarkets, hypermarkets, Groceries and convenience stores
- - - 0
Electrical and electronics - - - 0
Food products (Sweet, Confectionery, Bakery)
- - 100% 1
Mobile phone and mobile accessories
- - - 0
Furniture and furnishing 100% 50% 2
Overall 67% 33% 33% 3
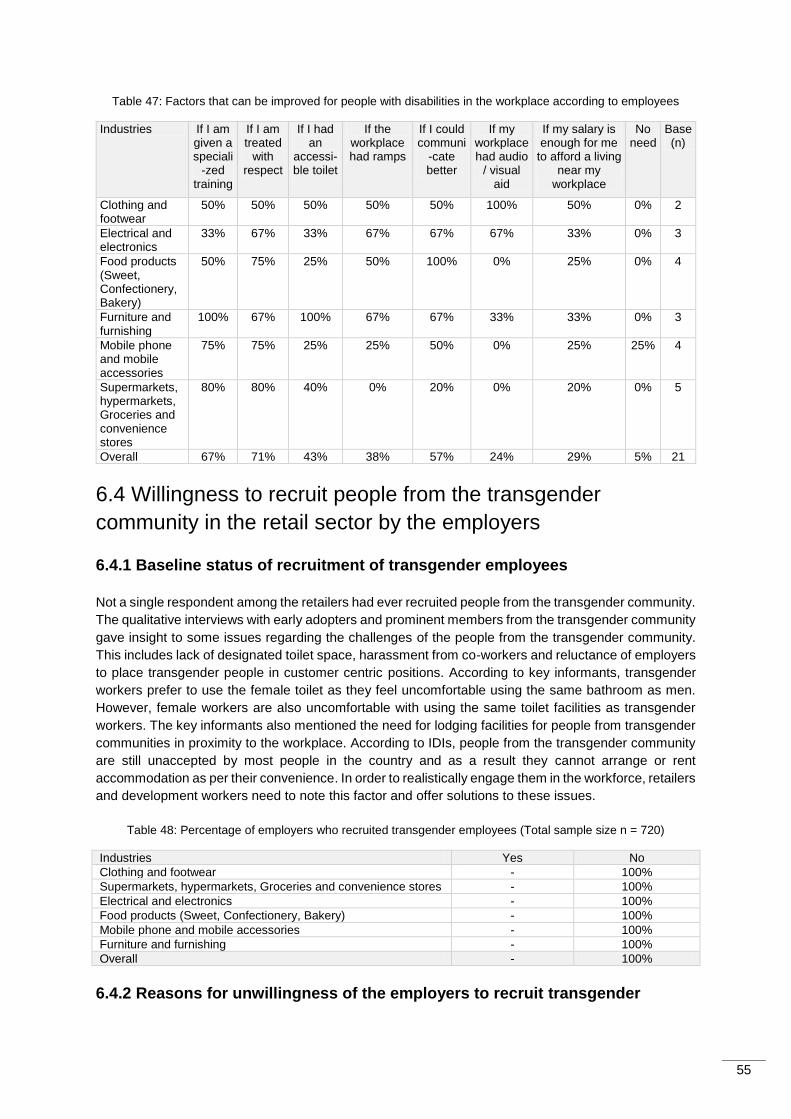
55
Table 47: Factors that can be improved for people with disabilities in the workplace according to employees
Industries If I am given a speciali
-zed training
If I am treated
with respect
If I had an
accessi-ble toilet
If the workplace had ramps
If I could communi
-cate better
If my workplace had audio
/ visual aid
If my salary is enough for me
to afford a living near my
workplace
No need
Base (n)
Clothing and footwear
50% 50% 50% 50% 50% 100% 50% 0% 2
Electrical and electronics
33% 67% 33% 67% 67% 67% 33% 0% 3
Food products (Sweet, Confectionery, Bakery)
50% 75% 25% 50% 100% 0% 25% 0% 4
Furniture and furnishing
100% 67% 100% 67% 67% 33% 33% 0% 3
Mobile phone and mobile accessories
75% 75% 25% 25% 50% 0% 25% 25% 4
Supermarkets, hypermarkets, Groceries and convenience stores
80% 80% 40% 0% 20% 0% 20% 0% 5
Overall 67% 71% 43% 38% 57% 24% 29% 5% 21
6.4 Willingness to recruit people from the transgender
community in the retail sector by the employers
6.4.1 Baseline status of recruitment of transgender employees
Not a single respondent among the retailers had ever recruited people from the transgender community.
The qualitative interviews with early adopters and prominent members from the transgender community
gave insight to some issues regarding the challenges of the people from the transgender community.
This includes lack of designated toilet space, harassment from co-workers and reluctance of employers
to place transgender people in customer centric positions. According to key informants, transgender
workers prefer to use the female toilet as they feel uncomfortable using the same bathroom as men.
However, female workers are also uncomfortable with using the same toilet facilities as transgender
workers. The key informants also mentioned the need for lodging facilities for people from transgender
communities in proximity to the workplace. According to IDIs, people from the transgender community
are still unaccepted by most people in the country and as a result they cannot arrange or rent
accommodation as per their convenience. In order to realistically engage them in the workforce, retailers
and development workers need to note this factor and offer solutions to these issues.
Table 48: Percentage of employers who recruited transgender employees (Total sample size n = 720)
Industries Yes No
Clothing and footwear - 100%
Supermarkets, hypermarkets, Groceries and convenience stores - 100%
Electrical and electronics - 100%
Food products (Sweet, Confectionery, Bakery) - 100%
Mobile phone and mobile accessories - 100%
Furniture and furnishing - 100%
Overall - 100%
6.4.2 Reasons for unwillingness of the employers to recruit transgender
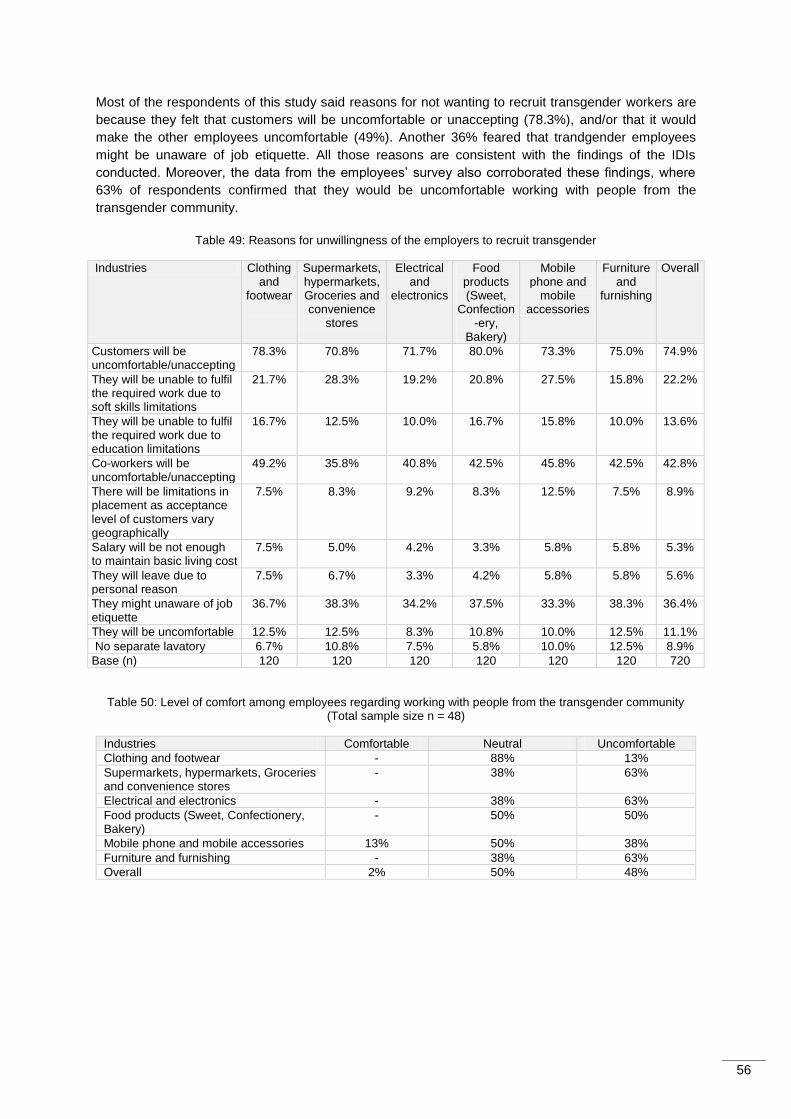
56
Most of the respondents of this study said reasons for not wanting to recruit transgender workers are
because they felt that customers will be uncomfortable or unaccepting (78.3%), and/or that it would
make the other employees uncomfortable (49%). Another 36% feared that trandgender employees
might be unaware of job etiquette. All those reasons are consistent with the findings of the IDIs
conducted. Moreover, the data from the employees’ survey also corroborated these findings, where
63% of respondents confirmed that they would be uncomfortable working with people from the
transgender community.
Table 49: Reasons for unwillingness of the employers to recruit transgender
Industries Clothing and
footwear
Supermarkets, hypermarkets, Groceries and convenience
stores
Electrical and
electronics
Food products (Sweet,
Confection-ery,
Bakery)
Mobile phone and
mobile accessories
Furniture and
furnishing
Overall
Customers will be uncomfortable/unaccepting
78.3% 70.8% 71.7% 80.0% 73.3% 75.0% 74.9%
They will be unable to fulfil the required work due to soft skills limitations
21.7% 28.3% 19.2% 20.8% 27.5% 15.8% 22.2%
They will be unable to fulfil the required work due to education limitations
16.7% 12.5% 10.0% 16.7% 15.8% 10.0% 13.6%
Co-workers will be uncomfortable/unaccepting
49.2% 35.8% 40.8% 42.5% 45.8% 42.5% 42.8%
There will be limitations in placement as acceptance level of customers vary geographically
7.5% 8.3% 9.2% 8.3% 12.5% 7.5% 8.9%
Salary will be not enough to maintain basic living cost
7.5% 5.0% 4.2% 3.3% 5.8% 5.8% 5.3%
They will leave due to personal reason
7.5% 6.7% 3.3% 4.2% 5.8% 5.8% 5.6%
They might unaware of job etiquette
36.7% 38.3% 34.2% 37.5% 33.3% 38.3% 36.4%
They will be uncomfortable 12.5% 12.5% 8.3% 10.8% 10.0% 12.5% 11.1%
No separate lavatory 6.7% 10.8% 7.5% 5.8% 10.0% 12.5% 8.9%
Base (n) 120 120 120 120 120 120 720
Table 50: Level of comfort among employees regarding working with people from the transgender community (Total sample size n = 48)
Industries Comfortable Neutral Uncomfortable
Clothing and footwear - 88% 13%
Supermarkets, hypermarkets, Groceries and convenience stores
- 38% 63%
Electrical and electronics - 38% 63%
Food products (Sweet, Confectionery, Bakery)
- 50% 50%
Mobile phone and mobile accessories 13% 50% 38%
Furniture and furnishing - 38% 63%
Overall 2% 50% 48%
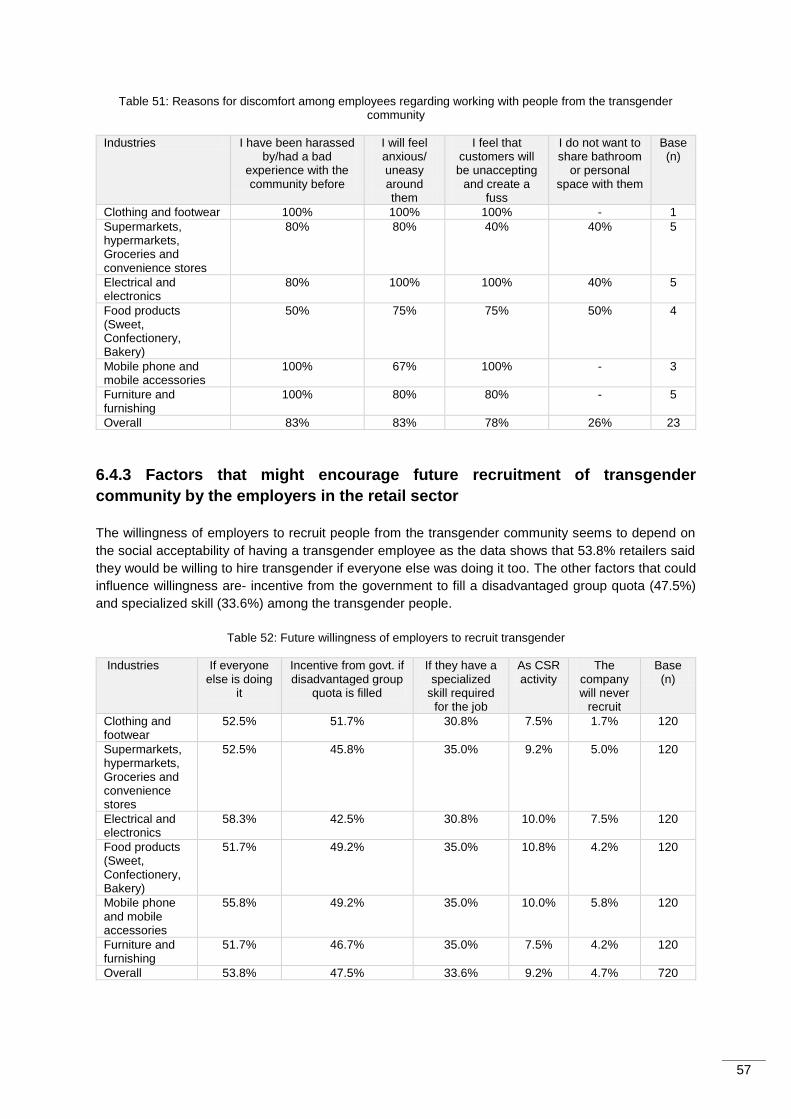
57
Table 51: Reasons for discomfort among employees regarding working with people from the transgender community
Industries I have been harassed by/had a bad
experience with the community before
I will feel anxious/ uneasy around them
I feel that customers will be unaccepting
and create a fuss
I do not want to share bathroom
or personal space with them
Base (n)
Clothing and footwear 100% 100% 100% - 1
Supermarkets, hypermarkets, Groceries and convenience stores
80% 80% 40% 40% 5
Electrical and electronics
80% 100% 100% 40% 5
Food products (Sweet, Confectionery, Bakery)
50% 75% 75% 50% 4
Mobile phone and mobile accessories
100% 67% 100% - 3
Furniture and furnishing
100% 80% 80% - 5
Overall 83% 83% 78% 26% 23
6.4.3 Factors that might encourage future recruitment of transgender
community by the employers in the retail sector
The willingness of employers to recruit people from the transgender community seems to depend on
the social acceptability of having a transgender employee as the data shows that 53.8% retailers said
they would be willing to hire transgender if everyone else was doing it too. The other factors that could
influence willingness are- incentive from the government to fill a disadvantaged group quota (47.5%)
and specialized skill (33.6%) among the transgender people.
Table 52: Future willingness of employers to recruit transgender
Industries If everyone else is doing
it
Incentive from govt. if disadvantaged group
quota is filled
If they have a specialized
skill required for the job
As CSR activity
The company will never
recruit
Base (n)
Clothing and footwear
52.5% 51.7% 30.8% 7.5% 1.7% 120
Supermarkets, hypermarkets, Groceries and convenience stores
52.5% 45.8% 35.0% 9.2% 5.0% 120
Electrical and electronics
58.3% 42.5% 30.8% 10.0% 7.5% 120
Food products (Sweet, Confectionery, Bakery)
51.7% 49.2% 35.0% 10.8% 4.2% 120
Mobile phone and mobile accessories
55.8% 49.2% 35.0% 10.0% 5.8% 120
Furniture and furnishing
51.7% 46.7% 35.0% 7.5% 4.2% 120
Overall 53.8% 47.5% 33.6% 9.2% 4.7% 720
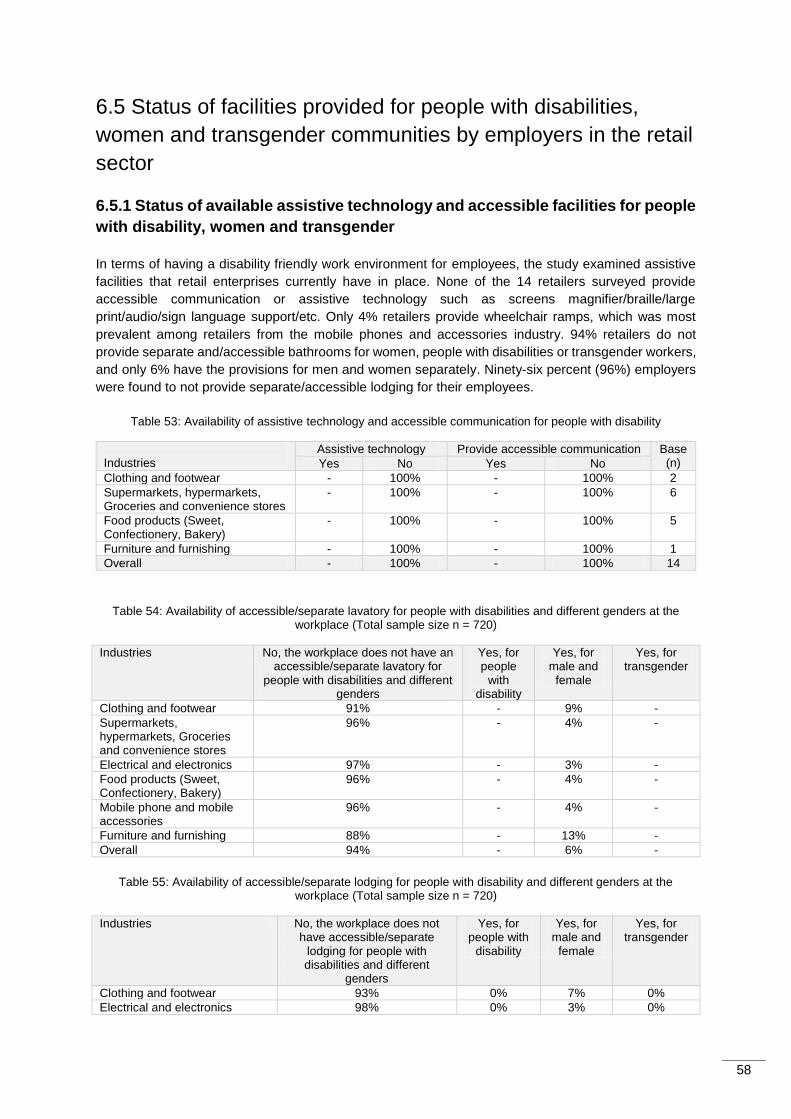
58
6.5 Status of facilities provided for people with disabilities,
women and transgender communities by employers in the retail
sector
6.5.1 Status of available assistive technology and accessible facilities for people
with disability, women and transgender
In terms of having a disability friendly work environment for employees, the study examined assistive
facilities that retail enterprises currently have in place. None of the 14 retailers surveyed provide
accessible communication or assistive technology such as screens magnifier/braille/large
print/audio/sign language support/etc. Only 4% retailers provide wheelchair ramps, which was most
prevalent among retailers from the mobile phones and accessories industry. 94% retailers do not
provide separate and/accessible bathrooms for women, people with disabilities or transgender workers,
and only 6% have the provisions for men and women separately. Ninety-six percent (96%) employers
were found to not provide separate/accessible lodging for their employees.
Table 53: Availability of assistive technology and accessible communication for people with disability
Industries
Assistive technology Provide accessible communication Base (n) Yes No Yes No
Clothing and footwear - 100% - 100% 2
Supermarkets, hypermarkets, Groceries and convenience stores
- 100% - 100% 6
Food products (Sweet, Confectionery, Bakery)
- 100% - 100% 5
Furniture and furnishing - 100% - 100% 1
Overall - 100% - 100% 14
Table 54: Availability of accessible/separate lavatory for people with disabilities and different genders at the workplace (Total sample size n = 720)
Industries No, the workplace does not have an accessible/separate lavatory for
people with disabilities and different genders
Yes, for people
with disability
Yes, for male and
female
Yes, for transgender
Clothing and footwear 91% - 9% -
Supermarkets, hypermarkets, Groceries and convenience stores
96% - 4% -
Electrical and electronics 97% - 3% -
Food products (Sweet, Confectionery, Bakery)
96% - 4% -
Mobile phone and mobile accessories
96% - 4% -
Furniture and furnishing 88% - 13% -
Overall 94% - 6% -
Table 55: Availability of accessible/separate lodging for people with disability and different genders at the workplace (Total sample size n = 720)
Industries No, the workplace does not have accessible/separate
lodging for people with disabilities and different
genders
Yes, for people with
disability
Yes, for male and
female
Yes, for transgender
Clothing and footwear 93% 0% 7% 0%
Electrical and electronics 98% 0% 3% 0%
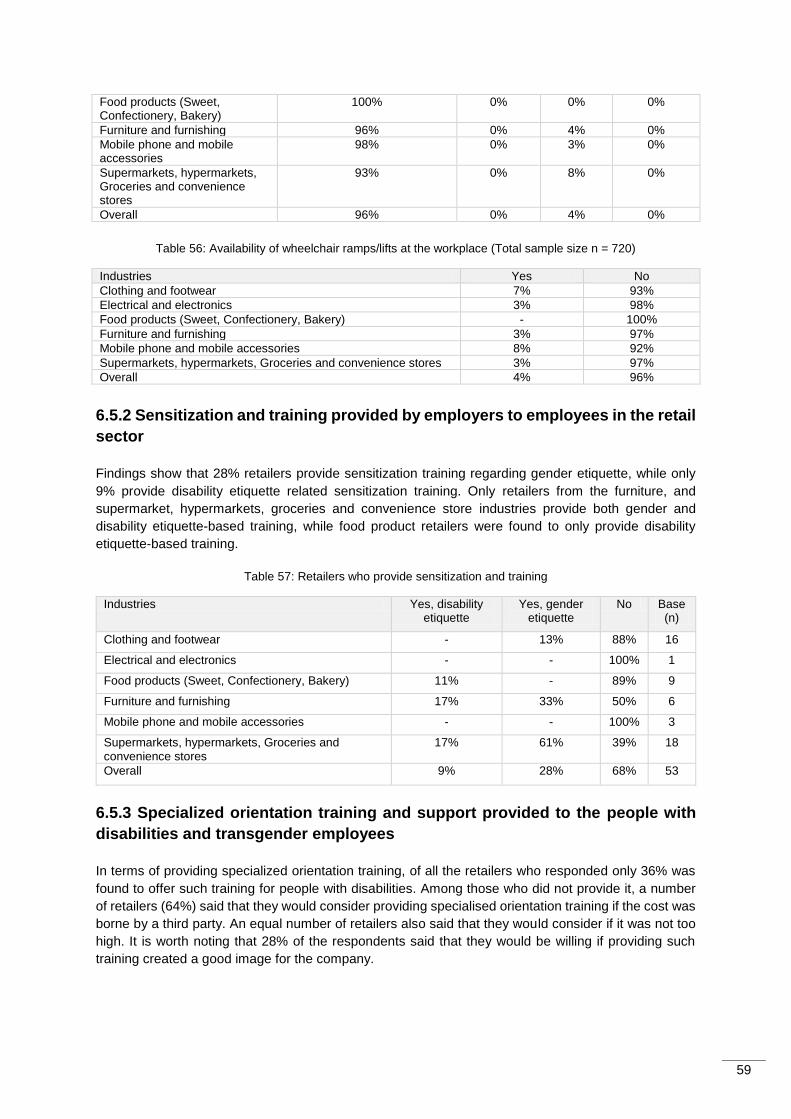
59
Food products (Sweet, Confectionery, Bakery)
100% 0% 0% 0%
Furniture and furnishing 96% 0% 4% 0%
Mobile phone and mobile accessories
98% 0% 3% 0%
Supermarkets, hypermarkets, Groceries and convenience stores
93% 0% 8% 0%
Overall 96% 0% 4% 0%
Table 56: Availability of wheelchair ramps/lifts at the workplace (Total sample size n = 720)
Industries Yes No
Clothing and footwear 7% 93%
Electrical and electronics 3% 98%
Food products (Sweet, Confectionery, Bakery) - 100%
Furniture and furnishing 3% 97%
Mobile phone and mobile accessories 8% 92%
Supermarkets, hypermarkets, Groceries and convenience stores 3% 97%
Overall 4% 96%
6.5.2 Sensitization and training provided by employers to employees in the retail
sector
Findings show that 28% retailers provide sensitization training regarding gender etiquette, while only
9% provide disability etiquette related sensitization training. Only retailers from the furniture, and
supermarket, hypermarkets, groceries and convenience store industries provide both gender and
disability etiquette-based training, while food product retailers were found to only provide disability
etiquette-based training.
Table 57: Retailers who provide sensitization and training
Industries Yes, disability etiquette
Yes, gender etiquette
No Base (n)
Clothing and footwear - 13% 88% 16
Electrical and electronics - - 100% 1
Food products (Sweet, Confectionery, Bakery) 11% - 89% 9
Furniture and furnishing 17% 33% 50% 6
Mobile phone and mobile accessories - - 100% 3
Supermarkets, hypermarkets, Groceries and convenience stores
17% 61% 39% 18
Overall 9% 28% 68% 53
6.5.3 Specialized orientation training and support provided to the people with
disabilities and transgender employees
In terms of providing specialized orientation training, of all the retailers who responded only 36% was
found to offer such training for people with disabilities. Among those who did not provide it, a number
of retailers (64%) said that they would consider providing specialised orientation training if the cost was
borne by a third party. An equal number of retailers also said that they would consider if it was not too
high. It is worth noting that 28% of the respondents said that they would be willing if providing such
training created a good image for the company.
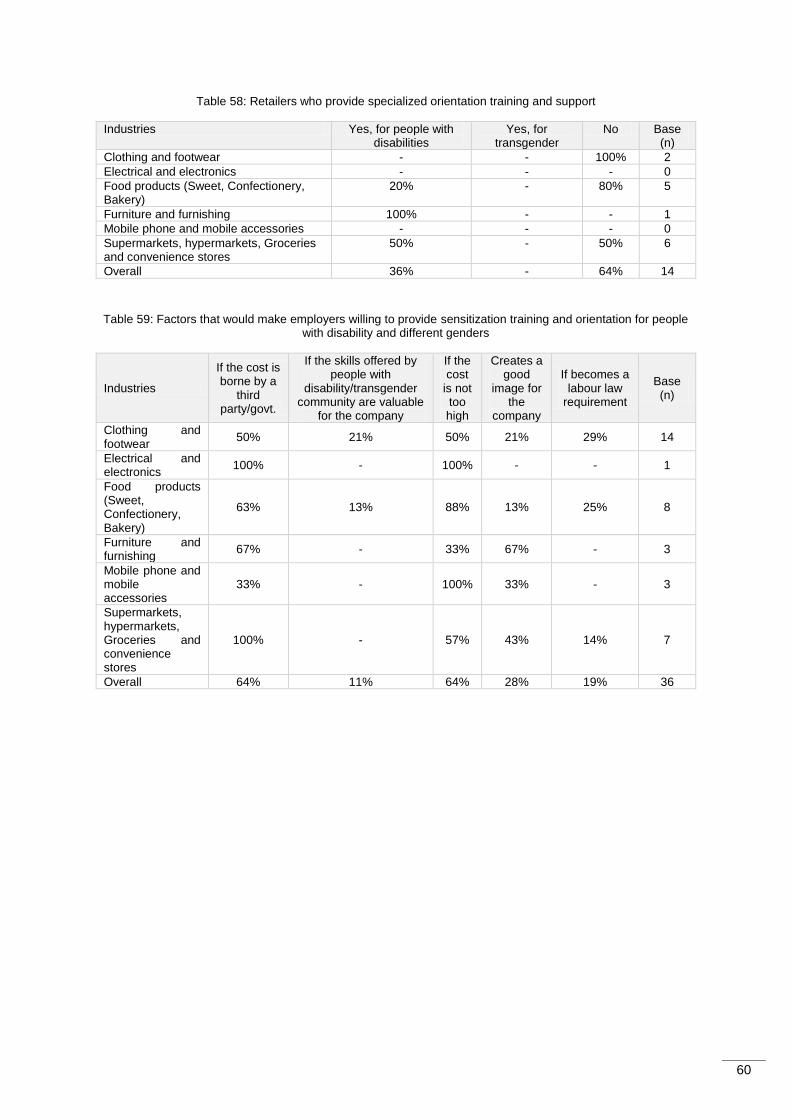
60
Table 58: Retailers who provide specialized orientation training and support
Industries Yes, for people with disabilities
Yes, for transgender
No Base (n)
Clothing and footwear - - 100% 2
Electrical and electronics - - - 0
Food products (Sweet, Confectionery, Bakery)
20% - 80% 5
Furniture and furnishing 100% - - 1
Mobile phone and mobile accessories - - - 0
Supermarkets, hypermarkets, Groceries and convenience stores
50% - 50% 6
Overall 36% - 64% 14
Table 59: Factors that would make employers willing to provide sensitization training and orientation for people with disability and different genders
Industries
If the cost is borne by a
third party/govt.
If the skills offered by people with
disability/transgender community are valuable
for the company
If the cost
is not too high
Creates a good
image for the
company
If becomes a labour law
requirement
Base (n)
Clothing and footwear
50% 21% 50% 21% 29% 14
Electrical and electronics
100% - 100% - - 1
Food products (Sweet, Confectionery, Bakery)
63% 13% 88% 13% 25% 8
Furniture and furnishing
67% - 33% 67% - 3
Mobile phone and mobile accessories
33% - 100% 33% - 3
Supermarkets, hypermarkets, Groceries and convenience stores
100% - 57% 43% 14% 7
Overall 64% 11% 64% 28% 19% 36
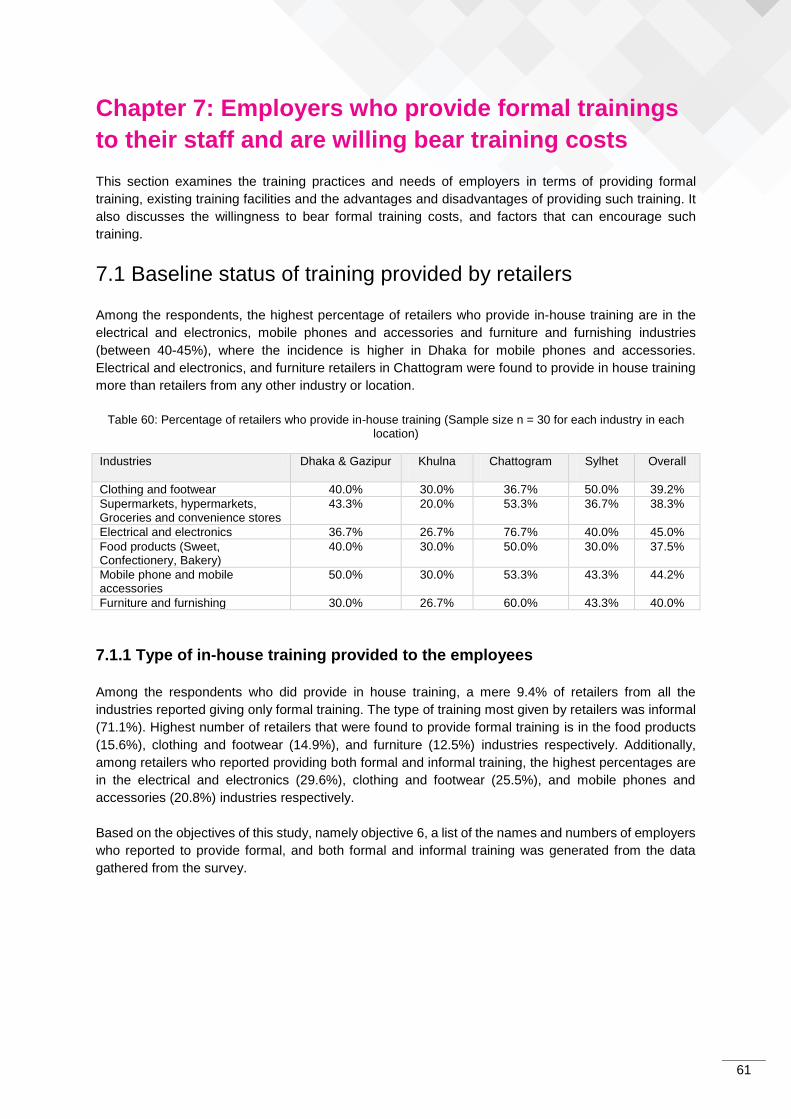
61
Chapter 7: Employers who provide formal trainings
to their staff and are willing bear training costs
This section examines the training practices and needs of employers in terms of providing formal
training, existing training facilities and the advantages and disadvantages of providing such training. It
also discusses the willingness to bear formal training costs, and factors that can encourage such
training.
7.1 Baseline status of training provided by retailers
Among the respondents, the highest percentage of retailers who provide in-house training are in the
electrical and electronics, mobile phones and accessories and furniture and furnishing industries
(between 40-45%), where the incidence is higher in Dhaka for mobile phones and accessories.
Electrical and electronics, and furniture retailers in Chattogram were found to provide in house training
more than retailers from any other industry or location.
Table 60: Percentage of retailers who provide in-house training (Sample size n = 30 for each industry in each location)
Industries Dhaka & Gazipur Khulna
Chattogram
Sylhet
Overall
Clothing and footwear 40.0% 30.0% 36.7% 50.0% 39.2%
Supermarkets, hypermarkets, Groceries and convenience stores
43.3% 20.0% 53.3% 36.7% 38.3%
Electrical and electronics 36.7% 26.7% 76.7% 40.0% 45.0%
Food products (Sweet, Confectionery, Bakery)
40.0% 30.0% 50.0% 30.0% 37.5%
Mobile phone and mobile accessories
50.0% 30.0% 53.3% 43.3% 44.2%
Furniture and furnishing 30.0% 26.7% 60.0% 43.3% 40.0%
7.1.1 Type of in-house training provided to the employees
Among the respondents who did provide in house training, a mere 9.4% of retailers from all the
industries reported giving only formal training. The type of training most given by retailers was informal
(71.1%). Highest number of retailers that were found to provide formal training is in the food products
(15.6%), clothing and footwear (14.9%), and furniture (12.5%) industries respectively. Additionally,
among retailers who reported providing both formal and informal training, the highest percentages are
in the electrical and electronics (29.6%), clothing and footwear (25.5%), and mobile phones and
accessories (20.8%) industries respectively.
Based on the objectives of this study, namely objective 6, a list of the names and numbers of employers
who reported to provide formal, and both formal and informal training was generated from the data
gathered from the survey.
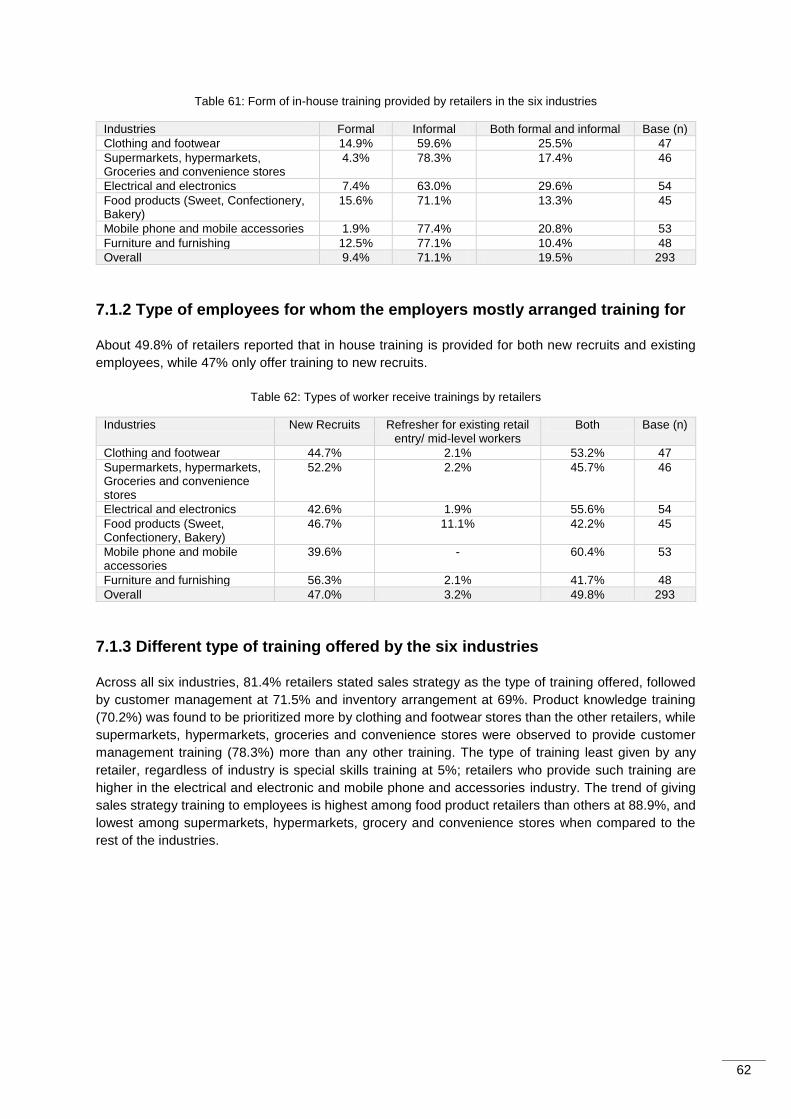
62
Table 61: Form of in-house training provided by retailers in the six industries
Industries Formal Informal Both formal and informal Base (n)
Clothing and footwear 14.9% 59.6% 25.5% 47
Supermarkets, hypermarkets, Groceries and convenience stores
4.3% 78.3% 17.4% 46
Electrical and electronics 7.4% 63.0% 29.6% 54
Food products (Sweet, Confectionery, Bakery)
15.6% 71.1% 13.3% 45
Mobile phone and mobile accessories 1.9% 77.4% 20.8% 53
Furniture and furnishing 12.5% 77.1% 10.4% 48
Overall 9.4% 71.1% 19.5% 293
7.1.2 Type of employees for whom the employers mostly arranged training for
About 49.8% of retailers reported that in house training is provided for both new recruits and existing
employees, while 47% only offer training to new recruits.
Table 62: Types of worker receive trainings by retailers
Industries New Recruits Refresher for existing retail entry/ mid-level workers
Both Base (n)
Clothing and footwear 44.7% 2.1% 53.2% 47
Supermarkets, hypermarkets, Groceries and convenience stores
52.2% 2.2% 45.7% 46
Electrical and electronics 42.6% 1.9% 55.6% 54
Food products (Sweet, Confectionery, Bakery)
46.7% 11.1% 42.2% 45
Mobile phone and mobile accessories
39.6% - 60.4% 53
Furniture and furnishing 56.3% 2.1% 41.7% 48
Overall 47.0% 3.2% 49.8% 293
7.1.3 Different type of training offered by the six industries
Across all six industries, 81.4% retailers stated sales strategy as the type of training offered, followed
by customer management at 71.5% and inventory arrangement at 69%. Product knowledge training
(70.2%) was found to be prioritized more by clothing and footwear stores than the other retailers, while
supermarkets, hypermarkets, groceries and convenience stores were observed to provide customer
management training (78.3%) more than any other training. The type of training least given by any
retailer, regardless of industry is special skills training at 5%; retailers who provide such training are
higher in the electrical and electronic and mobile phone and accessories industry. The trend of giving
sales strategy training to employees is highest among food product retailers than others at 88.9%, and
lowest among supermarkets, hypermarkets, grocery and convenience stores when compared to the
rest of the industries.
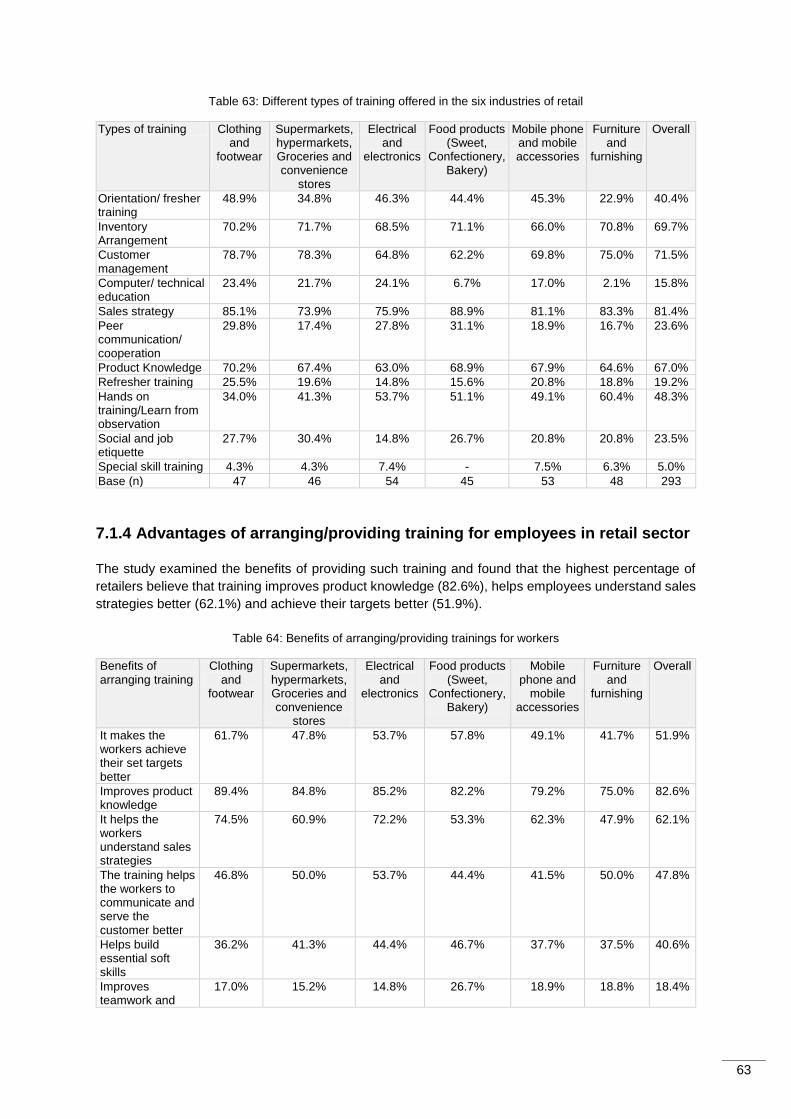
63
Table 63: Different types of training offered in the six industries of retail
Types of training Clothing and
footwear
Supermarkets, hypermarkets, Groceries and convenience
stores
Electrical and
electronics
Food products (Sweet,
Confectionery, Bakery)
Mobile phone and mobile accessories
Furniture and
furnishing
Overall
Orientation/ fresher training
48.9% 34.8% 46.3% 44.4% 45.3% 22.9% 40.4%
Inventory Arrangement
70.2% 71.7% 68.5% 71.1% 66.0% 70.8% 69.7%
Customer management
78.7% 78.3% 64.8% 62.2% 69.8% 75.0% 71.5%
Computer/ technical education
23.4% 21.7% 24.1% 6.7% 17.0% 2.1% 15.8%
Sales strategy 85.1% 73.9% 75.9% 88.9% 81.1% 83.3% 81.4%
Peer communication/ cooperation
29.8% 17.4% 27.8% 31.1% 18.9% 16.7% 23.6%
Product Knowledge 70.2% 67.4% 63.0% 68.9% 67.9% 64.6% 67.0%
Refresher training 25.5% 19.6% 14.8% 15.6% 20.8% 18.8% 19.2%
Hands on training/Learn from observation
34.0% 41.3% 53.7% 51.1% 49.1% 60.4% 48.3%
Social and job etiquette
27.7% 30.4% 14.8% 26.7% 20.8% 20.8% 23.5%
Special skill training 4.3% 4.3% 7.4% - 7.5% 6.3% 5.0%
Base (n) 47 46 54 45 53 48 293
7.1.4 Advantages of arranging/providing training for employees in retail sector
The study examined the benefits of providing such training and found that the highest percentage of
retailers believe that training improves product knowledge (82.6%), helps employees understand sales
strategies better (62.1%) and achieve their targets better (51.9%).
Table 64: Benefits of arranging/providing trainings for workers
Benefits of arranging training
Clothing and
footwear
Supermarkets, hypermarkets, Groceries and convenience
stores
Electrical and
electronics
Food products (Sweet,
Confectionery, Bakery)
Mobile phone and
mobile accessories
Furniture and
furnishing
Overall
It makes the workers achieve their set targets better
61.7% 47.8% 53.7% 57.8% 49.1% 41.7% 51.9%
Improves product knowledge
89.4% 84.8% 85.2% 82.2% 79.2% 75.0% 82.6%
It helps the workers understand sales strategies
74.5% 60.9% 72.2% 53.3% 62.3% 47.9% 62.1%
The training helps the workers to communicate and serve the customer better
46.8% 50.0% 53.7% 44.4% 41.5% 50.0% 47.8%
Helps build essential soft skills
36.2% 41.3% 44.4% 46.7% 37.7% 37.5% 40.6%
Improves teamwork and
17.0% 15.2% 14.8% 26.7% 18.9% 18.8% 18.4%
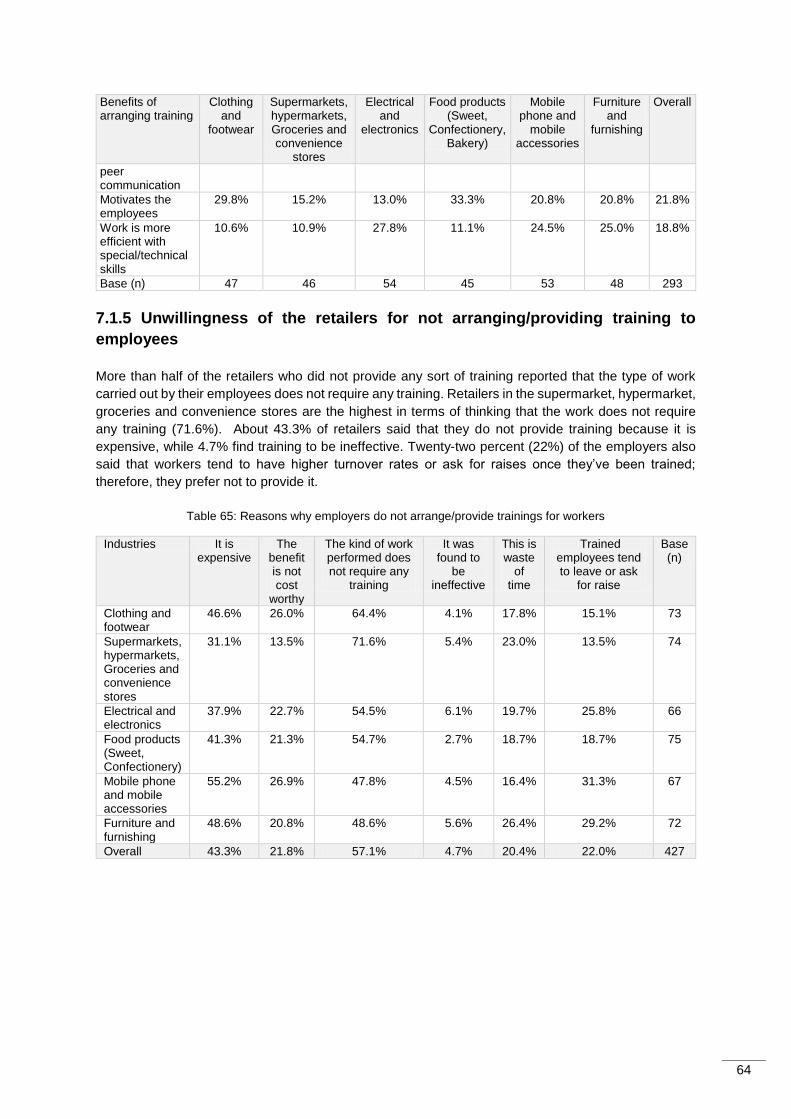
64
Benefits of arranging training
Clothing and
footwear
Supermarkets, hypermarkets, Groceries and convenience
stores
Electrical and
electronics
Food products (Sweet,
Confectionery, Bakery)
Mobile phone and
mobile accessories
Furniture and
furnishing
Overall
peer communication
Motivates the employees
29.8% 15.2% 13.0% 33.3% 20.8% 20.8% 21.8%
Work is more efficient with special/technical skills
10.6% 10.9% 27.8% 11.1% 24.5% 25.0% 18.8%
Base (n) 47 46 54 45 53 48 293
7.1.5 Unwillingness of the retailers for not arranging/providing training to
employees
More than half of the retailers who did not provide any sort of training reported that the type of work
carried out by their employees does not require any training. Retailers in the supermarket, hypermarket,
groceries and convenience stores are the highest in terms of thinking that the work does not require
any training (71.6%). About 43.3% of retailers said that they do not provide training because it is
expensive, while 4.7% find training to be ineffective. Twenty-two percent (22%) of the employers also
said that workers tend to have higher turnover rates or ask for raises once they’ve been trained;
therefore, they prefer not to provide it.
Table 65: Reasons why employers do not arrange/provide trainings for workers
Industries It is expensive
The benefit is not cost
worthy
The kind of work performed does not require any
training
It was found to
be ineffective
This is waste
of time
Trained employees tend to leave or ask
for raise
Base (n)
Clothing and footwear
46.6% 26.0% 64.4% 4.1% 17.8% 15.1% 73
Supermarkets, hypermarkets, Groceries and convenience stores
31.1% 13.5% 71.6% 5.4% 23.0% 13.5% 74
Electrical and electronics
37.9% 22.7% 54.5% 6.1% 19.7% 25.8% 66
Food products (Sweet, Confectionery)
41.3% 21.3% 54.7% 2.7% 18.7% 18.7% 75
Mobile phone and mobile accessories
55.2% 26.9% 47.8% 4.5% 16.4% 31.3% 67
Furniture and furnishing
48.6% 20.8% 48.6% 5.6% 26.4% 29.2% 72
Overall 43.3% 21.8% 57.1% 4.7% 20.4% 22.0% 427
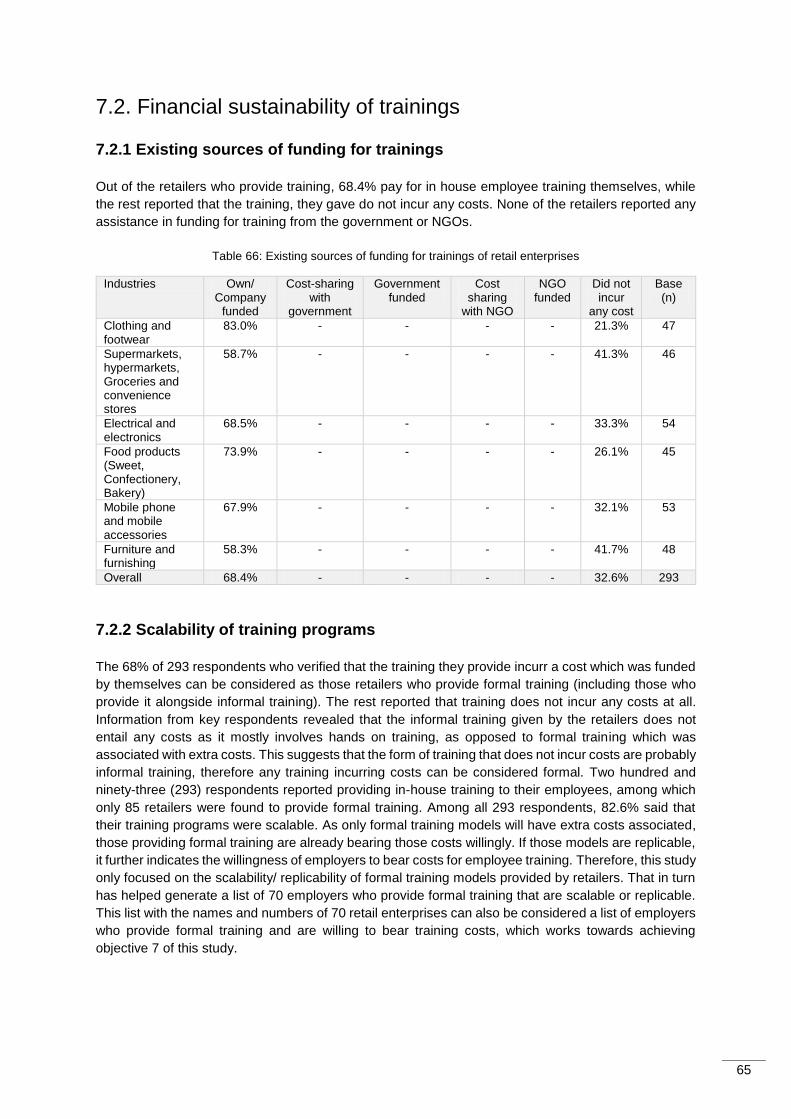
65
7.2. Financial sustainability of trainings
7.2.1 Existing sources of funding for trainings
Out of the retailers who provide training, 68.4% pay for in house employee training themselves, while
the rest reported that the training, they gave do not incur any costs. None of the retailers reported any
assistance in funding for training from the government or NGOs.
Table 66: Existing sources of funding for trainings of retail enterprises
Industries Own/ Company
funded
Cost-sharing with
government
Government funded
Cost sharing
with NGO
NGO funded
Did not incur
any cost
Base (n)
Clothing and footwear
83.0% - - - - 21.3% 47
Supermarkets, hypermarkets, Groceries and convenience stores
58.7% - - - - 41.3% 46
Electrical and electronics
68.5% - - - - 33.3% 54
Food products (Sweet, Confectionery, Bakery)
73.9% - - - - 26.1% 45
Mobile phone and mobile accessories
67.9% - - - - 32.1% 53
Furniture and furnishing
58.3% - - - - 41.7% 48
Overall 68.4% - - - - 32.6% 293
7.2.2 Scalability of training programs
The 68% of 293 respondents who verified that the training they provide incurr a cost which was funded
by themselves can be considered as those retailers who provide formal training (including those who
provide it alongside informal training). The rest reported that training does not incur any costs at all.
Information from key respondents revealed that the informal training given by the retailers does not
entail any costs as it mostly involves hands on training, as opposed to formal training which was
associated with extra costs. This suggests that the form of training that does not incur costs are probably
informal training, therefore any training incurring costs can be considered formal. Two hundred and
ninety-three (293) respondents reported providing in-house training to their employees, among which
only 85 retailers were found to provide formal training. Among all 293 respondents, 82.6% said that
their training programs were scalable. As only formal training models will have extra costs associated,
those providing formal training are already bearing those costs willingly. If those models are replicable,
it further indicates the willingness of employers to bear costs for employee training. Therefore, this study
only focused on the scalability/ replicability of formal training models provided by retailers. That in turn
has helped generate a list of 70 employers who provide formal training that are scalable or replicable.
This list with the names and numbers of 70 retail enterprises can also be considered a list of employers
who provide formal training and are willing to bear training costs, which works towards achieving
objective 7 of this study.
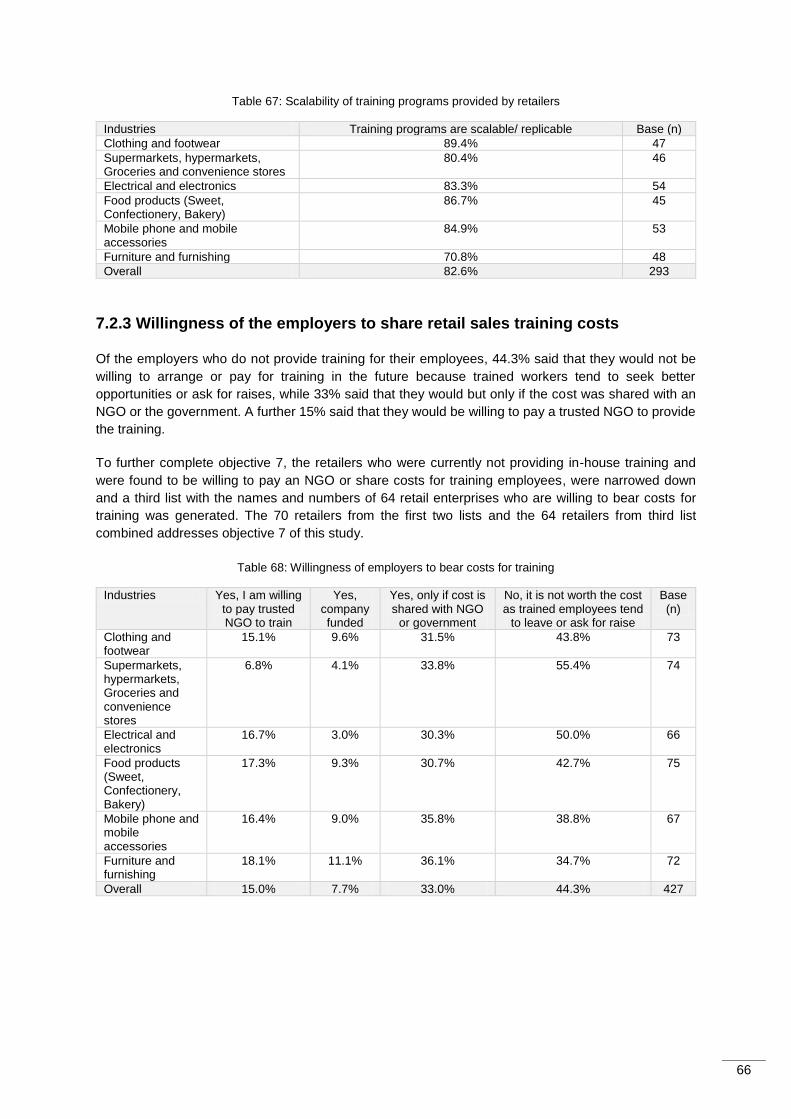
66
Table 67: Scalability of training programs provided by retailers
Industries Training programs are scalable/ replicable Base (n)
Clothing and footwear 89.4% 47
Supermarkets, hypermarkets, Groceries and convenience stores
80.4% 46
Electrical and electronics 83.3% 54
Food products (Sweet, Confectionery, Bakery)
86.7% 45
Mobile phone and mobile accessories
84.9% 53
Furniture and furnishing 70.8% 48
Overall 82.6% 293
7.2.3 Willingness of the employers to share retail sales training costs
Of the employers who do not provide training for their employees, 44.3% said that they would not be
willing to arrange or pay for training in the future because trained workers tend to seek better
opportunities or ask for raises, while 33% said that they would but only if the cost was shared with an
NGO or the government. A further 15% said that they would be willing to pay a trusted NGO to provide
the training.
To further complete objective 7, the retailers who were currently not providing in-house training and
were found to be willing to pay an NGO or share costs for training employees, were narrowed down
and a third list with the names and numbers of 64 retail enterprises who are willing to bear costs for
training was generated. The 70 retailers from the first two lists and the 64 retailers from third list
combined addresses objective 7 of this study.
Table 68: Willingness of employers to bear costs for training
Industries Yes, I am willing to pay trusted NGO to train
Yes, company funded
Yes, only if cost is shared with NGO
or government
No, it is not worth the cost as trained employees tend
to leave or ask for raise
Base (n)
Clothing and footwear
15.1% 9.6% 31.5% 43.8% 73
Supermarkets, hypermarkets, Groceries and convenience stores
6.8% 4.1% 33.8% 55.4% 74
Electrical and electronics
16.7% 3.0% 30.3% 50.0% 66
Food products (Sweet, Confectionery, Bakery)
17.3% 9.3% 30.7% 42.7% 75
Mobile phone and mobile accessories
16.4% 9.0% 35.8% 38.8% 67
Furniture and furnishing
18.1% 11.1% 36.1% 34.7% 72
Overall 15.0% 7.7% 33.0% 44.3% 427
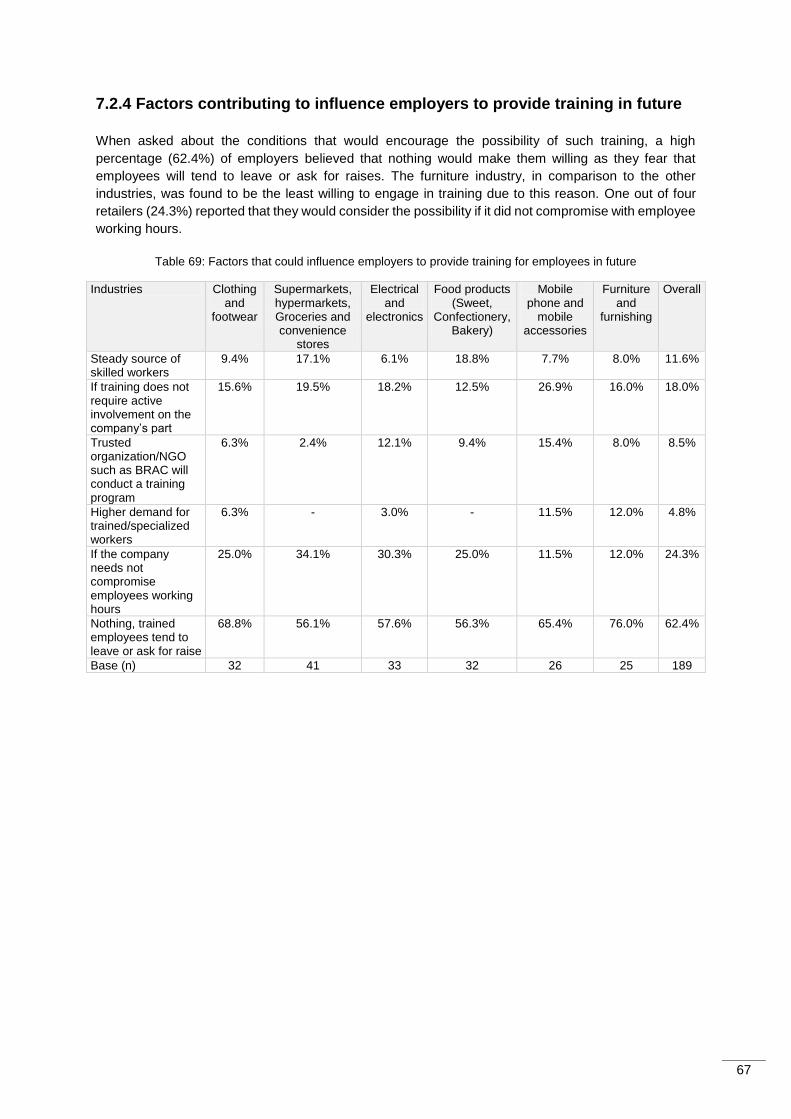
67
7.2.4 Factors contributing to influence employers to provide training in future
When asked about the conditions that would encourage the possibility of such training, a high
percentage (62.4%) of employers believed that nothing would make them willing as they fear that
employees will tend to leave or ask for raises. The furniture industry, in comparison to the other
industries, was found to be the least willing to engage in training due to this reason. One out of four
retailers (24.3%) reported that they would consider the possibility if it did not compromise with employee
working hours.
Table 69: Factors that could influence employers to provide training for employees in future
Industries Clothing and
footwear
Supermarkets, hypermarkets, Groceries and convenience
stores
Electrical and
electronics
Food products (Sweet,
Confectionery, Bakery)
Mobile phone and
mobile accessories
Furniture and
furnishing
Overall
Steady source of skilled workers
9.4% 17.1% 6.1% 18.8% 7.7% 8.0% 11.6%
If training does not require active involvement on the company’s part
15.6% 19.5% 18.2% 12.5% 26.9% 16.0% 18.0%
Trusted organization/NGO such as BRAC will conduct a training program
6.3% 2.4% 12.1% 9.4% 15.4% 8.0% 8.5%
Higher demand for trained/specialized workers
6.3% - 3.0% - 11.5% 12.0% 4.8%
If the company needs not compromise employees working hours
25.0% 34.1% 30.3% 25.0% 11.5% 12.0% 24.3%
Nothing, trained employees tend to leave or ask for raise
68.8% 56.1% 57.6% 56.3% 65.4% 76.0% 62.4%
Base (n) 32 41 33 32 26 25 189
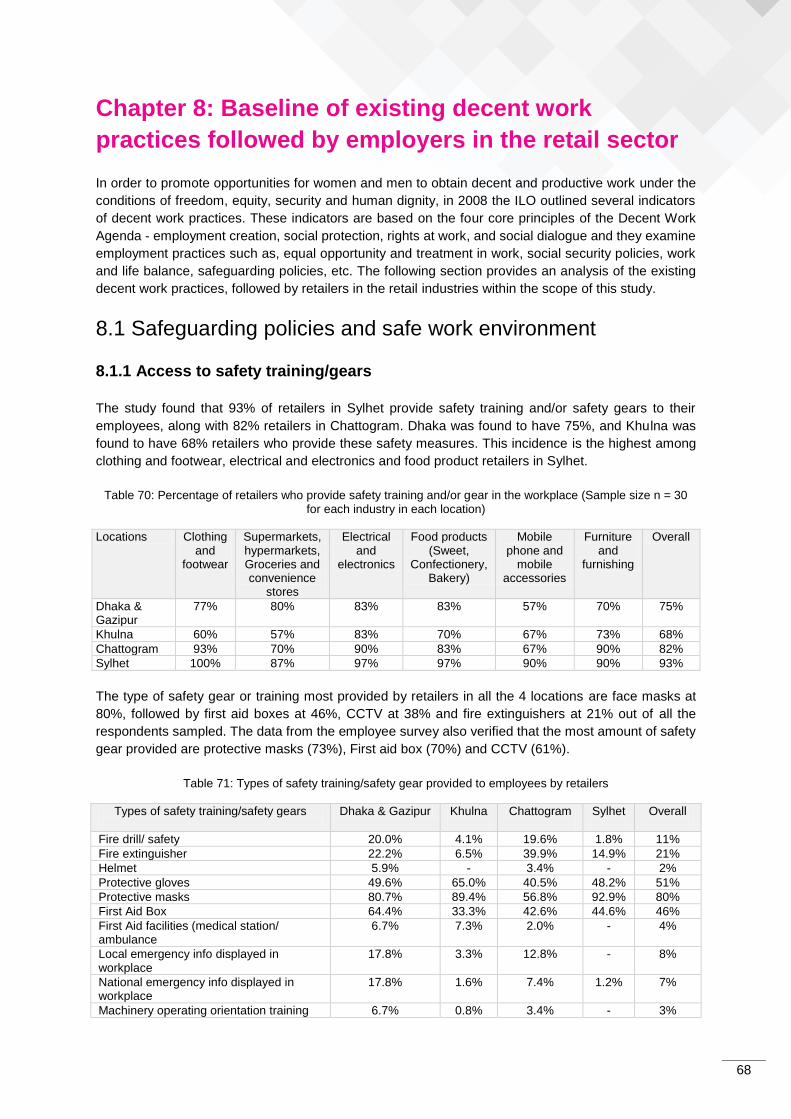
68
Chapter 8: Baseline of existing decent work
practices followed by employers in the retail sector
In order to promote opportunities for women and men to obtain decent and productive work under the
conditions of freedom, equity, security and human dignity, in 2008 the ILO outlined several indicators
of decent work practices. These indicators are based on the four core principles of the Decent Work
Agenda - employment creation, social protection, rights at work, and social dialogue and they examine
employment practices such as, equal opportunity and treatment in work, social security policies, work
and life balance, safeguarding policies, etc. The following section provides an analysis of the existing
decent work practices, followed by retailers in the retail industries within the scope of this study.
8.1 Safeguarding policies and safe work environment
8.1.1 Access to safety training/gears
The study found that 93% of retailers in Sylhet provide safety training and/or safety gears to their
employees, along with 82% retailers in Chattogram. Dhaka was found to have 75%, and Khulna was
found to have 68% retailers who provide these safety measures. This incidence is the highest among
clothing and footwear, electrical and electronics and food product retailers in Sylhet.
Table 70: Percentage of retailers who provide safety training and/or gear in the workplace (Sample size n = 30 for each industry in each location)
Locations Clothing and
footwear
Supermarkets, hypermarkets, Groceries and convenience
stores
Electrical and
electronics
Food products (Sweet,
Confectionery, Bakery)
Mobile phone and
mobile accessories
Furniture and
furnishing
Overall
Dhaka & Gazipur
77% 80% 83% 83% 57% 70% 75%
Khulna 60% 57% 83% 70% 67% 73% 68%
Chattogram 93% 70% 90% 83% 67% 90% 82%
Sylhet 100% 87% 97% 97% 90% 90% 93%
The type of safety gear or training most provided by retailers in all the 4 locations are face masks at
80%, followed by first aid boxes at 46%, CCTV at 38% and fire extinguishers at 21% out of all the
respondents sampled. The data from the employee survey also verified that the most amount of safety
gear provided are protective masks (73%), First aid box (70%) and CCTV (61%).
Table 71: Types of safety training/safety gear provided to employees by retailers
Types of safety training/safety gears
Dhaka & Gazipur Khulna
Chattogram
Sylhet
Overall
Fire drill/ safety 20.0% 4.1% 19.6% 1.8% 11%
Fire extinguisher 22.2% 6.5% 39.9% 14.9% 21%
Helmet 5.9% - 3.4% - 2%
Protective gloves 49.6% 65.0% 40.5% 48.2% 51%
Protective masks 80.7% 89.4% 56.8% 92.9% 80%
First Aid Box 64.4% 33.3% 42.6% 44.6% 46%
First Aid facilities (medical station/ ambulance
6.7% 7.3% 2.0% - 4%
Local emergency info displayed in workplace
17.8% 3.3% 12.8% - 8%
National emergency info displayed in workplace
17.8% 1.6% 7.4% 1.2% 7%
Machinery operating orientation training 6.7% 0.8% 3.4% - 3%
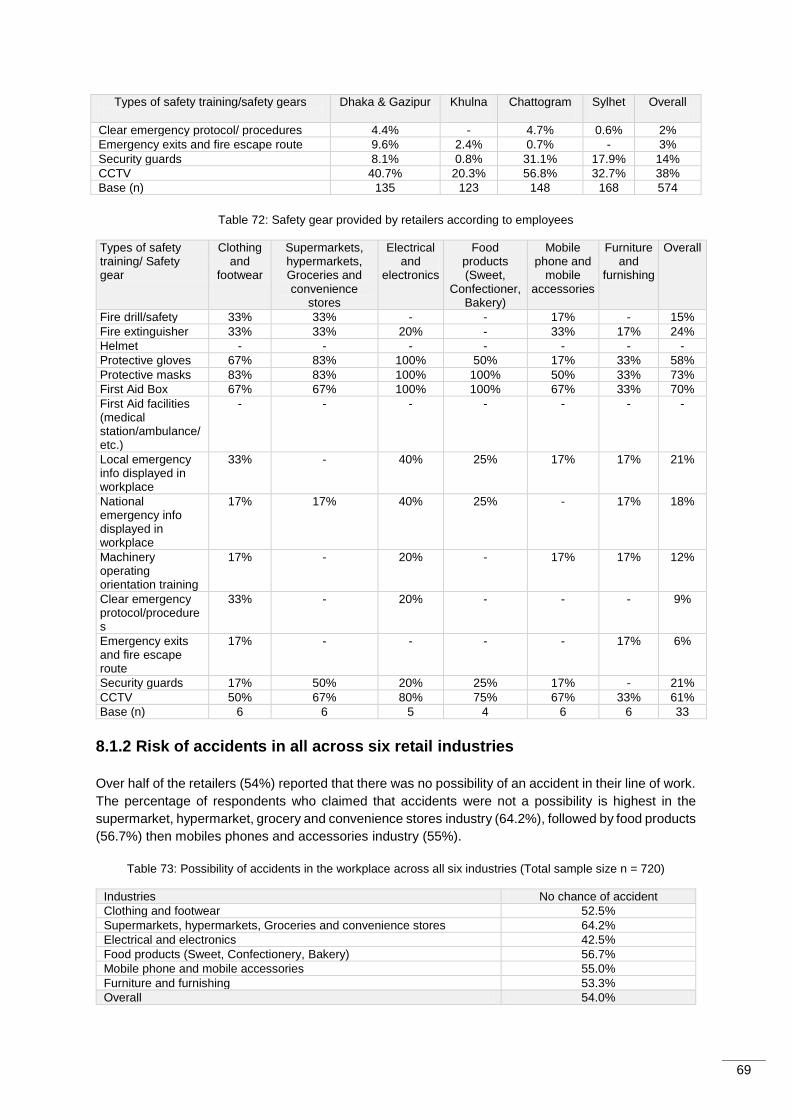
69
Types of safety training/safety gears
Dhaka & Gazipur Khulna
Chattogram
Sylhet
Overall
Clear emergency protocol/ procedures 4.4% - 4.7% 0.6% 2%
Emergency exits and fire escape route 9.6% 2.4% 0.7% - 3%
Security guards 8.1% 0.8% 31.1% 17.9% 14%
CCTV 40.7% 20.3% 56.8% 32.7% 38%
Base (n) 135 123 148 168 574
Table 72: Safety gear provided by retailers according to employees
Types of safety training/ Safety gear
Clothing and
footwear
Supermarkets, hypermarkets, Groceries and convenience
stores
Electrical and
electronics
Food products (Sweet,
Confectioner, Bakery)
Mobile phone and
mobile accessories
Furniture and
furnishing
Overall
Fire drill/safety 33% 33% - - 17% - 15%
Fire extinguisher 33% 33% 20% - 33% 17% 24%
Helmet - - - - - - -
Protective gloves 67% 83% 100% 50% 17% 33% 58%
Protective masks 83% 83% 100% 100% 50% 33% 73%
First Aid Box 67% 67% 100% 100% 67% 33% 70%
First Aid facilities (medical station/ambulance/ etc.)
- - - - - - -
Local emergency info displayed in workplace
33% - 40% 25% 17% 17% 21%
National emergency info displayed in workplace
17% 17% 40% 25% - 17% 18%
Machinery operating orientation training
17% - 20% - 17% 17% 12%
Clear emergency protocol/procedures
33% - 20% - - - 9%
Emergency exits and fire escape route
17% - - - - 17% 6%
Security guards 17% 50% 20% 25% 17% - 21%
CCTV 50% 67% 80% 75% 67% 33% 61%
Base (n) 6 6 5 4 6 6 33
8.1.2 Risk of accidents in all across six retail industries
Over half of the retailers (54%) reported that there was no possibility of an accident in their line of work.
The percentage of respondents who claimed that accidents were not a possibility is highest in the
supermarket, hypermarket, grocery and convenience stores industry (64.2%), followed by food products
(56.7%) then mobiles phones and accessories industry (55%).
Table 73: Possibility of accidents in the workplace across all six industries (Total sample size n = 720)
Industries No chance of accident
Clothing and footwear 52.5%
Supermarkets, hypermarkets, Groceries and convenience stores 64.2%
Electrical and electronics 42.5%
Food products (Sweet, Confectionery, Bakery) 56.7%
Mobile phone and mobile accessories 55.0%
Furniture and furnishing 53.3%
Overall 54.0%
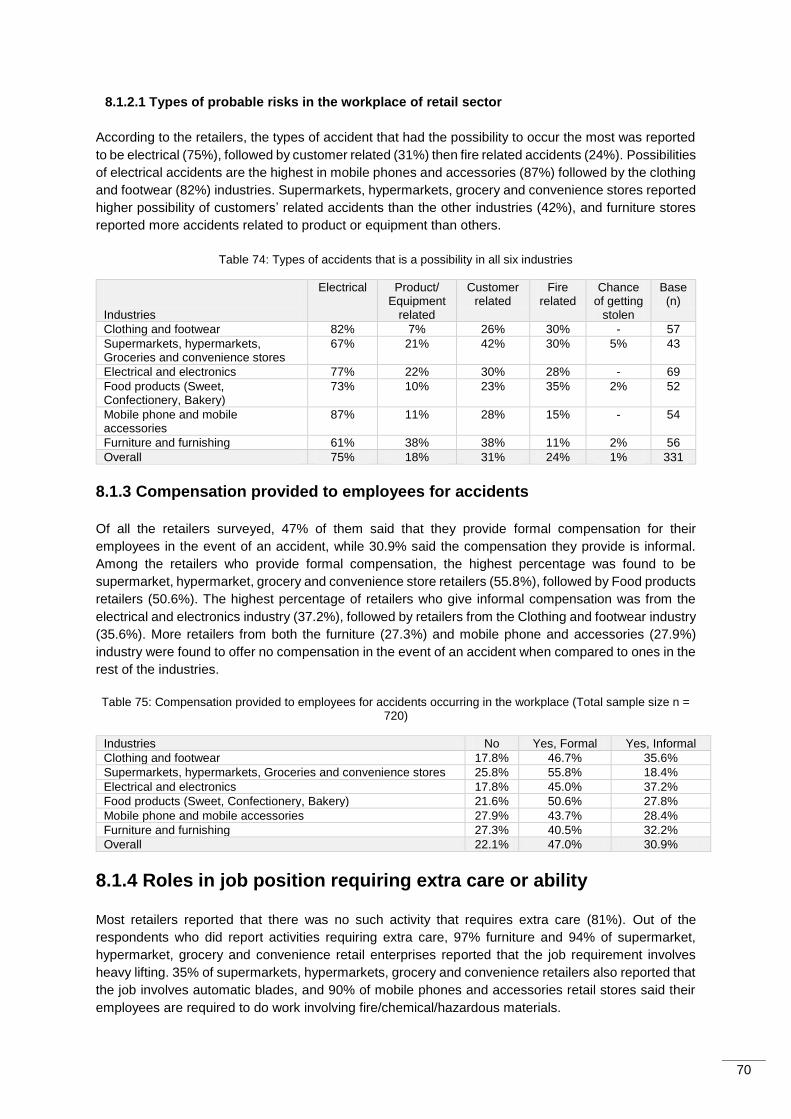
70
8.1.2.1 Types of probable risks in the workplace of retail sector
According to the retailers, the types of accident that had the possibility to occur the most was reported
to be electrical (75%), followed by customer related (31%) then fire related accidents (24%). Possibilities
of electrical accidents are the highest in mobile phones and accessories (87%) followed by the clothing
and footwear (82%) industries. Supermarkets, hypermarkets, grocery and convenience stores reported
higher possibility of customers’ related accidents than the other industries (42%), and furniture stores
reported more accidents related to product or equipment than others.
Table 74: Types of accidents that is a possibility in all six industries
Industries
Electrical Product/ Equipment
related
Customer related
Fire related
Chance of getting
stolen
Base (n)
Clothing and footwear 82% 7% 26% 30% - 57
Supermarkets, hypermarkets, Groceries and convenience stores
67% 21% 42% 30% 5% 43
Electrical and electronics 77% 22% 30% 28% - 69
Food products (Sweet, Confectionery, Bakery)
73% 10% 23% 35% 2% 52
Mobile phone and mobile accessories
87% 11% 28% 15% - 54
Furniture and furnishing 61% 38% 38% 11% 2% 56
Overall 75% 18% 31% 24% 1% 331
8.1.3 Compensation provided to employees for accidents
Of all the retailers surveyed, 47% of them said that they provide formal compensation for their
employees in the event of an accident, while 30.9% said the compensation they provide is informal.
Among the retailers who provide formal compensation, the highest percentage was found to be
supermarket, hypermarket, grocery and convenience store retailers (55.8%), followed by Food products
retailers (50.6%). The highest percentage of retailers who give informal compensation was from the
electrical and electronics industry (37.2%), followed by retailers from the Clothing and footwear industry
(35.6%). More retailers from both the furniture (27.3%) and mobile phone and accessories (27.9%)
industry were found to offer no compensation in the event of an accident when compared to ones in the
rest of the industries.
Table 75: Compensation provided to employees for accidents occurring in the workplace (Total sample size n = 720)
Industries No Yes, Formal Yes, Informal
Clothing and footwear 17.8% 46.7% 35.6%
Supermarkets, hypermarkets, Groceries and convenience stores 25.8% 55.8% 18.4%
Electrical and electronics 17.8% 45.0% 37.2%
Food products (Sweet, Confectionery, Bakery) 21.6% 50.6% 27.8%
Mobile phone and mobile accessories 27.9% 43.7% 28.4%
Furniture and furnishing 27.3% 40.5% 32.2%
Overall 22.1% 47.0% 30.9%
8.1.4 Roles in job position requiring extra care or ability
Most retailers reported that there was no such activity that requires extra care (81%). Out of the
respondents who did report activities requiring extra care, 97% furniture and 94% of supermarket,
hypermarket, grocery and convenience retail enterprises reported that the job requirement involves
heavy lifting. 35% of supermarkets, hypermarkets, grocery and convenience retailers also reported that
the job involves automatic blades, and 90% of mobile phones and accessories retail stores said their
employees are required to do work involving fire/chemical/hazardous materials.
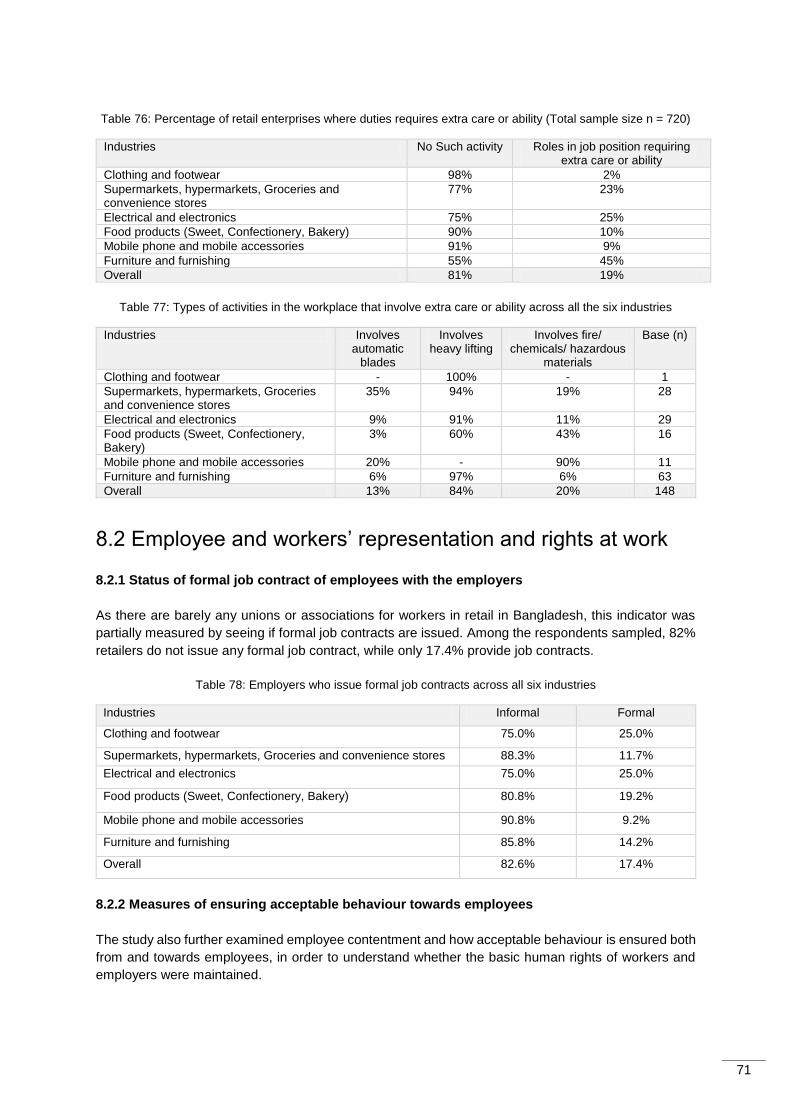
71
Table 76: Percentage of retail enterprises where duties requires extra care or ability (Total sample size n = 720)
Industries No Such activity Roles in job position requiring extra care or ability
Clothing and footwear 98% 2%
Supermarkets, hypermarkets, Groceries and convenience stores
77% 23%
Electrical and electronics 75% 25%
Food products (Sweet, Confectionery, Bakery) 90% 10%
Mobile phone and mobile accessories 91% 9%
Furniture and furnishing 55% 45%
Overall 81% 19%
Table 77: Types of activities in the workplace that involve extra care or ability across all the six industries
Industries Involves automatic
blades
Involves heavy lifting
Involves fire/ chemicals/ hazardous
materials
Base (n)
Clothing and footwear - 100% - 1
Supermarkets, hypermarkets, Groceries and convenience stores
35% 94% 19% 28
Electrical and electronics 9% 91% 11% 29
Food products (Sweet, Confectionery, Bakery)
3% 60% 43% 16
Mobile phone and mobile accessories 20% - 90% 11
Furniture and furnishing 6% 97% 6% 63
Overall 13% 84% 20% 148
8.2 Employee and workers’ representation and rights at work
8.2.1 Status of formal job contract of employees with the employers
As there are barely any unions or associations for workers in retail in Bangladesh, this indicator was
partially measured by seeing if formal job contracts are issued. Among the respondents sampled, 82%
retailers do not issue any formal job contract, while only 17.4% provide job contracts.
Table 78: Employers who issue formal job contracts across all six industries
Industries Informal Formal
Clothing and footwear 75.0% 25.0%
Supermarkets, hypermarkets, Groceries and convenience stores 88.3% 11.7%
Electrical and electronics 75.0% 25.0%
Food products (Sweet, Confectionery, Bakery) 80.8% 19.2%
Mobile phone and mobile accessories 90.8% 9.2%
Furniture and furnishing 85.8% 14.2%
Overall 82.6% 17.4%
8.2.2 Measures of ensuring acceptable behaviour towards employees
The study also further examined employee contentment and how acceptable behaviour is ensured both
from and towards employees, in order to understand whether the basic human rights of workers and
employers were maintained.
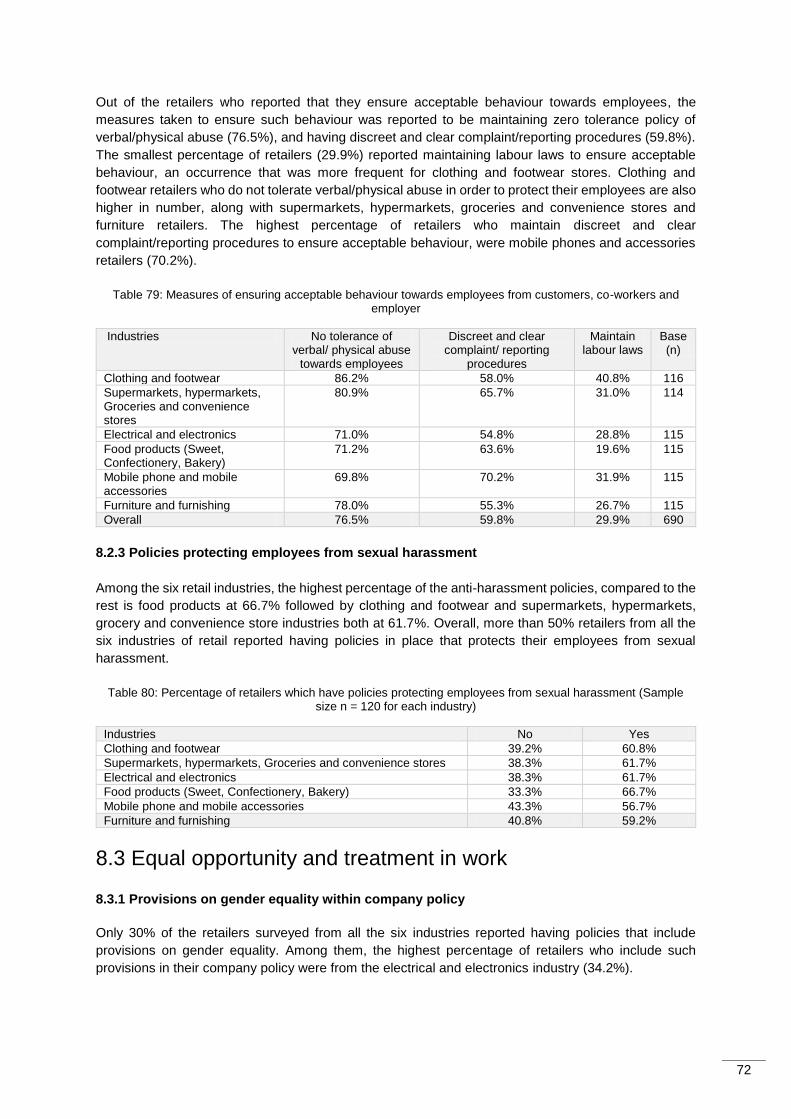
72
Out of the retailers who reported that they ensure acceptable behaviour towards employees, the
measures taken to ensure such behaviour was reported to be maintaining zero tolerance policy of
verbal/physical abuse (76.5%), and having discreet and clear complaint/reporting procedures (59.8%).
The smallest percentage of retailers (29.9%) reported maintaining labour laws to ensure acceptable
behaviour, an occurrence that was more frequent for clothing and footwear stores. Clothing and
footwear retailers who do not tolerate verbal/physical abuse in order to protect their employees are also
higher in number, along with supermarkets, hypermarkets, groceries and convenience stores and
furniture retailers. The highest percentage of retailers who maintain discreet and clear
complaint/reporting procedures to ensure acceptable behaviour, were mobile phones and accessories
retailers (70.2%).
Table 79: Measures of ensuring acceptable behaviour towards employees from customers, co-workers and employer
Industries No tolerance of verbal/ physical abuse
towards employees
Discreet and clear complaint/ reporting
procedures
Maintain labour laws
Base (n)
Clothing and footwear 86.2% 58.0% 40.8% 116
Supermarkets, hypermarkets, Groceries and convenience stores
80.9% 65.7% 31.0% 114
Electrical and electronics 71.0% 54.8% 28.8% 115
Food products (Sweet, Confectionery, Bakery)
71.2% 63.6% 19.6% 115
Mobile phone and mobile accessories
69.8% 70.2% 31.9% 115
Furniture and furnishing 78.0% 55.3% 26.7% 115
Overall 76.5% 59.8% 29.9% 690
8.2.3 Policies protecting employees from sexual harassment
Among the six retail industries, the highest percentage of the anti-harassment policies, compared to the
rest is food products at 66.7% followed by clothing and footwear and supermarkets, hypermarkets,
grocery and convenience store industries both at 61.7%. Overall, more than 50% retailers from all the
six industries of retail reported having policies in place that protects their employees from sexual
harassment.
Table 80: Percentage of retailers which have policies protecting employees from sexual harassment (Sample size n = 120 for each industry)
Industries No Yes
Clothing and footwear 39.2% 60.8%
Supermarkets, hypermarkets, Groceries and convenience stores 38.3% 61.7%
Electrical and electronics 38.3% 61.7%
Food products (Sweet, Confectionery, Bakery) 33.3% 66.7%
Mobile phone and mobile accessories 43.3% 56.7%
Furniture and furnishing 40.8% 59.2%
8.3 Equal opportunity and treatment in work
8.3.1 Provisions on gender equality within company policy
Only 30% of the retailers surveyed from all the six industries reported having policies that include
provisions on gender equality. Among them, the highest percentage of retailers who include such
provisions in their company policy were from the electrical and electronics industry (34.2%).
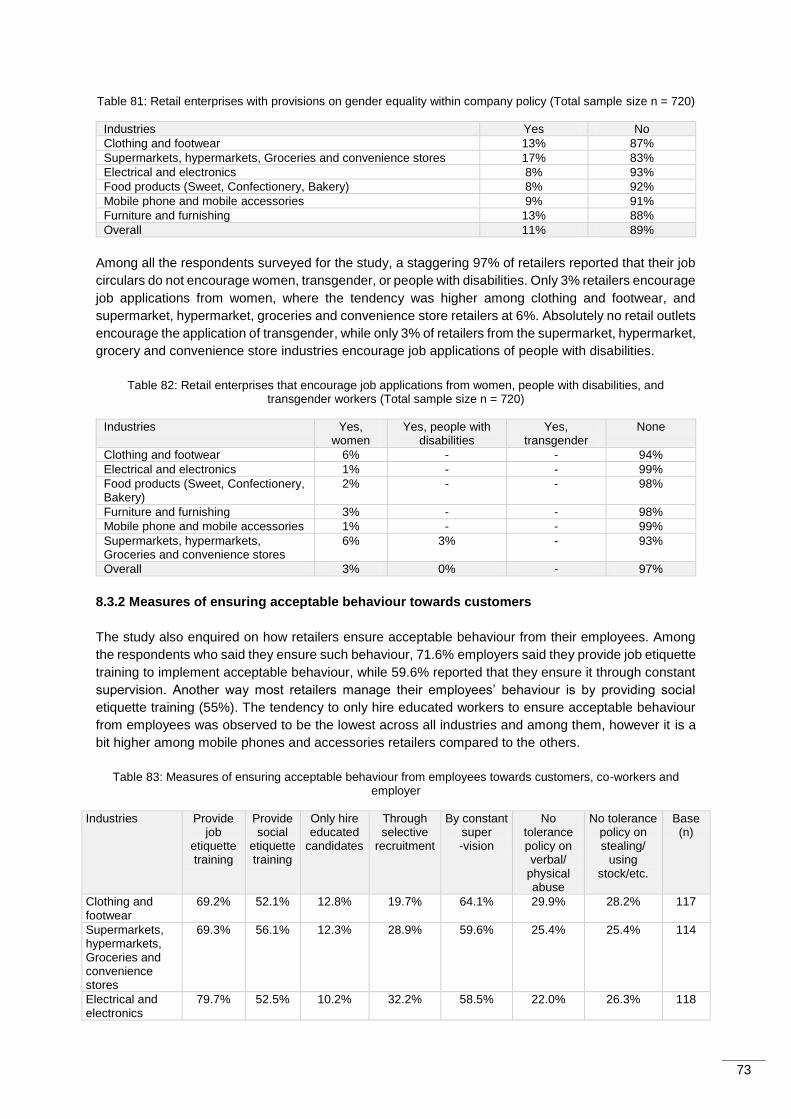
73
Table 81: Retail enterprises with provisions on gender equality within company policy (Total sample size n = 720)
Industries Yes No
Clothing and footwear 13% 87%
Supermarkets, hypermarkets, Groceries and convenience stores 17% 83%
Electrical and electronics 8% 93%
Food products (Sweet, Confectionery, Bakery) 8% 92%
Mobile phone and mobile accessories 9% 91%
Furniture and furnishing 13% 88%
Overall 11% 89%
Among all the respondents surveyed for the study, a staggering 97% of retailers reported that their job
circulars do not encourage women, transgender, or people with disabilities. Only 3% retailers encourage
job applications from women, where the tendency was higher among clothing and footwear, and
supermarket, hypermarket, groceries and convenience store retailers at 6%. Absolutely no retail outlets
encourage the application of transgender, while only 3% of retailers from the supermarket, hypermarket,
grocery and convenience store industries encourage job applications of people with disabilities.
Table 82: Retail enterprises that encourage job applications from women, people with disabilities, and transgender workers (Total sample size n = 720)
Industries Yes, women
Yes, people with disabilities
Yes, transgender
None
Clothing and footwear 6% - - 94%
Electrical and electronics 1% - - 99%
Food products (Sweet, Confectionery, Bakery)
2% - - 98%
Furniture and furnishing 3% - - 98%
Mobile phone and mobile accessories 1% - - 99%
Supermarkets, hypermarkets, Groceries and convenience stores
6% 3% - 93%
Overall 3% 0% - 97%
8.3.2 Measures of ensuring acceptable behaviour towards customers
The study also enquired on how retailers ensure acceptable behaviour from their employees. Among
the respondents who said they ensure such behaviour, 71.6% employers said they provide job etiquette
training to implement acceptable behaviour, while 59.6% reported that they ensure it through constant
supervision. Another way most retailers manage their employees’ behaviour is by providing social
etiquette training (55%). The tendency to only hire educated workers to ensure acceptable behaviour
from employees was observed to be the lowest across all industries and among them, however it is a
bit higher among mobile phones and accessories retailers compared to the others.
Table 83: Measures of ensuring acceptable behaviour from employees towards customers, co-workers and employer
Industries Provide job
etiquette training
Provide social
etiquette training
Only hire educated
candidates
Through selective
recruitment
By constant super -vision
No tolerance policy on verbal/
physical abuse
No tolerance policy on stealing/
using stock/etc.
Base (n)
Clothing and footwear
69.2% 52.1% 12.8% 19.7% 64.1% 29.9% 28.2% 117
Supermarkets, hypermarkets, Groceries and convenience stores
69.3% 56.1% 12.3% 28.9% 59.6% 25.4% 25.4% 114
Electrical and electronics
79.7% 52.5% 10.2% 32.2% 58.5% 22.0% 26.3% 118
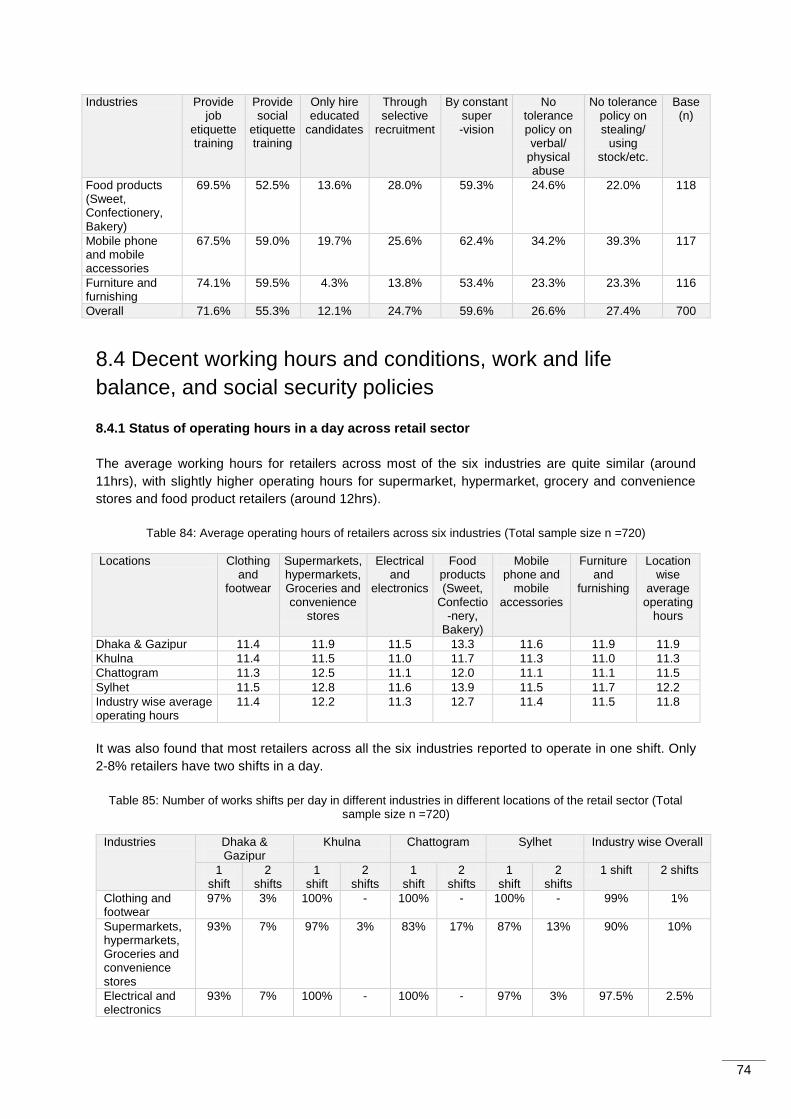
74
Industries Provide job
etiquette training
Provide social
etiquette training
Only hire educated
candidates
Through selective
recruitment
By constant super -vision
No tolerance policy on verbal/
physical abuse
No tolerance policy on stealing/
using stock/etc.
Base (n)
Food products (Sweet, Confectionery, Bakery)
69.5% 52.5% 13.6% 28.0% 59.3% 24.6% 22.0% 118
Mobile phone and mobile accessories
67.5% 59.0% 19.7% 25.6% 62.4% 34.2% 39.3% 117
Furniture and furnishing
74.1% 59.5% 4.3% 13.8% 53.4% 23.3% 23.3% 116
Overall 71.6% 55.3% 12.1% 24.7% 59.6% 26.6% 27.4% 700
8.4 Decent working hours and conditions, work and life
balance, and social security policies
8.4.1 Status of operating hours in a day across retail sector
The average working hours for retailers across most of the six industries are quite similar (around
11hrs), with slightly higher operating hours for supermarket, hypermarket, grocery and convenience
stores and food product retailers (around 12hrs).
Table 84: Average operating hours of retailers across six industries (Total sample size n =720)
Locations Clothing and
footwear
Supermarkets, hypermarkets, Groceries and convenience
stores
Electrical and
electronics
Food products (Sweet,
Confectio-nery,
Bakery)
Mobile phone and
mobile accessories
Furniture and
furnishing
Location wise
average operating
hours
Dhaka & Gazipur 11.4 11.9 11.5 13.3 11.6 11.9 11.9
Khulna 11.4 11.5 11.0 11.7 11.3 11.0 11.3
Chattogram 11.3 12.5 11.1 12.0 11.1 11.1 11.5
Sylhet 11.5 12.8 11.6 13.9 11.5 11.7 12.2
Industry wise average operating hours
11.4 12.2 11.3 12.7 11.4 11.5 11.8
It was also found that most retailers across all the six industries reported to operate in one shift. Only
2-8% retailers have two shifts in a day.
Table 85: Number of works shifts per day in different industries in different locations of the retail sector (Total sample size n =720)
Industries Dhaka & Gazipur
Khulna Chattogram Sylhet Industry wise Overall
1 shift
2 shifts
1 shift
2 shifts
1 shift
2 shifts
1 shift
2 shifts
1 shift 2 shifts
Clothing and footwear
97% 3% 100% - 100% - 100% - 99% 1%
Supermarkets, hypermarkets, Groceries and convenience stores
93% 7% 97% 3% 83% 17% 87% 13% 90% 10%
Electrical and electronics
93% 7% 100% - 100% - 97% 3% 97.5% 2.5%
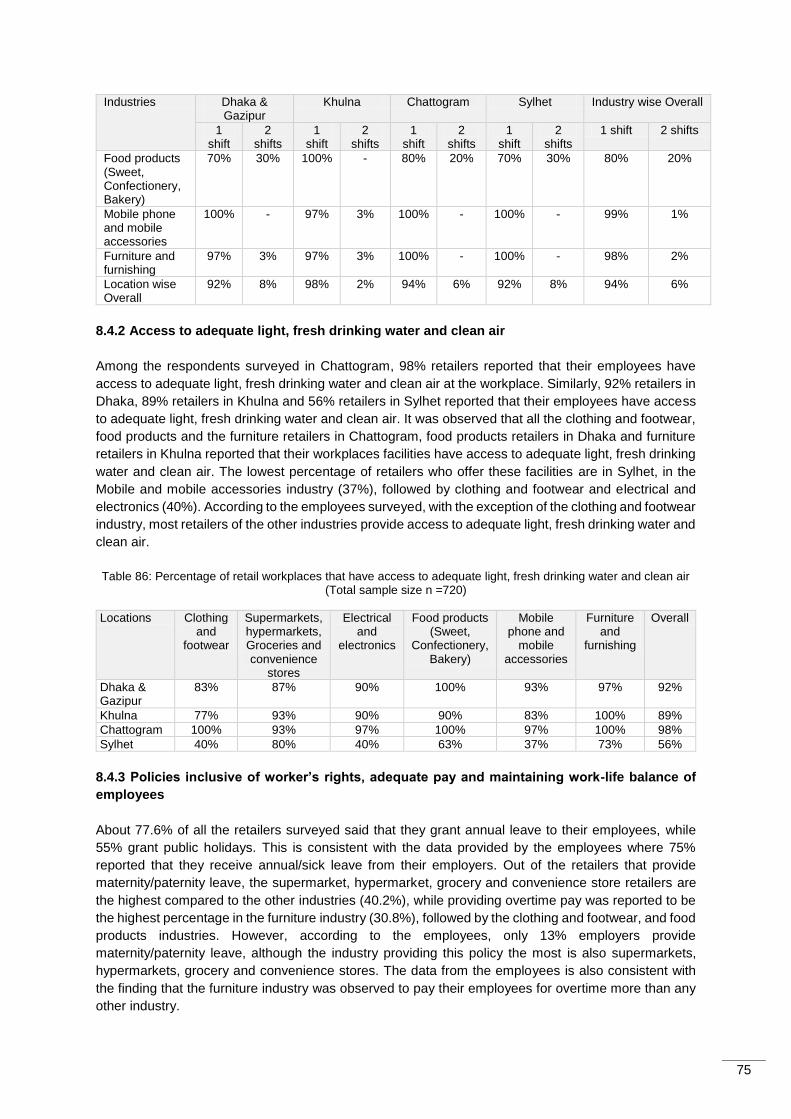
75
Industries Dhaka & Gazipur
Khulna Chattogram Sylhet Industry wise Overall
1 shift
2 shifts
1 shift
2 shifts
1 shift
2 shifts
1 shift
2 shifts
1 shift 2 shifts
Food products (Sweet, Confectionery, Bakery)
70% 30% 100% - 80% 20% 70% 30% 80% 20%
Mobile phone and mobile accessories
100% - 97% 3% 100% - 100% - 99% 1%
Furniture and furnishing
97% 3% 97% 3% 100% - 100% - 98% 2%
Location wise Overall
92% 8% 98% 2% 94% 6% 92% 8% 94% 6%
8.4.2 Access to adequate light, fresh drinking water and clean air
Among the respondents surveyed in Chattogram, 98% retailers reported that their employees have
access to adequate light, fresh drinking water and clean air at the workplace. Similarly, 92% retailers in
Dhaka, 89% retailers in Khulna and 56% retailers in Sylhet reported that their employees have access
to adequate light, fresh drinking water and clean air. It was observed that all the clothing and footwear,
food products and the furniture retailers in Chattogram, food products retailers in Dhaka and furniture
retailers in Khulna reported that their workplaces facilities have access to adequate light, fresh drinking
water and clean air. The lowest percentage of retailers who offer these facilities are in Sylhet, in the
Mobile and mobile accessories industry (37%), followed by clothing and footwear and electrical and
electronics (40%). According to the employees surveyed, with the exception of the clothing and footwear
industry, most retailers of the other industries provide access to adequate light, fresh drinking water and
clean air.
Table 86: Percentage of retail workplaces that have access to adequate light, fresh drinking water and clean air (Total sample size n =720)
Locations Clothing and
footwear
Supermarkets, hypermarkets, Groceries and convenience
stores
Electrical and
electronics
Food products (Sweet,
Confectionery, Bakery)
Mobile phone and
mobile accessories
Furniture and
furnishing
Overall
Dhaka & Gazipur
83% 87% 90% 100% 93% 97% 92%
Khulna 77% 93% 90% 90% 83% 100% 89%
Chattogram 100% 93% 97% 100% 97% 100% 98%
Sylhet 40% 80% 40% 63% 37% 73% 56%
8.4.3 Policies inclusive of worker’s rights, adequate pay and maintaining work-life balance of
employees
About 77.6% of all the retailers surveyed said that they grant annual leave to their employees, while
55% grant public holidays. This is consistent with the data provided by the employees where 75%
reported that they receive annual/sick leave from their employers. Out of the retailers that provide
maternity/paternity leave, the supermarket, hypermarket, grocery and convenience store retailers are
the highest compared to the other industries (40.2%), while providing overtime pay was reported to be
the highest percentage in the furniture industry (30.8%), followed by the clothing and footwear, and food
products industries. However, according to the employees, only 13% employers provide
maternity/paternity leave, although the industry providing this policy the most is also supermarkets,
hypermarkets, grocery and convenience stores. The data from the employees is also consistent with
the finding that the furniture industry was observed to pay their employees for overtime more than any
other industry.
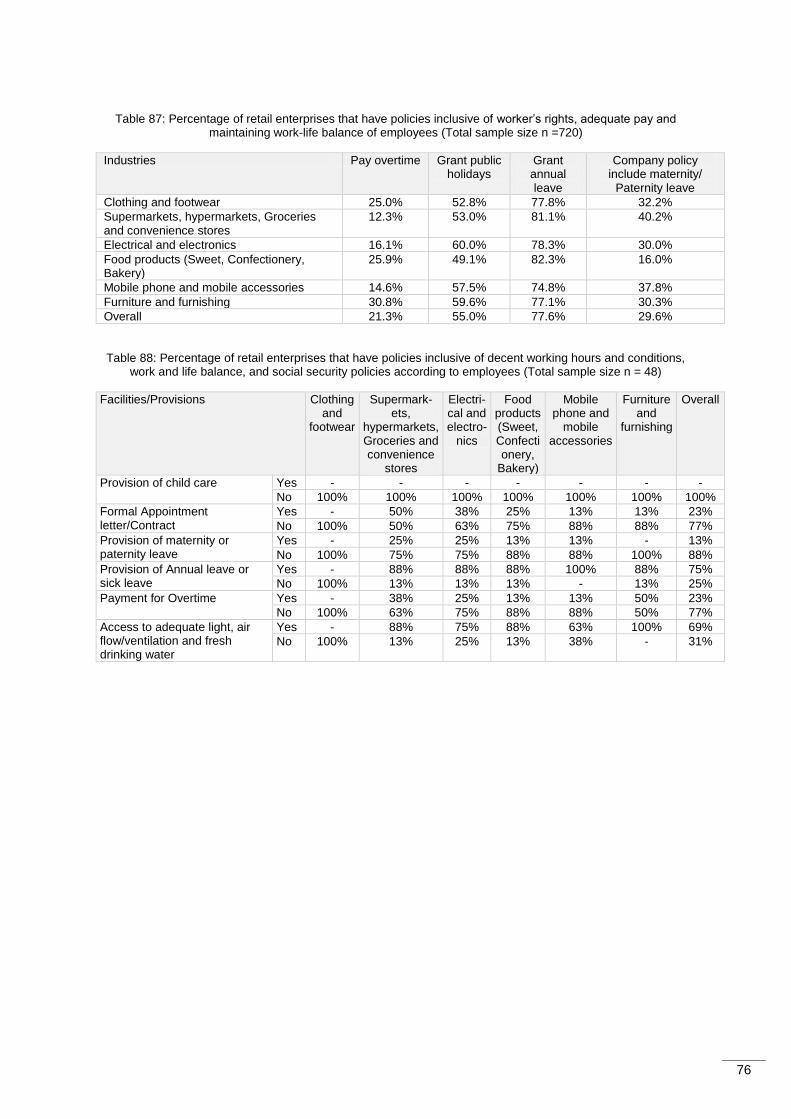
76
Table 87: Percentage of retail enterprises that have policies inclusive of worker’s rights, adequate pay and maintaining work-life balance of employees (Total sample size n =720)
Industries Pay overtime Grant public holidays
Grant annual leave
Company policy include maternity/
Paternity leave
Clothing and footwear 25.0% 52.8% 77.8% 32.2%
Supermarkets, hypermarkets, Groceries and convenience stores
12.3% 53.0% 81.1% 40.2%
Electrical and electronics 16.1% 60.0% 78.3% 30.0%
Food products (Sweet, Confectionery, Bakery)
25.9% 49.1% 82.3% 16.0%
Mobile phone and mobile accessories 14.6% 57.5% 74.8% 37.8%
Furniture and furnishing 30.8% 59.6% 77.1% 30.3%
Overall 21.3% 55.0% 77.6% 29.6%
Table 88: Percentage of retail enterprises that have policies inclusive of decent working hours and conditions, work and life balance, and social security policies according to employees (Total sample size n = 48)
Facilities/Provisions Clothing and
footwear
Supermark-ets,
hypermarkets, Groceries and convenience
stores
Electri-cal and electro-
nics
Food products (Sweet, Confectionery,
Bakery)
Mobile phone and
mobile accessories
Furniture and
furnishing
Overall
Provision of child care Yes - - - - - - -
No 100% 100% 100% 100% 100% 100% 100%
Formal Appointment letter/Contract
Yes - 50% 38% 25% 13% 13% 23%
No 100% 50% 63% 75% 88% 88% 77%
Provision of maternity or paternity leave
Yes - 25% 25% 13% 13% - 13%
No 100% 75% 75% 88% 88% 100% 88%
Provision of Annual leave or sick leave
Yes - 88% 88% 88% 100% 88% 75%
No 100% 13% 13% 13% - 13% 25%
Payment for Overtime Yes - 38% 25% 13% 13% 50% 23%
No 100% 63% 75% 88% 88% 50% 77%
Access to adequate light, air flow/ventilation and fresh drinking water
Yes - 88% 75% 88% 63% 100% 69%
No 100% 13% 25% 13% 38% - 31%
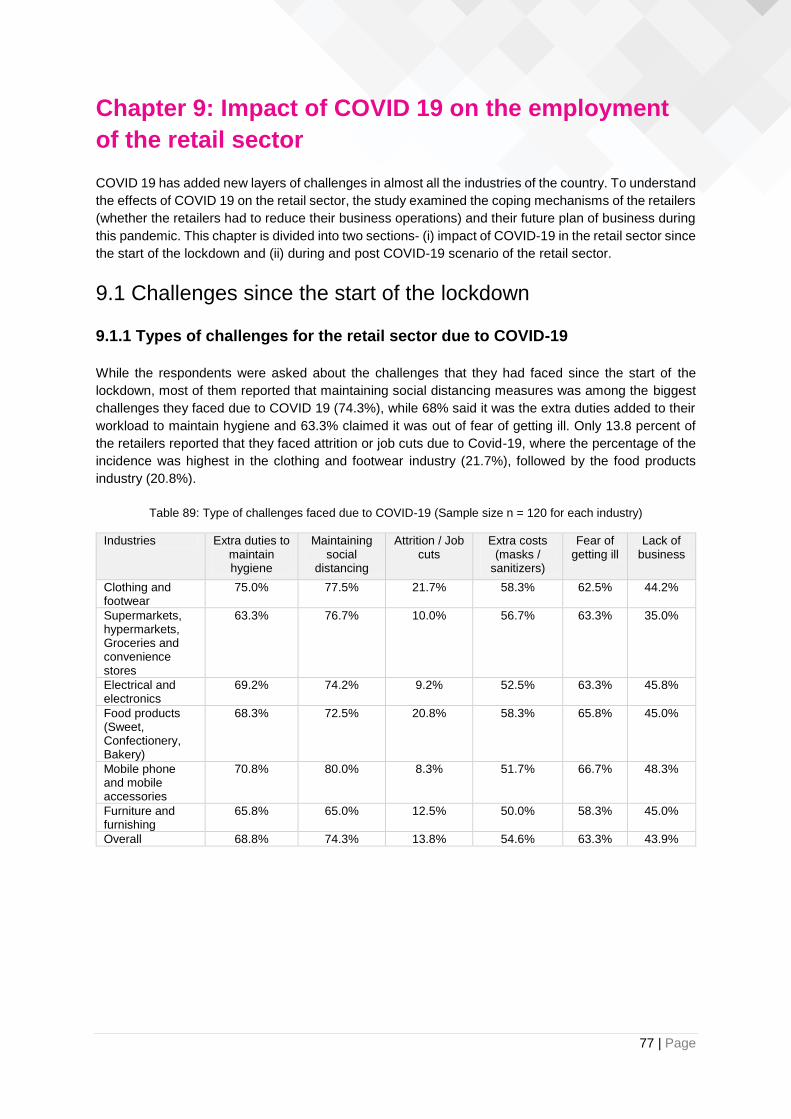
77 | Page
Chapter 9: Impact of COVID 19 on the employment
of the retail sector
COVID 19 has added new layers of challenges in almost all the industries of the country. To understand
the effects of COVID 19 on the retail sector, the study examined the coping mechanisms of the retailers
(whether the retailers had to reduce their business operations) and their future plan of business during
this pandemic. This chapter is divided into two sections- (i) impact of COVID-19 in the retail sector since
the start of the lockdown and (ii) during and post COVID-19 scenario of the retail sector.
9.1 Challenges since the start of the lockdown
9.1.1 Types of challenges for the retail sector due to COVID-19
While the respondents were asked about the challenges that they had faced since the start of the
lockdown, most of them reported that maintaining social distancing measures was among the biggest
challenges they faced due to COVID 19 (74.3%), while 68% said it was the extra duties added to their
workload to maintain hygiene and 63.3% claimed it was out of fear of getting ill. Only 13.8 percent of
the retailers reported that they faced attrition or job cuts due to Covid-19, where the percentage of the
incidence was highest in the clothing and footwear industry (21.7%), followed by the food products
industry (20.8%).
Table 89: Type of challenges faced due to COVID-19 (Sample size n = 120 for each industry)
Industries Extra duties to maintain hygiene
Maintaining social
distancing
Attrition / Job cuts
Extra costs (masks /
sanitizers)
Fear of getting ill
Lack of business
Clothing and footwear
75.0% 77.5% 21.7% 58.3% 62.5% 44.2%
Supermarkets, hypermarkets, Groceries and convenience stores
63.3% 76.7% 10.0% 56.7% 63.3% 35.0%
Electrical and electronics
69.2% 74.2% 9.2% 52.5% 63.3% 45.8%
Food products (Sweet, Confectionery, Bakery)
68.3% 72.5% 20.8% 58.3% 65.8% 45.0%
Mobile phone and mobile accessories
70.8% 80.0% 8.3% 51.7% 66.7% 48.3%
Furniture and furnishing
65.8% 65.0% 12.5% 50.0% 58.3% 45.0%
Overall 68.8% 74.3% 13.8% 54.6% 63.3% 43.9%
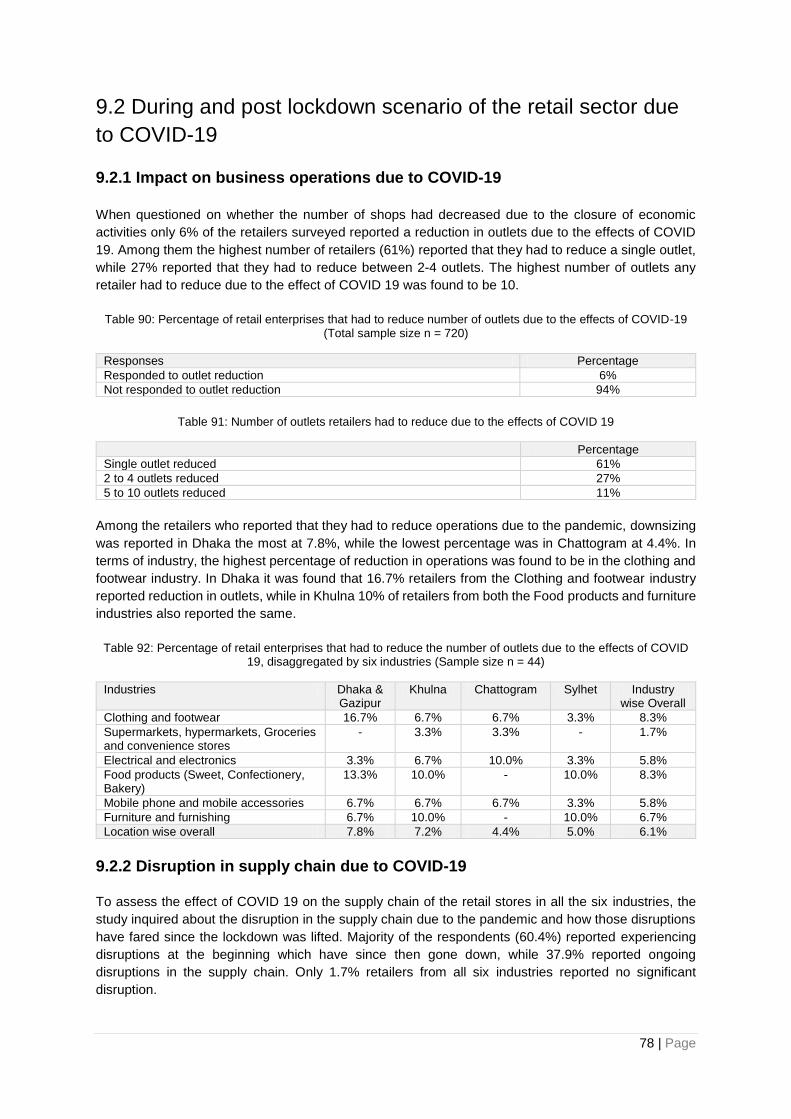
78 | Page
9.2 During and post lockdown scenario of the retail sector due
to COVID-19
9.2.1 Impact on business operations due to COVID-19
When questioned on whether the number of shops had decreased due to the closure of economic
activities only 6% of the retailers surveyed reported a reduction in outlets due to the effects of COVID
19. Among them the highest number of retailers (61%) reported that they had to reduce a single outlet,
while 27% reported that they had to reduce between 2-4 outlets. The highest number of outlets any
retailer had to reduce due to the effect of COVID 19 was found to be 10.
Table 90: Percentage of retail enterprises that had to reduce number of outlets due to the effects of COVID-19 (Total sample size n = 720)
Responses Percentage
Responded to outlet reduction 6%
Not responded to outlet reduction 94%
Table 91: Number of outlets retailers had to reduce due to the effects of COVID 19
Percentage
Single outlet reduced 61%
2 to 4 outlets reduced 27%
5 to 10 outlets reduced 11%
Among the retailers who reported that they had to reduce operations due to the pandemic, downsizing
was reported in Dhaka the most at 7.8%, while the lowest percentage was in Chattogram at 4.4%. In
terms of industry, the highest percentage of reduction in operations was found to be in the clothing and
footwear industry. In Dhaka it was found that 16.7% retailers from the Clothing and footwear industry
reported reduction in outlets, while in Khulna 10% of retailers from both the Food products and furniture
industries also reported the same.
Table 92: Percentage of retail enterprises that had to reduce the number of outlets due to the effects of COVID 19, disaggregated by six industries (Sample size n = 44)
Industries Dhaka & Gazipur
Khulna Chattogram Sylhet Industry wise Overall
Clothing and footwear 16.7% 6.7% 6.7% 3.3% 8.3%
Supermarkets, hypermarkets, Groceries and convenience stores
- 3.3% 3.3% - 1.7%
Electrical and electronics 3.3% 6.7% 10.0% 3.3% 5.8%
Food products (Sweet, Confectionery, Bakery)
13.3% 10.0% - 10.0% 8.3%
Mobile phone and mobile accessories 6.7% 6.7% 6.7% 3.3% 5.8%
Furniture and furnishing 6.7% 10.0% - 10.0% 6.7%
Location wise overall 7.8% 7.2% 4.4% 5.0% 6.1%
9.2.2 Disruption in supply chain due to COVID-19
To assess the effect of COVID 19 on the supply chain of the retail stores in all the six industries, the
study inquired about the disruption in the supply chain due to the pandemic and how those disruptions
have fared since the lockdown was lifted. Majority of the respondents (60.4%) reported experiencing
disruptions at the beginning which have since then gone down, while 37.9% reported ongoing
disruptions in the supply chain. Only 1.7% retailers from all six industries reported no significant
disruption.
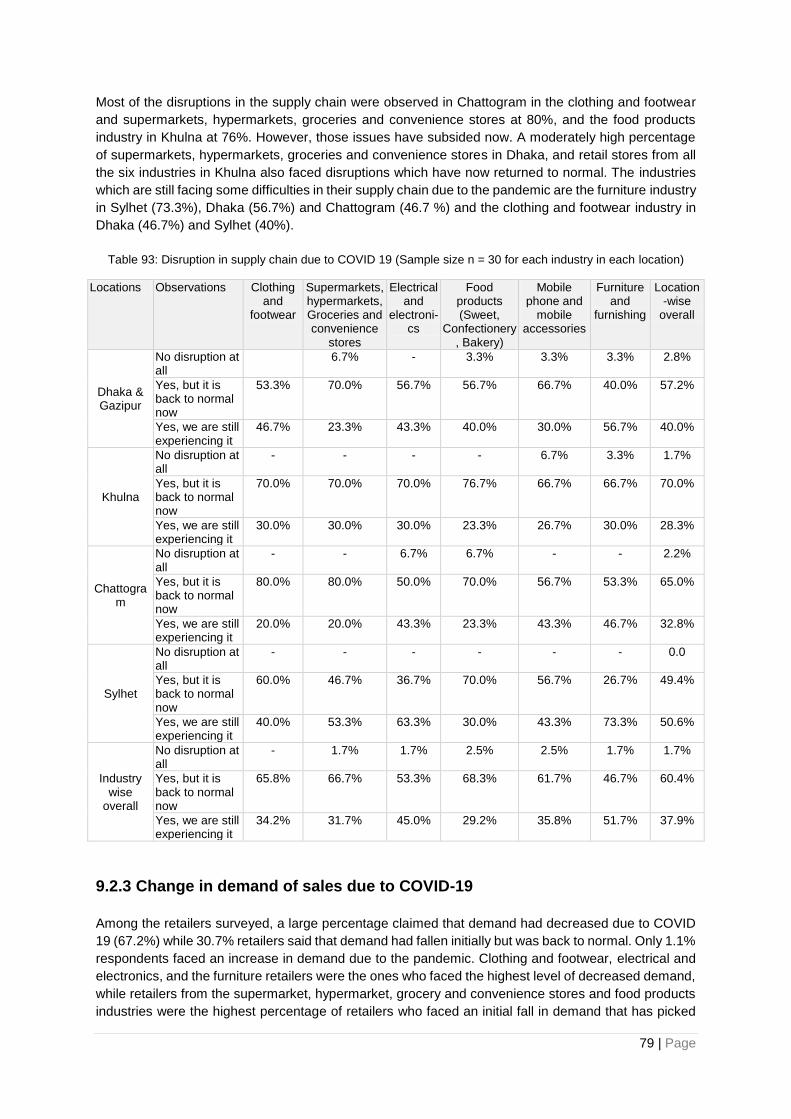
79 | Page
Most of the disruptions in the supply chain were observed in Chattogram in the clothing and footwear
and supermarkets, hypermarkets, groceries and convenience stores at 80%, and the food products
industry in Khulna at 76%. However, those issues have subsided now. A moderately high percentage
of supermarkets, hypermarkets, groceries and convenience stores in Dhaka, and retail stores from all
the six industries in Khulna also faced disruptions which have now returned to normal. The industries
which are still facing some difficulties in their supply chain due to the pandemic are the furniture industry
in Sylhet (73.3%), Dhaka (56.7%) and Chattogram (46.7 %) and the clothing and footwear industry in
Dhaka (46.7%) and Sylhet (40%).
Table 93: Disruption in supply chain due to COVID 19 (Sample size n = 30 for each industry in each location)
Locations Observations Clothing and
footwear
Supermarkets, hypermarkets, Groceries and convenience
stores
Electrical and
electroni-cs
Food products (Sweet,
Confectionery, Bakery)
Mobile phone and
mobile accessories
Furniture and
furnishing
Location -wise
overall
Dhaka & Gazipur
No disruption at all
6.7% - 3.3% 3.3% 3.3% 2.8%
Yes, but it is back to normal now
53.3% 70.0% 56.7% 56.7% 66.7% 40.0% 57.2%
Yes, we are still experiencing it
46.7% 23.3% 43.3% 40.0% 30.0% 56.7% 40.0%
Khulna
No disruption at all
- - - - 6.7% 3.3% 1.7%
Yes, but it is back to normal now
70.0% 70.0% 70.0% 76.7% 66.7% 66.7% 70.0%
Yes, we are still experiencing it
30.0% 30.0% 30.0% 23.3% 26.7% 30.0% 28.3%
Chattogram
No disruption at all
- - 6.7% 6.7% - - 2.2%
Yes, but it is back to normal now
80.0% 80.0% 50.0% 70.0% 56.7% 53.3% 65.0%
Yes, we are still experiencing it
20.0% 20.0% 43.3% 23.3% 43.3% 46.7% 32.8%
Sylhet
No disruption at all
- - - - - - 0.0
Yes, but it is back to normal now
60.0% 46.7% 36.7% 70.0% 56.7% 26.7% 49.4%
Yes, we are still experiencing it
40.0% 53.3% 63.3% 30.0% 43.3% 73.3% 50.6%
Industry wise
overall
No disruption at all
- 1.7% 1.7% 2.5% 2.5% 1.7% 1.7%
Yes, but it is back to normal now
65.8% 66.7% 53.3% 68.3% 61.7% 46.7% 60.4%
Yes, we are still experiencing it
34.2% 31.7% 45.0% 29.2% 35.8% 51.7% 37.9%
9.2.3 Change in demand of sales due to COVID-19
Among the retailers surveyed, a large percentage claimed that demand had decreased due to COVID
19 (67.2%) while 30.7% retailers said that demand had fallen initially but was back to normal. Only 1.1%
respondents faced an increase in demand due to the pandemic. Clothing and footwear, electrical and
electronics, and the furniture retailers were the ones who faced the highest level of decreased demand,
while retailers from the supermarket, hypermarket, grocery and convenience stores and food products
industries were the highest percentage of retailers who faced an initial fall in demand that has picked

80 | Page
up since then. A small percentage of electrical and electronics retailers reported an increase in sales
demand (3.3%) when compared to the retailers of the other industries.
Table 94: Change in demand of sales due to COVID-19 (Total sample size n = 720)
Industries No change
Yes, it decreased
Yes, it decreased but back to normal
Yes, it increased
Yes, increased but back to normal now
Clothing and footwear - 70.8% 29.2% - -
Supermarkets, hypermarkets, Groceries and convenience stores
0.8% 55.8% 41.7% 0.8% 0.8%
Electrical and electronics - 70.0% 25.8% 3.3% 0.8%
Food products (Sweet, Confectionery, Bakery)
0.8% 60.8% 35.8% 1.7% 0.8%
Mobile phone and mobile accessories
- 65.0% 33.3% - 1.7%
Furniture and furnishing - 80.8% 18.3% 0.8% -
Overall 0.3% 67.2% 30.7% 1.1% 0.7%
9.2.4 Change in online sales/ e-commerce due to COVID-19
For most of the respondents, online sales were not applicable (79.4%). Among the retailers who did
have the option available, most retail enterprises from all six industries reported that they observed no
change. Retailers from the electrical and electronics industry faced decreased demand in online sales
which is back to normal now (6.7%).
Table 95: Change in online sales/e-commerce (Total sample size n = 720)
Industries No change
Yes, it decreased
Yes, it decreased but back to normal
Yes, it increased
Yes, increased but back to normal now
Not applicable
Clothing and footwear
8.3% 0.8% 4.2% 3.3% 4.2% 79.2%
Supermarkets, hypermarkets, Groceries and convenience stores
5.8% 0.8% 4.2% 0.8% 1.7% 86.7%
Electrical and electronics
10.0% 5.0% 6.7% 1.7% 1.7% 75.0%
Food products (Sweet, Confectionery, Bakery)
11.7% 5.8% 3.3% 1.7% 2.5% 75.0%
Mobile phone and mobile accessories
12.5% 0.8% 4.2% 2.5% 2.5% 77.5%
Furniture and furnishing
10.8% 1.7% 1.7% 0.8% 1.7% 83.3%
Overall 9.9% 2.5% 4.0% 1.8% 2.4% 79.4%
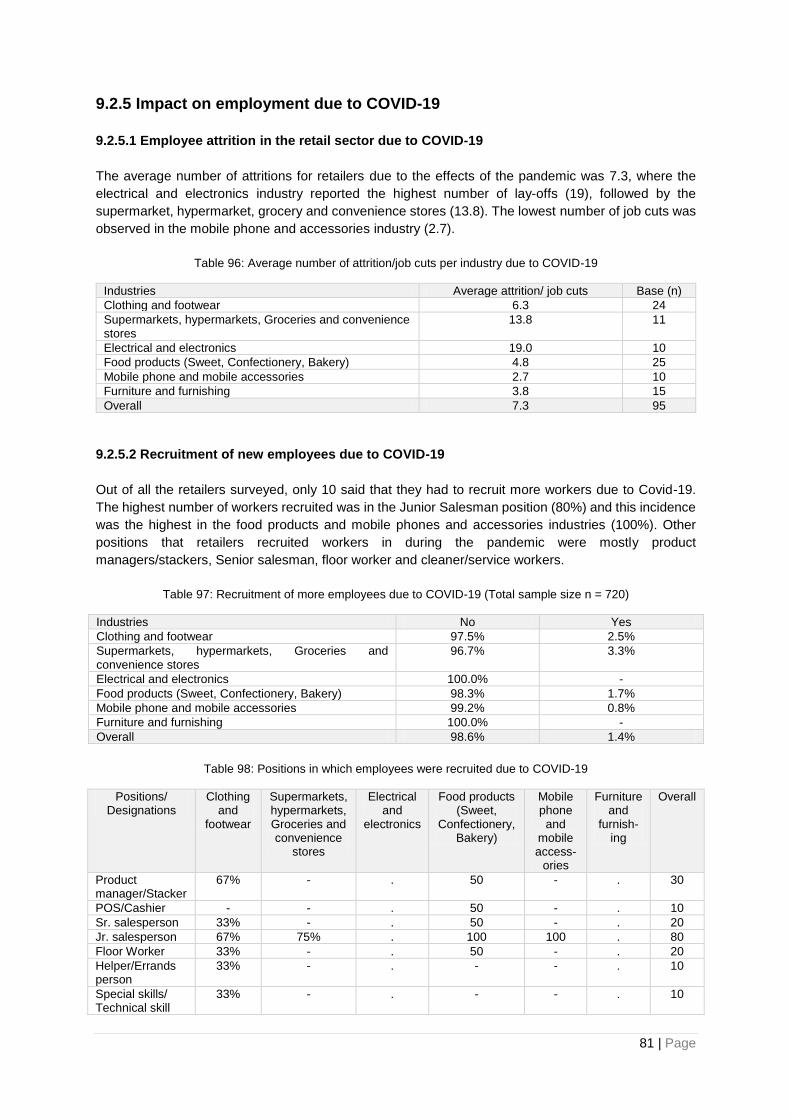
81 | Page
9.2.5 Impact on employment due to COVID-19
9.2.5.1 Employee attrition in the retail sector due to COVID-19
The average number of attritions for retailers due to the effects of the pandemic was 7.3, where the
electrical and electronics industry reported the highest number of lay-offs (19), followed by the
supermarket, hypermarket, grocery and convenience stores (13.8). The lowest number of job cuts was
observed in the mobile phone and accessories industry (2.7).
Table 96: Average number of attrition/job cuts per industry due to COVID-19
Industries Average attrition/ job cuts Base (n)
Clothing and footwear 6.3 24
Supermarkets, hypermarkets, Groceries and convenience stores
13.8 11
Electrical and electronics 19.0 10
Food products (Sweet, Confectionery, Bakery) 4.8 25
Mobile phone and mobile accessories 2.7 10
Furniture and furnishing 3.8 15
Overall 7.3 95
9.2.5.2 Recruitment of new employees due to COVID-19
Out of all the retailers surveyed, only 10 said that they had to recruit more workers due to Covid-19.
The highest number of workers recruited was in the Junior Salesman position (80%) and this incidence
was the highest in the food products and mobile phones and accessories industries (100%). Other
positions that retailers recruited workers in during the pandemic were mostly product
managers/stackers, Senior salesman, floor worker and cleaner/service workers.
Table 97: Recruitment of more employees due to COVID-19 (Total sample size n = 720)
Industries No Yes
Clothing and footwear 97.5% 2.5%
Supermarkets, hypermarkets, Groceries and convenience stores
96.7% 3.3%
Electrical and electronics 100.0% -
Food products (Sweet, Confectionery, Bakery) 98.3% 1.7%
Mobile phone and mobile accessories 99.2% 0.8%
Furniture and furnishing 100.0% -
Overall 98.6% 1.4%
Table 98: Positions in which employees were recruited due to COVID-19
Positions/ Designations
Clothing and
footwear
Supermarkets, hypermarkets, Groceries and convenience
stores
Electrical and
electronics
Food products (Sweet,
Confectionery, Bakery)
Mobile phone and
mobile access-
ories
Furniture and
furnish-ing
Overall
Product manager/Stacker
67% - . 50 - . 30
POS/Cashier - - . 50 - . 10
Sr. salesperson 33% - . 50 - . 20
Jr. salesperson 67% 75% . 100 100 . 80
Floor Worker 33% - . 50 - . 20
Helper/Errands person
33% - . - - . 10
Special skills/ Technical skill
33% - . - - . 10
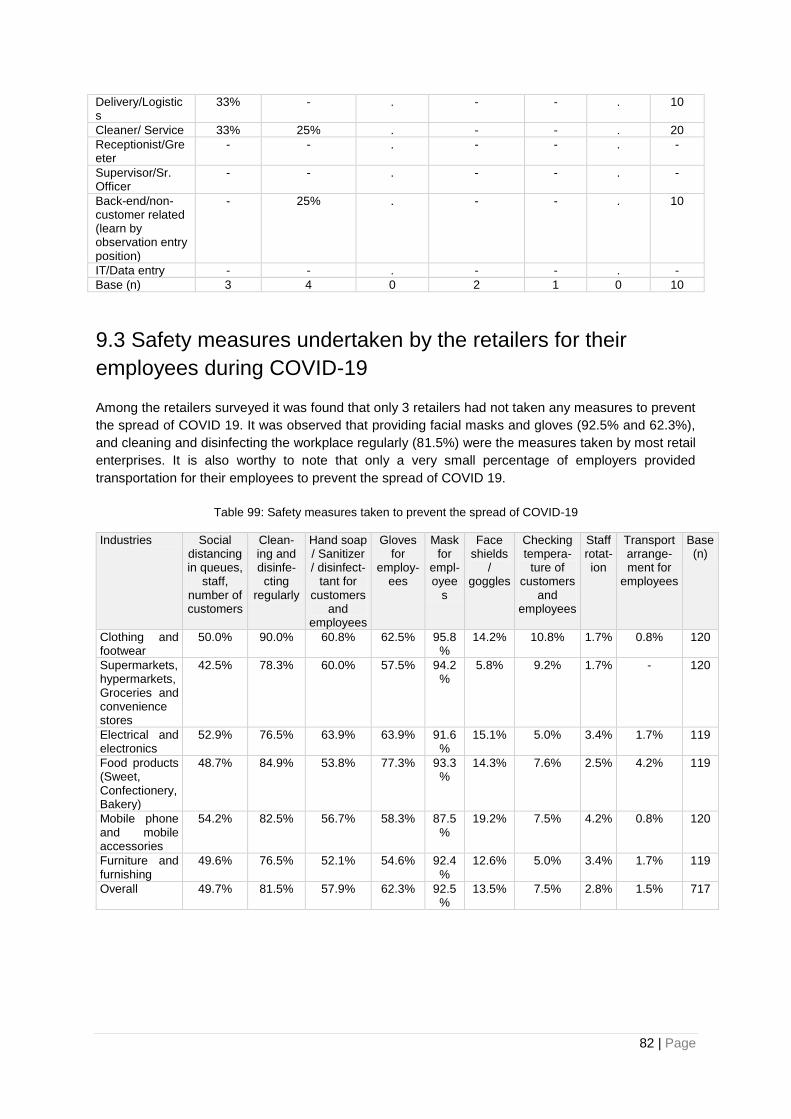
82 | Page
Delivery/Logistics
33% - . - - . 10
Cleaner/ Service 33% 25% . - - . 20
Receptionist/Greeter
- - . - - . -
Supervisor/Sr. Officer
- - . - - . -
Back-end/non-customer related (learn by observation entry position)
- 25% . - - . 10
IT/Data entry - - . - - . -
Base (n) 3 4 0 2 1 0 10
9.3 Safety measures undertaken by the retailers for their
employees during COVID-19
Among the retailers surveyed it was found that only 3 retailers had not taken any measures to prevent
the spread of COVID 19. It was observed that providing facial masks and gloves (92.5% and 62.3%),
and cleaning and disinfecting the workplace regularly (81.5%) were the measures taken by most retail
enterprises. It is also worthy to note that only a very small percentage of employers provided
transportation for their employees to prevent the spread of COVID 19.
Table 99: Safety measures taken to prevent the spread of COVID-19
Industries Social distancing in queues,
staff, number of customers
Clean-ing and disinfe-cting
regularly
Hand soap / Sanitizer / disinfect-
tant for customers
and employees
Gloves for
employ-ees
Mask for
empl-oyee
s
Face shields
/ goggles
Checking tempera-
ture of customers
and employees
Staff rotat-ion
Transport arrange-ment for
employees
Base (n)
Clothing and footwear
50.0% 90.0% 60.8% 62.5% 95.8%
14.2% 10.8% 1.7% 0.8% 120
Supermarkets, hypermarkets, Groceries and convenience stores
42.5% 78.3% 60.0% 57.5% 94.2%
5.8% 9.2% 1.7% - 120
Electrical and electronics
52.9% 76.5% 63.9% 63.9% 91.6%
15.1% 5.0% 3.4% 1.7% 119
Food products (Sweet, Confectionery, Bakery)
48.7% 84.9% 53.8% 77.3% 93.3%
14.3% 7.6% 2.5% 4.2% 119
Mobile phone and mobile accessories
54.2% 82.5% 56.7% 58.3% 87.5%
19.2% 7.5% 4.2% 0.8% 120
Furniture and furnishing
49.6% 76.5% 52.1% 54.6% 92.4%
12.6% 5.0% 3.4% 1.7% 119
Overall 49.7% 81.5% 57.9% 62.3% 92.5%
13.5% 7.5% 2.8% 1.5% 717
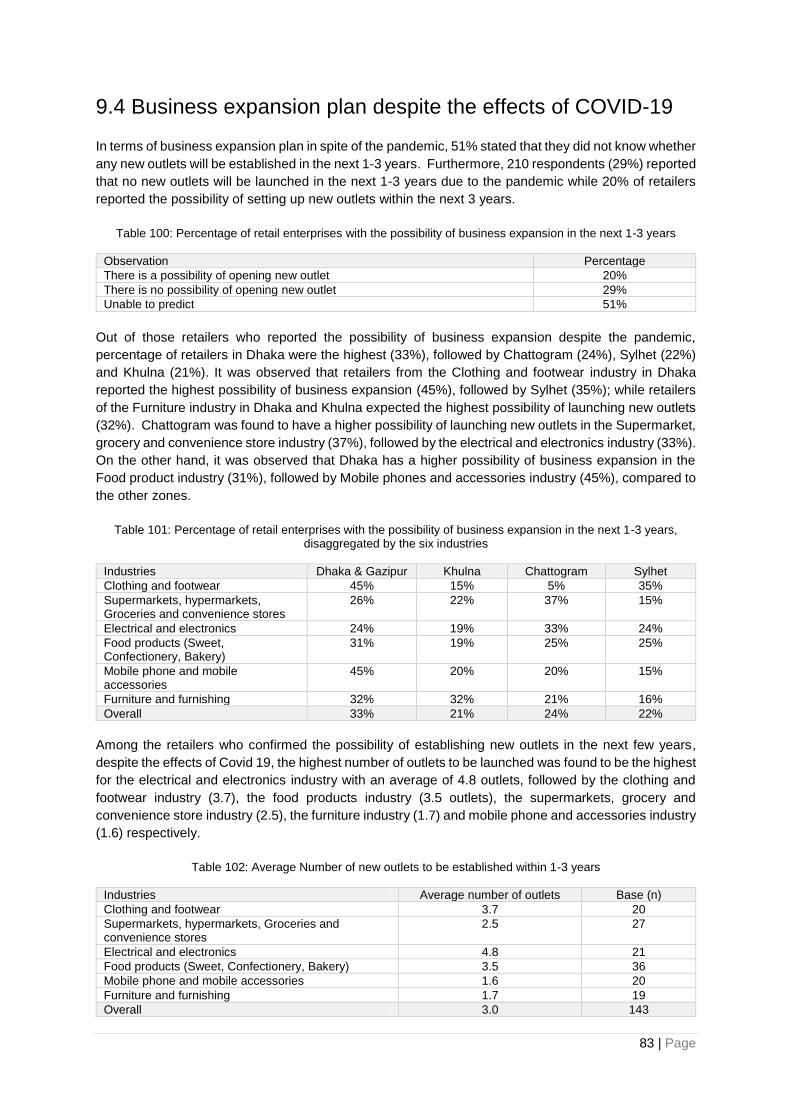
83 | Page
9.4 Business expansion plan despite the effects of COVID-19
In terms of business expansion plan in spite of the pandemic, 51% stated that they did not know whether
any new outlets will be established in the next 1-3 years. Furthermore, 210 respondents (29%) reported
that no new outlets will be launched in the next 1-3 years due to the pandemic while 20% of retailers
reported the possibility of setting up new outlets within the next 3 years.
Table 100: Percentage of retail enterprises with the possibility of business expansion in the next 1-3 years
Observation Percentage
There is a possibility of opening new outlet 20%
There is no possibility of opening new outlet 29%
Unable to predict 51%
Out of those retailers who reported the possibility of business expansion despite the pandemic,
percentage of retailers in Dhaka were the highest (33%), followed by Chattogram (24%), Sylhet (22%)
and Khulna (21%). It was observed that retailers from the Clothing and footwear industry in Dhaka
reported the highest possibility of business expansion (45%), followed by Sylhet (35%); while retailers
of the Furniture industry in Dhaka and Khulna expected the highest possibility of launching new outlets
(32%). Chattogram was found to have a higher possibility of launching new outlets in the Supermarket,
grocery and convenience store industry (37%), followed by the electrical and electronics industry (33%).
On the other hand, it was observed that Dhaka has a higher possibility of business expansion in the
Food product industry (31%), followed by Mobile phones and accessories industry (45%), compared to
the other zones.
Table 101: Percentage of retail enterprises with the possibility of business expansion in the next 1-3 years, disaggregated by the six industries
Industries Dhaka & Gazipur Khulna Chattogram Sylhet
Clothing and footwear 45% 15% 5% 35%
Supermarkets, hypermarkets, Groceries and convenience stores
26% 22% 37% 15%
Electrical and electronics 24% 19% 33% 24%
Food products (Sweet, Confectionery, Bakery)
31% 19% 25% 25%
Mobile phone and mobile accessories
45% 20% 20% 15%
Furniture and furnishing 32% 32% 21% 16%
Overall 33% 21% 24% 22%
Among the retailers who confirmed the possibility of establishing new outlets in the next few years,
despite the effects of Covid 19, the highest number of outlets to be launched was found to be the highest
for the electrical and electronics industry with an average of 4.8 outlets, followed by the clothing and
footwear industry (3.7), the food products industry (3.5 outlets), the supermarkets, grocery and
convenience store industry (2.5), the furniture industry (1.7) and mobile phone and accessories industry
(1.6) respectively.
Table 102: Average Number of new outlets to be established within 1-3 years
Industries Average number of outlets Base (n)
Clothing and footwear 3.7 20
Supermarkets, hypermarkets, Groceries and convenience stores
2.5 27
Electrical and electronics 4.8 21
Food products (Sweet, Confectionery, Bakery) 3.5 36
Mobile phone and mobile accessories 1.6 20
Furniture and furnishing 1.7 19
Overall 3.0 143
84 | Page
Chapter 10: Recommendation and Conclusion
Recommendations
The findings show that the trends related to skills gaps, engagement of women, transgender people
and people with disabilities, decent work practices are mostly similar across the different retail industries
that were studied. However, the opportunity for successful pilot of an inclusive skills development
programme in the retail sector varies as the industries are in different stages of growth and structure
(formal vs informal recruitment processes), have varying degrees of exposure to such interventions and
have varying needs for skilled work force. Based on the analysis, we recommend the following strategic
pillars for the pilot:
Targeting the early adopters first to create an evidence base: It will be more efficient for the project
to first target retailers who are already engaged in providing formal and informal training to the workers
and who have in general positive attitude towards training. A list of such employers is provided as an
outcome of this study. It is advisable that the project uses the experience with these retailers to develop
case studies on the impact of the training on retail sales, employee satisfaction and attrition rate which
can be used to engage the second batch of employers who are currently not engaged in training
services provision.
Targeting the sales representatives at the entry and mid-level: Even though there are different
types of jobs in the retail outlets across all industries that were surveyed, the highest proportion of jobs
are for the sales work force. The findings show that the programme will have more scalable results if it
focuses on the sales workforce who are tasked to handle customers. Also, this will reduce the need to
tailor the curriculum for the different industries and will allow for participation of employees from multiple
industries at the same time.
Focus on sales-oriented soft skills training curriculum and programme to attract both the
employers and the employees: The findings show that to both the employers and the employees
across all surveyed industries, sales target is the most universal indicator for measuring performance
of the retail workforce. As such, trainings on skills development should have direct contribution to the
workforce’s ability to achieve sales target. Soft skills training on customer relationship, communications,
agility, learning aptitude would have the highest impact as this would also allow the workers to shift
between different industries.
Mix of on the job training and classroom-based training over the weekend: The employers are
apprehensive about losing work hours because of training. However, they do not account for the loss
in work hours and sales that happen because of informal on the job training. The project will have more
traction if the training involves classroom-based training over the weekend which is followed up by on-
the-job practical test and a follow up training.
Developing a training service delivery channel for scalable impact: The industries that were
surveyed do not have organized associations or associations that are actively engaged in delivering
training services to the members. The Furniture Industries Owner’s Association is more capable to be
a training service delivery partner for the project for its members while the other associations are not.
For industries that have organized associations, the project can leverage them as partners to deliver
the training exclusively to the members of the association. For the other industries, the project can first
organize a training on its own and then use it as an evidence to gather buy in of the associations to
organize the follow-up rounds.
85 | Page
Employer’s orientation and change in HR policies for recruitment of women, people with
disabilities and transgender people and to ensure decent work practices: The employers are
predominantly male and the work force comprises small percentage of women. Only a very small
percentage has experience in employing people with disabilities and there is almost no precedence in
employing transgender people. Given that the workforce works long hours, the employers do not
perceive the work to be suitable for female workers. They are apprehensive about the security of the
female work force. Also, they perceive that the female work force lacks the strength and endurance to
undertake the works. Besides, there is a perception that the female workers will leave the job after
marriage. These social norms and perceptions continue to obstruct the employers from recruiting
women as work force. Besides, the work place does not have amenities like separate toilets for women
workers. There is no provision for maternity and paternity leaves. A strong percentage of employers do
not provide leave on public holidays.
Engagement of people with disabilities is seen as a cost as this will come with investments to make the
work space more accessible for people with disabilities. Also, it is perceived that the people with
disability will not be able to undertake the tedious tasks. Strength and endurance are perceived as
necessary qualifications across all the industries that were surveyed. Attitude towards transgender
people is largely negative. The co-workers are also not comfortable using the space with the
transgender people. The transgender people want to use female toilets while female co-workers are
not comfortable in sharing toilet. The employers perceive that the transgender people will have a
negative effect on customers and sales. Transgender people reported that they are often not given the
orientation required to perform as a sales work force.
The contracts are mostly informal across all the industries. The employers are not aware of fire safety
needs for both workers and customers; in general, there is apathy towards standard safeguarding
measures among the employers. Large number of workers are paid below the minimum wage fixed by
the government. The informal nature of recruitment allows for unregulated payment practices.
For the project to have sustained impact, the issues of informal contracts, decent work practices, gender
equality in recruitment and management of the retail space need to be addressed. This would require
long term strategic endeavours, the seed for which can be laid by the pilot project. Most of the employers
reported that they are willing to partner with NGOs to train the workers. They are willing to share cost
of training. The project can take a three staged strategy to have a long-term impact on skills
development for the workers and to make the workplace inclusive to women, people with disabilities
and the transgender people.
In stage 1, as explained earlier, the project should target the early adopters for soft skills training of the
current employees working as junior and mid-level sales representatives. These trainings would be
male dominated but will allow the project to have an entry. This can be completed within 6 months of
the pilot. The stage 1 should involve two types of trainings - (i) trainings directly offered by the
programme to willing employers and (ii) trainings offered by the programme through partner
associations.
In stage 2, the project should start documenting results achieved by employers who participated in the
first stage of the programme. In this stage the project should also engage some of the early adapters
and work with them to develop HR policies that can address the issues of recruitment of women, people
with disabilities and the transgender people. The policies should also allow for rewards for loyalty as
the employers are apprehensive that the trained workers will leave after the training. It is advisable that
the project organizes a residential orientation session for the employers which will incentivize their
participation in the programme activities. In this stage, the project should focus on developing strong
cases of employers from the different industries and from the different geographic areas to allow for
recruitment of women, people with disabilities and the transgender people. The recruitment should then
86 | Page
be followed up by training to the staffs as well as the store managers so that the new recruits are able
to perform and the work place is more conducive for them to perform.
Building on the evidence from stage 2, the project should scale the operations to involve more
employers from the different industries who can then be involved into two separate programmes- light
touch (stage 1) and long term (stage 2). The programme should also invest in a customer centric
promotion campaign as positive response from the customers for recruitment of women, people with
disabilities and the transgender people will reinforce the employer’s incentive to sustain recruitment of
the marginalized communities in the retail workforce.
Advocacy with the government for policies that enable recruitment of women, people with
disabilities and the transgender people: The findings show that the employers will react positively to
a quota-based system whereby the government requires a minimum percentage of employees to
represent women, people with disabilities and the transgender people. The findings also show that the
employers may not voluntarily invest in making their work place accessible. As such, while at one
spectrum the project can work to create evidence that employment of women, people with disabilities
and the transgender people can have positive impact on sales and growth, government policy can help
make the impact more sustainable and scalable. In this regard, the findings from the project can be
used to create a national programme anchored to government policies that aim for inclusive retail
industry in Bangladesh.
87 | Page
REFERENCES
Ahmed, S. (2018), Mobile accessories market booms, The Independent, http://www.theindependentbd.com/arcprint/details/159848/2018-07-29 Ahonen, S. (2018), New Bangladesh minimum wage, Sustainability Agents, https://sus-a.com/index.php/new-bangladesh-minimum-wage/2018/ Antara, N F. (2018), Aarong to explore potential of e-commerce in intl. markets, Dhaka Tribune, https://www.dhakatribune.com/business/2018/10/23/aarong-to-explore-potential-of-e-commerce-for-intl-market#:~:text=With%20an%20annual%20turnover%20of,Bangladesh%2C%20including%2014%20in%20Dhaka. Apparel Resources. (2020), How the Bangladesh Industry is emerging in fashion retail, Apparel Resources, https://bd.apparelresources.com/business-news/retail/bangladesh-industry-emerging-fashion-retail/ Chakma, J. (2019), A sweeter Pohela Baishakh, The Daily Star, https://www.thedailystar.net/business/news/sweeter-pahela-baishakh-1729756 Chakma, J. (2020), Consumer electronic companies predict grim outlook for 2020, The Daily Star, https://www.thedailystar.net/business/news/consumer-electronics-companies-predict-grim-outlook-2020-1968177 Chowdhury, P S. (2020). Demographic dividend: A roadmap to progress, The Financial Express, https://thefinancialexpress.com.bd/views/reviews/demographic-dividend-a-roadmap-to-progress-1600268 Industries. (2018), Consumer Electronics, Databd.Co, https://databd.co/profiles/industries/profile-consumer-electronics Industries. (2019), Timbee and Furniture, Databd.Co, https://databd.co/profiles/industries/profile-timber-and-furniture#:~:text=Albeit%20around%2090%25%20of%20furniture,population%20has%20high%20disposable%20income Islam, M Z. (2019), Smart accessories making life smarter, The Daily Star, https://www.thedailystar.net/business/smart-mobile-accessories-making-life-smarter-1828111 LightCastle Analytics Wing. (2019), Retail industry in Bangladesh: A different shapeup story, Databd.Co, https://databd.co/stories/organized-retail-industry-outlook-bangladesh-2077 Parvez, S. (2017), Footwear market expands fast as demand rises, The Daily Star, https://www.thedailystar.net/business/footwear-market-expands-fast-demand-rises-1394254 Parvez, S. (2020), Supermarkets turn knights in shining armour, The Daily Star, https://www.thedailystar.net/business/news/supermarkets-turn-knights-shining-armour-1893385 Sakib, S M N. (2018), Baking business booms, The Financial Express, https://today.thefinancialexpress.com.bd/print/baking-business-booms-1523554764 Tribune Desk. (2020), 4.1% growth in local mobile phone market in 2019, Dhaka Tribune, https://www.dhakatribune.com/business/2020/02/24/4-1-growth-in-local-mobile-phone-market-in-2019