Embed Size (px)
Citation preview
Copyright 2014 © W. Seth HunterConsumerMath.org
L6.2 Pie Charts
Don’t let your bills rule you. Set a budget, and decide what you will spend, then live within your budget.
The easy to see view of where your
money is going.
Copyright 2014 © W. Seth HunterConsumerMath.org
L6.2 Pie Charts
Lesson Objective
Students will learn how to create a pie chart based on their budget.
Copyright 2014 © W. Seth HunterConsumerMath.org
L6.2 Pie Charts
Pie Chart
A Pie Chart is a type if graph, drawn in a circle, that defines each section’s proportion in relation to the whole.
Copyright 2014 © W. Seth HunterConsumerMath.org
L6.2 Pie Charts
Equations
The equations we will use for this lesson:
Percent of Total:
Amount ÷ Total of all Amounts = % of Total
Percent of 360⁰:
% of Total x 360⁰ = % of 360⁰
Copyright 2014 © W. Seth HunterConsumerMath.org
L6.2 Pie Charts
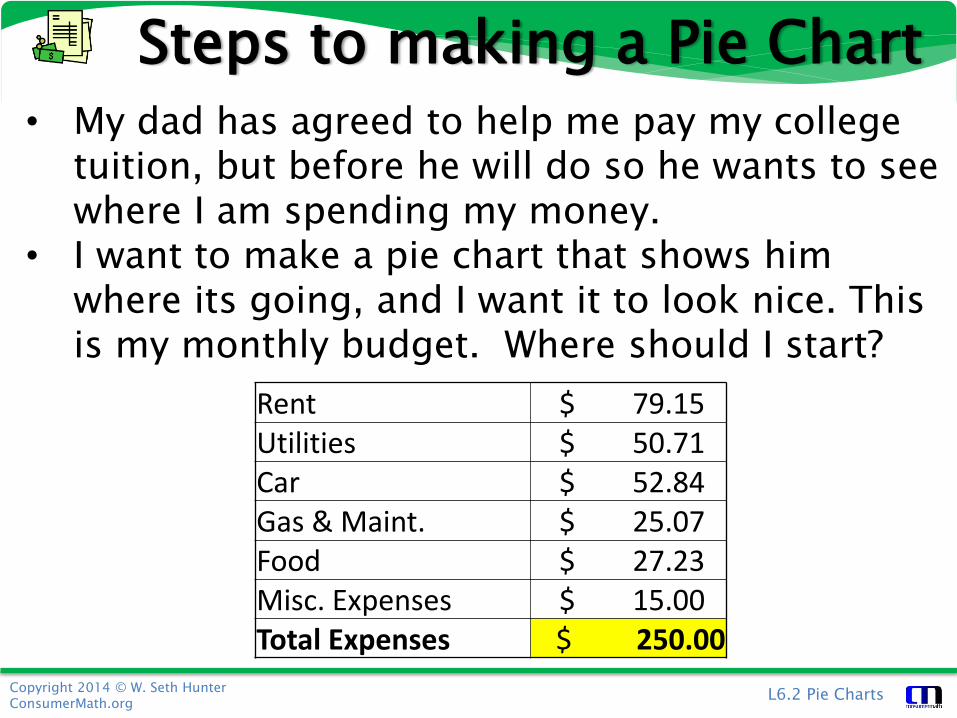
Steps to making a Pie Chart
Rent $ 79.15 Utilities $ 50.71 Car $ 52.84 Gas & Maint. $ 25.07 Food $ 27.23 Misc. Expenses $ 15.00 Total Expenses $ 250.00
• My dad has agreed to help me pay my college tuition, but before he will do so he wants to see where I am spending my money.
• I want to make a pie chart that shows him where its going, and I want it to look nice. This is my monthly budget. Where should I start?
Copyright 2014 © W. Seth HunterConsumerMath.org
L6.2 Pie Charts
Steps to making a Pie Chart
% of total
% of 360⁰
Rent $79.15 Utilities $50.71 Car $52.84 Gas & Maint. $25.07 Food $27.23
Misc. Expenses $15.00
Total Expenses $250.00
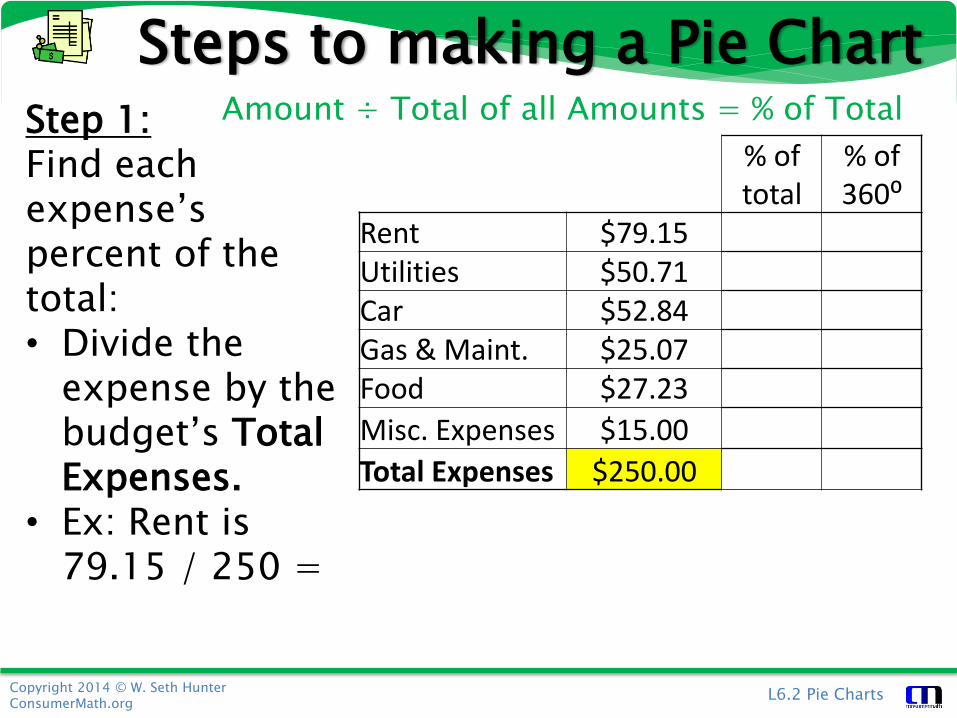
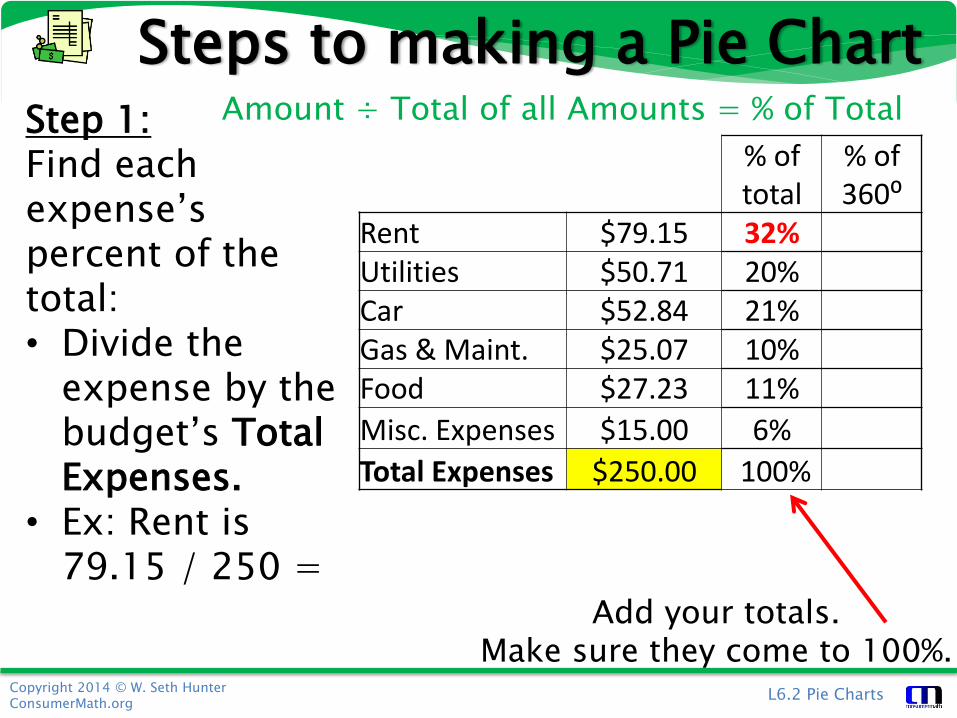
Step 1:Find each expense’s percent of the total:• Divide the
expense by the budget’s Total Expenses.
• Ex: Rent is 79.15 / 250 =
Amount ÷ Total of all Amounts = % of Total
Copyright 2014 © W. Seth HunterConsumerMath.org
L6.2 Pie Charts
Steps to making a Pie Chart
% of total
% of 360⁰
Rent $79.15 32%Utilities $50.71 Car $52.84 Gas & Maint. $25.07 Food $27.23
Misc. Expenses $15.00
Total Expenses $250.00
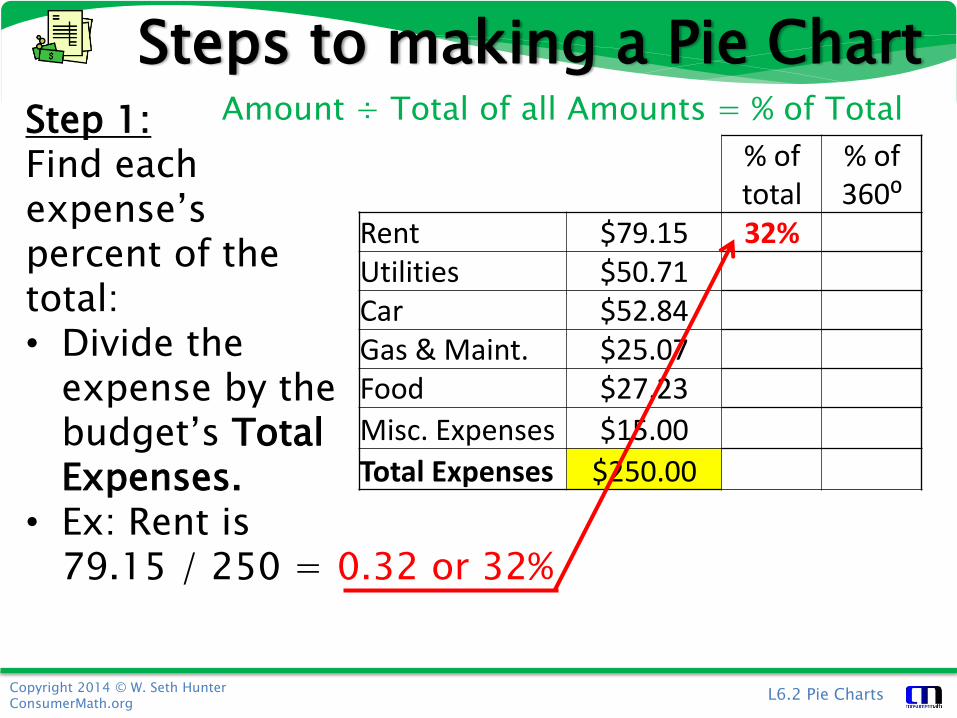
Step 1:Find each expense’s percent of the total:• Divide the
expense by the budget’s Total Expenses.
• Ex: Rent is 79.15 / 250 =
Amount ÷ Total of all Amounts = % of Total
0.32 or 32%
Copyright 2014 © W. Seth HunterConsumerMath.org
L6.2 Pie Charts
Steps to making a Pie Chart
% of total
% of 360⁰
Rent $79.15 32%Utilities $50.71 Car $52.84 Gas & Maint. $25.07 Food $27.23
Misc. Expenses $15.00
Total Expenses $250.00
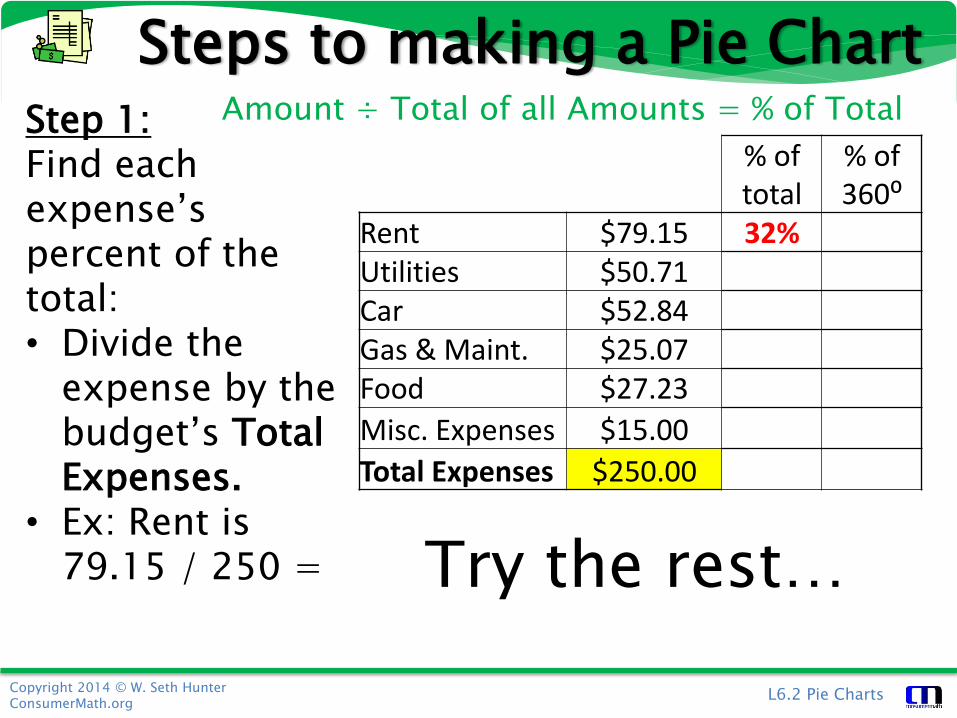
Step 1:Find each expense’s percent of the total:• Divide the
expense by the budget’s Total Expenses.
• Ex: Rent is 79.15 / 250 =
Amount ÷ Total of all Amounts = % of Total
Try the rest…
Copyright 2014 © W. Seth HunterConsumerMath.org
L6.2 Pie Charts
Steps to making a Pie Chart
% of total
% of 360⁰
Rent $79.15 32%Utilities $50.71 20%Car $52.84 21%Gas & Maint. $25.07 10%Food $27.23 11%
Misc. Expenses $15.00 6%
Total Expenses $250.00 100%
Step 1:Find each expense’s percent of the total:• Divide the
expense by the budget’s Total Expenses.
• Ex: Rent is 79.15 / 250 =
Add your totals. Make sure they come to 100%.
Amount ÷ Total of all Amounts = % of Total
Copyright 2014 © W. Seth HunterConsumerMath.org
L6.2 Pie Charts
Steps to making a Pie Chart
% of total
% of 360⁰
Rent $79.15 32%Utilities $50.71 20%Car $52.84 21%Gas & Maint. $25.07 10%Food $27.23 11%
Misc. Expenses $15.00 6%
Total Expenses $250.00 100%
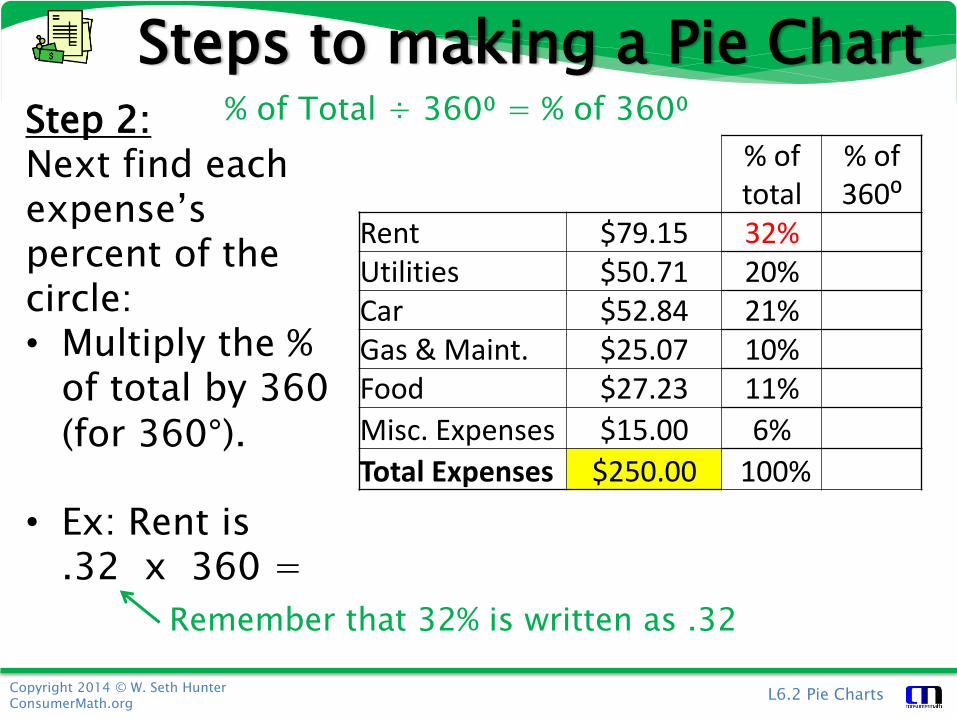
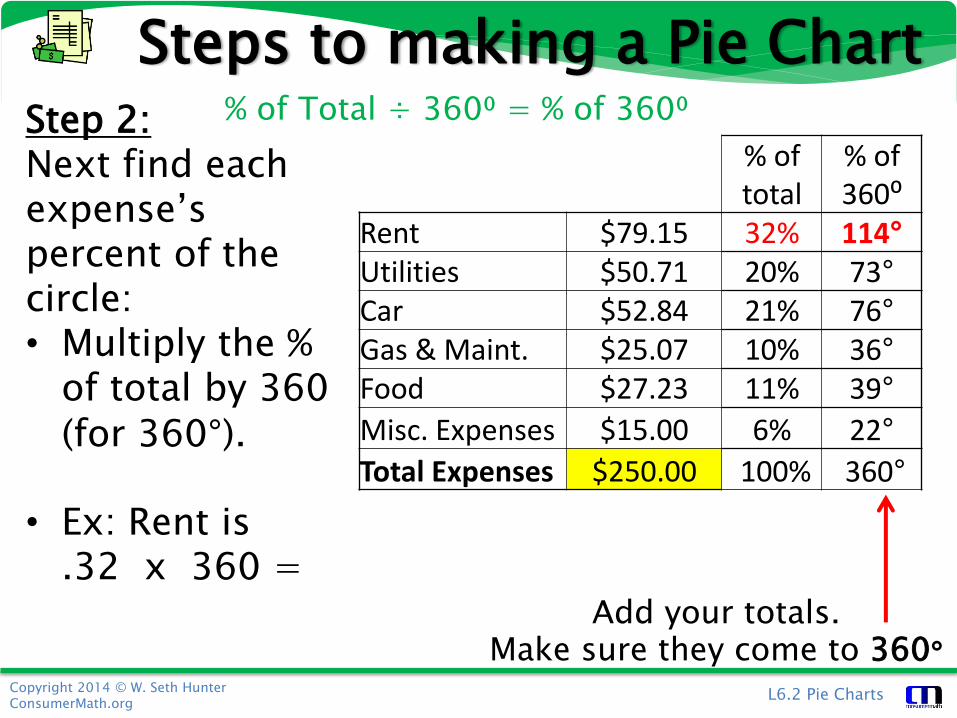
Step 2:Next find each expense’s percent of the circle:• Multiply the %
of total by 360 (for 360°).
• Ex: Rent is .32 x 360 =
% of Total ÷ 360⁰ = % of 360⁰
Remember that 32% is written as .32
Copyright 2014 © W. Seth HunterConsumerMath.org
L6.2 Pie Charts
Steps to making a Pie Chart
% of total
% of 360⁰
Rent $79.15 32% 114°Utilities $50.71 20%Car $52.84 21%Gas & Maint. $25.07 10%Food $27.23 11%
Misc. Expenses $15.00 6%
Total Expenses $250.00 100%
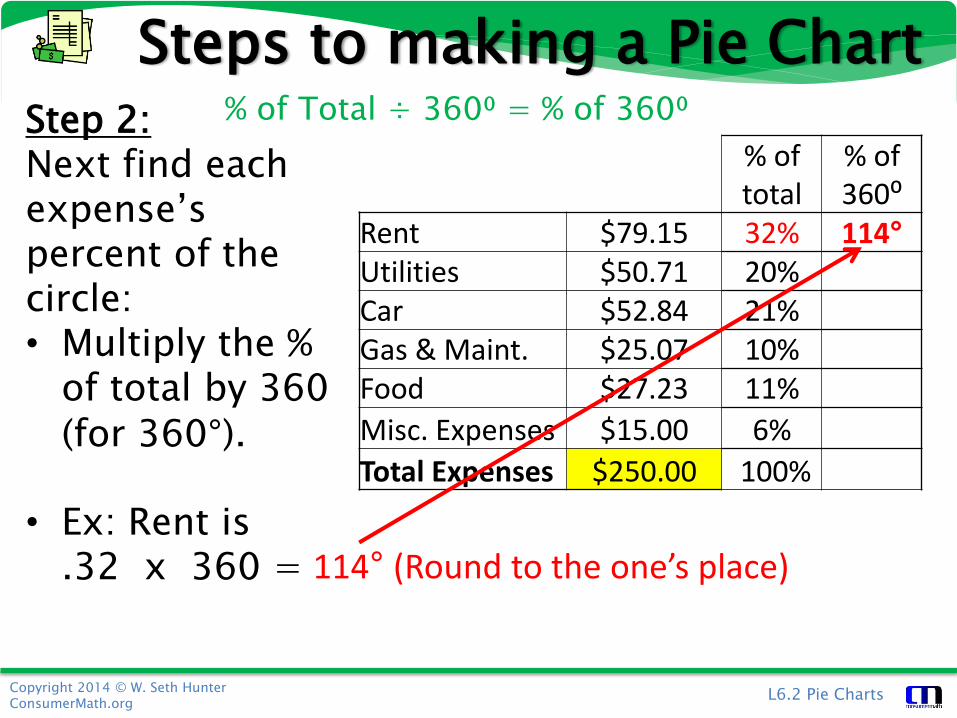
Step 2:Next find each expense’s percent of the circle:• Multiply the %
of total by 360 (for 360°).
• Ex: Rent is .32 x 360 = 114° (Round to the one’s place)
% of Total ÷ 360⁰ = % of 360⁰
Copyright 2014 © W. Seth HunterConsumerMath.org
L6.2 Pie Charts
Steps to making a Pie Chart
% of total
% of 360⁰
Rent $79.15 32% 114°Utilities $50.71 20%Car $52.84 21%Gas & Maint. $25.07 10%Food $27.23 11%
Misc. Expenses $15.00 6%
Total Expenses $250.00 100%
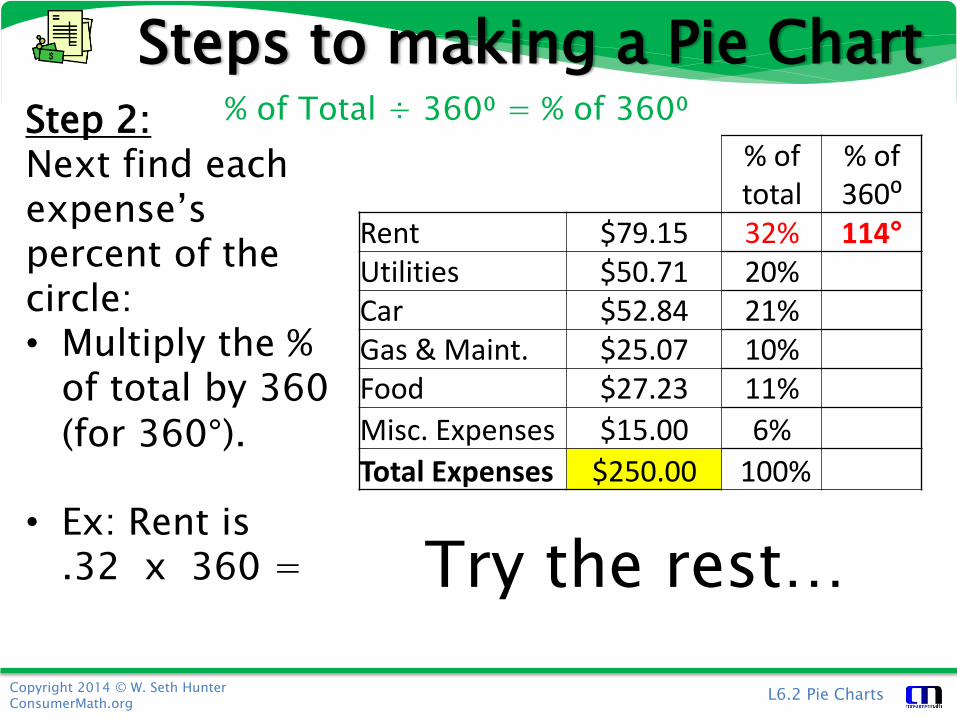
Step 2:Next find each expense’s percent of the circle:• Multiply the %
of total by 360 (for 360°).
• Ex: Rent is .32 x 360 =
% of Total ÷ 360⁰ = % of 360⁰
Try the rest…
Copyright 2014 © W. Seth HunterConsumerMath.org
L6.2 Pie Charts
Steps to making a Pie Chart
% of total
% of 360⁰
Rent $79.15 32% 114°Utilities $50.71 20% 73°Car $52.84 21% 76°Gas & Maint. $25.07 10% 36°Food $27.23 11% 39°
Misc. Expenses $15.00 6% 22°
Total Expenses $250.00 100% 360°
Step 2:Next find each expense’s percent of the circle:• Multiply the %
of total by 360 (for 360°).
• Ex: Rent is .32 x 360 =
Add your totals. Make sure they come to 360°
% of Total ÷ 360⁰ = % of 360⁰
Copyright 2014 © W. Seth HunterConsumerMath.org
L6.2 Pie Charts
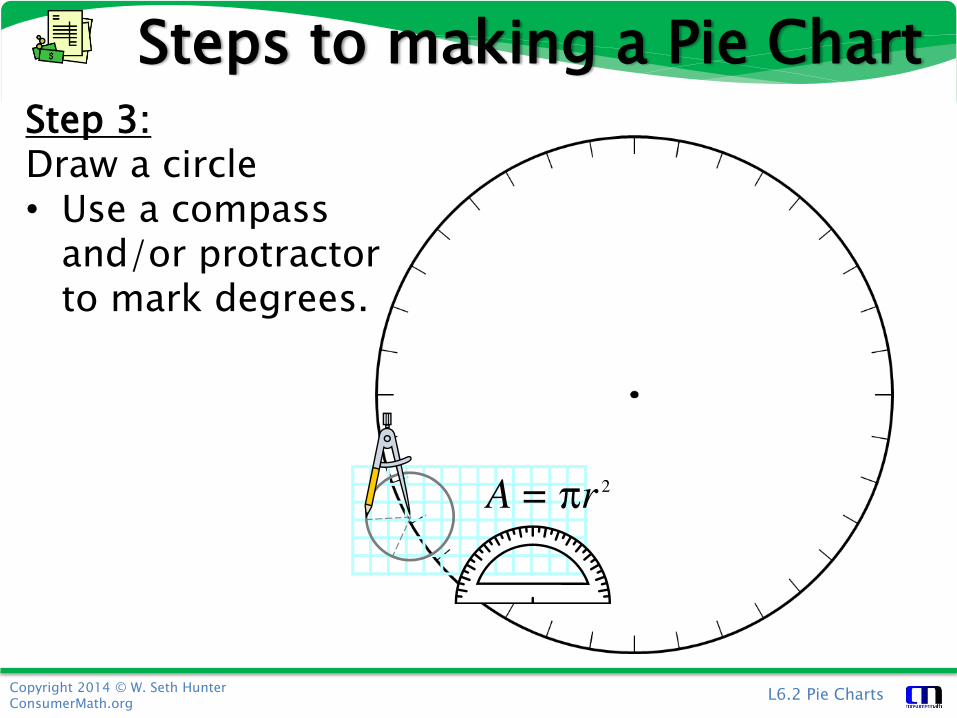
Steps to making a Pie ChartStep 3:Draw a circle• Use a compass
and/or protractor to mark degrees.
Copyright 2014 © W. Seth HunterConsumerMath.org
L6.2 Pie Charts
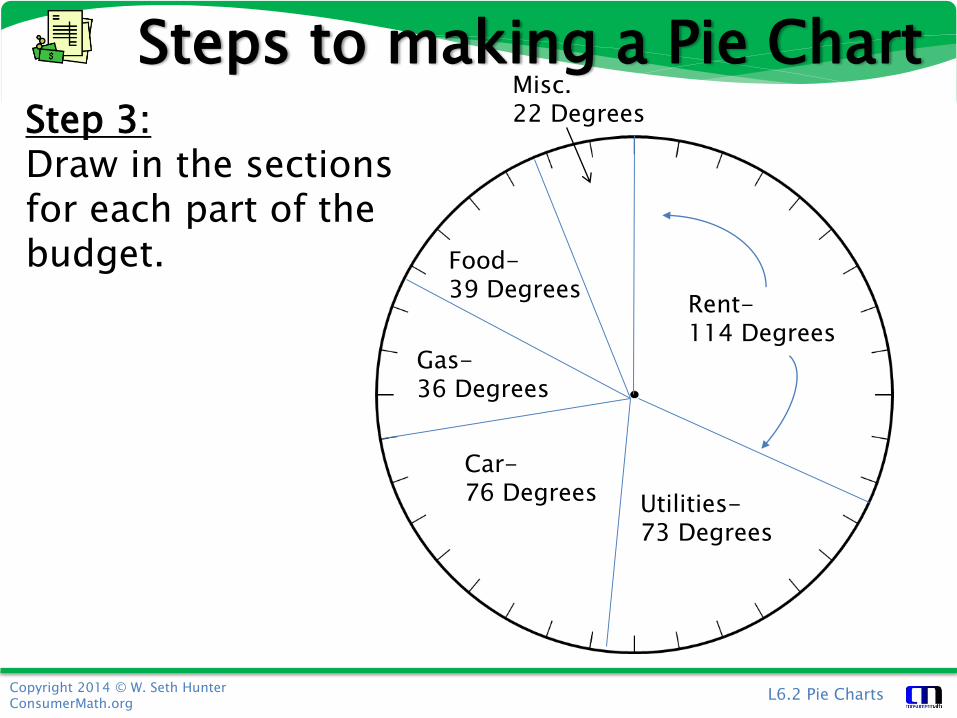
Steps to making a Pie ChartStep 3:Draw in the sections for each part of the budget.
Rent-114 Degrees
Utilities-73 Degrees
Car-76 Degrees
Gas-36 Degrees
Food-39 Degrees
Misc.22 Degrees
Copyright 2014 © W. Seth HunterConsumerMath.org
L6.2 Pie Charts
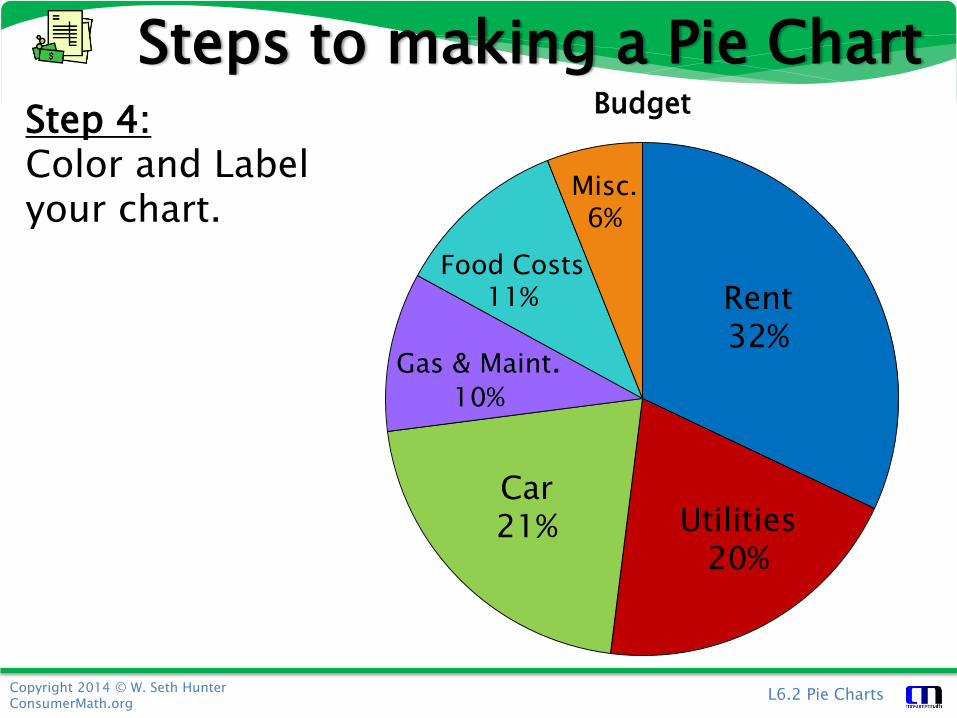
Budget
Steps to making a Pie ChartStep 4:Color and Label your chart.
Rent32%
Utilities20%
Car21%
Gas & Maint.10%
Food Costs11%
Misc.6%
Copyright 2014 © W. Seth HunterConsumerMath.org
L6.2 Pie Charts
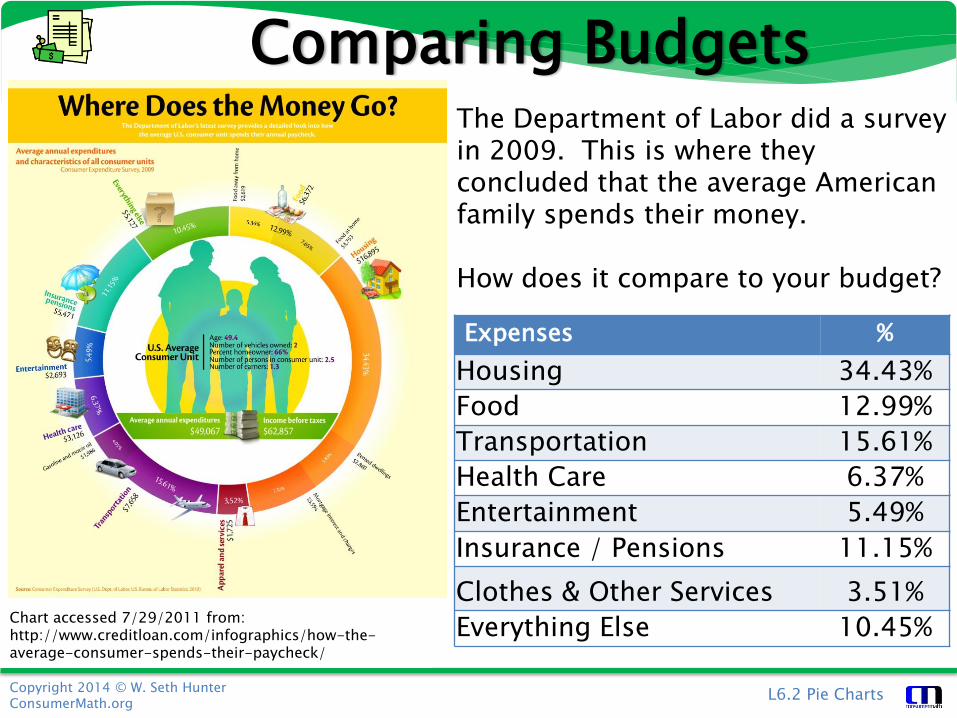
Comparing Budgets
Chart accessed 7/29/2011 from: http://www.creditloan.com/infographics/how-the-average-consumer-spends-their-paycheck/
The Department of Labor did a survey in 2009. This is where they concluded that the average American family spends their money.
How does it compare to your budget?
Expenses %
Housing 34.43%
Food 12.99%
Transportation 15.61%
Health Care 6.37%
Entertainment 5.49%
Insurance / Pensions 11.15%
Clothes & Other Services 3.51%
Everything Else 10.45%
Copyright 2014 © W. Seth HunterConsumerMath.org
L6.2 Pie Charts
Review:
1. What is a Pie Chart?
2. What is the equation for calculating the percent of total?
3. What is the equation for calculating the Percent of 360⁰?
Copyright 2014 © W. Seth HunterConsumerMath.org
L6.2 Pie Charts
Review:
1. What is a Pie Chart?
2. What is the equation for calculating the percent of total?
3. What is the equation for calculating the Percent of 360⁰?
No. It is not a chart showing how much pie you ate last week.
It is a type if graph, drawn in a circle, that defines each section’s proportion in relation to the whole.
Amount ÷ Total of all Amounts = % of Total
% of Total ÷ 360⁰ = % of 360⁰


