Embed Size (px)
Citation preview

Tony Reale and Bomin Sun
NOAA STAR
Quality of instantaneous water vapor
profiles assessed with NPROVS+
5th GEWEX G-VAP – Workshop
04 - 05 November 2015
Lowell Center,
Univ. Wisconsin, Madison

Outline
About NPROVS
Long Term Monitoring (NARCS)
Shorter Term More Detailed Monitoring (PDISP)
Strength vs Weakness: NPROVS vs NPROVS +
GRUAN vs Conv RAOB
RAOB vs NWP
CALWATER
Summary 2
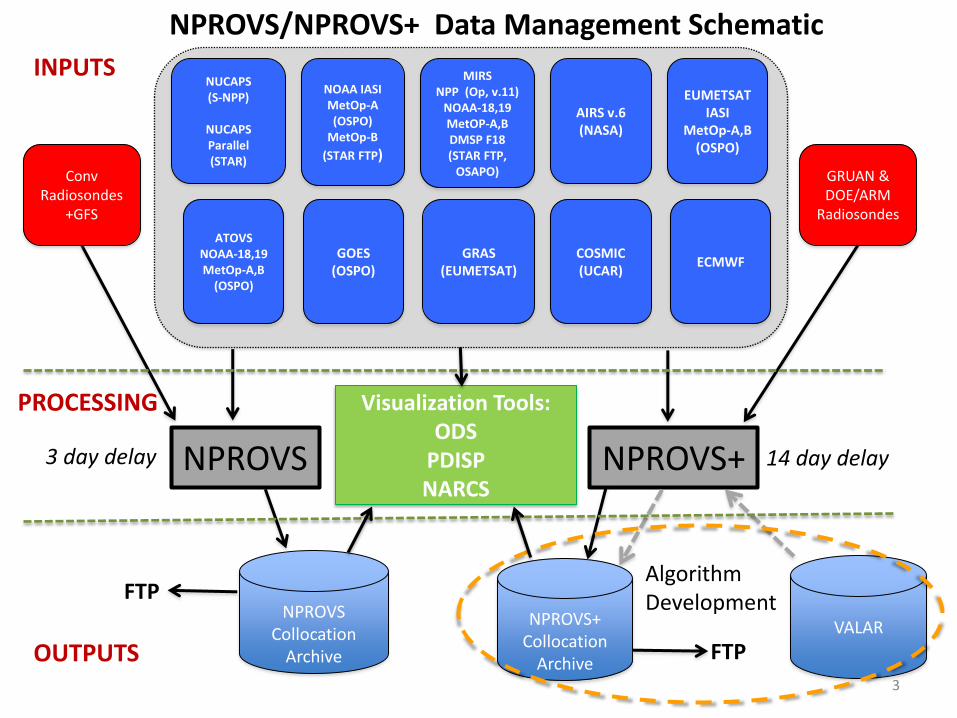
NPROVS
Collocation Archive
NPROVS NPROVS+
Conv Radiosondes
+GFS
GRUAN & DOE/ARM
Radiosondes
NUCAPS (S-NPP)
NUCAPS Parallel (STAR)
NOAA IASI MetOp-A (OSPO)
MetOp-B
(STAR FTP)
MIRS NPP (Op, v.11)
NOAA-18,19 MetOP-A,B DMSP F18 (STAR FTP,
OSAPO)
AIRS v.6 (NASA)
EUMETSAT IASI
MetOp-A,B (OSPO)
GOES (OSPO)
ATOVS NOAA-18,19 MetOp-A,B
(OSPO)
COSMIC (UCAR)
GRAS (EUMETSAT)
NPROVS+
Collocation Archive
3 day delay
FTP
VALAR
14 day delay
FTP
Algorithm Development
Visualization Tools: ODS
PDISP NARCS
INPUTS
PROCESSING
OUTPUTS
NPROVS/NPROVS+ Data Management Schematic
ECMWF
3

4
Collocation Criteria:
+/- 6-hour
250 km
Single Closest

5
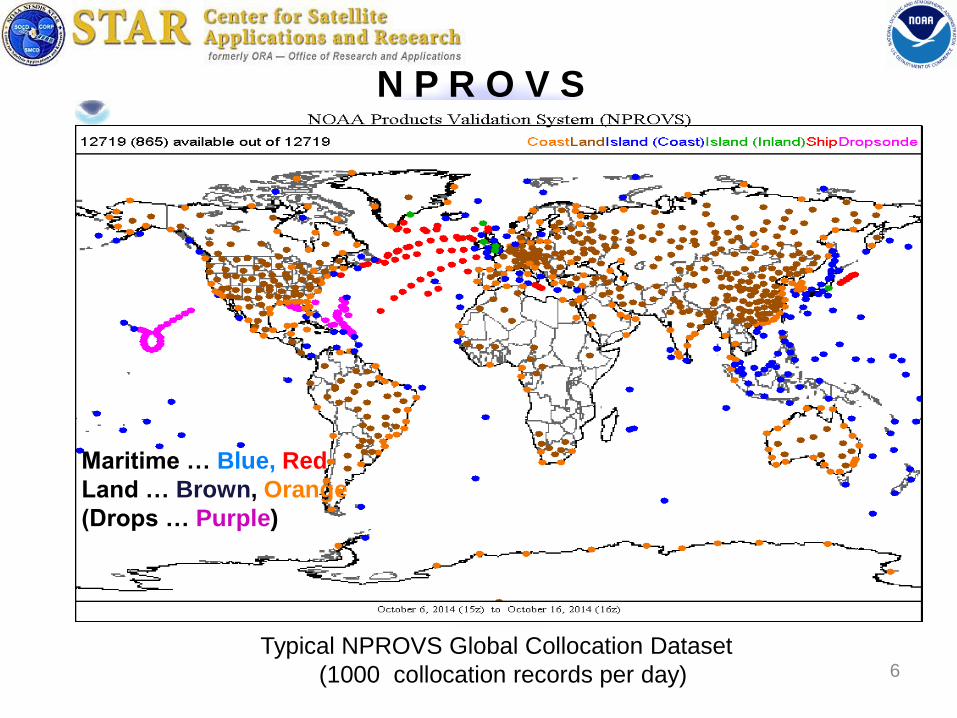
Typical NPROVS Global Collocation Dataset
(1000 collocation records per day) 6
Maritime … Blue, Red
Land … Brown, Orange
(Drops … Purple)
N P R O V S

GRUAN and JPSS funded Dedicated (S-NPP) RAOB Sites
Over 10,000 RAOBS (1000 Dedicated) available since July 2013
N P R O V S +
7

8
Global Climate Observing System (GCOS)
Reference Upper Air Network (GRUAN)
JPSS Funded Dedicated RAOB
• DOE ARM (SGP, NSA, ENA)
CIMSS
(2) per week
GRUAN processed
dual vs single, etc
• AEROSE
• CALWATER
• PMRF
• Sterling Test Site …
Request coordination with
“other” intensive field
experiments particularly if
synchronized with
S-NPP
N P R O V S +

9
WEB Site
http://www.star.nesdis.noaa.gov/smcd/opdb/nprovs/index.php EDR

10 http://www.star.nesdis.noaa.gov/icvs/
SDR
WEB Site

Continental IR
GFS Forecast
GFS CFSR
ECMWF Analysis
AIRS Aqua IR+MW
NUCAPS IR+MW
NOAA IASI MetOp-A IR+MW
NOAA IASI MetOp-B IR+MW
EU IASI MetOp-A IR+MW
EU IASI MetOp-B IR+MW
GFS Forecast
GFS CFSR
ECMWF Analysis
AIRS Aqua IR+MW
NUCAPS IR+MW
NOAA IASI MetOp-A IR+MW
NOAA IASI MetOp-B IR+MW
EU IASI MetOp-A IR+MW
EU IASI MetOp-B IR+MW
7/1
3
8/1
3
9/1
3
11
/13
10
/13
12
/13
1/1
4
2/1
4
3/1
4
4/1
4
5/1
4
6/1
4
7/1
4
8/1
4
9/1
4
10
/14
11
/14
12
/14
1/1
5
2/1
5
3/1
5
4/1
5
5/1
5
6/1
5
7/1
5
8/1
5
7/1
3
8/1
3
9/1
3
11
/13
10
/13
12
/13
1/1
4
2/1
4
3/1
4
4/1
4
5/1
4
6/1
4
7/1
4
8/1
4
9/1
4
10
/14
11
/14
12
/14
1/1
5
2/1
5
3/1
5
4/1
5
5/1
5
6/1
5
7/1
5
8/1
5
Temperature 649.99 mb Layer Statistics
Water Vapor Percent Error 649.8 mb Layer Statistics
RM
S
RM
S
2.5
1.94
1.38
0.81
0.25
80
60
40
20
0
sum winter summer winter sum
sum winter summer winter sum
11
1
NARCS NPROVS

Maritime IR
Temperature 649.99 mb Layer Statistics
Water Vapor Percent Error 649.8 mb Layer Statistics
7/1
3
8/1
3
9/1
3
11
/13
10
/13
12
/13
1/1
4
2/1
4
3/1
4
4/1
4
5/1
4
6/1
4
7/1
4
8/1
4
9/1
4
10
/14
11
/14
12
/14
1/1
5
2/1
5
3/1
5
4/1
5
5/1
5
6/1
5
7/1
5
8/1
5
7/1
3
8/1
3
9/1
3
11
/13
10
/13
12
/13
1/1
4
2/1
4
3/1
4
4/1
4
5/1
4
6/1
4
7/1
4
8/1
4
9/1
4
10
/14
11
/14
12
/14
1/1
5
2/1
5
3/1
5
4/1
5
5/1
5
6/1
5
7/1
5
8/1
5
RM
S
RM
S
2.5
1.94
1.38
0.81
0.25
80
60
40
20
0
GFS Forecast
GFS CFSR
ECMWF Analysis
AIRS Aqua IR+MW
NUCAPS IR+MW
NOAA IASI MetOp-A IR+MW
NOAA IASI MetOp-B IR+MW
EU IASI MetOp-A IR+MW
EU IASI MetOp-B IR+MW
GFS Forecast
GFS CFSR
ECMWF Analysis
AIRS Aqua IR+MW
NUCAPS IR+MW
NOAA IASI MetOp-A IR+MW
NOAA IASI MetOp-B IR+MW
EU IASI MetOp-A IR+MW
EU IASI MetOp-B IR+MW
sum winter summer winter sum
sum winter summer winter sum
12
0.3K improvement; less for AIRS 2
10% improvement
NARCS NPROVS

13
5/14 9/14 1/15 5/15 9/15
5/14 9/14 1/15 5/15 9/15
Maritime
Land
… sample 500 per week
… sample 4000 per week
weekly average SAT-minus-RAOB water vapor fraction
217 hPa
217 hPa
NARCS NPROVS
14
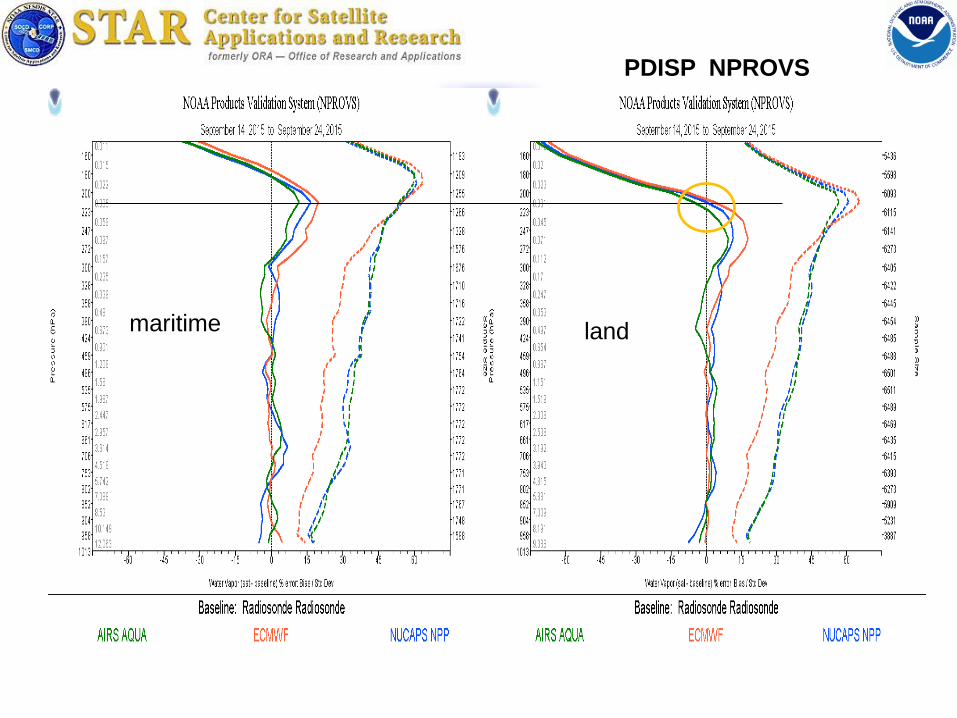
maritime land
PDISP NPROVS
15
NPROVS vs NPROVS+

16
Oct 14 Sept 15
Oct 14 Sept 15
NPROVS+
NPROVS
NARCS
monthly
weekly
(150)
(1500)

17
Oct 14
Oct 14
Sept 15
Sept 15
NPROVS+
NPROVS
NARCS
monthly
weekly
(150)
(1500)
18
H20 Weighting
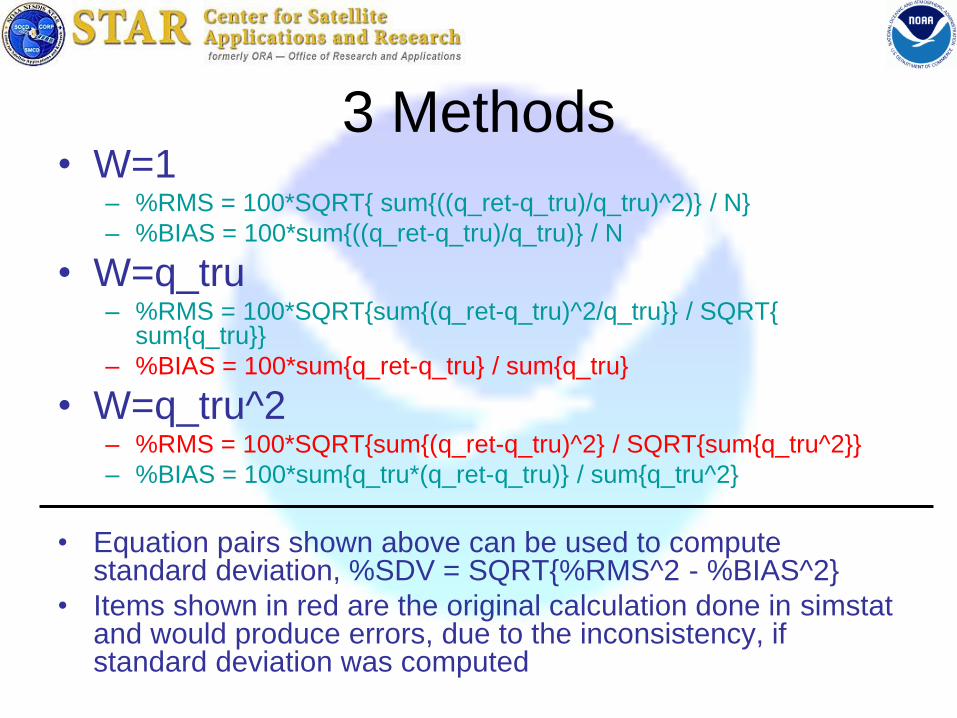
3 Methods • W=1
– %RMS = 100*SQRT{ sum{((q_ret-q_tru)/q_tru)^2)} / N}
– %BIAS = 100*sum{((q_ret-q_tru)/q_tru)} / N
• W=q_tru – %RMS = 100*SQRT{sum{(q_ret-q_tru)^2/q_tru}} / SQRT{
sum{q_tru}}
– %BIAS = 100*sum{q_ret-q_tru} / sum{q_tru}
• W=q_tru^2 – %RMS = 100*SQRT{sum{(q_ret-q_tru)^2} / SQRT{sum{q_tru^2}}
– %BIAS = 100*sum{q_tru*(q_ret-q_tru)} / sum{q_tru^2}
• Equation pairs shown above can be used to compute standard deviation, %SDV = SQRT{%RMS^2 - %BIAS^2}
• Items shown in red are the original calculation done in simstat and would produce errors, due to the inconsistency, if standard deviation was computed
20
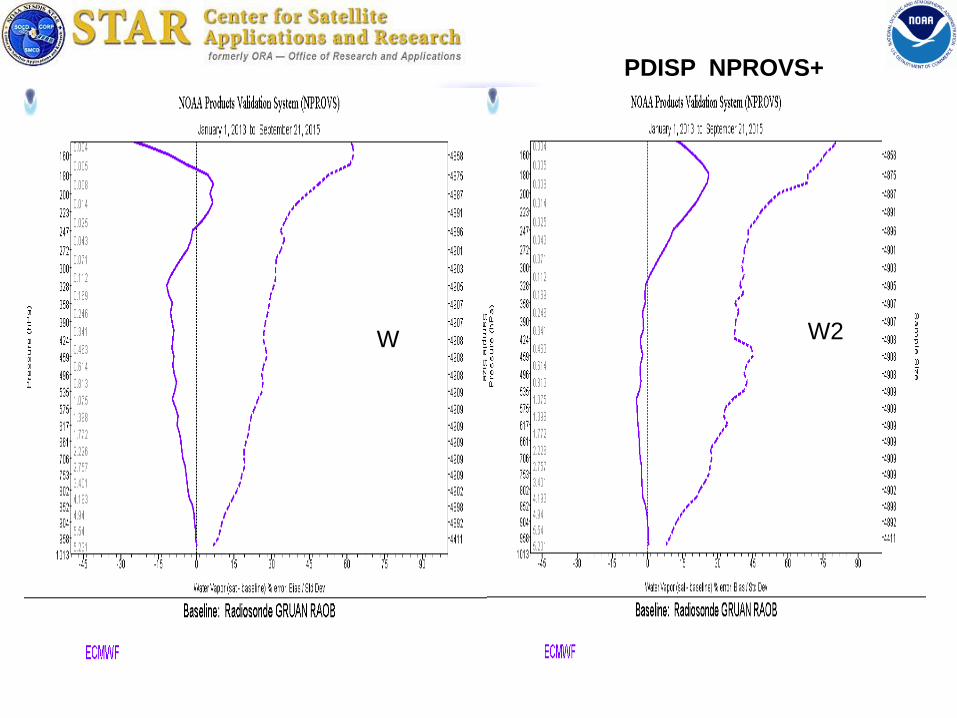
W W2
PDISP NPROVS+

21
W W2
PDISP NPROVS+

GRUAN vs GTS RAOB:
2011 vs 2012 vs 2013
(NPROVS+)
July 2014
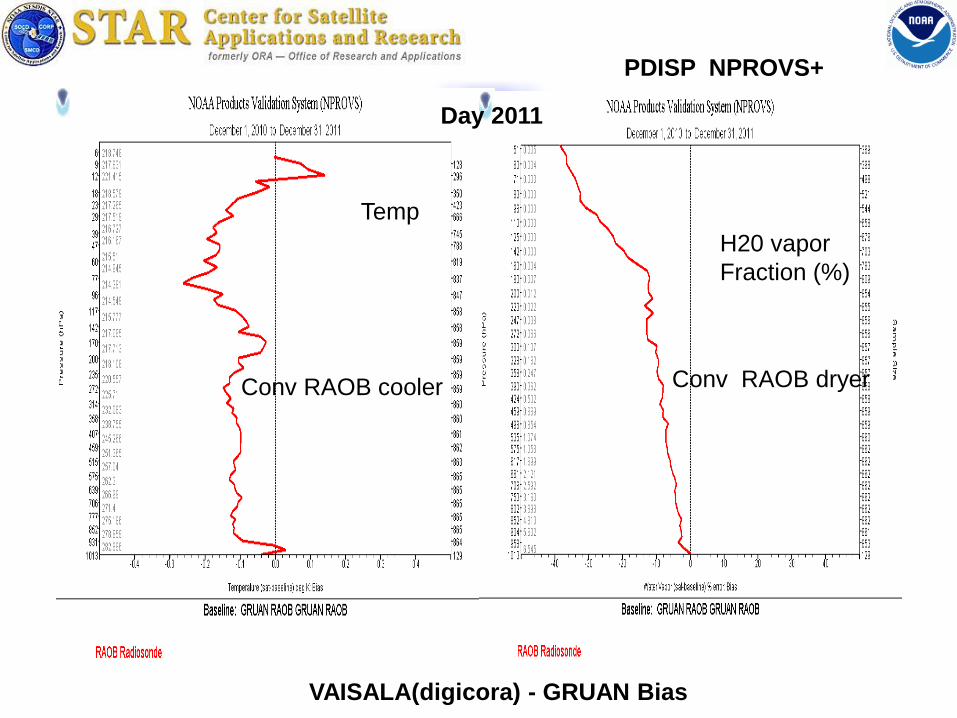
Day 2011
VAISALA(digicora) - GRUAN Bias
Temp
H20 vapor
Fraction (%)
Conv RAOB cooler Conv RAOB dryer
PDISP NPROVS+

Conv RAOB cooler Conv RAOB dryer
Temp
H20 vapor
Fraction (%)
Day 2012
PDISP NPROVS+
VAISALA(digicora) - GRUAN Bias

Conv RAOB cooler Conv RAOB dryer
Temp H20 vapor
Fraction (%)
Day 2013
PDISP NPROVS+
VAISALA(digicora) - GRUAN Bias

Temp
H20 vapor
Fraction (%)
Nite 2013
VAISALA(digicora) - GRUAN Bias
PDISP NPROVS+

Radiosonde type relative humidity (RH) bias
27
RAOB-minus-SAT 300 hPa RH Bias
(Calculated RAOB BT)-minus-(observed SAT BT) @ 183+/- 1 gHz
RAOB aloft too dry
particularly during day
RS92
Sun et al. (2010, JGR)
Bomin Sun

Daytime samples … 317 Polar, 373 midLat, 75 Tropic
PDISP NPROVS+

Day
Day
Nite
Nite
Polar/mid-lat Polar/mid-lat
Nite
Tropic Tropic
H20 Vapor 2012 PDISP NPROVS+

30
IASI RH vs cloud fraction
Change of IASI (dotted) and RAOB (solid) relative humidity with
effective cloud amount for different atmospheric layers. IASI pass
qc retrievals and collocated RAOB are used.
Bomin Sun

NWP vs Conv RAOB:
2013 vs 2015
(NPROVS)

32 10-day PDISP Collocation Dataset
PDISP NPROVS

NWP
2015
PDISP NPROVS

34 NWP
2013
PDISP NPROVS
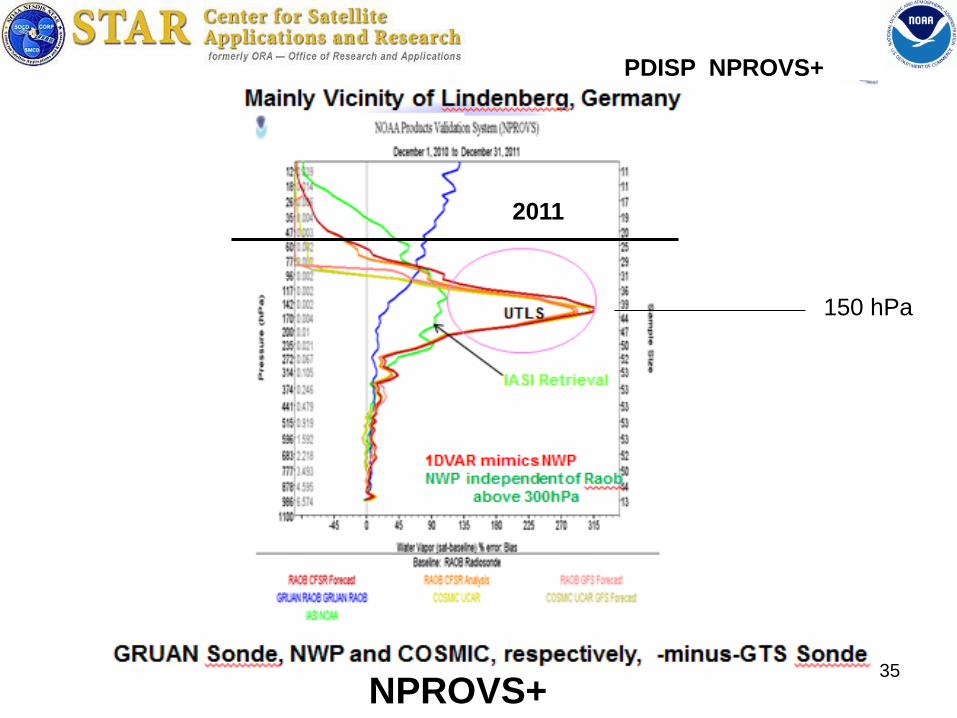
35
NPROVS+
2011
PDISP NPROVS+
150 hPa

36
PDISP NPROVS
150 hPa

Given two measurement (m1, m2), their uncertainty (u1, u2) and their
systematic variability (), then two observations are consistent if
“k” .le. 2
1)
2
2
2
1
2
21 uukmm
u2 is GRUAN uncertainty … given
u1 is SAT (or NWP) profile uncertainty … needed
σ is systematic variability between given platform pair… needed
GRUAN Reference Measurement Principles
37 NPROVS+
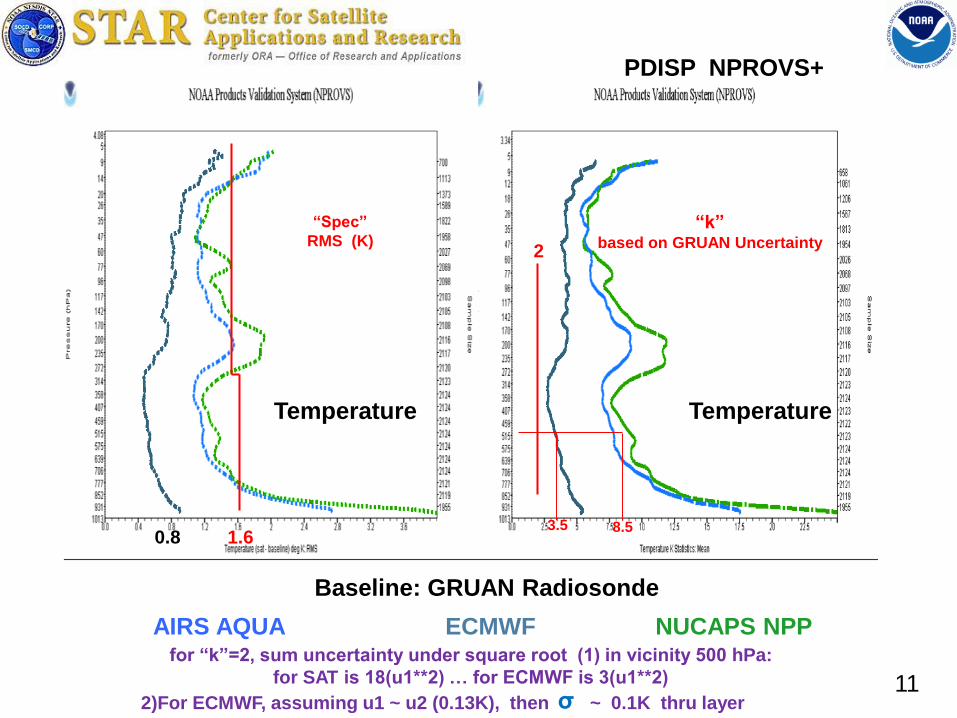
“k” based on GRUAN Uncertainty
Temperature Temperature
AIRS AQUA ECMWF NUCAPS NPP
Baseline: GRUAN Radiosonde
“Spec”
RMS (K) 2
for “k”=2, sum uncertainty under square root (1) in vicinity 500 hPa:
for SAT is 18(u1**2) … for ECMWF is 3(u1**2)
8.5 3.5
2)For ECMWF, assuming u1 ~ u2 (0.13K), then ~ 0.1K thru layer σ
0.8 1.6
11
PDISP NPROVS+

H20 Vapor Fraction H20 Mix Ratio
AIRS AQUA ECMWF NUCAPS NPP
Baseline: GRUAN Radiosonde
“Spec”
RMS ( % ) “k”
based on GRUAN Uncertainty 2
for “k”=2, sum uncertainty under square root (1) in vicinity 600 hPa
for SAT is 12(u1**2) … for ECMWF is 4(u1**2)
7 4 20 35
12
PDISP NPROVS+
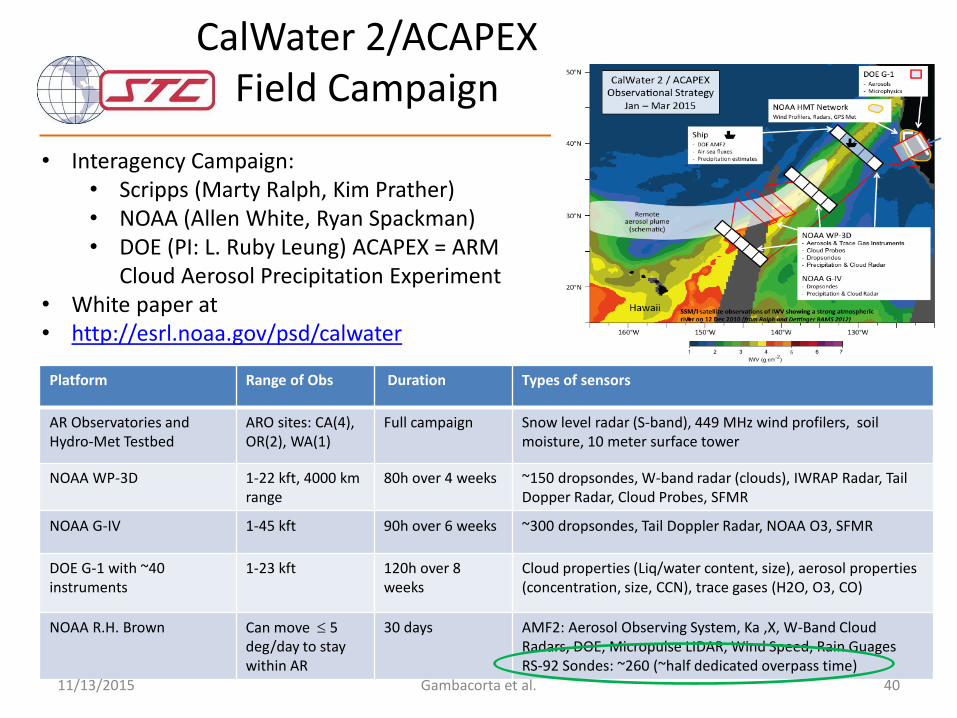
CalWater 2/ACAPEX Field Campaign
Platform Range of Obs Duration Types of sensors
AR Observatories and Hydro-Met Testbed
ARO sites: CA(4), OR(2), WA(1)
Full campaign Snow level radar (S-band), 449 MHz wind profilers, soil moisture, 10 meter surface tower
NOAA WP-3D 1-22 kft, 4000 km range
80h over 4 weeks ~150 dropsondes, W-band radar (clouds), IWRAP Radar, Tail Dopper Radar, Cloud Probes, SFMR
NOAA G-IV 1-45 kft 90h over 6 weeks ~300 dropsondes, Tail Doppler Radar, NOAA O3, SFMR
DOE G-1 with ~40 instruments
1-23 kft 120h over 8 weeks
Cloud properties (Liq/water content, size), aerosol properties (concentration, size, CCN), trace gases (H2O, O3, CO)
NOAA R.H. Brown Can move 5 deg/day to stay within AR
30 days AMF2: Aerosol Observing System, Ka ,X, W-Band Cloud Radars, DOE, Micropulse LIDAR, Wind Speed, Rain Guages RS-92 Sondes: ~260 (~half dedicated overpass time)
• Interagency Campaign: • Scripps (Marty Ralph, Kim Prather) • NOAA (Allen White, Ryan Spackman) • DOE (PI: L. Ruby Leung) ACAPEX = ARM
Cloud Aerosol Precipitation Experiment • White paper at • http://esrl.noaa.gov/psd/calwater
11/13/2015 Gambacorta et al. 40

GRUAN and JPSS funded Dedicated (S-NPP) RAOB Sites
Over 10,000 RAOBS (1000 dedicated) available since July 2013
N P R O V S +
41
PDISP

CALWATER RAOB collocated with NUCAPS
All
(169)
Collocated with NUCAPS
(150)
42
PDISP

Collocated with NUCAPS
+/- 1 hour, 50km
(61)
Collocated with NUCAPS
+/- 1 hour, 50km
IR+MW pass QC
(24)
43 CALWATER RAOB collocated with NUCAPS
PDISP

H20 frac
+/- 2 to 6hr
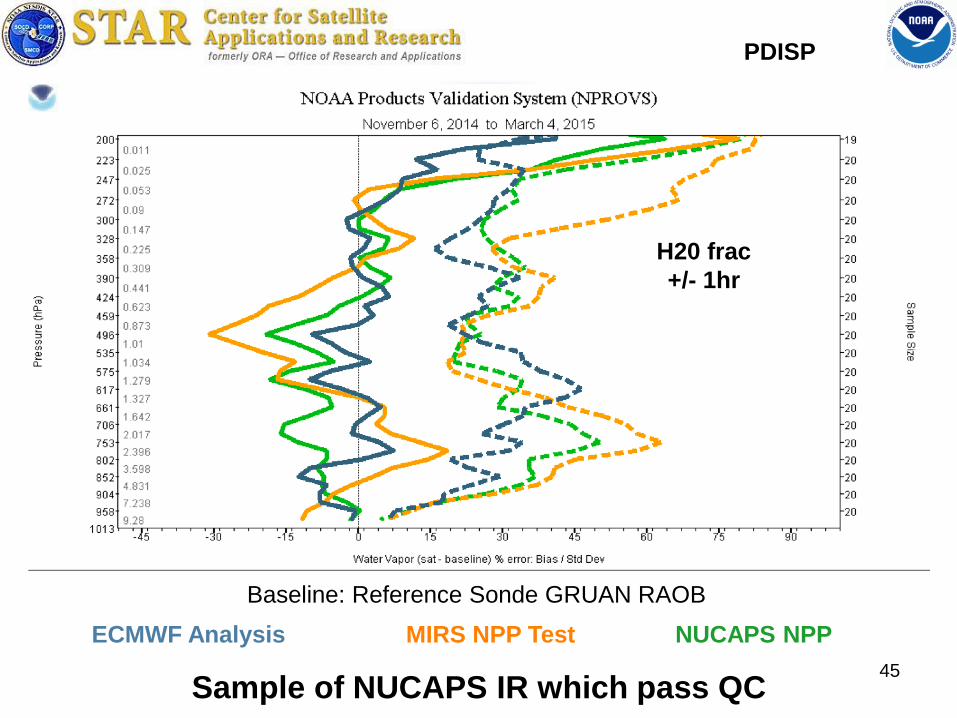
Sample of NUCAPS IR which pass QC
ECMWF Analysis MIRS NPP Test NUCAPS NPP
Baseline: Reference Sonde GRUAN RAOB
44
PDISP
ECMWF Analysis MIRS NPP Test NUCAPS NPP
Baseline: Reference Sonde GRUAN RAOB
45 Sample of NUCAPS IR which pass QC
H20 frac
+/- 1hr
PDISP

ECMWF 12Z ( Feb 7th) to 6Z (Feb 8th)
12Z 18Z
00Z 06Z
X
X X
X
46
650 hPa ODS
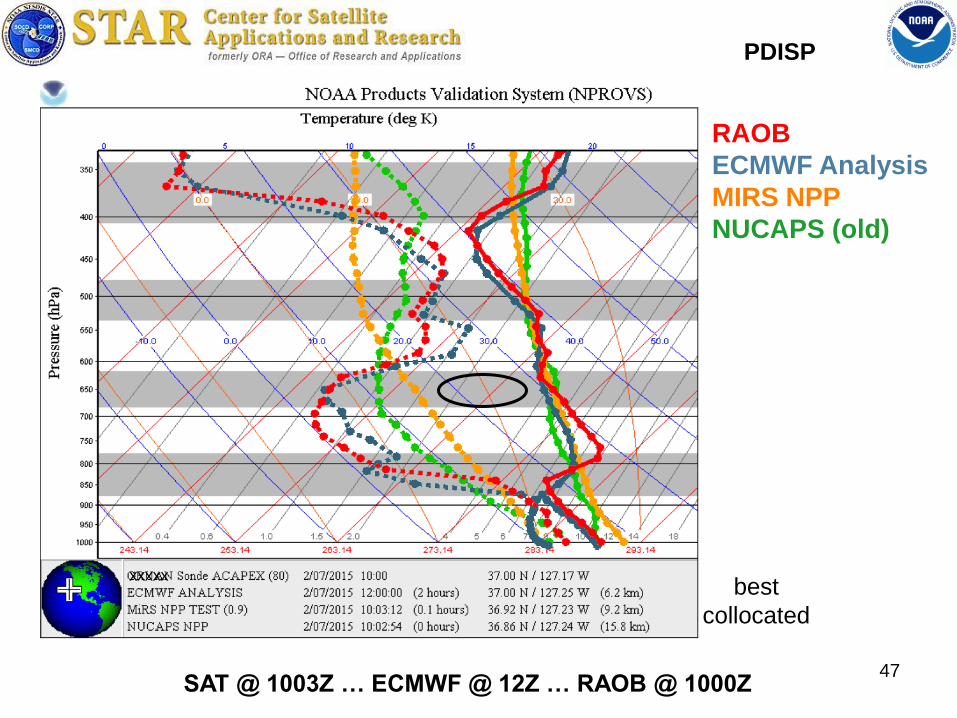
SAT @ 1003Z … ECMWF @ 12Z … RAOB @ 1000Z
RAOB
ECMWF Analysis
MIRS NPP
NUCAPS (old)
47
xxxxx best
collocated
PDISP

SAT @ 2123Z … ECMWF @ 18Z … RAOB @ 2032Z 48
xxxxx
RAOB
ECMWF Analysis
MIRS NPP
NUCAPS (old)
PDISP

SAT @ 2123Z … ECMWF @ 00Z … RAOB @ 2032Z 49
xxxxx
RAOB
ECMWF Analysis
MIRS NPP
NUCAPS (old)
PDISP

SAT @ 2123Z … ECMWF @ 00Z … RAOB @ 2138Z 50
xxxxx
RAOB
ECMWF Analysis
MIRS NPP
NUCAPS (old)
best
collocated
PDISP

SAT @ … ECMWF @ 06Z … RAOB @ 0256Z 51
xxxxx
RAOB
ECMWF Analysis
PDISP

SAT @ … ECMWF @ 06Z … RAOB @ 0435Z 52
xxxxx
RAOB
ECMWF Analysis
PDISP

SAT @ 21Z Feb 7th … ECMWF @ 18Z
NUCAPS
IR+MW
NUCAPS
MW only
650 hPa H20 Vapor
ECMWF
ANL
53
NUCAPS
IR+MW
NUCAPS
MW-only
MiRS NPP
ECMWF
ANL
X X
X X
ODS

SAT @ 2123Z … ECMWF @ 18Z … RAOB @ 2032Z 54
xxxxx
RAOB
ECMWF Analysis
MIRS NPP
NUCAPS (old)
PDISP

SAT @ 2123Z … ECMWF @ 00Z … RAOB @ 2138Z 55
xxxxx
RAOB
ECMWF Analysis
MIRS NPP
NUCAPS (old)
best
collocated
PDISP

SUMMARY • Assessments of satellite, ground and nwp moisture profiles
available via NPROVS (conventional) and NPROVS+ (reference)
• LTM , shorter term ensemble and instantaneous assessments
demonstrated
• HIRS water vapor (Shi) to be appended to NPROVS+ (Sun)
• H20 vapor challenging and requires tight spatial and temporal
sampling … regional / seasonal
• Weighting important for RMS but not for “k” analysis
• Coordination with ongoing GAIA-CLIM (GAIA-CLIM WP3/WP5
Meeting Darmstadt, 29/Oct/2015 )
• Identify key areas of instantaneous assessment section for report
56

57
LIN
Winter
2014
PDISP NPROVS


