Embed Size (px)
Citation preview

3 VII July 2015
www.ijraset.com Volume 3 Issue VII, July 2015 IC Value: 13.98 ISSN: 2321-9653
International Journal for Research in Applied Science & Engineering Technology (IJRASET)
©IJRASET 2015: All Rights are Reserved 254
Analysis of Water Transmission Behaviour in Sandy Loam Soil under Different Tillage
Operations of Mould Board Plough applying /Using Different Infiltration Models
Engr. Imran Arshad1, Engr. Asadullah Sarki2, Engr. Zaheer Ahmed Khan3
1Agriculture Engineer, Star Services LLC, Al Muroor Road – Abu Dhabi, United Arab Emirates (UAE), e-mail: 2Asistant Professor, Department of Land & Water Management, FAE - SAU, Tandojam, Pakistan
3Lecturer, Department of Farm Structures, FAE - SAU, Tandojam, Pakistan
Abstract- The present research work was performed to investigate the effect of tillage intensity to the water transmission behavior for sandy loam soil in terms of infiltration rates and cumulative infiltration and its validation with different infiltration models. An experiment was conducted on the sandy loam soil having particle density 2.49 g/cm3, moderately well drained and kept fallow since many years. The experiment was laid out in a RCBD with three replications and experimental treatments include MB0 = Unploughed soil, MB1 = 1 crosswise passing of a Plough Mouldboard plough, MB2 = 2 crosswise passing of a Raja MB Plough, and MB3 = 3 crosswise passing of a Raja MB Plough accordingly. The results revealed that the soil condition directly affects the infiltration rate and cumulative infiltration accordingly. The obtained results showed that the constant infiltration rate for unploughed and ploughed sandy loam soils by using tillage operations are found to be 5.340, 7.832, 8.096, and 8.103 cm / hr for MB1, MB2, MB3, and MB4 respectively. The measured infiltration rates, cumulative infiltration and its validation with other models for sandy loam soil under different tillage operations are elaborated in Table 01 (11.63118 &12.61353) – Table 08 (209.8315 &213.3462) respectively. The model validation showed that the highest cumulative infiltration (303.772 cm) was found under MB3 treatment and the lowest cumulative infiltration (192.54 cm) was recorded under MB1 treatment for Horton’s Model. Likewise, the highest rate of infiltration (58.14 cm/hr) was found under MB3 treatment and lowest rate of infiltration (36.72 cm/hr) was found under MB1 treatment respectively. Rate of infiltration was greater under three passing of a Raja MB Plough and lower under one passing of a Raja MB Plough. Thus, there was a strong correlation of field data with Horton’s model and hence, it is concluded that Horton’s model is appropriate model with high significant results of correlation coefficient and standard error. The results achieved by Horton’s Model along with other models are almost same along with the trend as shown in Figure 2.1 – Figure 2.8 which indicate the relationship between cumulative infiltration against the time. Different crosswise application of Raja MB Plough had a direct effect on cumulative infiltration and the rate of soil water infiltration due to the tillage intensity. The statistical data showed that the treatment MB3 demonstrated better performance as compared to the other treatments. The MB1 treatments showed less effective results when compared with different infiltration models. Hence, it can be concluded from the present research that different tillage intensities and infiltration are directly proportional to each other and can improve operation of water-harvesting, irrigation and fertigation criteria for plants for long term basis. Keywords: Infiltration, Cumulative Infiltration, Sandy Loam Soil, Mould board plough, Horton’s Model validation.
I. INTRODUCTION Infiltration is the process by which water on the ground surface enters the soil profile vertically. Infiltration rate in general soil science the infiltration rate is the velocity or speed at which (rainfall or irrigation) water enters into the soil. It is usually measured by the depth (in mm or cm) of the water layer that can enter the soil in one hour (Ayu, et al., 2013) [1]. Accurate determination of infiltration rates is an important factor in reliable prediction of surface runoff. The water is driven into the porous soil by force of gravity and capillary attraction. First the water saturate soil pores between particles and then the extra water moves down due to resulting gravitational force. Factors affecting the infiltration process are soil properties, initial moisture content, rainfall rates,
www.ijraset.com Volume 3 Issue VII, July 2015 IC Value: 13.98 ISSN: 2321-9653
International Journal for Research in Applied Science & Engineering Technology (IJRASET)
©IJRASET 2015: All Rights are Reserved 255
surface sealing and crusting, layered soils, and movement and entrapment of soil air (Jagdale et al., 2012) [2]. The infiltration plays an important role in generation of runoff volume, if infiltration rate of given soil is less than intensity of rainfall then it results in either accumulation of water on soil surface or in runoff. In order to determine the infiltration rate at any time approximate infiltration rate equations have been developed. Most of these equations are empirical i.e. they are based on observed behavior. In some equations the parameters have no physical meaning (Antigha et al., 2012) [3]. The different soil conditions affect the soil infiltration rate. It has been noticed from past studies that different tillage operations may influence the physical properties of soil such as soil bulk density, soil moisture content, soil porosity (Ranjan et al., 2006) [4]. The advantages of different tillage systems are moisture conservation, reduction of soil erosion, less labour and energy requirement, more timely planting of crops and increased intensity of land use (Diamond et al., 2006) [5]. It also increases the cumulative infiltration rate. As a result soil becomes permeable, aerated and has a good physical condition for crop production (Rahman et al., 2013) [6]. By keeping the discussed facts in view in present research study the constant infiltration rates of different soils under different soil conditions were calculated by double ring infiltrometer method, and compared with calculated values from Kostiakov, Modified Kostiakov, Horton’s and Green-Ampt infiltration models. And assessment of the suitability of different models for estimation of infiltration rate of particular soil under particular soil conditions was carried out with correlation coefficient and standard error as a tool.
II. MATERIALS AND METHODS A. Location The experiment was carried out at Rajput Farm, Tando Allahyar Sindh Pakistan, during the Rabi season of the year 2013-2014. The study was performed to investigate the effect of tillage intensity to the water transmission behavior for sandy loam soil in terms of infiltration rates and cumulative infiltration (base flow) and its validation with different infiltration models.
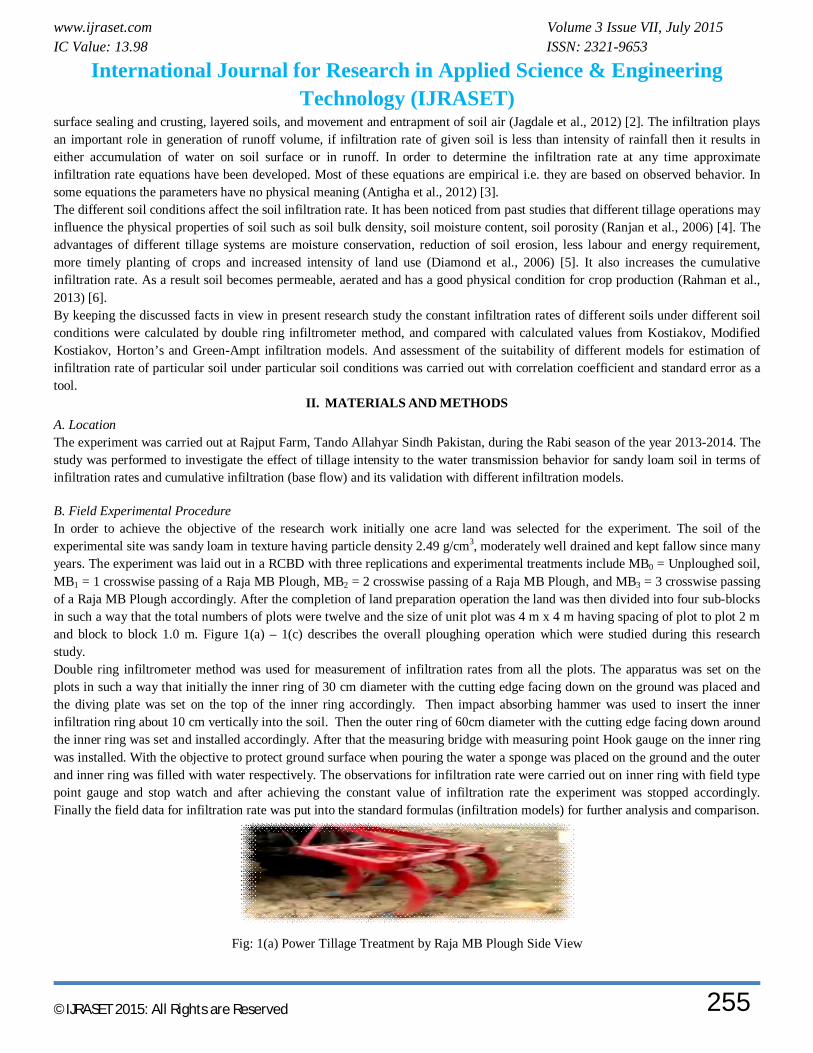
B. Field Experimental Procedure In order to achieve the objective of the research work initially one acre land was selected for the experiment. The soil of the experimental site was sandy loam in texture having particle density 2.49 g/cm3, moderately well drained and kept fallow since many years. The experiment was laid out in a RCBD with three replications and experimental treatments include MB0 = Unploughed soil, MB1 = 1 crosswise passing of a Raja MB Plough, MB2 = 2 crosswise passing of a Raja MB Plough, and MB3 = 3 crosswise passing of a Raja MB Plough accordingly. After the completion of land preparation operation the land was then divided into four sub-blocks in such a way that the total numbers of plots were twelve and the size of unit plot was 4 m x 4 m having spacing of plot to plot 2 m and block to block 1.0 m. Figure 1(a) – 1(c) describes the overall ploughing operation which were studied during this research study. Double ring infiltrometer method was used for measurement of infiltration rates from all the plots. The apparatus was set on the plots in such a way that initially the inner ring of 30 cm diameter with the cutting edge facing down on the ground was placed and the diving plate was set on the top of the inner ring accordingly. Then impact absorbing hammer was used to insert the inner infiltration ring about 10 cm vertically into the soil. Then the outer ring of 60cm diameter with the cutting edge facing down around the inner ring was set and installed accordingly. After that the measuring bridge with measuring point Hook gauge on the inner ring was installed. With the objective to protect ground surface when pouring the water a sponge was placed on the ground and the outer and inner ring was filled with water respectively. The observations for infiltration rate were carried out on inner ring with field type point gauge and stop watch and after achieving the constant value of infiltration rate the experiment was stopped accordingly. Finally the field data for infiltration rate was put into the standard formulas (infiltration models) for further analysis and comparison.
Fig: 1(a) Power Tillage Treatment by Raja MB Plough Side View
www.ijraset.com Volume 3 Issue VII, July 2015 IC Value: 13.98 ISSN: 2321-9653
International Journal for Research in Applied Science & Engineering Technology (IJRASET)
©IJRASET 2015: All Rights are Reserved 256
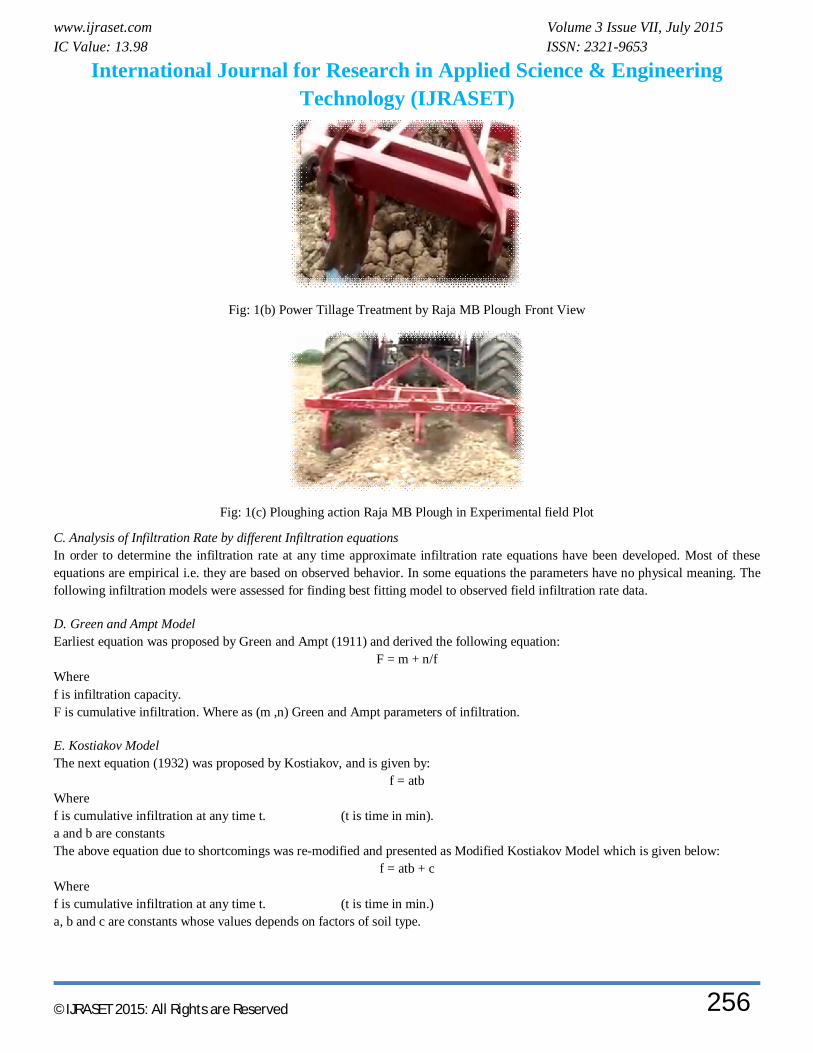
Fig: 1(b) Power Tillage Treatment by Raja MB Plough Front View
Fig: 1(c) Ploughing action Raja MB Plough in Experimental field Plot
C. Analysis of Infiltration Rate by different Infiltration equations In order to determine the infiltration rate at any time approximate infiltration rate equations have been developed. Most of these equations are empirical i.e. they are based on observed behavior. In some equations the parameters have no physical meaning. The following infiltration models were assessed for finding best fitting model to observed field infiltration rate data.
D. Green and Ampt Model Earliest equation was proposed by Green and Ampt (1911) and derived the following equation:
F = m + n/f Where f is infiltration capacity. F is cumulative infiltration. Where as (m ,n) Green and Ampt parameters of infiltration.
E. Kostiakov Model The next equation (1932) was proposed by Kostiakov, and is given by:
f = atb Where f is cumulative infiltration at any time t. (t is time in min). a and b are constants The above equation due to shortcomings was re-modified and presented as Modified Kostiakov Model which is given below:
f = atb + c Where f is cumulative infiltration at any time t. (t is time in min.) a, b and c are constants whose values depends on factors of soil type.
www.ijraset.com Volume 3 Issue VII, July 2015 IC Value: 13.98 ISSN: 2321-9653
International Journal for Research in Applied Science & Engineering Technology (IJRASET)
©IJRASET 2015: All Rights are Reserved 257
F. Horton’s Model The Horton developed a model to compute the infiltration in (1940). It is a 3 parameter model derived to further alleviate the problems in the asymptotic limits of the Kostiakov model. Horton expressed decrease of infiltration capacity with time as an exponential decrease up to base flow infiltration rate modified form is.
f = fc + (fo - fc) e-kt Where f is infiltration capacity at any time t. (t is time in hours.) fc is final steady state infiltration capacity. fo is initial infiltration capacity. k Horton’s constant representing rate of decrease in infiltration capacity.
III. RESULTS AND DISCUSSION The subject research was carried out to analyze the water transmission behavior for sandy loam soil under different tillage operations of Raja MB Plough and its comparison with different infiltration models. The measured infiltration rates, cumulative infiltration and its validation with other models for sandy loam soil under different tillage operations are elaborated in Table 01 – Table 08(209.8315 &213.3462) respectively. A graphical correlation of infiltration rate and cumulative infiltration versus time along with other infiltration validation is shown in Fig. 2.1 – 2.8 at (75 minutes is 10 cm/hr, and 40 minutes the cumulative rate is 150 for the all models) respectively.
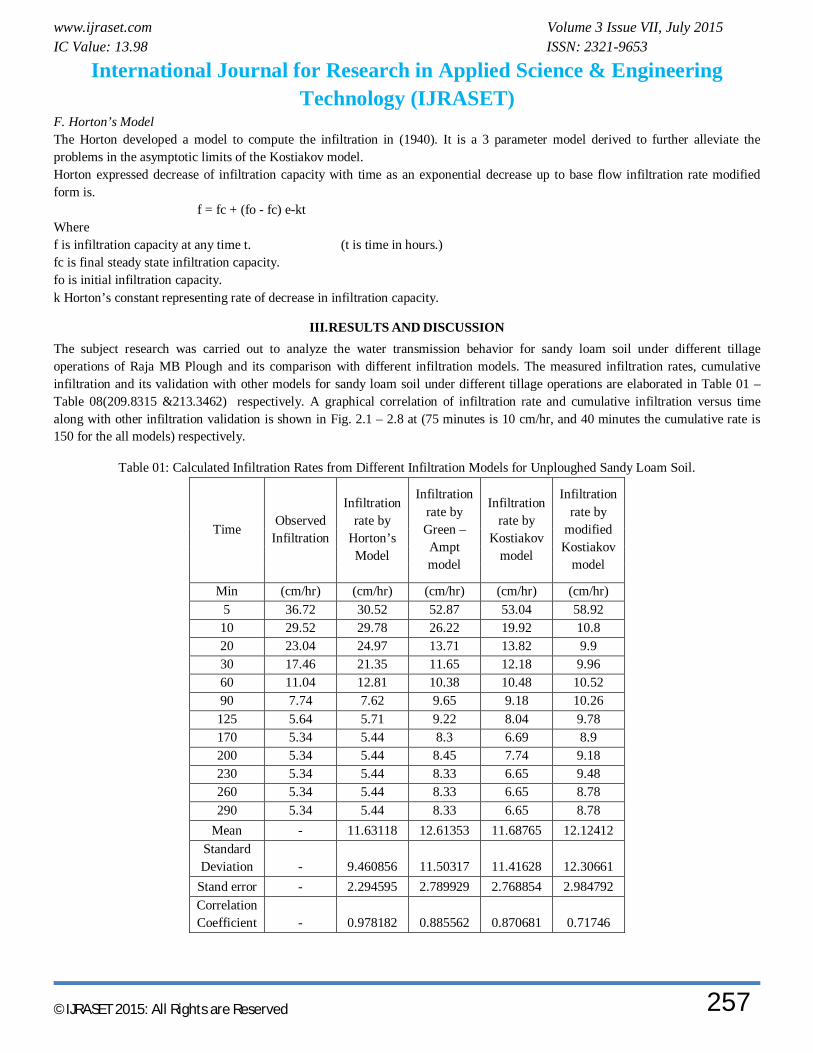
Table 01: Calculated Infiltration Rates from Different Infiltration Models for Unploughed Sandy Loam Soil.
Time Observed
Infiltration
Infiltration rate by
Horton’s Model
Infiltration rate by Green – Ampt model
Infiltration rate by
Kostiakov model
Infiltration rate by
modified Kostiakov
model
Min (cm/hr) (cm/hr) (cm/hr) (cm/hr) (cm/hr) 5 36.72 30.52 52.87 53.04 58.92 10 29.52 29.78 26.22 19.92 10.8 20 23.04 24.97 13.71 13.82 9.9 30 17.46 21.35 11.65 12.18 9.96 60 11.04 12.81 10.38 10.48 10.52 90 7.74 7.62 9.65 9.18 10.26 125 5.64 5.71 9.22 8.04 9.78 170 5.34 5.44 8.3 6.69 8.9 200 5.34 5.44 8.45 7.74 9.18 230 5.34 5.44 8.33 6.65 9.48 260 5.34 5.44 8.33 6.65 8.78 290 5.34 5.44 8.33 6.65 8.78
Mean - 11.63118 12.61353 11.68765 12.12412 Standard Deviation - 9.460856 11.50317 11.41628 12.30661
Stand error - 2.294595 2.789929 2.768854 2.984792 Correlation Coefficient - 0.978182 0.885562 0.870681 0.71746
www.ijraset.com Volume 3 Issue VII, July 2015 IC Value: 13.98 ISSN: 2321-9653
International Journal for Research in Applied Science & Engineering Technology (IJRASET)
©IJRASET 2015: All Rights are Reserved 258
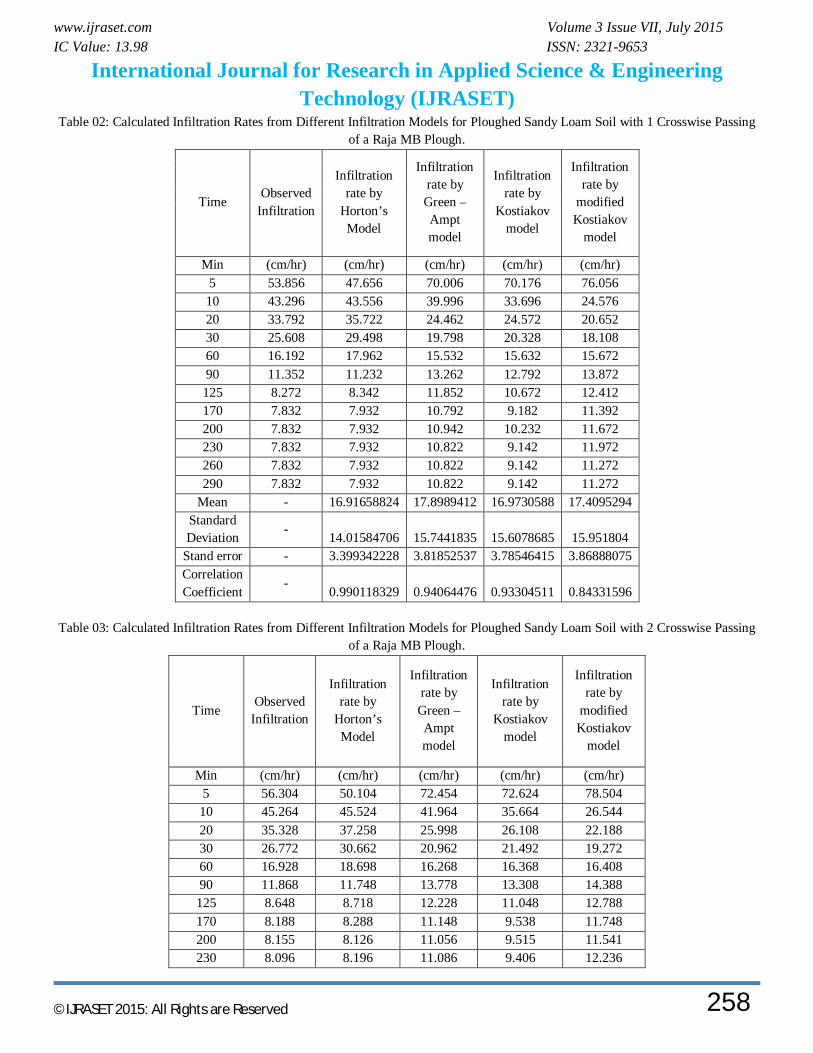
Table 02: Calculated Infiltration Rates from Different Infiltration Models for Ploughed Sandy Loam Soil with 1 Crosswise Passing of a Raja MB Plough.
Time Observed
Infiltration
Infiltration rate by
Horton’s Model
Infiltration rate by Green – Ampt model
Infiltration rate by
Kostiakov model
Infiltration rate by
modified Kostiakov
model
Min (cm/hr) (cm/hr) (cm/hr) (cm/hr) (cm/hr) 5 53.856 47.656 70.006 70.176 76.056 10 43.296 43.556 39.996 33.696 24.576 20 33.792 35.722 24.462 24.572 20.652 30 25.608 29.498 19.798 20.328 18.108 60 16.192 17.962 15.532 15.632 15.672 90 11.352 11.232 13.262 12.792 13.872 125 8.272 8.342 11.852 10.672 12.412 170 7.832 7.932 10.792 9.182 11.392 200 7.832 7.932 10.942 10.232 11.672 230 7.832 7.932 10.822 9.142 11.972 260 7.832 7.932 10.822 9.142 11.272 290 7.832 7.932 10.822 9.142 11.272
Mean - 16.91658824 17.8989412 16.9730588 17.4095294 Standard Deviation - 14.01584706 15.7441835 15.6078685 15.951804
Stand error - 3.399342228 3.81852537 3.78546415 3.86888075 Correlation Coefficient
- 0.990118329 0.94064476 0.93304511 0.84331596
Table 03: Calculated Infiltration Rates from Different Infiltration Models for Ploughed Sandy Loam Soil with 2 Crosswise Passing
of a Raja MB Plough.
Time Observed
Infiltration
Infiltration rate by
Horton’s Model
Infiltration rate by Green – Ampt model
Infiltration rate by
Kostiakov model
Infiltration rate by
modified Kostiakov
model
Min (cm/hr) (cm/hr) (cm/hr) (cm/hr) (cm/hr) 5 56.304 50.104 72.454 72.624 78.504 10 45.264 45.524 41.964 35.664 26.544 20 35.328 37.258 25.998 26.108 22.188 30 26.772 30.662 20.962 21.492 19.272 60 16.928 18.698 16.268 16.368 16.408 90 11.868 11.748 13.778 13.308 14.388 125 8.648 8.718 12.228 11.048 12.788 170 8.188 8.288 11.148 9.538 11.748 200 8.155 8.126 11.056 9.515 11.541 230 8.096 8.196 11.086 9.406 12.236
www.ijraset.com Volume 3 Issue VII, July 2015 IC Value: 13.98 ISSN: 2321-9653
International Journal for Research in Applied Science & Engineering Technology (IJRASET)
©IJRASET 2015: All Rights are Reserved 259
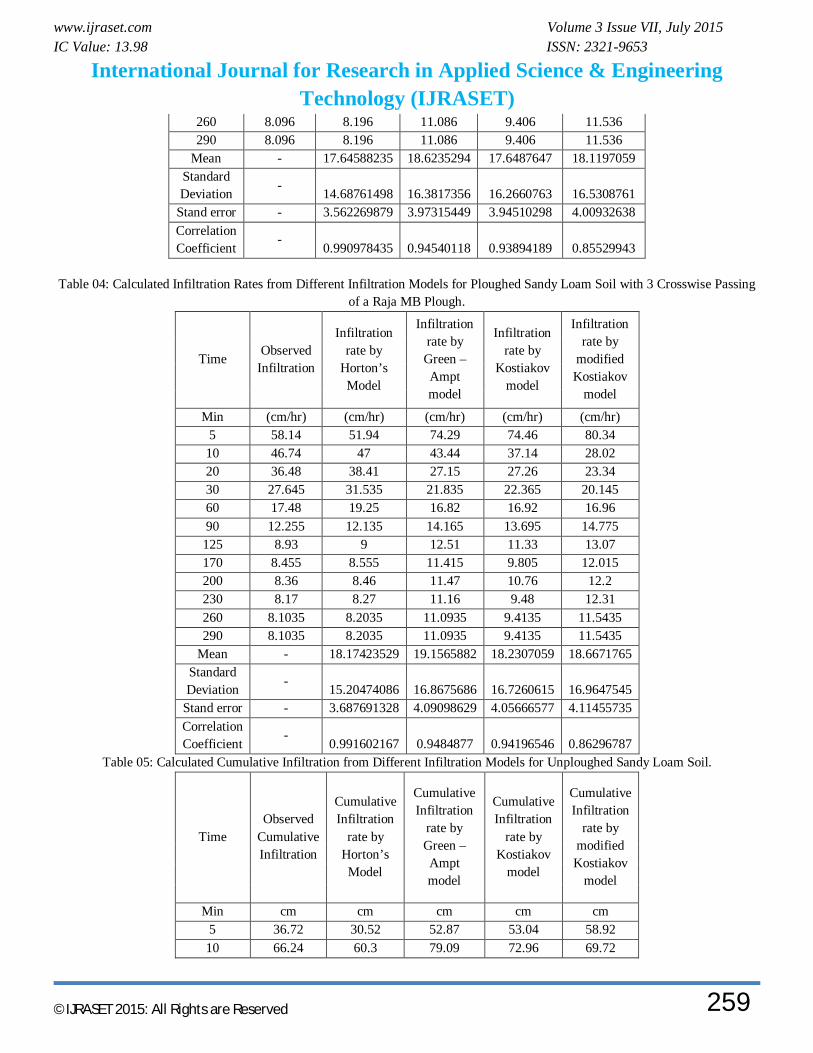
260 8.096 8.196 11.086 9.406 11.536 290 8.096 8.196 11.086 9.406 11.536
Mean - 17.64588235 18.6235294 17.6487647 18.1197059 Standard Deviation - 14.68761498 16.3817356 16.2660763 16.5308761
Stand error - 3.562269879 3.97315449 3.94510298 4.00932638 Correlation Coefficient
- 0.990978435 0.94540118 0.93894189 0.85529943
Table 04: Calculated Infiltration Rates from Different Infiltration Models for Ploughed Sandy Loam Soil with 3 Crosswise Passing
of a Raja MB Plough.
Time Observed Infiltration
Infiltration rate by
Horton’s Model
Infiltration rate by Green – Ampt model
Infiltration rate by
Kostiakov model
Infiltration rate by
modified Kostiakov
model
Min (cm/hr) (cm/hr) (cm/hr) (cm/hr) (cm/hr) 5 58.14 51.94 74.29 74.46 80.34 10 46.74 47 43.44 37.14 28.02 20 36.48 38.41 27.15 27.26 23.34 30 27.645 31.535 21.835 22.365 20.145 60 17.48 19.25 16.82 16.92 16.96 90 12.255 12.135 14.165 13.695 14.775 125 8.93 9 12.51 11.33 13.07 170 8.455 8.555 11.415 9.805 12.015 200 8.36 8.46 11.47 10.76 12.2 230 8.17 8.27 11.16 9.48 12.31 260 8.1035 8.2035 11.0935 9.4135 11.5435 290 8.1035 8.2035 11.0935 9.4135 11.5435
Mean - 18.17423529 19.1565882 18.2307059 18.6671765 Standard Deviation - 15.20474086 16.8675686 16.7260615 16.9647545
Stand error - 3.687691328 4.09098629 4.05666577 4.11455735 Correlation Coefficient
- 0.991602167 0.9484877 0.94196546 0.86296787
Table 05: Calculated Cumulative Infiltration from Different Infiltration Models for Unploughed Sandy Loam Soil.
Time Observed
Cumulative Infiltration
Cumulative Infiltration
rate by Horton’s Model
Cumulative Infiltration
rate by Green – Ampt model
Cumulative Infiltration
rate by Kostiakov
model
Cumulative Infiltration
rate by modified Kostiakov
model
Min cm cm cm cm cm 5 36.72 30.52 52.87 53.04 58.92 10 66.24 60.3 79.09 72.96 69.72

www.ijraset.com Volume 3 Issue VII, July 2015 IC Value: 13.98 ISSN: 2321-9653
International Journal for Research in Applied Science & Engineering Technology (IJRASET)
©IJRASET 2015: All Rights are Reserved 260
20 89.28 85.27 92.8 86.78 79.62 30 106.74 106.62 104.45 98.96 89.58 60 131.22 135.97 125.44 120.96 110.74 90 148.32 152.91 144.76 139.77 131.29 125 160.32 164.91 163.45 156.55 151.27 170 171.18 175.97 180.99 171 169.89 200 176.52 181.41 189.44 178.74 179.07 230 181.86 186.85 197.77 185.39 188.55 260 187.2 192.29 206.1 192.04 197.33 290 192.54 197.73 214.43 198.69 206.11
Mean - 133.466471 136.981176 129.927647 126.8129 Standard Deviation
- 58.6345327 58.2617378 54.419053 56.02637
Stand error - 14.220963 14.130547 13.198559 13.58839 Correlation Coefficient - 0.99919848 0.98801476 0.99121275 0.973022
Table 06: Calculated Cumulative Infiltration from Different Infiltration Models for Ploughed Sandy Loam Soil with 1 Crosswise
Passing of a Raja MB Plough.
Time Observed
Cumulative Infiltration
Cumulative Infiltration
rate by Horton’s Model
Cumulative Infiltration
rate by Green – Ampt model
Cumulative Infiltration
rate by Kostiakov
model
Cumulative Infiltration
rate by modified Kostiakov
model Min cm cm cm cm cm
5 53.856 47.656 70.006 70.176 76.056 10 97.152 91.212 110.002 103.872 100.632 20 130.944 126.934 134.464 128.444 121.284 30 156.552 156.432 154.262 148.772 139.392 60 192.456 197.206 186.676 182.196 171.976 90 217.536 222.126 213.976 208.986 200.506 125 235.136 239.726 238.266 231.366 226.086 170 251.064 255.854 260.874 250.884 249.774 200 258.896 263.786 271.816 261.116 261.446 230 266.728 271.718 282.638 270.258 273.418 260 274.56 279.65 293.46 279.4 284.69 290 282.392 287.582 304.282 288.542 295.962
Mean - 194.6662 198.1809 191.1274 188.0127 Standard Deviation
- 84.42812 83.85505 80.07303 81.35625
Stand error - 20.47683 20.33784 19.42056 19.73179 Correlation Coefficient - 0.999613 0.994232 0.995951 0.987298

www.ijraset.com Volume 3 Issue VII, July 2015 IC Value: 13.98 ISSN: 2321-9653
International Journal for Research in Applied Science & Engineering Technology (IJRASET)
©IJRASET 2015: All Rights are Reserved 261
Table 07: Calculated Cumulative Infiltration from Different Infiltration Models for Ploughed Sandy Loam Soil with 2 Crosswise Passing of a Raja MB Plough..
Time Observed
Cumulative Infiltration
Cumulative Infiltration
rate by Horton’s Model
Cumulative Infiltration
rate by Green –
Ampt model
Cumulative Infiltration
rate by Kostiakov
model
Cumulative Infiltration
rate by modified Kostiakov
model Min cm cm cm cm cm
5 56.304 50.104 72.454 72.624 78.504 10 101.568 95.628 114.418 108.288 105.048 20 136.896 132.886 140.416 134.396 127.236 30 163.668 163.548 161.378 155.888 146.508 60 201.204 205.954 195.424 190.944 180.724 90 227.424 232.014 223.864 218.874 210.394 125 245.824 250.414 248.954 242.054 236.774 170 262.476 267.266 272.286 262.296 261.186 200 270.631 275.392 283.342 271.811 272.727 230 278.727 283.588 294.428 281.217 284.963 260 286.823 291.784 305.514 290.623 296.499 290 294.919 299.98 316.6 300.029 308.035
Mean - 203.3385 206.8344 199.5853 196.6085 Standard Deviation - 88.03899 87.41656 83.42797 84.82097
Stand error - 21.35259 21.20163 20.23426 20.57211 Correlation Coefficient
- 0.999643 0.994756 0.996513 0.988532
Table 08: Calculated Cumulative Infiltration from Different Infiltration Models for Ploughed Sandy Loam Soil with 3 Crosswise
Passing of a Raja MB Plough.
Time Observed
Cumulative Infiltration
Cumulative Infiltration
rate by Horton’s Model
Cumulative Infiltration
rate by Green –
Ampt model
Cumulative Infiltration
rate by Kostiakov
model
Cumulative Infiltration
rate by modified Kostiakov
model Min cm cm cm cm cm
5 58.14 51.94 74.29 74.46 80.34 10 104.88 98.94 117.73 111.6 108.36 20 141.36 137.35 144.88 138.86 131.7 30 169.005 168.885 166.715 161.225 151.845 60 207.765 212.515 201.985 197.505 187.285 90 234.84 239.43 231.28 226.29 217.81 125 253.84 258.43 256.97 250.07 244.79 170 271.035 275.825 280.845 270.855 269.745 200 279.395 284.285 292.315 281.615 281.945 230 287.565 292.555 303.475 291.095 294.255
www.ijraset.com Volume 3 Issue VII, July 2015 IC Value: 13.98 ISSN: 2321-9653
International Journal for Research in Applied Science & Engineering Technology (IJRASET)
©IJRASET 2015: All Rights are Reserved 262
260 295.6685 300.7585 314.5685 300.5085 305.7985 290 303.772 308.962 325.662 309.922 317.342
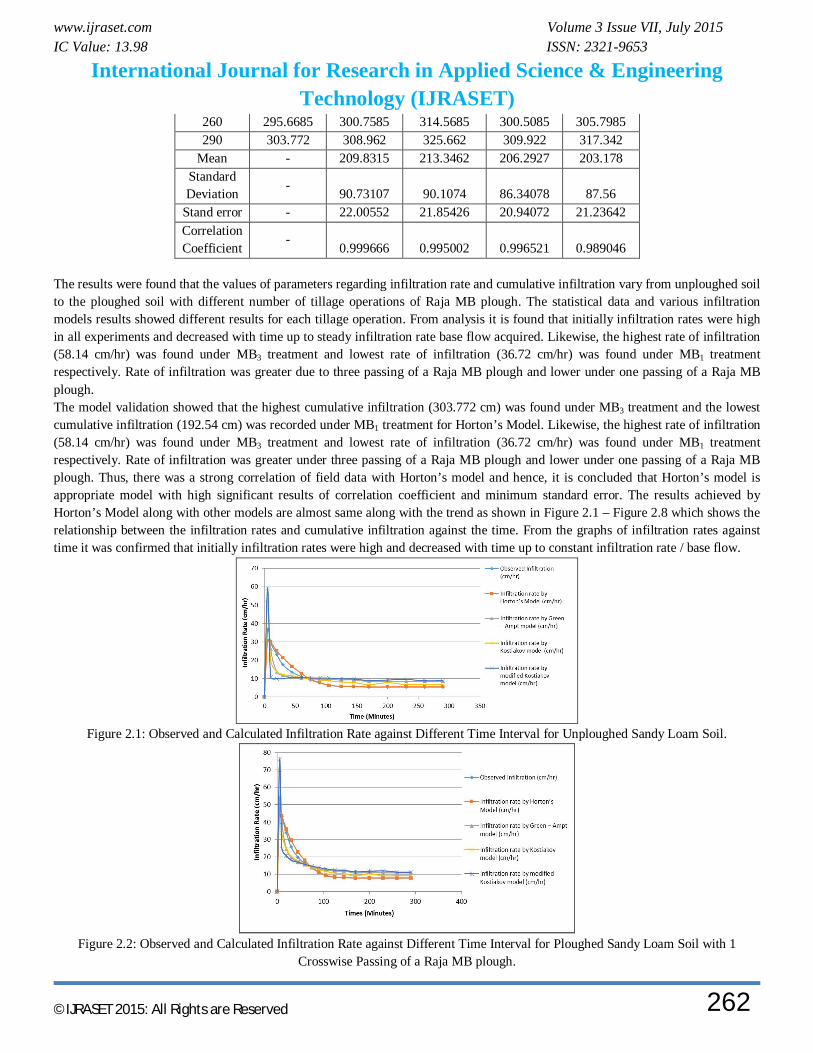
Mean - 209.8315 213.3462 206.2927 203.178 Standard Deviation - 90.73107 90.1074 86.34078 87.56
Stand error - 22.00552 21.85426 20.94072 21.23642 Correlation Coefficient
- 0.999666 0.995002 0.996521 0.989046
The results were found that the values of parameters regarding infiltration rate and cumulative infiltration vary from unploughed soil to the ploughed soil with different number of tillage operations of Raja MB plough. The statistical data and various infiltration models results showed different results for each tillage operation. From analysis it is found that initially infiltration rates were high in all experiments and decreased with time up to steady infiltration rate base flow acquired. Likewise, the highest rate of infiltration (58.14 cm/hr) was found under MB3 treatment and lowest rate of infiltration (36.72 cm/hr) was found under MB1 treatment respectively. Rate of infiltration was greater due to three passing of a Raja MB plough and lower under one passing of a Raja MB plough. The model validation showed that the highest cumulative infiltration (303.772 cm) was found under MB3 treatment and the lowest cumulative infiltration (192.54 cm) was recorded under MB1 treatment for Horton’s Model. Likewise, the highest rate of infiltration (58.14 cm/hr) was found under MB3 treatment and lowest rate of infiltration (36.72 cm/hr) was found under MB1 treatment respectively. Rate of infiltration was greater under three passing of a Raja MB plough and lower under one passing of a Raja MB plough. Thus, there was a strong correlation of field data with Horton’s model and hence, it is concluded that Horton’s model is appropriate model with high significant results of correlation coefficient and minimum standard error. The results achieved by Horton’s Model along with other models are almost same along with the trend as shown in Figure 2.1 – Figure 2.8 which shows the relationship between the infiltration rates and cumulative infiltration against the time. From the graphs of infiltration rates against time it was confirmed that initially infiltration rates were high and decreased with time up to constant infiltration rate / base flow.
Figure 2.1: Observed and Calculated Infiltration Rate against Different Time Interval for Unploughed Sandy Loam Soil.
Figure 2.2: Observed and Calculated Infiltration Rate against Different Time Interval for Ploughed Sandy Loam Soil with 1
Crosswise Passing of a Raja MB plough.
www.ijraset.com Volume 3 Issue VII, July 2015 IC Value: 13.98 ISSN: 2321-9653
International Journal for Research in Applied Science & Engineering Technology (IJRASET)
©IJRASET 2015: All Rights are Reserved 263
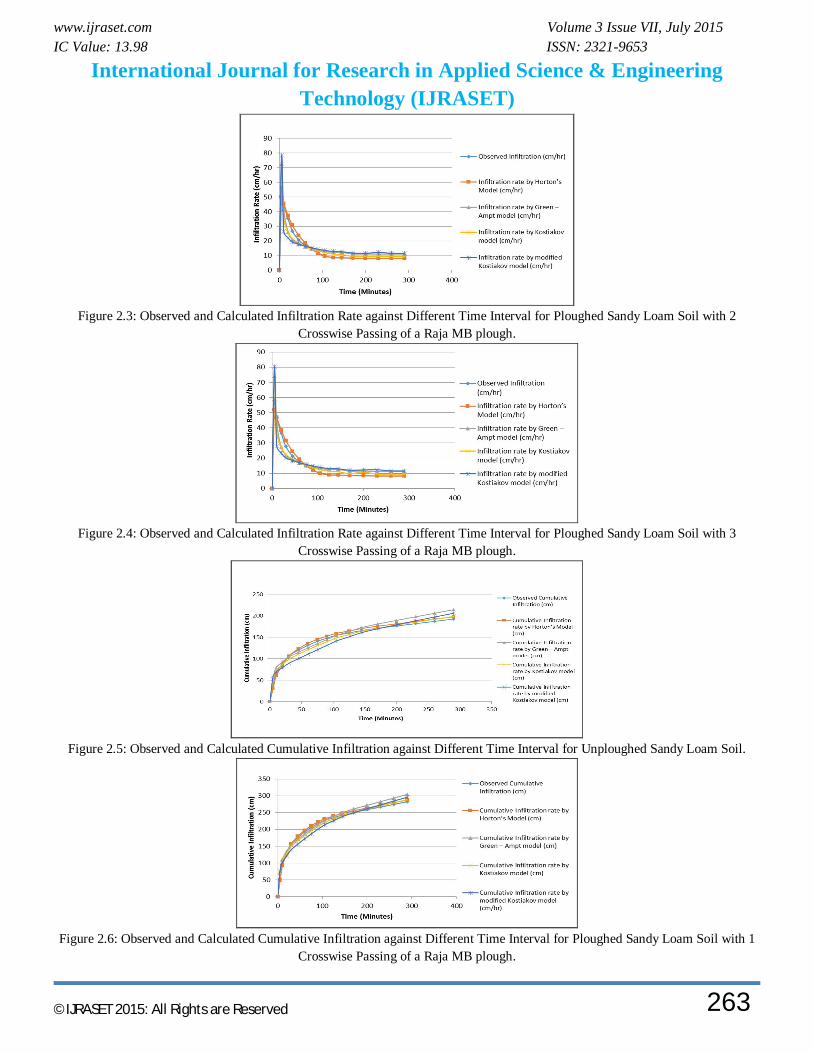
Figure 2.3: Observed and Calculated Infiltration Rate against Different Time Interval for Ploughed Sandy Loam Soil with 2
Crosswise Passing of a Raja MB plough.
Figure 2.4: Observed and Calculated Infiltration Rate against Different Time Interval for Ploughed Sandy Loam Soil with 3
Crosswise Passing of a Raja MB plough.
Figure 2.5: Observed and Calculated Cumulative Infiltration against Different Time Interval for Unploughed Sandy Loam Soil.
Figure 2.6: Observed and Calculated Cumulative Infiltration against Different Time Interval for Ploughed Sandy Loam Soil with 1
Crosswise Passing of a Raja MB plough.
www.ijraset.com Volume 3 Issue VII, July 2015 IC Value: 13.98 ISSN: 2321-9653
International Journal for Research in Applied Science & Engineering Technology (IJRASET)
©IJRASET 2015: All Rights are Reserved 264
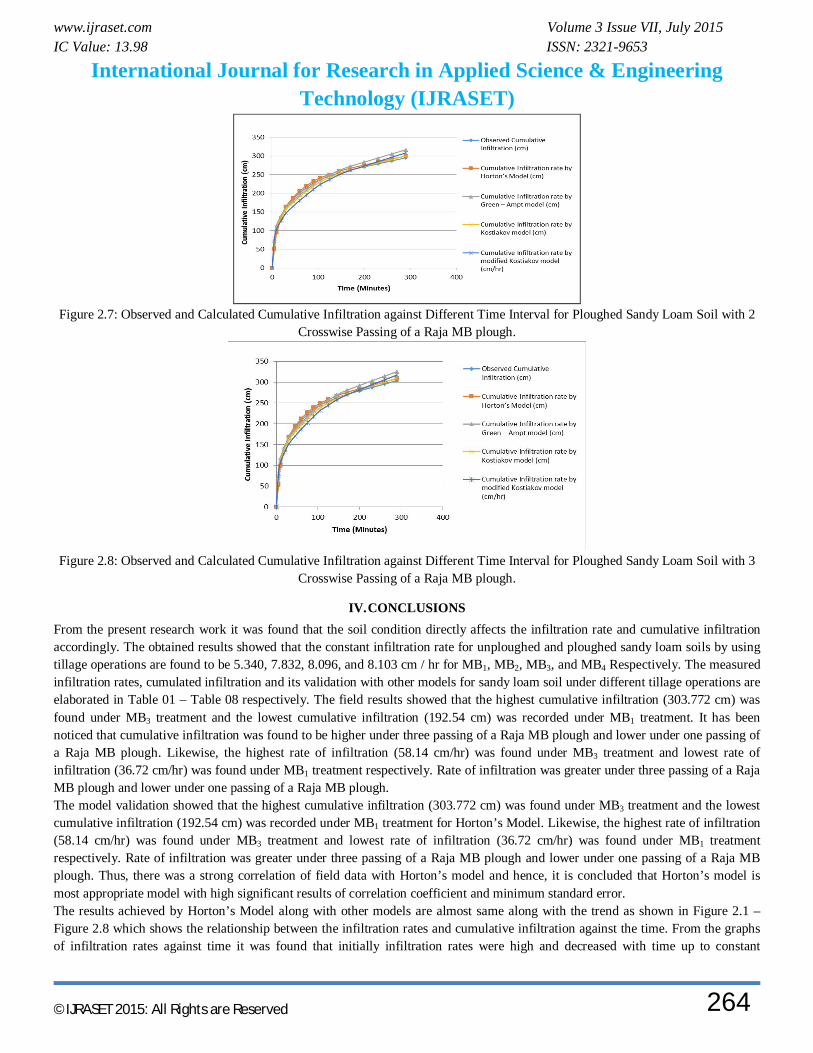
Figure 2.7: Observed and Calculated Cumulative Infiltration against Different Time Interval for Ploughed Sandy Loam Soil with 2
Crosswise Passing of a Raja MB plough.
Figure 2.8: Observed and Calculated Cumulative Infiltration against Different Time Interval for Ploughed Sandy Loam Soil with 3
Crosswise Passing of a Raja MB plough.
IV. CONCLUSIONS From the present research work it was found that the soil condition directly affects the infiltration rate and cumulative infiltration accordingly. The obtained results showed that the constant infiltration rate for unploughed and ploughed sandy loam soils by using tillage operations are found to be 5.340, 7.832, 8.096, and 8.103 cm / hr for MB1, MB2, MB3, and MB4 Respectively. The measured infiltration rates, cumulated infiltration and its validation with other models for sandy loam soil under different tillage operations are elaborated in Table 01 – Table 08 respectively. The field results showed that the highest cumulative infiltration (303.772 cm) was found under MB3 treatment and the lowest cumulative infiltration (192.54 cm) was recorded under MB1 treatment. It has been noticed that cumulative infiltration was found to be higher under three passing of a Raja MB plough and lower under one passing of a Raja MB plough. Likewise, the highest rate of infiltration (58.14 cm/hr) was found under MB3 treatment and lowest rate of infiltration (36.72 cm/hr) was found under MB1 treatment respectively. Rate of infiltration was greater under three passing of a Raja MB plough and lower under one passing of a Raja MB plough. The model validation showed that the highest cumulative infiltration (303.772 cm) was found under MB3 treatment and the lowest cumulative infiltration (192.54 cm) was recorded under MB1 treatment for Horton’s Model. Likewise, the highest rate of infiltration (58.14 cm/hr) was found under MB3 treatment and lowest rate of infiltration (36.72 cm/hr) was found under MB1 treatment respectively. Rate of infiltration was greater under three passing of a Raja MB plough and lower under one passing of a Raja MB plough. Thus, there was a strong correlation of field data with Horton’s model and hence, it is concluded that Horton’s model is most appropriate model with high significant results of correlation coefficient and minimum standard error. The results achieved by Horton’s Model along with other models are almost same along with the trend as shown in Figure 2.1 – Figure 2.8 which shows the relationship between the infiltration rates and cumulative infiltration against the time. From the graphs of infiltration rates against time it was found that initially infiltration rates were high and decreased with time up to constant
www.ijraset.com Volume 3 Issue VII, July 2015 IC Value: 13.98 ISSN: 2321-9653
International Journal for Research in Applied Science & Engineering Technology (IJRASET)
©IJRASET 2015: All Rights are Reserved 265
infiltration rate. Different crosswise application of Raja MB plough had a direct effect on cumulative infiltration and the rate of soil water infiltration due to the tillage intensity. The statistical data showed that the treatment MB3 demonstrated better performance as compared to the other treatments. The MB1 treatments showed less effective results when compared with different infiltration models. Hence, it can be concluded from the present research that different tillage number of operations and infiltration are directly proportional to each other and can improve operation of water-harvesting, irrigation and fertigation criteria for plants on long term basis.
V. ACKNOWLEDGEMENTS The author expresses profound unprecedented gratitude to Rajput Farm, Tando Allahyar farm owner Mr. Muhammed Shahzain Rajput, to the farm manager Mr. Lala Ansaar Khan for his kind assistance throughout the research work and all other individuals who have been source of help throughout the research period.
REFERENCES
[1] Ieke Wulan Ayu, Sugeng Prijono, and Soemarno (2013), “Assessment of Infiltration Rate under Different Drylands Types in Unter-Iwes Subdistrict Sumbawa Besar, Indonesia”. Journal of Natural Sciences Research ISSN 2224-3186 (Paper) ISSN 2225-0921 (Online) Vol.3, No.10, 2013
[2] Antigha, N. R. B. & Essien, I. E. (2007), “The Relationship between Infiltration rate and Hydraulic Conductivity of some soils of Akpabuyo Local Government Area of Cross River State –Nigeria; Global Journal of Pure and Applied Science (6) 2. www.ijastnet.com/journals/Vol_2.../10.pdf. Accessed 1-02-2013.
[3] Jagdale Satyawan Dagadu, Nimbalkar P. T., (2012). Infiltration Studies of Different Soils under Different Soil Conditions and Comparison of Infiltration Models with Field Data. International Journal of Advanced Engineering Technology E-ISSN 0976-3945 IJAET/Vol.III/ Issue II/April-June, 2012/154-157.
[4] Ranjan B, Singh RD, Chandra S, Kundu S and Gupta HS (2006). Effect of tillage and irrigation on yield and soil properties under rice (Oryza sativa), wheat (Triticum aestivum) system on a sandy clay loam soil of Uttaranchal. Indian. J. Agric. Sci. 76 (7): 405-409.
[5] John Diamond and Thomas Shanley (2003), Infiltration rate assessment of some major soils. Irish Geography, vol. 36(1): pp 32-46. [6] Md. Mahabubur Rahman, Md. Abdul Matin, Md. Rafiqul Islam (2013). “Integrated application of fertilizer and compost on water transmission behavior and
yield of wheat under different tillage systems”. A Thesis Submitted to Bangladesh Agricultural University, Mymensingh In partial Fulfillment of the Requirements for the Degree of Master of Science in Soil Science (June 2013).
AUTHOR PROFILES Engr. Imran Arshad Engr. Imran Arshad currently works at Star Services LLC, Abu Dhabi, UAE, as an Agriculture Engineer (Quality Controller) for past two years. He is a Post Graduate - Agriculture Engineer with strong technical background and five years of working experience in the Agriculture, Irrigation, Agricultural Soil Analysis and Sampling, Agricultural Land Survey (Periodic Monitoring), Research & Development, Saline Soil Reclamation and Social sector studies. He acquired his M.E degree in Hydraulics and Irrigation from IWREM, Mehran University of Engineering and Technology, Jamshoro, Pakistan and his B.E degree from Sindh Agriculture University, (SAU) Tando Jam, Pakistan. His academic studies include Soil Survey, Agronomy, Farm Machinery, Soil Science, Saline
Sodic & Waterlogged Soils, Farm Irrigation Systems, Water Quality, Irrigation Engineering, Post-Harvest Technology, Open Channel Flow, Drainage Engineering, Computational Hydraulics, Design of Hydraulic Structures, Seepage & Ground Water Flow, Finite Element Modeling, Operational Research, Hydrology, Irrigation & Water Management, Farm Management, and Water Resource Technology.
Engr. Asadullah Sarki Engr. Asadullah Sarki is having more than twenty five years of teaching, research and development experience. He is currently associated with Sindh Agriculture University, Tando Jam, Sindh – Pakistan as an Assistant Professor. He acquired his M.E degree in Hydraulics and Irrigation from IWREM, Mehran University of Engineering and Technology, Jamshoro, Pakistan and his B.E degree from Sindh Agriculture University, (SAU) Tando Jam, Pakistan. His academic studies include Soil Survey, Agronomy, Farm Machinery, Soil Science, Saline Sodic & Waterlogged Soils, Farm Irrigation Systems, Water Quality, Irrigation Engineering, Post-Harvest Technology, Open Channel Flow, Drainage Engineering,
Computational Hydraulics, Design of Hydraulic Structures, Seepage & Ground Water Flow, Hydrology, Irrigation & Water Management, Farm Management, and Water Resource Technology.
www.ijraset.com Volume 3 Issue VII, July 2015 IC Value: 13.98 ISSN: 2321-9653
International Journal for Research in Applied Science & Engineering Technology (IJRASET)
©IJRASET 2015: All Rights are Reserved 266
Engr. Zaheer Ahmed Khan Engr. Zaheer Ahmed Khan is having more than four years of field, research and teaching, experience. He is currently associated with Sindh Agriculture University, Tando Jam, Sindh – Pakistan as a Lecturer. He acquired his B.E degree from Sindh Agriculture University, (SAU) Tando Jam, Pakistan and his M.E in Irrigation and Hydraulics is in process. His academic studies include Soil Survey, Agronomy, Farm Machinery, Soil Science, Saline Sodic & Waterlogged Soils, Farm Irrigation Systems, Water Quality, Irrigation Engineering, Post-Harvest Technology, Open Channel Flow, Drainage Engineering, Hydrology, Irrigation & Water Management, Farm Management, and Water Resource Technology.


![ARTICLE VII [JUDICIAL BRANCH]](https://img.dokumen.tips/doc/110x75/633172337f0d9c38da00f948/article-vii-judicial-branch.jpg)


