Embed Size (px)
Citation preview
2022 Community Health Needs Assessment
Approved by the St. Peter's & Samaritan Hospital Board of Directors
May 20, 2022
2022 Community Health Needs Assessment Executive Summary
Overview: St. Peter’s Health Partners is the region’s largest and most comprehensive not-for profit network of high-quality, advanced medical care, primary care, rehabilitation, and senior services, with nearly 12,000 employees in more than 165 locations. These state-of-the-art services and programs are provided through St. Peter’s Hospital and Samaritan Hospital in Albany and Troy; Sunnyview Rehabilitation Hospital in Schenectady; as well as The Eddy system of continuing care and The Community Hospice and St. Peter’s Health Partners Medical Associates, one of the Capital Region’s largest multi-specialty physician groups with more than 850 physicians and advanced practitioners in more than 130 locations. St. Peter’s Health Partners is a member of Trinity Health, a national Catholic health system with an enduring legacy and a steadfast mission to be a transforming and healing presence within the communities we serve. For more information, please visit www.sphp.com.
Today, St. Peter's Health Partners serves over 6,000 people every day with comprehensive medical services, and many community health programs intended to restore wholeness and well-being to people within the community. Year after year, St. Peter’s Health Partners reinvests in communities with funding for charity care, primary care services, screenings, education, and research. This commitment has risen in proportion to the needs.
St. Peter’s Hospital is a 442-bed tertiary care hospital, located in Albany, New York (Albany County). At St. Peter's, caring for the community dates back to the principles established by the foundress of the Religious Sisters of Mercy, Catherine McCauley. In 1824, at the age of 50, she inherited a large fortune and used the money to build a house in Dublin, Ireland. It became the first House of Mercy—and was the home where Catherine and several other women provided educational, religious, and social services for women and children who were poor, homeless and in need. Carrying on that mission, four Sisters of Mercy founded St. Peter's Hospital in downtown Albany, NY, on November 1, 1869.
St. Peter's Hospital is a Magnet Hospital for Nursing, a Top 100 Cardiovascular Hospital, a Designated Heart and Stroke Emergency Center and the FIRST hospital in the Capital Region to receive Baby-Friendly designation, considered the gold standard in maternity care. Several recent awards and accolades include: • Named one of the best hospitals in New York State (ranking 12th among more than 200 hospitals) by U.S.
News & World Report. • Ranked 29th in the nation for gynecology by U.S. News & World Report. • Named to the 2019 NRC Health Top 100 Consumer Loyalty list. • Voted Best Hospital in the Capital Region by Capital Region Living magazine poll in 2019.
• Consumer Reports listed St. Peter’s Hospital among the top six hospitals in the Northeastern United States for outcomes from both heart bypass surgery and aortic valve replacement in 2018 Heart Surgery Safety Guide.
• Blue Distinction Center+ for Maternity Care, Cardiac Care, and Knee and Hip Replacement by BlueShield of Northeastern New York, as part of the Blue Distinction Specialty Care program.
• American Heart Association/American Stroke Association’s Get With The Guidelines® (GWTG) Stroke Gold Plus Target Stroke Elite Honor Roll Quality Achievement Award.
Samaritan Hospital is a 257-bed community hospital that provides comprehensive, compassionate medical care across three campuses in Troy and Albany (our Main Campus, Albany Memorial Campus, and St. Mary’s Campus in Troy). First located on Eighth Street in Troy, in the former Troy Orphan's Asylum, the main campus moved to its present location at the corner of Burdett and Peoples Avenues in the early 20th century.
Today, Samaritan Hospital provides comprehensive medical services including diagnostic and therapeutic cardiac catheterization, cancer treatment, inpatient and outpatient mental health care and surgical services.
Several recent accolades and awards include: • Awarded Integrated Care Certification by The Joint Commission. • Received the Mission: Lifeline® STEMI Receiving Center Silver Quality Achievement Award for
implementing specific quality improvement measures outlined by the American Heart Association for the treatment of patients who suffer severe heart attacks.
• Comprehensive Center accreditation from the Metabolic and Bariatric Surgery Accreditation and Quality Improvement Program (MBSAQIP).
• The American Heart Association/American Stroke Association’s Get with The Guidelines® (GWTG) Stroke Silver Plus Target: Stroke Elite Honor Roll Quality Achievement Award.
MISSION STATEMENT "We, St. Peter’s Health Partners and Trinity Health, serve together in the spirit of the gospel as a compassionate and transforming healing presence within our communities. Core Values Reverence - We honor the sacredness and dignity of every person. Commitment to Those who are Poor - We stand with and serve those who are poor, especially those most vulnerable. Justice - We foster right relationships to promote the common good, including sustainability of Earth. Stewardship - We honor our heritage and hold ourselves accountable for the human, financial and natural resources entrusted to our care. Integrity - We are faithful to who we say we are. Safety - We embrace a culture that prevents harm and nurtures a healing, safe environment for all.
St. Peter’s Health Partners’ Mission guides everything we do. We strive to both serve others and transform care delivery. We reinvest our resources back into the community through new technology, health services, and access for everyone regardless of circumstance.
As a member of Trinity Health, St. Peter's Health Partners' Community Health & Well-Being (CHWB) strategy promotes optimal health for those who are poor and vulnerable and the communities we serve by connecting social and clinical care, addressing social needs, dismantling systemic racism, and reducing health inequities. We do this by:
• Investing in our communities. • Delivering outstanding care for those who are poor and vulnerable. • Impacting social influencers of health.
St. Peter’s Health Partners reinvests in communities through financial support, screenings, education, and research. Definition and Brief Description of the Community Served
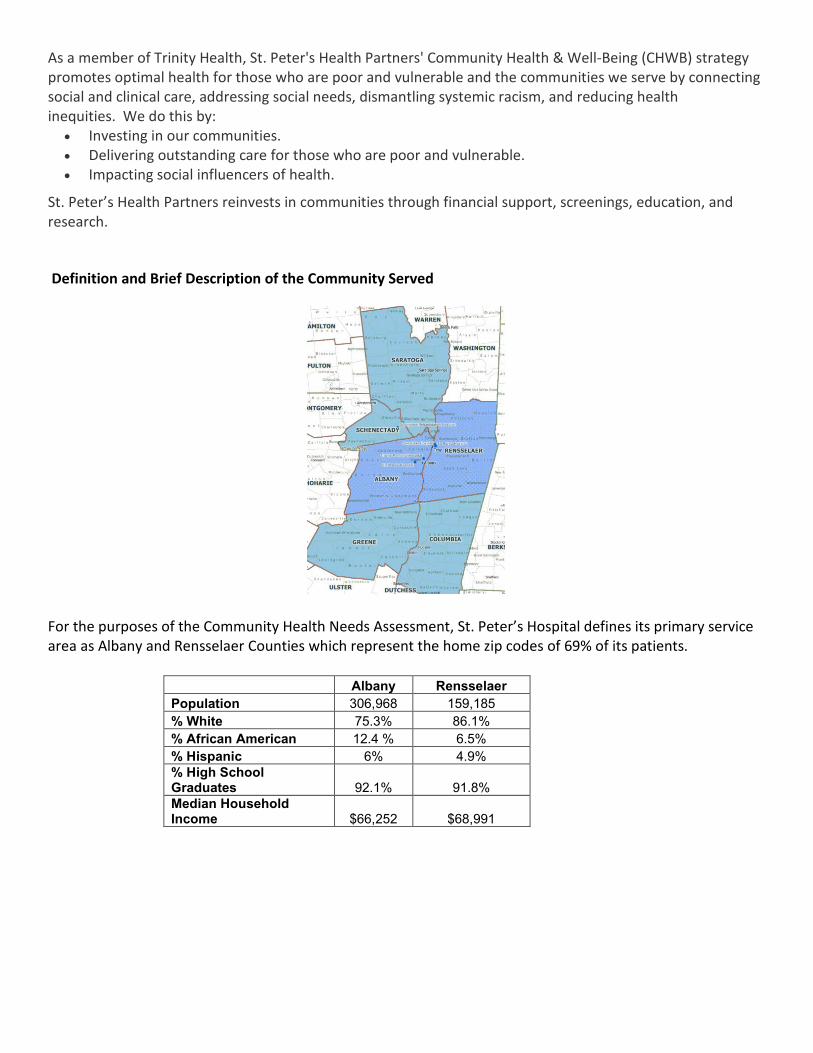
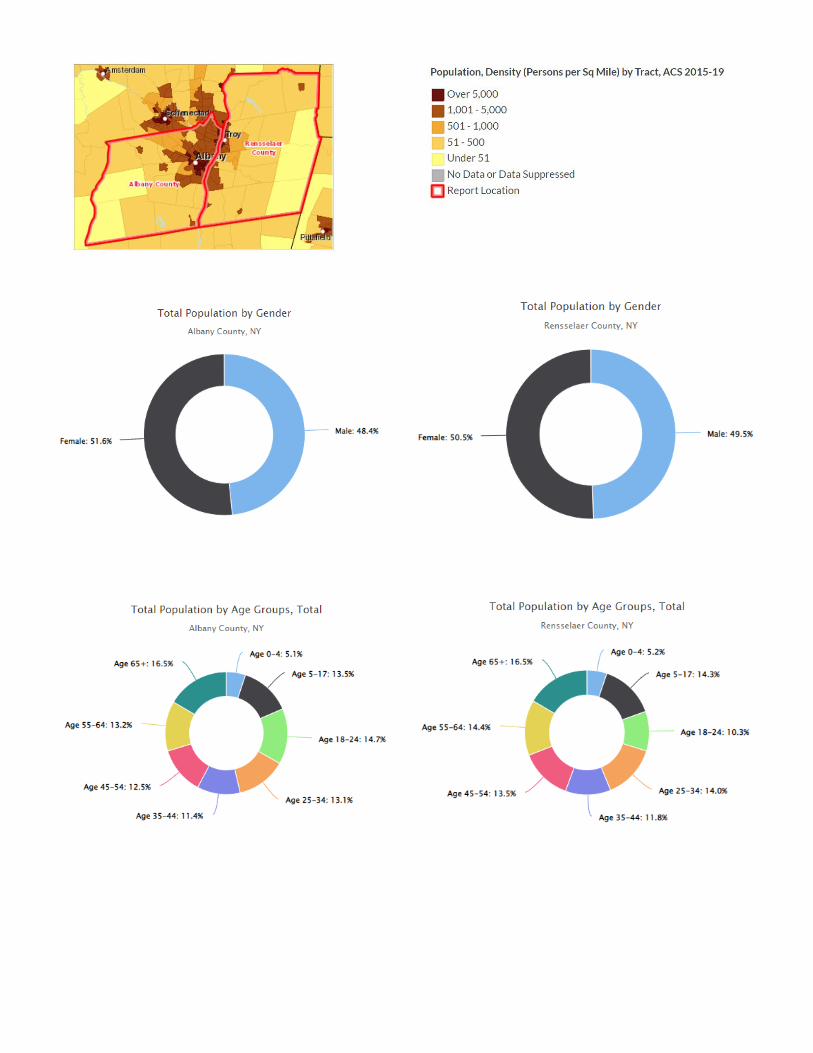
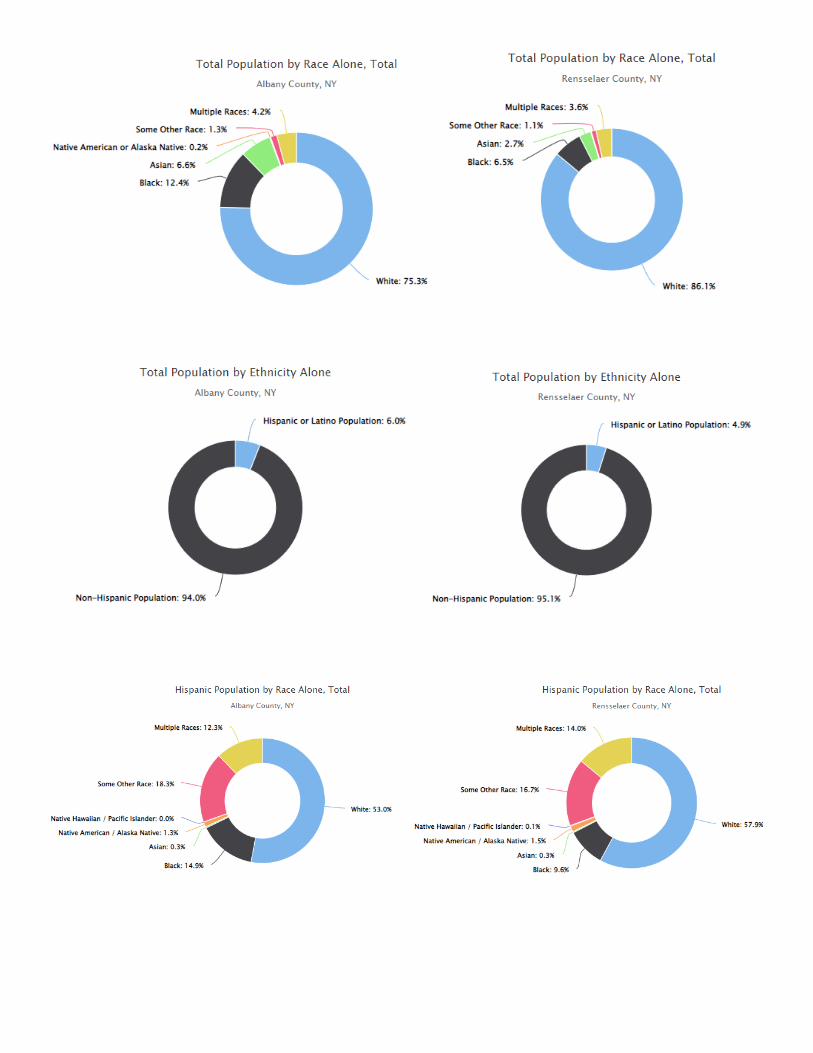
For the purposes of the Community Health Needs Assessment, St. Peter’s Hospital defines its primary service area as Albany and Rensselaer Counties which represent the home zip codes of 69% of its patients.
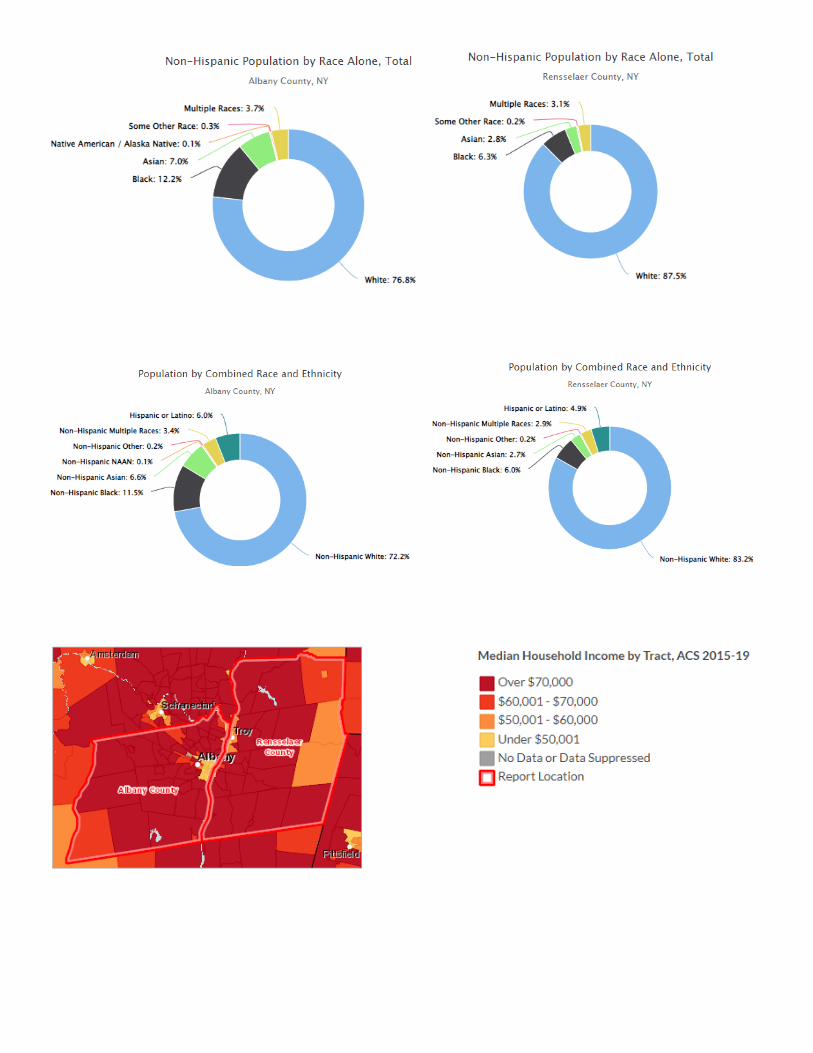
Albany Rensselaer Population 306,968 159,185 % White 75.3% 86.1% % African American 12.4 % 6.5% % Hispanic 6% 4.9% % High School Graduates 92.1% 91.8% Median Household Income $66,252 $68,991
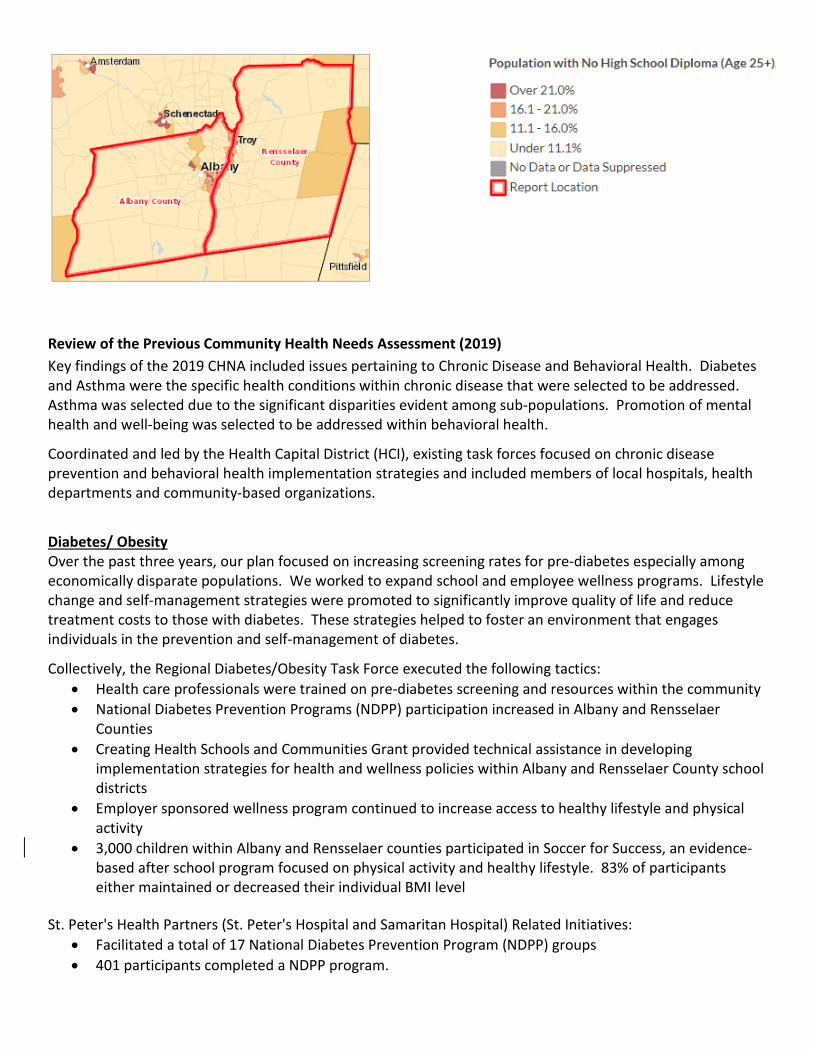
Review of the Previous Community Health Needs Assessment (2019) Key findings of the 2019 CHNA included issues pertaining to Chronic Disease and Behavioral Health. Diabetes and Asthma were the specific health conditions within chronic disease that were selected to be addressed. Asthma was selected due to the significant disparities evident among sub-populations. Promotion of mental health and well-being was selected to be addressed within behavioral health.
Coordinated and led by the Health Capital District (HCI), existing task forces focused on chronic disease prevention and behavioral health implementation strategies and included members of local hospitals, health departments and community-based organizations.
Diabetes/ Obesity Over the past three years, our plan focused on increasing screening rates for pre-diabetes especially among economically disparate populations. We worked to expand school and employee wellness programs. Lifestyle change and self-management strategies were promoted to significantly improve quality of life and reduce treatment costs to those with diabetes. These strategies helped to foster an environment that engages individuals in the prevention and self-management of diabetes.
Collectively, the Regional Diabetes/Obesity Task Force executed the following tactics: • Health care professionals were trained on pre-diabetes screening and resources within the community • National Diabetes Prevention Programs (NDPP) participation increased in Albany and Rensselaer
Counties • Creating Health Schools and Communities Grant provided technical assistance in developing
implementation strategies for health and wellness policies within Albany and Rensselaer County school districts
• Employer sponsored wellness program continued to increase access to healthy lifestyle and physical activity
• 3,000 children within Albany and Rensselaer counties participated in Soccer for Success, an evidence-based after school program focused on physical activity and healthy lifestyle. 83% of participants either maintained or decreased their individual BMI level
St. Peter's Health Partners (St. Peter's Hospital and Samaritan Hospital) Related Initiatives:
• Facilitated a total of 17 National Diabetes Prevention Program (NDPP) groups • 401 participants completed a NDPP program.
• Provided employee wellness and physical activity programs to our 12,000 colleagues. Three to five wellness were offered yearly, with a focus on mental health and well-being
• Provided technical assistance to 6 school districts within Albany and Rensselaer counties to implement strong school wellness policies
As a result of these initiatives both collectively and internally, the age adjusted adult diabetes prevalence decreased from 9.0% to 7.7% and was lower than the NYS Average (of 9.2%) Asthma/Tobacco Cessation: During the past three years, members of the Tobacco/Asthma Coalition of the Capital District worked to prevent initiation of tobacco use (including vape products), promoted tobacco use cessation programs and in the community setting, improve self-management skills for individuals with asthma and low socioeconomic status. Collectively:
• Advocated for strong tobacco control polices at both the local and county level. • 6,300 individuals within Albany and Rensselaer counties utilized to the NYS Smoker's Quitline for
tobacco cessation assistance • 3,389 low income and fair market apartments within Albany and Rensselaer counties transitioned to
tobacco free housing properties. • Promoted the Healthy Neighborhoods Program, a long-standing program run by the NYS Department
of Health and managed by local counties that aims to help community members with asthma achieve better health and quality of life.
St. Peter's Health Partners (St. Peter's Hospital and Samaritan Hospital) Related Initiatives: • Numerous tobacco control policies advocated for by the Tobacco Free Communities (spearheaded by
SPHP) resulting in the implementation such tobacco free grounds at the following: University of Albany, City of Rensselaer municipal owned property, and all community libraries within Albany and Rensselaer counties.
• Nearly 1,800 participants enrolled in The St. Peters’ Health Partners Butt Stops Here tobacco cessation program offered by St. Peter's Health Partners
• 2,159 individuals from our hospitals and ambulatory sites were referred to the NYS Smokers Quitline for tobacco cessation assistance
• Referred patients to both the Albany and Rensselaer County Healthy Neighborhood Program, as appropriate.
As a result of these initiatives both collectively and internally, the age adjusted asthma emergency department visit rate of 79.1/10,000 (Albany County) and 52.6/10,000 (Rensselaer County) met the Prevention Agenda 2024 Objective of 131.1/10,000. Also, the percentage of adults who smoke decreased from 14.3% to 11.6 % in Albany County and from 18.7% to 17.3% in Rensselaer County.
Mental Health and Well-Being In order to promote well-being and prevent mental and substance use disorders strategies were developed to promote well-being of community members, increase education and practice strategies to reduce opioid overdose and non-medical use of opiates, our plan, over the last three years, included provider education of addiction and pain management (prescribing guidelines and community resources for prevention, addiction treatment and recovery support), information to provide to patients regarding risk of harm and misuse,
promotion of safe storage and proper disposal of unused prescription medications (community education, increase disposal opportunities), New York State Opioid Overdose Prevention Training and establishment of ambulatory detoxification service locations. Collectively, members of the Regional Behavioral Health Task Force: • Both Albany and Rensselaer counties participated in task force meetings, which provided a forum for
coordinating activities of public health, public safety and behavioral health resources, with regards to the non-medical use of opioids and prescription pain medication
• Promoted referrals to the Healthy Families Programs of Albany and Rensselaer Counties to increase participation in evidence-based home visiting programs for pregnant individuals and families.
• Promoted Mental Health First Aid Programs offered within Albany and Rensselaer counties St. Peter's Health Partners (St. Peter's Hospital and Samaritan Hospital) Related Initiatives: • Leadership staff from St. Peter’s Health Partners participated in various internal and external workgroups,
such as Prescription for Progress and Project ECHO to improve the mental health and well-being of community members.
• Nearly 260 families were enrolled in the Healthy Families Program of Rensselaer County, which is managed by St. Peter’s Health Partners.
• Over 200 colleagues of St. Peter’s Health Partners attended either Mental Health First Aid or SCIP (Strategies for Crisis Intervention and Prevention) training.
As a result of these initiatives both collectively and internally, the Age adjusted suicide mortality rate for Albany County (9.7 /100,000) was slightly lower than NYS, excl. NYC (9.9/100,000). Written Comments on Prior CHNA The CHNA is well-known in our community and local health departments as well as numerous community-based agencies have been involved throughout the process of selecting priorities and developing improvement plans. To gather additional stakeholder feedback, the St. Peter’s Health Partners 2019 CHNA provided an email address in which written comments could be solicited. Albany and Rensselaer County health departments implemented a similar process to obtain feedback, as well. No specific written comments were received. Further information and directions for providing feedback on the 2022 CHNA is provided within this executive summary. 2022 Community Health Needs Assessment St. Peter's Hospital and Samaritan Hospital collaborated with other local health systems, county health departments and community-based agencies to complete a six county (Albany, Rensselaer, Schenectady, Saratoga, Columbia, and Greene) Community Health Needs Assessment, led by the Healthy Capital District (HCD). HCD is an incorporated not-for-profit which works with others in the community to determine ways in which the Capital Region could be more effective in identifying and addressing public health problems.
For the purposes of its CHNA, St, Peter's Hospital used data and information from this assessment relating to Albany and Rensselaer Counties which represent the home zip codes of 69% of its patients. Other health systems will be addressing the needs of remaining counties in the assessment based on their location and patient population. Data Sources and Indicator Selection The health indicators selected for this report were based on a review of available public health data and New York State priorities promulgated through the Prevention Agenda for a Healthier New York. The collection and
management of this data has been supported by the state for an extended period and is very likely to continue to be supported. This provides reliable and comparable data over time and across the state. These measures, when complemented by the Expanded Behavioral Risk Factor Surveillance System and Prevention Quality Indicators, provide health indicators that can be potentially impacted in the short-term.
The Common Ground Health provided SPARCS (hospitalizations and ED visits) data that were utilized to generate county and ZIP code level analyses of mortality, hospitalizations, and emergency room utilization, for all residents, by gender, race and ethnicity. The time frames used for the ZIP code analyses were 2012-2016 Vital Statistics and 20142018 Statewide Planning and Research Cooperative System (SPARCS) data. The 5-year period establishes more reliable rates when looking at small geographic areas or minority populations. Additional data were examined from a wide variety of sources:
• Prevention Agenda 2019-2024 Dashboard of Tracking Indicators (2016-2018) • Community Health Indicator Reports Dashboard (2016-2018) • County Health Indicators by Race/Ethnicity (2016-2018) • County Perinatal Profiles (2016-2018) • Vital Statistics Annual Reports (2018) • Behavioral Risk Factor Surveillance System (BRFSS) and Expanded BRFSS (2016, 2018) • Cancer Registry, New York State (2014-2018) • Prevention Quality Indicators (2016-2018) • Communicable Disease Annual Reports (2013-2018) • The Pediatric Nutrition Surveillance System (PedNSS) (2015-2017) • Student Weight Status Category Reporting System (2017-2019) • County Opioid Quarterly Reports (January 2020-October 2021) • NYS Opioid Data Dashboard (2017-2019) • NYS Child Health Lead Poisoning Prevention Program (2015 birth cohort; 2016-2018) • NYS Kids’ Well-being Indicator Clearinghouse (KWIC) (2016-2018) • County Health Rankings (2021) • NYS Division of Criminal Justice County Crime Rates (2019-2020) • Bureau of Census, Tables and Maps (https://www.census.gov/data.html) (2019) • Bureau of Census, American Community Survey (2015-2019)
These data sources were supplemented by a Capital Region Community Health Survey. The 2021 Community Health Survey was conducted in September-October 2021 by HCD with the assistance of the Albany, Columbia, Greene, Rensselaer and Schenectady Health Departments, and Albany Medical Center, Columbia Memorial, Ellis, and St. Peters Health Partners hospitals. The survey was a convenience sample of adult (18+ years) residents of the Capital Region. The survey included 2,104 total responses. This consumer survey was conducted to learn about the health needs, barriers, and concerns of residents in the Capital Region. The Appendix (2021 Capital Region Community Health Survey) contains a detailed summary of the findings, as well as the questionnaire used.
Local data were compiled from these data sources and draft sections were prepared by health condition for inclusion in this community health needs assessment. Drafts were reviewed for accuracy and thoroughness by two staff with specialized health data knowledge: Michael Medvesky, M.P.H. Director, Health Analytics, Healthy Capital District (HCD), and Spencer Keable, M.P.H., Public Health Data Analyst, HCD. The 2022 Capital Region Community Health Needs Assessment Draft was sent to local subject matter experts for review in the
health departments of Albany, Rensselaer, Schenectady, Columbia, and Greene Counties and in St. Peter’s Health Partners, Albany Medical Center, Ellis Hospital, and Columbia Memorial, as well as being placed on the HCD website for public review and comment. Comments were addressed and changes were incorporated into the final document. Collaboration and Community Engagement Engaging the community in the health needs assessment process was a priority of St. Peter’s Health Partners and its stakeholders. Broad community engagement began with participation in the community health survey. The survey offered multiple choice and open-ended response options to learn about residents’ health needs and priorities, access or barriers to care, mental health, and social determinants of health. Demographic information collected by the survey allowed review of information by county, age, gender, race/ethnicity and income.
Survey results, complied by our partner, Healthy Capital District (HCD), regarding the public’s opinions on the seriousness of public health issues were incorporated into the priority scoring of health needs by the members of the Capital Region Prevention Agenda Prioritization Work Groups (Albany-Rensselaer, and Schenectady Counties) The Work Groups included community voices through representatives from community-based organizations that serve low-income residents, the homeless, and other vulnerable populations; federally qualified health centers; advocacy groups; academic institutions; public health departments; providers; and health insurers. Participants were encouraged to share data and observations of their own, and to advocate for the needs of their constituents. St. Peter’s Health Partners and its stakeholders strategically invited partners with access to medically underserved populations.
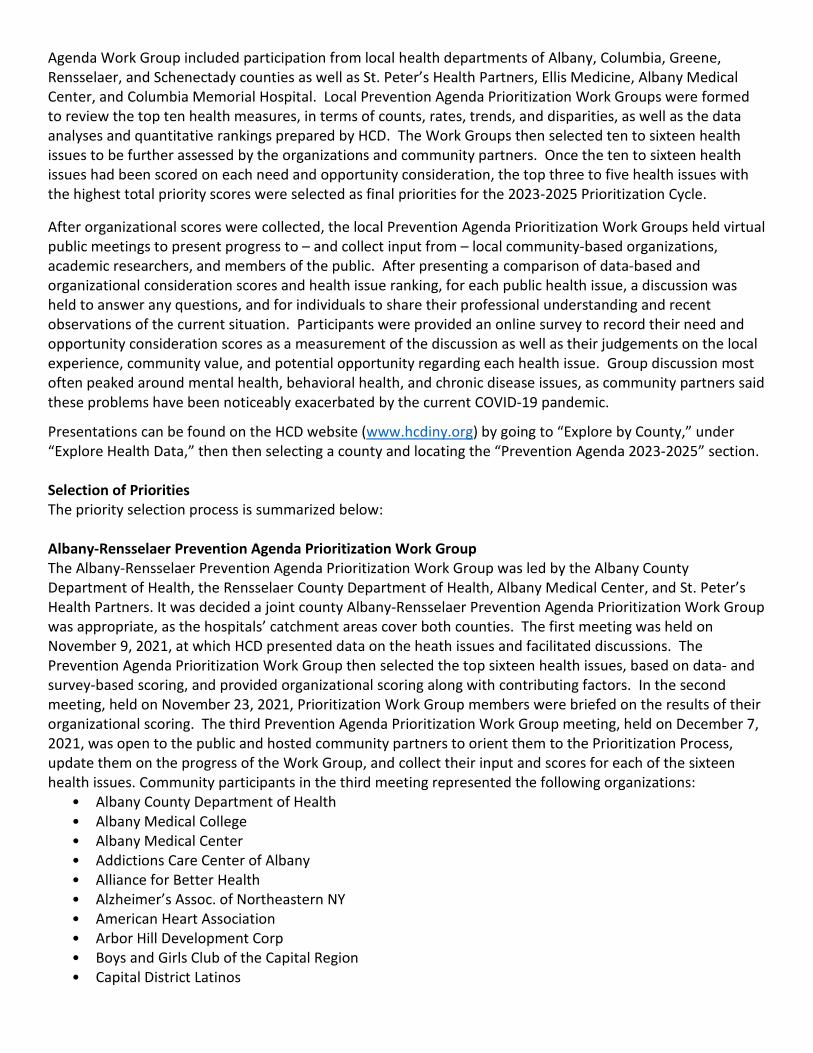
Health Issue Ranking Selection of the top health priorities for the Capital Region was facilitated by a new Public Health Issue Scoring Sheet (see next page) created by HCD, which built upon progress made during the 2019-2022 Prioritization Cycle. This scoring and ranking method was, again, based on a modified version of the Hanlon Method for Prioritizing Health Problems. The Scoring Sheet quantified considerations regarding both the need to address each health issue and the opportunity to make a positive impact. Opportunity considerations were based on guidance documents from the American Hospital Association, the National Association of County and City Health Officials as well as other industry resources. Need considerations included those used in the 2018 Prioritization Process, as well as a community priority score derived directly from the contributions of over 2,000 local residents in the 2021 Capital Region Community Health survey (see appendix). The Scoring Sheet also included “other considerations,” for both need and opportunity, to address any additional factors and capture the knowledge- and experience-based input of local community-based organizational partners.
In the Fall of 2021, Healthy Capital District staff reviewed approximately 700 public health measures across the five Prevention Agenda priority areas and categorized about 150 of the key indicators into 25 public health issues. Health issues were identified by reviewing the present New York State Department of Health Prevention Agenda Focus Areas, as well as health issues incorporated in the last Prioritization Process in 2018. The 25 health issues were initially ranked twice for each of the hospital and health department prioritization groups. Health issues were first ranked according to their five data-based need scores, then, again, with the additional consideration of their survey-based community priority score. These initial rankings were used to select a shorter list of ten to sixteen issues for participating partners to score, before final priorities were selected.
Public Health Issue Scoring Sheet
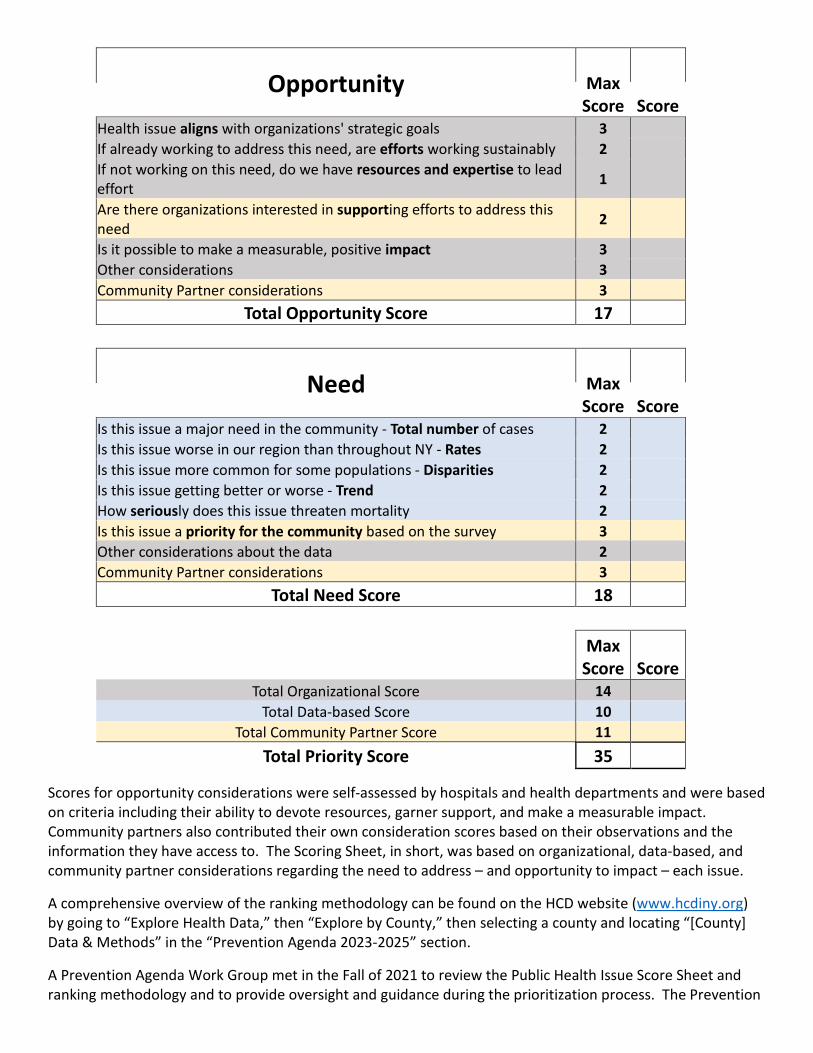
Scores for opportunity considerations were self-assessed by hospitals and health departments and were based on criteria including their ability to devote resources, garner support, and make a measurable impact. Community partners also contributed their own consideration scores based on their observations and the information they have access to. The Scoring Sheet, in short, was based on organizational, data-based, and community partner considerations regarding the need to address – and opportunity to impact – each issue.
A comprehensive overview of the ranking methodology can be found on the HCD website (www.hcdiny.org) by going to “Explore Health Data,” then “Explore by County,” then selecting a county and locating “[County] Data & Methods” in the “Prevention Agenda 2023-2025” section.
A Prevention Agenda Work Group met in the Fall of 2021 to review the Public Health Issue Score Sheet and ranking methodology and to provide oversight and guidance during the prioritization process. The Prevention
Opportunity Max Score Score
Health issue aligns with organizations' strategic goals 3
If already working to address this need, are efforts working sustainably 2
If not working on this need, do we have resources and expertise to lead effort 1
Are there organizations interested in supporting efforts to address this need 2
Is it possible to make a measurable, positive impact 3
Other considerations 3
Community Partner considerations 3
Total Opportunity Score 17
Need Max Score Score
Is this issue a major need in the community - Total number of cases 2
Is this issue worse in our region than throughout NY - Rates 2
Is this issue more common for some populations - Disparities 2
Is this issue getting better or worse - Trend 2
How seriously does this issue threaten mortality 2
Is this issue a priority for the community based on the survey 3
Other considerations about the data 2
Community Partner considerations 3
Total Need Score 18
Max Score Score
Total Organizational Score 14
Total Data-based Score 10
Total Community Partner Score 11
Total Priority Score 35
Agenda Work Group included participation from local health departments of Albany, Columbia, Greene, Rensselaer, and Schenectady counties as well as St. Peter’s Health Partners, Ellis Medicine, Albany Medical Center, and Columbia Memorial Hospital. Local Prevention Agenda Prioritization Work Groups were formed to review the top ten health measures, in terms of counts, rates, trends, and disparities, as well as the data analyses and quantitative rankings prepared by HCD. The Work Groups then selected ten to sixteen health issues to be further assessed by the organizations and community partners. Once the ten to sixteen health issues had been scored on each need and opportunity consideration, the top three to five health issues with the highest total priority scores were selected as final priorities for the 2023-2025 Prioritization Cycle.
After organizational scores were collected, the local Prevention Agenda Prioritization Work Groups held virtual public meetings to present progress to – and collect input from – local community-based organizations, academic researchers, and members of the public. After presenting a comparison of data-based and organizational consideration scores and health issue ranking, for each public health issue, a discussion was held to answer any questions, and for individuals to share their professional understanding and recent observations of the current situation. Participants were provided an online survey to record their need and opportunity consideration scores as a measurement of the discussion as well as their judgements on the local experience, community value, and potential opportunity regarding each health issue. Group discussion most often peaked around mental health, behavioral health, and chronic disease issues, as community partners said these problems have been noticeably exacerbated by the current COVID-19 pandemic.
Presentations can be found on the HCD website (www.hcdiny.org) by going to “Explore by County,” under “Explore Health Data,” then then selecting a county and locating the “Prevention Agenda 2023-2025” section. Selection of Priorities The priority selection process is summarized below: Albany-Rensselaer Prevention Agenda Prioritization Work Group The Albany-Rensselaer Prevention Agenda Prioritization Work Group was led by the Albany County Department of Health, the Rensselaer County Department of Health, Albany Medical Center, and St. Peter’s Health Partners. It was decided a joint county Albany-Rensselaer Prevention Agenda Prioritization Work Group was appropriate, as the hospitals’ catchment areas cover both counties. The first meeting was held on November 9, 2021, at which HCD presented data on the heath issues and facilitated discussions. The Prevention Agenda Prioritization Work Group then selected the top sixteen health issues, based on data- and survey-based scoring, and provided organizational scoring along with contributing factors. In the second meeting, held on November 23, 2021, Prioritization Work Group members were briefed on the results of their organizational scoring. The third Prevention Agenda Prioritization Work Group meeting, held on December 7, 2021, was open to the public and hosted community partners to orient them to the Prioritization Process, update them on the progress of the Work Group, and collect their input and scores for each of the sixteen health issues. Community participants in the third meeting represented the following organizations:
• Albany County Department of Health • Albany Medical College • Albany Medical Center • Addictions Care Center of Albany • Alliance for Better Health • Alzheimer’s Assoc. of Northeastern NY • American Heart Association • Arbor Hill Development Corp • Boys and Girls Club of the Capital Region • Capital District Latinos
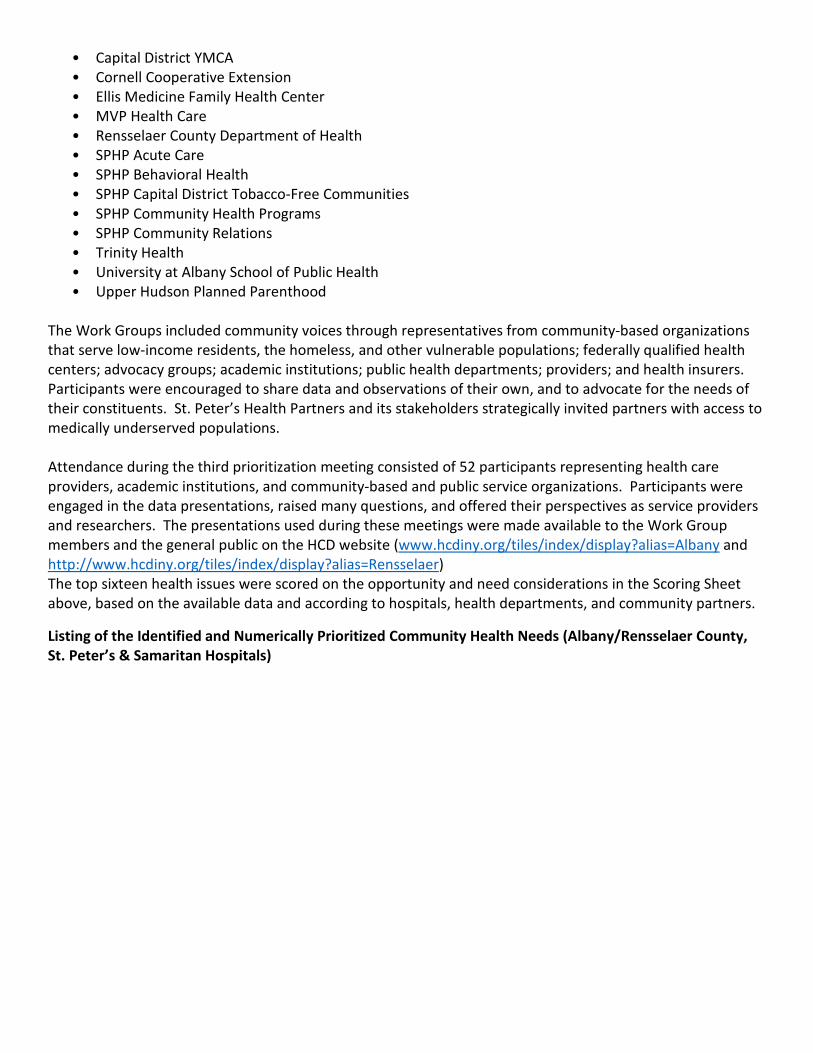
• Capital District YMCA • Cornell Cooperative Extension • Ellis Medicine Family Health Center • MVP Health Care • Rensselaer County Department of Health • SPHP Acute Care • SPHP Behavioral Health • SPHP Capital District Tobacco-Free Communities • SPHP Community Health Programs • SPHP Community Relations • Trinity Health • University at Albany School of Public Health • Upper Hudson Planned Parenthood
The Work Groups included community voices through representatives from community-based organizations that serve low-income residents, the homeless, and other vulnerable populations; federally qualified health centers; advocacy groups; academic institutions; public health departments; providers; and health insurers. Participants were encouraged to share data and observations of their own, and to advocate for the needs of their constituents. St. Peter’s Health Partners and its stakeholders strategically invited partners with access to medically underserved populations. Attendance during the third prioritization meeting consisted of 52 participants representing health care providers, academic institutions, and community-based and public service organizations. Participants were engaged in the data presentations, raised many questions, and offered their perspectives as service providers and researchers. The presentations used during these meetings were made available to the Work Group members and the general public on the HCD website (www.hcdiny.org/tiles/index/display?alias=Albany and http://www.hcdiny.org/tiles/index/display?alias=Rensselaer) The top sixteen health issues were scored on the opportunity and need considerations in the Scoring Sheet above, based on the available data and according to hospitals, health departments, and community partners.
Listing of the Identified and Numerically Prioritized Community Health Needs (Albany/Rensselaer County, St. Peter’s & Samaritan Hospitals)
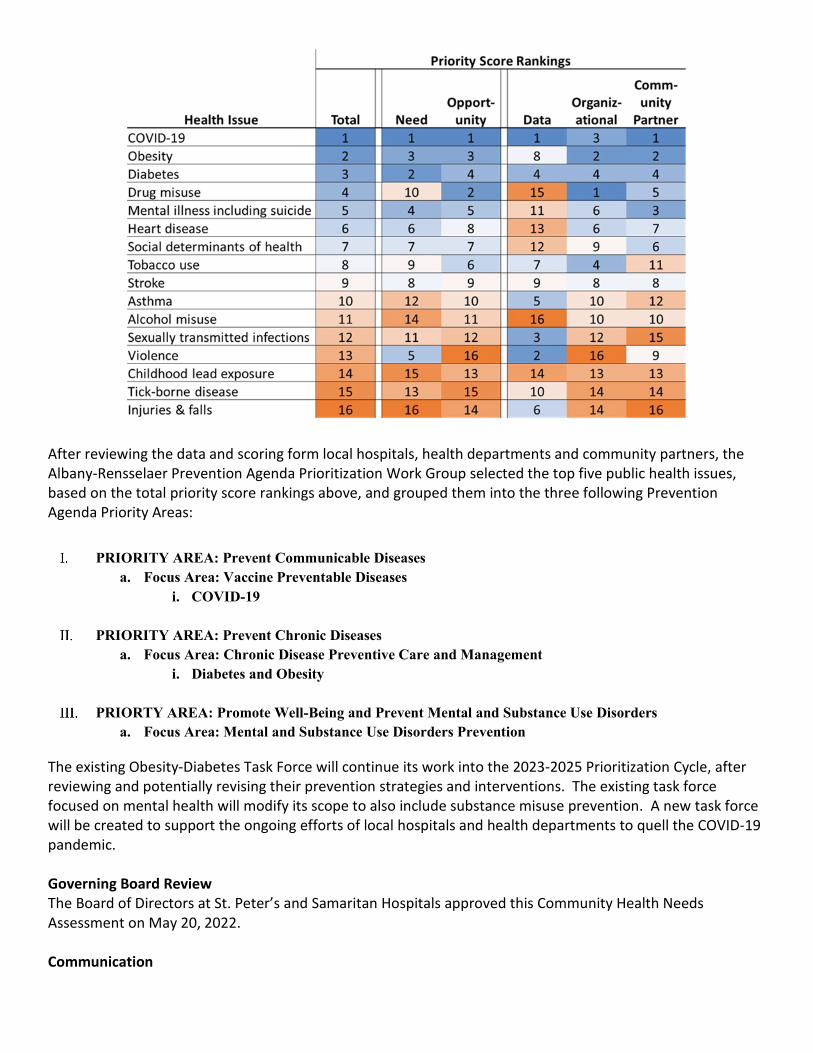
After reviewing the data and scoring form local hospitals, health departments and community partners, the Albany-Rensselaer Prevention Agenda Prioritization Work Group selected the top five public health issues, based on the total priority score rankings above, and grouped them into the three following Prevention Agenda Priority Areas:
PRIORITY AREA: Prevent Communicable Diseases
a. Focus Area: Vaccine Preventable Diseases i. COVID-19
PRIORITY AREA: Prevent Chronic Diseases
a. Focus Area: Chronic Disease Preventive Care and Management i. Diabetes and Obesity
PRIORTY AREA: Promote Well-Being and Prevent Mental and Substance Use Disorders
a. Focus Area: Mental and Substance Use Disorders Prevention
The existing Obesity-Diabetes Task Force will continue its work into the 2023-2025 Prioritization Cycle, after reviewing and potentially revising their prevention strategies and interventions. The existing task force focused on mental health will modify its scope to also include substance misuse prevention. A new task force will be created to support the ongoing efforts of local hospitals and health departments to quell the COVID-19 pandemic. Governing Board Review The Board of Directors at St. Peter’s and Samaritan Hospitals approved this Community Health Needs Assessment on May 20, 2022. Communication
This Community Health Needs Assessment was made available to the many community members and organizations who participated in the process. Additionally, it is available on the St. Peter's Hospital website (www.sphp.com/sph), the St. Peter's Health Partners website (www.sphp.com) and the Healthy Capital District Initiative website (www.hcdiny.org). Paper copies may be requested by contacting: St. Peter’s Health Partners Community Health and Well-Being 315 S. Manning Boulevard Albany, NY 12208 518-525-6640 Comments about this document may also be sent to the address above, SUBJECT: CHNA Comments.
2022 CAPITAL REGION COMMUNITY HEALTH NEEDS ASSESSMENT
The 2022 Capital Region Community Health Needs Assessment is a project of the Healthy Capital District and is made possible through the support of its board organization.
2022 CAPITAL REGION COM
MUNITY HEALTH NEEDS ASSESSM
ENT
On a pathway to health

I
INSIDE COVER
1 Healthy Capital District
Acknowledgments The principal authors of this report were:
Kevin Jobin-Davis, M.S., Ph.D.
Michael Medvesky, M.P.H.
Spencer Keable, M.P.H.
Dr. Jobin-Davis, the Executive Director of the Healthy Capital District (HCD), managed and edited the presentation of findings for this Community Health Needs Assessment and the prior editions in 2009, 2013, 2016, and 2019. He facilitated the prioritization process with our partner health departments and hospitals. Mr. Medvesky, the Director, Health Data Analytics (HCD), provided invaluable insights and technical expertise in public health indicators to be included, as well as detailed review of the data analysis, findings, and narrative contained in the Community Health Needs Assessment. Mr. Keable, Public Health Data Analyst (HCD), coordinated the Capital Region Community Health Survey and conducted the ranking analysis of Region’s public health issues. Mr. Keable also prepared the Appendices contained in the Report. Ms. Lillie Ruby, Communications Coordinator, HCD, was invaluable in the formatting of the document and its accompanying appendices.
This document benefited from the review and input of the members of the Prevention Agenda Workgroup of the Healthy Capital District. These individuals are subject matter experts from area county public health departments and each of the Capital Region hospitals. Their review of the narrative and the data resulted in helpful edits. They were joined by representatives from county agencies, community based organizations, businesses, consumers, schools, academics, and other partners, for a total of over 90 different organizations participating in the three Capital Region Public Health Prioritization, and CHIP Work Groups, who considered a data summary of the findings and to develop regional priorities.
The member organizations of HCD also provided valuable financial support for the development of this Report and the community health survey. We are grateful for the contributions of each and every one of these knowledgeable contributors.
2
I
Healthy Capital District
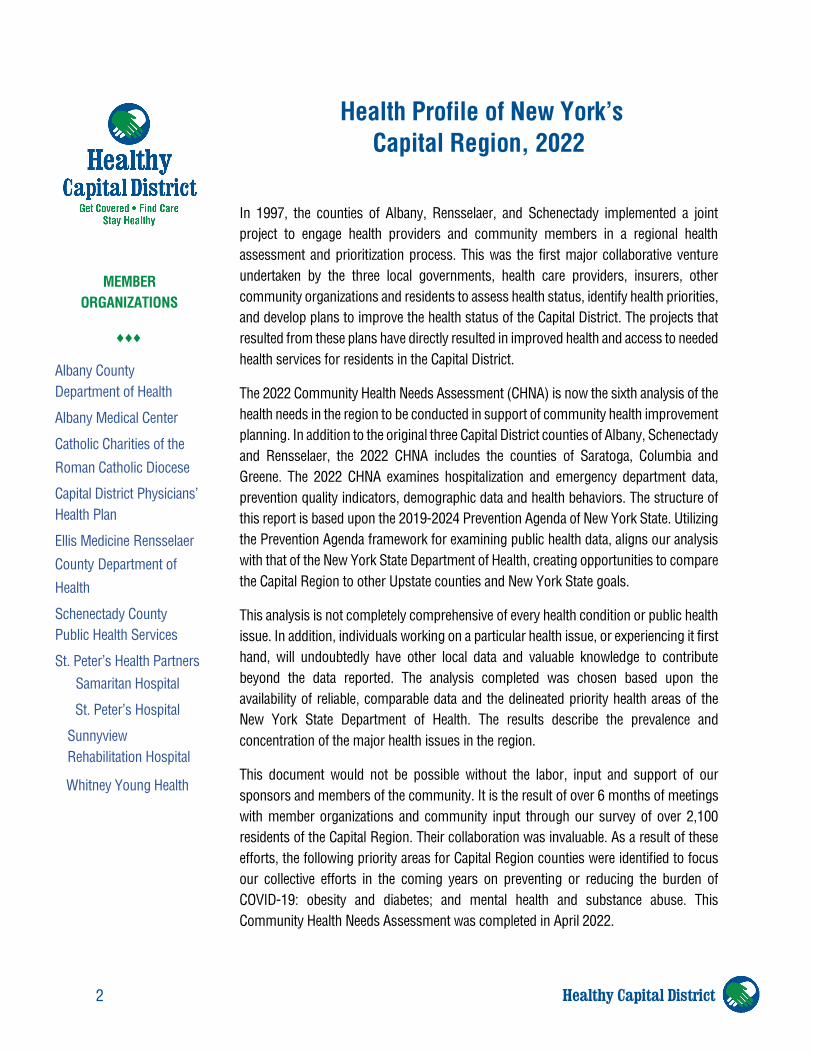
Health Profile of New York’s Capital Region, 2022
In 1997, the counties of Albany, Rensselaer, and Schenectady implemented a joint project to engage health providers and community members in a regional health assessment and prioritization process. This was the first major collaborative venture undertaken by the three local governments, health care providers, insurers, other community organizations and residents to assess health status, identify health priorities, and develop plans to improve the health status of the Capital District. The projects that resulted from these plans have directly resulted in improved health and access to needed health services for residents in the Capital District.
The 2022 Community Health Needs Assessment (CHNA) is now the sixth analysis of the health needs in the region to be conducted in support of community health improvement planning. In addition to the original three Capital District counties of Albany, Schenectady and Rensselaer, the 2022 CHNA includes the counties of Saratoga, Columbia and Greene. The 2022 CHNA examines hospitalization and emergency department data, prevention quality indicators, demographic data and health behaviors. The structure of this report is based upon the 2019-2024 Prevention Agenda of New York State. Utilizing the Prevention Agenda framework for examining public health data, aligns our analysis with that of the New York State Department of Health, creating opportunities to compare the Capital Region to other Upstate counties and New York State goals.
This analysis is not completely comprehensive of every health condition or public health issue. In addition, individuals working on a particular health issue, or experiencing it first hand, will undoubtedly have other local data and valuable knowledge to contribute beyond the data reported. The analysis completed was chosen based upon the availability of reliable, comparable data and the delineated priority health areas of the New York State Department of Health. The results describe the prevalence and concentration of the major health issues in the region.
This document would not be possible without the labor, input and support of our sponsors and members of the community. It is the result of over 6 months of meetings with member organizations and community input through our survey of over 2,100 residents of the Capital Region. Their collaboration was invaluable. As a result of these efforts, the following priority areas for Capital Region counties were identified to focus our collective efforts in the coming years on preventing or reducing the burden of COVID-19: obesity and diabetes; and mental health and substance abuse. This Community Health Needs Assessment was completed in April 2022.
MEMBER ORGANIZATIONS
♦♦♦
Albany County Department of Health
Albany Medical Center
Catholic Charities of the
Roman Catholic Diocese
Capital District Physicians’ Health Plan
Ellis Medicine Rensselaer
County Department of
Health
Schenectady County Public Health Services
St. Peter’s Health Partners Samaritan Hospital
St. Peter’s Hospital
Sunnyview Rehabilitation Hospital
Whitney Young Health
3 Healthy Capital District
Table of Contents I. Introduction and Data Summary ................................................................................................... 7
Community Being Assessed ................................................................................................................... 7
Data Sources and Indicator Selection ..................................................................................................... 7
Structure of this Report: Health Indicators ............................................................................................ 9
Rates and Comparisions .......................................................................................................................... 9
Data Summary ....................................................................................................................................... 10 Brief Summary of 2021 Capital Region Community Health Survey ........................................................... 11
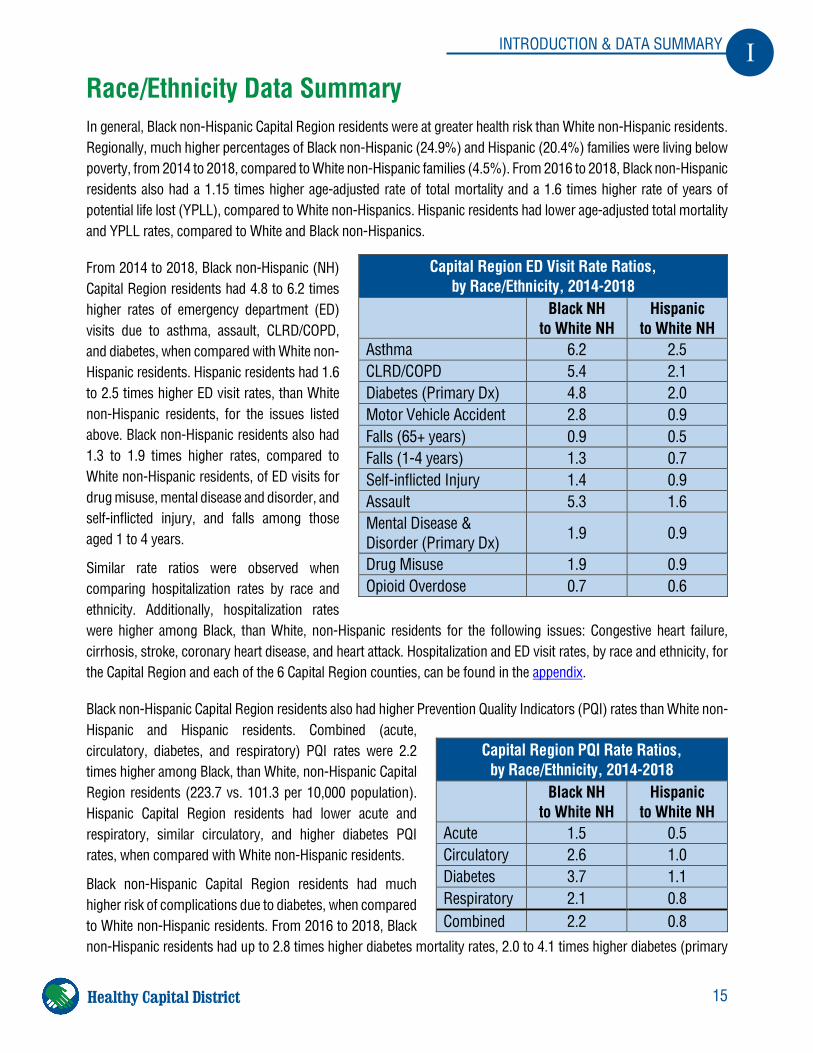
Race/Ethnicity Data Summary ............................................................................................................. 15
Counties .................................................................................................................................................. 16 Albany County ................................................................................................................................................. 16 Rensselaer County ............................................................................................................................................ 19 Schenectady County ......................................................................................................................................... 22 Saratoga County ............................................................................................................................................... 26 Columbia County ............................................................................................................................................. 28 Greene County .................................................................................................................................................. 30
County Health Rankings, 2021 ............................................................................................................. 34
II. Community Public Health Priorities ........................................................................................ 35
Collaboration and Community Engagement .................................................................................. 35
Health Issue Ranking .......................................................................................................................... 35
Selection of Priorities ............................................................................................................................ 37 Albany-Rensselaer Prevention Agenda Prioritization Work Group ............................................................. 37 Schenectady Prevention Agenda Prioritization Work Group ....................................................................... 39 Columbia-Greene Prevention Agenda Prioritization Work Group .............................................................. 40
III. Sociodemographic Information ................................................................................................ 41
IV. General Health Status ................................................................................................................. 47
Total Age-Adjusted Mortality ......................................................................................................................... 47 Leading Causes of Death ................................................................................................................................. 48 Premature Death and Years of Potential Life Lost (YPLL) .......................................................................... 49
Health Care: Usage and Access ......................................................................................................... 53 Health Care Usage ......................................................................................................................................... 53 Access to Primary and Preventive Care .......................................................................................................... 55
Dental Visits ........................................................................................................................................... 57
4
I
Healthy Capital District
V. Chronic Disease ........................................................................................................................... 59
Obesity, Physical Activity and Nutrition ............................................................................................. 59 Adult Obesity .................................................................................................................................................... 59 Childhood Obesity ........................................................................................................................................... 61 Physical Activity .............................................................................................................................................. 63 Sugary Beverages ............................................................................................................................................. 64
Tobacco Use .......................................................................................................................................... 67
Chronic Obstructive Pulmonary Disease ............................................................................................. 69
Asthma ................................................................................................................................................... 72
Diabetes .................................................................................................................................................. 76
Cardiovascular Disease ......................................................................................................................... 81 Heart Attack and Coronary Heart Disease ..................................................................................................... 81 Congestive Heart Failure ................................................................................................................................. 83 Cerebrovascular Disease .................................................................................................................................. 85
Cancer ..................................................................................................................................................... 88 Female Breast Cancer ...................................................................................................................................... 89 Cervical Cancer ................................................................................................................................................ 91 Colorectal Cancer ............................................................................................................................................. 92 Prostate Cancer ................................................................................................................................................. 94 Lung Cancer ..................................................................................................................................................... 96
VI. Healthy and Safe Environment ................................................................................................. 98
Childhood Lead Poisoning .................................................................................................................... 98 Lead Screening ................................................................................................................................................. 98 Children Younger than 6 Years with Elevated Lead Levels ......................................................................... 99 Lead in School Drinking Water .................................................................................................................... 100
Injury .................................................................................................................................................... 102 Motor Vehicle-Related Injuries ..................................................................................................................... 102 Falls in Children ............................................................................................................................................. 103 Falls in Older Adults ...................................................................................................................................... 104 Workplace Injuries ......................................................................................................................................... 106
Violence ............................................................................................................................................... 108
Built Environment ............................................................................................................................... 113 Climate Smart Communities ......................................................................................................................... 113 Alternate Modes of Transportation .......................................................................................................... 114 Substandard Housing ..................................................................................................................................... 115 Food Insecurity ............................................................................................................................................... 116 Cooling Towers .............................................................................................................................................. 117 Water Fluoridation ......................................................................................................................................... 118
5 Healthy Capital District
VII. Healthy Women, Infants, and Children ................................................................................ 120
Prenatal Care ........................................................................................................................................ 120
Adverse Birth Outcomes ..................................................................................................................... 123 Preterm Births ................................................................................................................................................. 123 Low Birth Weight Births ............................................................................................................................... 124 Infant Mortality............................................................................................................................................... 126
Adolescent Pregnancy ......................................................................................................................... 128
Breastfeeding ....................................................................................................................................... 130
VIII. Mental Health and Substance Misuse ................................................................................ 134
Mental Health, Self Harm, and Suicide ............................................................................................. 134
Substance Misuse ................................................................................................................................ 140 Alcohol Misuse ............................................................................................................................................... 141 Opiate Misuse ................................................................................................................................................. 142
IX. Infectious Disease ....................................................................................................................... 148
Vaccine-Preventable Disease .............................................................................................................. 148 Childhood Immunization ............................................................................................................................... 148 Human Papillomavirus Immunization .......................................................................................................... 149 COVID-19 ...................................................................................................................................................... 151
HIV/AIDS ............................................................................................................................................ 156
Sexually Transmitted Infection .......................................................................................................... 158 Gonorrhea ....................................................................................................................................................... 159 Chlamydia ....................................................................................................................................................... 160 Syphilis ............................................................................................................................................................ 161
Lyme Disease ....................................................................................................................................... 163
X. Appendices .................................................................................................................................. 164
Capital Region ZIP Code Groupings and Neighborhoods Maps ..................................................... 165
Age, Poverty Level, and Race/Ethnicity Demographics .................................................................. 177
County Birth Indicators by Neighborhood ........................................................................................ 197
Leading Causes of Death, 2018 .......................................................................................................... 205
Leading Causes of Premature Death (<75 years), 2018 ................................................................... 207
County Hospitalizations by Race/Ethnicity and Gender .................................................................. 209
County Emergency Dept. (ED) Visits by Race & Gender ............................................................... 215
County Hospitalization Rates by Neighborhood ............................................................................... 219
6
I
Healthy Capital District
ED Visit Rates by Neighborhood ....................................................................................................... 227
Prevention Quality Indicator Rates by Neighborhood ...................................................................... 233
Mortality Rates by Neighborhood ...................................................................................................... 237
County Health Rankings ..................................................................................................................... 247
Public Health Issue Ranking for Prioritization Results ..................................................................... 255
2021 Capital Region Community Health Survey Results ................................................................ 257 Introduction ..................................................................................................................................................... 257 Demographics ................................................................................................................................................. 258 Health Priorities .............................................................................................................................................. 261 Social Determinants of Health ....................................................................................................................... 265 Prevention & Communication Strategies ..................................................................................................... 267 Healthcare Access & Barriers ....................................................................................................................... 269 Mental Health ................................................................................................................................................. 272 Substance Misuse ........................................................................................................................................... 274 COVID-19 Vaccine ....................................................................................................................................... 276 Survey (Paper Version) .................................................................................................................................. 279 End .................................................................................................................................................................. 287
7
I INTRODUCTION & DATA SUMMARY
Healthy Capital District
I. Introduction and Data Summary The purpose of this report is to summarize the public health needs of communities in the Capital Region with the most reliable data available. These indicators provide a broad array of health information that may be useful in determining and monitoring health promotion priorities for the community.
The following sections provide an overview of the processes used to select indicators and priorities, and details about individuals and organizations who participated in these processes.
Community Being Assessed The communities being assessed in this report are the counties of Albany, Rensselaer, Schenectady, Saratoga, Columbia and Greene. They form the common service area covered by the local health departments in Albany, Rensselaer, Schenectady, Saratoga, Columbia and Greene Counties and the primary patient population served by Albany Medical Center, Ellis Hospital, St. Peter’s Health Partners, Saratoga Hospital and Columbia Memorial Hospital, which are located within the six counties.
Demographic information on the population in the Capital Region is available from the 2015-2019 U.S. Census’s American Community Survey (ACS). The combined population in the Capital Region was 957,309 individuals. About 19.5% were 0-18 years of age, while 17.5% were 65 years of age or older. Approximately 10.4% were living in poverty, down from 11.1% in the 2012-2016 ACS. The race/ethnicity distribution was 83.0% White, 7.7% Black, 4.2% Asian/Pacific Islander, and 5.2% other races; 5.2% were Hispanic/Latino (any race). Additional sociodemographic details are provided in Section III.
Data Sources and Indicator Selection The health indicators selected for this report were based on a review of available public health data and New York State priorities promulgated through the Prevention Agenda for a Healthier New York. The collection and management of these data has been supported by the state for an extended period and are very likely to continue to be supported. This provides reliable and comparable data over time and across the state. These measures, when complemented by the Expanded Behavioral Risk Factor Surveillance System and Prevention Quality Indicators, provide health indicators that can be potentially impacted in the short-term.
The Common Ground Health provided SPARCS (hospitalizations and ED visits) data that were utilized to generate county and ZIP code level analyses of mortality, hospitalizations, and emergency room utilization, for all residents, by gender, race and ethnicity. The time frames used for the ZIP code analyses were 2012-2016 Vital Statistics and 2014-2018 Statewide Planning and Research Cooperative System (SPARCS) data. The 5-year period establishes more reliable rates when looking at small geographic areas or minority populations.
8
I INTRODUCTION & DATA SUMMARY
Healthy Capital District
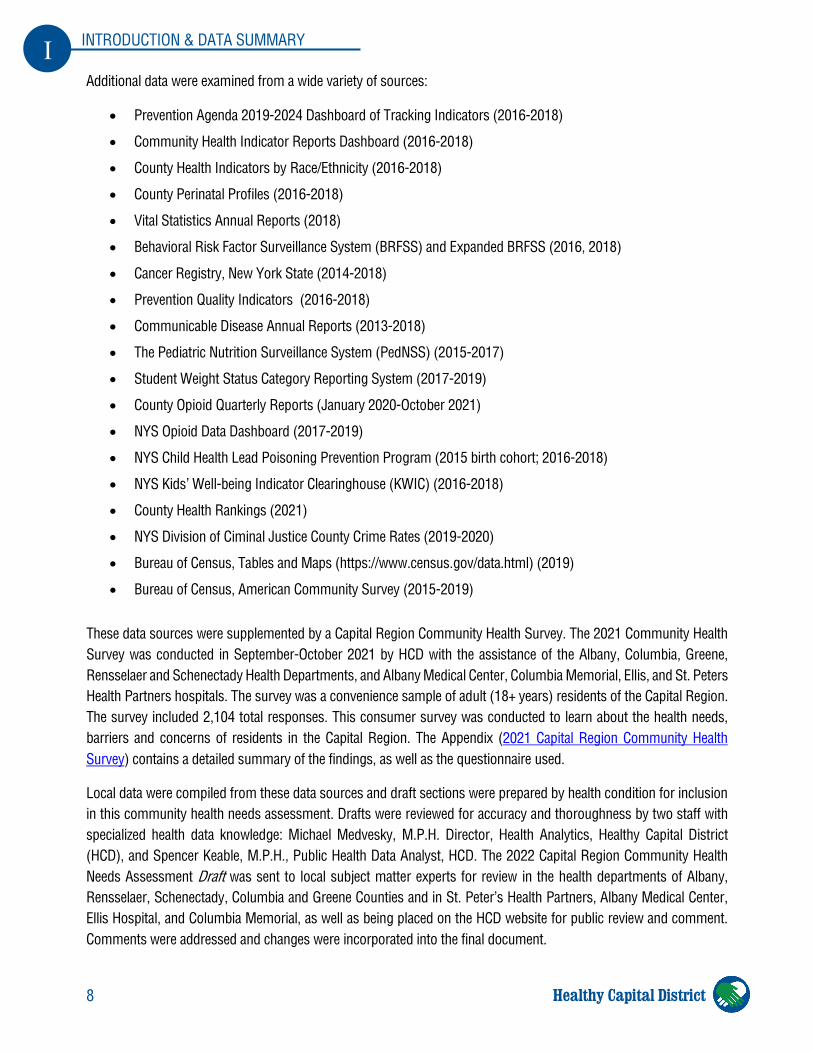
Additional data were examined from a wide variety of sources:
• Prevention Agenda 2019-2024 Dashboard of Tracking Indicators (2016-2018)
• Community Health Indicator Reports Dashboard (2016-2018)
• County Health Indicators by Race/Ethnicity (2016-2018)
• County Perinatal Profiles (2016-2018)
• Vital Statistics Annual Reports (2018)
• Behavioral Risk Factor Surveillance System (BRFSS) and Expanded BRFSS (2016, 2018)
• Cancer Registry, New York State (2014-2018)
• Prevention Quality Indicators (2016-2018)
• Communicable Disease Annual Reports (2013-2018)
• The Pediatric Nutrition Surveillance System (PedNSS) (2015-2017)
• Student Weight Status Category Reporting System (2017-2019)
• County Opioid Quarterly Reports (January 2020-October 2021)
• NYS Opioid Data Dashboard (2017-2019)
• NYS Child Health Lead Poisoning Prevention Program (2015 birth cohort; 2016-2018)
• NYS Kids’ Well-being Indicator Clearinghouse (KWIC) (2016-2018)
• County Health Rankings (2021)
• NYS Division of Ciminal Justice County Crime Rates (2019-2020)
• Bureau of Census, Tables and Maps (https://www.census.gov/data.html) (2019)
• Bureau of Census, American Community Survey (2015-2019)
These data sources were supplemented by a Capital Region Community Health Survey. The 2021 Community Health Survey was conducted in September-October 2021 by HCD with the assistance of the Albany, Columbia, Greene, Rensselaer and Schenectady Health Departments, and Albany Medical Center, Columbia Memorial, Ellis, and St. Peters Health Partners hospitals. The survey was a convenience sample of adult (18+ years) residents of the Capital Region. The survey included 2,104 total responses. This consumer survey was conducted to learn about the health needs, barriers and concerns of residents in the Capital Region. The Appendix (2021 Capital Region Community Health Survey) contains a detailed summary of the findings, as well as the questionnaire used.
Local data were compiled from these data sources and draft sections were prepared by health condition for inclusion in this community health needs assessment. Drafts were reviewed for accuracy and thoroughness by two staff with specialized health data knowledge: Michael Medvesky, M.P.H. Director, Health Analytics, Healthy Capital District (HCD), and Spencer Keable, M.P.H., Public Health Data Analyst, HCD. The 2022 Capital Region Community Health Needs Assessment Draft was sent to local subject matter experts for review in the health departments of Albany, Rensselaer, Schenectady, Columbia and Greene Counties and in St. Peter’s Health Partners, Albany Medical Center, Ellis Hospital, and Columbia Memorial, as well as being placed on the HCD website for public review and comment. Comments were addressed and changes were incorporated into the final document.
9
I INTRODUCTION & DATA SUMMARY
Healthy Capital District
Structure of this Report: Health Indicators Every year, the New York State Department of Health (NYSDOH) provides updated information on major health indicators for each county. NYSDOH provides county-level information on 2019-2024 Prevention Agenda indicators and objectives that can be used for tracking Prevention Agenda-based efforts via the 2019-2024 Prevention Agenda Dashboard. To supplement available information, this report focuses on more detailed information, such as analyses by ZIP code level, gender, race, ethnicity and trends over the past decade. In order to present meaningful information for smaller areas or subgroups, data for several years are combined. Thus, most information presented is based on three or five years of combined data. Still, some areas had too few cases to estimate rates accurately.
After presenting information on demographics and cause of death for the Capital Region, a summary of general health status is presented, including information on health care access and usage. This is followed by sections specific to each of the five New York State Prevention Agenda Priority Areas. Topics within each Priority Area contain a brief synopsis of the condition and why it is of concern. Prevention Agenda 2024 objectives are presented and compared to statistics for New York State, excluding New York City, the Capital Region, and the six Capital Region counties. If available, trend data as well as information by gender and race/ethnicity are presented. Indicators include mortality, natality, and emergency department (ED) visit and hospitalization rates. Additional information from disease registries, administrative data, and the Expanded Behavioral Risk Factor Surveillance System are also included.
ZIP code groups were chosen as a small-area breakdown because there were insufficient data for the primary alternative, census tracts. The groups were selected based on a minimum of 2,000 residents and meaningful groupings generally following municipal boundaries and at sub-municipal neighborhoods in urban areas.
Detailed tables are available in the appendices for: ZIP code neighborhood groupings by county; county socio-demographics (age, race/ethnicity, poverty) by neighborhood; county birth indicators by neighborhood; leading causes of death and premature death by county; county hospitalization rates by race and gender; county ED visit rates by race and gender; county hospitalization rates by neighborhood; county emergency department rates by neighborhood; county mortality rates by neighborhood; county and neighborhood prevention quality indicators (PQI); county health rankings; county-specific results of the ranking of Public Health Issues using a methodology developed by HCD; and 2021 Capital Region Community Health Survey results.
Rates and Comparisions For most indicators, age-adjusted rates are presented in the tables. Age-adjustment considers the differing age distributions within populations to calculate rates that can be used for comparison purposes. Direct standardization was used for this report. The advantage of this method is that comparisons of Capital Region data can be made with Prevention Agenda 2024 objectives for most indicators. Prevention Agenda and NYSDOH indicators have been age-standardized to the United States 2000 population, thus age-adjusted rates presented in this report are standardized similarly. Also, most comparisons are made between Capital Region data and data for the 57 counties in New York State which are not within the City of New York (referenced as “NYS excl. NYC”). This is a well-accepted methodology to allow comparison with typically more similar populations, excluding the sometimes unique population dynamics of the nation’s largest city.
10
I INTRODUCTION & DATA SUMMARY
Healthy Capital District
Data Summary In 2015-19, the most recent demographic profile available, the Capital Region was home to approximately 957,309 residents, equally distributed between males and females, with counties ranging from Urban (Schenectady-760 pop. /sq. mile) to Rural (Greene-73 pop. / sq. mile). The Region’s mean age of 39.9 years was higher than that of New York State (NYS). About 16% of the population was 14 years of age or younger, while 17.5% was 65 years of age and older. Approximately 17% of the Capital Region’s population was non-White and 5.2% Hispanic. The Region’s poverty rate of 10.4% was lower than NYS, excl. NYC. Over 14% of the Region’s children less than 18 years of age were below poverty. About 8.1% of the Capital Region’s population 25 years of age or older had less than a high school education.
The health of Capital Region residents was generally consistent with other New York counties outside New York City, although Capital Region residents had a higher overall age-adjusted mortality rate as well as a higher % of deaths that were premature (<65years) than NYS excl. NYC. The Region’s rate of Years of Potential Life Lost (YPLL) was lalso higher than NYS excl. NYC. Chronic diseases were the leading causes of death in the Capital Region, with heart disease, cancer, chronic lower respiratory disease (CLRD), and stroke being the major causes. Injuries were the major cause of death in the child, adolescent, and young adult populations.
Health care access indicators show the Capital Region having fewer barriers to care than NYS excl. NYC. Capital Region residents, both children and adults, had higher health insurance coverage rates compared to NYS excl. NYC. A higher percent of Capital Region residents also had a regular health care provider. The Capital Region’s primary care system also seemed to be working well compared to NYS excl. NYC. When looking at preventable hospitalizations, Capital Region residents had much lower rates than residents from NYS excl. NYC did. Total Emergency Department visit rates, as well as total hospitalization rates were also lower in the Capital Region compared to NYS excl. NYC.
There were many positive trends in the Capital Region. Coronary heart disease, asthma, childhood obesity, breastfeeding, teen pregnancy, premature births, childhood lead screening, childhood lead poisoning, and alcohol-related injuries and death trends improved over the past decade. Children 19-35 months of age had higher immunization rates, and adolescents aged 13-17 years had higher HPV vaccination rates than NYS excl. NYC. Capital Region colorectal and breast cancer screening rates were also higher than NYS excl. NYC. The Capital Region had also seen a positive change in certain health behaviors. A higher percentage of Capital Region residents participated in some leisure time physical activity than NYS excl. NYC. They also consumed less sugary drinks than their NYS excl. NYC counterparts. Adult current smoking rates for Capital Region also decreased. COVID-19 indicators show the Capital Region having lower test-positivity and mortality rates, and slightly higher vaccination rates than NYS excl. NYC.
However, many measurements were not as positive, particularly in lower income, inner-city neighborhoods where many rates were 3 to 7 times higher than the county average. The Capital Region has seen negative trends in Years of Potential life lost (YPLL), congestive heart failure, suicide, gonorrhea, syphilis, chlamydia, Lyme disease, and opioid overdose ED visits, hospitalizations and mortality. Obesity and its related diseases continue to be health issues in the Capital Region. Close to 30% of adult residents were considered obese, or approximately 228,000 adult residents. Obesity in the Capital Region’s school children was also alarming, with almost 17% of children being considered obese. Diabetes mortality and short-term complication hospitalizations were higher in the Capital Region than NYS excl. NYC. Adult smoking rates, lung cancer incidence and mortality, and chronic lower respiratory disease mortality rates were all higher in the Capital Region compared to NYS excl. NYC. Adult asthma prevalence, was also higher in
11
I INTRODUCTION & DATA SUMMARY
Healthy Capital District
the Capital Region. The incidence of positive blood lead in children less than 72 months of age continued to be a Capital Region issue, with rates much higher than residents of NYS excl. NYC.
Capital Region women had higher rates of infant mortality, and lower rates for early prenatal care than NYS excl. NYC women. Capital Region teens had much higher pregnancy rates compared to their NYS excl. NYC counterparts. Chlamydia, gonorrhea, and syphilis rates were also much higher in the Capital Region, with increasing trends over the past decade. Capital Region counties presented some of the highest Lyme disease case rates in New York State. Mental Health indicators such as mental disease and disorders ED and hospitalization rates, suicide mortality, and self-inflicted injury hospitalization rates were higher in the Capital Region compared to NYS excl. NYC. Binge drinking and cirrhosis mortality were also higher in the Capital Region compared to NYS excl. NYC.
Brief Summary of 2021 Capital Region Community Health Survey The 2021 Capital Region Community Health Survey collected over 2,100 responses from a convenient sample of Capital Region adults from September 13 to November 3, 2021. The survey aimed to identify the major needs, gaps, and priorities facing Capital Region residents regarding: public health priorities, social determinants of health, healthcare access and barriers, mental health, substance misuse, COVID-19 vaccination, and prevention strategies. Public health priority results were used to rank health issues in the prioritization process described in Section II.
The convenience sample underrepresented males, Latinos, residents aged under 35 or over 64 years, and those with a household income under $25,000. More information about the 2021 Capital Region Community Health Survey, including respondent sociodemographic distributions and results for each question – with income-level comparisons – can be found in the appendix. Some key findings from each section of the survey are summarized below:
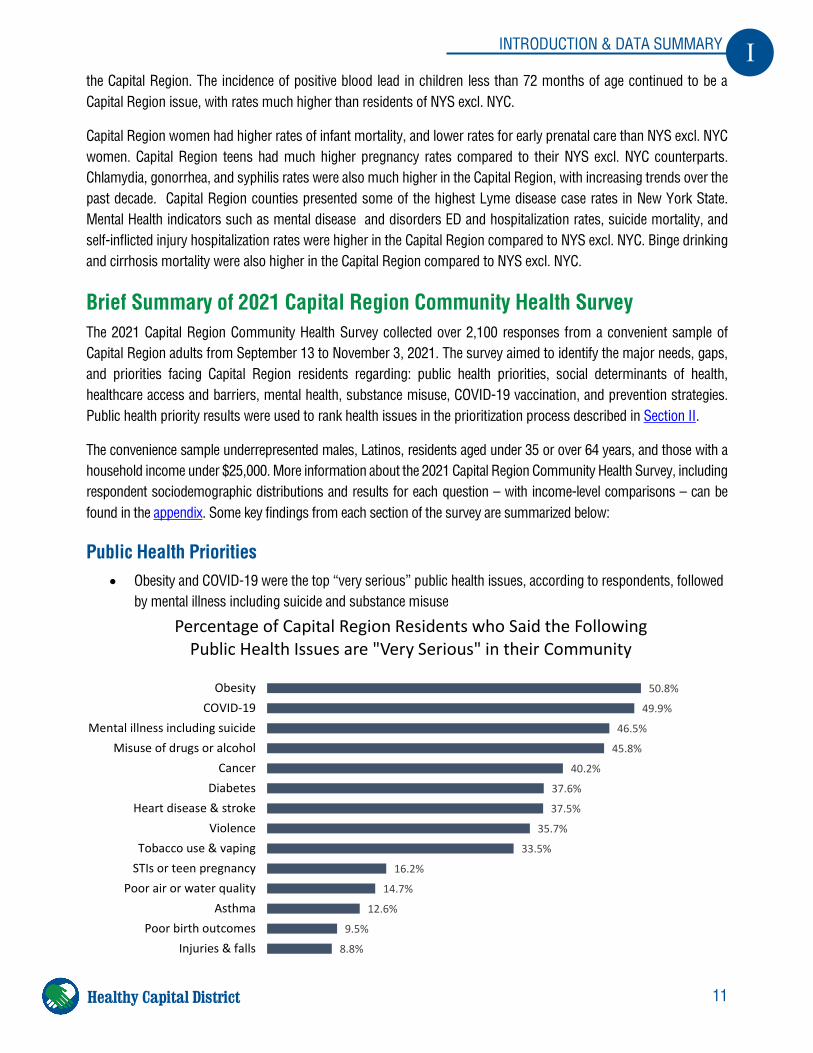
Public Health Priorities • Obesity and COVID-19 were the top “very serious” public health issues, according to respondents, followed
by mental illness including suicide and substance misuse
50.8%
49.9%
46.5%
45.8%
40.2%
37.6%
37.5%
35.7%
33.5%
16.2%
14.7%
12.6%
9.5%
8.8%
ObesityCOVID-19
Mental illness including suicideMisuse of drugs or alcohol
CancerDiabetes
Heart disease & strokeViolence
Tobacco use & vapingSTIs or teen pregnancy
Poor air or water qualityAsthma
Poor birth outcomesInjuries & falls
Percentage of Capital Region Residents who Said the Following Public Health Issues are "Very Serious" in their Community
12
I INTRODUCTION & DATA SUMMARY
Healthy Capital District
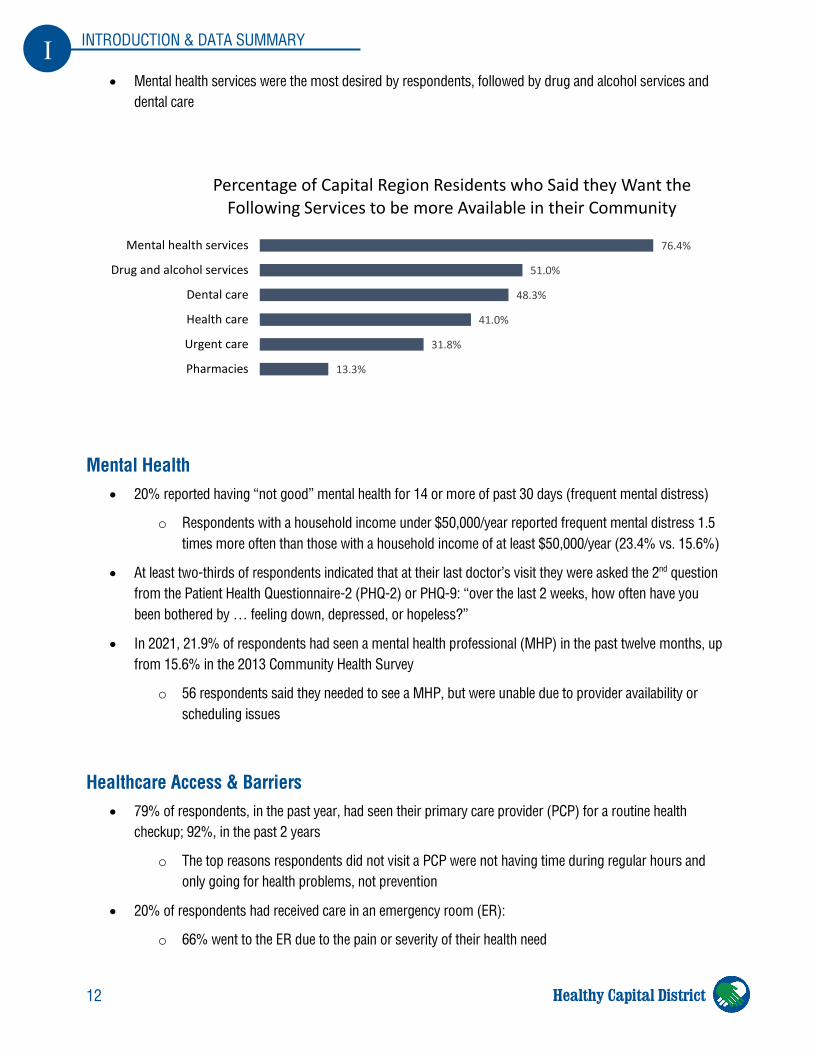
• Mental health services were the most desired by respondents, followed by drug and alcohol services and dental care
Mental Health • 20% reported having “not good” mental health for 14 or more of past 30 days (frequent mental distress)
o Respondents with a household income under $50,000/year reported frequent mental distress 1.5 times more often than those with a household income of at least $50,000/year (23.4% vs. 15.6%)
• At least two-thirds of respondents indicated that at their last doctor’s visit they were asked the 2nd question from the Patient Health Questionnaire-2 (PHQ-2) or PHQ-9: “over the last 2 weeks, how often have you been bothered by … feeling down, depressed, or hopeless?”
• In 2021, 21.9% of respondents had seen a mental health professional (MHP) in the past twelve months, up from 15.6% in the 2013 Community Health Survey
o 56 respondents said they needed to see a MHP, but were unable due to provider availability or scheduling issues
Healthcare Access & Barriers • 79% of respondents, in the past year, had seen their primary care provider (PCP) for a routine health
checkup; 92%, in the past 2 years
o The top reasons respondents did not visit a PCP were not having time during regular hours and only going for health problems, not prevention
• 20% of respondents had received care in an emergency room (ER):
o 66% went to the ER due to the pain or severity of their health need
76.4%
51.0%
48.3%
41.0%
31.8%
13.3%
Mental health services
Drug and alcohol services
Dental care
Health care
Urgent care
Pharmacies
Percentage of Capital Region Residents who Said they Want the Following Services to be more Available in their Community
13
I INTRODUCTION & DATA SUMMARY
Healthy Capital District
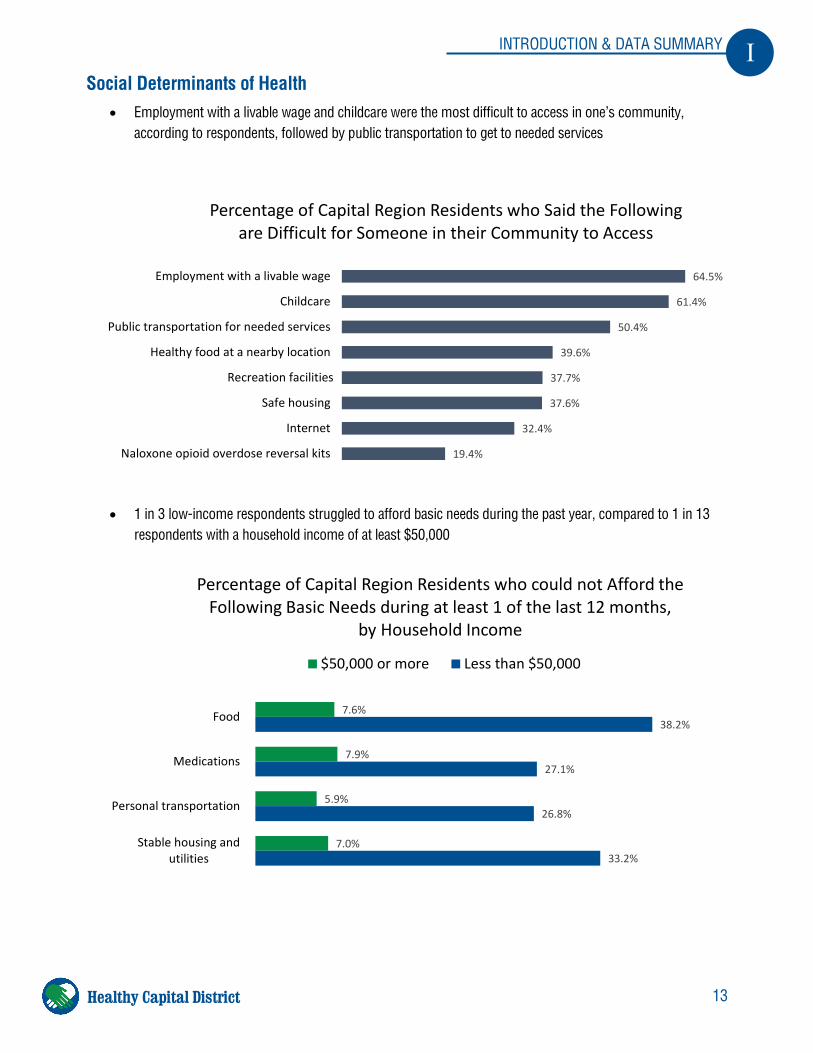
Social Determinants of Health • Employment with a livable wage and childcare were the most difficult to access in one’s community,
according to respondents, followed by public transportation to get to needed services
• 1 in 3 low-income respondents struggled to afford basic needs during the past year, compared to 1 in 13 respondents with a household income of at least $50,000
7.6%
7.9%
5.9%
7.0%
38.2%
27.1%
26.8%
33.2%
Food
Medications
Personal transportation
Stable housing andutilities
Percentage of Capital Region Residents who could not Afford the Following Basic Needs during at least 1 of the last 12 months,
by Household Income
$50,000 or more Less than $50,000
64.5%
61.4%
50.4%
39.6%
37.7%
37.6%
32.4%
19.4%
Employment with a livable wage
Childcare
Public transportation for needed services
Healthy food at a nearby location
Recreation facilities
Safe housing
Internet
Naloxone opioid overdose reversal kits
Percentage of Capital Region Residents who Said the Following are Difficult for Someone in their Community to Access
14
I INTRODUCTION & DATA SUMMARY
Healthy Capital District
Substance Misuse • More than half (59%) of respondents said a friend or extended family member had misused a substance, or
that someone they know shared that their friend or family member had
• Opioid misuse was the most serious problem, according to respondents, followed by alcohol and prescription medication misuse
COVID-19 Vaccination • 93% of respondents had been vaccinated for COVID-19
o This was higher than an expected range of 80-85%, based on vaccination rates, during the survey period, among Capital Region residents aged 18 and older
• Unvaccinated respondents most often said they chose not to get vaccinated because there was “not enough research yet [on the vaccines]” or they were “concerned about side effects”
• No single reason to get vaccinated was found to motivate more than 13.6% of unvaccinated respondents, indicating that the decision is personal and motivations vary by person
Prevention & Communication Strategies • Most respondents get their health information from a doctor or health professional, or the internet
o Unvaccinated respondents more often said they get most of their health information from social media, family or friends, or a library; less often said, from a worksite, doctor or health professional, health department, TV, newspaper or magazine, or hospital
• Respondents most often said they would participate in community health education offered in online video format, followed by virtual group meetings and health worker phone call or text
15
I INTRODUCTION & DATA SUMMARY
Healthy Capital District
Race/Ethnicity Data Summary In general, Black non-Hispanic Capital Region residents were at greater health risk than White non-Hispanic residents. Regionally, much higher percentages of Black non-Hispanic (24.9%) and Hispanic (20.4%) families were living below poverty, from 2014 to 2018, compared to White non-Hispanic families (4.5%). From 2016 to 2018, Black non-Hispanic residents also had a 1.15 times higher age-adjusted rate of total mortality and a 1.6 times higher rate of years of potential life lost (YPLL), compared to White non-Hispanics. Hispanic residents had lower age-adjusted total mortality and YPLL rates, compared to White and Black non-Hispanics.
From 2014 to 2018, Black non-Hispanic (NH) Capital Region residents had 4.8 to 6.2 times higher rates of emergency department (ED) visits due to asthma, assault, CLRD/COPD, and diabetes, when compared with White non-Hispanic residents. Hispanic residents had 1.6 to 2.5 times higher ED visit rates, than White non-Hispanic residents, for the issues listed above. Black non-Hispanic residents also had 1.3 to 1.9 times higher rates, compared to White non-Hispanic residents, of ED visits for drug misuse, mental disease and disorder, and self-inflicted injury, and falls among those aged 1 to 4 years.
Similar rate ratios were observed when comparing hospitalization rates by race and ethnicity. Additionally, hospitalization rates were higher among Black, than White, non-Hispanic residents for the following issues: Congestive heart failure, cirrhosis, stroke, coronary heart disease, and heart attack. Hospitalization and ED visit rates, by race and ethnicity, for the Capital Region and each of the 6 Capital Region counties, can be found in the appendix.
Black non-Hispanic Capital Region residents also had higher Prevention Quality Indicators (PQI) rates than White non-Hispanic and Hispanic residents. Combined (acute, circulatory, diabetes, and respiratory) PQI rates were 2.2 times higher among Black, than White, non-Hispanic Capital Region residents (223.7 vs. 101.3 per 10,000 population). Hispanic Capital Region residents had lower acute and respiratory, similar circulatory, and higher diabetes PQI rates, when compared with White non-Hispanic residents.
Black non-Hispanic Capital Region residents had much higher risk of complications due to diabetes, when compared to White non-Hispanic residents. From 2016 to 2018, Black non-Hispanic residents had up to 2.8 times higher diabetes mortality rates, 2.0 to 4.1 times higher diabetes (primary
Capital Region ED Visit Rate Ratios, by Race/Ethnicity, 2014-2018
Black NH to White NH
Hispanic to White NH
Asthma 6.2 2.5 CLRD/COPD 5.4 2.1 Diabetes (Primary Dx) 4.8 2.0 Motor Vehicle Accident 2.8 0.9 Falls (65+ years) 0.9 0.5 Falls (1-4 years) 1.3 0.7 Self-inflicted Injury 1.4 0.9 Assault 5.3 1.6 Mental Disease & Disorder (Primary Dx) 1.9 0.9
Drug Misuse 1.9 0.9 Opioid Overdose 0.7 0.6
Capital Region PQI Rate Ratios, by Race/Ethnicity, 2014-2018
Black NH to White NH
Hispanic to White NH
Acute 1.5 0.5 Circulatory 2.6 1.0 Diabetes 3.7 1.1 Respiratory 2.1 0.8 Combined 2.2 0.8
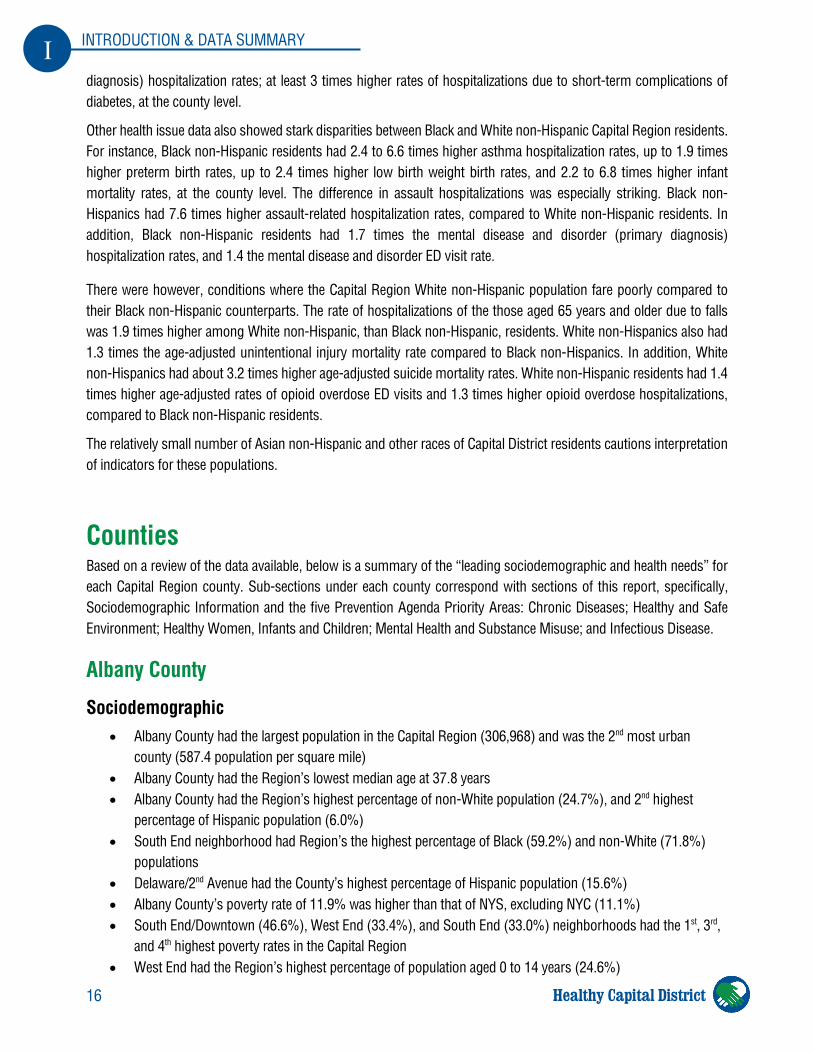
16
I INTRODUCTION & DATA SUMMARY
Healthy Capital District
diagnosis) hospitalization rates; at least 3 times higher rates of hospitalizations due to short-term complications of diabetes, at the county level.
Other health issue data also showed stark disparities between Black and White non-Hispanic Capital Region residents. For instance, Black non-Hispanic residents had 2.4 to 6.6 times higher asthma hospitalization rates, up to 1.9 times higher preterm birth rates, up to 2.4 times higher low birth weight birth rates, and 2.2 to 6.8 times higher infant mortality rates, at the county level. The difference in assault hospitalizations was especially striking. Black non-Hispanics had 7.6 times higher assault-related hospitalization rates, compared to White non-Hispanic residents. In addition, Black non-Hispanic residents had 1.7 times the mental disease and disorder (primary diagnosis) hospitalization rates, and 1.4 the mental disease and disorder ED visit rate.
There were however, conditions where the Capital Region White non-Hispanic population fare poorly compared to their Black non-Hispanic counterparts. The rate of hospitalizations of the those aged 65 years and older due to falls was 1.9 times higher among White non-Hispanic, than Black non-Hispanic, residents. White non-Hispanics also had 1.3 times the age-adjusted unintentional injury mortality rate compared to Black non-Hispanics. In addition, White non-Hispanics had about 3.2 times higher age-adjusted suicide mortality rates. White non-Hispanic residents had 1.4 times higher age-adjusted rates of opioid overdose ED visits and 1.3 times higher opioid overdose hospitalizations, compared to Black non-Hispanic residents.
The relatively small number of Asian non-Hispanic and other races of Capital District residents cautions interpretation of indicators for these populations.
Counties Based on a review of the data available, below is a summary of the “leading sociodemographic and health needs” for each Capital Region county. Sub-sections under each county correspond with sections of this report, specifically, Sociodemographic Information and the five Prevention Agenda Priority Areas: Chronic Diseases; Healthy and Safe Environment; Healthy Women, Infants and Children; Mental Health and Substance Misuse; and Infectious Disease.
Albany County
Sociodemographic • Albany County had the largest population in the Capital Region (306,968) and was the 2nd most urban
county (587.4 population per square mile) • Albany County had the Region’s lowest median age at 37.8 years • Albany County had the Region’s highest percentage of non-White population (24.7%), and 2nd highest
percentage of Hispanic population (6.0%) • South End neighborhood had Region’s the highest percentage of Black (59.2%) and non-White (71.8%)
populations • Delaware/2nd Avenue had the County’s highest percentage of Hispanic population (15.6%) • Albany County’s poverty rate of 11.9% was higher than that of NYS, excluding NYC (11.1%) • South End/Downtown (46.6%), West End (33.4%), and South End (33.0%) neighborhoods had the 1st, 3rd,
and 4th highest poverty rates in the Capital Region • West End had the Region’s highest percentage of population aged 0 to 14 years (24.6%)
17
I INTRODUCTION & DATA SUMMARY
Healthy Capital District
Chronic Disease • Albany County’s 2018 age-adjusted prevalence of adults with current asthma (11.7%), was down from
13.3% in 2016, and was higher than the NYS, excl. NYC rate of 10.8% • Albany County’s 2018 age-adjusted asthma emergency department (ED) visit rate (79.1 per 10,000) was
higher than NYS, excl. NYC (64.3) but met the Prevention Agenda 2024 objective of 131.1 per 10,000 • Age-adjusted Asthma hospitalization rates were 6.6 times higher among Black non-Hispanic residents
(21.7), and 2.4 times higher among Hispanic residents (8.0), than White non-Hispanic residents (4.0); higher ratios than in NYS, excl. NYC
• South End (214.5 per 10,000)) and West End (212.5) neighborhoods had 5.0 times higher 2014-18 age-adjusted asthma ED rates than NYS excl. NYC (42.8)
• Albany County’s age-adjusted adult smoking rate (11.6%) was lower than NYS, excl. NYC (13.9%), did not meet the Prevention Agenda 2024 objective (11.0%), but decreased from 14.3% in 2016
• Albany’s 2015-17 age-adjusted Lung cancer incidence (74.0) and mortality (41.9) rates, per 100,000, were higher than NYS, excl. NYC ( 66.1, 37.4 )
• Age-adjusted Lung cancer incidence increased (from 68.8) and mortality decreased (from 47.6), from 2012-14 to 2015-17
• Albany County’s 2016-18 age-adjusted COPD/CLRD hospitalization rate (23.8 per 10,000) was higher than NYS, excl. NYC (22.2)
• COPD/CLRD 2016-18 age-adjusted mortality rate (32.0 per 100,000) was lower than NYS, excl. NYC (35.0) and fell by 10%, from 2013-15 to 2016-18
• COPD/CLRD 2016-18 age-adjusted hospitalization rates were 3 times higher among Black (56.1 per 100,000), than White, non-Hispanic residents (18.6)
• West End (297.5 per 10,000) and South End (296.1) neighborhoods had 4.3 times higher 2014-18 age-adjusted COPD/CLRD ED visit rates than NYS, excl. NYC (68.5)
• Approximately 59,138 adults with an 2018 prevalence of 26.9%, and 6,735 school-aged children and adolescents with a 2017-19 prevalence of 16.3% were obese
• 2018 Age-adjusted adult diabetes prevalence (7.7%) was lower than NYS, excl. NYC (9.2%) and down from 9.0% in 2016
• 2016-18 Diabetes short-term complication aged 18+ years hospitalization rate (5.5 per 10,000), was higher than NYS, excl. NYC, (5.1) and 3.9 times higher among Black (15.5), than White, non-Hispanic residents (4.0)
• West End (40.5 per 10,000) and South End (46.0) neighborhoods had 3.0 to 3.4 times higher 2014-18 age-adjusted diabetes hospitalization rates than NYS, excl. NYC (13.7) and 3.7 (61.5 South End) to 4.2 times (69.4 West End) higher diabetes ED visit rates, than NYS, excl. NYC (16.6)
• Albany County’s 2016-18, age-adjusted congestive heart failure mortality (18.4 per 100,000) was higher than NYS, excl. NYC, (16.7) and down from 18.7 in 2013-15
• Albany County’s 2016-18, age-adjusted stroke mortality rate (28.4 per 100,000) was higher than NYS, excl. NYC, (27.6) and up from 26.1 in 2013-15
• Albany County’s 2015-17 age-adjusted colorectal cancer incidence rate (37.4/100,000) was lower than NYS, excl. NYC (38.6), while the county’s 2015-17 age-adjusted mortality rate (12.6/100,000) was higher than NYS, excl. NYC (11.9)
• Albany County’s 2018 colorectal cancer screening rate (68.1%) was higher than NYS, excl. NYC (66.5%) and met Prevention Agenda 2024 objective of 66.3%
18
I INTRODUCTION & DATA SUMMARY
Healthy Capital District
• Albany County’s 2015-17 age-adjusted female breast cancer incidence (157/100,000), late stage incidence (46.0/10,000) and mortality (20.5/100,000) rates were all higher than NYS, excl. NYC (140, 42.1, and 18.3).
• Albany County’s 2018 female breast cancer screening rate (84.7%) was higher than NYS, excl. NYC, (80.9%) among women 50 to 74 years of age
Healthy and Safe Environment • Albany County’s 2016-18 incidence rate of elevated blood lead levels (≥10 µg/dl) – 11.7 per 1,000 tested
children under 6 years of age – was the Region’s highest and 1.8 times higher than NYS, excl. NYC (6.5) • Albany County’s lead screening rates for children aged 9-17 months (70.6%) and up to 36 months
(53.6%) were below that of NYS, excl. NYC, (71.8% and 56.7%) and had increased slightly from 2 years prior
• The County had the Region’s highest 2017 hospitalization rates due to falls among adults aged 65+ (247.3 per 10,000) was highest in the Region, higher than NYS, excl. NYC (193.5), and did not meet the PA objective (173.7)
• Albany County’s 2016-18 age-adjusted assault hospitalization rate of 4.2 per 10,000 was the highest in the Region, higher than NYS, excl. NYC (2.2) and did not meet the PA objective (3.0)
• South End (19.1 per 10,000), South End/Downtown (18.3), and West End neighborhoods (13.3) had the 3 highest 2014-18 age-adjusted assault hospitalization rates in the Capital Region, each 5.9 to 8.5 times higher than NYS, excl. NYC (2.2)
• South End (184.1 per 10,000), West End (180.1), and South End/Downtown (149.1) neighborhoods had the 2nd, 3rd, and 4th highest 2014-18 age-adjusted assault ED visit rates in the Capital Region, each 4.3 to 5.3 times higher than NYS, excl. NYC (34.4)
Healthy Women, Infants, and Children • The 2016-18 Albany County infant mortality rate was 4.2 per 1,000 live births, lower than NYS, excl. NYC
(4.9) but did not meet the PA objective (4.0) • The 2016-18 infant mortality rates were 5 times higher among Black (11.2), than White (2.2), non-Hispanic
residents • South End/Downtown neighborhood had the Region’s highest 2016-18 rates of births with late or no
prenatal care (13.6%), 3.2 times higher than NYS, excl. NYC (4.3%), and neonatal mortality (14.9 per 1,000 births) which was about 4.5 times higher than NYS, excl. NYC (3.3)
• South End/Downtown neighborhood had the Region’s 2nd highest rate of infant mortality (14.9 per 1,000), 3 times higher than NYS, excl. NYC (4.9)
• Albany County’s 2016-18 rate of premature births (9.6%) was higher than NYS excl. NYC (9.0%) and did not meet the PA objective (8.3%).
• For 2016-16, Center Square/Arbor Hill neighborhood had the Region’s highest rate of premature births (15.7%), 1.9 times higher than NYS, excl. NYC (8.3%)
• Center Square/Arbor Hill neighborhood’s 2016-18 teen pregnancy rate (78.8 per 1,000 females aged 15-19 years) was 4 times higher than NYS, excl. NYC (19.6). and decreased by 45%, from 2007-09 to 2016-18
Mental Health and Substance Misuse
• Albany’s 2016-18 age-adjusted mental diseases and disorders (primary diagnosis) ED visit (161.8 per 10,000 vs 156.7) and hospitalization rates (78.5 vs 72.3) were slightly higher than NYS, excl. NYC
19
I INTRODUCTION & DATA SUMMARY
Healthy Capital District
• South End/Downtown neighborhood had the Region’s highest age-adjusted 2014-18 ED visit rate due to mental diseases and disorders (primary diagnosis) (1296.0/10,000) , which was about 8.3 times higher than NYS, excl. NYC (156.7)
• South End neighborhood had the Region’s 3rd highest 2014-18 age-adjusted hospitalization rate due to mental diseases and disorders (primary diagnosis) (219.7 per 10,000), which was about 3 times higher than NYS, excl. NYC (72.3)
• Albany County had the Region’s 3rd highest rate of 2016-18 age-adjusted ED visits (9.6/10,000) due to self-inflicted injuries, which was about 70% higher than NYS, excl. NYC (5.6)
• New Scotland Avenue neighborhood had the Region’s highest 2014-18 age-adjusted ED visit rate (30.5/10,000) and 2nd highest hospitalization rate (10.0/10,000) for self-inflicted injuries, which were 5.4 and 3.0 times higher than NYS, excl. NYC (5.6 and 3.3/10,000)
• Albany’s 2016-18 age-adjusted suicide mortality rate of 9.7 per 100,000 was slightly lower than NYS, excl. NYC (9.9), but did not meet the PA objective (7.0)
• Albany’s 2018 age-adjusted adult binge drinking rate of 19.2% was higher than NYS, excl. NYC (18.4%) and did not meet the PA objective (16.4%)
• Albany’s 2018 age-adjusted opioid ED visit rate of 64.7 per 100,000 was lower that NYS, excl. NYC, but did not meet the PA objective (53.3)
• South End and South End/Downtown neighborhoods had the Region’s 1st and 2nd highest rates, per 10,000, of 2014-18 age-adjusted ED visits (355.3 and 1,268.1) and hospitalizations (177.9 and 159.6) due to drug abuse, which were each 4.8 to 17.4 times higher than NYS, excl. NYC (72.7 and 33.1)
Infectious Disease • Coeymans Hollow ZIP code had the Region’s lowest rate of COVID-19 complete series vaccination (32.6%),
as of 11/14/21, which was lower than NYS, excl. NYC (65.7%) • Albany County’s 2016-18 HIV case rate of 9.2/100,000 was the Region’s highest, higher than NYS, excl.
NYC, (6.1), increased from 8.5 in 2013-15, and did not meet the PA objective (5.2) • Albany County’s 2016-18 gonorrhea diagnosis rate of 153.0/100,000: was the Region’s 2nd highest, was
higher than NYS, excl. NYC, (101.0), and increased by 61% from 94.9 in 2013-15 • Albany County’s 2016-18 chlamydia diagnosis rate of 521/100,000: was the Region’s 2nd highest, was
higher than NYS, excl. NYC, (420), and increased by 17% from 446 in 2013-15 • Albany County’s 2016-18 early syphilis diagnosis rate of 21.1/100,000: was the Region’s highest, was 2.0
times higher than NYS, excl. NYC, (10.5), and increased by 97% from 10.7 in 2013-15
Rensselaer County
Sociodemographic • Rensselaer County had a population of 159,185 and was the 3rd most rural county in the Capital Region
(244.4 population per square mile) • Rensselaer County had the 3rd lowest median age (39.8 years) in the Capital Region • 16.1% of Rensselaer County’s population was aged 0 to 14 years, while 16.5% was 65 years or older • 13.9% of Rensselaer County’s population was non-White, and 4.9% was Hispanic • Troy/Lansingburgh, the Region’s most populous neighborhood with 67,896 people, had the county’s
highest percentages of non-White (24.5%) and Hispanic (7.5%) populations
20
I INTRODUCTION & DATA SUMMARY
Healthy Capital District
• Rensselaer County’s poverty rate of 11.7% was higher than that of NYS, excluding NYC (11.1%) • Troy/Lansingburgh neighborhood had the highest neighborhood poverty rate in the county (19.1%)
Chronic Disease • Rensselaer County’s 2018 age-adjusted prevalence of adults with current asthma (13.1%), was up from
11.7% in 2016, and was higher than the NYS, excl. NYC rate of 10.8% • Rensselaer County’s 2018 age-adjusted asthma emergency department (ED) visit rate of 52.6 per 10,000
was lower than NYS, excl. NYC (64.3) and met the Prevention Agenda 2024 objective of 131.1 per 10,000 • Rensselaer County’s2016-18 age-adjusted asthma hospitalization rate (4.8 per 10,000) was lower than
NYS, excl. NYC (6.8) • 2016-18 age-adjusted asthma hospitalization rates were 4.8 times higher among Black non-Hispanic
residents (18.0/10,000), and 2.5 times higher among Hispanic residents (9.1), than White non-Hispanic residents (4.0); higher ratios than in NYS, excl. NYC
• Troy/Lansingburgh neighborhood (97.5/10,000) had 1.5 times higher 2014-18 age-adjusted asthma ED rates than NYS excl. NYC (42.8)
• Rensselaer County’s 2018 adult smoking rate (17.3%) was the Region’s 2nd highest, was above NYS, excl. NYC (13.9%), was above the Prevention Agenda 2024 objective of 11.0%, but decreased from 18.7% in 2016
• Rensselaer’s 2015-17 age adjusted lung cancer incidence (81.0 /100,000) and mortality (45.1) were higher than NYS, excl. NYC ( 66.1, 37.4)
• Rensselaer’s 2016-18 age-adjusted COPD/CLRD hospitalization rate (23.3 per 10,000) was slightly higher than NYS, excl. NYC (22.7)
• The 2016-18 age-adjusted COPD/CLRD mortality rate (48.2/100,000) was the Region’s highest, higher than NYS, excl. NYC (35.0), but fell by 11%, from 2013-15 to 2016-18
• Rensselaer’s 2016-18 age-adjusted COPD/CLRD hospitalization rate were 2.5 times higher among Black (51.6/10,000), than White, non-Hispanic (20.8) residents
• Troy/Lansingburgh neighborhood (136.5/10,000) had a 2.0 times higher 2014-18 age-adjusted COPD/CLRD ED visit rate than NYS excl. NYC (68.5)
• In 2018, approximately 36,004 Rensselaer adults were obese, a prevalence rate of 30.9%, higher than NYS, excl. NYC (29,1%) and did not meet the PA objective (24.2)
• During 2015-17, 4,263 school-aged children and adolescents (18.7%) were obese, a rate higher than NYS, excl. NYC (17.3%) and did not meet the PA objective (16.4%)
• The 2018 age-adjusted adult diabetes prevalence (10.1%) was higher than NYS, excl. NYC (9.2%) and up from 6.8% in 2016
• Rensselaer’s 2016-18 diabetes short-term complication hospitalization rate of 6.4 per 10,000 aged 18+ years), was higher than NYS, excl. NYC, (5.1) and 5.9 times higher among Black (28.4)), than White, non-Hispanic (4.8) residents
• Troy/Lansingburgh neighborhood (136.5 /10,000) had 8 times higher 2014-18 age-adjusted diabetes ED visit rates than NYS excl. NYC (16.6)
• Rensselaer County’s 2016-18 age-adjusted congestive heart failure mortality rate of19.4 per 100,000, was higher than NYS, excl. NYC, (16.7) but down from 20.7 in 2013-15
• Rensselaer County’s 2016-18 age-adjusted rate stroke mortality rate of 28.6 per 100,000 was higher than NYS, excl. NYC, (27.6) and up from 27.0 in 2013-15
21
I INTRODUCTION & DATA SUMMARY
Healthy Capital District
• Rensselaer County’s 2015-17 age-adjusted colorectal cancer incidence rate (38.5/100,000) was similar to NYS, excl. NYC (38.6), while the county’s 2015-17 age-adjusted mortality rate (12.9/100,000) was higher than NYS, excl. NYC (11.9)
• Rensselaer County’s colorectal cancer screening rate (75.4%) was higher than NYS, excl. NYC (66.5%) and met the Prevention Agenda 2024 objective of 66.3%
• Rensselaer County’s 2017-17 age-adjusted female breast cancer incidence (135/100,000 ) and late stage incidence (39.3) rates, were lower than NYS, excl. NYC (140 and 42.1), while mortality was higher (20.5 vs. 18.3)
• Rensselaer County’s female breast cancer screening rate (83.1%) was higher than NYS, excl. NYC, (80.9%) among women 50 to 74 years of age
Healthy and Safe Environment • Rensselaer County’s 2016-18 incidence rate of elevated blood lead levels (≥10 µg/dl), 10.8 per 1,000
tested children under 6 years of age, was the Region’s 2nd highest and 1.7 times higher than NYS, excl. NYC (6.5)
• Rensselaer County’s lead screening rates for children aged 9-17 months (72.9%) and two screenings by 36 months (57.6%) were higher than NYS, excl. NYC, (71.8% and 56.7%)
• Rensselaer County had the Region’s highest 2016-18 age-adjusted homicide mortality rate of 3.2 per 100,000, higher than NYS, excl. NYC (2.9)
Healthy Women, Infants, and Children • Rensselaer County had the Region’s highest 2016-18 infant mortality rates at 6.8 per 1,000 births, and
higher than NYS, exc. NYC (4.9) • Infant mortality rates were 8.1 times higher among Hispanic (26.8) residents and 6.8 times higher among
Black non-Hispanic (11.2) residents, compared to White non-Hispanic (3.3) residents, in Rensselaer County • North East neighborhood had the County’s highest 2016-18 neonatal and infant) mortality rates (13.8/
1000), as well as County’s highest premature birth rate (12.4%) • North East neighborhood had the Region’s highest rate of 2016-18 low birth weight births (14.4%) and the
County’s highest rate of births with late or no prenatal care (8.8%), both 1.9 to 2 times higher than in NYS, excl. NYC
• Rensselaer had the Regions highest 2016-18 % preterm birth rate at 9.7%, higher than NYS, excl. NYC (9.0) and did not meet the PA objective (8.3%)
• Rensselaer County’s 2016-18 teen pregnancy rate of 21.2 per 1,000 females aged 15-19 years was higher than NYS, excl. NYC, (19.6) and has decreased by 57% from 2009 to 2018
• Troy/Lansingburgh neighborhood had the County’s highest 2016-18 teen pregnancy rate (26.0/ 1,000), 1.3 times higher than NYS, excl. NYC (19.6)
Mental Health and Substance Misuse • Rensselaer County had the Region’s 3rd highest 2014-18 age-adjusted ED visit (163.7/10,000) and
hospitalizations (90.8) rates due to mental diseases and disorders (primary diagnosis); the hospitalizations rate about 1.3 times higher than NYS, excl. NYC (72.3)
22
I INTRODUCTION & DATA SUMMARY
Healthy Capital District
• Rensselaer County had the Region’s highest rate of 2014-18 age-adjusted ED visits due to self-inflicted injuries (9.9/10,000), which was about 76% higher than NYS, excl. NYC (5.6)
• Rensselaer’s 2016-18 age-adjusted suicide mortality rate of 11.8 per 100,000 was higher than NYS, excl. NYC (9.9) and did not meet the PA objective (8.0)
• Rensselaer County had the Region’s highest 2018 age-adjusted rate of adult binge drinking (23.5%); higher than NYS, excl. NYC (18.4%)
• Rensselaer County had the Region’s 2nd highest 2018 age-adjusted opioid overdose ED visit rate (74.1/100,000), slightly higher than NYS, excl. NYC, (71.9), and did not meet the PA objective (53.3)
• Rensselaer’s 2017-19 age-adjusted opioid analgesic prescription rate of 460 per 1,000 was higher than NYS, excl. NYC (413) and did not meet the PA objective (350)
Infectious Disease
• While Rensselaer’s 2018-19 HPV vaccination rate of 30.1% was similar to NYS, excl. NYC, it did not meet the PA objective (37.4%)
• Rensselaer County had the Region’s 2nd lowest rates of COVID-19 vaccination (67.3% with at least 1 dose and 62.1% with complete series), as of 11/14/21, which were lower than NYS, excl. NYC (72.6% & 65.7%)
• Rensselaer County’s 2016-18 age-adjusted gonorrhea diagnosis rate of 124.4/100,000 was higher than NYS, excl. NYC, (101.0), and doubled from 61.8 in 2013-15
• Rensselaer County’s 2016-18 age-adjusted chlamydia diagnosis rate of 459/100,000 was higher than NYS, excl. NYC, (420), and increased by 17% from 393 in 2013-15
• Rensselaer County’s 2016-18 age-adjusted early syphilis diagnosis rate of 12.4/100,000 was higher than NYS, excl. NYC (10.5), and increased by 165% from 4.7 in 2013-15
• Rensselaer County’s 2016-18 Lyme disease incidence rate of 311.3/100,000 was the 4th highest rate of all NYS counties
Schenectady County
Sociodemographic • Schenectady County had a population of 154,859 and was the Capital Region’s most urban county (759.6
population per square mile) • Schenectady County had the 2nd lowest median age (39.7 years) in the Capital Region • Schenectady County had the largest percentage of population 14 years of age or younger in the Region at
17.8%, while 16.8% of the County population was 65+ years of age • Schenectady County had the Region’s 2nd highest percentage of non-White population, at 23.7%, and
Region’s the highest percentage of Hispanic population, at 7.1% • Hamilton Hill neighborhood had the Region’s 2nd highest percentage of non-White population (68.2%) as
well as the Region’s highest percentage of Hispanic population (16.8%) • Schenectady’s poverty rate of 11.4% was higher than that of NYS, excluding NYC (11.1%) • Hamilton Hill neighborhood had the Region’s 2nd highest neighborhood poverty rate (37.5%) and the
Region’s highest percentage of population, aged 25 and over, without a high school diploma (25.6%)
23
I INTRODUCTION & DATA SUMMARY
Healthy Capital District
Chronic Disease
• Schenectady County’s 2018 age-adjusted prevalence of adults with current asthma (15.9%), was the highest in the Region, up from 11.2% in 2016, and was higher than the NYS, excl. NYC rate (10.8%)
• The 2016-18 age-adjusted asthma hospitalization rates were 2.9 times higher among Black non-Hispanic residents (12.6/10,000), and 1.6 times higher among Hispanic residents (7.0), than White non-Hispanic residents (4.3); lower ratios than in NYS, excl. NYC
• City/Stockade (140.4/10,000) and Hamilton Hill (195.4) neighborhoods had 3.2 and 4.6 times higher 2014-18 age-adjusted asthma ED rates than NYS excl. NYC (42.8)
• Schenectady County’s 2018 adult smoking rate (11.6%) was the Region’s lowest, was below NYS, excl. NYC (13.9%), decreased from 18.4% in 2016, but did not meet the Prevention Agenda 2024 objective (11.0%)
• The 2015-17 age-adjusted lung cancer incidence (72.4) and mortality (39.0) rates, per 100,000, were higher than NYS, excl. NYC (66.1; 37.4)
• The 2015-17 age-adjusted lung cancer incidence increased (from 63.8) and mortality decreased (from 45.1), from 2012-14 to 2015-17
• The 2016-18 age-adjusted COPD/CLRD hospitalization rate (25.0 per 10,000) was higher than NYS, excl. NYC (22.2)
• The 2016-18 age-adjusted COPD/CLRD mortality rate (41.1/100,000) was higher than NYS, excl. NYC (35.0) but fell by 11%, from 2013-15 to 2016-18
• The 2016-18 age-adjusted COPD/CLRD hospitalization rates were 1.6 times higher among Black (35.9/10,000), than White, non-Hispanic residents (23.1)
• City/Stockade (207.9/10,000) and Hamilton Hill (281.1) neighborhoods had 3.0 to 4.1 times higher 2014-18 age-adjusted COPD/CLRD ED visit rates and 2.3 (54.4 Hamilton Hill) to 2.5 times (58.6 City/Stockade) higher hospitalization rates, compared to NYS excl. NYC
• Approximately 37,720 Schenectady adults in 2018 (33.7%) were obese, higher than NYS, excl. NYC (29.1%), and did not meet the PA objective (24.2%)
• Approximately 4,600 Schenectady school-aged children and adolescents (18.8%) in 2017-19 were obese, higher than NYS, excl. NYC (17.3%) and did not meet the PA objective (16.4%)
• Schenectady’s 2018 age-adjusted adult diabetes prevalence (10.3%) was higher than NYS, excl. NYC (9.2%) and up from 9.0% in 2016
• The 2016-18 diabetes short-term complication hospitalization rate, aged 18+ years (6.9/10,000) was the Region’s highest, higher than NYS, excl. NYC (5.1), and was 3.6 times higher among Black (18.2) than White, non-Hispanic residents (5.1)
• Schenectady County had the Region’s highest rate of 2016-18 age-adjusted diabetes (primary diagnosis) ED visits, at 36.9 per 10,000, and 2016-18 age-adjusted diabetes mortality, at 21.2 per 100,000
• Hamilton Hill (40.7/10,000) and City/Stockade (32.1) neighborhoods had 2.3 to 3.0 times higher 2014-18 age-adjusted diabetes hospitalization rates and 4.0 (65.9 City Stockade)) to 6.1 times (102.0 Hamilton Hill) higher diabetes ED visit rates, than NYS, excl. NYC
• Schenectady County had Region-high 2016-18 age-adjusted heart attack (16.4/10,000) and coronary heart disease ( 24.9) hospitalization rates
• Schenectady County’s 2016-18 age-adjusted congestive heart failure mortality (17.9 /100,000) was higher than NYS, excl. NYC, (16.7) and down from 19.4 in 2013-15
24
I INTRODUCTION & DATA SUMMARY
Healthy Capital District
• Schenectady County’s 2016-18 age-adjusted stroke mortality (32.1 /100,000) was the Region’s highest, was higher than NYS, excl. NYC, (27.6), and was up from 30.6 in 2013-15
• Schenectady’s 2016-18 age-adjusted stroke hospitalization rate (26.8/10,000) was the highest in the Region, and higher than NYS, excl. NYC (21.1)
• Schenectady County’s 2015-17 age-adjusted colorectal cancer incidence rate (35.8/100,000) and mortality rate (9.5/100,000) were lower than NYS, excl. NYC (38.6 and 11.9)
• Schenectady County’s 2018 colorectal cancer screening rate (68.9%) was higher than NYS, excl. NYC (66.5%) and met the Prevention Agenda 2024 objective of 66.3%
• Schenectady County’s 2015-17 age-adjusted female breast cancer incidence (153/100,000), late stage incidence (52.8/100,000) and mortality (19.2/100,000) rates were all higher than NYS, excl. NYC (140, 42.1, and 18.3).
• Schenectady County’s 2018 female breast cancer screening rate among women 50 to 74 years of age (80.1%) was similar to NYS, excl. NYC, (80.9%)
Healthy and Safe Environment • Schenectady County’s 2016-18 incidence rate of elevated blood lead levels (≥10 µg/dl), 9.1 per 1,000
tested children under 6 years of age, was 1.4 times higher than NYS, excl. NYC (6.5) • Schenectady County’s lead screening rates of one screen for children aged 9-17 months (80.1%) and two
screens at 36 months (62.2%) were higher than NYS, excl. NYC, (71.8% and 56.7%) and had increased from 2 years prior
• In 2020, Schenectady County had the Region’s highest percentage (10.4%) of school drinking water outlets that exceeded the lead action limit of 15 µg/L, which was higher than NYS, excl. NYC (8.0%)
• Schenectady County had the Region’s highest 2014-18 age-adjusted ED visit rates due to motor vehicle accidents (84.2/10,000), higher than NYS, excl. NYC (77.4); the hospitalization rate of 6.7/10,000 was also higher than NYS, excl. NYC (5.9)
• Schenectady’s 2014-18 falls among adults 65 years and older ED visit rate (453.2/10,000) was the highest in the Region’ and higher than NYS, excl. NYC (434.5)
• Schenectady had the Region’s highest 2014-18 age-adjusted assault-related ED visit rate (61.4/10,000), about twice as high as NYS, excl. NYC (34.4)
• Schenectady’s 2016-18 age-adjusted assault-related hospitalization rate (3.5/10,000) was higher than NYS, excl. NYC (2.2) and did not meet the PA objective (3.0)
Healthy Women, Infants, and Children • The County’s 2016-18 infant mortality rate of 6.9 per 1,000 births was higher than NYS, excl. NYC (4.9)
and did not meet the PA objective (4.0) • Hamilton Hill neighborhood’s2016-18 neonatal mortality rate, at 11.0 per 1,000 births, was 3.3 times
higher than NYS, excl. NYC (3.3 per 1,000 births) • City/Stockade neighborhood’s 2016-18 infant mortality rate, at 17.5 per 1,000 births, was 3.6 times higher
than NYS, excl. NYC (4.9 per 1,000 births) and the highest in the Capital Region • For 2016-18, Schenectady County had a higher rate (5.4%) of late or no prenatal care than NYS, excl.
NYC, (4.3%) • Schenectady’s 2016-18 % of births that were premature (<37 weeks gest.) of 9.5% was higher than NYS,
excl. NYC (9.0%), and did not meet the PA objective (8.3%)
25
I INTRODUCTION & DATA SUMMARY
Healthy Capital District
• Schenectady County had the Region’s highest rate of 2016-18 low birthweight births (< 2.5 kg) at 9.3% and higher than NYS, excl. NYC (7.7%)
• Schenectady’s 2016-18 teen pregnancy rate of (38.1 per 1,000 females aged 15-19 years) was twice as high as NYS, excl. NYC, (18.9) but decreased by 43% from 2009 to 2018
• Hamilton Hill neighborhood’s 2016-18 teen pregnancy rate (119 per 1,000 females aged 15-19 years) was 6.3 times higher than NYS, excl. NYC (18.9) was the Region’s highest, but fell by 45% from 2007-09 to 2016-18
• Schenectady’s 2016-18 % of infants who exclusively breastfed in the hospital (52.8%) was the lowest in the Region, but met the PA objective (51.6%)
Mental Health and Substance Misuse • Schenectady County had the Region’s highest rates of 2014-18 age-adjusted ED visits (239.5/10,000) and
hospitalizations (108.1) due to mental diseases and disorders (primary diagnosis), both rates about 50% higher than NYS, excl. NYC (156.7, 72.3)
• Hamilton Hill (598.5/10,000) and City/Stockade (577.0) neighborhoods had the Region’s 2nd and 3rd highest 2014-18 age-adjusted ED visit rates and 1st and 2nd highest hospitalization rates (City/Stockade 276.3, Hamilton Hill 247.6), due to mental diseases and disorders (primary diagnosis), each about 3.4 to 3.8 times higher than NYS, excl. NYC
• Schenectady’s 2018 age-adjusted % of adults reporting frequent mental distress in the past month of 13.0% was higher than NYS, excl. NYC (11.8%) and did not meet the PA objective (10.7%)
• Schenectady’s 2016-18 age adjusted suicide mortality rate of 10.2 per 100,000 was slightly higher than NYS, excl. NYC (9.9) and did not meet the PA objective (7.0)
• Schenectady County had the Region’s highest 2014-18 age-adjusted rate of hospitalizations (5.3), and the 2nd highest rate of ED visits (9.8), per 10,000, due to self-inflicted injuries, both 61-74% higher than NYS, excl. NYC (3.3, 5.6)
• City/Stockade and Hamilton Hill had the Region’s 1st and 4th highest rates of 2014-18 age-adjusted self-inflicted injuries hospitalizations (13.1 and 9.0/10,000), which were 2.7 to 4.0 times higher than NYS, excl. NYC (3.3/10,000)
• Hamilton Hill and City/Stockade had the Region’s 2nd and 4th highest rates of 2014-18 age-adjusted ED visits due to self-inflicted injuries (21.5 and 19.1/10,000), which were 3.4 to 3.8 times higher than NYS, excl. NYC (5.6/10,000)
• Schenectady County had the Region’s 3rd highest 2016-18 age-adjusted opioid overdose mortality rate (19.7/100,000), which was equal to NYS, excl. NYC, (19.7), was 3.5 times higher than in 2013-15 (5.7, and did not meet the PA objective (14.3)
• Schenectady’s 2017-19 age-adjusted rate for opioid analgesic prescriptions for pain of 445/1000 was higher than NYS, excl. NYC (413) and did not meet the PA objective (350)
• Hamilton Hill and City/Stockade neighborhoods had the Region’s 3rd and 4th highest 2014-18 age-adjusted rates, per 10,000, of ED visits (332.1 and 285.2) and hospitalizations (120.8 and 119.1) due to drug abuse, which were each 3.6 to 4.6 times higher than NYS, excl. NYC (72.7 and 33.1)
Infectious Disease
26
I INTRODUCTION & DATA SUMMARY
Healthy Capital District
• From 1/12/21 to 1/11/22, Schenectady County had the Region’s 2nd highest rates of COVID-19 test positivity (123.0/1,000) and mortality (108.1/100,000); the positivity rate was lower than NYS, excl. NYC (146.1), but mortality was higher (94.4)
• Schenectady’s 2016-18 age-adjusted HIV case rate of 8.4 per 100,000 was higher than NYS, excl. NYC (6.1) and did not meet the PA objective (5.2)
• Schenectady County’s 2016-18 age-adjusted gonorrhea diagnosis rate of 191.1/100,000: was the Region’s highest, was higher than NYS, excl. NYC, (101.0), and nearly doubled from 99.5 in 2013-15
• Schenectady County’s 2016-18 age-adjusted chlamydia diagnosis rate of 580/100,000: was the Region’s highest, was higher than NYS, excl. NYC, (420), and increased by 13% from 515 in 2013-15
• Schenectady County’s 2016-18 age-adjusted early syphilis diagnosis rate of 14.7/100,000: was the Region’s 2nd highest, was higher than NYS, excl. NYC, (10.5), and increased by 67% from 8.8 in 2013-15
Saratoga County
Sociodemographic • Saratoga County, with a population of 228,502, was the 2nd most populated county in the Capital Region,
and the 3rd most urban (284.2 population per square mile) • Saratoga County had the 3rd highest median age (42.8 years) in the Capital Region • Saratoga County had 16.5% of population aged 0 to 14 years, while 17.6% of its population was 65+ years • Saratoga County had the smallest percentages of non-White (7.3%) and Hispanic (3.2%) populations in the
Capital Region • Clifton Park West neighborhood had the highest percentage of non-White population (14.5%), while
Ballston Spa had the highest percentage of Hispanic population (5.0%) • Saratoga County had the lowest poverty rate in the Capital Region, at 5.8% • North West neighborhood had the highest neighborhood poverty rate (14.6%) in the County.
Chronic Disease • Saratoga County’s 2018 prevalence of adults with current asthma (14.1%) was higher than the NYS, excl.
NYC 2018 prevalence of 10.8% and was down from 15.4% in 2016, • Saratoga County’s 2018 adult smoking rate (12.8%): was below NYS, excl. NYC (13.9%), met the
Prevention Agenda 2024 objective of 11.0%, and decreased from 16.5% in 2016 • Saratoga’s 2015-17 age-adjusted lung cancer incidence (71.8) and mortality (42.6) rates, per 100,000,
were higher than NYS, excl. NYC (66.1, 37.4) • Saratoga’s age-adjusted lung cancer incidence increased (from 70.0) and mortality fell (from 50.7), from
2012-14 to 2015-17 • Approximately 50,941 Saratoga adults (30.1%)were obese in 2018, and did not meet the PA objective of
24.2%; 4,557 school-aged children and adolescents (13.1%) in Saratoga were obese, but did meet the PA objective of 16.4%
• The 2018 age-adjusted adult diabetes prevalence (8.9%) was lower than NYS, excl. NYC (9.2%) and up from 6.9% in 2016
• Saratoga County’s 2016-18, age-adjusted congestive heart failure mortality rate (11.9/100,000), was the Region’s lowest, was higher than NYS, excl. NYC, (16.7), and was down from 13.0 in 2013-15
27
I INTRODUCTION & DATA SUMMARY
Healthy Capital District
• Saratoga County’s 2016-18 age-adjusted stroke mortality rate (31.0/100,000) was higher than NYS, excl. NYC, (27.6) and was up from 27.1 in 2013-15
• Saratoga County’s 2015-17 age adjusted colorectal cancer incidence rate (37.5/100,000) was lower than NYS, excl. NYC (38.6), while the county’s mortality rate (13.5/100,000) was higher than NYS, excl. NYC (11.9)
• Saratoga County’s colorectal cancer screening rate (76.8%) was higher than NYS, excl. NYC (66.5%) and met the Prevention Agenda 2024 objective of 66.3%
• Saratoga County’s 2015-17 age-adjusted female breast cancer incidence (143/100,000) and late stage incidence (44.7) rates were slightly higher than NYS, excl. NYC (140 and 42.1), while mortality was lower (17.0/100,000 vs. 18.3)
• Saratoga County’s female breast cancer screening rate (88.3%) was higher than NYS, excl. NYC, (80.9%) among women 50 to 74 years of age
Healthy and Safe Environment • Saratoga County had the Region’s highest rates of lead screening and lowest incidence of elevated blood
lead level, among young children • Saratoga’s 2917 firearm-related assault hospitalization rate of 0.39 per 10,000 was higher than NYS, excl.
NYC (0.26) and did not meet the PA objective (0.38)
Healthy Women, Infants, and Children • Saratoga County’s 2016-18 birth indicator rates (teen pregnancy and births, infant and neonatal mortality,
births with late or no prenatal care, and low birth weight and premature births) were all lower than NYS, excl. NYC
• North East neighborhood had the County’s highest 2016-18 rates of neonatal (8.2) and infant (8.2) mortality, per 1,000 births, as well as the County’s highest rate low birth weight births (8.0%)
• North West neighborhood had the County’s highest 2016-18 teen pregnancy rate (22.3 per 1,000 females aged 15-19 years) and the County’s highest premature birth rate (10.2%)
Mental Health and Substance Misuse • Saratoga County had the Region’s 2nd highest rate of frequent mental distress (13.7%), higher than NYS,
excl. NYC (11.8%) and did not meet the PA objective (10.7%) • Saratoga’s 2016-18 age-adjusted suicide mortality rate of 11.5 per 100,000 was higher than NYS, excl. NYC
(9.9) and did not meet the PA objective (7.0) • Saratoga County’s 2018 age-adjusted binge drinking rate of 19.5% was higher than NYS, excl. NYC
(18.4%) and did not meet the PA objective (16.4%) • Saratoga County’s 2017-19 opioid analgesic prescriptions for pain rate of 375/1,000, while less than NYS,
excl. NYC (413), did not meet the PA objective (350)
Infectious Disease • Saratoga County had the Region’s lowest 2018-19 rate of 13 year-olds with a complete HPV vaccine series
(26.1%), lower than NYS, excl. NYC (29.4%) and did not meet the PA objective (37.4%)
28
I INTRODUCTION & DATA SUMMARY
Healthy Capital District
• The County had the Region’s highest COVID-19 test positivity rate (126.8/1,000), from 1/12/21 to 1/11/22, but less than NYS, excl. NYC (146.1); the mortality rate of 95.1 per100,000 was slightly higher than NYS, excl. NYC (94.4)
Columbia County
Sociodemographic • Columbia County had a population of 60,371, and was the 2nd most rural county in the Capital Region
(94.4 population per square mile) • Columbia County had the highest median age (48.2 years) in the Capital Region • 13.9% of Columbia County’s population was aged 0 to 14 years; 23.1% of Columbia County’s population
was aged 65 years and older, the highest percentage in the Capital Region • Approximately 11.0% of Columbia County’s population was non-White, and 4.8% of the County’s
population was Hispanic • Hudson neighborhood had the county’s highest percentage of non-White (21.2%) and Hispanic (5.8%)
populations • Columbia County’s poverty rate of 11.6% was higher than that of NYS, excluding NYC (11.1%) • Hudson neighborhood had the highest neighborhood poverty rate (17.4%) in the County
Chronic Disease • Hudson neighborhood had a 1.9 times higher 2014-18 age-adjusted asthma ED visit rate (79.4/10,000)
than NYS excl. NYC (42.9) • The 2016-18 age-adjusted asthma hospitalization rates were 6.3 times higher among Black non-Hispanic
residents (24.7/10,000), and 3.6 times higher among Hispanic residents (13.9), than White non-Hispanic residents (3.9); higher ratios than in NYS, excl. NYC
• Columbia County’s 2018 adult smoking rate (16.2%) was higher than that of NYS, excl. NYC (13.9%), did not meet the PA objective (11.0%), but fell from 18.9% in 2016
• Columbia County had the Region’s highest 2016-18 age-adjusted COPD/CLRD hospitalization rate (30.0 per 10,000), higher than NYS, excl. NYC (22.2)
• Hudson had a 2.2 times higher the 2014-18 age-adjusted COPD/CLRD hospitalization rate (51.6/10,000), and a 1.6 times higher ED visit rate (109.8), than NYS excl. NYC (23.6, 68.5)
• Columbia County’s 2016-18 age-adjusted COPD/CLRD mortality rate of 41.9 per 100,000 was higher than NYS, excl. NYC (35.0) but fell from 42.6, from 2013-15 to 2016-18
• About 12,000 Columbia County adults were considered obese; the prevalence rate of 24.2% was lower than NYS, excl. NYC (29.1) but did not meet the PA objective (24.2%)
• For 2017-19, approximately 1,400 school-aged children and adolescents (17.3%) were obese, a prevalence similar to NYS, excl. NYC (17.3%), but did not meet the PA objective (16.4%)
• The 2018 age-adjusted adult diabetes prevalence (7.6%) was lower than NYS, excl. NYC (9.2%) but up from 4.4% in 2016
• The 2016-18 diabetes short-term complication hospitalization rate was 4 times higher among Black (13.5/10,000) than White (3.3), non-Hispanic residents
• Columbia County’s 2016-18 age-adjusted coronary heart disease mortality rate 118.7 per 100,000, was higher than NYS, excl. NYC, (115.6) but down from 130.1 in 2014-16
29
I INTRODUCTION & DATA SUMMARY
Healthy Capital District
• Columbia County’s 2016-18 age-adjusted congestive heart failure mortality rate of 19.0 per 100,000, was higher than NYS, excl. NYC, (16.7), and was up from 13.7 in 2013-15
• Columbia County’s 2015-17 age-adjusted colorectal cancer incidence rate (39.1/100,000) and mortality rate (16.9/100,000) were higher than NYS, excl. NYC (38.6 and 11.9)
• Columbia County’s 2018 colorectal cancer screening rate (68.6%) was higher than NYS, excl. NYC (66.5%) and met the PA objective of 66.3%
• Columbia County’s 2015-17 age-adjusted female breast cancer incidence (143/100,000) and late stage incidence (51.4) rates, per 100,000, were higher than NYS, excl. NYC (140 and 42.1), while mortality was lower (13.6 vs. 18.3)
• Columbia County’s 2018 female breast cancer screening rate (88.0%) was higher than NYS, excl. NYC, (80.9%) among women 50 to 74 years of age
Healthy and Safe Environment • Columbia County’s 2016-18 incidence rate of elevated blood lead levels (≥10 µg/dl) of 8.8 per 1,000
tested children under 6 years of age was 1.35 times higher than NYS, excl. NYC (6.5) • The County’s lead screening rates in children aged 9-17 months-one screen (58.5%) and two screens by
36 months (44.4%) were: the Region’s lowest, lower than NYS, excl. NYC, (71.8% and 56.7%), and higher than 2 years prior
• Columbia County had the Region’s lowest rate of 2019 cooling tower regulatory compliance, at 38.3%, lower than NYS, excl. NYC (62.4%) and did not meet the PA objective (93.0%)
• Columbia had the Region’s 2nd highest 2016-18 age-adjusted Motor Vehicle mortality rate of 11.6/100,000, higher than NYS, excl. NYC (6.8)
• Columbia’s 2017 falls to the elderly (65 years and over) hospitalization rate of 199.0/10,000 was higher than NYS, excl. NYC (193.5) and did not meet the PA objective (173.7)
• Columbia had the Region’s 2015-19 substandard housing rate of 25.4% of housing units, similar to NYS, excl. NYC (25.6%)
Healthy Women, Infants, and Children • Columbia County’s 2016-18 rate of births with adequate prenatal care (76.6%) was the Region’s highest,
and similar to NYS, excl. NYC (76.4) • Columbia’s 2016-18 birth/pregnancy indicator rates (infant mortality, prematurity and low birthweight, teen
pregnancy)were all lower than NYS, excl. NYC • Hudson neighborhood had the County’s highest rates of 2016-18 infant mortality (5.7 per 1,000 births),
teen pregnancy (20.4 per 1,000 females aged 15-19 years), and premature birth (10.2%) • Canaan neighborhood had the County’s highest 2016-18 rate of low birth weight births (9.3%) • Chatham neighborhood had the County’s highest 2016-18 rate of births with late or no prenatal care
(7.7%)
Mental Health and Substance Misuse • Columbia County had the Region’s 2nd highest 2014-18 age-adjusted rates of ED visits (178.9/10,000) and
hospitalizations (95.0/10,000) due to mental diseases and disorders (primary diagnosis), both higher than NYS, excl. NYC (156.7, 72.3)
30
I INTRODUCTION & DATA SUMMARY
Healthy Capital District
• Columbia County had the Region’s highest 2016-18 age-adjusted rate of suicide mortality (15.9/100,000), 61% higher than NYS, excl. NYC (9.9/100,000), and did not meet the PA objective of (7.0)
• Columbia County had the Region’s highest 2018 age-adjusted rate of adult binge drinking (23.8%); higher than NYS, excl. NYC (18.4%), and did not meet the PA objective (16.4)
• Columbia County had the Region’s highest 2016-18 age-adjusted rate of cirrhosis mortality (8.9/10,000); higher than NYS, excl. NYC (7.9/10,000)
• Columbia County had the Region’s 2nd highest 2016-18 age-adjusted opioid overdose mortality rate (21.4/100,000), higher than NYS, excl. NYC, (19.7), 1.8 times higher than in 2013-15 (11.6), and did not meet the PA objective (14.3)
• Columbia’s 2018 age-adjusted opioid overdose ED visit rate of 66.8 per 100,000, while lower than NYS, excl. NYC (71.9), did not meet the PA objective ((5.3.)
• Columbia County’s 2017-19 opioid analgesic prescriptions for pain rate of 473/1,000 was the Region’s 2nd highest, higher than NYS, excl. NYC (413), did not meet the PA objective (350)
• Columbia County had the Region’s highest 2018 rate of newborns with neonatal withdrawal symptoms and/or affected by maternal use of drugs of addiction (27.8/1,000 newborn discharges), which was 2.0 times higher than NYS, excl. NYC (14.0)
Infectious Disease • Columbia County had the Region’s 3rd lowest rates of COVID-19 vaccination (70.1% with at least 1 dose and
63.8% with complete series), as of 11/14/21, which were lower than NYS, excl. NYC (72.6% & 65.7%) • Columbia’s 2018-19 HPV vaccination rate of 29.9% was slightly higher than NYS, excl. NYC (29.4%), but
did not meet the PA objective (37.4%) • Columbia’s 2016-18 HIV case rate of 6.1 per 100,000 was higher than NYS, excl. NYC (6.1) and did not
meet the PA objective (5.2) • Columbia County’s 2016-18 Lyme disease incidence rate of 593.8/100,000 was significantly higher than
NYS, excl. NYC (65.4), and the highest rate of all NYS counties
Greene County
Sociodemographic • Greene County had a population of 47,424, and was the most rural county in the Capital Region (73.4
population per square mile) • Greene County had the 2nd highest median age (45.9 years) in the Capital Region • 13.5% of Greene County’s population was aged 0 to 14 years, while 21.6% was aged 65 years and older • Hunter/Tannersville (32.5%) and Windham/Ashland/Jewett (31.3%) neighborhoods had the 1st and 2nd
highest percentages of population aged 65 years and older, in the Capital Region • 10.4% of Greene County’s population was non-White, and 5.9% of its population was Hispanic • Coxsackie/Athens neighborhood had the county’s highest percentages of non-White (14.1%) and Hispanic
(10.1%) populations • Greene County’s poverty rate of 14.0% was the highest in the Capital Region, and was higher than that of
NYS, excluding NYC (11.1%) • Catskill neighborhood had the highest neighborhood poverty rate (19.4%) in the County
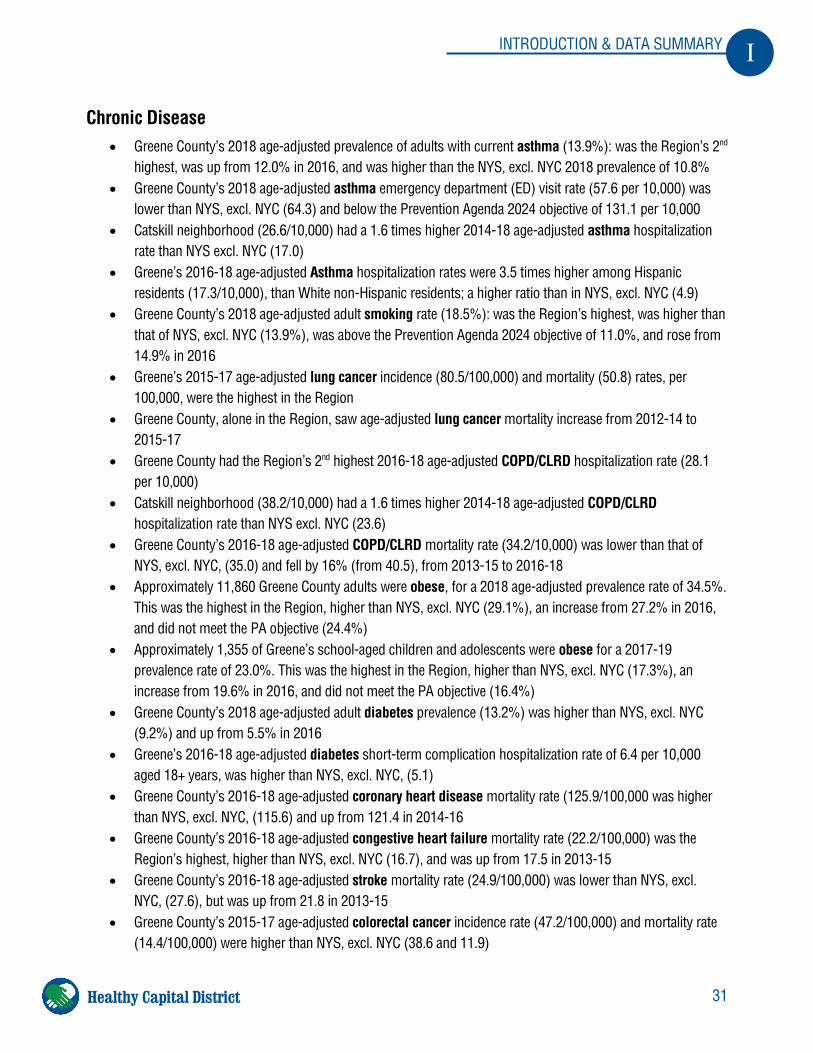
31
I INTRODUCTION & DATA SUMMARY
Healthy Capital District
Chronic Disease • Greene County’s 2018 age-adjusted prevalence of adults with current asthma (13.9%): was the Region’s 2nd
highest, was up from 12.0% in 2016, and was higher than the NYS, excl. NYC 2018 prevalence of 10.8% • Greene County’s 2018 age-adjusted asthma emergency department (ED) visit rate (57.6 per 10,000) was
lower than NYS, excl. NYC (64.3) and below the Prevention Agenda 2024 objective of 131.1 per 10,000 • Catskill neighborhood (26.6/10,000) had a 1.6 times higher 2014-18 age-adjusted asthma hospitalization
rate than NYS excl. NYC (17.0) • Greene’s 2016-18 age-adjusted Asthma hospitalization rates were 3.5 times higher among Hispanic
residents (17.3/10,000), than White non-Hispanic residents; a higher ratio than in NYS, excl. NYC (4.9) • Greene County’s 2018 age-adjusted adult smoking rate (18.5%): was the Region’s highest, was higher than
that of NYS, excl. NYC (13.9%), was above the Prevention Agenda 2024 objective of 11.0%, and rose from 14.9% in 2016
• Greene’s 2015-17 age-adjusted lung cancer incidence (80.5/100,000) and mortality (50.8) rates, per 100,000, were the highest in the Region
• Greene County, alone in the Region, saw age-adjusted lung cancer mortality increase from 2012-14 to 2015-17
• Greene County had the Region’s 2nd highest 2016-18 age-adjusted COPD/CLRD hospitalization rate (28.1 per 10,000)
• Catskill neighborhood (38.2/10,000) had a 1.6 times higher 2014-18 age-adjusted COPD/CLRD hospitalization rate than NYS excl. NYC (23.6)
• Greene County’s 2016-18 age-adjusted COPD/CLRD mortality rate (34.2/10,000) was lower than that of NYS, excl. NYC, (35.0) and fell by 16% (from 40.5), from 2013-15 to 2016-18
• Approximately 11,860 Greene County adults were obese, for a 2018 age-adjusted prevalence rate of 34.5%. This was the highest in the Region, higher than NYS, excl. NYC (29.1%), an increase from 27.2% in 2016, and did not meet the PA objective (24.4%)
• Approximately 1,355 of Greene’s school-aged children and adolescents were obese for a 2017-19 prevalence rate of 23.0%. This was the highest in the Region, higher than NYS, excl. NYC (17.3%), an increase from 19.6% in 2016, and did not meet the PA objective (16.4%)
• Greene County’s 2018 age-adjusted adult diabetes prevalence (13.2%) was higher than NYS, excl. NYC (9.2%) and up from 5.5% in 2016
• Greene’s 2016-18 age-adjusted diabetes short-term complication hospitalization rate of 6.4 per 10,000 aged 18+ years, was higher than NYS, excl. NYC, (5.1)
• Greene County’s 2016-18 age-adjusted coronary heart disease mortality rate (125.9/100,000 was higher than NYS, excl. NYC, (115.6) and up from 121.4 in 2014-16
• Greene County’s 2016-18 age-adjusted congestive heart failure mortality rate (22.2/100,000) was the Region’s highest, higher than NYS, excl. NYC (16.7), and was up from 17.5 in 2013-15
• Greene County’s 2016-18 age-adjusted stroke mortality rate (24.9/100,000) was lower than NYS, excl. NYC, (27.6), but was up from 21.8 in 2013-15
• Greene County’s 2015-17 age-adjusted colorectal cancer incidence rate (47.2/100,000) and mortality rate (14.4/100,000) were higher than NYS, excl. NYC (38.6 and 11.9)
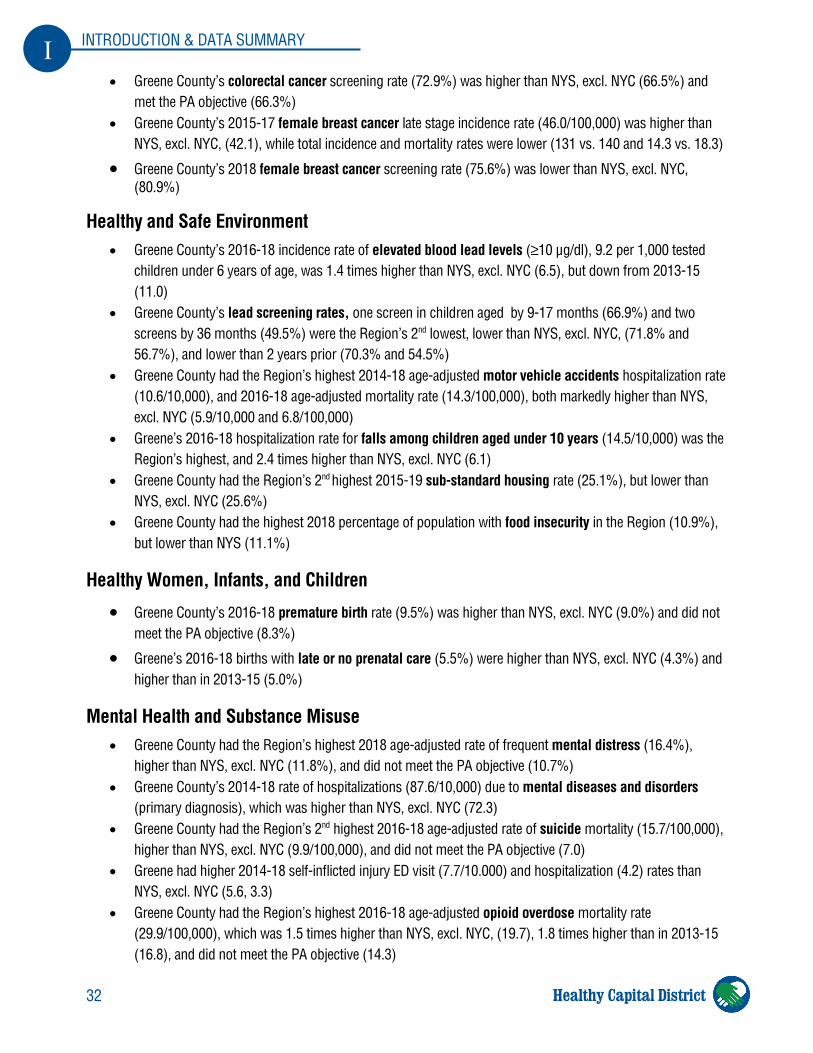
32
I INTRODUCTION & DATA SUMMARY
Healthy Capital District
• Greene County’s colorectal cancer screening rate (72.9%) was higher than NYS, excl. NYC (66.5%) and met the PA objective (66.3%)
• Greene County’s 2015-17 female breast cancer late stage incidence rate (46.0/100,000) was higher than NYS, excl. NYC, (42.1), while total incidence and mortality rates were lower (131 vs. 140 and 14.3 vs. 18.3)
• Greene County’s 2018 female breast cancer screening rate (75.6%) was lower than NYS, excl. NYC, (80.9%)
Healthy and Safe Environment • Greene County’s 2016-18 incidence rate of elevated blood lead levels (≥10 µg/dl), 9.2 per 1,000 tested
children under 6 years of age, was 1.4 times higher than NYS, excl. NYC (6.5), but down from 2013-15 (11.0)
• Greene County’s lead screening rates, one screen in children aged by 9-17 months (66.9%) and two screens by 36 months (49.5%) were the Region’s 2nd lowest, lower than NYS, excl. NYC, (71.8% and 56.7%), and lower than 2 years prior (70.3% and 54.5%)
• Greene County had the Region’s highest 2014-18 age-adjusted motor vehicle accidents hospitalization rate (10.6/10,000), and 2016-18 age-adjusted mortality rate (14.3/100,000), both markedly higher than NYS, excl. NYC (5.9/10,000 and 6.8/100,000)
• Greene’s 2016-18 hospitalization rate for falls among children aged under 10 years (14.5/10,000) was the Region’s highest, and 2.4 times higher than NYS, excl. NYC (6.1)
• Greene County had the Region’s 2nd highest 2015-19 sub-standard housing rate (25.1%), but lower than NYS, excl. NYC (25.6%)
• Greene County had the highest 2018 percentage of population with food insecurity in the Region (10.9%), but lower than NYS (11.1%)
Healthy Women, Infants, and Children
• Greene County’s 2016-18 premature birth rate (9.5%) was higher than NYS, excl. NYC (9.0%) and did not meet the PA objective (8.3%)
• Greene’s 2016-18 births with late or no prenatal care (5.5%) were higher than NYS, excl. NYC (4.3%) and higher than in 2013-15 (5.0%)
Mental Health and Substance Misuse • Greene County had the Region’s highest 2018 age-adjusted rate of frequent mental distress (16.4%),
higher than NYS, excl. NYC (11.8%), and did not meet the PA objective (10.7%) • Greene County’s 2014-18 rate of hospitalizations (87.6/10,000) due to mental diseases and disorders
(primary diagnosis), which was higher than NYS, excl. NYC (72.3) • Greene County had the Region’s 2nd highest 2016-18 age-adjusted rate of suicide mortality (15.7/100,000),
higher than NYS, excl. NYC (9.9/100,000), and did not meet the PA objective (7.0) • Greene had higher 2014-18 self-inflicted injury ED visit (7.7/10.000) and hospitalization (4.2) rates than
NYS, excl. NYC (5.6, 3.3) • Greene County had the Region’s highest 2016-18 age-adjusted opioid overdose mortality rate
(29.9/100,000), which was 1.5 times higher than NYS, excl. NYC, (19.7), 1.8 times higher than in 2013-15 (16.8), and did not meet the PA objective (14.3)
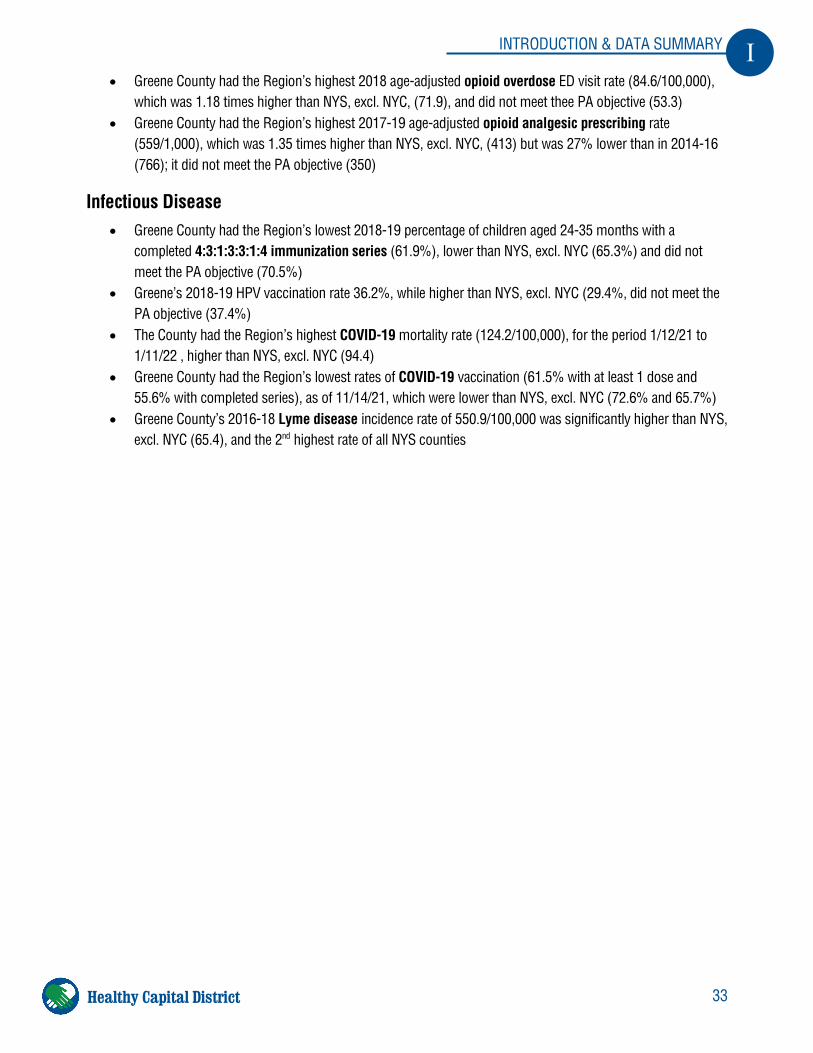
33
I INTRODUCTION & DATA SUMMARY
Healthy Capital District
• Greene County had the Region’s highest 2018 age-adjusted opioid overdose ED visit rate (84.6/100,000), which was 1.18 times higher than NYS, excl. NYC, (71.9), and did not meet thee PA objective (53.3)
• Greene County had the Region’s highest 2017-19 age-adjusted opioid analgesic prescribing rate (559/1,000), which was 1.35 times higher than NYS, excl. NYC, (413) but was 27% lower than in 2014-16 (766); it did not meet the PA objective (350)
Infectious Disease • Greene County had the Region’s lowest 2018-19 percentage of children aged 24-35 months with a
completed 4:3:1:3:3:1:4 immunization series (61.9%), lower than NYS, excl. NYC (65.3%) and did not meet the PA objective (70.5%)
• Greene’s 2018-19 HPV vaccination rate 36.2%, while higher than NYS, excl. NYC (29.4%, did not meet the PA objective (37.4%)
• The County had the Region’s highest COVID-19 mortality rate (124.2/100,000), for the period 1/12/21 to 1/11/22 , higher than NYS, excl. NYC (94.4)
• Greene County had the Region’s lowest rates of COVID-19 vaccination (61.5% with at least 1 dose and 55.6% with completed series), as of 11/14/21, which were lower than NYS, excl. NYC (72.6% and 65.7%)
• Greene County’s 2016-18 Lyme disease incidence rate of 550.9/100,000 was significantly higher than NYS, excl. NYC (65.4), and the 2nd highest rate of all NYS counties
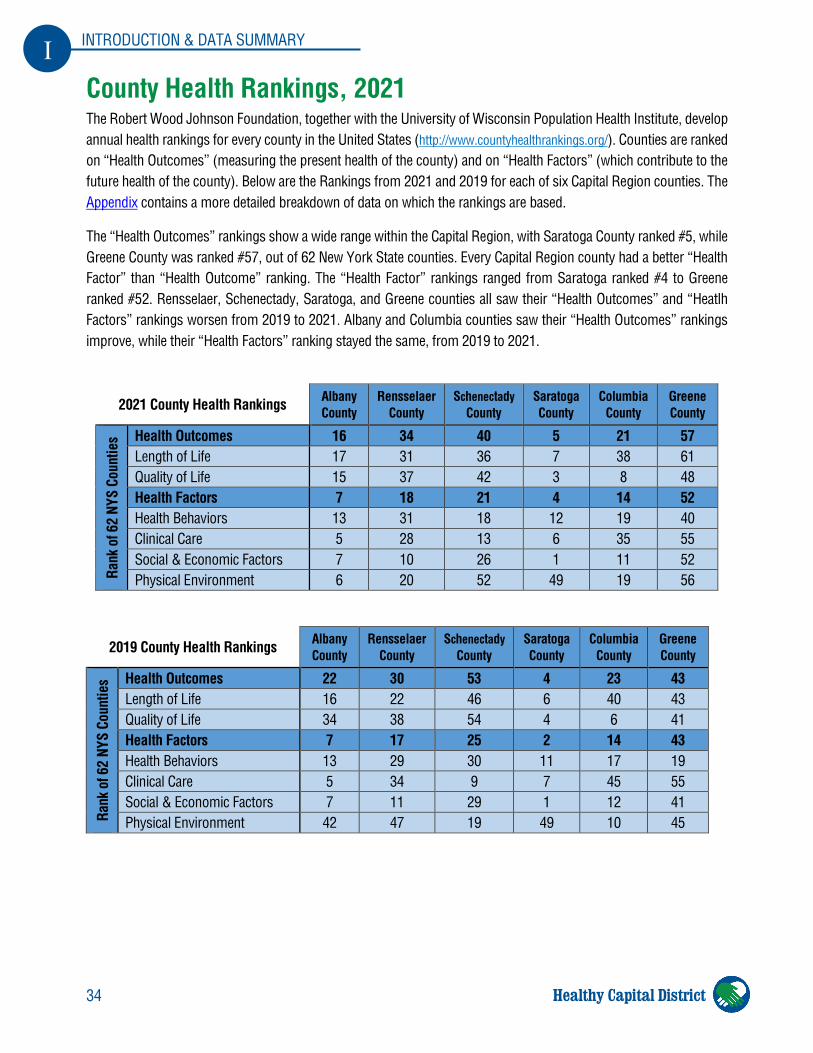
34
I INTRODUCTION & DATA SUMMARY
Healthy Capital District
County Health Rankings, 2021 The Robert Wood Johnson Foundation, together with the University of Wisconsin Population Health Institute, develop annual health rankings for every county in the United States (http://www.countyhealthrankings.org/). Counties are ranked on “Health Outcomes” (measuring the present health of the county) and on “Health Factors” (which contribute to the future health of the county). Below are the Rankings from 2021 and 2019 for each of six Capital Region counties. The Appendix contains a more detailed breakdown of data on which the rankings are based.
The “Health Outcomes” rankings show a wide range within the Capital Region, with Saratoga County ranked #5, while Greene County was ranked #57, out of 62 New York State counties. Every Capital Region county had a better “Health Factor” than “Health Outcome” ranking. The “Health Factor” rankings ranged from Saratoga ranked #4 to Greene ranked #52. Rensselaer, Schenectady, Saratoga, and Greene counties all saw their “Health Outcomes” and “Heatlh Factors” rankings worsen from 2019 to 2021. Albany and Columbia counties saw their “Health Outcomes” rankings improve, while their “Health Factors” ranking stayed the same, from 2019 to 2021.
2021 County Health Rankings Albany County
Rensselaer County
Schenectady County
Saratoga County
Columbia County
Greene County
Rank
of 6
2 NY
S Co
untie
s Health Outcomes 16 34 40 5 21 57 Length of Life 17 31 36 7 38 61 Quality of Life 15 37 42 3 8 48 Health Factors 7 18 21 4 14 52 Health Behaviors 13 31 18 12 19 40 Clinical Care 5 28 13 6 35 55 Social & Economic Factors 7 10 26 1 11 52 Physical Environment 6 20 52 49 19 56
2019 County Health Rankings Albany County
Rensselaer County
Schenectady County
Saratoga County
Columbia County
Greene County
Rank
of 6
2 NY
S Co
untie
s Health Outcomes 22 30 53 4 23 43 Length of Life 16 22 46 6 40 43 Quality of Life 34 38 54 4 6 41 Health Factors 7 17 25 2 14 43 Health Behaviors 13 29 30 11 17 19 Clinical Care 5 34 9 7 45 55 Social & Economic Factors 7 11 29 1 12 41 Physical Environment 42 47 19 49 10 45
35
II COMMUNITY PUBLIC HEALTH PRIORITIES
Healthy Capital District
II. Community Public Health Priorities
Collaboration and Community Engagement Engaging the community in the health needs assessment process was a priority of HCD and its stakeholders. Broad community engagement began with participation in the community health survey. The survey offered multiple choice and open-ended response options to learn about residents’ health needs and priorities, access or barriers to care, mental health, and social determinants of health. Demographic information collected by the survey allowed review of information by county, age, gender, race/ethnicity and income.
Survey results regarding the public’s opinions on the seriousness of public health issues were incorporated into the priority scoring of health needs by the members of the three Capital Region Prevention Agenda Prioritization Work Groups (Albany-Rensselaer, Columbia-Greene, and Schenectady). The Work Groups included community voices through representatives from community based organizations that serve low-income residents, the homeless, and other vulnerable populations; federally qualified health centers; advocacy groups; academic institutions; public health departments; providers; and health insurers. Participants were encouraged to share data and observations of their own, and to advocate for the needs of their constituents. HCD and its stakeholders strategically invited partners with access to medically underserved populations.
Health Issue Ranking Selection of the top health priorities for the Capital Region was facilitated by a new Public Health Issue Scoring Sheet (see next page) created by HCD, which built upon progress made during the 2019-2022 Prioritization Cycle. This scoring and ranking method was, again, based on a modified version of the Hanlon Method for Prioritizing Health Problems. The Scoring Sheet quantified considerations regarding both the need to address each health issue and the opportunity to make a positive impact. Opportunity considerations were based on guidance documents from the American Hospital Association, the National Association of County and City Health Officials as well as other industry resources. Need considerations included those used in the 2018 Prioritization Process, as well as a community priority score derived directly from the contributions of over 2,000 local residents in the 2021 Capital Region Community Health Survey (see appendix). The Scoring Sheet also included “other considerations,” for both need and opportunity, to address any additional factors and capture the knowledge- and experience-based input of local community-based organizational partners.
In the Fall of 2021, HCD staff reviewed approximately 700 public health measures across the five Prevention Agenda priority areas and categorized about 150 of the key indicators into 25 public health issues. Health issues were identified by reviewing the present New York State Department of Health Prevention Agenda Focus Areas, as well as health issues incorporated in the last Prioritization Process in 2018. The 25 health issues were initially ranked twice for each of the three hospital and health department prioritization groups. Health issues were first ranked according to their five data-based need scores, then, again, with the additional consideration of their survey-based community priority score. These initial rankings were used to select a shorter list of ten to sixteen issues for participating partners to score, before final priorities were selected.
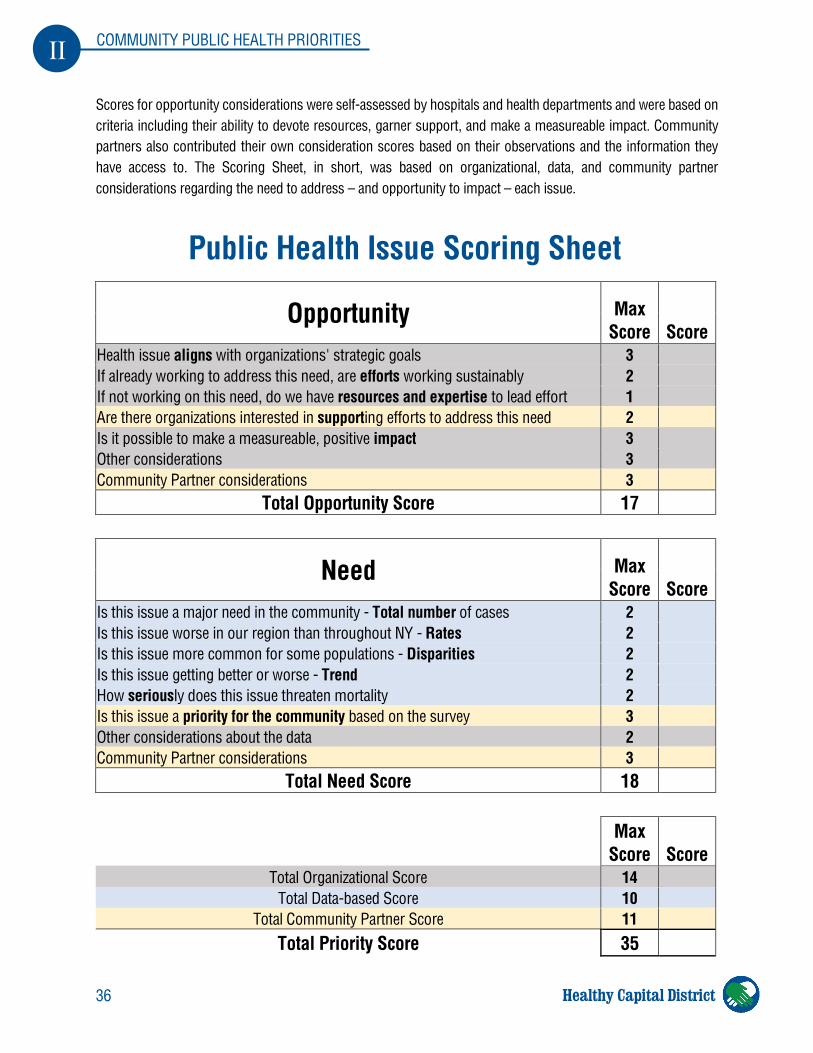
36
II COMMUNITY PUBLIC HEALTH PRIORITIES
Healthy Capital District
Scores for opportunity considerations were self-assessed by hospitals and health departments and were based on criteria including their ability to devote resources, garner support, and make a measureable impact. Community partners also contributed their own consideration scores based on their observations and the information they have access to. The Scoring Sheet, in short, was based on organizational, data, and community partner considerations regarding the need to address – and opportunity to impact – each issue.
Public Health Issue Scoring Sheet
Opportunity Max Score Score
Health issue aligns with organizations' strategic goals 3
If already working to address this need, are efforts working sustainably 2
If not working on this need, do we have resources and expertise to lead effort 1
Are there organizations interested in supporting efforts to address this need 2
Is it possible to make a measureable, positive impact 3
Other considerations 3
Community Partner considerations 3
Total Opportunity Score 17
Need Max Score Score
Is this issue a major need in the community - Total number of cases 2
Is this issue worse in our region than throughout NY - Rates 2
Is this issue more common for some populations - Disparities 2
Is this issue getting better or worse - Trend 2
How seriously does this issue threaten mortality 2
Is this issue a priority for the community based on the survey 3
Other considerations about the data 2
Community Partner considerations 3
Total Need Score 18
Max Score Score
Total Organizational Score 14
Total Data-based Score 10
Total Community Partner Score 11
Total Priority Score 35
37
II COMMUNITY PUBLIC HEALTH PRIORITIES
Healthy Capital District
A Prevention Agenda Work Group met in the Fall of 2021 to review the Public Health Issue Score Sheet and ranking methodology and to provide oversight and guidance during the prioritization process. The Prevention Agenda Work Group included participation from local health departments of Albany, Columbia, Greene, Rensselaer, and Schenectady counties as well as St. Peter’s Health Partners, Ellis Medicine, Albany Medical Center, and Columbia Memorial Hospital. Local Prevention Agenda Prioritization Work Groups were formed to review the top ten health measure counts, rates, trends, and disparities, as well as the data analyses and quantitative rankings prepared by HCD. The Work Groups then selected ten to sixteen issues to be assessed and scored organizationally and by community partners.
After organizational scores were collected, the local Prevention Agenda Prioritization Work Groups held virtual public meetings to present progress to – and collect input from – local community-based organizations, academic researchers, and members of the public. After presenting a comparison of data-based and organizational consideration scores and health issue ranking, for each public health issue, a discussion was held to answer any questions, and for individuals to share their professional understanding and recent observations of the current situation. Participants were provided an online survey to record their need and opportunity consideration scores as a measurement of the discussion as well as their judgements on the local experience, community value, and potential opportunity regarding each health issue. Group discussion most often peaked around mental health, behavioral health, and chronic disease issues, as community partners said these problems have been noticeably exacerbated by the current COVID-19 pandemic.
A comprehensive overview of the prioritization process, for each county, can be found on the HCD website (www.hcdiny.org) by going to “Explore Health Data,” then “Explore by County,” then selecting a county and locating the materials in the “Prevention Agenda 2023-2025” section. The initial data- and survey-based scoring and ranking methodology can be found in the “Data & Methods” presentation, while the final scores and rankings for each of the top health issues can be found in the “Prioritization Summary” presentation.
Selection of Priorities The priority selection process for each local Prevention Agenda Prioritization Work Group is summarized below:
Albany-Rensselaer Prevention Agenda Prioritization Work Group The Albany-Rensselaer Prevention Agenda Prioritization Work Group was led by the Albany County Department of Health, the Rensselaer County Department of Health, Albany Medical Center, and St. Peter’s Health Partners. It was decided a joint county Albany-Rensselaer Prevention Agenda Prioritization Work Group was appropriate, as the hospitals’ catchment areas cover both counties. The first meeting was held on November 9, 2021, at which HCD presented data on the heath issues and facilitated discussions. The Prevention Agenda Prioritization Work Group then selected the top sixteen health issues, based on data- and survey-based scoring, and provided organizational scoring along with contributing factors. In the second meeting, held on November 23, 2021, Prioritization Work Group members were briefed on the results of their organizational scoring. The third Prevention Agenda Prioritization Work Group meeting, held on December 7, 2021, was open to the public and hosted community partners to orient them to the Prioritization Process, update them on the progress of the Work Group, and collect their input and scores for each of the sixteen health issues. Community participants in the third meeting represented the following organizations:
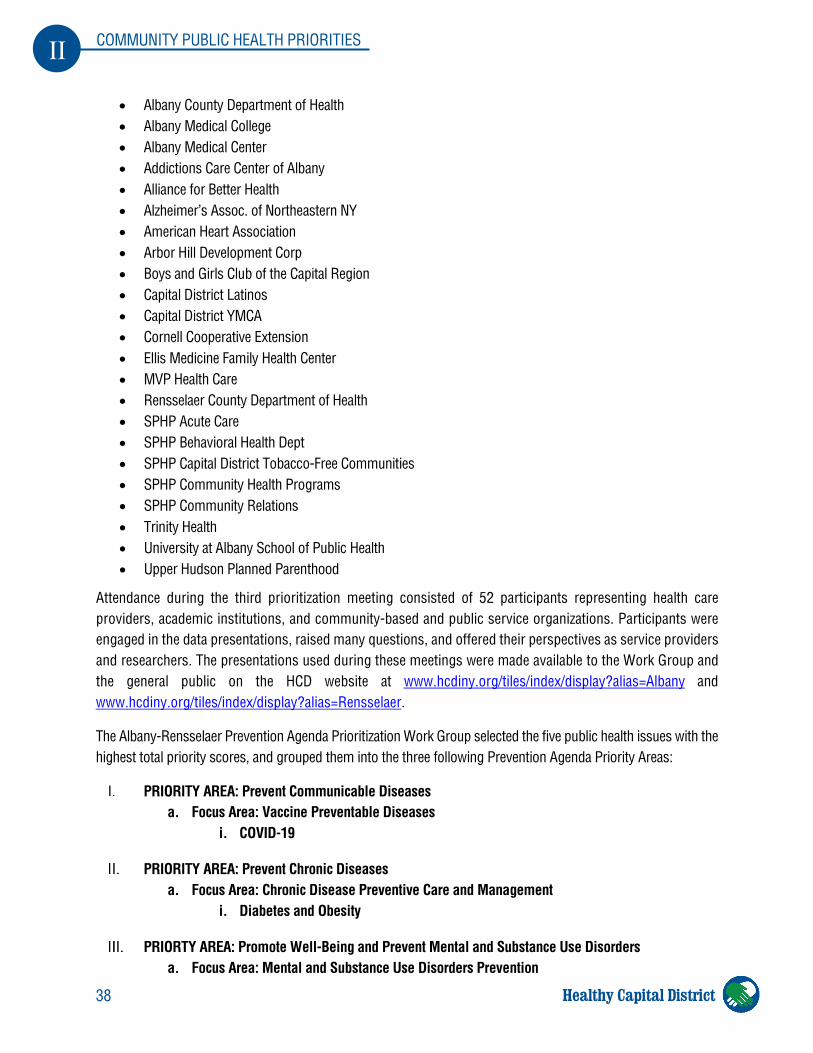
38
II COMMUNITY PUBLIC HEALTH PRIORITIES
Healthy Capital District
• Albany County Department of Health • Albany Medical College • Albany Medical Center • Addictions Care Center of Albany • Alliance for Better Health • Alzheimer’s Assoc. of Northeastern NY • American Heart Association • Arbor Hill Development Corp • Boys and Girls Club of the Capital Region • Capital District Latinos • Capital District YMCA • Cornell Cooperative Extension • Ellis Medicine Family Health Center • MVP Health Care • Rensselaer County Department of Health • SPHP Acute Care • SPHP Behavioral Health Dept • SPHP Capital District Tobacco-Free Communities • SPHP Community Health Programs • SPHP Community Relations • Trinity Health • University at Albany School of Public Health • Upper Hudson Planned Parenthood
Attendance during the third prioritization meeting consisted of 52 participants representing health care providers, academic institutions, and community-based and public service organizations. Participants were engaged in the data presentations, raised many questions, and offered their perspectives as service providers and researchers. The presentations used during these meetings were made available to the Work Group and the general public on the HCD website at www.hcdiny.org/tiles/index/display?alias=Albany and www.hcdiny.org/tiles/index/display?alias=Rensselaer.
The Albany-Rensselaer Prevention Agenda Prioritization Work Group selected the five public health issues with the highest total priority scores, and grouped them into the three following Prevention Agenda Priority Areas:
PRIORITY AREA: Prevent Communicable Diseases a. Focus Area: Vaccine Preventable Diseases
i. COVID-19
PRIORITY AREA: Prevent Chronic Diseases a. Focus Area: Chronic Disease Preventive Care and Management
i. Diabetes and Obesity
PRIORTY AREA: Promote Well-Being and Prevent Mental and Substance Use Disorders a. Focus Area: Mental and Substance Use Disorders Prevention
39
II COMMUNITY PUBLIC HEALTH PRIORITIES
Healthy Capital District
The existing Obesity-Diabetes Task Force will continue its work into the 2023-2025 Prioritization Cycle, after reviewing and potentially revising their prevention strategies and interventions. The existing task force focused on mental health will modify its scope to also include substance misuse prevention. A new task force will be created to support the ongoing efforts of local hospitals and health departments to quell the COVID-19 pandemic.
Schenectady Prevention Agenda Prioritization Work Group The Schenectady Prevention Agenda Prioritization Work Group was led by Schenectady County Public Health Services and Ellis Medicine. The Work Group was comprised of members of the Schenectady Coalition for a Healthy Community (SCHC), an informal coalition of community organizations created following the State-mandated consolidation of Schenectady’s hospitals, which has met regularly over the decade to share information on community health issues. The first meeting was held on November 15, 2021, at which HCD presented data on the heath issues and facilitated discussions. The Prevention Agenda Prioritization Work Group then selected the top ten health issues, based on data- and survey-based scoring, and then provided their organizational scoring along with contributing factors. In the second meeting, held on December 6, 2021, Work Group members were updated on the results of their organizational scoring. The third Prevention Agenda Prioritization Work Group meeting, held on December 16, 2021 was open to the public and hosted community partners to orient them to the Prioritization Process, update them on the progress of the Work Group, and collect their input and scores for each of the ten health issues. Community participants that attended the third meeting represented the following organizations:
• Capital District Tobacco-Free Communities • Capital Region Health Connections (Health Home) • CDPHP Health Plan • The Daily Gazette • Ellis Food Farmacy • Ellis Medicine • Ellis Primary Care • Hometown Health Centers • Safe Inc. of Schenectady • Schenectady City School District • Schenectady Community Action Program • Schenectady County Office of Community Service • Schenectady County Public Health Services • Schenectady County Public Library • Sheila Ferrucci, Esq. • St. Mary's Healthcare • St. Peters Health Partners • SPHP Community Health and Well-Being • Sunnyview Rehabilitation Hospital • University at Albany School of Public Health
40
II COMMUNITY PUBLIC HEALTH PRIORITIES
Healthy Capital District
Attendance during the third prioritization meeting consisted of more than 30 participants representing health care, community-based and public service providers. Participants were engaged in the data presentations, raised questions, and offered their perspectives as health planners and service providers. The presentations used during these meetings were made available to the Work Group members and the general public on the HCD website (at https://www.hcdiny.org/tiles/index/display?alias=Schenectady).
Schenectady County selected the following Prevention Agenda Priority Areas:
PRIORITY AREA: Prevent Communicable Diseases a. Focus Area: Vaccine Preventable Diseases
i. COVID-19 b. Focus Area: Sexually Transmitted Infections (STIs)
PRIORTY AREA: Promote Well-Being and Prevent Mental and Substance Use Disorders
a. Focus Area: Mental and Substance Use Disorders Prevention
A new task force will be created to support the ongoing efforts of local hospitals and health departments to quell the COVID-19 pandemic. The existing Mental and Substance Use Disorders Prevention Task Force will continue its work into the 2023-2025 Prioritization Cycle, after reviewing and potentially revising their prevention strategies and interventions.
Columbia-Greene Prevention Agenda Prioritization Work Group The Columbia-Greene Prevention Agenda Prioritization Work Group was led by Columbia County Department of Health, Greene County Public Health, and Columbia Memorial Hospital. Columbia and Greene Counties share a hospital and have similar demographic characteristics and health metrics, so the counties elected to, again, align their efforts surrounding mutually-selected priority areas. The first meeting of the Work Group was held on November 22, 2021, at which HCD presented data on the heath issues and facilitated discussions. The Prevention Agenda Prioritization Work Group then selected ten health issues, based on data- and survey-based scoring, to be further reviewed and scored by the organizations and community partners. In the second meeting, held on January 27, 2021, the Prioritization Work Group members were briefed on the results of their organizational scoring. The third Columbia-Greene Prevention Agenda Prioritization Work Group meeting will be held in March, 2021 and will be open to the public. The third meeting will host community partners to orient them to the Prioritization Process, update them on the progress of the Work Group, and collect their input and scores for each of the ten health issues. Once final health issue priority selections are made, based on the total priority scores, Community Health Improvement Plan (CHIP) task forces will either continue their work or be newly established, depending on the chosen priority areas.
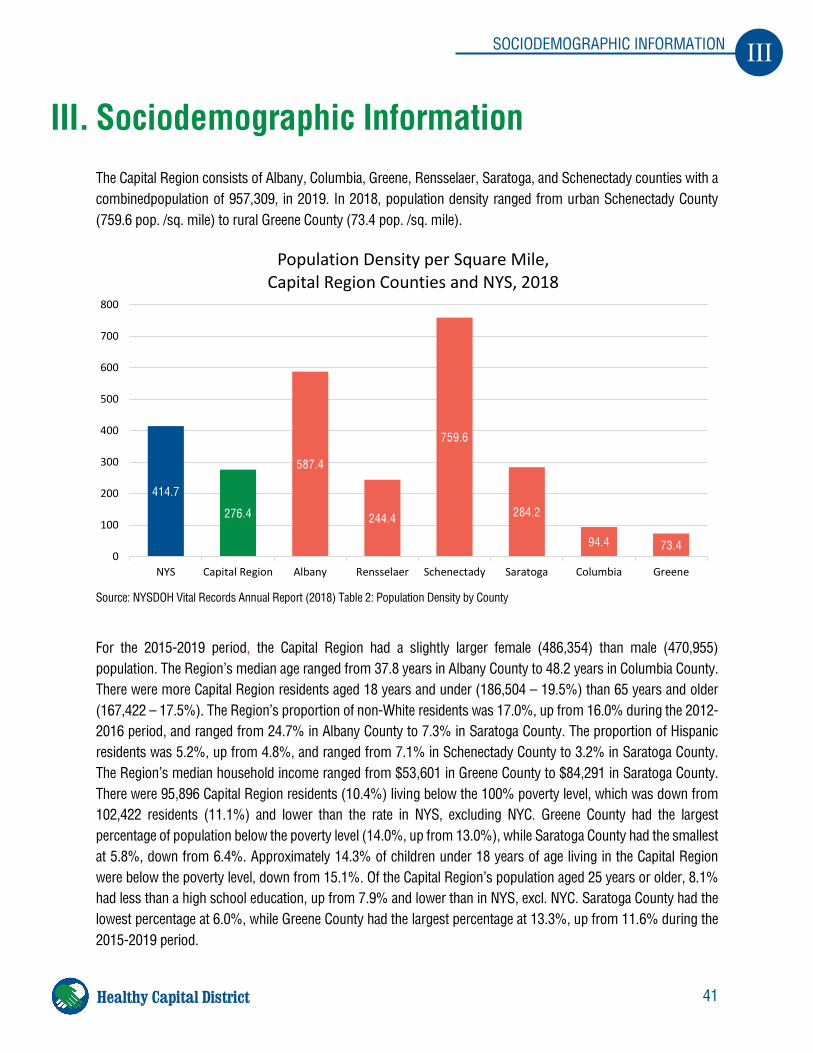
41
III SOCIODEMOGRAPHIC INFORMATION
Healthy Capital District
III. Sociodemographic Information The Capital Region consists of Albany, Columbia, Greene, Rensselaer, Saratoga, and Schenectady counties with a combinedpopulation of 957,309, in 2019. In 2018, population density ranged from urban Schenectady County (759.6 pop. /sq. mile) to rural Greene County (73.4 pop. /sq. mile).
Source: NYSDOH Vital Records Annual Report (2018) Table 2: Population Density by County
For the 2015-2019 period, the Capital Region had a slightly larger female (486,354) than male (470,955) population. The Region’s median age ranged from 37.8 years in Albany County to 48.2 years in Columbia County. There were more Capital Region residents aged 18 years and under (186,504 – 19.5%) than 65 years and older (167,422 – 17.5%). The Region’s proportion of non-White residents was 17.0%, up from 16.0% during the 2012-2016 period, and ranged from 24.7% in Albany County to 7.3% in Saratoga County. The proportion of Hispanic residents was 5.2%, up from 4.8%, and ranged from 7.1% in Schenectady County to 3.2% in Saratoga County. The Region’s median household income ranged from $53,601 in Greene County to $84,291 in Saratoga County. There were 95,896 Capital Region residents (10.4%) living below the 100% poverty level, which was down from 102,422 residents (11.1%) and lower than the rate in NYS, excluding NYC. Greene County had the largest percentage of population below the poverty level (14.0%, up from 13.0%), while Saratoga County had the smallest at 5.8%, down from 6.4%. Approximately 14.3% of children under 18 years of age living in the Capital Region were below the poverty level, down from 15.1%. Of the Capital Region’s population aged 25 years or older, 8.1% had less than a high school education, up from 7.9% and lower than in NYS, excl. NYC. Saratoga County had the lowest percentage at 6.0%, while Greene County had the largest percentage at 13.3%, up from 11.6% during the 2015-2019 period.
414.7
276.4
587.4
244.4
759.6
284.2
94.4 73.40
100
200
300
400
500
600
700
800
NYS Capital Region Albany Rensselaer Schenectady Saratoga Columbia Greene
Population Density per Square Mile, Capital Region Counties and NYS, 2018
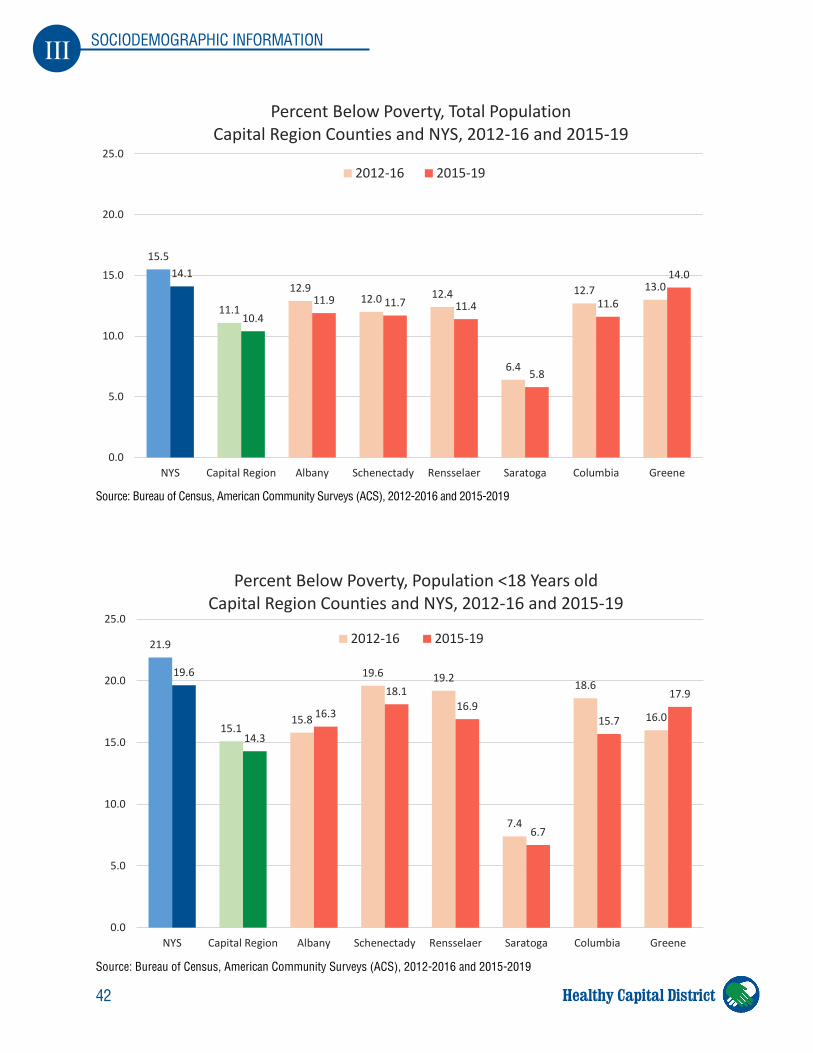
42
III SOCIODEMOGRAPHIC INFORMATION
Healthy Capital District
Source: Bureau of Census, American Community Surveys (ACS), 2012-2016 and 2015-2019
Source: Bureau of Census, American Community Surveys (ACS), 2012-2016 and 2015-2019
15.5
11.1
12.912.0 12.4
6.4
12.7 13.014.1
10.411.9 11.7 11.4
5.8
11.6
14.0
0.0
5.0
10.0
15.0
20.0
25.0
NYS Capital Region Albany Schenectady Rensselaer Saratoga Columbia Greene
Percent Below Poverty, Total PopulationCapital Region Counties and NYS, 2012-16 and 2015-19
2012-16 2015-19
21.9
15.115.8
19.6 19.2
7.4
18.6
16.0
19.6
14.3
16.3
18.116.9
6.7
15.7
17.9
0.0
5.0
10.0
15.0
20.0
25.0
NYS Capital Region Albany Schenectady Rensselaer Saratoga Columbia Greene
Percent Below Poverty, Population <18 Years oldCapital Region Counties and NYS, 2012-16 and 2015-19
2012-16 2015-19
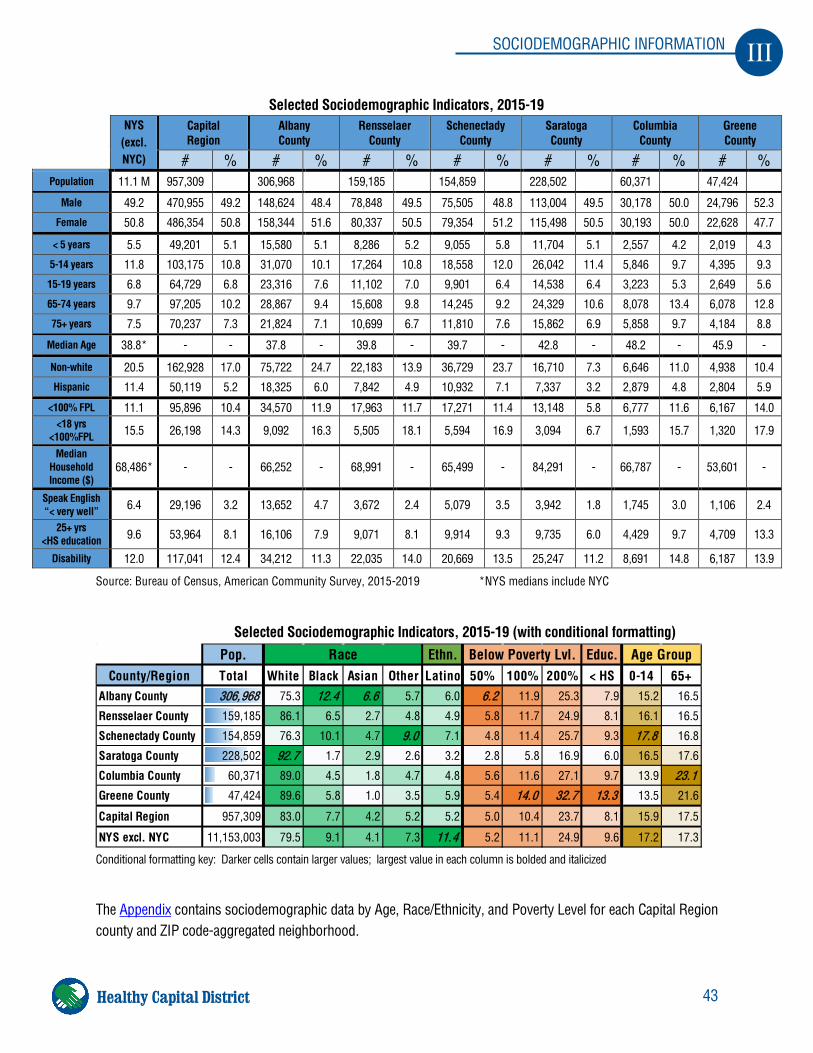
43
III SOCIODEMOGRAPHIC INFORMATION
Healthy Capital District
Selected Sociodemographic Indicators, 2015-19
NYS (excl. NYC)
Capital Region
Albany County
Rensselaer County
Schenectady County
Saratoga County
Columbia County
Greene County
# % # % # % # % # % # % # % Population 11.1 M 957,309 306,968 159,185 154,859 228,502 60,371 47,424
Male 49.2 470,955 49.2 148,624 48.4 78,848 49.5 75,505 48.8 113,004 49.5 30,178 50.0 24,796 52.3
Female 50.8 486,354 50.8 158,344 51.6 80,337 50.5 79,354 51.2 115,498 50.5 30,193 50.0 22,628 47.7
< 5 years 5.5 49,201 5.1 15,580 5.1 8,286 5.2 9,055 5.8 11,704 5.1 2,557 4.2 2,019 4.3
5-14 years 11.8 103,175 10.8 31,070 10.1 17,264 10.8 18,558 12.0 26,042 11.4 5,846 9.7 4,395 9.3
15-19 years 6.8 64,729 6.8 23,316 7.6 11,102 7.0 9,901 6.4 14,538 6.4 3,223 5.3 2,649 5.6
65-74 years 9.7 97,205 10.2 28,867 9.4 15,608 9.8 14,245 9.2 24,329 10.6 8,078 13.4 6,078 12.8
75+ years 7.5 70,237 7.3 21,824 7.1 10,699 6.7 11,810 7.6 15,862 6.9 5,858 9.7 4,184 8.8
Median Age 38.8* - - 37.8 - 39.8 - 39.7 - 42.8 - 48.2 - 45.9 -
Non-white 20.5 162,928 17.0 75,722 24.7 22,183 13.9 36,729 23.7 16,710 7.3 6,646 11.0 4,938 10.4
Hispanic 11.4 50,119 5.2 18,325 6.0 7,842 4.9 10,932 7.1 7,337 3.2 2,879 4.8 2,804 5.9
<100% FPL 11.1 95,896 10.4 34,570 11.9 17,963 11.7 17,271 11.4 13,148 5.8 6,777 11.6 6,167 14.0 <18 yrs
<100%FPL 15.5 26,198 14.3 9,092 16.3 5,505 18.1 5,594 16.9 3,094 6.7 1,593 15.7 1,320 17.9
Median Household Income ($)
68,486* - - 66,252 - 68,991 - 65,499 - 84,291 - 66,787 - 53,601 -
Speak English “< very well” 6.4 29,196 3.2 13,652 4.7 3,672 2.4 5,079 3.5 3,942 1.8 1,745 3.0 1,106 2.4
25+ yrs <HS education 9.6 53,964 8.1 16,106 7.9 9,071 8.1 9,914 9.3 9,735 6.0 4,429 9.7 4,709 13.3
Disability 12.0 117,041 12.4 34,212 11.3 22,035 14.0 20,669 13.5 25,247 11.2 8,691 14.8 6,187 13.9
Source: Bureau of Census, American Community Survey, 2015-2019 *NYS medians include NYC
Selected Sociodemographic Indicators, 2015-19 (with conditional formatting)
Conditional formatting key: Darker cells contain larger values; largest value in each column is bolded and italicized
The Appendix contains sociodemographic data by Age, Race/Ethnicity, and Poverty Level for each Capital Region county and ZIP code-aggregated neighborhood.
Pop. Ethn. Educ.County/Region Total White Black Asian Other Latino 50% 100% 200% < HS 0-14 65+
Albany County 306,968 75.3 12.4 6.6 5.7 6.0 6.2 11.9 25.3 7.9 15.2 16.5
Rensselaer County 159,185 86.1 6.5 2.7 4.8 4.9 5.8 11.7 24.9 8.1 16.1 16.5
Schenectady County 154,859 76.3 10.1 4.7 9.0 7.1 4.8 11.4 25.7 9.3 17.8 16.8
Saratoga County 228,502 92.7 1.7 2.9 2.6 3.2 2.8 5.8 16.9 6.0 16.5 17.6
Columbia County 60,371 89.0 4.5 1.8 4.7 4.8 5.6 11.6 27.1 9.7 13.9 23.1Greene County 47,424 89.6 5.8 1.0 3.5 5.9 5.4 14.0 32.7 13.3 13.5 21.6
Capital Region 957,309 83.0 7.7 4.2 5.2 5.2 5.0 10.4 23.7 8.1 15.9 17.5
NYS excl. NYC 11,153,003 79.5 9.1 4.1 7.3 11.4 5.2 11.1 24.9 9.6 17.2 17.3
Race Below Poverty Lvl. Age Group
44
III SOCIODEMOGRAPHIC INFORMATION
Healthy Capital District
Albany County • Albany County had the largest population (306,968), and was the second most urban county (587.4 pop. /sq.
mile) in the Capital Region
• Albany County had the lowest median age (37.8 years) in the Capital Region
• West End neighborhood had the largest proportion of 0-14 year olds (24.6%)
• South End neighborhood had the largest percentage of Black non-Hispanic population (59.2%), while Deleware/2nd Ave had the largest percentage of Hispanic population (15.6%)
• Median household income ($66,252) was lower than NYS and 3rd lowest in the Capital Region
• Poverty affected 11.9% of Albany County’s population in 2019, which was: down from 12.9% in 2016, below the rate in NYS, excl. NYC, and 2nd highest in the Capital Region
• South End/Downtown neighborhood had the highest poverty rate (46.6%) in the Capital Region, and South End (33.0%) and West End (33.4%) had the 3rd and 4th highest poverty rates
• Albany County had the 2nd lowest percent of population older than 25 with less than high school education in the Capital Region in 2019, at 7.9%, up from 7.2% in 2016
• The 2nd, 3rd, and 4th highest rates of Capital Region adults over 25 with less than a high school education, were South End/Downtown (22.9%), West End (21.5%), and South End (18.3%)
Rensselaer County • With a population of 159,185, Rensselaer County was the 3rd most rural county in the Capital Region (244.4
population /square mile)
• Rensselaer County had the 3rd lowest median age (39.8 years)
• 16.0% of Rensselaer’s population was aged 0-14 years, while 16.5% was aged 65+ years
• The North East neighborhood had the largest 0-14 year old population (20.1%)
• Rensselaer County had the Capital Region’s 3rd largest proportion of non-White population (13.9%), but the 3rd lowest proportion of Hispanic population (4.9%)
• Troy/Lansingburgh neighborhood had the greatest percentage of Black non-Hispanic population (13.1%) as well as the largest Hispanic population (7.5%)
• Rensselaer County had the 2nd highest Median Household Income in the Capital Region ($68,991 in 2019, up from $59,959 in 2016) and the 3rd smallest percentage of population below poverty (11.7%)
• Troy/Lansingburgh had the highest neighborhood poverty rate (19.1%)
• Rensselaer had the 3rd lowest percentage of population older than 25 with less than a high school education (8.1%)
• Troy/Lansingburgh neighborhood had the largest population older than 25 with less than a high school education (7.3% in 2019, which was down from 11.2% in 2016)
45
III SOCIODEMOGRAPHIC INFORMATION
Healthy Capital District
Schenectady County • With a population of 154,859, Schenectady County waste Capital Region’s most urban county (759.6
population /square mile)
• Schenectady County had the 2nd lowest median age (39.7 years)
• A Region-high 17.8% of Schenectady’s population were aged 0-14 years, while 16.8% were aged 65+
• The Hamilton Hill neighborhood had the largest 0-14 years of age population (23.5%)
• Schenectady County had the 2nd largest percentage of non-White population (23.7%) and the largest Hispanic population (7.1%) in the Capital Region
• Hamilton Hill had the highest proportion of Black non-Hispanic (38.6%) and Hispanic (16.8%) people
• Schenectady County had the 2nd lowest Median Household Income ($65,499), but the 2nd smallest percentage of population below poverty (11.4%)
• Hamilton Hill had the highest neighborhood poverty rate (37.5% in 2019, down from 47.4% in 2016)
• Schenectady County had the 3rd largest percentage of population 25+ years of age without a high school education (9.3%)
• Hamilton Hill had the highest percent population older than 25 without a high school education (25.6%)
Saratoga County • With a population of 228,502, Saratoga County was the 2nd most populated county in the Capital Region, and
the 3rd most urban county (284.2 population /square mile) in the Capital Region
• Saratoga County had the 3rd highest median age (42.8 years)
• 16.5% of Saratoga’s population was 0-14 years of age, while 17.5% was 65+ years of age
• North East neighborhood had the largest 0-14 years of age population (19.6%)
• Had the Capital Region’s smallest percentage of non-White (7.3%) and Hispanic (3.2%) population
• The Clifton Park West neighborhood had the highest percentage of Black non-Hispanic population (3.9%), while Ballston Spa had the largest percentage of the Hispanic (5.0%) population
• Had the highest Median Household Income ($84,291 in 2019, up from $74,080 in 2016), and smallest proportion of population below poverty (5.8%)
• The North West had the highest neighborhood poverty rate (14.6% in 2019, up from 10.9% in 2016)
• Had the smallest percentage of population aged 25+ years without a high school education (6.0%)
• The North West neighborhood had the largest proportion of population 25+ years of age without a high school education (8.6% in 2019, down from 10.6% in 2016)
46
III SOCIODEMOGRAPHIC INFORMATION
Healthy Capital District
Columbia County • With a population of 60,371, Columbia County was the 2nd most rural of the Capital Region counties (94.4
population /square mile)
• Columbia County had the highest median age (48.2 years)
• 23.1% of the population were 65+ years of age, the highest rate among Capital Region counties, while 13.9% of the population was 14 years of age or younger
• Ichabod neighborhood had the largest percent of population 14 years of age or younger (17.2%)
• The County had the 3rd lowest non-White population (11.0%) and 2nd lowest Hispanic population (4.8%)
• Hudson neighborhood had the largest proportion of Black non-Hispanic (10.5%) and Hispanic population (5.8%) in the County
• Had the 3rd lowest percentage of population experiencing poverty in the Capital Region (11.6%), with a median household income of $66,787
• Hudson (17.4%) had the largest population in poverty
• Had the 2nd highest percentage of population 25+ years of age with less than a high school education in the Capital Region, at 9.7% in 2019 (down from 10.7% in 2016) which was near NYS excl. NYC (9.6%)
• Pine Plains had the greatest neighborhood percentage of the population older than 25 with less than a high school education, at 9.9% in 2019 (was Hudson at 15.6% in 2016)
Greene County • With a population of 47,424, Greene County was the most rural county in the Capital Region (73.4 population
/square mile)
• The County had the 2nd highest median age (45.9 years)
• The County had the smallest proportion of population aged 0-14 years (13.6%), and the 2nd largest percentage of population 65+ years of age (21.6%, up from 19.7% in 2016)
• Greenville neighborhood had the largest proportion of population 0-14 years of age (17.9%)
• Greene County had the 2nd smallest proportion of non-White population (10.4%) in the Capital Region and the 3rd largest proportion of Hispanic population (5.9%)
• Coxsackie/Athens neighborhood had the largest proportions of Black non-Hispanic (11.9%) and Hispanic (10.1%) populations
• Had the lowest median household income ($53,601), and the highest percentage of population below the 100% poverty level (14.0%)
• Catskill neighborhood had the highest rate of poverty at 19.4% in 2019 (up from 16.1% in 2016)
• Had the highest percent in the Region of population aged 25+ years with less than a high school education at 13.3% in 2019 (down from 11.6% in 2016)
• Catskill and Cairo/Durham had the largest proportion of population older than 25 with less than a high school education (13.5%)
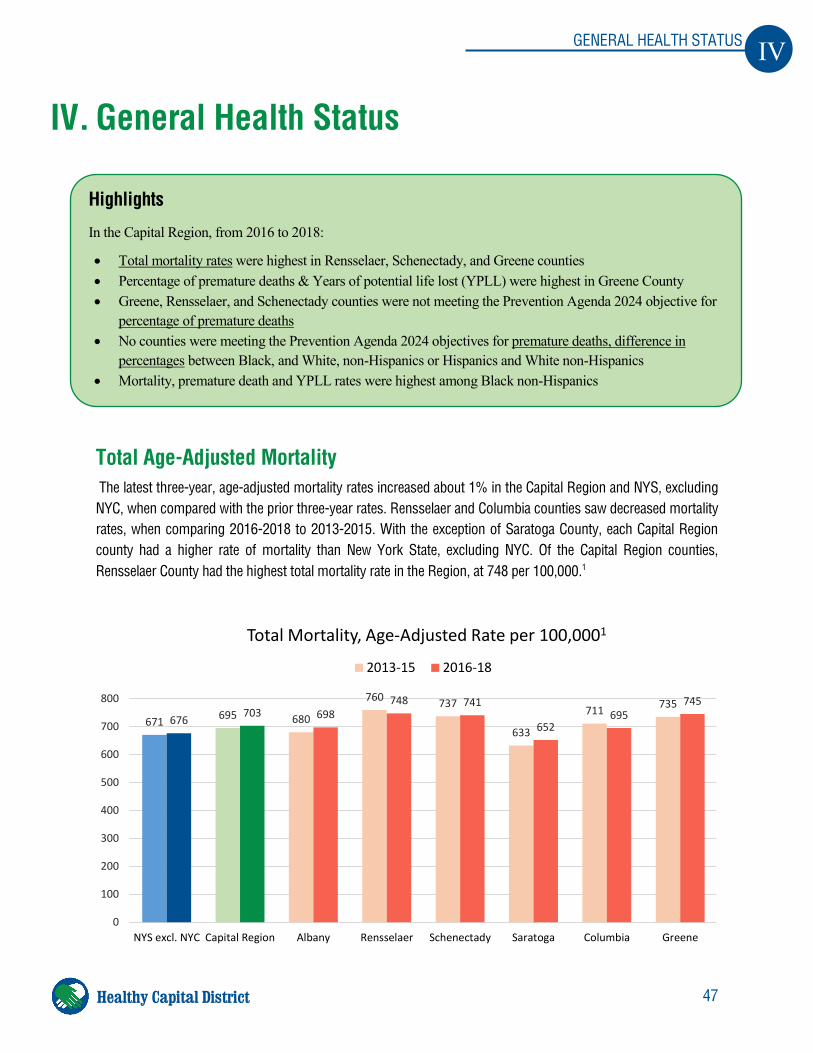
47
IV GENERAL HEALTH STATUS
Healthy Capital District
IV. General Health Status
Total Age-Adjusted Mortality The latest three-year, age-adjusted mortality rates increased about 1% in the Capital Region and NYS, excluding NYC, when compared with the prior three-year rates. Rensselaer and Columbia counties saw decreased mortality rates, when comparing 2016-2018 to 2013-2015. With the exception of Saratoga County, each Capital Region county had a higher rate of mortality than New York State, excluding NYC. Of the Capital Region counties, Rensselaer County had the highest total mortality rate in the Region, at 748 per 100,000.1
Highlights
In the Capital Region, from 2016 to 2018:
• Total mortality rates were highest in Rensselaer, Schenectady, and Greene counties • Percentage of premature deaths & Years of potential life lost (YPLL) were highest in Greene County • Greene, Rensselaer, and Schenectady counties were not meeting the Prevention Agenda 2024 objective for
percentage of premature deaths • No counties were meeting the Prevention Agenda 2024 objectives for premature deaths, difference in
percentages between Black, and White, non-Hispanics or Hispanics and White non-Hispanics • Mortality, premature death and YPLL rates were highest among Black non-Hispanics
671 695 680
760 737
633
711 735676 703 698
748 741
652695
745
0
100
200
300
400
500
600
700
800
NYS excl. NYC Capital Region Albany Rensselaer Schenectady Saratoga Columbia Greene
Total Mortality, Age-Adjusted Rate per 100,0001
2013-15 2016-18
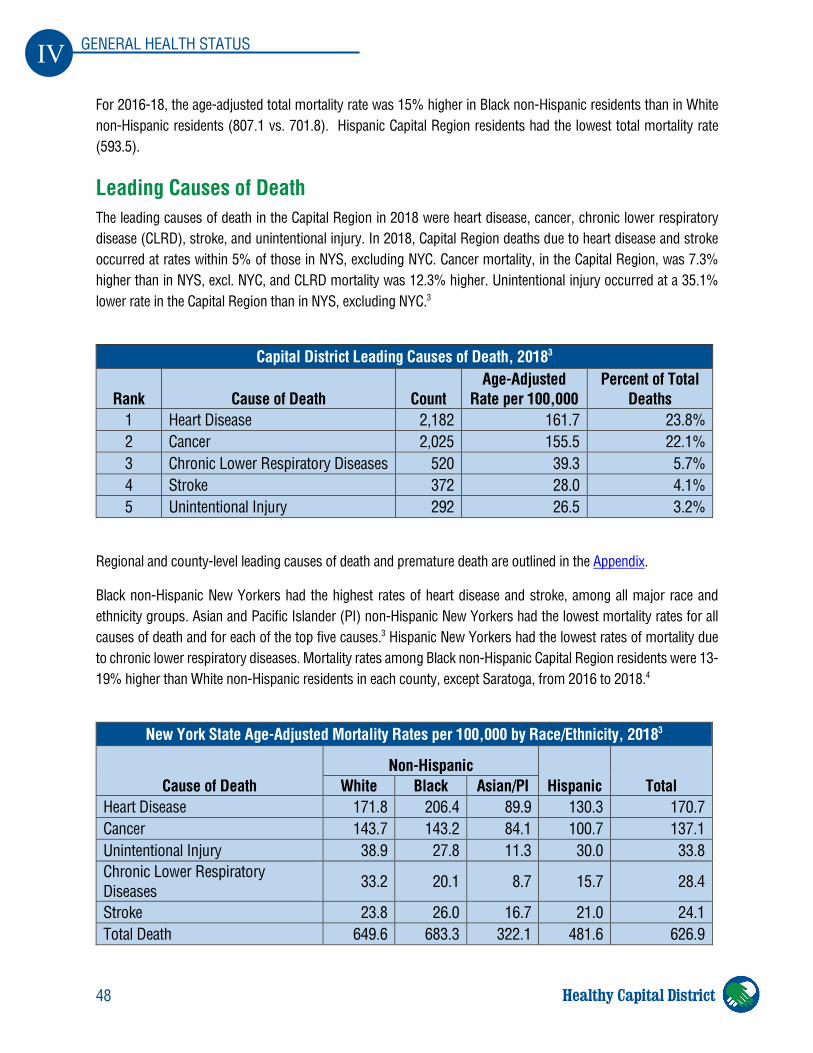
48
IV GENERAL HEALTH STATUS
Healthy Capital District
For 2016-18, the age-adjusted total mortality rate was 15% higher in Black non-Hispanic residents than in White non-Hispanic residents (807.1 vs. 701.8). Hispanic Capital Region residents had the lowest total mortality rate (593.5).
Leading Causes of Death The leading causes of death in the Capital Region in 2018 were heart disease, cancer, chronic lower respiratory disease (CLRD), stroke, and unintentional injury. In 2018, Capital Region deaths due to heart disease and stroke occurred at rates within 5% of those in NYS, excluding NYC. Cancer mortality, in the Capital Region, was 7.3% higher than in NYS, excl. NYC, and CLRD mortality was 12.3% higher. Unintentional injury occurred at a 35.1% lower rate in the Capital Region than in NYS, excluding NYC.3
Capital District Leading Causes of Death, 20183
Rank Cause of Death Count Age-Adjusted
Rate per 100,000 Percent of Total
Deaths 1 Heart Disease 2,182 161.7 23.8% 2 Cancer 2,025 155.5 22.1% 3 Chronic Lower Respiratory Diseases 520 39.3 5.7% 4 Stroke 372 28.0 4.1% 5 Unintentional Injury 292 26.5 3.2%
Regional and county-level leading causes of death and premature death are outlined in the Appendix.
Black non-Hispanic New Yorkers had the highest rates of heart disease and stroke, among all major race and ethnicity groups. Asian and Pacific Islander (PI) non-Hispanic New Yorkers had the lowest mortality rates for all causes of death and for each of the top five causes.3 Hispanic New Yorkers had the lowest rates of mortality due to chronic lower respiratory diseases. Mortality rates among Black non-Hispanic Capital Region residents were 13-19% higher than White non-Hispanic residents in each county, except Saratoga, from 2016 to 2018.4
New York State Age-Adjusted Mortality Rates per 100,000 by Race/Ethnicity, 20183
Cause of Death Non-Hispanic
Hispanic Total White Black Asian/PI Heart Disease 171.8 206.4 89.9 130.3 170.7 Cancer 143.7 143.2 84.1 100.7 137.1 Unintentional Injury 38.9 27.8 11.3 30.0 33.8 Chronic Lower Respiratory Diseases 33.2 20.1 8.7 15.7 28.4
Stroke 23.8 26.0 16.7 21.0 24.1 Total Death 649.6 683.3 322.1 481.6 626.9
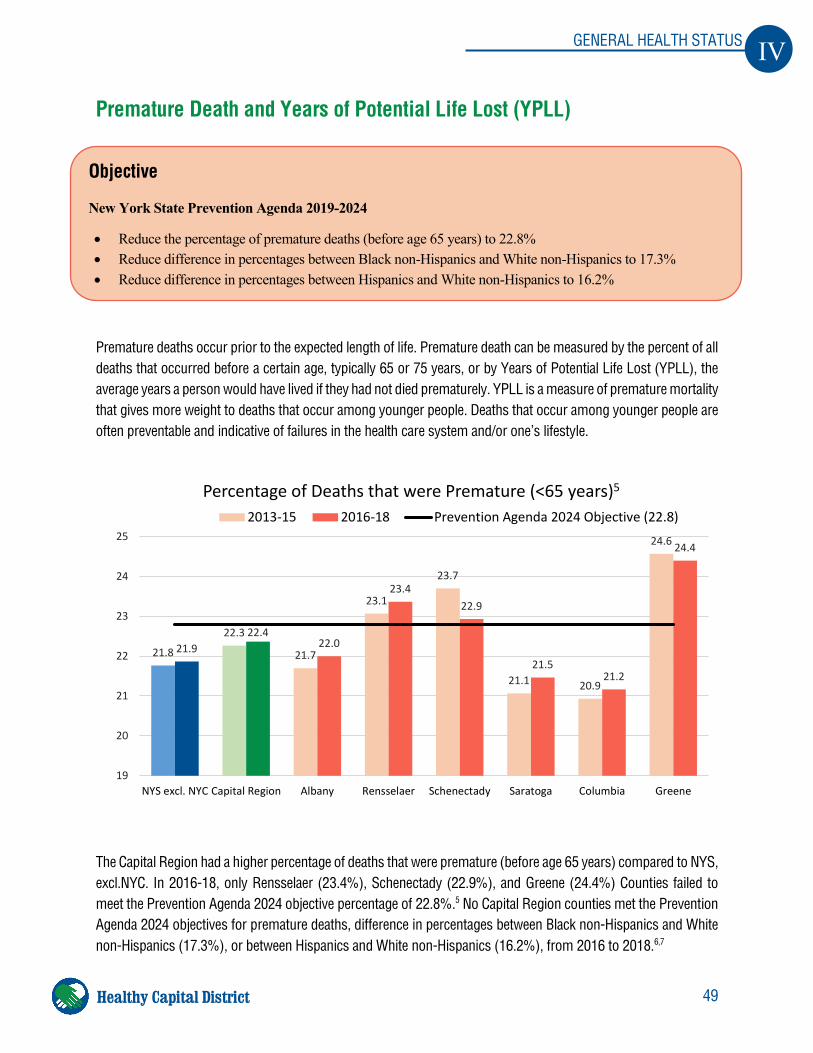
49
IV GENERAL HEALTH STATUS
Healthy Capital District
Premature Death and Years of Potential Life Lost (YPLL)
Premature deaths occur prior to the expected length of life. Premature death can be measured by the percent of all deaths that occurred before a certain age, typically 65 or 75 years, or by Years of Potential Life Lost (YPLL), the average years a person would have lived if they had not died prematurely. YPLL is a measure of premature mortality that gives more weight to deaths that occur among younger people. Deaths that occur among younger people are often preventable and indicative of failures in the health care system and/or one’s lifestyle.
The Capital Region had a higher percentage of deaths that were premature (before age 65 years) compared to NYS, excl.NYC. In 2016-18, only Rensselaer (23.4%), Schenectady (22.9%), and Greene (24.4%) Counties failed to meet the Prevention Agenda 2024 objective percentage of 22.8%.5 No Capital Region counties met the Prevention Agenda 2024 objectives for premature deaths, difference in percentages between Black non-Hispanics and White non-Hispanics (17.3%), or between Hispanics and White non-Hispanics (16.2%), from 2016 to 2018.6,7
Objective
New York State Prevention Agenda 2019-2024
• Reduce the percentage of premature deaths (before age 65 years) to 22.8% • Reduce difference in percentages between Black non-Hispanics and White non-Hispanics to 17.3% • Reduce difference in percentages between Hispanics and White non-Hispanics to 16.2%
21.8
22.3
21.7
23.1
23.7
21.1 20.9
24.6
21.922.4
22.0
23.422.9
21.521.2
24.4
19
20
21
22
23
24
25
NYS excl. NYC Capital Region Albany Rensselaer Schenectady Saratoga Columbia Greene
Percentage of Deaths that were Premature (<65 years)5
2013-15 2016-18 Prevention Agenda 2024 Objective (22.8)
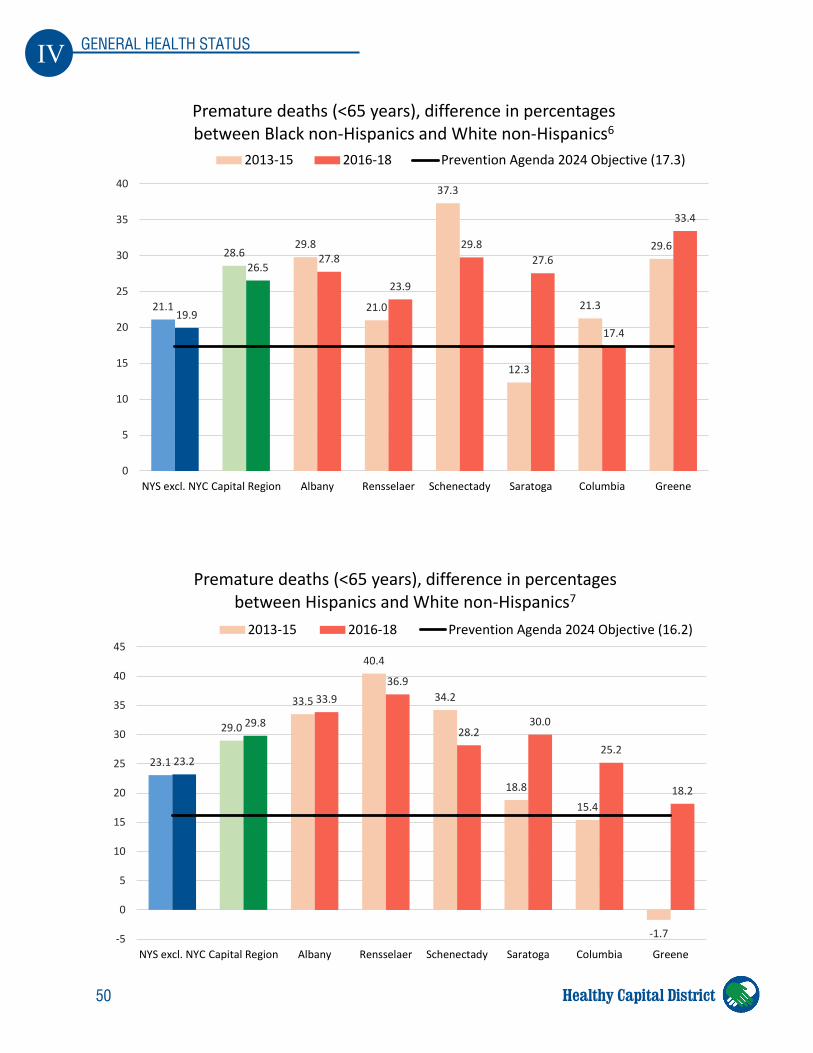
50
IV GENERAL HEALTH STATUS
Healthy Capital District
21.1
28.629.8
21.0
37.3
12.3
21.3
29.6
19.9
26.527.8
23.9
29.827.6
17.4
33.4
0
5
10
15
20
25
30
35
40
NYS excl. NYC Capital Region Albany Rensselaer Schenectady Saratoga Columbia Greene
Premature deaths (<65 years), difference in percentages between Black non-Hispanics and White non-Hispanics6
2013-15 2016-18 Prevention Agenda 2024 Objective (17.3)
23.1
29.0
33.5
40.4
34.2
18.8
15.4
-1.7
23.2
29.8
33.936.9
28.230.0
25.2
18.2
-5
0
5
10
15
20
25
30
35
40
45
NYS excl. NYC Capital Region Albany Rensselaer Schenectady Saratoga Columbia Greene
Premature deaths (<65 years), difference in percentages between Hispanics and White non-Hispanics7
2013-15 2016-18 Prevention Agenda 2024 Objective (16.2)
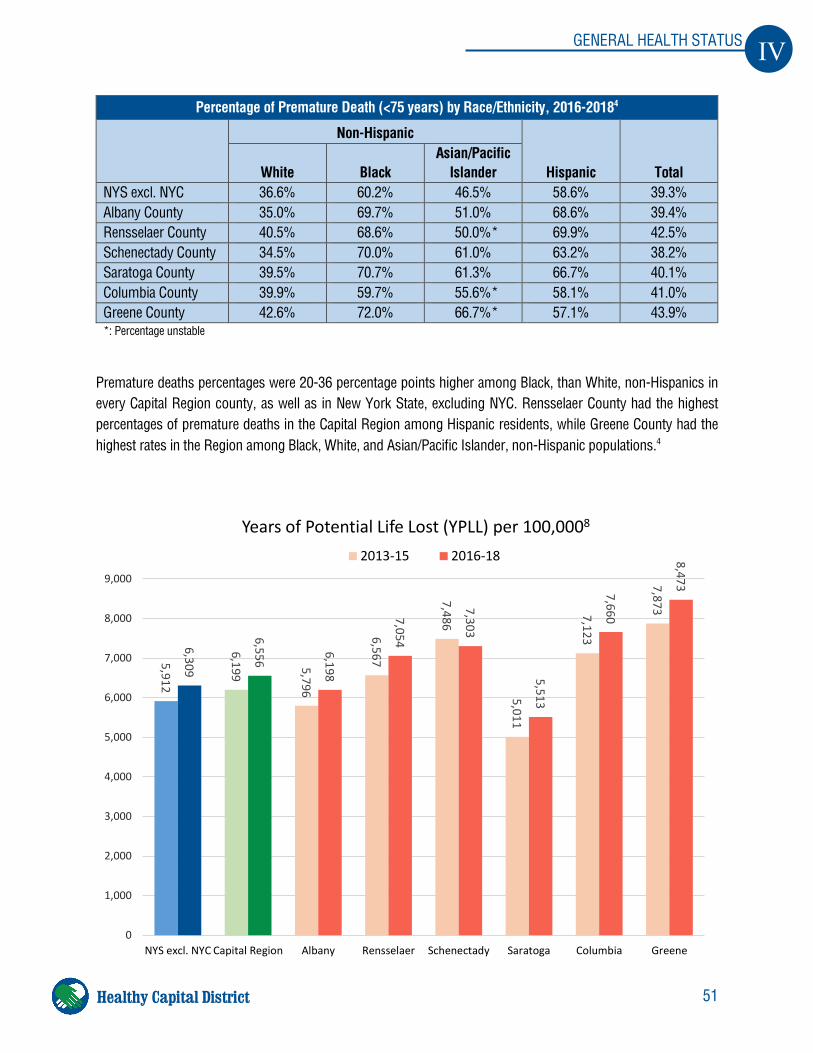
51
IV GENERAL HEALTH STATUS
Healthy Capital District
Percentage of Premature Death (<75 years) by Race/Ethnicity, 2016-20184
Non-Hispanic
Hispanic Total White Black Asian/Pacific
Islander NYS excl. NYC 36.6% 60.2% 46.5% 58.6% 39.3% Albany County 35.0% 69.7% 51.0% 68.6% 39.4% Rensselaer County 40.5% 68.6% 50.0%* 69.9% 42.5% Schenectady County 34.5% 70.0% 61.0% 63.2% 38.2% Saratoga County 39.5% 70.7% 61.3% 66.7% 40.1% Columbia County 39.9% 59.7% 55.6%* 58.1% 41.0% Greene County 42.6% 72.0% 66.7%* 57.1% 43.9% *: Percentage unstable
Premature deaths percentages were 20-36 percentage points higher among Black, than White, non-Hispanics in every Capital Region county, as well as in New York State, excluding NYC. Rensselaer County had the highest percentages of premature deaths in the Capital Region among Hispanic residents, while Greene County had the highest rates in the Region among Black, White, and Asian/Pacific Islander, non-Hispanic populations.4
5,912
6,199 5,796
6,567
7,486
5,011
7,123
7,873
6,309
6,556
6,198
7,054
7,303
5,513
7,660
8,473
0
1,000
2,000
3,000
4,000
5,000
6,000
7,000
8,000
9,000
NYS excl. NYC Capital Region Albany Rensselaer Schenectady Saratoga Columbia Greene
Years of Potential Life Lost (YPLL) per 100,0008
2013-15 2016-18
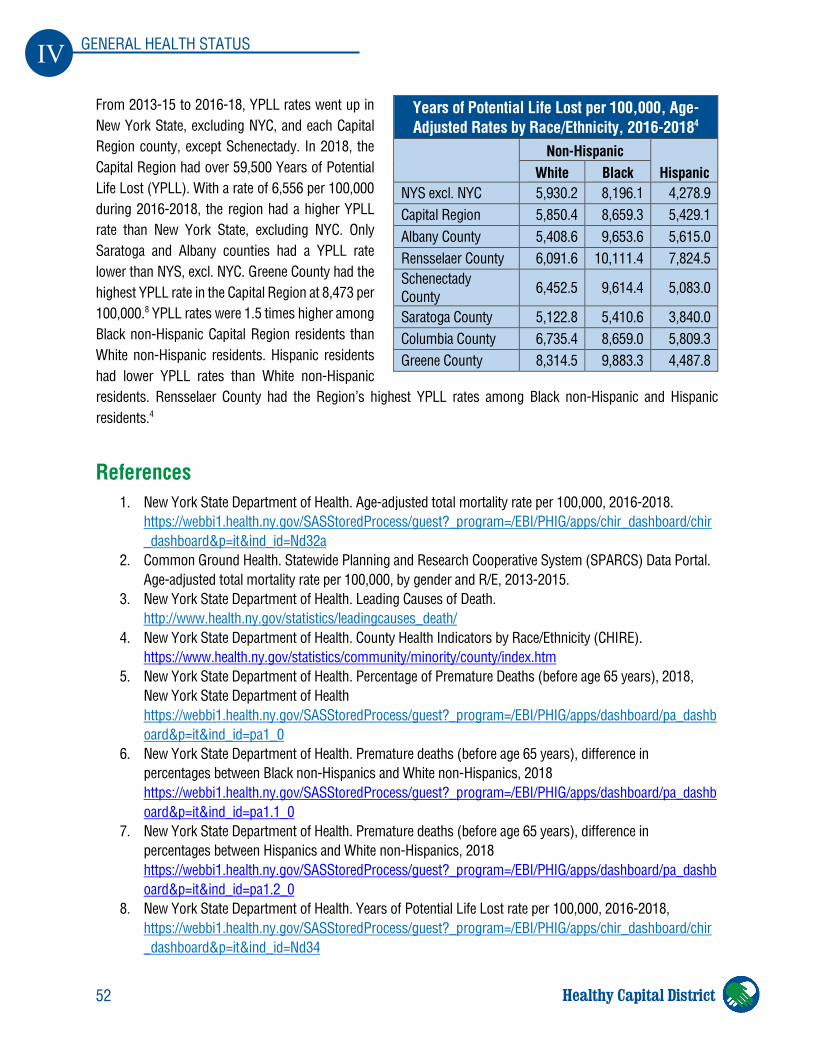
52
IV GENERAL HEALTH STATUS
Healthy Capital District
From 2013-15 to 2016-18, YPLL rates went up in New York State, excluding NYC, and each Capital Region county, except Schenectady. In 2018, the Capital Region had over 59,500 Years of Potential Life Lost (YPLL). With a rate of 6,556 per 100,000 during 2016-2018, the region had a higher YPLL rate than New York State, excluding NYC. Only Saratoga and Albany counties had a YPLL rate lower than NYS, excl. NYC. Greene County had the highest YPLL rate in the Capital Region at 8,473 per 100,000.8 YPLL rates were 1.5 times higher among Black non-Hispanic Capital Region residents than White non-Hispanic residents. Hispanic residents had lower YPLL rates than White non-Hispanic residents. Rensselaer County had the Region’s highest YPLL rates among Black non-Hispanic and Hispanic residents.4
References 1. New York State Department of Health. Age-adjusted total mortality rate per 100,000, 2016-2018.
https://webbi1.health.ny.gov/SASStoredProcess/guest?_program=/EBI/PHIG/apps/chir_dashboard/chir_dashboard&p=it&ind_id=Nd32a
2. Common Ground Health. Statewide Planning and Research Cooperative System (SPARCS) Data Portal. Age-adjusted total mortality rate per 100,000, by gender and R/E, 2013-2015.
3. New York State Department of Health. Leading Causes of Death. http://www.health.ny.gov/statistics/leadingcauses_death/
4. New York State Department of Health. County Health Indicators by Race/Ethnicity (CHIRE). https://www.health.ny.gov/statistics/community/minority/county/index.htm
5. New York State Department of Health. Percentage of Premature Deaths (before age 65 years), 2018, New York State Department of Health https://webbi1.health.ny.gov/SASStoredProcess/guest?_program=/EBI/PHIG/apps/dashboard/pa_dashboard&p=it&ind_id=pa1_0
6. New York State Department of Health. Premature deaths (before age 65 years), difference in percentages between Black non-Hispanics and White non-Hispanics, 2018 https://webbi1.health.ny.gov/SASStoredProcess/guest?_program=/EBI/PHIG/apps/dashboard/pa_dashboard&p=it&ind_id=pa1.1_0
7. New York State Department of Health. Premature deaths (before age 65 years), difference in percentages between Hispanics and White non-Hispanics, 2018 https://webbi1.health.ny.gov/SASStoredProcess/guest?_program=/EBI/PHIG/apps/dashboard/pa_dashboard&p=it&ind_id=pa1.2_0
8. New York State Department of Health. Years of Potential Life Lost rate per 100,000, 2016-2018, https://webbi1.health.ny.gov/SASStoredProcess/guest?_program=/EBI/PHIG/apps/chir_dashboard/chir_dashboard&p=it&ind_id=Nd34
Years of Potential Life Lost per 100,000, Age-Adjusted Rates by Race/Ethnicity, 2016-20184
Non-Hispanic
Hispanic White Black NYS excl. NYC 5,930.2 8,196.1 4,278.9 Capital Region 5,850.4 8,659.3 5,429.1 Albany County 5,408.6 9,653.6 5,615.0 Rensselaer County 6,091.6 10,111.4 7,824.5 Schenectady County 6,452.5 9,614.4 5,083.0
Saratoga County 5,122.8 5,410.6 3,840.0 Columbia County 6,735.4 8,659.0 5,809.3 Greene County 8,314.5 9,883.3 4,487.8
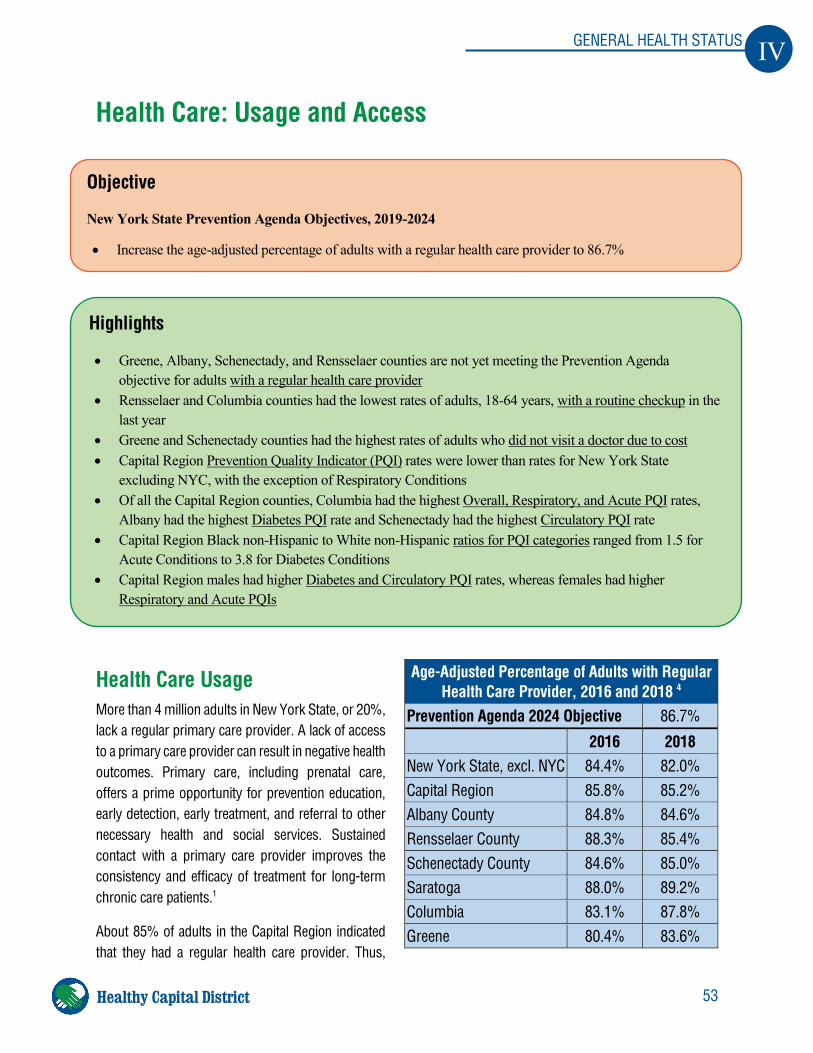
53
IV GENERAL HEALTH STATUS
Healthy Capital District
Health Care: Usage and Access
Health Care Usage More than 4 million adults in New York State, or 20%, lack a regular primary care provider. A lack of access to a primary care provider can result in negative health outcomes. Primary care, including prenatal care, offers a prime opportunity for prevention education, early detection, early treatment, and referral to other necessary health and social services. Sustained contact with a primary care provider improves the consistency and efficacy of treatment for long-term chronic care patients.1
About 85% of adults in the Capital Region indicated that they had a regular health care provider. Thus,
Age-Adjusted Percentage of Adults with Regular Health Care Provider, 2016 and 2018 4
Prevention Agenda 2024 Objective 86.7%
2016 2018 New York State, excl. NYC 84.4% 82.0% Capital Region 85.8% 85.2% Albany County 84.8% 84.6% Rensselaer County 88.3% 85.4% Schenectady County 84.6% 85.0% Saratoga 88.0% 89.2% Columbia 83.1% 87.8% Greene 80.4% 83.6%
Highlights
• Greene, Albany, Schenectady, and Rensselaer counties are not yet meeting the Prevention Agenda objective for adults with a regular health care provider
• Rensselaer and Columbia counties had the lowest rates of adults, 18-64 years, with a routine checkup in the last year
• Greene and Schenectady counties had the highest rates of adults who did not visit a doctor due to cost • Capital Region Prevention Quality Indicator (PQI) rates were lower than rates for New York State
excluding NYC, with the exception of Respiratory Conditions • Of all the Capital Region counties, Columbia had the highest Overall, Respiratory, and Acute PQI rates,
Albany had the highest Diabetes PQI rate and Schenectady had the highest Circulatory PQI rate • Capital Region Black non-Hispanic to White non-Hispanic ratios for PQI categories ranged from 1.5 for
Acute Conditions to 3.8 for Diabetes Conditions • Capital Region males had higher Diabetes and Circulatory PQI rates, whereas females had higher
Respiratory and Acute PQIs
Objective
New York State Prevention Agenda Objectives, 2019-2024
• Increase the age-adjusted percentage of adults with a regular health care provider to 86.7%
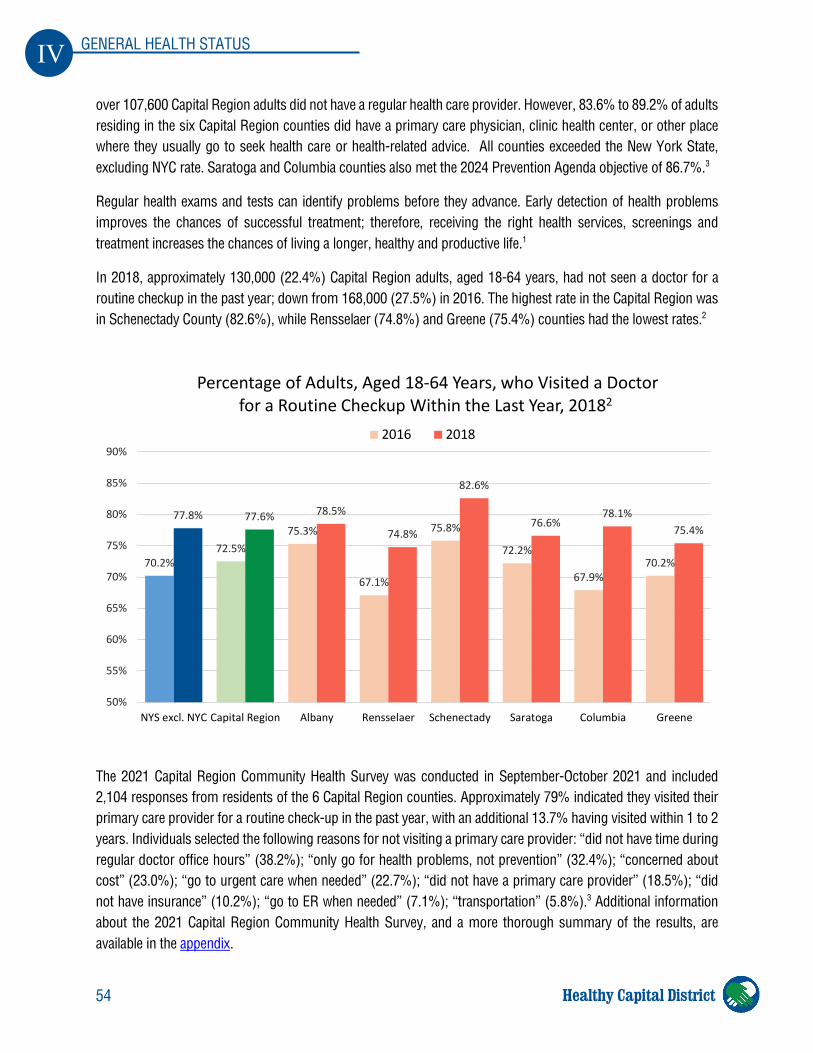
54
IV GENERAL HEALTH STATUS
Healthy Capital District
over 107,600 Capital Region adults did not have a regular health care provider. However, 83.6% to 89.2% of adults residing in the six Capital Region counties did have a primary care physician, clinic health center, or other place where they usually go to seek health care or health-related advice. All counties exceeded the New York State, excluding NYC rate. Saratoga and Columbia counties also met the 2024 Prevention Agenda objective of 86.7%.3
Regular health exams and tests can identify problems before they advance. Early detection of health problems improves the chances of successful treatment; therefore, receiving the right health services, screenings and treatment increases the chances of living a longer, healthy and productive life.1
In 2018, approximately 130,000 (22.4%) Capital Region adults, aged 18-64 years, had not seen a doctor for a routine checkup in the past year; down from 168,000 (27.5%) in 2016. The highest rate in the Capital Region was in Schenectady County (82.6%), while Rensselaer (74.8%) and Greene (75.4%) counties had the lowest rates.2
The 2021 Capital Region Community Health Survey was conducted in September-October 2021 and included 2,104 responses from residents of the 6 Capital Region counties. Approximately 79% indicated they visited their primary care provider for a routine check-up in the past year, with an additional 13.7% having visited within 1 to 2 years. Individuals selected the following reasons for not visiting a primary care provider: “did not have time during regular doctor office hours” (38.2%); “only go for health problems, not prevention” (32.4%); “concerned about cost” (23.0%); “go to urgent care when needed” (22.7%); “did not have a primary care provider” (18.5%); “did not have insurance” (10.2%); “go to ER when needed” (7.1%); “transportation” (5.8%).3 Additional information about the 2021 Capital Region Community Health Survey, and a more thorough summary of the results, are available in the appendix.
70.2%72.5%
75.3%
67.1%
75.8%
72.2%
67.9%70.2%
77.8% 77.6% 78.5%
74.8%
82.6%
76.6%78.1%
75.4%
50%
55%
60%
65%
70%
75%
80%
85%
90%
NYS excl. NYC Capital Region Albany Rensselaer Schenectady Saratoga Columbia Greene
Percentage of Adults, Aged 18-64 Years, who Visited a Doctor for a Routine Checkup Within the Last Year, 20182
2016 2018
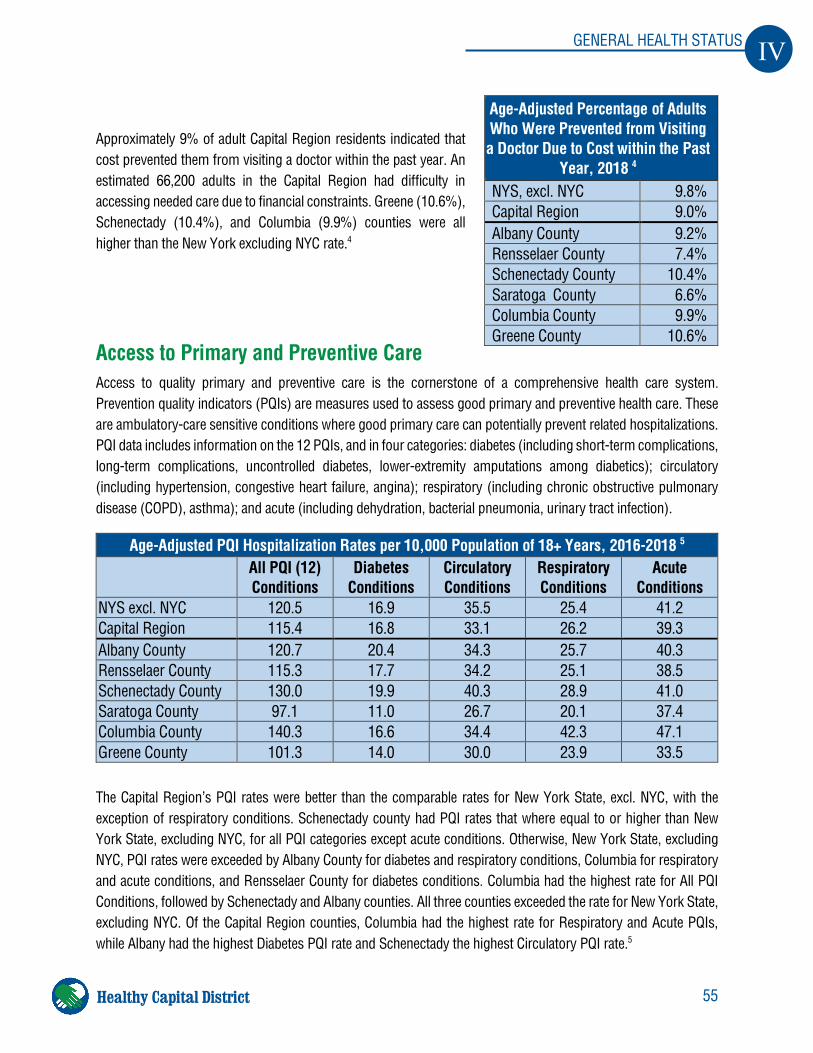
55
IV GENERAL HEALTH STATUS
Healthy Capital District
Approximately 9% of adult Capital Region residents indicated that cost prevented them from visiting a doctor within the past year. An estimated 66,200 adults in the Capital Region had difficulty in accessing needed care due to financial constraints. Greene (10.6%), Schenectady (10.4%), and Columbia (9.9%) counties were all higher than the New York excluding NYC rate.4
Access to Primary and Preventive Care Access to quality primary and preventive care is the cornerstone of a comprehensive health care system. Prevention quality indicators (PQIs) are measures used to assess good primary and preventive health care. These are ambulatory-care sensitive conditions where good primary care can potentially prevent related hospitalizations. PQI data includes information on the 12 PQIs, and in four categories: diabetes (including short-term complications, long-term complications, uncontrolled diabetes, lower-extremity amputations among diabetics); circulatory (including hypertension, congestive heart failure, angina); respiratory (including chronic obstructive pulmonary disease (COPD), asthma); and acute (including dehydration, bacterial pneumonia, urinary tract infection).
The Capital Region’s PQI rates were better than the comparable rates for New York State, excl. NYC, with the exception of respiratory conditions. Schenectady county had PQI rates that where equal to or higher than New York State, excluding NYC, for all PQI categories except acute conditions. Otherwise, New York State, excluding NYC, PQI rates were exceeded by Albany County for diabetes and respiratory conditions, Columbia for respiratory and acute conditions, and Rensselaer County for diabetes conditions. Columbia had the highest rate for All PQI Conditions, followed by Schenectady and Albany counties. All three counties exceeded the rate for New York State, excluding NYC. Of the Capital Region counties, Columbia had the highest rate for Respiratory and Acute PQIs, while Albany had the highest Diabetes PQI rate and Schenectady the highest Circulatory PQI rate.5
Age-Adjusted Percentage of Adults Who Were Prevented from Visiting a Doctor Due to Cost within the Past
Year, 2018 4 NYS, excl. NYC 9.8% Capital Region 9.0% Albany County 9.2% Rensselaer County 7.4% Schenectady County 10.4% Saratoga County 6.6% Columbia County 9.9% Greene County 10.6%
Age-Adjusted PQI Hospitalization Rates per 10,000 Population of 18+ Years, 2016-2018 5 All PQI (12)
Conditions Diabetes
Conditions Circulatory Conditions
Respiratory Conditions
Acute Conditions
NYS excl. NYC 120.5 16.9 35.5 25.4 41.2 Capital Region 115.4 16.8 33.1 26.2 39.3 Albany County 120.7 20.4 34.3 25.7 40.3 Rensselaer County 115.3 17.7 34.2 25.1 38.5 Schenectady County 130.0 19.9 40.3 28.9 41.0 Saratoga County 97.1 11.0 26.7 20.1 37.4 Columbia County 140.3 16.6 34.4 42.3 47.1 Greene County 101.3 14.0 30.0 23.9 33.5
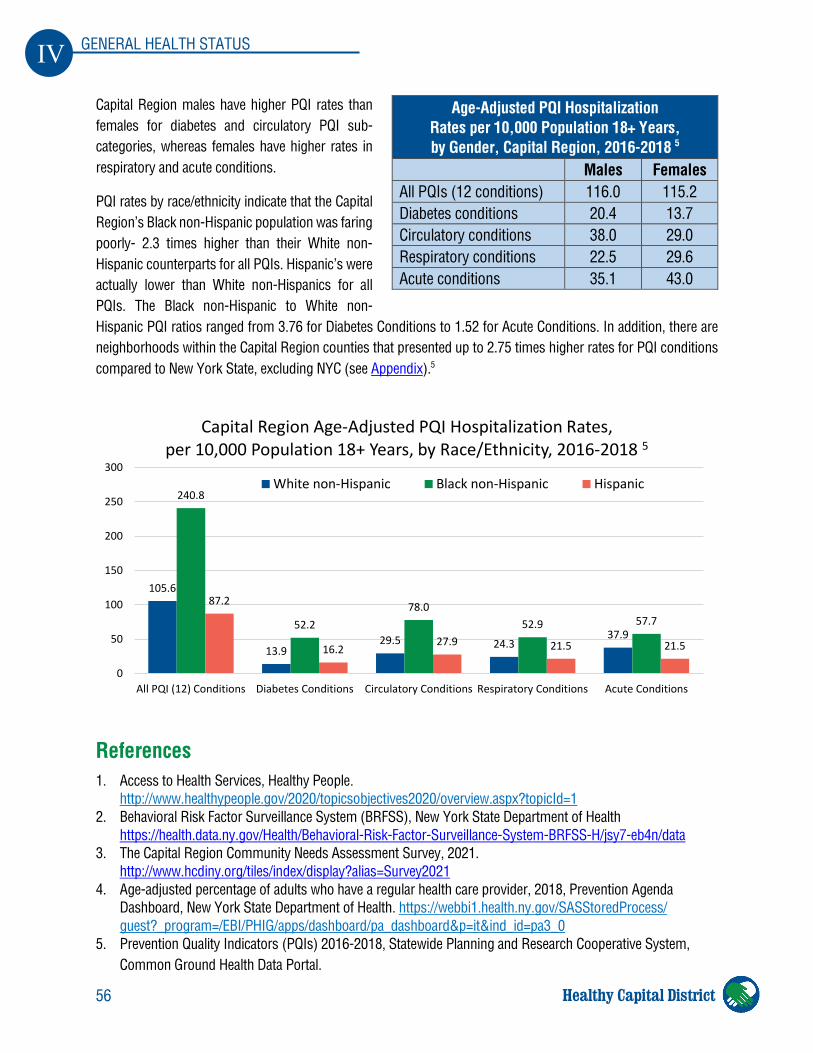
56
IV GENERAL HEALTH STATUS
Healthy Capital District
Capital Region males have higher PQI rates than females for diabetes and circulatory PQI sub-categories, whereas females have higher rates in respiratory and acute conditions.
PQI rates by race/ethnicity indicate that the Capital Region’s Black non-Hispanic population was faring poorly- 2.3 times higher than their White non-Hispanic counterparts for all PQIs. Hispanic’s were actually lower than White non-Hispanics for all PQIs. The Black non-Hispanic to White non-Hispanic PQI ratios ranged from 3.76 for Diabetes Conditions to 1.52 for Acute Conditions. In addition, there are neighborhoods within the Capital Region counties that presented up to 2.75 times higher rates for PQI conditions compared to New York State, excluding NYC (see Appendix).5
References 1. Access to Health Services, Healthy People.
http://www.healthypeople.gov/2020/topicsobjectives2020/overview.aspx?topicId=1 2. Behavioral Risk Factor Surveillance System (BRFSS), New York State Department of Health
https://health.data.ny.gov/Health/Behavioral-Risk-Factor-Surveillance-System-BRFSS-H/jsy7-eb4n/data 3. The Capital Region Community Needs Assessment Survey, 2021.
http://www.hcdiny.org/tiles/index/display?alias=Survey2021 4. Age-adjusted percentage of adults who have a regular health care provider, 2018, Prevention Agenda
Dashboard, New York State Department of Health. https://webbi1.health.ny.gov/SASStoredProcess/ guest?_program=/EBI/PHIG/apps/dashboard/pa_dashboard&p=it&ind_id=pa3_0
5. Prevention Quality Indicators (PQIs) 2016-2018, Statewide Planning and Research Cooperative System, Common Ground Health Data Portal.
Age-Adjusted PQI Hospitalization Rates per 10,000 Population 18+ Years, by Gender, Capital Region, 2016-2018 5
Males Females All PQIs (12 conditions) 116.0 115.2 Diabetes conditions 20.4 13.7 Circulatory conditions 38.0 29.0 Respiratory conditions 22.5 29.6 Acute conditions 35.1 43.0
105.6
13.929.5 24.3
37.9
240.8
52.278.0
52.9 57.7
87.2
16.227.9 21.5 21.5
0
50
100
150
200
250
300
All PQI (12) Conditions Diabetes Conditions Circulatory Conditions Respiratory Conditions Acute Conditions
Capital Region Age-Adjusted PQI Hospitalization Rates, per 10,000 Population 18+ Years, by Race/Ethnicity, 2016-2018 5
White non-Hispanic Black non-Hispanic Hispanic
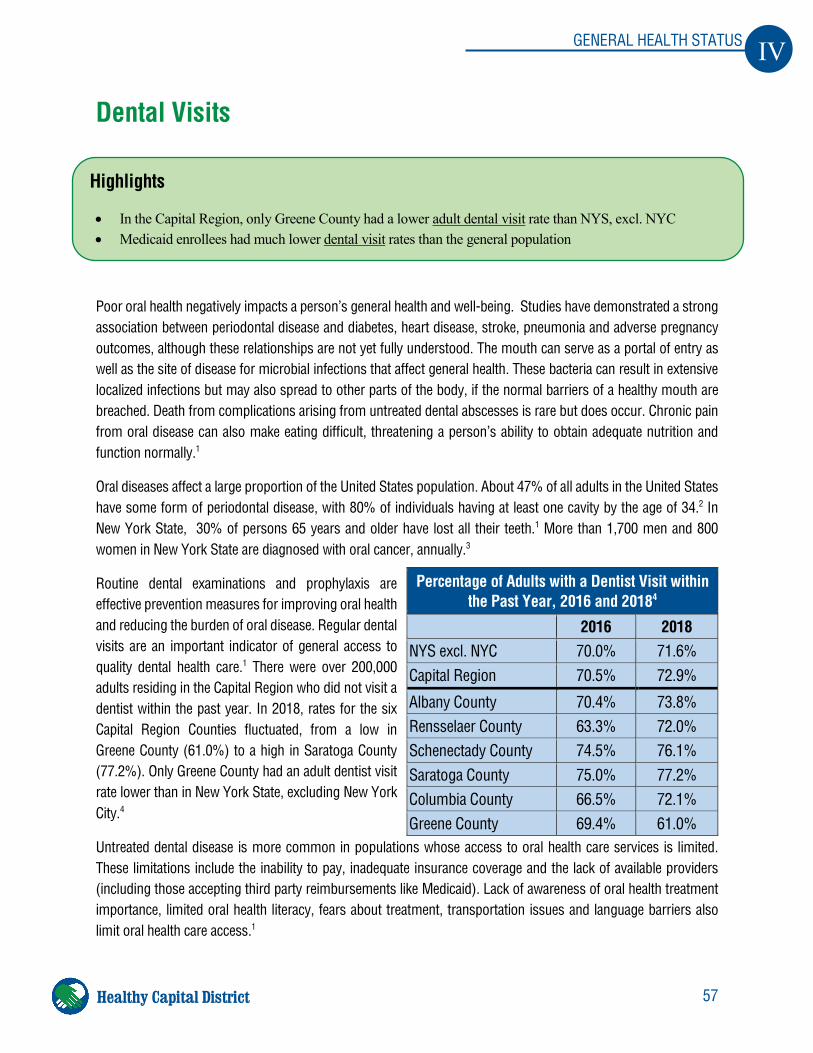
57
IV GENERAL HEALTH STATUS
Healthy Capital District
Dental Visits
Poor oral health negatively impacts a person’s general health and well-being. Studies have demonstrated a strong association between periodontal disease and diabetes, heart disease, stroke, pneumonia and adverse pregnancy outcomes, although these relationships are not yet fully understood. The mouth can serve as a portal of entry as well as the site of disease for microbial infections that affect general health. These bacteria can result in extensive localized infections but may also spread to other parts of the body, if the normal barriers of a healthy mouth are breached. Death from complications arising from untreated dental abscesses is rare but does occur. Chronic pain from oral disease can also make eating difficult, threatening a person’s ability to obtain adequate nutrition and function normally.1
Oral diseases affect a large proportion of the United States population. About 47% of all adults in the United States have some form of periodontal disease, with 80% of individuals having at least one cavity by the age of 34.2 In New York State, 30% of persons 65 years and older have lost all their teeth.1 More than 1,700 men and 800 women in New York State are diagnosed with oral cancer, annually.3
Routine dental examinations and prophylaxis are effective prevention measures for improving oral health and reducing the burden of oral disease. Regular dental visits are an important indicator of general access to quality dental health care.1 There were over 200,000 adults residing in the Capital Region who did not visit a dentist within the past year. In 2018, rates for the six Capital Region Counties fluctuated, from a low in Greene County (61.0%) to a high in Saratoga County (77.2%). Only Greene County had an adult dentist visit rate lower than in New York State, excluding New York City.4
Untreated dental disease is more common in populations whose access to oral health care services is limited. These limitations include the inability to pay, inadequate insurance coverage and the lack of available providers (including those accepting third party reimbursements like Medicaid). Lack of awareness of oral health treatment importance, limited oral health literacy, fears about treatment, transportation issues and language barriers also limit oral health care access.1
Percentage of Adults with a Dentist Visit within the Past Year, 2016 and 20184
2016 2018 NYS excl. NYC 70.0% 71.6% Capital Region 70.5% 72.9%
Albany County 70.4% 73.8% Rensselaer County 63.3% 72.0% Schenectady County 74.5% 76.1% Saratoga County 75.0% 77.2% Columbia County 66.5% 72.1% Greene County 69.4% 61.0%
Highlights
• In the Capital Region, only Greene County had a lower adult dental visit rate than NYS, excl. NYC • Medicaid enrollees had much lower dental visit rates than the general population
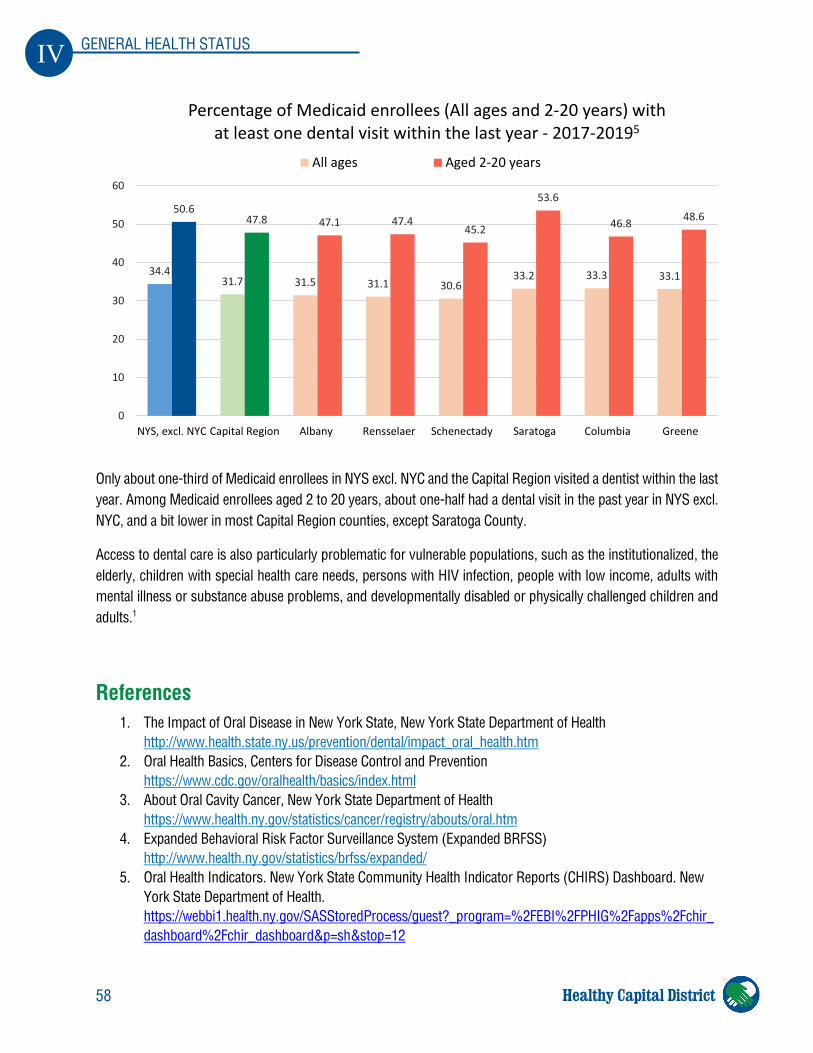
58
IV GENERAL HEALTH STATUS
Healthy Capital District
Only about one-third of Medicaid enrollees in NYS excl. NYC and the Capital Region visited a dentist within the last year. Among Medicaid enrollees aged 2 to 20 years, about one-half had a dental visit in the past year in NYS excl. NYC, and a bit lower in most Capital Region counties, except Saratoga County.
Access to dental care is also particularly problematic for vulnerable populations, such as the institutionalized, the elderly, children with special health care needs, persons with HIV infection, people with low income, adults with mental illness or substance abuse problems, and developmentally disabled or physically challenged children and adults.1
References 1. The Impact of Oral Disease in New York State, New York State Department of Health
http://www.health.state.ny.us/prevention/dental/impact_oral_health.htm 2. Oral Health Basics, Centers for Disease Control and Prevention
https://www.cdc.gov/oralhealth/basics/index.html 3. About Oral Cavity Cancer, New York State Department of Health
https://www.health.ny.gov/statistics/cancer/registry/abouts/oral.htm 4. Expanded Behavioral Risk Factor Surveillance System (Expanded BRFSS)
http://www.health.ny.gov/statistics/brfss/expanded/ 5. Oral Health Indicators. New York State Community Health Indicator Reports (CHIRS) Dashboard. New
York State Department of Health. https://webbi1.health.ny.gov/SASStoredProcess/guest?_program=%2FEBI%2FPHIG%2Fapps%2Fchir_dashboard%2Fchir_dashboard&p=sh&stop=12
34.431.7 31.5 31.1 30.6
33.2 33.3 33.1
50.647.8 47.1 47.4
45.2
53.6
46.8 48.6
0
10
20
30
40
50
60
NYS, excl. NYC Capital Region Albany Rensselaer Schenectady Saratoga Columbia Greene
Percentage of Medicaid enrollees (All ages and 2-20 years) with at least one dental visit within the last year - 2017-20195
All ages Aged 2-20 years
59
V CHRONIC DISEASE
Healthy Capital District
V. Chronic Disease
Obesity, Physical Activity and Nutrition
Adult Obesity
Many of the major causes of morbidity and mortality in the United States are related to poor diet and physical inactivity.1 Being overweight and/or obese is defined as falling into a range of weight that is greater than what is considered healthy for a given height. For adults, obesity ranges are determined by using weight and height to calculate a number called the "body mass index" (BMI). An adult with a BMI between 25 and 29.9 is considered overweight, and an adult with a BMI of 30 or higher is considered obese.2 Obesity is caused by a complex interaction of genetic, metabolic, behavioral, social and environmental factors. Obesity is associated with adverse health, social and economic consequences. It is the primary cause of type 2 diabetes; indeed, more than 80% of persons with type 2 diabetes are overweight or obese. It is also a major contributing factor to heart disease, stroke, cancer, asthma, arthritis, and a number of psychological conditions, including depression.3 Without strong action to reverse the obesity epidemic, for the first time in our history children are predicted to have a shorter lifespan than their parents.
Highlights
In the Capital Region, obestity rates:
• Were higher than the Prevention Agenda 2024 objective in every county • Were highest in Greene (34.5%) and Schenectady (33.7%) counties • Increased in each county, except Columbia County, between 2016 and 2018 • Were higher among low-income individuals (38.8%):
o Than in 2016 (28.6%) o Than in all adults (29.6%) o Than in NYS, excluding NYC (34.4%)
Objective
New York State Prevention Agenda, 2019-2024
• Reduce the percentage of adults ages 18 years and older who are obese to 24.2%
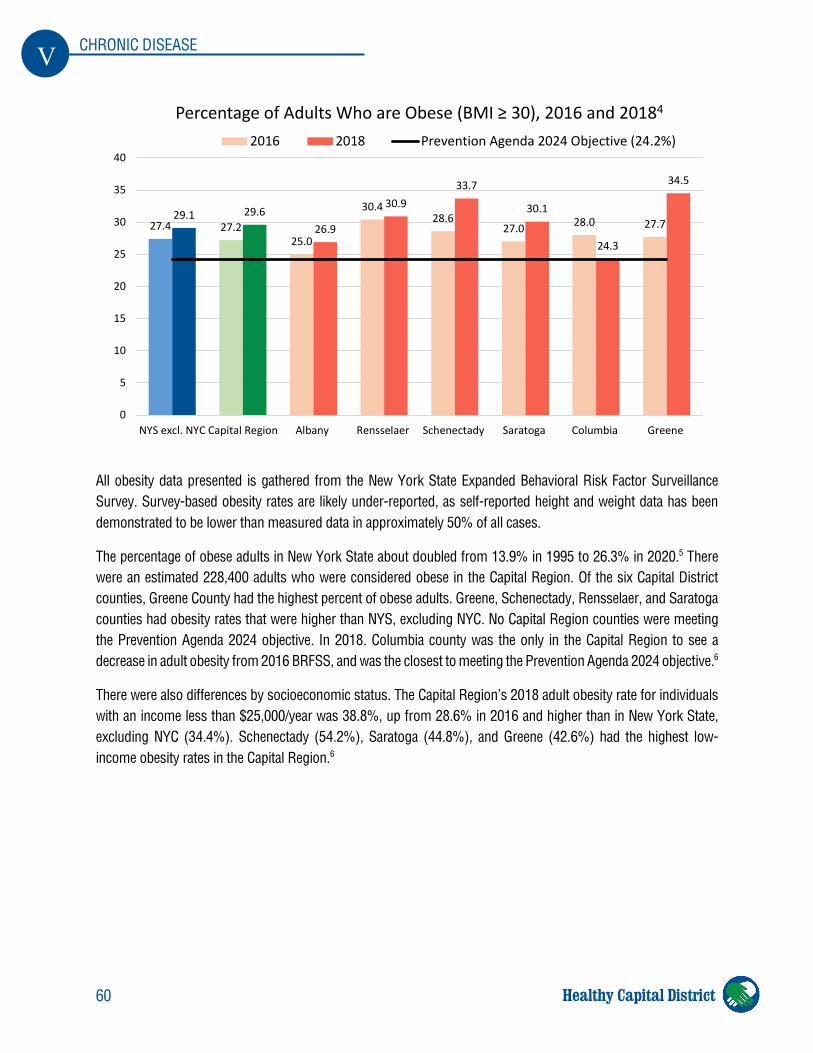
60
V CHRONIC DISEASE
Healthy Capital District
All obesity data presented is gathered from the New York State Expanded Behavioral Risk Factor Surveillance Survey. Survey-based obesity rates are likely under-reported, as self-reported height and weight data has been demonstrated to be lower than measured data in approximately 50% of all cases.
The percentage of obese adults in New York State about doubled from 13.9% in 1995 to 26.3% in 2020.5 There were an estimated 228,400 adults who were considered obese in the Capital Region. Of the six Capital District counties, Greene County had the highest percent of obese adults. Greene, Schenectady, Rensselaer, and Saratoga counties had obesity rates that were higher than NYS, excluding NYC. No Capital Region counties were meeting the Prevention Agenda 2024 objective. In 2018. Columbia county was the only in the Capital Region to see a decrease in adult obesity from 2016 BRFSS, and was the closest to meeting the Prevention Agenda 2024 objective.6
There were also differences by socioeconomic status. The Capital Region’s 2018 adult obesity rate for individuals with an income less than $25,000/year was 38.8%, up from 28.6% in 2016 and higher than in New York State, excluding NYC (34.4%). Schenectady (54.2%), Saratoga (44.8%), and Greene (42.6%) had the highest low-income obesity rates in the Capital Region.6
27.4 27.225.0
30.428.6
27.0 28.0 27.729.1 29.6
26.9
30.933.7
30.1
24.3
34.5
0
5
10
15
20
25
30
35
40
NYS excl. NYC Capital Region Albany Rensselaer Schenectady Saratoga Columbia Greene
Percentage of Adults Who are Obese (BMI ≥ 30), 2016 and 20184
2016 2018 Prevention Agenda 2024 Objective (24.2%)
61
V CHRONIC DISEASE
Healthy Capital District
Childhood Obesity
The life expectancy of children and adolescents in the United States and New York is significantly reduced due to increasing obesity rates. The prevalence of obesity in the United States has quadrupled since the 1970s among children aged 6-19 years from 5% to 19%, and doubled from 5% to 10% among preschool children aged 2-5 years.3
For children and teens ages 2-19, overweight and obese are defined differently than for adults. Overweight is defined as a BMI at or above the 85th percentile to below the 95th percentile and obese is at or above the 95th percentile on CDC growth charts for children. Additionally, an age- and sex-specific percentile is used for BMI rather than the BMI categories used for adults. Children's body compositions vary at different ages and vary between boys and girls.7
The Student Weight Status Category Report provides information from schools on children and adolescent BMI and weight status. Saratoga and Albany counties were meeting the Prevention Agenda 2024 objective of 16.4% of children with a BMI at or greater than the 95th percentile. Greene County has the highest prevalence of students classified as obese (23.0%) and was the only county to show an increase in the percentage of children and adolescents who are obese, when comparing the 2014-2016 to 2017-2019 school years.8
Highlights
Obestity Rate(s):
• Among children and adolescents, was highest in Greene County (23.0%) o Saratoga and Albany counties were meeting the Prevention Agenda objective
• Among children (aged 2-4 years) in WIC, were highest in Greene and Columbia counties (19.7%) o No Capital Region counties were meeting the Prevention Agenda objective
Objective
New York State Prevention Agenda, 2019-2024
• Reduce the percentage of children and adolescents who are obese so that the percentage of public school children in New York State (outside NYC) who are obese is reduced to 16.4%
• Reduce the percentage of children (aged 2-4 years) in WIC who are obese to 13.0%
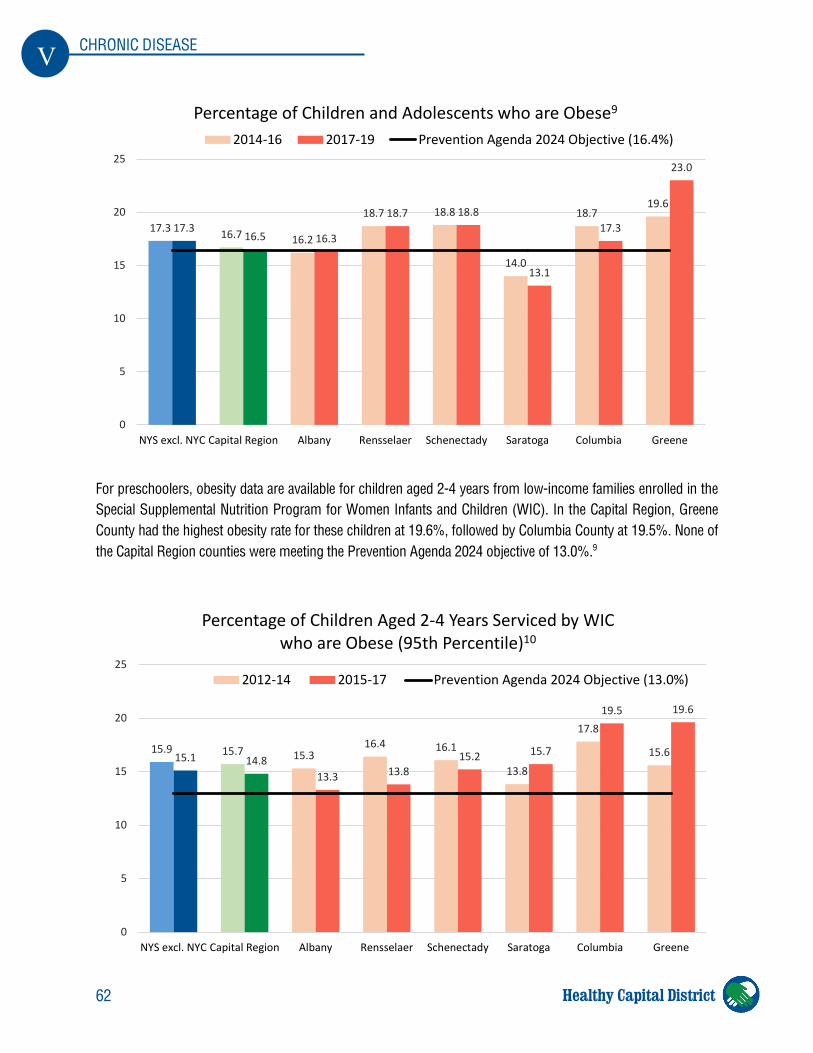
62
V CHRONIC DISEASE
Healthy Capital District
For preschoolers, obesity data are available for children aged 2-4 years from low-income families enrolled in the Special Supplemental Nutrition Program for Women Infants and Children (WIC). In the Capital Region, Greene County had the highest obesity rate for these children at 19.6%, followed by Columbia County at 19.5%. None of the Capital Region counties were meeting the Prevention Agenda 2024 objective of 13.0%.9
17.3 16.7 16.2
18.7 18.8
14.0
18.719.6
17.316.5 16.3
18.7 18.8
13.1
17.3
23.0
0
5
10
15
20
25
NYS excl. NYC Capital Region Albany Rensselaer Schenectady Saratoga Columbia Greene
Percentage of Children and Adolescents who are Obese9
2014-16 2017-19 Prevention Agenda 2024 Objective (16.4%)
15.9 15.7 15.316.4 16.1
13.8
17.8
15.615.1 14.813.3 13.8
15.2 15.7
19.5 19.6
0
5
10
15
20
25
NYS excl. NYC Capital Region Albany Rensselaer Schenectady Saratoga Columbia Greene
Percentage of Children Aged 2-4 Years Serviced by WIC who are Obese (95th Percentile)10
2012-14 2015-17 Prevention Agenda 2024 Objective (13.0%)
63
V CHRONIC DISEASE
Healthy Capital District
As with adults, childhood obesity is disproportionately distributed among lower-income populations. According to the New York State Department of Health, Division of Chronic Disease Prevention, public school districts in the fourth quartile of eligibility for free lunch had obesity rates almost twice as high as those in the first quartile of eligibility for free lunch, during the 2010-2012 school years.10
Physical Activity
Physical inactivity is a significant factor leading to overweight and obese children and adults. A lack of physical activity can also lead to many chronic diseases or conditions, including hypertension, heart disease, stroke, type 2 diabetes, and some cancers. Physical activity is proven to help maintain a healthy weight and lower the risk of heart disease and related risk factors, diabetes, and premature mortality. It can also help reduce depression and increase cognitive function in older adults. Staying active provides broad health benefits.11
Adults, per week, need at least 2.5 hours of moderate-intensity (or 75 minutes of vigorous-intensity) aerobic activity and two or more days with a muscle-strengthening activity. Adults 65 and older should follow the adult guidelines as closely as possible. Children and adolescents should be active at least 60 minutes daily and do aerobic, muscle-strengthening, and bone-strengthening activities at least 3 days per week.11
There were an estimated 146,000 adults residing in the Capital District who did not engage in any type of leisure time physical activity in the past month. Of the six Capital Region counties, Rensselaer and Greene Counties did not meet the Prevention Agenda 2024 objective of 77.4% of adults engaging in leisure time physical activity. Columbia and Greeene counties saw a reduction in leisure time physical activity between 2016 and 2018.12
Objective
New York State Prevention Agenda, 2019-2024
• Increase the percentage of adult New Yorkers who engage in some type of leisure time physical activity to at least 77.4%
Highlights
• Greene and Columbia counties saw a decrease in physical activity, between 2016 and 2018 • Greene and Rensselaer counties were not meeting meet the Prevention Agenda 2024 objective, in 2018
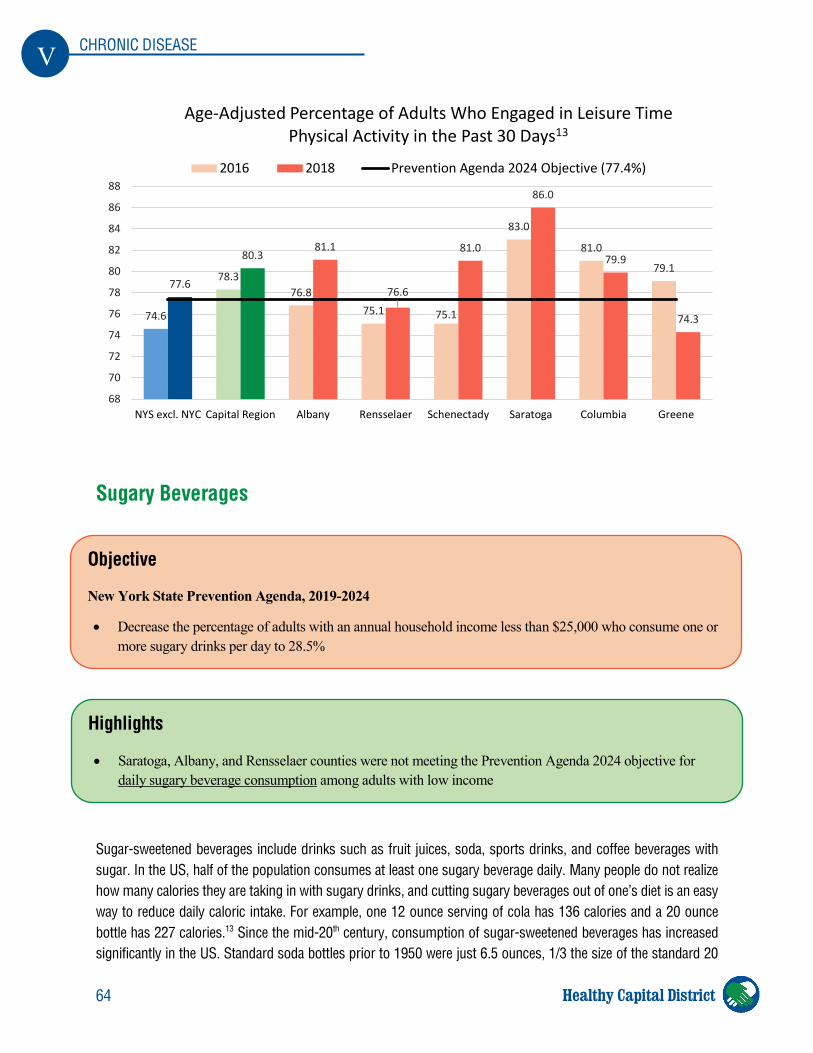
64
V CHRONIC DISEASE
Healthy Capital District
Sugary Beverages
Sugar-sweetened beverages include drinks such as fruit juices, soda, sports drinks, and coffee beverages with sugar. In the US, half of the population consumes at least one sugary beverage daily. Many people do not realize how many calories they are taking in with sugary drinks, and cutting sugary beverages out of one’s diet is an easy way to reduce daily caloric intake. For example, one 12 ounce serving of cola has 136 calories and a 20 ounce bottle has 227 calories.13 Since the mid-20th century, consumption of sugar-sweetened beverages has increased significantly in the US. Standard soda bottles prior to 1950 were just 6.5 ounces, 1/3 the size of the standard 20
Highlights
• Saratoga, Albany, and Rensselaer counties were not meeting the Prevention Agenda 2024 objective for daily sugary beverage consumption among adults with low income
Objective
New York State Prevention Agenda, 2019-2024
• Decrease the percentage of adults with an annual household income less than $25,000 who consume one or more sugary drinks per day to 28.5%
74.6
78.376.8
75.1 75.1
83.0
81.0
79.177.6
80.381.1
76.6
81.0
86.0
79.9
74.3
68
70
72
74
76
78
80
82
84
86
88
NYS excl. NYC Capital Region Albany Rensselaer Schenectady Saratoga Columbia Greene
Age-Adjusted Percentage of Adults Who Engaged in Leisure Time Physical Activity in the Past 30 Days13
2016 2018 Prevention Agenda 2024 Objective (77.4%)
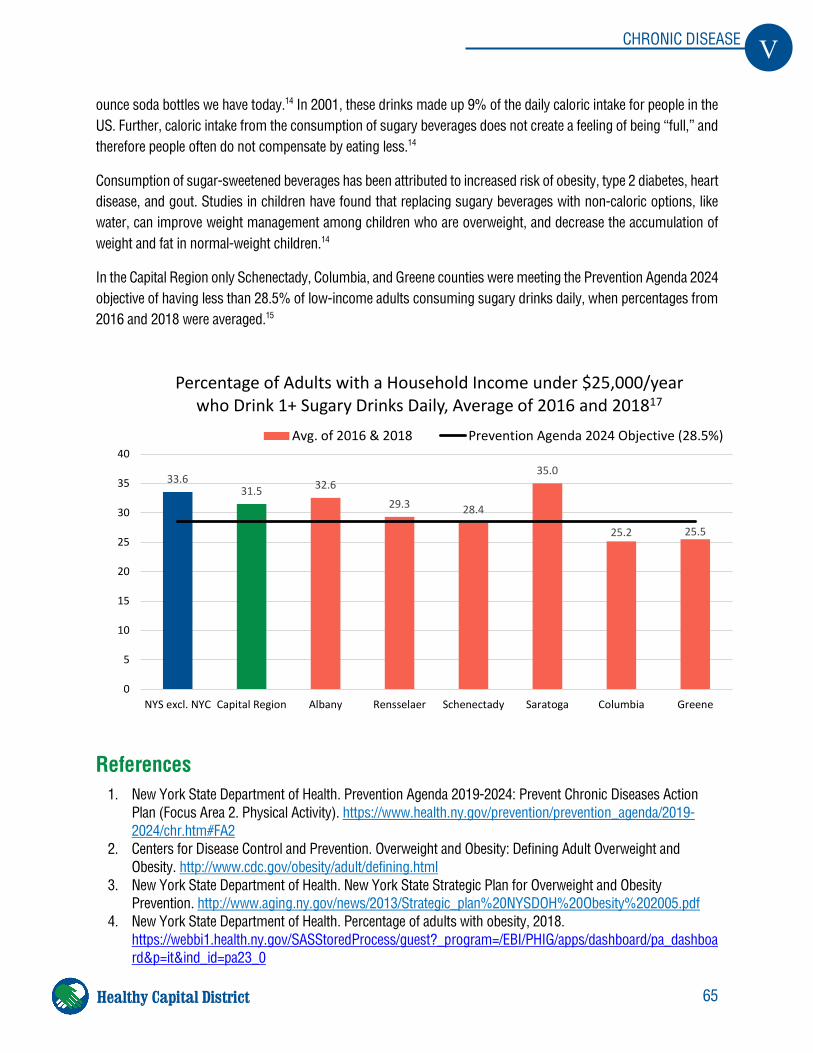
65
V CHRONIC DISEASE
Healthy Capital District
ounce soda bottles we have today.14 In 2001, these drinks made up 9% of the daily caloric intake for people in the US. Further, caloric intake from the consumption of sugary beverages does not create a feeling of being “full,” and therefore people often do not compensate by eating less.14
Consumption of sugar-sweetened beverages has been attributed to increased risk of obesity, type 2 diabetes, heart disease, and gout. Studies in children have found that replacing sugary beverages with non-caloric options, like water, can improve weight management among children who are overweight, and decrease the accumulation of weight and fat in normal-weight children.14
In the Capital Region only Schenectady, Columbia, and Greene counties were meeting the Prevention Agenda 2024 objective of having less than 28.5% of low-income adults consuming sugary drinks daily, when percentages from 2016 and 2018 were averaged.15
References 1. New York State Department of Health. Prevention Agenda 2019-2024: Prevent Chronic Diseases Action
Plan (Focus Area 2. Physical Activity). https://www.health.ny.gov/prevention/prevention_agenda/2019-2024/chr.htm#FA2
2. Centers for Disease Control and Prevention. Overweight and Obesity: Defining Adult Overweight and Obesity. http://www.cdc.gov/obesity/adult/defining.html
3. New York State Department of Health. New York State Strategic Plan for Overweight and Obesity Prevention. http://www.aging.ny.gov/news/2013/Strategic_plan%20NYSDOH%20Obesity%202005.pdf
4. New York State Department of Health. Percentage of adults with obesity, 2018. https://webbi1.health.ny.gov/SASStoredProcess/guest?_program=/EBI/PHIG/apps/dashboard/pa_dashboard&p=it&ind_id=pa23_0
33.631.5 32.6
29.3 28.4
35.0
25.2 25.5
0
5
10
15
20
25
30
35
40
NYS excl. NYC Capital Region Albany Rensselaer Schenectady Saratoga Columbia Greene
Percentage of Adults with a Household Income under $25,000/year who Drink 1+ Sugary Drinks Daily, Average of 2016 and 201817
Avg. of 2016 & 2018 Prevention Agenda 2024 Objective (28.5%)
66
V CHRONIC DISEASE
Healthy Capital District
5. Centers for Disease Control and Prevention. Adult Obesity Prevalence Maps. http://www.cdc.gov/obesity/data/prevalence-maps.html
6. New York State Department of Health. Expanded Behavioral Risk Factor Surveillance System (Expanded BRFSS). https://www.health.ny.gov/statistics/brfss/expanded/
7. New York State Department of Health.Student Weight Status Category Reporting System. https://health.data.ny.gov/Health/Student-Weight-Status-Category-Reporting-Results-B/es3k-2aus
8. New York State Department of Health. Percentage of children and adolescents with obesity, school years 2017-2019. https://webbi1.health.ny.gov/SASStoredProcess/guest?_program=/EBI/PHIG/apps/dashboard/pa_dashboard&p=it&ind_id=pa22_1
9. New York State Department of Health. Percentage of children with obesity, among children aged 2-4 years participating in the WIC program, 2015-2017. https://webbi1.health.ny.gov/SASStoredProcess/guest?_program=/EBI/PHIG/apps/chir_dashboard/chir_dashboard&p=it&ind_id=Jg72
10. New York State Department of Health. Rates of Student Obesity are Significantly Higher in High Need School Districts. https://www.health.ny.gov/statistics/prevention/injury_prevention/information_for_action/docs/2013-06_ifa_report.pdf
11. Centers for Disease Control and Prevention. Physical Activity Basics. http://www.cdc.gov/physicalactivity/basics/index.htm
12. New York State Department of Health. Percentage of adults who participate in leisure-time physical activity, 2018. https://webbi1.health.ny.gov/SASStoredProcess/guest?_program=/EBI/PHIG/apps/dashboard/pa_dashboard&p=it&ind_id=pa26_0
13. Centers for Disease Control and Prevention. Rethink Your Drink. http://www.cdc.gov/healthyweight/healthy_eating/drinks.html
14. Harvard School of Public Health. Sugary Drinks. http://www.hsph.harvard.edu/nutritionsource/healthy-drinks/sugary-drinks/
15. New York State Department of Health. Percentage of adults with an annual household income less than $25,000 who consume one or more sugary drinks per day, 2018. https://webbi1.health.ny.gov/SASStoredProcess/guest?_program=/EBI/PHIG/apps/dashboard/pa_dashboard&p=it&ind_id=pa24_0
67
V CHRONIC DISEASE
Healthy Capital District
Tobacco Use
Preventing and reducing tobacco use is a cornerstone of public health. Tobacco use and dependence on tobacco are the leading preventable causes of morbidity and mortality in New York State and in the country. Cigarette use alone results in an estimated 443,000 deaths each year in the U.S., including 25,400 deaths in New York State.1
In addition to its direct impact on people who smoke, smoking negatively affects non-smokers in proximity to smokers. Every year, 2,600 New Yorkers die from the effects of second-hand smoke. Secondhand smoke contains hundreds of toxic and cancer-causing chemicals. The Surgeon General has stated that there is no safe level of exposure to secondhand smoke. The United States Environmental Protection Agency has classified secondhand smoke as a known human carcinogen (cancer-causing agent).1
There are 389,000 children alive today who will die prematurely from second hand smoke. Many more children exposed to secondhand smoke will suffer from respiratory illnesses, including bronchitis and pneumonia, asthma, and eye and ear problems.1
More than half a million New Yorkers currently have a disease caused by smoking, resulting in about $8.17 billion in health care expenditures annually. Tobacco use and secondhand smoke exposure causes heart disease and stroke; chronic lung disease; cancers of the lung, mouth, pharynx, esophagus, and bladders; and other lung and vascular diseases. Tobacco use during pregnancy leads to poor birth outcomes and increases the chances for sudden infant death syndrome.1
Highlights
Prevalence of smoking:
• None of the Capital Region counties was meeting either of the Prevention Agenda 2024 objectives • Among adults, was highest in Greene County (18.5%) – the only Capital Region county where rates
increased from 2016 to 2018. • Among adults with low income (< $25,000), was highest in Rensselaer County (37%).
Objective
New York State Prevention Agenda, 2019-2024
• Decrease the prevalence of cigarette smoking among adults to 11.0%. • Decrease the prevalence of cigarette smoking among adults with an income < $25,000 to 15.3%.
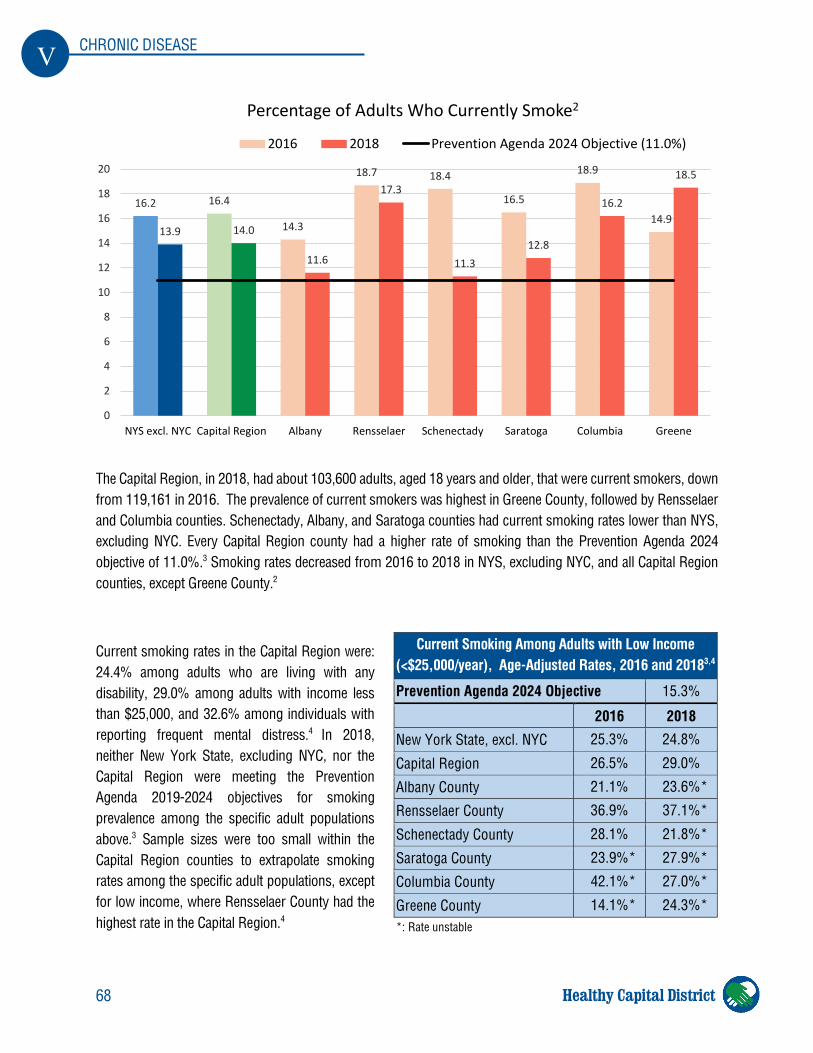
68
V CHRONIC DISEASE
Healthy Capital District
The Capital Region, in 2018, had about 103,600 adults, aged 18 years and older, that were current smokers, down from 119,161 in 2016. The prevalence of current smokers was highest in Greene County, followed by Rensselaer and Columbia counties. Schenectady, Albany, and Saratoga counties had current smoking rates lower than NYS, excluding NYC. Every Capital Region county had a higher rate of smoking than the Prevention Agenda 2024 objective of 11.0%.3 Smoking rates decreased from 2016 to 2018 in NYS, excluding NYC, and all Capital Region counties, except Greene County.2
Current smoking rates in the Capital Region were: 24.4% among adults who are living with any disability, 29.0% among adults with income less than $25,000, and 32.6% among individuals with reporting frequent mental distress.4 In 2018, neither New York State, excluding NYC, nor the Capital Region were meeting the Prevention Agenda 2019-2024 objectives for smoking prevalence among the specific adult populations above.3 Sample sizes were too small within the Capital Region counties to extrapolate smoking rates among the specific adult populations, except for low income, where Rensselaer County had the highest rate in the Capital Region.4
Current Smoking Among Adults with Low Income (<$25,000/year), Age-Adjusted Rates, 2016 and 20183,4
Prevention Agenda 2024 Objective 15.3%
2016 2018 New York State, excl. NYC 25.3% 24.8%
Capital Region 26.5% 29.0%
Albany County 21.1% 23.6%*
Rensselaer County 36.9% 37.1%*
Schenectady County 28.1% 21.8%*
Saratoga County 23.9%* 27.9%*
Columbia County 42.1%* 27.0%*
Greene County 14.1%* 24.3%* *: Rate unstable
16.2 16.4
14.3
18.7 18.4
16.5
18.9
14.913.9 14.0
11.6
17.3
11.312.8
16.2
18.5
0
2
4
6
8
10
12
14
16
18
20
NYS excl. NYC Capital Region Albany Rensselaer Schenectady Saratoga Columbia Greene
Percentage of Adults Who Currently Smoke2
2016 2018 Prevention Agenda 2024 Objective (11.0%)
69
V CHRONIC DISEASE
Healthy Capital District
Smoking is a special problem among youth. Nearly 80% of tobacco users begin before age 18. According to the New York State Department of Health, the cigarette smoking prevalence in youth increased for the first time since 2000, from 4.3% in 2016 to 4.8% in 2018. At the same time, there has been an startling trend in electronic cigarette use among high school students in NYS. The use of e-cigarettes more than doubled from 10.5% in 2014 to 27.4% in 2018.5
References 1. New York State Department of Health. Priority Area: Tobacco Use.
https://www.health.ny.gov/prevention/prevention_agenda/tobacco_use/ 2. New York State Department of Health. Prevalence of cigarette smoking among adults, 2018.
https://webbi1.health.ny.gov/SASStoredProcess/guest?_program=/EBI/PHIG/apps/dashboard/pa_dashboard&p=it&ind_id=pa30_0
3. New York State Department of Health. Prevention Agenda 2019-2024: Prevent Chronic Diseases Action Plan. https://www.health.ny.gov/prevention/prevention_agenda/2019-2024/chr.htm#FA3
4. New York State Department of Health. Expanded Behavioral Risk Factor Surveillance System (Expanded BRFSS). https://www.health.ny.gov/statistics/brfss/expanded/
5. 2018 Independent Evaluation Report of the New York Tobacco Control Program https://www.health.ny.gov/prevention/tobacco_control/docs/2018_independent_evaluation_report.pdf
Chronic Obstructive Pulmonary Disease
Chronic obstructive pulmonary disease (COPD), or chronic lower respiratory disease (CLRD), is a lung disease that makes it harder to breathe over time as the tubes that carry air into and out of the lungs are partially blocked or damaged. It is a group of diseases and includes emphysema, chronic bronchitis, or a combination of these and can coexist with asthma. The severity of COPD/CLRD can vary, but when severe, it can affect the most basic tasks and daily living.1,2 Early detection of COPD/CLRD might alter its course and progress. A simple spirometry test can detect COPD/CLRD before the symptoms become severe.1
In the United States, a history of current or former tobacco use is a key factor in the development and progression of COPD/CLRD. Smoking accounts for 8 out of 10 COPD-related deaths.3 COPD/CLRD is the fourth leading cause of death in the United States,1 and the third leading cause of death in all counties in the Capital Region.4 It is estimated that there are over 16 million people living with COPD in the United States, with millions more suffering from the disease without a diagnosis.2 In addition, COPD/CLRD is an important cause of hospitalization in older populations. 1
Highlights
• COPD Hospitalization rates: o were highest in Columbia and Greene counties. o were highest among Black non-Hispanics residents.
• COPD Mortality rate was highest in Rensselaer County.
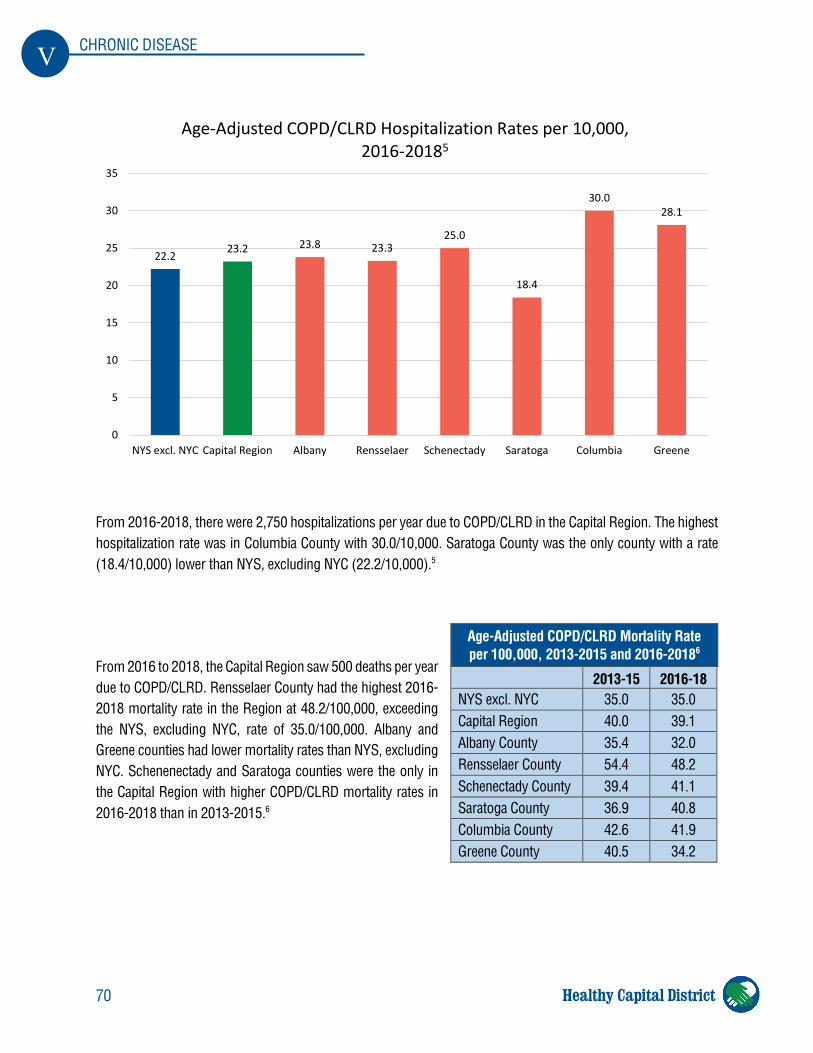
70
V CHRONIC DISEASE
Healthy Capital District
From 2016-2018, there were 2,750 hospitalizations per year due to COPD/CLRD in the Capital Region. The highest hospitalization rate was in Columbia County with 30.0/10,000. Saratoga County was the only county with a rate (18.4/10,000) lower than NYS, excluding NYC (22.2/10,000).5
From 2016 to 2018, the Capital Region saw 500 deaths per year due to COPD/CLRD. Rensselaer County had the highest 2016-2018 mortality rate in the Region at 48.2/100,000, exceeding the NYS, excluding NYC, rate of 35.0/100,000. Albany and Greene counties had lower mortality rates than NYS, excluding NYC. Schenenectady and Saratoga counties were the only in the Capital Region with higher COPD/CLRD mortality rates in 2016-2018 than in 2013-2015.6
Age-Adjusted COPD/CLRD Mortality Rate per 100,000, 2013-2015 and 2016-20186
2013-15 2016-18 NYS excl. NYC 35.0 35.0 Capital Region 40.0 39.1 Albany County 35.4 32.0 Rensselaer County 54.4 48.2 Schenectady County 39.4 41.1 Saratoga County 36.9 40.8 Columbia County 42.6 41.9 Greene County 40.5 34.2
22.2 23.2 23.8 23.325.0
18.4
30.028.1
0
5
10
15
20
25
30
35
NYS excl. NYC Capital Region Albany Rensselaer Schenectady Saratoga Columbia Greene
Age-Adjusted COPD/CLRD Hospitalization Rates per 10,000, 2016-20185
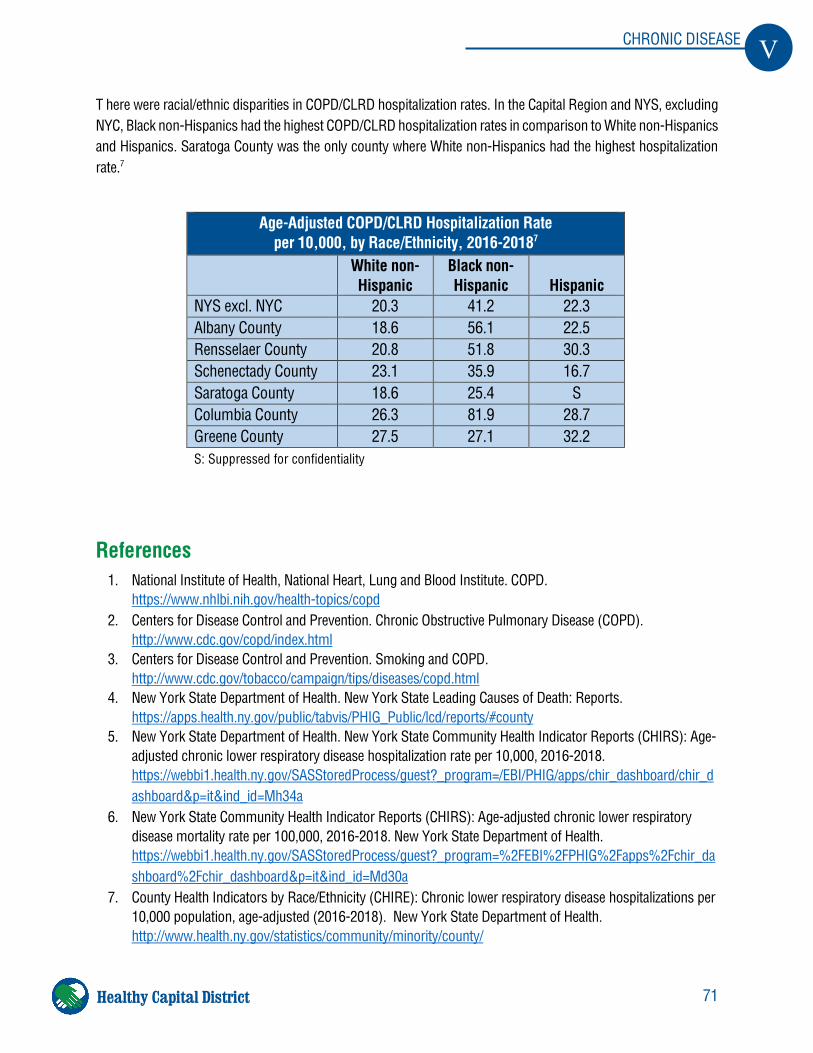
71
V CHRONIC DISEASE
Healthy Capital District
T here were racial/ethnic disparities in COPD/CLRD hospitalization rates. In the Capital Region and NYS, excluding NYC, Black non-Hispanics had the highest COPD/CLRD hospitalization rates in comparison to White non-Hispanics and Hispanics. Saratoga County was the only county where White non-Hispanics had the highest hospitalization rate.7
References 1. National Institute of Health, National Heart, Lung and Blood Institute. COPD.
https://www.nhlbi.nih.gov/health-topics/copd 2. Centers for Disease Control and Prevention. Chronic Obstructive Pulmonary Disease (COPD).
http://www.cdc.gov/copd/index.html 3. Centers for Disease Control and Prevention. Smoking and COPD.
http://www.cdc.gov/tobacco/campaign/tips/diseases/copd.html 4. New York State Department of Health. New York State Leading Causes of Death: Reports.
https://apps.health.ny.gov/public/tabvis/PHIG_Public/lcd/reports/#county 5. New York State Department of Health. New York State Community Health Indicator Reports (CHIRS): Age-
adjusted chronic lower respiratory disease hospitalization rate per 10,000, 2016-2018. https://webbi1.health.ny.gov/SASStoredProcess/guest?_program=/EBI/PHIG/apps/chir_dashboard/chir_dashboard&p=it&ind_id=Mh34a
6. New York State Community Health Indicator Reports (CHIRS): Age-adjusted chronic lower respiratory disease mortality rate per 100,000, 2016-2018. New York State Department of Health. https://webbi1.health.ny.gov/SASStoredProcess/guest?_program=%2FEBI%2FPHIG%2Fapps%2Fchir_dashboard%2Fchir_dashboard&p=it&ind_id=Md30a
7. County Health Indicators by Race/Ethnicity (CHIRE): Chronic lower respiratory disease hospitalizations per 10,000 population, age-adjusted (2016-2018). New York State Department of Health. http://www.health.ny.gov/statistics/community/minority/county/
Age-Adjusted COPD/CLRD Hospitalization Rate per 10,000, by Race/Ethnicity, 2016-20187
White non- Hispanic
Black non- Hispanic Hispanic
NYS excl. NYC 20.3 41.2 22.3 Albany County 18.6 56.1 22.5 Rensselaer County 20.8 51.8 30.3 Schenectady County 23.1 35.9 16.7 Saratoga County 18.6 25.4 S Columbia County 26.3 81.9 28.7 Greene County 27.5 27.1 32.2 S: Suppressed for confidentiality
72
V CHRONIC DISEASE
Healthy Capital District
Asthma
Asthma is a disease that affects the lungs and is characterized by difficulty breathing. In most cases the causes of asthma are unknown. Symptoms of asthma include wheezing, tightness in the chest, breathlessness, and coughing at night or early in the morning. It is one of the most common long-term diseases of children, but is prevalent in adults as well.1 Nationwide, about 6.2 million children, or 8.4% of children, and 19.0 million adults, or 7.7% of adults, are living with asthma.2 In New York State, more than 1.5 million adults (10.1%) and 260,000 (6.2%) school-aged children have current asthma.3
An asthma attack is a distressing and potentially life-threatening experience. When an attack occurs, the sides of the airways in the lungs swell, causing the airways to shrink. As a result, less air is able to able to get in and out of the lungs. If poorly treated, asthma can lead to persistent hospitalization and possibly death. Triggers for an asthma attack vary from person to person. Some triggers include tobacco smoke, dust mites, outdoor air pollution, cockroach allergen, pets, mold, and smoke from burning wood or grass.1
Asthma can interfere with daily activities, especially without proper management and treatment. Asthma is the leading cause of missed days of school for children. Parents are also affected, as they frequently miss days of work due to their child’s asthma. About 1 in 3 adults with asthma also miss at least one work day per year.4
Direct and indirect health care costs due to asthma add up to $56 billion yearly in the United States.4 Adults are less likely than children to receive care when cost is an issue. Cost also prevents routine doctor visits and medicine use, which makes asthma management difficult.2
Highlights
• Asthma ED visit rates (age 0-17) were highest in Albany and Schenectady counties. o Every Capital Region county was meeting the Prevention Agenda objective.
• Adult prevalence of asthma was highest in Schenectady County. • Asthma hospitalization rates:
o were lower in every Capital Region county than in NYS, excl. NYC. o were highest in Albany and Schenectady counties. o were 2.4x to 6.6x higher among Black non-Hispanic residents than White non-Hispanic residents
Objective
New York State Prevention Agenda 2019-2024
• Reduce the asthma emergency department visit rate among children aged 0-17 to 131.1 per 10,000.
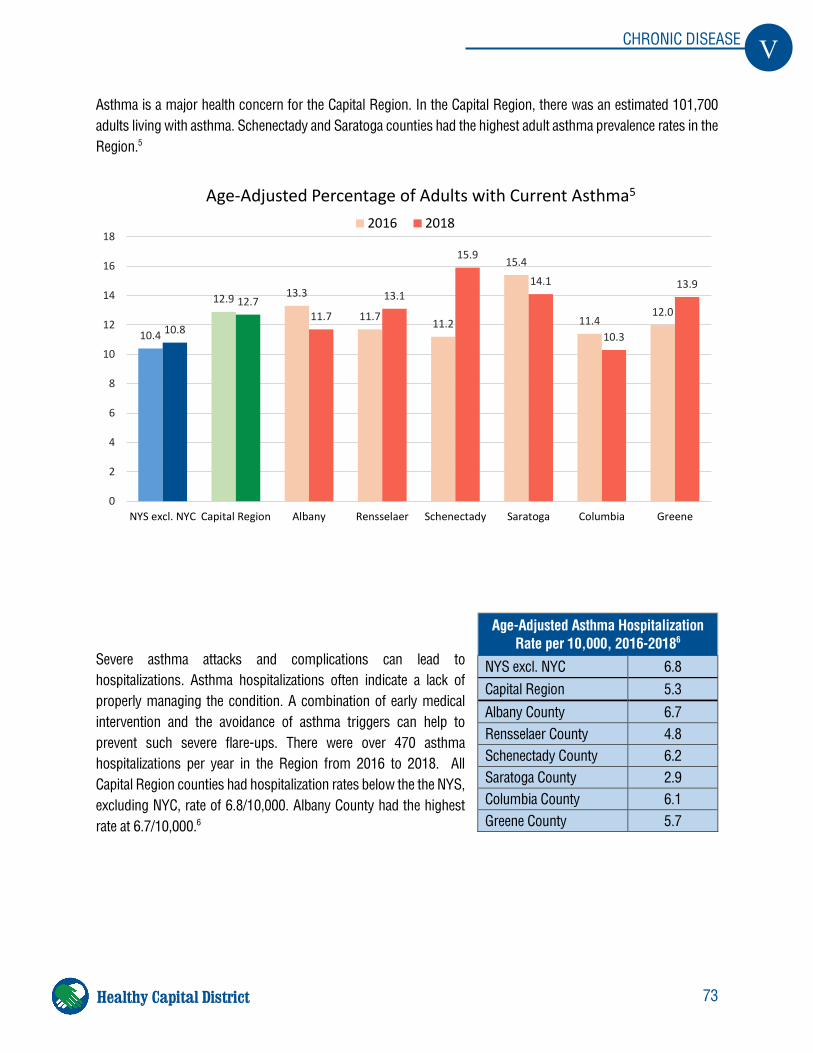
73
V CHRONIC DISEASE
Healthy Capital District
Asthma is a major health concern for the Capital Region. In the Capital Region, there was an estimated 101,700 adults living with asthma. Schenectady and Saratoga counties had the highest adult asthma prevalence rates in the Region.5
Severe asthma attacks and complications can lead to hospitalizations. Asthma hospitalizations often indicate a lack of properly managing the condition. A combination of early medical intervention and the avoidance of asthma triggers can help to prevent such severe flare-ups. There were over 470 asthma hospitalizations per year in the Region from 2016 to 2018. All Capital Region counties had hospitalization rates below the the NYS, excluding NYC, rate of 6.8/10,000. Albany County had the highest rate at 6.7/10,000.6
Age-Adjusted Asthma Hospitalization Rate per 10,000, 2016-20186
NYS excl. NYC 6.8 Capital Region 5.3 Albany County 6.7 Rensselaer County 4.8 Schenectady County 6.2 Saratoga County 2.9 Columbia County 6.1 Greene County 5.7
10.4
12.9 13.3
11.7 11.2
15.4
11.412.0
10.8
12.711.7
13.1
15.9
14.1
10.3
13.9
0
2
4
6
8
10
12
14
16
18
NYS excl. NYC Capital Region Albany Rensselaer Schenectady Saratoga Columbia Greene
Age-Adjusted Percentage of Adults with Current Asthma5
2016 2018
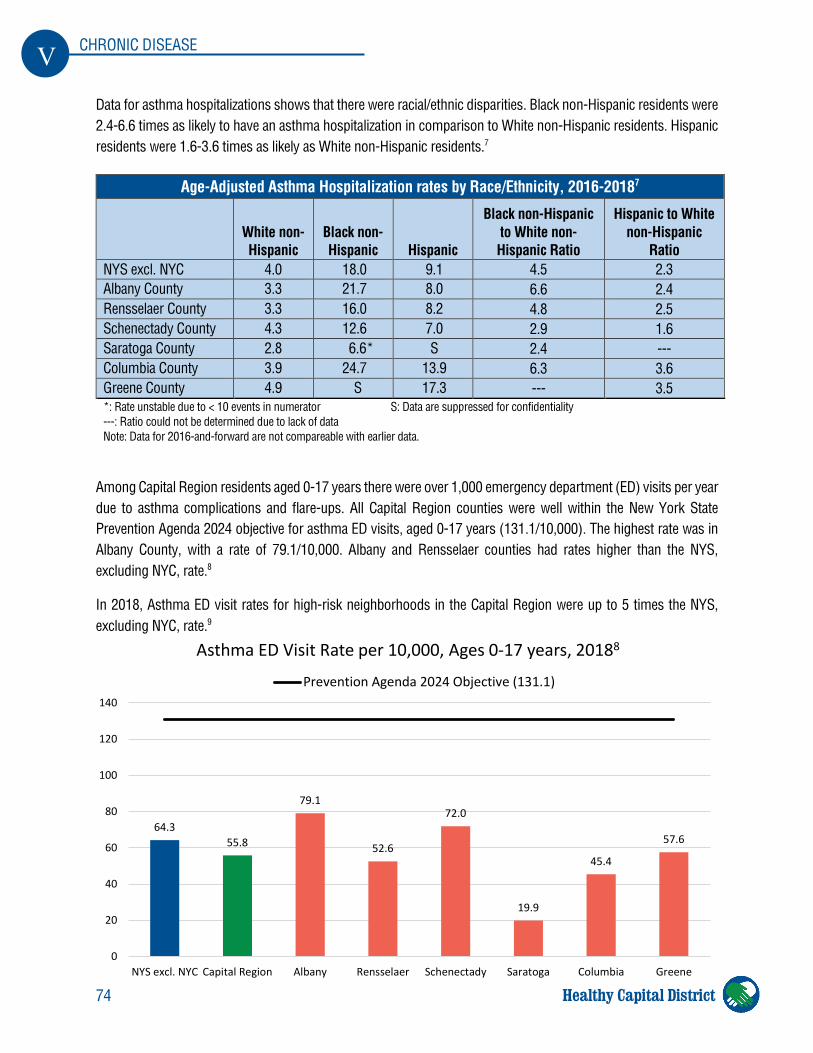
74
V CHRONIC DISEASE
Healthy Capital District
Data for asthma hospitalizations shows that there were racial/ethnic disparities. Black non-Hispanic residents were 2.4-6.6 times as likely to have an asthma hospitalization in comparison to White non-Hispanic residents. Hispanic residents were 1.6-3.6 times as likely as White non-Hispanic residents.7
Among Capital Region residents aged 0-17 years there were over 1,000 emergency department (ED) visits per year due to asthma complications and flare-ups. All Capital Region counties were well within the New York State Prevention Agenda 2024 objective for asthma ED visits, aged 0-17 years (131.1/10,000). The highest rate was in Albany County, with a rate of 79.1/10,000. Albany and Rensselaer counties had rates higher than the NYS, excluding NYC, rate.8
In 2018, Asthma ED visit rates for high-risk neighborhoods in the Capital Region were up to 5 times the NYS, excluding NYC, rate.9
Age-Adjusted Asthma Hospitalization rates by Race/Ethnicity, 2016-20187
White non-Hispanic
Black non-Hispanic Hispanic
Black non-Hispanic to White non-Hispanic Ratio
Hispanic to White non-Hispanic
Ratio NYS excl. NYC 4.0 18.0 9.1 4.5 2.3 Albany County 3.3 21.7 8.0 6.6 2.4 Rensselaer County 3.3 16.0 8.2 4.8 2.5 Schenectady County 4.3 12.6 7.0 2.9 1.6 Saratoga County 2.8 6.6* S 2.4 --- Columbia County 3.9 24.7 13.9 6.3 3.6 Greene County 4.9 S 17.3 --- 3.5 *: Rate unstable due to < 10 events in numerator S: Data are suppressed for confidentiality ---: Ratio could not be determined due to lack of data Note: Data for 2016-and-forward are not compareable with earlier data.
64.355.8
79.1
52.6
72.0
19.9
45.4
57.6
0
20
40
60
80
100
120
140
NYS excl. NYC Capital Region Albany Rensselaer Schenectady Saratoga Columbia Greene
Asthma ED Visit Rate per 10,000, Ages 0-17 years, 20188
Prevention Agenda 2024 Objective (131.1)
75
V CHRONIC DISEASE
Healthy Capital District
References 1. Centers for Disease Control and Prevention. What is Asthma?
http://www.cdc.gov/asthma/faqs.htm 2. Centers for Disease Control and Prevention. Asthma, National Center for Health Statistics.
http://www.cdc.gov/nchs/fastats/asthma.htm 3. New York State Department of Health. Asthma Information.
http://www.health.ny.gov/diseases/asthma/ 4. Centers for Disease Control and Prevention. Asthma’s Impact on the Nation.
http://www.cdc.gov/asthma/impacts_nation/asthmafactsheet.pdf 5. New York State Department of Health. Expanded Behavioral Risk Factor Surveillance System (Expanded
BRFSS) http://www.health.ny.gov/statistics/brfss/expanded/
6. New York State Department of Health. Asthma hospitalization rate per 10,000, 2016-2018. https://webbi1.health.ny.gov/SASStoredProcess/guest?_program=/EBI/PHIG/apps/chir_dashboard/chir_dashboard&p=it&ind_id=Mh35
7. New York State Department of Health.County Health Indicators by Race/Ethnicity (CHIRE). http://www.health.ny.gov/statistics/community/minority/county/
8. New York State Department of Health. Asthma emergency department visits, rate per 10,000, aged 0-17 years, 2018. https://webbi1.health.ny.gov/SASStoredProcess/guest?_program=/EBI/PHIG/apps/dashboard/pa_dashboard&p=it&ind_id=pa36_0
9. Common Ground Health. Statewide Planning and Research Cooperative System (SPARCS) data portal. Asthma Emergency Department Visit Rates, 2016.
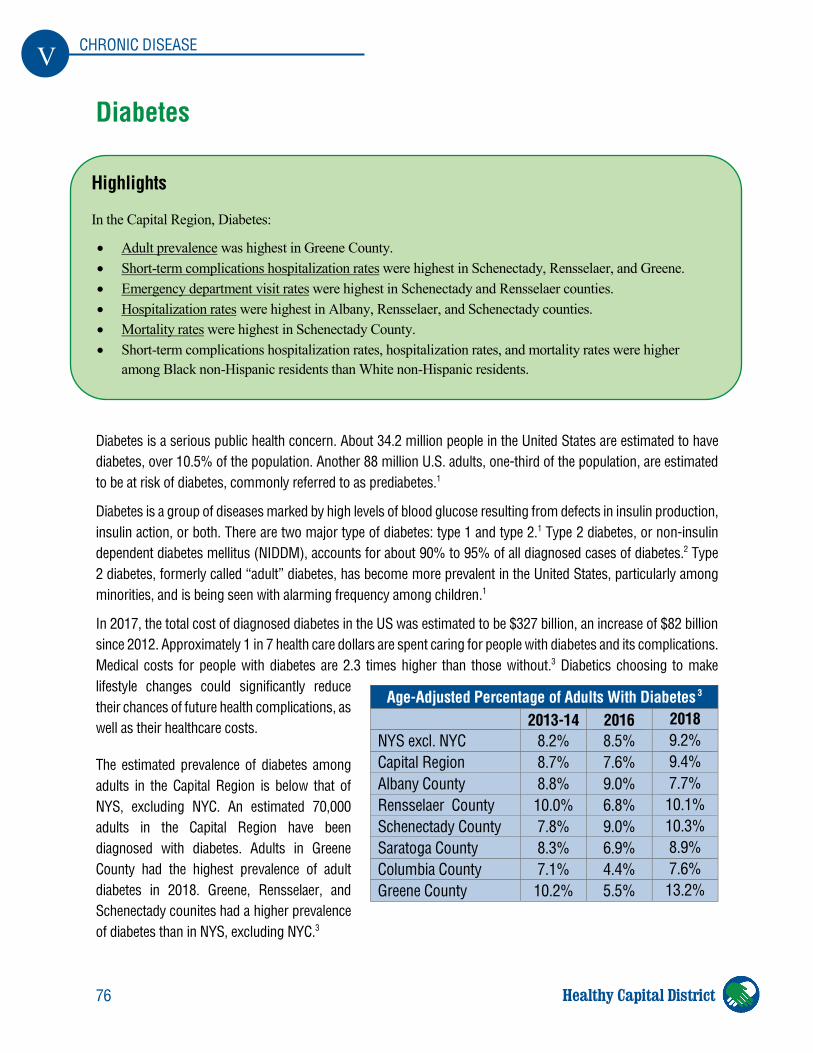
76
V CHRONIC DISEASE
Healthy Capital District
Diabetes
Diabetes is a serious public health concern. About 34.2 million people in the United States are estimated to have diabetes, over 10.5% of the population. Another 88 million U.S. adults, one-third of the population, are estimated to be at risk of diabetes, commonly referred to as prediabetes.1
Diabetes is a group of diseases marked by high levels of blood glucose resulting from defects in insulin production, insulin action, or both. There are two major type of diabetes: type 1 and type 2.1 Type 2 diabetes, or non-insulin dependent diabetes mellitus (NIDDM), accounts for about 90% to 95% of all diagnosed cases of diabetes.2 Type 2 diabetes, formerly called “adult” diabetes, has become more prevalent in the United States, particularly among minorities, and is being seen with alarming frequency among children.1
In 2017, the total cost of diagnosed diabetes in the US was estimated to be $327 billion, an increase of $82 billion since 2012. Approximately 1 in 7 health care dollars are spent caring for people with diabetes and its complications. Medical costs for people with diabetes are 2.3 times higher than those without.3 Diabetics choosing to make lifestyle changes could significantly reduce their chances of future health complications, as well as their healthcare costs.
The estimated prevalence of diabetes among adults in the Capital Region is below that of NYS, excluding NYC. An estimated 70,000 adults in the Capital Region have been diagnosed with diabetes. Adults in Greene County had the highest prevalence of adult diabetes in 2018. Greene, Rensselaer, and Schenectady counites had a higher prevalence of diabetes than in NYS, excluding NYC.3
Age-Adjusted Percentage of Adults With Diabetes 3 2013-14 2016 2018
NYS excl. NYC 8.2% 8.5% 9.2% Capital Region 8.7% 7.6% 9.4% Albany County 8.8% 9.0% 7.7% Rensselaer County 10.0% 6.8% 10.1% Schenectady County 7.8% 9.0% 10.3% Saratoga County 8.3% 6.9% 8.9% Columbia County 7.1% 4.4% 7.6% Greene County 10.2% 5.5% 13.2%
Highlights
In the Capital Region, Diabetes:
• Adult prevalence was highest in Greene County. • Short-term complications hospitalization rates were highest in Schenectady, Rensselaer, and Greene. • Emergency department visit rates were highest in Schenectady and Rensselaer counties. • Hospitalization rates were highest in Albany, Rensselaer, and Schenectady counties. • Mortality rates were highest in Schenectady County. • Short-term complications hospitalization rates, hospitalization rates, and mortality rates were higher
among Black non-Hispanic residents than White non-Hispanic residents.
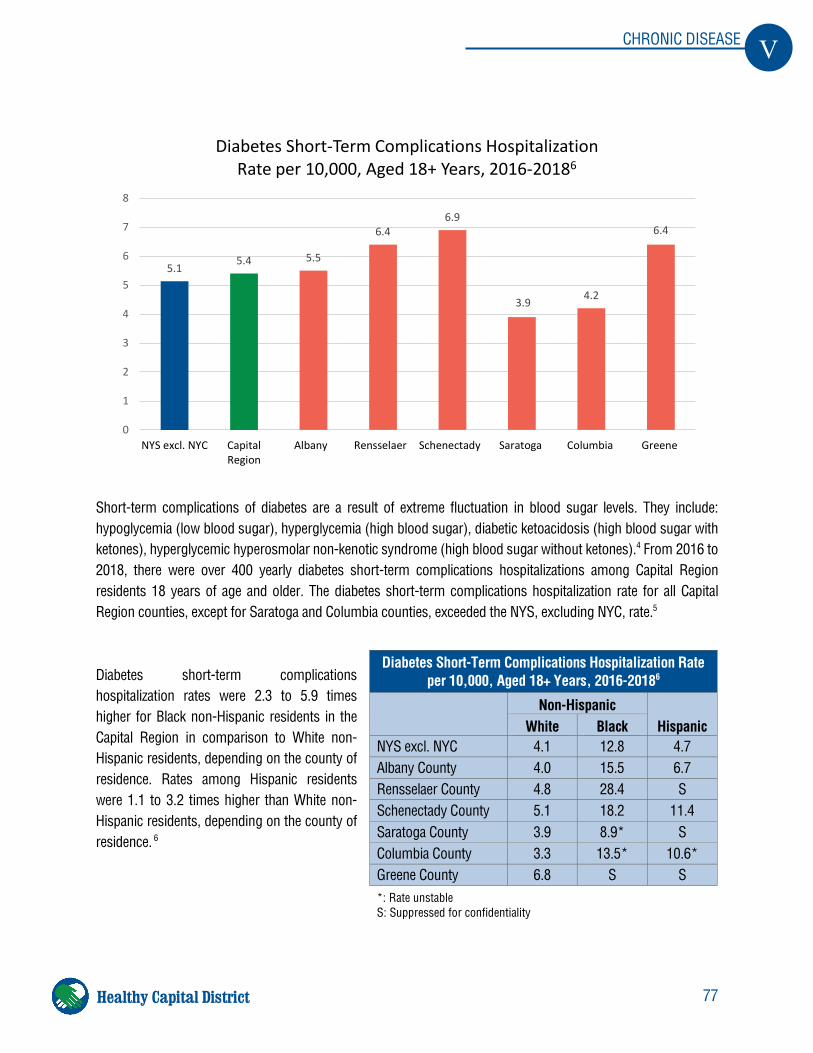
77
V CHRONIC DISEASE
Healthy Capital District
Short-term complications of diabetes are a result of extreme fluctuation in blood sugar levels. They include: hypoglycemia (low blood sugar), hyperglycemia (high blood sugar), diabetic ketoacidosis (high blood sugar with ketones), hyperglycemic hyperosmolar non-kenotic syndrome (high blood sugar without ketones).4 From 2016 to 2018, there were over 400 yearly diabetes short-term complications hospitalizations among Capital Region residents 18 years of age and older. The diabetes short-term complications hospitalization rate for all Capital Region counties, except for Saratoga and Columbia counties, exceeded the NYS, excluding NYC, rate.5
Diabetes short-term complications hospitalization rates were 2.3 to 5.9 times higher for Black non-Hispanic residents in the Capital Region in comparison to White non-Hispanic residents, depending on the county of residence. Rates among Hispanic residents were 1.1 to 3.2 times higher than White non-Hispanic residents, depending on the county of residence. 6
Diabetes Short-Term Complications Hospitalization Rate per 10,000, Aged 18+ Years, 2016-20186
Non-Hispanic Hispanic White Black
NYS excl. NYC 4.1 12.8 4.7 Albany County 4.0 15.5 6.7 Rensselaer County 4.8 28.4 S Schenectady County 5.1 18.2 11.4 Saratoga County 3.9 8.9* S Columbia County 3.3 13.5* 10.6* Greene County 6.8 S S *: Rate unstable S: Suppressed for confidentiality
5.15.4 5.5
6.46.9
3.9 4.2
6.4
0
1
2
3
4
5
6
7
8
NYS excl. NYC CapitalRegion
Albany Rensselaer Schenectady Saratoga Columbia Greene
Diabetes Short-Term Complications Hospitalization Rate per 10,000, Aged 18+ Years, 2016-20186
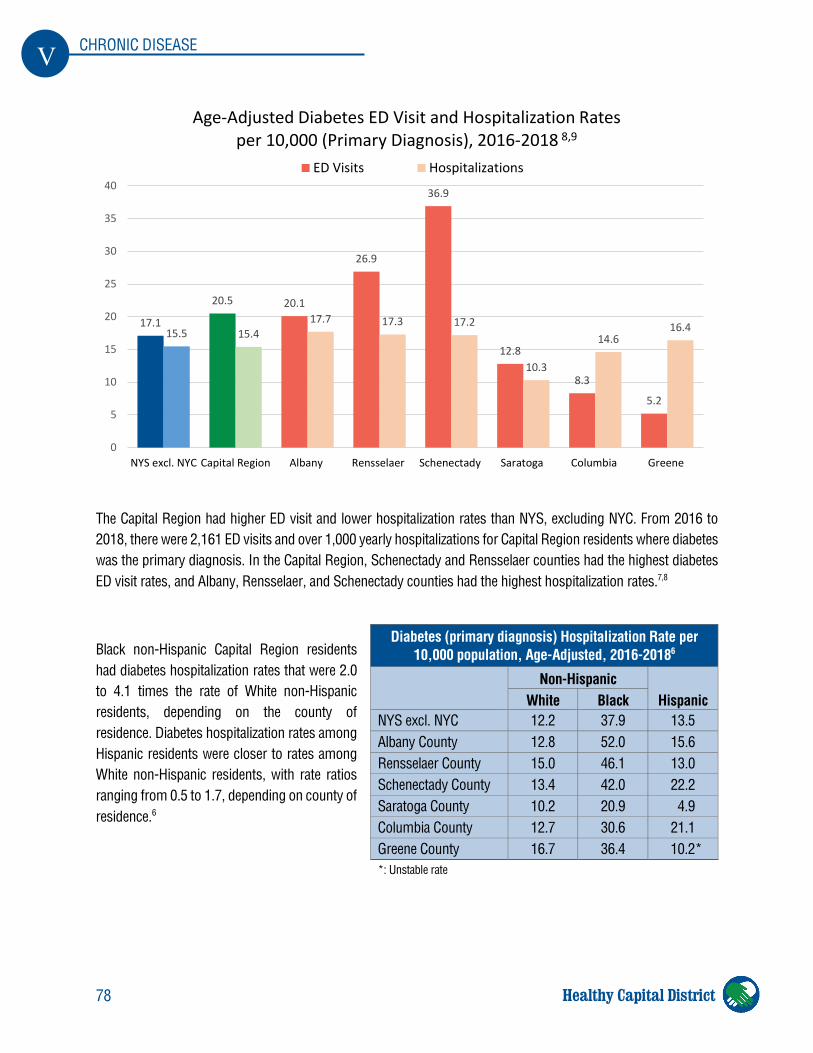
78
V CHRONIC DISEASE
Healthy Capital District
The Capital Region had higher ED visit and lower hospitalization rates than NYS, excluding NYC. From 2016 to 2018, there were 2,161 ED visits and over 1,000 yearly hospitalizations for Capital Region residents where diabetes was the primary diagnosis. In the Capital Region, Schenectady and Rensselaer counties had the highest diabetes ED visit rates, and Albany, Rensselaer, and Schenectady counties had the highest hospitalization rates.7,8
Black non-Hispanic Capital Region residents had diabetes hospitalization rates that were 2.0 to 4.1 times the rate of White non-Hispanic residents, depending on the county of residence. Diabetes hospitalization rates among Hispanic residents were closer to rates among White non-Hispanic residents, with rate ratios ranging from 0.5 to 1.7, depending on county of residence.6
Diabetes (primary diagnosis) Hospitalization Rate per 10,000 population, Age-Adjusted, 2016-20186
Non-Hispanic
Hispanic White Black NYS excl. NYC 12.2 37.9 13.5 Albany County 12.8 52.0 15.6 Rensselaer County 15.0 46.1 13.0 Schenectady County 13.4 42.0 22.2 Saratoga County 10.2 20.9 4.9 Columbia County 12.7 30.6 21.1 Greene County 16.7 36.4 10.2* *: Unstable rate
17.1
20.5 20.1
26.9
36.9
12.8
8.3
5.2
15.5 15.417.7 17.3 17.2
10.3
14.616.4
0
5
10
15
20
25
30
35
40
NYS excl. NYC Capital Region Albany Rensselaer Schenectady Saratoga Columbia Greene
Age-Adjusted Diabetes ED Visit and Hospitalization Ratesper 10,000 (Primary Diagnosis), 2016-2018 8,9
ED Visits Hospitalizations
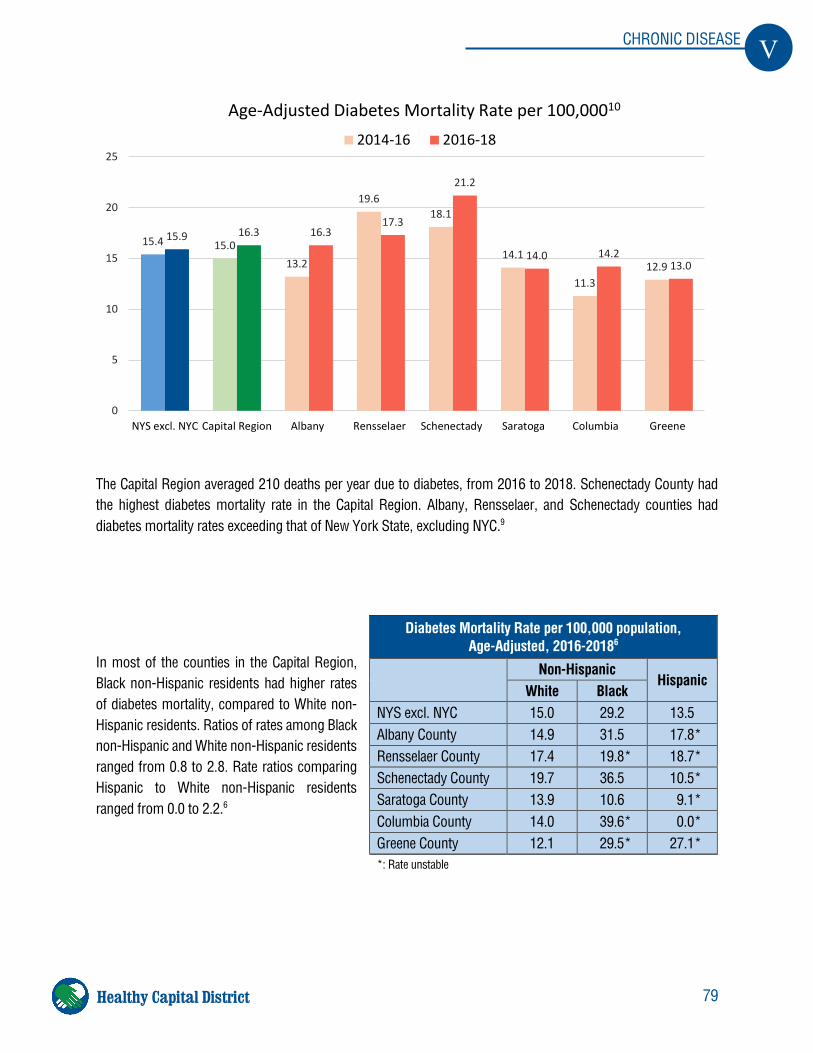
79
V CHRONIC DISEASE
Healthy Capital District
The Capital Region averaged 210 deaths per year due to diabetes, from 2016 to 2018. Schenectady County had the highest diabetes mortality rate in the Capital Region. Albany, Rensselaer, and Schenectady counties had diabetes mortality rates exceeding that of New York State, excluding NYC.9
In most of the counties in the Capital Region, Black non-Hispanic residents had higher rates of diabetes mortality, compared to White non-Hispanic residents. Ratios of rates among Black non-Hispanic and White non-Hispanic residents ranged from 0.8 to 2.8. Rate ratios comparing Hispanic to White non-Hispanic residents ranged from 0.0 to 2.2.6
Diabetes Mortality Rate per 100,000 population, Age-Adjusted, 2016-20186
Non-Hispanic
Hispanic White Black
NYS excl. NYC 15.0 29.2 13.5 Albany County 14.9 31.5 17.8* Rensselaer County 17.4 19.8* 18.7* Schenectady County 19.7 36.5 10.5* Saratoga County 13.9 10.6 9.1* Columbia County 14.0 39.6* 0.0* Greene County 12.1 29.5* 27.1* *: Rate unstable
15.4 15.013.2
19.618.1
14.1
11.312.9
15.9 16.3 16.317.3
21.2
14.0 14.213.0
0
5
10
15
20
25
NYS excl. NYC Capital Region Albany Rensselaer Schenectady Saratoga Columbia Greene
Age-Adjusted Diabetes Mortality Rate per 100,00010
2014-16 2016-18
80
V CHRONIC DISEASE
Healthy Capital District
References 1. Centers for Disease Control and Prevention (CDC). Diabetes Report Card, 2019.
https://www.cdc.gov/diabetes/pdfs/library/diabetesreportcard2017-508.pdf 2. American Diabetes Association. The Cost of Diabetes.
http://www.diabetes.org/advocacy/news-events/cost-of-diabetes.html 3. New York State Department of Health. Expanded Behavioral Risk Factor Surveillance System (Expanded
BRFSS). https://health.data.ny.gov/Health/Behavioral-Risk-Factor-Surveillance-System-BRFSS-H/jsy7-eb4n/data
4. University Pittsburgh Medical Center (UPMC). Diabetes Complications. https://www.upmc.com/services/diabetes-education-and-support/education/complications#shortterm
5. New York State Department of Health. Potentially preventable diabetes short-term complications hospitalization rate per 10,000 - Aged 18 years and older, 2016-2018 https://webbi1.health.ny.gov/SASStoredProcess/guest?_program=/EBI/PHIG/apps/chir_dashboard/chir_dashboard&p=it&ind_id=Dh48
6. New York State Department of Health. County Health Indicators by Race/Ethnicity (CHIRE). https://www.health.ny.gov/statistics/community/minority/county/
7. New York State Department of Health. Age-adjusted diabetes hospitalization rate per 10,000 (primary diagnosis), 2016-2018. https://webbi1.health.ny.gov/SASStoredProcess/guest?_program=%2FEBI%2FPHIG%2Fapps%2Fchir_dashboard%2Fchir_dashboard&p=it&ind_id=Dh11a
8. Common Ground Health. Statewide Planning and Research Cooperative System (SPARCS) data portal. Diabetes Emergency Department Visit Rates (Primary Diagnosis), 2016.
9. New York State Department of Health. Age-adjusted diabetes mortality rate per 100,000, 2016-2018. https://webbi1.health.ny.gov/SASStoredProcess/guest?_program=%2FEBI%2FPHIG%2Fapps%2Fchir_dashboard%2Fchir_dashboard&p=it&ind_id=Dd22a
81
V CHRONIC DISEASE
Healthy Capital District
Cardiovascular Disease
Cardiovascular disease refers to a group of diseases that affect the heart and the circulatory system. Almost 630,000 Americans die from cardiovascular diseases each year, which is 1 in every 4 deaths. Risk factors for cardiovascular disease include high blood pressure, high low-density lipoprotein (LDL) cholesterol and smoking, of which 49% of Americans live with at least one of the three.1 More than one third of the population live with some form of cardiovascular disease.2 These diseases take more lives than the next five leading causes of death combined, excluding cancer (cancer, chronic lower respiratory diseases, injuries, stroke, Alzheimer Disease).3 In New York State, Cardiovascular disease was responsible for 35% of all statewide mortality.4
Heart Attack and Coronary Heart Disease Heart disease is the leading cause of death both in the United States and in New York State.4 Residents of New York State are 25% more likely to die from coronary heart disease than the next leading cause of death.5
Coronary heart disease is a disorder that affects the coronary arteries (blood vessels that supply blood to the heart) and the heart muscle. A serious consequence of coronary heart disease is a heart attack, which occurs when the supply of blood to the heart is greatly reduced or stopped due to blockage in a coronary artery and the heart muscle is damaged.6
It is estimated that in the U.S., 13% of 2018 deaths, 365,700 individuals, were attributed to coronary heart disease.2 Heart attacks occur in approximately 805,000 Americans annually. Approximately every 40 seconds, an American will suffer a heart attack.2,7
Highlights
• Heart attack: o Hospitalization rate was highest in Schenectady County
• Coronary heart disease: o Hospitalization rate was highest in Schenectady County o Mortality rate was highest in Greene and Columbia counties o Hospitalization rates among Black non-Hispanic residents, in 2016-2018, were lower than in 2014-
2016 and were 0.8 to 1.5 times that of White non-Hispanic residents o Hospitalization rates among Hispanic residents were lower than White non-Hispanic residents
• Congestive heart failure: o Hospitalization and Mortality rates were highest in Greene County
• Stroke: o Hospitalization and Mortality rates were highest in Schenectady County o Mortality rates were higher among Black, than White, non-Hispanic residents
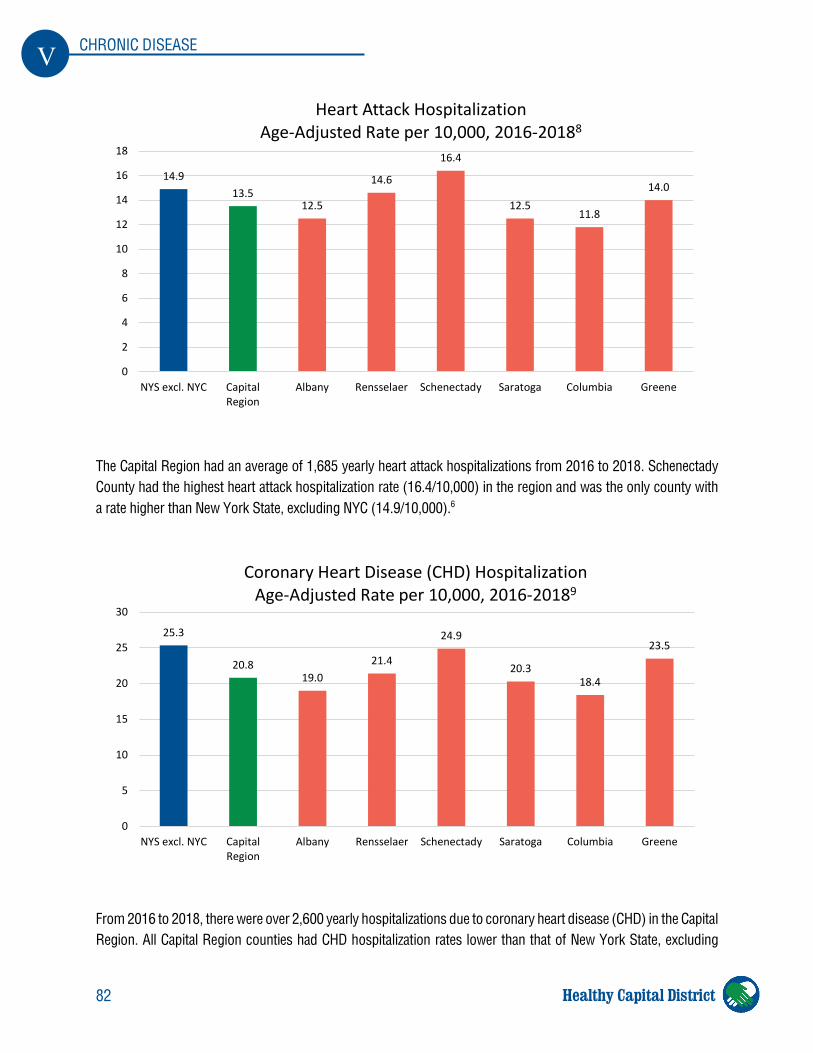
82
V CHRONIC DISEASE
Healthy Capital District
The Capital Region had an average of 1,685 yearly heart attack hospitalizations from 2016 to 2018. Schenectady County had the highest heart attack hospitalization rate (16.4/10,000) in the region and was the only county with a rate higher than New York State, excluding NYC (14.9/10,000).6
From 2016 to 2018, there were over 2,600 yearly hospitalizations due to coronary heart disease (CHD) in the Capital Region. All Capital Region counties had CHD hospitalization rates lower than that of New York State, excluding
14.913.5
12.5
14.6
16.4
12.511.8
14.0
0
2
4
6
8
10
12
14
16
18
NYS excl. NYC CapitalRegion
Albany Rensselaer Schenectady Saratoga Columbia Greene
Heart Attack Hospitalization Age-Adjusted Rate per 10,000, 2016-20188
25.3
20.819.0
21.4
24.9
20.318.4
23.5
0
5
10
15
20
25
30
NYS excl. NYC CapitalRegion
Albany Rensselaer Schenectady Saratoga Columbia Greene
Coronary Heart Disease (CHD) HospitalizationAge-Adjusted Rate per 10,000, 2016-20189
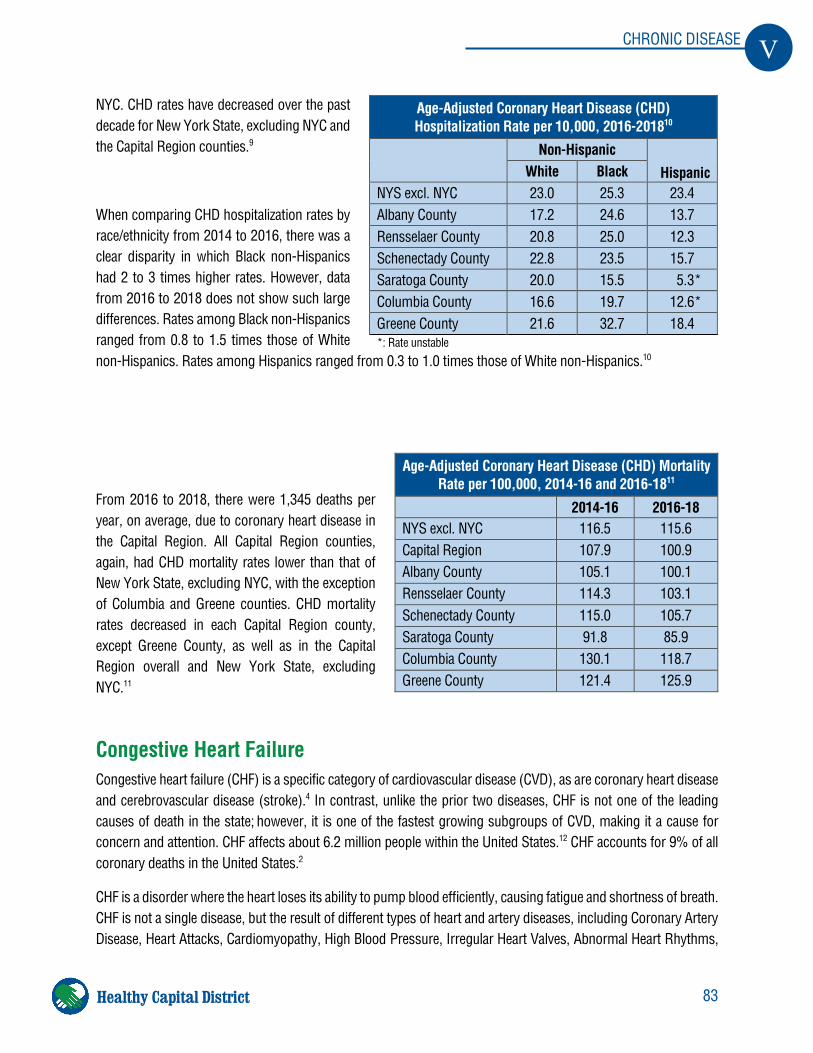
83
V CHRONIC DISEASE
Healthy Capital District
NYC. CHD rates have decreased over the past decade for New York State, excluding NYC and the Capital Region counties.9
When comparing CHD hospitalization rates by race/ethnicity from 2014 to 2016, there was a clear disparity in which Black non-Hispanics had 2 to 3 times higher rates. However, data from 2016 to 2018 does not show such large differences. Rates among Black non-Hispanics ranged from 0.8 to 1.5 times those of White non-Hispanics. Rates among Hispanics ranged from 0.3 to 1.0 times those of White non-Hispanics.10
From 2016 to 2018, there were 1,345 deaths per year, on average, due to coronary heart disease in the Capital Region. All Capital Region counties, again, had CHD mortality rates lower than that of New York State, excluding NYC, with the exception of Columbia and Greene counties. CHD mortality rates decreased in each Capital Region county, except Greene County, as well as in the Capital Region overall and New York State, excluding NYC.11
Congestive Heart Failure Congestive heart failure (CHF) is a specific category of cardiovascular disease (CVD), as are coronary heart disease and cerebrovascular disease (stroke).4 In contrast, unlike the prior two diseases, CHF is not one of the leading causes of death in the state; however, it is one of the fastest growing subgroups of CVD, making it a cause for concern and attention. CHF affects about 6.2 million people within the United States.12 CHF accounts for 9% of all coronary deaths in the United States.2
CHF is a disorder where the heart loses its ability to pump blood efficiently, causing fatigue and shortness of breath. CHF is not a single disease, but the result of different types of heart and artery diseases, including Coronary Artery Disease, Heart Attacks, Cardiomyopathy, High Blood Pressure, Irregular Heart Valves, Abnormal Heart Rhythms,
Age-Adjusted Coronary Heart Disease (CHD) Hospitalization Rate per 10,000, 2016-201810
Non-Hispanic
Hispanic White Black NYS excl. NYC 23.0 25.3 23.4 Albany County 17.2 24.6 13.7 Rensselaer County 20.8 25.0 12.3 Schenectady County 22.8 23.5 15.7 Saratoga County 20.0 15.5 5.3* Columbia County 16.6 19.7 12.6* Greene County 21.6 32.7 18.4 *: Rate unstable
Age-Adjusted Coronary Heart Disease (CHD) Mortality Rate per 100,000, 2014-16 and 2016-1811
2014-16 2016-18 NYS excl. NYC 116.5 115.6 Capital Region 107.9 100.9 Albany County 105.1 100.1 Rensselaer County 114.3 103.1 Schenectady County 115.0 105.7 Saratoga County 91.8 85.9 Columbia County 130.1 118.7 Greene County 121.4 125.9
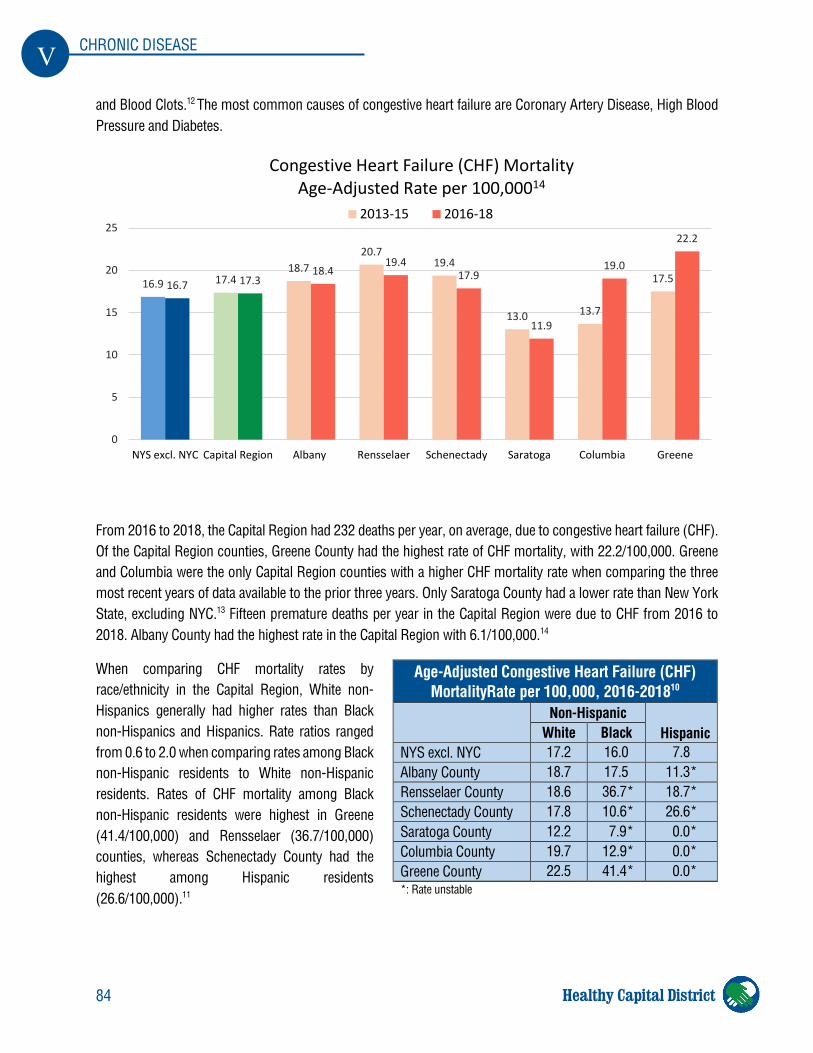
84
V CHRONIC DISEASE
Healthy Capital District
and Blood Clots.12 The most common causes of congestive heart failure are Coronary Artery Disease, High Blood Pressure and Diabetes.
From 2016 to 2018, the Capital Region had 232 deaths per year, on average, due to congestive heart failure (CHF). Of the Capital Region counties, Greene County had the highest rate of CHF mortality, with 22.2/100,000. Greene and Columbia were the only Capital Region counties with a higher CHF mortality rate when comparing the three most recent years of data available to the prior three years. Only Saratoga County had a lower rate than New York State, excluding NYC.13 Fifteen premature deaths per year in the Capital Region were due to CHF from 2016 to 2018. Albany County had the highest rate in the Capital Region with 6.1/100,000.14
When comparing CHF mortality rates by race/ethnicity in the Capital Region, White non-Hispanics generally had higher rates than Black non-Hispanics and Hispanics. Rate ratios ranged from 0.6 to 2.0 when comparing rates among Black non-Hispanic residents to White non-Hispanic residents. Rates of CHF mortality among Black non-Hispanic residents were highest in Greene (41.4/100,000) and Rensselaer (36.7/100,000) counties, whereas Schenectady County had the highest among Hispanic residents (26.6/100,000).11
Age-Adjusted Congestive Heart Failure (CHF) MortalityRate per 100,000, 2016-201810
Non-Hispanic
Hispanic White Black NYS excl. NYC 17.2 16.0 7.8 Albany County 18.7 17.5 11.3* Rensselaer County 18.6 36.7* 18.7* Schenectady County 17.8 10.6* 26.6* Saratoga County 12.2 7.9* 0.0* Columbia County 19.7 12.9* 0.0* Greene County 22.5 41.4* 0.0* *: Rate unstable
16.9 17.418.7
20.719.4
13.0 13.7
17.516.7 17.318.4
19.417.9
11.9
19.0
22.2
0
5
10
15
20
25
NYS excl. NYC Capital Region Albany Rensselaer Schenectady Saratoga Columbia Greene
Congestive Heart Failure (CHF) MortalityAge-Adjusted Rate per 100,00014
2013-15 2016-18
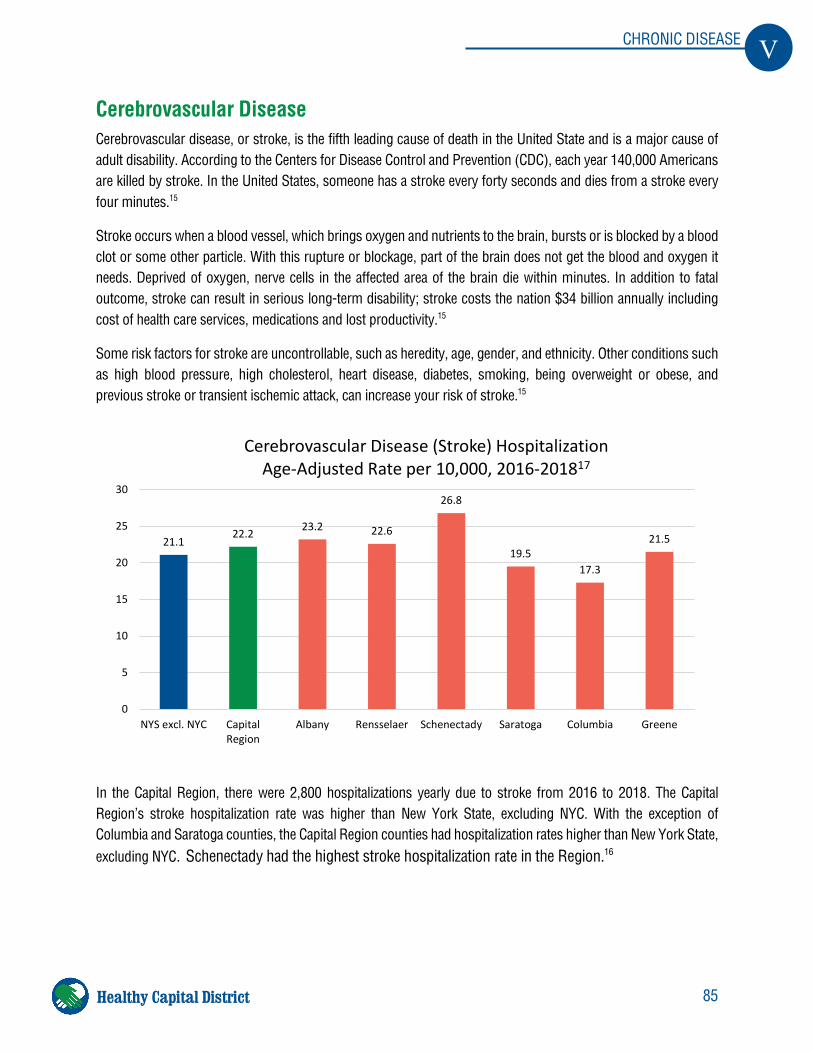
85
V CHRONIC DISEASE
Healthy Capital District
Cerebrovascular Disease Cerebrovascular disease, or stroke, is the fifth leading cause of death in the United State and is a major cause of adult disability. According to the Centers for Disease Control and Prevention (CDC), each year 140,000 Americans are killed by stroke. In the United States, someone has a stroke every forty seconds and dies from a stroke every four minutes.15
Stroke occurs when a blood vessel, which brings oxygen and nutrients to the brain, bursts or is blocked by a blood clot or some other particle. With this rupture or blockage, part of the brain does not get the blood and oxygen it needs. Deprived of oxygen, nerve cells in the affected area of the brain die within minutes. In addition to fatal outcome, stroke can result in serious long-term disability; stroke costs the nation $34 billion annually including cost of health care services, medications and lost productivity.15
Some risk factors for stroke are uncontrollable, such as heredity, age, gender, and ethnicity. Other conditions such as high blood pressure, high cholesterol, heart disease, diabetes, smoking, being overweight or obese, and previous stroke or transient ischemic attack, can increase your risk of stroke.15
In the Capital Region, there were 2,800 hospitalizations yearly due to stroke from 2016 to 2018. The Capital Region’s stroke hospitalization rate was higher than New York State, excluding NYC. With the exception of Columbia and Saratoga counties, the Capital Region counties had hospitalization rates higher than New York State, excluding NYC. Schenectady had the highest stroke hospitalization rate in the Region.16
21.122.2 23.2 22.6
26.8
19.517.3
21.5
0
5
10
15
20
25
30
NYS excl. NYC CapitalRegion
Albany Rensselaer Schenectady Saratoga Columbia Greene
Cerebrovascular Disease (Stroke) HospitalizationAge-Adjusted Rate per 10,000, 2016-201817
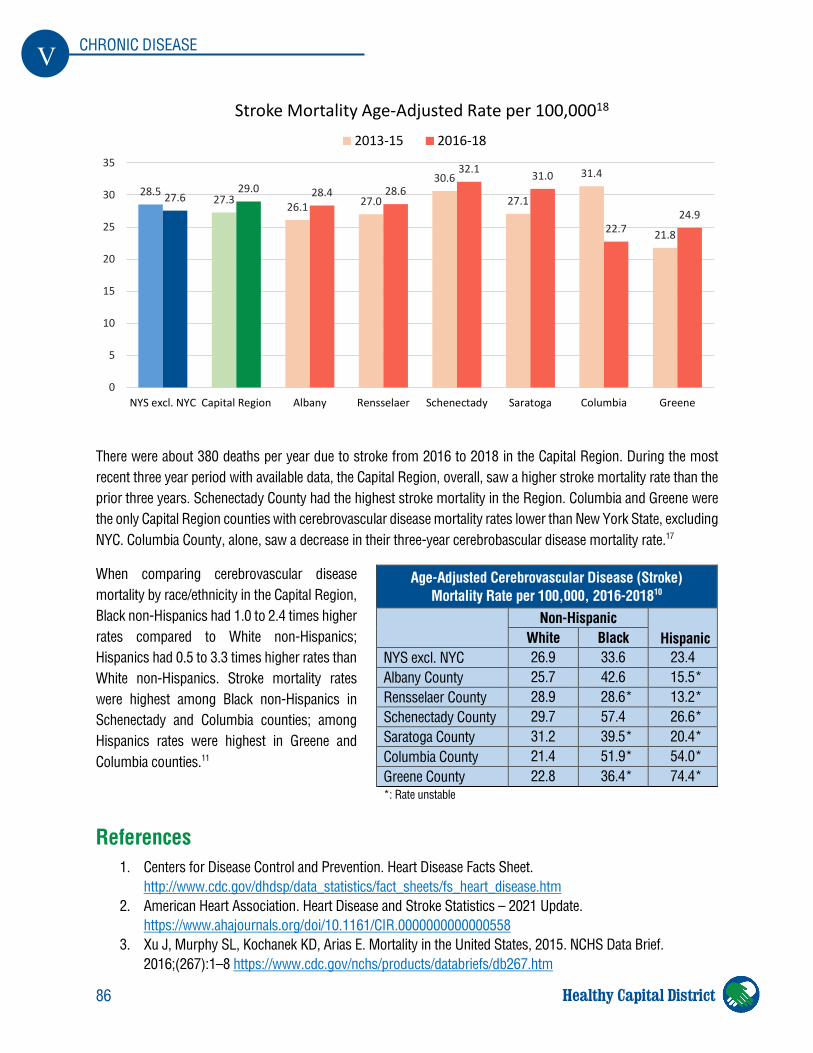
86
V CHRONIC DISEASE
Healthy Capital District
There were about 380 deaths per year due to stroke from 2016 to 2018 in the Capital Region. During the most recent three year period with available data, the Capital Region, overall, saw a higher stroke mortality rate than the prior three years. Schenectady County had the highest stroke mortality in the Region. Columbia and Greene were the only Capital Region counties with cerebrovascular disease mortality rates lower than New York State, excluding NYC. Columbia County, alone, saw a decrease in their three-year cerebrobascular disease mortality rate.17
When comparing cerebrovascular disease mortality by race/ethnicity in the Capital Region, Black non-Hispanics had 1.0 to 2.4 times higher rates compared to White non-Hispanics; Hispanics had 0.5 to 3.3 times higher rates than White non-Hispanics. Stroke mortality rates were highest among Black non-Hispanics in Schenectady and Columbia counties; among Hispanics rates were highest in Greene and Columbia counties.11
References 1. Centers for Disease Control and Prevention. Heart Disease Facts Sheet.
http://www.cdc.gov/dhdsp/data_statistics/fact_sheets/fs_heart_disease.htm 2. American Heart Association. Heart Disease and Stroke Statistics – 2021 Update.
https://www.ahajournals.org/doi/10.1161/CIR.0000000000000558 3. Xu J, Murphy SL, Kochanek KD, Arias E. Mortality in the United States, 2015. NCHS Data Brief.
2016;(267):1–8 https://www.cdc.gov/nchs/products/databriefs/db267.htm
Age-Adjusted Cerebrovascular Disease (Stroke) Mortality Rate per 100,000, 2016-201810
Non-Hispanic
Hispanic White Black NYS excl. NYC 26.9 33.6 23.4 Albany County 25.7 42.6 15.5* Rensselaer County 28.9 28.6* 13.2* Schenectady County 29.7 57.4 26.6* Saratoga County 31.2 39.5* 20.4* Columbia County 21.4 51.9* 54.0* Greene County 22.8 36.4* 74.4* *: Rate unstable
28.527.3 26.1 27.0
30.6
27.1
31.4
21.8
27.629.0 28.4 28.6
32.1 31.0
22.724.9
0
5
10
15
20
25
30
35
NYS excl. NYC Capital Region Albany Rensselaer Schenectady Saratoga Columbia Greene
Stroke Mortality Age-Adjusted Rate per 100,00018
2013-15 2016-18
87
V CHRONIC DISEASE
Healthy Capital District
4. New York State Department of Health. Heart Disease and Stroke Prevention. https://www.health.ny.gov/diseases/cardiovascular/heart_disease/
5. New York State Department of Health. New York State Leading Causes of Death. https://apps.health.ny.gov/public/tabvis/PHIG_Public/lcd/
6. New York State Department of Health. Types of Cardiovascular Disease. https://www.health.ny.gov/diseases/cardiovascular/heart_disease/types_of_cv.htm
7. Centers for Disease Control and Prevention. Heart Disease Factstats. https://www.cdc.gov/nchs/fastats/heart-disease.htm
8. Centers for Disease Control and Prevention. Heart Disease Fact Sheet. https://www.cdc.gov/dhdsp/data_statistics/fact_sheets/fs_heart_disease.htm
9. New York State Department of Health. Age-adjusted heart attack hospitalization rate per 10,000, 2016-2018. https://webbi1.health.ny.gov/SASStoredProcess/guest?_program=/EBI/PHIG/apps/chir_dashboard/chir_dashboard&p=it&ind_id=Bh49a
10. New York State Department of Health. New York State Community Health Indicator Reports (CHIRS): Age-adjusted coronary heart disease hospitalization rate per 10,000, 2016-2018. https://webbi1.health.ny.gov/SASStoredProcess/guest?_program=/EBI/PHIG/apps/chir_dashboard/chir_dashboard&p=it&ind_id=Bh3a
11. New York State Department of Health. County Health Indicators by Race/ethnicity. http://www.health.ny.gov/statistics/community/minority/county/
12. Centers for Disease Control and Prevention. Heart Failure Fact Sheet. https://www.cdc.gov/heartdisease/heart_failure.htm
13. New York State Department of Health. Age-adjusted congestive heart failure mortality rate per 100,000, 2016-2018. https://webbi1.health.ny.gov/SASStoredProcess/guest?_program=/EBI/PHIG/apps/chir_dashboard/chir_dashboard&p=it&ind_id=Bd10a
14. New York State Department of Health. Congestive heart failure premature death (aged 35-64 years) rate per 100,000, 2016-2018. https://webbi1.health.ny.gov/SASStoredProcess/guest?_program=/EBI/PHIG/apps/chir_dashboard/chir_dashboard&p=it&ind_id=Bd11
15. Centers for Disease Control and Prevention. Stroke Facts. https://www.cdc.gov/stroke/facts.htm 16. New York State Department of Health. Age-adjusted cerebrovascular disease (stroke) hospitalization rate
per 10,000, 2016-2018. https://webbi1.health.ny.gov/SASStoredProcess/guest?_program=/EBI/PHIG/apps/chir_dashboard/chir_dashboard&p=it&ind_id=Bh5a
17. New York State Department of Health. Age-adjusted cerebrovascular disease (stroke) mortality rate per 100,000, 2016-2018, https://webbi1.health.ny.gov/SASStoredProcess/guest?_program=/EBI/PHIG/apps/chir_dashboard/chir_dashboard&p=it&ind_id=Bd13a
88
V CHRONIC DISEASE
Healthy Capital District
Cancer
Cancer is a disease in which abnormal cells in the body grow out of control. It can be caused by many different factors, such as genetics, lifestyle, and the environment. Cancer is the second leading cause of death in New York State, as well as in the Capital Region. Each year, about 110,000 New Yorkers are diagnosed with cancer and over 35,000 New Yorkers die from malignant cancers each year. Lung, colorectal, breast and prostate cancers account for the majority of cancers in New York and nationally.1
Many cancer deaths are preventable through early detection. For several types of cancer, detection at an early stage significantly increases the options for treatment and its overall success. “Early stage” is defined as identifying invasive cancers before they have spread from the tissue of origin. Cancer screening helps to identify cancers at an early stage before the onset of clinical symptoms.1
In general, gender and race are important factors in the frequency of different types of cancers. At all ages, women have lower cancer incidence and mortality rates than men in the same age group. This gender difference has remained stable over time in New York State.1
Highlights
• Breast cancer screening rates were higher in the Capital Region than NYS, excluding NYC. o Screening rates were lower in Greene and Schenectady counties than NYS, excluding NYC. o Incidence (total and late stage) was higher in the Capital Region than NYS, excluding NYC. o Incidence (total) was highest in Albany and Schenectady counties. o Incidence (late stage) was highest in Schenectady and Columbia counties. o Mortality was higher in Capital Region than NYS, excluding NYC; highest in Rensselaer County.
• Cervical cancer screening and incidence rates improved in the Capital Region, overall. o Columbia County had the lowest screening rate; Schenectady, the highest incidence.
• Colorectal cancer incidence and mortality rates were highest in Columbia and Greene counties. o Every Capital Region county met the Prevention Agenda objective for colorectal screening.
• Prostate cancer incidence (total and late stage) rates were highest in Albany and Saratoga counties o Albany County had the highest mortality; Greene, alone, was lower than NYS excluding NYC.
• Lung cancer mortality in the Capital Region fell 28% from 2011 to 2017, but remained higher than NYS, excluding NYC. o Greene County had the highest lung cancer incidence and mortality rates in the Capital Region.
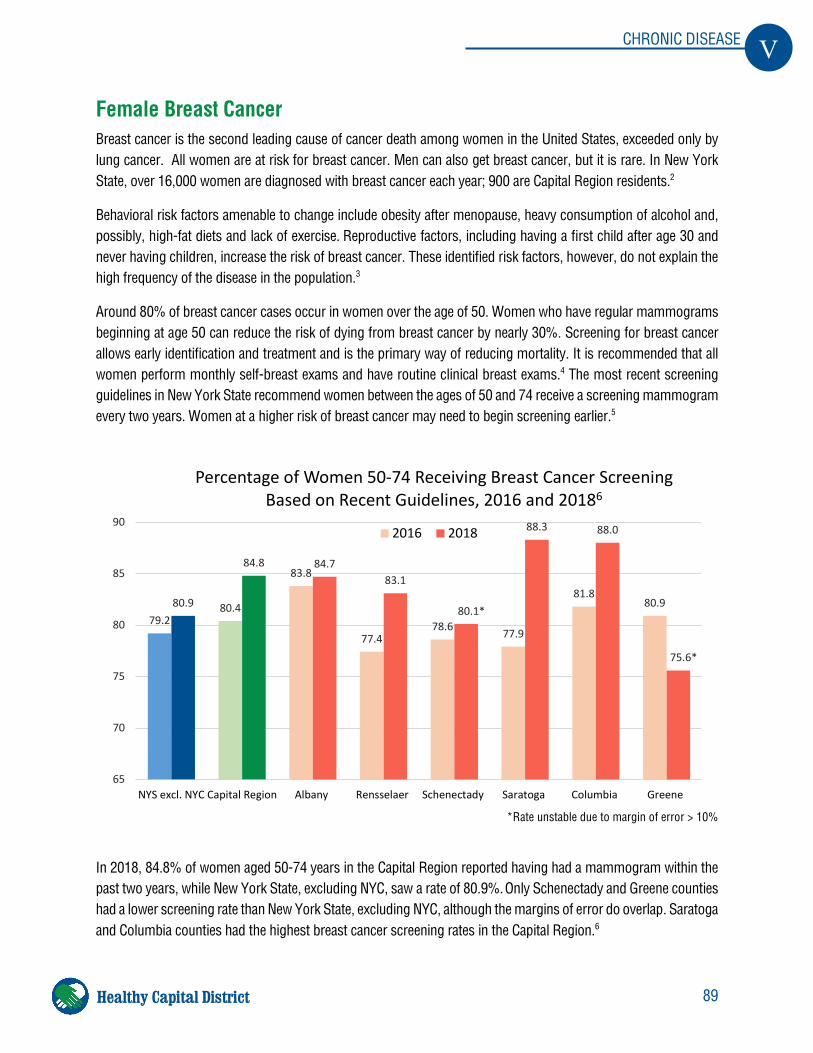
89
V CHRONIC DISEASE
Healthy Capital District
Female Breast Cancer Breast cancer is the second leading cause of cancer death among women in the United States, exceeded only by lung cancer. All women are at risk for breast cancer. Men can also get breast cancer, but it is rare. In New York State, over 16,000 women are diagnosed with breast cancer each year; 900 are Capital Region residents.2
Behavioral risk factors amenable to change include obesity after menopause, heavy consumption of alcohol and, possibly, high-fat diets and lack of exercise. Reproductive factors, including having a first child after age 30 and never having children, increase the risk of breast cancer. These identified risk factors, however, do not explain the high frequency of the disease in the population.3
Around 80% of breast cancer cases occur in women over the age of 50. Women who have regular mammograms beginning at age 50 can reduce the risk of dying from breast cancer by nearly 30%. Screening for breast cancer allows early identification and treatment and is the primary way of reducing mortality. It is recommended that all women perform monthly self-breast exams and have routine clinical breast exams.4 The most recent screening guidelines in New York State recommend women between the ages of 50 and 74 receive a screening mammogram every two years. Women at a higher risk of breast cancer may need to begin screening earlier.5
*Rate unstable due to margin of error > 10%
In 2018, 84.8% of women aged 50-74 years in the Capital Region reported having had a mammogram within the past two years, while New York State, excluding NYC, saw a rate of 80.9%. Only Schenectady and Greene counties had a lower screening rate than New York State, excluding NYC, although the margins of error do overlap. Saratoga and Columbia counties had the highest breast cancer screening rates in the Capital Region.6
79.280.4
83.8
77.478.6 77.9
81.880.980.9
84.8 84.783.1
80.1*
88.3 88.0
75.6*
65
70
75
80
85
90
NYS excl. NYC Capital Region Albany Rensselaer Schenectady Saratoga Columbia Greene
Percentage of Women 50-74 Receiving Breast Cancer Screening Based on Recent Guidelines, 2016 and 20186
2016 2018
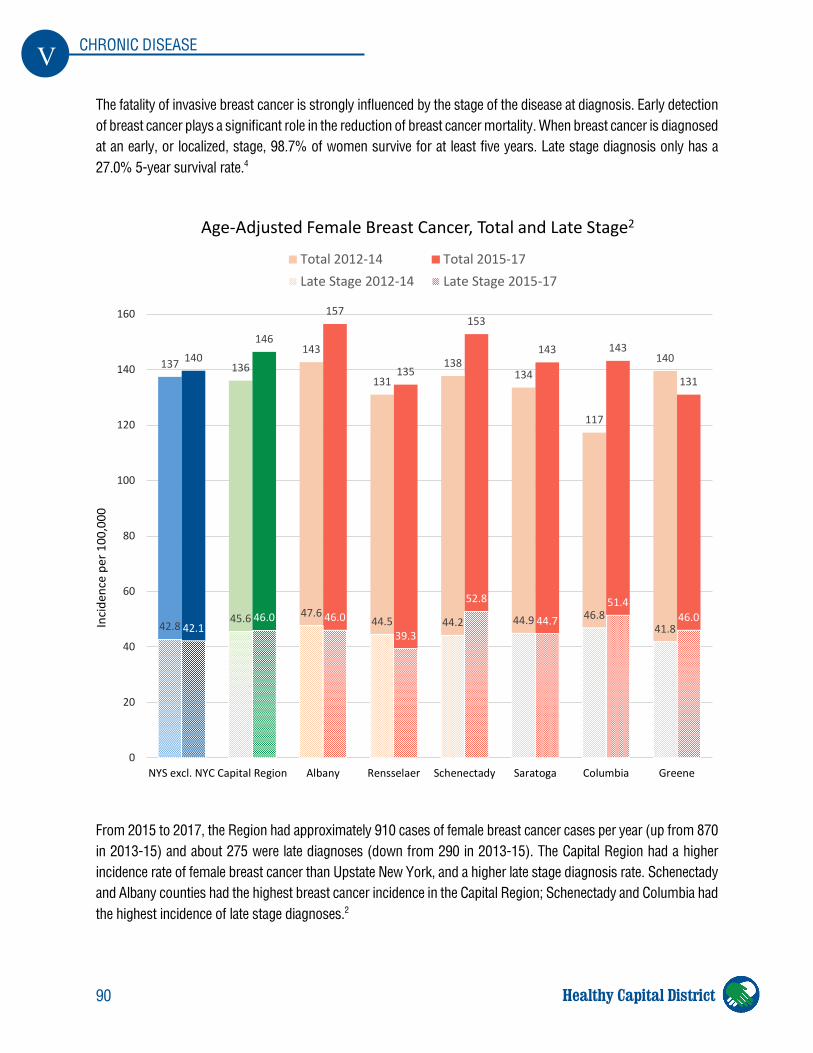
90
V CHRONIC DISEASE
Healthy Capital District
The fatality of invasive breast cancer is strongly influenced by the stage of the disease at diagnosis. Early detection of breast cancer plays a significant role in the reduction of breast cancer mortality. When breast cancer is diagnosed at an early, or localized, stage, 98.7% of women survive for at least five years. Late stage diagnosis only has a 27.0% 5-year survival rate.4
From 2015 to 2017, the Region had approximately 910 cases of female breast cancer cases per year (up from 870 in 2013-15) and about 275 were late diagnoses (down from 290 in 2013-15). The Capital Region had a higher incidence rate of female breast cancer than Upstate New York, and a higher late stage diagnosis rate. Schenectady and Albany counties had the highest breast cancer incidence in the Capital Region; Schenectady and Columbia had the highest incidence of late stage diagnoses.2
137 136143
131138
134
117
140140146
157
135
153
143 143
131
42.845.6 47.6
44.5 44.2 44.9 46.841.842.1
46.0 46.039.3
52.8
44.751.4
46.0
0
20
40
60
80
100
120
140
160
NYS excl. NYC Capital Region Albany Rensselaer Schenectady Saratoga Columbia Greene
Inci
denc
e pe
r 100
,000
Age-Adjusted Female Breast Cancer, Total and Late Stage2
Total 2012-14 Total 2015-17Late Stage 2012-14 Late Stage 2015-17
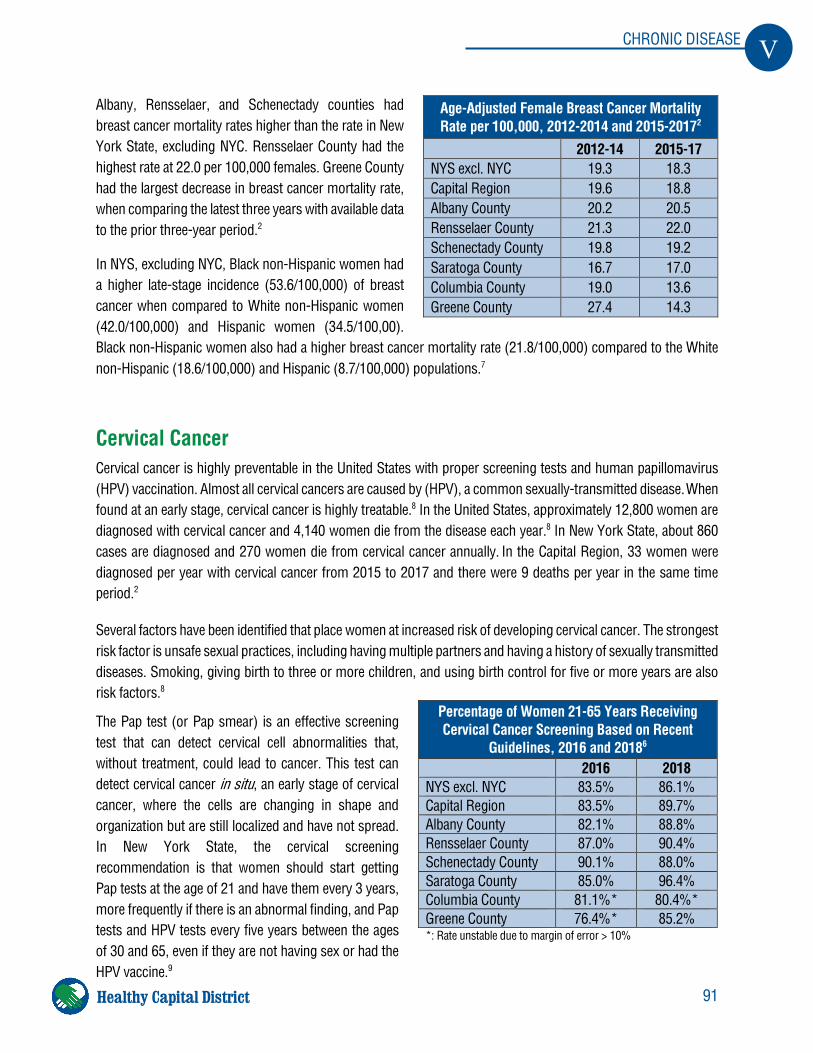
91
V CHRONIC DISEASE
Healthy Capital District
Albany, Rensselaer, and Schenectady counties had breast cancer mortality rates higher than the rate in New York State, excluding NYC. Rensselaer County had the highest rate at 22.0 per 100,000 females. Greene County had the largest decrease in breast cancer mortality rate, when comparing the latest three years with available data to the prior three-year period.2
In NYS, excluding NYC, Black non-Hispanic women had a higher late-stage incidence (53.6/100,000) of breast cancer when compared to White non-Hispanic women (42.0/100,000) and Hispanic women (34.5/100,00). Black non-Hispanic women also had a higher breast cancer mortality rate (21.8/100,000) compared to the White non-Hispanic (18.6/100,000) and Hispanic (8.7/100,000) populations.7
Cervical Cancer Cervical cancer is highly preventable in the United States with proper screening tests and human papillomavirus (HPV) vaccination. Almost all cervical cancers are caused by (HPV), a common sexually-transmitted disease. When found at an early stage, cervical cancer is highly treatable.8 In the United States, approximately 12,800 women are diagnosed with cervical cancer and 4,140 women die from the disease each year.8 In New York State, about 860 cases are diagnosed and 270 women die from cervical cancer annually. In the Capital Region, 33 women were diagnosed per year with cervical cancer from 2015 to 2017 and there were 9 deaths per year in the same time period.2
Several factors have been identified that place women at increased risk of developing cervical cancer. The strongest risk factor is unsafe sexual practices, including having multiple partners and having a history of sexually transmitted diseases. Smoking, giving birth to three or more children, and using birth control for five or more years are also risk factors.8
The Pap test (or Pap smear) is an effective screening test that can detect cervical cell abnormalities that, without treatment, could lead to cancer. This test can detect cervical cancer in situ, an early stage of cervical cancer, where the cells are changing in shape and organization but are still localized and have not spread. In New York State, the cervical screening recommendation is that women should start getting Pap tests at the age of 21 and have them every 3 years, more frequently if there is an abnormal finding, and Pap tests and HPV tests every five years between the ages of 30 and 65, even if they are not having sex or had the HPV vaccine.9
Age-Adjusted Female Breast Cancer Mortality Rate per 100,000, 2012-2014 and 2015-20172
2012-14 2015-17 NYS excl. NYC 19.3 18.3 Capital Region 19.6 18.8 Albany County 20.2 20.5 Rensselaer County 21.3 22.0 Schenectady County 19.8 19.2 Saratoga County 16.7 17.0 Columbia County 19.0 13.6 Greene County 27.4 14.3
Percentage of Women 21-65 Years Receiving Cervical Cancer Screening Based on Recent
Guidelines, 2016 and 20186 2016 2018 NYS excl. NYC 83.5% 86.1% Capital Region 83.5% 89.7% Albany County 82.1% 88.8% Rensselaer County 87.0% 90.4% Schenectady County 90.1% 88.0% Saratoga County 85.0% 96.4% Columbia County 81.1%* 80.4%* Greene County 76.4%* 85.2% *: Rate unstable due to margin of error > 10%
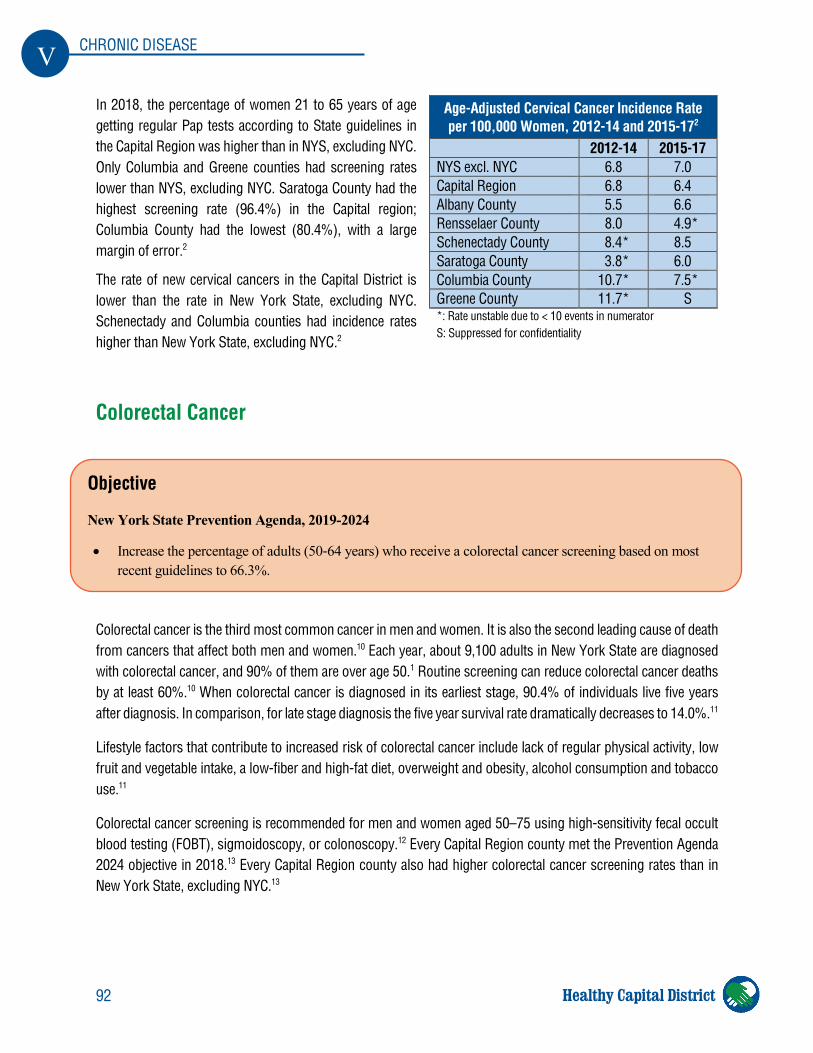
92
V CHRONIC DISEASE
Healthy Capital District
In 2018, the percentage of women 21 to 65 years of age getting regular Pap tests according to State guidelines in the Capital Region was higher than in NYS, excluding NYC.
Only Columbia and Greene counties had screening rates lower than NYS, excluding NYC. Saratoga County had the highest screening rate (96.4%) in the Capital region; Columbia County had the lowest (80.4%), with a large margin of error.2
The rate of new cervical cancers in the Capital District is lower than the rate in New York State, excluding NYC. Schenectady and Columbia counties had incidence rates higher than New York State, excluding NYC.2
Colorectal Cancer
Colorectal cancer is the third most common cancer in men and women. It is also the second leading cause of death from cancers that affect both men and women.10 Each year, about 9,100 adults in New York State are diagnosed with colorectal cancer, and 90% of them are over age 50.1 Routine screening can reduce colorectal cancer deaths by at least 60%.10 When colorectal cancer is diagnosed in its earliest stage, 90.4% of individuals live five years after diagnosis. In comparison, for late stage diagnosis the five year survival rate dramatically decreases to 14.0%.11
Lifestyle factors that contribute to increased risk of colorectal cancer include lack of regular physical activity, low fruit and vegetable intake, a low-fiber and high-fat diet, overweight and obesity, alcohol consumption and tobacco use.11
Colorectal cancer screening is recommended for men and women aged 50–75 using high-sensitivity fecal occult blood testing (FOBT), sigmoidoscopy, or colonoscopy.12 Every Capital Region county met the Prevention Agenda 2024 objective in 2018.13 Every Capital Region county also had higher colorectal cancer screening rates than in New York State, excluding NYC.13
Age-Adjusted Cervical Cancer Incidence Rate per 100,000 Women, 2012-14 and 2015-172
2012-14 2015-17 NYS excl. NYC 6.8 7.0 Capital Region 6.8 6.4 Albany County 5.5 6.6 Rensselaer County 8.0 4.9* Schenectady County 8.4* 8.5 Saratoga County 3.8* 6.0 Columbia County 10.7* 7.5* Greene County 11.7* S *: Rate unstable due to < 10 events in numerator S: Suppressed for confidentiality
Objective
New York State Prevention Agenda, 2019-2024
• Increase the percentage of adults (50‐64 years) who receive a colorectal cancer screening based on most recent guidelines to 66.3%.
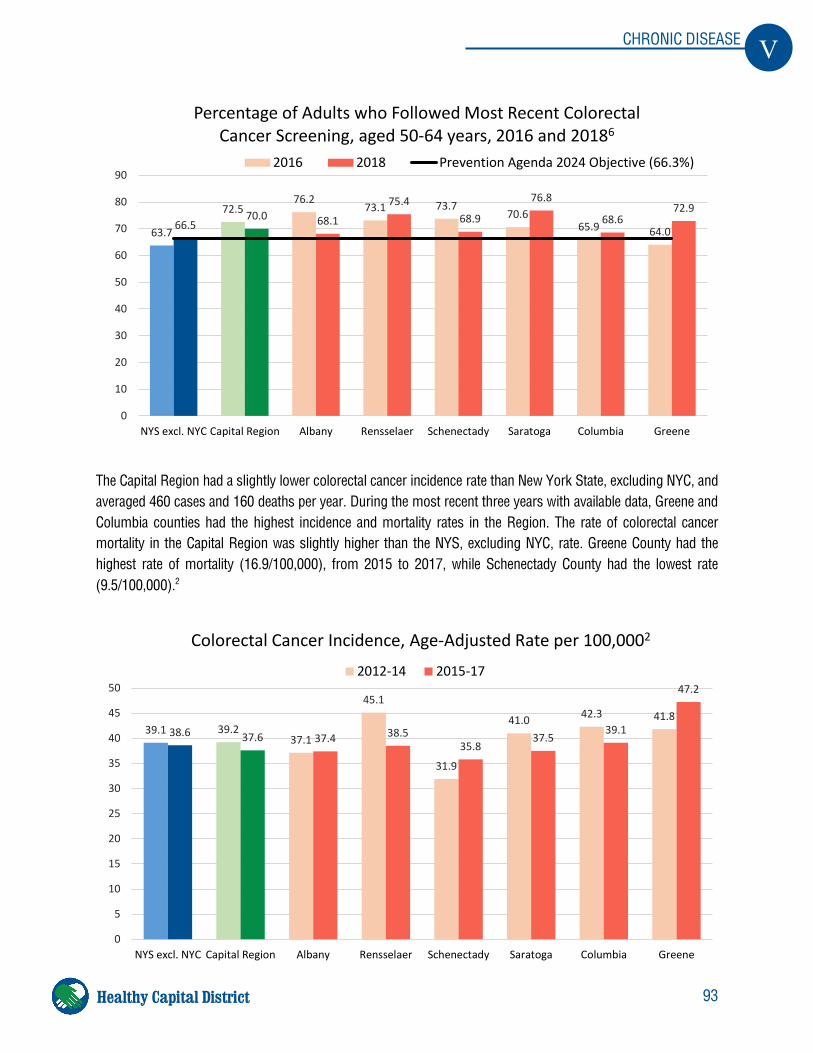
93
V CHRONIC DISEASE
Healthy Capital District
The Capital Region had a slightly lower colorectal cancer incidence rate than New York State, excluding NYC, and averaged 460 cases and 160 deaths per year. During the most recent three years with available data, Greene and Columbia counties had the highest incidence and mortality rates in the Region. The rate of colorectal cancer mortality in the Capital Region was slightly higher than the NYS, excluding NYC, rate. Greene County had the highest rate of mortality (16.9/100,000), from 2015 to 2017, while Schenectady County had the lowest rate (9.5/100,000).2
63.7
72.576.2
73.1 73.770.6
65.9 64.066.570.0 68.1
75.468.9
76.8
68.672.9
0
10
20
30
40
50
60
70
80
90
NYS excl. NYC Capital Region Albany Rensselaer Schenectady Saratoga Columbia Greene
Percentage of Adults who Followed Most Recent Colorectal Cancer Screening, aged 50-64 years, 2016 and 20186
2016 2018 Prevention Agenda 2024 Objective (66.3%)
39.1 39.237.1
45.1
31.9
41.0 42.3 41.838.6 37.6 37.4 38.5
35.837.5
39.1
47.2
0
5
10
15
20
25
30
35
40
45
50
NYS excl. NYC Capital Region Albany Rensselaer Schenectady Saratoga Columbia Greene
Colorectal Cancer Incidence, Age-Adjusted Rate per 100,0002
2012-14 2015-17
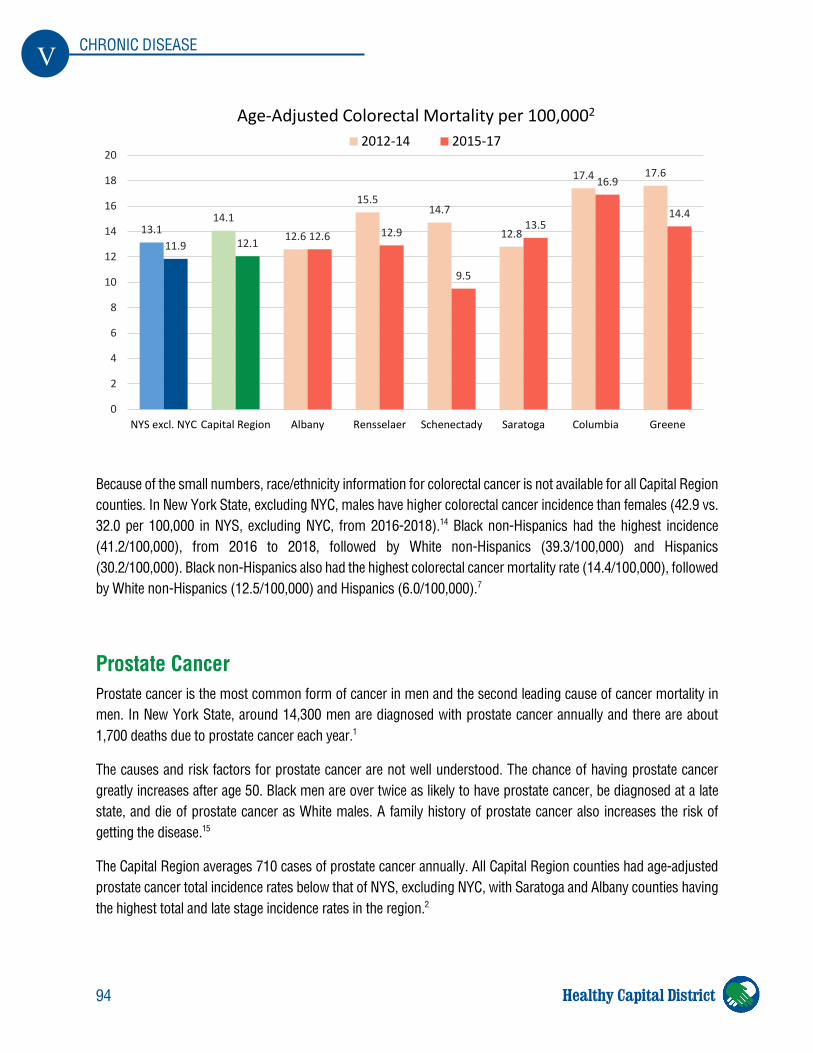
94
V CHRONIC DISEASE
Healthy Capital District
Because of the small numbers, race/ethnicity information for colorectal cancer is not available for all Capital Region counties. In New York State, excluding NYC, males have higher colorectal cancer incidence than females (42.9 vs. 32.0 per 100,000 in NYS, excluding NYC, from 2016-2018).14 Black non-Hispanics had the highest incidence (41.2/100,000), from 2016 to 2018, followed by White non-Hispanics (39.3/100,000) and Hispanics (30.2/100,000). Black non-Hispanics also had the highest colorectal cancer mortality rate (14.4/100,000), followed by White non-Hispanics (12.5/100,000) and Hispanics (6.0/100,000).7
Prostate Cancer Prostate cancer is the most common form of cancer in men and the second leading cause of cancer mortality in men. In New York State, around 14,300 men are diagnosed with prostate cancer annually and there are about 1,700 deaths due to prostate cancer each year.1
The causes and risk factors for prostate cancer are not well understood. The chance of having prostate cancer greatly increases after age 50. Black men are over twice as likely to have prostate cancer, be diagnosed at a late state, and die of prostate cancer as White males. A family history of prostate cancer also increases the risk of getting the disease.15
The Capital Region averages 710 cases of prostate cancer annually. All Capital Region counties had age-adjusted prostate cancer total incidence rates below that of NYS, excluding NYC, with Saratoga and Albany counties having the highest total and late stage incidence rates in the region.2
13.114.1
12.6
15.514.7
12.8
17.4 17.6
11.9 12.1 12.6 12.9
9.5
13.5
16.9
14.4
0
2
4
6
8
10
12
14
16
18
20
NYS excl. NYC Capital Region Albany Rensselaer Schenectady Saratoga Columbia Greene
Age-Adjusted Colorectal Mortality per 100,0002
2012-14 2015-17
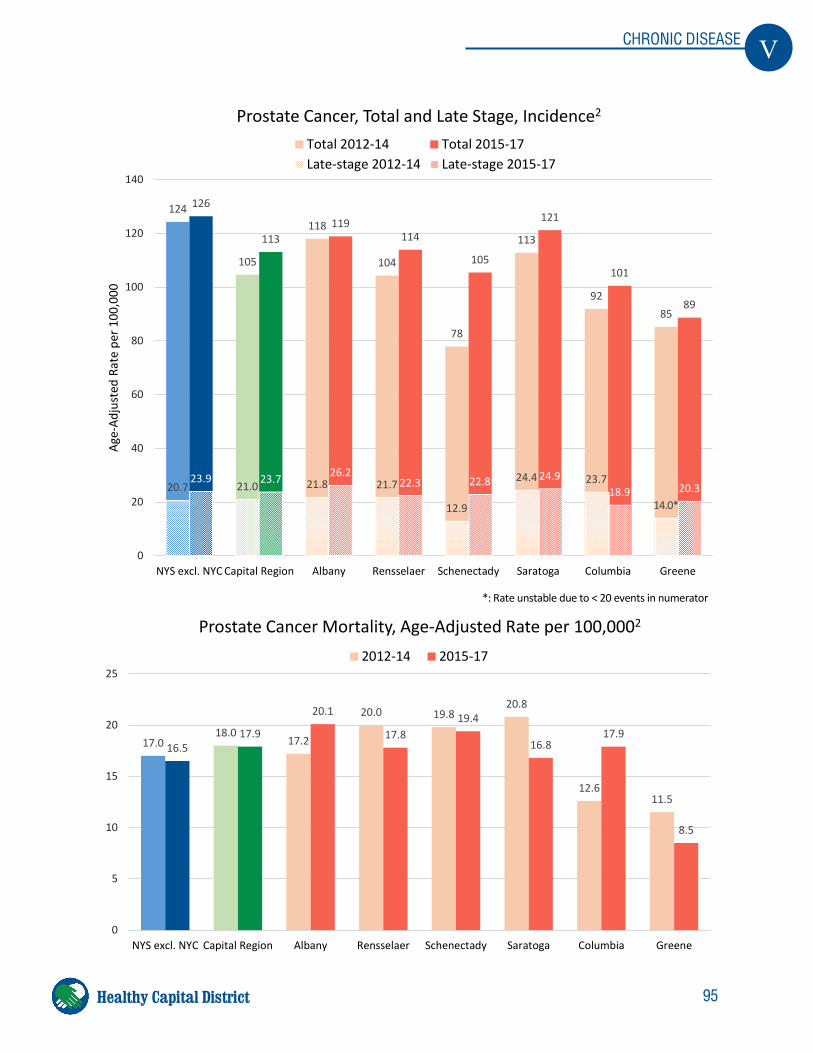
95
V CHRONIC DISEASE
Healthy Capital District
124
105
118
104
78
113
9285
126
113119
114
105
121
101
89
20.7 21.0 21.8 21.7
12.9
24.4 23.7
14.0*
23.9 23.7 26.222.3 22.8 24.9
18.9 20.3
0
20
40
60
80
100
120
140
NYS excl. NYC Capital Region Albany Rensselaer Schenectady Saratoga Columbia Greene
Age-
Adju
sted
Rat
e pe
r 100
,000
Prostate Cancer, Total and Late Stage, Incidence2
Total 2012-14 Total 2015-17Late-stage 2012-14 Late-stage 2015-17
17.018.0
17.2
20.0 19.820.8
12.611.5
16.517.9
20.1
17.819.4
16.817.9
8.5
0
5
10
15
20
25
NYS excl. NYC Capital Region Albany Rensselaer Schenectady Saratoga Columbia Greene
Prostate Cancer Mortality, Age-Adjusted Rate per 100,0002
2012-14 2015-17
*: Rate unstable due to < 20 events in numerator
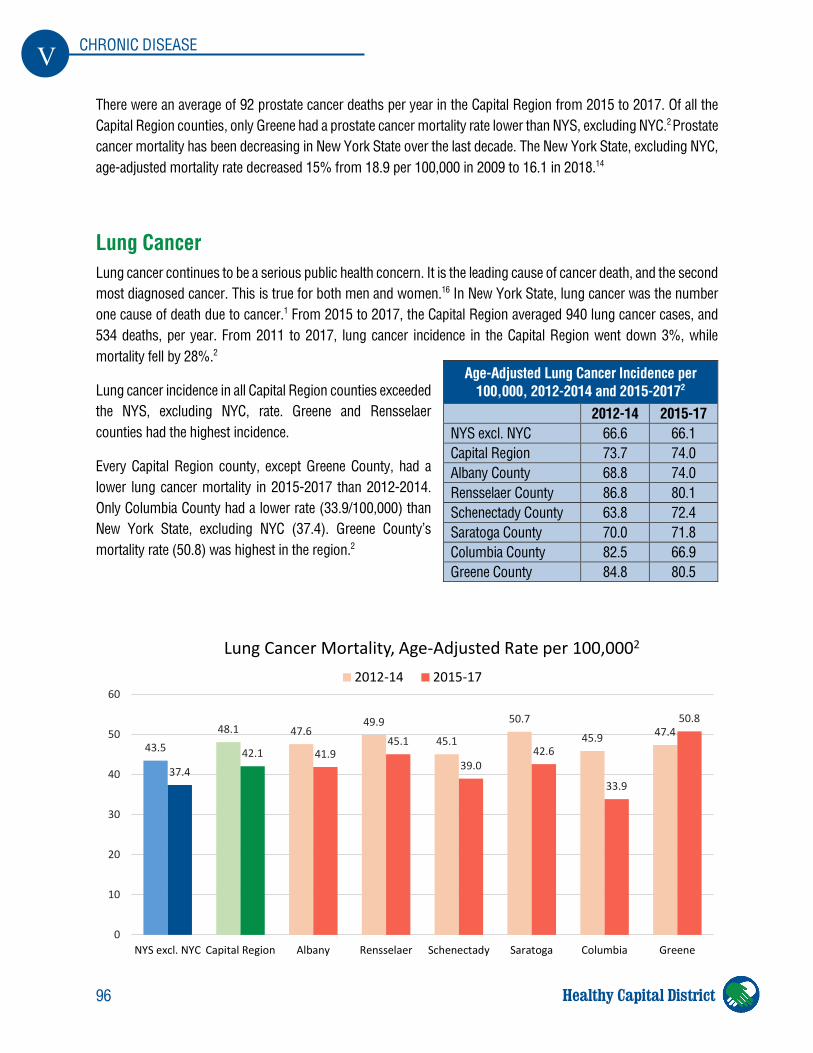
96
V CHRONIC DISEASE
Healthy Capital District
There were an average of 92 prostate cancer deaths per year in the Capital Region from 2015 to 2017. Of all the Capital Region counties, only Greene had a prostate cancer mortality rate lower than NYS, excluding NYC.2 Prostate cancer mortality has been decreasing in New York State over the last decade. The New York State, excluding NYC, age-adjusted mortality rate decreased 15% from 18.9 per 100,000 in 2009 to 16.1 in 2018.14
Lung Cancer Lung cancer continues to be a serious public health concern. It is the leading cause of cancer death, and the second most diagnosed cancer. This is true for both men and women.16 In New York State, lung cancer was the number one cause of death due to cancer.1 From 2015 to 2017, the Capital Region averaged 940 lung cancer cases, and 534 deaths, per year. From 2011 to 2017, lung cancer incidence in the Capital Region went down 3%, while mortality fell by 28%.2
Lung cancer incidence in all Capital Region counties exceeded the NYS, excluding NYC, rate. Greene and Rensselaer counties had the highest incidence.
Every Capital Region county, except Greene County, had a lower lung cancer mortality in 2015-2017 than 2012-2014. Only Columbia County had a lower rate (33.9/100,000) than New York State, excluding NYC (37.4). Greene County’s mortality rate (50.8) was highest in the region.2
Age-Adjusted Lung Cancer Incidence per 100,000, 2012-2014 and 2015-20172
2012-14 2015-17 NYS excl. NYC 66.6 66.1 Capital Region 73.7 74.0 Albany County 68.8 74.0 Rensselaer County 86.8 80.1 Schenectady County 63.8 72.4 Saratoga County 70.0 71.8 Columbia County 82.5 66.9 Greene County 84.8 80.5
43.548.1 47.6
49.9
45.1
50.7
45.9 47.4
37.442.1 41.9
45.1
39.042.6
33.9
50.8
0
10
20
30
40
50
60
NYS excl. NYC Capital Region Albany Rensselaer Schenectady Saratoga Columbia Greene
Lung Cancer Mortality, Age-Adjusted Rate per 100,0002
2012-14 2015-17
97
V CHRONIC DISEASE
Healthy Capital District
References 1. New York State Department of Health. 2018-2023 New York State Comprehensive Cancer Control Plan.
https://www.health.ny.gov/diseases/cancer/consortium/docs/2018-2023_comp_cancer_control_plan.pdf 2. New York State Department of Health. New York State Community Health Indicator Reports (CHIRS): Cancer
Indicators. https://webbi1.health.ny.gov/SASStoredProcess/guest?_program=%2FEBI%2FPHIG%2Fapps%2Fchir_dashboard%2Fchir_dashboard&p=sh&stop=1
3. American Cancer Society. Breast Cancer: Risk and Prevention. http://www.cancer.org/cancer/breast-cancer/risk-and-prevention.html
4. National Institutes of Health, National Cancer Institute. Cancer Stat Facts: Female Breast Cancer. http://seer.cancer.gov/statfacts/html/breast.html
5. New York State Department of Health. Breast Cancer Screening Recommendations. https://www.health.ny.gov/diseases/cancer/breast/screening_recommendations.htm
6. New York State Department of Health. Expanded Behavioral Risk Factor Surveillance System (Expanded BRFSS). https://www.health.ny.gov/statistics/brfss/expanded/
7. New York State Department of Health. County Health Indicators by Race/Ethnicity. http://www.health.ny.gov/statistics/community/minority/county/
8. Centers for Disease Control and Prevention. Gynecological Cancers: Cervical Cancer. http://www.cdc.gov/cancer/cervical/
9. New York State Department of Health. Cervical Cancer Screening Recommendations. https://www.health.ny.gov/diseases/cancer/cervical/screening_recommendations/
10. Centers for Disease Control and Prevention. Basic Information: Colorectal Cancer. http://www.cdc.gov/cancer/colorectal/basic_info/
11. American Cancer Society. Colorectal Cancer. http://www.cancer.org/cancer/colon-rectal-cancer.html 12. American Cancer Society. Colorectal (Colon) Cancer.
http://www.cdc.gov/cancer/colorectal/basic_info/screening/tests.htm 13. New York State Department of Health. Percentage of adults who receive a colorectal cancer screening based
on the most recent guidelines, aged 50-64 years, 2018. https://webbi1.health.ny.gov/SASStoredProcess/guest?_program=/EBI/PHIG/apps/dashboard/pa_dashboard&p=it&ind_id=pa34_0
14. New York State Cancer Registry. Cancer Incidence and Mortality in New York State, 1976-2018. http://www.health.ny.gov/statistics/cancer/registry/. Accessed 8/26/2021.
15. American Cancer Society. Prostate Cancer Risk Factors. http://www.cancer.org/cancer/prostate-cancer/causes-risks-prevention/risk-factors.html
16. Centers for Disease Control and Prevention. Lung Cancer. http://www.cdc.gov/cancer/lung/
98
VI HEALTHY AND SAFE ENVIRONMENT
Healthy Capital District
VI. Healthy and Safe Environment
Childhood Lead Poisoning
Lead poisoning is a completely preventable public health problem. Lead is a heavy metal that was used in many products and materials before the risk to young children was identified.1 For example, paint containing lead was used in many houses built before 1978.2 Products that can be hazardous still remain. Lead is also found in air, water, soil, or dust. Lead poisoning leads to serious adverse health, developmental, and cognitive outcomes that can affect individuals throughout their lives.1
Lead Screening Lead poisoning often occurs with no obvious symptoms. Therefore, it is important to screen children for elevated blood lead levels before they are harmed. Screening is performed by physicians using a blood draw or a finger prick. In New York State, healthcare providers are required to obtain a blood test on all children at 1 and 2 years of age. In addition, children age 6 months to 6 years are required to be assessed annually as a part of routine care, with a blood lead level obtained for any child with an increased risk of exposure. Early identification of lead exposure can prevent harm and minimize further exposures.1
Highlights
In the Capital Region,
• 2,300 (24.0%) children born in 2015 did not have one lead screening while 9-17 months of age, down from 2,600 (28.3%) children born in 2013
• 3,850 (40.0%) children born in 2015 did not have two lead screenings by 36 months of age, down from 4,100 (42.1%) children born in 2013
• Lead screening rates increased in all counties, except Greene • Elevated blood lead level incidence fell 42%, when comparing 2016-2018 to 2013-2015
o Incidence was higher than NYS, excl. NYC, in every Capital Region county, except Saratoga o Incidence among children under 6 years of age was highest in Albany County
• The rate of school drinking water outlets exceeding 15 µg lead/L was halved, from 2016 to 2020 o Schenectady County had a higher lead action level exceedance rate than NYS, excl. NYC
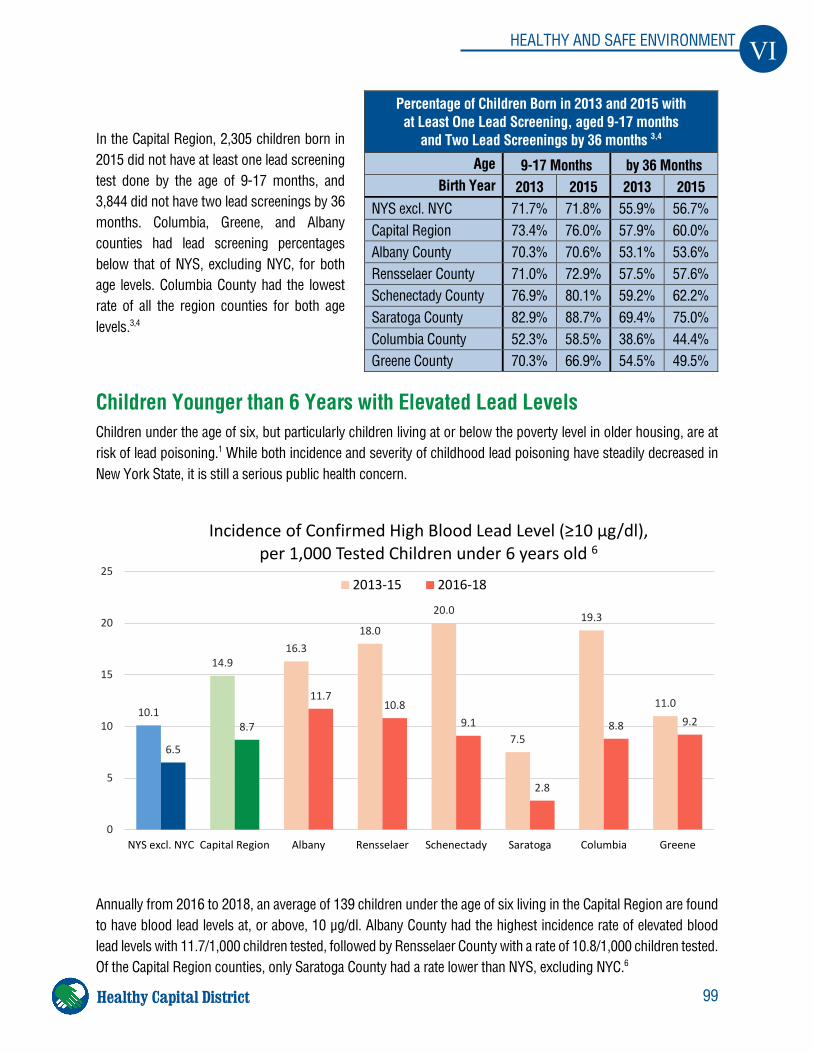
99
VI HEALTHY AND SAFE ENVIRONMENT
Healthy Capital District
In the Capital Region, 2,305 children born in 2015 did not have at least one lead screening test done by the age of 9-17 months, and 3,844 did not have two lead screenings by 36 months. Columbia, Greene, and Albany counties had lead screening percentages below that of NYS, excluding NYC, for both age levels. Columbia County had the lowest rate of all the region counties for both age levels.3,4
Children Younger than 6 Years with Elevated Lead Levels Children under the age of six, but particularly children living at or below the poverty level in older housing, are at risk of lead poisoning.1 While both incidence and severity of childhood lead poisoning have steadily decreased in New York State, it is still a serious public health concern.
Annually from 2016 to 2018, an average of 139 children under the age of six living in the Capital Region are found to have blood lead levels at, or above, 10 µg/dl. Albany County had the highest incidence rate of elevated blood lead levels with 11.7/1,000 children tested, followed by Rensselaer County with a rate of 10.8/1,000 children tested. Of the Capital Region counties, only Saratoga County had a rate lower than NYS, excluding NYC.6
Percentage of Children Born in 2013 and 2015 with at Least One Lead Screening, aged 9-17 months
and Two Lead Screenings by 36 months 3,4
Age 9-17 Months by 36 Months Birth Year 2013 2015 2013 2015
NYS excl. NYC 71.7% 71.8% 55.9% 56.7% Capital Region 73.4% 76.0% 57.9% 60.0% Albany County 70.3% 70.6% 53.1% 53.6% Rensselaer County 71.0% 72.9% 57.5% 57.6% Schenectady County 76.9% 80.1% 59.2% 62.2% Saratoga County 82.9% 88.7% 69.4% 75.0% Columbia County 52.3% 58.5% 38.6% 44.4% Greene County 70.3% 66.9% 54.5% 49.5%
10.1
14.916.3
18.0
20.0
7.5
19.3
11.0
6.5
8.7
11.710.8
9.1
2.8
8.8 9.2
0
5
10
15
20
25
NYS excl. NYC Capital Region Albany Rensselaer Schenectady Saratoga Columbia Greene
Incidence of Confirmed High Blood Lead Level (≥10 µg/dl), per 1,000 Tested Children under 6 years old 6
2013-15 2016-18
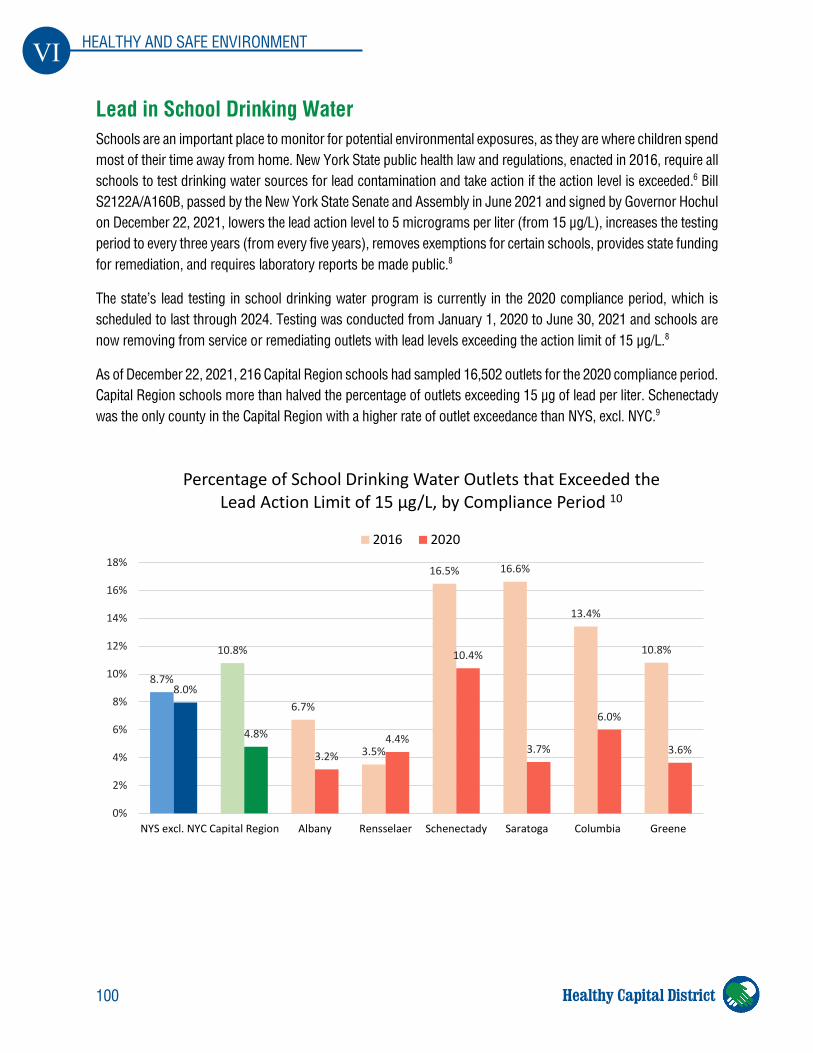
100
VI HEALTHY AND SAFE ENVIRONMENT
Healthy Capital District
Lead in School Drinking Water Schools are an important place to monitor for potential environmental exposures, as they are where children spend most of their time away from home. New York State public health law and regulations, enacted in 2016, require all schools to test drinking water sources for lead contamination and take action if the action level is exceeded.6 Bill S2122A/A160B, passed by the New York State Senate and Assembly in June 2021 and signed by Governor Hochul on December 22, 2021, lowers the lead action level to 5 micrograms per liter (from 15 µg/L), increases the testing period to every three years (from every five years), removes exemptions for certain schools, provides state funding for remediation, and requires laboratory reports be made public.8
The state’s lead testing in school drinking water program is currently in the 2020 compliance period, which is scheduled to last through 2024. Testing was conducted from January 1, 2020 to June 30, 2021 and schools are now removing from service or remediating outlets with lead levels exceeding the action limit of 15 µg/L.8
As of December 22, 2021, 216 Capital Region schools had sampled 16,502 outlets for the 2020 compliance period. Capital Region schools more than halved the percentage of outlets exceeding 15 µg of lead per liter. Schenectady was the only county in the Capital Region with a higher rate of outlet exceedance than NYS, excl. NYC.9
8.7%
10.8%
6.7%
3.5%
16.5% 16.6%
13.4%
10.8%
8.0%
4.8%
3.2%4.4%
10.4%
3.7%
6.0%
3.6%
0%
2%
4%
6%
8%
10%
12%
14%
16%
18%
NYS excl. NYC Capital Region Albany Rensselaer Schenectady Saratoga Columbia Greene
Percentage of School Drinking Water Outlets that Exceeded the Lead Action Limit of 15 µg/L, by Compliance Period 10
2016 2020
101
VI HEALTHY AND SAFE ENVIRONMENT
Healthy Capital District
References 1. New York State Department of Health. Lead Poisoning Prevention.
http://www.health.ny.gov/environmental/lead 2. New York State Department of Health. Sources of Lead.
https://www.health.ny.gov/environmental/lead/sources.htm 3. New York State Department of Health. Percentage of children born in 2015 with a lead screening - aged
9-17 months. https://webbi1.health.ny.gov/SASStoredProcess/guest?_program=/EBI/PHIG/apps/chir_dashboard/chir_dashboard&p=it&ind_id=Cg26
4. New York State Department of Health. Percentage of children born in 2015 with at least two lead screenings by 36 months. https://webbi1.health.ny.gov/SASStoredProcess/guest?_program=%2FEBI%2FPHIG%2Fapps%2Fchir_dashboard%2Fchir_dashboard&p=it&ind_id=Cg27
5. New York State Department of Health. Incidence of confirmed high blood lead level (10 micrograms or higher per deciliter) - rate per 1,000 tested children aged <72 months, 2016-2018. https://webbi1.health.ny.gov/SASStoredProcess/guest?_program=/EBI/PHIG/apps/chir_dashboard/chir_dashboard&p=it&ind_id=Cg28
6. New York State Department of Health. Lead Testing of School Drinking Water. https://www.health.ny.gov/environmental/water/drinking/lead/lead_testing_of_school_drinking_water.htm
7. New York State Senate. Senate Bill 2122A. https://www.nysenate.gov/legislation/bills/2021/s2122 8. New York State Department of Health. Lead Testing in School Drinking Water Program Guidance
Manual: February 2021. https://www.health.ny.gov/environmental/water/drinking/lead/docs/LeadTestinginSchoolsGuidanceDocument.pdf
9. New York State Department of Health. Health Data NY: Lead Reporting Interactive Search. https://health.data.ny.gov/browse?tags=lead
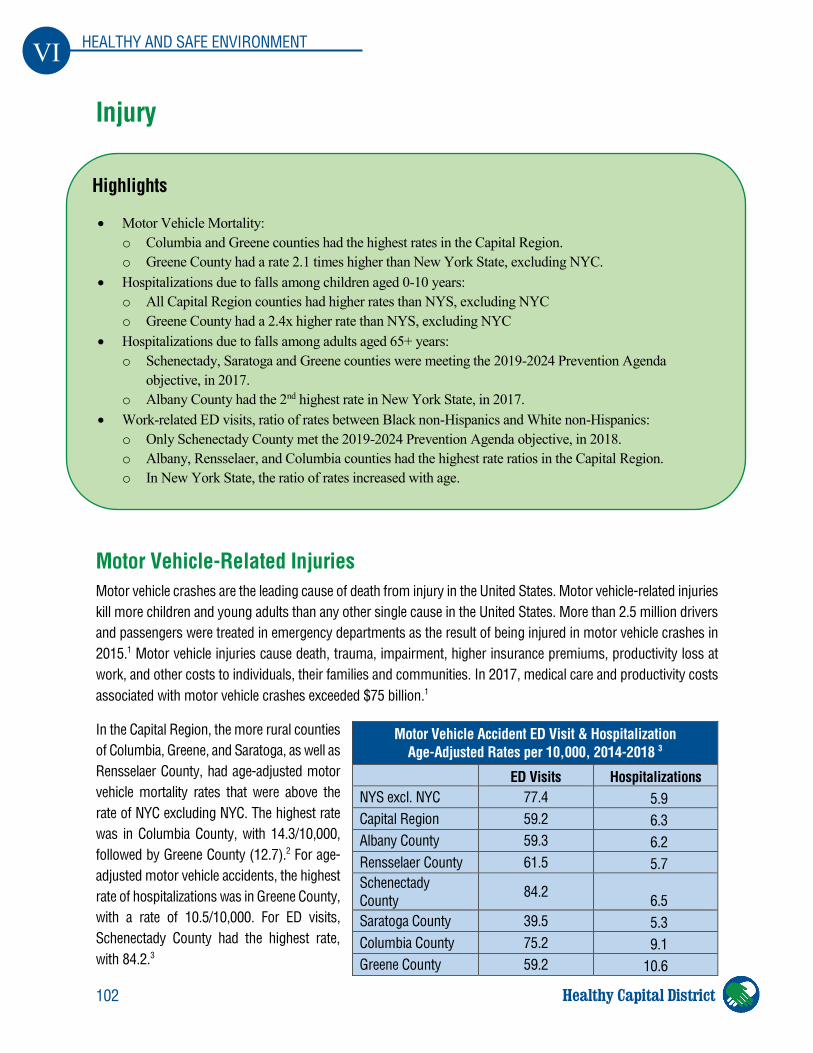
102
VI HEALTHY AND SAFE ENVIRONMENT
Healthy Capital District
Injury
Motor Vehicle-Related Injuries Motor vehicle crashes are the leading cause of death from injury in the United States. Motor vehicle-related injuries kill more children and young adults than any other single cause in the United States. More than 2.5 million drivers and passengers were treated in emergency departments as the result of being injured in motor vehicle crashes in 2015.1 Motor vehicle injuries cause death, trauma, impairment, higher insurance premiums, productivity loss at work, and other costs to individuals, their families and communities. In 2017, medical care and productivity costs associated with motor vehicle crashes exceeded $75 billion.1
In the Capital Region, the more rural counties of Columbia, Greene, and Saratoga, as well as Rensselaer County, had age-adjusted motor vehicle mortality rates that were above the rate of NYC excluding NYC. The highest rate was in Columbia County, with 14.3/10,000, followed by Greene County (12.7).2 For age-adjusted motor vehicle accidents, the highest rate of hospitalizations was in Greene County, with a rate of 10.5/10,000. For ED visits, Schenectady County had the highest rate, with 84.2.3
Motor Vehicle Accident ED Visit & Hospitalization Age-Adjusted Rates per 10,000, 2014-2018 3
ED Visits Hospitalizations NYS excl. NYC 77.4 5.9 Capital Region 59.2 6.3 Albany County 59.3 6.2 Rensselaer County 61.5 5.7 Schenectady County 84.2 6.5 Saratoga County 39.5 5.3 Columbia County 75.2 9.1 Greene County 59.2 10.6
Highlights
• Motor Vehicle Mortality: o Columbia and Greene counties had the highest rates in the Capital Region. o Greene County had a rate 2.1 times higher than New York State, excluding NYC.
• Hospitalizations due to falls among children aged 0-10 years: o All Capital Region counties had higher rates than NYS, excluding NYC o Greene County had a 2.4x higher rate than NYS, excluding NYC
• Hospitalizations due to falls among adults aged 65+ years: o Schenectady, Saratoga and Greene counties were meeting the 2019-2024 Prevention Agenda
objective, in 2017. o Albany County had the 2nd highest rate in New York State, in 2017.
• Work-related ED visits, ratio of rates between Black non-Hispanics and White non-Hispanics: o Only Schenectady County met the 2019-2024 Prevention Agenda objective, in 2018. o Albany, Rensselaer, and Columbia counties had the highest rate ratios in the Capital Region. o In New York State, the ratio of rates increased with age.
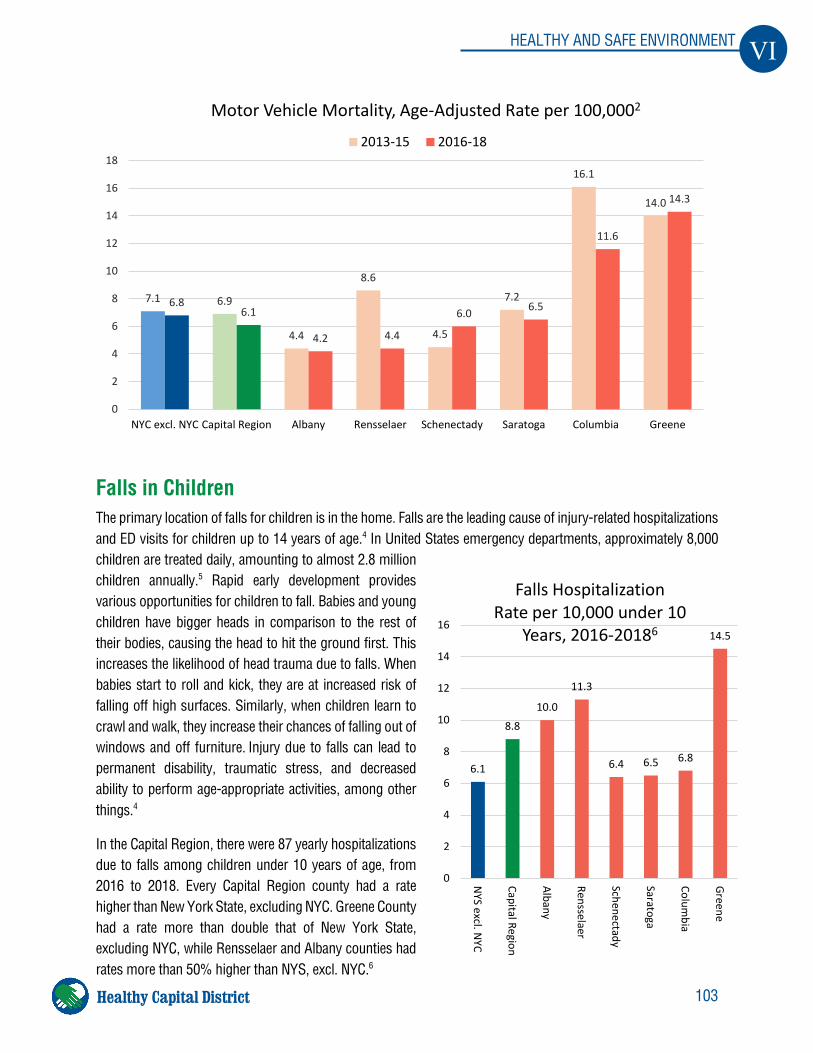
103
VI HEALTHY AND SAFE ENVIRONMENT
Healthy Capital District
Falls in Children The primary location of falls for children is in the home. Falls are the leading cause of injury-related hospitalizations and ED visits for children up to 14 years of age.4 In United States emergency departments, approximately 8,000 children are treated daily, amounting to almost 2.8 million children annually.5 Rapid early development provides various opportunities for children to fall. Babies and young children have bigger heads in comparison to the rest of their bodies, causing the head to hit the ground first. This increases the likelihood of head trauma due to falls. When babies start to roll and kick, they are at increased risk of falling off high surfaces. Similarly, when children learn to crawl and walk, they increase their chances of falling out of windows and off furniture. Injury due to falls can lead to permanent disability, traumatic stress, and decreased ability to perform age-appropriate activities, among other things.4
In the Capital Region, there were 87 yearly hospitalizations due to falls among children under 10 years of age, from 2016 to 2018. Every Capital Region county had a rate higher than New York State, excluding NYC. Greene County had a rate more than double that of New York State, excluding NYC, while Rensselaer and Albany counties had rates more than 50% higher than NYS, excl. NYC.6
7.1 6.9
4.4
8.6
4.5
7.2
16.1
14.0
6.86.1
4.2 4.4
6.0 6.5
11.6
14.3
0
2
4
6
8
10
12
14
16
18
NYC excl. NYC Capital Region Albany Rensselaer Schenectady Saratoga Columbia Greene
Motor Vehicle Mortality, Age-Adjusted Rate per 100,0002
2013-15 2016-18
6.1
8.8
10.0
11.3
6.4 6.5 6.8
14.5
0
2
4
6
8
10
12
14
16
NYS excl. N
YC
Capital Region
Albany
Rensselaer
Schenectady
Saratoga
Columbia
Greene
Falls Hospitalization Rate per 10,000 under 10
Years, 2016-20186
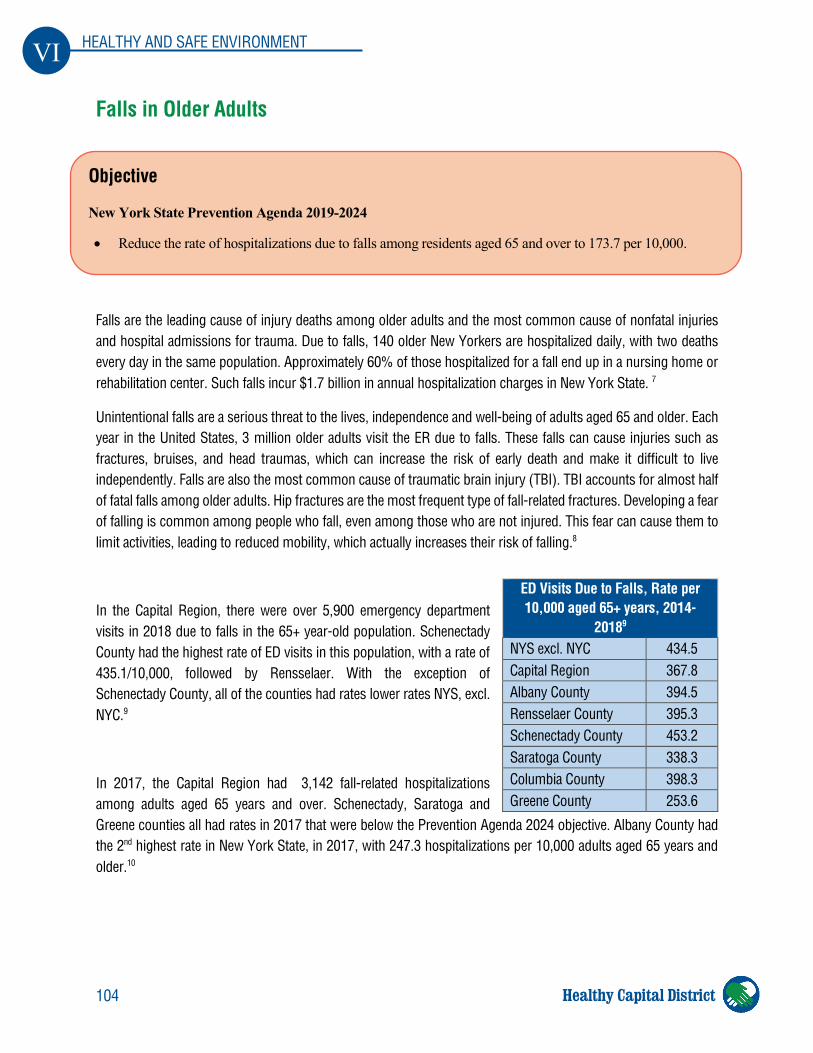
104
VI HEALTHY AND SAFE ENVIRONMENT
Healthy Capital District
Falls in Older Adults
Falls are the leading cause of injury deaths among older adults and the most common cause of nonfatal injuries and hospital admissions for trauma. Due to falls, 140 older New Yorkers are hospitalized daily, with two deaths every day in the same population. Approximately 60% of those hospitalized for a fall end up in a nursing home or rehabilitation center. Such falls incur $1.7 billion in annual hospitalization charges in New York State. 7
Unintentional falls are a serious threat to the lives, independence and well-being of adults aged 65 and older. Each year in the United States, 3 million older adults visit the ER due to falls. These falls can cause injuries such as fractures, bruises, and head traumas, which can increase the risk of early death and make it difficult to live independently. Falls are also the most common cause of traumatic brain injury (TBI). TBI accounts for almost half of fatal falls among older adults. Hip fractures are the most frequent type of fall-related fractures. Developing a fear of falling is common among people who fall, even among those who are not injured. This fear can cause them to limit activities, leading to reduced mobility, which actually increases their risk of falling.8
In the Capital Region, there were over 5,900 emergency department visits in 2018 due to falls in the 65+ year-old population. Schenectady County had the highest rate of ED visits in this population, with a rate of 435.1/10,000, followed by Rensselaer. With the exception of Schenectady County, all of the counties had rates lower rates NYS, excl. NYC.9
In 2017, the Capital Region had 3,142 fall-related hospitalizations among adults aged 65 years and over. Schenectady, Saratoga and Greene counties all had rates in 2017 that were below the Prevention Agenda 2024 objective. Albany County had the 2nd highest rate in New York State, in 2017, with 247.3 hospitalizations per 10,000 adults aged 65 years and older.10
ED Visits Due to Falls, Rate per 10,000 aged 65+ years, 2014-
20189
NYS excl. NYC 434.5 Capital Region 367.8 Albany County 394.5 Rensselaer County 395.3 Schenectady County 453.2 Saratoga County 338.3 Columbia County 398.3 Greene County 253.6
Objective
New York State Prevention Agenda 2019-2024
• Reduce the rate of hospitalizations due to falls among residents aged 65 and over to 173.7 per 10,000.
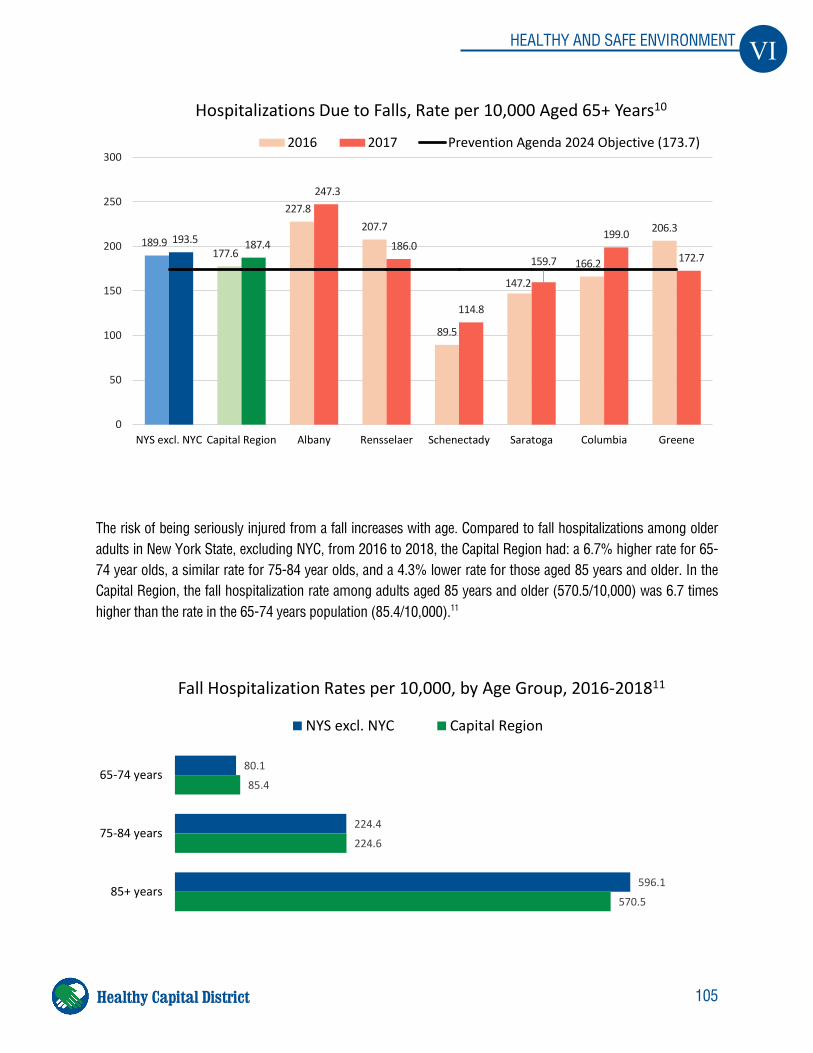
105
VI HEALTHY AND SAFE ENVIRONMENT
Healthy Capital District
The risk of being seriously injured from a fall increases with age. Compared to fall hospitalizations among older adults in New York State, excluding NYC, from 2016 to 2018, the Capital Region had: a 6.7% higher rate for 65-74 year olds, a similar rate for 75-84 year olds, and a 4.3% lower rate for those aged 85 years and older. In the Capital Region, the fall hospitalization rate among adults aged 85 years and older (570.5/10,000) was 6.7 times higher than the rate in the 65-74 years population (85.4/10,000).11
189.9177.6
227.8207.7
89.5
147.2
166.2
206.3193.5 187.4
247.3
186.0
114.8
159.7
199.0
172.7
0
50
100
150
200
250
300
NYS excl. NYC Capital Region Albany Rensselaer Schenectady Saratoga Columbia Greene
Hospitalizations Due to Falls, Rate per 10,000 Aged 65+ Years10
2016 2017 Prevention Agenda 2024 Objective (173.7)
80.1
224.4
596.1
85.4
224.6
570.5
65-74 years
75-84 years
85+ years
Fall Hospitalization Rates per 10,000, by Age Group, 2016-201811
NYS excl. NYC Capital Region
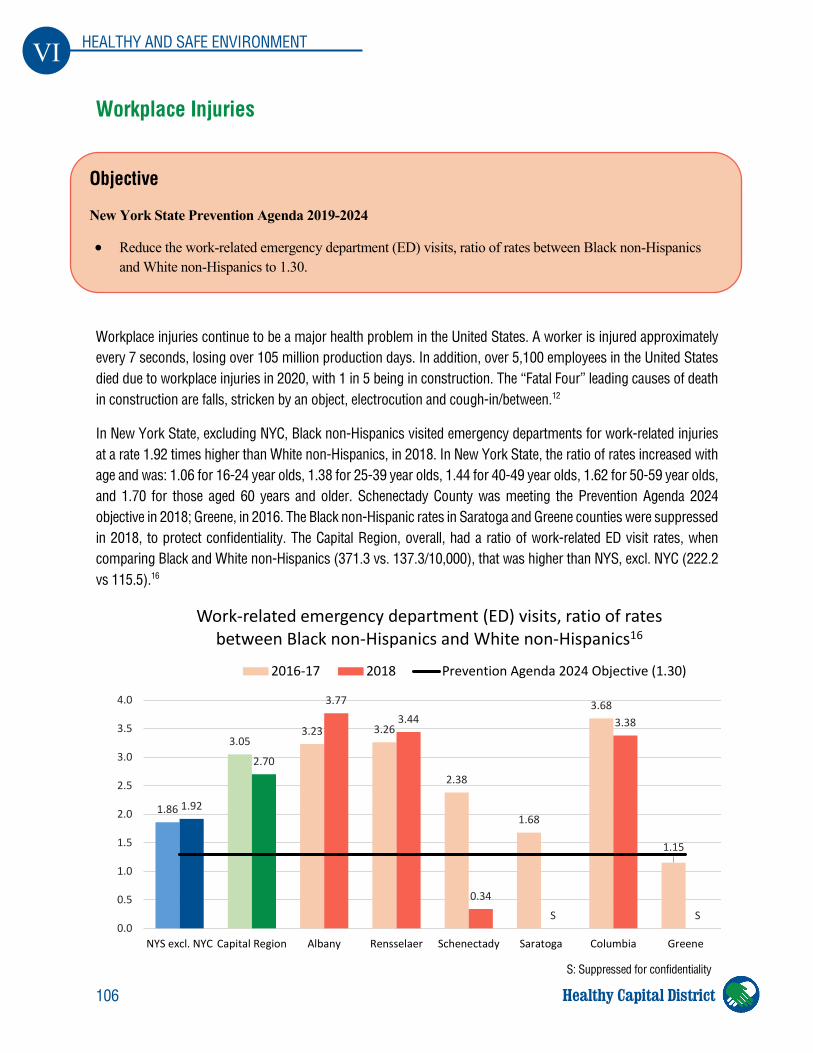
106
VI HEALTHY AND SAFE ENVIRONMENT
Healthy Capital District
Workplace Injuries
Workplace injuries continue to be a major health problem in the United States. A worker is injured approximately every 7 seconds, losing over 105 million production days. In addition, over 5,100 employees in the United States died due to workplace injuries in 2020, with 1 in 5 being in construction. The “Fatal Four” leading causes of death in construction are falls, stricken by an object, electrocution and cough-in/between.12
In New York State, excluding NYC, Black non-Hispanics visited emergency departments for work-related injuries at a rate 1.92 times higher than White non-Hispanics, in 2018. In New York State, the ratio of rates increased with age and was: 1.06 for 16-24 year olds, 1.38 for 25-39 year olds, 1.44 for 40-49 year olds, 1.62 for 50-59 year olds, and 1.70 for those aged 60 years and older. Schenectady County was meeting the Prevention Agenda 2024 objective in 2018; Greene, in 2016. The Black non-Hispanic rates in Saratoga and Greene counties were suppressed in 2018, to protect confidentiality. The Capital Region, overall, had a ratio of work-related ED visit rates, when comparing Black and White non-Hispanics (371.3 vs. 137.3/10,000), that was higher than NYS, excl. NYC (222.2 vs 115.5).16
1.86
3.053.23 3.26
2.38
1.68
3.68
1.15
1.92
2.70
3.773.44
0.34
S
3.38
S0.0
0.5
1.0
1.5
2.0
2.5
3.0
3.5
4.0
NYS excl. NYC Capital Region Albany Rensselaer Schenectady Saratoga Columbia Greene
Work-related emergency department (ED) visits, ratio of rates between Black non-Hispanics and White non-Hispanics16
2016-17 2018 Prevention Agenda 2024 Objective (1.30)
Objective
New York State Prevention Agenda 2019-2024
• Reduce the work-related emergency department (ED) visits, ratio of rates between Black non-Hispanics and White non-Hispanics to 1.30.
S: Suppressed for confidentiality
107
VI HEALTHY AND SAFE ENVIRONMENT
Healthy Capital District
Occupational fatalities and losses arising from workplace disabilities also cause tremendous personal and economic costs. In the Capital Region, from 2015 to 2017, 600 yearly work-related hospitalizations occurred in those employed aged 16 years and older. From 2016 to 2018, there were 15 fatalities per year due to work-related injuries in the Capital Region, up from 13 fatalities per year from 2013 to 2015.12
References 1. Centers for Disease Control and Prevention. Motor Vehicle Carsh Injuries
https://www.cdc.gov/vitalsigns/crash-injuries/index.html 2. New York State Department of Health. Age-adjusted motor vehicle injury mortality rate per 100,000.
https://webbi1.health.ny.gov/SASStoredProcess/guest?_program=/EBI/PHIG/apps/chir_dashboard/chir_dashboard&p=it&ind_id=Hd28a
3. Common Ground Health. Statewide Planning and Research Cooperative System (SPARCS) data portal. Motor Vehicle Accident ED visits and hospitalizations, 2016-2018.
4. New York State Department of Health. Childhood Fall Prevention Toolkit. https://www.health.ny.gov/prevention/injury_prevention/children/toolkits/childhood_fall/
5. Centers for Disease Control and Prevention. Protect the Ones You Love: Child Injuries are Preventable. https://www.cdc.gov/safechild/nap/index.html
6. New York State Department of Health. Falls hospitalization rate per 10,000 - Aged <10 years. https://webbi1.health.ny.gov/SASStoredProcess/guest?_program=/EBI/PHIG/apps/chir_dashboard/chir_dashboard&p=it&ind_id=Hh25
7. New York State Department of Health. Falls in Older Adults, New York State. http://www.health.ny.gov/prevention/injury_prevention/falls_in_older_adults_nys.htm
8. Centers for Disease Control and Prevention. Home and Recreational Safety: Important Facts about Falls. http://www.cdc.gov/homeandrecreationalsafety/falls/adultfalls.html
9. Common Ground Health. Statewide Planning and Research Cooperative System (SPARCS) data portal. Unintentional Falls, ED Visits, ages 65+, 2016-2018.
10. New York State Department of Health. Rate of Hospitalizations due to falls per 10,000-ages 65+. https://webbi1.health.ny.gov/SASStoredProcess/guest?_program=/EBI/PHIG/apps/dashboard/pa_dashboard&p=it&ind_id=pa5_0
11. New York State Department of Health. New York State Community Health Indicator Reports (CHIRS): Injury Indicators. https://webbi1.health.ny.gov/SASStoredProcess/guest?_program=%2FEBI%2FPHIG%2Fapps%2Fchir_dashboard%2Fchir_dashboard&p=sh&stop=8
12. National Safety Council. Work Injury Overview. https://injuryfacts.nsc.org/work/work-overview/work-safety-introduction/
13. New York State Department of Health. New York State Community Health Indicator Reports (CHIRS): Occupational Health Indicators. https://webbi1.health.ny.gov/SASStoredProcess/guest?_program=%2FEBI%2FPHIG%2Fapps%2Fchir_dashboard%2Fchir_dashboard&p=sh&stop=11
14. New York State Department of Health. Work-related emergency department (ED) visits, ratio of rates between Black non-Hispanics and White non-Hispanics, 2018. https://webbi1.health.ny.gov/SASStoredProcess/guest?_program=/EBI/PHIG/apps/dashboard/pa_dashboard&p=it&ind_id=pa8_0
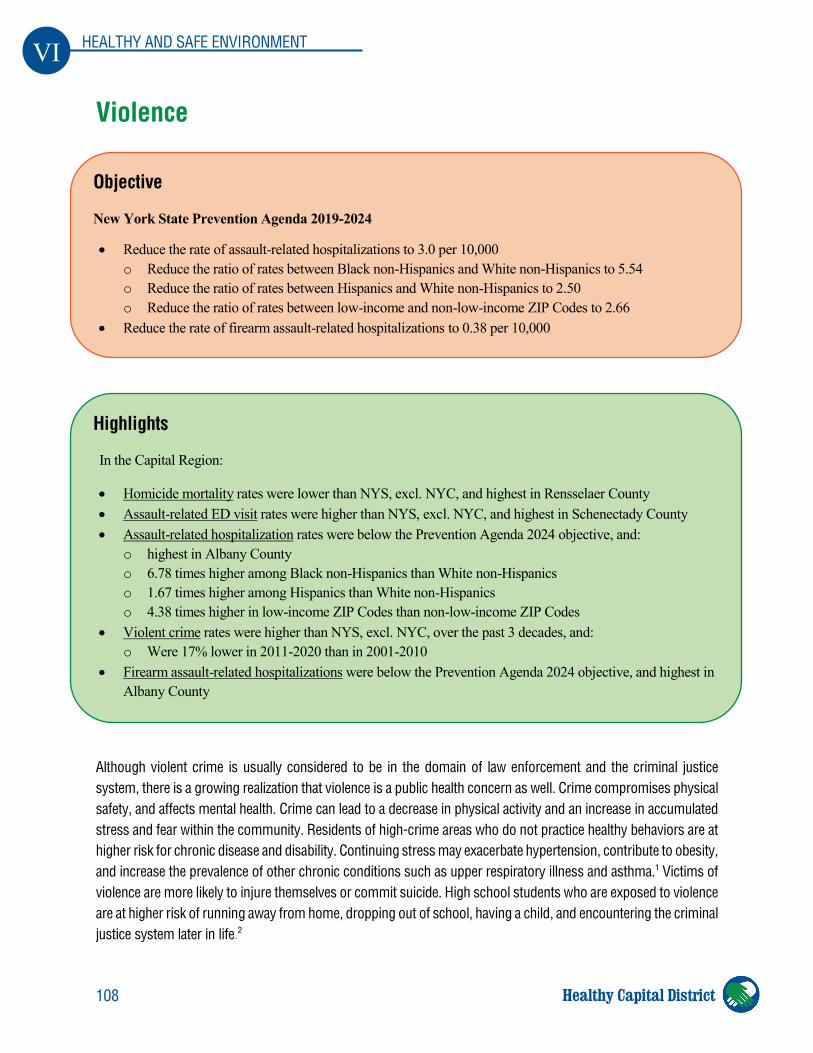
108
VI HEALTHY AND SAFE ENVIRONMENT
Healthy Capital District
Violence
Although violent crime is usually considered to be in the domain of law enforcement and the criminal justice system, there is a growing realization that violence is a public health concern as well. Crime compromises physical safety, and affects mental health. Crime can lead to a decrease in physical activity and an increase in accumulated stress and fear within the community. Residents of high-crime areas who do not practice healthy behaviors are at higher risk for chronic disease and disability. Continuing stress may exacerbate hypertension, contribute to obesity, and increase the prevalence of other chronic conditions such as upper respiratory illness and asthma.1 Victims of violence are more likely to injure themselves or commit suicide. High school students who are exposed to violence are at higher risk of running away from home, dropping out of school, having a child, and encountering the criminal justice system later in life.2
Objective
New York State Prevention Agenda 2019-2024
• Reduce the rate of assault-related hospitalizations to 3.0 per 10,000 o Reduce the ratio of rates between Black non-Hispanics and White non-Hispanics to 5.54 o Reduce the ratio of rates between Hispanics and White non-Hispanics to 2.50 o Reduce the ratio of rates between low-income and non-low-income ZIP Codes to 2.66
• Reduce the rate of firearm assault-related hospitalizations to 0.38 per 10,000
Highlights
In the Capital Region:
• Homicide mortality rates were lower than NYS, excl. NYC, and highest in Rensselaer County • Assault-related ED visit rates were higher than NYS, excl. NYC, and highest in Schenectady County • Assault-related hospitalization rates were below the Prevention Agenda 2024 objective, and:
o highest in Albany County o 6.78 times higher among Black non-Hispanics than White non-Hispanics o 1.67 times higher among Hispanics than White non-Hispanics o 4.38 times higher in low-income ZIP Codes than non-low-income ZIP Codes
• Violent crime rates were higher than NYS, excl. NYC, over the past 3 decades, and: o Were 17% lower in 2011-2020 than in 2001-2010
• Firearm assault-related hospitalizations were below the Prevention Agenda 2024 objective, and highest in Albany County
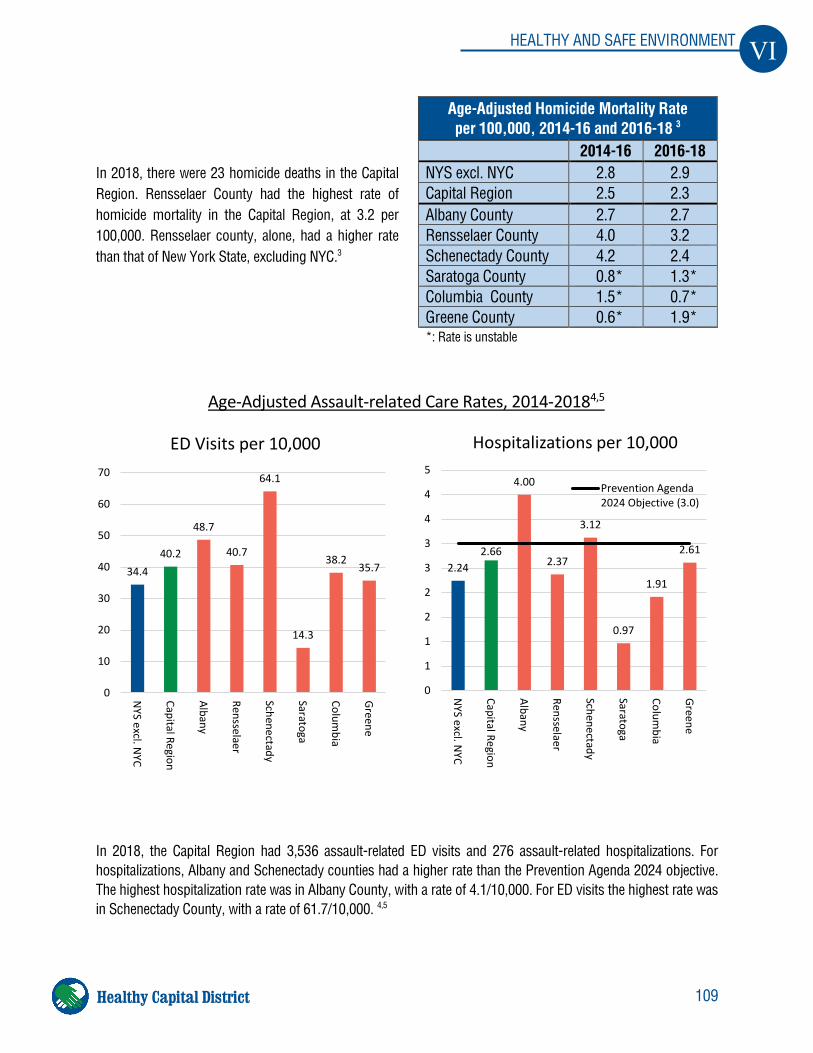
109
VI HEALTHY AND SAFE ENVIRONMENT
Healthy Capital District
In 2018, there were 23 homicide deaths in the Capital Region. Rensselaer County had the highest rate of homicide mortality in the Capital Region, at 3.2 per 100,000. Rensselaer county, alone, had a higher rate than that of New York State, excluding NYC.3
In 2018, the Capital Region had 3,536 assault-related ED visits and 276 assault-related hospitalizations. For hospitalizations, Albany and Schenectady counties had a higher rate than the Prevention Agenda 2024 objective. The highest hospitalization rate was in Albany County, with a rate of 4.1/10,000. For ED visits the highest rate was in Schenectady County, with a rate of 61.7/10,000. 4,5
Age-Adjusted Homicide Mortality Rate per 100,000, 2014-16 and 2016-18 3
2014-16 2016-18 NYS excl. NYC 2.8 2.9 Capital Region 2.5 2.3 Albany County 2.7 2.7 Rensselaer County 4.0 3.2 Schenectady County 4.2 2.4 Saratoga County 0.8* 1.3* Columbia County 1.5* 0.7* Greene County 0.6* 1.9* *: Rate is unstable
34.440.2
48.7
40.7
64.1
14.3
38.235.7
0
10
20
30
40
50
60
70
NYS excl. N
YC
Capital Region
Albany
Rensselaer
Schenectady
Saratoga
Columbia
GreeneED Visits per 10,000
2.242.66
4.00
2.37
3.12
0.97
1.91
2.61
0
1
1
2
2
3
3
4
4
5
NYS excl. N
YC
Capital Region
Albany
Rensselaer
Schenectady
Saratoga
Columbia
Greene
Hospitalizations per 10,000
Prevention Agenda2024 Objective (3.0)
Age-Adjusted Assault-related Care Rates, 2014-20184,5
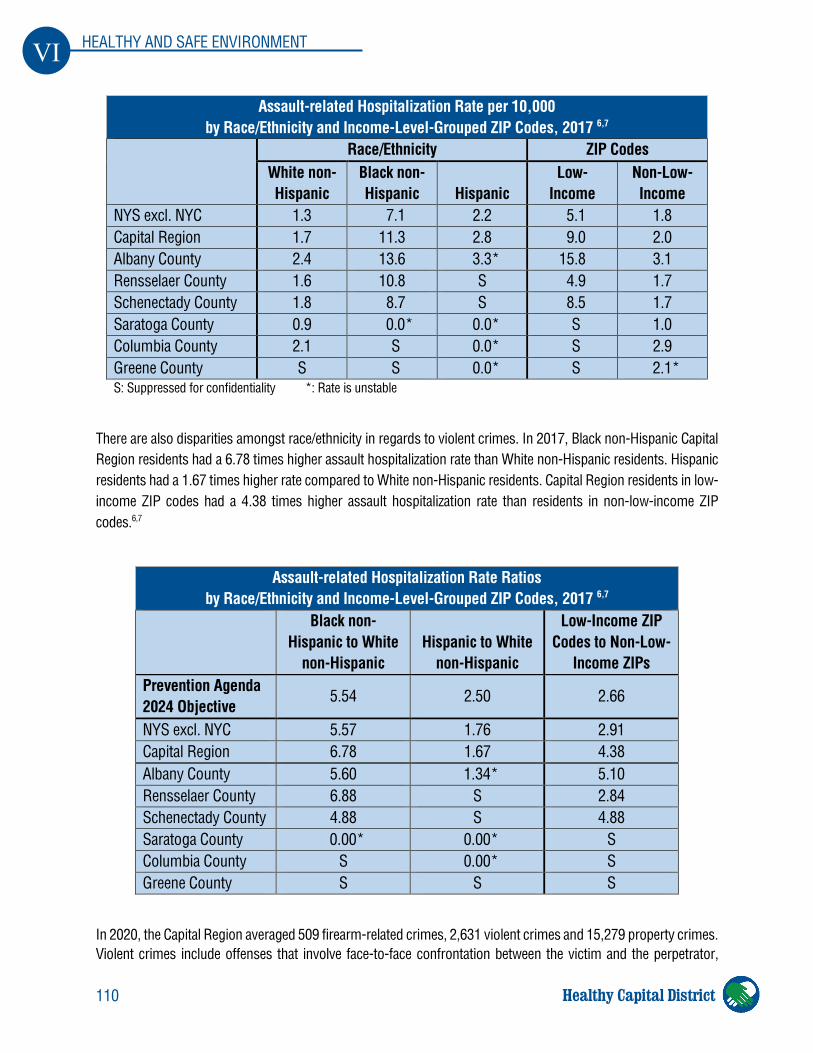
110
VI HEALTHY AND SAFE ENVIRONMENT
Healthy Capital District
There are also disparities amongst race/ethnicity in regards to violent crimes. In 2017, Black non-Hispanic Capital Region residents had a 6.78 times higher assault hospitalization rate than White non-Hispanic residents. Hispanic residents had a 1.67 times higher rate compared to White non-Hispanic residents. Capital Region residents in low-income ZIP codes had a 4.38 times higher assault hospitalization rate than residents in non-low-income ZIP codes.6,7
In 2020, the Capital Region averaged 509 firearm-related crimes, 2,631 violent crimes and 15,279 property crimes. Violent crimes include offenses that involve face-to-face confrontation between the victim and the perpetrator,
Assault-related Hospitalization Rate per 10,000 by Race/Ethnicity and Income-Level-Grouped ZIP Codes, 2017 6,7
Race/Ethnicity ZIP Codes White non-Hispanic
Black non-Hispanic Hispanic
Low-Income
Non-Low-Income
NYS excl. NYC 1.3 7.1 2.2 5.1 1.8 Capital Region 1.7 11.3 2.8 9.0 2.0 Albany County 2.4 13.6 3.3* 15.8 3.1 Rensselaer County 1.6 10.8 S 4.9 1.7 Schenectady County 1.8 8.7 S 8.5 1.7 Saratoga County 0.9 0.0* 0.0* S 1.0 Columbia County 2.1 S 0.0* S 2.9 Greene County S S 0.0* S 2.1* S: Suppressed for confidentiality *: Rate is unstable
Assault-related Hospitalization Rate Ratios by Race/Ethnicity and Income-Level-Grouped ZIP Codes, 2017 6,7
Black non-Hispanic to White
non-Hispanic Hispanic to White
non-Hispanic
Low-Income ZIP Codes to Non-Low-
Income ZIPs Prevention Agenda 2024 Objective
5.54 2.50 2.66
NYS excl. NYC 5.57 1.76 2.91 Capital Region 6.78 1.67 4.38 Albany County 5.60 1.34* 5.10 Rensselaer County 6.88 S 2.84 Schenectady County 4.88 S 4.88 Saratoga County 0.00* 0.00* S Columbia County S 0.00* S Greene County S S S
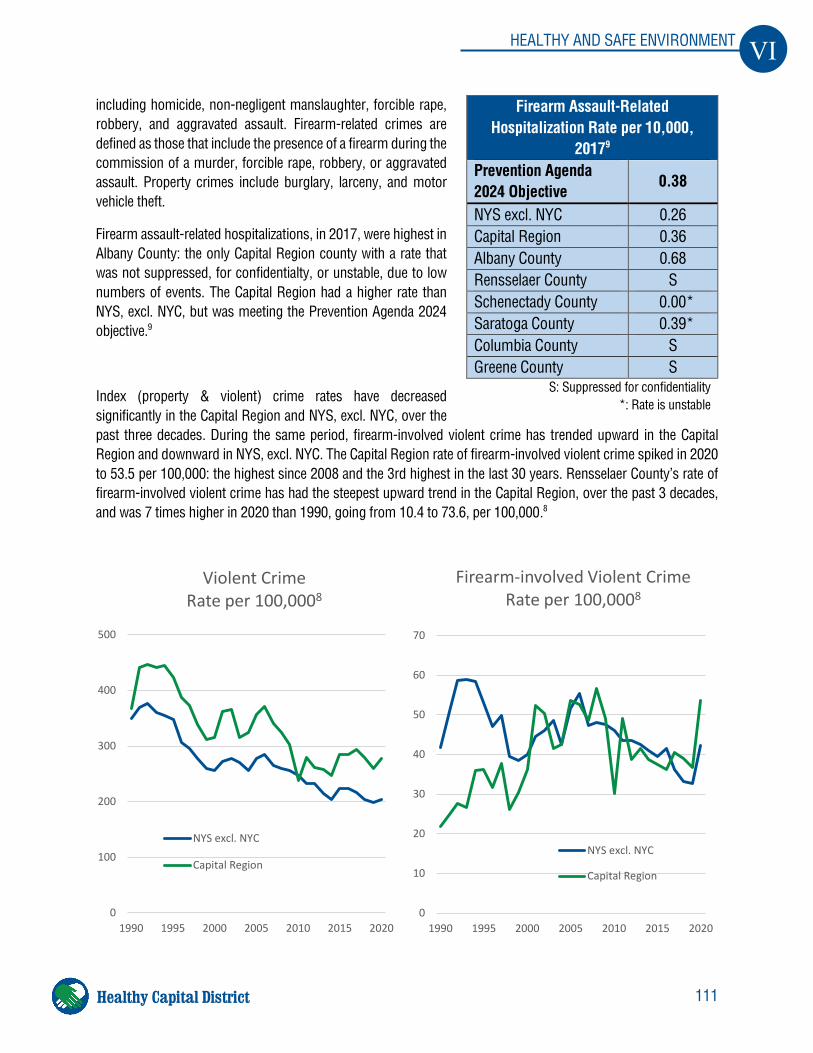
111
VI HEALTHY AND SAFE ENVIRONMENT
Healthy Capital District
including homicide, non-negligent manslaughter, forcible rape, robbery, and aggravated assault. Firearm-related crimes are defined as those that include the presence of a firearm during the commission of a murder, forcible rape, robbery, or aggravated assault. Property crimes include burglary, larceny, and motor vehicle theft.
Firearm assault-related hospitalizations, in 2017, were highest in Albany County: the only Capital Region county with a rate that was not suppressed, for confidentialty, or unstable, due to low numbers of events. The Capital Region had a higher rate than NYS, excl. NYC, but was meeting the Prevention Agenda 2024 objective.9
Index (property & violent) crime rates have decreased significantly in the Capital Region and NYS, excl. NYC, over the past three decades. During the same period, firearm-involved violent crime has trended upward in the Capital Region and downward in NYS, excl. NYC. The Capital Region rate of firearm-involved violent crime spiked in 2020 to 53.5 per 100,000: the highest since 2008 and the 3rd highest in the last 30 years. Rensselaer County’s rate of firearm-involved violent crime has had the steepest upward trend in the Capital Region, over the past 3 decades, and was 7 times higher in 2020 than 1990, going from 10.4 to 73.6, per 100,000.8
Firearm Assault-Related Hospitalization Rate per 10,000,
20179 Prevention Agenda 2024 Objective
0.38
NYS excl. NYC 0.26 Capital Region 0.36 Albany County 0.68 Rensselaer County S Schenectady County 0.00* Saratoga County 0.39* Columbia County S Greene County S
S: Suppressed for confidentiality *: Rate is unstable
0
100
200
300
400
500
1990 1995 2000 2005 2010 2015 2020
Violent Crime Rate per 100,0008
NYS excl. NYC
Capital Region
0
10
20
30
40
50
60
70
1990 1995 2000 2005 2010 2015 2020
Firearm-involved Violent Crime Rate per 100,0008
NYS excl. NYC
Capital Region
112
VI HEALTHY AND SAFE ENVIRONMENT
Healthy Capital District
References 1. Violent Crime Rate, County Health Rankings & Roadmaps.
http://www.countyhealthrankings.org/app/new-york/2015/measure/factors/43/description 2. Exposure to Violence in Adolescence and Precocious Role Exits
http://link.springer.com/article/10.1007%2Fs10964-008-9343-2?LI=true 3. Homicide mortality rate per 100,000, 2016-2018, Community Health Indicator Reports, New York State
Department of Health. https://webbi1.health.ny.gov/SASStoredProcess/guest?_program=/EBI/PHIG/apps/chir_dashboard/chir_dashboard&p=it&ind_id=Hd26
4. Assault-related ED visits per 10,000, Statewide Planning and Research Cooperative System, Common Ground Health SPARCS data portal.
5. Assault-related Hospitalizations per 10,000, New York State Department of Health. https://webbi1.health.ny.gov/SASStoredProcess/guest?_program=/EBI/PHIG/apps/dashboard/pa_dashboard&p=it&ind_id=pa6_0
6. Ratio of Black non-Hispanics to White non-Hispanics for assault-related hospitalization rate, 2016, New York State Department of Health. https://webbi1.health.ny.gov/SASStoredProcess/guest?_program=/EBI/PHIG/apps/dashboard/pa_dashboard&p=it&ind_id=pa6.1_0
7. Ratio of Hispanics to White non-Hispanics for assault-related hospitalization rate, 2014-2016, New York State Department of Health. https://webbi1.health.ny.gov/SASStoredProcess/guest?_program=/EBI/PHIG/apps/dashboard/pa_dashboard&p=it&ind_id=pa6.2_0
8. Division of Criminal Justice Services. County Crime Rates. https://www.criminaljustice.ny.gov/crimnet/ojsa/countycrimestats.htm
9. Firearm assault-related hospitalizations, rate per 10,000 population, 2017. New York State Prevention Agenda Dashboard. New York State Department of Health. https://webbi1.health.ny.gov/SASStoredProcess/guest?_program=/EBI/PHIG/apps/dashboard/pa_dashboard&p=it&ind_id=pa7_0
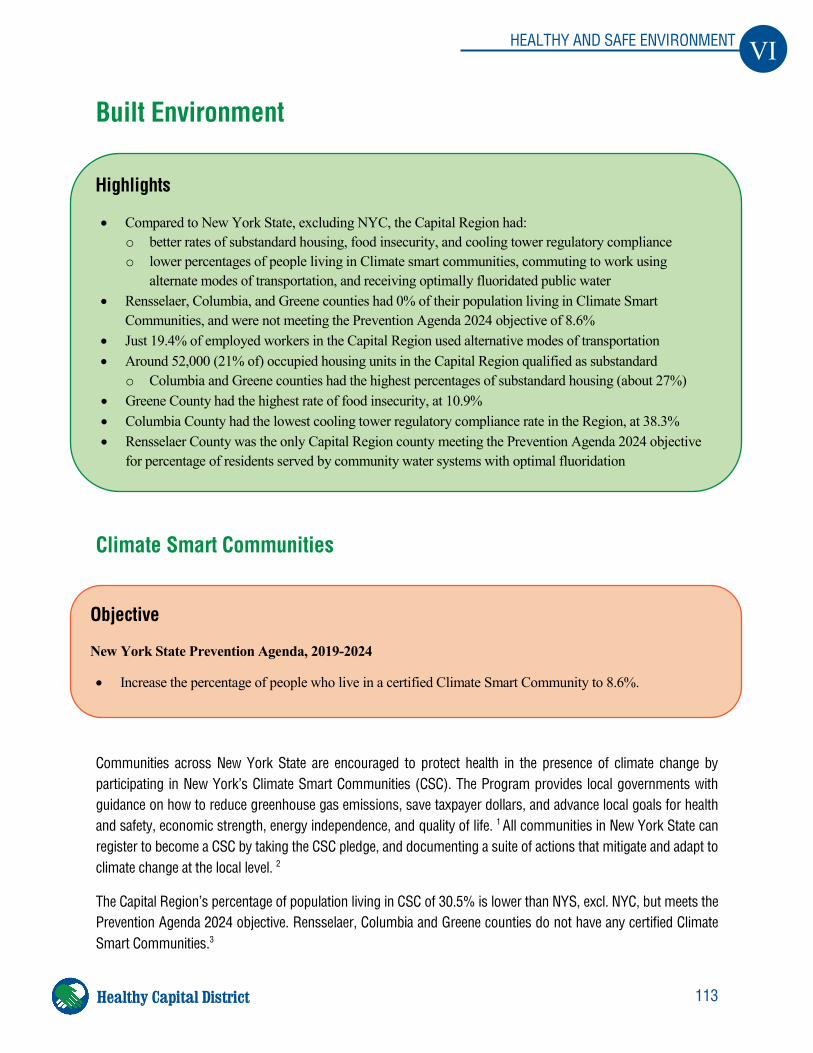
113
VI HEALTHY AND SAFE ENVIRONMENT
Healthy Capital District
Built Environment
Climate Smart Communities
Communities across New York State are encouraged to protect health in the presence of climate change by participating in New York’s Climate Smart Communities (CSC). The Program provides local governments with guidance on how to reduce greenhouse gas emissions, save taxpayer dollars, and advance local goals for health and safety, economic strength, energy independence, and quality of life. 1 All communities in New York State can register to become a CSC by taking the CSC pledge, and documenting a suite of actions that mitigate and adapt to climate change at the local level. 2
The Capital Region’s percentage of population living in CSC of 30.5% is lower than NYS, excl. NYC, but meets the Prevention Agenda 2024 objective. Rensselaer, Columbia and Greene counties do not have any certified Climate Smart Communities.3
Highlights
• Compared to New York State, excluding NYC, the Capital Region had: o better rates of substandard housing, food insecurity, and cooling tower regulatory compliance o lower percentages of people living in Climate smart communities, commuting to work using
alternate modes of transportation, and receiving optimally fluoridated public water • Rensselaer, Columbia, and Greene counties had 0% of their population living in Climate Smart
Communities, and were not meeting the Prevention Agenda 2024 objective of 8.6% • Just 19.4% of employed workers in the Capital Region used alternative modes of transportation • Around 52,000 (21% of) occupied housing units in the Capital Region qualified as substandard
o Columbia and Greene counties had the highest percentages of substandard housing (about 27%) • Greene County had the highest rate of food insecurity, at 10.9% • Columbia County had the lowest cooling tower regulatory compliance rate in the Region, at 38.3% • Rensselaer County was the only Capital Region county meeting the Prevention Agenda 2024 objective
for percentage of residents served by community water systems with optimal fluoridation
Objective
New York State Prevention Agenda, 2019-2024
• Increase the percentage of people who live in a certified Climate Smart Community to 8.6%.
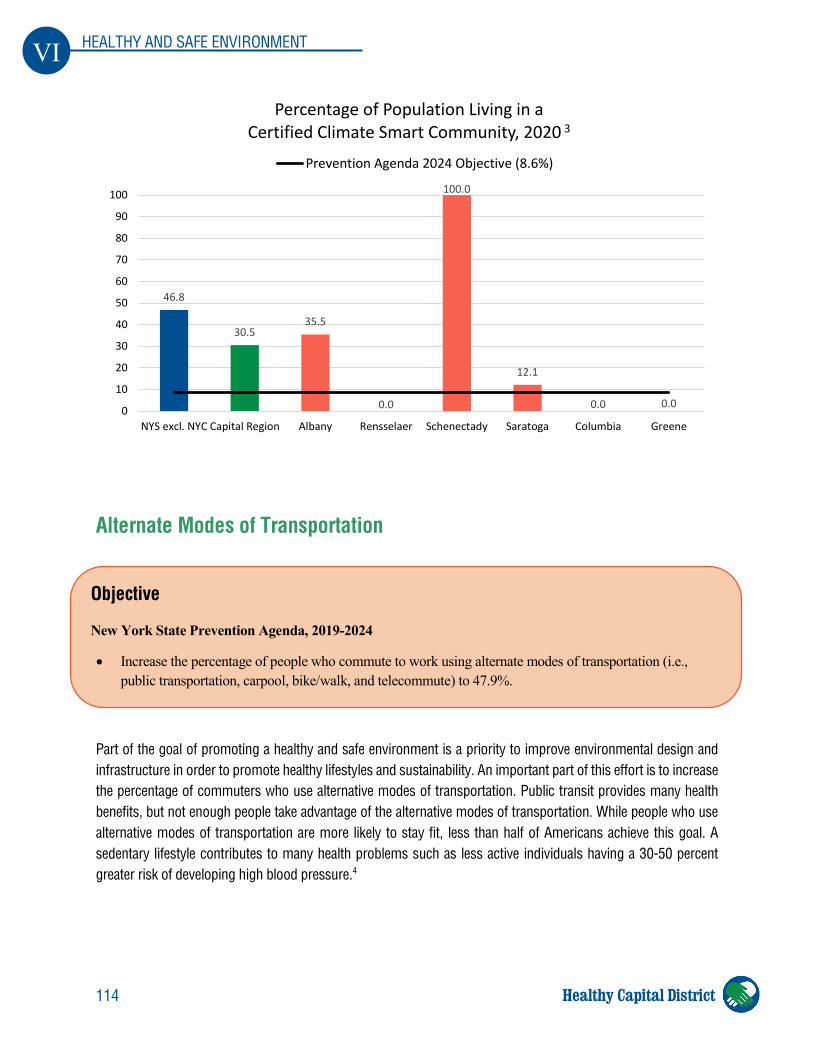
114
VI HEALTHY AND SAFE ENVIRONMENT
Healthy Capital District
Alternate Modes of Transportation
Part of the goal of promoting a healthy and safe environment is a priority to improve environmental design and infrastructure in order to promote healthy lifestyles and sustainability. An important part of this effort is to increase the percentage of commuters who use alternative modes of transportation. Public transit provides many health benefits, but not enough people take advantage of the alternative modes of transportation. While people who use alternative modes of transportation are more likely to stay fit, less than half of Americans achieve this goal. A sedentary lifestyle contributes to many health problems such as less active individuals having a 30-50 percent greater risk of developing high blood pressure.4
46.8
30.535.5
0.0
100.0
12.1
0.0 0.00
10
20
30
40
50
60
70
80
90
100
NYS excl. NYC Capital Region Albany Rensselaer Schenectady Saratoga Columbia Greene
Percentage of Population Living in a Certified Climate Smart Community, 2020 3
Prevention Agenda 2024 Objective (8.6%)
Objective
New York State Prevention Agenda, 2019-2024
• Increase the percentage of people who commute to work using alternate modes of transportation (i.e., public transportation, carpool, bike/walk, and telecommute) to 47.9%.
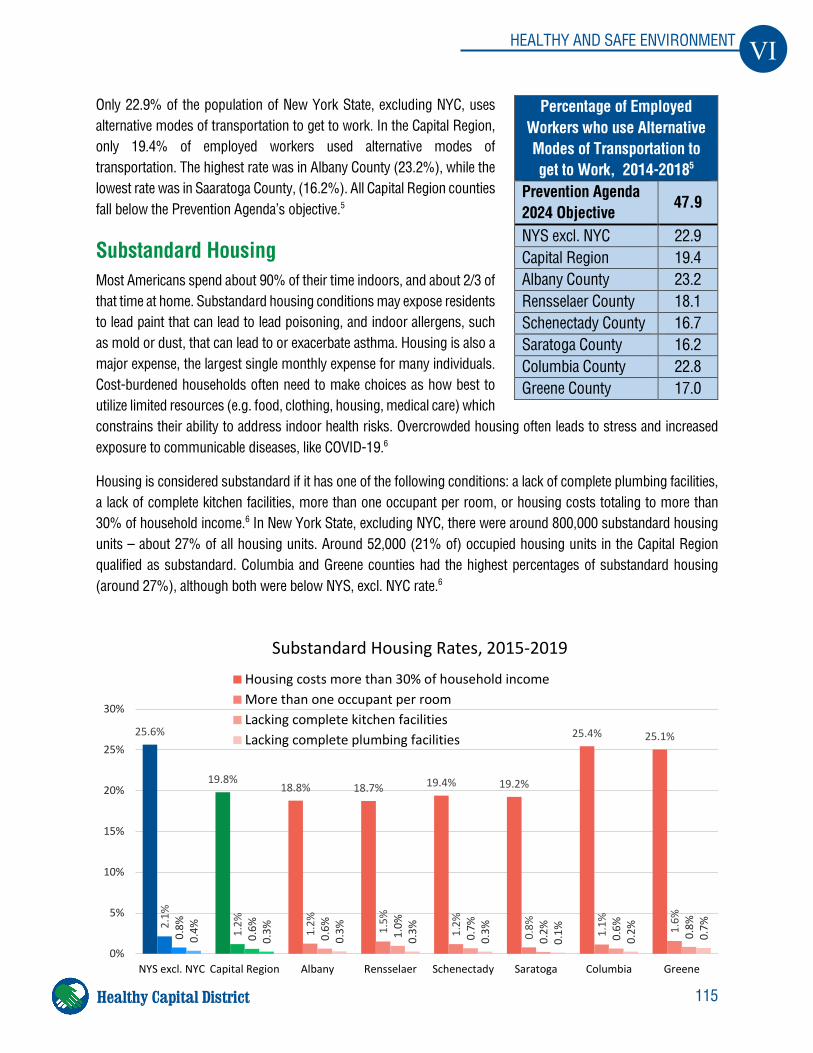
115
VI HEALTHY AND SAFE ENVIRONMENT
Healthy Capital District
Only 22.9% of the population of New York State, excluding NYC, uses alternative modes of transportation to get to work. In the Capital Region, only 19.4% of employed workers used alternative modes of transportation. The highest rate was in Albany County (23.2%), while the lowest rate was in Saaratoga County, (16.2%). All Capital Region counties fall below the Prevention Agenda’s objective.5
Substandard Housing Most Americans spend about 90% of their time indoors, and about 2/3 of that time at home. Substandard housing conditions may expose residents to lead paint that can lead to lead poisoning, and indoor allergens, such as mold or dust, that can lead to or exacerbate asthma. Housing is also a major expense, the largest single monthly expense for many individuals. Cost-burdened households often need to make choices as how best to utilize limited resources (e.g. food, clothing, housing, medical care) which constrains their ability to address indoor health risks. Overcrowded housing often leads to stress and increased exposure to communicable diseases, like COVID-19.6
Housing is considered substandard if it has one of the following conditions: a lack of complete plumbing facilities, a lack of complete kitchen facilities, more than one occupant per room, or housing costs totaling to more than 30% of household income.6 In New York State, excluding NYC, there were around 800,000 substandard housing units – about 27% of all housing units. Around 52,000 (21% of) occupied housing units in the Capital Region qualified as substandard. Columbia and Greene counties had the highest percentages of substandard housing (around 27%), although both were below NYS, excl. NYC rate.6
Percentage of Employed Workers who use Alternative Modes of Transportation to get to Work, 2014-20185
Prevention Agenda 2024 Objective
47.9
NYS excl. NYC 22.9 Capital Region 19.4 Albany County 23.2 Rensselaer County 18.1 Schenectady County 16.7 Saratoga County 16.2 Columbia County 22.8 Greene County 17.0
25.6%
19.8%18.8% 18.7% 19.4% 19.2%
25.4% 25.1%
2.1%
1.2%
1.2% 1.5%
1.2%
0.8% 1.1% 1.6%
0.8%
0.6%
0.6% 1.0%
0.7%
0.2% 0.6% 0.8%
0.4%
0.3%
0.3%
0.3%
0.3%
0.1%
0.2% 0.7%
0%
5%
10%
15%
20%
25%
30%
NYS excl. NYC Capital Region Albany Rensselaer Schenectady Saratoga Columbia Greene
Substandard Housing Rates, 2015-2019
Housing costs more than 30% of household incomeMore than one occupant per roomLacking complete kitchen facilitiesLacking complete plumbing facilities
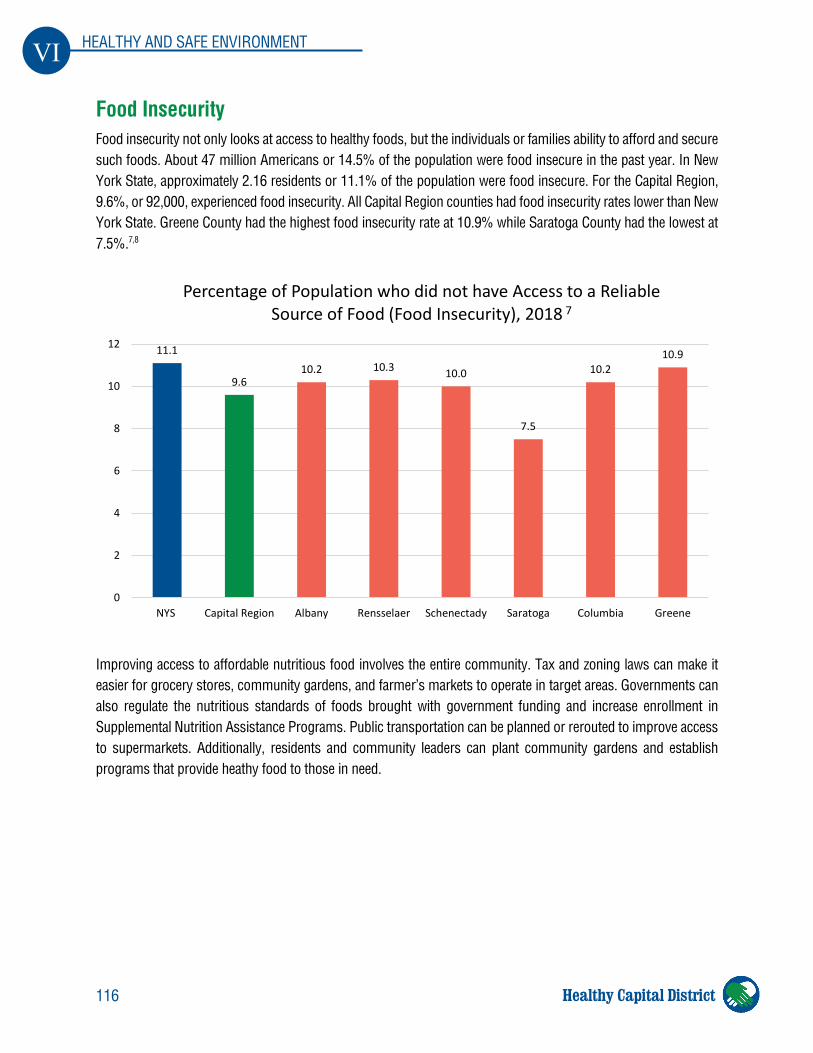
116
VI HEALTHY AND SAFE ENVIRONMENT
Healthy Capital District
Food Insecurity Food insecurity not only looks at access to healthy foods, but the individuals or families ability to afford and secure such foods. About 47 million Americans or 14.5% of the population were food insecure in the past year. In New York State, approximately 2.16 residents or 11.1% of the population were food insecure. For the Capital Region, 9.6%, or 92,000, experienced food insecurity. All Capital Region counties had food insecurity rates lower than New York State. Greene County had the highest food insecurity rate at 10.9% while Saratoga County had the lowest at 7.5%.7,8
Improving access to affordable nutritious food involves the entire community. Tax and zoning laws can make it easier for grocery stores, community gardens, and farmer’s markets to operate in target areas. Governments can also regulate the nutritious standards of foods brought with government funding and increase enrollment in Supplemental Nutrition Assistance Programs. Public transportation can be planned or rerouted to improve access to supermarkets. Additionally, residents and community leaders can plant community gardens and establish programs that provide heathy food to those in need.
NYS excl. NYC
11.1
9.610.2 10.3 10.0
7.5
10.210.9
0
2
4
6
8
10
12
NYS Capital Region Albany Rensselaer Schenectady Saratoga Columbia Greene
Percentage of Population who did not have Access to a Reliable Source of Food (Food Insecurity), 2018 7
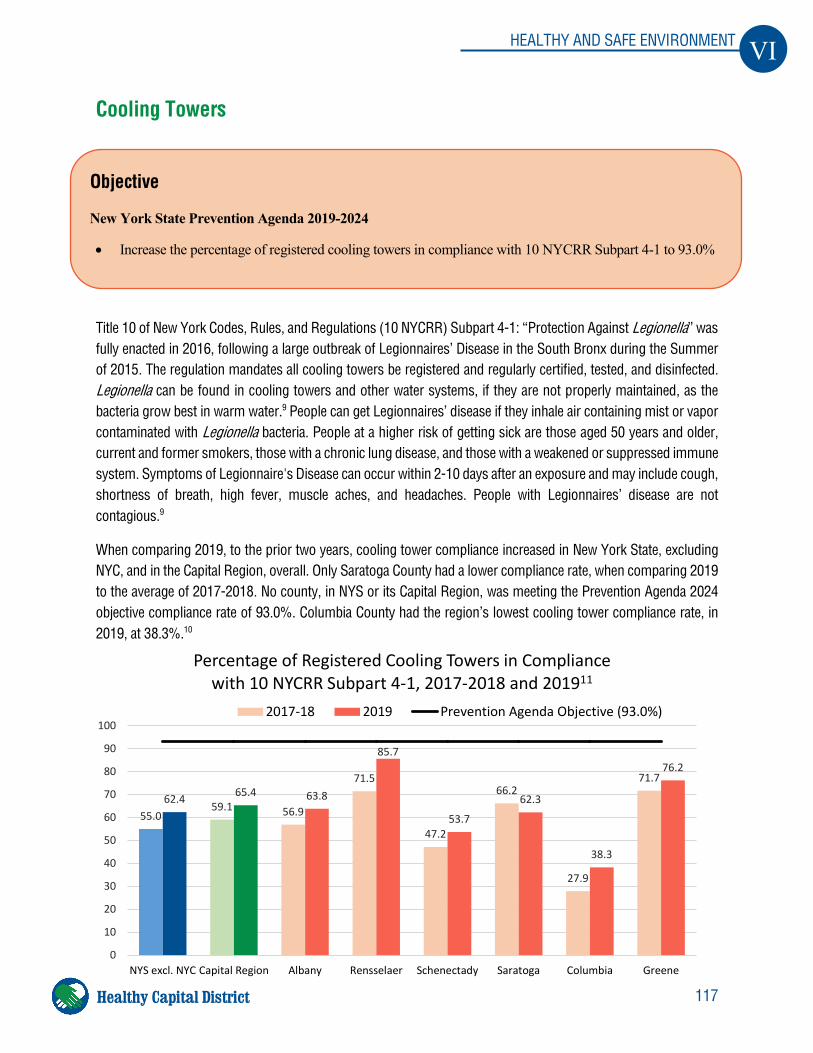
117
VI HEALTHY AND SAFE ENVIRONMENT
Healthy Capital District
Cooling Towers
Title 10 of New York Codes, Rules, and Regulations (10 NYCRR) Subpart 4-1: “Protection Against Legionella” was fully enacted in 2016, following a large outbreak of Legionnaires’ Disease in the South Bronx during the Summer of 2015. The regulation mandates all cooling towers be registered and regularly certified, tested, and disinfected. Legionella can be found in cooling towers and other water systems, if they are not properly maintained, as the bacteria grow best in warm water.9 People can get Legionnaires’ disease if they inhale air containing mist or vapor contaminated with Legionella bacteria. People at a higher risk of getting sick are those aged 50 years and older, current and former smokers, those with a chronic lung disease, and those with a weakened or suppressed immune system. Symptoms of Legionnaire's Disease can occur within 2-10 days after an exposure and may include cough, shortness of breath, high fever, muscle aches, and headaches. People with Legionnaires’ disease are not contagious.9
When comparing 2019, to the prior two years, cooling tower compliance increased in New York State, excluding NYC, and in the Capital Region, overall. Only Saratoga County had a lower compliance rate, when comparing 2019 to the average of 2017-2018. No county, in NYS or its Capital Region, was meeting the Prevention Agenda 2024 objective compliance rate of 93.0%. Columbia County had the region’s lowest cooling tower compliance rate, in 2019, at 38.3%.10
Objective
New York State Prevention Agenda 2019-2024
• Increase the percentage of registered cooling towers in compliance with 10 NYCRR Subpart 4-1 to 93.0%
55.059.1 56.9
71.5
47.2
66.2
27.9
71.7
62.4 65.4 63.8
85.7
53.7
62.3
38.3
76.2
0
10
20
30
40
50
60
70
80
90
100
NYS excl. NYC Capital Region Albany Rensselaer Schenectady Saratoga Columbia Greene
Percentage of Registered Cooling Towers in Compliance with 10 NYCRR Subpart 4-1, 2017-2018 and 201911
2017-18 2019 Prevention Agenda Objective (93.0%)
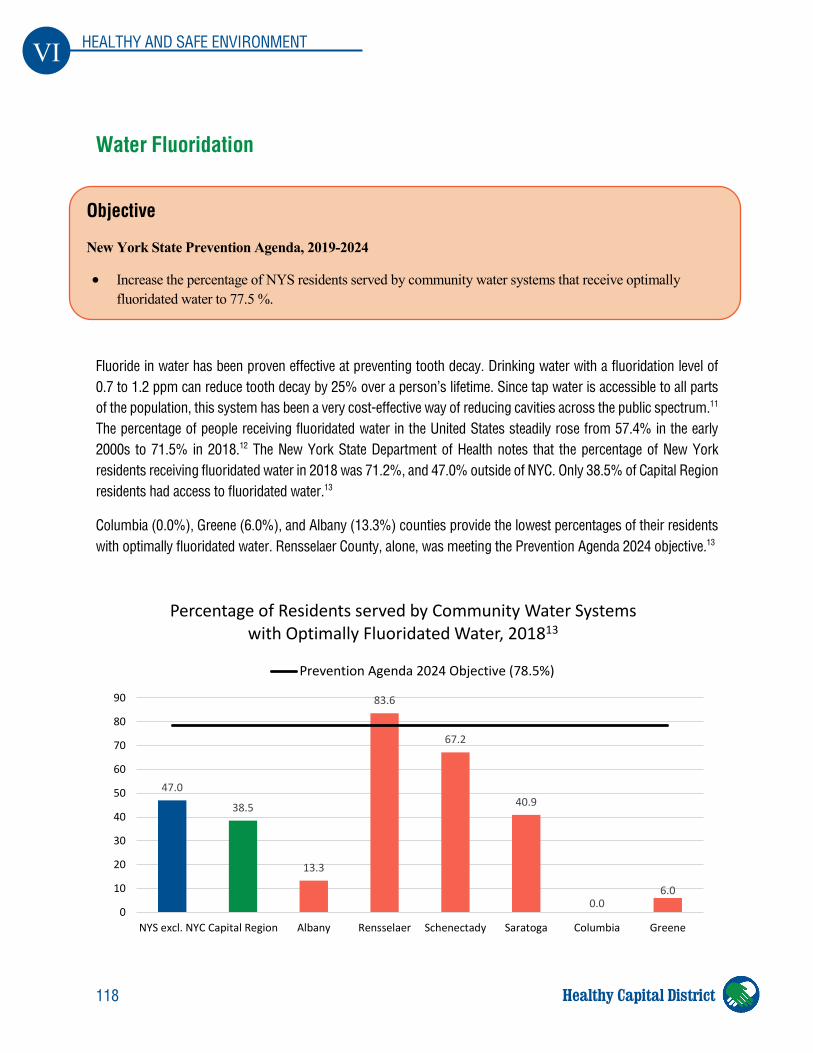
118
VI HEALTHY AND SAFE ENVIRONMENT
Healthy Capital District
Water Fluoridation
Fluoride in water has been proven effective at preventing tooth decay. Drinking water with a fluoridation level of 0.7 to 1.2 ppm can reduce tooth decay by 25% over a person’s lifetime. Since tap water is accessible to all parts of the population, this system has been a very cost-effective way of reducing cavities across the public spectrum.11 The percentage of people receiving fluoridated water in the United States steadily rose from 57.4% in the early 2000s to 71.5% in 2018.12 The New York State Department of Health notes that the percentage of New York residents receiving fluoridated water in 2018 was 71.2%, and 47.0% outside of NYC. Only 38.5% of Capital Region residents had access to fluoridated water.13
Columbia (0.0%), Greene (6.0%), and Albany (13.3%) counties provide the lowest percentages of their residents with optimally fluoridated water. Rensselaer County, alone, was meeting the Prevention Agenda 2024 objective.13
Objective
New York State Prevention Agenda, 2019-2024
• Increase the percentage of NYS residents served by community water systems that receive optimally fluoridated water to 77.5 %.
47.0
38.5
13.3
83.6
67.2
40.9
0.06.0
0
10
20
30
40
50
60
70
80
90
NYS excl. NYC Capital Region Albany Rensselaer Schenectady Saratoga Columbia Greene
Percentage of Residents served by Community Water Systems with Optimally Fluoridated Water, 201813
Prevention Agenda 2024 Objective (78.5%)
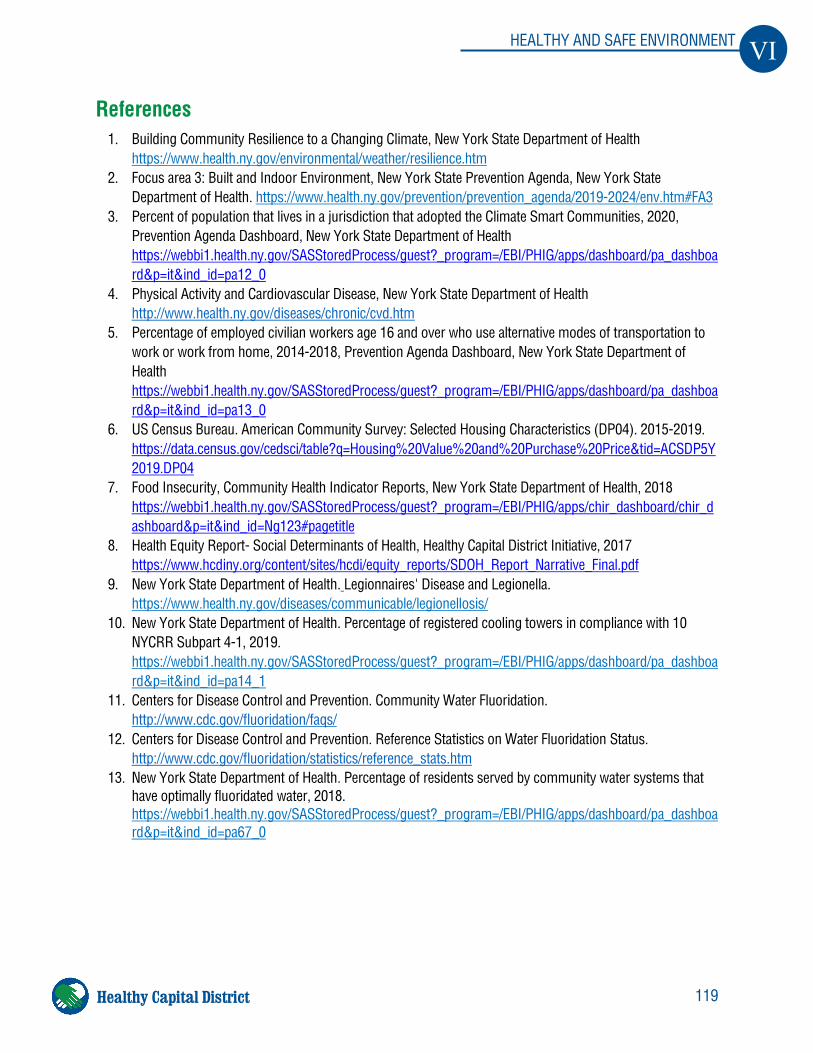
119
VI HEALTHY AND SAFE ENVIRONMENT
Healthy Capital District
References 1. Building Community Resilience to a Changing Climate, New York State Department of Health
https://www.health.ny.gov/environmental/weather/resilience.htm 2. Focus area 3: Built and Indoor Environment, New York State Prevention Agenda, New York State
Department of Health. https://www.health.ny.gov/prevention/prevention_agenda/2019-2024/env.htm#FA3 3. Percent of population that lives in a jurisdiction that adopted the Climate Smart Communities, 2020,
Prevention Agenda Dashboard, New York State Department of Health https://webbi1.health.ny.gov/SASStoredProcess/guest?_program=/EBI/PHIG/apps/dashboard/pa_dashboard&p=it&ind_id=pa12_0
4. Physical Activity and Cardiovascular Disease, New York State Department of Health http://www.health.ny.gov/diseases/chronic/cvd.htm
5. Percentage of employed civilian workers age 16 and over who use alternative modes of transportation to work or work from home, 2014-2018, Prevention Agenda Dashboard, New York State Department of Health https://webbi1.health.ny.gov/SASStoredProcess/guest?_program=/EBI/PHIG/apps/dashboard/pa_dashboard&p=it&ind_id=pa13_0
6. US Census Bureau. American Community Survey: Selected Housing Characteristics (DP04). 2015-2019. https://data.census.gov/cedsci/table?q=Housing%20Value%20and%20Purchase%20Price&tid=ACSDP5Y2019.DP04
7. Food Insecurity, Community Health Indicator Reports, New York State Department of Health, 2018 https://webbi1.health.ny.gov/SASStoredProcess/guest?_program=/EBI/PHIG/apps/chir_dashboard/chir_dashboard&p=it&ind_id=Ng123#pagetitle
8. Health Equity Report- Social Determinants of Health, Healthy Capital District Initiative, 2017 https://www.hcdiny.org/content/sites/hcdi/equity_reports/SDOH_Report_Narrative_Final.pdf
9. New York State Department of Health. Legionnaires' Disease and Legionella. https://www.health.ny.gov/diseases/communicable/legionellosis/
10. New York State Department of Health. Percentage of registered cooling towers in compliance with 10 NYCRR Subpart 4-1, 2019. https://webbi1.health.ny.gov/SASStoredProcess/guest?_program=/EBI/PHIG/apps/dashboard/pa_dashboard&p=it&ind_id=pa14_1
11. Centers for Disease Control and Prevention. Community Water Fluoridation. http://www.cdc.gov/fluoridation/faqs/
12. Centers for Disease Control and Prevention. Reference Statistics on Water Fluoridation Status. http://www.cdc.gov/fluoridation/statistics/reference_stats.htm
13. New York State Department of Health. Percentage of residents served by community water systems that have optimally fluoridated water, 2018. https://webbi1.health.ny.gov/SASStoredProcess/guest?_program=/EBI/PHIG/apps/dashboard/pa_dashboard&p=it&ind_id=pa67_0
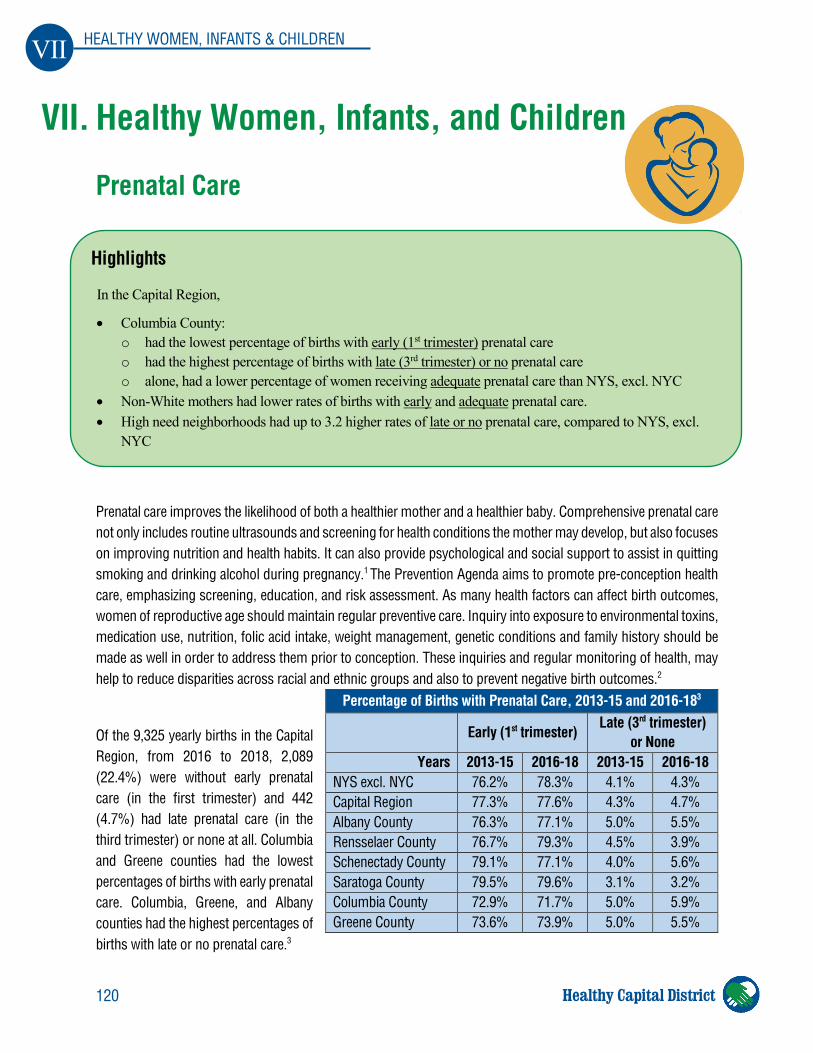
120
VII HEALTHY WOMEN, INFANTS & CHILDREN
Healthy Capital District
VII. Healthy Women, Infants, and Children
Prenatal Care
Prenatal care improves the likelihood of both a healthier mother and a healthier baby. Comprehensive prenatal care not only includes routine ultrasounds and screening for health conditions the mother may develop, but also focuses on improving nutrition and health habits. It can also provide psychological and social support to assist in quitting smoking and drinking alcohol during pregnancy.1 The Prevention Agenda aims to promote pre-conception health care, emphasizing screening, education, and risk assessment. As many health factors can affect birth outcomes, women of reproductive age should maintain regular preventive care. Inquiry into exposure to environmental toxins, medication use, nutrition, folic acid intake, weight management, genetic conditions and family history should be made as well in order to address them prior to conception. These inquiries and regular monitoring of health, may help to reduce disparities across racial and ethnic groups and also to prevent negative birth outcomes.2
Of the 9,325 yearly births in the Capital Region, from 2016 to 2018, 2,089 (22.4%) were without early prenatal care (in the first trimester) and 442 (4.7%) had late prenatal care (in the third trimester) or none at all. Columbia and Greene counties had the lowest percentages of births with early prenatal care. Columbia, Greene, and Albany counties had the highest percentages of births with late or no prenatal care.3
Percentage of Births with Prenatal Care, 2013-15 and 2016-183
Early (1st trimester) Late (3rd trimester)
or None Years 2013-15 2016-18 2013-15 2016-18
NYS excl. NYC 76.2% 78.3% 4.1% 4.3% Capital Region 77.3% 77.6% 4.3% 4.7% Albany County 76.3% 77.1% 5.0% 5.5% Rensselaer County 76.7% 79.3% 4.5% 3.9% Schenectady County 79.1% 77.1% 4.0% 5.6% Saratoga County 79.5% 79.6% 3.1% 3.2% Columbia County 72.9% 71.7% 5.0% 5.9% Greene County 73.6% 73.9% 5.0% 5.5%
Highlights
In the Capital Region,
• Columbia County: o had the lowest percentage of births with early (1st trimester) prenatal care o had the highest percentage of births with late (3rd trimester) or no prenatal care o alone, had a lower percentage of women receiving adequate prenatal care than NYS, excl. NYC
• Non-White mothers had lower rates of births with early and adequate prenatal care. • High need neighborhoods had up to 3.2 higher rates of late or no prenatal care, compared to NYS, excl.
NYC
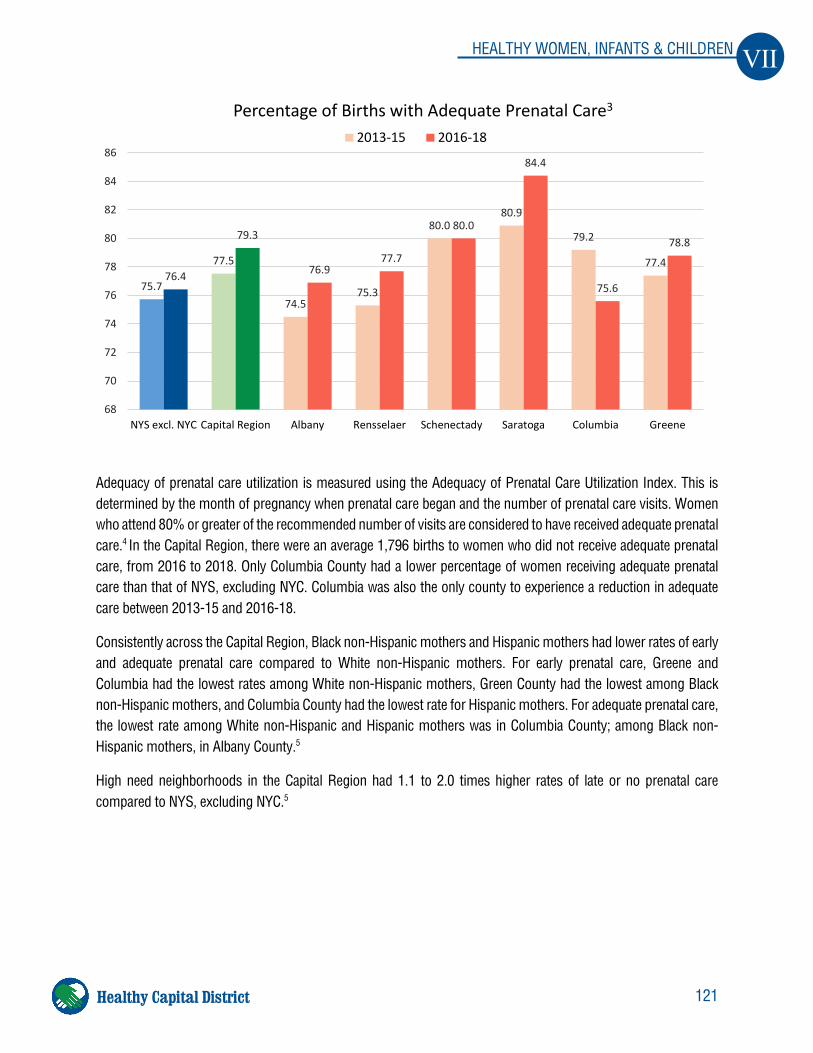
121
VII HEALTHY WOMEN, INFANTS & CHILDREN
Healthy Capital District
Adequacy of prenatal care utilization is measured using the Adequacy of Prenatal Care Utilization Index. This is determined by the month of pregnancy when prenatal care began and the number of prenatal care visits. Women who attend 80% or greater of the recommended number of visits are considered to have received adequate prenatal care.4 In the Capital Region, there were an average 1,796 births to women who did not receive adequate prenatal care, from 2016 to 2018. Only Columbia County had a lower percentage of women receiving adequate prenatal care than that of NYS, excluding NYC. Columbia was also the only county to experience a reduction in adequate care between 2013-15 and 2016-18.
Consistently across the Capital Region, Black non-Hispanic mothers and Hispanic mothers had lower rates of early and adequate prenatal care compared to White non-Hispanic mothers. For early prenatal care, Greene and Columbia had the lowest rates among White non-Hispanic mothers, Green County had the lowest among Black non-Hispanic mothers, and Columbia County had the lowest rate for Hispanic mothers. For adequate prenatal care, the lowest rate among White non-Hispanic and Hispanic mothers was in Columbia County; among Black non-Hispanic mothers, in Albany County.5
High need neighborhoods in the Capital Region had 1.1 to 2.0 times higher rates of late or no prenatal care compared to NYS, excluding NYC.5
75.7
77.5
74.575.3
80.080.9
79.2
77.476.4
79.3
76.977.7
80.0
84.4
75.6
78.8
68
70
72
74
76
78
80
82
84
86
NYS excl. NYC Capital Region Albany Rensselaer Schenectady Saratoga Columbia Greene
Percentage of Births with Adequate Prenatal Care3
2013-15 2016-18
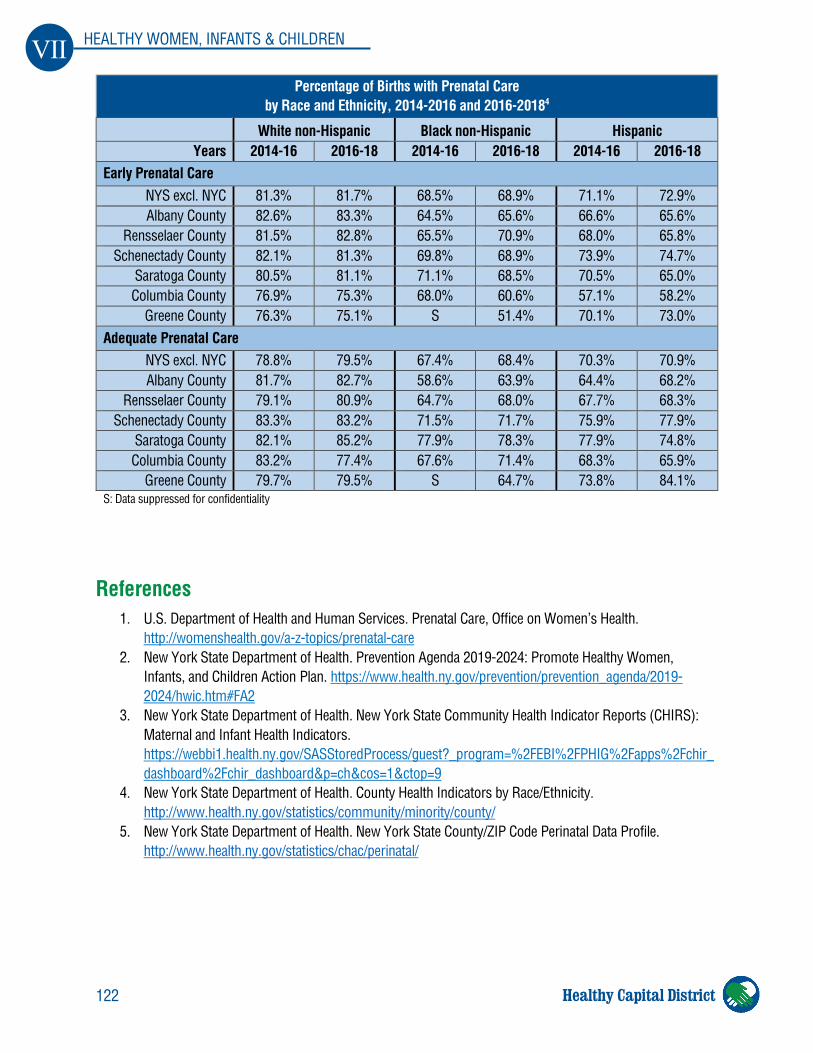
122
VII HEALTHY WOMEN, INFANTS & CHILDREN
Healthy Capital District
References 1. U.S. Department of Health and Human Services. Prenatal Care, Office on Women’s Health.
http://womenshealth.gov/a-z-topics/prenatal-care 2. New York State Department of Health. Prevention Agenda 2019-2024: Promote Healthy Women,
Infants, and Children Action Plan. https://www.health.ny.gov/prevention/prevention_agenda/2019-2024/hwic.htm#FA2
3. New York State Department of Health. New York State Community Health Indicator Reports (CHIRS): Maternal and Infant Health Indicators. https://webbi1.health.ny.gov/SASStoredProcess/guest?_program=%2FEBI%2FPHIG%2Fapps%2Fchir_dashboard%2Fchir_dashboard&p=ch&cos=1&ctop=9
4. New York State Department of Health. County Health Indicators by Race/Ethnicity. http://www.health.ny.gov/statistics/community/minority/county/
5. New York State Department of Health. New York State County/ZIP Code Perinatal Data Profile. http://www.health.ny.gov/statistics/chac/perinatal/
Percentage of Births with Prenatal Care by Race and Ethnicity, 2014-2016 and 2016-20184
White non-Hispanic Black non-Hispanic Hispanic Years 2014-16 2016-18 2014-16 2016-18 2014-16 2016-18
Early Prenatal Care NYS excl. NYC 81.3% 81.7% 68.5% 68.9% 71.1% 72.9% Albany County 82.6% 83.3% 64.5% 65.6% 66.6% 65.6%
Rensselaer County 81.5% 82.8% 65.5% 70.9% 68.0% 65.8% Schenectady County 82.1% 81.3% 69.8% 68.9% 73.9% 74.7%
Saratoga County 80.5% 81.1% 71.1% 68.5% 70.5% 65.0% Columbia County 76.9% 75.3% 68.0% 60.6% 57.1% 58.2%
Greene County 76.3% 75.1% S 51.4% 70.1% 73.0% Adequate Prenatal Care
NYS excl. NYC 78.8% 79.5% 67.4% 68.4% 70.3% 70.9% Albany County 81.7% 82.7% 58.6% 63.9% 64.4% 68.2%
Rensselaer County 79.1% 80.9% 64.7% 68.0% 67.7% 68.3% Schenectady County 83.3% 83.2% 71.5% 71.7% 75.9% 77.9%
Saratoga County 82.1% 85.2% 77.9% 78.3% 77.9% 74.8% Columbia County 83.2% 77.4% 67.6% 71.4% 68.3% 65.9%
Greene County 79.7% 79.5% S 64.7% 73.8% 84.1% S: Data suppressed for confidentiality
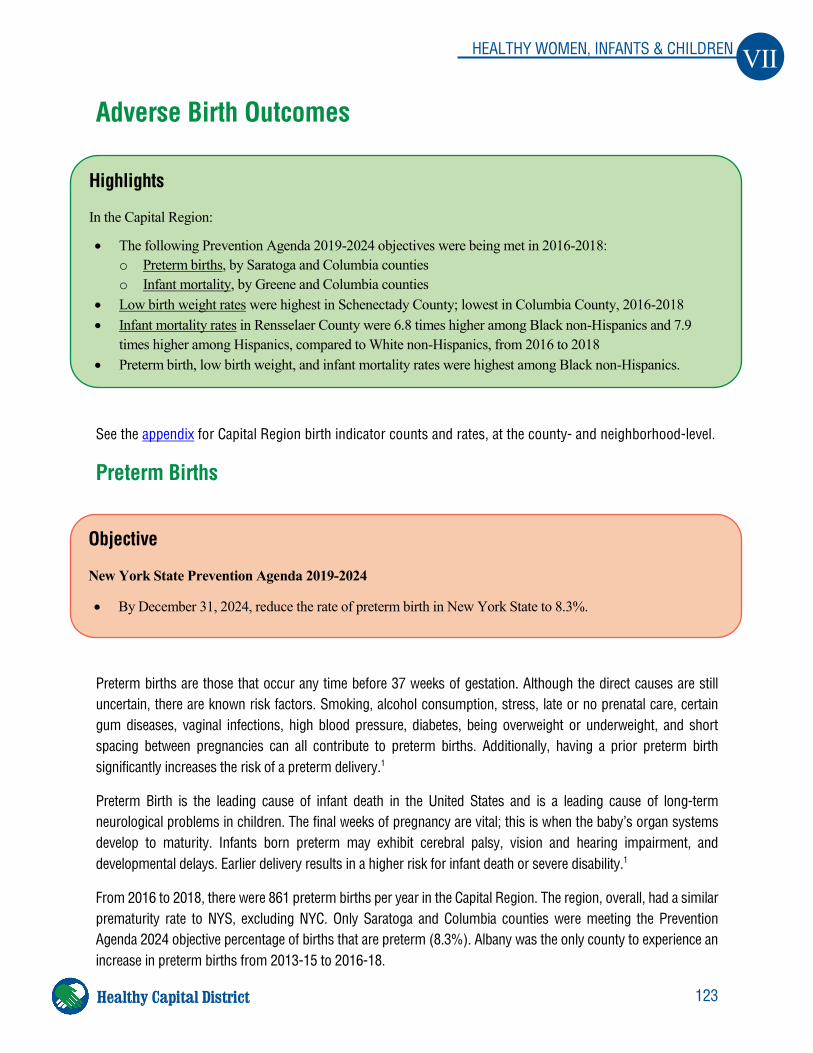
123
VII HEALTHY WOMEN, INFANTS & CHILDREN
Healthy Capital District
Adverse Birth Outcomes
See the appendix for Capital Region birth indicator counts and rates, at the county- and neighborhood-level.
Preterm Births
Preterm births are those that occur any time before 37 weeks of gestation. Although the direct causes are still uncertain, there are known risk factors. Smoking, alcohol consumption, stress, late or no prenatal care, certain gum diseases, vaginal infections, high blood pressure, diabetes, being overweight or underweight, and short spacing between pregnancies can all contribute to preterm births. Additionally, having a prior preterm birth significantly increases the risk of a preterm delivery.1
Preterm Birth is the leading cause of infant death in the United States and is a leading cause of long-term neurological problems in children. The final weeks of pregnancy are vital; this is when the baby’s organ systems develop to maturity. Infants born preterm may exhibit cerebral palsy, vision and hearing impairment, and developmental delays. Earlier delivery results in a higher risk for infant death or severe disability.1
From 2016 to 2018, there were 861 preterm births per year in the Capital Region. The region, overall, had a similar prematurity rate to NYS, excluding NYC. Only Saratoga and Columbia counties were meeting the Prevention Agenda 2024 objective percentage of births that are preterm (8.3%). Albany was the only county to experience an increase in preterm births from 2013-15 to 2016-18.
Highlights
In the Capital Region:
• The following Prevention Agenda 2019-2024 objectives were being met in 2016-2018: o Preterm births, by Saratoga and Columbia counties o Infant mortality, by Greene and Columbia counties
• Low birth weight rates were highest in Schenectady County; lowest in Columbia County, 2016-2018 • Infant mortality rates in Rensselaer County were 6.8 times higher among Black non-Hispanics and 7.9
times higher among Hispanics, compared to White non-Hispanics, from 2016 to 2018 • Preterm birth, low birth weight, and infant mortality rates were highest among Black non-Hispanics.
Objective
New York State Prevention Agenda 2019-2024
• By December 31, 2024, reduce the rate of preterm birth in New York State to 8.3%.
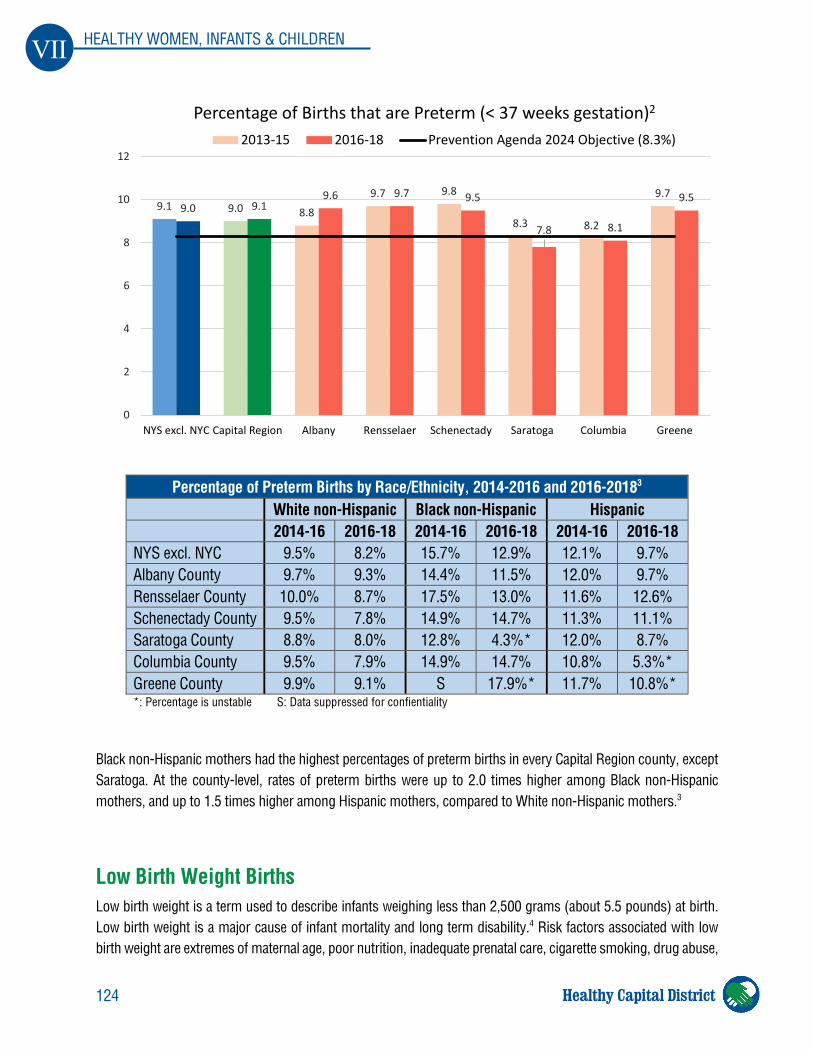
124
VII HEALTHY WOMEN, INFANTS & CHILDREN
Healthy Capital District
Percentage of Preterm Births by Race/Ethnicity, 2014-2016 and 2016-20183 White non-Hispanic Black non-Hispanic Hispanic 2014-16 2016-18 2014-16 2016-18 2014-16 2016-18 NYS excl. NYC 9.5% 8.2% 15.7% 12.9% 12.1% 9.7% Albany County 9.7% 9.3% 14.4% 11.5% 12.0% 9.7% Rensselaer County 10.0% 8.7% 17.5% 13.0% 11.6% 12.6% Schenectady County 9.5% 7.8% 14.9% 14.7% 11.3% 11.1% Saratoga County 8.8% 8.0% 12.8% 4.3%* 12.0% 8.7% Columbia County 9.5% 7.9% 14.9% 14.7% 10.8% 5.3%* Greene County 9.9% 9.1% S 17.9%* 11.7% 10.8%* *: Percentage is unstable S: Data suppressed for confientiality
Black non-Hispanic mothers had the highest percentages of preterm births in every Capital Region county, except Saratoga. At the county-level, rates of preterm births were up to 2.0 times higher among Black non-Hispanic mothers, and up to 1.5 times higher among Hispanic mothers, compared to White non-Hispanic mothers.3
Low Birth Weight Births Low birth weight is a term used to describe infants weighing less than 2,500 grams (about 5.5 pounds) at birth. Low birth weight is a major cause of infant mortality and long term disability.4 Risk factors associated with low birth weight are extremes of maternal age, poor nutrition, inadequate prenatal care, cigarette smoking, drug abuse,
9.1 9.0 8.8
9.7 9.8
8.3 8.2
9.79.0 9.1
9.6 9.7 9.5
7.8 8.1
9.5
0
2
4
6
8
10
12
NYS excl. NYC Capital Region Albany Rensselaer Schenectady Saratoga Columbia Greene
Percentage of Births that are Preterm (< 37 weeks gestation)2
2013-15 2016-18 Prevention Agenda 2024 Objective (8.3%)
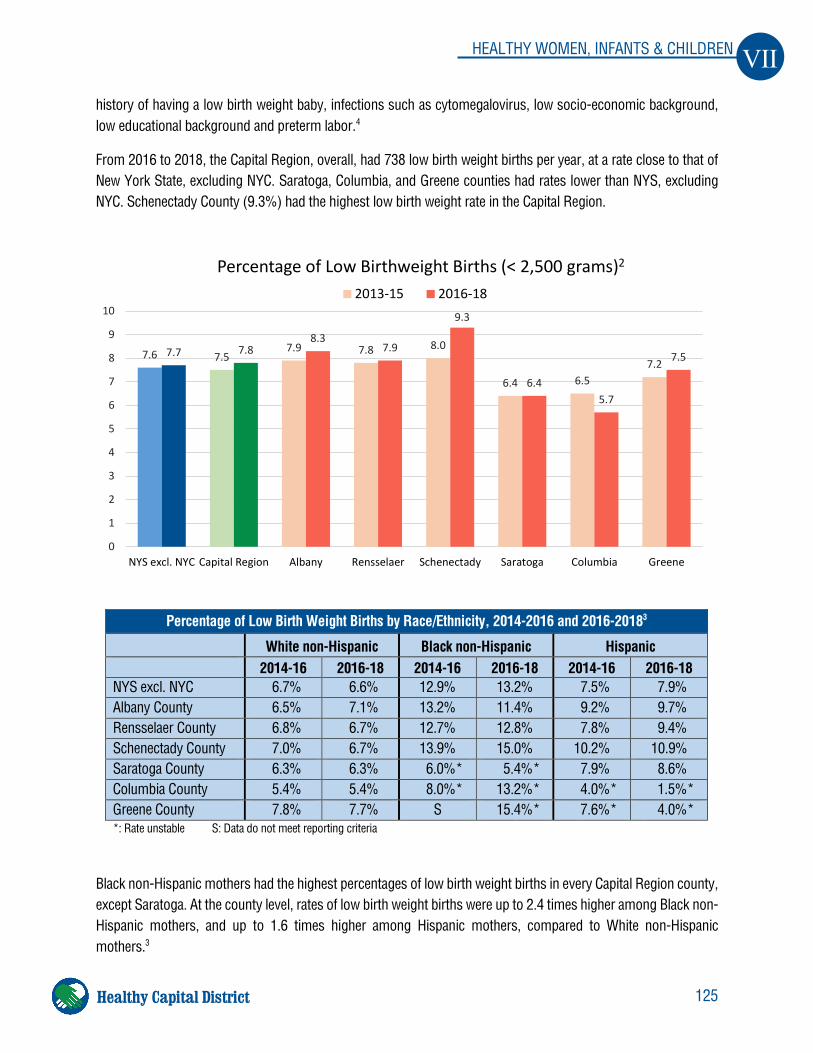
125
VII HEALTHY WOMEN, INFANTS & CHILDREN
Healthy Capital District
history of having a low birth weight baby, infections such as cytomegalovirus, low socio-economic background, low educational background and preterm labor.4
From 2016 to 2018, the Capital Region, overall, had 738 low birth weight births per year, at a rate close to that of New York State, excluding NYC. Saratoga, Columbia, and Greene counties had rates lower than NYS, excluding NYC. Schenectady County (9.3%) had the highest low birth weight rate in the Capital Region.
Black non-Hispanic mothers had the highest percentages of low birth weight births in every Capital Region county, except Saratoga. At the county level, rates of low birth weight births were up to 2.4 times higher among Black non-Hispanic mothers, and up to 1.6 times higher among Hispanic mothers, compared to White non-Hispanic mothers.3
Percentage of Low Birth Weight Births by Race/Ethnicity, 2014-2016 and 2016-20183
White non-Hispanic Black non-Hispanic Hispanic 2014-16 2016-18 2014-16 2016-18 2014-16 2016-18 NYS excl. NYC 6.7% 6.6% 12.9% 13.2% 7.5% 7.9% Albany County 6.5% 7.1% 13.2% 11.4% 9.2% 9.7% Rensselaer County 6.8% 6.7% 12.7% 12.8% 7.8% 9.4% Schenectady County 7.0% 6.7% 13.9% 15.0% 10.2% 10.9% Saratoga County 6.3% 6.3% 6.0%* 5.4%* 7.9% 8.6% Columbia County 5.4% 5.4% 8.0%* 13.2%* 4.0%* 1.5%* Greene County 7.8% 7.7% S 15.4%* 7.6%* 4.0%* *: Rate unstable S: Data do not meet reporting criteria
7.6 7.57.9 7.8 8.0
6.4 6.57.2
7.7 7.88.3
7.9
9.3
6.45.7
7.5
0
1
2
3
4
5
6
7
8
9
10
NYS excl. NYC Capital Region Albany Rensselaer Schenectady Saratoga Columbia Greene
Percentage of Low Birthweight Births (< 2,500 grams)2
2013-15 2016-18
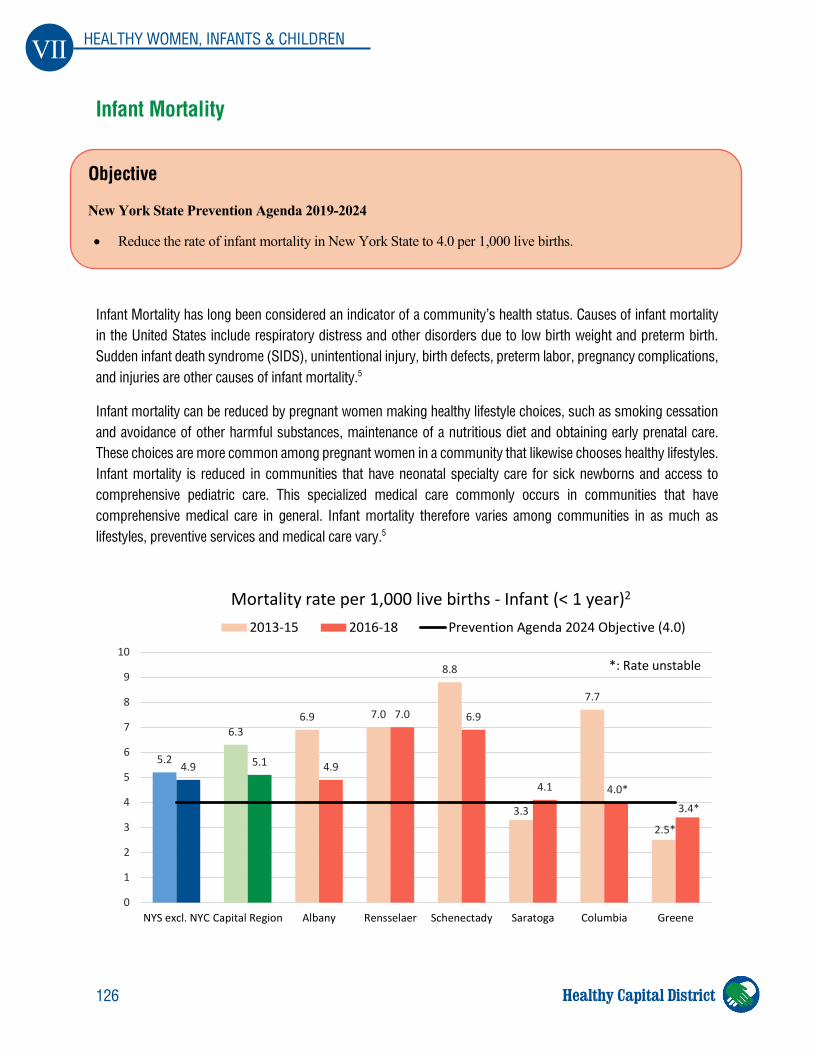
126
VII HEALTHY WOMEN, INFANTS & CHILDREN
Healthy Capital District
Infant Mortality
Infant Mortality has long been considered an indicator of a community’s health status. Causes of infant mortality in the United States include respiratory distress and other disorders due to low birth weight and preterm birth. Sudden infant death syndrome (SIDS), unintentional injury, birth defects, preterm labor, pregnancy complications, and injuries are other causes of infant mortality.5
Infant mortality can be reduced by pregnant women making healthy lifestyle choices, such as smoking cessation and avoidance of other harmful substances, maintenance of a nutritious diet and obtaining early prenatal care. These choices are more common among pregnant women in a community that likewise chooses healthy lifestyles. Infant mortality is reduced in communities that have neonatal specialty care for sick newborns and access to comprehensive pediatric care. This specialized medical care commonly occurs in communities that have comprehensive medical care in general. Infant mortality therefore varies among communities in as much as lifestyles, preventive services and medical care vary.5
Objective
New York State Prevention Agenda 2019-2024
• Reduce the rate of infant mortality in New York State to 4.0 per 1,000 live births.
5.2
6.36.9 7.0
8.8
3.3
7.7
2.5*
4.9 5.1 4.9
7.0 6.9
4.1 4.0*
3.4*
0
1
2
3
4
5
6
7
8
9
10
NYS excl. NYC Capital Region Albany Rensselaer Schenectady Saratoga Columbia Greene
Mortality rate per 1,000 live births - Infant (< 1 year)2
2013-15 2016-18 Prevention Agenda 2024 Objective (4.0)
*: Rate unstable
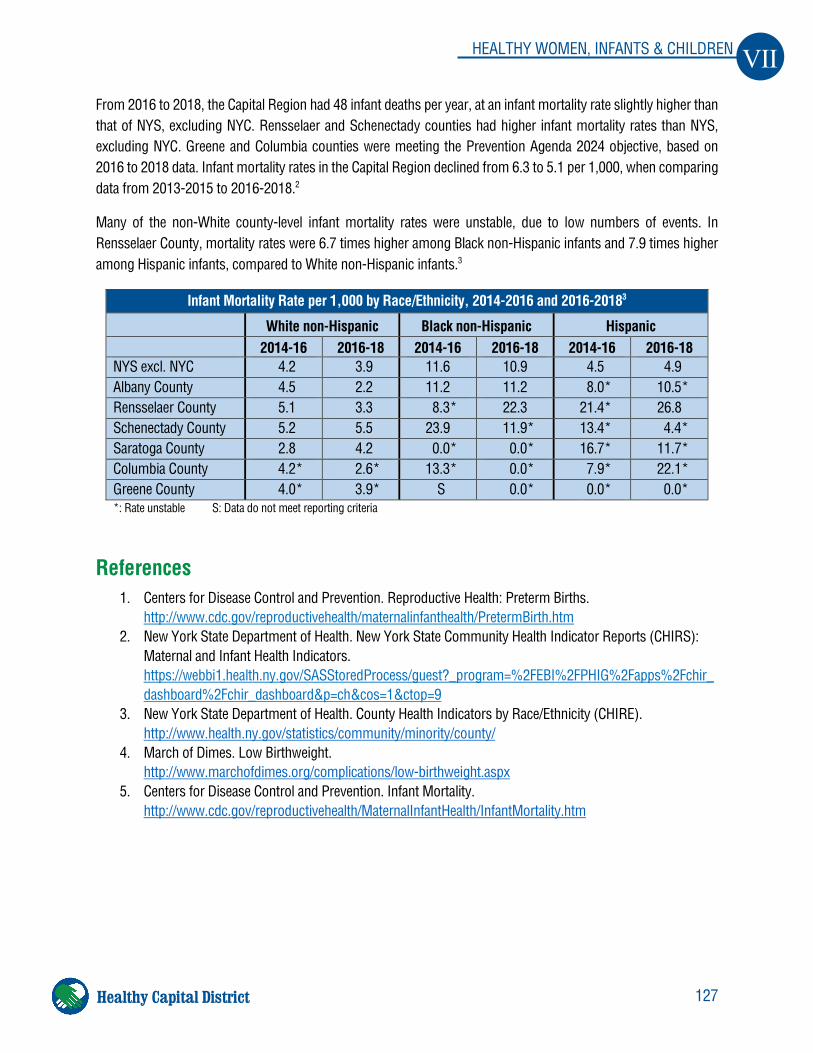
127
VII HEALTHY WOMEN, INFANTS & CHILDREN
Healthy Capital District
From 2016 to 2018, the Capital Region had 48 infant deaths per year, at an infant mortality rate slightly higher than that of NYS, excluding NYC. Rensselaer and Schenectady counties had higher infant mortality rates than NYS, excluding NYC. Greene and Columbia counties were meeting the Prevention Agenda 2024 objective, based on 2016 to 2018 data. Infant mortality rates in the Capital Region declined from 6.3 to 5.1 per 1,000, when comparing data from 2013-2015 to 2016-2018.2
Many of the non-White county-level infant mortality rates were unstable, due to low numbers of events. In Rensselaer County, mortality rates were 6.7 times higher among Black non-Hispanic infants and 7.9 times higher among Hispanic infants, compared to White non-Hispanic infants.3
Infant Mortality Rate per 1,000 by Race/Ethnicity, 2014-2016 and 2016-20183
White non-Hispanic Black non-Hispanic Hispanic 2014-16 2016-18 2014-16 2016-18 2014-16 2016-18 NYS excl. NYC 4.2 3.9 11.6 10.9 4.5 4.9 Albany County 4.5 2.2 11.2 11.2 8.0* 10.5* Rensselaer County 5.1 3.3 8.3* 22.3 21.4* 26.8 Schenectady County 5.2 5.5 23.9 11.9* 13.4* 4.4* Saratoga County 2.8 4.2 0.0* 0.0* 16.7* 11.7* Columbia County 4.2* 2.6* 13.3* 0.0* 7.9* 22.1* Greene County 4.0* 3.9* S 0.0* 0.0* 0.0* *: Rate unstable S: Data do not meet reporting criteria
References 1. Centers for Disease Control and Prevention. Reproductive Health: Preterm Births.
http://www.cdc.gov/reproductivehealth/maternalinfanthealth/PretermBirth.htm 2. New York State Department of Health. New York State Community Health Indicator Reports (CHIRS):
Maternal and Infant Health Indicators. https://webbi1.health.ny.gov/SASStoredProcess/guest?_program=%2FEBI%2FPHIG%2Fapps%2Fchir_dashboard%2Fchir_dashboard&p=ch&cos=1&ctop=9
3. New York State Department of Health. County Health Indicators by Race/Ethnicity (CHIRE). http://www.health.ny.gov/statistics/community/minority/county/
4. March of Dimes. Low Birthweight. http://www.marchofdimes.org/complications/low-birthweight.aspx
5. Centers for Disease Control and Prevention. Infant Mortality. http://www.cdc.gov/reproductivehealth/MaternalInfantHealth/InfantMortality.htm
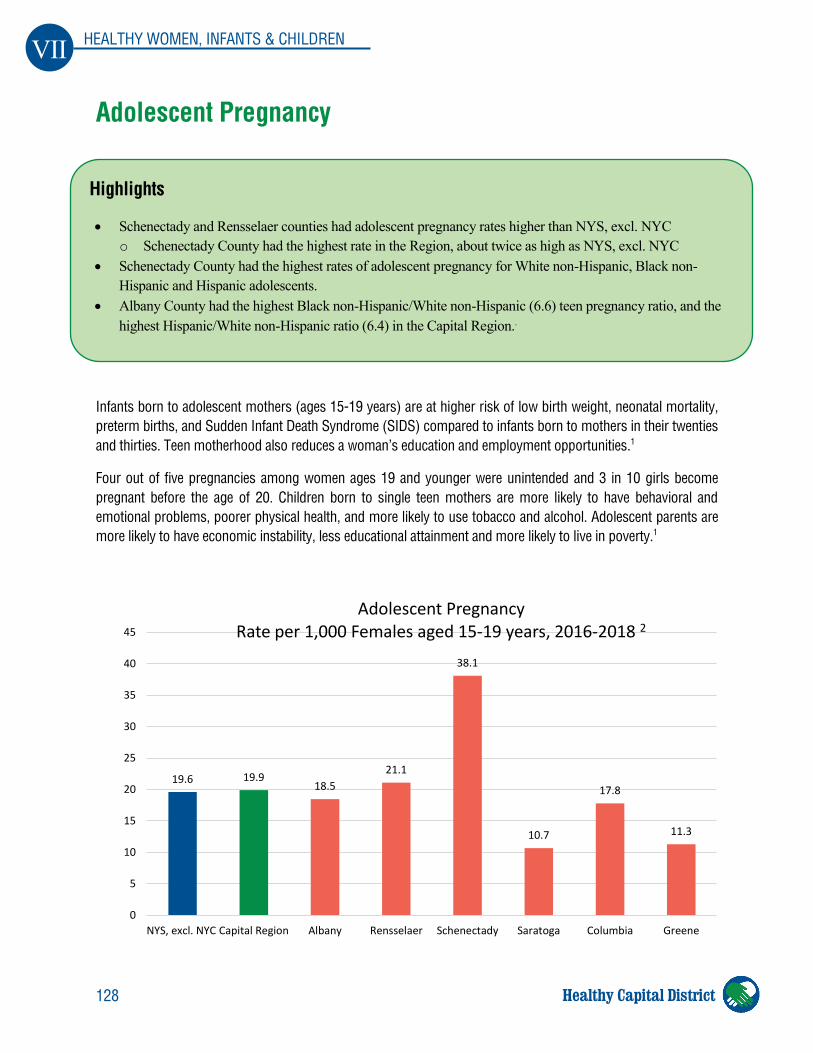
128
VII HEALTHY WOMEN, INFANTS & CHILDREN
Healthy Capital District
Adolescent Pregnancy
Infants born to adolescent mothers (ages 15-19 years) are at higher risk of low birth weight, neonatal mortality, preterm births, and Sudden Infant Death Syndrome (SIDS) compared to infants born to mothers in their twenties and thirties. Teen motherhood also reduces a woman’s education and employment opportunities.1
Four out of five pregnancies among women ages 19 and younger were unintended and 3 in 10 girls become pregnant before the age of 20. Children born to single teen mothers are more likely to have behavioral and emotional problems, poorer physical health, and more likely to use tobacco and alcohol. Adolescent parents are more likely to have economic instability, less educational attainment and more likely to live in poverty.1
Highlights
• Schenectady and Rensselaer counties had adolescent pregnancy rates higher than NYS, excl. NYC o Schenectady County had the highest rate in the Region, about twice as high as NYS, excl. NYC
• Schenectady County had the highest rates of adolescent pregnancy for White non-Hispanic, Black non-Hispanic and Hispanic adolescents.
• Albany County had the highest Black non-Hispanic/White non-Hispanic (6.6) teen pregnancy ratio, and the highest Hispanic/White non-Hispanic ratio (6.4) in the Capital Region..
19.6 19.918.5
21.1
38.1
10.7
17.8
11.3
0
5
10
15
20
25
30
35
40
45
NYS, excl. NYC Capital Region Albany Rensselaer Schenectady Saratoga Columbia Greene
Adolescent Pregnancy Rate per 1,000 Females aged 15-19 years, 2016-2018 2
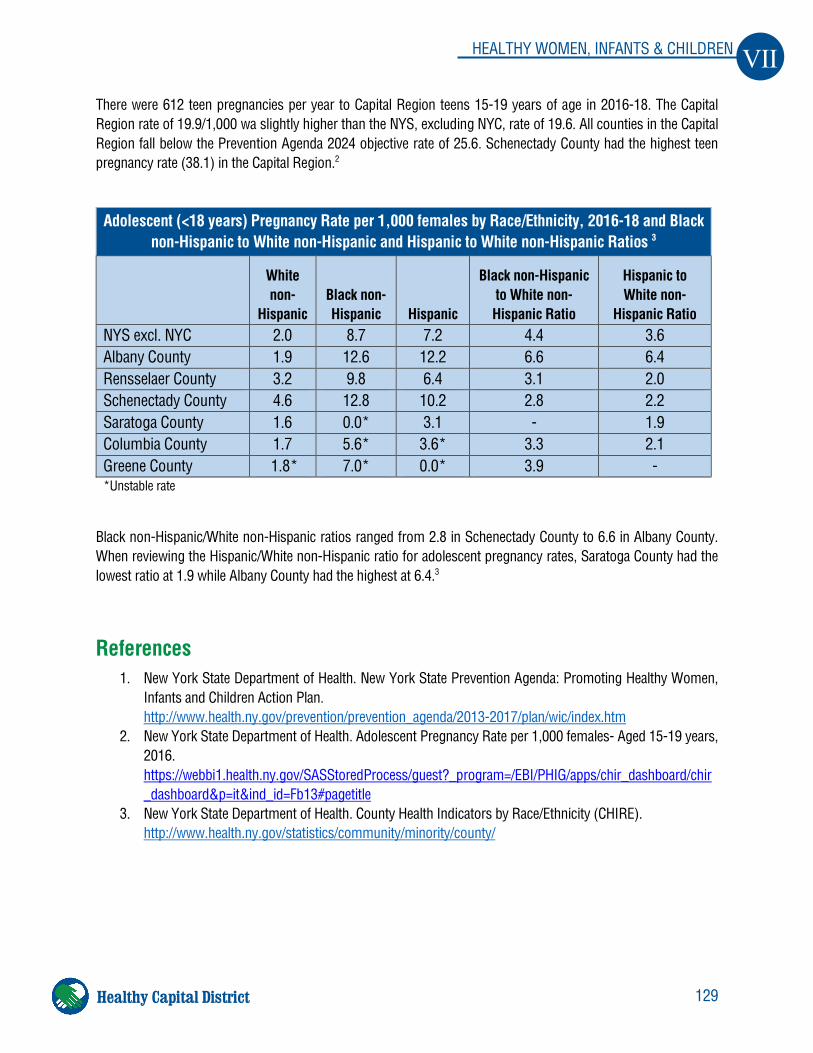
129
VII HEALTHY WOMEN, INFANTS & CHILDREN
Healthy Capital District
There were 612 teen pregnancies per year to Capital Region teens 15-19 years of age in 2016-18. The Capital Region rate of 19.9/1,000 wa slightly higher than the NYS, excluding NYC, rate of 19.6. All counties in the Capital Region fall below the Prevention Agenda 2024 objective rate of 25.6. Schenectady County had the highest teen pregnancy rate (38.1) in the Capital Region.2
Black non-Hispanic/White non-Hispanic ratios ranged from 2.8 in Schenectady County to 6.6 in Albany County. When reviewing the Hispanic/White non-Hispanic ratio for adolescent pregnancy rates, Saratoga County had the lowest ratio at 1.9 while Albany County had the highest at 6.4.3
References 1. New York State Department of Health. New York State Prevention Agenda: Promoting Healthy Women,
Infants and Children Action Plan. http://www.health.ny.gov/prevention/prevention_agenda/2013-2017/plan/wic/index.htm
2. New York State Department of Health. Adolescent Pregnancy Rate per 1,000 females- Aged 15-19 years, 2016. https://webbi1.health.ny.gov/SASStoredProcess/guest?_program=/EBI/PHIG/apps/chir_dashboard/chir_dashboard&p=it&ind_id=Fb13#pagetitle
3. New York State Department of Health. County Health Indicators by Race/Ethnicity (CHIRE). http://www.health.ny.gov/statistics/community/minority/county/
Adolescent (<18 years) Pregnancy Rate per 1,000 females by Race/Ethnicity, 2016-18 and Black non-Hispanic to White non-Hispanic and Hispanic to White non-Hispanic Ratios 3
White non-
Hispanic Black non-Hispanic Hispanic
Black non-Hispanic to White non-Hispanic Ratio
Hispanic to White non-
Hispanic Ratio NYS excl. NYC 2.0 8.7 7.2 4.4 3.6 Albany County 1.9 12.6 12.2 6.6 6.4 Rensselaer County 3.2 9.8 6.4 3.1 2.0 Schenectady County 4.6 12.8 10.2 2.8 2.2 Saratoga County 1.6 0.0* 3.1 - 1.9 Columbia County 1.7 5.6* 3.6* 3.3 2.1 Greene County 1.8* 7.0* 0.0* 3.9 - *Unstable rate
130
VII HEALTHY WOMEN, INFANTS & CHILDREN
Healthy Capital District
Breastfeeding
Breastfeeding is the healthiest way to feed a baby. A mother’s milk provides vital vitamins and nutrients for the baby, supporting the developing brain and boosting the immune system. Additionally, breastfed babies are less likely to develop diseases and infections such as diabetes, asthma, sudden infant death syndrome (SIDS), childhood obesity, and allergies. Breast milk protects the infant against a growing list of chronic diseases, including cardiovascular disease, cancer, and diabetes. Since breast milk is easier to digest than formula, it also causes less vomiting and diarrhea. Automatically adjusting to the baby’s changing needs and eliminating the use of bottles, breastfeeding may be more convenient for the mother as well. Breastfeeding strengthens the bond between mother and baby and may help prevent certain cancers, depression, and osteoporosis in the mother.1
The positive economic impact of exclusive breastfeeding is well documented. In addition to families saving $1,200-$1,500 in formula expenses in the first year, healthier babies and mothers put less financial stress on insurance companies and workplaces.2 More than $3 billion a year in medical costs for mothers and children in the United States are attributable to low rates of breastfeeding.3
Highlights
In the Capital Region:
• In 2018, Schenectady County was not meeting the Prevention Agenda 2024 objective for the percentage of infants exclusively breastfed in the hospital among Hispanic, and all, infants.
• In 2018, Schenectady and Albany counties were not meeting the Prevention Agenda 2024 objective for the percentage of infants exclusively breastfed in the hospital among Black, non-Hispanic infants.
• Since at least 2009, Black non-Hispanic and Hispanic infants were exclusively breastfed in the hospital at lower rates than White infants.
• In 2017, the percentage of infants enrolled in WIC breatfed at 6 months was much lower, in every county, than in New York State and the Prevention Agenda 2024 objective.
Objective
New York State Prevention Agenda 2019-2024
• Increase the percentage of infants who are exclusively breastfed in the hospital: o to 51.7% among all infants o to 37.4% among Hispanic infants o to 38.4% among Black non-Hispanic infants
• Increase the percentage of infants enrolled in WIC who are breastfed at 6 months to 45.5%.
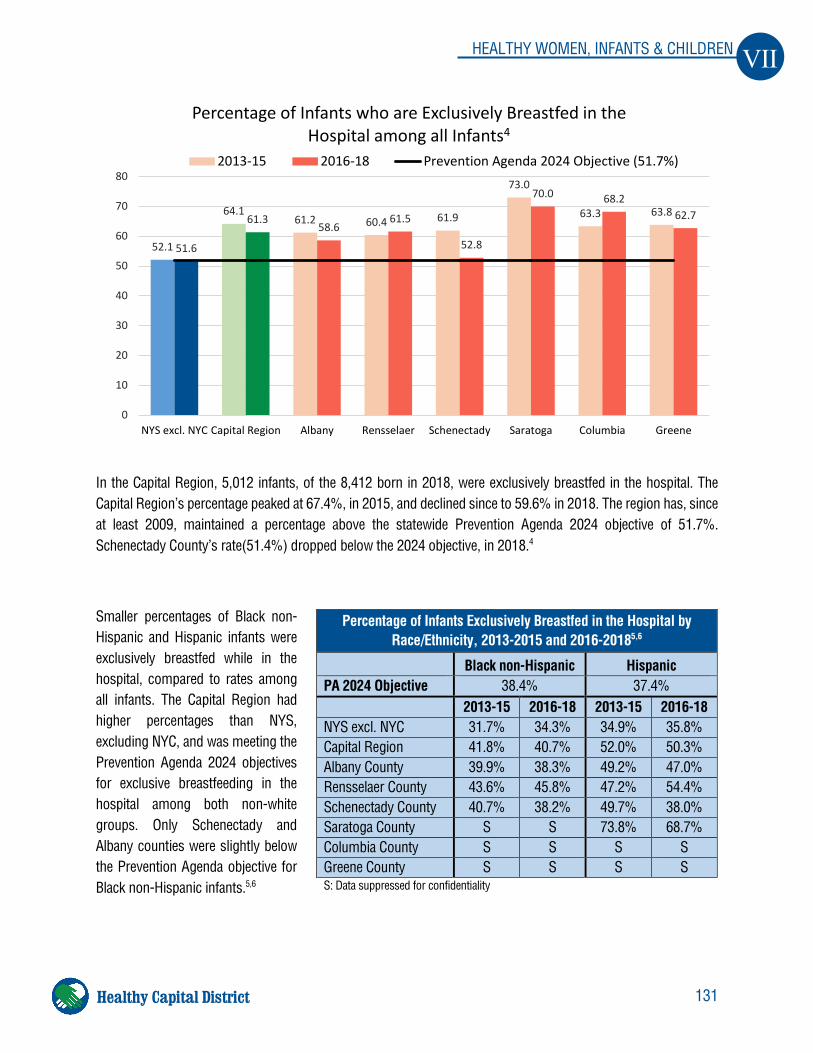
131
VII HEALTHY WOMEN, INFANTS & CHILDREN
Healthy Capital District
In the Capital Region, 5,012 infants, of the 8,412 born in 2018, were exclusively breastfed in the hospital. The Capital Region’s percentage peaked at 67.4%, in 2015, and declined since to 59.6% in 2018. The region has, since at least 2009, maintained a percentage above the statewide Prevention Agenda 2024 objective of 51.7%.
Schenectady County’s rate(51.4%) dropped below the 2024 objective, in 2018.4
Smaller percentages of Black non-Hispanic and Hispanic infants were exclusively breastfed while in the hospital, compared to rates among all infants. The Capital Region had higher percentages than NYS, excluding NYC, and was meeting the Prevention Agenda 2024 objectives for exclusive breastfeeding in the hospital among both non-white groups. Only Schenectady and Albany counties were slightly below the Prevention Agenda objective for Black non-Hispanic infants.5,6
Percentage of Infants Exclusively Breastfed in the Hospital by Race/Ethnicity, 2013-2015 and 2016-20185,6
Black non-Hispanic Hispanic PA 2024 Objective 38.4% 37.4% 2013-15 2016-18 2013-15 2016-18 NYS excl. NYC 31.7% 34.3% 34.9% 35.8% Capital Region 41.8% 40.7% 52.0% 50.3% Albany County 39.9% 38.3% 49.2% 47.0% Rensselaer County 43.6% 45.8% 47.2% 54.4% Schenectady County 40.7% 38.2% 49.7% 38.0% Saratoga County S S 73.8% 68.7% Columbia County S S S S Greene County S S S S S: Data suppressed for confidentiality
52.1
64.161.2 60.4 61.9
73.0
63.3 63.8
51.6
61.358.6
61.5
52.8
70.0 68.262.7
0
10
20
30
40
50
60
70
80
NYS excl. NYC Capital Region Albany Rensselaer Schenectady Saratoga Columbia Greene
Percentage of Infants who are Exclusively Breastfed in the Hospital among all Infants4
2013-15 2016-18 Prevention Agenda 2024 Objective (51.7%)
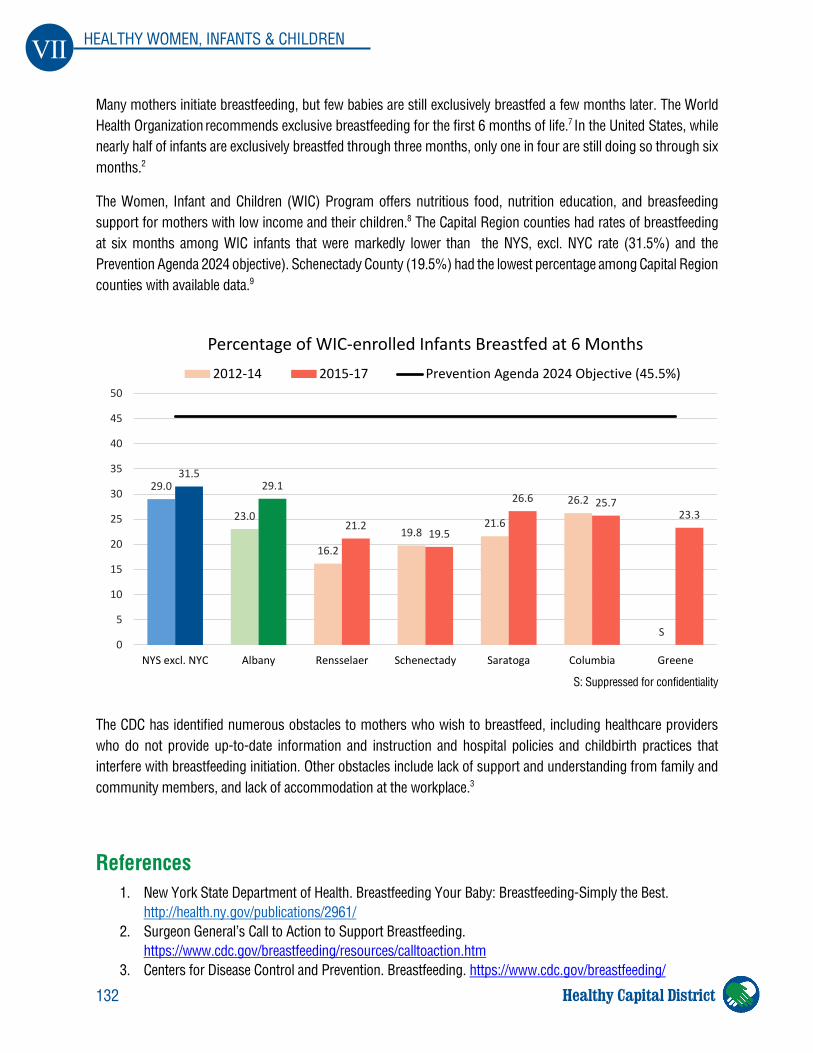
132
VII HEALTHY WOMEN, INFANTS & CHILDREN
Healthy Capital District
Many mothers initiate breastfeeding, but few babies are still exclusively breastfed a few months later. The World Health Organization recommends exclusive breastfeeding for the first 6 months of life.7 In the United States, while nearly half of infants are exclusively breastfed through three months, only one in four are still doing so through six months.2
The Women, Infant and Children (WIC) Program offers nutritious food, nutrition education, and breasfeeding support for mothers with low income and their children.8 The Capital Region counties had rates of breastfeeding at six months among WIC infants that were markedly lower than the NYS, excl. NYC rate (31.5%) and the Prevention Agenda 2024 objective). Schenectady County (19.5%) had the lowest percentage among Capital Region counties with available data.9
S: Suppressed for confidentiality
The CDC has identified numerous obstacles to mothers who wish to breastfeed, including healthcare providers who do not provide up-to-date information and instruction and hospital policies and childbirth practices that interfere with breastfeeding initiation. Other obstacles include lack of support and understanding from family and community members, and lack of accommodation at the workplace.3
References 1. New York State Department of Health. Breastfeeding Your Baby: Breastfeeding-Simply the Best.
http://health.ny.gov/publications/2961/ 2. Surgeon General’s Call to Action to Support Breastfeeding.
https://www.cdc.gov/breastfeeding/resources/calltoaction.htm 3. Centers for Disease Control and Prevention. Breastfeeding. https://www.cdc.gov/breastfeeding/
29.0
23.0
16.219.8
21.6
26.2
S
31.529.1
21.219.5
26.6 25.723.3
0
5
10
15
20
25
30
35
40
45
50
NYS excl. NYC Albany Rensselaer Schenectady Saratoga Columbia Greene
Percentage of WIC-enrolled Infants Breastfed at 6 Months2012-14 2015-17 Prevention Agenda 2024 Objective (45.5%)
133
VII HEALTHY WOMEN, INFANTS & CHILDREN
Healthy Capital District
4. New York State Prevention Agenda Dashboard, Percentage of infants exclusively breastfed in the hospital, 2018, New York State Department of Health. https://webbi1.health.ny.gov/SASStoredProcess/guest?_program=/EBI/PHIG/apps/dashboard/pa_dashboard&p=it&ind_id=pa59_0
5. New York State Prevention Agenda Dashboard, Percentage of infants who are exclusively breastfed in the hospital among Black non-Hispanic infants, 2018, New York State Department of Health. https://webbi1.health.ny.gov/SASStoredProcess/guest?_program=/EBI/PHIG/apps/dashboard/pa_dashboard&p=it&ind_id=pa59.2_0
6. New York State Prevention Agenda Dashboard, Percentage of infants who are exclusively breastfed in the hospital among Hispanic infants, 2018, New York State Department of Health. https://webbi1.health.ny.gov/SASStoredProcess/guest?_program=/EBI/PHIG/apps/dashboard/pa_dashboard&p=it&ind_id=pa59.1_0
7. World Health Organization. Breastfeeding. http://www.who.int/topics/breastfeeding/en/
8. New York State Department of Health. Nutrition: WIC Program. https://www.health.ny.gov/prevention/nutrition/wic/
9. New York State Department of Health. Percentage of infants enrolled in WIC who are breastfed at 6 months among all WIC infants, 2015-2017. https://webbi1.health.ny.gov/SASStoredProcess/guest?_program=/EBI/PHIG/apps/chir_dashboard/chir_dashboard&p=it&ind_id=Ig62
134
VIII MENTAL HEALTH & SUBSTANCE MISUSE
Healthy Capital District
VIII. Mental Health and Substance Misuse
Mental Health, Self Harm, and Suicide
Mental health is a core function which has physical, spiritual, and socio-economic impacts. Poor mental health is a cause of adverse physical health outcomes, academic under-achievement, homelessness, unemployment and isolation. One in five New Yorkers experiences a diagnosable mental disorder annually; and one in ten experiences an illness serious enough to impair functioning.1 An estimated 92,500 adults (11.2%) in the Capital Region, in 2018, reported 14 or more days with poor mental health in the last month.2
Highlights
• Columbia and Albany counties met the Prevention Agenda 2024 objective for frequent mental distress • The Capital Region had higher mental disease and disorder ED visit and hospitalization rates than NYS
excl. NYC • Black non-Hispanic residents had 1.9 times higher mental disease and disorder ED visit, and 1.7 times
higher hospitalization rates compared to White non-Hispanic residents • Females had 1.6 times higher ED visit, and 1.4 times higher hospitalization, self-inflicted injury rates • All counties had higher self-inflicted injury hospitalization and ED visit rates than NYS excl. NYC • Schenectady County had the highest rates in the Capital Region for mental disease and disorder ED visit
and hospitalization rates, as well as for self-inflicted injury hospitalizations • Rensselaer County had the highest rate in the Capital Region for self-inflicted injury ED visits • No counties were meeting the Prevention Agenda 2024 objective for age-adjusted suicide mortality • Columbia and Greene counties had the highest age-adjusted suicide mortality rates in the region
Objective
New York State Prevention Agenda 2019-2024
• Reduce the age‐adjusted percentage of adults with frequent mental distress (14 or more days) in the last month to no more than 10.7%.
• Reduce the age‐adjusted suicide mortality rate to 7.0 per 100,000.
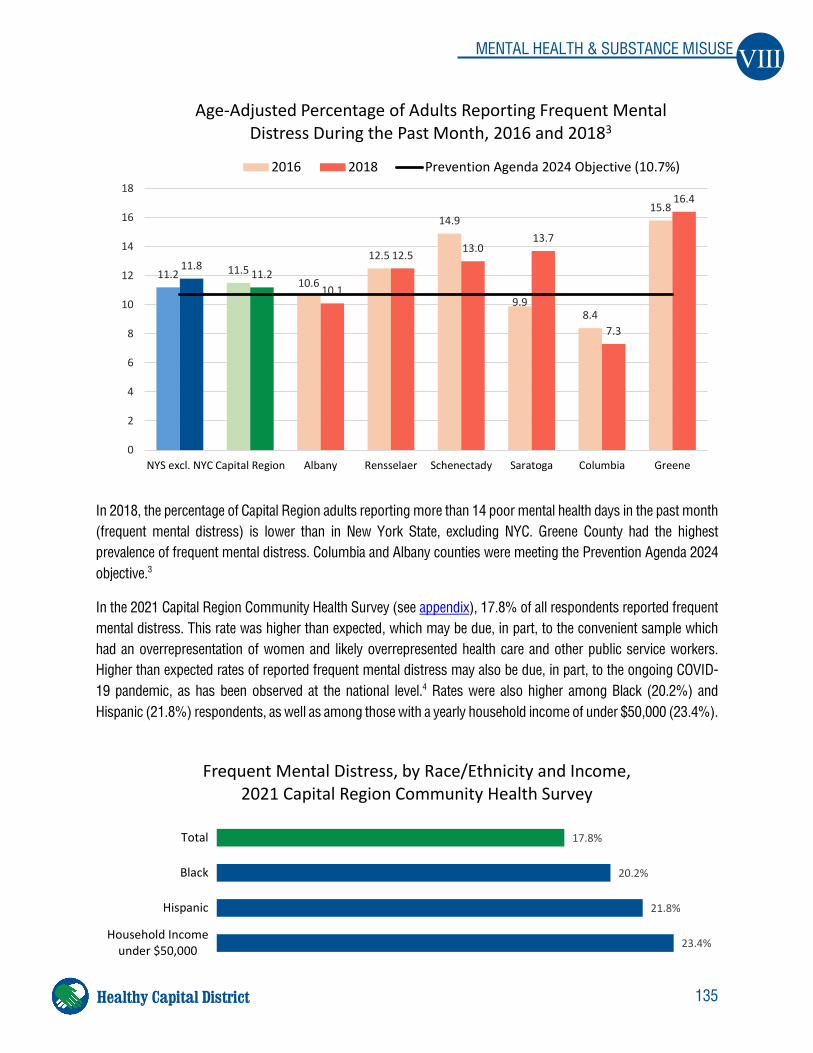
135
VIII MENTAL HEALTH & SUBSTANCE MISUSE
Healthy Capital District
In 2018, the percentage of Capital Region adults reporting more than 14 poor mental health days in the past month (frequent mental distress) is lower than in New York State, excluding NYC. Greene County had the highest prevalence of frequent mental distress. Columbia and Albany counties were meeting the Prevention Agenda 2024 objective.3
In the 2021 Capital Region Community Health Survey (see appendix), 17.8% of all respondents reported frequent mental distress. This rate was higher than expected, which may be due, in part, to the convenient sample which had an overrepresentation of women and likely overrepresented health care and other public service workers. Higher than expected rates of reported frequent mental distress may also be due, in part, to the ongoing COVID-19 pandemic, as has been observed at the national level.4 Rates were also higher among Black (20.2%) and Hispanic (21.8%) respondents, as well as among those with a yearly household income of under $50,000 (23.4%).
11.2 11.510.6
12.5
14.9
9.98.4
15.8
11.811.2
10.1
12.5 13.013.7
7.3
16.4
0
2
4
6
8
10
12
14
16
18
NYS excl. NYC Capital Region Albany Rensselaer Schenectady Saratoga Columbia Greene
Age-Adjusted Percentage of Adults Reporting Frequent Mental Distress During the Past Month, 2016 and 20183
2016 2018 Prevention Agenda 2024 Objective (10.7%)
17.8%
20.2%
21.8%
23.4%
Total
Black
Hispanic
Household Incomeunder $50,000
Frequent Mental Distress, by Race/Ethnicity and Income,2021 Capital Region Community Health Survey
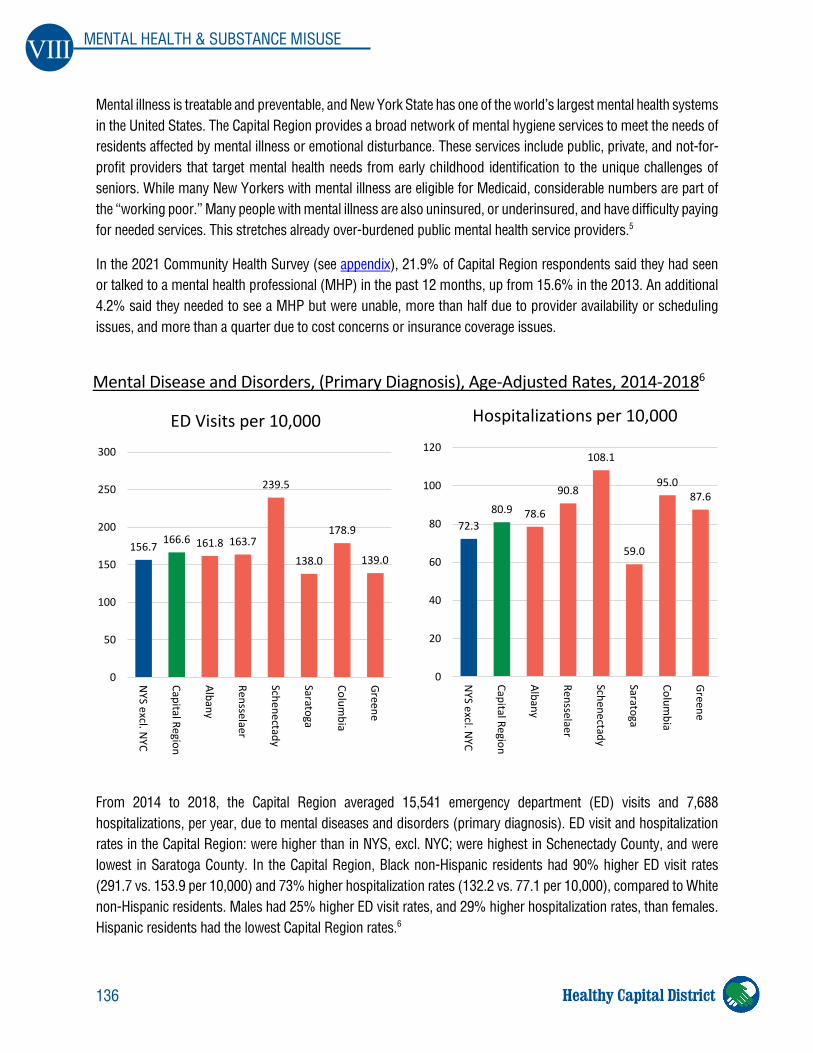
136
VIII MENTAL HEALTH & SUBSTANCE MISUSE
Healthy Capital District
Mental illness is treatable and preventable, and New York State has one of the world’s largest mental health systems in the United States. The Capital Region provides a broad network of mental hygiene services to meet the needs of residents affected by mental illness or emotional disturbance. These services include public, private, and not-for-profit providers that target mental health needs from early childhood identification to the unique challenges of seniors. While many New Yorkers with mental illness are eligible for Medicaid, considerable numbers are part of the “working poor.” Many people with mental illness are also uninsured, or underinsured, and have difficulty paying for needed services. This stretches already over-burdened public mental health service providers.5
In the 2021 Community Health Survey (see appendix), 21.9% of Capital Region respondents said they had seen or talked to a mental health professional (MHP) in the past 12 months, up from 15.6% in the 2013. An additional 4.2% said they needed to see a MHP but were unable, more than half due to provider availability or scheduling issues, and more than a quarter due to cost concerns or insurance coverage issues.
From 2014 to 2018, the Capital Region averaged 15,541 emergency department (ED) visits and 7,688 hospitalizations, per year, due to mental diseases and disorders (primary diagnosis). ED visit and hospitalization rates in the Capital Region: were higher than in NYS, excl. NYC; were highest in Schenectady County, and were lowest in Saratoga County. In the Capital Region, Black non-Hispanic residents had 90% higher ED visit rates (291.7 vs. 153.9 per 10,000) and 73% higher hospitalization rates (132.2 vs. 77.1 per 10,000), compared to White non-Hispanic residents. Males had 25% higher ED visit rates, and 29% higher hospitalization rates, than females. Hispanic residents had the lowest Capital Region rates.6
156.7 166.6 161.8 163.7
239.5
138.0
178.9
139.0
0
50
100
150
200
250
300
NYS excl. N
YC
Capital Region
Albany
Rensselaer
Schenectady
Saratoga
Columbia
GreeneED Visits per 10,000
72.380.9 78.6
90.8
108.1
59.0
95.087.6
0
20
40
60
80
100
120
NYS excl. N
YC
Capital Region
Albany
Rensselaer
Schenectady
Saratoga
Columbia
Greene
Hospitalizations per 10,000
Mental Disease and Disorders, (Primary Diagnosis), Age-Adjusted Rates, 2014-20186
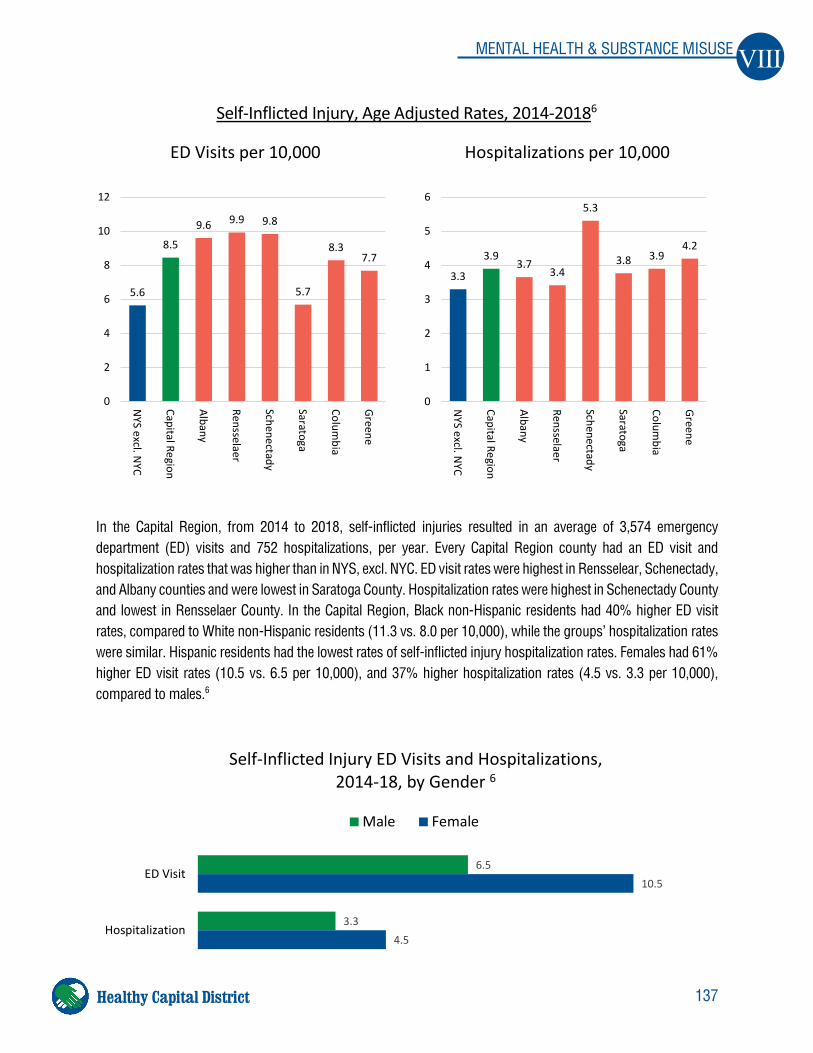
137
VIII MENTAL HEALTH & SUBSTANCE MISUSE
Healthy Capital District
In the Capital Region, from 2014 to 2018, self-inflicted injuries resulted in an average of 3,574 emergency department (ED) visits and 752 hospitalizations, per year. Every Capital Region county had an ED visit and hospitalization rates that was higher than in NYS, excl. NYC. ED visit rates were highest in Rensselear, Schenectady, and Albany counties and were lowest in Saratoga County. Hospitalization rates were highest in Schenectady County and lowest in Rensselaer County. In the Capital Region, Black non-Hispanic residents had 40% higher ED visit rates, compared to White non-Hispanic residents (11.3 vs. 8.0 per 10,000), while the groups’ hospitalization rates were similar. Hispanic residents had the lowest rates of self-inflicted injury hospitalization rates. Females had 61% higher ED visit rates (10.5 vs. 6.5 per 10,000), and 37% higher hospitalization rates (4.5 vs. 3.3 per 10,000), compared to males.6
Self-Inflicted Injury, Age Adjusted Rates, 2014-20186
3.3
3.93.7
3.4
5.3
3.8 3.94.2
0
1
2
3
4
5
6
NYS excl. N
YC
Capital Region
Albany
Rensselaer
Schenectady
Saratoga
Columbia
Greene
Hospitalizations per 10,000
5.6
8.5
9.6 9.9 9.8
5.7
8.37.7
0
2
4
6
8
10
12
NYS excl. N
YC
Capital Region
Albany
Rensselaer
Schenectady
Saratoga
Columbia
Greene
ED Visits per 10,000
6.5
3.3
10.5
4.5
ED Visit
Hospitalization
Self-Inflicted Injury ED Visits and Hospitalizations, 2014-18, by Gender 6
Male Female
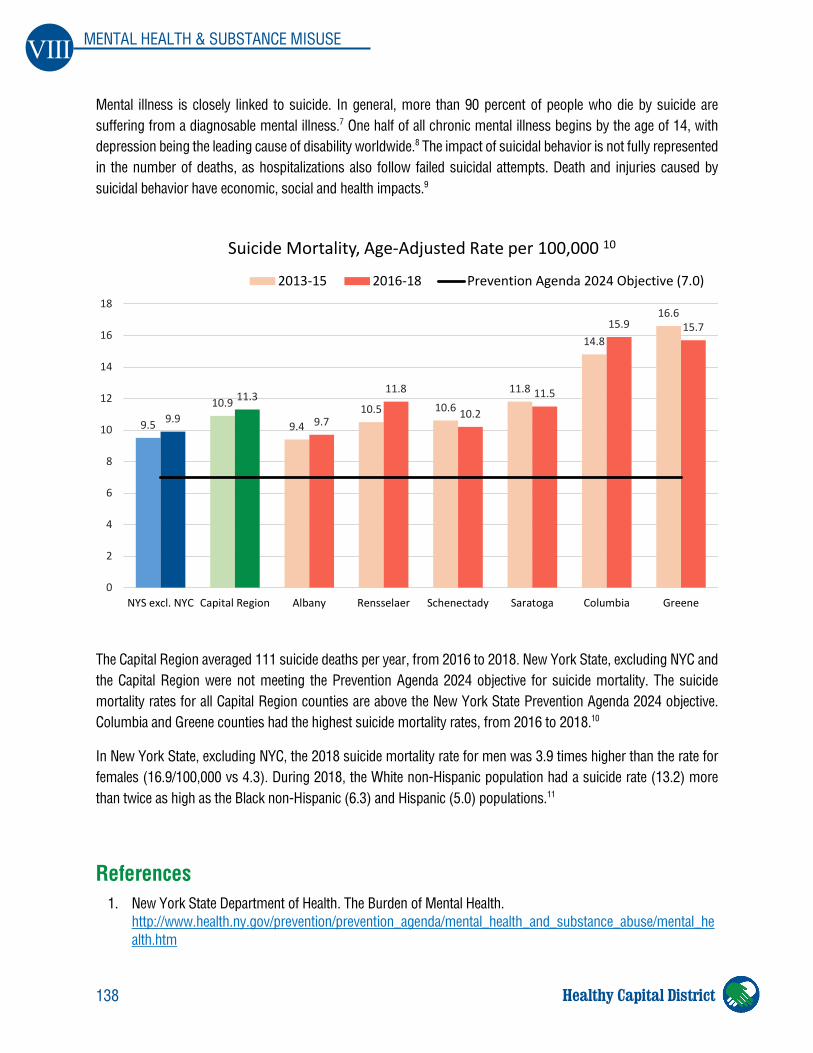
138
VIII MENTAL HEALTH & SUBSTANCE MISUSE
Healthy Capital District
Mental illness is closely linked to suicide. In general, more than 90 percent of people who die by suicide are suffering from a diagnosable mental illness.7 One half of all chronic mental illness begins by the age of 14, with depression being the leading cause of disability worldwide.8 The impact of suicidal behavior is not fully represented in the number of deaths, as hospitalizations also follow failed suicidal attempts. Death and injuries caused by suicidal behavior have economic, social and health impacts.9
The Capital Region averaged 111 suicide deaths per year, from 2016 to 2018. New York State, excluding NYC and the Capital Region were not meeting the Prevention Agenda 2024 objective for suicide mortality. The suicide mortality rates for all Capital Region counties are above the New York State Prevention Agenda 2024 objective. Columbia and Greene counties had the highest suicide mortality rates, from 2016 to 2018.10
In New York State, excluding NYC, the 2018 suicide mortality rate for men was 3.9 times higher than the rate for females (16.9/100,000 vs 4.3). During 2018, the White non-Hispanic population had a suicide rate (13.2) more than twice as high as the Black non-Hispanic (6.3) and Hispanic (5.0) populations.11
References 1. New York State Department of Health. The Burden of Mental Health.
http://www.health.ny.gov/prevention/prevention_agenda/mental_health_and_substance_abuse/mental_health.htm
9.5
10.9
9.410.5 10.6
11.8
14.8
16.6
9.9
11.3
9.7
11.8
10.2
11.5
15.9 15.7
0
2
4
6
8
10
12
14
16
18
NYS excl. NYC Capital Region Albany Rensselaer Schenectady Saratoga Columbia Greene
Suicide Mortality, Age-Adjusted Rate per 100,000 10
2013-15 2016-18 Prevention Agenda 2024 Objective (7.0)
139
VIII MENTAL HEALTH & SUBSTANCE MISUSE
Healthy Capital District
2. New York State Department of Health. Expanded Behavioral Risk Factor Surveillance System (Expanded BRFSS). http://www.health.ny.gov/statistics/brfss/expanded/
3. New York State Department of Health. Frequent mental distress during the past month among adults, age-adjusted percentage, 2018. https://webbi1.health.ny.gov/SASStoredProcess/guest?_program=/EBI/PHIG/apps/dashboard/pa_dashboard&p=it&ind_id=pa69_0
4. Kaiser Family Foundation. Panchal N, Kamal R, Cox C, and Garfield R. The Implications of COVID-19 for Mental Health and Substance Use. The Implications of COVID-19 for Mental Health and Substance Use. Published February 10, 2021. https://www.kff.org/coronavirus-covid-19/issue-brief/the-implications-of-covid-19-for-mental-health-and-substance-use/
5. New York State Department of Health. Office of Mental Health. http://www.omh.ny.gov/ 6. Common Ground Health. Statewide Planning and Research Cooperative System (SPARCS) data portal.
Mental Disease and Disorder, and Self-Inflicted Injury: Hospitalization and ED visits. 7. National Alliance on Mental Illness. Mental Health Facts by the Numbers. https://www.nami.org/learn-
more/mental-health-by-the-numbers 8. National Institutes of Health, National Institute of Mental Health. Mental Health Information: Statistics.
https://www.nimh.nih.gov/health/statistics 9. Suicide Prevention Resource Center. Scope of the Problem. http://www.sprc.org/ 10. New York State Department of Health. Suicide mortality, age-adjusted rate per 100,000 population, 2016-
2018. https://webbi1.health.ny.gov/SASStoredProcess/guest?_program=/EBI/PHIG/apps/dashboard/pa_dashboard&p=it&ind_id=pa83_0
11. Deaths due to Suicide by Race/Ethnicity, Sex, and Age, by Region, NYS 2018. https://www.health.ny.gov/statistics/vital_statistics/2018/table43.htm
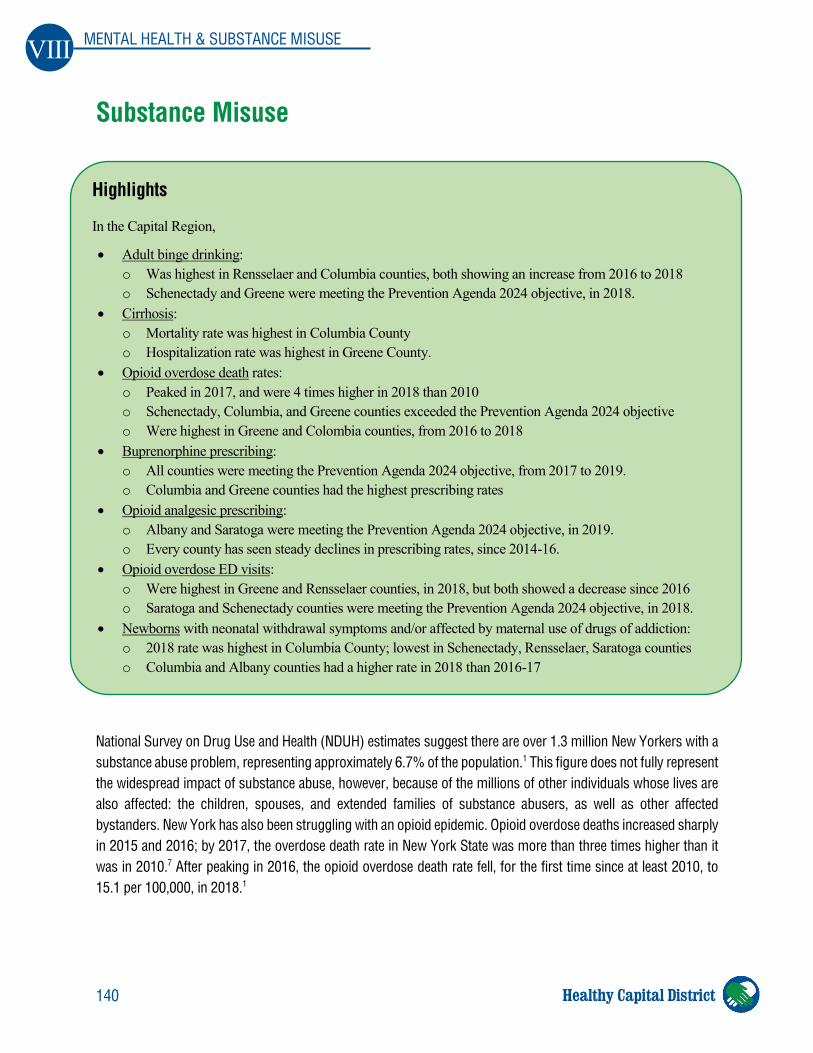
140
VIII MENTAL HEALTH & SUBSTANCE MISUSE
Healthy Capital District
Substance Misuse
National Survey on Drug Use and Health (NDUH) estimates suggest there are over 1.3 million New Yorkers with a substance abuse problem, representing approximately 6.7% of the population.1 This figure does not fully represent the widespread impact of substance abuse, however, because of the millions of other individuals whose lives are also affected: the children, spouses, and extended families of substance abusers, as well as other affected bystanders. New York has also been struggling with an opioid epidemic. Opioid overdose deaths increased sharply in 2015 and 2016; by 2017, the overdose death rate in New York State was more than three times higher than it was in 2010.7 After peaking in 2016, the opioid overdose death rate fell, for the first time since at least 2010, to 15.1 per 100,000, in 2018.1
Highlights
In the Capital Region,
• Adult binge drinking: o Was highest in Rensselaer and Columbia counties, both showing an increase from 2016 to 2018 o Schenectady and Greene were meeting the Prevention Agenda 2024 objective, in 2018.
• Cirrhosis: o Mortality rate was highest in Columbia County o Hospitalization rate was highest in Greene County.
• Opioid overdose death rates: o Peaked in 2017, and were 4 times higher in 2018 than 2010 o Schenectady, Columbia, and Greene counties exceeded the Prevention Agenda 2024 objective o Were highest in Greene and Colombia counties, from 2016 to 2018
• Buprenorphine prescribing: o All counties were meeting the Prevention Agenda 2024 objective, from 2017 to 2019. o Columbia and Greene counties had the highest prescribing rates
• Opioid analgesic prescribing: o Albany and Saratoga were meeting the Prevention Agenda 2024 objective, in 2019. o Every county has seen steady declines in prescribing rates, since 2014-16.
• Opioid overdose ED visits: o Were highest in Greene and Rensselaer counties, in 2018, but both showed a decrease since 2016 o Saratoga and Schenectady counties were meeting the Prevention Agenda 2024 objective, in 2018.
• Newborns with neonatal withdrawal symptoms and/or affected by maternal use of drugs of addiction: o 2018 rate was highest in Columbia County; lowest in Schenectady, Rensselaer, Saratoga counties o Columbia and Albany counties had a higher rate in 2018 than 2016-17
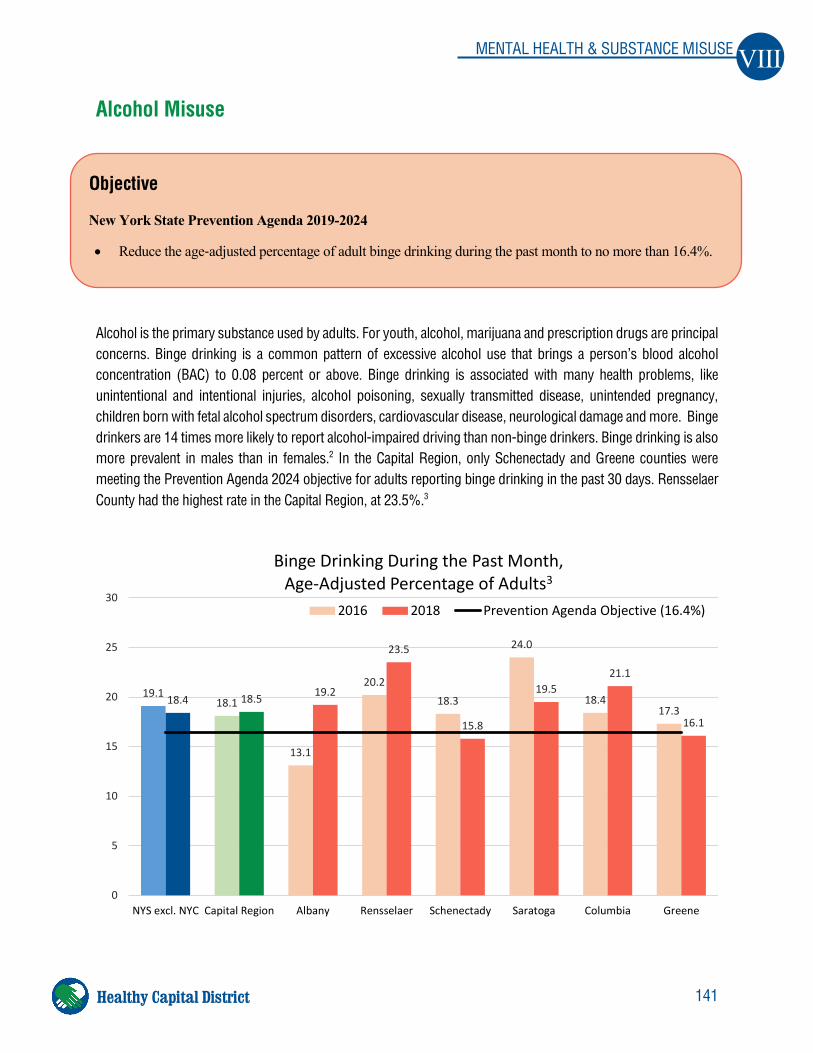
141
VIII MENTAL HEALTH & SUBSTANCE MISUSE
Healthy Capital District
Alcohol Misuse
Alcohol is the primary substance used by adults. For youth, alcohol, marijuana and prescription drugs are principal concerns. Binge drinking is a common pattern of excessive alcohol use that brings a person’s blood alcohol concentration (BAC) to 0.08 percent or above. Binge drinking is associated with many health problems, like unintentional and intentional injuries, alcohol poisoning, sexually transmitted disease, unintended pregnancy, children born with fetal alcohol spectrum disorders, cardiovascular disease, neurological damage and more. Binge drinkers are 14 times more likely to report alcohol-impaired driving than non-binge drinkers. Binge drinking is also more prevalent in males than in females.2 In the Capital Region, only Schenectady and Greene counties were meeting the Prevention Agenda 2024 objective for adults reporting binge drinking in the past 30 days. Rensselaer County had the highest rate in the Capital Region, at 23.5%.3
Objective
New York State Prevention Agenda 2019-2024
• Reduce the age‐adjusted percentage of adult binge drinking during the past month to no more than 16.4%.
19.118.1
13.1
20.218.3
24.0
18.417.3
18.4 18.5 19.2
23.5
15.8
19.521.1
16.1
0
5
10
15
20
25
30
NYS excl. NYC Capital Region Albany Rensselaer Schenectady Saratoga Columbia Greene
Binge Drinking During the Past Month,Age-Adjusted Percentage of Adults3
2016 2018 Prevention Agenda Objective (16.4%)
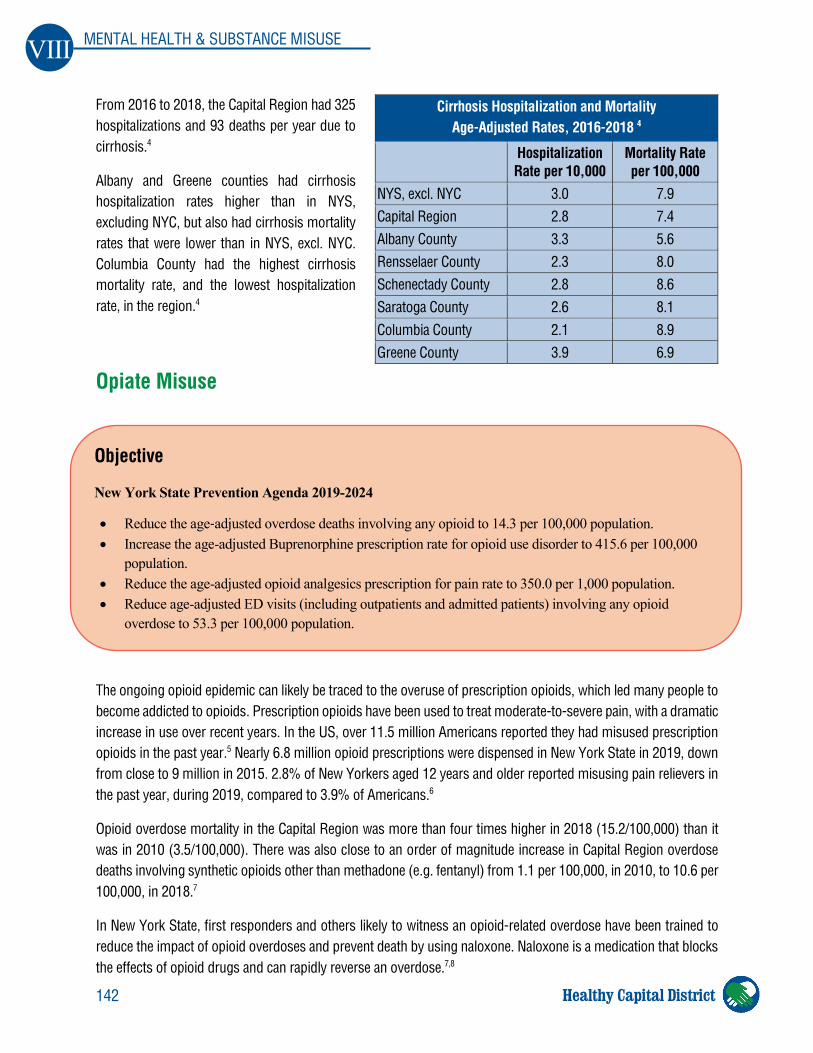
142
VIII MENTAL HEALTH & SUBSTANCE MISUSE
Healthy Capital District
From 2016 to 2018, the Capital Region had 325 hospitalizations and 93 deaths per year due to cirrhosis.4
Albany and Greene counties had cirrhosis hospitalization rates higher than in NYS, excluding NYC, but also had cirrhosis mortality rates that were lower than in NYS, excl. NYC. Columbia County had the highest cirrhosis mortality rate, and the lowest hospitalization rate, in the region.4
Opiate Misuse
The ongoing opioid epidemic can likely be traced to the overuse of prescription opioids, which led many people to become addicted to opioids. Prescription opioids have been used to treat moderate-to-severe pain, with a dramatic increase in use over recent years. In the US, over 11.5 million Americans reported they had misused prescription opioids in the past year.5 Nearly 6.8 million opioid prescriptions were dispensed in New York State in 2019, down from close to 9 million in 2015. 2.8% of New Yorkers aged 12 years and older reported misusing pain relievers in the past year, during 2019, compared to 3.9% of Americans.6
Opioid overdose mortality in the Capital Region was more than four times higher in 2018 (15.2/100,000) than it was in 2010 (3.5/100,000). There was also close to an order of magnitude increase in Capital Region overdose deaths involving synthetic opioids other than methadone (e.g. fentanyl) from 1.1 per 100,000, in 2010, to 10.6 per 100,000, in 2018.7
In New York State, first responders and others likely to witness an opioid-related overdose have been trained to reduce the impact of opioid overdoses and prevent death by using naloxone. Naloxone is a medication that blocks the effects of opioid drugs and can rapidly reverse an overdose.7,8
Cirrhosis Hospitalization and Mortality Age-Adjusted Rates, 2016-2018 4
Hospitalization Rate per 10,000
Mortality Rate per 100,000
NYS, excl. NYC 3.0 7.9 Capital Region 2.8 7.4 Albany County 3.3 5.6 Rensselaer County 2.3 8.0 Schenectady County 2.8 8.6 Saratoga County 2.6 8.1 Columbia County 2.1 8.9 Greene County 3.9 6.9
Objective
New York State Prevention Agenda 2019-2024
• Reduce the age‐adjusted overdose deaths involving any opioid to 14.3 per 100,000 population. • Increase the age-adjusted Buprenorphine prescription rate for opioid use disorder to 415.6 per 100,000
population. • Reduce the age-adjusted opioid analgesics prescription for pain rate to 350.0 per 1,000 population. • Reduce age-adjusted ED visits (including outpatients and admitted patients) involving any opioid
overdose to 53.3 per 100,000 population.
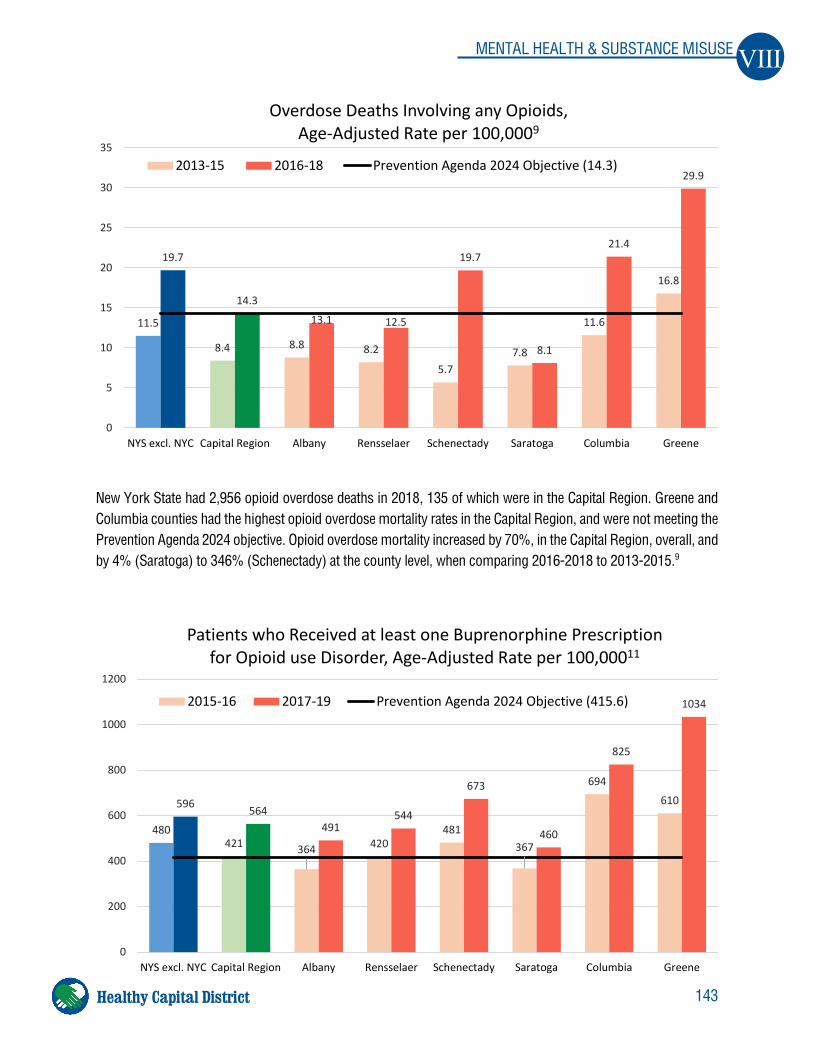
143
VIII MENTAL HEALTH & SUBSTANCE MISUSE
Healthy Capital District
New York State had 2,956 opioid overdose deaths in 2018, 135 of which were in the Capital Region. Greene and Columbia counties had the highest opioid overdose mortality rates in the Capital Region, and were not meeting the Prevention Agenda 2024 objective. Opioid overdose mortality increased by 70%, in the Capital Region, overall, and by 4% (Saratoga) to 346% (Schenectady) at the county level, when comparing 2016-2018 to 2013-2015.9
480421 364 420
481367
694
610596 564491
544
673
460
825
1034
0
200
400
600
800
1000
1200
NYS excl. NYC Capital Region Albany Rensselaer Schenectady Saratoga Columbia Greene
Patients who Received at least one Buprenorphine Prescription for Opioid use Disorder, Age-Adjusted Rate per 100,00011
2015-16 2017-19 Prevention Agenda 2024 Objective (415.6)
11.5
8.4 8.8 8.2
5.77.8
11.6
16.8
19.7
14.3
13.1 12.5
19.7
8.1
21.4
29.9
0
5
10
15
20
25
30
35
NYS excl. NYC Capital Region Albany Rensselaer Schenectady Saratoga Columbia Greene
Overdose Deaths Involving any Opioids, Age-Adjusted Rate per 100,0009
2013-15 2016-18 Prevention Agenda 2024 Objective (14.3)
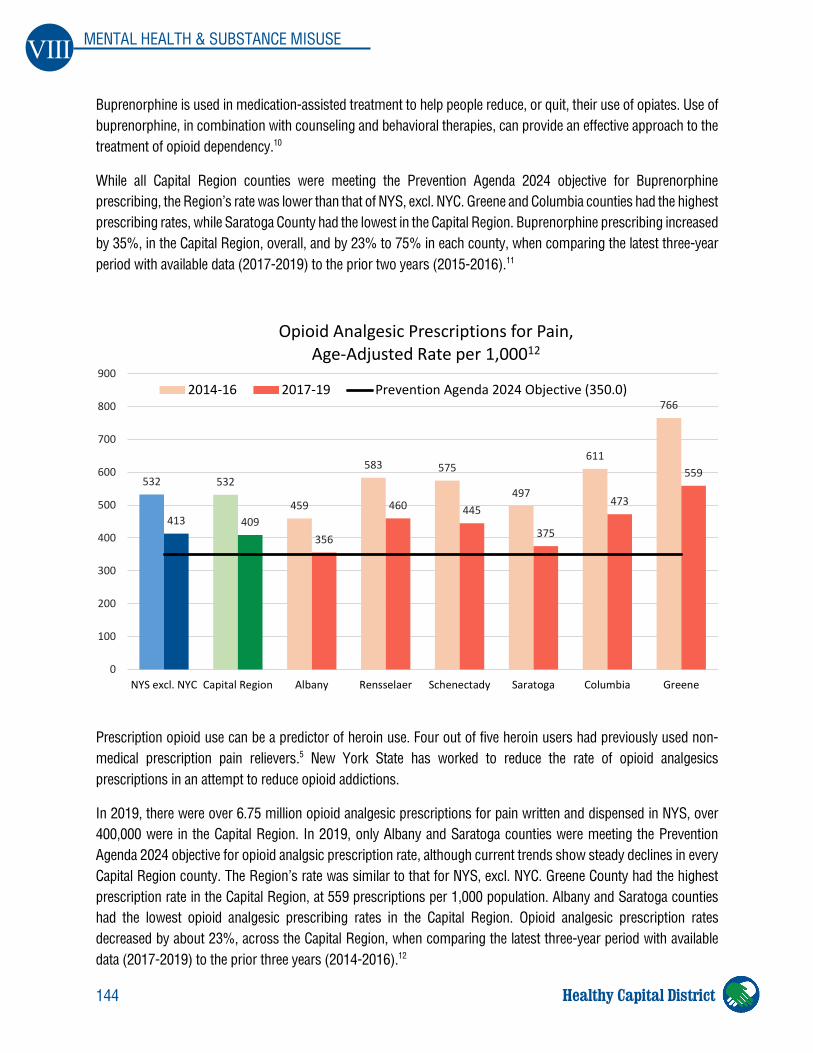
144
VIII MENTAL HEALTH & SUBSTANCE MISUSE
Healthy Capital District
Buprenorphine is used in medication-assisted treatment to help people reduce, or quit, their use of opiates. Use of buprenorphine, in combination with counseling and behavioral therapies, can provide an effective approach to the treatment of opioid dependency.10
While all Capital Region counties were meeting the Prevention Agenda 2024 objective for Buprenorphine prescribing, the Region’s rate was lower than that of NYS, excl. NYC. Greene and Columbia counties had the highest prescribing rates, while Saratoga County had the lowest in the Capital Region. Buprenorphine prescribing increased by 35%, in the Capital Region, overall, and by 23% to 75% in each county, when comparing the latest three-year period with available data (2017-2019) to the prior two years (2015-2016).11
Prescription opioid use can be a predictor of heroin use. Four out of five heroin users had previously used non-medical prescription pain relievers.5 New York State has worked to reduce the rate of opioid analgesics prescriptions in an attempt to reduce opioid addictions.
In 2019, there were over 6.75 million opioid analgesic prescriptions for pain written and dispensed in NYS, over 400,000 were in the Capital Region. In 2019, only Albany and Saratoga counties were meeting the Prevention Agenda 2024 objective for opioid analgsic prescription rate, although current trends show steady declines in every Capital Region county. The Region’s rate was similar to that for NYS, excl. NYC. Greene County had the highest prescription rate in the Capital Region, at 559 prescriptions per 1,000 population. Albany and Saratoga counties had the lowest opioid analgesic prescribing rates in the Capital Region. Opioid analgesic prescription rates decreased by about 23%, across the Capital Region, when comparing the latest three-year period with available data (2017-2019) to the prior three years (2014-2016).12
532 532
459
583 575
497
611
766
413 409356
460 445
375
473
559
0
100
200
300
400
500
600
700
800
900
NYS excl. NYC Capital Region Albany Rensselaer Schenectady Saratoga Columbia Greene
Opioid Analgesic Prescriptions for Pain,Age-Adjusted Rate per 1,00012
2014-16 2017-19 Prevention Agenda 2024 Objective (350.0)
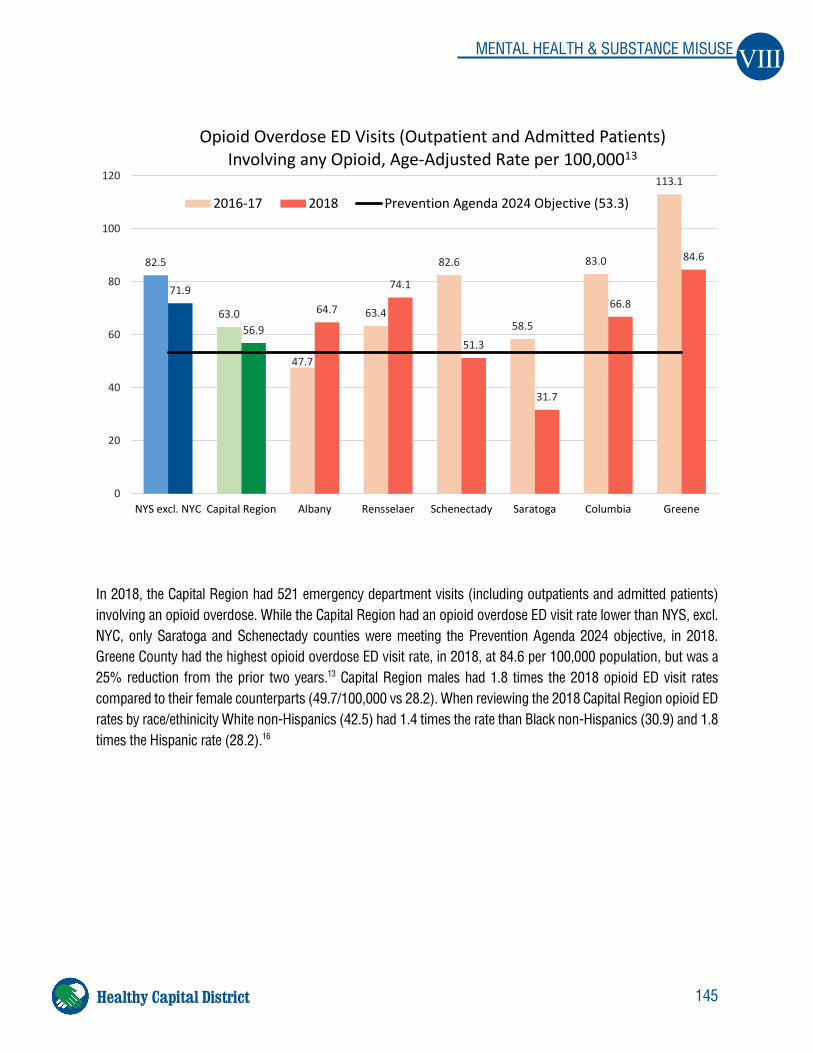
145
VIII MENTAL HEALTH & SUBSTANCE MISUSE
Healthy Capital District
In 2018, the Capital Region had 521 emergency department visits (including outpatients and admitted patients) involving an opioid overdose. While the Capital Region had an opioid overdose ED visit rate lower than NYS, excl. NYC, only Saratoga and Schenectady counties were meeting the Prevention Agenda 2024 objective, in 2018. Greene County had the highest opioid overdose ED visit rate, in 2018, at 84.6 per 100,000 population, but was a 25% reduction from the prior two years.13 Capital Region males had 1.8 times the 2018 opioid ED visit rates compared to their female counterparts (49.7/100,000 vs 28.2). When reviewing the 2018 Capital Region opioid ED rates by race/ethinicity White non-Hispanics (42.5) had 1.4 times the rate than Black non-Hispanics (30.9) and 1.8 times the Hispanic rate (28.2).16
82.5
63.0
47.7
63.4
82.6
58.5
83.0
113.1
71.9
56.9
64.7
74.1
51.3
31.7
66.8
84.6
0
20
40
60
80
100
120
NYS excl. NYC Capital Region Albany Rensselaer Schenectady Saratoga Columbia Greene
Opioid Overdose ED Visits (Outpatient and Admitted Patients) Involving any Opioid, Age-Adjusted Rate per 100,00013
2016-17 2018 Prevention Agenda 2024 Objective (53.3)
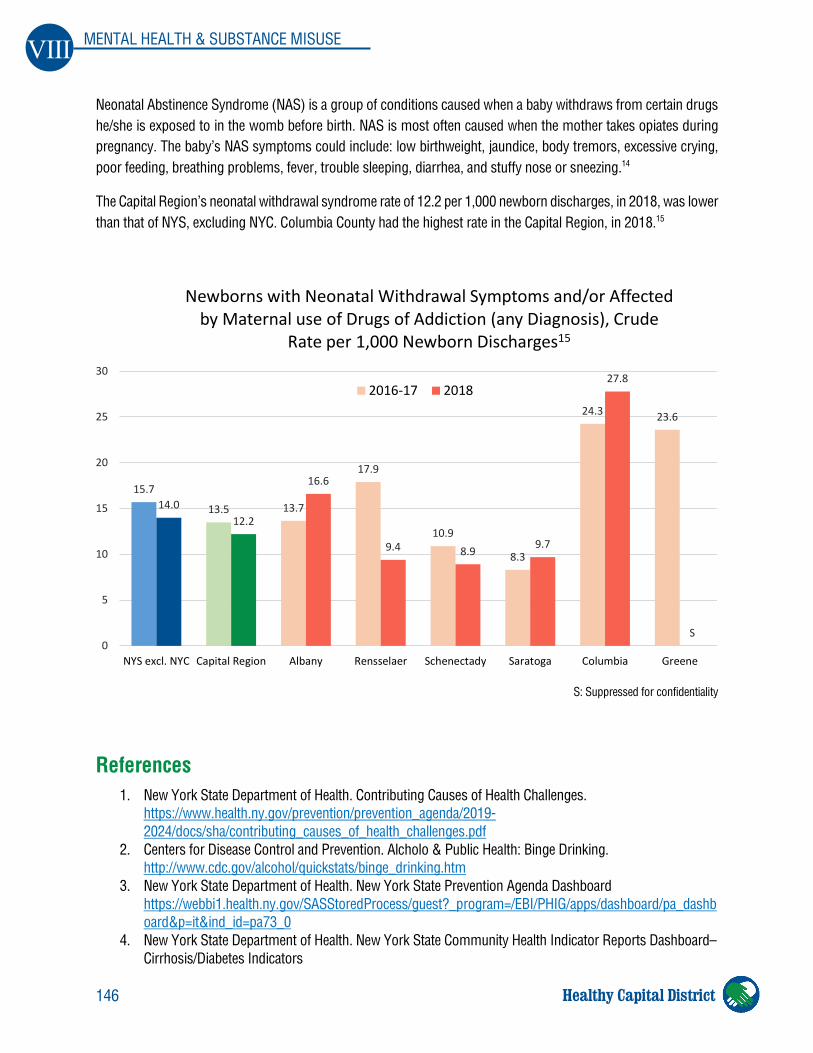
146
VIII MENTAL HEALTH & SUBSTANCE MISUSE
Healthy Capital District
Neonatal Abstinence Syndrome (NAS) is a group of conditions caused when a baby withdraws from certain drugs he/she is exposed to in the womb before birth. NAS is most often caused when the mother takes opiates during pregnancy. The baby’s NAS symptoms could include: low birthweight, jaundice, body tremors, excessive crying, poor feeding, breathing problems, fever, trouble sleeping, diarrhea, and stuffy nose or sneezing.14
The Capital Region’s neonatal withdrawal syndrome rate of 12.2 per 1,000 newborn discharges, in 2018, was lower than that of NYS, excluding NYC. Columbia County had the highest rate in the Capital Region, in 2018.15
S: Suppressed for confidentiality
References 1. New York State Department of Health. Contributing Causes of Health Challenges.
https://www.health.ny.gov/prevention/prevention_agenda/2019-2024/docs/sha/contributing_causes_of_health_challenges.pdf
2. Centers for Disease Control and Prevention. Alcholo & Public Health: Binge Drinking. http://www.cdc.gov/alcohol/quickstats/binge_drinking.htm
3. New York State Department of Health. New York State Prevention Agenda Dashboard https://webbi1.health.ny.gov/SASStoredProcess/guest?_program=/EBI/PHIG/apps/dashboard/pa_dashboard&p=it&ind_id=pa73_0
4. New York State Department of Health. New York State Community Health Indicator Reports Dashboard– Cirrhosis/Diabetes Indicators
15.7
13.5 13.7
17.9
10.9
8.3
24.3 23.6
14.012.2
16.6
9.4 8.9 9.7
27.8
S0
5
10
15
20
25
30
NYS excl. NYC Capital Region Albany Rensselaer Schenectady Saratoga Columbia Greene
Newborns with Neonatal Withdrawal Symptoms and/or Affected by Maternal use of Drugs of Addiction (any Diagnosis), Crude
Rate per 1,000 Newborn Discharges15
2016-17 2018
147
VIII MENTAL HEALTH & SUBSTANCE MISUSE
Healthy Capital District
https://webbi1.health.ny.gov/SASStoredProcess/guest?_program=%2FEBI%2FPHIG%2Fapps%2Fchir_dashboard%2Fchir_dashboard&p=sh&stop=4
5. Centers for Disease Control and Prevention. Prescription Opioids. https://www.cdc.gov/drugoverdose/opioids/prescribed.html
6. New York State Department of Health. New York State Opioid Annual Report 2020. https://www.health.ny.gov/statistics/opioid/data/pdf/nys_opioid_annual_report_2020.pdf
7. New York State Department of Health. New York State Opioid Data Dashboard. https://webbi1.health.ny.gov/SASStoredProcess/guest?_program=/EBI/PHIG/apps/opioid_dashboard/op_dashboard&p=sh
8. DrugBank. Naloxone. https://go.drugbank.com/drugs/DB01183 9. New York State Department of Health. Overdose deaths involving any opioids, age-adjusted rate per
100,000 population, 2018. https://webbi1.health.ny.gov/SASStoredProcess/guest?_program=/EBI/PHIG/apps/opioid_dashboard/op_dashboard&p=it&ind_id=op9
10. Substance Abuse and Mental Health Services Administration (SAMHSA). Buprenorphine. https://www.samhsa.gov/medication-assisted-treatment/medications-counseling-related-conditions/buprenorphine
11. New York State Department of Health. Patients who received at least one buprenorphine prescription for opioid use disorder, age-adjusted rate per 100,000 population. https://webbi1.health.ny.gov/SASStoredProcess/guest?_program=/EBI/PHIG/apps/dashboard/pa_dashboard&p=ctr&ind_id=pa75_0
12. New York State Department of Health. Opioid analgesic prescriptions for pain, age-adjusted rate per 1,000 population https://webbi1.health.ny.gov/SASStoredProcess/guest?_program=/EBI/PHIG/apps/dashboard/pa_dashboard&p=it&ind_id=pa76_0
13. New York State Department of Health. Emergency department visits (including outpatients and admitted patients) involving any opioid overdose, age-adjusted rate per 100,000 population, 2018. https://webbi1.health.ny.gov/SASStoredProcess/guest?_program=/EBI/PHIG/apps/dashboard/pa_dashboard&p=it&ind_id=pa77_0
14. March of Dimes. Neonatal Abstinence Syndrome (NAS). https://www.marchofdimes.org/complications/neonatal-abstinence-syndrome-(nas).aspx
15. New York State Department of Health. Newborns with neonatal withdrawal symptoms and/or affected by maternal use of drugs of addiction (any diagnosis), crude rate per 1,000 newborn discharges, 2018. https://webbi1.health.ny.gov/SASStoredProcess/guest?_program=/EBI/PHIG/apps/opioid_dashboard/op_dashboard&p=it&ind_id=op34
16. Common Ground Health. Statewide Planning and Research Cooperative System (SPARCS) data portal. Opioid related ED visits.
148
IX INFECTIOUS DISEASE
Healthy Capital District
IX. Infectious Disease
Vaccine-Preventable Disease
Vaccines are used worldwide to protect against disease by inducing immunity. Immunization is a proven tool for controlling and even eradicating disease. Thanks to vaccines, diseases such as smallpox have been eradicated and many other vaccines have saved millions of lives all over the world. Vaccines contain or produce the same antigens that are involved in disease. In the case of viral vaccines, a weakened, harmless virus is introduced to the body, while mRNA vaccines use our own cell’s machinery to produce viral antigens. Both types of vaccines bolster our immunity to a disease, without causing it, by generating memory B and T cells with specific immunologic memory that can more quickly respond if an infection occurs with that virus.1,2
Childhood Immunization
Highlights
In the Capital Region, in 2019:
• Greene County, alone, had a percentage of children aged 24-35 months with a completed 4:3:1:3:3:1:4 immunization series that was lower than NYS, excl. NYC, and the Prevention Agenda 2024 objective.
• Albany and Greene counties were meeting the Prevention Agenda 2024 objective for the percentage of 13-year-olds with a complete HPV vaccine series.
• No Capital Region counties met the Prevention Agenda objective of 70% of adults, ages 65 and older, receiving a flu immunization in the past year.
• Only Albany and Schenectady counties met the Prevention Agenda Objective of 76.2% of the 65 + year population ever receiving a pneumococcal vaccination.
Objective
New York State Prevention Agenda 2019-2024
• Increase the percentage of 24-35 month olds with the 4:3:1:3:3:1:4 (4 Tdap, 3 polio, 1 MMR, 3 Hep B, 3 Hib, 1 varicella, 4 PCV13) immunization series to 95.0% or higher.
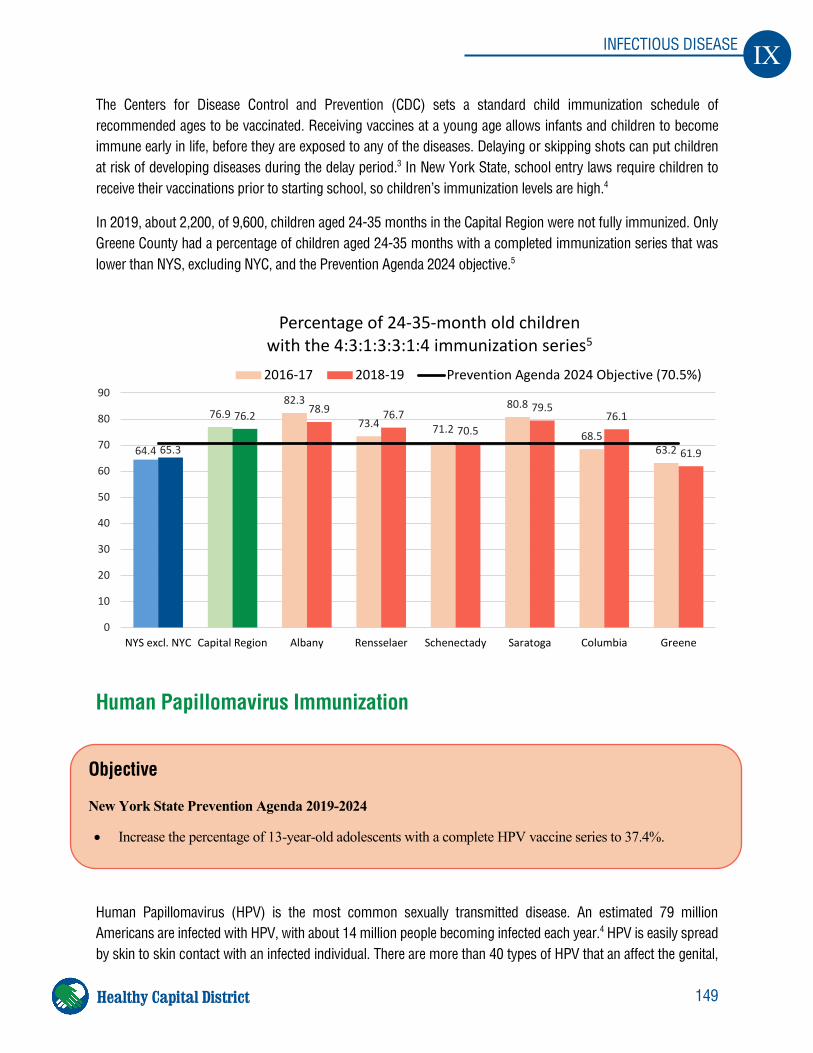
149
IX INFECTIOUS DISEASE
Healthy Capital District
The Centers for Disease Control and Prevention (CDC) sets a standard child immunization schedule of recommended ages to be vaccinated. Receiving vaccines at a young age allows infants and children to become immune early in life, before they are exposed to any of the diseases. Delaying or skipping shots can put children at risk of developing diseases during the delay period.3 In New York State, school entry laws require children to receive their vaccinations prior to starting school, so children’s immunization levels are high.4
In 2019, about 2,200, of 9,600, children aged 24-35 months in the Capital Region were not fully immunized. Only Greene County had a percentage of children aged 24-35 months with a completed immunization series that was lower than NYS, excluding NYC, and the Prevention Agenda 2024 objective.5
Human Papillomavirus Immunization
Human Papillomavirus (HPV) is the most common sexually transmitted disease. An estimated 79 million Americans are infected with HPV, with about 14 million people becoming infected each year.4 HPV is easily spread by skin to skin contact with an infected individual. There are more than 40 types of HPV that an affect the genital,
Objective
New York State Prevention Agenda 2019-2024
• Increase the percentage of 13-year-old adolescents with a complete HPV vaccine series to 37.4%.
64.4
76.982.3
73.4 71.2
80.8
68.563.265.3
76.2 78.9 76.770.5
79.576.1
61.9
0
10
20
30
40
50
60
70
80
90
NYS excl. NYC Capital Region Albany Rensselaer Schenectady Saratoga Columbia Greene
Percentage of 24-35-month old children with the 4:3:1:3:3:1:4 immunization series5
2016-17 2018-19 Prevention Agenda 2024 Objective (70.5%)
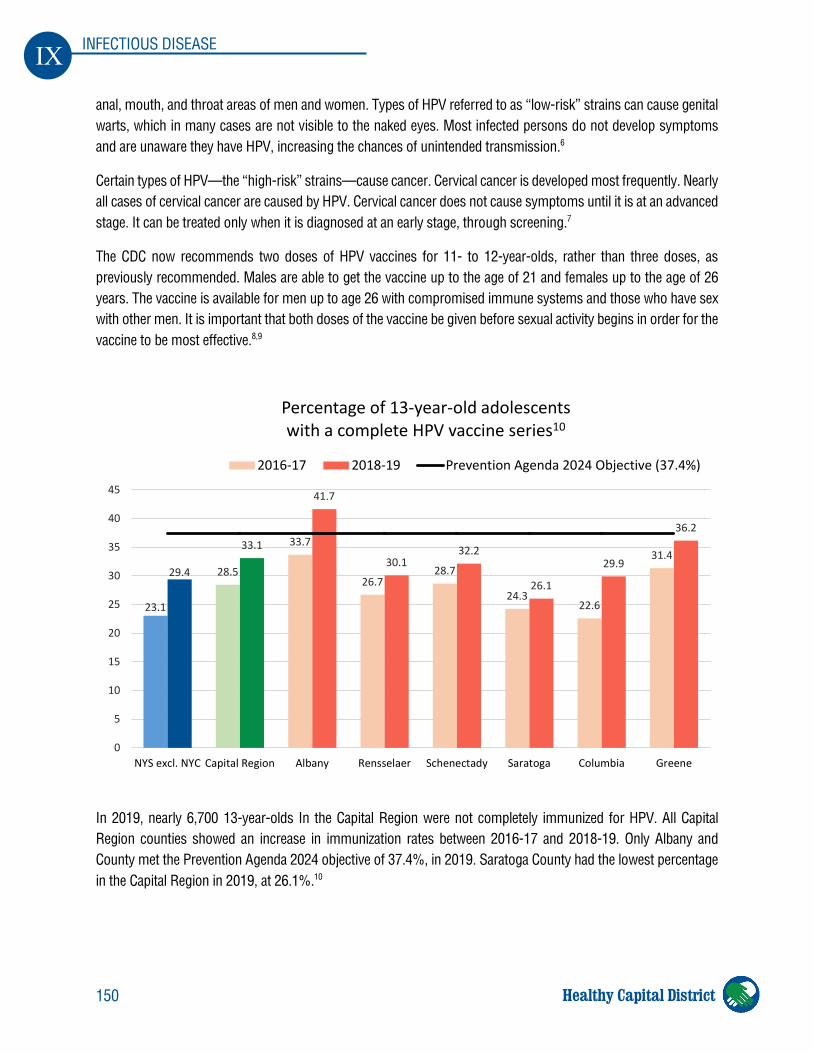
150
IX INFECTIOUS DISEASE
Healthy Capital District
anal, mouth, and throat areas of men and women. Types of HPV referred to as “low-risk” strains can cause genital warts, which in many cases are not visible to the naked eyes. Most infected persons do not develop symptoms and are unaware they have HPV, increasing the chances of unintended transmission.6
Certain types of HPV—the “high-risk” strains—cause cancer. Cervical cancer is developed most frequently. Nearly all cases of cervical cancer are caused by HPV. Cervical cancer does not cause symptoms until it is at an advanced stage. It can be treated only when it is diagnosed at an early stage, through screening.7
The CDC now recommends two doses of HPV vaccines for 11- to 12-year-olds, rather than three doses, as previously recommended. Males are able to get the vaccine up to the age of 21 and females up to the age of 26 years. The vaccine is available for men up to age 26 with compromised immune systems and those who have sex with other men. It is important that both doses of the vaccine be given before sexual activity begins in order for the vaccine to be most effective.8,9
In 2019, nearly 6,700 13-year-olds In the Capital Region were not completely immunized for HPV. All Capital Region counties showed an increase in immunization rates between 2016-17 and 2018-19. Only Albany and County met the Prevention Agenda 2024 objective of 37.4%, in 2019. Saratoga County had the lowest percentage in the Capital Region in 2019, at 26.1%.10
23.1
28.5
33.7
26.728.7
24.322.6
31.429.4
33.1
41.7
30.132.2
26.1
29.9
36.2
0
5
10
15
20
25
30
35
40
45
NYS excl. NYC Capital Region Albany Rensselaer Schenectady Saratoga Columbia Greene
Percentage of 13-year-old adolescents with a complete HPV vaccine series10
2016-17 2018-19 Prevention Agenda 2024 Objective (37.4%)
151
IX INFECTIOUS DISEASE
Healthy Capital District
COVID-19
Coronavirus disease (COVID-19) is an infectious disease caused by SARS-CoV-2 virus. While most people infected with the virus experience mild to moderate respiratory illness, some will become severely ill and require medical attention. Older people, and those with underlying medical conditions, are more likely to develop serious illness.11
The first case of COVID-19 was identified on Dec. 31, 2019 in Wuhon China, while the first confirmed US case occurred on Feb. 20, 2020. In March 2020, the WHO declared COVID-19 a worldwide pandemic, and the US declared a State of Emergency due to COVID. By May 2020, the US had over 100,000 deaths due to COVID, and mid-June, the US passed one million cases. In August 2020, COVID became the 3rd leading cause of death in the US. A mutated, more virulent COVID variant “Alpha” was discovered in Sept. 2020 in the United Kingdom. Another variant “Gamma” was identified in Brazil in Jan. 2021, and in April 2021, the first cases of a new, more virulent, “Delta” variant occurred in India. The Delta variant became the most dominant COVID-19 strain in both the US and in New York State (NYS) in July 2021. By the end of August 2021, over 99% of all COVID- 19 cases in NYS were the Delta variant. The WHO classified Omicron as a Variant of Concern on November 26, 2021. Omicron was first confirmed in NYS on December 2, 2021 Between December 9 and December 22, 62.4% of COVID cases were due to the Omicron variant, and by January 15, 2022, 98.4% of cases were of the Omicron variant.12, 13
As of Nov. 12, 2021, there have been approximately 46.9 million total COVID-19 cases, and 760,300 COVID-related deaths in the US. During that period, NYS experienced approximately 2.6 million cases and 58,500 deaths due to COVID-19. As of March 3, 2021, the US experienced almost 880,000 COVID-related hospitalizations while NYS had 90,000 hospitalizations.14
New York State and the Capital Region experienced peaks in the number of COVID-19 cases, rates and hospitalizations both in late April 2020, and mid-January 2021. NYS experienced 10,553 COVID cases on April 24, 2020, and 18,832 cases on Jan. 7, 2021. The Capital Region had 321 COVID cases on April 24 2020, but on Jan. 7, 2021, the Capital Region experienced a peak of 1,017 cases. After a downward trend in COVID cases during the spring/summer of 2021 the cases and rates are trending upward during the fall of 2021. As of Nov 10, 2021, NYS
Highlights
• In the Capital Region, COVID cases and hospitalizations peaked in late April 2020, again in mid-January 2021, then fell in Spring and Summer 2021, and are trending upward during Fall 2021.
• The Capital Region had lower COVID test positivity and mortality rates than NYS, excl. NYC. • Mortality rates were highest in Columbia and Greene counties; test positivity, in Schenectady County. • Black non-Hispanic residents accounted for 13% of COVID deaths and 9% of the population. • COVID vaccination rates were higher among older residents and females, in the region and statewide. • The Capital Region Black population is less vaccinated compared to the White and Asian populations,
while the Capital Region Hispanic population had vaccination rate similar to the total population. • When reviewing the COVID vaccination rates by Zip Code for the Capital Region, the under-vaccinated
areas were predominantly rural or in low-income, inner-city neighborhoods.
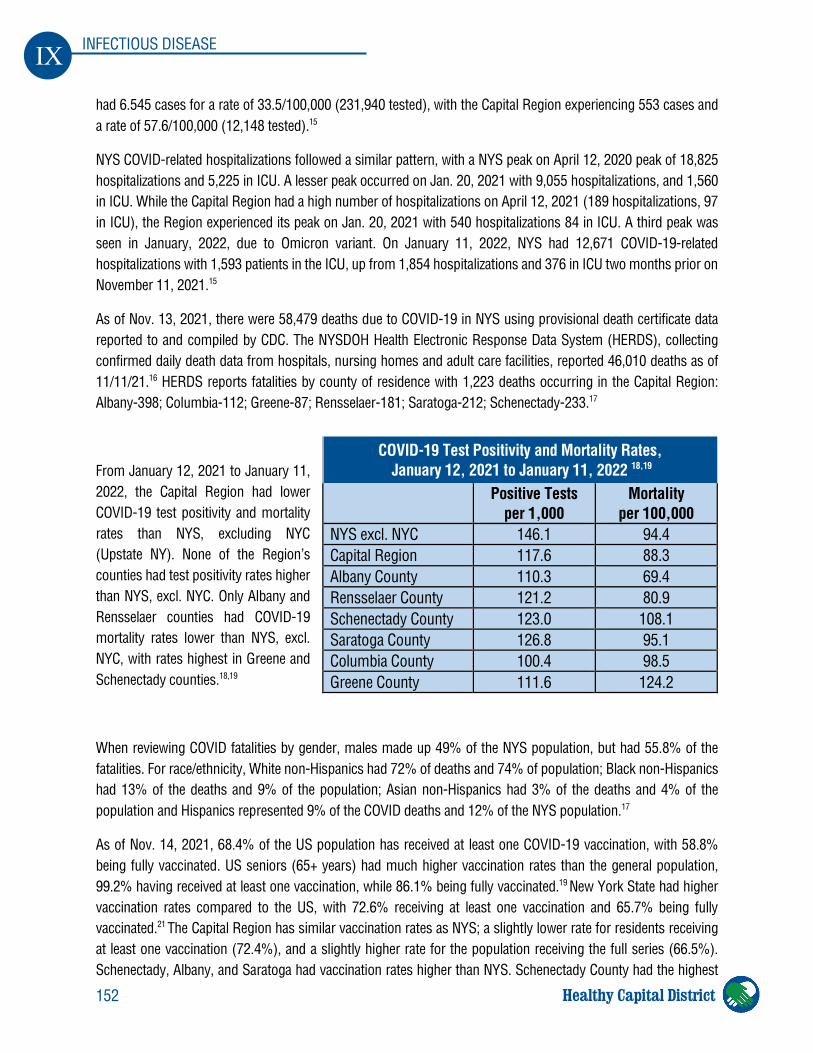
152
IX INFECTIOUS DISEASE
Healthy Capital District
had 6.545 cases for a rate of 33.5/100,000 (231,940 tested), with the Capital Region experiencing 553 cases and a rate of 57.6/100,000 (12,148 tested).15
NYS COVID-related hospitalizations followed a similar pattern, with a NYS peak on April 12, 2020 peak of 18,825 hospitalizations and 5,225 in ICU. A lesser peak occurred on Jan. 20, 2021 with 9,055 hospitalizations, and 1,560 in ICU. While the Capital Region had a high number of hospitalizations on April 12, 2021 (189 hospitalizations, 97 in ICU), the Region experienced its peak on Jan. 20, 2021 with 540 hospitalizations 84 in ICU. A third peak was seen in January, 2022, due to Omicron variant. On January 11, 2022, NYS had 12,671 COVID-19-related hospitalizations with 1,593 patients in the ICU, up from 1,854 hospitalizations and 376 in ICU two months prior on November 11, 2021.15
As of Nov. 13, 2021, there were 58,479 deaths due to COVID-19 in NYS using provisional death certificate data reported to and compiled by CDC. The NYSDOH Health Electronic Response Data System (HERDS), collecting confirmed daily death data from hospitals, nursing homes and adult care facilities, reported 46,010 deaths as of 11/11/21.16 HERDS reports fatalities by county of residence with 1,223 deaths occurring in the Capital Region: Albany-398; Columbia-112; Greene-87; Rensselaer-181; Saratoga-212; Schenectady-233.17
From January 12, 2021 to January 11, 2022, the Capital Region had lower COVID-19 test positivity and mortality rates than NYS, excluding NYC (Upstate NY). None of the Region’s counties had test positivity rates higher than NYS, excl. NYC. Only Albany and Rensselaer counties had COVID-19 mortality rates lower than NYS, excl. NYC, with rates highest in Greene and Schenectady counties.18,19
When reviewing COVID fatalities by gender, males made up 49% of the NYS population, but had 55.8% of the fatalities. For race/ethnicity, White non-Hispanics had 72% of deaths and 74% of population; Black non-Hispanics had 13% of the deaths and 9% of the population; Asian non-Hispanics had 3% of the deaths and 4% of the population and Hispanics represented 9% of the COVID deaths and 12% of the NYS population.17
As of Nov. 14, 2021, 68.4% of the US population has received at least one COVID-19 vaccination, with 58.8% being fully vaccinated. US seniors (65+ years) had much higher vaccination rates than the general population, 99.2% having received at least one vaccination, while 86.1% being fully vaccinated.19 New York State had higher vaccination rates compared to the US, with 72.6% receiving at least one vaccination and 65.7% being fully vaccinated.21 The Capital Region has similar vaccination rates as NYS; a slightly lower rate for residents receiving at least one vaccination (72.4%), and a slightly higher rate for the population receiving the full series (66.5%). Schenectady, Albany, and Saratoga had vaccination rates higher than NYS. Schenectady County had the highest
COVID-19 Test Positivity and Mortality Rates, January 12, 2021 to January 11, 2022 18,19
Positive Tests per 1,000
Mortality per 100,000
NYS excl. NYC 146.1 94.4 Capital Region 117.6 88.3 Albany County 110.3 69.4 Rensselaer County 121.2 80.9 Schenectady County 123.0 108.1 Saratoga County 126.8 95.1 Columbia County 100.4 98.5 Greene County 111.6 124.2
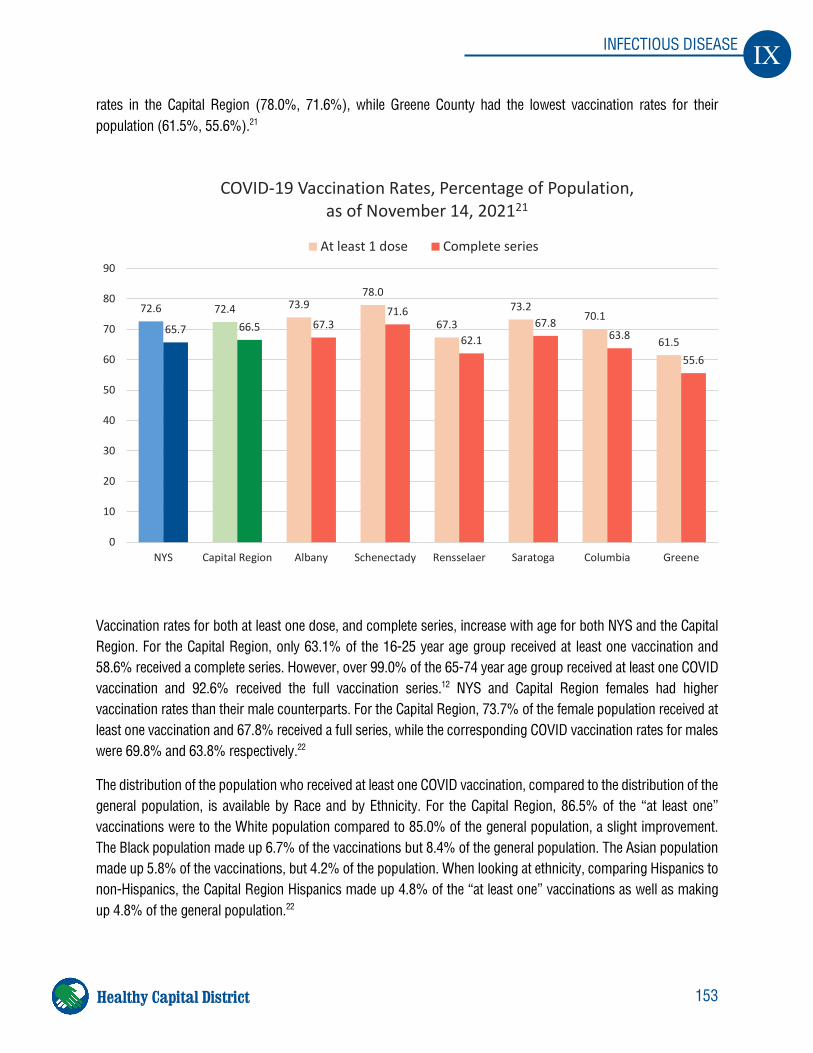
153
IX INFECTIOUS DISEASE
Healthy Capital District
rates in the Capital Region (78.0%, 71.6%), while Greene County had the lowest vaccination rates for their population (61.5%, 55.6%).21
Vaccination rates for both at least one dose, and complete series, increase with age for both NYS and the Capital Region. For the Capital Region, only 63.1% of the 16-25 year age group received at least one vaccination and 58.6% received a complete series. However, over 99.0% of the 65-74 year age group received at least one COVID vaccination and 92.6% received the full vaccination series.12 NYS and Capital Region females had higher vaccination rates than their male counterparts. For the Capital Region, 73.7% of the female population received at least one vaccination and 67.8% received a full series, while the corresponding COVID vaccination rates for males were 69.8% and 63.8% respectively.22
The distribution of the population who received at least one COVID vaccination, compared to the distribution of the general population, is available by Race and by Ethnicity. For the Capital Region, 86.5% of the “at least one” vaccinations were to the White population compared to 85.0% of the general population, a slight improvement. The Black population made up 6.7% of the vaccinations but 8.4% of the general population. The Asian population made up 5.8% of the vaccinations, but 4.2% of the population. When looking at ethnicity, comparing Hispanics to non-Hispanics, the Capital Region Hispanics made up 4.8% of the “at least one” vaccinations as well as making up 4.8% of the general population.22
72.6 72.4 73.978.0
67.373.2
70.1
61.565.7 66.5 67.3
71.6
62.167.8
63.8
55.6
0
10
20
30
40
50
60
70
80
90
NYS Capital Region Albany Schenectady Rensselaer Saratoga Columbia Greene
COVID-19 Vaccination Rates, Percentage of Population, as of November 14, 202121
At least 1 dose Complete series
154
IX INFECTIOUS DISEASE
Healthy Capital District
The NYS Department of Health provides COVID-19 vaccination rates by Zip code, allowing a sub-county view of under-vaccinated areas.23 When reviewing complete series vaccination rates, the following Zip codes show especially under-vaccinated populations (as of 11/14/21):
Albany: rural South Albany/Hill Town Zip codes of Coeymans Hollow (32.6%), Medusa (43.5%), South Bethlehem (46.6%), Preston Hollow (51.7%), Berne (53.0%), and West Hill in the City of Albany (50.6%).
Schenectady: Alphaus (49.9%), rural West Zip codes of Duanesburg (50.7%), and Pattersonville (55.1%), and Hamilton Hill (50.3%), City/Stockade (51.4%), and Goose Hill/Union (54.7%) in Schenectady City.
Rensselaer: rural East Zip codes of Stephentown (49.5%), Petersburgh (50.7%), and Cropseyville (55.7%), rural Northeast Johnsonville (50.6%), Southwest Schodack Landing (51.1%), and Northwest Valley Falls (55.0%).
Saratoga: Northwest Zip codes of Porter Corners (49.3%), Corinth (56.3%); Hadley (59.8%), and Rock City Falls (60.0%), and Northeast Victory Mills (50.6%), and Schuylerville (61.4%).
Columbia: rural Zip code of Copake Falls (45.1%), rural Northeast New Lebanon (49.0%), West Lebanon (52.2%) and Austerlitz (52.4%), and Northwest Stuyvesant Falls (52.3%) and Stuyvesant (53.6%).
Greene: rural Zip code of Surprise (33.7%), Coxackie (34.4%), Durham (37.4%), Oak Hill (36.1%), and rural mountain areas of Jewett (35.1%), Maplecrest (35.5%), and Lexington (37.1%).
References 1. Centers for Disease Control and Prevention. Different COVID-19 Vaccines.
https://www.cdc.gov/coronavirus/2019-ncov/vaccines/different-vaccines.html 2. Goel, R. R., Painter, M. M., Apostolidis, S. A., Mathew, D., Meng, W., Rosenfeld, A. M., Lundgreen, K. A.,
Reynaldi, A., Khoury, D. S., Pattekar, A., Gouma, S., Kuri-Cervantes, L., Hicks, P., Dysinger, S., Hicks, A., Sharma, H., Herring, S., Korte, S., Baxter, A. E., Oldridge, D. A., Giles, J. R., Weirick, M. E., McAllister, C. M., Awofolaju, M., Tanenbaum, N., Drapeau, E. M., Dougherty, J., Long, S., D'Andrea, K., Hamilton, J. T., McLaughlin, M., Williams, J. C., Adamski, S., Kuthuru, O., Frank, I., Betts, M. R., Vella, L. A., Grifoni, A., Weiskopf, D., Sette, A., Hensley, S. E., Davenport, M. P., Bates, P., Luning Prak, E. T., Greenplate, A. R., Wherry, E. J. (2021). mRNA vaccines induce durable immune memory to SARS-CoV-2 and variants of concern. Science (New York, N.Y.), 374(6572), abm0829. https://doi.org/10.1126/science.abm0829
3. Centers for Disease Control and Prevention. Immunization Schedules. http://www.cdc.gov/vaccines/schedules/index.html
4. New York State Department of Health. Immunization Laws and Regulations. https://www.health.ny.gov/prevention/immunization/laws_regs.htm
5. New York State Department of Health. Percentage of 24-35-month old children with the 4:3:1:3:3:1:4 immunization series, 2019. https://webbi1.health.ny.gov/SASStoredProcess/guest?_program=/EBI/PHIG/apps/dashboard/pa_dashboard&p=it&ind_id=pa40_0
155
IX INFECTIOUS DISEASE
Healthy Capital District
6. Centers for Disease Control and Prevention. Human Papillomavirus: Questions and Answers. http://www.cdc.gov/hpv/parents/questions-answers.html
7. Centers for Disease Control and Prevention. Basic Information about HPV and Cancer. http://www.cdc.gov/cancer/hpv/basic_info/
8. New York State Department of Health. Communicable Diseases: The Human Papillomavirus (HPV) vaccine. https://www.health.ny.gov/diseases/communicable/human_papillomavirus/index.htm
9. Centers for Disease Control and Prevention. HPV Vaccines: Vaccinating Your Preteen or Teen. http://www.cdc.gov/hpv/parents/vaccine.html
10. New York State Department of Health. Percentage of 13-year-old adolescents with a complete HPV vaccine series, 2019. https://webbi1.health.ny.gov/SASStoredProcess/guest?_program=/EBI/PHIG/apps/dashboard/pa_dashboard&p=it&ind_id=pa41_0
11. Coronavirus disease (COVID-19), World Health Organization https://www.who.int/health-topics/coronavirus#tab=tab_1
12. A Timeline of COVID-19 Developments in 2020, American Journal of Managed Care https://www.ajmc.com/view/a-timeline-of-covid19-developments-in-2020
13. COVID-19 Pandemic in the United States, Wikipedia https://en.wikipedia.org/wiki/COVID-19_pandemic_in_the_United_States
14. State Health Facts COVID-19-Custom State Report, Kaiser Family Foundation https://www.kff.org/statedata/custom/
15. Positive Tests Over Time by Region and County, New York State Department of Health https://coronavirus.health.ny.gov/positive-tests-over-time-region-and-county
16. Daily Hospitalization Summary, New York State Department of Health https://coronavirus.health.ny.gov/daily-hospitalization-summary
17. Fatalities, New York State Department of Health https://coronavirus.health.ny.gov/fatalities-0 18. New York State Statewide COVID-19 Testing, New York State Department of Health
https://health.data.ny.gov/Health/New-York-State-Statewide-COVID-19-Testing/xdss-u53e 19. New York State Department of Health COVID-19 Fatalities by County, New York State Department of
Health https://health.data.ny.gov/Health/New-York-State-Statewide-COVID-19-Fatalities-by-Co/xymy-pny5 20. COVID-19 Vaccinations in the United States, Centers for Disease Control and Prevention
https://covid.cdc.gov/covid-data-tracker/#vaccinations_vacc-total-admin-rate-total 21. Vaccination Progress to Date, New York State Department of Health
https://coronavirus.health.ny.gov/vaccination-progress-date 22. Demographic Vaccination Data, New York State Department of Health
https://coronavirus.health.ny.gov/demographic-vaccination-data 23. Zip Code Vaccination Data, New York State Department of Health https://coronavirus.health.ny.gov/zip-
code-vaccination-data
156
IX INFECTIOUS DISEASE
Healthy Capital District
HIV/AIDS
Human Immunodeficiency Virus (HIV) is the virus that can lead to acquired immunodeficiency syndrome (AIDS). The virus attacks the cells of the immune system, leaving the body more susceptible to life-threatening infections. HIV progresses to AIDS, the most advanced stage of the disease, in which the body can no longer fight off infections.1
HIV testing is the only way to know definitively if a person is infected with HIV. The virus is transmitted through contact with bodily fluids such as blood, semen, genial fluids, or breast milk. Unprotected sex and sharing needles or syringes with an infected person are the most common ways the virus is transmitted. Flu-like symptoms can occur within 2-4 weeks after exposure and last from a few days to several weeks. Although it may take 10 or more years for symptoms of HIV to develop, HIV antibodies can be detected in most people within 3 to 12 weeks of infection.1
Post-exposure prophylaxis, or PEP, is a method to prevent HIV infection following a recent unprotected sexual encounter, sharing needles, sexual assault or occupational exposure. It involves taking antiretroviral medicines within 72 hours of the exposure event. PEP should only be used in emergencies. Pre-exposure prophylaxis, or PrEP, is designed to prevent HIV-negative individuals in high-risk populations from contracting the virus, by taking daily antiretroviral medicines. High-risk populations may include HIV negative individuals who are in an ongoing sexual relationship with an HIV positive partner, or anyone who does not regularly use condoms during sex with partners of unknown HIV status who are at substantial risk of HIV infection.1
There is no cure for HIV currently. Once infected, a person has HIV for life. Antiretroviral therapy (ART) is a treatment for persons infected with HIV that consists of taking a combination of at least three medications that work to slow the growth of the virus. ART can extend and improve the quality of life for those infected with HIV. As more people are living longer due to ART, the prevalence of HIV has increased.1
In the United States, the Centers for Disease Control (CDC) estimates that there were about 1.2 million people living with HIV at the end of 2019, and that about 13% did not know they were infected. In 2019, there were 36,801 newly diagnosed HIV cases in the United States and dependent areas, down from 38,739 in 2017. Research has shown
Highlights
• Albany and Schenectady counties had the highest newly diagnosed HIV case rates in the region. • Rensselaer and Saratoga were meeting the Prevention Agenda 2024 objective.
Objective
New York State Prevention Agenda 2019-2024
• Reduce the newly diagnosed HIV case rate to no more than 5.2 new diagnoses per 100,000.
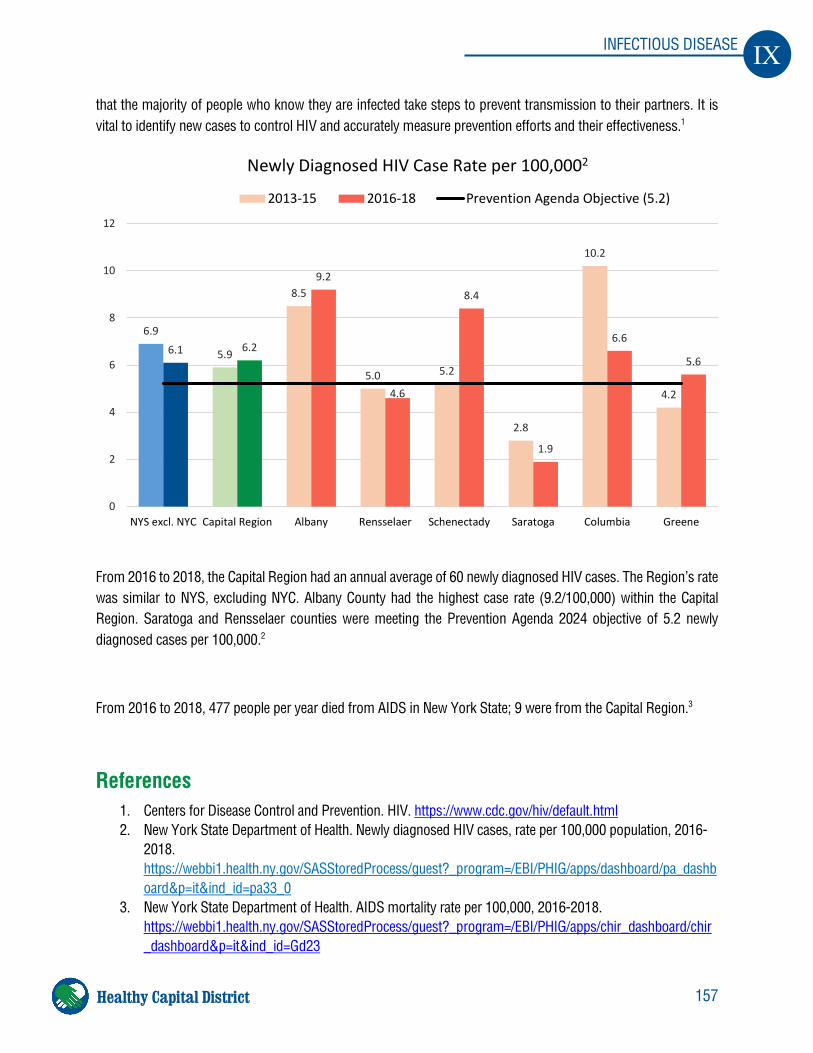
157
IX INFECTIOUS DISEASE
Healthy Capital District
that the majority of people who know they are infected take steps to prevent transmission to their partners. It is vital to identify new cases to control HIV and accurately measure prevention efforts and their effectiveness.1
From 2016 to 2018, the Capital Region had an annual average of 60 newly diagnosed HIV cases. The Region’s rate was similar to NYS, excluding NYC. Albany County had the highest case rate (9.2/100,000) within the Capital Region. Saratoga and Rensselaer counties were meeting the Prevention Agenda 2024 objective of 5.2 newly diagnosed cases per 100,000.2
From 2016 to 2018, 477 people per year died from AIDS in New York State; 9 were from the Capital Region.3
References 1. Centers for Disease Control and Prevention. HIV. https://www.cdc.gov/hiv/default.html 2. New York State Department of Health. Newly diagnosed HIV cases, rate per 100,000 population, 2016-
2018. https://webbi1.health.ny.gov/SASStoredProcess/guest?_program=/EBI/PHIG/apps/dashboard/pa_dashboard&p=it&ind_id=pa33_0
3. New York State Department of Health. AIDS mortality rate per 100,000, 2016-2018. https://webbi1.health.ny.gov/SASStoredProcess/guest?_program=/EBI/PHIG/apps/chir_dashboard/chir_dashboard&p=it&ind_id=Gd23
6.9
5.9
8.5
5.0 5.2
2.8
10.2
4.2
6.1 6.2
9.2
4.6
8.4
1.9
6.6
5.6
0
2
4
6
8
10
12
NYS excl. NYC Capital Region Albany Rensselaer Schenectady Saratoga Columbia Greene
Newly Diagnosed HIV Case Rate per 100,0002
2013-15 2016-18 Prevention Agenda Objective (5.2)
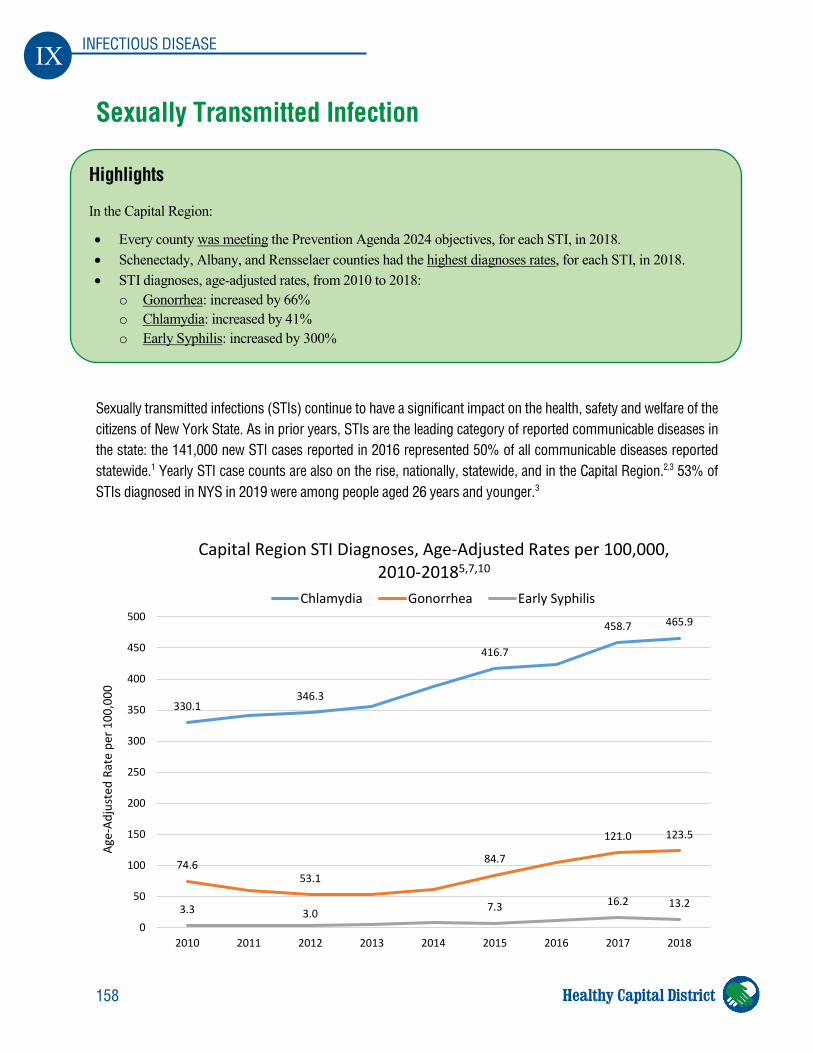
158
IX INFECTIOUS DISEASE
Healthy Capital District
Sexually Transmitted Infection
Sexually transmitted infections (STIs) continue to have a significant impact on the health, safety and welfare of the citizens of New York State. As in prior years, STIs are the leading category of reported communicable diseases in the state: the 141,000 new STI cases reported in 2016 represented 50% of all communicable diseases reported statewide.1 Yearly STI case counts are also on the rise, nationally, statewide, and in the Capital Region.2,3 53% of STIs diagnosed in NYS in 2019 were among people aged 26 years and younger.3
Highlights
In the Capital Region:
• Every county was meeting the Prevention Agenda 2024 objectives, for each STI, in 2018. • Schenectady, Albany, and Rensselaer counties had the highest diagnoses rates, for each STI, in 2018. • STI diagnoses, age-adjusted rates, from 2010 to 2018:
o Gonorrhea: increased by 66% o Chlamydia: increased by 41% o Early Syphilis: increased by 300%
330.1346.3
416.7
458.7 465.9
74.653.1
84.7
121.0 123.5
3.3 3.0 7.3 16.2 13.2
0
50
100
150
200
250
300
350
400
450
500
2010 2011 2012 2013 2014 2015 2016 2017 2018
Age-
Adju
sted
Rat
e pe
r 100
,000
Capital Region STI Diagnoses, Age-Adjusted Rates per 100,000, 2010-20185,7,10
Chlamydia Gonorrhea Early Syphilis
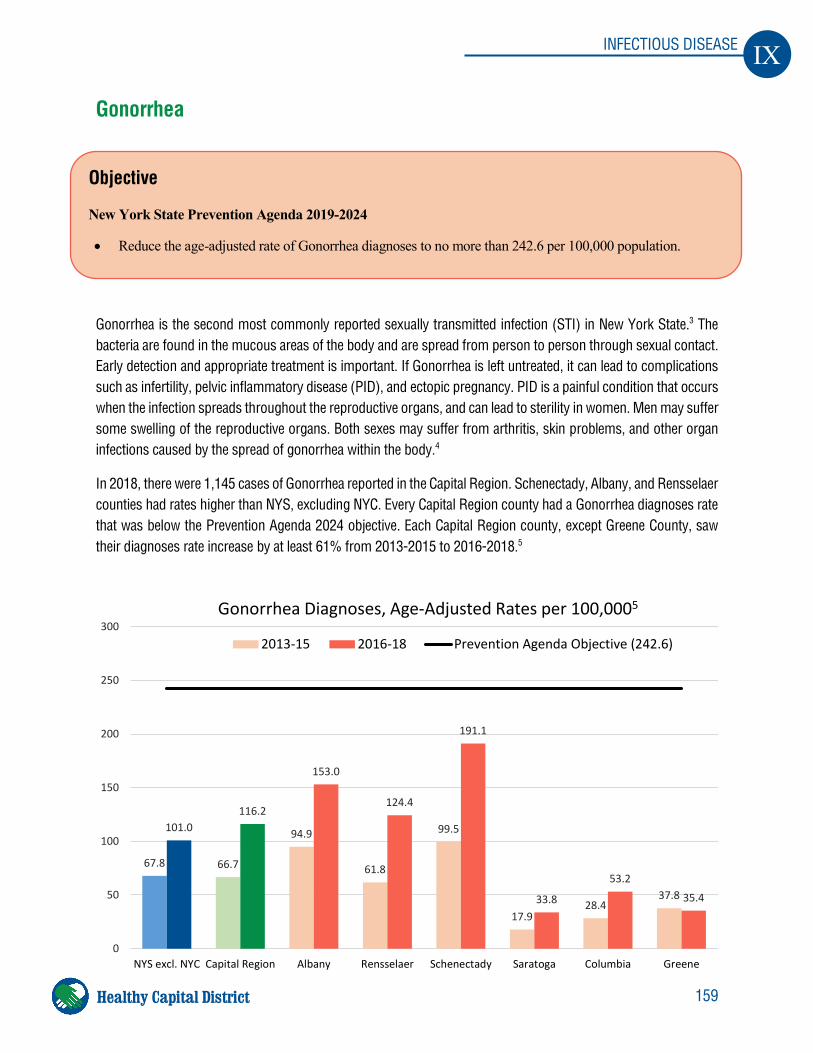
159
IX INFECTIOUS DISEASE
Healthy Capital District
Gonorrhea
Gonorrhea is the second most commonly reported sexually transmitted infection (STI) in New York State.3 The bacteria are found in the mucous areas of the body and are spread from person to person through sexual contact. Early detection and appropriate treatment is important. If Gonorrhea is left untreated, it can lead to complications such as infertility, pelvic inflammatory disease (PID), and ectopic pregnancy. PID is a painful condition that occurs when the infection spreads throughout the reproductive organs, and can lead to sterility in women. Men may suffer some swelling of the reproductive organs. Both sexes may suffer from arthritis, skin problems, and other organ infections caused by the spread of gonorrhea within the body.4
In 2018, there were 1,145 cases of Gonorrhea reported in the Capital Region. Schenectady, Albany, and Rensselaer counties had rates higher than NYS, excluding NYC. Every Capital Region county had a Gonorrhea diagnoses rate that was below the Prevention Agenda 2024 objective. Each Capital Region county, except Greene County, saw their diagnoses rate increase by at least 61% from 2013-2015 to 2016-2018.5
Objective
New York State Prevention Agenda 2019-2024
• Reduce the age-adjusted rate of Gonorrhea diagnoses to no more than 242.6 per 100,000 population.
67.8 66.7
94.9
61.8
99.5
17.928.4
37.8
101.0116.2
153.0
124.4
191.1
33.8
53.2
35.4
0
50
100
150
200
250
300
NYS excl. NYC Capital Region Albany Rensselaer Schenectady Saratoga Columbia Greene
Gonorrhea Diagnoses, Age-Adjusted Rates per 100,0005
2013-15 2016-18 Prevention Agenda Objective (242.6)
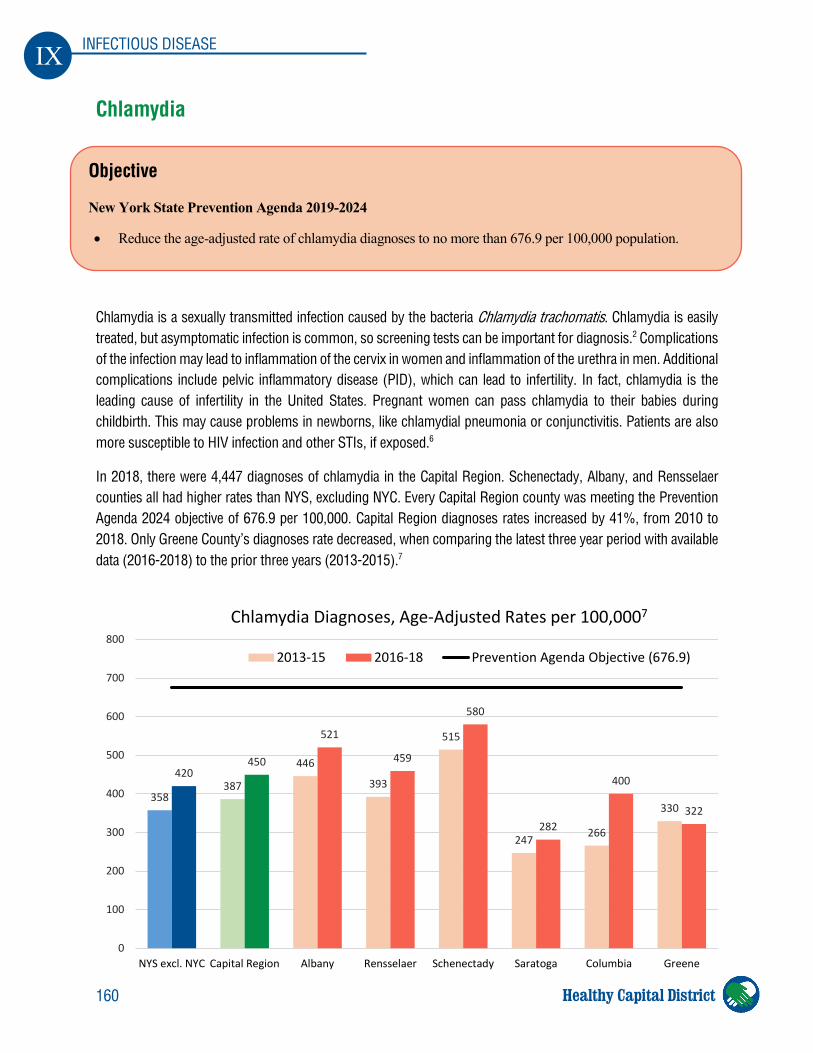
160
IX INFECTIOUS DISEASE
Healthy Capital District
Chlamydia
Chlamydia is a sexually transmitted infection caused by the bacteria Chlamydia trachomatis. Chlamydia is easily treated, but asymptomatic infection is common, so screening tests can be important for diagnosis.2 Complications of the infection may lead to inflammation of the cervix in women and inflammation of the urethra in men. Additional complications include pelvic inflammatory disease (PID), which can lead to infertility. In fact, chlamydia is the leading cause of infertility in the United States. Pregnant women can pass chlamydia to their babies during childbirth. This may cause problems in newborns, like chlamydial pneumonia or conjunctivitis. Patients are also more susceptible to HIV infection and other STIs, if exposed.6
In 2018, there were 4,447 diagnoses of chlamydia in the Capital Region. Schenectady, Albany, and Rensselaer counties all had higher rates than NYS, excluding NYC. Every Capital Region county was meeting the Prevention Agenda 2024 objective of 676.9 per 100,000. Capital Region diagnoses rates increased by 41%, from 2010 to 2018. Only Greene County’s diagnoses rate decreased, when comparing the latest three year period with available data (2016-2018) to the prior three years (2013-2015).7
Objective
New York State Prevention Agenda 2019-2024
• Reduce the age-adjusted rate of chlamydia diagnoses to no more than 676.9 per 100,000 population.
358387
446
393
515
247 266
330
420450
521
459
580
282
400
322
0
100
200
300
400
500
600
700
800
NYS excl. NYC Capital Region Albany Rensselaer Schenectady Saratoga Columbia Greene
Chlamydia Diagnoses, Age-Adjusted Rates per 100,0007
2013-15 2016-18 Prevention Agenda Objective (676.9)
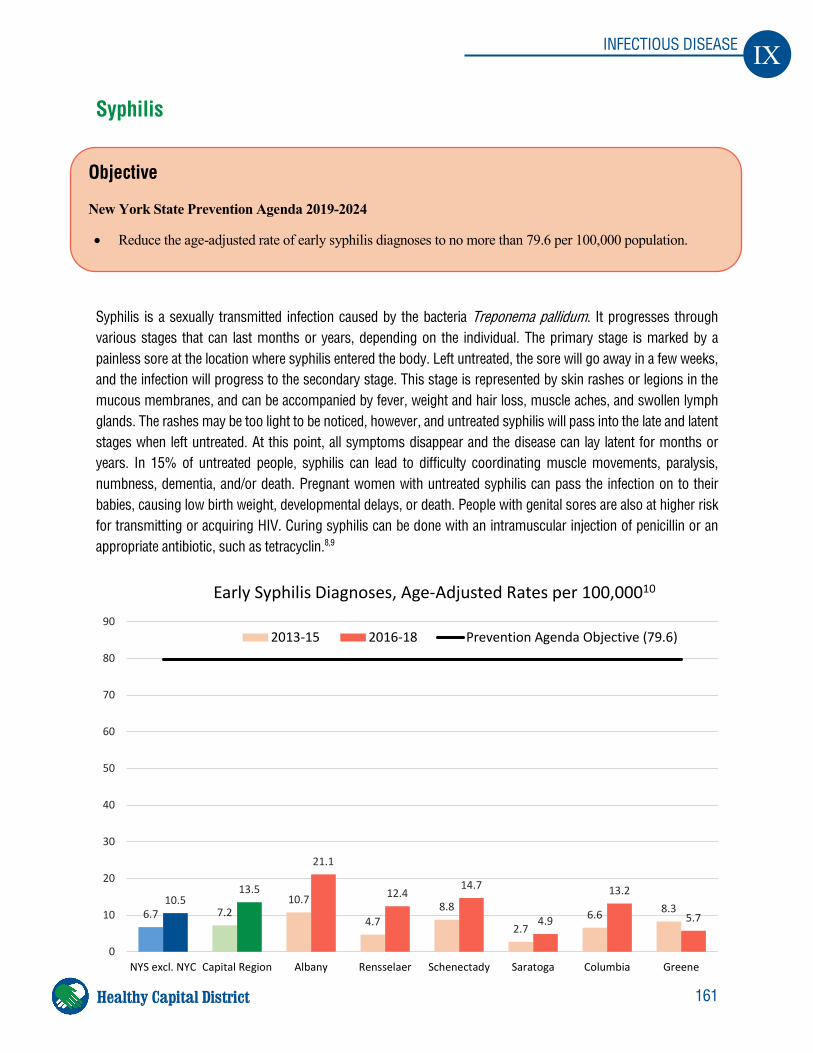
161
IX INFECTIOUS DISEASE
Healthy Capital District
Syphilis
Syphilis is a sexually transmitted infection caused by the bacteria Treponema pallidum. It progresses through various stages that can last months or years, depending on the individual. The primary stage is marked by a painless sore at the location where syphilis entered the body. Left untreated, the sore will go away in a few weeks, and the infection will progress to the secondary stage. This stage is represented by skin rashes or legions in the mucous membranes, and can be accompanied by fever, weight and hair loss, muscle aches, and swollen lymph glands. The rashes may be too light to be noticed, however, and untreated syphilis will pass into the late and latent stages when left untreated. At this point, all symptoms disappear and the disease can lay latent for months or years. In 15% of untreated people, syphilis can lead to difficulty coordinating muscle movements, paralysis, numbness, dementia, and/or death. Pregnant women with untreated syphilis can pass the infection on to their babies, causing low birth weight, developmental delays, or death. People with genital sores are also at higher risk for transmitting or acquiring HIV. Curing syphilis can be done with an intramuscular injection of penicillin or an appropriate antibiotic, such as tetracyclin.8,9
6.7 7.210.7
4.78.8
2.76.6 8.3
10.513.5
21.1
12.414.7
4.9
13.2
5.7
0
10
20
30
40
50
60
70
80
90
NYS excl. NYC Capital Region Albany Rensselaer Schenectady Saratoga Columbia Greene
Early Syphilis Diagnoses, Age-Adjusted Rates per 100,00010
2013-15 2016-18 Prevention Agenda Objective (79.6)
Objective
New York State Prevention Agenda 2019-2024
• Reduce the age-adjusted rate of early syphilis diagnoses to no more than 79.6 per 100,000 population.
162
IX INFECTIOUS DISEASE
Healthy Capital District
Although in the 1990s, Syphilis was more prevalent among heterosexual people of color aged 30 to 39 years, the 2000s saw an epidemiologic shift. More recently, syphilis is most prevalent in 20-29 year-old men who have sex with men (MSM). The majority of primary and secondary syphilis cases in the United States in 2019 were among MSM only and men who have sex with both men and women.8
In 2018, there were 127 cases of syphilis in the Capital Region. The Capital Region counties were well below the Prevention Agenda 2024 objective of no more than 79.6 cases per 100,000. Albany (21.1/100,000) and Schenectady (14.7) counties had the highest rates, per 100,000, in 2016-18. The Capital Region rate of diagnoses increased by 300%, from 2010 to 2018. Capital Region counties, except Greene County, saw their diagnoses rates increase by 67% to 165%, when comparing the latest three year period with available data (2016-2018) to the prior three years.10
References 1. New York State Department of Health. Contributing Causes of Health Challenges.
https://www.health.ny.gov/prevention/prevention_agenda/2019-2024/docs/sha/contributing_causes_of_health_challenges.pdf
2. Centers for Disease Control and Prevention. Sexually Transmitted Diseases (STDs). https://www.cdc.gov/std/default.htm
3. New York State Department of Health. Sexually Transmitted Infections Surveillance Report, 2019, https://www.health.ny.gov/statistics/diseases/communicable/std/docs/sti_surveillance_report_2019.pdf
4. New York State Department of Health. Gonorrhea Gonococcal Infection (clap, drip). http://www.health.ny.gov/diseases/communicable/gonorrhea/fact_sheet.htm
5. New York State Department of Health. Gonorrhea diagnoses, age-adjusted rate per 100,000 population, 2018. https://webbi1.health.ny.gov/SASStoredProcess/guest?_program=/EBI/PHIG/apps/dashboard/pa_dashboard&p=it&ind_id=pa45_0
6. New York State Department of Health. Chlamydia (chlamydia trachomatis genital infection). http://www.health.ny.gov/diseases/communicable/chlamydia/fact_sheet.htm
7. New York State Department of Health. Chlamydia diagnoses, age-adjusted rate per 100,000 population, 2018. https://webbi1.health.ny.gov/SASStoredProcess/guest?_program=/EBI/PHIG/apps/dashboard/pa_dashboard&p=it&ind_id=pa46_0
8. Centers for Disease Control and Prevention. Syphilis-CDC Fact Sheet (Detailed). http://www.cdc.gov/std/syphilis/stdfact-syphilis-detailed.htm
9. New York State Department of Health. Syphilis. http://www.health.ny.gov/diseases/communicable/syphilis/fact_sheet.htm
10. New York State Department of Health. Early syphilis diagnoses, age-adjusted rate per 100,000 population, 2018. https://webbi1.health.ny.gov/SASStoredProcess/guest?_program=/EBI/PHIG/apps/dashboard/pa_dashboard&p=it&ind_id=pa47_0
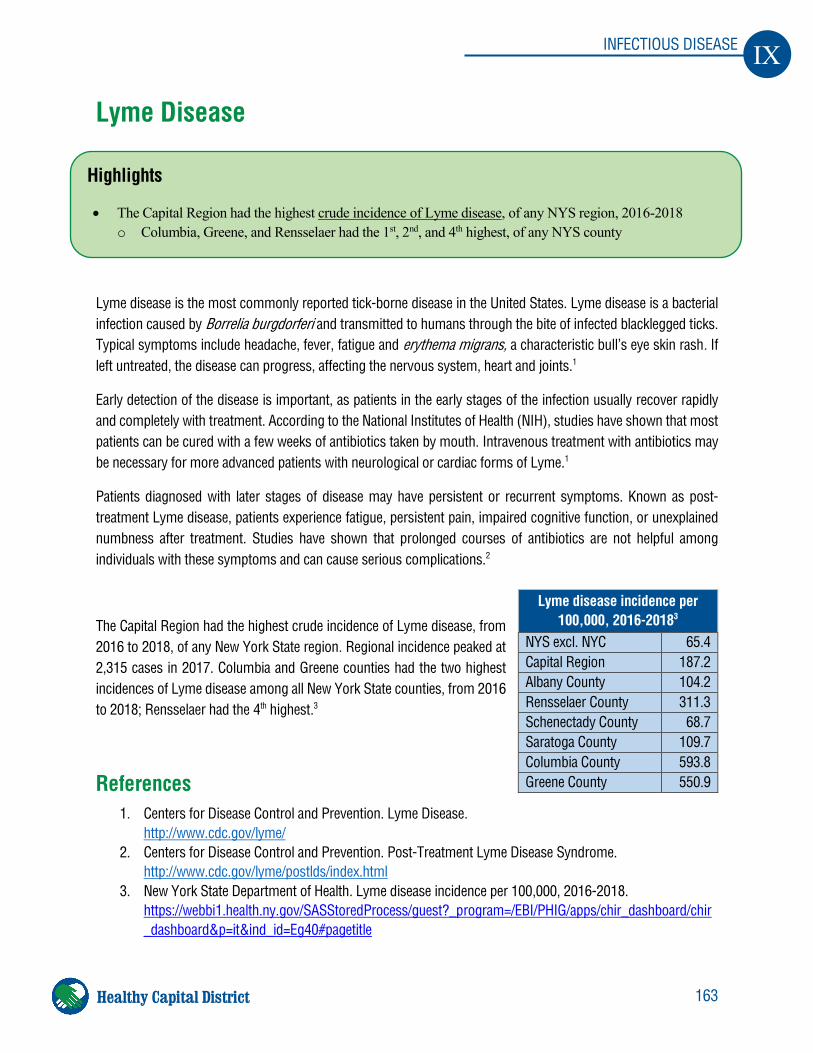
163
IX INFECTIOUS DISEASE
Healthy Capital District
Lyme Disease
Lyme disease is the most commonly reported tick-borne disease in the United States. Lyme disease is a bacterial infection caused by Borrelia burgdorferi and transmitted to humans through the bite of infected blacklegged ticks. Typical symptoms include headache, fever, fatigue and erythema migrans, a characteristic bull’s eye skin rash. If left untreated, the disease can progress, affecting the nervous system, heart and joints.1
Early detection of the disease is important, as patients in the early stages of the infection usually recover rapidly and completely with treatment. According to the National Institutes of Health (NIH), studies have shown that most patients can be cured with a few weeks of antibiotics taken by mouth. Intravenous treatment with antibiotics may be necessary for more advanced patients with neurological or cardiac forms of Lyme.1
Patients diagnosed with later stages of disease may have persistent or recurrent symptoms. Known as post-treatment Lyme disease, patients experience fatigue, persistent pain, impaired cognitive function, or unexplained numbness after treatment. Studies have shown that prolonged courses of antibiotics are not helpful among individuals with these symptoms and can cause serious complications.2
The Capital Region had the highest crude incidence of Lyme disease, from 2016 to 2018, of any New York State region. Regional incidence peaked at 2,315 cases in 2017. Columbia and Greene counties had the two highest incidences of Lyme disease among all New York State counties, from 2016 to 2018; Rensselaer had the 4th highest.3
References 1. Centers for Disease Control and Prevention. Lyme Disease.
http://www.cdc.gov/lyme/ 2. Centers for Disease Control and Prevention. Post-Treatment Lyme Disease Syndrome.
http://www.cdc.gov/lyme/postlds/index.html 3. New York State Department of Health. Lyme disease incidence per 100,000, 2016-2018.
https://webbi1.health.ny.gov/SASStoredProcess/guest?_program=/EBI/PHIG/apps/chir_dashboard/chir_dashboard&p=it&ind_id=Eg40#pagetitle
Lyme disease incidence per 100,000, 2016-20183
NYS excl. NYC 65.4 Capital Region 187.2 Albany County 104.2 Rensselaer County 311.3 Schenectady County 68.7 Saratoga County 109.7 Columbia County 593.8 Greene County 550.9
Highlights
• The Capital Region had the highest crude incidence of Lyme disease, of any NYS region, 2016-2018 o Columbia, Greene, and Rensselaer had the 1st, 2nd, and 4th highest, of any NYS county
164
X APPENDICES
Healthy Capital District
X. Appendices
Table of Contents Capital Region ZIP Code Groupings and Neighborhoods Maps ..... Error! Bookmark not defined.
Age, Poverty Level, and Race/Ethnicity Demographics .................. Error! Bookmark not defined.
County Birth Indicators by Neighborhood ........................................ Error! Bookmark not defined.
Leading Causes of Death, 2018 .......................................................... Error! Bookmark not defined.
Leading Causes of Premature Death (<75 years), 2018 ................... Error! Bookmark not defined.
County Hospitalizations by Race/Ethnicity and Gender .................. Error! Bookmark not defined.
County Emergency Dept. (ED) Visits by Race & Gender ............... Error! Bookmark not defined.
County Hospitalization Rates by Neighborhood ............................... Error! Bookmark not defined.
ED Visit Rates by Neighborhood ....................................................... Error! Bookmark not defined.
Prevention Quality Indicator Rates by Neighborhood ...................... Error! Bookmark not defined.
Mortality Rates by Neighborhood ...................................................... Error! Bookmark not defined.
County Health Rankings ..................................................................... Error! Bookmark not defined.
Public Health Issue Ranking for Prioritization Results ..................... Error! Bookmark not defined.
2021 Capital Region Community Health Survey Results ................ Error! Bookmark not defined. Introduction ...................................................................................... Error! Bookmark not defined. Demographics .................................................................................. Error! Bookmark not defined. Health Priorities ............................................................................... Error! Bookmark not defined. Social Determinants of Health ........................................................ Error! Bookmark not defined. Prevention & Communication Strategies....................................... Error! Bookmark not defined. Healthcare Access & Barriers ......................................................... Error! Bookmark not defined. Mental Health .................................................................................. Error! Bookmark not defined. Substance Misuse ............................................................................ Error! Bookmark not defined. COVID-19 Vaccine ......................................................................... Error! Bookmark not defined. Survey (Paper Version) ................................................................... Error! Bookmark not defined.
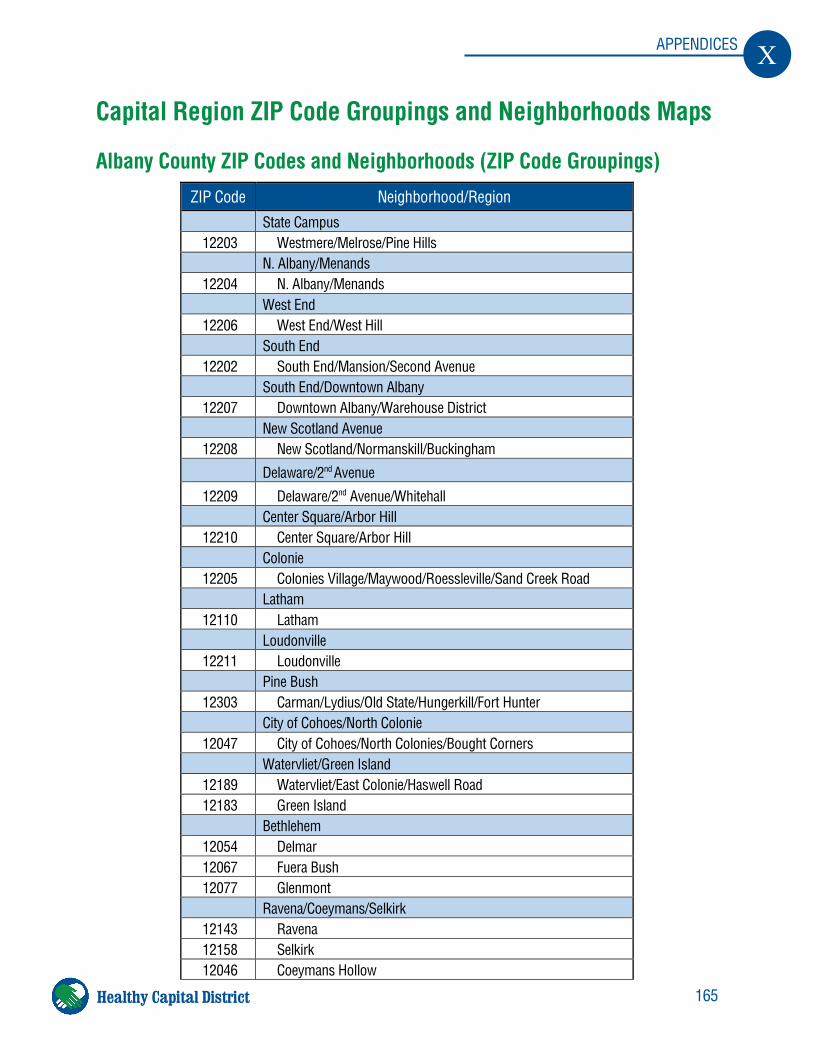
165
X APPENDICES
Healthy Capital District
Capital Region ZIP Code Groupings and Neighborhoods Maps
Albany County ZIP Codes and Neighborhoods (ZIP Code Groupings) ZIP Code Neighborhood/Region State Campus
12203 Westmere/Melrose/Pine Hills N. Albany/Menands 12204 N. Albany/Menands West End 12206 West End/West Hill South End 12202 South End/Mansion/Second Avenue South End/Downtown Albany 12207 Downtown Albany/Warehouse District New Scotland Avenue 12208 New Scotland/Normanskill/Buckingham
Delaware/2nd Avenue
12209 Delaware/2nd Avenue/Whitehall Center Square/Arbor Hill 12210 Center Square/Arbor Hill Colonie 12205 Colonies Village/Maywood/Roessleville/Sand Creek Road Latham 12110 Latham Loudonville 12211 Loudonville Pine Bush 12303 Carman/Lydius/Old State/Hungerkill/Fort Hunter City of Cohoes/North Colonie 12047 City of Cohoes/North Colonies/Bought Corners Watervliet/Green Island 12189 Watervliet/East Colonie/Haswell Road 12183 Green Island Bethlehem 12054 Delmar 12067 Fuera Bush 12077 Glenmont Ravena/Coeymans/Selkirk 12143 Ravena 12158 Selkirk 12046 Coeymans Hollow
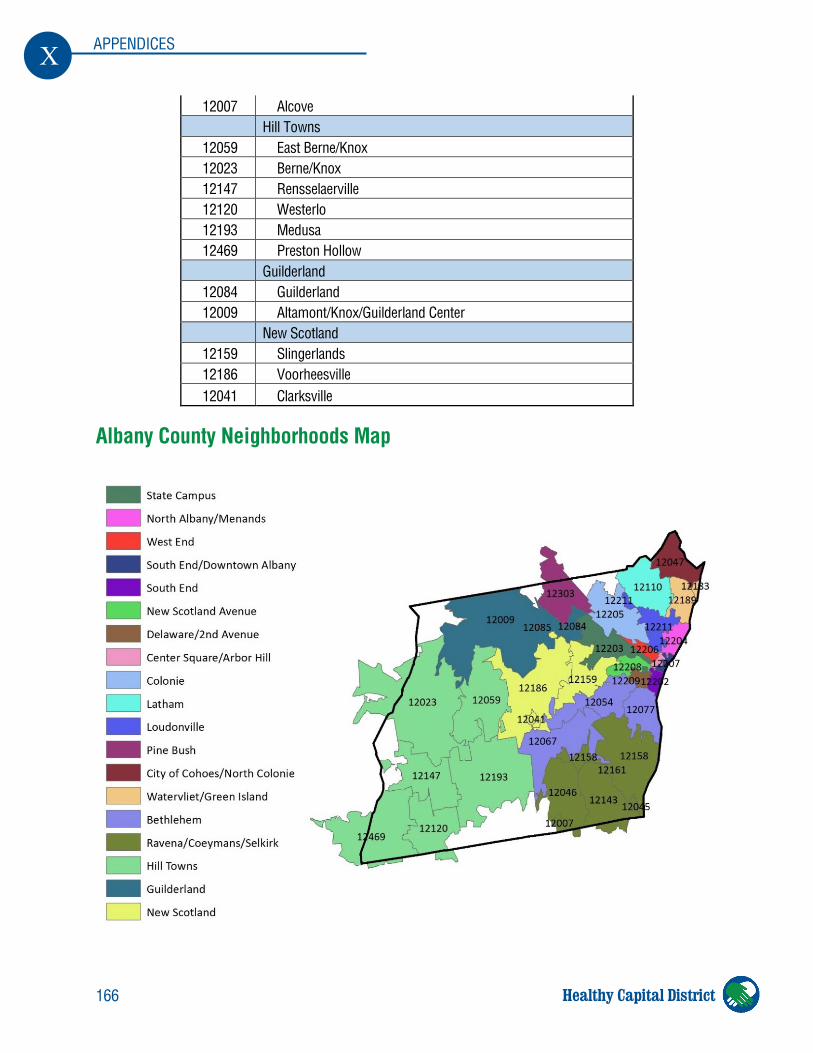
166
X APPENDICES
Healthy Capital District
12007 Alcove Hill Towns 12059 East Berne/Knox 12023 Berne/Knox 12147 Rensselaerville 12120 Westerlo 12193 Medusa 12469 Preston Hollow Guilderland 12084 Guilderland 12009 Altamont/Knox/Guilderland Center New Scotland 12159 Slingerlands 12186 Voorheesville 12041 Clarksville
Albany County Neighborhoods Map
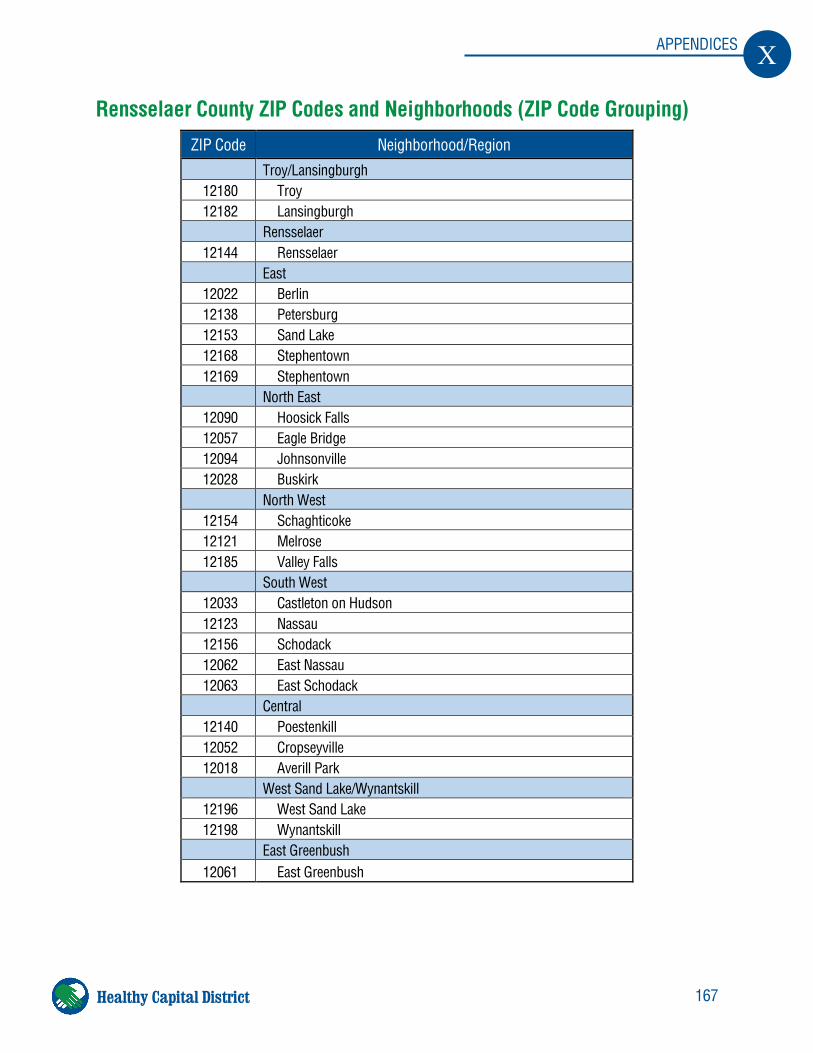
167
X APPENDICES
Healthy Capital District
Rensselaer County ZIP Codes and Neighborhoods (ZIP Code Grouping) ZIP Code Neighborhood/Region Troy/Lansingburgh
12180 Troy 12182 Lansingburgh
Rensselaer 12144 Rensselaer
East 12022 Berlin 12138 Petersburg 12153 Sand Lake 12168 Stephentown 12169 Stephentown
North East 12090 Hoosick Falls 12057 Eagle Bridge 12094 Johnsonville 12028 Buskirk
North West 12154 Schaghticoke 12121 Melrose 12185 Valley Falls
South West 12033 Castleton on Hudson 12123 Nassau 12156 Schodack 12062 East Nassau 12063 East Schodack
Central 12140 Poestenkill 12052 Cropseyville 12018 Averill Park
West Sand Lake/Wynantskill 12196 West Sand Lake 12198 Wynantskill
East Greenbush 12061 East Greenbush
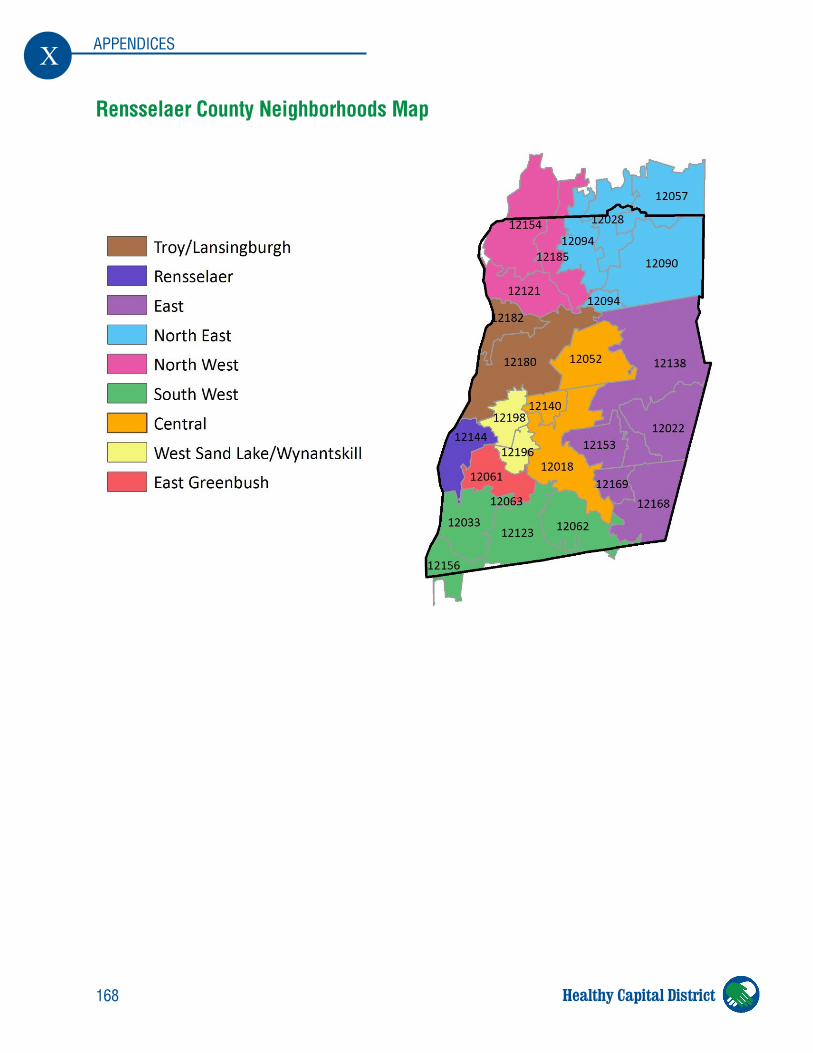
168
X APPENDICES
Healthy Capital District
Rensselaer County Neighborhoods Map
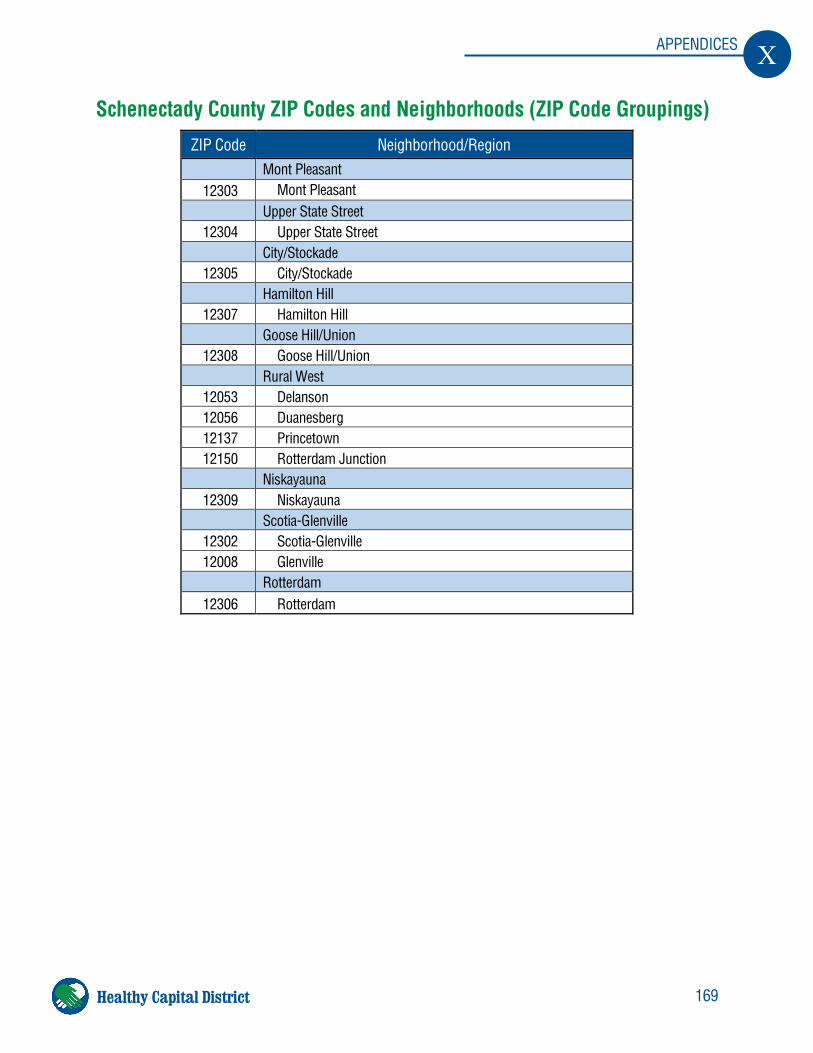
169
X APPENDICES
Healthy Capital District
Schenectady County ZIP Codes and Neighborhoods (ZIP Code Groupings) ZIP Code Neighborhood/Region Mont Pleasant
12303 Mont Pleasant Upper State Street
12304 Upper State Street City/Stockade
12305 City/Stockade Hamilton Hill
12307 Hamilton Hill Goose Hill/Union
12308 Goose Hill/Union Rural West
12053 Delanson 12056 Duanesberg 12137 Princetown 12150 Rotterdam Junction
Niskayauna 12309 Niskayauna
Scotia-Glenville 12302 Scotia-Glenville 12008 Glenville
Rotterdam 12306 Rotterdam
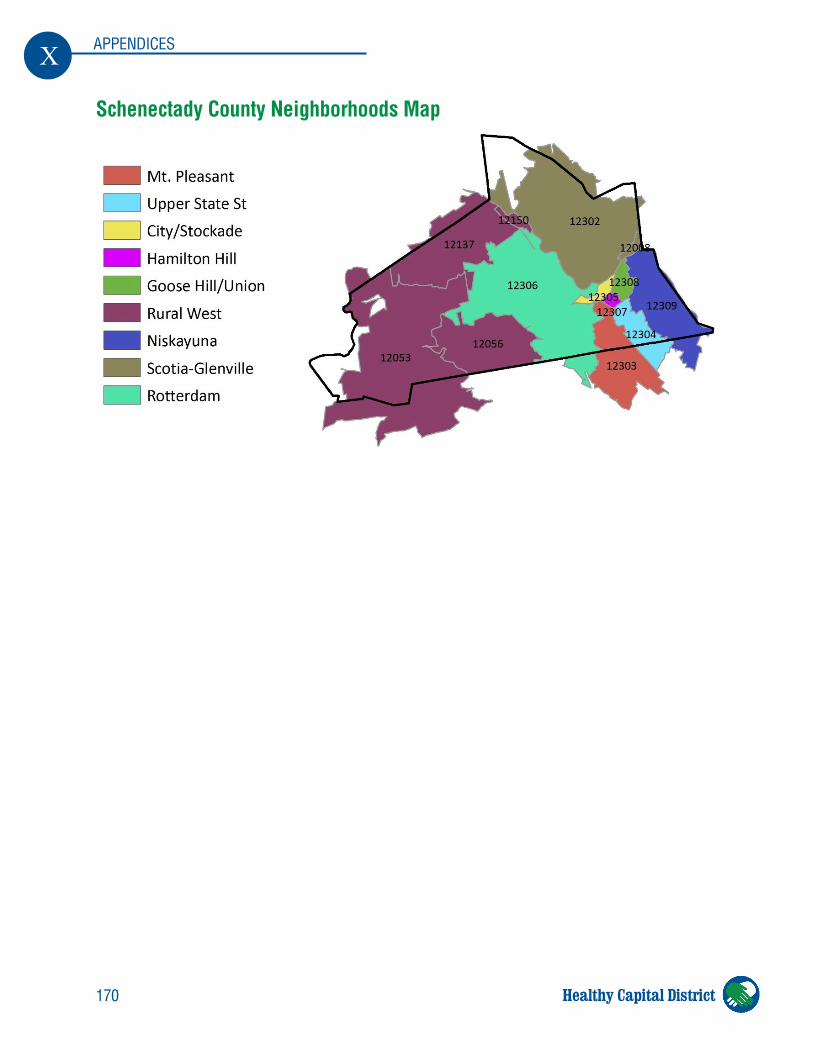
170
X APPENDICES
Healthy Capital District
Schenectady County Neighborhoods Map
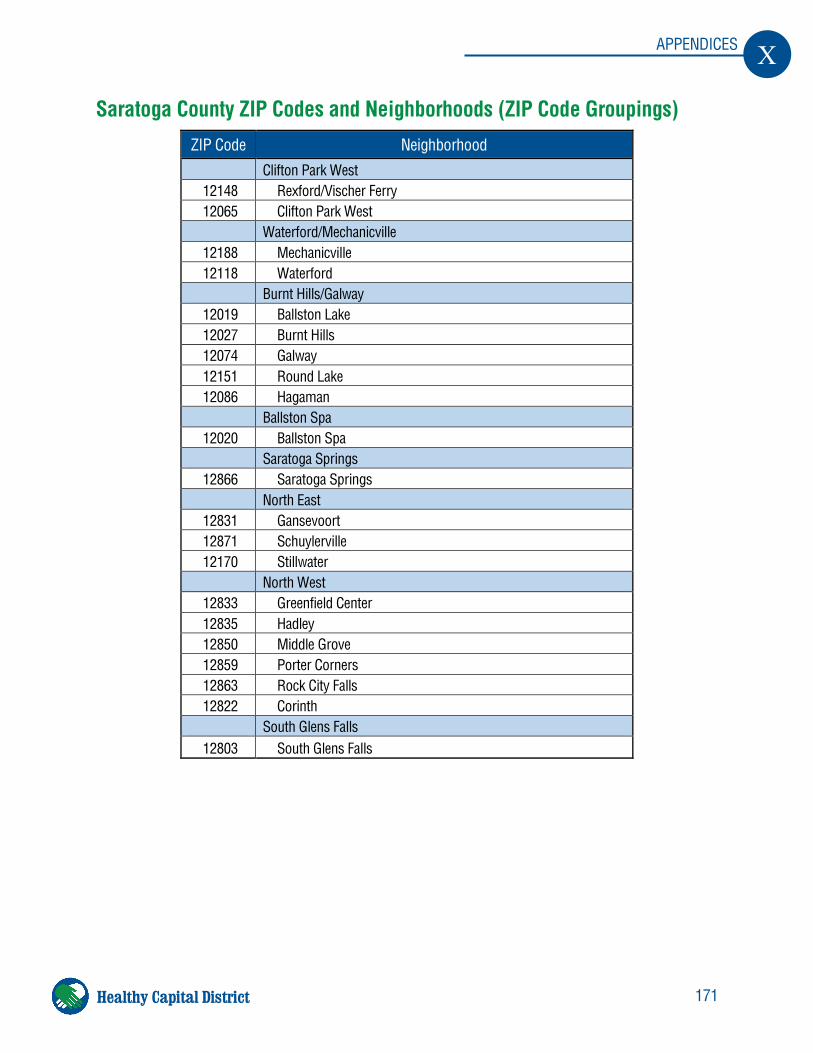
171
X APPENDICES
Healthy Capital District
Saratoga County ZIP Codes and Neighborhoods (ZIP Code Groupings) ZIP Code Neighborhood Clifton Park West
12148 Rexford/Vischer Ferry 12065 Clifton Park West Waterford/Mechanicville 12188 Mechanicville 12118 Waterford Burnt Hills/Galway 12019 Ballston Lake 12027 Burnt Hills 12074 Galway 12151 Round Lake 12086 Hagaman Ballston Spa 12020 Ballston Spa Saratoga Springs 12866 Saratoga Springs North East 12831 Gansevoort 12871 Schuylerville 12170 Stillwater North West 12833 Greenfield Center 12835 Hadley 12850 Middle Grove 12859 Porter Corners 12863 Rock City Falls 12822 Corinth South Glens Falls 12803 South Glens Falls
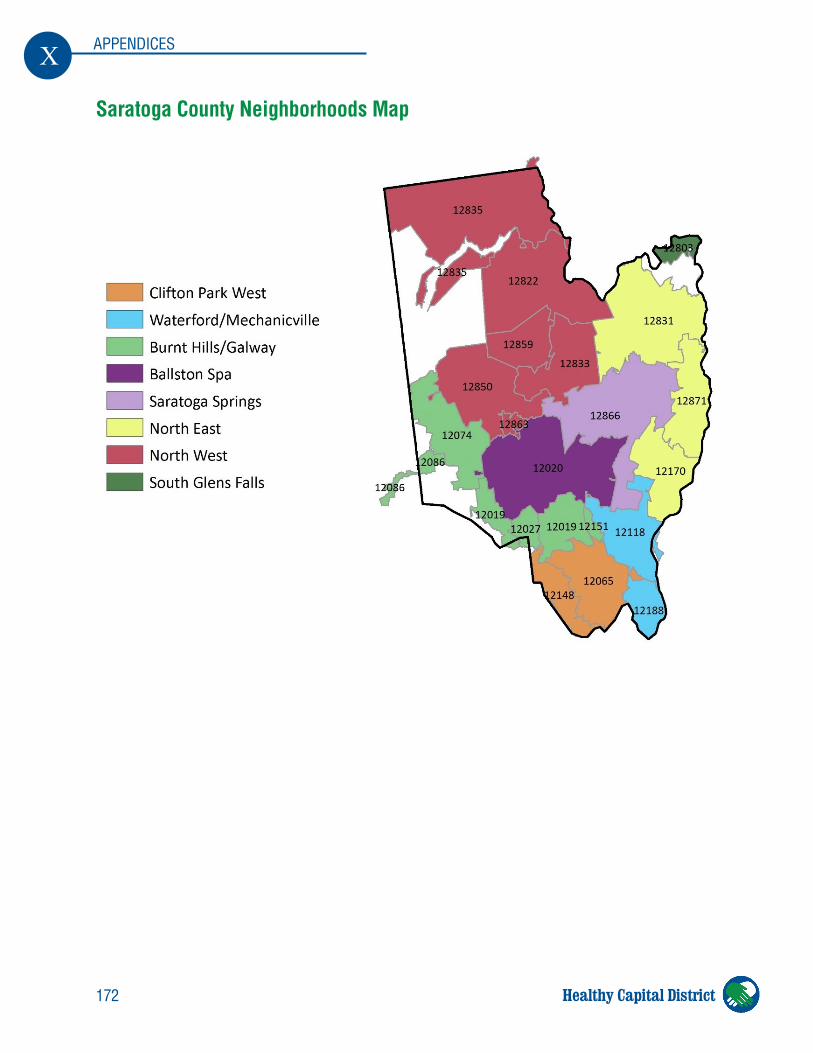
172
X APPENDICES
Healthy Capital District
Saratoga County Neighborhoods Map
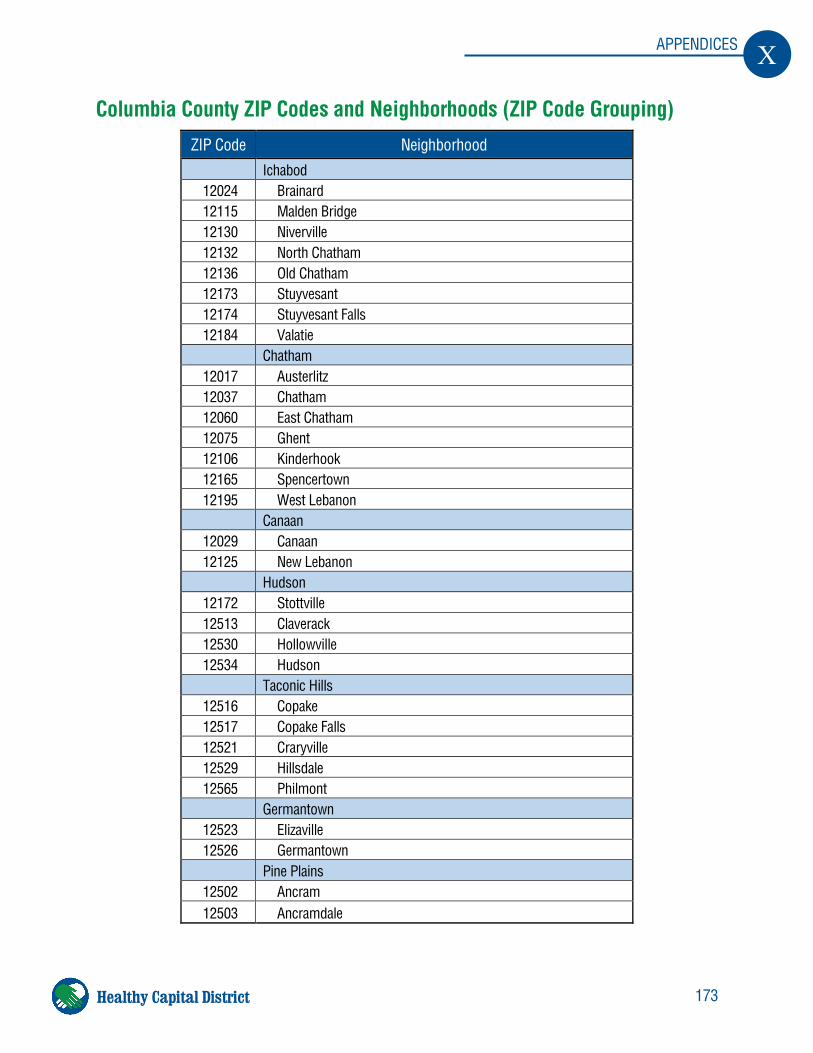
173
X APPENDICES
Healthy Capital District
Columbia County ZIP Codes and Neighborhoods (ZIP Code Grouping) ZIP Code Neighborhood Ichabod
12024 Brainard 12115 Malden Bridge 12130 Niverville 12132 North Chatham 12136 Old Chatham 12173 Stuyvesant 12174 Stuyvesant Falls 12184 Valatie Chatham 12017 Austerlitz 12037 Chatham 12060 East Chatham 12075 Ghent 12106 Kinderhook 12165 Spencertown 12195 West Lebanon Canaan 12029 Canaan 12125 New Lebanon Hudson 12172 Stottville 12513 Claverack 12530 Hollowville 12534 Hudson Taconic Hills 12516 Copake 12517 Copake Falls 12521 Craryville 12529 Hillsdale 12565 Philmont Germantown 12523 Elizaville 12526 Germantown Pine Plains 12502 Ancram 12503 Ancramdale
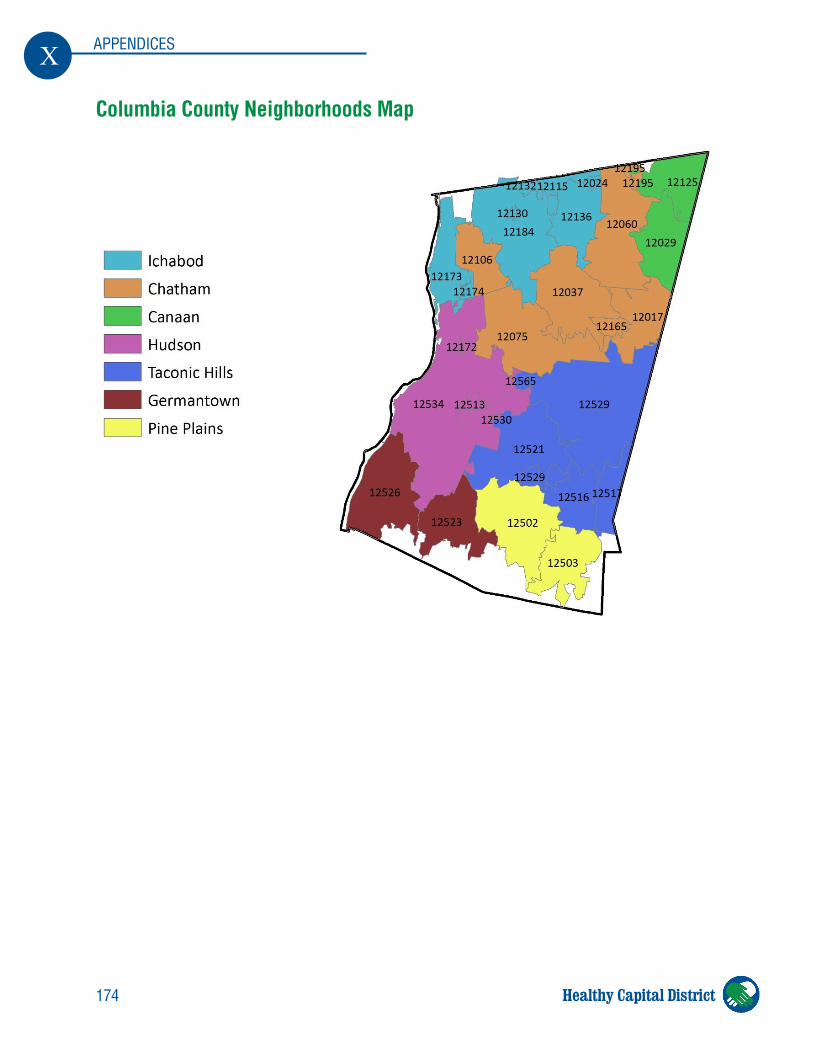
174
X APPENDICES
Healthy Capital District
Columbia County Neighborhoods Map
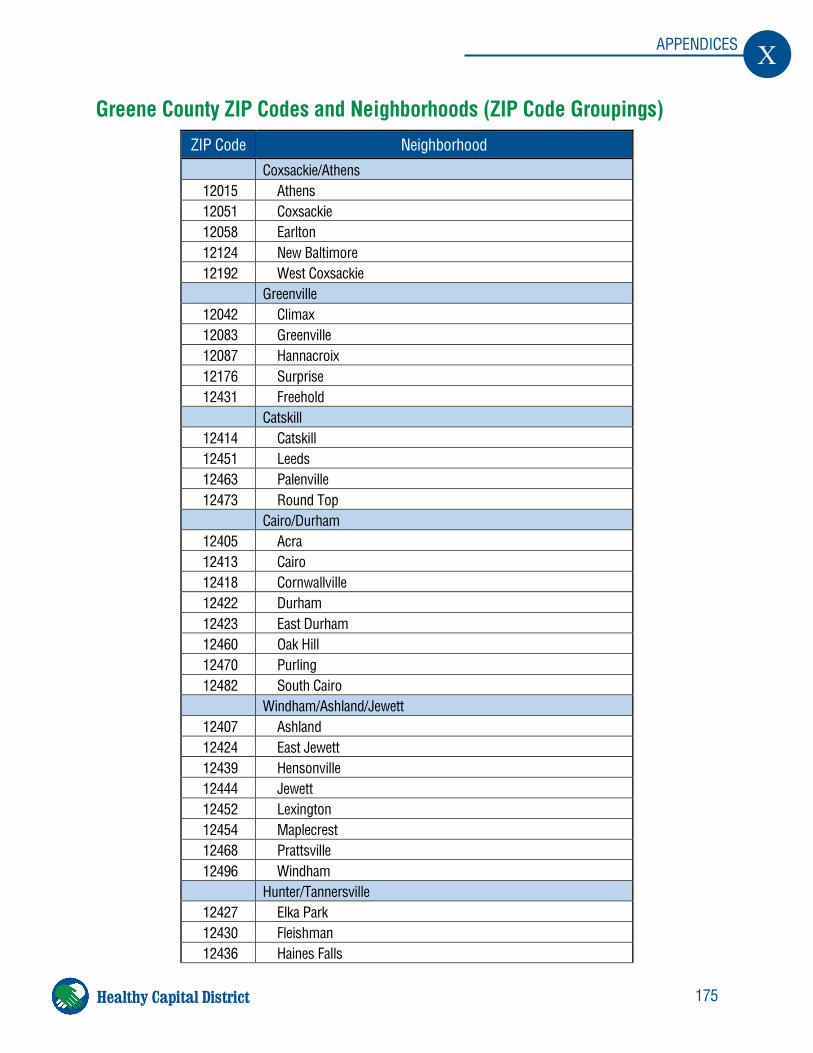
175
X APPENDICES
Healthy Capital District
Greene County ZIP Codes and Neighborhoods (ZIP Code Groupings) ZIP Code Neighborhood Coxsackie/Athens
12015 Athens 12051 Coxsackie 12058 Earlton 12124 New Baltimore 12192 West Coxsackie Greenville 12042 Climax 12083 Greenville 12087 Hannacroix 12176 Surprise 12431 Freehold Catskill 12414 Catskill 12451 Leeds 12463 Palenville 12473 Round Top Cairo/Durham 12405 Acra 12413 Cairo 12418 Cornwallville 12422 Durham 12423 East Durham 12460 Oak Hill 12470 Purling 12482 South Cairo Windham/Ashland/Jewett 12407 Ashland 12424 East Jewett 12439 Hensonville 12444 Jewett 12452 Lexington 12454 Maplecrest 12468 Prattsville 12496 Windham Hunter/Tannersville 12427 Elka Park 12430 Fleishman 12436 Haines Falls
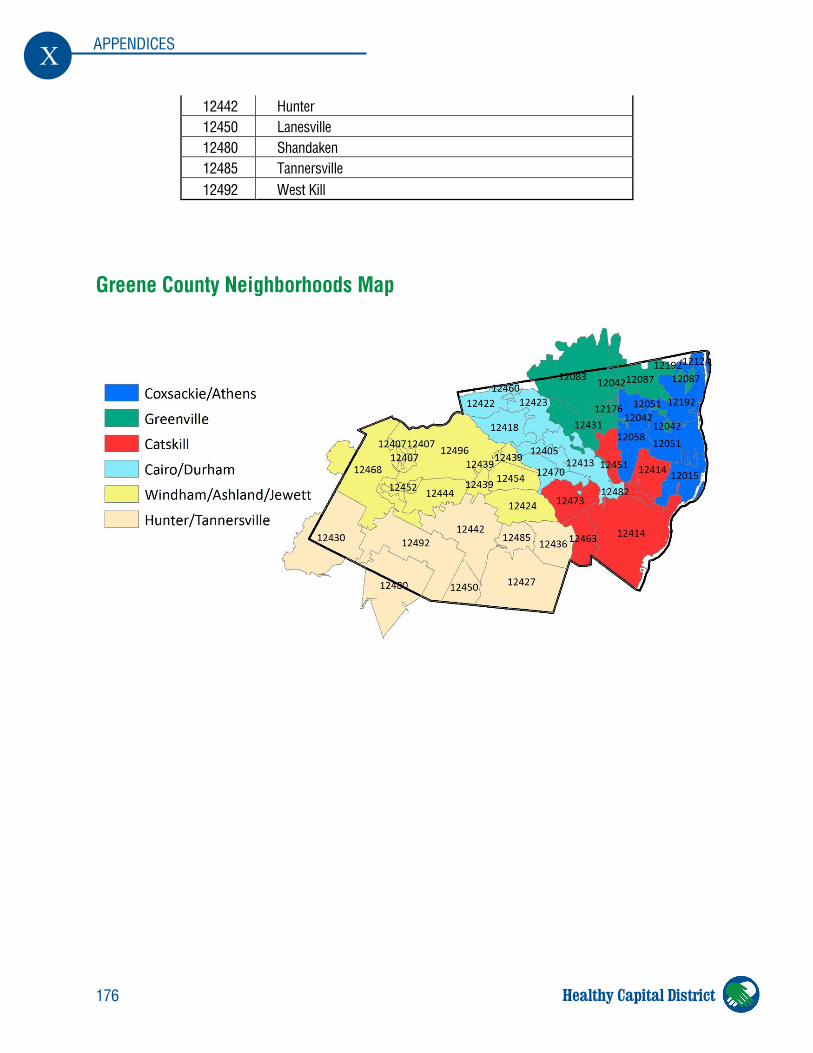
176
X APPENDICES
Healthy Capital District
12442 Hunter 12450 Lanesville 12480 Shandaken 12485 Tannersville 12492 West Kill
Greene County Neighborhoods Map
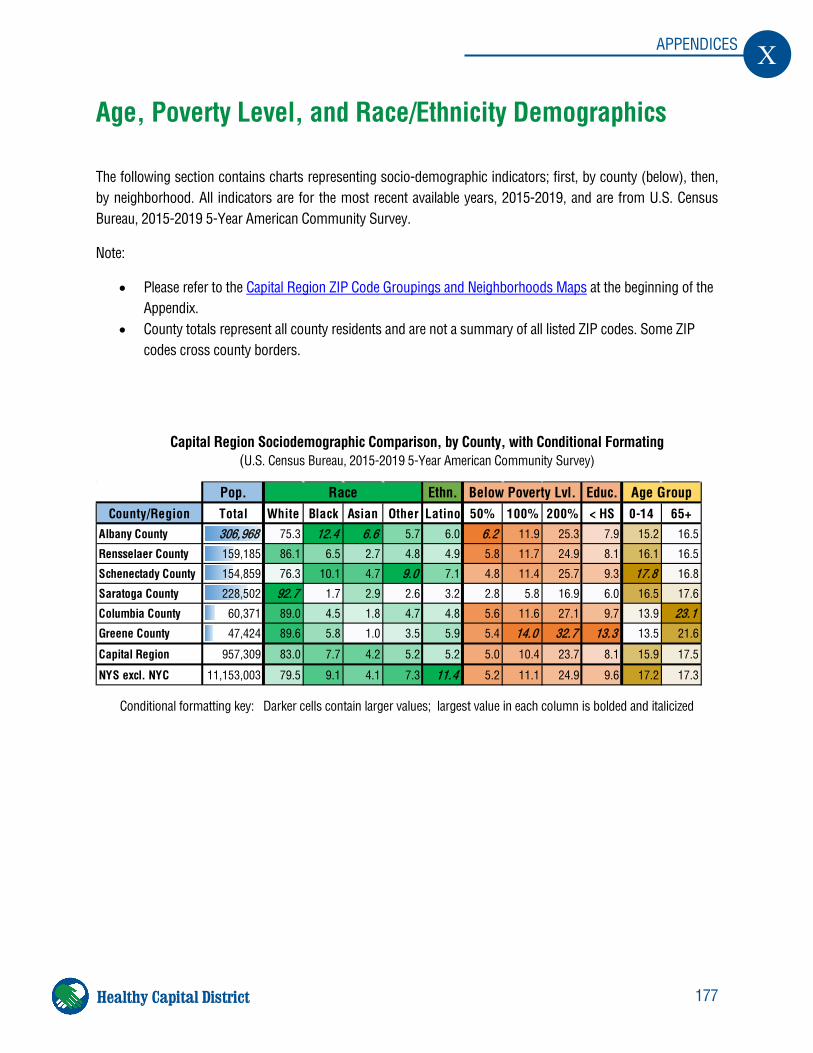
177
X APPENDICES
Healthy Capital District
Age, Poverty Level, and Race/Ethnicity Demographics
The following section contains charts representing socio-demographic indicators; first, by county (below), then, by neighborhood. All indicators are for the most recent available years, 2015-2019, and are from U.S. Census Bureau, 2015-2019 5-Year American Community Survey.
Note:
• Please refer to the Capital Region ZIP Code Groupings and Neighborhoods Maps at the beginning of the Appendix.
• County totals represent all county residents and are not a summary of all listed ZIP codes. Some ZIP codes cross county borders.
Conditional formatting key: Darker cells contain larger values; largest value in each column is bolded and italicized
Pop. Ethn. Educ.County/Region Total White Black Asian Other Latino 50% 100% 200% < HS 0-14 65+
Albany County 306,968 75.3 12.4 6.6 5.7 6.0 6.2 11.9 25.3 7.9 15.2 16.5
Rensselaer County 159,185 86.1 6.5 2.7 4.8 4.9 5.8 11.7 24.9 8.1 16.1 16.5
Schenectady County 154,859 76.3 10.1 4.7 9.0 7.1 4.8 11.4 25.7 9.3 17.8 16.8
Saratoga County 228,502 92.7 1.7 2.9 2.6 3.2 2.8 5.8 16.9 6.0 16.5 17.6
Columbia County 60,371 89.0 4.5 1.8 4.7 4.8 5.6 11.6 27.1 9.7 13.9 23.1Greene County 47,424 89.6 5.8 1.0 3.5 5.9 5.4 14.0 32.7 13.3 13.5 21.6
Capital Region 957,309 83.0 7.7 4.2 5.2 5.2 5.0 10.4 23.7 8.1 15.9 17.5
NYS excl. NYC 11,153,003 79.5 9.1 4.1 7.3 11.4 5.2 11.1 24.9 9.6 17.2 17.3
Race Below Poverty Lvl. Age Group
Capital Region Sociodemographic Comparison, by County, with Conditional Formating (U.S. Census Bureau, 2015-2019 5-Year American Community Survey)
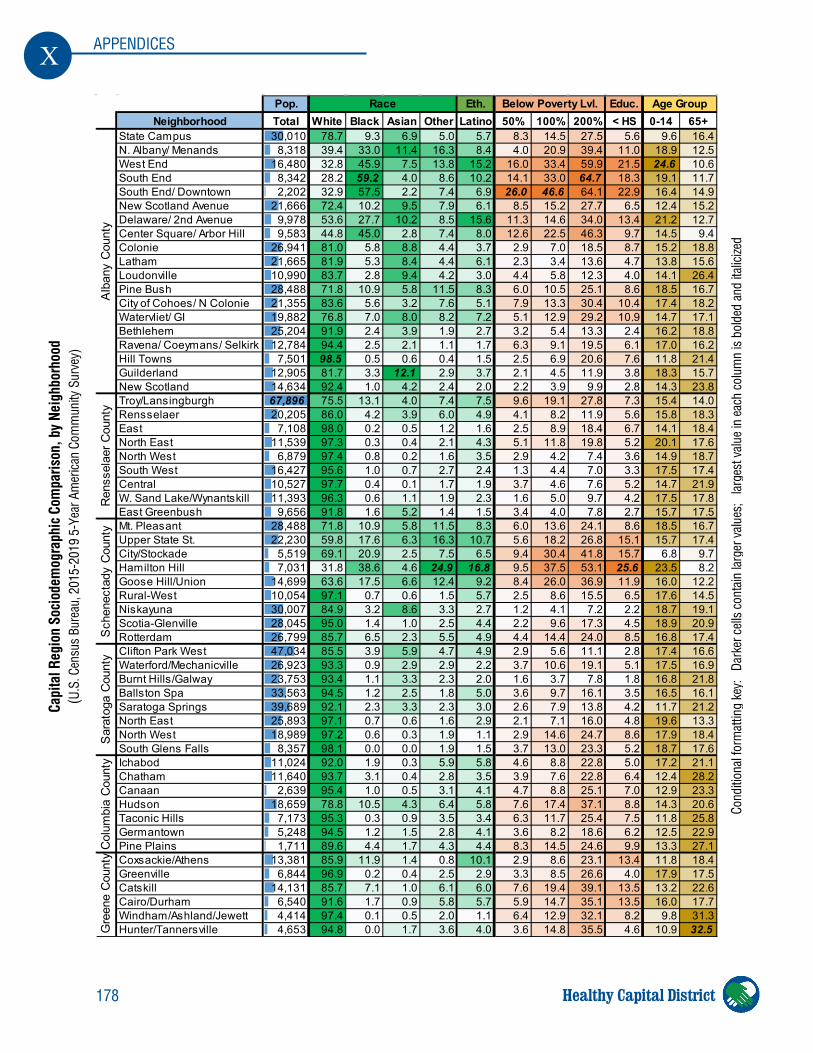
178
X APPENDICES
Healthy Capital District
Pop. Eth. Educ.Neighborhood Total White Black Asian Other Latino 50% 100% 200% < HS 0-14 65+
State Campus 30,010 78.7 9.3 6.9 5.0 5.7 8.3 14.5 27.5 5.6 9.6 16.4N. Albany/ Menands 8,318 39.4 33.0 11.4 16.3 8.4 4.0 20.9 39.4 11.0 18.9 12.5West End 16,480 32.8 45.9 7.5 13.8 15.2 16.0 33.4 59.9 21.5 24.6 10.6South End 8,342 28.2 59.2 4.0 8.6 10.2 14.1 33.0 64.7 18.3 19.1 11.7South End/ Downtown 2,202 32.9 57.5 2.2 7.4 6.9 26.0 46.6 64.1 22.9 16.4 14.9New Scotland Avenue 21,666 72.4 10.2 9.5 7.9 6.1 8.5 15.2 27.7 6.5 12.4 15.2Delaware/ 2nd Avenue 9,978 53.6 27.7 10.2 8.5 15.6 11.3 14.6 34.0 13.4 21.2 12.7Center Square/ Arbor Hill 9,583 44.8 45.0 2.8 7.4 8.0 12.6 22.5 46.3 9.7 14.5 9.4Colonie 26,941 81.0 5.8 8.8 4.4 3.7 2.9 7.0 18.5 8.7 15.2 18.8Latham 21,665 81.9 5.3 8.4 4.4 6.1 2.3 3.4 13.6 4.7 13.8 15.6Loudonville 10,990 83.7 2.8 9.4 4.2 3.0 4.4 5.8 12.3 4.0 14.1 26.4Pine Bush 28,488 71.8 10.9 5.8 11.5 8.3 6.0 10.5 25.1 8.6 18.5 16.7City of Cohoes/ N Colonie 21,355 83.6 5.6 3.2 7.6 5.1 7.9 13.3 30.4 10.4 17.4 18.2Watervliet/ GI 19,882 76.8 7.0 8.0 8.2 7.2 5.1 12.9 29.2 10.9 14.7 17.1Bethlehem 25,204 91.9 2.4 3.9 1.9 2.7 3.2 5.4 13.3 2.4 16.2 18.8Ravena/ Coeymans/ Selkirk 12,784 94.4 2.5 2.1 1.1 1.7 6.3 9.1 19.5 6.1 17.0 16.2Hill Towns 7,501 98.5 0.5 0.6 0.4 1.5 2.5 6.9 20.6 7.6 11.8 21.4Guilderland 12,905 81.7 3.3 12.1 2.9 3.7 2.1 4.5 11.9 3.8 18.3 15.7New Scotland 14,634 92.4 1.0 4.2 2.4 2.0 2.2 3.9 9.9 2.8 14.3 23.8Troy/Lansingburgh 67,896 75.5 13.1 4.0 7.4 7.5 9.6 19.1 27.8 7.3 15.4 14.0Rensselaer 20,205 86.0 4.2 3.9 6.0 4.9 4.1 8.2 11.9 5.6 15.8 18.3East 7,108 98.0 0.2 0.5 1.2 1.6 2.5 8.9 18.4 6.7 14.1 18.4North East 11,539 97.3 0.3 0.4 2.1 4.3 5.1 11.8 19.8 5.2 20.1 17.6North West 6,879 97.4 0.8 0.2 1.6 3.5 2.9 4.2 7.4 3.6 14.9 18.7South West 16,427 95.6 1.0 0.7 2.7 2.4 1.3 4.4 7.0 3.3 17.5 17.4Central 10,527 97.7 0.4 0.1 1.7 1.9 3.7 4.6 7.6 5.2 14.7 21.9W. Sand Lake/Wynantskill 11,393 96.3 0.6 1.1 1.9 2.3 1.6 5.0 9.7 4.2 17.5 17.8East Greenbush 9,656 91.8 1.6 5.2 1.4 1.5 3.4 4.0 7.8 2.7 15.7 17.5Mt. Pleasant 28,488 71.8 10.9 5.8 11.5 8.3 6.0 13.6 24.1 8.6 18.5 16.7Upper State St. 22,230 59.8 17.6 6.3 16.3 10.7 5.6 18.2 26.8 15.1 15.7 17.4City/Stockade 5,519 69.1 20.9 2.5 7.5 6.5 9.4 30.4 41.8 15.7 6.8 9.7Hamilton Hill 7,031 31.8 38.6 4.6 24.9 16.8 9.5 37.5 53.1 25.6 23.5 8.2Goose Hill/Union 14,699 63.6 17.5 6.6 12.4 9.2 8.4 26.0 36.9 11.9 16.0 12.2Rural-West 10,054 97.1 0.7 0.6 1.5 5.7 2.5 8.6 15.5 6.5 17.6 14.5Niskayuna 30,007 84.9 3.2 8.6 3.3 2.7 1.2 4.1 7.2 2.2 18.7 19.1Scotia-Glenville 28,045 95.0 1.4 1.0 2.5 4.4 2.2 9.6 17.3 4.5 18.9 20.9Rotterdam 26,799 85.7 6.5 2.3 5.5 4.9 4.4 14.4 24.0 8.5 16.8 17.4Clifton Park West 47,034 85.5 3.9 5.9 4.7 4.9 2.9 5.6 11.1 2.8 17.4 16.6Waterford/Mechanicville 26,923 93.3 0.9 2.9 2.9 2.2 3.7 10.6 19.1 5.1 17.5 16.9Burnt Hills/Galway 23,753 93.4 1.1 3.3 2.3 2.0 1.6 3.7 7.8 1.8 16.8 21.8Ballston Spa 33,563 94.5 1.2 2.5 1.8 5.0 3.6 9.7 16.1 3.5 16.5 16.1Saratoga Springs 39,689 92.1 2.3 3.3 2.3 3.0 2.6 7.9 13.8 4.2 11.7 21.2North East 25,893 97.1 0.7 0.6 1.6 2.9 2.1 7.1 16.0 4.8 19.6 13.3North West 18,989 97.2 0.6 0.3 1.9 1.1 2.9 14.6 24.7 8.6 17.9 18.4South Glens Falls 8,357 98.1 0.0 0.0 1.9 1.5 3.7 13.0 23.3 5.2 18.7 17.6Ichabod 11,024 92.0 1.9 0.3 5.9 5.8 4.6 8.8 22.8 5.0 17.2 21.1Chatham 11,640 93.7 3.1 0.4 2.8 3.5 3.9 7.6 22.8 6.4 12.4 28.2Canaan 2,639 95.4 1.0 0.5 3.1 4.1 4.7 8.8 25.1 7.0 12.9 23.3Hudson 18,659 78.8 10.5 4.3 6.4 5.8 7.6 17.4 37.1 8.8 14.3 20.6Taconic Hills 7,173 95.3 0.3 0.9 3.5 3.4 6.3 11.7 25.4 7.5 11.8 25.8Germantown 5,248 94.5 1.2 1.5 2.8 4.1 3.6 8.2 18.6 6.2 12.5 22.9Pine Plains 1,711 89.6 4.4 1.7 4.3 4.4 8.3 14.5 24.6 9.9 13.3 27.1Coxsackie/Athens 13,381 85.9 11.9 1.4 0.8 10.1 2.9 8.6 23.1 13.4 11.8 18.4Greenville 6,844 96.9 0.2 0.4 2.5 2.9 3.3 8.5 26.6 4.0 17.9 17.5Catskill 14,131 85.7 7.1 1.0 6.1 6.0 7.6 19.4 39.1 13.5 13.2 22.6Cairo/Durham 6,540 91.6 1.7 0.9 5.8 5.7 5.9 14.7 35.1 13.5 16.0 17.7Windham/Ashland/Jewett 4,414 97.4 0.1 0.5 2.0 1.1 6.4 12.9 32.1 8.2 9.8 31.3Hunter/Tannersville 4,653 94.8 0.0 1.7 3.6 4.0 3.6 14.8 35.5 4.6 10.9 32.5
Col
umbi
a C
ount
yG
reen
e C
ount
yRace Below Poverty Lvl. Age Group
Alb
any
Cou
nty
Ren
ssel
aer C
ount
yS
chen
ecta
dy C
ount
yS
arat
oga
Cou
nty
Capi
tal R
egio
n So
ciod
emog
raph
ic C
ompa
rison
, by
Neig
hbor
hood
(U
.S. C
ensu
s Bu
reau
, 201
5-20
19 5
-Yea
r Am
erica
n Co
mm
unity
Sur
vey)
Cond
ition
al fo
rmat
ting
key:
Da
rker
cell
s co
ntain
larg
er v
alues
; la
rges
t valu
e in
eac
h co
lum
n is
bold
ed a
nd it
aliciz
ed
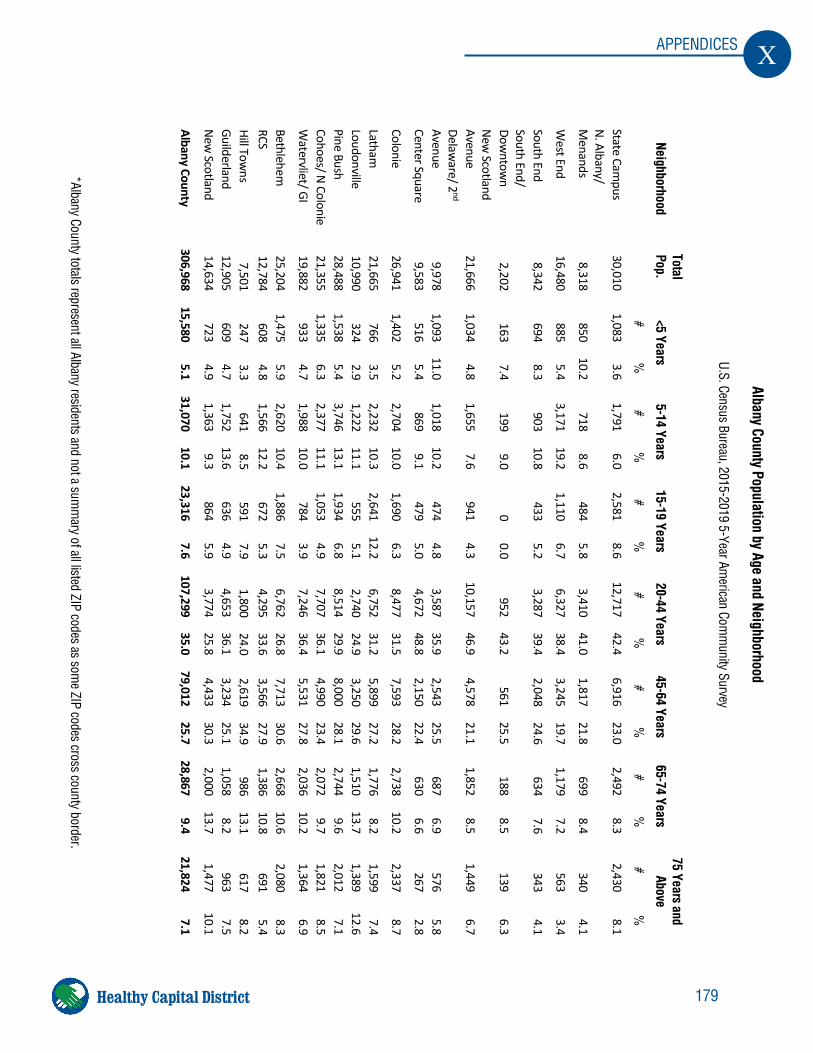
179
X APPENDICES
Healthy Capital District
Albany County Population by Age and Neighborhood
U.S. Census Bureau, 2015-2019 5-Year American Com
munity Survey
*Albany County totals represent all Albany residents and not a summ
ary of all listed ZIP codes as some ZIP codes cross county border.
Neighborhood Total Pop.
<5 Years 5-14 Years
15-19 Years 20-44 Years
45-64 Years 65-74 Years
75 Years and Above
# %
#
%
# %
#
%
# %
#
%
# %
State Campus
30,010 1,083
3.6 1,791
6.0 2,581
8.6 12,717
42.4 6,916
23.0 2,492
8.3 2,430
8.1 N. Albany/ M
enands 8,318
850 10.2
718 8.6
484 5.8
3,410 41.0
1,817 21.8
699 8.4
340 4.1
West End
16,480 885
5.4 3,171
19.2 1,110
6.7 6,327
38.4 3,245
19.7 1,179
7.2 563
3.4
South End 8,342
694 8.3
903 10.8
433 5.2
3,287 39.4
2,048 24.6
634 7.6
343 4.1
South End/ Dow
ntown
2,202 163
7.4 199
9.0 0
0.0 952
43.2 561
25.5 188
8.5 139
6.3 New
Scotland Avenue
21,666 1,034
4.8 1,655
7.6 941
4.3 10,157
46.9 4,578
21.1 1,852
8.5 1,449
6.7 Delaw
are/ 2nd
Avenue 9,978
1,093 11.0
1,018 10.2
474 4.8
3,587 35.9
2,543 25.5
687 6.9
576 5.8
Center Square 9,583
516 5.4
869 9.1
479 5.0
4,672 48.8
2,150 22.4
630 6.6
267 2.8
Colonie 26,941
1,402 5.2
2,704 10.0
1,690 6.3
8,477 31.5
7,593 28.2
2,738 10.2
2,337 8.7
Latham
21,665 766
3.5 2,232
10.3 2,641
12.2 6,752
31.2 5,899
27.2 1,776
8.2 1,599
7.4 Loudonville
10,990 324
2.9 1,222
11.1 555
5.1 2,740
24.9 3,250
29.6 1,510
13.7 1,389
12.6 Pine Bush
28,488 1,538
5.4 3,746
13.1 1,934
6.8 8,514
29.9 8,000
28.1 2,744
9.6 2,012
7.1 Cohoes/ N Colonie
21,355 1,335
6.3 2,377
11.1 1,053
4.9 7,707
36.1 4,990
23.4 2,072
9.7 1,821
8.5 W
atervliet/ GI 19,882
933 4.7
1,988 10.0
784 3.9
7,246 36.4
5,531 27.8
2,036 10.2
1,364 6.9
Bethlehem
25,204 1,475
5.9 2,620
10.4 1,886
7.5 6,762
26.8 7,713
30.6 2,668
10.6 2,080
8.3 RCS
12,784 608
4.8 1,566
12.2 672
5.3 4,295
33.6 3,566
27.9 1,386
10.8 691
5.4 Hill Tow
ns 7,501
247 3.3
641 8.5
591 7.9
1,800 24.0
2,619 34.9
986 13.1
617 8.2
Gu ilderland 12,905
609 4.7
1,752 13.6
636 4.9
4,653 36.1
3,234 25.1
1,058 8.2
963 7.5
New Scotland
14,634 723
4.9 1,363
9.3 864
5.9 3,774
25.8 4,433
30.3 2,000
13.7 1,477
10.1
Albany County 306,968
15,580 5.1
31,070 10.1
23,316 7.6
107,299 35.0
79,012 25.7
28,867 9.4
21,824 7.1
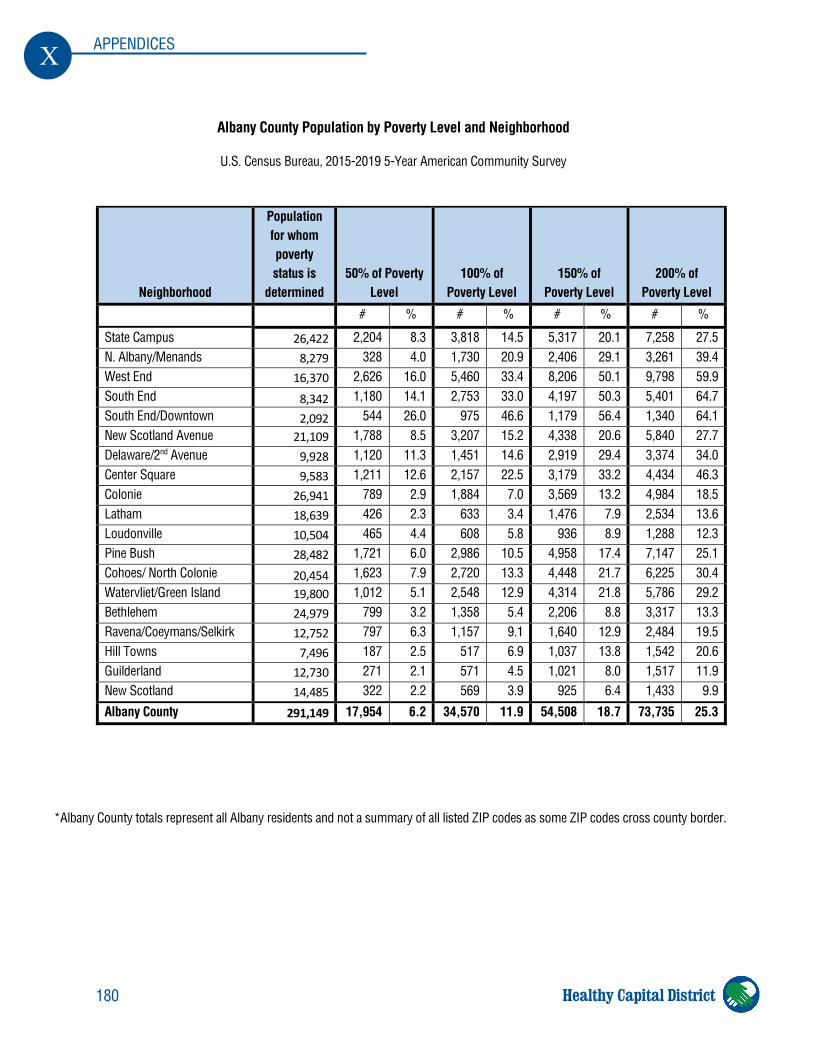
180
X APPENDICES
Healthy Capital District
Neighborhood
Population for whom poverty status is
determined
50% of Poverty
Level
100% of
Poverty Level
150% of
Poverty Level
200% of
Poverty Level
# % # % # % # %
State Campus 26,422 2,204 8.3 3,818 14.5 5,317 20.1 7,258 27.5 N. Albany/Menands 8,279 328 4.0 1,730 20.9 2,406 29.1 3,261 39.4 West End 16,370 2,626 16.0 5,460 33.4 8,206 50.1 9,798 59.9 South End 8,342 1,180 14.1 2,753 33.0 4,197 50.3 5,401 64.7 South End/Downtown 2,092 544 26.0 975 46.6 1,179 56.4 1,340 64.1 New Scotland Avenue 21,109 1,788 8.5 3,207 15.2 4,338 20.6 5,840 27.7 Delaware/2nd Avenue 9,928 1,120 11.3 1,451 14.6 2,919 29.4 3,374 34.0 Center Square 9,583 1,211 12.6 2,157 22.5 3,179 33.2 4,434 46.3 Colonie 26,941 789 2.9 1,884 7.0 3,569 13.2 4,984 18.5 Latham 18,639 426 2.3 633 3.4 1,476 7.9 2,534 13.6 Loudonville 10,504 465 4.4 608 5.8 936 8.9 1,288 12.3 Pine Bush 28,482 1,721 6.0 2,986 10.5 4,958 17.4 7,147 25.1 Cohoes/ North Colonie 20,454 1,623 7.9 2,720 13.3 4,448 21.7 6,225 30.4 Watervliet/Green Island 19,800 1,012 5.1 2,548 12.9 4,314 21.8 5,786 29.2 Bethlehem 24,979 799 3.2 1,358 5.4 2,206 8.8 3,317 13.3 Ravena/Coeymans/Selkirk 12,752 797 6.3 1,157 9.1 1,640 12.9 2,484 19.5 Hill Towns 7,496 187 2.5 517 6.9 1,037 13.8 1,542 20.6 Guilderland 12,730 271 2.1 571 4.5 1,021 8.0 1,517 11.9 New Scotland 14,485 322 2.2 569 3.9 925 6.4 1,433 9.9
Albany County 291,149 17,954 6.2 34,570 11.9 54,508 18.7 73,735 25.3
Albany County Population by Poverty Level and Neighborhood
U.S. Census Bureau, 2015-2019 5-Year American Community Survey
*Albany County totals represent all Albany residents and not a summary of all listed ZIP codes as some ZIP codes cross county border.

181
X APPENDICES
Healthy Capital District
Race Ethnicity
White Black Asian Other
Hispanic or Latino
Neighborhood # % # % # % # % # %
State Campus 23,622 78.7 2,800 9.3 2,074 6.9 1,514 5.0 1,696 5.7 N. Albany/ Menands 3,280 39.4 2,741 33.0 945 11.4 1,352 16.3 697 8.4 West End 5,403 32.8 7,569 45.9 1,233 7.5 2,275 13.8 2,509 15.2 South End 2,355 28.2 4,936 59.2 331 4.0 720 8.6 850 10.2 South End/ Downtown 724 32.9 1,266 57.5 48 2.2 164 7.4 152 6.9 New Scotland Avenue 15,683 72.4 2,211 10.2 2,054 9.5 1,718 7.9 1,313 6.1 Delaware/ 2nd Avenue 5,353 53.6 2,762 27.7 1,018 10.2 845 8.5 1,552 15.6 Center Square 4,289 44.8 4,317 45.0 271 2.8 706 7.4 771 8.0 Colonie 21,810 81.0 1,570 5.8 2,383 8.8 1,178 4.4 1,000 3.7 Latham 17,743 81.9 1,145 5.3 1,816 8.4 961 4.4 1,316 6.1 Loudonville 9,199 83.7 303 2.8 1,031 9.4 457 4.2 326 3.0 Pine Bush 20,458 71.8 3,112 10.9 1,649 5.8 3,269 11.5 2,354 8.3 City of Cohoes/ N Colonie 17,848 83.6 1,197 5.6 678 3.2 1,632 7.6 1,098 5.1 Watervliet/ GI 15,272 76.8 1,395 7.0 1,590 8.0 1,625 8.2 1,427 7.2 Bethlehem 23,152 91.9 598 2.4 983 3.9 471 1.9 686 2.7 Ravena/ Coeymans/ Selkirk 12,065 94.4 319 2.5 264 2.1 136 1.1 219 1.7 Hill Towns 7,389 98.5 35 0.5 45 0.6 32 0.4 112 1.5 Guilderland 10,540 81.7 424 3.3 1,566 12.1 375 2.9 474 3.7 New Scotland 13,521 92.4 145 1.0 614 4.2 354 2.4 294 2.0
Albany County 231,246 75.3 38,035 12.4 20,192 6.6 17,495 5.7 18,325 6.0
Albany County Population by Race/Ethnicity and Neighborhood
U.S. Census Bureau, 2015-2019 5-Year American Community Survey
*Albany County totals represent all Albany residents and not a summary of all listed ZIP codes as some ZIP codes cross county border.
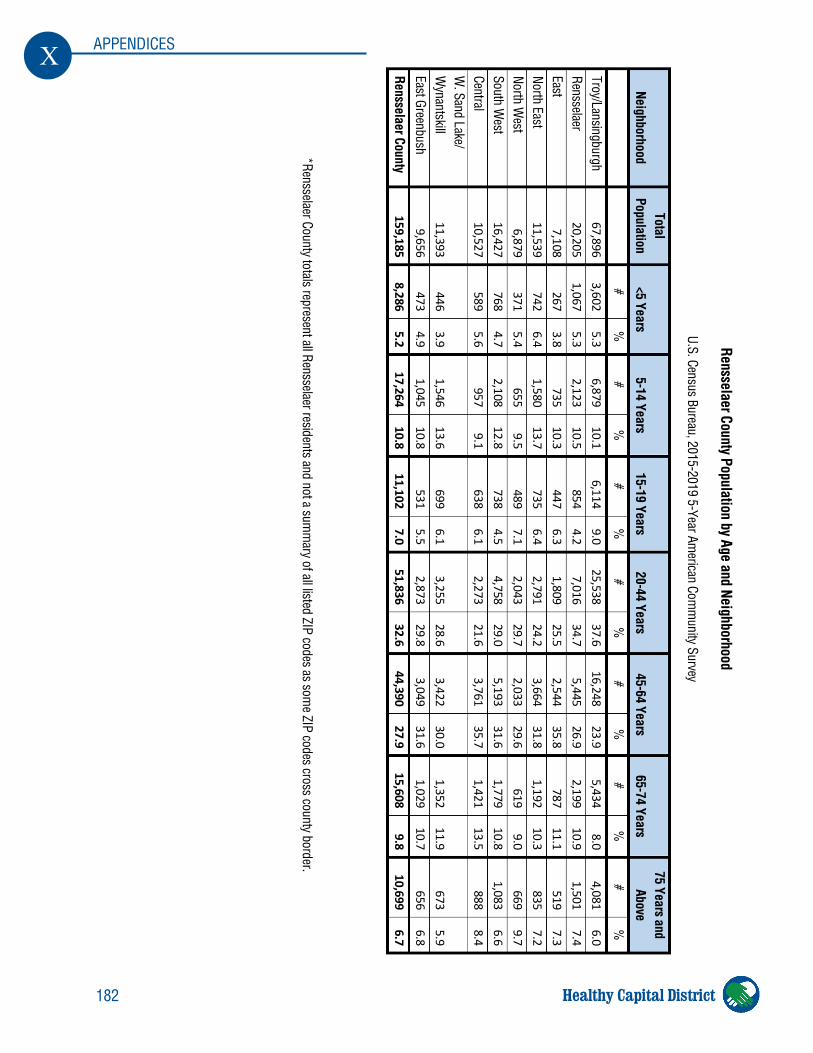
182
X APPENDICES
Healthy Capital District
Rensselaer County Population by Age and Neighborhood
U.S. Census Bureau, 2015-2019 5-Year American Com
munity Survey
*Rensselaer County totals represent all Rensselaer residents and not a summ
ary of all listed ZIP codes as some ZIP codes cross county border.
Neighborhood Total
Population <5 Years
5-14 Years 15-19 Years
20-44 Years 45-64 Years
65-74 Years 75 Years and
Above
# %
#
%
# %
#
%
# %
#
%
# %
Troy/Lansingburgh 67,896
3,602 5.3
6,879 10.1
6,114 9.0
25,538 37.6
16,248 23.9
5,434 8.0
4,081 6.0
Rensselaer 20,205
1,067 5.3
2,123 10.5
854 4.2
7,016 34.7
5,445 26.9
2,199 10.9
1,501 7.4
East 7,108
267 3.8
735 10.3
447 6.3
1,809 25.5
2,544 35.8
787 11.1
519 7.3
North East 11,539
742 6.4
1,580 13.7
735 6.4
2,791 24.2
3,664 31.8
1,192 10.3
835 7.2
North West
6,879 371
5.4 655
9.5 489
7.1 2,043
29.7 2,033
29.6 619
9.0 669
9.7 South W
est 16,427
768 4.7
2,108 12.8
738 4.5
4,758 29.0
5,193 31.6
1,779 10.8
1,083 6.6
Central 10,527
589 5.6
957 9.1
638 6.1
2,273 21.6
3,761 35.7
1,421 13.5
888 8.4
W. Sand Lake/
Wynantskill
11,393 446
3.9 1,546
13.6 699
6.1 3,255
28.6 3,422
30.0 1,352
11.9 673
5.9 East Greenbush
9,656 473
4.9 1,045
10.8 531
5.5 2,873
29.8 3,049
31.6 1,029
10.7 656
6.8
Rensselaer County 159,185
8,286 5.2
17,264 10.8
11,102 7.0
51,836 32.6
44,390 27.9
15,608 9.8
10,699 6.7
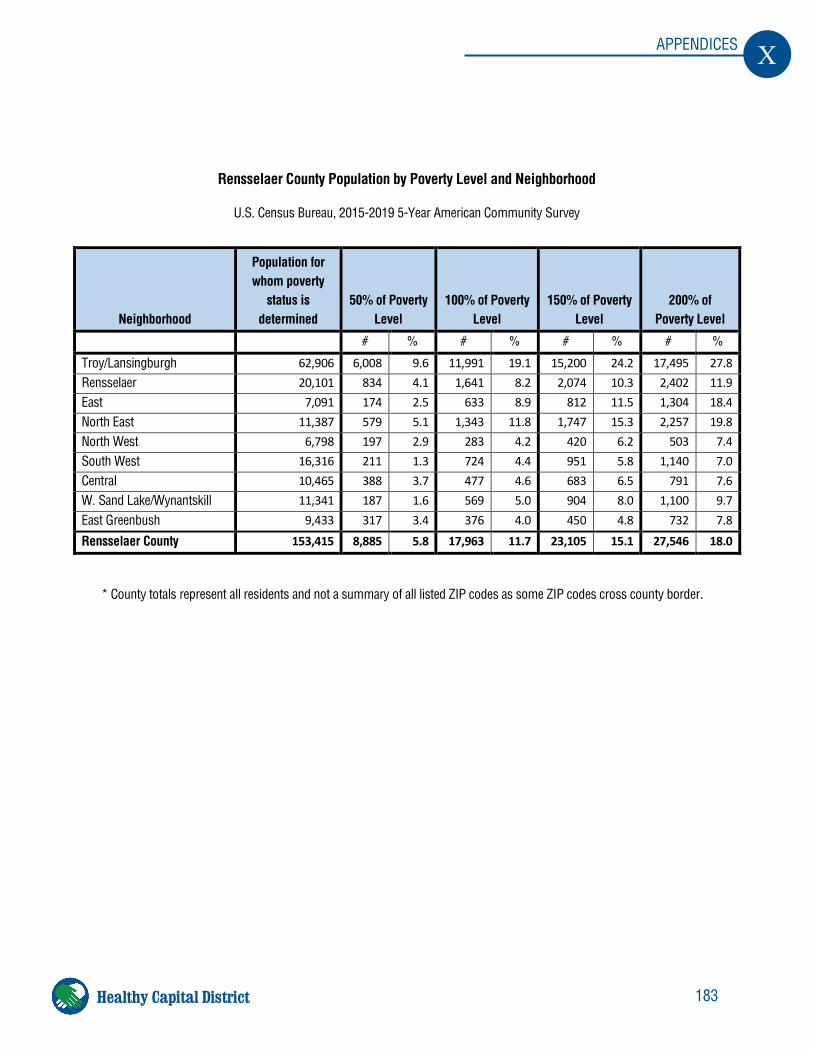
183
X APPENDICES
Healthy Capital District
Neighborhood
Population for whom poverty
status is determined
50% of Poverty
Level
100% of Poverty
Level
150% of Poverty
Level
200% of
Poverty Level
# % # % # % # %
Troy/Lansingburgh 62,906 6,008 9.6 11,991 19.1 15,200 24.2 17,495 27.8 Rensselaer 20,101 834 4.1 1,641 8.2 2,074 10.3 2,402 11.9 East 7,091 174 2.5 633 8.9 812 11.5 1,304 18.4 North East 11,387 579 5.1 1,343 11.8 1,747 15.3 2,257 19.8 North West 6,798 197 2.9 283 4.2 420 6.2 503 7.4 South West 16,316 211 1.3 724 4.4 951 5.8 1,140 7.0 Central 10,465 388 3.7 477 4.6 683 6.5 791 7.6 W. Sand Lake/Wynantskill 11,341 187 1.6 569 5.0 904 8.0 1,100 9.7 East Greenbush 9,433 317 3.4 376 4.0 450 4.8 732 7.8
Rensselaer County 153,415 8,885 5.8 17,963 11.7 23,105 15.1 27,546 18.0
Rensselaer County Population by Poverty Level and Neighborhood
U.S. Census Bureau, 2015-2019 5-Year American Community Survey
* County totals represent all residents and not a summary of all listed ZIP codes as some ZIP codes cross county border.
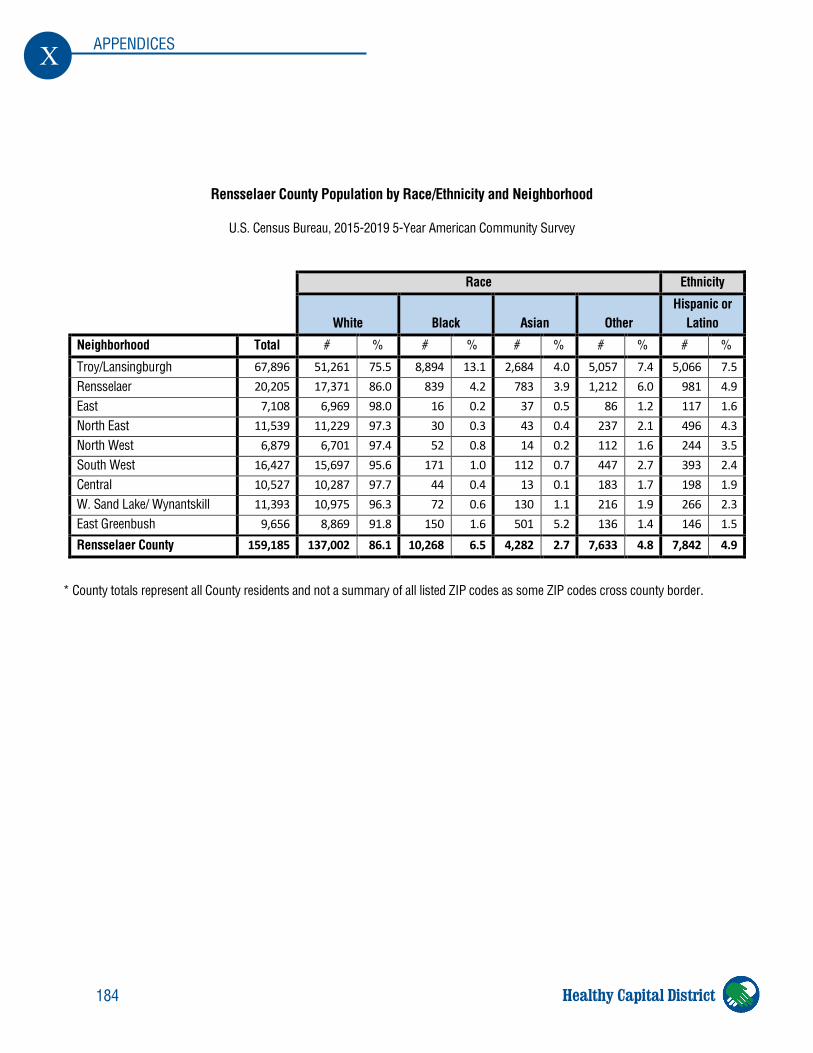
184
X APPENDICES
Healthy Capital District
Race Ethnicity
White Black Asian Other
Hispanic or Latino
Neighborhood Total # % # % # % # % # %
Troy/Lansingburgh 67,896 51,261 75.5 8,894 13.1 2,684 4.0 5,057 7.4 5,066 7.5 Rensselaer 20,205 17,371 86.0 839 4.2 783 3.9 1,212 6.0 981 4.9 East 7,108 6,969 98.0 16 0.2 37 0.5 86 1.2 117 1.6 North East 11,539 11,229 97.3 30 0.3 43 0.4 237 2.1 496 4.3 North West 6,879 6,701 97.4 52 0.8 14 0.2 112 1.6 244 3.5 South West 16,427 15,697 95.6 171 1.0 112 0.7 447 2.7 393 2.4 Central 10,527 10,287 97.7 44 0.4 13 0.1 183 1.7 198 1.9 W. Sand Lake/ Wynantskill 11,393 10,975 96.3 72 0.6 130 1.1 216 1.9 266 2.3 East Greenbush 9,656 8,869 91.8 150 1.6 501 5.2 136 1.4 146 1.5
Rensselaer County 159,185 137,002 86.1 10,268 6.5 4,282 2.7 7,633 4.8 7,842 4.9
Rensselaer County Population by Race/Ethnicity and Neighborhood
U.S. Census Bureau, 2015-2019 5-Year American Community Survey
* County totals represent all County residents and not a summary of all listed ZIP codes as some ZIP codes cross county border.
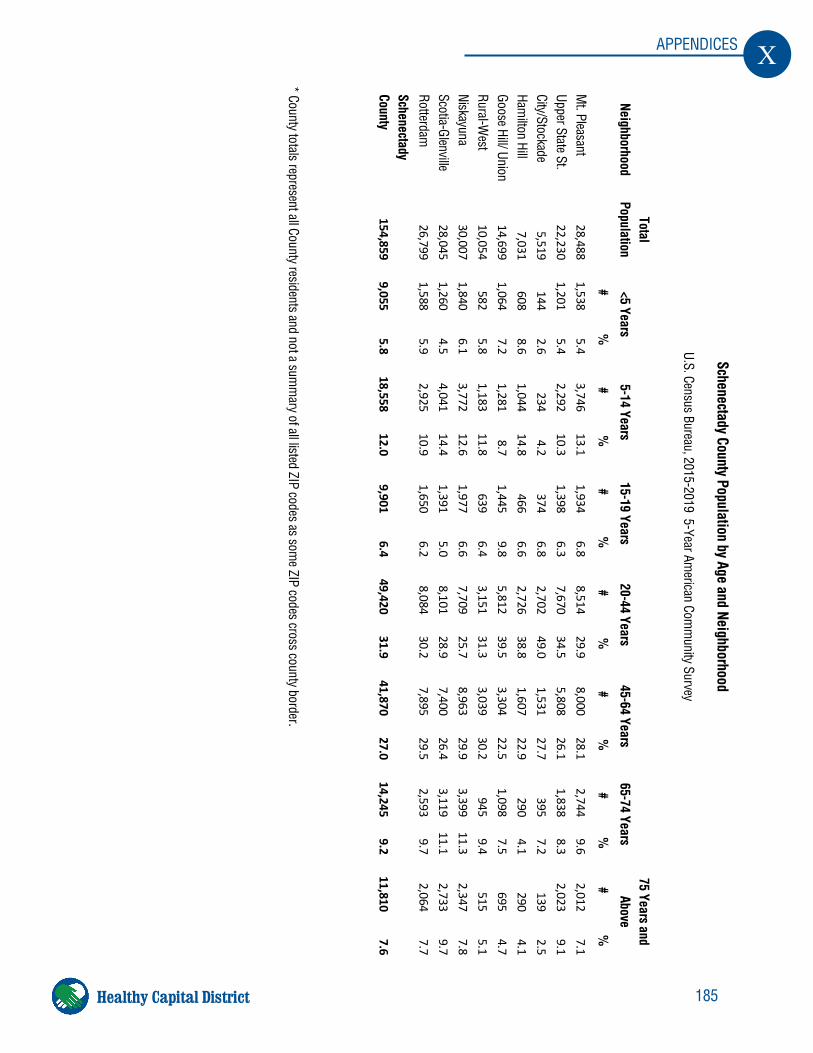
185
X APPENDICES
Healthy Capital District
Schenectady County Population by Age and Neighborhood
U.S. Census Bureau, 2015-2019 5-Year American Com
munity Survey
Neighborhood Total
Population <5 Years
5-14 Years 15-19 Years
20-44 Years 45-64 Years
65-74 Years 75 Years and
Above
# %
#
%
# %
#
%
# %
#
%
# %
Mt. Pleasant
28,488 1,538
5.4 3,746
13.1 1,934
6.8 8,514
29.9 8,000
28.1 2,744
9.6 2,012
7.1 Upper State St.
22,230 1,201
5.4 2,292
10.3 1,398
6.3 7,670
34.5 5,808
26.1 1,838
8.3 2,023
9.1 City/Stockade
5,519 144
2.6 234
4.2 374
6.8 2,702
49.0 1,531
27.7 395
7.2 139
2.5 Ham
ilton Hill 7,031
608 8.6
1,044 14.8
466 6.6
2,726 38.8
1,607 22.9
290 4.1
290 4.1
Goose Hill/ Union 14,699
1,064 7.2
1,281 8.7
1,445 9.8
5,812 39.5
3,304 22.5
1,098 7.5
695 4.7
Rural-West
10,054 582
5.8 1,183
11.8 639
6.4 3,151
31.3 3,039
30.2 945
9.4 515
5.1 Niskayuna
30,007 1,840
6.1 3,772
12.6 1,977
6.6 7,709
25.7 8,963
29.9 3,399
11.3 2,347
7.8 Scotia-Glenville
28,045 1,260
4.5 4,041
14.4 1,391
5.0 8,101
28.9 7,400
26.4 3,119
11.1 2,733
9.7 Rotterdam
26,799
1,588 5.9
2,925 10.9
1,650 6.2
8,084 30.2
7,895 29.5
2,593 9.7
2,064 7.7
Schenectady County
154,859 9,055
5.8 18,558
12.0 9,901
6.4 49,420
31.9 41,870
27.0 14,245
9.2 11,810
7.6
* County totals represent all County residents and not a summ
ary of all listed ZIP codes as some ZIP codes cross county border.
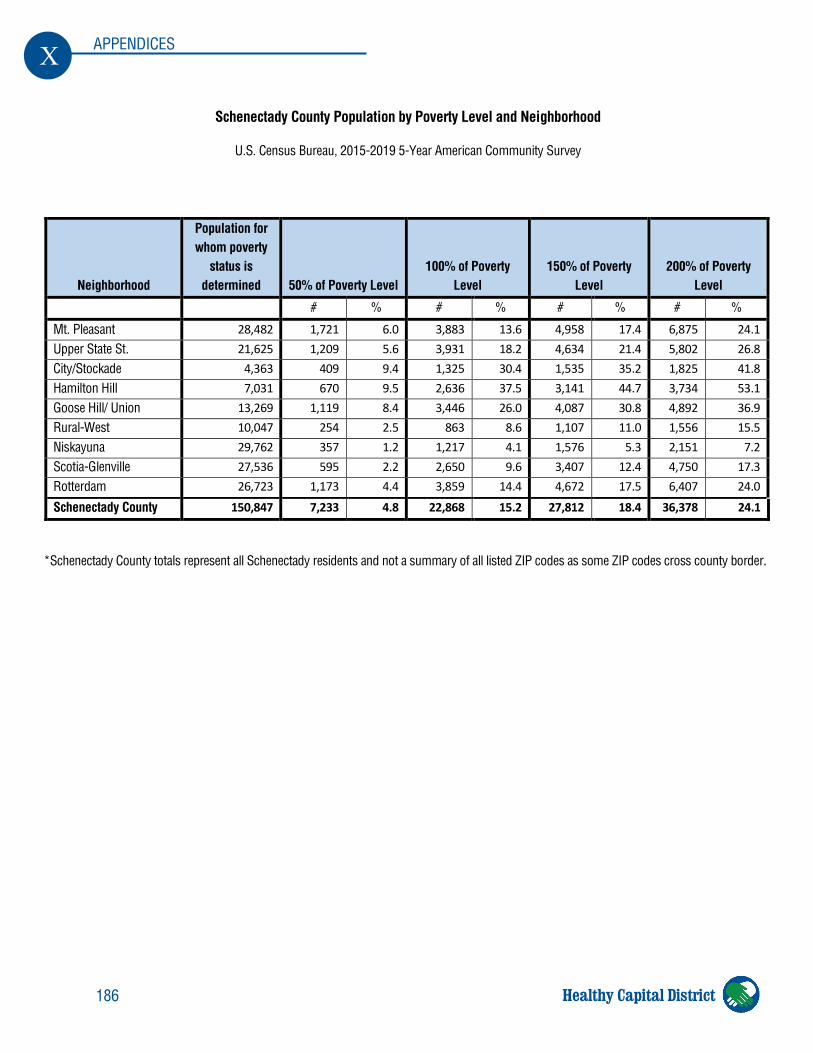
186
X APPENDICES
Healthy Capital District
Neighborhood
Population for whom poverty
status is determined
50% of Poverty Level
100% of Poverty
Level
150% of Poverty
Level
200% of Poverty
Level
# % # % # % # %
Mt. Pleasant 28,482 1,721 6.0 3,883 13.6 4,958 17.4 6,875 24.1 Upper State St. 21,625 1,209 5.6 3,931 18.2 4,634 21.4 5,802 26.8 City/Stockade 4,363 409 9.4 1,325 30.4 1,535 35.2 1,825 41.8 Hamilton Hill 7,031 670 9.5 2,636 37.5 3,141 44.7 3,734 53.1 Goose Hill/ Union 13,269 1,119 8.4 3,446 26.0 4,087 30.8 4,892 36.9 Rural-West 10,047 254 2.5 863 8.6 1,107 11.0 1,556 15.5 Niskayuna 29,762 357 1.2 1,217 4.1 1,576 5.3 2,151 7.2 Scotia-Glenville 27,536 595 2.2 2,650 9.6 3,407 12.4 4,750 17.3 Rotterdam 26,723 1,173 4.4 3,859 14.4 4,672 17.5 6,407 24.0
Schenectady County 150,847 7,233 4.8 22,868 15.2 27,812 18.4 36,378 24.1
Schenectady County Population by Poverty Level and Neighborhood
U.S. Census Bureau, 2015-2019 5-Year American Community Survey
*Schenectady County totals represent all Schenectady residents and not a summary of all listed ZIP codes as some ZIP codes cross county border.
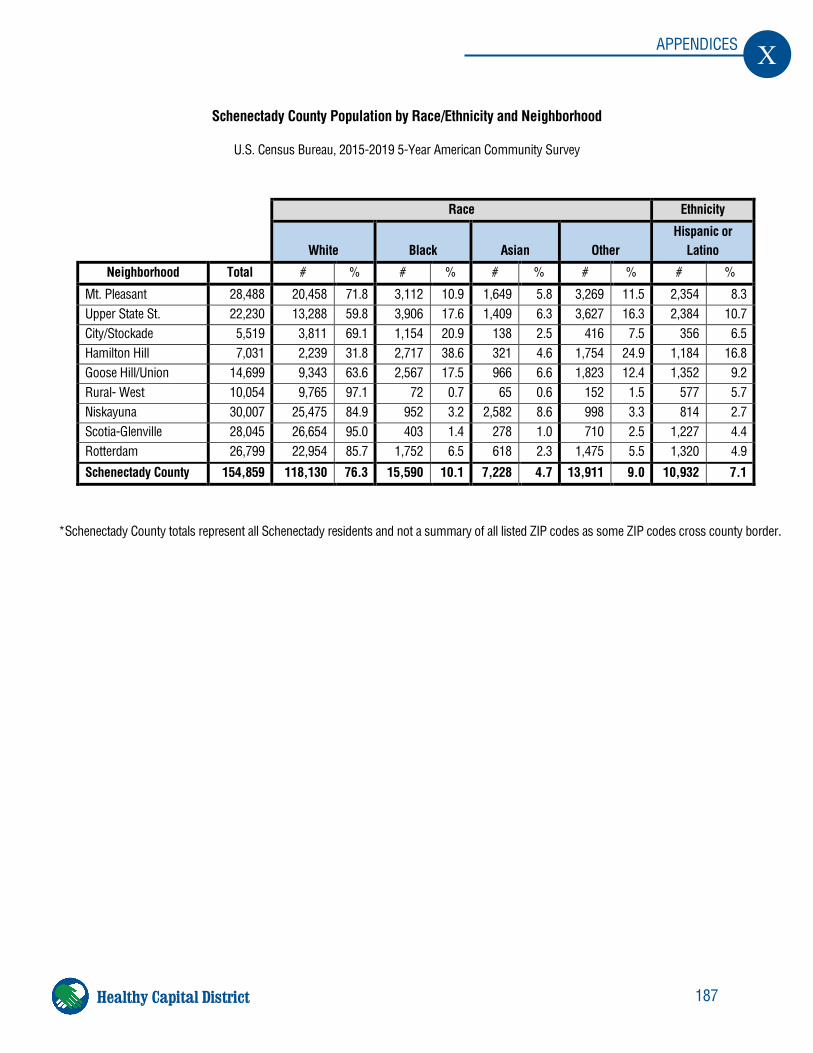
187
X APPENDICES
Healthy Capital District
Race Ethnicity
White Black Asian Other
Hispanic or Latino
Neighborhood Total # % # % # % # % # %
Mt. Pleasant 28,488 20,458 71.8 3,112 10.9 1,649 5.8 3,269 11.5 2,354 8.3 Upper State St. 22,230 13,288 59.8 3,906 17.6 1,409 6.3 3,627 16.3 2,384 10.7 City/Stockade 5,519 3,811 69.1 1,154 20.9 138 2.5 416 7.5 356 6.5 Hamilton Hill 7,031 2,239 31.8 2,717 38.6 321 4.6 1,754 24.9 1,184 16.8 Goose Hill/Union 14,699 9,343 63.6 2,567 17.5 966 6.6 1,823 12.4 1,352 9.2 Rural- West 10,054 9,765 97.1 72 0.7 65 0.6 152 1.5 577 5.7 Niskayuna 30,007 25,475 84.9 952 3.2 2,582 8.6 998 3.3 814 2.7 Scotia-Glenville 28,045 26,654 95.0 403 1.4 278 1.0 710 2.5 1,227 4.4 Rotterdam 26,799 22,954 85.7 1,752 6.5 618 2.3 1,475 5.5 1,320 4.9
Schenectady County 154,859 118,130 76.3 15,590 10.1 7,228 4.7 13,911 9.0 10,932 7.1
Schenectady County Population by Race/Ethnicity and Neighborhood
U.S. Census Bureau, 2015-2019 5-Year American Community Survey
*Schenectady County totals represent all Schenectady residents and not a summary of all listed ZIP codes as some ZIP codes cross county border.
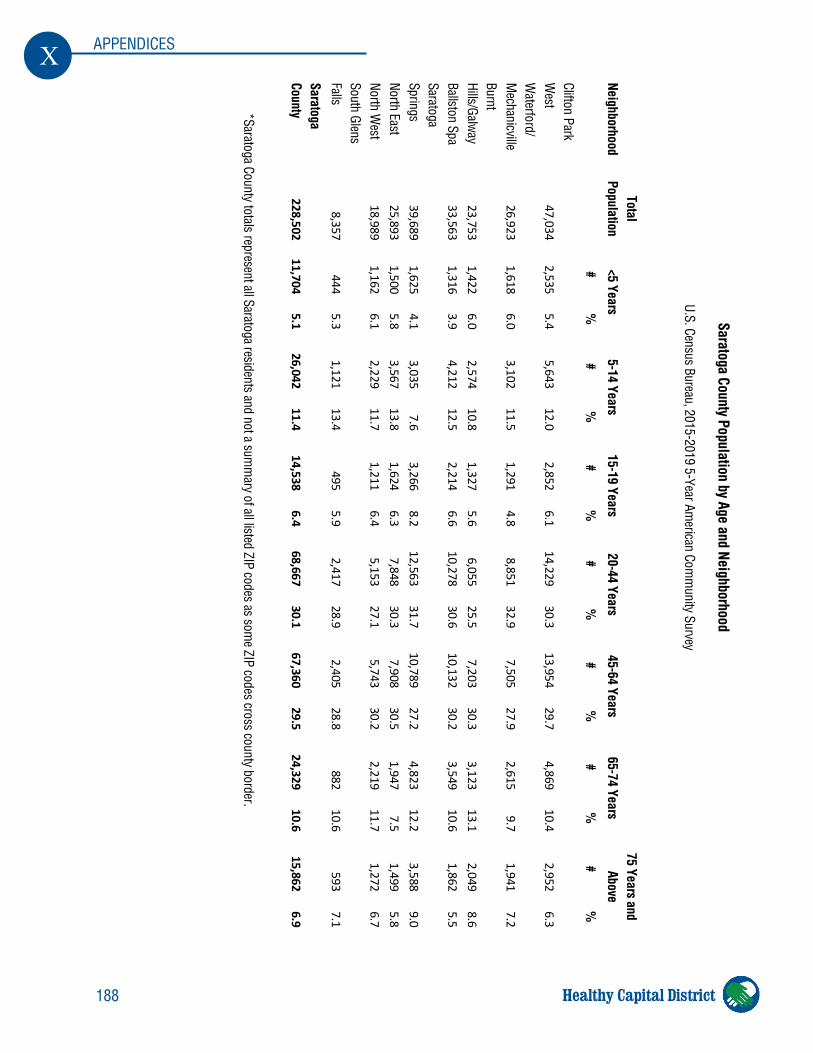
188
X APPENDICES
Healthy Capital District
Saratoga County Population by Age and Neighborhood
U.S. Census Bureau, 2015-2019 5-Year American Com
munity Survey
Neighborhood Total
Population <5 Years
5-14 Years 15-19 Years
20-44 Years 45-64 Years
65-74 Years 75 Years and
Above
# %
#
%
# %
#
%
# %
#
%
# %
Clifton Park W
est 47,034
2,535 5.4
5,643 12.0
2,852 6.1
14,229 30.3
13,954 29.7
4,869 10.4
2,952 6.3
Waterford/
Mechanicville
26,923 1,618
6.0 3,102
11.5 1,291
4.8 8,851
32.9 7,505
27.9 2,615
9.7 1,941
7.2 Burnt Hills/Galw
ay 23,753
1,422 6.0
2,574 10.8
1,327 5.6
6,055 25.5
7,203 30.3
3,123 13.1
2,049 8.6
Ballston Spa 33,563
1,316 3.9
4,212 12.5
2,214 6.6
10,278 30.6
10,132 30.2
3,549 10.6
1,862 5.5
Saratoga Springs
39,689 1,625
4.1 3,035
7.6 3,266
8.2 12,563
31. 7 10,789
27.2 4,823
12.2 3,588
9.0 North East
25,893 1,500
5.8 3,567
13.8 1,624
6.3 7,848
30.3 7,908
30.5 1,947
7.5 1,499
5.8 North W
est 18,989
1,162 6.1
2,229 11.7
1,211 6.4
5,153 27.1
5,743 30.2
2,219 11.7
1,272 6.7
South Glens Falls
8,357 444
5.3 1,121
13.4 495
5.9 2,417
28.9 2,405
28.8 882
10.6 593
7.1
Saratoga County
228,502 11,704
5.1 26,042
11.4 14,538
6.4 68,667
30.1 67,360
29.5 24,329
10.6 15,862
6.9
*Saratoga County totals represent all Saratoga residents and not a summ
ary of all listed ZIP codes as some ZIP codes cross county border.

189
X APPENDICES
Healthy Capital District
Neighborhood
Population for whom poverty
status is determined
50% of Poverty
Level
100% of Poverty
Level
150% of Poverty
Level
200% of
Poverty Level
# % # % # % # %
Clifton Park West 46,839 1,346 2.9 2,639 5.6 3,371 7.2 5,215 11.1 Waterford/Mechanicville 26,856 1,004 3.7 2,848 10.6 3,875 14.4 5,125 19.1 Burnt Hills/Galway 23,706 379 1.6 878 3.7 1,132 4.8 1,855 7.8 Ballston Spa 33,052 1,197 3.6 3,222 9.7 4,308 13.0 5,308 16.1 Saratoga Springs 37,064 976 2.6 2,932 7.9 3,572 9.6 5,109 13.8 North East 25,834 545 2.1 1,833 7.1 2,702 10.5 4,143 16.0 North West 18,975 551 2.9 2,779 14.6 3,418 18.0 4,691 24.7 South Glens Falls 8,357 306 3.7 1,085 13.0 1,392 16.7 1,951 23.3
Saratoga County 224,972 6,406 2.8 18,625 8.3 24,366 10.8 34,051 15.1
*Saratoga County totals represent all Saratoga residents and not a summary of all listed ZIP codes as some ZIP codes cross county border.
Saratoga County Population by Poverty Level and Neighborhood
U.S. Census Bureau, 2015-2019 5-Year American Community Survey
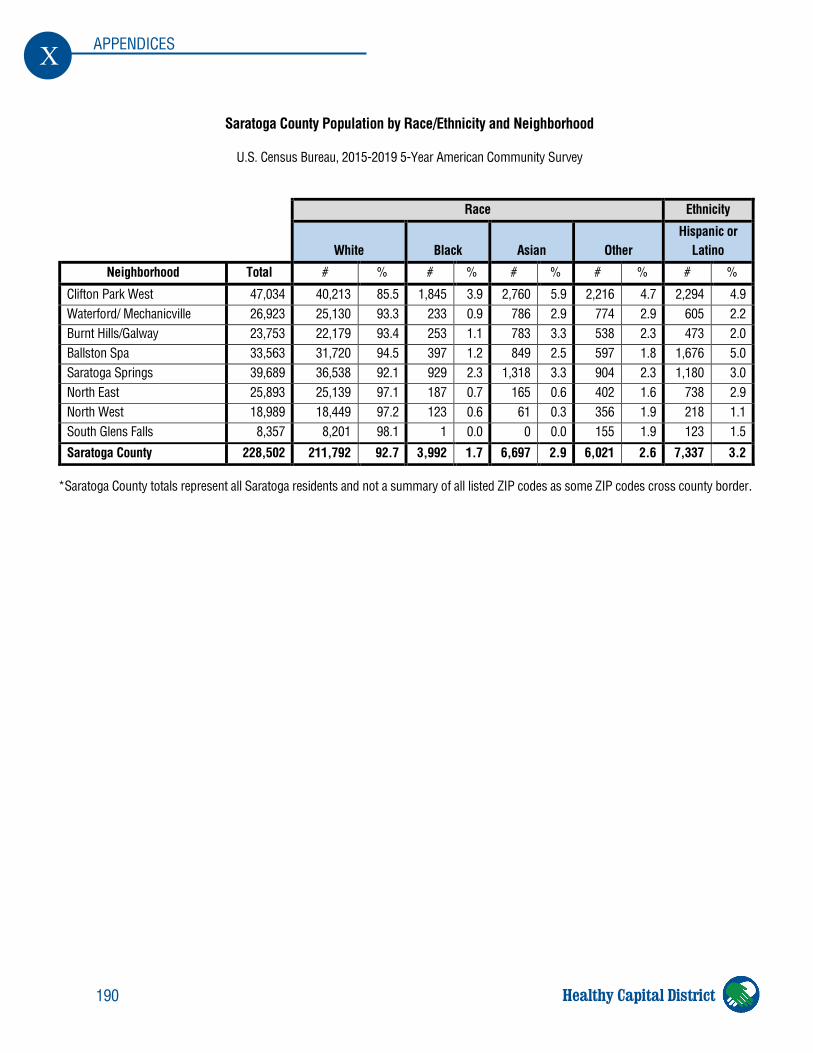
190
X APPENDICES
Healthy Capital District
Race Ethnicity
White Black Asian Other
Hispanic or Latino
Neighborhood Total # % # % # % # % # %
Clifton Park West 47,034 40,213 85.5 1,845 3.9 2,760 5.9 2,216 4.7 2,294 4.9 Waterford/ Mechanicville 26,923 25,130 93.3 233 0.9 786 2.9 774 2.9 605 2.2 Burnt Hills/Galway 23,753 22,179 93.4 253 1.1 783 3.3 538 2.3 473 2.0 Ballston Spa 33,563 31,720 94.5 397 1.2 849 2.5 597 1.8 1,676 5.0 Saratoga Springs 39,689 36,538 92.1 929 2.3 1,318 3.3 904 2.3 1,180 3.0 North East 25,893 25,139 97.1 187 0.7 165 0.6 402 1.6 738 2.9 North West 18,989 18,449 97.2 123 0.6 61 0.3 356 1.9 218 1.1 South Glens Falls 8,357 8,201 98.1 1 0.0 0 0.0 155 1.9 123 1.5
Saratoga County 228,502 211,792 92.7 3,992 1.7 6,697 2.9 6,021 2.6 7,337 3.2
Saratoga County Population by Race/Ethnicity and Neighborhood
U.S. Census Bureau, 2015-2019 5-Year American Community Survey
*Saratoga County totals represent all Saratoga residents and not a summary of all listed ZIP codes as some ZIP codes cross county border.
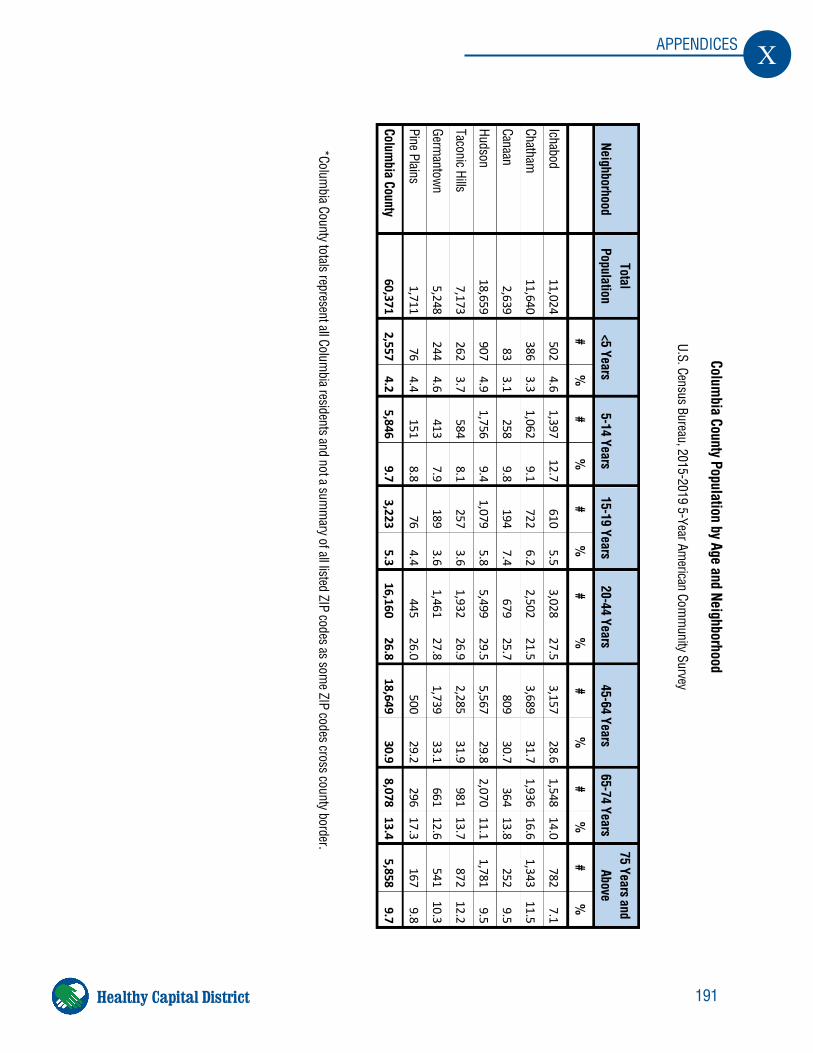
191
X APPENDICES
Healthy Capital District
Columbia County Population by Age and Neighborhood
U.S. Census Bureau, 2015-2019 5-Year American Com
munity Survey
*Columbia County totals represent all Colum
bia residents and not a summ
ary of all listed ZIP codes as some ZIP codes cross county border.
Neighborhood Total
Population <5 Years
5-14 Years 15-19 Years
20-44 Years 45-64 Years
65-74 Years 75 Years and
Above
# %
#
%
# %
#
%
# %
#
%
# %
Ichabod 11,024
502 4.6
1,397 12.7
610 5.5
3,028 27.5
3,157 28.6
1,548 14.0
782 7.1
Chatham
11,640 386
3.3 1,062
9.1 722
6.2 2,502
21.5 3,689
31.7 1,936
16.6 1,343
11.5
Canaan 2,639
83 3.1
258 9.8
194 7.4
679 25.7
809 30.7
364 13.8
252 9.5
Hudson 18,659
907 4.9
1,756 9.4
1,079 5.8
5,499 29.5
5,567 29.8
2,070 11.1
1,781 9.5
Taconic Hills 7,173
262 3.7
584 8.1
257 3.6
1,932 26.9
2, 285 31.9
981 13.7
872 12.2
Germantow
n 5,248
244 4.6
413 7.9
189 3.6
1,461 27.8
1,739 33.1
661 12.6
541 10.3
Pine Plains 1,711
76 4.4
151 8.8
76 4.4
445 26.0
500 29.2
296 17. 3
167 9.8
Columbia County
60,371 2,557
4.2 5,846
9.7 3,223
5.3 16,160
26.8 18,649
30.9 8,078
13.4 5,858
9.7
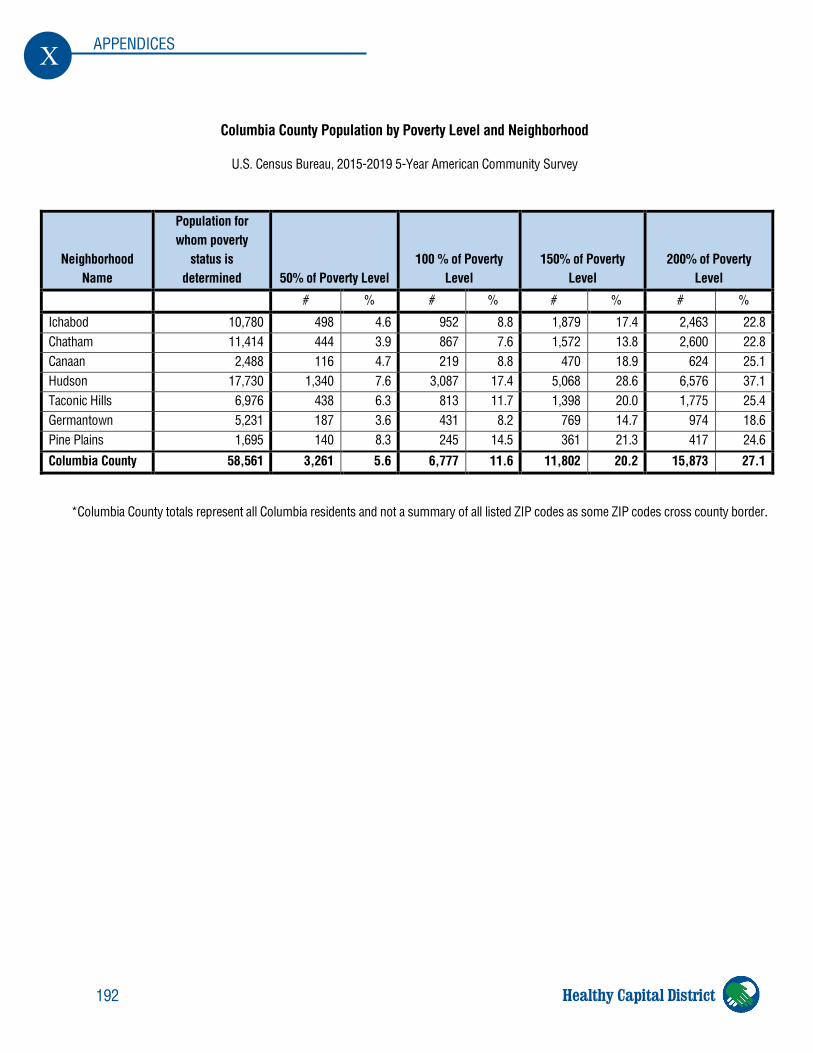
192
X APPENDICES
Healthy Capital District
Neighborhood Name
Population for whom poverty
status is determined
50% of Poverty Level
100 % of Poverty
Level
150% of Poverty
Level
200% of Poverty
Level
# % # % # % # %
Ichabod 10,780 498 4.6 952 8.8 1,879 17.4 2,463 22.8 Chatham 11,414 444 3.9 867 7.6 1,572 13.8 2,600 22.8 Canaan 2,488 116 4.7 219 8.8 470 18.9 624 25.1 Hudson 17,730 1,340 7.6 3,087 17.4 5,068 28.6 6,576 37.1 Taconic Hills 6,976 438 6.3 813 11.7 1,398 20.0 1,775 25.4 Germantown 5,231 187 3.6 431 8.2 769 14.7 974 18.6 Pine Plains 1,695 140 8.3 245 14.5 361 21.3 417 24.6 Columbia County 58,561 3,261 5.6 6,777 11.6 11,802 20.2 15,873 27.1
Columbia County Population by Poverty Level and Neighborhood
U.S. Census Bureau, 2015-2019 5-Year American Community Survey
*Columbia County totals represent all Columbia residents and not a summary of all listed ZIP codes as some ZIP codes cross county border.
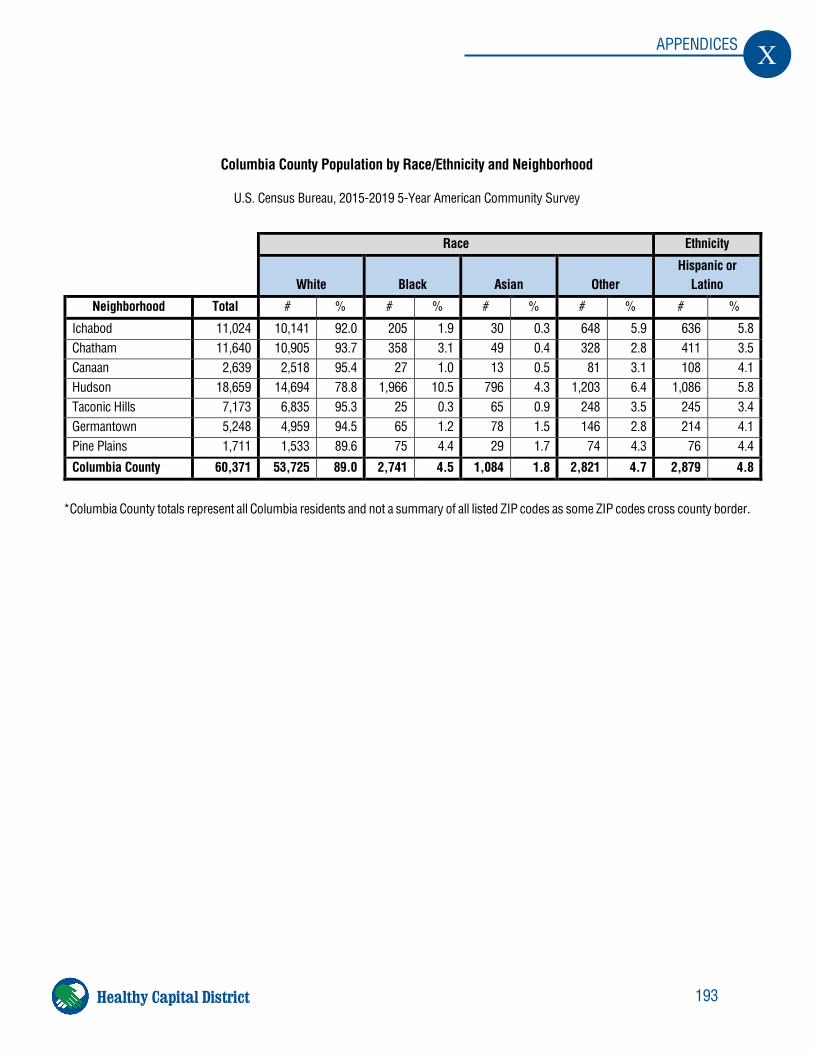
193
X APPENDICES
Healthy Capital District
Race Ethnicity
White Black Asian Other
Hispanic or Latino
Neighborhood Total # % # % # % # % # %
Ichabod 11,024 10,141 92.0 205 1.9 30 0.3 648 5.9 636 5.8 Chatham 11,640 10,905 93.7 358 3.1 49 0.4 328 2.8 411 3.5 Canaan 2,639 2,518 95.4 27 1.0 13 0.5 81 3.1 108 4.1 Hudson 18,659 14,694 78.8 1,966 10.5 796 4.3 1,203 6.4 1,086 5.8 Taconic Hills 7,173 6,835 95.3 25 0.3 65 0.9 248 3.5 245 3.4 Germantown 5,248 4,959 94.5 65 1.2 78 1.5 146 2.8 214 4.1 Pine Plains 1,711 1,533 89.6 75 4.4 29 1.7 74 4.3 76 4.4
Columbia County 60,371 53,725 89.0 2,741 4.5 1,084 1.8 2,821 4.7 2,879 4.8
Columbia County Population by Race/Ethnicity and Neighborhood
U.S. Census Bureau, 2015-2019 5-Year American Community Survey
*Columbia County totals represent all Columbia residents and not a summary of all listed ZIP codes as some ZIP codes cross county border.
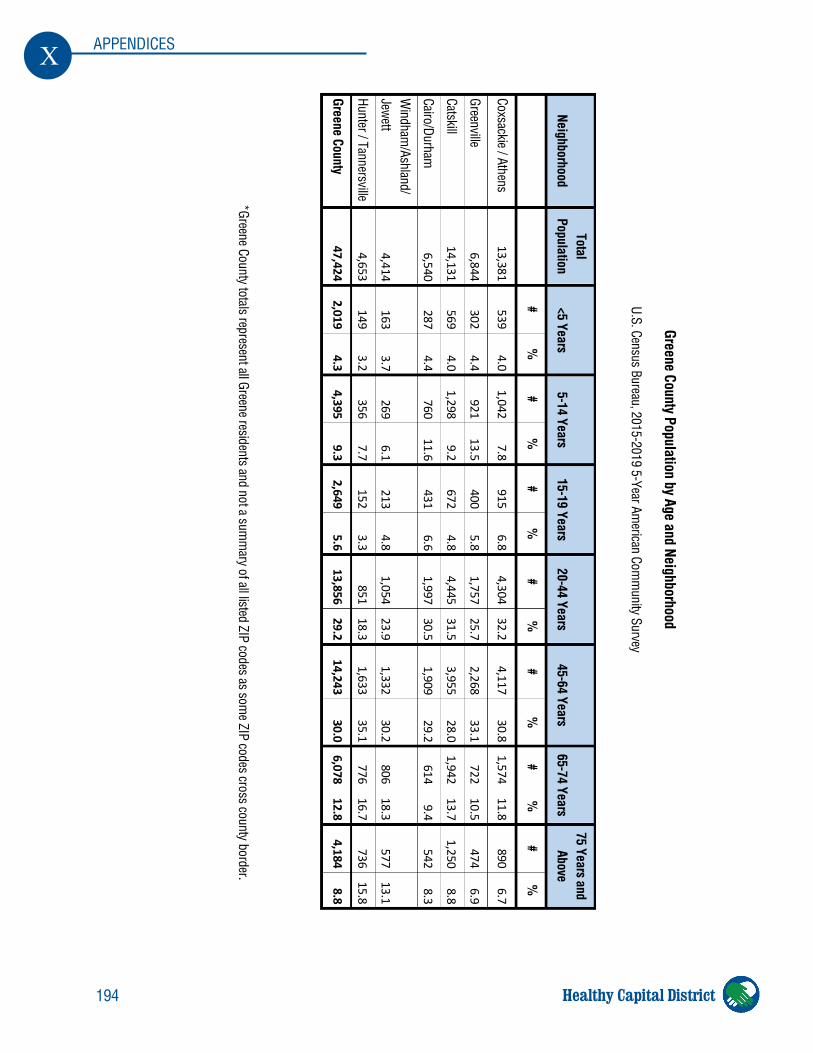
194
X APPENDICES
Healthy Capital District
Greene County Population by Age and Neighborhood
U.S. Census Bureau, 2015-2019 5-Year American Com
munity Survey
Neighborhood Total
Population <5 Years
5-14 Years 15-19 Years
20-44 Years 45-64 Years
65-74 Years 75 Years and
Above
# %
#
%
# %
#
%
# %
#
%
# %
Coxsackie / Athens 13,381
539 4.0
1,042 7.8
915 6.8
4,304 32.2
4,117 30.8
1,574 11.8
890 6.7
Greenville 6,844
302 4.4
921 13.5
400 5.8
1,757 25.7
2,268 33.1
722 10.5
474 6.9
Catskill 14,131
569 4.0
1,298 9.2
672 4.8
4,445 31.5
3,955 28.0
1,942 13.7
1,250 8.8
Cairo/Durham
6,540 287
4.4 760
11.6 431
6.6 1,997
30.5 1,909
29.2 614
9.4 542
8.3
Windham
/Ashland/ Jew
ett 4,414
163 3.7
269 6.1
213 4.8
1,054 23.9
1,332 30.2
806 18.3
577 13.1
Hunter / Tannersville 4,653
149 3.2
356 7.7
152 3.3
851 18.3
1,633 35.1
776 16.7
736 15.8
Greene County 47,424
2,019 4.3
4,395 9.3
2,649 5.6
13,856 29.2
14,243 30.0
6,078 12.8
4,184 8.8
*Greene County totals represent all Greene residents and not a summ
ary of all listed ZIP codes as some ZIP codes cross county border.
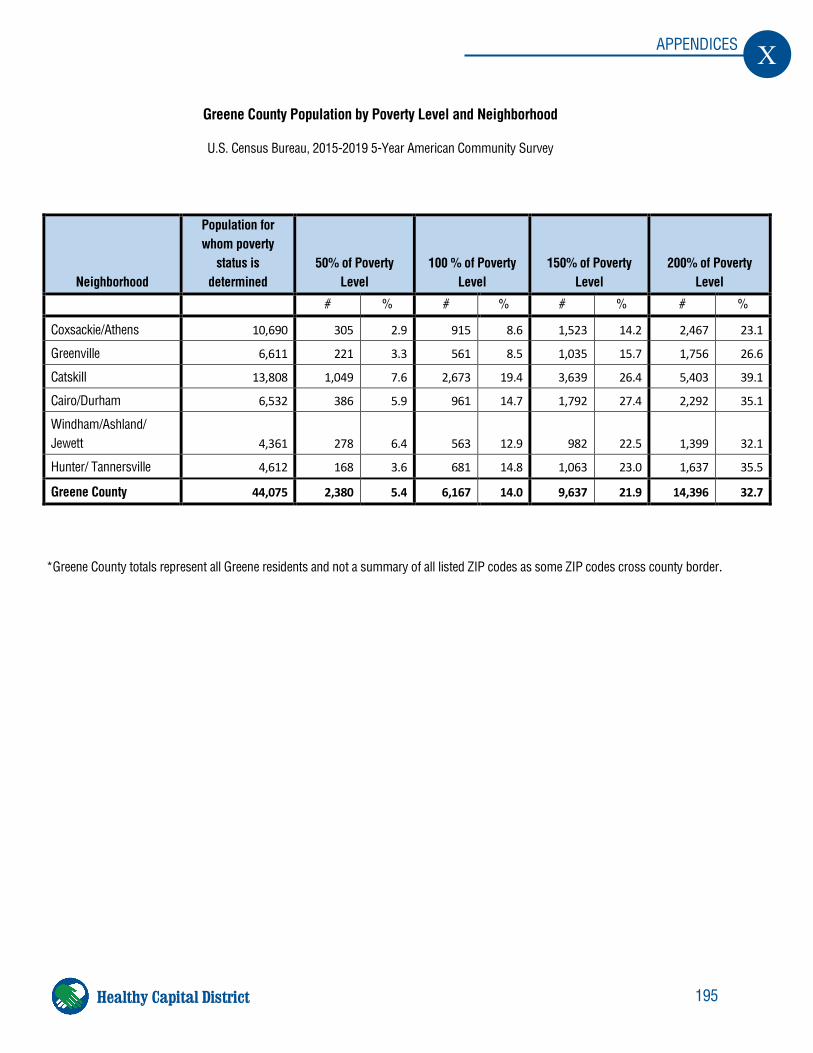
195
X APPENDICES
Healthy Capital District
Neighborhood
Population for whom poverty
status is determined
50% of Poverty
Level
100 % of Poverty
Level
150% of Poverty
Level
200% of Poverty
Level
# % # % # % # %
Coxsackie/Athens 10,690 305 2.9 915 8.6 1,523 14.2 2,467 23.1
Greenville 6,611 221 3.3 561 8.5 1,035 15.7 1,756 26.6
Catskill 13,808 1,049 7.6 2,673 19.4 3,639 26.4 5,403 39.1
Cairo/Durham 6,532 386 5.9 961 14.7 1,792 27.4 2,292 35.1
Windham/Ashland/ Jewett 4,361 278 6.4 563 12.9 982 22.5 1,399 32.1
Hunter/ Tannersville 4,612 168 3.6 681 14.8 1,063 23.0 1,637 35.5
Greene County 44,075 2,380 5.4 6,167 14.0 9,637 21.9 14,396 32.7
Greene County Population by Poverty Level and Neighborhood
U.S. Census Bureau, 2015-2019 5-Year American Community Survey
*Greene County totals represent all Greene residents and not a summary of all listed ZIP codes as some ZIP codes cross county border.
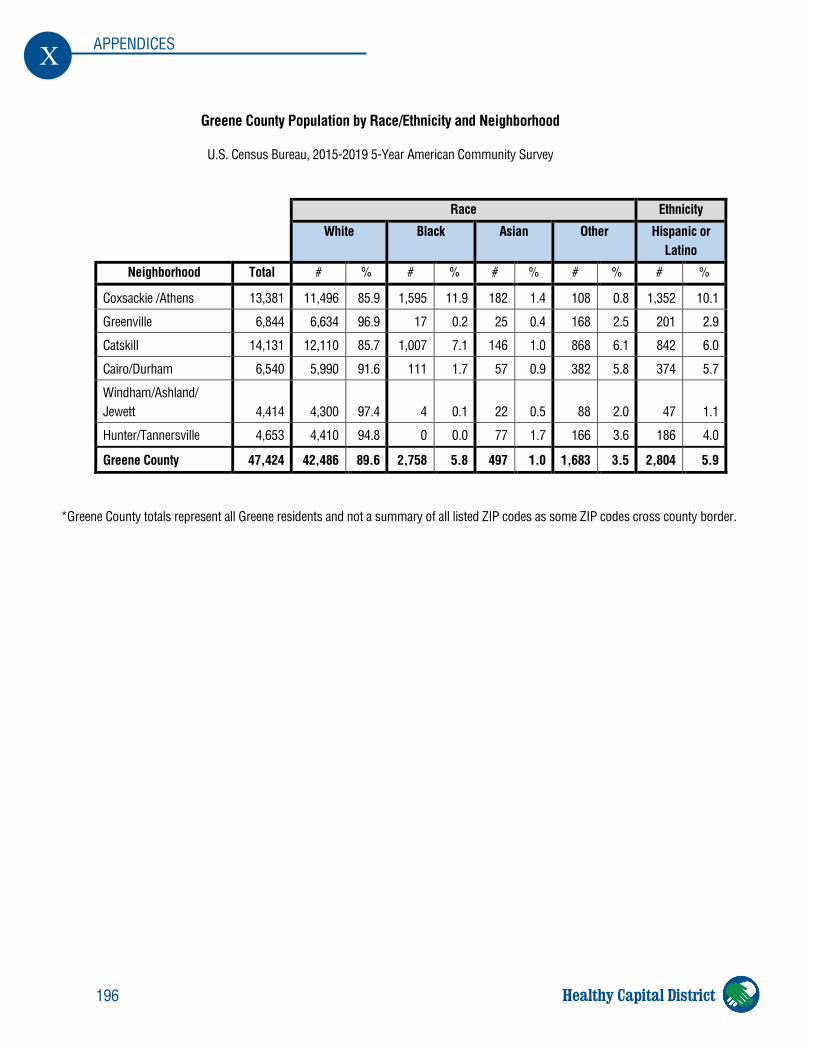
196
X APPENDICES
Healthy Capital District
Race Ethnicity
White Black Asian Other Hispanic or Latino
Neighborhood Total # % # % # % # % # %
Coxsackie /Athens 13,381 11,496 85.9 1,595 11.9 182 1.4 108 0.8 1,352 10.1
Greenville 6,844 6,634 96.9 17 0.2 25 0.4 168 2.5 201 2.9
Catskill 14,131 12,110 85.7 1,007 7.1 146 1.0 868 6.1 842 6.0
Cairo/Durham 6,540 5,990 91.6 111 1.7 57 0.9 382 5.8 374 5.7
Windham/Ashland/ Jewett 4,414 4,300 97.4 4 0.1 22 0.5 88 2.0 47 1.1
Hunter/Tannersville 4,653 4,410 94.8 0 0.0 77 1.7 166 3.6 186 4.0
Greene County 47,424 42,486 89.6 2,758 5.8 497 1.0 1,683 3.5 2,804 5.9
Greene County Population by Race/Ethnicity and Neighborhood
U.S. Census Bureau, 2015-2019 5-Year American Community Survey
*Greene County totals represent all Greene residents and not a summary of all listed ZIP codes as some ZIP codes cross county border.
197
X APPENDICES
Healthy Capital District
County Birth Indicators by Neighborhood
The following section contains charts representing birth indicators – first by county, then by neighborhood. All perinatal and natality rates are for the most recent available years, 2016-2018, and are from the New York State County/ZIP Code Perinatal Data Profile.
Note:
• Some ZIP codes are not included as data was not available for reasons of confidentiality. • Some ZIP codes in which teen birth information was unavailable for reasons of confidentiality are not
included in the neighborhood totals. • ZIP codes with a population of less than 30 teenage women are suppressed for reasons of
confidentiality. • Please refer to the Capital Region ZIP Code Groupings and Neighborhoods Maps at the beginning of the
Appendix.
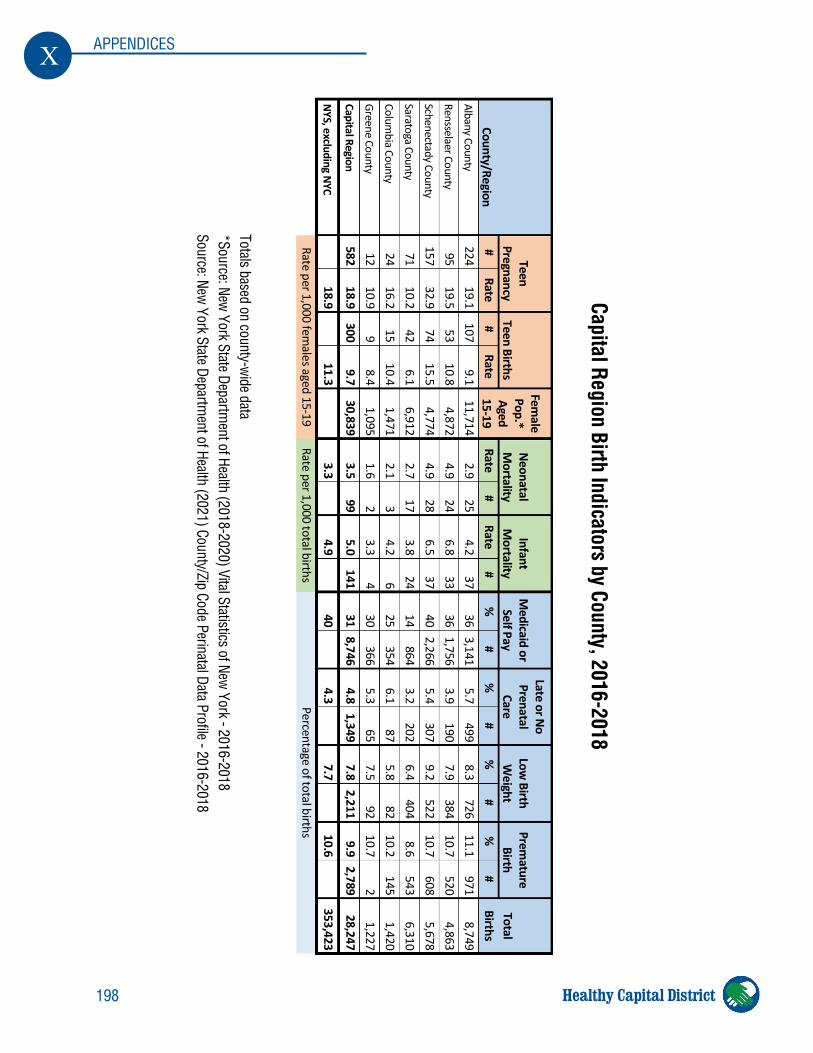
198
X APPENDICES
Healthy Capital District
County/Region
Teen Pregnancy
Teen Births
Female
Pop.* Aged 15-19
Neonatal
Mortality
Infant M
ortality M
edicaid or Self Pay
Late or No
Prenatal Care
Low Birth
Weight
Premature
Birth Total Births
# Rate
# Rate
Rate #
Rate #
%
# %
#
%
# %
#
Albany County 224
19.1 107
9.1 11,714
2.9 25
4.2 37
36 3,141
5.7 499
8.3 726
11.1 971
8,749 Rensselaer County
95 19.5
53 10.8
4,872 4.9
24 6.8
33 36
1,756 3.9
190 7.9
384 10.7
520 4,863
Schenectady County 157
32.9 74
15.5 4,774
4.9 28
6.5 37
40 2,266
5.4 307
9.2 522
10.7 608
5,678 Saratoga County
71 10.2
42 6.1
6,912 2.7
17 3.8
24 14
864 3.2
202 6.4
404 8.6
543 6,310
Columbia County
24 16.2
15 10.4
1,471 2.1
3 4.2
6 25
354 6.1
87 5.8
82 10.2
145 1,420
Greene County 12
10.9 9
8.4 1,095
1.6 2
3.3 4
30 366
5.3 65
7.5 92
10.7 2
1,227 Capital Region
582 18.9
300 9.7
30,839 3.5
99 5.0
141 31
8,746 4.8
1,349 7.8
2,211 9.9
2,789 28,247
NYS, excluding NYC
18.9
11.3
3.3
4.9
40
4.3
7.7
10.6
353,423
Rate per 1,000 fem
ales aged 15-19 Rate per 1,000 total births
Percentage of total births
Capital Region Birth Indicators by County, 2016-2018
Totals based on county-wide data
*Source: New York State Departm
ent of Health (2018-2020) Vital Statistics of New York - 2016-2018
Source: New York State Departm
ent of Health (2021) County/Zip Code Perinatal Data Profile - 2016-2018
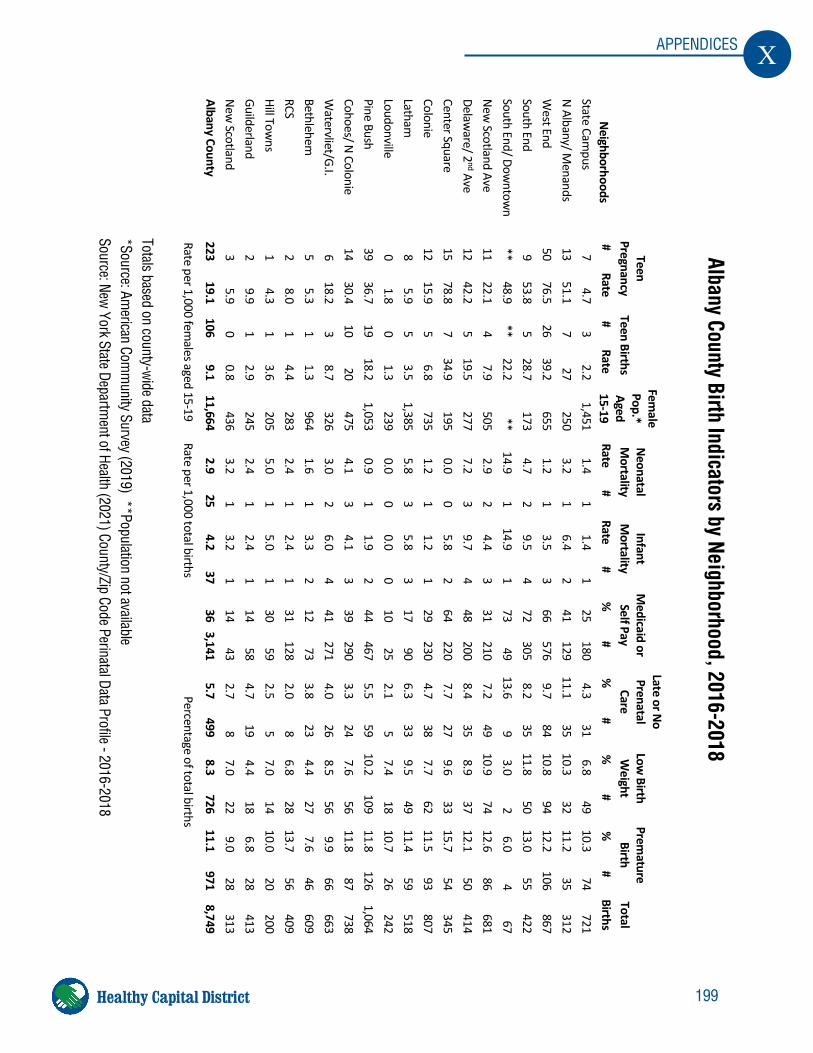
199
X APPENDICES
Healthy Capital District
Neighborhoods
Teen Pregnancy
Teen Births
Female
Pop.* Aged 15-19
Neonatal
Mortality
Infant M
ortality M
edicaid or Self Pay
Late or No
Prenatal Care
Low Birth
Weight
Premature
Birth Total Births
# Rate
# Rate
Rate #
Rate #
%
# %
#
%
# %
#
State Campus
7 4.7
3 2.2
1,451 1.4
1 1.4
1 25
180 4.3
31 6.8
49 10.3
74 721
N Albany/ Menands
13 51.1
7 27
250 3.2
1 6.4
2 41
129 11.1
35 10.3
32 11.2
35 312
West End
50 76.5
26 39.2
655 1.2
1 3.5
3 66
576 9.7
84 10.8
94 12.2
106 867
South End 9
53.8 5
28.7 173
4.7 2
9.5 4
72 305
8.2 35
11.8 50
13.0 55
422 South End/ Dow
ntown
** 48.9
** 22.2
** 14.9
1 14.9
1 73
49 13.6
9 3.0
2 6.0
4 67
New Scotland Ave
11 22.1
4 7.9
505 2.9
2 4.4
3 31
210 7.2
49 10.9
74 12.6
86 681
Delaware/ 2
nd Ave 12
42.2 5
19.5 277
7.2 3
9.7 4
48 200
8.4 35
8.9 37
12.1 50
414 Center Square
15 78.8
7 34.9
195 0.0
0 5.8
2 64
220 7.7
27 9.6
33 15.7
54 345
Colonie 12
15.9 5
6.8 735
1.2 1
1.2 1
29 230
4.7 38
7.7 62
11. 5 93
807 Latham
8
5.9 5
3.5 1,385
5.8 3
5.8 3
17 90
6.3 33
9.5 49
11.4 59
518 Loudonville
0 1.8
0 1.3
239 0.0
0 0.0
0 10
25 2.1
5 7.4
18 10.7
26 242
Pine Bush 39
36.7 19
18.2 1,053
0.9 1
1.9 2
44 467
5.5 59
10.2 109
11.8 126
1,064 Cohoes/ N Colonie
14 30.4
10 20
475 4.1
3 4.1
3 39
290 3. 3
24 7.6
56 11.8
87 738
Watervliet/G.I.
6 18.2
3 8.7
326 3.0
2 6.0
4 41
271 4.0
26 8.5
56 9.9
66 663
Bethlehem
5 5.3
1 1.3
964 1.6
1 3.3
2 12
73 3.8
23 4.4
27 7.6
46 609
RCS 2
8.0 1
4.4 283
2.4 1
2.4 1
31 128
2.0 8
6.8 28
13.7 56
409 Hill Tow
ns 1
4.3 1
3.6 205
5.0 1
5.0 1
30 59
2.5 5
7.0 14
10.0 20
200 Guilderland
2 9.9
1 2.9
245 2.4
1 2.4
1 14
58 4.7
19 4.4
18 6.8
28 413
New Scotland
3 5.9
0 0.8
436 3.2
1 3.2
1 14
43 2.7
8 7.0
22 9.0
28 313
Albany County 223
19.1 106
9.1 11,664
2. 9 25
4.2 37
36 3,141
5.7 499
8.3 726
11.1 971
8,749
Rate per 1,000 fem
ales aged 15-19 Rate per 1,000 total births
Percentage of total births
Albany County Birth Indicators by Neighborhood, 2016-2018
Totals based on county-wide data
*Source: American Com
munity Survey (2019) **Population not available
Source: New
York State Department of Health (2021) County/Zip Code Perinatal Data Profile - 2016-2018
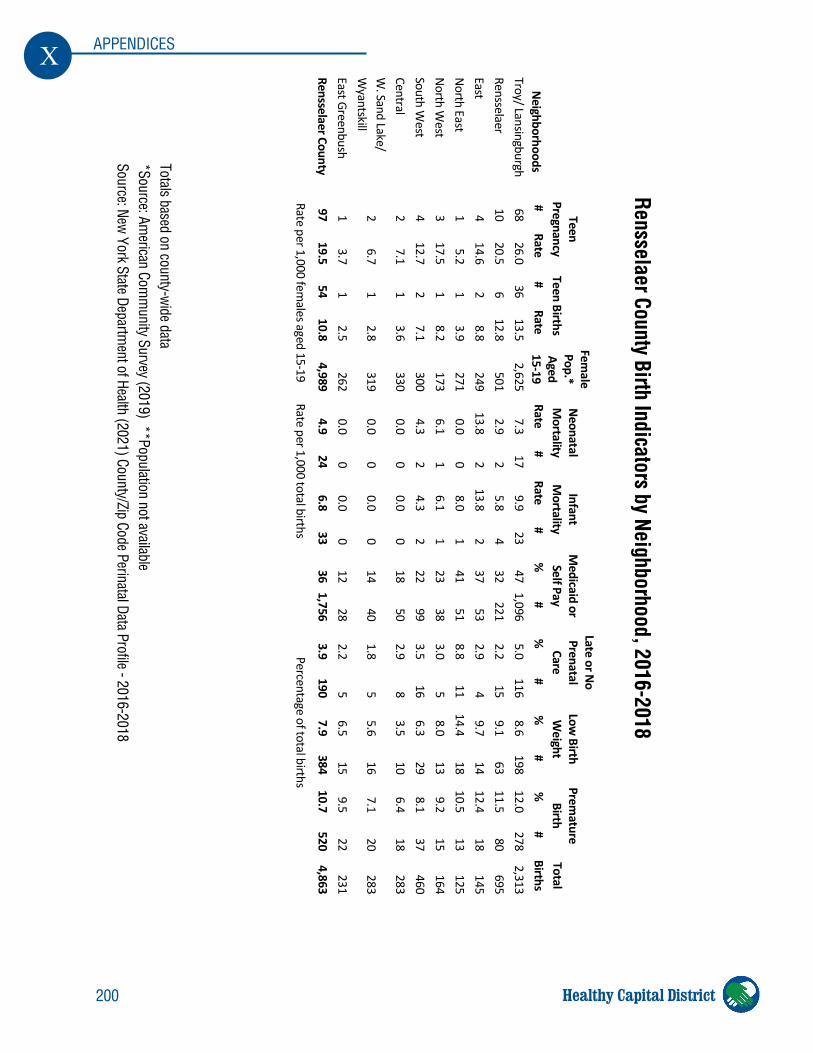
200
X APPENDICES
Healthy Capital District
Neighborhoods
Teen Pregnancy
Teen Births
Female
Pop.* Aged 15-19
Neonatal
Mortality
Infant M
ortality M
edicaid or Self Pay
Late or No
Prenatal Care
Low Birth
Weight
Premature
Birth Total Births
# Rate
# Rate
Rate #
Rate #
%
# %
#
%
# %
#
Troy/ Lansingburgh 68
26.0 36
13.5 2,625
7.3 17
9.9 23
47 1,096
5.0 116
8.6 198
12.0 278
2,313 Rensselaer
10 20.5
6 12.8
501 2.9
2 5.8
4 32
221 2.2
15 9.1
63 11.5
80 695
East 4
14.6 2
8.8 249
13.8 2
13.8 2
37 53
2.9 4
9.7 14
12.4 18
145 North East
1 5.2
1 3.9
271 0.0
0 8.0
1 41
51 8.8
11 14.4
18 10.5
13 125
North West
3 17.5
1 8.2
173 6.1
1 6.1
1 23
38 3.0
5 8.0
13 9.2
15 164
South West
4 12.7
2 7.1
300 4.3
2 4.3
2 22
99 3.5
16 6.3
29 8.1
37 460
Central 2
7.1 1
3.6 330
0.0 0
0.0 0
18 50
2.9 8
3.5 10
6.4 18
283 W
. Sand Lake/ W
yantskill 2
6.7 1
2.8 319
0.0 0
0.0 0
14 40
1.8 5
5.6 16
7.1 20
283
East Greenbush 1
3.7 1
2.5 262
0.0 0
0.0 0
12 28
2.2 5
6.5 15
9.5 22
231 Rensselaer County
97 19.5
54 10.8
4,989 4.9
24 6.8
33 36
1,756 3.9
190 7.9
384 10.7
520 4,863
Rate per 1,000 fem
ales aged 15-19 Rate per 1,000 total births
Percentage of total births
Rensselaer County Birth Indicators by Neighborhood, 2016-2018
Totals based on county-wide data
*Source: American Com
munity Survey (2019) **Population not available
Source: New
York State Department of Health (2021) County/Zip Code Perinatal Data Profile - 2016-2018
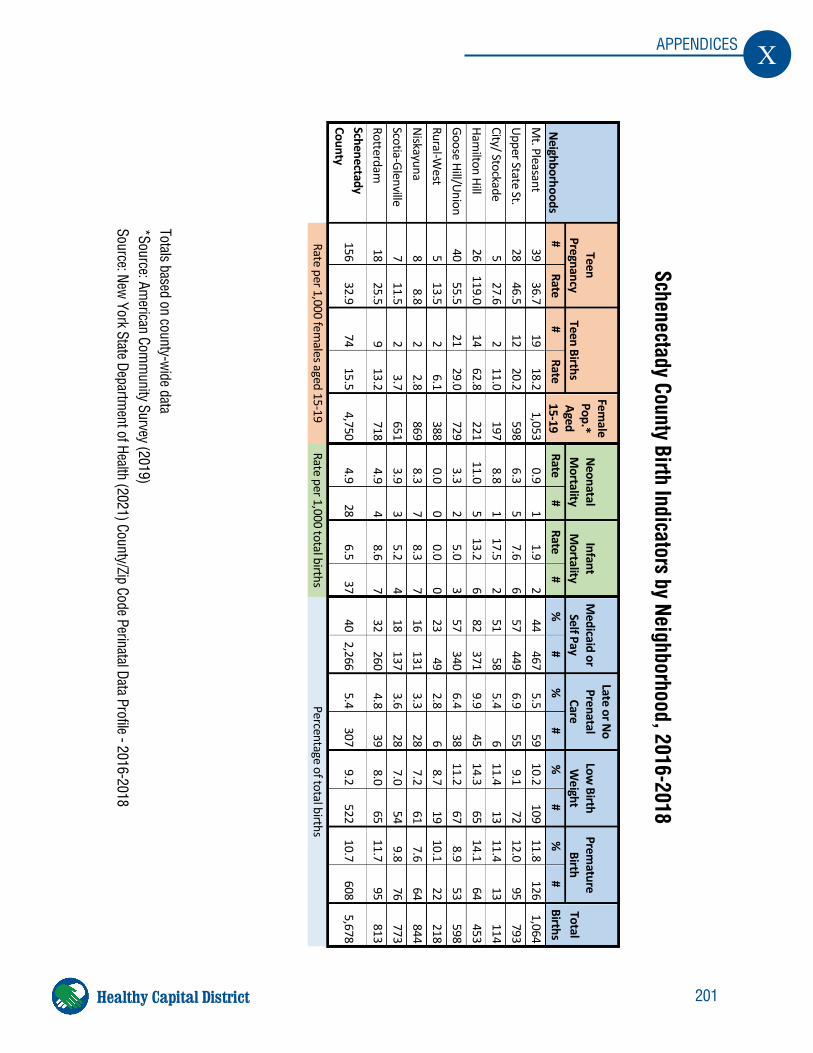
201
X APPENDICES
Healthy Capital District
Neighborhoods
Teen Pregnancy
Teen Births
Female
Pop.* Aged 15-19
Neonatal
Mortality
Infant M
ortality M
edicaid or Self Pay
Late or No
Prenatal Care
Low Birth
Weight
Premature
Birth Total Births
# Rate
# Rate
Rate #
Rate #
%
# %
#
%
# %
#
Mt. Pleasant
39 36.7
19 18.2
1,053 0.9
1 1.9
2 44
467 5.5
59 10.2
109 11.8
126 1,064
Upper State St. 28
46.5 12
20.2 598
6.3 5
7.6 6
57 449
6.9 55
9.1 72
12.0 95
793 City/ Stockade
5 27.6
2 11.0
197 8.8
1 17.5
2 51
58 5.4
6 11.4
13 11.4
13 114
Hamilton Hill
26 119.0
14 62.8
221 11.0
5 13.2
6 82
371 9.9
45 14.3
65 14.1
64 453
Goose Hill/Union 40
55.5 21
29.0 729
3.3 2
5.0 3
57 340
6.4 38
11.2 67
8.9 53
598 Rural-W
est 5
13.5 2
6.1 388
0.0 0
0.0 0
23 49
2.8 6
8.7 19
10.1 22
218 Niskayuna
8 8.8
2 2.8
869 8.3
7 8.3
7 16
131 3.3
28 7.2
61 7.6
64 844
Scotia-Glenville 7
11.5 2
3.7 651
3.9 3
5.2 4
18 137
3.6 28
7.0 54
9.8 76
773 Rotterdam
18
25.5 9
13.2 718
4.9 4
8.6 7
32 260
4.8 39
8.0 65
11.7 95
81 3 Schenectady County
156 32.9
74 15.5
4,750 4.9
28 6.5
37 40
2,266 5.4
307 9.2
522 10.7
608 5,678
Rate per 1,000 fem
ales aged 15-19 Rate per 1,000 total births
Percentage of total births
Schenectady County Birth Indicators by Neighborhood, 2016-2018
Totals based on county-wide data
*Source: Am
erican Comm
unity Survey (2019)
Source: New
York State Department of Health (2021) County/Zip Code Perinatal Data Profile - 2016-2018
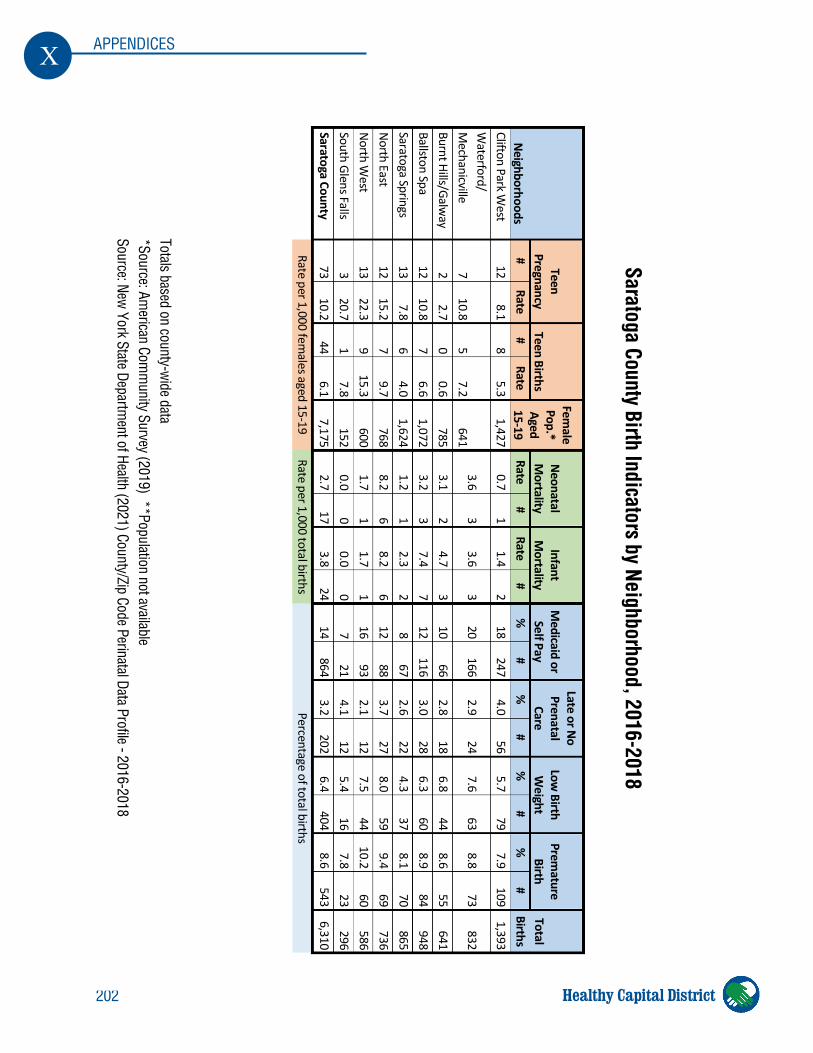
202
X APPENDICES
Healthy Capital District
Neighborhoods
Teen Pregnancy
Teen Births
Female
Pop.* Aged 15-19
Neonatal
Mortality
Infant M
ortality M
edicaid or Self Pay
Late or No
Prenatal Care
Low Birth
Weight
Premature
Birth Total Births
# Rate
# Rate
Rate #
Rate #
%
# %
#
%
# %
#
Clifton Park West
12 8.1
8 5.3
1,427 0.7
1 1.4
2 18
247 4.0
56 5.7
79 7.9
109 1,393
Waterford/
Mechanicville
7 10.8
5 7.2
641 3.6
3 3.6
3 20
166 2.9
24 7.6
63 8.8
73 832
Burnt Hills/Galway
2 2.7
0 0.6
785 3.1
2 4.7
3 10
66 2.8
18 6.8
44 8.6
55 641
Ballston Spa 12
10.8 7
6.6 1,072
3.2 3
7.4 7
12 116
3.0 28
6. 3 60
8.9 84
948 Saratoga Springs
13 7.8
6 4.0
1,624 1.2
1 2.3
2 8
67 2.6
22 4.3
37 8.1
70 865
North East 12
15.2 7
9.7 768
8.2 6
8.2 6
12 88
3.7 27
8.0 59
9.4 69
736 North W
est 13
22.3 9
15.3 600
1.7 1
1.7 1
16 93
2.1 12
7.5 44
10.2 60
586 South Glens Falls
3 20.7
1 7.8
152 0.0
0 0.0
0 7
21 4.1
12 5.4
16 7.8
23 296
Saratoga County 73
10.2 44
6.1 7,175
2.7 17
3.8 24
14 864
3.2 202
6.4 404
8.6 543
6, 310
Rate per 1,000 fem
ales aged 15-19 Rate per 1,000 total births
Percentage of total births
Saratoga County Birth Indicators by Neighborhood, 2016-2018
Totals based on county-wide data
*Source: American Com
munity Survey (2019) **Population not available
Source: New
York State Department of Health (2021) County/Zip Code Perinatal Data Profile - 2016-2018
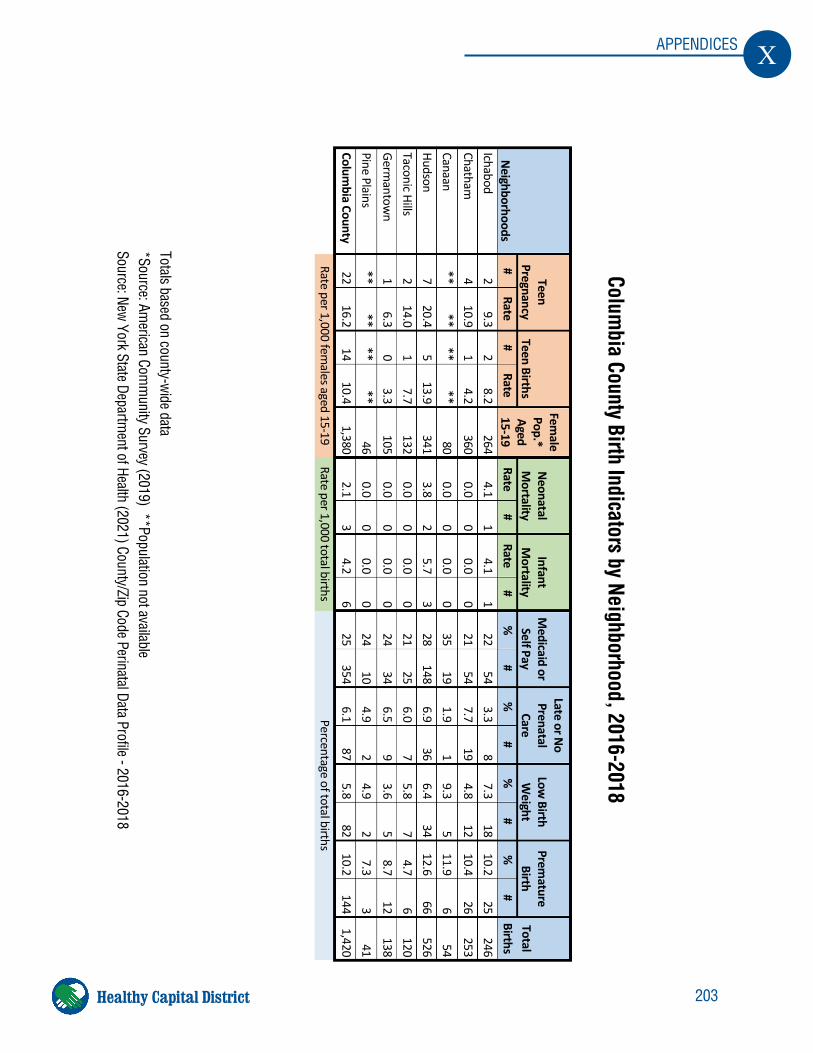
203
X APPENDICES
Healthy Capital District
Neighborhoods
Teen Pregnancy
Teen Births
Female
Pop.* Aged 15-19
Neonatal
Mortality
Infant M
ortality M
edicaid or Self Pay
Late or No
Prenatal Care
Low Birth
Weight
Premature
Birth Total Births
# Rate
# Rate
Rate #
Rate #
%
# %
#
%
# %
#
Ichabod 2
9.3 2
8.2 264
4.1 1
4.1 1
22 54
3.3 8
7.3 18
10.2 25
246 Chatham
4
10.9 1
4.2 360
0.0 0
0.0 0
21 54
7.7 19
4.8 12
10.4 26
253
Canaan **
** **
** 80
0.0 0
0.0 0
35 19
1.9 1
9.3 5
11.9 6
54 Hudson
7 20.4
5 13.9
341 3.8
2 5.7
3 28
148 6.9
36 6. 4
34 12.6
66 526
Taconic Hills 2
14.0 1
7.7 132
0.0 0
0.0 0
21 25
6.0 7
5.8 7
4.7 6
120 Germ
antown
1 6.3
0 3.3
105 0.0
0 0.0
0 24
34 6.5
9 3.6
5 8.7
12 138
Pine Plains **
** **
** 46
0.0 0
0.0 0
24 10
4.9 2
4.9 2
7.3 3
41 Colum
bia County 22
16.2 14
10.4 1,380
2.1 3
4.2 6
25 354
6.1 87
5.8 82
10.2 144
1,420
Rate per 1,000 fem
ales aged 15-19 Rate per 1,000 total births
Percentage of total births
Columbia County Birth Indicators by Neighborhood, 2016-2018
Totals based on county-wide data
*Source: American Com
munity Survey (2019) **Population not available
Source: New York State Departm
ent of Health (2021) County/Zip Code Perinatal Data Profile - 2016-2018
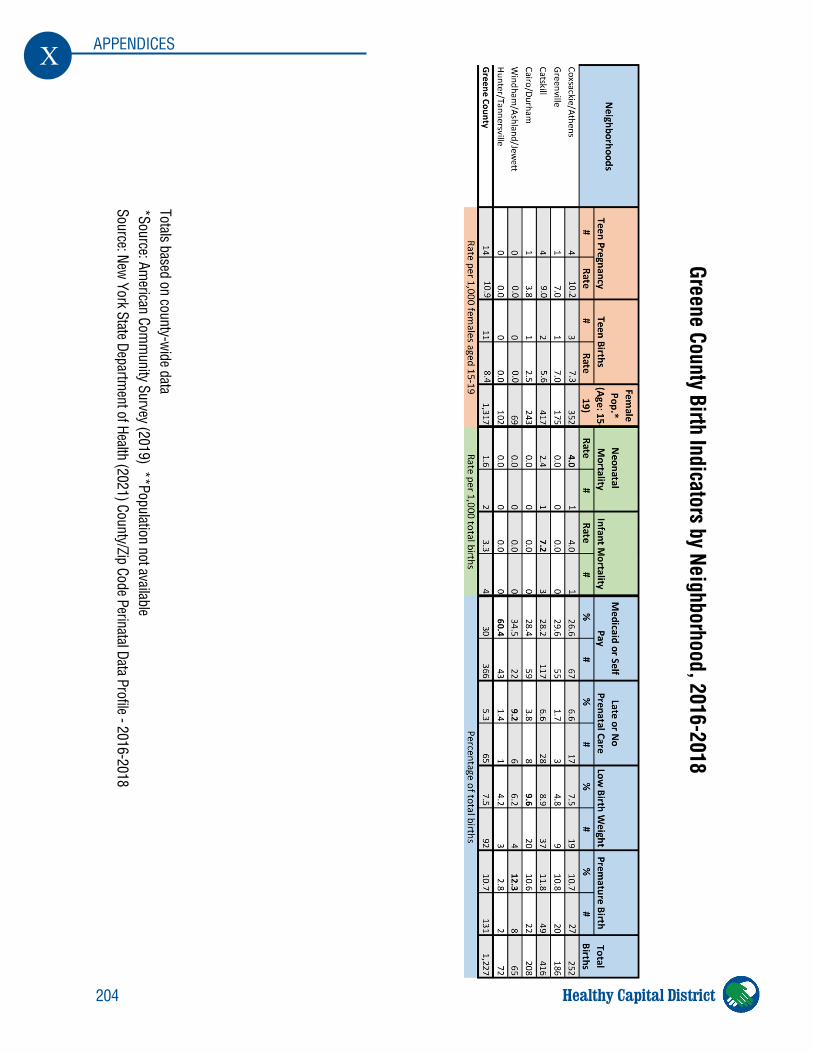
204
X APPENDICES
Healthy Capital District
Greene County Birth Indicators by Neighborhood, 2016-2018
Totals based on county-wide data
*Source: American Com
munity Survey (2019) **Population not available
Source: New
York State Department of Health (2021) County/Zip Code Perinatal Data Profile - 2016-2018
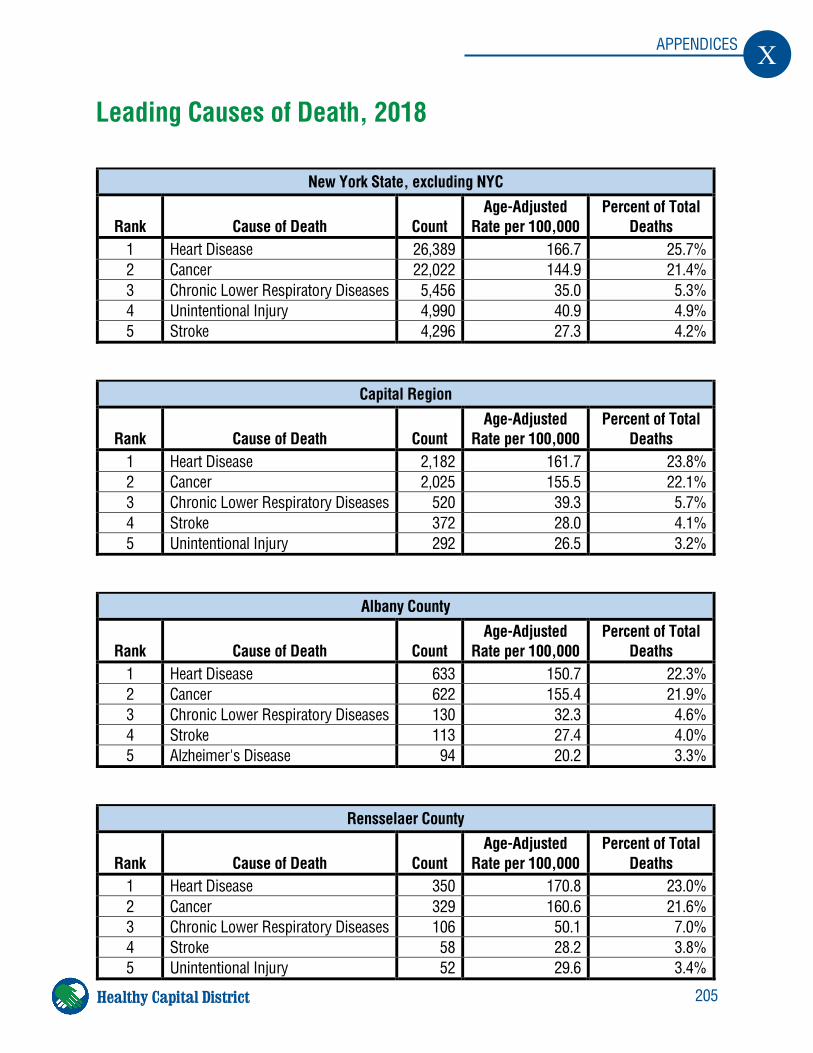
205
X APPENDICES
Healthy Capital District
Leading Causes of Death, 2018
New York State, excluding NYC
Rank Cause of Death Count Age-Adjusted
Rate per 100,000 Percent of Total
Deaths 1 Heart Disease 26,389 166.7 25.7% 2 Cancer 22,022 144.9 21.4% 3 Chronic Lower Respiratory Diseases 5,456 35.0 5.3% 4 Unintentional Injury 4,990 40.9 4.9% 5 Stroke 4,296 27.3 4.2%
Capital Region
Rank Cause of Death Count Age-Adjusted
Rate per 100,000 Percent of Total
Deaths 1 Heart Disease 2,182 161.7 23.8% 2 Cancer 2,025 155.5 22.1% 3 Chronic Lower Respiratory Diseases 520 39.3 5.7% 4 Stroke 372 28.0 4.1% 5 Unintentional Injury 292 26.5 3.2%
Albany County
Rank Cause of Death Count Age-Adjusted
Rate per 100,000 Percent of Total
Deaths 1 Heart Disease 633 150.7 22.3% 2 Cancer 622 155.4 21.9% 3 Chronic Lower Respiratory Diseases 130 32.3 4.6% 4 Stroke 113 27.4 4.0% 5 Alzheimer's Disease 94 20.2 3.3%
Rensselaer County
Rank Cause of Death Count Age-Adjusted
Rate per 100,000 Percent of Total
Deaths 1 Heart Disease 350 170.8 23.0% 2 Cancer 329 160.6 21.6% 3 Chronic Lower Respiratory Diseases 106 50.1 7.0% 4 Stroke 58 28.2 3.8% 5 Unintentional Injury 52 29.6 3.4%
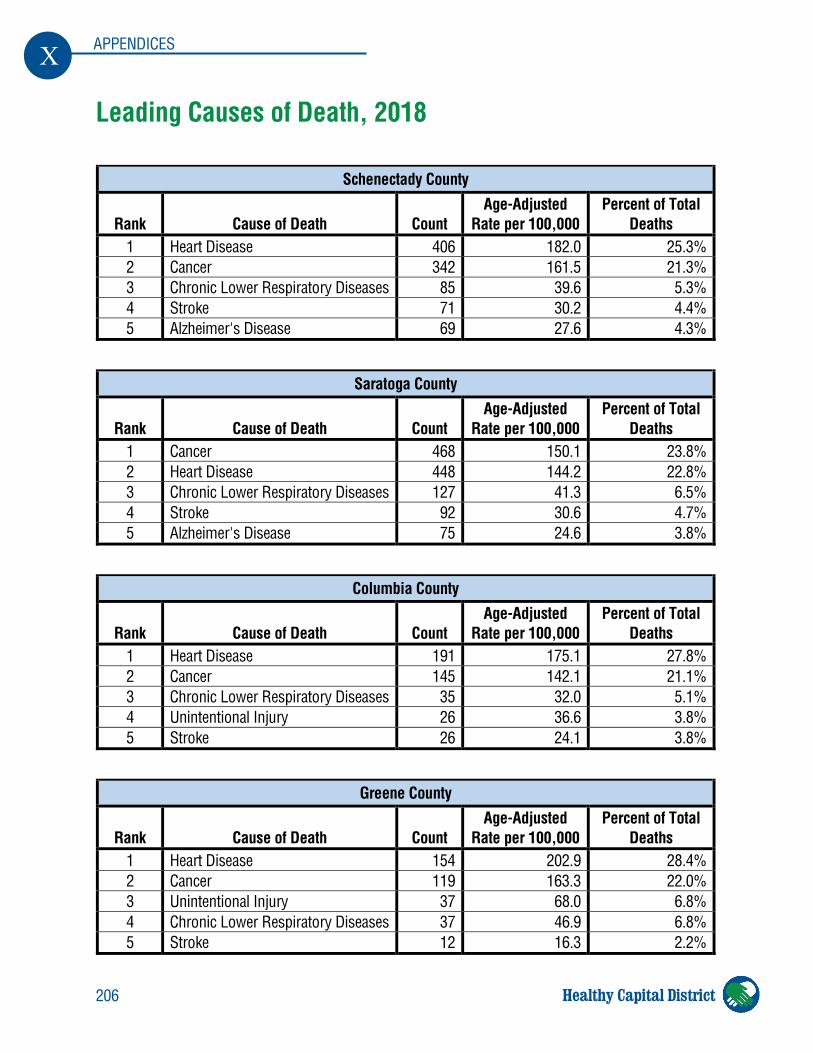
206
X APPENDICES
Healthy Capital District
Leading Causes of Death, 2018
Schenectady County
Rank Cause of Death Count Age-Adjusted
Rate per 100,000 Percent of Total
Deaths 1 Heart Disease 406 182.0 25.3% 2 Cancer 342 161.5 21.3% 3 Chronic Lower Respiratory Diseases 85 39.6 5.3% 4 Stroke 71 30.2 4.4% 5 Alzheimer's Disease 69 27.6 4.3%
Saratoga County
Rank Cause of Death Count Age-Adjusted
Rate per 100,000 Percent of Total
Deaths 1 Cancer 468 150.1 23.8% 2 Heart Disease 448 144.2 22.8% 3 Chronic Lower Respiratory Diseases 127 41.3 6.5% 4 Stroke 92 30.6 4.7% 5 Alzheimer's Disease 75 24.6 3.8%
Columbia County
Rank Cause of Death Count Age-Adjusted
Rate per 100,000 Percent of Total
Deaths 1 Heart Disease 191 175.1 27.8% 2 Cancer 145 142.1 21.1% 3 Chronic Lower Respiratory Diseases 35 32.0 5.1% 4 Unintentional Injury 26 36.6 3.8% 5 Stroke 26 24.1 3.8%
Greene County
Rank Cause of Death Count Age-Adjusted
Rate per 100,000 Percent of Total
Deaths 1 Heart Disease 154 202.9 28.4% 2 Cancer 119 163.3 22.0% 3 Unintentional Injury 37 68.0 6.8% 4 Chronic Lower Respiratory Diseases 37 46.9 6.8% 5 Stroke 12 16.3 2.2%
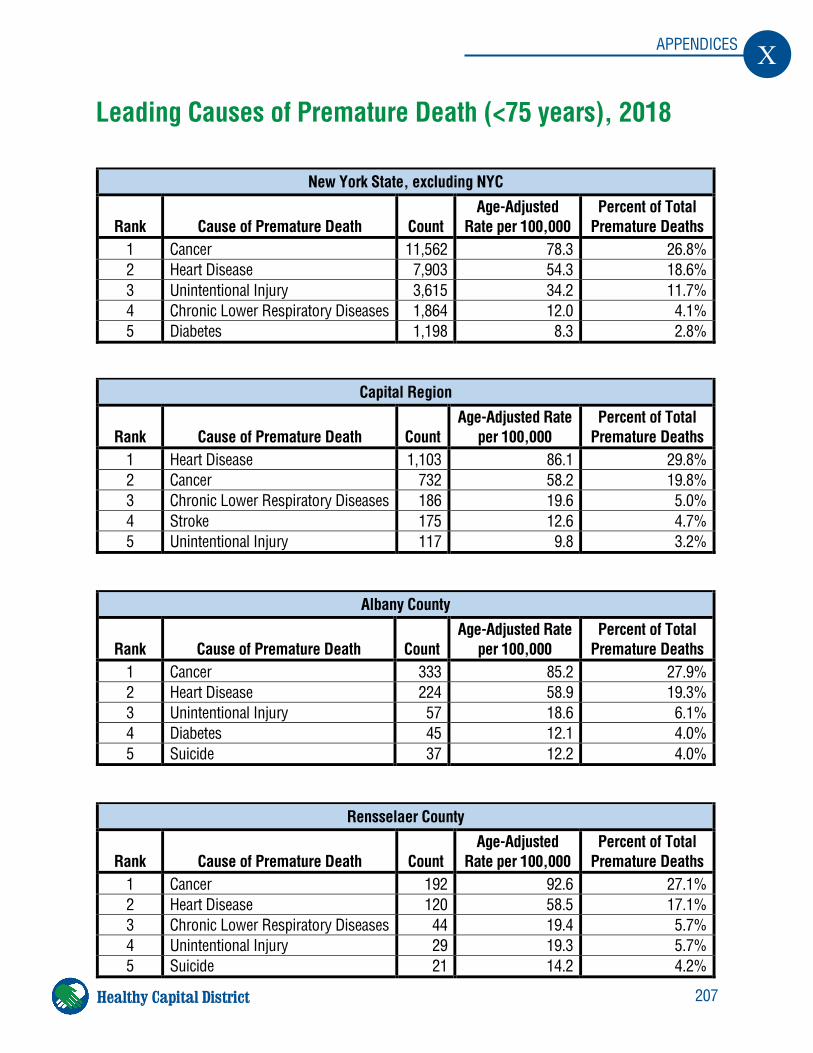
207
X APPENDICES
Healthy Capital District
Leading Causes of Premature Death (<75 years), 2018
New York State, excluding NYC
Rank Cause of Premature Death Count Age-Adjusted
Rate per 100,000 Percent of Total
Premature Deaths 1 Cancer 11,562 78.3 26.8% 2 Heart Disease 7,903 54.3 18.6% 3 Unintentional Injury 3,615 34.2 11.7% 4 Chronic Lower Respiratory Diseases 1,864 12.0 4.1% 5 Diabetes 1,198 8.3 2.8%
Capital Region
Rank Cause of Premature Death Count Age-Adjusted Rate
per 100,000 Percent of Total
Premature Deaths 1 Heart Disease 1,103 86.1 29.8% 2 Cancer 732 58.2 19.8% 3 Chronic Lower Respiratory Diseases 186 19.6 5.0% 4 Stroke 175 12.6 4.7% 5 Unintentional Injury 117 9.8 3.2%
Albany County
Rank Cause of Premature Death Count Age-Adjusted Rate
per 100,000 Percent of Total
Premature Deaths 1 Cancer 333 85.2 27.9% 2 Heart Disease 224 58.9 19.3% 3 Unintentional Injury 57 18.6 6.1% 4 Diabetes 45 12.1 4.0% 5 Suicide 37 12.2 4.0%
Rensselaer County
Rank Cause of Premature Death Count Age-Adjusted
Rate per 100,000 Percent of Total
Premature Deaths 1 Cancer 192 92.6 27.1% 2 Heart Disease 120 58.5 17.1% 3 Chronic Lower Respiratory Diseases 44 19.4 5.7% 4 Unintentional Injury 29 19.3 5.7% 5 Suicide 21 14.2 4.2%
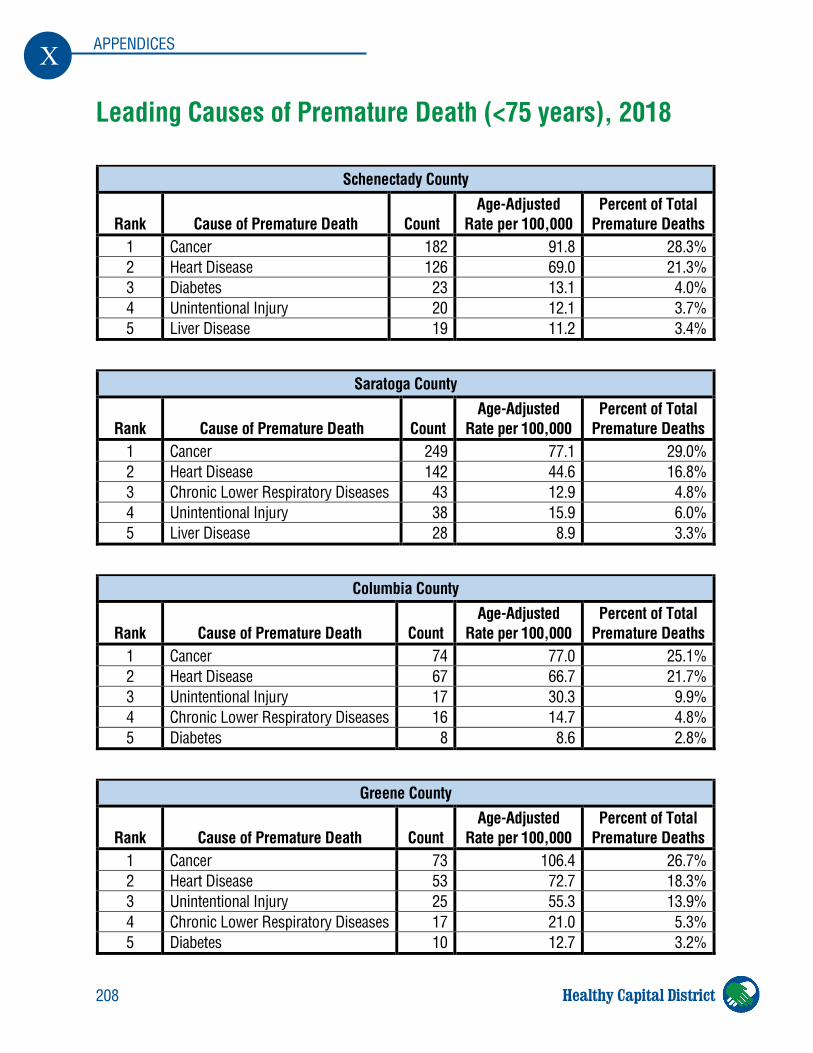
208
X APPENDICES
Healthy Capital District
Leading Causes of Premature Death (<75 years), 2018
Schenectady County
Rank Cause of Premature Death Count Age-Adjusted
Rate per 100,000 Percent of Total
Premature Deaths 1 Cancer 182 91.8 28.3% 2 Heart Disease 126 69.0 21.3% 3 Diabetes 23 13.1 4.0% 4 Unintentional Injury 20 12.1 3.7% 5 Liver Disease 19 11.2 3.4%
Saratoga County
Rank Cause of Premature Death Count Age-Adjusted
Rate per 100,000 Percent of Total
Premature Deaths 1 Cancer 249 77.1 29.0% 2 Heart Disease 142 44.6 16.8% 3 Chronic Lower Respiratory Diseases 43 12.9 4.8% 4 Unintentional Injury 38 15.9 6.0% 5 Liver Disease 28 8.9 3.3%
Columbia County
Rank Cause of Premature Death Count Age-Adjusted
Rate per 100,000 Percent of Total
Premature Deaths 1 Cancer 74 77.0 25.1% 2 Heart Disease 67 66.7 21.7% 3 Unintentional Injury 17 30.3 9.9% 4 Chronic Lower Respiratory Diseases 16 14.7 4.8% 5 Diabetes 8 8.6 2.8%
Greene County
Rank Cause of Premature Death Count Age-Adjusted
Rate per 100,000 Percent of Total
Premature Deaths 1 Cancer 73 106.4 26.7% 2 Heart Disease 53 72.7 18.3% 3 Unintentional Injury 25 55.3 13.9% 4 Chronic Lower Respiratory Diseases 17 21.0 5.3% 5 Diabetes 10 12.7 3.2%
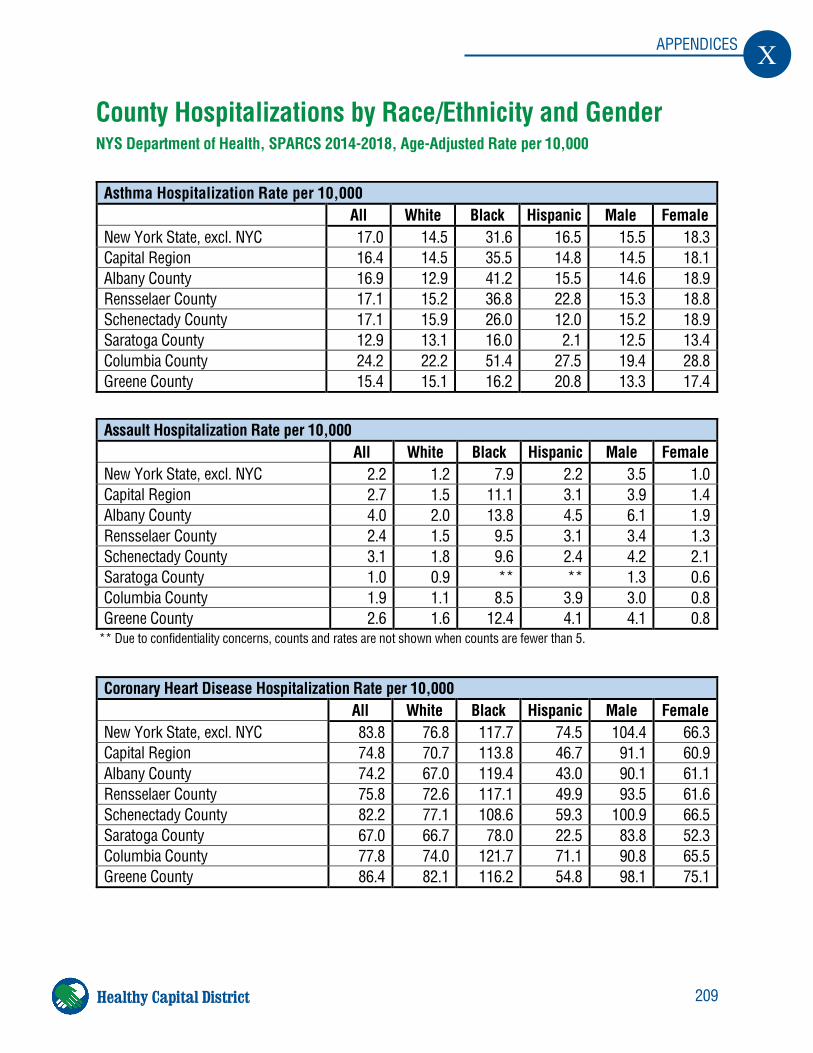
209
X APPENDICES
Healthy Capital District
County Hospitalizations by Race/Ethnicity and Gender NYS Department of Health, SPARCS 2014-2018, Age-Adjusted Rate per 10,000
** Due to confidentiality concerns, counts and rates are not shown when counts are fewer than 5.
Asthma Hospitalization Rate per 10,000 All White Black Hispanic Male Female New York State, excl. NYC 17.0 14.5 31.6 16.5 15.5 18.3 Capital Region 16.4 14.5 35.5 14.8 14.5 18.1 Albany County 16.9 12.9 41.2 15.5 14.6 18.9 Rensselaer County 17.1 15.2 36.8 22.8 15.3 18.8 Schenectady County 17.1 15.9 26.0 12.0 15.2 18.9 Saratoga County 12.9 13.1 16.0 2.1 12.5 13.4 Columbia County 24.2 22.2 51.4 27.5 19.4 28.8 Greene County 15.4 15.1 16.2 20.8 13.3 17.4
Assault Hospitalization Rate per 10,000 All White Black Hispanic Male Female
New York State, excl. NYC 2.2 1.2 7.9 2.2 3.5 1.0 Capital Region 2.7 1.5 11.1 3.1 3.9 1.4 Albany County 4.0 2.0 13.8 4.5 6.1 1.9 Rensselaer County 2.4 1.5 9.5 3.1 3.4 1.3 Schenectady County 3.1 1.8 9.6 2.4 4.2 2.1 Saratoga County 1.0 0.9 ** ** 1.3 0.6 Columbia County 1.9 1.1 8.5 3.9 3.0 0.8 Greene County 2.6 1.6 12.4 4.1 4.1 0.8
Coronary Heart Disease Hospitalization Rate per 10,000 All White Black Hispanic Male Female
New York State, excl. NYC 83.8 76.8 117.7 74.5 104.4 66.3 Capital Region 74.8 70.7 113.8 46.7 91.1 60.9 Albany County 74.2 67.0 119.4 43.0 90.1 61.1 Rensselaer County 75.8 72.6 117.1 49.9 93.5 61.6 Schenectady County 82.2 77.1 108.6 59.3 100.9 66.5 Saratoga County 67.0 66.7 78.0 22.5 83.8 52.3 Columbia County 77.8 74.0 121.7 71.1 90.8 65.5 Greene County 86.4 82.1 116.2 54.8 98.1 75.1
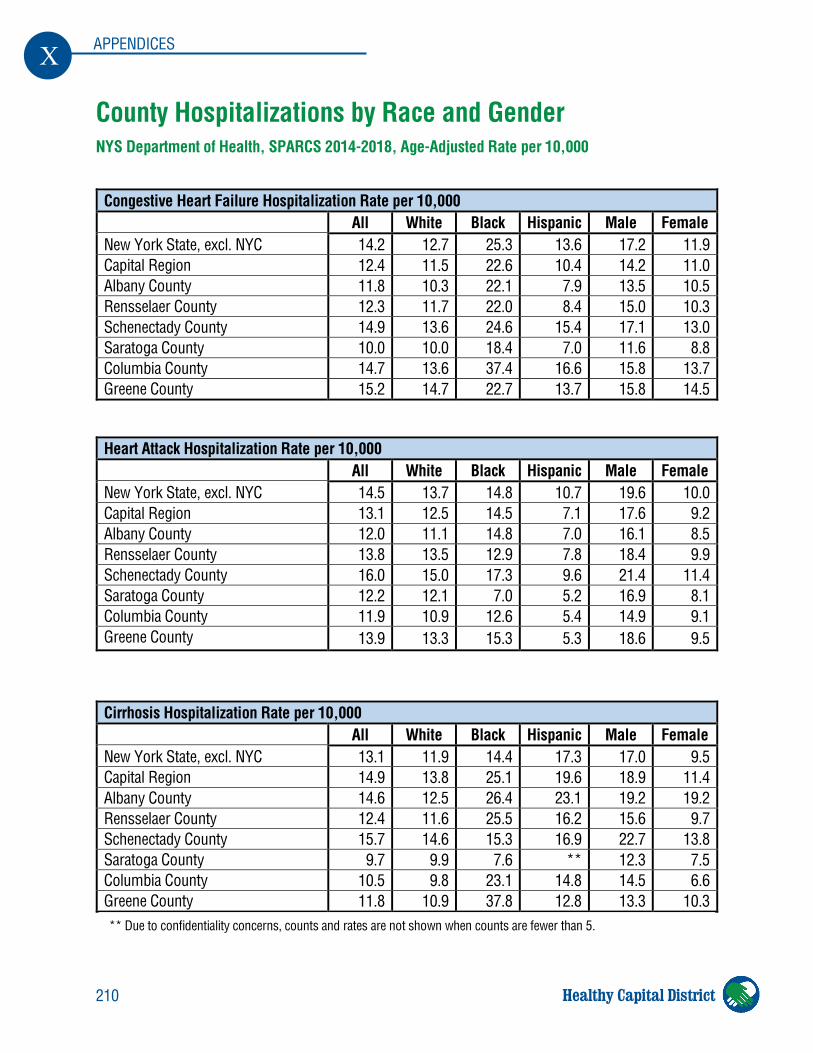
210
X APPENDICES
Healthy Capital District
County Hospitalizations by Race and Gender NYS Department of Health, SPARCS 2014-2018, Age-Adjusted Rate per 10,000
Congestive Heart Failure Hospitalization Rate per 10,000 All White Black Hispanic Male Female
New York State, excl. NYC 14.2 12.7 25.3 13.6 17.2 11.9 Capital Region 12.4 11.5 22.6 10.4 14.2 11.0 Albany County 11.8 10.3 22.1 7.9 13.5 10.5 Rensselaer County 12.3 11.7 22.0 8.4 15.0 10.3 Schenectady County 14.9 13.6 24.6 15.4 17.1 13.0 Saratoga County 10.0 10.0 18.4 7.0 11.6 8.8 Columbia County 14.7 13.6 37.4 16.6 15.8 13.7 Greene County 15.2 14.7 22.7 13.7 15.8 14.5
Heart Attack Hospitalization Rate per 10,000 All White Black Hispanic Male Female
New York State, excl. NYC 14.5 13.7 14.8 10.7 19.6 10.0 Capital Region 13.1 12.5 14.5 7.1 17.6 9.2 Albany County 12.0 11.1 14.8 7.0 16.1 8.5 Rensselaer County 13.8 13.5 12.9 7.8 18.4 9.9 Schenectady County 16.0 15.0 17.3 9.6 21.4 11.4 Saratoga County 12.2 12.1 7.0 5.2 16.9 8.1 Columbia County 11.9 10.9 12.6 5.4 14.9 9.1 Greene County 13.9 13.3 15.3 5.3 18.6 9.5
Cirrhosis Hospitalization Rate per 10,000 All White Black Hispanic Male Female
New York State, excl. NYC 13.1 11.9 14.4 17.3 17.0 9.5 Capital Region 14.9 13.8 25.1 19.6 18.9 11.4 Albany County 14.6 12.5 26.4 23.1 19.2 19.2 Rensselaer County 12.4 11.6 25.5 16.2 15.6 9.7 Schenectady County 15.7 14.6 15.3 16.9 22.7 13.8 Saratoga County 9.7 9.9 7.6 ** 12.3 7.5 Columbia County 10.5 9.8 23.1 14.8 14.5 6.6 Greene County 11.8 10.9 37.8 12.8 13.3 10.3 ** Due to confidentiality concerns, counts and rates are not shown when counts are fewer than 5.
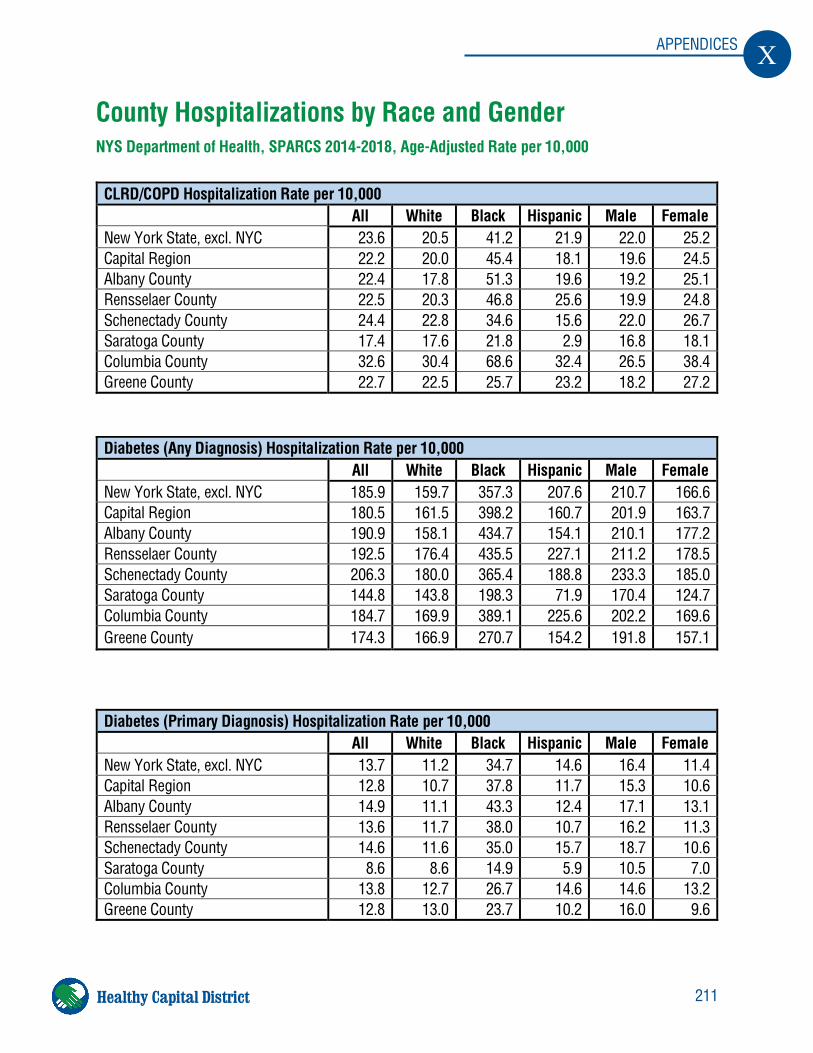
211
X APPENDICES
Healthy Capital District
County Hospitalizations by Race and Gender NYS Department of Health, SPARCS 2014-2018, Age-Adjusted Rate per 10,000
CLRD/COPD Hospitalization Rate per 10,000 All White Black Hispanic Male Female
New York State, excl. NYC 23.6 20.5 41.2 21.9 22.0 25.2 Capital Region 22.2 20.0 45.4 18.1 19.6 24.5 Albany County 22.4 17.8 51.3 19.6 19.2 25.1 Rensselaer County 22.5 20.3 46.8 25.6 19.9 24.8 Schenectady County 24.4 22.8 34.6 15.6 22.0 26.7 Saratoga County 17.4 17.6 21.8 2.9 16.8 18.1 Columbia County 32.6 30.4 68.6 32.4 26.5 38.4 Greene County 22.7 22.5 25.7 23.2 18.2 27.2
Diabetes (Any Diagnosis) Hospitalization Rate per 10,000 All White Black Hispanic Male Female
New York State, excl. NYC 185.9 159.7 357.3 207.6 210.7 166.6 Capital Region 180.5 161.5 398.2 160.7 201.9 163.7 Albany County 190.9 158.1 434.7 154.1 210.1 177.2 Rensselaer County 192.5 176.4 435.5 227.1 211.2 178.5 Schenectady County 206.3 180.0 365.4 188.8 233.3 185.0 Saratoga County 144.8 143.8 198.3 71.9 170.4 124.7 Columbia County 184.7 169.9 389.1 225.6 202.2 169.6 Greene County 174.3 166.9 270.7 154.2 191.8 157.1
Diabetes (Primary Diagnosis) Hospitalization Rate per 10,000 All White Black Hispanic Male Female
New York State, excl. NYC 13.7 11.2 34.7 14.6 16.4 11.4 Capital Region 12.8 10.7 37.8 11.7 15.3 10.6 Albany County 14.9 11.1 43.3 12.4 17.1 13.1 Rensselaer County 13.6 11.7 38.0 10.7 16.2 11.3 Schenectady County 14.6 11.6 35.0 15.7 18.7 10.6 Saratoga County 8.6 8.6 14.9 5.9 10.5 7.0 Columbia County 13.8 12.7 26.7 14.6 14.6 13.2 Greene County 12.8 13.0 23.7 10.2 16.0 9.6
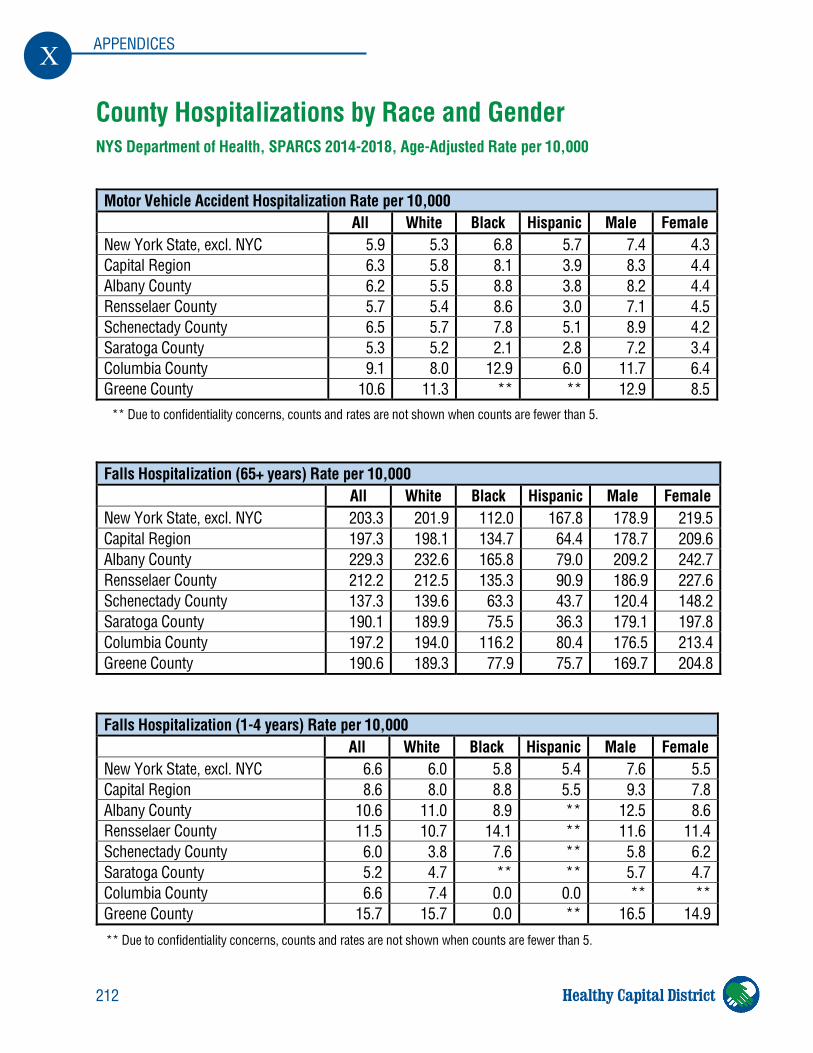
212
X APPENDICES
Healthy Capital District
** Due to confidentiality concerns, counts and rates are not shown when counts are fewer than 5.
** Due to confidentiality concerns, counts and rates are not shown when counts are fewer than 5.
County Hospitalizations by Race and Gender NYS Department of Health, SPARCS 2014-2018, Age-Adjusted Rate per 10,000
Motor Vehicle Accident Hospitalization Rate per 10,000 All White Black Hispanic Male Female
New York State, excl. NYC 5.9 5.3 6.8 5.7 7.4 4.3 Capital Region 6.3 5.8 8.1 3.9 8.3 4.4 Albany County 6.2 5.5 8.8 3.8 8.2 4.4 Rensselaer County 5.7 5.4 8.6 3.0 7.1 4.5 Schenectady County 6.5 5.7 7.8 5.1 8.9 4.2 Saratoga County 5.3 5.2 2.1 2.8 7.2 3.4 Columbia County 9.1 8.0 12.9 6.0 11.7 6.4 Greene County 10.6 11.3 ** ** 12.9 8.5
Falls Hospitalization (65+ years) Rate per 10,000 All White Black Hispanic Male Female
New York State, excl. NYC 203.3 201.9 112.0 167.8 178.9 219.5 Capital Region 197.3 198.1 134.7 64.4 178.7 209.6 Albany County 229.3 232.6 165.8 79.0 209.2 242.7 Rensselaer County 212.2 212.5 135.3 90.9 186.9 227.6 Schenectady County 137.3 139.6 63.3 43.7 120.4 148.2 Saratoga County 190.1 189.9 75.5 36.3 179.1 197.8 Columbia County 197.2 194.0 116.2 80.4 176.5 213.4 Greene County 190.6 189.3 77.9 75.7 169.7 204.8
Falls Hospitalization (1-4 years) Rate per 10,000 All White Black Hispanic Male Female
New York State, excl. NYC 6.6 6.0 5.8 5.4 7.6 5.5 Capital Region 8.6 8.0 8.8 5.5 9.3 7.8 Albany County 10.6 11.0 8.9 ** 12.5 8.6 Rensselaer County 11.5 10.7 14.1 ** 11.6 11.4 Schenectady County 6.0 3.8 7.6 ** 5.8 6.2 Saratoga County 5.2 4.7 ** ** 5.7 4.7 Columbia County 6.6 7.4 0.0 0.0 ** ** Greene County 15.7 15.7 0.0 ** 16.5 14.9
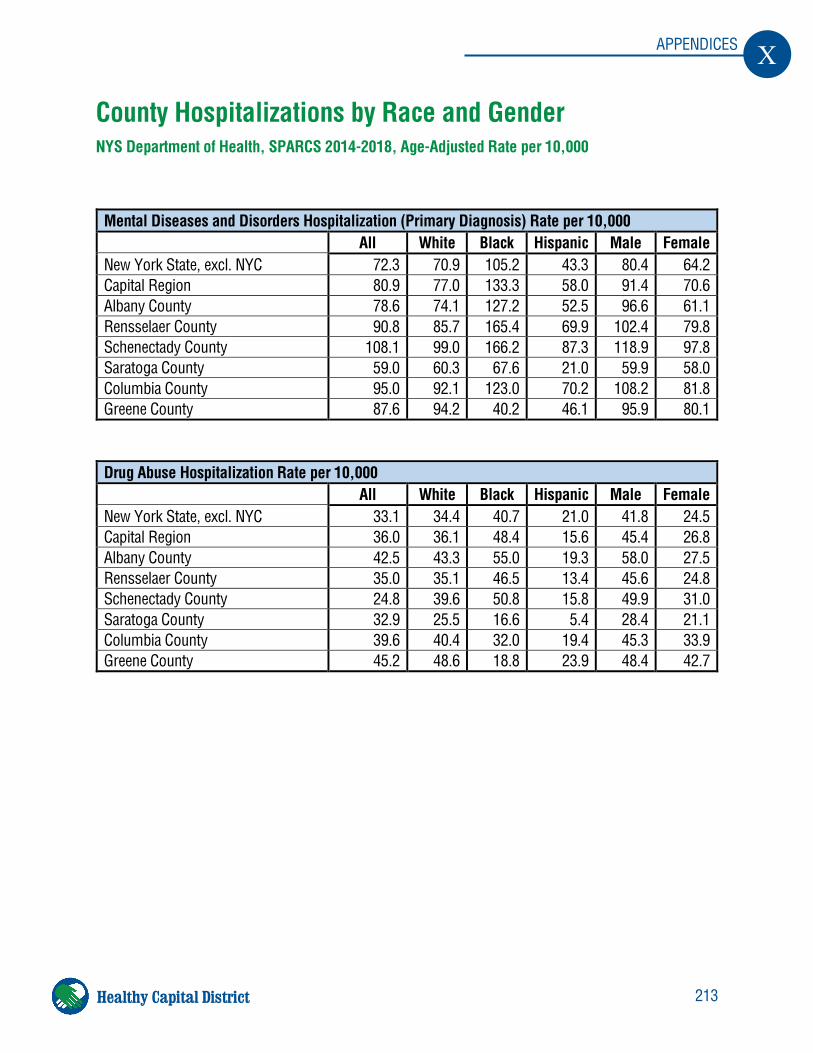
213
X APPENDICES
Healthy Capital District
County Hospitalizations by Race and Gender NYS Department of Health, SPARCS 2014-2018, Age-Adjusted Rate per 10,000
Mental Diseases and Disorders Hospitalization (Primary Diagnosis) Rate per 10,000 All White Black Hispanic Male Female
New York State, excl. NYC 72.3 70.9 105.2 43.3 80.4 64.2 Capital Region 80.9 77.0 133.3 58.0 91.4 70.6 Albany County 78.6 74.1 127.2 52.5 96.6 61.1 Rensselaer County 90.8 85.7 165.4 69.9 102.4 79.8 Schenectady County 108.1 99.0 166.2 87.3 118.9 97.8 Saratoga County 59.0 60.3 67.6 21.0 59.9 58.0 Columbia County 95.0 92.1 123.0 70.2 108.2 81.8 Greene County 87.6 94.2 40.2 46.1 95.9 80.1
Drug Abuse Hospitalization Rate per 10,000 All White Black Hispanic Male Female
New York State, excl. NYC 33.1 34.4 40.7 21.0 41.8 24.5 Capital Region 36.0 36.1 48.4 15.6 45.4 26.8 Albany County 42.5 43.3 55.0 19.3 58.0 27.5 Rensselaer County 35.0 35.1 46.5 13.4 45.6 24.8 Schenectady County 24.8 39.6 50.8 15.8 49.9 31.0 Saratoga County 32.9 25.5 16.6 5.4 28.4 21.1 Columbia County 39.6 40.4 32.0 19.4 45.3 33.9 Greene County 45.2 48.6 18.8 23.9 48.4 42.7
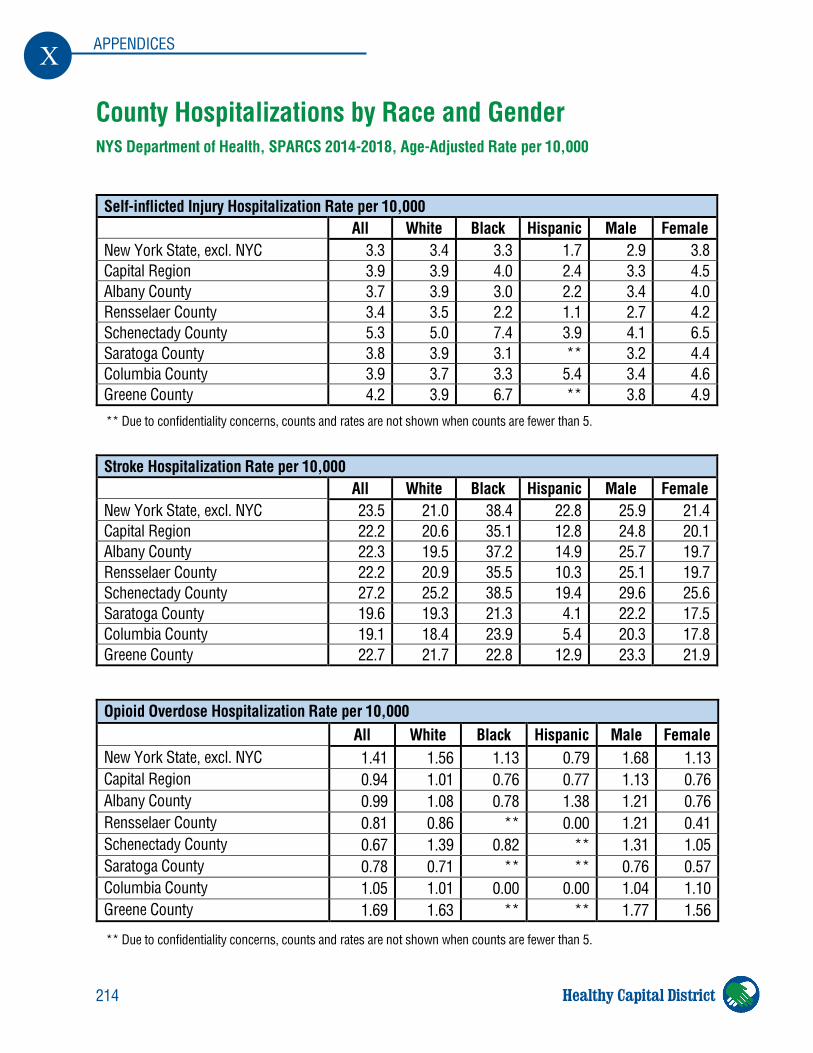
214
X APPENDICES
Healthy Capital District
** Due to confidentiality concerns, counts and rates are not shown when counts are fewer than 5.
** Due to confidentiality concerns, counts and rates are not shown when counts are fewer than 5.
County Hospitalizations by Race and Gender NYS Department of Health, SPARCS 2014-2018, Age-Adjusted Rate per 10,000
Opioid Overdose Hospitalization Rate per 10,000 All White Black Hispanic Male Female
New York State, excl. NYC 1.41 1.56 1.13 0.79 1.68 1.13 Capital Region 0.94 1.01 0.76 0.77 1.13 0.76 Albany County 0.99 1.08 0.78 1.38 1.21 0.76 Rensselaer County 0.81 0.86 ** 0.00 1.21 0.41 Schenectady County 0.67 1.39 0.82 ** 1.31 1.05 Saratoga County 0.78 0.71 ** ** 0.76 0.57 Columbia County 1.05 1.01 0.00 0.00 1.04 1.10 Greene County 1.69 1.63 ** ** 1.77 1.56
Self-inflicted Injury Hospitalization Rate per 10,000 All White Black Hispanic Male Female
New York State, excl. NYC 3.3 3.4 3.3 1.7 2.9 3.8 Capital Region 3.9 3.9 4.0 2.4 3.3 4.5 Albany County 3.7 3.9 3.0 2.2 3.4 4.0 Rensselaer County 3.4 3.5 2.2 1.1 2.7 4.2 Schenectady County 5.3 5.0 7.4 3.9 4.1 6.5 Saratoga County 3.8 3.9 3.1 ** 3.2 4.4 Columbia County 3.9 3.7 3.3 5.4 3.4 4.6 Greene County 4.2 3.9 6.7 ** 3.8 4.9
Stroke Hospitalization Rate per 10,000 All White Black Hispanic Male Female
New York State, excl. NYC 23.5 21.0 38.4 22.8 25.9 21.4 Capital Region 22.2 20.6 35.1 12.8 24.8 20.1 Albany County 22.3 19.5 37.2 14.9 25.7 19.7 Rensselaer County 22.2 20.9 35.5 10.3 25.1 19.7 Schenectady County 27.2 25.2 38.5 19.4 29.6 25.6 Saratoga County 19.6 19.3 21.3 4.1 22.2 17.5 Columbia County 19.1 18.4 23.9 5.4 20.3 17.8 Greene County 22.7 21.7 22.8 12.9 23.3 21.9
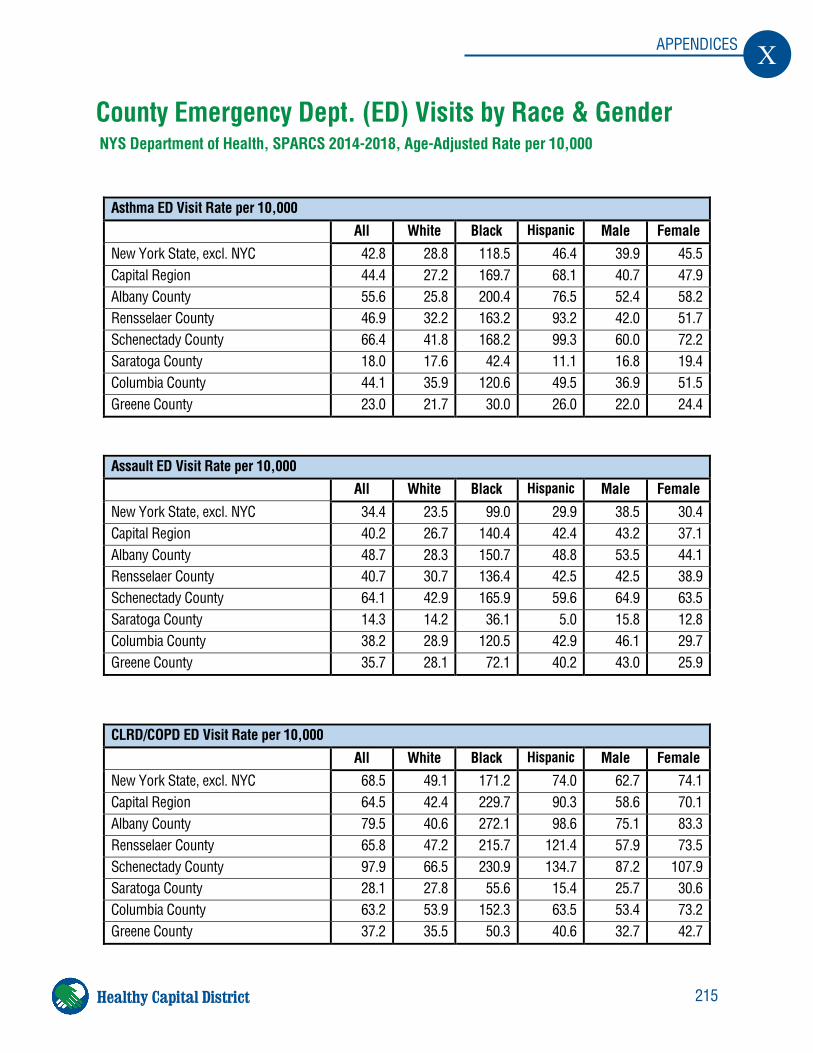
215
X APPENDICES
Healthy Capital District
County Emergency Dept. (ED) Visits by Race & Gender NYS Department of Health, SPARCS 2014-2018, Age-Adjusted Rate per 10,000
Asthma ED Visit Rate per 10,000 All White Black Hispanic Male Female
New York State, excl. NYC 42.8 28.8 118.5 46.4 39.9 45.5 Capital Region 44.4 27.2 169.7 68.1 40.7 47.9 Albany County 55.6 25.8 200.4 76.5 52.4 58.2 Rensselaer County 46.9 32.2 163.2 93.2 42.0 51.7 Schenectady County 66.4 41.8 168.2 99.3 60.0 72.2 Saratoga County 18.0 17.6 42.4 11.1 16.8 19.4 Columbia County 44.1 35.9 120.6 49.5 36.9 51.5 Greene County 23.0 21.7 30.0 26.0 22.0 24.4
Assault ED Visit Rate per 10,000 All White Black Hispanic Male Female
New York State, excl. NYC 34.4 23.5 99.0 29.9 38.5 30.4 Capital Region 40.2 26.7 140.4 42.4 43.2 37.1 Albany County 48.7 28.3 150.7 48.8 53.5 44.1 Rensselaer County 40.7 30.7 136.4 42.5 42.5 38.9 Schenectady County 64.1 42.9 165.9 59.6 64.9 63.5 Saratoga County 14.3 14.2 36.1 5.0 15.8 12.8 Columbia County 38.2 28.9 120.5 42.9 46.1 29.7 Greene County 35.7 28.1 72.1 40.2 43.0 25.9
CLRD/COPD ED Visit Rate per 10,000 All White Black Hispanic Male Female
New York State, excl. NYC 68.5 49.1 171.2 74.0 62.7 74.1 Capital Region 64.5 42.4 229.7 90.3 58.6 70.1 Albany County 79.5 40.6 272.1 98.6 75.1 83.3 Rensselaer County 65.8 47.2 215.7 121.4 57.9 73.5 Schenectady County 97.9 66.5 230.9 134.7 87.2 107.9 Saratoga County 28.1 27.8 55.6 15.4 25.7 30.6 Columbia County 63.2 53.9 152.3 63.5 53.4 73.2 Greene County 37.2 35.5 50.3 40.6 32.7 42.7
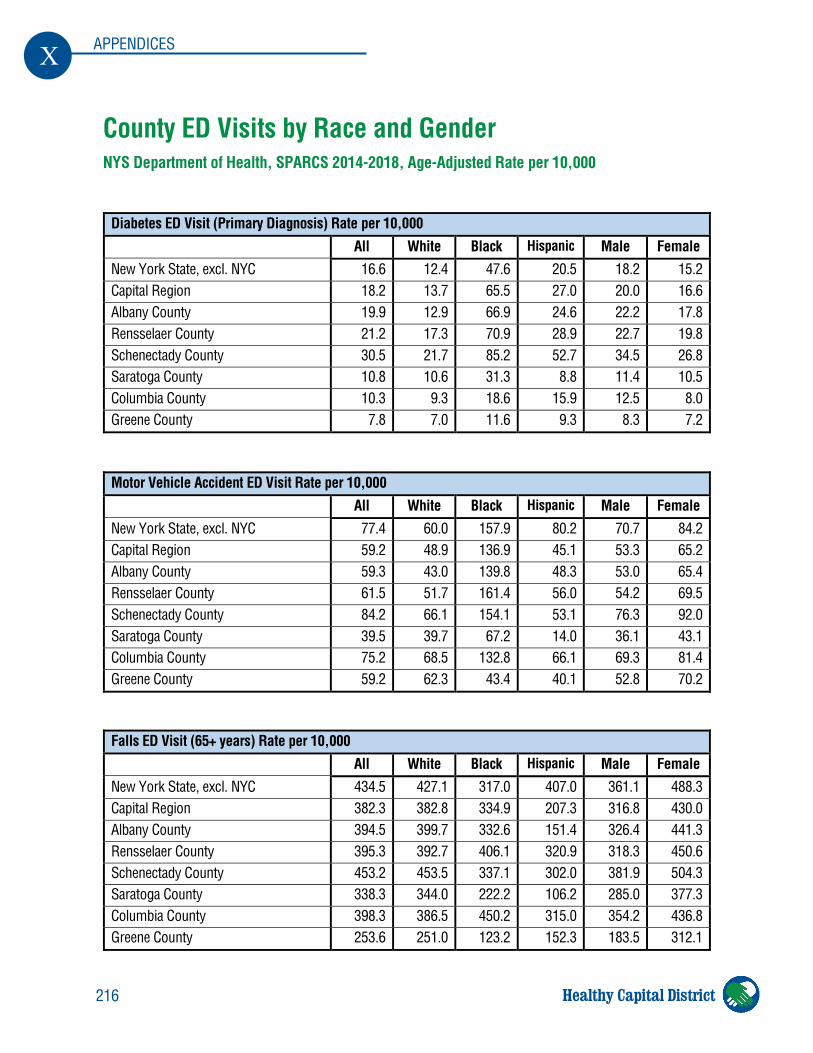
216
X APPENDICES
Healthy Capital District
County ED Visits by Race and Gender NYS Department of Health, SPARCS 2014-2018, Age-Adjusted Rate per 10,000
Diabetes ED Visit (Primary Diagnosis) Rate per 10,000 All White Black Hispanic Male Female
New York State, excl. NYC 16.6 12.4 47.6 20.5 18.2 15.2 Capital Region 18.2 13.7 65.5 27.0 20.0 16.6 Albany County 19.9 12.9 66.9 24.6 22.2 17.8 Rensselaer County 21.2 17.3 70.9 28.9 22.7 19.8 Schenectady County 30.5 21.7 85.2 52.7 34.5 26.8 Saratoga County 10.8 10.6 31.3 8.8 11.4 10.5 Columbia County 10.3 9.3 18.6 15.9 12.5 8.0 Greene County 7.8 7.0 11.6 9.3 8.3 7.2
Motor Vehicle Accident ED Visit Rate per 10,000 All White Black Hispanic Male Female
New York State, excl. NYC 77.4 60.0 157.9 80.2 70.7 84.2 Capital Region 59.2 48.9 136.9 45.1 53.3 65.2 Albany County 59.3 43.0 139.8 48.3 53.0 65.4 Rensselaer County 61.5 51.7 161.4 56.0 54.2 69.5 Schenectady County 84.2 66.1 154.1 53.1 76.3 92.0 Saratoga County 39.5 39.7 67.2 14.0 36.1 43.1 Columbia County 75.2 68.5 132.8 66.1 69.3 81.4 Greene County 59.2 62.3 43.4 40.1 52.8 70.2
Falls ED Visit (65+ years) Rate per 10,000 All White Black Hispanic Male Female
New York State, excl. NYC 434.5 427.1 317.0 407.0 361.1 488.3 Capital Region 382.3 382.8 334.9 207.3 316.8 430.0 Albany County 394.5 399.7 332.6 151.4 326.4 441.3 Rensselaer County 395.3 392.7 406.1 320.9 318.3 450.6 Schenectady County 453.2 453.5 337.1 302.0 381.9 504.3 Saratoga County 338.3 344.0 222.2 106.2 285.0 377.3 Columbia County 398.3 386.5 450.2 315.0 354.2 436.8 Greene County 253.6 251.0 123.2 152.3 183.5 312.1
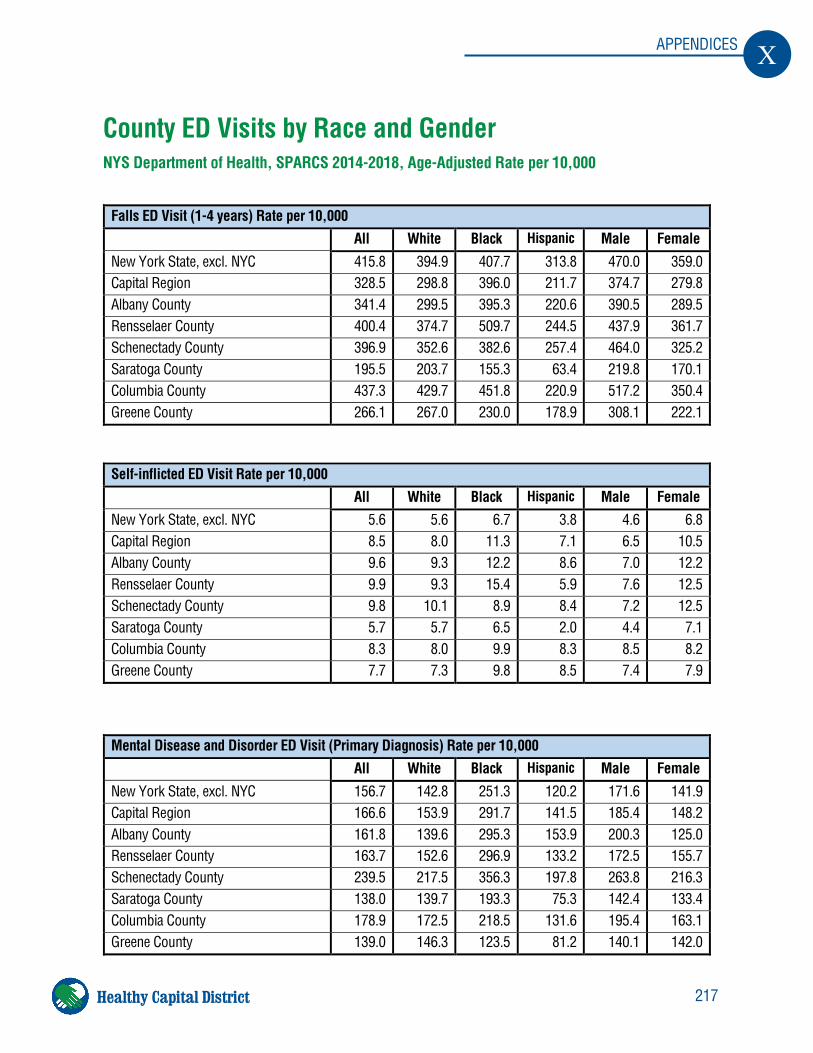
217
X APPENDICES
Healthy Capital District
County ED Visits by Race and Gender NYS Department of Health, SPARCS 2014-2018, Age-Adjusted Rate per 10,000
Falls ED Visit (1-4 years) Rate per 10,000 All White Black Hispanic Male Female
New York State, excl. NYC 415.8 394.9 407.7 313.8 470.0 359.0 Capital Region 328.5 298.8 396.0 211.7 374.7 279.8 Albany County 341.4 299.5 395.3 220.6 390.5 289.5 Rensselaer County 400.4 374.7 509.7 244.5 437.9 361.7 Schenectady County 396.9 352.6 382.6 257.4 464.0 325.2 Saratoga County 195.5 203.7 155.3 63.4 219.8 170.1 Columbia County 437.3 429.7 451.8 220.9 517.2 350.4 Greene County 266.1 267.0 230.0 178.9 308.1 222.1
Self-inflicted ED Visit Rate per 10,000 All White Black Hispanic Male Female
New York State, excl. NYC 5.6 5.6 6.7 3.8 4.6 6.8 Capital Region 8.5 8.0 11.3 7.1 6.5 10.5 Albany County 9.6 9.3 12.2 8.6 7.0 12.2 Rensselaer County 9.9 9.3 15.4 5.9 7.6 12.5 Schenectady County 9.8 10.1 8.9 8.4 7.2 12.5 Saratoga County 5.7 5.7 6.5 2.0 4.4 7.1 Columbia County 8.3 8.0 9.9 8.3 8.5 8.2 Greene County 7.7 7.3 9.8 8.5 7.4 7.9
Mental Disease and Disorder ED Visit (Primary Diagnosis) Rate per 10,000 All White Black Hispanic Male Female
New York State, excl. NYC 156.7 142.8 251.3 120.2 171.6 141.9 Capital Region 166.6 153.9 291.7 141.5 185.4 148.2 Albany County 161.8 139.6 295.3 153.9 200.3 125.0 Rensselaer County 163.7 152.6 296.9 133.2 172.5 155.7 Schenectady County 239.5 217.5 356.3 197.8 263.8 216.3 Saratoga County 138.0 139.7 193.3 75.3 142.4 133.4 Columbia County 178.9 172.5 218.5 131.6 195.4 163.1 Greene County 139.0 146.3 123.5 81.2 140.1 142.0
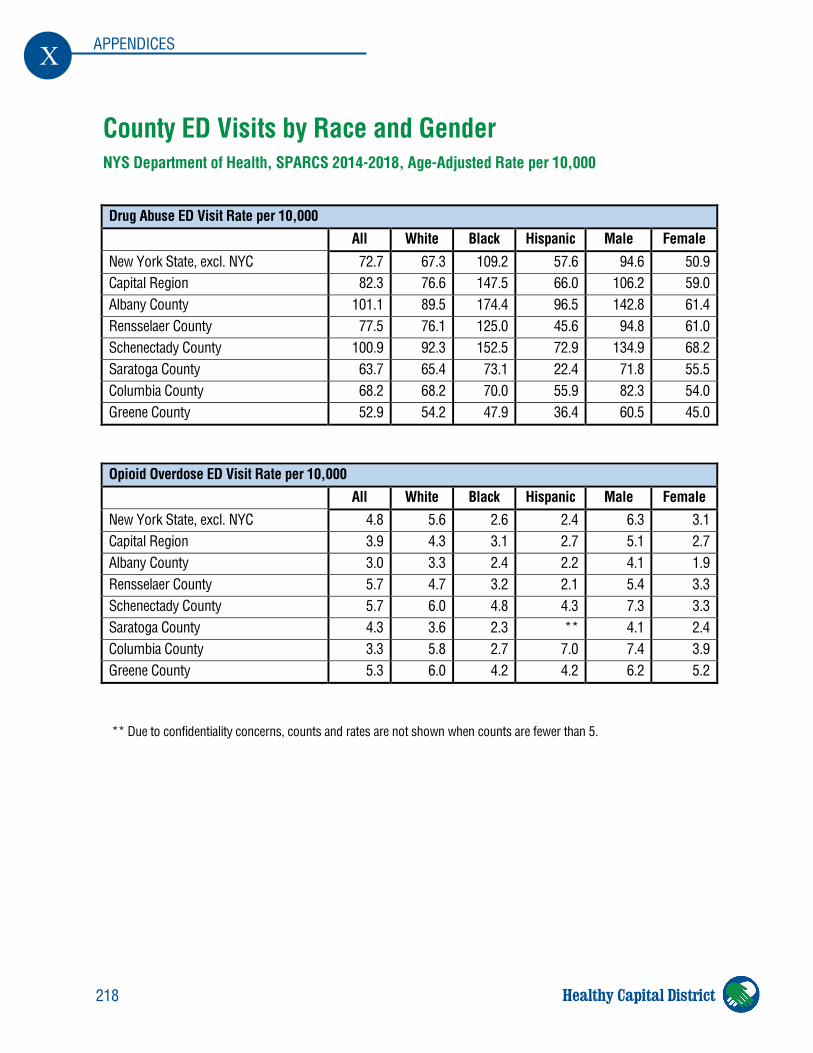
218
X APPENDICES
Healthy Capital District
** Due to confidentiality concerns, counts and rates are not shown when counts are fewer than 5.
County ED Visits by Race and Gender NYS Department of Health, SPARCS 2014-2018, Age-Adjusted Rate per 10,000
Drug Abuse ED Visit Rate per 10,000 All White Black Hispanic Male Female
New York State, excl. NYC 72.7 67.3 109.2 57.6 94.6 50.9 Capital Region 82.3 76.6 147.5 66.0 106.2 59.0 Albany County 101.1 89.5 174.4 96.5 142.8 61.4 Rensselaer County 77.5 76.1 125.0 45.6 94.8 61.0 Schenectady County 100.9 92.3 152.5 72.9 134.9 68.2 Saratoga County 63.7 65.4 73.1 22.4 71.8 55.5 Columbia County 68.2 68.2 70.0 55.9 82.3 54.0 Greene County 52.9 54.2 47.9 36.4 60.5 45.0
Opioid Overdose ED Visit Rate per 10,000 All White Black Hispanic Male Female
New York State, excl. NYC 4.8 5.6 2.6 2.4 6.3 3.1 Capital Region 3.9 4.3 3.1 2.7 5.1 2.7 Albany County 3.0 3.3 2.4 2.2 4.1 1.9 Rensselaer County 5.7 4.7 3.2 2.1 5.4 3.3 Schenectady County 5.7 6.0 4.8 4.3 7.3 3.3 Saratoga County 4.3 3.6 2.3 ** 4.1 2.4 Columbia County 3.3 5.8 2.7 7.0 7.4 3.9 Greene County 5.3 6.0 4.2 4.2 6.2 5.2
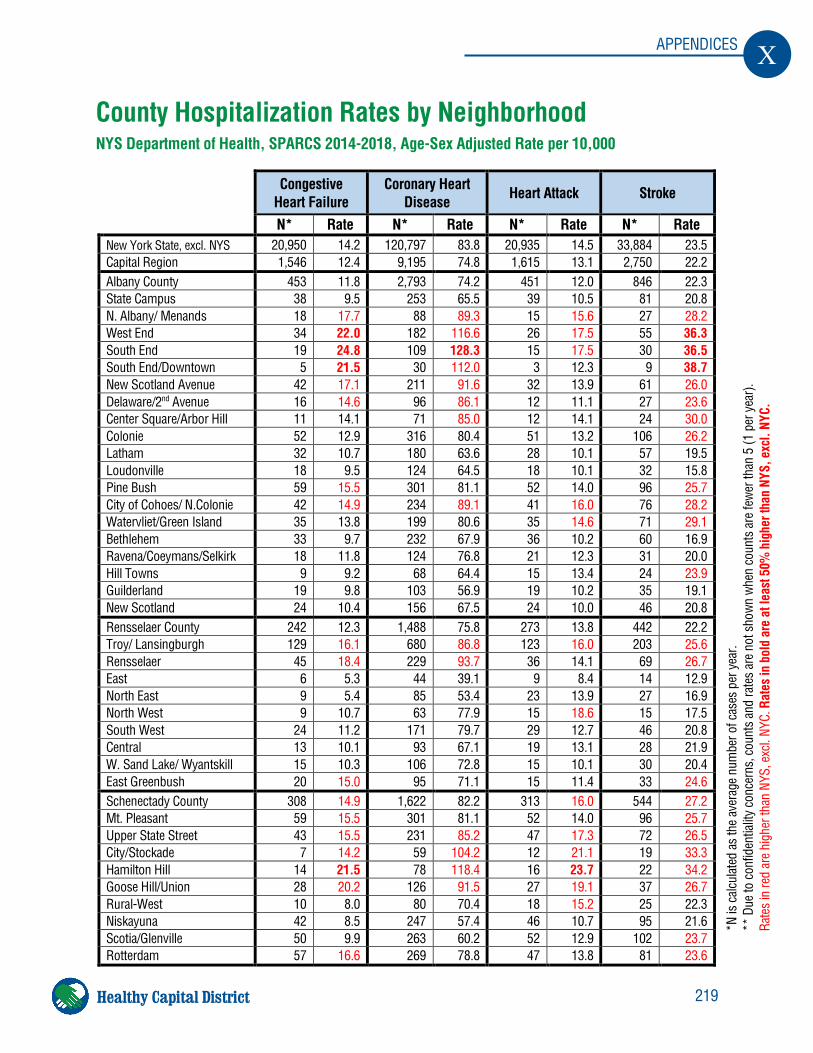
219
X APPENDICES
Healthy Capital District
County Hospitalization Rates by Neighborhood
NYS Department of Health, SPARCS 2014-2018, Age-Sex Adjusted Rate per 10,000
Congestive
Heart Failure Coronary Heart
Disease Heart Attack Stroke
N* Rate N* Rate N* Rate N* Rate New York State, excl. NYS 20,950 14.2 120,797 83.8 20,935 14.5 33,884 23.5 Capital Region 1,546 12.4 9,195 74.8 1,615 13.1 2,750 22.2 Albany County 453 11.8 2,793 74.2 451 12.0 846 22.3 State Campus 38 9.5 253 65.5 39 10.5 81 20.8 N. Albany/ Menands 18 17.7 88 89.3 15 15.6 27 28.2 West End 34 22.0 182 116.6 26 17.5 55 36.3 South End 19 24.8 109 128.3 15 17.5 30 36.5 South End/Downtown 5 21.5 30 112.0 3 12.3 9 38.7 New Scotland Avenue 42 17.1 211 91.6 32 13.9 61 26.0 Delaware/2nd Avenue 16 14.6 96 86.1 12 11.1 27 23.6 Center Square/Arbor Hill 11 14.1 71 85.0 12 14.1 24 30.0 Colonie 52 12.9 316 80.4 51 13.2 106 26.2 Latham 32 10.7 180 63.6 28 10.1 57 19.5 Loudonville 18 9.5 124 64.5 18 10.1 32 15.8 Pine Bush 59 15.5 301 81.1 52 14.0 96 25.7 City of Cohoes/ N.Colonie 42 14.9 234 89.1 41 16.0 76 28.2 Watervliet/Green Island 35 13.8 199 80.6 35 14.6 71 29.1 Bethlehem 33 9.7 232 67.9 36 10.2 60 16.9 Ravena/Coeymans/Selkirk 18 11.8 124 76.8 21 12.3 31 20.0 Hill Towns 9 9.2 68 64.4 15 13.4 24 23.9 Guilderland 19 9.8 103 56.9 19 10.2 35 19.1 New Scotland 24 10.4 156 67.5 24 10.0 46 20.8 Rensselaer County 242 12.3 1,488 75.8 273 13.8 442 22.2 Troy/ Lansingburgh 129 16.1 680 86.8 123 16.0 203 25.6 Rensselaer 45 18.4 229 93.7 36 14.1 69 26.7 East 6 5.3 44 39.1 9 8.4 14 12.9 North East 9 5.4 85 53.4 23 13.9 27 16.9 North West 9 10.7 63 77.9 15 18.6 15 17.5 South West 24 11.2 171 79.7 29 12.7 46 20.8 Central 13 10.1 93 67.1 19 13.1 28 21.9 W. Sand Lake/ Wyantskill 15 10.3 106 72.8 15 10.1 30 20.4 East Greenbush 20 15.0 95 71.1 15 11.4 33 24.6 Schenectady County 308 14.9 1,622 82.2 313 16.0 544 27.2 Mt. Pleasant 59 15.5 301 81.1 52 14.0 96 25.7 Upper State Street 43 15.5 231 85.2 47 17.3 72 26.5 City/Stockade 7 14.2 59 104.2 12 21.1 19 33.3 Hamilton Hill 14 21.5 78 118.4 16 23.7 22 34.2 Goose Hill/Union 28 20.2 126 91.5 27 19.1 37 26.7 Rural-West 10 8.0 80 70.4 18 15.2 25 22.3 Niskayuna 42 8.5 247 57.4 46 10.7 95 21.6 Scotia/Glenville 50 9.9 263 60.2 52 12.9 102 23.7 Rotterdam 57 16.6 269 78.8 47 13.8 81 23.6
*N is
cal
culat
ed a
s th
e av
erag
e nu
mbe
r of c
ases
per
yea
r. **
Due
to c
onfid
entia
lity
conc
erns
, cou
nts
and
rate
s ar
e no
t sho
wn w
hen
coun
ts a
re fe
wer
than
5 (1
per
yea
r).
Rate
s in
red
are
high
er th
an N
YS, e
xcl.
NYC.
Rat
es in
bol
d ar
e at
leas
t 50%
hig
her t
han
NYS,
exc
l. NY
C.
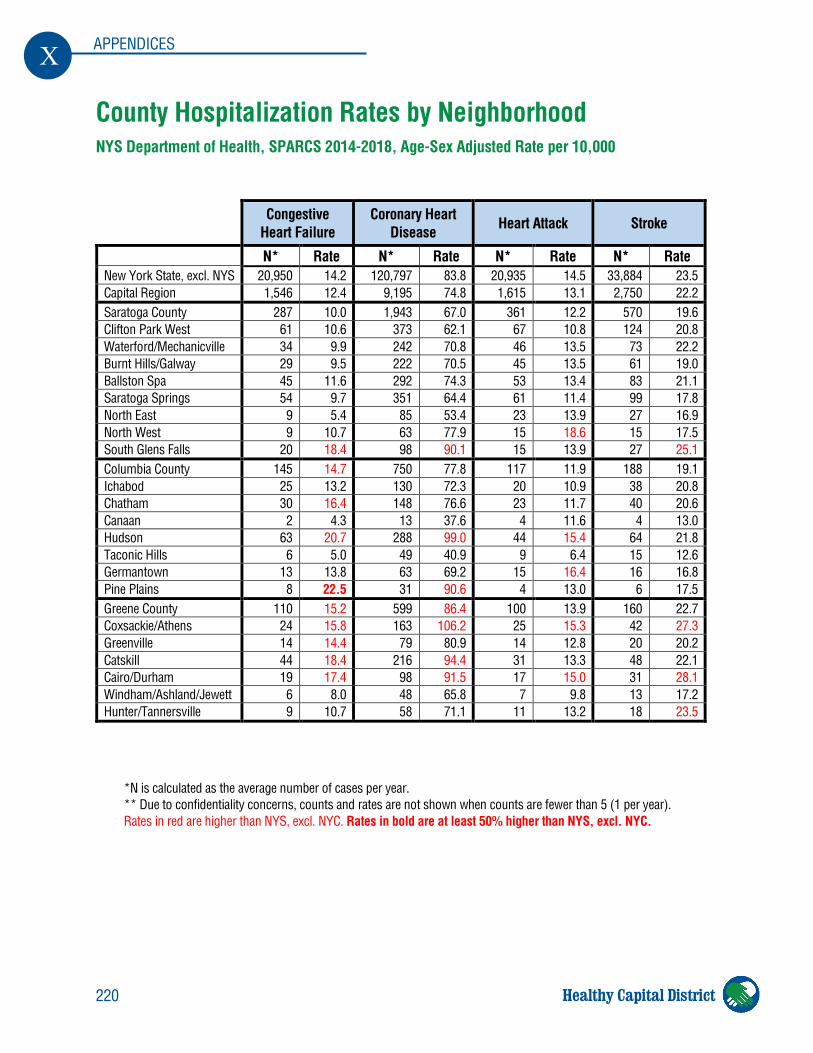
220
X APPENDICES
Healthy Capital District
County Hospitalization Rates by Neighborhood NYS Department of Health, SPARCS 2014-2018, Age-Sex Adjusted Rate per 10,000
Congestive Heart Failure
Coronary Heart Disease Heart Attack Stroke
N* Rate N* Rate N* Rate N* Rate New York State, excl. NYS 20,950 14.2 120,797 83.8 20,935 14.5 33,884 23.5 Capital Region 1,546 12.4 9,195 74.8 1,615 13.1 2,750 22.2 Saratoga County 287 10.0 1,943 67.0 361 12.2 570 19.6 Clifton Park West 61 10.6 373 62.1 67 10.8 124 20.8 Waterford/Mechanicville 34 9.9 242 70.8 46 13.5 73 22.2 Burnt Hills/Galway 29 9.5 222 70.5 45 13.5 61 19.0 Ballston Spa 45 11.6 292 74.3 53 13.4 83 21.1 Saratoga Springs 54 9.7 351 64.4 61 11.4 99 17.8 North East 9 5.4 85 53.4 23 13.9 27 16.9 North West 9 10.7 63 77.9 15 18.6 15 17.5 South Glens Falls 20 18.4 98 90.1 15 13.9 27 25.1 Columbia County 145 14.7 750 77.8 117 11.9 188 19.1 Ichabod 25 13.2 130 72.3 20 10.9 38 20.8 Chatham 30 16.4 148 76.6 23 11.7 40 20.6 Canaan 2 4.3 13 37.6 4 11.6 4 13.0 Hudson 63 20.7 288 99.0 44 15.4 64 21.8 Taconic Hills 6 5.0 49 40.9 9 6.4 15 12.6 Germantown 13 13.8 63 69.2 15 16.4 16 16.8 Pine Plains 8 22.5 31 90.6 4 13.0 6 17.5 Greene County 110 15.2 599 86.4 100 13.9 160 22.7 Coxsackie/Athens 24 15.8 163 106.2 25 15.3 42 27.3 Greenville 14 14.4 79 80.9 14 12.8 20 20.2 Catskill 44 18.4 216 94.4 31 13.3 48 22.1 Cairo/Durham 19 17.4 98 91.5 17 15.0 31 28.1 Windham/Ashland/Jewett 6 8.0 48 65.8 7 9.8 13 17.2 Hunter/Tannersville 9 10.7 58 71.1 11 13.2 18 23.5
*N is calculated as the average number of cases per year. ** Due to confidentiality concerns, counts and rates are not shown when counts are fewer than 5 (1 per year). Rates in red are higher than NYS, excl. NYC. Rates in bold are at least 50% higher than NYS, excl. NYC.

221
X APPENDICES
Healthy Capital District
Asthma COPD/CLRD Diabetes (Any
Diagnosis) Diabetes (Primary)
N* Rate N* Rate N* Rate N* Rate New York State, excl. NYS 22,700 17.0 31,829 23.6 261,968 185.9 17,328 13.7 Capital Region 1,879 16.4 2,594 22.2 21,673 180.5 1,353 12.8 Albany County 576 16.9 781 22.4 6,936 190.9 479 14.9 State Campus 43 14.5 63 20.3 617 174.0 37 12.5 N. Albany/ Menands 15 16.9 21 23.4 238 253.0 21 24.8 West End 72 46.5 97 61.7 612 390.8 65 40.5 South End 58 68.6 70 82.9 415 484.7 41 46.0 South End/Downtown 12 41.4 17 57.3 112 427.8 8 32.0 New Scotland Avenue 44 20.9 57 26.9 598 269.2 47 22.4 Delaware/2nd Avenue 22 19.9 29 26.5 230 207.5 20 19.3 Center Square/Arbor Hill 27 29.6 34 38.0 274 324.0 31 30.0 Colonie 58 16.6 80 22.3 731 189.0 40 12.3 Latham 21 8.5 32 12.6 353 130.1 16 7.0 Loudonville 15 8.2 20 10.4 256 131.8 11 8.1 Pine Bush 61 16.6 91 24.5 690 189.8 38 12.3 City of Cohoes/ N.Colonie 59 23.2 84 32.7 613 239.5 36 15.5 Watervliet/Green Island 39 16.9 58 24.6 528 219.8 39 17.8 Bethlehem 24 7.7 35 11.1 423 125.8 28 10.5 Ravena/Coeymans/Selkirk 26 16.2 33 21.2 317 199.8 16 10.6 Hill Towns 10 10.4 17 16.4 152 145.1 6 6.5 Guilderland 20 12.4 27 16.2 274 157.4 15 9.1 New Scotland 17 8.1 24 11.1 244 112.1 12 7.1 Rensselaer County 322 17.1 430 22.5 3,711 192.5 236 13.6 Troy/ Lansingburgh 190 26.1 274 36.8 2,015 266.6 140 19.6 Rensselaer 51 20.5 67 26.9 563 225.6 25 10.7 East 11 10.4 15 14.8 89 80.7 4 5.6 North East 9 6.1 11 7.6 183 118.7 12 8.7 North West 14 15.5 19 21.2 149 181.5 17 25.8 South West 23 11.4 36 16.7 354 165.5 21 12.2 Central 11 7.6 18 12.2 175 126.6 10 7.9 W. Sand Lake/ Wyantskill 18 13.8 26 18.7 203 140.9 14 10.2 East Greenbush 12 10.0 17 13.6 236 179.8 12 10.8 Schenectady County 312 17.1 454 24.4 3,918 206.3 239 14.6 Mt. Pleasant 61 16.6 91 24.5 690 189.8 38 12.3 Upper State Street 49 20.0 67 26.7 613 240.8 28 12.6 City/Stockade 21 40.6 30 58.6 217 357.9 21 32.1 Hamilton Hill 28 35.7 42 54.4 315 454.5 30 40.7 Goose Hill/Union 31 21.3 48 34.5 357 260.3 26 18.1 Rural-West 12 11.2 15 13.9 165 142.6 9 9.9 Niskayuna 28 8.1 39 10.7 490 120.6 22 5.9 Scotia/Glenville 36 9.6 58 14.6 555 134.9 28 8.7 Rotterdam 54 17.5 76 24.0 627 188.6 42 14.4
Hospitalization Rates by Neighborhood NYS Department of Health, SPARCS 2014-2018, Age-Sex Adjusted Rate per 10,000
*N is
cal
culat
ed a
s th
e av
erag
e nu
mbe
r of c
ases
per
yea
r. **
Due
to c
onfid
entia
lity
conc
erns
, cou
nts
and
rate
s ar
e no
t sho
wn w
hen
coun
ts a
re fe
wer
than
5 (1
per
yea
r).
Rate
s in
red
are
high
er th
an N
YS, e
xcl.
NYC.
Rat
es in
bol
d ar
e at
leas
t 50%
hig
her t
han
NYS,
exc
l. NY
C.
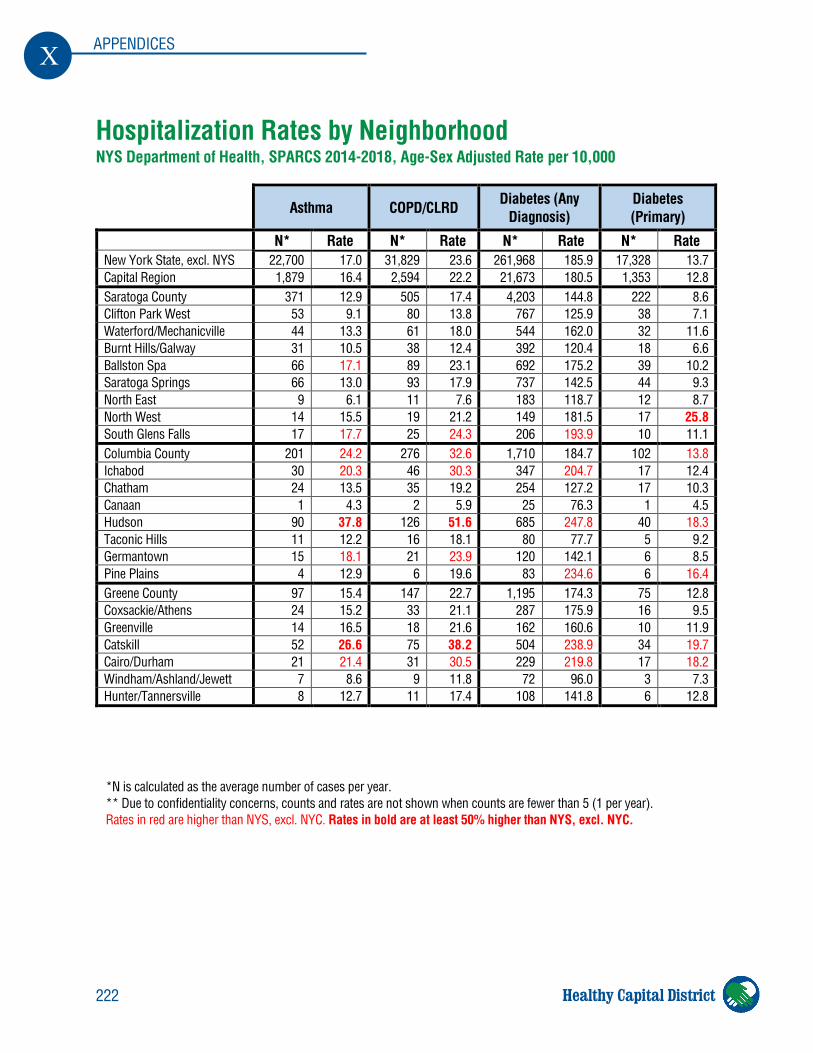
222
X APPENDICES
Healthy Capital District
Hospitalization Rates by Neighborhood NYS Department of Health, SPARCS 2014-2018, Age-Sex Adjusted Rate per 10,000
Asthma COPD/CLRD Diabetes (Any
Diagnosis) Diabetes (Primary)
N* Rate N* Rate N* Rate N* Rate New York State, excl. NYS 22,700 17.0 31,829 23.6 261,968 185.9 17,328 13.7 Capital Region 1,879 16.4 2,594 22.2 21,673 180.5 1,353 12.8 Saratoga County 371 12.9 505 17.4 4,203 144.8 222 8.6 Clifton Park West 53 9.1 80 13.8 767 125.9 38 7.1 Waterford/Mechanicville 44 13.3 61 18.0 544 162.0 32 11.6 Burnt Hills/Galway 31 10.5 38 12.4 392 120.4 18 6.6 Ballston Spa 66 17.1 89 23.1 692 175.2 39 10.2 Saratoga Springs 66 13.0 93 17.9 737 142.5 44 9.3 North East 9 6.1 11 7.6 183 118.7 12 8.7 North West 14 15.5 19 21.2 149 181.5 17 25.8 South Glens Falls 17 17.7 25 24.3 206 193.9 10 11.1 Columbia County 201 24.2 276 32.6 1,710 184.7 102 13.8 Ichabod 30 20.3 46 30.3 347 204.7 17 12.4 Chatham 24 13.5 35 19.2 254 127.2 17 10.3 Canaan 1 4.3 2 5.9 25 76.3 1 4.5 Hudson 90 37.8 126 51.6 685 247.8 40 18.3 Taconic Hills 11 12.2 16 18.1 80 77.7 5 9.2 Germantown 15 18.1 21 23.9 120 142.1 6 8.5 Pine Plains 4 12.9 6 19.6 83 234.6 6 16.4 Greene County 97 15.4 147 22.7 1,195 174.3 75 12.8 Coxsackie/Athens 24 15.2 33 21.1 287 175.9 16 9.5 Greenville 14 16.5 18 21.6 162 160.6 10 11.9 Catskill 52 26.6 75 38.2 504 238.9 34 19.7 Cairo/Durham 21 21.4 31 30.5 229 219.8 17 18.2 Windham/Ashland/Jewett 7 8.6 9 11.8 72 96.0 3 7.3 Hunter/Tannersville 8 12.7 11 17.4 108 141.8 6 12.8
*N is calculated as the average number of cases per year. ** Due to confidentiality concerns, counts and rates are not shown when counts are fewer than 5 (1 per year). Rates in red are higher than NYS, excl. NYC. Rates in bold are at least 50% higher than NYS, excl. NYC.
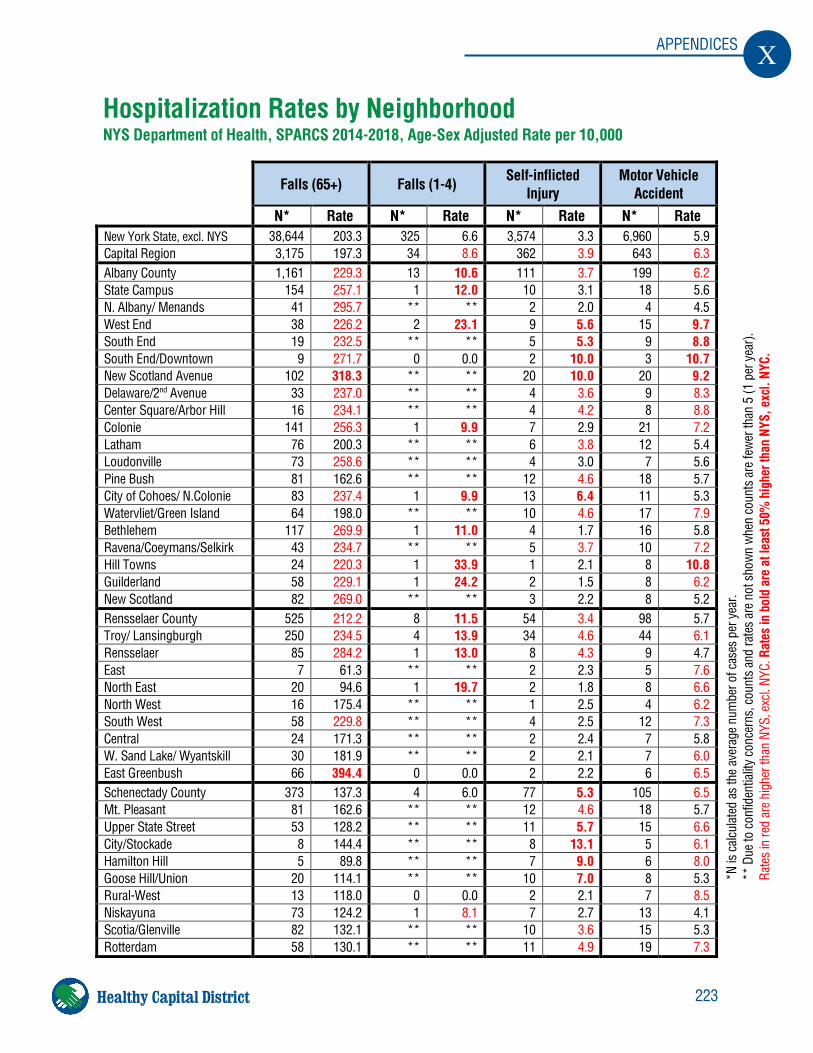
223
X APPENDICES
Healthy Capital District
Falls (65+) Falls (1-4) Self-inflicted
Injury Motor Vehicle
Accident N* Rate N* Rate N* Rate N* Rate New York State, excl. NYS 38,644 203.3 325 6.6 3,574 3.3 6,960 5.9 Capital Region 3,175 197.3 34 8.6 362 3.9 643 6.3 Albany County 1,161 229.3 13 10.6 111 3.7 199 6.2 State Campus 154 257.1 1 12.0 10 3.1 18 5.6 N. Albany/ Menands 41 295.7 ** ** 2 2.0 4 4.5 West End 38 226.2 2 23.1 9 5.6 15 9.7 South End 19 232.5 ** ** 5 5.3 9 8.8 South End/Downtown 9 271.7 0 0.0 2 10.0 3 10.7 New Scotland Avenue 102 318.3 ** ** 20 10.0 20 9.2 Delaware/2nd Avenue 33 237.0 ** ** 4 3.6 9 8.3 Center Square/Arbor Hill 16 234.1 ** ** 4 4.2 8 8.8 Colonie 141 256.3 1 9.9 7 2.9 21 7.2 Latham 76 200.3 ** ** 6 3.8 12 5.4 Loudonville 73 258.6 ** ** 4 3.0 7 5.6 Pine Bush 81 162.6 ** ** 12 4.6 18 5.7 City of Cohoes/ N.Colonie 83 237.4 1 9.9 13 6.4 11 5.3 Watervliet/Green Island 64 198.0 ** ** 10 4.6 17 7.9 Bethlehem 117 269.9 1 11.0 4 1.7 16 5.8 Ravena/Coeymans/Selkirk 43 234.7 ** ** 5 3.7 10 7.2 Hill Towns 24 220.3 1 33.9 1 2.1 8 10.8 Guilderland 58 229.1 1 24.2 2 1.5 8 6.2 New Scotland 82 269.0 ** ** 3 2.2 8 5.2 Rensselaer County 525 212.2 8 11.5 54 3.4 98 5.7 Troy/ Lansingburgh 250 234.5 4 13.9 34 4.6 44 6.1 Rensselaer 85 284.2 1 13.0 8 4.3 9 4.7 East 7 61.3 ** ** 2 2.3 5 7.6 North East 20 94.6 1 19.7 2 1.8 8 6.6 North West 16 175.4 ** ** 1 2.5 4 6.2 South West 58 229.8 ** ** 4 2.5 12 7.3 Central 24 171.3 ** ** 2 2.4 7 5.8 W. Sand Lake/ Wyantskill 30 181.9 ** ** 2 2.1 7 6.0 East Greenbush 66 394.4 0 0.0 2 2.2 6 6.5 Schenectady County 373 137.3 4 6.0 77 5.3 105 6.5 Mt. Pleasant 81 162.6 ** ** 12 4.6 18 5.7 Upper State Street 53 128.2 ** ** 11 5.7 15 6.6 City/Stockade 8 144.4 ** ** 8 13.1 5 6.1 Hamilton Hill 5 89.8 ** ** 7 9.0 6 8.0 Goose Hill/Union 20 114.1 ** ** 10 7.0 8 5.3 Rural-West 13 118.0 0 0.0 2 2.1 7 8.5 Niskayuna 73 124.2 1 8.1 7 2.7 13 4.1 Scotia/Glenville 82 132.1 ** ** 10 3.6 15 5.3 Rotterdam 58 130.1 ** ** 11 4.9 19 7.3
Hospitalization Rates by Neighborhood NYS Department of Health, SPARCS 2014-2018, Age-Sex Adjusted Rate per 10,000
*N is
cal
culat
ed a
s th
e av
erag
e nu
mbe
r of c
ases
per
yea
r. **
Due
to c
onfid
entia
lity
conc
erns
, cou
nts
and
rate
s ar
e no
t sho
wn
whe
n co
unts
are
few
er th
an 5
(1 p
er y
ear).
Ra
tes
in re
d ar
e hi
gher
than
NYS
, exc
l. NY
C. R
ates
in b
old
are
at le
ast 5
0% h
ighe
r tha
n NY
S, e
xcl.
NYC.
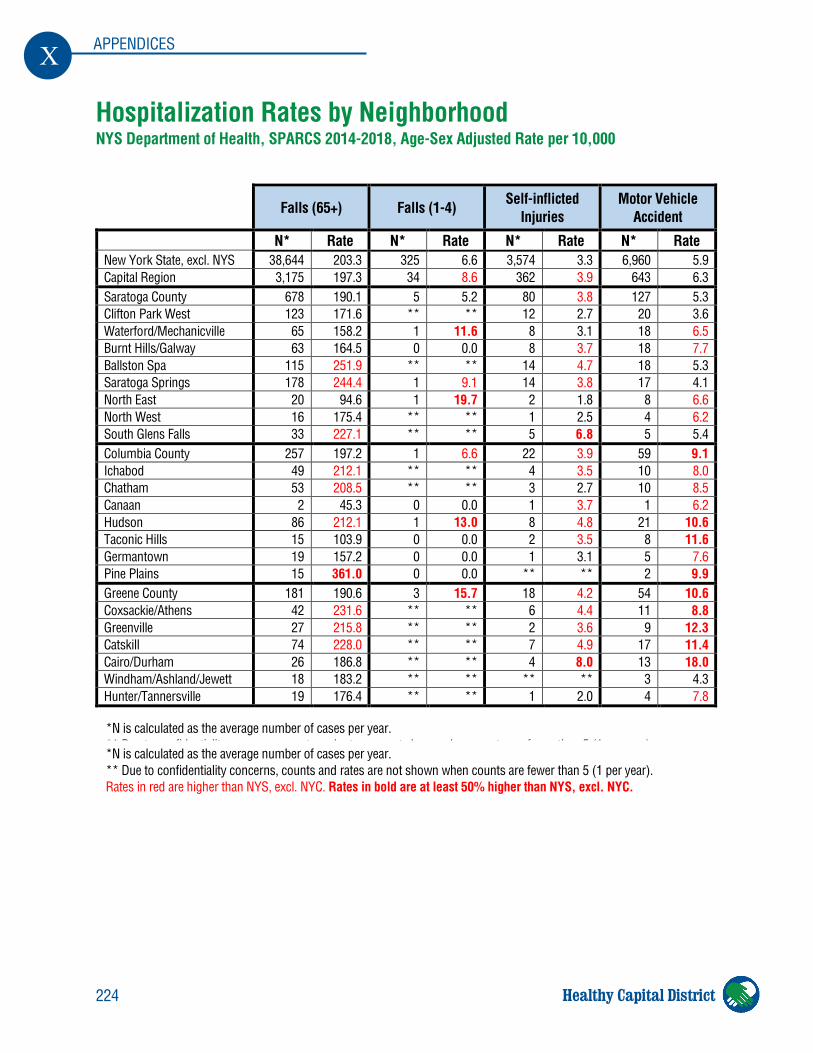
224
X APPENDICES
Healthy Capital District
Hospitalization Rates by Neighborhood NYS Department of Health, SPARCS 2014-2018, Age-Sex Adjusted Rate per 10,000
Falls (65+) Falls (1-4) Self-inflicted
Injuries Motor Vehicle
Accident N* Rate N* Rate N* Rate N* Rate New York State, excl. NYS 38,644 203.3 325 6.6 3,574 3.3 6,960 5.9 Capital Region 3,175 197.3 34 8.6 362 3.9 643 6.3 Saratoga County 678 190.1 5 5.2 80 3.8 127 5.3 Clifton Park West 123 171.6 ** ** 12 2.7 20 3.6 Waterford/Mechanicville 65 158.2 1 11.6 8 3.1 18 6.5 Burnt Hills/Galway 63 164.5 0 0.0 8 3.7 18 7.7 Ballston Spa 115 251.9 ** ** 14 4.7 18 5.3 Saratoga Springs 178 244.4 1 9.1 14 3.8 17 4.1 North East 20 94.6 1 19.7 2 1.8 8 6.6 North West 16 175.4 ** ** 1 2.5 4 6.2 South Glens Falls 33 227.1 ** ** 5 6.8 5 5.4 Columbia County 257 197.2 1 6.6 22 3.9 59 9.1 Ichabod 49 212.1 ** ** 4 3.5 10 8.0 Chatham 53 208.5 ** ** 3 2.7 10 8.5 Canaan 2 45.3 0 0.0 1 3.7 1 6.2 Hudson 86 212.1 1 13.0 8 4.8 21 10.6 Taconic Hills 15 103.9 0 0.0 2 3.5 8 11.6 Germantown 19 157.2 0 0.0 1 3.1 5 7.6 Pine Plains 15 361.0 0 0.0 ** ** 2 9.9 Greene County 181 190.6 3 15.7 18 4.2 54 10.6 Coxsackie/Athens 42 231.6 ** ** 6 4.4 11 8.8 Greenville 27 215.8 ** ** 2 3.6 9 12.3 Catskill 74 228.0 ** ** 7 4.9 17 11.4 Cairo/Durham 26 186.8 ** ** 4 8.0 13 18.0 Windham/Ashland/Jewett 18 183.2 ** ** ** ** 3 4.3 Hunter/Tannersville 19 176.4 ** ** 1 2.0 4 7.8
*N is calculated as the average number of cases per year. ** Due to confidentiality concerns, counts and rates are not shown when counts are fewer than 5 (1 per year). Rates in red are higher than NYS, excl. NYC. Rates in bold are at least 50% higher than NYS, excl. NYC.
*N is calculated as the average number of cases per year. ** Due to confidentiality concerns, counts and rates are not shown when counts are fewer than 5 (1 per year). Rates in red are higher than NYS, excl. NYC. Rates in bold are at least 50% higher than NYS, excl. NYC.
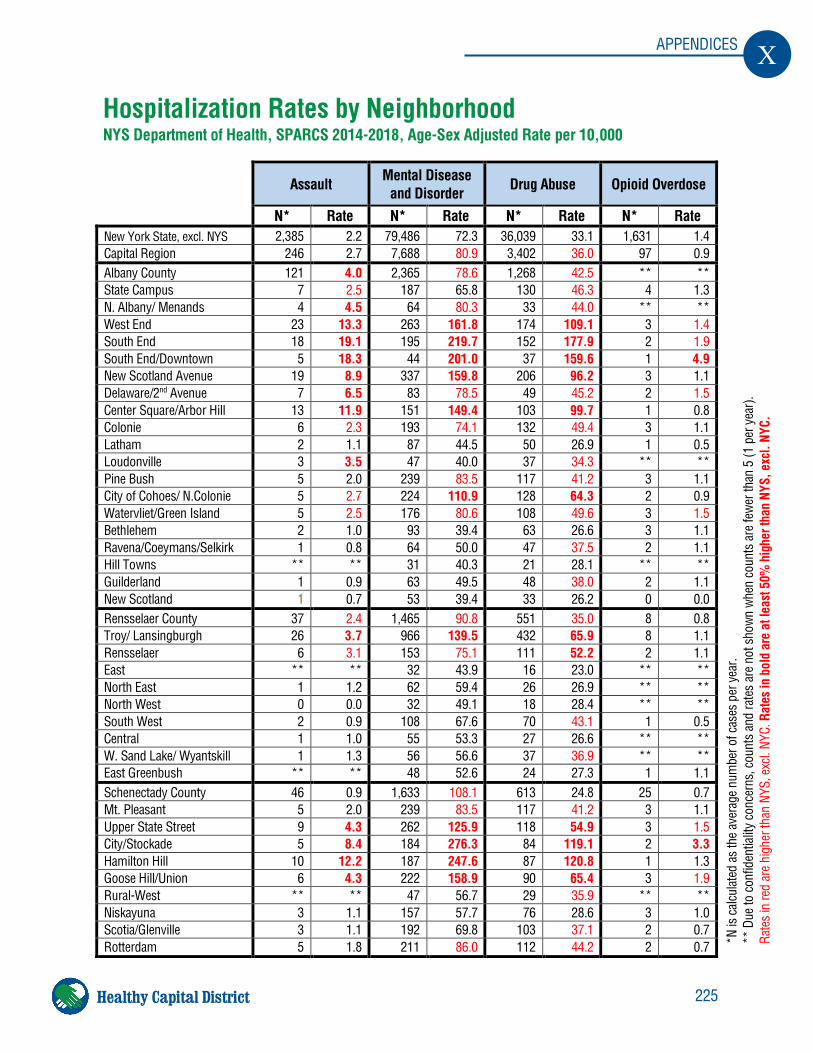
225
X APPENDICES
Healthy Capital District
Assault Mental Disease
and Disorder Drug Abuse Opioid Overdose
N* Rate N* Rate N* Rate N* Rate New York State, excl. NYS 2,385 2.2 79,486 72.3 36,039 33.1 1,631 1.4 Capital Region 246 2.7 7,688 80.9 3,402 36.0 97 0.9 Albany County 121 4.0 2,365 78.6 1,268 42.5 ** ** State Campus 7 2.5 187 65.8 130 46.3 4 1.3 N. Albany/ Menands 4 4.5 64 80.3 33 44.0 ** ** West End 23 13.3 263 161.8 174 109.1 3 1.4 South End 18 19.1 195 219.7 152 177.9 2 1.9 South End/Downtown 5 18.3 44 201.0 37 159.6 1 4.9 New Scotland Avenue 19 8.9 337 159.8 206 96.2 3 1.1 Delaware/2nd Avenue 7 6.5 83 78.5 49 45.2 2 1.5 Center Square/Arbor Hill 13 11.9 151 149.4 103 99.7 1 0.8 Colonie 6 2.3 193 74.1 132 49.4 3 1.1 Latham 2 1.1 87 44.5 50 26.9 1 0.5 Loudonville 3 3.5 47 40.0 37 34.3 ** ** Pine Bush 5 2.0 239 83.5 117 41.2 3 1.1 City of Cohoes/ N.Colonie 5 2.7 224 110.9 128 64.3 2 0.9 Watervliet/Green Island 5 2.5 176 80.6 108 49.6 3 1.5 Bethlehem 2 1.0 93 39.4 63 26.6 3 1.1 Ravena/Coeymans/Selkirk 1 0.8 64 50.0 47 37.5 2 1.1 Hill Towns ** ** 31 40.3 21 28.1 ** ** Guilderland 1 0.9 63 49.5 48 38.0 2 1.1 New Scotland 1 0.7 53 39.4 33 26.2 0 0.0 Rensselaer County 37 2.4 1,465 90.8 551 35.0 8 0.8 Troy/ Lansingburgh 26 3.7 966 139.5 432 65.9 8 1.1 Rensselaer 6 3.1 153 75.1 111 52.2 2 1.1 East ** ** 32 43.9 16 23.0 ** ** North East 1 1.2 62 59.4 26 26.9 ** ** North West 0 0.0 32 49.1 18 28.4 ** ** South West 2 0.9 108 67.6 70 43.1 1 0.5 Central 1 1.0 55 53.3 27 26.6 ** ** W. Sand Lake/ Wyantskill 1 1.3 56 56.6 37 36.9 ** ** East Greenbush ** ** 48 52.6 24 27.3 1 1.1 Schenectady County 46 0.9 1,633 108.1 613 24.8 25 0.7 Mt. Pleasant 5 2.0 239 83.5 117 41.2 3 1.1 Upper State Street 9 4.3 262 125.9 118 54.9 3 1.5 City/Stockade 5 8.4 184 276.3 84 119.1 2 3.3 Hamilton Hill 10 12.2 187 247.6 87 120.8 1 1.3 Goose Hill/Union 6 4.3 222 158.9 90 65.4 3 1.9 Rural-West ** ** 47 56.7 29 35.9 ** ** Niskayuna 3 1.1 157 57.7 76 28.6 3 1.0 Scotia/Glenville 3 1.1 192 69.8 103 37.1 2 0.7 Rotterdam 5 1.8 211 86.0 112 44.2 2 0.7
Hospitalization Rates by Neighborhood NYS Department of Health, SPARCS 2014-2018, Age-Sex Adjusted Rate per 10,000
*N is
cal
culat
ed a
s th
e av
erag
e nu
mbe
r of c
ases
per
yea
r. **
Due
to c
onfid
entia
lity
conc
erns
, cou
nts
and
rate
s ar
e no
t sho
wn w
hen
coun
ts a
re fe
wer
than
5 (1
per
yea
r).
Rate
s in
red
are
high
er th
an N
YS, e
xcl.
NYC.
Rat
es in
bol
d ar
e at
leas
t 50%
hig
her t
han
NYS,
exc
l. NY
C.
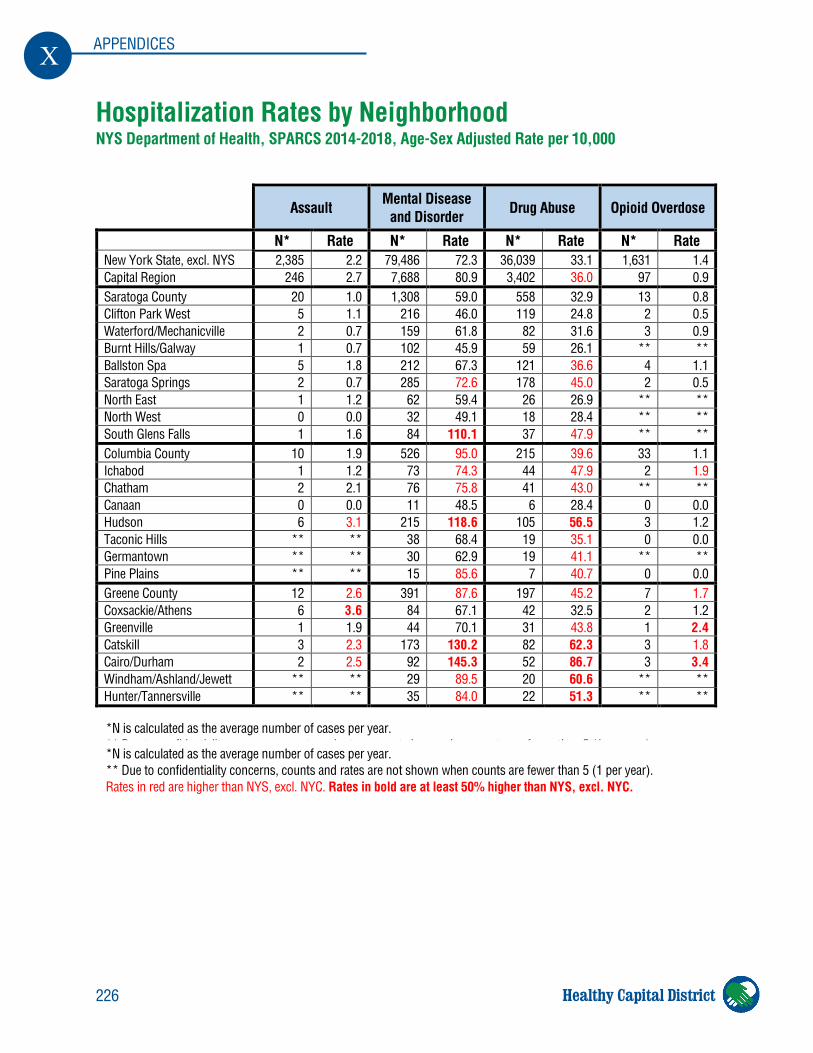
226
X APPENDICES
Healthy Capital District
Hospitalization Rates by Neighborhood NYS Department of Health, SPARCS 2014-2018, Age-Sex Adjusted Rate per 10,000
Assault Mental Disease
and Disorder Drug Abuse Opioid Overdose
N* Rate N* Rate N* Rate N* Rate New York State, excl. NYS 2,385 2.2 79,486 72.3 36,039 33.1 1,631 1.4 Capital Region 246 2.7 7,688 80.9 3,402 36.0 97 0.9 Saratoga County 20 1.0 1,308 59.0 558 32.9 13 0.8 Clifton Park West 5 1.1 216 46.0 119 24.8 2 0.5 Waterford/Mechanicville 2 0.7 159 61.8 82 31.6 3 0.9 Burnt Hills/Galway 1 0.7 102 45.9 59 26.1 ** ** Ballston Spa 5 1.8 212 67.3 121 36.6 4 1.1 Saratoga Springs 2 0.7 285 72.6 178 45.0 2 0.5 North East 1 1.2 62 59.4 26 26.9 ** ** North West 0 0.0 32 49.1 18 28.4 ** ** South Glens Falls 1 1.6 84 110.1 37 47.9 ** ** Columbia County 10 1.9 526 95.0 215 39.6 33 1.1 Ichabod 1 1.2 73 74.3 44 47.9 2 1.9 Chatham 2 2.1 76 75.8 41 43.0 ** ** Canaan 0 0.0 11 48.5 6 28.4 0 0.0 Hudson 6 3.1 215 118.6 105 56.5 3 1.2 Taconic Hills ** ** 38 68.4 19 35.1 0 0.0 Germantown ** ** 30 62.9 19 41.1 ** ** Pine Plains ** ** 15 85.6 7 40.7 0 0.0 Greene County 12 2.6 391 87.6 197 45.2 7 1.7 Coxsackie/Athens 6 3.6 84 67.1 42 32.5 2 1.2 Greenville 1 1.9 44 70.1 31 43.8 1 2.4 Catskill 3 2.3 173 130.2 82 62.3 3 1.8 Cairo/Durham 2 2.5 92 145.3 52 86.7 3 3.4 Windham/Ashland/Jewett ** ** 29 89.5 20 60.6 ** ** Hunter/Tannersville ** ** 35 84.0 22 51.3 ** **
*N is calculated as the average number of cases per year. ** Due to confidentiality concerns, counts and rates are not shown when counts are fewer than 5 (1 per year). Rates in red are higher than NYS, excl. NYC. Rates in bold are at least 50% higher than NYS, excl. NYC.
*N is calculated as the average number of cases per year. ** Due to confidentiality concerns, counts and rates are not shown when counts are fewer than 5 (1 per year). Rates in red are higher than NYS, excl. NYC. Rates in bold are at least 50% higher than NYS, excl. NYC.
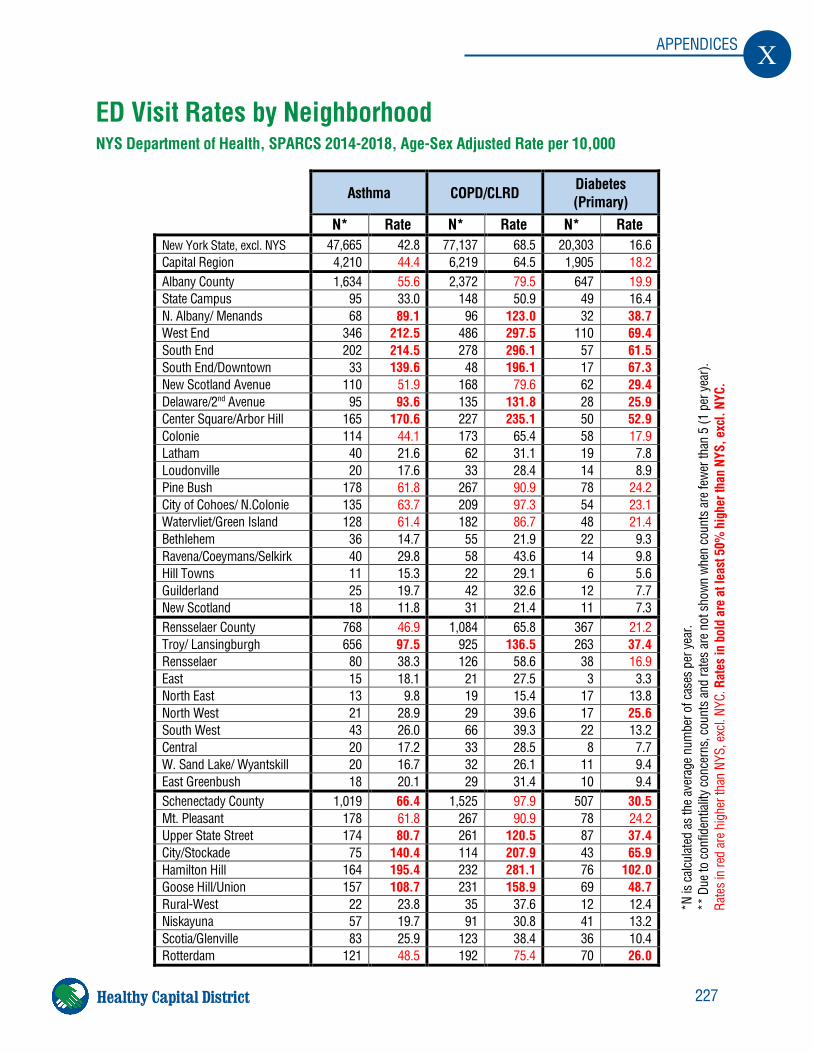
227
X APPENDICES
Healthy Capital District
ED Visit Rates by Neighborhood
NYS Department of Health, SPARCS 2014-2018, Age-Sex Adjusted Rate per 10,000
Asthma COPD/CLRD Diabetes
(Primary) N* Rate N* Rate N* Rate New York State, excl. NYS 47,665 42.8 77,137 68.5 20,303 16.6 Capital Region 4,210 44.4 6,219 64.5 1,905 18.2 Albany County 1,634 55.6 2,372 79.5 647 19.9 State Campus 95 33.0 148 50.9 49 16.4 N. Albany/ Menands 68 89.1 96 123.0 32 38.7 West End 346 212.5 486 297.5 110 69.4 South End 202 214.5 278 296.1 57 61.5 South End/Downtown 33 139.6 48 196.1 17 67.3 New Scotland Avenue 110 51.9 168 79.6 62 29.4 Delaware/2nd Avenue 95 93.6 135 131.8 28 25.9 Center Square/Arbor Hill 165 170.6 227 235.1 50 52.9 Colonie 114 44.1 173 65.4 58 17.9 Latham 40 21.6 62 31.1 19 7.8 Loudonville 20 17.6 33 28.4 14 8.9 Pine Bush 178 61.8 267 90.9 78 24.2 City of Cohoes/ N.Colonie 135 63.7 209 97.3 54 23.1 Watervliet/Green Island 128 61.4 182 86.7 48 21.4 Bethlehem 36 14.7 55 21.9 22 9.3 Ravena/Coeymans/Selkirk 40 29.8 58 43.6 14 9.8 Hill Towns 11 15.3 22 29.1 6 5.6 Guilderland 25 19.7 42 32.6 12 7.7 New Scotland 18 11.8 31 21.4 11 7.3 Rensselaer County 768 46.9 1,084 65.8 367 21.2 Troy/ Lansingburgh 656 97.5 925 136.5 263 37.4 Rensselaer 80 38.3 126 58.6 38 16.9 East 15 18.1 21 27.5 3 3.3 North East 13 9.8 19 15.4 17 13.8 North West 21 28.9 29 39.6 17 25.6 South West 43 26.0 66 39.3 22 13.2 Central 20 17.2 33 28.5 8 7.7 W. Sand Lake/ Wyantskill 20 16.7 32 26.1 11 9.4 East Greenbush 18 20.1 29 31.4 10 9.4 Schenectady County 1,019 66.4 1,525 97.9 507 30.5 Mt. Pleasant 178 61.8 267 90.9 78 24.2 Upper State Street 174 80.7 261 120.5 87 37.4 City/Stockade 75 140.4 114 207.9 43 65.9 Hamilton Hill 164 195.4 232 281.1 76 102.0 Goose Hill/Union 157 108.7 231 158.9 69 48.7 Rural-West 22 23.8 35 37.6 12 12.4 Niskayuna 57 19.7 91 30.8 41 13.2 Scotia/Glenville 83 25.9 123 38.4 36 10.4 Rotterdam 121 48.5 192 75.4 70 26.0
*N is
cal
culat
ed a
s th
e av
erag
e nu
mbe
r of c
ases
per
yea
r. **
Due
to c
onfid
entia
lity
conc
erns
, cou
nts
and
rate
s ar
e no
t sho
wn w
hen
coun
ts a
re fe
wer
than
5 (1
per
yea
r).
Rate
s in
red
are
high
er th
an N
YS, e
xcl.
NYC.
Rat
es in
bol
d ar
e at
leas
t 50%
hig
her t
han
NYS,
exc
l. NY
C.
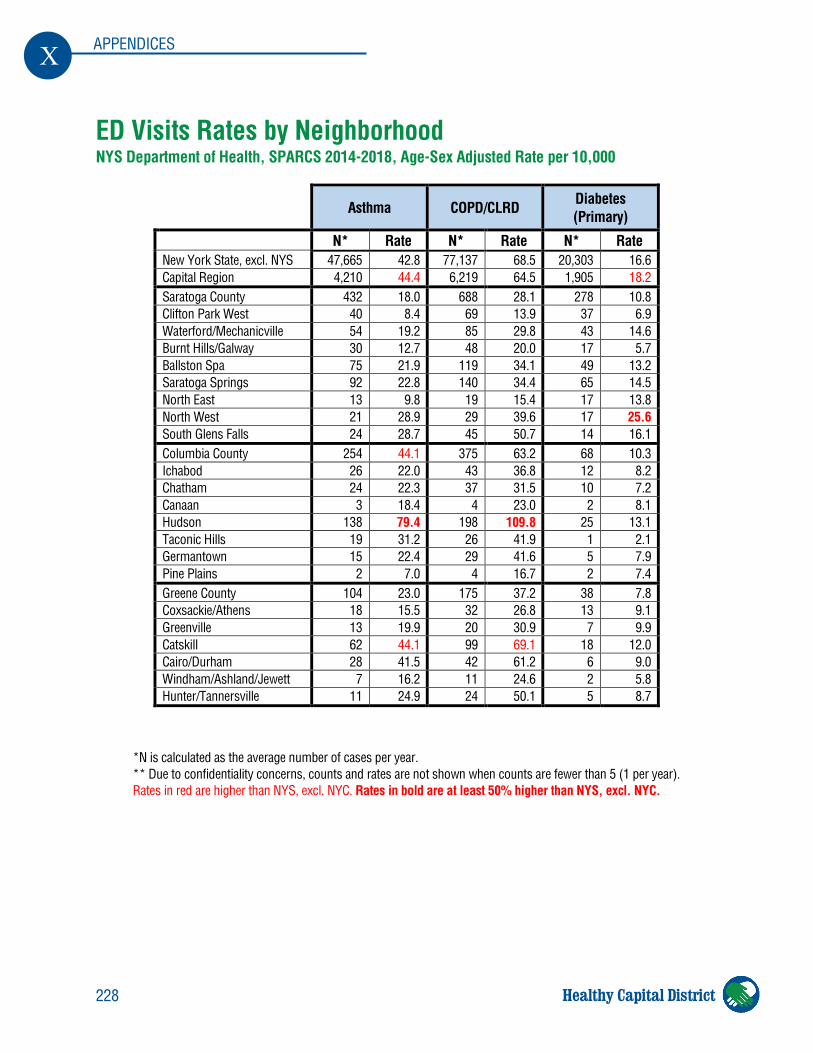
228
X APPENDICES
Healthy Capital District
ED Visits Rates by Neighborhood NYS Department of Health, SPARCS 2014-2018, Age-Sex Adjusted Rate per 10,000
Asthma COPD/CLRD Diabetes
(Primary) N* Rate N* Rate N* Rate New York State, excl. NYS 47,665 42.8 77,137 68.5 20,303 16.6 Capital Region 4,210 44.4 6,219 64.5 1,905 18.2 Saratoga County 432 18.0 688 28.1 278 10.8 Clifton Park West 40 8.4 69 13.9 37 6.9 Waterford/Mechanicville 54 19.2 85 29.8 43 14.6 Burnt Hills/Galway 30 12.7 48 20.0 17 5.7 Ballston Spa 75 21.9 119 34.1 49 13.2 Saratoga Springs 92 22.8 140 34.4 65 14.5 North East 13 9.8 19 15.4 17 13.8 North West 21 28.9 29 39.6 17 25.6 South Glens Falls 24 28.7 45 50.7 14 16.1 Columbia County 254 44.1 375 63.2 68 10.3 Ichabod 26 22.0 43 36.8 12 8.2 Chatham 24 22.3 37 31.5 10 7.2 Canaan 3 18.4 4 23.0 2 8.1 Hudson 138 79.4 198 109.8 25 13.1 Taconic Hills 19 31.2 26 41.9 1 2.1 Germantown 15 22.4 29 41.6 5 7.9 Pine Plains 2 7.0 4 16.7 2 7.4 Greene County 104 23.0 175 37.2 38 7.8 Coxsackie/Athens 18 15.5 32 26.8 13 9.1 Greenville 13 19.9 20 30.9 7 9.9 Catskill 62 44.1 99 69.1 18 12.0 Cairo/Durham 28 41.5 42 61.2 6 9.0 Windham/Ashland/Jewett 7 16.2 11 24.6 2 5.8 Hunter/Tannersville 11 24.9 24 50.1 5 8.7
*N is calculated as the average number of cases per year. ** Due to confidentiality concerns, counts and rates are not shown when counts are fewer than 5 (1 per year). Rates in red are higher than NYS, excl. NYC. Rates in bold are at least 50% higher than NYS, excl. NYC.
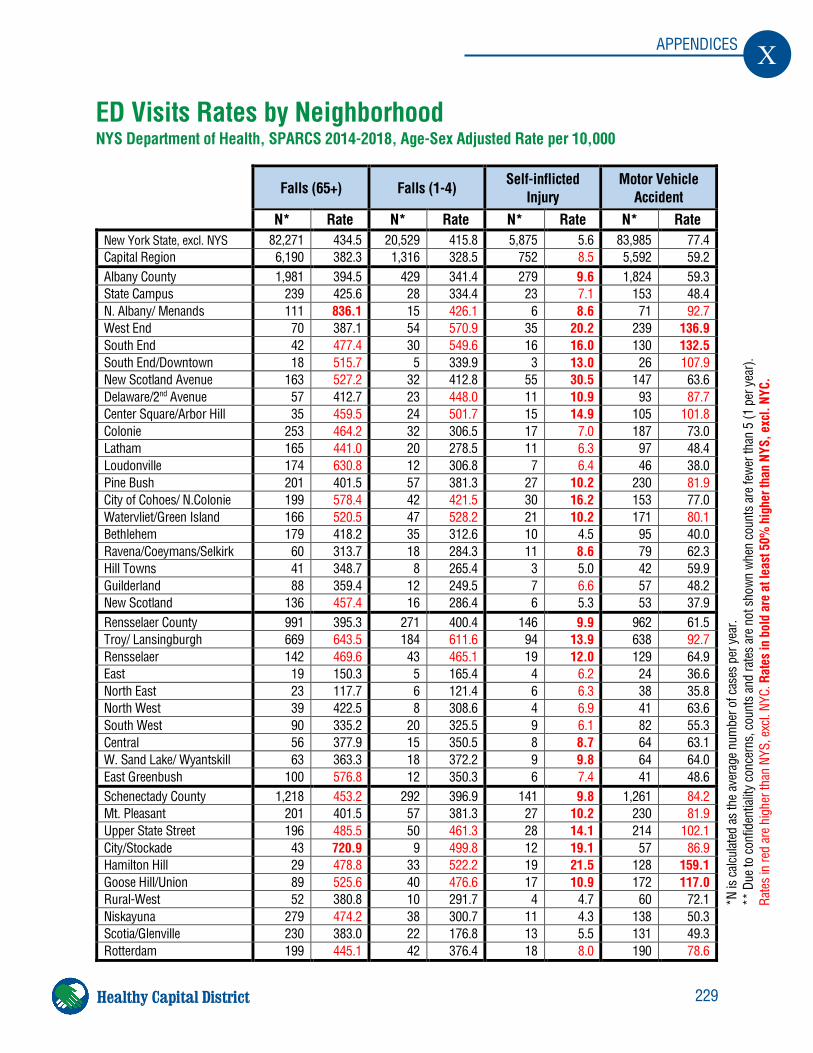
229
X APPENDICES
Healthy Capital District
ED Visits Rates by Neighborhood NYS Department of Health, SPARCS 2014-2018, Age-Sex Adjusted Rate per 10,000
Falls (65+) Falls (1-4) Self-inflicted
Injury Motor Vehicle
Accident N* Rate N* Rate N* Rate N* Rate New York State, excl. NYS 82,271 434.5 20,529 415.8 5,875 5.6 83,985 77.4 Capital Region 6,190 382.3 1,316 328.5 752 8.5 5,592 59.2 Albany County 1,981 394.5 429 341.4 279 9.6 1,824 59.3 State Campus 239 425.6 28 334.4 23 7.1 153 48.4 N. Albany/ Menands 111 836.1 15 426.1 6 8.6 71 92.7 West End 70 387.1 54 570.9 35 20.2 239 136.9 South End 42 477.4 30 549.6 16 16.0 130 132.5 South End/Downtown 18 515.7 5 339.9 3 13.0 26 107.9 New Scotland Avenue 163 527.2 32 412.8 55 30.5 147 63.6 Delaware/2nd Avenue 57 412.7 23 448.0 11 10.9 93 87.7 Center Square/Arbor Hill 35 459.5 24 501.7 15 14.9 105 101.8 Colonie 253 464.2 32 306.5 17 7.0 187 73.0 Latham 165 441.0 20 278.5 11 6.3 97 48.4 Loudonville 174 630.8 12 306.8 7 6.4 46 38.0 Pine Bush 201 401.5 57 381.3 27 10.2 230 81.9 City of Cohoes/ N.Colonie 199 578.4 42 421.5 30 16.2 153 77.0 Watervliet/Green Island 166 520.5 47 528.2 21 10.2 171 80.1 Bethlehem 179 418.2 35 312.6 10 4.5 95 40.0 Ravena/Coeymans/Selkirk 60 313.7 18 284.3 11 8.6 79 62.3 Hill Towns 41 348.7 8 265.4 3 5.0 42 59.9 Guilderland 88 359.4 12 249.5 7 6.6 57 48.2 New Scotland 136 457.4 16 286.4 6 5.3 53 37.9 Rensselaer County 991 395.3 271 400.4 146 9.9 962 61.5 Troy/ Lansingburgh 669 643.5 184 611.6 94 13.9 638 92.7 Rensselaer 142 469.6 43 465.1 19 12.0 129 64.9 East 19 150.3 5 165.4 4 6.2 24 36.6 North East 23 117.7 6 121.4 6 6.3 38 35.8 North West 39 422.5 8 308.6 4 6.9 41 63.6 South West 90 335.2 20 325.5 9 6.1 82 55.3 Central 56 377.9 15 350.5 8 8.7 64 63.1 W. Sand Lake/ Wyantskill 63 363.3 18 372.2 9 9.8 64 64.0 East Greenbush 100 576.8 12 350.3 6 7.4 41 48.6 Schenectady County 1,218 453.2 292 396.9 141 9.8 1,261 84.2 Mt. Pleasant 201 401.5 57 381.3 27 10.2 230 81.9 Upper State Street 196 485.5 50 461.3 28 14.1 214 102.1 City/Stockade 43 720.9 9 499.8 12 19.1 57 86.9 Hamilton Hill 29 478.8 33 522.2 19 21.5 128 159.1 Goose Hill/Union 89 525.6 40 476.6 17 10.9 172 117.0 Rural-West 52 380.8 10 291.7 4 4.7 60 72.1 Niskayuna 279 474.2 38 300.7 11 4.3 138 50.3 Scotia/Glenville 230 383.0 22 176.8 13 5.5 131 49.3 Rotterdam 199 445.1 42 376.4 18 8.0 190 78.6
*N is
cal
culat
ed a
s th
e av
erag
e nu
mbe
r of c
ases
per
yea
r. **
Due
to c
onfid
entia
lity
conc
erns
, cou
nts
and
rate
s ar
e no
t sho
wn w
hen
coun
ts a
re fe
wer
than
5 (1
per
yea
r).
Rate
s in
red
are
high
er th
an N
YS, e
xcl.
NYC.
Rat
es in
bol
d ar
e at
leas
t 50%
hig
her t
han
NYS,
exc
l. NY
C.
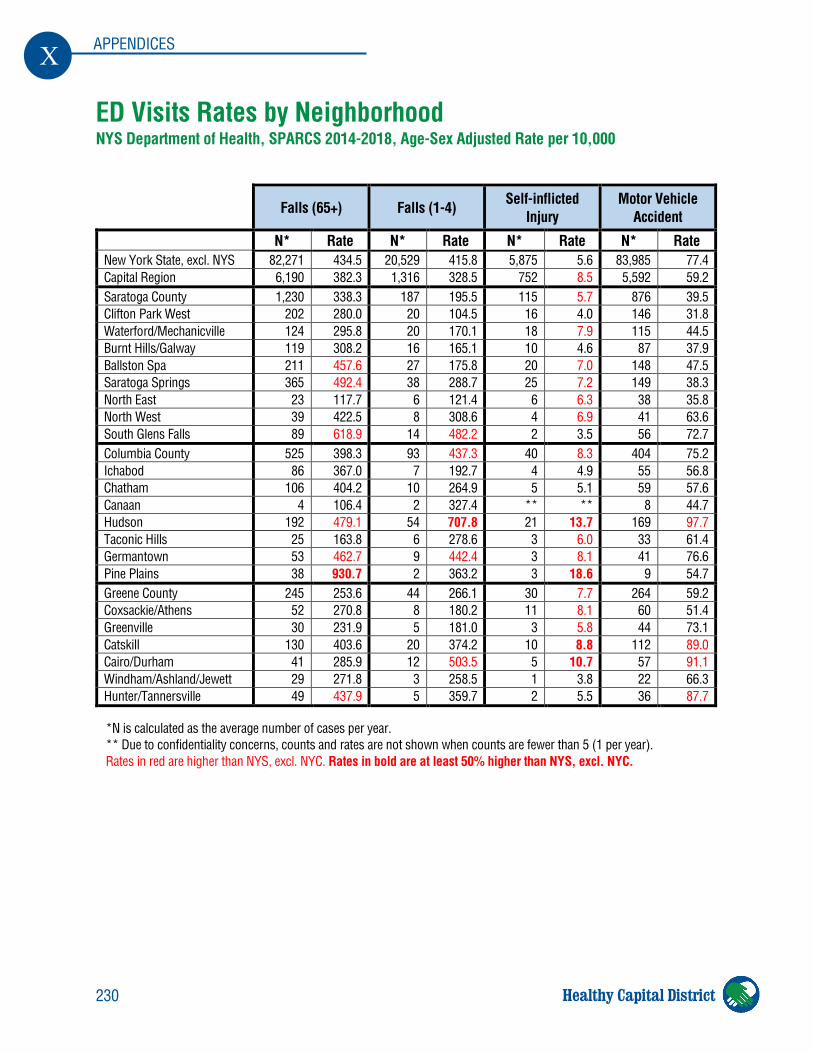
230
X APPENDICES
Healthy Capital District
ED Visits Rates by Neighborhood NYS Department of Health, SPARCS 2014-2018, Age-Sex Adjusted Rate per 10,000
Falls (65+) Falls (1-4) Self-inflicted
Injury Motor Vehicle
Accident N* Rate N* Rate N* Rate N* Rate New York State, excl. NYS 82,271 434.5 20,529 415.8 5,875 5.6 83,985 77.4 Capital Region 6,190 382.3 1,316 328.5 752 8.5 5,592 59.2 Saratoga County 1,230 338.3 187 195.5 115 5.7 876 39.5 Clifton Park West 202 280.0 20 104.5 16 4.0 146 31.8 Waterford/Mechanicville 124 295.8 20 170.1 18 7.9 115 44.5 Burnt Hills/Galway 119 308.2 16 165.1 10 4.6 87 37.9 Ballston Spa 211 457.6 27 175.8 20 7.0 148 47.5 Saratoga Springs 365 492.4 38 288.7 25 7.2 149 38.3 North East 23 117.7 6 121.4 6 6.3 38 35.8 North West 39 422.5 8 308.6 4 6.9 41 63.6 South Glens Falls 89 618.9 14 482.2 2 3.5 56 72.7 Columbia County 525 398.3 93 437.3 40 8.3 404 75.2 Ichabod 86 367.0 7 192.7 4 4.9 55 56.8 Chatham 106 404.2 10 264.9 5 5.1 59 57.6 Canaan 4 106.4 2 327.4 ** ** 8 44.7 Hudson 192 479.1 54 707.8 21 13.7 169 97.7 Taconic Hills 25 163.8 6 278.6 3 6.0 33 61.4 Germantown 53 462.7 9 442.4 3 8.1 41 76.6 Pine Plains 38 930.7 2 363.2 3 18.6 9 54.7 Greene County 245 253.6 44 266.1 30 7.7 264 59.2 Coxsackie/Athens 52 270.8 8 180.2 11 8.1 60 51.4 Greenville 30 231.9 5 181.0 3 5.8 44 73.1 Catskill 130 403.6 20 374.2 10 8.8 112 89.0 Cairo/Durham 41 285.9 12 503.5 5 10.7 57 91.1 Windham/Ashland/Jewett 29 271.8 3 258.5 1 3.8 22 66.3 Hunter/Tannersville 49 437.9 5 359.7 2 5.5 36 87.7
*N is calculated as the average number of cases per year. ** Due to confidentiality concerns, counts and rates are not shown when counts are fewer than 5 (1 per year). Rates in red are higher than NYS, excl. NYC. Rates in bold are at least 50% higher than NYS, excl. NYC.
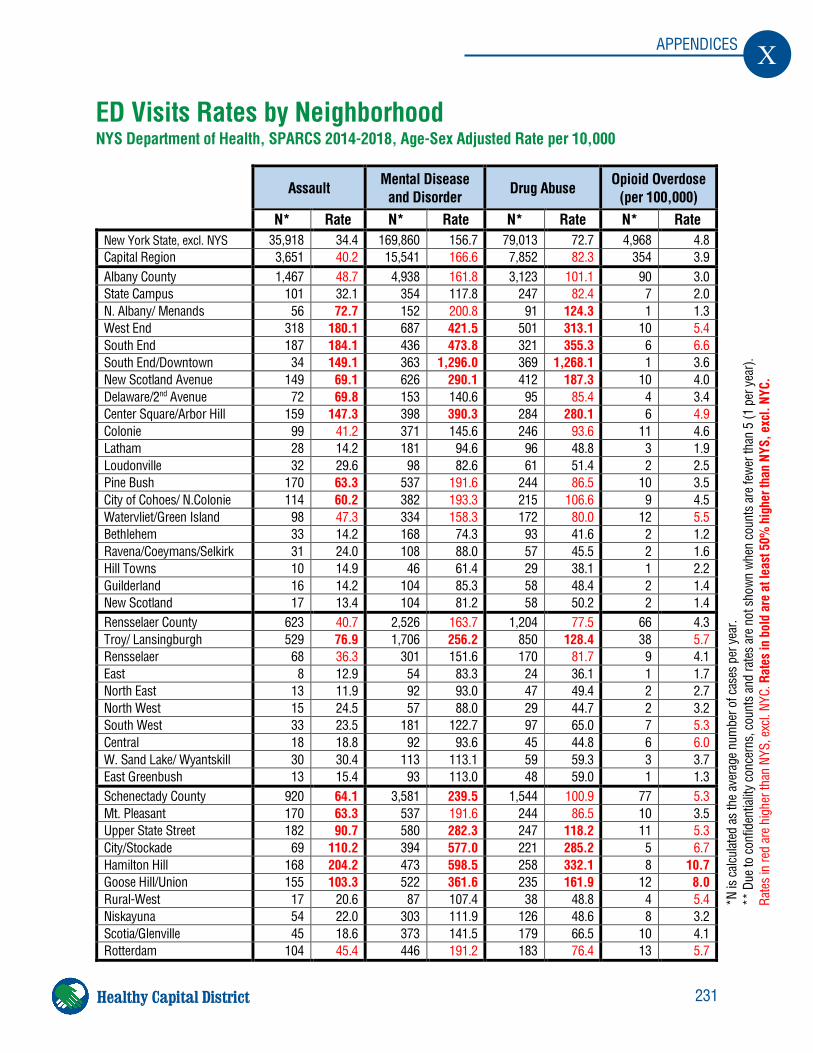
231
X APPENDICES
Healthy Capital District
ED Visits Rates by Neighborhood NYS Department of Health, SPARCS 2014-2018, Age-Sex Adjusted Rate per 10,000
Assault Mental Disease
and Disorder Drug Abuse Opioid Overdose (per 100,000)
N* Rate N* Rate N* Rate N* Rate New York State, excl. NYS 35,918 34.4 169,860 156.7 79,013 72.7 4,968 4.8 Capital Region 3,651 40.2 15,541 166.6 7,852 82.3 354 3.9 Albany County 1,467 48.7 4,938 161.8 3,123 101.1 90 3.0 State Campus 101 32.1 354 117.8 247 82.4 7 2.0 N. Albany/ Menands 56 72.7 152 200.8 91 124.3 1 1.3 West End 318 180.1 687 421.5 501 313.1 10 5.4 South End 187 184.1 436 473.8 321 355.3 6 6.6 South End/Downtown 34 149.1 363 1,296.0 369 1,268.1 1 3.6 New Scotland Avenue 149 69.1 626 290.1 412 187.3 10 4.0 Delaware/2nd Avenue 72 69.8 153 140.6 95 85.4 4 3.4 Center Square/Arbor Hill 159 147.3 398 390.3 284 280.1 6 4.9 Colonie 99 41.2 371 145.6 246 93.6 11 4.6 Latham 28 14.2 181 94.6 96 48.8 3 1.9 Loudonville 32 29.6 98 82.6 61 51.4 2 2.5 Pine Bush 170 63.3 537 191.6 244 86.5 10 3.5 City of Cohoes/ N.Colonie 114 60.2 382 193.3 215 106.6 9 4.5 Watervliet/Green Island 98 47.3 334 158.3 172 80.0 12 5.5 Bethlehem 33 14.2 168 74.3 93 41.6 2 1.2 Ravena/Coeymans/Selkirk 31 24.0 108 88.0 57 45.5 2 1.6 Hill Towns 10 14.9 46 61.4 29 38.1 1 2.2 Guilderland 16 14.2 104 85.3 58 48.4 2 1.4 New Scotland 17 13.4 104 81.2 58 50.2 2 1.4 Rensselaer County 623 40.7 2,526 163.7 1,204 77.5 66 4.3 Troy/ Lansingburgh 529 76.9 1,706 256.2 850 128.4 38 5.7 Rensselaer 68 36.3 301 151.6 170 81.7 9 4.1 East 8 12.9 54 83.3 24 36.1 1 1.7 North East 13 11.9 92 93.0 47 49.4 2 2.7 North West 15 24.5 57 88.0 29 44.7 2 3.2 South West 33 23.5 181 122.7 97 65.0 7 5.3 Central 18 18.8 92 93.6 45 44.8 6 6.0 W. Sand Lake/ Wyantskill 30 30.4 113 113.1 59 59.3 3 3.7 East Greenbush 13 15.4 93 113.0 48 59.0 1 1.3 Schenectady County 920 64.1 3,581 239.5 1,544 100.9 77 5.3 Mt. Pleasant 170 63.3 537 191.6 244 86.5 10 3.5 Upper State Street 182 90.7 580 282.3 247 118.2 11 5.3 City/Stockade 69 110.2 394 577.0 221 285.2 5 6.7 Hamilton Hill 168 204.2 473 598.5 258 332.1 8 10.7 Goose Hill/Union 155 103.3 522 361.6 235 161.9 12 8.0 Rural-West 17 20.6 87 107.4 38 48.8 4 5.4 Niskayuna 54 22.0 303 111.9 126 48.6 8 3.2 Scotia/Glenville 45 18.6 373 141.5 179 66.5 10 4.1 Rotterdam 104 45.4 446 191.2 183 76.4 13 5.7
*N is
cal
culat
ed a
s th
e av
erag
e nu
mbe
r of c
ases
per
yea
r. **
Due
to c
onfid
entia
lity
conc
erns
, cou
nts
and
rate
s ar
e no
t sho
wn w
hen
coun
ts a
re fe
wer
than
5 (1
per
yea
r).
Rate
s in
red
are
high
er th
an N
YS, e
xcl.
NYC.
Rat
es in
bol
d ar
e at
leas
t 50%
hig
her t
han
NYS,
exc
l. NY
C.
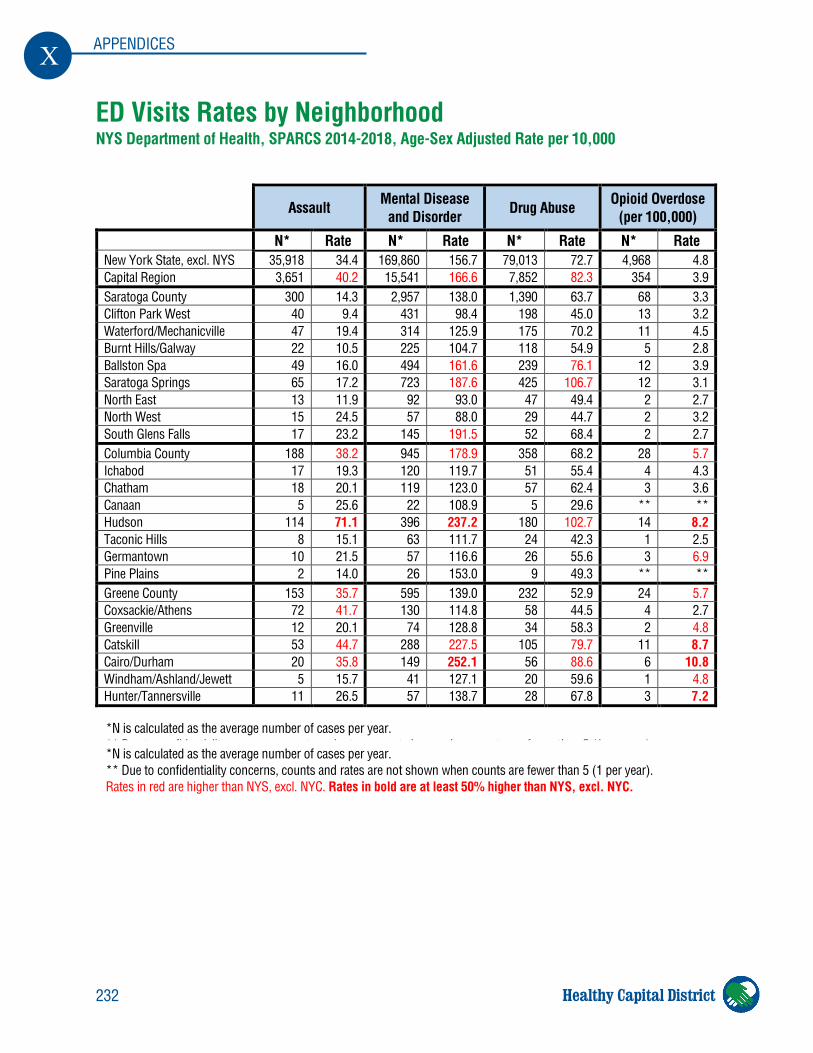
232
X APPENDICES
Healthy Capital District
ED Visits Rates by Neighborhood NYS Department of Health, SPARCS 2014-2018, Age-Sex Adjusted Rate per 10,000
Assault Mental Disease
and Disorder Drug Abuse Opioid Overdose (per 100,000)
N* Rate N* Rate N* Rate N* Rate New York State, excl. NYS 35,918 34.4 169,860 156.7 79,013 72.7 4,968 4.8 Capital Region 3,651 40.2 15,541 166.6 7,852 82.3 354 3.9 Saratoga County 300 14.3 2,957 138.0 1,390 63.7 68 3.3 Clifton Park West 40 9.4 431 98.4 198 45.0 13 3.2 Waterford/Mechanicville 47 19.4 314 125.9 175 70.2 11 4.5 Burnt Hills/Galway 22 10.5 225 104.7 118 54.9 5 2.8 Ballston Spa 49 16.0 494 161.6 239 76.1 12 3.9 Saratoga Springs 65 17.2 723 187.6 425 106.7 12 3.1 North East 13 11.9 92 93.0 47 49.4 2 2.7 North West 15 24.5 57 88.0 29 44.7 2 3.2 South Glens Falls 17 23.2 145 191.5 52 68.4 2 2.7 Columbia County 188 38.2 945 178.9 358 68.2 28 5.7 Ichabod 17 19.3 120 119.7 51 55.4 4 4.3 Chatham 18 20.1 119 123.0 57 62.4 3 3.6 Canaan 5 25.6 22 108.9 5 29.6 ** ** Hudson 114 71.1 396 237.2 180 102.7 14 8.2 Taconic Hills 8 15.1 63 111.7 24 42.3 1 2.5 Germantown 10 21.5 57 116.6 26 55.6 3 6.9 Pine Plains 2 14.0 26 153.0 9 49.3 ** ** Greene County 153 35.7 595 139.0 232 52.9 24 5.7 Coxsackie/Athens 72 41.7 130 114.8 58 44.5 4 2.7 Greenville 12 20.1 74 128.8 34 58.3 2 4.8 Catskill 53 44.7 288 227.5 105 79.7 11 8.7 Cairo/Durham 20 35.8 149 252.1 56 88.6 6 10.8 Windham/Ashland/Jewett 5 15.7 41 127.1 20 59.6 1 4.8 Hunter/Tannersville 11 26.5 57 138.7 28 67.8 3 7.2
*N is calculated as the average number of cases per year. ** Due to confidentiality concerns, counts and rates are not shown when counts are fewer than 5 (1 per year). Rates in red are higher than NYS, excl. NYC. Rates in bold are at least 50% higher than NYS, excl. NYC.
*N is calculated as the average number of cases per year. ** Due to confidentiality concerns, counts and rates are not shown when counts are fewer than 5 (1 per year). Rates in red are higher than NYS, excl. NYC. Rates in bold are at least 50% higher than NYS, excl. NYC.
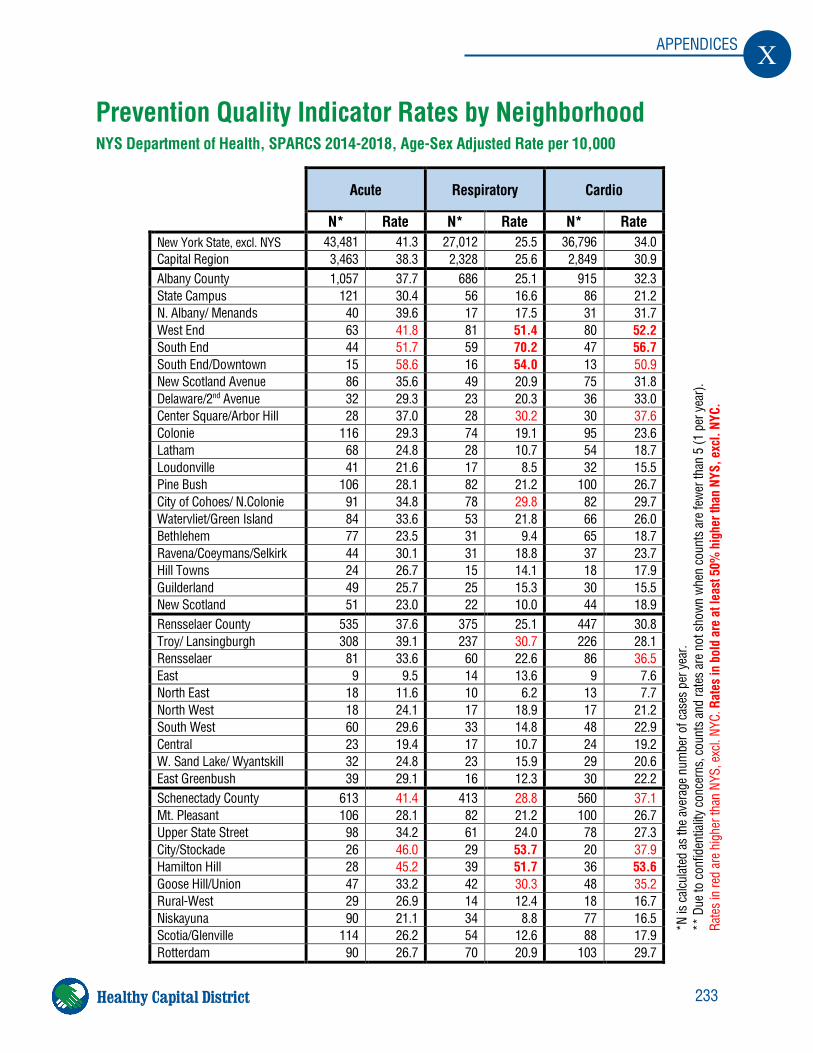
233
X APPENDICES
Healthy Capital District
Prevention Quality Indicator Rates by Neighborhood NYS Department of Health, SPARCS 2014-2018, Age-Sex Adjusted Rate per 10,000
Acute Respiratory Cardio
N* Rate N* Rate N* Rate New York State, excl. NYS 43,481 41.3 27,012 25.5 36,796 34.0 Capital Region 3,463 38.3 2,328 25.6 2,849 30.9 Albany County 1,057 37.7 686 25.1 915 32.3 State Campus 121 30.4 56 16.6 86 21.2 N. Albany/ Menands 40 39.6 17 17.5 31 31.7 West End 63 41.8 81 51.4 80 52.2 South End 44 51.7 59 70.2 47 56.7 South End/Downtown 15 58.6 16 54.0 13 50.9 New Scotland Avenue 86 35.6 49 20.9 75 31.8 Delaware/2nd Avenue 32 29.3 23 20.3 36 33.0 Center Square/Arbor Hill 28 37.0 28 30.2 30 37.6 Colonie 116 29.3 74 19.1 95 23.6 Latham 68 24.8 28 10.7 54 18.7 Loudonville 41 21.6 17 8.5 32 15.5 Pine Bush 106 28.1 82 21.2 100 26.7 City of Cohoes/ N.Colonie 91 34.8 78 29.8 82 29.7 Watervliet/Green Island 84 33.6 53 21.8 66 26.0 Bethlehem 77 23.5 31 9.4 65 18.7 Ravena/Coeymans/Selkirk 44 30.1 31 18.8 37 23.7 Hill Towns 24 26.7 15 14.1 18 17.9 Guilderland 49 25.7 25 15.3 30 15.5 New Scotland 51 23.0 22 10.0 44 18.9 Rensselaer County 535 37.6 375 25.1 447 30.8 Troy/ Lansingburgh 308 39.1 237 30.7 226 28.1 Rensselaer 81 33.6 60 22.6 86 36.5 East 9 9.5 14 13.6 9 7.6 North East 18 11.6 10 6.2 13 7.7 North West 18 24.1 17 18.9 17 21.2 South West 60 29.6 33 14.8 48 22.9 Central 23 19.4 17 10.7 24 19.2 W. Sand Lake/ Wyantskill 32 24.8 23 15.9 29 20.6 East Greenbush 39 29.1 16 12.3 30 22.2 Schenectady County 613 41.4 413 28.8 560 37.1 Mt. Pleasant 106 28.1 82 21.2 100 26.7 Upper State Street 98 34.2 61 24.0 78 27.3 City/Stockade 26 46.0 29 53.7 20 37.9 Hamilton Hill 28 45.2 39 51.7 36 53.6 Goose Hill/Union 47 33.2 42 30.3 48 35.2 Rural-West 29 26.9 14 12.4 18 16.7 Niskayuna 90 21.1 34 8.8 77 16.5 Scotia/Glenville 114 26.2 54 12.6 88 17.9 Rotterdam 90 26.7 70 20.9 103 29.7
*N is
cal
culat
ed a
s th
e av
erag
e nu
mbe
r of c
ases
per
yea
r. **
Due
to c
onfid
entia
lity
conc
erns
, cou
nts
and
rate
s ar
e no
t sho
wn
whe
n co
unts
are
few
er th
an 5
(1 p
er y
ear).
Ra
tes
in re
d ar
e hi
gher
than
NYS
, exc
l. NY
C. R
ates
in b
old
are
at le
ast 5
0% h
ighe
r tha
n NY
S, e
xcl.
NYC.
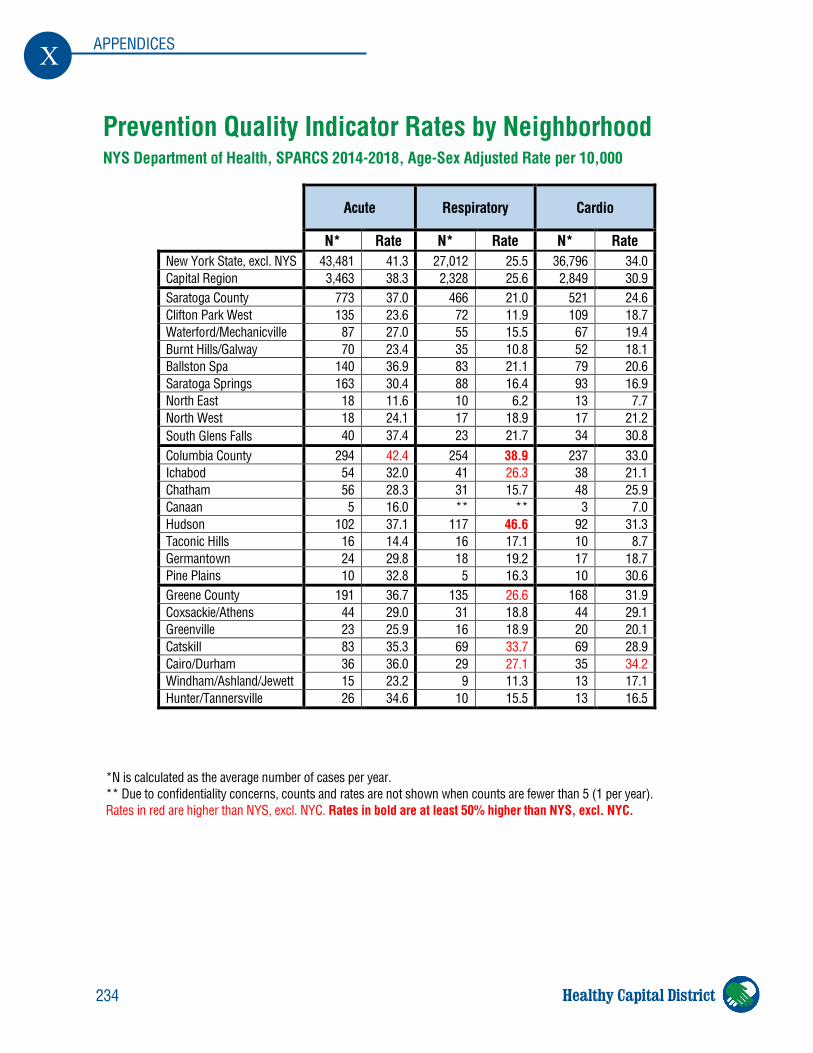
234
X APPENDICES
Healthy Capital District
Acute Respiratory Cardio
N* Rate N* Rate N* Rate New York State, excl. NYS 43,481 41.3 27,012 25.5 36,796 34.0 Capital Region 3,463 38.3 2,328 25.6 2,849 30.9 Saratoga County 773 37.0 466 21.0 521 24.6 Clifton Park West 135 23.6 72 11.9 109 18.7 Waterford/Mechanicville 87 27.0 55 15.5 67 19.4 Burnt Hills/Galway 70 23.4 35 10.8 52 18.1 Ballston Spa 140 36.9 83 21.1 79 20.6 Saratoga Springs 163 30.4 88 16.4 93 16.9 North East 18 11.6 10 6.2 13 7.7 North West 18 24.1 17 18.9 17 21.2 South Glens Falls 40 37.4 23 21.7 34 30.8 Columbia County 294 42.4 254 38.9 237 33.0 Ichabod 54 32.0 41 26.3 38 21.1 Chatham 56 28.3 31 15.7 48 25.9 Canaan 5 16.0 ** ** 3 7.0 Hudson 102 37.1 117 46.6 92 31.3 Taconic Hills 16 14.4 16 17.1 10 8.7 Germantown 24 29.8 18 19.2 17 18.7 Pine Plains 10 32.8 5 16.3 10 30.6 Greene County 191 36.7 135 26.6 168 31.9 Coxsackie/Athens 44 29.0 31 18.8 44 29.1 Greenville 23 25.9 16 18.9 20 20.1 Catskill 83 35.3 69 33.7 69 28.9 Cairo/Durham 36 36.0 29 27.1 35 34.2 Windham/Ashland/Jewett 15 23.2 9 11.3 13 17.1 Hunter/Tannersville 26 34.6 10 15.5 13 16.5
Prevention Quality Indicator Rates by Neighborhood NYS Department of Health, SPARCS 2014-2018, Age-Sex Adjusted Rate per 10,000
*N is calculated as the average number of cases per year. ** Due to confidentiality concerns, counts and rates are not shown when counts are fewer than 5 (1 per year). Rates in red are higher than NYS, excl. NYC. Rates in bold are at least 50% higher than NYS, excl. NYC.
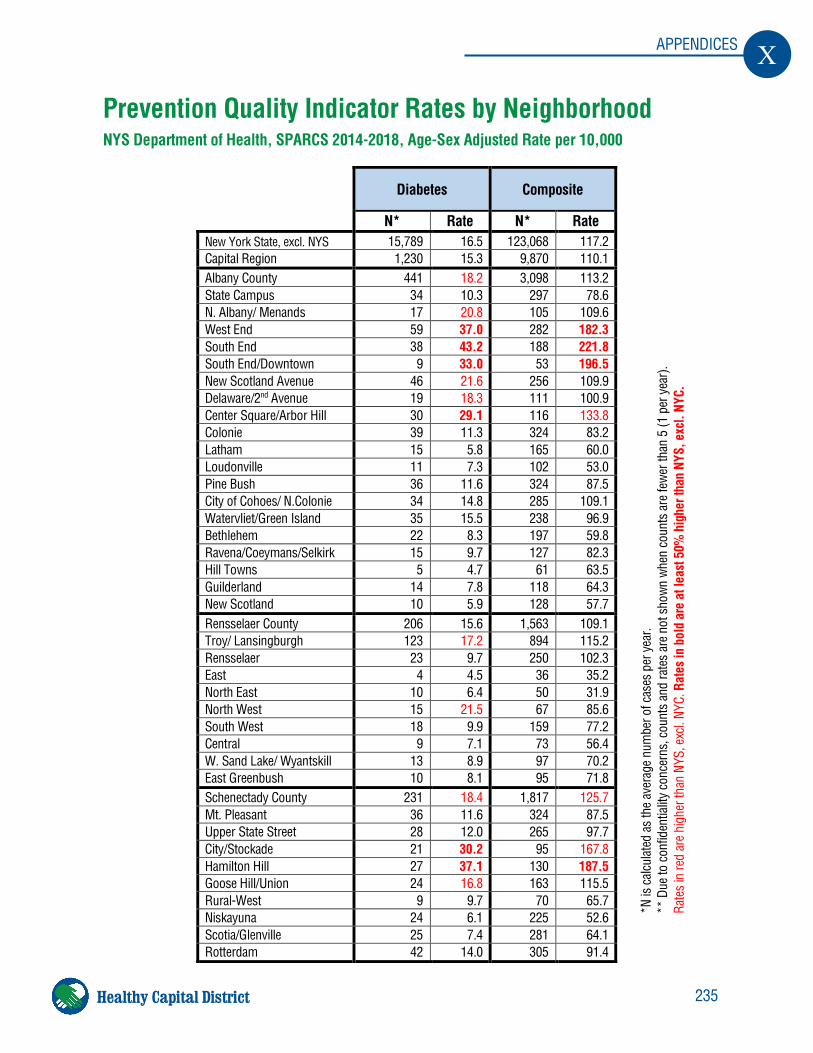
235
X APPENDICES
Healthy Capital District
Diabetes Composite
N* Rate N* Rate New York State, excl. NYS 15,789 16.5 123,068 117.2 Capital Region 1,230 15.3 9,870 110.1 Albany County 441 18.2 3,098 113.2 State Campus 34 10.3 297 78.6 N. Albany/ Menands 17 20.8 105 109.6 West End 59 37.0 282 182.3 South End 38 43.2 188 221.8 South End/Downtown 9 33.0 53 196.5 New Scotland Avenue 46 21.6 256 109.9 Delaware/2nd Avenue 19 18.3 111 100.9 Center Square/Arbor Hill 30 29.1 116 133.8 Colonie 39 11.3 324 83.2 Latham 15 5.8 165 60.0 Loudonville 11 7.3 102 53.0 Pine Bush 36 11.6 324 87.5 City of Cohoes/ N.Colonie 34 14.8 285 109.1 Watervliet/Green Island 35 15.5 238 96.9 Bethlehem 22 8.3 197 59.8 Ravena/Coeymans/Selkirk 15 9.7 127 82.3 Hill Towns 5 4.7 61 63.5 Guilderland 14 7.8 118 64.3 New Scotland 10 5.9 128 57.7 Rensselaer County 206 15.6 1,563 109.1 Troy/ Lansingburgh 123 17.2 894 115.2 Rensselaer 23 9.7 250 102.3 East 4 4.5 36 35.2 North East 10 6.4 50 31.9 North West 15 21.5 67 85.6 South West 18 9.9 159 77.2 Central 9 7.1 73 56.4 W. Sand Lake/ Wyantskill 13 8.9 97 70.2 East Greenbush 10 8.1 95 71.8 Schenectady County 231 18.4 1,817 125.7 Mt. Pleasant 36 11.6 324 87.5 Upper State Street 28 12.0 265 97.7 City/Stockade 21 30.2 95 167.8 Hamilton Hill 27 37.1 130 187.5 Goose Hill/Union 24 16.8 163 115.5 Rural-West 9 9.7 70 65.7 Niskayuna 24 6.1 225 52.6 Scotia/Glenville 25 7.4 281 64.1 Rotterdam 42 14.0 305 91.4
Prevention Quality Indicator Rates by Neighborhood NYS Department of Health, SPARCS 2014-2018, Age-Sex Adjusted Rate per 10,000
*N is
cal
culat
ed a
s th
e av
erag
e nu
mbe
r of c
ases
per
yea
r. **
Due
to c
onfid
entia
lity
conc
erns
, cou
nts
and
rate
s ar
e no
t sho
wn w
hen
coun
ts a
re fe
wer
than
5 (1
per
yea
r).
Rate
s in
red
are
high
er th
an N
YS, e
xcl.
NYC.
Rat
es in
bol
d ar
e at
leas
t 50%
hig
her t
han
NYS,
exc
l. NY
C.
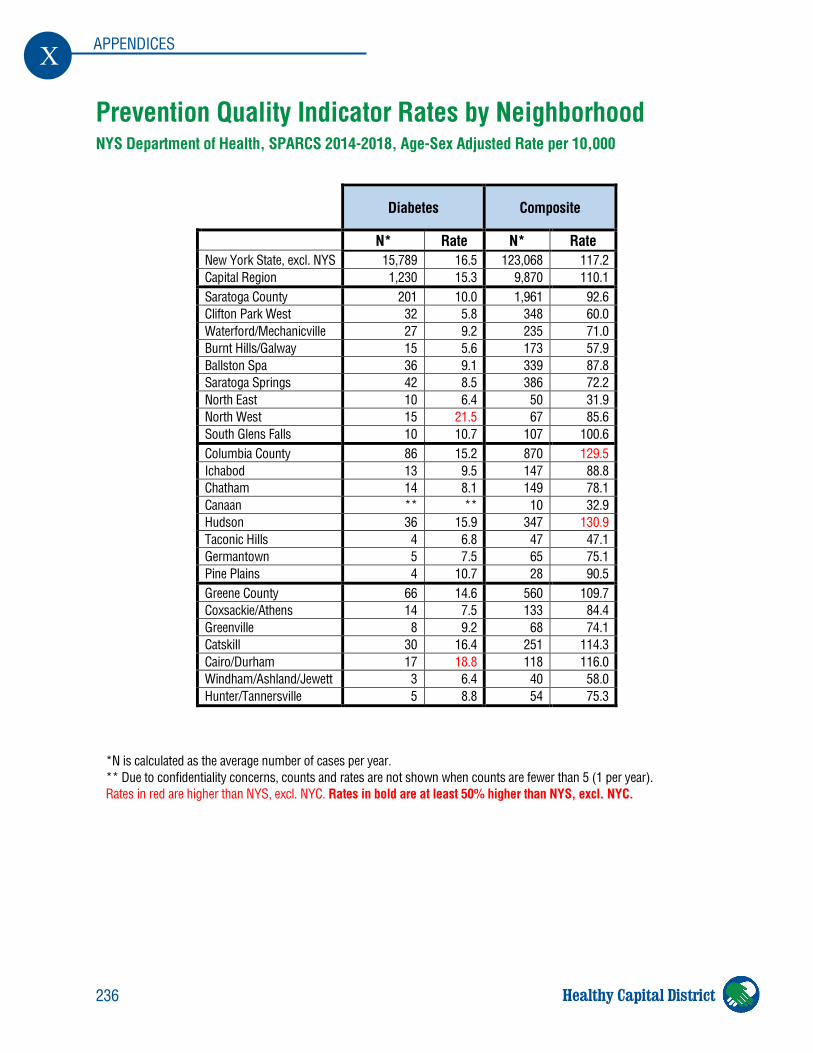
236
X APPENDICES
Healthy Capital District
Prevention Quality Indicator Rates by Neighborhood NYS Department of Health, SPARCS 2014-2018, Age-Sex Adjusted Rate per 10,000
Diabetes Composite
N* Rate N* Rate New York State, excl. NYS 15,789 16.5 123,068 117.2 Capital Region 1,230 15.3 9,870 110.1 Saratoga County 201 10.0 1,961 92.6 Clifton Park West 32 5.8 348 60.0 Waterford/Mechanicville 27 9.2 235 71.0 Burnt Hills/Galway 15 5.6 173 57.9 Ballston Spa 36 9.1 339 87.8 Saratoga Springs 42 8.5 386 72.2 North East 10 6.4 50 31.9 North West 15 21.5 67 85.6 South Glens Falls 10 10.7 107 100.6 Columbia County 86 15.2 870 129.5 Ichabod 13 9.5 147 88.8 Chatham 14 8.1 149 78.1 Canaan ** ** 10 32.9 Hudson 36 15.9 347 130.9 Taconic Hills 4 6.8 47 47.1 Germantown 5 7.5 65 75.1 Pine Plains 4 10.7 28 90.5 Greene County 66 14.6 560 109.7 Coxsackie/Athens 14 7.5 133 84.4 Greenville 8 9.2 68 74.1 Catskill 30 16.4 251 114.3 Cairo/Durham 17 18.8 118 116.0 Windham/Ashland/Jewett 3 6.4 40 58.0 Hunter/Tannersville 5 8.8 54 75.3
*N is calculated as the average number of cases per year. ** Due to confidentiality concerns, counts and rates are not shown when counts are fewer than 5 (1 per year). Rates in red are higher than NYS, excl. NYC. Rates in bold are at least 50% higher than NYS, excl. NYC.
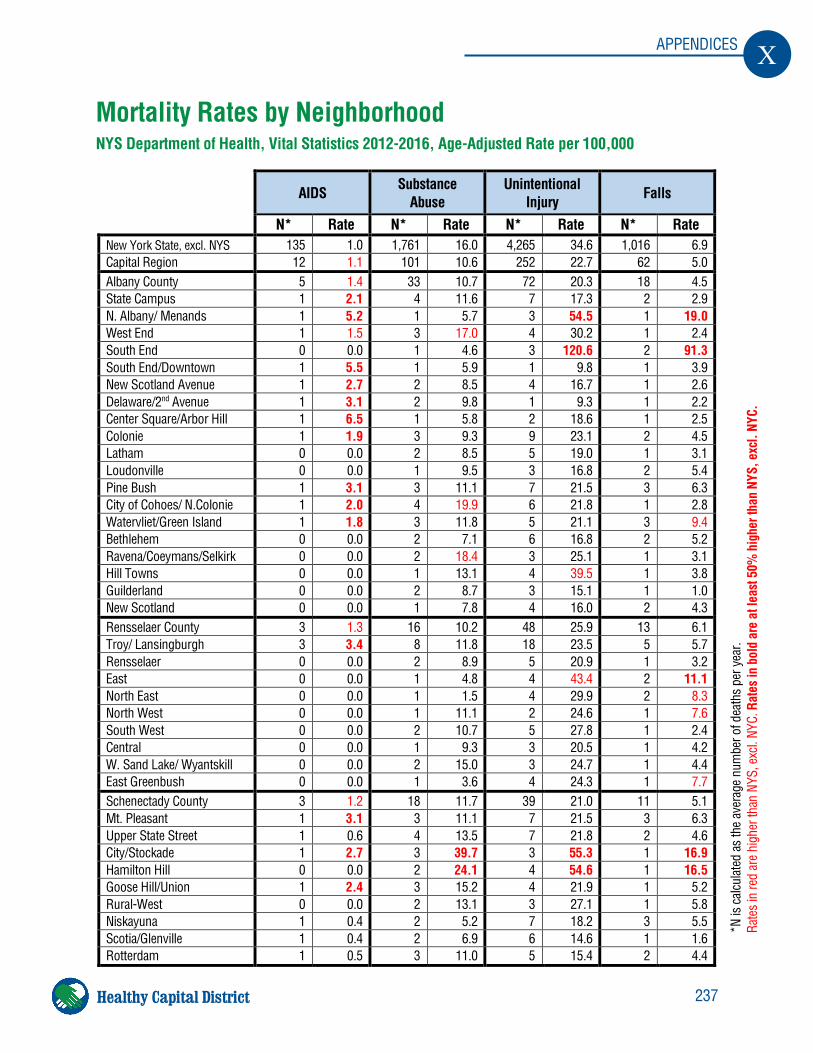
237
X APPENDICES
Healthy Capital District
Mortality Rates by Neighborhood
NYS Department of Health, Vital Statistics 2012-2016, Age-Adjusted Rate per 100,000
AIDS Substance
Abuse Unintentional
Injury Falls
N* Rate N* Rate N* Rate N* Rate New York State, excl. NYS 135 1.0 1,761 16.0 4,265 34.6 1,016 6.9 Capital Region 12 1.1 101 10.6 252 22.7 62 5.0 Albany County 5 1.4 33 10.7 72 20.3 18 4.5 State Campus 1 2.1 4 11.6 7 17.3 2 2.9 N. Albany/ Menands 1 5.2 1 5.7 3 54.5 1 19.0 West End 1 1.5 3 17.0 4 30.2 1 2.4 South End 0 0.0 1 4.6 3 120.6 2 91.3 South End/Downtown 1 5.5 1 5.9 1 9.8 1 3.9 New Scotland Avenue 1 2.7 2 8.5 4 16.7 1 2.6 Delaware/2nd Avenue 1 3.1 2 9.8 1 9.3 1 2.2 Center Square/Arbor Hill 1 6.5 1 5.8 2 18.6 1 2.5 Colonie 1 1.9 3 9.3 9 23.1 2 4.5 Latham 0 0.0 2 8.5 5 19.0 1 3.1 Loudonville 0 0.0 1 9.5 3 16.8 2 5.4 Pine Bush 1 3.1 3 11.1 7 21.5 3 6.3 City of Cohoes/ N.Colonie 1 2.0 4 19.9 6 21.8 1 2.8 Watervliet/Green Island 1 1.8 3 11.8 5 21.1 3 9.4 Bethlehem 0 0.0 2 7.1 6 16.8 2 5.2 Ravena/Coeymans/Selkirk 0 0.0 2 18.4 3 25.1 1 3.1 Hill Towns 0 0.0 1 13.1 4 39.5 1 3.8 Guilderland 0 0.0 2 8.7 3 15.1 1 1.0 New Scotland 0 0.0 1 7.8 4 16.0 2 4.3 Rensselaer County 3 1.3 16 10.2 48 25.9 13 6.1 Troy/ Lansingburgh 3 3.4 8 11.8 18 23.5 5 5.7 Rensselaer 0 0.0 2 8.9 5 20.9 1 3.2 East 0 0.0 1 4.8 4 43.4 2 11.1 North East 0 0.0 1 1.5 4 29.9 2 8.3 North West 0 0.0 1 11.1 2 24.6 1 7.6 South West 0 0.0 2 10.7 5 27.8 1 2.4 Central 0 0.0 1 9.3 3 20.5 1 4.2 W. Sand Lake/ Wyantskill 0 0.0 2 15.0 3 24.7 1 4.4 East Greenbush 0 0.0 1 3.6 4 24.3 1 7.7 Schenectady County 3 1.2 18 11.7 39 21.0 11 5.1 Mt. Pleasant 1 3.1 3 11.1 7 21.5 3 6.3 Upper State Street 1 0.6 4 13.5 7 21.8 2 4.6 City/Stockade 1 2.7 3 39.7 3 55.3 1 16.9 Hamilton Hill 0 0.0 2 24.1 4 54.6 1 16.5 Goose Hill/Union 1 2.4 3 15.2 4 21.9 1 5.2 Rural-West 0 0.0 2 13.1 3 27.1 1 5.8 Niskayuna 1 0.4 2 5.2 7 18.2 3 5.5 Scotia/Glenville 1 0.4 2 6.9 6 14.6 1 1.6 Rotterdam 1 0.5 3 11.0 5 15.4 2 4.4
*N is
cal
culat
ed a
s th
e av
erag
e nu
mbe
r of d
eath
s pe
r yea
r. Ra
tes
in re
d ar
e hi
gher
than
NYS
, exc
l. NY
C. R
ates
in b
old
are
at le
ast 5
0% h
ighe
r tha
n NY
S, e
xcl.
NYC.
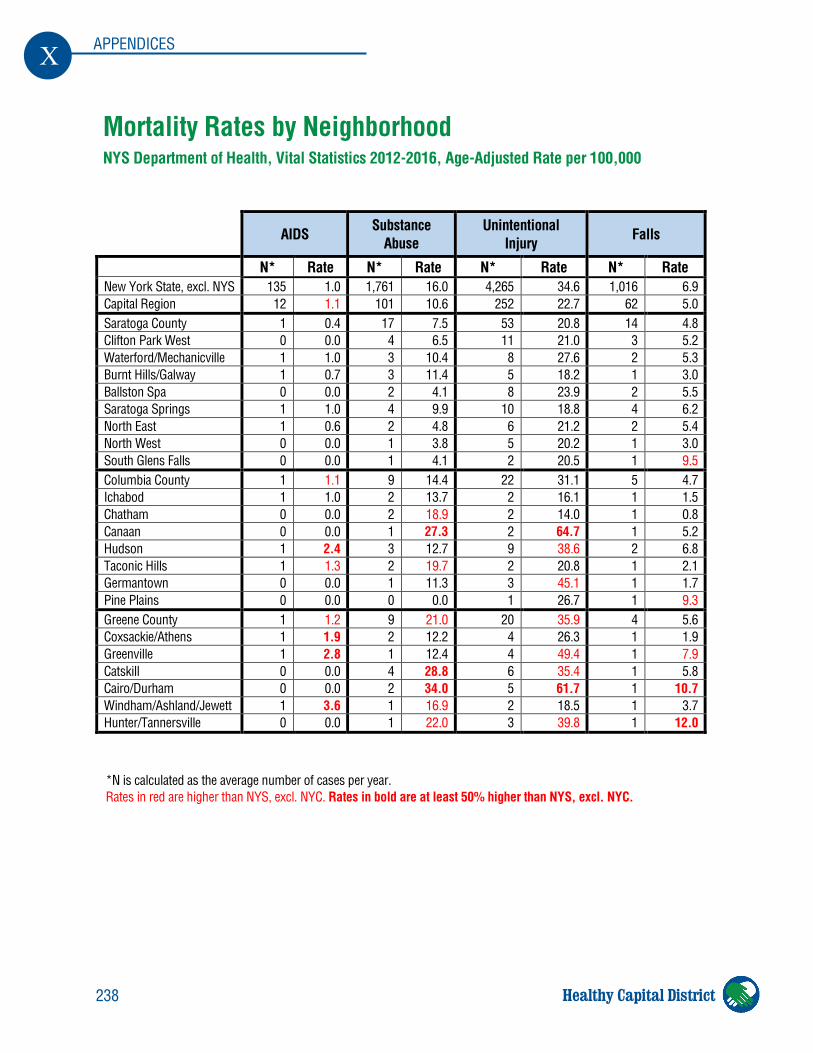
238
X APPENDICES
Healthy Capital District
AIDS Substance
Abuse Unintentional
Injury Falls
N* Rate N* Rate N* Rate N* Rate New York State, excl. NYS 135 1.0 1,761 16.0 4,265 34.6 1,016 6.9 Capital Region 12 1.1 101 10.6 252 22.7 62 5.0 Saratoga County 1 0.4 17 7.5 53 20.8 14 4.8 Clifton Park West 0 0.0 4 6.5 11 21.0 3 5.2 Waterford/Mechanicville 1 1.0 3 10.4 8 27.6 2 5.3 Burnt Hills/Galway 1 0.7 3 11.4 5 18.2 1 3.0 Ballston Spa 0 0.0 2 4.1 8 23.9 2 5.5 Saratoga Springs 1 1.0 4 9.9 10 18.8 4 6.2 North East 1 0.6 2 4.8 6 21.2 2 5.4 North West 0 0.0 1 3.8 5 20.2 1 3.0 South Glens Falls 0 0.0 1 4.1 2 20.5 1 9.5 Columbia County 1 1.1 9 14.4 22 31.1 5 4.7 Ichabod 1 1.0 2 13.7 2 16.1 1 1.5 Chatham 0 0.0 2 18.9 2 14.0 1 0.8 Canaan 0 0.0 1 27.3 2 64.7 1 5.2 Hudson 1 2.4 3 12.7 9 38.6 2 6.8 Taconic Hills 1 1.3 2 19.7 2 20.8 1 2.1 Germantown 0 0.0 1 11.3 3 45.1 1 1.7 Pine Plains 0 0.0 0 0.0 1 26.7 1 9.3 Greene County 1 1.2 9 21.0 20 35.9 4 5.6 Coxsackie/Athens 1 1.9 2 12.2 4 26.3 1 1.9 Greenville 1 2.8 1 12.4 4 49.4 1 7.9 Catskill 0 0.0 4 28.8 6 35.4 1 5.8 Cairo/Durham 0 0.0 2 34.0 5 61.7 1 10.7 Windham/Ashland/Jewett 1 3.6 1 16.9 2 18.5 1 3.7 Hunter/Tannersville 0 0.0 1 22.0 3 39.8 1 12.0
Mortality Rates by Neighborhood NYS Department of Health, Vital Statistics 2012-2016, Age-Adjusted Rate per 100,000
*N is calculated as the average number of cases per year. Rates in red are higher than NYS, excl. NYC. Rates in bold are at least 50% higher than NYS, excl. NYC.
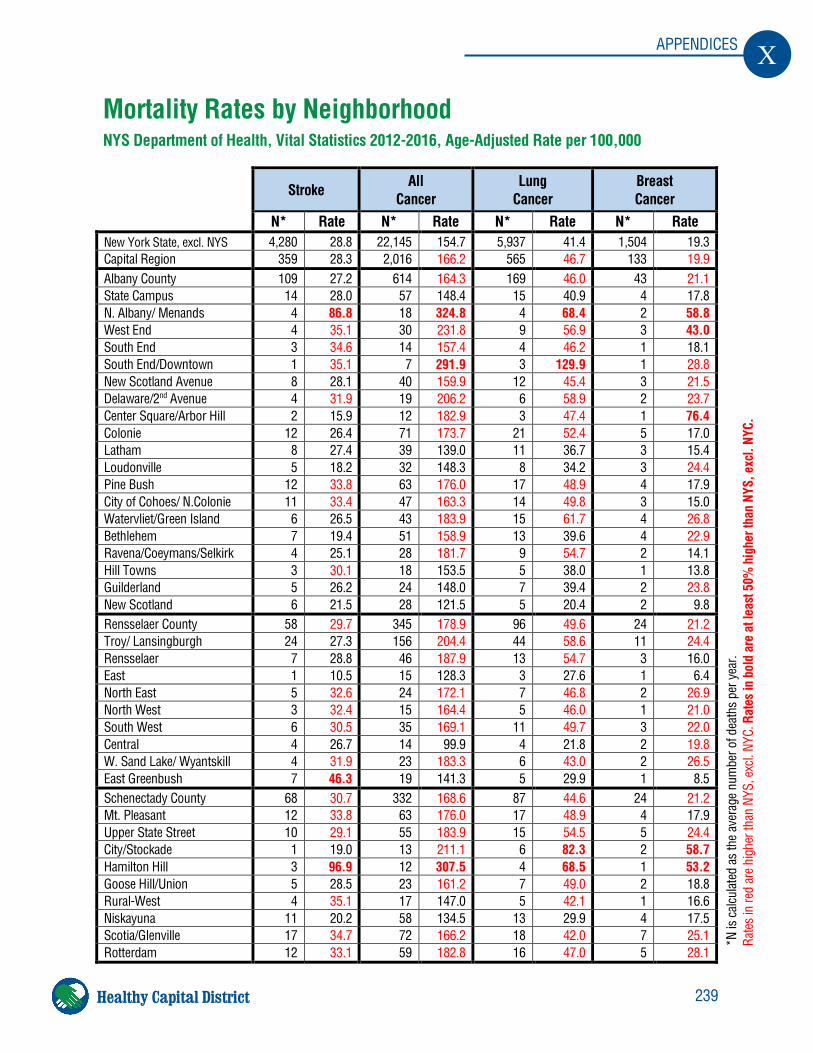
239
X APPENDICES
Healthy Capital District
Stroke All
Cancer Lung
Cancer Breast Cancer
N* Rate N* Rate N* Rate N* Rate New York State, excl. NYS 4,280 28.8 22,145 154.7 5,937 41.4 1,504 19.3 Capital Region 359 28.3 2,016 166.2 565 46.7 133 19.9 Albany County 109 27.2 614 164.3 169 46.0 43 21.1 State Campus 14 28.0 57 148.4 15 40.9 4 17.8 N. Albany/ Menands 4 86.8 18 324.8 4 68.4 2 58.8 West End 4 35.1 30 231.8 9 56.9 3 43.0 South End 3 34.6 14 157.4 4 46.2 1 18.1 South End/Downtown 1 35.1 7 291.9 3 129.9 1 28.8 New Scotland Avenue 8 28.1 40 159.9 12 45.4 3 21.5 Delaware/2nd Avenue 4 31.9 19 206.2 6 58.9 2 23.7 Center Square/Arbor Hill 2 15.9 12 182.9 3 47.4 1 76.4 Colonie 12 26.4 71 173.7 21 52.4 5 17.0 Latham 8 27.4 39 139.0 11 36.7 3 15.4 Loudonville 5 18.2 32 148.3 8 34.2 3 24.4 Pine Bush 12 33.8 63 176.0 17 48.9 4 17.9 City of Cohoes/ N.Colonie 11 33.4 47 163.3 14 49.8 3 15.0 Watervliet/Green Island 6 26.5 43 183.9 15 61.7 4 26.8 Bethlehem 7 19.4 51 158.9 13 39.6 4 22.9 Ravena/Coeymans/Selkirk 4 25.1 28 181.7 9 54.7 2 14.1 Hill Towns 3 30.1 18 153.5 5 38.0 1 13.8 Guilderland 5 26.2 24 148.0 7 39.4 2 23.8 New Scotland 6 21.5 28 121.5 5 20.4 2 9.8 Rensselaer County 58 29.7 345 178.9 96 49.6 24 21.2 Troy/ Lansingburgh 24 27.3 156 204.4 44 58.6 11 24.4 Rensselaer 7 28.8 46 187.9 13 54.7 3 16.0 East 1 10.5 15 128.3 3 27.6 1 6.4 North East 5 32.6 24 172.1 7 46.8 2 26.9 North West 3 32.4 15 164.4 5 46.0 1 21.0 South West 6 30.5 35 169.1 11 49.7 3 22.0 Central 4 26.7 14 99.9 4 21.8 2 19.8 W. Sand Lake/ Wyantskill 4 31.9 23 183.3 6 43.0 2 26.5 East Greenbush 7 46.3 19 141.3 5 29.9 1 8.5 Schenectady County 68 30.7 332 168.6 87 44.6 24 21.2 Mt. Pleasant 12 33.8 63 176.0 17 48.9 4 17.9 Upper State Street 10 29.1 55 183.9 15 54.5 5 24.4 City/Stockade 1 19.0 13 211.1 6 82.3 2 58.7 Hamilton Hill 3 96.9 12 307.5 4 68.5 1 53.2 Goose Hill/Union 5 28.5 23 161.2 7 49.0 2 18.8 Rural-West 4 35.1 17 147.0 5 42.1 1 16.6 Niskayuna 11 20.2 58 134.5 13 29.9 4 17.5 Scotia/Glenville 17 34.7 72 166.2 18 42.0 7 25.1 Rotterdam 12 33.1 59 182.8 16 47.0 5 28.1
Mortality Rates by Neighborhood NYS Department of Health, Vital Statistics 2012-2016, Age-Adjusted Rate per 100,000
*N is
cal
culat
ed a
s th
e av
erag
e nu
mbe
r of d
eath
s pe
r yea
r. Ra
tes
in re
d ar
e hi
gher
than
NYS
, exc
l. NY
C. R
ates
in b
old
are
at le
ast 5
0% h
ighe
r tha
n NY
S, e
xcl.
NYC.
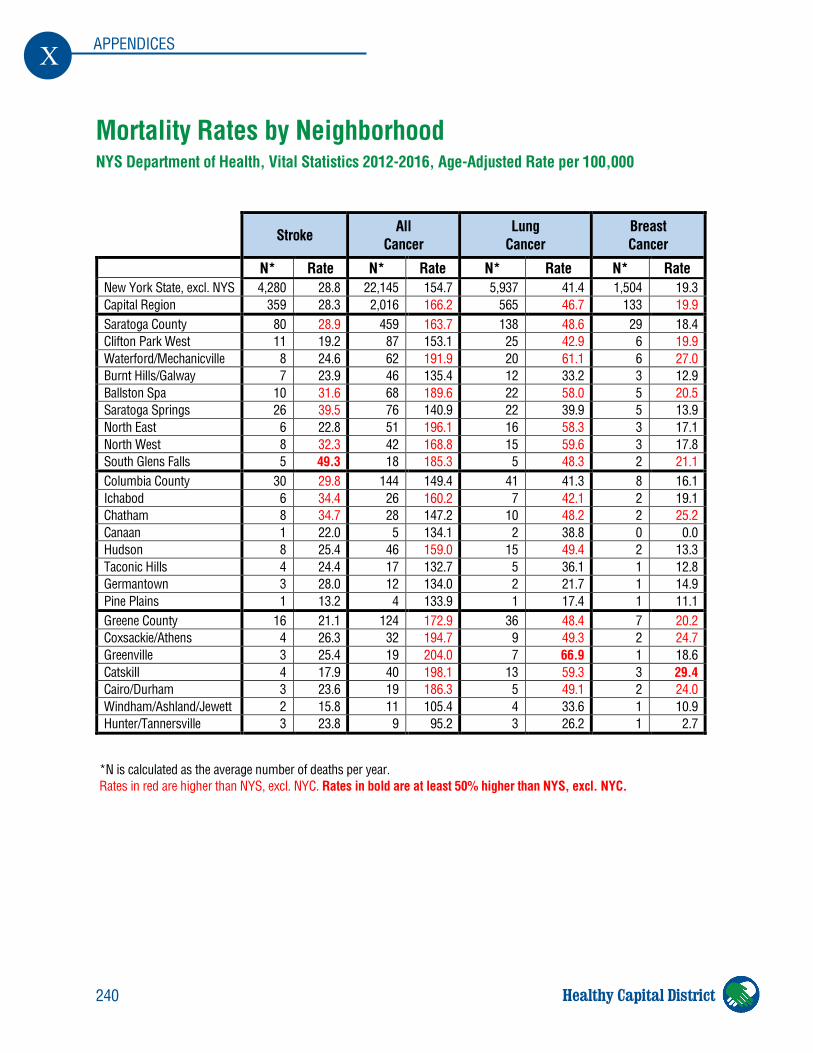
240
X APPENDICES
Healthy Capital District
Mortality Rates by Neighborhood NYS Department of Health, Vital Statistics 2012-2016, Age-Adjusted Rate per 100,000
Stroke All
Cancer Lung
Cancer Breast Cancer
N* Rate N* Rate N* Rate N* Rate New York State, excl. NYS 4,280 28.8 22,145 154.7 5,937 41.4 1,504 19.3 Capital Region 359 28.3 2,016 166.2 565 46.7 133 19.9 Saratoga County 80 28.9 459 163.7 138 48.6 29 18.4 Clifton Park West 11 19.2 87 153.1 25 42.9 6 19.9 Waterford/Mechanicville 8 24.6 62 191.9 20 61.1 6 27.0 Burnt Hills/Galway 7 23.9 46 135.4 12 33.2 3 12.9 Ballston Spa 10 31.6 68 189.6 22 58.0 5 20.5 Saratoga Springs 26 39.5 76 140.9 22 39.9 5 13.9 North East 6 22.8 51 196.1 16 58.3 3 17.1 North West 8 32.3 42 168.8 15 59.6 3 17.8 South Glens Falls 5 49.3 18 185.3 5 48.3 2 21.1 Columbia County 30 29.8 144 149.4 41 41.3 8 16.1 Ichabod 6 34.4 26 160.2 7 42.1 2 19.1 Chatham 8 34.7 28 147.2 10 48.2 2 25.2 Canaan 1 22.0 5 134.1 2 38.8 0 0.0 Hudson 8 25.4 46 159.0 15 49.4 2 13.3 Taconic Hills 4 24.4 17 132.7 5 36.1 1 12.8 Germantown 3 28.0 12 134.0 2 21.7 1 14.9 Pine Plains 1 13.2 4 133.9 1 17.4 1 11.1 Greene County 16 21.1 124 172.9 36 48.4 7 20.2 Coxsackie/Athens 4 26.3 32 194.7 9 49.3 2 24.7 Greenville 3 25.4 19 204.0 7 66.9 1 18.6 Catskill 4 17.9 40 198.1 13 59.3 3 29.4 Cairo/Durham 3 23.6 19 186.3 5 49.1 2 24.0 Windham/Ashland/Jewett 2 15.8 11 105.4 4 33.6 1 10.9 Hunter/Tannersville 3 23.8 9 95.2 3 26.2 1 2.7
*N is calculated as the average number of deaths per year. Rates in red are higher than NYS, excl. NYC. Rates in bold are at least 50% higher than NYS, excl. NYC.
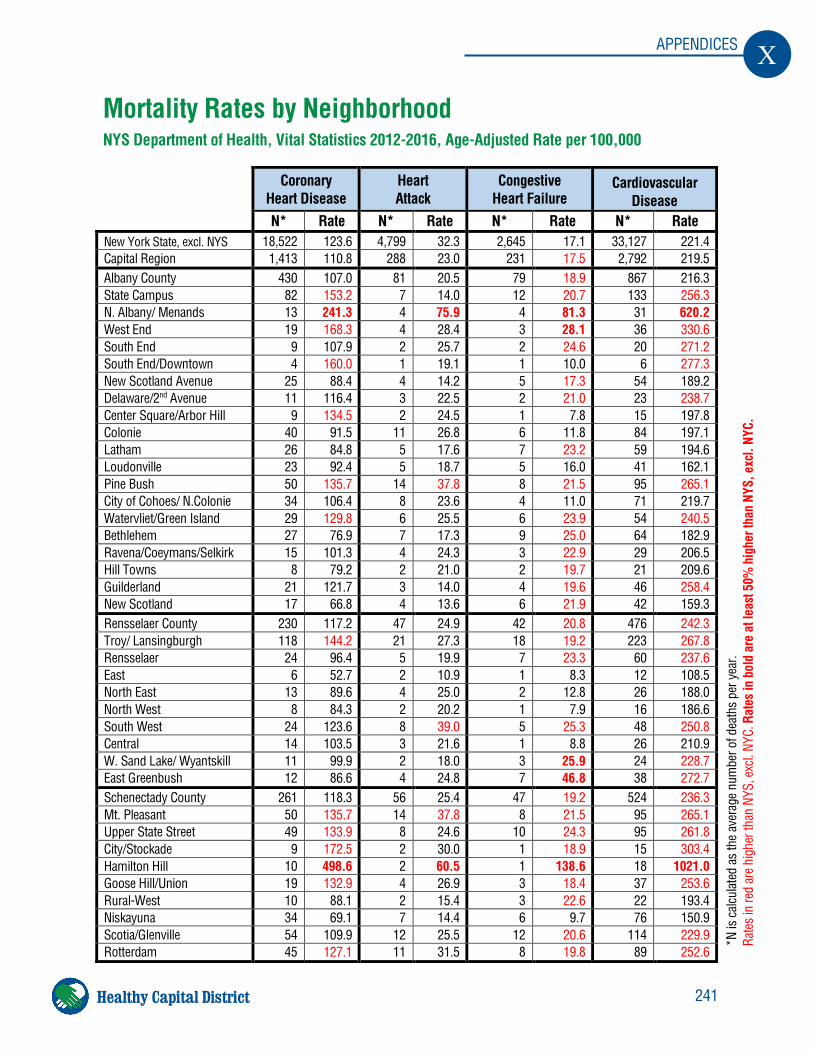
241
X APPENDICES
Healthy Capital District
Coronary
Heart Disease Heart Attack
Congestive Heart Failure
Cardiovascular Disease
N* Rate N* Rate N* Rate N* Rate New York State, excl. NYS 18,522 123.6 4,799 32.3 2,645 17.1 33,127 221.4 Capital Region 1,413 110.8 288 23.0 231 17.5 2,792 219.5 Albany County 430 107.0 81 20.5 79 18.9 867 216.3 State Campus 82 153.2 7 14.0 12 20.7 133 256.3 N. Albany/ Menands 13 241.3 4 75.9 4 81.3 31 620.2 West End 19 168.3 4 28.4 3 28.1 36 330.6 South End 9 107.9 2 25.7 2 24.6 20 271.2 South End/Downtown 4 160.0 1 19.1 1 10.0 6 277.3 New Scotland Avenue 25 88.4 4 14.2 5 17.3 54 189.2 Delaware/2nd Avenue 11 116.4 3 22.5 2 21.0 23 238.7 Center Square/Arbor Hill 9 134.5 2 24.5 1 7.8 15 197.8 Colonie 40 91.5 11 26.8 6 11.8 84 197.1 Latham 26 84.8 5 17.6 7 23.2 59 194.6 Loudonville 23 92.4 5 18.7 5 16.0 41 162.1 Pine Bush 50 135.7 14 37.8 8 21.5 95 265.1 City of Cohoes/ N.Colonie 34 106.4 8 23.6 4 11.0 71 219.7 Watervliet/Green Island 29 129.8 6 25.5 6 23.9 54 240.5 Bethlehem 27 76.9 7 17.3 9 25.0 64 182.9 Ravena/Coeymans/Selkirk 15 101.3 4 24.3 3 22.9 29 206.5 Hill Towns 8 79.2 2 21.0 2 19.7 21 209.6 Guilderland 21 121.7 3 14.0 4 19.6 46 258.4 New Scotland 17 66.8 4 13.6 6 21.9 42 159.3 Rensselaer County 230 117.2 47 24.9 42 20.8 476 242.3 Troy/ Lansingburgh 118 144.2 21 27.3 18 19.2 223 267.8 Rensselaer 24 96.4 5 19.9 7 23.3 60 237.6 East 6 52.7 2 10.9 1 8.3 12 108.5 North East 13 89.6 4 25.0 2 12.8 26 188.0 North West 8 84.3 2 20.2 1 7.9 16 186.6 South West 24 123.6 8 39.0 5 25.3 48 250.8 Central 14 103.5 3 21.6 1 8.8 26 210.9 W. Sand Lake/ Wyantskill 11 99.9 2 18.0 3 25.9 24 228.7 East Greenbush 12 86.6 4 24.8 7 46.8 38 272.7 Schenectady County 261 118.3 56 25.4 47 19.2 524 236.3 Mt. Pleasant 50 135.7 14 37.8 8 21.5 95 265.1 Upper State Street 49 133.9 8 24.6 10 24.3 95 261.8 City/Stockade 9 172.5 2 30.0 1 18.9 15 303.4 Hamilton Hill 10 498.6 2 60.5 1 138.6 18 1021.0 Goose Hill/Union 19 132.9 4 26.9 3 18.4 37 253.6 Rural-West 10 88.1 2 15.4 3 22.6 22 193.4 Niskayuna 34 69.1 7 14.4 6 9.7 76 150.9 Scotia/Glenville 54 109.9 12 25.5 12 20.6 114 229.9 Rotterdam 45 127.1 11 31.5 8 19.8 89 252.6
Mortality Rates by Neighborhood NYS Department of Health, Vital Statistics 2012-2016, Age-Adjusted Rate per 100,000
*N is
cal
culat
ed a
s th
e av
erag
e nu
mbe
r of d
eath
s pe
r yea
r. Ra
tes
in re
d ar
e hi
gher
than
NYS
, exc
l. NY
C. R
ates
in b
old
are
at le
ast 5
0% h
ighe
r tha
n NY
S, e
xcl.
NYC.
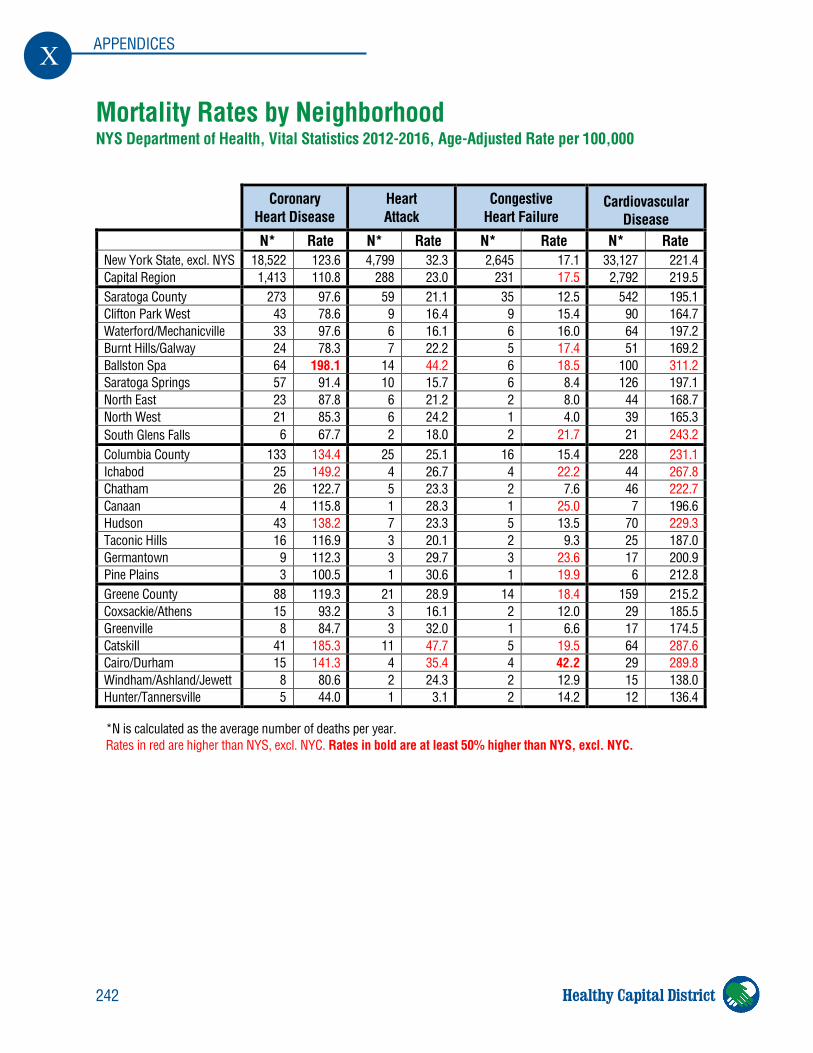
242
X APPENDICES
Healthy Capital District
Mortality Rates by Neighborhood NYS Department of Health, Vital Statistics 2012-2016, Age-Adjusted Rate per 100,000
Coronary
Heart Disease Heart Attack
Congestive Heart Failure
Cardiovascular Disease
N* Rate N* Rate N* Rate N* Rate New York State, excl. NYS 18,522 123.6 4,799 32.3 2,645 17.1 33,127 221.4 Capital Region 1,413 110.8 288 23.0 231 17.5 2,792 219.5 Saratoga County 273 97.6 59 21.1 35 12.5 542 195.1 Clifton Park West 43 78.6 9 16.4 9 15.4 90 164.7 Waterford/Mechanicville 33 97.6 6 16.1 6 16.0 64 197.2 Burnt Hills/Galway 24 78.3 7 22.2 5 17.4 51 169.2 Ballston Spa 64 198.1 14 44.2 6 18.5 100 311.2 Saratoga Springs 57 91.4 10 15.7 6 8.4 126 197.1 North East 23 87.8 6 21.2 2 8.0 44 168.7 North West 21 85.3 6 24.2 1 4.0 39 165.3 South Glens Falls 6 67.7 2 18.0 2 21.7 21 243.2 Columbia County 133 134.4 25 25.1 16 15.4 228 231.1 Ichabod 25 149.2 4 26.7 4 22.2 44 267.8 Chatham 26 122.7 5 23.3 2 7.6 46 222.7 Canaan 4 115.8 1 28.3 1 25.0 7 196.6 Hudson 43 138.2 7 23.3 5 13.5 70 229.3 Taconic Hills 16 116.9 3 20.1 2 9.3 25 187.0 Germantown 9 112.3 3 29.7 3 23.6 17 200.9 Pine Plains 3 100.5 1 30.6 1 19.9 6 212.8 Greene County 88 119.3 21 28.9 14 18.4 159 215.2 Coxsackie/Athens 15 93.2 3 16.1 2 12.0 29 185.5 Greenville 8 84.7 3 32.0 1 6.6 17 174.5 Catskill 41 185.3 11 47.7 5 19.5 64 287.6 Cairo/Durham 15 141.3 4 35.4 4 42.2 29 289.8 Windham/Ashland/Jewett 8 80.6 2 24.3 2 12.9 15 138.0 Hunter/Tannersville 5 44.0 1 3.1 2 14.2 12 136.4
*N is calculated as the average number of deaths per year. Rates in red are higher than NYS, excl. NYC. Rates in bold are at least 50% higher than NYS, excl. NYC.
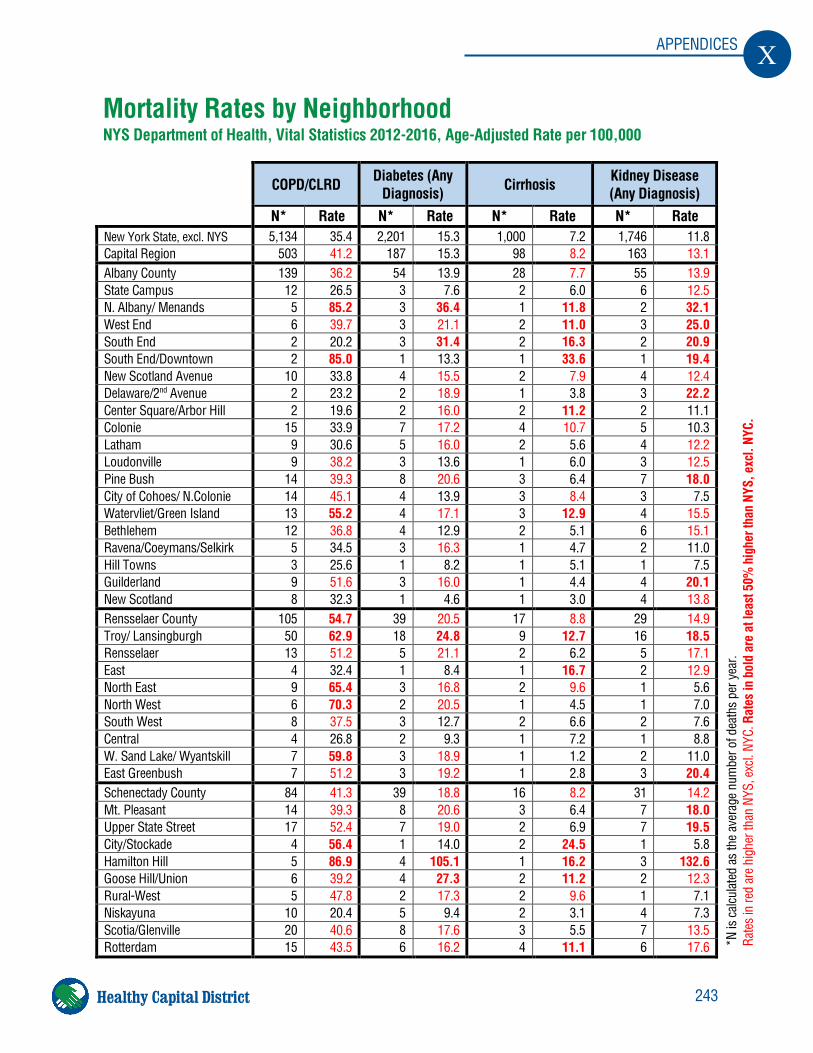
243
X APPENDICES
Healthy Capital District
COPD/CLRD Diabetes (Any
Diagnosis) Cirrhosis Kidney Disease (Any Diagnosis)
N* Rate N* Rate N* Rate N* Rate New York State, excl. NYS 5,134 35.4 2,201 15.3 1,000 7.2 1,746 11.8 Capital Region 503 41.2 187 15.3 98 8.2 163 13.1 Albany County 139 36.2 54 13.9 28 7.7 55 13.9 State Campus 12 26.5 3 7.6 2 6.0 6 12.5 N. Albany/ Menands 5 85.2 3 36.4 1 11.8 2 32.1 West End 6 39.7 3 21.1 2 11.0 3 25.0 South End 2 20.2 3 31.4 2 16.3 2 20.9 South End/Downtown 2 85.0 1 13.3 1 33.6 1 19.4 New Scotland Avenue 10 33.8 4 15.5 2 7.9 4 12.4 Delaware/2nd Avenue 2 23.2 2 18.9 1 3.8 3 22.2 Center Square/Arbor Hill 2 19.6 2 16.0 2 11.2 2 11.1 Colonie 15 33.9 7 17.2 4 10.7 5 10.3 Latham 9 30.6 5 16.0 2 5.6 4 12.2 Loudonville 9 38.2 3 13.6 1 6.0 3 12.5 Pine Bush 14 39.3 8 20.6 3 6.4 7 18.0 City of Cohoes/ N.Colonie 14 45.1 4 13.9 3 8.4 3 7.5 Watervliet/Green Island 13 55.2 4 17.1 3 12.9 4 15.5 Bethlehem 12 36.8 4 12.9 2 5.1 6 15.1 Ravena/Coeymans/Selkirk 5 34.5 3 16.3 1 4.7 2 11.0 Hill Towns 3 25.6 1 8.2 1 5.1 1 7.5 Guilderland 9 51.6 3 16.0 1 4.4 4 20.1 New Scotland 8 32.3 1 4.6 1 3.0 4 13.8 Rensselaer County 105 54.7 39 20.5 17 8.8 29 14.9 Troy/ Lansingburgh 50 62.9 18 24.8 9 12.7 16 18.5 Rensselaer 13 51.2 5 21.1 2 6.2 5 17.1 East 4 32.4 1 8.4 1 16.7 2 12.9 North East 9 65.4 3 16.8 2 9.6 1 5.6 North West 6 70.3 2 20.5 1 4.5 1 7.0 South West 8 37.5 3 12.7 2 6.6 2 7.6 Central 4 26.8 2 9.3 1 7.2 1 8.8 W. Sand Lake/ Wyantskill 7 59.8 3 18.9 1 1.2 2 11.0 East Greenbush 7 51.2 3 19.2 1 2.8 3 20.4 Schenectady County 84 41.3 39 18.8 16 8.2 31 14.2 Mt. Pleasant 14 39.3 8 20.6 3 6.4 7 18.0 Upper State Street 17 52.4 7 19.0 2 6.9 7 19.5 City/Stockade 4 56.4 1 14.0 2 24.5 1 5.8 Hamilton Hill 5 86.9 4 105.1 1 16.2 3 132.6 Goose Hill/Union 6 39.2 4 27.3 2 11.2 2 12.3 Rural-West 5 47.8 2 17.3 2 9.6 1 7.1 Niskayuna 10 20.4 5 9.4 2 3.1 4 7.3 Scotia/Glenville 20 40.6 8 17.6 3 5.5 7 13.5 Rotterdam 15 43.5 6 16.2 4 11.1 6 17.6
Mortality Rates by Neighborhood NYS Department of Health, Vital Statistics 2012-2016, Age-Adjusted Rate per 100,000
*N is
cal
culat
ed a
s th
e av
erag
e nu
mbe
r of d
eath
s pe
r yea
r. Ra
tes
in re
d ar
e hi
gher
than
NYS
, exc
l. NY
C. R
ates
in b
old
are
at le
ast 5
0% h
ighe
r tha
n NY
S, e
xcl.
NYC.
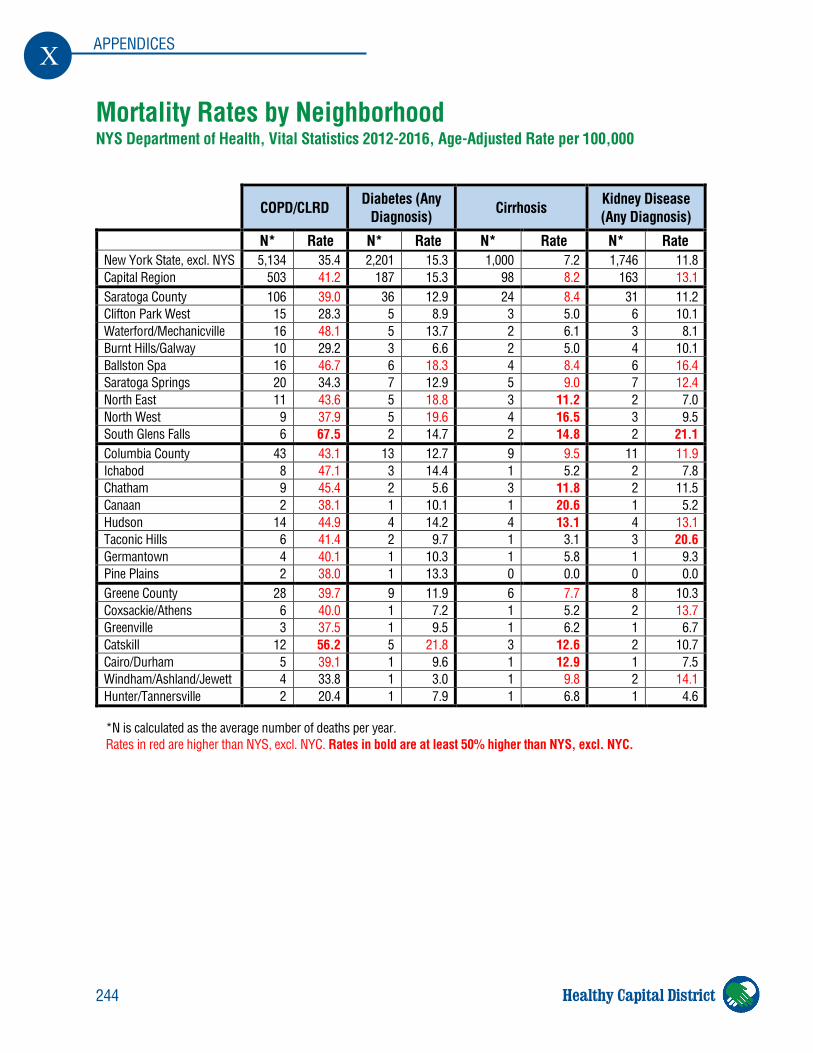
244
X APPENDICES
Healthy Capital District
Mortality Rates by Neighborhood NYS Department of Health, Vital Statistics 2012-2016, Age-Adjusted Rate per 100,000
COPD/CLRD Diabetes (Any
Diagnosis) Cirrhosis Kidney Disease (Any Diagnosis)
N* Rate N* Rate N* Rate N* Rate New York State, excl. NYS 5,134 35.4 2,201 15.3 1,000 7.2 1,746 11.8 Capital Region 503 41.2 187 15.3 98 8.2 163 13.1 Saratoga County 106 39.0 36 12.9 24 8.4 31 11.2 Clifton Park West 15 28.3 5 8.9 3 5.0 6 10.1 Waterford/Mechanicville 16 48.1 5 13.7 2 6.1 3 8.1 Burnt Hills/Galway 10 29.2 3 6.6 2 5.0 4 10.1 Ballston Spa 16 46.7 6 18.3 4 8.4 6 16.4 Saratoga Springs 20 34.3 7 12.9 5 9.0 7 12.4 North East 11 43.6 5 18.8 3 11.2 2 7.0 North West 9 37.9 5 19.6 4 16.5 3 9.5 South Glens Falls 6 67.5 2 14.7 2 14.8 2 21.1 Columbia County 43 43.1 13 12.7 9 9.5 11 11.9 Ichabod 8 47.1 3 14.4 1 5.2 2 7.8 Chatham 9 45.4 2 5.6 3 11.8 2 11.5 Canaan 2 38.1 1 10.1 1 20.6 1 5.2 Hudson 14 44.9 4 14.2 4 13.1 4 13.1 Taconic Hills 6 41.4 2 9.7 1 3.1 3 20.6 Germantown 4 40.1 1 10.3 1 5.8 1 9.3 Pine Plains 2 38.0 1 13.3 0 0.0 0 0.0 Greene County 28 39.7 9 11.9 6 7.7 8 10.3 Coxsackie/Athens 6 40.0 1 7.2 1 5.2 2 13.7 Greenville 3 37.5 1 9.5 1 6.2 1 6.7 Catskill 12 56.2 5 21.8 3 12.6 2 10.7 Cairo/Durham 5 39.1 1 9.6 1 12.9 1 7.5 Windham/Ashland/Jewett 4 33.8 1 3.0 1 9.8 2 14.1 Hunter/Tannersville 2 20.4 1 7.9 1 6.8 1 4.6
*N is calculated as the average number of deaths per year. Rates in red are higher than NYS, excl. NYC. Rates in bold are at least 50% higher than NYS, excl. NYC.
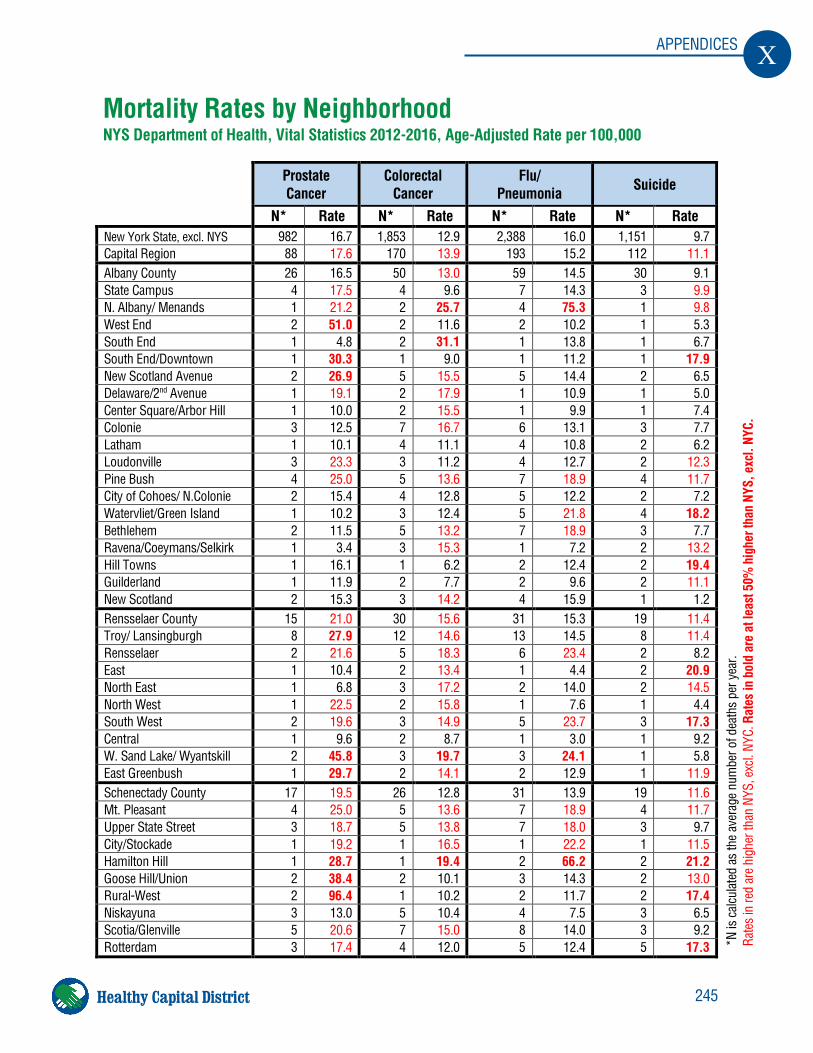
245
X APPENDICES
Healthy Capital District
Prostate Cancer
Colorectal Cancer
Flu/ Pneumonia Suicide
N* Rate N* Rate N* Rate N* Rate New York State, excl. NYS 982 16.7 1,853 12.9 2,388 16.0 1,151 9.7 Capital Region 88 17.6 170 13.9 193 15.2 112 11.1 Albany County 26 16.5 50 13.0 59 14.5 30 9.1 State Campus 4 17.5 4 9.6 7 14.3 3 9.9 N. Albany/ Menands 1 21.2 2 25.7 4 75.3 1 9.8 West End 2 51.0 2 11.6 2 10.2 1 5.3 South End 1 4.8 2 31.1 1 13.8 1 6.7 South End/Downtown 1 30.3 1 9.0 1 11.2 1 17.9 New Scotland Avenue 2 26.9 5 15.5 5 14.4 2 6.5 Delaware/2nd Avenue 1 19.1 2 17.9 1 10.9 1 5.0 Center Square/Arbor Hill 1 10.0 2 15.5 1 9.9 1 7.4 Colonie 3 12.5 7 16.7 6 13.1 3 7.7 Latham 1 10.1 4 11.1 4 10.8 2 6.2 Loudonville 3 23.3 3 11.2 4 12.7 2 12.3 Pine Bush 4 25.0 5 13.6 7 18.9 4 11.7 City of Cohoes/ N.Colonie 2 15.4 4 12.8 5 12.2 2 7.2 Watervliet/Green Island 1 10.2 3 12.4 5 21.8 4 18.2 Bethlehem 2 11.5 5 13.2 7 18.9 3 7.7 Ravena/Coeymans/Selkirk 1 3.4 3 15.3 1 7.2 2 13.2 Hill Towns 1 16.1 1 6.2 2 12.4 2 19.4 Guilderland 1 11.9 2 7.7 2 9.6 2 11.1 New Scotland 2 15.3 3 14.2 4 15.9 1 1.2 Rensselaer County 15 21.0 30 15.6 31 15.3 19 11.4 Troy/ Lansingburgh 8 27.9 12 14.6 13 14.5 8 11.4 Rensselaer 2 21.6 5 18.3 6 23.4 2 8.2 East 1 10.4 2 13.4 1 4.4 2 20.9 North East 1 6.8 3 17.2 2 14.0 2 14.5 North West 1 22.5 2 15.8 1 7.6 1 4.4 South West 2 19.6 3 14.9 5 23.7 3 17.3 Central 1 9.6 2 8.7 1 3.0 1 9.2 W. Sand Lake/ Wyantskill 2 45.8 3 19.7 3 24.1 1 5.8 East Greenbush 1 29.7 2 14.1 2 12.9 1 11.9 Schenectady County 17 19.5 26 12.8 31 13.9 19 11.6 Mt. Pleasant 4 25.0 5 13.6 7 18.9 4 11.7 Upper State Street 3 18.7 5 13.8 7 18.0 3 9.7 City/Stockade 1 19.2 1 16.5 1 22.2 1 11.5 Hamilton Hill 1 28.7 1 19.4 2 66.2 2 21.2 Goose Hill/Union 2 38.4 2 10.1 3 14.3 2 13.0 Rural-West 2 96.4 1 10.2 2 11.7 2 17.4 Niskayuna 3 13.0 5 10.4 4 7.5 3 6.5 Scotia/Glenville 5 20.6 7 15.0 8 14.0 3 9.2 Rotterdam 3 17.4 4 12.0 5 12.4 5 17.3
Mortality Rates by Neighborhood NYS Department of Health, Vital Statistics 2012-2016, Age-Adjusted Rate per 100,000
*N is
cal
culat
ed a
s th
e av
erag
e nu
mbe
r of d
eath
s pe
r yea
r. Ra
tes
in re
d ar
e hi
gher
than
NYS
, exc
l. NY
C. R
ates
in b
old
are
at le
ast 5
0% h
ighe
r tha
n NY
S, e
xcl.
NYC.
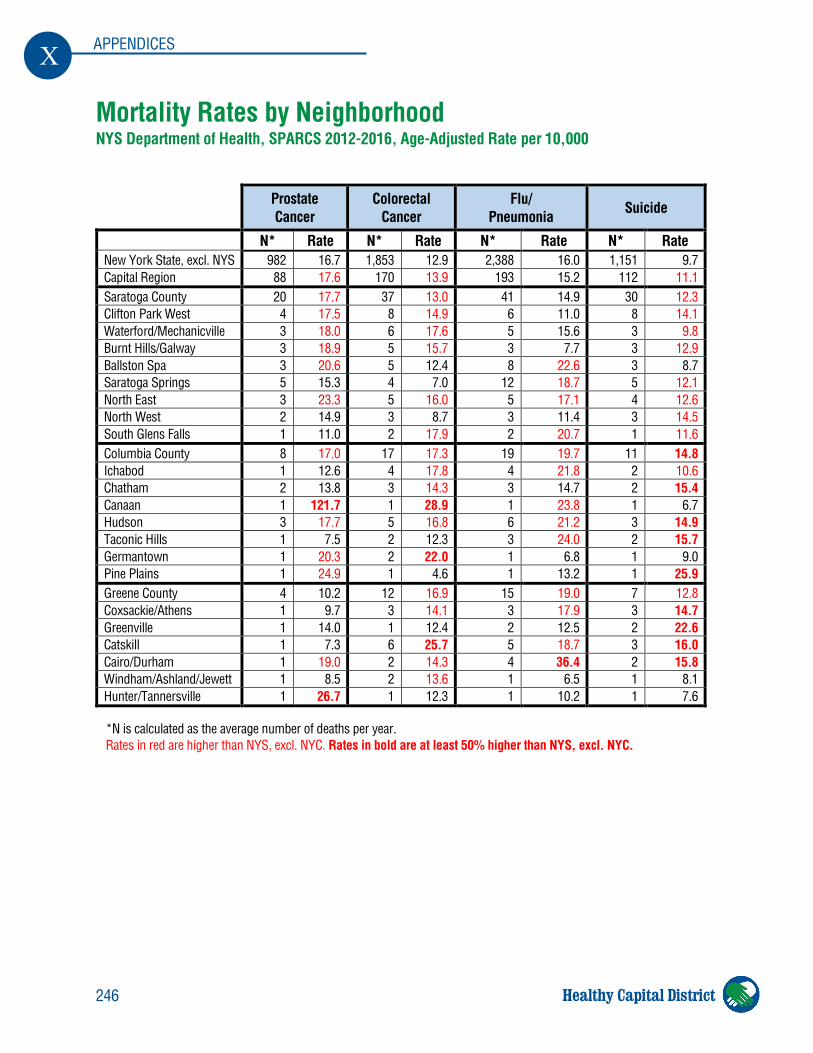
246
X APPENDICES
Healthy Capital District
Mortality Rates by Neighborhood NYS Department of Health, SPARCS 2012-2016, Age-Adjusted Rate per 10,000
Prostate Cancer
Colorectal Cancer
Flu/ Pneumonia Suicide
N* Rate N* Rate N* Rate N* Rate New York State, excl. NYS 982 16.7 1,853 12.9 2,388 16.0 1,151 9.7 Capital Region 88 17.6 170 13.9 193 15.2 112 11.1 Saratoga County 20 17.7 37 13.0 41 14.9 30 12.3 Clifton Park West 4 17.5 8 14.9 6 11.0 8 14.1 Waterford/Mechanicville 3 18.0 6 17.6 5 15.6 3 9.8 Burnt Hills/Galway 3 18.9 5 15.7 3 7.7 3 12.9 Ballston Spa 3 20.6 5 12.4 8 22.6 3 8.7 Saratoga Springs 5 15.3 4 7.0 12 18.7 5 12.1 North East 3 23.3 5 16.0 5 17.1 4 12.6 North West 2 14.9 3 8.7 3 11.4 3 14.5 South Glens Falls 1 11.0 2 17.9 2 20.7 1 11.6 Columbia County 8 17.0 17 17.3 19 19.7 11 14.8 Ichabod 1 12.6 4 17.8 4 21.8 2 10.6 Chatham 2 13.8 3 14.3 3 14.7 2 15.4 Canaan 1 121.7 1 28.9 1 23.8 1 6.7 Hudson 3 17.7 5 16.8 6 21.2 3 14.9 Taconic Hills 1 7.5 2 12.3 3 24.0 2 15.7 Germantown 1 20.3 2 22.0 1 6.8 1 9.0 Pine Plains 1 24.9 1 4.6 1 13.2 1 25.9 Greene County 4 10.2 12 16.9 15 19.0 7 12.8 Coxsackie/Athens 1 9.7 3 14.1 3 17.9 3 14.7 Greenville 1 14.0 1 12.4 2 12.5 2 22.6 Catskill 1 7.3 6 25.7 5 18.7 3 16.0 Cairo/Durham 1 19.0 2 14.3 4 36.4 2 15.8 Windham/Ashland/Jewett 1 8.5 2 13.6 1 6.5 1 8.1 Hunter/Tannersville 1 26.7 1 12.3 1 10.2 1 7.6
*N is calculated as the average number of deaths per year. Rates in red are higher than NYS, excl. NYC. Rates in bold are at least 50% higher than NYS, excl. NYC.
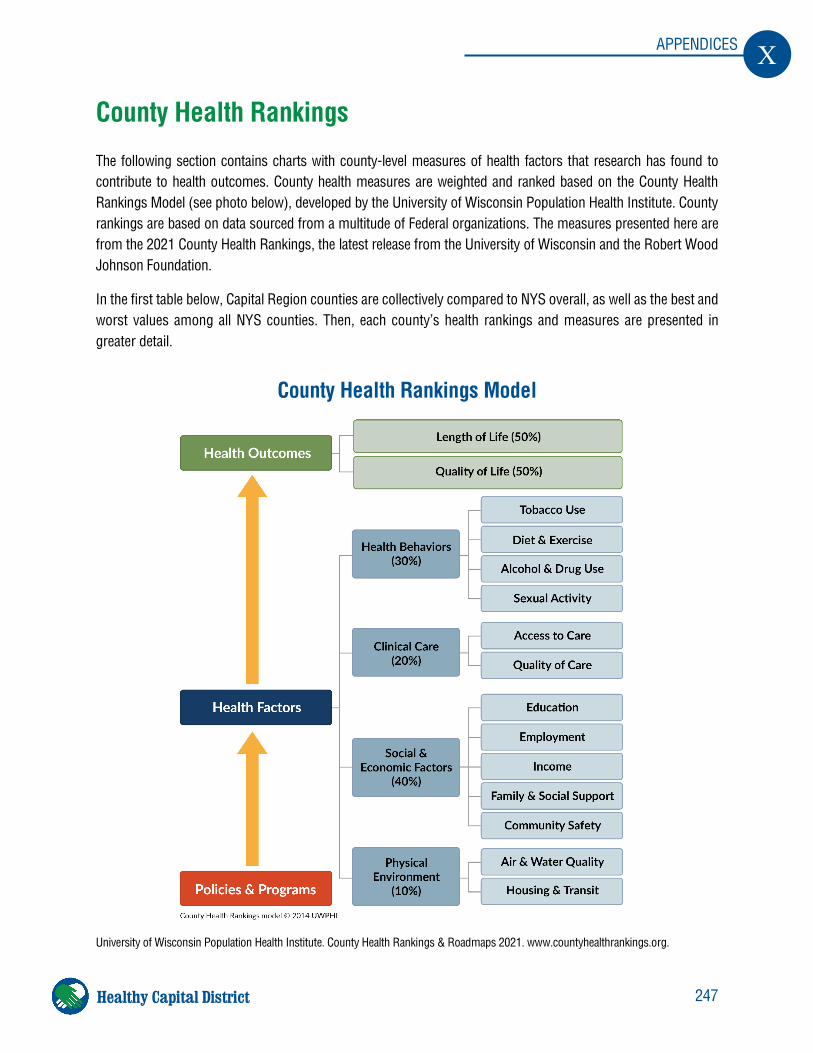
247
X APPENDICES
Healthy Capital District
County Health Rankings
The following section contains charts with county-level measures of health factors that research has found to contribute to health outcomes. County health measures are weighted and ranked based on the County Health Rankings Model (see photo below), developed by the University of Wisconsin Population Health Institute. County rankings are based on data sourced from a multitude of Federal organizations. The measures presented here are from the 2021 County Health Rankings, the latest release from the University of Wisconsin and the Robert Wood Johnson Foundation.
In the first table below, Capital Region counties are collectively compared to NYS overall, as well as the best and worst values among all NYS counties. Then, each county’s health rankings and measures are presented in greater detail.
County Health Rankings Model
University of Wisconsin Population Health Institute. County Health Rankings & Roadmaps 2021. www.countyhealthrankings.org.
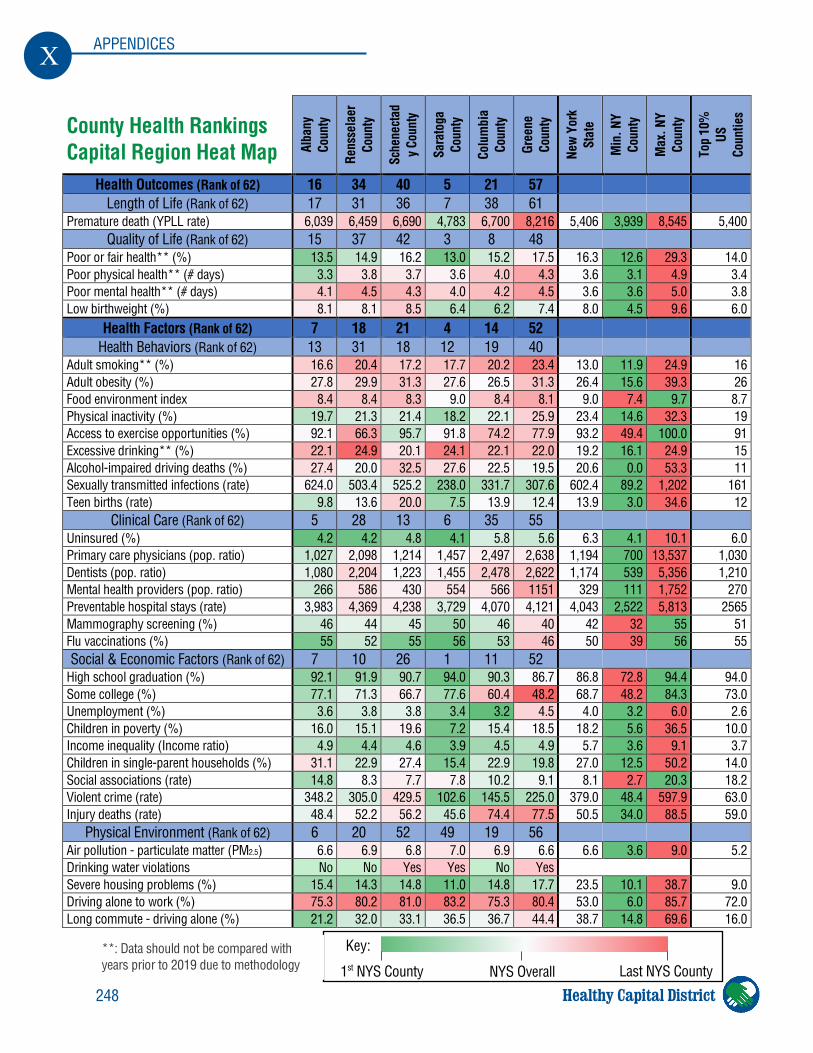
248
X APPENDICES
Healthy Capital District
County Health Rankings Capital Region Heat Map Al
bany
Co
unty
Rens
sela
er
Coun
ty
Sche
nect
ady C
ount
y
Sara
toga
Co
unty
Colu
mbi
a Co
unty
Gree
ne
Coun
ty
New
York
St
ate
Min
. NY
Coun
ty
Max
. NY
Coun
ty
Top
10%
US
Co
untie
s
Health Outcomes (Rank of 62) 16 34 40 5 21 57 Length of Life (Rank of 62) 17 31 36 7 38 61
Premature death (YPLL rate) 6,039 6,459 6,690 4,783 6,700 8,216 5,406 3,939 8,545 5,400 Quality of Life (Rank of 62) 15 37 42 3 8 48
Poor or fair health** (%) 13.5 14.9 16.2 13.0 15.2 17.5 16.3 12.6 29.3 14.0 Poor physical health** (# days) 3.3 3.8 3.7 3.6 4.0 4.3 3.6 3.1 4.9 3.4 Poor mental health** (# days) 4.1 4.5 4.3 4.0 4.2 4.5 3.6 3.6 5.0 3.8 Low birthweight (%) 8.1 8.1 8.5 6.4 6.2 7.4 8.0 4.5 9.6 6.0
Health Factors (Rank of 62) 7 18 21 4 14 52 Health Behaviors (Rank of 62) 13 31 18 12 19 40
Adult smoking** (%) 16.6 20.4 17.2 17.7 20.2 23.4 13.0 11.9 24.9 16 Adult obesity (%) 27.8 29.9 31.3 27.6 26.5 31.3 26.4 15.6 39.3 26 Food environment index 8.4 8.4 8.3 9.0 8.4 8.1 9.0 7.4 9.7 8.7 Physical inactivity (%) 19.7 21.3 21.4 18.2 22.1 25.9 23.4 14.6 32.3 19 Access to exercise opportunities (%) 92.1 66.3 95.7 91.8 74.2 77.9 93.2 49.4 100.0 91 Excessive drinking** (%) 22.1 24.9 20.1 24.1 22.1 22.0 19.2 16.1 24.9 15 Alcohol-impaired driving deaths (%) 27.4 20.0 32.5 27.6 22.5 19.5 20.6 0.0 53.3 11 Sexually transmitted infections (rate) 624.0 503.4 525.2 238.0 331.7 307.6 602.4 89.2 1,202 161 Teen births (rate) 9.8 13.6 20.0 7.5 13.9 12.4 13.9 3.0 34.6 12
Clinical Care (Rank of 62) 5 28 13 6 35 55 Uninsured (%) 4.2 4.2 4.8 4.1 5.8 5.6 6.3 4.1 10.1 6.0 Primary care physicians (pop. ratio) 1,027 2,098 1,214 1,457 2,497 2,638 1,194 700 13,537 1,030 Dentists (pop. ratio) 1,080 2,204 1,223 1,455 2,478 2,622 1,174 539 5,356 1,210 Mental health providers (pop. ratio) 266 586 430 554 566 1151 329 111 1,752 270 Preventable hospital stays (rate) 3,983 4,369 4,238 3,729 4,070 4,121 4,043 2,522 5,813 2565 Mammography screening (%) 46 44 45 50 46 40 42 32 55 51 Flu vaccinations (%) 55 52 55 56 53 46 50 39 56 55 Social & Economic Factors (Rank of 62) 7 10 26 1 11 52
High school graduation (%) 92.1 91.9 90.7 94.0 90.3 86.7 86.8 72.8 94.4 94.0 Some college (%) 77.1 71.3 66.7 77.6 60.4 48.2 68.7 48.2 84.3 73.0 Unemployment (%) 3.6 3.8 3.8 3.4 3.2 4.5 4.0 3.2 6.0 2.6 Children in poverty (%) 16.0 15.1 19.6 7.2 15.4 18.5 18.2 5.6 36.5 10.0 Income inequality (Income ratio) 4.9 4.4 4.6 3.9 4.5 4.9 5.7 3.6 9.1 3.7 Children in single-parent households (%) 31.1 22.9 27.4 15.4 22.9 19.8 27.0 12.5 50.2 14.0 Social associations (rate) 14.8 8.3 7.7 7.8 10.2 9.1 8.1 2.7 20.3 18.2 Violent crime (rate) 348.2 305.0 429.5 102.6 145.5 225.0 379.0 48.4 597.9 63.0 Injury deaths (rate) 48.4 52.2 56.2 45.6 74.4 77.5 50.5 34.0 88.5 59.0
Physical Environment (Rank of 62) 6 20 52 49 19 56 Air pollution - particulate matter (PM2.5) 6.6 6.9 6.8 7.0 6.9 6.6 6.6 3.6 9.0 5.2 Drinking water violations No No Yes Yes No Yes Severe housing problems (%) 15.4 14.3 14.8 11.0 14.8 17.7 23.5 10.1 38.7 9.0 Driving alone to work (%) 75.3 80.2 81.0 83.2 75.3 80.4 53.0 6.0 85.7 72.0 Long commute - driving alone (%) 21.2 32.0 33.1 36.5 36.7 44.4 38.7 14.8 69.6 16.0
Last NYS County 1st NYS County NYS Overall
Key: **: Data should not be compared with years prior to 2019 due to methodology
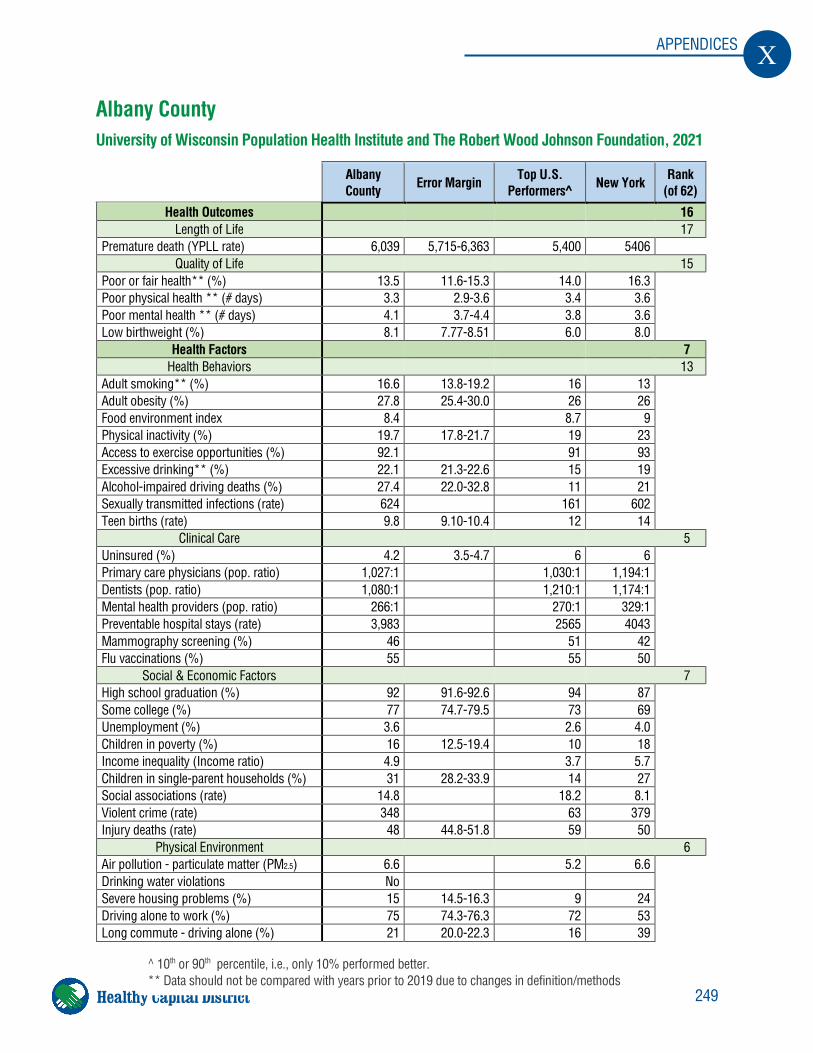
249
X APPENDICES
Healthy Capital District
Albany County University of Wisconsin Population Health Institute and The Robert Wood Johnson Foundation, 2021
Albany County Error Margin Top U.S.
Performers^ New York Rank (of 62)
Health Outcomes 16 Length of Life 17
Premature death (YPLL rate) 6,039 5,715-6,363 5,400 5406
Quality of Life 15 Poor or fair health** (%) 13.5 11.6-15.3 14.0 16.3
Poor physical health ** (# days) 3.3 2.9-3.6 3.4 3.6 Poor mental health ** (# days) 4.1 3.7-4.4 3.8 3.6 Low birthweight (%) 8.1 7.77-8.51 6.0 8.0
Health Factors 7 Health Behaviors 13
Adult smoking** (%) 16.6 13.8-19.2 16 13
Adult obesity (%) 27.8 25.4-30.0 26 26 Food environment index 8.4 8.7 9 Physical inactivity (%) 19.7 17.8-21.7 19 23 Access to exercise opportunities (%) 92.1 91 93 Excessive drinking** (%) 22.1 21.3-22.6 15 19 Alcohol-impaired driving deaths (%) 27.4 22.0-32.8 11 21 Sexually transmitted infections (rate) 624 161 602 Teen births (rate) 9.8 9.10-10.4 12 14
Clinical Care 5 Uninsured (%) 4.2 3.5-4.7 6 6
Primary care physicians (pop. ratio) 1,027:1 1,030:1 1,194:1 Dentists (pop. ratio) 1,080:1 1,210:1 1,174:1 Mental health providers (pop. ratio) 266:1 270:1 329:1 Preventable hospital stays (rate) 3,983 2565 4043 Mammography screening (%) 46 51 42 Flu vaccinations (%) 55 55 50
Social & Economic Factors 7 High school graduation (%) 92 91.6-92.6 94 87
Some college (%) 77 74.7-79.5 73 69 Unemployment (%) 3.6 2.6 4.0 Children in poverty (%) 16 12.5-19.4 10 18 Income inequality (Income ratio) 4.9 3.7 5.7 Children in single-parent households (%) 31 28.2-33.9 14 27 Social associations (rate) 14.8 18.2 8.1 Violent crime (rate) 348 63 379 Injury deaths (rate) 48 44.8-51.8 59 50
Physical Environment 6 Air pollution - particulate matter (PM2.5) 6.6 5.2 6.6
Drinking water violations No Severe housing problems (%) 15 14.5-16.3 9 24 Driving alone to work (%) 75 74.3-76.3 72 53 Long commute - driving alone (%) 21 20.0-22.3 16 39
^ 10th or 90th percentile, i.e., only 10% performed better. ** Data should not be compared with years prior to 2019 due to changes in definition/methods
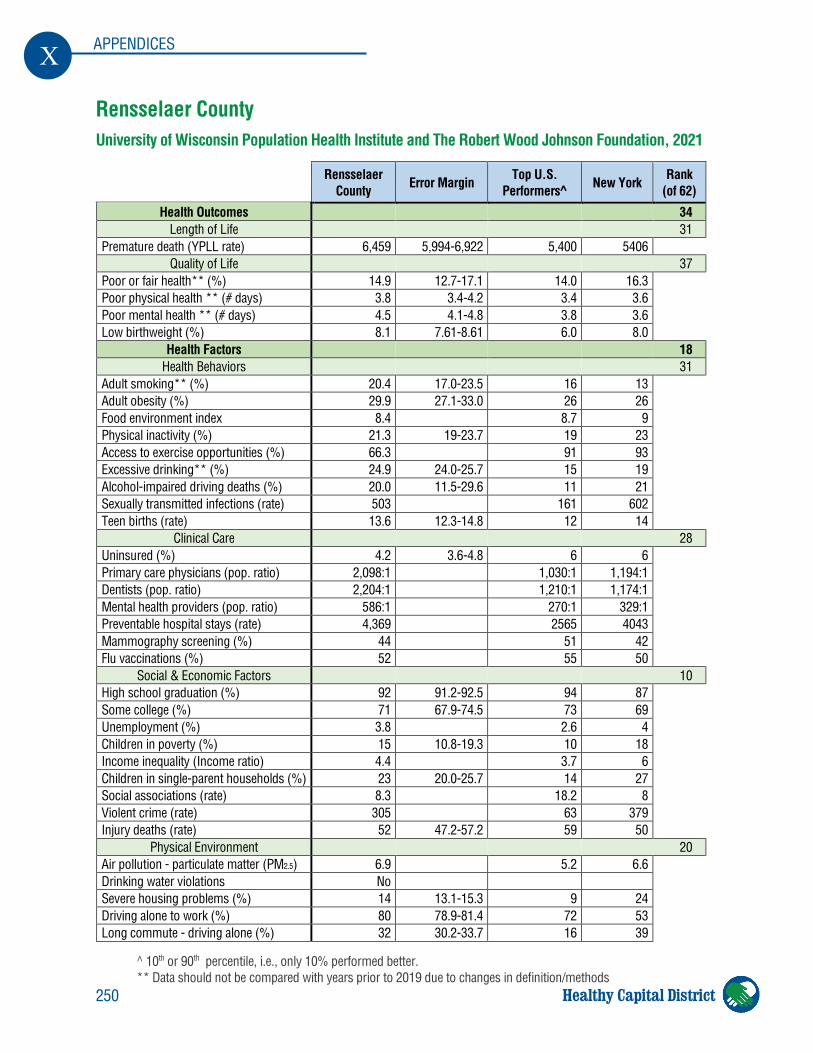
250
X APPENDICES
Healthy Capital District
Rensselaer County University of Wisconsin Population Health Institute and The Robert Wood Johnson Foundation, 2021
Rensselaer County Error Margin Top U.S.
Performers^ New York Rank (of 62)
Health Outcomes 34 Length of Life 31
Premature death (YPLL rate) 6,459 5,994-6,922 5,400 5406 Quality of Life 37
Poor or fair health** (%) 14.9 12.7-17.1 14.0 16.3 Poor physical health ** (# days) 3.8 3.4-4.2 3.4 3.6 Poor mental health ** (# days) 4.5 4.1-4.8 3.8 3.6 Low birthweight (%) 8.1 7.61-8.61 6.0 8.0
Health Factors 18 Health Behaviors 31
Adult smoking** (%) 20.4 17.0-23.5 16 13 Adult obesity (%) 29.9 27.1-33.0 26 26 Food environment index 8.4 8.7 9 Physical inactivity (%) 21.3 19-23.7 19 23 Access to exercise opportunities (%) 66.3 91 93 Excessive drinking** (%) 24.9 24.0-25.7 15 19 Alcohol-impaired driving deaths (%) 20.0 11.5-29.6 11 21 Sexually transmitted infections (rate) 503 161 602 Teen births (rate) 13.6 12.3-14.8 12 14
Clinical Care 28 Uninsured (%) 4.2 3.6-4.8 6 6 Primary care physicians (pop. ratio) 2,098:1 1,030:1 1,194:1 Dentists (pop. ratio) 2,204:1 1,210:1 1,174:1 Mental health providers (pop. ratio) 586:1 270:1 329:1 Preventable hospital stays (rate) 4,369 2565 4043 Mammography screening (%) 44 51 42 Flu vaccinations (%) 52 55 50
Social & Economic Factors 10 High school graduation (%) 92 91.2-92.5 94 87 Some college (%) 71 67.9-74.5 73 69 Unemployment (%) 3.8 2.6 4 Children in poverty (%) 15 10.8-19.3 10 18 Income inequality (Income ratio) 4.4 3.7 6 Children in single-parent households (%) 23 20.0-25.7 14 27 Social associations (rate) 8.3 18.2 8 Violent crime (rate) 305 63 379 Injury deaths (rate) 52 47.2-57.2 59 50
Physical Environment 20 Air pollution - particulate matter (PM2.5) 6.9 5.2 6.6 Drinking water violations No Severe housing problems (%) 14 13.1-15.3 9 24 Driving alone to work (%) 80 78.9-81.4 72 53 Long commute - driving alone (%) 32 30.2-33.7 16 39
^ 10th or 90th percentile, i.e., only 10% performed better. ** Data should not be compared with years prior to 2019 due to changes in definition/methods
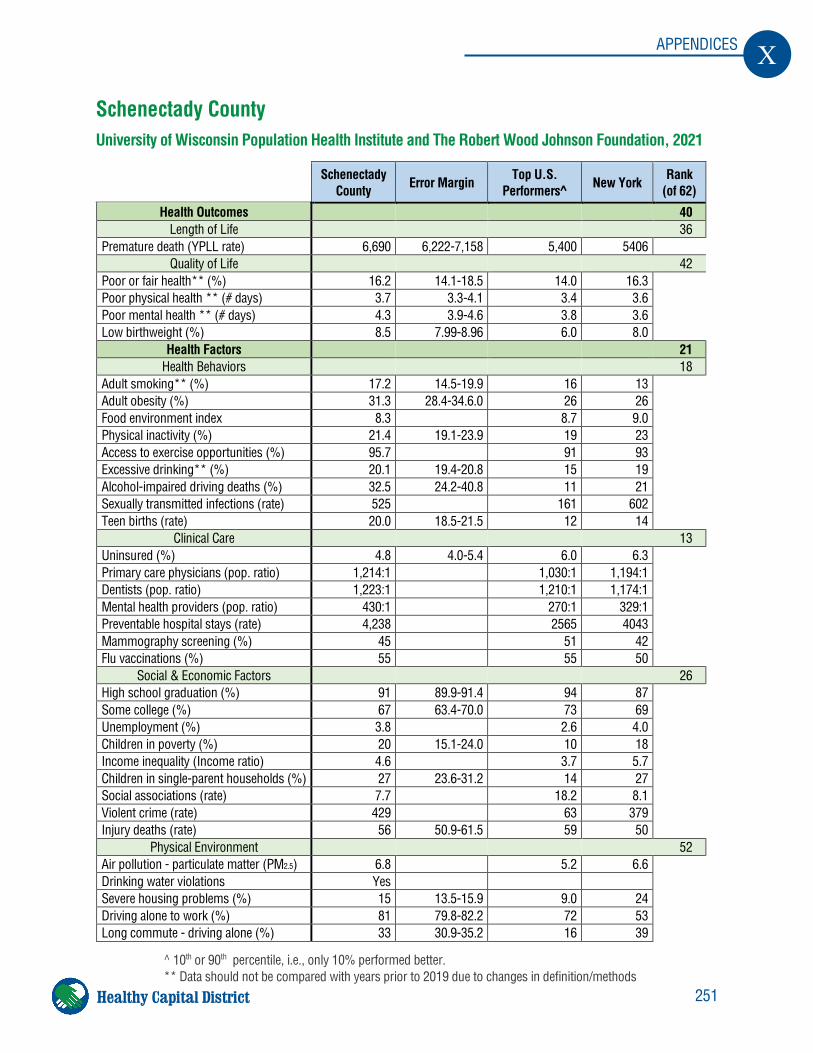
251
X APPENDICES
Healthy Capital District
Schenectady County University of Wisconsin Population Health Institute and The Robert Wood Johnson Foundation, 2021
Schenectady County Error Margin Top U.S.
Performers^ New York Rank (of 62)
Health Outcomes 40 Length of Life 36
Premature death (YPLL rate) 6,690 6,222-7,158 5,400 5406 Quality of Life 42
Poor or fair health** (%) 16.2 14.1-18.5 14.0 16.3 Poor physical health ** (# days) 3.7 3.3-4.1 3.4 3.6 Poor mental health ** (# days) 4.3 3.9-4.6 3.8 3.6 Low birthweight (%) 8.5 7.99-8.96 6.0 8.0
Health Factors 21 Health Behaviors 18
Adult smoking** (%) 17.2 14.5-19.9 16 13 Adult obesity (%) 31.3 28.4-34.6.0 26 26 Food environment index 8.3 8.7 9.0 Physical inactivity (%) 21.4 19.1-23.9 19 23 Access to exercise opportunities (%) 95.7 91 93 Excessive drinking** (%) 20.1 19.4-20.8 15 19 Alcohol-impaired driving deaths (%) 32.5 24.2-40.8 11 21 Sexually transmitted infections (rate) 525 161 602 Teen births (rate) 20.0 18.5-21.5 12 14
Clinical Care 13 Uninsured (%) 4.8 4.0-5.4 6.0 6.3 Primary care physicians (pop. ratio) 1,214:1 1,030:1 1,194:1 Dentists (pop. ratio) 1,223:1 1,210:1 1,174:1 Mental health providers (pop. ratio) 430:1 270:1 329:1 Preventable hospital stays (rate) 4,238 2565 4043 Mammography screening (%) 45 51 42 Flu vaccinations (%) 55 55 50
Social & Economic Factors 26 High school graduation (%) 91 89.9-91.4 94 87 Some college (%) 67 63.4-70.0 73 69 Unemployment (%) 3.8 2.6 4.0 Children in poverty (%) 20 15.1-24.0 10 18 Income inequality (Income ratio) 4.6 3.7 5.7 Children in single-parent households (%) 27 23.6-31.2 14 27 Social associations (rate) 7.7 18.2 8.1 Violent crime (rate) 429 63 379 Injury deaths (rate) 56 50.9-61.5 59 50
Physical Environment 52 Air pollution - particulate matter (PM2.5) 6.8 5.2 6.6 Drinking water violations Yes Severe housing problems (%) 15 13.5-15.9 9.0 24 Driving alone to work (%) 81 79.8-82.2 72 53 Long commute - driving alone (%) 33 30.9-35.2 16 39
^ 10th or 90th percentile, i.e., only 10% performed better. ** Data should not be compared with years prior to 2019 due to changes in definition/methods
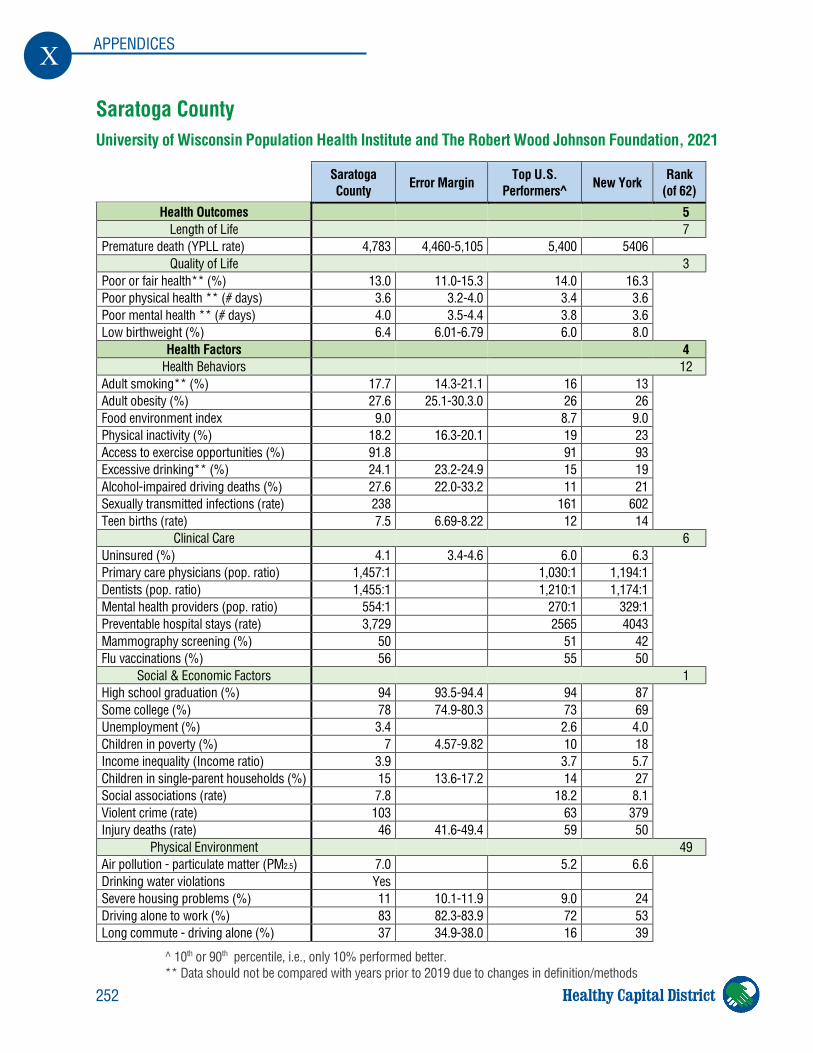
252
X APPENDICES
Healthy Capital District
Saratoga County University of Wisconsin Population Health Institute and The Robert Wood Johnson Foundation, 2021
Saratoga County Error Margin Top U.S.
Performers^ New York Rank (of 62)
Health Outcomes 5 Length of Life 7
Premature death (YPLL rate) 4,783 4,460-5,105 5,400 5406 Quality of Life 3
Poor or fair health** (%) 13.0 11.0-15.3 14.0 16.3 Poor physical health ** (# days) 3.6 3.2-4.0 3.4 3.6 Poor mental health ** (# days) 4.0 3.5-4.4 3.8 3.6 Low birthweight (%) 6.4 6.01-6.79 6.0 8.0
Health Factors 4 Health Behaviors 12
Adult smoking** (%) 17.7 14.3-21.1 16 13 Adult obesity (%) 27.6 25.1-30.3.0 26 26 Food environment index 9.0 8.7 9.0 Physical inactivity (%) 18.2 16.3-20.1 19 23 Access to exercise opportunities (%) 91.8 91 93 Excessive drinking** (%) 24.1 23.2-24.9 15 19 Alcohol-impaired driving deaths (%) 27.6 22.0-33.2 11 21 Sexually transmitted infections (rate) 238 161 602 Teen births (rate) 7.5 6.69-8.22 12 14
Clinical Care 6 Uninsured (%) 4.1 3.4-4.6 6.0 6.3 Primary care physicians (pop. ratio) 1,457:1 1,030:1 1,194:1 Dentists (pop. ratio) 1,455:1 1,210:1 1,174:1 Mental health providers (pop. ratio) 554:1 270:1 329:1 Preventable hospital stays (rate) 3,729 2565 4043 Mammography screening (%) 50 51 42 Flu vaccinations (%) 56 55 50
Social & Economic Factors 1 High school graduation (%) 94 93.5-94.4 94 87 Some college (%) 78 74.9-80.3 73 69 Unemployment (%) 3.4 2.6 4.0 Children in poverty (%) 7 4.57-9.82 10 18 Income inequality (Income ratio) 3.9 3.7 5.7 Children in single-parent households (%) 15 13.6-17.2 14 27 Social associations (rate) 7.8 18.2 8.1 Violent crime (rate) 103 63 379 Injury deaths (rate) 46 41.6-49.4 59 50
Physical Environment 49 Air pollution - particulate matter (PM2.5) 7.0 5.2 6.6 Drinking water violations Yes Severe housing problems (%) 11 10.1-11.9 9.0 24 Driving alone to work (%) 83 82.3-83.9 72 53 Long commute - driving alone (%) 37 34.9-38.0 16 39
^ 10th or 90th percentile, i.e., only 10% performed better. ** Data should not be compared with years prior to 2019 due to changes in definition/methods
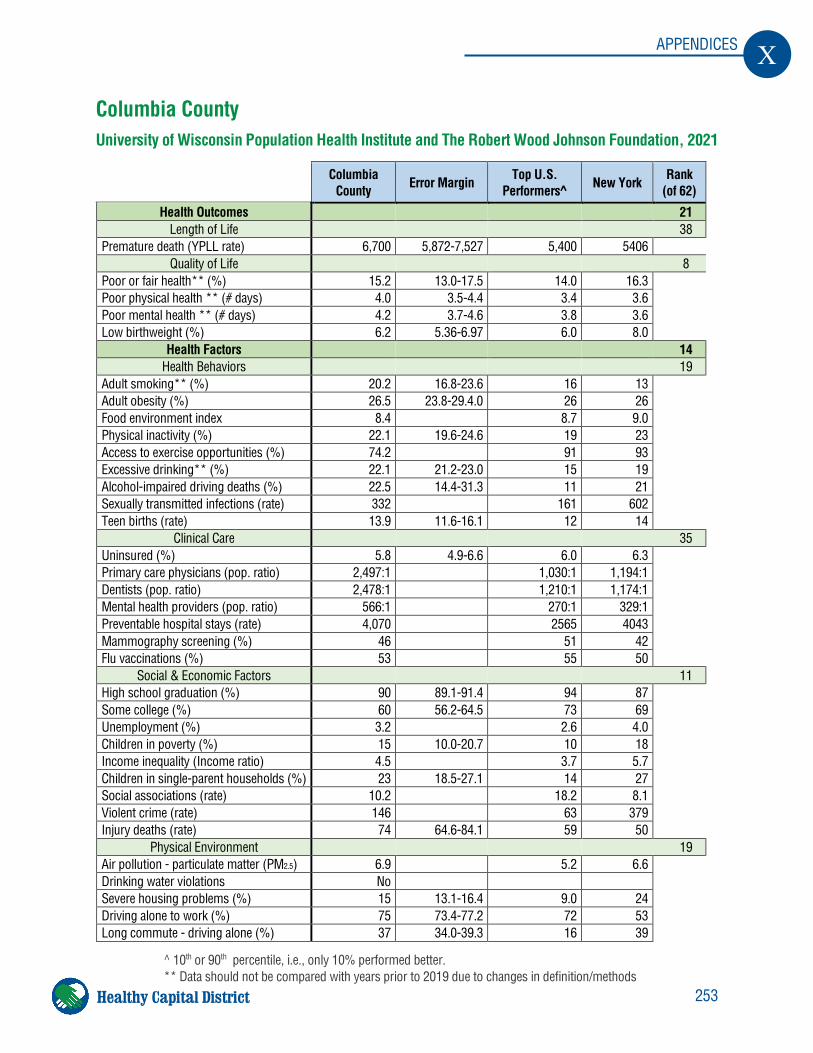
253
X APPENDICES
Healthy Capital District
Columbia County University of Wisconsin Population Health Institute and The Robert Wood Johnson Foundation, 2021
Columbia County Error Margin Top U.S.
Performers^ New York Rank (of 62)
Health Outcomes 21 Length of Life 38
Premature death (YPLL rate) 6,700 5,872-7,527 5,400 5406 Quality of Life 8
Poor or fair health** (%) 15.2 13.0-17.5 14.0 16.3 Poor physical health ** (# days) 4.0 3.5-4.4 3.4 3.6 Poor mental health ** (# days) 4.2 3.7-4.6 3.8 3.6 Low birthweight (%) 6.2 5.36-6.97 6.0 8.0
Health Factors 14 Health Behaviors 19
Adult smoking** (%) 20.2 16.8-23.6 16 13 Adult obesity (%) 26.5 23.8-29.4.0 26 26 Food environment index 8.4 8.7 9.0 Physical inactivity (%) 22.1 19.6-24.6 19 23 Access to exercise opportunities (%) 74.2 91 93 Excessive drinking** (%) 22.1 21.2-23.0 15 19 Alcohol-impaired driving deaths (%) 22.5 14.4-31.3 11 21 Sexually transmitted infections (rate) 332 161 602 Teen births (rate) 13.9 11.6-16.1 12 14
Clinical Care 35 Uninsured (%) 5.8 4.9-6.6 6.0 6.3 Primary care physicians (pop. ratio) 2,497:1 1,030:1 1,194:1 Dentists (pop. ratio) 2,478:1 1,210:1 1,174:1 Mental health providers (pop. ratio) 566:1 270:1 329:1 Preventable hospital stays (rate) 4,070 2565 4043 Mammography screening (%) 46 51 42 Flu vaccinations (%) 53 55 50
Social & Economic Factors 11 High school graduation (%) 90 89.1-91.4 94 87 Some college (%) 60 56.2-64.5 73 69 Unemployment (%) 3.2 2.6 4.0 Children in poverty (%) 15 10.0-20.7 10 18 Income inequality (Income ratio) 4.5 3.7 5.7 Children in single-parent households (%) 23 18.5-27.1 14 27 Social associations (rate) 10.2 18.2 8.1 Violent crime (rate) 146 63 379 Injury deaths (rate) 74 64.6-84.1 59 50
Physical Environment 19 Air pollution - particulate matter (PM2.5) 6.9 5.2 6.6 Drinking water violations No Severe housing problems (%) 15 13.1-16.4 9.0 24 Driving alone to work (%) 75 73.4-77.2 72 53 Long commute - driving alone (%) 37 34.0-39.3 16 39
^ 10th or 90th percentile, i.e., only 10% performed better. ** Data should not be compared with years prior to 2019 due to changes in definition/methods

254
X APPENDICES
Healthy Capital District
Greene County University of Wisconsin Population Health Institute and The Robert Wood Johnson Foundation, 2021
Greene County Error Margin Top U.S.
Performers^ New York Rank (of 62)
Health Outcomes 57 Length of Life 61
Premature death (YPLL rate) 8,216 7,199-9,232 5,400 5406 Quality of Life 48
Poor or fair health** (%) 17.5 15.3-19.7 14.0 16.3 Poor physical health ** (# days) 4.3 3.9-4.7 3.4 3.6 Poor mental health ** (# days) 4.5 4.1-4.8 3.8 3.6 Low birthweight (%) 7.4 6.47-8.42 6.0 8.0
Health Factors 52 Health Behaviors 40
Adult smoking** (%) 23.4 20.1-26.5 16 13 Adult obesity (%) 31.3 28.2-34.6.0 26 26 Food environment index 8.1 8.7 9.0 Physical inactivity (%) 25.9 23-28.7 19 23 Access to exercise opportunities (%) 77.9 91 93 Excessive drinking** (%) 22.0 21.0-22.7 15 19 Alcohol-impaired driving deaths (%) 19.5 11.7-28.3 11 21 Sexually transmitted infections (rate) 308 161 602 Teen births (rate) 12.4 10.1-15.1 12 14
Clinical Care 55 Uninsured (%) 5.6 4.7-6.4 6.0 6.3 Primary care physicians (pop. ratio) 2,638:1 1,030:1 1,194:1 Dentists (pop. ratio) 2,622:1 1,210:1 1,174:1 Mental health providers (pop. ratio) 1,151:1 270:1 329:1 Preventable hospital stays (rate) 4,121 2565 4043 Mammography screening (%) 40 51 42 Flu vaccinations (%) 46 55 50
Social & Economic Factors 52 High school graduation (%) 87 84.9-88.4 94 87 Some college (%) 48 43.0-53.3 73 69 Unemployment (%) 4.5 2.6 4.0 Children in poverty (%) 19 11.9-25.0 10 18 Income inequality (Income ratio) 4.9 3.7 5.7 Children in single-parent households (%) 20 14.5-24.9 14 27 Social associations (rate) 9.1 18.2 8.1 Violent crime (rate) 225 63 379 Injury deaths (rate) 78 66.3-88.7 59 50
Physical Environment 56 Air pollution - particulate matter (PM2.5) 6.6 5.2 6.6 Drinking water violations Yes Severe housing problems (%) 18 15.2-20.2 9.0 24 Driving alone to work (%) 80 77.6-83.0 72 53 Long commute - driving alone (%) 44 40.0-48.7 16 39
^ 10th or 90th percentile, i.e., only 10% performed better. ** Data should not be compared with years prior to 2019 due to changes in definition/methods
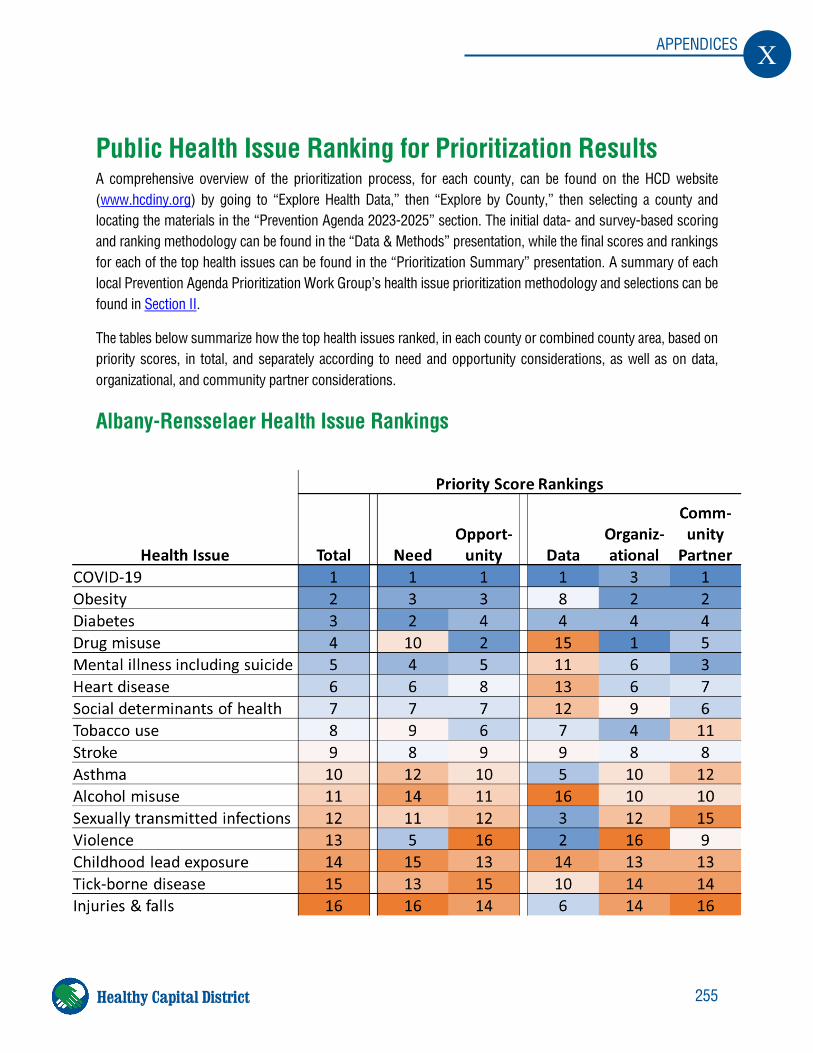
255
X APPENDICES
Healthy Capital District
Public Health Issue Ranking for Prioritization Results A comprehensive overview of the prioritization process, for each county, can be found on the HCD website (www.hcdiny.org) by going to “Explore Health Data,” then “Explore by County,” then selecting a county and locating the materials in the “Prevention Agenda 2023-2025” section. The initial data- and survey-based scoring and ranking methodology can be found in the “Data & Methods” presentation, while the final scores and rankings for each of the top health issues can be found in the “Prioritization Summary” presentation. A summary of each local Prevention Agenda Prioritization Work Group’s health issue prioritization methodology and selections can be found in Section II.
The tables below summarize how the top health issues ranked, in each county or combined county area, based on priority scores, in total, and separately according to need and opportunity considerations, as well as on data, organizational, and community partner considerations.
Albany-Rensselaer Health Issue Rankings
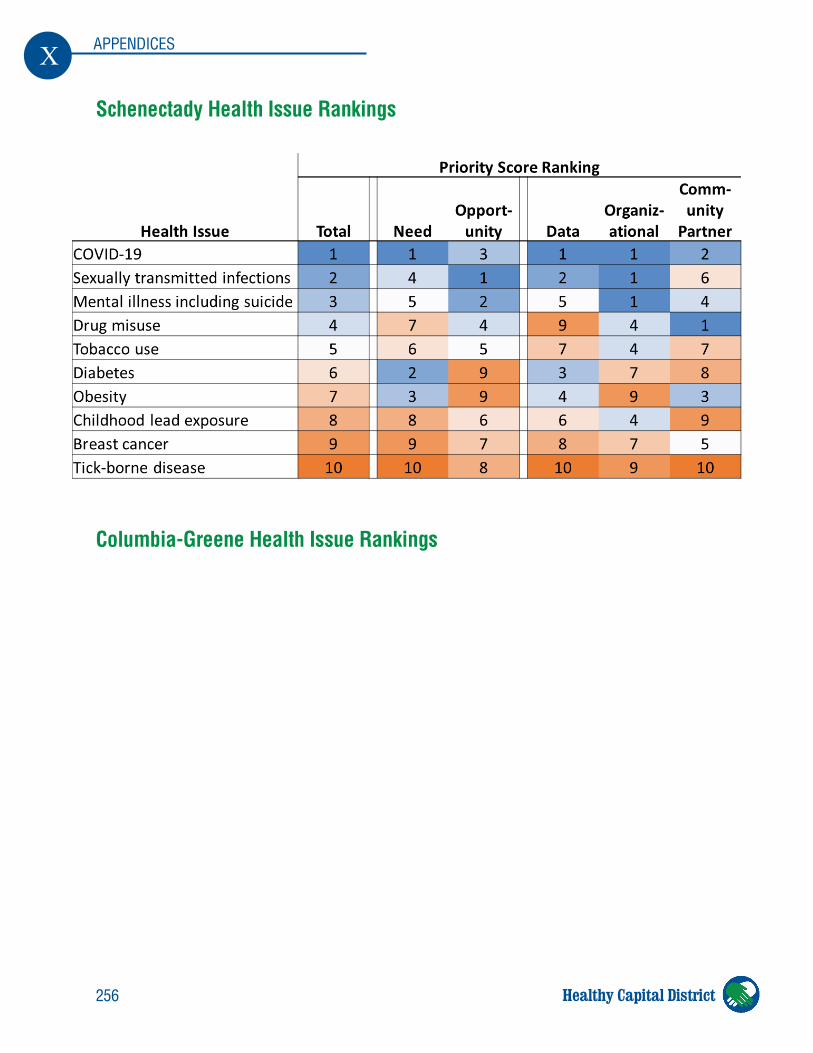
256
X APPENDICES
Healthy Capital District
Schenectady Health Issue Rankings
Columbia-Greene Health Issue Rankings
257
X APPENDICES
Healthy Capital District
2021 Capital Region Community Health Survey Results
Introduction The Healthy Capital District (HCD) conducted its fourth Community Health Survey of Capital Region residents from September 13th to November 3rd, 2021. The survey was conducted online and in paper format, and was offered in English- and Spanish-language versions. The survey was collaboratively created and distributed by HCD and its hospital and health department partners. The aim of the survey was to identify the major needs, gaps, and priorities facing Capital Region residents regarding the following aspects of public health:
• Public health priorities • Social determinants of health • Healthcare access & barriers • Mental health • Substance misuse • COVID-19 vaccination • Prevention & communication strategies
Sociodemographic information was also collected to gauge the representativeness of the surveyed sample of residents and to compare results by county, income level, and race/ethnicity. Survey questions and response options were developed by HCD, in collaboration with the Prevention Agenda Workgroup, and were based on prior editions from 2018, 2016, and 2013, as well as other resources from Montefiore Medical Center, the Kaiser Family Foundation, and the U.S. Preventive Services Task Force.
Response percentages are based on 2,104 responses from individuals who indicated they live in the county of Albany (n=547), Rensselaer (n=268), Schenectady (n=426), Saratoga (n=194), Columbia (n=387), or Greene (n=282). An additional 203 responses were received from individuals who either did not indicate their county of residence, or indicated they live in a county other than the 6 listed above. The survey took approximately 7 minutes to complete and 62% of those who opened the online survey completed it.
Participants who completed the survey were given the option to enter a cash prize drawing if they provided an email or phone number to be notified if they were randomly selected. Of the 2,307 total survey respondents, 1,744 participated in the drawing. The six winners were contacted directly and their first names and last initials were announced by HCD in a December, 2021 newsletter as well as in a January, 2022 email to participants.
The results of the survey are summarized on the following pages. The English language, paper version of the survey is included at the end of this section. To see the survey results in entirety, or to download the data:
• For the Capital Region, visit: https://www.hcdiny.org/tiles/index/display?alias=Survey2021 • For each county, as well as for Albany-Rensselaer or Columbia-Greene combined, visit:
https://www.hcdiny.org/content/sites/hcdi/CHNA2022/Community_Health_Needs_Survey_Results_by_County.pdf
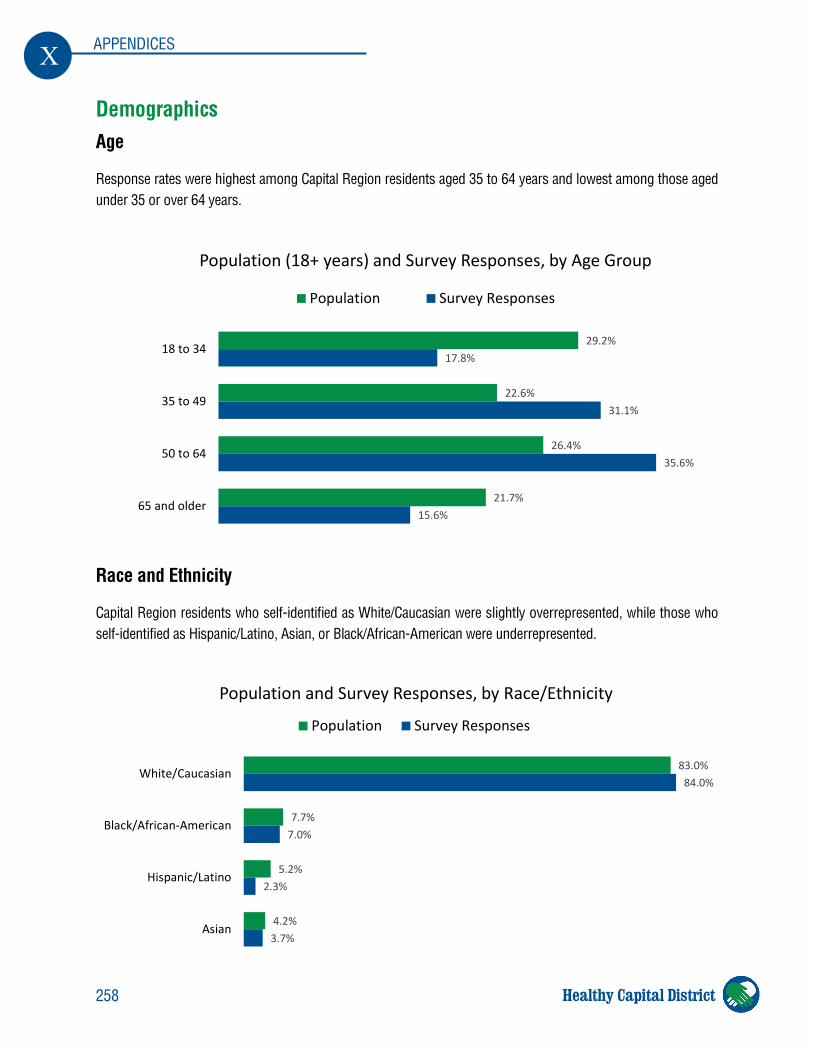
258
X APPENDICES
Healthy Capital District
Demographics Age
Response rates were highest among Capital Region residents aged 35 to 64 years and lowest among those aged under 35 or over 64 years.
Race and Ethnicity
Capital Region residents who self-identified as White/Caucasian were slightly overrepresented, while those who self-identified as Hispanic/Latino, Asian, or Black/African-American were underrepresented.
29.2%
22.6%
26.4%
21.7%
17.8%
31.1%
35.6%
15.6%
18 to 34
35 to 49
50 to 64
65 and older
Population (18+ years) and Survey Responses, by Age Group
Population Survey Responses
83.0%
7.7%
5.2%
4.2%
84.0%
7.0%
2.3%
3.7%
White/Caucasian
Black/African-American
Hispanic/Latino
Asian
Population and Survey Responses, by Race/Ethnicity
Population Survey Responses
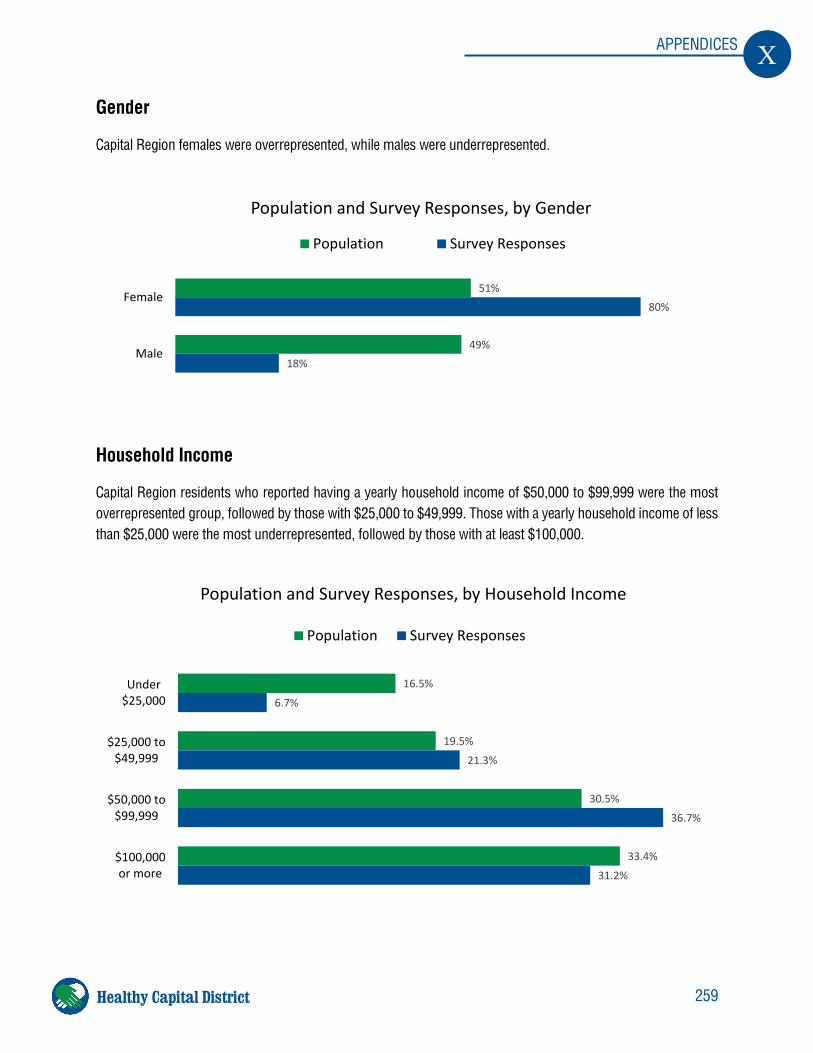
259
X APPENDICES
Healthy Capital District
Gender
Capital Region females were overrepresented, while males were underrepresented.
Household Income
Capital Region residents who reported having a yearly household income of $50,000 to $99,999 were the most overrepresented group, followed by those with $25,000 to $49,999. Those with a yearly household income of less than $25,000 were the most underrepresented, followed by those with at least $100,000.
51%
49%
80%
18%
Female
Male
Population and Survey Responses, by Gender
Population Survey Responses
16.5%
19.5%
30.5%
33.4%
6.7%
21.3%
36.7%
31.2%
Under$25,000
$25,000 to$49,999
$50,000 to$99,999
$100,000or more
Population and Survey Responses, by Household Income
Population Survey Responses
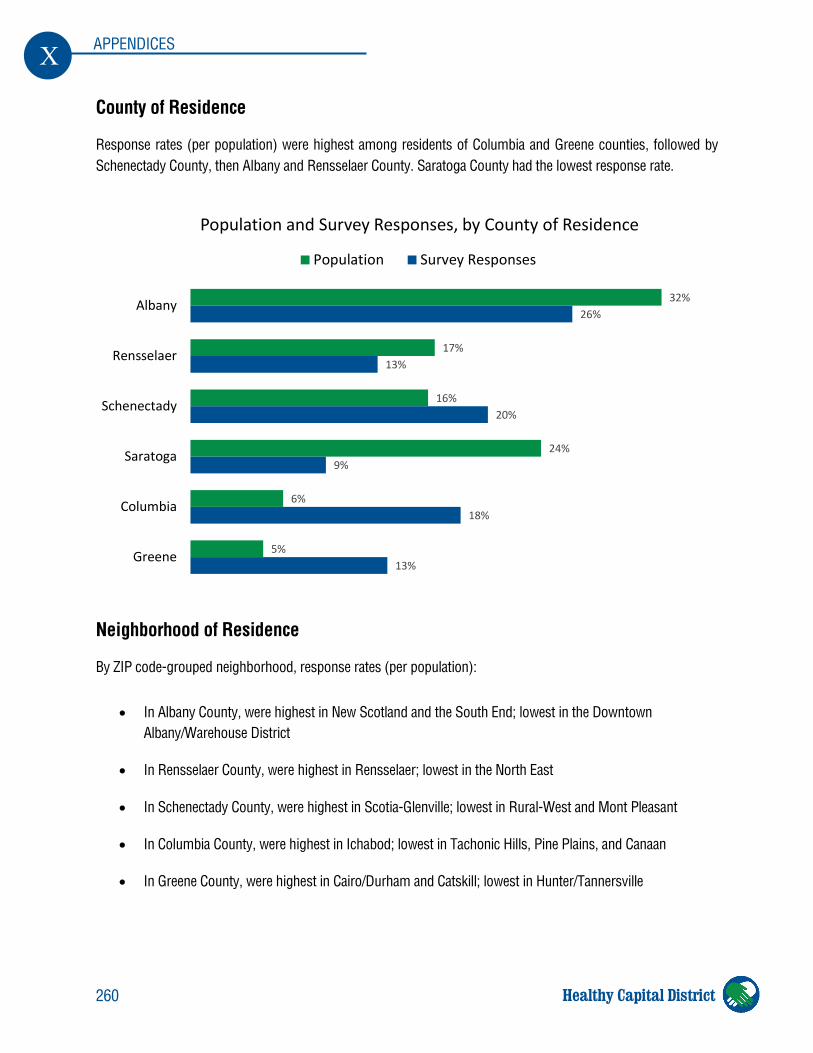
260
X APPENDICES
Healthy Capital District
County of Residence
Response rates (per population) were highest among residents of Columbia and Greene counties, followed by Schenectady County, then Albany and Rensselaer County. Saratoga County had the lowest response rate.
Neighborhood of Residence
By ZIP code-grouped neighborhood, response rates (per population):
• In Albany County, were highest in New Scotland and the South End; lowest in the Downtown Albany/Warehouse District
• In Rensselaer County, were highest in Rensselaer; lowest in the North East
• In Schenectady County, were highest in Scotia-Glenville; lowest in Rural-West and Mont Pleasant
• In Columbia County, were highest in Ichabod; lowest in Tachonic Hills, Pine Plains, and Canaan
• In Greene County, were highest in Cairo/Durham and Catskill; lowest in Hunter/Tannersville
32%
17%
16%
24%
6%
5%
26%
13%
20%
9%
18%
13%
Albany
Rensselaer
Schenectady
Saratoga
Columbia
Greene
Population and Survey Responses, by County of Residence
Population Survey Responses
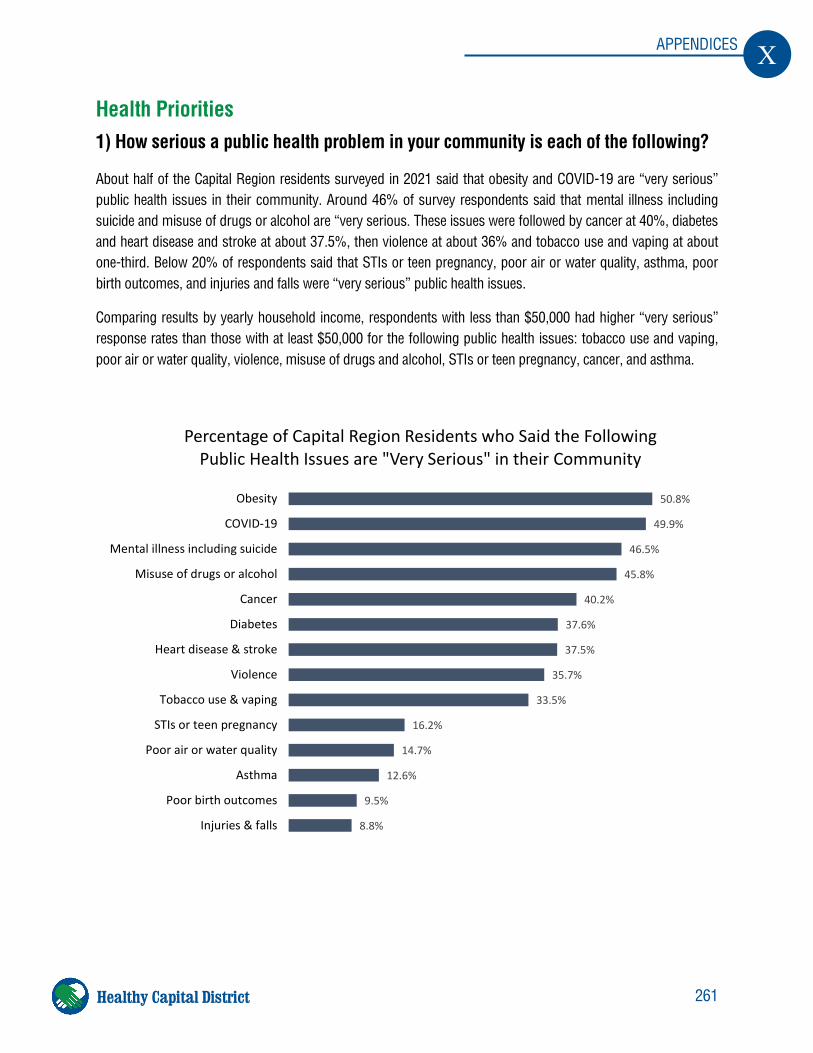
261
X APPENDICES
Healthy Capital District
Health Priorities 1) How serious a public health problem in your community is each of the following?
About half of the Capital Region residents surveyed in 2021 said that obesity and COVID-19 are “very serious” public health issues in their community. Around 46% of survey respondents said that mental illness including suicide and misuse of drugs or alcohol are “very serious. These issues were followed by cancer at 40%, diabetes and heart disease and stroke at about 37.5%, then violence at about 36% and tobacco use and vaping at about one-third. Below 20% of respondents said that STIs or teen pregnancy, poor air or water quality, asthma, poor birth outcomes, and injuries and falls were “very serious” public health issues.
Comparing results by yearly household income, respondents with less than $50,000 had higher “very serious” response rates than those with at least $50,000 for the following public health issues: tobacco use and vaping, poor air or water quality, violence, misuse of drugs and alcohol, STIs or teen pregnancy, cancer, and asthma.
50.8%
49.9%
46.5%
45.8%
40.2%
37.6%
37.5%
35.7%
33.5%
16.2%
14.7%
12.6%
9.5%
8.8%
Obesity
COVID-19
Mental illness including suicide
Misuse of drugs or alcohol
Cancer
Diabetes
Heart disease & stroke
Violence
Tobacco use & vaping
STIs or teen pregnancy
Poor air or water quality
Asthma
Poor birth outcomes
Injuries & falls
Percentage of Capital Region Residents who Said the Following Public Health Issues are "Very Serious" in their Community
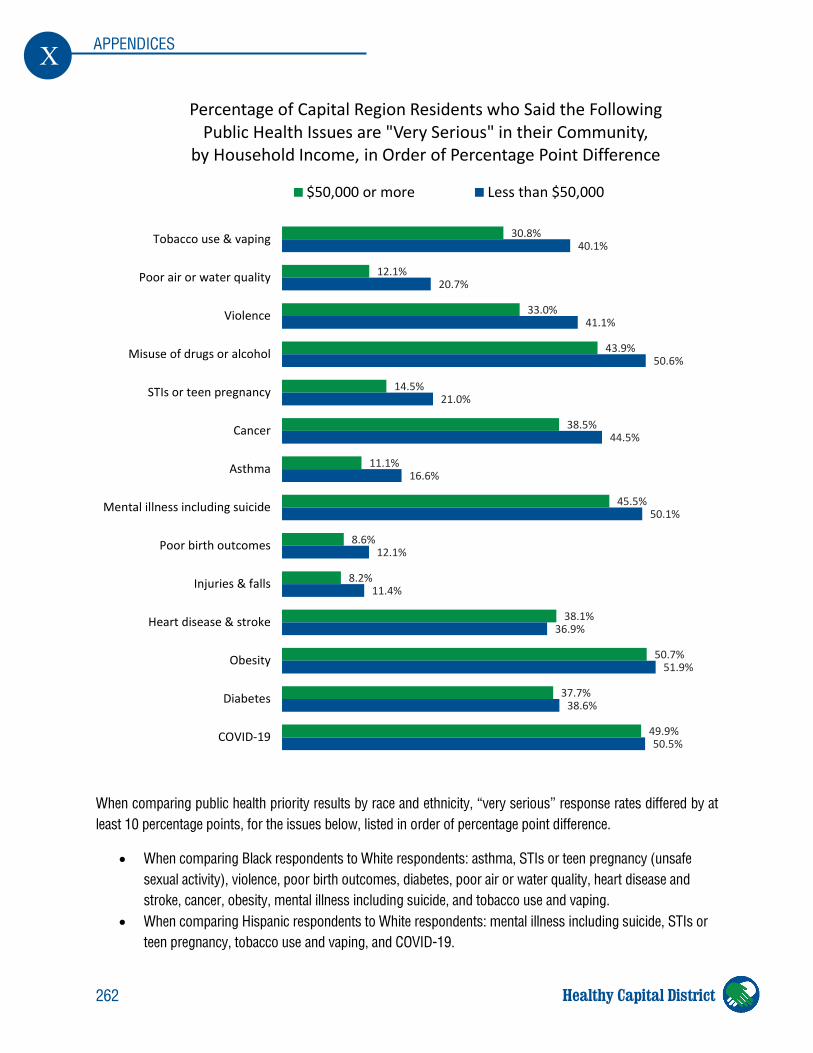
262
X APPENDICES
Healthy Capital District
When comparing public health priority results by race and ethnicity, “very serious” response rates differed by at least 10 percentage points, for the issues below, listed in order of percentage point difference.
• When comparing Black respondents to White respondents: asthma, STIs or teen pregnancy (unsafe sexual activity), violence, poor birth outcomes, diabetes, poor air or water quality, heart disease and stroke, cancer, obesity, mental illness including suicide, and tobacco use and vaping.
• When comparing Hispanic respondents to White respondents: mental illness including suicide, STIs or teen pregnancy, tobacco use and vaping, and COVID-19.
30.8%
12.1%
33.0%
43.9%
14.5%
38.5%
11.1%
45.5%
8.6%
8.2%
38.1%
50.7%
37.7%
49.9%
40.1%
20.7%
41.1%
50.6%
21.0%
44.5%
16.6%
50.1%
12.1%
11.4%
36.9%
51.9%
38.6%
50.5%
Tobacco use & vaping
Poor air or water quality
Violence
Misuse of drugs or alcohol
STIs or teen pregnancy
Cancer
Asthma
Mental illness including suicide
Poor birth outcomes
Injuries & falls
Heart disease & stroke
Obesity
Diabetes
COVID-19
Percentage of Capital Region Residents who Said the Following Public Health Issues are "Very Serious" in their Community,
by Household Income, in Order of Percentage Point Difference
$50,000 or more Less than $50,000
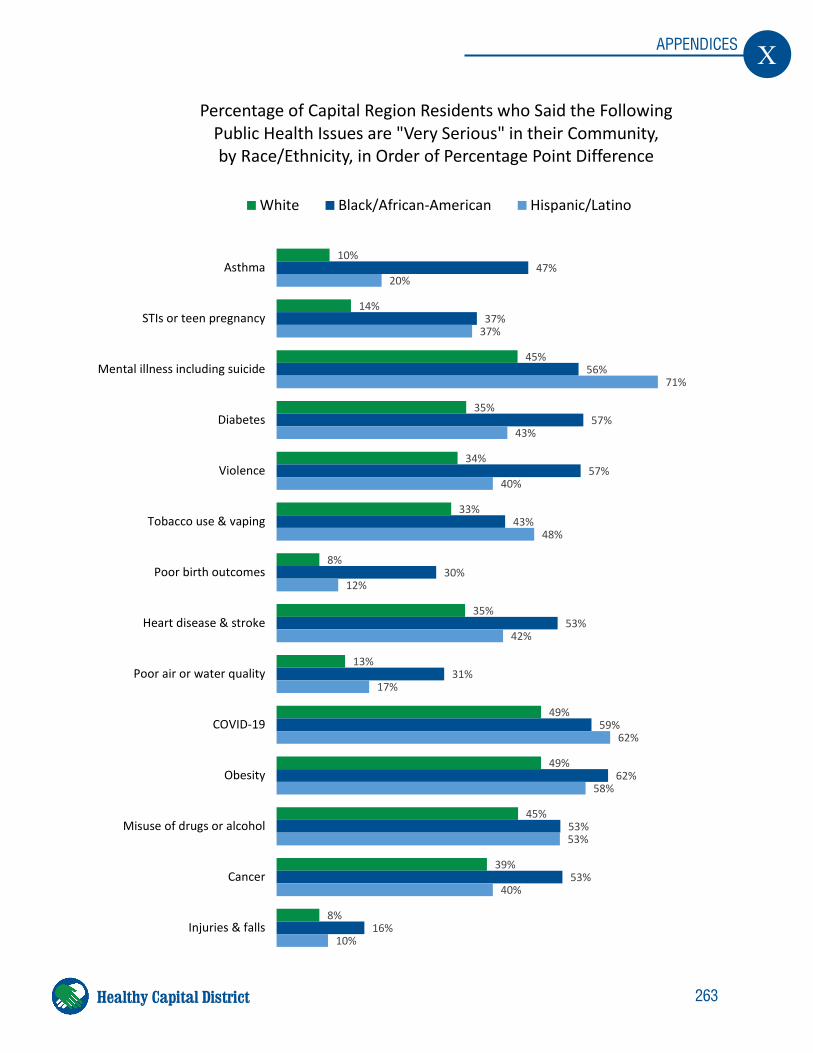
263
X APPENDICES
Healthy Capital District
10%
14%
45%
35%
34%
33%
8%
35%
13%
49%
49%
45%
39%
8%
47%
37%
56%
57%
57%
43%
30%
53%
31%
59%
62%
53%
53%
16%
20%
37%
71%
43%
40%
48%
12%
42%
17%
62%
58%
53%
40%
10%
Asthma
STIs or teen pregnancy
Mental illness including suicide
Diabetes
Violence
Tobacco use & vaping
Poor birth outcomes
Heart disease & stroke
Poor air or water quality
COVID-19
Obesity
Misuse of drugs or alcohol
Cancer
Injuries & falls
Percentage of Capital Region Residents who Said the Following Public Health Issues are "Very Serious" in their Community, by Race/Ethnicity, in Order of Percentage Point Difference
White Black/African-American Hispanic/Latino
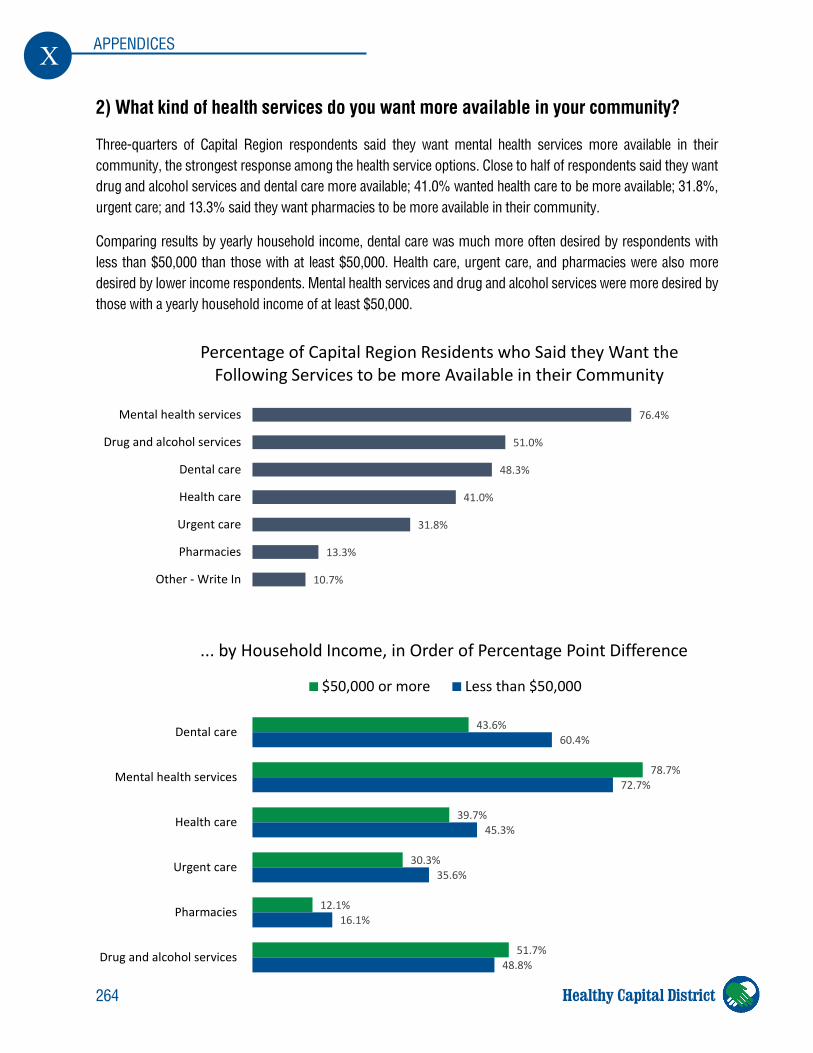
264
X APPENDICES
Healthy Capital District
2) What kind of health services do you want more available in your community?
Three-quarters of Capital Region respondents said they want mental health services more available in their community, the strongest response among the health service options. Close to half of respondents said they want drug and alcohol services and dental care more available; 41.0% wanted health care to be more available; 31.8%, urgent care; and 13.3% said they want pharmacies to be more available in their community.
Comparing results by yearly household income, dental care was much more often desired by respondents with less than $50,000 than those with at least $50,000. Health care, urgent care, and pharmacies were also more desired by lower income respondents. Mental health services and drug and alcohol services were more desired by those with a yearly household income of at least $50,000.
43.6%
78.7%
39.7%
30.3%
12.1%
51.7%
60.4%
72.7%
45.3%
35.6%
16.1%
48.8%
Dental care
Mental health services
Health care
Urgent care
Pharmacies
Drug and alcohol services
... by Household Income, in Order of Percentage Point Difference
$50,000 or more Less than $50,000
76.4%
51.0%
48.3%
41.0%
31.8%
13.3%
10.7%
Mental health services
Drug and alcohol services
Dental care
Health care
Urgent care
Pharmacies
Other - Write In
Percentage of Capital Region Residents who Said they Want the Following Services to be more Available in their Community
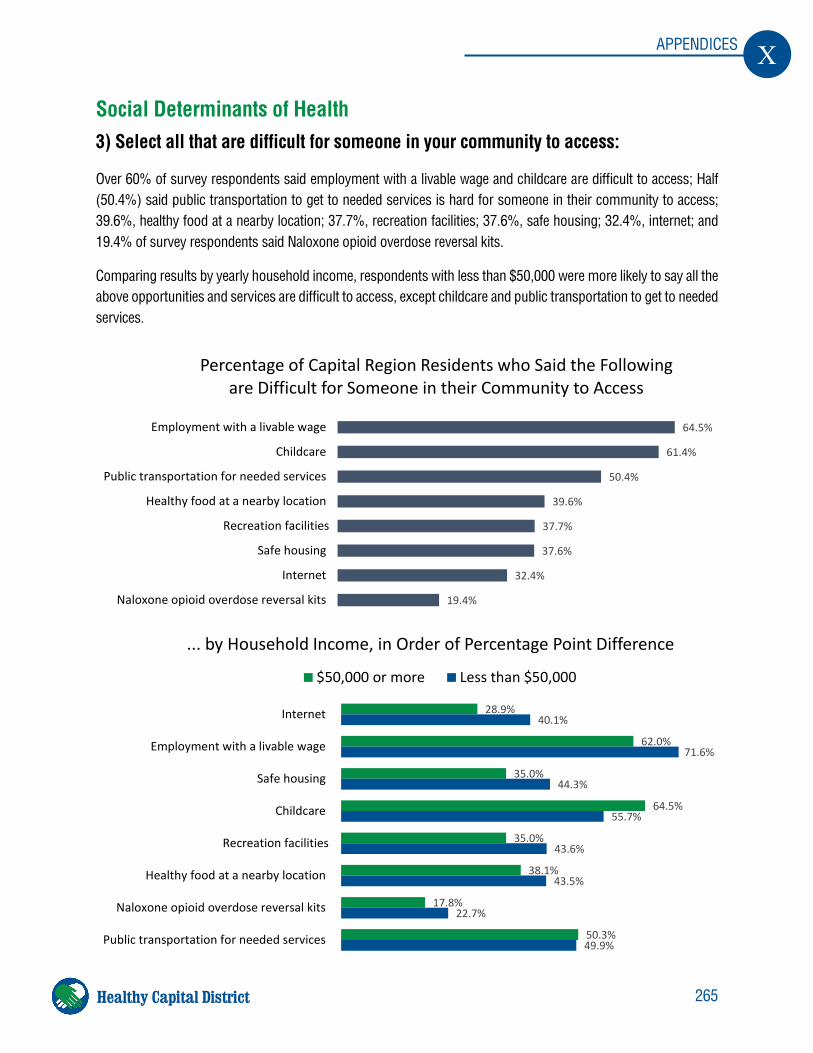
265
X APPENDICES
Healthy Capital District
Social Determinants of Health 3) Select all that are difficult for someone in your community to access:
Over 60% of survey respondents said employment with a livable wage and childcare are difficult to access; Half (50.4%) said public transportation to get to needed services is hard for someone in their community to access; 39.6%, healthy food at a nearby location; 37.7%, recreation facilities; 37.6%, safe housing; 32.4%, internet; and 19.4% of survey respondents said Naloxone opioid overdose reversal kits.
Comparing results by yearly household income, respondents with less than $50,000 were more likely to say all the above opportunities and services are difficult to access, except childcare and public transportation to get to needed services.
64.5%
61.4%
50.4%
39.6%
37.7%
37.6%
32.4%
19.4%
Employment with a livable wage
Childcare
Public transportation for needed services
Healthy food at a nearby location
Recreation facilities
Safe housing
Internet
Naloxone opioid overdose reversal kits
Percentage of Capital Region Residents who Said the Following are Difficult for Someone in their Community to Access
28.9%
62.0%
35.0%
64.5%
35.0%
38.1%
17.8%
50.3%
40.1%
71.6%
44.3%
55.7%
43.6%
43.5%
22.7%
49.9%
Internet
Employment with a livable wage
Safe housing
Childcare
Recreation facilities
Healthy food at a nearby location
Naloxone opioid overdose reversal kits
Public transportation for needed services
... by Household Income, in Order of Percentage Point Difference
$50,000 or more Less than $50,000
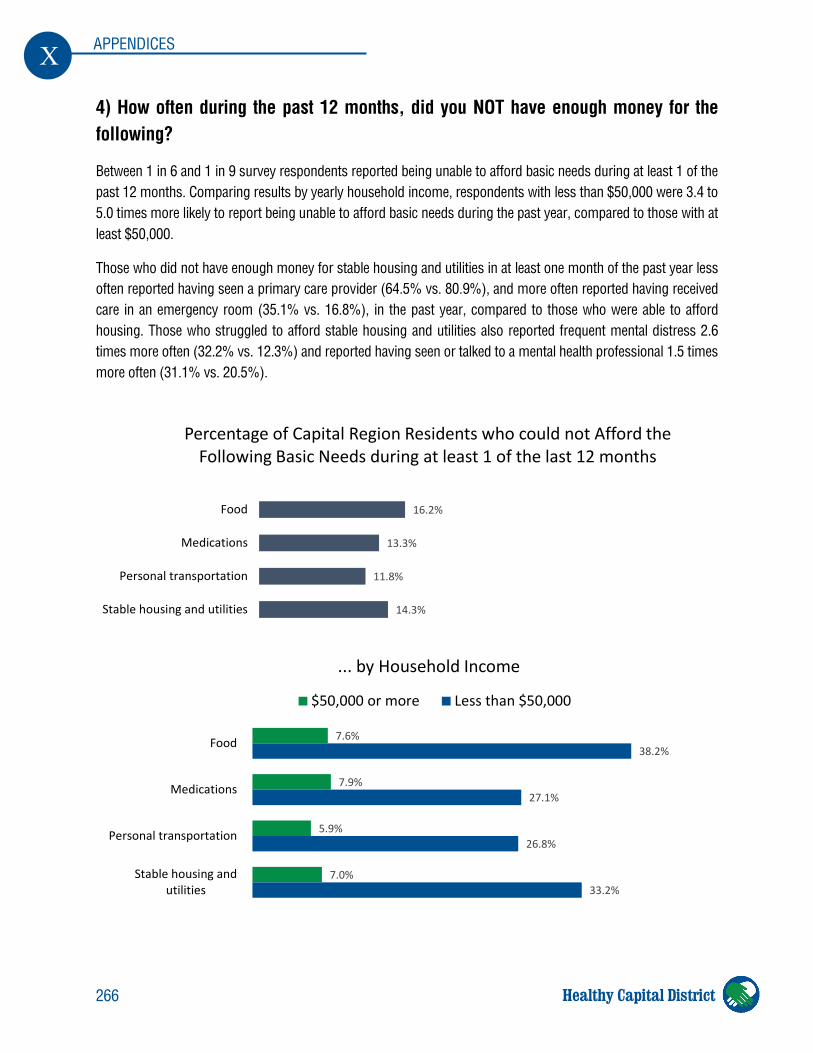
266
X APPENDICES
Healthy Capital District
4) How often during the past 12 months, did you NOT have enough money for the following?
Between 1 in 6 and 1 in 9 survey respondents reported being unable to afford basic needs during at least 1 of the past 12 months. Comparing results by yearly household income, respondents with less than $50,000 were 3.4 to 5.0 times more likely to report being unable to afford basic needs during the past year, compared to those with at least $50,000.
Those who did not have enough money for stable housing and utilities in at least one month of the past year less often reported having seen a primary care provider (64.5% vs. 80.9%), and more often reported having received care in an emergency room (35.1% vs. 16.8%), in the past year, compared to those who were able to afford housing. Those who struggled to afford stable housing and utilities also reported frequent mental distress 2.6 times more often (32.2% vs. 12.3%) and reported having seen or talked to a mental health professional 1.5 times more often (31.1% vs. 20.5%).
16.2%
13.3%
11.8%
14.3%
Food
Medications
Personal transportation
Stable housing and utilities
Percentage of Capital Region Residents who could not Afford the Following Basic Needs during at least 1 of the last 12 months
7.6%
7.9%
5.9%
7.0%
38.2%
27.1%
26.8%
33.2%
Food
Medications
Personal transportation
Stable housing andutilities
... by Household Income
$50,000 or more Less than $50,000
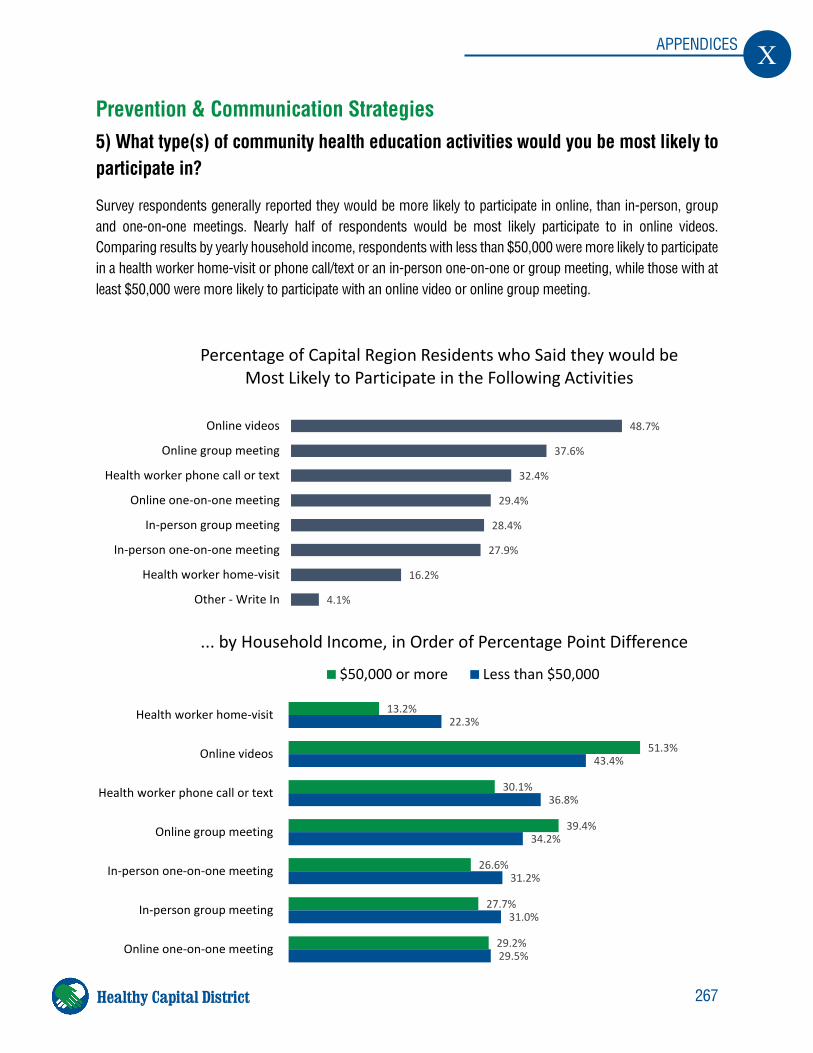
267
X APPENDICES
Healthy Capital District
Prevention & Communication Strategies 5) What type(s) of community health education activities would you be most likely to participate in?
Survey respondents generally reported they would be more likely to participate in online, than in-person, group and one-on-one meetings. Nearly half of respondents would be most likely participate to in online videos. Comparing results by yearly household income, respondents with less than $50,000 were more likely to participate in a health worker home-visit or phone call/text or an in-person one-on-one or group meeting, while those with at least $50,000 were more likely to participate with an online video or online group meeting.
48.7%
37.6%
32.4%
29.4%
28.4%
27.9%
16.2%
4.1%
Online videos
Online group meeting
Health worker phone call or text
Online one-on-one meeting
In-person group meeting
In-person one-on-one meeting
Health worker home-visit
Other - Write In
Percentage of Capital Region Residents who Said they would be Most Likely to Participate in the Following Activities
13.2%
51.3%
30.1%
39.4%
26.6%
27.7%
29.2%
22.3%
43.4%
36.8%
34.2%
31.2%
31.0%
29.5%
Health worker home-visit
Online videos
Health worker phone call or text
Online group meeting
In-person one-on-one meeting
In-person group meeting
Online one-on-one meeting
... by Household Income, in Order of Percentage Point Difference
$50,000 or more Less than $50,000
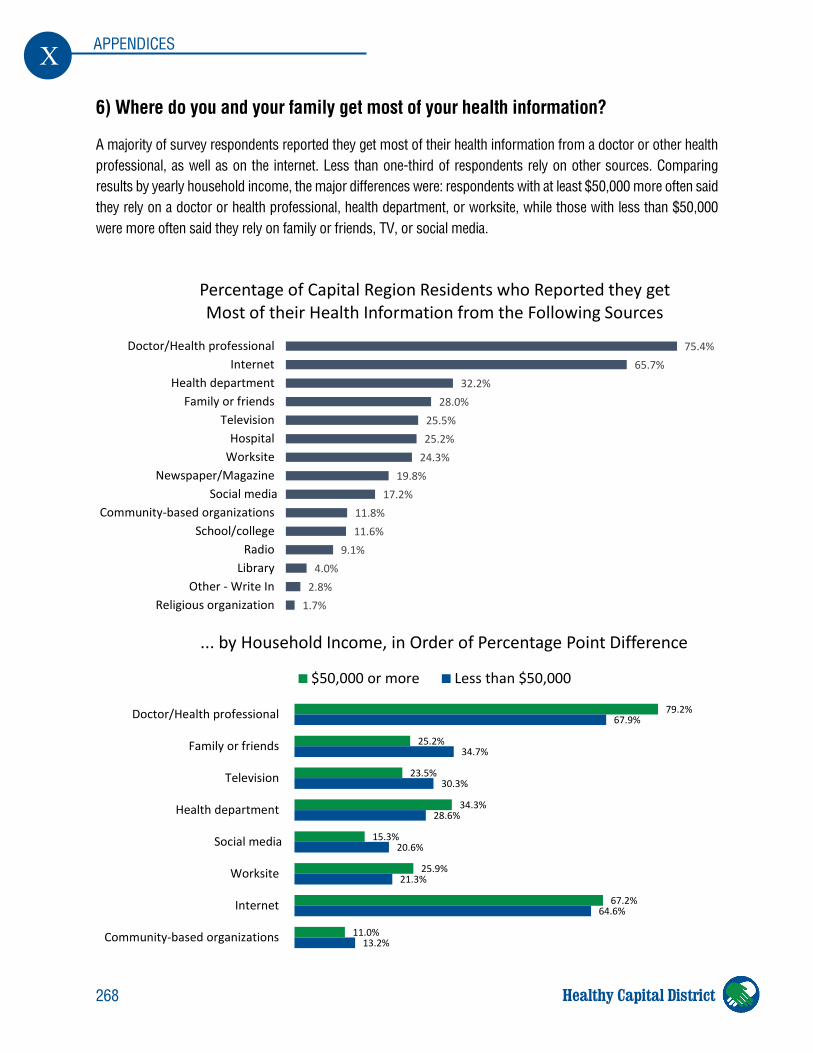
268
X APPENDICES
Healthy Capital District
6) Where do you and your family get most of your health information?
A majority of survey respondents reported they get most of their health information from a doctor or other health professional, as well as on the internet. Less than one-third of respondents rely on other sources. Comparing results by yearly household income, the major differences were: respondents with at least $50,000 more often said they rely on a doctor or health professional, health department, or worksite, while those with less than $50,000 were more often said they rely on family or friends, TV, or social media.
75.4%65.7%
32.2%28.0%
25.5%25.2%
24.3%19.8%
17.2%11.8%11.6%
9.1%4.0%
2.8%1.7%
Doctor/Health professionalInternet
Health departmentFamily or friends
TelevisionHospital
WorksiteNewspaper/Magazine
Social mediaCommunity-based organizations
School/collegeRadio
LibraryOther - Write In
Religious organization
Percentage of Capital Region Residents who Reported they get Most of their Health Information from the Following Sources
79.2%
25.2%
23.5%
34.3%
15.3%
25.9%
67.2%
11.0%
67.9%
34.7%
30.3%
28.6%
20.6%
21.3%
64.6%
13.2%
Doctor/Health professional
Family or friends
Television
Health department
Social media
Worksite
Internet
Community-based organizations
... by Household Income, in Order of Percentage Point Difference
$50,000 or more Less than $50,000
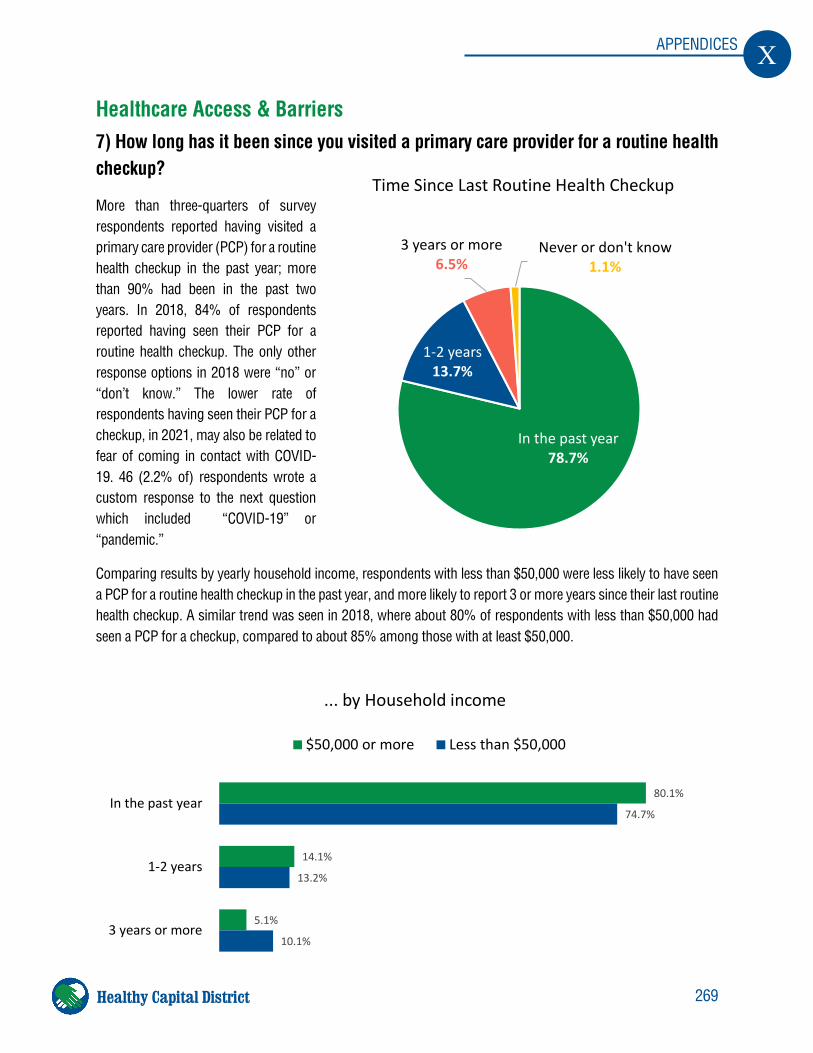
269
X APPENDICES
Healthy Capital District
Healthcare Access & Barriers 7) How long has it been since you visited a primary care provider for a routine health checkup?
More than three-quarters of survey respondents reported having visited a primary care provider (PCP) for a routine health checkup in the past year; more than 90% had been in the past two years. In 2018, 84% of respondents reported having seen their PCP for a routine health checkup. The only other response options in 2018 were “no” or “don’t know.” The lower rate of respondents having seen their PCP for a checkup, in 2021, may also be related to fear of coming in contact with COVID-19. 46 (2.2% of) respondents wrote a custom response to the next question which included “COVID-19” or “pandemic.”
Comparing results by yearly household income, respondents with less than $50,000 were less likely to have seen a PCP for a routine health checkup in the past year, and more likely to report 3 or more years since their last routine health checkup. A similar trend was seen in 2018, where about 80% of respondents with less than $50,000 had seen a PCP for a checkup, compared to about 85% among those with at least $50,000.
In the past year 78.7%
1-2 years 13.7%
3 years or more 6.5%
Never or don't know1.1%
Time Since Last Routine Health Checkup
80.1%
14.1%
5.1%
74.7%
13.2%
10.1%
In the past year
1-2 years
3 years or more
... by Household income
$50,000 or more Less than $50,000
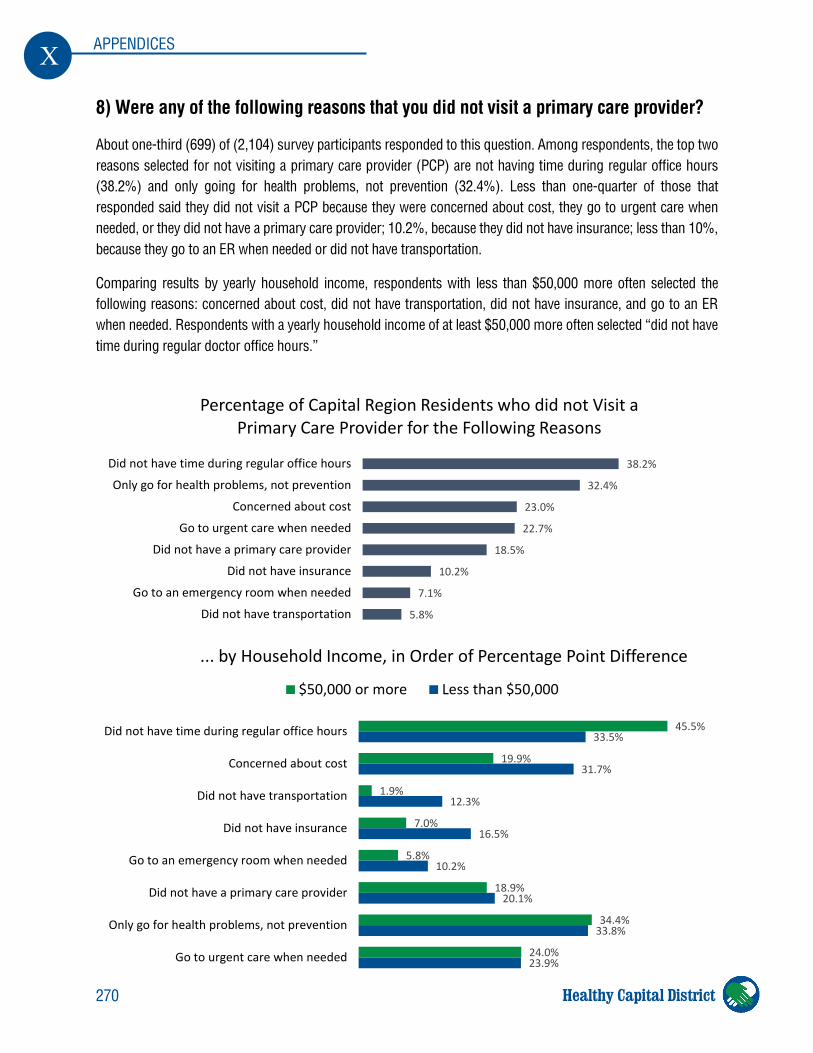
270
X APPENDICES
Healthy Capital District
8) Were any of the following reasons that you did not visit a primary care provider?
About one-third (699) of (2,104) survey participants responded to this question. Among respondents, the top two reasons selected for not visiting a primary care provider (PCP) are not having time during regular office hours (38.2%) and only going for health problems, not prevention (32.4%). Less than one-quarter of those that responded said they did not visit a PCP because they were concerned about cost, they go to urgent care when needed, or they did not have a primary care provider; 10.2%, because they did not have insurance; less than 10%, because they go to an ER when needed or did not have transportation.
Comparing results by yearly household income, respondents with less than $50,000 more often selected the following reasons: concerned about cost, did not have transportation, did not have insurance, and go to an ER when needed. Respondents with a yearly household income of at least $50,000 more often selected “did not have time during regular doctor office hours.”
38.2%
32.4%
23.0%
22.7%
18.5%
10.2%
7.1%
5.8%
Did not have time during regular office hours
Only go for health problems, not prevention
Concerned about cost
Go to urgent care when needed
Did not have a primary care provider
Did not have insurance
Go to an emergency room when needed
Did not have transportation
Percentage of Capital Region Residents who did not Visit a Primary Care Provider for the Following Reasons
45.5%
19.9%
1.9%
7.0%
5.8%
18.9%
34.4%
24.0%
33.5%
31.7%
12.3%
16.5%
10.2%
20.1%
33.8%
23.9%
Did not have time during regular office hours
Concerned about cost
Did not have transportation
Did not have insurance
Go to an emergency room when needed
Did not have a primary care provider
Only go for health problems, not prevention
Go to urgent care when needed
... by Household Income, in Order of Percentage Point Difference
$50,000 or more Less than $50,000
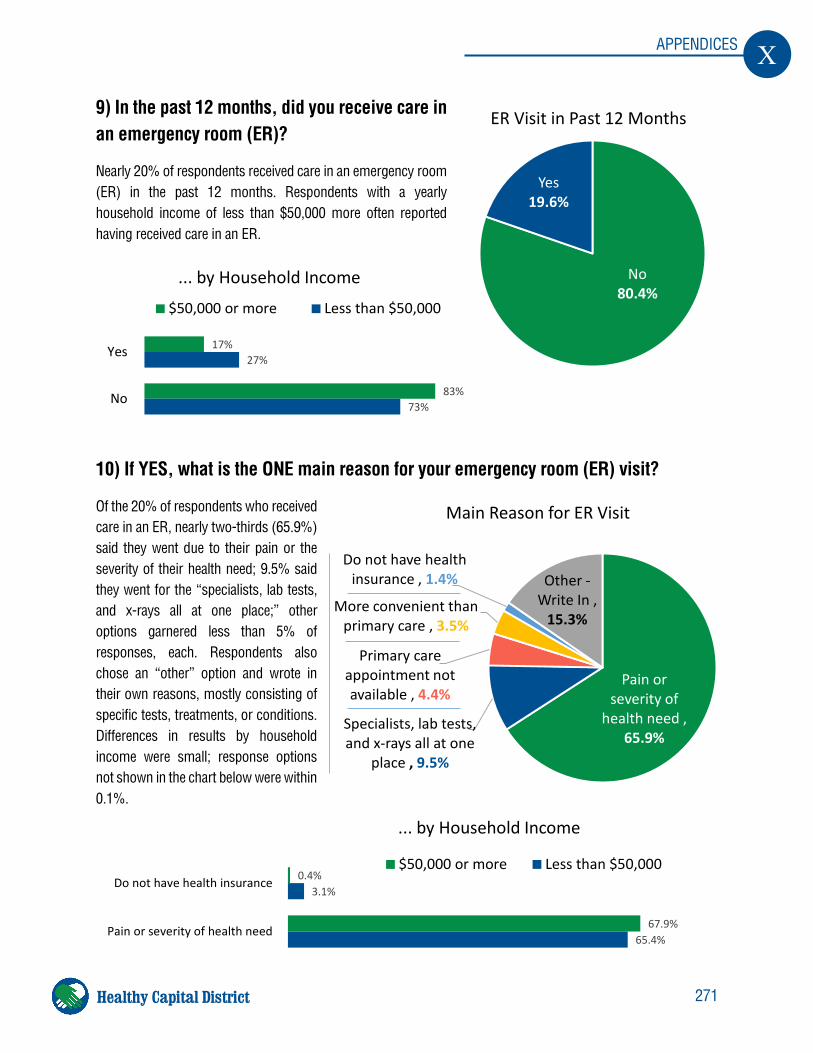
271
X APPENDICES
Healthy Capital District
9) In the past 12 months, did you receive care in an emergency room (ER)?
Nearly 20% of respondents received care in an emergency room (ER) in the past 12 months. Respondents with a yearly household income of less than $50,000 more often reported having received care in an ER.
10) If YES, what is the ONE main reason for your emergency room (ER) visit?
Of the 20% of respondents who received care in an ER, nearly two-thirds (65.9%) said they went due to their pain or the severity of their health need; 9.5% said they went for the “specialists, lab tests, and x-rays all at one place;” other options garnered less than 5% of responses, each. Respondents also chose an “other” option and wrote in their own reasons, mostly consisting of specific tests, treatments, or conditions. Differences in results by household income were small; response options not shown in the chart below were within 0.1%.
17%
83%
27%
73%
Yes
No
... by Household Income
$50,000 or more Less than $50,000
Pain or severity of
health need , 65.9%
Specialists, lab tests, and x-rays all at one
place , 9.5%
Primary care appointment not available , 4.4%
More convenient than primary care , 3.5%
Do not have health insurance , 1.4% Other -
Write In , 15.3%
Main Reason for ER Visit
No 80.4%
Yes 19.6%
ER Visit in Past 12 Months
0.4%
67.9%
3.1%
65.4%
Do not have health insurance
Pain or severity of health need
... by Household Income
$50,000 or more Less than $50,000
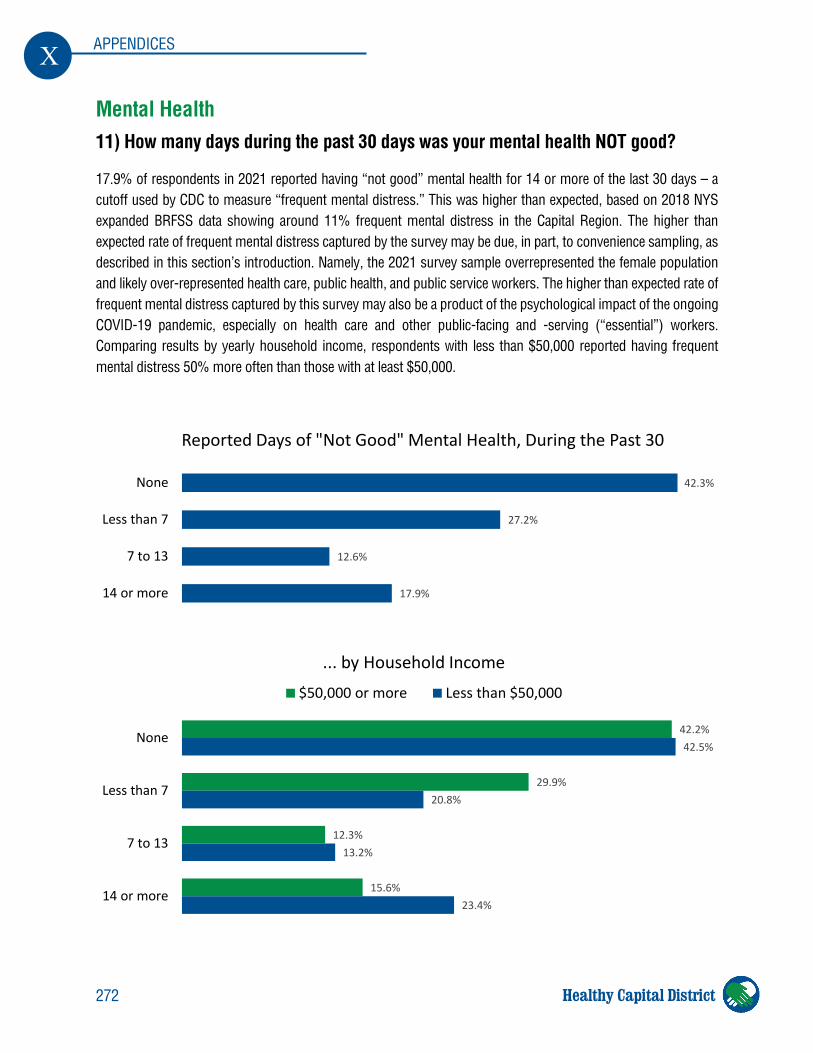
272
X APPENDICES
Healthy Capital District
Mental Health 11) How many days during the past 30 days was your mental health NOT good?
17.9% of respondents in 2021 reported having “not good” mental health for 14 or more of the last 30 days – a cutoff used by CDC to measure “frequent mental distress.” This was higher than expected, based on 2018 NYS expanded BRFSS data showing around 11% frequent mental distress in the Capital Region. The higher than expected rate of frequent mental distress captured by the survey may be due, in part, to convenience sampling, as described in this section’s introduction. Namely, the 2021 survey sample overrepresented the female population and likely over-represented health care, public health, and public service workers. The higher than expected rate of frequent mental distress captured by this survey may also be a product of the psychological impact of the ongoing COVID-19 pandemic, especially on health care and other public-facing and -serving (“essential”) workers. Comparing results by yearly household income, respondents with less than $50,000 reported having frequent mental distress 50% more often than those with at least $50,000.
42.3%
27.2%
12.6%
17.9%
None
Less than 7
7 to 13
14 or more
Reported Days of "Not Good" Mental Health, During the Past 30
42.2%
29.9%
12.3%
15.6%
42.5%
20.8%
13.2%
23.4%
None
Less than 7
7 to 13
14 or more
... by Household Income
$50,000 or more Less than $50,000
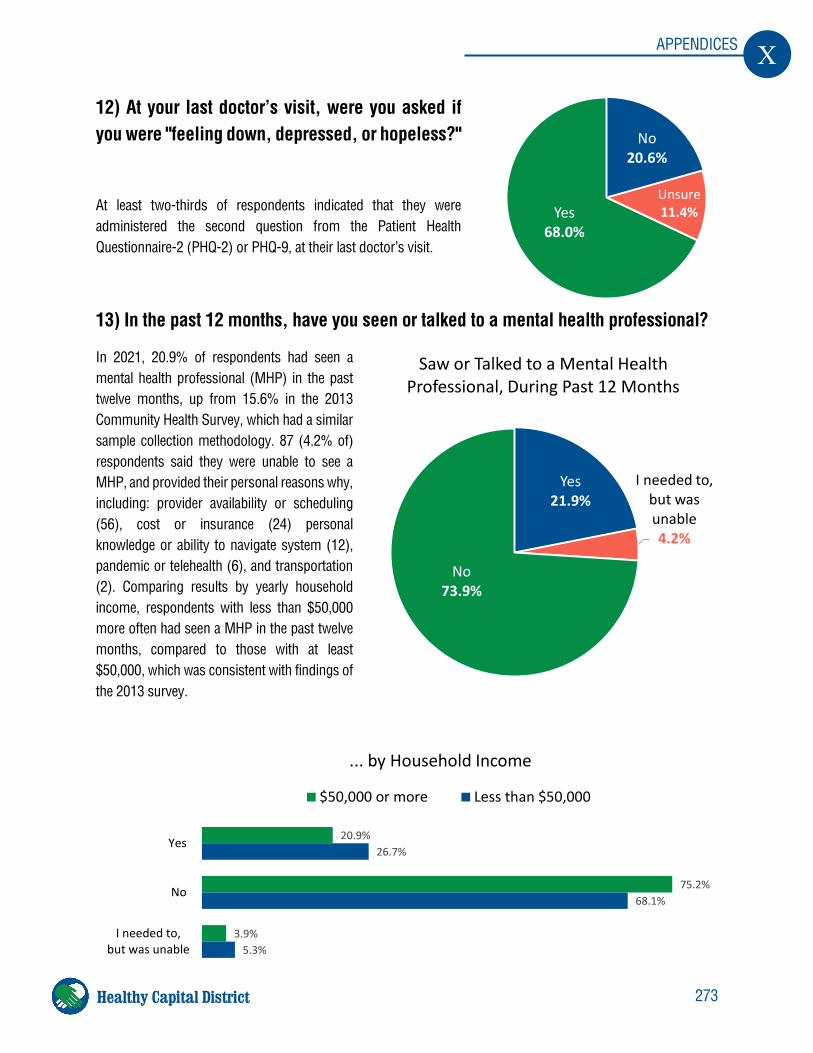
273
X APPENDICES
Healthy Capital District
12) At your last doctor’s visit, were you asked if you were "feeling down, depressed, or hopeless?"
At least two-thirds of respondents indicated that they were administered the second question from the Patient Health Questionnaire-2 (PHQ-2) or PHQ-9, at their last doctor’s visit.
13) In the past 12 months, have you seen or talked to a mental health professional?
In 2021, 20.9% of respondents had seen a mental health professional (MHP) in the past twelve months, up from 15.6% in the 2013 Community Health Survey, which had a similar sample collection methodology. 87 (4.2% of) respondents said they were unable to see a MHP, and provided their personal reasons why, including: provider availability or scheduling (56), cost or insurance (24) personal knowledge or ability to navigate system (12), pandemic or telehealth (6), and transportation (2). Comparing results by yearly household income, respondents with less than $50,000 more often had seen a MHP in the past twelve months, compared to those with at least $50,000, which was consistent with findings of the 2013 survey.
No 20.6%
Unsure 11.4%Yes
68.0%
20.9%
75.2%
3.9%
26.7%
68.1%
5.3%
Yes
No
I needed to,but was unable
... by Household Income
$50,000 or more Less than $50,000
Yes 21.9%
I needed to, but was unable4.2%
No 73.9%
Saw or Talked to a Mental Health Professional, During Past 12 Months
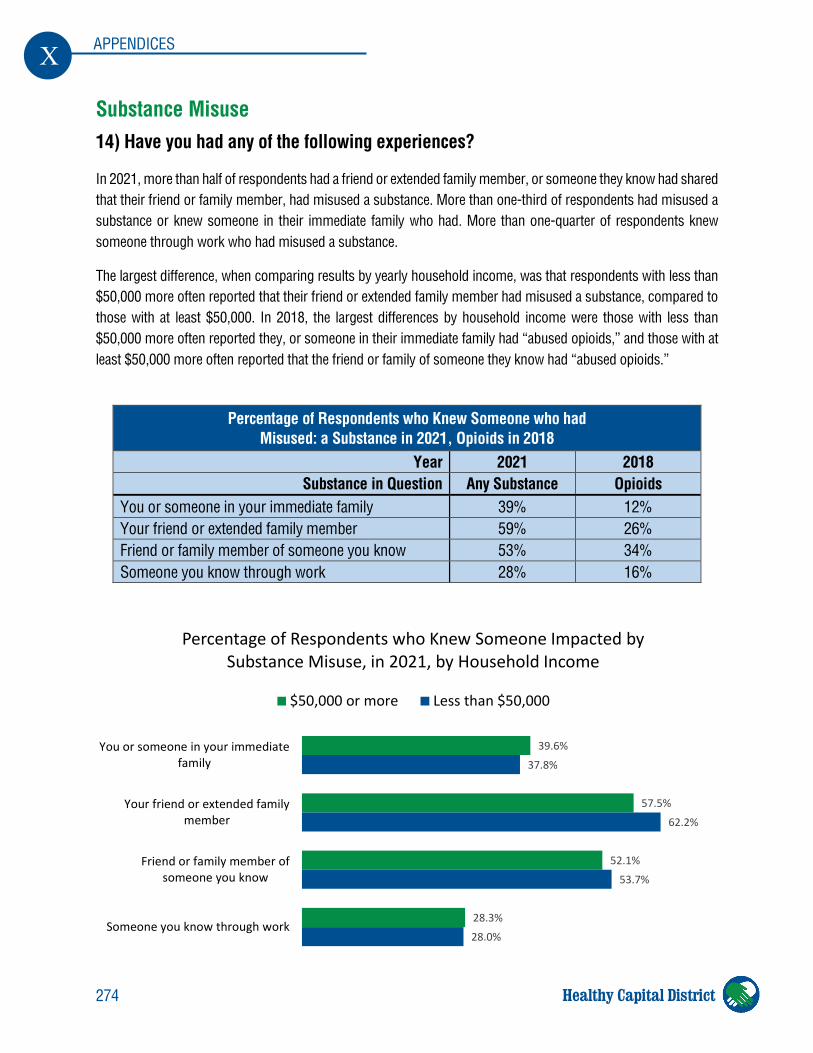
274
X APPENDICES
Healthy Capital District
Substance Misuse 14) Have you had any of the following experiences?
In 2021, more than half of respondents had a friend or extended family member, or someone they know had shared that their friend or family member, had misused a substance. More than one-third of respondents had misused a substance or knew someone in their immediate family who had. More than one-quarter of respondents knew someone through work who had misused a substance.
The largest difference, when comparing results by yearly household income, was that respondents with less than $50,000 more often reported that their friend or extended family member had misused a substance, compared to those with at least $50,000. In 2018, the largest differences by household income were those with less than $50,000 more often reported they, or someone in their immediate family had “abused opioids,” and those with at least $50,000 more often reported that the friend or family of someone they know had “abused opioids.”
Percentage of Respondents who Knew Someone who had Misused: a Substance in 2021, Opioids in 2018
Year 2021 2018 Substance in Question Any Substance Opioids
You or someone in your immediate family 39% 12% Your friend or extended family member 59% 26% Friend or family member of someone you know 53% 34% Someone you know through work 28% 16%
39.6%
57.5%
52.1%
28.3%
37.8%
62.2%
53.7%
28.0%
You or someone in your immediatefamily
Your friend or extended familymember
Friend or family member ofsomeone you know
Someone you know through work
Percentage of Respondents who Knew Someone Impacted bySubstance Misuse, in 2021, by Household Income
$50,000 or more Less than $50,000
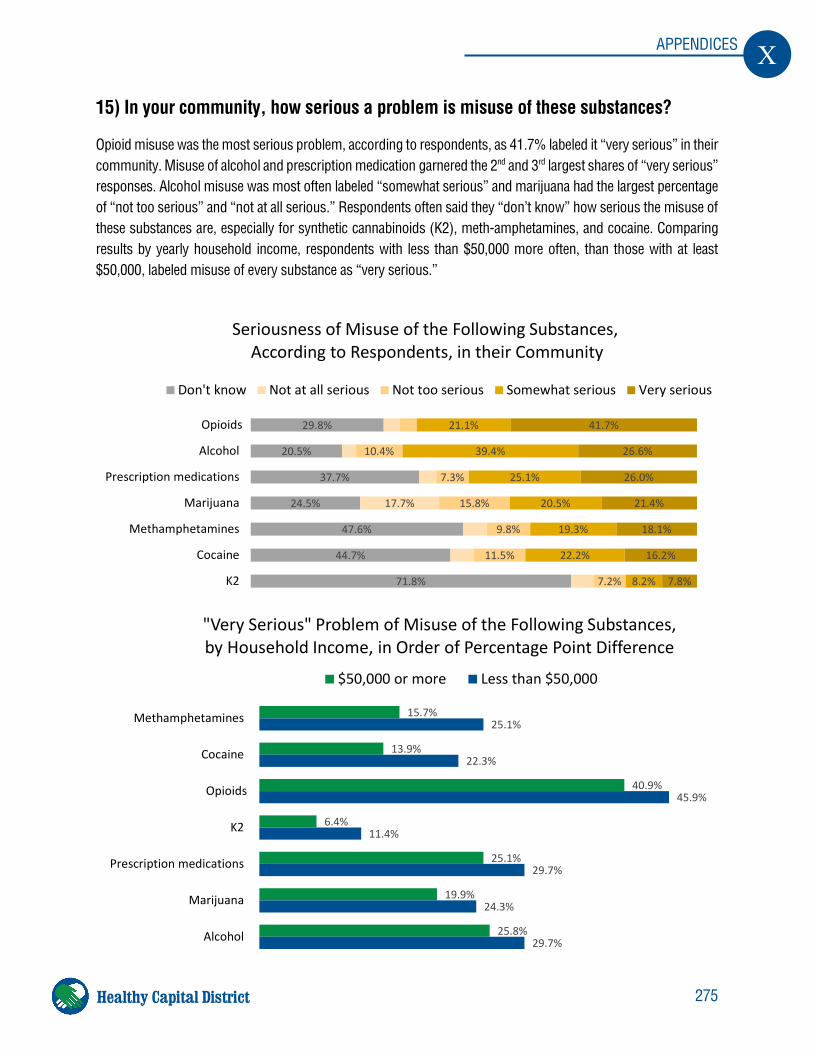
275
X APPENDICES
Healthy Capital District
15) In your community, how serious a problem is misuse of these substances?
Opioid misuse was the most serious problem, according to respondents, as 41.7% labeled it “very serious” in their community. Misuse of alcohol and prescription medication garnered the 2nd and 3rd largest shares of “very serious” responses. Alcohol misuse was most often labeled “somewhat serious” and marijuana had the largest percentage of “not too serious” and “not at all serious.” Respondents often said they “don’t know” how serious the misuse of these substances are, especially for synthetic cannabinoids (K2), meth-amphetamines, and cocaine. Comparing results by yearly household income, respondents with less than $50,000 more often, than those with at least $50,000, labeled misuse of every substance as “very serious.”
15.7%
13.9%
40.9%
6.4%
25.1%
19.9%
25.8%
25.1%
22.3%
45.9%
11.4%
29.7%
24.3%
29.7%
Methamphetamines
Cocaine
Opioids
K2
Prescription medications
Marijuana
Alcohol
"Very Serious" Problem of Misuse of the Following Substances, by Household Income, in Order of Percentage Point Difference
$50,000 or more Less than $50,000
29.8%
20.5%
37.7%
24.5%
47.6%
44.7%
71.8%
17.7%
10.4%
7.3%
15.8%
9.8%
11.5%
7.2%
21.1%
39.4%
25.1%
20.5%
19.3%
22.2%
8.2%
41.7%
26.6%
26.0%
21.4%
18.1%
16.2%
7.8%
Opioids
Alcohol
Prescription medications
Marijuana
Methamphetamines
Cocaine
K2
Seriousness of Misuse of the Following Substances,According to Respondents, in their Community
Don't know Not at all serious Not too serious Somewhat serious Very serious
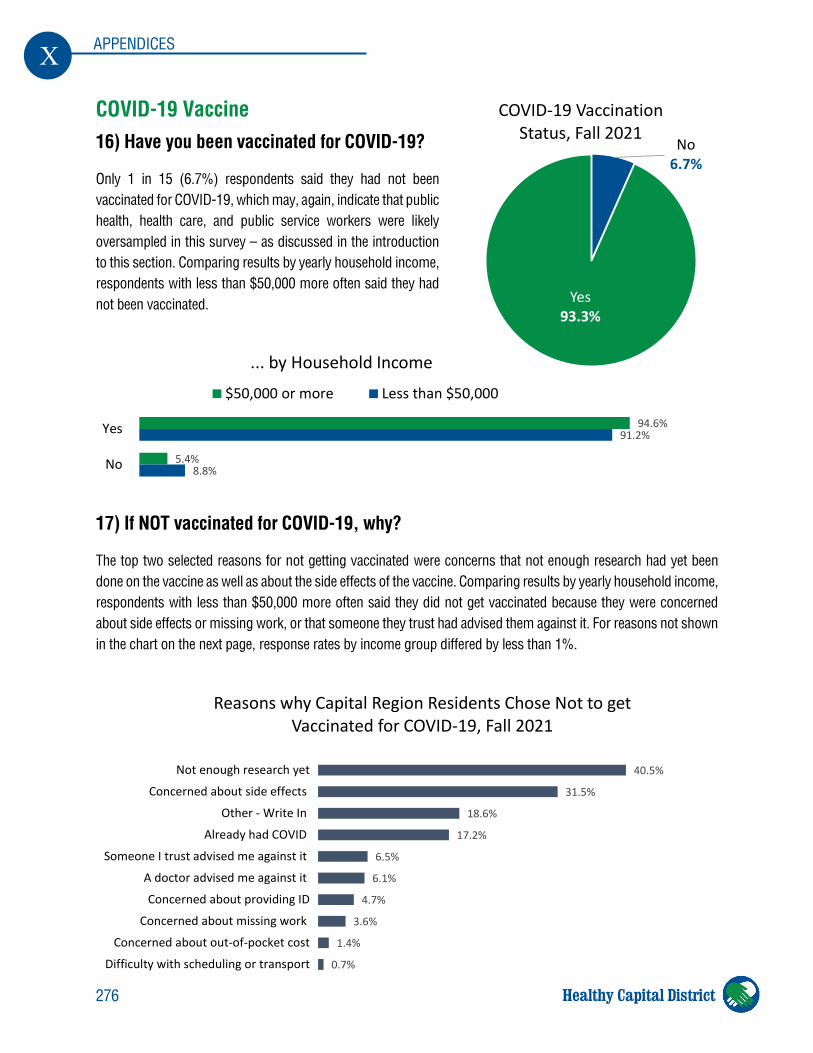
276
X APPENDICES
Healthy Capital District
COVID-19 Vaccine 16) Have you been vaccinated for COVID-19?
Only 1 in 15 (6.7%) respondents said they had not been vaccinated for COVID-19, which may, again, indicate that public health, health care, and public service workers were likely oversampled in this survey – as discussed in the introduction to this section. Comparing results by yearly household income, respondents with less than $50,000 more often said they had not been vaccinated.
17) If NOT vaccinated for COVID-19, why?
The top two selected reasons for not getting vaccinated were concerns that not enough research had yet been done on the vaccine as well as about the side effects of the vaccine. Comparing results by yearly household income, respondents with less than $50,000 more often said they did not get vaccinated because they were concerned about side effects or missing work, or that someone they trust had advised them against it. For reasons not shown in the chart on the next page, response rates by income group differed by less than 1%.
94.6%
5.4%
91.2%
8.8%
Yes
No
... by Household Income
$50,000 or more Less than $50,000
40.5%
31.5%
18.6%
17.2%
6.5%
6.1%
4.7%
3.6%
1.4%
0.7%
Not enough research yet
Concerned about side effects
Other - Write In
Already had COVID
Someone I trust advised me against it
A doctor advised me against it
Concerned about providing ID
Concerned about missing work
Concerned about out-of-pocket cost
Difficulty with scheduling or transport
Reasons why Capital Region Residents Chose Not to get Vaccinated for COVID-19, Fall 2021
No 6.7%
Yes 93.3%
COVID-19 Vaccination Status, Fall 2021
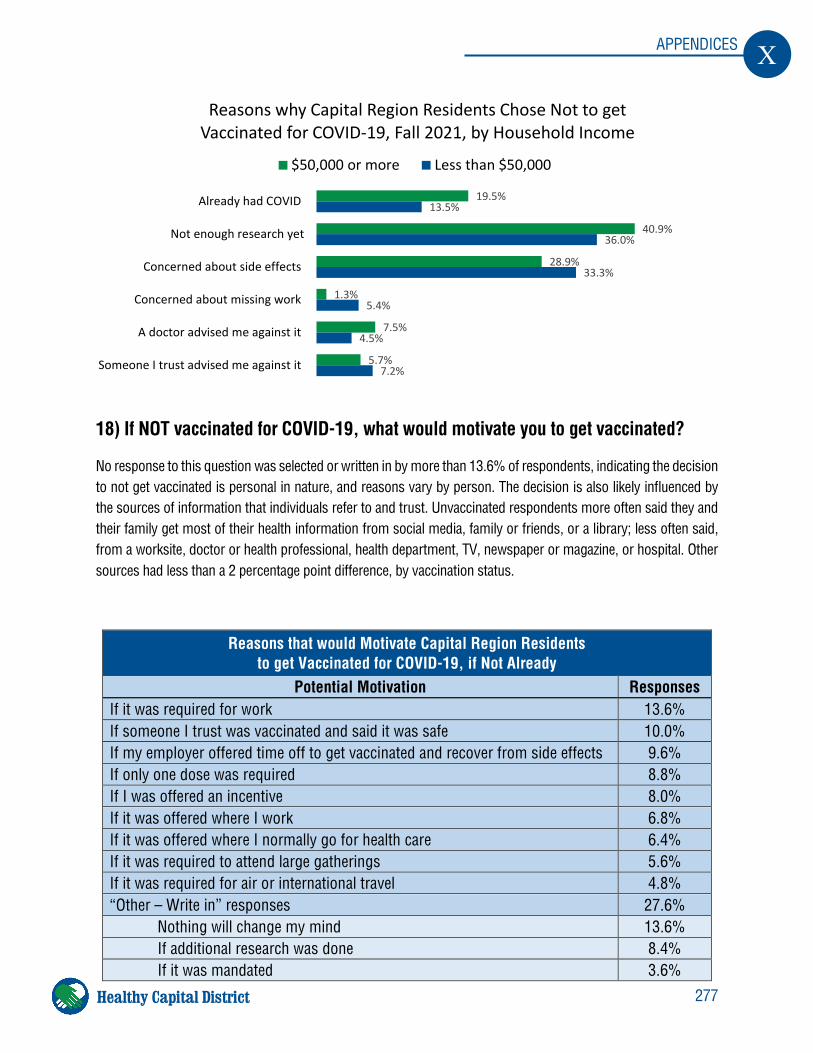
277
X APPENDICES
Healthy Capital District
18) If NOT vaccinated for COVID-19, what would motivate you to get vaccinated?
No response to this question was selected or written in by more than 13.6% of respondents, indicating the decision to not get vaccinated is personal in nature, and reasons vary by person. The decision is also likely influenced by the sources of information that individuals refer to and trust. Unvaccinated respondents more often said they and their family get most of their health information from social media, family or friends, or a library; less often said, from a worksite, doctor or health professional, health department, TV, newspaper or magazine, or hospital. Other sources had less than a 2 percentage point difference, by vaccination status.
Reasons that would Motivate Capital Region Residents to get Vaccinated for COVID-19, if Not Already
Potential Motivation Responses If it was required for work 13.6% If someone I trust was vaccinated and said it was safe 10.0% If my employer offered time off to get vaccinated and recover from side effects 9.6% If only one dose was required 8.8% If I was offered an incentive 8.0% If it was offered where I work 6.8% If it was offered where I normally go for health care 6.4% If it was required to attend large gatherings 5.6% If it was required for air or international travel 4.8% “Other – Write in” responses 27.6% Nothing will change my mind 13.6% If additional research was done 8.4% If it was mandated 3.6%
19.5%
40.9%
28.9%
1.3%
7.5%
5.7%
13.5%
36.0%
33.3%
5.4%
4.5%
7.2%
Already had COVID
Not enough research yet
Concerned about side effects
Concerned about missing work
A doctor advised me against it
Someone I trust advised me against it
Reasons why Capital Region Residents Chose Not to get Vaccinated for COVID-19, Fall 2021, by Household Income
$50,000 or more Less than $50,000
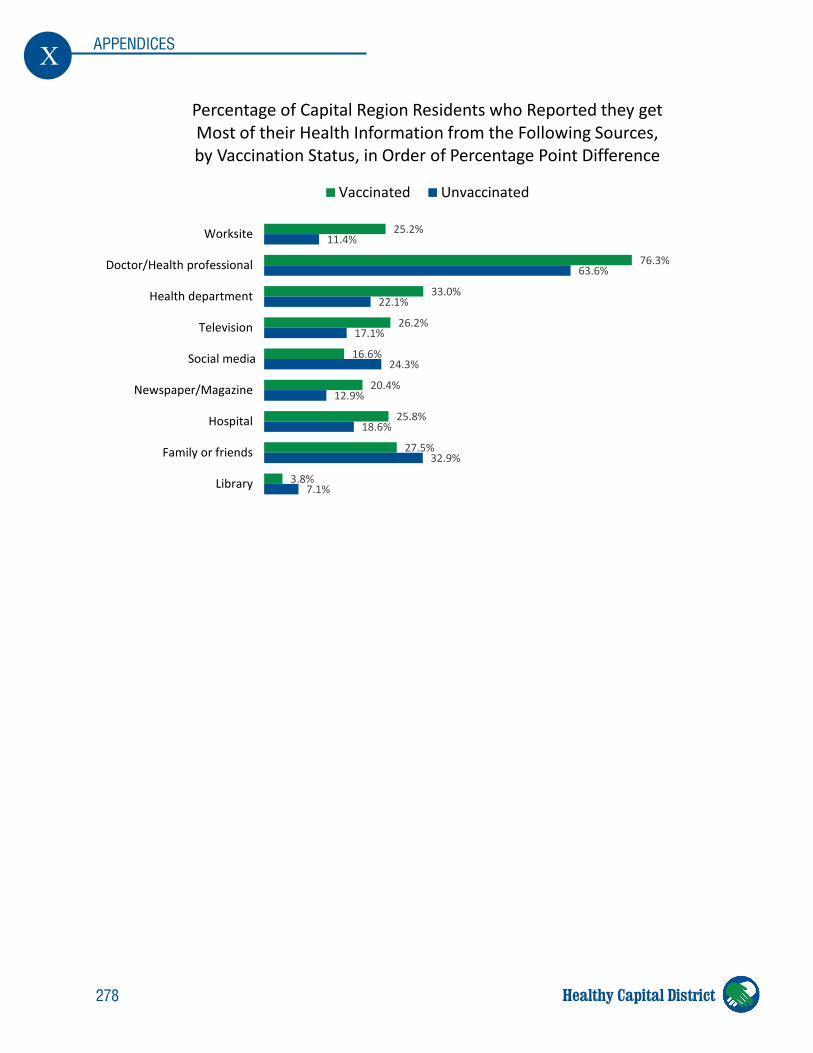
278
X APPENDICES
Healthy Capital District
25.2%
76.3%
33.0%
26.2%
16.6%
20.4%
25.8%
27.5%
3.8%
11.4%
63.6%
22.1%
17.1%
24.3%
12.9%
18.6%
32.9%
7.1%
Worksite
Doctor/Health professional
Health department
Television
Social media
Newspaper/Magazine
Hospital
Family or friends
Library
Percentage of Capital Region Residents who Reported they get Most of their Health Information from the Following Sources, by Vaccination Status, in Order of Percentage Point Difference
Vaccinated Unvaccinated
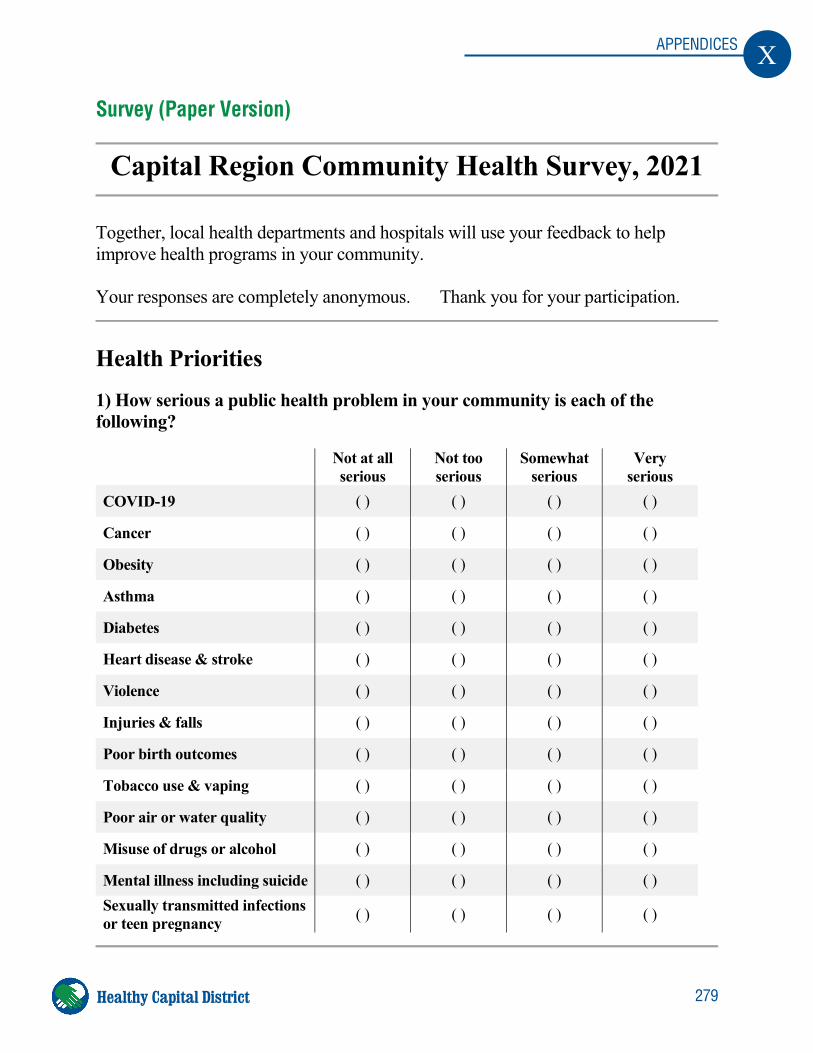
279
X APPENDICES
Healthy Capital District
Survey (Paper Version)
Capital Region Community Health Survey, 2021
Together, local health departments and hospitals will use your feedback to help improve health programs in your community. Your responses are completely anonymous. Thank you for your participation.
Health Priorities
1) How serious a public health problem in your community is each of the following?
Not at all serious
Not too serious
Somewhat serious
Very serious
COVID-19 ( ) ( ) ( ) ( )
Cancer ( ) ( ) ( ) ( )
Obesity ( ) ( ) ( ) ( )
Asthma ( ) ( ) ( ) ( )
Diabetes ( ) ( ) ( ) ( )
Heart disease & stroke ( ) ( ) ( ) ( )
Violence ( ) ( ) ( ) ( )
Injuries & falls ( ) ( ) ( ) ( )
Poor birth outcomes ( ) ( ) ( ) ( )
Tobacco use & vaping ( ) ( ) ( ) ( )
Poor air or water quality ( ) ( ) ( ) ( )
Misuse of drugs or alcohol ( ) ( ) ( ) ( )
Mental illness including suicide ( ) ( ) ( ) ( ) Sexually transmitted infections or teen pregnancy ( ) ( ) ( ) ( )
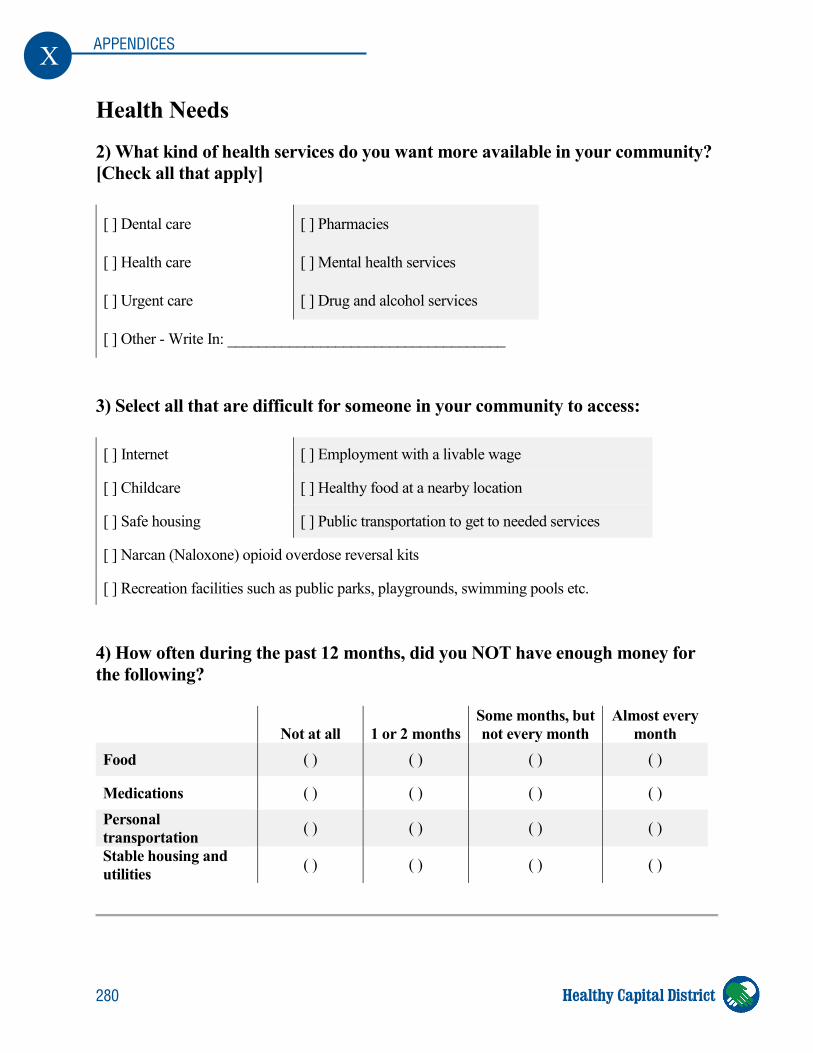
280
X APPENDICES
Healthy Capital District
Health Needs
2) What kind of health services do you want more available in your community? [Check all that apply] [ ] Dental care [ ] Pharmacies
[ ] Health care [ ] Mental health services
[ ] Urgent care [ ] Drug and alcohol services
[ ] Other - Write In: ____________________________________
3) Select all that are difficult for someone in your community to access: [ ] Internet [ ] Employment with a livable wage
[ ] Childcare [ ] Healthy food at a nearby location
[ ] Safe housing [ ] Public transportation to get to needed services
[ ] Narcan (Naloxone) opioid overdose reversal kits
[ ] Recreation facilities such as public parks, playgrounds, swimming pools etc. 4) How often during the past 12 months, did you NOT have enough money for the following?
Not at all 1 or 2 months Some months, but not every month
Almost every month
Food ( ) ( ) ( ) ( )
Medications ( ) ( ) ( ) ( ) Personal transportation ( ) ( ) ( ) ( )
Stable housing and utilities ( ) ( ) ( ) ( )
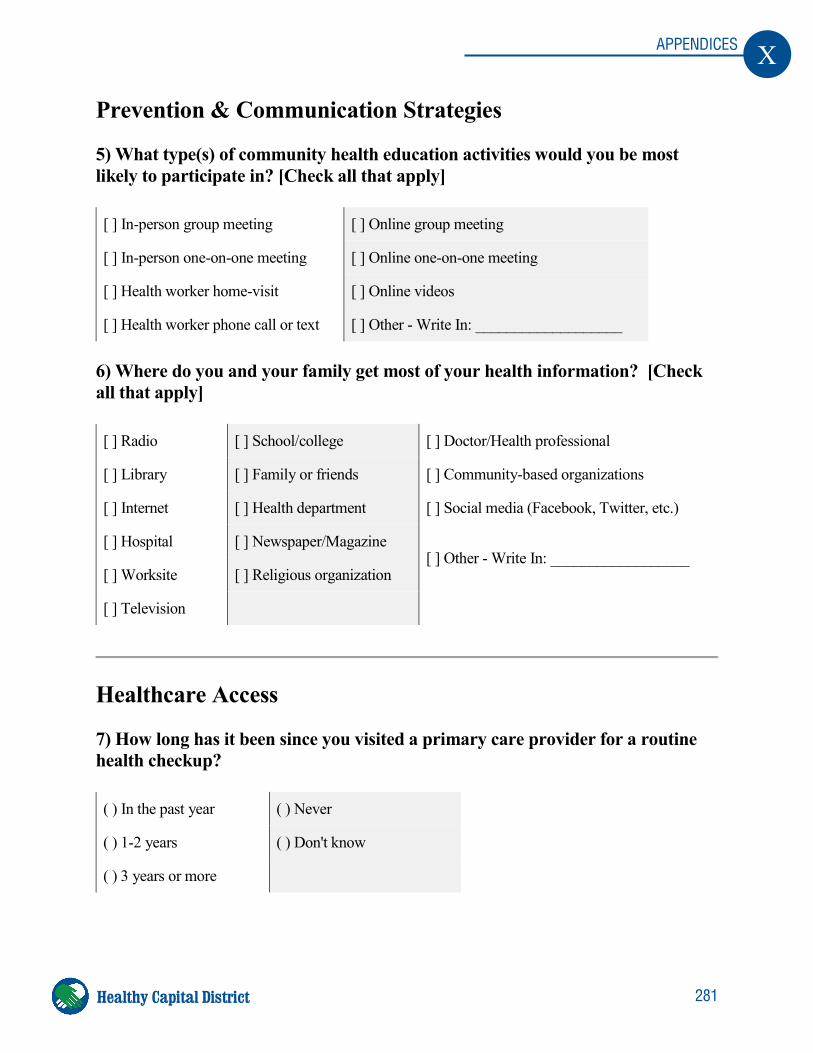
281
X APPENDICES
Healthy Capital District
Prevention & Communication Strategies
5) What type(s) of community health education activities would you be most likely to participate in? [Check all that apply] [ ] In-person group meeting [ ] Online group meeting
[ ] In-person one-on-one meeting [ ] Online one-on-one meeting
[ ] Health worker home-visit [ ] Online videos
[ ] Health worker phone call or text [ ] Other - Write In: ___________________ 6) Where do you and your family get most of your health information? [Check all that apply] [ ] Radio [ ] School/college [ ] Doctor/Health professional
[ ] Library [ ] Family or friends [ ] Community-based organizations
[ ] Internet [ ] Health department [ ] Social media (Facebook, Twitter, etc.)
[ ] Hospital [ ] Newspaper/Magazine [ ] Other - Write In: __________________
[ ] Worksite [ ] Religious organization
[ ] Television
Healthcare Access
7) How long has it been since you visited a primary care provider for a routine health checkup? ( ) In the past year ( ) Never
( ) 1-2 years ( ) Don't know
( ) 3 years or more
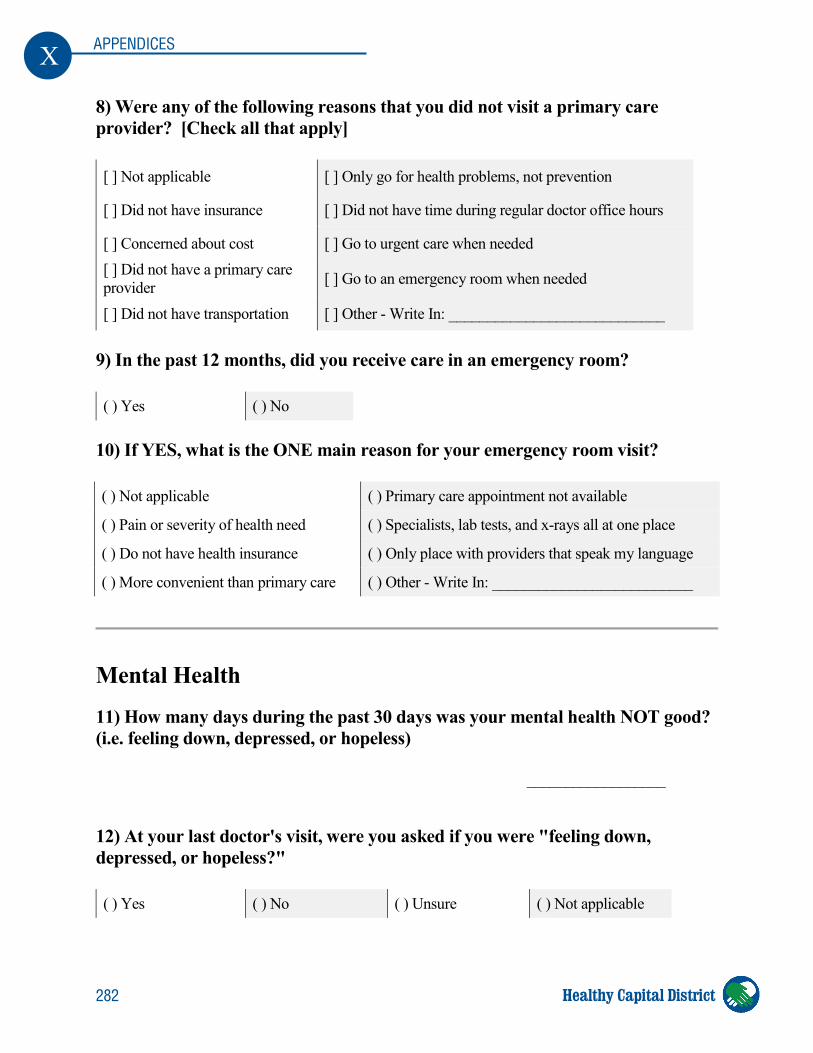
282
X APPENDICES
Healthy Capital District
8) Were any of the following reasons that you did not visit a primary care provider? [Check all that apply] [ ] Not applicable [ ] Only go for health problems, not prevention
[ ] Did not have insurance [ ] Did not have time during regular doctor office hours
[ ] Concerned about cost [ ] Go to urgent care when needed [ ] Did not have a primary care provider [ ] Go to an emergency room when needed
[ ] Did not have transportation [ ] Other - Write In: ____________________________ 9) In the past 12 months, did you receive care in an emergency room? ( ) Yes ( ) No
10) If YES, what is the ONE main reason for your emergency room visit? ( ) Not applicable ( ) Primary care appointment not available
( ) Pain or severity of health need ( ) Specialists, lab tests, and x-rays all at one place
( ) Do not have health insurance ( ) Only place with providers that speak my language
( ) More convenient than primary care ( ) Other - Write In: __________________________
Mental Health
11) How many days during the past 30 days was your mental health NOT good? (i.e. feeling down, depressed, or hopeless)
__________________ 12) At your last doctor's visit, were you asked if you were "feeling down, depressed, or hopeless?" ( ) Yes ( ) No ( ) Unsure ( ) Not applicable
283
X APPENDICES
Healthy Capital District
13) During the past 12 months, have you seen or talked to a mental health professional? (e.g. a psychologist, psychiatrist, psychiatric nurse or clinical social worker) ( ) Yes ( ) No
( ) I needed to, but was unable because: _____________________________________
Substance Misuse Substance misuse is the use of drugs or alcohol in a way that could cause harm to the user or to those around them. 14) Have you had any of the following experiences? [Check all that apply] [ ] You or someone in your immediate family has misused a substance
[ ] A friend or extended family member has misused a substance
[ ] Someone you know through work has misused a substance
[ ] Someone you know shared with you that their friend or family member misused a substance 15) In your community, how serious a problem is misuse of the following substances?
Don't know
Not at all serious
Not too serious
Somewhat serious
Very serious
Alcohol ( ) ( ) ( ) ( ) ( )
Cocaine ( ) ( ) ( ) ( ) ( )
Marijuana ( ) ( ) ( ) ( ) ( )
Methamphetamines ( ) ( ) ( ) ( ) ( )
Opioids ( ) ( ) ( ) ( ) ( )
Prescription medications ( ) ( ) ( ) ( ) ( )
K2 ( ) ( ) ( ) ( ) ( )
284
X APPENDICES
Healthy Capital District
COVID-19 Vaccine
16) Have you been vaccinated for COVID-19?* ( ) Yes ( ) No *If yes, skip questions 17 & 18
17) If you have NOT been vaccinated for COVID-19, why? [Check all that apply] [ ] Already had COVID [ ] Concerned about side effects [ ] Concerned about missing work [ ] Concerned about out-of-pocket cost [ ] Concerned about having to provide a government-issued ID [ ] Difficulty scheduling appointment or traveling to site [ ] A close friend or family member advised me against it [ ] A doctor advised me against it [ ] Not enough research on vaccine yet [ ] Other - Write In: _____________________________________
18) If you have NOT been vaccinated for COVID-19, what would motivate you to get vaccinated? [Check all that apply] [ ] If I was offered an incentive [ ] If my employer offered time off to get vaccinated and recover from side effects [ ] If only one dose was required [ ] If it was offered where I normally go for health care [ ] If it was offered where I work [ ] If it was required for work [ ] If it was required for air or international travel [ ] If it was required to attend large gatherings (eg. concerts, sports, etc.) [ ] If someone I trust was vaccinated and told me it was safe [ ] Other - Write In: _________________________________________________
285
X APPENDICES
Healthy Capital District
Demographic Information We only use this information to ensure our survey is representative of Capital Region residents. 19) In what year were you born? 20) What is your zip code?
__________________________________ __________________________________ 21) How would you describe yourself? [Check all that apply] [ ] White/Caucasian [ ] Asian
[ ] Black/African-American [ ] Native Hawaiian or Other Pacific Islander
[ ] Hispanic/Latino [ ] American Indian or Alaska Native
[ ] Other - Write In: _________________________________________________
22) What is your gender? ( ) Male ( ) Transgender Male ( ) Gender Variant / Non-conforming
( ) Female ( ) Transgender Female ( ) Prefer not to answer
( ) Other - Write In: _________________________________________________
23) What County do you live in? ( ) Albany ( ) Columbia ( ) Saratoga
( ) Other ( ) Rensselaer ( ) Greene ( ) Schenectady
24) Which of the following general income categories is your total household income before taxes? ( ) Under $25,000 ( ) At least $25,000 but under $50,000
( ) Over $100,000 ( ) At least $50,000 but under $100,000
286
X APPENDICES
Healthy Capital District
Enter to Win a Prize! If you would like to be entered for the chance to win a cash prize of up to $1,000*, please enter your contact information below so we can reach out to you if you win. *One Grand Prize of $1,000 and five $100 prizes will be given out. Your contact information will not be shared.
Email Phone Number
Are you willing to be contacted by the Health Capital District to possibly answer public health questions in the future? ( ) Yes ( ) No
Thank You!
We appreciate the time you took to complete our survey.
Your response is very important to Healthy Capital District and its partners.
Please return to person/organization you received this survey from, or mail to:
Healthy Capital District 175 Central Avenue Albany, NY 12206

End


INSIDE BACK COVER

2022 CAPITAL REGION COMMUNITY HEALTH NEEDS ASSESSMENT
The 2022 Capital Region Community Health Needs Assessment is a project of the Healthy Capital District and is made possible through the support of its board organization.
2022 CAPITAL REGION COMM
UNITY HEALTH NEEDS ASSESSMENT
On a pathway to health


