Embed Size (px)
Citation preview
This electronic thesis or dissertation has been
downloaded from the King’s Research Portal at
https://kclpure.kcl.ac.uk/portal/
Take down policy
If you believe that this document breaches copyright please contact [email protected] providing
details, and we will remove access to the work immediately and investigate your claim.
END USER LICENCE AGREEMENT
Unless another licence is stated on the immediately following page this work is licensed
under a Creative Commons Attribution-NonCommercial-NoDerivatives 4.0 International
licence. https://creativecommons.org/licenses/by-nc-nd/4.0/
You are free to copy, distribute and transmit the work
Under the following conditions:
Attribution: You must attribute the work in the manner specified by the author (but not in anyway that suggests that they endorse you or your use of the work).
Non Commercial: You may not use this work for commercial purposes.
No Derivative Works - You may not alter, transform, or build upon this work.
Any of these conditions can be waived if you receive permission from the author. Your fair dealings and
other rights are in no way affected by the above.
The copyright of this thesis rests with the author and no quotation from it or information derived from it
may be published without proper acknowledgement.
A biophysical investigation of a membrane-active cyclodextrin-inliposome formulationfor antibiotic delivery
Vandera, Kalliopi-Kelli Apostolos
Awarding institution:King's College London
Download date: 06. Jul. 2022

0
A biophysical investigation of a membrane-active cyclodextrin-in-liposome formulation for antibiotic
delivery
A thesis submitted by
Kelly-Kalliopi Vandera
In fulfilment of the requirement for the degree of Doctor of Philosophy in
the Institute of Pharmaceutical Science of the School of Biomedical and
Life Sciences
2018
Department of Pharmacy
King’s College London
October, 2018
i
Acknowledgements
First, I would like to express my deepest gratitude to Dr. Richard Harvey and Dr. Cecile Dreiss
for imparting their knowledge and offering their invaluable support and guidance throughout
my research. They are both exceptional supervisors and friends! I could not have asked for
better supervisors. I truly appreciate their help and encouragement!
I would like to thank Dr. Stuart Jones for believing in me during my MSc research project and
introducing me to Richard as my PhD supervisor. A further big thank you to Dr. Miraz Rahman
for his warm welcome into his lab, as well as Dr. Kazi Nahar and Dr. Pietro Picconi for teaching
me drug synthesis. I would also like to thank Dr. Andrew Chan for enlightening me with his
expertise; and Dr. Ken Bruce for both letting me work in the microbiology lab and his advice
on how to write a thesis. I greatly appreciate the assistance of Dr. Luke Clifton and Dr.
Maximilian Skoda during my neutron time at the ISIS facilities. A big thanks goes to Professor
Peter Hylands and Nicola Tingley for their assistance when I was “banned” accidentally from
KCL (funny, but it is true!).
I acknowledge all the people that helped me throughout my PhD: Dr. Gianluca Bello for giving
me advice and tips on Langmuir trough, when I was really struggling to find answers to things
that didn’t make any sense; Dr. Helene Marbach, Dr. Masirah Zain, Dr. Arcadia Woods, Dr.
Giorgia Manzo, Dr. Margarita Valero and Dr. Raquel Barbosa for their invaluable help
concerning microbiology and formulation techniques; and Simona Di Blasio, DeDe and
Caroline thank you for your advice and your support. I am really grateful to you all for making
my PhD life more enjoyable, full of smiles and good vibes.
Last but not least, I would like to thank my family for their endless support. I am exceptionally
grateful to my late father, Apostole Vanderas, for providing me with the ethical foundation,
strength and patience to achieve my life goals, during the first 17 years of my life, and my
mother, Sophia Dimeli, for being both a mother and a father up to now. Mum, thank you from
the bottom of my heart for being my mainstay throughout the PhD. Chryssanthi Vandera, thank
you for being such a supportive sister and stand beside me at every step of my PhD. I would
also like to thank my in-laws, John and Katie Gateley, for supporting me through this journey.
A special thanks goes to my beloved husband, Dimitri Gateley, for believing in me, supporting
and encouraging me over the last 4 years. I am grateful for having such an affectionate
husband, who loves me unconditionally and makes me smile.
Thank you all for being part of this journey!
List of publications
ii
List of publications Hubbard ATM, Barker R, Rehal R, Vandera K-KA, Harvey RD, Coates ARM. Mechanism of
Action of a Membrane-Active Quinoline-Based Antimicrobial on Natural and Model Bacterial
Membranes. Biochemistry. 2017;56(8):1163-1174.
Kumar A, Terakosolphan W, Hassoun M, Vandera K-KA, Novicky A, Harvey RD, Royall PG,
Bicer EM, Eriksson J, Edwards K, Valkenborg D, Nelissen I, Hassall D, Mudway IS, Forbes B.
A Biocompatible Synthetic Lung Fluid Based on Human Respiratory Tract Lining Fluid
Composition. Pharm Res. 2017;34(12):2454-2465.
Urbano L, Clifton L, Ku HK, Kendall-Troughton H, Vandera K-KA, Matarese BFE, Abelha T, Li
P, Desai T, Dreiss CA, Barker R, Green M, Dailey LA, Harvey RD. Influence of the Surfactant
Structure on Photoluminescent π-Conjugated Polymer Nanoparticles: Interfacial Properties
and Protein Binding. Langmuir. 2018;34(21):6125-6137.
Abstract
iii
Abstract Gram-negative bacteria possess numerous defence mechanisms against antibiotics, due to
the intrinsic permeability barrier afforded by their outer membrane and the various efflux
mechanisms which pump out drugs, explaining the recalcitrance of some common and life-
threatening infections. A novel compound, PPA148, was synthesised in-house and showed
promising activity against Gram-negative bacteria. Nevertheless, in some clinical bacterial
strains, drug efflux resulted in reduced efficacy was observed, which was reversed in the
presence of the efflux pump inhibitor phenylalanine-arginine β naphthylamide (PAβN). A
formulation of PPA148 consisting of a drug/cyclodextrin (drug/CD) complex encapsulated in
liposomes is investigated as a way to increase drug uptake. PPA148 has very low water
solubility, which was measured using spectroscopic techniques: photon correlation
spectroscopy (PCS) and Ultra-Violet spectroscopy (UV). Its solubility is improved by
complexation with βCD derivatives (HPβCD and RAMEB) and the complex is characterized
by applying nuclear magnetic resonance (NMR) and fluorescence. Fluidosomes, loaded with
the drug/CD complex, are manufactured by applying the thin-film hydration method followed
by extrusion for reducing the size of liposomes. PCS is used to size the particles and measure
their zeta-potential. A Stewart assay and UV were used to quantify the lipid and drug
concentration respectively, in the final formulation. A disk diffusion microbiological assay is
used to assess the efficacy of the formulation against E. coli (DH5a). A variety of in vitro
biophysical techniques are used to assess the mechanism of the drug uptake. Phospholipids,
Re Lipid A extracted from S. Minnesota and Rc J5 LPS extracted from E. coli are used to
make a synthetic monolayer and bilayer model of the outer and inner bacterial membranes.
They are adapted for use with the Langmuir trough (LT) and neutron reflectivity (NR)
techniques to monitor changes occurring upon interaction with the drug alone and the
formulated drug. The results revealed an possible increase in drug efficacy with a possible
fusion mechanism of uptake. NR provides a new method to examine the fusion mechanism of
fluidosomes with bacterial membrane.
Table of Contents
iv
Table of Contents Acknowledgements ........................................................................................................................................ i
List of publications ......................................................................................................................................... ii
Abstract ........................................................................................................................................................ iii
Table of Contents .......................................................................................................................................... iv
Table of Figures ........................................................................................................................................... viii
Table of Tables ............................................................................................................................................. xv
Abbreviations ............................................................................................................................................. xvii
Symbols ...................................................................................................................................................... xix
Physical Constants ...................................................................................................................................... xxi
Chapter 1 General Introduction .............................................................................................................. 1
1.1 Antibiotics and Bacteria: a unique class of medicines and pathogens ................................... 2
1.2 Antibiotic classification ........................................................................................................ 2
1.3 Bacterial classification .......................................................................................................... 3
1.3.1 Physicochemical properties of antibiotics ........................................................................................... 3
1.3.2 Gram negative bacterial cell envelope as a barrier to antibiotics ....................................................... 4
1.3.3 Drug uptake mechanisms .................................................................................................................... 6
1.4 Antimicrobial Resistance (AMR) ........................................................................................... 7
1.4.1 Causes of AMR ..................................................................................................................................... 8
1.4.2 Mechanisms of bacterial resistance .................................................................................................... 9
1.5 Strategies to combat antimicrobial resistance .................................................................... 10
1.5.1 Drug development ............................................................................................................................. 11
1.5.2 Antibiotic combination therapy ........................................................................................................ 11
Table of Contents
v
1.6 Formulation approaches for antimicrobials to overcome resistance ................................... 13
1.6.1 Cyclodextrin-drug complexes ............................................................................................................ 13
1.6.2 Liposomal carriers ............................................................................................................................. 16
1.7 Aims and scope of this project ............................................................................................ 17
1.7.1 Drug-in-Cyclodextrin-in-Liposomes ................................................................................................... 18
1.7.2 Plan of the study and techniques used ............................................................................................. 19
1.7.3 Interfacial techniques used to investigate drug-membrane interactions ......................................... 20
Chapter 2 Synthesis, characterization and solubility of PPA148 .............................................................. 28
2.1 Introduction ....................................................................................................................... 29
2.2 Materials ............................................................................................................................ 32
2.3 Methods ............................................................................................................................ 33
2.3.1 Synthetic pathway of PPA148 ........................................................................................................... 33
2.3.2 Thin Layer Chromatography (TLC) ..................................................................................................... 37
2.3.3 Liquid Chromatography-Mass Spectrometry (LC/MS) ....................................................................... 37
2.3.4 Nuclear Magnetic Resonance (NMR) spectroscopy .......................................................................... 38
2.3.5 Fourier Transform Infra-Red (FTIR) Spectroscopy ............................................................................. 38
2.3.6 Adsorption assay ............................................................................................................................... 38
2.3.7 Ultra Violet Spectroscopy .................................................................................................................. 39
2.3.8 Turbidimetric Assay ........................................................................................................................... 40
2.3.9 Water Solubility Test ......................................................................................................................... 40
2.3.10 Quantification of drug:cyclodextrin binding constant by fluorescence spectroscopy .................... 41
2.3.11 Phase solubility diagram .................................................................................................................. 41
2.3.12 Continuous method variation (Job’s plot) (156) .............................................................................. 43
2.4 Results ............................................................................................................................... 44
Table of Contents
vi
2.4.1 Synthesis ............................................................................................................................................ 44
2.4.2 Physicochemical characteristics ........................................................................................................ 50
2.5 Discussion .......................................................................................................................... 58
2.6 Conclusion ......................................................................................................................... 62
Chapter 3 Liposomaly encapsulated drug/cyclodextrin inclusion complexes .......................................... 63
3.1 Introduction ....................................................................................................................... 64
3.2 Materials ............................................................................................................................ 66
3.3 Methods ............................................................................................................................ 66
3.3.1 Formation of Large Multi-Lamellar Fluidosomes .............................................................................. 66
3.3.2 Size reduction methods for the manufacture of Fluidosomes .......................................................... 67
3.3.3 Preparation of drug-cyclodextrin inclusion complexes ..................................................................... 67
3.3.4 Incorporation of drug/cyclodextrin complexes into liposomes ........................................................ 67
3.3.5 Size Exclusion Chromatography ........................................................................................................ 67
3.3.6 Photon Correlation Spectroscopy (PCS) ............................................................................................ 68
3.3.7 Stewart assay ..................................................................................................................................... 68
3.3.8 Drug quantification ............................................................................................................................ 69
3.3.9 Kirby Bauer assay .............................................................................................................................. 70
3.3.10 Dispersion stability of empty fluidosomes ...................................................................................... 71
3.3.11 Statistical analysis ............................................................................................................................ 71
3.4 Results ............................................................................................................................... 71
3.4.1 Characterization of empty/control Fluidosomes ............................................................................... 71
3.4.2 Characterization of drug-CD inclusion complexes in the Fluidosomes ............................................. 75
3.4.3 Encapsulation Efficiency and Drug Loading ....................................................................................... 76
3.4.4 Kirby Bauer assay .............................................................................................................................. 77
Table of Figures
vii
3.5 Discussion .......................................................................................................................... 80
3.6 Conclusion ......................................................................................................................... 84
Chapter 4 A biophysical investigation into the uptake mechanism of PPA148 and its delivery system .... 86
4.1 Introduction ....................................................................................................................... 87
4.2 Materials ............................................................................................................................ 90
4.3 Methods ............................................................................................................................ 90
4.3.1 Surface Pressure-Area isotherms at the air-liquid interface ............................................................. 90
4.3.2 Drug - monolayer interaction ............................................................................................................ 91
4.3.3 Drug - lipid bilayer interaction using fluorescence spectroscopy ...................................................... 92
4.3.4 Neutron reflectivity of asymmetric bilayer of DPPC and LPS and interaction with fluidosomes ...... 93
4.4 Results ............................................................................................................................... 97
4.4.1 Surface Pressure-Area isotherms of Langmuir monolayers at the air-liquid interface ..................... 97
4.4.2 Drug interactions with model inner membranes ............................................................................ 101
4.4.3 Drug interaction with model outer membranes ............................................................................. 107
4.5 Discussion ......................................................................................................................... 115
4.6 Conclusion ........................................................................................................................ 119
Chapter 5 General Conclusion .............................................................................................................. 120
5.1.1 Future Work .................................................................................................................................... 123
References ................................................................................................................................................. 125
Appendix A ................................................................................................................................................. 141
Quantum-mechanic rule ......................................................................................................... 141
Appendix B ................................................................................................................................................. 142
Appendix C ................................................................................................................................................. 145
Table of Figures
viii
Table of Figures Figure 1.1: Mechanism of action of some major antibiotic agents reproduced from Clatworthy et al. (10).
............................................................................................................................................................... 3
Figure 1.2: Cell envelope of Gram-negative bacteria reproduced from Silhavy et al. (18). ................... 5
Figure 1.3: Structure of phospholipid headgroups with different substitution in the phosphate group which gives a different curvature and charge. R1 and R2 are the fatty acid chains which can be either
saturated (PC with C16:0 is DPPC while PC with C14:0 is DMPC) or unsaturated (PC with C16:1 is
POPC). ................................................................................................................................................... 6
Figure 1.4: Different ways by which a substance can be transported across the membranes reproduced from Bolla et al., (34). Hydrophilic components and nutrients can pass through porins (a) and
hydrophobic molecules diffuse through the OM and/or IM (b and d respectively). The diffusion through
the periplasm which is packed with proteins is represented by (c). Drugs can be recognised as foreign
molecules by the efflux pumps (e and f) and can be transported out of the membranes. Several pumps
such as AcrA/B and AcrE/F must recruit the OM barrel protein such as TolC (g) in order to expel drugs
directly out of the cell (35). ..................................................................................................................... 7
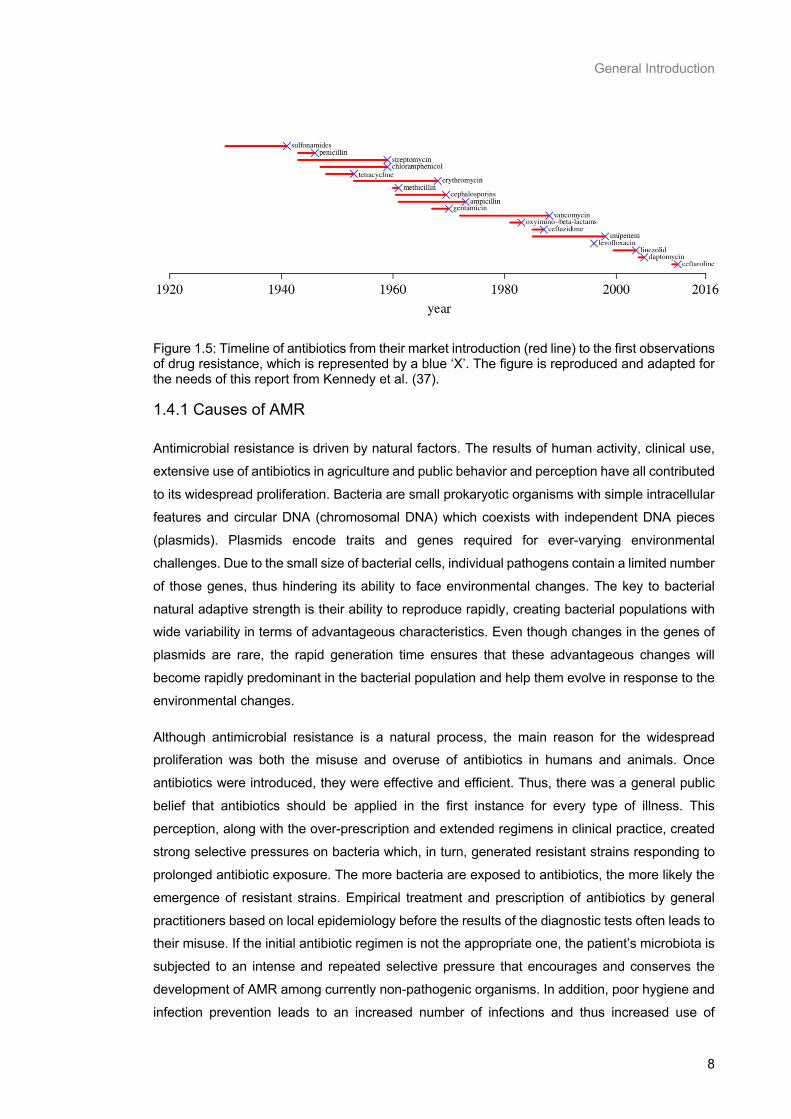
Figure 1.5: Timeline of antibiotics from their market introduction (red line) to the first observations of
drug resistance, which is represented by a blue ‘X’. The figure is reproduced and adapted for the needs
of this report from Kennedy et al. (37). .................................................................................................. 8
Figure 1.6: Mechanisms through which drug resistance can be spread horizontally from one bacterium to another reproduced from Levy et al. (9). .......................................................................................... 10
Figure 1.7: Mechanism of pro-drug platform, reproduced by Kim Lewis (70). The prodrug enters the cell
and is converted into the reactive drug by a bacteria-specific enzyme (E). Inside the cell, the reactive
compound covalently binds to unrelated targets, T1, T2 and T3, which causes cell death. This mechanism kills not only dividing cell but also dormant cell. ............................................................... 13
Figure 1.8: Native cyclodextrin structures for α-, β- and γ-cyclodextrin (CD). ..................................... 14
Figure 1.9: Chemical structure of rifampicin, gentamicin and chlorhexidine. ....................................... 20
Figure 1.10: Structure of Ra LPS derived from E. coli EH100, Rc LPS derived from E. coli J5 and Re
LPS derived from S. minnesota. .......................................................................................................... 22
Figure 1.11: Langmuir trough lipid monolayers and their transition stages upon compression as described by changes in the Surface Pressure-Area isotherm. The illustration depicts the packing or
Table of Figures
ix
the lipid alcyl chain upon compression from its 2D gas state until the collapse of the monolayer and the
formation of 3D structures. ................................................................................................................... 23
Figure 1.12: The classic optics of a beam, hitting a planar surface, related to the geometry of this process with the wavevector transfer. The wavevector is the “spatial” frequency of the neutron wave
and is described by the 𝑘 = 2𝜋𝜆 , where k is the wavevector and λ is the neutron wavelength. 𝑘𝑖, 𝑘𝑓
and 𝑘𝑟 are the wavevectors of incident, reflected and refracted neutron beam, respectively. 𝑄 is the
wavevector transfer (𝑘𝑖 − 𝑘𝑓), 𝜃𝑖𝑛, 𝜃𝑜𝑢𝑡 and 𝜃𝑟 are the incident, outgoing and refracted angle of the
neutron beam. ...................................................................................................................................... 24
Figure 1.13: (A) The oscillations in the reflectivity profile resulting from the interference which depends on the thickness (d) of the layer (in terms of the position) and the difference in scattering contrasts
between the respective interfaces (in terms of the amplitude). 𝑘𝑡 is the wavevectors of the incident
neutron beam and 𝑘𝑓1 and 𝑘𝑓2 the outgoing neutron beam from the top and bottom of the interfacial
layer, respectively. 𝑛1 and 𝑛2 are the refractive index of light while SLD1 and SLD2 are the refractive
indexes of neutrons in two different bulk phases. 𝜃𝑖𝑛, 𝜃𝑜 and 𝜃𝑟 are the incident, outgoing and refracted
angle of the neutron beam. (B) The scattering geometry in both Cartesian and spherical polar
coordinates with ϕ and θ are angles determining the direction of the outgoing neutron beam. 𝑘𝑓 is the
wavevectors of reflected neutron beam and λ is the neutron wavelength. .......................................... 25
Figure 1.14: Asymmetric lipid bilayer formed of Ra-EH100 LPS and DPPC and deposited on a silicon
surface. The red arrows show the neutron path when the bean hits the surface. ............................... 27
Figure 2.1: Mechanism of tricycle PBD core binding to the N2 of guanine in the DNA minor groove reproduced from Brucoli et al. (143). ................................................................................................... 29
Figure 2.2: Chemical structure of PPA148. .......................................................................................... 30
Figure 2.3: Different representations of the structure and conformation of β-cyclodextrin, showing the
orientation of the hydrogens and hydroxyl groups. Native βCD contains hydroxyl groups, while its
derivatives can be substituted by different functional groups. RAMEB contains either hydrogens or
methyl groups, while HPβCD has either hydrogens or hydroxypropyl groups. .................................... 31
Figure 2.4: Types of phase solubility diagrams (“A” and “B”) and their deviations (“AP”, “AN”, “BS” and “BI”) (154). ............................................................................................................................................ 42
Figure 2.5: 1NMR of sequential reaction monitoring for the synthesis of the final PBD core compound
(#9). ...................................................................................................................................................... 45
Figure 2.6: 1NMR of sequential reaction monitoring for the synthesis of the final tail compound (#11).
............................................................................................................................................................. 46
Table of Figures
x
Figure 2.7: 1NMR signals for the secondary amide and double bond hydrogens of the final de-protected
compound (#12), PPA148. ................................................................................................................... 47
Figure 2.8: 1H-NMR signals for the hydrocarbon chain, methyl moieties, thiomorpholine and the pyrrole group of the PBD tricyclic core of the final compound, PPA148. ......................................................... 47
Figure 2.9: FTIR monitoring of the core synthesis. .............................................................................. 48
Figure 2.10: FTIR monitoring the tail synthesis. .................................................................................. 49
Figure 2.11: FTIR monitoring of the final protected and de-protected PPA148. ................................. 49
Figure 2.12: A representative adsorption profile of PPA148 at the air/liquid interface at 23 °C. The drug was injected below a 0.9% NaCl subphase and changes in surface pressure were recorded until a
plateau was reached. The representative curve was fitted (red line) based on a 3-parameter Hill
equation (Equation 2.4), R2=0.99 (P≤0.0001). The mean and std of maximum surface pressure (12.34
± 0.77 mN/m), Hill slope (1.03 ± 0.22) and t50% (0.33 ± 0.15 h) was calculated from a set of 3 runs. .. 51
Figure 2.13: Representative UV/Vis spectra of PPA148 in three solvents: EtOH, H2O, EtOH/H2O (80:10) at 25 °C. ............................................................................................................................................... 52
Figure 2.14: (A) Effect of solvent and drug concentration on the absorbance profile. Inset: concentration
range where the Beer-Lambert law is followed (𝑦 = 0.04𝑥 + 0.02, 𝑅2 = 0.98 for EtOH/H2O, 𝑦 = 0.04𝑥 +
0.06, 𝑅2 = 0.75 for EtOH, 𝑦 = 0.03𝑥 + 0.05, 𝑅2 = 0.98 for H2O). First derivative of UV/Vis spectrum of a
series of PPA148 concentrations in: (B) H2O; (C) EtOH; and (D) EtOH:H2O (80:20). The peaks and
troughs of the spectrum profile is presented with zero first derivative. The insets show the changes of
λmax with increasing drug concentration. ............................................................................................ 53
Figure 2.15: Increasing concentration of PPA148 in water 7 days under mild stirring at 25 °C. Visual observation of the precipitation point is at 50 μg/mL. ........................................................................... 54
Figure 2.16: Turbidimetric assay: Effect of cyclodextrin concentration in the aggregation of PPA148
using dynamic light scattering (A) and UV/Vis spectroscopy (B). ........................................................ 54
Figure 2.17: Changes in the fluorescence intensity of PPA148 with increasing cyclodextrin
concentration (HPβCD or RAMEB) at 25 ˚C (A). The lines represent the non-linear regression fit
(Equation 2.7) of the experimental data points assuming a 1:1 complex. The phase solubility diagram
(B) was built by adding an excess of drug to solutions of cyclodextrin to measure drug solubilisation. In
both experiments, the solution used was HEPES buffered saline including CaCl2 at pH 7.2. ............ 55
Figure 2.18: Changes in the fluorescence intensity of rifampicin in increasing cyclodextrin concentration
(A) show the drug’s affinity to HPβCD and RAMEB at 25 ˚C. The lines represent the non-linear
regression fit of the experimental data points assuming a 1:1 complex. The phase solubility diagram (B)
was built to observe the approximate amount of drug that can be solubilized with CDs and gave an
Table of Figures
xi
indication of the complex stoichiometry and affinity. In both experiments, the solution used was Tris
buffer pH 9. .......................................................................................................................................... 56
Figure 2.19: Job’s plot for rifampicin/DIMEB (A) and PPA148/DIMEB (B) complexes. In the case of rifampicin, the normalized chemical shift (Δδ*XCD) of the H1 protons of DIMEB were plotted against the
molar fraction of DIMEB (XCD). For, PPA148, protons at position 5 of the cyclodextrin structure. ....... 58
Figure 2.20: Schematic representation of rifampicin/CD inclusion complex as it was found by molecular simulation by He et al. and Tewes et al. (162,164). ............................................................................. 61
Figure 3.1: Structure DPPC (16:0) and DMPG (14:0). ......................................................................... 65
Figure 3.2: Empty Fluidosomes (SUVs, 1mg/mL) were manufactured with the thin film hydration method and probe sonication for size reduction. (A) Effect of liposome integrity in terms of size and intensity
distribution profile of liposomes at a concentration of 1 mg/mL and temperature of 25 ˚C, measured by
dynamic light scattering, over a period of 2 months. The samples were stored at 4 ˚C and tested
between measurement intervals. All samples presented a polydispersity index of approximately 0.2 ±
0.01. (B) Effect of PBS buffer pH 7.4 on the size of a series diluted SUVs (1, 0.5, 0.25, 0.125 and 0.0625
mg/mL) over time. ................................................................................................................................ 73
Figure 3.3: Fluidosome (1 mg/mL SUVs) encapsulated with a series of HPβCD solutions in PBS buffer
pH 7.4 (0.1, 1, 2.5 and 5% w/w) manufactured with thin film hydration method and probe sonication for
size reduction. (A) Effect of HPβCD on the size and polydispersity of Fluidosomes in terms of the intensity distribution profile of liposomes at 25 ˚C, measured by dynamic light scattering. All samples
presented a polydispersity index of approximately 0.3 ± 0.01. (B) Comparison of size changes in the
absence and presence of HPβCD. ...................................................................................................... 74
Figure 3.4: Method development for the separation of unentrapped material from fluidosomes. Empty liposomes (2.5 mg/mL), prepared with thin film hydration method and extrusion through a 100 nm
polycarbonate membrane for size reduction, were passed through a Sephadex PD10G25 size exclusion
chromatography column, washed 8 times and the eluted volumes (8 fractions) were collected and
analyzed. (A) Elution pattern of empty fluidosomes (2.5 mg/mL). The derived count rate profile and lipid
content in each aliquot were measured to investigate the elution of liposomes. (B) Representative
intensity distribution of empty fluidosomes in HEPES buffered saline at pH 7.2 (aliquot #3). ............. 75
Figure 3.5: (A) Elution pattern of PPA148/RAMEB encapsulated fluidosomes (2.5 mg/mL). The derived count rate profile and lipid content in each aliquot were measured to investigate the elution profile of
loaded liposomes. (B). Representative intensity distribution of drug/RAMEB encapsulated fluidosomes
in HEPES buffered saline at pH 7.2 (aliquot #3). ................................................................................. 76
Figure 3.6: (A) Drug quantification profile of the eluted fraction from the PD10G25 size exclusion chromatography column with the inset being the calibration curve (y=0.7937+5.717,R^2=0.9966) is
Table of Figures
xii
presented as a function of the area under the curve (AUC). (B) The UV spectra of pure and extracted
drug in ethanol/water (80:20). Version 1 and 2 and the two UV spectra of extracted PPA148 from aliquot
3, which present changes in drug peak shape. .................................................................................... 77
Figure 3.7: Kirby-Bauer assay for measuring the growth inhibition of Escherichia coli DH5α. The
inhibition zone diameter was measured for PPA148 as a pure substance and as a formulated drug (in
a 5% RAMEB complex and incorporated into 0.1 mg fluidosomes as a complex with 5% RAMEB) after
24 hour incubation at 37 °C. Rifampicin and vancomycin were used as positive and negative control
samples. The asterisks denote the level of significance going from lower to higher (as follows) and four asterisks indicate the highest level: 0.1244 (ns), 0.0332 (*), 0.0021 (**), 0.0002 (***), <0.0001 (****). All
samples were tested in triplicate apart from the final formulation (PPA148-in-RAMEB-in-fluidosomes)
which was tested 5 times. .................................................................................................................... 78
Figure 3.8: Tukey’s test of experimental data (n=3,5) with confidence interval of 95%. (A) Zero is
included in the interval of PPA148-in-CD and PPA148-in-CD-in-liposome which indicates that their mean is not statistically significant. Residuals distribution of experimental observations for each group
(B). ....................................................................................................................................................... 79
Figure 3.9: Monte-Carlo simulation was carried out based on the standard deviation of the experimental
data. 100 observations were generated by the simulation and one-way ANOVA and Tukey’s test was
carried out with 95% confidence interval (A). All sets of groups have statistical difference. Residual distributions of simulated data (B). ....................................................................................................... 79
Figure 3.10: Schematic representation of the possible organization of PPA148/RAMEB complex
incorporated into Fluidosomes. The electrophilic center of PPA148 is presented inside the CD cavity
while the headgroup of DPPC is associated with the exterior hydrogens of the narrow side of RAMEB
molecules. ............................................................................................................................................ 84
Figure 4.1: Langmuir-Blodget and Langmuir-Schafer deposition on a silicon crystal to manufacture the
assymetric model outer membrane of Gram negative bacteria. .......................................................... 95
Figure 4.2: A, C and E present the Surface Pressure-Area (P-A) isotherms generated at 23 °C for a series of pure or mixtures of phospholipids (E. coli extract, DPPC, DPPG, POPC, POPG). All
phospholipids were suspended in chloroform apart from d62DPPC which was prepared in
chloroform:methanol:water (6:4:1) before deposition. The subphase used was 1mM MgCl2 for all
monolayers apart from d62DPPC which was 5 mM CaCl2. The E. coli B monolayer was deposited either
on ultra pure water or 0.9% NaCl The subphase for hydrogenous DPPC/DPPG and POPC/POP
mixtures monolayers was MgCl2. E. coli isotherm was measured on ultra pure water and isotonic saline.
The red arrows show the L1/L2 and the L2/S transition of the lipids where applicable. B, D and F show the calculated compressibility modulus derived from P-A isotherms at 23 °C. The red arrows show
transition phases of the lipids which are more pronounced than in the P-A isotherm. ........................ 99
Table of Figures
xiii
Figure 4.3: Collapse surface pressure (A), area per molecule (B) and compressibility modulus (C) at 30
mN/m of all the phospholipid lipid monolayers ................................................................................... 100
Figure 4.4: (A) Surface Pressure-Area (P-A) isotherms generated at 23 °C for a series of glycolipids: Ra EH100 LPS, Rc J5 LPS and Lipid A. The subphase for Rc-LPS and Lipid A monolayers was MgCl2
while CaCl2 was used for Ra-LPS. The red arrows show the L1/L2 and the L2/S transition of the lipids
where applicable. (B) Compressibility modulus derived from P-A isotherms at 23 °C. The red arrows
show transition phases of the lipids which are more pronounced than in the P-A isotherm. ............. 101
Figure 4.5: Collapse surface pressure (A), area per molecule (B) and compressibility modulus (C) at 30 mN/m of three types of glycolipid monolayers. The Ra-LPS did not reach its collapse pressure and it is
excluded from the figure. ................................................................................................................... 102
Figure 4.6: Representative surface pressure – time isotherms at 23°C of chlorhexidine digluconate (A), rifampicin (B), gentamicin (B), PPA148 (C) and DMSO (0.5, 1 and 1.5 % v/v) (D) against E. coli B
monolayer using 0.9% NaCl as a subphase. The black lines are the fitted curves based on the
mathematical model, Hill curve, when it was applicable. ................................................................... 104
Figure 4.7: CF release from liposomes, manufactured from natural E. coli lipid extract, after administration of PPA148, chlorhexidine digluconate and gentamicin at 25°C. ................................ 105
Figure 4.8: Representative surface pressure – time isotherms at 23°C of rifampicin (A), PPA148 (B),
against DPPC/DPPG monolayer using 1 mM MgCl2 as a subphase. The black lines are the fitted curves
based on the mathematical model when it was applicable. ............................................................... 106
Figure 4.9: Representative surface pressure – time isotherms at 23°C of HPβCD (A) and RAMEB (B), against DPPC/DPPG (3:1) and POPC/POPG (3:1) monolayers using MgCl2 as a subphase. ......... 108
Figure 4.10: Interaction isotherm of 20 μg/mL PPA148 (A), 20 μg/mL rifampicin (B) and 0.1 mg/mL
fluidosomes (C) against different types of OM lipid monolayers (Lipid A and Rc-LPS J5) at constant surface area at 23 °C. The profile was fitted, when applicable, to specific binding Hill slope model to
investigate the kinetics and affinity of the interaction. The black lines are the fitted curves based on the
mathematical model. .......................................................................................................................... 109
Figure 4.11: Pressure-time interaction isotherm of HPβCD (A) and RAMEB (B) with 2 monolayers under
constant surface area at 23°C. .......................................................................................................... 110
Figure 4.12: Neutron reflectivity profile (A) and model data fits with their scattering length density profiles
(B) for an assymetrically deposited DPPC (inner leaflet) and Ra-LPS (outer leaflet) model membrane
at room temperature. The sample was measured at three isotopic contrasts (100% D2O, 100% H2O
and SMW). The model membrane was fitted into five-layered mathematical model: Silicon oxide (SiO2),
DPPC headgroup (Inner HG), DPPC tails (Inner tails), Ra LPS tails (Outer tails) and Ra LPS headgroups (Core). ............................................................................................................................ 111
Table of Figures
xiv
Figure 4.13: Neutron reflectivity profile (A and model data fits with their scattering length density profiles
(B) for an assymetrically deposited DPPC (inner leaflet) and Ra-LPS (outer leaflet) model membrane
at 38 °C. The sample was measured in three isotopic contrasts (100% D2O, 100% H2O and 38% D2O/SMW). The model membrane was fitted into a five-layered mathematical model: Silicon oxide
(SiO2), DPPC headgroup (Inner HG), DPPC tails (Inner tails), Ra LPS tails (Outer tails) and Ra LPS
headgroups (Core). ............................................................................................................................ 113
Figure 4.14: Neutron reflectivity profile (A) and model data fits with their scattering length density profiles
(B) for an assymetrically deposited DPPC (inner leaflet) and Ra-LPS (outer leaflet) model membrane after being challenged with 0.1 mg/mL fluidosomes (DPPC/DMPG, 18:1) at 38 °C. The sample was
measured in three isotopic contrasts (100% D2O, 100% H2O and 38% D2O/SMW). The model
membrane was fitted into a seven-layered mathematical model: Silicon oxide (SiO2), DPPC headgroup
(Inner HG), DPPC tails (Inner tails), Ra LPS tails (Outer tails) and Ra LPS headgroups (Core), Bridge
and Floating bilayer. ........................................................................................................................... 114
Figure 4.15: Representation of the possible structural changes in the model OM system after being challenged by fluidosomes. ................................................................................................................ 116
Figure 4.16: Schematic representation of the movement of phospholipids within a membrane: transpose
diffusion (1), rotation (2), swing (3), flexion (4) and transverse diffusion or “flip-flop” movement (5). 118
Figure 4.17: Schematic representation of the effect of temperature change on membrane structure and behavior of lipid bilayers adapted from Los and Murata (249). Low temperatures cause “rigidification”
of membranes, whereas high temperatures cause “fluidization” of membranes. .............................. 119
Figure B 1: 13CNMR of intermediate compounds of the PBD core synthesis. The samples were
suspended in deuterated chloroform. ................................................................................................ 145
Figure B 2: 13CNMR of intermediate compounds of the tail synthesis. The samples were suspended in deuterated DMSO. ............................................................................................................................. 145
Figure B 3: 13CNMR of the final compound, PPA148. The sample was suspended in deuterated
chloroform. ......................................................................................................................................... 146
Figure B 4: The linear regression (A) met the assumptions that the residuals follow a normal distribution (B) and their variance is constant (B). ................................................................................................ 146
Table of Tables
xv
Table of Tables Table 1.1: Comparison of non-antibiotic drug properties with the generic optimal properties for
antibacterial drugs for oral or parental administration as were calculated by O’Shea et al based on data
collected from the literature and drug data bases (12). ......................................................................... 4
Table 1.2: WHO priority list for the development and discovery of new antibiotics for antibiotic resistant bacteria (54). ........................................................................................................................................ 11
Table 1.3: Summary of antibiotic-cyclodextrin complexes investigated by research groups to achieve
sustained drug release, better bioavailability, increased antimicrobial activity and enhanced drug
solubility. .............................................................................................................................................. 16
Table 1.4: Several liposomal carriers investigated against Gram negative bacteria. .......................... 17
Table 1.5: Physicochemical properties of PPA148, rifampicin, gentamicin and chlorhexidine. ........... 20
Table 1.6: Fatty acid composition of E. coli lipid extract as it was found by White et al. (127). ........... 21
Table 1.7: Potential isotopic contrasts and main information content of a monolayer on an air/water
interface or a deposited lipid bilayer on a silicon surface consisting for tail deuterated phospholipids.
NRW and SMW stand for null reflective water (8.2% D2O) and silicon match water (38% D2O) respectively and are used to cancel out the background of the two mediums and highlight the interface.
............................................................................................................................................................. 26
Table 2.1: Comparison of the physicochemical properties of PPA148 estimated by ChemDraw
compared (the experimental values are presented in parenthesis) with the generic optimal properties
of antibacterial drugs for oral or parental administration as calculated by O’Shea et al. (12) based on data collected from the literature and drug data bases. ....................................................................... 30
Table 2.2: Chemical characteristics of each intermediate and the final compound. ............................ 50
Table 2.3 Solubility values and aggregation concentration of PPA148 in water, HEPES buffered saline pH 7.2 and HPβCD or RAMEB in HEPES obtained by different techniques. ...................................... 54
Table 2.4: Binding constant of PPA148 and rifampicin as obtained by two different techniques. ....... 57
Table 2.5: Gibbs free energy of transfer of rifampicin and PPA148 from pure water to aqueous CD solutions at room temperature calculated using Equation 2.11. .......................................................... 57
Table 4.1: Summary of scattering length densities of the lipid components studied, and the solution
subphases. ........................................................................................................................................... 96

Table of Tables
xvi
Table 4.2: Kinetic parameters obtained from the fitting of the binding isotherms of rifampicin, gentamicin
and PPA148 and the E. coli B monolayers at 23°C on water sub-phase containing isotonic saline. 104
Table 4.3: Kinetic parameters obtained from the fitting of the binding isotherms of rifampicin and PPA148 and the DPPC/DPPG monolayers at 23°C on water sub-phase containing1 mM MgCl2. ... 107
Table 4.4: Kinetic parameters obtained from fitting the binding isotherms of rifampicin and PPA148 and the Rc J5 LPS and R595 Lipid A monolayers at 23°C on a water sub-phase containing1 mM MgCl2.
........................................................................................................................................................... 109
Table 4.5: Volume fractions of deuterated DPPC tails, hydrogenous LPS tails and water within the
bilayers of Ra-LPS/d-DPPC at room temperature (25 °C). ................................................................ 111
Table 4.6: Structural parameters, thickness, hydration and roughness, of the Ra-LPS/DPPC membrane at room temperature and 38 °C as obtained from the fitting of the neutron reflectivity data. The numbers
in parentheses are the 95% confidence interval error. ...................................................................... 112
Table 4.7: Volume fraction of deuterated DPPC tails, hydrogenous LPS tails and water within the bilayers of Ra-LPS/d-DPPC 38 °C before and after the challenge by the fluidosomes. .................... 113
Table 4.8: Structural parameters, namely, thickness, hydration and roughness, of the challenged Ra-
LPS/DPPC membrane at 38 °C as obtained from fits to the neutron reflectivity data shown in Figure
4.14. ................................................................................................................................................... 115
Table B 1: Minimum Inhibitory concentrations (MIC) of PPA148 against Gram-negative bacteria in the
absence and presence of the efflux pump inhibitor PaβN. ................................................................ 144
Table B 2: Minimum Inhibitory concentrations (MIC) of PPA148 against Gram-positive bacteria in the
absence and presence of the efflux pump inhibitor PaβN. ................................................................ 144
Table C 1: Number and Volume distribution of empty and loaded fluidosomes. ............................... 147

Abbreviations
xvii
Abbreviations ABC: ATP binding cassettes
AMR: Antimicrobial Resistance
CE: complexation efficiency
CL: cardiolipins
CymA: cyclodextrin metabolism A
DCR: derived count rate
DIMEB: Heptakis (2,6-di-O-methyl)-β-cyclodextrin
DNA: deoxyribonucleic acid
EARS-Net: European Antimicrobial Resistance Surveillance Network
ECDC: European Center of Disease Control
IM: Inner membrane
IUPAC: International Union of Pure and Applied Chemistry
Kdo: 3-deoxy-d-manno-oct-ulosonic acid
LC-MS: Liquid Chromatography-Mass Spectrometry
LPS: Lipopolysaccharide
MATE: multidrug and toxic-compound efflux
MDR: multi-drug resistant
MIC: minimum inhibitory concentration
MW: molecular weight
NRW: null reflected water
OM: Outer mambrane
Abbreviations
xviii
OMP: Outer membrane protein
PC: phosphatidylcholine
PE: phosphatidylethanolamines
PG: phosphatidylglycerols
PSA: polar surface area
RNA: ribonucleic acid
RND: resistance-nodulation-division
SMR: small multidrug resistance
SMW: silicon matched water
US CDC: US Center for Disease Control and Prevention
WHO: World Health Organization
Symbols
xix
Symbols (m:n): stoichiometry of CD/drug complex
ΔGtro: Gibbs free energy
A: area per molecule
Cs: Area compression modulus
D: Brownian motion diffusion coefficient
d: thickness
dH: hydrodynamic diameter
Es or Cs-1: Compressibility modulus
f: wave frequency
G: gaseous state
h: Hill slope
I: Fluorescence intensity
K: binding constant
k: wavevector
Ka: distance travelled by the analytefrom its origin
Ks: distance travelled by the solvent from its origin
L1: liquid-expanded state
L2: condensed state
p: momentum of neutrons
Q: wavevector transfer
Rf: retardation factor
Symbols
xx
S: solid state
S0: Solubility in the presence of cyclodextrin
Sint: intrinsic solubility
T: Temperature in Kelvin
v: neutron velocity
XCD: mole fraction of cyclodextrin
ΔΠ: Difference in surface pressure
ΔΠ/ΔA: slope of isotherm
η: solvent viscosity
θ: incident angle
λ: wavelength
Π: Surface pressure
ρ: Scattering Length Density (SLD)
φ: volume fraction
Physical Constants
xxi
Physical Constants h: Planck's constant, 6.626 × 10⁻³⁴ J
k: Boltzman’s constant, 1.381 × 10⁻²³ J K-1
mn: neutron mass, 1.675 × 10⁻²⁴ kg
R: Gas constant 8.314 JK-1mol-1

General Introduction
1
Chapter 1 General Introduction
General Introduction
2
1.1 Antibiotics and Bacteria: a unique class of medicines and
pathogens
Antibiotics are a group of drugs used to treat bacterial infections. They are a unique class of
medicines because of their complicated mechanisms of action as well as their restricting use and long-term efficacy. Unlike other drugs, antibiotics should selectively target several pathogens
that are responsible for conditions ranging from pneumonia to urinary infections, acting in
different body sites, whilst at the same time they should not affect the host organism (1).
Antibiotics made a significant contribution to public health, having been used not only in medical
practice but also in agriculture and other industries. They also help to promote growth in livestock,
preserve building materials from contamination and treat blight in orchards (2). Antibiotics have
saved countless lives and improved surgery conditions by preventing or curing bacterial
infections in patients including those: receiving chemotherapy treatments; suffering from chronic diseases such as cystic fibrosis, diabetes, end-stage renal disease, or rheumatoid arthritis; or
having undertaken complex surgical procedures such as organ transplants, joint replacements,
or cardiac surgery (3–5). Moreover, they have increased the average life expectancy and
decreased the morbidity and mortality caused by food-borne and other poverty-related infections
(5,6).
1.2 Antibiotic classification
Antibiotics are classified based on their chemical family and mechanism of action. They are
separated into 32 groups, based on their chemical functional groups, the larger being aminoglycosides, glycopeptides, imidazole, macrolides, nucleosides, penicillins and
cephalosporines (β-lactams), peptides, pyrimidines and pyridines, sulfonamides and
tetracyclines. Each of them possesses unique chemical properties and functional groups to target
different parts of bacterial cells. For example, penicillins inhibit cell wall synthesis (7), whilst
rifampins target RNA synthesis (8). Their action to either kill bacteria (bacteriocidal) or inhibit
bacterial growth (bacteriostatic) falls within four categories. Three of those functions are the
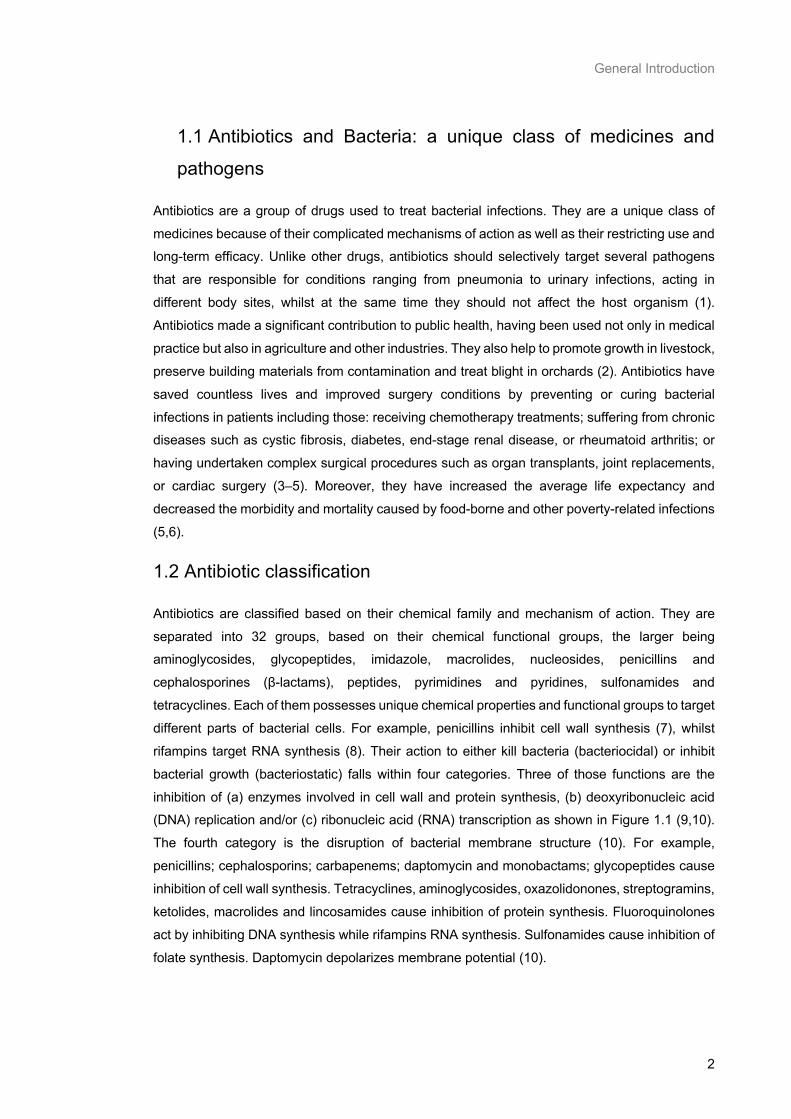
inhibition of (a) enzymes involved in cell wall and protein synthesis, (b) deoxyribonucleic acid (DNA) replication and/or (c) ribonucleic acid (RNA) transcription as shown in Figure 1.1 (9,10).
The fourth category is the disruption of bacterial membrane structure (10). For example,
penicillins; cephalosporins; carbapenems; daptomycin and monobactams; glycopeptides cause
inhibition of cell wall synthesis. Tetracyclines, aminoglycosides, oxazolidonones, streptogramins,
ketolides, macrolides and lincosamides cause inhibition of protein synthesis. Fluoroquinolones
act by inhibiting DNA synthesis while rifampins RNA synthesis. Sulfonamides cause inhibition of
folate synthesis. Daptomycin depolarizes membrane potential (10).
General Introduction
3
Figure 1.1: Mechanism of action of some major antibiotic agents reproduced from Clatworthy et al. (10).
1.3 Bacterial classification
Bacteria are prokaryotic microorganisms which can be classified as either Gram positive or Gram negative, on the basis of their cell envelope structure. The cell envelope of Gram positive bacteria
possesses a thick peptidoglycan wall external to their plasma membrane, whereas the
peptidoglycan of Gram negative constitutes a thinner layer between their outer and inner
membranes.
The activity of antibiotics is designated as broad, intermediate or narrow-spectrum based on the number of different bacterial species they can affect (11). For example, antibiotics that kill both
Gram positive and negative bacteria are called broad spectrum antibiotics, while those which kill
only Gram positive bacteria are considered narrow spectrum (11). The research conducted in
this project is focused exclusively on Gram negative bacteria because their complex outer
membrane (OM) hinders drug uptake, resulting in low efficacy.
1.3.1 Physicochemical properties of antibiotics
Active pharmaceutical compounds are classified based on their physicochemical properties and
fall within the Lipinski's rule of five (i.e., a molecule with a molecular mass under 500 Da, no more
than 5 hydrogen bond donors, no more than 10 hydrogen bond acceptors, and an octanol–water
partition coefficient, logP, no greater than 5). Antibacterial agents have always been deemed to
deviate from Lipinski’s rule of five due to their higher molecular weight and polarity (Table 1.1)
(12,13). Several research groups have tried to correlate the physicochemical properties of
antibiotics with their activity by collecting experimental data from the literature and databases of already marketed drugs to compare them in terms of lipophilicity (clogP), polarity (PSA),
General Introduction
4
molecular weight (MW), number of H-donors, number of H-acceptors and number of aromatic
rings. Leeson and Davis compared drugs, including antibiotics, from five different therapeutic
areas (cardiovascular, nervous system, gastrointestinal, respiratory/inflammation and infection) that were launched from 1983 to 2002 (14). Antibiotics, antimalarial, antiviral, antifungal and
antiparasitic drugs were all included in the general infection category, known as anti-infectives.
Their results showed that anti-infectives have a different physicochemical profile by being larger
and less lipophilic than the other classes, which can be explained by their activity against non-
human cells and their need to penetrate the bacterial cell envelope. O’Shea and co-workers,
particularly, examined the properties of 147 antibacterial agents, classifying the results into
activity against Gram negative and Gram positive bacteria, and compared them with results from non-antibiotic drugs (12). Their analysis is presented in Table 1.1.
Table 1.1: Comparison of non-antibiotic drug properties with the generic optimal properties for antibacterial drugs for oral or parental administration as were calculated by O’Shea et al based on data collected from the literature and drug data bases (12).
Physicochemical properties Non-antibiotic
Antibiotics with optimal properties against Gram
negative
Antibiotics with optimal properties
against Gram positive
Molecular weight (g/mol)
338 414 813
cLogP 2.7 -0.1 2.1
cLogD7.4 1.6 -2.8 -0.2
PSA (Å2) 70 165 243 cLogP is the logarithm of the partition coefficient (LogP) between n-octanol and water and is a measure of the compound’s hydrophilicity and an indication of absorption and permeation. clogD7.4 is the logarithm of the distribution coefficient at pH 7.4 which is another measure of lipophilicity of unionized and ionized forms. PSA is the polar surface area, which provides a prediction of drug passive intestinal permeability (<140 Å2) and blood-brain barrier penetration (<60 Å2) (15–17).
Table 1.1 shows that in general, antibiotics have significantly higher molecular weights and
polarities compared to non-antibiotic drugs. Interestingly, there are variations between drugs
acting against Gram negative and positive bacteria which can be explained by the differences in
the constitution of the cell envelopes between these two groups. The lipophilicity of non-
antibacterial drugs and the Gram positive activity group present similarities, but a substantially
higher polarity is noted for the Gram negative specific group. This difference in lipophilicity is
more obvious when comparing the cLogD7.4 (4 log units lower, which means more hydrophilic)
and PSA values.
1.3.2 Gram negative bacterial cell envelope as a barrier to antibiotics
Gram negative bacteria possess a complex envelope structure with two main permeability
barriers: the outer membrane (OM) and the inner (cytoplasmic) membrane (IM). The OM is a
unique feature of the Gram negative bacterial cell envelope providing cell protection. It is a lipid

General Introduction
5
bilayer whose outer leaflet consists of lipopolysaccharide (LPS) while the inner leaflet is
composed of phospholipids (18).
Figure 1.2: Cell envelope of Gram-negative bacteria reproduced from Silhavy et al. (18).
LPS belongs to the category of glycolipids and consists of Lipid A, a hydrophilic oligosaccharide
core and a hydrophilic O-antigenic polysaccharide side chain (O-chain) (Figure 1.2). Lipid A
provides the membrane anchor for the LPS molecule, and is made up of a β(1 → 6)-linked
glucosamine disaccharide backbone which is acylated at positions 2 and 3 of each monosaccharide portion involving six to seven fatty acid chains (Figure 1.10). This acylated
disaccharide is also mostly phosphorylated at positions 1 and 4′ or even further substituted (19–
21). The core oligosaccharide is subdivided into an inner and outer core. The inner core is
composed of 3-deoxy-d-manno-oct-ulosonic acid (Kdo) and L-glycerol-D-manno-heptose which
are typically phosphorylated or modified with phosphate containing groups, increasing their
overall negative charge helping stabilize the structure through divalent cation cross-linking (22).
Kdo links the core oligosaccharide with Lipid A anchor while the outer core attaches to the O-
antigen. The outer core is more diverse than the inner and is composed of three to six additional saccharides such as D-glucose and N-acetyl-D-glucosamine and D-galactose (23,24). There are
also proteins present in the outer membrane (OMP); lipoproteins and β-barrels. OMP such as
porins are of major importance because they are transmembrane and their function is to allow
the uptake of nutrients and hydrophilic compounds. LPS provides protection against hydrophobic
compounds (18), and makes the OM a semipermeable barrier which protects the cell from
harmful organic compounds such as antimicrobials and allows the uptake of sufficient nutrients.
A thin peptidoglycan layer sits between the OM and IM to provide extra support and flexibility to
the IM, which is the last part of the cell envelope and is composed of phospholipids and proteins.
IM proteins are responsible for the energy production, lipid biosynthesis, protein secretion and
transport of materials in and out of the cell. The principal lipids which are present in the IM of the
majority of bacteria, such as P. aeruginosa and Escherichia coli (E. coli), are
General Introduction
6
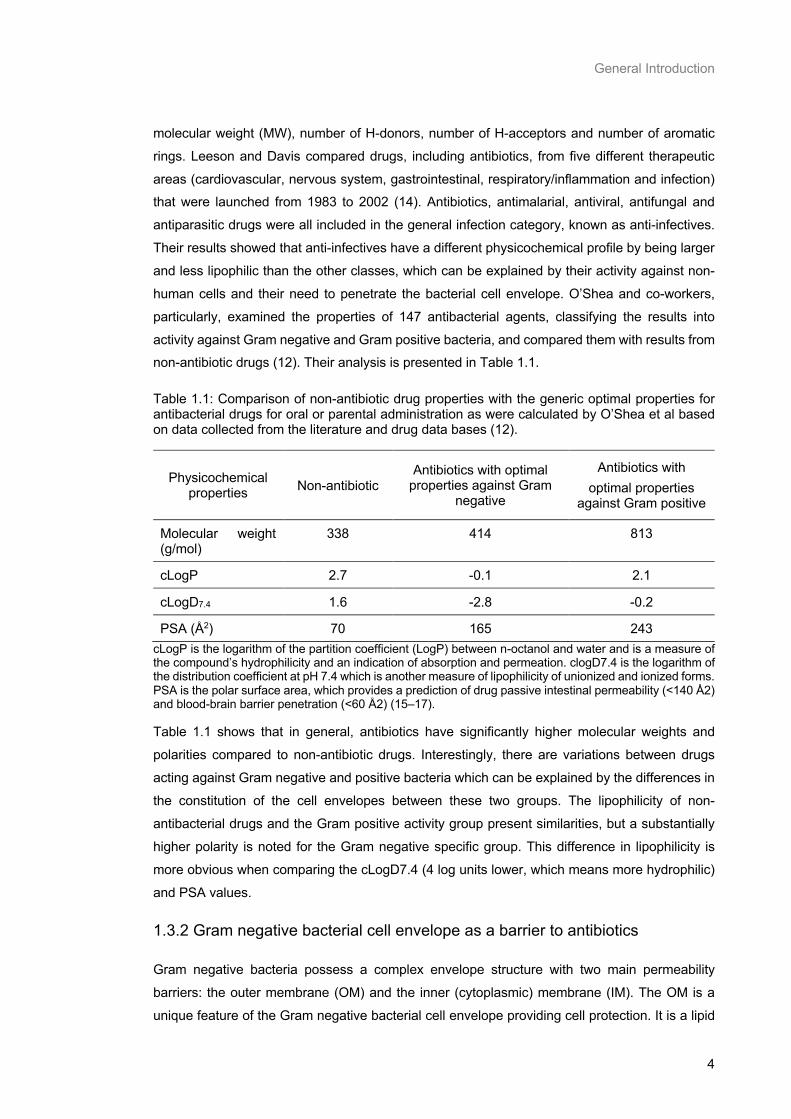
phosphatidylcholines (PCs), phosphatidylethanolamines (PEs), phosphatidylglycerols (PGs) and
cardiolipins (CL) (25) (Figure 1.3). Bacterial efflux pumps present in the cell envelope prevent
the accumulation of toxic compounds, such as antimicrobial drugs, in the cell. Efflux pumps are comprised of a transporter (protein) in the IM, an accessory protein (membrane-fusion protein)
in the periplasm and an outer membrane protein channel in the OM (Figure 1.4 e, f, g) (26).
Figure 1.3: Structure of phospholipid headgroups with different substitution in the phosphate group which gives a different curvature and charge. R1 and R2 are the fatty acid chains which can be either saturated (PC with C16:0 is DPPC while PC with C14:0 is DMPC) or unsaturated (PC with C16:1 is POPC).
1.3.3 Drug uptake mechanisms
Based on the cell envelope structure (Figure 1.2) it can be seen that there are several
mechanisms of drug and ion uptake (Figure 1.4). They are divided into two major categories: passive and active transport (27). Hydrophobic compounds diffuse passively through the
membrane because of their lipid solubility (passive diffusion) while hydrophilic agents are
transported through the water channels (facilitated diffusion). General diffusion porins form water
channels facilitating the passage of small hydrophilic molecules (~ 400 Da, >600 pass very
slowly) and ions (non-specific diffusion) while the specific porins allow the passage of specific
molecules or classes of molecules that binds to the substrates that preferentially flow through
these channels (self-promoted diffusion) (18,28–30). For instance, it has been found that uptake of native α- and β-cyclodextrin depends on specific membrane protein channels (cyclodextrin
metabolism A or CymA) in the outer membrane of the Gram negative bacterium, Klebsiella
oxytoca (31). Drugs might have a different mechanism of uptake across OM and IM as is the
case with the aminoglycosides. Gentamicin is known to pass passively (self-promoted) through
the OM and actively through the IM (32,33).
Phosphatidylethanolamine (PE)
Phosphatidylglycerol(PG)
Phosphatidylcholine (PC)
Cardiolipin(CL)

General Introduction
7
Figure 1.4: Different ways by which a substance can be transported across the membranes reproduced from Bolla et al., (34). Hydrophilic components and nutrients can pass through porins (a) and hydrophobic molecules diffuse through the OM and/or IM (b and d respectively). The diffusion through the periplasm which is packed with proteins is represented by (c). Drugs can be recognised as foreign molecules by the efflux pumps (e and f) and can be transported out of the membranes. Several pumps such as AcrA/B and AcrE/F must recruit the OM barrel protein such as TolC (g) in order to expel drugs directly out of the cell (35).
1.4 Antimicrobial Resistance (AMR)
Although antibiotics have been highly effective against pathogens, they impose substantial
selective pressures on bacteria, which are living organisms and thus tend to adapt to changes
and evolve. Antibiotic-resistance is a natural process because bacteria develop their own
resistance mechanisms and constantly acquire those that had evolved over billions of years in
environmental bacteria (36). Therefore, resistance is not a new phenomenon, as it is shown in
Figure 1.5. It first emerged in hospitals in the late 1930s with the sulfonamide-resistant Streptococcus pyogenes bacteria, shortly after sulfonamides were made available on the market,
and penicillin-resistant Staphylococcus aureus appeared 6 months after being used in clinical
practice in the UK (36–38). After 1985, the antibiotic pipeline began to dry up and fewer new
drugs were introduced; leading to a situation now, where we are in danger of entering a “post-
antibiotic” era (2,10,36,37,39–41).
General Introduction
8
Figure 1.5: Timeline of antibiotics from their market introduction (red line) to the first observations of drug resistance, which is represented by a blue ‘X’. The figure is reproduced and adapted for the needs of this report from Kennedy et al. (37).
1.4.1 Causes of AMR
Antimicrobial resistance is driven by natural factors. The results of human activity, clinical use,
extensive use of antibiotics in agriculture and public behavior and perception have all contributed
to its widespread proliferation. Bacteria are small prokaryotic organisms with simple intracellular
features and circular DNA (chromosomal DNA) which coexists with independent DNA pieces
(plasmids). Plasmids encode traits and genes required for ever-varying environmental
challenges. Due to the small size of bacterial cells, individual pathogens contain a limited number
of those genes, thus hindering its ability to face environmental changes. The key to bacterial
natural adaptive strength is their ability to reproduce rapidly, creating bacterial populations with wide variability in terms of advantageous characteristics. Even though changes in the genes of
plasmids are rare, the rapid generation time ensures that these advantageous changes will
become rapidly predominant in the bacterial population and help them evolve in response to the
environmental changes.
Although antimicrobial resistance is a natural process, the main reason for the widespread proliferation was both the misuse and overuse of antibiotics in humans and animals. Once
antibiotics were introduced, they were effective and efficient. Thus, there was a general public
belief that antibiotics should be applied in the first instance for every type of illness. This
perception, along with the over-prescription and extended regimens in clinical practice, created
strong selective pressures on bacteria which, in turn, generated resistant strains responding to
prolonged antibiotic exposure. The more bacteria are exposed to antibiotics, the more likely the
emergence of resistant strains. Empirical treatment and prescription of antibiotics by general
practitioners based on local epidemiology before the results of the diagnostic tests often leads to their misuse. If the initial antibiotic regimen is not the appropriate one, the patient’s microbiota is
subjected to an intense and repeated selective pressure that encourages and conserves the
development of AMR among currently non-pathogenic organisms. In addition, poor hygiene and
infection prevention leads to an increased number of infections and thus increased use of
General Introduction
9
antibiotics. Moreover, the use of antibiotics in agriculture too, may have increased productivity
but it has been increasing the abundance and diversity of AMR genes across rural and urban
environments.
Bacteria have become resistant to a number of drugs because they have resistance mechanisms
to first and second line of infection treatment. The deficiency of existing antibiotics and the
widespread proliferation of antimicrobial resistance has been examined in depth by the US
Center for Disease Control and Prevention (CDC) (42), European CDC (ECDC) (43), WHO (44)
and European Antimicrobial Resistance Surveillance Network (EARS-Net) (43). These organizations reported that Gram negative bacteria are becoming pan-drug or extensively-drug
resistant which leads to increased morbidity and mortality.
1.4.2 Mechanisms of bacterial resistance
Resistance to antibiotics falls into two broad categories: intrinsic and acquired. The conventional
example of intrinsic resistance is the multi-drug resistant (MDR) phenotype existing in Gram negative bacteria which includes inherent active drug efflux and low permeability of the OM. As
mentioned previously, the Gram negative bacterial outer membrane outer leaflet consists of LPS
which is anchored by Lipid A and stabilized by divalent cation crosslinking between the
phosphate groups which decorate the inner core oligosaccharides (Figure 1.10). This cross-
linking facilitates tight packing of the Lipid A hydrocarbon chains, decreasing OM fluidity and
increasing the permeability threshold for drugs whose main mechanism of uptake is passive
diffusion (45). For those drugs requiring other means of being transported into the bacterial cell
envelope, the limiting step is the structure and properties of the porins and proteins present in the OM (45). Porins selectively retard the influx of drugs and nutrients according to their size,
hydrophobicity and charge. The OM can also control the efflux of materials via efflux pumps
which primarily actively transport toxins out of the cell. Efflux pumps can either be substrate
specific, and only export one molecule, or they can be broad-spectrum, and export structurally
distinct classes of molecules (26). There are five types of efflux pumps: ATP binding cassettes
(ABC), major facilitators (MF), multidrug and toxic-compound efflux (MATE) pumps, small
multidrug resistance (SMR) pumps, and the resistance-nodulation-division family (RND). However, only the latter is the main facilitators of intrinsic resistance (26,46,47). RNDs are also
known as outer membrane proteins and are transmembrane. For example, MexAB-OprM
contributes to β-lactam and fluoroquinolone intrinsic resistance in P. aeruginosa (48) and the
AcrAB-TolC in E. coli facilitates resistance to a broad range of antibiotics such as the
tetracyclines, fluoroquinolones, β-lactams and the macrolides (26). The high level of intrinsic
resistance in Gram negative bacteria is a result of the synergistic effect between the low
permeability of the outer membrane and the efflux pumps. Mutations in genes encoding efflux
pump expression may lead to their upregulation which is clinically associated with the multi-drug resistance phenotype of bacteria (9,26,29,34).
General Introduction
10
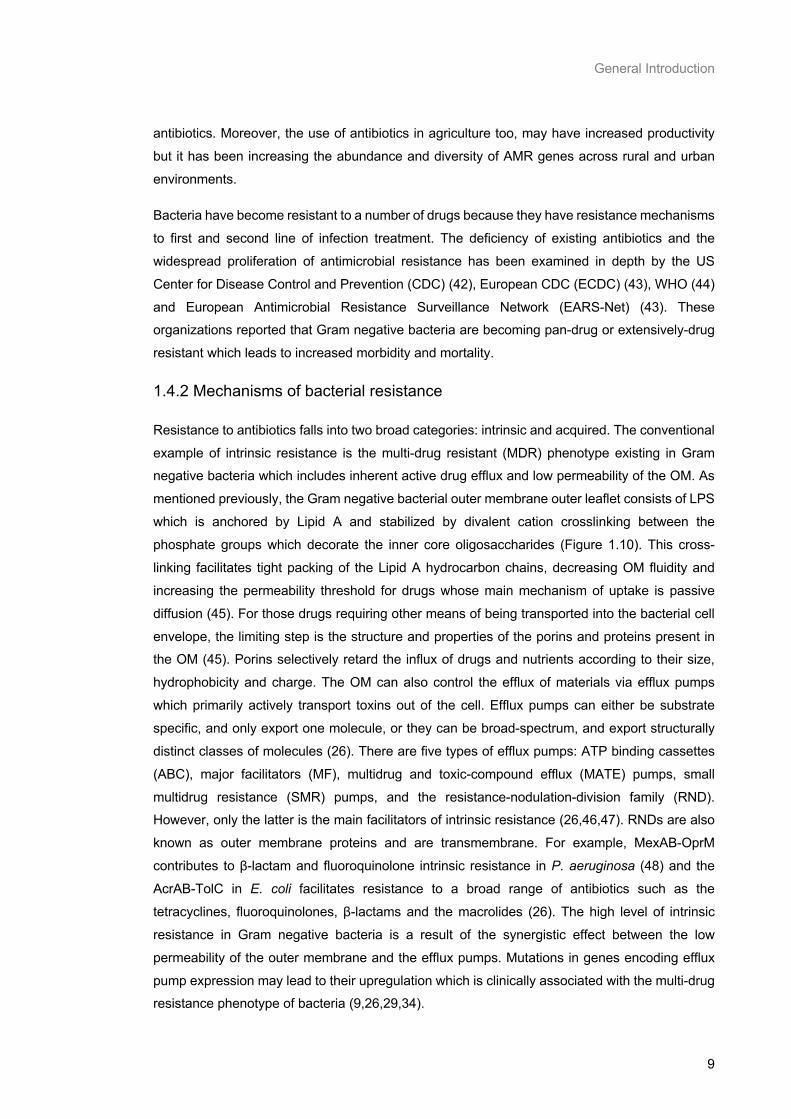
Acquired antimicrobial resistance mechanisms includes genetic modifications in the efflux pumps
and porins or incorporation of new genetic material through plasmids, bacteriophages,
transposons and naked DNA (Figure 1.6). The genes for single drug resistance traits developed from a mutation in an intrinsic chromosomal gene can spread from one generation to another
(vertical gene transfer). These genetic mutations can not only cause upregulation of efflux pumps
but also alter antibiotic targets or cause target overexpression (9,45). Moreover, acquired
resistance can occur by transferring genetic material between related or unrelated species
(horizontal gene transfer), which accounts for the rapid proliferation of acquired resistances.
Multiple genes can accumulate in the same organism, leading to multi-, pan- or extensive- drug
resistance (9,45).
Figure 1.6: Mechanisms through which drug resistance can be spread horizontally from one bacterium to another reproduced from Levy et al. (9).
1.5 Strategies to combat antimicrobial resistance
Several reviews have stated that the last resorts for treatment of infections caused by resistant
bacteria were the broad spectrum carbapenem agents. Over recent years, the emergence of
carbapenem-resistant Enterobacteriaceae as well as carbapenem-resistant Gram negative bacilli (Acinetobacter baumannii, Pseudomonas aeruginosa) have left a few treatment options,
while the spread of carbapenem-resistant Enterobacteriaceae has created a serious threat to
public health worldwide (49). In this context, older drugs with adverse effects, such as polymyxins
(colistin and polymyxin B), have been used by clinicians. The re-introduction of polymyxins for
antimicrobial therapy has been followed by an increase in reports of acquired polymyxin
resistance in clinical isolates such as P. aeruginosa, A. baumannii and Klebsiella pneumoniae
(50). Therefore, there is an urgent need to overcome antimicrobial resistance by either discovering new antibiotics, applying combined antibiotic therapy or developing new drug carriers
and rapid diagnostics.

General Introduction
11
1.5.1 Drug development
The development of new drugs was initiated by modifying already marketed antibiotics to extend
their spectrum activity (51). Examples of this initiative are penicillins, fluoroquinolones and cephalosporins. However, bacteria also became resistant to those drugs because the
modifications in their structure failed to change their site and mechanism of action. Attempts have
been made by research groups to introduce new drugs but the majority of these attempts have
failed because their physicochemical properties reduce their bioavailability and reduce outer
membrane penetration. Teixobactin was discovered in 2015 as a new class of antibiotics against
Gram positive bacteria but its activity is limited. Therefore, new drugs need to be discovered as
was proposed by O’Neill (52) in his wide-ranging report into antimicrobial resistance strategies
for the UK government. Table 1.2 presents a list of resistant bacteria deemed by the WHO as urgently requiring the discovery and development of new antibiotics in order to tackle them (53).
1.5.2 Antibiotic combination therapy
The rise of multi-drug resistant (MDR) Gram negative bacteria and the lack of new antibiotic
classes make monotherapy inadequate for treating infections and increases the likelihood that
combination therapy would be more effective (54). Antibiotic combination therapy is widely used to treat severe infections caused by Gram negative bacteria and may be divided into two
categories: antibiotic synergism and antibiotic/adjuvant combination (55,56).
Table 1.2: WHO priority list for the development and discovery of new antibiotics for antibiotic resistant bacteria (57).
Priority 1: Critical Acinetobacter baumannii, carbapenem-resistant
Pseudomonas aeruginosa, carbapenem-resistant Enterobacteriaceae, carbapenem-resistant, 3rd generation cephalosporin-resistant
Priority 2: High Enterococcus faecium, vancomycin-resistant
Staphylococcus aureus, methicillin-resistant, vancomycin intermediate and resistant Helicobacter pylori, clarithromycin-resistant Campylobacter, fluoroquinolone-resistant Salmonella spp., fluoroquinolone-resistant
Neisseria gonorrhoeae, 3rd generation cephalosporin-resistant, fluoroquinolone-resistant
Priority 3: Medium Streptococcus pneumoniae, penicillin-non-susceptible
Haemophilus influenzae, ampicillin-resistant Shigella spp., fluoroquinolone-resistant
General Introduction
12
1.5.2.1 Combination of two or more antibiotics
The combination of antimicrobial agents to produce potent synergistic effects has been applied to combat MDR in Gram negative bacteria. Combination therapy of two to four different antibiotics
against multidrug-resistant Pseudomonas spp. typically includes a broad-spectrum beta-lactam
and an aminoglycoside or a fluoroquinolone, colistin, a macrolide, or rifampin (55,58). The
mechanisms of synergistic bacteriostatic activity are not fully understood for all drug combination
but plausible explanations exist for some antibiotics. For example, colistin increased membrane
permeability by acting as a disruptive agent, enabling rifampin to exert its action against colistin-
resistant Klebsiella pneumoniae carbapenemase (KPC)-producing bacteria (59). Co-administration of colistin and sulfamethoxazole causes an increased in vitro activity against
colistin resistant and susceptible Gram negative bacterial strains when compared to
monotherapy (50). The combination of colistin with meropenem or doripenem has also resulted
in synergistic effects in vitro against multidrug-resistant Pseudomonas spp., Acinetobacter spp.,
and carbapenemase-producing Enterobacteriaceae and has been reported as a successful
treatment in case reports (55).
1.5.2.2 Antibiotic-adjuvant
Antibiotic-adjuvant combination is an alternative approach for reviving antibacterial drug
discovery by targeting the resistance processes (60). Adjuvants are compounds that enhance
antibacterial drug activity but do not act as antibacterial agents themselves. Products consisting
of beta-lactam antibiotics and an inhibitor of the beta-lactamase enzyme are already on the
market and represent a successful approach in targeting resistance to a defined class of antibiotics (61,62). A well-known example is the combination of amoxicillin with clavulanic acid,
which is a beta-lactamase inhibitor but is not effective as an antibiotic by itself (63). There are
newly synthesized beta-lactamase inhibitors for co-administration with cephalosporins and
carbapenemes, i.e. avibactam (64) and vaborbactam (65), respectively. The combination of
avibactam and ceftazidime has recently been approved for therapeutic use in the US and Europe
(66).
Within a similar conceptual framework, efflux pump inhibitors have also been investigated as
adjuvants. A common synthetic efflux pump inhibitor, widely used in vitro, is phenylalanine-
arginine β-naphthylamide (PAβN), capable of inhibiting clinically relevant pumps for resistance
in P. aeruginosa, as well as similar pumps in other MDR Gram-negative bacteria (63,67). The
combination of PAβN and levofloxacin decreased resistance to the drug by eight-fold in wild-type
strains of P. aeruginosa, while in efflux pump overexpressing strains it increased efficacy by up to 64-fold (68). In addition, PAβN has been shown to have membrane permeabilizing activity in
a concentration dependent manner. It promotes its own entry into the cells where it can access
its efflux pump targets (69). Therefore, PAβN has an excellent potential as an antibiotic adjuvant
by increasing outer membrane permeability and/or impairing drug efflux pumps.
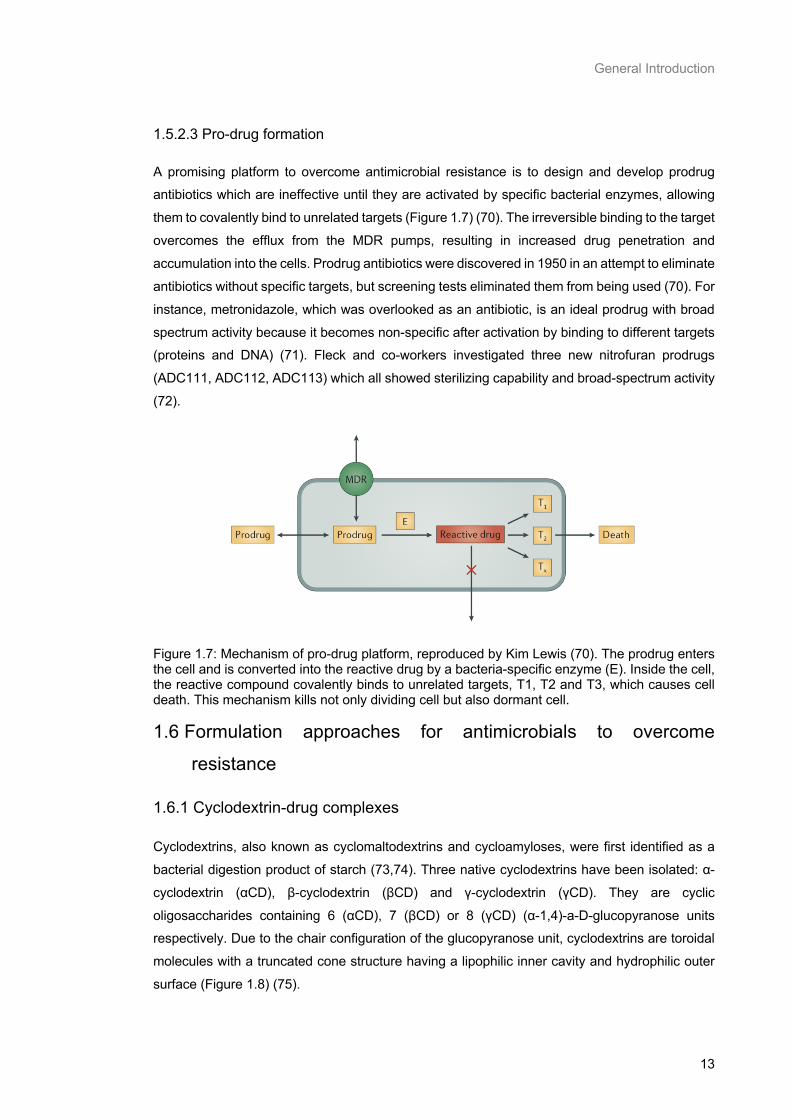
General Introduction
13
1.5.2.3 Pro-drug formation
A promising platform to overcome antimicrobial resistance is to design and develop prodrug antibiotics which are ineffective until they are activated by specific bacterial enzymes, allowing
them to covalently bind to unrelated targets (Figure 1.7) (70). The irreversible binding to the target
overcomes the efflux from the MDR pumps, resulting in increased drug penetration and
accumulation into the cells. Prodrug antibiotics were discovered in 1950 in an attempt to eliminate
antibiotics without specific targets, but screening tests eliminated them from being used (70). For
instance, metronidazole, which was overlooked as an antibiotic, is an ideal prodrug with broad
spectrum activity because it becomes non-specific after activation by binding to different targets (proteins and DNA) (71). Fleck and co-workers investigated three new nitrofuran prodrugs
(ADC111, ADC112, ADC113) which all showed sterilizing capability and broad-spectrum activity
(72).
Figure 1.7: Mechanism of pro-drug platform, reproduced by Kim Lewis (70). The prodrug enters the cell and is converted into the reactive drug by a bacteria-specific enzyme (E). Inside the cell, the reactive compound covalently binds to unrelated targets, T1, T2 and T3, which causes cell death. This mechanism kills not only dividing cell but also dormant cell.
1.6 Formulation approaches for antimicrobials to overcome
resistance
1.6.1 Cyclodextrin-drug complexes
Cyclodextrins, also known as cyclomaltodextrins and cycloamyloses, were first identified as a
bacterial digestion product of starch (73,74). Three native cyclodextrins have been isolated: α-
cyclodextrin (αCD), β-cyclodextrin (βCD) and γ-cyclodextrin (γCD). They are cyclic
oligosaccharides containing 6 (αCD), 7 (βCD) or 8 (γCD) (α-1,4)-a-D-glucopyranose units respectively. Due to the chair configuration of the glucopyranose unit, cyclodextrins are toroidal
molecules with a truncated cone structure having a lipophilic inner cavity and hydrophilic outer
surface (Figure 1.8) (75).
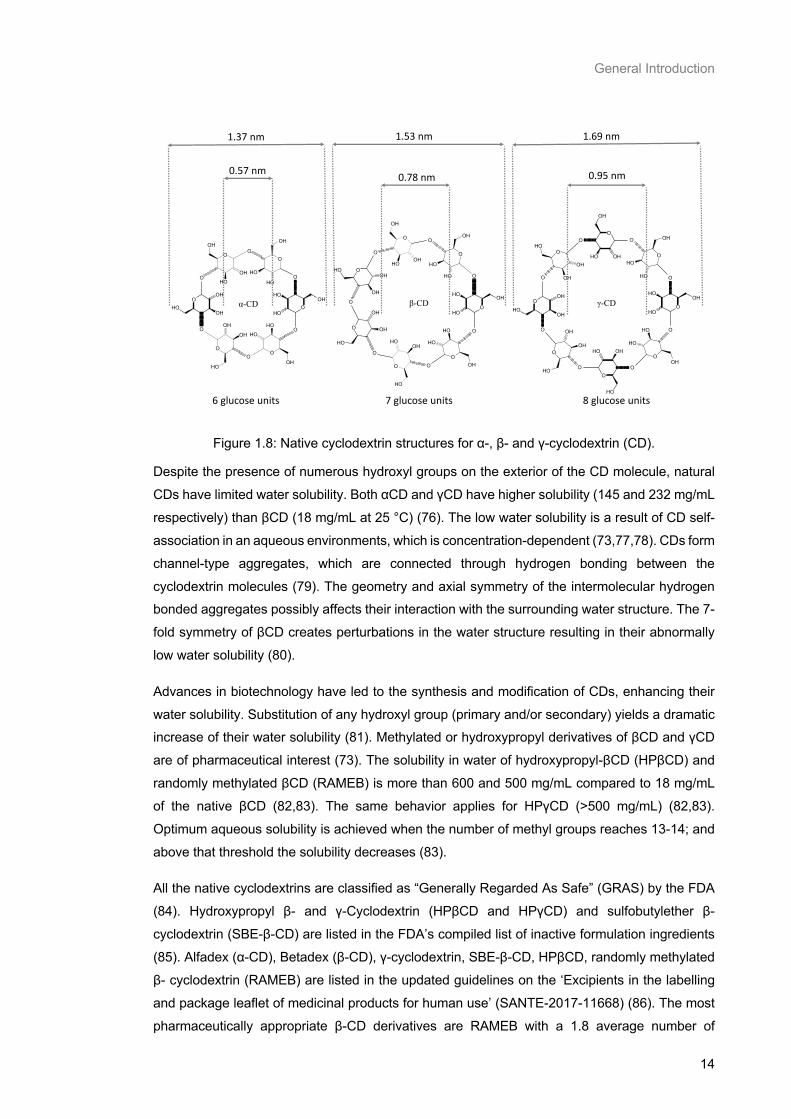
General Introduction
14
Figure 1.8: Native cyclodextrin structures for α-, β- and γ-cyclodextrin (CD).
Despite the presence of numerous hydroxyl groups on the exterior of the CD molecule, natural
CDs have limited water solubility. Both αCD and γCD have higher solubility (145 and 232 mg/mL
respectively) than βCD (18 mg/mL at 25 °C) (76). The low water solubility is a result of CD self-
association in an aqueous environments, which is concentration-dependent (73,77,78). CDs form
channel-type aggregates, which are connected through hydrogen bonding between the
cyclodextrin molecules (79). The geometry and axial symmetry of the intermolecular hydrogen bonded aggregates possibly affects their interaction with the surrounding water structure. The 7-
fold symmetry of βCD creates perturbations in the water structure resulting in their abnormally
low water solubility (80).
Advances in biotechnology have led to the synthesis and modification of CDs, enhancing their
water solubility. Substitution of any hydroxyl group (primary and/or secondary) yields a dramatic increase of their water solubility (81). Methylated or hydroxypropyl derivatives of βCD and γCD
are of pharmaceutical interest (73). The solubility in water of hydroxypropyl-βCD (HPβCD) and
randomly methylated βCD (RAMEB) is more than 600 and 500 mg/mL compared to 18 mg/mL
of the native βCD (82,83). The same behavior applies for HPγCD (>500 mg/mL) (82,83).
Optimum aqueous solubility is achieved when the number of methyl groups reaches 13-14; and
above that threshold the solubility decreases (83).
All the native cyclodextrins are classified as “Generally Regarded As Safe” (GRAS) by the FDA
(84). Hydroxypropyl β- and γ-Cyclodextrin (HPβCD and HPγCD) and sulfobutylether β-
cyclodextrin (SBE-β-CD) are listed in the FDA’s compiled list of inactive formulation ingredients
(85). Alfadex (α-CD), Betadex (β-CD), γ-cyclodextrin, SBE-β-CD, HPβCD, randomly methylated
β- cyclodextrin (RAMEB) are listed in the updated guidelines on the ‘Excipients in the labelling
and package leaflet of medicinal products for human use’ (SANTE-2017-11668) (86). The most
pharmaceutically appropriate β-CD derivatives are RAMEB with a 1.8 average number of
0.57 nm
1.37 nm 1.53 nm
0.78 nm
1.69 nm
0.95 nm
6 glucose units 7 glucose units 8 glucose units

General Introduction
15
substituents per repeated glucose unit and HPβCD with 0.65 (73,87). All the aforementioned
cyclodextrins have been approved and marketed by the European Pharmacopoeia, Japanese
Pharmaceutical Codex and the US Pharmacopoeia/National Formulary. Particularly, αCD can be found in intravenous alprostadil solution (Carveject® Dual from Pfizer). Native β- cyclodextrin
(βCD) can be found in numerous marketed oral, topical, buccal and rectal drug formulations:
notable examples are Nicorette® (sublingual tablets, Pfizer) and Nimedex® (tablets, Novartis).
Hydrocortisone solution (Dexocort, Actavis), indomethacin eye drop solution (Indocid, Chauvin)
and itraconazole oral and i.v. solutions (Sporanox®, Janssen) contain HPβCD and insulin nasal
sprays which contain RAMEB. Voltaren® Ophthalmic (Novartis) is an eye drop solution containing
diclofenac sodium salt and HPγCD (73).
Cyclodextrins have long been known for their ability to increase the water solubility of
hydrophobic drugs by entrapping them into their non-polar cavity (88). Long before that, the
purpose of using CDs in the pharmaceutical industry has been to protect drugs from oxidation
and heat, prolong their shelf-life and masking unpleasant flavours and odours (89).
Cyclodextrins have been investigated for the treatment of infectious diseases by formulating
them with anti-infective drugs. Their unique structure enables cyclodextrins to fully or partially
incorporate hydrophobic drugs in the cavity providing the drug with improved solubility properties
and enhanced biological activity. Table 1.3 shows a summary of antibiotic-cyclodextrin
complexes that have been studied and how the complex improved drug efficacy. In 2003, a US
patent was filed for improved growth inhibition of several Gram negative bacteria by HPβCD and RAMEB complexes with chlorhexidine, gentamycin, tobramycin and tetracycline via improved
permeation through the bacterial cell envelope (90). The inventors claimed that this patent was
of great interest for a wider range of antibiotics: penicillin derivatives, cephalosporins,
aminoglycosides, macrolides, rifamycin, chloramphenicol, imipenem, vancomycin, tetracyclines,
fusidic acid, novobiocin, neomycin, bacitracin, polymyxin, colistimethate, colistin and gramicidin.
Over the last few years, the interest in using drug-CD complexes to enhance antibiotic efficacy
is not based only on their enhanced permeation but also on improving drug water solubility,
stability and dissolution. For instance, native βCD and γCD protected penicillins from β-lactamase hydrolysis in E. coli and improved the cell permeation in vitro (91). Cyclodextrin
complexes have been investigated as drug release modifiers for sustained and prolonged drug
delivery, such as in the case of rifampicin, tobramycin and meropenem (92–95).
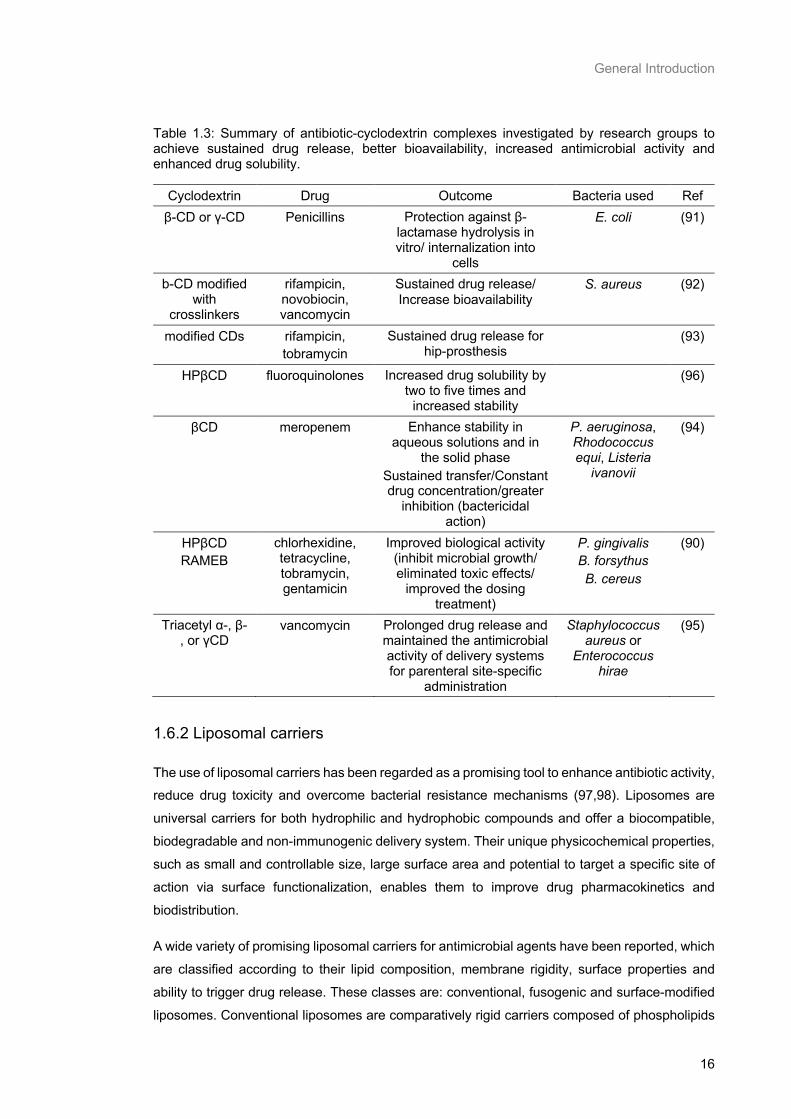
General Introduction
16
Table 1.3: Summary of antibiotic-cyclodextrin complexes investigated by research groups to achieve sustained drug release, better bioavailability, increased antimicrobial activity and enhanced drug solubility.
Cyclodextrin Drug Outcome Bacteria used Ref β-CD or γ-CD Penicillins Protection against β-
lactamase hydrolysis in vitro/ internalization into
cells
E. coli (91)
b-CD modified with
crosslinkers
rifampicin, novobiocin, vancomycin
Sustained drug release/ Increase bioavailability
S. aureus (92)
modified CDs rifampicin, tobramycin
Sustained drug release for hip-prosthesis
(93)
HPβCD fluoroquinolones Increased drug solubility by two to five times and
increased stability
(96)
βCD meropenem Enhance stability in aqueous solutions and in
the solid phase Sustained transfer/Constant drug concentration/greater
inhibition (bactericidal action)
P. aeruginosa, Rhodococcus equi, Listeria
ivanovii
(94)
HPβCD RAMEB
chlorhexidine, tetracycline, tobramycin, gentamicin
Improved biological activity (inhibit microbial growth/ eliminated toxic effects/
improved the dosing treatment)
P. gingivalis B. forsythus B. cereus
(90)
Triacetyl α-, β-, or γCD
vancomycin Prolonged drug release and maintained the antimicrobial activity of delivery systems for parenteral site-specific
administration
Staphylococcus aureus or
Enterococcus hirae
(95)
1.6.2 Liposomal carriers
The use of liposomal carriers has been regarded as a promising tool to enhance antibiotic activity, reduce drug toxicity and overcome bacterial resistance mechanisms (97,98). Liposomes are
universal carriers for both hydrophilic and hydrophobic compounds and offer a biocompatible,
biodegradable and non-immunogenic delivery system. Their unique physicochemical properties,
such as small and controllable size, large surface area and potential to target a specific site of
action via surface functionalization, enables them to improve drug pharmacokinetics and
biodistribution.
A wide variety of promising liposomal carriers for antimicrobial agents have been reported, which
are classified according to their lipid composition, membrane rigidity, surface properties and
ability to trigger drug release. These classes are: conventional, fusogenic and surface-modified
liposomes. Conventional liposomes are comparatively rigid carriers composed of phospholipids

General Introduction
17
with or without cholesterol, while fusogenic liposomes, also known as fluidosomes, are
characterized by more fluid lipid bilayers and their ability to fuse with other lipid membranes.
Table 1.4 presents several examples of how liposomes have been investigated and the outcome of the research in Gram negative antibacterial activity.
Liposomes can enhance the activity against both intracellular (Brucella melitensis, Salmonella
enterica serovar Typhimurium and Francisella tularensis) and extracellular (Pseudomonas
aeruginosa, Escherichia coli, Klebsiella pneumoniae and Burkholderia cepacia) pathogens (99).
Liposomal carriers designed for the eradication of intracellular pathogens are taken-up by cells of the mononuclear phagocyte system. For instance, conventional liposomes encapsulating
gentamicin lead to drug accumulation in the liver and spleen as a result of MPS cell phagocytosis,
resulting in decreased bacterial number in these tissues (99). Liposomes designed for targeting
extracellular pathogens can function in two main ways to aid drug delivery. Firstly, they can
entrap, dissolve or encapsulate the active ingredient or, secondly, they can attach, conjugate or
absorb the active substance. These properties can be applied to facilitate the administration of
antimicrobial drugs, thereby overcoming some of the limitations of antimicrobial drug uptake.
Table 1.4: Several liposomal carriers investigated against Gram negative bacteria.
Liposome composition Drug Bacteria Outcome Ref DPPC/Chol/SA,
DPPC/DPPG, DPPC/PI, DPPC/Chol/DDAB
Chlorhexidine P. vulgaris Enhanced bactericidal activity
Diffusion mechanism
(97)
DPPC/Chol (2:1) Amicacin P. aeruginosa Superior activity of inhaled liposomes than to free drug
(100)
DPPC/DMPG in several molar ratios (15:1, 18:1,
10:1)
Tobramycin P. aeruginosa B. cepacian
E. coli S. maltophilia
Superior activity of fluidosomes than free
drug Fusion mechanism
(101–103)
DPPC/DMPG (1:1) Gentamicin-gallium
P. aeruginosa Eradication of biofilm (104)
PC(60 mg/mL)/Chol Rifampicin High encapsulation and nebulization
efficiency Good stability
(105)
1.7 Aims and scope of this project
Most of the antimicrobial drugs in the current clinical pipeline are modified versions of existing
classes of antibiotics which are likely to offer only short-term solutions to the current AMR crisis
(106). A novel antimicrobial agent, PPA148 (belonging to the byrrolobenzodiazepine (PBD)
group of anticancer and antimicrobial drugs), has shown very promising activity against Gram
negative bacteria, and was synthesized at King’s College London (107). Among other
antimicrobial agents, PPA148 was included in a patent filed by Rahman et al. regarding its activity
General Introduction
18
against both Gram positive and negative bacteria (107). Its inhibitory concentration (MIC) in the
presence and absence of the efflux pump inhibitor PAβN (107,108) revealed promising activity
against Gram negatives amongst the ESKAPE pathogens. A possible drug efflux from the bacterial membrane was also observed because the MIC decreased in all bacterial strains tested
in the presence of the pump inhibitor (107). The focus of this project is on Gram negative bacteria
because of their increasing contribution to the incidence of ventilator-associated pneumonia
(VAP) (109), low OM permeability and high activity of multiple efflux pumps (29), which facilitate
resistance. Therefore, the aim of this project has been to develop a suitable carrier to overcome
the drug efflux and increase drug efficacy against Gram negative bacteria. Taking into account
the physicochemical properties of PPA148, the challenges of drug uptake across bacterial membrane and multi-drug resistance in Gram negative bacteria, a formulation based on a drug-
cyclodextrin complex incorporated into fluidosomes was selected.
1.7.1 Drug-in-Cyclodextrin-in-Liposomes
The system described as drug-in-cyclodextrin-in-liposomes allows delivery of hydrophobic,
insoluble and membrane-destabilizing drugs by combining the unique properties of liposomes,
with those of cyclodextrins (110). As mentioned above, each delivery system individually enhances drug bioavailability and stability (chemical and physical) and reduces toxicity; but their
combination offers a superior formulation (111).
This formulation was first introduced by McCormack and Gregoriadis to enhance the delivery of
dehydroepiandrosterone, retinol and retinoic acid (111). This approach has also been used in
the food industry to increase the stability and water solubility of natural molecules, decrease their volatilization, allowing controlled release, while maintaining the biological effects (antioxidant
activity) of free ones (112). Nerolidol, which is a natural sesquiterpene with antibacterial activity,
exhibited prolonged release and increased photostability when encapsulated as a complex with
HPβCD-in-liposomes, making it a strong candidate for a natural preservative use in the food
industry (113). Recent reviews reveal that a number of drugs have been encapsulated in
liposomes as inclusion complexes with cyclodextrins (CDs) (110,114). Particularly, this type of
formulation was tried with anti-inflammatory drugs (115,116) and anesthetics (117) to improve their encapsulation efficiency and membrane permeation; with anti-cancer drugs to improve their
solubility and prolonged retention (118,119); with Ca2+ channel blocker drugs to increase
entrapment and liposome stability (120); and with immunosuppressants to improve solubility,
drug uptake and penetration (121).
While there are reports of antibiotics solubilized by either inclusion complexes with CDs (Table 1.3), or encapsulated in liposomes (Table 1.4), we are not aware of any publication on antibiotics
formulated in CD complexes encapsulated into liposomes.
General Introduction
19
1.7.2 Plan of the study and techniques used
This work is an attempt to increase the water solubility and enhance the antimicrobial activity of
the novel antimicrobial agent, PPA148, against Gram negative bacteria by formulating it with cyclodextrins and liposomes. The first experimental chapter (Chapter 2) introduces the novel
antimicrobial compound, its synthetic pathway and presents the efforts used to enhance its water
solubility by using two types of modified βCD, HPβCD and RAMEB. The binding constant of a
1:1 complex is measured through the band shift method using fluorescence spectroscopy.
Fluorescence was studied as a function of host (CD) concentration at fixed guest (drug)
concentration. The increase in fluorescence intensity and blue shift in the spectra indicates the
formation of the host-guest inclusion complexes of drug with cyclodextrin. The overall
stoichiometry of the complex was better investigated measuring changes in the proton resonances using NMR.
The objective of Chapter 3 is to develop a robust method for the fabrication of the drug-in-
cyclodextrin-in-liposome formulation and compares its microbial activity with that of the free drug.
The encapsulation efficiency and loading capacity of the carrier is determined by spectroscopic
techniques. The formulated drug was used to challenge live bacteria to assess its antimicrobial efficacy and compare it with the efficacy of the unformulated drug.
Chapter 4 investigates the diffusion through lipid membranes of pure PPA148, PPA148/CD
complex and empty liposomes separately using interfacial techniques. Model lipid monolayers
are used to mimic the lipidic content of IM and OM of the Gram negative bacterial envelope, to
assess their interaction with drug and carrier components using the Langmuir trough technique. An asymmetric model Gram negative bacterial outer membrane is used to investigate the
interaction of the liposomal carrier with the lipidic content of the OM. Details on the interfacial
techniques used throughout this work is given in the next section (1.7.3).
Throughout this study, rifampicin and gentamicin sulfate were used as positive and negative
controls for the novel PP-A148 in the membrane interaction studies using monolayers at the air/liquid interface, whilst in bilayer studies chlorhexidine digluconate (CHD) was used as a
control drug (Table 1.5, Figure 1.9). Rifampicin and gentamicin are both broad spectrum
antibiotic agents against a series of Gram negative bacteria. The former passively diffuses
through the cell envelope, while gentamicin follows a self-promoted diffusion across the OM and
active transport across the IM (32,33,122). Chlorhexidine is known for its ability to damage
membranes (123).

General Introduction
20
Table 1.5: Physicochemical properties of PPA148, rifampicin, gentamicin and chlorhexidine.
Physicochemical properties
PPA148 Rifampicin Gentamicin Sulfate CHD
Molecular weight (g/mol)
698.25 822.41 477.6 897.76
LogP 0.76 2.7 -3.1 6.2 logS -7.461 - - -
S (mg/mL) - 2.5 100 50%w/v tPSA ( Å2) 142.11 217 200 455
Figure 1.9: Chemical structure of rifampicin, gentamicin and chlorhexidine.
1.7.3 Interfacial techniques used to investigate drug-membrane interactions
In the current work, the interaction of pure PPA148 and its formulated form with OM and IM Gram
negative bacterial membranes was investigated using two interfacial techniques: subphase
injection techniques using Langmuir monolayers and neutron reflectivity (NR) on substrate-
supported asymmetric bilayers. In both techniques, phospholipids and glycolipids (specifically lipopolysaccharides), were used to mimic the lipidic component of the IM and the OM,
respectively.
PE and PC possess zwitterionic headgroups and PG and CL are acidic lipids (Figure 1.3). The
relative proportions of these lipids and their generalized molecular shapes affect the way in which
they pack together in a membrane. PE has a conical shape (Figure 1.3) which imparts a large negative curvature to the membrane, CL also favors negative curvature, whilst PG and PC have
Rifampicin Gentamicin sulfate
Chlorhexidine
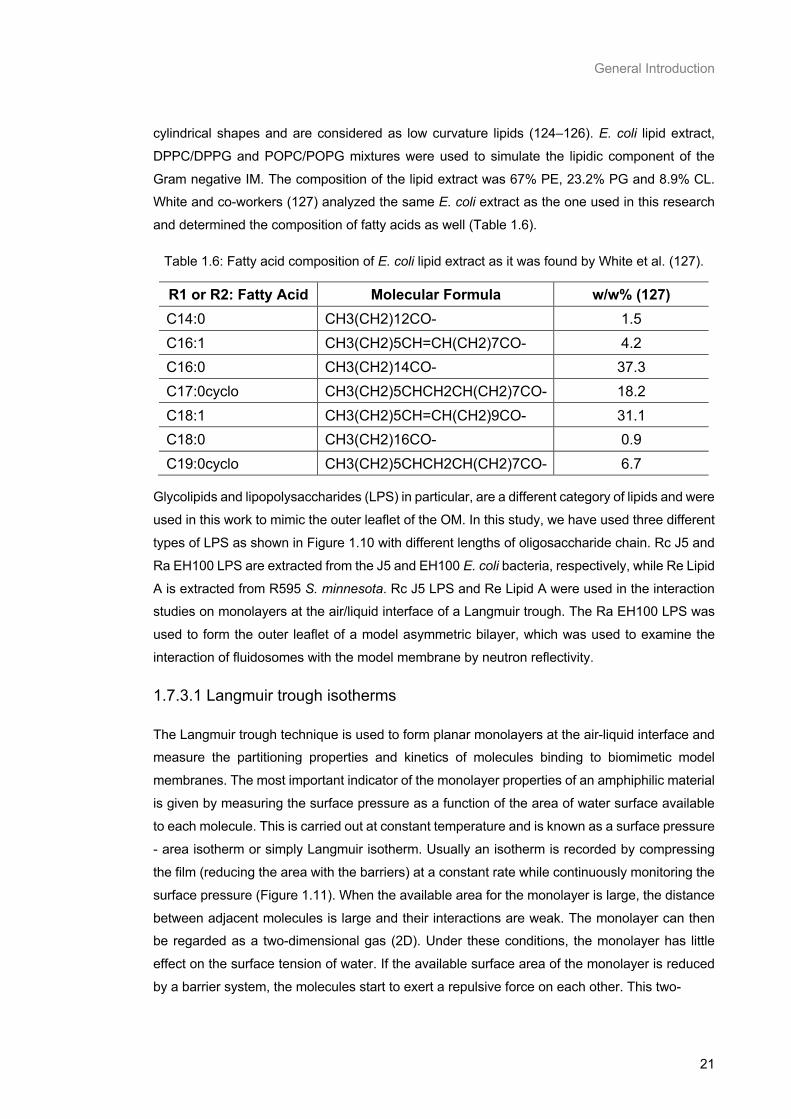
General Introduction
21
cylindrical shapes and are considered as low curvature lipids (124–126). E. coli lipid extract,
DPPC/DPPG and POPC/POPG mixtures were used to simulate the lipidic component of the
Gram negative IM. The composition of the lipid extract was 67% PE, 23.2% PG and 8.9% CL. White and co-workers (127) analyzed the same E. coli extract as the one used in this research
and determined the composition of fatty acids as well (Table 1.6).
Table 1.6: Fatty acid composition of E. coli lipid extract as it was found by White et al. (127).
R1 or R2: Fatty Acid Molecular Formula w/w% (127) C14:0 CH3(CH2)12CO- 1.5 C16:1 CH3(CH2)5CH=CH(CH2)7CO- 4.2 C16:0 CH3(CH2)14CO- 37.3 C17:0cyclo CH3(CH2)5CHCH2CH(CH2)7CO- 18.2 C18:1 CH3(CH2)5CH=CH(CH2)9CO- 31.1 C18:0 CH3(CH2)16CO- 0.9 C19:0cyclo CH3(CH2)5CHCH2CH(CH2)7CO- 6.7
Glycolipids and lipopolysaccharides (LPS) in particular, are a different category of lipids and were
used in this work to mimic the outer leaflet of the OM. In this study, we have used three different
types of LPS as shown in Figure 1.10 with different lengths of oligosaccharide chain. Rc J5 and
Ra EH100 LPS are extracted from the J5 and EH100 E. coli bacteria, respectively, while Re Lipid
A is extracted from R595 S. minnesota. Rc J5 LPS and Re Lipid A were used in the interaction studies on monolayers at the air/liquid interface of a Langmuir trough. The Ra EH100 LPS was
used to form the outer leaflet of a model asymmetric bilayer, which was used to examine the
interaction of fluidosomes with the model membrane by neutron reflectivity.
1.7.3.1 Langmuir trough isotherms
The Langmuir trough technique is used to form planar monolayers at the air-liquid interface and measure the partitioning properties and kinetics of molecules binding to biomimetic model
membranes. The most important indicator of the monolayer properties of an amphiphilic material
is given by measuring the surface pressure as a function of the area of water surface available
to each molecule. This is carried out at constant temperature and is known as a surface pressure
- area isotherm or simply Langmuir isotherm. Usually an isotherm is recorded by compressing
the film (reducing the area with the barriers) at a constant rate while continuously monitoring the
surface pressure (Figure 1.11). When the available area for the monolayer is large, the distance
between adjacent molecules is large and their interactions are weak. The monolayer can then be regarded as a two-dimensional gas (2D). Under these conditions, the monolayer has little
effect on the surface tension of water. If the available surface area of the monolayer is reduced
by a barrier system, the molecules start to exert a repulsive force on each other. This two-
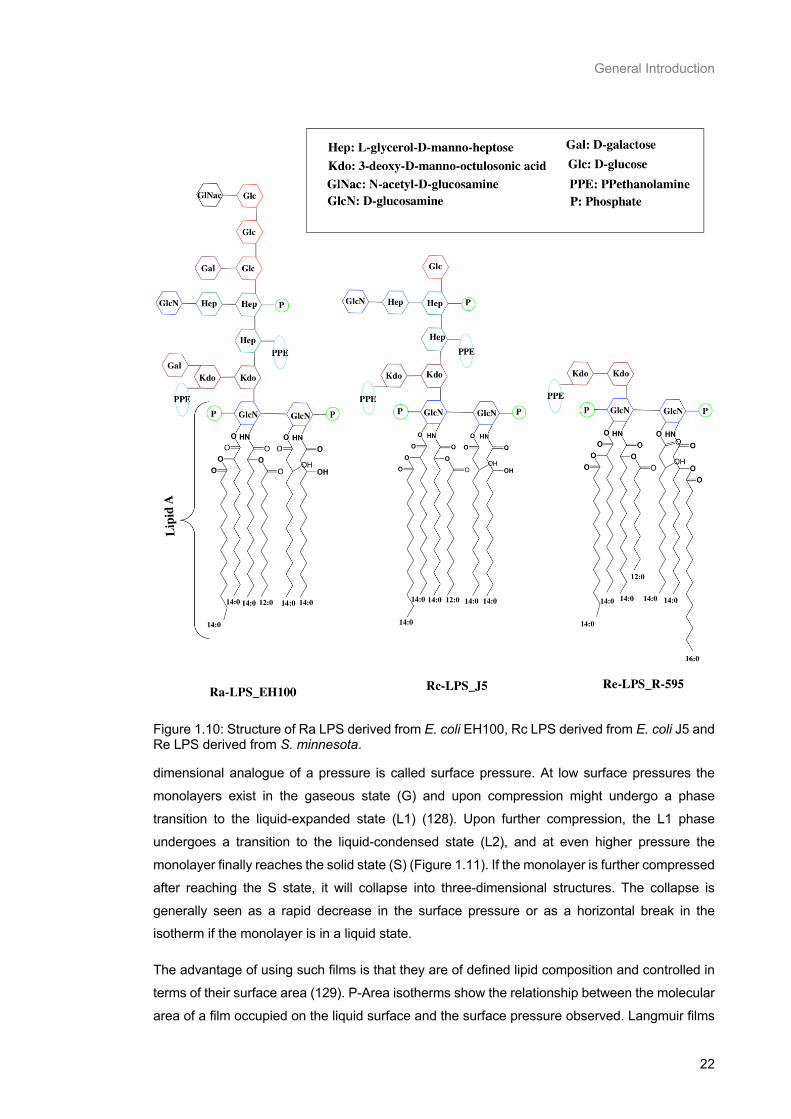
General Introduction
22
Figure 1.10: Structure of Ra LPS derived from E. coli EH100, Rc LPS derived from E. coli J5 and Re LPS derived from S. minnesota.
dimensional analogue of a pressure is called surface pressure. At low surface pressures the
monolayers exist in the gaseous state (G) and upon compression might undergo a phase
transition to the liquid-expanded state (L1) (128). Upon further compression, the L1 phase
undergoes a transition to the liquid-condensed state (L2), and at even higher pressure the
monolayer finally reaches the solid state (S) (Figure 1.11). If the monolayer is further compressed
after reaching the S state, it will collapse into three-dimensional structures. The collapse is
generally seen as a rapid decrease in the surface pressure or as a horizontal break in the isotherm if the monolayer is in a liquid state.
The advantage of using such films is that they are of defined lipid composition and controlled in
terms of their surface area (129). P-Area isotherms show the relationship between the molecular
area of a film occupied on the liquid surface and the surface pressure observed. Langmuir films
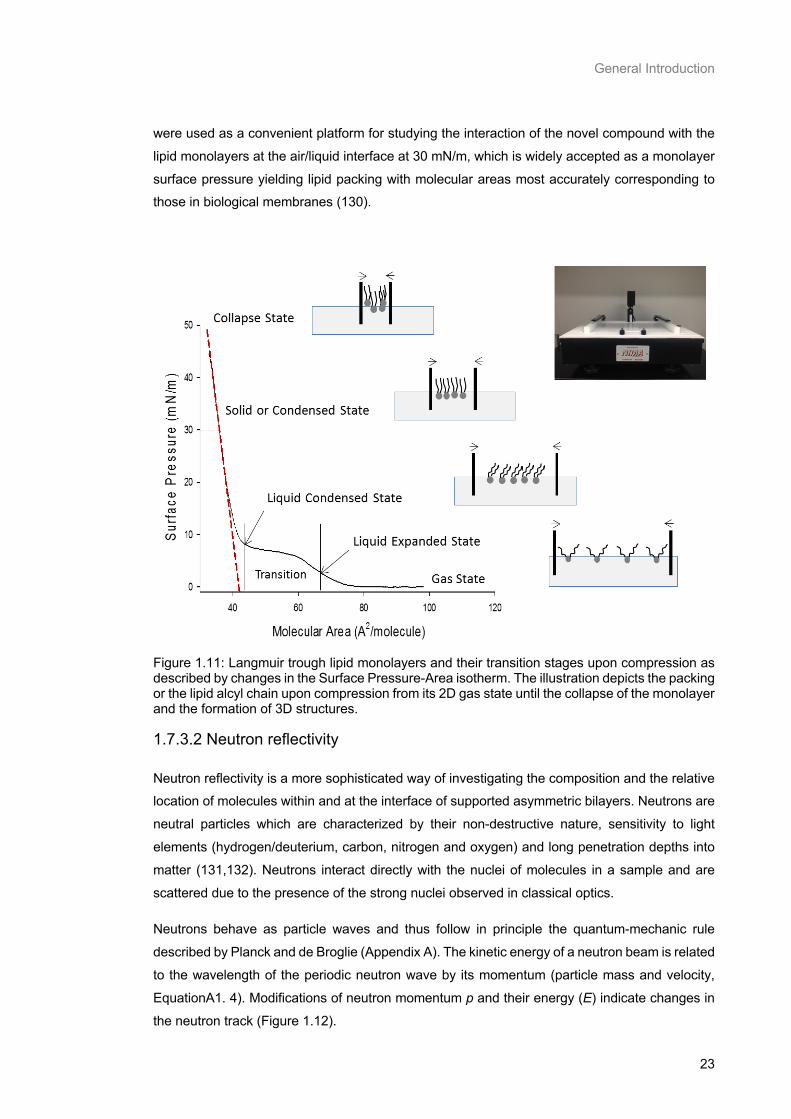
General Introduction
23
were used as a convenient platform for studying the interaction of the novel compound with the
lipid monolayers at the air/liquid interface at 30 mN/m, which is widely accepted as a monolayer
surface pressure yielding lipid packing with molecular areas most accurately corresponding to those in biological membranes (130).
Figure 1.11: Langmuir trough lipid monolayers and their transition stages upon compression as described by changes in the Surface Pressure-Area isotherm. The illustration depicts the packing or the lipid alcyl chain upon compression from its 2D gas state until the collapse of the monolayer and the formation of 3D structures.
1.7.3.2 Neutron reflectivity
Neutron reflectivity is a more sophisticated way of investigating the composition and the relative location of molecules within and at the interface of supported asymmetric bilayers. Neutrons are
neutral particles which are characterized by their non-destructive nature, sensitivity to light
elements (hydrogen/deuterium, carbon, nitrogen and oxygen) and long penetration depths into
matter (131,132). Neutrons interact directly with the nuclei of molecules in a sample and are
scattered due to the presence of the strong nuclei observed in classical optics.
Neutrons behave as particle waves and thus follow in principle the quantum-mechanic rule
described by Planck and de Broglie (Appendix A). The kinetic energy of a neutron beam is related
to the wavelength of the periodic neutron wave by its momentum (particle mass and velocity,
EquationA1. 4). Modifications of neutron momentum p and their energy (E) indicate changes in
the neutron track (Figure 1.12).
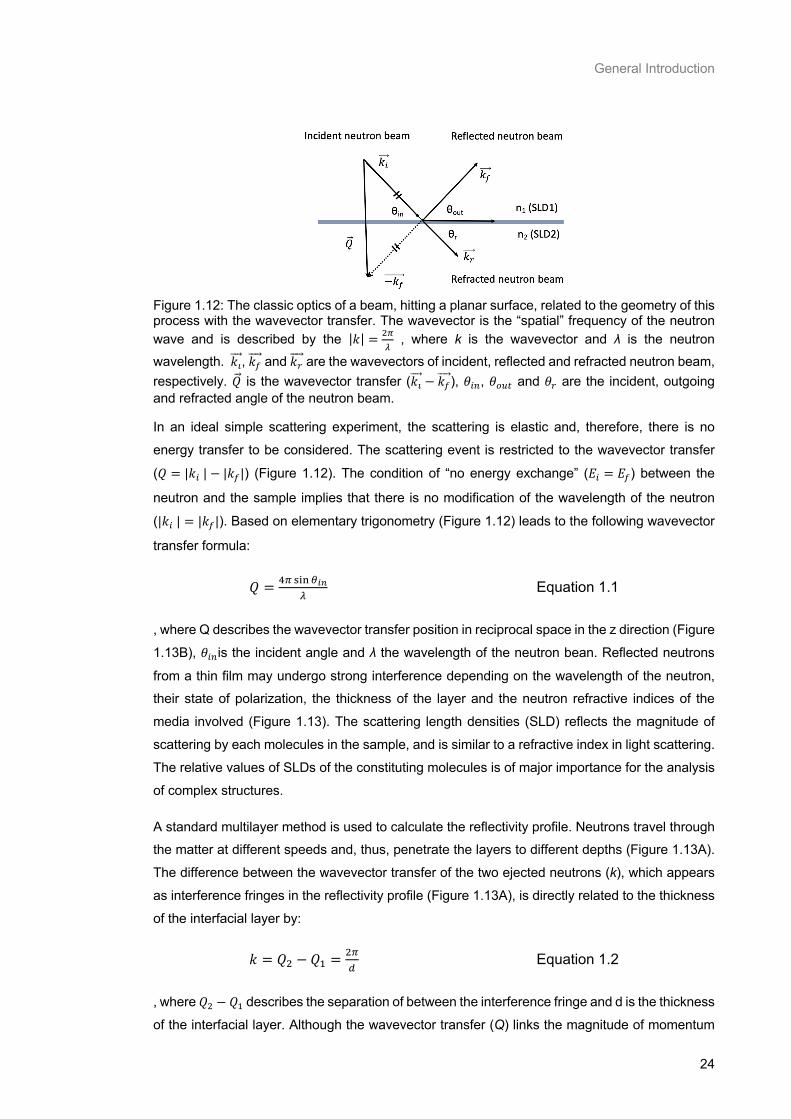
General Introduction
24
Figure 1.12: The classic optics of a beam, hitting a planar surface, related to the geometry of this process with the wavevector transfer. The wavevector is the “spatial” frequency of the neutron wave and is described by the |𝑘| = @A
B , where k is the wavevector and λ is the neutron
wavelength. 𝑘CDDD⃗ , 𝑘FDDDD⃗ and 𝑘GDDDD⃗ are the wavevectors of incident, reflected and refracted neutron beam, respectively. 𝑄D⃗ is the wavevector transfer (𝑘CDDD⃗ − 𝑘FDDDD⃗ ), 𝜃HI, 𝜃JKL and 𝜃G are the incident, outgoing and refracted angle of the neutron beam.
In an ideal simple scattering experiment, the scattering is elastic and, therefore, there is no
energy transfer to be considered. The scattering event is restricted to the wavevector transfer
(𝑄 = |𝑘H| − |𝑘F|) (Figure 1.12). The condition of “no energy exchange” (𝐸H = 𝐸F) between the
neutron and the sample implies that there is no modification of the wavelength of the neutron
(|𝑘H| = |𝑘F|). Based on elementary trigonometry (Figure 1.12) leads to the following wavevector
transfer formula:
𝑄 = OA PQRSTUB
Equation 1.1
, where Q describes the wavevector transfer position in reciprocal space in the z direction (Figure
1.13B), 𝜃HIis the incident angle and λ the wavelength of the neutron bean. Reflected neutrons
from a thin film may undergo strong interference depending on the wavelength of the neutron, their state of polarization, the thickness of the layer and the neutron refractive indices of the
media involved (Figure 1.13). The scattering length densities (SLD) reflects the magnitude of
scattering by each molecules in the sample, and is similar to a refractive index in light scattering.
The relative values of SLDs of the constituting molecules is of major importance for the analysis
of complex structures.
A standard multilayer method is used to calculate the reflectivity profile. Neutrons travel through the matter at different speeds and, thus, penetrate the layers to different depths (Figure 1.13A).
The difference between the wavevector transfer of the two ejected neutrons (k), which appears
as interference fringes in the reflectivity profile (Figure 1.13A), is directly related to the thickness
of the interfacial layer by:
𝑘 = 𝑄@ − 𝑄V =@AW
Equation 1.2
, where 𝑄@ − 𝑄V describes the separation of between the interference fringe and d is the thickness
of the interfacial layer. Although the wavevector transfer (Q) links the magnitude of momentum
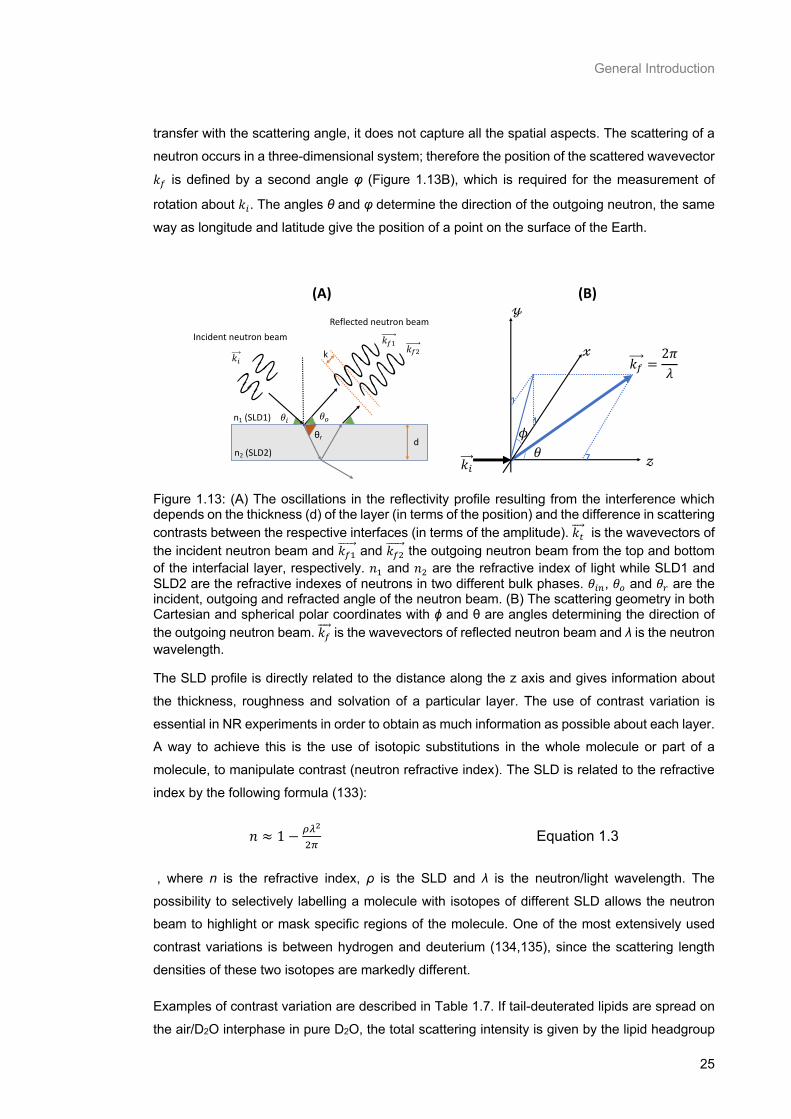
General Introduction
25
transfer with the scattering angle, it does not capture all the spatial aspects. The scattering of a
neutron occurs in a three-dimensional system; therefore the position of the scattered wavevector
𝑘F is defined by a second angle φ (Figure 1.13B), which is required for the measurement of
rotation about 𝑘H. The angles θ and φ determine the direction of the outgoing neutron, the same
way as longitude and latitude give the position of a point on the surface of the Earth.
Figure 1.13: (A) The oscillations in the reflectivity profile resulting from the interference which depends on the thickness (d) of the layer (in terms of the position) and the difference in scattering contrasts between the respective interfaces (in terms of the amplitude). 𝑘LDDD⃗ is the wavevectors of the incident neutron beam and 𝑘FVDDDDDD⃗ and 𝑘F@DDDDDD⃗ the outgoing neutron beam from the top and bottom of the interfacial layer, respectively. 𝑛V and 𝑛@ are the refractive index of light while SLD1 and SLD2 are the refractive indexes of neutrons in two different bulk phases. 𝜃HI, 𝜃J and 𝜃G are the incident, outgoing and refracted angle of the neutron beam. (B) The scattering geometry in both Cartesian and spherical polar coordinates with ϕ and θ are angles determining the direction of the outgoing neutron beam. 𝑘FDDDD⃗ is the wavevectors of reflected neutron beam and λ is the neutron wavelength.
The SLD profile is directly related to the distance along the z axis and gives information about
the thickness, roughness and solvation of a particular layer. The use of contrast variation is
essential in NR experiments in order to obtain as much information as possible about each layer. A way to achieve this is the use of isotopic substitutions in the whole molecule or part of a
molecule, to manipulate contrast (neutron refractive index). The SLD is related to the refractive
index by the following formula (133):
𝑛 ≈ 1 − YBZ
@A Equation 1.3
, where n is the refractive index, ρ is the SLD and λ is the neutron/light wavelength. The
possibility to selectively labelling a molecule with isotopes of different SLD allows the neutron beam to highlight or mask specific regions of the molecule. One of the most extensively used
contrast variations is between hydrogen and deuterium (134,135), since the scattering length
densities of these two isotopes are markedly different.
Examples of contrast variation are described in Table 1.7. If tail-deuterated lipids are spread on
the air/D2O interphase in pure D2O, the total scattering intensity is given by the lipid headgroup
Incident neutron beam Reflected neutron beam
θr d
n1 (SLD1)
n2 (SLD2)
!"!#$ !#%
&" &'
k (
)
*
!"
!# =2-.
&/
(A) (B)

General Introduction
26
(135). It is possible to match the SLD of an H2O and D2O mixture to the scattering length density
of specific biological molecules and materials. For instance, a mixture of approximately 38% D2O
in H2O (v/v) matches the SLD of silicon, whereas a mixture of 13% D2O in H2O (v/v) would match the SLD of hydrogenated lipids. The matched molecules would not contribute to the neutron
scattering and the scattering profile contains no information regarding these molecules. In
air/water Langmuir interface experiments, it is convenient to use 8% D2O in H2O (v/v) solution
which has no scattering (SLD=0) (136). The SLD is identical to that of air and, therefore, the
solution is called null reflected water (NRW). In contrast, in supported lipid bilayers on a silicon
surface, a mixture of 32% D2O and 62% water matches the SLD of silicon and is called silicon
matched water (SMW).
Table 1.7: Potential isotopic contrasts and main information content of a monolayer on an air/water interface or a deposited lipid bilayer on a silicon surface consisting for tail deuterated phospholipids. NRW and SMW stand for null reflective water (8.2% D2O) and silicon match water (38% D2O) respectively and are used to cancel out the background of the two mediums and highlight the interface.
Contrast cartoon/ Mololayer
Main information
Contrast cartoon/ Bilayer
Main information
Lipid hydrocarbon
tail
Hydrocarbon lipid tails
Lipid headgroup
Lipid Headgroups
Lipid components
Interface Lipid bilayer
SLDD2O = 6.35×10⁻⁶ Å −2 SLDNRW = 0 Å −2
SLDH2O = -0.56×10⁻⁶ Å −2 SLDSMW = 2.00×10⁻⁶ Å −2
All these advantages have made neutrons an ideal tool for studying the composition and structure of supported model lipid membranes by measuring the diffracted neutron beam. In this
study, specular neutron reflectivity is used to characterize the in- plane model asymmetric
membranes and study changes in their structure caused by exposure to a liposomal drug carrier.
Ra-EH100 LPS and DPPC, which account for the lipidic component of the outer and inner leaflet
respectively of the OM, were deposited on a flat silicon surface forming a model asymmetric
membrane as presented in Figure 1.14.
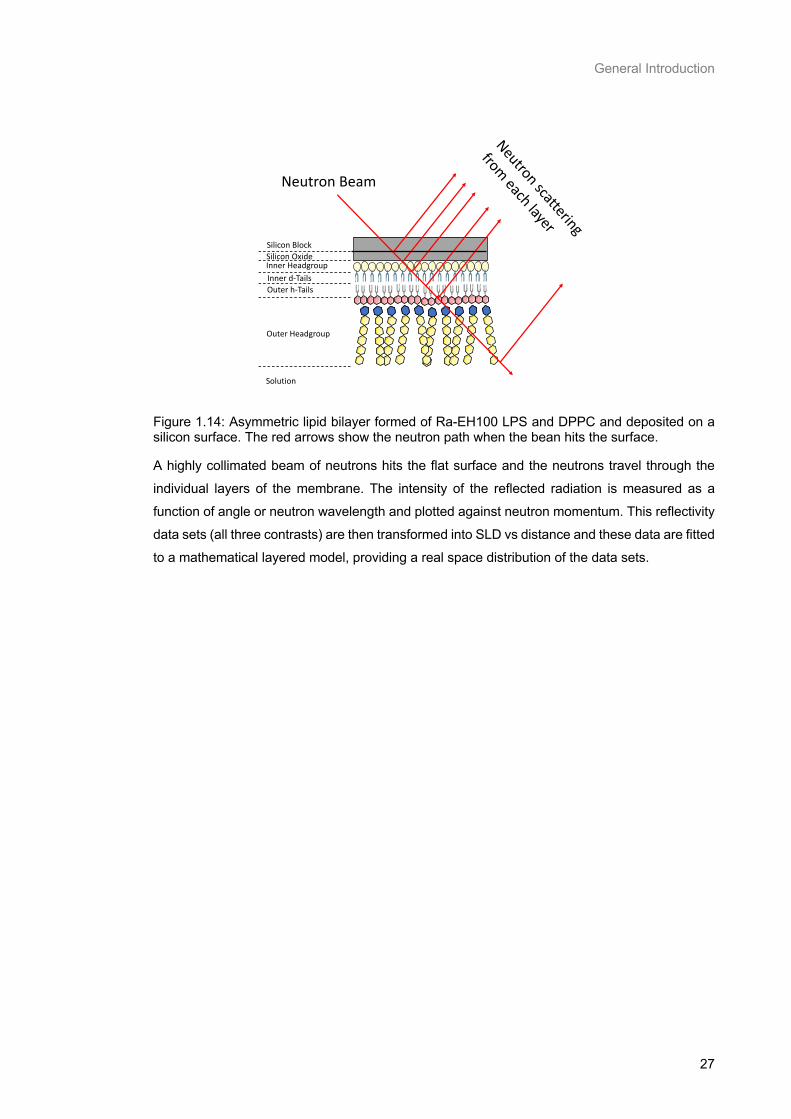
General Introduction
27
Figure 1.14: Asymmetric lipid bilayer formed of Ra-EH100 LPS and DPPC and deposited on a silicon surface. The red arrows show the neutron path when the bean hits the surface.
A highly collimated beam of neutrons hits the flat surface and the neutrons travel through the
individual layers of the membrane. The intensity of the reflected radiation is measured as a
function of angle or neutron wavelength and plotted against neutron momentum. This reflectivity
data sets (all three contrasts) are then transformed into SLD vs distance and these data are fitted
to a mathematical layered model, providing a real space distribution of the data sets.
Neutron Beam
Neutron scattering
from each layerInner Headgroup
Outer Headgroup
Outer h-TailsInner d-Tails
Silicon Block
Solution
Silicon Oxide
Synthesis, characterization and solubility of PPA148
28
Chapter 2 Synthesis,
characterization and solubility of
PPA148

Synthesis, characterization and solubility of PPA148
29
2.1 Introduction
Pyrrolobenzodiazepine (PBD) drugs are a family of natural anticancer-antibiotics isolated from
various Actinomycetes bacteria. They are a class of sequence-selective DNA minor-groove
agents. The first PBD monomer, anthramycin, was originally discovered as a metabolite of
Streptomyces refuineus (137). Since then, several natural PBDs have been isolated from
Streptomyces, Micrococcus (138) and Klebsiella (139) bacteria and various PBDs have been chemically synthesized (140). A tricyclic scaffold is the basic skeletal structure of the PBD
molecules (Figure 2.1) (107,108,141,142). The system consists of a substituted aromatic A-ring,
a diazepine B-ring and a pyrrolidine C-ring (Figure 2.1). Their biological activity is facilitated via
covalent binding of the imine moiety at position N10-C11 to the C2-amino group of guanine. The
imine moiety at N10-C11 is the electrophilic center responsible for DNA binding (142). It has
been reported that PBDs have antimicrobial activity against Gram positive and Gram negative
bacteria. However, their high degree of toxicity has hindered their use as antibiotics (108). Derivatization and the use of different synthetic routes from several research groups have
attempted to decrease their toxicity while maintaining their antibacterial activity (108).
Figure 2.1: Mechanism of tricycle PBD core binding to the N2 of guanine in the DNA minor groove reproduced from Brucoli et al. (143).
A novel series of modified PBD biaryl hybrids with lower cytotoxicity against eukaryotic cells compared to the monomer was chemically synthesized at King’s College London (108). The
chemical structure of this class is described as a tricycle PBD scaffold linked to a lateral
polyamidic tail in position 8 via a 4-carbon aliphatic chain. PPA148 is the lead antimicrobial
compound of this novel class of molecules. Its tail comprises three units linked with an amide
bond, an N-methyl-pyrrole-4-amino methyl ester, a benzofuran unit and a thiomorpholine unit
(Figure 2.2). Three building blocks have been proven to give optimum antibacterial activity (108).
A screening of the physicochemical properties was performed using ChemDraw software to obtain a first indication of the lipophilicity and polarity of PPA148. Based on the structure, drug
family and physicochemical properties estimated by ChemDraw (Mw = 698.25 g/mol, clogP =
2.09 and logP = 0.76) (Table 2.1), PPA148 is a large and non-ionic lipophilic molecule, whose
bactericidal activity is attributed to its binding onto bacterial DNA. According to O’Shea et al. (12)
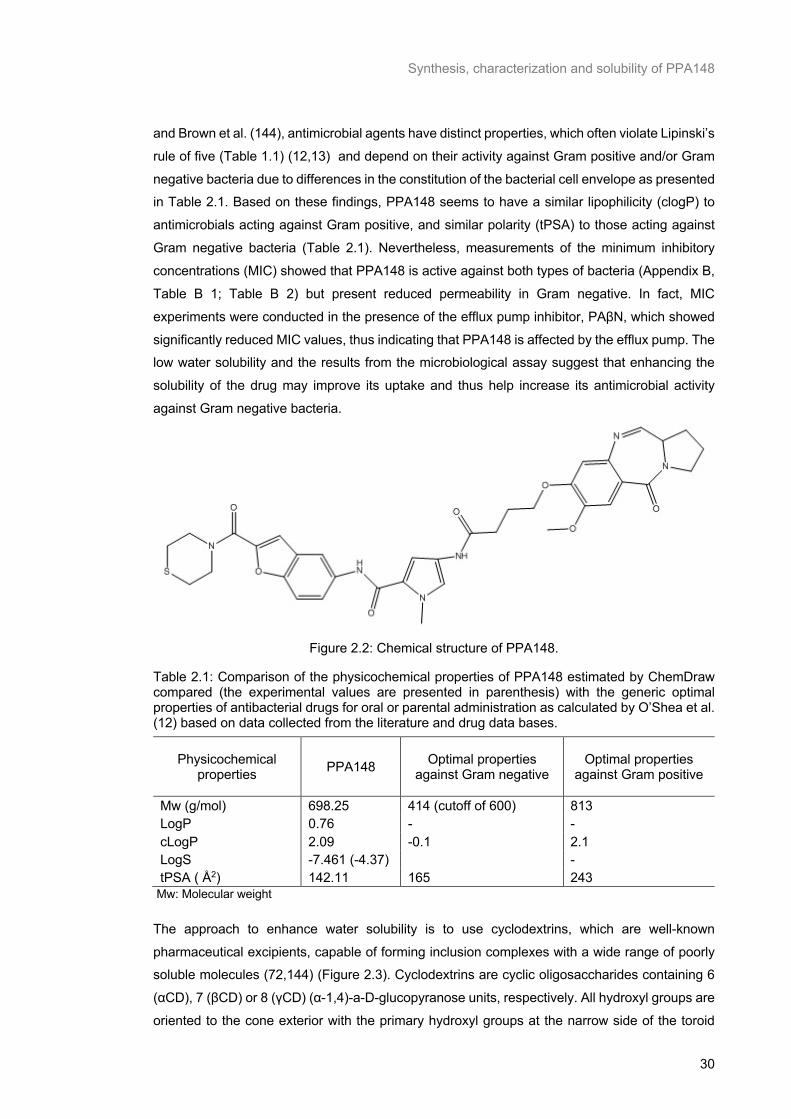
Synthesis, characterization and solubility of PPA148
30
and Brown et al. (144), antimicrobial agents have distinct properties, which often violate Lipinski’s
rule of five (Table 1.1) (12,13) and depend on their activity against Gram positive and/or Gram
negative bacteria due to differences in the constitution of the bacterial cell envelope as presented in Table 2.1. Based on these findings, PPA148 seems to have a similar lipophilicity (clogP) to
antimicrobials acting against Gram positive, and similar polarity (tPSA) to those acting against
Gram negative bacteria (Table 2.1). Nevertheless, measurements of the minimum inhibitory
concentrations (MIC) showed that PPA148 is active against both types of bacteria (Appendix B,
Table B 1; Table B 2) but present reduced permeability in Gram negative. In fact, MIC
experiments were conducted in the presence of the efflux pump inhibitor, PAβN, which showed
significantly reduced MIC values, thus indicating that PPA148 is affected by the efflux pump. The low water solubility and the results from the microbiological assay suggest that enhancing the
solubility of the drug may improve its uptake and thus help increase its antimicrobial activity
against Gram negative bacteria.
Figure 2.2: Chemical structure of PPA148.
Table 2.1: Comparison of the physicochemical properties of PPA148 estimated by ChemDraw compared (the experimental values are presented in parenthesis) with the generic optimal properties of antibacterial drugs for oral or parental administration as calculated by O’Shea et al. (12) based on data collected from the literature and drug data bases.
Physicochemical properties PPA148 Optimal properties
against Gram negative Optimal properties
against Gram positive
Mw (g/mol) 698.25 414 (cutoff of 600) 813 LogP 0.76 - - cLogP 2.09 -0.1 2.1 LogS -7.461 (-4.37) - tPSA ( Å2) 142.11 165 243
Mw: Molecular weight
The approach to enhance water solubility is to use cyclodextrins, which are well-known
pharmaceutical excipients, capable of forming inclusion complexes with a wide range of poorly soluble molecules (72,144) (Figure 2.3). Cyclodextrins are cyclic oligosaccharides containing 6
(αCD), 7 (βCD) or 8 (γCD) (α-1,4)-a-D-glucopyranose units, respectively. All hydroxyl groups are
oriented to the cone exterior with the primary hydroxyl groups at the narrow side of the toroid
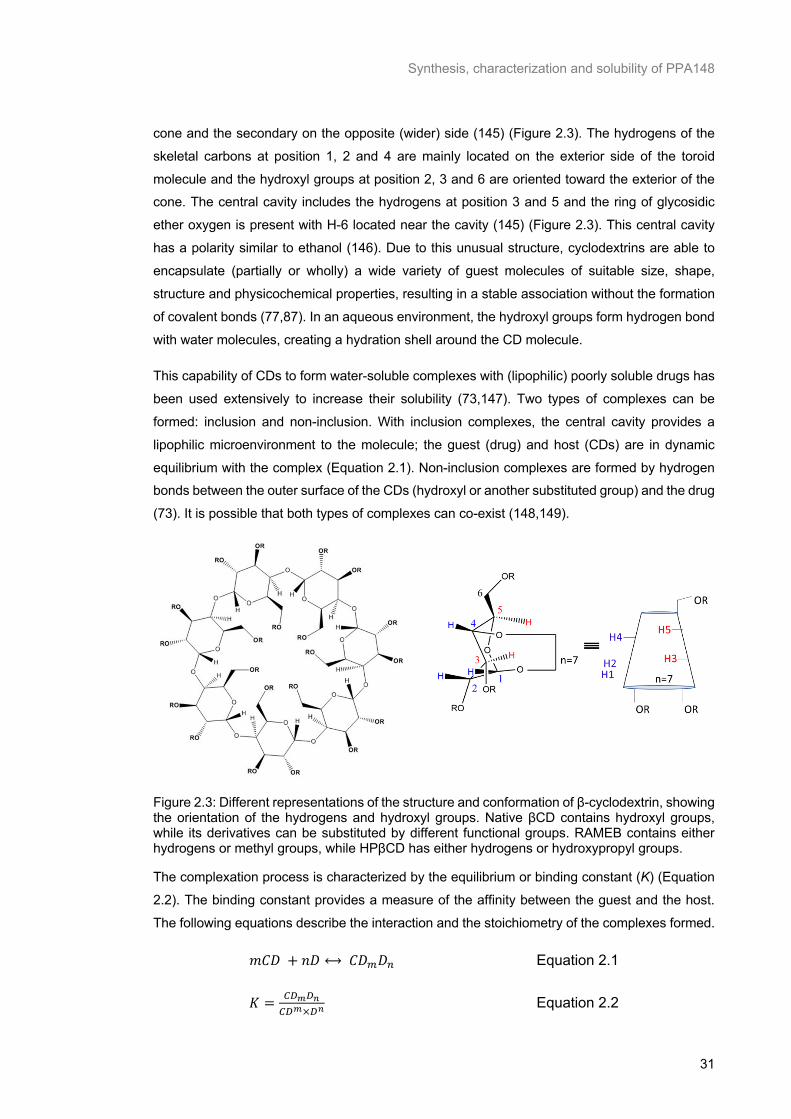
Synthesis, characterization and solubility of PPA148
31
cone and the secondary on the opposite (wider) side (145) (Figure 2.3). The hydrogens of the
skeletal carbons at position 1, 2 and 4 are mainly located on the exterior side of the toroid
molecule and the hydroxyl groups at position 2, 3 and 6 are oriented toward the exterior of the cone. The central cavity includes the hydrogens at position 3 and 5 and the ring of glycosidic
ether oxygen is present with H-6 located near the cavity (145) (Figure 2.3). This central cavity
has a polarity similar to ethanol (146). Due to this unusual structure, cyclodextrins are able to
encapsulate (partially or wholly) a wide variety of guest molecules of suitable size, shape,
structure and physicochemical properties, resulting in a stable association without the formation
of covalent bonds (77,87). In an aqueous environment, the hydroxyl groups form hydrogen bond
with water molecules, creating a hydration shell around the CD molecule.
This capability of CDs to form water-soluble complexes with (lipophilic) poorly soluble drugs has
been used extensively to increase their solubility (73,147). Two types of complexes can be
formed: inclusion and non-inclusion. With inclusion complexes, the central cavity provides a
lipophilic microenvironment to the molecule; the guest (drug) and host (CDs) are in dynamic
equilibrium with the complex (Equation 2.1). Non-inclusion complexes are formed by hydrogen bonds between the outer surface of the CDs (hydroxyl or another substituted group) and the drug
(73). It is possible that both types of complexes can co-exist (148,149).
Figure 2.3: Different representations of the structure and conformation of β-cyclodextrin, showing the orientation of the hydrogens and hydroxyl groups. Native βCD contains hydroxyl groups, while its derivatives can be substituted by different functional groups. RAMEB contains either hydrogens or methyl groups, while HPβCD has either hydrogens or hydroxypropyl groups.
The complexation process is characterized by the equilibrium or binding constant (K) (Equation
2.2). The binding constant provides a measure of the affinity between the guest and the host.
The following equations describe the interaction and the stoichiometry of the complexes formed.
𝑚𝐶𝐷 + 𝑛𝐷 ⟷𝐶𝐷_𝐷I Equation 2.1
𝐾 = abcbUabc×bU
Equation 2.2
Synthesis, characterization and solubility of PPA148
32
, where m and n describe the stoichiometry of the CD/drug complex. For instance, a 2:1 CD/drug
complex would have m of 2 and n of 1. Binding constants for cyclodextrin lie between 50 and
2000 M-1 (73) and inconsistencies among the methods used to determine the binding constant have been reported (75).
In this chapter we report the synthesis of a novel antibiotic, PPA148, its characterization and the
formation of inclusion complexes with either HPβCD or RAMEB to increase its solubility. A
convergent synthetic route was applied based on the separate synthesis of the tricyclic PBD
scaffold and the lateral polyamidic tail (107,108). The two final pure core and tail molecules were linked via an amidic bond to form the final PPA148. Following the synthesis, the physicochemical
characteristics, such as solubility, of this novel antimicrobial agent were measured. Finally, the
drug was formulated with HPβCD and RAMEB and drug/CD binding constants measured using
fluorescence spectroscopy. Given the low solubility of the drug, this was the first step towards
potentially enhancing its efficacy by forming inclusion complex with a βCD derivative.
Enhancement of water solubility will help to optimize the drug for local use to the lungs by
avoiding precipitation and side effects (150). The second step for achieving increased antibacterial activity was to prepare a liposomal carrier to help PPA148 breach the bacterial cell
envelope and bind to the chromosomal DNA (Chapter 3).
2.2 Materials
Reagents and chemicals used for the synthesis: (Diacetoxyiodo)benzene (BAIB), 3,4-
dihydro-2H-pyran (DHP), 4-(dimethylamino)pyridine (DMAP), ptoluenesulfonic acid
monohydrate (PTSA) (≤ 100%, sulphuric acid 1 - 5%), 2,2,6,6-tetramethylpiperidinooxy
(TEMPO), tetrakis(triphenylphosphine)palladium(0), triphenylphosphine and N-(3-
dimethylaminopropyl)-N’-ethylcarbodiimide hydrochloride (EDCI) were purchased from Sigma-
Aldrich, UK. Dichloromethane (DCM), dioxane, N,N-dimethylformamide (DMF), methanol,
acetone, ethyl acetate (EA), acetonitrile (ACN) and thiomorpholine were purchased from Sigma-
Aldrich, UK. LC/MS grade water was supplied by Merck, UK. Ethyl-5-amino-1-benzofuran-2-
carboxylate and 4-tert-butoxycarbonylamino-1-methyl-1H-pyrrole-2-carboxylic acid were purchased by Fluorochem Ltd (Hadfield, UK). Citric acid, sodium chloride (NaCl), brine and
sodium bicarbonate (NaHCO3) were purchased from Sigma-Aldrich, UK. Formic acid for use in
LC/MS was purchased by Fisher Scientific UK. Silica was purchased from Sigma-Aldrich, UK,
and TLC silica gel 60 F254 aluminium sheets (20 cm) were supplied by VWR International, UK.
Deuterated water, chloroform and DMSO were purchased by Sigma-Aldrich, UK.
Cyclodextrins: Hydroxypropyl-β-cyclodextrin (HPβCD), randomly methylated β-cyclodextrin
(RAMEB) and heptakis (2,6-di-O-methyl)-β-cyclodextrin (DIMEB) were purchased from Sigma-
Aldrich, UK
Synthesis, characterization and solubility of PPA148
33
Active Pharmaceutical Compounds: Rifampicin, gentamicin sulfate and chlorhexidine
digluconate were purchased by Sigma-Aldrich, UK.
Buffer preparation: Trizma(R) hydrochloride (BioUltra, for molecular biology, >=99.0%) and
HEPES (>=99.5%) purchased from Sigma-Aldrich, UK. Sodium chloride (NaCl), calcium chloride
(CaCl2) and magnesium chloride (MgCl2), supplied from Sigma-Aldrich, UK. The ultrapure water
at 18.2 MΩ was produced by a Purelab Ultra machine from ELGA process water (Marlow, UK).
2.3 Methods
This section describes the methods applied for the synthesis and characterization of all intermediate and final compounds. All the compounds were tested with TLC (2.3.2), LC/MS
(2.3.3), proton and carbon NMR (2.3.4) and FTIR (2.3.5). The conditions of these tests are stated
in separate sections from that of the synthetic pathway (2.3.1). Methods used for further
characterization of the final compound (aqueous solubility) and complex formation for enhancing
water solubility will be described at the end of this section (2.3.6: Adsorption assay using the
Langmuir trough, 2.3.7: Ultra Violet Spectroscopy, 2.3.8: Turbidimetric Assay, 2.3.9: Water
Solubility Test, 2.3.10: Quantification of drug binding affinities to Cyclodextrin (Fluorescence
Binding constant assay), 2.3.11: Phase solubility diagram, 2.3.12: Continuous method variation (Job’s plot))
2.3.1 Synthetic pathway of PPA148
The complete reaction sequence is shown in Scheme B 1, Appendix B (107). In the present work,
the synthetic route was performed according to Scheme 2.1. It is separated into 3 sections. The
first (Scheme 2.1A) describes the core synthesis, the second (Scheme 2.1B) the tail and the last (Scheme 2.1C) shows the coupling of the two parts to form the final compound #12 (PPA148).
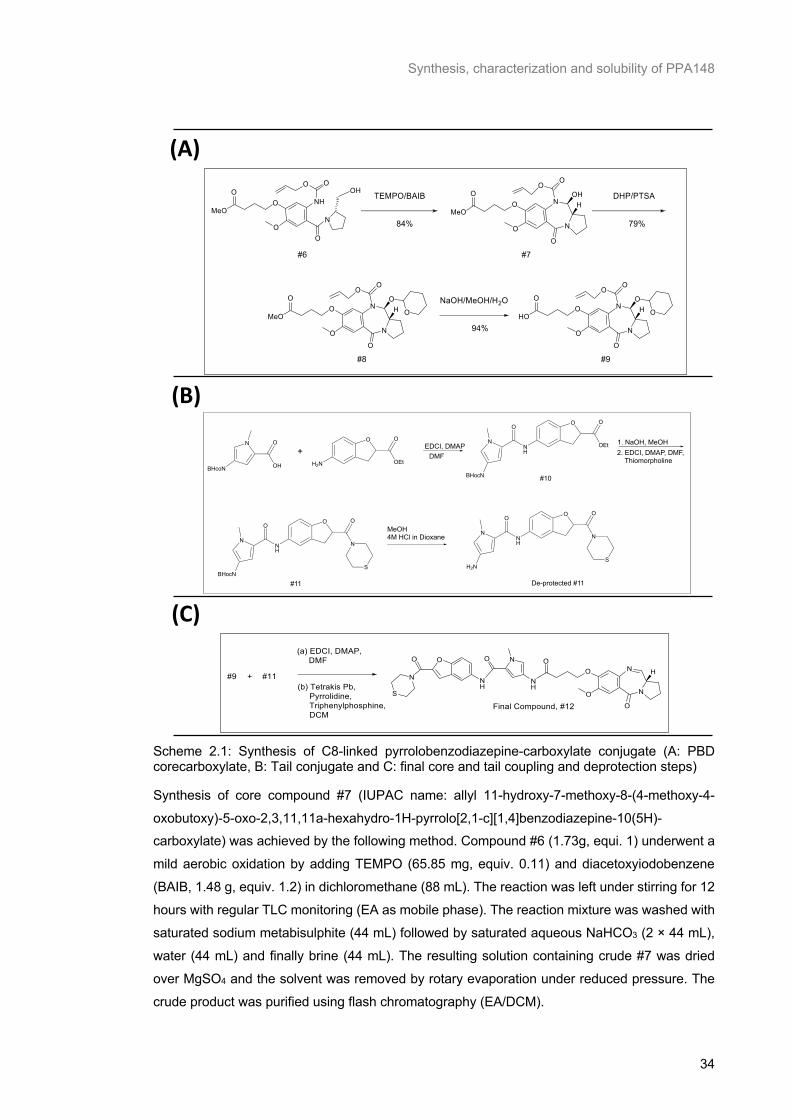
Synthesis, characterization and solubility of PPA148
34
Scheme 2.1: Synthesis of C8-linked pyrrolobenzodiazepine-carboxylate conjugate (A: PBD corecarboxylate, B: Tail conjugate and C: final core and tail coupling and deprotection steps)
Synthesis of core compound #7 (IUPAC name: allyl 11-hydroxy-7-methoxy-8-(4-methoxy-4-
oxobutoxy)-5-oxo-2,3,11,11a-hexahydro-1H-pyrrolo[2,1-c][1,4]benzodiazepine-10(5H)-carboxylate) was achieved by the following method. Compound #6 (1.73g, equi. 1) underwent a
mild aerobic oxidation by adding TEMPO (65.85 mg, equiv. 0.11) and diacetoxyiodobenzene
(BAIB, 1.48 g, equiv. 1.2) in dichloromethane (88 mL). The reaction was left under stirring for 12
hours with regular TLC monitoring (EA as mobile phase). The reaction mixture was washed with
saturated sodium metabisulphite (44 mL) followed by saturated aqueous NaHCO3 (2 × 44 mL),
water (44 mL) and finally brine (44 mL). The resulting solution containing crude #7 was dried
over MgSO4 and the solvent was removed by rotary evaporation under reduced pressure. The
crude product was purified using flash chromatography (EA/DCM).
N
BHcoN
O
OH
+H2N
O O
OEt
EDCI, DMAPDMF
N
BHocN
O
NH
O O
OEt
N
BHocN
O
NH
O O
N
S
1. NaOH, MeOH2. EDCI, DMAP, DMF, Thiomorpholine
#11
#10
MeOH4M HCl in Dioxane
N
H2N
O
NH
O O
N
S
De-protected #11
(A)
(B)
(C)
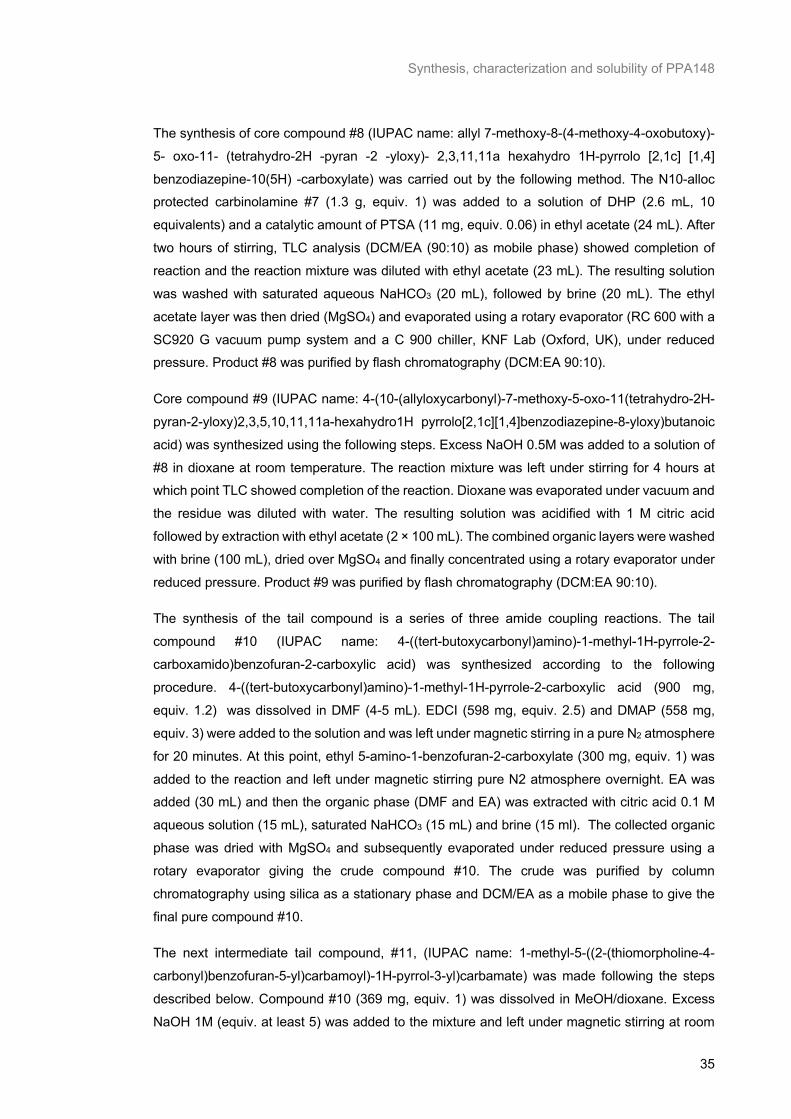
Synthesis, characterization and solubility of PPA148
35
The synthesis of core compound #8 (IUPAC name: allyl 7-methoxy-8-(4-methoxy-4-oxobutoxy)-
5- oxo-11- (tetrahydro-2H -pyran -2 -yloxy)- 2,3,11,11a hexahydro 1H-pyrrolo [2,1c] [1,4]
benzodiazepine-10(5H) -carboxylate) was carried out by the following method. The N10-alloc protected carbinolamine #7 (1.3 g, equiv. 1) was added to a solution of DHP (2.6 mL, 10
equivalents) and a catalytic amount of PTSA (11 mg, equiv. 0.06) in ethyl acetate (24 mL). After
two hours of stirring, TLC analysis (DCM/EA (90:10) as mobile phase) showed completion of
reaction and the reaction mixture was diluted with ethyl acetate (23 mL). The resulting solution
was washed with saturated aqueous NaHCO3 (20 mL), followed by brine (20 mL). The ethyl
acetate layer was then dried (MgSO4) and evaporated using a rotary evaporator (RC 600 with a
SC920 G vacuum pump system and a C 900 chiller, KNF Lab (Oxford, UK), under reduced pressure. Product #8 was purified by flash chromatography (DCM:EA 90:10).
Core compound #9 (IUPAC name: 4-(10-(allyloxycarbonyl)-7-methoxy-5-oxo-11(tetrahydro-2H-
pyran-2-yloxy)2,3,5,10,11,11a-hexahydro1H pyrrolo[2,1c][1,4]benzodiazepine-8-yloxy)butanoic
acid) was synthesized using the following steps. Excess NaOH 0.5M was added to a solution of
#8 in dioxane at room temperature. The reaction mixture was left under stirring for 4 hours at which point TLC showed completion of the reaction. Dioxane was evaporated under vacuum and
the residue was diluted with water. The resulting solution was acidified with 1 M citric acid
followed by extraction with ethyl acetate (2 × 100 mL). The combined organic layers were washed
with brine (100 mL), dried over MgSO4 and finally concentrated using a rotary evaporator under
reduced pressure. Product #9 was purified by flash chromatography (DCM:EA 90:10).
The synthesis of the tail compound is a series of three amide coupling reactions. The tail
compound #10 (IUPAC name: 4-((tert-butoxycarbonyl)amino)-1-methyl-1H-pyrrole-2-
carboxamido)benzofuran-2-carboxylic acid) was synthesized according to the following
procedure. 4-((tert-butoxycarbonyl)amino)-1-methyl-1H-pyrrole-2-carboxylic acid (900 mg,
equiv. 1.2) was dissolved in DMF (4-5 mL). EDCI (598 mg, equiv. 2.5) and DMAP (558 mg,
equiv. 3) were added to the solution and was left under magnetic stirring in a pure N2 atmosphere
for 20 minutes. At this point, ethyl 5-amino-1-benzofuran-2-carboxylate (300 mg, equiv. 1) was
added to the reaction and left under magnetic stirring pure N2 atmosphere overnight. EA was added (30 mL) and then the organic phase (DMF and EA) was extracted with citric acid 0.1 M
aqueous solution (15 mL), saturated NaHCO3 (15 mL) and brine (15 ml). The collected organic
phase was dried with MgSO4 and subsequently evaporated under reduced pressure using a
rotary evaporator giving the crude compound #10. The crude was purified by column
chromatography using silica as a stationary phase and DCM/EA as a mobile phase to give the
final pure compound #10.
The next intermediate tail compound, #11, (IUPAC name: 1-methyl-5-((2-(thiomorpholine-4-
carbonyl)benzofuran-5-yl)carbamoyl)-1H-pyrrol-3-yl)carbamate) was made following the steps
described below. Compound #10 (369 mg, equiv. 1) was dissolved in MeOH/dioxane. Excess
NaOH 1M (equiv. at least 5) was added to the mixture and left under magnetic stirring at room
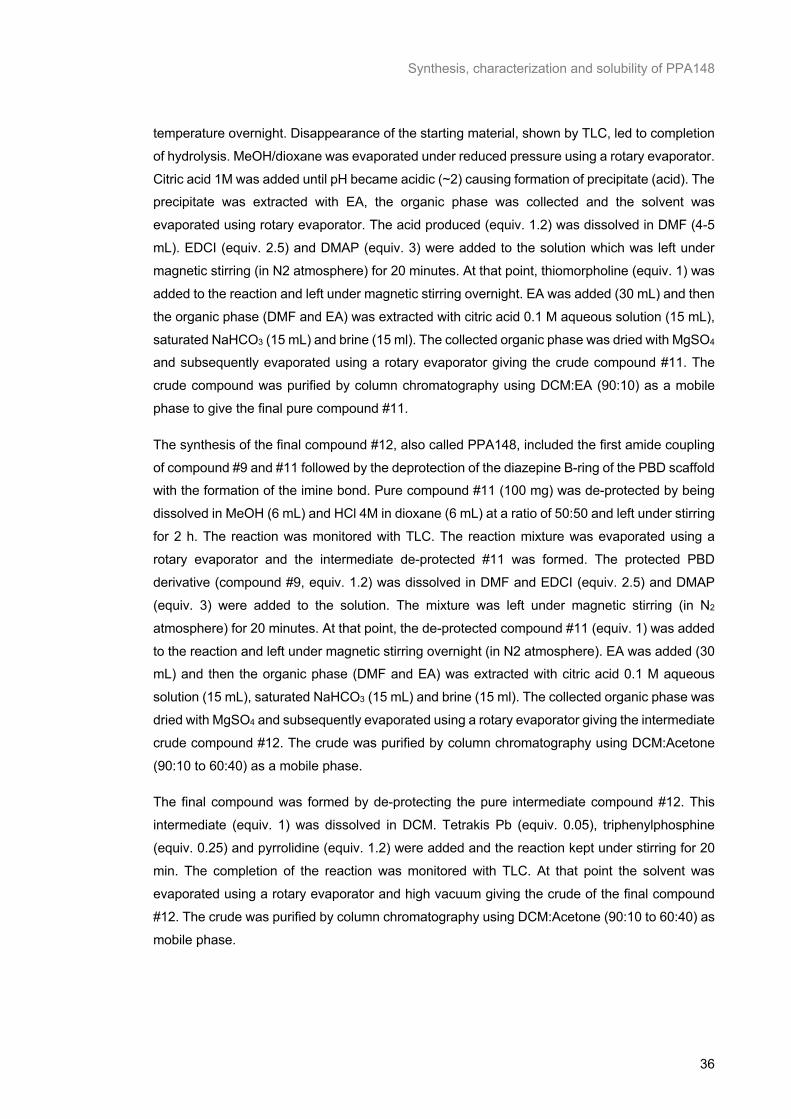
Synthesis, characterization and solubility of PPA148
36
temperature overnight. Disappearance of the starting material, shown by TLC, led to completion
of hydrolysis. MeOH/dioxane was evaporated under reduced pressure using a rotary evaporator.
Citric acid 1M was added until pH became acidic (~2) causing formation of precipitate (acid). The precipitate was extracted with EA, the organic phase was collected and the solvent was
evaporated using rotary evaporator. The acid produced (equiv. 1.2) was dissolved in DMF (4-5
mL). EDCI (equiv. 2.5) and DMAP (equiv. 3) were added to the solution which was left under
magnetic stirring (in N2 atmosphere) for 20 minutes. At that point, thiomorpholine (equiv. 1) was
added to the reaction and left under magnetic stirring overnight. EA was added (30 mL) and then
the organic phase (DMF and EA) was extracted with citric acid 0.1 M aqueous solution (15 mL),
saturated NaHCO3 (15 mL) and brine (15 ml). The collected organic phase was dried with MgSO4 and subsequently evaporated using a rotary evaporator giving the crude compound #11. The
crude compound was purified by column chromatography using DCM:EA (90:10) as a mobile
phase to give the final pure compound #11.
The synthesis of the final compound #12, also called PPA148, included the first amide coupling
of compound #9 and #11 followed by the deprotection of the diazepine B-ring of the PBD scaffold with the formation of the imine bond. Pure compound #11 (100 mg) was de-protected by being
dissolved in MeOH (6 mL) and HCl 4M in dioxane (6 mL) at a ratio of 50:50 and left under stirring
for 2 h. The reaction was monitored with TLC. The reaction mixture was evaporated using a
rotary evaporator and the intermediate de-protected #11 was formed. The protected PBD
derivative (compound #9, equiv. 1.2) was dissolved in DMF and EDCI (equiv. 2.5) and DMAP
(equiv. 3) were added to the solution. The mixture was left under magnetic stirring (in N2
atmosphere) for 20 minutes. At that point, the de-protected compound #11 (equiv. 1) was added
to the reaction and left under magnetic stirring overnight (in N2 atmosphere). EA was added (30 mL) and then the organic phase (DMF and EA) was extracted with citric acid 0.1 M aqueous
solution (15 mL), saturated NaHCO3 (15 mL) and brine (15 ml). The collected organic phase was
dried with MgSO4 and subsequently evaporated using a rotary evaporator giving the intermediate
crude compound #12. The crude was purified by column chromatography using DCM:Acetone
(90:10 to 60:40) as a mobile phase.
The final compound was formed by de-protecting the pure intermediate compound #12. This
intermediate (equiv. 1) was dissolved in DCM. Tetrakis Pb (equiv. 0.05), triphenylphosphine
(equiv. 0.25) and pyrrolidine (equiv. 1.2) were added and the reaction kept under stirring for 20
min. The completion of the reaction was monitored with TLC. At that point the solvent was
evaporated using a rotary evaporator and high vacuum giving the crude of the final compound
#12. The crude was purified by column chromatography using DCM:Acetone (90:10 to 60:40) as
mobile phase.

Synthesis, characterization and solubility of PPA148
37
2.3.2 Thin Layer Chromatography (TLC)
TLC is a planar chromatographic technique extensively used in synthetic organic chemistry as a
rapid and straightforward tool to determine each compound’s purity and a means of following the progress of a reaction. It was performed for all intermediates and the final compound. As a mobile
phase a mixture of organic solvents was used depending on the nature and affinity of each
compound (DCM:EA at different ratios for the intermediate and DCM:Acetone for the final
compound). Silica gel-coated aluminium sheets were used as a stationary phase. The mobile
phase travels through the stationary phase and carries the components of the mixture with it.
The movement of the analyte can be seen under the UV light and expressed by the retardation
factor (Rf). Rf depends on the distribution coefficient (K) and is the relation between the distance
travelled by the analyte from its origin (Kα) to the distance travelled by the solvent from its origin (Ks) using the following formula:
𝑅F =fgfh Equation 2.3
If the analyte spot is not UV visible, a number of solutions can be applied on the dried TLC plate
and produce colored products. Potassium permanganate (KMnO4) was used for all compounds
that can be oxidized such as phospholipids and cyclodextrins. UV radiation at 254 nm was used
for all samples.
2.3.3 Liquid Chromatography-Mass Spectrometry (LC/MS)
LC-MS was conducted with the triple quadrupole Agilent Infinity Automated LC/MS Purification
System to identify the purity and mass of the compounds at every step of the synthetic route.
The physical separation was performed on a OnyxTM monolithic C18 column with dimensions
of 50mmx4.60mm and pore size of 130 Å. The mobile phase was a mixture of HPLC grade water
with 0.1% formic acid (Solvent A) and HPLC grade ACN with 0.1% formic acid (Solvent B). The
gradient was ramped from 95% A at t = 0min to 50% A at 2 min, then to 10% at 2.5 min, and kept
it until 4.5 min and finally ramped to 95% at 4.6 min and keep there for 5 min. The injection volume was 10 µL, the flow rate was 1 mL/min and minimum/maximum flow ramp up/down was
100 mL/min2. The LC detector was an Agilent 1260 Infinity II Diode Array Detector (DAD) G7115A
and the detection wavelength range was 220-400 nm. The UV absorbance was recorded at 260
nm with a slit width of 4 nm at 0.8 °C. The LC was coupled with the mass spectrometer via an
electrospray ionization (ESI) interface operating in both positive (ESI+) and negative (ESI-)
modes. The nebulization pressure was 50 psig, the gas used N2 and the quadrupole temperature
set at 0 °C. The voltage capillary was 4000 V and 3500 V for ESI+ and ESI- respectively and the drying gas temperature and flow were 350 °C and 13 L/h. The sample cone (skimmer) voltage
and ion energy was set at 8 and 5 V respectively for both ionization modes. Lens1, Lens2, IRIS
lens and HED were set at 2.4, 23, -400 and 10000 V for the ESI+ and -4, 23, 400 and 10000 V
for the ESI-.
Synthesis, characterization and solubility of PPA148
38
For all the compounds, the relative purity was assessed based on the LC chromatogram because
there were no analytical standards to assess their absolute purity. Therefore, it was calculated
based on the relative area of each intermediate and final compound as a percentage of all other peak areas in the chromatogram. For the purpose of this research, the term relative purity will be
referred to as purity or RP.
2.3.4 Nuclear Magnetic Resonance (NMR) spectroscopy
Liquid state NMR spectroscopy was carried out on an AscendTM 400 MHz spectrometer
equipped with a SampleXpress autosampler system (Bruker, UK) for all intermediates and the final compound of the synthetic procedure to identify their molecular content and purity. 1-
dimentional (1D) proton (1H) and carbon (13C) NMR were performed to assign the resonances.
The spectra were recorded using TOPSpin software for data acquisition and MestReNova
software for data analysis. 1H NMR parameters included sweep width of 8012.82 Hz, acquisition
time of 4.09 sec and 16 scans and were collected with a zg30 pulse program. 13C NMR used a
sweep width of 24038.46 Hz, acquisition time of 1.36 sec and 1024 scans. The solvent used was
either deuterated chloroform (CDCl3) or deuterated DMSO, depending on the solubility of the
compound.
2.3.5 Fourier Transform Infra-Red (FTIR) Spectroscopy
FTIR was carried out to confirm the presence of the basic functional groups of newly synthesized
compounds. It is an additional technique to NMR to confirm the structure of each intermediate
and the final compound. A Perkin Elmer, UK, Frontier FTIR (serial number 95462) with a LiTa03
detector, IR-laser wavenumber of 15798 cm-1 and a zinc selenide (ZnSe) crystal was used to analyze the samples in their solid state. For a better contact of the sample with the crystal, the
DATR 1 bounce diamond accessory with a pressure arm force indicator (part number L1250240,
Perkin-Elmer Ltd, UK) was attached to the main piece of equipment. All spectra were produced
using 16 scans and collected at a scan speed of 0.2 cm-1/min and spectral resolution of 2 cm-1.
The data were analyzed using Spectrum One software (version 10.03.06, Perkin-Elmer Ltd, UK).
Each spectrum was scale-base normalized by dividing the absorbance of each point with that of
the C-H stretch at around 2950 cm-1 (internal standard) to minimize the errors caused by the
amount of sample used.
2.3.6 Adsorption assay
The adsorption of the drugs chlorhexidine digluconate, rifampicin, gentamicin and PPA148 at the
air/water interface was recorded by measuring changes in surface pressure after subphase
injection. A Langmuir trough (NIMA Technologies Ltd., Coventry, UK) equipped with a calibrated
NIMA PS4 pressure sensor and a Wilhelmy plate (Whatman, grade 1, chromatographic paper), connected to a controlling computer with the NIMA IU4 interface unit. For all the experiments a
50 mm diameter perfluoroalkoxy (PFA) petri dish (Saint-Gobain Performance Plastics) with a 20

Synthesis, characterization and solubility of PPA148
39
mL volume capacity, was placed over a magnetic stirring plate and referred to as the “small
trough”. A dust and contaminant free subphase (approximately 20 mL filtered ultrapure water
containing 0.9% w/v NaCl) was poured into the petri dish and a clean Wilhelmy plate was suspended from the NIMA PS4 pressure sensor and partially submerged into the subphase. The
subphase surface was cleaned by sweeping and suction using a pressure pump (Aspirator A-
3S, EYELA, Tokyo Rikakikai Co, Ltd) in order to remove any remaining dust and contaminants
from the surface (Π = 0± 2 mN/m).
Drug solution was injected (0.1 μL) below the surface directly into the subphase using a 1 mL disposable plastic syringe (fitted with a 25 G x 25 mm needle) of 1 mL volume (BD biosciences
UK, Oxford, UK) whilst continuously stirring. Chlorhexidine digluconate (CHD) and gentamicin
sulfate were dissolved in water whilst rifampicin and PPA148 were dissolved in DMSO. In each
case, the final drug concentration in the trough was 2 μg/mL. The adsorption of the drug on the
surface causes changes in surface pressure which are recorded over time whilst maintaining a
constant surface area (21.3 A2/m) at 23 °C. Each sample was run in triplicate (n=3) and the
changes in surface pressure were plotted against time (Π and A-Time isotherm). Nonlinear regression was applied to estimate the kinetics of the Pressure-Time isotherm curves. The
isotherm was fitted with a sigmoidal model (Hill plot with 3 parameters) using GraphPad Prism
7.03 software (USA). The Hill plot model explained approximately 99% of the pressure variability
in time for all individual data and is described by the following formula:
𝑓(𝑥) = (k∗mn)(onpmn)
Equation 2.4
, where a is the maximum difference in surface pressure reached at the plateau (ΔΠmax), b is the
hill coefficient of sigmoidicity (hill slope at its midpoint) and c is the time for which 50% of
maximum pressure is obtained (t50%).
2.3.7 Ultra Violet Spectroscopy
The UV spectrum of PPA148 was recorded on a Lamda 2 spectrophotometer (Perkin Elmer, UK), at 25 ˚C using a quartz cuvette (Hellma 114-QS) with a pathlength of 1 cm and volume
capacity of 1400 μL. The absorbance was recorded within a wavelength range of 200-550 nm
with spectral slit width of 2 nm and scan speed of 60 nm/min. The drug concentration was 20
μg/mL and it was measured in DI water, ethanol and ethanol/water (80:20).
The linearity of this method was determined by analysing the solutions of PA148 in the range of 2-200 μg/mL. For quantification purposes, the Limit of Detection (LOD) and Quantification (LOQ)
were established by regression analysis of the linear part (calibration curve). Both values were
calculated using the standard error mean (se) and slope (S) taken from the regression line. The
linear regression assumes that the errors between observed and predicted values, i.e. the
residuals of the regression, should not fall outside the straight line (normal distribution) and its
Synthesis, characterization and solubility of PPA148
40
variance should be equally distributed (homoskedasticity) (Appendix B, Figure B 4). Otherwise,
the residuals are not constant and normally distributed, leading to false estimations. All the
formulas are as follows:
𝐿𝑂𝐷 = s.s×tuv
Equation 2.5
𝐿𝑂𝑄 = Vw×tuv
Equation 2.6
2.3.8 Turbidimetric Assay
Turbidimetric assay is a preliminary screening test to rapidly evaluate the enhancement of water
solubility of compounds at their early stage of development. Initially, a stock solution of PPA148
(5 mM) in DCM was used to produce a range of concentrations (0, 5, 10, 15, 20, 25, 30, 40, 50,
60, 70, 100, 130 and 160 μg/ml) in water or aqueous buffer. DCM was evaporated before the
addition of the water to a final volume of 4 mL. The samples were left under mild stirring (290 rpm) for 7 days and changes in the light scattering of the samples were tracked using two
techniques. Photon correlation spectroscopy (PCS), also known as dynamic light scattering
(DLS), was the first technique used at 25 °C. A Malvern Zetasizer, Nano-ZS (Malvern
Instruments, UK) was used with a laser of wavelength 623.8 nm and backscatter detection angle
of 173°. The value of the viscosity of water (as the dispersant) and refractive index were used,
respectively 0.889 cP and 1.33211. The samples were placed in disposable semi-micro dynamic
light scattering cuvettes with volume capacity of 1.5 mL (VWR International, UK). The linear
derived count rate (DCR) was recorded and plotted against drug concentration.
UV/Vis spectroscopy was also used as an additional technique to measure the scattered light at
a wavelength of 620 nm at 25 ˚C. Solutions were placed a quartz cuvettes (Hellma 114-QS) with
a pathlength of 1 cm and measured on a spectrophotometer (Perkin Elmer, UK) with slit width
set at 2 nm. The absorbance value at 620 nm was recorded and plotted as a function of drug
concentration.
In the absence of aggregates, scattering from the samples is nearly zero; the onset of
aggregation is denoted by a break in the slope, with scattering (or turbidity) increasing linearly
with concentration. The intersection of the two linear profiles is used as an estimation of the
aggregation concentration.
2.3.9 Water Solubility Test
An excess amount of PPA148 (1 mg) was added to deionized water and 20 mM HEPES, 2 mM
CaCl2, 145 mM NaCl (pH =7.2) buffer (1 mL). The samples were left under mild stirring (290 rpm)
for 7 days. After incubation, samples were centrifuged (5 min at 10,000 rpm) and the supernatant
was freeze-dried overnight and resuspended in ethanol: water (4:1). The saturated concentration

Synthesis, characterization and solubility of PPA148
41
was assayed by UV/Vis spectroscopy using a calibration curve as described in the corresponding
methods section (2.3.7).
2.3.10 Quantification of drug:cyclodextrin binding constant by fluorescence
spectroscopy
The increase in aqueous solubility of the antimicrobial agents (PPA148 and rifampicin) obtained
by their incorporation into cyclodextrins was measured by fluorescence spectroscopy. Two types
of modified -βcyclodextrins were used: HPβCD and RAMEB and the binding constant was
measured as reported by Valero et al. (151). Specific volumes of either PPA148 in DCM, or
rifampicin in ethanol were transferred into separate vials and the solvent evaporated. CD
solutions (0, 1, 2, 3, 4, 5, 6, 10, 15, 20, 25 and 30%) in HEPES (20 mM) buffered saline, pH 7.2,
or 50 mM Tris buffer pH 9 were then added to achieve a final drug concentration of 10 µg/mL. The samples were left under mild stirring overnight. The fluorescence intensity of the drug was
measured as a function of concentration. The fluorescence intensity of the drug increases upon
complexation with CDs until the drug is fully complexed with the CD and a plateau is reached.
The fluorescence intensity from PPA148 was measured with a Luminescence spectrometer LS
50 B (Perkin Elmer, UK), and was conducted with an excitation wavelength of 300 nm, and an emission wavelength scan range of 340-530 nm, with emission/excitation slit widths of 5 nm.
Shifts in the fluorescence drug peak at 422 nm for PPA148 and the ratio of 338/419 nm for
rifampicin are due to inclusion complex formation. Assuming that the drug forms a 1:1 complex
with CD, the binding constant (K) was determined by fitting the data with the following equation
(152):
𝐼 = yzpy{f[ab]Vpf[ab]
Equation 2.7
, where 𝐼w, 𝐼 and 𝐼L are the fluorescence intensity from the drug in the absence of cyclodextrin,
at intermediate and infinite cyclodextrin (excess) concentration, K is the binding constant and
[CD] is the molar concentration of free cyclodextrin. A non-linear least squares method was used
to fit the experimental results to Equation 2.7. The differences between the calculated solubility
and the experimentally derived data were minimized by varying the values of the binding constant
(the iterative approach of Nelder–Mead) using the Microsoft Excel Solver function (153).
2.3.11 Phase solubility diagram
Complex formation between cyclodextrin (solubilizer) and drug was also investigated by studying
phase solubility (147). Twelve vials containing an excess of drug, i.e. 1 mg (1.4 mM) for PPA148
and 10 mg (12 mM) for rifampicin, were prepared. The aqueous solution used for PPA148 was
HEPES buffered saline including CaCl2 at pH 7.2; for rifampicin, Tris buffer at pH 9 was used.
Each vial contained varying amounts of cyclodextrin (0, 0.2, 0.4, 0.6, 0.8, 1, 1.5, 2, 4, 6, 10 and
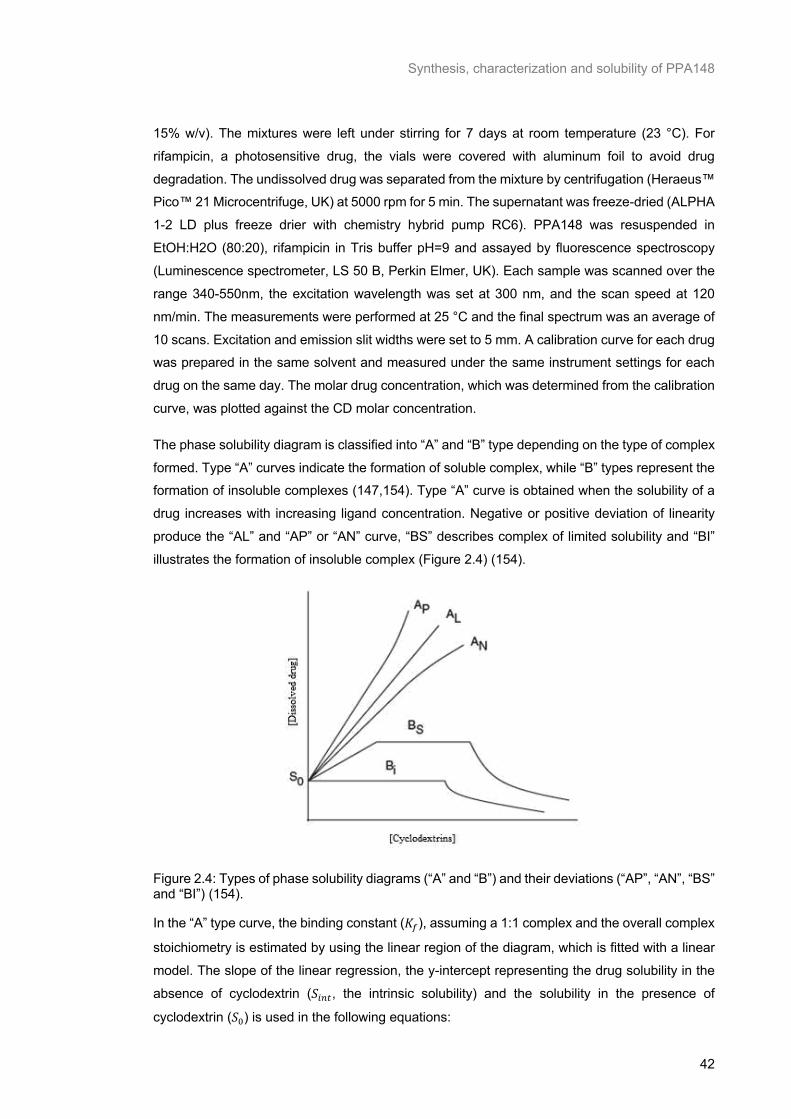
Synthesis, characterization and solubility of PPA148
42
15% w/v). The mixtures were left under stirring for 7 days at room temperature (23 °C). For
rifampicin, a photosensitive drug, the vials were covered with aluminum foil to avoid drug
degradation. The undissolved drug was separated from the mixture by centrifugation (Heraeus™ Pico™ 21 Microcentrifuge, UK) at 5000 rpm for 5 min. The supernatant was freeze-dried (ALPHA
1-2 LD plus freeze drier with chemistry hybrid pump RC6). PPA148 was resuspended in
EtOH:H2O (80:20), rifampicin in Tris buffer pH=9 and assayed by fluorescence spectroscopy
(Luminescence spectrometer, LS 50 B, Perkin Elmer, UK). Each sample was scanned over the
range 340-550nm, the excitation wavelength was set at 300 nm, and the scan speed at 120
nm/min. The measurements were performed at 25 °C and the final spectrum was an average of
10 scans. Excitation and emission slit widths were set to 5 mm. A calibration curve for each drug was prepared in the same solvent and measured under the same instrument settings for each
drug on the same day. The molar drug concentration, which was determined from the calibration
curve, was plotted against the CD molar concentration.
The phase solubility diagram is classified into “A” and “B” type depending on the type of complex
formed. Type “A” curves indicate the formation of soluble complex, while “B” types represent the formation of insoluble complexes (147,154). Type “A” curve is obtained when the solubility of a
drug increases with increasing ligand concentration. Negative or positive deviation of linearity
produce the “AL” and “AP” or “AN” curve, “BS” describes complex of limited solubility and “BI”
illustrates the formation of insoluble complex (Figure 2.4) (154).
Figure 2.4: Types of phase solubility diagrams (“A” and “B”) and their deviations (“AP”, “AN”, “BS” and “BI”) (154).
In the “A” type curve, the binding constant (𝐾F), assuming a 1:1 complex and the overall complex
stoichiometry is estimated by using the linear region of the diagram, which is fitted with a linear
model. The slope of the linear regression, the y-intercept representing the drug solubility in the
absence of cyclodextrin (𝑆HIL, the intrinsic solubility) and the solubility in the presence of
cyclodextrin (𝑆w) is used in the following equations:
Synthesis, characterization and solubility of PPA148
43
𝐾F =t�J�u
vTU{(V�t�J�u) Equation 2.8
𝑔𝑢𝑒𝑠𝑡: 𝐶𝐷 = 1: Vpvz(V�vz)
Equation 2.9
Due to poor water solubility of hydrophobic drugs, the y-intercept is not always equal to the
intrinsic solubility because of the presence of dimers, trimers or other water-soluble oligomers,
which render the formation of the complexes (147). Therefore, complexation efficiency (CE) is a
more accurate method to determine the solubilizing effect of cyclodextrins. CE is the
concentration ratio between cyclodextrin in the complex and its free form in the system (155). CE
is calculated based on the slope of the linear part of the phase solubility diagram.
𝐶𝐸 = 𝑆w × 𝐾F =t�J�uV�t�J�u
Equation 2.10
The Gibbs free energy of transfer ∆𝐺LGJ is the energy needed for the drug to be transferred from
the aqueous environment to the cyclodextrin cavity and is calculated using the function:
∆𝐺LGJ = −𝑅𝑇𝑙𝑜𝑔(vTU{vz) Equation 2.11
, where R is the gas constant (8.314 JK-1mol-1), T is temperature in Kelvin, 𝑆HIL and 𝑆w are the
molar solubility of the drug in the absence (y-intercept of the linear part of the phase solubility
diagram or intrinsic solubility) and presence of CD, respectively.
2.3.12 Continuous method variation (Job’s plot) (156)
The molecular association of the drug and CD was also studied by NMR spectroscopy. Equimolar
solutions (1mM) of drug and CD in D2O were prepared and mixed in varying volume fractions
while keeping the total concentration constant (1 mM). DIMEB was used instead of RAMEB as it provides a high resolution spectrum from which all protons can be assigned, unlike RAMEB and
HPβCD, which are randomly substituted and therefore lead to spectra with broad peaks (157).
Rifampicin and DIMEB solutions were mixed in volume fractions ranging from 0 to 1 mL with an
increment of 0.1. The inclusion of rifampicin into the DIMEB cavity is evidenced by changes in
the chemical shift observed with selected protons of the cyclodextrin. The spectral peaks of
cyclodextrin hydrogens were assigned according to the literature (158). The settings were the
same as those described in the NMR method section (2.3.4). The resonances of the DIMEB interior hydrogens (in positions 3 and 5) and exterior (position 1) were selected as changes in
those hydrogens indicate inclusion of drug into the cyclodextrin cavity (159). The chemical shifts
of H1 was presented as a doublet at 5.19 and 5.18 ppm, that of H3 was observed as a triplet at
3.90, 3.92 and 3.94 ppm and of H5 as a doublet at 3.84 and 3.86 ppm. The stoichiometry of the
complex was obtained by normalizing the variations of the chemical shifts of the host by its mole
fraction (XCD) and plotting them against cyclodextrin mole fraction (XCD) (160). The shift of CD’s
Synthesis, characterization and solubility of PPA148
44
hydrogen resonance depends on the mole fraction of pure drug, pure CD and drug/CD
complexes. A 1:1 complex presents a maximum signal at 0.5 CD mole fraction.
2.4 Results
2.4.1 Synthesis
PPA148 is a novel modified biaryl PBD hybrid analogue and its synthesis is based on a
convergent strategy. The PBD tricyclic scaffold and the lateral polyamidic tail were synthesized
separately and the two pure compounds (#9 and #11) were coupled to give the final PPA148
(#12). The synthesis of PPA148 was performed according to Scheme 2.1, starting from the
intermediate core compound #6 which was previously synthesized by another group member.
The complete synthetic route can be found in Appendix B, which is the one described in the
patent (107). Each reaction was monitored with TLC and upon completion the compounds were characterized with LCMS, both 1H and 13C NMR, TLC and FTIR to verify their structure and the
mass.
The PBD core followed a retrosynthetic pathway. The pro-imine bond was formed on N10C11
via intramolecular oxidative cyclization of the protected amino-alcohol compound #6. Compound
#7 was obtained with a 74.6% yield and 76.2% relative purity (RP). In order to control the final bonding site of the core and tail coupling, the -OH group of compound #7 was protected (93%
yield and 71.2% RP) prior to the saponification reaction (83% yield, 85.9% RP) of the terminal
methyl ester group. Proton NMR revealed all the differences in magnetic environment during the
series of reactions (Figure 2.5, Figure 2.6).
Compound #6 was the starting material for this project. Its 1HNMR generated a signal at 8.73 ppm which was assigned to the amide hydrogen (Figure 2.5). This signal disappeared in
compound #7 which indicated that the pro-imine bond had formed. All proton NMR spectra
contained several overlapping signals due to the similar magnetic environment of the
hydrocarbon chains. The tetrahydropyran protective group added more hydrocarbon chains to
compound #8 which increased dramatically the signal of the protons at 1.63 ppm. The two sharp
peaks in compounds #6, 7 and 8 were assigned to the two methyl groups (Figure 2.5). Although
compound #6 generated the signals at 3.68 and 3.89 ppm, there was a slight shift in signal
towards higher frequencies in #7 and 8. Compound #9 generated only one signal for the methyl hydrogens which validates the hydrolysis of the methyl ester to create the equivalent acid (83%
yield and 85.9% RP) (Figure 2.5). In all spectra traces of solvent signals might be present or
hidden. 13C NMR was performed for all molecules and it showed all the different carbon
environments (Appendix B, Figure B 2).
The tail consisted of three constitutive units at the C8 position which were sequentially connected via an amide bond (Scheme 2.1). The Boc-protected pyrrole-2-carboxylic acid (first unit) was
bonded with the benzofuran carboxylate (second unit) to give the intermediate compound #10

Synthesis, characterization and solubility of PPA148
45
which was derivatized with the cyclic secondary amine, i.e. thiomorpholine (third unit), after being
hydrolysed.
The series of amide couplings for the tail formation were successful (Figure 2.6). Compound #10
was formed with a 65.4% yield and 99.4% purity. The final tail was obtained with 56.3% yield and
89.4% purity. The signals at 4.39-4.34 ppm (quadruplet) and 1.36-1.32 (triplet) assigned to the
ethyl group in compound #10 disappeared while the thiomorpholine hydrocarbon chains
appeared at both higher and lower frequencies depending on the neighboring atom (3.93, 3.88
and 2.72 ppm (Figure 2.6). This was an indication that there was no starting material left because if both compounds were present all peaks would be observed in the final spectrum. The four
methyl groups generated from the Boc-protection and the tertiary amine were assigned in the
final spectrum, too, at 1.46 and 3.82 ppm respectively. This was another indication that the
coupling of compound #10 and thiomorpholine succeeded.
Figure 2.5: 1NMR of sequential reaction monitoring for the synthesis of the final PBD core compound (#9).

Synthesis, characterization and solubility of PPA148
46
Figure 2.6: 1NMR of sequential reaction monitoring for the synthesis of the final tail compound (#11).
The conversion of compound #10 to the intermediate acid is a crucial step. Citric acid was used
for precipitation of the acid which was formed during hydrolysis with methanol and dioxane.
However, if traces of citric acid remain in the precipitant, it prevents the final amide coupling. The intermediate product with molecular weight of 555 g/mL was formed but it did not interact with
thiomorpholine to give the expected tail product (Scheme 2.2). An attempt to overcome this issue
was to increase the concentration of reagents. Unfortunately, that was not the case, even after
doubling the amount of EDCI and DMAP.
Scheme 2.2: A detailed scheme presenting the second amide coupling of the tail synthesis. When citric acid is present, the reactions did not go to completion and instead only the intermediate product was formed.
The final amide coupling of the PBD core (#9) and tail (#11), de-protection and purification were
successful with 82% yield and 78.1% RP. The proton NMR of PPA148 contained overlapping
signals for the secondary amides, giving a “W” shaped peak instead of two singlets (Figure 2.7).
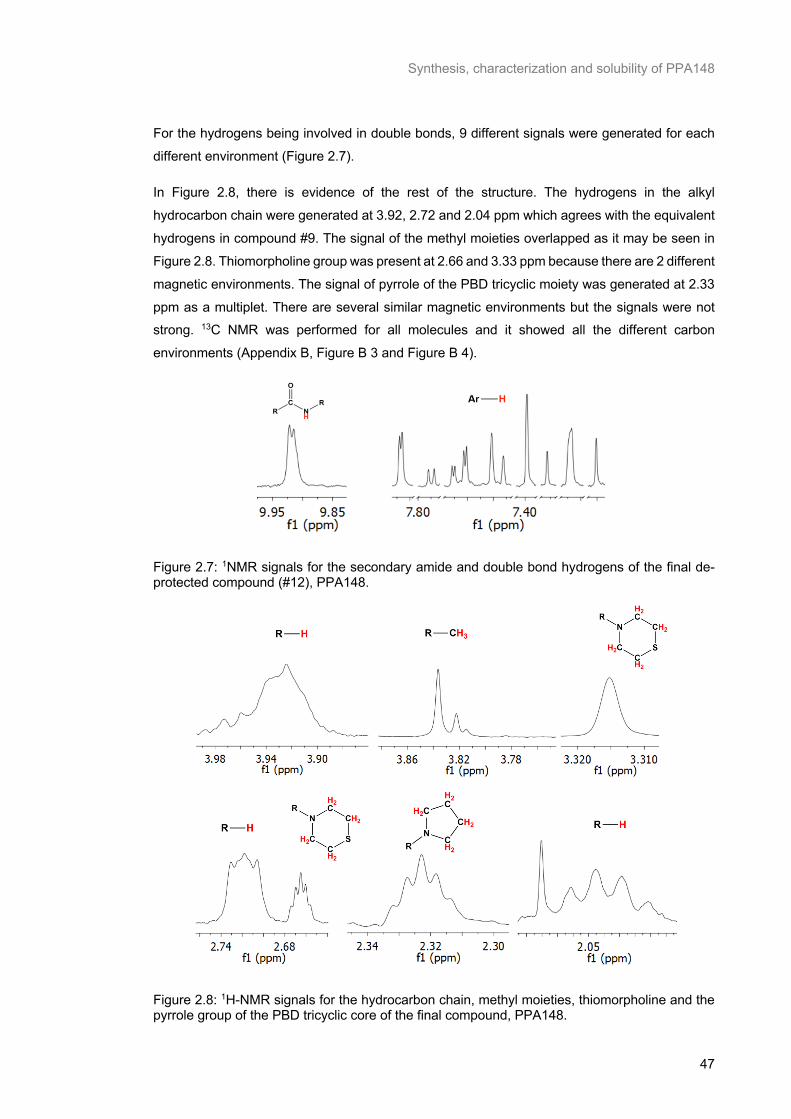
Synthesis, characterization and solubility of PPA148
47
For the hydrogens being involved in double bonds, 9 different signals were generated for each
different environment (Figure 2.7).
In Figure 2.8, there is evidence of the rest of the structure. The hydrogens in the alkyl
hydrocarbon chain were generated at 3.92, 2.72 and 2.04 ppm which agrees with the equivalent
hydrogens in compound #9. The signal of the methyl moieties overlapped as it may be seen in
Figure 2.8. Thiomorpholine group was present at 2.66 and 3.33 ppm because there are 2 different
magnetic environments. The signal of pyrrole of the PBD tricyclic moiety was generated at 2.33
ppm as a multiplet. There are several similar magnetic environments but the signals were not strong. 13C NMR was performed for all molecules and it showed all the different carbon
environments (Appendix B, Figure B 3 and Figure B 4).
Figure 2.7: 1NMR signals for the secondary amide and double bond hydrogens of the final de-protected compound (#12), PPA148.
Figure 2.8: 1H-NMR signals for the hydrocarbon chain, methyl moieties, thiomorpholine and the pyrrole group of the PBD tricyclic core of the final compound, PPA148.
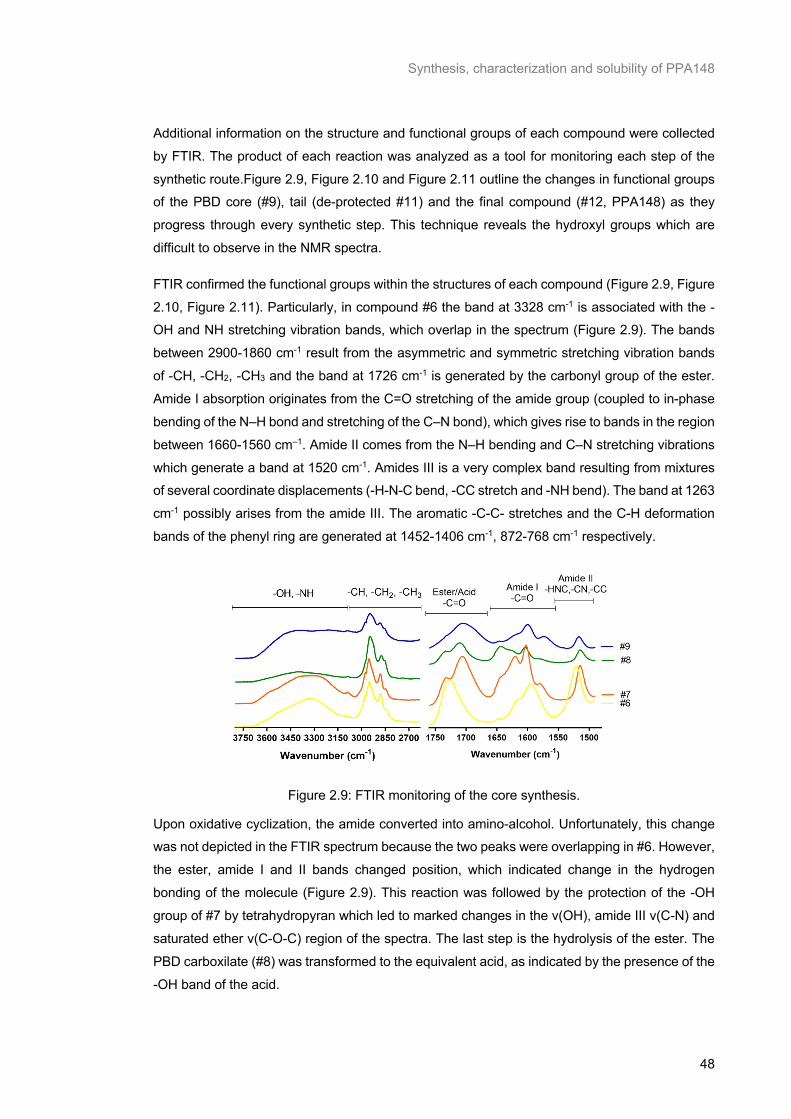
Synthesis, characterization and solubility of PPA148
48
Additional information on the structure and functional groups of each compound were collected
by FTIR. The product of each reaction was analyzed as a tool for monitoring each step of the
synthetic route.Figure 2.9, Figure 2.10 and Figure 2.11 outline the changes in functional groups of the PBD core (#9), tail (de-protected #11) and the final compound (#12, PPA148) as they
progress through every synthetic step. This technique reveals the hydroxyl groups which are
difficult to observe in the NMR spectra.
FTIR confirmed the functional groups within the structures of each compound (Figure 2.9, Figure
2.10, Figure 2.11). Particularly, in compound #6 the band at 3328 cm-1 is associated with the -OH and NH stretching vibration bands, which overlap in the spectrum (Figure 2.9). The bands
between 2900-1860 cm-1 result from the asymmetric and symmetric stretching vibration bands
of -CH, -CH2, -CH3 and the band at 1726 cm-1 is generated by the carbonyl group of the ester.
Amide I absorption originates from the C=O stretching of the amide group (coupled to in-phase
bending of the N–H bond and stretching of the C–N bond), which gives rise to bands in the region
between 1660-1560 cm–1. Amide II comes from the N–H bending and C–N stretching vibrations
which generate a band at 1520 cm-1. Amides III is a very complex band resulting from mixtures of several coordinate displacements (-H-N-C bend, -CC stretch and -NH bend). The band at 1263
cm-1 possibly arises from the amide III. The aromatic -C-C- stretches and the C-H deformation
bands of the phenyl ring are generated at 1452-1406 cm-1, 872-768 cm-1 respectively.
Figure 2.9: FTIR monitoring of the core synthesis.
Upon oxidative cyclization, the amide converted into amino-alcohol. Unfortunately, this change was not depicted in the FTIR spectrum because the two peaks were overlapping in #6. However,
the ester, amide I and II bands changed position, which indicated change in the hydrogen
bonding of the molecule (Figure 2.9). This reaction was followed by the protection of the -OH
group of #7 by tetrahydropyran which led to marked changes in the v(OH), amide III v(C-N) and
saturated ether v(C-O-C) region of the spectra. The last step is the hydrolysis of the ester. The
PBD carboxilate (#8) was transformed to the equivalent acid, as indicated by the presence of the
-OH band of the acid.
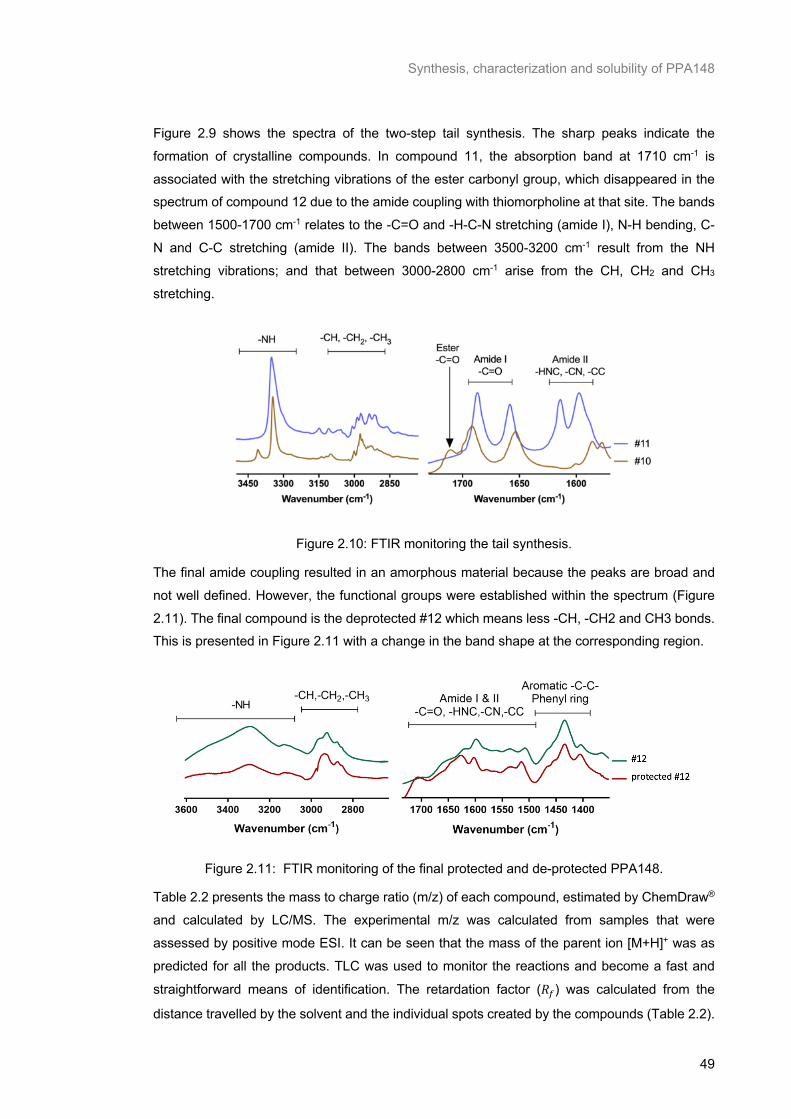
Synthesis, characterization and solubility of PPA148
49
Figure 2.9 shows the spectra of the two-step tail synthesis. The sharp peaks indicate the
formation of crystalline compounds. In compound 11, the absorption band at 1710 cm-1 is
associated with the stretching vibrations of the ester carbonyl group, which disappeared in the spectrum of compound 12 due to the amide coupling with thiomorpholine at that site. The bands
between 1500-1700 cm-1 relates to the -C=O and -H-C-N stretching (amide I), N-H bending, C-
N and C-C stretching (amide II). The bands between 3500-3200 cm-1 result from the NH
stretching vibrations; and that between 3000-2800 cm-1 arise from the CH, CH2 and CH3
stretching.
Figure 2.10: FTIR monitoring the tail synthesis.
The final amide coupling resulted in an amorphous material because the peaks are broad and
not well defined. However, the functional groups were established within the spectrum (Figure
2.11). The final compound is the deprotected #12 which means less -CH, -CH2 and CH3 bonds. This is presented in Figure 2.11 with a change in the band shape at the corresponding region.
Figure 2.11: FTIR monitoring of the final protected and de-protected PPA148.
Table 2.2 presents the mass to charge ratio (m/z) of each compound, estimated by ChemDraw®
and calculated by LC/MS. The experimental m/z was calculated from samples that were
assessed by positive mode ESI. It can be seen that the mass of the parent ion [M+H]+ was as
predicted for all the products. TLC was used to monitor the reactions and become a fast and
straightforward means of identification. The retardation factor (𝑅F) was calculated from the
distance travelled by the solvent and the individual spots created by the compounds (Table 2.2).
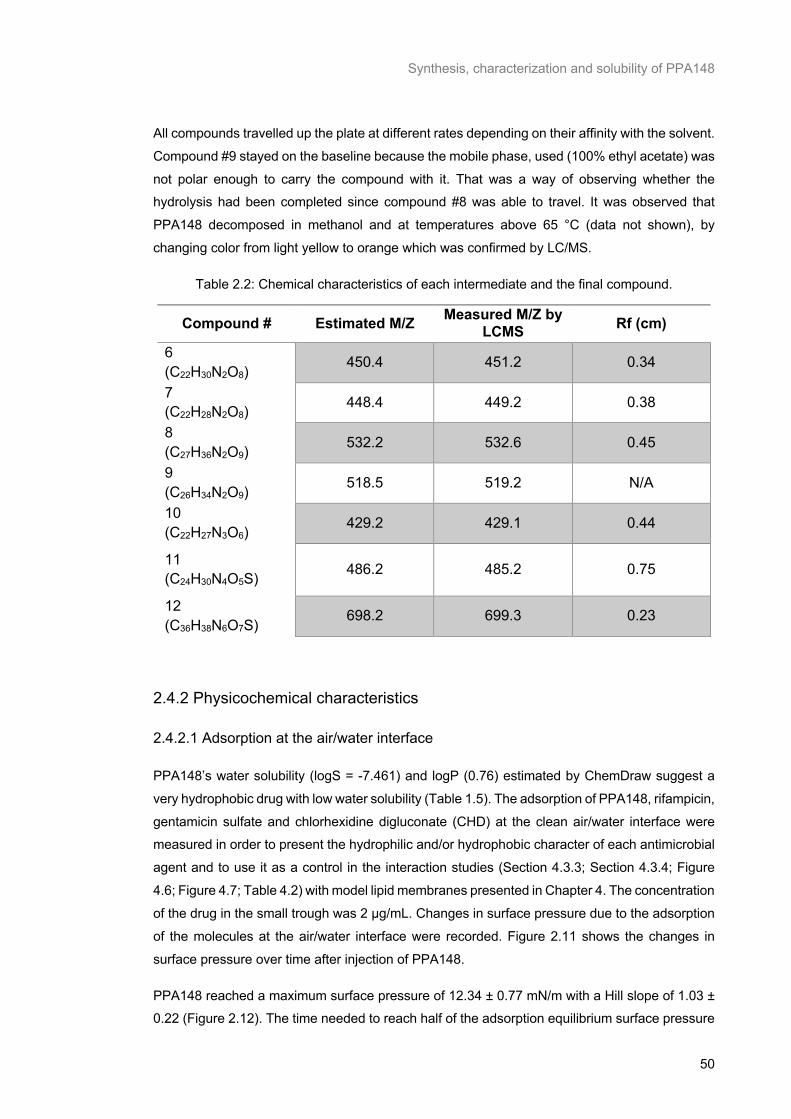
Synthesis, characterization and solubility of PPA148
50
All compounds travelled up the plate at different rates depending on their affinity with the solvent.
Compound #9 stayed on the baseline because the mobile phase, used (100% ethyl acetate) was
not polar enough to carry the compound with it. That was a way of observing whether the hydrolysis had been completed since compound #8 was able to travel. It was observed that
PPA148 decomposed in methanol and at temperatures above 65 °C (data not shown), by
changing color from light yellow to orange which was confirmed by LC/MS.
Table 2.2: Chemical characteristics of each intermediate and the final compound.
Compound # Estimated M/Z Measured M/Z by LCMS Rf (cm)
6 (C22H30N2O8)
450.4 451.2 0.34
7 (C22H28N2O8)
448.4 449.2 0.38
8 (C27H36N2O9)
532.2 532.6 0.45
9 (C26H34N2O9)
518.5 519.2 N/A
10 (C22H27N3O6)
429.2 429.1 0.44
11 (C24H30N4O5S) 486.2 485.2 0.75
12 (C36H38N6O7S) 698.2 699.3 0.23
2.4.2 Physicochemical characteristics
2.4.2.1 Adsorption at the air/water interface
PPA148’s water solubility (logS = -7.461) and logP (0.76) estimated by ChemDraw suggest a
very hydrophobic drug with low water solubility (Table 1.5). The adsorption of PPA148, rifampicin,
gentamicin sulfate and chlorhexidine digluconate (CHD) at the clean air/water interface were measured in order to present the hydrophilic and/or hydrophobic character of each antimicrobial
agent and to use it as a control in the interaction studies (Section 4.3.3; Section 4.3.4; Figure
4.6; Figure 4.7; Table 4.2) with model lipid membranes presented in Chapter 4. The concentration
of the drug in the small trough was 2 μg/mL. Changes in surface pressure due to the adsorption
of the molecules at the air/water interface were recorded. Figure 2.11 shows the changes in
surface pressure over time after injection of PPA148.
PPA148 reached a maximum surface pressure of 12.34 ± 0.77 mN/m with a Hill slope of 1.03 ± 0.22 (Figure 2.12). The time needed to reach half of the adsorption equilibrium surface pressure
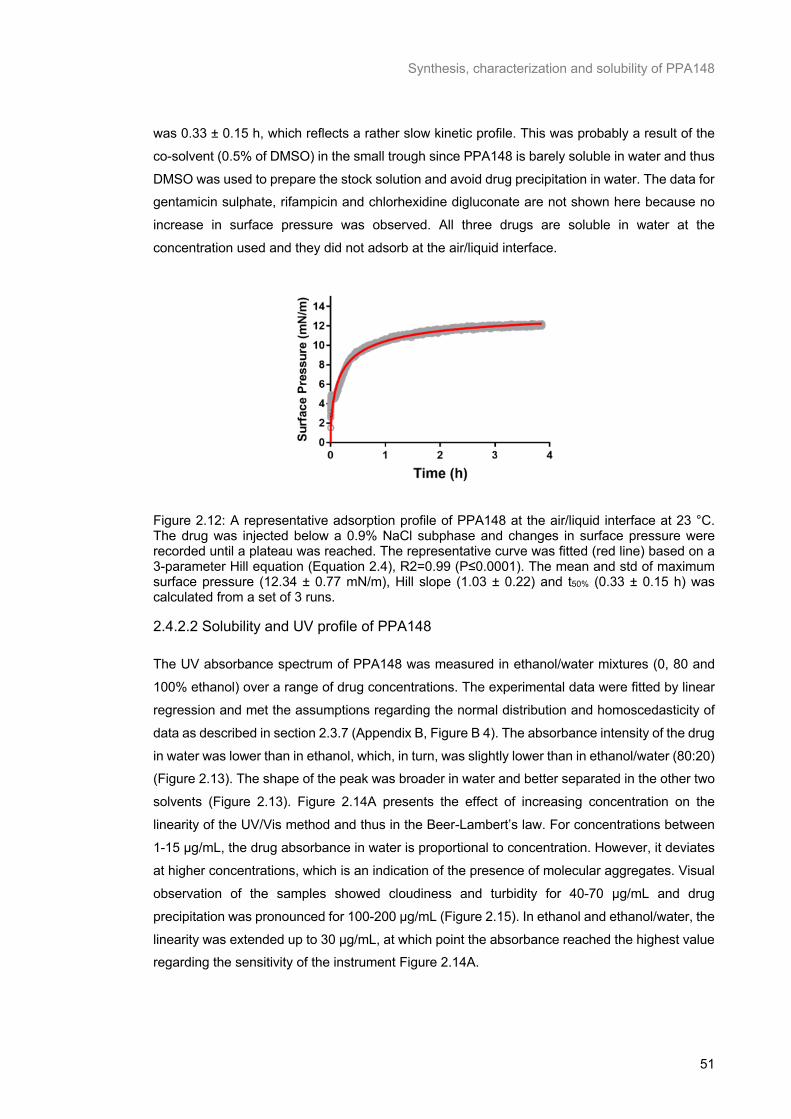
Synthesis, characterization and solubility of PPA148
51
was 0.33 ± 0.15 h, which reflects a rather slow kinetic profile. This was probably a result of the
co-solvent (0.5% of DMSO) in the small trough since PPA148 is barely soluble in water and thus
DMSO was used to prepare the stock solution and avoid drug precipitation in water. The data for gentamicin sulphate, rifampicin and chlorhexidine digluconate are not shown here because no
increase in surface pressure was observed. All three drugs are soluble in water at the
concentration used and they did not adsorb at the air/liquid interface.
Figure 2.12: A representative adsorption profile of PPA148 at the air/liquid interface at 23 °C. The drug was injected below a 0.9% NaCl subphase and changes in surface pressure were recorded until a plateau was reached. The representative curve was fitted (red line) based on a 3-parameter Hill equation (Equation 2.4), R2=0.99 (P≤0.0001). The mean and std of maximum surface pressure (12.34 ± 0.77 mN/m), Hill slope (1.03 ± 0.22) and t50% (0.33 ± 0.15 h) was calculated from a set of 3 runs.
2.4.2.2 Solubility and UV profile of PPA148
The UV absorbance spectrum of PPA148 was measured in ethanol/water mixtures (0, 80 and
100% ethanol) over a range of drug concentrations. The experimental data were fitted by linear
regression and met the assumptions regarding the normal distribution and homoscedasticity of
data as described in section 2.3.7 (Appendix B, Figure B 4). The absorbance intensity of the drug
in water was lower than in ethanol, which, in turn, was slightly lower than in ethanol/water (80:20) (Figure 2.13). The shape of the peak was broader in water and better separated in the other two
solvents (Figure 2.13). Figure 2.14A presents the effect of increasing concentration on the
linearity of the UV/Vis method and thus in the Beer-Lambert’s law. For concentrations between
1-15 µg/mL, the drug absorbance in water is proportional to concentration. However, it deviates
at higher concentrations, which is an indication of the presence of molecular aggregates. Visual
observation of the samples showed cloudiness and turbidity for 40-70 µg/mL and drug
precipitation was pronounced for 100-200 µg/mL (Figure 2.15). In ethanol and ethanol/water, the
linearity was extended up to 30 µg/mL, at which point the absorbance reached the highest value regarding the sensitivity of the instrument Figure 2.14A.
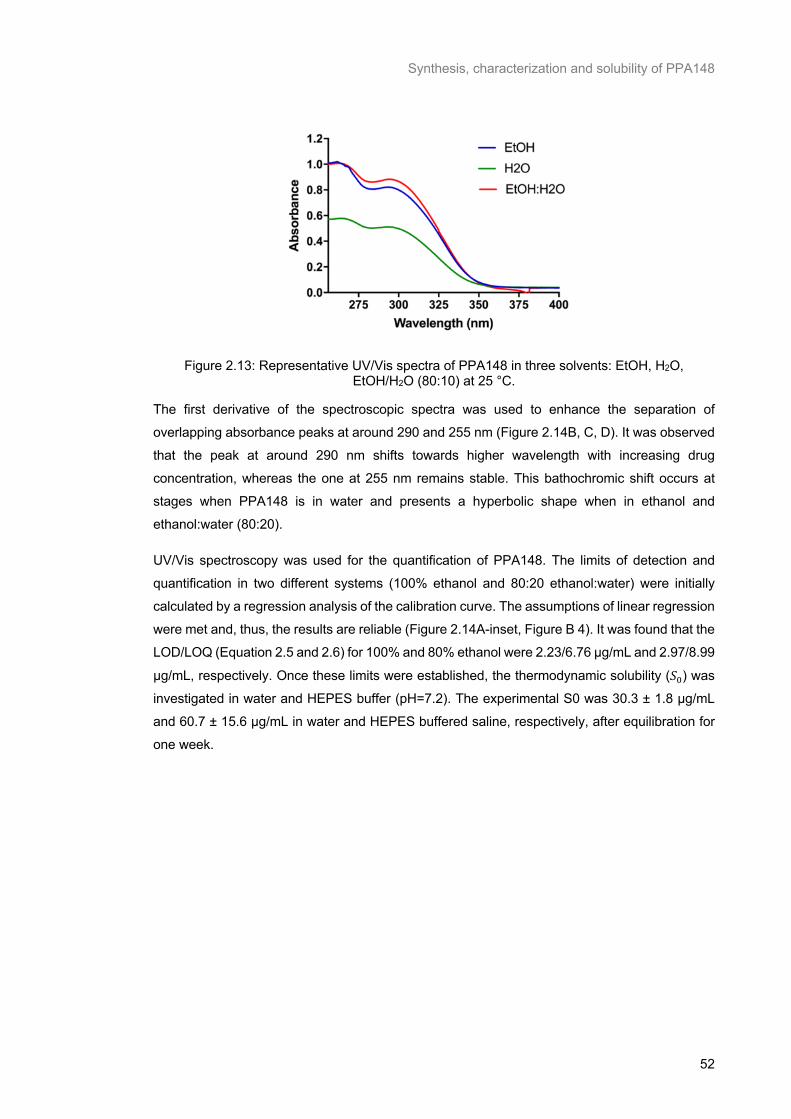
Synthesis, characterization and solubility of PPA148
52
Figure 2.13: Representative UV/Vis spectra of PPA148 in three solvents: EtOH, H2O, EtOH/H2O (80:10) at 25 °C.
The first derivative of the spectroscopic spectra was used to enhance the separation of
overlapping absorbance peaks at around 290 and 255 nm (Figure 2.14B, C, D). It was observed
that the peak at around 290 nm shifts towards higher wavelength with increasing drug
concentration, whereas the one at 255 nm remains stable. This bathochromic shift occurs at
stages when PPA148 is in water and presents a hyperbolic shape when in ethanol and
ethanol:water (80:20).
UV/Vis spectroscopy was used for the quantification of PPA148. The limits of detection and
quantification in two different systems (100% ethanol and 80:20 ethanol:water) were initially
calculated by a regression analysis of the calibration curve. The assumptions of linear regression
were met and, thus, the results are reliable (Figure 2.14A-inset, Figure B 4). It was found that the
LOD/LOQ (Equation 2.5 and 2.6) for 100% and 80% ethanol were 2.23/6.76 µg/mL and 2.97/8.99
µg/mL, respectively. Once these limits were established, the thermodynamic solubility (𝑆w) was
investigated in water and HEPES buffer (pH=7.2). The experimental S0 was 30.3 ± 1.8 µg/mL
and 60.7 ± 15.6 μg/mL in water and HEPES buffered saline, respectively, after equilibration for
one week.
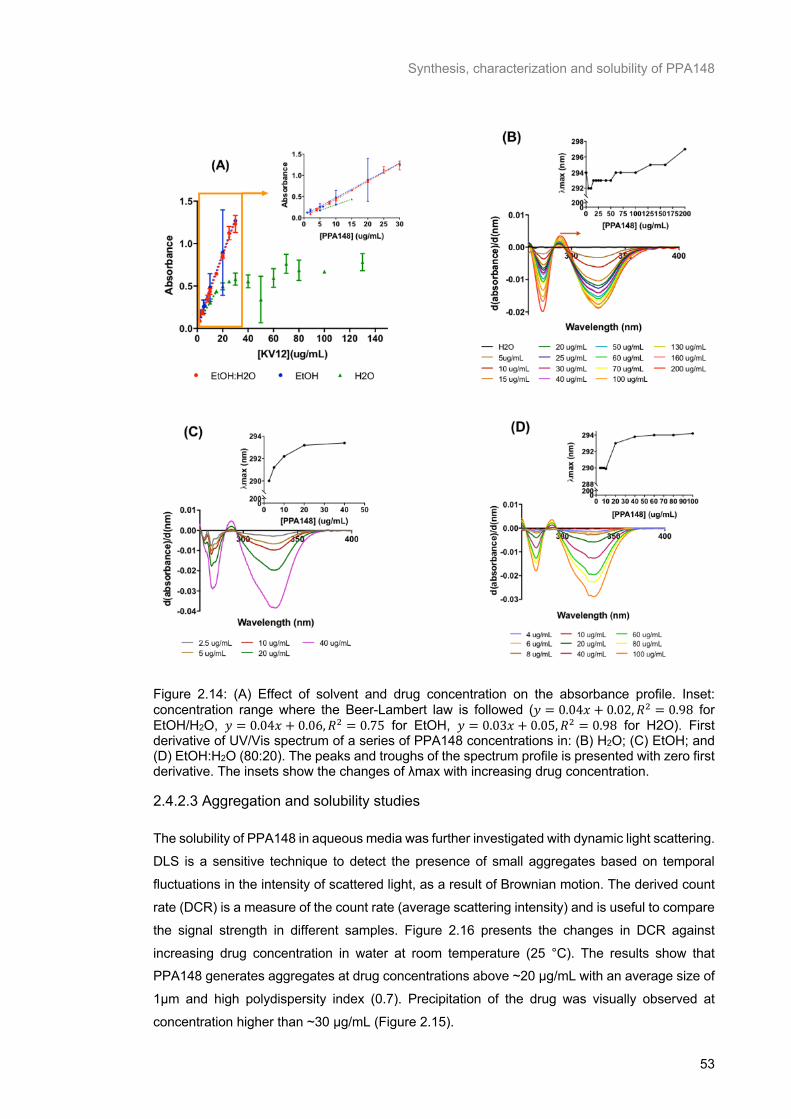
Synthesis, characterization and solubility of PPA148
53
Figure 2.14: (A) Effect of solvent and drug concentration on the absorbance profile. Inset: concentration range where the Beer-Lambert law is followed (𝑦 = 0.04𝑥 + 0.02, 𝑅@ = 0.98 for EtOH/H2O, 𝑦 = 0.04𝑥 + 0.06, 𝑅@ = 0.75 for EtOH, 𝑦 = 0.03𝑥 + 0.05, 𝑅@ = 0.98 for H2O). First derivative of UV/Vis spectrum of a series of PPA148 concentrations in: (B) H2O; (C) EtOH; and (D) EtOH:H2O (80:20). The peaks and troughs of the spectrum profile is presented with zero first derivative. The insets show the changes of λmax with increasing drug concentration.
2.4.2.3 Aggregation and solubility studies
The solubility of PPA148 in aqueous media was further investigated with dynamic light scattering.
DLS is a sensitive technique to detect the presence of small aggregates based on temporal
fluctuations in the intensity of scattered light, as a result of Brownian motion. The derived count
rate (DCR) is a measure of the count rate (average scattering intensity) and is useful to compare
the signal strength in different samples. Figure 2.16 presents the changes in DCR against
increasing drug concentration in water at room temperature (25 °C). The results show that PPA148 generates aggregates at drug concentrations above ~20 μg/mL with an average size of
1µm and high polydispersity index (0.7). Precipitation of the drug was visually observed at
concentration higher than ~30 μg/mL (Figure 2.15).
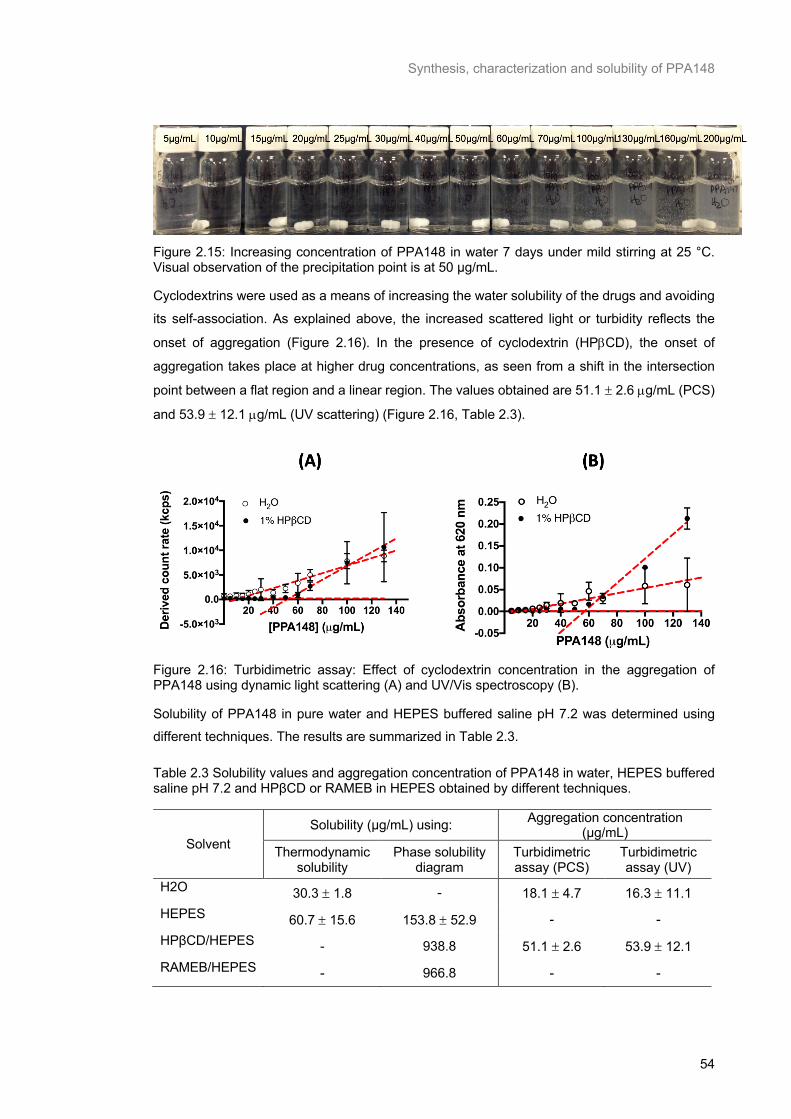
Synthesis, characterization and solubility of PPA148
54
Figure 2.15: Increasing concentration of PPA148 in water 7 days under mild stirring at 25 °C. Visual observation of the precipitation point is at 50 μg/mL.
Cyclodextrins were used as a means of increasing the water solubility of the drugs and avoiding
its self-association. As explained above, the increased scattered light or turbidity reflects the
onset of aggregation (Figure 2.16). In the presence of cyclodextrin (HPbCD), the onset of
aggregation takes place at higher drug concentrations, as seen from a shift in the intersection
point between a flat region and a linear region. The values obtained are 51.1 ± 2.6 µg/mL (PCS)
and 53.9 ± 12.1 µg/mL (UV scattering) (Figure 2.16, Table 2.3).
Figure 2.16: Turbidimetric assay: Effect of cyclodextrin concentration in the aggregation of PPA148 using dynamic light scattering (A) and UV/Vis spectroscopy (B).
Solubility of PPA148 in pure water and HEPES buffered saline pH 7.2 was determined using different techniques. The results are summarized in Table 2.3.
Table 2.3 Solubility values and aggregation concentration of PPA148 in water, HEPES buffered saline pH 7.2 and HPβCD or RAMEB in HEPES obtained by different techniques.
Solvent Solubility (µg/mL) using: Aggregation concentration
(µg/mL) Thermodynamic
solubility Phase solubility
diagram Turbidimetric assay (PCS)
Turbidimetric assay (UV)
H2O 30.3 ± 1.8 - 18.1 ± 4.7 16.3 ± 11.1 HEPES 60.7 ± 15.6 153.8 ± 52.9 - - HPβCD/HEPES - 938.8 51.1 ± 2.6 53.9 ± 12.1 RAMEB/HEPES - 966.8 - -

Synthesis, characterization and solubility of PPA148
55
2.4.2.4 Drug/Cyclodextrin inclusion complex formation: binding constant
The formation of an inclusion complex between CD and drug was examined by two methods: binding constant determination by fluorescence spectroscopy (161) (section 2.3.10) and phase
solubility diagram (section 2.3.11) (147). Rifampicin was used as a positive control to evaluate
and establish the method because it is known to form an inclusion complex with CDs (158,162–
164). With the spectroscopic method, the binding of the drug to the CD is reflected by a hyperbolic
function in UV absorbance as the concentration of CD is increased while the total drug
concentration is held constant. The addition of increasing cyclodextrin (either RAMEB or HPβCD)
from 0 to 30 % w/v to a fixed concentration of 10 µg/mL PPA148 and 50 µg/mL rifampicin produces a hyperchromic effect (Figure 2.17, Figure 2.18) reflecting an interaction between the
drug and HPβCD or RAMEB. For both types of cyclodextrin, a good fit (Equation 2.7) of the
experimental data was obtained by assuming a 1:1 stoichiometry. Higher affinity of PPA148 to
RAMEB (102 ± 26 M-1) over HPβCD (63 ± 20 M-1) could be attributed to the different
hydrophobicity of the methylated and hydroxypropyl substitutions. The data were fitted using a
1:2 PPA148:CD complex (data not shown) but the root mean squared error between the
experimental and the fitted data was better when a 1:1 complex was assumed, which illustrated
a better fitting. The binding constants of rifampicin to RAMEB and HPβCD at 50 mM Tris buffer pH 9 were found to be 38 ± 9 M-1 and 22 ± 2 M-1 (Figure 2.18) respectively, which are lower than
values from the literature, namely, 73.4 ± 8.2 M-1 and 68.5 ± 5.2 M-1 for RAMEB and HPβCD,
respectively in sodium tetraborate buffer, pH 9 (162). A much higher binding constant (209.0 M-
1) was found for HPβCD at pH 6 (164) and with DIMEB at PBS buffer pH 5.7 (300 M-1) (158).
Chadha et al. obtained the binding constant using solution calorimetry and the reported values
are 1564 ± 8 M-1 for RAMEB and 1038 ± 11 M-1 for HPβCD in PBS (163). The difference in the
binding constants may be the different methods used and buffer used during the experiment.
Figure 2.17: Changes in the fluorescence intensity of PPA148 with increasing cyclodextrin concentration (HPβCD or RAMEB) at 25 ˚C (A). The lines represent the non-linear regression fit (Equation 2.7) of the experimental data points assuming a 1:1 complex. The phase solubility diagram (B) was built by adding an excess of drug to solutions of cyclodextrin to measure drug
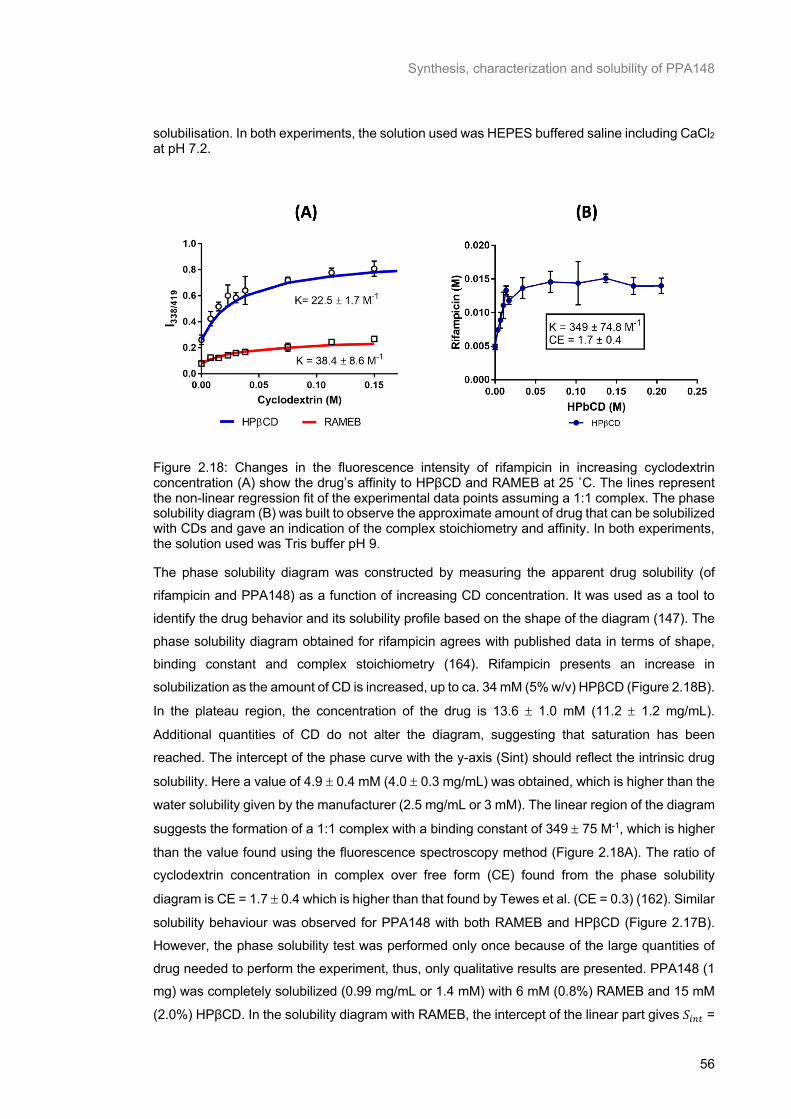
Synthesis, characterization and solubility of PPA148
56
solubilisation. In both experiments, the solution used was HEPES buffered saline including CaCl2 at pH 7.2.
Figure 2.18: Changes in the fluorescence intensity of rifampicin in increasing cyclodextrin concentration (A) show the drug’s affinity to HPβCD and RAMEB at 25 ˚C. The lines represent the non-linear regression fit of the experimental data points assuming a 1:1 complex. The phase solubility diagram (B) was built to observe the approximate amount of drug that can be solubilized with CDs and gave an indication of the complex stoichiometry and affinity. In both experiments, the solution used was Tris buffer pH 9.
The phase solubility diagram was constructed by measuring the apparent drug solubility (of
rifampicin and PPA148) as a function of increasing CD concentration. It was used as a tool to
identify the drug behavior and its solubility profile based on the shape of the diagram (147). The
phase solubility diagram obtained for rifampicin agrees with published data in terms of shape, binding constant and complex stoichiometry (164). Rifampicin presents an increase in
solubilization as the amount of CD is increased, up to ca. 34 mM (5% w/v) HPβCD (Figure 2.18B).
In the plateau region, the concentration of the drug is 13.6 ± 1.0 mM (11.2 ± 1.2 mg/mL).
Additional quantities of CD do not alter the diagram, suggesting that saturation has been
reached. The intercept of the phase curve with the y-axis (Sint) should reflect the intrinsic drug
solubility. Here a value of 4.9 ± 0.4 mM (4.0 ± 0.3 mg/mL) was obtained, which is higher than the
water solubility given by the manufacturer (2.5 mg/mL or 3 mM). The linear region of the diagram
suggests the formation of a 1:1 complex with a binding constant of 349 ± 75 M-1, which is higher
than the value found using the fluorescence spectroscopy method (Figure 2.18A). The ratio of cyclodextrin concentration in complex over free form (CE) found from the phase solubility
diagram is CE = 1.7 ± 0.4 which is higher than that found by Tewes et al. (CE = 0.3) (162). Similar
solubility behaviour was observed for PPA148 with both RAMEB and HPβCD (Figure 2.17B).
However, the phase solubility test was performed only once because of the large quantities of
drug needed to perform the experiment, thus, only qualitative results are presented. PPA148 (1 mg) was completely solubilized (0.99 mg/mL or 1.4 mM) with 6 mM (0.8%) RAMEB and 15 mM
(2.0%) HPβCD. In the solubility diagram with RAMEB, the intercept of the linear part gives 𝑆HIL =
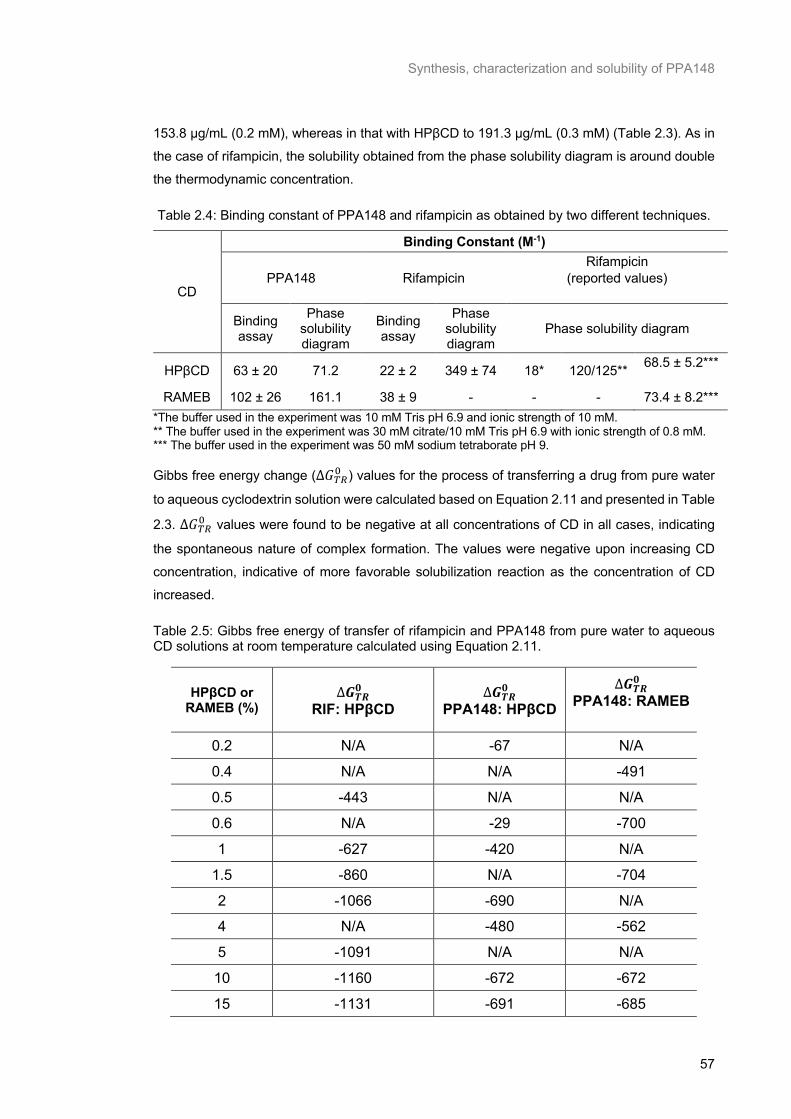
Synthesis, characterization and solubility of PPA148
57
153.8 µg/mL (0.2 mM), whereas in that with HPβCD to 191.3 µg/mL (0.3 mM) (Table 2.3). As in
the case of rifampicin, the solubility obtained from the phase solubility diagram is around double
the thermodynamic concentration.
Table 2.4: Binding constant of PPA148 and rifampicin as obtained by two different techniques.
CD
Binding Constant (M-1)
PPA148 Rifampicin Rifampicin
(reported values)
Binding assay
Phase solubility diagram
Binding assay
Phase solubility diagram
Phase solubility diagram
HPβCD 63 ± 20 71.2 22 ± 2 349 ± 74 18* 120/125** 68.5 ± 5.2***
RAMEB 102 ± 26 161.1 38 ± 9 - - - 73.4 ± 8.2*** *The buffer used in the experiment was 10 mM Tris pH 6.9 and ionic strength of 10 mM. ** The buffer used in the experiment was 30 mM citrate/10 mM Tris pH 6.9 with ionic strength of 0.8 mM. *** The buffer used in the experiment was 50 mM sodium tetraborate pH 9.
Gibbs free energy change (∆𝐺��w ) values for the process of transferring a drug from pure water
to aqueous cyclodextrin solution were calculated based on Equation 2.11 and presented in Table
2.3. ∆𝐺��w values were found to be negative at all concentrations of CD in all cases, indicating
the spontaneous nature of complex formation. The values were negative upon increasing CD
concentration, indicative of more favorable solubilization reaction as the concentration of CD
increased.
Table 2.5: Gibbs free energy of transfer of rifampicin and PPA148 from pure water to aqueous CD solutions at room temperature calculated using Equation 2.11.
HPβCD or RAMEB (%)
∆𝑮𝑻𝑹𝟎 RIF: HPβCD
∆𝑮𝑻𝑹𝟎 PPA148: HPβCD
∆𝑮𝑻𝑹𝟎 PPA148: RAMEB
0.2 N/A -67 N/A
0.4 N/A N/A -491
0.5 -443 N/A N/A
0.6 N/A -29 -700
1 -627 -420 N/A
1.5 -860 N/A -704
2 -1066 -690 N/A
4 N/A -480 -562
5 -1091 N/A N/A
10 -1160 -672 -672
15 -1131 -691 -685

Synthesis, characterization and solubility of PPA148
58
2.4.2.5 Stoichiometry of drug/CD complexes
The stoichiometry of the complex was examined using the Job’s plot method from NMR data (section 2.3.12, Figure 2.19). The normalized NMR signal is plotted against the mole fraction of
one reactant (molar fraction of cyclodextrin in this case), while the total reactant concentration is
kept constant (1 mM). Figure 2.19 presents changes in protons at position 1 (external) and 5
(internal) in a series of cyclodextrin molar fraction for rifampicin and PPA148, respectively. The
Job’s plot of H1 for rifampicin and DIMEB reflects the formation of a 1:1 inclusion complex, with
a maximum at XCD=0.5. This stoichiometry is in agreement with published data (158).
Figure 2.19: Job’s plot for rifampicin/DIMEB (A) and PPA148/DIMEB (B) complexes. In the case of rifampicin, the normalized chemical shift (Δδ*XCD) of the H1 protons of DIMEB were plotted against the molar fraction of DIMEB (XCD). For, PPA148, protons at position 5 of the cyclodextrin structure.
In order to build a Job’s plot, PPA148 was used at very low concentration (20 µg/mL, or 0.03
mM) because of its poor solubility in water (Table 2.3). The spectra were noisier, due to the low
concentration, but the chemical shift of H5 shows a skewed Job’s plot with a maximum around
XCD=0.6, thus revealing a dominating 1:2 PPA148/DIMEB complex, namely, the drug is
encapsulated by two cyclodextrins in two different positions.
2.5 Discussion
A novel biaryl pyrrolobenzodiazepine (PBD) hybrid analogue, PPA148, was successfully
synthesized based on the reported synthetic route (107). Specifically, a convergent synthetic
strategy was used, based on the separate synthesis of the PBD tricyclic scaffold (core) and the
lateral polyamidic tail. The two constituents of the final core and tail molecules were coupled to
give the final PPA148 with 82% yield and 78.1% relative purity. Based on the ICH guidelines, the
purity of new compounds should be calculated based on an analytical standard (165). Here, the
purity was calculated based on PPA148’s peak areas as a percentage of all other peak areas in the LC/MS chromatograms because there was no analytical standard. The drawback of this
approach is that any non-UV active impurities present in the sample are not detected.
Synthesis, characterization and solubility of PPA148
59
Affinity for the air/water interface, a measure of amphiphilicity, was investigated at the molecular
level using the Langmuir trough technique (Figure 2.12). PPA148 adsorbed at the air-water
interface and reached a surface pressure of 12.3 ± 0.7 mN/m. It was expected that the adsorption
would be instantaneous because of the properties estimated by ChemDraw (logP = 0.76 and
logS = -7.461). However, PPA148 reached half of the maximum pressure within 20 min and from
that point it took another 2 h to reach the final maximum. This slow kinetic profile can be explained
by two possible transport-limiting steps. The drug was injected below the air/water interface
under mild stirring in order to mix the drug with the subphase. The initial adsorption was delayed due to the diffusion of the co-solvent (0.5% DMSO) in the aqueous subphase of the trough.
DMSO is miscible with water and forms strong hydrogen bonding interactions with 3 water
molecules (166). It was introduced into the aqueous system as a solvent for the drug via injection
which possibly affected the kinetic profile of the drug absorption process (167). The second stage
was due to the saturated surface after 40 min (Figure 2.11). In the early stages of adsorption, i.e.
after drug injection, the surface is relatively empty and molecules adhere as fast as they reach
the surface. However, as the surface gets saturated by drug molecules, the diffusion at the
interface might be slowed down before the pseudo-steady equilibrium is reached (168).
PPA148 is a hydrophobic antibiotic with low water solubility. It presented a water solubility of 30.3
± 1.8 µg/mL and aggregation occurred at concentrations above 18 µg/mL (Table 2.3).
Sedimentation arose by attraction forces between drug molecules and repulsion forces between
drug and water, which are responsible for low-concentration agglomeration, possibly leading to
drug sedimentation at around 50 μg/mL (Figure 2.15). (169). In addition, the fact that the
absorption intensity of PPA148 decreased with increasing water content in the EtOH/H2O
mixture (Figure 2.13) and in 100% water deviated from linearity with increasing amount of drug
(Figure 2.14A and Figure 2.16) indicated the formation of agglomerates/aggregates. The
thermodynamic water solubility (30.3 ± 1.8 µg/mL) was higher than the aggregation concentration
(Table 2.3), which implies the presence of both monomers and small aggregates (169). The
aggregates were not optically visible at 30 µg/mL which implies that the aggregates might have
been dimers, trimers or other water-soluble oligomers whose size is below the visible light
wavelength range (400-700 nm) (110,155).
Drug aggregation can have a negative impact on antimicrobials, because their bioavailability is
reduced and less substance is available to interact with microorganisms (170). Cyclodextrins
were successfully used to improve the solubility of the drug through inclusion complex formation.
RAMEB and HPβCD were shown to solubilize PPA148 up to approximately 50 µg/mL in HEPES
buffered saline pH 7.2 (Table 2.3) in HEPES buffered saline (pH 7.2) by delaying the formation
of aggregates. Rifampicin and PPA148 possess hydrophobic moieties (Figure 1.9, Figure 2.2)
capable of entering the apolar CD cavity through inclusion complex formation (171). One of the aims of this project was to avoid the formation of aggregates and improve drug water solubility
by forming cyclodextrin inclusion complexes, as a way to improve bioavailability and as a first
Synthesis, characterization and solubility of PPA148
60
step in the formulation, which would then involve encapsulation in liposomes (Chapter 3).
Rifampicin, an antimicrobial agent that would benefit from an optimized formulation, was used as
a control drug because it is hydrophobic and is known to form complexes with cyclodextrins (162). The data obtained from fluorescence spectroscopy was fitted by a 1:1 binding constant
both for rifampicin and PPA148 with RAMEB and HPβCD. Based on the calculated binding
constant for a 1:1 complex from the fluorescence intensity, PPA148 present a higher affinity for
RAMEB (102 ± 26 M-1) than HPβCD (63.3 ± 20.3 M-1) (Figure 2.17A, Table 2.4). The method
based on phase solubility showed a lower value for the PPA148/RAMEB complex (161.1 M-1) but a similar value for PPA148/HPβCD (71.2 M-1) (Figure 2.17B, Table 2.4). In the spectroscopic
method, the total drug concentration is kept constant at a low value but the free (soluble) drug
decreases due to inclusion into the CD cavity, up to a plateau value. Instead, in the phase
solubility diagram, an excess of drug is added, which is solubilized by increasing amounts of
cyclodextrin (73). In contrast to the binding constant and phase solubility methods, NMR (Job’s
plot) showed that a 2:1 PPA148/DIMEB complex was formed. Both the phase solubility diagram
and fluorescence spectroscopy illustrated higher affinity for both drugs towards the randomly
methylated cyclodextrin (RAMEB). This is also observed for rifampicin (162,163) and hemisuccinate ester, prodrug of Δ9-Tetrahydrocannabinol, (172). The methylation of βCD
creates a more hydrophobic environment and enhances molecular flexibility, which allows an
increased adaptability of the cyclodextrin towards the guest molecule (163).
Although the findings on the complex stoichiometry for rifampicin agree with the literature, the
binding constant values differ slightly from previous reports (158,162,164). Rifampicin has three ionization states (Figure 1.9) with a maximum water solubility at pH between 6-9 because the
predominant state is anionic. In this study, the binding constant between rifampicin and
cyclodextrin was determined at pH = 9 using two methods, a phase solubility diagram and the
shift in fluorescence intensity, with slightly different results (Table 2.4). The binding constants for
rifampicin with RAMEB or HPβCD reported in the literature vary between 500 and 5000 M-1
depending on the pH, temperature, buffer solution and calculation method. The binding constant
K for a 1:1 rifampicin/HPβCD complex calculated from the phase solubility study was 349.4 ±
74.8 M-1 and it approaches the value reported by He et al. (164) (227.3 M-1). However, the binding
constant determination by fluorescence spectroscopy (assuming a 1:1 complex) resulted in lower
K values (22.5 ± 1.7 M-1 for HPβCD and 38.4 ± 8.6 M-1 for RAMEB in Tris buffer pH 9), compared
to those found by the phase solubility diagram under the same experimental conditions, and to
those published by Tewes et al. (68.5 ± 5.2 M-1 for HPβCD and 73.4 ± 8.2 M-1 for RAMEB in
sodium tetraborate pH 9) (162). Overall, the interaction with RAMEB was stronger compared to
HPβCD, which is in agreement with Chadha et al., who found binding constants of 1038 and
1564 M-1 using solution calorimetry (163). Job’s plot actually showed that a 1:1 rifampicin/DIMEB
complex was formed, which confirms the binding constant and phase solubility assumption of the calculations. It has been reported that it is the piperazine moiety of rifampicin that inserts into the

Synthesis, characterization and solubility of PPA148
61
CD cavity with both types of CD used in this study (Figure 2.20). This postulated structure of
rifampicin/CD complex is established by using 1H and 13C-NMR and 15N-NMR (173).
Figure 2.20: Schematic representation of rifampicin/CD inclusion complex as it was found by molecular simulation by He et al. and Tewes et al. (162,164).
Another measure of solubilizing efficiency is to determine the molar concentration ratio of
cyclodextrin in a complexed form to the free cyclodextrin; this is referred to as complexation efficiency (CE). According to Loftsson and Brewster (155), CE is a better measure of efficiency
because it is less sensitive to errors related to the estimation of the intrinsic solubility. The
aggregation of highly hydrophobic drugs in aqueous solutions may affect the slope obtained in
the phase solubility diagram and may cause deviations in the value of the y-intercept (𝑆HIL) from
𝑆w, leading to possible inaccuracies and over-estimation of the binding constant (73). The CE
calculated for rifampicin was 1.8 at pH 9 (Figure 2.18B) which is higher than values cited in the literature using the same method at pH 9 (0.347) (174). This means that one in two cyclodextrin
molecules are forming a water-soluble complex with rifampicin, compared to the cited one in four.
The values of CE for PPA148/HPβCD and PPA148/RAMEB were found to be 0.05 and 0.1,
respectively (Figure 2.17B). CE is correlated with drug hydrophobicity and S0 (155). Hydrophobic
drugs with S0 higher than 0.01 mg/mL possess a high CE (175). For example, it has been found
than clotrimazole (𝑆w = 0.037 mg/mL) has a CE of 0.05 with HPβCD in water, hydrocortizone (𝑆w
= 0.4 mg/mL) has a CE of 1.3 with HPβCD at pH 7 and fluoxetine HCl (𝑆w = 12.6 mg/mL) has a
CE of 4.7 at pH 3.6 (175).
The driving force for complex formation is a combination of electrostatic interactions, van der
Waals forces, hydrogen bonding and charge-transfer interactions (146,175,176). The binding
process can be separated into 3 steps (146). The first step is the exclusion of cavity-bound high
energy water molecules into the gas phase, accompanied by changes in CD conformation energy. The second is the solvent (water) rearrangement and transformation of the excluded
Synthesis, characterization and solubility of PPA148
62
gaseous water molecules into a liquid phase which is accompanied with a negative enthalpy and
entropy change. The third step is the fit of the hydrophobic guest molecule into the nonpolar CD
cavity accompanied by host-guest intermolecular interactions and a change in the conformation energy of the host (176). Therefore, van der Waals forces and hydrophobic interactions constitute
the basic driving force for complex formation and hydrogen bonding, and electrostatic interaction
can affect the conformation of complexes (146).
The estimated Gibbs free energy of transfer for both rifampicin and PPA148 were negative,
indicating that the complexation is spontaneous, as expected. The interaction of both drugs with RAMEB were found to be sterically favored compared to other CDs, because the methyl
substitution creates a more hydrophobic microenvironment compared to the hydroxypropyl
substitution (163).
2.6 Conclusion
The novel antimicrobial agent was successfully synthesized and characterized. It was found that
PPA148 is barely soluble in water (30.3 ± 1.8 µg/mL) and self-associates when dispersed in an
aqueous environment above its water solubility level. To enhance water solubility and avoid
aggregation, cyclodextrins (RAMEB and HPβCD) were used to form an inclusion complex with
PPA148. Water solubility increased 6-fold through the incorporation of PPA148 into
cyclodextrin’s cavity and a higher affinity was obtained with RAMEB compared to HPβCD.
Enhancing water solubility was the first step towards developing a formulation for PPA148 to
enhance its antibacterial efficacy against Gram negative bacteria. The next two chapters focus
on incorporating the PPA148/RAMEB complex into fluid liposomes (fluidosomes) to improve its antibacterial activity and drug uptake, which are assessed using biophysical approaches.
Liposomaly encapsulated drug/cyclodextrin inclusion complexes
63
Chapter 3 Liposomaly
encapsulated drug/cyclodextrin
inclusion complexes
Liposomaly encapsulated drug/cyclodextrin inclusion complexes
64
3.1 Introduction
The development of new antimicrobial agents and the understanding of their mechanism of
action is a pressing need because of the widespread proliferation of drug resistance, especially
in Gram-negative bacteria, the most common cause of nosocomial infections in Europe and USA
(177,178). Antimicrobials are losing their effectiveness at an increasing rate, resulting in growing
difficulty in treating bacterial infections. The World Health Organization (WHO) has developed the global priority pathogen list, which includes critical, high and medium risk pathogens for public
health (Table 1.2) (44). Among the critical and high-risk pathogens are Enterococcus faecium,
Staphylococcus aureus, Klebsiella pneumoniae, Acinetobacter baumannii, Pseudomonas
aeruginosa and Enterobacter spp, also known as the ESKAPE pathogens, which cause hospital
acquired infections (57). In the same report in 2017 (57), the WHO stated the need to support
R&D, and furthermore, discover and develop new antibiotics against multi- and extensively drug-
resistant Gram negative bacteria.
The objective of this work was to develop a suitable carrier to increase drug uptake and drug
efficacy against Gram negative bacteria. This chapter describes our attempt at developing and
characterizing a formulation for the newly discovered antimicrobial PPA148, combining
cyclodextrins and liposomes, based on their respective characteristics which were considered
advantageous to achieve criteria of improved efficacy and higher solubility. The rationale behind
this formulation is that the liposomal carrier (fluidosomes) will enhance the permeation of PPA148 through the Gram negative OM, while cyclodextrins enhance its water solubility and permeation
through the IM.
Fluidosomes are fluid liposomes composed of DPPC/DMPG (18/1), which are characterized by
their ability to fuse into lipid membranes (179). Beaulac and co-workers were the first to evaluate
the efficacy of tobramycin encapsulated into several types of liposomes against Pseudomonas aeruginosa (102,103). Their results showed antibacterial efficacy of the encapsulated
tobramycin, and that the most efficient carriers were the fluid (fluidosomes) rather than the more
rigid liposomes. Sachatelli et al. then published encouraging results on fluidosomes, using
immunoelectron microscopy and Gram staining techniques to show that fluidosomes may fuse
with the bacterial cell envelope and release tobramycin in the cytoplasm (179). Until now, only a
few antibiotics encapsulated in fluidosomes have been examined for their increased efficacy
(Table 1.4).
Molecules with poor water solubility, such as PPA148, are mainly loaded in the hydrophobic tail
region of the bilayer, leading to limited drug loading and immediate drug release (180). Therefore,
the first step of this work was to increase the water solubility of PPA148 by using
pharmaceutically acceptable βCD derivatives, as we showed in Chapter 2. Water solubility
increased 5-fold by incorporating PPA148 into the cavity of cyclodextrins (Figure 2.16, Table 2.3).
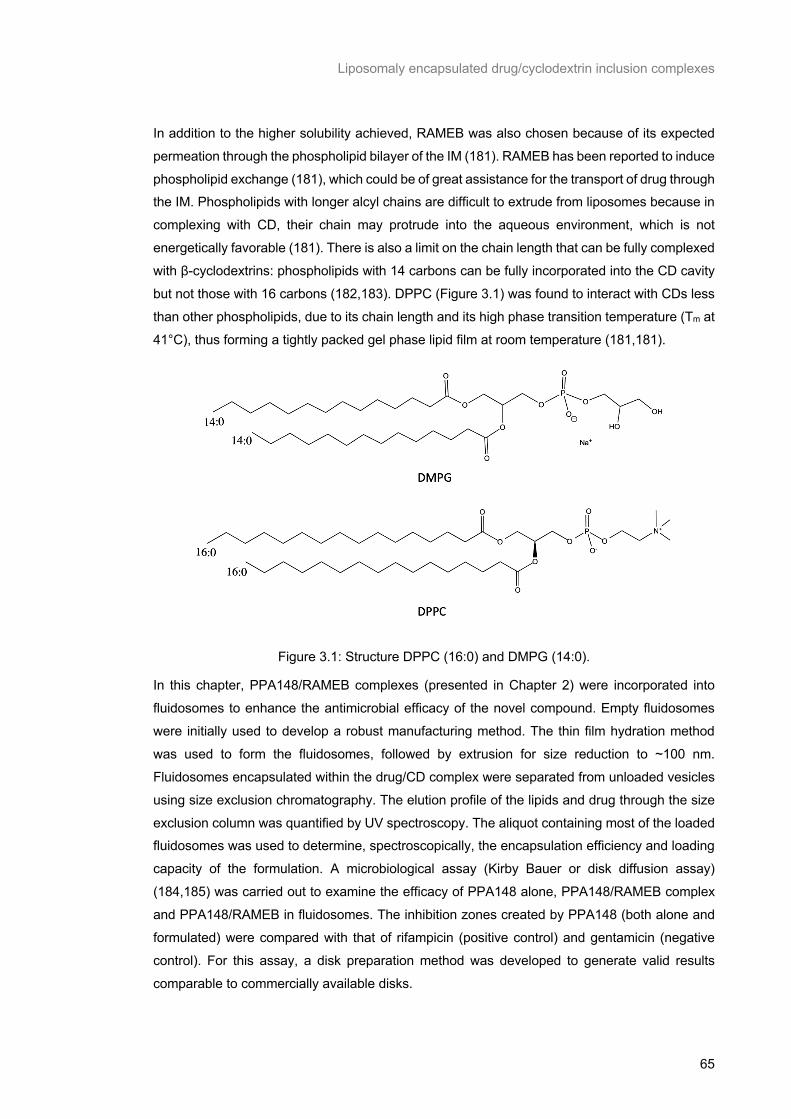
Liposomaly encapsulated drug/cyclodextrin inclusion complexes
65
In addition to the higher solubility achieved, RAMEB was also chosen because of its expected
permeation through the phospholipid bilayer of the IM (181). RAMEB has been reported to induce
phospholipid exchange (181), which could be of great assistance for the transport of drug through the IM. Phospholipids with longer alcyl chains are difficult to extrude from liposomes because in
complexing with CD, their chain may protrude into the aqueous environment, which is not
energetically favorable (181). There is also a limit on the chain length that can be fully complexed
with β-cyclodextrins: phospholipids with 14 carbons can be fully incorporated into the CD cavity
but not those with 16 carbons (182,183). DPPC (Figure 3.1) was found to interact with CDs less
than other phospholipids, due to its chain length and its high phase transition temperature (Tm at
41°C), thus forming a tightly packed gel phase lipid film at room temperature (181,181).
Figure 3.1: Structure DPPC (16:0) and DMPG (14:0).
In this chapter, PPA148/RAMEB complexes (presented in Chapter 2) were incorporated into
fluidosomes to enhance the antimicrobial efficacy of the novel compound. Empty fluidosomes
were initially used to develop a robust manufacturing method. The thin film hydration method
was used to form the fluidosomes, followed by extrusion for size reduction to ~100 nm.
Fluidosomes encapsulated within the drug/CD complex were separated from unloaded vesicles
using size exclusion chromatography. The elution profile of the lipids and drug through the size
exclusion column was quantified by UV spectroscopy. The aliquot containing most of the loaded fluidosomes was used to determine, spectroscopically, the encapsulation efficiency and loading
capacity of the formulation. A microbiological assay (Kirby Bauer or disk diffusion assay)
(184,185) was carried out to examine the efficacy of PPA148 alone, PPA148/RAMEB complex
and PPA148/RAMEB in fluidosomes. The inhibition zones created by PPA148 (both alone and
formulated) were compared with that of rifampicin (positive control) and gentamicin (negative
control). For this assay, a disk preparation method was developed to generate valid results
comparable to commercially available disks.
Liposomaly encapsulated drug/cyclodextrin inclusion complexes
66
3.2 Materials
Lipids: 1,2-dipalmitoyl-sn-glycero-3-phosphocholine (DPPC, 16:0 PC) and 1,2-dimyristoyl-sn-
glycero-3-phosphoglycerol, sodium salt (DMPG, 14:0 PG) were obtained from Avanti polar lipids
(Alabama, USA) and supplied by Stratech Scientific (Newmarket, UK).
Microbiological Assay: Blank, rifampicin (30 μg) and vancomycin (30 μg) susceptibility disks,
agar powder and Muller Hinton broth for microbiology were purchased from Oxoid (UK). LC/MS
grade water was supplied by Merck, UK. E. coli bacteria DH5α were obtained from Invitrogen
Life Science Technology (Thermo Fisher Scientific, UK).
Salts used for buffer and reagent preparation: Sodium chloride (NaCl), magnesium chloride
(MgCl2), monosodium phosphate (NaH2PO4), sodium hydroxide (NaOH) Ammonium
thiocyanate, ferric chloride and HEPES (>=99.5%) were supplied by Sigma-Aldrich, UK.
Cyclodextrins: Hydroxypropyl-β-cyclodextrin (HPβCD), randomly methylated β-cyclodextrin
(RAMEB) supplied from Sigma-Aldrich, UK.
Solvents: Dichloromethane (DCM), chloroform and deuterated water were purchased by Sigma-
Aldrich, UK. The ultrapure water at 18.2 MΩ was produced by a Purelab Ultra machine from
ELGA process water (Marlow, UK).
3.3 Methods
3.3.1 Formation of Large Multi-Lamellar Fluidosomes
Fluidosomes consisted of DPPC/DMPG in a molar ratio of 18:1 and were manufactured by the thin film hydration method (186). The mixture of lipids (10 mg) was dissolved in 1 mL of
chloroform in a round-bottom flask and sonicated in a sonicating bath (Fisherbrand®, FB11203,
Fisher Scientific, UK) at 25°C for approximately 1 min until achieving a clear solution. The solvent
was evaporated using a rotary evaporator (Rotavapor® RII, Büchi, Switzerland) attached to a
vacuum pump (KNF Lab, UK). The temperature of the water bath was set to 40°C and the rotation
speed to approximately 190 rpm. The resulting thin lipid film was kept under reduced pressure in
a pyrex vacuum desiccator for 12 h to further remove traces of organic solvent. The lipid film was
then solvated by adding 4 mL of phosphate buffer pH 7.4 (50mM PBS, 40mM NaH2PO4 and 26 mM NaCl) or 20 mM HEPES buffered saline pH 7.2 (145 mM NaCl and 10 mM CaCl2) under
vigorous stirring and bath sonication (Fisherbrand®, FB11203, Fisher Scientific, UK) at 40°C to
facilitate vesicle formation. The lipid suspension was dipped into an ice bath (4°C) for 1 min and
then placed in the water bath (40°C) for another minute. This temperature changing sequence
was repeated 5 times followed by a 1 h resting period at 4°C before using them for size reduction.
Liposomaly encapsulated drug/cyclodextrin inclusion complexes
67
Empty liposomes of the desired size were used to validate the separation method of free
molecules from the drug-in-CD encapsulated liposomes using a PD10 G25 Sephadex column
(GE Healthcare, UK). The method is described in section 3.3.5.
3.3.2 Size reduction methods for the manufacture of Fluidosomes
Size reduction of fluidosomes was carried out by two different methods: probe sonication and
extrusion, to manufacture homogeneous lipid dispersions with unilamellar vesicles. Following the
probe sonication, the lipid suspension was vortexed (Cyclone-Vortex mixer CM-1, Nickel-Electro
Ltd) for 60 sec at 2800 rpm, sonicated (Soniprep 150 Plus ultrasonic disintegrator 120V 60Hz, London, UK) for 5 min with a microprobe at an amplitude of 10 microns and left at room
temperature for one hour prior to further use.
The second method was extrusion, which was carried out by placing 1 mL of suspension in a
tight gas syringe on a mini-extruder (Avanti Polar Lipids) thermostated at 55 °C and manually
extruded through a 0.1 μm polycarbonate membrane 11 times. The extruded liposomes were kept at 4°C and were extruded again under the same experimental set up after 12 hours. The
double extruded liposomes were stored for further use.
The SUVs vesicles formed with the two different methods were compared in terms of
hydrodynamic diameter using photon correlation spectroscopy.
3.3.3 Preparation of drug-cyclodextrin inclusion complexes
A 1:1 complex of drug and RAMEB was used for its encapsulation into liposomes. Drug and
cyclodextrin were mixed in a 1:1 molar ratio in HEPES buffered saline at pH 7.2. The mixture
was left under stirring (190 rpm) for 24 hours.
3.3.4 Incorporation of drug/cyclodextrin complexes into liposomes
For the entrapment of drug/CD complexes into fluidosomes, 20 mg of DPPC/DMPG mixture
(molar ratio of 18:1), 0.7 mM PPA148 and 0.7 mM RAMEB were used. The 1:1 PPA148/RAMEB
complex was prepared as described above in 20 mM HEPES buffered saline, pH 7.2, and was
used to hydrate the lipid film as described in section 3.3.1. Extrusion or sonication was applied
for size reduction of liposomes (section 3.3.2) and the separation of the liposomes from the
unentrapped drug/CD was carried through size exclusion chromatography (section 3.3.5).
3.3.5 Size Exclusion Chromatography
A Sephadex™ G-25 PD-10 column (GE Healthcare, UK) (packed bed dimensions of 1.45 x 5 cm
and particle size range 85-260 μm) was equilibrated with 15 mL (3 washes of 5mL) of 20 mM
HEPES buffered saline, pH 7.2. The flow through the column was driven by gravity. Each
liposome mixture (1 mL) was allowed to penetrate the gel entirely and the eluted volume was
Liposomaly encapsulated drug/cyclodextrin inclusion complexes
68
discarded. Then, aliquots of HEPES buffered saline (1 mL) were added to the column
sequentially (8 times) to elute various fractions which were collected separately. Each fraction
was characterized for its hydrodynamic diameter, derived count rate, lipid and drug concentration so as to investigate which aliquot contained the majority of the loaded liposomes. Zeta (ζ)-
potential was used to measure the electrokinetic potential properties of liposomes.
3.3.6 Photon Correlation Spectroscopy (PCS)
PCS, also known as Dynamic Light Scattering (DLS), was used to investigate the presence of
particles dispersed in a liquid medium and to determine their average hydrodynamic diameter, zeta-potential and derived count rate. This method measures the scattering of light coming from
the Brownian motion of the suspended particles. The particles’ movement is related to the particle
size, which can be measured using the Stokes–Einstein relationship as follows:
𝑑� =��
sA�b Equation 3.1
where 𝑑� is the hydrodynamic diameter, k is the Boltzman’s constant, T is the absolute
temperature, η is the solvent viscosity and D is Brownian motion diffusion coefficient.
The sample was placed into a disposable semi-micro dynamic light scattering cuvettes (VWR
International, UK) and the size and derived count rate was measured by a Malvern Zetasizer
(Nano-ZS, Malvern Instruments, UK) at 25 ˚C with a laser wavelength of 623.8 nm, backscatter
detection angle of 173°, viscosity of dispersant of 0.889 cP (water) and refractive index 1.590. Placing detectors at 173° enables scattered light signals of low intensity originating from smaller
particles to be revealed and excludes excess scattered light (187).
The Malvern Zetasizer (Nano-ZS, Malvern Instruments, UK) was also used for measuring the ζ-
potential by electrophoretic light scattering spectroscopy. It provides information on the
electrokinetic charge of Fluidosomes and the effect of PBS, pH 7.4 (40 mM NaH2PO4 and 30 mM NaCl) on their stability. A folded disposable capillary cell (Malvern Panalytical, UK) was used to
measure the voltage signal at 25 ˚C with the dielectric constant set at 78.5. The dispersant
refractive index and viscosity were set as per the light scattering experiments. The equilibration
time for both size and zeta-potential measurements was 120 sec and the appropriate attenuator
position was automatically determined by the Nano software. All measurements were carried out
in triplicate.
3.3.7 Stewart assay
The determination of lipid concentration in the final formulation was achieved using the
colorimetric Stewart assay (188). This assay is based on the fact that DPPC forms a complex
with a reagent comprising of ferric chloride hexahydrate (0.17 M) and ammonium thiocyanate
Liposomaly encapsulated drug/cyclodextrin inclusion complexes
69
(0.4 M) in DI water. The ferrothiocyanate reagent is insoluble in chloroform unless it forms a
complex with DPPC.
A calibration curve was established from standard DPPC solutions in chloroform. All standard
samples were prepared by vigorously mixing the aqueous solution (2mL) containing the reagent
and the chloroform (2mL) containing increasing concentration of lipids (0-0.05 mg/mL). In order
to ensure the full partition of the complex into the organic phase, the mixture was vigorously
mixed and then centrifuged (AllegraTM X-12 centrifuge, Beckman Coulter, UK) for 10 min at
1000 rpm to separate the two phases. The lower layer (organic phase) was collected and its absorbance measured at 467 nm. A linear relationship was observed between the absorbance
and the DPPC concentration in the complex and used as a calibration curve.
For the test samples, the suspension before separation and the 8 eluted aliquots from the PD10
column were used to determine the lipid content in the starting and purified liposomes to detect
any material loss during the process. The samples were lyophilized in an Alpha 1-2 LDplus freeze dryer (Martin Christ Gefriertrocknungsanlagen GmbH, Germany), connected with a Chemistry
hybrid RC 6 pump (Vaccubrand GMBH, Germany) and then re-suspended in chloroform. A
volume of 2 mL was transferred in chloroform (2 mL) which was added into the reagent solution
to form the biphasic system. All tubes were vortexed as the standard samples and the DPPC
concentration of the test tubes was interpolated from the calibration curve. All measurements
were carried out in triplicate.
3.3.8 Drug quantification
Drug quantification was carried out using UV/Vis spectroscopy to determine the encapsulation
efficiency (EE) and the drug loading (DL) of liposomes. Measurements of the LOD and LOQ were
reported in Chapter 2, section 2.3.7. The UV spectrum of PPA148 was recorded on a Lamda 2
spectrophotometer (Perkin Elmer, UK), at 25˚C using a 1 cm pathlength quartz cuvette (Hellma
114-QS). The spectra were recorded within the wavelength range 200-550 nm, with spectral slit
width of 2 nm and scan speed of 60 nm/min. PPA148 was extracted from all 8 aliquots collected from the size exclusion chromatography used to purify the formulation. Each aliquot was washed
with DCM 5 times and the organic phase was collected, dried with magnesium sulfate (MgSO4)
and evaporated using a rotary evaporator (Rotavapor® RII, Büchi®, Switzerland) attached to a
vacuum pump (KNF Lab, UK). The resulting dry sample was re-suspended in ethanol:water
(80:20) and the unknown drug concentration was calculated by interpolating from a linear
calibration curve, which was determined under the same experimental conditions. The area
under the curve (AUC) of all samples was used for drug quantification and calculated using GraphPad Prism 7.03 software (GraphPad software Inc., USA). The number of test and
calibration curve sample measurements was 4 and 3, respectively. The Encapsulation Efficiency
(EE) and Drug Loading (DL) were calculated using the following the equations,
Liposomaly encapsulated drug/cyclodextrin inclusion complexes
70
𝐸𝐸(%) = a��a�a�
× 100% Equation 3.2
𝐷𝐿(%) = a��a�a�pa��a�
× 100% Equation 3.3
, where 𝐶K is the un-entrapped drug concentration, 𝐶� and 𝐶� are the concentration of lipids and
drug added into the liposome system, respectively.
3.3.9 Kirby Bauer assay
The Kirby Bauer method, also known as the disk diffusion assay, is used for testing the resistance
or susceptibility of bacteria to drugs and chemicals (184,185). It is a well-established assay by
the World Health Organization (WHO) and widely accepted by many clinical laboratories. Escherichia coli (E. coli) was cultured in a Mueller-Hinton (MH) agar (21 g/L MH broth and 17 g/L
agar) plate from a gel-bead for 24 h at 37 ˚C. A few bacterial colonies were taken with a loop
from the cultured disk, placed in MH broth and shaken while incubating for 24 h at 37˚C. The
growth of the bacterial culture was monitored by measuring the optical density (OD) of the
bacterial suspension at 600 nm using a single beam JENWAY 6300 Visible Spectrophotometer
(Staffordshire, UK) with resolution of 1 nm and spectral bandwidth of 8 nm. An OD600 of 1, which
was achieved for this experiment, means that there are ~8´108 cells/mL in the suspension. To
stop bacterial growth, 1 mL of the suspension was centrifuged at 10,000G for 5 min and the
bacterial pellets were re-dispersed in sterile physiological saline (0.9% NaCl). An aliquot of this
suspension (100 μL) was swabbed on an MH agar plate, and filter disks impregnated with
antibiotic were placed on top. The plates were incubated for 24 h at 37˚C and the diameter of the
inhibition zones was measured after incubation.
Commercially available disks for rifampicin (30 μg) and vancomycin (30 μg) were used as positive
and negative controls based on their ability to inhibit bacterial growth. However, the filter disk for
the novel antibiotic (PPA148 1 μg) as well as for the complex and final formulation, were prepared
in-house. All stock solutions (PPA148 5 mM in DCM, 1:1 complex (0.5 mg/mL) and encapsulated
Fluidosomes (0.5 mg/ml) were sterilized using a UV lamp (Spectroline®, ENF-24C/FE,
Spectronics corporation, Westbury, New York, USA) at 254 nm (ultraviolet germicidal irradiation). A volume equivalent to PPA148 1 μg was placed on the plate, absorbed and evaporated under
reduced pressure. Each disk can absorb a maximum of 10 μL per deposition. Thus, for the
complex- and liposome-impregnated disks the process had to be repeated 5 times because the
stock solution/suspension was not concentrated enough. To validate the preparation method of
the in-house disks, disks containing 30 μg of rifampicin were prepared and the result was
compared to that of the commercially available disk.

Liposomaly encapsulated drug/cyclodextrin inclusion complexes
71
3.3.10 Dispersion stability of empty fluidosomes
Fluidosomes prepared with the probe sonicator were tested for their stability in terms of
hydrodynamic size. Dynamic light scattering was measured using the experimental parameters described in section 3.3.6. The stability of the dispersion was investigated by measuring their
size over a period of 60 days as a concentrated suspension (1 mg/mL) and diluted in PBS buffer,
pH 7.4 (dilution factor of 2, 4, 8 and 16). The effect of adding HPβCD (0.1, 1, 2.5 and 5%) on the
size of the liposomes (1 mg/mL) was also examined. All samples were kept at 4˚C between the
measurement intervals and were measured in triplicates.
3.3.11 Statistical analysis
All error values were expressed as their mean ± standard deviation (SD). Statistical analysis of
the data was performed using GraphPad Prism 7. The non-parametric Mann-Whitney U-test was
used to detect differences between the empty and loaded liposomes. Statistically significant
differences were assumed when P ≤ 0.05. For the disk diffusion assay, simulations of each data
set were computed to tabulate 100 runs based on a Gaussian absolute scatter and the standard
deviation of each experimental data set. The Brown-Forsythe variability test was conducted to
ensure all sample group data was of acceptable distribution (P > 0.05) before statistical significance between the groups was assessed by one-way analysis of variance (ANOVA) tests
with post-hoc Tukey analysis for multiple comparison. Statistically significant differences were
assumed when P ≤ 0.05 for the experimental analysis and the simulated observations. P-value
style is based on GraphPad Prism 7 and the asterisks symbolize the significance as follows:
0.1244 (ns), 0.0332 (*), 0.0021 (**), 0.0002 (***), <0.0001 (****).
For the Kirby Bauer microbiological assay, Monte Carlo simulation was performed for the data
sets because the number of observations was small, and any outlier could affect the final result.
A number of 100 simulated observations were generated based on the mean and standard
deviation of the experimental data set. These simulated data were used to perform one-way
ANOVA analysis in addition to Tukey’s test as described above, which give an estimation of the
result if we had 100 experimental observations.
3.4 Results
3.4.1 Characterization of empty/control Fluidosomes
Liposomes consisting of DPPC/DMPG in a molar ratio of 18:1 were manufactured using the thin film hydration method. Size reduction was performed by either probe sonication of the lipid
suspension or extrusion of iced/thawed lipid suspension through a polycarbonate membrane of
100 nm pore size. The lipid suspension was applied to a gravity column, washed 8 times and the
eluted aliquots were collected. The column fractions were tested for the presence of liposomes
Liposomaly encapsulated drug/cyclodextrin inclusion complexes
72
by measuring the derived count rate and the lipid content by the Stewart assay. The aliquot
containing liposomes was further characterized for liposome size and zeta potential.
Dynamic light scattering was initially used to verify the presence of liposomes after the
manufacturing and purification process. The derived count rate (DCR) represents the average
intensity scattered and is directly related with the number of photons detected and, thus, the
concentration and number of particles present in the eluted samples from the PD10 column
suspension. The development of the Fluidosome preparation began in parallel with the synthesis
and characterization of the drug, described in Chapter 2. During this period, small unilamellar vesicles (SUVs) were prepared by probe sonication and to test their stability over time and
dilution. This method produced liposomes (1 mg/mL) with size of 56.30 ± 0.50 nm and PdI of
0.21 ± 0.01 (Figure 3.2A). The size of the 1 mg/mL liposomes was also tested over time (Figure
3.2A). The shift of the intensity distribution towards higher hydrodynamic size reflects an increase
in liposomal size of 27.3 ± 2.5% during a period of 2 months (Figure 3.2A), which suggests some
aggregation of the liposomes (189).
The effect of PBS on the stability of Fluidosomes was examined by diluting the initial lipid
suspension up to 16 times from its original concentration (1 mg/mL). The size of all 4 diluted
liposomal suspensions was measured and compared over time (Figure 3.2B). Between
measurements, the samples were stored at 4 ˚C and the measurements were performed at 25
˚C. The least concentrated suspension (0.0625 mg/ml) displayed a 16.0 ± 3.1% and 55.3 ± 2.6%
increase 4 days and 2 months after fabrication, respectively (Figure 3.2B). The liposome size in
the rest of the samples exceeded the original size by 10%, 11 days after preparation. Their overall
size increase ranged between 19 and 29% 1 month after preparation (Figure 3.2B). The results
on the stability of liposomes are in agreement with studies on DPPC liposomes at the same
concentration (1 mg/mL) (191).
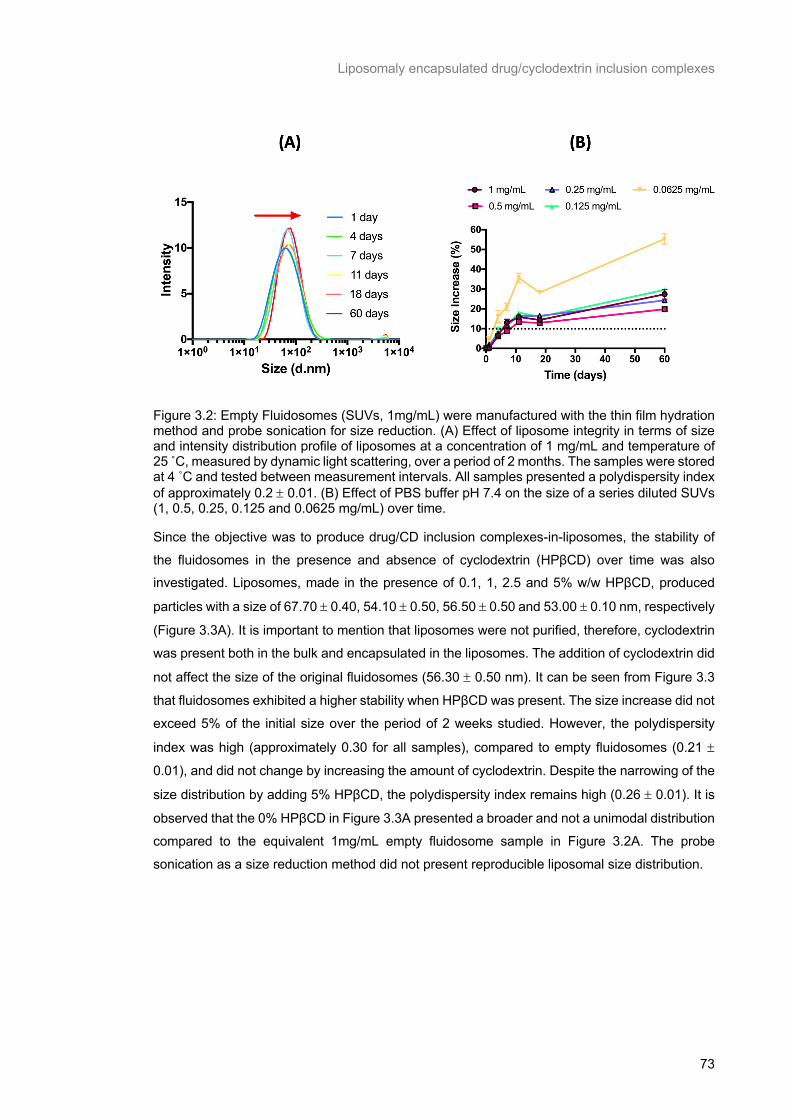
Liposomaly encapsulated drug/cyclodextrin inclusion complexes
73
Figure 3.2: Empty Fluidosomes (SUVs, 1mg/mL) were manufactured with the thin film hydration method and probe sonication for size reduction. (A) Effect of liposome integrity in terms of size and intensity distribution profile of liposomes at a concentration of 1 mg/mL and temperature of 25 ̊ C, measured by dynamic light scattering, over a period of 2 months. The samples were stored at 4 ˚C and tested between measurement intervals. All samples presented a polydispersity index of approximately 0.2 ± 0.01. (B) Effect of PBS buffer pH 7.4 on the size of a series diluted SUVs (1, 0.5, 0.25, 0.125 and 0.0625 mg/mL) over time.
Since the objective was to produce drug/CD inclusion complexes-in-liposomes, the stability of
the fluidosomes in the presence and absence of cyclodextrin (HPβCD) over time was also investigated. Liposomes, made in the presence of 0.1, 1, 2.5 and 5% w/w HPβCD, produced
particles with a size of 67.70 ± 0.40, 54.10 ± 0.50, 56.50 ± 0.50 and 53.00 ± 0.10 nm, respectively
(Figure 3.3A). It is important to mention that liposomes were not purified, therefore, cyclodextrin
was present both in the bulk and encapsulated in the liposomes. The addition of cyclodextrin did
not affect the size of the original fluidosomes (56.30 ± 0.50 nm). It can be seen from Figure 3.3
that fluidosomes exhibited a higher stability when HPβCD was present. The size increase did not
exceed 5% of the initial size over the period of 2 weeks studied. However, the polydispersity
index was high (approximately 0.30 for all samples), compared to empty fluidosomes (0.21 ±
0.01), and did not change by increasing the amount of cyclodextrin. Despite the narrowing of the
size distribution by adding 5% HPβCD, the polydispersity index remains high (0.26 ± 0.01). It is
observed that the 0% HPβCD in Figure 3.3A presented a broader and not a unimodal distribution
compared to the equivalent 1mg/mL empty fluidosome sample in Figure 3.2A. The probe
sonication as a size reduction method did not present reproducible liposomal size distribution.
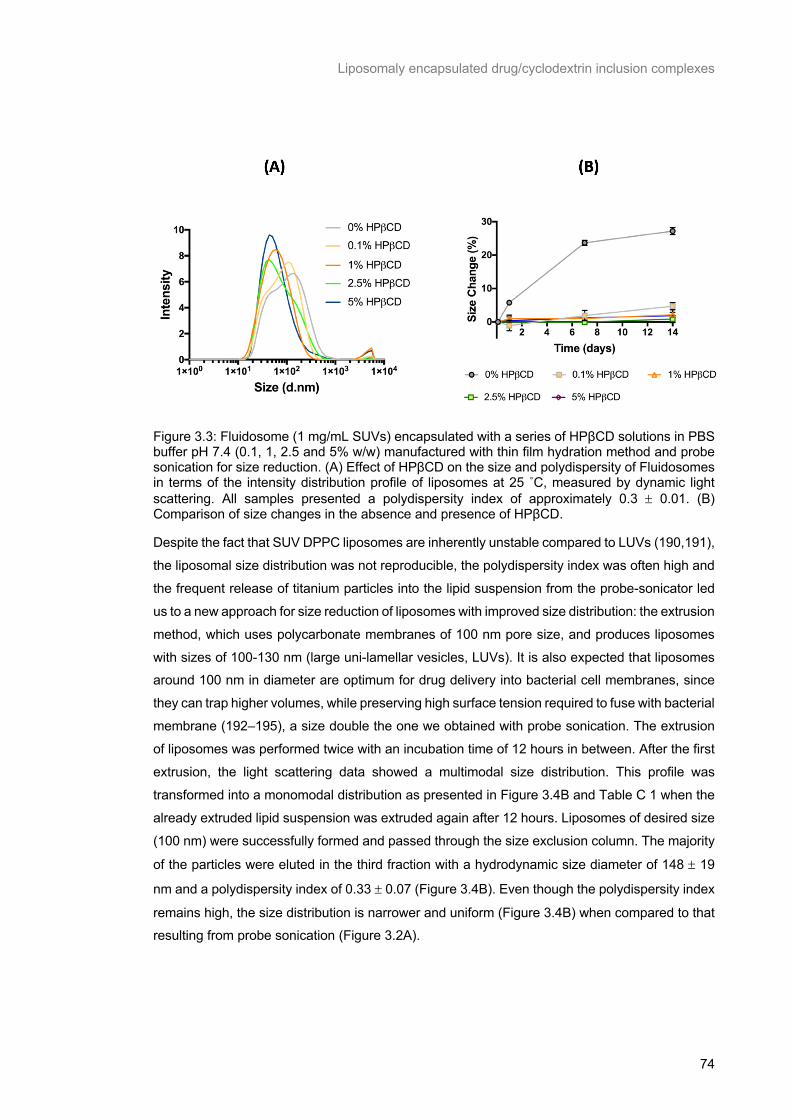
Liposomaly encapsulated drug/cyclodextrin inclusion complexes
74
Figure 3.3: Fluidosome (1 mg/mL SUVs) encapsulated with a series of HPβCD solutions in PBS buffer pH 7.4 (0.1, 1, 2.5 and 5% w/w) manufactured with thin film hydration method and probe sonication for size reduction. (A) Effect of HPβCD on the size and polydispersity of Fluidosomes in terms of the intensity distribution profile of liposomes at 25 ˚C, measured by dynamic light scattering. All samples presented a polydispersity index of approximately 0.3 ± 0.01. (B) Comparison of size changes in the absence and presence of HPβCD.
Despite the fact that SUV DPPC liposomes are inherently unstable compared to LUVs (190,191),
the liposomal size distribution was not reproducible, the polydispersity index was often high and
the frequent release of titanium particles into the lipid suspension from the probe-sonicator led
us to a new approach for size reduction of liposomes with improved size distribution: the extrusion
method, which uses polycarbonate membranes of 100 nm pore size, and produces liposomes
with sizes of 100-130 nm (large uni-lamellar vesicles, LUVs). It is also expected that liposomes around 100 nm in diameter are optimum for drug delivery into bacterial cell membranes, since
they can trap higher volumes, while preserving high surface tension required to fuse with bacterial
membrane (192–195), a size double the one we obtained with probe sonication. The extrusion
of liposomes was performed twice with an incubation time of 12 hours in between. After the first
extrusion, the light scattering data showed a multimodal size distribution. This profile was
transformed into a monomodal distribution as presented in Figure 3.4B and Table C 1 when the
already extruded lipid suspension was extruded again after 12 hours. Liposomes of desired size
(100 nm) were successfully formed and passed through the size exclusion column. The majority
of the particles were eluted in the third fraction with a hydrodynamic size diameter of 148 ± 19
nm and a polydispersity index of 0.33 ± 0.07 (Figure 3.4B). Even though the polydispersity index
remains high, the size distribution is narrower and uniform (Figure 3.4B) when compared to that resulting from probe sonication (Figure 3.2A).
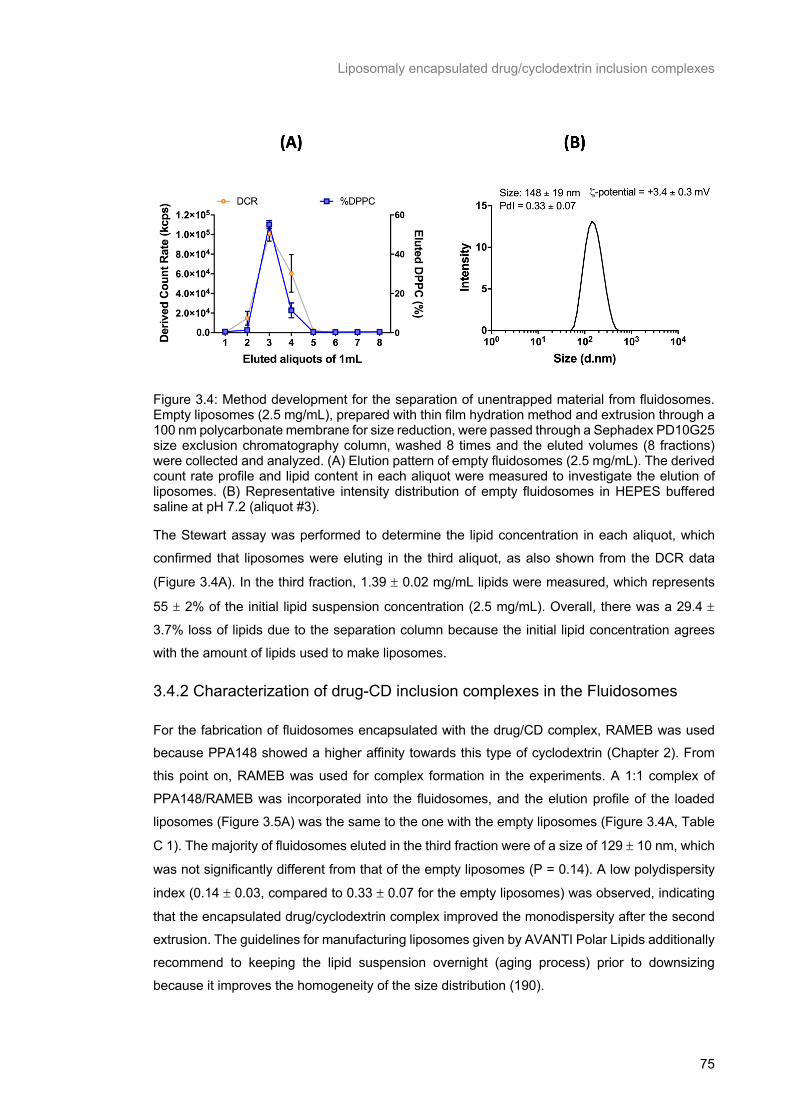
Liposomaly encapsulated drug/cyclodextrin inclusion complexes
75
Figure 3.4: Method development for the separation of unentrapped material from fluidosomes. Empty liposomes (2.5 mg/mL), prepared with thin film hydration method and extrusion through a 100 nm polycarbonate membrane for size reduction, were passed through a Sephadex PD10G25 size exclusion chromatography column, washed 8 times and the eluted volumes (8 fractions) were collected and analyzed. (A) Elution pattern of empty fluidosomes (2.5 mg/mL). The derived count rate profile and lipid content in each aliquot were measured to investigate the elution of liposomes. (B) Representative intensity distribution of empty fluidosomes in HEPES buffered saline at pH 7.2 (aliquot #3).
The Stewart assay was performed to determine the lipid concentration in each aliquot, which
confirmed that liposomes were eluting in the third aliquot, as also shown from the DCR data
(Figure 3.4A). In the third fraction, 1.39 ± 0.02 mg/mL lipids were measured, which represents
55 ± 2% of the initial lipid suspension concentration (2.5 mg/mL). Overall, there was a 29.4 ±
3.7% loss of lipids due to the separation column because the initial lipid concentration agrees
with the amount of lipids used to make liposomes.
3.4.2 Characterization of drug-CD inclusion complexes in the Fluidosomes
For the fabrication of fluidosomes encapsulated with the drug/CD complex, RAMEB was used because PPA148 showed a higher affinity towards this type of cyclodextrin (Chapter 2). From
this point on, RAMEB was used for complex formation in the experiments. A 1:1 complex of
PPA148/RAMEB was incorporated into the fluidosomes, and the elution profile of the loaded
liposomes (Figure 3.5A) was the same to the one with the empty liposomes (Figure 3.4A, Table
C 1). The majority of fluidosomes eluted in the third fraction were of a size of 129 ± 10 nm, which
was not significantly different from that of the empty liposomes (P = 0.14). A low polydispersity
index (0.14 ± 0.03, compared to 0.33 ± 0.07 for the empty liposomes) was observed, indicating
that the encapsulated drug/cyclodextrin complex improved the monodispersity after the second
extrusion. The guidelines for manufacturing liposomes given by AVANTI Polar Lipids additionally
recommend to keeping the lipid suspension overnight (aging process) prior to downsizing
because it improves the homogeneity of the size distribution (190).
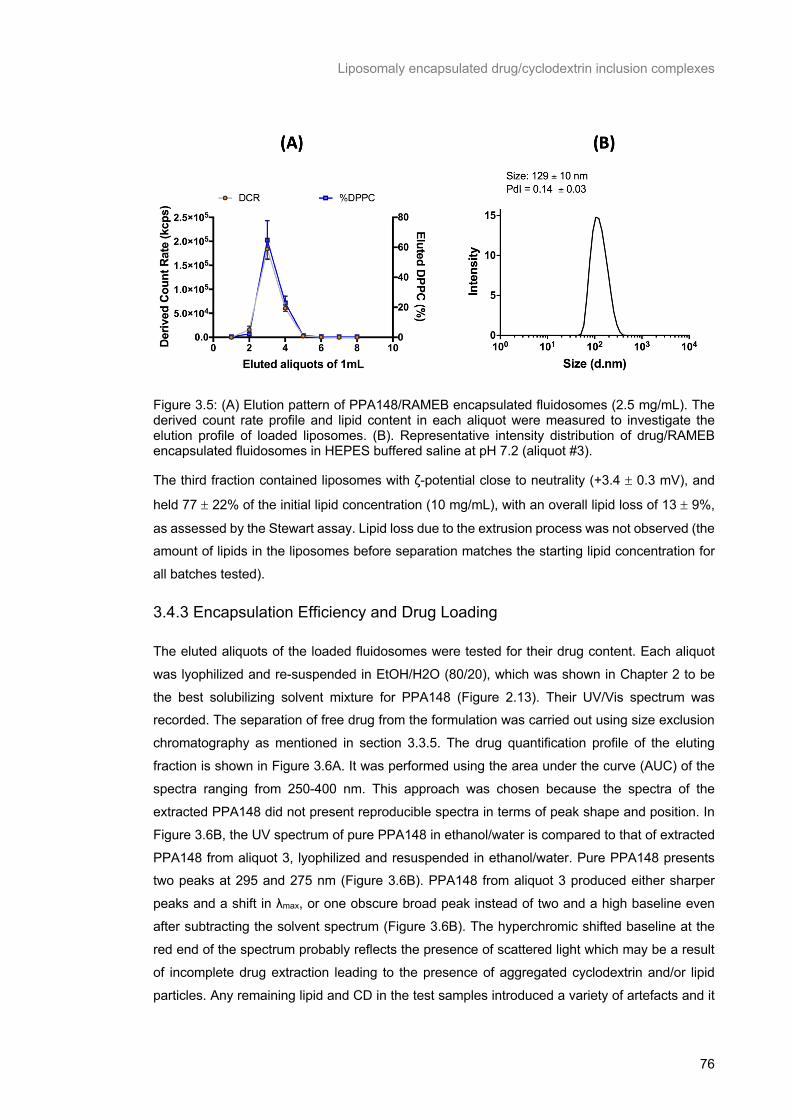
Liposomaly encapsulated drug/cyclodextrin inclusion complexes
76
Figure 3.5: (A) Elution pattern of PPA148/RAMEB encapsulated fluidosomes (2.5 mg/mL). The derived count rate profile and lipid content in each aliquot were measured to investigate the elution profile of loaded liposomes. (B). Representative intensity distribution of drug/RAMEB encapsulated fluidosomes in HEPES buffered saline at pH 7.2 (aliquot #3).
The third fraction contained liposomes with ζ-potential close to neutrality (+3.4 ± 0.3 mV), and
held 77 ± 22% of the initial lipid concentration (10 mg/mL), with an overall lipid loss of 13 ± 9%,
as assessed by the Stewart assay. Lipid loss due to the extrusion process was not observed (the amount of lipids in the liposomes before separation matches the starting lipid concentration for
all batches tested).
3.4.3 Encapsulation Efficiency and Drug Loading
The eluted aliquots of the loaded fluidosomes were tested for their drug content. Each aliquot
was lyophilized and re-suspended in EtOH/H2O (80/20), which was shown in Chapter 2 to be
the best solubilizing solvent mixture for PPA148 (Figure 2.13). Their UV/Vis spectrum was recorded. The separation of free drug from the formulation was carried out using size exclusion
chromatography as mentioned in section 3.3.5. The drug quantification profile of the eluting
fraction is shown in Figure 3.6A. It was performed using the area under the curve (AUC) of the
spectra ranging from 250-400 nm. This approach was chosen because the spectra of the
extracted PPA148 did not present reproducible spectra in terms of peak shape and position. In
Figure 3.6B, the UV spectrum of pure PPA148 in ethanol/water is compared to that of extracted
PPA148 from aliquot 3, lyophilized and resuspended in ethanol/water. Pure PPA148 presents two peaks at 295 and 275 nm (Figure 3.6B). PPA148 from aliquot 3 produced either sharper
peaks and a shift in λmax, or one obscure broad peak instead of two and a high baseline even
after subtracting the solvent spectrum (Figure 3.6B). The hyperchromic shifted baseline at the
red end of the spectrum probably reflects the presence of scattered light which may be a result
of incomplete drug extraction leading to the presence of aggregated cyclodextrin and/or lipid
particles. Any remaining lipid and CD in the test samples introduced a variety of artefacts and it
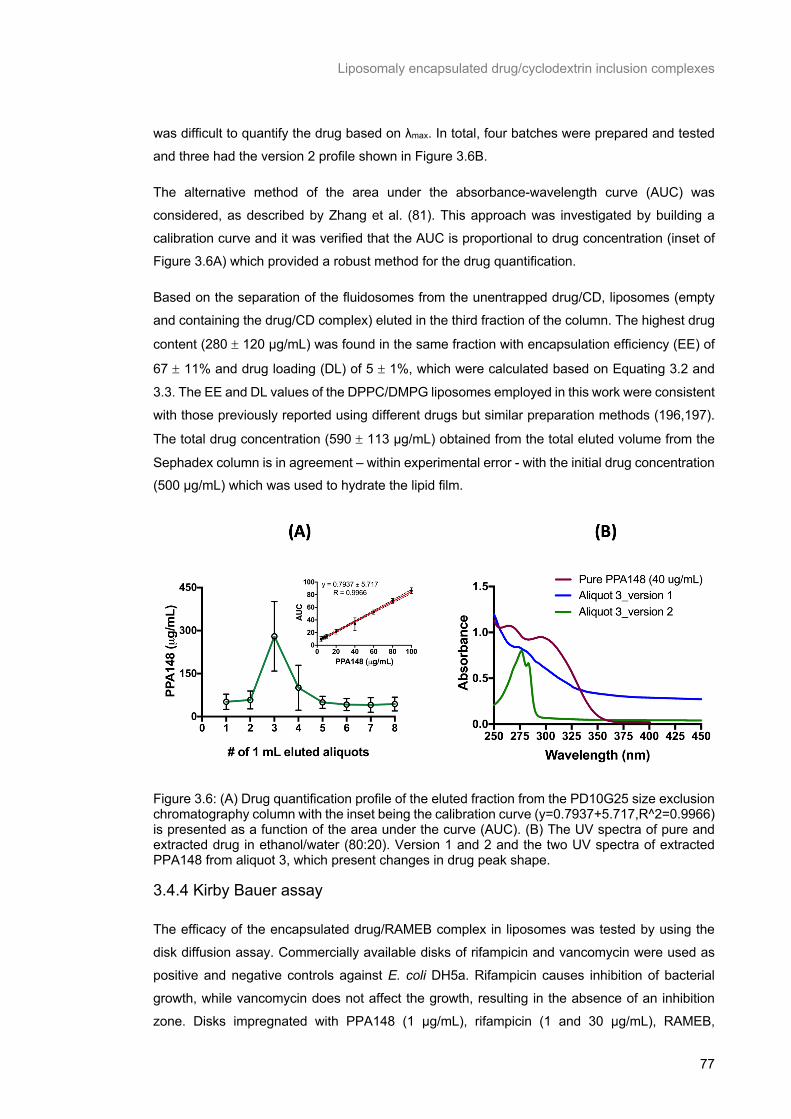
Liposomaly encapsulated drug/cyclodextrin inclusion complexes
77
was difficult to quantify the drug based on λmax. In total, four batches were prepared and tested
and three had the version 2 profile shown in Figure 3.6B.
The alternative method of the area under the absorbance-wavelength curve (AUC) was
considered, as described by Zhang et al. (81). This approach was investigated by building a
calibration curve and it was verified that the AUC is proportional to drug concentration (inset of
Figure 3.6A) which provided a robust method for the drug quantification.
Based on the separation of the fluidosomes from the unentrapped drug/CD, liposomes (empty
and containing the drug/CD complex) eluted in the third fraction of the column. The highest drug
content (280 ± 120 μg/mL) was found in the same fraction with encapsulation efficiency (EE) of
67 ± 11% and drug loading (DL) of 5 ± 1%, which were calculated based on Equating 3.2 and
3.3. The EE and DL values of the DPPC/DMPG liposomes employed in this work were consistent
with those previously reported using different drugs but similar preparation methods (196,197).
The total drug concentration (590 ± 113 μg/mL) obtained from the total eluted volume from the
Sephadex column is in agreement – within experimental error - with the initial drug concentration (500 μg/mL) which was used to hydrate the lipid film.
Figure 3.6: (A) Drug quantification profile of the eluted fraction from the PD10G25 size exclusion chromatography column with the inset being the calibration curve (y=0.7937+5.717,R^2=0.9966) is presented as a function of the area under the curve (AUC). (B) The UV spectra of pure and extracted drug in ethanol/water (80:20). Version 1 and 2 and the two UV spectra of extracted PPA148 from aliquot 3, which present changes in drug peak shape.
3.4.4 Kirby Bauer assay
The efficacy of the encapsulated drug/RAMEB complex in liposomes was tested by using the
disk diffusion assay. Commercially available disks of rifampicin and vancomycin were used as
positive and negative controls against E. coli DH5a. Rifampicin causes inhibition of bacterial
growth, while vancomycin does not affect the growth, resulting in the absence of an inhibition
zone. Disks impregnated with PPA148 (1 μg/mL), rifampicin (1 and 30 μg/mL), RAMEB,
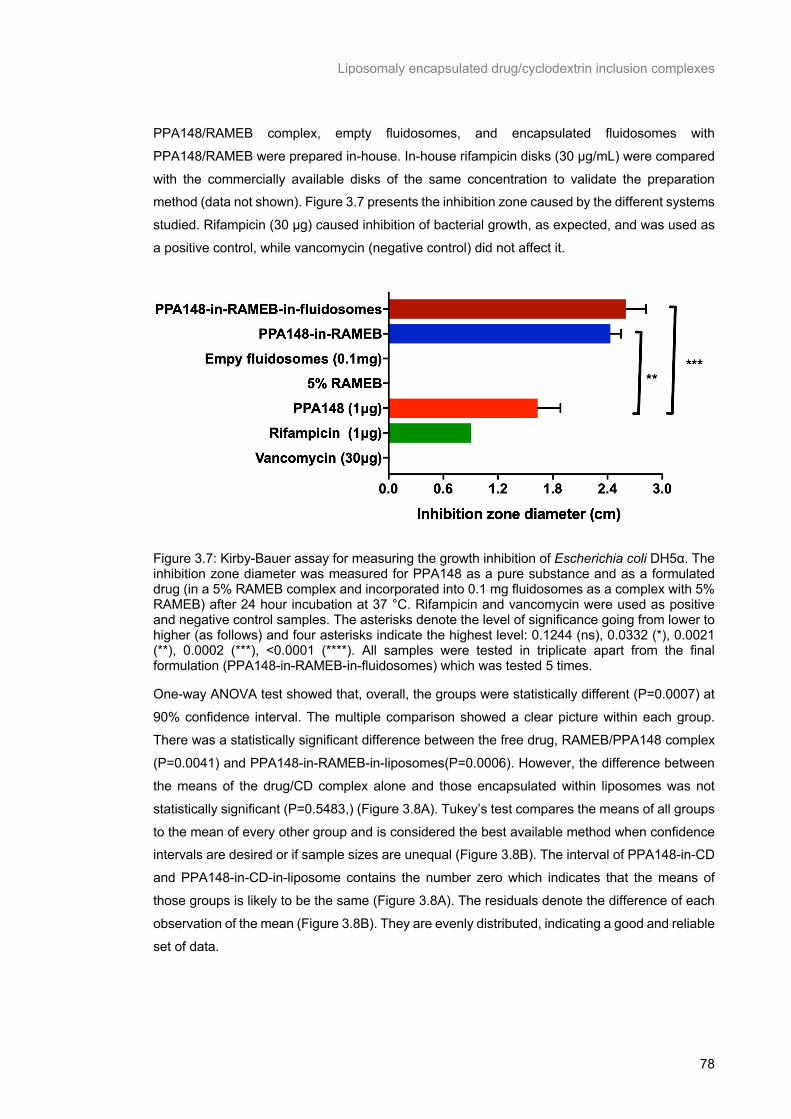
Liposomaly encapsulated drug/cyclodextrin inclusion complexes
78
PPA148/RAMEB complex, empty fluidosomes, and encapsulated fluidosomes with
PPA148/RAMEB were prepared in-house. In-house rifampicin disks (30 μg/mL) were compared
with the commercially available disks of the same concentration to validate the preparation method (data not shown). Figure 3.7 presents the inhibition zone caused by the different systems
studied. Rifampicin (30 μg) caused inhibition of bacterial growth, as expected, and was used as
a positive control, while vancomycin (negative control) did not affect it.
Figure 3.7: Kirby-Bauer assay for measuring the growth inhibition of Escherichia coli DH5α. The inhibition zone diameter was measured for PPA148 as a pure substance and as a formulated drug (in a 5% RAMEB complex and incorporated into 0.1 mg fluidosomes as a complex with 5% RAMEB) after 24 hour incubation at 37 °C. Rifampicin and vancomycin were used as positive and negative control samples. The asterisks denote the level of significance going from lower to higher (as follows) and four asterisks indicate the highest level: 0.1244 (ns), 0.0332 (*), 0.0021 (**), 0.0002 (***), <0.0001 (****). All samples were tested in triplicate apart from the final formulation (PPA148-in-RAMEB-in-fluidosomes) which was tested 5 times.
One-way ANOVA test showed that, overall, the groups were statistically different (P=0.0007) at
90% confidence interval. The multiple comparison showed a clear picture within each group.
There was a statistically significant difference between the free drug, RAMEB/PPA148 complex
(P=0.0041) and PPA148-in-RAMEB-in-liposomes(P=0.0006). However, the difference between
the means of the drug/CD complex alone and those encapsulated within liposomes was not
statistically significant (P=0.5483,) (Figure 3.8A). Tukey’s test compares the means of all groups
to the mean of every other group and is considered the best available method when confidence intervals are desired or if sample sizes are unequal (Figure 3.8B). The interval of PPA148-in-CD
and PPA148-in-CD-in-liposome contains the number zero which indicates that the means of
those groups is likely to be the same (Figure 3.8A). The residuals denote the difference of each
observation of the mean (Figure 3.8B). They are evenly distributed, indicating a good and reliable
set of data.
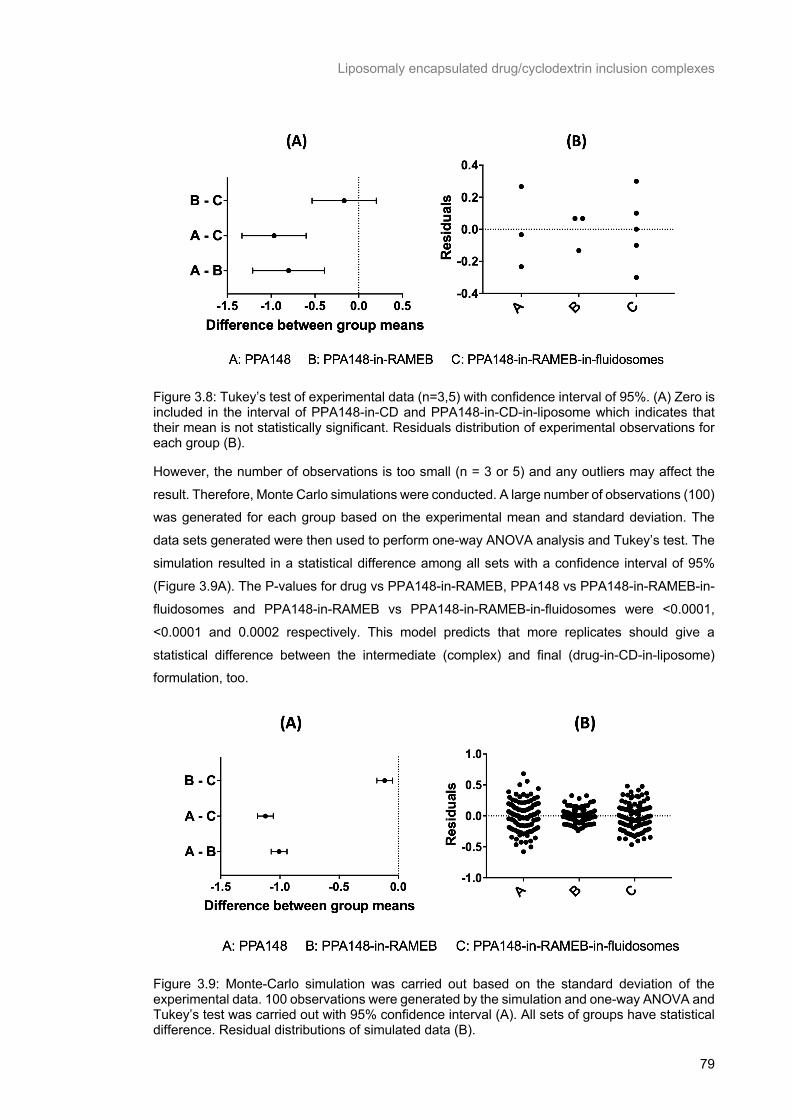
Liposomaly encapsulated drug/cyclodextrin inclusion complexes
79
Figure 3.8: Tukey’s test of experimental data (n=3,5) with confidence interval of 95%. (A) Zero is included in the interval of PPA148-in-CD and PPA148-in-CD-in-liposome which indicates that their mean is not statistically significant. Residuals distribution of experimental observations for each group (B).
However, the number of observations is too small (n = 3 or 5) and any outliers may affect the
result. Therefore, Monte Carlo simulations were conducted. A large number of observations (100) was generated for each group based on the experimental mean and standard deviation. The
data sets generated were then used to perform one-way ANOVA analysis and Tukey’s test. The
simulation resulted in a statistical difference among all sets with a confidence interval of 95%
(Figure 3.9A). The P-values for drug vs PPA148-in-RAMEB, PPA148 vs PPA148-in-RAMEB-in-
fluidosomes and PPA148-in-RAMEB vs PPA148-in-RAMEB-in-fluidosomes were <0.0001,
<0.0001 and 0.0002 respectively. This model predicts that more replicates should give a
statistical difference between the intermediate (complex) and final (drug-in-CD-in-liposome) formulation, too.
Figure 3.9: Monte-Carlo simulation was carried out based on the standard deviation of the experimental data. 100 observations were generated by the simulation and one-way ANOVA and Tukey’s test was carried out with 95% confidence interval (A). All sets of groups have statistical difference. Residual distributions of simulated data (B).
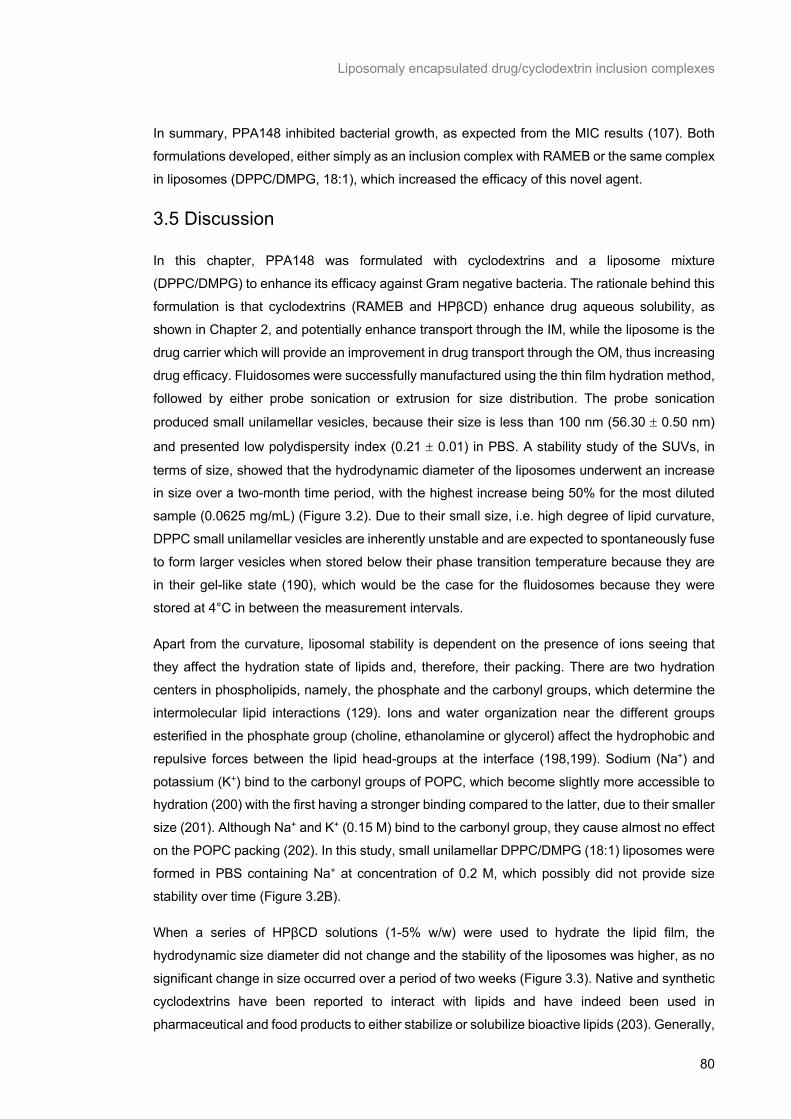
Liposomaly encapsulated drug/cyclodextrin inclusion complexes
80
In summary, PPA148 inhibited bacterial growth, as expected from the MIC results (107). Both
formulations developed, either simply as an inclusion complex with RAMEB or the same complex
in liposomes (DPPC/DMPG, 18:1), which increased the efficacy of this novel agent.
3.5 Discussion
In this chapter, PPA148 was formulated with cyclodextrins and a liposome mixture
(DPPC/DMPG) to enhance its efficacy against Gram negative bacteria. The rationale behind this
formulation is that cyclodextrins (RAMEB and HPβCD) enhance drug aqueous solubility, as
shown in Chapter 2, and potentially enhance transport through the IM, while the liposome is the
drug carrier which will provide an improvement in drug transport through the OM, thus increasing
drug efficacy. Fluidosomes were successfully manufactured using the thin film hydration method,
followed by either probe sonication or extrusion for size distribution. The probe sonication
produced small unilamellar vesicles, because their size is less than 100 nm (56.30 ± 0.50 nm)
and presented low polydispersity index (0.21 ± 0.01) in PBS. A stability study of the SUVs, in
terms of size, showed that the hydrodynamic diameter of the liposomes underwent an increase in size over a two-month time period, with the highest increase being 50% for the most diluted
sample (0.0625 mg/mL) (Figure 3.2). Due to their small size, i.e. high degree of lipid curvature,
DPPC small unilamellar vesicles are inherently unstable and are expected to spontaneously fuse
to form larger vesicles when stored below their phase transition temperature because they are
in their gel-like state (190), which would be the case for the fluidosomes because they were
stored at 4°C in between the measurement intervals.
Apart from the curvature, liposomal stability is dependent on the presence of ions seeing that
they affect the hydration state of lipids and, therefore, their packing. There are two hydration
centers in phospholipids, namely, the phosphate and the carbonyl groups, which determine the
intermolecular lipid interactions (129). Ions and water organization near the different groups
esterified in the phosphate group (choline, ethanolamine or glycerol) affect the hydrophobic and
repulsive forces between the lipid head-groups at the interface (198,199). Sodium (Na+) and
potassium (K+) bind to the carbonyl groups of POPC, which become slightly more accessible to hydration (200) with the first having a stronger binding compared to the latter, due to their smaller
size (201). Although Na+ and K+ (0.15 M) bind to the carbonyl group, they cause almost no effect
on the POPC packing (202). In this study, small unilamellar DPPC/DMPG (18:1) liposomes were
formed in PBS containing Na+ at concentration of 0.2 M, which possibly did not provide size
stability over time (Figure 3.2B).
When a series of HPβCD solutions (1-5% w/w) were used to hydrate the lipid film, the
hydrodynamic size diameter did not change and the stability of the liposomes was higher, as no
significant change in size occurred over a period of two weeks (Figure 3.3). Native and synthetic
cyclodextrins have been reported to interact with lipids and have indeed been used in
pharmaceutical and food products to either stabilize or solubilize bioactive lipids (203). Generally,

Liposomaly encapsulated drug/cyclodextrin inclusion complexes
81
cyclodextrins interact with phospholipids mainly though the inclusion of fatty acid chains into their
cavity since the polar headgroup interaction with the CD cavity is limited and weak (203). Native
CDs have been reported to form complexes of low solubility with phospholipids while their derivatives present a higher degree of interaction (203). RAMEB (45 mM) has been shown to
solubilize phospholipids (181), while non-methylated CD derivatives and in particular HPβCD do
not increase the permeability of DPPC liposomes for concentrations up to 125 mM (17% w/w)
(181,203–205). In this study, we found, from the evolution on size (Figure 3.3), that HPβCD (up
to 5%) stabilized the fluidosomes rather than solubilizing the lipids as also found by other groups
(181). The interaction of both RAMEB and HPβCD with lipid monolayers (DPPC/DPPG and
POPC/POPG in molar ratio of 3:1) have been studied by surface pressure measurements in a
Langmuir trough and are described in Chapter 4. Our results (Chapter 4) show a weak interaction
between HPβCD and the DPPC/DPPG monolayer, while RAMEB displays a stronger interaction (Figure 4.9).
The instability of SUVs, due to their small size, high curvature and choice of buffer, led us to
explore an alternative approach to manufacturing large unilamellar vesicles (LUVs) using
extrusion, to achieve sizes above 100 nm. LUVs display higher stability and retain the large
encapsulation efficiency of SUV (115,190). LUVs of a hydrodynamic diameter of 148 ± 19 nm
and a polydispersity index of 0.33 ± 0.07 (Figure 3.4A) were prepared in HEPES buffered saline
containing 20 mM CaCl2. Ca2+ were added into the saline (145 mM) because they tend to stabilize
unilamellar lipid PC vesicles at a concentration range of 1-60 mM by forming Ca2+ bridges between lipids (206). Ca2+ ions at low concentration (1-5 mM) adsorbs deeply into POPC and
POPS bilayer (202) and they bind more strongly to the carbonyl, phosphate and carboxylate
groups of both PC and PG, compared with Na+ ions, causing partial dehydration, conformational
change and immobilization of the phosphodiester groups (200,207). The influence of 1 mM CaCl2
is comparable to the one obtained with 150 mM NaCl, which shows the different affinity of each
ion to the lipid headgroup (202). The increased size of LUVs, along with the presence of Ca2+,
creates a more stable environment for fluidosomes. The total ionic strength of HEPES buffered saline containing CaCl2 was 211 mM which is of the same magnitude as PBS used in the SUV
preparation. According to Lapinski et al. (208), if the ionic strength of the two buffers is the same,
experimental data on bilayer lipid membranes formed by sonication (SUVs) can, in fact, be
compared directly to data on bilayer systems formed by extrusion (LUVs). Based on that finding,
the presence of HPβCD could possibly stabilize LUVs as found in the case of SUVs (Figure
3.3B).
The LUVs were encapsulated with the PPA148/RAMEB complex and it was observed that the
size of the encapsulated liposomes (129 ± 10 nm) was not statistically different from that of the
empty liposomes (148 ± 19 nm). The stability of the loaded liposomes depends on the competitive
binding of either the lipids or the drug (PPA148) to the CD cavity. This may happen because
inclusion complexes in solution are in equilibrium with the free molecules (209) and have been
Liposomaly encapsulated drug/cyclodextrin inclusion complexes
82
found to extract phospholipids and cholesterol from membranes by forming complexes (181). In
Chapter 2 (Figure 2.17A), the affinity of PPA148 to RAMEB was calculated by measuring the
binding constant using fluorescence spectroscopy. The binding constant of DPPC/RAMEB complexes has not been measured and no reference was found in the literature. Instead, the
binding constant for a 1:1 cholesterol/DIMEB complex is characterized by a binding constant of
102 M-1 (210), which is similar to the binding constant of drug/RAMEB (102 ± 26 M-1) found in
Chapter 2. As cholesterol has higher affinity towards cyclodextrin methyl-derivatives than DPPC,
it can be speculated that DPPC undergoes weaker binding with RAMEB than PPA148. The
presence of drug/CD complex improved the polydispersity index of the lipid suspension,
indicating the formation of a more monodisperse system. RAMEB was used at low concentration (0.7 mM) as it is known to solubilize phospholipids above 10-15 mM membrane (181,182). Below
this cut-off concentration, RAMEB retains the ability to facilitate lipid exchange without disturbing
the membrane (181,182).
The next step was to separate the loaded liposomes from the unentrapped material using size
exclusion chromatography and characterize the system in terms of encapsulation efficiency and loading capacity. The separation method was first validated using unloaded empty fluidosomes
to develop a robust eluting pattern of the fluidosomes. The lipids were eluted from the Sephadex
column by 8 successive additions of HEPES buffered saline pH 7.2 after equilibrating the column
with 15 mL of buffer. After the separation, an overall loss of lipids of 29.4 ± 3.7% and 13 ± 9%
was observed for the empty and encapsulated liposomes, respectively. The third aliquot of the
eluted empty fluidosomes contained 55 ± 2 % lipids of the initial amount used, as assessed by
the Stewart assay (Figure 3.5). The rest (29% lipid loss) was probably retained in the column
because lipid loss was not observed during the extrusion stage. When using the liposomes
prepared in the presence of the drug/RAMEB complex, the loss of lipids after the separation
process was lower, at only 13 ± 9% (Figure 3.5). The loss of lipids may be a result of poor column
condition before elution. It has been reported elsewhere (211) that pre-saturation of the column
with empty liposomes helps to avoid material loss during size exclusion chromatography. The
binding and release of liposomes on the dextran stationary phase of a Sephadex column is a
dynamic equilibrium process between the free and entrapped liposomes. However, pre-
saturation of the column can be problematic as it may contaminate the test sample. Further
investigation needs to be done in order to clarify the cause of lipid loss during the size exclusion chromatography.
The high encapsulation efficiency of drug in the liposomes, assessed by the area under the
absorbance-wavelength curve (67 ± 11%) showed that the drug/RAMEB complex was
successfully incorporated into the liposomes. Drug quantification was performed after extracting
PPA148 from the carrier and cyclodextrin, by washing with DCM. The extracted PPA148
displayed a UV spectra with λmax shifted compared to the pure drug in ethanol/water and change
in the shape of the peak (Figure 3.6B). Based on these data and the findings in Chapter 2 of a
Liposomaly encapsulated drug/cyclodextrin inclusion complexes
83
PPA148/RAMEB complex, it was assumed that the extracted PPA148 from the formulation was
not pure or had undergone structural conformation changes, leading to an altered UV profile
(Figure 3.6B). It is possible that the extraction was incomplete because of incomplete dissociation of the PPA148/RAMEB complexes, the presence of cyclodextrin dimers or even RAMEB/lipid
complexes that had not been removed from the mixture. Yamamoto and coworkers investigated
the dissociation of cholesterol/βCD complexes and cholesterol recovery was found to be 44%
(212). They found that dissociated and undissociated cholesterol was present in the mixture,
along with βCD dimers. The encapsulated fluidosomes with PPA148/RAMEB complexes is a
very complex system and during the drug extraction several types of aggregates may have been
formed, affecting the final drug absorbance. RAMEB may associate with lipid headgroups while being complexed with PPA148 as found with mono–(N-n-alkyl,N,N-dimethylamino)-β-
cyclodextrin, which can associate with the bilayer of DPPC:cholesterol (7:3) liposomes, while
having the adamantoyl moiety of the adamantoylglucose molecule included into the cavity (213).
Since the size of the encapsulated fluidosomes did not change and the encapsulation efficiency
is high, possibly PPA148 may be inserted into the CD cavity from one side and RAMEB can be
attached from the other side with the headgroups of the inner leaflet of the liposomes (Figure
3.10). Although there is no evidence concerning such an arrangement, it may explain the poor
drug extraction because of the complexity and difficulty in separating the individual molecules.
The efficacy of PPA148-in-RAMEB-in-liposomes was assessed against live bacteria (E. coli,
DH5α) (Figure 3.7). The disk diffusion assay revealed a statistically significant increase in the
inhibition zone of the drug-CD complex on its own and when it is incorporated into liposomes.
Due to the small number of observations (n=3-5) the difference between the PPA148/RAMEB
complex and the encapsulated liposomes was not significant (Figure 3.8). Based on the fact that cyclodextrin enhance the antimicrobial activity of drugs (171) and the lack of significance
between the PPA148/RAMEB complex and the encapsulated fluidosomes, Monte Carlo
simulations were conducted in order to investigate this result further. A higher number of
simulated observations (100) were generated based on the standard deviation of the
experimental data sets and tested using one-way ANOVA. The results showed a statistical
difference between the drug/RAMEB and the drug/RAMEB incorporated into liposomes (Figure
3.9). The increased efficacy of antibiotics by encapsulation into liposomes was first reported by
Beaulac and co-workers in 1998 and later by Sachetelli et al. in 2000 (102,179). They showed that DPPC/DMPG (18:1) liposomes encapsulated with tobramycin showed a decrease in the
bacterial counts in a sub-MIC concentration (102,179). Other reports regarding increased
efficacy of antibiotics with fluidosomes and other types of liposomes have been published up to
the present time (98). Interestingly, there have been publications regarding the increased efficacy
of drugs in the form of cyclodextrin complex or encapsulated into liposomes (Table 1.3, Table
1.4) (90,214), but there is only one report about a drug-in-CD-in-liposomes formulation in the
food industry (113), with nerolidol, a sesquiterpene with antibacterial activity and under investigation for its potential as a natural preservative in the food industry. In the next Chapter,

Liposomaly encapsulated drug/cyclodextrin inclusion complexes
84
we use lipid monolayers representing the inner and outer bacterial membrane and a model Gram
negative bacterial outer membrane to elucidate the mechanisms responsible for the increased
activity of this novel antimicrobial agent by using interfacial techniques (Langmuir trough monolayer interaction studies and neutron reflectivity).
Figure 3.10: Schematic representation of the possible organization of PPA148/RAMEB complex incorporated into Fluidosomes. The electrophilic center of PPA148 is presented inside the CD cavity while the headgroup of DPPC is associated with the exterior hydrogens of the narrow side of RAMEB molecules.
3.6 Conclusion
Fluidosomes encapsulated with PPA148/RAMEB complex were successfully manufactured with
a size of 129 ± 10 nm, polydispersity index of 0.14 ± 0.03 and high encapsulation efficiency (67
± 11%). The separation method of unentrapped material from loaded liposomes was developed
using empty liposomes. The final formulation was tested against E. coli DH5α and presented a
significant increase in drug efficacy. In the next chapter, PPA148 in its pure form and
cyclodextrins (HPβCD and RAMEB) are assessed over a series of lipid monolayers. The effect
of fluidosomes on the outer membrane is tested on a model Gram negative bacterial membrane,
Liposomaly encapsulated drug/cyclodextrin inclusion complexes
85
which was developed at the ISIS neutron source (Didcot, Oxfordshire) and neutron reflectivity is
used to assess the interaction.
A biophysical investigation into the uptake mechanism of PPA148 and its delivery system
86
Chapter 4 A biophysical
investigation into the uptake
mechanism of PPA148 and its
delivery system

A biophysical investigation into the uptake mechanism of PPA148 and its delivery system
87
4.1 Introduction
The uptake of drugs and their delivery systems across the bacterial cell envelope is a complex
process, which is difficult to elucidate because of its dynamic nature. The envelope of Gram
negative bacteria possesses two membranes, acting as discrete permeability barriers which
drugs and nutrients need to cross so as to enter the cytoplasm. The outer membrane (OM) of
Gram negatives consists of an asymmetric lipopolysaccharide (LPS) and phospholipid bilayer spanned by porin proteins which play an important role in nutrient and drug uptake (Figure 1.2).
The β-barrel porins are transmembrane proteins, which regulate the uptake of nutrients and
hydrophilic compounds. The OM also provides protection against environmental stressors and
inhibits the uptake of some antibiotics. The second permeability barrier, the inner membrane
(IM), consists mostly of intrinsic proteins and phospholipids. The uptake of compounds by the
bacterial cell is divided into passive and active processes. The former is characterized by either
drug penetration through the lipids or transport through general or specific transporter proteins. The latter requires energy input for the transport of compounds through the proteins. The
transmembrane proteins (porins), located in the OM, can act as both passive and active
transporters for the influx of beneficial compounds and efflux of unwanted molecules, such as
antibiotics. The nature of LPS and the presence of porins challenge the antibiotic uptake by Gram
negative bacteria and there is a real need to find means of overcoming these drug permeability
obstacles.
In Chapter 3, a drug-in cyclodextrin-in liposome formulation was evaluated, which showed an
enhancement of PPA148’s solubility and antimicrobial efficiency. The rationale behind this
formulation is based on two factors: the results from the microbiological assay (Table B 1; Table
B 2) of pure PPA148; and PPA148’s physicochemical properties, in particular water solubility
and lipophilicity, as calculated by ChemDraw software (Table 1.5). The results from the
microbiological assays (minimum inhibitory concentration or MIC) in the presence and absence
of the efflux pump inhibitor phenylalanine-arginine-β-naphthylamide (PAβN) (107,108) revealed difficulties in the transport through the cell envelope and a possible synergistic effect between
PPA148 and PAβN either by inhibiting the efflux pumps or by PAβN's permeabilizing effect on
both OM and IM (69). The MIC, in the absence of the pump inhibitor, was relatively high (2 μg/mL
against A. baumannii, 0.25-32 μg/mL in K. pseumoniae and 16-128 μg/mL in P. aeruginosa) but
decreased dramatically in all bacterial strains tested in its presence (107). In this work, a
liposomal carrier was used to overcome PPA148’s uptake challenges. The microbiological assay
described in Chapter 3 showed an enhanced inhibition of E. coli DH5α bacteria when the
drug/RAMEB complex was incorporated into liposomes (Figure 3.7; Figure 3.8; Figure 3.9). Fluidosomes were selected to enhance the transport of PPA148 through the OM because they
have been found to fuse through bacterial membranes (179). It was, therefore, hypothesized that
the fluidosomes would fuse into the OM while releasing their core content into the periplasmic
space. Based on the lipophilicity of PPA148, it was also hypothesized that the novel drug might
A biophysical investigation into the uptake mechanism of PPA148 and its delivery system
88
partition into the IM in order to reach its site of action inside the cell. The low water solubility of
PPA148 may lead to drug precipitation when entering the periplasm, leading to ineffective
antimicrobial action. For this reason, RAMEB was successfully used as a solubilizing agent for PPA148 (Chapter 2), which is barely soluble in aqueous solvents as a pure substance. It has
also been reported that β-cyclodextrins and their derivatives, such as RAMEB and HPβCD, not
only enhance water solubility of poorly soluble drugs but also increase their internalization into
cells and improve their biological activity against Gram negative bacteria (90,91,94). RAMEB has
been found to cause cell lysis and inhibit the growth of the Gram positive Bacillus strains (185).
While the mechanism of bacterial growth inhibition by RAMEB has not been investigated, native
βCD has been found to adhere to the peptidoglycan surface of Gram positive bacteria via hydrogen bonds (215) and to be transported with facilitated diffusion via specific channels
(CymA) in the outer membrane of the Gram negative bacterium, Klebsiella oxytoca (31). In Gram
negative bacteria, increased electrostatic interactions have been observed between the inclusion
complex of chlorhexidine/native-βCD and the LPS of Aggregatibacter actinomycetemcomitans,
whose structure is similar to that of E. coli (216,217). Therefore, we hypothesized that
cyclodextrin may also help the passive transport of PPA148 through the IM via the formation of
phospholipid-cyclodextrin complex by releasing pure PPA148 inside the cytoplasm where the
site of action (DNA minor groove) is located.
Based on the results from Chapters 2 and 3, this chapter investigates the mechanism of uptake
of this novel antimicrobial agent and assesses the effectiveness of a drug-in-cyclodextrin-in-
liposome formulation to increase OM and IM permeability. The investigation of the drug-
membrane interactions and possible drug penetration was carried out by using interfacial
techniques (Langmuir trough and neutron reflectivity) with both monolayer and bilayer model membranes. Passive diffusion can occur either via diffusion across the lipid bilayers for
antibiotics with a high degree of lipophilicity and some degree of polarity or via the OM proteins,
which can either be specific transporters or general water channels, for small hydrophilic
compounds (218). Based on the possible fusion mechanism of fluidosomes, the cyclodextrin-
phospholipid complex formation and the high lipophilicity of PPA148, simplified artificial
membrane systems were used to mimic the lipidic component of the relevant biological
membranes in order to examine the passive diffusion across lipid layers.
In the monolayer studies, lipids representing the outer leaflet of OM and IM of the Gram negative
bacterial envelope were used to model the membranes. There are two types of LPS: rough and
smooth, which differ by the presence or absence of O-antigen. Mutations into the bacterial
genome produces LPS without or with truncated O-antigen which are called rough or semi-rough
LPS chemotypes. Within the rough chemotypes, further modifications and mutations lead to the
expression of LPS with shorter oligosaccharide, divided into Ra, Rb, Rc, Rd and Re subgroups, depending on the length of their core region (Figure 1.10). Ra LPS has the longest and Re LPS
has the shortest core. In this study, the focus is on a Ra-EH100 and Rc-J5 LPS extracted from
E. coli and Lipid A extracted from the Re-R595 S. minessota. In addition, Rc LPS was used to
A biophysical investigation into the uptake mechanism of PPA148 and its delivery system
89
form stable planar monolayers because of its short headgroup. This type of LPS and Lipid A
extracted from Re LPS were also used to test the influence of the OM steric barrier. The bilayer
studies were conducted on a model asymmetric Gram negative bacterial membrane consisting of Ra LPS as the outer leaflet. Ra LPS is a substitute for LPS molecules containing O-antigen
because smooth LPS is less hydrophobic than truncated LPS and, thus, Ra LPS does not form
water soluble aggregates. It has been found that truncated rough LPS can be deposited as
insoluble monolayers (219,220) while smooth LPS act as surfactants by forming micelles in
solution (221). The more truncated rough mutant LPS was used to form more stable monolayers
and compare the drug-membrane interaction in the presence (Rc LPS) and absence (Re Lipid
A) of steric hindrance.
The phospholipids in the OM are zwitterionic and negatively charged and their distribution within
the individual OM and IM is inhomogeneous (222). The predominant phospholipids are
phosphatidylethanolamine (PE), phosphatidylglycerol (PG) and cardiolipin (CL), while some
species, such as P. aeruginosa, can also produce phosphatidylcholine (PC) (223). It has been
shown that PE and PG are mostly located in the inner and outer leaflet of the plasma membrane (IM) respectively, while CL is evenly distributed in both leaflets of IM (224). E. coli polar lipid
extract has been extensively studied and its phospholipid composition has been found to be 67%
PE, 23.2% PG and 8.9% CL (127). The anionic phospholipids (PG and CL) of the IM represent
18% of the total IM lipids, while they constitute only 9% of the OM lipids. The remaining
phospholipid lipid fraction (>98%) in both the inner leaflet of the OM and the whole IM is PE
(222).
The structural complexity of LPS and the small size of bacteria make it difficult to obtain detailed
molecular information on the interactions between drug molecules and the OM and IM (225).
However, biophysical studies of isolated phospholipid and LPS monolayers and bilayers provide
an insight into these interactions.
In this work, monolayers composed of the phospholipids or rough mutant LPS were deposited at the air/liquid interface and examined in the presence of PPA148 and cyclodextrin using a
Langmuir trough. These experiments provided useful insights into the molecular interactions of
the drug on the membranes, either at the level of the polar region when they are in contact with
the outer leaflet of the OM or IM of the cell envelope, or at the level of the hydrophobic domain
of the lipid bilayer in which they can be partitioned and inserted.
To complement these monolayer studies, a model Gram negative bacterial asymmetric
membrane consisting of Ra LPS and DPPC as the outer and inner leaflet of the OM was used to
examine the interaction between the liposomal carrier and the OM. This model membrane has
been extensively studied and validated by a group of scientists working in collaboration with the
Science and Technology Facilities Council (STFS), Rutherford Appleton laboratory in Chilton,
UK (225–227). Neutron reflectivity (NR) was used to characterize the structural changes in this

A biophysical investigation into the uptake mechanism of PPA148 and its delivery system
90
model membrane when put in contact with the formulation. In particular, NR can give information
on the relative location of fluidosomes within and at the interface of a supported asymmetric
model OM, thus giving clues on the mode of interaction, namely either fusion into the OM or a possible partitioning into the membrane’s hydrophobic core and diffusion across the membrane.
4.2 Materials
Lipids: The phospholipids 1,2-dipalmitoyl-sn-glycero-3-phosphocholine (DPPC, 16:0 PC), 1,2-
dimyristoyl-sn-glycero-3-phosphoglycerol, sodium salt (DMPG, 14:0 PG), E. coli polar lipid
extract (E. coli B), 1-palmitoyl-2-oleoyl-sn-glycero-3-phosphocholine (POPC, 16:0-18:1 PC) and
1-palmitoyl-2-oleoyl-sn-glycero-3- phospho-(1'-rac-glycerol) (sodium salt) (POPG, 16:0-18:1 PC)
powders were manufactured by Avanti Polar Lipids (Alabama, USA) and supplied by Stratech
Scientific (Newmarket, UK). Rc LPS from E. coli J5 (purity: protein 1.4%, nucleic acid 0.340%, phosphate 7.3%, Kdo 5.9%), Ra LPS from E. coli EH100 and Re Lipid A from S. minnessota
R595 containing containing ≤0.3% proteins was obtained from Sigma-Aldrich, UK. and were used
without further purification.
Cyclodextrins: Hydroxy-propyl-beta-cyclodextrin (HPβCD) and randomly methylated
cyclodextrin (RAMEB) were purchased from Sigma-Aldrich, UK.
Chemicals and material used in the microbiological assay: Blank, rifampicin (30 ug) and
vancomycin (30 ug) susceptibility disks, agar powder and Muller Hinton broth for microbiology
were purchased from Oxoid (UK).
Solvents: Dichloromethane (DCM) and chloroform (CHCl3) were purchased from Sigma-
Aldrich, UK. LC/MS grade water was supplied by Merck, UK. The ultrapure water at 18.2 MΩ cm
was produced by a Purelab Ultra machine from ELGA Process Water (Marlow, UK).
Salts used for buffer preparation: Sodium chloride (NaCl), magnesium chloride (MgCl2),
monosodium phosphate (NaH2PO4), sodium hydroxide (NaOH) and HEPES (>=99.5%) were purchased from Sigma-Aldrich, UK.
Devices and tubes: Disposable semi-micro dynamic light scattering cuvettes (volume capacity
of 1.5 mL) purchased from VWR International, UK. Silicon crystal (50 * 80 * 20 mm) polished with
silicon oxide and a customized cell made of PTFE was kindly provided by the ISIS facility (Chilton,
UK).
4.3 Methods
4.3.1 Surface Pressure-Area isotherms at the air-liquid interface
Pressure-area measurements were carried out at a constant temperature of 23°C on a Nima
602A Langmuir trough (Nima Technologies Ltd., Coventry, UK) equipped with a Nima PS4
A biophysical investigation into the uptake mechanism of PPA148 and its delivery system
91
surface pressure microbalance (0-240 mN/m range, 0.1 mN/m resolution) controlled by a PC via
a Nima IU4 computer interface unit. The microbalance was calibrated with a 10 mg standard
weight and the area enclosed by the barriers was also calibrated. Prior to use, the PTFE surface of the trough was thoroughly cleaned with ethanol and chloroform in order to remove any
impurities. A clean Wilhelmy plate (chromatographic paper roll, Whatman Grade 1, 10 mm width,
GE Healthcare life sciences UK, Little Chalfont, UK) was attached to the microbalance,
suspended and partially submerged in the subphase (0.9% w/v NaCl or 1 mM MgCl2). The
subphase surface was examined for dust and contaminants prior to commencing the experiment
by repeated compression of the barriers and suction of the surface using a vacuum pump. The
subphase was considered clean when, upon compression, the change in surface pressure did not exceed 0.2 mN/m.
Solutions of DPPC/DPPG and POPC/POPG mixtures (in a molar ratio of 3/1), Lipid A from S.
minnessota (R595 Lipid A) and LPS J5 from E. coli (Rc J5 LPS) were prepared in pure chloroform
at a total lipid or LPS concentration of 2 mg/mL. To form air/liquid interface monolayers, 30-70
µL of lipid solution were deposited dropwise on the subphase surface using a Hamilton syringe (Hamilton Co. Europe, Bonaduz, Switzerland), with the barriers open at their maximum. Before
compressing the barriers at a constant rate of 35 cm2/min, 10 min were allowed for the solvent
to evaporate. During the compression, changes in the surface pressure were recorded until the
monolayer reached its collapse point. Each sample was run in triplicate. The molecular area for
each monolayer was determined at the pressure of 30 mN/m and compared for their changes in
molecular size. In addition, the compressibility modulus (Es or Cs-1), which is the reciprocal of the
area compression modulus of the monolayer (Cs) (228) , was calculated using the following
formula:
𝐸t =Vah= −𝐴 × ∆�
�� Equation 4.1
, where A is the area per molecule and ΔΠ/ΔA is the slope of the isotherm at a defined surface
pressure (229). The compressibility modulus (Cs-1) of phospholipid and glycolipid monolayers
was calculated at 30 mN/m, which is considered as the approximate lateral pressure of a lipid bilayer (130). The compressibility modulus is an indication of the packing elasticity of the lipid
monolayer and the equilibrium among the lipids. In the liquid expanded film, the compressibility
modulus ranges between 12.5 and 50 mN/m and in for the liquid intermediate takes values bellow
100 mN/m (228). The liquid condensed phase is characterised by a compressibility modulus of
100-250 mN/m while the condensed state, which is described as closely packed lipids in the
equilibrium state, is denoted by values above 250 mN/m (230).
4.3.2 Drug - monolayer interaction
A variation of the adsorption isotherm method (Chapter 2, section 2.3.6) was adopted to
investigate the interaction of drugs and the lipid monolayer. The set-up of the reduced area
A biophysical investigation into the uptake mechanism of PPA148 and its delivery system
92
custom-made Teflon® petri dish was as described in the adsorption studies in Chapter 2 (section
2.3.6). On the clean subphase surface (0.9% NaCl or 1 mM MgCl2) a lipid solution (total lipid
mixture) was spread dropwise until the surface pressure reached 30-35 mN/m, while stirring the subphase with a 4.5×15 mm magnetic stirrer bar. A period of time (40-60 min) was allowed for
the solvent to evaporate and for the monolayer to reach equilibrium (stabilization of the surface
pressure). Thereafter, the drug solution in DMSO was injected below the surface using a small
disposable plastic syringe with a hypodermic needle (BD biosciences UK, Oxford, UK). The
following drug concentrations were used in the trough: 2, 20, 40 and 60 μg/mL when it was tested
with DPPC:DPPG (3:1) monolayer; and 20 μg/mL when it was tested with Rc J5 LPS and Re
595 Lipid A. HPβCD and RAMEB were tested against DPPC/DPPG (3/1), DOPC/POPG (3/1) and Re 595 Lipid A monolayers while fluidosomes were tested at 0.1 mg/mL against J5 LPS
only. The changes in surface pressure were recorded at constant slow stirring of the subphase,
with the magnet speed set at its minimum to avoid a variation of pressure greater than 0.2 mN/m.
The difference in surface pressure change was plotted against time and the binding isotherms
produced were fitted with a sigmoidal model, specifically a Hill plot with 3 parameters as it is displayed in GraphPad, Prism to obtain the kinetic parameters as follows:
𝑦 = ∆�cg�m�
L�z%� pm�
Equation 4.2
,where ΔΠmax is the maximum difference in surface pressure, h is the hill slope, and t50% is the
time needed to achieve half ΔΠmax.
4.3.3 Drug - lipid bilayer interaction using fluorescence spectroscopy
4.3.3.1 Preparation of E. coli B liposomes encapsulating 5(6)-carboxyfluorescein
Liposomes were prepared by the thin film hydration method. A sample of E. coli B lipid extract
(10 mg) was dissolved in chloroform. The solution was placed in a vacuum desiccator overnight
to let the organic solvent evaporate, resulting in the formation of a dry lipid film. The dried film was then hydrated with 2.5 mL of 40 mM 5(6)-caboxyfluorescein (CF) solution (pH = 7.4) at 30
°C. The mixture was vortexed (Cyclone-Vortex mixer CM-1, Nickel-Electro Ltd) for 60 sec at 2800
rpm, sonicated (Soniprep 150 Plus ultrasonic disintegrator 120V 60Hz, London, UK) for 5 min
with an exponential microprobe and amplitude 10 microns and left at room temperature for one
hour prior to further use.
The separation of the liposomes from the unentrapped dye was carried out using size exclusion
chromatography. A Sephadex™ G-25 PD-10 column (GE Healthcare, UK) (packed bed
dimensions of 1.45 × 5 cm and particle size range 85-260 μm) was equilibrated with 15 mL (3
washes of 5 mL) of 70 mM sodium chloride. The liposome mixture (1 mL) was then eluted through
the column and washed with 1 mL of sodium chloride 5 times. The eluted fractions were collected
separately. The fourth fraction contained the liposomes and was used for the CF-release study.
A biophysical investigation into the uptake mechanism of PPA148 and its delivery system
93
A sodium chloride solution of 70 mM (135 mOsm) was used to match the osmolality of the
entrapped CF solution (129 mOsm measured with the advanced MICRO-OSMOMETER, Vitech
Scientific Ltd, West Sussex, UK) which should not differ significantly from that of the sodium chloride solution outside of the liposomes (234).
4.3.3.2 5(6)-carboxyfluorescein (CF) release profile
Fluorescence spectroscopy was used to evaluate the ability of chlorhexidine digluconate (CHD)
and PP-A148 to disrupt the bilayers of vesicles composed of E. coli lipids. In each experiment 50 μL of CF-loaded liposomes were added to 2350 µL of NaCl (70 mM) in a cuvette (10 × 10 mm)
and the fluorescence intensity was measured using a Varian Cary Eclipse fluorimeter (Agilent,
USA) at 25 °C. Antimicrobial solutions (3.15 mM) were added (0.1 ml) after 60 s and the
fluorescence intensity of the mixture was again measured at an excitation/emission wavelength
of 490/510 nm and a slit width of 2.5 nm for both processes. The fluorescence was monitored at
hourly intervals, and at the end of the experiment the total concentration of CF was determined
after lysing the liposomes with 100 μL of Triton X-100 (10 w/v%). CF-liposomes in sodium chloride (70 mM) were also monitored hourly, to determine their integrity. The data was
normalized against controls designed to compensate for the effects of dye photobleaching over
the duration of the experiment. The percentage dye release was calculated using the following
formula:
𝐶𝐹% = ¡{�¡z¡��¡z
× 100, 𝑓𝑜𝑟𝑡 ∈ [0, 𝑇] Equation 4.3
, where 𝐹L is the fluorescence intensity of each sample at time t, 𝐹w is the fluorescence intensity
prior to the addition of the drug (liposomes in NaCl) of each time point, and 𝐹� is the intensity of
each sample after the addition of Triton X-100, which corresponds to 100% dye release.
4.3.4 Neutron reflectivity of asymmetric bilayer of DPPC and LPS and interaction
with fluidosomes
4.3.4.1 Asymmetric bilayer deposition
The lipid components of model Gram negative bacterial membranes were deposited on a
piranha-cleaned (SiO2) surface of single silicon crystals (50×80×20 mm), using a Langmuir-
Blodget (LB) trough (KSV-NIMA, Biolin Scientific, Finland) (Figure 4.1). The LB technique was
used to deposit the inner leaflet of the membrane (d62DPPC) on the 50×80 mm polished surface of the crystal, and the Langmuir-Schaefer (LS) deposition used for the outer leaflet of the
membrane (Ra LPS) (Figure 4.1). Three isotherm cycles were conducted prior to deposition to
examine the stability of the monolayers. For the LB deposition, the silicon block was submerged
into the ultrapure non-buffered water subphase (containing 5 mM CaCl2), cooled to 10°C. A
solution of d62DPPC in chloroform was deposited dropwise (50 uL of 2.5 mg/mL) on the subphase
surface and compressed slowly to a constant surface pressure of 38 mN/m. The block was lifted
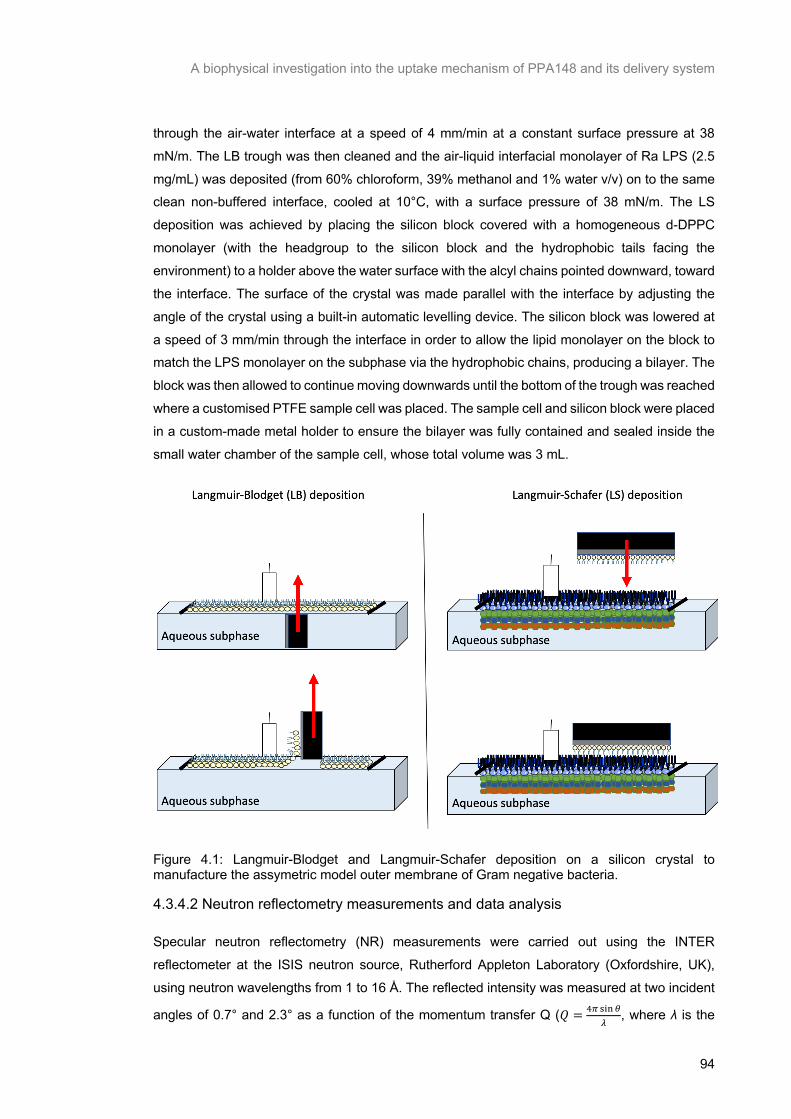
A biophysical investigation into the uptake mechanism of PPA148 and its delivery system
94
through the air-water interface at a speed of 4 mm/min at a constant surface pressure at 38
mN/m. The LB trough was then cleaned and the air-liquid interfacial monolayer of Ra LPS (2.5
mg/mL) was deposited (from 60% chloroform, 39% methanol and 1% water v/v) on to the same clean non-buffered interface, cooled at 10°C, with a surface pressure of 38 mN/m. The LS
deposition was achieved by placing the silicon block covered with a homogeneous d-DPPC
monolayer (with the headgroup to the silicon block and the hydrophobic tails facing the
environment) to a holder above the water surface with the alcyl chains pointed downward, toward
the interface. The surface of the crystal was made parallel with the interface by adjusting the
angle of the crystal using a built-in automatic levelling device. The silicon block was lowered at
a speed of 3 mm/min through the interface in order to allow the lipid monolayer on the block to match the LPS monolayer on the subphase via the hydrophobic chains, producing a bilayer. The
block was then allowed to continue moving downwards until the bottom of the trough was reached
where a customised PTFE sample cell was placed. The sample cell and silicon block were placed
in a custom-made metal holder to ensure the bilayer was fully contained and sealed inside the
small water chamber of the sample cell, whose total volume was 3 mL.
Figure 4.1: Langmuir-Blodget and Langmuir-Schafer deposition on a silicon crystal to manufacture the assymetric model outer membrane of Gram negative bacteria.
4.3.4.2 Neutron reflectometry measurements and data analysis
Specular neutron reflectometry (NR) measurements were carried out using the INTER
reflectometer at the ISIS neutron source, Rutherford Appleton Laboratory (Oxfordshire, UK),
using neutron wavelengths from 1 to 16 Å. The reflected intensity was measured at two incident
angles of 0.7° and 2.3° as a function of the momentum transfer Q (𝑄 = OA PQRSB
, where λ is the
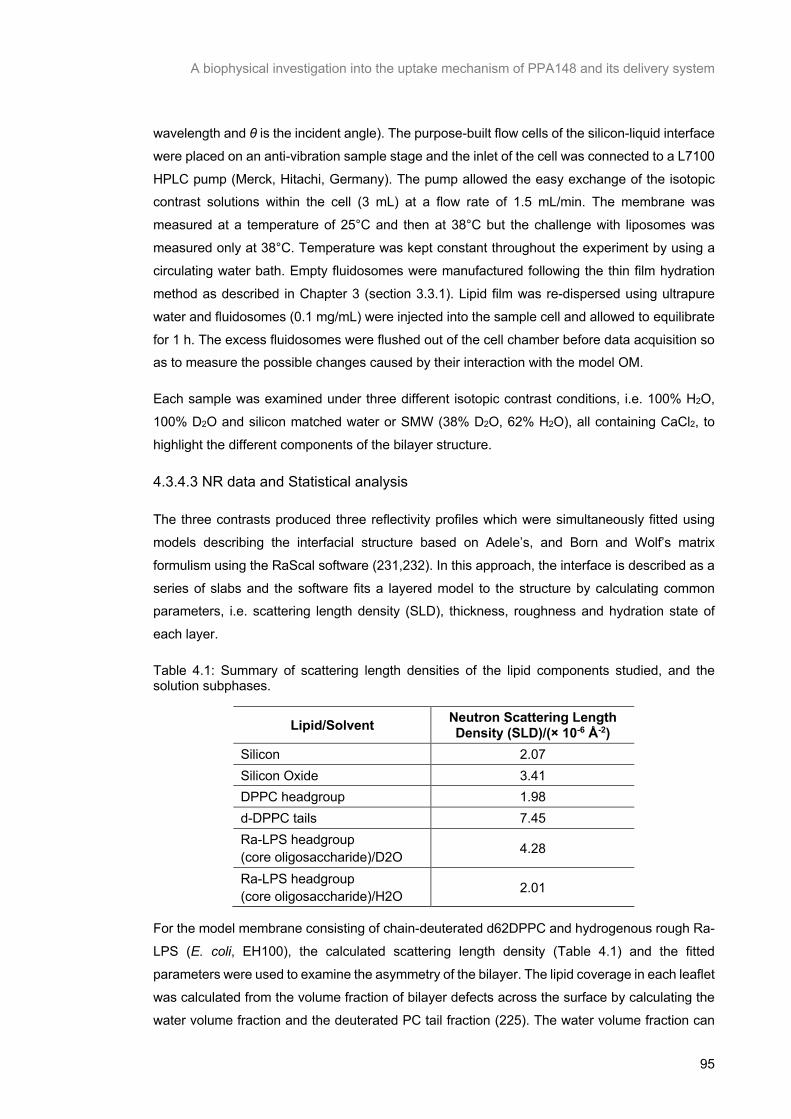
A biophysical investigation into the uptake mechanism of PPA148 and its delivery system
95
wavelength and θ is the incident angle). The purpose-built flow cells of the silicon-liquid interface
were placed on an anti-vibration sample stage and the inlet of the cell was connected to a L7100
HPLC pump (Merck, Hitachi, Germany). The pump allowed the easy exchange of the isotopic contrast solutions within the cell (3 mL) at a flow rate of 1.5 mL/min. The membrane was
measured at a temperature of 25°C and then at 38°C but the challenge with liposomes was
measured only at 38°C. Temperature was kept constant throughout the experiment by using a
circulating water bath. Empty fluidosomes were manufactured following the thin film hydration
method as described in Chapter 3 (section 3.3.1). Lipid film was re-dispersed using ultrapure
water and fluidosomes (0.1 mg/mL) were injected into the sample cell and allowed to equilibrate
for 1 h. The excess fluidosomes were flushed out of the cell chamber before data acquisition so as to measure the possible changes caused by their interaction with the model OM.
Each sample was examined under three different isotopic contrast conditions, i.e. 100% H2O,
100% D2O and silicon matched water or SMW (38% D2O, 62% H2O), all containing CaCl2, to
highlight the different components of the bilayer structure.
4.3.4.3 NR data and Statistical analysis
The three contrasts produced three reflectivity profiles which were simultaneously fitted using
models describing the interfacial structure based on Adele’s, and Born and Wolf’s matrix
formulism using the RaScal software (231,232). In this approach, the interface is described as a
series of slabs and the software fits a layered model to the structure by calculating common parameters, i.e. scattering length density (SLD), thickness, roughness and hydration state of
each layer.
Table 4.1: Summary of scattering length densities of the lipid components studied, and the solution subphases.
Lipid/Solvent Neutron Scattering Length Density (SLD)/(× 10-6 Å-2)
Silicon 2.07 Silicon Oxide 3.41 DPPC headgroup 1.98 d-DPPC tails 7.45 Ra-LPS headgroup (core oligosaccharide)/D2O 4.28
Ra-LPS headgroup (core oligosaccharide)/H2O 2.01
For the model membrane consisting of chain-deuterated d62DPPC and hydrogenous rough Ra-
LPS (E. coli, EH100), the calculated scattering length density (Table 4.1) and the fitted
parameters were used to examine the asymmetry of the bilayer. The lipid coverage in each leaflet
was calculated from the volume fraction of bilayer defects across the surface by calculating the
water volume fraction and the deuterated PC tail fraction (225). The water volume fraction can

A biophysical investigation into the uptake mechanism of PPA148 and its delivery system
96
be determined by the difference in SLD of the DPPC and LPS tails in the three solvent contrasts.
In the tail region, both lipid tails do not possess labile hydrogens and, therefore, do not undergo
changes in SLD (ρ). The mathematical model uses the following formulas to calculate the water volume fraction from the raw data, and the parameter is called “Tail-hydration”.
𝜌FHLLuW = 𝜌b¤¤a𝜑b¤¤a + 𝜌�¤v𝜑�¤v + 𝜌�@¦𝜑�@¦ Equation 4.4
𝜑�@¦ =YTUU§¨{gT©ª«U{¨gh{¬�YTUU§¨{gT©ª«U{¨gh{Z
Yª«U{¨gh{¬�Yª«U{¨gh{Z Equation 4.5
where 𝜌FHLLuW is the fitted SLD value of the bilayer, 𝜌b¤¤a , 𝜌�¤v, 𝜌�@¦ are the calculated SLD of
the deuterated DPPC tails, hydrogenous LPS tails and water, respectively, 𝜑b¤¤a , 𝜑�¤v and
𝜑�@¦ are the volume fractions, 𝜌HIIuGLkH�oJILGktLV, 𝜌HIIuGLkH�oJILGktL@, 𝜌oJILGktL and are the
experimental SLD values of the inner tails in two contrast solutions (for example H2O and D2O)
and the experimental SLD of the two chosen contrast solvents. Based on Equation 4.4 and
Equation 4.5, the volume fraction of deuterated DPPC tails was calculated using the following
formula:
𝜑b¤¤aLkH�t =Y�YZ®¯Z®�¯�°±{gT©h(V�¯Z®)
Y²³°°´�Y�°±{gT©h Equation 4.6
, where 𝜌 is the fitted SLD, 𝜌�@¦,𝜌Wb¤¤a and 𝜑�¤vLkH�t is the SLD of the water, DPPC and LPS
are the experimental values. The PC-tail volume fraction 𝜑b¤¤aLkH�t was calculated before taking
into account the hydration of the bilayer tail region, which is a separate fitted parameter of the
mathematical model. Therefore, the volume fraction of the LPS tails 𝜑�¤vLkH�t was reduced by the
following formula:
𝜑�¤vLkH�t = 1 − (𝜑b¤¤aLkH�t + 𝜑�@¦) Equation 4.7
All three samples (RT, 38°C before and after liposome introduction) shared the same silicon
substrate because the same model membrane was measured in different conditions. The models were fitted to the data using a Bayesian Markov Chain Monte Carlo (MCMC) algorithm (227,233).
In addition to the model parameters, the backgrounds, scale factors and instrument resolutions
were also fitted. A Bayesian approach was followed for the fitting, with prior probability distribution
(priors) chosen according to already known information prior to the analysis, posteriors obtained
using a Delayed Rejection (DR) algorithm and the best fit parameters taken as the distribution
maxima. DR is a way of modifying the standard Metropolis-Hastings (MH) algorithm to improve
the efficiency of the resulting MCMC estimators and decrease the asymptotic variance (234).
The idea is that upon rejection in an MH algorithm, instead of advancing the run time and retaining the same position, a second stage is proposed with improved distribution. This process
can be iterated for a fixed or a random number of stages, and higher stage proposals depend on
the proposed and rejected fits. The error analysis was run at 95% confidence intervals for each
distribution.
A biophysical investigation into the uptake mechanism of PPA148 and its delivery system
97
4.4 Results
4.4.1 Surface Pressure-Area isotherms of Langmuir monolayers at the air-liquid
interface
Pressure-area isotherms were used to determine the physical state and mechanical properties
of the E. coli polar lipid extract, DPPC/DPPG [3/1], POPC/POPG [3/1], Rc LPS J5, Ra LPS
EH100 and Lipid A monolayers. E. coli B lipid extract and both PC/PG monolayers were used to
mimic the Gram negative IM. Rc J5 LPS J5 and R595 Lipid A, both of which were used to model
the outer leaflet of the OM. The average molecular weight of each mixture was used to plot the
surface pressure-area isotherms (Figure 4.2) which showed the phase transitions of each monolayer during compression. Changes in the slope and shape of the curves during
compression resulted from changes in the orientation, packing and arrangement of phospholipids
at the interface.
4.4.1.1 Inner membrane model monolayers
All pressure-area isotherms in (Figure 4.2A, C, E) are representative curves chosen from
triplicate measurements for each lipid monolayer. The isotherm obtained from pure DPPC
monolayers (Figure 4.2C) nearly reached the solid state because the slope was almost
perpendicular to the y-axis (235,236), whereas from E. coli B, POPC, POPG and POPC:POPG
(3:1) (Figure 4.2A, E) displayed typical expanded monolayers.
DPPC (hydrogenous and deuterated) and DPPC/DPPG undergo an L1/L2 transition, marked by
a plateau (or pseudo plateau) in the isotherm and a corresponding minimum in the compression
modulus plot (Figure 4.2C and D). The transition began at approximately 4 mN/m for h-DPPC
and the mixture (237,238), while for d-DPPC it started at 9mN/m (239). The DPPC/DPPG
monolayer reached its liquid condensed phase just below 20 mN/m with a maximum Es of 197
mN/m. For POPC/POPG, the transition to liquid condensed state was initiated around 25 mN/m,
making it less compressible than the DPPC/DPPG monolayer (Figure 4.2E, F). The E. coli B
display areas of liquid-expanded phases before turning into the coexistence of L1/L2 phase at surface areas of ~ 15 mN/m, and remained until the collapse of the monolayer (Figure 4.2A, B).
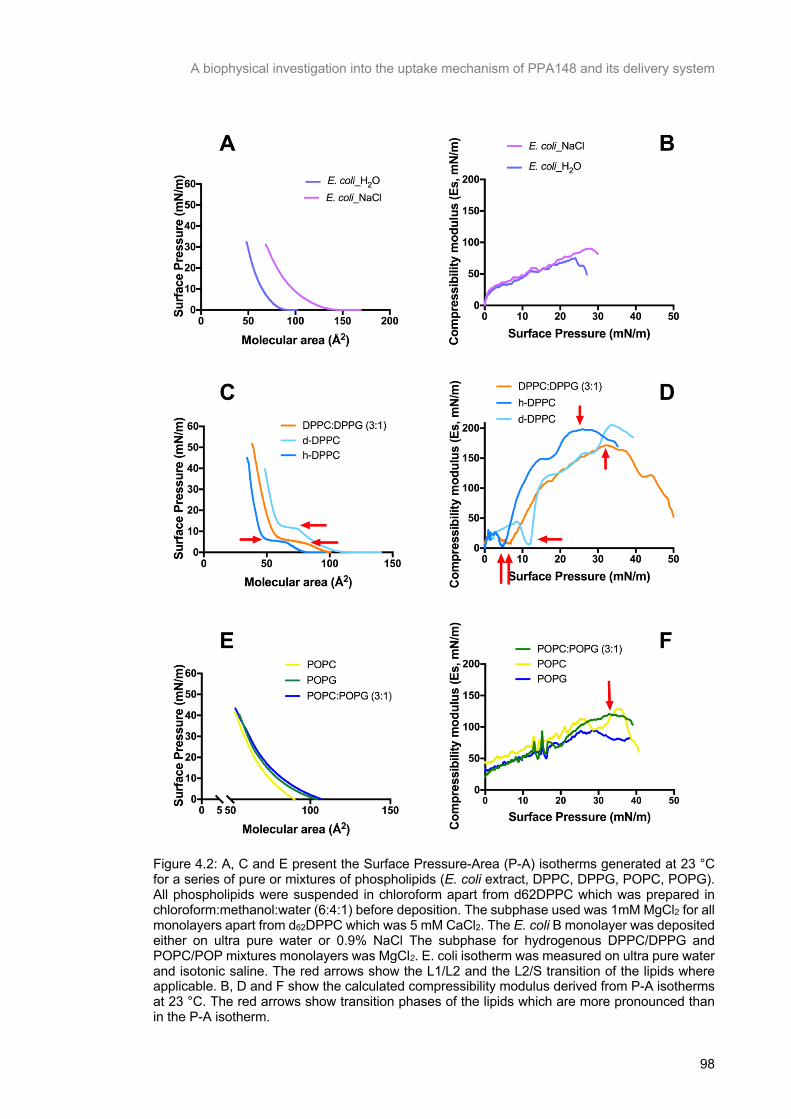
A biophysical investigation into the uptake mechanism of PPA148 and its delivery system
98
Figure 4.2: A, C and E present the Surface Pressure-Area (P-A) isotherms generated at 23 °C for a series of pure or mixtures of phospholipids (E. coli extract, DPPC, DPPG, POPC, POPG). All phospholipids were suspended in chloroform apart from d62DPPC which was prepared in chloroform:methanol:water (6:4:1) before deposition. The subphase used was 1mM MgCl2 for all monolayers apart from d62DPPC which was 5 mM CaCl2. The E. coli B monolayer was deposited either on ultra pure water or 0.9% NaCl The subphase for hydrogenous DPPC/DPPG and POPC/POP mixtures monolayers was MgCl2. E. coli isotherm was measured on ultra pure water and isotonic saline. The red arrows show the L1/L2 and the L2/S transition of the lipids where applicable. B, D and F show the calculated compressibility modulus derived from P-A isotherms at 23 °C. The red arrows show transition phases of the lipids which are more pronounced than in the P-A isotherm.
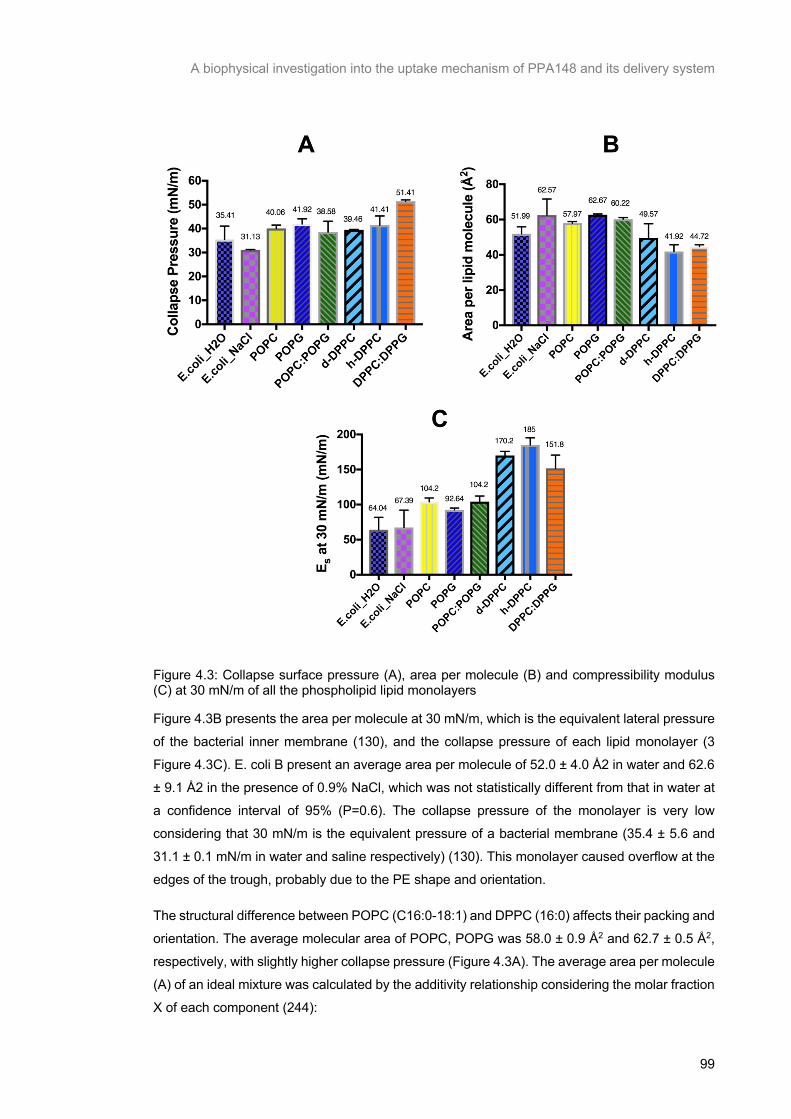
A biophysical investigation into the uptake mechanism of PPA148 and its delivery system
99
Figure 4.3: Collapse surface pressure (A), area per molecule (B) and compressibility modulus (C) at 30 mN/m of all the phospholipid lipid monolayers
Figure 4.3B presents the area per molecule at 30 mN/m, which is the equivalent lateral pressure
of the bacterial inner membrane (130), and the collapse pressure of each lipid monolayer (3
Figure 4.3C). E. coli B present an average area per molecule of 52.0 ± 4.0 Å2 in water and 62.6
± 9.1 Å2 in the presence of 0.9% NaCl, which was not statistically different from that in water at
a confidence interval of 95% (P=0.6). The collapse pressure of the monolayer is very low
considering that 30 mN/m is the equivalent pressure of a bacterial membrane (35.4 ± 5.6 and
31.1 ± 0.1 mN/m in water and saline respectively) (130). This monolayer caused overflow at the
edges of the trough, probably due to the PE shape and orientation.
The structural difference between POPC (C16:0-18:1) and DPPC (16:0) affects their packing and
orientation. The average molecular area of POPC, POPG was 58.0 ± 0.9 Å2 and 62.7 ± 0.5 Å2,
respectively, with slightly higher collapse pressure (Figure 4.3A). The average area per molecule
(A) of an ideal mixture was calculated by the additivity relationship considering the molar fraction
X of each component (244):
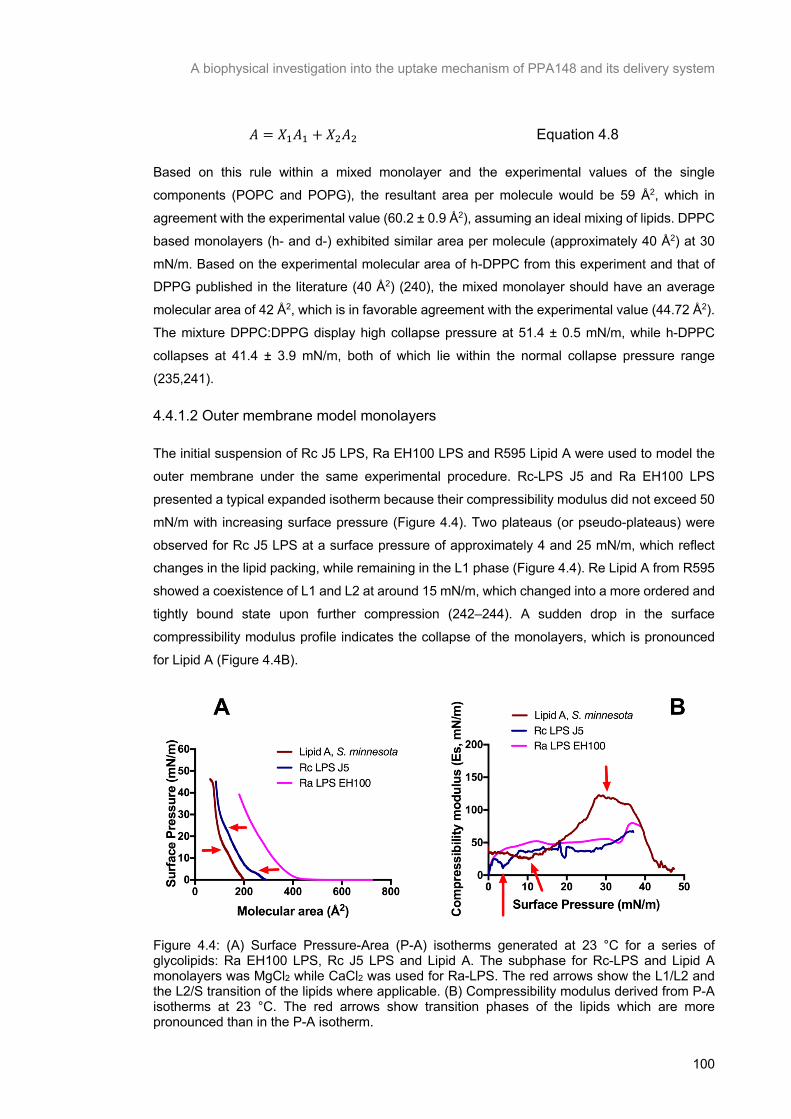
A biophysical investigation into the uptake mechanism of PPA148 and its delivery system
100
𝐴 = 𝑋V𝐴V + 𝑋@𝐴@ Equation 4.8
Based on this rule within a mixed monolayer and the experimental values of the single
components (POPC and POPG), the resultant area per molecule would be 59 Å2, which in
agreement with the experimental value (60.2 ± 0.9 Å2), assuming an ideal mixing of lipids. DPPC
based monolayers (h- and d-) exhibited similar area per molecule (approximately 40 Å2) at 30
mN/m. Based on the experimental molecular area of h-DPPC from this experiment and that of DPPG published in the literature (40 Å2) (240), the mixed monolayer should have an average
molecular area of 42 Å2, which is in favorable agreement with the experimental value (44.72 Å2).
The mixture DPPC:DPPG display high collapse pressure at 51.4 ± 0.5 mN/m, while h-DPPC
collapses at 41.4 ± 3.9 mN/m, both of which lie within the normal collapse pressure range
(235,241).
4.4.1.2 Outer membrane model monolayers
The initial suspension of Rc J5 LPS, Ra EH100 LPS and R595 Lipid A were used to model the
outer membrane under the same experimental procedure. Rc-LPS J5 and Ra EH100 LPS
presented a typical expanded isotherm because their compressibility modulus did not exceed 50
mN/m with increasing surface pressure (Figure 4.4). Two plateaus (or pseudo-plateaus) were
observed for Rc J5 LPS at a surface pressure of approximately 4 and 25 mN/m, which reflect changes in the lipid packing, while remaining in the L1 phase (Figure 4.4). Re Lipid A from R595
showed a coexistence of L1 and L2 at around 15 mN/m, which changed into a more ordered and
tightly bound state upon further compression (242–244). A sudden drop in the surface
compressibility modulus profile indicates the collapse of the monolayers, which is pronounced
for Lipid A (Figure 4.4B).
Figure 4.4: (A) Surface Pressure-Area (P-A) isotherms generated at 23 °C for a series of glycolipids: Ra EH100 LPS, Rc J5 LPS and Lipid A. The subphase for Rc-LPS and Lipid A monolayers was MgCl2 while CaCl2 was used for Ra-LPS. The red arrows show the L1/L2 and the L2/S transition of the lipids where applicable. (B) Compressibility modulus derived from P-A isotherms at 23 °C. The red arrows show transition phases of the lipids which are more pronounced than in the P-A isotherm.
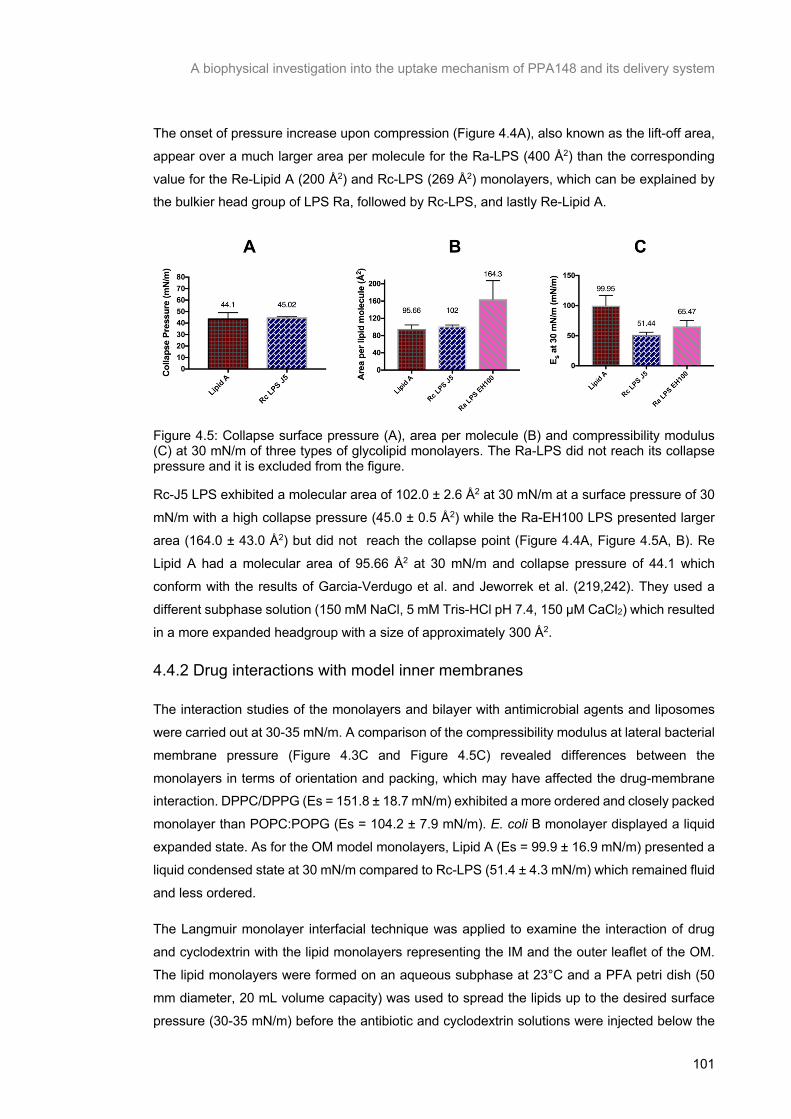
A biophysical investigation into the uptake mechanism of PPA148 and its delivery system
101
The onset of pressure increase upon compression (Figure 4.4A), also known as the lift-off area,
appear over a much larger area per molecule for the Ra-LPS (400 Å2) than the corresponding
value for the Re-Lipid A (200 Å2) and Rc-LPS (269 Å2) monolayers, which can be explained by the bulkier head group of LPS Ra, followed by Rc-LPS, and lastly Re-Lipid A.
Figure 4.5: Collapse surface pressure (A), area per molecule (B) and compressibility modulus (C) at 30 mN/m of three types of glycolipid monolayers. The Ra-LPS did not reach its collapse pressure and it is excluded from the figure.
Rc-J5 LPS exhibited a molecular area of 102.0 ± 2.6 Å2 at 30 mN/m at a surface pressure of 30
mN/m with a high collapse pressure (45.0 ± 0.5 Å2) while the Ra-EH100 LPS presented larger
area (164.0 ± 43.0 Å2) but did not reach the collapse point (Figure 4.4A, Figure 4.5A, B). Re
Lipid A had a molecular area of 95.66 Å2 at 30 mN/m and collapse pressure of 44.1 which
conform with the results of Garcia-Verdugo et al. and Jeworrek et al. (219,242). They used a
different subphase solution (150 mM NaCl, 5 mM Tris-HCl pH 7.4, 150 μM CaCl2) which resulted
in a more expanded headgroup with a size of approximately 300 Å2.
4.4.2 Drug interactions with model inner membranes
The interaction studies of the monolayers and bilayer with antimicrobial agents and liposomes
were carried out at 30-35 mN/m. A comparison of the compressibility modulus at lateral bacterial
membrane pressure (Figure 4.3C and Figure 4.5C) revealed differences between the
monolayers in terms of orientation and packing, which may have affected the drug-membrane interaction. DPPC/DPPG (Es = 151.8 ± 18.7 mN/m) exhibited a more ordered and closely packed
monolayer than POPC:POPG (Es = 104.2 ± 7.9 mN/m). E. coli B monolayer displayed a liquid
expanded state. As for the OM model monolayers, Lipid A (Es = 99.9 ± 16.9 mN/m) presented a
liquid condensed state at 30 mN/m compared to Rc-LPS (51.4 ± 4.3 mN/m) which remained fluid
and less ordered.
The Langmuir monolayer interfacial technique was applied to examine the interaction of drug
and cyclodextrin with the lipid monolayers representing the IM and the outer leaflet of the OM.
The lipid monolayers were formed on an aqueous subphase at 23°C and a PFA petri dish (50
mm diameter, 20 mL volume capacity) was used to spread the lipids up to the desired surface
pressure (30-35 mN/m) before the antibiotic and cyclodextrin solutions were injected below the
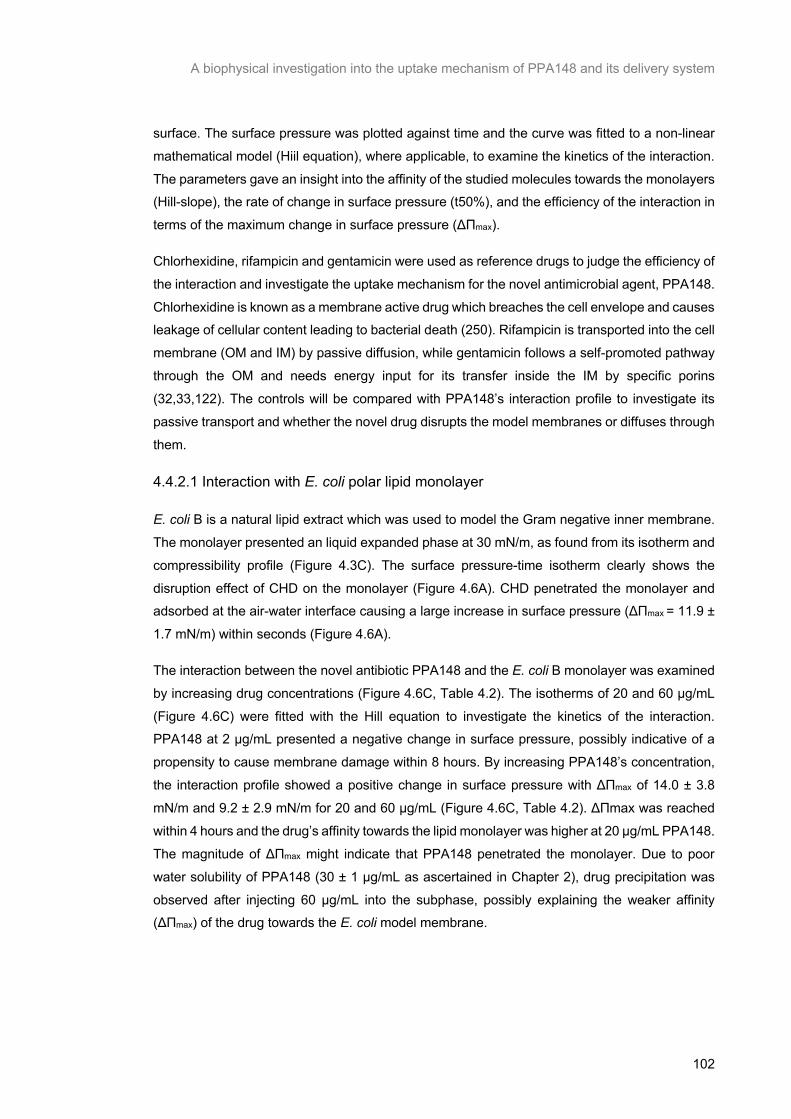
A biophysical investigation into the uptake mechanism of PPA148 and its delivery system
102
surface. The surface pressure was plotted against time and the curve was fitted to a non-linear
mathematical model (Hiil equation), where applicable, to examine the kinetics of the interaction.
The parameters gave an insight into the affinity of the studied molecules towards the monolayers (Hill-slope), the rate of change in surface pressure (t50%), and the efficiency of the interaction in
terms of the maximum change in surface pressure (ΔΠmax).
Chlorhexidine, rifampicin and gentamicin were used as reference drugs to judge the efficiency of
the interaction and investigate the uptake mechanism for the novel antimicrobial agent, PPA148.
Chlorhexidine is known as a membrane active drug which breaches the cell envelope and causes leakage of cellular content leading to bacterial death (250). Rifampicin is transported into the cell
membrane (OM and IM) by passive diffusion, while gentamicin follows a self-promoted pathway
through the OM and needs energy input for its transfer inside the IM by specific porins
(32,33,122). The controls will be compared with PPA148’s interaction profile to investigate its
passive transport and whether the novel drug disrupts the model membranes or diffuses through
them.
4.4.2.1 Interaction with E. coli polar lipid monolayer
E. coli B is a natural lipid extract which was used to model the Gram negative inner membrane.
The monolayer presented an liquid expanded phase at 30 mN/m, as found from its isotherm and
compressibility profile (Figure 4.3C). The surface pressure-time isotherm clearly shows the
disruption effect of CHD on the monolayer (Figure 4.6A). CHD penetrated the monolayer and adsorbed at the air-water interface causing a large increase in surface pressure (ΔΠmax = 11.9 ±
1.7 mN/m) within seconds (Figure 4.6A).
The interaction between the novel antibiotic PPA148 and the E. coli B monolayer was examined
by increasing drug concentrations (Figure 4.6C, Table 4.2). The isotherms of 20 and 60 μg/mL
(Figure 4.6C) were fitted with the Hill equation to investigate the kinetics of the interaction. PPA148 at 2 μg/mL presented a negative change in surface pressure, possibly indicative of a
propensity to cause membrane damage within 8 hours. By increasing PPA148’s concentration,
the interaction profile showed a positive change in surface pressure with ΔΠmax of 14.0 ± 3.8
mN/m and 9.2 ± 2.9 mN/m for 20 and 60 μg/mL (Figure 4.6C, Table 4.2). ΔΠmax was reached
within 4 hours and the drug’s affinity towards the lipid monolayer was higher at 20 μg/mL PPA148.
The magnitude of ΔΠmax might indicate that PPA148 penetrated the monolayer. Due to poor
water solubility of PPA148 (30 ± 1 μg/mL as ascertained in Chapter 2), drug precipitation was
observed after injecting 60 μg/mL into the subphase, possibly explaining the weaker affinity (ΔΠmax) of the drug towards the E. coli model membrane.
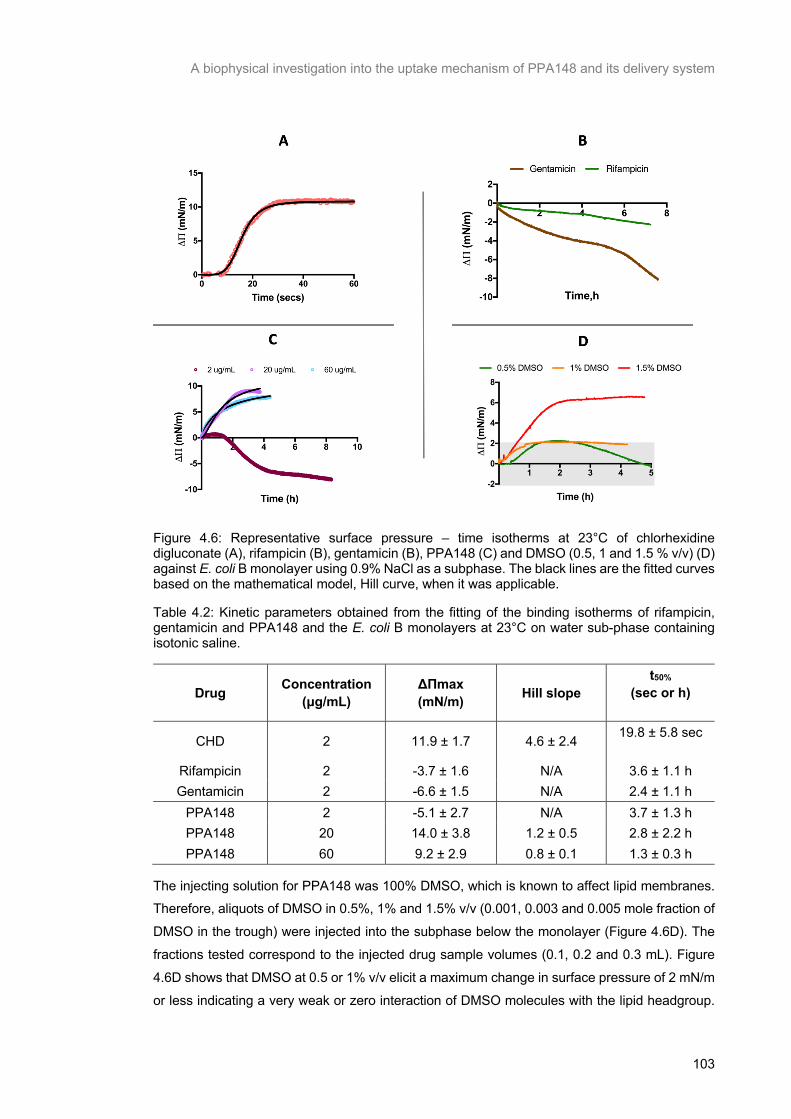
A biophysical investigation into the uptake mechanism of PPA148 and its delivery system
103
Figure 4.6: Representative surface pressure – time isotherms at 23°C of chlorhexidine digluconate (A), rifampicin (B), gentamicin (B), PPA148 (C) and DMSO (0.5, 1 and 1.5 % v/v) (D) against E. coli B monolayer using 0.9% NaCl as a subphase. The black lines are the fitted curves based on the mathematical model, Hill curve, when it was applicable.
Table 4.2: Kinetic parameters obtained from the fitting of the binding isotherms of rifampicin, gentamicin and PPA148 and the E. coli B monolayers at 23°C on water sub-phase containing isotonic saline.
Drug Concentration (μg/mL)
ΔΠmax (mN/m) Hill slope
t50% (sec or h)
CHD 2 11.9 ± 1.7 4.6 ± 2.4 19.8 ± 5.8 sec
Rifampicin 2 -3.7 ± 1.6 N/A 3.6 ± 1.1 h Gentamicin 2 -6.6 ± 1.5 N/A 2.4 ± 1.1 h
PPA148 2 -5.1 ± 2.7 N/A 3.7 ± 1.3 h PPA148 20 14.0 ± 3.8 1.2 ± 0.5 2.8 ± 2.2 h PPA148 60 9.2 ± 2.9 0.8 ± 0.1 1.3 ± 0.3 h
The injecting solution for PPA148 was 100% DMSO, which is known to affect lipid membranes. Therefore, aliquots of DMSO in 0.5%, 1% and 1.5% v/v (0.001, 0.003 and 0.005 mole fraction of
DMSO in the trough) were injected into the subphase below the monolayer (Figure 4.6D). The
fractions tested correspond to the injected drug sample volumes (0.1, 0.2 and 0.3 mL). Figure
4.6D shows that DMSO at 0.5 or 1% v/v elicit a maximum change in surface pressure of 2 mN/m
or less indicating a very weak or zero interaction of DMSO molecules with the lipid headgroup.
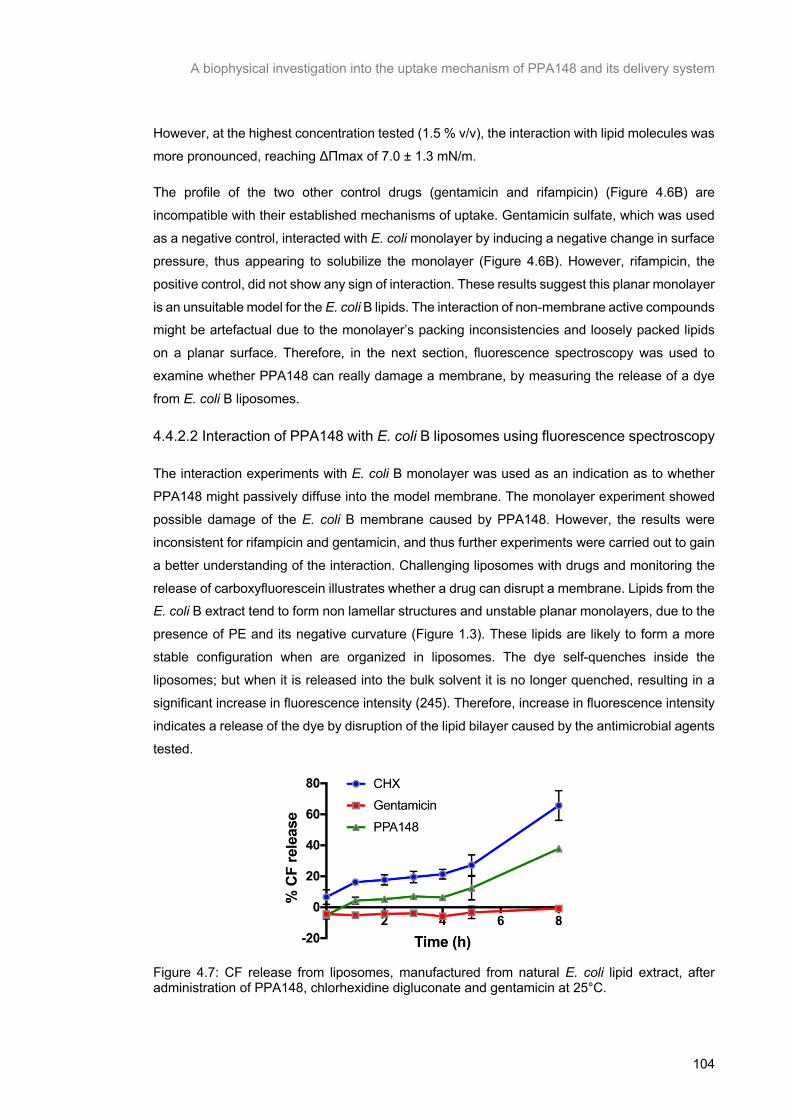
A biophysical investigation into the uptake mechanism of PPA148 and its delivery system
104
However, at the highest concentration tested (1.5 % v/v), the interaction with lipid molecules was
more pronounced, reaching ΔΠmax of 7.0 ± 1.3 mN/m.
The profile of the two other control drugs (gentamicin and rifampicin) (Figure 4.6B) are
incompatible with their established mechanisms of uptake. Gentamicin sulfate, which was used
as a negative control, interacted with E. coli monolayer by inducing a negative change in surface
pressure, thus appearing to solubilize the monolayer (Figure 4.6B). However, rifampicin, the
positive control, did not show any sign of interaction. These results suggest this planar monolayer
is an unsuitable model for the E. coli B lipids. The interaction of non-membrane active compounds might be artefactual due to the monolayer’s packing inconsistencies and loosely packed lipids
on a planar surface. Therefore, in the next section, fluorescence spectroscopy was used to
examine whether PPA148 can really damage a membrane, by measuring the release of a dye
from E. coli B liposomes.
4.4.2.2 Interaction of PPA148 with E. coli B liposomes using fluorescence spectroscopy
The interaction experiments with E. coli B monolayer was used as an indication as to whether
PPA148 might passively diffuse into the model membrane. The monolayer experiment showed
possible damage of the E. coli B membrane caused by PPA148. However, the results were
inconsistent for rifampicin and gentamicin, and thus further experiments were carried out to gain
a better understanding of the interaction. Challenging liposomes with drugs and monitoring the
release of carboxyfluorescein illustrates whether a drug can disrupt a membrane. Lipids from the E. coli B extract tend to form non lamellar structures and unstable planar monolayers, due to the
presence of PE and its negative curvature (Figure 1.3). These lipids are likely to form a more
stable configuration when are organized in liposomes. The dye self-quenches inside the
liposomes; but when it is released into the bulk solvent it is no longer quenched, resulting in a
significant increase in fluorescence intensity (245). Therefore, increase in fluorescence intensity
indicates a release of the dye by disruption of the lipid bilayer caused by the antimicrobial agents
tested.
Figure 4.7: CF release from liposomes, manufactured from natural E. coli lipid extract, after administration of PPA148, chlorhexidine digluconate and gentamicin at 25°C.
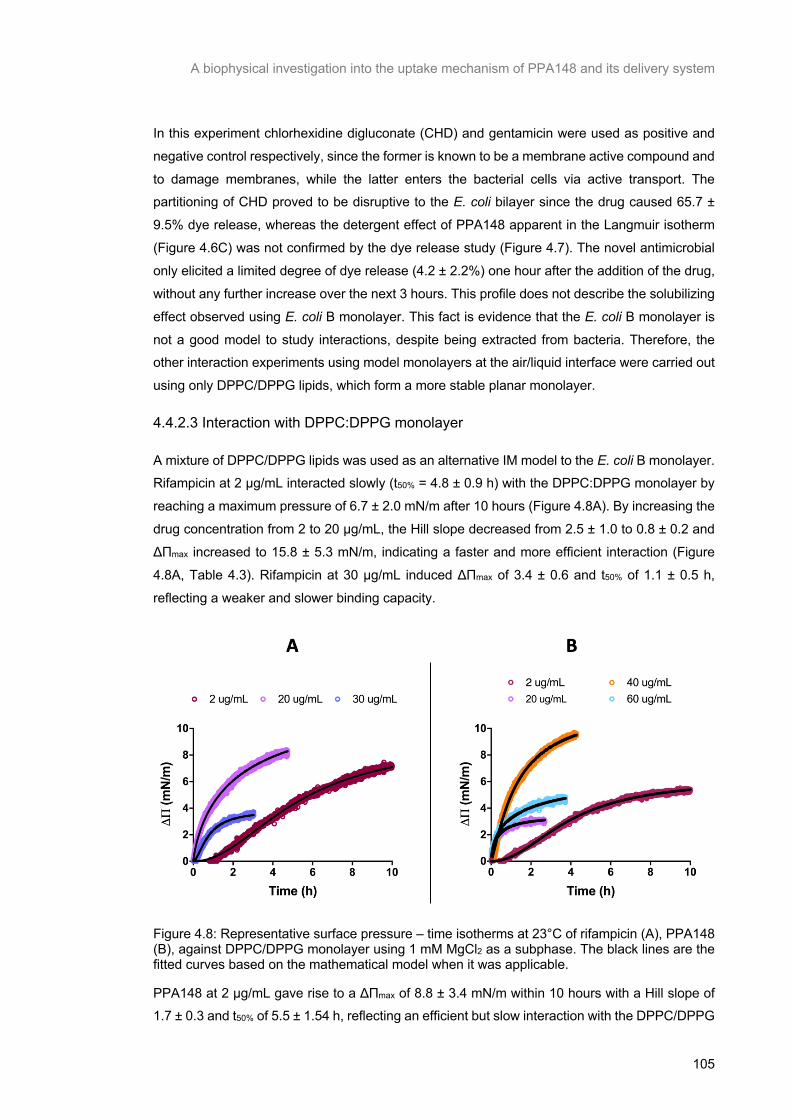
A biophysical investigation into the uptake mechanism of PPA148 and its delivery system
105
In this experiment chlorhexidine digluconate (CHD) and gentamicin were used as positive and
negative control respectively, since the former is known to be a membrane active compound and
to damage membranes, while the latter enters the bacterial cells via active transport. The partitioning of CHD proved to be disruptive to the E. coli bilayer since the drug caused 65.7 ±
9.5% dye release, whereas the detergent effect of PPA148 apparent in the Langmuir isotherm
(Figure 4.6C) was not confirmed by the dye release study (Figure 4.7). The novel antimicrobial
only elicited a limited degree of dye release (4.2 ± 2.2%) one hour after the addition of the drug,
without any further increase over the next 3 hours. This profile does not describe the solubilizing
effect observed using E. coli B monolayer. This fact is evidence that the E. coli B monolayer is
not a good model to study interactions, despite being extracted from bacteria. Therefore, the other interaction experiments using model monolayers at the air/liquid interface were carried out
using only DPPC/DPPG lipids, which form a more stable planar monolayer.
4.4.2.3 Interaction with DPPC:DPPG monolayer
A mixture of DPPC/DPPG lipids was used as an alternative IM model to the E. coli B monolayer. Rifampicin at 2 μg/mL interacted slowly (t50% = 4.8 ± 0.9 h) with the DPPC:DPPG monolayer by
reaching a maximum pressure of 6.7 ± 2.0 mN/m after 10 hours (Figure 4.8A). By increasing the
drug concentration from 2 to 20 μg/mL, the Hill slope decreased from 2.5 ± 1.0 to 0.8 ± 0.2 and
ΔΠmax increased to 15.8 ± 5.3 mN/m, indicating a faster and more efficient interaction (Figure
4.8A, Table 4.3). Rifampicin at 30 μg/mL induced ΔΠmax of 3.4 ± 0.6 and t50% of 1.1 ± 0.5 h,
reflecting a weaker and slower binding capacity.
Figure 4.8: Representative surface pressure – time isotherms at 23°C of rifampicin (A), PPA148 (B), against DPPC/DPPG monolayer using 1 mM MgCl2 as a subphase. The black lines are the fitted curves based on the mathematical model when it was applicable.
PPA148 at 2 μg/mL gave rise to a ΔΠmax of 8.8 ± 3.4 mN/m within 10 hours with a Hill slope of 1.7 ± 0.3 and t50% of 5.5 ± 1.54 h, reflecting an efficient but slow interaction with the DPPC/DPPG
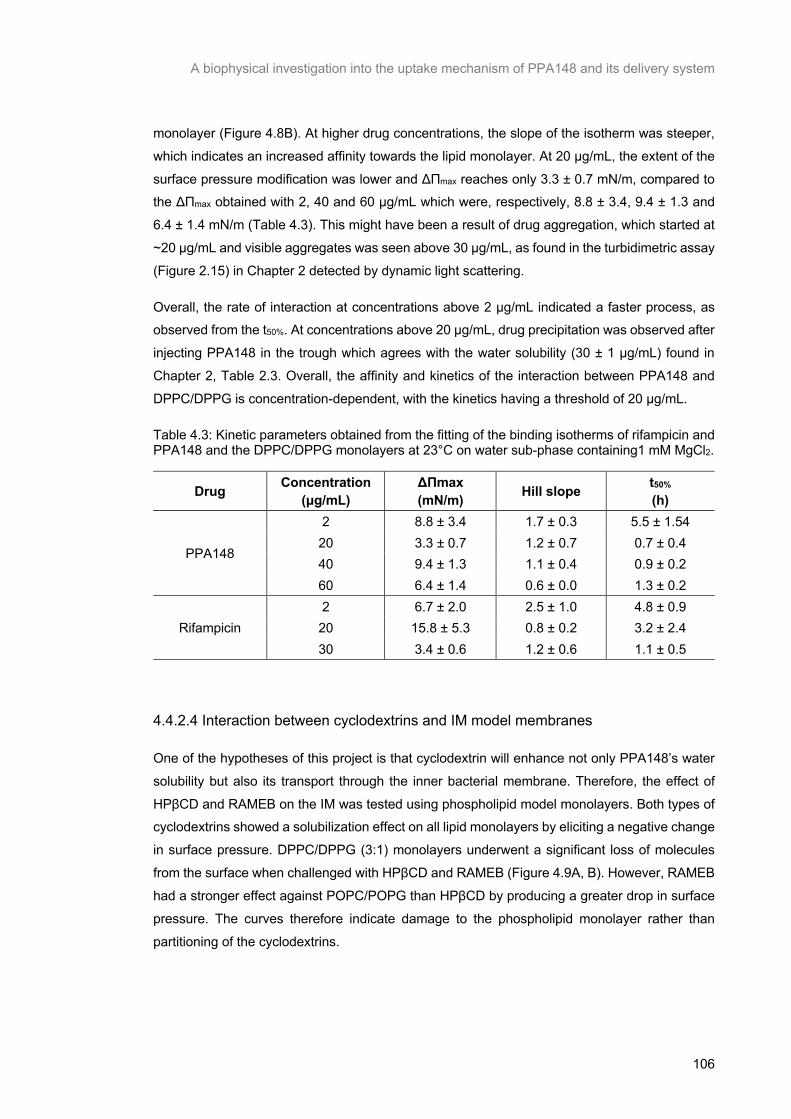
A biophysical investigation into the uptake mechanism of PPA148 and its delivery system
106
monolayer (Figure 4.8B). At higher drug concentrations, the slope of the isotherm was steeper,
which indicates an increased affinity towards the lipid monolayer. At 20 μg/mL, the extent of the
surface pressure modification was lower and ΔΠmax reaches only 3.3 ± 0.7 mN/m, compared to the ΔΠmax obtained with 2, 40 and 60 μg/mL which were, respectively, 8.8 ± 3.4, 9.4 ± 1.3 and
6.4 ± 1.4 mN/m (Table 4.3). This might have been a result of drug aggregation, which started at
~20 μg/mL and visible aggregates was seen above 30 μg/mL, as found in the turbidimetric assay
(Figure 2.15) in Chapter 2 detected by dynamic light scattering.
Overall, the rate of interaction at concentrations above 2 μg/mL indicated a faster process, as observed from the t50%. At concentrations above 20 μg/mL, drug precipitation was observed after
injecting PPA148 in the trough which agrees with the water solubility (30 ± 1 μg/mL) found in
Chapter 2, Table 2.3. Overall, the affinity and kinetics of the interaction between PPA148 and
DPPC/DPPG is concentration-dependent, with the kinetics having a threshold of 20 μg/mL.
Table 4.3: Kinetic parameters obtained from the fitting of the binding isotherms of rifampicin and PPA148 and the DPPC/DPPG monolayers at 23°C on water sub-phase containing1 mM MgCl2.
Drug Concentration (μg/mL)
ΔΠmax (mN/m) Hill slope t50%
(h)
PPA148
2 8.8 ± 3.4 1.7 ± 0.3 5.5 ± 1.54 20 3.3 ± 0.7 1.2 ± 0.7 0.7 ± 0.4 40 9.4 ± 1.3 1.1 ± 0.4 0.9 ± 0.2 60 6.4 ± 1.4 0.6 ± 0.0 1.3 ± 0.2
Rifampicin 2 6.7 ± 2.0 2.5 ± 1.0 4.8 ± 0.9 20 15.8 ± 5.3 0.8 ± 0.2 3.2 ± 2.4 30 3.4 ± 0.6 1.2 ± 0.6 1.1 ± 0.5
4.4.2.4 Interaction between cyclodextrins and IM model membranes
One of the hypotheses of this project is that cyclodextrin will enhance not only PPA148’s water
solubility but also its transport through the inner bacterial membrane. Therefore, the effect of
HPβCD and RAMEB on the IM was tested using phospholipid model monolayers. Both types of cyclodextrins showed a solubilization effect on all lipid monolayers by eliciting a negative change
in surface pressure. DPPC/DPPG (3:1) monolayers underwent a significant loss of molecules
from the surface when challenged with HPβCD and RAMEB (Figure 4.9A, B). However, RAMEB
had a stronger effect against POPC/POPG than HPβCD by producing a greater drop in surface
pressure. The curves therefore indicate damage to the phospholipid monolayer rather than
partitioning of the cyclodextrins.

A biophysical investigation into the uptake mechanism of PPA148 and its delivery system
107
Figure 4.9: Representative surface pressure – time isotherms at 23°C of HPβCD (A) and RAMEB (B), against DPPC/DPPG (3:1) and POPC/POPG (3:1) monolayers using MgCl2 as a subphase.
4.4.3 Drug interaction with model outer membranes
4.4.3.1 Interaction between PPA148, fluidosomes, and model OM monolayers
Lipid A and Rc-LPS J5 monolayers were used to investigate the effect of steric barrier from the
OM on PPA148, rifampicin and fluidosomes. Lipid A constitutes the innermost compartment of LPS and lacks the polysaccharide chain region. In this experiment rifampicin was used as a
positive control because it shows a very good correlation with PPA148 when tested against
model IM lipid monolayers (Figure 4.8). Rifampicin (20 μg/mL) did not affect the packing of the
Lipid A monolayer and the surface pressure remained constant for 2 h (Figure 4.10B). Instead,
PPA148 produced an increase in surface pressure of 6.9 ± 0.7 mN/m, reaching a plateau in less
than an hour with a high binding affinity (Hill slope = 1.3 ± 0.2) (Figure 4.10A).
When PPA148 was used to challenge Rc-LPS J5 monolayers, it revealed low efficiency (ΔΠmax
= 3.7 ± 2.1 mN/m), weak binding capacity (Hill slope = 3.7 ± 2.6) but a fast rate of t50% = 0.2 ± 0.1
h (Figure 4.10A). The presence of the polysaccharide chain hindered the interaction of PPA148
with the J5 LPS monolayer, probably due to a steric effect. The affinity (Hill slope) and efficiency
(ΔΠmax) of PPA148 towards J5 LPS was non-reproducible (Table 4.4).
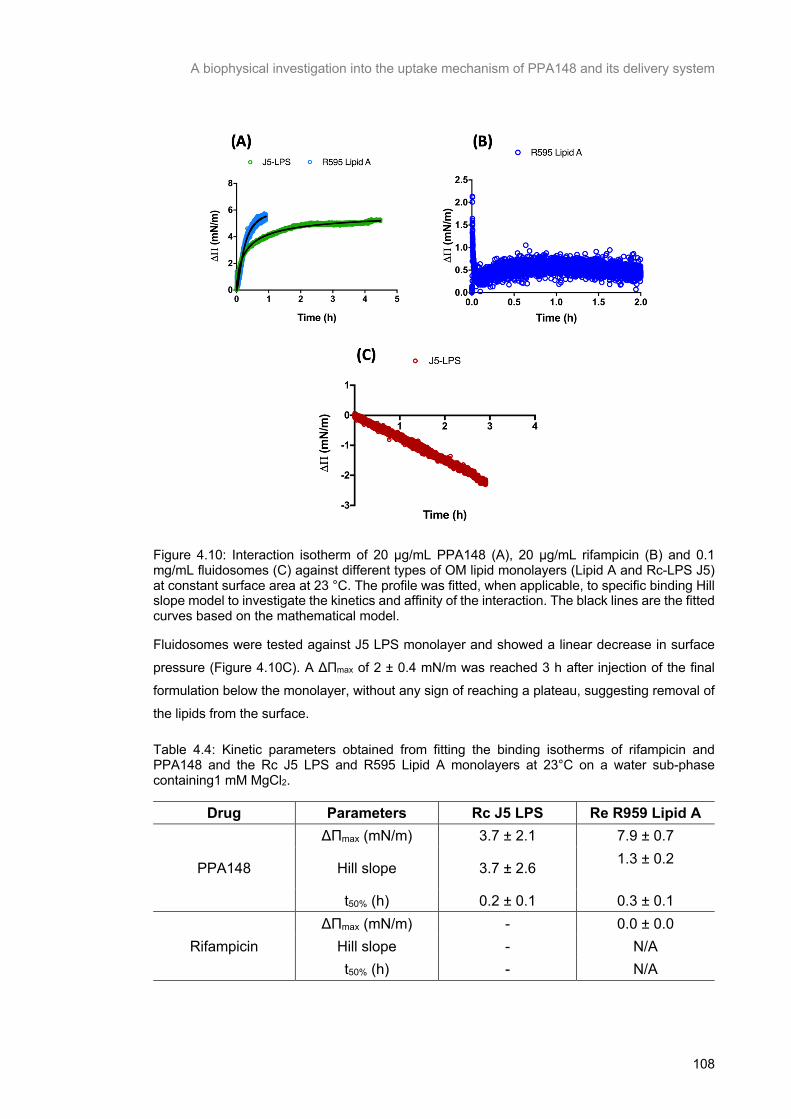
A biophysical investigation into the uptake mechanism of PPA148 and its delivery system
108
Figure 4.10: Interaction isotherm of 20 μg/mL PPA148 (A), 20 μg/mL rifampicin (B) and 0.1 mg/mL fluidosomes (C) against different types of OM lipid monolayers (Lipid A and Rc-LPS J5) at constant surface area at 23 °C. The profile was fitted, when applicable, to specific binding Hill slope model to investigate the kinetics and affinity of the interaction. The black lines are the fitted curves based on the mathematical model.
Fluidosomes were tested against J5 LPS monolayer and showed a linear decrease in surface
pressure (Figure 4.10C). A ΔΠmax of 2 ± 0.4 mN/m was reached 3 h after injection of the final
formulation below the monolayer, without any sign of reaching a plateau, suggesting removal of
the lipids from the surface.
Table 4.4: Kinetic parameters obtained from fitting the binding isotherms of rifampicin and PPA148 and the Rc J5 LPS and R595 Lipid A monolayers at 23°C on a water sub-phase containing1 mM MgCl2.
Drug Parameters Rc J5 LPS Re R959 Lipid A
PPA148
ΔΠmax (mN/m) 3.7 ± 2.1 7.9 ± 0.7
Hill slope 3.7 ± 2.6 1.3 ± 0.2
t50% (h) 0.2 ± 0.1 0.3 ± 0.1
Rifampicin ΔΠmax (mN/m) - 0.0 ± 0.0
Hill slope - N/A t50% (h) - N/A
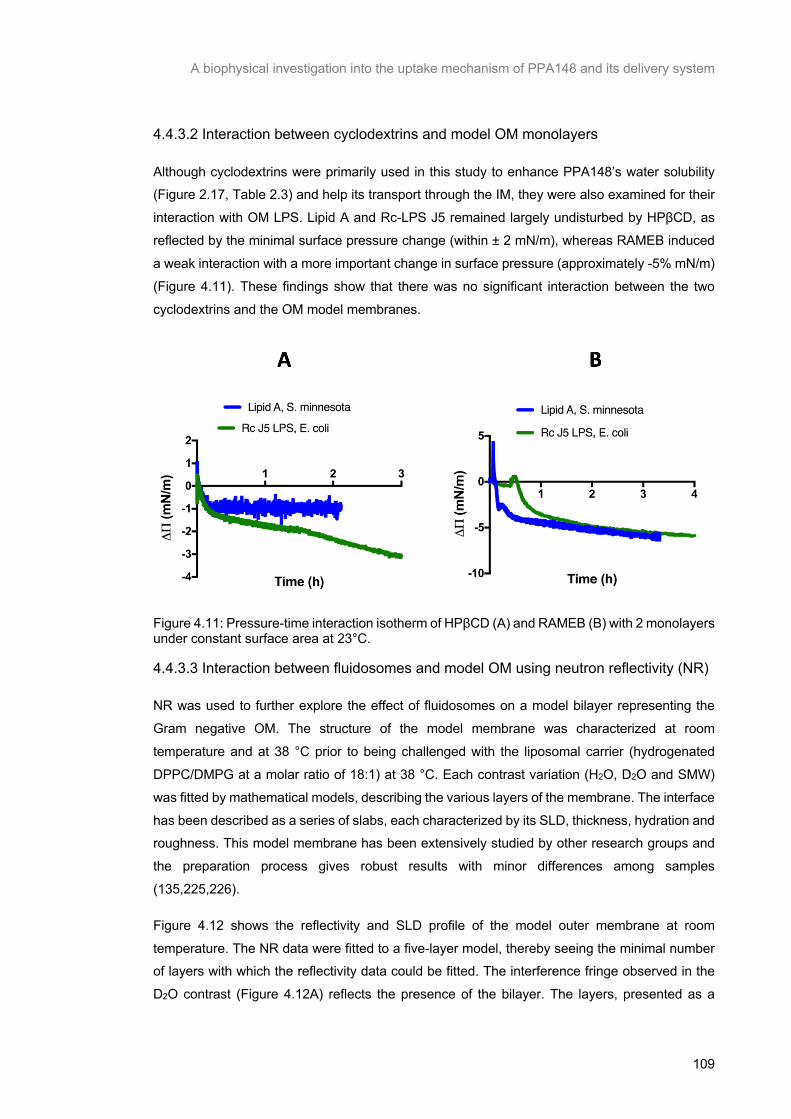
A biophysical investigation into the uptake mechanism of PPA148 and its delivery system
109
4.4.3.2 Interaction between cyclodextrins and model OM monolayers
Although cyclodextrins were primarily used in this study to enhance PPA148’s water solubility (Figure 2.17, Table 2.3) and help its transport through the IM, they were also examined for their
interaction with OM LPS. Lipid A and Rc-LPS J5 remained largely undisturbed by HPβCD, as
reflected by the minimal surface pressure change (within ± 2 mN/m), whereas RAMEB induced
a weak interaction with a more important change in surface pressure (approximately -5% mN/m)
(Figure 4.11). These findings show that there was no significant interaction between the two
cyclodextrins and the OM model membranes.
Figure 4.11: Pressure-time interaction isotherm of HPβCD (A) and RAMEB (B) with 2 monolayers under constant surface area at 23°C.
4.4.3.3 Interaction between fluidosomes and model OM using neutron reflectivity (NR)
NR was used to further explore the effect of fluidosomes on a model bilayer representing the
Gram negative OM. The structure of the model membrane was characterized at room
temperature and at 38 °C prior to being challenged with the liposomal carrier (hydrogenated
DPPC/DMPG at a molar ratio of 18:1) at 38 °C. Each contrast variation (H2O, D2O and SMW)
was fitted by mathematical models, describing the various layers of the membrane. The interface
has been described as a series of slabs, each characterized by its SLD, thickness, hydration and roughness. This model membrane has been extensively studied by other research groups and
the preparation process gives robust results with minor differences among samples
(135,225,226).
Figure 4.12 shows the reflectivity and SLD profile of the model outer membrane at room
temperature. The NR data were fitted to a five-layer model, thereby seeing the minimal number of layers with which the reflectivity data could be fitted. The interference fringe observed in the
D2O contrast (Figure 4.12A) reflects the presence of the bilayer. The layers, presented as a
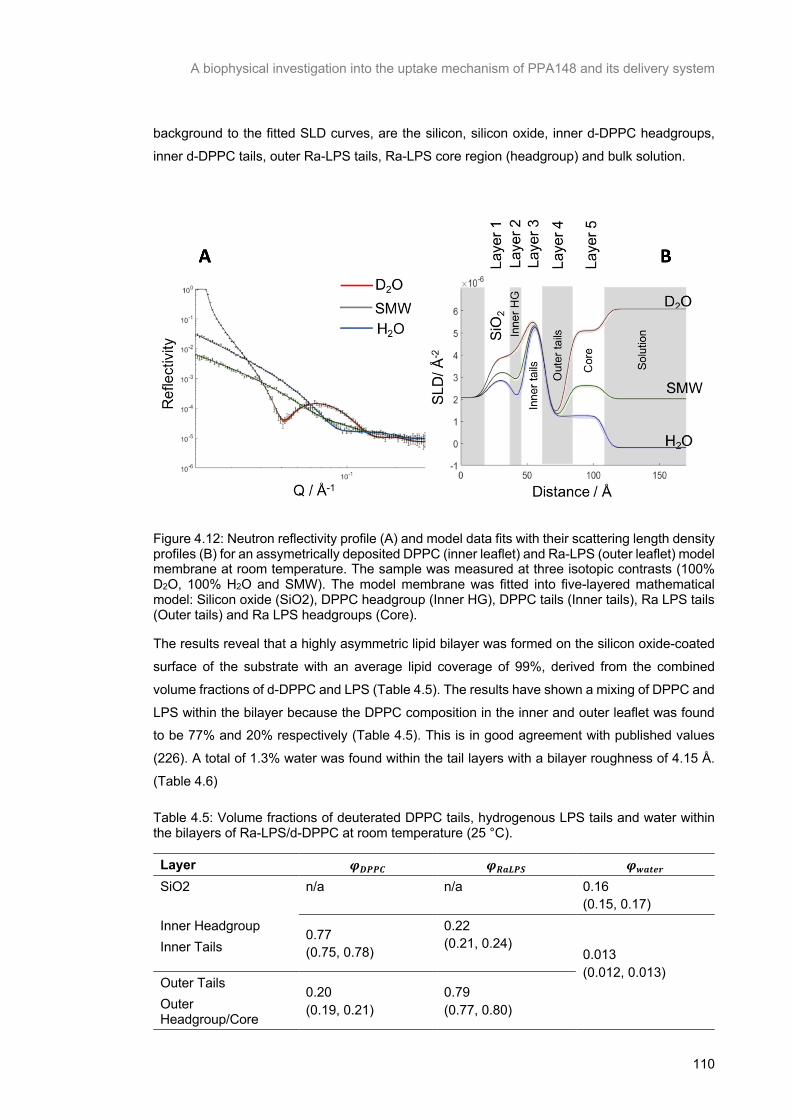
A biophysical investigation into the uptake mechanism of PPA148 and its delivery system
110
background to the fitted SLD curves, are the silicon, silicon oxide, inner d-DPPC headgroups,
inner d-DPPC tails, outer Ra-LPS tails, Ra-LPS core region (headgroup) and bulk solution.
Figure 4.12: Neutron reflectivity profile (A) and model data fits with their scattering length density profiles (B) for an assymetrically deposited DPPC (inner leaflet) and Ra-LPS (outer leaflet) model membrane at room temperature. The sample was measured at three isotopic contrasts (100% D2O, 100% H2O and SMW). The model membrane was fitted into five-layered mathematical model: Silicon oxide (SiO2), DPPC headgroup (Inner HG), DPPC tails (Inner tails), Ra LPS tails (Outer tails) and Ra LPS headgroups (Core).
The results reveal that a highly asymmetric lipid bilayer was formed on the silicon oxide-coated
surface of the substrate with an average lipid coverage of 99%, derived from the combined
volume fractions of d-DPPC and LPS (Table 4.5). The results have shown a mixing of DPPC and
LPS within the bilayer because the DPPC composition in the inner and outer leaflet was found to be 77% and 20% respectively (Table 4.5). This is in good agreement with published values
(226). A total of 1.3% water was found within the tail layers with a bilayer roughness of 4.15 Å.
(Table 4.6)
Table 4.5: Volume fractions of deuterated DPPC tails, hydrogenous LPS tails and water within the bilayers of Ra-LPS/d-DPPC at room temperature (25 °C).
Layer 𝝋𝑫𝑷𝑷𝑪 𝝋𝑹𝒂𝑳𝑷𝑺 𝝋𝒘𝒂𝒕𝒆𝒓 SiO2 n/a n/a 0.16
(0.15, 0.17) Inner Headgroup 0.77
(0.75, 0.78)
0.22 (0.21, 0.24) 0.013
(0.012, 0.013)
Inner Tails
Outer Tails 0.20 (0.19, 0.21)
0.79 (0.77, 0.80) Outer
Headgroup/Core

A biophysical investigation into the uptake mechanism of PPA148 and its delivery system
111
At 38 °C the membrane displayed a similar reflectivity profile and the data were fitted using the
same five-layer model (Figure 4.13). However, the structural parameters changed slightly (Table
4.6; Table 4.7). The d-DPPC volume fraction did not change in the inner leaflet (0.78) whilst increasing (0.14) in the outer leaflet. The thickness of the inner and outer headgroups decreased
from 7.66 Å and 28.35 Å at 25 °C to 7.41 Å and 23.06 Å at 38 °C respectively. Moreover, the
hydration of the inner headgroup decreased from ~50 % to ~28 ± 1 % and the bilayer roughness
increased by ~ 2 Å, which was expected due to the increase in fluidity of the bilayer.
Table 4.6: Structural parameters, thickness, hydration and roughness, of the Ra-LPS/DPPC membrane at room temperature and 38 °C as obtained from the fitting of the neutron reflectivity data. The numbers in parentheses are the 95% confidence interval error.
Layer
Asymmetric bilayer at:
RT 38 °C
Thickness (Å)
% water
Roughness (Å)
Thickness (Å)
% water
Roughness (Å)
SiO2 20.13
(19.58, 20.72)
16.27 (15.56, 16.90)
4.61 (4.39, 4.86)
20.13 (19.58, 20.72)
16.27 (15.56, 16.90)
4.61 (4.39, 4.86)
Inner HG 7.66
(7.346, 7.98)
50.10 (47.86, 52.38)
4.15 (4.02, 4.30)
7.41 (7.03, 7.80)
28.27 (27.13, 29.48)
6.35 (5.99, 6.70)
Inner Tails
14.94 (14.35, 15.6) 1.26
(1.22, 1.30)
14.7 (14.32, 15.10) 1.26
(1.22, 1.30) Outer
Tails
16.87 (16.70, 16.99)
14.84 (14.44, 15.29)
Outer HG/Core
28.35 (27.66, 28.98)
53.59 (51.42, 55.97)
23.06 (22.36, 23.68)
51.77 (49.61, 54.06)
HG: Headgroup

A biophysical investigation into the uptake mechanism of PPA148 and its delivery system
112
Figure 4.13: Neutron reflectivity profile (A and model data fits with their scattering length density profiles (B) for an assymetrically deposited DPPC (inner leaflet) and Ra-LPS (outer leaflet) model membrane at 38 °C. The sample was measured in three isotopic contrasts (100% D2O, 100% H2O and 38% D2O/SMW). The model membrane was fitted into a five-layered mathematical model: Silicon oxide (SiO2), DPPC headgroup (Inner HG), DPPC tails (Inner tails), Ra LPS tails (Outer tails) and Ra LPS headgroups (Core).
Table 4.7: Volume fraction of deuterated DPPC tails, hydrogenous LPS tails and water within the bilayers of Ra-LPS/d-DPPC 38 °C before and after the challenge by the fluidosomes.
Layer Asymmetric bilayer at 38 °C
Before challenge After challenge 𝝋𝑫𝑷𝑷𝑪 𝝋𝑹𝒂𝑳𝑷𝑺 𝝋𝒘𝒂𝒕𝒆𝒓 𝝋𝑫𝑷𝑷𝑪 𝝋𝑹𝒂𝑳𝑷𝑺 𝝋𝒘𝒂𝒕𝒆𝒓
SiO2 n/a n/a 0.16
(0.15, 0.17) n/a n/a
0.16 (0.16, 0.17)
Inner Headgroup 0.78
(0.77, 0.79) 0.21
(0.21, 0.20) 0.013
(0.012, 0.013)
0.65 (0.64, 0.67)
0.35 (0.34, 0.31)
0.0003 (0.0003, 0.0003)
Inner Tails
Outer Tails 0.14
(0.13, 0.16) 0.85
(0.85, 0.83) 0.21
(0.20, 0.22) 0.79
(0.77, 0.78) Outer Headgroup (Core)
Next, the reflectivity profile of the model membrane after interaction with fluidosomes was
studied. The damaging effect of fluidosomes on the Rc J5 LPS, which had been seen in the
air/liquid interface experiments (Figure 4.10C) was further investigated by measuring changes in
the structure of the fully characterised d-DPPC:h-Ra-LPS bilayer after being challenged with 0.1
mg/mL empty fluidosomes for 1 h. The reflectivity profile of the system was measured after flushing out excess fluidosomes, composed of hydrogenated lipids (DPPC:DMPG). Most of the
structural changes occurring following the addition of fluidosomes involved the tail and outer
headgroup regions. The exposure of the bilayer to fluidosomes resulted in the addition of a fringe

A biophysical investigation into the uptake mechanism of PPA148 and its delivery system
113
in the reflectivity profile, reflecting the presence of two lipid bilayer, one being the model OM and
the second being described as floating bilayer (7th layer) in the SLD profile (Figure 4.14B).
Figure 4.14: Neutron reflectivity profile (A) and model data fits with their scattering length density profiles (B) for an assymetrically deposited DPPC (inner leaflet) and Ra-LPS (outer leaflet) model membrane after being challenged with 0.1 mg/mL fluidosomes (DPPC/DMPG, 18:1) at 38 °C. The sample was measured in three isotopic contrasts (100% D2O, 100% H2O and 38% D2O/SMW). The model membrane was fitted into a seven-layered mathematical model: Silicon oxide (SiO2), DPPC headgroup (Inner HG), DPPC tails (Inner tails), Ra LPS tails (Outer tails) and Ra LPS headgroups (Core), Bridge and Floating bilayer.
Mixing of lipids within the bilayer region occurred, as derived from the lipid composition in the
model membrane, with the inner leaflet consisting of 65% d-DPPC and 34% h-Ra LPS, while the
outer leaflet of 21% d-DPPC and 78% LPS (Table 4.7). It can be observed that the contribution
of hydrogenous phospholipids in the inner leaflet layers, which might be either h-Ra LPS or h-
phospholipids from fluidosomes, had increased from 21% to 34% after adding the fluidosomes. In addition, the fitting parameters in Table 4.8 showed an increase of the model OM roughness
from 6.3 Å to 7.1 Å, before and after the challenge, respectively, which illustrates structural
changes of the membrane. A thinner inner headgroup region (5.7 Å) with higher hydration levels
(48.44 %) and a thicker outer headgroup region (21.0 Å) with lower hydration (35.95 %) were
also observed, compared to the unchallenged membrane (Table 4.6) under the same conditions.
Of the two additional layers formed, the one adjacent to the membrane is a solvent layer (99.94%
water content) with an SLD of 1.78×10⁻⁷ (1.7224×10⁻⁷, 1.8266×10⁻⁷) Å-2, thickness of 34.6 and
roughness of 3.4 Å. The outermost layer has high water content (75.80%) with an SLD of 2.6×10-
8 (2.4608×10⁻⁸, 2.7494×10⁻⁸) Å-2. If liposomes were intact on the membrane surface, their tail
SLD would have been similar to the reported SLD of h- or d-DPPC tails (-0.4 or 7.4 ×10⁻⁶ Å-2
respectively) as published by Clifton and coworkers (226). The thickness of the additional layers
was found to be 35 and 46 Å for the 6th and 7th layer, respectively.
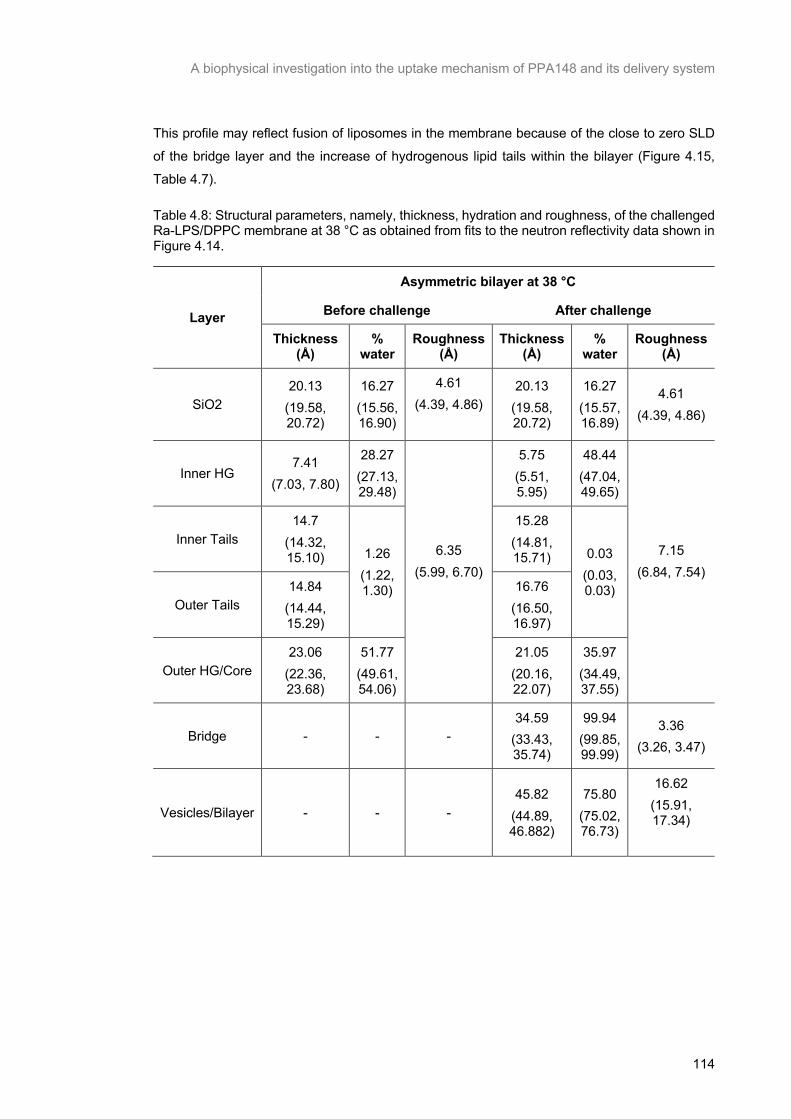
A biophysical investigation into the uptake mechanism of PPA148 and its delivery system
114
This profile may reflect fusion of liposomes in the membrane because of the close to zero SLD
of the bridge layer and the increase of hydrogenous lipid tails within the bilayer (Figure 4.15,
Table 4.7).
Table 4.8: Structural parameters, namely, thickness, hydration and roughness, of the challenged Ra-LPS/DPPC membrane at 38 °C as obtained from fits to the neutron reflectivity data shown in Figure 4.14.
Layer
Asymmetric bilayer at 38 °C
Before challenge After challenge
Thickness (Å)
% water
Roughness (Å)
Thickness (Å)
% water
Roughness (Å)
SiO2 20.13
(19.58, 20.72)
16.27 (15.56, 16.90)
4.61 (4.39, 4.86)
20.13 (19.58, 20.72)
16.27 (15.57, 16.89)
4.61 (4.39, 4.86)
Inner HG 7.41
(7.03, 7.80)
28.27 (27.13, 29.48)
6.35 (5.99, 6.70)
5.75 (5.51, 5.95)
48.44 (47.04, 49.65)
7.15 (6.84, 7.54)
Inner Tails 14.7
(14.32, 15.10) 1.26
(1.22, 1.30)
15.28 (14.81, 15.71) 0.03
(0.03, 0.03)
Outer Tails 14.84
(14.44, 15.29)
16.76 (16.50, 16.97)
Outer HG/Core 23.06
(22.36, 23.68)
51.77 (49.61, 54.06)
21.05 (20.16, 22.07)
35.97 (34.49, 37.55)
Bridge - - - 34.59
(33.43, 35.74)
99.94 (99.85, 99.99)
3.36 (3.26, 3.47)
Vesicles/Bilayer - - - 45.82
(44.89, 46.882)
75.80 (75.02, 76.73)
16.62 (15.91, 17.34)
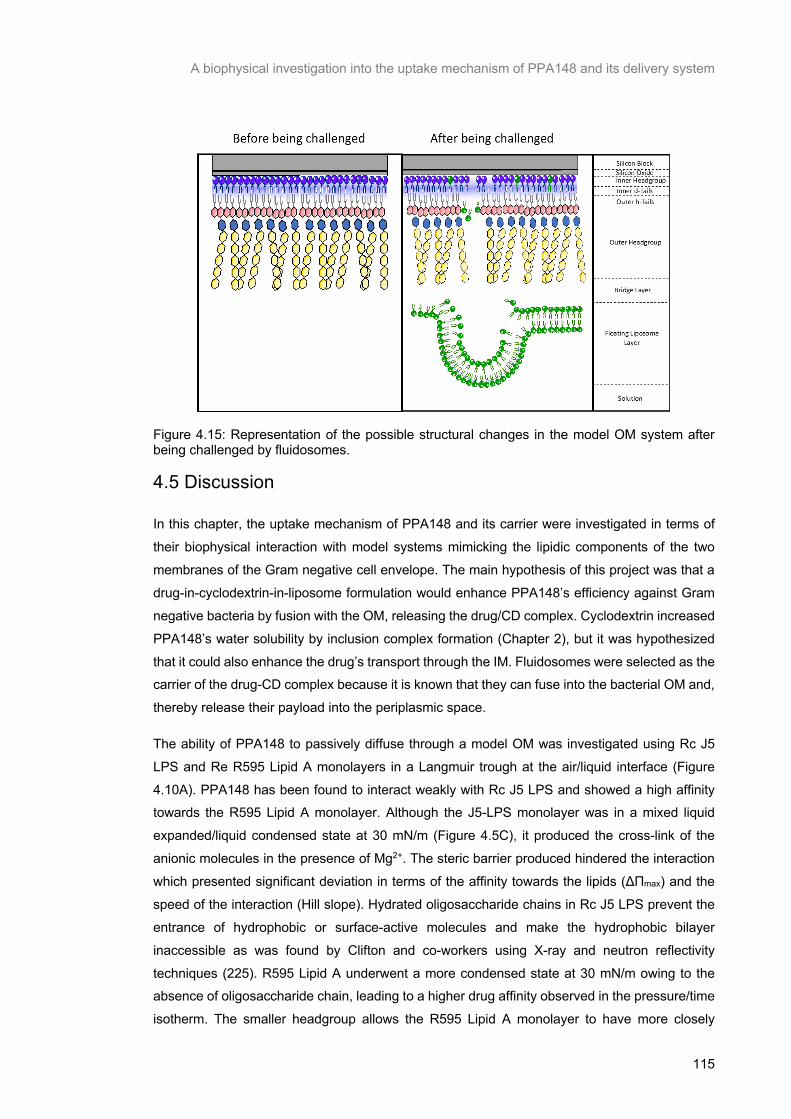
A biophysical investigation into the uptake mechanism of PPA148 and its delivery system
115
Figure 4.15: Representation of the possible structural changes in the model OM system after being challenged by fluidosomes.
4.5 Discussion
In this chapter, the uptake mechanism of PPA148 and its carrier were investigated in terms of
their biophysical interaction with model systems mimicking the lipidic components of the two
membranes of the Gram negative cell envelope. The main hypothesis of this project was that a
drug-in-cyclodextrin-in-liposome formulation would enhance PPA148’s efficiency against Gram
negative bacteria by fusion with the OM, releasing the drug/CD complex. Cyclodextrin increased
PPA148’s water solubility by inclusion complex formation (Chapter 2), but it was hypothesized
that it could also enhance the drug’s transport through the IM. Fluidosomes were selected as the carrier of the drug-CD complex because it is known that they can fuse into the bacterial OM and,
thereby release their payload into the periplasmic space.
The ability of PPA148 to passively diffuse through a model OM was investigated using Rc J5
LPS and Re R595 Lipid A monolayers in a Langmuir trough at the air/liquid interface (Figure
4.10A). PPA148 has been found to interact weakly with Rc J5 LPS and showed a high affinity towards the R595 Lipid A monolayer. Although the J5-LPS monolayer was in a mixed liquid
expanded/liquid condensed state at 30 mN/m (Figure 4.5C), it produced the cross-link of the
anionic molecules in the presence of Mg2+. The steric barrier produced hindered the interaction
which presented significant deviation in terms of the affinity towards the lipids (ΔΠmax) and the
speed of the interaction (Hill slope). Hydrated oligosaccharide chains in Rc J5 LPS prevent the
entrance of hydrophobic or surface-active molecules and make the hydrophobic bilayer
inaccessible as was found by Clifton and co-workers using X-ray and neutron reflectivity
techniques (225). R595 Lipid A underwent a more condensed state at 30 mN/m owing to the absence of oligosaccharide chain, leading to a higher drug affinity observed in the pressure/time
isotherm. The smaller headgroup allows the R595 Lipid A monolayer to have more closely
A biophysical investigation into the uptake mechanism of PPA148 and its delivery system
116
packed molecules (Figure 4.5C), presenting a weaker steric hindrance to PPA148. Although
PPA148 interacted with R595 Lipid A, rifampicin did not show any interaction (Figure 4.10B),
which was unexpected based on its proposed mechanism of uptake. This can be explained by the topological polar surface area (tPSA), a parameter predicting the passive drug permeation
through the Gram-negative (tPSA of 165 Å2) and Gram-positive (tPSA 243 Å2) bacterial envelope
(12). It was estimated by ChemDraw that PPA148 has a tPSA of 141 Å2 (Table 2.1), which
indicates a less polar compound than rifampicin (tPSA of 217 Å2). Thus the novel drug is more
likely to interact with the R595 Lipid A, as found in the air/liquid monolayer experiments.
We also obtained evidence that PPA148 interacts with the IM lipid monolayers (Figure 4.6C,
Figure 4.8B). Despite some stability difficulties with the E. coli B monolayer (Figure 4.6C, Figure
4.7), it was found that PPA148 interacted with phospholipids, but it did not cause membrane
damage as happened with chlorhexidine (Figure 4.7). E. coli B lipid monolayer is a poor model
of the membrane because it contains a diverse mixture of lipids (Table 1.6), which, in live
bacteria, would form an asymmetric bilayer, with the lipids which impart negative curvature
localized on the inside (124,125). Instead, in a monolayer, these lipids are forced to adopt a planar configuration and, thus, the monolayer presents packing discontinuities without a
reproducible interaction profile (Figure 4.6C).
Using a monolayer model, composed of DPPC/DPPG (3:1), it was observed that PPA148 and
rifampicin presented a similar interaction profile (Figure 4.8). The findings for rifampicin are in
agreement with its mechanism of transport: that it partitions in DPPC monolayers by establishing ionic bonds with the head groups of DPPC in an acidic environment of pH=5 (255). Since the
kinetic profile of PPA148 was similar to that of rifampicin, it is suggested that PPA148 is likely to
enter the cell via diffusion through the membrane. However, PPA148 cannot be ionized (Figure
2.2) and, thus, the possibility of this type of interaction occurring with phospholipids was
discounted. It is more likely that PPA148 is partitioning into the membrane because of its
hydrophobicity.
As PPA148’s solubilizers, HPβCD and RAMEB were examined separately for their interaction
with both model OM and IM monolayers (Figure 4.9; Figure 4.11). It was found that HPβCD did
not affect the OM monolayer, while RAMEB presented a weak interaction with it, possibly
resulting from the different substituted groups (Figure 4.11). RAMEB is a methyl substituted βCD
derivative with high hydrophobicity which makes it more likely to partition into LPS. It has been
reported that complexes of drug-β-cyclodextrin and its derivatives, such as RAMEB, improve
antibiotic potency but the mechanism has not been clarified yet. It is hypothesized that β-CD may drive internalization of the β-CD-antibiotic complex via (i) the OM protein CymA (cyclodextrin
metabolism A), (ii) enhanced adhesion to the bacterial surface with potential local release of the
antibiotic, and (iii) destabilization of the bacterial envelope (215,216,246). The transport through
the CymA channels is a controversial issue seeing that some scientists have found that α-CD
and β-CD bind and can transported into the cell via those porins but others have found that only
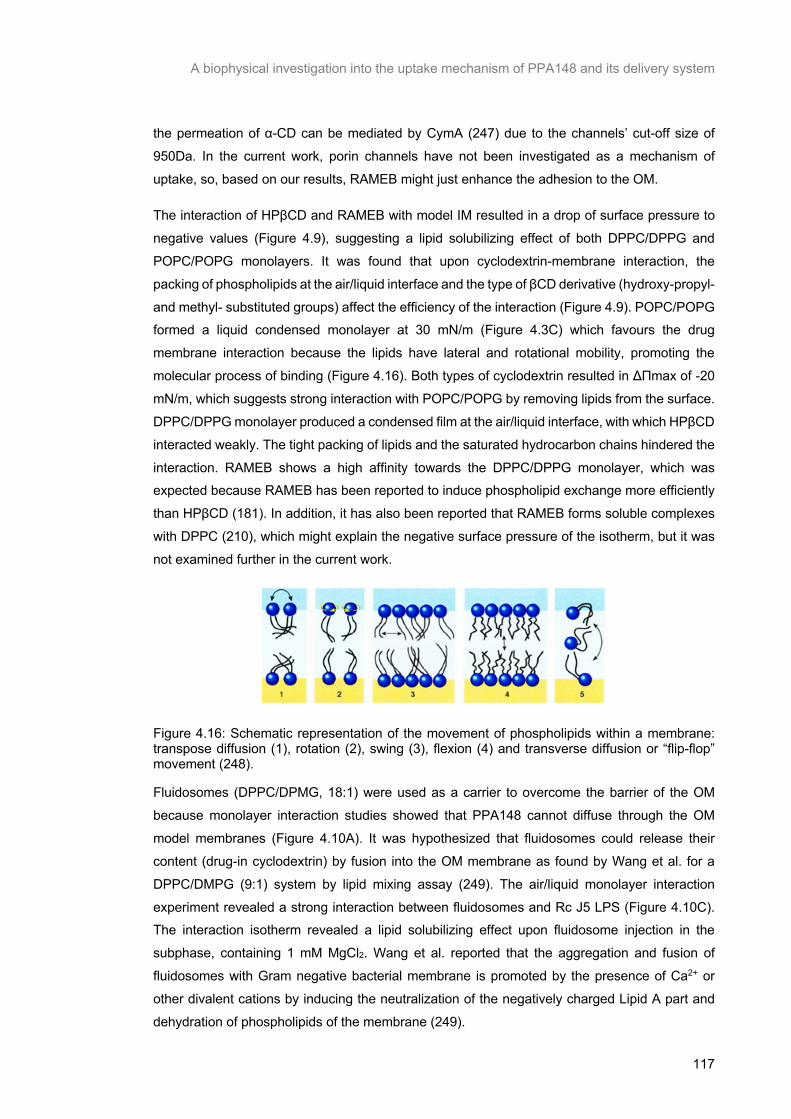
A biophysical investigation into the uptake mechanism of PPA148 and its delivery system
117
the permeation of α-CD can be mediated by CymA (247) due to the channels’ cut-off size of
950Da. In the current work, porin channels have not been investigated as a mechanism of
uptake, so, based on our results, RAMEB might just enhance the adhesion to the OM.
The interaction of HPβCD and RAMEB with model IM resulted in a drop of surface pressure to
negative values (Figure 4.9), suggesting a lipid solubilizing effect of both DPPC/DPPG and
POPC/POPG monolayers. It was found that upon cyclodextrin-membrane interaction, the
packing of phospholipids at the air/liquid interface and the type of βCD derivative (hydroxy-propyl-
and methyl- substituted groups) affect the efficiency of the interaction (Figure 4.9). POPC/POPG formed a liquid condensed monolayer at 30 mN/m (Figure 4.3C) which favours the drug
membrane interaction because the lipids have lateral and rotational mobility, promoting the
molecular process of binding (Figure 4.16). Both types of cyclodextrin resulted in ΔΠmax of -20
mN/m, which suggests strong interaction with POPC/POPG by removing lipids from the surface.
DPPC/DPPG monolayer produced a condensed film at the air/liquid interface, with which HPβCD
interacted weakly. The tight packing of lipids and the saturated hydrocarbon chains hindered the
interaction. RAMEB shows a high affinity towards the DPPC/DPPG monolayer, which was expected because RAMEB has been reported to induce phospholipid exchange more efficiently
than HPβCD (181). In addition, it has also been reported that RAMEB forms soluble complexes
with DPPC (210), which might explain the negative surface pressure of the isotherm, but it was
not examined further in the current work.
Figure 4.16: Schematic representation of the movement of phospholipids within a membrane: transpose diffusion (1), rotation (2), swing (3), flexion (4) and transverse diffusion or “flip-flop” movement (248).
Fluidosomes (DPPC/DPMG, 18:1) were used as a carrier to overcome the barrier of the OM
because monolayer interaction studies showed that PPA148 cannot diffuse through the OM
model membranes (Figure 4.10A). It was hypothesized that fluidosomes could release their
content (drug-in cyclodextrin) by fusion into the OM membrane as found by Wang et al. for a
DPPC/DMPG (9:1) system by lipid mixing assay (249). The air/liquid monolayer interaction
experiment revealed a strong interaction between fluidosomes and Rc J5 LPS (Figure 4.10C). The interaction isotherm revealed a lipid solubilizing effect upon fluidosome injection in the
subphase, containing 1 mM MgCl2. Wang et al. reported that the aggregation and fusion of
fluidosomes with Gram negative bacterial membrane is promoted by the presence of Ca2+ or
other divalent cations by inducing the neutralization of the negatively charged Lipid A part and
dehydration of phospholipids of the membrane (249).

A biophysical investigation into the uptake mechanism of PPA148 and its delivery system
118
To further investigate the interaction between fluidosomes and OM, neutron reflectivity was used
on an asymmetric model Gram negative bacterial membrane consisting of Ra-EH100 LPS and
DPPC in the outer and inner leaflet, respectively. Before introducing fluidosomes into the system, the model membrane was characterized in terms of structural properties at room temperature
(25 °C) and 38 °C (Figure 4.12; Figure 4.13). At 38 °C lipids become more flexible (250,251) as
found in this work. The thickness of all the individual compartments of the model membrane
decreased as the temperature increased (Table 4.6). Membrane rigidity was modulated
thermodynamically by changes in temperature and decreased with increasing temperature.
Changes in orientation and hydration of lipids upon increasing temperature caused thinning of
lipid bilayers (250) because the hydrocarbon lipid chains became more flexible (Figure 4.17). The roughness of the membrane increased with increasing temperature which indicated a liquid
crystalline phase of the lipids, allowing a less rigid structure of the membrane (Table 4.6). In a
liquid crystalline membrane, lipids can simply transpose with neighboring molecules (transpose
diffusion), rotate quickly around their axis, swing from side to side, following contraction
movement or, less frequent, undergo flip-flop movement (transverse diffusion) (Figure 4.16;
Figure 4.17) (248). The lipid movement creates a more favorable environment for interaction with
the membrane.
Figure 4.17: Schematic representation of the effect of temperature change on membrane structure and behavior of lipid bilayers adapted from Los and Murata (250). Low temperatures cause “rigidification” of membranes, whereas high temperatures cause “fluidization” of membranes.
The effect of fluidosomes on the assymetric model OM was observed at 38 °C (Figure 4.14;
Figure 4.15). The NR profile of the membrane after addition of fluidosomes revealed a lipid mixing
profile with an additional bilayer associated with the deposited membrane. The roughness of the
model OM increased compared to the membrane before being challenged by the fluidosomes,
and the volume fractions of deuterated and hydrogenous tails of the inner and outer leaflets
changed, revealing a mixing of the lipids (Table 4.6; Table 4.7; Table 4.8). More specifically, the volume fraction of d62DPPC increased in the outer leaflet, while hydrogenous lipids increased in

A biophysical investigation into the uptake mechanism of PPA148 and its delivery system
119
the inner leaflet of the membrane. Based on the fitted parameters, the SLD of the additional layer
adjacent to the membrane was close to zero, indicating that it is composed of both deuterated
and hydrogenous material to adjust the SLD at 0.18×10⁻⁷ Å-2. The outermost additional layer presented a similar thickness (46 Å) to a DPPC bilayer (50 Å) in the presence of CaCl2 (206).
This strongly suggests that fluidosomes fused into the OM membrane by creating a Ca2+ bridge
layer between the outer leaflets of the membrane and liposome at the contact site (Figure 4.15).
Ca2+ is able to keep fluidosomes attached to the model membrane by interacting with both
liposomes and LPS accompanied by local dehydration, lowering the free energy and creating
local packing defects on the outer leaflet of both systems (Figure 4.15). Moreover, fluidosomes
tend to destabilize thermodynamically at 38 °C which also aids their fusion with the bacterial OM (252). Vesicle fusion with bacterial membranes, promoted by divalent cations, requires fluidity
which is achieved at a temperature higher than the phase transition temperature of fluidosomes
(approximately 35°C ) (249). The thinning of the model OM and increased flexibility of lipids at
38 °C (Table 4.6) facilitate the fusion of fluidosomes with the model Gram negative bacterial
membrane.
After considering both the air/liquid interface interaction and the NR experiment, it is suggested
that both fluidosomes and model OM underwent conformational changes, leading to their
collapse and fusion at the point of contact (Figure 4.15).
4.6 Conclusion
In the current study, the uptake mechanism of PPA148 and its formulation was studied using
biophysical interfacial techniques. The monolayer studies suggest that PPA148 slowly diffuses
through the lipidic components of the PC/PG model IM while it presents weak interaction with the
model OM consisting of DPPC and Ra-EH100 LPS as the inner and outer leaflet, respectively.
When compared to the pressure-time isotherm profile of chlorhexidine, rifampicin and gentamicin, whose mechanism of uptake is known, PPA148 showed a similar profile with that of
rifampicin, indicating that PPA148 passively diffuses through the IM. The interaction of PPA148
with the LPS monolayer, characterized by slow kinetics, suggests that the main mechanism of
PPA148’s transport through the OM is dependent on non-specific or self-promoted diffusion or
even active transport. In this chapter, it was found that cyclodextrins might act as permeation
enhancers through the IM, in addition to increasing the drug’s water solubility. The structural
changes occurring in the model membrane upon being exposed to fluidosomes were examined by neutron reflectivity and suggest that fluidosomes enter into the LPS leaflet of the OM through
a fusion mechanism.

General Conclusion
120
Chapter 5 General Conclusion
General Conclusion
121
Experience has demonstrated that bacteria are quick to develop resistance to new antibiotics.
This predictable resistance is essentially related to the mechanism of action of traditional
antibiotics with five main specific targets in the cell: cell wall synthesis, DNA-gyrase, DNA-directed-RNA-polymerase, protein synthesis and enzymes (253), and the speed at which
mutation may facilitate target alteration. The development of new classes of antibiotics with
specificity towards bacteria, but which act non-specifically against novel targets, needs to be
pursued as a possible method to delay the onset of resistance. At King’s College London, an antimicrobial compound, PPA148, was synthesized, which is active against Gram-negative bacteria with a novel antimicrobial mechanism of action. PPA148’s
bactericidal activity is attributed to its binding onto the minor-groove of bacterial DNA. It showed
promising activity against the Gram negative members of the ESKAPE organisms, and little
toxicity to human cells (107,108). Nevertheless, in some clinical strains, difficulties in drug
uptake, due to the bacterial semi-permeable OM and/or the efflux mechanisms, was observed.
It is known that intracellular drug accumulation is a complex process including drug uptake into
the cell, retention and distribution in the cell, and efflux from the cell. At any given time, the accumulation of a drug in cells is dependent upon the different rates of drug uptake and efflux
(254). Overexpression of efflux mechanisms leads to a decrease in drug accumulation resulting
in drug-resistant cells. Based on our knowledge of the physicochemical properties of PPA148, reducing particle
aggregation and enhancing water solubility was the first step towards developing a formulation to enhance its antibacterial efficacy against Gram negative bacteria. The solubility increased 6-
fold by incorporating PPA148 into cyclodectrin’s cavity (Table 2.3; Table 2.4). Fluorescence
spectroscopy was used to determine the binding constant of a 1:1 complex with HPβCD and
RAMEB, which was found to be 63 ± 20 M-1 and 102 ± 26 M-1, respectively (Table 2.4). Evidence
of the formation of inclusion complex include NMR spectroscopy, which presented a shift of the
DIMEB proton at position 5 protruding towards the CD cavity (Figure 2.19). The results revealed
the formation of a 1:2 PPA148/DIMEB complex.
The next step was to incorporate the 1:1 PPA148/RAMEB complex into fluidosomes
(DPPC/DMPG, 18:1) and test the efficacy of the drug in its pure and formulated form. The
entrapment of the water-soluble inclusion complex into fluidosomes led to accommodation of the
insoluble PPA148 in the aqueous phase of neutral vesicles with a size of 129 ±10 nm and high
encapsulation efficiency (67 ± 11%). Loaded fluidosomes presented a more monodisperse
system than the empty fluidosomes (Figure 3.4; Figure 3.5), indicating that the presence of the complex created structures with increased integrity. Generally, in liposomes, cyclodextrin
complexation competes with liposomal membrane binding, which in our case led to a more intact
system because the affinity of the drug towards CD is higher than that of lipids. The LT
experiment showed weak interaction of RAMEB with a DPPC/DPPG monolayer (Figure 4.9),
which describes interrelation with the lipid headgroups without causing any damage to the
General Conclusion
122
membrane. PPA148 might be inserted into the CD cavity from one side while the other side of
RAMEB can be attached with the headgroups of the inner leaflet of the liposomes, thus forming
more stable vesicles (Figure 3.10).
The efficacy of PPA148 against the E. coli DH5α (PPA148-in-RAMEB-in-fluidosomes) increased
when it was complexed with RAMEB. Pure PPA148 created an inhibition zone of 1.6 ± 0.2 cm,
while the complex generated a 2.4 ± 0.1 cm inhibition zone (Figure 3.7). The difference was
statically significant (Figure 3.8), thus showing that the efficacy of PPA148 was enhanced.
Therefore, RAMEB has a dual role in (1) increasing the solubility of the PPA148 and (2) transporting drug molecules across membranes (intrinsic antimicrobial activity). The efficacy was
also enhanced when the complex was incorporated into fluidosomes with an inhibition zone of
2.7 ± 0.2 cm which was statistically significantly different from the pure drug; but the difference
between the inhibition zone of the complex and the final formulation (Figure 3.8) was not
statistically significant, which might be a result of the small number of experimental observations
To further elucidate the efficiency of the final formulation, Monte Carlo simulation was performed
by building a probability distribution and creating a substituted set of data (100 observations) based on the experimental observations. Predicted data were analyzed, and it was estimated
that the difference between the efficacy of the final formulation and the complex would be
statistically significant (Figure 3.9). This preliminary microbiological test presented in this thesis
has some statistical limitations due to the small number of observations, nevertheless it shows
that the final formulation increased the antimicrobial activity of the novel compound.
Following the microbiological assay, a biophysical approach was pursued to investigate the
mechanism of uptake of PPA148 and its carriers. Knowing the physicochemical properties of
PPA148, passive diffusion through lipid monolayers was hypothesized as a possible mechanism
of uptake. The LT experiments at the air/liquid interface revealed that PPA148 slowly diffuses
through both the IM (DPPC/DPPG) (Figure 4.8B) and OM (Rc J5 LPS and R595 Lipid A) (Figure
4.10A) model monolayers. The use of Lipid A and LPS revealed the steric barrier created by the
oligosaccharide chains which hinders the permeation of PPA148 through the OM. These results,
in combination with the inhibition caused in live bacteria, reveal that the main mechanism of PPA148’s transport is dependent on non-specific or self-promoted diffusion or even active
transport.
HPβCD and RAMEB presented a strong interaction with POPC/POPG monolayers but a weak
interaction with those formed from DPPC/DPPG (Figure 4.9). Neither was cyclodextrin able to
interact strongly with the OM model membrane (Figure 4.11), yet it enhanced the antimicrobial efficacy of the drug when tested against E. coli DH5α live bacteria. These results reveal that
RAMEB is able to potentiate the transport of PPA148 by improving the adhesion to the bacterial
surface with potential local release of the antibiotic through the IM, without causing any damage
to the membrane.
General Conclusion
123
It is suggested that fluidosomes act as drug carriers, releasing their content via fusion with the
bacterial OM. Langmuir trough experiments at the air/liquid interface presented a strong
interaction between fluidosomes and Rc J5 LPS (Figure 4.10C), revealing the removal of lipids from the surface. This behaviour was investigated in depth using neutron reflectivity, which
provides a better insight into the mechanism of action of fluidosomes focusing at the molecular
level on the localization of vesicles interacting with membrane models. Fluidosomes challenged
an assymetric Gram negative bacterial OM, consisting of Ra EH100 LPS and d62-DPPC as the
outer and inner leaflet, respectively (Figure 4.14). The results suggested the mixing of lipids
induced by fluidosomes because the volume fraction of d62-DPPC increased in the outer leaflet,
while hydrogenous lipids increased in the inner leaflet of the membrane (Table 4.7). The NR profile presented two additional layers attached to the model membrane, the one describing a
water layer connecting the membrane with fluidosomes and the other being the bilayer of the
fluidosomes (Figure 4.14; Figure 4.15).
Overall, the data gathered in this thesis has shown that drug-in-RAMEB-in-fluidosomes is a
promising formulation for antimicrobial applications and should be tested in a range of Gram negative bacterial membrane. This work has demonstrated that fluidosomes fuse into the model
bacterial OM, facilitating the release of its core content (Figure 4.15) and derivatives of βCD
(HPβCD and RAMEB) enable possibly the transport through the IM. This work is also the first
characterization of the novel antimicrobial compound, PPA148, in terms of solubility,
environmental stability (temperature and pH) and spectroscopic profile.
5.1.1 Future Work
This thesis was an attempt to characterize a novel antimicrobial compound, and enhance its
water solubility and efficacy against Gram negative bacteria. The hypotheses of this project were
driven by PPA148’s predicted physicochemical properties and its MIC against a range of
bacterial strains. The MIC of pure PPA148 presented a drop in the presence of PAβN, which
may have been either due to its efflux pump inhibitory action or its bacterial membrane
permeabilizing behavior. Therefore, future work should include the assessment of the integrity of
bacterial cell membranes using the fluorescent probe, 8-anilino-1-naphthylenesulfonic acid (ANS). ANS is a neutrally charged, hydrophobic probe that fluoresces weakly in aqueous
environments, but exhibits enhanced fluorescence in non- polar/hydrophobic environment (255).
This will give an insight on the effect of PAβN on PPA148’s antibacterial activity which in turn will
provide invaluable information about the drug’s mechanism of action. The interaction studies
would provide structural insights on the complexes and the spherical morphology of the loaded
liposomes (110). Future work should also include a drug release profile of PPA148, or any other
antimicrobial compound encapsulated in cyclodextrin/liposome formulation to determine the
degree of drug leakage over time. The dialysis method is applied widely and drug analysis with UV/Vis spectroscopy will identify the released drug concentration. Stability of the drug in the
General Conclusion
124
formulation over time is another important aspect that needs to be defined using mass
spectroscopy to detect any possible decomposed products.
In this study, the fusion of fluidosomes with the lipidic component of a model assymetric Gram
negative bacterial membrane was observed using neutron reflectivity. Development of advanced
models of Gram negative membranes containing proteins are in progress (256). Using these
advanced model membranes to investigate the fusion will give an insight on whether proteins
affect this mechanism of action. For a more realistic approach, in vitro experiments on live
bacteria should be applied using spectroscopic techniques to localize the formulation within the bacterial cell. Even though the lipid composition in eukaryotic and prokaryotic cells is different
(223,224), the toxicity profile of fluidosomes should also be investigated with human epithelial
cells to ascertain whether there are any possible side effects for host cells.
Disk diffusion assay was used to assess the susceptibility of bacteria to PPA148-in-RAMEB-in-
liposomes. The microbiological assay was focused only on one bacterial strain (E coli DH5α) yet, to obtain more conclusive data regarding the efficacy of the final formulation on Gram negative
bacteria, it must be tested across a wide range of antibiotic-resistant bacteria, such as P.
aeruginosa. In this test, which is qualitative, the diameter of the inhibition zone is related to the
susceptibility of the isolate and to the diffusion rate of the drug through the agar medium. The
drawback of this method is that the category of susceptibility is derived from the test rather than
from the minimum inhibitory concentration (MIC). That being the case, the MIC of the final
formulation needs to be determined in the different types of bacteria used. Formulation with other antibiotics, whose target is in the cytoplasm, i.e. rifampicin, and have become ineffective due to
the rise of antimicrobial resistance, should also be tested to elucidate the effectiveness of the
drug-in-cyclodextrin-in-liposomes formulation. Collecting all the aforementioned data will help to
elucidate the antibacterial activity of a drug-in-cyclodextrin-in-fluidosomes.
References
125
References 1. Livermore DM, Blaser M, Carrs O, Cassell G, Fishman N, Guidos R, et al. Discovery
research: the scientific challenge of finding new antibiotics. J Antimicrob Chemother. 2011 Sep;66(9):1941–1944.
2. Ventola CL. The antibiotic resistance crisis: part 1: causes and threats. P T Peer-Rev J Formul Manag. 2015 Apr;40(4):277–83.
3. Gould IM, Bal AM. New antibiotic agents in the pipeline and how they can help overcome microbial resistance. Virulence. 2013 Feb;4(2):185–91.
4. Wright GD. Something old, something new: revisiting natural products in antibiotic drug discovery. Can J Microbiol. 2014 Mar;60(3):147–154.
5. Rossolini GM, Arena F, Pecile P, Pollini S. Update on the antibiotic resistance crisis. Curr Opin Pharmacol. 2014 Oct;18:56–60.
6. Piddock LJ. The crisis of no new antibiotics—what is the way forward? Lancet Infect Dis. 2012 Mar;12(3):249–253.
7. Yocum RR, Rasmussen JR, Strominger JL. The mechanism of action of penicillin. Penicillin acylates the active site of Bacillus stearothermophilus D-alanine carboxypeptidase. J Biol Chem. 1980 May;255(9):3977–86.
8. Wehrli W. Rifampin: mechanisms of action and resistance. Rev Infect Dis. 1983;5 Suppl 3:S407–11.
9. Levy SB, Marshall B. Antibacterial resistance worldwide: causes, challenges and responses. Nat Med. 2004 Dec;10(12s):S122–S129.
10. Clatworthy AE, Pierson E, Hung DT. Targeting virulence: a new paradigm for antimicrobial therapy. Nat Chem Biol. 2007 Sep;3(9):541–548.
11. van Saene R, Fairclough S, Petros A. Broad- and narrow-spectrum antibiotics: a different approach. Clin Microbiol Infect Off Publ Eur Soc Clin Microbiol Infect Dis. 1998 Jan;4(1):56–57.
12. O’Shea R, Moser HE. Physicochemical Properties of Antibacterial Compounds: Implications for Drug Discovery. J Med Chem. 2008 May;51(10):2871–2878.
13. Macielag MJ. Chemical Properties of Antimicrobials and Their Uniqueness. In: Dougherty T, Pucci M, editors. Antibiotic Discovery and Development. Boston, MA: Springer US; 2012. p. 793–820.
14. Leeson PD, Davis AM. Time-Related Differences in the Physical Property Profiles of Oral Drugs. 2004;47(25):6338–6348.
15. ChemBioDraw Ultra 14.0 Suite - Adept Scientific [Internet]. [cited 2018 Oct 6]. Available from: http://www.adeptscience.co.uk/products/lab/chembiodraw/chembiodraw-ultra-suite.html
16. Fernandes J, Gattass CR. Topological Polar Surface Area Defines Substrate Transport by Multidrug Resistance Associated Protein 1 (MRP1/ABCC1). J Med Chem. 2009 Feb;52(4):1214–1218.

References
126
17. Hou TJ, Zhang W, Xia K, Qiao XB, Xu XJ. ADME Evaluation in Drug Discovery. 5. Correlation of Caco-2 Permeation with Simple Molecular Properties. J Chem Inf Comput Sci. 2004 Sep;44(5):1585–1600.
18. Silhavy TJ, Kahne D, Walker S. The bacterial cell envelope. Cold Spring Harb Perspect Biol. 2010 May;2(5):a000414.
19. Galanos C, Freudenberg MA. Bacterial endotoxins: biological properties and mechanisms of action. Mediators Inflamm. 1993;2(7):S11–16.
20. Homma JY, Matsuura M, Kanegasaki S, Kawakubo Y, Kojima Y, Shibukawa N, et al. Structural requirements of lipid A responsible for the functions: a study with chemically synthesized lipid A and its analogues. J Biochem (Tokyo). 1985 Aug;98(2):395–406.
21. Kotani S, Takada H, Tsujimoto M, Ogawa T, Takahashi I, Ikeda T, et al. Synthetic lipid A with endotoxic and related biological activities comparable to those of a natural lipid A from an Escherichia coli re-mutant. Infect Immun. 1985 Jul;49(1):225–237.
22. Merck KGaA. Lipopolysaccharides - Structure, Function and Application | Sigma-Aldrich [Internet]. 2018 [cited 2018 Oct 20]. Available from: https://www.sigmaaldrich.com/technical-documents/articles/biology/glycobiology/lipopolysaccharides.html
23. Rivera M, McGroarty EJ. Analysis of a common-antigen lipopolysaccharide from Pseudomonas aeruginosa. J Bacteriol. 1989 Apr;171(4):2244–2248.
24. Steimle A, Autenrieth IB, Frick J-S. Structure and function: Lipid A modifications in commensals and pathogens. Int J Med Microbiol. 2016 Aug;306(5):290–301.
25. Wydro P, Flasiński M, Broniatowski M. Molecular organization of bacterial membrane lipids in mixed systems—A comprehensive monolayer study combined with Grazing Incidence X-ray Diffraction and Brewster Angle Microscopy experiments. Biochim Biophys Acta BBA - Biomembr. 2012 Jul;1818(7):1745–1754.
26. Piddock LJV. Clinically Relevant Chromosomally Encoded Multidrug Resistance Efflux Pumps in Bacteria. Clin Microbiol Rev. 2006 Apr;19(2):382–402.
27. Livermore DM. Antibiotic uptake and transport by bacteria. Scand J Infect Dis Suppl. 1990;74:15–22.
28. Tipper DJ. Mode of action of beta-lactam antibiotics. Pharmacol Ther. 1985;27(1):1–35.
29. Fernandez L, Hancock REW. Adaptive and Mutational Resistance: Role of Porins and Efflux Pumps in Drug Resistance. Clin Microbiol Rev. 2012 Oct;25(4):661–681.
30. Vila J, Martí S, Sánchez-Céspedes J. Porins, efflux pumps and multidrug resistance in Acinetobacter baumannii. J Antimicrob Chemother. 2007 Jun;59(6):1210–1215.
31. Pajatsch M, Andersen C, Mathes A, Böck A, Benz R, Engelhardt H. Properties of a cyclodextrin-specific, unusual porin from Klebsiella oxytoca. J Biol Chem. 1999 Aug;274(35):25159–66.
32. Taber HW, Mueller JP, Miller PF, Arrow AS. Bacterial uptake of aminoglycoside antibiotics. Microbiol Rev. 1987 Dec;51(4):439–457.
33. Nikaido H. Molecular basis of bacterial outer membrane permeability revisited. Microbiol Mol Biol Rev MMBR. 2003 Dec;67(4):593–656.
References
127
34. Bolla J-M, Alibert-Franco S, Handzlik J, Chevalier J, Mahamoud A, Boyer G, et al. Strategies for bypassing the membrane barrier in multidrug resistant Gram-negative bacteria. FEBS Lett. 2011 Jun;585(11):1682–1690.
35. Amaral L, Martins A, Spengler G, Molnar J. Efflux pumps of Gram-negative bacteria: what they do, how they do it, with what and how to deal with them. Front Pharmacol. 2014;4:168.
36. Lewis K. New approaches to antimicrobial discovery. Biochem Pharmacol. 2017 Jun;134:87–98.
37. Kennedy DA, Read AF. Why does drug resistance readily evolve but vaccine resistance does not? Proc Biol Sci. 2017 Mar;284(1851):20162562.
38. Barber M, Whitehead JEM. Bacteriophage types in penicillin-resistant staphylococcal infection. Br Med J. 1949 Sep;2(4627):565–9.
39. Zaman SB, Hussain MA, Nye R, Mehta V, Mamun KT, Hossain N. A Review on Antibiotic Resistance: Alarm Bells are Ringing. Cureus. 2017 Jun;9(6):e1403.
40. Högberg LD, Heddini A, Cars O. The global need for effective antibiotics: challenges and recent advances. Trends Pharmacol Sci. 2010 Nov;31(11):509–515.
41. Dahal RH, Chaudhary DK. Microbial Infections and Antimicrobial Resistance in Nepal: Current Trends and Recommendations. Open Microbiol J. 2018;12:230–242.
42. Antibiotic / Antimicrobial Resistance | CDC [Internet]. [cited 2018 Oct 6]. Available from: https://www.cdc.gov/drugresistance/index.html
43. European Antimicrobial Resistance Surveillance Network (EARS-Net) [Internet]. [cited 2018 Oct 6]. Available from: https://ecdc.europa.eu/en/about-us/partnerships-and-networks/disease-and-laboratory-networks/ears-net
44. WHO | Antimicrobial resistance. WHO [Internet]. 2018; Available from: http://www.who.int/antimicrobial-resistance/en/
45. Delcour AH. Outer membrane permeability and antibiotic resistance. Biochim Biophys Acta. 2009;1794(5):808–16.
46. Pagès J-M, Masi M, Barbe J. Inhibitors of efflux pumps in Gram-negative bacteria. Trends Mol Med. 2005 Aug;11(8):382–9.
47. Webber MA, Piddock LJV. The importance of efflux pumps in bacterial antibiotic resistance. J Antimicrob Chemother. 2003 Jan;51(1):9–11.
48. Rice LB. Challenges in Identifying New Antimicrobial Agents Effective for Treating Infections with Acinetobacter baumannii and Pseudomonas aeruginosa. Clin Infect Dis. 2006;43:100–105.
49. Meletis G. Carbapenem resistance: overview of the problem and future perspectives. Ther Adv Infect Dis. 2016 Feb;3(1):15–21.
50. Okdah L, Le Page S, Olaitan AO, Dubourg G, Hadjadj L, Rolain J-M. New therapy from old drugs: synergistic bactericidal activity of sulfadiazine with colistin against colistin-resistant bacteria, including plasmid-mediated colistin-resistant mcr-1 isolates. Int J Antimicrob Agents. 2018 May;51(5):775–783.
51. Watkins RR, Bonomo RA. β-Lactam Antibiotics. Infect Dis. 2017 Jan;1203–1216.e2.
References
128
52. O’neil J. Securing New Drugs For Future Generations: The Pipeline Of Antibiotics [Internet]. 2015. Available from: https://amr-review.org/sites/default/files/SECURING NEW DRUGS FOR FUTURE GENERATIONS FINAL WEB_0.pdf
53. Tacconelli E, Carrara E, Savoldi A, Kattula D, Burkert F. Global Priority List Of Antibiotic-Resistant Bacteria To Guide Research, Discovery, And Development Of New Antibiotics [Internet]. 2017. Available from: http://www.cdc.gov/drugresistance/threat-report-2013/
54. Bassetti M, Righi E. New antibiotics and antimicrobial combination therapy for the treatment of gram-negative bacterial infections. Curr Opin Crit Care. 2015 Oct;21(5):402–411.
55. Tängdén T. Combination antibiotic therapy for multidrug-resistant Gram-negative bacteria. Ups J Med Sci. 2014 May;119(2):149–53.
56. Worthington RJ, Melander C. Combination approaches to combat multidrug-resistant bacteria. Trends Biotechnol. 2013 Mar;31(3):177–84.
57. WHO publishes list of bacteria for which new antibiotics are urgently needed [Internet]. [cited 2018 Oct 6]. Available from: http://www.who.int/news-room/detail/27-02-2017-who-publishes-list-of-bacteria-for-which-new-antibiotics-are-urgently-needed
58. Tamma PD, Cosgrove SE, Maragakis LL. Combination Therapy for Treatment of Infections with Gram-Negative Bacteria. Clin Microbiol Rev. 2012 Jul;25(3):450–470.
59. Tascini C, Tagliaferri E, Giani T, Leonildi A, Flammini S, Casini B, et al. Synergistic activity of colistin plus rifampin against colistin-resistant KPC-producing Klebsiella pneumoniae. Antimicrob Agents Chemother. 2013 Aug;57(8):3990–3.
60. Melander RJ, Melander C. The Challenge of Overcoming Antibiotic Resistance: An Adjuvant Approach? ACS Infect Dis. 2017;3(8):559–563.
61. Rolinson GN. The history and background of Augmentin. South Afr Med J Suid-Afr Tydskr Vir Geneeskd. 1982 Jul;62(5 Spec No):3A–4A.
62. Coates ARM, Hu Y. Novel approaches to developing new antibiotics for bacterial infections. Br J Pharmacol. 2007 Dec;152(8):1147–54.
63. Pagès J-M, Amaral L. Mechanisms of drug efflux and strategies to combat them: Challenging the efflux pump of Gram-negative bacteria. Biochim Biophys Acta BBA - Proteins Proteomics. 2009 May;1794(5):826–833.
64. Torres A, Zhong N, Pachl J, Timsit J-F, Kollef M, Chen Z, et al. Ceftazidime-avibactam versus meropenem in nosocomial pneumonia, including ventilator-associated pneumonia (REPROVE): a randomised, double-blind, phase 3 non-inferiority trial. Lancet Infect Dis. 2018 Mar;18(3):285–295.
65. Castanheira M, Rhomberg PR, Flamm RK, Jones RN. Effect of the β-Lactamase Inhibitor Vaborbactam Combined with Meropenem against Serine Carbapenemase-Producing Enterobacteriaceae. Antimicrob Agents Chemother. 2016 Sep;60(9):5454–5458.
66. Zhanel GG, Chung P, Adam H, Zelenitsky S, Denisuik A, Schweizer F, et al. Ceftolozane/Tazobactam: A Novel Cephalosporin/β-Lactamase Inhibitor Combination with Activity Against Multidrug-Resistant Gram-Negative Bacilli. Drugs. 2014 Jan;74(1):31–51.
67. Lomovskaya O, Warren MS, Lee A, Galazzo J, Fronko R, Lee M, et al. Identification and Characterization of Inhibitors of Multidrug Resistance Efflux Pumps in Pseudomonas
References
129
aeruginosa: Novel Agents for Combination Therapy. Antimicrob Agents Chemother. 2001 Jan;45(1):105–116.
68. Lomovskaya O, Bostian KA. Practical applications and feasibility of efflux pump inhibitors in the clinic—A vision for applied use. Biochem Pharmacol. 2006 Mar;71(7):910–918.
69. Lamers RP, Cavallari JF, Burrows LL. The Efflux Inhibitor Phenylalanine-Arginine Beta-Naphthylamide (PAβN) Permeabilizes the Outer Membrane of Gram-Negative Bacteria. PLOS ONE. 2013 Mar 27;8(3):e60666.
70. Lewis K. Platforms for antibiotic discovery. Nat Rev Drug Discov. 2013 May;12(5):371–387.
71. Edwards DI. Nitroimidazole drugs–action and resistance mechanisms. I. Mechanisms of action. J Antimicrob Chemother. 1993 Jan;31(1):9–20.
72. Fleck LE, North EJ, Lee RE, Mulcahy LR, Casadei G, Lewis K. A Screen for and Validation of Prodrug Antimicrobials. Antimicrob Agents Chemother. 2014 Mar;58(3):1410–1419.
73. Brewster ME, Loftsson T. Cyclodextrins as pharmaceutical solubilizers. Adv Drug Deliv Rev. 2007 Jul;59(7):645–666.
74. French D. The Schardinger Dextrins. Adv Carbohydr Chem. 1957 Jan;12:189–260.
75. Loftsson T, Másson M, Brewster ME. Self-Association of Cyclodextrins and Cyclodextrin Complexes. J Pharm Sci. 2004 May;93(5):1091–1099.
76. Biwer A, Antranikian G, Heinzle E. Enzymatic production of cyclodextrins. Appl Microbiol Biotechnol. 2002 Sep;59(6):609–617.
77. Ryzhakov A, Do Thi T, Stappaerts J, Bertoletti L, Kimpe K, Sá Couto AR, et al. Self-Assembly of Cyclodextrins and Their Complexes in Aqueous Solutions. J Pharm Sci. 2016 Sep;105(9):2556–2569.
78. González-Gaitano G, Rodríguez P, Isasi JR, Fuentes M, Tardajos G, Sánchez M. The Aggregation of Cyclodextrins as Studied by Photon Correlation Spectroscopy. J Incl Phenom Macrocycl Chem. 2002;44(1/4):101–105.
79. Santosh S. Terdale, Dagade and DH, Patil* KJ. Thermodynamic Studies of Molecular Interactions in Aqueous α-Cyclodextrin Solutions: Application of McMillan−Mayer and Kirkwood−Buff Theories. 2006;110(37):18583–18593.
80. Coleman AW, Nicolis I, Keller N, Dalbiez JP. Aggregation of cyclodextrins: An explanation of the abnormal solubility of?-cyclodextrin. J Incl Phenom Mol Recognit Chem. 1992 Jun;13(2):139–143.
81. Zhang J, Ma PX. Cyclodextrin-based supramolecular systems for drug delivery: Recent progress and future perspective. Adv Drug Deliv Rev. 2013 Aug;65(9):1215–1233.
82. Sharma N, Baldi A. Exploring versatile applications of cyclodextrins: an overview. Drug Deliv. 2016 Jul;23(3):1–19.
83. Gidwani B, Vyas A. Inclusion complexes of bendamustine with β-CD, HP-β-CD and Epi-β-CD: in-vitro and in-vivo evaluation. Drug Dev Ind Pharm. 2015 Dec;41(12):1978–1988.
84. GRAS Notices [Internet]. 2016 [cited 2018 Oct 6]. Available from: https://www.accessdata.fda.gov/scripts/fdcc/index.cfm?set=GRASNotices&sort=Date_of_closure&order=DESC&showAll=true&type=basic&search=
References
130
85. Medicines Agency E. Background review for cyclodextrins used as excipients [Internet]. 2014. Available from: www.ema.europa.eu/contact
86. Annex to the European Commission guideline on “Excipients in the labelling and package leaflet of medicinal products for human use” (SANTE-2017-11668) Excipients and information for the package leaflet [Internet]. 2017. Available from: https://www.ema.europa.eu/documents/scientific-guideline/annex-european-commission-guideline-excipients-labelling-package-leaflet-medicinal-products-human_en.pdf
87. Szente, Szejtli. Highly soluble cyclodextrin derivatives: chemistry, properties, and trends in development. Adv Drug Deliv Rev. 1999 Mar;36(1):17–28.
88. Uekama K, Otagiri M. Cyclodextrins in drug carrier systems. Crit Rev Ther Drug Carrier Syst. 1987;3(1):1–40.
89. Tiwari G, Tiwari R, Rai AK. Cyclodextrins in delivery systems: Applications. J Pharm Bioallied Sci. 2010 Apr;2(2):72–79.
90. Shastri VR, Yue I, Hildgen P, Sinistera RD, Langer R. Method of increasing the efficacy Of Antibiotics By Compexing With Cyclodextrins. US2003/0078215A1., 2003.
91. Agnes M, Thanassoulas A, Stavropoulos P, Nounesis G, Miliotis G, Miriagou V, et al. Designed positively charged cyclodextrin hosts with enhanced binding of penicillins as carriers for the delivery of antibiotics: The case of oxacillin. Int J Pharm. 2017 Oct;531(2):480–491.
92. Thatiparti TR, von Recum HA. Cyclodextrin Complexation for Affinity-Based Antibiotic Delivery. Macromol Biosci. 2010 Jan;10(1):82–90.
93. Taha M, Chai F, Blanchemain N, Neut C, Goube M, Maton M, et al. Evaluation of sorption capacity of antibiotics and antibacterial properties of a cyclodextrin-polymer functionalized hydroxyapatite-coated titanium hip prosthesis. Int J Pharm. 2014 Dec;477(1–2):380–389.
94. Paczkowska M, Mizera M, Szymanowska-Powa\lowska D, Lewandowska K, B\laszczak W, Gościańska J, et al. β-Cyclodextrin complexation as an effective drug delivery system for meropenem. Eur J Pharm Biopharm. 2016 Feb;99:24–34.
95. Ferrari F, Sorrenti M, Rossi S, Catenacci L, Sandri G, Bonferoni MC, et al. Vancomycin–Triacetyl Cyclodextrin Interaction Products for Prolonged Drug Delivery. Pharm Dev Technol. 2008 Jan;13(1):65–73.
96. Deygen IM, Egorov AM, Kudryashova EV. Structure and stability of fluoroquinolone-(2-hydroxypropyl)-β-cyclodextrin complexes as perspective antituberculosis drugs. Mosc Univ Chem Bull. 2016 Jan;71(1):1–6.
97. Jones MN, Song Y-H, Kaszuba M, Reboiras MD. The Interaction of Phospholipid Liposomes with Bacteria and Their Use in the Delivery of Bactericides. J Drug Target. 1997 Jan;5(1):25–34.
98. Rukavina Z, Vanić Ž. Current Trends in Development of Liposomes for Targeting Bacterial Biofilms. Pharmaceutics. 2016 May;8(2):18.
99. Schiffelers R, Storm G, Bakker-Woudenberg I. Liposome-encapsulated aminoglycosides in pre-clinical and clinical studies. J Antimicrob Chemother. 2001 Sep;48(3):333–344.
100. Meers P, Neville M, Malinin V, Scotto AW, Sardaryan G, Kurumunda R, et al. Biofilm penetration, triggered release and in vivo activity of inhaled liposomal amikacin in chronic
References
131
Pseudomonas aeruginosa lung infections. J Antimicrob Chemother. 2008 Feb;61(4):859–868.
101. Beaulac C, Sachetelli S, Lagacé J. Aerosolization of Low Phase Transition Temperature Liposomal Tobramycin as a Dry Powder in an Animal Model of Chronic Pulmonary Infection Caused by Pseudomonas aeruginosa. J Drug Target. 1999 Jan;7(1):33–41.
102. Beaulac C, Sachetelli S, Lagace J. In-vitro bactericidal efficacy of sub-MIC concentrations of liposome- encapsulated antibiotic against gram-negative and gram-positive bacteria. J Antimicrob Chemother. 1998 Jan;41(1):35–41.
103. Beaulac C, Clément-Major S, Hawari J, Lagacé J. Eradication of mucoid Pseudomonas aeruginosa with fluid liposome-encapsulated tobramycin in an animal model of chronic pulmonary infection. Antimicrob Agents Chemother. 1996 Mar;40(3):665–669.
104. Halwani M, Yebio B, Suntres ZE, Alipour M, Azghani AO, Omri A. Co-encapsulation of gallium with gentamicin in liposomes enhances antimicrobial activity of gentamicin against Pseudomonas aeruginosa. J Antimicrob Chemother. 2008 Sep;62(6):1291–1297.
105. Manca ML, Sinico C, Maccioni AM, Diez O, Fadda AM, Manconi M. Composition influence on pulmonary delivery of rifampicin liposomes. Pharmaceutics. 2012 Nov;4(4):590–606.
106. WHO. ANTIBACTERIAL AGENTS IN CLINICAL DEVELOPMENT [Internet]. 2017. Available from: http://www.who.int/about/licensing.
107. Rahman KM, Sutton JM, Picconi P. Pbd antibacterial agents. WO 2017/098257 Al, 2017.
108. Picconi P, Miraz Rahman Anthony Coates Mark Sutton K. Design, Synthesis and Biological Evaluation of Minor Groove Binders as Antibacterial Agents Against Multi-Drug Resistant Pathogens. 2017;
109. Park DR. The microbiology of ventilator-associated pneumonia. Respir Care. 2005 Jun;50(6):742–63; discussion 763–5.
110. Zhang L, Zhang Q, Wang X, Zhang W, Lin C, Chen F, et al. Drug-in-cyclodextrin-in-liposomes: A novel drug delivery system for flurbiprofen. Int J Pharm. 2015 Aug;492(1–2):40–45.
111. McCormack B, Gregoriadis G. Entrapment of Cyclodextrin-Drug Complexes into Liposomes: Potential Advantages in Drug Delivery. J Drug Target. 1994 Jan;2(5):449–454.
112. Sebaaly C, Charcosset C, Fourmentin S, Greige-Gerges H. Potential Applications of Cyclodextrin Inclusion Complexes, Liposomes, and Drug-in-Cyclodextrin-in-Liposome in Food Industry and Packaging. Role Mater Sci Food Bioeng. 2018 Jan;187–234.
113. Azzi J, Auezova L, Danjou P-E, Fourmentin S, Greige-Gerges H. First evaluation of drug-in-cyclodextrin-in-liposomes as an encapsulating system for nerolidol. Food Chem. 2018 Jul;255:399–404.
114. Gharib R, Greige-Gerges H, Fourmentin S, Charcosset C, Auezova L. Liposomes incorporating cyclodextrin–drug inclusion complexes: Current state of knowledge. Carbohydr Polym. 2015 Sep;129:175–186.
115. Maestrelli F, González-Rodríguez ML, Rabasco AM, Mura P. Effect of preparation technique on the properties of liposomes encapsulating ketoprofen–cyclodextrin complexes aimed for transdermal delivery. Int J Pharm. 2006 Apr;312(1–2):53–60.
References
132
116. Fatouros DG, Hatzidimitriou K, Antimisiaris SG. Liposomes encapsulating prednisolone and prednisolone-cyclodextrin complexes: comparison of membrane integrity and drug release. Eur J Pharm Sci Off J Eur Fed Pharm Sci. 2001 Jun;13(3):287–96.
117. Bragagni M, Maestrelli F, Mennini N, Ghelardini C, Mura P. Liposomal formulations of prilocaine: effect of complexation with hydroxypropyl-\s s-cyclodextrin on drug anesthetic efficacy. J Liposome Res. 2010 Dec;20(4):315–322.
118. Hagiwara Y, Arima H, Hirayama F, Uekama K. Prolonged Retention of Doxorubicin in Tumor Cells by Encapsulation of γ-Cyclodextrin Complex in Pegylated Liposomes. J Incl Phenom Macrocycl Chem. 2006 Oct;56(1–2):65–68.
119. Dhule SS, Penfornis P, Frazier T, Walker R, Feldman J, Tan G, et al. Curcumin-loaded γ-cyclodextrin liposomal nanoparticles as delivery vehicles for osteosarcoma. Nanomedicine Nanotechnol Biol Med. 2012 May;8(4):440–451.
120. Škalko N, Brandl M, Bećirević-Laćan M, Filipović-Grčić J, Jalšenjak I. Liposomes with nifedipine and nifedipine-cyclodextrin complex: calorimetrical and plasma stability comparison. Eur J Pharm Sci. 1996 Nov;4(6):359–366.
121. Zhu Q, Guo T, Xia D, Li X, Zhu C, Li H, et al. Pluronic F127-modified liposome-containing tacrolimus-cyclodextrin inclusion complexes: improved solubility, cellular uptake and intestinal penetration. J Pharm Pharmacol. 2013 Aug;65(8):1107–1117.
122. Muheim C, Götzke H, Eriksson AU, Lindberg S, Lauritsen I, Nørholm MHH, et al. Increasing the permeability of Escherichia coli using MAC13243. Sci Rep. 2017 Dec;7(1):17629.
123. Komljenović I, Marquardt D, Harroun TA, Sternin E. Location of chlorhexidine in DMPC model membranes: a neutron diffraction study. Chem Phys Lipids. 2010 Jun;163(6):480–487.
124. Dickey A, Faller R. Examining the contributions of lipid shape and headgroup charge on bilayer behavior. Biophys J. 2008 Sep;95(6):2636–2646.
125. Jouhet J. Importance of the hexagonal lipid phase in biological membrane organization. Front Plant Sci. 2013;4:494.
126. Khalifat N, Fournier J-B, Angelova MI, Puff N. Lipid packing variations induced by pH in cardiolipin-containing bilayers: The driving force for the cristae-like shape instability. Biochim Biophys Acta BBA - Biomembr. 2011 Nov;1808(11):2724–2733.
127. White GF, Racher KI, Lipski A, Hallett FR, Wood JM. Physical properties of liposomes and proteoliposomes prepared from Escherichia coli polar lipids. Biochim Biophys Acta BBA - Biomembr. 2000 Sep;1468(1–2):175–186.
128. Brown RE, Brockman HL. Using Monomolecular Films to Characterize Lipid Lateral Interactions. Methods Mol Biol Clifton NJ. 2007;398:41–58.
129. Brockman H. Dipole potential of lipid membranes. Chem Phys Lipids. 1994 Sep;73(1–2):57–79.
130. Marsh D. Lateral pressure in membranes. Biochim Biophys Acta. 1996 Oct;1286(3):183–223.
131. Penfold J, Thomas RK. The application of the specular reflection of neutrons to the study of surfaces and interfaces. J Phys Condens Matter. 1990 Feb;2(6):1369–1412.
References
133
132. Doshi DA, Dattelbaum AM, Watkins EB, Brinker CJ, Swanson BI, Shreve AP, et al. Neutron Reflectivity Study of Lipid Membranes Assembled on Ordered Nanocomposite and Nanoporous Silica Thin Films. Langmuir. 2005;21(7):2865–2870.
133. Sivia, D. S. (St John’s College O. Elementary Scattering Theory: For X-ray and Neutron Users. 1st ed. Oxford University Press; 2011.
134. Lakey JH. Neutrons for biologists: a beginner’s guide, or why you should consider using neutrons. J R Soc Interface. 2009 Oct;6 Suppl 5(Suppl 5):S567–573.
135. Clifton LA, Neylon C, Lakey JH. Examining Protein–Lipid Complexes Using Neutron Scattering. In: Methods in molecular biology. 2013. p. 119–150.
136. Lu JR, Su TJ, Thomas RK. Structural Conformation of Bovine Serum Albumin Layers at the Air–Water Interface Studied by Neutron Reflection. J Colloid Interface Sci. 1999 May;213(2):426–437.
137. Leimgruber W, Stefanović V, Schenker F, Karr A, Berger J. Isolation and characterization of anthramycin, a new antitumor antibiotic. J Am Chem Soc. 1965 Dec;87(24):5791–5793.
138. Mantaj J, Jackson PJM, Karu K, Rahman KM, Thurston DE. Covalent Bonding of Pyrrolobenzodiazepines (PBDs) to Terminal Guanine Residues within Duplex and Hairpin DNA Fragments. PloS One. 2016;11(4):e0152303.
139. Tse H, Gu Q, Sze K-H, Chu IK, Kao RY-T, Lee K-C, et al. A tricyclic pyrrolobenzodiazepine produced by Klebsiella oxytoca is associated with cytotoxicity in antibiotic-associated hemorrhagic colitis. J Biol Chem. 2017 Sep;292(47):19503–19520.
140. Gerratana B. Biosynthesis, synthesis, and biological activities of pyrrolobenzodiazepines. Med Res Rev. 2012 Mar;32(2):254–93.
141. Basher MA, Rahman KM, Jackson PJM, Thurston DE, Fox KR. Sequence-selective binding of C8-conjugated pyrrolobenzodiazepines (PBDs) to DNA. Biophys Chem. 2017 Nov;230:53–61.
142. Mantaj J, Jackson PJM, Rahman KM, Thurston DE. From Anthramycin to Pyrrolobenzodiazepine (PBD)-Containing Antibody–Drug Conjugates (ADCs). Angew Chem - Int Ed. 2017;56(2):462–488.
143. Brucoli F, Guzman JD, Basher MA, Evangelopoulos D, McMahon E, Munshi T, et al. DNA sequence-selective C8-linked pyrrolobenzodiazepine–heterocyclic polyamide conjugates show anti-tubercular-specific activities. J Antibiot (Tokyo). 2016 Dec;69(12):843–9.
144. Brown DG, May-Dracka TL, Gagnon MM, Tommasi R. Trends and Exceptions of Physical Properties on Antibacterial Activity for Gram-Positive and Gram-Negative Pathogens. J Med Chem. 2014 Dec;57(23):10144–10161.
145. Upadhyay S, Kumar G. NMR and molecular modelling studies on the interaction of fluconazole with β-cyclodextrin. Chem Cent J. 2009 Aug;3(1):9.
146. Loftsson T, Jarho P, Másson M, Järvinen T. Cyclodextrins in drug delivery. Expert Opin Drug Deliv. 2005 Mar;2(2):335–351.
147. Loftsson T, Másson M. Evaluation of cyclodextrin solubilization of drugs. Int J Pharm. 2005;302:18–28.
148. Gabelica V, Galic N, Pauw E. On the specificity of cyclodextrin complexes detected by electrospray mass spectrometry. J Am Soc Mass Spectrom. 2002 Aug;13(8):946–953.
References
134
149. Correia I, Bezzenine N, Ronzani N, Platzer N, Beloeil J-C, Doan B-T. Study of inclusion complexes of acridine with β- and (2,6-di-O-methyl)-β-cyclodextrin by use of solubility diagrams and NMR spectroscopy. J Phys Org Chem. 2002 Sep;15(9):647–659.
150. Tolman JA, Williams RO. Advances in the pulmonary delivery of poorly water-soluble drugs: influence of solubilization on pharmacokinetic properties. Drug Dev Ind Pharm. 2010 Jan;36(1):1–30.
151. Valero M, Castiglione F, Mele A, da Silva MA, Grillo I, González-Gaitano G, et al. Competitive and Synergistic Interactions between Polymer Micelles, Drugs, and Cyclodextrins: The Importance of Drug Solubilization Locus. Langmuir ACS J Surf Colloids. 2016 13;32(49):13174–86.
152. Nigam S, Durocher G. Spectral and Photophysical Studies of Inclusion Complexes of Some Neutral 3H-Indoles and Their Cations and Anions with β-Cyclodextrin. J Phys Chem. 1996 Jan;100(17):7135–7142.
153. Peeters J, Neeskens P, Tollenaere JP, Van Remoortere P, Brewster ME. Characterization of the interaction of 2-hydroxypropyl-β-cyclodextrin with itraconazole at pH 2, 4, and 7. J Pharm Sci. 2002 Jun;91(6):1414–1422.
154. Chen A, Liu M, Dong L, Sun D. Study on the effect of solvent on the inclusion interaction of hydroxypropyl-β-cyclodextrin with three kinds of coumarins by phase solubility method. Fluid Phase Equilibria. 2013 Mar;341:42–47.
155. Loftsson T, Brewster ME. Cyclodextrins as Functional Excipients: Methods to Enhance Complexation Efficiency. J Pharm Sci. 2012 Sep;101(9):3019–3032.
156. Huang CY. Determination of binding stoichiometry by the continuous variation method: The job plot. Methods Enzymol. 1982 Jan;87:509–525.
157. Bertholet P, Gueders M, Dive G, Albert A, Barillaro V, Perly B, et al. The effect of cyclodextrins on the aqueous solubility of a new MMP inhibitor: phase solubility, 1 H-NMR spectroscopy and molecular modeling studies, preparation and stability study of nebulizable solutions. J Pharm Pharm Sci Publ Can Soc Pharm Sci Soc Can Sci Pharm. 2005 Jul;8(2):163–174.
158. Angiolini L, Agnes M, Cohen B, Yannakopoulou K, Douhal A. Formation, characterization and pH dependence of rifampicin: heptakis(2,6-di- O -methyl)-β-cyclodextrin complexes. Int J Pharm. 2017 Oct;531(2):668–675.
159. Hirayama F, Kurihara M, Horiuchi Y, Utsuki T, Uekama K, Yamasaki M. Preparation of heptakis(2,6-di-O-ethyl)-beta-cyclodextrin and its nuclear magnetic resonance spectroscopic characterization. Pharm Res. 1993 Feb;10(2):208–13.
160. Iza N, Guerrero-Martínez A, Tardajos G, Ortiz MJ, Palao E, Montoro T, et al. Using Inclusion Complexes with Cyclodextrins To Explore the Aggregation Behavior of a Ruthenium Metallosurfactant. Langmuir. 2015 Mar;31(9):2677–2688.
161. Poór M, Zand A, Szente L, Lemli B, Kunsági-Máté S, Poór M, et al. Interaction of α- and β-zearalenols with β-cyclodextrins. Molecules. 2017 Nov;22(11):1910.
162. Tewes F, Brillault J, Couet W, Olivier J-C. Formulation of rifampicin–cyclodextrin complexes for lung nebulization. J Controlled Release. 2008 Jul;129(2):93–99.
163. Chadha R, Saini A, Gupta S, Arora P, Thakur D, Jain DVS. Encapsulation of rifampicin by natural and modified β-cyclodextrins: characterization and thermodynamic parameters. J Incl Phenom Macrocycl Chem. 2010 Jun;67(1–2):109–116.
References
135
164. He D, Deng P, Yang L, Tan Q, Liu J, Yang M, et al. Molecular encapsulation of rifampicin as an inclusion complex of hydroxypropyl-β-cyclodextrin: Design; characterization and in vitro dissolution. Colloids Surf B Biointerfaces. 2013 Mar;103:580–585.
165. International Conference on Harmonization. Impurities in New Drug Products - Q3B (R2) [Internet]. 2006 p. 12. Report No.: June. Available from: http://scholar.google.com/scholar?hl=en&btnG=Search&q=intitle:Q3B(R2)+-+Impurities+in+New+Drug+Products#2
166. Dabkowski J, Zagórska I, Dabkowska M, Koczorowski Z, Trasatti S. Adsorption of DMSO at the free surface of water: surface excesses and surface potential shifts in the low concentration range. J Chem Soc Faraday Trans. 1996 Jan;92(20):3873–3878.
167. David S. Karpovich, Ray D. Adsorption of Dimethyl Sulfoxide to the Liquid/Vapor Interface of Water and the Thermochemistry of Transport across the Interface. J Phys Chem B. 1998;102(4):649–652.
168. Christian F. Wertz, Santore MM. Effect of Surface Hydrophobicity on Adsorption and Relaxation Kinetics of Albumin and Fibrinogen: Single-Species and Competitive Behavior. Langmuir. 2001;17(10):3006–3016.
169. Wang J, Matayoshi E. Solubility at the molecular level: development of a critical aggregation concentration (CAC) assay for estimating compound monomer solubility. Pharm Res. 2012 Jul;29(7):1745–54.
170. Bonev B, Hooper J, Parisot J. Principles of assessing bacterial susceptibility to antibiotics using the agar diffusion method. J Antimicrob Chemother. 2008 Mar;61(6):1295–1301.
171. Loftsson T. Non-inclusion cyclodextrin complexes [Internet]. US7,115,586B2, 2004. Available from: https://patentimages.storage.googleapis.com/6d/3b/97/875e2cd02c0c26/US7115586.pdf
172. Upadhye SB, Kulkarni SJ, Majumdar S, Avery MA, Gul W, ElSohly MA, et al. Preparation and characterization of inclusion complexes of a hemisuccinate ester prodrug of delta9-tetrahydrocannabinol with modified beta-cyclodextrins. AAPS PharmSciTech. 2010 Jun;11(2):509–17.
173. Ferreira DA, Ferreira AG, Vizzotto L, Federman Neto A, de Oliveira AG. Analysis of the molecular association of rifampicin with hydroxypropyl-β-cyclodextrin. Rev Bras Ciênc Farm. 2004 Mar;40(1):43–51.
174. Drulis-Kawa Z, Gubernator J, Dorotkiewicz-Jach A, Doroszkiewicz W, Kozubek A. In vitro antimicrobial activity of liposomal meropenem against Pseudomonas aeruginosa strains. Int J Pharm. 2006 Jun;315(1–2):59–66.
175. Loftsson T, Hreinsdóttir D, Másson M. The complexation efficiency. J Incl Phenom Macrocycl Chem. 2007 Mar;57(1–4):545–552.
176. Liu L, Guo Q-X. The Driving Forces in the Inclusion Complexation of Cyclodextrins. J Incl Phenom Macrocycl Chem. 2002;42(1–2):1–14.
177. Antimicrobial resistance (EARS-Net) - Annual Epidemiological Report for 2014 [Internet]. [cited 2018 Oct 6]. Available from: https://ecdc.europa.eu/en/publications-data/antimicrobial-resistance-ears-net-annual-epidemiological-report-2014
178. Peleg AY, Hooper DC. Hospital-Acquired Infections Due to Gram-Negative Bacteria. N Engl J Med. 2010 May;362(19):1804–1813.
References
136
179. Sachetelli S, Khalil H, Chen T, Beaulac C, Sénéchal S, Lagacé J. Demonstration of a fusion mechanism between a fluid bactericidal liposomal formulation and bacterial cells. Biochim Biophys Acta. 2000 Feb;1463(2):254–66.
180. Akbarzadeh A, Rezaei-Sadabady R, Davaran S, Joo SW, Zarghami N, Hanifehpour Y, et al. Liposome: classification, preparation, and applications. Nanoscale Res Lett. 2013 Feb;8(1):102.
181. Huang Z, London E. Effect of Cyclodextrin and Membrane Lipid Structure upon Cyclodextrin–Lipid Interaction. Langmuir. 2013 Nov;29(47):14631–14638.
182. Anderson TG, Tan A, Ganz P, Seelig J. Calorimetric measurement of phospholipid interaction with methyl-beta-cyclodextrin. Biochemistry. 2004 Mar;43(8):2251–2261.
183. Liossi ΑS, Ntountaniotis D, Kellici TF, Chatziathanasiadou MV, Megariotis G, Mania M, et al. Exploring the interactions of irbesartan and irbesartan–2-hydroxypropyl-β-cyclodextrin complex with model membranes. Biochim Biophys Acta BBA - Biomembr. 2017 Jun;1859(6):1089–1098.
184. Hudzicki J. Kirby-Bauer Disk Diffusion Susceptibility Test Protocol. Am Soc Microbiol. 2009 Dec;1–23.
185. Zhang H-M, Li Z, Uematsu K, Kobayashi T, Horikoshi K. Antibacterial activity of cyclodextrins against Bacillus strains. Arch Microbiol. 2008 Nov;190(5):605–609.
186. Szoka F, Papahadjopoulos D. Comparative Properties and Methods of Preparation of Lipid Vesicles (Liposomes). Annu Rev Biophys Bioeng. 1980 Jun;9(1):467–508.
187. Bhattacharjee S. DLS and zeta potential – What they are and what they are not? J Controlled Release. 2016 Aug;235:337–351.
188. Stewart JCM. Colorimetric determination of phospholipids with ammonium ferrothiocyanate. Anal Biochem. 1980 May;104(1):10–14.
189. Bozzuto G, Molinari A. Liposomes as nanomedical devices. Int J Nanomedicine. 2015 Feb;10:975–999.
190. Burgess S. Liposome Preparation - Avanti® Polar Lipids | Sigma-Aldrich [Internet]. 1998 [cited 2018 Oct 7]. Available from: https://www.sigmaaldrich.com/technical-documents/articles/biology/liposome-preparation.html
191. Wetterau JR, Jonas A. Effect of dipalmitoylphosphatidylcholine vesicle curvature on the reaction with human apolipoprotein A-I. J Biol Chem. 1982 Sep;257(18):10961–10966.
192. Huang C-M, Chen C-H, Pornpattananangkul D, Zhang L, Chan M, Hsieh M-F, et al. Eradication of drug resistant Staphylococcus aureus by liposomal oleic acids. Biomaterials. 2011 Jan;32(1):214–221.
193. Hope MJ, Bally MB, Mayer LD, Janoff AS, Cullis PR. Generation of multilamellar and unilamellar phospholipid vesicles. Chem Phys Lipids. 1986 Jun;40(2–4):89–107.
194. Connor J, Sullivan S, Huang H L. Monoclonal Antibody And Liposomes. Pharmacol Ther. 1985;28(3):341–365.
195. Drulis-Kawa Z, Dorotkiewicz-Jach A. Liposomes as delivery systems for antibiotics. Int J Pharm. 2010 Mar;387(1–2):187–198.

References
137
196. Drulis-Kawa Z, Gubernator J, Dorotkiewicz-Jach A, Doroszkiewicz W, Kozubek A. A comparison of the in vitro antimicrobial activity of liposomes containing meropenem and gentamicin. Cell Mol Biol Lett. 2006;11(3):360–375.
197. Tandrup Schmidt S, Foged C, Smith Korsholm K, Rades T, Christensen D. Liposome-Based Adjuvants for Subunit Vaccines: Formulation Strategies for Subunit Antigens and Immunostimulators. Pharmaceutics. 2016 Mar;8(1):7.
198. Disalvo EA, Hollmann A, Martini MF. Hydration in Lipid Monolayers: Correlation of Water Activity and Surface Pressure. Subcell Biochem. 2015;71:213–231.
199. Disalvo EA, Lairion F, Martini F, Tymczyszyn E, Frías M, Almaleck H, et al. Structural and functional properties of hydration and confined water in membrane interfaces. Biochim Biophys Acta BBA - Biomembr. 2008 Dec;1778(12):2655–2670.
200. Binder H, Zschörnig O. The effect of metal cations on the phase behavior and hydration characteristics of phospholipid membranes. Chem Phys Lipids. 2002 May;115(1–2):39–61.
201. Gurtovenko AA, Vattulainen I. Effect of NaCl and KCl on Phosphatidylcholine and Phosphatidylethanolamine Lipid Membranes: Insight from Atomic-Scale Simulations for Understanding Salt-Induced Effects in the Plasma Membrane. J Phys Chem B. 2008 Feb;112(7):1953–1962.
202. Melcrová A, Pokorna S, Pullanchery S, Kohagen M, Jurkiewicz P, Hof M, et al. The complex nature of calcium cation interactions with phospholipid bilayers. Sci Rep. 2016 Dec;6(1):38035.
203. Szente L, Fenyvesi É. Cyclodextrin-Lipid Complexes: Cavity Size Matters. Struct Chem. 2017 Apr;28(2):479–492.
204. Szejtli J, Cserháti T, Szögyi M. Interactions between cyclodextrins and cell-membrane phospholipids. Carbohydr Polym. 1986 Jan;6(1):35–49.
205. Nishijo J, Shiota S, Mazima K, Inoue Y, Mizuno H, Yoshida J. Interactions of cyclodextrins with dipalmitoyl, distearoyl, and dimyristoyl phosphatidyl choline liposomes. A study by leakage of carboxyfluorescein in inner aqueous phase of unilamellar liposomes. Chem Pharm Bull (Tokyo). 2000 Jan;48(1):48–52.
206. Uhríková D, Kučerka N, Teixeira J, Gordeliy V, Balgavý P. Structural changes in dipalmitoylphosphatidylcholine bilayer promoted by Ca2+ ions: a small-angle neutron scattering study. Chem Phys Lipids. 2008 Oct;155(2):80–89.
207. Pedersen UR, Leidy C, Westh P, Peters GH. The effect of calcium on the properties of charged phospholipid bilayers. Biochim Biophys Acta BBA - Biomembr. 2006 May;1758(5):573–582.
208. Lapinski MM, Castro-Forero A, Greiner AJ, Ofoli RY, Blanchard GJ. Comparison of Liposomes Formed by Sonication and Extrusion: Rotational and Translational Diffusion of an Embedded Chromophore. Langmuir. 2007 Nov;23(23):11677–11683.
209. Connors KA, Pendergast DD. Microscopic binding constants in cyclodextrin systems: complexation of .alpha.-cyclodextrin with sym-1,4-disubstituted benzenes. J Am Chem Soc. 1984 Nov;106(24):7607–7614.
210. Nishijo J, Moriyama S, Shiota S. Interactions of cholesterol with cyclodextrins in aqueous solution. Chem Pharm Bull (Tokyo). 2003 Nov;51(11):1253–1257.

References
138
211. Ruysschaert T, Marque A, Duteyrat J-L, Lesieur S, Winterhalter M, Fournier D. Liposome retention in size exclusion chromatography. BMC Biotechnol. 2005 May;5(1):11.
212. Yamamoto S, Kurihara H, Mutoh T, Xing X, Unno H. Cholesterol recovery from inclusion complex of β-cyclodextrin and cholesterol by aeration at elevated temperatures. Biochem Eng J. 2005 Feb;22(3):197–205.
213. Machut-Binkowski C, Hapiot F, Cecchelli R, Martin P, Monflier E. A versatile liposome/cyclodextrin supramolecular carrier for drug delivery through the blood-brain barrier. J Incl Phenom Macrocycl Chem. 2007 Mar;57(1–4):567–572.
214. Donova MV, Nikolayeva VM, Dovbnya DV, Gulevskaya SA, Suzina NE. Methyl-beta-cyclodextrin alters growth, activity and cell envelope features of sterol-transforming mycobacteria. Microbiology. 2007 Jun;153(6):1981–1992.
215. Suárez DF, Consuegra J, Trajano VC, Gontijo SML, Guimarães PPG, Cortés ME, et al. Structural and thermodynamic characterization of doxycycline/β-cyclodextrin supramolecular complex and its bacterial membrane interactions. Colloids Surf B Biointerfaces. 2014 Jun;118:194–201.
216. Rosa Teixeira KI, Araújo PV, Almeida Neves BR, Bohorquez Mahecha GA, Sinisterra RD, Cortés ME. Ultrastructural changes in bacterial membranes induced by nano-assemblies β-cyclodextrin chlorhexidine: SEM, AFM, and TEM evaluation. Pharm Dev Technol. 2013 Jun;18(3):600–608.
217. Li X, Zhou L, Takai H, Sasaki Y, Mezawa M, Li Z, et al. Aggregatibacter actinomycetemcomitans lipopolysaccharide regulates bone sialoprotein gene transcription. J Cell Biochem. 2012 Sep;113(9):2822–2834.
218. Santos RS, Figueiredo C, Azevedo NF, Braeckmans K, De Smedt SC. Nanomaterials and molecular transporters to overcome the bacterial envelope barrier: Towards advanced delivery of antibiotics. Adv Drug Deliv Rev. 2017 Dec;136–137:28–48.
219. Jeworrek C, Evers F, Howe J, Brandenburg K, Tolan M, Winter R. Effects of Specific versus Nonspecific Ionic Interactions on the Structure and Lateral Organization of Lipopolysaccharides. Biophys J. 2011 May;100(9):2169–2177.
220. Le Brun AP, Clifton LA, Halbert CE, Lin B, Meron M, Holden PJ, et al. Structural characterization of a model gram-negative bacterial surface using lipopolysaccharides from rough strains of Escherichia coli. Biomacromolecules. 2013 Jun;14(6):2014–2022.
221. Santos NC, Silva AC, Castanho MARB, Martins-Silva J, Saldanha C. Evaluation of Lipopolysaccharide Aggregation by Light Scattering Spectroscopy. ChemBioChem. 2003 Jan;4(1):96–100.
222. Furse S, Scott DJ. Three-Dimensional Distribution of Phospholipids in Gram Negative Bacteria. Biochemistry. 2016 Aug;55(34):4742–4747.
223. Sohlenkamp C, Geiger O. Bacterial membrane lipids: diversity in structures and pathways. Narberhaus F, editor. FEMS Microbiol Rev. 2016 Jan;40(1):133–159.
224. Marquardt D, Geier B, Pabst G. Asymmetric Lipid Membranes: Towards More Realistic Model Systems. Membranes. 2015 May;5(2):180–196.
225. Clifton LA, Skoda MWA, Le Brun AP, Ciesielski F, Kuzmenko I, Holt SA, et al. Effect of Divalent Cation Removal on the Structure of Gram-Negative Bacterial Outer Membrane Models. Langmuir. 2015 Jan;31(1):404–412.
References
139
226. Clifton LukeA, Ciesielski F, Skoda MWA, Paracini N, Holt SA, Lakey JH. The Effect of Lipopolysaccharide Core Oligosaccharide Size on the Electrostatic Binding of Antimicrobial Proteins to Models of the Gram Negative Bacterial Outer Membrane. Langmuir. 2016 Apr;32(14):3485–3494.
227. Clifton LA, Holt SA, Hughes AV, Daulton EL, Arunmanee W, Heinrich F, et al. An Accurate In Vitro Model of the E. coli Envelope. Angew Chem Int Ed. 2015 Oct;54(41):11952–11955.
228. Clausell A, Garcia-Subirats M, Pujol M, Busquets MA, Rabanal F, Cajal Y. Gram-negative outer and inner membrane models: insertion of cyclic cationic lipopeptides. J Phys Chem B. 2007 Jan;111(3):551–563.
229. Vollhardt D, Fainerman VB. Progress in characterization of Langmuir monolayers by consideration of compressibility. Adv Colloid Interface Sci. 2006 Nov;127(2):83–97.
230. Dynarowicz-Łatka P, Hac-Wydro K. Interactions between phosphatidylcholines and cholesterol in monolayers at the air/water interface. Colloids Surf B Biointerfaces. 2004 Aug;37(1–2):21–5.
231. Hughes AV. RasCAL download | SourceForge.net [Internet]. 2013 [cited 2018 Oct 7]. Available from: https://sourceforge.net/projects/rscl/
232. Born M, Wolf Emil. Principles of optics : electromagnetic theory of propagation, interference and diffraction of light. Cambridge University Press; 1999. 952 p.
233. Haario H, Laine M, Mira A, Saksman E. DRAM: Efficient adaptive MCMC. Stat Comput. 2006 Dec;16(4):339–354.
234. Haario H, Saksman E, Tamminen J. An Adaptive Metropolis Algorithm. Bernoulli. 2001 Apr;7(2):223.
235. Duncan SL, Larson RG. Comparing Experimental and Simulated Pressure-Area Isotherms for DPPC. Biophys J. 2008 Apr;94(8):2965–2986.
236. Zuo YY, Chen R, Wang X, Yang J, Policova Z, Neumann AW. Phase Transitions in Dipalmitoylphosphatidylcholine Monolayers. Langmuir. 2016 Aug;32(33):8501–8506.
237. Shapovalov VL. Interaction of DPPC monolayer at air–water interface with hydrophobic ions. Thin Solid Films. 1998 Aug;327–329:599–602.
238. Dahmen-Levison U, Brezesinski G, Möhwald H. Specific adsorption of PLA2 at monolayers. Thin Solid Films. 1998 Aug;327–329:616–620.
239. Campbell RA, Saaka Y, Shao Y, Gerelli Y, Cubitt R, Nazaruk E, et al. Structure of surfactant and phospholipid monolayers at the air/water interface modeled from neutron reflectivity data. J Colloid Interface Sci. 2018 Dec;531:98–108.
240. Harvey RD, Ara N, Heenan RK, Barlow DJ, Quinn PJ, Lawrence MJ. Stabilization of Distearoylphosphatidylcholine Lamellar Phases in Propylene Glycol Using Cholesterol. Mol Pharm. 2013 Dec;10(12):4408–4417.
241. Galdston M, Shah DO. Surface properties and hysteresis of dipalmitoyllecithin in relation to the alveolar lining layer. Biochim Biophys Acta BBA - Lipids Lipid Metab. 1967 Apr;137(2):255–263.
242. García-Verdugo I, Cañadas O, Taneva SG, Keough KMW, Casals C. Surfactant Protein A Forms Extensive Lattice-Like Structures on 1,2-Dipalmitoylphosphatidylcholine/Rough-Lipopolysaccharide- Mixed Monolayers. Biophys J. 2007 Nov;93(10):3529–3540.
140
243. Herrmann M, Schneck E, Gutsmann T, Brandenburg K, Tanaka M. Bacterial lipopolysaccharides form physically cross-linked, two-dimensional gels in the presence of divalent cations. Soft Matter. 2015 Jul;11(30):6037–6044.
244. Michel JP, Wang YX, Dé E, Fontaine P, Goldmann M, Rosilio V. Charge and aggregation pattern govern the interaction of plasticins with LPS monolayers mimicking the external leaflet of the outer membrane of Gram-negative bacteria. Biochim Biophys Acta BBA - Biomembr. 2015 Nov;1848(11):2967–2979.
245. Lee H, Wu W, Oh JK, Mueller L, Sherwood G, Peteanu L, et al. Light-Induced Reversible Formation of Polymeric Micelles. Angew Chem Int Ed. 2007 Mar;46(14):2453–2457.
246. Athanassiou G, Michaleas S, Lada-Chitiroglou E, Tsitsa T, Antoniadou-Vyza E. Antimicrobial activity of β-lactam antibiotics against clinical pathogens after molecular inclusion in several cyclodextrins. A novel approach to bacterial resistance. J Pharm Pharmacol. 2003 Mar;55(3):291–300.
247. Bhamidimarri SP, Prajapati JD, van den Berg B, Winterhalter M, Kleinekathöfer U. Role of Electroosmosis in the Permeation of Neutral Molecules: CymA and Cyclodextrin as an Example. Biophys J. 2016 Feb;110(3):600–611.
248. Charitat T, Lecuyer S, Fragneto G. Fluctuations and destabilization of single phospholipid bilayers. Biointerphases. 2008 Jun;3(2):FB3–FB15.
249. Wang Z, Ma Y, Khalil H, Wang R, Lu T, Zhao W, et al. Fusion between fluid liposomes and intact bacteria: study of driving parameters and in vitro bactericidal efficacy. Int J Nanomedicine. 2016;11:4025–4036.
250. Los DA, Murata N. Membrane fluidity and its roles in the perception of environmental signals. Biochim Biophys Acta BBA - Biomembr. 2004 Nov;1666(1–2):142–157.
251. Chow AHL, Hsia CK, Gordon JD, Young JWM, Vargha-Butler EI. Assessment of wettability and its relationship to the intrinsic dissolution rate of doped phenytoin crystals. Int J Pharm. 1995 Dec;126(1–2):21–28.
252. Desjardins A, Chen T, Khalil H, Sayasith K, Lagacé J. Differential Behaviour of Fluid Liposomes Toward Mammalian Epithelial Cells and Bacteria: Restriction of Fusion to Bacteria. J Drug Target. 2002 Jan;10(1):47–54.
253. Coates A, Hu Y, Bax R, Page C. The future challenges facing the development of new antimicrobial drugs. Nat Rev Drug Discov. 2002 Nov;1(11):895–910.
254. Shen F, Chu S, Bence AK, Bailey B, Xue X, Erickson PA, et al. Quantitation of Doxorubicin Uptake, Efflux, and Modulation of Multidrug Resistance (MDR) in MDR Human Cancer Cells. J Pharmacol Exp Ther. 2007 Oct;324(1):95–102.
255. Loh B, Grant C, Hancock RE. Use of the fluorescent probe 1-N-phenylnaphthylamine to study the interactions of aminoglycoside antibiotics with the outer membrane of Pseudomonas aeruginosa. Antimicrob Agents Chemother. 1984 Oct;26(4):546–51.
256. Hatty CR, Le Brun AP, Lake V, Clifton LA, Liu GJ, James M, et al. Investigating the interactions of the 18kDa translocator protein and its ligand PK11195 in planar lipid bilayers. Biochim Biophys Acta BBA - Biomembr. 2014 Mar 1;1838(3):1019–30.
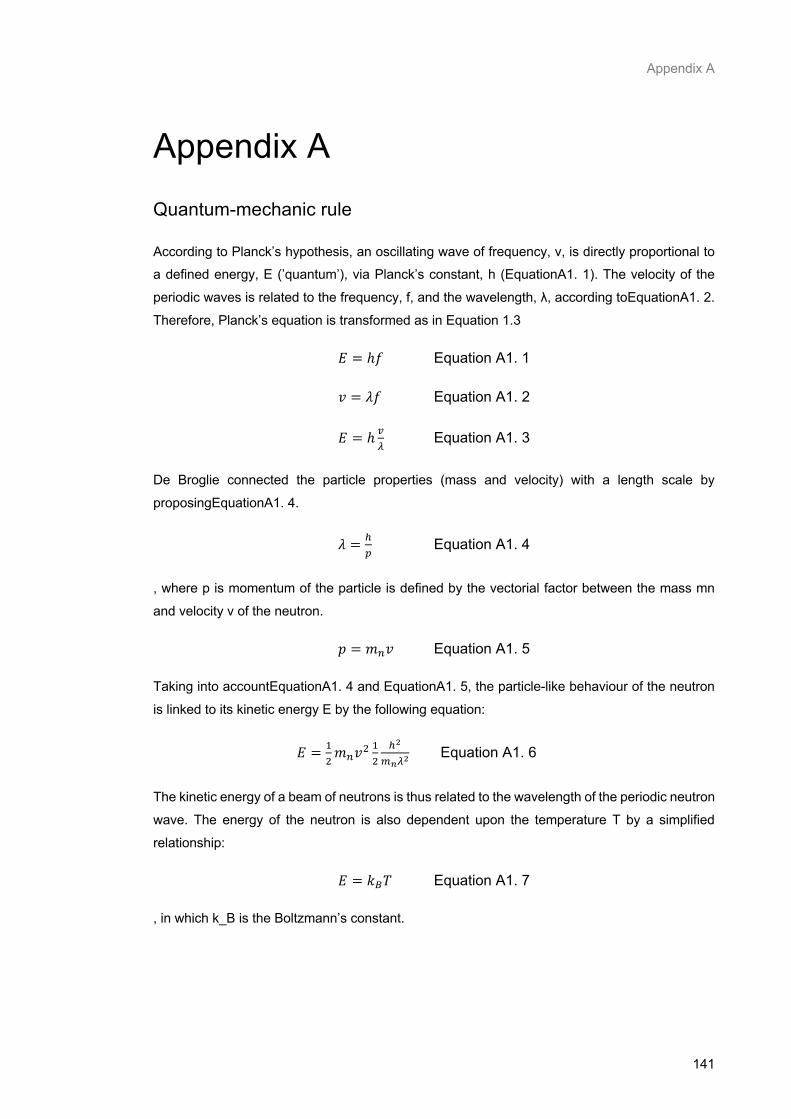
Appendix A
141
Appendix A Quantum-mechanic rule
According to Planck’s hypothesis, an oscillating wave of frequency, ν, is directly proportional to a defined energy, E (’quantum’), via Planck’s constant, h (EquationA1. 1). The velocity of the
periodic waves is related to the frequency, f, and the wavelength, λ, according toEquationA1. 2.
Therefore, Planck’s equation is transformed as in Equation 1.3
𝐸 = ℎ𝑓 Equation A1. 1
𝑣 = 𝜆𝑓 Equation A1. 2
𝐸 = ℎ ÄB Equation A1. 3
De Broglie connected the particle properties (mass and velocity) with a length scale by
proposingEquationA1. 4.
𝜆 = Å� Equation A1. 4
, where p is momentum of the particle is defined by the vectorial factor between the mass mn
and velocity v of the neutron.
𝑝 = 𝑚I𝑣 Equation A1. 5
Taking into accountEquationA1. 4 and EquationA1. 5, the particle-like behaviour of the neutron
is linked to its kinetic energy E by the following equation:
𝐸 = V@𝑚I𝑣@
V@
ÅZ
_UBZ Equation A1. 6
The kinetic energy of a beam of neutrons is thus related to the wavelength of the periodic neutron
wave. The energy of the neutron is also dependent upon the temperature T by a simplified
relationship:
𝐸 = 𝑘Ç𝑇 Equation A1. 7
, in which k_B is the Boltzmann’s constant.

Appendix B
142
Appendix B Table B 1: Minimum Inhibitory concentrations (MIC) of PPA148 against Gram-negative bacteria
in the absence and presence of the efflux pump inhibitor PaβN.
Compound
MIC (μg/mL)
Acinetobacter baumannii K. pseumoniae P. aeruginosa
ATTCC 17978 AYE M6 NCTC
13368 PA01 NCTC 13437
PP-A148 2 2 0.25-0.5 16-32 128 16
PP-A148 with PAβN 0.125-0.5 0.125-0.5 0.125-0.25 2-8 4-8 0.25-2
Table B 2: Minimum Inhibitory concentrations (MIC) of PPA148 against Gram-positive bacteria in the absence and presence of the efflux pump inhibitor PaβN.
Compound
MIC (μg/mL)
VRE VSE MRSA MSSA
NCTC 12201
NCTC 12204
NCTC 775
EMRSA 15
EMRSA 16
ARCC 9144
PP-A148 0.25-0.5 0.01 1 2 2
0.5
PP-A148 with PAβN <0.125 <0.125 <0.125 <0.125 <0.125 <0.125
Scheme B 1: Complete synthetic route of PPA148.
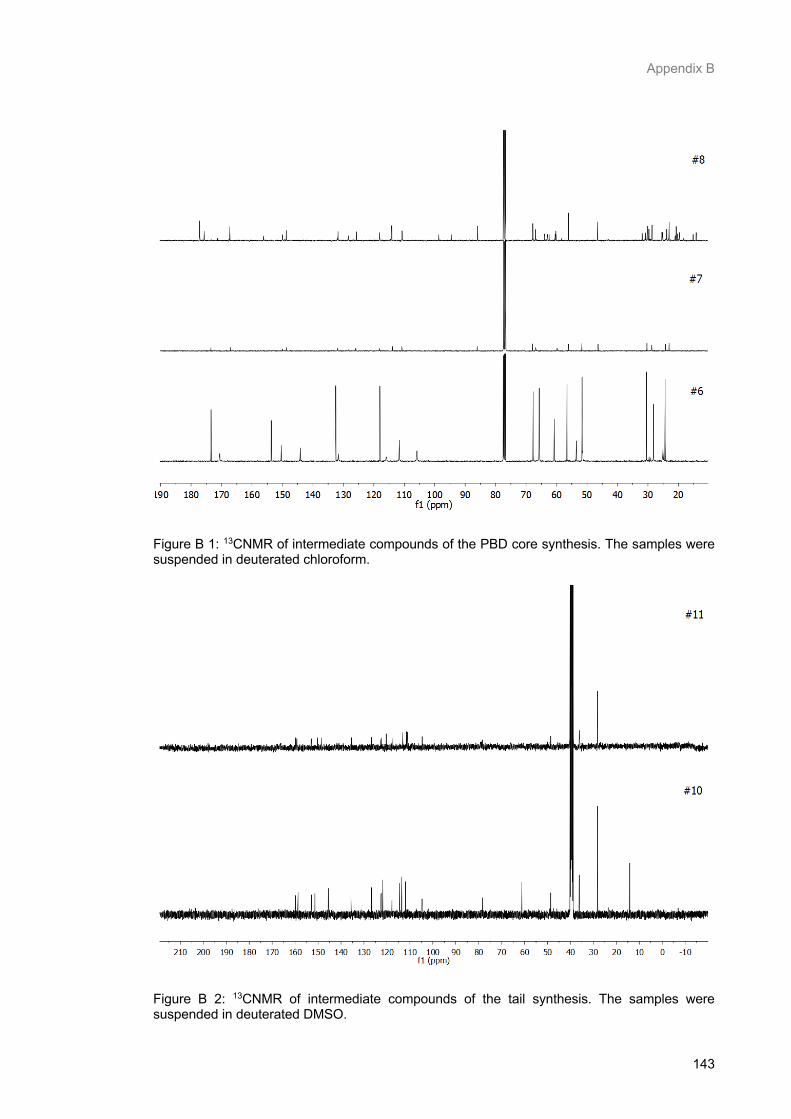
Appendix B
143
Figure B 1: 13CNMR of intermediate compounds of the PBD core synthesis. The samples were suspended in deuterated chloroform.
Figure B 2: 13CNMR of intermediate compounds of the tail synthesis. The samples were suspended in deuterated DMSO.
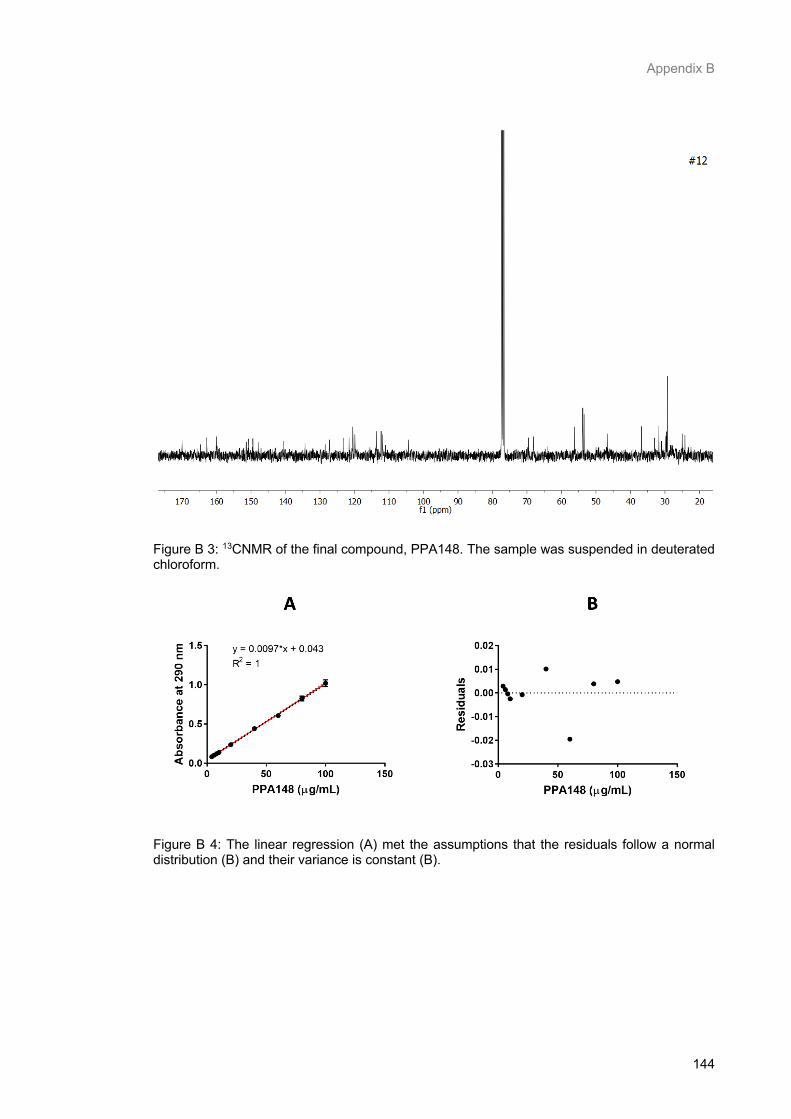
Appendix B
144
Figure B 3: 13CNMR of the final compound, PPA148. The sample was suspended in deuterated chloroform.
Figure B 4: The linear regression (A) met the assumptions that the residuals follow a normal distribution (B) and their variance is constant (B).
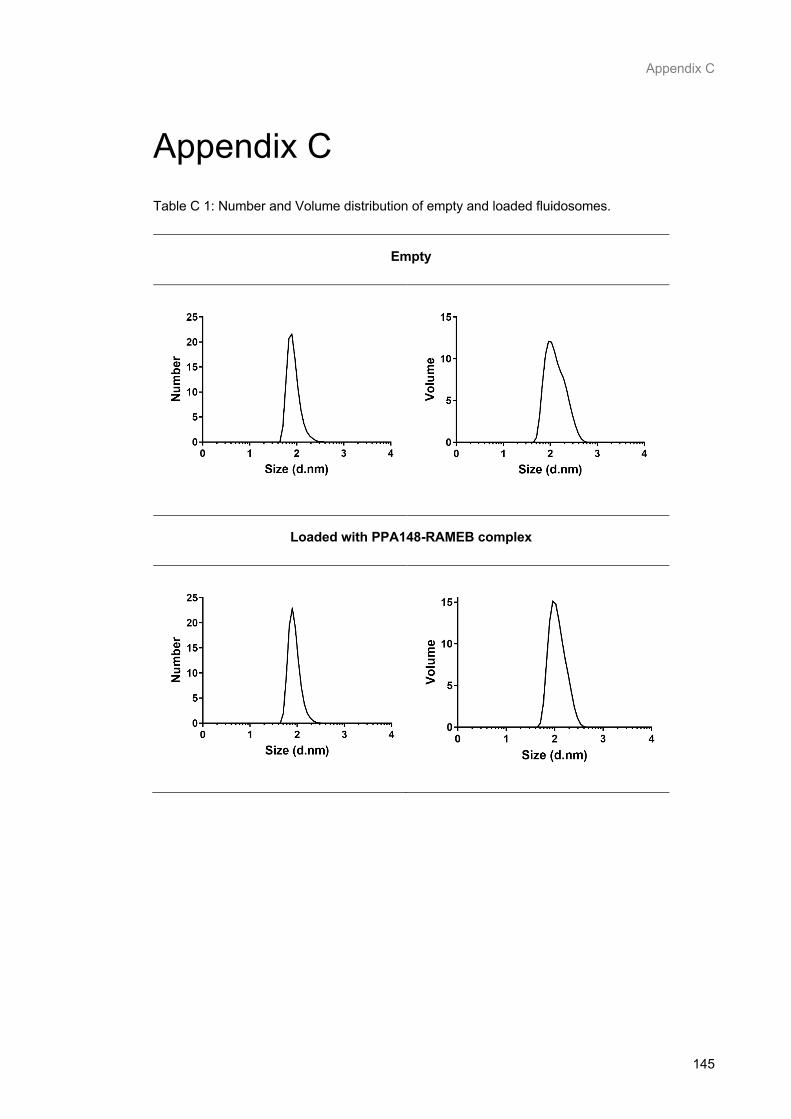
Appendix C
145
Appendix C Table C 1: Number and Volume distribution of empty and loaded fluidosomes.
Empty
Loaded with PPA148-RAMEB complex


