Embed Size (px)
Citation preview
CONTENTS
Interim Report 2015 1
Corporate Information 2
Management Discussion and Analysis 4
Other Information 22
Report on Review of Condensed Consolidated Interim Financial Information 29
Condensed Consolidated Interim Balance Sheet 31
Condensed Consolidated Interim Income Statement 33
Condensed Consolidated Interim Statement of Comprehensive Income 34
Condensed Consolidated Interim Statement of Changes in Equity 35
Condensed Consolidated Interim Cash Flow Statement 36
Notes to the Condensed Consolidated Interim Financial Information 37
CORPORATE INFORMATION
2 Anton Oilfield Services Group
BOARD OF DIRECTORS
Executive Directors
Mr. LUO Lin
Mr. WU Di
Mr. PI Zhifeng
Independent Non-executive Directors
Mr. ZHANG Yongyi
Mr. ZHU Xiaoping
Mr. WANG Mingcai
AUDIT COMMITTEE
Mr. ZHU Xiaoping (Chairman)
Mr. ZHANG Yongyi
Mr. WANG Mingcai
REMUNERATION COMMITTEE
Mr. WANG Mingcai (Chairman)
Mr. ZHU Xiaoping
Mr. LUO Lin
NOMINATION COMMITTEE
Mr. ZHANG Yongyi (Chairman)
Mr. WANG Mingcai
Mr. LUO Lin
QHSE (“QUALITY, HEALTH, SAFETY ANDENVIRONMENT”) COMMITTEE
Mr. PI Zhifeng (Chairman)
Mr. LUO Lin
AUTHORIZED REPRESENTATIVES
Mr. LUO Lin
Dr. NGAI Wai Fung
COMPANY SECRETARY
Dr. NGAI Wai Fung (FCIS, FCS (PE), CPA, FCCA)
COMPANY’S WEBSITE
www.antonoil.com
INVESTOR RELATIONS HOTLINE
+86 10 57397584
+852 29077108
Email: [email protected]
PRINCIPAL PLACE OF BUSINESS INHONG KONG
Unit 2109, Cosco Tower
183 Queen’s Road Central
Central
Hong Kong
PRINCIPAL PLACE OF BUSINESS IN PRC
No. 8, Pingcui West Road, Donghuqu
Chaoyang District
Beijing, China 100102
Corporate Information
Interim Report 2015 3
REGISTERED OFFICE
PO Box 309, Ugland House
Grand Cayman KY1-1104
Cayman Islands
PRINCIPAL SHARE REGISTRAR ANDTRANSFER OFFICE
Royal Bank of Canada Trust Company (Cayman) Limited
4th Floor, Royal Bank House
24 Shedden Road, George Town
Grand Cayman KY1-1110
Cayman Islands
HONG KONG BRANCH SHARE REGISTRARAND TRANSFER OFFICE
Computershare Hong Kong Investor Services Limited
Shops 1712-1716, 17th Floor
Hopewell Centre
183 Queen’s Road East
Wanchai
Hong Kong
AUDITORS
PricewaterhouseCoopers
Certified Public Accountants
LEGAL ADVISERS
as to Hong Kong and U.S. law:
Sidley Austin
as to PRC law:
RRDS LAW OFFICES
as to Cayman Islands law:
Maples and Calder
PRINCIPAL BANKS
Bank of China
China Merchants Bank
Bank of Beijing
Deutsch Bank
STOCK CODE ON MAIN BOARD OF THESTOCK EXCHANGE OFHONG KONG LIMITED
3337
DATE OF LISTING
14 December 2007
MANAGEMENT DISCUSSION AND ANALYSIS
4 Anton Oilfield Services Group
BUSINESS REVIEW
In the first half of 2015, domestic clients slowed the pace of capital expenditure on upstream exploration and development due to
the implications of the global oil price. Growth was lackluster across some regional markets. The Group saw sluggish progress on
some of its engineering jobs as a result of delayed execution in the first quarter. In the second quarter, projects under various product
lines commenced sequentially. Total engineering volume recovered and gradually stabilized. Meanwhile, oil companies’ demand for
oil and gas production rebounded. The domestic market marched fully with pilots of unconventional technologies and methods. The
demand for harnessing unconventional oil and gas development solutions to tackle old wells and conventional oil and gas resources
further intensified. The Group fully leveraged its pre-established and featured technical advantages on natural gas and unconventional
resources to actively participate in and win many projects of tight oil and gas and shale gas. It also made new progress in the coal-
bed methane segment. In addition, recognizing the needs of domestic oil companies for further market-oriented reform and service
outsourcing in order to become cost-efficient and focus on their main business, the Group seized the reform opportunities and drew
upon its strong brand image as the best independent engineering technology partner in China, actively adapted and took on services
aligned with its main business to serve as a partner for state-owned enterprises looking to reinvent on a more profound level. This in
turn laid a foundation for the leap-frog growth of the Group’s business and enhancement of its market position.
In overseas markets, the international oil market in general showed weaknesses, but the Middle East held up strong. In such market
environment, oil companies became more cost-conscious about project development, which enabled Chinese service providers with
solid and affordable services to compete fully against their multinational counterparts. Under such market circumstances, the Group
leveraged its strong brand as the best Chinese partner and quickened the pace of displacing the market shares of international oil
service providers in regions where Chinese companies enjoyed systemic advantages in order to quickly grow its overseas revenue
streams. In the first half of 2015, the Group moved beyond the “follow-up strategy” on its overseas business. In Iraq, the Group
conducted meaningful cooperation with international oil companies and received long-term orders. In South America, the Group
gained solid growth on its featured offerings and achieved remarkable progress on new market and customer acquisition. In Central
Asia and Africa, the Group followed Chinese investors into Ethiopia and secured large service orders without heavy asset commitment.
Overall, in the first half of 2015, the Group had a smooth run of its overseas projects and its order book expanded significantly, paving
the way for even broader expansion of its overseas business.
In the first half of 2015, the Group recorded RMB861.5 million in revenue, a decline of RMB250.9 million or 22.6% from RMB1,112.4
million in the same period of 2014. The major year-on-year drop in revenue was mainly the result of reduced capital spending from
customers and project delays.
Management Discussion and Analysis
Interim Report 2015 5
In the first half of 2015, the Group’s operating profit was RMB32.5 million, a decrease of RMB136.5 million, or 80.8%, from RMB169.0
million in the same period of 2014. A net loss of RMB76.1 million was recorded, which was RMB108.2 million, or 337.1% below
the profit of RMB32.1 million in the same period of 2014. Loss attributable to equity holders of the Company was RMB73.8 million,
RMB101.2 million, or 369.3%, below the net profit of RMB27.4 million in the same period of 2014. The margin of net profit attributable
to equity holders of the Company was -8.6%, a decrease of 11.1 percentage points, from 2.5% in the same period of 2014. The
margin squeeze was due to intensified competition and downward pricing pressure. During the reporting period, the Group recognized
the market situation and adapted swiftly by fully enforcing cost controls. For the six months ended 30 June 2015, cost-cutting
measures already showed initial results. Profit decline was reversed and loss narrowed compared with the second half of 2014.
In the first half of 2015, the Group tightened the recovery of trade receivables and curbed the further increase of trade receivable days
in response to the challenging home market. For the six months ended 30 June 2015, the Group’s average trade receivables turnover
days were 274 days, up 51 days as compared with the same period last year. The average inventory turnover days were 232 days,
up 83 days as compared with the same period last year. Average accounts payable turnover days was 200 days, up 37 days as
compared with the same period last year. Cash flow from operating activities was RMB-32.5 million, up RMB401.1 million compared
with RMB-433.6 million in the same period last year.
Geographical Market Analysis
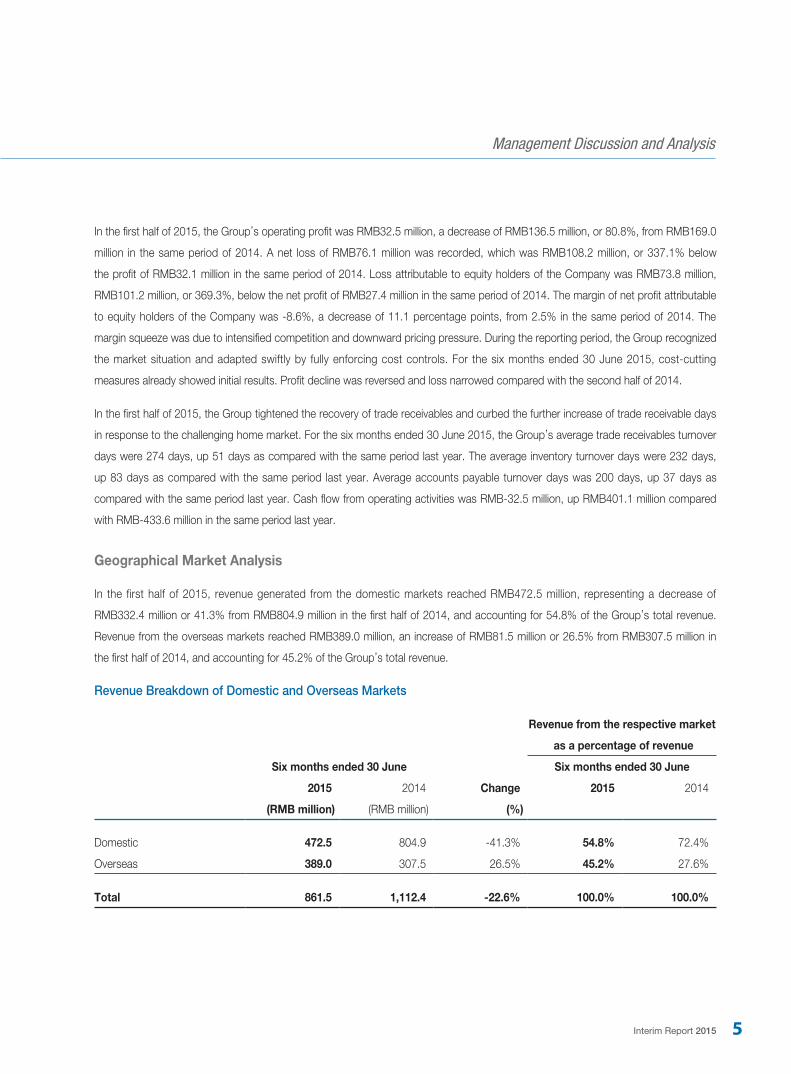
In the first half of 2015, revenue generated from the domestic markets reached RMB472.5 million, representing a decrease of
RMB332.4 million or 41.3% from RMB804.9 million in the first half of 2014, and accounting for 54.8% of the Group’s total revenue.
Revenue from the overseas markets reached RMB389.0 million, an increase of RMB81.5 million or 26.5% from RMB307.5 million in
the first half of 2014, and accounting for 45.2% of the Group’s total revenue.
Revenue Breakdown of Domestic and Overseas Markets
Revenue from the respective market
as a percentage of revenue
Six months ended 30 June Six months ended 30 June
2015 2014 Change 2015 2014
(RMB million) (RMB million) (%)
Domestic 472.5 804.9 -41.3% 54.8% 72.4%
Overseas 389.0 307.5 26.5% 45.2% 27.6%
Total 861.5 1,112.4 -22.6% 100.0% 100.0%
Management Discussion and Analysis
6 Anton Oilfield Services Group
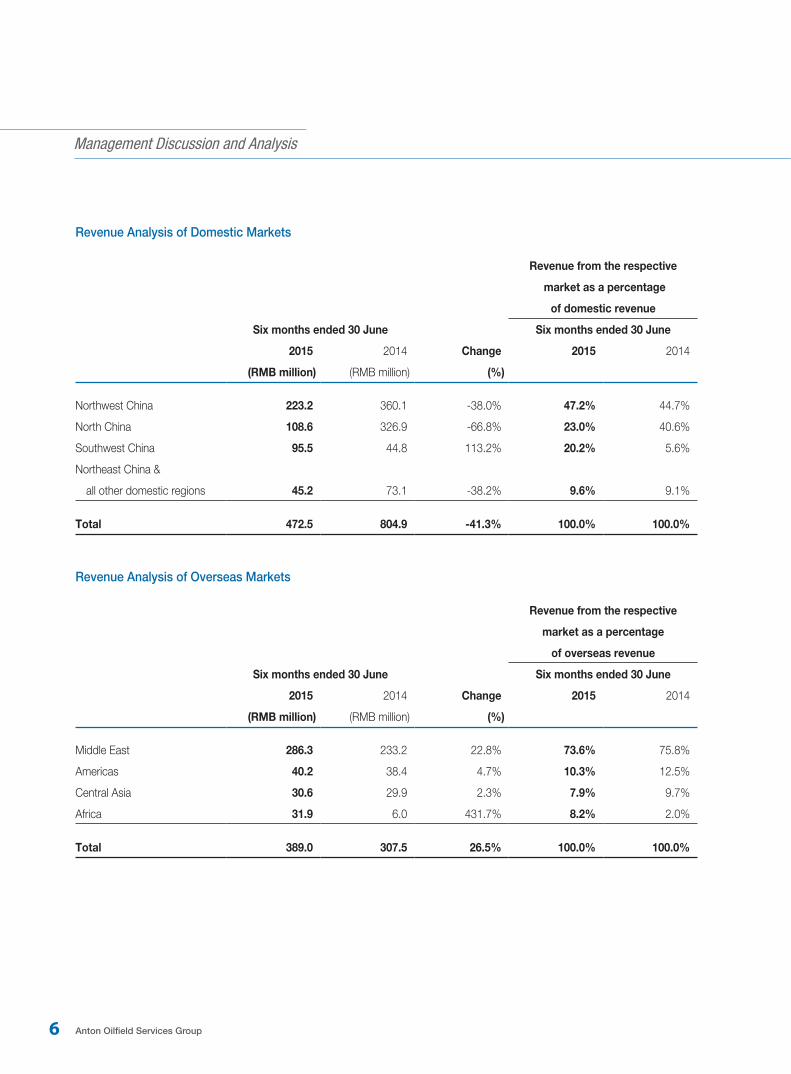
Revenue Analysis of Domestic Markets
Revenue from the respective
market as a percentage
of domestic revenue
Six months ended 30 June Six months ended 30 June
2015 2014 Change 2015 2014
(RMB million) (RMB million) (%)
Northwest China 223.2 360.1 -38.0% 47.2% 44.7%
North China 108.6 326.9 -66.8% 23.0% 40.6%
Southwest China 95.5 44.8 113.2% 20.2% 5.6%
Northeast China &
all other domestic regions 45.2 73.1 -38.2% 9.6% 9.1%
Total 472.5 804.9 -41.3% 100.0% 100.0%
Revenue Analysis of Overseas Markets
Revenue from the respective
market as a percentage
of overseas revenue
Six months ended 30 June Six months ended 30 June
2015 2014 Change 2015 2014
(RMB million) (RMB million) (%)
Middle East 286.3 233.2 22.8% 73.6% 75.8%
Americas 40.2 38.4 4.7% 10.3% 12.5%
Central Asia 30.6 29.9 2.3% 7.9% 9.7%
Africa 31.9 6.0 431.7% 8.2% 2.0%
Total 389.0 307.5 26.5% 100.0% 100.0%
Management Discussion and Analysis
Interim Report 2015 7
Domestic Markets
In the first half of 2015, the effects of capital spending cuts of oil companies started to materialize. Growth was subdued in some
regional markets. Recognizing the macro environment, the Group seized the opportunity of pilot development of old oilfields with
unconventional technologies and approaches. Through pre-established technological advantages, the Group increased its market
share. Meanwhile, facing the opportunity for reform of Chinese state-owned oil companies, the Group leveraged its positioning as the
best independent engineering technology partner in China, engaged proactively to undertake projects pertinent to the Group’s core
business and to serve as a preferred partner for the state-owned enterprises undergoing deeper reform. This laid a foundation for the
leap-frog growth of the Group’s business scale and enhancement of its market influence.
Major Business Developments in the Domestic Markets
‧ In Northwest China, investment slowed and revenue decreased in the Tarim Basin; workover business as part of the reinvention
of old oilfields grew remarkably and generated stable incomes in the Turpan and Hami areas; tight oil pilot development in the
Junggar Basin unveiled new opportunities and filled up the order book quickly. If the pilot projects turn out successful, explosive
growth on the deployment of unconventional technologies would likely ensue.
‧ In North China, the market continued to open up in the Erdos Basin. Tight gas development and the local tendering model
for year-long contracts drove order growth, but slow project progress as a result of the new environmental law had a notable
dampening effect on revenue.
‧ In Southwest China, shale gas development picked up pace in the Sichuan Basin. The Group fully penetrated the market with
its unconventional technologies and reaped substantially higher revenues. The Group’s proprietary fracturing proppant also won
long-term contracts in shale gas blocks. Meanwhile, the Group also received orders for coal-bed methane fracturing in Guizhou.
‧ In Eastern China, the Group captured tight oil development opportunities in its traditional market of Northeast China where
orders increased and revenue started to recover.
Overseas Markets
In the first half of 2015, oil companies operating under cost constraints started to seek out Chinese partners with reliable and
affordable services. Leveraging its positioning as the best Chinese partner and through previously established service capacity, track
record and brand equity, the Group further went beyond the “follow-up” strategy and diversified its customer base and expanded its
global footprint in markets where Chinese companies enjoyed a comparative advantage.
Management Discussion and Analysis
8 Anton Oilfield Services Group
Major Business Developments in the Overseas Markets
‧ In the Middle East, OPEC countries kept their oil and gas production largely unchanged. In the first half of 2015, Iraqi oil and
gas exports set new records. Given the persistently low oil prices, oil companies became more cost conscious, making the
Group’s combined strengths in Iraq a more attractive proposition. In the first half of the year, the Group further moved beyond
its “follow-up” strategy and expanded its customer base, pursued large-scale cooperation with international oil companies and
secured long-term orders. Its order book grew swiftly and partnership opportunities continued to emerge. Meanwhile, thanks to
customers’ need for yield consistency, the Group’s engineering workload remained stable and revenue grew steadily compared
with the same period last year.
‧ In the Americas, the Group’s proprietary and featured products started to gain scale and generate steadily rising revenues.
Remarkable progress was achieved in new market and customer development. In the current stage, oil companies looking
to cut recovery costs are starting to consider replacing existing service vendors with those who could both meet technical
requirements and offer more attractive prices. In this connection, the Americas present abundant opportunities.
‧ In Central Asia and Africa, the Group entered new markets with the “follow-up” strategy. In the first half of the year, the Group
won a new order worth RMB200 million in Ethiopia for providing drilling fluid and well cementing services to a private Chinese
company. Preparations by the Group for the Iran market were made in advance to reap potentially greater opportunities as soon
as the market benefits from successful Iranian nuclear talks.
Business Cluster Analysis
In the first half of 2015, the Group saw steady performance across all business clusters. The drilling technology cluster posted
RMB219.4 million in revenue, a decrease of 23.0% from the first half of 2014. The well completion cluster recorded revenue of
RMB129.4 million, a year-on-year decline of 50.7%. The down-hole operation cluster saw its revenue drop 10.6% from the first half of
2014 to RMB402.8 million in the first half of 2015. The tubular services cluster recorded RMB109.9 million in revenue, a decrease of
4.1% from the same period of 2014.
In the first half of 2015, the Group amassed integrated services capabilities for the entire lifecycle of oil and gas development after
nearly 2 years of improvement efforts. Meanwhile, the Group refined its management of engineering projects, deployed information
technology to increase engineering efficiency, clearly defined engineering goals, improved performance evaluation, tightened
operational risk control and increased QHSE support.
Management Discussion and Analysis
Interim Report 2015 9
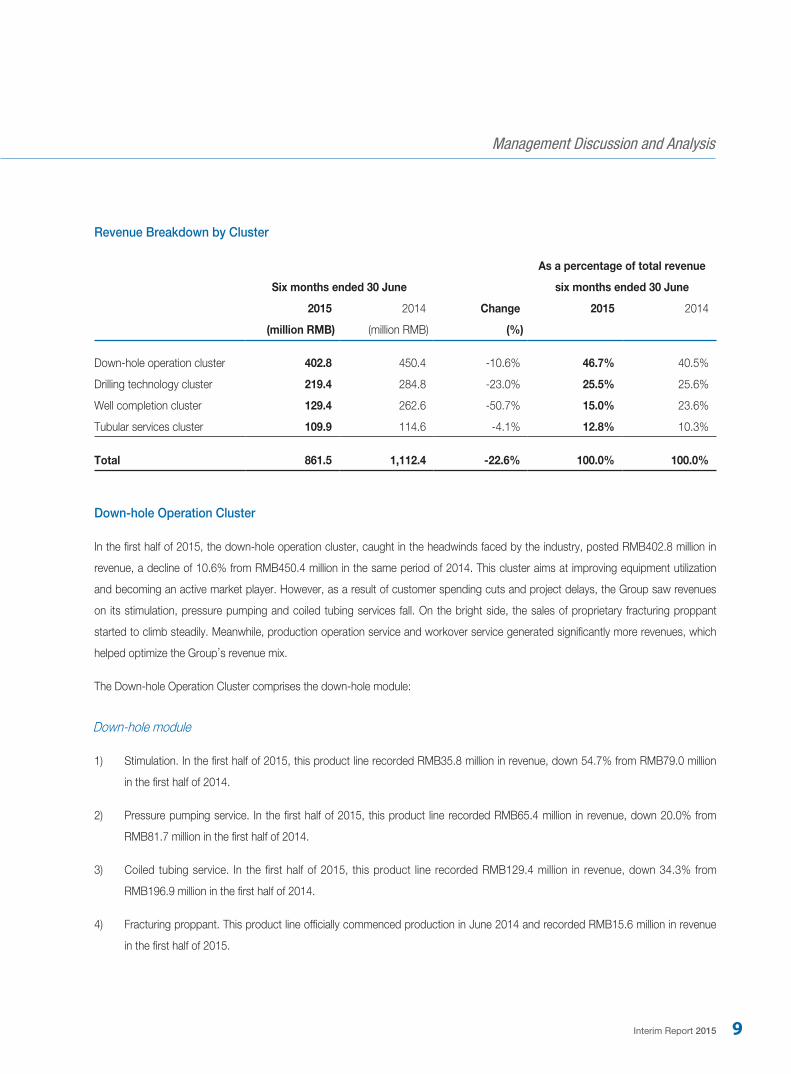
Revenue Breakdown by Cluster
As a percentage of total revenue
Six months ended 30 June six months ended 30 June
2015 2014 Change 2015 2014
(million RMB) (million RMB) (%)
Down-hole operation cluster 402.8 450.4 -10.6% 46.7% 40.5%
Drilling technology cluster 219.4 284.8 -23.0% 25.5% 25.6%
Well completion cluster 129.4 262.6 -50.7% 15.0% 23.6%
Tubular services cluster 109.9 114.6 -4.1% 12.8% 10.3%
Total 861.5 1,112.4 -22.6% 100.0% 100.0%
Down-hole Operation Cluster
In the first half of 2015, the down-hole operation cluster, caught in the headwinds faced by the industry, posted RMB402.8 million in
revenue, a decline of 10.6% from RMB450.4 million in the same period of 2014. This cluster aims at improving equipment utilization
and becoming an active market player. However, as a result of customer spending cuts and project delays, the Group saw revenues
on its stimulation, pressure pumping and coiled tubing services fall. On the bright side, the sales of proprietary fracturing proppant
started to climb steadily. Meanwhile, production operation service and workover service generated significantly more revenues, which
helped optimize the Group’s revenue mix.
The Down-hole Operation Cluster comprises the down-hole module:
Down-hole module
1) Stimulation. In the first half of 2015, this product line recorded RMB35.8 million in revenue, down 54.7% from RMB79.0 million
in the first half of 2014.
2) Pressure pumping service. In the first half of 2015, this product line recorded RMB65.4 million in revenue, down 20.0% from
RMB81.7 million in the first half of 2014.
3) Coiled tubing service. In the first half of 2015, this product line recorded RMB129.4 million in revenue, down 34.3% from
RMB196.9 million in the first half of 2014.
4) Fracturing proppant. This product line officially commenced production in June 2014 and recorded RMB15.6 million in revenue
in the first half of 2015.
Management Discussion and Analysis
10 Anton Oilfield Services Group
5) Helium testing service. In the first half of 2015, this product line recorded RMB17.5 million in revenue, down 59.4% from
RMB43.1 million in the first half of 2014.
6) Down-hole chemicals. In the first half of 2015, this product line recorded RMB2.4 million in revenue, down 64.2% from RMB6.7
million in the first half of 2014.
7) Oil production and workover cluster. In the first half of 2015, this cluster recorded RMB136.7 million in revenue, up 217.9% from
RMB43.0 million in the first half of 2014.
EBITDA for the down-hole operation cluster decreased by 49.9% from RMB256.6 million in the first half of 2014 to RMB128.6 million
in the first half of 2015. The EBITDA margin of the cluster was 31.9% in the first half of 2015, a drop of 25.1 percentage points from
57.0% in the first half of 2014. The fall in EBITDA margin was mainly due to pressure pumping service being affected by customer
spending cuts and rising competition in the market.
Major Development in the Down-hole Operation Cluster
‧ The stimulation business line saw order volume slide due to customer capital spending cut, project delays and rising
competition. The Erdos region was particularly worst hit, suffering a big price cut on service per well. This led to significantly
lower revenue compared with the first half of 2014. However, the tight oil project in Xinjiang was an encouraging breakthrough
for the Group’s stimulation business. In a northern block of Xinjiang, the Group was awarded a general platform contract for
horizontal wells. In the Turpan and Hami areas, the Group won an annual contract for multi-stage fracturing.
‧ Pressure pumping service was affected by customers’ project delays though bids were won prevailingly in the Erdos Basin. As
a result, fracturing equipment utilization remained low in the first half of the year and revenue declined compared with the same
period last year. At the same time, the Group joined its partners in tackling the shale gas market and received new orders in the
Southwest.
‧ Coiled tubing business saw revenue decline due to capital spending cuts among its domestic customers. But the Group
continued to receive orders and maintain engineering workload on the shale gas project in the Sichuan Basin and engineering
work in Iraq was also at full capacity.
‧ The fracturing proppant business line remained consistently stable. Product sales missed expected target due to sluggish
demand for regular ceramic products at home, but the active shale market added to domestic demand for ultralow intensity and
high-quality products. The Group secured long-term supply contracts with shale gas customers. Meanwhile, the Group adopted
a broad range of measures to cut costs on manufacturing, purchasing, sales and overheads and to improve productivity so as
to make this business line more competitive both in domestic and overseas markets.
Management Discussion and Analysis
Interim Report 2015 11
‧ The oil production and workover module saw a surge in revenue compared with the same period of last year. In the first half of
2015, the oil production and workover module as a stable and fast-growing business targeting oil companies in the production
stage had taken up a more significant share of the Group’s revenue. Its stable income streams helped optimize the Group’s
revenue mix. In Iraq, this module was on track in fulfilling the annual service contract with stable revenue. At the same time, the
Group pursued large-scaled cooperation with international and local oil companies, winning a general contract worth USD140
million for workover and well completion. In the Turpan and Hami areas, the 16 units of workover equipment taken over from the
customer in early 2015 continued to operate stably during the reporting period. The Group also received rave reviews from the
customer for its superb managerial expertise and operational capabilities. Going forward, the number of equipment units under
the Group’s management and the corresponding operational demand will likely increase.
Drilling Technology Cluster
In the first half of 2015, the drilling technology cluster grew steadily and recorded RMB219.4 million in revenue, a decline of 23.0%
from RMB284.8 million in the first half of 2014. As a result of reduced customer spending and delays of awarded projects, land
drilling service only commenced work in the second quarter and generated less revenue. Following the successful experiment of the
proprietary oil-based mud service, drilling fluid service grew and oilfield waste management service continued to be nurtured and
developed.
The drilling technology cluster comprises the integrated module and drilling module, more specifically:
Integrated module:
1) Integrated project management (IPM) service. In the first half of 2015, the IPM service recorded RMB2.3 million in revenue.
Drilling module:
1) Drilling new technology service. In the first half of 2015, this product line booked RMB50.2 million in revenue, a decrease of
13.4% from RMB58.0 million in the first half of 2014.
2) Directional drilling. In the first half of 2015, this product line booked RMB67.0 million in revenue, a decrease of 31.2% from
RMB97.4 million in the first half of 2014.
3) Drilling fluid service. In the first half of 2015, this product line recorded RMB57.5 million in revenue, an increase of 87.3% from
RMB30.7 million in the first half of 2014.
4) Land drilling services. In the first half of 2015, this product line booked RMB40.3 million in revenue, a decrease of 30.8% from
RMB58.2 million in the first half of 2014.
Management Discussion and Analysis
12 Anton Oilfield Services Group
5) Oilfield waste management service. In the first half of 2015, this product line recorded RMB2.1 million in revenue, an increase of
31.3% from RMB1.6 million in the first half of 2014.
EBITDA of the drilling technology cluster dropped from RMB61.9 million in the first half of 2014 to RMB58.8 million in the first half of
2015, a decrease of 5.0%. EBITDA margin for the first half of 2015 stood at 26.8%, up 5.1 percentage points from 21.7% in the first
half of 2014, mainly thanks to the Group’s more rigorous cost controls, which yielded initial results on overheads and raw material
costs.
Major Development in the Drilling Technology Cluster
‧ Directional drilling service saw a significant volume decline compared with the same period last year due to customers scaling
back capital expenditure. The Northwest and Southwest regions were particularly affected whereas the Northeast region made
a breakthrough where the deployment of the purchased rotary geological steering equipment was rewarded with a generous
customer order. In overseas markets, service volume was inadequate in South America and Central Asia, but volume held up
and revenue grew in Iraq thanks to outstanding engineering performance.
‧ Drilling fluid service embraced new developments and booked a significant increase in revenue compared with the same period
last year. Oil-based mud service remained stable in Tarim while water-based mud service blazed a new trail, paving the way for
subsequent growth. The proprietary oil-based mud service was successfully deployed for shale gas in the Southwest, further
cementing the technology and market foundations for the rollout of the service. In overseas markets, drilling fluid service gained
phenomenal success in offering product sales and technical services in Iraq. In the new market of Ethiopia, a high-quality, long-
term contract for drilling fluid and supporting services was acquired. The marketing of drilling fluid services and the successful
deployment of proprietary products will likely lead this business line towards rapid growth in the future.
‧ Land drilling service experienced job delays in the first quarter due to winter breaks in regional markets and delays of awarded
projects. But in the second quarter, all the five domestically stationed rigs were deployed one after another. In overseas markets,
two rigs scheduled for engineering jobs in the first half of 2015 remained on standby due to customer delays and are expected
to start running in the second half.
‧ Integrated drilling service booked similar revenue in the first half of 2015 compared with the same period of 2014. As customers
became more conscious about cost-efficiency, the demand for high-velocity and low-cost services increased. While the Group
seized the opportunity of catering to such customer needs, it strengthened technological exchanges and imported advanced
technology in due course. In the Karamay oilfield, the Group won a general service contract for tight oil pilots. In overseas
markets, well cementing products and services gained access to the new market of Ethiopia and will likely generate strong
revenue growth in the second half of 2015.
Management Discussion and Analysis
Interim Report 2015 13
‧ Through market development and investment in supporting infrastructure, oilfield waste management service saw increases in
both job volume and revenue as compared with the same period last year. This business line had built presence and generated
continuous jobs in the Southwest, Erdos and Xinjiang regions.
Well Completion Cluster
In the first half of 2015, the well completion cluster recorded RMB129.4 million in revenue, down 50.7% compared with RMB262.6
million in the same period of 2014. The revenue decline was the result of customers opting for less expensive well completion
techniques and rising competition in the industry.
The well completion cluster comprises the following business lines:
1) Well completion integration. This business includes integrated well completion solution, well completion tools and sand and
water control products and technical services. In the first half of 2015, this business line recorded RMB118.4 million in revenue,
a decrease of 39.1% from RMB194.4 million in the first half of 2014.
2) Gravel packing service. This business line came from Shandong Precede, a majority-owned subsidiary acquired by the Group in
2008, which provides gravel packing well completion products and services. In the first half of 2015, this business line recorded
RMB11.0 million in revenue, a decrease of 83.9% from RMB68.2 million in the first half of 2014.
EBITDA of the well completion cluster dropped 62.7% from RMB75.4 million in the first half of 2014 to RMB28.1 million in the first
half of 2015. EBITDA margin for the first half of 2015 was 21.7%, down by 7.0 percentage points from 28.7% in the first half of 2014,
which was mainly attributable to dwindling investment of domestic customers, rising competition and mounting downward pressure on
price. Furthermore, Shandong Precede, the Group’s majority-owned subsidiary, suffered a dented profit margin due to its customers
switching to alternative well completion processes.
Major Development in the Well Completion Cluster
‧ Well completion tool service. Domestically, customers cut process costs, making inexpensive processes and technologies
look more attractive. While improving capacity at its captive manufacturing base in Tianjin, the Group intensified research
and development support and promoted well cementing and completion tools, production completion tools, well cementing
fracturing sliding sleeves and water control technologies in the domestic markets. In overseas markets, the Group focused
more efforts on promoting its proprietary tools. In South America, it successfully marketed sand control tools and packers and
received orders. In the Iraqi Oasis and Sudan, it promoted the automatic fluid control valve, which was well received by the
markets.
Management Discussion and Analysis
14 Anton Oilfield Services Group
‧ Integrated well completion service. Domestically, the job volume of full-bore multi-stage acid fracturing in Tarim was on a
par with that of the same period of 2014. The Group pushed ahead with completion tools. In the Southwest, the focus was
on promoting the micro-seismic fissure monitoring project and the proprietary well cementing sliding sleeve project. In the
Northeast market, the micro-seismic fissure monitoring project made a breakthrough and gained a certain number of orders. In
overseas markets, the production well completion service was being performed steadily in Iraq.
‧ Sand and water control business operated under bigger cost constraints due to the market environment. But the Group adapted
the business line in real time by tightening cost control, introducing new technology and improving product performance. As a
result, it made more revenue than in the first half of 2014. In Canada and Colombia, orders increased steadily. In Iraq, the Group
won a screen order from a well-known international oil company.
‧ Gravel packing service witnessed a major drop in revenue as compared with the same period last year due to old oilfield
customers cutting investment and switching to alternative well completion solutions.
Tubular Services Cluster
In the first half of 2015, the tubular services cluster posted RMB109.9 million in revenue, a decrease of 4.1% from RMB114.6 million in
the same period of 2014. Despite customer spending cuts, the Group held up its market performance through proprietary technology
and products and revenue declined only marginally.
EBITDA of the tubular services cluster decrease by 46.5% from RMB66.9 million in the first half of 2014 to RMB35.8 million in the
first half of 2015. EBITDA margin for the first half of 2015 reached 32.5%, down 25.9 percentage points from 58.4% in the first half of
2014. The margin decline was mainly due to mounting downward pressure on pricing of traditional business lines such as drilling tool
leasing, oil tubing and casing and anti-corrosion.
Major Development in the Tubular Services Cluster
‧ Inspection and evaluation service covered oil drilling tools inspection, oil casing and tubing inspection, and instrument and
device inspection and recalibration. For its inspection and evaluation capabilities, the Group already gained the status as a
leading independent third-party inspection service provider in China. In the first half of 2015, the volume of work of this business
line remained stable, largely on a par with the first half of 2014.
‧ Drilling tools leasing was affected by customers’ austerity measures and falling drill utilization rate. Total job volume declined.
‧ Oil casing and tubing and anti-corrosion service. In the first half of 2015, this business line made a breakthrough in Iraq by
securing a long-term service contract. Total job volume rose compared with the same period last year.
Management Discussion and Analysis
Interim Report 2015 15
Alignment of Strategic Resources
In the first half of 2015, the Group adjusted its strategic capital expenditures and redirected its priority towards the fine-tuning and
rationalization of its various business lines with an emphasis on technological innovation geared towards customer needs. In the first
half of 2015, the Group made RMB167.7 million in capital expenditure, most of which were payments for projects already committed
in previous years. The number was down 26.0% compared with RMB226.5 million in the same period of 2014.
Investment
In the first half of 2015, considering the Group’s business development needs under the capital expenditure constraints, the
investment in business lines mainly targeted oilfield waste management and supporting activities for newly acquired large orders.
In the first half of 2015, the Group deployed drilling waste disposal equipment in the Northwest and Erdos regions to improve the
market presence of oilfield waste management service in these regions. In addition, to advance the fulfillment of the newly awarded
contract in Ethiopia, the Group added well cementing equipment and mud experiment equipment. As at the date of this report, all the
supporting equipment had arrived at the project site.
Research and Development
In the first half of 2015, driven by actual business needs and customers’ need for higher productivity at lower costs, the Group
engaged in reengineering and innovation activities in relation to technologies or tools. In the first half of 2015, the Group invested
RMB31.5 million in research and development, a decline of 21.6% compared with RMB40.2 million in the first half of 2014.
Key Research and Development Projects
– Research and application of oil-based drilling fluid technology
– Research on proprietary directional drilling tools
– Rotary drilling liner hanger
Human Resources
On human resources, since second half of 2014, the Group has initiated a workforce optimization and redundancy program and
improved the staff mix through internal reassignments. As at 30 June 2015, the Group’s staff size shrank by 25%. Such measures
were estimated to save the Group of RMB186 million in overhead for 2015.
Management Discussion and Analysis
16 Anton Oilfield Services Group
Major development in human resources
‧ Capped total headcount, enforced more rigorous performance review and disqualification scheme; redundancy and cost-cutting
programs achieved the targets set at the beginning of the year in 2015;
‧ Optimized organizational structure, reassigned employees internally and improved managerial efficiency;
‧ Continued to attract experienced industry champions and improved on talent management and development;
‧ In the first half of 2015, the Group granted a total of 49,500,000 ordinary share options to more than 200 top-performing
employees and principal staff members, exercisable at a price of HKD1.82 per share.
OUTLOOK
In the short term, international oil prices will likely to remain low and competition fierce, but oil companies’ demand for oil and gas
production is showing signs of recovery. Such recovery is expected to recover sooner internationally than domestically. Domestically,
demand for unconventional energy development will likely persist and business remains largely stable. The reform of state-owned
enterprises will bring about brand-new opportunities. In the long term, the global market landscape has shifted. Chinese companies
with comparative advantage will likely displace international oilfield service companies in some local markets. The “Belt and Road”
Initiative will open up new opportunities in Central Asia and Africa.
In the second half of 2015, the Group will continue implementing a full market coverage strategy to capture market shares and hotspot
opportunities both at home and abroad with a view to substantially increasing orders. Domestically, the Group will further leverage the
historic opportunities of oil and gas sector reform in China with unconventional technologies and solutions as the drivers. It will actively
participate in preliminary pilots for tight oil and gas, coal-bed methane and shale gas; seize the new opportunities arising from SOE
Reform policy, build on its brand equity, proactively host business outsourced by national oil companies and further cement strategic
partnerships.
Overseas, the Group will fully implement a global network coverage strategy in geographies where Chinese companies enjoy
comparative advantage. It will ride on the shifts in the global market landscape, work towards taking shares from international oilfield
service providers in regions where Chinese companies excel. It will further move beyond the “follow-up” strategy and continue to
acquire large orders. Benefiting from the prospects of stable production in OPEC countries in the Middle East and production increase
in Iraq, the Group will strengthen and deepen cooperation with local oil companies and international oil companies to secure long-term
orders. In South America, the Group will continue to capitalize on the new opportunities from low-cost development needs in a low oil
price environment and look for new breakthroughs.
Management Discussion and Analysis
Interim Report 2015 17
In terms of engineering work, the Group will promote quick implementation on the back of an ample order backlog. In the second half
of 2015, oil companies is expected forcefully push for the completion of jobs, which in turn will lead the Group’s engineering activities
to peak and revenues to recover. In the drilling cluster, all drills will commence engineering work. Domestically, waste management
service will progress steadily. Mud and well cementing services will initiate engineering jobs overseas. In the well completion cluster,
the Group will grasp the global opportunities for its featured sand and water control products and services and aim for full delivery. In
the down-hole cluster, fracturing operations will resume in the Erdos and Sichuan basins. Acidizing service will fully recover overseas.
In the oil production cluster, production operation management service will move ahead in solid steps in Iraq. Workover service will
be in normal operating condition domestically. Meanwhile, the Group has won a general contract for workover and well completion
services from an international company in Iraq. In the tubular cluster, inspection and evaluation service will operate as usual.
In terms of strategic management and control, the Group will intensify efforts to collect trade receivables, reduce the need for current
funds and maintain healthy cash flow. It will tighten operational control aimed towards settlement to shorten capital turnover and
enforce more rigorous project capital management. While further optimizing and streamlining the workforce, it will continue to attract
industry champions. It will strictly rein in capital expenditure to remain resilient against any further headwinds in the industry.
Recognizing the challenging outlook, the Group will tighten cost control and increase capacity utilization. Meanwhile, it will leverage
comparative advantages to seize market shares and grow revenue and to stand ready for potential opportunities on the horizon.
FINANCIAL REVIEW
In order to present a more straightforward cost structure for investors’ analysis, the Group has since 2012 adopted an accounting
methodology consistent with its internal management, which itemizes costs and expenses by function instead of by nature as in
previous disclosures. The new format helps investors to better analyze direct cost of sales and various expenses for the reporting
period.
Revenue
The Group’s revenue in the first half of 2015 amounted to RMB861.5 million, representing a decline of RMB250.9 million or 22.6% as
compared with RMB1,112.4 million in the same period of 2014. This was mainly the result of reduced capital spending from customers
and project delays at home amid subdue international oil prices.
Cost of Sales
The cost of sales dropped 9.6% from RMB691.2 million in the first half of 2014 to RMB625.0 million in the first half of 2015. This was
mainly attributable to lower raw material costs associated with the lower revenue.
Management Discussion and Analysis
18 Anton Oilfield Services Group
Other Gains
Other gains increased from RMB2.9 million in the first half of 2014 to RMB13.8 million in the first half of 2015, mainly due to the receipt
of government subsidies this year.
Selling Expenses
The selling expenses in the first half of 2015 amounted to RMB72.0 million, representing a decrease of RMB10.9 million or 13.1% as
compared with RMB82.9 million in the first half of 2014. This was mainly attributable to the Group’s tightening control on day-to-day
operational expenses at regional sales units.
Administrative Expenses
The administrative expenses in the first half of 2015 amounted to RMB129.1 million, representing a drop of RMB8.6 million or 6.2% as
compared with RMB137.7 million in the first half of 2014. This was mainly attributable to the rein-in of expenses at administrative units.
Research and Development Expenses
The research and development expenses in the first half of 2015 amounted to RMB9.2 million, representing a decrease of RMB13.6
million or 59.6% as compared with RMB22.8 million in the first half of 2014. This was mainly attributable to the Group’s cap on
research and development expenses.
Sales Tax and Surcharges
The sales tax and surcharge in the first half of 2015 amounted to RMB7.6 million, representing a decrease of RMB4.0 million or 34.5%
as compared with RMB11.6 million in the first half of 2014. This was mainly due to the combined effects of a year-on-year revenue
decline and more rigorous turnover tax planning.
Operating Profit
The operating profit of the Group in the first half of 2015 amounted to RMB32.5 million, representing a decrease of RMB136.5 million
or 80.8% as compared with RMB169.0 million in the first half of 2014. The operating profit margin for the first half of 2015 was 3.8%,
representing a drop of 11.4 percentage points from 15.2% in the first half of 2014.
Management Discussion and Analysis
Interim Report 2015 19
Finance Costs (Net)
Net finance costs in the first half of 2015 was RMB95.1 million, an increase of approximately RMB6.3 million as compared with the first
half of 2014. The increase in finance costs was mainly due to the year-on-year decline in deposit interest in the first half of 2015.
Share of Loss of Joint Ventures
The share of loss of joint ventures in the first half of 2015 amounted to RMB1.0 million, mainly because of the loss of a joint venture,
“Tongzhou Integrated Oilfield Technology Co., Ltd”.
Income Tax Expense
Income tax expense in the first half of 2015 amounted to RMB12.4 million, representing a decrease of RMB30.7 million or 71.2% as
compared with RMB43.1 million in the first half of 2014, mainly due to modest profitability squeeze of domestic companies.
Profit for the First Half of 2015
As a result of the foregoing, the Group’s loss for the first half of 2015 was RMB76.1 million, representing a change of 337.1% from a
profit of RMB32.1 million for the same period of 2014.
Loss Attributable to Equity Holders of the Company
The Group’s loss attributable to equity holders of the Company in the first half of 2015 amounted to RMB73.8 million, representing a
change of 369.3% from a profit of RMB27.4 million for the first half of 2014.
Trade and Notes Receivables
As at 30 June 2015, the Group’s net trade and notes receivables were RMB1,342.9 million, representing a decrease of RMB245.3
million as compared with 31 December 2014. The average trade receivables turnover days (excluding quality guarantee deposits and
other deposits) in the first half of 2015 were 274 days, representing an increase of 51 days as compared with the first half of 2014.
This was mainly attributable to the year-on-year decline in business revenue.
Inventory
As at 30 June 2015, the Group’s inventory was RMB901.0 million, representing an increase of RMB191.3 million as compared with 31
December 2014, mainly due to the Group’s inventory buildup in support of business operations for the whole year.
Management Discussion and Analysis
20 Anton Oilfield Services Group
LIQUIDITY AND CAPITAL RESOURCES
As at 30 June 2015, the Group’s cash and bank deposits amounted to approximately RMB434.5 million (including: restricted bank
deposits, term deposits with initial terms of over three months, cash and cash equivalents), representing a drop of RMB405.6 million
as compared with 31 December 2014, mainly due to the Group repaying its mature external debts on schedule including RMB300.0
million in mid-term notes.
As at 30 June 2015, the Group’s outstanding short-term bank loans amounted to RMB696.4 million. Credit facilities extended to the
Group by banks amounted to RMB1,020.0 million of which approximately RMB563.6 million were not used.
As at 30 June 2015, the gearing ratio of the Group was 66.3%, representing a decrease of 0.6 percentage point from the gearing ratio
of 66.9% as at 31 December 2014. This was mainly due to the repayment of mid-term notes. Net debt includes borrowings and trade
and notes payables. Total capital is calculated as equity plus net debt.
The equity attributable to equity holders of the Company decreased from RMB2,053.9 million as at 31 December 2014 to RMB2,001.4
million as at 30 June 2015.
EXCHANGE RISK
With growing exposure in the overseas markets, the Group now conducts more business settled in foreign currencies. This, coupled
with the bond issue in US dollar, further complicated the effects of RMB exchange rate fluctuations on the Group. The exchange risk
of the Group mainly arises from its foreign currency deposits and trade receivables denominated in foreign currencies. In particular,
fluctuations in the RMB exchange rate against the US dollar may have a negative impact on the Group’s operating results and financial
position due to its borrowings in US dollar.
CASH FLOW FROM OPERATING ACTIVITIES
For the six months ended 30 June 2015, net cash outflow from operating activities of the Group amounted to RMB32.5 million,
representing a drop of RMB401.1 million compared with the same period of 2014. This was mainly attributable to the Group’s ability to
tightened the recovery of trade receivables and control its operating expenses in accordance with its cost control targets.
Management Discussion and Analysis
Interim Report 2015 21
CAPITAL EXPENDITURE AND INVESTMENT
The Group’s capital expenditure for the first half of 2015 was RMB167.7 million, of which, investments in fixed assets were RMB145.4
million and investments in intangible assets (including land use rights) were RMB22.3 million and there was no payment for equity
investments. The Group will impose strict capital expenditure measures in accordance with its business development strategy.
CONTRACTUAL LIABILITY
The Group’s contractual commitments mainly consist of payment obligations under the Group’s operating lease arrangements and
capital commitments. The Group leases offices and certain equipment and machinery through operating leases. As at 30 June 2015,
the Group’s operating lease commitments amounted to approximately RMB52.8 million. As at the balance sheet date (30 June 2015),
the Group had capital commitments of approximately RMB89.6 million (but not yet provided for in the balance sheet).
CONTINGENT LIABILITIES
As at 30 June 2015, the Group had no material contingent liabilities or guarantees.
OFF-BALANCE SHEET ARRANGEMENTS
As at 30 June 2015, the Group had made no off-balance sheet arrangements.
OTHER INFORMATION
22 Anton Oilfield Services Group
INTERIM DIVIDEND
The board of directors (the “Board”) of the Company did not recommend the payment of an interim dividend for the six months ended
30 June 2015 (For the six months ended 30 June 2014: nil).
PURCHASE, SALE OR REDEMPTION OF THE COMPANY’S LISTED SECURITIES
For the period ended 30 June 2015, neither the Company nor any of its subsidiaries has purchased, sold or redeemed any of the
Company’s listed securities.
DIRECTORS’ AND CHIEF EXECUTIVE’S INTERESTS AND SHORT POSITIONS IN SHARES, UNDERLYING SHARES AND DEBENTURES OF THE COMPANY AND ITS ASSOCIATED CORPORATION
As at 30 June 2015, the interests and short positions of the directors (the “Directors”) and chief executive of the Company in the
shares, underlying shares and debentures of the Company and its associated corporations (within the meaning of Part XV of the
Securities and Futures Ordinance (the “SFO”)) as recorded in the register required to be kept by the Company under Section 352 of
the SFO or otherwise notified to the Company and The Stock Exchange of Hong Kong Limited (the “Stock Exchange”) pursuant to
the Model Code for Securities Transaction by Directors of Listed Issuers (the “Model Code”) contained in Appendix 10 to the Rules
Governing the Listing of Securities on the Stock Exchange (the “Listing Rules”) were as follows:
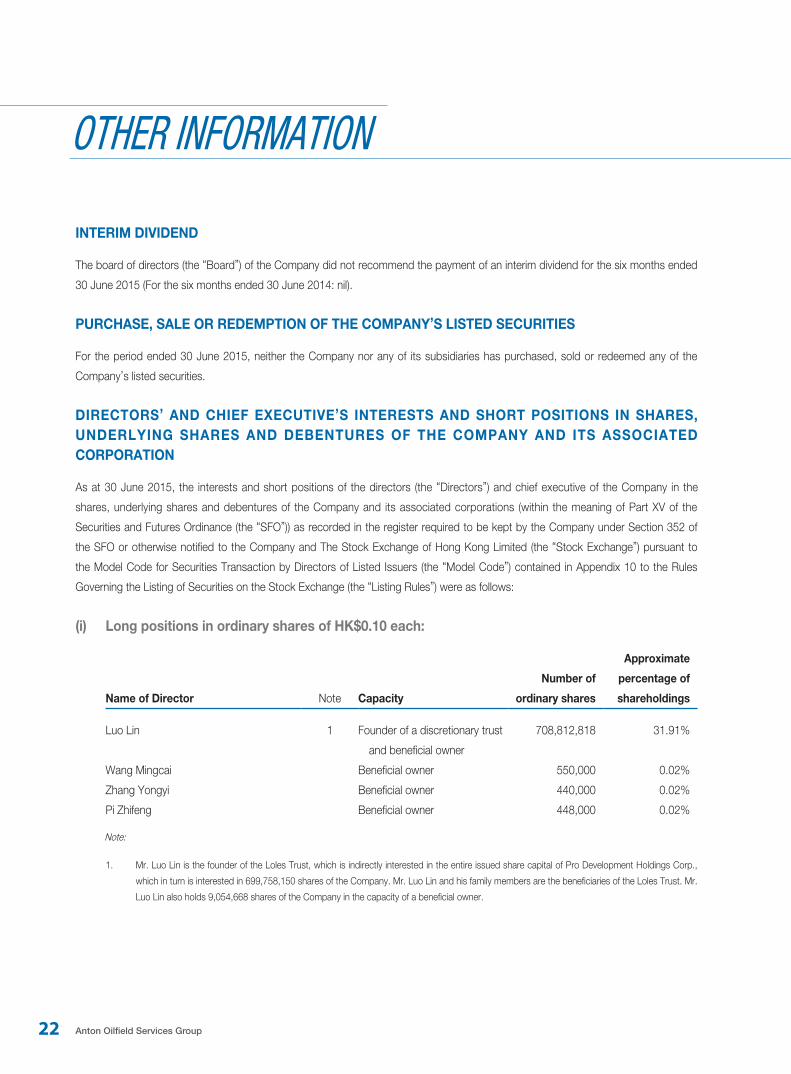
(i) Long positions in ordinary shares of HK$0.10 each:
Approximate
Number of percentage of
Name of Director Note Capacity ordinary shares shareholdings
Luo Lin 1 Founder of a discretionary trust 708,812,818 31.91%
and beneficial owner
Wang Mingcai Beneficial owner 550,000 0.02%
Zhang Yongyi Beneficial owner 440,000 0.02%
Pi Zhifeng Beneficial owner 448,000 0.02%
Note:
1. Mr. Luo Lin is the founder of the Loles Trust, which is indirectly interested in the entire issued share capital of Pro Development Holdings Corp.,
which in turn is interested in 699,758,150 shares of the Company. Mr. Luo Lin and his family members are the beneficiaries of the Loles Trust. Mr.
Luo Lin also holds 9,054,668 shares of the Company in the capacity of a beneficial owner.
Other Information
Interim Report 2015 23
DIRECTORS’ AND CHIEF EXECUTIVE’S INTERESTS AND SHORT POSITIONS IN SHARES, UNDERLYING SHARES AND DEBENTURES OF THE COMPANY AND ITS ASSOCIATED CORPORATION (CONTINUED)
(ii) Long positions in underlying shares of share options:
The Directors have been granted share options under the Company’s share option scheme, details of which are set out in “Share
Option Scheme” below.
Save as disclosed above, at no time during the six months ended 30 June 2015, the Directors and chief executive (including their
spouses and children under the age of 18 years) had any interests in, or had been granted, or exercised, any rights to subscribe for
shares of the Company and its associated corporations required to be disclosed pursuant to the SFO or otherwise notified to the
Company and the Stock Exchange pursuant to the Model Code.
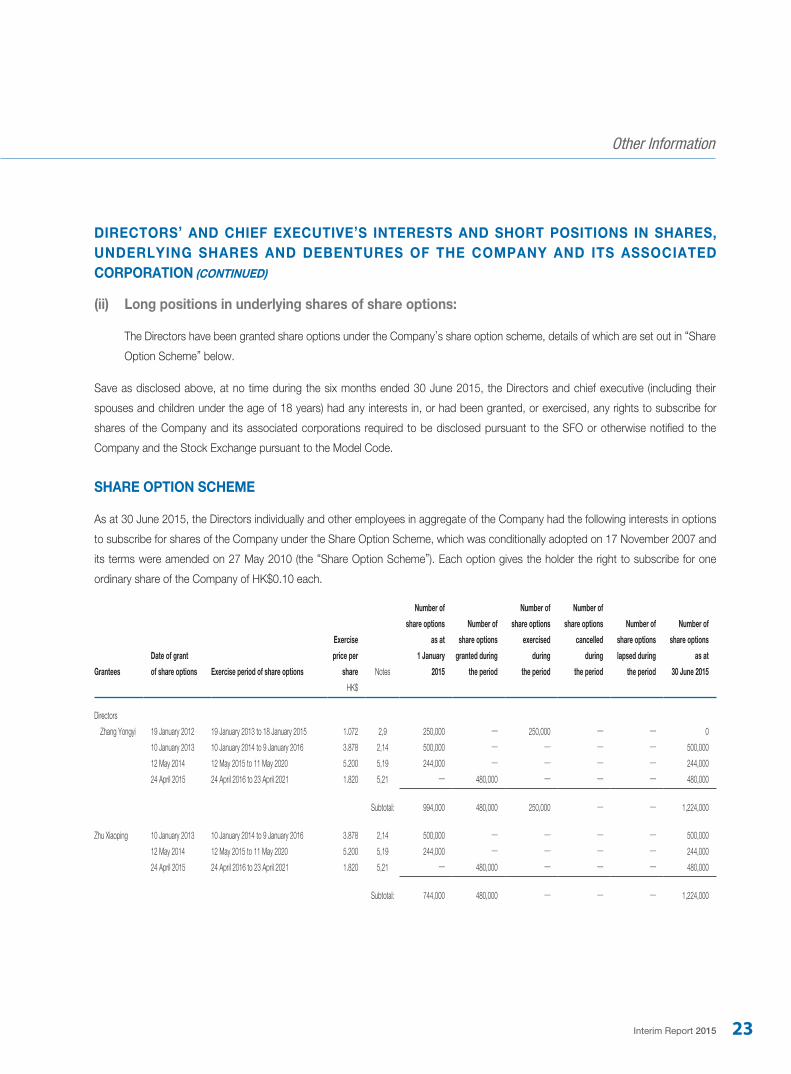
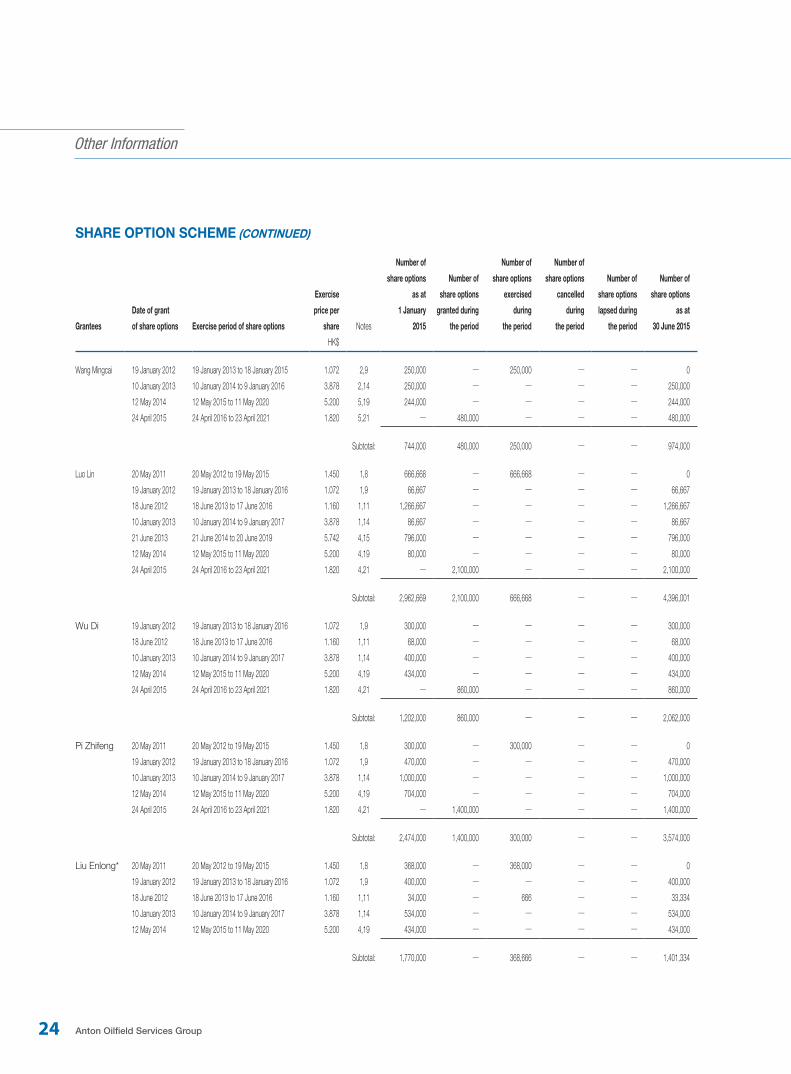
SHARE OPTION SCHEME
As at 30 June 2015, the Directors individually and other employees in aggregate of the Company had the following interests in options
to subscribe for shares of the Company under the Share Option Scheme, which was conditionally adopted on 17 November 2007 and
its terms were amended on 27 May 2010 (the “Share Option Scheme”). Each option gives the holder the right to subscribe for one
ordinary share of the Company of HK$0.10 each.
Grantees
Date of grant
of share options Exercise period of share options
Exercise
price per
share Notes
Number of
share options
as at
1 January
2015
Number of
share options
granted during
the period
Number of
share options
exercised
during
the period
Number of
share options
cancelled
during
the period
Number of
share options
lapsed during
the period
Number of
share options
as at
30 June 2015
HK$
Directors
Zhang Yongyi 19 January 2012 19 January 2013 to 18 January 2015 1.072 2,9 250,000 — 250,000 — — 0
10 January 2013 10 January 2014 to 9 January 2016 3.878 2,14 500,000 — — — — 500,000
12 May 2014 12 May 2015 to 11 May 2020 5.200 5,19 244,000 — — — — 244,000
24 April 2015 24 April 2016 to 23 April 2021 1.820 5,21 — 480,000 — — — 480,000
Subtotal: 994,000 480,000 250,000 — — 1,224,000
Zhu Xiaoping 10 January 2013 10 January 2014 to 9 January 2016 3.878 2,14 500,000 — — — — 500,000
12 May 2014 12 May 2015 to 11 May 2020 5.200 5,19 244,000 — — — — 244,000
24 April 2015 24 April 2016 to 23 April 2021 1.820 5,21 — 480,000 — — — 480,000
Subtotal: 744,000 480,000 — — — 1,224,000
Other Information
24 Anton Oilfield Services Group
SHARE OPTION SCHEME (CONTINUED)
Grantees
Date of grant
of share options Exercise period of share options
Exercise
price per
share Notes
Number of
share options
as at
1 January
2015
Number of
share options
granted during
the period
Number of
share options
exercised
during
the period
Number of
share options
cancelled
during
the period
Number of
share options
lapsed during
the period
Number of
share options
as at
30 June 2015
HK$
Wang Mingcai 19 January 2012 19 January 2013 to 18 January 2015 1.072 2,9 250,000 — 250,000 — — 0
10 January 2013 10 January 2014 to 9 January 2016 3.878 2,14 250,000 — — — — 250,000
12 May 2014 12 May 2015 to 11 May 2020 5.200 5,19 244,000 — — — — 244,000
24 April 2015 24 April 2016 to 23 April 2021 1.820 5,21 — 480,000 — — — 480,000
Subtotal: 744,000 480,000 250,000 — — 974,000
Luo Lin 20 May 2011 20 May 2012 to 19 May 2015 1.450 1,8 666,668 — 666,668 — — 0
19 January 2012 19 January 2013 to 18 January 2016 1.072 1,9 66,667 — — — — 66,667
18 June 2012 18 June 2013 to 17 June 2016 1.160 1,11 1,266,667 — — — — 1,266,667
10 January 2013 10 January 2014 to 9 January 2017 3.878 1,14 86,667 — — — — 86,667
21 June 2013 21 June 2014 to 20 June 2019 5.742 4,15 796,000 — — — — 796,000
12 May 2014 12 May 2015 to 11 May 2020 5.200 4,19 80,000 — — — — 80,000
24 April 2015 24 April 2016 to 23 April 2021 1.820 4,21 — 2,100,000 — — — 2,100,000
Subtotal: 2,962,669 2,100,000 666,668 — — 4,396,001
Wu Di 19 January 2012 19 January 2013 to 18 January 2016 1.072 1,9 300,000 — — — — 300,000
18 June 2012 18 June 2013 to 17 June 2016 1.160 1,11 68,000 — — — — 68,000
10 January 2013 10 January 2014 to 9 January 2017 3.878 1,14 400,000 — — — — 400,000
12 May 2014 12 May 2015 to 11 May 2020 5.200 4,19 434,000 — — — — 434,000
24 April 2015 24 April 2016 to 23 April 2021 1.820 4,21 — 860,000 — — — 860,000
Subtotal: 1,202,000 860,000 — — — 2,062,000
Pi Zhifeng 20 May 2011 20 May 2012 to 19 May 2015 1.450 1,8 300,000 — 300,000 — — 0
19 January 2012 19 January 2013 to 18 January 2016 1.072 1,9 470,000 — — — — 470,000
10 January 2013 10 January 2014 to 9 January 2017 3.878 1,14 1,000,000 — — — — 1,000,000
12 May 2014 12 May 2015 to 11 May 2020 5.200 4,19 704,000 — — — — 704,000
24 April 2015 24 April 2016 to 23 April 2021 1.820 4,21 — 1,400,000 — — — 1,400,000
Subtotal: 2,474,000 1,400,000 300,000 — — 3,574,000
Liu Enlong* 20 May 2011 20 May 2012 to 19 May 2015 1.450 1,8 368,000 — 368,000 — — 0
19 January 2012 19 January 2013 to 18 January 2016 1.072 1,9 400,000 — — — — 400,000
18 June 2012 18 June 2013 to 17 June 2016 1.160 1,11 34,000 — 666 — — 33,334
10 January 2013 10 January 2014 to 9 January 2017 3.878 1,14 534,000 — — — — 534,000
12 May 2014 12 May 2015 to 11 May 2020 5.200 4,19 434,000 — — — — 434,000
Subtotal: 1,770,000 — 368,666 — — 1,401,334
Other Information
Interim Report 2015 25
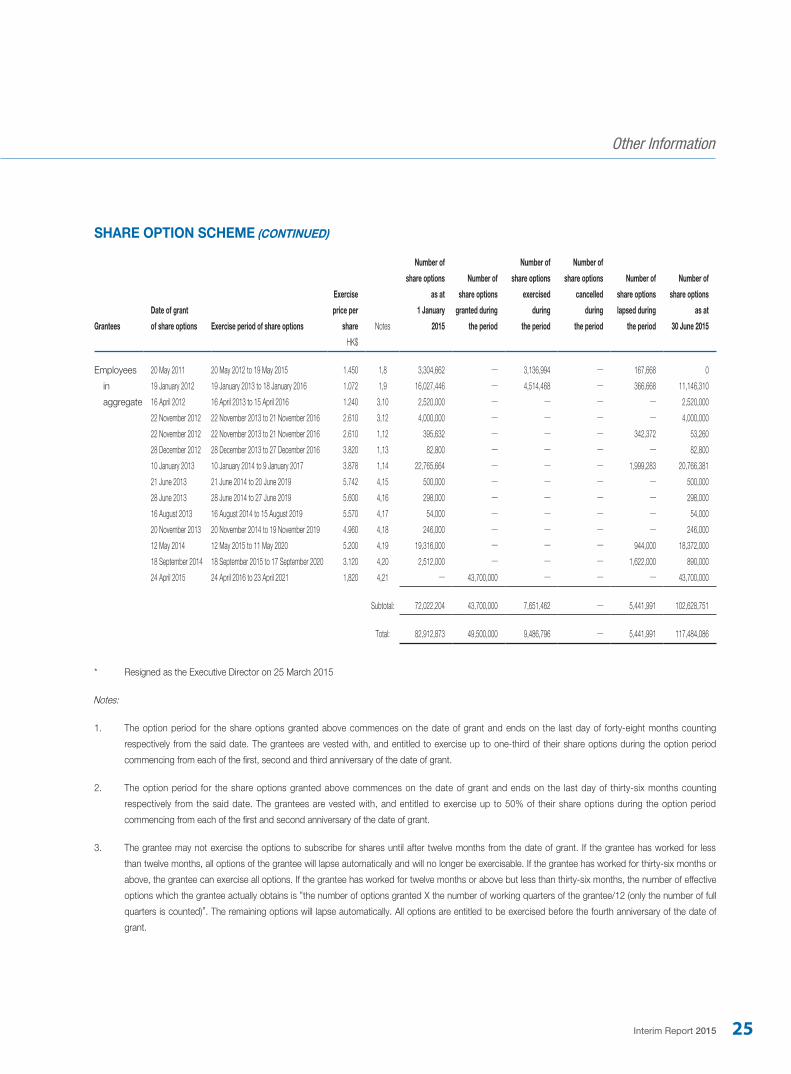
SHARE OPTION SCHEME (CONTINUED)
Grantees
Date of grant
of share options Exercise period of share options
Exercise
price per
share Notes
Number of
share options
as at
1 January
2015
Number of
share options
granted during
the period
Number of
share options
exercised
during
the period
Number of
share options
cancelled
during
the period
Number of
share options
lapsed during
the period
Number of
share options
as at
30 June 2015
HK$
Employees 20 May 2011 20 May 2012 to 19 May 2015 1.450 1,8 3,304,662 — 3,136,994 — 167,668 0
in 19 January 2012 19 January 2013 to 18 January 2016 1.072 1,9 16,027,446 — 4,514,468 — 366,668 11,146,310
aggregate 16 April 2012 16 April 2013 to 15 April 2016 1.240 3,10 2,520,000 — — — — 2,520,000
22 November 2012 22 November 2013 to 21 November 2016 2.610 3,12 4,000,000 — — — — 4,000,000
22 November 2012 22 November 2013 to 21 November 2016 2.610 1,12 395,632 — — — 342,372 53,260
28 December 2012 28 December 2013 to 27 December 2016 3.820 1,13 82,800 — — — — 82,800
10 January 2013 10 January 2014 to 9 January 2017 3.878 1,14 22,765,664 — — — 1,999,283 20,766,381
21 June 2013 21 June 2014 to 20 June 2019 5.742 4,15 500,000 — — — — 500,000
28 June 2013 28 June 2014 to 27 June 2019 5.600 4,16 298,000 — — — — 298,000
16 August 2013 16 August 2014 to 15 August 2019 5.570 4,17 54,000 — — — — 54,000
20 November 2013 20 November 2014 to 19 November 2019 4.960 4,18 246,000 — — — — 246,000
12 May 2014 12 May 2015 to 11 May 2020 5.200 4,19 19,316,000 — — — 944,000 18,372,000
18 September 2014 18 September 2015 to 17 September 2020 3.120 4,20 2,512,000 — — — 1,622,000 890,000
24 April 2015 24 April 2016 to 23 April 2021 1,820 4,21 — 43,700,000 — — — 43,700,000
Subtotal: 72,022,204 43,700,000 7,651,462 — 5,441,991 102,628,751
Total: 82,912,873 49,500,000 9,486,796 — 5,441,991 117,484,086
* Resigned as the Executive Director on 25 March 2015
Notes:
1. The option period for the share options granted above commences on the date of grant and ends on the last day of forty-eight months counting
respectively from the said date. The grantees are vested with, and entitled to exercise up to one-third of their share options during the option period
commencing from each of the first, second and third anniversary of the date of grant.
2. The option period for the share options granted above commences on the date of grant and ends on the last day of thirty-six months counting
respectively from the said date. The grantees are vested with, and entitled to exercise up to 50% of their share options during the option period
commencing from each of the first and second anniversary of the date of grant.
3. The grantee may not exercise the options to subscribe for shares until after twelve months from the date of grant. If the grantee has worked for less
than twelve months, all options of the grantee will lapse automatically and will no longer be exercisable. If the grantee has worked for thirty-six months or
above, the grantee can exercise all options. If the grantee has worked for twelve months or above but less than thirty-six months, the number of effective
options which the grantee actually obtains is “the number of options granted X the number of working quarters of the grantee/12 (only the number of full
quarters is counted)”. The remaining options will lapse automatically. All options are entitled to be exercised before the fourth anniversary of the date of
grant.
Other Information
26 Anton Oilfield Services Group
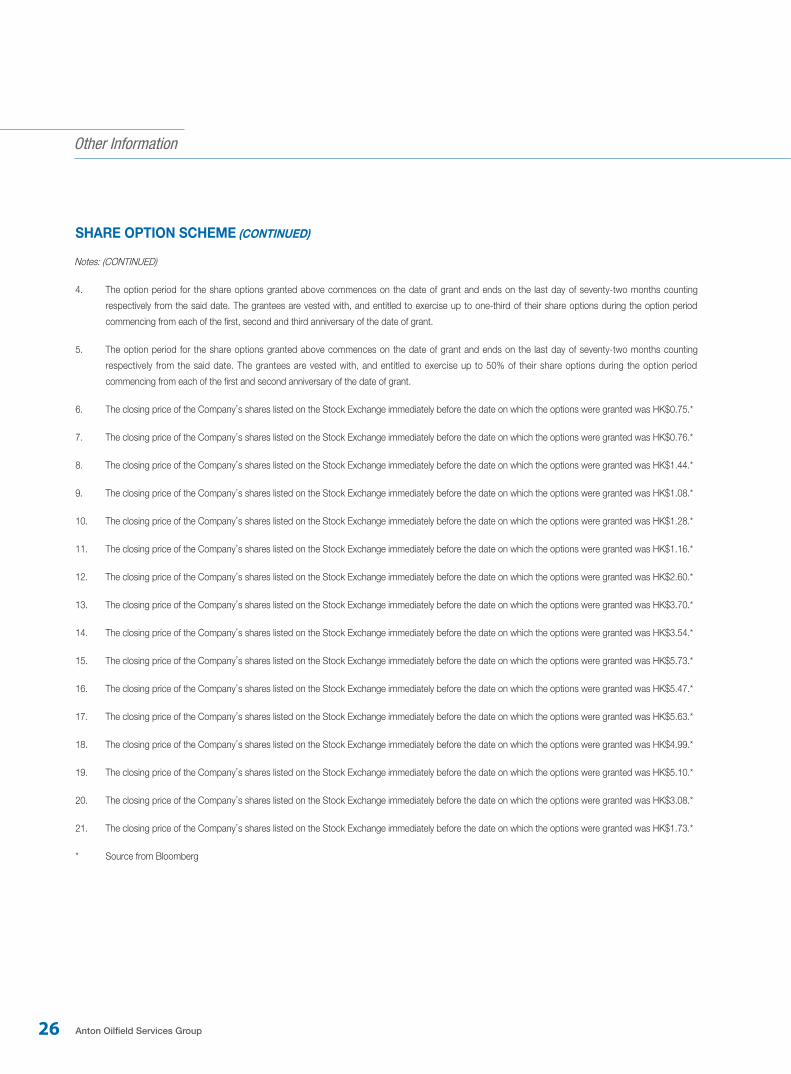
SHARE OPTION SCHEME (CONTINUED)
Notes: (CONTINUED)
4. The option period for the share options granted above commences on the date of grant and ends on the last day of seventy-two months counting
respectively from the said date. The grantees are vested with, and entitled to exercise up to one-third of their share options during the option period
commencing from each of the first, second and third anniversary of the date of grant.
5. The option period for the share options granted above commences on the date of grant and ends on the last day of seventy-two months counting
respectively from the said date. The grantees are vested with, and entitled to exercise up to 50% of their share options during the option period
commencing from each of the first and second anniversary of the date of grant.
6. The closing price of the Company’s shares listed on the Stock Exchange immediately before the date on which the options were granted was HK$0.75.*
7. The closing price of the Company’s shares listed on the Stock Exchange immediately before the date on which the options were granted was HK$0.76.*
8. The closing price of the Company’s shares listed on the Stock Exchange immediately before the date on which the options were granted was HK$1.44.*
9. The closing price of the Company’s shares listed on the Stock Exchange immediately before the date on which the options were granted was HK$1.08.*
10. The closing price of the Company’s shares listed on the Stock Exchange immediately before the date on which the options were granted was HK$1.28.*
11. The closing price of the Company’s shares listed on the Stock Exchange immediately before the date on which the options were granted was HK$1.16.*
12. The closing price of the Company’s shares listed on the Stock Exchange immediately before the date on which the options were granted was HK$2.60.*
13. The closing price of the Company’s shares listed on the Stock Exchange immediately before the date on which the options were granted was HK$3.70.*
14. The closing price of the Company’s shares listed on the Stock Exchange immediately before the date on which the options were granted was HK$3.54.*
15. The closing price of the Company’s shares listed on the Stock Exchange immediately before the date on which the options were granted was HK$5.73.*
16. The closing price of the Company’s shares listed on the Stock Exchange immediately before the date on which the options were granted was HK$5.47.*
17. The closing price of the Company’s shares listed on the Stock Exchange immediately before the date on which the options were granted was HK$5.63.*
18. The closing price of the Company’s shares listed on the Stock Exchange immediately before the date on which the options were granted was HK$4.99.*
19. The closing price of the Company’s shares listed on the Stock Exchange immediately before the date on which the options were granted was HK$5.10.*
20. The closing price of the Company’s shares listed on the Stock Exchange immediately before the date on which the options were granted was HK$3.08.*
21. The closing price of the Company’s shares listed on the Stock Exchange immediately before the date on which the options were granted was HK$1.73.*
* Source from Bloomberg
Other Information
Interim Report 2015 27
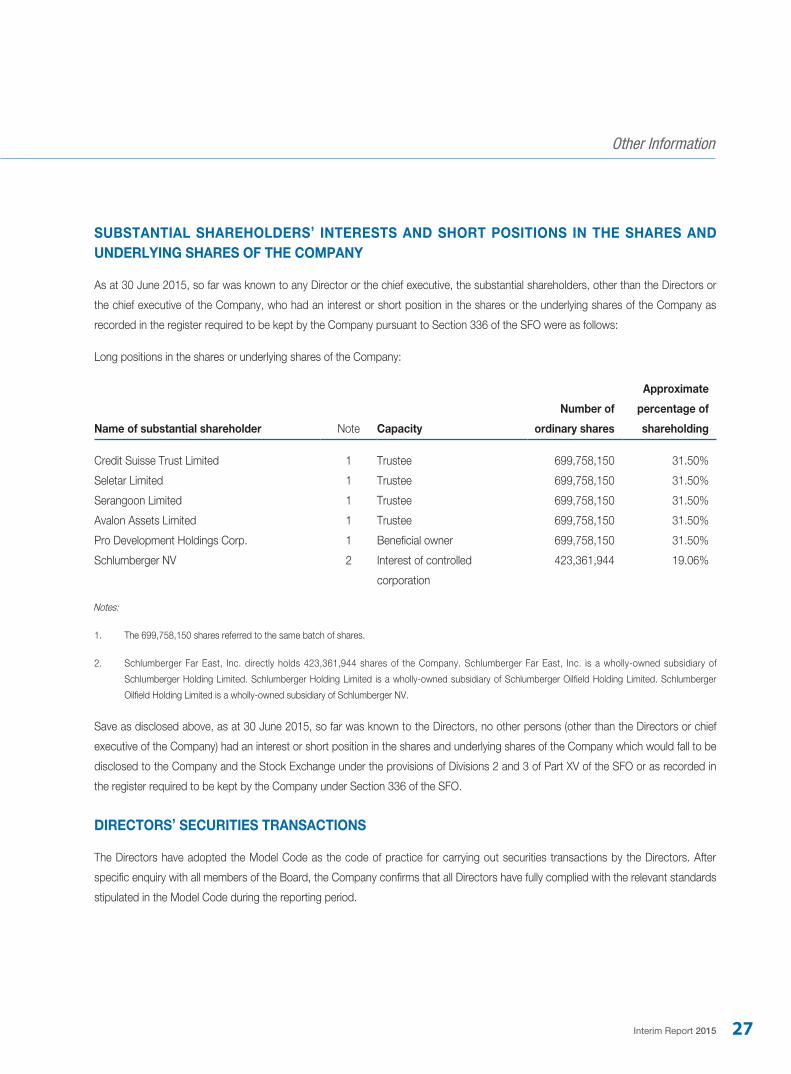
SUBSTANTIAL SHAREHOLDERS’ INTERESTS AND SHORT POSITIONS IN THE SHARES AND UNDERLYING SHARES OF THE COMPANY
As at 30 June 2015, so far was known to any Director or the chief executive, the substantial shareholders, other than the Directors or
the chief executive of the Company, who had an interest or short position in the shares or the underlying shares of the Company as
recorded in the register required to be kept by the Company pursuant to Section 336 of the SFO were as follows:
Long positions in the shares or underlying shares of the Company:
Name of substantial shareholder Note Capacity
Number of
ordinary shares
Approximate
percentage of
shareholding
Credit Suisse Trust Limited 1 Trustee 699,758,150 31.50%
Seletar Limited 1 Trustee 699,758,150 31.50%
Serangoon Limited 1 Trustee 699,758,150 31.50%
Avalon Assets Limited 1 Trustee 699,758,150 31.50%
Pro Development Holdings Corp. 1 Beneficial owner 699,758,150 31.50%
Schlumberger NV 2 Interest of controlled 423,361,944 19.06%
corporation
Notes:
1. The 699,758,150 shares referred to the same batch of shares.
2. Schlumberger Far East, Inc. directly holds 423,361,944 shares of the Company. Schlumberger Far East, Inc. is a wholly-owned subsidiary of
Schlumberger Holding Limited. Schlumberger Holding Limited is a wholly-owned subsidiary of Schlumberger Oilfield Holding Limited. Schlumberger
Oilfield Holding Limited is a wholly-owned subsidiary of Schlumberger NV.
Save as disclosed above, as at 30 June 2015, so far was known to the Directors, no other persons (other than the Directors or chief
executive of the Company) had an interest or short position in the shares and underlying shares of the Company which would fall to be
disclosed to the Company and the Stock Exchange under the provisions of Divisions 2 and 3 of Part XV of the SFO or as recorded in
the register required to be kept by the Company under Section 336 of the SFO.
DIRECTORS’ SECURITIES TRANSACTIONS
The Directors have adopted the Model Code as the code of practice for carrying out securities transactions by the Directors. After
specific enquiry with all members of the Board, the Company confirms that all Directors have fully complied with the relevant standards
stipulated in the Model Code during the reporting period.
Other Information
28 Anton Oilfield Services Group
CHANGE IN INFORMATION REGARDING THE DIRECTORS AND CHIEF EXECUTIVES ACCORDING TO RULE 13.51B(1) OF THE LISTING RULES
There has been no change in the information regarding the Directors and Chief Executives of the Company since the date of the
Company’s 2014 annual report.
CORPORATE GOVERNANCE
The Company has complied with all the code provisions set out in the Corporate Governance Code (the “CG Code”) under Appendix
14 to the Listing Rules during the six months ended 30 June 2015, except for the following deviation:
Code provision A.2.1 of the CG Code stipulates that the roles of chairman and chief executive should be separate, and should not
be performed by the same individual. The Company does not separate the roles of Chairman and Chief Executive Officer. Mr. Luo
served as both Chairman and Chief Executive Officer of the Company during the reporting period. Mr. Luo was the main founder of the
Group. He has been responsible for the operational management of the Group since our establishment and has been instrumental to
the development of the Group. Mr. Luo possesses rich petroleum industry experience and excellent operational management ability.
The Board is of the view that continuing to engage Mr. Luo to serve as both the Chairman and Chief Executive Officer of the Company
will safeguard the continuity of our operational management and can protect shareholders’ interests.
AUDIT COMMITTEE
The Company has established an audit committee (the “Audit Committee”) comprising all three Independent Non-executive Directors,
namely Mr. Zhu Xiaoping (Chairman of the Audit Committee), Mr. Zhang Yongyi and Mr. Wang Mingcai. The Audit Committee has
reviewed the unaudited interim financial statements of the Group for the six months ended 30 June 2015.
By Order of the Board
Anton Oilfield Services Group
Luo Lin
Chairman
Hong Kong, 25 August 2015
Interim Report 2015 29
REPORT ON REVIEW OF CONDENSED CONSOLIDATED INTERIM FINANCIAL INFORMATION
TO THE BOARD OF DIRECTORS OF
ANTON OILFIELD SERVICES GROUP
(incorporated in the Cayman Islands with limited liability)
INTRODUCTION
We have reviewed the interim financial information set out on pages 31 to 66, which comprises the condensed consolidated interim
balance sheet of Anton Oilfield Services Group (the “Company”) and its subsidiaries (together, the “Group”) as at 30 June 2015 and
the related condensed consolidated interim statements of income, comprehensive income, changes in equity and cash flows for the
six-month period then ended, and a summary of significant accounting policies and other explanatory notes. The Rules Governing the
Listing of Securities on The Stock Exchange of Hong Kong Limited require the preparation of a report on interim financial information
to be in compliance with the relevant provisions thereof and International Accounting Standard 34 “Interim Financial Reporting”. The
directors of the Company are responsible for the preparation and presentation of this interim financial information in accordance
with International Accounting Standard 34 “Interim Financial Reporting”. Our responsibility is to express a conclusion on this interim
financial information based on our review and to report our conclusion solely to you, as a body, in accordance with our agreed terms
of engagement and for no other purpose. We do not assume responsibility towards or accept liability to any other person for the
contents of this report.
SCOPE OF REVIEW
We conducted our review in accordance with International Standard on Review Engagements 2410, “Review of Interim Financial
Information Performed by the Independent Auditor of the Entity”. A review of interim financial information consists of making inquiries,
primarily of persons responsible for financial and accounting matters, and applying analytical and other review procedures. A review is
substantially less in scope than an audit conducted in accordance with International Standards on Auditing and consequently does not
enable us to obtain assurance that we would become aware of all significant matters that might be identified in an audit. Accordingly,
we do not express an audit opinion.
30 Anton Oilfield Services Group
REPORT ON REVIEW OF CONDENSED CONSOLIDATED INTERIM FINANCIAL INFORMATION
CONCLUSION
Based on our review, nothing has come to our attention that causes us to believe that the interim financial information is not prepared,
in all material respects, in accordance with International Accounting Standard 34 “Interim Financial Reporting”.
PricewaterhouseCoopers
Certified Public Accountants
Hong Kong, 25 August 2015
Interim Report 2015 31
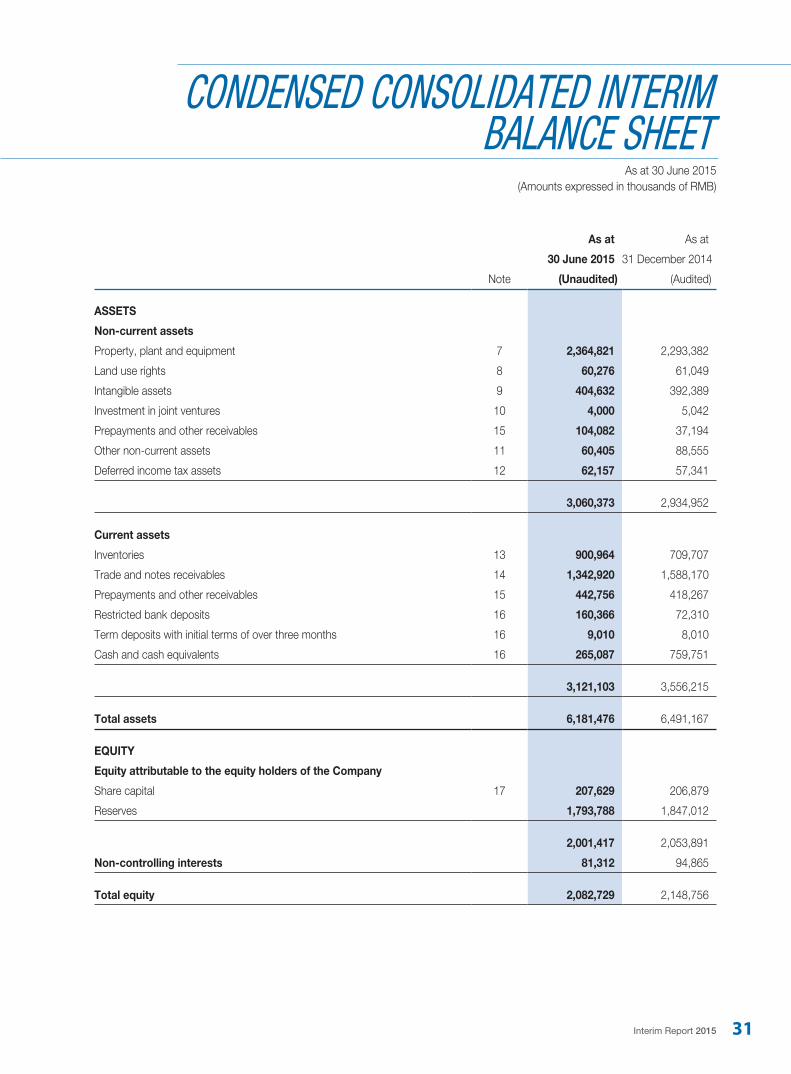
CONDENSED CONSOLIDATED INTERIM BALANCE SHEET
As at 30 June 2015(Amounts expressed in thousands of RMB)
As at As at
30 June 2015 31 December 2014
Note (Unaudited) (Audited)
ASSETS
Non-current assets
Property, plant and equipment 7 2,364,821 2,293,382
Land use rights 8 60,276 61,049
Intangible assets 9 404,632 392,389
Investment in joint ventures 10 4,000 5,042
Prepayments and other receivables 15 104,082 37,194
Other non-current assets 11 60,405 88,555
Deferred income tax assets 12 62,157 57,341
3,060,373 2,934,952
Current assets
Inventories 13 900,964 709,707
Trade and notes receivables 14 1,342,920 1,588,170
Prepayments and other receivables 15 442,756 418,267
Restricted bank deposits 16 160,366 72,310
Term deposits with initial terms of over three months 16 9,010 8,010
Cash and cash equivalents 16 265,087 759,751
3,121,103 3,556,215
Total assets 6,181,476 6,491,167
EQUITY
Equity attributable to the equity holders of the Company
Share capital 17 207,629 206,879
Reserves 1,793,788 1,847,012
2,001,417 2,053,891
Non-controlling interests 81,312 94,865
Total equity 2,082,729 2,148,756
32 Anton Oilfield Services Group
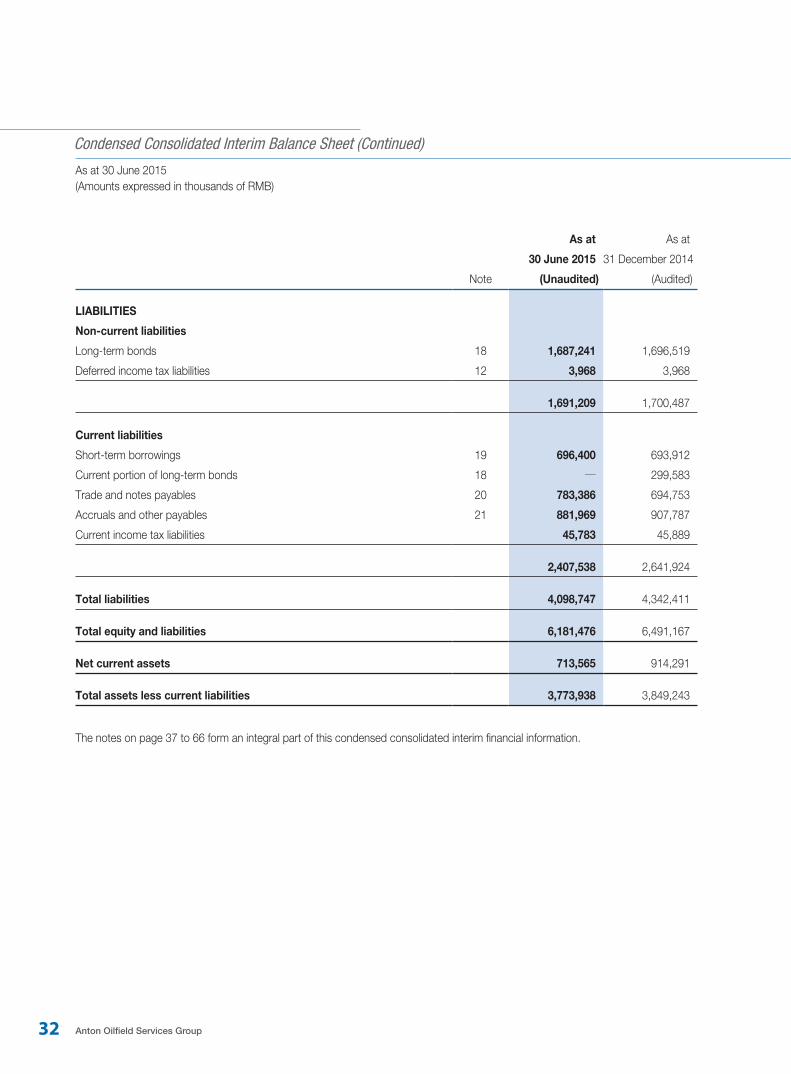
Condensed Consolidated Interim Balance Sheet (Continued)
As at 30 June 2015(Amounts expressed in thousands of RMB)
As at As at
30 June 2015 31 December 2014
Note (Unaudited) (Audited)
LIABILITIES
Non-current liabilities
Long-term bonds 18 1,687,241 1,696,519
Deferred income tax liabilities 12 3,968 3,968
1,691,209 1,700,487
Current liabilities
Short-term borrowings 19 696,400 693,912
Current portion of long-term bonds 18 — 299,583
Trade and notes payables 20 783,386 694,753
Accruals and other payables 21 881,969 907,787
Current income tax liabilities 45,783 45,889
2,407,538 2,641,924
Total liabilities 4,098,747 4,342,411
Total equity and liabilities 6,181,476 6,491,167
Net current assets 713,565 914,291
Total assets less current liabilities 3,773,938 3,849,243
The notes on page 37 to 66 form an integral part of this condensed consolidated interim financial information.
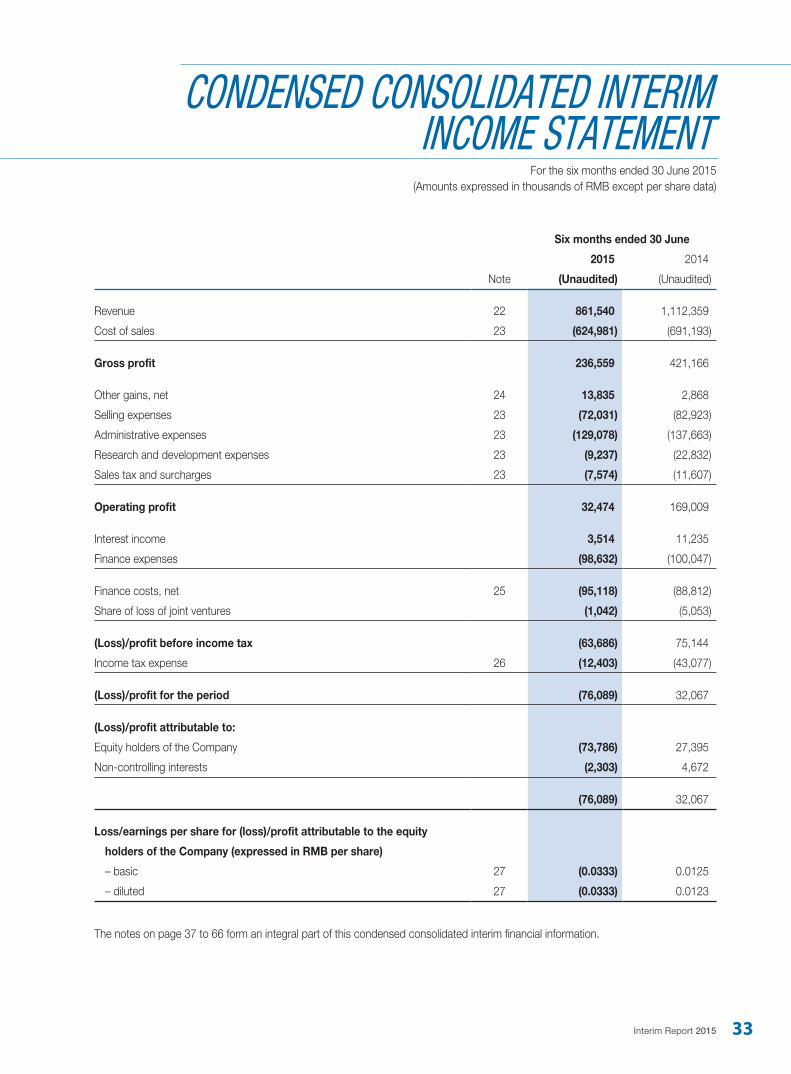
Interim Report 2015 33
CONDENSED CONSOLIDATED INTERIM INCOME STATEMENT
For the six months ended 30 June 2015(Amounts expressed in thousands of RMB except per share data)
Six months ended 30 June
2015 2014
Note (Unaudited) (Unaudited)
Revenue 22 861,540 1,112,359
Cost of sales 23 (624,981) (691,193)
Gross profit 236,559 421,166
Other gains, net 24 13,835 2,868
Selling expenses 23 (72,031) (82,923)
Administrative expenses 23 (129,078) (137,663)
Research and development expenses 23 (9,237) (22,832)
Sales tax and surcharges 23 (7,574) (11,607)
Operating profit 32,474 169,009
Interest income 3,514 11,235
Finance expenses (98,632) (100,047)
Finance costs, net 25 (95,118) (88,812)
Share of loss of joint ventures (1,042) (5,053)
(Loss)/profit before income tax (63,686) 75,144
Income tax expense 26 (12,403) (43,077)
(Loss)/profit for the period (76,089) 32,067
(Loss)/profit attributable to:
Equity holders of the Company (73,786) 27,395
Non-controlling interests (2,303) 4,672
(76,089) 32,067
Loss/earnings per share for (loss)/profit attributable to the equity
holders of the Company (expressed in RMB per share)
– basic 27 (0.0333) 0.0125
– diluted 27 (0.0333) 0.0123
The notes on page 37 to 66 form an integral part of this condensed consolidated interim financial information.
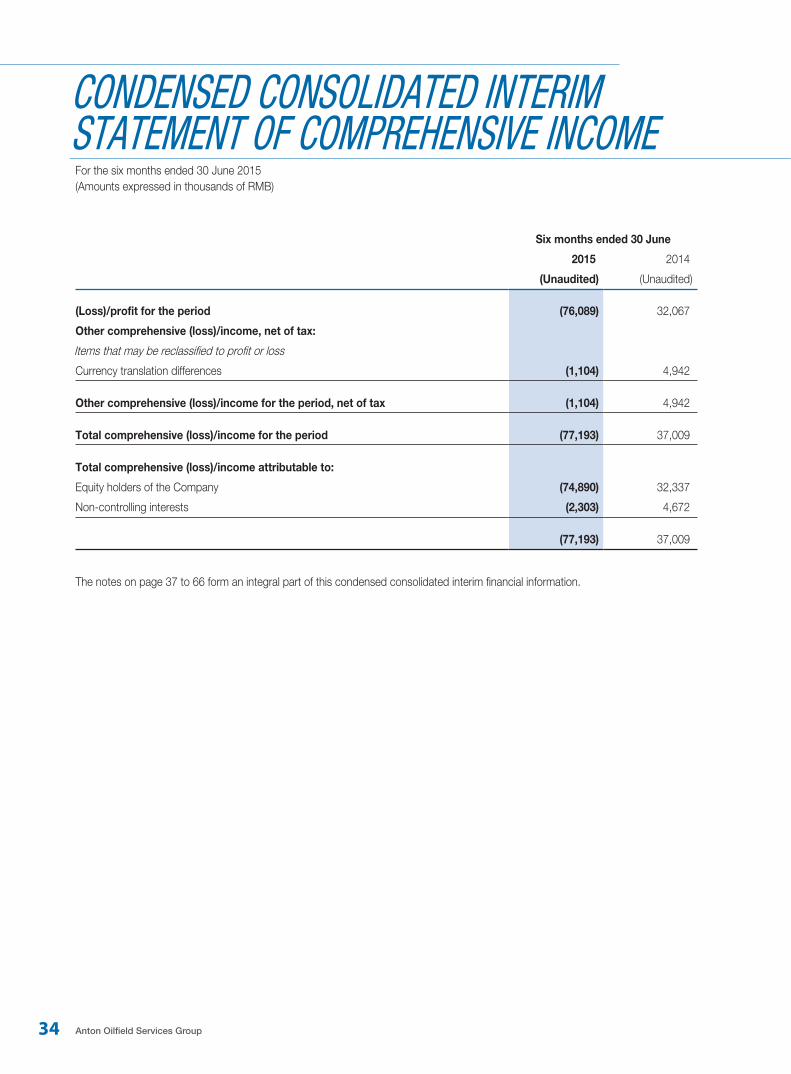
34 Anton Oilfield Services Group
CONDENSED CONSOLIDATED INTERIM STATEMENT OF COMPREHENSIVE INCOMEFor the six months ended 30 June 2015(Amounts expressed in thousands of RMB)
Six months ended 30 June
2015 2014
(Unaudited) (Unaudited)
(Loss)/profit for the period (76,089) 32,067
Other comprehensive (loss)/income, net of tax:
Items that may be reclassified to profit or loss
Currency translation differences (1,104) 4,942
Other comprehensive (loss)/income for the period, net of tax (1,104) 4,942
Total comprehensive (loss)/income for the period (77,193) 37,009
Total comprehensive (loss)/income attributable to:
Equity holders of the Company (74,890) 32,337
Non-controlling interests (2,303) 4,672
(77,193) 37,009
The notes on page 37 to 66 form an integral part of this condensed consolidated interim financial information.
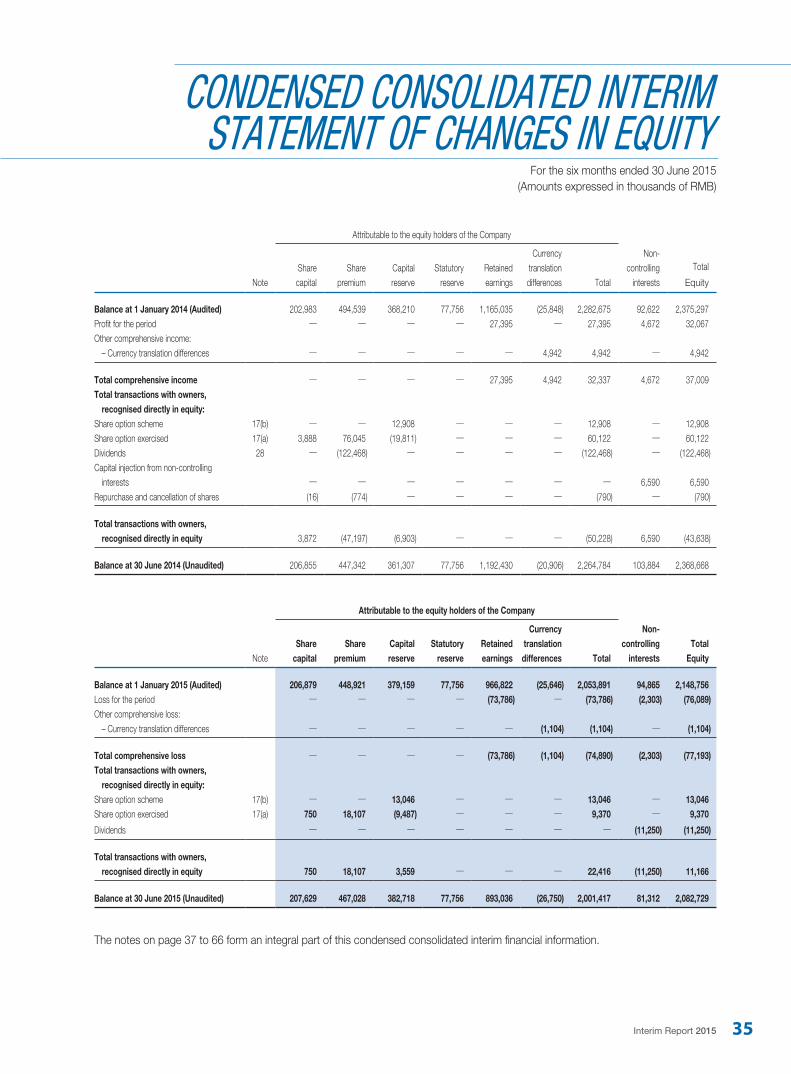
Interim Report 2015 35
CONDENSED CONSOLIDATED INTERIM STATEMENT OF CHANGES IN EQUITY
For the six months ended 30 June 2015(Amounts expressed in thousands of RMB)
Attributable to the equity holders of the Company
NoteSharecapital
Share premium
Capital reserve
Statutory reserve
Retained earnings
Currency translation differences Total
Non-controlling
interests
Total
Equity
Balance at 1 January 2014 (Audited) 202,983 494,539 368,210 77,756 1,165,035 (25,848) 2,282,675 92,622 2,375,297Profit for the period — — — — 27,395 — 27,395 4,672 32,067Other comprehensive income: – Currency translation differences — — — — — 4,942 4,942 — 4,942 Total comprehensive income — — — — 27,395 4,942 32,337 4,672 37,009Total transactions with owners, recognised directly in equity:Share option scheme 17(b) — — 12,908 — — — 12,908 — 12,908Share option exercised 17(a) 3,888 76,045 (19,811) — — — 60,122 — 60,122Dividends 28 — (122,468) — — — — (122,468) — (122,468)Capital injection from non-controlling interests — — — — — — — 6,590 6,590Repurchase and cancellation of shares (16) (774) — — — — (790) — (790) Total transactions with owners, recognised directly in equity 3,872 (47,197) (6,903) — — — (50,228) 6,590 (43,638) Balance at 30 June 2014 (Unaudited) 206,855 447,342 361,307 77,756 1,192,430 (20,906) 2,264,784 103,884 2,368,668
Attributable to the equity holders of the Company
NoteShare
capitalShare
premiumCapital reserve
Statutory reserve
Retained earnings
Currency translation differences Total
Non-controlling
interestsTotal
Equity
Balance at 1 January 2015 (Audited) 206,879 448,921 379,159 77,756 966,822 (25,646) 2,053,891 94,865 2,148,756Loss for the period — — — — (73,786) — (73,786) (2,303) (76,089)Other comprehensive loss: – Currency translation differences — — — — — (1,104) (1,104) — (1,104) Total comprehensive loss — — — — (73,786) (1,104) (74,890) (2,303) (77,193)Total transactions with owners, recognised directly in equity:Share option scheme 17(b) — — 13,046 — — — 13,046 — 13,046Share option exercised 17(a) 750 18,107 (9,487) — — — 9,370 — 9,370
Dividends — — — — — — — (11,250) (11,250) Total transactions with owners, recognised directly in equity 750 18,107 3,559 — — — 22,416 (11,250) 11,166 Balance at 30 June 2015 (Unaudited) 207,629 467,028 382,718 77,756 893,036 (26,750) 2,001,417 81,312 2,082,729
The notes on page 37 to 66 form an integral part of this condensed consolidated interim financial information.
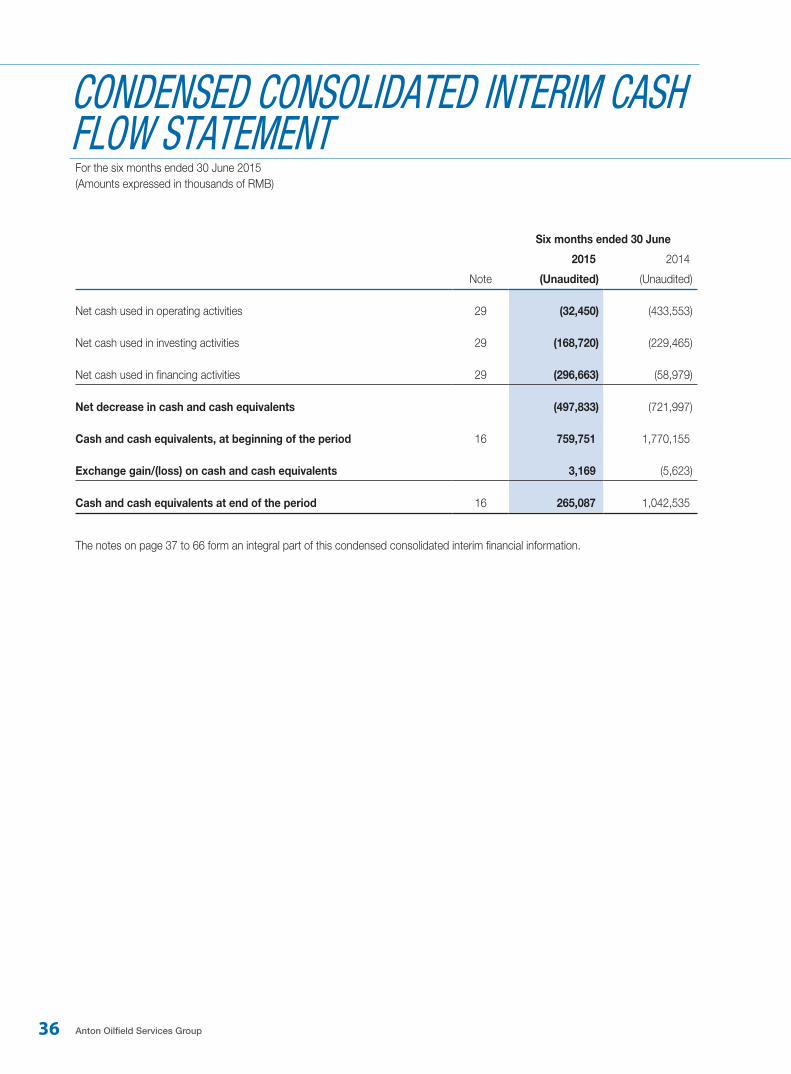
36 Anton Oilfield Services Group
CONDENSED CONSOLIDATED INTERIM CASH FLOW STATEMENTFor the six months ended 30 June 2015(Amounts expressed in thousands of RMB)
Six months ended 30 June
2015 2014
Note (Unaudited) (Unaudited)
Net cash used in operating activities 29 (32,450) (433,553)
Net cash used in investing activities 29 (168,720) (229,465)
Net cash used in financing activities 29 (296,663) (58,979)
Net decrease in cash and cash equivalents (497,833) (721,997)
Cash and cash equivalents, at beginning of the period 16 759,751 1,770,155
Exchange gain/(loss) on cash and cash equivalents 3,169 (5,623)
Cash and cash equivalents at end of the period 16 265,087 1,042,535
The notes on page 37 to 66 form an integral part of this condensed consolidated interim financial information.
Interim Report 2015 37
NOTES TO THE CONDENSED CONSOLIDATED INTERIM FINANCIAL INFORMATION
For the six months ended 30 June 2015(Amounts expressed in thousands of RMB unless otherwise stated)
1. GENERAL INFORMATION
Anton Oilfield Services Group (the ‘Company’) was incorporated in the Cayman Islands on 3 August 2007 as an exempted
company with limited liability under the Companies Law of the Cayman Islands. The address of its registered office is PO Box
309, Ugland House, Grand Cayman, KY1-1104, the Cayman Islands.
The Company is an investment holding company. The Company and its subsidiaries (the ‘Group’) are principally engaged in
providing oilfield technology services, manufacturing and trading of related products in the People’s Republic of China (the ‘PRC’)
and other oversea countries. The Company listed its shares on the Main Board of The Stock Exchange of Hong Kong Limited
on 14 December 2007.
The directors regard Pro Development Holdings Corp., a company incorporated in the British Virgin Islands, as the ultimate
holding company of the Company, which is controlled by Mr. Luo Lin, the Company’s controlling shareholder.
This unaudited condensed consolidated interim financial information was approved for issue by the board of directors on 25
August 2015.
2. BASIS OF PREPARATION
This condensed consolidated interim financial information for the six months ended 30 June 2015 has been prepared in
accordance with International Accounting Standard (‘IAS’) 34, ‘Interim Financial Reporting’. The condensed consolidated interim
financial information should be read in conjunction with the annual financial statements for the year ended 31 December 2014,
which have been prepared in accordance with International Financial Reporting Standards (‘IFRS’).
38 Anton Oilfield Services Group
Notes to the Condensed Consolidated Interim Financial Information
For the six months ended 30 June 2015(Amounts expressed in thousands of RMB unless otherwise stated)
3. ACCOUNTING POLICIES
The accounting policies applied are consistent with those of the annual financial statements for the year ended 31 December
2014, as described in those annual financial statements.
Amendments to IFRSs effective for the financial year ending 31 December 2015 do not have a material impact on the Group.
Taxes on income in the interim periods are accrued using the tax rates that would be applicable to expected total annual
earnings.
There are no other amended standards or interpretations that are effective for the first time for this interim period that would be
expected to have a material impact on the Group.
4. ESTIMATES
The preparation of condensed consolidated interim financial information requires management to make judgements, estimates
and assumptions that affect the application of accounting policies and the reported amounts of assets and liabilities, income
and expense. Actual results may differ from these estimates.
In preparing this condensed consolidated interim financial information, the significant judgements made by management in
applying the Group’s accounting policies and the key sources of estimation uncertainty were the same as those that applied to
the consolidated financial statements for the year ended 31 December 2014, except for the following:
• Change in accounting estimate
Useful lives of the Group’s assets are subject to regular review by management. Prior to 2015, certain intangible assets,
mainly comprising patents and computer software, were amortised at the estimated useful lives of 3 to 8 years and 5
years respectively. After a review, as these assets are still generating economic benefits to the Group, management has
determined that the estimated useful lives of these assets are extended to 10 years with effect from 1 January 2015.
The effect of extension has been applied on a prospective basis. As a result of this change, amortisation for the period
has been reduced by approximately RMB 5,128,000 and is expected to be reduced by approximately RMB 10,367,000
for the full year.
Interim Report 2015 39
Notes to the Condensed Consolidated Interim Financial Information
For the six months ended 30 June 2015(Amounts expressed in thousands of RMB unless otherwise stated)
5. FINANCIAL RISK MANAGEMENT
5.1 Financial risk factors
The Group’s activities expose it to a variety of financial risks: market risk (including currency risk and fair value interest rate
risk), credit risk and liquidity risk.
The interim condensed consolidated financial information does not include all financial risk management information
and disclosures required in the annual financial statements, and should be read in conjunction with the Group’s annual
financial statements as at 31 December 2014.
There have been no changes in the risk management policies since year end.
5.2 Liquidity risk
Compared to the year end, there was no material change in the contractual undiscounted cash outflows for financial
liabilities.
5.3 Credit risk
The Group has policies in place to ensure that sales of products and services are made to customers with an appropriate
credit history. The Group’s historical experience in collection of trade and other receivables falls within the recorded
allowance and the directors are of the opinion that adequate provision for uncollectible receivables has been made in the
financial statements.
A considerable portion of sales were made to the several major oilfield operators of the PRC and their affiliates, which are
state-owned entities with good credit reputation, therefore the trade receivables of the Group had concentration risk (Note
6). Most of the Group’s cash and cash equivalents were placed with state-owned banks in the PRC and Hong Kong, the
corresponding credit risk is relatively low.
40 Anton Oilfield Services Group
Notes to the Condensed Consolidated Interim Financial Information
For the six months ended 30 June 2015(Amounts expressed in thousands of RMB unless otherwise stated)
5. FINANCIAL RISK MANAGEMENT (CONTINUED)
5.4 Fair value estimation
The carrying amounts of the Group’s financial assets including cash and cash equivalents, deposits in approved financial
institutions, trade and notes receivables, other receivables and financial liabilities including trade and other payables,
short-term borrowings, the current portion of long-term bonds approximate their fair values due to their short maturities.
The carrying amounts of long-term bonds approximated their fair values as the fluctuation of comparable interest rates
with similar terms is relatively low.
6. SEGMENT INFORMATION
The chief executive officer, executive vice presidents and directors are the Group’s chief operating decision-makers.
Management has determined the operating segments based on the information reviewed by the chief operating decision-
makers for the purposes of allocating resources and assessing performance.
The Group’s reportable segments are entity or group of entities that offer different products and services, which is the basis by
which the chief operating decision-makers make decisions about resources to be allocated to the segments and assesses their
performance. Financial information of these entities has been separated to present discrete segment information to be reviewed
by the chief operating decision-makers.
The chief operating decision-makers assess performance of four reportable segments: drilling technology, well completion,
down-hole operation and tubular services.
The measurement of profit or loss, assets and liabilities of the operating segments is the same as those described in the
summary of significant accounting policies. The chief operating decision-makers evaluate the performance of the operating
segments based on profit or loss before income tax, depreciation and amortisation, interest income, finance expenses and
share of loss of joint ventures (‘EBITDA’). The corporate overheads and corporate assets are the general management expenses
and assets incurred and held by the headquarters of the Group.
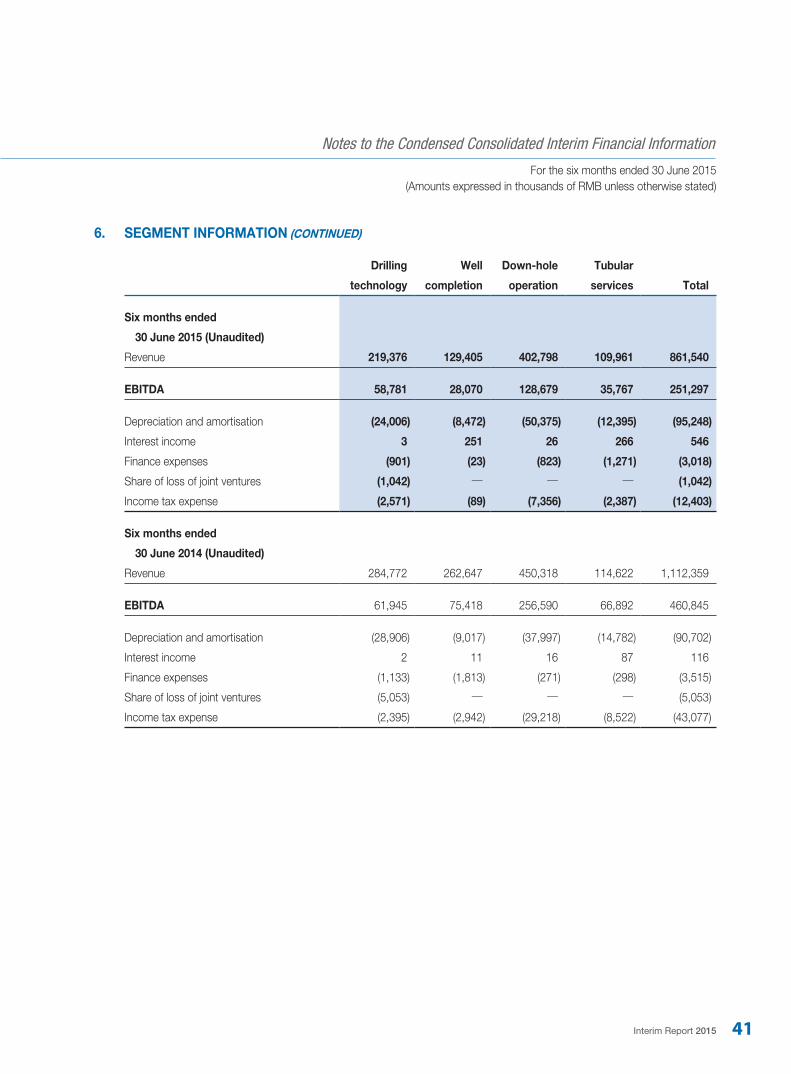
Interim Report 2015 41
Notes to the Condensed Consolidated Interim Financial Information
For the six months ended 30 June 2015(Amounts expressed in thousands of RMB unless otherwise stated)
6. SEGMENT INFORMATION (CONTINUED)
Drilling
technology
Well
completion
Down-hole
operation
Tubular
services Total
Six months ended
30 June 2015 (Unaudited)
Revenue 219,376 129,405 402,798 109,961 861,540
EBITDA 58,781 28,070 128,679 35,767 251,297
Depreciation and amortisation (24,006) (8,472) (50,375) (12,395) (95,248)
Interest income 3 251 26 266 546
Finance expenses (901) (23) (823) (1,271) (3,018)
Share of loss of joint ventures (1,042) — — — (1,042)
Income tax expense (2,571) (89) (7,356) (2,387) (12,403)
Six months ended
30 June 2014 (Unaudited)
Revenue 284,772 262,647 450,318 114,622 1,112,359
EBITDA 61,945 75,418 256,590 66,892 460,845
Depreciation and amortisation (28,906) (9,017) (37,997) (14,782) (90,702)
Interest income 2 11 16 87 116
Finance expenses (1,133) (1,813) (271) (298) (3,515)
Share of loss of joint ventures (5,053) — — — (5,053)
Income tax expense (2,395) (2,942) (29,218) (8,522) (43,077)
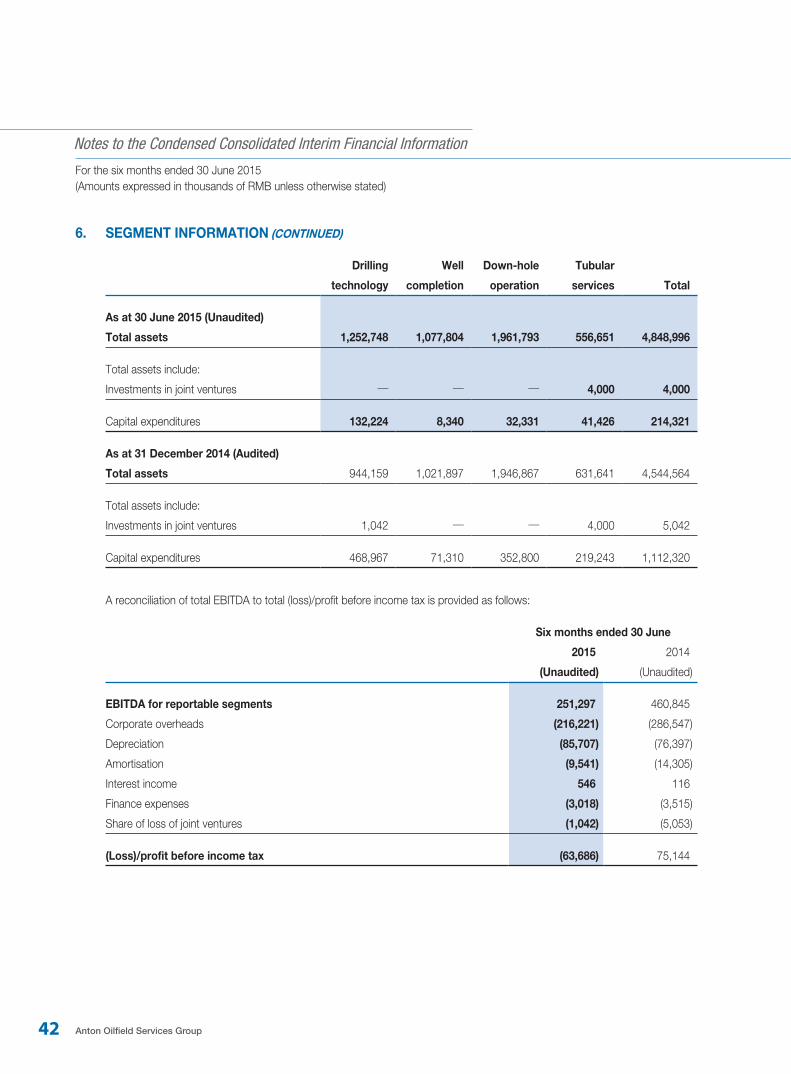
42 Anton Oilfield Services Group
Notes to the Condensed Consolidated Interim Financial Information
For the six months ended 30 June 2015(Amounts expressed in thousands of RMB unless otherwise stated)
6. SEGMENT INFORMATION (CONTINUED)
Drilling
technology
Well
completion
Down-hole
operation
Tubular
services Total
As at 30 June 2015 (Unaudited)
Total assets 1,252,748 1,077,804 1,961,793 556,651 4,848,996
Total assets include:
Investments in joint ventures — — — 4,000 4,000
Capital expenditures 132,224 8,340 32,331 41,426 214,321
As at 31 December 2014 (Audited)
Total assets 944,159 1,021,897 1,946,867 631,641 4,544,564
Total assets include:
Investments in joint ventures 1,042 — — 4,000 5,042
Capital expenditures 468,967 71,310 352,800 219,243 1,112,320
A reconciliation of total EBITDA to total (loss)/profit before income tax is provided as follows:
Six months ended 30 June
2015 2014
(Unaudited) (Unaudited)
EBITDA for reportable segments 251,297 460,845
Corporate overheads (216,221) (286,547)
Depreciation (85,707) (76,397)
Amortisation (9,541) (14,305)
Interest income 546 116
Finance expenses (3,018) (3,515)
Share of loss of joint ventures (1,042) (5,053)
(Loss)/profit before income tax (63,686) 75,144
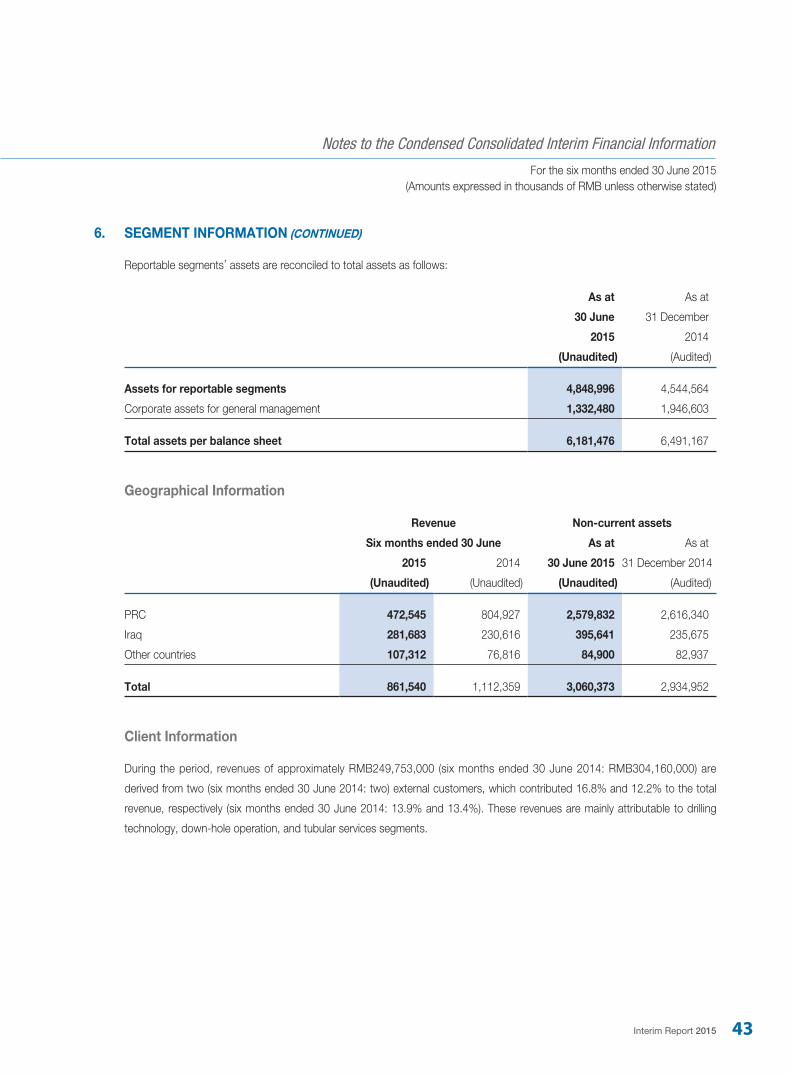
Interim Report 2015 43
Notes to the Condensed Consolidated Interim Financial Information
For the six months ended 30 June 2015(Amounts expressed in thousands of RMB unless otherwise stated)
6. SEGMENT INFORMATION (CONTINUED)
Reportable segments’ assets are reconciled to total assets as follows:
As at As at
30 June
2015
31 December
2014
(Unaudited) (Audited)
Assets for reportable segments 4,848,996 4,544,564
Corporate assets for general management 1,332,480 1,946,603
Total assets per balance sheet 6,181,476 6,491,167
Geographical Information
Revenue Non-current assets
Six months ended 30 June As at As at
2015 2014 30 June 2015 31 December 2014
(Unaudited) (Unaudited) (Unaudited) (Audited)
PRC 472,545 804,927 2,579,832 2,616,340
Iraq 281,683 230,616 395,641 235,675
Other countries 107,312 76,816 84,900 82,937
Total 861,540 1,112,359 3,060,373 2,934,952
Client Information
During the period, revenues of approximately RMB249,753,000 (six months ended 30 June 2014: RMB304,160,000) are
derived from two (six months ended 30 June 2014: two) external customers, which contributed 16.8% and 12.2% to the total
revenue, respectively (six months ended 30 June 2014: 13.9% and 13.4%). These revenues are mainly attributable to drilling
technology, down-hole operation, and tubular services segments.
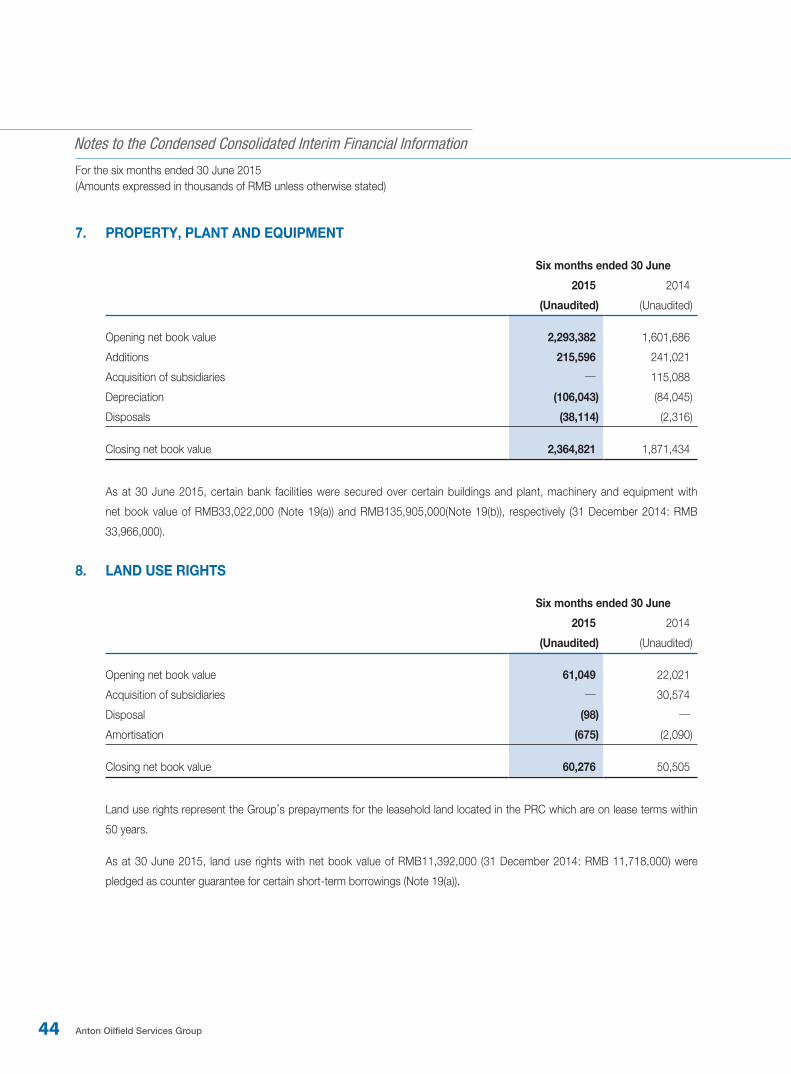
44 Anton Oilfield Services Group
Notes to the Condensed Consolidated Interim Financial Information
For the six months ended 30 June 2015(Amounts expressed in thousands of RMB unless otherwise stated)
7. PROPERTY, PLANT AND EQUIPMENT
Six months ended 30 June
2015 2014
(Unaudited) (Unaudited)
Opening net book value 2,293,382 1,601,686
Additions 215,596 241,021
Acquisition of subsidiaries — 115,088
Depreciation (106,043) (84,045)
Disposals (38,114) (2,316)
Closing net book value 2,364,821 1,871,434
As at 30 June 2015, certain bank facilities were secured over certain buildings and plant, machinery and equipment with
net book value of RMB33,022,000 (Note 19(a)) and RMB135,905,000(Note 19(b)), respectively (31 December 2014: RMB
33,966,000).
8. LAND USE RIGHTS
Six months ended 30 June
2015 2014
(Unaudited) (Unaudited)
Opening net book value 61,049 22,021
Acquisition of subsidiaries — 30,574
Disposal (98) —
Amortisation (675) (2,090)
Closing net book value 60,276 50,505
Land use rights represent the Group’s prepayments for the leasehold land located in the PRC which are on lease terms within
50 years.
As at 30 June 2015, land use rights with net book value of RMB11,392,000 (31 December 2014: RMB 11,718,000) were
pledged as counter guarantee for certain short-term borrowings (Note 19(a)).
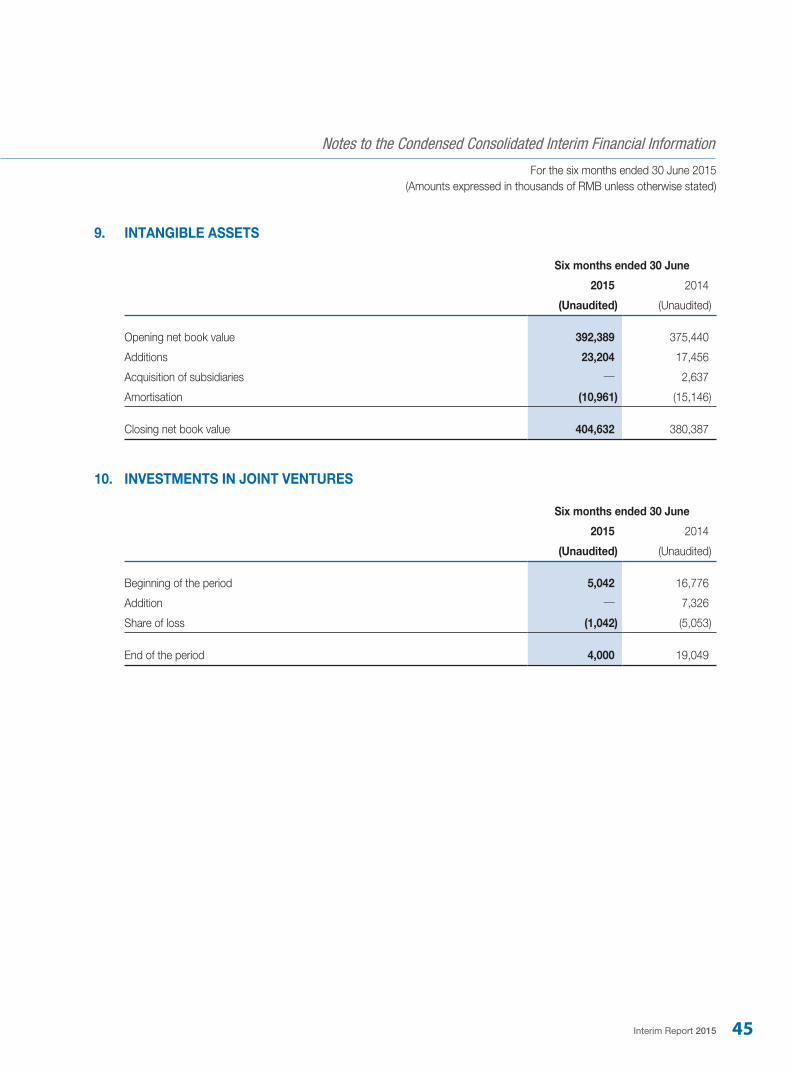
Interim Report 2015 45
Notes to the Condensed Consolidated Interim Financial Information
For the six months ended 30 June 2015(Amounts expressed in thousands of RMB unless otherwise stated)
9. INTANGIBLE ASSETS
Six months ended 30 June
2015 2014
(Unaudited) (Unaudited)
Opening net book value 392,389 375,440
Additions 23,204 17,456
Acquisition of subsidiaries — 2,637
Amortisation (10,961) (15,146)
Closing net book value 404,632 380,387
10. INVESTMENTS IN JOINT VENTURES
Six months ended 30 June
2015 2014
(Unaudited) (Unaudited)
Beginning of the period 5,042 16,776
Addition — 7,326
Share of loss (1,042) (5,053)
End of the period 4,000 19,049
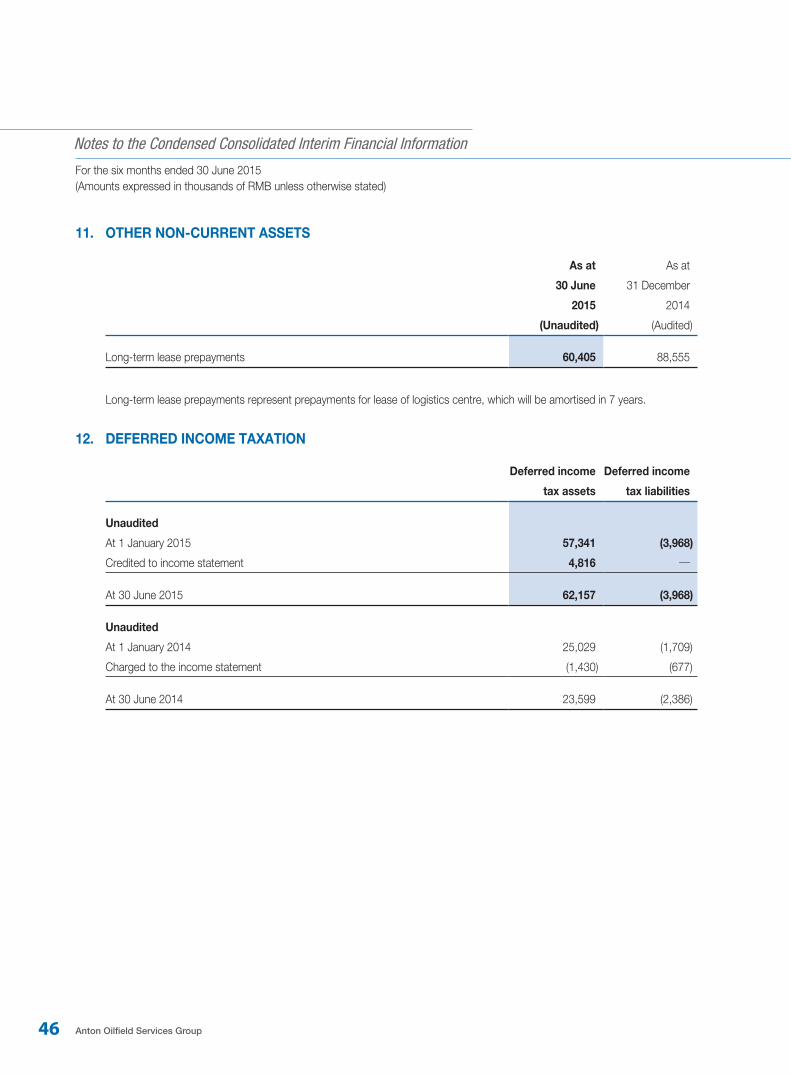
46 Anton Oilfield Services Group
Notes to the Condensed Consolidated Interim Financial Information
For the six months ended 30 June 2015(Amounts expressed in thousands of RMB unless otherwise stated)
11. OTHER NON-CURRENT ASSETS
As at As at
30 June
2015
31 December
2014
(Unaudited) (Audited)
Long-term lease prepayments 60,405 88,555
Long-term lease prepayments represent prepayments for lease of logistics centre, which will be amortised in 7 years.
12. DEFERRED INCOME TAXATION
Deferred income
tax assets
Deferred income
tax liabilities
Unaudited
At 1 January 2015 57,341 (3,968)
Credited to income statement 4,816 —
At 30 June 2015 62,157 (3,968)
Unaudited
At 1 January 2014 25,029 (1,709)
Charged to the income statement (1,430) (677)
At 30 June 2014 23,599 (2,386)
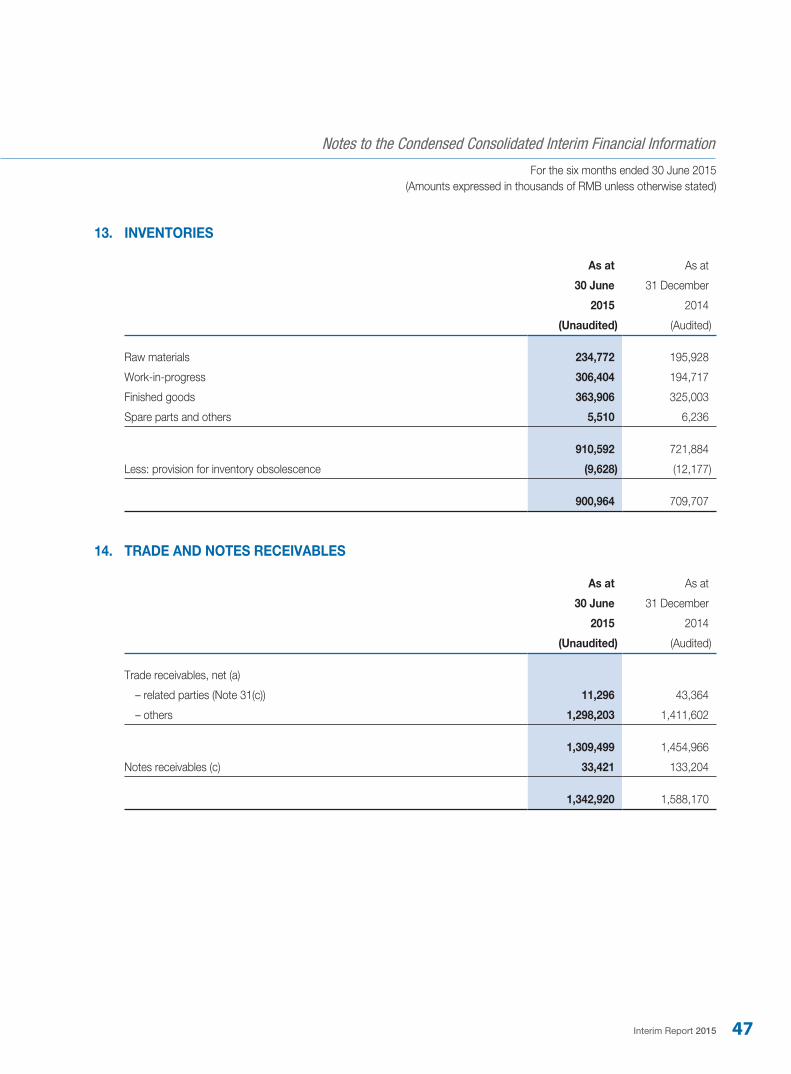
Interim Report 2015 47
Notes to the Condensed Consolidated Interim Financial Information
For the six months ended 30 June 2015(Amounts expressed in thousands of RMB unless otherwise stated)
13. INVENTORIES
As at As at
30 June
2015
31 December
2014
(Unaudited) (Audited)
Raw materials 234,772 195,928
Work-in-progress 306,404 194,717
Finished goods 363,906 325,003
Spare parts and others 5,510 6,236
910,592 721,884
Less: provision for inventory obsolescence (9,628) (12,177)
900,964 709,707
14. TRADE AND NOTES RECEIVABLES
As at As at
30 June
2015
31 December
2014
(Unaudited) (Audited)
Trade receivables, net (a)
– related parties (Note 31(c)) 11,296 43,364
– others 1,298,203 1,411,602
1,309,499 1,454,966
Notes receivables (c) 33,421 133,204
1,342,920 1,588,170
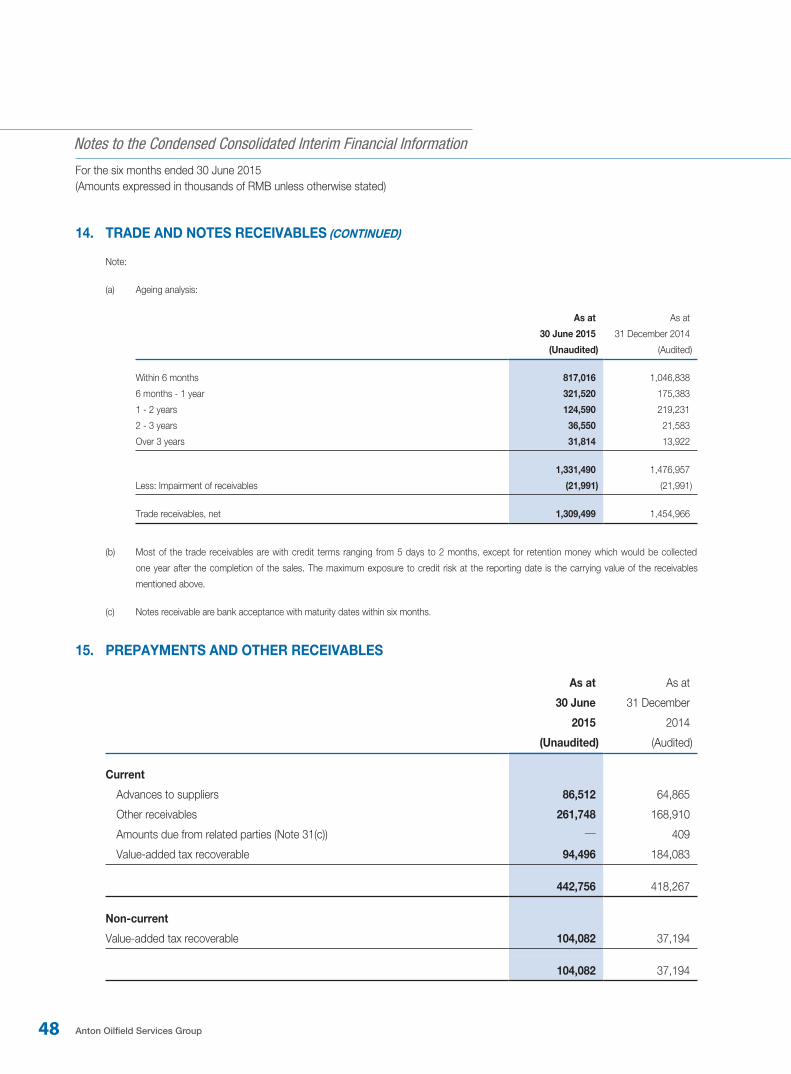
48 Anton Oilfield Services Group
Notes to the Condensed Consolidated Interim Financial Information
For the six months ended 30 June 2015(Amounts expressed in thousands of RMB unless otherwise stated)
14. TRADE AND NOTES RECEIVABLES (CONTINUED)
Note:
(a) Ageing analysis:
As at As at
30 June 2015 31 December 2014
(Unaudited) (Audited)
Within 6 months 817,016 1,046,838
6 months - 1 year 321,520 175,383
1 - 2 years 124,590 219,231
2 - 3 years 36,550 21,583
Over 3 years 31,814 13,922
1,331,490 1,476,957
Less: Impairment of receivables (21,991) (21,991) Trade receivables, net 1,309,499 1,454,966
(b) Most of the trade receivables are with credit terms ranging from 5 days to 2 months, except for retention money which would be collected
one year after the completion of the sales. The maximum exposure to credit risk at the reporting date is the carrying value of the receivables
mentioned above.
(c) Notes receivable are bank acceptance with maturity dates within six months.
15. PREPAYMENTS AND OTHER RECEIVABLES
As at As at
30 June
2015
31 December
2014
(Unaudited) (Audited)
Current
Advances to suppliers 86,512 64,865
Other receivables 261,748 168,910
Amounts due from related parties (Note 31(c)) — 409
Value-added tax recoverable 94,496 184,083
442,756 418,267
Non-current
Value-added tax recoverable 104,082 37,194
104,082 37,194
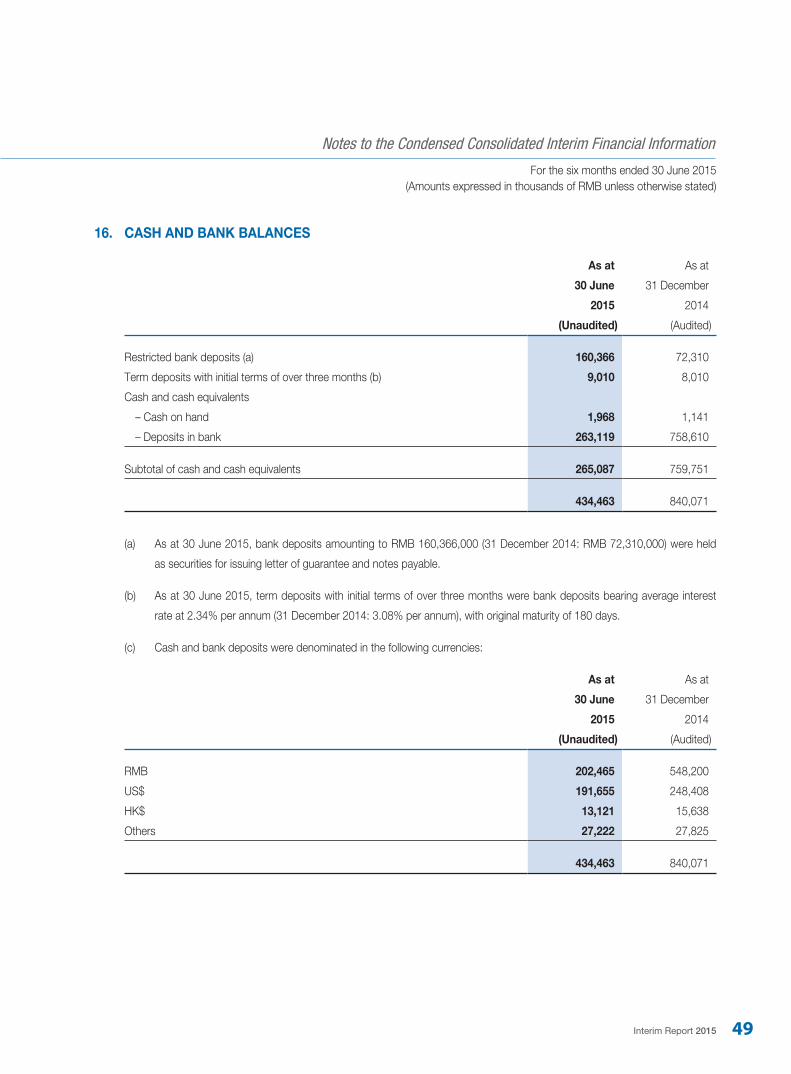
Interim Report 2015 49
Notes to the Condensed Consolidated Interim Financial Information
For the six months ended 30 June 2015(Amounts expressed in thousands of RMB unless otherwise stated)
16. CASH AND BANK BALANCES
As at As at
30 June
2015
31 December
2014
(Unaudited) (Audited)
Restricted bank deposits (a) 160,366 72,310
Term deposits with initial terms of over three months (b) 9,010 8,010
Cash and cash equivalents
– Cash on hand 1,968 1,141
– Deposits in bank 263,119 758,610
Subtotal of cash and cash equivalents 265,087 759,751
434,463 840,071
(a) As at 30 June 2015, bank deposits amounting to RMB 160,366,000 (31 December 2014: RMB 72,310,000) were held
as securities for issuing letter of guarantee and notes payable.
(b) As at 30 June 2015, term deposits with initial terms of over three months were bank deposits bearing average interest
rate at 2.34% per annum (31 December 2014: 3.08% per annum), with original maturity of 180 days.
(c) Cash and bank deposits were denominated in the following currencies:
As at As at
30 June
2015
31 December
2014
(Unaudited) (Audited)
RMB 202,465 548,200
US$ 191,655 248,408
HK$ 13,121 15,638
Others 27,222 27,825
434,463 840,071
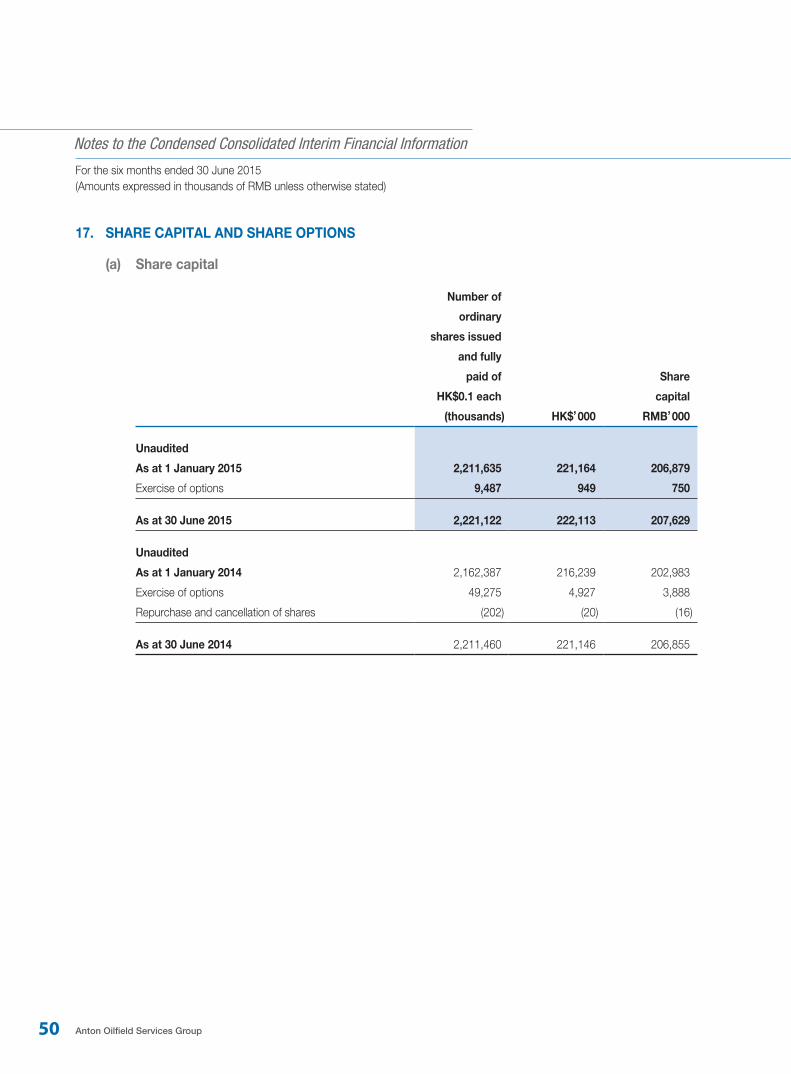
50 Anton Oilfield Services Group
Notes to the Condensed Consolidated Interim Financial Information
For the six months ended 30 June 2015(Amounts expressed in thousands of RMB unless otherwise stated)
17. SHARE CAPITAL AND SHARE OPTIONS
(a) Share capital
Number of
ordinary
shares issued
and fully
paid of
HK$0.1 each
(thousands) HK$’000
Share
capital
RMB’000
Unaudited
As at 1 January 2015 2,211,635 221,164 206,879
Exercise of options 9,487 949 750
As at 30 June 2015 2,221,122 222,113 207,629
Unaudited
As at 1 January 2014 2,162,387 216,239 202,983
Exercise of options 49,275 4,927 3,888
Repurchase and cancellation of shares (202) (20) (16)
As at 30 June 2014 2,211,460 221,146 206,855
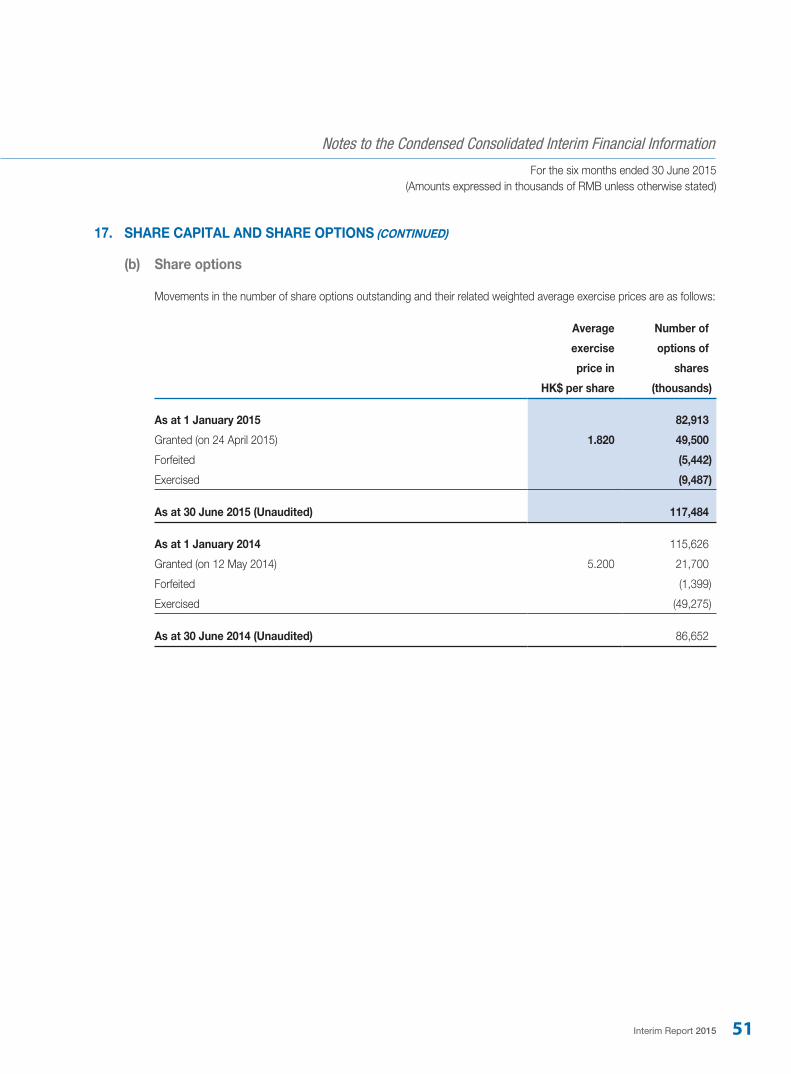
Interim Report 2015 51
Notes to the Condensed Consolidated Interim Financial Information
For the six months ended 30 June 2015(Amounts expressed in thousands of RMB unless otherwise stated)
17. SHARE CAPITAL AND SHARE OPTIONS (CONTINUED)
(b) Share options
Movements in the number of share options outstanding and their related weighted average exercise prices are as follows:
Average
exercise
price in
HK$ per share
Number of
options of
shares
(thousands)
As at 1 January 2015 82,913
Granted (on 24 April 2015) 1.820 49,500
Forfeited (5,442)
Exercised (9,487)
As at 30 June 2015 (Unaudited) 117,484
As at 1 January 2014 115,626
Granted (on 12 May 2014) 5.200 21,700
Forfeited (1,399)
Exercised (49,275)
As at 30 June 2014 (Unaudited) 86,652
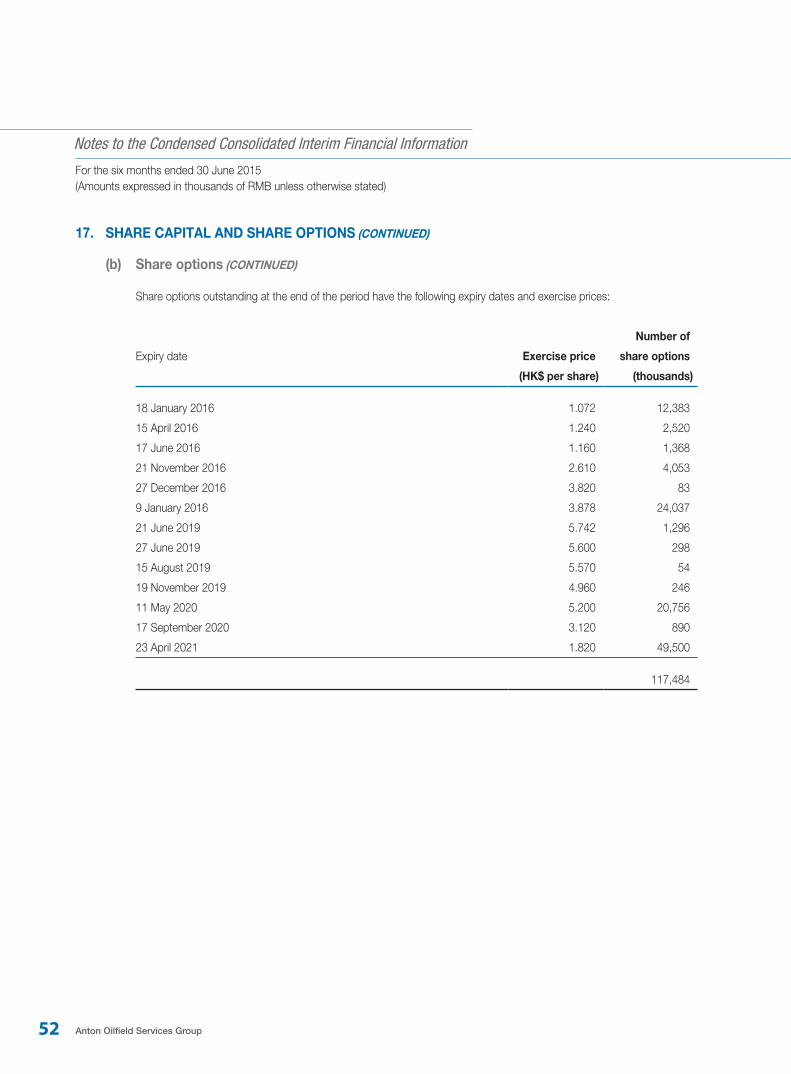
52 Anton Oilfield Services Group
Notes to the Condensed Consolidated Interim Financial Information
For the six months ended 30 June 2015(Amounts expressed in thousands of RMB unless otherwise stated)
17. SHARE CAPITAL AND SHARE OPTIONS (CONTINUED)
(b) Share options (CONTINUED)
Share options outstanding at the end of the period have the following expiry dates and exercise prices:
Expiry date Exercise price
Number of
share options
(HK$ per share) (thousands)
18 January 2016 1.072 12,383
15 April 2016 1.240 2,520
17 June 2016 1.160 1,368
21 November 2016 2.610 4,053
27 December 2016 3.820 83
9 January 2016 3.878 24,037
21 June 2019 5.742 1,296
27 June 2019 5.600 298
15 August 2019 5.570 54
19 November 2019 4.960 246
11 May 2020 5.200 20,756
17 September 2020 3.120 890
23 April 2021 1.820 49,500
117,484
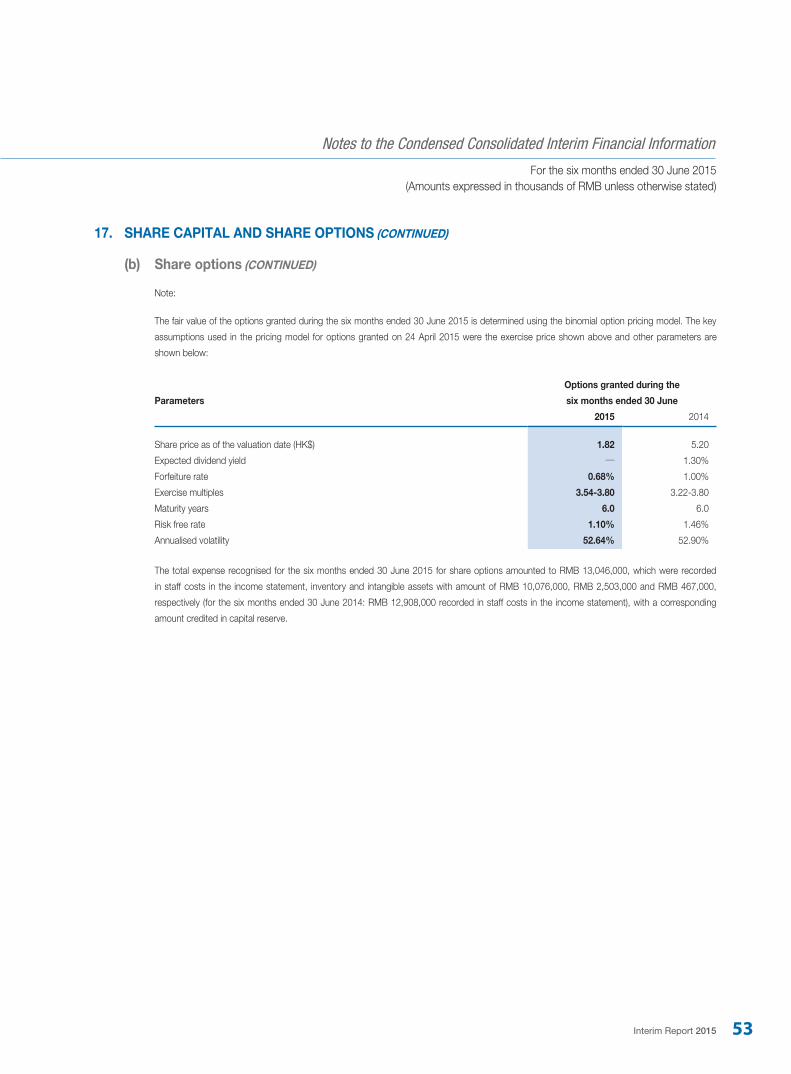
Interim Report 2015 53
Notes to the Condensed Consolidated Interim Financial Information
For the six months ended 30 June 2015(Amounts expressed in thousands of RMB unless otherwise stated)
17. SHARE CAPITAL AND SHARE OPTIONS (CONTINUED)
(b) Share options (CONTINUED)
Note:
The fair value of the options granted during the six months ended 30 June 2015 is determined using the binomial option pricing model. The key
assumptions used in the pricing model for options granted on 24 April 2015 were the exercise price shown above and other parameters are
shown below:
Parameters
Options granted during the
six months ended 30 June
2015 2014
Share price as of the valuation date (HK$) 1.82 5.20
Expected dividend yield — 1.30%
Forfeiture rate 0.68% 1.00%
Exercise multiples 3.54-3.80 3.22-3.80
Maturity years 6.0 6.0
Risk free rate 1.10% 1.46%
Annualised volatility 52.64% 52.90%
The total expense recognised for the six months ended 30 June 2015 for share options amounted to RMB 13,046,000, which were recorded
in staff costs in the income statement, inventory and intangible assets with amount of RMB 10,076,000, RMB 2,503,000 and RMB 467,000,
respectively (for the six months ended 30 June 2014: RMB 12,908,000 recorded in staff costs in the income statement), with a corresponding
amount credited in capital reserve.
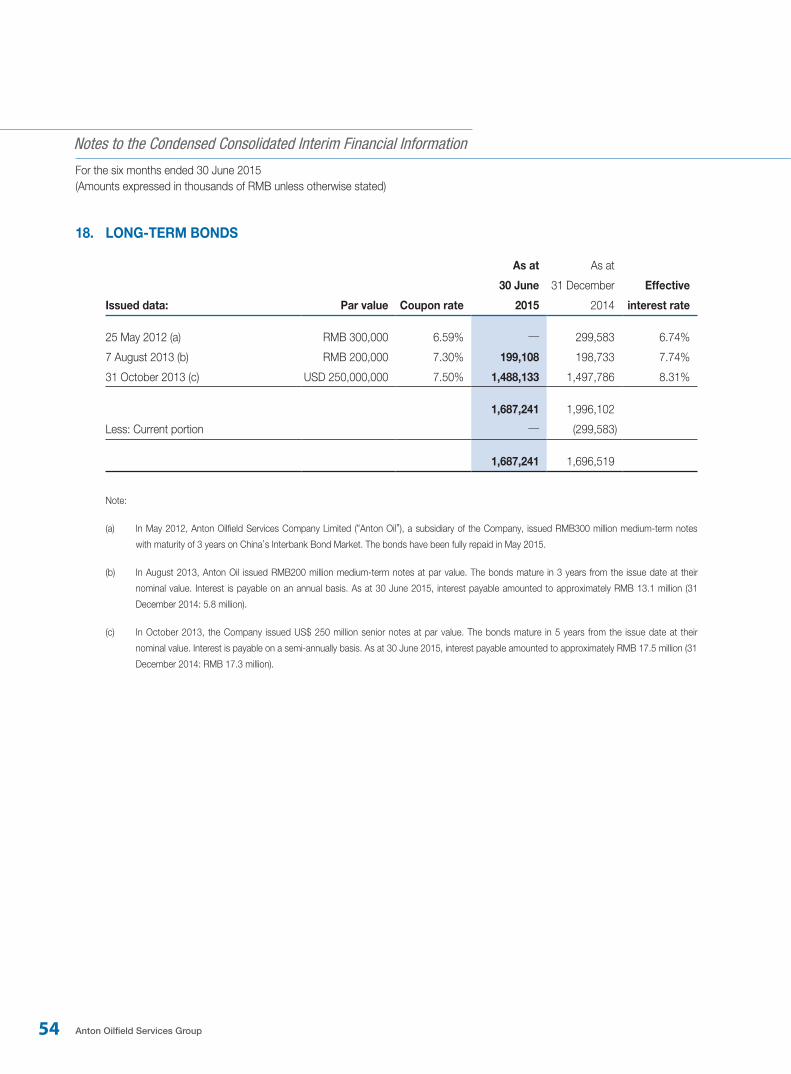
54 Anton Oilfield Services Group
Notes to the Condensed Consolidated Interim Financial Information
For the six months ended 30 June 2015(Amounts expressed in thousands of RMB unless otherwise stated)
18. LONG-TERM BONDS
Issued data: Par value Coupon rate
As at
30 June
2015
As at
31 December
2014
Effective
interest rate
25 May 2012 (a) RMB 300,000 6.59% — 299,583 6.74%
7 August 2013 (b) RMB 200,000 7.30% 199,108 198,733 7.74%
31 October 2013 (c) USD 250,000,000 7.50% 1,488,133 1,497,786 8.31%
1,687,241 1,996,102
Less: Current portion — (299,583)
1,687,241 1,696,519
Note:
(a) In May 2012, Anton Oilfield Services Company Limited (“Anton Oil”), a subsidiary of the Company, issued RMB300 million medium-term notes
with maturity of 3 years on China’s Interbank Bond Market. The bonds have been fully repaid in May 2015.
(b) In August 2013, Anton Oil issued RMB200 million medium-term notes at par value. The bonds mature in 3 years from the issue date at their
nominal value. Interest is payable on an annual basis. As at 30 June 2015, interest payable amounted to approximately RMB 13.1 million (31
December 2014: 5.8 million).
(c) In October 2013, the Company issued US$ 250 million senior notes at par value. The bonds mature in 5 years from the issue date at their
nominal value. Interest is payable on a semi-annually basis. As at 30 June 2015, interest payable amounted to approximately RMB 17.5 million (31
December 2014: RMB 17.3 million).
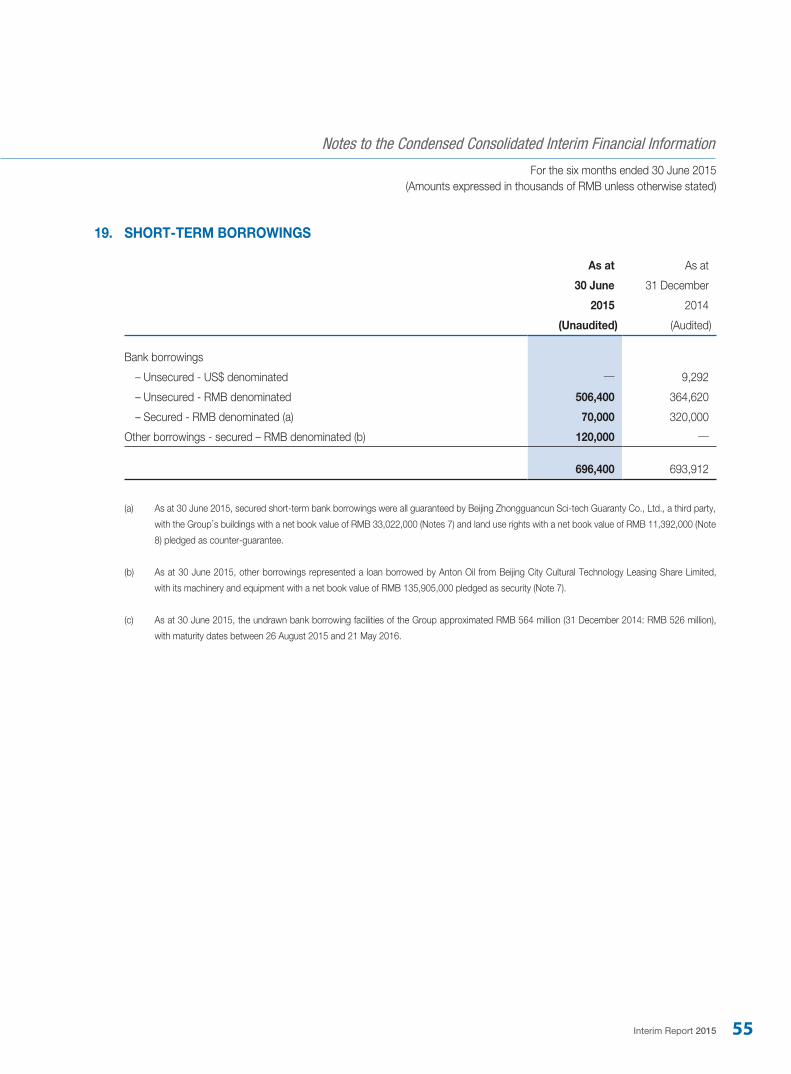
Interim Report 2015 55
Notes to the Condensed Consolidated Interim Financial Information
For the six months ended 30 June 2015(Amounts expressed in thousands of RMB unless otherwise stated)
19. SHORT-TERM BORROWINGS
As at As at
30 June
2015
31 December
2014
(Unaudited) (Audited)
Bank borrowings
– Unsecured - US$ denominated — 9,292
– Unsecured - RMB denominated 506,400 364,620
– Secured - RMB denominated (a) 70,000 320,000
Other borrowings - secured – RMB denominated (b) 120,000 —
696,400 693,912
(a) As at 30 June 2015, secured short-term bank borrowings were all guaranteed by Beijing Zhongguancun Sci-tech Guaranty Co., Ltd., a third party,
with the Group’s buildings with a net book value of RMB 33,022,000 (Notes 7) and land use rights with a net book value of RMB 11,392,000 (Note
8) pledged as counter-guarantee.
(b) As at 30 June 2015, other borrowings represented a loan borrowed by Anton Oil from Beijing City Cultural Technology Leasing Share Limited,
with its machinery and equipment with a net book value of RMB 135,905,000 pledged as security (Note 7).
(c) As at 30 June 2015, the undrawn bank borrowing facilities of the Group approximated RMB 564 million (31 December 2014: RMB 526 million),
with maturity dates between 26 August 2015 and 21 May 2016.
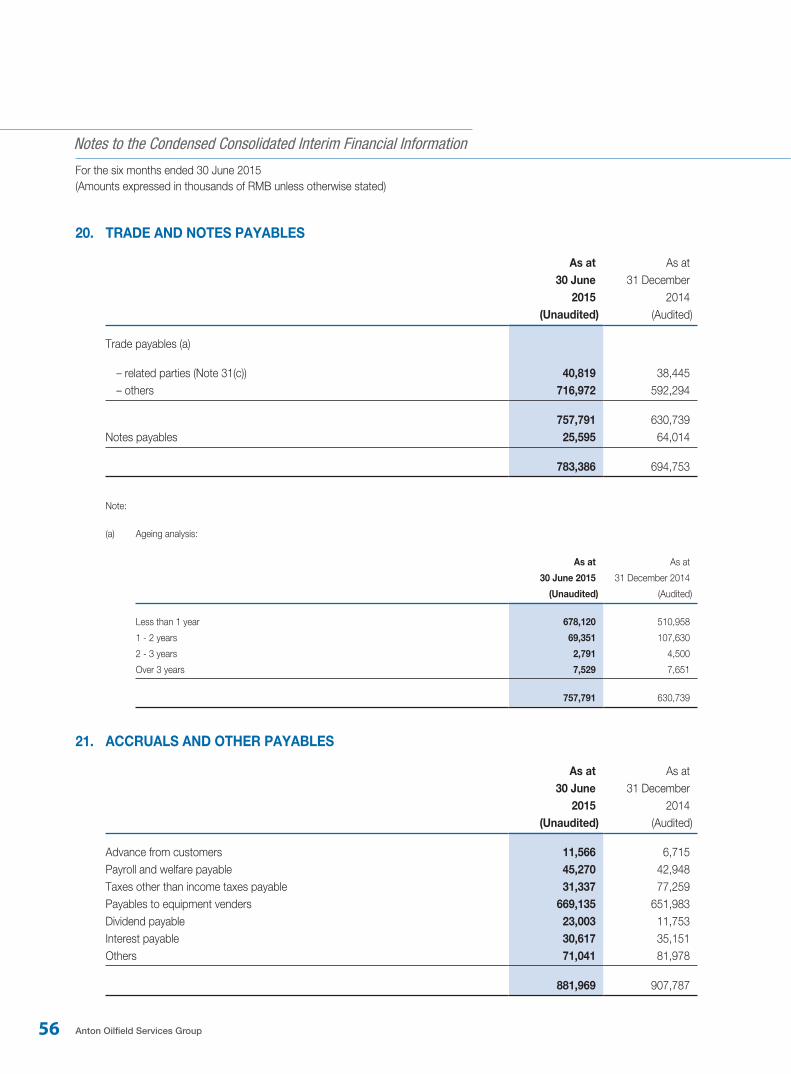
56 Anton Oilfield Services Group
Notes to the Condensed Consolidated Interim Financial Information
For the six months ended 30 June 2015(Amounts expressed in thousands of RMB unless otherwise stated)
20. TRADE AND NOTES PAYABLES
As at As at30 June
201531 December
2014(Unaudited) (Audited)
Trade payables (a)
– related parties (Note 31(c)) 40,819 38,445 – others 716,972 592,294
757,791 630,739Notes payables 25,595 64,014
783,386 694,753
Note:
(a) Ageing analysis:
As at As at
30 June 2015 31 December 2014
(Unaudited) (Audited)
Less than 1 year 678,120 510,958
1 - 2 years 69,351 107,630
2 - 3 years 2,791 4,500
Over 3 years 7,529 7,651
757,791 630,739
21. ACCRUALS AND OTHER PAYABLES
As at As at30 June
201531 December
2014(Unaudited) (Audited)
Advance from customers 11,566 6,715Payroll and welfare payable 45,270 42,948Taxes other than income taxes payable 31,337 77,259Payables to equipment venders 669,135 651,983Dividend payable 23,003 11,753Interest payable 30,617 35,151Others 71,041 81,978
881,969 907,787
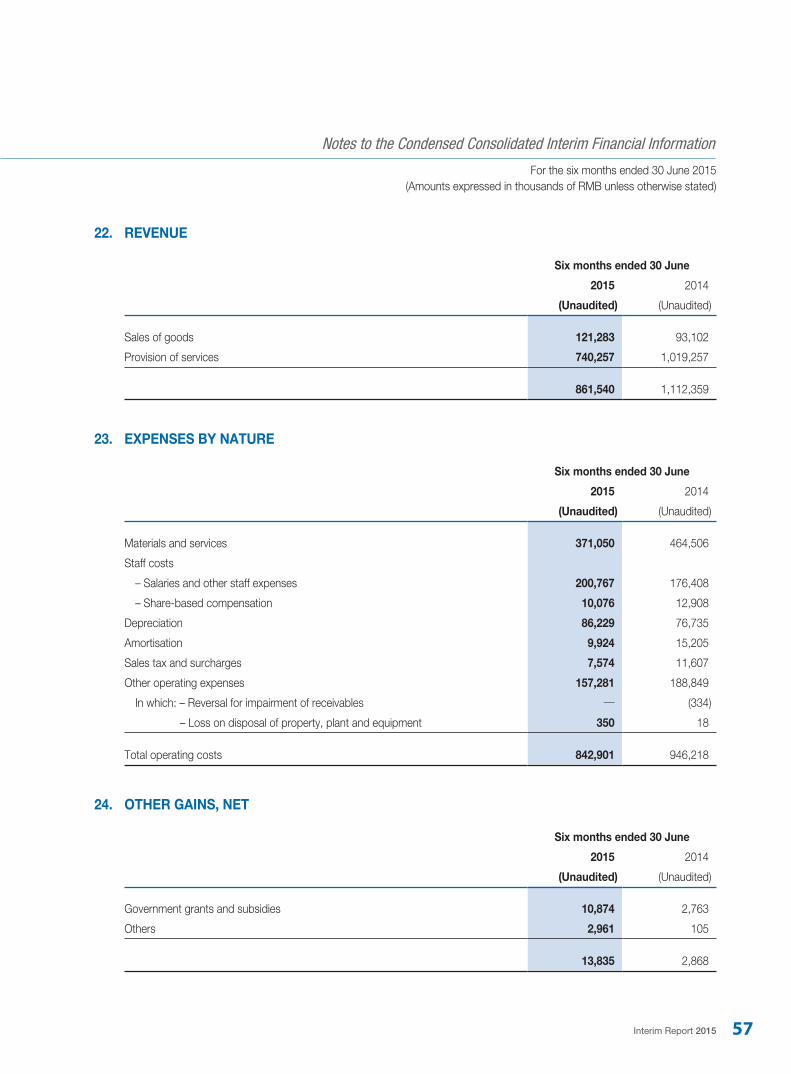
Interim Report 2015 57
Notes to the Condensed Consolidated Interim Financial Information
For the six months ended 30 June 2015(Amounts expressed in thousands of RMB unless otherwise stated)
22. REVENUE
Six months ended 30 June
2015 2014
(Unaudited) (Unaudited)
Sales of goods 121,283 93,102
Provision of services 740,257 1,019,257
861,540 1,112,359
23. EXPENSES BY NATURE
Six months ended 30 June
2015 2014
(Unaudited) (Unaudited)
Materials and services 371,050 464,506
Staff costs
– Salaries and other staff expenses 200,767 176,408
– Share-based compensation 10,076 12,908
Depreciation 86,229 76,735
Amortisation 9,924 15,205
Sales tax and surcharges 7,574 11,607
Other operating expenses 157,281 188,849
In which: – Reversal for impairment of receivables — (334)
– Loss on disposal of property, plant and equipment 350 18
Total operating costs 842,901 946,218
24. OTHER GAINS, NET
Six months ended 30 June
2015 2014
(Unaudited) (Unaudited)
Government grants and subsidies 10,874 2,763
Others 2,961 105
13,835 2,868
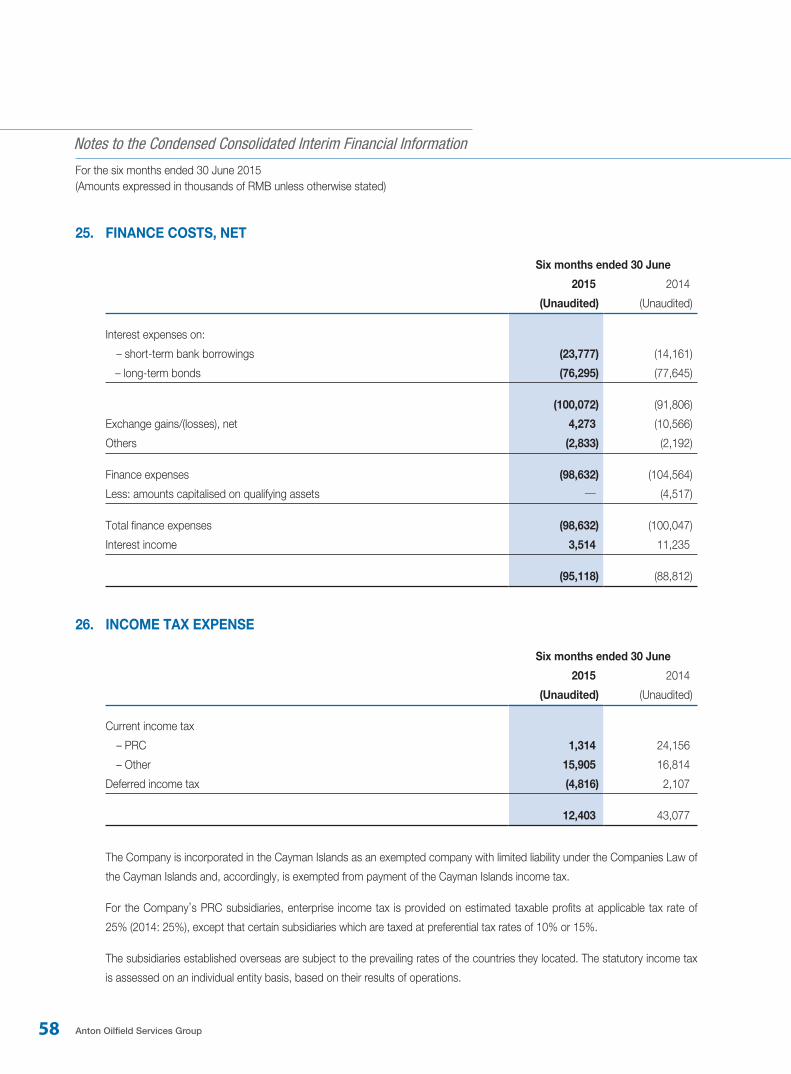
58 Anton Oilfield Services Group
Notes to the Condensed Consolidated Interim Financial Information
For the six months ended 30 June 2015(Amounts expressed in thousands of RMB unless otherwise stated)
25. FINANCE COSTS, NET
Six months ended 30 June
2015 2014
(Unaudited) (Unaudited)
Interest expenses on:
– short-term bank borrowings (23,777) (14,161)
– long-term bonds (76,295) (77,645)
(100,072) (91,806)
Exchange gains/(losses), net 4,273 (10,566)
Others (2,833) (2,192)
Finance expenses (98,632) (104,564)
Less: amounts capitalised on qualifying assets — (4,517)
Total finance expenses (98,632) (100,047)
Interest income 3,514 11,235
(95,118) (88,812)
26. INCOME TAX EXPENSE
Six months ended 30 June
2015 2014
(Unaudited) (Unaudited)
Current income tax
– PRC 1,314 24,156
– Other 15,905 16,814
Deferred income tax (4,816) 2,107
12,403 43,077
The Company is incorporated in the Cayman Islands as an exempted company with limited liability under the Companies Law of
the Cayman Islands and, accordingly, is exempted from payment of the Cayman Islands income tax.
For the Company’s PRC subsidiaries, enterprise income tax is provided on estimated taxable profits at applicable tax rate of
25% (2014: 25%), except that certain subsidiaries which are taxed at preferential tax rates of 10% or 15%.
The subsidiaries established overseas are subject to the prevailing rates of the countries they located. The statutory income tax
is assessed on an individual entity basis, based on their results of operations.
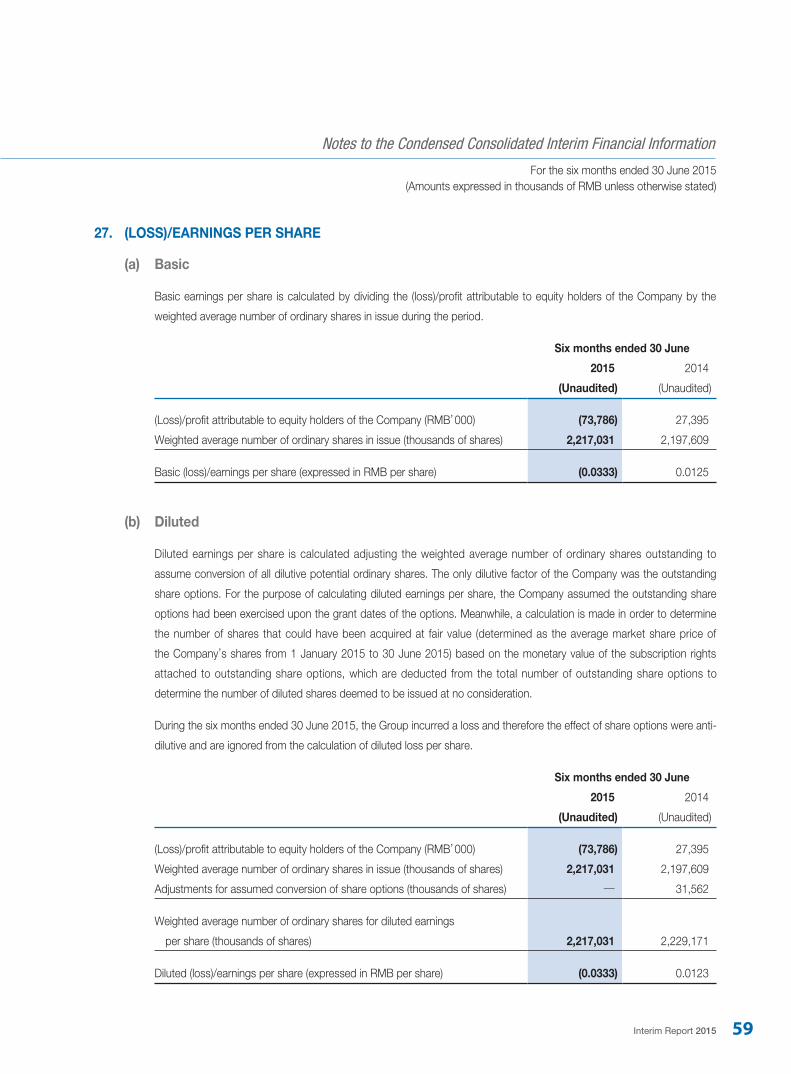
Interim Report 2015 59
Notes to the Condensed Consolidated Interim Financial Information
For the six months ended 30 June 2015(Amounts expressed in thousands of RMB unless otherwise stated)
27. (LOSS)/EARNINGS PER SHARE
(a) Basic
Basic earnings per share is calculated by dividing the (loss)/profit attributable to equity holders of the Company by the
weighted average number of ordinary shares in issue during the period.
Six months ended 30 June
2015 2014
(Unaudited) (Unaudited)
(Loss)/profit attributable to equity holders of the Company (RMB’000) (73,786) 27,395
Weighted average number of ordinary shares in issue (thousands of shares) 2,217,031 2,197,609
Basic (loss)/earnings per share (expressed in RMB per share) (0.0333) 0.0125
(b) Diluted
Diluted earnings per share is calculated adjusting the weighted average number of ordinary shares outstanding to
assume conversion of all dilutive potential ordinary shares. The only dilutive factor of the Company was the outstanding
share options. For the purpose of calculating diluted earnings per share, the Company assumed the outstanding share
options had been exercised upon the grant dates of the options. Meanwhile, a calculation is made in order to determine
the number of shares that could have been acquired at fair value (determined as the average market share price of
the Company’s shares from 1 January 2015 to 30 June 2015) based on the monetary value of the subscription rights
attached to outstanding share options, which are deducted from the total number of outstanding share options to
determine the number of diluted shares deemed to be issued at no consideration.
During the six months ended 30 June 2015, the Group incurred a loss and therefore the effect of share options were anti-
dilutive and are ignored from the calculation of diluted loss per share.
Six months ended 30 June
2015 2014
(Unaudited) (Unaudited)
(Loss)/profit attributable to equity holders of the Company (RMB’000) (73,786) 27,395
Weighted average number of ordinary shares in issue (thousands of shares) 2,217,031 2,197,609
Adjustments for assumed conversion of share options (thousands of shares) — 31,562
Weighted average number of ordinary shares for diluted earnings
per share (thousands of shares) 2,217,031 2,229,171
Diluted (loss)/earnings per share (expressed in RMB per share) (0.0333) 0.0123
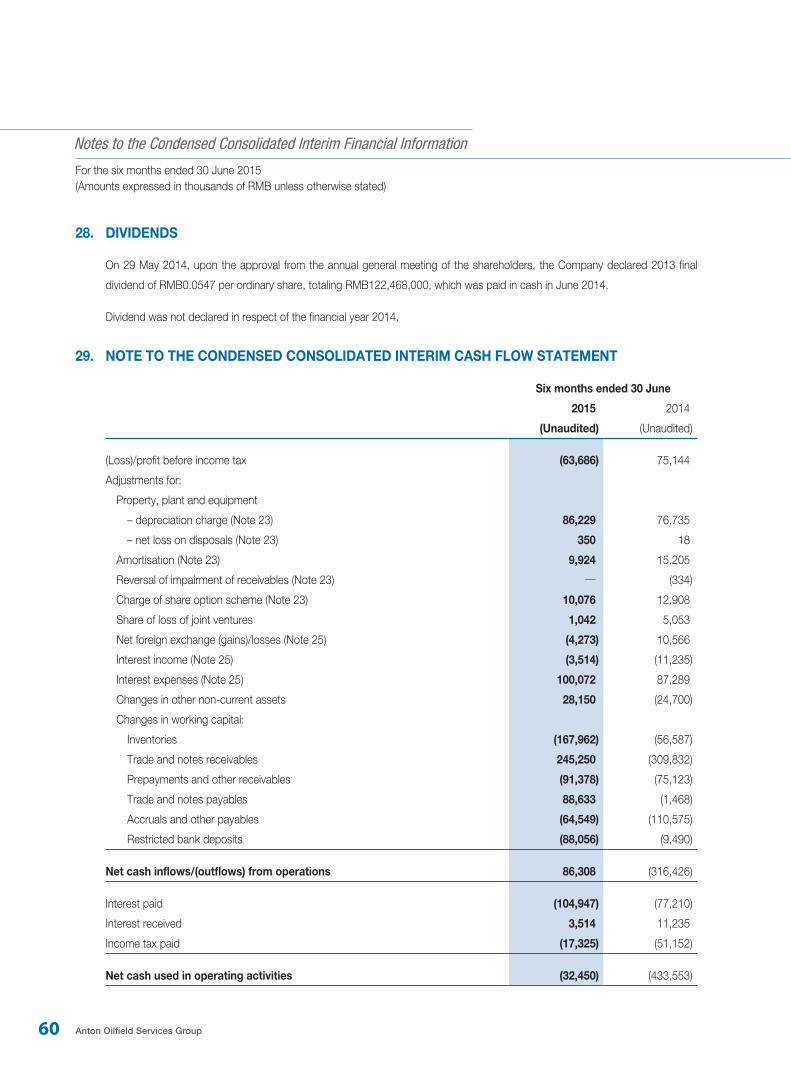
60 Anton Oilfield Services Group
Notes to the Condensed Consolidated Interim Financial Information
For the six months ended 30 June 2015(Amounts expressed in thousands of RMB unless otherwise stated)
28. DIVIDENDS
On 29 May 2014, upon the approval from the annual general meeting of the shareholders, the Company declared 2013 final
dividend of RMB0.0547 per ordinary share, totaling RMB122,468,000, which was paid in cash in June 2014.
Dividend was not declared in respect of the financial year 2014.
29. NOTE TO THE CONDENSED CONSOLIDATED INTERIM CASH FLOW STATEMENT
Six months ended 30 June
2015 2014
(Unaudited) (Unaudited)
(Loss)/profit before income tax (63,686) 75,144
Adjustments for:
Property, plant and equipment
– depreciation charge (Note 23) 86,229 76,735
– net loss on disposals (Note 23) 350 18
Amortisation (Note 23) 9,924 15,205
Reversal of impairment of receivables (Note 23) — (334)
Charge of share option scheme (Note 23) 10,076 12,908
Share of loss of joint ventures 1,042 5,053
Net foreign exchange (gains)/losses (Note 25) (4,273) 10,566
Interest income (Note 25) (3,514) (11,235)
Interest expenses (Note 25) 100,072 87,289
Changes in other non-current assets 28,150 (24,700)
Changes in working capital:
Inventories (167,962) (56,587)
Trade and notes receivables 245,250 (309,832)
Prepayments and other receivables (91,378) (75,123)
Trade and notes payables 88,633 (1,468)
Accruals and other payables (64,549) (110,575)
Restricted bank deposits (88,056) (9,490)
Net cash inflows/(outflows) from operations 86,308 (316,426)
Interest paid (104,947) (77,210)
Interest received 3,514 11,235
Income tax paid (17,325) (51,152)
Net cash used in operating activities (32,450) (433,553)
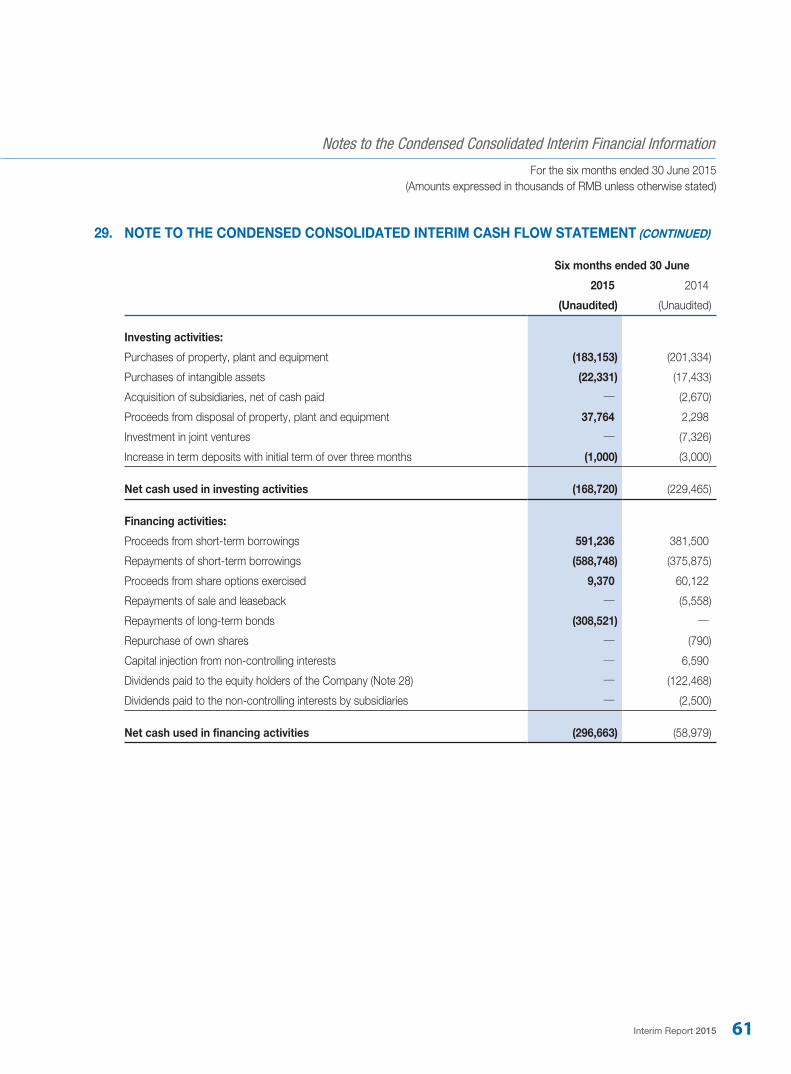
Interim Report 2015 61
Notes to the Condensed Consolidated Interim Financial Information
For the six months ended 30 June 2015(Amounts expressed in thousands of RMB unless otherwise stated)
29. NOTE TO THE CONDENSED CONSOLIDATED INTERIM CASH FLOW STATEMENT (CONTINUED)
Six months ended 30 June
2015 2014
(Unaudited) (Unaudited)
Investing activities:
Purchases of property, plant and equipment (183,153) (201,334)
Purchases of intangible assets (22,331) (17,433)
Acquisition of subsidiaries, net of cash paid — (2,670)
Proceeds from disposal of property, plant and equipment 37,764 2,298
Investment in joint ventures — (7,326)
Increase in term deposits with initial term of over three months (1,000) (3,000)
Net cash used in investing activities (168,720) (229,465)
Financing activities:
Proceeds from short-term borrowings 591,236 381,500
Repayments of short-term borrowings (588,748) (375,875)
Proceeds from share options exercised 9,370 60,122
Repayments of sale and leaseback — (5,558)
Repayments of long-term bonds (308,521) —
Repurchase of own shares — (790)
Capital injection from non-controlling interests — 6,590
Dividends paid to the equity holders of the Company (Note 28) — (122,468)
Dividends paid to the non-controlling interests by subsidiaries — (2,500)
Net cash used in financing activities (296,663) (58,979)
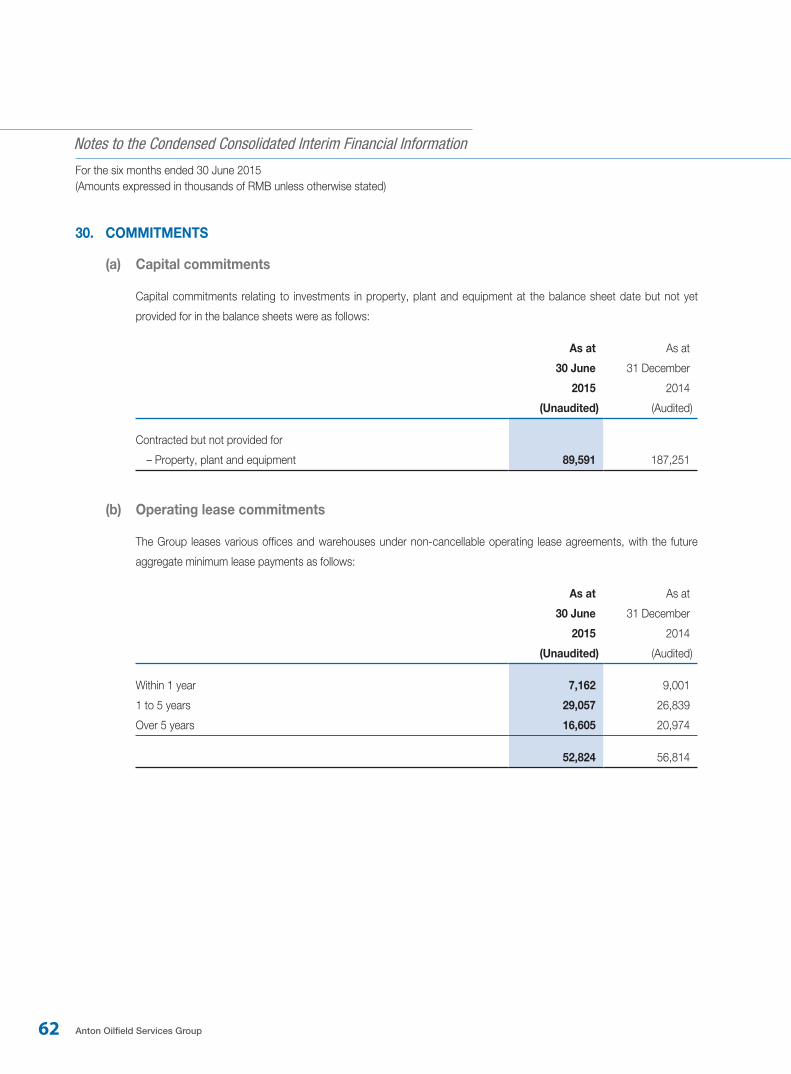
62 Anton Oilfield Services Group
Notes to the Condensed Consolidated Interim Financial Information
For the six months ended 30 June 2015(Amounts expressed in thousands of RMB unless otherwise stated)
30. COMMITMENTS
(a) Capital commitments
Capital commitments relating to investments in property, plant and equipment at the balance sheet date but not yet
provided for in the balance sheets were as follows:
As at As at
30 June
2015
31 December
2014
(Unaudited) (Audited)
Contracted but not provided for
– Property, plant and equipment 89,591 187,251
(b) Operating lease commitments
The Group leases various offices and warehouses under non-cancellable operating lease agreements, with the future
aggregate minimum lease payments as follows:
As at As at
30 June
2015
31 December
2014
(Unaudited) (Audited)
Within 1 year 7,162 9,001
1 to 5 years 29,057 26,839
Over 5 years 16,605 20,974
52,824 56,814
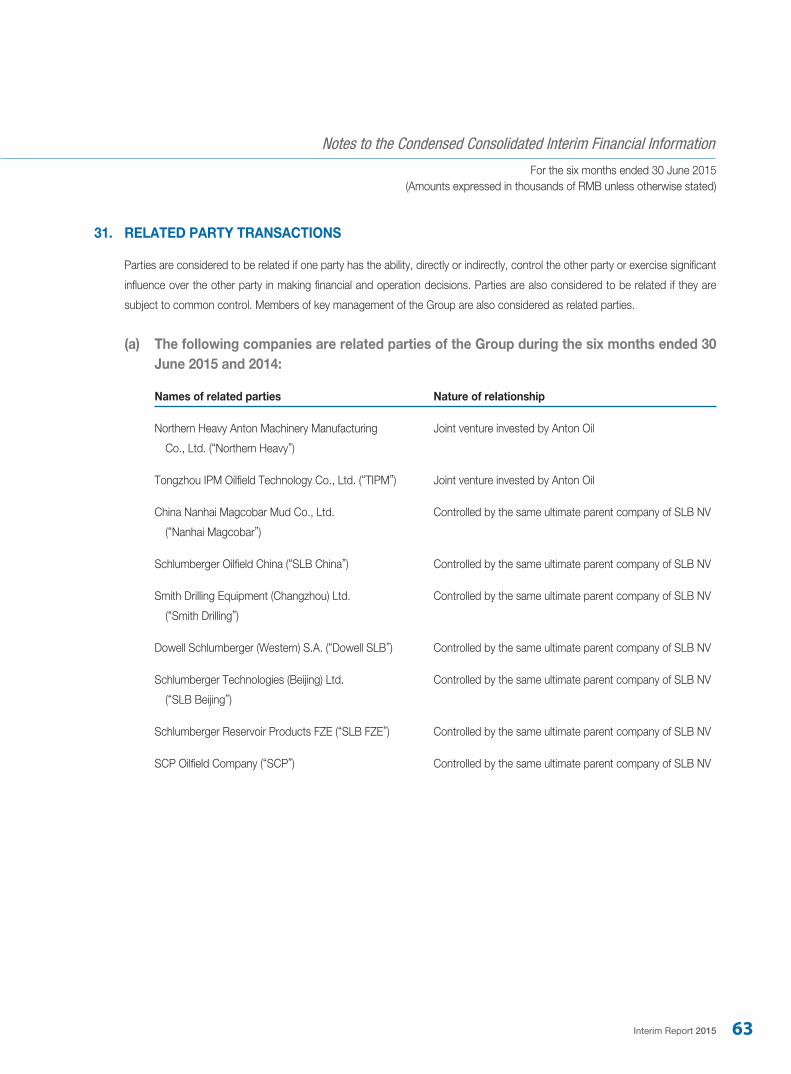
Interim Report 2015 63
Notes to the Condensed Consolidated Interim Financial Information
For the six months ended 30 June 2015(Amounts expressed in thousands of RMB unless otherwise stated)
31. RELATED PARTY TRANSACTIONS
Parties are considered to be related if one party has the ability, directly or indirectly, control the other party or exercise significant
influence over the other party in making financial and operation decisions. Parties are also considered to be related if they are
subject to common control. Members of key management of the Group are also considered as related parties.
(a) The following companies are related parties of the Group during the six months ended 30 June 2015 and 2014:
Names of related parties Nature of relationship
Northern Heavy Anton Machinery Manufacturing
Co., Ltd. (“Northern Heavy”)
Joint venture invested by Anton Oil
Tongzhou IPM Oilfield Technology Co., Ltd. (“TIPM”) Joint venture invested by Anton Oil
China Nanhai Magcobar Mud Co., Ltd.
(“Nanhai Magcobar”)
Controlled by the same ultimate parent company of SLB NV
Schlumberger Oilfield China (“SLB China”) Controlled by the same ultimate parent company of SLB NV
Smith Drilling Equipment (Changzhou) Ltd.
(“Smith Drilling”)
Controlled by the same ultimate parent company of SLB NV
Dowell Schlumberger (Western) S.A. (“Dowell SLB”) Controlled by the same ultimate parent company of SLB NV
Schlumberger Technologies (Beijing) Ltd.
(“SLB Beijing”)
Controlled by the same ultimate parent company of SLB NV
Schlumberger Reservoir Products FZE (“SLB FZE”) Controlled by the same ultimate parent company of SLB NV
SCP Oilfield Company (“SCP”) Controlled by the same ultimate parent company of SLB NV
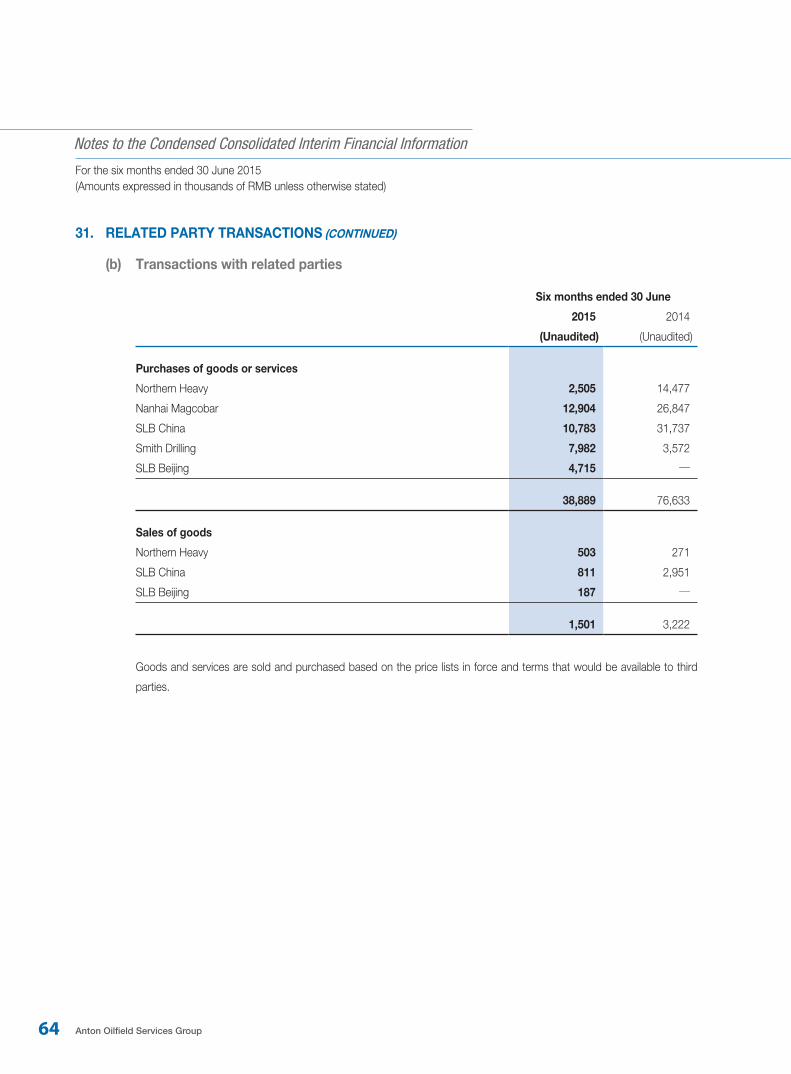
64 Anton Oilfield Services Group
Notes to the Condensed Consolidated Interim Financial Information
For the six months ended 30 June 2015(Amounts expressed in thousands of RMB unless otherwise stated)
31. RELATED PARTY TRANSACTIONS (CONTINUED)
(b) Transactions with related parties
Six months ended 30 June
2015 2014
(Unaudited) (Unaudited)
Purchases of goods or services
Northern Heavy 2,505 14,477
Nanhai Magcobar 12,904 26,847
SLB China 10,783 31,737
Smith Drilling 7,982 3,572
SLB Beijing 4,715 —
38,889 76,633
Sales of goods
Northern Heavy 503 271
SLB China 811 2,951
SLB Beijing 187 —
1,501 3,222
Goods and services are sold and purchased based on the price lists in force and terms that would be available to third
parties.
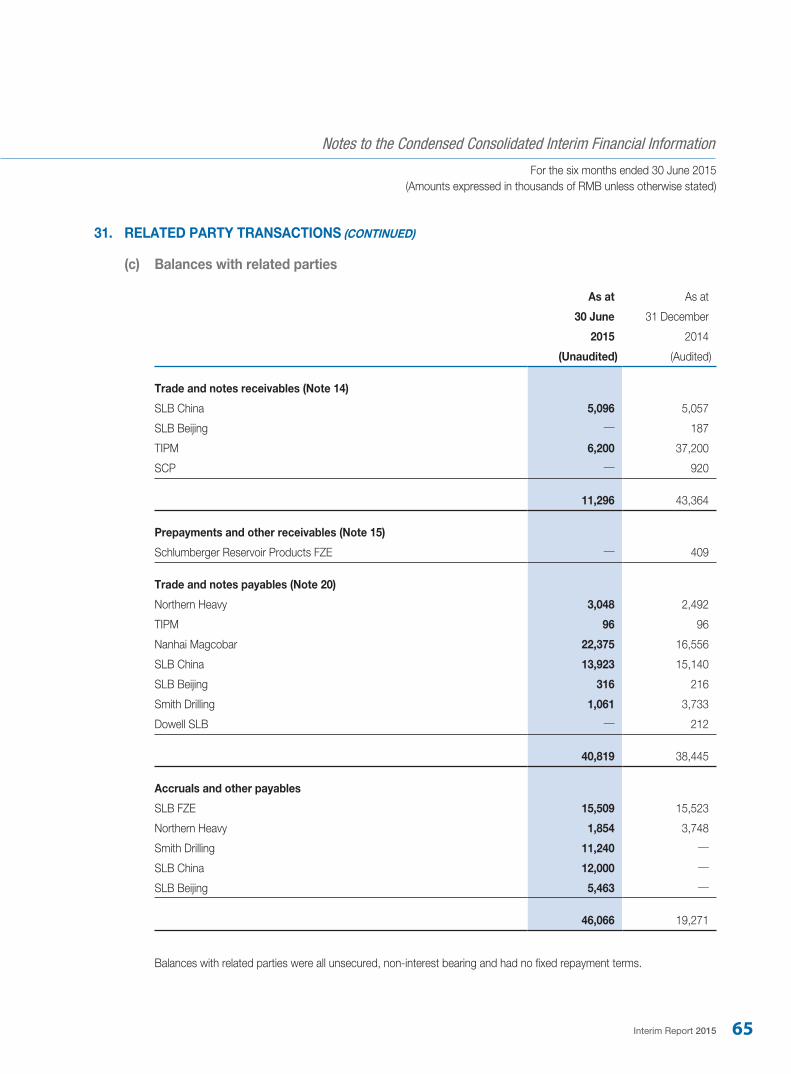
Interim Report 2015 65
Notes to the Condensed Consolidated Interim Financial Information
For the six months ended 30 June 2015(Amounts expressed in thousands of RMB unless otherwise stated)
31. RELATED PARTY TRANSACTIONS (CONTINUED)
(c) Balances with related parties
As at As at
30 June
2015
31 December
2014
(Unaudited) (Audited)
Trade and notes receivables (Note 14)
SLB China 5,096 5,057
SLB Beijing — 187
TIPM 6,200 37,200
SCP — 920
11,296 43,364
Prepayments and other receivables (Note 15)
Schlumberger Reservoir Products FZE — 409
Trade and notes payables (Note 20)
Northern Heavy 3,048 2,492
TIPM 96 96
Nanhai Magcobar 22,375 16,556
SLB China 13,923 15,140
SLB Beijing 316 216
Smith Drilling 1,061 3,733
Dowell SLB — 212
40,819 38,445
Accruals and other payables
SLB FZE 15,509 15,523
Northern Heavy 1,854 3,748
Smith Drilling 11,240 —
SLB China 12,000 —
SLB Beijing 5,463 —
46,066 19,271
Balances with related parties were all unsecured, non-interest bearing and had no fixed repayment terms.
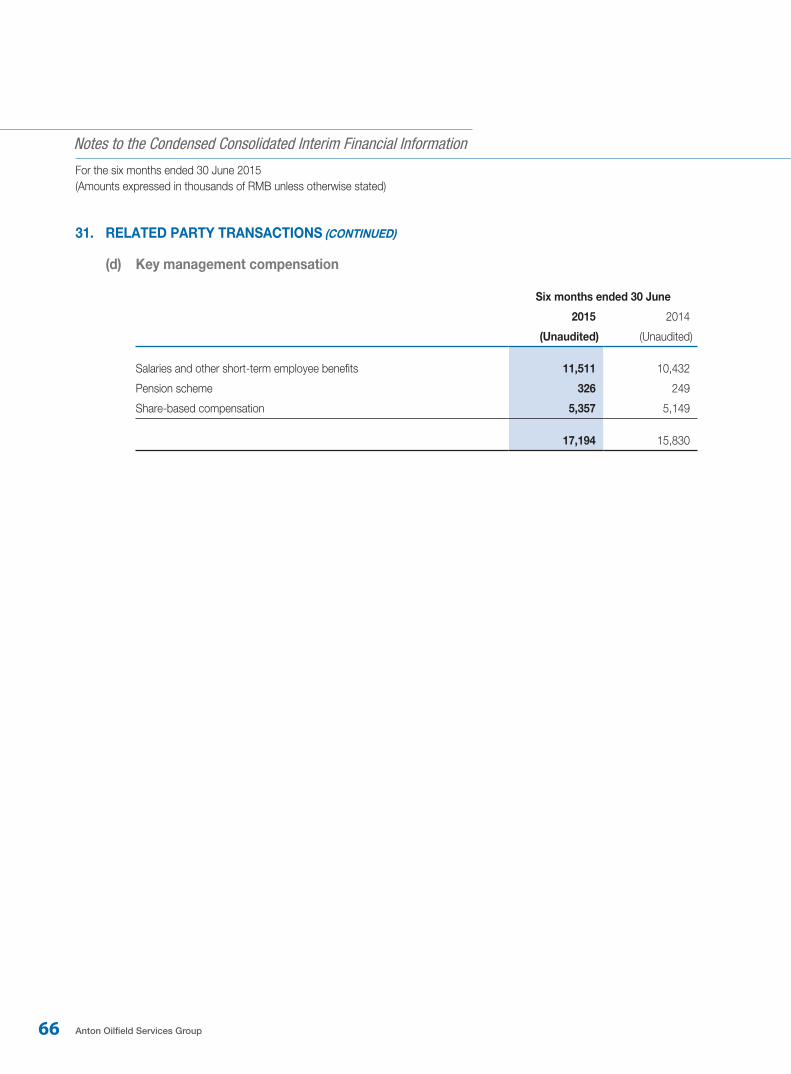
66 Anton Oilfield Services Group
Notes to the Condensed Consolidated Interim Financial Information
For the six months ended 30 June 2015(Amounts expressed in thousands of RMB unless otherwise stated)
31. RELATED PARTY TRANSACTIONS (CONTINUED)
(d) Key management compensation
Six months ended 30 June
2015 2014
(Unaudited) (Unaudited)
Salaries and other short-term employee benefits 11,511 10,432
Pension scheme 326 249
Share-based compensation 5,357 5,149
17,194 15,830


