Embed Size (px)
Citation preview
Laredo Independent School District
Laredo, Texas
2014-2015 Annual Budget
For Fiscal Year
September 1, 2014 – August 31, 2015
Issued by:
Division of Finance
i
TABLE OF CONTENTS
BUDGET PRESENTATION AWARDS ................................................................................................................... v
CITIZEN’S GUIDE TO OUR BUDGET ................................................................................................................. vi
RECOGNITION ........................................................................................................................................................ vii
INTRODUCTORY SECTION
Executive Summary................................................................................................................................................ 1
District Officials, Staff & Consultants.................................................................................................................. 16
Superintendent’s Biography ................................................................................................................................. 18
Board of Trustees Biographies ............................................................................................................................. 20
ORGANIZATIONAL SECTION
District Profile ...................................................................................................................................................... 25
Organizational Chart ............................................................................................................................................ 26
District’s Mission, Goals & Objectives ................................................................................................................ 27
Budget Administration & Financial Policies ........................................................................................................ 28
Budget Development Process ............................................................................................................................... 38
2014-2014 Budget Calendar ................................................................................................................................. 42
Capital Improvement Plan .................................................................................................................................... 46
Budgetary Control & Basis of Accounting ........................................................................................................... 50
FINANCIAL SECTION
District’s Funds Structure & Fund Types ............................................................................................................. 55
Governmental Funds Selected Items Summary .................................................................................................... 57
Governmental Funds - All Fund Types Summary ................................................................................................ 58
General Fund ........................................................................................................................................................ 60
General Operating Fund ................................................................................................................................ 63
Child Nutrition Program Fund ...................................................................................................................... 68
ERATE Fund ................................................................................................................................................. 71
Athletics Fund ............................................................................................................................................... 73
Technology Fund ........................................................................................................................................... 76
Debt Service Fund ................................................................................................................................................ 78
Special Revenue Funds ......................................................................................................................................... 86
Capital Projects Fund ........................................................................................................................................... 94
Capital Improvement Program .................................................................................................................... 107
Impact of Capital Projects to the General Operating Fund .......................................................................... 115
Internal Service Fund ......................................................................................................................................... 116
INFORMATIONAL SECTION
General Operating Fund - Major Revenue Sources ............................................................................................ 119
Debt Service Fund – Major Revenue Sources .................................................................................................... 124
Major Revenue Assumptions.............................................................................................................................. 127
Trends & Forecasts ............................................................................................................................................. 128
Appraisal Roll and Property Values ................................................................................................................... 136
Property Tax Rates and Tax Levies Comparison ............................................................................................... 137
LISD Property Tax Rates and Tax Levies .......................................................................................................... 138
LISD Property Tax Levies and Collections ........................................................................................................ 139
District’s Principal Taxpayers ............................................................................................................................ 140
Analysis of Budget’s Effect on Taxpayers ......................................................................................................... 141
Ratio of Annual Debt Service Expenditures for General Bonded Debt to Total Expenditures (1)..................... 142
Ratio of Net General Bonded Debt to Net Bonded Debt per Average Daily Attendance (ADA) ...................... 143
General Governmental Revenues (Last 10 Fiscal Years) ................................................................................... 144
General Governmental Expenditures (Last 10 Fiscal Years) ............................................................................. 146
Table of Contents
ii Laredo Independent School District
District Personnel ............................................................................................................................................... 148
Student Enrollment - Historical and Projected ................................................................................................... 152
Administrative Cost Ratio .................................................................................................................................. 154
Student Demographics ........................................................................................................................................ 155
Academic Performance ..................................................................................................................................... 156
Annual Dropout, Attendance & Completion Rates ............................................................................................ 159
Community Profile ............................................................................................................................................. 160
Location ....................................................................................................................................................... 160
Local History ............................................................................................................................................... 160
Population ................................................................................................................................................... 161
Education .................................................................................................................................................... 162
Income ........................................................................................................................................................ 162
Housing ....................................................................................................................................................... 163
Hotel Statistics............................................................................................................................................. 163
Labor Statistics ............................................................................................................................................ 163
Major Employers ......................................................................................................................................... 164
Finance ........................................................................................................................................................ 164
Tourism ....................................................................................................................................................... 164
Transportation ............................................................................................................................................. 164
Governmental Structure and Public Safety ................................................................................................. 166
Utilities and Public Works .......................................................................................................................... 166
Healthcare ................................................................................................................................................... 166
Education Facilities ..................................................................................................................................... 167
Entertainment & Recreation Highlights ...................................................................................................... 168
CAMPUSES SECTION
Overview of Campus Section ............................................................................................................................. 169
School Directory ................................................................................................................................................. 171
001 – Martin High School .................................................................................................................................. 172
002 – J.W. Nixon High School ........................................................................................................................... 174
003 – Dr. L. Cigarroa High School .................................................................................................................... 176
004 – Vidal M. Treviño School of Communications & Fine Arts ...................................................................... 178
007 – F.S. Lara Academy ................................................................................................................................... 180
008 – Early College High School ....................................................................................................................... 182
011 – Jose a. Valdez High School ...................................................................................................................... 184
041 – L.J. Christen Middle School ..................................................................................................................... 186
042 – M.B. Lamar Middle School ...................................................................................................................... 188
043 – Dr. Joaquin G. Cigarroa Middle School ................................................................................................... 190
044 – Memorial Middle School .......................................................................................................................... 192
101 – A.M. Bruni Elementary School ................................................................................................................ 194
102 – Don Jose Gallego Elementary School ...................................................................................................... 196
104 – Leon Daiches Elementary School ............................................................................................................. 198
105 – F. Farias Elementary School ..................................................................................................................... 200
106 – Heights Elementary School ...................................................................................................................... 202
107 – K. Tarver Elementary School ................................................................................................................... 204
108 – J.Z. Leyendecker Elementary School ....................................................................................................... 206
109 – C.M. Macdonell Elementary School ........................................................................................................ 208
110 – C.L. Milton Elementary School ................................................................................................................ 210
111 – Alma A. Pierce Elementary School .......................................................................................................... 212
112 – M.S. Ryan Elementary School ................................................................................................................. 214
115 – Santa Maria Elementary School ............................................................................................................... 216
116 – Santo Niño Elementary School ................................................................................................................. 218
119 – D.D. Hachar Elementary School .............................................................................................................. 220
120 – J.C. Martin Elementary School ................................................................................................................. 222
121 – H.B. Zachry Elementary School ............................................................................................................... 224
122 – J.A. Kawas Elementary School ................................................................................................................ 226
Table of Contents
2014-2015 Annual Budget iii
123 – Anita T. Dovalina Elementary School ...................................................................................................... 228
124 – Honore Ligarde Elementary School ......................................................................................................... 230
125 – Sanchez/Ochoa Elementary School .......................................................................................................... 232
DEPARTMENTAL SECTION
Overview of Departmental Section .................................................................................................................... 235
006 – Pregnancy, Education & Parenting ........................................................................................................... 236
701 – Superintendent’s Office ............................................................................................................................ 237
702 – Board of Trustees ..................................................................................................................................... 238
703 – Tax Office ................................................................................................................................................. 239
726 – Risk Management ..................................................................................................................................... 240
727 – Financial Management ............................................................................................................................. 241
728 – Human Resources ..................................................................................................................................... 242
729 – Procurement Department .......................................................................................................................... 243
730 – Office of Communications ....................................................................................................................... 244
731 – Safety & Occupational Health Department .............................................................................................. 245
733 – Internal Audit............................................................................................................................................ 246
734 – Postal Services .......................................................................................................................................... 247
735 – Hearings Officer ....................................................................................................................................... 248
736 – Fixed Assets & Custodial Services ........................................................................................................... 250
737 – Textbooks & Records Management ......................................................................................................... 251
737 – Textbooks & Records Management ......................................................................................................... 251
738 – Performance Arts Center .......................................................................................................................... 252
802 – Bilingual Education Program ................................................................................................................... 253
805 – Fine Arts / U.I.L ....................................................................................................................................... 254
806 – Elementary Physical Education ................................................................................................................ 255
808 – English Language Arts ............................................................................................................................. 256
811 – Instructional Technology .......................................................................................................................... 257
813 – Social Studies Department ........................................................................................................................ 258
814 – Mathematics Department .......................................................................................................................... 259
815 – Science Department .................................................................................................................................. 260
816 – Early Childhood........................................................................................................................................ 261
817 – Attendance Department ............................................................................................................................ 262
820 – Innovative Programs ................................................................................................................................. 263
833 – Department of Elementary Education ...................................................................................................... 264
834 – Department of Secondary Education ........................................................................................................ 265
835 – Curriculum & Instruction ......................................................................................................................... 266
836 – Gifted and Talented .................................................................................................................................. 267
837 – Staff Development .................................................................................................................................... 268
838 – Career and Technology Education ............................................................................................................ 269
844 – 504 Services / Dyslexia ............................................................................................................................ 270
846 – Testing & Assessment .............................................................................................................................. 271
848 – Parental Involvement ................................................................................................................................ 272
849 – Grants ....................................................................................................................................................... 273
873 – Crime Stoppers ........................................................................................................................................ 274
874 – Guidance & Counseling............................................................................................................................ 275
876 – Health Services ......................................................................................................................................... 276
877 – Pupil Transportation ................................................................................................................................. 277
878 – Athletics Department ................................................................................................................................ 278
879 – Special Education ..................................................................................................................................... 279
881 – Library & Media Services ........................................................................................................................ 280
882 – Printing & Creative Services .................................................................................................................... 281
883 – Instructional Television ............................................................................................................................ 282
934 – Information Technology ........................................................................................................................... 283
936 – Division of Operations.............................................................................................................................. 284
937 – Plant Facilities & Support Services .......................................................................................................... 285
Table of Contents
iv Laredo Independent School District
938 – LISD Construction Department ................................................................................................................ 286
943 – LISD Police Department .......................................................................................................................... 287
946 – Child Nutrition Program ........................................................................................................................... 288
SUPPLEMENTARY SECTION
TEA Summary of Finances (Release 5.0) Preliminary 2014-15 Estimate of State Aid Worksheet ................... 289
Possible Function Groups for Aggregate Per-Student Spending ....................................................................... 295
Minimum Required Expense Analysis of the General Operating Fund for 2014-2015...................................... 296
Comparison of Peer Districts Operating Costs by Function using Refined Average Daily Attendance (ADA) 297
2012-2013 Academic Excellence Indicator System .......................................................................................... 298
Resolution Levying a Tax Rate .......................................................................................................................... 302
Webb County Appraisal District Affidavit ......................................................................................................... 303
Webb County Appraisal District Valuation ........................................................................................................ 304
ACCRONYMS ......................................................................................................................................................... 305
GLOSSARY ............................................................................................................................................................. 307
Awards
2014-2015 Annual Budget v
Distinguished Budget Presentation Award
The Government Financial Officers Association of the United States and Canada (GFOA) presented a Distinguished
Budget Presentation Award to Laredo Independent School District, Texas for its annual budget for the fiscal year
beginning September 1, 2013. In order to receive this award, a governmental unit must publish a budget document
that meets program criteria as a policy documents, as an operations guide, as a financial plan, and as a
communications device.
This award is valid for a period of one year only. We believe our current budget continues to conform to program
requirements, and we are submitting it to GFOA to determine its eligibility for another award.
Citizen’s Guide
vi Laredo Independent School District
CITIZEN’S GUIDE TO OUR BUDGET
WHAT IS A DISTRICT BUDGET?
The district budget is an annually revised document that describes the financial performance, and the detailed
financial allocations made to maintain district operations for the proposed budget year.
WHAT IS THE PURPOSE OF A BUDGET?
The objective of the budget is to communicate the financial plan about district operations to the public, the Laredo
Independent School District (LISD) Board of Trustees, and all members of the organization for each budget year.
WHAT ARE PROPERTY TAXES?
Property taxes are funds that are levied, assessed, and collected annually (ad valorem taxes) for the further
maintenance of public schools in the district and to pay bonds issued by the school district.
WHAT IS A TAX RATE?
It is the amount of dollars levied per $100 of taxable value (after exemptions). The resulting amount is called Ad
Valorem Taxes.
WHAT IS AD VALOREM TAX?
Ad Valorem Tax is the Property Tax (after exemptions) that is placed on all the property within the district’s
jurisdiction. The appraised value is determined by the Webb County Appraisal District.
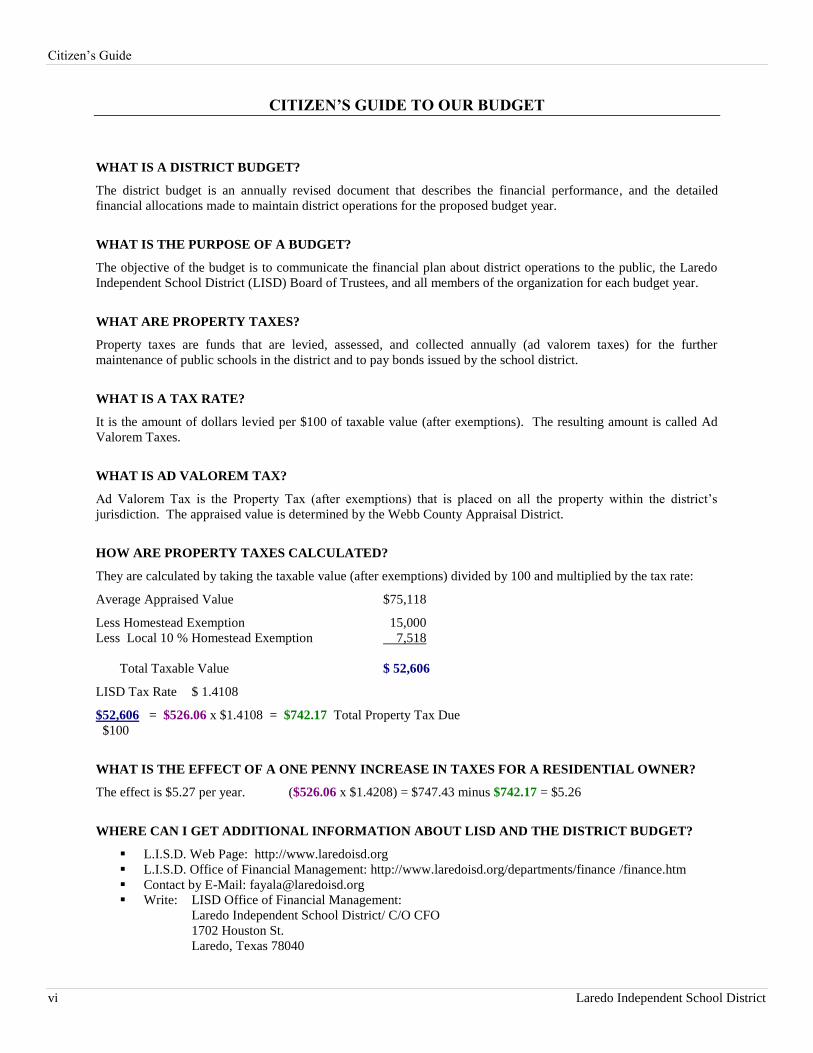
HOW ARE PROPERTY TAXES CALCULATED?
They are calculated by taking the taxable value (after exemptions) divided by 100 and multiplied by the tax rate:
Average Appraised Value $75,118
Less Homestead Exemption 15,000
Less Local 10 % Homestead Exemption 7,518
Total Taxable Value $ 52,606
LISD Tax Rate $ 1.4108
$52,606 = $526.06 x $1.4108 = $742.17 Total Property Tax Due
$100
WHAT IS THE EFFECT OF A ONE PENNY INCREASE IN TAXES FOR A RESIDENTIAL OWNER?
The effect is $5.27 per year. ($526.06 x $1.4208) = $747.43 minus $742.17 = $5.26
WHERE CAN I GET ADDITIONAL INFORMATION ABOUT LISD AND THE DISTRICT BUDGET?
L.I.S.D. Web Page: http://www.laredoisd.org
L.I.S.D. Office of Financial Management: http://www.laredoisd.org/departments/finance /finance.htm
Contact by E-Mail: [email protected]
Write: LISD Office of Financial Management:
Laredo Independent School District/ C/O CFO
1702 Houston St.
Laredo, Texas 78040
2014-2015 Annual Budget vii
RECOGNITION
We would like to acknowledge and thank the following Financial Management Department individuals
who greatly contributed to the development of the Laredo Independent School District’s 2013-2014 Annual
Budget:
Nohemi Abrego
Flor Ayala, CPA
Lourdes Dilley
Adolfo Gonzalez IV
Alicia Gonzalez
Nancy Gutierrez
Adelfa Kazen
Leticia Gamiño
Gloria Garza
Lulu Medina
Edith Perez
John Rodriguez
Oralia Santana
Gloria Vargas
Sara Vasquez
Reveca Zarazua
We would also like to recognize the Information Technology Department for providing numerous reports
and queries that assisted in the development of this budget document, the Human Resources, and Tax
Office Departments for making available all information we requested.
viii Laredo Independent School District
Page left blank intentionally.
INTRODUCTORY SECTION
TABLE OF CONTENTS
Executive Summary ....................................................................................................................................................... 1
District Officials, Staff & Consultants ......................................................................................................................... 16
Superintendent’s Biography ......................................................................................................................................... 18
Board of Trustees Biographies .................................................................................................................................... 20
2014-2015 Annual Budget 1
702 Houston St. ● Laredo, Texas 78040 ● Ph. 956-273-1000
November 20, 2014
Board of Trustees and Taxpayers of
Laredo Independent School District
1702 Houston St.
Laredo, TX 78040
Dear Board Members and Taxpayers:
We are pleased to submit the final Laredo Independent School District’s Annual Budget
for fiscal year 2014-2015. This budget presents the district’s financial and operational
plan.
Our staff has developed a financial plan for the 2014-2015 General Operating Fund, Child
Nutrition Fund, Athletic Fund, ERATE Fund, Technology Fund and Debt Service Fund
Budgets. This document provides information on each of the fund budgets. In addition,
we also provide information about our projected grants, construction funds, and
proprietary fund for fiscal year 2014-2015.
This Annual Budget for 2014-2015 is comprised of an introductory, organizational,
financial, informational, campuses and departments, supplementary, and glossary
sections.
This budget report and the year-end Comprehensive Annual Financial Report (CAFR) are
the District’s primary vehicles used to present the financial plan and the results of
operations of the District. This document was prepared in the format necessary to meet
the requirements of the Government Finance Officers Association (GFOA) Distinguished
Budget Presentation Award Program. To receive this award, an entity must publish a
budget document that meets the number of specific program criteria and serves as a policy
document, an operations guide, a financial plan, and a communications device. These
awards represent the highest level of recognition in budgeting for school entities. GFOA
presented its Distinguished Budget Presentation Award to Laredo Independent School
District for its 2013-2014 Annual Budget, making it the fifteenth year the District receives
this award. We believe our current budget continues to conform to GFOA’s requirements
for submission and are respectfully submitting it to this organization for evaluation and
suggestions for improvement.
The primary purpose of this document is to provide timely and useful information
concerning the past, current, and projected financial status of the District, in order to
facilitate financial decisions that support the educational goals of the District. This
budget’s main focus is the improvement of the instructional program with the fiscal
resources available to the district. This budget addresses the essential needs of the District
by directing resources to those areas that will assist our staff in carrying out the mission of
the school system.
Dr. A. Marcus Nelson Superintendent of Schools
Board of Trustees
Jesus Martinez
President, District 2
Jose A. Valdez
Vice President, District 1
Ricardo Garza
Secretary, District 4
Trustees
Hector J. Noyola
Trustee, District 3
Dr. Cecilia M. Moreno
Trustee, District 5
Hector J. Garcia
Trustee, District 6
Jose R. Perez, Jr.
Trustee, District 7
Introductory Section 2014-2015 District Budget Executive Summary
2 Laredo Independent School District
Within our budget, we have identified innovative programs and developed standards for all campuses and
departments. The expectations are high and this budget provides funding for the improvement of students, staff, and
fiscal performance.
In this budget, you will see evidence of efforts to assure that the district achieves an exemplary school district status
by:
1. Implementing the District’s Goals;
2. Ensuring that there is accountability among staff members to improve student learning;
3. Attracting and retaining qualified staff members;
4. Maximizing resources and utilizing sound fiscal planning; and
5. Communicating results and expectations throughout the educational system to all stakeholders.
This budget document is the first step towards achieving these goals. It includes sound prudent fiscal policies that
will ensure the continuity of the district.
About Laredo Independent School District
Mission
The mission of the Laredo Independent School District is to ensure that all students achieve their potential and
graduate as bilingual, bi-literate, and be responsible adults with the skills to succeed in higher education, the
workforce, or the military.
District Goals
Goal I The school district will continue to develop, implement and monitor a quality educational program
including curriculum, instruction, assessment and professional development which considers the specific
needs of each Laredo I.S.D. student and the community, supports high academic standards and addresses
state and federal accountability requirements.
Goal II The school district will provide all students with a safe and nurturing learning environment that promotes
attendance, character building and high achievement.
Goal III The school district will encourage and promote a climate that engages families in the education of their
children and establish a process that cultivates open and timely communication with our public.
Goal IV The school district shall implement a Health and Wellness Program designed to improve the general
health of children and adults by promoting practices that lead to living healthy, active lifestyles.
Goal V The school district will continue to seek all possible avenues to contain and/or reduce costs of all
initiatives in order to best represent the financial interests of the taxpayers. In addition, the school district
will effectively manage financial resources, and conduct program evaluations that will support providing
quality educational experiences for LISD students.
Goal VI The school district will actively pursue and hire highly qualified personnel and provide support that
encourages growth, improvement and increased student achievement.
Budget Process and Significant Changes
Legal Requirements in Preparing the Budget
The Texas Education Code requires that a local education agency prepare a budget of anticipated expenditures and
revenues on or before August 20th. The budget must be adopted by the Board of Trustees, inclusive of amendments,
no later than August 31st. Minutes from the district board meetings will be used by the Texas Education Agency to
record the adoption of and amendments to the budget. The officially adopted district budget, as amended, must be
filed with TEA through PEIMS (Public Education Information Management System) by the date prescribed in the
2014-2015 District Budget Executive Summary Introductory Section
2014-2015 Annual Budget 3
annual system guidelines. The budget must be itemized in detail according to purpose of expenditure (function),
classification (object), and be prepared according to Generally Accepted Accounting Principles (GAAP).
A district may adopt a tax rate before receipt of a certified appraisal roll and before the adoption of the budget. If the
district elects to adopt a tax rate before adopting a budget, the district must publish a notice and hold a meeting for
the purpose of discussing the proposed tax rate and then following the adoption of the tax rate must publish a notice
and hold another public meeting before the district may adopt a budget. The president of the Board of Trustees must
call a public meeting of the Board of Trustees giving ten days public notice in a newspaper for the adoption of the
budget. Any taxpayer in the district may be present and participate in the meeting.
Budget Development Process
The budget development process comprises three stages: planning, preparation, and evaluation. The first phase,
planning, involves defining the mission, goals, and objectives of campuses, departments, and the District. Once
these plans and programs have been established, the preparation phase of budgeting begins by allocating resources
to support them. Evaluation is the last step of the District’s budget cycle where information is compiled and
analyzed to assess the performance of each individual campus and department as well as the District as a whole.
The budgeting process for Laredo Independent School District was initiated on September 2013, complying with the
Texas Education Agency’s (TEA) legal requirements and preliminary funding estimates made by the Division of
Finance. Individual, as well as group training workshops, were held with principals, department heads, and Site-
Based Decision-Making (SBDM) committees to guide them in developing their budgets. Each campus received a
basic allotment per student in the different programs to be used for supplies, materials, equipment, staff
development, and other appropriate instructional costs.
The Human Resources Department played an important role assisting the Division of Finance in the budget process
as they developed salary estimates utilizing established staffing guidelines. Personnel units (FTEs) were allocated to
each campus based on student membership following state mandated ratios, as applicable.
Following the initial budget development process and through a series of workshops with the Superintendent and
Board of Trustees, the final budget proposal was approved on August 26, 2014 and implemented on September 1,
2014.
Amending the Budget
The legal level of authority of the approved budget is at the function code area. Any increase or decrease in a
functional area requires board approval. Periodically during the year, budget amendments are submitted to the
Board of Trustees for consideration and approval regarding any fiscal functional changes. All other changes are
submitted by campuses and departments to the Finance Division for review and processing.
Significant Changes
The overall budget did experience significant changes for the 2014-2015 budget year. The District experienced a
reduction in net taxable value of $4,851,778 or 0.23% due to an increase in property exemptions. For fiscal year
2014-2015, the Board of Trustees approved an increase to the Interest and Sinking tax rate of 17.68 cents, from
$0.234 to $.3708. The District had not increased its tax rate since fiscal year 2007-2008. This tax increase will
generate approximately $2,758,004 in local taxes and $2,011,069 in state aid. These revenues will be used to meet
the District’s debt service requirements. The Board of Trustees hired the Texas Association of School Boards
(TASB) to review the District’s pay plans and positions. On June 12, 2014, the Board of Trustees approved the
TASB’s recommendation to implement six new pay plans. This recommendation also included some
reclassifications and equity adjustments. The total cost of the 2014-2015 approved employee increased is
approximately $10,136,835.
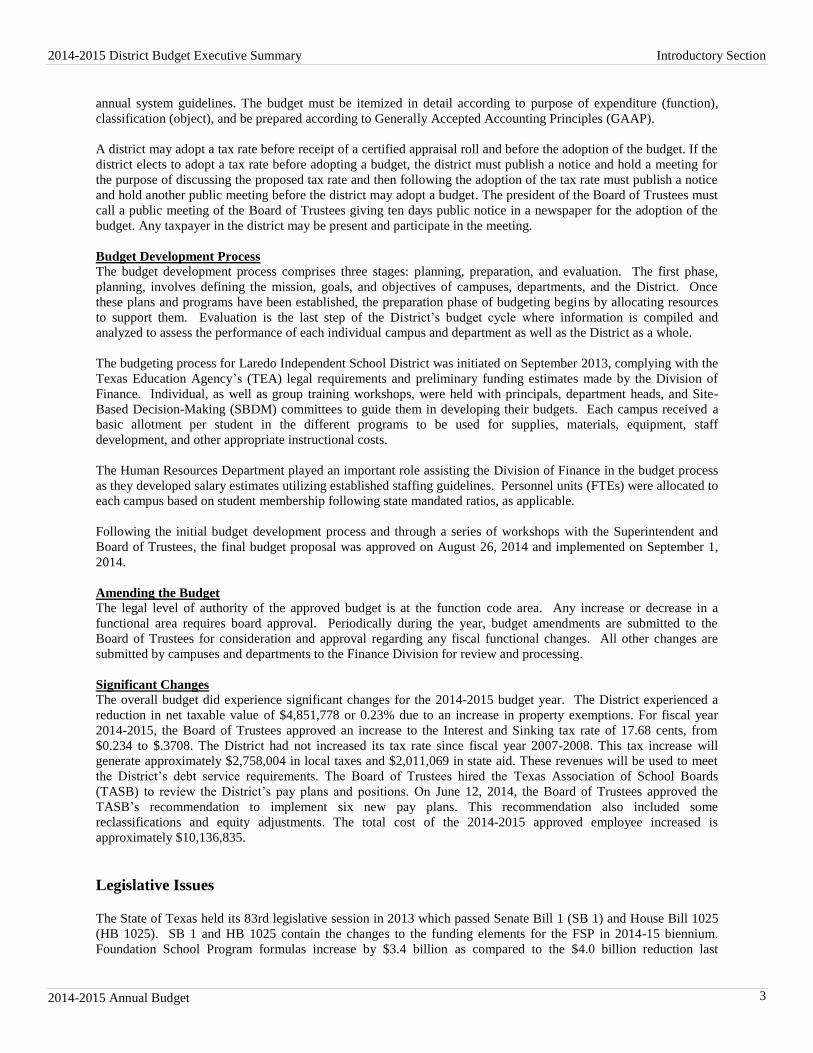
Legislative Issues The State of Texas held its 83rd legislative session in 2013 which passed Senate Bill 1 (SB 1) and House Bill 1025
(HB 1025). SB 1 and HB 1025 contain the changes to the funding elements for the FSP in 2014-15 biennium.
Foundation School Program formulas increase by $3.4 billion as compared to the $4.0 billion reduction last
Introductory Section 2014-2015 District Budget Executive Summary
4 Laredo Independent School District
biennium from Foundation School Program. SB 1 also increased grant programs by about $292 million ($1.4 billion
reduction last biennium to these programs). The District is projecting an increase in state aid of approximately
$3,428,004 for fiscal year 2014-2015. SB 1 and HB 1025 combined parameters:
2013-2014 2014-2015
Basic Allotment $4,950 $5,040
RPAF 1 1
Equalized Wealth Level, Tier 1 $495,000 $504,000
Target Reduction Factor 0.9263 0.9263
Austin Yield (first 6 cents above compressed) $59.97 $61.86
Summary of Proposed Budgets
All of the District’s fund structure is comprised of Governmental Funds, consisting of General Funds, Special
Revenue Funds, Debt Service Funds, and Capital Projects Funds and a Proprietary Fund. It is important to note that
the Board of Trustees approves annual budgets for the General Funds and Debt Service Fund. The Special Revenue
Funds and the Capital Projects Funds adopt project-length budgets which do not correspond to the District’s fiscal
year end and are not subject to Board of Trustees approval; thus, the information presented on these funds is for
information purposes only. The Proprietary Fund budget is not subject to the Board of Trustees approval and are
presented for information purpose.
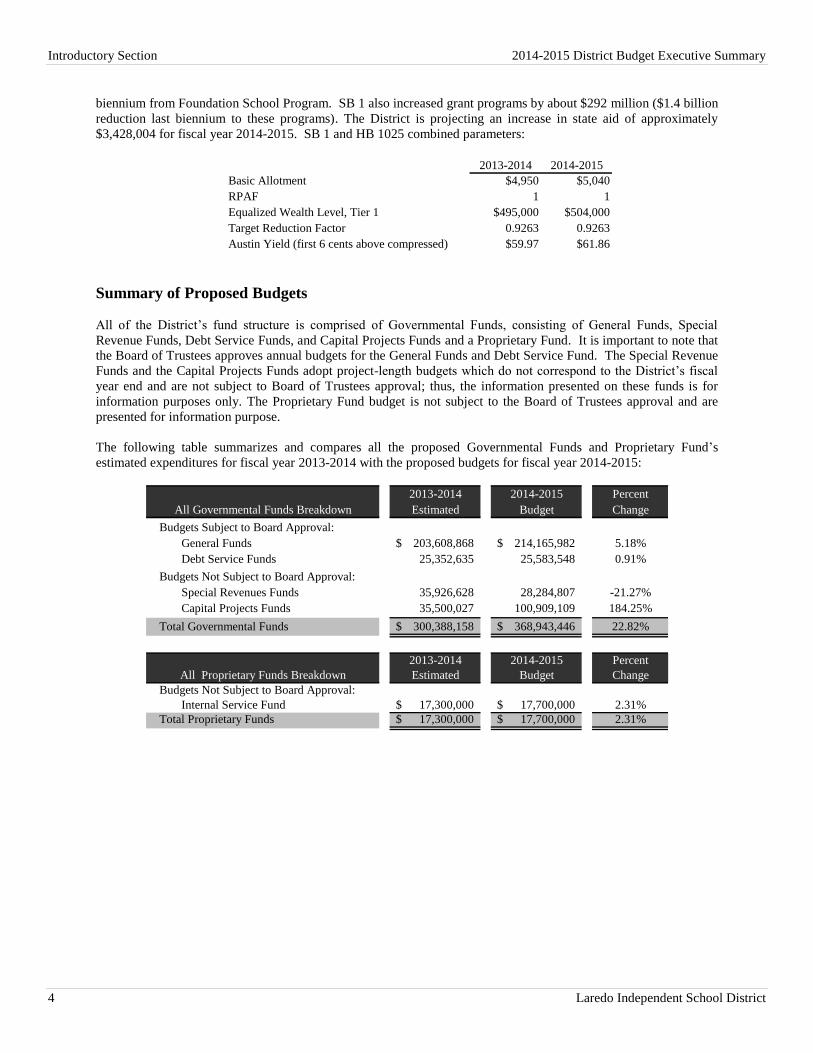
The following table summarizes and compares all the proposed Governmental Funds and Proprietary Fund’s
estimated expenditures for fiscal year 2013-2014 with the proposed budgets for fiscal year 2014-2015:
2013-2014 2014-2015 Percent
All Governmental Funds Breakdown Estimated Budget Change
Budgets Subject to Board Approval:
General Funds 203,608,868$ 214,165,982$ 5.18%
Debt Service Funds 25,352,635 25,583,548 0.91%
Budgets Not Subject to Board Approval:
Special Revenues Funds 35,926,628 28,284,807 -21.27%
Capital Projects Funds 35,500,027 100,909,109 184.25%#DIV/0!
Total Governmental Funds 300,388,158$ 368,943,446$ 22.82%
2013-2014 2014-2015 Percent
All Proprietary Funds Breakdown Estimated Budget Change
Budgets Not Subject to Board Approval:
Internal Service Fund 17,300,000$ 17,700,000$ 2.31%
Total Proprietary Funds 17,300,000$ 17,700,000$ 2.31%
2014-2015 District Budget Executive Summary Introductory Section
2014-2015 Annual Budget 5
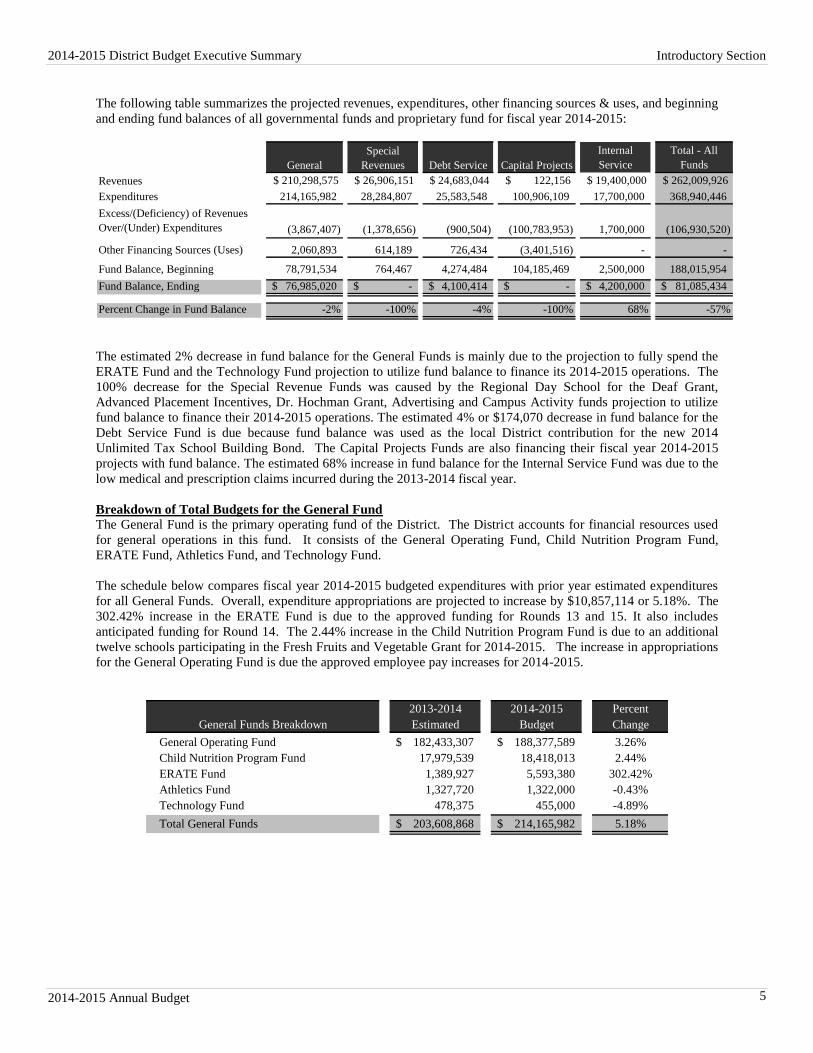
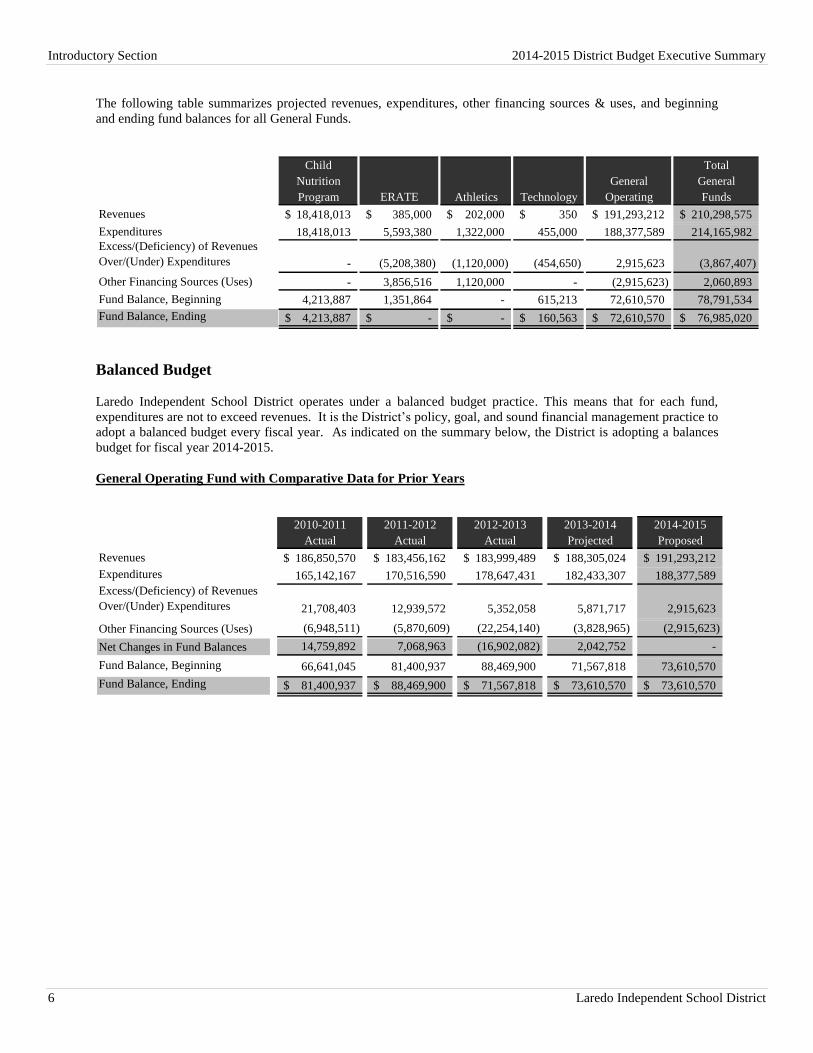
The following table summarizes the projected revenues, expenditures, other financing sources & uses, and beginning
and ending fund balances of all governmental funds and proprietary fund for fiscal year 2014-2015:
Internal
Service
Total - All
FundsGeneral Funds Special Debt Service Capital Projects Capital
Revenues $ 210,298,575 $ 26,906,151 $ 24,683,044 $ 122,156 $ 19,400,000 $ 262,009,926 228,725,206 26,906,151
Expenditures 214,165,982 28,284,807 25,583,548 100,906,109 17,700,000 368,940,446
Excess/(Deficiency) of Revenues
Over/(Under) Expenditures (3,867,407) (1,378,656) (900,504) (100,783,953) 1,700,000 (106,930,520)
Other Financing Sources (Uses) 2,060,893 614,189 726,434 (3,401,516) - -
Fund Balance, Beginning 78,791,534 764,467 4,274,484 104,185,469 2,500,000 188,015,954
Fund Balance, Ending 76,985,020$ -$ 4,100,414$ -$ 4,200,000$ 81,085,434$
Percent Change in Fund Balance -2% -100% -4% -100% 68% -57%
General
Special
Revenues Debt Service Capital Projects
The estimated 2% decrease in fund balance for the General Funds is mainly due to the projection to fully spend the
ERATE Fund and the Technology Fund projection to utilize fund balance to finance its 2014-2015 operations. The
100% decrease for the Special Revenue Funds was caused by the Regional Day School for the Deaf Grant,
Advanced Placement Incentives, Dr. Hochman Grant, Advertising and Campus Activity funds projection to utilize
fund balance to finance their 2014-2015 operations. The estimated 4% or $174,070 decrease in fund balance for the
Debt Service Fund is due because fund balance was used as the local District contribution for the new 2014
Unlimited Tax School Building Bond. The Capital Projects Funds are also financing their fiscal year 2014-2015
projects with fund balance. The estimated 68% increase in fund balance for the Internal Service Fund was due to the
low medical and prescription claims incurred during the 2013-2014 fiscal year.
Breakdown of Total Budgets for the General Fund
The General Fund is the primary operating fund of the District. The District accounts for financial resources used
for general operations in this fund. It consists of the General Operating Fund, Child Nutrition Program Fund,
ERATE Fund, Athletics Fund, and Technology Fund.
The schedule below compares fiscal year 2014-2015 budgeted expenditures with prior year estimated expenditures
for all General Funds. Overall, expenditure appropriations are projected to increase by $10,857,114 or 5.18%. The
302.42% increase in the ERATE Fund is due to the approved funding for Rounds 13 and 15. It also includes
anticipated funding for Round 14. The 2.44% increase in the Child Nutrition Program Fund is due to an additional
twelve schools participating in the Fresh Fruits and Vegetable Grant for 2014-2015. The increase in appropriations
for the General Operating Fund is due the approved employee pay increases for 2014-2015.
2013-2014 2014-2015 Percent
General Funds Breakdown Estimated Budget Change
General Operating Fund 182,433,307$ 188,377,589$ 3.26%
Child Nutrition Program Fund 17,979,539 18,418,013 2.44%
ERATE Fund 1,389,927 5,593,380 302.42%
Athletics Fund 1,327,720 1,322,000 -0.43%
Technology Fund 478,375 455,000 -4.89%
Total General Funds 203,608,868$ 214,165,982$ 5.18%
Introductory Section 2014-2015 District Budget Executive Summary
6 Laredo Independent School District
The following table summarizes projected revenues, expenditures, other financing sources & uses, and beginning
and ending fund balances for all General Funds.
Child Total
Nutrition General General
Program ERATE Athletics Technology Operating Funds
Revenues 18,418,013$ 385,000$ 202,000$ 350$ 191,293,212$ 210,298,575$ 1,000 780
Expenditures 18,418,013 5,593,380 1,322,000 455,000 188,377,589 214,165,982
Excess/(Deficiency) of Revenues
Over/(Under) Expenditures - (5,208,380) (1,120,000) (454,650) 2,915,623 (3,867,407)
Other Financing Sources (Uses) - 3,856,516 1,120,000 - (2,915,623) 2,060,893
Fund Balance, Beginning 4,213,887 1,351,864 - 615,213 72,610,570 78,791,534
Fund Balance, Ending 4,213,887$ -$ -$ 160,563$ 72,610,570$ 76,985,020$
Balanced Budget
Laredo Independent School District operates under a balanced budget practice. This means that for each fund,
expenditures are not to exceed revenues. It is the District’s policy, goal, and sound financial management practice to
adopt a balanced budget every fiscal year. As indicated on the summary below, the District is adopting a balances
budget for fiscal year 2014-2015.
General Operating Fund with Comparative Data for Prior Years
2010-2011 2011-2012 2012-2013 2013-2014 2014-2015
Actual Actual Actual Projected Proposed
Revenues 186,850,570$ 183,456,162$ 183,999,489$ 188,305,024$ 191,293,212$
Expenditures 165,142,167 170,516,590 178,647,431 182,433,307 188,377,589
Excess/(Deficiency) of Revenues
Over/(Under) Expenditures 21,708,403 12,939,572 5,352,058 5,871,717 2,915,623
Other Financing Sources (Uses) (6,948,511) (5,870,609) (22,254,140) (3,828,965) (2,915,623)
Net Changes in Fund Balances 14,759,892 7,068,963 (16,902,082) 2,042,752 -
Fund Balance, Beginning 66,641,045 81,400,937 88,469,900 71,567,818 73,610,570
Fund Balance, Ending 81,400,937$ 88,469,900$ 71,567,818$ 73,610,570$ 73,610,570$
2014-2015 District Budget Executive Summary Introductory Section
2014-2015 Annual Budget 7
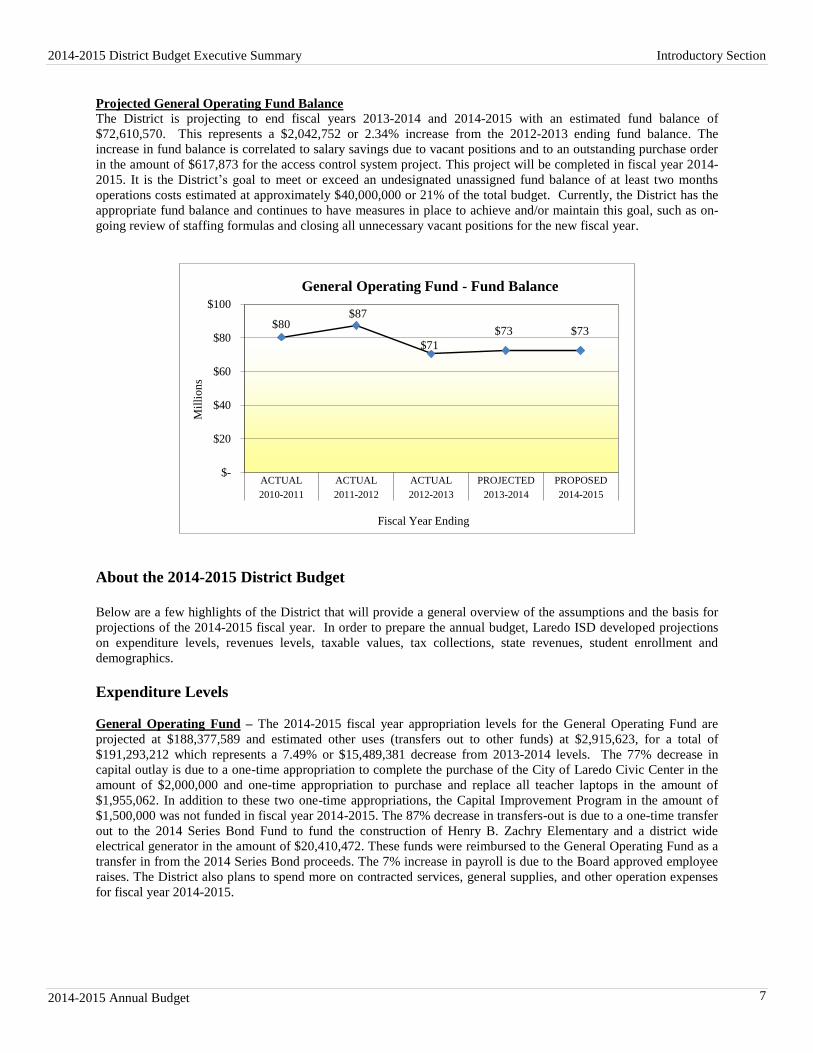
Projected General Operating Fund Balance
The District is projecting to end fiscal years 2013-2014 and 2014-2015 with an estimated fund balance of
$72,610,570. This represents a $2,042,752 or 2.34% increase from the 2012-2013 ending fund balance. The
increase in fund balance is correlated to salary savings due to vacant positions and to an outstanding purchase order
in the amount of $617,873 for the access control system project. This project will be completed in fiscal year 2014-
2015. It is the District’s goal to meet or exceed an undesignated unassigned fund balance of at least two months
operations costs estimated at approximately $40,000,000 or 21% of the total budget. Currently, the District has the
appropriate fund balance and continues to have measures in place to achieve and/or maintain this goal, such as on-
going review of staffing formulas and closing all unnecessary vacant positions for the new fiscal year.
$80 $87
$71
$73 $73
$-
$20
$40
$60
$80
$100
ACTUAL ACTUAL ACTUAL PROJECTED PROPOSED
2010-2011 2011-2012 2012-2013 2013-2014 2014-2015
Mil
lion
s
Fiscal Year Ending
General Operating Fund - Fund Balance
About the 2014-2015 District Budget
Below are a few highlights of the District that will provide a general overview of the assumptions and the basis for
projections of the 2014-2015 fiscal year. In order to prepare the annual budget, Laredo ISD developed projections
on expenditure levels, revenues levels, taxable values, tax collections, state revenues, student enrollment and
demographics.
Expenditure Levels
General Operating Fund – The 2014-2015 fiscal year appropriation levels for the General Operating Fund are
projected at $188,377,589 and estimated other uses (transfers out to other funds) at $2,915,623, for a total of
$191,293,212 which represents a 7.49% or $15,489,381 decrease from 2013-2014 levels. The 77% decrease in
capital outlay is due to a one-time appropriation to complete the purchase of the City of Laredo Civic Center in the
amount of $2,000,000 and one-time appropriation to purchase and replace all teacher laptops in the amount of
$1,955,062. In addition to these two one-time appropriations, the Capital Improvement Program in the amount of
$1,500,000 was not funded in fiscal year 2014-2015. The 87% decrease in transfers-out is due to a one-time transfer
out to the 2014 Series Bond Fund to fund the construction of Henry B. Zachry Elementary and a district wide
electrical generator in the amount of $20,410,472. These funds were reimbursed to the General Operating Fund as a
transfer in from the 2014 Series Bond proceeds. The 7% increase in payroll is due to the Board approved employee
raises. The District also plans to spend more on contracted services, general supplies, and other operation expenses
for fiscal year 2014-2015.
Introductory Section 2014-2015 District Budget Executive Summary
8 Laredo Independent School District
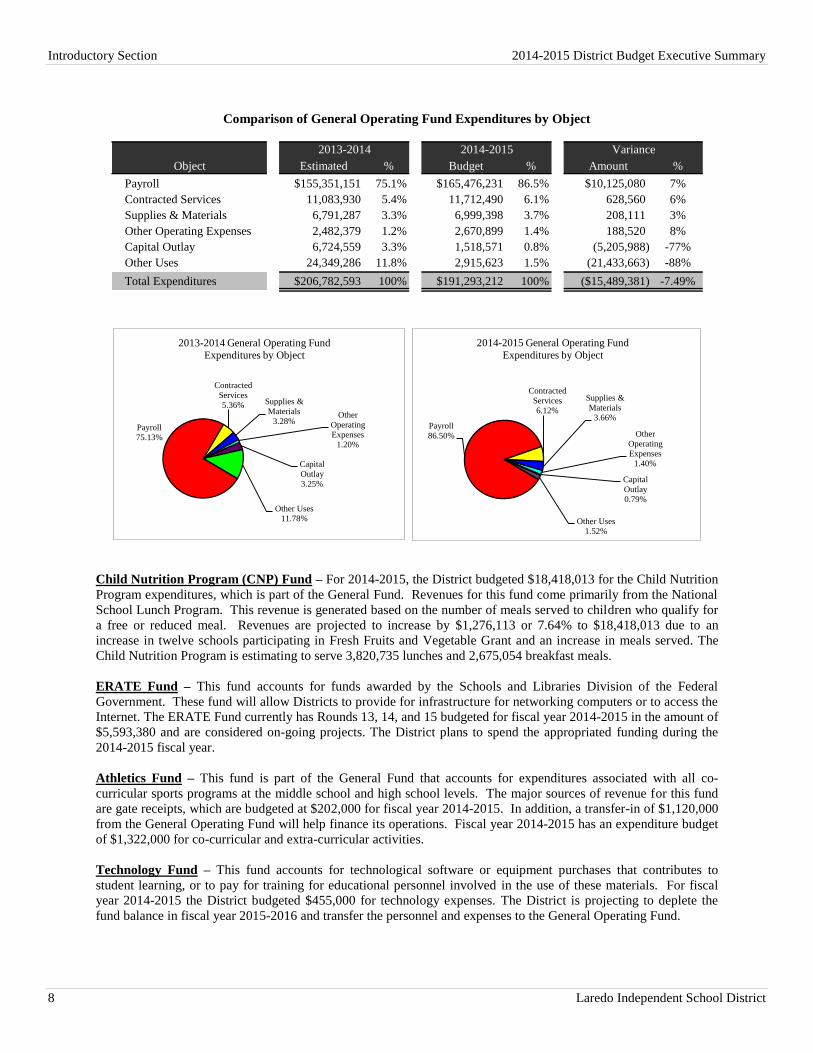
Comparison of General Operating Fund Expenditures by Object
Object Estimated % Budget % Amount %
Payroll $155,351,151 75.1% $165,476,231 86.5% $10,125,080 7%
Contracted Services 11,083,930 5.4% 11,712,490 6.1% 628,560 6%
Supplies & Materials 6,791,287 3.3% 6,999,398 3.7% 208,111 3%
Other Operating Expenses 2,482,379 1.2% 2,670,899 1.4% 188,520 8%
Capital Outlay 6,724,559 3.3% 1,518,571 0.8% (5,205,988) -77%
Other Uses 24,349,286 11.8% 2,915,623 1.5% (21,433,663) -88%
Total Expenditures $206,782,593 100% $191,293,212 100% ($15,489,381) -7.49%
2013-2014 2014-2015 Variance
Payroll
86.50%
Contracted
Services
6.12%
Supplies &
Materials
3.66%
Other
Operating
Expenses
1.40%
Capital
Outlay
0.79%
Other Uses
1.52%
2014-2015 General Operating Fund
Expenditures by Object
Payroll
75.13%
Contracted
Services
5.36% Supplies &
Materials
3.28%Other
Operating
Expenses
1.20%
Capital
Outlay
3.25%
Other Uses
11.78%
2013-2014 General Operating Fund
Expenditures by Object
Child Nutrition Program (CNP) Fund – For 2014-2015, the District budgeted $18,418,013 for the Child Nutrition
Program expenditures, which is part of the General Fund. Revenues for this fund come primarily from the National
School Lunch Program. This revenue is generated based on the number of meals served to children who qualify for
a free or reduced meal. Revenues are projected to increase by $1,276,113 or 7.64% to $18,418,013 due to an
increase in twelve schools participating in Fresh Fruits and Vegetable Grant and an increase in meals served. The
Child Nutrition Program is estimating to serve 3,820,735 lunches and 2,675,054 breakfast meals.
ERATE Fund – This fund accounts for funds awarded by the Schools and Libraries Division of the Federal
Government. These fund will allow Districts to provide for infrastructure for networking computers or to access the
Internet. The ERATE Fund currently has Rounds 13, 14, and 15 budgeted for fiscal year 2014-2015 in the amount of
$5,593,380 and are considered on-going projects. The District plans to spend the appropriated funding during the
2014-2015 fiscal year.
Athletics Fund – This fund is part of the General Fund that accounts for expenditures associated with all co-
curricular sports programs at the middle school and high school levels. The major sources of revenue for this fund
are gate receipts, which are budgeted at $202,000 for fiscal year 2014-2015. In addition, a transfer-in of $1,120,000
from the General Operating Fund will help finance its operations. Fiscal year 2014-2015 has an expenditure budget
of $1,322,000 for co-curricular and extra-curricular activities.
Technology Fund – This fund accounts for technological software or equipment purchases that contributes to
student learning, or to pay for training for educational personnel involved in the use of these materials. For fiscal
year 2014-2015 the District budgeted $455,000 for technology expenses. The District is projecting to deplete the
fund balance in fiscal year 2015-2016 and transfer the personnel and expenses to the General Operating Fund.
2014-2015 District Budget Executive Summary Introductory Section
2014-2015 Annual Budget 9
Debt Service Fund – The District budgeted $25,583,548 for fiscal year 2014-2015. Resources in the Debt Service
Fund must and will be used to pay for general long-term debt principal and interest for debt issues and other long-
term debts for which a tax has been dedicated.
Special Revenues Funds – Appropriations for these funds are restricted to, or designated for, specific purposes by a
grantor. For fiscal year 2014-2015, the District’s appropriation is $28,284,807. Note: The District provides
information to the Board of Trustees on all District grants, but they do not approve an annual budget for these funds.
Capital Projects Funds – For fiscal year 2014-2015, the District is appropriating $100,906,109 for the repair,
rehabilitation, renovation, and replacement of school facilities funded by the General Operating Fund, Instructional
Facilities Allotment (IFA), Existing Debt Allotment (EDA), and Qualified Zone Academy Bonds (QZAB). It is
important to note that these funds are capital project budgets.
Internal Service Fund – This fund accounts for good or services provided to other funds, agencies, or departments
of the primary government and component units, or to other governments, on a cost reimbursement basis. On June
13, 2013, the school district moved from a fully funded health insurance program to a self-funded program. This
fund is used to account for the insurance premiums and claims. For fiscal year 2014-2015 the District is
appropriating $17,700,000 for insurance premiums and claims.
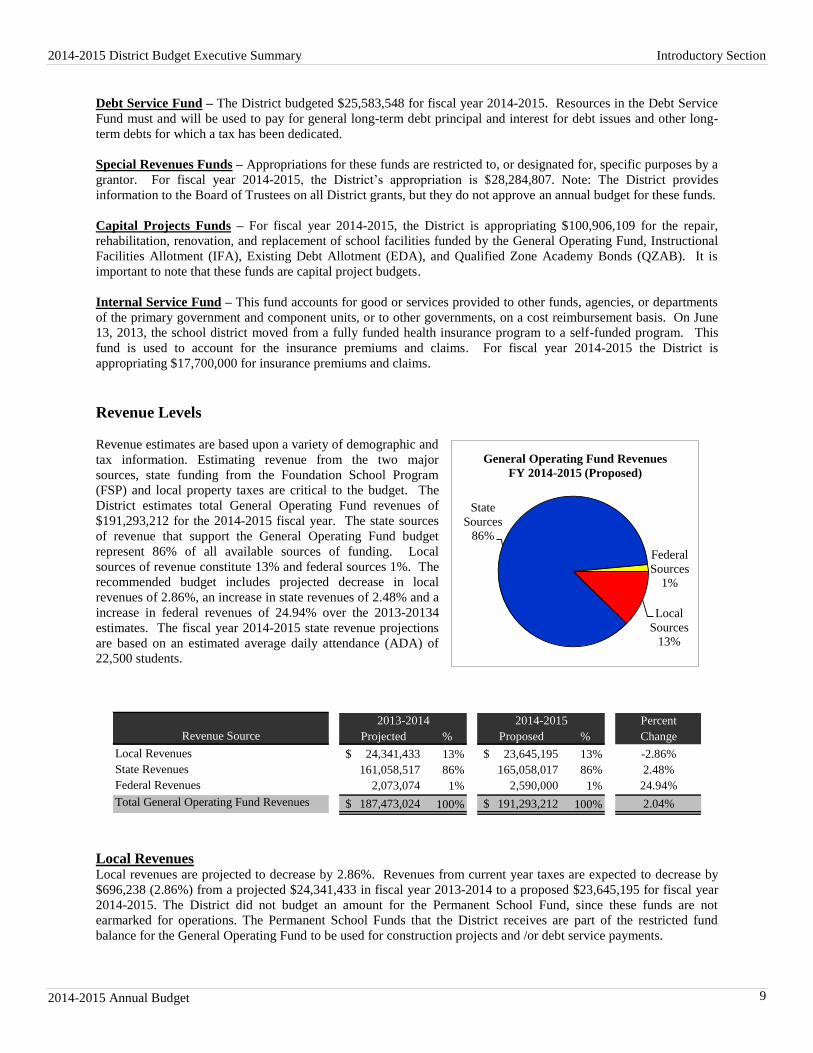
Revenue Levels
Revenue estimates are based upon a variety of demographic and
tax information. Estimating revenue from the two major
sources, state funding from the Foundation School Program
(FSP) and local property taxes are critical to the budget. The
District estimates total General Operating Fund revenues of
$191,293,212 for the 2014-2015 fiscal year. The state sources
of revenue that support the General Operating Fund budget
represent 86% of all available sources of funding. Local
sources of revenue constitute 13% and federal sources 1%. The
recommended budget includes projected decrease in local
revenues of 2.86%, an increase in state revenues of 2.48% and a
increase in federal revenues of 24.94% over the 2013-20134
estimates. The fiscal year 2014-2015 state revenue projections
are based on an estimated average daily attendance (ADA) of
22,500 students.
Percent
Revenue Source Projected % Proposed % Change
Local Revenues 24,341,433$ 13% 23,645,195$ 13% -2.86%
State Revenues 161,058,517 86% 165,058,017 86% 2.48%
Federal Revenues 2,073,074 1% 2,590,000 1% 24.94%
Total General Operating Fund Revenues 187,473,024$ 100% 191,293,212$ 100% 2.04%
2013-2014 2014-2015
Local Revenues Local revenues are projected to decrease by 2.86%. Revenues from current year taxes are expected to decrease by
$696,238 (2.86%) from a projected $24,341,433 in fiscal year 2013-2014 to a proposed $23,645,195 for fiscal year
2014-2015. The District did not budget an amount for the Permanent School Fund, since these funds are not
earmarked for operations. The Permanent School Funds that the District receives are part of the restricted fund
balance for the General Operating Fund to be used for construction projects and /or debt service payments.
Local
Sources
13%
State
Sources
86%
Federal
Sources
1%
General Operating Fund Revenues
FY 2014-2015 (Proposed)
Introductory Section 2014-2015 District Budget Executive Summary
10 Laredo Independent School District
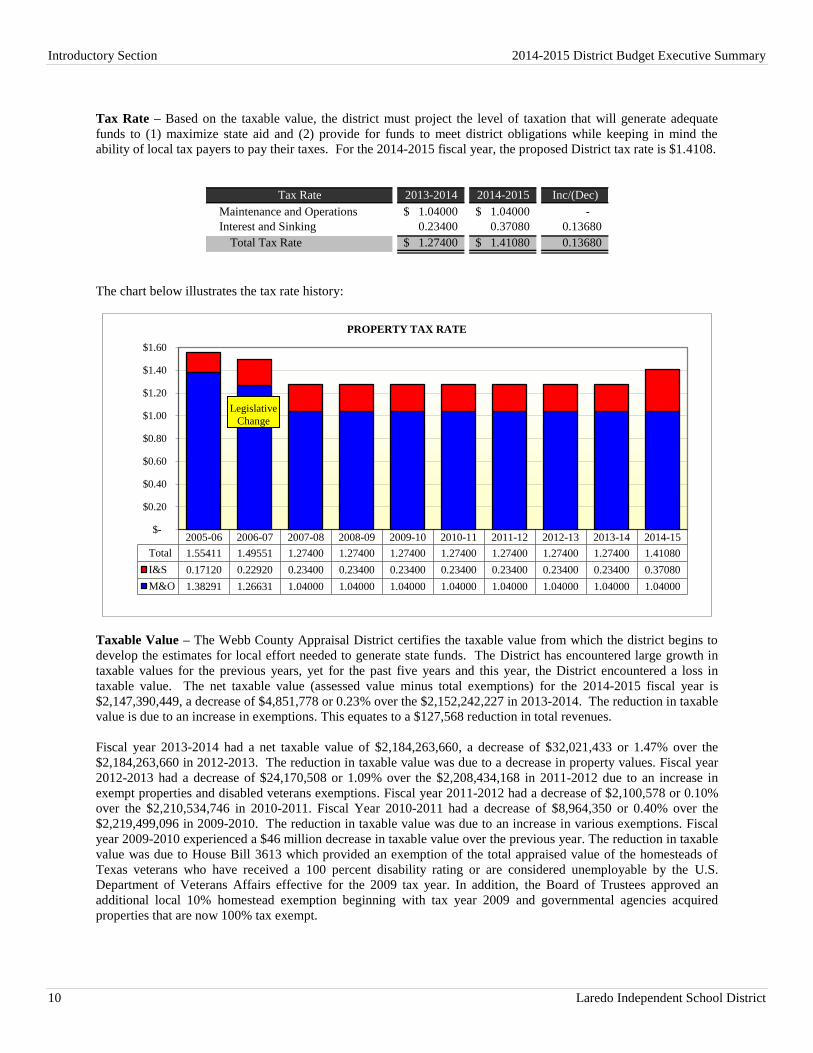
Tax Rate – Based on the taxable value, the district must project the level of taxation that will generate adequate
funds to (1) maximize state aid and (2) provide for funds to meet district obligations while keeping in mind the
ability of local tax payers to pay their taxes. For the 2014-2015 fiscal year, the proposed District tax rate is $1.4108.
Tax Rate 2013-2014 2014-2015 Inc/(Dec)
Maintenance and Operations 1.04000$ 1.04000$ -
Interest and Sinking 0.23400 0.37080 0.13680
Total Tax Rate 1.27400$ 1.41080$ 0.13680
The chart below illustrates the tax rate history:
2005-06 2006-07 2007-08 2008-09 2009-10 2010-11 2011-12 2012-13 2013-14 2014-15
Total 1.55411 1.49551 1.27400 1.27400 1.27400 1.27400 1.27400 1.27400 1.27400 1.41080
I&S 0.17120 0.22920 0.23400 0.23400 0.23400 0.23400 0.23400 0.23400 0.23400 0.37080
M&O 1.38291 1.26631 1.04000 1.04000 1.04000 1.04000 1.04000 1.04000 1.04000 1.04000
$-
$0.20
$0.40
$0.60
$0.80
$1.00
$1.20
$1.40
$1.60
PROPERTY TAX RATE
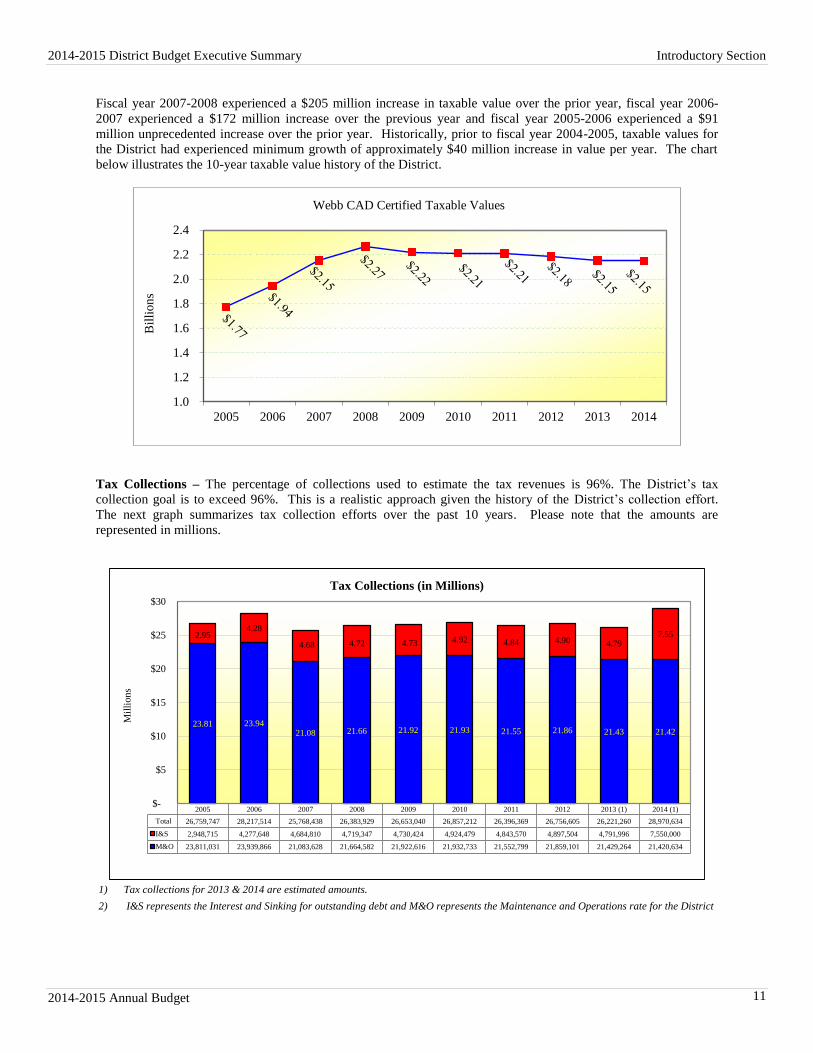
Taxable Value – The Webb County Appraisal District certifies the taxable value from which the district begins to
develop the estimates for local effort needed to generate state funds. The District has encountered large growth in
taxable values for the previous years, yet for the past five years and this year, the District encountered a loss in
taxable value. The net taxable value (assessed value minus total exemptions) for the 2014-2015 fiscal year is
$2,147,390,449, a decrease of $4,851,778 or 0.23% over the $2,152,242,227 in 2013-2014. The reduction in taxable
value is due to an increase in exemptions. This equates to a $127,568 reduction in total revenues.
Fiscal year 2013-2014 had a net taxable value of $2,184,263,660, a decrease of $32,021,433 or 1.47% over the
$2,184,263,660 in 2012-2013. The reduction in taxable value was due to a decrease in property values. Fiscal year
2012-2013 had a decrease of $24,170,508 or 1.09% over the $2,208,434,168 in 2011-2012 due to an increase in
exempt properties and disabled veterans exemptions. Fiscal year 2011-2012 had a decrease of $2,100,578 or 0.10%
over the $2,210,534,746 in 2010-2011. Fiscal Year 2010-2011 had a decrease of $8,964,350 or 0.40% over the
$2,219,499,096 in 2009-2010. The reduction in taxable value was due to an increase in various exemptions. Fiscal
year 2009-2010 experienced a $46 million decrease in taxable value over the previous year. The reduction in taxable
value was due to House Bill 3613 which provided an exemption of the total appraised value of the homesteads of
Texas veterans who have received a 100 percent disability rating or are considered unemployable by the U.S.
Department of Veterans Affairs effective for the 2009 tax year. In addition, the Board of Trustees approved an
additional local 10% homestead exemption beginning with tax year 2009 and governmental agencies acquired
properties that are now 100% tax exempt.
Legislative
Change
2014-2015 District Budget Executive Summary Introductory Section
2014-2015 Annual Budget 11
Fiscal year 2007-2008 experienced a $205 million increase in taxable value over the prior year, fiscal year 2006-
2007 experienced a $172 million increase over the previous year and fiscal year 2005-2006 experienced a $91
million unprecedented increase over the prior year. Historically, prior to fiscal year 2004-2005, taxable values for
the District had experienced minimum growth of approximately $40 million increase in value per year. The chart
below illustrates the 10-year taxable value history of the District.
1.0
1.2
1.4
1.6
1.8
2.0
2.2
2.4
2005 2006 2007 2008 2009 2010 2011 2012 2013 2014
Bil
lion
s
Webb CAD Certified Taxable Values
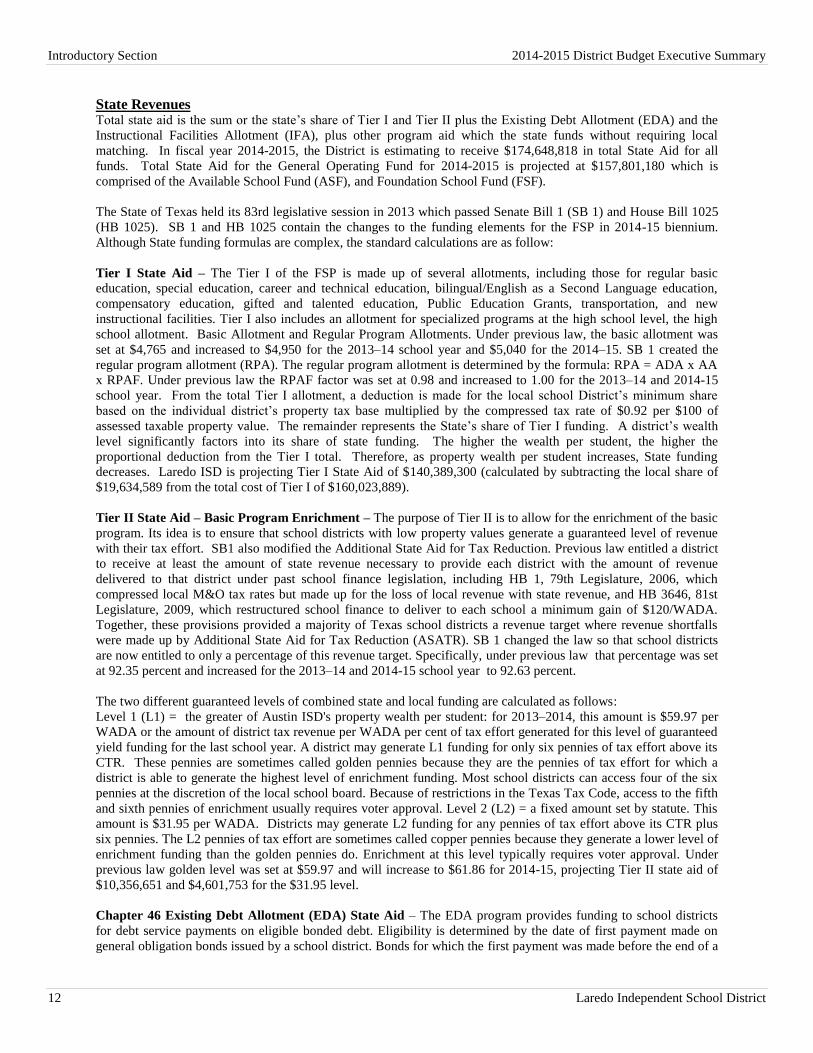
Tax Collections – The percentage of collections used to estimate the tax revenues is 96%. The District’s tax
collection goal is to exceed 96%. This is a realistic approach given the history of the District’s collection effort.
The next graph summarizes tax collection efforts over the past 10 years. Please note that the amounts are
represented in millions.
2005 2006 2007 2008 2009 2010 2011 2012 2013 (1) 2014 (1)
Total 26,759,747 28,217,514 25,768,438 26,383,929 26,653,040 26,857,212 26,396,369 26,756,605 26,221,260 28,970,634
I&S 2,948,715 4,277,648 4,684,810 4,719,347 4,730,424 4,924,479 4,843,570 4,897,504 4,791,996 7,550,000
M&O 23,811,031 23,939,866 21,083,628 21,664,582 21,922,616 21,932,733 21,552,799 21,859,101 21,429,264 21,420,634
23.81 23.9421.08 21.66 21.92 21.93 21.55 21.86 21.43 21.42
2.954.28
4.68 4.72 4.73 4.92 4.84 4.90 4.797.55
$-
$5
$10
$15
$20
$25
$30
Mil
lion
s
Tax Collections (in Millions)
1) Tax collections for 2013 & 2014 are estimated amounts.
2) I&S represents the Interest and Sinking for outstanding debt and M&O represents the Maintenance and Operations rate for the District
Introductory Section 2014-2015 District Budget Executive Summary
12 Laredo Independent School District
State Revenues Total state aid is the sum or the state’s share of Tier I and Tier II plus the Existing Debt Allotment (EDA) and the
Instructional Facilities Allotment (IFA), plus other program aid which the state funds without requiring local
matching. In fiscal year 2014-2015, the District is estimating to receive $174,648,818 in total State Aid for all
funds. Total State Aid for the General Operating Fund for 2014-2015 is projected at $157,801,180 which is
comprised of the Available School Fund (ASF), and Foundation School Fund (FSF).
The State of Texas held its 83rd legislative session in 2013 which passed Senate Bill 1 (SB 1) and House Bill 1025
(HB 1025). SB 1 and HB 1025 contain the changes to the funding elements for the FSP in 2014-15 biennium.
Although State funding formulas are complex, the standard calculations are as follow:
Tier I State Aid – The Tier I of the FSP is made up of several allotments, including those for regular basic
education, special education, career and technical education, bilingual/English as a Second Language education,
compensatory education, gifted and talented education, Public Education Grants, transportation, and new
instructional facilities. Tier I also includes an allotment for specialized programs at the high school level, the high
school allotment. Basic Allotment and Regular Program Allotments. Under previous law, the basic allotment was
set at $4,765 and increased to $4,950 for the 2013–14 school year and $5,040 for the 2014–15. SB 1 created the
regular program allotment (RPA). The regular program allotment is determined by the formula: RPA = ADA x AA
x RPAF. Under previous law the RPAF factor was set at 0.98 and increased to 1.00 for the 2013–14 and 2014-15
school year. From the total Tier I allotment, a deduction is made for the local school District’s minimum share
based on the individual district’s property tax base multiplied by the compressed tax rate of $0.92 per $100 of
assessed taxable property value. The remainder represents the State’s share of Tier I funding. A district’s wealth
level significantly factors into its share of state funding. The higher the wealth per student, the higher the
proportional deduction from the Tier I total. Therefore, as property wealth per student increases, State funding
decreases. Laredo ISD is projecting Tier I State Aid of $140,389,300 (calculated by subtracting the local share of
$19,634,589 from the total cost of Tier I of $160,023,889).
Tier II State Aid – Basic Program Enrichment – The purpose of Tier II is to allow for the enrichment of the basic
program. Its idea is to ensure that school districts with low property values generate a guaranteed level of revenue
with their tax effort. SB1 also modified the Additional State Aid for Tax Reduction. Previous law entitled a district
to receive at least the amount of state revenue necessary to provide each district with the amount of revenue
delivered to that district under past school finance legislation, including HB 1, 79th Legislature, 2006, which
compressed local M&O tax rates but made up for the loss of local revenue with state revenue, and HB 3646, 81st
Legislature, 2009, which restructured school finance to deliver to each school a minimum gain of $120/WADA.
Together, these provisions provided a majority of Texas school districts a revenue target where revenue shortfalls
were made up by Additional State Aid for Tax Reduction (ASATR). SB 1 changed the law so that school districts
are now entitled to only a percentage of this revenue target. Specifically, under previous law that percentage was set
at 92.35 percent and increased for the 2013–14 and 2014-15 school year to 92.63 percent.
The two different guaranteed levels of combined state and local funding are calculated as follows:
Level 1 (L1) = the greater of Austin ISD's property wealth per student: for 2013–2014, this amount is $59.97 per
WADA or the amount of district tax revenue per WADA per cent of tax effort generated for this level of guaranteed
yield funding for the last school year. A district may generate L1 funding for only six pennies of tax effort above its
CTR. These pennies are sometimes called golden pennies because they are the pennies of tax effort for which a
district is able to generate the highest level of enrichment funding. Most school districts can access four of the six
pennies at the discretion of the local school board. Because of restrictions in the Texas Tax Code, access to the fifth
and sixth pennies of enrichment usually requires voter approval. Level 2 (L2) = a fixed amount set by statute. This
amount is $31.95 per WADA. Districts may generate L2 funding for any pennies of tax effort above its CTR plus
six pennies. The L2 pennies of tax effort are sometimes called copper pennies because they generate a lower level of
enrichment funding than the golden pennies do. Enrichment at this level typically requires voter approval. Under
previous law golden level was set at $59.97 and will increase to $61.86 for 2014-15, projecting Tier II state aid of
$10,356,651 and $4,601,753 for the $31.95 level.
Chapter 46 Existing Debt Allotment (EDA) State Aid – The EDA program provides funding to school districts
for debt service payments on eligible bonded debt. Eligibility is determined by the date of first payment made on
general obligation bonds issued by a school district. Bonds for which the first payment was made before the end of a
2014-2015 District Budget Executive Summary Introductory Section
2014-2015 Annual Budget 13
state biennium are eligible to receive EDA funding beginning with the following biennium. The amount of funding
is determined by the district’s I&S tax effort during the last year of the preceding state biennium. A school district
does not need to apply to receive EDA funding, and there is no award cycle, as there is for the IFA program.
Payments to establish eligibility must be included in the debt service schedule reported to the Municipal Advisory
Council of Texas (MAC of Texas). The TEA determines the EDA funds to which a school district is entitled based
on I&S tax collection and bond data that the agency receives from the MAC of Texas and through Public Education
Information Management System reporting. The 2014-2015 budget includes $3,179,133 from EDA funding.
Chapter 46 Instructional Facilities Allotment (IFA) State Aid – The IFA program provides funding to school
districts for debt service payments on debt associated with the purchase, construction, renovation, and expansion of
instructional facilities. Districts use this funding to make annual debt service payments on qualifying bonds and
lease-purchase agreements. To receive IFA program assistance, a district must apply to the TEA. The TEA
determines a biennial maximum allotment based on the annual debt service payment or $250 per student in ADA,
whichever is less. IFA-supported debt must support the construction of instructional facilities. State aid is reduced
for expenditures on non-instructional facilities. Laredo ISD currently receives IFA funding and estimates to receive
$13,668,504 for the 2014-2015 school year.
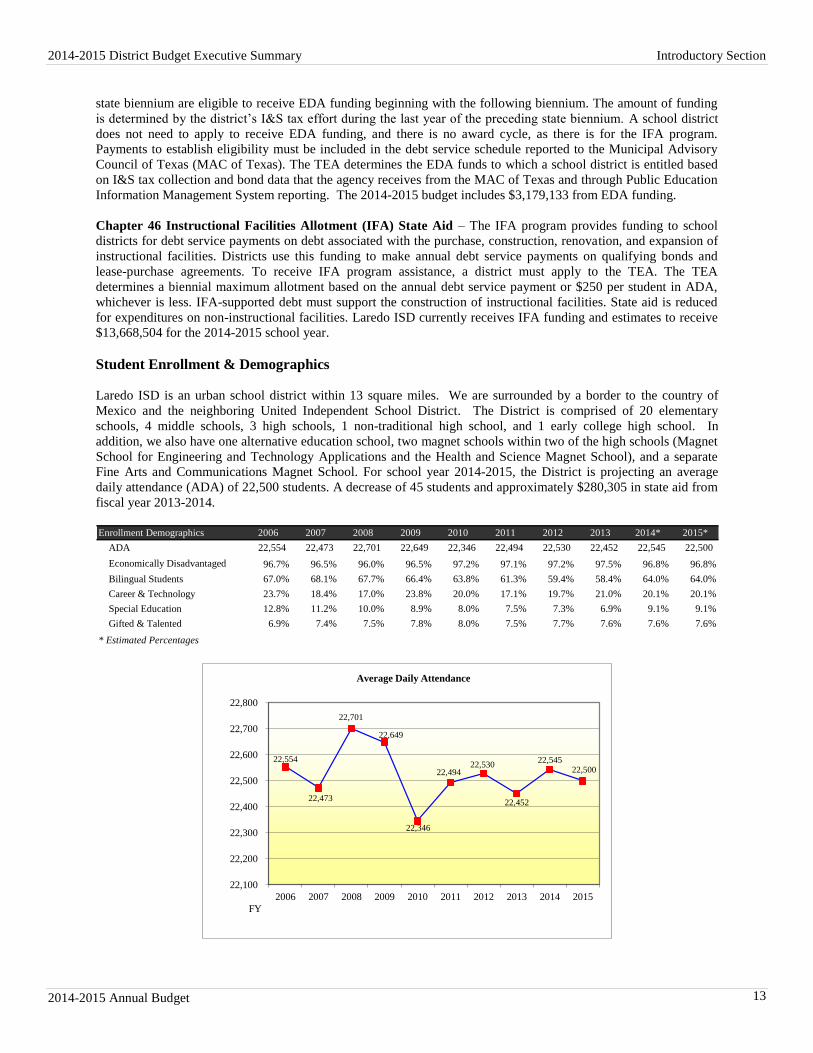
Student Enrollment & Demographics
Laredo ISD is an urban school district within 13 square miles. We are surrounded by a border to the country of
Mexico and the neighboring United Independent School District. The District is comprised of 20 elementary
schools, 4 middle schools, 3 high schools, 1 non-traditional high school, and 1 early college high school. In
addition, we also have one alternative education school, two magnet schools within two of the high schools (Magnet
School for Engineering and Technology Applications and the Health and Science Magnet School), and a separate
Fine Arts and Communications Magnet School. For school year 2014-2015, the District is projecting an average
daily attendance (ADA) of 22,500 students. A decrease of 45 students and approximately $280,305 in state aid from
fiscal year 2013-2014.
Enrollment Demographics 2006 2007 2008 2009 2010 2011 2012 2013 2014* 2015*
ADA 22,554 22,473 22,701 22,649 22,346 22,494 22,530 22,452 22,545 22,500
Economically Disadvantaged 96.7% 96.5% 96.0% 96.5% 97.2% 97.1% 97.2% 97.5% 96.8% 96.8%
Bilingual Students 67.0% 68.1% 67.7% 66.4% 63.8% 61.3% 59.4% 58.4% 64.0% 64.0%
Career & Technology 23.7% 18.4% 17.0% 23.8% 20.0% 17.1% 19.7% 21.0% 20.1% 20.1%
Special Education 12.8% 11.2% 10.0% 8.9% 8.0% 7.5% 7.3% 6.9% 9.1% 9.1%
Gifted & Talented 6.9% 7.4% 7.5% 7.8% 8.0% 7.5% 7.7% 7.6% 7.6% 7.6%
* Estimated Percentages
22,554
22,473
22,701
22,649
22,346
22,494 22,530
22,452
22,545 22,500
22,100
22,200
22,300
22,400
22,500
22,600
22,700
22,800
2006 2007 2008 2009 2010 2011 2012 2013 2014 2015
FY
Average Daily Attendance
Introductory Section 2014-2015 District Budget Executive Summary
14 Laredo Independent School District
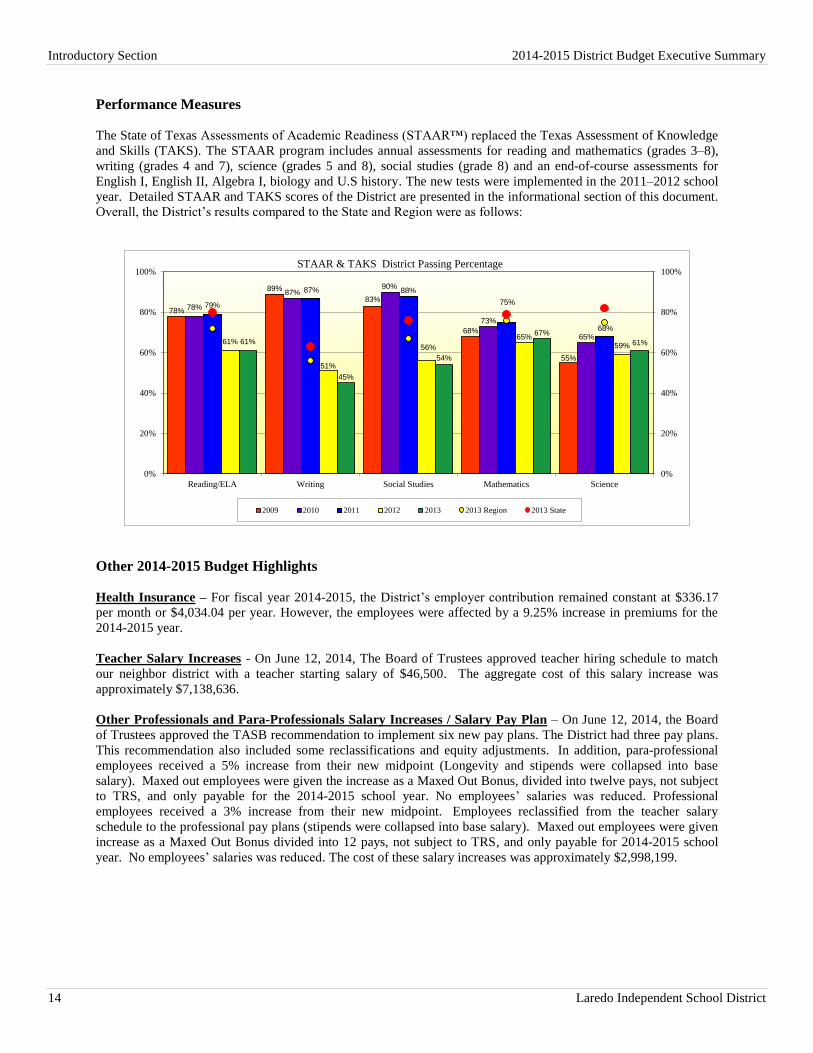
Performance Measures
The State of Texas Assessments of Academic Readiness (STAAR™) replaced the Texas Assessment of Knowledge
and Skills (TAKS). The STAAR program includes annual assessments for reading and mathematics (grades 3–8),
writing (grades 4 and 7), science (grades 5 and 8), social studies (grade 8) and an end-of-course assessments for
English I, English II, Algebra I, biology and U.S history. The new tests were implemented in the 2011–2012 school
year. Detailed STAAR and TAKS scores of the District are presented in the informational section of this document.
Overall, the District’s results compared to the State and Region were as follows:
78%
89%
83%
68%
55%
78%
87%90%
73%
65%
79%
87% 88%
75%
68%
61%
51%
56%
65%59%
61%
45%
54%
67%
61%
0%
20%
40%
60%
80%
100%
0%
20%
40%
60%
80%
100%
Reading/ELA Writing Social Studies Mathematics Science
STAAR & TAKS District Passing Percentage
2009 2010 2011 2012 2013 2013 Region 2013 State
Other 2014-2015 Budget Highlights
Health Insurance – For fiscal year 2014-2015, the District’s employer contribution remained constant at $336.17
per month or $4,034.04 per year. However, the employees were affected by a 9.25% increase in premiums for the
2014-2015 year.
Teacher Salary Increases - On June 12, 2014, The Board of Trustees approved teacher hiring schedule to match
our neighbor district with a teacher starting salary of $46,500. The aggregate cost of this salary increase was
approximately $7,138,636.
Other Professionals and Para-Professionals Salary Increases / Salary Pay Plan – On June 12, 2014, the Board
of Trustees approved the TASB recommendation to implement six new pay plans. The District had three pay plans.
This recommendation also included some reclassifications and equity adjustments. In addition, para-professional
employees received a 5% increase from their new midpoint (Longevity and stipends were collapsed into base
salary). Maxed out employees were given the increase as a Maxed Out Bonus, divided into twelve pays, not subject
to TRS, and only payable for the 2014-2015 school year. No employees’ salaries was reduced. Professional
employees received a 3% increase from their new midpoint. Employees reclassified from the teacher salary
schedule to the professional pay plans (stipends were collapsed into base salary). Maxed out employees were given
increase as a Maxed Out Bonus divided into 12 pays, not subject to TRS, and only payable for 2014-2015 school
year. No employees’ salaries was reduced. The cost of these salary increases was approximately $2,998,199.
2014-2015 District Budget Executive Summary Introductory Section
2014-2015 Annual Budget 15
Final Comments
Developing and preparing a budget is a very complex and tedious process that requires many collaborative planning
work sessions with campuses, staff, Superintendent, the Board of Trustees, and the community. I am very proud
that we have adopted a balanced budget. I owe special appreciation and recognition to our entire Division of
Finance staff for leading our budget process. I also especially thank our Board of Trustees for providing the high
level of leadership and for clearly being outstanding and responsible stewards of the District’s tax-payer dollars.
Respectfully,
A. Marcus Nelson, Ed.D.
Superintendent of Schools
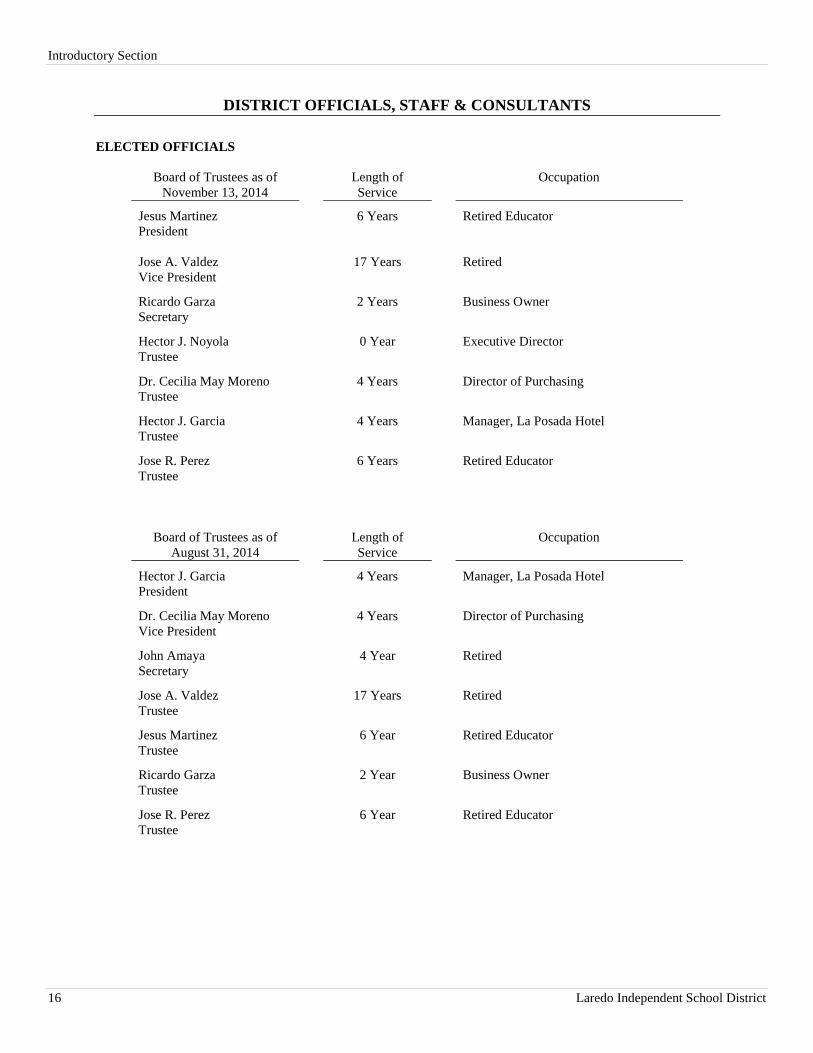
Introductory Section
16 Laredo Independent School District
DISTRICT OFFICIALS, STAFF & CONSULTANTS
ELECTED OFFICIALS
Board of Trustees as of
November 13, 2014
Length of
Service
Occupation
Jesus Martinez
President
6 Years Retired Educator
Jose A. Valdez
Vice President
17 Years Retired
Ricardo Garza
Secretary
2 Years Business Owner
Hector J. Noyola
Trustee
0 Year Executive Director
Dr. Cecilia May Moreno
Trustee
4 Years Director of Purchasing
Hector J. Garcia
Trustee
4 Years Manager, La Posada Hotel
Jose R. Perez
Trustee
6 Years Retired Educator
Board of Trustees as of
August 31, 2014
Length of
Service
Occupation
Hector J. Garcia
President
4 Years Manager, La Posada Hotel
Dr. Cecilia May Moreno
Vice President
4 Years Director of Purchasing
John Amaya
Secretary
4 Year Retired
Jose A. Valdez
Trustee
17 Years Retired
Jesus Martinez
Trustee
6 Year Retired Educator
Ricardo Garza
Trustee
2 Year Business Owner
Jose R. Perez
Trustee
6 Year Retired Educator
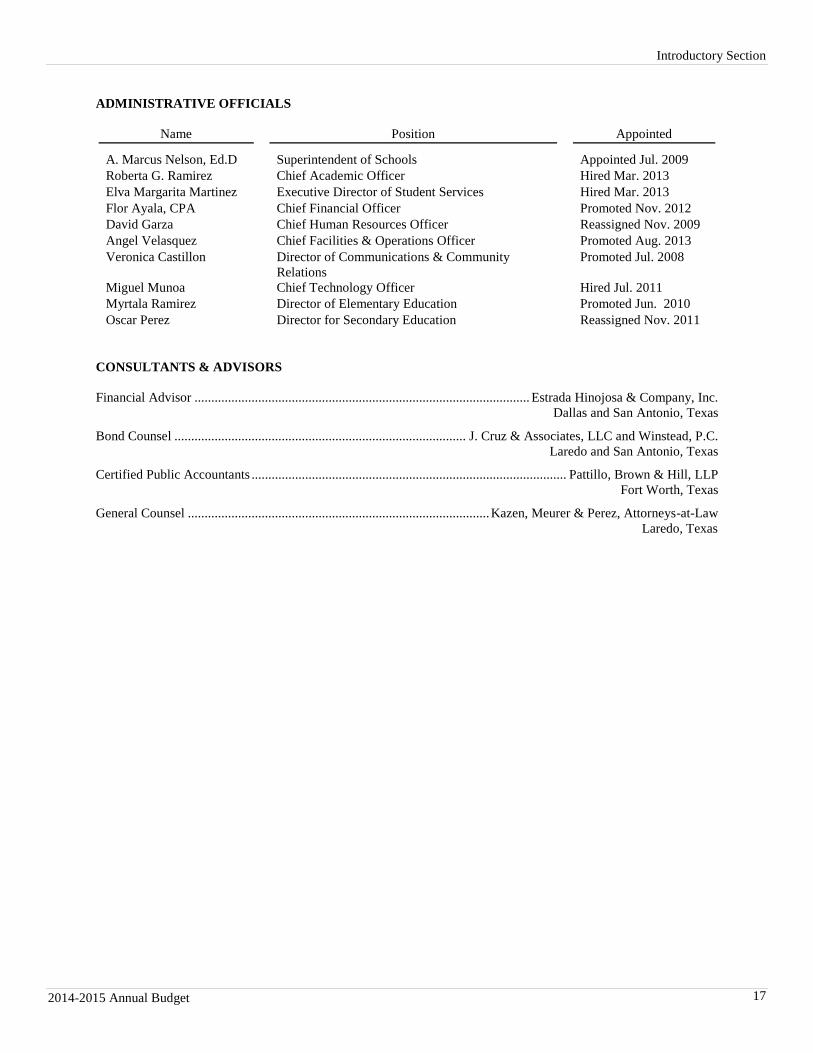
Introductory Section
2014-2015 Annual Budget 17
ADMINISTRATIVE OFFICIALS
Name Position Appointed
A. Marcus Nelson, Ed.D Superintendent of Schools Appointed Jul. 2009 Roberta G. Ramirez Chief Academic Officer Hired Mar. 2013 Elva Margarita Martinez Executive Director of Student Services Hired Mar. 2013 Flor Ayala, CPA Chief Financial Officer Promoted Nov. 2012 David Garza Chief Human Resources Officer Reassigned Nov. 2009 Angel Velasquez Chief Facilities & Operations Officer Promoted Aug. 2013 Veronica Castillon Director of Communications & Community
Relations Promoted Jul. 2008
Miguel Munoa Chief Technology Officer Hired Jul. 2011 Myrtala Ramirez Director of Elementary Education Promoted Jun. 2010 Oscar Perez Director for Secondary Education Reassigned Nov. 2011
CONSULTANTS & ADVISORS
Financial Advisor .................................................................................................... Estrada Hinojosa & Company, Inc.
Dallas and San Antonio, Texas
Bond Counsel ....................................................................................... J. Cruz & Associates, LLC and Winstead, P.C.
Laredo and San Antonio, Texas
Certified Public Accountants .............................................................................................. Pattillo, Brown & Hill, LLP
Fort Worth, Texas
General Counsel .......................................................................................... Kazen, Meurer & Perez, Attorneys-at-Law
Laredo, Texas

Introductory Section
18 Laredo Independent School District
SUPERINTENDENT’S BIOGRAPHY
Marcus Nelson, Ed.D.
Superintendent of Schools
Dr. A. Marcus Nelson is currently Superintendent of Schools for the Laredo
Independent School District. This urban school system serves over 25,500
students on 33 campuses including 20 elementary schools, four middle
schools, three comprehensive high schools, three magnet schools, an
alternative education academy, a nationally recognized Early College High
School located on the campus of Texas A&M International University, and
the new Jose A. Valdez High School, non-traditional high school. Laredo,
Texas is located on the North bank of the Rio Grande River and is the U.S.
principal port of transportation entry into Mexico.
Since his arrival in 2009, Laredo ISD has accomplished several noteworthy
achievements. He has reorganized the central office for higher efficiency,
reduced the district personnel costs by over $2 million, and improved
academic achievement to exceptional levels including having one of the few
exemplary high schools in the State of Texas. In 2010, Laredo ISD reached
unprecedented academic gains with 43% of the schools earning the state’s
top recognized and exemplary ratings. Dr. Nelson has also launched the district's Non-Traditional High School that
is specifically designed to meet the needs of students who have not been successful in LISD comprehensive high
schools. This online credit recovery program personalizes the education for every student and recaptures students
who have dropped out of high school for various reasons.
Nelson elevated the academic rigor in Laredo ISD by creating a college readiness initiative, which improved the
number of Advanced Placement Exams taken by LISD students over 47%. This leadership has also produced
substantial increases in test scores, student attendance, the number of college scholarships, and graduation rates.
The district now provides universal pre-kindergarten for children beginning at three years of age. All high school
students receive a laptop computer. He also created the “Hammer Bowl” which recognizes the oldest football
rivalry in Laredo.
In November, 2013, a bond referendum of $125 million was approved by record-breaking 75% of LISD’s voters.
This transaction has provided the school district with a performing arts center, a swimming pool, a baseball field, a
renovated middle school, and a new elementary school. A few months later, the district’s bond rating was upgraded
to AA- from A+.
Prior to his position at Laredo ISD, Dr. Nelson served as the Chief Academic Officer and second-in-command for
the Judson Independent School District. During his tenure at Judson ISD, Nelson was part of a senior leadership
team that was responsible for quadrupling the number of Recognized/Exemplary campuses according to the Texas
Education Agency. Over the course of his career, he has also served as an elementary, middle, and high school
teacher, middle school vice principal, high school assistant principal, high school principal, and Director of
Secondary Schools.
At each stage of his career, Dr. Nelson has been an agent for change and instructional alignment. As an award-
winning urban Superintendent and nationally renowned former high school principal, Dr. Nelson has inspired
audiences throughout the country with his powerful message of positive thinking, team work, and resiliency. This
San Antonio native has earned several college degrees including an undergraduate degree from Abilene Christian
University, two master’s degrees, and a Doctorate in Educational Administration from Texas A&M University –
Commerce.
Dr. Nelson has found ways to be a leader outside the classroom as well. In 2011, the League of United Latin
American Citizens (LULAC) recognized Dr. Nelson with the Tejano Achiever Award in Laredo, Texas for his
Introductory Section
2014-2015 Annual Budget 19
extraordinary community service. In 2006, Dr. Nelson was awarded the “Change The World” Award from Abilene
Christian University (ACU). This honor was given to 100 alumni that “quietly make a difference in small and large
ways in their communities and throughout the world.” In 2009, he received the coveted Grover C. Morlan Award
given annually by ACU’s Department of Education and Kappa Delta Pi, the education honor society. Recipients are
alumni who have made significant contributions or improvements in the field of education. Dr. Nelson was also
recognized as the 2013 Young Alumnus of the Year at ACU and 2014 Region One Superintendent of the Year.
Dr. Nelson’s commitment to public education is evident in his work with various organizations devoted to
supporting underprivileged students and their communities. He is currently an advisory member of the Board of
Directors for Laredo Boys and Girls Clubs and an active member of the Laredo Kiwanis Club, LULAC, and the
Laredo Chamber of Commerce Board of Directors. While working in Austin area schools, Dr. Nelson served as a
board member for the Boys and Girls Club of the Greater Austin Area and Big Brothers Big Sisters of Central
Texas. In addition, he is a life member of Omega Psi Phi Fraternity, Inc., a fraternal organization dedicated to
uplifting their respective chapter cities.

Introductory Section
20 Laredo Independent School District
BOARD OF TRUSTEES BIOGRAPHIES
Jesus Martinez
District 2, President
Jesus Martinez was elected to Place 2 of the LISD Board of Trustees on
November 4, 2008. He was appointed President of the Board on November
12, 2014. He grew up in the neighborhood he now represents. After
graduating from Martin High School and serving as a medic and
pharmacist in the U.S. Army, Mr. Martinez earned degrees in science
education, school administration, counseling and psychology. He worked
as a science teacher and assistant principal at MHS for over 20 years.
As a businessman, Mr. Martinez was instrumental in developing and
managing The Laredo Ranch Store, U.S. Postal Contract Station,
Apartment Manager and Private Counseling Practice. He has volunteered
his time as a Cub Scout Master, 4-H Club sponsor, elementary school
coach, board member of the LULAC Housing Project and Juvenile
Detention Center. He was president of the LULAC #624 and Laredo
Chapter of the Texas State Teachers Association.
Martinez dedicates most of his spare time to the students of LISD because he believes "Students must be motivated
to appreciate education before effective learning can be achieved." Mr. Martinez is the school board trustee for
Daiches Elementary School, Dovalina Elementary School and Macdonell School.
Jose A. Valdez
District 1, Vice President
Jose A. Valdez has been a member of the Laredo ISD School Board of
Trustees since 1997. A former Laredo City Council Member, Mr. Valdez is
an active member of the community. He was named Vice President of the
Board on November 12, 2014.
He is also the former South Texas Coordinator of the Retired Senior
Volunteer Program, or RSVP. Mr. Valdez’s work experience includes
serving as Executive Director of the Webb County Community Action
Agency, Deputy Director of the Texas Migrant Council, and Executive
Director of the Minnesota Migrant Council.
He is married to the former Romana Castillo. They have two sons, and two
daughters, and 12 grandchildren. Mr. Valdez earned his Bachelors degree in
2012.
“Parental involvement is critical to student success,” believes Mr. Valdez. “We invite our parents to become active
participants in their child’s education.”

Introductory Section
2014-2015 Annual Budget 21
Ricardo Garza
District 4, Secretary
Ricardo “Rick” Garza was elected to the Laredo ISD Board of Trustees
for District 4 in November, 2012. He was named Board Secretary on
November 12, 2014.
A product of LISD and a 1981 graduate of Nixon High School, Garza
received a bachelor’s in Science Degree from Southwest Texas State
University in 1986. Mr. Garza currently is owner/operator of Twins
Mechanical, Inc.
An active civic leader, Garza has volunteered in various leadership
positions with the Laredo Under Seven Flags Rotary Club (Paul Harris
Fellow), City of Laredo Airport Committee, Laredo Beautification
Committee, City of Laredo Transportation Committee, and the Laredo
Center for the Arts. He also served as founding member of the
Washington’s Birthday Celebration Association/Streets of Laredo
Jamboozie Celebration and Laredo Proud Campaign.
Mr. Garza and his wife, Adelina Flores Garza, have two children, Hannah Victoria and Sarah Sophia.
“I’m honored to be serving the children of our community,” Garza said. “It is my obligation as a member of the
LISD Board of Trustees to make sure that all of our students have access to a quality education.”
Mr. Garza represents District 4 which includes Alma Pierce Elementary, K. Tarver Elementary, and Nixon High
Schools.
Hector J. Noyola
District 3, Trustee
Hector J. Noyola was elected to the LISD Board of Trustees for District 3 in
November, 2014.
A graduate of Martin High School, Noyola received a Bachelor’s of Science
in Education from Texas A&I Kingsville in 1965. Mr. Noyola is currently
the Executive Director of the Boys and Girls Clubs of Laredo.
An active member of the community, Noyola has given his time and talents
to the Texas Workforce, Angel of Hope, Inc., Airport Advisory Board,
LULAC, and the Optimist Club.
His three children, Veronica Yvette, Clarissa Laura, and Hector Jr., are all
LISD educators.
Mr. Noyola is the school board trustee for District 3, which includes Bruni
Elementary School, J.C. Martin Elementary School, and Sanchez/Ochoa
Elementary School.

Introductory Section
22 Laredo Independent School District
Dr. Cecilia May Moreno
District 5, Trustee
Dr. Cecilia Moreno was elected to the Laredo ISD Board of Trustees in
November, 2010.
Dr. Moreno is currently employed with Webb County as a Purchasing
Agent. A former educator, Dr. Moreno worked at LISD for 39 years, and
served as Superintendent of Schools for Carrizo Springs Consolidated
Independent School District for five years, giving her a total of 44 years of
public school experience. She was a Laredo City Council member for 10
years and served as the mayor pro-tem for the city.
In 1997, former Texas Governor George Bush appointed Dr. Moreno to the
Teachers Retirement System of Texas Board of Trustees. In May, 2007,
The Texas State Senate confirmed the appointment of Dr. Moreno, to the
Texas Woman’s University (TWU) Board of Regents. She will serve on
the TWU governing board until Feb. 1, 2013.
Dr. Moreno was named a TWU Distinguished Alumna in 2003 and has been inducted into the Laredo Commission
for Women’s Hall of Fame and the LULAC Hispanic Heritage Hall of Fame. She is a member of the Texas
Association of School Administrators, LULAC Council No. 12, Webb County Heritage Foundation, and the Laredo
Center for the Arts. Dr. Moreno’s accomplishments were included in the Smithsonian Institute’s Traveling Exhibit
entitled, “Our Journeys/Our Stories.” In this exhibit, TAMIU Portraits of Alumni Achievements showcased the
university’s outstanding alumni who achieved their dreams and serve as role models and mentors to the next
generations of students.
A graduate of Martin High School, Dr. Moreno earned a bachelor’s and master’s degree from TWU, an MBA in
Accounting from Laredo State University and her doctorate of education from Texas A&M University at Kingsville.
She is married to Samuel Moreno, a former Memorial Middle School principal. They have five children and 10
grandchildren.
She will represent Gallego Elementary, Heights Elementary, and Memorial Middle Schools. "It is a privilege to
serve the needs of our local youth as a member of the Board of Trustees for District 5. As a career educator,
counselor, mother and grandmother, I understand the importance of receiving a quality education. My inspiration
are the children who fill our classrooms and the desire they have to participate in school activities. My greatest
desire is to see all our students graduate from high school and continue with the higher education necessary for their
career choice. May they hold great memories of their LISD school years and may the school involvement they
experience help them become model contributing community members," stated Moreno.

Introductory Section
2014-2015 Annual Budget 23
Hector J. Garcia
District 6, Trustee
Hector “Tito” Garcia was elected to the Laredo ISD Board of Trustees in
November, 2010.
A graduate of J.W. Nixon High School, Mr. Garcia is currently employed
as the assistant general manager at La Posada Hotel. For more than 25
years, he worked for both LISD and UISD.
Mr. Garcia served as a Laredo City Council member from 2002-2010.
While on the City Council, he worked on issues and concerns important to
the neighborhoods in his district. He understands the importance of
education and the need to provide students with the opportunity to attend
higher education.
An active member of the community, Garcia has volunteered his time to
events such as the Border Olympics, Jalapeno Festival, Borderfest,
Jamboozie and the Washington’s Birthday Celebration. Garcia also
founded the Sister Cities Youth Advisory Committee.
"I am committed to providing the neighborhoods of LISD with every available resource to secure each student with
every opportunity to receive a quality education," stated Garcia. As the District 6 representative, Mr. Garcia
represents D.D. Hachar Elementary School, Milton Elementary School, Ryan Elementary School, and Lamar
Middle School.
Jose R. Perez
District 7, Trustee
Jose R. Perez was elected to the Laredo ISD Board of Trustees for District
7 in November, 2008, and was elected President of the Board January,
2012.
A former LISD educator of 36 years, Perez received a bachelor’s degree in
Bilingual Education from Texas A&I University in Laredo. He also holds
a master’s degree in Educational Administration from Laredo State
University. He began his career with the district as a teacher at Daiches
Elementary and Lamar Middle Schools. He served as assistant principal at
M.S. Ryan Elementary School.
Perez also worked as an administrator with the Division of Operations and
was Director of Transportation. Most recently, he was the Director of the
Fixed Assets Department with the district. He also served as a member of
the Laredo City Council from 1990 to 1998.
Mr. Perez and his wife, Idalia, have five children, Monica, Joe, Rebecca,
Agapito, and Jerry. “Our students deserve the best education possible,” stated Perez. “As a member of the board, I
promise that I will work tirelessly with the district’s administration, faculty, and staff to help the students achieve
their goals.”
Mr. Perez is the school board trustee for District 7, which includes Kawas Elementary School, Ligarde Elementary
School, Santo Niño Elementary School, Zachry Elementary School, Cigarroa Middle School, and Cigarroa High
School.
Introductory Section
24 Laredo Independent School District
Page left blank intentionally.
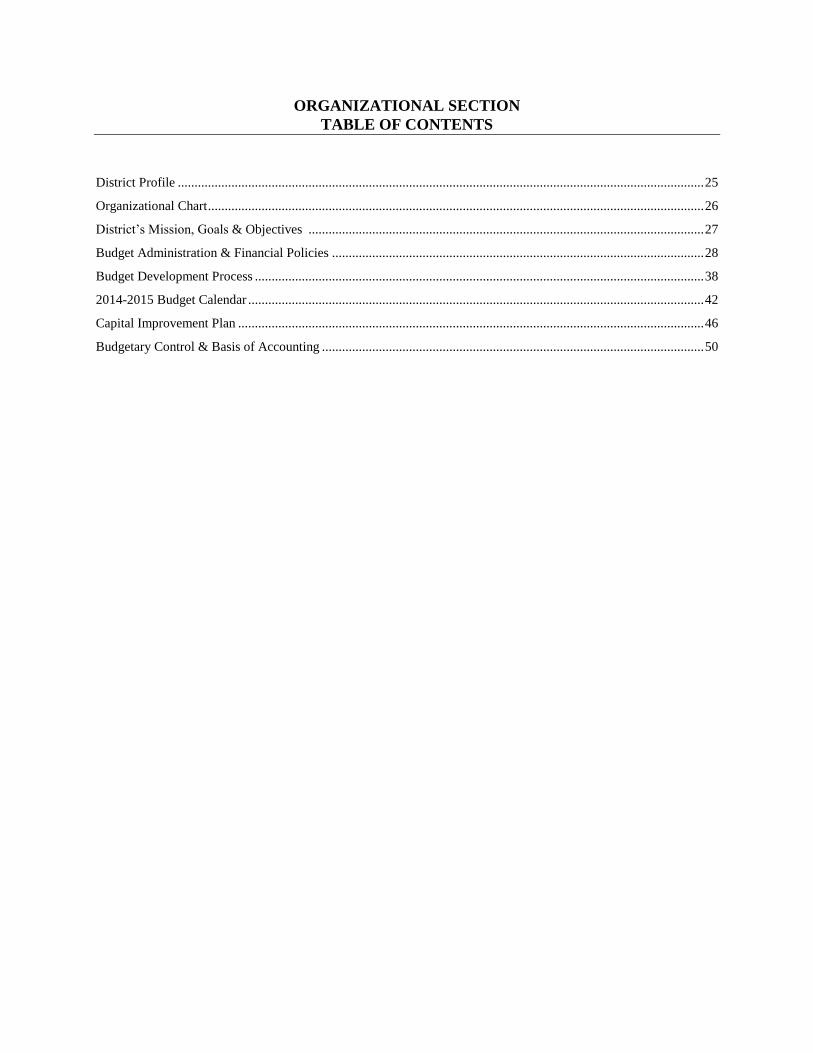
ORGANIZATIONAL SECTION
TABLE OF CONTENTS
District Profile ............................................................................................................................................................. 25
Organizational Chart .................................................................................................................................................... 26
District’s Mission, Goals & Objectives ...................................................................................................................... 27
Budget Administration & Financial Policies ............................................................................................................... 28
Budget Development Process ...................................................................................................................................... 38
2014-2015 Budget Calendar ........................................................................................................................................ 42
Capital Improvement Plan ........................................................................................................................................... 46
Budgetary Control & Basis of Accounting .................................................................................................................. 50
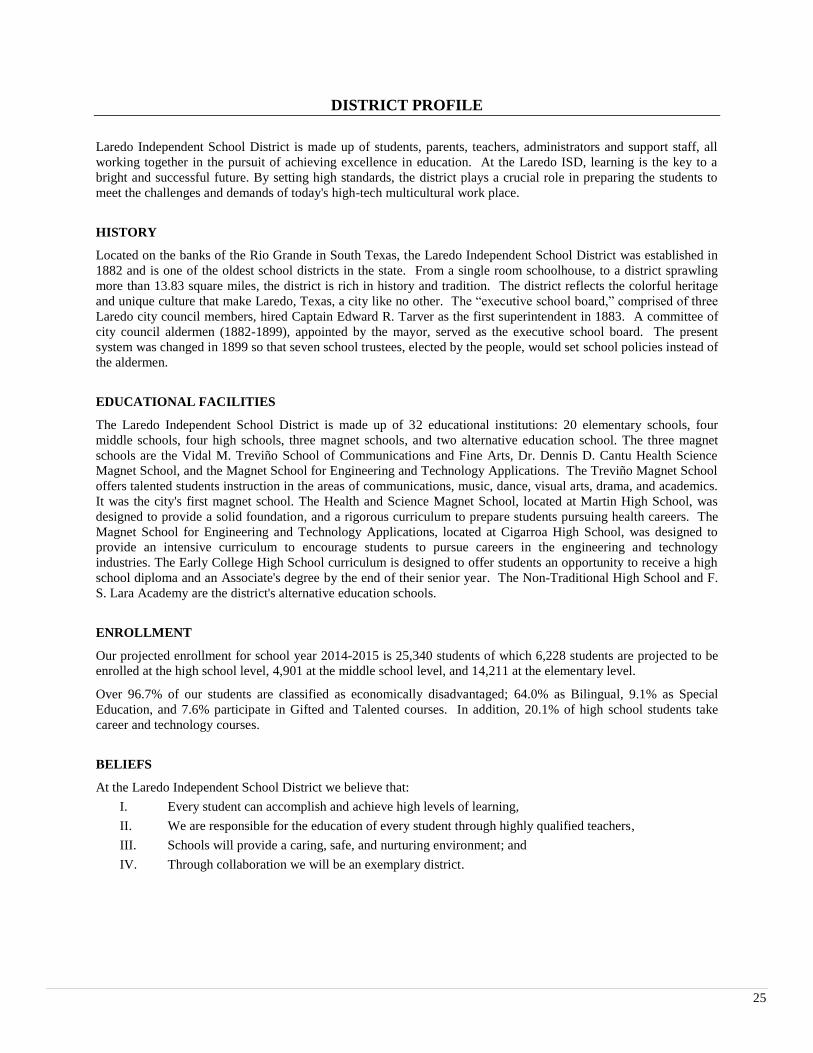
25
DISTRICT PROFILE
Laredo Independent School District is made up of students, parents, teachers, administrators and support staff, all
working together in the pursuit of achieving excellence in education. At the Laredo ISD, learning is the key to a
bright and successful future. By setting high standards, the district plays a crucial role in preparing the students to
meet the challenges and demands of today's high-tech multicultural work place.
HISTORY
Located on the banks of the Rio Grande in South Texas, the Laredo Independent School District was established in
1882 and is one of the oldest school districts in the state. From a single room schoolhouse, to a district sprawling
more than 13.83 square miles, the district is rich in history and tradition. The district reflects the colorful heritage
and unique culture that make Laredo, Texas, a city like no other. The “executive school board,” comprised of three
Laredo city council members, hired Captain Edward R. Tarver as the first superintendent in 1883. A committee of
city council aldermen (1882-1899), appointed by the mayor, served as the executive school board. The present
system was changed in 1899 so that seven school trustees, elected by the people, would set school policies instead of
the aldermen.
EDUCATIONAL FACILITIES
The Laredo Independent School District is made up of 32 educational institutions: 20 elementary schools, four
middle schools, four high schools, three magnet schools, and two alternative education school. The three magnet
schools are the Vidal M. Treviño School of Communications and Fine Arts, Dr. Dennis D. Cantu Health Science
Magnet School, and the Magnet School for Engineering and Technology Applications. The Treviño Magnet School
offers talented students instruction in the areas of communications, music, dance, visual arts, drama, and academics.
It was the city's first magnet school. The Health and Science Magnet School, located at Martin High School, was
designed to provide a solid foundation, and a rigorous curriculum to prepare students pursuing health careers. The
Magnet School for Engineering and Technology Applications, located at Cigarroa High School, was designed to
provide an intensive curriculum to encourage students to pursue careers in the engineering and technology
industries. The Early College High School curriculum is designed to offer students an opportunity to receive a high
school diploma and an Associate's degree by the end of their senior year. The Non-Traditional High School and F.
S. Lara Academy are the district's alternative education schools.
ENROLLMENT
Our projected enrollment for school year 2014-2015 is 25,340 students of which 6,228 students are projected to be
enrolled at the high school level, 4,901 at the middle school level, and 14,211 at the elementary level.
Over 96.7% of our students are classified as economically disadvantaged; 64.0% as Bilingual, 9.1% as Special
Education, and 7.6% participate in Gifted and Talented courses. In addition, 20.1% of high school students take
career and technology courses.
BELIEFS
At the Laredo Independent School District we believe that:
I. Every student can accomplish and achieve high levels of learning,
II. We are responsible for the education of every student through highly qualified teachers,
III. Schools will provide a caring, safe, and nurturing environment; and
IV. Through collaboration we will be an exemplary district.
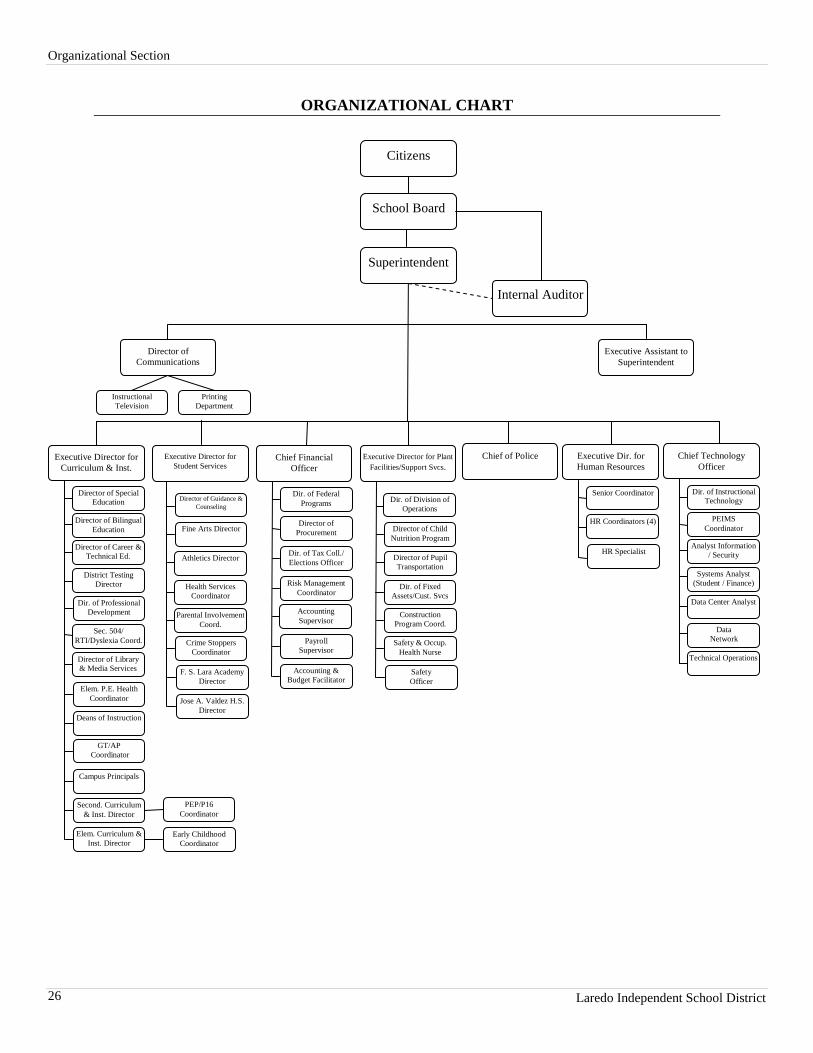
Organizational Section
Laredo Independent School District 26
ORGANIZATIONAL CHART
Executive Director for Plant
Facilities/Support Svcs.
Dir. of Division of
Operations
Director of Child
Nutrition Program
Dir. of Fixed
Assets/Cust. Svcs
Construction
Program Coord.
Director of Pupil
Transportation
Chief Technology
Officer Chief Financial
Officer
Dir. of Federal
Programs
Director of
Procurement
Risk Management
Coordinator
Dir. of Tax Coll./
Elections Officer
Executive Director for
Curriculum & Inst.
Director of Bilingual
Education
Health Services
Coordinator
Sec. 504/
RTI/Dyslexia Coord.
Fine Arts Director
Early Childhood
Coordinator
District Testing
Director
Director of Career &
Technical Ed.
Director of Special
Education
Director of Library
& Media Services
Citizens
School Board
Internal Auditor
Superintendent
Director of
Communications
Instructional
Television
Printing
Department
Elem. P.E. Health
Coordinator
PEP/P16
Coordinator
GT/AP
Coordinator
Deans of Instruction
Campus Principals
Elem. Curriculum &
Inst. Director
PEIMS
Coordinator
Systems Analyst
(Student / Finance)
Data Center Analyst
Data
Network
Analyst Information
/ Security
Dir. of Instructional
Technology
Technical Operations
Safety & Occup.
Health Nurse
Executive Dir. for
Human Resources
Senior Coordinator
HR Specialist
Executive Assistant to
Superintendent
Accounting
Supervisor
Payroll
Supervisor
Accounting &
Budget Facilitator
Dir. of Professional
Development
Second. Curriculum
& Inst. Director
Safety
Officer
Director of Guidance &
Counseling
Executive Director for
Student Services
Athletics Director
Parental Involvement
Coord.
Crime Stoppers
Coordinator
F. S. Lara Academy
Director
Jose A. Valdez H.S.
Director
HR Coordinators (4)
Chief of Police
Organizational Section
2014-2015 Annual Budget 27
DISTRICT’S MISSION, GOALS & OBJECTIVES
MISSION
The mission of the Laredo Independent School District is to ensure that all students achieve their potential and
graduate as bilingual, bi-literate, and be responsible adults with the skills to succeed in higher education, the
workforce, or the military.
VISION
Our schools are safe and caring environments that motivate and prepare students to contribute and excel in life. They
build on the strong and expanding foundation already established by families involved in their children's learning.
Our students are highly successful. They are critical thinkers and effective problem solvers who are confident, self-
motivated, and actively involved in our local and global community. Our community actively supports the learning
process. It provides full access to human, technological, and fiscal resources. This partnership demonstrates total
confidence in our school system and holds it to the highest educational standards.
DISTRICT GOALS
Goal I The school district will continue to develop, implement and monitor a quality educational program
including curriculum, instruction, assessment and professional development which considers the specific
needs of each Laredo I.S.D. student and the community, supports high academic standards and addresses
state and federal accountability requirements.
Goal II The school district will provide all students with a safe and nurturing learning environment that promotes
attendance, character building and high achievement.
Goal III The school district will encourage and promote a climate that engages families in the education of their
children and establish a process that cultivates open and timely communication with our public.
Goal IV The school district shall implement a Health and Wellness Program designed to improve the general
health of children and adults by promoting practices that lead to living healthy, active lifestyles.
Goal V The school district will continue to seek all possible avenues to contain and/or reduce costs of all
initiatives in order to best represent the financial interests of the taxpayers. In addition, the school district
will effectively manage financial resources, and conduct program evaluations that will support providing
quality educational experiences for LISD students.
Goal VI The school district will actively pursue and hire highly qualified personnel and provide support that
encourages growth, improvement and increased student achievement
THE FINANCIAL PLAN WITHIN THE STRATEGIC PLAN
The financial plan is embedded within Goal V of the strategic plan and the major organizational tasks are as follows:
1. To implement an effective accounting internal controls system that assures compliance with all laws and
regulations,
2. To develop and submit a balanced budget,
3. To maintain the fund balance to two months operating costs,
4. To maintain an updated inventory each year for fixed assets,
5. To implement a system of compliance with all grant and program requirements at the campus level, and
6. To continue to earn the Certificate of Achievement in Financial Reporting and Budget.
Organizational Section
Laredo Independent School District 28
BUDGET ADMINISTRATION & FINANCIAL POLICIES
LEGAL REQUIREMENTS FOR BUDGETS
Legal requirements for school district budgets are formulated by the state, the Texas Education Agency (TEA), and
the local district. In addition to these requirements, individual school districts also may have their own legal
requirements for budget preparation. Additional legal requirements also may be imposed by state and federal grants;
however, this section deals only with state legal mandates, TEA legal requirements and local district requirements
for basic budget development and submission.
STATEMENT OF TEXAS LAW
Sections 44.002 through 44.006 of the Texas Education Code establish the legal basis for budget development in
school districts. The following items summarize the legal requirements from the code:
The superintendent is the budget officer for the district and prepares or causes the budget to be prepared.
The district budget must be prepared by a date set by the state board of education, currently August 31. In
order for the budget to be adopted by the board of trustees, inclusive of amendments, the district budget
must be prepared by August 20.
The president of the board of trustees must call a public meeting of the board of trustees, giving ten days
public notice in a newspaper, for the adoption of the district budget. Any taxpayer in the district may be
present and participate in the meeting.
Concurrently with the publication of notice of the budget above, a school district must post a summary of
the proposed budget on the school district’s Internet website or in the district’s central administrative office
if the school district has no Internet website. The budget summary must include a comparison to the
previous year’s actual spending and information relating to per-student and aggregate spending on
instruction, instructional support, central administration, district operations, debt service, and any other
category designated by the commissioner. (Section 44.0041, TEC).
No funds may be expended in any manner other than as provided for in the adopted budget. The board
does have the authority to amend the budget or adopt a supplementary emergency budget to cover
unforeseen expenditures.
The budget must be prepared in accordance with GAAP (generally accepted accounting principles) and
state guidelines.
The budget must be legally adopted before the adoption of the tax rate unless the district elects to adopt a
tax rate before receiving the certified appraisal roll for the district as provided by Section 26.05(g), Tax
Code (see the following point if the district elects to adopt the tax rate first). Additionally, a school district
must publish a revised notice and hold another public meeting before the district may adopt a tax rate that
exceeds the following: (1) The rate proposed in the notice prepared using the estimate; or (2) The district’s
rollback rate determined under Section 26.08, Tax Code, using the certified appraisal roll.
If a school district elects to adopt a tax rate before adopting a budget, the district must publish notice and
hold a meeting for the purpose of discussing the proposed tax rate as provided by TEC 44.004. Following
adoption of the tax rate, the district must publish notice and hold another public meeting before the district
may adopt a budget. The comptroller shall prescribe the language and format to be used in the notices. The
school district may use the certified estimate of taxable value in preparing a notice.
HB 3, 81st Regular Session, added TEC 39.084 which requires that on final approval of the budget by the
school board, the school district shall post on the district’s internet website a copy of the adopted budget.
The website must prominently display the electronic link to the adopted budget until the third anniversary
of the date the budget was adopted.
Organizational Section
2014-2015 Annual Budget 29
TEXAS EDUCATION AGENCY (TEA) LEGAL REQUIREMENTS
TEA has developed additional requirements for school district budget preparation as follows:
The budget must be adopted by the board of trustees, inclusive of amendments, no later than August 31.
Minutes from district board meetings will be used by TEA to record adoption of and amendments to the
budget.
Budgets for the General Fund, the Food Service Fund (whether accounted for in the General Fund, a
Special Revenue Fund or Enterprise Fund) and the Debt Service Fund must be included in the official
district budget (legal or fiscal year basis). These budgets must be prepared and approved at least at the
fund and function levels to comply with the state’s legal level of control mandates.
The officially adopted district budget, as amended, must be filed with TEA through PEIMS (Public
Education Information Management System) by the date prescribed in the annual system guidelines.
Revenues, other sources, other uses, and fund balances must be reported by fund, object (at the fourth
level), fiscal year, and amount. Expenditures must be reported by fund, function, object (at the second
level), organization, fiscal year, program intent and amount. These requirements are discussed in further
detail in the Data Collection and Reporting module.
A school district must amend the official budget before exceeding a functional expenditure category, i.e.,
instruction, administration, etc., in the total district budget. The annual financial and compliance report
should reflect the amended budget amounts on the schedule comparing budgeted and actual amounts. The
requirement for filing the amended budget with TEA is satisfied when the school district files its Annual
Financial and Compliance Report.
LISD FINANCIAL POLICIES
In addition to state legal requirements, LISD has established its own requirements for annual budget preparation.
The District recognizes the importance of maintaining its financial integrity; therefore, it has developed this policy
to support its mission and its goals and objectives. The district’s fiscal policies dictate budgetary requirements that
go beyond those required by the Texas Education Code and TEA. These policies are delineated below.
Fiscal Policy & Objectives
Financial Stability
In seeking to fulfill its mission, the District shall maintain a high level of financial stability and shall
not compromise the long-term financial integrity to achieve short-term benefits.
In an effort to provide adequate cash flow for its operations, the District shall maintain an unassigned
fund balance equal to a minimum of two months of operations costs.
To achieve or maintain this goal, the Superintendent and chief financial officer are instructed to
implement the following financial plan:
1. Develop and submit for Board approval a balanced budget with input from site-based decision-
making (SBDM) committees and instructional programs.
2. Develop staffing patterns and funding formulas based on a per pupil basis.
3. Restrict any surplus funds towards unassigned fund balance.
Funds from Operations
Funds from operations should provide adequate funds to support its:
1. Instructional programs
2. Capital programs
3. Debt service programs
Organizational Section
Laredo Independent School District 30
Revenue
Revenue levels shall be evaluated with staff recommendations yearly in consideration of:
1. Bond ratings,
2. Facility and construction requirements,
3. Current business conditions (local economy),
4. Economic projections (state economy, legislative issues, etc.),
5. Student growth assumptions,
6. The projected level of expenditures.
General Operating Fund Expenditures
General fund expenditures shall maintain the following priorities of obligation:
1. Payments of all legal and reasonable expenditures relating to maintenance and operations of the
District’s operating fund.
2. Payments to meet all debt service requirements of outstanding bond indebtedness including the interest
and sinking fund.
3. Payments to special revenue funds that require a matching for federal or state grants, including the
food service fund, the athletic fund, and the construction fund.
4. All net surplus after payment of items 1 to 3 above may be used to fund necessary capital equipment
purchases, facility expansion, and renovation. All remaining funds will go toward maintaining a
budgeted ending cash balance (unassigned balance) which equates to at least two months of operating
costs. This amount would be determined by first adding budgeted operations and maintenance costs
plus debt service requirements. This total would be divided by 12 and then multiplied by two to
calculate the two months operating costs.
Long Term Financing
In the absence of surplus funds in item 4 above, the District will utilize long term financing for capital projects
and equipment. Available mechanisms include the following:
1. Public Property Finance Contractual Obligations (PPFCO)
2. General Obligations Bonds
3. Time Warrants
4. Delinquent Tax Notes
5. Any other legal mechanism
Short Term Financing
The District will strive to minimize its short term financing by maintaining a two month undesignated fund
balance. Based on cash flow projections, the business manager may recommend to the Board to utilize short
term financing to satisfy the cash flow requirements of the District. Available mechanisms include the
following:
1. Tax anticipation notes
2. Tax warrants
3. Delinquent tax notes
Organizational Section
2014-2015 Annual Budget 31
Reporting
The District will prepare reports of financial operations as follows:
1. A monthly operating and financial report, requiring review by the finance committee and/or the Board
as the Board deems necessary.
2. An annual financial plan (budget) detailing revenues, expenditures, and capital additions presented for
approval prior to September 1 of each year. Midyear analysis and review shall be presented to the
Board for approval.
3. An annual audit by an outside professional auditing firm that would include all necessary details in
reconciling all of the year’s financial operation. The audit report will be submitted for review and
approval to the Board after the end of the fiscal year.
Fund Balance
The District shall report fund balances for governmental funds in classifications based primarily on the extent to
which the District is bound to honor constraints on the specific purposes for which amounts in those funds can
be spent.
Nonspendable and Restricted
The nonspendable classification shall represent assets that will be consumed or must remain intact, such as
inventories of supplies and endowments, and therefore cannot be converted to cash. Provisions of law,
contracts, and grants shall specify how fund resources can be used in the restricted classification. The nature of
these two classifications precludes a need for a policy from the Board. However, the Board has adopted rules
for the three unrestricted classifications of committed, assigned, and unassigned.
Committed
From time to time, the Board may commit fund balances by a majority vote in a scheduled meeting. This
commitment may be modified or rescinded by a majority vote in a scheduled meeting. Board commitments
shall not exceed the amount of fund balance that is greater than the sum of nonspendable and restricted fund
balances, as this practice would commit funds that the District does and would not have. Commitments may be
made for facility expansion or renovation, program modifications, wage and salary adjustments, financial
cushions such as a rainy day fund, and other purposes determined by the Board.
Assigned
Assigned fund balance comprises amounts intended to be used by the government for specific purposes. Funds
set aside for carryover appropriations, early termination notification, contingencies, and projected budgetary
deficit in the subsequent year’s budget are examples to be included in the assigned category. Any funds set
aside must be reported to the Board. The Board has authority to remove or change the assignment of the funds
with a majority vote. The assignment need not be made before the end of the reporting period, but rather may
be made any time prior to the issuance of the financial statements.
Unassigned
Unassigned fund balance is the residual classification for the general fund and shall include all amounts not
contained in the other classifications. Unassigned amounts represent the resources available for future
spending. The District’s goal to maintain two months of operating costs shall be identified as unassigned fund
balance. The general fund should be the only fund that reports a positive unassigned fund balance amount.
However, in funds other than the general fund, it may be necessary to report a negative unassigned fund balance
amount if expenditures incurred for specific purposes exceeded the amounts restricted, committed, or assigned
to those purposes.
Delegation to Make Assignments
The Board shall retain the authority to assign funds.
The Board may delegate authority to specified persons or groups to make assignments of certain fund balances
by a majority vote in a scheduled meeting. The Board may modify or rescind its delegation of authority by the
Organizational Section
Laredo Independent School District 32
same action. The authority to make assignments shall be in effect until modified or rescinded by the Board by a
majority vote in a scheduled meeting.
Order of Expenditures
When the District incurs expenditures that can be made from either restricted or unrestricted balances, the
expenditures shall be charged to restricted balances. When the District incurs expenditures that can be made
from either committed, assigned, or unassigned balances, the expenditures shall be charged first to committed
balances, then to assigned balances, and then to unassigned balances.
Investments
Investment Authority
District depository and investment authority is established within the office of the Superintendent. By the
authority of the Board, the Superintendent, the business manager, the accounting director, and a senior
accountant/investor are designated as the District’s investment officers. The investment officers are responsible
for depositing funds, investing such funds, ensuring that each investment has the proper authorized collateral,
monitoring investments, ensuring the security of the District’s principal and interest, receiving and reporting
principal and interest at the maturity of each investment, and providing the proper documentation and reports on
such investments to the Superintendent and the Board in accordance with the District’s written investment
policy and generally accepted accounting procedures.
The investment officers shall be bonded or shall be covered under a fidelity insurance policy. All investment
transactions except investment pool funds and mutual funds shall be executed on a delivery-versus-payment
basis.
Approved Investment Instruments
From those investments authorized by law and described further in CDA(LEGAL), the Board shall permit
investment of District funds in only the following investment types, consistent with the strategies and maturities
defined in this policy:
1. Obligations of, or guaranteed by, governmental entities as permitted by Government Code 2256.009.
2. Certificates of deposit and share certificates as permitted by Government Code 2256.010.
3. Fully collateralized repurchase agreements permitted by Government Code 2256.011.
4. A securities lending program as permitted by Government Code 2256.0115.
5. Banker's acceptances as permitted by Government Code 2256.012.
6. Commercial paper as permitted by Government Code 2256.013.
7. No-load money market mutual funds and no-load mutual funds as permitted by Government Code
2256.014.
8. A guaranteed investment contract as an investment vehicle for bond proceeds provided it meets the
criteria and eligibility requirements established by Government Code 2256.015.
9. Public funds investment pools as permitted by Government Code 2256.016.
Safety and Investment Management
The main goal of the investment program is to ensure its safety and maximize financial returns within current
market conditions in accordance with this policy. Investments shall be made in a manner that ensures the
preservation of capital in the overall portfolio, and offsets during a 12-month period any market price losses
resulting from interest-rate fluctuations by income received from the balance of the portfolio. No individual
investment transaction shall be undertaken that jeopardizes the total capital position of the overall.
Organizational Section
2014-2015 Annual Budget 33
Liquidity and Maturity
Any internally created pool fund group of the District shall have a maximum dollar weighted maturity of less
than 365 days. The maximum allowable stated maturity of any other individual investment owned by the
District shall not exceed two and one-half years from the time of purchase. The Board may specifically
authorize a longer maturity for a given investment, within legal limits.
The District’s investment portfolio shall have sufficient liquidity to meet anticipated cash flow requirements.
Diversity
The investment portfolio shall be diversified in terms of investment instruments, maturity scheduling, and
financial institutions to reduce risk of loss resulting from over concentration of assets in a specific class of
investments, specific maturity, or specific issuer.
Monitoring Market Prices
The investment officers shall monitor the investment portfolio and shall keep the Board informed of significant
declines in the market value of the District's investment portfolio. Information sources may include
financial/investment publications and electronic media, available software for tracking investments, depository
banks, commercial or investment banks, financial advisors, and representatives/advisors of investment pools or
money market funds. Monitoring shall be done monthly or more often as economic conditions warrant by using
appropriate reports, indices, or benchmarks for the type of investment.
Monitoring Rating Changes
In accordance with Government Code 2256.005(b), the investment officer shall develop a procedure to monitor
changes in investment ratings and to liquidate investments that do not maintain satisfactory ratings.
Funds/Strategies
Investments of the following fund categories shall be consistent with this policy and in accordance with the
strategy defined below.
Operating Funds – Investment strategies for operating funds (including any commingled pools
containing operating funds) shall have as their primary objectives safety, investment liquidity, and
maturity sufficient to meet anticipated cash flow requirements.
Agency Funds – Investment strategies for agency funds shall have as their objectives safety,
investment liquidity, and maturity sufficient to meet anticipated cash flow requirements.
Debt Service Funds – Investment strategies for debt service funds shall have as their objective
sufficient investment liquidity to timely meet debt service payment obligations in accordance with
provisions in the bond documents. Maturities longer than eighteen months are authorized provided
legal limits are not exceeded.
Capital Projects – Investment strategies for capital project funds shall have as their objective sufficient
investment liquidity to timely meet capital project obligations. Maturities longer than eighteen months
are authorized provided legal limits are not exceeded.
Safekeeping and Custody
The District shall retain clearly marked receipts providing proof of the District's ownership. The District may
delegate, however, to an investment pool the authority to hold legal title as custodian of investments purchased
with District funds by the investment pool.
Organizational Section
Laredo Independent School District 34
Brokers/Dealers
Prior to handling investments on behalf of the District, brokers/dealers must submit required written documents
in accordance with law. Representatives of brokers/dealers shall be registered with the Texas State Securities
Board and must have membership in the Securities Investor Protection Corporation (SIPC), and be in good
standing with the Financial Industry Regulatory Authority.
Soliciting Bids for CD's
In order to get the best return on its investments, the District may solicit bids for certificates of deposit in
writing, by telephone, or electronically, or by a combination of these methods.
Interest Rate Risks
To reduce exposure to changes in interest rates that could adversely affect the value of investments, the District
shall use final and weighted-average-maturity limits and diversification.
The District shall monitor interest rate risk using weighted average maturity and specific identification.
Internal Controls
A system of internal controls shall be established and documented in writing and must include specific
procedures designating who has authority to withdraw funds. Also, they shall be designed to protect against
losses of public funds arising from fraud, employee error, misrepresentation by third parties, unanticipated
changes in financial markets, or imprudent actions by employees and officers of the District. Controls deemed
most important shall include:
1. Separation of transaction authority from accounting and recordkeeping and electronic transfer of
funds.
2. Avoidance of collusion.
3. Custodial safekeeping.
4. Clear delegation of authority.
5. Written confirmation of telephone transactions.
6. Documentation of dealer questionnaires, quotations and bids, evaluations, transactions, and rationale.
7. Avoidance of bearer-form securities.
These controls shall be reviewed by the District's independent auditing firm.
Portfolio Report
In addition to the quarterly report required by law and signed by the District's investment officer, a
comprehensive report on the investment program and investment activity shall be presented annually to the
Board.
Ad-Valorem Taxes
Discounts
Discounts for the early payment of property taxes shall apply regardless of the date on which the District mails
its tax bills, unless the taxes were calculated too late for the discount to be available. The following property
tax discounts shall apply:
1. Three percent if the tax is paid in October or earlier.
2. Two percent if the tax is paid in November.
3. One percent if the tax is paid in December
Organizational Section
2014-2015 Annual Budget 35
Split Payments
Split payment of taxes shall be allowed in accordance with statutory provisions.
Purchasing & Acquisition
Purchasing Authority
The Board delegates to the Superintendent or designee the authority to determine the method of purchasing, in
accordance with CH (LEGAL), and to make budgeted purchases. However, any purchase that costs or
aggregates to a cost of $25,000 or more shall require Board approval before a transaction may take place.
Competitive Bidding
If competitive bidding is chosen as the purchasing method, the Superintendent or designee shall prepare bid
specifications. All bids shall be submitted in sealed envelopes, plainly marked with the name of the bidder and
the time of opening. All bidders shall be invited to attend the bid opening. Any bid may be withdrawn prior to
the scheduled time for opening. Bids received after the specified time shall not be considered. The District may
reject any and all bids.
Competitive Sealed Proposals
If competitive sealed proposals are chosen as the purchasing method, the Superintendent or designee shall
prepare the request for proposals and/or specifications for items to be purchased. All proposals shall be
submitted in sealed envelopes, plainly marked with the name of the proposer and the time of opening. Proposals
received after the specified time shall not be considered. Proposals shall be opened at the time specified, and all
proposers shall be invited to attend the proposal opening. Proposals may be withdrawn prior to the scheduled
time of opening. Changes in the content of a proposal, and in prices, may be negotiated after proposals are
opened. The District may reject any and all proposals.
Responsibility for Debts
The Board shall assume responsibility for debts incurred in the name of the District so long as those debts are
for purchases made in accordance with adopted Board policy and current administrative procedures. The Board
shall not be responsible for debts incurred by persons or organizations not directly under Board control; persons
making unauthorized purchases shall assume full responsibility for all such debts.
Purchase Commitments
All purchase commitments shall be made by the Superintendent or designee on a properly drawn and issued
purchase order, in accordance with administrative procedures.
Personnel
New Positions
Any new positions of employment shall be prominently described and set out in the budget for the fiscal year in
which the position is created and shall be approved by the Board at the time that the budget is approved. Notice
of vacancies shall be posted at campuses but not be limited to campuses.
New positions created after approval of the budget shall be approved by the Board at public meeting before the
positions can be advertised, offered, or funded.
Annual Operating Budget
Fiscal Year
The District operates on a fiscal year beginning September 1 and ending August 31.
Organizational Section
Laredo Independent School District 36
Budget Planning
Budget planning shall be an integral part of overall program planning so that the budget effectively reflects the
District’s programs and activities and provides the resources to implement them. In the budget planning
process, general educational goals, specific program goals, capital improvement goals, and alternatives for
achieving program goals shall be considered, as well as input from the District and campus level planning and
decision-making committees. Budget planning and evaluation are continuous processes and shall be a part of
each month’s activities.
Budget Meeting
The annual public meeting to discuss the proposed budget and tax rate shall be conducted as follows:
1. The Board President shall request at the beginning of the meeting that all persons who desire to speak
on the proposed budget and/or tax rate sign up on the sheet provided.
2. Prior to the beginning of the meeting, the Board may establish time limits for speakers.
3. Speakers shall confine their remarks to the appropriation of funds as contained in the proposed budget
and/or the tax rate.
4. No officer or employee of the District shall be required to respond to questions from speakers at the
meeting.
Authorized Expenditures
The adopted budget provides authority to expend funds for the purposes indicated and in accordance with state
law, Board policy, and the District’s approved purchasing procedures. The expenditure of funds shall be under
the direction of the Superintendent or designee who shall ensure that funds are expended in accordance with the
adopted budget.
Budget Amendments
The Board shall amend the budget when a change is made increasing any one of the functional spending
categories or increasing revenue object accounts and other resources.
Capital Budget
Once the multi-year capital plan has been adopted, the District shall develop and implement a capital
improvement projects budget or a capital budget. The capital budget shall be essential to ensure the proper
planning, funding, and implementing of major projects. The capital budget shall be adopted as part of the
annual budget process and shall incorporate the appropriate year of the multi-year capital plan.
Capital projects shall be considered different from programs adopted in the operating budget since they will
often represent very large financial obligations that may span two or more fiscal years. Therefore, the processes
for preparing, prioritizing, and presenting them to the Board may be different from the operating budget.
Non-Routine Projects
The District shall provide a greater level of detail and information for non-routine capital projects. For non-
routine projects, the capital budget shall describe the impact on the operating budget, number of additional
positions required, tax or fee implications, and other financial or service impacts. When developing the capital
budget, the District shall consider measures to mitigate risk related to undertaking major non-routine projects.
Based on the size of the capital budget and the complexity of the capital projects, it may be necessary for the
District to budget additional reserves for project overruns or insurance coverage.
Reviewing and Reporting
All stakeholders shall have the ability to review the status and expected completion of approved capital projects.
Periodic reports shall be discussed with the Board regarding ongoing capital projects. These reports shall
compare actual expenditures with those in the original budget, identify the level of completion of the project,
Organizational Section
2014-2015 Annual Budget 37
enumerate any changes in the scope of the project, and alert the Board to any concerns with the completion of
the project on time or on schedule.
Budget Amendments/Transfers
Budget amendments/transfers must be aligned with modifications to district/campus improvement plans. Every time
that a significant change is made to a campus budget, the change must be reflected in the campus improvement plan.
In the processing of the budget amendment/transfer, the campus must include documentation to verify that the
campus improvement plan has been changed accordingly. For example, if the campus is notified that their budget
allocation will be increased, and the campus planning committee decides to use the money to add teacher aides to
the first grade classrooms, the campus principal must submit a budget amendment in order to designate the
additional funds. The campus improvement plan must be modified to include the additional FTE’s by the
appropriate strategy. The page(s) that include the modifications to the campus improvement plan must be submitted
with the budget amendment. Budget amendments/transfers will not be approved if the required documentation is
not included with the amendment or transfer form.
Budget Amendments Signature Authority
Subsequent inter-function budget transfers must be approved by the Board for the General Fund Budget. For
Special Revenue Funds, inter-function budget transfers are approved subject to the approval by the granting agency.
A summary of all transfers is presented to the Board of Trustees. Any increase or decrease or operating
appropriations must be approved by the Board of Trustees and the Superintendent. All departments are required to
operate within their budgetary constraints. The operating budgets are amended prior to expenditure, and the
accounting system provides a strong budgetary control over expenditures.
Organizational Section
Laredo Independent School District 38
BUDGET DEVELOPMENT PROCESS
The annual Budget Development Process and the annual Planning Process are overlapping and augment one
another, although the focus of each is different. The overlapping is illustrated within the timetable section. The
Budget Development Process is comprised of three major phases: planning, preparation, and evaluation.
The budgetary process begins with sound planning. Planning defines the goals and objectives and develops
strategies to attain those goals and objectives. Once these programs and plans have been established, budgetary
resource allocations are made to support them. Budgetary resource allocation is the preparation phase of budgeting.
The allocations cannot be made, however, until plans and programs have been established.
Finally, the budget is evaluated for its effectiveness in attaining goals and objectives. Evaluation typically involves
an examination of: how funds were expended, what outcomes resulted from the expenditure of funds, and to what
degree these outcomes achieved the objectives stated during the planning phase. This evaluation phase is important
in determining the following year’s budgetary allocations. Budget preparation is not a one-time exercise to
determine how a school district will allocate funds rather, school district budget preparation is part of a continuous
cycle of planning and evaluation to achieve district goals.
The development of campus and district annual budgets should be part of ongoing planning processes and those
levels. The advent of site-based decision-making, mandated by the state, has increased integration of planning and
budgeting at the campus level; however, state guidance allows for considerable district autonomy in budget
preparation. The organizational structure of a school district, the size and complexity of its administrative structure,
the budgetary approach chosen, and the level of centralization in budget development all will affect the budget
development process and the final budget document. Beyond the budgetary requirements for federal and state
programs, the school board and the district superintendent largely will determine a school district’s budget
preparation process and related budget responsibilities. The concept of site-based budgeting, mandated by TEA, is
the recommended approach.
PLANNING PHASE
The first phase of the Budget Development Process is planning. Planning involves defining the mission, goals and
objectives of campuses, departments, and the district. Importance is placed upon sound budget planning for the
following reasons:
In implementing the type, quantity, and quality of school district instruction, the budget becomes the
limiting force.
Providing quality education is very important to the public interest.
The scope and diversity of school district operations make comprehensive planning necessary for good
decision-making.
Planning is a process that is critical to the expression of citizen preferences and through with consensus is
reached among citizens, school boards members, and district/campus /department staff on the future
direction of a district’s operations.
The Budget Development Team was created by the Superintendent and met bi-weekly to guide the budget
development process. It included the District’s Executive Directors and key members from the Human Resources
and Financial Management Department. The objective of this team was to provide ideas on budget cuts, major
factor affecting the budget, etc. on the administrative level. Since strategies to attain the goals and objectives need to
be developed before starting the actual budget calculation process, it is important that each campus and department
prepare statements in the “Mission, Goals and Objectives” and “Performance Evaluation” forms as the initial
exercise in planning the annual campus/department budget. This exercise comprises developing narrative and
quantitative statements. These statements must be consistent with the Campus Initiative Program goals and
objectives developed by the Site-Based Decision Making (SBDM) committees. This information will be used to
analyze and justify the district’s basic programs and operational request, as well as to ensure that individual campus
and department mission, goals and objectives are consistent with the district’s overall mission, goals, and objectives.
Organizational Section
2014-2015 Annual Budget 39
Line item budgeting remains the primary fiscal tool; thus completion of the “Mission, Goals and Objectives” and
“Performance Evaluation” forms is an important step in summarizing and evaluating each campus/department and
its budget. Any factors having major affects on programs should also be explained as “Significant Changes”
comments.
Listed below are standardized definitions to be used in the development of these statements and completion of the
appropriate forms. It is recommended that strict adherence to these definition parameters be kept in order to insure
consistency throughout the district:
Campus/Department Mission: A statement of specific overall mission.
Campus/Department Goals: “Broad” statements of desired results; ultimate accomplishments; overall end
results. The goals outlined in the Campus Improvement Plan may be identified and utilized in this section.
Campus/Department Objectives: “Specific” statements of desired program accomplishments; usually
measurable; shows progress toward a goal; desired results of activities. Clearly stated measurable
objectives should represent a concise summary of the principal work activities in which progress can be
monitored and evaluated periodically throughout the fiscal year. Objectives should be stated in common
“action-oriented phrases such as “to maintain,” “to increase,” “to reduce,” “to facilitate,” “to continue,” etc.
Specific objectives outlined in the Campus Improvement Plan may be identified and utilized in this section.
Strategy(ies): Specific activities, methods, and procedures, which will be implemented in order to reach
the established goals and objectives.
Performance Evaluation: Specific quantitative and qualitative measures of work performed by
campus/department must be included in this section. Quantitative measures are defined as observable and
in narrative format. This evaluation tool is new to the district and each administrator is allowed flexibility
to develop individual performance evaluation methods.
Significant Changes: Summary comments should be made concerning circumstances that will materially
change the campus/department operations and/or budget request(s). For example, these changes would
include proposed implementation of new programs, addition or deletion of programs, functions, duties, on
time expenses, etc.
With the Budget Development Process beginning in November, schools and departments were allowed a time to
integrate the total District’s planning objectives into their specific budget requests. During school/department
budget hearings the Finance Department reviewed revenue projections and refined budget requests to develop a
preliminary district budget. As a result of this collaborated process, the Finance Department was able to present a
preview of the proposed 2014-2015 budget to the Board of Trustees before the August Workshop. This preview
enabled the Board of Trustees and the Chief Financial Officer to review and discuss the direction of the budget
before the August 26th public hearing.
PREPARATION PHASE
Revenue Projections
In order to meet the future needs of the district, administrators should forecast the source and amount of resources or
revenue available. Therefore, projections of revenue from the three major sources should be made. These revenue
sources include Local, State, and Federal aid.
Local Revenues typically consists of monies generated by the local tax efforts. Factors that need to be
taken into account include such things as assessed property values, property value growth/decline rates,
applicable tax rates, historical collection rates, applicable state wealth per student limitations, state
mandated tax rate rollback thresholds, and delinquent tax collections.
State Revenues traditionally consists of monies received as a result of state funding. The tool that plays a
major part in the estimation of this type of resources is the state provided “Summary of Finances” which
takes into account several components. These components include such things as student enrollment,
Organizational Section
Laredo Independent School District 40
enrollment population classifications, allotment weights, student attendance, weighted average daily
attendance, free and reduced lunch participation, as well as all of the Local Revenue tax efforts.
For 2014-2015, all Directors involved in Special Education, Gifted & Talented, Career & Technology
Education, State Compensatory Education, and Bilingual Education forecasted Special Population FTEs.
The Special Population counts from each category help determine the revenue projections from the Texas
Education Agency.
Federal Revenues involve a variety of amounts and sources. These sources generally are federally
distributed funds, which can flow through the district, Region Education Centers, Texas Education Agency,
or directly from the federal source. Methods of allocations can vary from payment of indirect costs to
applications for specific grants.
Expenditure Projections
In order to support the mission, goals and objectives of the district, administrators should forecast the operating costs
for all funds necessary to achieve those intents. Expenditures/expenses should be classified by the major object
classes according to the types of items purchased or services obtained. These budgetary allocations should project
costs for the major expenditure categories (objects), which include:
Payroll Costs (6100) are the costs of employee salaries and benefits. These costs make up 85% or more of
annual operating expenditures and should be based primarily upon enrollment projections and applicable
state mandates concerning class, size, minimum salaries, etc. When appropriating or after appropriation of
this area, it is important that the appropriate administrator conducts a full analysis of the personnel situation
as well as submit recommendations addressing the findings. The “Payroll Analysis” form is the
management tool that can assist to address this issue. Therefore, this form needs to be completed and
submitted to the Finance Department by the Budget Request deadline.
Professional and Contracted Services (6200), Supplies and Materials (6300) and Other Operating Costs
(6400) are typically variable and miscellaneous expenditures. The projection of these costs may also be
based upon student enrollments or can be disbursed based on the authorized administrator’s discretion. The
completion of expenditure estimates for costs not directly related to enrollment levels such as utilities,
insurance and maintenance costs are simply calculated based upon historical data or anticipated changes.
Debt Service Costs (6500) are usually repayment of financed debt and should be based upon debt
repayment schedules when bonds or other debt is issued. The appropriation of this type of expenditure is
very limited or non-existent at the school or department levels.
Capital Outlay Costs (6600) includes items that are inventoried and become part of the district’s fixed
assets group such as furniture, audio-visual equipment, computer equipment, and other equipment. These
costs should be forecasted and budgeted based on an overall district Capital Improvement Cost Plan rather
than on an individual campus or department basis, the proper “Capital Outlay Justification” form needs to
be submitted as well.
Preparation, the second phase of the Budget Development Process, is the process of allocating resources to the
prioritized needs of a school district in support of its planned mission, goals, and objectives. Although budget
formats and policies are by no means uniform in school districts, formal budgets play a far more important role in
the planning, control and evaluation of school district operations than in those of privately owned organizations. In
school districts, the adoption of a budget implies that a set of decisions have been made by school board members
and school district administrators which culminate in matching a school district’s resources with its needs. As such,
the budget is a product of the planning process. The budget also provides an important tool for the control and
evaluation of a school district’s sources and uses of resources. With the assistance of the accounting system,
administrators are able to execute and control the activities that have been authorized by the budget and evaluate
performance based upon comparisons between budgeted and actual operations.
The link between planning and budget preparation in school districts gives budgets a unique role in these
organizations. Budgets in the public arena are often considered the ultimate policy document since they are the
financial plan a school district uses to achieve its goals and objectives reflecting:
Public choices about what goods and services the district will and will not produce.
Organizational Section
2014-2015 Annual Budget 41
School district’s priorities among the wide range of activities in which they are involved.
Relative weight given to the influence of various participants and interest groups in the budget development
process.
How a school district has acquired and used its resources.
The budget, itself, then becomes intrinsically a political document reflecting school district administrators’
accountability for fiduciary responsibility to citizens.
The budgeting process for the District was initiated in September 2013. The annual operating budget or financial
plan is proposed by the Superintendent and enacted by the Board of Trustees after public discussion. The site-based
decision making process, as mandated by the education code, is the cornerstone of all LISD budgetary decisions.
Each campus must have an SBDM committee made up of the campus principal, teachers, and community members.
Their role is to build consensus and support all efforts consistent with reaching the campus goals and objectives.
SBDM committee members, department directors and community members are involved in the budgetary cycle.
Teachers, principals, and other staff of the District, as well as the Citizens of our community, under the direction of
the Superintendent, will develop the budget. Individual, as well as group training workshops, will be held with
principals, department heads and Site-Based Decision-Making budget committees (SBDM) from March to April.
The budget deadline set for campuses and departments is April 26, 2014, and the Division of Finance will compile
the budget requests.
The Superintendent’s Budget Development Team will review various budget options for personnel and financing.
This entails maintaining competitive salaries and benefits for our employees, providing adequate funding for
curriculum development, providing for construction and repairs to facilities, and other miscellaneous projects.
Several budget workshops were held with the Board of Trustees to review the budget estimates, legislative impact of
various bills, and financial position of the District. The citizens of Laredo and District employees were invited to
attend the budget workshops. In August 26, the Board of Trustees approved the final budget which was
implemented on September 1, 2014.
EVALUATION PHASE
Evaluation is the last step of the district’s budget cycle. Information is compiled and analyzed to assess the
performance of each individual department and campus, as well as the District as a whole. This information is a
fundamental part of the planning phase for the following budget year.
In the educational context, budgeting is a valuable tool in both planning and evaluation processes. Budgeting
provides a vehicle for translating educational goals and programs into financial resource plans. Thus, instruction
planning (to attain student educational goals) should determine budgetary allocations. This link between instruction
and financial planning is critical to effective budgeting. In addition, such a budgeting practice may enhance the
evaluation of budgetary and educational performance since resource allocations are closely associated with
instructional plans.
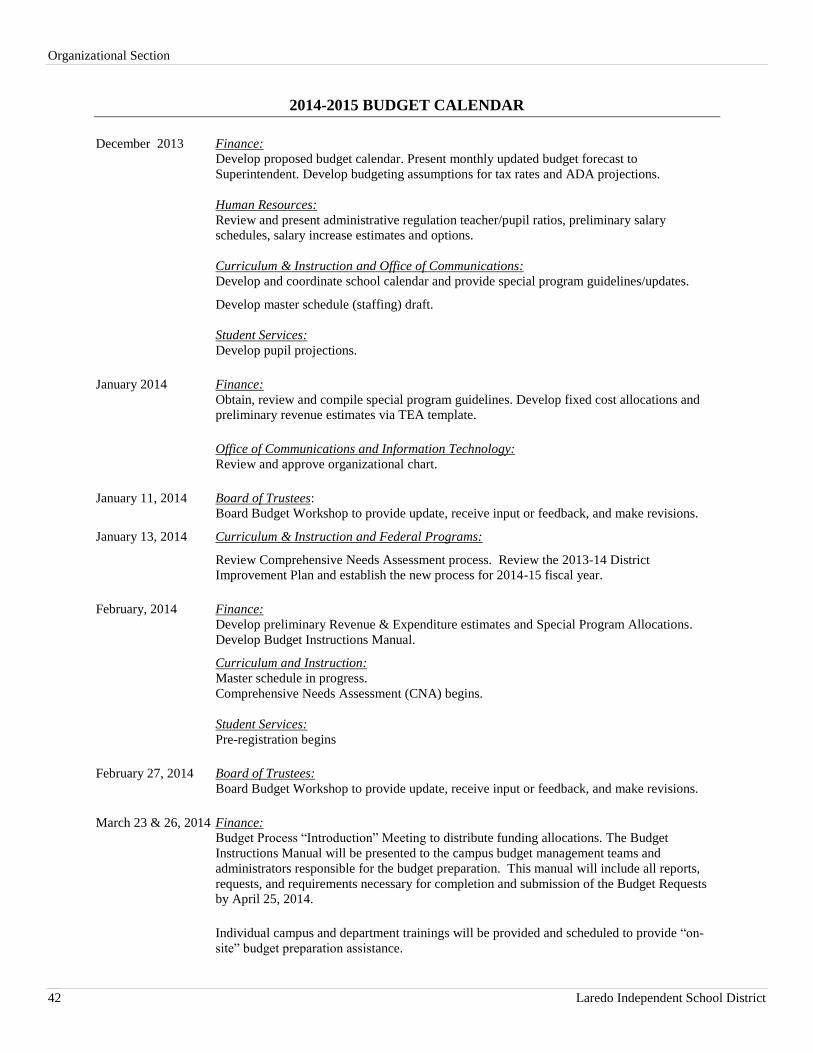
Organizational Section
Laredo Independent School District 42
2014-2015 BUDGET CALENDAR
December 2013 Finance:
Develop proposed budget calendar. Present monthly updated budget forecast to
Superintendent. Develop budgeting assumptions for tax rates and ADA projections.
Human Resources:
Review and present administrative regulation teacher/pupil ratios, preliminary salary
schedules, salary increase estimates and options.
Curriculum & Instruction and Office of Communications:
Develop and coordinate school calendar and provide special program guidelines/updates.
Develop master schedule (staffing) draft.
Student Services:
Develop pupil projections.
January 2014 Finance:
Obtain, review and compile special program guidelines. Develop fixed cost allocations and
preliminary revenue estimates via TEA template.
Office of Communications and Information Technology:
Review and approve organizational chart.
January 11, 2014 Board of Trustees:
Board Budget Workshop to provide update, receive input or feedback, and make revisions.
January 13, 2014 Curriculum & Instruction and Federal Programs:
Review Comprehensive Needs Assessment process. Review the 2013-14 District
Improvement Plan and establish the new process for 2014-15 fiscal year.
February, 2014 Finance:
Develop preliminary Revenue & Expenditure estimates and Special Program Allocations.
Develop Budget Instructions Manual.
Curriculum and Instruction:
Master schedule in progress.
Comprehensive Needs Assessment (CNA) begins.
Student Services:
Pre-registration begins
February 27, 2014 Board of Trustees:
Board Budget Workshop to provide update, receive input or feedback, and make revisions.
March 23 & 26, 2014 Finance:
Budget Process “Introduction” Meeting to distribute funding allocations. The Budget
Instructions Manual will be presented to the campus budget management teams and
administrators responsible for the budget preparation. This manual will include all reports,
requests, and requirements necessary for completion and submission of the Budget Requests
by April 25, 2014.
Individual campus and department trainings will be provided and scheduled to provide “on-
site” budget preparation assistance.
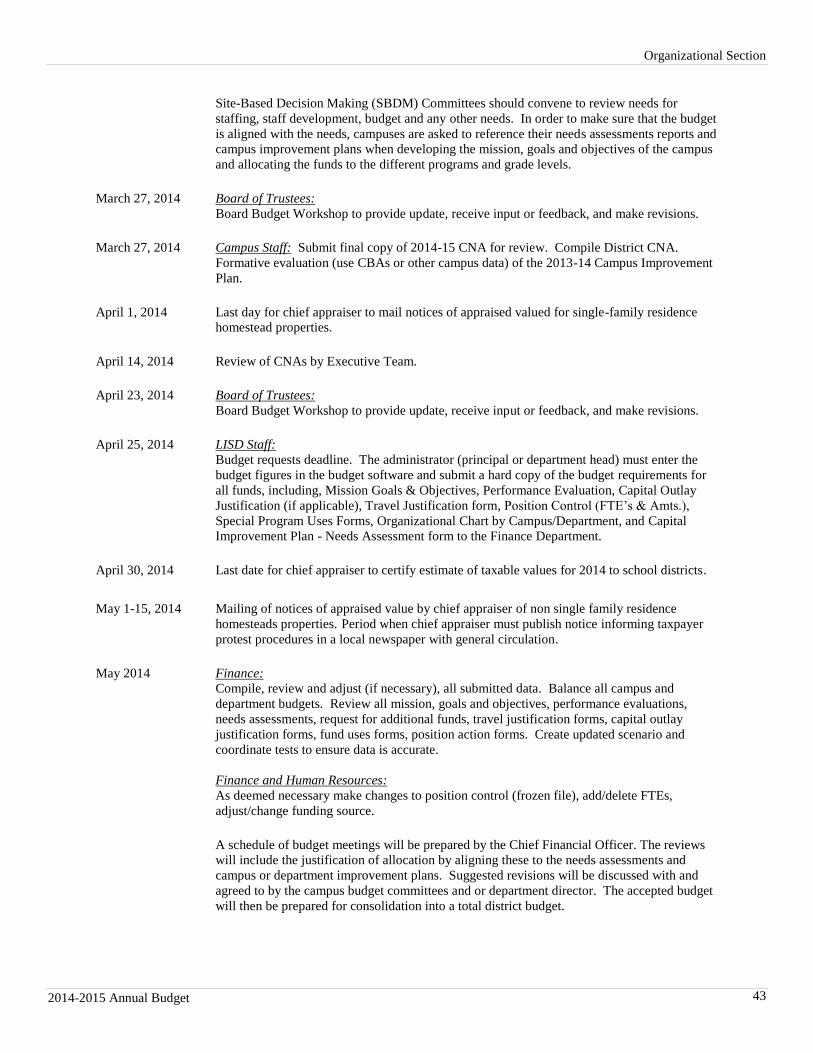
Organizational Section
2014-2015 Annual Budget 43
Site-Based Decision Making (SBDM) Committees should convene to review needs for
staffing, staff development, budget and any other needs. In order to make sure that the budget
is aligned with the needs, campuses are asked to reference their needs assessments reports and
campus improvement plans when developing the mission, goals and objectives of the campus
and allocating the funds to the different programs and grade levels.
March 27, 2014 Board of Trustees:
Board Budget Workshop to provide update, receive input or feedback, and make revisions.
March 27, 2014 Campus Staff: Submit final copy of 2014-15 CNA for review. Compile District CNA.
Formative evaluation (use CBAs or other campus data) of the 2013-14 Campus Improvement
Plan.
April 1, 2014 Last day for chief appraiser to mail notices of appraised valued for single-family residence
homestead properties.
April 14, 2014 Review of CNAs by Executive Team.
April 23, 2014 Board of Trustees:
Board Budget Workshop to provide update, receive input or feedback, and make revisions.
April 25, 2014 LISD Staff:
Budget requests deadline. The administrator (principal or department head) must enter the
budget figures in the budget software and submit a hard copy of the budget requirements for
all funds, including, Mission Goals & Objectives, Performance Evaluation, Capital Outlay
Justification (if applicable), Travel Justification form, Position Control (FTE’s & Amts.),
Special Program Uses Forms, Organizational Chart by Campus/Department, and Capital
Improvement Plan - Needs Assessment form to the Finance Department.
April 30, 2014 Last date for chief appraiser to certify estimate of taxable values for 2014 to school districts.
May 1-15, 2014 Mailing of notices of appraised value by chief appraiser of non single family residence
homesteads properties. Period when chief appraiser must publish notice informing taxpayer
protest procedures in a local newspaper with general circulation.
May 2014 Finance:
Compile, review and adjust (if necessary), all submitted data. Balance all campus and
department budgets. Review all mission, goals and objectives, performance evaluations,
needs assessments, request for additional funds, travel justification forms, capital outlay
justification forms, fund uses forms, position action forms. Create updated scenario and
coordinate tests to ensure data is accurate.
Finance and Human Resources:
As deemed necessary make changes to position control (frozen file), add/delete FTEs,
adjust/change funding source.
A schedule of budget meetings will be prepared by the Chief Financial Officer. The reviews
will include the justification of allocation by aligning these to the needs assessments and
campus or department improvement plans. Suggested revisions will be discussed with and
agreed to by the campus budget committees and or department director. The accepted budget
will then be prepared for consolidation into a total district budget.
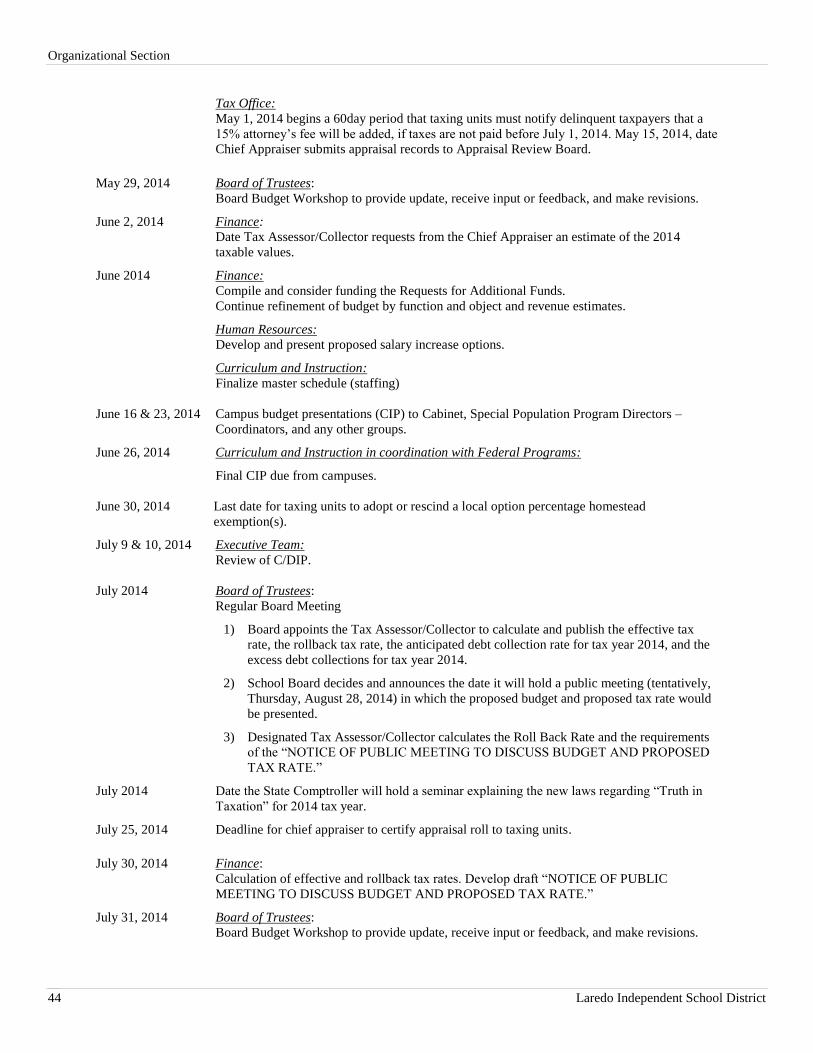
Organizational Section
Laredo Independent School District 44
Tax Office:
May 1, 2014 begins a 60day period that taxing units must notify delinquent taxpayers that a
15% attorney’s fee will be added, if taxes are not paid before July 1, 2014. May 15, 2014, date
Chief Appraiser submits appraisal records to Appraisal Review Board.
May 29, 2014 Board of Trustees:
Board Budget Workshop to provide update, receive input or feedback, and make revisions.
June 2, 2014 Finance:
Date Tax Assessor/Collector requests from the Chief Appraiser an estimate of the 2014
taxable values.
June 2014 Finance:
Compile and consider funding the Requests for Additional Funds.
Continue refinement of budget by function and object and revenue estimates.
Human Resources:
Develop and present proposed salary increase options.
Curriculum and Instruction:
Finalize master schedule (staffing)
June 16 & 23, 2014 Campus budget presentations (CIP) to Cabinet, Special Population Program Directors –
Coordinators, and any other groups.
June 26, 2014 Curriculum and Instruction in coordination with Federal Programs:
Final CIP due from campuses.
June 30, 2014 Last date for taxing units to adopt or rescind a local option percentage homestead
exemption(s).
July 9 & 10, 2014 Executive Team:
Review of C/DIP.
July 2014 Board of Trustees:
Regular Board Meeting
1) Board appoints the Tax Assessor/Collector to calculate and publish the effective tax
rate, the rollback tax rate, the anticipated debt collection rate for tax year 2014, and the
excess debt collections for tax year 2014.
2) School Board decides and announces the date it will hold a public meeting (tentatively,
Thursday, August 28, 2014) in which the proposed budget and proposed tax rate would
be presented.
3) Designated Tax Assessor/Collector calculates the Roll Back Rate and the requirements
of the “NOTICE OF PUBLIC MEETING TO DISCUSS BUDGET AND PROPOSED
TAX RATE.”
July 2014 Date the State Comptroller will hold a seminar explaining the new laws regarding “Truth in
Taxation” for 2014 tax year.
July 25, 2014 Deadline for chief appraiser to certify appraisal roll to taxing units.
July 30, 2014 Finance:
Calculation of effective and rollback tax rates. Develop draft “NOTICE OF PUBLIC
MEETING TO DISCUSS BUDGET AND PROPOSED TAX RATE.”
July 31, 2014 Board of Trustees:
Board Budget Workshop to provide update, receive input or feedback, and make revisions.
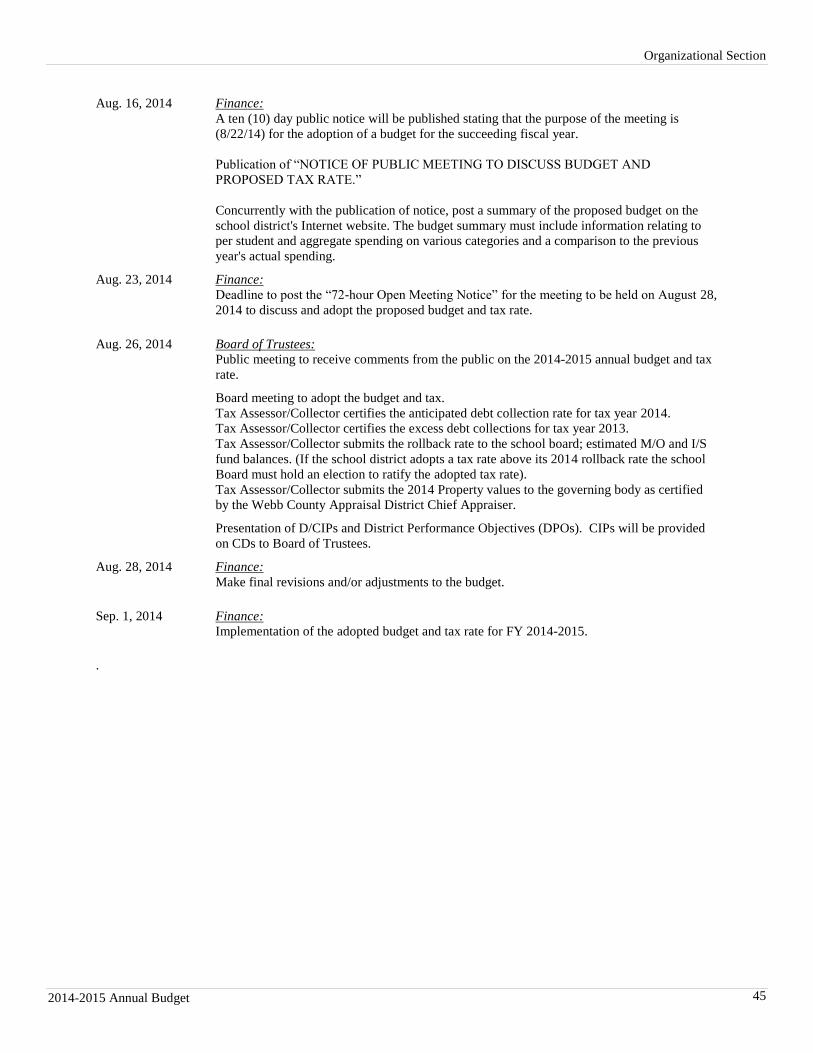
Organizational Section
2014-2015 Annual Budget 45
Aug. 16, 2014 Finance:
A ten (10) day public notice will be published stating that the purpose of the meeting is
(8/22/14) for the adoption of a budget for the succeeding fiscal year.
Publication of “NOTICE OF PUBLIC MEETING TO DISCUSS BUDGET AND
PROPOSED TAX RATE.”
Concurrently with the publication of notice, post a summary of the proposed budget on the
school district's Internet website. The budget summary must include information relating to
per student and aggregate spending on various categories and a comparison to the previous
year's actual spending.
Aug. 23, 2014 Finance:
Deadline to post the “72-hour Open Meeting Notice” for the meeting to be held on August 28,
2014 to discuss and adopt the proposed budget and tax rate.
Aug. 26, 2014 Board of Trustees:
Public meeting to receive comments from the public on the 2014-2015 annual budget and tax
rate.
Board meeting to adopt the budget and tax.
Tax Assessor/Collector certifies the anticipated debt collection rate for tax year 2014.
Tax Assessor/Collector certifies the excess debt collections for tax year 2013.
Tax Assessor/Collector submits the rollback rate to the school board; estimated M/O and I/S
fund balances. (If the school district adopts a tax rate above its 2014 rollback rate the school
Board must hold an election to ratify the adopted tax rate).
Tax Assessor/Collector submits the 2014 Property values to the governing body as certified
by the Webb County Appraisal District Chief Appraiser.
Presentation of D/CIPs and District Performance Objectives (DPOs). CIPs will be provided
on CDs to Board of Trustees.
Aug. 28, 2014 Finance:
Make final revisions and/or adjustments to the budget.
Sep. 1, 2014 Finance:
Implementation of the adopted budget and tax rate for FY 2014-2015.
.
Organizational Section
Laredo Independent School District 46
CAPITAL IMPROVEMENT PLAN
OVERVIEW
Capital planning is an important component of the District’s academic program and strategic plan. The District shall
prepare and adopt a multi-year capital plan that identifies and prioritizes expected needs based on the District’s
strategic plan, establishes project scope and cost, details estimated amounts of funding from various sources, and
projects future operating and maintenance costs. The multi-year capital plan shall cover a period of at least three
years.
Creating and maintaining the educational facility design specifications and construction standards;
Assisting in the selection of design professionals, contractors, consultants and vendors.
Negotiating fees and developing contracts for board approval;
Directing the work of project architects, engineers and contractors;
Overseeing and evaluating funds spent during construction;
Obtaining soil and material tests, land surveys and traffic studies;
Coordinating platting, easements , zoning, drainage and municipal utility district (MUD) requirements;
Preparing all work-in-progress reports; and
Conducting project observation reports on ongoing construction projects.
Identifying Needs
The first step in capital planning shall be to identify District needs. The District shall use the needs assessment form
to identify needs and shall incorporate other information from development projections, strategic plans,
comprehensive plans, facility master plans, regional plans, and citizen input processes to identify present and future
service needs that will require capital infrastructure or equipment. When identifying needs, attention should be
given to the following items:
Capital assets that require repair, maintenance, or replacement, that, if not addressed, will result in
higher costs in future years.
Infrastructure improvements needed to support new development or redevelopment.
Projects with revenue-generating potential.
Improvements that support student achievement.
Changes in policy or community needs.
Determining Costs
The full extent of project costs should be determined when developing the multi-year capital plan. Cost issues to
consider shall include the following:
The scope and timing of a planned project should be well defined in the early stages of the planning
process.
The District shall identify and use the most appropriate approaches, including outside assistance, when
estimating project costs and potential revenues.
For projects programmed beyond the first year of the plan, the District should adjust cost projections
based on anticipated inflation.
Ongoing operating costs associated with each project should be quantified, and the sources of funding
for those costs should be identified
A clear estimate of all major components required to implement a project shall be outlined, including
land acquisition needs, design, construction, contingency, and post-construction costs.
The non-financial impacts of the project on the community shall be recognized.
Organizational Section
2014-2015 Annual Budget 47
Prioritizing Capital Requests
The District shall prioritize capital project requests due to ongoing and extensive capital needs and limited financial
resources. When evaluating project submittals, the District should consider the following:
Reflect the relationship of project submittals to financial and governing policies, plans, and studies.
Allow submitting schools/departments to provide an initial prioritization.
Incorporate input and participation from major stakeholders and the general public.
Adhere to legal mandates and requirements.
Anticipate the operating budget impacts resulting from capital projects.
Apply analytical techniques, as appropriate, for evaluating potential projects (net present value,
payback period, cost-benefit analysis, life cycle costing, cash flow modeling, and the like).
Reevaluate capital projects approved in previous multi-year capital plans.
Use a rating system to facilitate decision making.
Developing Financial Strategies
Financing strategies should align with expected project requirements while sustaining the financial health of the
District. Given this, the District should consider the following when undertaking the capital financing plan:
Anticipate expected revenue and expenditure trends, including their relationship to multi-year financial
plans.
Prepare cash flow projections of the amount and timing of the capital financing.
Continue compliance with all established financial policies.
Recognize appropriate legal constraints.
Consider and estimate funding amounts from all appropriate funding alternatives.
Ensure reliability and stability of identified funding sources.
Evaluate the affordability of the financing strategy, including the impact on debt ratios, taxpayers, and
others.
The multi-year capital plan shall be used by the District to develop and implement its capital budget.
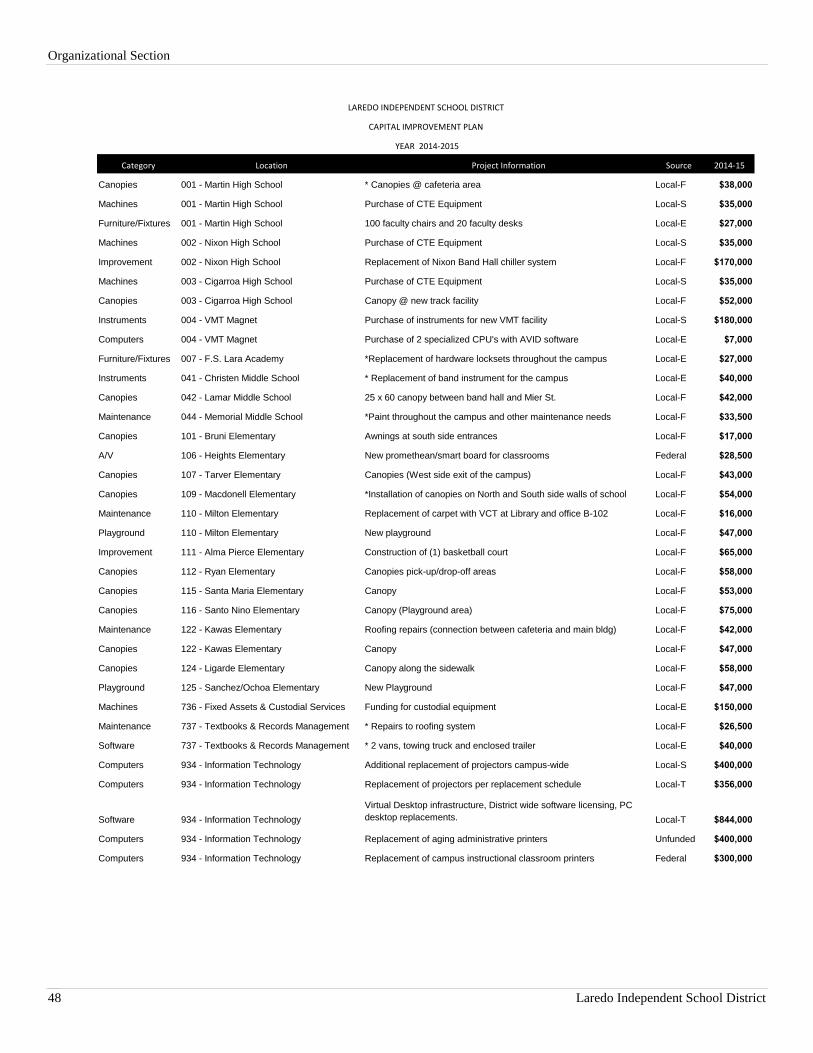
Organizational Section
Laredo Independent School District 48
Category Location Project Information Source 2014-15
Canopies 001 - Martin High School * Canopies @ cafeteria area Local-F $38,000
Machines 001 - Martin High School Purchase of CTE Equipment Local-S $35,000
Furniture/Fixtures 001 - Martin High School 100 faculty chairs and 20 faculty desks Local-E $27,000
Machines 002 - Nixon High School Purchase of CTE Equipment Local-S $35,000
Improvement 002 - Nixon High School Replacement of Nixon Band Hall chiller system Local-F $170,000
Machines 003 - Cigarroa High School Purchase of CTE Equipment Local-S $35,000
Canopies 003 - Cigarroa High School Canopy @ new track facility Local-F $52,000
Instruments 004 - VMT Magnet Purchase of instruments for new VMT facility Local-S $180,000
Computers 004 - VMT Magnet Purchase of 2 specialized CPU's with AVID software Local-E $7,000
Furniture/Fixtures 007 - F.S. Lara Academy *Replacement of hardware locksets throughout the campus Local-E $27,000
Instruments 041 - Christen Middle School * Replacement of band instrument for the campus Local-E $40,000
Canopies 042 - Lamar Middle School 25 x 60 canopy between band hall and Mier St. Local-F $42,000
Maintenance 044 - Memorial Middle School *Paint throughout the campus and other maintenance needs Local-F $33,500
Canopies 101 - Bruni Elementary Awnings at south side entrances Local-F $17,000
A/V 106 - Heights Elementary New promethean/smart board for classrooms Federal $28,500
Canopies 107 - Tarver Elementary Canopies (West side exit of the campus) Local-F $43,000
Canopies 109 - Macdonell Elementary *Installation of canopies on North and South side walls of school Local-F $54,000
Maintenance 110 - Milton Elementary Replacement of carpet with VCT at Library and office B-102 Local-F $16,000
Playground 110 - Milton Elementary New playground Local-F $47,000
Improvement 111 - Alma Pierce Elementary Construction of (1) basketball court Local-F $65,000
Canopies 112 - Ryan Elementary Canopies pick-up/drop-off areas Local-F $58,000
Canopies 115 - Santa Maria Elementary Canopy Local-F $53,000
Canopies 116 - Santo Nino Elementary Canopy (Playground area) Local-F $75,000
Maintenance 122 - Kawas Elementary Roofing repairs (connection between cafeteria and main bldg) Local-F $42,000
Canopies 122 - Kawas Elementary Canopy Local-F $47,000
Canopies 124 - Ligarde Elementary Canopy along the sidewalk Local-F $58,000
Playground 125 - Sanchez/Ochoa Elementary New Playground Local-F $47,000
Machines 736 - Fixed Assets & Custodial Services Funding for custodial equipment Local-E $150,000
Maintenance 737 - Textbooks & Records Management * Repairs to roofing system Local-F $26,500
Software 737 - Textbooks & Records Management * 2 vans, towing truck and enclosed trailer Local-E $40,000
Computers 934 - Information Technology Additional replacement of projectors campus-wide Local-S $400,000
Computers 934 - Information Technology Replacement of projectors per replacement schedule Local-T $356,000
Software 934 - Information Technology
Virtual Desktop infrastructure, District wide software licensing, PC
desktop replacements. Local-T $844,000
Computers 934 - Information Technology Replacement of aging administrative printers Unfunded $400,000
Computers 934 - Information Technology Replacement of campus instructional classroom printers Federal $300,000
LAREDO INDEPENDENT SCHOOL DISTRICT
CAPITAL IMPROVEMENT PLAN
YEAR 2014-2015
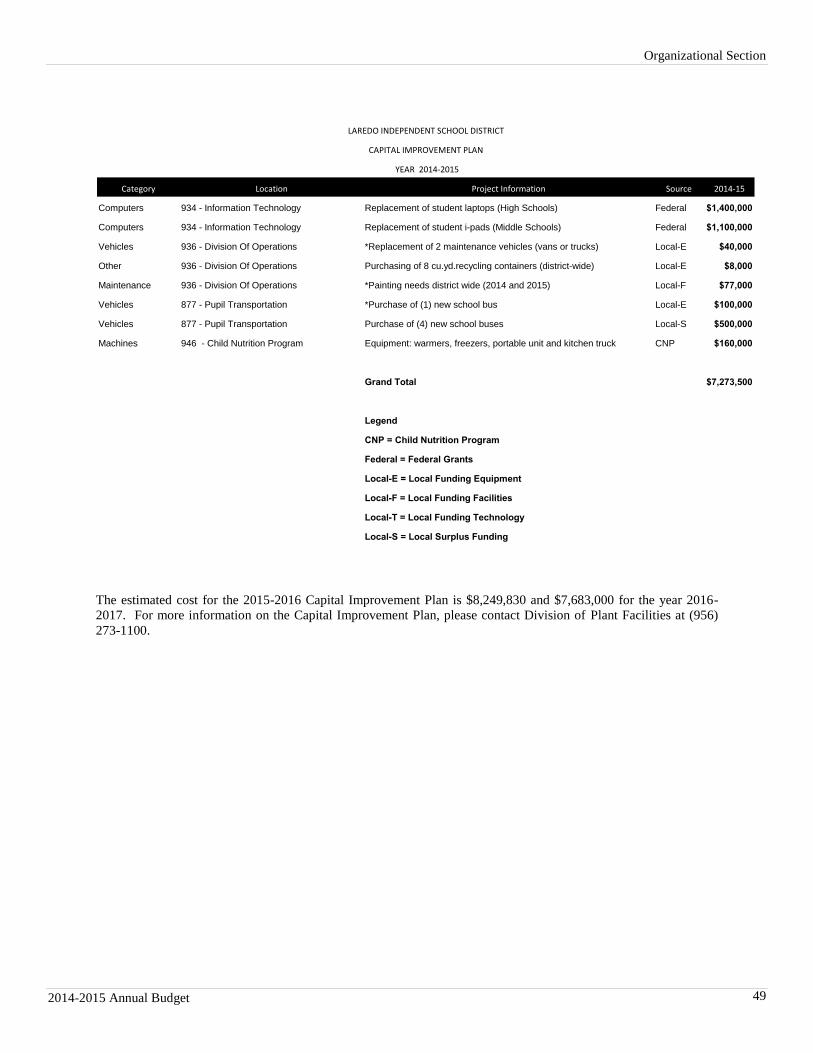
Organizational Section
2014-2015 Annual Budget 49
Category Location Project Information Source 2014-15
Computers 934 - Information Technology Replacement of student laptops (High Schools) Federal $1,400,000
Computers 934 - Information Technology Replacement of student i-pads (Middle Schools) Federal $1,100,000
Vehicles 936 - Division Of Operations *Replacement of 2 maintenance vehicles (vans or trucks) Local-E $40,000
Other 936 - Division Of Operations Purchasing of 8 cu.yd.recycling containers (district-wide) Local-E $8,000
Maintenance 936 - Division Of Operations *Painting needs district wide (2014 and 2015) Local-F $77,000
Vehicles 877 - Pupil Transportation *Purchase of (1) new school bus Local-E $100,000
Vehicles 877 - Pupil Transportation Purchase of (4) new school buses Local-S $500,000
Machines 946 - Child Nutrition Program Equipment: warmers, freezers, portable unit and kitchen truck CNP $160,000
Grand Total $7,273,500
Legend
CNP = Child Nutrition Program
Federal = Federal Grants
Local-E = Local Funding Equipment
Local-F = Local Funding Facilities
Local-T = Local Funding Technology
Local-S = Local Surplus Funding
LAREDO INDEPENDENT SCHOOL DISTRICT
CAPITAL IMPROVEMENT PLAN
YEAR 2014-2015
The estimated cost for the 2015-2016 Capital Improvement Plan is $8,249,830 and $7,683,000 for the year 2016-
2017. For more information on the Capital Improvement Plan, please contact Division of Plant Facilities at (956)
273-1100.
Organizational Section
Laredo Independent School District 50
BUDGETARY CONTROL & BASIS OF ACCOUNTING
REPORTING ENTITY
The Board of School Trustees (“Board”), a seven member group, has governance responsibilities over all activities
related to public elementary and secondary education within the jurisdiction of the District. The Board is appointed
and has the exclusive power and duty to govern and oversee the management of the public schools of the District.
All powers and duties not specifically delegated by statute to the Texas Education Agency (“TEA”) or to the State
Board of Education are reserved for the Board, and the TEA may not substitute its judgment for the lawful exercise
of those powers and duties by the Board. The District receives funding from local, state, and federal government
sources and must comply with the requirements of those funding entities. The District is considered an independent
entity for financial reporting purposes and is considered a primary government.
ACCOUNTING SYSTEMS STRUCTURE
The Division of Finance is responsible for providing all District financial services including financial accounting
and reporting, payroll and accounts payable disbursement functions, cash and investment management, debt
management, budgeting, purchasing, federal funds applications, Title 1, grant writing, tax office collections, and
special financial and policy analyses to District management. The Chief Financial Officer, appointed by the
Superintendent, has oversight responsibility of the division’s operations.
The District’s hardware includes a Hewlett Packard 996 minicomputer as well as numerous personal computers and
system terminals. The District utilizes the Information Design Incorporated government software applications and
computerized financial accounting system, which includes a system of internal accounting controls. Such controls
have been designed and are continually being reevaluated to provide reasonable, but not absolute, assurance for the
safeguarding of assets against loss from unauthorized use of disposition and the reliability of financial records for
preparing financial statements and maintaining accountability over the District’s assets.
The District also operates a Skyward Student Management Suite. This system services all campuses of the district.
The applications being used are attendance, grades and report cards, student tracking, and all other information
required by the State of Texas.
The concept of reasonable assurance recognizes that the cost of a control should not exceed the benefits likely to be
derived, and the evaluation of costs and benefits requires estimates and judgments by management. All internal
control evaluations occur within this framework and are believed to adequately safeguard assets and provide
reasonable assurance of proper recording of financial transactions.
BASIS OF ACCOUNTING
Accounting records for governmental fund types are maintained on a modified accrual basis with revenues recorded
when services or goods are received and the liabilities are incurred. Accounting records for trust funds are
maintained on the accrual basis.
The modified accrual basis of accounting is used for the governmental fund types. This basis of accounting
recognizes revenues in the accounting period in which they become susceptible to accrual (i.e., both measurable and
available), and expenditures in the accounting period in which the fund liability is incurred, if measurable, except for
certain compensated absences, which are recognized when the obligations are expected to be liquidated with
expendable, available financial resources.
Federal grant funds are generally considered to be earned to the extent of expenditures made under the provisions of
the grant and, accordingly, when such funds are received, they are recorded as deferred revenues until earned.
BASIS OF BUDGETING
The funds and accounts of the District have been established under the rules prescribed in the Financial Accounting
and Reporting Module of the Texas Education Agency Financial Accountability System Resource Guide. The Board
of Trustees requires that annual budgets be adopted for the General Fund, the Child Nutrition Fund and the Debt
Organizational Section
2014-2015 Annual Budget 51
Service Fund. Budgets are prepared using the same accounting basis (modified accrual) as for financial statements.
The modified accrual basis of accounting recognizes revenues in the accounting period in which they become both
measurable and available and it recognizes expenditures in the accounting period in which the fund liability is
incurred, if measurable, except for unmatured interest and principal on long -term debt, which is recognized when
due. The Special Revenue Funds and Capital Projects Funds adopt project-length budgets which do not correspond
to the District’s fiscal year and are not subject to Board approval. The Proprietary Fund budget is not subject to the
Board of Trustees approval and are presented for information purpose. Following is a description of the District’s
funds.
FUNDS AND FUND TYPES
The district’s accounting systems is organized and operated on a fund basis and account groups. In addition, the
district budgets on an organizational unit basis within each fund. Each fund is considered a separate accounting
entity. The operations of each fund are accounted for through a separate set of self-balancing accounts that are
comprised of its assets, liabilities, fund equity, revenue and expenditures and/or expenses. Governmental resources
are allocated and accounted in individual funds based upon the purposes for which spending activities are controlled.
Governmental Fund Types
Governmental funds are funds through which most of the District’s functions are financed. Governmental fund
reporting focuses primarily on the sources, uses, and balances of current financial resources and often has a
budgetary orientation. Most of LISD funds are governmental, which include the general fund, special revenue
funds, capital projects funds, and debt service funds. These funds follow the modified basis of accounting method in
which revenues are recognized when they become both measurable and available to finance expenditures of the
current period. Expenditures are recognized when the related fund liability is incurred. The district’s funds are
described below, and more detail in each fund is presented in the Financial Section of this document.
General Funds (appropriated) – The General Fund is the primary operating fund of the District. The
District accounts for financial resources used for general operations in this fund. It is a budgeted fund, and
any fund balances are considered resources available for current operations. All general tax revenues and
other receipts that are not allocated by law or contractual agreement to some other fund are accounted for in
this fund. The General Fund consists of the General Operating Fund, Child Nutrition Program Fund,
ERATE Fund, Technology Fund, and Athletics Fund.
Special Revenue Funds (not appropriated) – The District uses these funds to account for resources
restricted to, or designated for, specific purposes by a grantor. Federal and State financial assistance often
is accounted for in a Special Revenue Fund. In many special revenue funds, unused balances are returned
to the grantor at the close of specified projects periods. The District accounts for these funds on a project
rather than on an annual basis and uses project accounting for them in order to maintain integrity for the
various sources of funds. The District provides information to the Board of Trustees on all District grants,
but they do not approve the budget for these funds.
Debt Service Fund (appropriated) – The District accounts for revenues collected to pay interest on, and
retire long-term debt – including bonds, long-term mortgage notes, etc. in the Debt Service Fund. The
District approves an annual budget for this fund. The debt service fund is financed primarily through
property taxes, these funds account for the accumulation of resources, payment of general long-term debt
principal, interest, and related costs.
Capital Projects Funds (not appropriated) – The District accounts for proceeds from long-term debt
financing (including the sale of bonds), revenues and expenditures related to authorized construction and
other capital asset acquisitions (except for any financed by proprietary funds or trust funds).. The Board
reviews and approves the capital project budget.
Internal Service Funds (not appropriated) – The District accounts for goods and/or services provided by
one department or agency to another department/agency or to other governmental sectors on a cost-
reimbursement basis. The District has one Internal Service fund that is accounted for on an accrual
accounting basis. Therefore, revenue is recognized when it is earned and expenses are recognized when
they are incurred
Organizational Section
Laredo Independent School District 52
EXPENDITURE FUNCTIONS
A function represents a general operational area in a school district and groups together related activities. Most
school districts use all of the functions in the process of educating students or organizing the resources to educate
students. For example, in order to provide the appropriate atmosphere for learning, school districts transport
students to school, teach students, feed students and provide health services. Each of these activities is a function as
required by the Texas Education Agency (TEA) Financial Accountability System Resource Guide (FASRG).
Instruction (Function 11) - This function is used for activities that deal directly with the interaction
between teachers and students. Teaching may be provided for students in a school classroom, in another
location such as a home or hospital, and in other learning situations. It may also be provided through some
other approved medium such as television, radio, telephone, telecommunications, multimedia and
correspondence. This function includes expenditures for direct classroom instruction and other activities
that deliver, enhance or direct the delivery of learning situations to students.
Instructional Resources and Media Services (Function 12) - This function is used for expenditures that
are directly and exclusively used for resource centers, establishing and maintaining libraries and other
major facilities dealing with educational resources and media.
Curriculum Development and Instructional Staff Development (Function 13) - This function is used
for expenditures/expenses that are directly and exclusively used to aid instructional staff in planning,
developing and evaluating the process of providing learning experiences for students. Expenditures include
in-service training and other staff development for instructional or instructional-related personnel
(Functions 11, 12 and 13) of the school district. This function also includes expenditures and expenses
related to research and development activities that investigate, experiment, and/or follow-through with the
development of new or modified instructional methods, techniques, procedures, services, etc.
Instructional Leadership (Function 21) - This function is used for expenditures that are directly used for
managing, directing, supervising, and providing leadership for staff who provide general and specific
instructional services.
School Leadership (Function 23) - This function is used for expenditures that are used to direct and
manage a school campus. They include the activities performed by the principal, assistant principals and
other assistants while they:
o Supervise all operations of the campus
o Evaluate staff members of the campus
o Assign duties to staff members maintaining the records of the students on the campus
Guidance, Counseling and Evaluation Services (Function 31) - This function is used for expenditures
that are directly and exclusively used for assessing and testing students' abilities, aptitudes and interests;
counseling students with respect to career and educational opportunities and helping them establish realistic
goals. This function includes costs of psychological services, identification of individual characteristics,
testing, educational counseling, student evaluation and occupational counseling.
Social Work Services (Function 32) - This function is used for expenditures that are directly and
exclusively used for activities such as:
o Investigating and diagnosing student social needs arising out of the home, school or community
o Casework and group work services for the child, parent or both
o Interpreting the social needs of students for other staff members
o Promoting modification of the circumstances surrounding the individual student which are related
to his or her social needs.
Health Services (Function 33) - This function is used for expenditures that are directly and exclusively
used for providing physical health services which are not direct instruction. This includes activities that
provide students with appropriate medical, dental and nursing services.
Organizational Section
2014-2015 Annual Budget 53
Student (Pupil) Transportation (Function 34) - This function is used for expenditures that are incurred
for transporting students to and from school.
Food Services – (Function 35) - This function is used for food service operation expenditures, including
the cost of food, labor, and other expenditures necessary for the preparation, transportation and storage of
food to provide to students and staff. Expenditures are used directly and exclusively for supervision and
maintenance of a food service operation.
Extracurricular Activities (Function 36) - This function is used for expenditures for school-sponsored
activities outside of the school day. These activities are generally designed to provide students with
experiences such as motivation and the enjoyment and improvement of skills in either a competitive or
noncompetitive setting. Extracurricular activities include athletics and other activities that normally involve
competition between schools (and frequently involve offsetting gate receipts or fees such as football,
baseball, volleyball, track and tennis). Other kinds of related activities are included (such as drill team, pep
squad and cheerleading, University Interscholastic League competition such as one-act plays, speech,
debate, band, Future Farmers of America (FFA), National Honor Society, etc.).
General Administration (Function 41) - This function is for expenditures that are for purposes of
managing or governing the school district as an overall entity. This function covers multiple activities that
are not directly and exclusively used for costs applicable to specific functions. General administration is an
indirect cost applicable to other expenditure functions of a school district.
Facilities Maintenance and Operations (Function 51) - This function is used for expenditures for
activities to keep the facilities and grounds open, clean, comfortable and in effective working condition and
state of repair, and insured. This function is used to record expenditures for the maintenance and operation
of the physical plant and grounds. This function also includes expenditures associated with warehousing
and receiving services.
Security and Monitoring Services (Function 52) - This function is used for expenditures that are for
activities to keep student and staff surroundings safe, whether in transit to or from school, on a campus or
participating in school-sponsored events at another location.
Data Processing Services (Function 53) - This function is for expenditures for data processing services,
whether in-house or contracted. Examples of Function 53 costs are costs for computer facility management,
computer processing, systems development, analysis and design, and those interfacing costs associated with
general types of technical assistance to data users. Specific types of applications include attendance
accounting, grade reporting, financial accounting and human resources/personnel. Personal Computers
(PC’s) that are stand alone are to be charged to the appropriate function. Peripherals including terminals
and printers are to be charged to the appropriate function. Costs associated with mainframe, minicomputers
and networked or standalone microcomputers that provide services to multiple functions are to be recorded
here.
Community Services (Function 61) - This function is used for expenditures that are for activities or
purposes other than regular public education and adult basic education services. These types of
expenditures are used for services or activities relating to the whole community or some segment of the
community. This includes providing resources to non-public schools, institutions of higher education, and
any proprietary types of services incurred for outside entities in the community.
Debt Service (Function 71) - This function is used for expenditures that are for the retirement of recurring
bond, capital lease principal, and other debt, related debt service fees, and for all debt interest.
Facilities Acquisition and Construction (Function 81) - This function is used by school districts for
expenditures that are for acquiring, equipping, and/or making additions to real property and sites, including
lease and capital lease transactions.
Payments to Juvenile Justice Alternative Education Programs (Function 95) - This function code is
used for expenditures that are for the purpose of providing financial resources for Juvenile Justice
Alternative Education Programs under Chapter 37, TEC. This function code is used to account for
payments to other governmental entities in connection with students that are placed in discretionary or
mandatory JJAEP settings.
Organizational Section
Laredo Independent School District 54
Page left blank intentionally.
FINANCIAL SECTION
TABLE OF CONTENTS
District’s Funds Structure & Fund Types .................................................................................................................... 55
Governmental Funds Selected Items Summary............................................................................................................ 57
Governmental Funds – All Fund Types Summary ....................................................................................................... 58
General Fund ............................................................................................................................................................... 60
General Operating Fund ....................................................................................................................................... 63
Child Nutrition Program Fund .............................................................................................................................. 68
ERATE Fund ........................................................................................................................................................ 71
Athletics Fund....................................................................................................................................................... 73
Technology Fund .................................................................................................................................................. 76
Debt Service Fund ....................................................................................................................................................... 78
Special Revenue Funds ................................................................................................................................................ 86
Capital Projects Fund ................................................................................................................................................... 94
Capital Improvement Program ............................................................................................................................ 107
Impact of Capital Projects to the General Operating Fund ................................................................................. 115
Internal Service Fund ................................................................................................................................................. 116
55
DISTRICT’S FUNDS STRUCTURE & FUND TYPES
The District’s finances are organized into individual funds for each of the major account groups based on the
purpose of a fund’s spending activities. Each fund is considered to be a separate accounting entity, with its own set
of self-balancing accounts consisting of assets, liabilities, fund equity, revenue, and expenditures. The majority of
the District’s funds are classified as either Governmental or Proprietary Funds.
GOVERNMENTAL FUND TYPES
Governmental fund types for Texas school districts consist of four governmental fund groups (General, Special
Revenue, Capital Projects, and Debt Service) that account for the acquisition, use, and balances of expendable
financial resources and related liabilities as required by law or rule.
These funds follow the modified accrual basis of accounting method. Under this method, revenues are recognized
when they become both measurable and available to finance expenditures of the current period. Expenditures are
recognized when the related fund liability is incurred.
The following are the District’s governmental funds:
General Fund – The general fund typically serves as the chief operating fund of a government. The general
fund is used to account for all financial resources except those required to be accounted for in another fund.
Special Revenue Fund – A governmental fund type used to account for the proceeds of specific revenue
sources (other than for major capital projects) that are legally restricted to expenditures for specified
purposes.
Debt Service Fund – Governmental fund type used to account for the accumulation of resources for, and
the payment of, general long-term debt principal and interest.
Capital Projects Fund – Fund type used to account for financial resources to be used for the acquisition or
construction of major capital facilities (other than those financed by proprietary funds and trust funds.)
PROPRIETARY FUND TYPES
Proprietary Funds are used to account for the District's ongoing activities that are similar to those found in the
private sector. Goods or services from such activities may be provided to either outside parties or to other
departments or agencies within the governmental entity. The determination of net income, financial position, and
cash flows are essential to the effective financial management of these funds.
Proprietary Funds are comprised of the following two types of funds:
Enterprise Funds are used to account for operations that are either (a) financed with debt that is secured
solely by pledge of the net revenues from fees and charges of the activity, or (b) laws or regulations require
that the activity's costs of providing services, including capital costs (such as depreciation or debt service),
be recovered with fees and charges, rather than with taxes or similar revenues, or (c) the pricing policies of
the activity establish fees and charges designed to recover its costs, including capital costs (such as
depreciation or debt service.
Internal Service Funds are used to account for goods and/or services provided by one department or agency
to another department/agency or to other governmental sectors on a cost-reimbursement basis.
The District has one Internal Service fund that is accounted for on an accrual accounting basis. Therefore, revenue is
recognized when it is earned and expenses are recognized when they are incurred.
FIDUCIARY FUND TYPES
In addition, the District has one Fiduciary Fund which is not budgeted and is a non-major fund. It is classified as a
Private Purpose Trust Fund and is used to account for assets held by the District in a trustee capacity, or as an agent
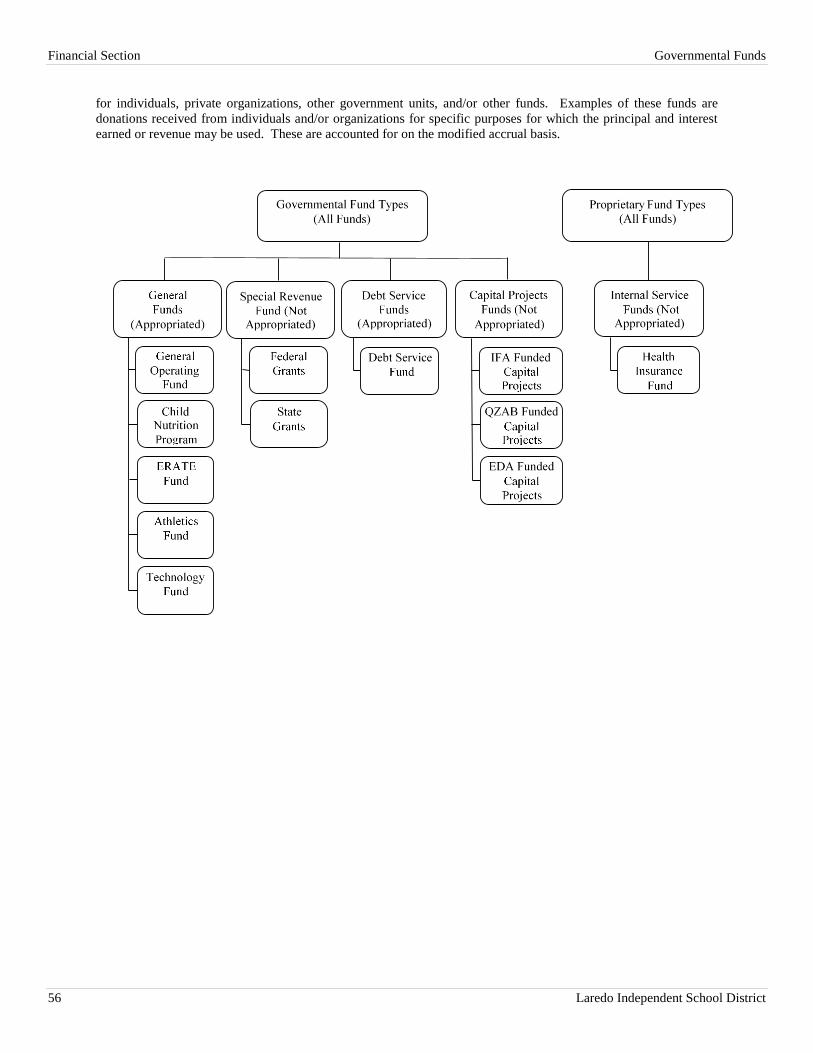
Financial Section Governmental Funds
56 Laredo Independent School District
for individuals, private organizations, other government units, and/or other funds. Examples of these funds are
donations received from individuals and/or organizations for specific purposes for which the principal and interest
earned or revenue may be used. These are accounted for on the modified accrual basis.
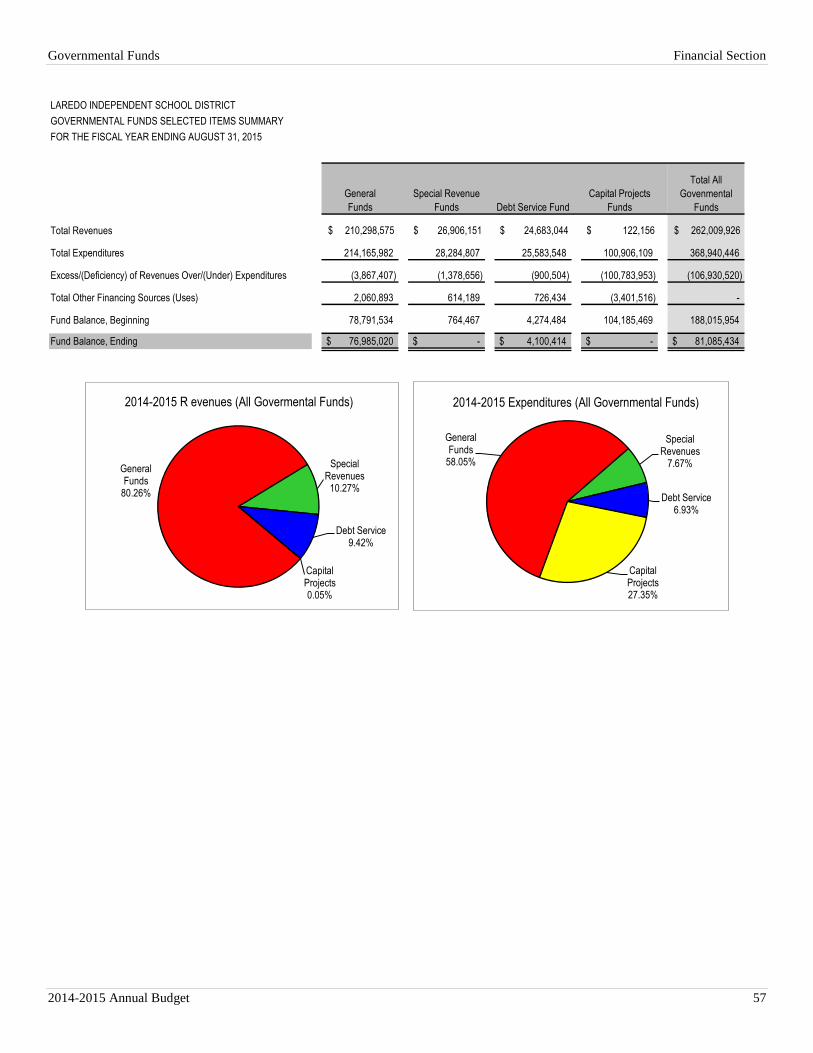
Governmental Funds Financial Section
2014-2015 Annual Budget 57
LAREDO INDEPENDENT SCHOOL DISTRICT
GOVERNMENTAL FUNDS SELECTED ITEMS SUMMARY
FOR THE FISCAL YEAR ENDING AUGUST 31, 2015
General
Funds
Special Revenue
Funds Debt Service Fund
Capital Projects
FundsGeneral Funds Special Revenues Debt Service Capital Projects
Total Revenues $ 210,298,575 $ 26,906,151 $ 24,683,044 $ 122,156 $ 262,009,926
Total Expenditures 214,165,982 28,284,807 25,583,548 100,906,109 368,940,446
Excess/(Deficiency) of Revenues Over/(Under) Expenditures (3,867,407) (1,378,656) (900,504) (100,783,953) (106,930,520)
Total Other Financing Sources (Uses) 2,060,893 614,189 726,434 (3,401,516) -
Fund Balance, Beginning 78,791,534 764,467 4,274,484 104,185,469 188,015,954
Fund Balance, Ending 76,985,020$ -$ 4,100,414$ -$ 81,085,434$
Total All
Govenmental
Funds
General Funds
80.26%
Special Revenues
10.27%
Debt Service9.42%
Capital Projects0.05%
2014-2015 R evenues (All Govermental Funds)
General Funds
58.05%
Special Revenues
7.67%
Debt Service6.93%
Capital Projects27.35%
2014-2015 Expenditures (All Governmental Funds)
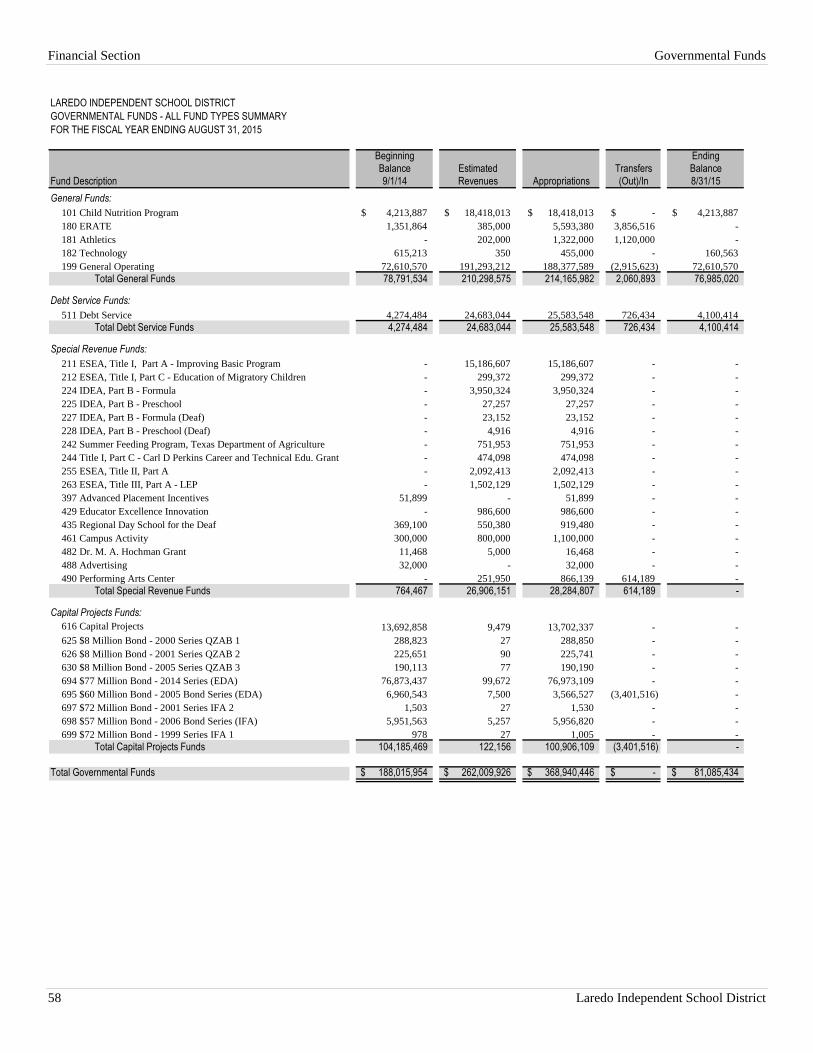
Financial Section Governmental Funds
58 Laredo Independent School District
LAREDO INDEPENDENT SCHOOL DISTRICT
GOVERNMENTAL FUNDS - ALL FUND TYPES SUMMARY
FOR THE FISCAL YEAR ENDING AUGUST 31, 2015
Beginning Ending
Balance Estimated Transfers Balance
Fund Description 9/1/14 Revenues Appropriations (Out)/In 8/31/15
General Funds:
101 Child Nutrition Program 4,213,887$ 18,418,013$ 18,418,013$ -$ 4,213,887$
180 ERATE 1,351,864 385,000 5,593,380 3,856,516 -
181 Athletics - 202,000 1,322,000 1,120,000 -
182 Technology 615,213 350 455,000 - 160,563
199 General Operating 72,610,570 191,293,212 188,377,589 (2,915,623) 72,610,570
Total General Funds 78,791,534 210,298,575 214,165,982 2,060,893 76,985,020
Debt Service Funds:
511 Debt Service 4,274,484 24,683,044 25,583,548 726,434 4,100,414
Total Debt Service Funds 4,274,484 24,683,044 25,583,548 726,434 4,100,414
Special Revenue Funds:
211 ESEA, Title I, Part A - Improving Basic Program - 15,186,607 15,186,607 - -
212 ESEA, Title I, Part C - Education of Migratory Children - 299,372 299,372 - -
224 IDEA, Part B - Formula - 3,950,324 3,950,324 - -
225 IDEA, Part B - Preschool - 27,257 27,257 - -
227 IDEA, Part B - Formula (Deaf) - 23,152 23,152 - -
228 IDEA, Part B - Preschool (Deaf) - 4,916 4,916 - -
242 Summer Feeding Program, Texas Department of Agriculture - 751,953 751,953 - -
244 Title I, Part C - Carl D Perkins Career and Technical Edu. Grant - 474,098 474,098 - -
255 ESEA, Title II, Part A - 2,092,413 2,092,413 - -
263 ESEA, Title III, Part A - LEP - 1,502,129 1,502,129 - -
397 Advanced Placement Incentives 51,899 - 51,899 - -
429 Educator Excellence Innovation - 986,600 986,600 - -
435 Regional Day School for the Deaf 369,100 550,380 919,480 - -
461 Campus Activity 300,000 800,000 1,100,000 - -
482 Dr. M. A. Hochman Grant 11,468 5,000 16,468 - -
488 Advertising 32,000 - 32,000 - -
490 Performing Arts Center - 251,950 866,139 614,189 -
Total Special Revenue Funds 764,467 26,906,151 28,284,807 614,189 -
Capital Projects Funds:
616 Capital Projects 13,692,858 9,479 13,702,337 - -
625 $8 Million Bond - 2000 Series QZAB 1 288,823 27 288,850 - -
626 $8 Million Bond - 2001 Series QZAB 2 225,651 90 225,741 - -
630 $8 Million Bond - 2005 Series QZAB 3 190,113 77 190,190 - -
694 $77 Million Bond - 2014 Series (EDA) 76,873,437 99,672 76,973,109 - -
695 $60 Million Bond - 2005 Bond Series (EDA) 6,960,543 7,500 3,566,527 (3,401,516) -
697 $72 Million Bond - 2001 Series IFA 2 1,503 27 1,530 - -
698 $57 Million Bond - 2006 Bond Series (IFA) 5,951,563 5,257 5,956,820 - -
699 $72 Million Bond - 1999 Series IFA 1 978 27 1,005 - -
Total Capital Projects Funds 104,185,469 122,156 100,906,109 (3,401,516) -
Total Governmental Funds 188,015,954$ 262,009,926$ 368,940,446$ -$ 81,085,434$
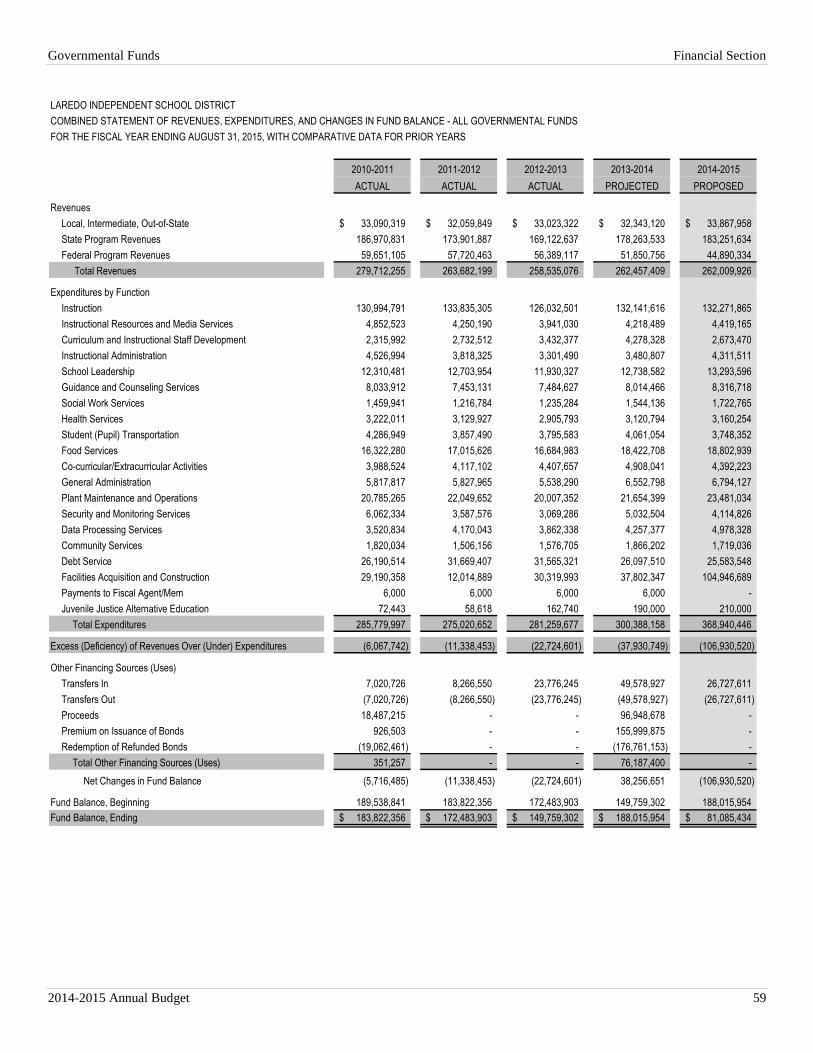
Governmental Funds Financial Section
2014-2015 Annual Budget 59
LAREDO INDEPENDENT SCHOOL DISTRICT
COMBINED STATEMENT OF REVENUES, EXPENDITURES, AND CHANGES IN FUND BALANCE - ALL GOVERNMENTAL FUNDS
FOR THE FISCAL YEAR ENDING AUGUST 31, 2015, WITH COMPARATIVE DATA FOR PRIOR YEARS
2010-2011 2011-2012 2012-2013 2013-2014 2014-2015
ACTUAL ACTUAL ACTUAL PROJECTED PROPOSED
Revenues
Local, Intermediate, Out-of-State 33,090,319$ 32,059,849$ 33,023,322$ 32,343,120$ 33,867,958$
State Program Revenues 186,970,831 173,901,887 169,122,637 178,263,533 183,251,634
Federal Program Revenues 59,651,105 57,720,463 56,389,117 51,850,756 44,890,334
Total Revenues 279,712,255 263,682,199 258,535,076 262,457,409 262,009,926
Expenditures by Function
Instruction 130,994,791 133,835,305 126,032,501 132,141,616 132,271,865
Instructional Resources and Media Services 4,852,523 4,250,190 3,941,030 4,218,489 4,419,165
Curriculum and Instructional Staff Development 2,315,992 2,732,512 3,432,377 4,278,328 2,673,470
Instructional Administration 4,526,994 3,818,325 3,301,490 3,480,807 4,311,511
School Leadership 12,310,481 12,703,954 11,930,327 12,738,582 13,293,596
Guidance and Counseling Services 8,033,912 7,453,131 7,484,627 8,014,466 8,316,718
Social Work Services 1,459,941 1,216,784 1,235,284 1,544,136 1,722,765
Health Services 3,222,011 3,129,927 2,905,793 3,120,794 3,160,254
Student (Pupil) Transportation 4,286,949 3,857,490 3,795,583 4,061,054 3,748,352
Food Services 16,322,280 17,015,626 16,684,983 18,422,708 18,802,939
Co-curricular/Extracurricular Activities 3,988,524 4,117,102 4,407,657 4,908,041 4,392,223
General Administration 5,817,817 5,827,965 5,538,290 6,552,798 6,794,127
Plant Maintenance and Operations 20,785,265 22,049,652 20,007,352 21,654,399 23,481,034
Security and Monitoring Services 6,062,334 3,587,576 3,069,286 5,032,504 4,114,826
Data Processing Services 3,520,834 4,170,043 3,862,338 4,257,377 4,978,328
Community Services 1,820,034 1,506,156 1,576,705 1,866,202 1,719,036
Debt Service 26,190,514 31,669,407 31,565,321 26,097,510 25,583,548
Facilities Acquisition and Construction 29,190,358 12,014,889 30,319,993 37,802,347 104,946,689
Payments to Fiscal Agent/Mem 6,000 6,000 6,000 6,000 -
Juvenile Justice Alternative Education 72,443 58,618 162,740 190,000 210,000
Total Expenditures 285,779,997 275,020,652 281,259,677 300,388,158 368,940,446
Excess (Deficiency) of Revenues Over (Under) Expenditures (6,067,742) (11,338,453) (22,724,601) (37,930,749) (106,930,520)
Other Financing Sources (Uses)
Transfers In 7,020,726 8,266,550 23,776,245 49,578,927 26,727,611
Transfers Out (7,020,726) (8,266,550) (23,776,245) (49,578,927) (26,727,611)
Proceeds 18,487,215 - - 96,948,678 -
Premium on Issuance of Bonds 926,503 - - 155,999,875 -
Redemption of Refunded Bonds (19,062,461) - - (176,761,153) -
Total Other Financing Sources (Uses) 351,257 - - 76,187,400 -
Net Changes in Fund Balance (5,716,485) (11,338,453) (22,724,601) 38,256,651 (106,930,520)
Fund Balance, Beginning 189,538,841 183,822,356 172,483,903 149,759,302 188,015,954
Fund Balance, Ending 183,822,356$ 172,483,903$ 149,759,302$ 188,015,954$ 81,085,434$
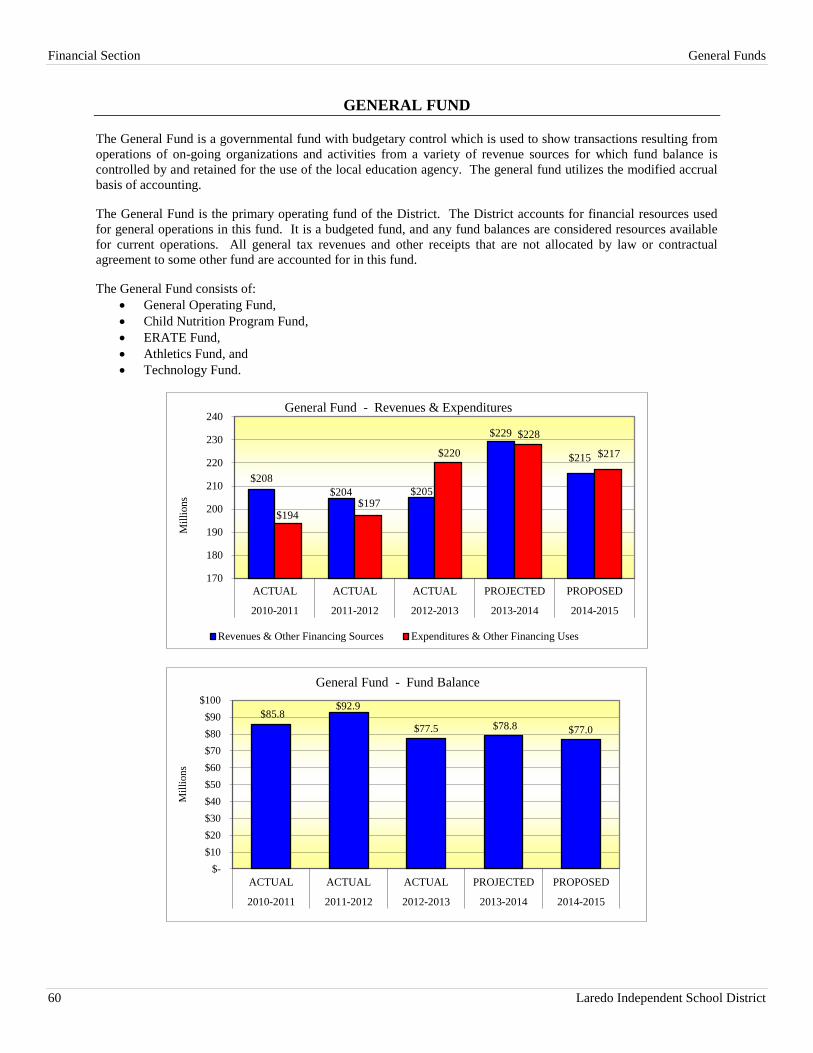
Financial Section General Funds
60 Laredo Independent School District
GENERAL FUND
The General Fund is a governmental fund with budgetary control which is used to show transactions resulting from
operations of on-going organizations and activities from a variety of revenue sources for which fund balance is
controlled by and retained for the use of the local education agency. The general fund utilizes the modified accrual
basis of accounting.
The General Fund is the primary operating fund of the District. The District accounts for financial resources used
for general operations in this fund. It is a budgeted fund, and any fund balances are considered resources available
for current operations. All general tax revenues and other receipts that are not allocated by law or contractual
agreement to some other fund are accounted for in this fund.
The General Fund consists of:
General Operating Fund,
Child Nutrition Program Fund,
ERATE Fund,
Athletics Fund, and
Technology Fund.
$208
$204 $205
$229
$215
$194 $197
$220
$228
$217
170
180
190
200
210
220
230
240
ACTUAL ACTUAL ACTUAL PROJECTED PROPOSED
2010-2011 2011-2012 2012-2013 2013-2014 2014-2015
Mil
lions
General Fund - Revenues & Expenditures
Revenues & Other Financing Sources Expenditures & Other Financing Uses
$85.8 $92.9
$77.5 $78.8 $77.0
$-
$10
$20
$30
$40
$50
$60
$70
$80
$90
$100
ACTUAL ACTUAL ACTUAL PROJECTED PROPOSED
2010-2011 2011-2012 2012-2013 2013-2014 2014-2015
Mil
lion
s
General Fund - Fund Balance
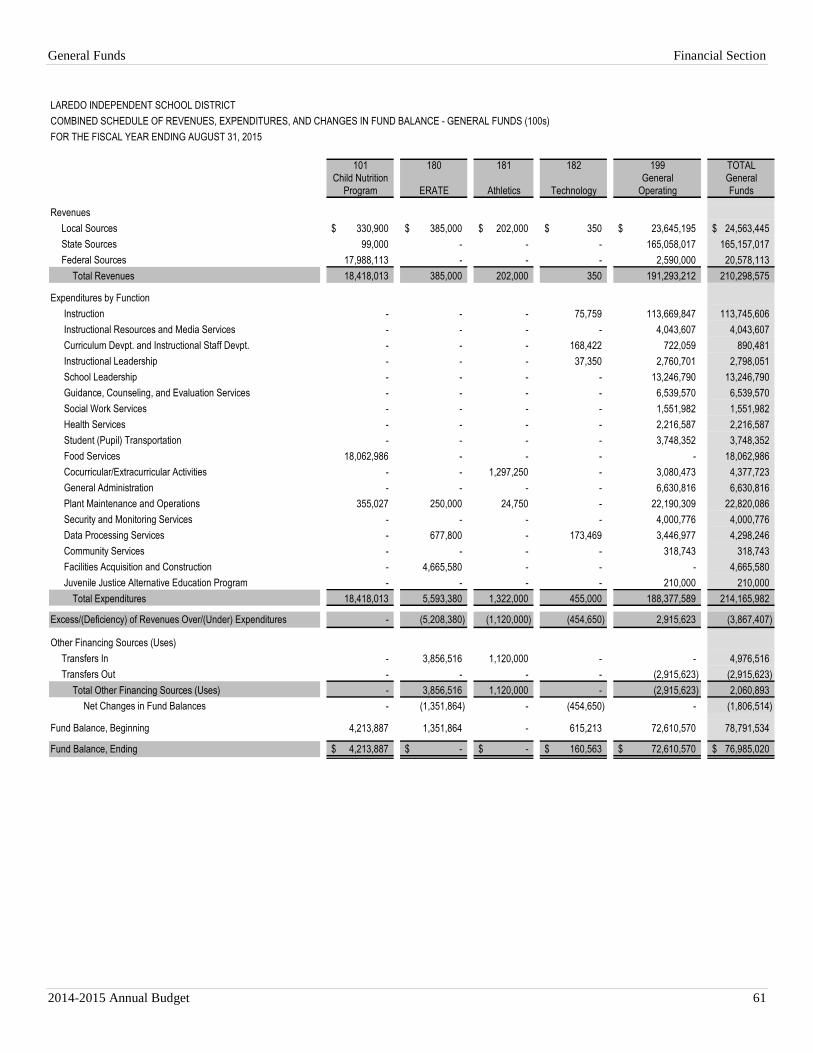
General Funds Financial Section
2014-2015 Annual Budget 61
LAREDO INDEPENDENT SCHOOL DISTRICT
COMBINED SCHEDULE OF REVENUES, EXPENDITURES, AND CHANGES IN FUND BALANCE - GENERAL FUNDS (100s)
FOR THE FISCAL YEAR ENDING AUGUST 31, 2015
101 180 181 182 199 TOTAL
Child Nutrition General General
Program ERATE Athletics Technology Operating Funds
Revenues
Local Sources 330,900$ 385,000$ 202,000$ 350$ 23,645,195$ 24,563,445$
State Sources 99,000 - - - 165,058,017 165,157,017
Federal Sources 17,988,113 - - - 2,590,000 20,578,113
Total Revenues 18,418,013 385,000 202,000 350 191,293,212 210,298,575
Expenditures by Function
Instruction - - - 75,759 113,669,847 113,745,606
Instructional Resources and Media Services - - - - 4,043,607 4,043,607
Curriculum Devpt. and Instructional Staff Devpt. - - - 168,422 722,059 890,481
Instructional Leadership - - - 37,350 2,760,701 2,798,051
School Leadership - - - - 13,246,790 13,246,790
Guidance, Counseling, and Evaluation Services - - - - 6,539,570 6,539,570
Social Work Services - - - - 1,551,982 1,551,982
Health Services - - - - 2,216,587 2,216,587
Student (Pupil) Transportation - - - - 3,748,352 3,748,352
Food Services 18,062,986 - - - - 18,062,986
Cocurricular/Extracurricular Activities - - 1,297,250 - 3,080,473 4,377,723
General Administration - - - - 6,630,816 6,630,816
Plant Maintenance and Operations 355,027 250,000 24,750 - 22,190,309 22,820,086
Security and Monitoring Services - - - - 4,000,776 4,000,776
Data Processing Services - 677,800 - 173,469 3,446,977 4,298,246
Community Services - - - - 318,743 318,743
Facilities Acquisition and Construction - 4,665,580 - - - 4,665,580
Juvenile Justice Alternative Education Program - - - - 210,000 210,000
Total Expenditures 18,418,013 5,593,380 1,322,000 455,000 188,377,589 214,165,982
Excess/(Deficiency) of Revenues Over/(Under) Expenditures - (5,208,380) (1,120,000) (454,650) 2,915,623 (3,867,407)
Other Financing Sources (Uses)
Transfers In - 3,856,516 1,120,000 - - 4,976,516
Transfers Out - - - - (2,915,623) (2,915,623)
Total Other Financing Sources (Uses) - 3,856,516 1,120,000 - (2,915,623) 2,060,893
Net Changes in Fund Balances - (1,351,864) - (454,650) - (1,806,514)
Fund Balance, Beginning 4,213,887 1,351,864 - 615,213 72,610,570 78,791,534
Fund Balance, Ending 4,213,887$ -$ -$ 160,563$ 72,610,570$ 76,985,020$
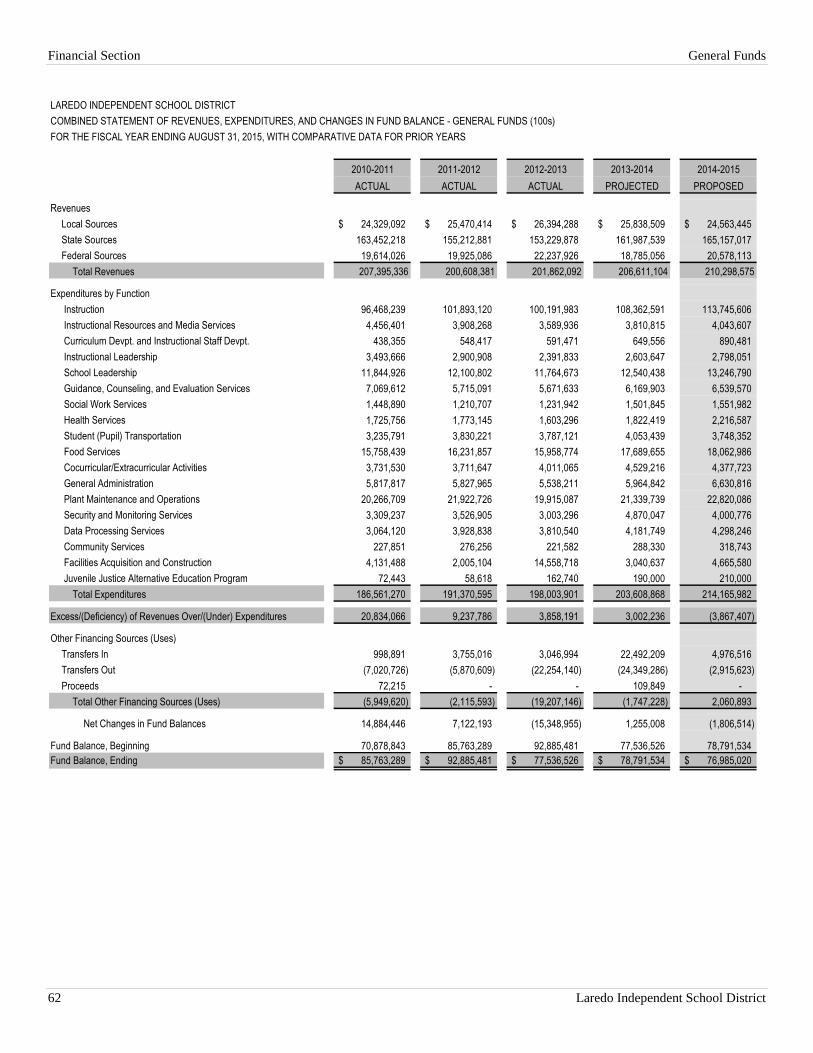
Financial Section General Funds
62 Laredo Independent School District
LAREDO INDEPENDENT SCHOOL DISTRICT
COMBINED STATEMENT OF REVENUES, EXPENDITURES, AND CHANGES IN FUND BALANCE - GENERAL FUNDS (100s)
FOR THE FISCAL YEAR ENDING AUGUST 31, 2015, WITH COMPARATIVE DATA FOR PRIOR YEARS
2010-2011 2011-2012 2012-2013 2013-2014 2014-2015
ACTUAL ACTUAL ACTUAL PROJECTED PROPOSED
Revenues
Local Sources 24,329,092$ 25,470,414$ 26,394,288$ 25,838,509$ 24,563,445$
State Sources 163,452,218 155,212,881 153,229,878 161,987,539 165,157,017
Federal Sources 19,614,026 19,925,086 22,237,926 18,785,056 20,578,113
Total Revenues 207,395,336 200,608,381 201,862,092 206,611,104 210,298,575
Expenditures by Function
Instruction 96,468,239 101,893,120 100,191,983 108,362,591 113,745,606
Instructional Resources and Media Services 4,456,401 3,908,268 3,589,936 3,810,815 4,043,607
Curriculum Devpt. and Instructional Staff Devpt. 438,355 548,417 591,471 649,556 890,481
Instructional Leadership 3,493,666 2,900,908 2,391,833 2,603,647 2,798,051
School Leadership 11,844,926 12,100,802 11,764,673 12,540,438 13,246,790
Guidance, Counseling, and Evaluation Services 7,069,612 5,715,091 5,671,633 6,169,903 6,539,570
Social Work Services 1,448,890 1,210,707 1,231,942 1,501,845 1,551,982
Health Services 1,725,756 1,773,145 1,603,296 1,822,419 2,216,587
Student (Pupil) Transportation 3,235,791 3,830,221 3,787,121 4,053,439 3,748,352
Food Services 15,758,439 16,231,857 15,958,774 17,689,655 18,062,986
Cocurricular/Extracurricular Activities 3,731,530 3,711,647 4,011,065 4,529,216 4,377,723
General Administration 5,817,817 5,827,965 5,538,211 5,964,842 6,630,816
Plant Maintenance and Operations 20,266,709 21,922,726 19,915,087 21,339,739 22,820,086
Security and Monitoring Services 3,309,237 3,526,905 3,003,296 4,870,047 4,000,776
Data Processing Services 3,064,120 3,928,838 3,810,540 4,181,749 4,298,246
Community Services 227,851 276,256 221,582 288,330 318,743
Facilities Acquisition and Construction 4,131,488 2,005,104 14,558,718 3,040,637 4,665,580
Juvenile Justice Alternative Education Program 72,443 58,618 162,740 190,000 210,000
Total Expenditures 186,561,270 191,370,595 198,003,901 203,608,868 214,165,982
Excess/(Deficiency) of Revenues Over/(Under) Expenditures 20,834,066 9,237,786 3,858,191 3,002,236 (3,867,407)
Other Financing Sources (Uses)
Transfers In 998,891 3,755,016 3,046,994 22,492,209 4,976,516
Transfers Out (7,020,726) (5,870,609) (22,254,140) (24,349,286) (2,915,623)
Proceeds 72,215 - - 109,849 -
Total Other Financing Sources (Uses) (5,949,620) (2,115,593) (19,207,146) (1,747,228) 2,060,893
Net Changes in Fund Balances 14,884,446 7,122,193 (15,348,955) 1,255,008 (1,806,514)
Fund Balance, Beginning 70,878,843 85,763,289 92,885,481 77,536,526 78,791,534
Fund Balance, Ending 85,763,289$ 92,885,481$ 77,536,526$ 78,791,534$ 76,985,020$
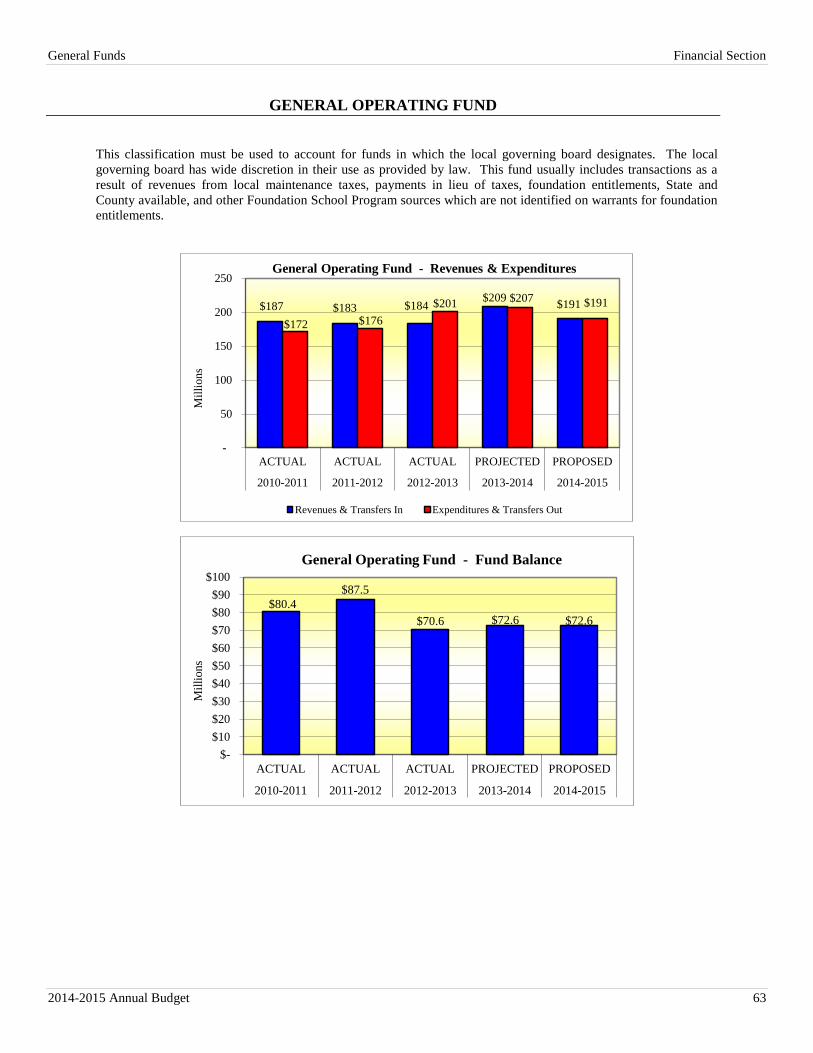
General Funds Financial Section
2014-2015 Annual Budget 63
GENERAL OPERATING FUND
This classification must be used to account for funds in which the local governing board designates. The local
governing board has wide discretion in their use as provided by law. This fund usually includes transactions as a
result of revenues from local maintenance taxes, payments in lieu of taxes, foundation entitlements, State and
County available, and other Foundation School Program sources which are not identified on warrants for foundation
entitlements.
$80.4
$87.5
$70.6 $72.6 $72.6
$-
$10
$20
$30
$40
$50
$60
$70
$80
$90
$100
ACTUAL ACTUAL ACTUAL PROJECTED PROPOSED
2010-2011 2011-2012 2012-2013 2013-2014 2014-2015
Mil
lions
General Operating Fund - Fund Balance
$187 $183 $184 $209
$191
$172 $176
$201 $207 $191
-
50
100
150
200
250
ACTUAL ACTUAL ACTUAL PROJECTED PROPOSED
2010-2011 2011-2012 2012-2013 2013-2014 2014-2015
Mil
lion
s
General Operating Fund - Revenues & Expenditures
Revenues & Transfers In Expenditures & Transfers Out
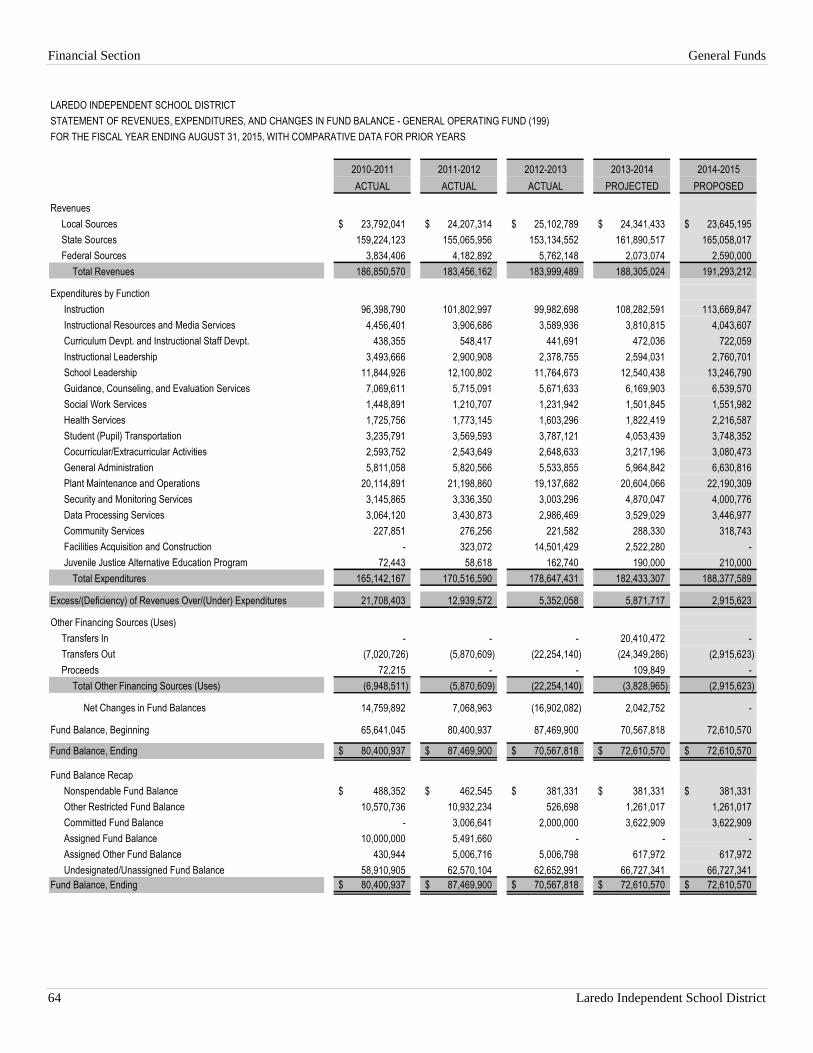
Financial Section General Funds
64 Laredo Independent School District
LAREDO INDEPENDENT SCHOOL DISTRICT
STATEMENT OF REVENUES, EXPENDITURES, AND CHANGES IN FUND BALANCE - GENERAL OPERATING FUND (199)
FOR THE FISCAL YEAR ENDING AUGUST 31, 2015, WITH COMPARATIVE DATA FOR PRIOR YEARS
2010-2011 2011-2012 2012-2013 2013-2014 2014-2015
ACTUAL ACTUAL ACTUAL PROJECTED PROPOSED
Revenues
Local Sources 23,792,041$ 24,207,314$ 25,102,789$ 24,341,433$ 23,645,195$
State Sources 159,224,123 155,065,956 153,134,552 161,890,517 165,058,017
Federal Sources 3,834,406 4,182,892 5,762,148 2,073,074 2,590,000
Total Revenues 186,850,570 183,456,162 183,999,489 188,305,024 191,293,212
Expenditures by Function
Instruction 96,398,790 101,802,997 99,982,698 108,282,591 113,669,847
Instructional Resources and Media Services 4,456,401 3,906,686 3,589,936 3,810,815 4,043,607
Curriculum Devpt. and Instructional Staff Devpt. 438,355 548,417 441,691 472,036 722,059
Instructional Leadership 3,493,666 2,900,908 2,378,755 2,594,031 2,760,701
School Leadership 11,844,926 12,100,802 11,764,673 12,540,438 13,246,790
Guidance, Counseling, and Evaluation Services 7,069,611 5,715,091 5,671,633 6,169,903 6,539,570
Social Work Services 1,448,891 1,210,707 1,231,942 1,501,845 1,551,982
Health Services 1,725,756 1,773,145 1,603,296 1,822,419 2,216,587
Student (Pupil) Transportation 3,235,791 3,569,593 3,787,121 4,053,439 3,748,352
Cocurricular/Extracurricular Activities 2,593,752 2,543,649 2,648,633 3,217,196 3,080,473
General Administration 5,811,058 5,820,566 5,533,855 5,964,842 6,630,816
Plant Maintenance and Operations 20,114,891 21,198,860 19,137,682 20,604,066 22,190,309
Security and Monitoring Services 3,145,865 3,336,350 3,003,296 4,870,047 4,000,776
Data Processing Services 3,064,120 3,430,873 2,986,469 3,529,029 3,446,977
Community Services 227,851 276,256 221,582 288,330 318,743
Facilities Acquisition and Construction - 323,072 14,501,429 2,522,280 -
Juvenile Justice Alternative Education Program 72,443 58,618 162,740 190,000 210,000
Total Expenditures 165,142,167 170,516,590 178,647,431 182,433,307 188,377,589
Excess/(Deficiency) of Revenues Over/(Under) Expenditures 21,708,403 12,939,572 5,352,058 5,871,717 2,915,623
Other Financing Sources (Uses)
Transfers In - - - 20,410,472 -
Transfers Out (7,020,726) (5,870,609) (22,254,140) (24,349,286) (2,915,623)
Proceeds 72,215 - - 109,849 -
Total Other Financing Sources (Uses) (6,948,511) (5,870,609) (22,254,140) (3,828,965) (2,915,623)
Net Changes in Fund Balances 14,759,892 7,068,963 (16,902,082) 2,042,752 -
Fund Balance, Beginning 65,641,045 80,400,937 87,469,900 70,567,818 72,610,570
Fund Balance, Ending 80,400,937$ 87,469,900$ 70,567,818$ 72,610,570$ 72,610,570$
Fund Balance Recap
Nonspendable Fund Balance 488,352$ 462,545$ 381,331$ 381,331$ 381,331$
Other Restricted Fund Balance 10,570,736 10,932,234 526,698 1,261,017 1,261,017
Committed Fund Balance - 3,006,641 2,000,000 3,622,909 3,622,909
Assigned Fund Balance 10,000,000 5,491,660 - - -
Assigned Other Fund Balance 430,944 5,006,716 5,006,798 617,972 617,972
Undesignated/Unassigned Fund Balance 58,910,905 62,570,104 62,652,991 66,727,341 66,727,341
Fund Balance, Ending 80,400,937$ 87,469,900$ 70,567,818$ 72,610,570$ 72,610,570$
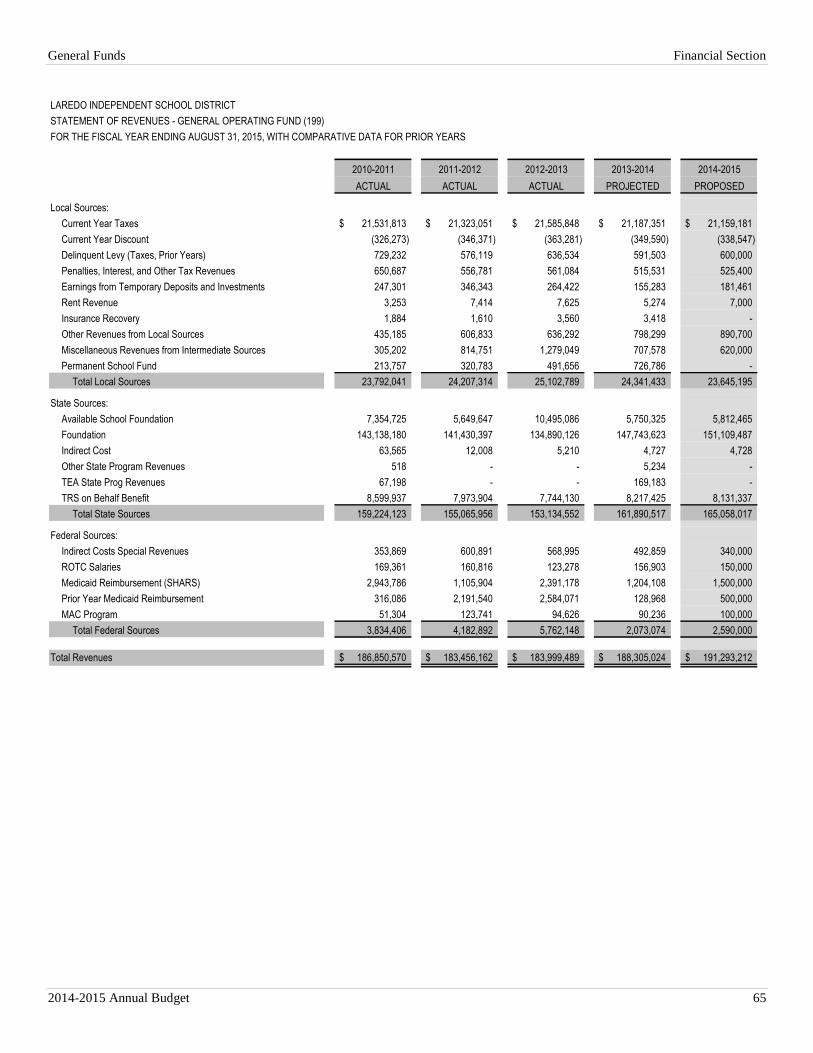
General Funds Financial Section
2014-2015 Annual Budget 65
LAREDO INDEPENDENT SCHOOL DISTRICT
STATEMENT OF REVENUES - GENERAL OPERATING FUND (199)
FOR THE FISCAL YEAR ENDING AUGUST 31, 2015, WITH COMPARATIVE DATA FOR PRIOR YEARS
2010-2011 2011-2012 2012-2013 2013-2014 2014-2015
ACTUAL ACTUAL ACTUAL PROJECTED PROPOSED
Local Sources:
Current Year Taxes 21,531,813$ 21,323,051$ 21,585,848$ 21,187,351$ 21,159,181$
Current Year Discount (326,273) (346,371) (363,281) (349,590) (338,547)
Delinquent Levy (Taxes, Prior Years) 729,232 576,119 636,534 591,503 600,000
Penalties, Interest, and Other Tax Revenues 650,687 556,781 561,084 515,531 525,400
Earnings from Temporary Deposits and Investments 247,301 346,343 264,422 155,283 181,461
Rent Revenue 3,253 7,414 7,625 5,274 7,000
Insurance Recovery 1,884 1,610 3,560 3,418 -
Other Revenues from Local Sources 435,185 606,833 636,292 798,299 890,700
Miscellaneous Revenues from Intermediate Sources 305,202 814,751 1,279,049 707,578 620,000
Permanent School Fund 213,757 320,783 491,656 726,786 -
Total Local Sources 23,792,041 24,207,314 25,102,789 24,341,433 23,645,195
State Sources:
Available School Foundation 7,354,725 5,649,647 10,495,086 5,750,325 5,812,465
Foundation 143,138,180 141,430,397 134,890,126 147,743,623 151,109,487
Indirect Cost 63,565 12,008 5,210 4,727 4,728
Other State Program Revenues 518 - - 5,234 -
TEA State Prog Revenues 67,198 - - 169,183 -
TRS on Behalf Benefit 8,599,937 7,973,904 7,744,130 8,217,425 8,131,337
Total State Sources 159,224,123 155,065,956 153,134,552 161,890,517 165,058,017
Federal Sources:
Indirect Costs Special Revenues 353,869 600,891 568,995 492,859 340,000
ROTC Salaries 169,361 160,816 123,278 156,903 150,000
Medicaid Reimbursement (SHARS) 2,943,786 1,105,904 2,391,178 1,204,108 1,500,000
Prior Year Medicaid Reimbursement 316,086 2,191,540 2,584,071 128,968 500,000
MAC Program 51,304 123,741 94,626 90,236 100,000
Total Federal Sources 3,834,406 4,182,892 5,762,148 2,073,074 2,590,000
Total Revenues 186,850,570$ 183,456,162$ 183,999,489$ 188,305,024$ 191,293,212$
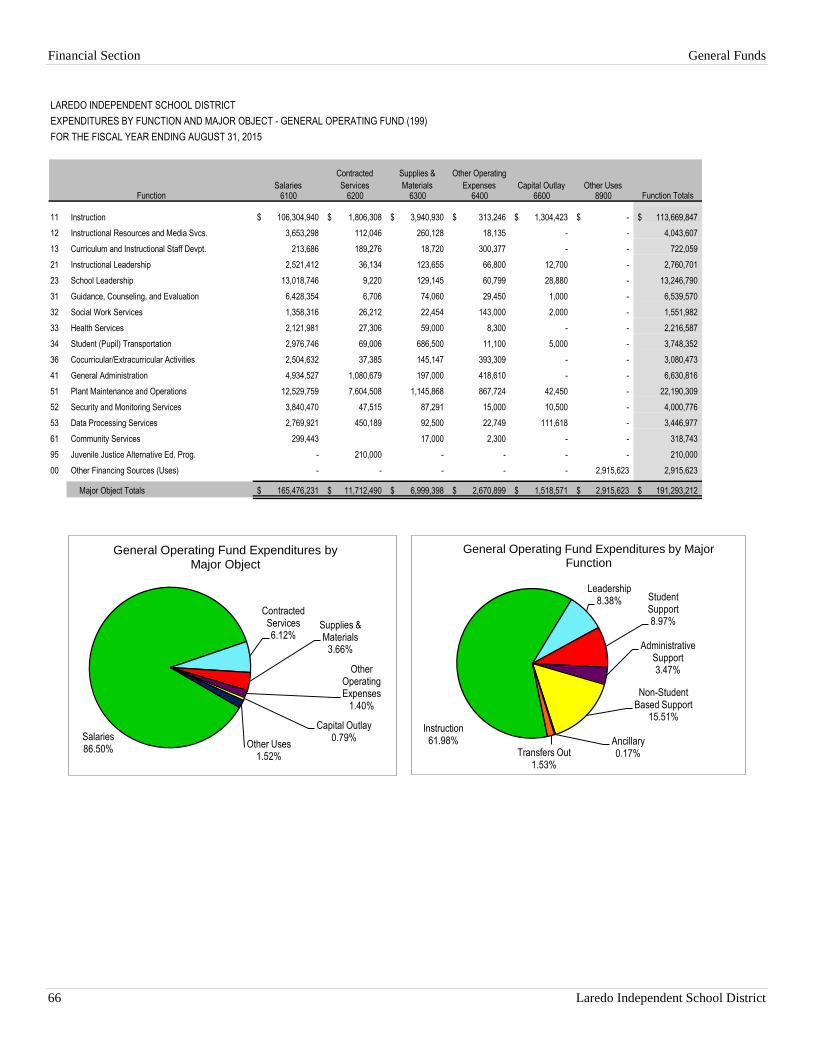
Financial Section General Funds
66 Laredo Independent School District
LAREDO INDEPENDENT SCHOOL DISTRICT
EXPENDITURES BY FUNCTION AND MAJOR OBJECT - GENERAL OPERATING FUND (199)
FOR THE FISCAL YEAR ENDING AUGUST 31, 2015
Salaries
Contracted
Services
Supplies &
Materials
Other Operating
Expenses Capital Outlay Other Uses6100 6200 6300 6400 6600 8900
11 Instruction 106,304,940$ 1,806,308$ 3,940,930$ 313,246$ 1,304,423$ -$ 113,669,847$
12 Instructional Resources and Media Svcs. 3,653,298 112,046 260,128 18,135 - - 4,043,607
13 Curriculum and Instructional Staff Devpt. 213,686 189,276 18,720 300,377 - - 722,059
21 Instructional Leadership 2,521,412 36,134 123,655 66,800 12,700 - 2,760,701
23 School Leadership 13,018,746 9,220 129,145 60,799 28,880 - 13,246,790
31 Guidance, Counseling, and Evaluation 6,428,354 6,706 74,060 29,450 1,000 - 6,539,570
32 Social Work Services 1,358,316 26,212 22,454 143,000 2,000 - 1,551,982
33 Health Services 2,121,981 27,306 59,000 8,300 - - 2,216,587
34 Student (Pupil) Transportation 2,976,746 69,006 686,500 11,100 5,000 - 3,748,352
36 Cocurricular/Extracurricular Activities 2,504,632 37,385 145,147 393,309 - - 3,080,473
41 General Administration 4,934,527 1,080,679 197,000 418,610 - - 6,630,816
51 Plant Maintenance and Operations 12,529,759 7,604,508 1,145,868 867,724 42,450 - 22,190,309
52 Security and Monitoring Services 3,840,470 47,515 87,291 15,000 10,500 - 4,000,776
53 Data Processing Services 2,769,921 450,189 92,500 22,749 111,618 - 3,446,977
61 Community Services 299,443 17,000 2,300 - - 318,743
95 Juvenile Justice Alternative Ed. Prog. - 210,000 - - - - 210,000
00 Other Financing Sources (Uses) - - - - - 2,915,623 2,915,623
Major Object Totals 165,476,231$ 11,712,490$ 6,999,398$ 2,670,899$ 1,518,571$ 2,915,623$ 191,293,212$
Function TotalsFunction
Salaries86.50%
Contracted Services6.12%
Supplies & Materials
3.66%
Other Operating Expenses
1.40%
Capital Outlay0.79%
Other Uses1.52%
General Operating Fund Expenditures by Major Object
Instruction 61.98%
Leadership8.38% Student
Support8.97%
Administrative Support3.47%
Non-Student Based Support
15.51%
Ancillary0.17%Transfers Out
1.53%
General Operating Fund Expenditures by Major Function

General Funds Financial Section
2014-2015 Annual Budget 67
LAREDO INDEPENDENT SCHOOL DISTRICT
EXPENDITURES BY PROGRAM AND MAJOR OBJECT - GENERAL OPERATING FUND (199)
FOR THE FISCAL YEAR ENDING AUGUST 31, 2015
Salaries
Contracted
Services
Supplies &
Materials
Other Operating
Expenses Debt Service Capital Outlay Other Uses6100 6200 6300 6400 6500 6600 8900
11 Basic Educational Services 89,295,183$ 1,050,985$ 1,116,662$ 487,776$ -$ 1,214,256$ -$ 93,164,862$
21 Gifted & Talented 544,057 8,600 25,722 3,900 - - - 582,279
22 Career & Technology 4,558,106 206,041 73,670 37,440 - 5,500 - 4,880,757
23 Svcs. to Students with Disabilities (Special Ed.) 17,041,138 13,334 119,235 500 - - - 17,174,207
25 Bilingual Ed. and Special Language Programs 4,240,663 6,611 924,597 55,936 - 2,467 - 5,230,274
28 Disciplinary Alternative Education Program 1,700,132 69,544 211,427 60,800 - 96,200 - 2,138,103
30 State Compensatory Ed. 11,985,428 108,170 1,884,293 184,691 - - - 14,162,582
31 High School Allotment 1,025,947 692,759 54,638 1,500 - - - 1,774,844
91 Athletics & Related Activities 1,556,952 2,606 11,900 1,500 - 1,500 - 1,574,458
99 Undistributed 33,433,625 9,588,840 2,577,254 1,896,856 - 198,648 - 47,695,223
00 Other Financing Sources (Uses) - - - - - - 2,915,623 2,915,623
Major Object Totals 165,381,231$ 11,747,490$ 6,999,398$ 2,730,899$ -$ 1,518,571$ 2,915,623$ 191,293,212$
Program Intent
TotalsProgram
Basic Educational Services48.70%
Gifted & Talented0.30%
Career & Technology2.55%
Svcs. to Students with Disabilities (Special
Ed.)8.98%
Bilingual Ed. and Special Language
Programs2.73%
Disciplinary Alternative Education Program
1.12%
State Compensatory Ed.
7.40%
High School Allotment 0.93%Athletics & Related
Activities0.82%
Undistributed 24.93%
Other Financing Sources (Uses)
1.52%
General Operating Fund Expenditures by Program Intent
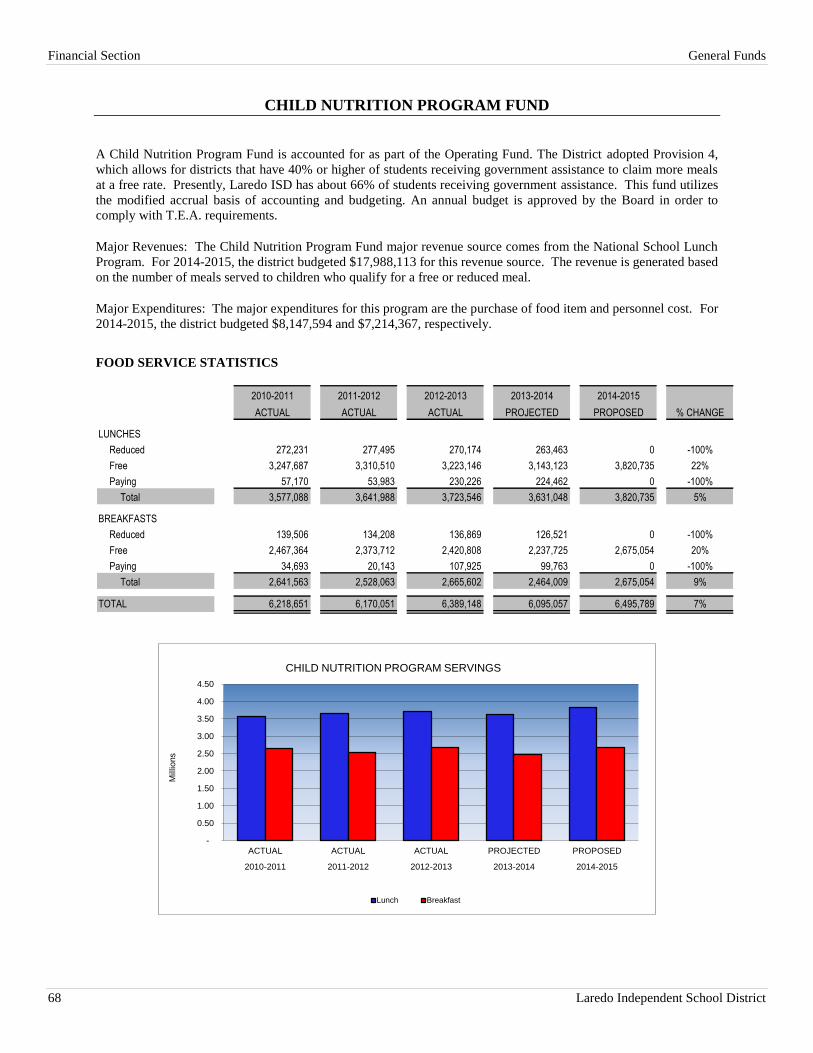
Financial Section General Funds
68 Laredo Independent School District
CHILD NUTRITION PROGRAM FUND
A Child Nutrition Program Fund is accounted for as part of the Operating Fund. The District adopted Provision 4,
which allows for districts that have 40% or higher of students receiving government assistance to claim more meals
at a free rate. Presently, Laredo ISD has about 66% of students receiving government assistance. This fund utilizes
the modified accrual basis of accounting and budgeting. An annual budget is approved by the Board in order to
comply with T.E.A. requirements.
Major Revenues: The Child Nutrition Program Fund major revenue source comes from the National School Lunch
Program. For 2014-2015, the district budgeted $17,988,113 for this revenue source. The revenue is generated based
on the number of meals served to children who qualify for a free or reduced meal.
Major Expenditures: The major expenditures for this program are the purchase of food item and personnel cost. For
2014-2015, the district budgeted $8,147,594 and $7,214,367, respectively.
FOOD SERVICE STATISTICS
2010-2011 2011-2012 2012-2013 2013-2014 2014-2015
ACTUAL ACTUAL ACTUAL PROJECTED PROPOSED % CHANGE
LUNCHES
Reduced 272,231 277,495 270,174 263,463 0 -100%
Free 3,247,687 3,310,510 3,223,146 3,143,123 3,820,735 22%
Paying 57,170 53,983 230,226 224,462 0 -100%
Total 3,577,088 3,641,988 3,723,546 3,631,048 3,820,735 5%
BREAKFASTS
Reduced 139,506 134,208 136,869 126,521 0 -100%
Free 2,467,364 2,373,712 2,420,808 2,237,725 2,675,054 20%
Paying 34,693 20,143 107,925 99,763 0 -100%
Total 2,641,563 2,528,063 2,665,602 2,464,009 2,675,054 9%
TOTAL 6,218,651 6,170,051 6,389,148 6,095,057 6,495,789 7%
-
0.50
1.00
1.50
2.00
2.50
3.00
3.50
4.00
4.50
ACTUAL ACTUAL ACTUAL PROJECTED PROPOSED
2010-2011 2011-2012 2012-2013 2013-2014 2014-2015
Millio
ns
CHILD NUTRITION PROGRAM SERVINGS
Lunch Breakfast
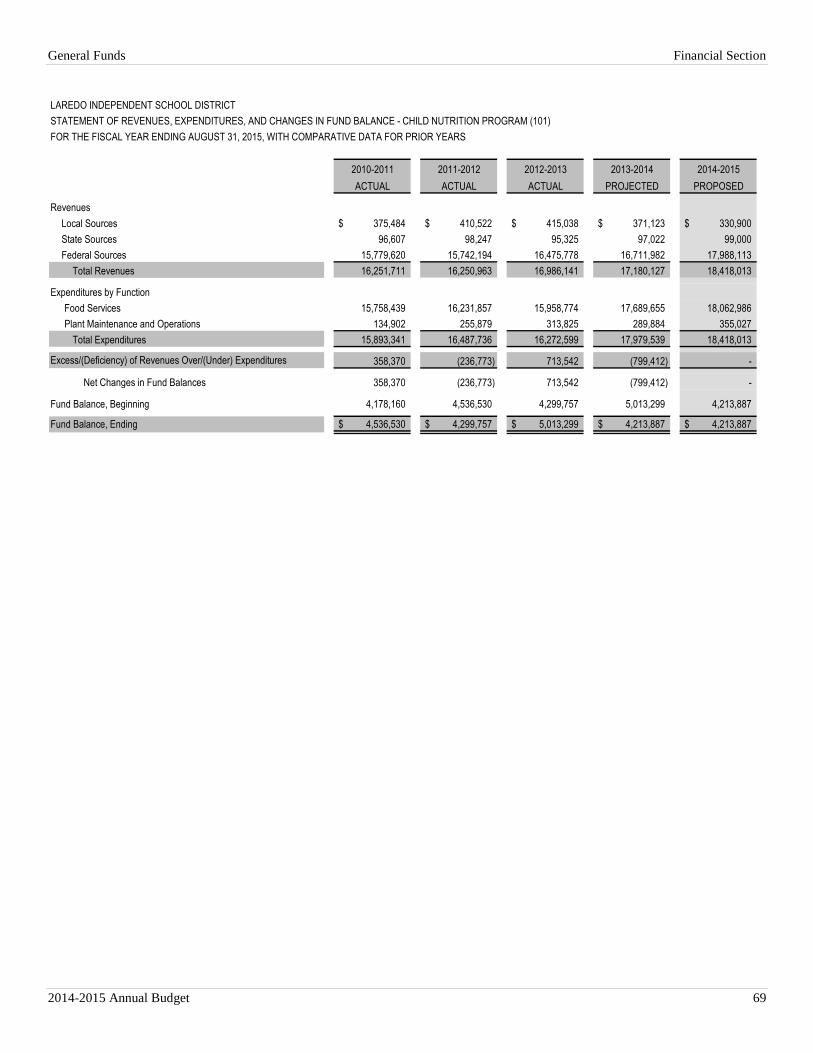
General Funds Financial Section
2014-2015 Annual Budget 69
LAREDO INDEPENDENT SCHOOL DISTRICT
STATEMENT OF REVENUES, EXPENDITURES, AND CHANGES IN FUND BALANCE - CHILD NUTRITION PROGRAM (101)
FOR THE FISCAL YEAR ENDING AUGUST 31, 2015, WITH COMPARATIVE DATA FOR PRIOR YEARS
2010-2011 2011-2012 2012-2013 2013-2014 2014-2015
ACTUAL ACTUAL ACTUAL PROJECTED PROPOSED
Revenues
Local Sources 375,484$ 410,522$ 415,038$ 371,123$ 330,900$
State Sources 96,607 98,247 95,325 97,022 99,000
Federal Sources 15,779,620 15,742,194 16,475,778 16,711,982 17,988,113
Total Revenues 16,251,711 16,250,963 16,986,141 17,180,127 18,418,013
Expenditures by Function
Food Services 15,758,439 16,231,857 15,958,774 17,689,655 18,062,986
Plant Maintenance and Operations 134,902 255,879 313,825 289,884 355,027
Total Expenditures 15,893,341 16,487,736 16,272,599 17,979,539 18,418,013
Excess/(Deficiency) of Revenues Over/(Under) Expenditures 358,370 (236,773) 713,542 (799,412) -
Net Changes in Fund Balances 358,370 (236,773) 713,542 (799,412) -
Fund Balance, Beginning 4,178,160 4,536,530 4,299,757 5,013,299 4,213,887
Fund Balance, Ending 4,536,530$ 4,299,757$ 5,013,299$ 4,213,887$ 4,213,887$
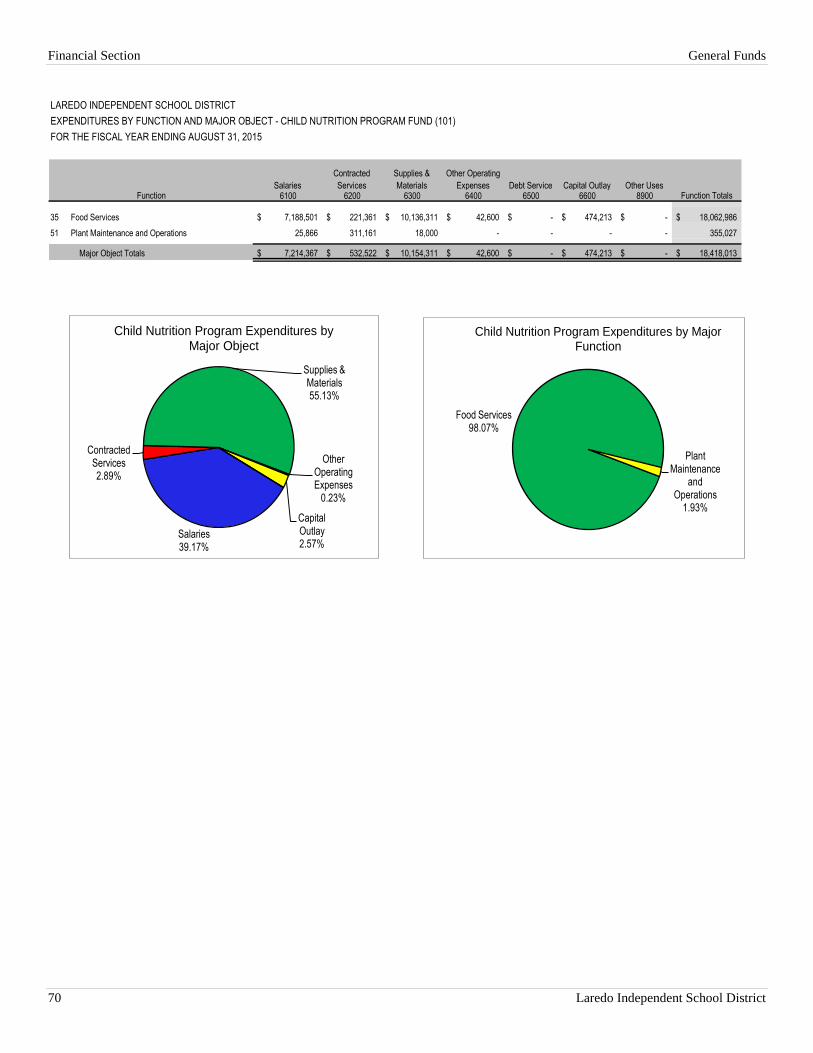
Financial Section General Funds
70 Laredo Independent School District
LAREDO INDEPENDENT SCHOOL DISTRICT
EXPENDITURES BY FUNCTION AND MAJOR OBJECT - CHILD NUTRITION PROGRAM FUND (101)
FOR THE FISCAL YEAR ENDING AUGUST 31, 2015
Salaries
Contracted
Services
Supplies &
Materials
Other Operating
Expenses Debt Service Capital Outlay Other Uses6100 6200 6300 6400 6500 6600 8900
35 Food Services 7,188,501$ 221,361$ 10,136,311$ 42,600$ -$ 474,213$ -$ 18,062,986$
51 Plant Maintenance and Operations 25,866 311,161 18,000 - - - - 355,027
Major Object Totals 7,214,367$ 532,522$ 10,154,311$ 42,600$ -$ 474,213$ -$ 18,418,013$
Function TotalsFunction
Salaries39.17%
Contracted Services2.89%
Supplies & Materials55.13%
Other Operating Expenses
0.23%
Capital Outlay2.57%
Child Nutrition Program Expenditures by Major Object
Food Services98.07%
Plant Maintenance
and Operations
1.93%
Child Nutrition Program Expenditures by Major Function
General Funds Financial Section
2014-2015 Annual Budget 71
ERATE FUND
This fund accounts for funds awarded by the Schools and Libraries Division of the Federal Government. These
funds will allow the District to provide for infrastructure for networking computers and to access the Internet.

Financial Section General Funds
72 Laredo Independent School District
LAREDO INDEPENDENT SCHOOL DISTRICT
STATEMENT OF REVENUES, EXPENDITURES, AND CHANGES IN FUND BALANCE - ERATE FUND (180)
FOR THE FISCAL YEAR ENDING AUGUST 31, 2015, WITH COMPARATIVE DATA FOR PRIOR YEARS
2010-2011 2011-2012 2012-2013 2013-2014 2014-2015
ACTUAL ACTUAL ACTUAL PROJECTED PROPOSED
Revenues
Local Sources -$ 567,357$ 649,702$ 906,332$ 385,000$
State Sources - - - - -
Federal Sources - - - - -
Total Revenues - 567,357 649,702 906,332 385,000
Expenditures by Function
Plant Maintenance and Operations - 441,859 444,896 430,089 250,000
Data Processing Services - 497,965 642,824 441,481 677,800
Facilities Acquisition and Construction - 1,633,355 57,289 518,357 4,665,580
Total Expenditures - 2,573,179 1,145,009 1,389,927 5,593,380
Excess/(Deficiency) of Revenues Over/(Under) Expenditures - (2,005,822) (495,307) (483,595) (5,208,380)
Other Financing Sources (Uses)
Transfers In - 2,850,942 512,289 973,357 3,856,516
Total Other Financing Sources (Uses) - 2,850,942 512,289 973,357 3,856,516
Net Changes in Fund Balances - 845,120 16,982 489,762 (1,351,864)
Fund Balance, Beginning - - 845,120 862,102 1,351,864 -
Fund Balance, Ending -$ 845,120$ 862,102$ 1,351,864$ -$
General Funds Financial Section
2014-2015 Annual Budget 73
ATHLETICS FUND
This fund accounts for expenditures associated with all sport programs at the middle school and high school levels.
The current programs available for our student athletes include: football, volleyball, cross-country, tennis,
basketball, soccer, track & field, golf, baseball, softball, and power-lifting. The current funding allotment for a
particular sports program is dependent on the number of participants which compete, and the variable cost of their
equipment.
Major Revenues: The major source of revenue for the Athletics Fund is the gate receipts. The projected income for
2014-2015 is $202,000.
Major Expenditures: Most of the expenditures are for other operating expenses and general supplies. The total
projected expenditures for 2014-2015 is $1,322,000.
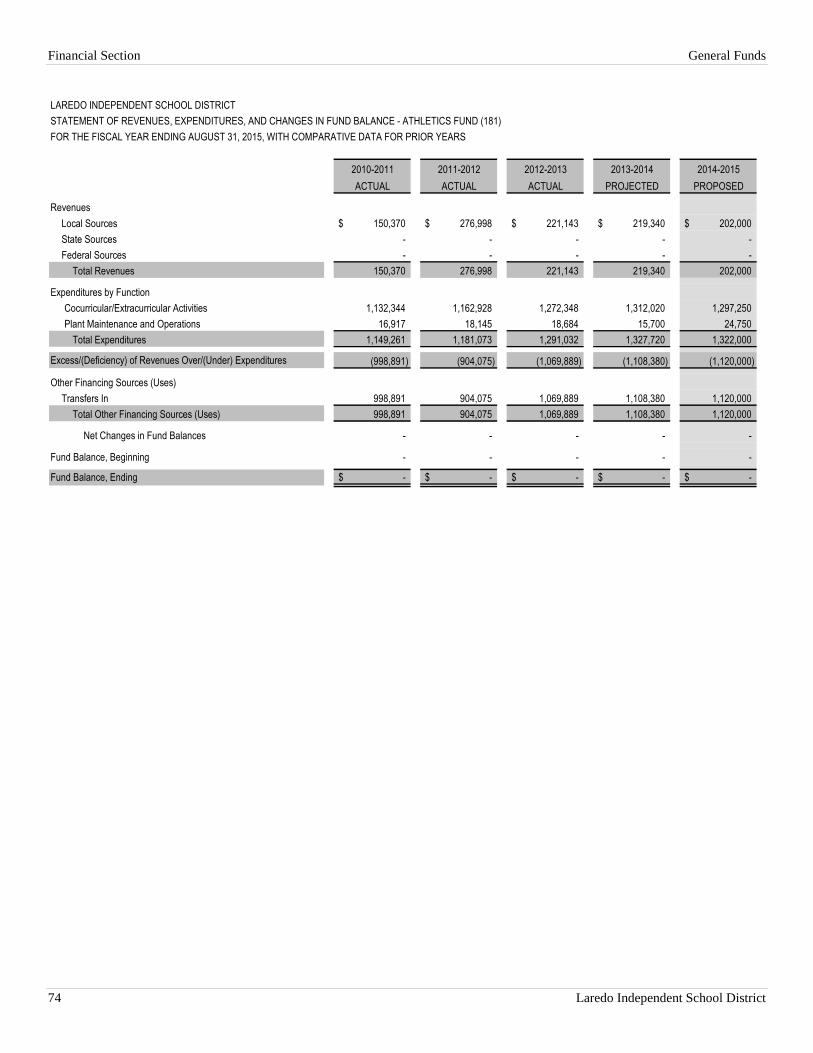
Financial Section General Funds
74 Laredo Independent School District
LAREDO INDEPENDENT SCHOOL DISTRICT
STATEMENT OF REVENUES, EXPENDITURES, AND CHANGES IN FUND BALANCE - ATHLETICS FUND (181)
FOR THE FISCAL YEAR ENDING AUGUST 31, 2015, WITH COMPARATIVE DATA FOR PRIOR YEARS
2010-2011 2011-2012 2012-2013 2013-2014 2014-2015
ACTUAL ACTUAL ACTUAL PROJECTED PROPOSED
Revenues
Local Sources 150,370$ 276,998$ 221,143$ 219,340$ 202,000$
State Sources - - - - -
Federal Sources - - - - -
Total Revenues 150,370 276,998 221,143 219,340 202,000
Expenditures by Function
Cocurricular/Extracurricular Activities 1,132,344 1,162,928 1,272,348 1,312,020 1,297,250
Plant Maintenance and Operations 16,917 18,145 18,684 15,700 24,750
Total Expenditures 1,149,261 1,181,073 1,291,032 1,327,720 1,322,000
Excess/(Deficiency) of Revenues Over/(Under) Expenditures (998,891) (904,075) (1,069,889) (1,108,380) (1,120,000)
Other Financing Sources (Uses)
Transfers In 998,891 904,075 1,069,889 1,108,380 1,120,000
Total Other Financing Sources (Uses) 998,891 904,075 1,069,889 1,108,380 1,120,000
Net Changes in Fund Balances - - - - -
Fund Balance, Beginning - - - - - - -
Fund Balance, Ending -$ -$ -$ -$ -$
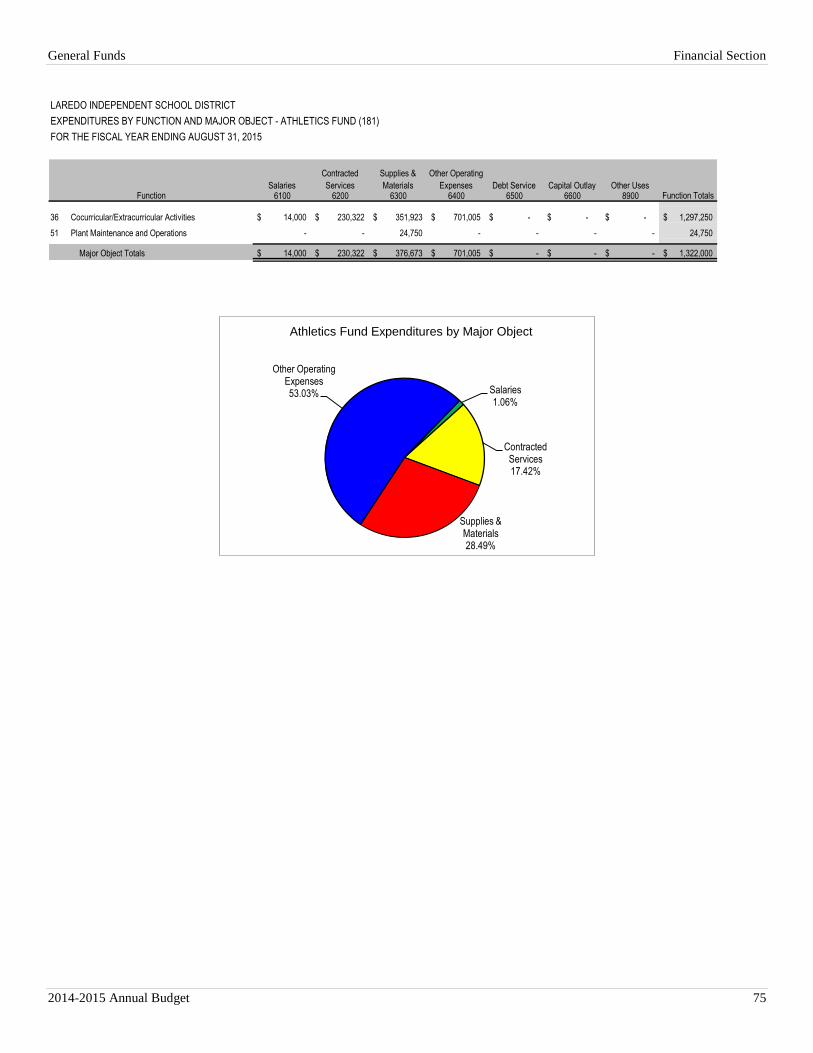
General Funds Financial Section
2014-2015 Annual Budget 75
LAREDO INDEPENDENT SCHOOL DISTRICT
EXPENDITURES BY FUNCTION AND MAJOR OBJECT - ATHLETICS FUND (181)
FOR THE FISCAL YEAR ENDING AUGUST 31, 2015
Salaries
Contracted
Services
Supplies &
Materials
Other Operating
Expenses Debt Service Capital Outlay Other Uses6100 6200 6300 6400 6500 6600 8900
36 Cocurricular/Extracurricular Activities 14,000$ 230,322$ 351,923$ 701,005$ -$ -$ -$ 1,297,250$
51 Plant Maintenance and Operations - - 24,750 - - - - 24,750
Major Object Totals 14,000$ 230,322$ 376,673$ 701,005$ -$ -$ -$ 1,322,000$
Function TotalsFunction
Salaries1.06%
Contracted Services17.42%
Supplies & Materials28.49%
Other Operating Expenses53.03%
Athletics Fund Expenditures by Major Object

Financial Section General Funds
76 Laredo Independent School District
TECHNOLOGY FUND
This fund accounts for technological software or equipment purchases that contributes to student learning, or to pay
for training for educational personnel involved in the use of these materials.
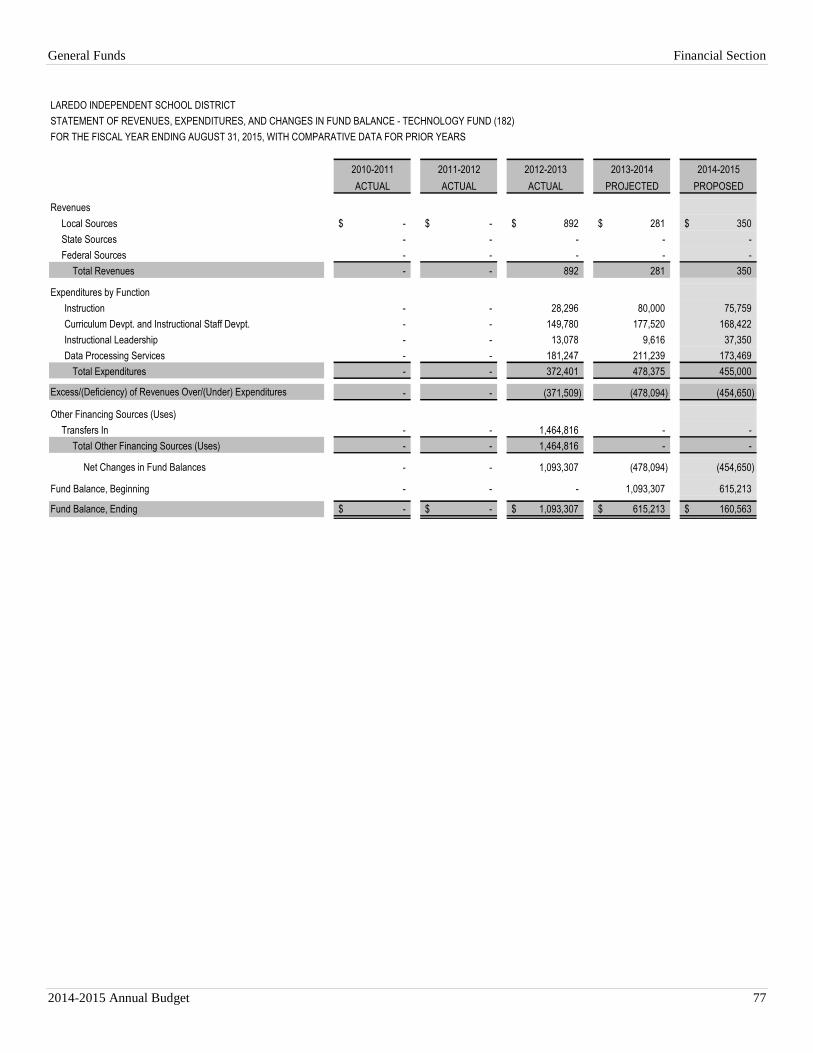
General Funds Financial Section
2014-2015 Annual Budget 77
LAREDO INDEPENDENT SCHOOL DISTRICT
STATEMENT OF REVENUES, EXPENDITURES, AND CHANGES IN FUND BALANCE - TECHNOLOGY FUND (182)
FOR THE FISCAL YEAR ENDING AUGUST 31, 2015, WITH COMPARATIVE DATA FOR PRIOR YEARS
2010-2011 2011-2012 2012-2013 2013-2014 2014-2015
ACTUAL ACTUAL ACTUAL PROJECTED PROPOSED
Revenues
Local Sources -$ -$ 892$ 281$ 350$
State Sources - - - - -
Federal Sources - - - - -
Total Revenues - - 892 281 350
Expenditures by Function
Instruction - - 28,296 80,000 75,759
Curriculum Devpt. and Instructional Staff Devpt. - - 149,780 177,520 168,422
Instructional Leadership - - 13,078 9,616 37,350
Data Processing Services - - 181,247 211,239 173,469
Total Expenditures - - 372,401 478,375 455,000
Excess/(Deficiency) of Revenues Over/(Under) Expenditures - - (371,509) (478,094) (454,650)
Other Financing Sources (Uses)
Transfers In - - 1,464,816 - -
Total Other Financing Sources (Uses) - - 1,464,816 - -
Net Changes in Fund Balances - - 1,093,307 (478,094) (454,650)
Fund Balance, Beginning - - - 1,093,307 615,213 -
Fund Balance, Ending -$ -$ 1,093,307$ 615,213$ 160,563$
Financial Section Debt Service Funds
78 Laredo Independent School District
DEBT SERVICE FUND
The Debt Service Fund is a governmental fund type, with budgetary control, that must be used to account for general
long-term debt principal and interest for debt issues and other long-term debts for which a tax has been dedicated. A
separate bank account must be kept for this fund. Principal and interest payments for operating indebtedness,
including warrants, notes, and short-term lease-purchase agreements, are to be made from the fund for which the
debt was incurred. This fund utilizes the modified accrual basis of accounting.
DEBT MANAGEMENT POLICIES
Laredo Independent School District has managed its debt by maintaining a conservative approach to financing and
refunding of debt instruments. All previous bonds have been financed and savings in interest have realized.
Type of Debt
General Obligation Bonds (GOs): GOs are used only to fund capital assets of the general government and
are not to be used to fund operating needs of the District. The full faith and credit of the District as well as
the ad valorem tax authority of the District back these bonds. General obligation bonds must be authorized
by a vote of the citizens of the Laredo Independent School District.
Qualified Zone Academy Bond (QZAB): The QZAB is for the purpose of paying all or a portion of the
District’s costs incurred in connection with the repair, rehabilitation, renovation, and replacement of school
facilities at the Qualified Zone Academies.
Method of Sale
The District uses a combination of competitive bidding process and a negotiation process in the sale of bonds. The
notice of sale is carefully constructed to ensure the best possible value for the District, while considering the existing
market conditions and other prevailing factors. Parameters to be examined include:
Limits between lowest and highest coupons
Coupon requirements relative to the yield curve
Method of underwriter compensation, discount or premium coupons
Use of bond insurance
Deep discount bonds
Variable rate bonds
Call provisions
Currently, the District has approximately $270,246,316 million in debt of which $8,000,000 is qualified zone
academy bonds (QZAB).
Federal Requirements
The District complies with arbitrage rebate and other federal requirements.
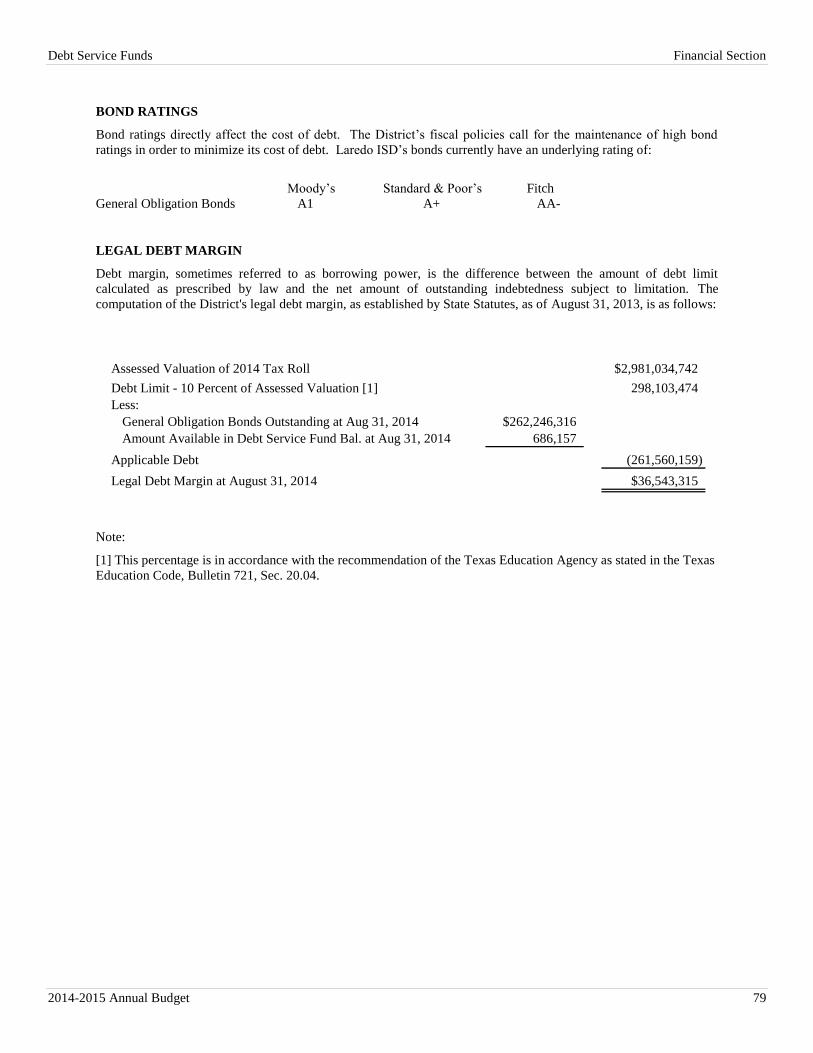
Debt Service Funds Financial Section
2014-2015 Annual Budget 79
BOND RATINGS
Bond ratings directly affect the cost of debt. The District’s fiscal policies call for the maintenance of high bond
ratings in order to minimize its cost of debt. Laredo ISD’s bonds currently have an underlying rating of:
Moody’s Standard & Poor’s Fitch
General Obligation Bonds A1 A+ AA-
LEGAL DEBT MARGIN
Debt margin, sometimes referred to as borrowing power, is the difference between the amount of debt limit
calculated as prescribed by law and the net amount of outstanding indebtedness subject to limitation. The
computation of the District's legal debt margin, as established by State Statutes, as of August 31, 2013, is as follows:
Assessed Valuation of 2014 Tax Roll $2,981,034,742
Debt Limit - 10 Percent of Assessed Valuation [1] 298,103,474
Less:
General Obligation Bonds Outstanding at Aug 31, 2014 $262,246,316
Amount Available in Debt Service Fund Bal. at Aug 31, 2014 686,157
Applicable Debt (261,560,159)
Legal Debt Margin at August 31, 2014 $36,543,315
Note:
[1] This percentage is in accordance with the recommendation of the Texas Education Agency as stated in the Texas
Education Code, Bulletin 721, Sec. 20.04.
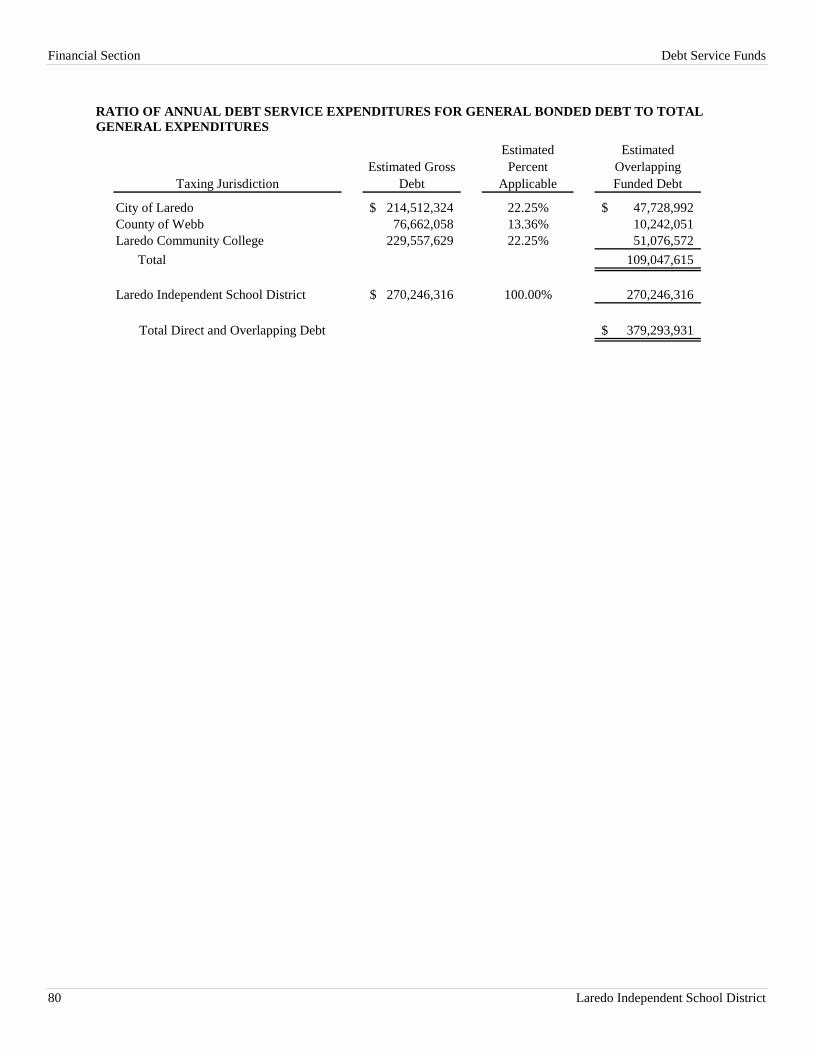
Financial Section Debt Service Funds
80 Laredo Independent School District
RATIO OF ANNUAL DEBT SERVICE EXPENDITURES FOR GENERAL BONDED DEBT TO TOTAL
GENERAL EXPENDITURES
Taxing Jurisdiction
Estimated Gross
Debt
Estimated
Percent
Applicable
Estimated
Overlapping
Funded Debt
City of Laredo 214,512,324$ 22.25% 47,728,992$
County of Webb 76,662,058 13.36% 10,242,051
Laredo Community College 229,557,629 22.25% 51,076,572
Total 109,047,615
Laredo Independent School District 270,246,316$ 100.00% 270,246,316
Total Direct and Overlapping Debt 379,293,931$
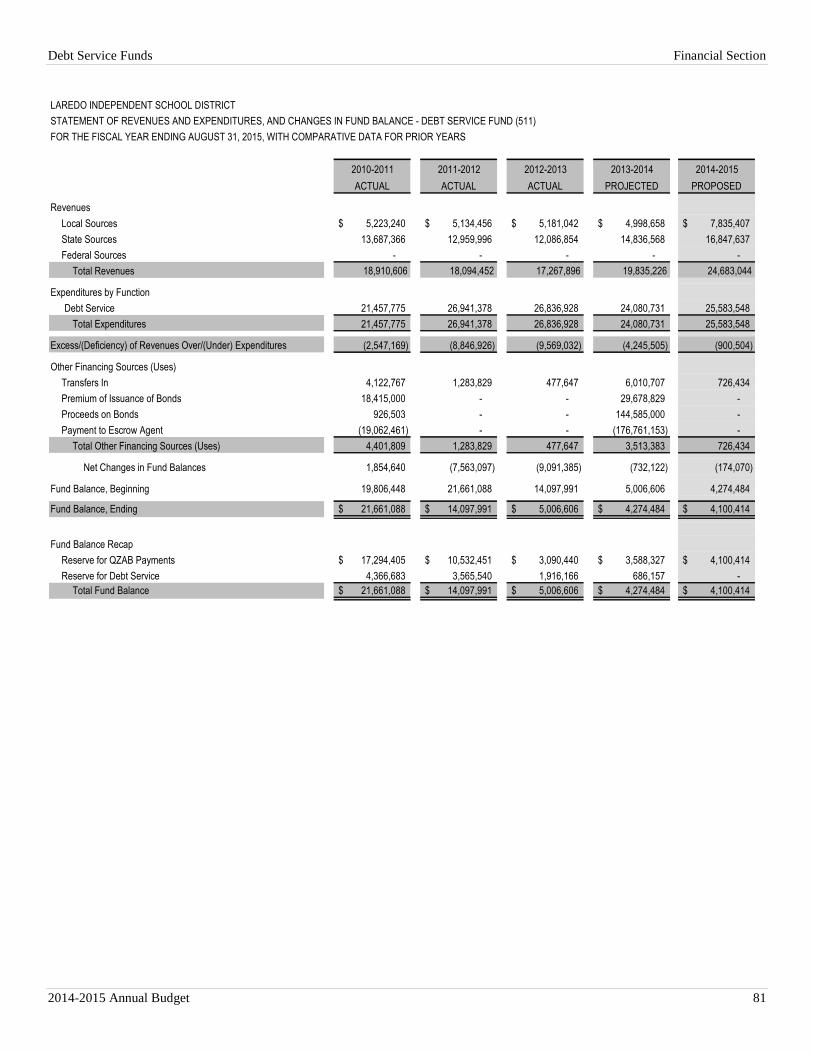
Debt Service Funds Financial Section
2014-2015 Annual Budget 81
LAREDO INDEPENDENT SCHOOL DISTRICT
STATEMENT OF REVENUES AND EXPENDITURES, AND CHANGES IN FUND BALANCE - DEBT SERVICE FUND (511)
FOR THE FISCAL YEAR ENDING AUGUST 31, 2015, WITH COMPARATIVE DATA FOR PRIOR YEARS
2010-2011 2011-2012 2012-2013 2013-2014 2014-2015
ACTUAL ACTUAL ACTUAL PROJECTED PROPOSED
Revenues
Local Sources 5,223,240$ 5,134,456$ 5,181,042$ 4,998,658$ 7,835,407$
State Sources 13,687,366 12,959,996 12,086,854 14,836,568 16,847,637
Federal Sources - - - - -
Total Revenues 18,910,606 18,094,452 17,267,896 19,835,226 24,683,044
Expenditures by Function
Debt Service 21,457,775 26,941,378 26,836,928 24,080,731 25,583,548
Total Expenditures 21,457,775 26,941,378 26,836,928 24,080,731 25,583,548
Excess/(Deficiency) of Revenues Over/(Under) Expenditures (2,547,169) (8,846,926) (9,569,032) (4,245,505) (900,504)
Other Financing Sources (Uses)
Transfers In 4,122,767 1,283,829 477,647 6,010,707 726,434
Premium of Issuance of Bonds 18,415,000 - - 29,678,829 -
Proceeds on Bonds 926,503 - - 144,585,000 -
Payment to Escrow Agent (19,062,461) - - (176,761,153) -
Total Other Financing Sources (Uses) 4,401,809 1,283,829 477,647 3,513,383 726,434
Net Changes in Fund Balances 1,854,640 (7,563,097) (9,091,385) (732,122) (174,070)
Fund Balance, Beginning 19,806,448 21,661,088 14,097,991 5,006,606 4,274,484
Fund Balance, Ending 21,661,088$ 14,097,991$ 5,006,606$ 4,274,484$ 4,100,414$
Fund Balance Recap
Reserve for QZAB Payments 17,294,405$ 10,532,451$ 3,090,440$ 3,588,327$ 4,100,414$
Reserve for Debt Service 4,366,683 3,565,540 1,916,166 686,157 -
Total Fund Balance 21,661,088$ 14,097,991$ 5,006,606$ 4,274,484$ 4,100,414$
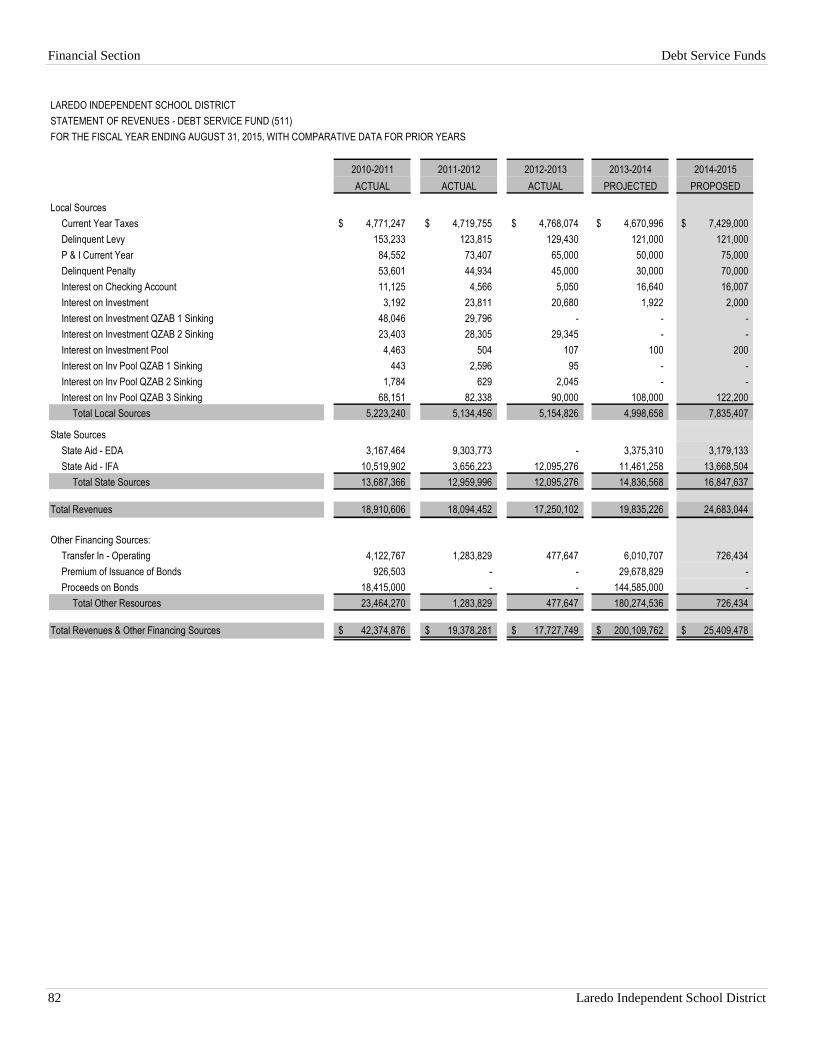
Financial Section Debt Service Funds
82 Laredo Independent School District
LAREDO INDEPENDENT SCHOOL DISTRICT
STATEMENT OF REVENUES - DEBT SERVICE FUND (511)
FOR THE FISCAL YEAR ENDING AUGUST 31, 2015, WITH COMPARATIVE DATA FOR PRIOR YEARS
2010-2011 2011-2012 2012-2013 2013-2014 2014-2015
ACTUAL ACTUAL ACTUAL PROJECTED PROPOSED
Local Sources
Current Year Taxes 4,771,247$ 4,719,755$ 4,768,074$ 4,670,996$ 7,429,000$
Delinquent Levy 153,233 123,815 129,430 121,000 121,000
P & I Current Year 84,552 73,407 65,000 50,000 75,000
Delinquent Penalty 53,601 44,934 45,000 30,000 70,000
Interest on Checking Account 11,125 4,566 5,050 16,640 16,007
Interest on Investment 3,192 23,811 20,680 1,922 2,000
Interest on Investment QZAB 1 Sinking 48,046 29,796 - - -
Interest on Investment QZAB 2 Sinking 23,403 28,305 29,345 - -
Interest on Investment Pool 4,463 504 107 100 200
Interest on Inv Pool QZAB 1 Sinking 443 2,596 95 - -
Interest on Inv Pool QZAB 2 Sinking 1,784 629 2,045 - -
Interest on Inv Pool QZAB 3 Sinking 68,151 82,338 90,000 108,000 122,200
Total Local Sources 5,223,240 5,134,456 5,154,826 4,998,658 7,835,407
State Sources
State Aid - EDA 3,167,464 9,303,773 - 3,375,310 3,179,133
State Aid - IFA 10,519,902 3,656,223 12,095,276 11,461,258 13,668,504
Total State Sources 13,687,366 12,959,996 12,095,276 14,836,568 16,847,637
Total Revenues 18,910,606 18,094,452 17,250,102 19,835,226 24,683,044
Other Financing Sources:
Transfer In - Operating 4,122,767 1,283,829 477,647 6,010,707 726,434
Premium of Issuance of Bonds 926,503 - - 29,678,829 -
Proceeds on Bonds 18,415,000 - - 144,585,000 -
Total Other Resources 23,464,270 1,283,829 477,647 180,274,536 726,434
Total Revenues & Other Financing Sources 42,374,876$ 19,378,281$ 17,727,749$ 200,109,762$ 25,409,478$
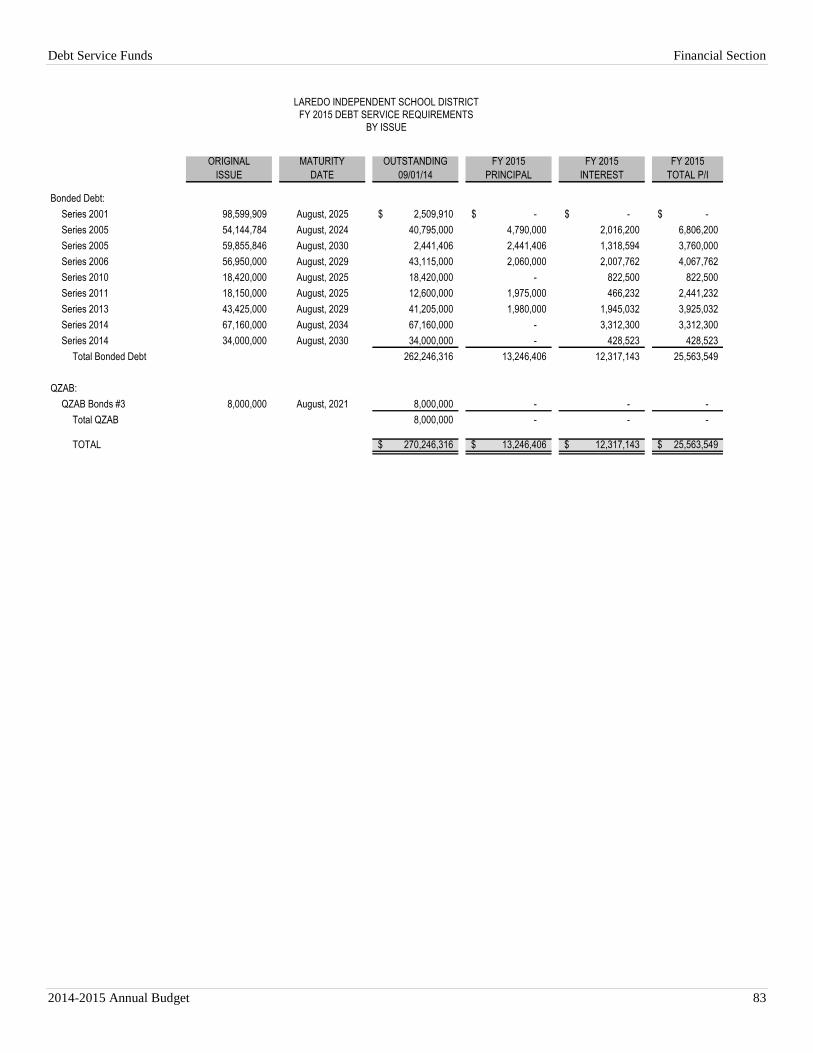
Debt Service Funds Financial Section
2014-2015 Annual Budget 83
ORIGINAL
ISSUE
MATURITY
DATE
OUTSTANDING
09/01/14
FY 2015
PRINCIPAL
FY 2015
INTEREST
FY 2015
TOTAL P/I
Bonded Debt:
Series 2001 98,599,909 August, 2025 2,509,910$ -$ -$ -$
Series 2005 54,144,784 August, 2024 40,795,000 4,790,000 2,016,200 6,806,200
Series 2005 59,855,846 August, 2030 2,441,406 2,441,406 1,318,594 3,760,000
Series 2006 56,950,000 August, 2029 43,115,000 2,060,000 2,007,762 4,067,762
Series 2010 18,420,000 August, 2025 18,420,000 - 822,500 822,500
Series 2011 18,150,000 August, 2025 12,600,000 1,975,000 466,232 2,441,232
Series 2013 43,425,000 August, 2029 41,205,000 1,980,000 1,945,032 3,925,032
Series 2014 67,160,000 August, 2034 67,160,000 - 3,312,300 3,312,300
Series 2014 34,000,000 August, 2030 34,000,000 - 428,523 428,523
Total Bonded Debt 262,246,316 13,246,406 12,317,143 25,563,549
QZAB:
QZAB Bonds #3 8,000,000 August, 2021 8,000,000 - - -
Total QZAB 8,000,000 - - -
TOTAL 270,246,316$ 13,246,406$ 12,317,143$ 25,563,549$
LAREDO INDEPENDENT SCHOOL DISTRICT
FY 2015 DEBT SERVICE REQUIREMENTS
BY ISSUE
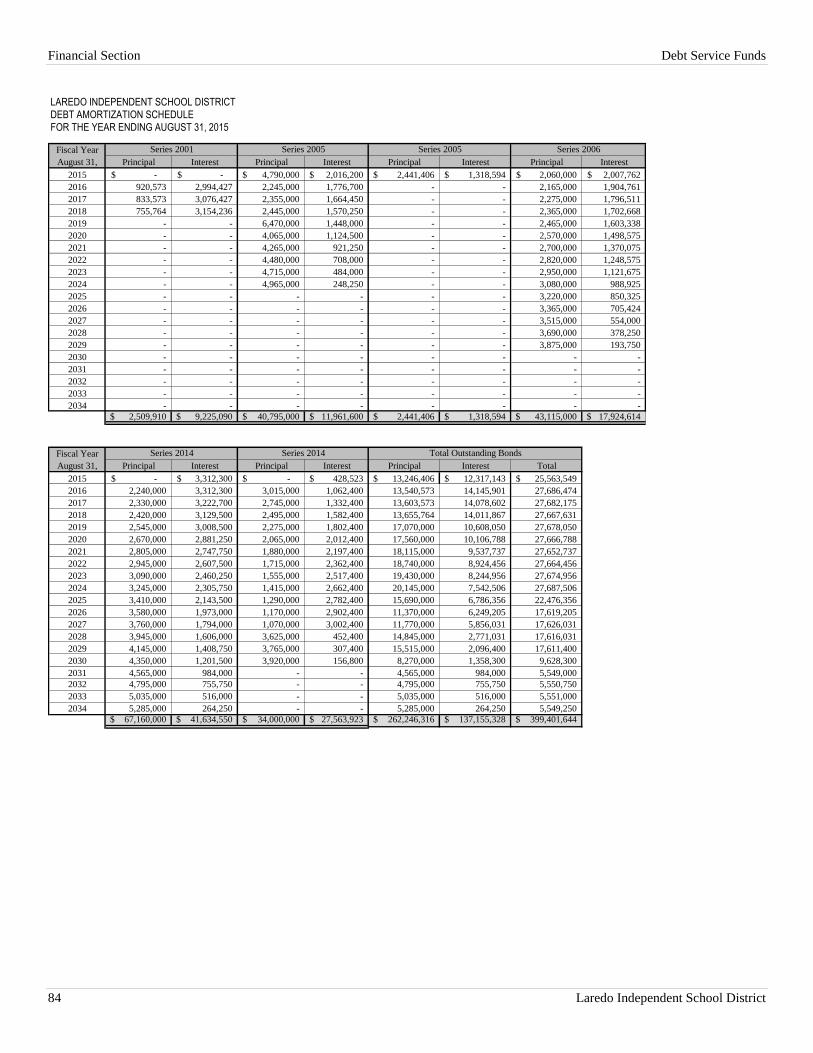
Financial Section Debt Service Funds
84 Laredo Independent School District
LAREDO INDEPENDENT SCHOOL DISTRICT
DEBT AMORTIZATION SCHEDULE
FOR THE YEAR ENDING AUGUST 31, 2015
Fiscal Year
August 31, Principal Interest Principal Interest Principal Interest Principal Interest
2015 -$ -$ 4,790,000$ 2,016,200$ 2,441,406$ 1,318,594$ 2,060,000$ 2,007,762$
2016 920,573 2,994,427 2,245,000 1,776,700 - - 2,165,000 1,904,761
2017 833,573 3,076,427 2,355,000 1,664,450 - - 2,275,000 1,796,511
2018 755,764 3,154,236 2,445,000 1,570,250 - - 2,365,000 1,702,668
2019 - - 6,470,000 1,448,000 - - 2,465,000 1,603,338
2020 - - 4,065,000 1,124,500 - - 2,570,000 1,498,575
2021 - - 4,265,000 921,250 - - 2,700,000 1,370,075
2022 - - 4,480,000 708,000 - - 2,820,000 1,248,575
2023 - - 4,715,000 484,000 - - 2,950,000 1,121,675
2024 - - 4,965,000 248,250 - - 3,080,000 988,925
2025 - - - - - - 3,220,000 850,325
2026 - - - - - - 3,365,000 705,424
2027 - - - - - - 3,515,000 554,000
2028 - - - - - - 3,690,000 378,250
2029 - - - - - - 3,875,000 193,750
2030 - - - - - - - -
2031 - - - - - - - -
2032 - - - - - - - -
2033 - - - - - - - -
2034 - - - - - - - -
2,509,910$ 9,225,090$ 40,795,000$ 11,961,600$ 2,441,406$ 1,318,594$ 43,115,000$ 17,924,614$
Fiscal Year
August 31, Principal Interest Principal Interest Principal Interest Total
2015 -$ 3,312,300$ -$ 428,523$ 13,246,406$ 12,317,143$ 25,563,549$
2016 2,240,000 3,312,300 3,015,000 1,062,400 13,540,573 14,145,901 27,686,474
2017 2,330,000 3,222,700 2,745,000 1,332,400 13,603,573 14,078,602 27,682,175
2018 2,420,000 3,129,500 2,495,000 1,582,400 13,655,764 14,011,867 27,667,631
2019 2,545,000 3,008,500 2,275,000 1,802,400 17,070,000 10,608,050 27,678,050
2020 2,670,000 2,881,250 2,065,000 2,012,400 17,560,000 10,106,788 27,666,788
2021 2,805,000 2,747,750 1,880,000 2,197,400 18,115,000 9,537,737 27,652,737
2022 2,945,000 2,607,500 1,715,000 2,362,400 18,740,000 8,924,456 27,664,456
2023 3,090,000 2,460,250 1,555,000 2,517,400 19,430,000 8,244,956 27,674,956
2024 3,245,000 2,305,750 1,415,000 2,662,400 20,145,000 7,542,506 27,687,506
2025 3,410,000 2,143,500 1,290,000 2,782,400 15,690,000 6,786,356 22,476,356
2026 3,580,000 1,973,000 1,170,000 2,902,400 11,370,000 6,249,205 17,619,205
2027 3,760,000 1,794,000 1,070,000 3,002,400 11,770,000 5,856,031 17,626,031
2028 3,945,000 1,606,000 3,625,000 452,400 14,845,000 2,771,031 17,616,031
2029 4,145,000 1,408,750 3,765,000 307,400 15,515,000 2,096,400 17,611,400
2030 4,350,000 1,201,500 3,920,000 156,800 8,270,000 1,358,300 9,628,300
2031 4,565,000 984,000 - - 4,565,000 984,000 5,549,000
2032 4,795,000 755,750 - - 4,795,000 755,750 5,550,750
2033 5,035,000 516,000 - - 5,035,000 516,000 5,551,000
2034 5,285,000 264,250 - - 5,285,000 264,250 5,549,250
67,160,000$ 41,634,550$ 34,000,000$ 27,563,923$ 262,246,316$ 137,155,328$ 399,401,644$
Series 2001 Series 2006Series 2005 Series 2005
Series 2014 Total Outstanding BondsSeries 2014
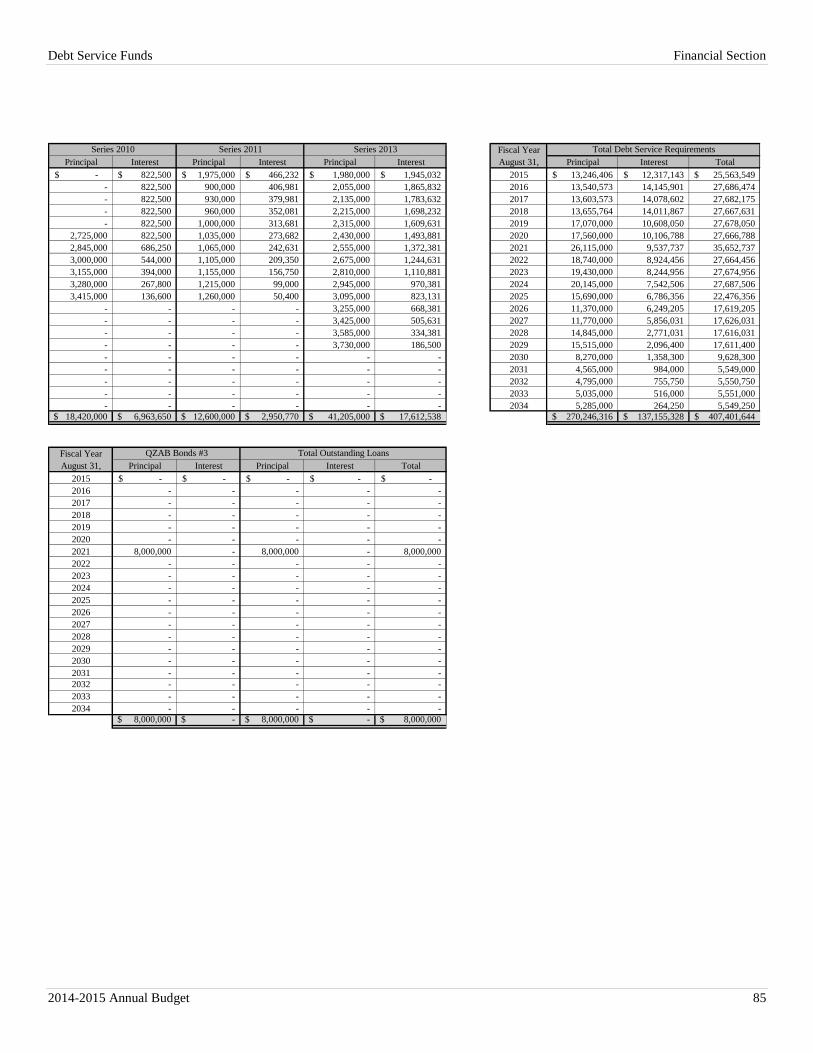
Debt Service Funds Financial Section
2014-2015 Annual Budget 85
Fiscal Year
Principal Interest Principal Interest Principal Interest August 31, Principal Interest Total
-$ 822,500$ 1,975,000$ 466,232$ 1,980,000$ 1,945,032$ 2015 13,246,406$ 12,317,143$ 25,563,549$
- 822,500 900,000 406,981 2,055,000 1,865,832 2016 13,540,573 14,145,901 27,686,474
- 822,500 930,000 379,981 2,135,000 1,783,632 2017 13,603,573 14,078,602 27,682,175
- 822,500 960,000 352,081 2,215,000 1,698,232 2018 13,655,764 14,011,867 27,667,631
- 822,500 1,000,000 313,681 2,315,000 1,609,631 2019 17,070,000 10,608,050 27,678,050
2,725,000 822,500 1,035,000 273,682 2,430,000 1,493,881 2020 17,560,000 10,106,788 27,666,788
2,845,000 686,250 1,065,000 242,631 2,555,000 1,372,381 2021 26,115,000 9,537,737 35,652,737
3,000,000 544,000 1,105,000 209,350 2,675,000 1,244,631 2022 18,740,000 8,924,456 27,664,456
3,155,000 394,000 1,155,000 156,750 2,810,000 1,110,881 2023 19,430,000 8,244,956 27,674,956
3,280,000 267,800 1,215,000 99,000 2,945,000 970,381 2024 20,145,000 7,542,506 27,687,506
3,415,000 136,600 1,260,000 50,400 3,095,000 823,131 2025 15,690,000 6,786,356 22,476,356
- - - - 3,255,000 668,381 2026 11,370,000 6,249,205 17,619,205
- - - - 3,425,000 505,631 2027 11,770,000 5,856,031 17,626,031
- - - - 3,585,000 334,381 2028 14,845,000 2,771,031 17,616,031
- - - - 3,730,000 186,500 2029 15,515,000 2,096,400 17,611,400
- - - - - - 2030 8,270,000 1,358,300 9,628,300
- - - - - - 2031 4,565,000 984,000 5,549,000
- - - - - - 2032 4,795,000 755,750 5,550,750
- - - - - - 2033 5,035,000 516,000 5,551,000
- - - - - - 2034 5,285,000 264,250 5,549,250
18,420,000$ 6,963,650$ 12,600,000$ 2,950,770$ 41,205,000$ 17,612,538$ 270,246,316$ 137,155,328$ 407,401,644$
Fiscal Year
August 31, Principal Interest Principal Interest Total
2015 -$ -$ -$ -$ -$
2016 - - - - -
2017 - - - - -
2018 - - - - -
2019 - - - - -
2020 - - - - -
2021 8,000,000 - 8,000,000 - 8,000,000
2022 - - - - -
2023 - - - - -
2024 - - - - -
2025 - - - - -
2026 - - - - -
2027 - - - - -
2028 - - - - -
2029 - - - - -
2030 - - - - -
2031 - - - - -
2032 - - - - -
2033 - - - - -
2034 - - - - -
8,000,000$ -$ 8,000,000$ -$ 8,000,000$
Total Debt Service RequirementsSeries 2011
Total Outstanding LoansQZAB Bonds #3
Series 2010 Series 2013
Financial Section Special Revenues Funds
86 Laredo Independent School District
SPECIAL REVENUE FUNDS
Special Revenue Funds are used to account for resources restricted to, or committed for, specific purposes by a
grantor. Federal financial assistance often is accounted for in a Special Revenue Fund. In most Special Revenue
Funds, unused balances are recorded as deferred revenue and carried forward to the succeeding fiscal year, provided
the amount carried forward is within the limits established by the grantor. In some cases, the unused balances are
returned to the grantor at the close of specified project periods. The District budgets for Special Revenue Funds and
uses project accounting for them in order to maintain integrity for the various sources of funds. These funds utilize
the modified accrual basis of accounting and budgeting.
211 ESEA, Title I, Part A - Improving Basic Program
This fund classification is to be used to account, on a project basis, for funds allocated to local educational agencies
to enable schools to provide opportunities for children served to acquire the knowledge and skills contained in the
challenging State content standards and to meet the challenging State performance standards developed for all
children.
212 ESEA, Title I, Part C - Education of Migratory Children
This fund classification is to be used to account, on a project basis, for funds granted for programs benefiting
children of migrant agriculture or agriculture-related workers and children of migrant fishermen.
224 IDEA, Part B - Formula
This fund classification is to be used to account, on a project basis, for funds granted to operate educational
programs for children with disabilities.
225 IDEA, Part B - Preschool
This fund classification is to be used to account, on a project basis, for funds granted for preschool children with
disabilities.
227 IDEA, Part B - Formula (Deaf)
This fund classification is to be used to account, on a project basis, for funds granted to operate educational
programs for children with disabilities.
228 IDEA, Part B - Preschool (Deaf)
This fund classification is to be used to account, on a project basis, for funds granted for preschool children with
disabilities.
242 Summer Feeding Program, Texas Department of Agriculture (TDA)
This fund classification is to be used to account, on a project basis, for funds received from the Department of
Human Services that are awarded for meals provided to the community based on the average number of daily
participants. This fund should be used regardless of whether a school district’s National School Breakfast and Lunch
Program is accounted for in the General Fund (101), a Special Revenue Fund (240) or an Enterprise Fund (701).
244 Title I, Part C – Carl D. Perkins Career and Technical Edu. Grant
This fund classification is to be used to account, on a project basis, for funds granted to provide career and
technology education to develop new and/or improve career and technology education programs for paid and unpaid
employment. Full participation in the basic grant is from individuals who are members of special populations, at 1) a
limited number of campuses (sites) or 2) a limited number of program areas.
255 ESEA, Title II, Part A
This fund classification is to be used to provide financial assistance to LEAs to (1) Increase student academic
achievement through improving teacher and principal quality and increasing the number of highly qualified teachers
in classrooms and highly qualified principals and assistant principals in schools, and (2) hold local education
agencies and schools accountable for improving student academic achievement.
Special Revenue Funds Financial Section
2014-2015 Annual Budget 87
263 ESEA, Title III, Part A – LEP
This fund classification is to be used to account, on a project basis, for funds granted to improve the education of
limited English proficient children, by assisting the children to learn English and meet challenging State academic
content and student academic achievement standards.
397 Advanced Placement Incentives
This fund classification is to be used to recognize and reward those students, teachers, and schools that successfully
achieve the educational goals of the state. The subsidies and awards granted are for the purpose of promoting
academic enhancement.
429 Educator Excellence Innovation
This fund classification is to be used to account, on a project basis, for funds granted to improve educator
effectiveness in teaching, learning, leadership, and to support innovative practices, and established rigorous
academic standards for students.
435 Regional Day School for the Deaf
This fund classification is to be used by the fiscal agent of a shared services arrangement to account, on a project
basis for funds allocated for staff and activities of the Regional Day School Program for the Deaf (RDSPD). These
funds are not to be used to pay salaries of teachers with a teaching assignment other than deaf students in the
RDSPD. State deaf funds should not be used to pay the salary of teachers of American Sign Language as a foreign
language at the junior high or high school level, as this is a course for regular education credit.
461 Campus Activity
This fund classification is to be used to account for transactions related to a principal’s activity fund if the monies
generated are not subject to recall by the school district’s board of trustees into the General Fund.
482 Dr. Hochman Grant
This fund classification is to be used to account for awards granted to teachers on a need basis allowing purchases
for educational materials and supplies.
488 Advertising
This fund classification is to be used, on a project basis, to account for proceeds from advertising activities and to
earmark the proceeds to promote school projects and educational programs that directly benefit students.
490 Performing Arts Center
This fund classification is to be used to account for rental receipts from the auditorium, ballroom, meeting rooms,
Veterans Field and swimming pool, and the disbursements for its operation and maintenance.
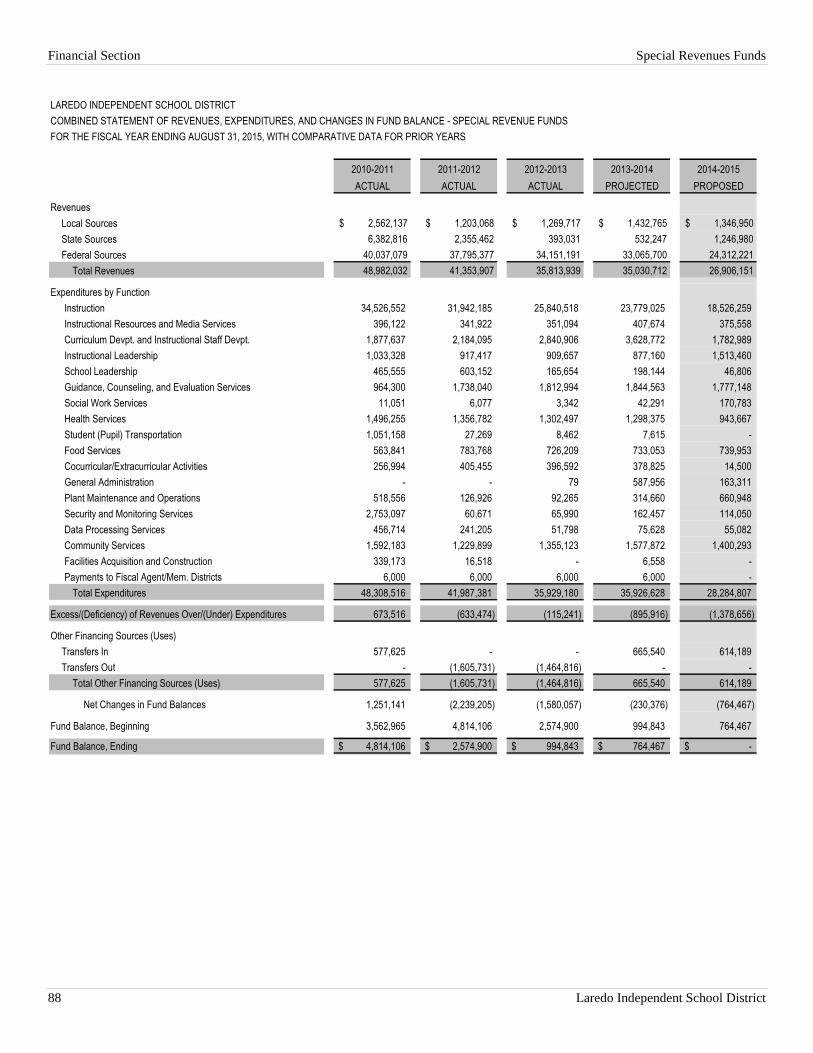
Financial Section Special Revenues Funds
88 Laredo Independent School District
LAREDO INDEPENDENT SCHOOL DISTRICT
COMBINED STATEMENT OF REVENUES, EXPENDITURES, AND CHANGES IN FUND BALANCE - SPECIAL REVENUE FUNDS
FOR THE FISCAL YEAR ENDING AUGUST 31, 2015, WITH COMPARATIVE DATA FOR PRIOR YEARS
2010-2011 2011-2012 2012-2013 2013-2014 2014-2015
ACTUAL ACTUAL ACTUAL PROJECTED PROPOSED
Revenues
Local Sources $ 2,562,137 $ 1,203,068 $ 1,269,717 $ 1,432,765 $ 1,346,950
State Sources 6,382,816 2,355,462 393,031 532,247 1,246,980
Federal Sources 40,037,079 37,795,377 34,151,191 33,065,700 24,312,221
Total Revenues 48,982,032 41,353,907 35,813,939 35,030,712 26,906,151
Expenditures by Function
Instruction 34,526,552 31,942,185 25,840,518 23,779,025 18,526,259
Instructional Resources and Media Services 396,122 341,922 351,094 407,674 375,558
Curriculum Devpt. and Instructional Staff Devpt. 1,877,637 2,184,095 2,840,906 3,628,772 1,782,989
Instructional Leadership 1,033,328 917,417 909,657 877,160 1,513,460
School Leadership 465,555 603,152 165,654 198,144 46,806
Guidance, Counseling, and Evaluation Services 964,300 1,738,040 1,812,994 1,844,563 1,777,148
Social Work Services 11,051 6,077 3,342 42,291 170,783
Health Services 1,496,255 1,356,782 1,302,497 1,298,375 943,667
Student (Pupil) Transportation 1,051,158 27,269 8,462 7,615 -
Food Services 563,841 783,768 726,209 733,053 739,953
Cocurricular/Extracurricular Activities 256,994 405,455 396,592 378,825 14,500
General Administration - - 79 587,956 163,311
Plant Maintenance and Operations 518,556 126,926 92,265 314,660 660,948
Security and Monitoring Services 2,753,097 60,671 65,990 162,457 114,050
Data Processing Services 456,714 241,205 51,798 75,628 55,082
Community Services 1,592,183 1,229,899 1,355,123 1,577,872 1,400,293
Facilities Acquisition and Construction 339,173 16,518 - 6,558 -
Payments to Fiscal Agent/Mem. Districts 6,000 6,000 6,000 6,000 -
Total Expenditures 48,308,516 41,987,381 35,929,180 35,926,628 28,284,807
Excess/(Deficiency) of Revenues Over/(Under) Expenditures 673,516 (633,474) (115,241) (895,916) (1,378,656)
Other Financing Sources (Uses)
Transfers In 577,625 - - 665,540 614,189
Transfers Out - (1,605,731) (1,464,816) - -
Total Other Financing Sources (Uses) 577,625 (1,605,731) (1,464,816) 665,540 614,189
Net Changes in Fund Balances 1,251,141 (2,239,205) (1,580,057) (230,376) (764,467)
Fund Balance, Beginning 3,562,965 4,814,106 2,574,900 994,843 764,467
Fund Balance, Ending 4,814,106$ 2,574,900$ 994,843$ 764,467$ -$
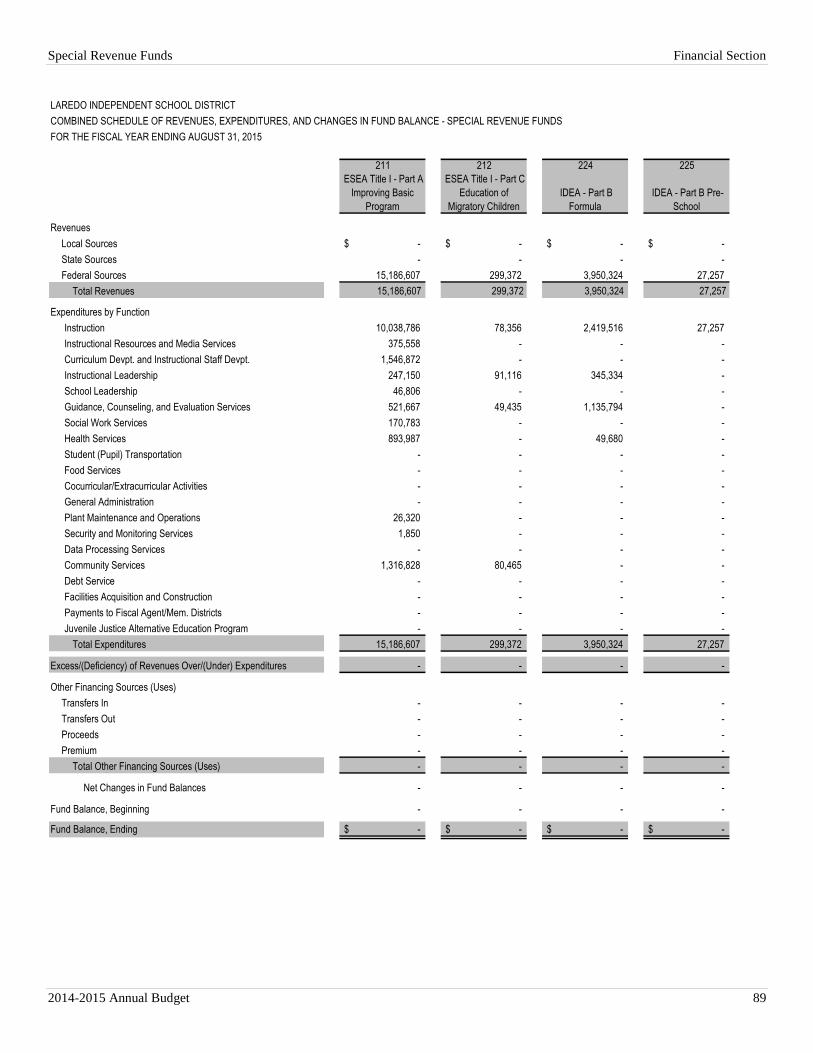
Special Revenue Funds Financial Section
2014-2015 Annual Budget 89
LAREDO INDEPENDENT SCHOOL DISTRICT
COMBINED SCHEDULE OF REVENUES, EXPENDITURES, AND CHANGES IN FUND BALANCE - SPECIAL REVENUE FUNDS
FOR THE FISCAL YEAR ENDING AUGUST 31, 2015
211 212 224 225
Revenues
Local Sources -$ -$ -$ -$
State Sources - - - -
Federal Sources 15,186,607 299,372 3,950,324 27,257
Total Revenues 15,186,607 299,372 3,950,324 27,257
Expenditures by Function
Instruction 10,038,786 78,356 2,419,516 27,257
Instructional Resources and Media Services 375,558 - - -
Curriculum Devpt. and Instructional Staff Devpt. 1,546,872 - - -
Instructional Leadership 247,150 91,116 345,334 -
School Leadership 46,806 - - -
Guidance, Counseling, and Evaluation Services 521,667 49,435 1,135,794 -
Social Work Services 170,783 - - -
Health Services 893,987 - 49,680 -
Student (Pupil) Transportation - - - -
Food Services - - - -
Cocurricular/Extracurricular Activities - - - -
General Administration - - - -
Plant Maintenance and Operations 26,320 - - -
Security and Monitoring Services 1,850 - - -
Data Processing Services - - - -
Community Services 1,316,828 80,465 - -
Debt Service - - - -
Facilities Acquisition and Construction - - - -
Payments to Fiscal Agent/Mem. Districts - - - -
Juvenile Justice Alternative Education Program - - - -
Total Expenditures 15,186,607 299,372 3,950,324 27,257
Excess/(Deficiency) of Revenues Over/(Under) Expenditures - - - -
Other Financing Sources (Uses)
Transfers In - - - -
Transfers Out - - - -
Proceeds - - - -
Premium - - - -
Total Other Financing Sources (Uses) - - - -
Net Changes in Fund Balances - - - -
Fund Balance, Beginning - - - -
Fund Balance, Ending -$ -$ -$ -$
ESEA Title I - Part C
Education of
Migratory Children
ESEA Title I - Part A
Improving Basic
Program
IDEA - Part B
Formula
IDEA - Part B Pre-
School
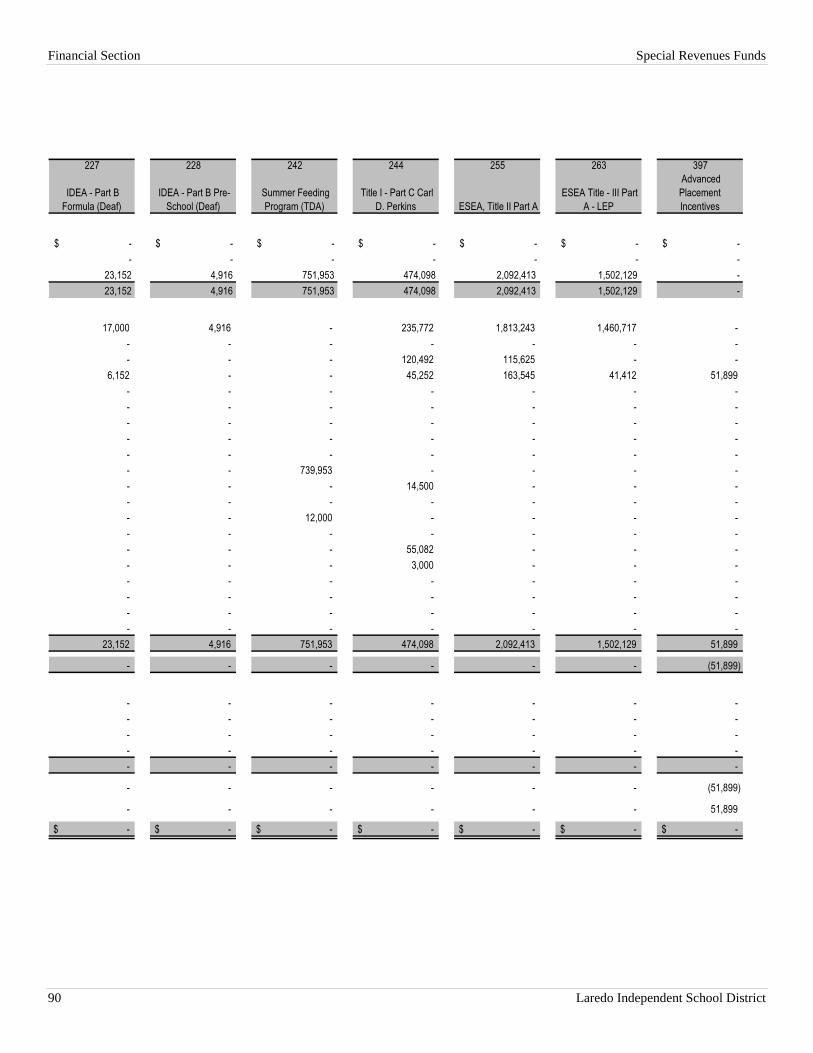
Financial Section Special Revenues Funds
90 Laredo Independent School District
227 228 242 244 255 263 397
$ - $ - $ - $ - $ - $ - $ -
- - - - - - -
23,152 4,916 751,953 474,098 2,092,413 1,502,129 -
23,152 4,916 751,953 474,098 2,092,413 1,502,129 -
17,000 4,916 - 235,772 1,813,243 1,460,717 -
- - - - - - -
- - - 120,492 115,625 - -
6,152 - - 45,252 163,545 41,412 51,899
- - - - - - -
- - - - - - -
- - - - - - -
- - - - - - -
- - - - - - -
- - 739,953 - - - -
- - - 14,500 - - -
- - - - - - -
- - 12,000 - - - -
- - - - - - -
- - - 55,082 - - -
- - - 3,000 - - -
- - - - - - -
- - - - - - -
- - - - - - -
- - - - - - -
23,152 4,916 751,953 474,098 2,092,413 1,502,129 51,899
- - - - - - (51,899)
- - - - - - -
- - - - - - -
- - - - - - -
- - - - - - -
- - - - - - -
- - - - - - (51,899)
- - - - - - 51,899
-$ -$ -$ -$ -$ -$ -$
ESEA Title - III Part
A - LEP ESEA, Title II Part A
Title I - Part C Carl
D. Perkins
IDEA - Part B Pre-
School (Deaf)
IDEA - Part B
Formula (Deaf)
Summer Feeding
Program (TDA)
Advanced
Placement
Incentives
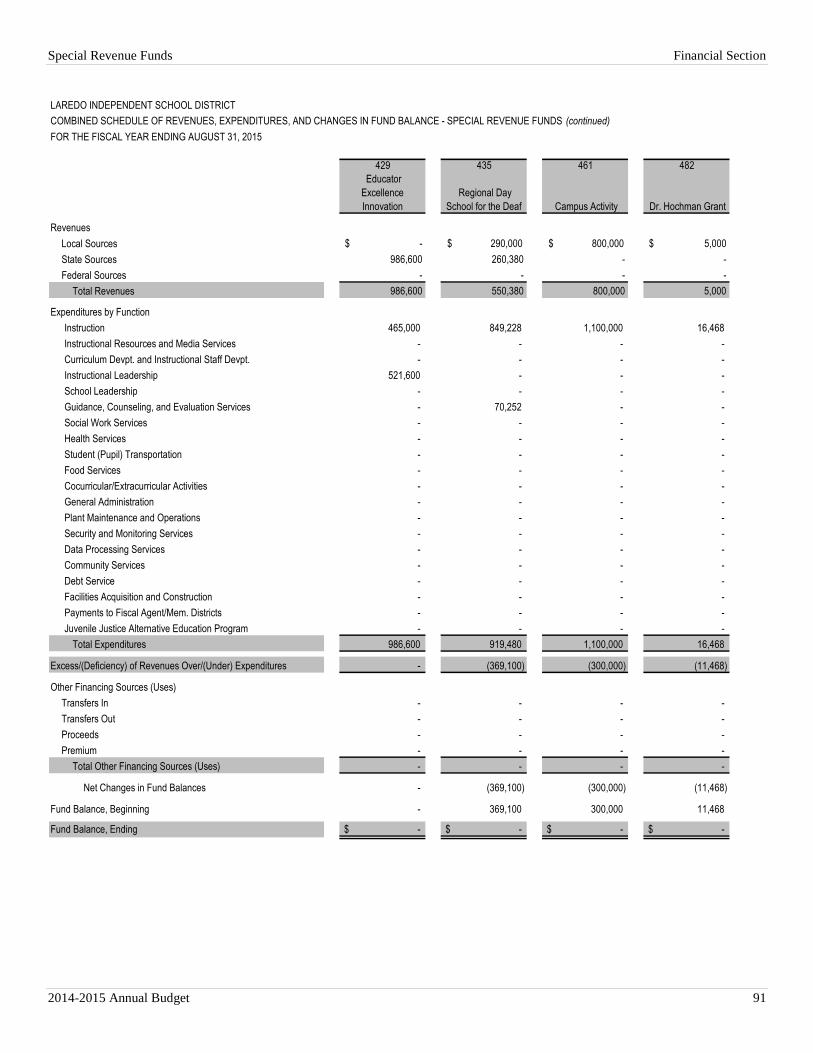
Special Revenue Funds Financial Section
2014-2015 Annual Budget 91
LAREDO INDEPENDENT SCHOOL DISTRICT
COMBINED SCHEDULE OF REVENUES, EXPENDITURES, AND CHANGES IN FUND BALANCE - SPECIAL REVENUE FUNDS (continued)
FOR THE FISCAL YEAR ENDING AUGUST 31, 2015
429 435 461 482
Revenues
Local Sources $ - $ 290,000 $ 800,000 $ 5,000
State Sources 986,600 260,380 - -
Federal Sources - - - -
Total Revenues 986,600 550,380 800,000 5,000
Expenditures by Function
Instruction 465,000 849,228 1,100,000 16,468
Instructional Resources and Media Services - - - -
Curriculum Devpt. and Instructional Staff Devpt. - - - -
Instructional Leadership 521,600 - - -
School Leadership - - - -
Guidance, Counseling, and Evaluation Services - 70,252 - -
Social Work Services - - - -
Health Services - - - -
Student (Pupil) Transportation - - - -
Food Services - - - -
Cocurricular/Extracurricular Activities - - - -
General Administration - - - -
Plant Maintenance and Operations - - - -
Security and Monitoring Services - - - -
Data Processing Services - - - -
Community Services - - - -
Debt Service - - - -
Facilities Acquisition and Construction - - - -
Payments to Fiscal Agent/Mem. Districts - - - -
Juvenile Justice Alternative Education Program - - - -
Total Expenditures 986,600 919,480 1,100,000 16,468
Excess/(Deficiency) of Revenues Over/(Under) Expenditures - (369,100) (300,000) (11,468)
Other Financing Sources (Uses)
Transfers In - - - -
Transfers Out - - - -
Proceeds - - - -
Premium - - - -
Total Other Financing Sources (Uses) - - - -
Net Changes in Fund Balances - (369,100) (300,000) (11,468)
Fund Balance, Beginning - 369,100 300,000 11,468
Fund Balance, Ending -$ -$ -$ -$
Campus Activity
Educator
Excellence
Innovation
Regional Day
School for the Deaf Dr. Hochman Grant
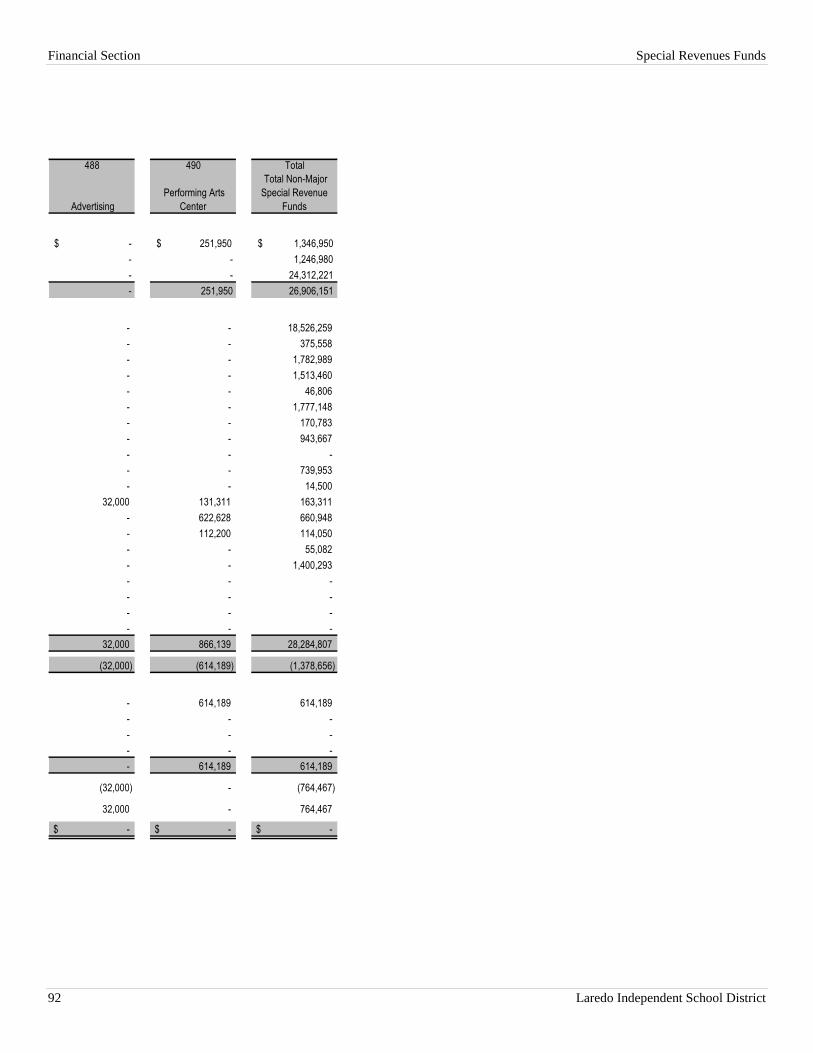
Financial Section Special Revenues Funds
92 Laredo Independent School District
488 490 Total
$ - $ 251,950 $ 1,346,950
- - 1,246,980
- - 24,312,221
- 251,950 26,906,151
- - 18,526,259
- - 375,558
- - 1,782,989
- - 1,513,460
- - 46,806
- - 1,777,148
- - 170,783
- - 943,667
- - -
- - 739,953
- - 14,500
32,000 131,311 163,311
- 622,628 660,948
- 112,200 114,050
- - 55,082
- - 1,400,293
- - -
- - -
- - -
- - -
32,000 866,139 28,284,807
(32,000) (614,189) (1,378,656)
- 614,189 614,189
- - -
- - -
- - -
- 614,189 614,189
(32,000) - (764,467)
32,000 - 764,467
-$ -$ -$
Total Non-Major
Special Revenue
Funds
Performing Arts
Center Advertising
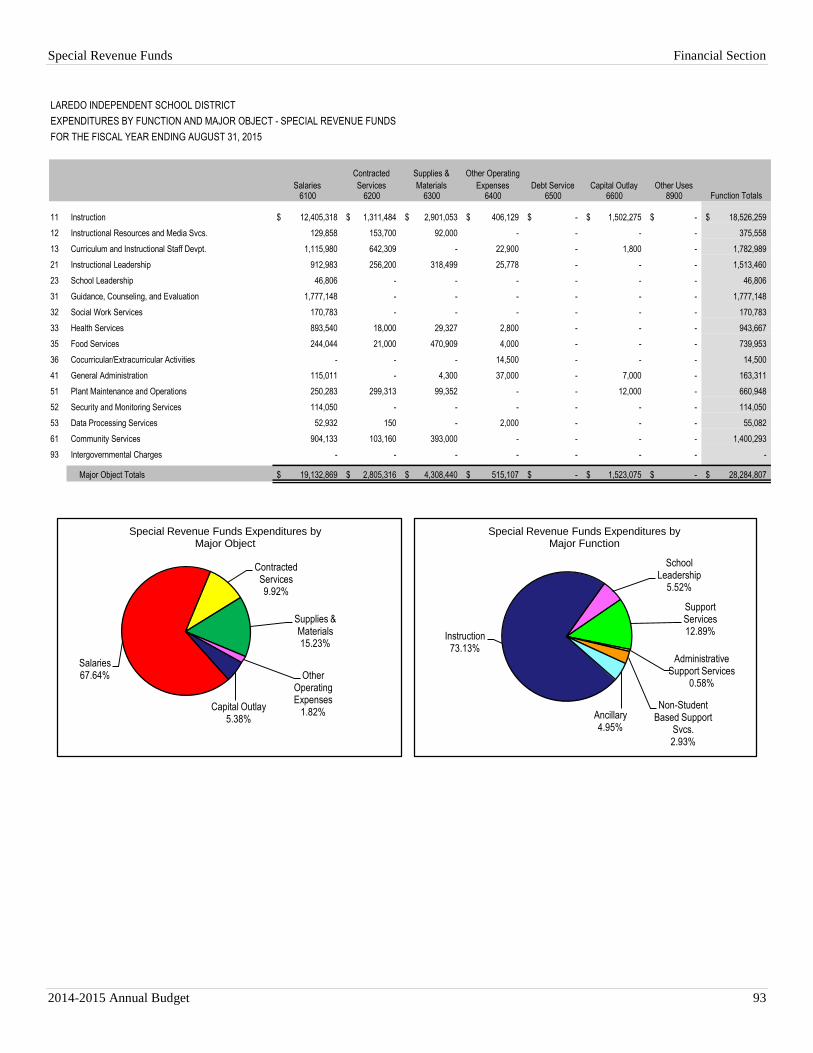
Special Revenue Funds Financial Section
2014-2015 Annual Budget 93
LAREDO INDEPENDENT SCHOOL DISTRICT
EXPENDITURES BY FUNCTION AND MAJOR OBJECT - SPECIAL REVENUE FUNDS
FOR THE FISCAL YEAR ENDING AUGUST 31, 2015
Salaries
Contracted
Services
Supplies &
Materials
Other Operating
Expenses Debt Service Capital Outlay Other Uses6100 6200 6300 6400 6500 6600 8900
11 Instruction 12,405,318$ 1,311,484$ 2,901,053$ 406,129$ -$ 1,502,275$ -$ 18,526,259$
12 Instructional Resources and Media Svcs. 129,858 153,700 92,000 - - - - 375,558
13 Curriculum and Instructional Staff Devpt. 1,115,980 642,309 - 22,900 - 1,800 - 1,782,989
21 Instructional Leadership 912,983 256,200 318,499 25,778 - - - 1,513,460
23 School Leadership 46,806 - - - - - - 46,806
31 Guidance, Counseling, and Evaluation 1,777,148 - - - - - - 1,777,148
32 Social Work Services 170,783 - - - - - - 170,783
33 Health Services 893,540 18,000 29,327 2,800 - - - 943,667
35 Food Services 244,044 21,000 470,909 4,000 - - - 739,953
36 Cocurricular/Extracurricular Activities - - - 14,500 - - - 14,500
41 General Administration 115,011 - 4,300 37,000 - 7,000 - 163,311
51 Plant Maintenance and Operations 250,283 299,313 99,352 - - 12,000 - 660,948
52 Security and Monitoring Services 114,050 - - - - - - 114,050
53 Data Processing Services 52,932 150 - 2,000 - - - 55,082
61 Community Services 904,133 103,160 393,000 - - - - 1,400,293
93 Intergovernmental Charges - - - - - - - -
Major Object Totals 19,132,869$ 2,805,316$ 4,308,440$ 515,107$ -$ 1,523,075$ -$ 28,284,807$
Function Totals
Salaries67.64%
Contracted Services9.92%
Supplies & Materials15.23%
Other Operating Expenses
1.82%Capital Outlay
5.38%
Special Revenue Funds Expenditures byMajor Object
Instruction 73.13%
School Leadership
5.52%
Support Services12.89%
Administrative Support Services
0.58%
Non-Student Based Support
Svcs.2.93%
Ancillary4.95%
Special Revenue Funds Expenditures byMajor Function
Financial Section Capital Projects Funds
94 Laredo Independent School District
CAPITAL PROJECTS FUND
The capital projects fund is a governmental fund type, with budgetary control, that must be used to account, on a
project basis, for projects financed by the proceeds from the bond issues, or for capital projects otherwise mandated
to be accounted for in this fund. The capital projects fund utilizes the modified accrual basis of accounting.
FUNDING SOURCES OF CAPITAL PROJECTS
IFA – Instructional Facilities Allotment
The District accounts for proceeds from long-term debt financing (including the sale of bonds) and
revenues and expenditures related to authorized construction and other capital asset acquisitions in these
funds. The board approves project budgets, not annual appropriated budgets.
QZAB – Qualified Zone Academy Bond
The purpose of paying all or a portion of the District’s costs incurred in connection with the repair,
rehabilitation, renovation, and replacement of school facilities under the Qualified Zone Academy Bond.
EDA – Existing Debt Allotment
The EDA is a grant from the Texas Education Agency (TEA) for the purpose of financing the principal and
interest payments for eligible bonds issued. The program operates without applications and has no award
cycles.
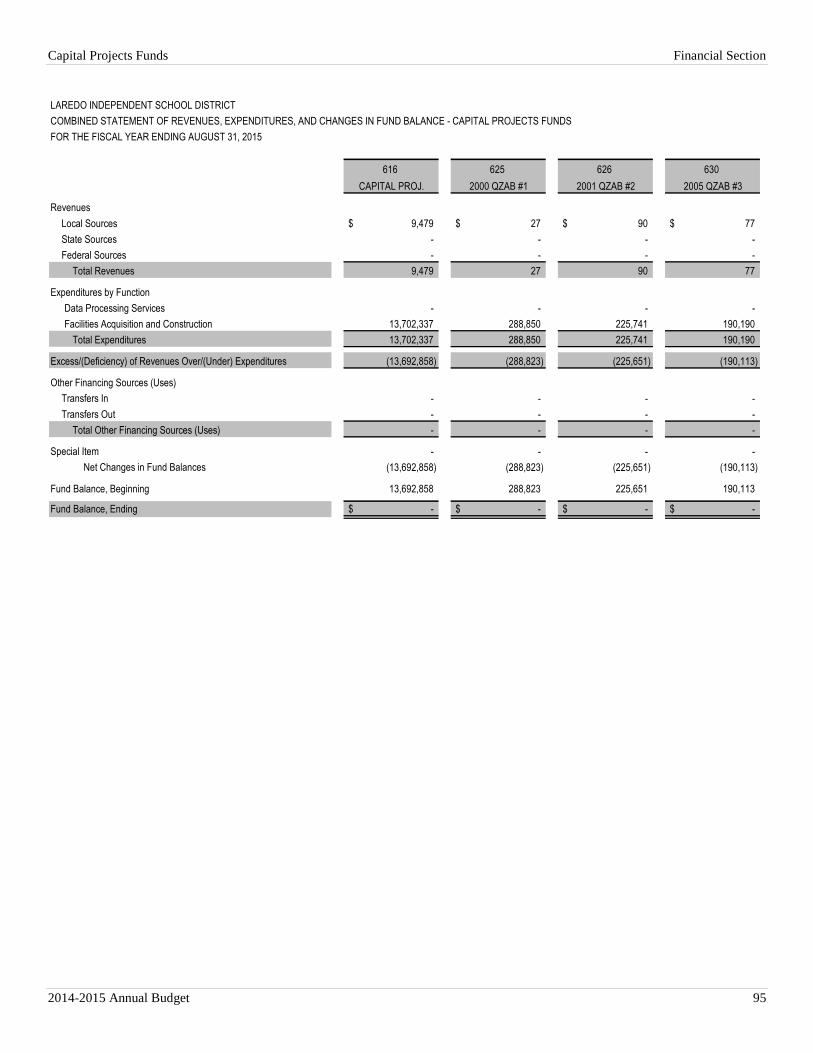
Capital Projects Funds Financial Section
2014-2015 Annual Budget 95
LAREDO INDEPENDENT SCHOOL DISTRICT
COMBINED STATEMENT OF REVENUES, EXPENDITURES, AND CHANGES IN FUND BALANCE - CAPITAL PROJECTS FUNDS
FOR THE FISCAL YEAR ENDING AUGUST 31, 2015
616 625 626 630
CAPITAL PROJ. 2000 QZAB #1 2001 QZAB #2 2005 QZAB #3
Revenues
Local Sources 9,479$ 27$ 90$ 77$
State Sources - - - -
Federal Sources - - - -
Total Revenues 9,479 27 90 77
Expenditures by Function
Data Processing Services - - - -
Facilities Acquisition and Construction 13,702,337 288,850 225,741 190,190
Total Expenditures 13,702,337 288,850 225,741 190,190
Excess/(Deficiency) of Revenues Over/(Under) Expenditures (13,692,858) (288,823) (225,651) (190,113)
Other Financing Sources (Uses)
Transfers In - - - -
Transfers Out - - - -
Total Other Financing Sources (Uses) - - - -
Special Item - - - -
Net Changes in Fund Balances (13,692,858) (288,823) (225,651) (190,113)
Fund Balance, Beginning 13,692,858 288,823 225,651 190,113
Fund Balance, Ending -$ -$ -$ -$
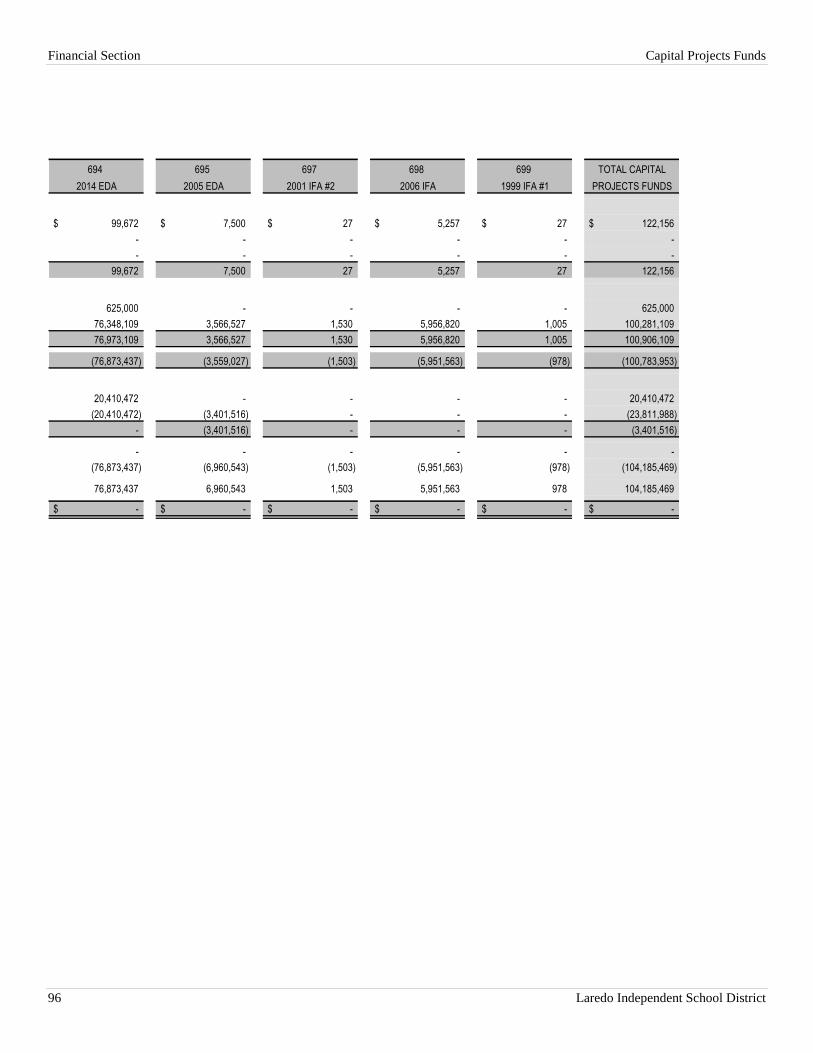
Financial Section Capital Projects Funds
96 Laredo Independent School District
694 695 697 698 699 TOTAL CAPITAL
2014 EDA 2005 EDA 2001 IFA #2 2006 IFA 1999 IFA #1 PROJECTS FUNDS
99,672$ 7,500$ 27$ 5,257$ 27$ 122,156$
- - - - - -
- - - - - -
99,672 7,500 27 5,257 27 122,156
625,000 - - - - 625,000
76,348,109 3,566,527 1,530 5,956,820 1,005 100,281,109
76,973,109 3,566,527 1,530 5,956,820 1,005 100,906,109
(76,873,437) (3,559,027) (1,503) (5,951,563) (978) (100,783,953)
20,410,472 - - - - 20,410,472
(20,410,472) (3,401,516) - - - (23,811,988)
- (3,401,516) - - - (3,401,516)
- - - - - -
(76,873,437) (6,960,543) (1,503) (5,951,563) (978) (104,185,469)
76,873,437 6,960,543 1,503 5,951,563 978 104,185,469
-$ -$ -$ -$ -$ -$
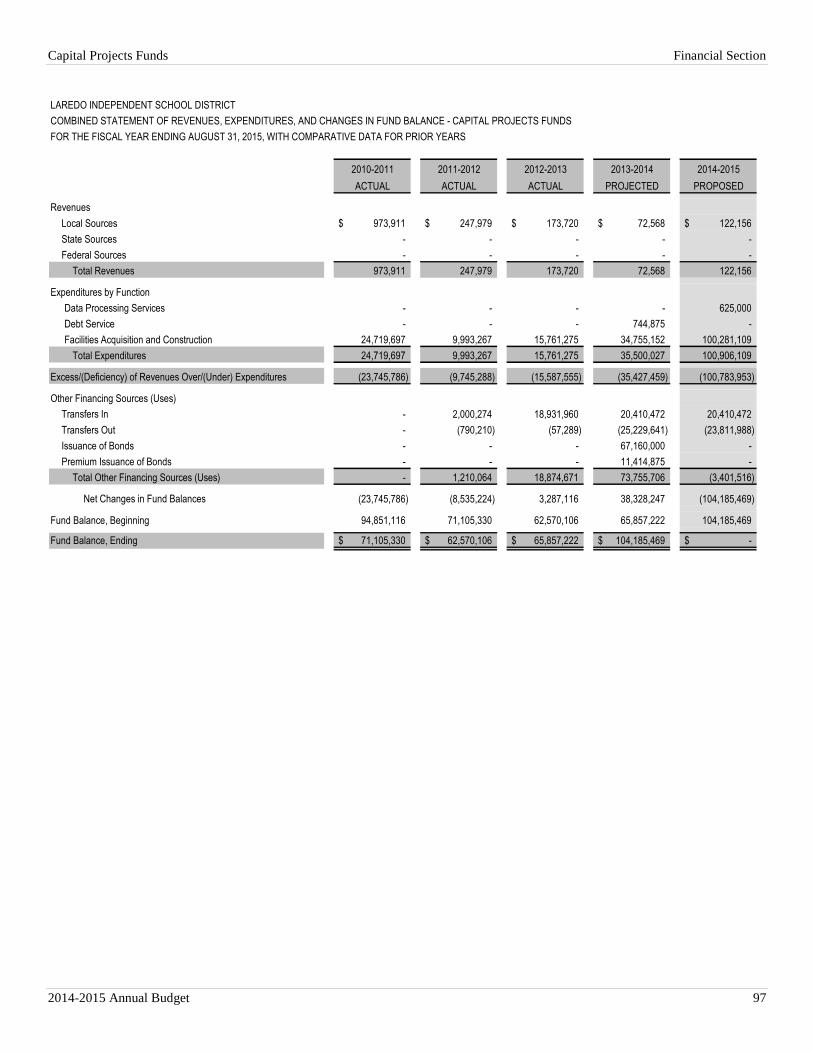
Capital Projects Funds Financial Section
2014-2015 Annual Budget 97
LAREDO INDEPENDENT SCHOOL DISTRICT
COMBINED STATEMENT OF REVENUES, EXPENDITURES, AND CHANGES IN FUND BALANCE - CAPITAL PROJECTS FUNDS
FOR THE FISCAL YEAR ENDING AUGUST 31, 2015, WITH COMPARATIVE DATA FOR PRIOR YEARS
2010-2011 2011-2012 2012-2013 2013-2014 2014-2015
ACTUAL ACTUAL ACTUAL PROJECTED PROPOSED
Revenues
Local Sources 973,911$ 247,979$ 173,720$ 72,568$ 122,156$
State Sources - - - - -
Federal Sources - - - - -
Total Revenues 973,911 247,979 173,720 72,568 122,156
Expenditures by Function
Data Processing Services - - - - 625,000
Debt Service - - - 744,875 -
Facilities Acquisition and Construction 24,719,697 9,993,267 15,761,275 34,755,152 100,281,109
Total Expenditures 24,719,697 9,993,267 15,761,275 35,500,027 100,906,109
Excess/(Deficiency) of Revenues Over/(Under) Expenditures (23,745,786) (9,745,288) (15,587,555) (35,427,459) (100,783,953)
Other Financing Sources (Uses)
Transfers In - 2,000,274 18,931,960 20,410,472 20,410,472
Transfers Out - (790,210) (57,289) (25,229,641) (23,811,988)
Issuance of Bonds - - - 67,160,000 -
Premium Issuance of Bonds - - - 11,414,875 -
Total Other Financing Sources (Uses) - 1,210,064 18,874,671 73,755,706 (3,401,516)
Net Changes in Fund Balances (23,745,786) (8,535,224) 3,287,116 38,328,247 (104,185,469)
Fund Balance, Beginning 94,851,116 71,105,330 62,570,106 65,857,222 104,185,469
Fund Balance, Ending 71,105,330$ 62,570,106$ 65,857,222$ 104,185,469$ -$
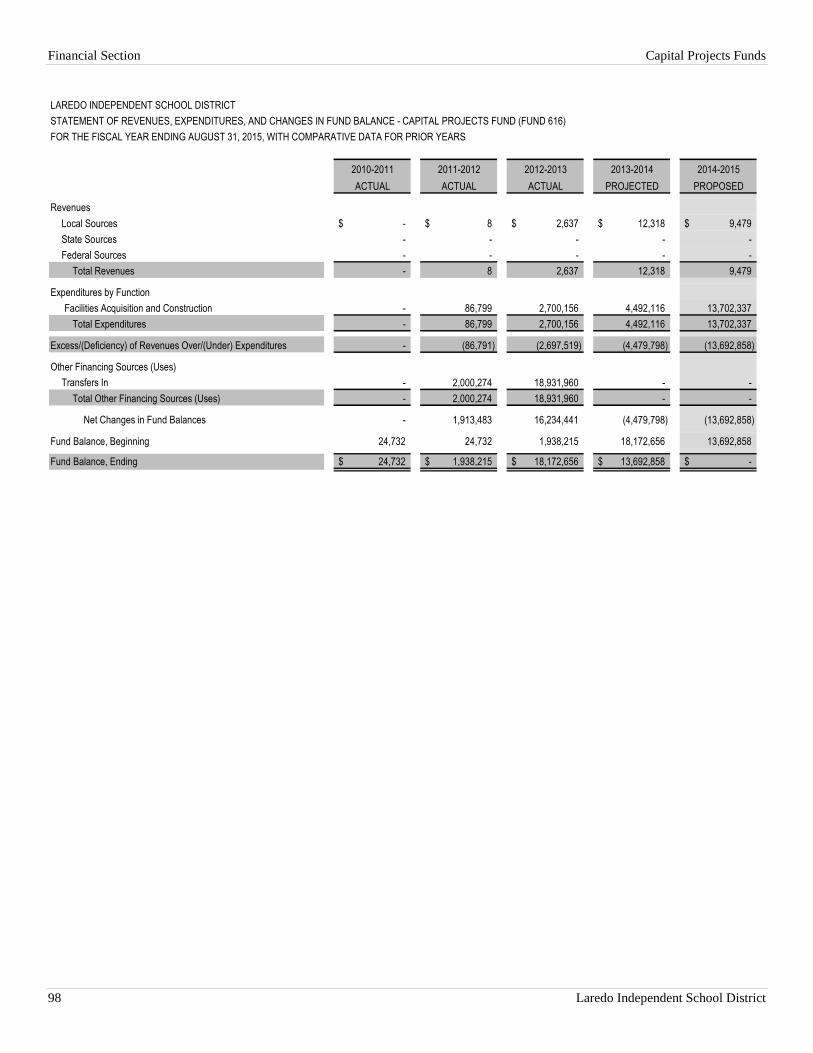
Financial Section Capital Projects Funds
98 Laredo Independent School District
LAREDO INDEPENDENT SCHOOL DISTRICT
STATEMENT OF REVENUES, EXPENDITURES, AND CHANGES IN FUND BALANCE - CAPITAL PROJECTS FUND (FUND 616)
FOR THE FISCAL YEAR ENDING AUGUST 31, 2015, WITH COMPARATIVE DATA FOR PRIOR YEARS
2010-2011 2011-2012 2012-2013 2013-2014 2014-2015
ACTUAL ACTUAL ACTUAL PROJECTED PROPOSED
Revenues
Local Sources -$ 8$ 2,637$ 12,318$ 9,479$
State Sources - - - - -
Federal Sources - - - - -
Total Revenues - 8 2,637 12,318 9,479
Expenditures by Function
Facilities Acquisition and Construction - 86,799 2,700,156 4,492,116 13,702,337
Total Expenditures - 86,799 2,700,156 4,492,116 13,702,337
Excess/(Deficiency) of Revenues Over/(Under) Expenditures - (86,791) (2,697,519) (4,479,798) (13,692,858)
Other Financing Sources (Uses)
Transfers In - 2,000,274 18,931,960 - -
Total Other Financing Sources (Uses) - 2,000,274 18,931,960 - -
Net Changes in Fund Balances - 1,913,483 16,234,441 (4,479,798) (13,692,858)
Fund Balance, Beginning 24,732 24,732 1,938,215 18,172,656 13,692,858
Fund Balance, Ending 24,732$ 1,938,215$ 18,172,656$ 13,692,858$ -$
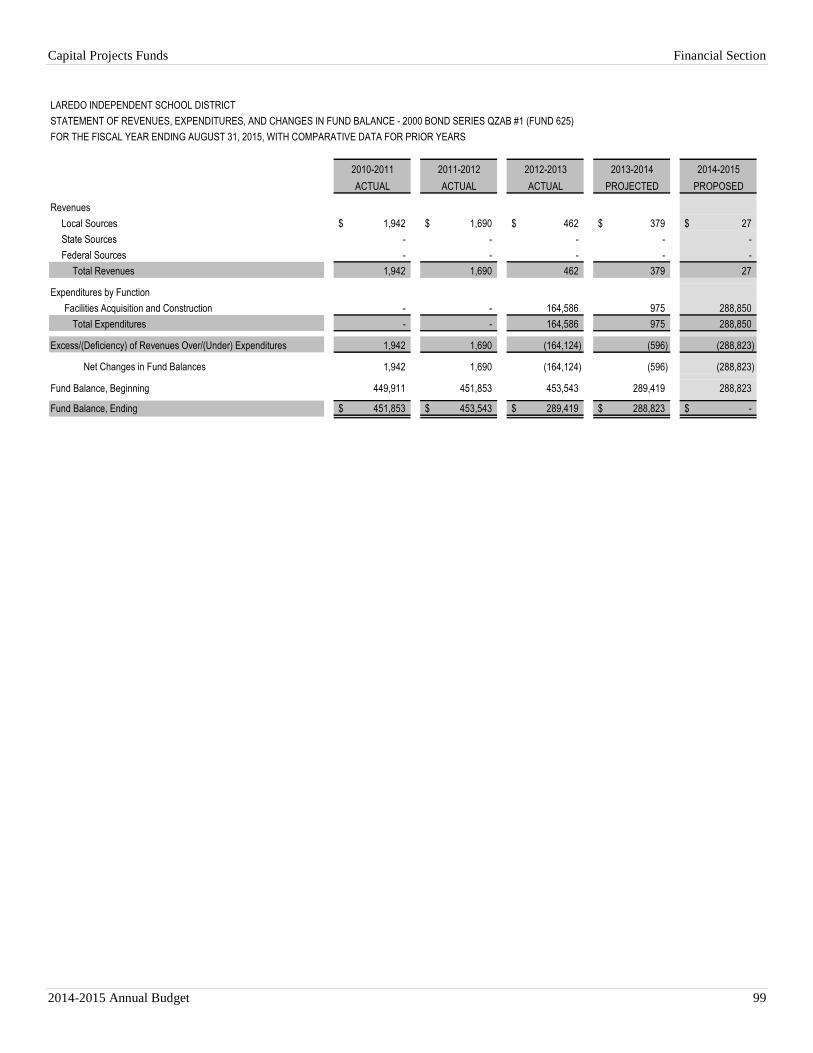
Capital Projects Funds Financial Section
2014-2015 Annual Budget 99
LAREDO INDEPENDENT SCHOOL DISTRICT
STATEMENT OF REVENUES, EXPENDITURES, AND CHANGES IN FUND BALANCE - 2000 BOND SERIES QZAB #1 (FUND 625)
FOR THE FISCAL YEAR ENDING AUGUST 31, 2015, WITH COMPARATIVE DATA FOR PRIOR YEARS
2010-2011 2011-2012 2012-2013 2013-2014 2014-2015
ACTUAL ACTUAL ACTUAL PROJECTED PROPOSED
Revenues
Local Sources 1,942$ 1,690$ 462$ 379$ 27$
State Sources - - - - -
Federal Sources - - - - -
Total Revenues 1,942 1,690 462 379 27
Expenditures by Function
Facilities Acquisition and Construction - - 164,586 975 288,850
Total Expenditures - - 164,586 975 288,850
Excess/(Deficiency) of Revenues Over/(Under) Expenditures 1,942 1,690 (164,124) (596) (288,823)
Net Changes in Fund Balances 1,942 1,690 (164,124) (596) (288,823)
Fund Balance, Beginning 449,911 451,853 453,543 289,419 288,823
Fund Balance, Ending 451,853$ 453,543$ 289,419$ 288,823$ -$
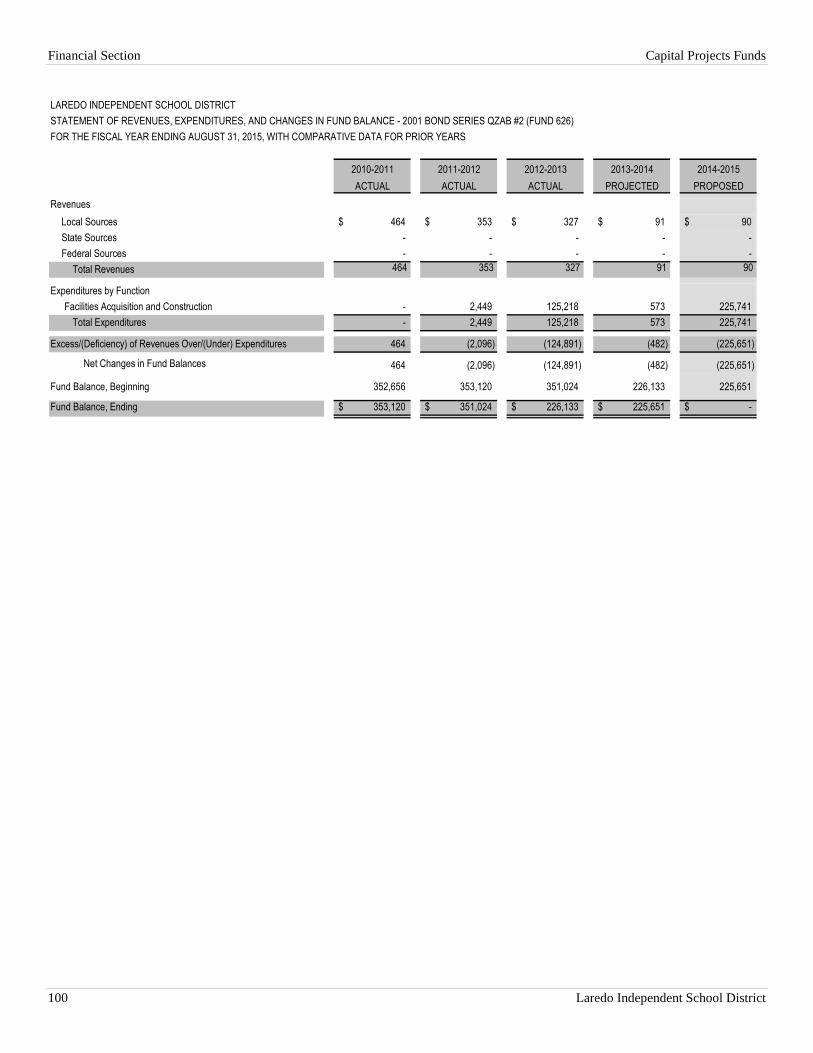
Financial Section Capital Projects Funds
100 Laredo Independent School District
LAREDO INDEPENDENT SCHOOL DISTRICT
STATEMENT OF REVENUES, EXPENDITURES, AND CHANGES IN FUND BALANCE - 2001 BOND SERIES QZAB #2 (FUND 626)
FOR THE FISCAL YEAR ENDING AUGUST 31, 2015, WITH COMPARATIVE DATA FOR PRIOR YEARS
2010-2011 2011-2012 2012-2013 2013-2014 2014-2015
ACTUAL ACTUAL ACTUAL PROJECTED PROPOSED
Revenues
Local Sources 464$ 353$ 327$ 91$ 90$
State Sources - - - - -
Federal Sources - - - - -
Total Revenues 464 353 327 91 90
Expenditures by Function
Facilities Acquisition and Construction - 2,449 125,218 573 225,741
Total Expenditures - 2,449 125,218 573 225,741
Excess/(Deficiency) of Revenues Over/(Under) Expenditures 464 (2,096) (124,891) (482) (225,651)
Net Changes in Fund Balances 464 (2,096) (124,891) (482) (225,651)
Fund Balance, Beginning 352,656 353,120 351,024 226,133 225,651
Fund Balance, Ending 353,120$ 351,024$ 226,133$ 225,651$ -$

Capital Projects Funds Financial Section
2014-2015 Annual Budget 101
LAREDO INDEPENDENT SCHOOL DISTRICT
STATEMENT OF REVENUES, EXPENDITURES, AND CHANGES IN FUND BALANCE - 2005 BOND SERIES QZAB #3 (FUND 630)
FOR THE FISCAL YEAR ENDING AUGUST 31, 2015, WITH COMPARATIVE DATA FOR PRIOR YEARS
2010-2011 2011-2012 2012-2013 2013-2014 2014-2015
ACTUAL ACTUAL ACTUAL PROJECTED PROPOSED
Revenues
Local Sources 739$ 559$ 478$ 79$ 77$
State Sources - - - - -
Federal Sources - - - - -
Total Revenues 739 559 478 79 77
Expenditures by Function
Facilities Acquisition and Construction 3,750 - 369,028 1,375 190,190
Total Expenditures 3,750 - 369,028 1,375 190,190
Excess/(Deficiency) of Revenues Over/(Under) Expenditures (3,011) 559 (368,550) (1,296) (190,113)
Net Changes in Fund Balances (3,011) 559 (368,550) (1,296) (190,113)
Fund Balance, Beginning 562,411 559,400 559,959 191,409 190,113
Fund Balance, Ending 559,400$ 559,959$ 191,409$ 190,113$ -$
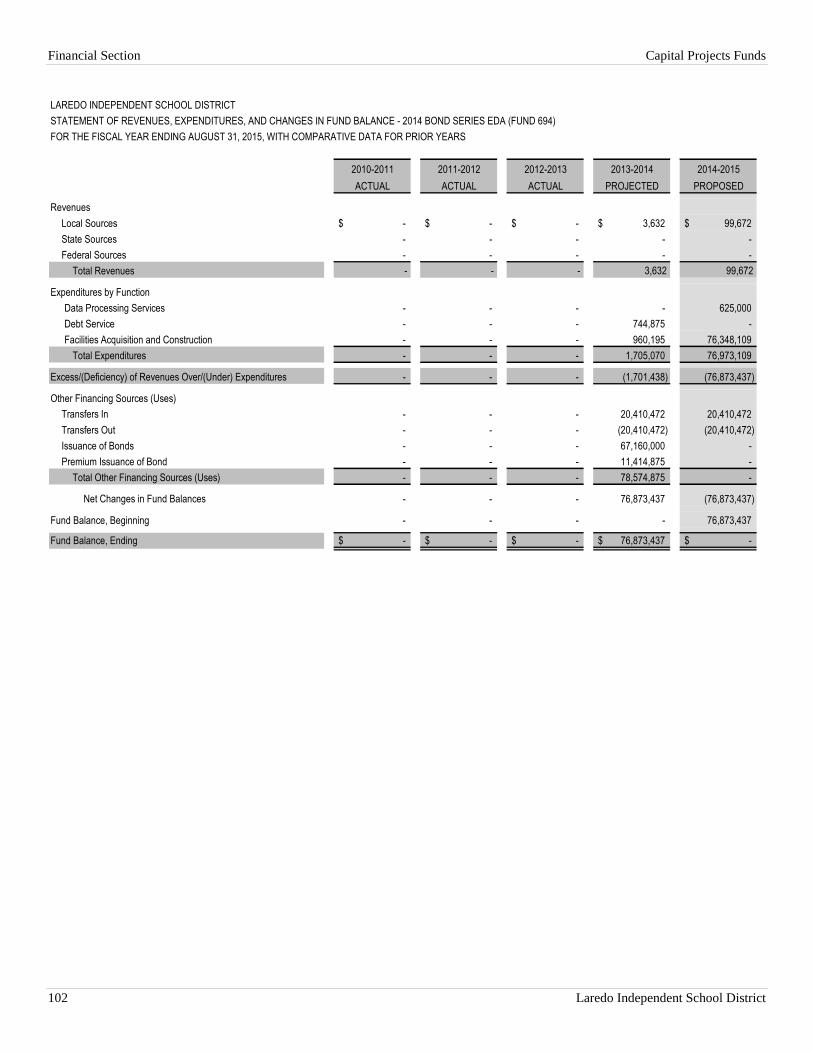
Financial Section Capital Projects Funds
102 Laredo Independent School District
LAREDO INDEPENDENT SCHOOL DISTRICT
STATEMENT OF REVENUES, EXPENDITURES, AND CHANGES IN FUND BALANCE - 2014 BOND SERIES EDA (FUND 694)
FOR THE FISCAL YEAR ENDING AUGUST 31, 2015, WITH COMPARATIVE DATA FOR PRIOR YEARS
2010-2011 2011-2012 2012-2013 2013-2014 2014-2015
ACTUAL ACTUAL ACTUAL PROJECTED PROPOSED
Revenues
Local Sources -$ -$ -$ 3,632$ 99,672$
State Sources - - - - -
Federal Sources - - - - -
Total Revenues - - - 3,632 99,672
Expenditures by Function
Data Processing Services - - - - 625,000
Debt Service - - - 744,875 -
Facilities Acquisition and Construction - - - 960,195 76,348,109
Total Expenditures - - - 1,705,070 76,973,109
Excess/(Deficiency) of Revenues Over/(Under) Expenditures - - - (1,701,438) (76,873,437)
Other Financing Sources (Uses)
Transfers In - - - 20,410,472 20,410,472
Transfers Out - - - (20,410,472) (20,410,472)
Issuance of Bonds - - - 67,160,000 -
Premium Issuance of Bond - - - 11,414,875 -
Total Other Financing Sources (Uses) - - - 78,574,875 -
Net Changes in Fund Balances - - - 76,873,437 (76,873,437)
Fund Balance, Beginning - - - - 76,873,437
Fund Balance, Ending -$ -$ -$ 76,873,437$ -$
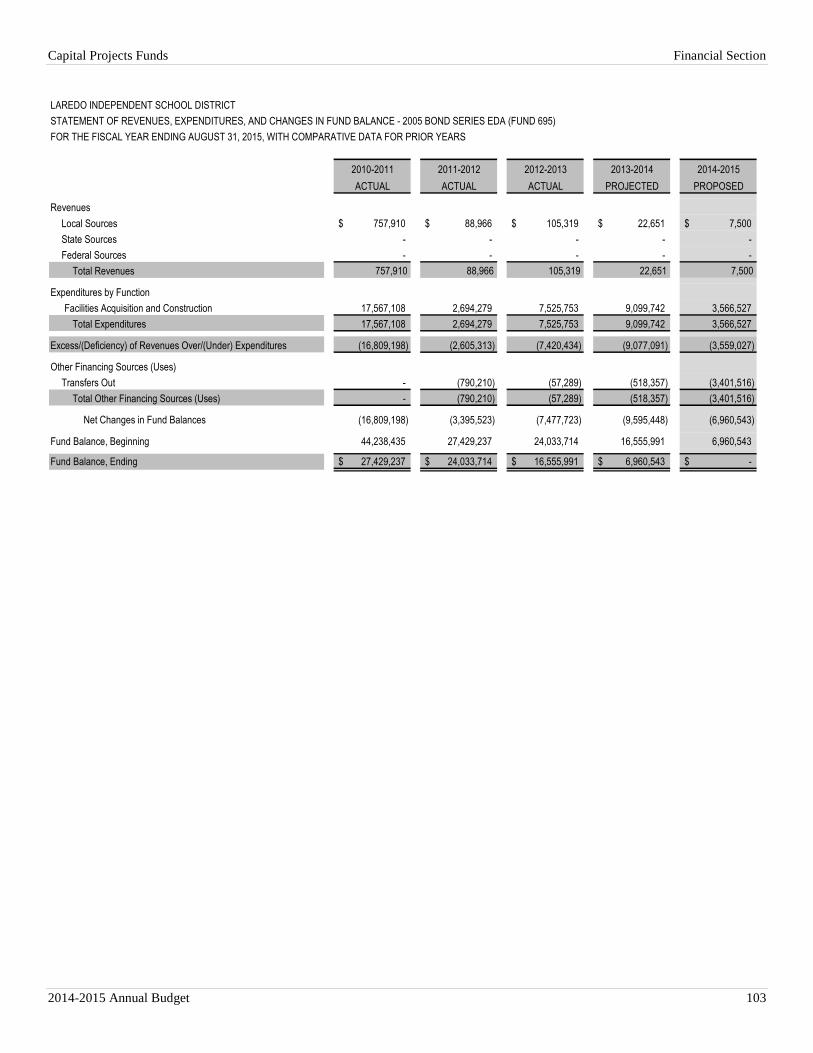
Capital Projects Funds Financial Section
2014-2015 Annual Budget 103
LAREDO INDEPENDENT SCHOOL DISTRICT
STATEMENT OF REVENUES, EXPENDITURES, AND CHANGES IN FUND BALANCE - 2005 BOND SERIES EDA (FUND 695)
FOR THE FISCAL YEAR ENDING AUGUST 31, 2015, WITH COMPARATIVE DATA FOR PRIOR YEARS
2010-2011 2011-2012 2012-2013 2013-2014 2014-2015
ACTUAL ACTUAL ACTUAL PROJECTED PROPOSED
Revenues
Local Sources 757,910$ 88,966$ 105,319$ 22,651$ 7,500$
State Sources - - - - -
Federal Sources - - - - -
Total Revenues 757,910 88,966 105,319 22,651 7,500
Expenditures by Function
Facilities Acquisition and Construction 17,567,108 2,694,279 7,525,753 9,099,742 3,566,527
Total Expenditures 17,567,108 2,694,279 7,525,753 9,099,742 3,566,527
Excess/(Deficiency) of Revenues Over/(Under) Expenditures (16,809,198) (2,605,313) (7,420,434) (9,077,091) (3,559,027)
Other Financing Sources (Uses)
Transfers Out - (790,210) (57,289) (518,357) (3,401,516)
Total Other Financing Sources (Uses) - (790,210) (57,289) (518,357) (3,401,516)
Net Changes in Fund Balances (16,809,198) (3,395,523) (7,477,723) (9,595,448) (6,960,543)
Fund Balance, Beginning 44,238,435 27,429,237 24,033,714 16,555,991 6,960,543
Fund Balance, Ending 27,429,237$ 24,033,714$ 16,555,991$ 6,960,543$ -$
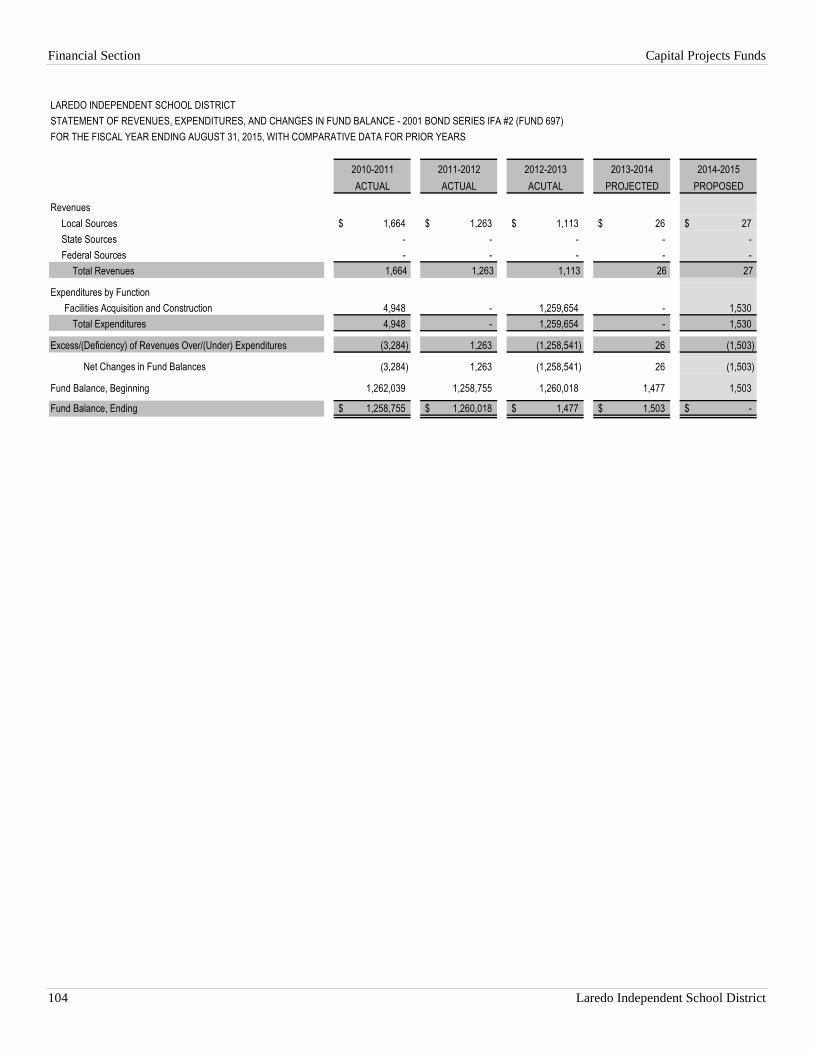
Financial Section Capital Projects Funds
104 Laredo Independent School District
LAREDO INDEPENDENT SCHOOL DISTRICT
STATEMENT OF REVENUES, EXPENDITURES, AND CHANGES IN FUND BALANCE - 2001 BOND SERIES IFA #2 (FUND 697)
FOR THE FISCAL YEAR ENDING AUGUST 31, 2015, WITH COMPARATIVE DATA FOR PRIOR YEARS
2010-2011 2011-2012 2012-2013 2013-2014 2014-2015
ACTUAL ACTUAL ACUTAL PROJECTED PROPOSED
Revenues
Local Sources 1,664$ 1,263$ 1,113$ 26$ 27$
State Sources - - - - -
Federal Sources - - - - -
Total Revenues 1,664 1,263 1,113 26 27
Expenditures by Function
Facilities Acquisition and Construction 4,948 - 1,259,654 - 1,530
Total Expenditures 4,948 - 1,259,654 - 1,530
Excess/(Deficiency) of Revenues Over/(Under) Expenditures (3,284) 1,263 (1,258,541) 26 (1,503)
Net Changes in Fund Balances (3,284) 1,263 (1,258,541) 26 (1,503)
Fund Balance, Beginning 1,262,039 1,258,755 1,260,018 1,477 1,503
Fund Balance, Ending 1,258,755$ 1,260,018$ 1,477$ 1,503$ -$
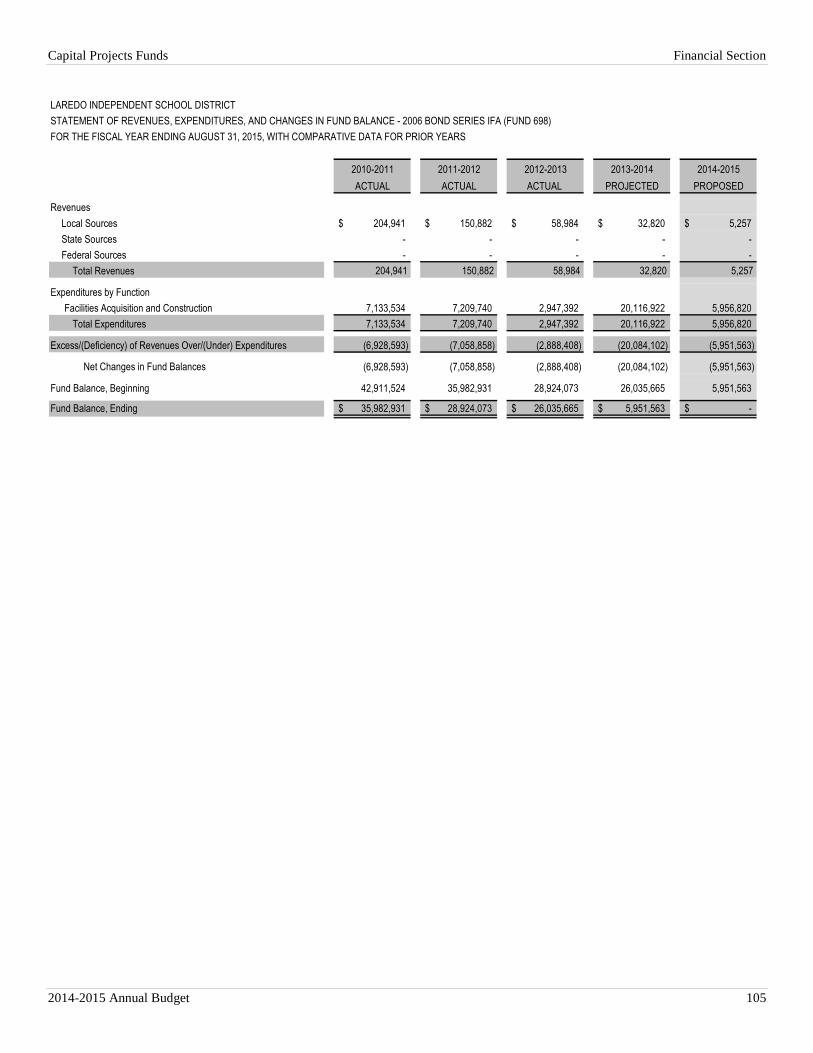
Capital Projects Funds Financial Section
2014-2015 Annual Budget 105
LAREDO INDEPENDENT SCHOOL DISTRICT
STATEMENT OF REVENUES, EXPENDITURES, AND CHANGES IN FUND BALANCE - 2006 BOND SERIES IFA (FUND 698)
FOR THE FISCAL YEAR ENDING AUGUST 31, 2015, WITH COMPARATIVE DATA FOR PRIOR YEARS
2010-2011 2011-2012 2012-2013 2013-2014 2014-2015
ACTUAL ACTUAL ACTUAL PROJECTED PROPOSED
Revenues
Local Sources 204,941$ 150,882$ 58,984$ 32,820$ 5,257$
State Sources - - - - -
Federal Sources - - - - -
Total Revenues 204,941 150,882 58,984 32,820 5,257
Expenditures by Function
Facilities Acquisition and Construction 7,133,534 7,209,740 2,947,392 20,116,922 5,956,820
Total Expenditures 7,133,534 7,209,740 2,947,392 20,116,922 5,956,820
Excess/(Deficiency) of Revenues Over/(Under) Expenditures (6,928,593) (7,058,858) (2,888,408) (20,084,102) (5,951,563)
Net Changes in Fund Balances (6,928,593) (7,058,858) (2,888,408) (20,084,102) (5,951,563)
Fund Balance, Beginning 42,911,524 35,982,931 28,924,073 26,035,665 5,951,563
Fund Balance, Ending 35,982,931$ 28,924,073$ 26,035,665$ 5,951,563$ -$
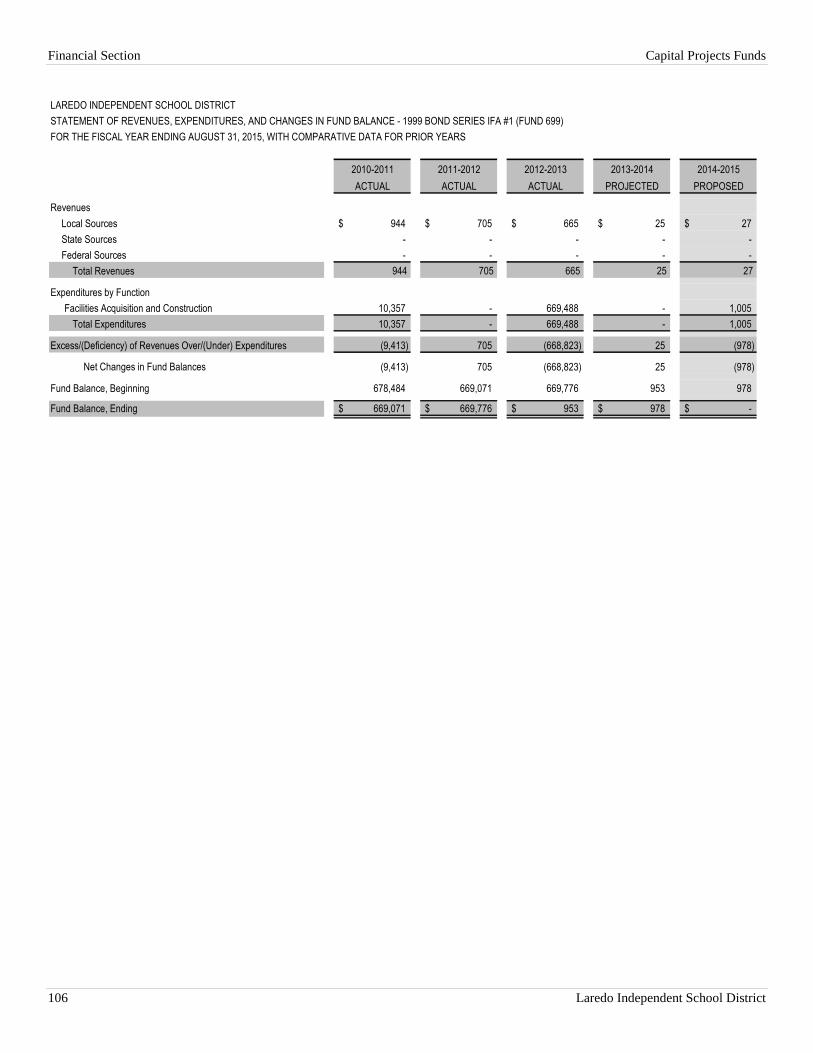
Financial Section Capital Projects Funds
106 Laredo Independent School District
LAREDO INDEPENDENT SCHOOL DISTRICT
STATEMENT OF REVENUES, EXPENDITURES, AND CHANGES IN FUND BALANCE - 1999 BOND SERIES IFA #1 (FUND 699)
FOR THE FISCAL YEAR ENDING AUGUST 31, 2015, WITH COMPARATIVE DATA FOR PRIOR YEARS
2010-2011 2011-2012 2012-2013 2013-2014 2014-2015
ACTUAL ACTUAL ACTUAL PROJECTED PROPOSED
Revenues
Local Sources 944$ 705$ 665$ 25$ 27$
State Sources - - - - -
Federal Sources - - - - -
Total Revenues 944 705 665 25 27
Expenditures by Function
Facilities Acquisition and Construction 10,357 - 669,488 - 1,005
Total Expenditures 10,357 - 669,488 - 1,005
Excess/(Deficiency) of Revenues Over/(Under) Expenditures (9,413) 705 (668,823) 25 (978)
Net Changes in Fund Balances (9,413) 705 (668,823) 25 (978)
Fund Balance, Beginning 678,484 669,071 669,776 953 978
Fund Balance, Ending 669,071$ 669,776$ 953$ 978$ -$
Capital Projects Funds Financial Section
2014-2015 Annual Budget 107
CAPITAL IMPROVEMENT PROGRAM
OVERVIEW
The Capital Improvement Program of the Laredo Independent School District is an aggressive plan that focuses in
enhancing the instructional environment for all LISD students. When the construction program began in 1999,
LISD promised to provide its students with state-of-the-art facilities that would be conducive to learning. LISD is
making every effort to keep its promise. Our schools now feature technology-ready classrooms, air conditioned
gymnasiums, larger cafeterias with full-service kitchens, new and expanded libraries, convenient student drop-off
and pick-up zones, and other amenities. In addition, the District utilized other funding sources such as General Fund,
Science Lab grants, NIFA funds, Child Nutrition funds, and other energy incentive monies to support and provide
for the various construction projects approved.
In 1999, 2005, 2006, and 2013, the Laredo Independent School District voters approved four bond elections for
school construction.
1999 A Facilities Needs Assessment was conducted, and the Vitteta Architects and Consultants developed a
bond package totaling $144 million with various project options. On May 1, 1999, LISD constituents
approved $144 million in bonds to be sold to finance the Capital Improvement Plan (CIP).
2000 In June 2000, a revised plan was developed which increased the original scope of the CIP, adjusting it from
$144 million to $175.1 million. Funding for the additional $31.1 million would be provided by $16 million
of Qualified Zone Academy Bonds (QZAB) and $15.1 million in interest earnings. This investment of over
$175 million will be for the replacement of 12 elementary schools and provide significant additions and
renovations to the various campuses as well as support facilities.
2004 In 2004, a Public Facilities Corporation (PFC) was created to finance $68 million in new construction
funds. A PFC is a non-profit organization created by the State of Texas which allows school districts to
issue debt. It is an alternate finance mechanism similar to a lease-purchase program based on the
availability of state funding. In addition, an $8 million QZAB was issued to finance renovations for
different schools. These projects were comprised primarily of educational facilities and additional scope of
work for improvements to schools under construction.
2005 Although less than three percent of registered voters living within the Laredo Independent School District
cast a ballot during the special election on June 25, 2005, it was enough to secure $60 million in bonds for
additional facilities construction. These projects are comprised of non-instructional facilities such as
athletic fields, field houses, fine arts, and other support service facilities.
2006 Additional projects identified by the District were placed in an election for May 2006. With a 58.41%
ratio, the election passed and it included $57 million in projects. The estimated number of voters in Laredo
ISD is 45,410; 7,521 cast a vote for the bond proposition. These projects were instructional in nature. It was
comprised of additions and improvements to various school facilities and the replacement of an Elementary
School not completed with Phase I.
2013 On November 5, 2013, the Laredo School District voters approved the issuance of $77.83 million in bonds
for the construction, acquisition, and equipping of school facilities. With an estimated 42,546 eligible
voters in the Laredo ISD jurisdiction; 6.36% cast a vote. The bond proposition passed with a 73.18%
approval.
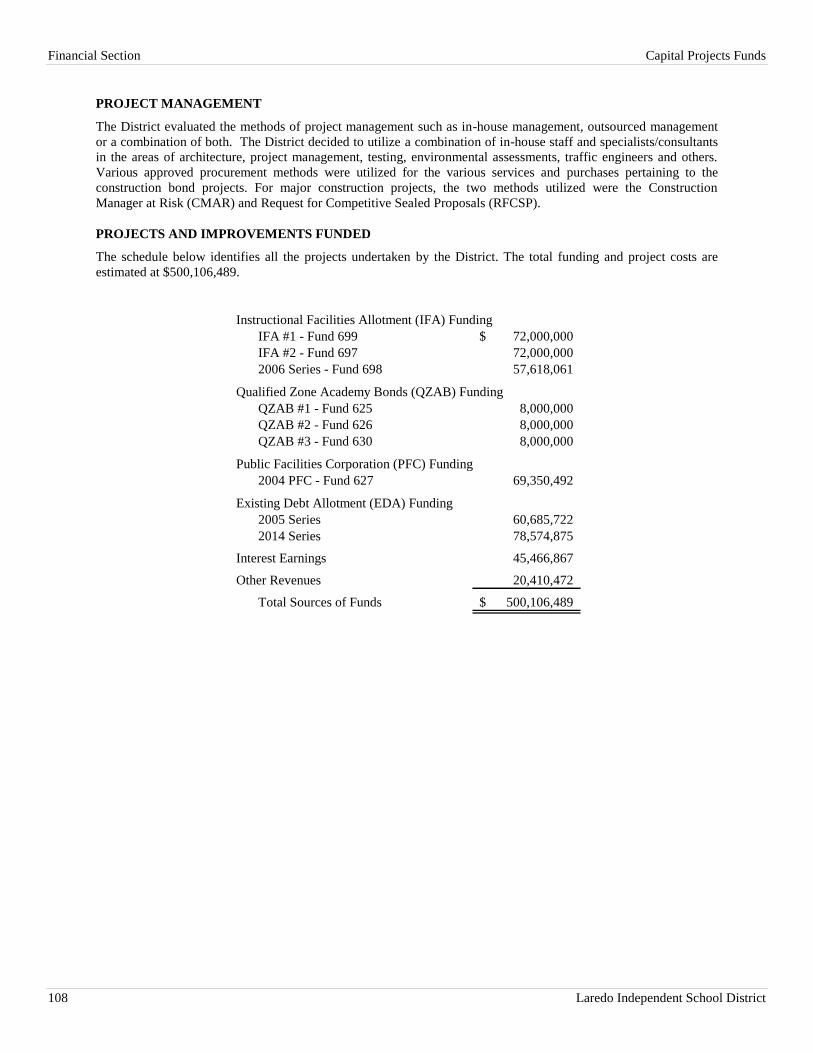
Financial Section Capital Projects Funds
108 Laredo Independent School District
PROJECT MANAGEMENT
The District evaluated the methods of project management such as in-house management, outsourced management
or a combination of both. The District decided to utilize a combination of in-house staff and specialists/consultants
in the areas of architecture, project management, testing, environmental assessments, traffic engineers and others.
Various approved procurement methods were utilized for the various services and purchases pertaining to the
construction bond projects. For major construction projects, the two methods utilized were the Construction
Manager at Risk (CMAR) and Request for Competitive Sealed Proposals (RFCSP).
PROJECTS AND IMPROVEMENTS FUNDED
The schedule below identifies all the projects undertaken by the District. The total funding and project costs are
estimated at $500,106,489.
Instructional Facilities Allotment (IFA) Funding
IFA #1 - Fund 699 72,000,000$
IFA #2 - Fund 697 72,000,000
2006 Series - Fund 698 57,618,061
Qualified Zone Academy Bonds (QZAB) Funding
QZAB #1 - Fund 625 8,000,000
QZAB #2 - Fund 626 8,000,000
QZAB #3 - Fund 630 8,000,000
Public Facilities Corporation (PFC) Funding
2004 PFC - Fund 627 69,350,492
Existing Debt Allotment (EDA) Funding
2005 Series 60,685,722
2014 Series 78,574,875
Interest Earnings 45,466,867
Other Revenues 20,410,472
Total Sources of Funds 500,106,489$
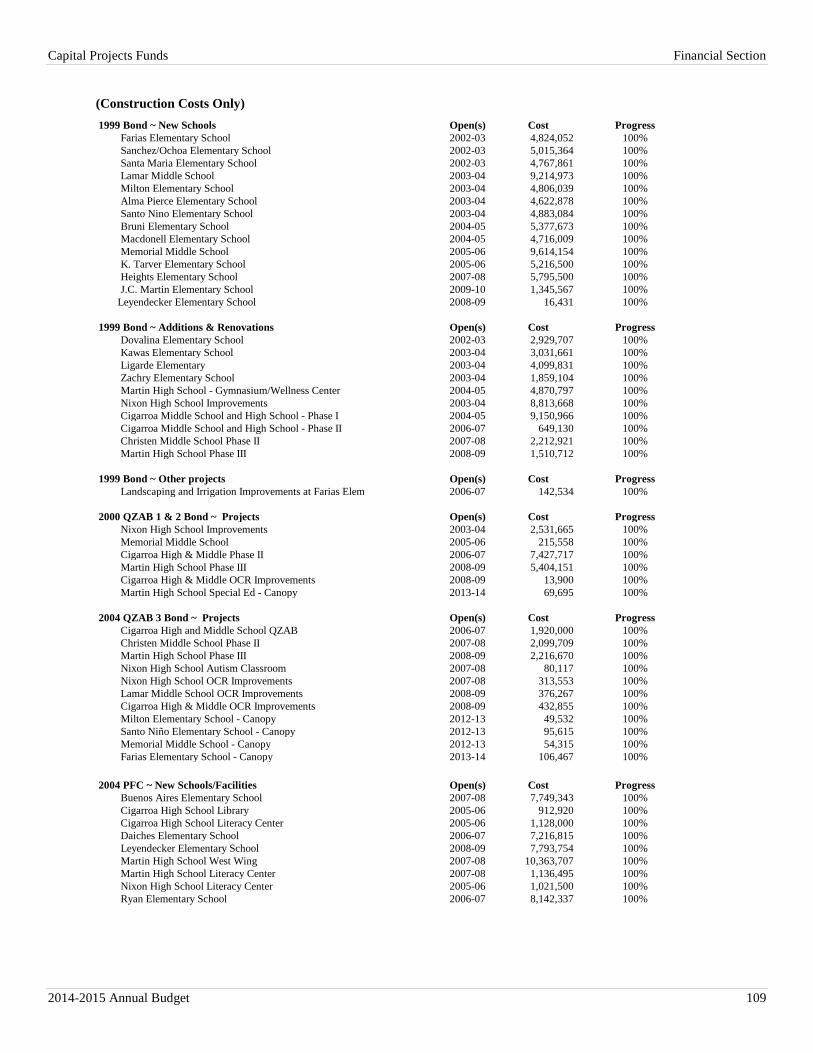
Capital Projects Funds Financial Section
2014-2015 Annual Budget 109
(Construction Costs Only)
1999 Bond ~ New Schools Open(s) Cost Progress
Farias Elementary School 2002-03 4,824,052 100%
Sanchez/Ochoa Elementary School 2002-03 5,015,364 100%
Santa Maria Elementary School 2002-03 4,767,861 100%
Lamar Middle School 2003-04 9,214,973 100%
Milton Elementary School 2003-04 4,806,039 100%
Alma Pierce Elementary School 2003-04 4,622,878 100%
Santo Nino Elementary School 2003-04 4,883,084 100%
Bruni Elementary School 2004-05 5,377,673 100%
Macdonell Elementary School 2004-05 4,716,009 100%
Memorial Middle School 2005-06 9,614,154 100%
K. Tarver Elementary School 2005-06 5,216,500 100%
Heights Elementary School 2007-08 5,795,500 100%
J.C. Martin Elementary School 2009-10 1,345,567 100%
Leyendecker Elementary School 2008-09 16,431 100%
1999 Bond ~ Additions & Renovations Open(s) Cost Progress
Dovalina Elementary School 2002-03 2,929,707 100%
Kawas Elementary School 2003-04 3,031,661 100%
Ligarde Elementary 2003-04 4,099,831 100%
Zachry Elementary School 2003-04 1,859,104 100%
Martin High School - Gymnasium/Wellness Center 2004-05 4,870,797 100%
Nixon High School Improvements 2003-04 8,813,668 100%
Cigarroa Middle School and High School - Phase I 2004-05 9,150,966 100%
Cigarroa Middle School and High School - Phase II 2006-07 649,130 100%
Christen Middle School Phase II 2007-08 2,212,921 100%
Martin High School Phase III 2008-09 1,510,712 100%
1999 Bond ~ Other projects Open(s) Cost Progress
Landscaping and Irrigation Improvements at Farias Elem 2006-07 142,534 100%
2000 QZAB 1 & 2 Bond ~ Projects Open(s) Cost Progress
Nixon High School Improvements 2003-04 2,531,665 100%
Memorial Middle School 2005-06 215,558 100%
Cigarroa High & Middle Phase II 2006-07 7,427,717 100%
Martin High School Phase III 2008-09 5,404,151 100%
Cigarroa High & Middle OCR Improvements 2008-09 13,900 100%
Martin High School Special Ed - Canopy 2013-14 69,695 100%
2004 QZAB 3 Bond ~ Projects Open(s) Cost Progress
Cigarroa High and Middle School QZAB 2006-07 1,920,000 100%
Christen Middle School Phase II 2007-08 2,099,709 100%
Martin High School Phase III 2008-09 2,216,670 100%
Nixon High School Autism Classroom 2007-08 80,117 100%
Nixon High School OCR Improvements 2007-08 313,553 100%
Lamar Middle School OCR Improvements 2008-09 376,267 100%
Cigarroa High & Middle OCR Improvements 2008-09 432,855 100%
Milton Elementary School - Canopy 2012-13 49,532 100%
Santo Niño Elementary School - Canopy 2012-13 95,615 100%
Memorial Middle School - Canopy 2012-13 54,315 100%
Farias Elementary School - Canopy 2013-14 106,467 100%
2004 PFC ~ New Schools/Facilities Open(s) Cost Progress
Buenos Aires Elementary School 2007-08 7,749,343 100%
Cigarroa High School Library 2005-06 912,920 100%
Cigarroa High School Literacy Center 2005-06 1,128,000 100%
Daiches Elementary School 2006-07 7,216,815 100%
Leyendecker Elementary School 2008-09 7,793,754 100%
Martin High School West Wing 2007-08 10,363,707 100%
Martin High School Literacy Center 2007-08 1,136,495 100%
Nixon High School Literacy Center 2005-06 1,021,500 100%
Ryan Elementary School 2006-07 8,142,337 100%
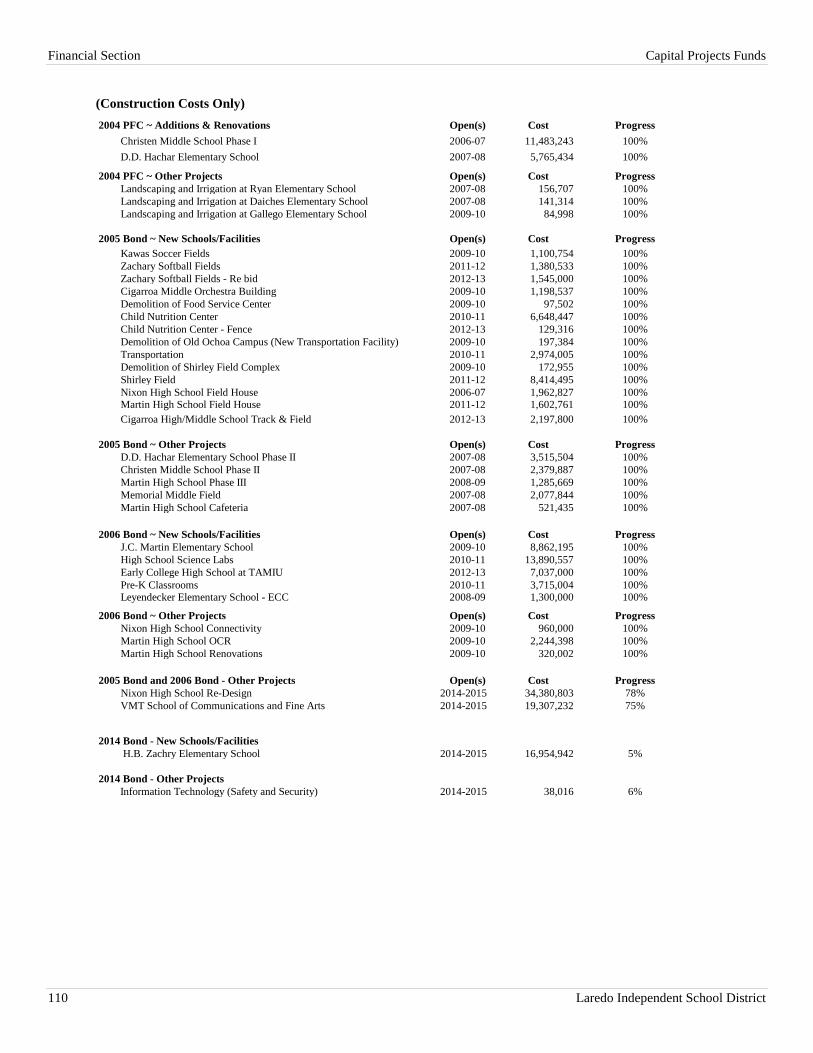
Financial Section Capital Projects Funds
110 Laredo Independent School District
(Construction Costs Only)
2004 PFC ~ Additions & Renovations Open(s) Cost Progress
Christen Middle School Phase I 2006-07 11,483,243 100%
D.D. Hachar Elementary School 2007-08 5,765,434 100%
2004 PFC ~ Other Projects Open(s) Cost Progress
Landscaping and Irrigation at Ryan Elementary School 2007-08 156,707 100%
Landscaping and Irrigation at Daiches Elementary School 2007-08 141,314 100%
Landscaping and Irrigation at Gallego Elementary School 2009-10 84,998 100%
2005 Bond ~ New Schools/Facilities Open(s) Cost Progress
Kawas Soccer Fields 2009-10 1,100,754 100%
Zachary Softball Fields 2011-12 1,380,533 100%
Zachary Softball Fields - Re bid 2012-13 1,545,000 100%
Cigarroa Middle Orchestra Building 2009-10 1,198,537 100%
Demolition of Food Service Center 2009-10 97,502 100%
Child Nutrition Center 2010-11 6,648,447 100%
Child Nutrition Center - Fence 2012-13 129,316 100%
Demolition of Old Ochoa Campus (New Transportation Facility) 2009-10 197,384 100%
Transportation 2010-11 2,974,005 100%
Demolition of Shirley Field Complex 2009-10 172,955 100%
Shirley Field 2011-12 8,414,495 100%
Nixon High School Field House 2006-07 1,962,827 100%Martin High School Field House 2011-12 1,602,761 100%
Cigarroa High/Middle School Track & Field 2012-13 2,197,800 100%
2005 Bond ~ Other Projects Open(s) Cost Progress
D.D. Hachar Elementary School Phase II 2007-08 3,515,504 100%
Christen Middle School Phase II 2007-08 2,379,887 100%
Martin High School Phase III 2008-09 1,285,669 100%
Memorial Middle Field 2007-08 2,077,844 100%
Martin High School Cafeteria 2007-08 521,435 100%
2006 Bond ~ New Schools/Facilities Open(s) Cost Progress
J.C. Martin Elementary School 2009-10 8,862,195 100%
High School Science Labs 2010-11 13,890,557 100%
Early College High School at TAMIU 2012-13 7,037,000 100%
Pre-K Classrooms 2010-11 3,715,004 100%Leyendecker Elementary School - ECC 2008-09 1,300,000 100%
2006 Bond ~ Other Projects Open(s) Cost Progress
Nixon High School Connectivity 2009-10 960,000 100%
Martin High School OCR 2009-10 2,244,398 100%
Martin High School Renovations 2009-10 320,002 100%
2005 Bond and 2006 Bond - Other Projects Open(s) Cost Progress
Nixon High School Re-Design 2014-2015 34,380,803 78%
VMT School of Communications and Fine Arts 2014-2015 19,307,232 75%
2014 Bond - New Schools/Facilities
H.B. Zachry Elementary School 2014-2015 16,954,942 5%
2014 Bond - Other Projects
Information Technology (Safety and Security) 2014-2015 38,016 6%
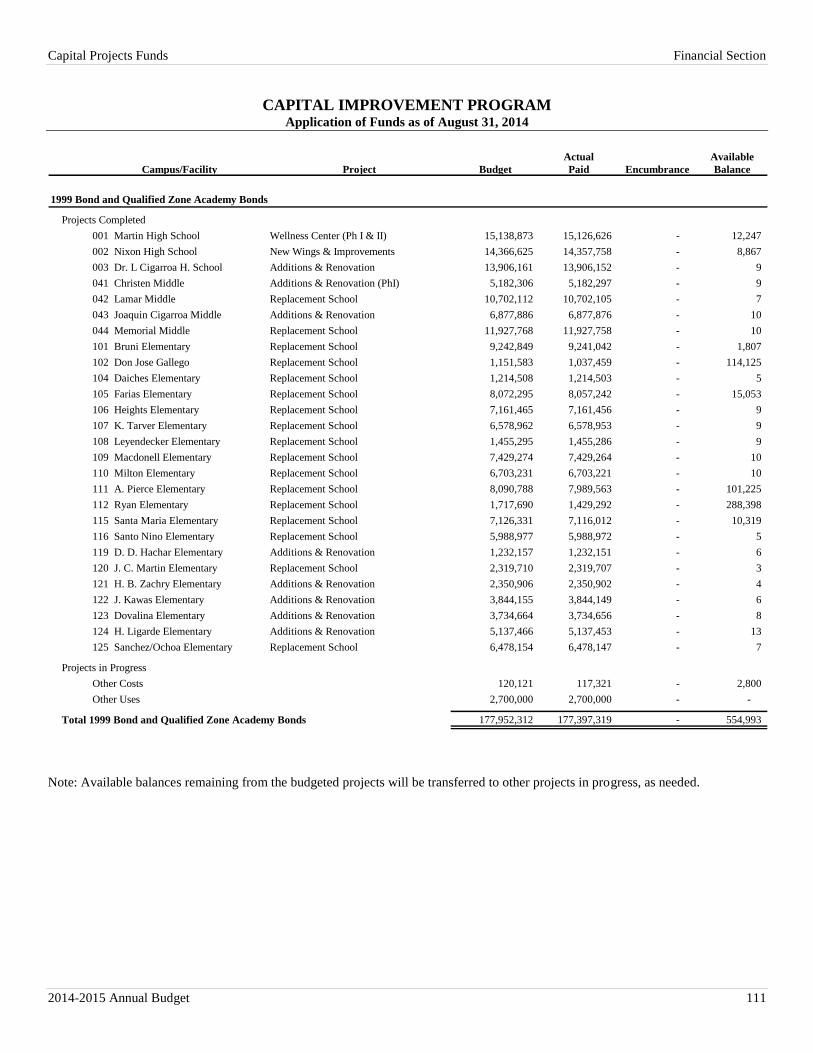
Capital Projects Funds Financial Section
2014-2015 Annual Budget 111
CAPITAL IMPROVEMENT PROGRAM Application of Funds as of August 31, 2014
Actual Available
Campus/Facility Project Budget Paid Encumbrance Balance
1999 Bond and Qualified Zone Academy Bonds
Projects Completed
001 Martin High School Wellness Center (Ph I & II) 15,138,873 15,126,626 - 12,247
002 Nixon High School New Wings & Improvements 14,366,625 14,357,758 - 8,867
003 Dr. L Cigarroa H. School Additions & Renovation 13,906,161 13,906,152 - 9
041 Christen Middle Additions & Renovation (PhI) 5,182,306 5,182,297 - 9
042 Lamar Middle Replacement School 10,702,112 10,702,105 - 7
043 Joaquin Cigarroa Middle Additions & Renovation 6,877,886 6,877,876 - 10
044 Memorial Middle Replacement School 11,927,768 11,927,758 - 10
101 Bruni Elementary Replacement School 9,242,849 9,241,042 - 1,807
102 Don Jose Gallego Replacement School 1,151,583 1,037,459 - 114,125
104 Daiches Elementary Replacement School 1,214,508 1,214,503 - 5
105 Farias Elementary Replacement School 8,072,295 8,057,242 - 15,053
106 Heights Elementary Replacement School 7,161,465 7,161,456 - 9
107 K. Tarver Elementary Replacement School 6,578,962 6,578,953 - 9
108 Leyendecker Elementary Replacement School 1,455,295 1,455,286 - 9
109 Macdonell Elementary Replacement School 7,429,274 7,429,264 - 10
110 Milton Elementary Replacement School 6,703,231 6,703,221 - 10
111 A. Pierce Elementary Replacement School 8,090,788 7,989,563 - 101,225
112 Ryan Elementary Replacement School 1,717,690 1,429,292 - 288,398
115 Santa Maria Elementary Replacement School 7,126,331 7,116,012 - 10,319
116 Santo Nino Elementary Replacement School 5,988,977 5,988,972 - 5
119 D. D. Hachar Elementary Additions & Renovation 1,232,157 1,232,151 - 6
120 J. C. Martin Elementary Replacement School 2,319,710 2,319,707 - 3
121 H. B. Zachry Elementary Additions & Renovation 2,350,906 2,350,902 - 4
122 J. Kawas Elementary Additions & Renovation 3,844,155 3,844,149 - 6
123 Dovalina Elementary Additions & Renovation 3,734,664 3,734,656 - 8
124 H. Ligarde Elementary Additions & Renovation 5,137,466 5,137,453 - 13
125 Sanchez/Ochoa Elementary Replacement School 6,478,154 6,478,147 - 7
Projects in Progress
Other Costs 120,121 117,321 - 2,800
Other Uses 2,700,000 2,700,000 - -
Total 1999 Bond and Qualified Zone Academy Bonds 177,952,312 177,397,319 - 554,993
Note: Available balances remaining from the budgeted projects will be transferred to other projects in progress, as needed.
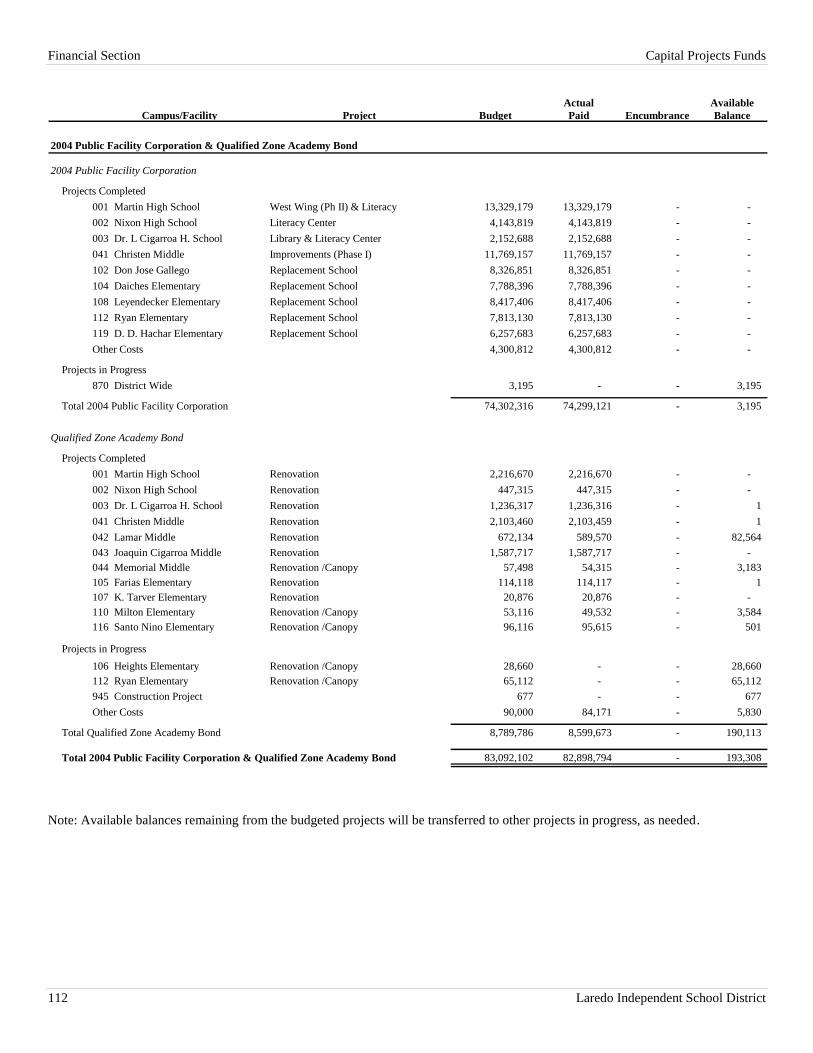
Financial Section Capital Projects Funds
112 Laredo Independent School District
Actual Available
Campus/Facility Project Budget Paid Encumbrance Balance
2004 Public Facility Corporation & Qualified Zone Academy Bond
2004 Public Facility Corporation
Projects Completed
001 Martin High School West Wing (Ph II) & Literacy 13,329,179 13,329,179 - -
002 Nixon High School Literacy Center 4,143,819 4,143,819 - -
003 Dr. L Cigarroa H. School Library & Literacy Center 2,152,688 2,152,688 - -
041 Christen Middle Improvements (Phase I) 11,769,157 11,769,157 - -
102 Don Jose Gallego Replacement School 8,326,851 8,326,851 - -
104 Daiches Elementary Replacement School 7,788,396 7,788,396 - -
108 Leyendecker Elementary Replacement School 8,417,406 8,417,406 - -
112 Ryan Elementary Replacement School 7,813,130 7,813,130 - -
119 D. D. Hachar Elementary Replacement School 6,257,683 6,257,683 - -
Other Costs 4,300,812 4,300,812 - -
Projects in Progress
870 District Wide 3,195 - - 3,195
Total 2004 Public Facility Corporation 74,302,316 74,299,121 - 3,195
Qualified Zone Academy Bond
Projects Completed
001 Martin High School Renovation 2,216,670 2,216,670 - -
002 Nixon High School Renovation 447,315 447,315 - -
003 Dr. L Cigarroa H. School Renovation 1,236,317 1,236,316 - 1
041 Christen Middle Renovation 2,103,460 2,103,459 - 1
042 Lamar Middle Renovation 672,134 589,570 - 82,564
043 Joaquin Cigarroa Middle Renovation 1,587,717 1,587,717 - -
044 Memorial Middle Renovation /Canopy 57,498 54,315 - 3,183
105 Farias Elementary Renovation 114,118 114,117 - 1
107 K. Tarver Elementary Renovation 20,876 20,876 - -
110 Milton Elementary Renovation /Canopy 53,116 49,532 - 3,584
116 Santo Nino Elementary Renovation /Canopy 96,116 95,615 - 501
Projects in Progress
106 Heights Elementary Renovation /Canopy 28,660 - - 28,660
112 Ryan Elementary Renovation /Canopy 65,112 - - 65,112
945 Construction Project 677 - - 677
Other Costs 90,000 84,171 - 5,830
Total Qualified Zone Academy Bond 8,789,786 8,599,673 - 190,113
Total 2004 Public Facility Corporation & Qualified Zone Academy Bond 83,092,102 82,898,794 - 193,308
Note: Available balances remaining from the budgeted projects will be transferred to other projects in progress, as needed.
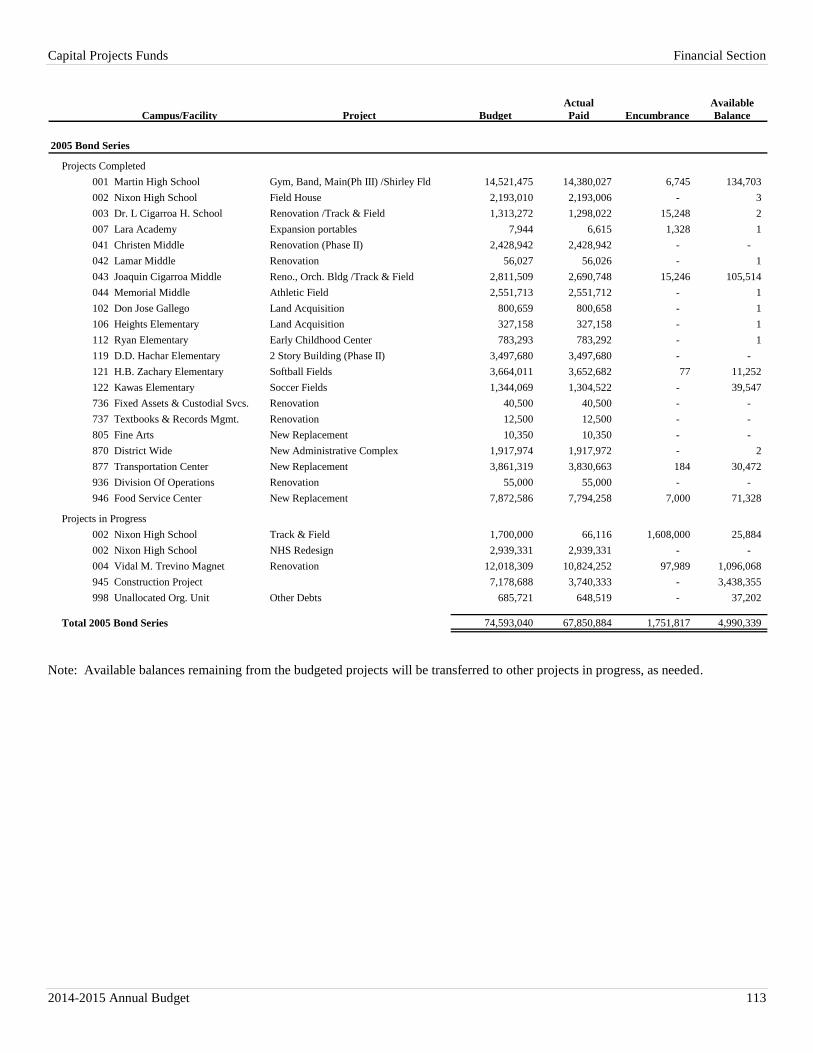
Capital Projects Funds Financial Section
2014-2015 Annual Budget 113
Actual Available
Campus/Facility Project Budget Paid Encumbrance Balance
2005 Bond Series
Projects Completed
001 Martin High School Gym, Band, Main(Ph III) /Shirley Fld 14,521,475 14,380,027 6,745 134,703
002 Nixon High School Field House 2,193,010 2,193,006 - 3
003 Dr. L Cigarroa H. School Renovation /Track & Field 1,313,272 1,298,022 15,248 2
007 Lara Academy Expansion portables 7,944 6,615 1,328 1
041 Christen Middle Renovation (Phase II) 2,428,942 2,428,942 - -
042 Lamar Middle Renovation 56,027 56,026 - 1
043 Joaquin Cigarroa Middle Reno., Orch. Bldg /Track & Field 2,811,509 2,690,748 15,246 105,514
044 Memorial Middle Athletic Field 2,551,713 2,551,712 - 1
102 Don Jose Gallego Land Acquisition 800,659 800,658 - 1
106 Heights Elementary Land Acquisition 327,158 327,158 - 1
112 Ryan Elementary Early Childhood Center 783,293 783,292 - 1
119 D.D. Hachar Elementary 2 Story Building (Phase II) 3,497,680 3,497,680 - -
121 H.B. Zachary Elementary Softball Fields 3,664,011 3,652,682 77 11,252
122 Kawas Elementary Soccer Fields 1,344,069 1,304,522 - 39,547
736 Fixed Assets & Custodial Svcs. Renovation 40,500 40,500 - -
737 Textbooks & Records Mgmt. Renovation 12,500 12,500 - -
805 Fine Arts New Replacement 10,350 10,350 - -
870 District Wide New Administrative Complex 1,917,974 1,917,972 - 2
877 Transportation Center New Replacement 3,861,319 3,830,663 184 30,472
936 Division Of Operations Renovation 55,000 55,000 - -
946 Food Service Center New Replacement 7,872,586 7,794,258 7,000 71,328
Projects in Progress
002 Nixon High School Track & Field 1,700,000 66,116 1,608,000 25,884
002 Nixon High School NHS Redesign 2,939,331 2,939,331 - -
004 Vidal M. Trevino Magnet Renovation 12,018,309 10,824,252 97,989 1,096,068
945 Construction Project 7,178,688 3,740,333 - 3,438,355
998 Unallocated Org. Unit Other Debts 685,721 648,519 - 37,202
Total 2005 Bond Series 74,593,040 67,850,884 1,751,817 4,990,339
Note: Available balances remaining from the budgeted projects will be transferred to other projects in progress, as needed.
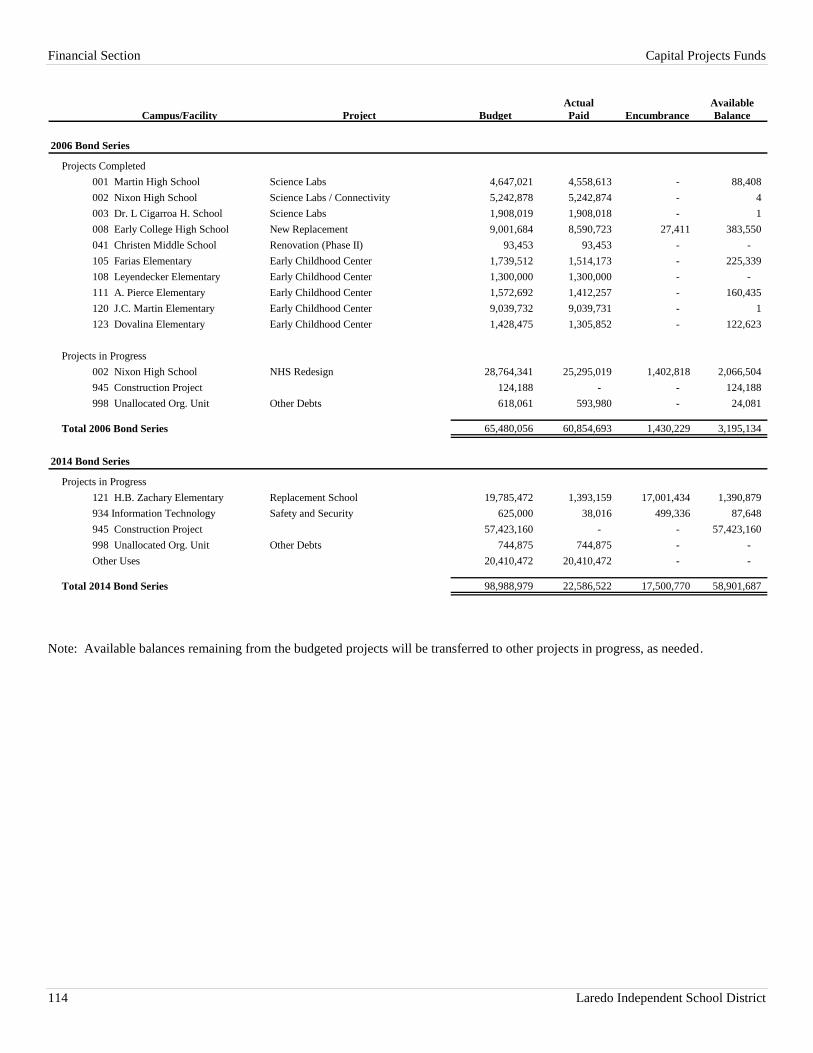
Financial Section Capital Projects Funds
114 Laredo Independent School District
Actual Available
Campus/Facility Project Budget Paid Encumbrance Balance
2006 Bond Series
Projects Completed
001 Martin High School Science Labs 4,647,021 4,558,613 - 88,408
002 Nixon High School Science Labs / Connectivity 5,242,878 5,242,874 - 4
003 Dr. L Cigarroa H. School Science Labs 1,908,019 1,908,018 - 1
008 Early College High School New Replacement 9,001,684 8,590,723 27,411 383,550
041 Christen Middle School Renovation (Phase II) 93,453 93,453 - -
105 Farias Elementary Early Childhood Center 1,739,512 1,514,173 - 225,339
108 Leyendecker Elementary Early Childhood Center 1,300,000 1,300,000 - -
111 A. Pierce Elementary Early Childhood Center 1,572,692 1,412,257 - 160,435
120 J.C. Martin Elementary Early Childhood Center 9,039,732 9,039,731 - 1
123 Dovalina Elementary Early Childhood Center 1,428,475 1,305,852 - 122,623
Projects in Progress
002 Nixon High School NHS Redesign 28,764,341 25,295,019 1,402,818 2,066,504
945 Construction Project 124,188 - - 124,188
998 Unallocated Org. Unit Other Debts 618,061 593,980 - 24,081
Total 2006 Bond Series 65,480,056 60,854,693 1,430,229 3,195,134
2014 Bond Series
Projects in Progress
121 H.B. Zachary Elementary Replacement School 19,785,472 1,393,159 17,001,434 1,390,879
934 Information Technology Safety and Security 625,000 38,016 499,336 87,648
945 Construction Project 57,423,160 - - 57,423,160
998 Unallocated Org. Unit Other Debts 744,875 744,875 - -
Other Uses 20,410,472 20,410,472 - -
Total 2014 Bond Series 98,988,979 22,586,522 17,500,770 58,901,687
Note: Available balances remaining from the budgeted projects will be transferred to other projects in progress, as needed.
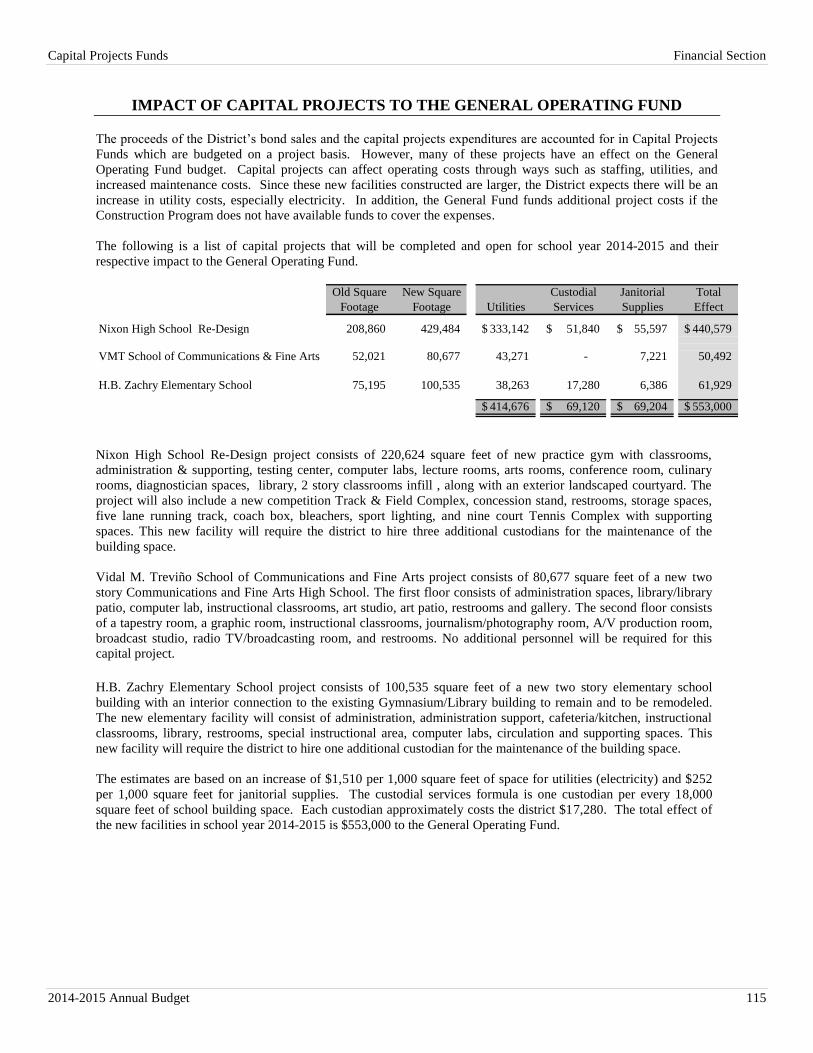
Capital Projects Funds Financial Section
2014-2015 Annual Budget 115
IMPACT OF CAPITAL PROJECTS TO THE GENERAL OPERATING FUND
The proceeds of the District’s bond sales and the capital projects expenditures are accounted for in Capital Projects
Funds which are budgeted on a project basis. However, many of these projects have an effect on the General
Operating Fund budget. Capital projects can affect operating costs through ways such as staffing, utilities, and
increased maintenance costs. Since these new facilities constructed are larger, the District expects there will be an
increase in utility costs, especially electricity. In addition, the General Fund funds additional project costs if the
Construction Program does not have available funds to cover the expenses.
The following is a list of capital projects that will be completed and open for school year 2014-2015 and their
respective impact to the General Operating Fund.
Old Square New Square Custodial Janitorial Total
Footage Footage Utilities Services Supplies Effect
Nixon High School Re-Design 208,860 429,484 333,142$ 51,840$ 55,597$ 440,579$
VMT School of Communications & Fine Arts 52,021 80,677 43,271 - 7,221 50,492
H.B. Zachry Elementary School 75,195 100,535 38,263 17,280 6,386 61,929
414,676$ 69,120$ 69,204$ 553,000$
Nixon High School Re-Design project consists of 220,624 square feet of new practice gym with classrooms,
administration & supporting, testing center, computer labs, lecture rooms, arts rooms, conference room, culinary
rooms, diagnostician spaces, library, 2 story classrooms infill , along with an exterior landscaped courtyard. The
project will also include a new competition Track & Field Complex, concession stand, restrooms, storage spaces,
five lane running track, coach box, bleachers, sport lighting, and nine court Tennis Complex with supporting
spaces. This new facility will require the district to hire three additional custodians for the maintenance of the
building space.
Vidal M. Treviño School of Communications and Fine Arts project consists of 80,677 square feet of a new two
story Communications and Fine Arts High School. The first floor consists of administration spaces, library/library
patio, computer lab, instructional classrooms, art studio, art patio, restrooms and gallery. The second floor consists
of a tapestry room, a graphic room, instructional classrooms, journalism/photography room, A/V production room,
broadcast studio, radio TV/broadcasting room, and restrooms. No additional personnel will be required for this
capital project. H.B. Zachry Elementary School project consists of 100,535 square feet of a new two story elementary school
building with an interior connection to the existing Gymnasium/Library building to remain and to be remodeled.
The new elementary facility will consist of administration, administration support, cafeteria/kitchen, instructional
classrooms, library, restrooms, special instructional area, computer labs, circulation and supporting spaces. This
new facility will require the district to hire one additional custodian for the maintenance of the building space.
The estimates are based on an increase of $1,510 per 1,000 square feet of space for utilities (electricity) and $252
per 1,000 square feet for janitorial supplies. The custodial services formula is one custodian per every 18,000
square feet of school building space. Each custodian approximately costs the district $17,280. The total effect of
the new facilities in school year 2014-2015 is $553,000 to the General Operating Fund.
Financial Section Proprietary Funds
116 Laredo Independent School District
INTERNAL SERVICE FUND
The internal service fund is a governmental fund type, with budgetary control, that must be used to account for good
or services provided to other funds, agencies, or departments of the primary government and component units, or to
other governments, on a cost reimbursement basis.
On June 13, 2013, the school district switched from a fully funded health insurance program to a self-funded
program. The Internal Service Fund is used to account for the insurance premiums and claims.
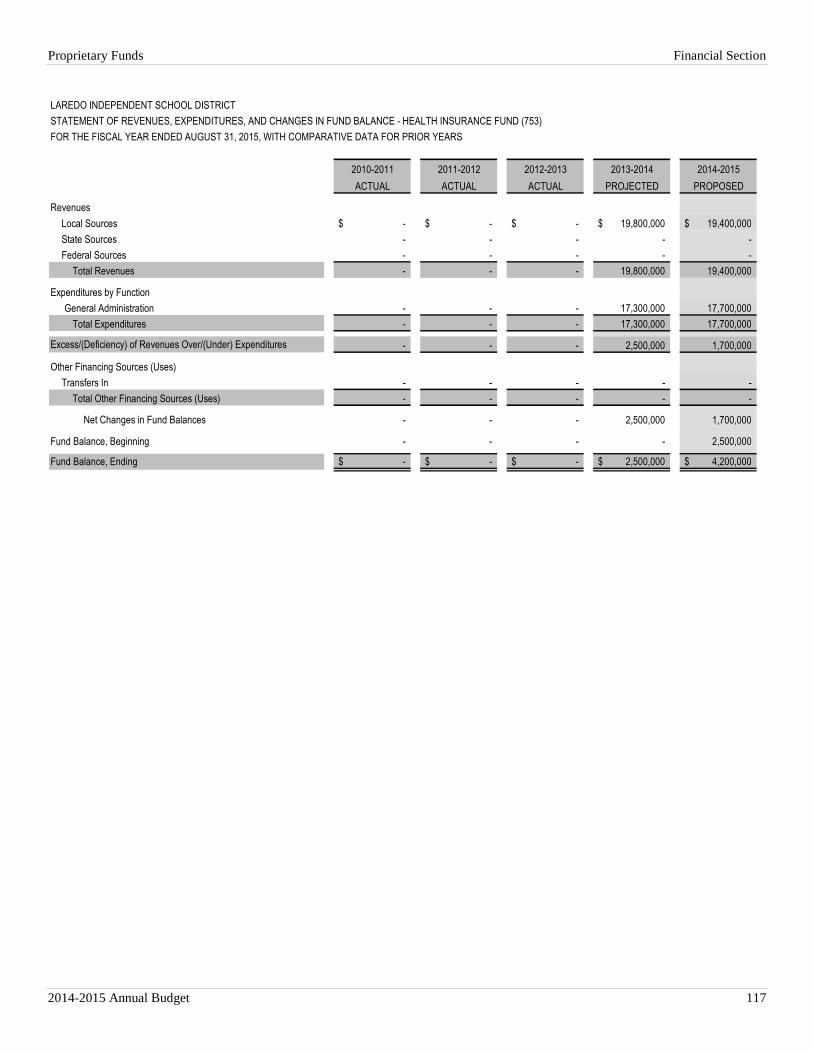
Proprietary Funds Financial Section
2014-2015 Annual Budget 117
LAREDO INDEPENDENT SCHOOL DISTRICT
STATEMENT OF REVENUES, EXPENDITURES, AND CHANGES IN FUND BALANCE - HEALTH INSURANCE FUND (753)
FOR THE FISCAL YEAR ENDED AUGUST 31, 2015, WITH COMPARATIVE DATA FOR PRIOR YEARS
2010-2011 2011-2012 2012-2013 2013-2014 2014-2015
ACTUAL ACTUAL ACTUAL PROJECTED PROPOSED
Revenues
Local Sources -$ -$ -$ 19,800,000$ 19,400,000$
State Sources - - - - -
Federal Sources - - - - -
Total Revenues - - - 19,800,000 19,400,000
Expenditures by Function
General Administration - - - 17,300,000 17,700,000
Total Expenditures - - - 17,300,000 17,700,000
Excess/(Deficiency) of Revenues Over/(Under) Expenditures - - - 2,500,000 1,700,000
Other Financing Sources (Uses)
Transfers In - - - - -
Total Other Financing Sources (Uses) - - - - -
Net Changes in Fund Balances - - - 2,500,000 1,700,000
Fund Balance, Beginning - - - - 2,500,000 -
Fund Balance, Ending -$ -$ -$ 2,500,000$ 4,200,000$
Financial Section Internal Service Funds
118 Laredo Independent School District
Page left blank intentionally.
INFORMATIONAL SECTION
TABLE OF CONTENTS
General Operating Fund - Major Revenue Sources ................................................................................................... 119
Debt Service Fund – Major Revenue Sources ........................................................................................................... 124
Major Revenue Assumptions ..................................................................................................................................... 127
Trends & Forecasts .................................................................................................................................................... 128
Appraisal Roll and Property Values .......................................................................................................................... 136
Property Tax Rates and Tax Levies Comparison ....................................................................................................... 137
LISD Property Tax Rates and Tax Levies ................................................................................................................. 138
LISD Property Tax Levies and Collections ............................................................................................................... 139
District’s Principal Taxpayers ................................................................................................................................... 140
Analysis of Budget’s Effect on Taxpayers ................................................................................................................. 141
Ratio of Annual Debt Service Expenditures for General Bonded Debt to Total Expenditures (1) ............................ 142
Ratio of Net General Bonded Debt to Net Bonded Debt per Average Daily Attendance (ADA) .............................. 143
General Governmental Revenues (Last 10 Fiscal Years)........................................................................................... 144
General Governmental Expenditures (Last 10 Fiscal Years) ..................................................................................... 146
District Personnel ...................................................................................................................................................... 148
Student Enrollment - Historical & Projected ............................................................................................................. 152
Administrative Cost Ratio .......................................................................................................................................... 154
Student Demographics ............................................................................................................................................... 155
Academic Performance ............................................................................................................................................. 156
Annual Dropout, Attendance & Completion Rates .................................................................................................... 159
Community Profile..................................................................................................................................................... 160
Location .............................................................................................................................................................. 160
Local History ...................................................................................................................................................... 160
Population .......................................................................................................................................................... 161
Education ........................................................................................................................................................... 162
Income ............................................................................................................................................................... 162
Housing ............................................................................................................................................................. 163
Hotel Statistics .................................................................................................................................................... 163
Labor Statistics ................................................................................................................................................... 163
Major Employers ................................................................................................................................................ 164
Finance ............................................................................................................................................................... 164
Tourism .............................................................................................................................................................. 164
Transportation .................................................................................................................................................... 164
Governmental Structure and Public Safety ......................................................................................................... 166
Utilities and Public Works .................................................................................................................................. 166
Healthcare ........................................................................................................................................................... 166
Education Facilities ............................................................................................................................................ 167
Entertainment & Recreation Highlights .............................................................................................................. 168
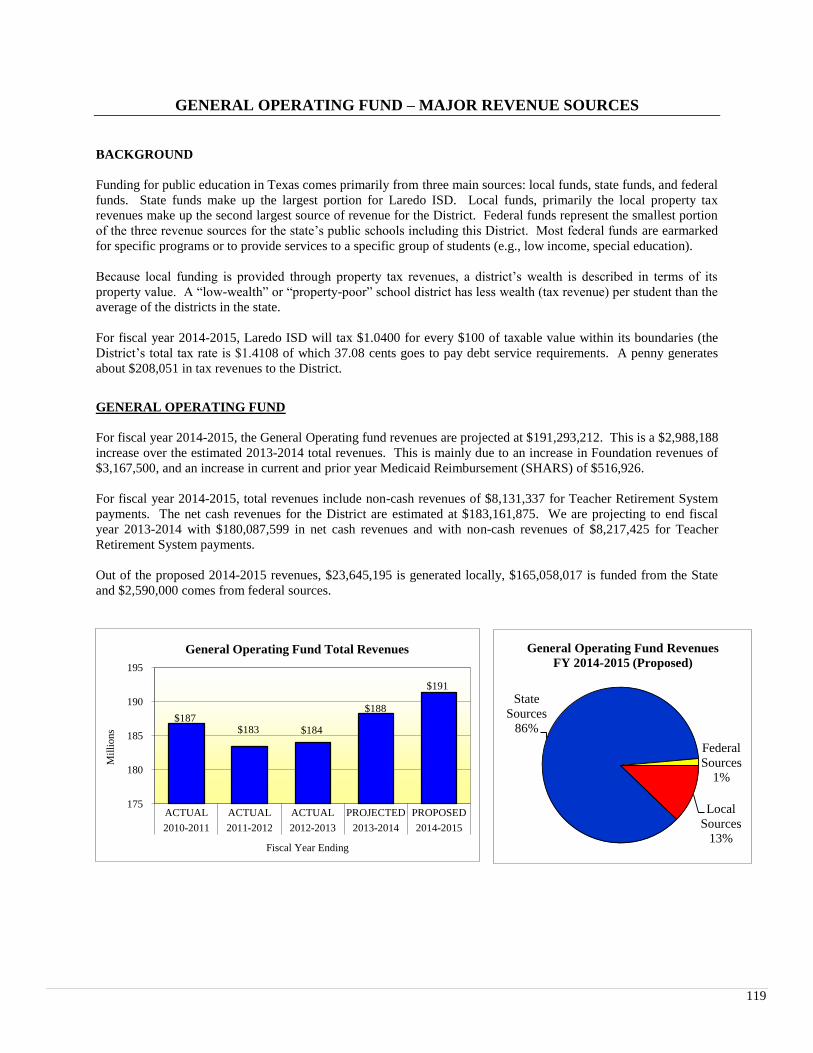
119
GENERAL OPERATING FUND – MAJOR REVENUE SOURCES
BACKGROUND
Funding for public education in Texas comes primarily from three main sources: local funds, state funds, and federal
funds. State funds make up the largest portion for Laredo ISD. Local funds, primarily the local property tax
revenues make up the second largest source of revenue for the District. Federal funds represent the smallest portion
of the three revenue sources for the state’s public schools including this District. Most federal funds are earmarked
for specific programs or to provide services to a specific group of students (e.g., low income, special education).
Because local funding is provided through property tax revenues, a district’s wealth is described in terms of its
property value. A “low-wealth” or “property-poor” school district has less wealth (tax revenue) per student than the
average of the districts in the state.
For fiscal year 2014-2015, Laredo ISD will tax $1.0400 for every $100 of taxable value within its boundaries (the
District’s total tax rate is $1.4108 of which 37.08 cents goes to pay debt service requirements. A penny generates
about $208,051 in tax revenues to the District.
GENERAL OPERATING FUND
For fiscal year 2014-2015, the General Operating fund revenues are projected at $191,293,212. This is a $2,988,188
increase over the estimated 2013-2014 total revenues. This is mainly due to an increase in Foundation revenues of
$3,167,500, and an increase in current and prior year Medicaid Reimbursement (SHARS) of $516,926.
For fiscal year 2014-2015, total revenues include non-cash revenues of $8,131,337 for Teacher Retirement System
payments. The net cash revenues for the District are estimated at $183,161,875. We are projecting to end fiscal
year 2013-2014 with $180,087,599 in net cash revenues and with non-cash revenues of $8,217,425 for Teacher
Retirement System payments.
Out of the proposed 2014-2015 revenues, $23,645,195 is generated locally, $165,058,017 is funded from the State
and $2,590,000 comes from federal sources.
$187$183 $184
$188
$191
175
180
185
190
195
ACTUAL ACTUAL ACTUAL PROJECTED PROPOSED
2010-2011 2011-2012 2012-2013 2013-2014 2014-2015
Mil
lions
Fiscal Year Ending
General Operating Fund Total Revenues
Local
Sources
13%
State
Sources
86%
Federal
Sources
1%
General Operating Fund Revenues
FY 2014-2015 (Proposed)
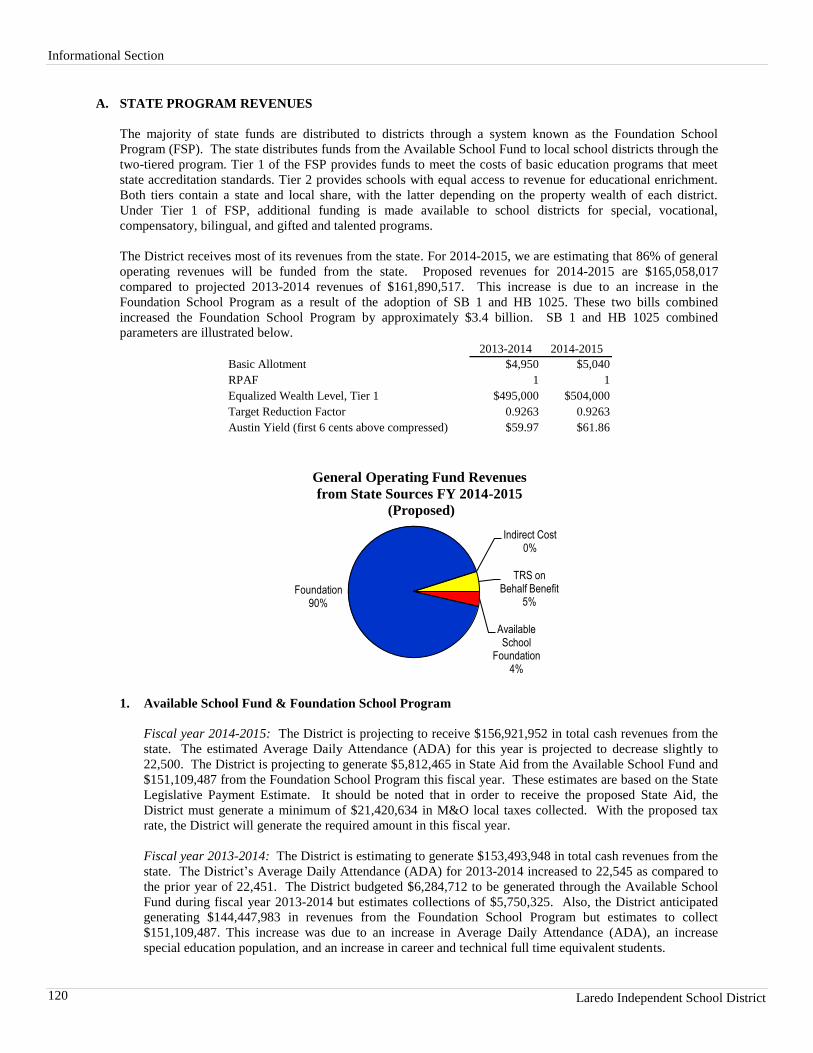
Informational Section
Laredo Independent School District 120
A. STATE PROGRAM REVENUES
The majority of state funds are distributed to districts through a system known as the Foundation School
Program (FSP). The state distributes funds from the Available School Fund to local school districts through the
two-tiered program. Tier 1 of the FSP provides funds to meet the costs of basic education programs that meet
state accreditation standards. Tier 2 provides schools with equal access to revenue for educational enrichment.
Both tiers contain a state and local share, with the latter depending on the property wealth of each district.
Under Tier 1 of FSP, additional funding is made available to school districts for special, vocational,
compensatory, bilingual, and gifted and talented programs.
The District receives most of its revenues from the state. For 2014-2015, we are estimating that 86% of general
operating revenues will be funded from the state. Proposed revenues for 2014-2015 are $165,058,017
compared to projected 2013-2014 revenues of $161,890,517. This increase is due to an increase in the
Foundation School Program as a result of the adoption of SB 1 and HB 1025. These two bills combined
increased the Foundation School Program by approximately $3.4 billion. SB 1 and HB 1025 combined
parameters are illustrated below.
2013-2014 2014-2015
Basic Allotment $4,950 $5,040
RPAF 1 1
Equalized Wealth Level, Tier 1 $495,000 $504,000
Target Reduction Factor 0.9263 0.9263
Austin Yield (first 6 cents above compressed) $59.97 $61.86
Available School
Foundation4%
Foundation90%
Indirect Cost0%
TRS on Behalf Benefit
5%
General Operating Fund Revenues
from State Sources FY 2014-2015
(Proposed)
1. Available School Fund & Foundation School Program
Fiscal year 2014-2015: The District is projecting to receive $156,921,952 in total cash revenues from the
state. The estimated Average Daily Attendance (ADA) for this year is projected to decrease slightly to
22,500. The District is projecting to generate $5,812,465 in State Aid from the Available School Fund and
$151,109,487 from the Foundation School Program this fiscal year. These estimates are based on the State
Legislative Payment Estimate. It should be noted that in order to receive the proposed State Aid, the
District must generate a minimum of $21,420,634 in M&O local taxes collected. With the proposed tax
rate, the District will generate the required amount in this fiscal year.
Fiscal year 2013-2014: The District is estimating to generate $153,493,948 in total cash revenues from the
state. The District’s Average Daily Attendance (ADA) for 2013-2014 increased to 22,545 as compared to
the prior year of 22,451. The District budgeted $6,284,712 to be generated through the Available School
Fund during fiscal year 2013-2014 but estimates collections of $5,750,325. Also, the District anticipated
generating $144,447,983 in revenues from the Foundation School Program but estimates to collect
$151,109,487. This increase was due to an increase in Average Daily Attendance (ADA), an increase
special education population, and an increase in career and technical full time equivalent students.
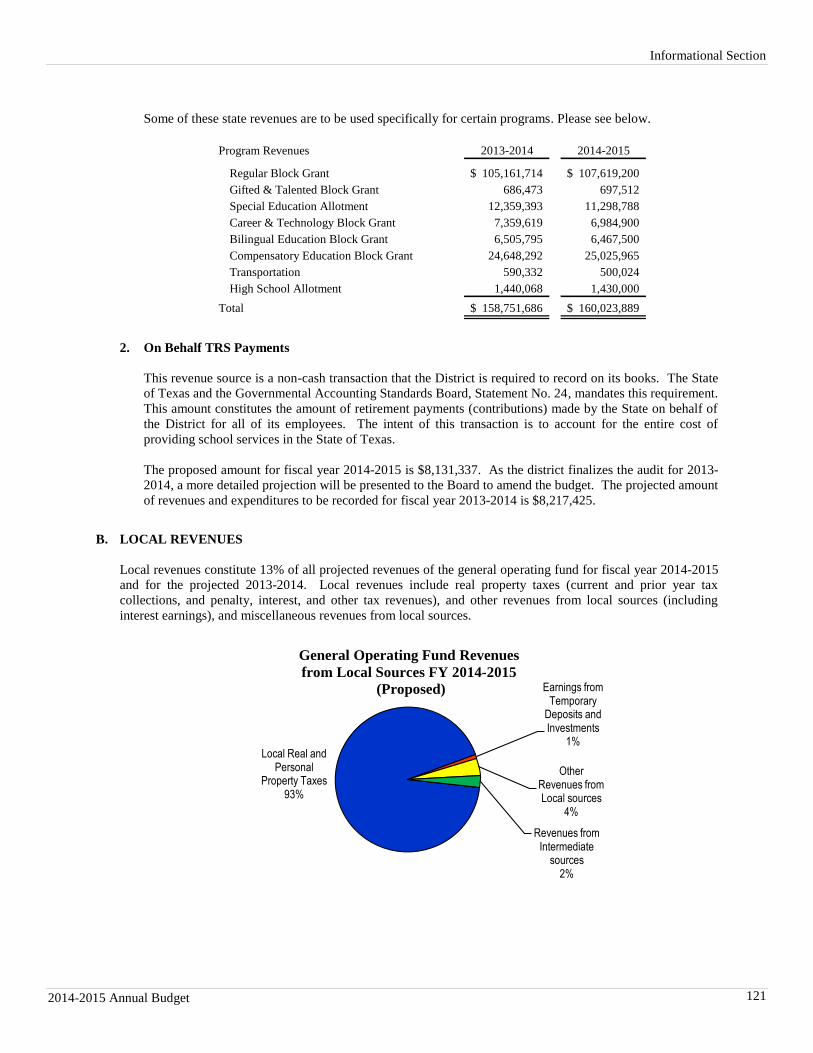
Informational Section
2014-2015 Annual Budget 121
Some of these state revenues are to be used specifically for certain programs. Please see below.
Program Revenues 2013-2014 2014-2015
Regular Block Grant 105,161,714$ 107,619,200$
Gifted & Talented Block Grant 686,473 697,512
Special Education Allotment 12,359,393 11,298,788
Career & Technology Block Grant 7,359,619 6,984,900
Bilingual Education Block Grant 6,505,795 6,467,500
Compensatory Education Block Grant 24,648,292 25,025,965
Transportation 590,332 500,024
High School Allotment 1,440,068 1,430,000
Total 158,751,686$ 160,023,889$
2. On Behalf TRS Payments
This revenue source is a non-cash transaction that the District is required to record on its books. The State
of Texas and the Governmental Accounting Standards Board, Statement No. 24, mandates this requirement.
This amount constitutes the amount of retirement payments (contributions) made by the State on behalf of
the District for all of its employees. The intent of this transaction is to account for the entire cost of
providing school services in the State of Texas.
The proposed amount for fiscal year 2014-2015 is $8,131,337. As the district finalizes the audit for 2013-
2014, a more detailed projection will be presented to the Board to amend the budget. The projected amount
of revenues and expenditures to be recorded for fiscal year 2013-2014 is $8,217,425.
B. LOCAL REVENUES
Local revenues constitute 13% of all projected revenues of the general operating fund for fiscal year 2014-2015
and for the projected 2013-2014. Local revenues include real property taxes (current and prior year tax
collections, and penalty, interest, and other tax revenues), and other revenues from local sources (including
interest earnings), and miscellaneous revenues from local sources.
Local Real and Personal
Property Taxes93%
Earnings from Temporary
Deposits and Investments
1%
Other Revenues from Local sources
4%
Revenues from Intermediate
sources2%
General Operating Fund Revenues
from Local Sources FY 2014-2015
(Proposed)
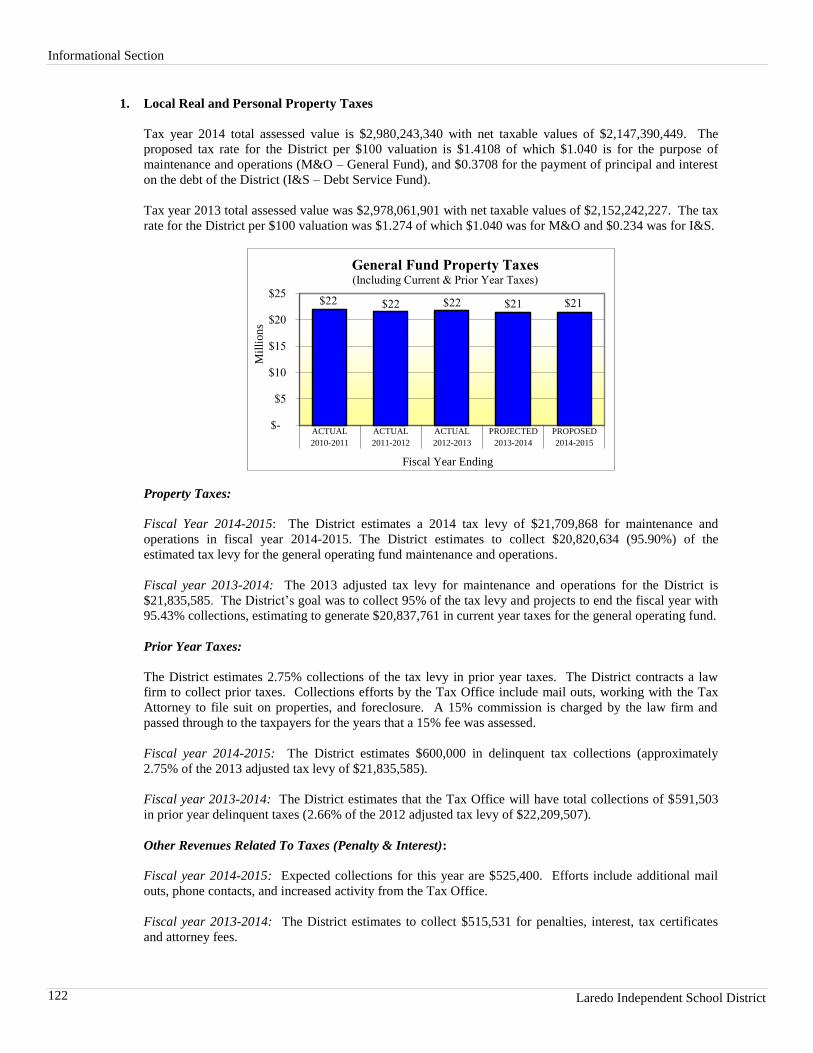
Informational Section
Laredo Independent School District 122
1. Local Real and Personal Property Taxes
Tax year 2014 total assessed value is $2,980,243,340 with net taxable values of $2,147,390,449. The
proposed tax rate for the District per $100 valuation is $1.4108 of which $1.040 is for the purpose of
maintenance and operations (M&O – General Fund), and $0.3708 for the payment of principal and interest
on the debt of the District (I&S – Debt Service Fund).
Tax year 2013 total assessed value was $2,978,061,901 with net taxable values of $2,152,242,227. The tax
rate for the District per $100 valuation was $1.274 of which $1.040 was for M&O and $0.234 was for I&S.
$22 $22 $22 $21 $21
$-
$5
$10
$15
$20
$25
ACTUAL ACTUAL ACTUAL PROJECTED PROPOSED
2010-2011 2011-2012 2012-2013 2013-2014 2014-2015
Mil
lion
s
Fiscal Year Ending
General Fund Property Taxes (Including Current & Prior Year Taxes)
Property Taxes:
Fiscal Year 2014-2015: The District estimates a 2014 tax levy of $21,709,868 for maintenance and
operations in fiscal year 2014-2015. The District estimates to collect $20,820,634 (95.90%) of the
estimated tax levy for the general operating fund maintenance and operations.
Fiscal year 2013-2014: The 2013 adjusted tax levy for maintenance and operations for the District is
$21,835,585. The District’s goal was to collect 95% of the tax levy and projects to end the fiscal year with
95.43% collections, estimating to generate $20,837,761 in current year taxes for the general operating fund.
Prior Year Taxes:
The District estimates 2.75% collections of the tax levy in prior year taxes. The District contracts a law
firm to collect prior taxes. Collections efforts by the Tax Office include mail outs, working with the Tax
Attorney to file suit on properties, and foreclosure. A 15% commission is charged by the law firm and
passed through to the taxpayers for the years that a 15% fee was assessed.
Fiscal year 2014-2015: The District estimates $600,000 in delinquent tax collections (approximately
2.75% of the 2013 adjusted tax levy of $21,835,585).
Fiscal year 2013-2014: The District estimates that the Tax Office will have total collections of $591,503
in prior year delinquent taxes (2.66% of the 2012 adjusted tax levy of $22,209,507).
Other Revenues Related To Taxes (Penalty & Interest):
Fiscal year 2014-2015: Expected collections for this year are $525,400. Efforts include additional mail
outs, phone contacts, and increased activity from the Tax Office.
Fiscal year 2013-2014: The District estimates to collect $515,531 for penalties, interest, tax certificates
and attorney fees.
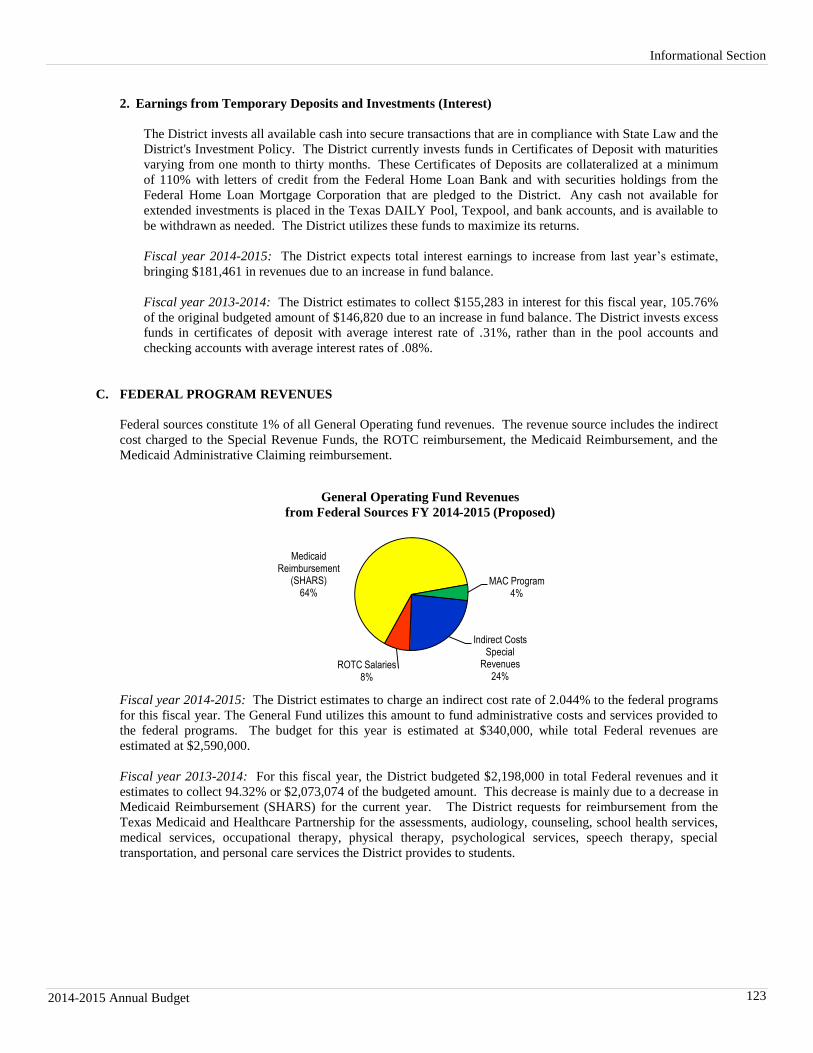
Informational Section
2014-2015 Annual Budget 123
2. Earnings from Temporary Deposits and Investments (Interest)
The District invests all available cash into secure transactions that are in compliance with State Law and the
District's Investment Policy. The District currently invests funds in Certificates of Deposit with maturities
varying from one month to thirty months. These Certificates of Deposits are collateralized at a minimum
of 110% with letters of credit from the Federal Home Loan Bank and with securities holdings from the
Federal Home Loan Mortgage Corporation that are pledged to the District. Any cash not available for
extended investments is placed in the Texas DAILY Pool, Texpool, and bank accounts, and is available to
be withdrawn as needed. The District utilizes these funds to maximize its returns.
Fiscal year 2014-2015: The District expects total interest earnings to increase from last year’s estimate,
bringing $181,461 in revenues due to an increase in fund balance.
Fiscal year 2013-2014: The District estimates to collect $155,283 in interest for this fiscal year, 105.76%
of the original budgeted amount of $146,820 due to an increase in fund balance. The District invests excess
funds in certificates of deposit with average interest rate of .31%, rather than in the pool accounts and
checking accounts with average interest rates of .08%.
C. FEDERAL PROGRAM REVENUES
Federal sources constitute 1% of all General Operating fund revenues. The revenue source includes the indirect
cost charged to the Special Revenue Funds, the ROTC reimbursement, the Medicaid Reimbursement, and the
Medicaid Administrative Claiming reimbursement.
Indirect Costs Special
Revenues24%
ROTC Salaries8%
Medicaid Reimbursement
(SHARS)64%
MAC Program4%
General Operating Fund Revenues
from Federal Sources FY 2014-2015 (Proposed)
Fiscal year 2014-2015: The District estimates to charge an indirect cost rate of 2.044% to the federal programs
for this fiscal year. The General Fund utilizes this amount to fund administrative costs and services provided to
the federal programs. The budget for this year is estimated at $340,000, while total Federal revenues are
estimated at $2,590,000.
Fiscal year 2013-2014: For this fiscal year, the District budgeted $2,198,000 in total Federal revenues and it
estimates to collect 94.32% or $2,073,074 of the budgeted amount. This decrease is mainly due to a decrease in
Medicaid Reimbursement (SHARS) for the current year. The District requests for reimbursement from the
Texas Medicaid and Healthcare Partnership for the assessments, audiology, counseling, school health services,
medical services, occupational therapy, physical therapy, psychological services, speech therapy, special
transportation, and personal care services the District provides to students.
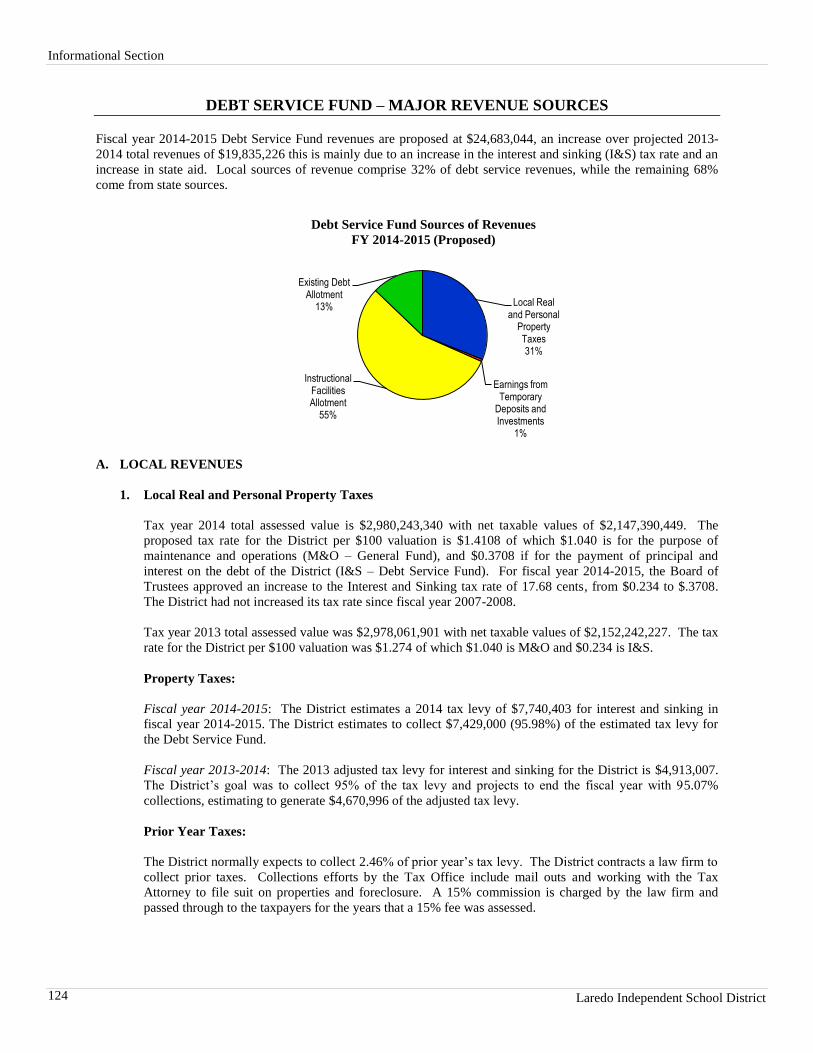
Informational Section
Laredo Independent School District 124
DEBT SERVICE FUND – MAJOR REVENUE SOURCES
Fiscal year 2014-2015 Debt Service Fund revenues are proposed at $24,683,044, an increase over projected 2013-
2014 total revenues of $19,835,226 this is mainly due to an increase in the interest and sinking (I&S) tax rate and an
increase in state aid. Local sources of revenue comprise 32% of debt service revenues, while the remaining 68%
come from state sources.
Local Real and Personal
Property Taxes31%
Earnings from Temporary
Deposits and Investments
1%
Instructional Facilities Allotment
55%
Existing Debt Allotment
13%
Debt Service Fund Sources of Revenues
FY 2014-2015 (Proposed)
A. LOCAL REVENUES
1. Local Real and Personal Property Taxes
Tax year 2014 total assessed value is $2,980,243,340 with net taxable values of $2,147,390,449. The
proposed tax rate for the District per $100 valuation is $1.4108 of which $1.040 is for the purpose of
maintenance and operations (M&O – General Fund), and $0.3708 if for the payment of principal and
interest on the debt of the District (I&S – Debt Service Fund). For fiscal year 2014-2015, the Board of
Trustees approved an increase to the Interest and Sinking tax rate of 17.68 cents, from $0.234 to $.3708.
The District had not increased its tax rate since fiscal year 2007-2008.
Tax year 2013 total assessed value was $2,978,061,901 with net taxable values of $2,152,242,227. The tax
rate for the District per $100 valuation was $1.274 of which $1.040 is M&O and $0.234 is I&S.
Property Taxes:
Fiscal year 2014-2015: The District estimates a 2014 tax levy of $7,740,403 for interest and sinking in
fiscal year 2014-2015. The District estimates to collect $7,429,000 (95.98%) of the estimated tax levy for
the Debt Service Fund.
Fiscal year 2013-2014: The 2013 adjusted tax levy for interest and sinking for the District is $4,913,007.
The District’s goal was to collect 95% of the tax levy and projects to end the fiscal year with 95.07%
collections, estimating to generate $4,670,996 of the adjusted tax levy.
Prior Year Taxes:
The District normally expects to collect 2.46% of prior year’s tax levy. The District contracts a law firm to
collect prior taxes. Collections efforts by the Tax Office include mail outs and working with the Tax
Attorney to file suit on properties and foreclosure. A 15% commission is charged by the law firm and
passed through to the taxpayers for the years that a 15% fee was assessed.
Informational Section
2014-2015 Annual Budget 125
Fiscal year 2014-2015: The District estimates $120,000 delinquent tax collections (approximately 2.46%
of the 2013 adjusted tax levy of $4,913,007).
Fiscal year 2013-2014: The District estimates to collect 2.42% of the estimated 2012 I&S adjusted tax
levy of $4,997,139. Total projected collections are $121,000.
Other Revenues Related to Taxes (Penalty & Interest)
Fiscal year 2014-2015: Proposed collections for this year are $145,000. Efforts include additional mail
outs, phone contacts, and increased activity from the Tax Office.
Fiscal year 2013-2014: The District estimates to collect $80,000 for penalties, interest, tax certificates and
attorney fees.
2. Earnings from Temporary Deposits and Investments (Interest)
The District invests all available cash into secure transactions that are in compliance with State Law and the
District's Investment Policy. The District currently invests funds in Certificates of Deposit with maturities
varying from one month to thirty months. These Certificates of Deposits are collateralized at a minimum
of 110% with letters of credit from the Federal Home Loan Bank and with securities holdings from the
Federal Home Loan Mortgage Corporation that are pledged to the District. Any cash not available for
extended investments is placed in the Texas DAILY Pool, Texpool, and bank accounts, and is available to
be withdrawn as needed.
Fiscal year 2014-2015: The District expects total interest earnings to be $140,407 an increase from last
year’s estimate due to an increase the Interest and Sinking tax rate from $0.2340 to $0.3708.
Fiscal year 2013-2014: The District estimates to collect $126,662 in interest for this fiscal year, 93.88% of
the original budgeted amount of $134,925. This is due to a reduction in fund balance in the amount of
$732,122 for the issuance of the 2013 Unlimited Tax School Building Bonds Bond, 2014 Unlimited Tax
School Building Bonds, and the 2014 Unlimited Tax Refunding Bonds.
B. STATE REVENUES
Texas provides state aid for facilities through equalized support for debt service taxes. An Instructional
Facilities Allotment (IFA) is available to low-wealth school districts to assist them in paying debt service on
bonded indebtedness for new instructional facilities. An Equalized Debt Allotment (EDA) is available to all
districts to provide equalized assistance for existing debt.
Both IFA and EDA funds are calculated using a guaranteed-yield program. Districts levy a debt service tax and
raise as much of the yield as possible from local property taxes. The state makes up the difference between what
the district raises from property taxes and the total guaranteed yield. State support for debt service for facilities
is limited to the amount of money appropriated by the Texas Legislature.
1. State Aid – Instructional Facilities Allotment (IFA)
The IFA is a grant from the Texas Education Agency (TEA) for the purpose of financing the principal and
interest payments for eligible bonds for the construction and repair of schools.
Fiscal year 2014-2015: The District projects to receive $13,668,504 from this grant. The increase in state
aid is due to the increase in local tax effort the new Interest and Sinking (I&S) tax rate will generate.
Fiscal year 2013-2014: The District estimates to receive $11,461,258 from this revenue source.
Informational Section
Laredo Independent School District 126
2. State Aid – Existing Debt Allotment (EDA)
The EDA is a grant from the Texas Education Agency (TEA) for the purpose of financing the principal and
interest payments for eligible bonds issued. The program operates without applications and has no award
cycles.
Fiscal year 2014-2015: The District projects to receive $3,179,133 from this grant.
Fiscal year 2013-2014: The District estimates to receive $3,375,310 from this revenue source.
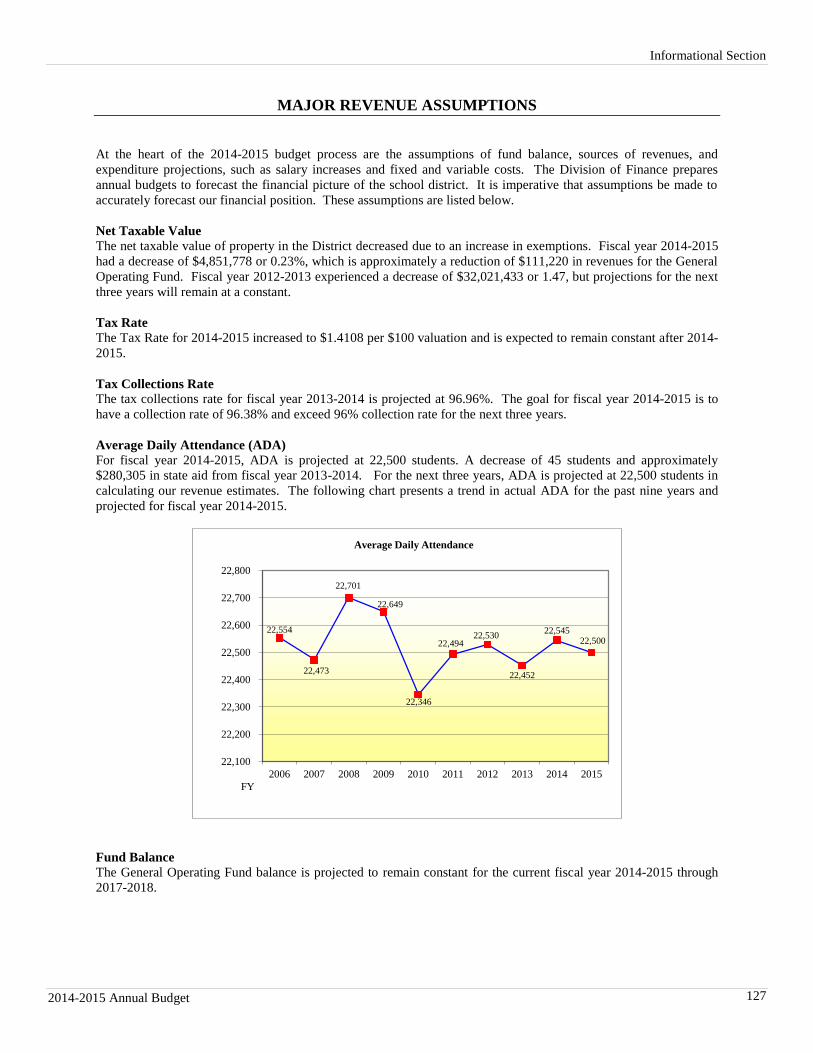
Informational Section
2014-2015 Annual Budget 127
MAJOR REVENUE ASSUMPTIONS
At the heart of the 2014-2015 budget process are the assumptions of fund balance, sources of revenues, and
expenditure projections, such as salary increases and fixed and variable costs. The Division of Finance prepares
annual budgets to forecast the financial picture of the school district. It is imperative that assumptions be made to
accurately forecast our financial position. These assumptions are listed below.
Net Taxable Value The net taxable value of property in the District decreased due to an increase in exemptions. Fiscal year 2014-2015
had a decrease of $4,851,778 or 0.23%, which is approximately a reduction of $111,220 in revenues for the General
Operating Fund. Fiscal year 2012-2013 experienced a decrease of $32,021,433 or 1.47, but projections for the next
three years will remain at a constant.
Tax Rate The Tax Rate for 2014-2015 increased to $1.4108 per $100 valuation and is expected to remain constant after 2014-
2015.
Tax Collections Rate The tax collections rate for fiscal year 2013-2014 is projected at 96.96%. The goal for fiscal year 2014-2015 is to
have a collection rate of 96.38% and exceed 96% collection rate for the next three years.
Average Daily Attendance (ADA) For fiscal year 2014-2015, ADA is projected at 22,500 students. A decrease of 45 students and approximately
$280,305 in state aid from fiscal year 2013-2014. For the next three years, ADA is projected at 22,500 students in
calculating our revenue estimates. The following chart presents a trend in actual ADA for the past nine years and
projected for fiscal year 2014-2015.
22,554
22,473
22,701
22,649
22,346
22,494 22,530
22,452
22,545 22,500
22,100
22,200
22,300
22,400
22,500
22,600
22,700
22,800
2006 2007 2008 2009 2010 2011 2012 2013 2014 2015
FY
Average Daily Attendance
Fund Balance The General Operating Fund balance is projected to remain constant for the current fiscal year 2014-2015 through
2017-2018.
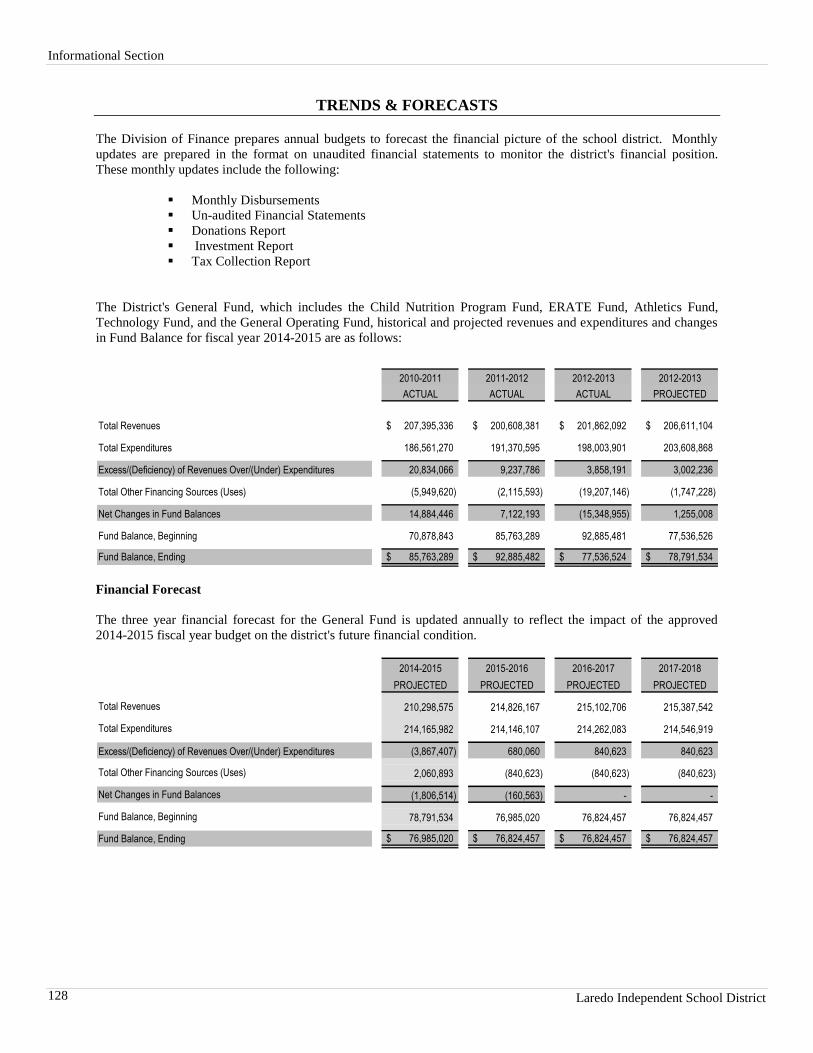
Informational Section
Laredo Independent School District 128
TRENDS & FORECASTS
The Division of Finance prepares annual budgets to forecast the financial picture of the school district. Monthly
updates are prepared in the format on unaudited financial statements to monitor the district's financial position.
These monthly updates include the following:
Monthly Disbursements
Un-audited Financial Statements
Donations Report
Investment Report
Tax Collection Report
The District's General Fund, which includes the Child Nutrition Program Fund, ERATE Fund, Athletics Fund,
Technology Fund, and the General Operating Fund, historical and projected revenues and expenditures and changes
in Fund Balance for fiscal year 2014-2015 are as follows:
2010-2011 2011-2012 2012-2013 2012-2013
ACTUAL ACTUAL ACTUAL PROJECTED
Total Revenues 207,395,336$ 200,608,381$ 201,862,092$ 206,611,104$
Total Expenditures 186,561,270 191,370,595 198,003,901 203,608,868
Excess/(Deficiency) of Revenues Over/(Under) Expenditures 20,834,066 9,237,786 3,858,191 3,002,236
Total Other Financing Sources (Uses) (5,949,620) (2,115,593) (19,207,146) (1,747,228)
Net Changes in Fund Balances 14,884,446 7,122,193 (15,348,955) 1,255,008
Fund Balance, Beginning 70,878,843 85,763,289 92,885,481 77,536,526
Fund Balance, Ending 85,763,289$ 92,885,482$ 77,536,524$ 78,791,534$
Financial Forecast
The three year financial forecast for the General Fund is updated annually to reflect the impact of the approved
2014-2015 fiscal year budget on the district's future financial condition.
2014-2015 2015-2016 2016-2017 2017-2018
PROJECTED PROJECTED PROJECTED PROJECTED
Total Revenues 210,298,575 214,826,167 215,102,706 215,387,542
Total Expenditures 214,165,982 214,146,107 214,262,083 214,546,919
Excess/(Deficiency) of Revenues Over/(Under) Expenditures (3,867,407) 680,060 840,623 840,623
Total Other Financing Sources (Uses) 2,060,893 (840,623) (840,623) (840,623)
Net Changes in Fund Balances (1,806,514) (160,563) - -
Fund Balance, Beginning 78,791,534 76,985,020 76,824,457 76,824,457
Fund Balance, Ending 76,985,020$ 76,824,457$ 76,824,457$ 76,824,457$
Informational Section
2014-2015 Annual Budget 129
To understand these projections you must see the pages ahead. A brief basis for our assumptions is included for the
General Funds. Funding formulas due to legislative sessions are not set in advance; however, given the history of
formulas and levels of expenditures experienced by the district, these levels are attainable.
Projections are also included for our Debt Service funds, which are also approved by the board.
Development of the Financial Forecast
The objective of the financial forecast is to provide a framework for evaluating the district financial condition as a
basis for decision making during the year keeping in mind the short term and long term impact of decisions.
Decisions in 2014-2015 Affecting Future Condition
The District's decision making process for LISD involves many stakeholders and it starts in September with the
program managers and director that oversee the different grants and programs. Other individuals involved at this
early stage include the Human Resources Staff who develop staffing formulas to be applied to the different
programs.
The principals and department directors evaluate their programs and recommend to the Division of Finance the
funding priorities for their programs and departments. The funding requests are evaluated by the Superintendent's
Office and the Board of Trustees and approved for implementation for the new budget year.
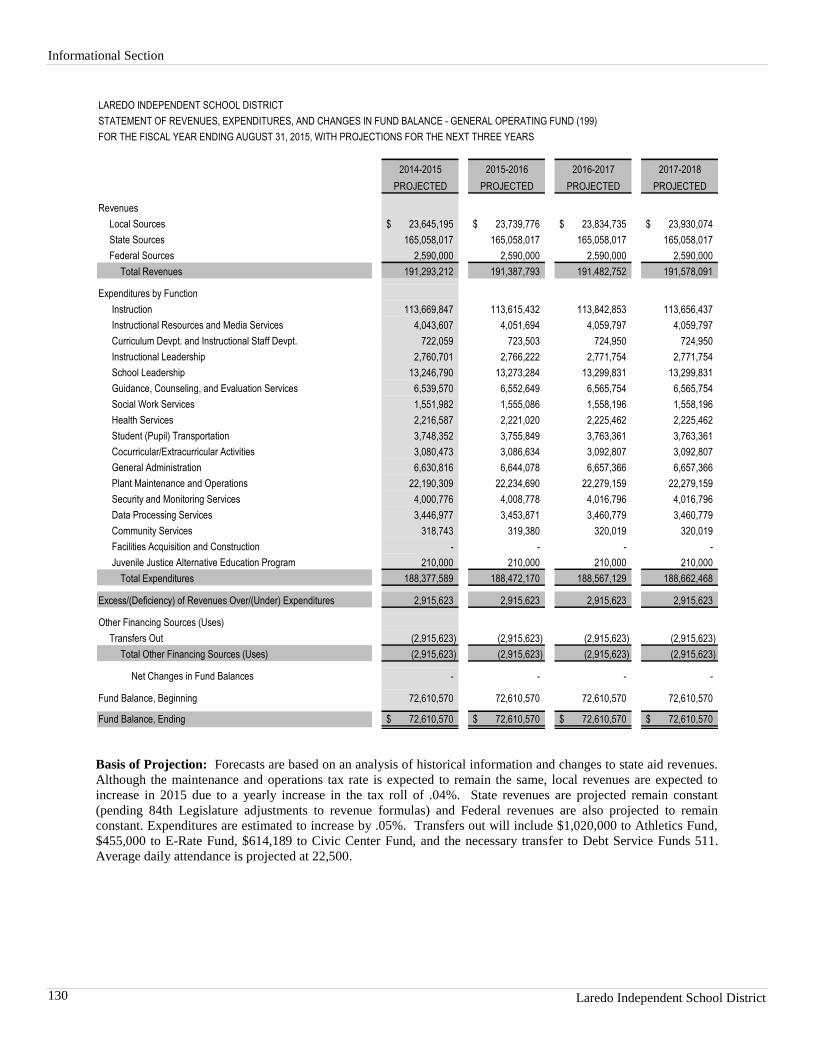
Informational Section
Laredo Independent School District 130
LAREDO INDEPENDENT SCHOOL DISTRICT
STATEMENT OF REVENUES, EXPENDITURES, AND CHANGES IN FUND BALANCE - GENERAL OPERATING FUND (199)
FOR THE FISCAL YEAR ENDING AUGUST 31, 2015, WITH PROJECTIONS FOR THE NEXT THREE YEARS
2014-2015 2015-2016 2016-2017 2017-2018
PROJECTED PROJECTED PROJECTED PROJECTED
Revenues
Local Sources 23,645,195$ 23,739,776$ 23,834,735$ 23,930,074$
State Sources 165,058,017 165,058,017 165,058,017 165,058,017
Federal Sources 2,590,000 2,590,000 2,590,000 2,590,000
Total Revenues 191,293,212 191,387,793 191,482,752 191,578,091
Expenditures by Function
Instruction 113,669,847 113,615,432 113,842,853 113,656,437
Instructional Resources and Media Services 4,043,607 4,051,694 4,059,797 4,059,797
Curriculum Devpt. and Instructional Staff Devpt. 722,059 723,503 724,950 724,950
Instructional Leadership 2,760,701 2,766,222 2,771,754 2,771,754
School Leadership 13,246,790 13,273,284 13,299,831 13,299,831
Guidance, Counseling, and Evaluation Services 6,539,570 6,552,649 6,565,754 6,565,754
Social Work Services 1,551,982 1,555,086 1,558,196 1,558,196
Health Services 2,216,587 2,221,020 2,225,462 2,225,462
Student (Pupil) Transportation 3,748,352 3,755,849 3,763,361 3,763,361
Cocurricular/Extracurricular Activities 3,080,473 3,086,634 3,092,807 3,092,807
General Administration 6,630,816 6,644,078 6,657,366 6,657,366
Plant Maintenance and Operations 22,190,309 22,234,690 22,279,159 22,279,159
Security and Monitoring Services 4,000,776 4,008,778 4,016,796 4,016,796
Data Processing Services 3,446,977 3,453,871 3,460,779 3,460,779
Community Services 318,743 319,380 320,019 320,019
Facilities Acquisition and Construction - - - -
Juvenile Justice Alternative Education Program 210,000 210,000 210,000 210,000
Total Expenditures 188,377,589 188,472,170 188,567,129 188,662,468
Excess/(Deficiency) of Revenues Over/(Under) Expenditures 2,915,623 2,915,623 2,915,623 2,915,623
Other Financing Sources (Uses)
Transfers Out (2,915,623) (2,915,623) (2,915,623) (2,915,623)
Total Other Financing Sources (Uses) (2,915,623) (2,915,623) (2,915,623) (2,915,623)
Net Changes in Fund Balances - - - -
Fund Balance, Beginning 72,610,570 72,610,570 72,610,570 72,610,570
Fund Balance, Ending 72,610,570$ 72,610,570$ 72,610,570$ 72,610,570$
Basis of Projection: Forecasts are based on an analysis of historical information and changes to state aid revenues.
Although the maintenance and operations tax rate is expected to remain the same, local revenues are expected to
increase in 2015 due to a yearly increase in the tax roll of .04%. State revenues are projected remain constant
(pending 84th Legislature adjustments to revenue formulas) and Federal revenues are also projected to remain
constant. Expenditures are estimated to increase by .05%. Transfers out will include $1,020,000 to Athletics Fund,
$455,000 to E-Rate Fund, $614,189 to Civic Center Fund, and the necessary transfer to Debt Service Funds 511.
Average daily attendance is projected at 22,500.
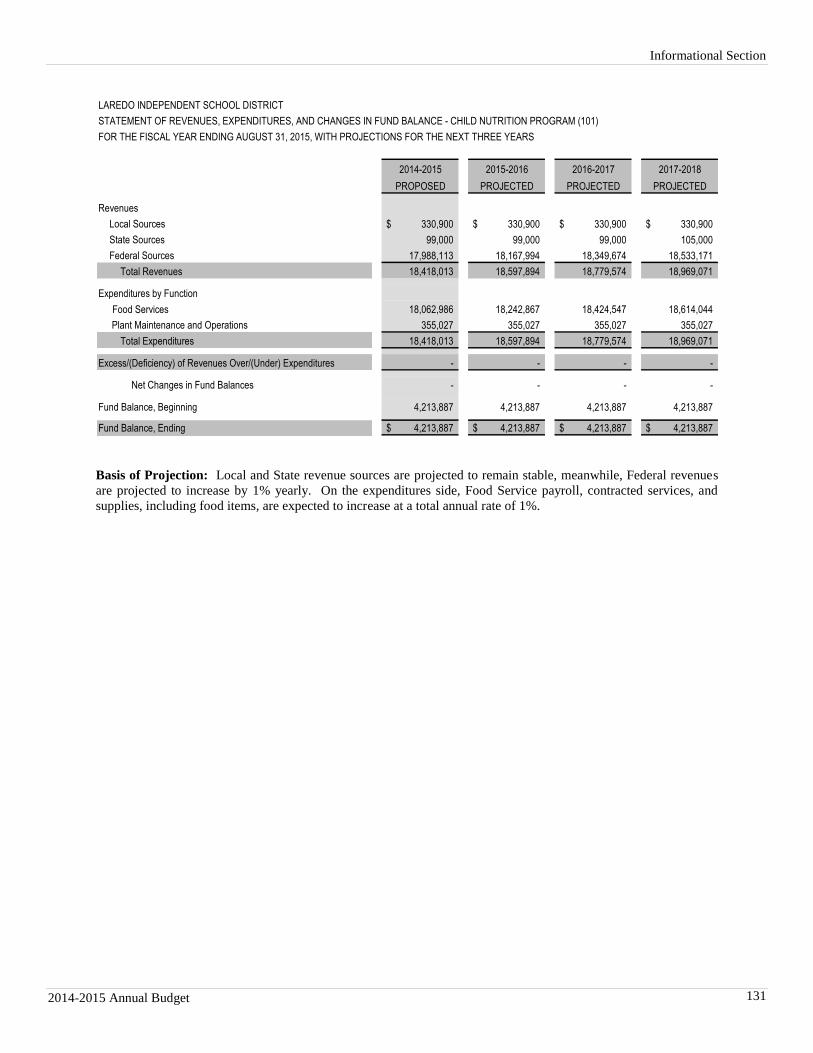
Informational Section
2014-2015 Annual Budget 131
LAREDO INDEPENDENT SCHOOL DISTRICT
STATEMENT OF REVENUES, EXPENDITURES, AND CHANGES IN FUND BALANCE - CHILD NUTRITION PROGRAM (101)
FOR THE FISCAL YEAR ENDING AUGUST 31, 2015, WITH PROJECTIONS FOR THE NEXT THREE YEARS
2014-2015 2015-2016 2016-2017 2017-2018
PROPOSED PROJECTED PROJECTED PROJECTED
Revenues
Local Sources 330,900$ 330,900$ 330,900$ 330,900$
State Sources 99,000 99,000 99,000 105,000
Federal Sources 17,988,113 18,167,994 18,349,674 18,533,171
Total Revenues 18,418,013 18,597,894 18,779,574 18,969,071
Expenditures by Function
Food Services 18,062,986 18,242,867 18,424,547 18,614,044
Plant Maintenance and Operations 355,027 355,027 355,027 355,027
Total Expenditures 18,418,013 18,597,894 18,779,574 18,969,071
Excess/(Deficiency) of Revenues Over/(Under) Expenditures - - - -
Net Changes in Fund Balances - - - -
Fund Balance, Beginning 4,213,887 4,213,887 4,213,887 4,213,887
Fund Balance, Ending 4,213,887$ 4,213,887$ 4,213,887$ 4,213,887$
Basis of Projection: Local and State revenue sources are projected to remain stable, meanwhile, Federal revenues
are projected to increase by 1% yearly. On the expenditures side, Food Service payroll, contracted services, and
supplies, including food items, are expected to increase at a total annual rate of 1%.
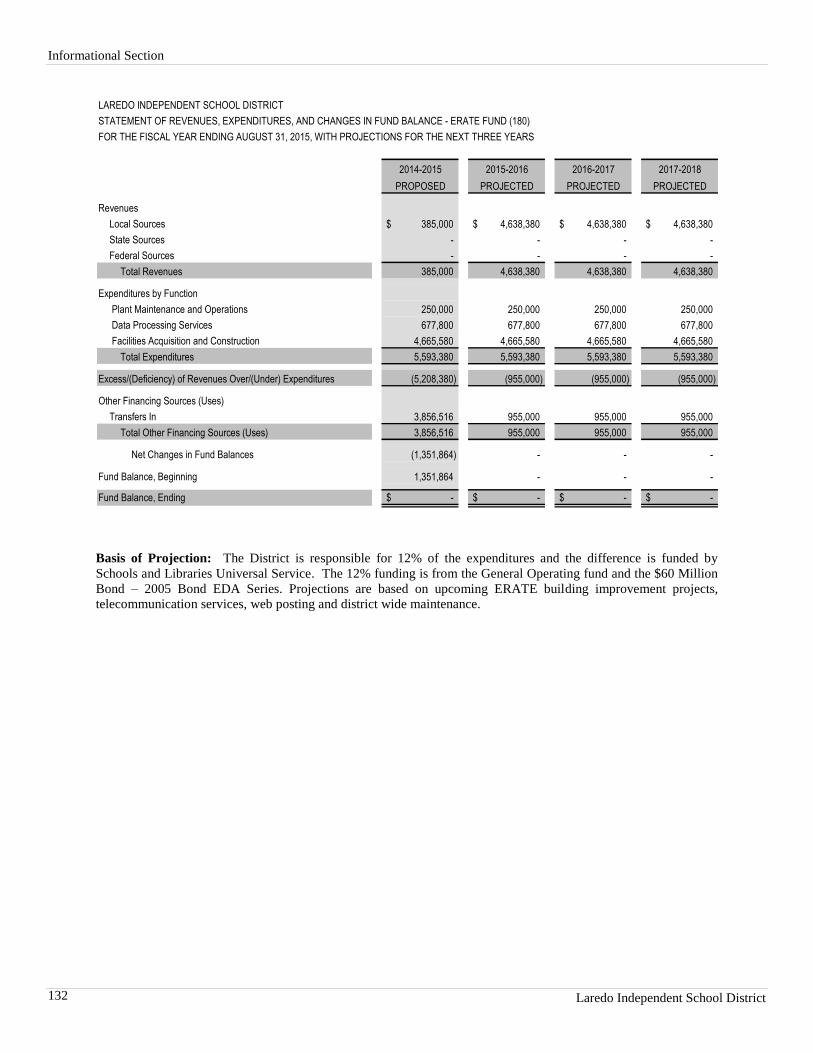
Informational Section
Laredo Independent School District 132
LAREDO INDEPENDENT SCHOOL DISTRICT
STATEMENT OF REVENUES, EXPENDITURES, AND CHANGES IN FUND BALANCE - ERATE FUND (180)
FOR THE FISCAL YEAR ENDING AUGUST 31, 2015, WITH PROJECTIONS FOR THE NEXT THREE YEARS
2014-2015 2015-2016 2016-2017 2017-2018
PROPOSED PROJECTED PROJECTED PROJECTED
Revenues
Local Sources 385,000$ 4,638,380$ 4,638,380$ 4,638,380$
State Sources - - - -
Federal Sources - - - -
Total Revenues 385,000 4,638,380 4,638,380 4,638,380
Expenditures by Function
Plant Maintenance and Operations 250,000 250,000 250,000 250,000
Data Processing Services 677,800 677,800 677,800 677,800
Facilities Acquisition and Construction 4,665,580 4,665,580 4,665,580 4,665,580
Total Expenditures 5,593,380 5,593,380 5,593,380 5,593,380
Excess/(Deficiency) of Revenues Over/(Under) Expenditures (5,208,380) (955,000) (955,000) (955,000)
Other Financing Sources (Uses)
Transfers In 3,856,516 955,000 955,000 955,000
Total Other Financing Sources (Uses) 3,856,516 955,000 955,000 955,000
Net Changes in Fund Balances (1,351,864) - - -
Fund Balance, Beginning 1,351,864 - - -
Fund Balance, Ending -$ -$ -$ -$
Basis of Projection: The District is responsible for 12% of the expenditures and the difference is funded by
Schools and Libraries Universal Service. The 12% funding is from the General Operating fund and the $60 Million
Bond – 2005 Bond EDA Series. Projections are based on upcoming ERATE building improvement projects,
telecommunication services, web posting and district wide maintenance.
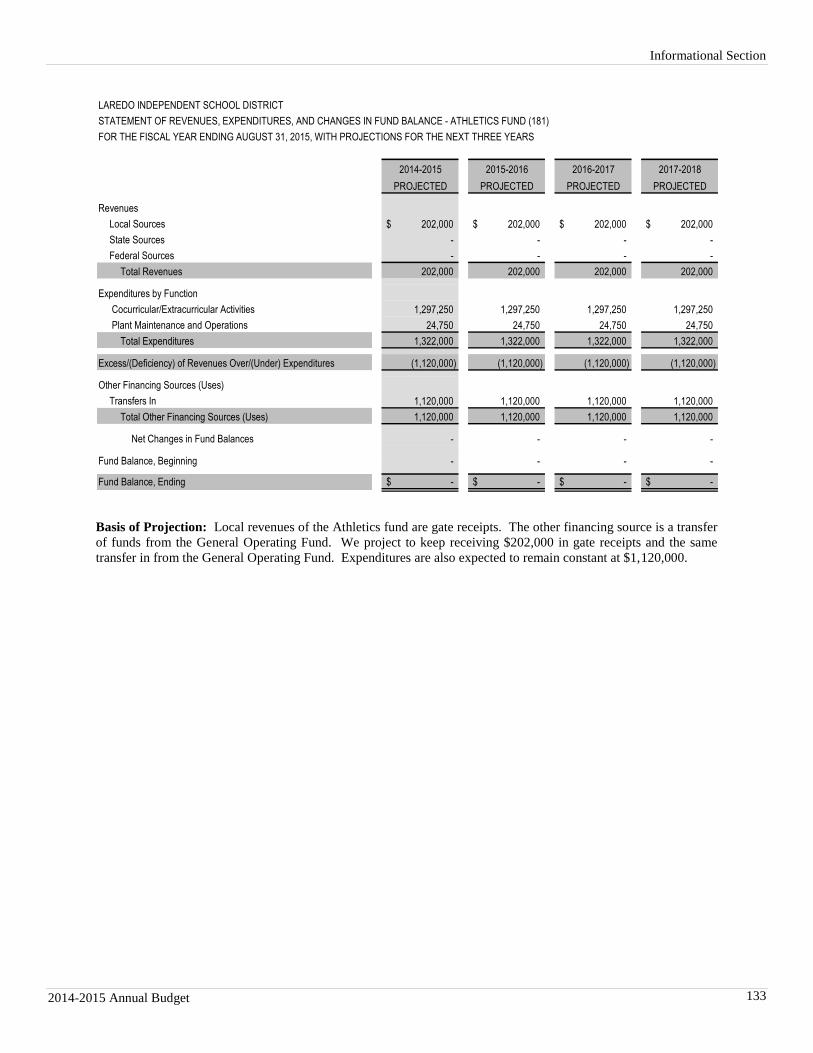
Informational Section
2014-2015 Annual Budget 133
LAREDO INDEPENDENT SCHOOL DISTRICT
STATEMENT OF REVENUES, EXPENDITURES, AND CHANGES IN FUND BALANCE - ATHLETICS FUND (181)
FOR THE FISCAL YEAR ENDING AUGUST 31, 2015, WITH PROJECTIONS FOR THE NEXT THREE YEARS
2014-2015 2015-2016 2016-2017 2017-2018
PROJECTED PROJECTED PROJECTED PROJECTED
Revenues
Local Sources 202,000$ 202,000$ 202,000$ 202,000$
State Sources - - - -
Federal Sources - - - -
Total Revenues 202,000 202,000 202,000 202,000
Expenditures by Function
Cocurricular/Extracurricular Activities 1,297,250 1,297,250 1,297,250 1,297,250
Plant Maintenance and Operations 24,750 24,750 24,750 24,750
Total Expenditures 1,322,000 1,322,000 1,322,000 1,322,000
Excess/(Deficiency) of Revenues Over/(Under) Expenditures (1,120,000) (1,120,000) (1,120,000) (1,120,000)
Other Financing Sources (Uses)
Transfers In 1,120,000 1,120,000 1,120,000 1,120,000
Total Other Financing Sources (Uses) 1,120,000 1,120,000 1,120,000 1,120,000
Net Changes in Fund Balances - - - -
Fund Balance, Beginning - - - -
Fund Balance, Ending -$ -$ -$ -$
Basis of Projection: Local revenues of the Athletics fund are gate receipts. The other financing source is a transfer
of funds from the General Operating Fund. We project to keep receiving $202,000 in gate receipts and the same
transfer in from the General Operating Fund. Expenditures are also expected to remain constant at $1,120,000.
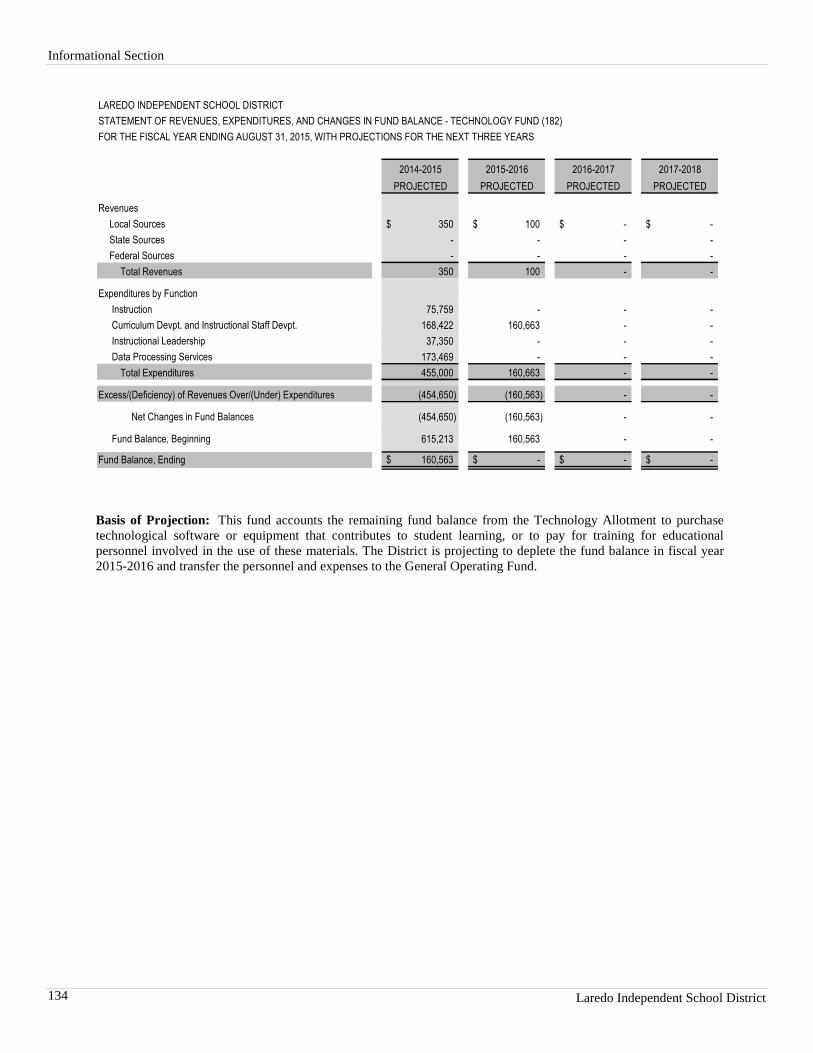
Informational Section
Laredo Independent School District 134
LAREDO INDEPENDENT SCHOOL DISTRICT
STATEMENT OF REVENUES, EXPENDITURES, AND CHANGES IN FUND BALANCE - TECHNOLOGY FUND (182)
FOR THE FISCAL YEAR ENDING AUGUST 31, 2015, WITH PROJECTIONS FOR THE NEXT THREE YEARS
2014-2015 2015-2016 2016-2017 2017-2018
PROJECTED PROJECTED PROJECTED PROJECTED
Revenues
Local Sources 350$ 100$ -$ -$
State Sources - - - -
Federal Sources - - - -
Total Revenues 350 100 - -
Expenditures by Function
Instruction 75,759 - - -
Curriculum Devpt. and Instructional Staff Devpt. 168,422 160,663 - -
Instructional Leadership 37,350 - - -
Data Processing Services 173,469 - - -
Total Expenditures 455,000 160,663 - -
Excess/(Deficiency) of Revenues Over/(Under) Expenditures (454,650) (160,563) - -
Net Changes in Fund Balances (454,650) (160,563) - -
Fund Balance, Beginning 615,213 160,563 - -
Fund Balance, Ending 160,563$ -$ -$ -$
Basis of Projection: This fund accounts the remaining fund balance from the Technology Allotment to purchase
technological software or equipment that contributes to student learning, or to pay for training for educational
personnel involved in the use of these materials. The District is projecting to deplete the fund balance in fiscal year
2015-2016 and transfer the personnel and expenses to the General Operating Fund.
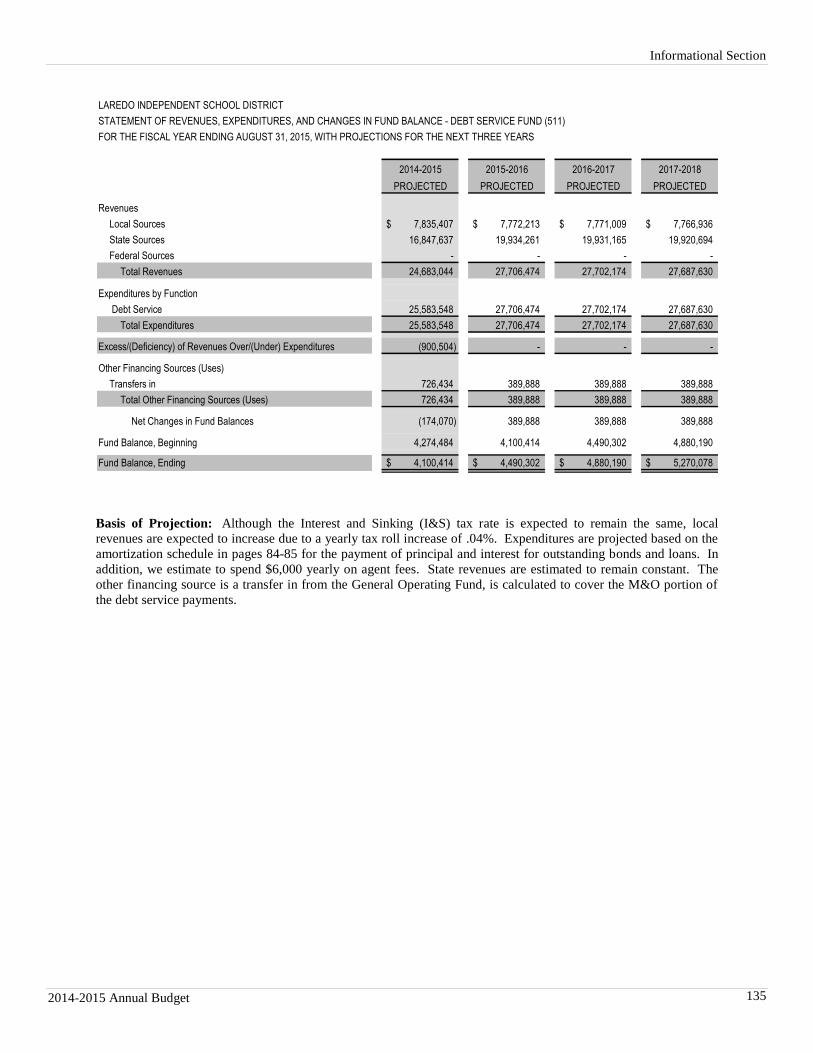
Informational Section
2014-2015 Annual Budget 135
LAREDO INDEPENDENT SCHOOL DISTRICT
STATEMENT OF REVENUES, EXPENDITURES, AND CHANGES IN FUND BALANCE - DEBT SERVICE FUND (511)
FOR THE FISCAL YEAR ENDING AUGUST 31, 2015, WITH PROJECTIONS FOR THE NEXT THREE YEARS
2014-2015 2015-2016 2016-2017 2017-2018
PROJECTED PROJECTED PROJECTED PROJECTED
Revenues
Local Sources 7,835,407$ 7,772,213$ 7,771,009$ 7,766,936$
State Sources 16,847,637 19,934,261 19,931,165 19,920,694
Federal Sources - - - -
Total Revenues 24,683,044 27,706,474 27,702,174 27,687,630
Expenditures by Function
Debt Service 25,583,548 27,706,474 27,702,174 27,687,630
Total Expenditures 25,583,548 27,706,474 27,702,174 27,687,630
Excess/(Deficiency) of Revenues Over/(Under) Expenditures (900,504) - - -
Other Financing Sources (Uses)
Transfers in 726,434 389,888 389,888 389,888
Total Other Financing Sources (Uses) 726,434 389,888 389,888 389,888
Net Changes in Fund Balances (174,070) 389,888 389,888 389,888
Fund Balance, Beginning 4,274,484 4,100,414 4,490,302 4,880,190
Fund Balance, Ending 4,100,414$ 4,490,302$ 4,880,190$ 5,270,078$
Basis of Projection: Although the Interest and Sinking (I&S) tax rate is expected to remain the same, local
revenues are expected to increase due to a yearly tax roll increase of .04%. Expenditures are projected based on the
amortization schedule in pages 84-85 for the payment of principal and interest for outstanding bonds and loans. In
addition, we estimate to spend $6,000 yearly on agent fees. State revenues are estimated to remain constant. The
other financing source is a transfer in from the General Operating Fund, is calculated to cover the M&O portion of
the debt service payments.
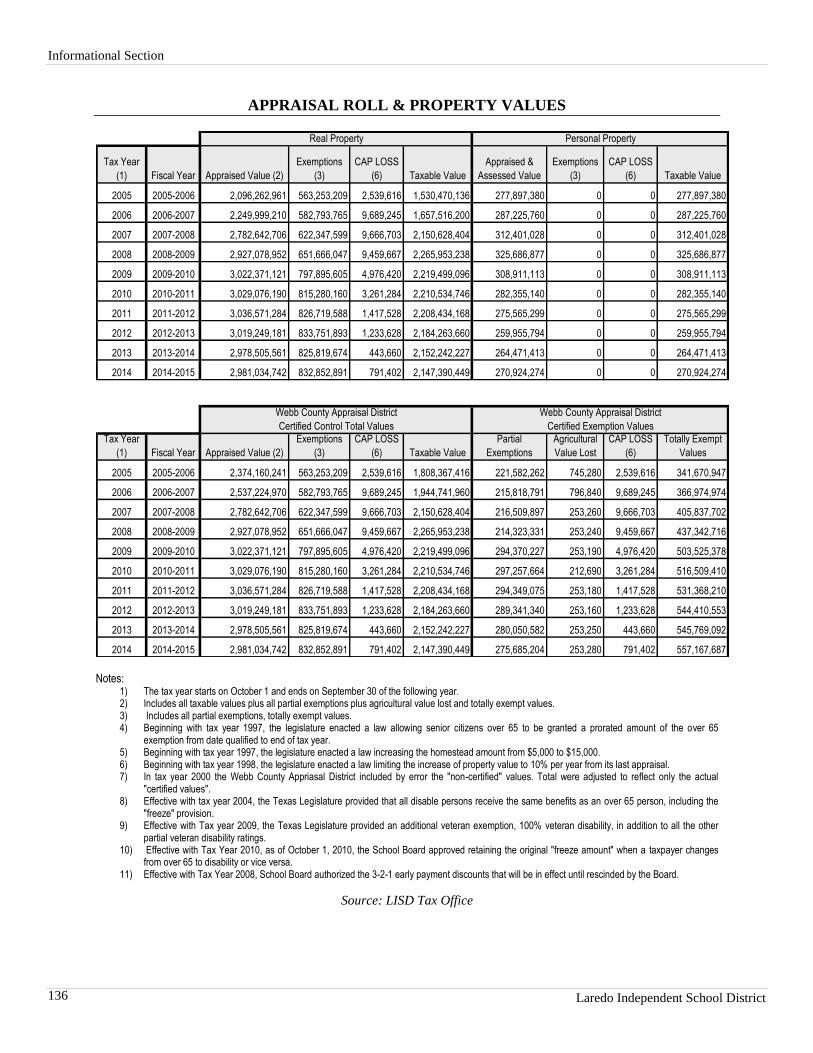
Informational Section
Laredo Independent School District 136
APPRAISAL ROLL & PROPERTY VALUES
Tax Year
(1) Fiscal Year Appraised Value (2)
Exemptions
(3)
CAP LOSS
(6) Taxable Value
Appraised &
Assessed Value
Exemptions
(3)
CAP LOSS
(6) Taxable Value
2005 2005-2006 2,096,262,961 563,253,209 2,539,616 1,530,470,136 277,897,380 0 0 277,897,380
2006 2006-2007 2,249,999,210 582,793,765 9,689,245 1,657,516,200 287,225,760 0 0 287,225,760
2007 2007-2008 2,782,642,706 622,347,599 9,666,703 2,150,628,404 312,401,028 0 0 312,401,028
2008 2008-2009 2,927,078,952 651,666,047 9,459,667 2,265,953,238 325,686,877 0 0 325,686,877
2009 2009-2010 3,022,371,121 797,895,605 4,976,420 2,219,499,096 308,911,113 0 0 308,911,113
2010 2010-2011 3,029,076,190 815,280,160 3,261,284 2,210,534,746 282,355,140 0 0 282,355,140
2011 2011-2012 3,036,571,284 826,719,588 1,417,528 2,208,434,168 275,565,299 0 0 275,565,299
2012 2012-2013 3,019,249,181 833,751,893 1,233,628 2,184,263,660 259,955,794 0 0 259,955,794
2013 2013-2014 2,978,505,561 825,819,674 443,660 2,152,242,227 264,471,413 0 0 264,471,413
2014 2014-2015 2,981,034,742 832,852,891 791,402 2,147,390,449 270,924,274 0 0 270,924,274
Tax Year
(1) Fiscal Year Appraised Value (2)
Exemptions
(3)
CAP LOSS
(6) Taxable Value
Partial
Exemptions
Agricultural
Value Lost
CAP LOSS
(6)
Totally Exempt
Values
2005 2005-2006 2,374,160,241 563,253,209 2,539,616 1,808,367,416 221,582,262 745,280 2,539,616 341,670,947
2006 2006-2007 2,537,224,970 582,793,765 9,689,245 1,944,741,960 215,818,791 796,840 9,689,245 366,974,974
2007 2007-2008 2,782,642,706 622,347,599 9,666,703 2,150,628,404 216,509,897 253,260 9,666,703 405,837,702
2008 2008-2009 2,927,078,952 651,666,047 9,459,667 2,265,953,238 214,323,331 253,240 9,459,667 437,342,716
2009 2009-2010 3,022,371,121 797,895,605 4,976,420 2,219,499,096 294,370,227 253,190 4,976,420 503,525,378
2010 2010-2011 3,029,076,190 815,280,160 3,261,284 2,210,534,746 297,257,664 212,690 3,261,284 516,509,410
2011 2011-2012 3,036,571,284 826,719,588 1,417,528 2,208,434,168 294,349,075 253,180 1,417,528 531,368,210
2012 2012-2013 3,019,249,181 833,751,893 1,233,628 2,184,263,660 289,341,340 253,160 1,233,628 544,410,553
2013 2013-2014 2,978,505,561 825,819,674 443,660 2,152,242,227 280,050,582 253,250 443,660 545,769,092
2014 2014-2015 2,981,034,742 832,852,891 791,402 2,147,390,449 275,685,204 253,280 791,402 557,167,687
Real Property Personal Property
Webb County Appraisal District
Certified Control Total Values
Webb County Appraisal District
Certified Exemption Values
Notes: 1) The tax year starts on October 1 and ends on September 30 of the following year. 2) Includes all taxable values plus all partial exemptions plus agricultural value lost and totally exempt values. 3) Includes all partial exemptions, totally exempt values. 4) Beginning with tax year 1997, the legislature enacted a law allowing senior citizens over 65 to be granted a prorated amount of the over 65
exemption from date qualified to end of tax year. 5) Beginning with tax year 1997, the legislature enacted a law increasing the homestead amount from $5,000 to $15,000. 6) Beginning with tax year 1998, the legislature enacted a law limiting the increase of property value to 10% per year from its last appraisal. 7) In tax year 2000 the Webb County Appriasal District included by error the "non-certified" values. Total were adjusted to reflect only the actual
"certified values". 8) Effective with tax year 2004, the Texas Legislature provided that all disable persons receive the same benefits as an over 65 person, including the
"freeze" provision. 9) Effective with Tax year 2009, the Texas Legislature provided an additional veteran exemption, 100% veteran disability, in addition to all the other
partial veteran disability ratings. 10) Effective with Tax Year 2010, as of October 1, 2010, the School Board approved retaining the original "freeze amount" when a taxpayer changes
from over 65 to disability or vice versa. 11) Effective with Tax Year 2008, School Board authorized the 3-2-1 early payment discounts that will be in effect until rescinded by the Board.
Source: LISD Tax Office
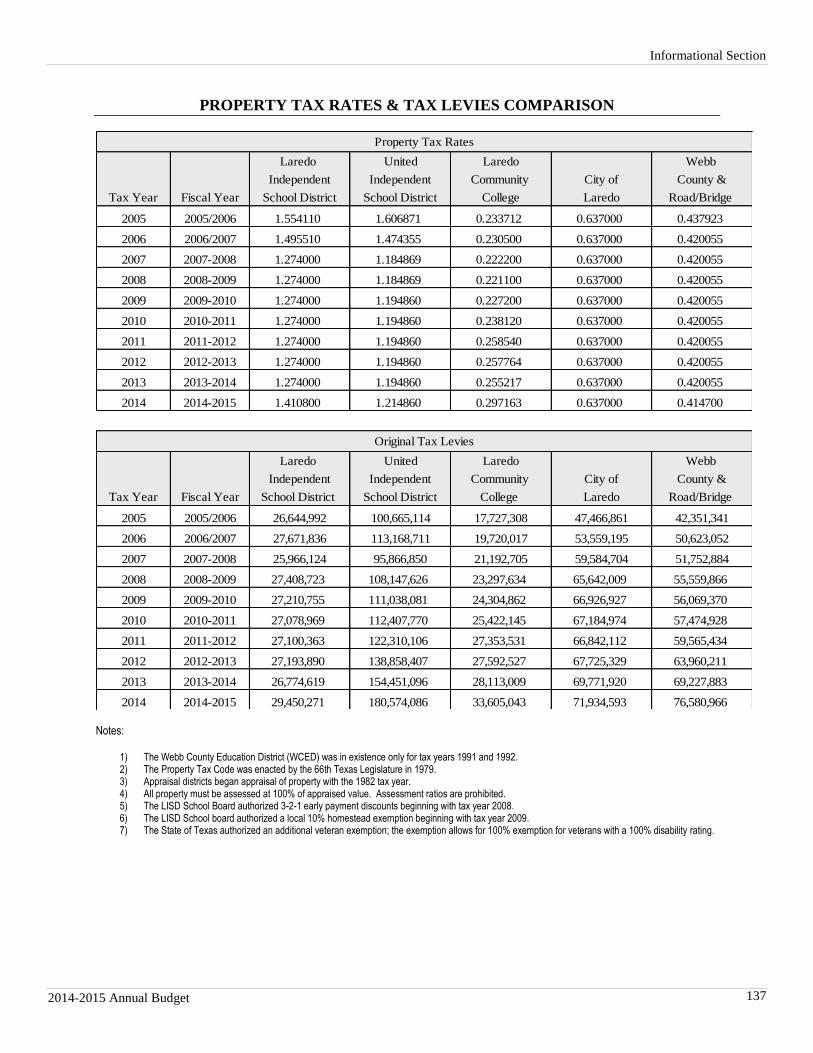
Informational Section
2014-2015 Annual Budget 137
PROPERTY TAX RATES & TAX LEVIES COMPARISON
Laredo United Laredo Webb
Independent Independent Community City of County &
Tax Year Fiscal Year School District School District College Laredo Road/Bridge
2005 2005/2006 1.554110 1.606871 0.233712 0.637000 0.437923
2006 2006/2007 1.495510 1.474355 0.230500 0.637000 0.420055
2007 2007-2008 1.274000 1.184869 0.222200 0.637000 0.420055
2008 2008-2009 1.274000 1.184869 0.221100 0.637000 0.420055
2009 2009-2010 1.274000 1.194860 0.227200 0.637000 0.420055
2010 2010-2011 1.274000 1.194860 0.238120 0.637000 0.420055
2011 2011-2012 1.274000 1.194860 0.258540 0.637000 0.420055
2012 2012-2013 1.274000 1.194860 0.257764 0.637000 0.420055
2013 2013-2014 1.274000 1.194860 0.255217 0.637000 0.420055
2014 2014-2015 1.410800 1.214860 0.297163 0.637000 0.414700
Laredo United Laredo Webb
Independent Independent Community City of County &
Tax Year Fiscal Year School District School District College Laredo Road/Bridge
2005 2005/2006 26,644,992 100,665,114 17,727,308 47,466,861 42,351,341
2006 2006/2007 27,671,836 113,168,711 19,720,017 53,559,195 50,623,052
2007 2007-2008 25,966,124 95,866,850 21,192,705 59,584,704 51,752,884
2008 2008-2009 27,408,723 108,147,626 23,297,634 65,642,009 55,559,866
2009 2009-2010 27,210,755 111,038,081 24,304,862 66,926,927 56,069,370
2010 2010-2011 27,078,969 112,407,770 25,422,145 67,184,974 57,474,928
2011 2011-2012 27,100,363 122,310,106 27,353,531 66,842,112 59,565,434
2012 2012-2013 27,193,890 138,858,407 27,592,527 67,725,329 63,960,211
2013 2013-2014 26,774,619 154,451,096 28,113,009 69,771,920 69,227,883
2014 2014-2015 29,450,271 180,574,086 33,605,043 71,934,593 76,580,966
Property Tax Rates
Original Tax Levies
Notes:
1) The Webb County Education District (WCED) was in existence only for tax years 1991 and 1992. 2) The Property Tax Code was enacted by the 66th Texas Legislature in 1979. 3) Appraisal districts began appraisal of property with the 1982 tax year. 4) All property must be assessed at 100% of appraised value. Assessment ratios are prohibited. 5) The LISD School Board authorized 3-2-1 early payment discounts beginning with tax year 2008. 6) The LISD School board authorized a local 10% homestead exemption beginning with tax year 2009. 7) The State of Texas authorized an additional veteran exemption; the exemption allows for 100% exemption for veterans with a 100% disability rating.
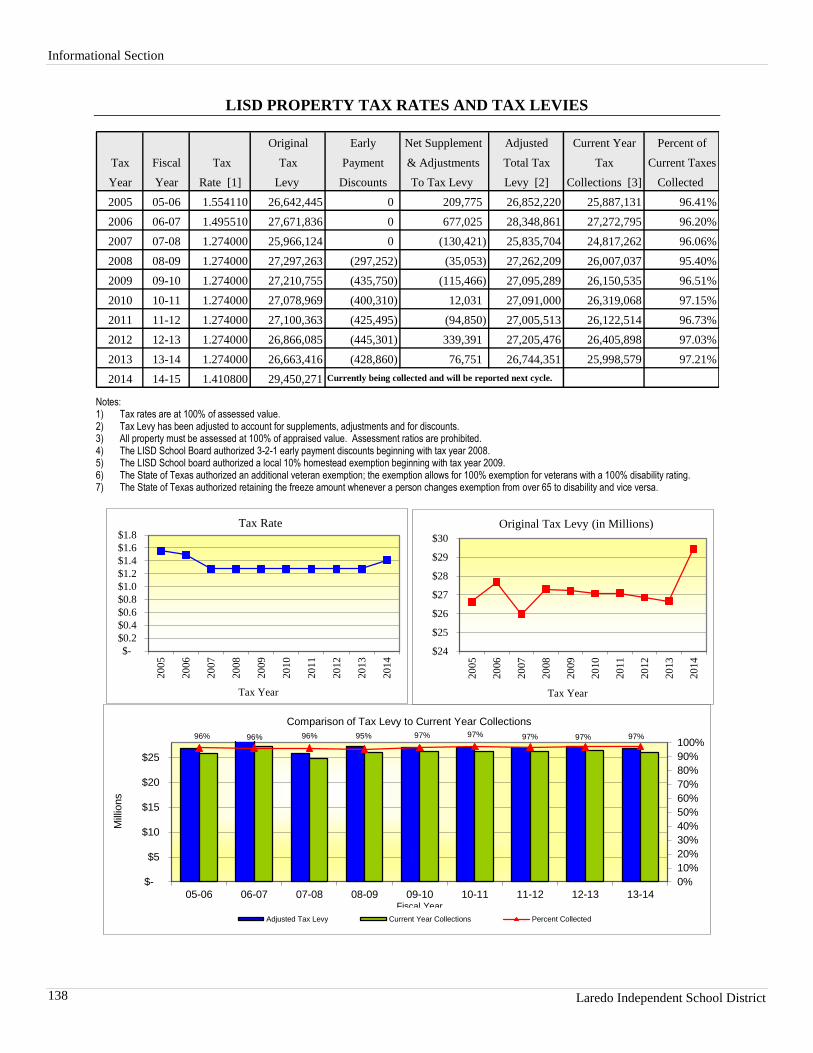
Informational Section
Laredo Independent School District 138
LISD PROPERTY TAX RATES AND TAX LEVIES
Original Early Net Supplement Adjusted Current Year Percent of
Tax Fiscal Tax Tax Payment & Adjustments Total Tax Tax Current Taxes
Year Year Rate [1] Levy Discounts To Tax Levy Levy [2] Collections [3] Collected
2005 05-06 1.554110 26,642,445 0 209,775 26,852,220 25,887,131 96.41%
2006 06-07 1.495510 27,671,836 0 677,025 28,348,861 27,272,795 96.20%
2007 07-08 1.274000 25,966,124 0 (130,421) 25,835,704 24,817,262 96.06%
2008 08-09 1.274000 27,297,263 (297,252) (35,053) 27,262,209 26,007,037 95.40%
2009 09-10 1.274000 27,210,755 (435,750) (115,466) 27,095,289 26,150,535 96.51%
2010 10-11 1.274000 27,078,969 (400,310) 12,031 27,091,000 26,319,068 97.15%
2011 11-12 1.274000 27,100,363 (425,495) (94,850) 27,005,513 26,122,514 96.73%
2012 12-13 1.274000 26,866,085 (445,301) 339,391 27,205,476 26,405,898 97.03%
2013 13-14 1.274000 26,663,416 (428,860) 76,751 26,744,351 25,998,579 97.21%
2014 14-15 1.410800 29,450,271 Currently being collected and will be reported next cycle.
Notes: 1) Tax rates are at 100% of assessed value. 2) Tax Levy has been adjusted to account for supplements, adjustments and for discounts. 3) All property must be assessed at 100% of appraised value. Assessment ratios are prohibited. 4) The LISD School Board authorized 3-2-1 early payment discounts beginning with tax year 2008. 5) The LISD School board authorized a local 10% homestead exemption beginning with tax year 2009. 6) The State of Texas authorized an additional veteran exemption; the exemption allows for 100% exemption for veterans with a 100% disability rating. 7) The State of Texas authorized retaining the freeze amount whenever a person changes exemption from over 65 to disability and vice versa.
$-
$0.2
$0.4
$0.6
$0.8
$1.0
$1.2
$1.4
$1.6
$1.8
20
05
20
06
20
07
20
08
20
09
20
10
20
11
20
12
20
13
20
14
Tax Year
Tax Rate
$24
$25
$26
$27
$28
$29
$30
20
05
20
06
20
07
20
08
20
09
20
10
20
11
20
12
20
13
20
14
Tax Year
Original Tax Levy (in Millions)
96% 96% 96% 95% 97% 97% 97% 97% 97%
0%
10%
20%
30%
40%
50%
60%
70%
80%
90%
100%
$-
$5
$10
$15
$20
$25
05-06 06-07 07-08 08-09 09-10 10-11 11-12 12-13 13-14
Mill
ions
Fiscal Year
Comparison of Tax Levy to Current Year Collections
Adjusted Tax Levy Current Year Collections Percent Collected
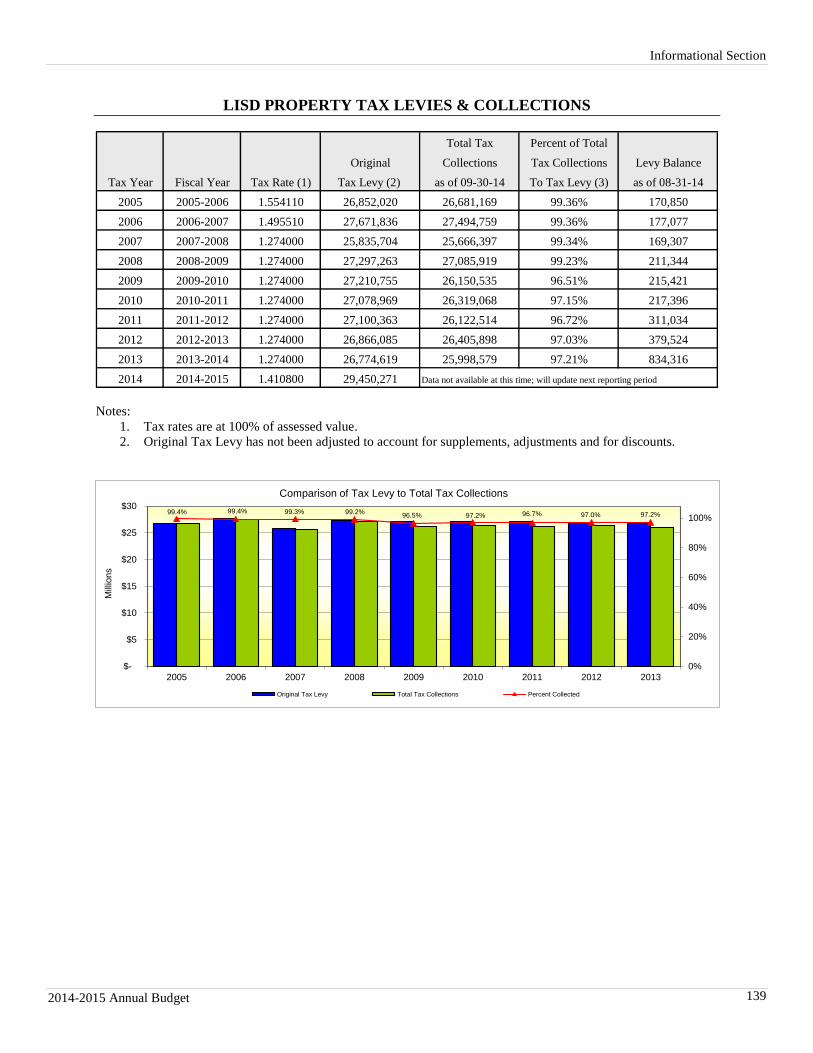
Informational Section
2014-2015 Annual Budget 139
LISD PROPERTY TAX LEVIES & COLLECTIONS
Total Tax Percent of Total
Original Collections Tax Collections Levy Balance
Tax Year Fiscal Year Tax Rate (1) Tax Levy (2) as of 09-30-14 To Tax Levy (3) as of 08-31-14
2005 2005-2006 1.554110 26,852,020 26,681,169 99.36% 170,850
2006 2006-2007 1.495510 27,671,836 27,494,759 99.36% 177,077
2007 2007-2008 1.274000 25,835,704 25,666,397 99.34% 169,307
2008 2008-2009 1.274000 27,297,263 27,085,919 99.23% 211,344
2009 2009-2010 1.274000 27,210,755 26,150,535 96.51% 215,421
2010 2010-2011 1.274000 27,078,969 26,319,068 97.15% 217,396
2011 2011-2012 1.274000 27,100,363 26,122,514 96.72% 311,034
2012 2012-2013 1.274000 26,866,085 26,405,898 97.03% 379,524
2013 2013-2014 1.274000 26,774,619 25,998,579 97.21% 834,316
2014 2014-2015 1.410800 29,450,271 Data not available at this time; will update next reporting period
Notes:
1. Tax rates are at 100% of assessed value.
2. Original Tax Levy has not been adjusted to account for supplements, adjustments and for discounts.
99.4% 99.4% 99.3% 99.2%96.5% 97.2% 96.7% 97.0% 97.2%
0%
20%
40%
60%
80%
100%
$-
$5
$10
$15
$20
$25
$30
2005 2006 2007 2008 2009 2010 2011 2012 2013
Mill
ions
Fiscal Year
Comparison of Tax Levy to Total Tax Collections
Original Tax Levy Total Tax Collections Percent Collected
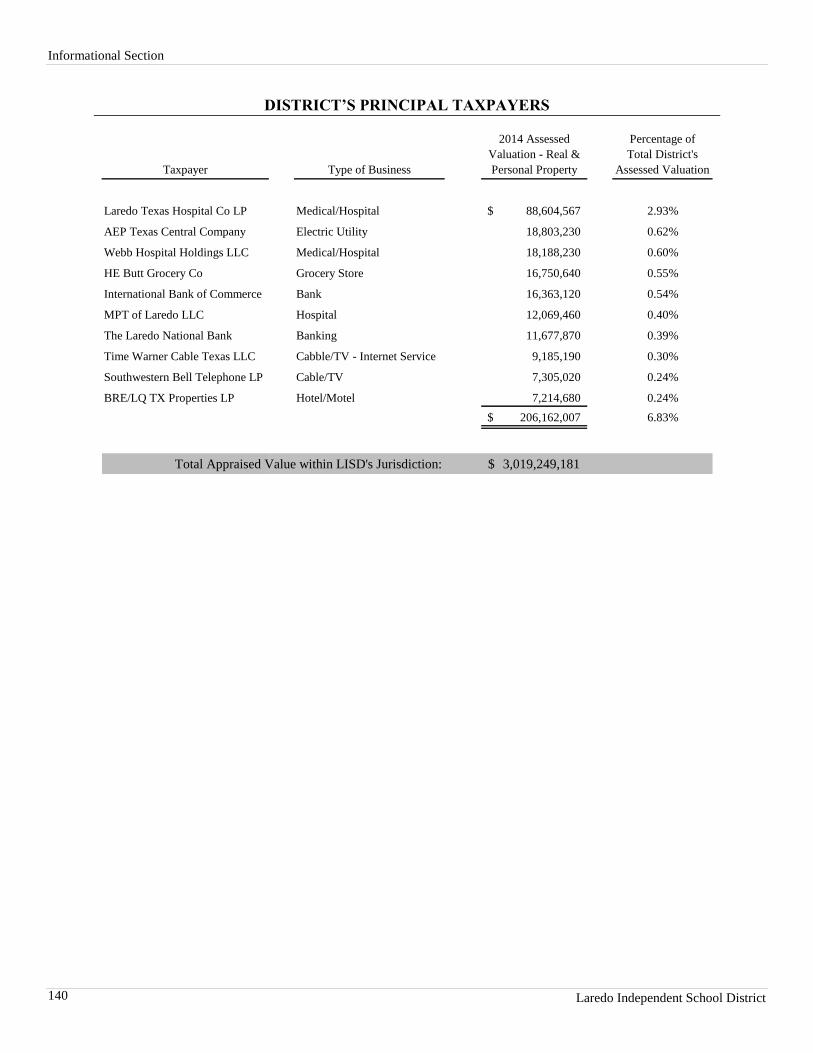
Informational Section
Laredo Independent School District 140
DISTRICT’S PRINCIPAL TAXPAYERS
Taxpayer Type of Business
2014 Assessed
Valuation - Real &
Personal Property
Percentage of
Total District's
Assessed Valuation
Laredo Texas Hospital Co LP Medical/Hospital 88,604,567$ 2.93%
AEP Texas Central Company Electric Utility 18,803,230 0.62%
Webb Hospital Holdings LLC Medical/Hospital 18,188,230 0.60%
HE Butt Grocery Co Grocery Store 16,750,640 0.55%
International Bank of Commerce Bank 16,363,120 0.54%
MPT of Laredo LLC Hospital 12,069,460 0.40%
The Laredo National Bank Banking 11,677,870 0.39%
Time Warner Cable Texas LLC Cabble/TV - Internet Service 9,185,190 0.30%
Southwestern Bell Telephone LP Cable/TV 7,305,020 0.24%
BRE/LQ TX Properties LP Hotel/Motel 7,214,680 0.24%
206,162,007$ 6.83%
Total Appraised Value within LISD's Jurisdiction: 3,019,249,181$
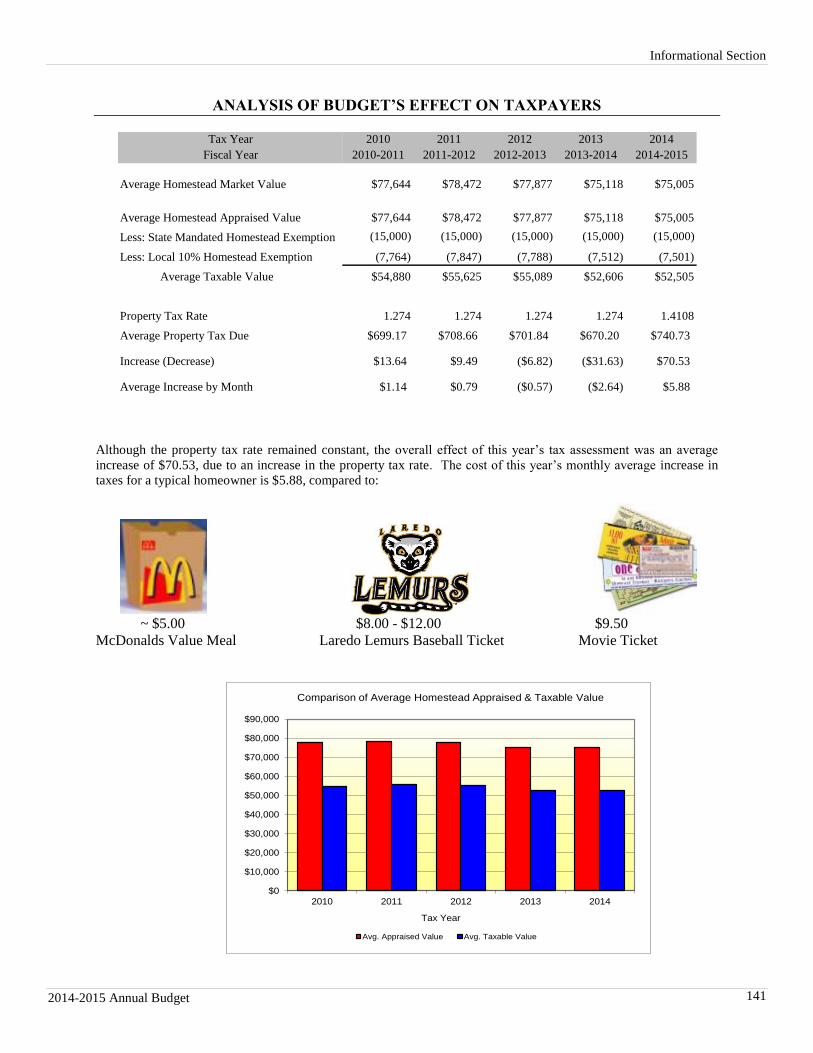
Informational Section
2014-2015 Annual Budget 141
ANALYSIS OF BUDGET’S EFFECT ON TAXPAYERS
Tax Year 2010 2011 2012 2013 2014
Fiscal Year 2010-2011 2011-2012 2012-2013 2013-2014 2014-2015
Average Homestead Market Value $77,644 $78,472 $77,877 $75,118 $75,005
Average Homestead Appraised Value $77,644 $78,472 $77,877 $75,118 $75,005
Less: State Mandated Homestead Exemption (15,000) (15,000) (15,000) (15,000) (15,000)
Less: Local 10% Homestead Exemption (7,764) (7,847) (7,788) (7,512) (7,501)
Average Taxable Value $54,880 $55,625 $55,089 $52,606 $52,505
Property Tax Rate 1.274 1.274 1.274 1.274 1.4108
Average Property Tax Due $699.17 $708.66 $701.84 $670.20 $740.73
Increase (Decrease) $13.64 $9.49 ($6.82) ($31.63) $70.53
Average Increase by Month $1.14 $0.79 ($0.57) ($2.64) $5.88
Although the property tax rate remained constant, the overall effect of this year’s tax assessment was an average
increase of $70.53, due to an increase in the property tax rate. The cost of this year’s monthly average increase in
taxes for a typical homeowner is $5.88, compared to:
~ $5.00 $8.00 - $12.00 $9.50
McDonalds Value Meal Laredo Lemurs Baseball Ticket Movie Ticket
$0
$10,000
$20,000
$30,000
$40,000
$50,000
$60,000
$70,000
$80,000
$90,000
2010 2011 2012 2013 2014
Tax Year
Comparison of Average Homestead Appraised & Taxable Value
Avg. Appraised Value Avg. Taxable Value
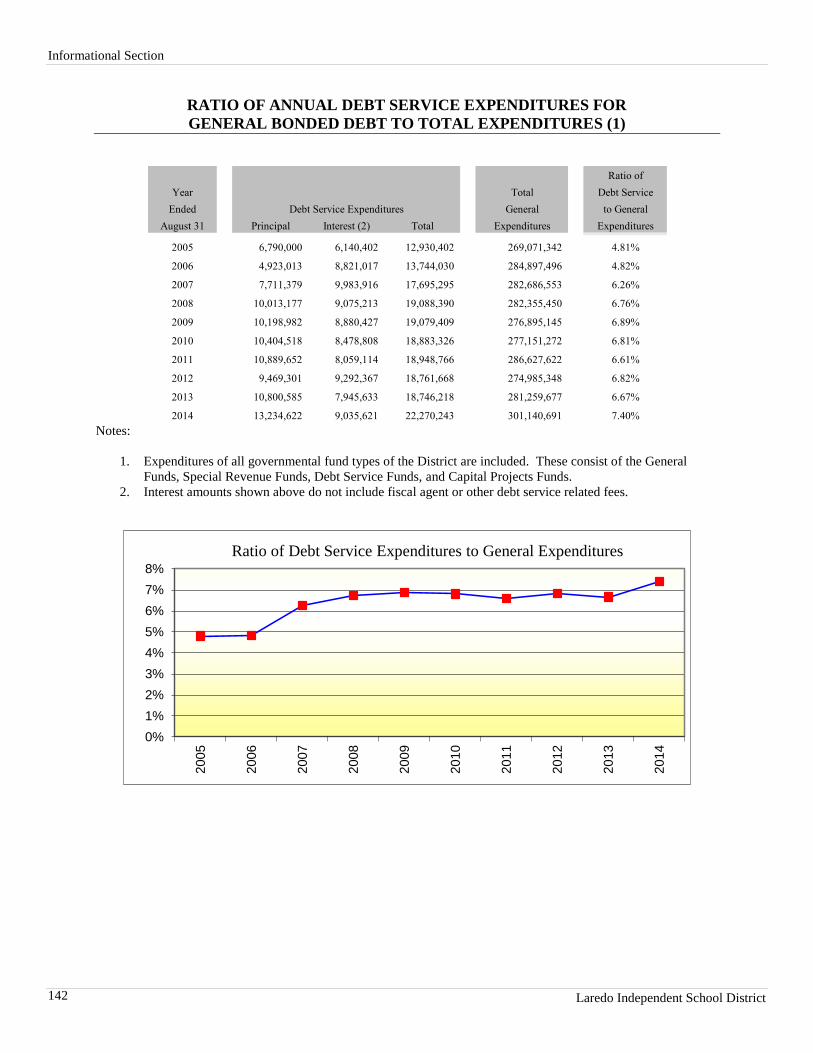
Informational Section
Laredo Independent School District 142
RATIO OF ANNUAL DEBT SERVICE EXPENDITURES FOR
GENERAL BONDED DEBT TO TOTAL EXPENDITURES (1)
Ratio of
Year Total Debt Service
Ended General to General
August 31 Principal Interest (2) Total Expenditures Expenditures
2005 6,790,000 6,140,402 12,930,402 269,071,342 4.81%
2006 4,923,013 8,821,017 13,744,030 284,897,496 4.82%
2007 7,711,379 9,983,916 17,695,295 282,686,553 6.26%
2008 10,013,177 9,075,213 19,088,390 282,355,450 6.76%
2009 10,198,982 8,880,427 19,079,409 276,895,145 6.89%
2010 10,404,518 8,478,808 18,883,326 277,151,272 6.81%
2011 10,889,652 8,059,114 18,948,766 286,627,622 6.61%
2012 9,469,301 9,292,367 18,761,668 274,985,348 6.82%
2013 10,800,585 7,945,633 18,746,218 281,259,677 6.67%
2014 13,234,622 9,035,621 22,270,243 301,140,691 7.40%
Debt Service Expenditures
Notes:
1. Expenditures of all governmental fund types of the District are included. These consist of the General
Funds, Special Revenue Funds, Debt Service Funds, and Capital Projects Funds. 2. Interest amounts shown above do not include fiscal agent or other debt service related fees.
0%
1%
2%
3%
4%
5%
6%
7%
8%
2005
2006
2007
2008
2009
2010
2011
2012
2013
2014
Ratio of Debt Service Expenditures to General Expenditures
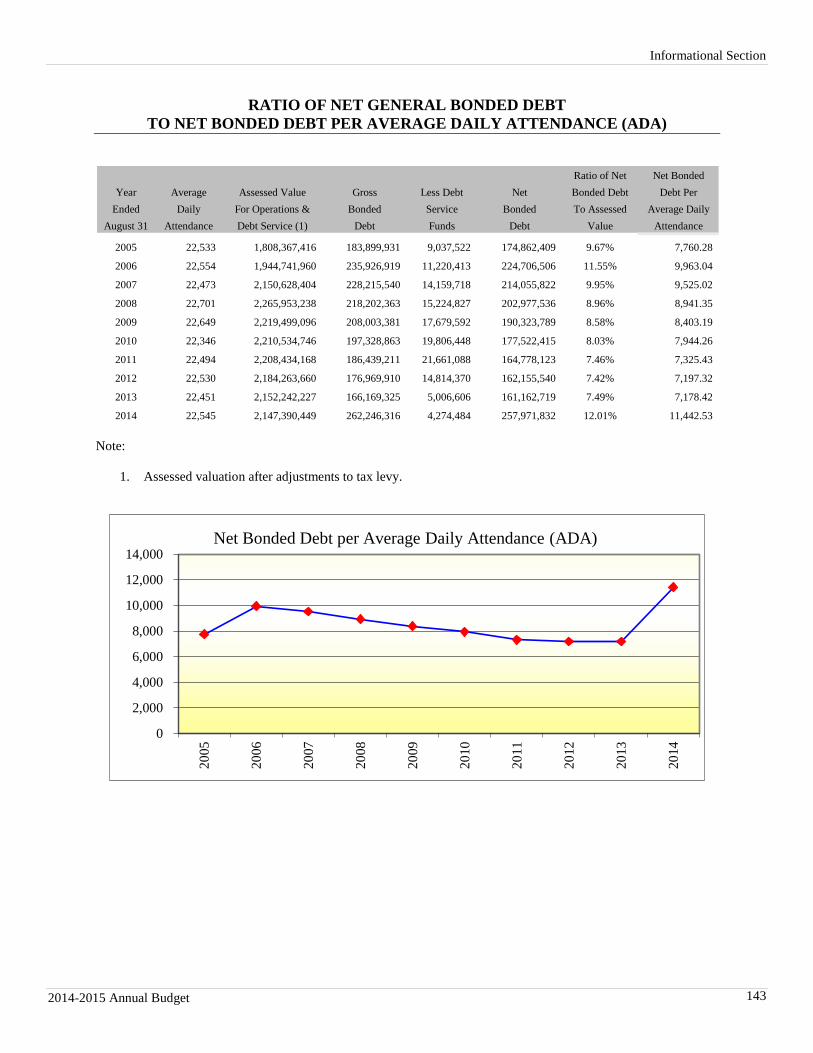
Informational Section
2014-2015 Annual Budget 143
RATIO OF NET GENERAL BONDED DEBT
TO NET BONDED DEBT PER AVERAGE DAILY ATTENDANCE (ADA)
Ratio of Net Net Bonded
Year Average Assessed Value Gross Less Debt Net Bonded Debt Debt Per
Ended Daily For Operations & Bonded Service Bonded To Assessed Average Daily
August 31 Attendance Debt Service (1) Debt Funds Debt Value Attendance
2005 22,533 1,808,367,416 183,899,931 9,037,522 174,862,409 9.67% 7,760.28
2006 22,554 1,944,741,960 235,926,919 11,220,413 224,706,506 11.55% 9,963.04
2007 22,473 2,150,628,404 228,215,540 14,159,718 214,055,822 9.95% 9,525.02
2008 22,701 2,265,953,238 218,202,363 15,224,827 202,977,536 8.96% 8,941.35
2009 22,649 2,219,499,096 208,003,381 17,679,592 190,323,789 8.58% 8,403.19
2010 22,346 2,210,534,746 197,328,863 19,806,448 177,522,415 8.03% 7,944.26
2011 22,494 2,208,434,168 186,439,211 21,661,088 164,778,123 7.46% 7,325.43
2012 22,530 2,184,263,660 176,969,910 14,814,370 162,155,540 7.42% 7,197.32
2013 22,451 2,152,242,227 166,169,325 5,006,606 161,162,719 7.49% 7,178.42
2014 22,545 2,147,390,449 262,246,316 4,274,484 257,971,832 12.01% 11,442.53
Note:
1. Assessed valuation after adjustments to tax levy.
0
2,000
4,000
6,000
8,000
10,000
12,000
14,000
20
05
20
06
20
07
20
08
20
09
20
10
20
11
20
12
20
13
20
14
Net Bonded Debt per Average Daily Attendance (ADA)
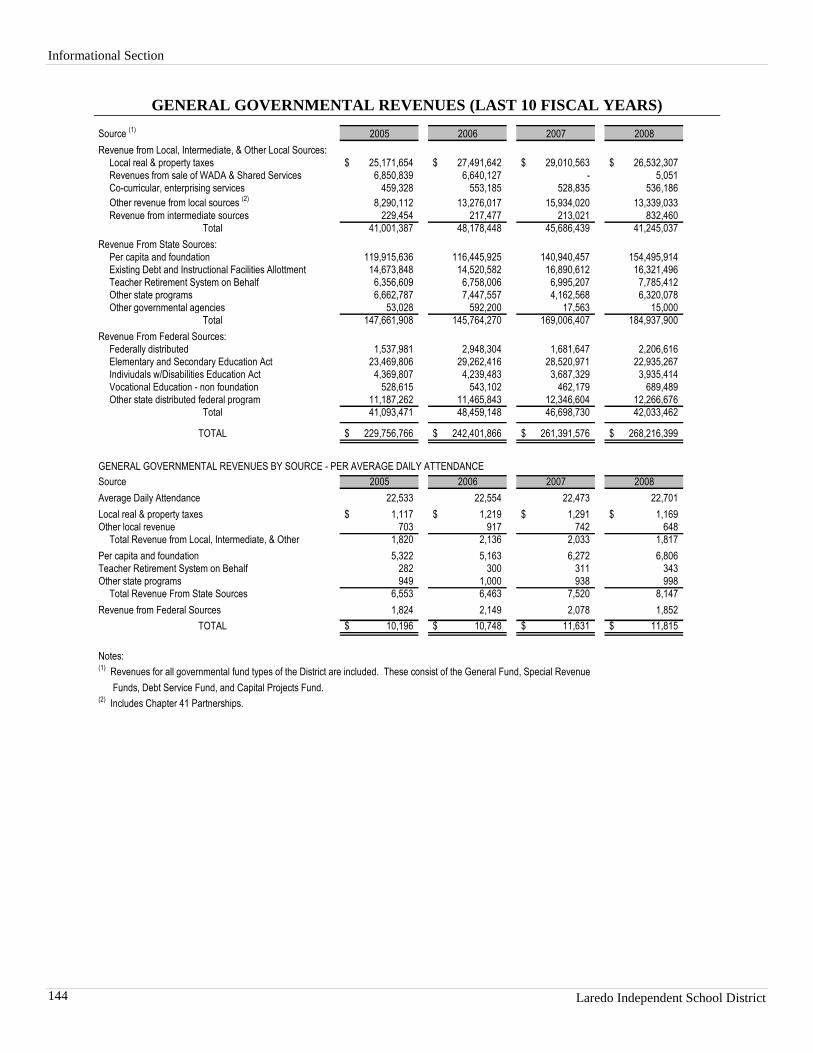
Informational Section
Laredo Independent School District 144
GENERAL GOVERNMENTAL REVENUES (LAST 10 FISCAL YEARS)
Source (1)
2005 2006 2007 2008
Revenue from Local, Intermediate, & Other Local Sources:
Local real & property taxes 25,171,654$ 27,491,642$ 29,010,563$ 26,532,307$
Revenues from sale of WADA & Shared Services 6,850,839 6,640,127 - 5,051
Co-curricular, enterprising services 459,328 553,185 528,835 536,186
Other revenue from local sources (2)
8,290,112 13,276,017 15,934,020 13,339,033
Revenue from intermediate sources 229,454 217,477 213,021 832,460
Total 41,001,387 48,178,448 45,686,439 41,245,037
Revenue From State Sources:
Per capita and foundation 119,915,636 116,445,925 140,940,457 154,495,914
Existing Debt and Instructional Facilities Allottment 14,673,848 14,520,582 16,890,612 16,321,496
Teacher Retirement System on Behalf 6,356,609 6,758,006 6,995,207 7,785,412
Other state programs 6,662,787 7,447,557 4,162,568 6,320,078
Other governmental agencies 53,028 592,200 17,563 15,000
Total 147,661,908 145,764,270 169,006,407 184,937,900
Revenue From Federal Sources:
Federally distributed 1,537,981 2,948,304 1,681,647 2,206,616
Elementary and Secondary Education Act 23,469,806 29,262,416 28,520,971 22,935,267
Indiviudals w/Disabilities Education Act 4,369,807 4,239,483 3,687,329 3,935,414
Vocational Education - non foundation 528,615 543,102 462,179 689,489
Other state distributed federal program 11,187,262 11,465,843 12,346,604 12,266,676
Total 41,093,471 48,459,148 46,698,730 42,033,462
TOTAL 229,756,766$ 242,401,866$ 261,391,576$ 268,216,399$
GENERAL GOVERNMENTAL REVENUES BY SOURCE - PER AVERAGE DAILY ATTENDANCE
Source 2005 2006 2007 2008
Average Daily Attendance 22,533 22,554 22,473 22,701
Local real & property taxes 1,117$ 1,219$ 1,291$ 1,169$
Other local revenue 703 917 742 648
Total Revenue from Local, Intermediate, & Other 1,820 2,136 2,033 1,817
Per capita and foundation 5,322 5,163 6,272 6,806
Teacher Retirement System on Behalf 282 300 311 343
Other state programs 949 1,000 938 998
Total Revenue From State Sources 6,553 6,463 7,520 8,147
Revenue from Federal Sources 1,824 2,149 2,078 1,852
TOTAL 10,196$ 10,748$ 11,631$ 11,815$
Notes:(1)
Revenues for all governmental fund types of the District are included. These consist of the General Fund, Special Revenue
Funds, Debt Service Fund, and Capital Projects Fund.(2)
Includes Chapter 41 Partnerships.
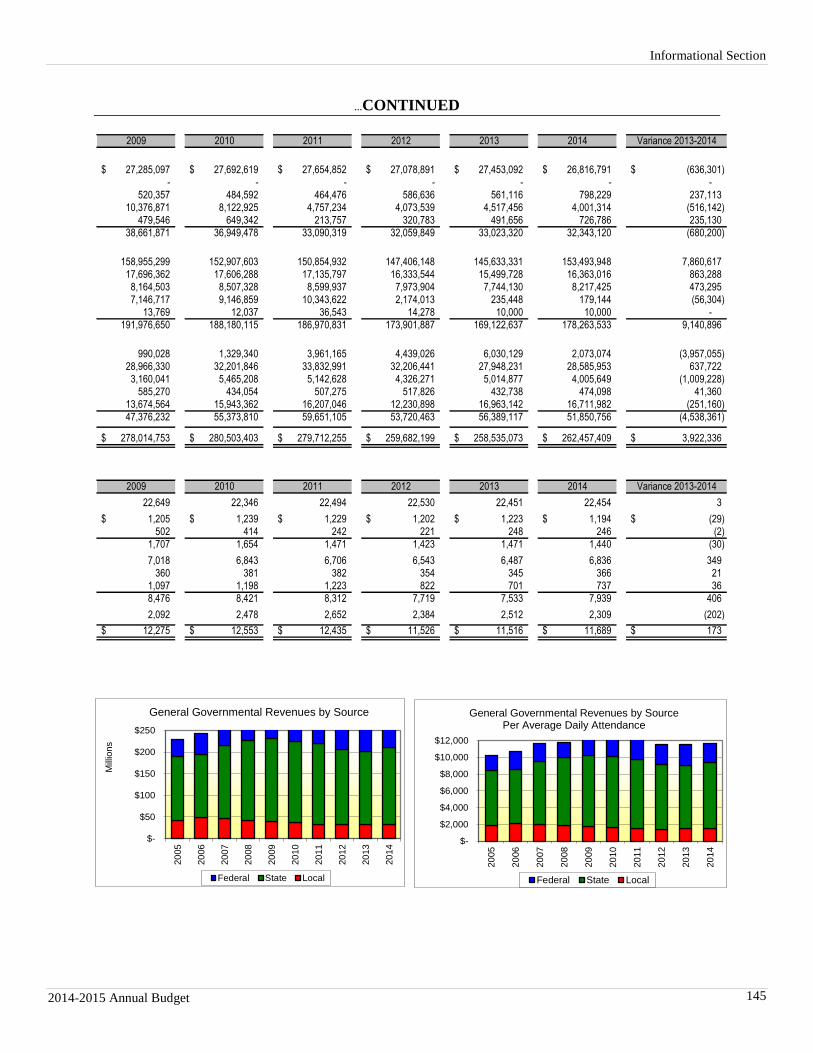
Informational Section
2014-2015 Annual Budget 145
…CONTINUED
2009 2010 2011 2012 2013 2014 Variance 2013-2014
27,285,097$ 27,692,619$ 27,654,852$ 27,078,891$ 27,453,092$ 26,816,791$ (636,301)$
- - - - - - -
520,357 484,592 464,476 586,636 561,116 798,229 237,113
10,376,871 8,122,925 4,757,234 4,073,539 4,517,456 4,001,314 (516,142)
479,546 649,342 213,757 320,783 491,656 726,786 235,130
38,661,871 36,949,478 33,090,319 32,059,849 33,023,320 32,343,120 (680,200)
158,955,299 152,907,603 150,854,932 147,406,148 145,633,331 153,493,948 7,860,617
17,696,362 17,606,288 17,135,797 16,333,544 15,499,728 16,363,016 863,288
8,164,503 8,507,328 8,599,937 7,973,904 7,744,130 8,217,425 473,295
7,146,717 9,146,859 10,343,622 2,174,013 235,448 179,144 (56,304)
13,769 12,037 36,543 14,278 10,000 10,000 -
191,976,650 188,180,115 186,970,831 173,901,887 169,122,637 178,263,533 9,140,896
990,028 1,329,340 3,961,165 4,439,026 6,030,129 2,073,074 (3,957,055)
28,966,330 32,201,846 33,832,991 32,206,441 27,948,231 28,585,953 637,722
3,160,041 5,465,208 5,142,628 4,326,271 5,014,877 4,005,649 (1,009,228)
585,270 434,054 507,275 517,826 432,738 474,098 41,360
13,674,564 15,943,362 16,207,046 12,230,898 16,963,142 16,711,982 (251,160)
47,376,232 55,373,810 59,651,105 53,720,463 56,389,117 51,850,756 (4,538,361)
278,014,753$ 280,503,403$ 279,712,255$ 259,682,199$ 258,535,073$ 262,457,409$ 3,922,336$
2009 2010 2011 2012 2013 2014 Variance 2013-2014
22,649 22,346 22,494 22,530 22,451 22,454 3
1,205$ 1,239$ 1,229$ 1,202$ 1,223$ 1,194$ (29)$
502 414 242 221 248 246 (2)
1,707 1,654 1,471 1,423 1,471 1,440 (30)
7,018 6,843 6,706 6,543 6,487 6,836 349
360 381 382 354 345 366 21
1,097 1,198 1,223 822 701 737 36
8,476 8,421 8,312 7,719 7,533 7,939 406
2,092 2,478 2,652 2,384 2,512 2,309 (202)
12,275$ 12,553$ 12,435$ 11,526$ 11,516$ 11,689$ 173$
$-
$50
$100
$150
$200
$250
20
05
20
06
20
07
20
08
20
09
20
10
20
11
20
12
20
13
20
14
Mill
ions
General Governmental Revenues by Source
Federal State Local
$-
$2,000
$4,000
$6,000
$8,000
$10,000
$12,000
20
05
20
06
20
07
20
08
20
09
20
10
20
11
20
12
20
13
20
14
General Governmental Revenues by SourcePer Average Daily Attendance
Federal State Local
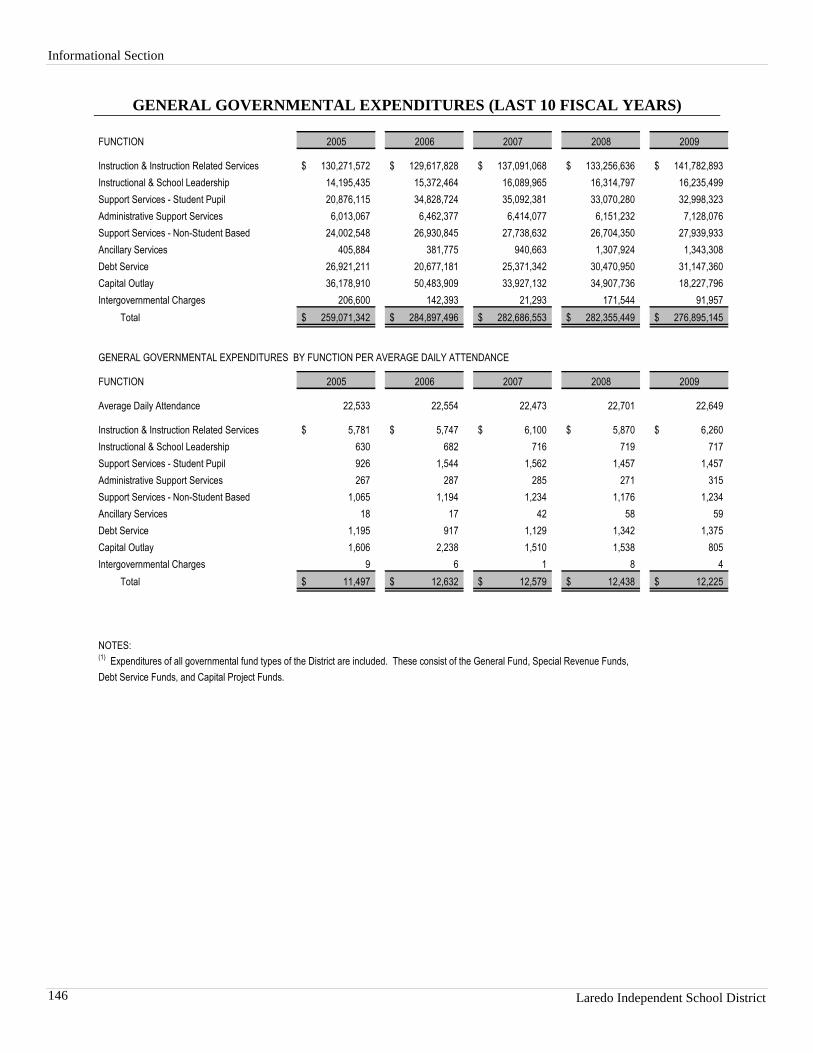
Informational Section
Laredo Independent School District 146
GENERAL GOVERNMENTAL EXPENDITURES (LAST 10 FISCAL YEARS)
FUNCTION 2005 2006 2007 2008 2009
Instruction & Instruction Related Services 130,271,572$ 129,617,828$ 137,091,068$ 133,256,636$ 141,782,893$
Instructional & School Leadership 14,195,435 15,372,464 16,089,965 16,314,797 16,235,499
Support Services - Student Pupil 20,876,115 34,828,724 35,092,381 33,070,280 32,998,323
Administrative Support Services 6,013,067 6,462,377 6,414,077 6,151,232 7,128,076
Support Services - Non-Student Based 24,002,548 26,930,845 27,738,632 26,704,350 27,939,933
Ancillary Services 405,884 381,775 940,663 1,307,924 1,343,308
Debt Service 26,921,211 20,677,181 25,371,342 30,470,950 31,147,360
Capital Outlay 36,178,910 50,483,909 33,927,132 34,907,736 18,227,796
Intergovernmental Charges 206,600 142,393 21,293 171,544 91,957
Total 259,071,342$ 284,897,496$ 282,686,553$ 282,355,449$ 276,895,145$
GENERAL GOVERNMENTAL EXPENDITURES BY FUNCTION PER AVERAGE DAILY ATTENDANCE
FUNCTION 2005 2006 2007 2008 2009
Average Daily Attendance 22,533 22,554 22,473 22,701 22,649
Instruction & Instruction Related Services 5,781$ 5,747$ 6,100$ 5,870$ 6,260$
Instructional & School Leadership 630 682 716 719 717
Support Services - Student Pupil 926 1,544 1,562 1,457 1,457
Administrative Support Services 267 287 285 271 315
Support Services - Non-Student Based 1,065 1,194 1,234 1,176 1,234
Ancillary Services 18 17 42 58 59
Debt Service 1,195 917 1,129 1,342 1,375
Capital Outlay 1,606 2,238 1,510 1,538 805
Intergovernmental Charges 9 6 1 8 4
Total 11,497$ 12,632$ 12,579$ 12,438$ 12,225$
NOTES:(1)
Expenditures of all governmental fund types of the District are included. These consist of the General Fund, Special Revenue Funds,
Debt Service Funds, and Capital Project Funds.
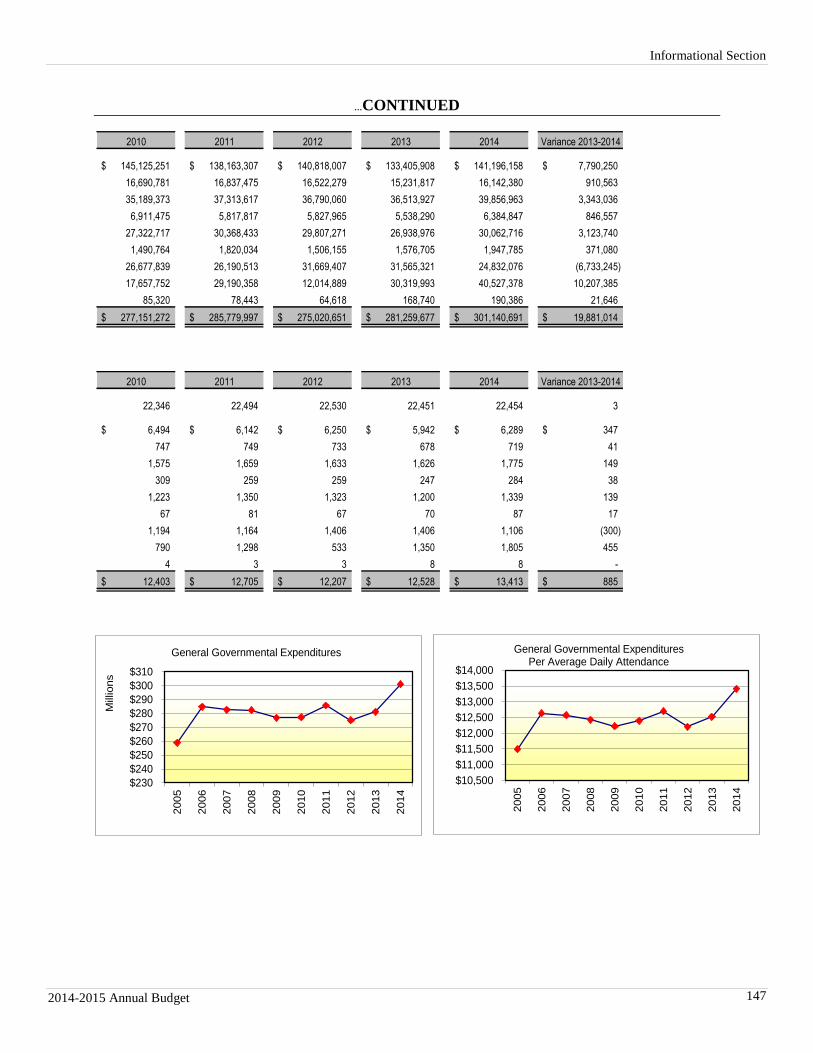
Informational Section
2014-2015 Annual Budget 147
…CONTINUED
2010 2011 2012 2013 2014 Variance 2013-2014
145,125,251$ 138,163,307$ 140,818,007$ 133,405,908$ 141,196,158$ 7,790,250$
16,690,781 16,837,475 16,522,279 15,231,817 16,142,380 910,563
35,189,373 37,313,617 36,790,060 36,513,927 39,856,963 3,343,036
6,911,475 5,817,817 5,827,965 5,538,290 6,384,847 846,557
27,322,717 30,368,433 29,807,271 26,938,976 30,062,716 3,123,740
1,490,764 1,820,034 1,506,155 1,576,705 1,947,785 371,080
26,677,839 26,190,513 31,669,407 31,565,321 24,832,076 (6,733,245)
17,657,752 29,190,358 12,014,889 30,319,993 40,527,378 10,207,385
85,320 78,443 64,618 168,740 190,386 21,646
277,151,272$ 285,779,997$ 275,020,651$ 281,259,677$ 301,140,691$ 19,881,014$
2010 2011 2012 2013 2014 Variance 2013-2014
22,346 22,494 22,530 22,451 22,454 3
6,494$ 6,142$ 6,250$ 5,942$ 6,289$ 347$
747 749 733 678 719 41
1,575 1,659 1,633 1,626 1,775 149
309 259 259 247 284 38
1,223 1,350 1,323 1,200 1,339 139
67 81 67 70 87 17
1,194 1,164 1,406 1,406 1,106 (300)
790 1,298 533 1,350 1,805 455
4 3 3 8 8 -
12,403$ 12,705$ 12,207$ 12,528$ 13,413$ 885$
$230
$240
$250
$260
$270
$280
$290
$300
$310
2005
2006
2007
2008
2009
2010
2011
2012
2013
2014
Millions
General Governmental Expenditures
$10,500
$11,000
$11,500
$12,000
$12,500
$13,000
$13,500
$14,000
2005
2006
2007
2008
2009
2010
2011
2012
2013
2014
General Governmental ExpendituresPer Average Daily Attendance
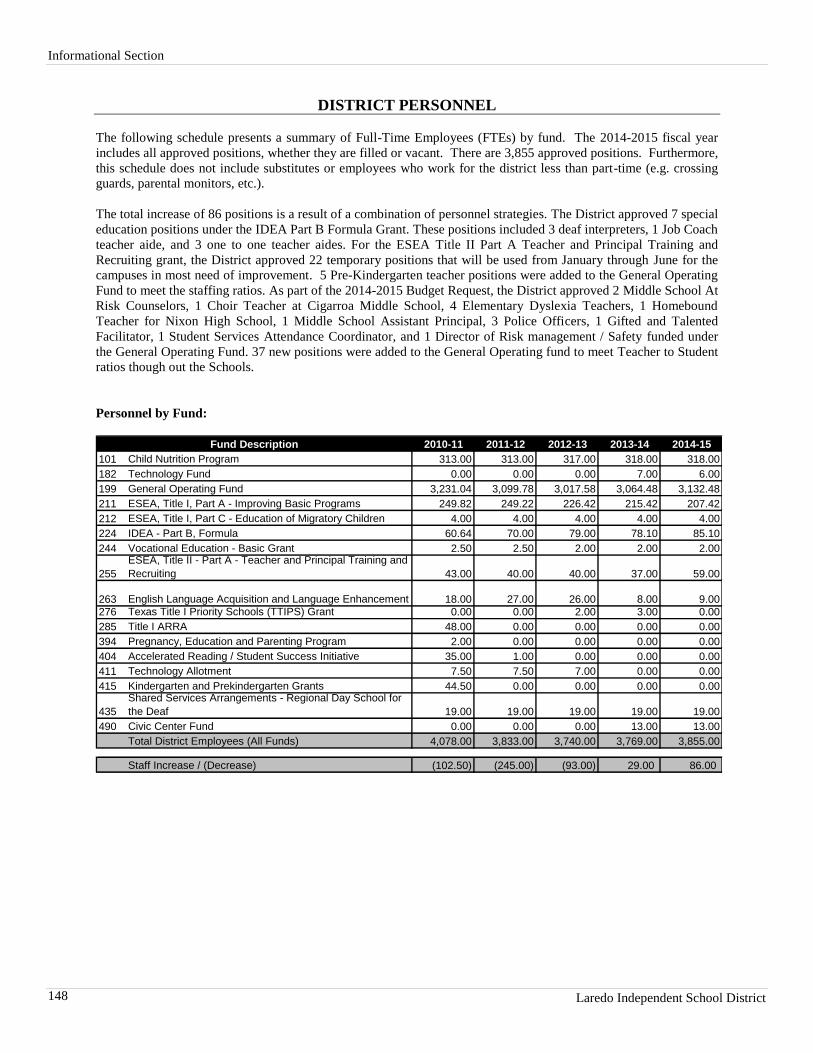
Informational Section
Laredo Independent School District 148
DISTRICT PERSONNEL
The following schedule presents a summary of Full-Time Employees (FTEs) by fund. The 2014-2015 fiscal year
includes all approved positions, whether they are filled or vacant. There are 3,855 approved positions. Furthermore,
this schedule does not include substitutes or employees who work for the district less than part-time (e.g. crossing
guards, parental monitors, etc.).
The total increase of 86 positions is a result of a combination of personnel strategies. The District approved 7 special
education positions under the IDEA Part B Formula Grant. These positions included 3 deaf interpreters, 1 Job Coach
teacher aide, and 3 one to one teacher aides. For the ESEA Title II Part A Teacher and Principal Training and
Recruiting grant, the District approved 22 temporary positions that will be used from January through June for the
campuses in most need of improvement. 5 Pre-Kindergarten teacher positions were added to the General Operating
Fund to meet the staffing ratios. As part of the 2014-2015 Budget Request, the District approved 2 Middle School At
Risk Counselors, 1 Choir Teacher at Cigarroa Middle School, 4 Elementary Dyslexia Teachers, 1 Homebound
Teacher for Nixon High School, 1 Middle School Assistant Principal, 3 Police Officers, 1 Gifted and Talented
Facilitator, 1 Student Services Attendance Coordinator, and 1 Director of Risk management / Safety funded under
the General Operating Fund. 37 new positions were added to the General Operating fund to meet Teacher to Student
ratios though out the Schools.
Personnel by Fund:
2010-11 2011-12 2012-13 2013-14 2014-15
101 Child Nutrition Program 313.00 313.00 317.00 318.00 318.00
182 Technology Fund 0.00 0.00 0.00 7.00 6.00
199 General Operating Fund 3,231.04 3,099.78 3,017.58 3,064.48 3,132.48
211 ESEA, Title I, Part A - Improving Basic Programs 249.82 249.22 226.42 215.42 207.42
212 ESEA, Title I, Part C - Education of Migratory Children 4.00 4.00 4.00 4.00 4.00
224 IDEA - Part B, Formula 60.64 70.00 79.00 78.10 85.10
244 Vocational Education - Basic Grant 2.50 2.50 2.00 2.00 2.00
255
ESEA, Title II - Part A - Teacher and Principal Training and
Recruiting 43.00 40.00 40.00 37.00 59.00
263 English Language Acquisition and Language Enhancement 18.00 27.00 26.00 8.00 9.00
276 Texas Title I Priority Schools (TTIPS) Grant 0.00 0.00 2.00 3.00 0.00
285 Title I ARRA 48.00 0.00 0.00 0.00 0.00
394 Pregnancy, Education and Parenting Program 2.00 0.00 0.00 0.00 0.00
404 Accelerated Reading / Student Success Initiative 35.00 1.00 0.00 0.00 0.00
411 Technology Allotment 7.50 7.50 7.00 0.00 0.00
415 Kindergarten and Prekindergarten Grants 44.50 0.00 0.00 0.00 0.00
435
Shared Services Arrangements - Regional Day School for
the Deaf 19.00 19.00 19.00 19.00 19.00
490 Civic Center Fund 0.00 0.00 0.00 13.00 13.00
Total District Employees (All Funds) 4,078.00 3,833.00 3,740.00 3,769.00 3,855.00
Staff Increase / (Decrease) (102.50) (245.00) (93.00) 29.00 86.00
Fund Description
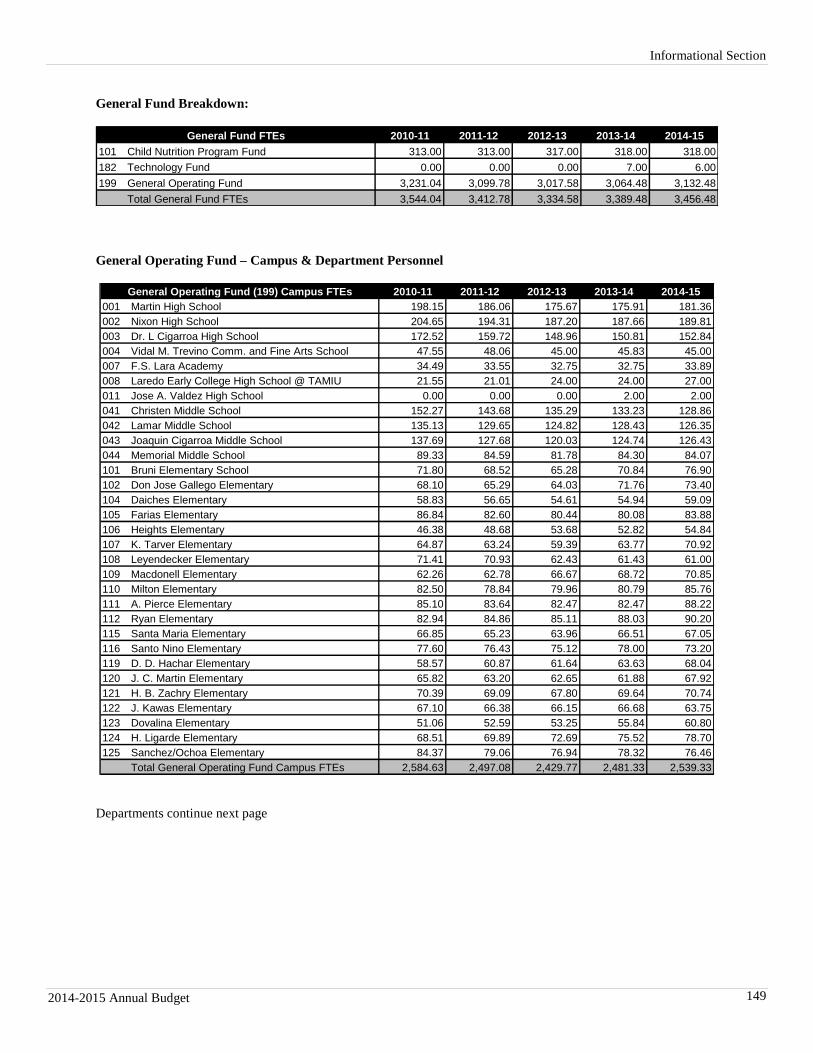
Informational Section
2014-2015 Annual Budget 149
General Fund Breakdown:
2010-11 2011-12 2012-13 2013-14 2014-15
101 Child Nutrition Program Fund 313.00 313.00 317.00 318.00 318.00
182 Technology Fund 0.00 0.00 0.00 7.00 6.00
199 General Operating Fund 3,231.04 3,099.78 3,017.58 3,064.48 3,132.48
Total General Fund FTEs 3,544.04 3,412.78 3,334.58 3,389.48 3,456.48
General Fund FTEs
General Operating Fund – Campus & Department Personnel
2010-11 2011-12 2012-13 2013-14 2014-15
001 Martin High School 198.15 186.06 175.67 175.91 181.36
002 Nixon High School 204.65 194.31 187.20 187.66 189.81
003 Dr. L Cigarroa High School 172.52 159.72 148.96 150.81 152.84
004 Vidal M. Trevino Comm. and Fine Arts School 47.55 48.06 45.00 45.83 45.00
007 F.S. Lara Academy 34.49 33.55 32.75 32.75 33.89
008 Laredo Early College High School @ TAMIU 21.55 21.01 24.00 24.00 27.00
011 Jose A. Valdez High School 0.00 0.00 0.00 2.00 2.00
041 Christen Middle School 152.27 143.68 135.29 133.23 128.86
042 Lamar Middle School 135.13 129.65 124.82 128.43 126.35
043 Joaquin Cigarroa Middle School 137.69 127.68 120.03 124.74 126.43
044 Memorial Middle School 89.33 84.59 81.78 84.30 84.07
101 Bruni Elementary School 71.80 68.52 65.28 70.84 76.90
102 Don Jose Gallego Elementary 68.10 65.29 64.03 71.76 73.40
104 Daiches Elementary 58.83 56.65 54.61 54.94 59.09
105 Farias Elementary 86.84 82.60 80.44 80.08 83.88
106 Heights Elementary 46.38 48.68 53.68 52.82 54.84
107 K. Tarver Elementary 64.87 63.24 59.39 63.77 70.92
108 Leyendecker Elementary 71.41 70.93 62.43 61.43 61.00
109 Macdonell Elementary 62.26 62.78 66.67 68.72 70.85
110 Milton Elementary 82.50 78.84 79.96 80.79 85.76
111 A. Pierce Elementary 85.10 83.64 82.47 82.47 88.22
112 Ryan Elementary 82.94 84.86 85.11 88.03 90.20
115 Santa Maria Elementary 66.85 65.23 63.96 66.51 67.05
116 Santo Nino Elementary 77.60 76.43 75.12 78.00 73.20
119 D. D. Hachar Elementary 58.57 60.87 61.64 63.63 68.04
120 J. C. Martin Elementary 65.82 63.20 62.65 61.88 67.92
121 H. B. Zachry Elementary 70.39 69.09 67.80 69.64 70.74
122 J. Kawas Elementary 67.10 66.38 66.15 66.68 63.75
123 Dovalina Elementary 51.06 52.59 53.25 55.84 60.80
124 H. Ligarde Elementary 68.51 69.89 72.69 75.52 78.70
125 Sanchez/Ochoa Elementary 84.37 79.06 76.94 78.32 76.46
Total General Operating Fund Campus FTEs 2,584.63 2,497.08 2,429.77 2,481.33 2,539.33
General Operating Fund (199) Campus FTEs
Departments continue next page
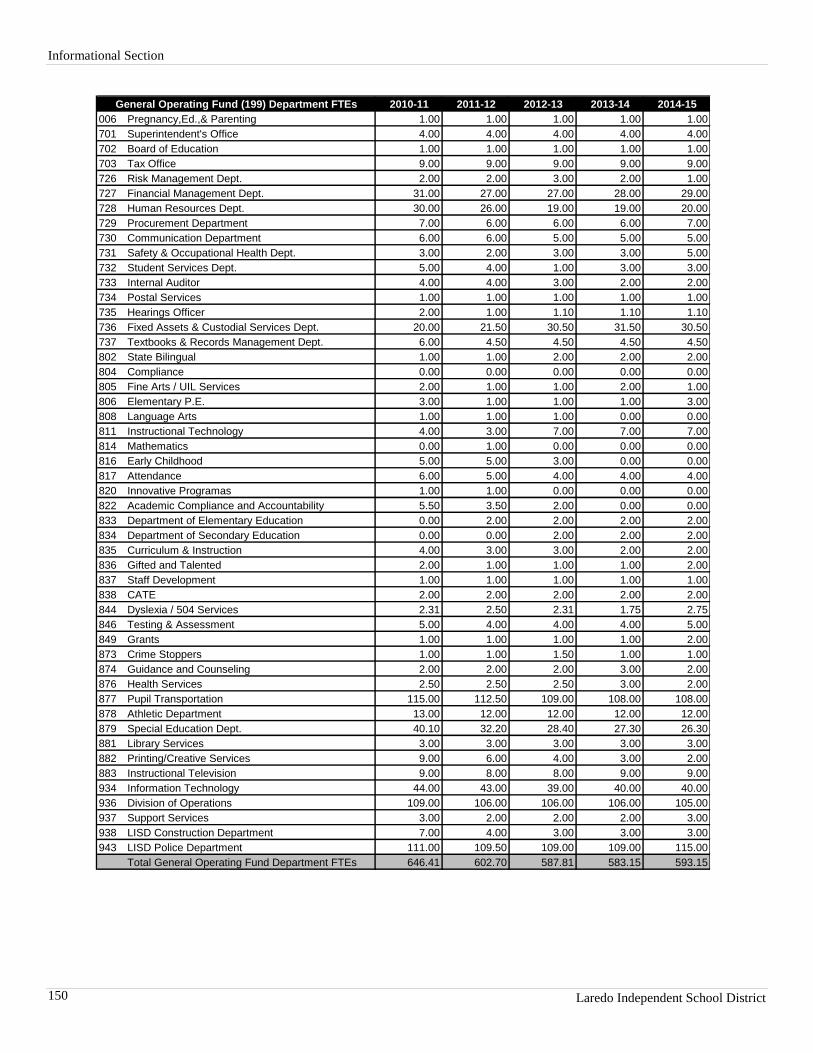
Informational Section
Laredo Independent School District 2006-2007 Annual Budget 150
2010-11 2011-12 2012-13 2013-14 2014-15
006 Pregnancy,Ed.,& Parenting 1.00 1.00 1.00 1.00 1.00
701 Superintendent's Office 4.00 4.00 4.00 4.00 4.00
702 Board of Education 1.00 1.00 1.00 1.00 1.00
703 Tax Office 9.00 9.00 9.00 9.00 9.00
726 Risk Management Dept. 2.00 2.00 3.00 2.00 1.00
727 Financial Management Dept. 31.00 27.00 27.00 28.00 29.00
728 Human Resources Dept. 30.00 26.00 19.00 19.00 20.00
729 Procurement Department 7.00 6.00 6.00 6.00 7.00
730 Communication Department 6.00 6.00 5.00 5.00 5.00
731 Safety & Occupational Health Dept. 3.00 2.00 3.00 3.00 5.00
732 Student Services Dept. 5.00 4.00 1.00 3.00 3.00
733 Internal Auditor 4.00 4.00 3.00 2.00 2.00
734 Postal Services 1.00 1.00 1.00 1.00 1.00
735 Hearings Officer 2.00 1.00 1.10 1.10 1.10
736 Fixed Assets & Custodial Services Dept. 20.00 21.50 30.50 31.50 30.50
737 Textbooks & Records Management Dept. 6.00 4.50 4.50 4.50 4.50
802 State Bilingual 1.00 1.00 2.00 2.00 2.00
804 Compliance 0.00 0.00 0.00 0.00 0.00
805 Fine Arts / UIL Services 2.00 1.00 1.00 2.00 1.00
806 Elementary P.E. 3.00 1.00 1.00 1.00 3.00
808 Language Arts 1.00 1.00 1.00 0.00 0.00
811 Instructional Technology 4.00 3.00 7.00 7.00 7.00
814 Mathematics 0.00 1.00 0.00 0.00 0.00
816 Early Childhood 5.00 5.00 3.00 0.00 0.00
817 Attendance 6.00 5.00 4.00 4.00 4.00
820 Innovative Programas 1.00 1.00 0.00 0.00 0.00
822 Academic Compliance and Accountability 5.50 3.50 2.00 0.00 0.00
833 Department of Elementary Education 0.00 2.00 2.00 2.00 2.00
834 Department of Secondary Education 0.00 0.00 2.00 2.00 2.00
835 Curriculum & Instruction 4.00 3.00 3.00 2.00 2.00
836 Gifted and Talented 2.00 1.00 1.00 1.00 2.00
837 Staff Development 1.00 1.00 1.00 1.00 1.00
838 CATE 2.00 2.00 2.00 2.00 2.00
844 Dyslexia / 504 Services 2.31 2.50 2.31 1.75 2.75
846 Testing & Assessment 5.00 4.00 4.00 4.00 5.00
849 Grants 1.00 1.00 1.00 1.00 2.00
873 Crime Stoppers 1.00 1.00 1.50 1.00 1.00
874 Guidance and Counseling 2.00 2.00 2.00 3.00 2.00
876 Health Services 2.50 2.50 2.50 3.00 2.00
877 Pupil Transportation 115.00 112.50 109.00 108.00 108.00
878 Athletic Department 13.00 12.00 12.00 12.00 12.00
879 Special Education Dept. 40.10 32.20 28.40 27.30 26.30
881 Library Services 3.00 3.00 3.00 3.00 3.00
882 Printing/Creative Services 9.00 6.00 4.00 3.00 2.00
883 Instructional Television 9.00 8.00 8.00 9.00 9.00
934 Information Technology 44.00 43.00 39.00 40.00 40.00
936 Division of Operations 109.00 106.00 106.00 106.00 105.00
937 Support Services 3.00 2.00 2.00 2.00 3.00
938 LISD Construction Department 7.00 4.00 3.00 3.00 3.00
943 LISD Police Department 111.00 109.50 109.00 109.00 115.00
Total General Operating Fund Department FTEs 646.41 602.70 587.81 583.15 593.15
General Operating Fund (199) Department FTEs
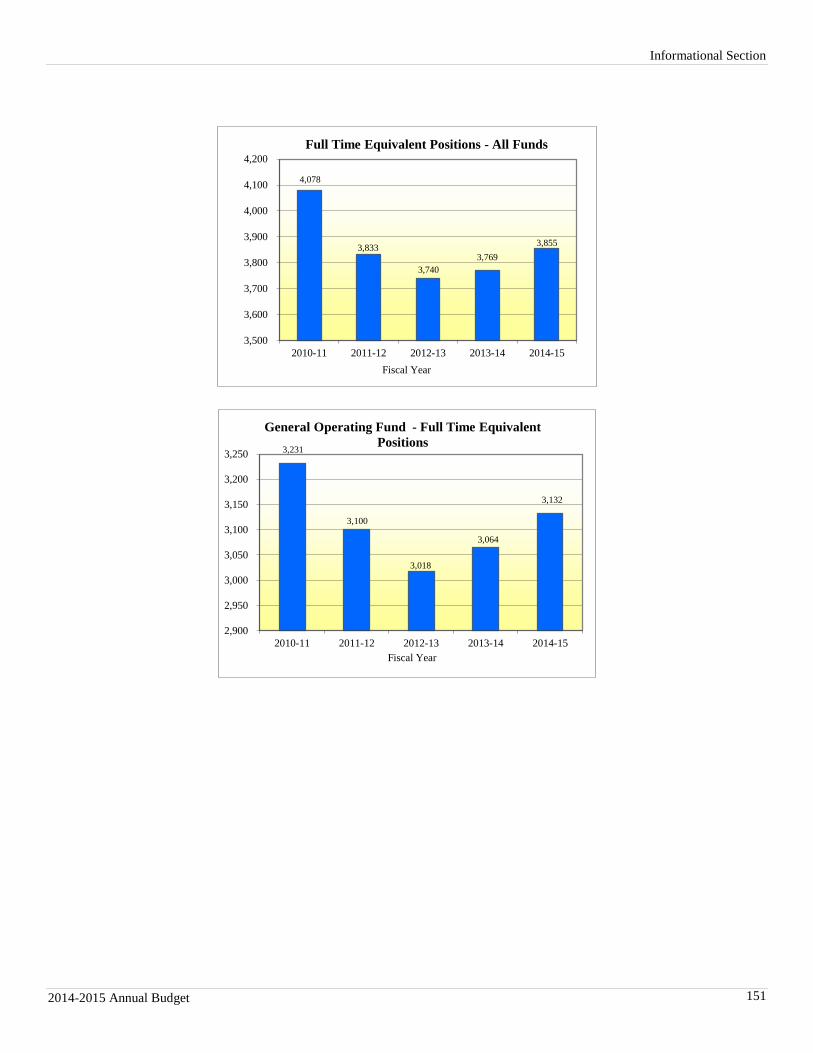
Informational Section
2014-2015 Annual Budget 151
4,078
3,833
3,740
3,769
3,855
3,500
3,600
3,700
3,800
3,900
4,000
4,100
4,200
2010-11 2011-12 2012-13 2013-14 2014-15
Fiscal Year
Full Time Equivalent Positions - All Funds
3,231
3,100
3,018
3,064
3,132
2,900
2,950
3,000
3,050
3,100
3,150
3,200
3,250
2010-11 2011-12 2012-13 2013-14 2014-15
Fiscal Year
General Operating Fund - Full Time Equivalent
Positions
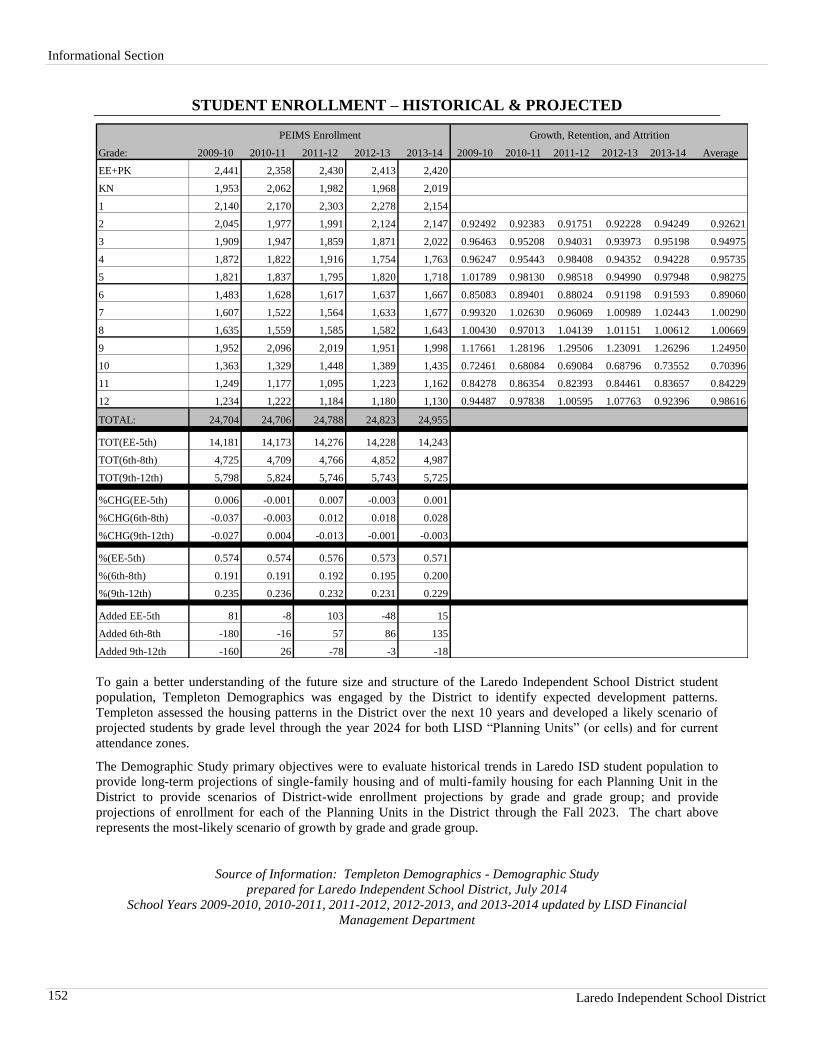
Informational Section
Laredo Independent School District 2006-2007 Annual Budget 152
STUDENT ENROLLMENT – HISTORICAL & PROJECTED
Grade: 2009-10 2010-11 2011-12 2012-13 2013-14 2009-10 2010-11 2011-12 2012-13 2013-14 Average
EE+PK 2,441 2,358 2,430 2,413 2,420
KN 1,953 2,062 1,982 1,968 2,019
1 2,140 2,170 2,303 2,278 2,154
2 2,045 1,977 1,991 2,124 2,147 0.92492 0.92383 0.91751 0.92228 0.94249 0.92621
3 1,909 1,947 1,859 1,871 2,022 0.96463 0.95208 0.94031 0.93973 0.95198 0.94975
4 1,872 1,822 1,916 1,754 1,763 0.96247 0.95443 0.98408 0.94352 0.94228 0.95735
5 1,821 1,837 1,795 1,820 1,718 1.01789 0.98130 0.98518 0.94990 0.97948 0.98275
6 1,483 1,628 1,617 1,637 1,667 0.85083 0.89401 0.88024 0.91198 0.91593 0.89060
7 1,607 1,522 1,564 1,633 1,677 0.99320 1.02630 0.96069 1.00989 1.02443 1.00290
8 1,635 1,559 1,585 1,582 1,643 1.00430 0.97013 1.04139 1.01151 1.00612 1.00669
9 1,952 2,096 2,019 1,951 1,998 1.17661 1.28196 1.29506 1.23091 1.26296 1.24950
10 1,363 1,329 1,448 1,389 1,435 0.72461 0.68084 0.69084 0.68796 0.73552 0.70396
11 1,249 1,177 1,095 1,223 1,162 0.84278 0.86354 0.82393 0.84461 0.83657 0.84229
12 1,234 1,222 1,184 1,180 1,130 0.94487 0.97838 1.00595 1.07763 0.92396 0.98616
TOTAL: 24,704 24,706 24,788 24,823 24,955
TOT(EE-5th) 14,181 14,173 14,276 14,228 14,243
TOT(6th-8th) 4,725 4,709 4,766 4,852 4,987
TOT(9th-12th) 5,798 5,824 5,746 5,743 5,725
%CHG(EE-5th) 0.006 -0.001 0.007 -0.003 0.001
%CHG(6th-8th) -0.037 -0.003 0.012 0.018 0.028
%CHG(9th-12th) -0.027 0.004 -0.013 -0.001 -0.003
%(EE-5th) 0.574 0.574 0.576 0.573 0.571
%(6th-8th) 0.191 0.191 0.192 0.195 0.200
%(9th-12th) 0.235 0.236 0.232 0.231 0.229
Added EE-5th 81 -8 103 -48 15
Added 6th-8th -180 -16 57 86 135
Added 9th-12th -160 26 -78 -3 -18
Growth, Retention, and AttritionPEIMS Enrollment
To gain a better understanding of the future size and structure of the Laredo Independent School District student
population, Templeton Demographics was engaged by the District to identify expected development patterns.
Templeton assessed the housing patterns in the District over the next 10 years and developed a likely scenario of
projected students by grade level through the year 2024 for both LISD “Planning Units” (or cells) and for current
attendance zones.
The Demographic Study primary objectives were to evaluate historical trends in Laredo ISD student population to
provide long-term projections of single-family housing and of multi-family housing for each Planning Unit in the
District to provide scenarios of District-wide enrollment projections by grade and grade group; and provide
projections of enrollment for each of the Planning Units in the District through the Fall 2023. The chart above
represents the most-likely scenario of growth by grade and grade group.
Source of Information: Templeton Demographics - Demographic Study
prepared for Laredo Independent School District, July 2014
School Years 2009-2010, 2010-2011, 2011-2012, 2012-2013, and 2013-2014 updated by LISD Financial
Management Department
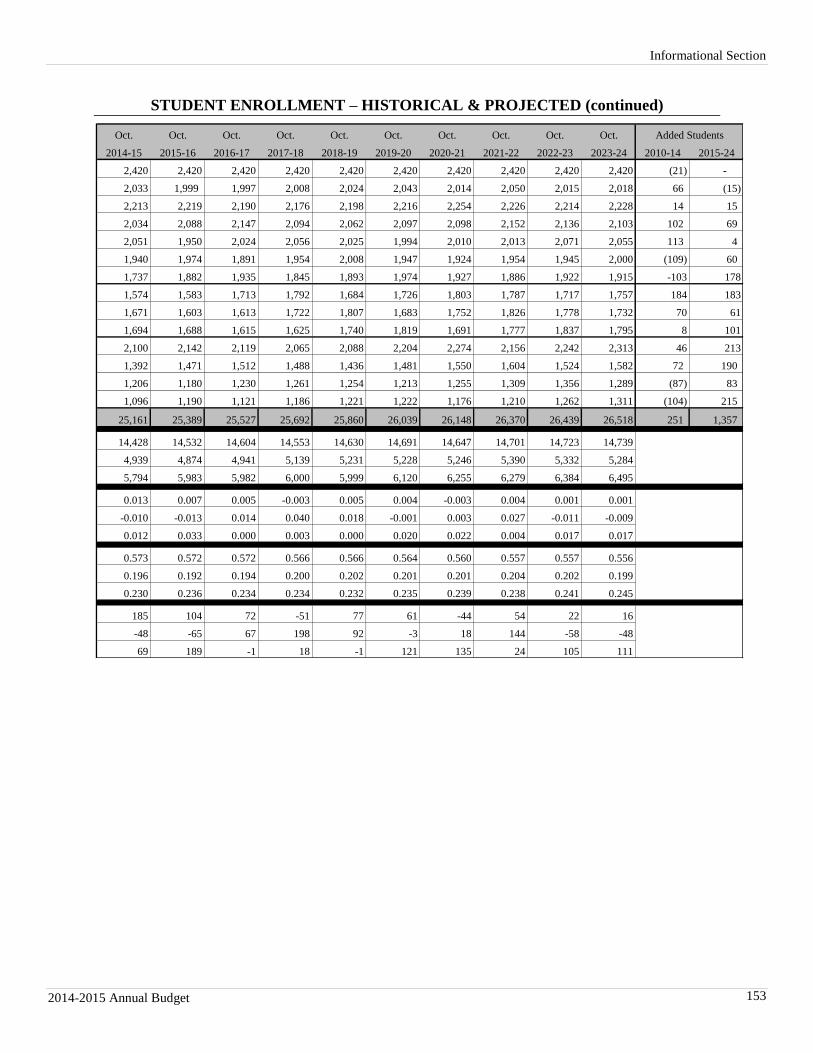
Informational Section
2014-2015 Annual Budget 153
STUDENT ENROLLMENT – HISTORICAL & PROJECTED (continued)
Oct. Oct. Oct. Oct. Oct. Oct. Oct. Oct. Oct. Oct.
2014-15 2015-16 2016-17 2017-18 2018-19 2019-20 2020-21 2021-22 2022-23 2023-24 2010-14 2015-24
2,420 2,420 2,420 2,420 2,420 2,420 2,420 2,420 2,420 2,420 (21) -
2,033 1,999 1,997 2,008 2,024 2,043 2,014 2,050 2,015 2,018 66 (15)
2,213 2,219 2,190 2,176 2,198 2,216 2,254 2,226 2,214 2,228 14 15
2,034 2,088 2,147 2,094 2,062 2,097 2,098 2,152 2,136 2,103 102 69
2,051 1,950 2,024 2,056 2,025 1,994 2,010 2,013 2,071 2,055 113 4
1,940 1,974 1,891 1,954 2,008 1,947 1,924 1,954 1,945 2,000 (109) 60
1,737 1,882 1,935 1,845 1,893 1,974 1,927 1,886 1,922 1,915 -103 178
1,574 1,583 1,713 1,792 1,684 1,726 1,803 1,787 1,717 1,757 184 183
1,671 1,603 1,613 1,722 1,807 1,683 1,752 1,826 1,778 1,732 70 61
1,694 1,688 1,615 1,625 1,740 1,819 1,691 1,777 1,837 1,795 8 101
2,100 2,142 2,119 2,065 2,088 2,204 2,274 2,156 2,242 2,313 46 213
1,392 1,471 1,512 1,488 1,436 1,481 1,550 1,604 1,524 1,582 72 190
1,206 1,180 1,230 1,261 1,254 1,213 1,255 1,309 1,356 1,289 (87) 83
1,096 1,190 1,121 1,186 1,221 1,222 1,176 1,210 1,262 1,311 (104) 215
25,161 25,389 25,527 25,692 25,860 26,039 26,148 26,370 26,439 26,518 251 1,357
14,428 14,532 14,604 14,553 14,630 14,691 14,647 14,701 14,723 14,739
4,939 4,874 4,941 5,139 5,231 5,228 5,246 5,390 5,332 5,284
5,794 5,983 5,982 6,000 5,999 6,120 6,255 6,279 6,384 6,495
0.013 0.007 0.005 -0.003 0.005 0.004 -0.003 0.004 0.001 0.001
-0.010 -0.013 0.014 0.040 0.018 -0.001 0.003 0.027 -0.011 -0.009
0.012 0.033 0.000 0.003 0.000 0.020 0.022 0.004 0.017 0.017
0.573 0.572 0.572 0.566 0.566 0.564 0.560 0.557 0.557 0.556
0.196 0.192 0.194 0.200 0.202 0.201 0.201 0.204 0.202 0.199
0.230 0.236 0.234 0.234 0.232 0.235 0.239 0.238 0.241 0.245
185 104 72 -51 77 61 -44 54 22 16
-48 -65 67 198 92 -3 18 144 -58 -48
69 189 -1 18 -1 121 135 24 105 111
Added Students
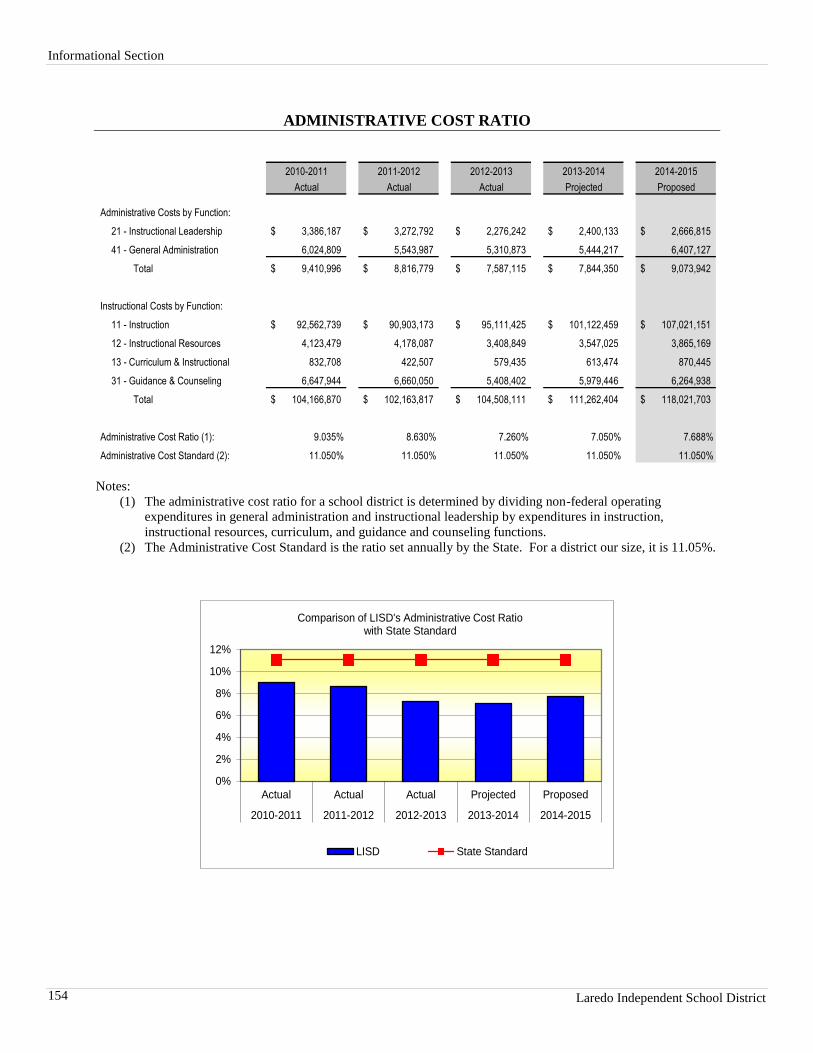
Informational Section
Laredo Independent School District 2006-2007 Annual Budget 154
ADMINISTRATIVE COST RATIO
2010-2011 2011-2012 2012-2013 2013-2014 2014-2015
Actual Actual Actual Projected Proposed
Administrative Costs by Function:
21 - Instructional Leadership 3,386,187$ 3,272,792$ 2,276,242$ 2,400,133$ 2,666,815$
41 - General Administration 6,024,809 5,543,987 5,310,873 5,444,217 6,407,127
Total 9,410,996$ 8,816,779$ 7,587,115$ 7,844,350$ 9,073,942$
Instructional Costs by Function:
11 - Instruction 92,562,739$ 90,903,173$ 95,111,425$ 101,122,459$ 107,021,151$
12 - Instructional Resources 4,123,479 4,178,087 3,408,849 3,547,025 3,865,169
13 - Curriculum & Instructional 832,708 422,507 579,435 613,474 870,445
31 - Guidance & Counseling 6,647,944 6,660,050 5,408,402 5,979,446 6,264,938
Total 104,166,870$ 102,163,817$ 104,508,111$ 111,262,404$ 118,021,703$
Administrative Cost Ratio (1): 9.035% 8.630% 7.260% 7.050% 7.688%
Administrative Cost Standard (2): 11.050% 11.050% 11.050% 11.050% 11.050%
Notes:
(1) The administrative cost ratio for a school district is determined by dividing non-federal operating
expenditures in general administration and instructional leadership by expenditures in instruction,
instructional resources, curriculum, and guidance and counseling functions.
(2) The Administrative Cost Standard is the ratio set annually by the State. For a district our size, it is 11.05%.
0%
2%
4%
6%
8%
10%
12%
Actual Actual Actual Projected Proposed
2010-2011 2011-2012 2012-2013 2013-2014 2014-2015
Comparison of LISD's Administrative Cost Ratiowith State Standard
LISD State Standard
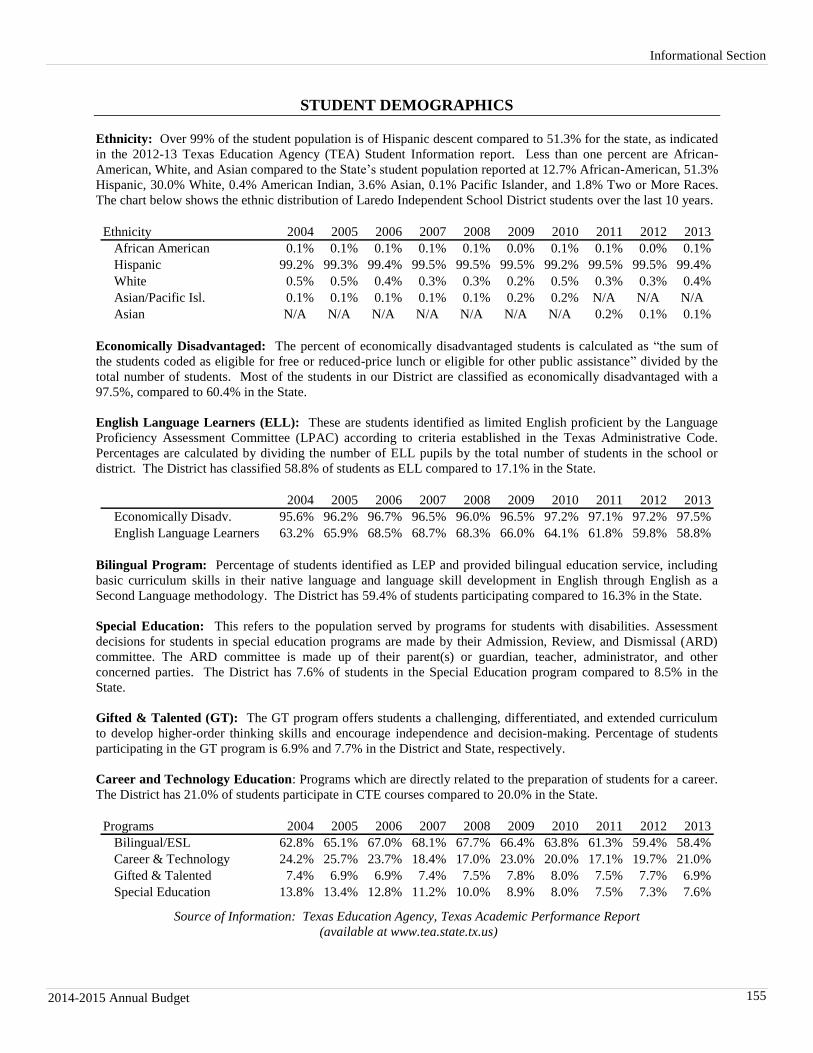
Informational Section
2014-2015 Annual Budget 155
STUDENT DEMOGRAPHICS
Ethnicity: Over 99% of the student population is of Hispanic descent compared to 51.3% for the state, as indicated
in the 2012-13 Texas Education Agency (TEA) Student Information report. Less than one percent are African-
American, White, and Asian compared to the State’s student population reported at 12.7% African-American, 51.3%
Hispanic, 30.0% White, 0.4% American Indian, 3.6% Asian, 0.1% Pacific Islander, and 1.8% Two or More Races.
The chart below shows the ethnic distribution of Laredo Independent School District students over the last 10 years.
Ethnicity 2004 2005 2006 2007 2008 2009 2010 2011 2012 2013
African American 0.1% 0.1% 0.1% 0.1% 0.1% 0.0% 0.1% 0.1% 0.0% 0.1%
Hispanic 99.2% 99.3% 99.4% 99.5% 99.5% 99.5% 99.2% 99.5% 99.5% 99.4%
White 0.5% 0.5% 0.4% 0.3% 0.3% 0.2% 0.5% 0.3% 0.3% 0.4%
Asian/Pacific Isl. 0.1% 0.1% 0.1% 0.1% 0.1% 0.2% 0.2% N/A N/A N/A
Asian N/A N/A N/A N/A N/A N/A N/A 0.2% 0.1% 0.1%
Economically Disadvantaged: The percent of economically disadvantaged students is calculated as “the sum of
the students coded as eligible for free or reduced-price lunch or eligible for other public assistance” divided by the
total number of students. Most of the students in our District are classified as economically disadvantaged with a
97.5%, compared to 60.4% in the State.
English Language Learners (ELL): These are students identified as limited English proficient by the Language
Proficiency Assessment Committee (LPAC) according to criteria established in the Texas Administrative Code.
Percentages are calculated by dividing the number of ELL pupils by the total number of students in the school or
district. The District has classified 58.8% of students as ELL compared to 17.1% in the State.
2004 2005 2006 2007 2008 2009 2010 2011 2012 2013
Economically Disadv. 95.6% 96.2% 96.7% 96.5% 96.0% 96.5% 97.2% 97.1% 97.2% 97.5%
English Language Learners 63.2% 65.9% 68.5% 68.7% 68.3% 66.0% 64.1% 61.8% 59.8% 58.8%
Bilingual Program: Percentage of students identified as LEP and provided bilingual education service, including
basic curriculum skills in their native language and language skill development in English through English as a
Second Language methodology. The District has 59.4% of students participating compared to 16.3% in the State.
Special Education: This refers to the population served by programs for students with disabilities. Assessment
decisions for students in special education programs are made by their Admission, Review, and Dismissal (ARD)
committee. The ARD committee is made up of their parent(s) or guardian, teacher, administrator, and other
concerned parties. The District has 7.6% of students in the Special Education program compared to 8.5% in the
State.
Gifted & Talented (GT): The GT program offers students a challenging, differentiated, and extended curriculum
to develop higher-order thinking skills and encourage independence and decision-making. Percentage of students
participating in the GT program is 6.9% and 7.7% in the District and State, respectively.
Career and Technology Education: Programs which are directly related to the preparation of students for a career.
The District has 21.0% of students participate in CTE courses compared to 20.0% in the State.
Programs 2004 2005 2006 2007 2008 2009 2010 2011 2012 2013
Bilingual/ESL 62.8% 65.1% 67.0% 68.1% 67.7% 66.4% 63.8% 61.3% 59.4% 58.4%
Career & Technology 24.2% 25.7% 23.7% 18.4% 17.0% 23.0% 20.0% 17.1% 19.7% 21.0%
Gifted & Talented 7.4% 6.9% 6.9% 7.4% 7.5% 7.8% 8.0% 7.5% 7.7% 6.9%
Special Education 13.8% 13.4% 12.8% 11.2% 10.0% 8.9% 8.0% 7.5% 7.3% 7.6%
Source of Information: Texas Education Agency, Texas Academic Performance Report
(available at www.tea.state.tx.us)
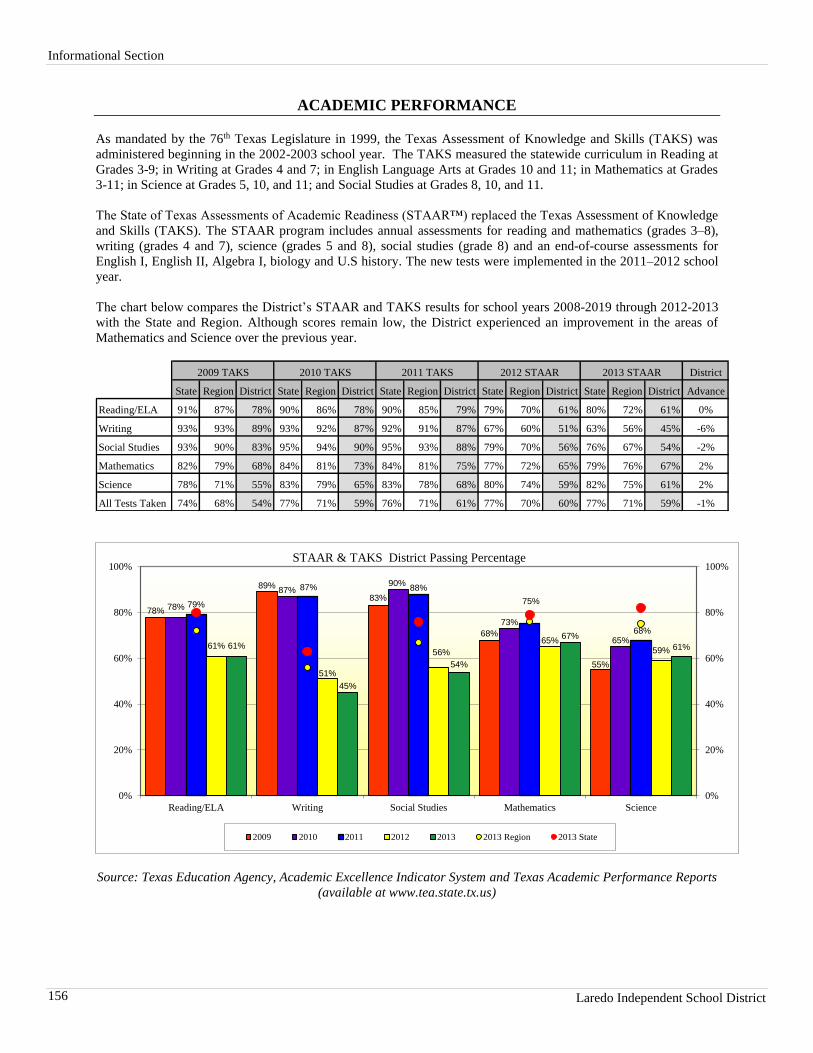
Informational Section
Laredo Independent School District 156
ACADEMIC PERFORMANCE
As mandated by the 76th Texas Legislature in 1999, the Texas Assessment of Knowledge and Skills (TAKS) was
administered beginning in the 2002-2003 school year. The TAKS measured the statewide curriculum in Reading at
Grades 3-9; in Writing at Grades 4 and 7; in English Language Arts at Grades 10 and 11; in Mathematics at Grades
3-11; in Science at Grades 5, 10, and 11; and Social Studies at Grades 8, 10, and 11.
The State of Texas Assessments of Academic Readiness (STAAR™) replaced the Texas Assessment of Knowledge
and Skills (TAKS). The STAAR program includes annual assessments for reading and mathematics (grades 3–8),
writing (grades 4 and 7), science (grades 5 and 8), social studies (grade 8) and an end-of-course assessments for
English I, English II, Algebra I, biology and U.S history. The new tests were implemented in the 2011–2012 school
year.
The chart below compares the District’s STAAR and TAKS results for school years 2008-2019 through 2012-2013
with the State and Region. Although scores remain low, the District experienced an improvement in the areas of
Mathematics and Science over the previous year.
District
State Region District State Region District State Region District State Region District State Region District Advance
Reading/ELA 91% 87% 78% 90% 86% 78% 90% 85% 79% 79% 70% 61% 80% 72% 61% 0%
Writing 93% 93% 89% 93% 92% 87% 92% 91% 87% 67% 60% 51% 63% 56% 45% -6%
Social Studies 93% 90% 83% 95% 94% 90% 95% 93% 88% 79% 70% 56% 76% 67% 54% -2%
Mathematics 82% 79% 68% 84% 81% 73% 84% 81% 75% 77% 72% 65% 79% 76% 67% 2%
Science 78% 71% 55% 83% 79% 65% 83% 78% 68% 80% 74% 59% 82% 75% 61% 2%
All Tests Taken 74% 68% 54% 77% 71% 59% 76% 71% 61% 77% 70% 60% 77% 71% 59% -1%
2012 STAAR 2013 STAAR2011 TAKS2010 TAKS2009 TAKS
78%
89%
83%
68%
55%
78%
87%90%
73%
65%
79%
87% 88%
75%
68%
61%
51%
56%
65%59%
61%
45%
54%
67%
61%
0%
20%
40%
60%
80%
100%
0%
20%
40%
60%
80%
100%
Reading/ELA Writing Social Studies Mathematics Science
STAAR & TAKS District Passing Percentage
2009 2010 2011 2012 2013 2013 Region 2013 State
Source: Texas Education Agency, Academic Excellence Indicator System and Texas Academic Performance Reports
(available at www.tea.state.tx.us)
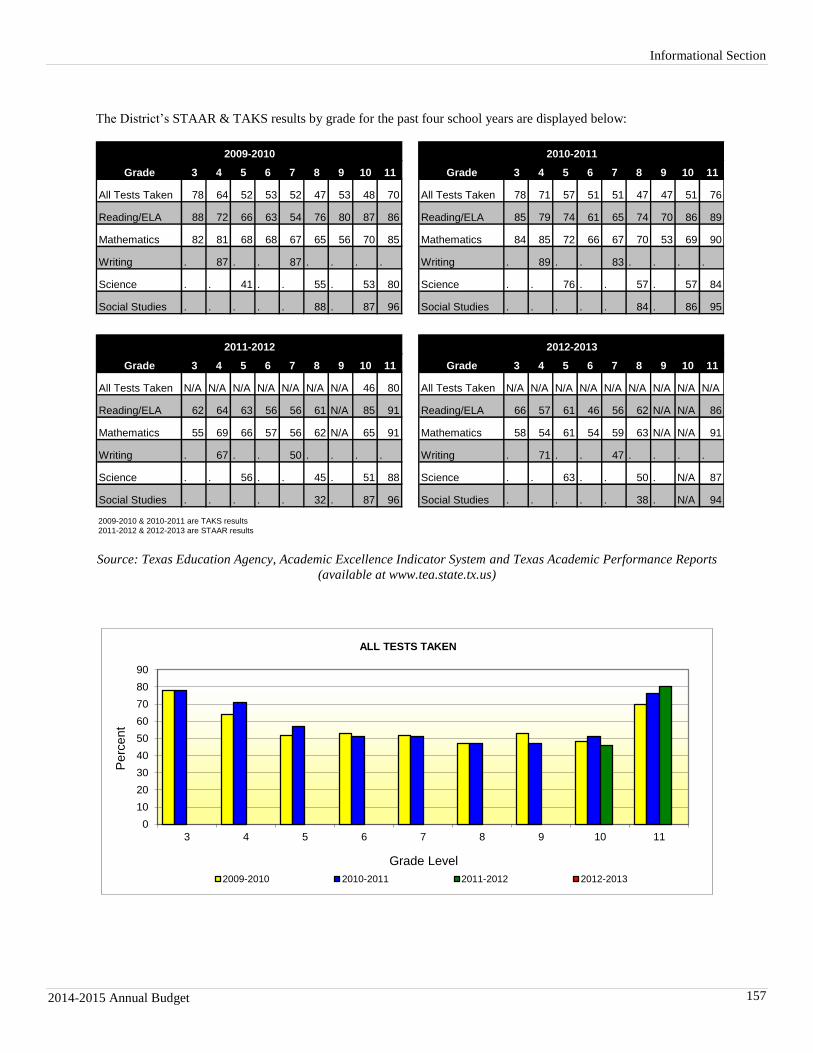
Informational Section
2014-2015 Annual Budget 157
The District’s STAAR & TAKS results by grade for the past four school years are displayed below:
Grade 3 4 5 6 7 8 9 10 11 Grade 3 4 5 6 7 8 9 10 11
All Tests Taken 78 64 52 53 52 47 53 48 70 All Tests Taken 78 71 57 51 51 47 47 51 76
Reading/ELA 88 72 66 63 54 76 80 87 86 Reading/ELA 85 79 74 61 65 74 70 86 89
Mathematics 82 81 68 68 67 65 56 70 85 Mathematics 84 85 72 66 67 70 53 69 90
Writing . 87 . . 87 . . . . Writing . 89 . . 83 . . . .
Science . . 41 . . 55 . 53 80 Science . . 76 . . 57 . 57 84
Social Studies . . . . . 88 . 87 96 Social Studies . . . . . 84 . 86 95
Grade 3 4 5 6 7 8 9 10 11 Grade 3 4 5 6 7 8 9 10 11
All Tests Taken N/A N/A N/A N/A N/A N/A N/A 46 80 All Tests Taken N/A N/A N/A N/A N/A N/A N/A N/A N/A
Reading/ELA 62 64 63 56 56 61 N/A 85 91 Reading/ELA 66 57 61 46 56 62 N/A N/A 86
Mathematics 55 69 66 57 56 62 N/A 65 91 Mathematics 58 54 61 54 59 63 N/A N/A 91
Writing . 67 . . 50 . . . . Writing . 71 . . 47 . . . .
Science . . 56 . . 45 . 51 88 Science . . 63 . . 50 . N/A 87
Social Studies . . . . . 32 . 87 96 Social Studies . . . . . 38 . N/A 94
2009-2010 & 2010-2011 are TAKS results
2011-2012 & 2012-2013 are STAAR results
2011-2012 2012-2013
2009-2010 2010-2011
Source: Texas Education Agency, Academic Excellence Indicator System and Texas Academic Performance Reports
(available at www.tea.state.tx.us)
0
10
20
30
40
50
60
70
80
90
3 4 5 6 7 8 9 10 11
Perc
ent
Grade Level
ALL TESTS TAKEN
2009-2010 2010-2011 2011-2012 2012-2013
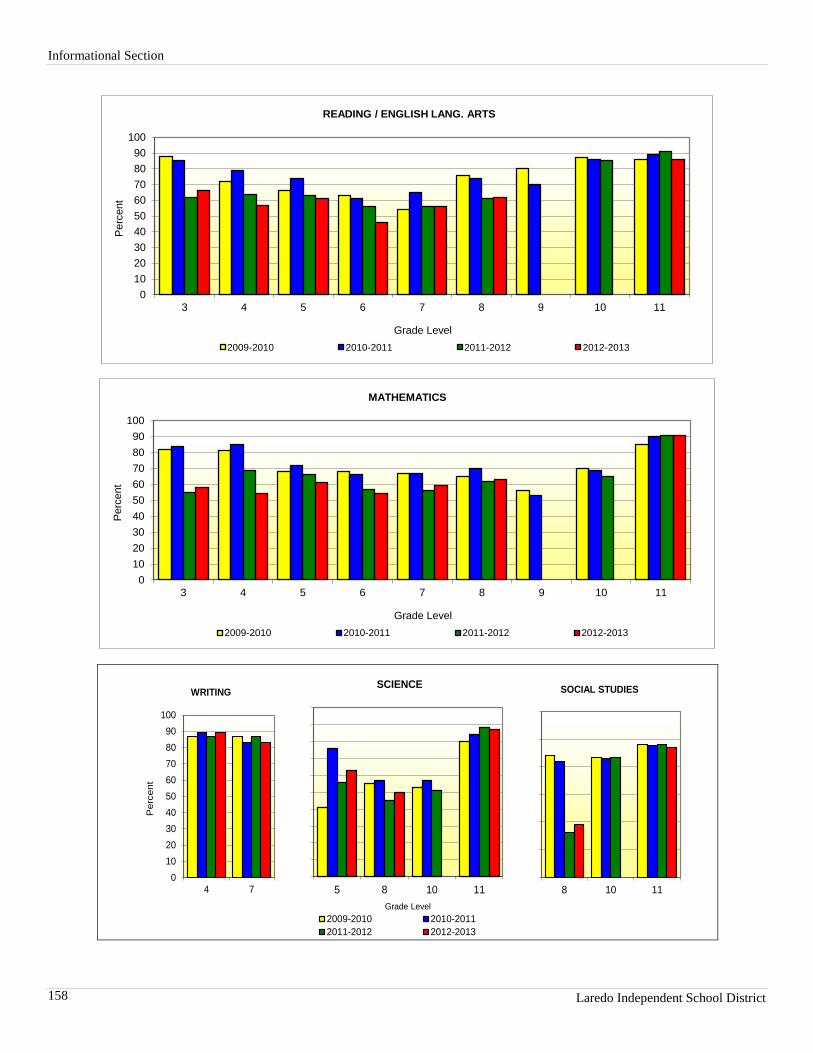
Informational Section
Laredo Independent School District 2006-2007 Annual Budget 158
0
10
20
30
40
50
60
70
80
90
100
3 4 5 6 7 8 9 10 11
Perc
ent
Grade Level
READING / ENGLISH LANG. ARTS
2009-2010 2010-2011 2011-2012 2012-2013
0
10
20
30
40
50
60
70
80
90
100
3 4 5 6 7 8 9 10 11
Perc
ent
Grade Level
MATHEMATICS
2009-2010 2010-2011 2011-2012 2012-2013
0
10
20
30
40
50
60
70
80
90
100
4 7
Perc
ent
WRITING
0
10
20
30
40
50
60
70
80
90
100
5 8 10 11
Grade Level
SCIENCE
2009-2010 2010-2011
2011-2012 2012-2013
0
20
40
60
80
100
120
8 10 11
SOCIAL STUDIES
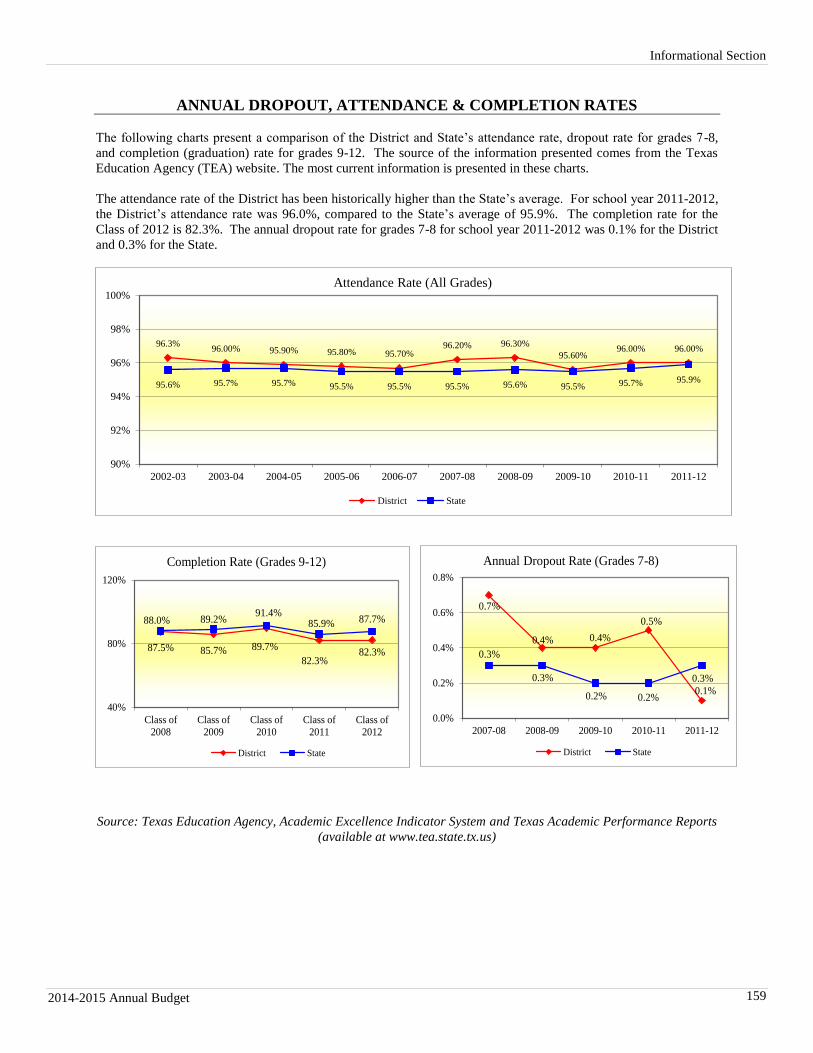
Informational Section
2014-2015 Annual Budget 159
ANNUAL DROPOUT, ATTENDANCE & COMPLETION RATES
The following charts present a comparison of the District and State’s attendance rate, dropout rate for grades 7-8,
and completion (graduation) rate for grades 9-12. The source of the information presented comes from the Texas
Education Agency (TEA) website. The most current information is presented in these charts.
The attendance rate of the District has been historically higher than the State’s average. For school year 2011-2012,
the District’s attendance rate was 96.0%, compared to the State’s average of 95.9%. The completion rate for the
Class of 2012 is 82.3%. The annual dropout rate for grades 7-8 for school year 2011-2012 was 0.1% for the District
and 0.3% for the State.
96.3%96.00% 95.90% 95.80% 95.70%
96.20% 96.30%
95.60%96.00% 96.00%
95.6% 95.7% 95.7% 95.5% 95.5% 95.5% 95.6% 95.5% 95.7% 95.9%
90%
92%
94%
96%
98%
100%
2002-03 2003-04 2004-05 2005-06 2006-07 2007-08 2008-09 2009-10 2010-11 2011-12
Attendance Rate (All Grades)
District State
87.5% 85.7% 89.7%
82.3%82.3%
88.0% 89.2%91.4%
85.9% 87.7%
40%
80%
120%
Class of
2008
Class of
2009
Class of
2010
Class of
2011
Class of
2012
Completion Rate (Grades 9-12)
District State
0.7%
0.4% 0.4%
0.5%
0.1%
0.3%
0.3%
0.2% 0.2%
0.3%
0.0%
0.2%
0.4%
0.6%
0.8%
2007-08 2008-09 2009-10 2010-11 2011-12
Annual Dropout Rate (Grades 7-8)
District State
Source: Texas Education Agency, Academic Excellence Indicator System and Texas Academic Performance Reports
(available at www.tea.state.tx.us)
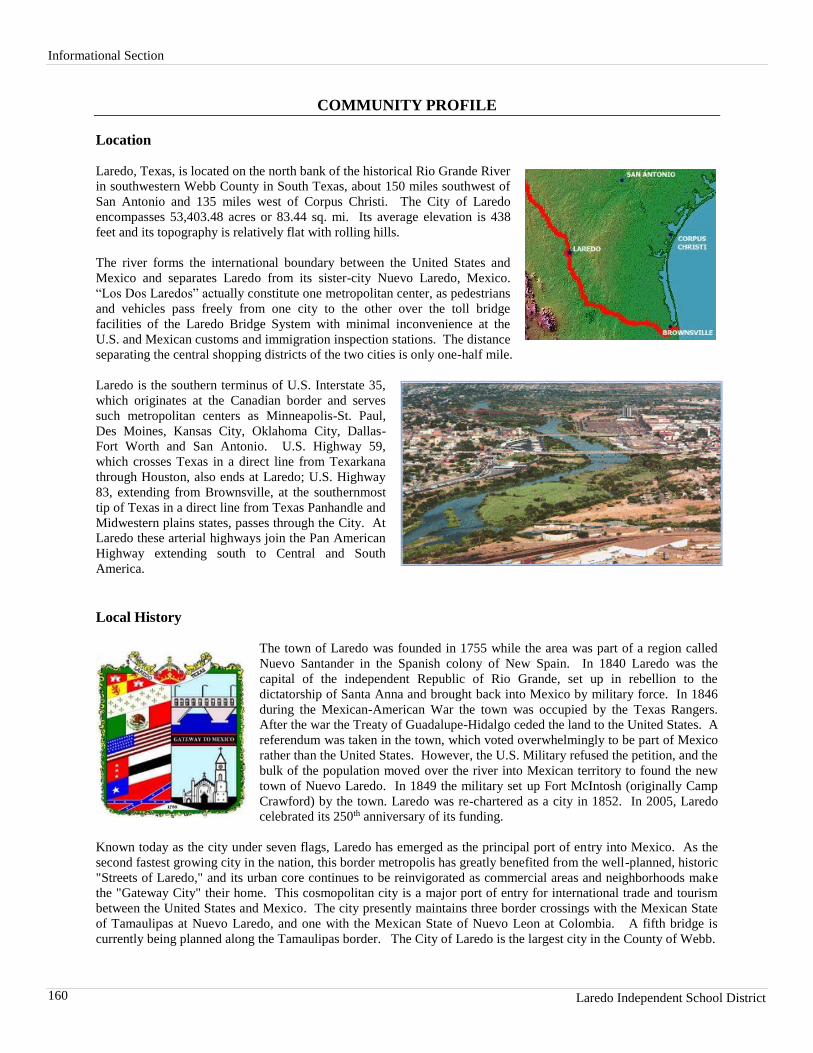
Informational Section
Laredo Independent School District 2006-2007 Annual Budget 160
COMMUNITY PROFILE
Location
Laredo, Texas, is located on the north bank of the historical Rio Grande River
in southwestern Webb County in South Texas, about 150 miles southwest of
San Antonio and 135 miles west of Corpus Christi. The City of Laredo
encompasses 53,403.48 acres or 83.44 sq. mi. Its average elevation is 438
feet and its topography is relatively flat with rolling hills.
The river forms the international boundary between the United States and
Mexico and separates Laredo from its sister-city Nuevo Laredo, Mexico.
“Los Dos Laredos” actually constitute one metropolitan center, as pedestrians
and vehicles pass freely from one city to the other over the toll bridge
facilities of the Laredo Bridge System with minimal inconvenience at the
U.S. and Mexican customs and immigration inspection stations. The distance
separating the central shopping districts of the two cities is only one-half mile.
Laredo is the southern terminus of U.S. Interstate 35,
which originates at the Canadian border and serves
such metropolitan centers as Minneapolis-St. Paul,
Des Moines, Kansas City, Oklahoma City, Dallas-
Fort Worth and San Antonio. U.S. Highway 59,
which crosses Texas in a direct line from Texarkana
through Houston, also ends at Laredo; U.S. Highway
83, extending from Brownsville, at the southernmost
tip of Texas in a direct line from Texas Panhandle and
Midwestern plains states, passes through the City. At
Laredo these arterial highways join the Pan American
Highway extending south to Central and South
America.
Local History
The town of Laredo was founded in 1755 while the area was part of a region called
Nuevo Santander in the Spanish colony of New Spain. In 1840 Laredo was the
capital of the independent Republic of Rio Grande, set up in rebellion to the
dictatorship of Santa Anna and brought back into Mexico by military force. In 1846
during the Mexican-American War the town was occupied by the Texas Rangers.
After the war the Treaty of Guadalupe-Hidalgo ceded the land to the United States. A
referendum was taken in the town, which voted overwhelmingly to be part of Mexico
rather than the United States. However, the U.S. Military refused the petition, and the
bulk of the population moved over the river into Mexican territory to found the new
town of Nuevo Laredo. In 1849 the military set up Fort McIntosh (originally Camp
Crawford) by the town. Laredo was re-chartered as a city in 1852. In 2005, Laredo
celebrated its 250th anniversary of its funding.
Known today as the city under seven flags, Laredo has emerged as the principal port of entry into Mexico. As the
second fastest growing city in the nation, this border metropolis has greatly benefited from the well-planned, historic
"Streets of Laredo," and its urban core continues to be reinvigorated as commercial areas and neighborhoods make
the "Gateway City" their home. This cosmopolitan city is a major port of entry for international trade and tourism
between the United States and Mexico. The city presently maintains three border crossings with the Mexican State
of Tamaulipas at Nuevo Laredo, and one with the Mexican State of Nuevo Leon at Colombia. A fifth bridge is
currently being planned along the Tamaulipas border. The City of Laredo is the largest city in the County of Webb.
Informational Section
2014-2015 Annual Budget 161
Population
The U.S. census reported
Laredo’s population in 1980 at
91,449, in 1990 at 122,899, and in
2000 at 176,576. During the 10
years since 2000, Laredo’s MSA
population grew by 34.4% to
reach 237,244 in 2010. Laredo’s
MSA has a current estimated 2013
population of about 249,085
people, an increase of approximately 4.99% from 2010. Nuevo Laredo’s estimated population for 2013 is 402,287.
Laredo is part of the Laredo-Nuevo Laredo Metropolitan Area with an estimate population of 651,372.
Laredo experienced a population increase of 4.99% since the 2010 census. According to the U.S. Census Bureau, as
of the 2013 Census Estimates, there are 249,085 people, 65,685 households, and 54,894 families residing in the city.
The racial makeup of the city is predominantly White (95.3%), 0.5% African American, 0.4% American Indian,
0.4% Asian, 2.9% from other races, and 0.4% from two or more races. 95.2% of the population is of Hispanic or
Latino origin.
The average age in Laredo is 28.8 years, younger than the state and national average of 34.0 and 37.5, respectively.
The population is spread out with 29.0% under the age of 14, 16.1% from 15-24, 27.5% from 25-44, 18.9% from 45-
64, and 8.5% who are 65 years of age or older.
Texas U.S.A.
Population
Total population 249,085 26,448,193 316,128,839
Gender
Male 121,967 49.0% 49.7% 49.2%
Female 127,118 51.0% 50.3% 50.8%
Age
14 or younger 72,248 29.0% 22.3% 19.4%
15-24 40,161 16.1% 14.6% 14.0%
25-44 68,499 27.5% 28.0% 26.3%
45-64 47,026 18.9% 23.8% 26.3%
65+ 21,151 8.5% 11.2% 14.2%
Average age (years) 28.8 34 37.5
Race and Ethnicity
White 237,387 95.3% 75.0% 73.7%
Black or African American 1317 0.5% 11.9% 12.6%
American Indian and Alaska Native 977 0.4% 0.4% 0.8%
Asian 1098 0.4% 4.1% 5.1%
Native Hawaiian and Other Pacific Islander 0 0.0% 0.1% 0.2%
Some other race 7,320 2.9% 6.0% 4.7%
Two or more races 986 0.4% 2.4% 3.0%
Hispanic or Latino * 237,018 95.2% 38.4% 17.1%
Laredo
Source: U.S. Census Bureau - 2013 Census Estimates
Note: * Hispanic ethnicity is a separate data category from race. This number should not be added to race totals.
Year 1980 1990 2000 2010 2013
City 91,449 122,899 176,576 237,244 249,085
County 99,258 133,239 193,117 251,632 262,495
State 14,229,000 17,045,000 20,851,820 25,257,114 26,448,193
U.S. 226,546,000 248,791,000 281,422,000 309,349,689 316,128,839
Source: U.S. Census Bureau - 2013 Census Estimates
Informational Section
Laredo Independent School District 2006-2007 Annual Budget 162
Education
The U.S. Census Bureau indicates that 136,676 of the population are 25 years of age or older, from which 25.4%
have at least a high school degree, 17.0% have some college, 6.8% have an associate’s degree, 12.0% have a
bachelor’s degree, and 5.3% have a graduate or professional degree.
Texas U.S.A.
Educational Attainment
Population 25 and older 136,676 16,673,656 210,910,615
High school graduates (includes equivalency) 34,723 25.4% 25.2% 27.8%
Some college, no degree 23,293 17.0% 22.6% 21.1%
Associate's degree 9,355 6.8% 6.5% 8.1%
Bachelor's degree 16,359 12.0% 18.3% 18.4%
Graduate or professional degree 7,264 5.3% 9.3% 11.2%
School Enrollment
Population 3 years and over enrolled in school 83,339 7,416,105 82,395,254
Nursery school, preschool 5,987 7.2% 6.2% 6.0%
Kindergarten 4,275 5.1% 5.7% 5.2%
Elementary school (grades 1-8) 39,125 46.9% 43.2% 40.0%
High School (grades 9-12) 17,377 20.9% 20.4% 20.6%
College or graduate school 16,575 19.9% 24.5% 28.3%
Laredo
Source: U.S. Census Bureau - 2013 Census Estimates
Income
According to the U.S. Census Bureau, the median income for a household in the city is $40,599, and the median
income for a family is $43,331. Males have a median income of $26,524 versus $19,255 for females. The per
capita income for the city is $14,973. 30.70% of the population and 27.60% of families are below the poverty line.
Out of the total population, 40.70% of those are age 18 and younger, and 22.80% of those are 65 and older are living
below the poverty line.
Household $40,599 Population 30.70%
Family $43,331 Families 27.60%
Males $26,524 Age 65 and over 22.80%
Females $19,255 Age 18 and younger 40.70%
Poverty StatusMedian Income
Age Laredo Texas USA Age Laredo Texas USA
15 to 24 years $17,427 $26,451 $25,391 White $40,378 $54,802 $55,867
25 to 44 years $41,154 $54,742 $56,987 Black or African American $99,762 $37,608 $34,815
45 to 64 years $49,295 $62,381 $63,474 American Indian & Alaska Native n/a $47,538 $36,641
65 years & over $24,575 $37,588 $37,847 Asian $62,016 $76,376 $72,472
Native Hawaiian & Other Islander n/a $54,624 $50,591
Some other race $32,206 $39,533 $39,346
Per Capita Income $14,973 $26,327 $28,184 Two or more races n/a $47,707 $46,709
Hispanic or Latino origin (of any race) $38,775 $40,473 $41,508
White alone, not Hispanic or Latino $61,493 $63,682 $57,684
Household Income by Race or Ethnicity
Source: U.S. Census Bureau - 2013 Census Estimates
Median Household Income by Age
Informational Section
2014-2015 Annual Budget 163
Housing
The Census indicates that there were 23,177 or 35.3 percent of renter occupied units and 42,508 or 64.7 percent of
owner occupied units. The average household size in Laredo for renter occupied units is 3.53 and 3.86 for owner
occupied units.
Laredo Texas USA Laredo Texas USA
Occupied Housing Units 23,177 3,476,536 42,447,172 42,508 5,634,317 73,843,861
% Occupied Housing Units 35.3% 38.2% 36.5% 64.7% 61.8% 63.5%
Avg. Household Size 3.53 2.64 2.54 3.86 2.96 2.71
Vacancy Rate 5.70 7.90 6.50 2.10 1.60 1.90
Median Monthly Cost ($) $445 $434 $439 $1,223 $1,375 $1,436
Median Rent ($) or Value (S) $716 $857 $905 $110,300 $132,000 $173,900
Owner Occupied
Source: U.S. Census Bureau - 2013 Census Estimates
Renter Occupied
Hotel Statistics
In 2013, Laredo reportedly had 38 hotels/motels with about 3,900 rooms. In 2013 the occupancy rate for Laredo
was 67.5 and in 2012 it was 70.5 while the state average was 63.6 and 62.5 respectively. The average daily rental
rate for Laredo during 2013 was $73.31 compared to a state average of $94.44.
Year-End Corpus Christi El Paso Laredo McAllen/Edinburg San Antonio Texas
2004 50.8 67.6 65.8 56.5 60.1 56.4
2005 51.6 67.1 63.5 56.2 63.3 60.4
2006 52.6 71.2 63.0 58.1 63.2 61.5
2007 50.1 67.2 58.8 59.2 61.7 61.7
2008 49.0 68.0 55.7 58.2 60.6 61.8
2009 49.1 64.0 48.6 52.1 56.0 54.2
2010 50.2 68.5 60.5 53.0 57.7 55.6
2011 53.0 68.4 68.0 52.5 59.9 59.5
2012 55.1 64.8 70.5 55.2 62.4 62.5
2013 55.9 64.5 67.5 55.8 62.5 63.6
Source: Market Texas Tourism
Labor Statistics
At the end of 2013, Laredo’s unemployment rate was 6.3%. The 2012 average was 6.8%, compared to 6.5% in
2004. The labor force continues to increase, while the unemployment level decreased.
Annual Average Labor Force Employment Unemployment Unemployment Rate
2004 78,064 73,026 5,038 6.5%
2005 81,085 76,489 4,596 5.7%
2006 83,120 78,823 4,297 5.2%
2007 84,532 80,731 3,801 4.5%
2008 87,683 83,123 4,560 5.2%
2009 89,626 82,583 7,043 7.9%
2010 92,769 85,081 7,688 8.3%
2011 95,183 87,767 7,416 7.8%
2012 95,933 89,441 6,492 6.8%
2013 96,981 90,823 6,158 6.3%
Source: U.S. Department of Labor - Bureau of Labor Statistics
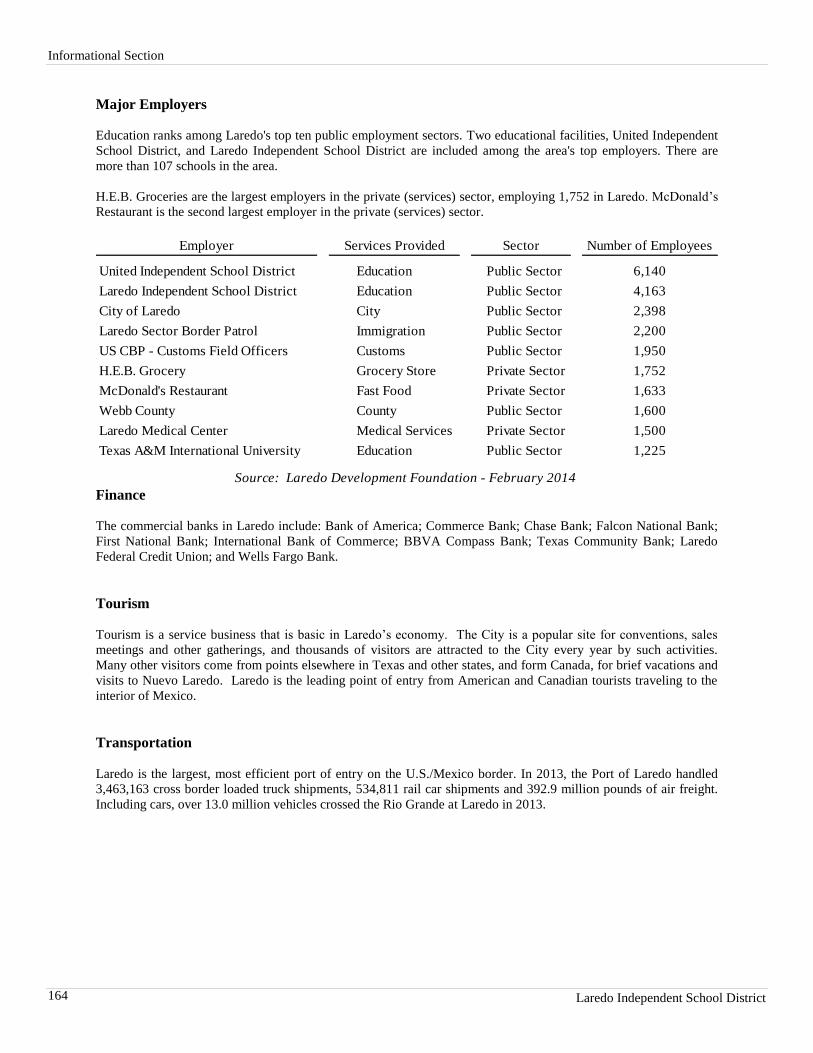
Informational Section
Laredo Independent School District 2006-2007 Annual Budget 164
Major Employers
Education ranks among Laredo's top ten public employment sectors. Two educational facilities, United Independent
School District, and Laredo Independent School District are included among the area's top employers. There are
more than 107 schools in the area.
H.E.B. Groceries are the largest employers in the private (services) sector, employing 1,752 in Laredo. McDonald’s
Restaurant is the second largest employer in the private (services) sector.
Employer Services Provided Sector Number of Employees
United Independent School District Education Public Sector 6,140
Laredo Independent School District Education Public Sector 4,163
City of Laredo City Public Sector 2,398
Laredo Sector Border Patrol Immigration Public Sector 2,200
US CBP - Customs Field Officers Customs Public Sector 1,950
H.E.B. Grocery Grocery Store Private Sector 1,752
McDonald's Restaurant Fast Food Private Sector 1,633
Webb County County Public Sector 1,600
Laredo Medical Center Medical Services Private Sector 1,500
Texas A&M International University Education Public Sector 1,225
Source: Laredo Development Foundation - February 2014 Finance
The commercial banks in Laredo include: Bank of America; Commerce Bank; Chase Bank; Falcon National Bank;
First National Bank; International Bank of Commerce; BBVA Compass Bank; Texas Community Bank; Laredo
Federal Credit Union; and Wells Fargo Bank.
Tourism
Tourism is a service business that is basic in Laredo’s economy. The City is a popular site for conventions, sales
meetings and other gatherings, and thousands of visitors are attracted to the City every year by such activities.
Many other visitors come from points elsewhere in Texas and other states, and form Canada, for brief vacations and
visits to Nuevo Laredo. Laredo is the leading point of entry from American and Canadian tourists traveling to the
interior of Mexico.
Transportation
Laredo is the largest, most efficient port of entry on the U.S./Mexico border. In 2013, the Port of Laredo handled
3,463,163 cross border loaded truck shipments, 534,811 rail car shipments and 392.9 million pounds of air freight.
Including cars, over 13.0 million vehicles crossed the Rio Grande at Laredo in 2013.
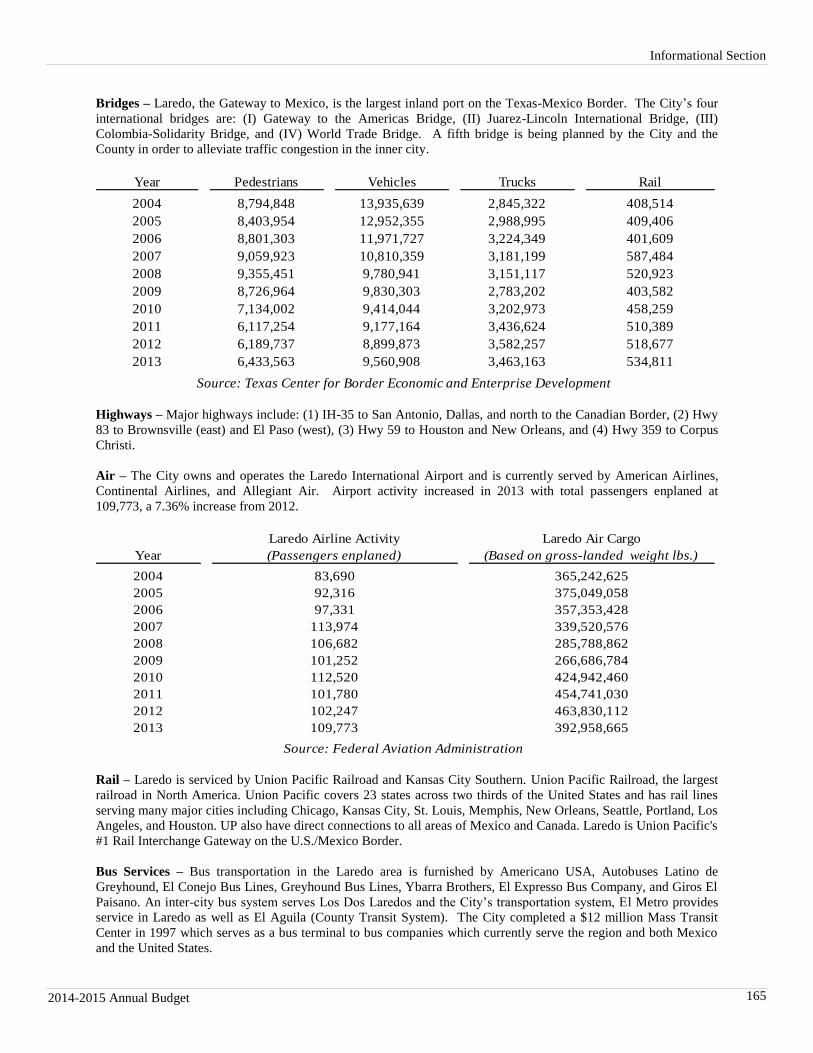
Informational Section
2014-2015 Annual Budget 165
Bridges – Laredo, the Gateway to Mexico, is the largest inland port on the Texas-Mexico Border. The City’s four
international bridges are: (I) Gateway to the Americas Bridge, (II) Juarez-Lincoln International Bridge, (III)
Colombia-Solidarity Bridge, and (IV) World Trade Bridge. A fifth bridge is being planned by the City and the
County in order to alleviate traffic congestion in the inner city.
Year Pedestrians Vehicles Trucks Rail
2004 8,794,848 13,935,639 2,845,322 408,514
2005 8,403,954 12,952,355 2,988,995 409,406
2006 8,801,303 11,971,727 3,224,349 401,609
2007 9,059,923 10,810,359 3,181,199 587,484
2008 9,355,451 9,780,941 3,151,117 520,923
2009 8,726,964 9,830,303 2,783,202 403,582
2010 7,134,002 9,414,044 3,202,973 458,259
2011 6,117,254 9,177,164 3,436,624 510,389
2012 6,189,737 8,899,873 3,582,257 518,677
2013 6,433,563 9,560,908 3,463,163 534,811
Source: Texas Center for Border Economic and Enterprise Development
Highways – Major highways include: (1) IH-35 to San Antonio, Dallas, and north to the Canadian Border, (2) Hwy
83 to Brownsville (east) and El Paso (west), (3) Hwy 59 to Houston and New Orleans, and (4) Hwy 359 to Corpus
Christi.
Air – The City owns and operates the Laredo International Airport and is currently served by American Airlines,
Continental Airlines, and Allegiant Air. Airport activity increased in 2013 with total passengers enplaned at
109,773, a 7.36% increase from 2012.
Laredo Airline Activity Laredo Air Cargo
Year (Passengers enplaned) (Based on gross-landed weight lbs.)
2004 83,690 365,242,625
2005 92,316 375,049,058
2006 97,331 357,353,428
2007 113,974 339,520,576
2008 106,682 285,788,862
2009 101,252 266,686,784
2010 112,520 424,942,460
2011 101,780 454,741,030
2012 102,247 463,830,112
2013 109,773 392,958,665
Source: Federal Aviation Administration
Rail – Laredo is serviced by Union Pacific Railroad and Kansas City Southern. Union Pacific Railroad, the largest
railroad in North America. Union Pacific covers 23 states across two thirds of the United States and has rail lines
serving many major cities including Chicago, Kansas City, St. Louis, Memphis, New Orleans, Seattle, Portland, Los
Angeles, and Houston. UP also have direct connections to all areas of Mexico and Canada. Laredo is Union Pacific's
#1 Rail Interchange Gateway on the U.S./Mexico Border.
Bus Services – Bus transportation in the Laredo area is furnished by Americano USA, Autobuses Latino de
Greyhound, El Conejo Bus Lines, Greyhound Bus Lines, Ybarra Brothers, El Expresso Bus Company, and Giros El
Paisano. An inter-city bus system serves Los Dos Laredos and the City’s transportation system, El Metro provides
service in Laredo as well as El Aguila (County Transit System). The City completed a $12 million Mass Transit
Center in 1997 which serves as a bus terminal to bus companies which currently serve the region and both Mexico
and the United States.
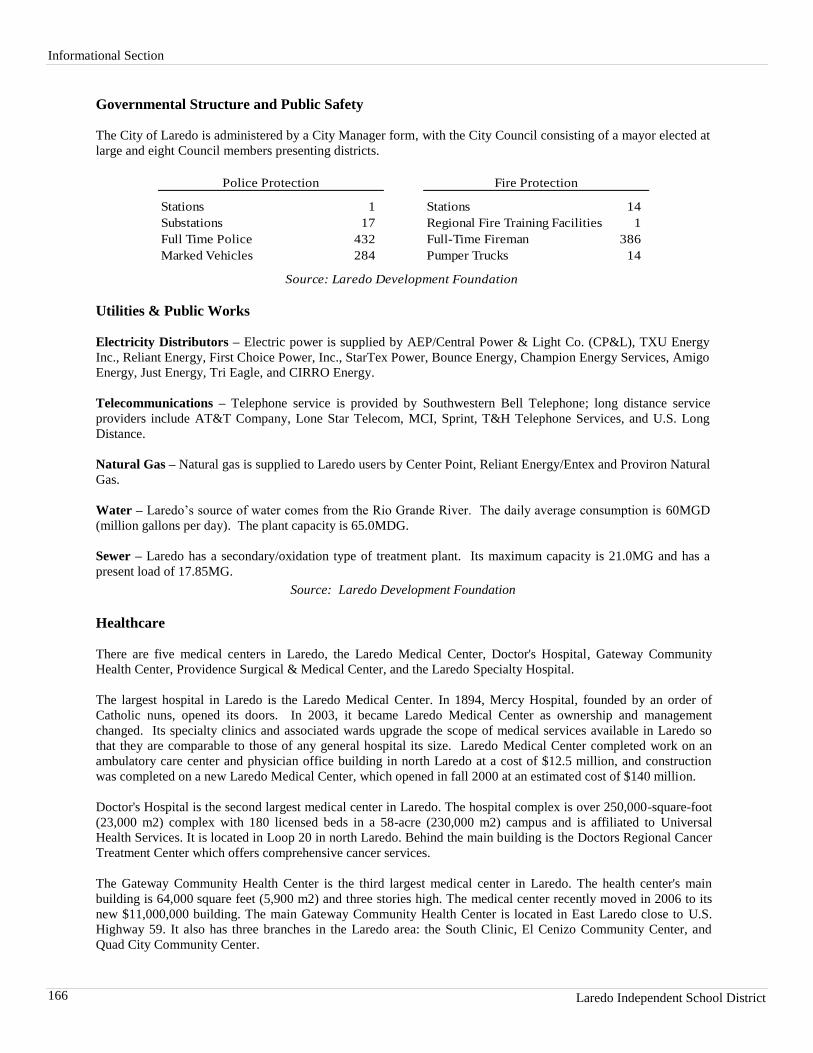
Informational Section
Laredo Independent School District 2006-2007 Annual Budget 166
Governmental Structure and Public Safety
The City of Laredo is administered by a City Manager form, with the City Council consisting of a mayor elected at
large and eight Council members presenting districts.
Stations 1 Stations 14
Substations 17 Regional Fire Training Facilities 1
Full Time Police 432 Full-Time Fireman 386
Marked Vehicles 284 Pumper Trucks 14
Police Protection Fire Protection
Source: Laredo Development Foundation
Utilities & Public Works
Electricity Distributors – Electric power is supplied by AEP/Central Power & Light Co. (CP&L), TXU Energy
Inc., Reliant Energy, First Choice Power, Inc., StarTex Power, Bounce Energy, Champion Energy Services, Amigo
Energy, Just Energy, Tri Eagle, and CIRRO Energy.
Telecommunications – Telephone service is provided by Southwestern Bell Telephone; long distance service
providers include AT&T Company, Lone Star Telecom, MCI, Sprint, T&H Telephone Services, and U.S. Long
Distance.
Natural Gas – Natural gas is supplied to Laredo users by Center Point, Reliant Energy/Entex and Proviron Natural
Gas.
Water – Laredo’s source of water comes from the Rio Grande River. The daily average consumption is 60MGD
(million gallons per day). The plant capacity is 65.0MDG.
Sewer – Laredo has a secondary/oxidation type of treatment plant. Its maximum capacity is 21.0MG and has a
present load of 17.85MG.
Source: Laredo Development Foundation
Healthcare
There are five medical centers in Laredo, the Laredo Medical Center, Doctor's Hospital, Gateway Community
Health Center, Providence Surgical & Medical Center, and the Laredo Specialty Hospital.
The largest hospital in Laredo is the Laredo Medical Center. In 1894, Mercy Hospital, founded by an order of
Catholic nuns, opened its doors. In 2003, it became Laredo Medical Center as ownership and management
changed. Its specialty clinics and associated wards upgrade the scope of medical services available in Laredo so
that they are comparable to those of any general hospital its size. Laredo Medical Center completed work on an
ambulatory care center and physician office building in north Laredo at a cost of $12.5 million, and construction
was completed on a new Laredo Medical Center, which opened in fall 2000 at an estimated cost of $140 million.
Doctor's Hospital is the second largest medical center in Laredo. The hospital complex is over 250,000-square-foot
(23,000 m2) complex with 180 licensed beds in a 58-acre (230,000 m2) campus and is affiliated to Universal
Health Services. It is located in Loop 20 in north Laredo. Behind the main building is the Doctors Regional Cancer
Treatment Center which offers comprehensive cancer services.
The Gateway Community Health Center is the third largest medical center in Laredo. The health center's main
building is 64,000 square feet (5,900 m2) and three stories high. The medical center recently moved in 2006 to its
new $11,000,000 building. The main Gateway Community Health Center is located in East Laredo close to U.S.
Highway 59. It also has three branches in the Laredo area: the South Clinic, El Cenizo Community Center, and
Quad City Community Center.
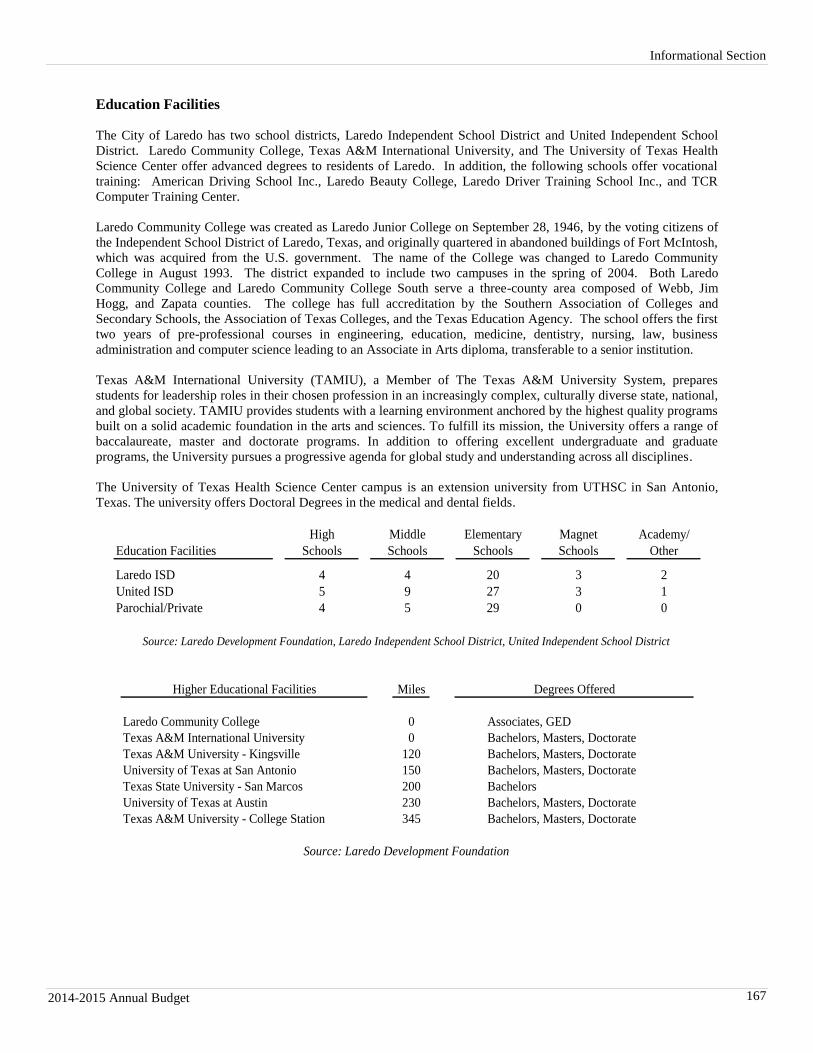
Informational Section
2014-2015 Annual Budget 167
Education Facilities
The City of Laredo has two school districts, Laredo Independent School District and United Independent School
District. Laredo Community College, Texas A&M International University, and The University of Texas Health
Science Center offer advanced degrees to residents of Laredo. In addition, the following schools offer vocational
training: American Driving School Inc., Laredo Beauty College, Laredo Driver Training School Inc., and TCR
Computer Training Center.
Laredo Community College was created as Laredo Junior College on September 28, 1946, by the voting citizens of
the Independent School District of Laredo, Texas, and originally quartered in abandoned buildings of Fort McIntosh,
which was acquired from the U.S. government. The name of the College was changed to Laredo Community
College in August 1993. The district expanded to include two campuses in the spring of 2004. Both Laredo
Community College and Laredo Community College South serve a three-county area composed of Webb, Jim
Hogg, and Zapata counties. The college has full accreditation by the Southern Association of Colleges and
Secondary Schools, the Association of Texas Colleges, and the Texas Education Agency. The school offers the first
two years of pre-professional courses in engineering, education, medicine, dentistry, nursing, law, business
administration and computer science leading to an Associate in Arts diploma, transferable to a senior institution.
Texas A&M International University (TAMIU), a Member of The Texas A&M University System, prepares
students for leadership roles in their chosen profession in an increasingly complex, culturally diverse state, national,
and global society. TAMIU provides students with a learning environment anchored by the highest quality programs
built on a solid academic foundation in the arts and sciences. To fulfill its mission, the University offers a range of
baccalaureate, master and doctorate programs. In addition to offering excellent undergraduate and graduate
programs, the University pursues a progressive agenda for global study and understanding across all disciplines.
The University of Texas Health Science Center campus is an extension university from UTHSC in San Antonio,
Texas. The university offers Doctoral Degrees in the medical and dental fields.
High Middle Elementary Magnet Academy/
Education Facilities Schools Schools Schools Schools Other
Laredo ISD 4 4 20 3 2
United ISD 5 9 27 3 1
Parochial/Private 4 5 29 0 0
Source: Laredo Development Foundation, Laredo Independent School District, United Independent School District
Higher Educational Facilities Miles Degrees Offered
Laredo Community College 0 Associates, GED
Texas A&M International University 0 Bachelors, Masters, Doctorate
Texas A&M University - Kingsville 120 Bachelors, Masters, Doctorate
University of Texas at San Antonio 150 Bachelors, Masters, Doctorate
Texas State University - San Marcos 200 Bachelors
University of Texas at Austin 230 Bachelors, Masters, Doctorate
Texas A&M University - College Station 345 Bachelors, Masters, Doctorate
Source: Laredo Development Foundation
Informational Section
Laredo Independent School District 2006-2007 Annual Budget 168
Entertainment & Recreation Highlights
Lake Casa Blanca International State Park - Hunting and fishing are good in the Laredo area. Lake Casa Blanca, a
1,500-acre lake built by Webb County on the outskirts of Laredo, provides diversified recreational opportunities.
The lake yields black bass, catfish and other varieties of fish and is used for boating and water skiing. The adjacent
park area provides a large swimming pool, picnic and game areas and an 18-hole public golf course and club house.
Activities include camping, picnicking, lake swimming, boating, mountain biking, and fishing.
LIFE Downs – Quarter horse race meets are held several times each year at the LIFE Downs track located at the
Laredo International Fair and Exposition grounds near Lake Casa Blanca. Many thoroughbred horse owners and
trainers stable their horses at LIFE Downs during winter months, where permanent stables can accommodate over
300 animals. The annual Laredo International Fair and Exposition attracts visitors from all parts of Texas and
Mexico.
Laredo Energy Arena – This multi-purpose facility has established itself as the premiere entertainment option in
south Texas and Northern Mexico. It allows affordable, family-oriented entertainment for sporting events, concerts,
trade shows, civic events, ice shows, circuses, boxing, rodeos and more. The 178,000 square foot $36.5 million
facility seats 8,000 people for ice hockey and arena football, and up to 10,000 for concerts. It has 14 luxury suites,
four meeting rooms and a private club for 200 charter members.
George Washington's Birthday Celebration – The Washington's Birthday Celebration is a month long event that
celebrates George Washington's Birthday. It was founded in 1898 by the Improved Order of the Red Men, local
chapter Yaqui Tribe #59. It is the largest celebration of its kind in the United States, with 400,000 attendees
annually. The first celebration was a success, and its popularity grew rapidly; in 1923 it received its state charter. In
1924, the Celebration featured its first Colonial Pageant, which featured 13 young girls from Laredo, representing
the 13 original colonies. The celebration includes parades, a carnival, an air show, fireworks, live concerts, and a
city-wide prom during which many of Laredo's elite dress in very formal attire. The related Jalapeño Festival is one
of the United States' top 10 eating festivals. It is the largest Celebration of its kind in the United States with
approximately 400,000 attendees annually. The Washington's Birthday Celebration was selected as one of the
American Bus Association's Top 100 Events in North America for group travel in 2011.
Jamboozie Street Festival - Jamboozie is held in late January in downtown Laredo as part of the Washington
Birthday Celebrations. As somewhat of an imitation of New Orleans’s Mardi Gras, the Jamboozie is known to be a
colorful event, with many people dressed in beads and masks and sometimes flamboyant outfits. Besides many
concession stands and up to four stages that feature local and regional bands (mostly alternative rock, classic rock
and Spanish music), there are also several bars along the proximity that are open.
Border Olympics – The annual Border Olympics Track Meet and Golf Tournament, which started in 1933, in which
athletes from universities, colleges and high schools throughout Texas, New Mexico, Oklahoma, and Arkansas, as
well as the Republic of Mexico compete, also attracts many tourists.
San Agustin Church – Part of Laredo's historic district, the current church building dates back to 1872 and contains
genealogical records from the late 1700s.
Republic of the Rio Grande Capitol Building Museum - Located in the downtown historical district next to the
historical La Posada Hotel. It was once the Republic of the Rio Grande Capitol building now showcases
memorabilia from the short lived Republic of the Rio Grande. It displays pictures, books, and furniture from the
19th century Laredo area. It offers guided tours for school age children and adults year-round. Because of this
Republic, Laredo had flown seven flags instead of the traditional Six Flags over Texas.
Imaginarium of South Texas - Formerly Laredo Children's Museum, located in Mall del Norte, provides a hands-on
experience with science, technology, and art for Laredo's youth. A second museum is planned on the Texas A&M
International University campus.
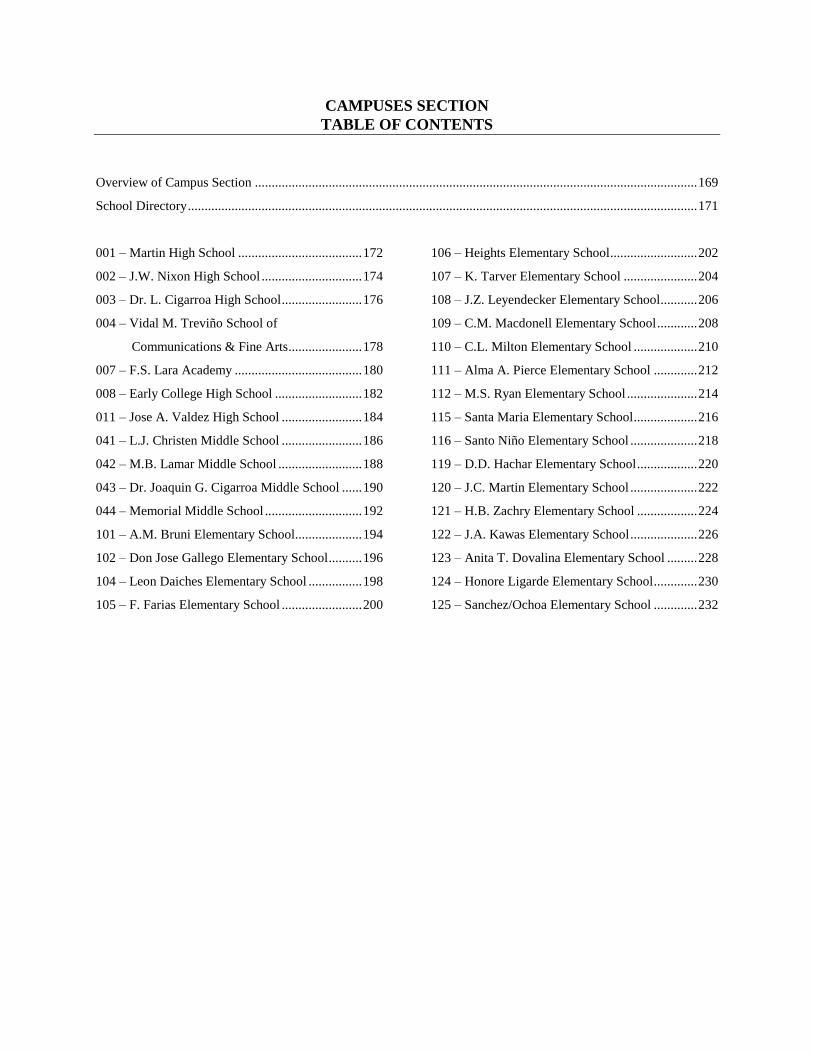
CAMPUSES SECTION
TABLE OF CONTENTS
Overview of Campus Section .................................................................................................................................... 169
School Directory ........................................................................................................................................................ 171
001 – Martin High School ..................................... 172
002 – J.W. Nixon High School .............................. 174
003 – Dr. L. Cigarroa High School ........................ 176
004 – Vidal M. Treviño School of
Communications & Fine Arts ...................... 178
007 – F.S. Lara Academy ...................................... 180
008 – Early College High School .......................... 182
011 – Jose A. Valdez High School ........................ 184
041 – L.J. Christen Middle School ........................ 186
042 – M.B. Lamar Middle School ......................... 188
043 – Dr. Joaquin G. Cigarroa Middle School ...... 190
044 – Memorial Middle School ............................. 192
101 – A.M. Bruni Elementary School.................... 194
102 – Don Jose Gallego Elementary School .......... 196
104 – Leon Daiches Elementary School ................ 198
105 – F. Farias Elementary School ........................ 200
106 – Heights Elementary School .......................... 202
107 – K. Tarver Elementary School ...................... 204
108 – J.Z. Leyendecker Elementary School ........... 206
109 – C.M. Macdonell Elementary School ............ 208
110 – C.L. Milton Elementary School ................... 210
111 – Alma A. Pierce Elementary School ............. 212
112 – M.S. Ryan Elementary School ..................... 214
115 – Santa Maria Elementary School ................... 216
116 – Santo Niño Elementary School .................... 218
119 – D.D. Hachar Elementary School .................. 220
120 – J.C. Martin Elementary School .................... 222
121 – H.B. Zachry Elementary School .................. 224
122 – J.A. Kawas Elementary School .................... 226
123 – Anita T. Dovalina Elementary School ......... 228
124 – Honore Ligarde Elementary School ............. 230
125 – Sanchez/Ochoa Elementary School ............. 232
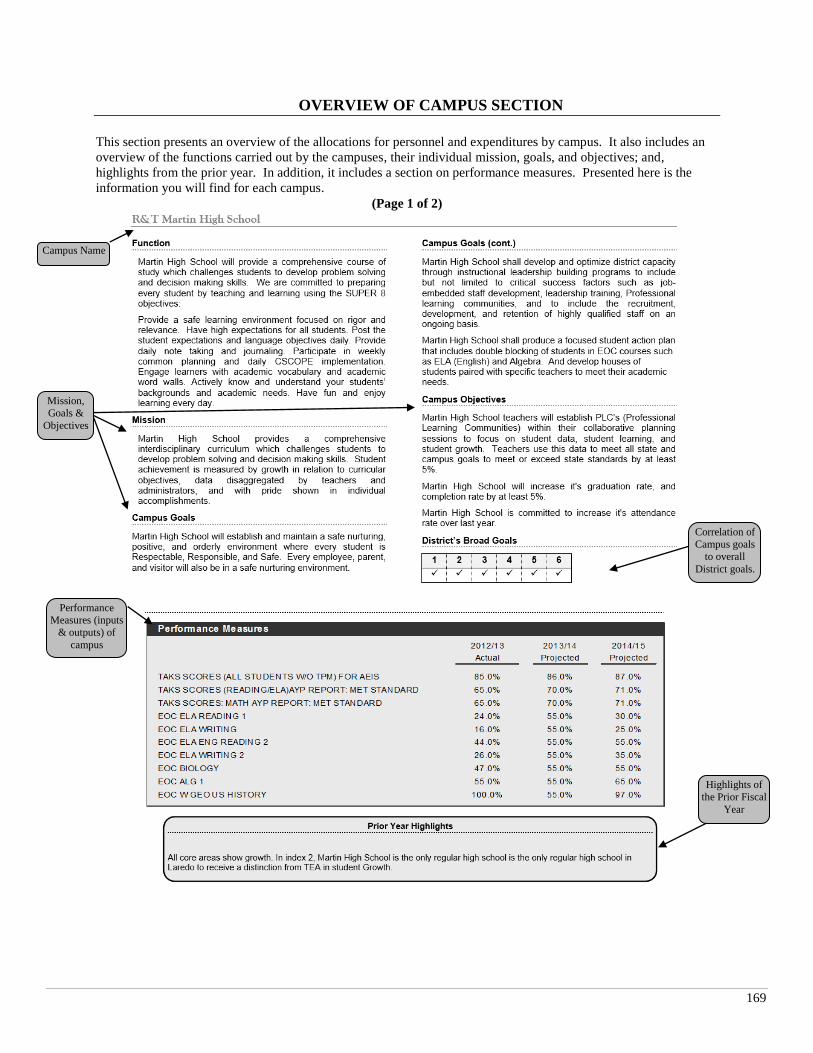
169
OVERVIEW OF CAMPUS SECTION
This section presents an overview of the allocations for personnel and expenditures by campus. It also includes an
overview of the functions carried out by the campuses, their individual mission, goals, and objectives; and,
highlights from the prior year. In addition, it includes a section on performance measures. Presented here is the
information you will find for each campus.
(Page 1 of 2)
Mission,
Goals &
Objectives
Campus Name
Performance
Measures (inputs
& outputs) of
campus
Correlation of
Campus goals
to overall
District goals.
Highlights of
the Prior Fiscal
Year
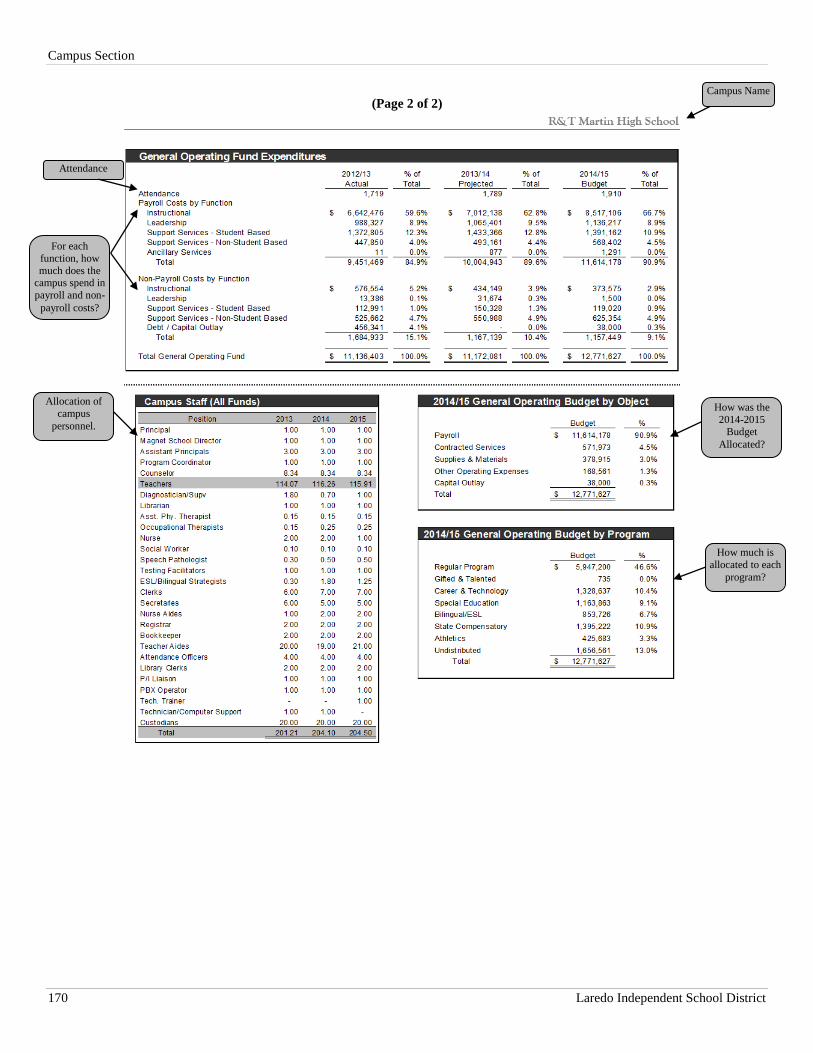
Campus Section
170 Laredo Independent School District
(Page 2 of 2)
For each function,
how much does the
campus spend in payroll and non-
payroll costs?
How much is
allocated to each
program?
Allocation of
campus
personnel.
How was the
2009-2010 Budget
Allocated?
For each
function, how
much does the campus spend in
payroll and non-
payroll costs?
Allocation of
campus
personnel.
Campus Name
How was the
2014-2015 Budget
Allocated?
Attendance
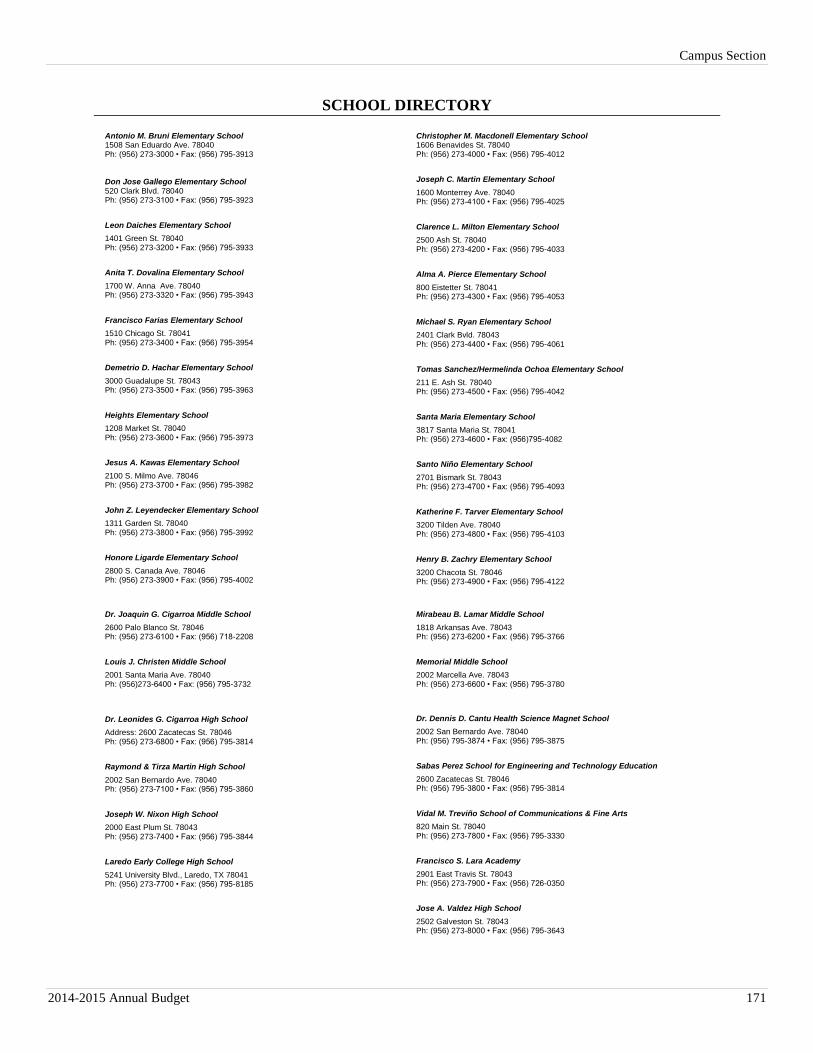
Campus Section
2014-2015 Annual Budget 171
SCHOOL DIRECTORY
Antonio M. Bruni Elementary School 1508 San Eduardo Ave. 78040 Ph: (956) 273-3000 • Fax: (956) 795-3913 Don Jose Gallego Elementary School 520 Clark Blvd. 78040 Ph: (956) 273-3100 • Fax: (956) 795-3923
Leon Daiches Elementary School
1401 Green St. 78040 Ph: (956) 273-3200 • Fax: (956) 795-3933
Anita T. Dovalina Elementary School
1700 W. Anna Ave. 78040 Ph: (956) 273-3320 • Fax: (956) 795-3943
Francisco Farias Elementary School
1510 Chicago St. 78041 Ph: (956) 273-3400 • Fax: (956) 795-3954
Demetrio D. Hachar Elementary School
3000 Guadalupe St. 78043 Ph: (956) 273-3500 • Fax: (956) 795-3963
Heights Elementary School
1208 Market St. 78040 Ph: (956) 273-3600 • Fax: (956) 795-3973
Jesus A. Kawas Elementary School
2100 S. Milmo Ave. 78046 Ph: (956) 273-3700 • Fax: (956) 795-3982
John Z. Leyendecker Elementary School
1311 Garden St. 78040 Ph: (956) 273-3800 • Fax: (956) 795-3992
Honore Ligarde Elementary School
2800 S. Canada Ave. 78046 Ph: (956) 273-3900 • Fax: (956) 795-4002
Christopher M. Macdonell Elementary School 1606 Benavides St. 78040 Ph: (956) 273-4000 • Fax: (956) 795-4012
Joseph C. Martin Elementary School
1600 Monterrey Ave. 78040 Ph: (956) 273-4100 • Fax: (956) 795-4025
Clarence L. Milton Elementary School
2500 Ash St. 78040 Ph: (956) 273-4200 • Fax: (956) 795-4033
Alma A. Pierce Elementary School
800 Eistetter St. 78041 Ph: (956) 273-4300 • Fax: (956) 795-4053
Michael S. Ryan Elementary School
2401 Clark Bvld. 78043 Ph: (956) 273-4400 • Fax: (956) 795-4061
Tomas Sanchez/Hermelinda Ochoa Elementary School
211 E. Ash St. 78040 Ph: (956) 273-4500 • Fax: (956) 795-4042
Santa Maria Elementary School
3817 Santa Maria St. 78041 Ph: (956) 273-4600 • Fax: (956)795-4082
Santo Niño Elementary School
2701 Bismark St. 78043 Ph: (956) 273-4700 • Fax: (956) 795-4093
Katherine F. Tarver Elementary School
3200 Tilden Ave. 78040 Ph: (956) 273-4800 • Fax: (956) 795-4103
Henry B. Zachry Elementary School
3200 Chacota St. 78046 Ph: (956) 273-4900 • Fax: (956) 795-4122
Dr. Joaquin G. Cigarroa Middle School
2600 Palo Blanco St. 78046 Ph: (956) 273-6100 • Fax: (956) 718-2208
Louis J. Christen Middle School
2001 Santa Maria Ave. 78040 Ph: (956)273-6400 • Fax: (956) 795-3732
Mirabeau B. Lamar Middle School
1818 Arkansas Ave. 78043 Ph: (956) 273-6200 • Fax: (956) 795-3766
Memorial Middle School
2002 Marcella Ave. 78043 Ph: (956) 273-6600 • Fax: (956) 795-3780
Dr. Leonides G. Cigarroa High School
Address: 2600 Zacatecas St. 78046 Ph: (956) 273-6800 • Fax: (956) 795-3814
Raymond & Tirza Martin High School
2002 San Bernardo Ave. 78040 Ph: (956) 273-7100 • Fax: (956) 795-3860
Joseph W. Nixon High School
2000 East Plum St. 78043 Ph: (956) 273-7400 • Fax: (956) 795-3844
Laredo Early College High School
5241 University Blvd., Laredo, TX 78041 Ph: (956) 273-7700 • Fax: (956) 795-8185
Dr. Dennis D. Cantu Health Science Magnet School
2002 San Bernardo Ave. 78040 Ph: (956) 795-3874 • Fax: (956) 795-3875
Sabas Perez School for Engineering and Technology Education
2600 Zacatecas St. 78046 Ph: (956) 795-3800 • Fax: (956) 795-3814
Vidal M. Treviño School of Communications & Fine Arts
820 Main St. 78040 Ph: (956) 273-7800 • Fax: (956) 795-3330
Francisco S. Lara Academy
2901 East Travis St. 78043 Ph: (956) 273-7900 • Fax: (956) 726-0350
Jose A. Valdez High School
2502 Galveston St. 78043 Ph: (956) 273-8000 • Fax: (956) 795-3643

R&T Martin High School
172 Laredo Independent School District
Function
Martin High School will provide a comprehensive course of study which challenges students to develop problem solving and decision making skills. We are committed to preparing every student by teaching and learning using the SUPER 8 objectives:
Provide a safe learning environment focused on rigor and relevance. Have high expectations for all students. Post the student expectations and language objectives daily. Provide daily note taking and journaling. Participate in weekly common planning and daily CSCOPE implementation. Engage learners with academic vocabulary and academic word walls. Actively know and understand your students’ backgrounds and academic needs. Have fun and enjoy learning every day.
Mission
Martin High School provides a comprehensive interdisciplinary curriculum which challenges students to develop problem solving and decision making skills. Student achievement is measured by growth in relation to curricular objectives, data disaggregated by teachers and administrators, and with pride shown in individual accomplishments.
Campus Goals
Martin High School will establish and maintain a safe nurturing, positive, and orderly environment where every student is Respectable, Responsible, and Safe. Every employee, parent, and visitor will also be in a safe nurturing environment.
Campus Goals (cont.)
Martin High School shall develop and optimize district capacity through instructional leadership building programs to include but not limited to critical success factors such as job-embedded staff development, leadership training, Professional learning communities, and to include the recruitment, development, and retention of highly qualified staff on an ongoing basis.
Martin High School shall produce a focused student action plan that includes double blocking of students in EOC courses such as ELA (English) and Algebra. And develop houses of students paired with specific teachers to meet their academic needs.
Campus Objectives
Martin High School teachers will establish PLC’s (Professional Learning Communities) within their collaborative planning sessions to focus on student data, student learning, and student growth. Teachers use this data to meet all state and campus goals to meet or exceed state standards by at least 5%.
Martin High School will increase its graduation rate, and completion rate by at least 5%.
Martin High School is committed to increase its attendance rate over last year.
District’s Broad Goals
1 2 3 4 5 6
Performance Measures
2012/13 2013/14 2014/15
Actual Projected Projected
TAKS SCORES (ALL STUDENTS W/O TPM) FOR AEIS 85.0% 86.0% 87.0%
TAKS SCORES (READING/ELA)AYP REPORT: MET STANDARD 65.0% 70.0% 71.0%
TAKS SCORES: MATH AYP REPORT: MET STANDARD 65.0% 70.0% 71.0%
EOC ELA READING 1 24.0% 55.0% 30.0%
EOC ELA WRITING 16.0% 55.0% 25.0%
EOC ELA ENG READING 2 44.0% 55.0% 55.0%
EOC ELA WRITING 2 26.0% 55.0% 35.0%
EOC BIOLOGY 47.0% 55.0% 55.0%
EOC ALG 1 55.0% 55.0% 65.0%
EOC W GEO US HISTORY 100.0% 55.0% 97.0%
Prior Year Highlights
All core areas show growth. In index 2, Martin High School is the only regular high school is in Laredo to receive a distinction from TEA in student Growth.
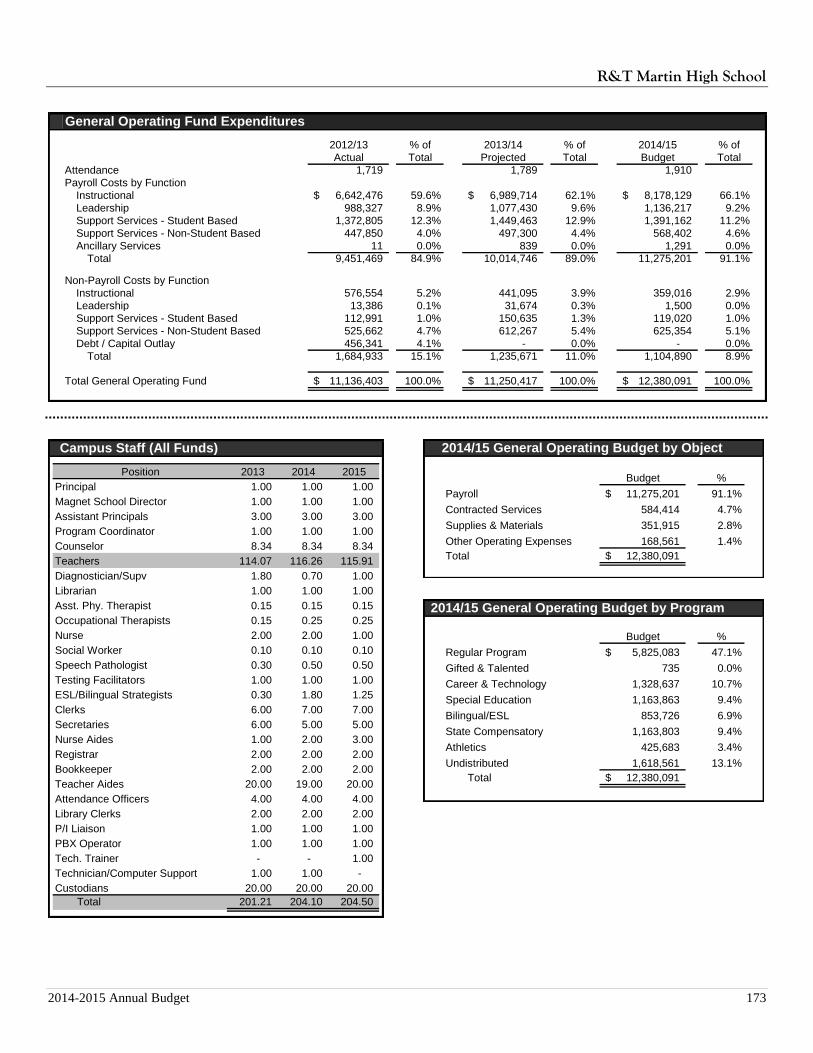
R&T Martin High School
2014-2015 Annual Budget 173
General Operating Fund Expenditures
2012/13 % of 2013/14 % of 2014/15 % of
Actual Total Projected Total Budget Total
Attendance 1,719 1,789 1,910
Payroll Costs by Function
Instructional 6,642,476$ 59.6% 6,989,714$ 62.1% 8,178,129$ 66.1%
Leadership 988,327 8.9% 1,077,430 9.6% 1,136,217 9.2%
Support Services - Student Based 1,372,805 12.3% 1,449,463 12.9% 1,391,162 11.2%
Support Services - Non-Student Based 447,850 4.0% 497,300 4.4% 568,402 4.6%
Ancillary Services 11 0.0% 839 0.0% 1,291 0.0%
Total 9,451,469 84.9% 10,014,746 89.0% 11,275,201 91.1%
Non-Payroll Costs by Function
Instructional 576,554 5.2% 441,095 3.9% 359,016 2.9%
Leadership 13,386 0.1% 31,674 0.3% 1,500 0.0%
Support Services - Student Based 112,991 1.0% 150,635 1.3% 119,020 1.0%
Support Services - Non-Student Based 525,662 4.7% 612,267 5.4% 625,354 5.1%
Debt / Capital Outlay 456,341 4.1% - 0.0% - 0.0%
Total 1,684,933 15.1% 1,235,671 11.0% 1,104,890 8.9%
Total General Operating Fund 11,136,403$ 100.0% 11,250,417$ 100.0% 12,380,091$ 100.0%
Campus Staff (All Funds)
Position 2013 2014 2015
Principal 1.00 1.00 1.00
Magnet School Director 1.00 1.00 1.00
Assistant Principals 3.00 3.00 3.00
Program Coordinator 1.00 1.00 1.00
Counselor 8.34 8.34 8.34
Teachers 114.07 116.26 115.91
Diagnostician/Supv 1.80 0.70 1.00
Librarian 1.00 1.00 1.00
Asst. Phy. Therapist 0.15 0.15 0.15
Occupational Therapists 0.15 0.25 0.25
Nurse 2.00 2.00 1.00
Social Worker 0.10 0.10 0.10
Speech Pathologist 0.30 0.50 0.50
Testing Facilitators 1.00 1.00 1.00
ESL/Bilingual Strategists 0.30 1.80 1.25
Clerks 6.00 7.00 7.00
Secretaries 6.00 5.00 5.00
Nurse Aides 1.00 2.00 3.00
Registrar 2.00 2.00 2.00
Bookkeeper 2.00 2.00 2.00
Teacher Aides 20.00 19.00 20.00
Attendance Officers 4.00 4.00 4.00
Library Clerks 2.00 2.00 2.00
P/I Liaison 1.00 1.00 1.00
PBX Operator 1.00 1.00 1.00
Tech. Trainer - - 1.00
Technician/Computer Support 1.00 1.00 -
Custodians 20.00 20.00 20.00
Total 201.21 204.10 204.50
2014/15 General Operating Budget by Object
Budget %
Payroll 11,275,201$ 91.1%
Contracted Services 584,414 4.7%
Supplies & Materials 351,915 2.8%
Other Operating Expenses 168,561 1.4%
Total 12,380,091$
2014/15 General Operating Budget by Program
Budget %
Regular Program 5,825,083$ 47.1%
Gifted & Talented 735 0.0%
Career & Technology 1,328,637 10.7%
Special Education 1,163,863 9.4%
Bilingual/ESL 853,726 6.9%
State Compensatory 1,163,803 9.4%
Athletics 425,683 3.4%
Undistributed 1,618,561 13.1%
Total 12,380,091$
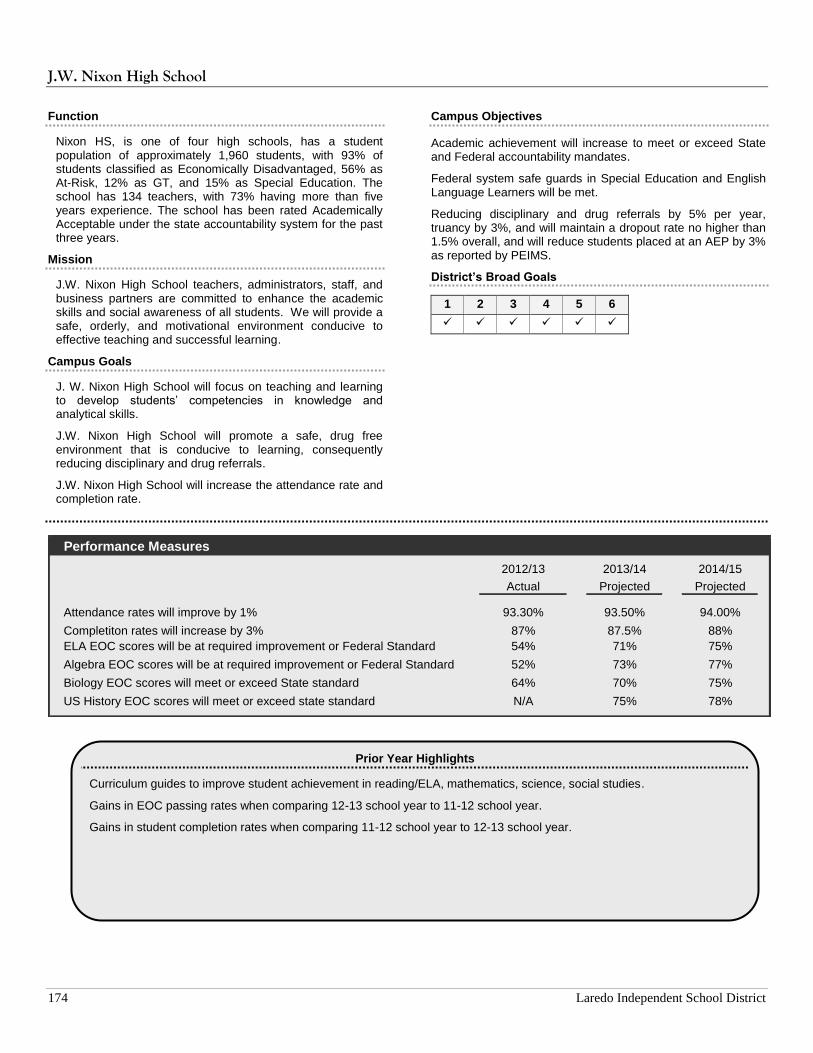
J.W. Nixon High School
174 Laredo Independent School District
Function
Nixon HS, is one of four high schools, has a student population of approximately 1,960 students, with 93% of students classified as Economically Disadvantaged, 56% as At-Risk, 12% as GT, and 15% as Special Education. The school has 134 teachers, with 73% having more than five years experience. The school has been rated Academically Acceptable under the state accountability system for the past three years.
Mission
J.W. Nixon High School teachers, administrators, staff, and business partners are committed to enhance the academic skills and social awareness of all students. We will provide a safe, orderly, and motivational environment conducive to effective teaching and successful learning.
Campus Goals
J. W. Nixon High School will focus on teaching and learning to develop students’ competencies in knowledge and analytical skills.
J.W. Nixon High School will promote a safe, drug free environment that is conducive to learning, consequently reducing disciplinary and drug referrals.
J.W. Nixon High School will increase the attendance rate and completion rate.
Campus Objectives
Academic achievement will increase to meet or exceed State and Federal accountability mandates.
Federal system safe guards in Special Education and English Language Learners will be met.
Reducing disciplinary and drug referrals by 5% per year, truancy by 3%, and will maintain a dropout rate no higher than 1.5% overall, and will reduce students placed at an AEP by 3% as reported by PEIMS.
District’s Broad Goals
1 2 3 4 5 6
Performance Measures
2012/13 2013/14 2014/15
Actual Projected Projected
Attendance rates will improve by 1% 93.30% 93.50% 94.00%
Completiton rates will increase by 3% 87% 87.5% 88%
ELA EOC scores will be at required improvement or Federal Standard 54% 71% 75%
Algebra EOC scores will be at required improvement or Federal Standard 52% 73% 77%
Biology EOC scores will meet or exceed State standard 64% 70% 75%
US History EOC scores will meet or exceed state standard N/A 75% 78%
Prior Year Highlights
Curriculum guides to improve student achievement in reading/ELA, mathematics, science, social studies.
Gains in EOC passing rates when comparing 12-13 school year to 11-12 school year.
Gains in student completion rates when comparing 11-12 school year to 12-13 school year.
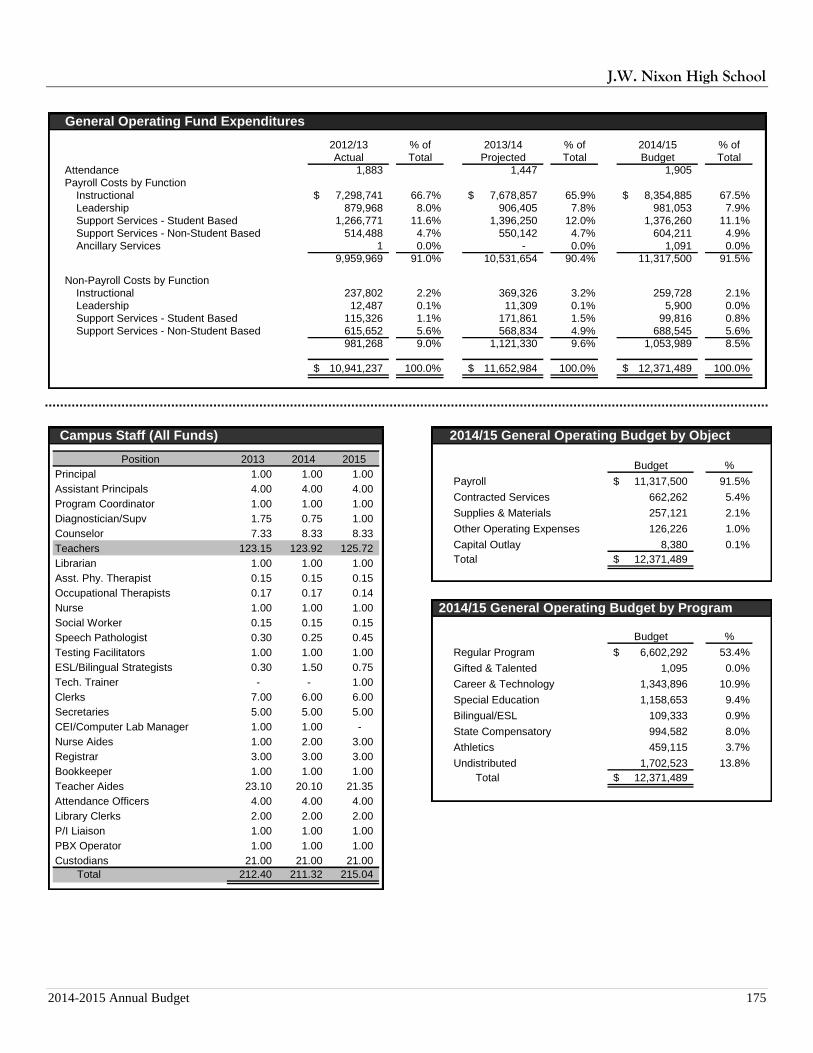
J.W. Nixon High School
2014-2015 Annual Budget 175
General Operating Fund Expenditures
2012/13 % of 2013/14 % of 2014/15 % of
Actual Total Projected Total Budget Total
Attendance 1,883 1,447 1,905
Payroll Costs by Function
Instructional 7,298,741$ 66.7% 7,678,857$ 65.9% 8,354,885$ 67.5%
Leadership 879,968 8.0% 906,405 7.8% 981,053 7.9%
Support Services - Student Based 1,266,771 11.6% 1,396,250 12.0% 1,376,260 11.1%
Support Services - Non-Student Based 514,488 4.7% 550,142 4.7% 604,211 4.9%
Ancillary Services 1 0.0% - 0.0% 1,091 0.0%
9,959,969 91.0% 10,531,654 90.4% 11,317,500 91.5%
Non-Payroll Costs by Function
Instructional 237,802 2.2% 369,326 3.2% 259,728 2.1%
Leadership 12,487 0.1% 11,309 0.1% 5,900 0.0%
Support Services - Student Based 115,326 1.1% 171,861 1.5% 99,816 0.8%
Support Services - Non-Student Based 615,652 5.6% 568,834 4.9% 688,545 5.6%
981,268 9.0% 1,121,330 9.6% 1,053,989 8.5%
10,941,237$ 100.0% 11,652,984$ 100.0% 12,371,489$ 100.0%
Campus Staff (All Funds)
Position 2013 2014 2015
Principal 1.00 1.00 1.00
Assistant Principals 4.00 4.00 4.00
Program Coordinator 1.00 1.00 1.00
Diagnostician/Supv 1.75 0.75 1.00
Counselor 7.33 8.33 8.33
Teachers 123.15 123.92 125.72
Librarian 1.00 1.00 1.00
Asst. Phy. Therapist 0.15 0.15 0.15
Occupational Therapists 0.17 0.17 0.14
Nurse 1.00 1.00 1.00
Social Worker 0.15 0.15 0.15
Speech Pathologist 0.30 0.25 0.45
Testing Facilitators 1.00 1.00 1.00
ESL/Bilingual Strategists 0.30 1.50 0.75
Tech. Trainer - - 1.00
Clerks 7.00 6.00 6.00
Secretaries 5.00 5.00 5.00
CEI/Computer Lab Manager 1.00 1.00 -
Nurse Aides 1.00 2.00 3.00
Registrar 3.00 3.00 3.00
Bookkeeper 1.00 1.00 1.00
Teacher Aides 23.10 20.10 21.35
Attendance Officers 4.00 4.00 4.00
Library Clerks 2.00 2.00 2.00
P/I Liaison 1.00 1.00 1.00
PBX Operator 1.00 1.00 1.00
Custodians 21.00 21.00 21.00
Total 212.40 211.32 215.04
2014/15 General Operating Budget by Object
Budget %
Payroll 11,317,500$ 91.5%
Contracted Services 662,262 5.4%
Supplies & Materials 257,121 2.1%
Other Operating Expenses 126,226 1.0%
Capital Outlay 8,380 0.1%
Total 12,371,489$
2014/15 General Operating Budget by Program
Budget %
Regular Program 6,602,292$ 53.4%
Gifted & Talented 1,095 0.0%
Career & Technology 1,343,896 10.9%
Special Education 1,158,653 9.4%
Bilingual/ESL 109,333 0.9%
State Compensatory 994,582 8.0%
Athletics 459,115 3.7%
Undistributed 1,702,523 13.8%
Total 12,371,489$
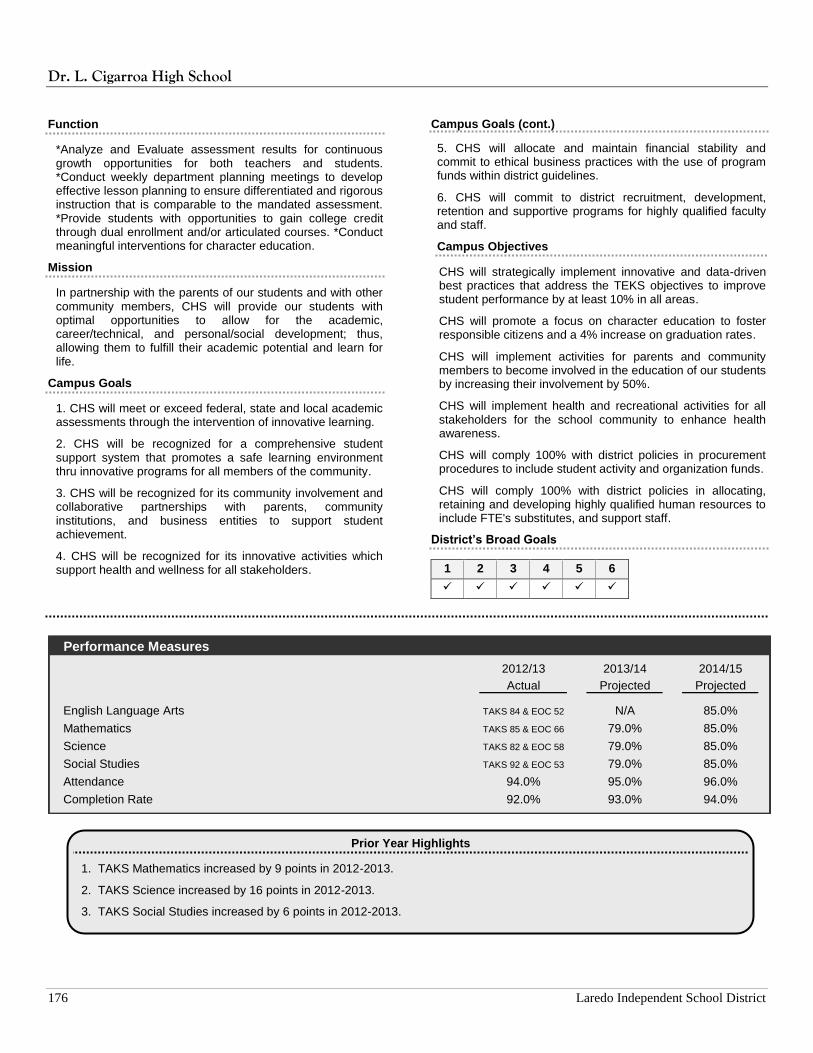
Dr. L. Cigarroa High School
176 Laredo Independent School District
Function
*Analyze and Evaluate assessment results for continuous growth opportunities for both teachers and students. *Conduct weekly department planning meetings to develop effective lesson planning to ensure differentiated and rigorous instruction that is comparable to the mandated assessment. *Provide students with opportunities to gain college credit through dual enrollment and/or articulated courses. *Conduct meaningful interventions for character education.
Mission
In partnership with the parents of our students and with other community members, CHS will provide our students with optimal opportunities to allow for the academic, career/technical, and personal/social development; thus, allowing them to fulfill their academic potential and learn for life.
Campus Goals
1. CHS will meet or exceed federal, state and local academic assessments through the intervention of innovative learning.
2. CHS will be recognized for a comprehensive student support system that promotes a safe learning environment thru innovative programs for all members of the community.
3. CHS will be recognized for its community involvement and collaborative partnerships with parents, community institutions, and business entities to support student achievement.
4. CHS will be recognized for its innovative activities which support health and wellness for all stakeholders.
Campus Goals (cont.)
5. CHS will allocate and maintain financial stability and commit to ethical business practices with the use of program funds within district guidelines.
6. CHS will commit to district recruitment, development, retention and supportive programs for highly qualified faculty and staff.
Campus Objectives
CHS will strategically implement innovative and data-driven best practices that address the TEKS objectives to improve student performance by at least 10% in all areas.
CHS will promote a focus on character education to foster responsible citizens and a 4% increase on graduation rates.
CHS will implement activities for parents and community members to become involved in the education of our students by increasing their involvement by 50%.
CHS will implement health and recreational activities for all stakeholders for the school community to enhance health awareness.
CHS will comply 100% with district policies in procurement procedures to include student activity and organization funds.
CHS will comply 100% with district policies in allocating, retaining and developing highly qualified human resources to include FTE's substitutes, and support staff.
District’s Broad Goals
1 2 3 4 5 6
Performance Measures
2012/13 2013/14 2014/15
Actual Projected Projected
English Language Arts TAKS 84 & EOC 52 N/A 85.0%
Mathematics TAKS 85 & EOC 66 79.0% 85.0%
Science TAKS 82 & EOC 58 79.0% 85.0%
Social Studies TAKS 92 & EOC 53 79.0% 85.0%
Attendance 94.0% 95.0% 96.0%
Completion Rate 92.0% 93.0% 94.0%
Prior Year Highlights
1. TAKS Mathematics increased by 9 points in 2012-2013.
2. TAKS Science increased by 16 points in 2012-2013.
3. TAKS Social Studies increased by 6 points in 2012-2013.
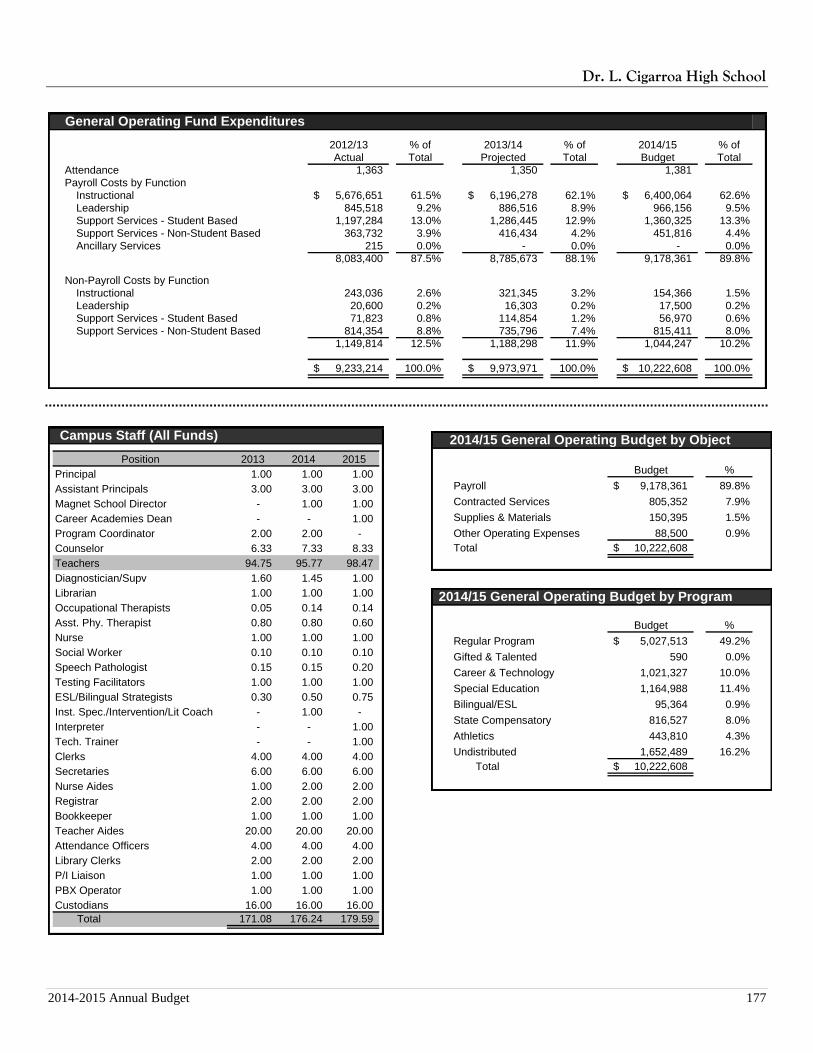
Dr. L. Cigarroa High School
2014-2015 Annual Budget 177
General Operating Fund Expenditures
2012/13 % of 2013/14 % of 2014/15 % of
Actual Total Projected Total Budget Total
Attendance 1,363 1,350 1,381
Payroll Costs by Function
Instructional 5,676,651$ 61.5% 6,196,278$ 62.1% 6,400,064$ 62.6%
Leadership 845,518 9.2% 886,516 8.9% 966,156 9.5%
Support Services - Student Based 1,197,284 13.0% 1,286,445 12.9% 1,360,325 13.3%
Support Services - Non-Student Based 363,732 3.9% 416,434 4.2% 451,816 4.4%
Ancillary Services 215 0.0% - 0.0% - 0.0%
8,083,400 87.5% 8,785,673 88.1% 9,178,361 89.8%
Non-Payroll Costs by Function
Instructional 243,036 2.6% 321,345 3.2% 154,366 1.5%
Leadership 20,600 0.2% 16,303 0.2% 17,500 0.2%
Support Services - Student Based 71,823 0.8% 114,854 1.2% 56,970 0.6%
Support Services - Non-Student Based 814,354 8.8% 735,796 7.4% 815,411 8.0%
1,149,814 12.5% 1,188,298 11.9% 1,044,247 10.2%
9,233,214$ 100.0% 9,973,971$ 100.0% 10,222,608$ 100.0%
Campus Staff (All Funds)
Position 2013 2014 2015
Principal 1.00 1.00 1.00
Assistant Principals 3.00 3.00 3.00
Magnet School Director - 1.00 1.00
Career Academies Dean - - 1.00
Program Coordinator 2.00 2.00 -
Counselor 6.33 7.33 8.33
Teachers 94.75 95.77 98.47
Diagnostician/Supv 1.60 1.45 1.00
Librarian 1.00 1.00 1.00
Occupational Therapists 0.05 0.14 0.14
Asst. Phy. Therapist 0.80 0.80 0.60
Nurse 1.00 1.00 1.00
Social Worker 0.10 0.10 0.10
Speech Pathologist 0.15 0.15 0.20
Testing Facilitators 1.00 1.00 1.00
ESL/Bilingual Strategists 0.30 0.50 0.75
Inst. Spec./Intervention/Lit Coach - 1.00 -
Interpreter - - 1.00
Tech. Trainer - - 1.00
Clerks 4.00 4.00 4.00
Secretaries 6.00 6.00 6.00
Nurse Aides 1.00 2.00 2.00
Registrar 2.00 2.00 2.00
Bookkeeper 1.00 1.00 1.00
Teacher Aides 20.00 20.00 20.00
Attendance Officers 4.00 4.00 4.00
Library Clerks 2.00 2.00 2.00
P/I Liaison 1.00 1.00 1.00
PBX Operator 1.00 1.00 1.00
Custodians 16.00 16.00 16.00
Total 171.08 176.24 179.59
2014/15 General Operating Budget by Object
Budget %
Payroll 9,178,361$ 89.8%
Contracted Services 805,352 7.9%
Supplies & Materials 150,395 1.5%
Other Operating Expenses 88,500 0.9%
Total 10,222,608$
2014/15 General Operating Budget by Program
Budget %
Regular Program 5,027,513$ 49.2%
Gifted & Talented 590 0.0%
Career & Technology 1,021,327 10.0%
Special Education 1,164,988 11.4%
Bilingual/ESL 95,364 0.9%
State Compensatory 816,527 8.0%
Athletics 443,810 4.3%
Undistributed 1,652,489 16.2%
Total 10,222,608$
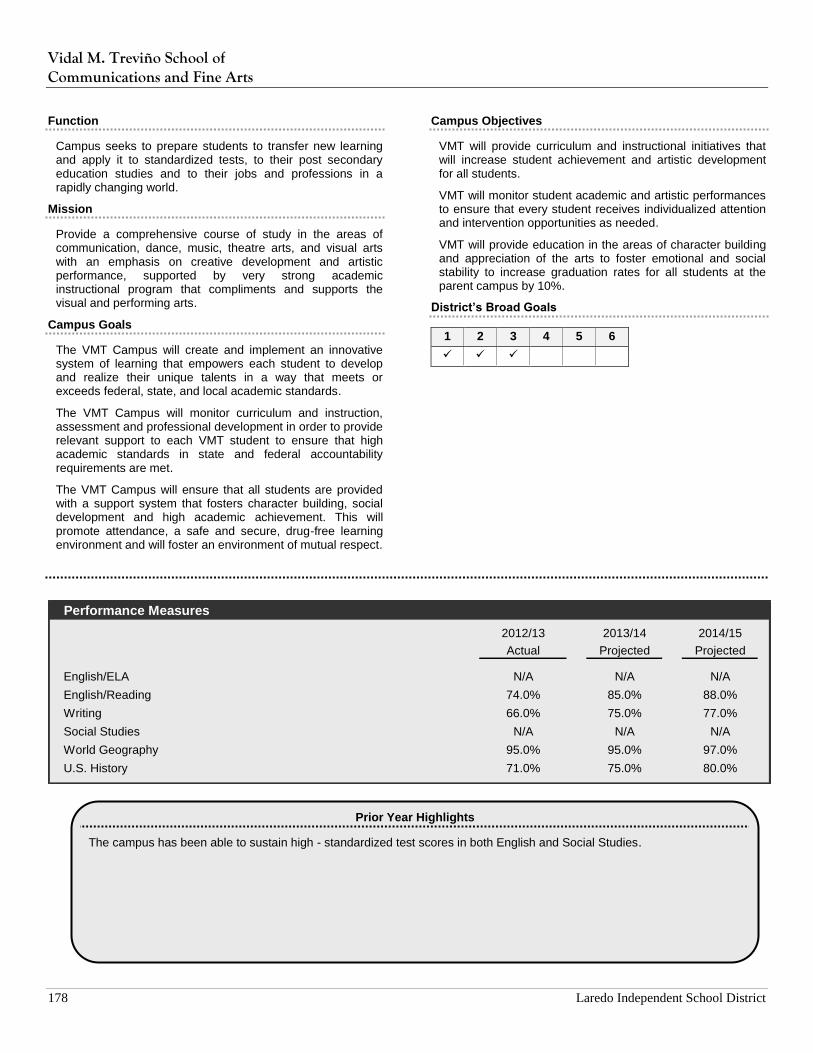
Vidal M. Treviño School of Communications and Fine Arts
178 Laredo Independent School District
Function
Campus seeks to prepare students to transfer new learning and apply it to standardized tests, to their post secondary education studies and to their jobs and professions in a rapidly changing world.
Mission
Provide a comprehensive course of study in the areas of communication, dance, music, theatre arts, and visual arts with an emphasis on creative development and artistic performance, supported by very strong academic instructional program that compliments and supports the visual and performing arts.
Campus Goals
The VMT Campus will create and implement an innovative system of learning that empowers each student to develop and realize their unique talents in a way that meets or exceeds federal, state, and local academic standards.
The VMT Campus will monitor curriculum and instruction, assessment and professional development in order to provide relevant support to each VMT student to ensure that high academic standards in state and federal accountability requirements are met.
The VMT Campus will ensure that all students are provided with a support system that fosters character building, social development and high academic achievement. This will promote attendance, a safe and secure, drug-free learning environment and will foster an environment of mutual respect.
Campus Objectives
VMT will provide curriculum and instructional initiatives that will increase student achievement and artistic development for all students.
VMT will monitor student academic and artistic performances to ensure that every student receives individualized attention and intervention opportunities as needed.
VMT will provide education in the areas of character building and appreciation of the arts to foster emotional and social stability to increase graduation rates for all students at the parent campus by 10%.
District’s Broad Goals
1 2 3 4 5 6
Performance Measures
2012/13 2013/14 2014/15
Actual Projected Projected
English/ELA N/A N/A N/A
English/Reading 74.0% 85.0% 88.0%
Writing 66.0% 75.0% 77.0%
Social Studies N/A N/A N/A
World Geography 95.0% 95.0% 97.0%
U.S. History 71.0% 75.0% 80.0%
Prior Year Highlights
The campus has been able to sustain high - standardized test scores in both English and Social Studies.
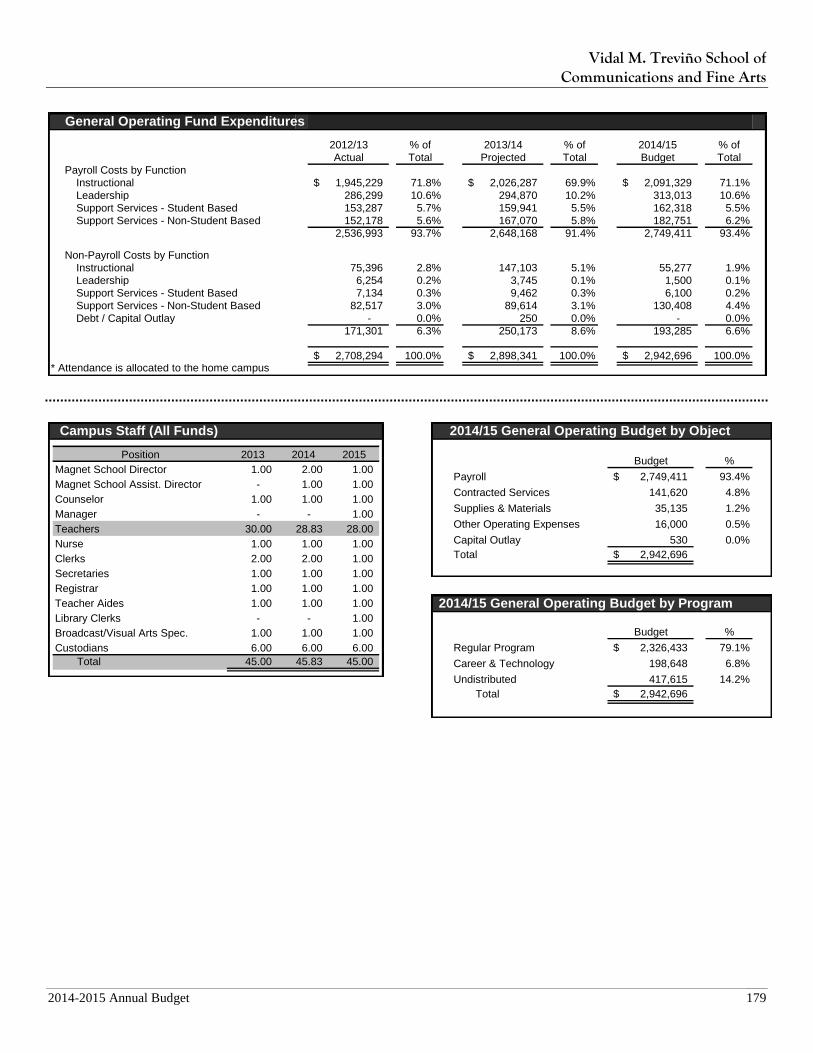
Vidal M. Treviño School of Communications and Fine Arts
2014-2015 Annual Budget 179
General Operating Fund Expenditures
2012/13 % of 2013/14 % of 2014/15 % of
Actual Total Projected Total Budget Total
Payroll Costs by Function
Instructional 1,945,229$ 71.8% 2,026,287$ 69.9% 2,091,329$ 71.1%
Leadership 286,299 10.6% 294,870 10.2% 313,013 10.6%
Support Services - Student Based 153,287 5.7% 159,941 5.5% 162,318 5.5%
Support Services - Non-Student Based 152,178 5.6% 167,070 5.8% 182,751 6.2%
2,536,993 93.7% 2,648,168 91.4% 2,749,411 93.4%
Non-Payroll Costs by Function
Instructional 75,396 2.8% 147,103 5.1% 55,277 1.9%
Leadership 6,254 0.2% 3,745 0.1% 1,500 0.1%
Support Services - Student Based 7,134 0.3% 9,462 0.3% 6,100 0.2%
Support Services - Non-Student Based 82,517 3.0% 89,614 3.1% 130,408 4.4%
Debt / Capital Outlay - 0.0% 250 0.0% - 0.0%
171,301 6.3% 250,173 8.6% 193,285 6.6%
2,708,294$ 100.0% 2,898,341$ 100.0% 2,942,696$ 100.0%* Attendance is allocated to the home campus
Campus Staff (All Funds)
Position 2013 2014 2015
Magnet School Director 1.00 2.00 1.00
Magnet School Assist. Director - 1.00 1.00
Counselor 1.00 1.00 1.00
Manager - - 1.00
Teachers 30.00 28.83 28.00
Nurse 1.00 1.00 1.00
Clerks 2.00 2.00 1.00
Secretaries 1.00 1.00 1.00
Registrar 1.00 1.00 1.00
Teacher Aides 1.00 1.00 1.00
Library Clerks - - 1.00
Broadcast/Visual Arts Spec. 1.00 1.00 1.00
Custodians 6.00 6.00 6.00
Total 45.00 45.83 45.00
2014/15 General Operating Budget by Object
Budget %
Payroll 2,749,411$ 93.4%
Contracted Services 141,620 4.8%
Supplies & Materials 35,135 1.2%
Other Operating Expenses 16,000 0.5%
Capital Outlay 530 0.0%
Total 2,942,696$
2014/15 General Operating Budget by Program
Budget %
Regular Program 2,326,433$ 79.1%
Career & Technology 198,648 6.8%
Undistributed 417,615 14.2%
Total 2,942,696$
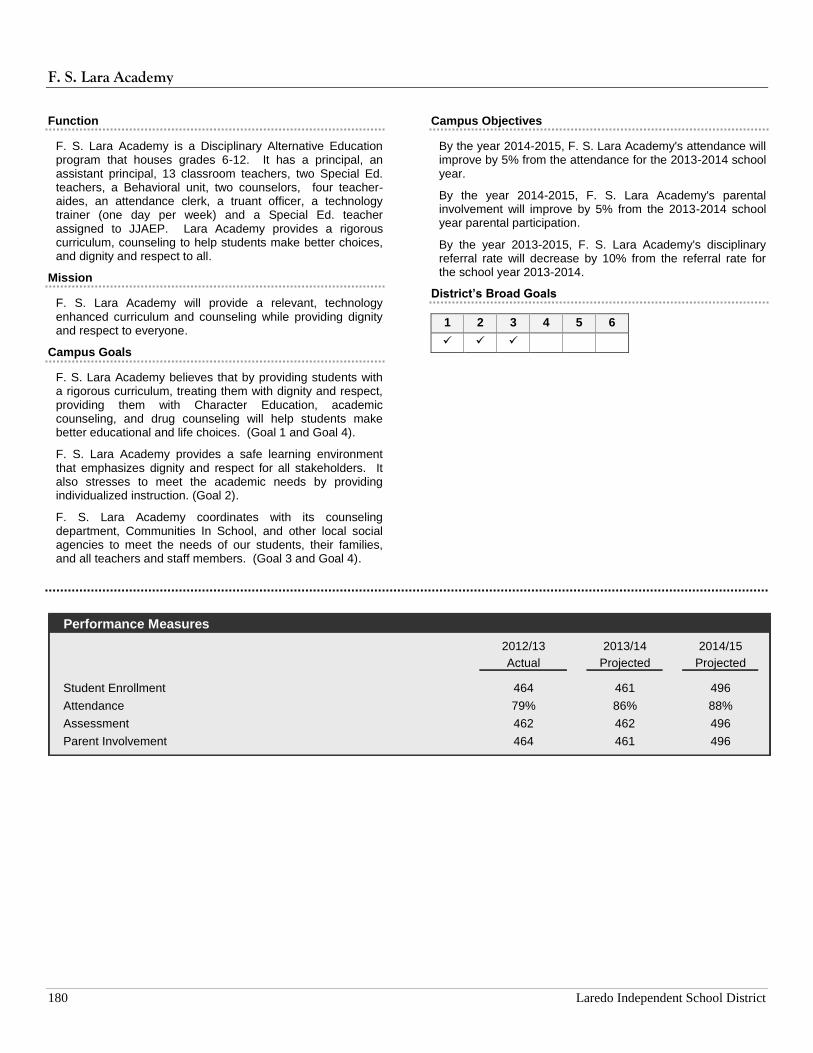
F. S. Lara Academy
180 Laredo Independent School District
Function
F. S. Lara Academy is a Disciplinary Alternative Education program that houses grades 6-12. It has a principal, an assistant principal, 13 classroom teachers, two Special Ed. teachers, a Behavioral unit, two counselors, four teacher-aides, an attendance clerk, a truant officer, a technology trainer (one day per week) and a Special Ed. teacher assigned to JJAEP. Lara Academy provides a rigorous curriculum, counseling to help students make better choices, and dignity and respect to all.
Mission
F. S. Lara Academy will provide a relevant, technology enhanced curriculum and counseling while providing dignity and respect to everyone.
Campus Goals
F. S. Lara Academy believes that by providing students with a rigorous curriculum, treating them with dignity and respect, providing them with Character Education, academic counseling, and drug counseling will help students make better educational and life choices. (Goal 1 and Goal 4).
F. S. Lara Academy provides a safe learning environment that emphasizes dignity and respect for all stakeholders. It also stresses to meet the academic needs by providing individualized instruction. (Goal 2).
F. S. Lara Academy coordinates with its counseling department, Communities In School, and other local social agencies to meet the needs of our students, their families, and all teachers and staff members. (Goal 3 and Goal 4).
Campus Objectives
By the year 2014-2015, F. S. Lara Academy's attendance will improve by 5% from the attendance for the 2013-2014 school year.
By the year 2014-2015, F. S. Lara Academy's parental involvement will improve by 5% from the 2013-2014 school year parental participation.
By the year 2013-2015, F. S. Lara Academy's disciplinary referral rate will decrease by 10% from the referral rate for the school year 2013-2014.
District’s Broad Goals
1 2 3 4 5 6
Performance Measures
2012/13 2013/14 2014/15
Actual Projected Projected
Student Enrollment 464 461 496
Attendance 79% 86% 88%
Assessment 462 462 496
Parent Involvement 464 461 496
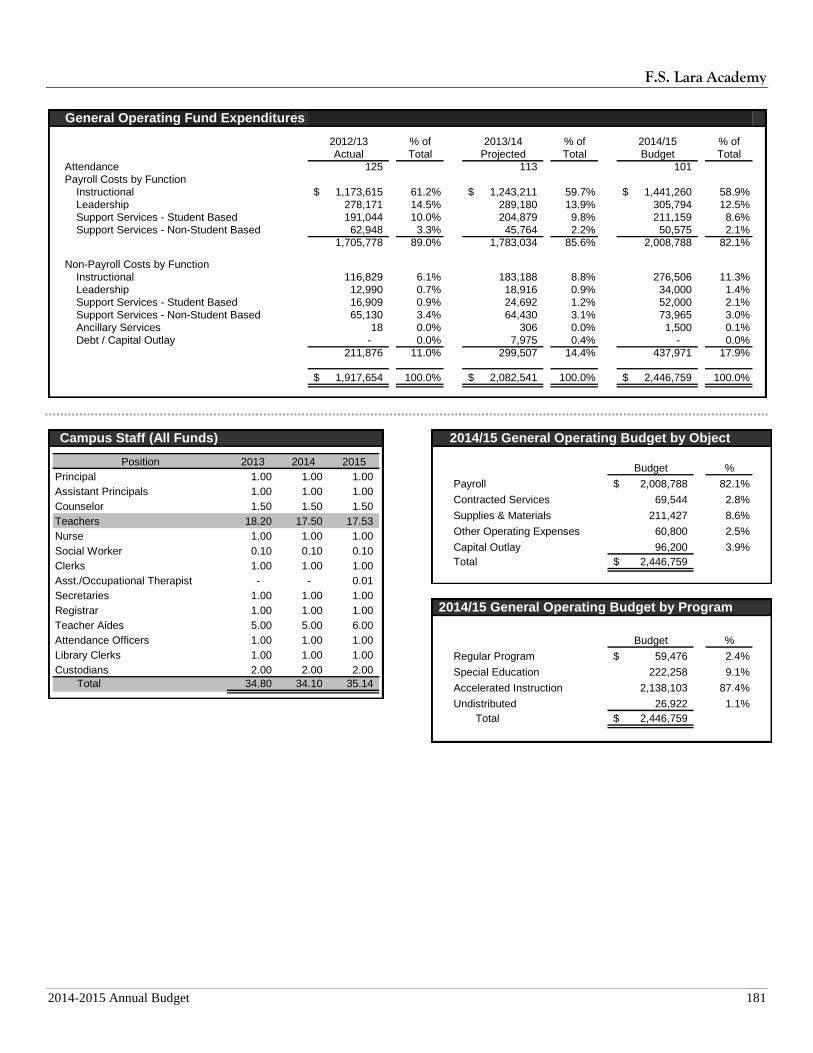
F.S. Lara Academy
2014-2015 Annual Budget 181
General Operating Fund Expenditures
2012/13 % of 2013/14 % of 2014/15 % of
Actual Total Projected Total Budget Total
Attendance 125 113 101
Payroll Costs by Function
Instructional 1,173,615$ 61.2% 1,243,211$ 59.7% 1,441,260$ 58.9%
Leadership 278,171 14.5% 289,180 13.9% 305,794 12.5%
Support Services - Student Based 191,044 10.0% 204,879 9.8% 211,159 8.6%
Support Services - Non-Student Based 62,948 3.3% 45,764 2.2% 50,575 2.1%
1,705,778 89.0% 1,783,034 85.6% 2,008,788 82.1%
Non-Payroll Costs by Function
Instructional 116,829 6.1% 183,188 8.8% 276,506 11.3%
Leadership 12,990 0.7% 18,916 0.9% 34,000 1.4%
Support Services - Student Based 16,909 0.9% 24,692 1.2% 52,000 2.1%
Support Services - Non-Student Based 65,130 3.4% 64,430 3.1% 73,965 3.0%
Ancillary Services 18 0.0% 306 0.0% 1,500 0.1%
Debt / Capital Outlay - 0.0% 7,975 0.4% - 0.0%
211,876 11.0% 299,507 14.4% 437,971 17.9%
1,917,654$ 100.0% 2,082,541$ 100.0% 2,446,759$ 100.0%
Campus Staff (All Funds)
Position 2013 2014 2015
Principal 1.00 1.00 1.00
Assistant Principals 1.00 1.00 1.00
Counselor 1.50 1.50 1.50
Teachers 18.20 17.50 17.53
Nurse 1.00 1.00 1.00
Social Worker 0.10 0.10 0.10
Clerks 1.00 1.00 1.00
Asst./Occupational Therapist - - 0.01
Secretaries 1.00 1.00 1.00
Registrar 1.00 1.00 1.00
Teacher Aides 5.00 5.00 6.00
Attendance Officers 1.00 1.00 1.00
Library Clerks 1.00 1.00 1.00
Custodians 2.00 2.00 2.00
Total 34.80 34.10 35.14
2014/15 General Operating Budget by Object
Budget %
Payroll 2,008,788$ 82.1%
Contracted Services 69,544 2.8%
Supplies & Materials 211,427 8.6%
Other Operating Expenses 60,800 2.5%
Capital Outlay 96,200 3.9%
Total 2,446,759$
2014/15 General Operating Budget by Program
Budget %
Regular Program 59,476$ 2.4%
Special Education 222,258 9.1%
Accelerated Instruction 2,138,103 87.4%
Undistributed 26,922 1.1%
Total 2,446,759$
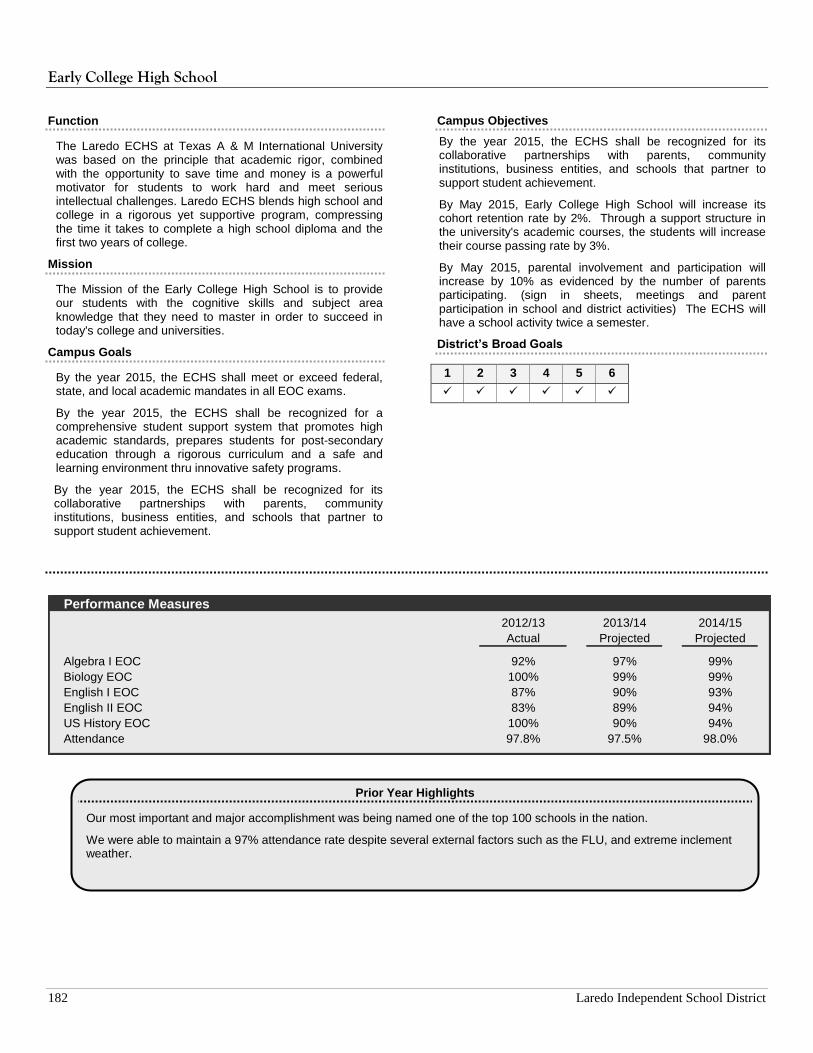
Early College High School
182 Laredo Independent School District
Function
The Laredo ECHS at Texas A & M International University was based on the principle that academic rigor, combined with the opportunity to save time and money is a powerful motivator for students to work hard and meet serious intellectual challenges. Laredo ECHS blends high school and college in a rigorous yet supportive program, compressing the time it takes to complete a high school diploma and the first two years of college.
Mission
The Mission of the Early College High School is to provide our students with the cognitive skills and subject area knowledge that they need to master in order to succeed in today's college and universities.
Campus Goals
By the year 2015, the ECHS shall meet or exceed federal, state, and local academic mandates in all EOC exams.
By the year 2015, the ECHS shall be recognized for a comprehensive student support system that promotes high academic standards, prepares students for post-secondary education through a rigorous curriculum and a safe and learning environment thru innovative safety programs.
By the year 2015, the ECHS shall be recognized for its collaborative partnerships with parents, community institutions, business entities, and schools that partner to support student achievement.
Campus Objectives
By the year 2015, the ECHS shall be recognized for its collaborative partnerships with parents, community institutions, business entities, and schools that partner to support student achievement.
By May 2015, Early College High School will increase its cohort retention rate by 2%. Through a support structure in the university's academic courses, the students will increase their course passing rate by 3%.
By May 2015, parental involvement and participation will increase by 10% as evidenced by the number of parents participating. (sign in sheets, meetings and parent participation in school and district activities) The ECHS will have a school activity twice a semester.
District’s Broad Goals
1 2 3 4 5 6
Performance Measures
2012/13 2013/14 2014/15
Actual Projected Projected
Algebra I EOC 92% 97% 99%
Biology EOC 100% 99% 99%
English I EOC 87% 90% 93%
English II EOC 83% 89% 94%
US History EOC 100% 90% 94%
Attendance 97.8% 97.5% 98.0%
Prior Year Highlights
Our most important and major accomplishment was being named one of the top 100 schools in the nation.
We were able to maintain a 97% attendance rate despite several external factors such as the FLU, and extreme inclement weather.
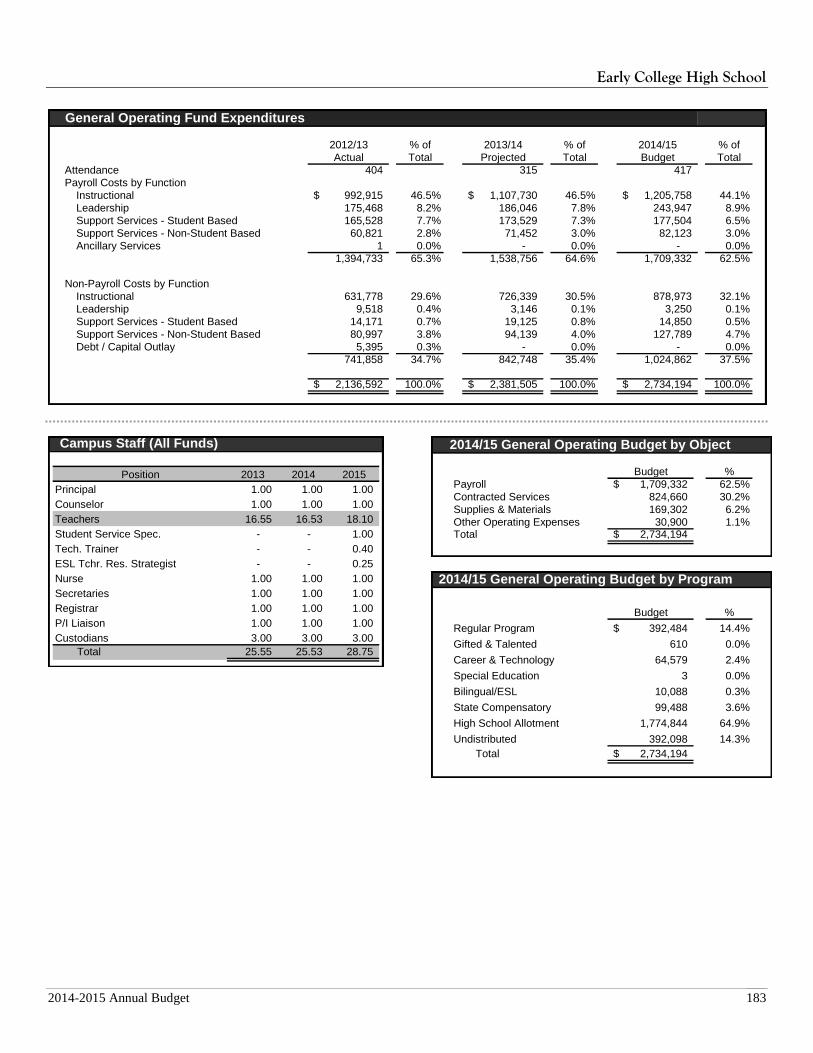
Early College High School
2014-2015 Annual Budget 183
General Operating Fund Expenditures
2012/13 % of 2013/14 % of 2014/15 % of
Actual Total Projected Total Budget Total
Attendance 404 315 417
Payroll Costs by Function
Instructional 992,915$ 46.5% 1,107,730$ 46.5% 1,205,758$ 44.1%
Leadership 175,468 8.2% 186,046 7.8% 243,947 8.9%
Support Services - Student Based 165,528 7.7% 173,529 7.3% 177,504 6.5%
Support Services - Non-Student Based 60,821 2.8% 71,452 3.0% 82,123 3.0%
Ancillary Services 1 0.0% - 0.0% - 0.0%
1,394,733 65.3% 1,538,756 64.6% 1,709,332 62.5%
Non-Payroll Costs by Function
Instructional 631,778 29.6% 726,339 30.5% 878,973 32.1%
Leadership 9,518 0.4% 3,146 0.1% 3,250 0.1%
Support Services - Student Based 14,171 0.7% 19,125 0.8% 14,850 0.5%
Support Services - Non-Student Based 80,997 3.8% 94,139 4.0% 127,789 4.7%
Debt / Capital Outlay 5,395 0.3% - 0.0% - 0.0%
741,858 34.7% 842,748 35.4% 1,024,862 37.5%
2,136,592$ 100.0% 2,381,505$ 100.0% 2,734,194$ 100.0%
Campus Staff (All Funds)
Position 2013 2014 2015
Principal 1.00 1.00 1.00
Counselor 1.00 1.00 1.00
Teachers 16.55 16.53 18.10
Student Service Spec. - - 1.00
Tech. Trainer - - 0.40
ESL Tchr. Res. Strategist - - 0.25
Nurse 1.00 1.00 1.00
Secretaries 1.00 1.00 1.00
Registrar 1.00 1.00 1.00
P/I Liaison 1.00 1.00 1.00
Custodians 3.00 3.00 3.00
Total 25.55 25.53 28.75
2014/15 General Operating Budget by Object
Budget %
Payroll 1,709,332$ 62.5%
Contracted Services 824,660 30.2%
Supplies & Materials 169,302 6.2%
Other Operating Expenses 30,900 1.1%Total 2,734,194$
2014/15 General Operating Budget by Program
Budget %
Regular Program 392,484$ 14.4%
Gifted & Talented 610 0.0%
Career & Technology 64,579 2.4%
Special Education 3 0.0%
Bilingual/ESL 10,088 0.3%
State Compensatory 99,488 3.6%
High School Allotment 1,774,844 64.9%
Undistributed 392,098 14.3%
Total 2,734,194$
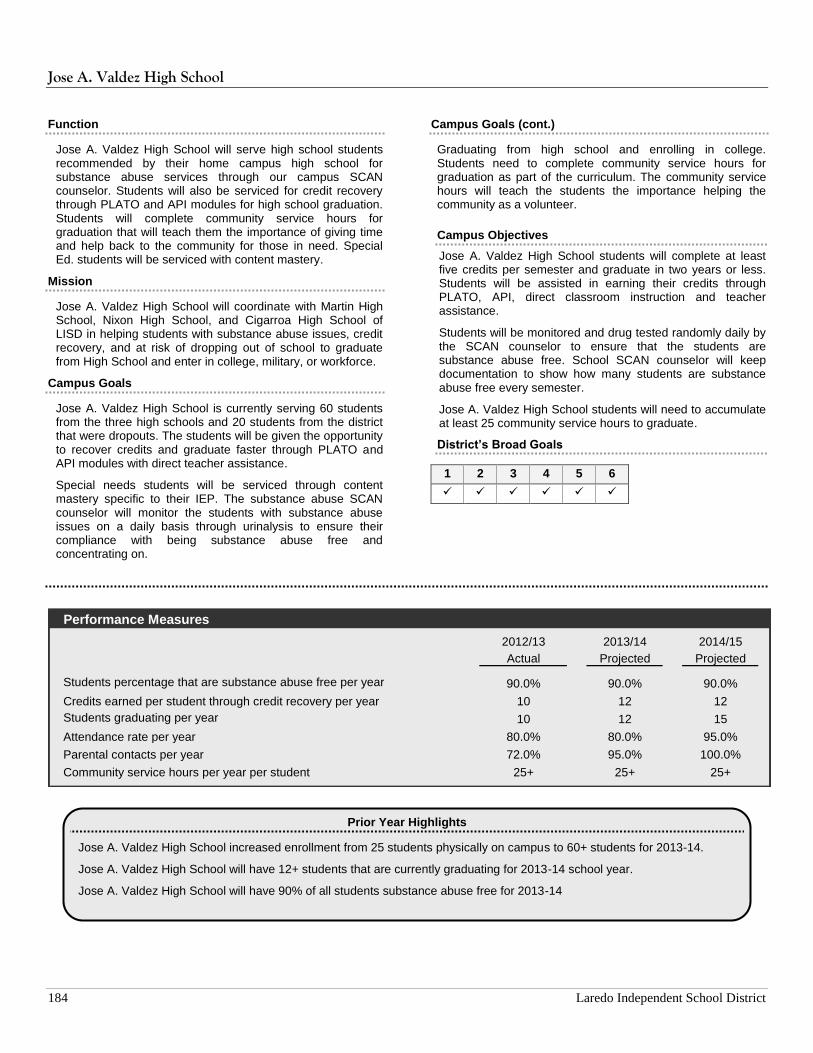
Jose A. Valdez High School
184 Laredo Independent School District
Function
Jose A. Valdez High School will serve high school students recommended by their home campus high school for substance abuse services through our campus SCAN counselor. Students will also be serviced for credit recovery through PLATO and API modules for high school graduation. Students will complete community service hours for graduation that will teach them the importance of giving time and help back to the community for those in need. Special Ed. students will be serviced with content mastery.
Mission
Jose A. Valdez High School will coordinate with Martin High School, Nixon High School, and Cigarroa High School of LISD in helping students with substance abuse issues, credit recovery, and at risk of dropping out of school to graduate from High School and enter in college, military, or workforce.
Campus Goals
Jose A. Valdez High School is currently serving 60 students from the three high schools and 20 students from the district that were dropouts. The students will be given the opportunity to recover credits and graduate faster through PLATO and API modules with direct teacher assistance.
Special needs students will be serviced through content mastery specific to their IEP. The substance abuse SCAN counselor will monitor the students with substance abuse issues on a daily basis through urinalysis to ensure their compliance with being substance abuse free and concentrating on.
Campus Goals (cont.)
Graduating from high school and enrolling in college. Students need to complete community service hours for graduation as part of the curriculum. The community service hours will teach the students the importance helping the community as a volunteer.
Campus Objectives
Jose A. Valdez High School students will complete at least five credits per semester and graduate in two years or less. Students will be assisted in earning their credits through PLATO, API, direct classroom instruction and teacher assistance.
Students will be monitored and drug tested randomly daily by the SCAN counselor to ensure that the students are substance abuse free. School SCAN counselor will keep documentation to show how many students are substance abuse free every semester.
Jose A. Valdez High School students will need to accumulate at least 25 community service hours to graduate.
District’s Broad Goals
1 2 3 4 5 6
Performance Measures
2012/13 2013/14 2014/15
Actual Projected Projected
Students percentage that are substance abuse free per year 90.0% 90.0% 90.0%
Credits earned per student through credit recovery per year 10 12 12
Students graduating per year 10 12 15
Attendance rate per year 80.0% 80.0% 95.0%
Parental contacts per year 72.0% 95.0% 100.0%
Community service hours per year per student 25+ 25+ 25+
Prior Year Highlights
Jose A. Valdez High School increased enrollment from 25 students physically on campus to 60+ students for 2013-14.
Jose A. Valdez High School will have 12+ students that are currently graduating for 2013-14 school year.
Jose A. Valdez High School will have 90% of all students substance abuse free for 2013-14
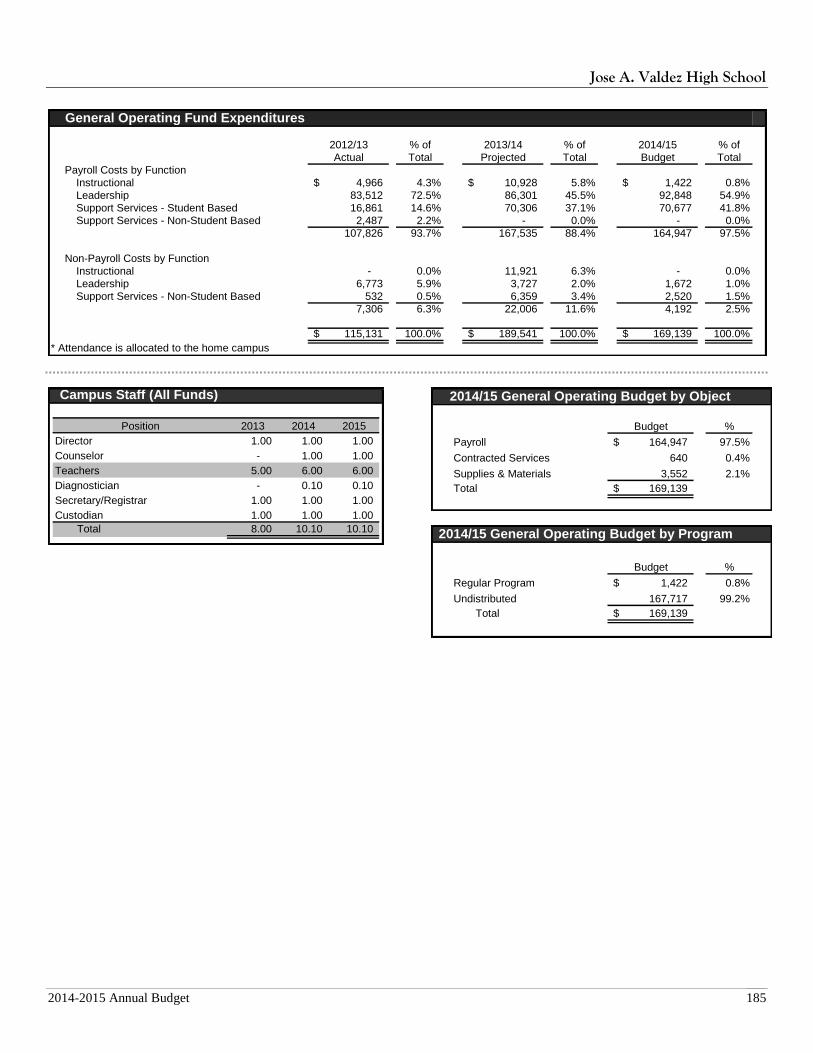
Jose A. Valdez High School
2014-2015 Annual Budget 185
General Operating Fund Expenditures
2012/13 % of 2013/14 % of 2014/15 % of
Actual Total Projected Total Budget Total
Payroll Costs by Function
Instructional 4,966$ 4.3% 10,928$ 5.8% 1,422$ 0.8%
Leadership 83,512 72.5% 86,301 45.5% 92,848 54.9%
Support Services - Student Based 16,861 14.6% 70,306 37.1% 70,677 41.8%
Support Services - Non-Student Based 2,487 2.2% - 0.0% - 0.0%
107,826 93.7% 167,535 88.4% 164,947 97.5%
Non-Payroll Costs by Function
Instructional - 0.0% 11,921 6.3% - 0.0%
Leadership 6,773 5.9% 3,727 2.0% 1,672 1.0%
Support Services - Non-Student Based 532 0.5% 6,359 3.4% 2,520 1.5%
7,306 6.3% 22,006 11.6% 4,192 2.5%
115,131$ 100.0% 189,541$ 100.0% 169,139$ 100.0%
* Attendance is allocated to the home campus
Campus Staff (All Funds)
Position 2013 2014 2015
Director 1.00 1.00 1.00
Counselor - 1.00 1.00
Teachers 5.00 6.00 6.00
Diagnostician - 0.10 0.10
Secretary/Registrar 1.00 1.00 1.00
Custodian 1.00 1.00 1.00
Total 8.00 10.10 10.10
2014/15 General Operating Budget by Object
Budget %
Payroll 164,947$ 97.5%
Contracted Services 640 0.4%
Supplies & Materials 3,552 2.1%
Total 169,139$
2014/15 General Operating Budget by Program
Budget %
Regular Program 1,422$ 0.8%
Undistributed 167,717 99.2%
Total 169,139$
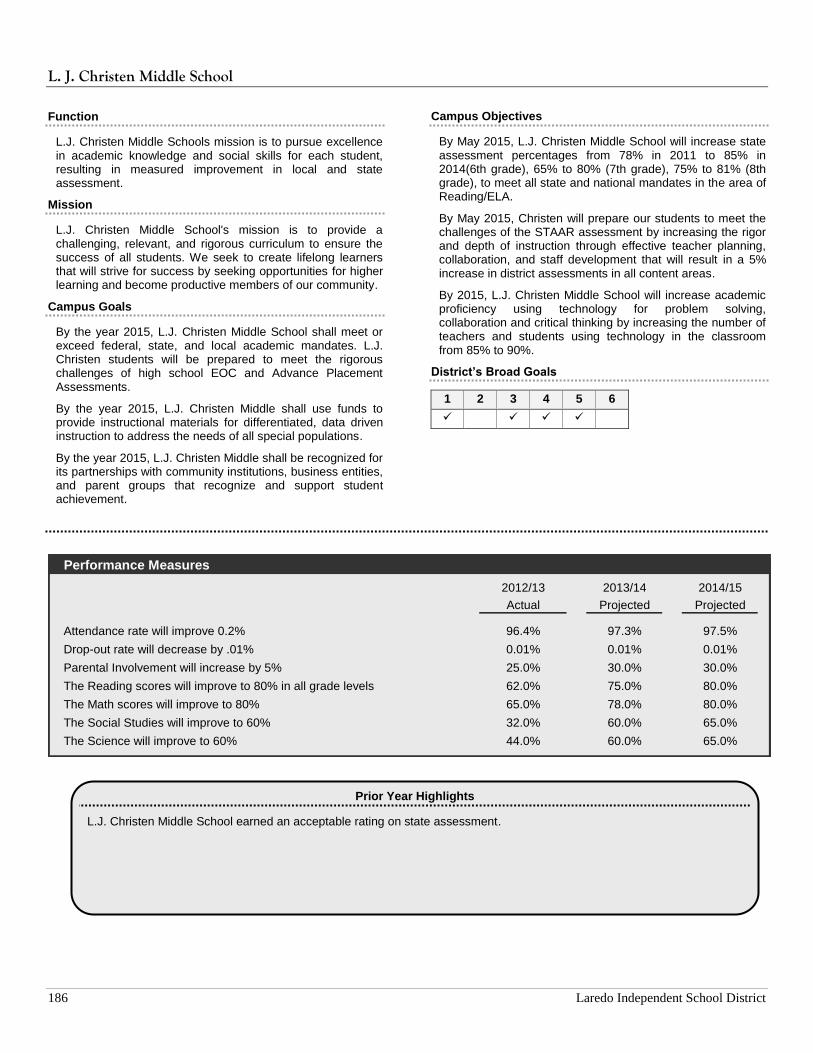
L. J. Christen Middle School
186 Laredo Independent School District
Function
L.J. Christen Middle Schools mission is to pursue excellence in academic knowledge and social skills for each student, resulting in measured improvement in local and state assessment.
Mission
L.J. Christen Middle School's mission is to provide a challenging, relevant, and rigorous curriculum to ensure the success of all students. We seek to create lifelong learners that will strive for success by seeking opportunities for higher learning and become productive members of our community.
Campus Goals
By the year 2015, L.J. Christen Middle School shall meet or exceed federal, state, and local academic mandates. L.J. Christen students will be prepared to meet the rigorous challenges of high school EOC and Advance Placement Assessments.
By the year 2015, L.J. Christen Middle shall use funds to provide instructional materials for differentiated, data driven instruction to address the needs of all special populations.
By the year 2015, L.J. Christen Middle shall be recognized for its partnerships with community institutions, business entities, and parent groups that recognize and support student achievement.
Campus Objectives
By May 2015, L.J. Christen Middle School will increase state assessment percentages from 78% in 2011 to 85% in 2014(6th grade), 65% to 80% (7th grade), 75% to 81% (8th grade), to meet all state and national mandates in the area of Reading/ELA.
By May 2015, Christen will prepare our students to meet the challenges of the STAAR assessment by increasing the rigor and depth of instruction through effective teacher planning, collaboration, and staff development that will result in a 5% increase in district assessments in all content areas.
By 2015, L.J. Christen Middle School will increase academic proficiency using technology for problem solving, collaboration and critical thinking by increasing the number of teachers and students using technology in the classroom from 85% to 90%.
District’s Broad Goals
1 2 3 4 5 6
Performance Measures
2012/13 2013/14 2014/15
Actual Projected Projected
Attendance rate will improve 0.2% 96.4% 97.3% 97.5%
Drop-out rate will decrease by .01% 0.01% 0.01% 0.01%
Parental Involvement will increase by 5% 25.0% 30.0% 30.0%
The Reading scores will improve to 80% in all grade levels 62.0% 75.0% 80.0%
The Math scores will improve to 80% 65.0% 78.0% 80.0%
The Social Studies will improve to 60% 32.0% 60.0% 65.0%
The Science will improve to 60% 44.0% 60.0% 65.0%
Prior Year Highlights
L.J. Christen Middle School earned an acceptable rating on state assessment.
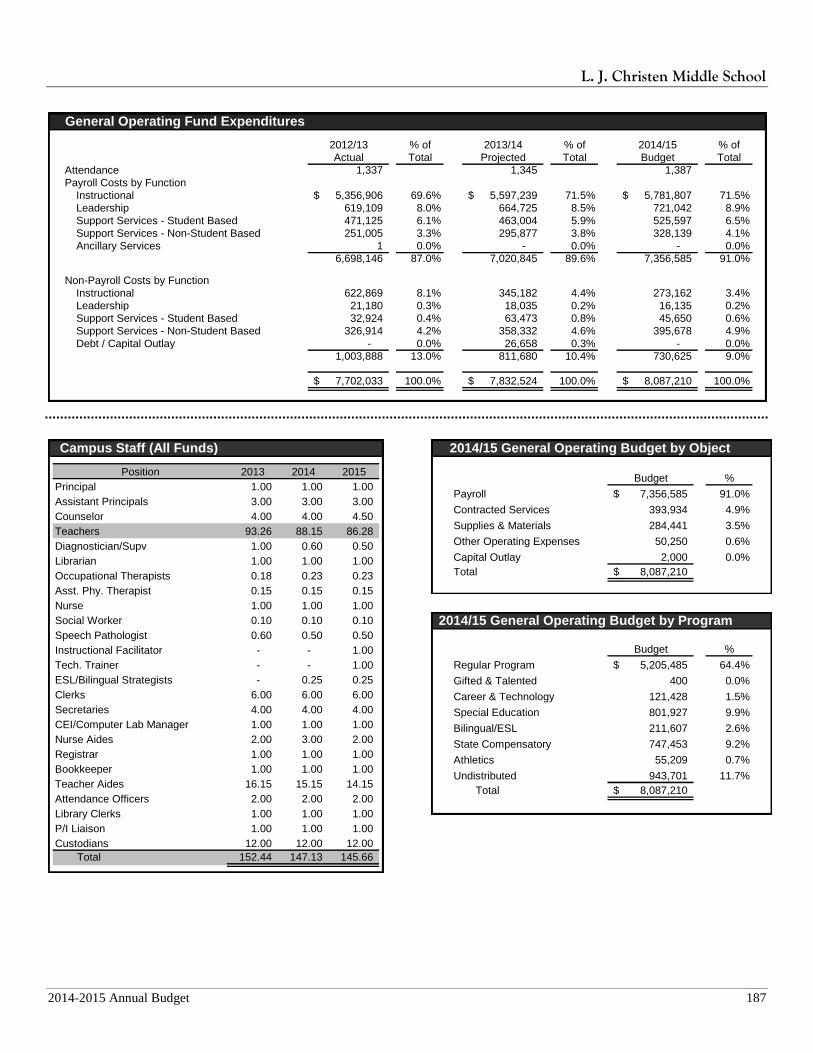
L. J. Christen Middle School
2014-2015 Annual Budget 187
General Operating Fund Expenditures
2012/13 % of 2013/14 % of 2014/15 % of
Actual Total Projected Total Budget Total
Attendance 1,337 1,345 1,387
Payroll Costs by Function
Instructional 5,356,906$ 69.6% 5,597,239$ 71.5% 5,781,807$ 71.5%
Leadership 619,109 8.0% 664,725 8.5% 721,042 8.9%
Support Services - Student Based 471,125 6.1% 463,004 5.9% 525,597 6.5%
Support Services - Non-Student Based 251,005 3.3% 295,877 3.8% 328,139 4.1%
Ancillary Services 1 0.0% - 0.0% - 0.0%
6,698,146 87.0% 7,020,845 89.6% 7,356,585 91.0%
Non-Payroll Costs by Function
Instructional 622,869 8.1% 345,182 4.4% 273,162 3.4%
Leadership 21,180 0.3% 18,035 0.2% 16,135 0.2%
Support Services - Student Based 32,924 0.4% 63,473 0.8% 45,650 0.6%
Support Services - Non-Student Based 326,914 4.2% 358,332 4.6% 395,678 4.9%
Debt / Capital Outlay - 0.0% 26,658 0.3% - 0.0%
1,003,888 13.0% 811,680 10.4% 730,625 9.0%
7,702,033$ 100.0% 7,832,524$ 100.0% 8,087,210$ 100.0%
Campus Staff (All Funds)
Position 2013 2014 2015
Principal 1.00 1.00 1.00
Assistant Principals 3.00 3.00 3.00
Counselor 4.00 4.00 4.50
Teachers 93.26 88.15 86.28
Diagnostician/Supv 1.00 0.60 0.50
Librarian 1.00 1.00 1.00
Occupational Therapists 0.18 0.23 0.23
Asst. Phy. Therapist 0.15 0.15 0.15
Nurse 1.00 1.00 1.00
Social Worker 0.10 0.10 0.10
Speech Pathologist 0.60 0.50 0.50
Instructional Facilitator - - 1.00
Tech. Trainer - - 1.00
ESL/Bilingual Strategists - 0.25 0.25
Clerks 6.00 6.00 6.00
Secretaries 4.00 4.00 4.00
CEI/Computer Lab Manager 1.00 1.00 1.00
Nurse Aides 2.00 3.00 2.00
Registrar 1.00 1.00 1.00
Bookkeeper 1.00 1.00 1.00
Teacher Aides 16.15 15.15 14.15
Attendance Officers 2.00 2.00 2.00
Library Clerks 1.00 1.00 1.00
P/I Liaison 1.00 1.00 1.00
Custodians 12.00 12.00 12.00
Total 152.44 147.13 145.66
2014/15 General Operating Budget by Object
Budget %
Payroll 7,356,585$ 91.0%
Contracted Services 393,934 4.9%
Supplies & Materials 284,441 3.5%
Other Operating Expenses 50,250 0.6%
Capital Outlay 2,000 0.0%
Total 8,087,210$
2014/15 General Operating Budget by Program
Budget %
Regular Program 5,205,485$ 64.4%
Gifted & Talented 400 0.0%
Career & Technology 121,428 1.5%
Special Education 801,927 9.9%
Bilingual/ESL 211,607 2.6%
State Compensatory 747,453 9.2%
Athletics 55,209 0.7%
Undistributed 943,701 11.7%
Total 8,087,210$
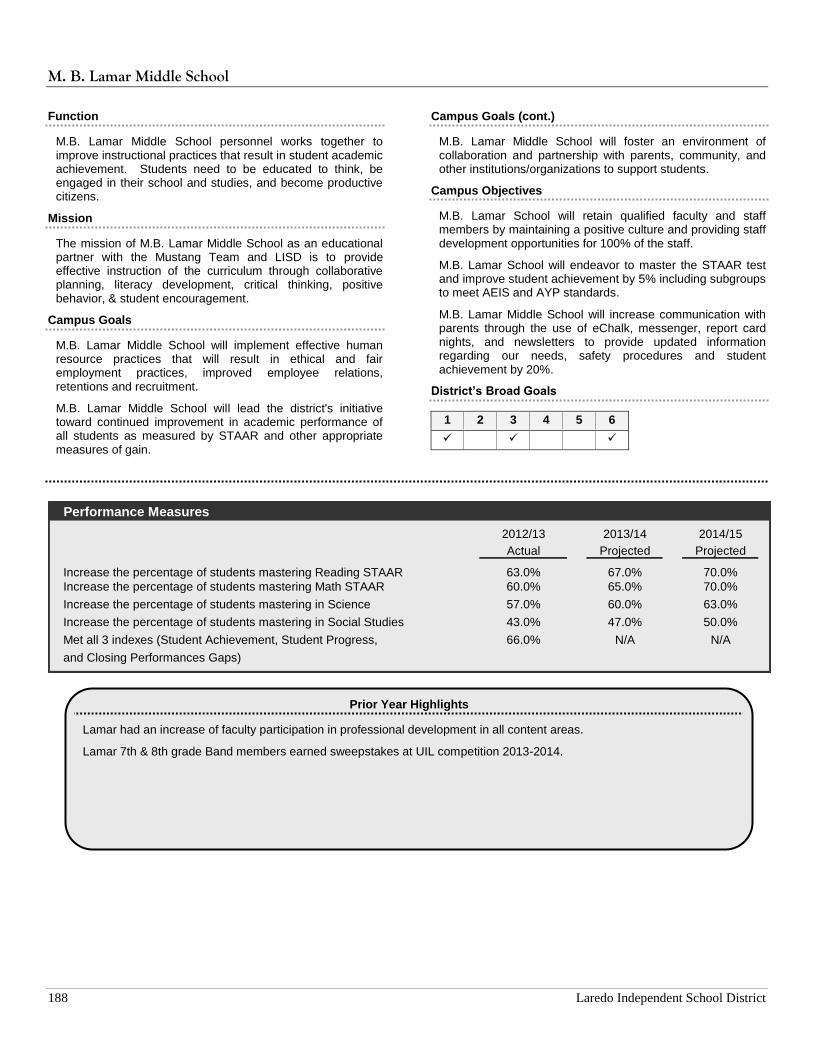
M. B. Lamar Middle School
188 Laredo Independent School District
Function
M.B. Lamar Middle School personnel works together to improve instructional practices that result in student academic achievement. Students need to be educated to think, be engaged in their school and studies, and become productive citizens.
Mission
The mission of M.B. Lamar Middle School as an educational partner with the Mustang Team and LISD is to provide effective instruction of the curriculum through collaborative planning, literacy development, critical thinking, positive behavior, & student encouragement.
Campus Goals
M.B. Lamar Middle School will implement effective human resource practices that will result in ethical and fair employment practices, improved employee relations, retentions and recruitment.
M.B. Lamar Middle School will lead the district's initiative toward continued improvement in academic performance of all students as measured by STAAR and other appropriate measures of gain.
Campus Goals (cont.)
M.B. Lamar Middle School will foster an environment of collaboration and partnership with parents, community, and other institutions/organizations to support students.
Campus Objectives
M.B. Lamar School will retain qualified faculty and staff members by maintaining a positive culture and providing staff development opportunities for 100% of the staff.
M.B. Lamar School will endeavor to master the STAAR test and improve student achievement by 5% including subgroups to meet AEIS and AYP standards.
M.B. Lamar Middle School will increase communication with parents through the use of eChalk, messenger, report card nights, and newsletters to provide updated information regarding our needs, safety procedures and student achievement by 20%.
District’s Broad Goals
1 2 3 4 5 6
Performance Measures
2012/13 2013/14 2014/15
Actual Projected Projected
Increase the percentage of students mastering Reading STAAR 63.0% 67.0% 70.0%
Increase the percentage of students mastering Math STAAR 60.0% 65.0% 70.0%
Increase the percentage of students mastering in Science 57.0% 60.0% 63.0%
Increase the percentage of students mastering in Social Studies 43.0% 47.0% 50.0%
Met all 3 indexes (Student Achievement, Student Progress, 66.0% N/A N/A
and Closing Performances Gaps)
Prior Year Highlights
Lamar had an increase of faculty participation in professional development in all content areas.
Lamar 7th & 8th grade Band members earned sweepstakes at UIL competition 2013-2014.
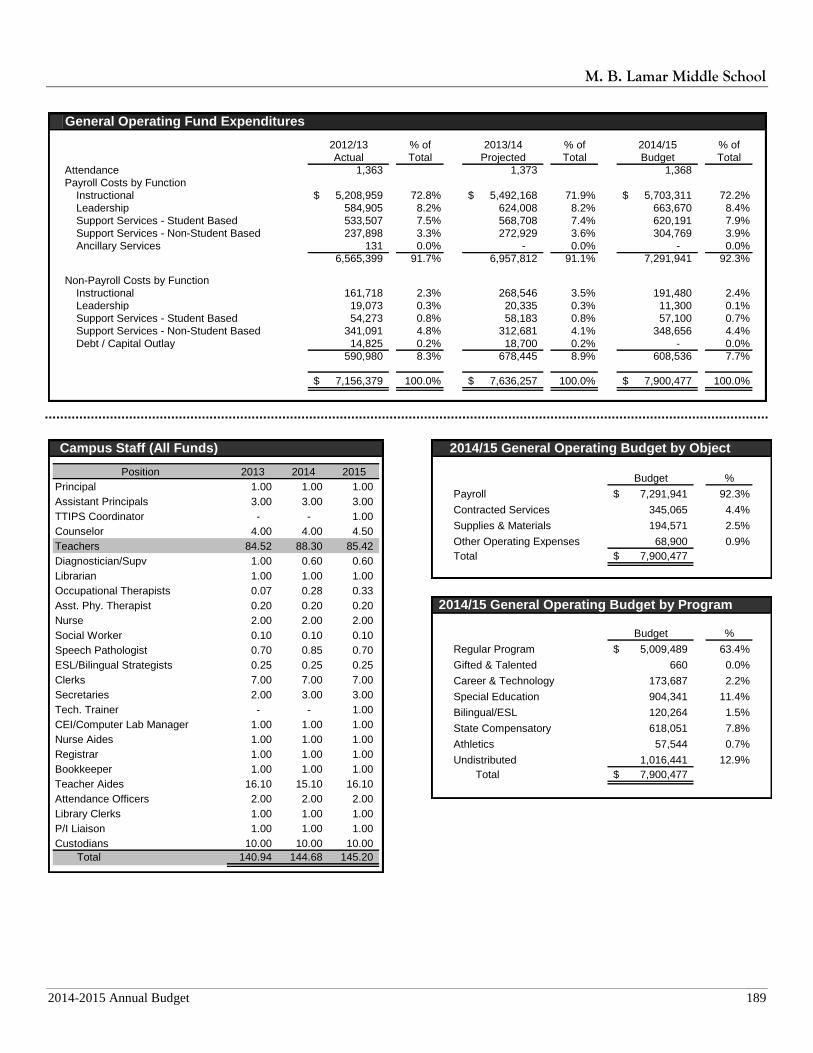
M. B. Lamar Middle School
2014-2015 Annual Budget 189
General Operating Fund Expenditures
2012/13 % of 2013/14 % of 2014/15 % of
Actual Total Projected Total Budget Total
Attendance 1,363 1,373 1,368
Payroll Costs by Function
Instructional 5,208,959$ 72.8% 5,492,168$ 71.9% 5,703,311$ 72.2%
Leadership 584,905 8.2% 624,008 8.2% 663,670 8.4%
Support Services - Student Based 533,507 7.5% 568,708 7.4% 620,191 7.9%
Support Services - Non-Student Based 237,898 3.3% 272,929 3.6% 304,769 3.9%
Ancillary Services 131 0.0% - 0.0% - 0.0%
6,565,399 91.7% 6,957,812 91.1% 7,291,941 92.3%
Non-Payroll Costs by Function
Instructional 161,718 2.3% 268,546 3.5% 191,480 2.4%
Leadership 19,073 0.3% 20,335 0.3% 11,300 0.1%
Support Services - Student Based 54,273 0.8% 58,183 0.8% 57,100 0.7%
Support Services - Non-Student Based 341,091 4.8% 312,681 4.1% 348,656 4.4%
Debt / Capital Outlay 14,825 0.2% 18,700 0.2% - 0.0%
590,980 8.3% 678,445 8.9% 608,536 7.7%
7,156,379$ 100.0% 7,636,257$ 100.0% 7,900,477$ 100.0%
Campus Staff (All Funds)
Position 2013 2014 2015
Principal 1.00 1.00 1.00
Assistant Principals 3.00 3.00 3.00
TTIPS Coordinator - - 1.00
Counselor 4.00 4.00 4.50
Teachers 84.52 88.30 85.42
Diagnostician/Supv 1.00 0.60 0.60
Librarian 1.00 1.00 1.00
Occupational Therapists 0.07 0.28 0.33
Asst. Phy. Therapist 0.20 0.20 0.20
Nurse 2.00 2.00 2.00
Social Worker 0.10 0.10 0.10
Speech Pathologist 0.70 0.85 0.70
ESL/Bilingual Strategists 0.25 0.25 0.25
Clerks 7.00 7.00 7.00
Secretaries 2.00 3.00 3.00
Tech. Trainer - - 1.00
CEI/Computer Lab Manager 1.00 1.00 1.00
Nurse Aides 1.00 1.00 1.00
Registrar 1.00 1.00 1.00
Bookkeeper 1.00 1.00 1.00
Teacher Aides 16.10 15.10 16.10
Attendance Officers 2.00 2.00 2.00
Library Clerks 1.00 1.00 1.00
P/I Liaison 1.00 1.00 1.00
Custodians 10.00 10.00 10.00
Total 140.94 144.68 145.20
2014/15 General Operating Budget by Object
Budget %
Payroll 7,291,941$ 92.3%
Contracted Services 345,065 4.4%
Supplies & Materials 194,571 2.5%
Other Operating Expenses 68,900 0.9%
Total 7,900,477$
2014/15 General Operating Budget by Program
Budget %
Regular Program 5,009,489$ 63.4%
Gifted & Talented 660 0.0%
Career & Technology 173,687 2.2%
Special Education 904,341 11.4%
Bilingual/ESL 120,264 1.5%
State Compensatory 618,051 7.8%
Athletics 57,544 0.7%
Undistributed 1,016,441 12.9%
Total 7,900,477$
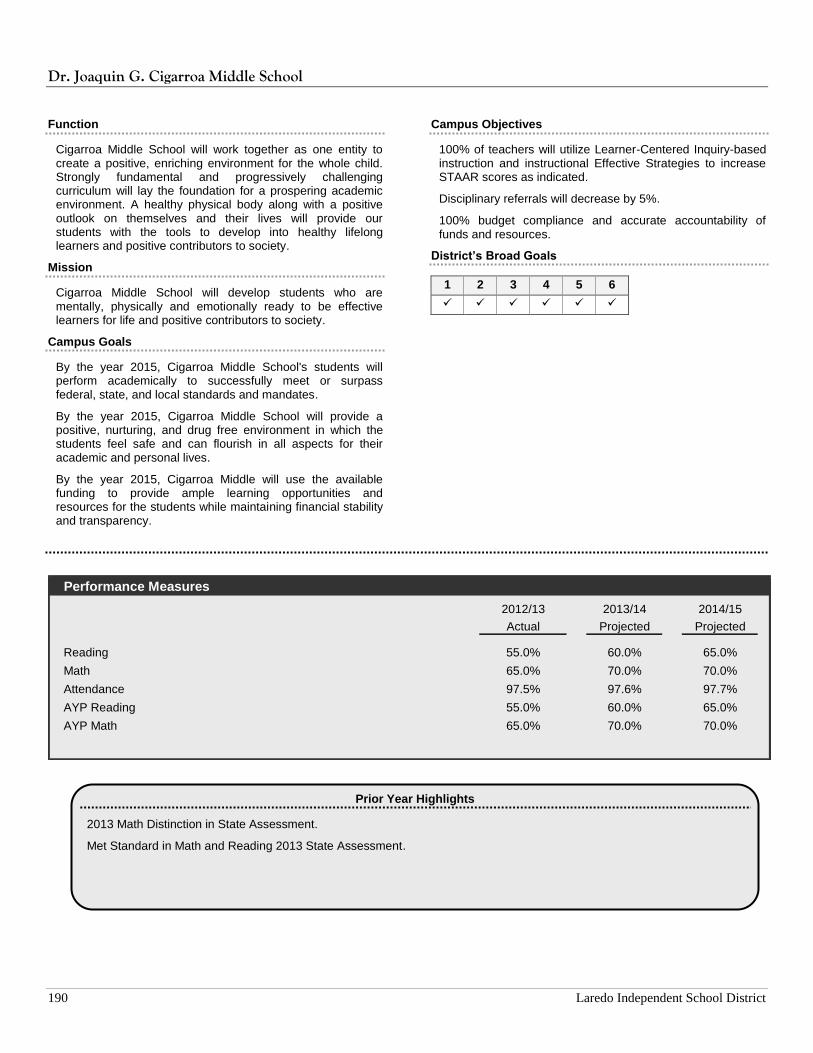
Dr. Joaquin G. Cigarroa Middle School
190 Laredo Independent School District
Function
Cigarroa Middle School will work together as one entity to create a positive, enriching environment for the whole child. Strongly fundamental and progressively challenging curriculum will lay the foundation for a prospering academic environment. A healthy physical body along with a positive outlook on themselves and their lives will provide our students with the tools to develop into healthy lifelong learners and positive contributors to society.
Mission
Cigarroa Middle School will develop students who are mentally, physically and emotionally ready to be effective learners for life and positive contributors to society.
Campus Goals
By the year 2015, Cigarroa Middle School's students will perform academically to successfully meet or surpass federal, state, and local standards and mandates.
By the year 2015, Cigarroa Middle School will provide a positive, nurturing, and drug free environment in which the students feel safe and can flourish in all aspects for their academic and personal lives.
By the year 2015, Cigarroa Middle will use the available funding to provide ample learning opportunities and resources for the students while maintaining financial stability and transparency.
Campus Objectives
100% of teachers will utilize Learner-Centered Inquiry-based instruction and instructional Effective Strategies to increase STAAR scores as indicated.
Disciplinary referrals will decrease by 5%.
100% budget compliance and accurate accountability of funds and resources.
District’s Broad Goals
1 2 3 4 5 6
Performance Measures
2012/13 2013/14 2014/15
Actual Projected Projected
Reading 55.0% 60.0% 65.0%
Math 65.0% 70.0% 70.0%
Attendance 97.5% 97.6% 97.7%
AYP Reading 55.0% 60.0% 65.0%
AYP Math 65.0% 70.0% 70.0%
Prior Year Highlights
2013 Math Distinction in State Assessment.
Met Standard in Math and Reading 2013 State Assessment.

Dr. Joaquin G. Cigarroa Middle School
2014-2015 Annual Budget 191
General Operating Fund Expenditures
2012/13 % of 2013/14 % of 2014/15 % of
Actual Total Projected Total Budget Total
Attendance 1,318 1,388 1,397
Payroll Costs by Function
Instructional 4,874,789$ 76.1% 5,466,723$ 74.7% 5,650,608$ 75.3%
Leadership 562,212 8.8% 622,153 8.5% 661,028 8.8%
Support Services - Student Based 483,117 7.5% 518,039 7.1% 566,840 7.5%
Support Services - Non-Student Based 265,627 4.1% 309,962 4.2% 343,918 4.6%
Ancillary Services 1 0.0% - 0.0% - 0.0%
6,185,745 96.5% 6,916,878 94.5% 7,222,394 96.2%
Non-Payroll Costs by Function
Instructional 144,913 2.3% 218,219 3.0% 184,126 2.5%
Leadership 14,858 0.2% 12,393 0.2% 10,500 0.1%
Support Services - Student Based 15,699 0.2% 46,842 0.6% 51,000 0.7%
Support Services - Non-Student Based 45,610 0.7% 124,311 1.7% 40,253 0.5%
Debt / Capital Outlay - 0.0% - 0.0% - 0.0%
221,079 3.5% 401,765 5.5% 285,879 3.8%
6,406,824$ 100.0% 7,318,643$ 100.0% 7,508,273$ 100.0%
Campus Staff (All Funds)
Position 2013 2014 2015
Principal 1.00 1.00 1.00
Assistant Principals 3.00 3.00 3.00
Counselor 4.00 4.00 5.00
Teachers 83.48 86.72 88.74
Diagnostician/Supv 1.00 0.80 0.80
Librarian 1.00 1.00 1.00
Occupational Therapists 0.08 0.10 0.10
Asst. Phy. Therapist 0.20 0.20 0.20
Nurse 1.00 1.00 1.00
Social Worker 0.10 0.10 0.10
Speech Pathologist 0.90 0.65 0.70
ESL/Bilingual Strategists 0.25 0.25 0.25
Clerks 6.00 7.00 7.00
Secretaries 3.00 3.00 3.00
Instructional Facilitator - - 1.00
Interpreter - - 1.00
Tech. Trainer - - 0.60
CEI/Computer Lab Manager 1.00 1.00 -
Nurse Aides 2.00 2.00 2.00
Registrar 1.00 1.00 1.00
Bookkeeper 1.00 1.00 1.00
Teacher Aides 14.00 14.00 15.00
Attendance Officers 2.00 2.00 2.00
Library Clerks 1.00 1.00 1.00
P/I Liaison 1.00 1.00 1.00
Custodians 12.00 12.00 12.00
Total 140.01 143.82 149.49
2014/15 General Operating Budget by Object
Budget %
Payroll 7,222,394$ 96.2%
Contracted Services 45,195 0.6%
Supplies & Materials 182,184 2.4%
Other Operating Expenses 58,500 0.8%
Total 7,508,273$
2014/15 General Operating Budget by Program
Budget %
Regular Program 5,131,860$ 68.3%
Gifted & Talented 376 0.0%
Career & Technology 138,549 1.8%
Special Education 765,761 10.2%
Bilingual/ESL 149,515 2.0%
State Compensatory 612,243 8.2%
Athletics 56,850 0.8%
Undistributed 653,119 8.7%
Total 7,508,273$
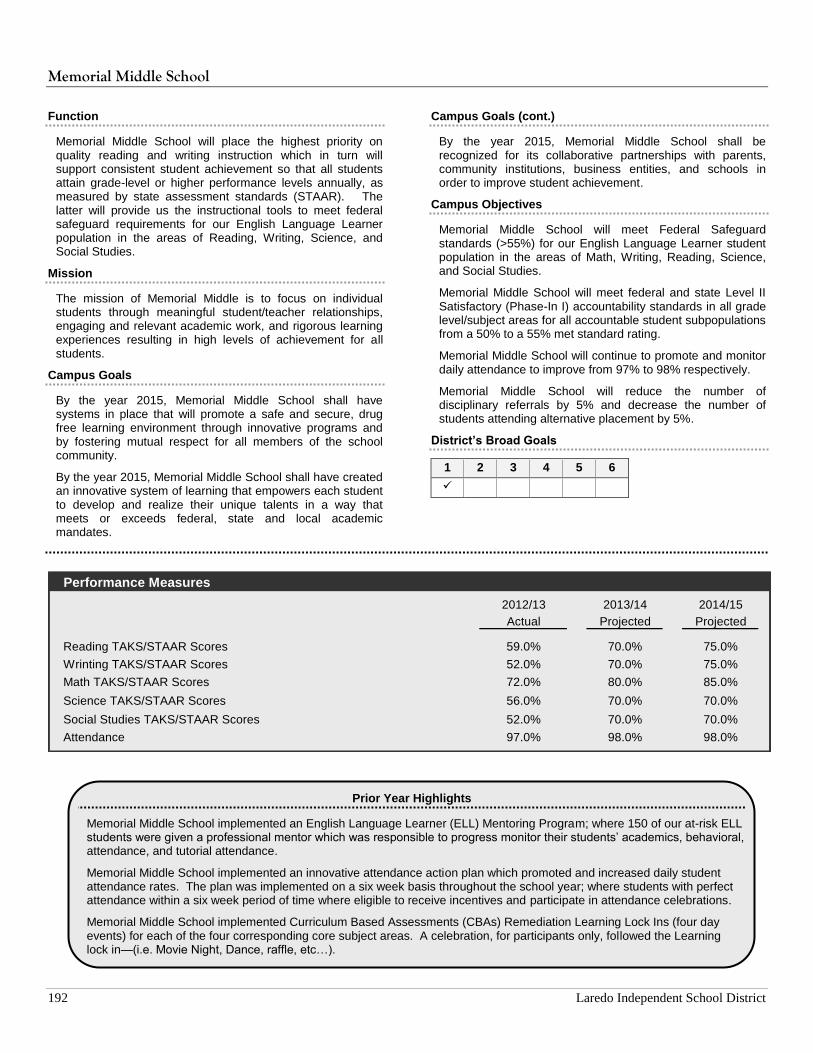
Memorial Middle School
192 Laredo Independent School District
Function
Memorial Middle School will place the highest priority on quality reading and writing instruction which in turn will support consistent student achievement so that all students attain grade-level or higher performance levels annually, as measured by state assessment standards (STAAR). The latter will provide us the instructional tools to meet federal safeguard requirements for our English Language Learner population in the areas of Reading, Writing, Science, and Social Studies.
Mission
The mission of Memorial Middle is to focus on individual students through meaningful student/teacher relationships, engaging and relevant academic work, and rigorous learning experiences resulting in high levels of achievement for all students.
Campus Goals
By the year 2015, Memorial Middle School shall have systems in place that will promote a safe and secure, drug free learning environment through innovative programs and by fostering mutual respect for all members of the school community.
By the year 2015, Memorial Middle School shall have created an innovative system of learning that empowers each student to develop and realize their unique talents in a way that meets or exceeds federal, state and local academic mandates.
Campus Goals (cont.)
By the year 2015, Memorial Middle School shall be recognized for its collaborative partnerships with parents, community institutions, business entities, and schools in order to improve student achievement.
Campus Objectives
Memorial Middle School will meet Federal Safeguard standards (>55%) for our English Language Learner student population in the areas of Math, Writing, Reading, Science, and Social Studies.
Memorial Middle School will meet federal and state Level II Satisfactory (Phase-In I) accountability standards in all grade level/subject areas for all accountable student subpopulations from a 50% to a 55% met standard rating.
Memorial Middle School will continue to promote and monitor daily attendance to improve from 97% to 98% respectively.
Memorial Middle School will reduce the number of disciplinary referrals by 5% and decrease the number of students attending alternative placement by 5%.
District’s Broad Goals
1 2 3 4 5 6
Performance Measures
2012/13 2013/14 2014/15
Actual Projected Projected
Reading TAKS/STAAR Scores 59.0% 70.0% 75.0%
Wrinting TAKS/STAAR Scores 52.0% 70.0% 75.0%
Math TAKS/STAAR Scores 72.0% 80.0% 85.0%
Science TAKS/STAAR Scores 56.0% 70.0% 70.0%
Social Studies TAKS/STAAR Scores 52.0% 70.0% 70.0%
Attendance 97.0% 98.0% 98.0%
Prior Year Highlights
Memorial Middle School implemented an English Language Learner (ELL) Mentoring Program; where 150 of our at-risk ELL students were given a professional mentor which was responsible to progress monitor their students’ academics, behavioral, attendance, and tutorial attendance.
Memorial Middle School implemented an innovative attendance action plan which promoted and increased daily student attendance rates. The plan was implemented on a six week basis throughout the school year; where students with perfect attendance within a six week period of time where eligible to receive incentives and participate in attendance celebrations.
Memorial Middle School implemented Curriculum Based Assessments (CBAs) Remediation Learning Lock Ins (four day events) for each of the four corresponding core subject areas. A celebration, for participants only, followed the Learning lock in—(i.e. Movie Night, Dance, raffle, etc…).
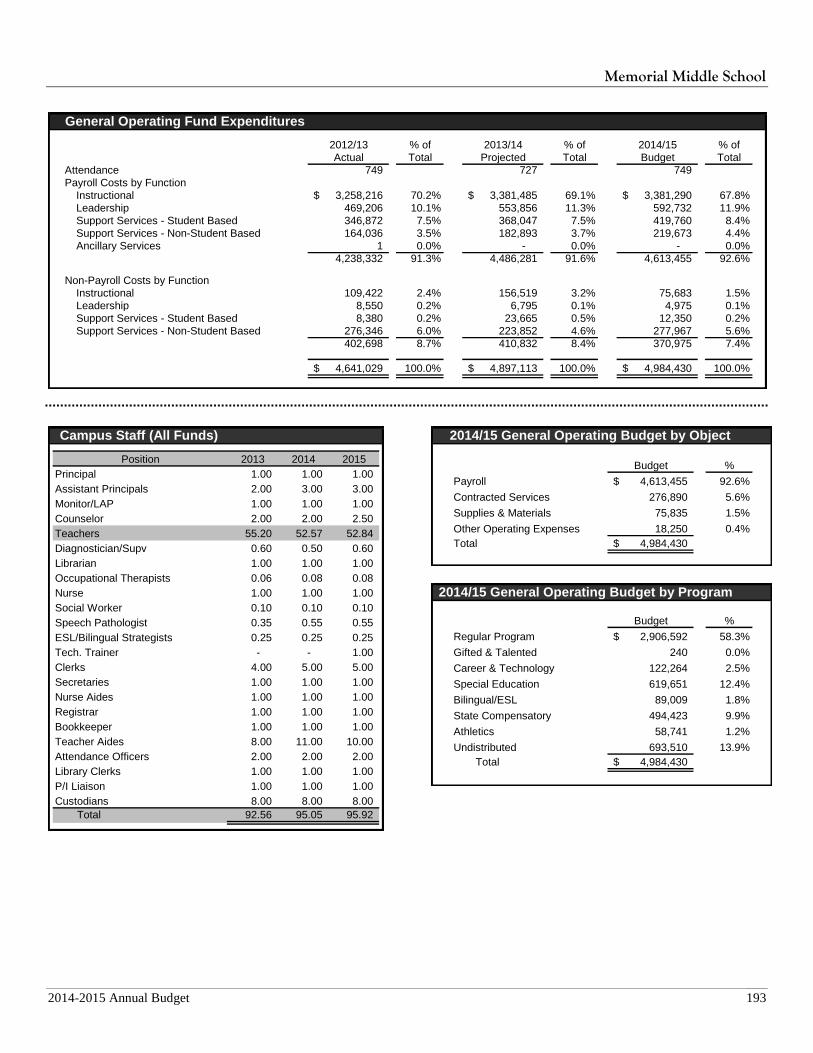
Memorial Middle School
2014-2015 Annual Budget 193
General Operating Fund Expenditures
2012/13 % of 2013/14 % of 2014/15 % of
Actual Total Projected Total Budget Total
Attendance 749 727 749
Payroll Costs by Function
Instructional 3,258,216$ 70.2% 3,381,485$ 69.1% 3,381,290$ 67.8%
Leadership 469,206 10.1% 553,856 11.3% 592,732 11.9%
Support Services - Student Based 346,872 7.5% 368,047 7.5% 419,760 8.4%
Support Services - Non-Student Based 164,036 3.5% 182,893 3.7% 219,673 4.4%
Ancillary Services 1 0.0% - 0.0% - 0.0%
4,238,332 91.3% 4,486,281 91.6% 4,613,455 92.6%
Non-Payroll Costs by Function
Instructional 109,422 2.4% 156,519 3.2% 75,683 1.5%
Leadership 8,550 0.2% 6,795 0.1% 4,975 0.1%
Support Services - Student Based 8,380 0.2% 23,665 0.5% 12,350 0.2%
Support Services - Non-Student Based 276,346 6.0% 223,852 4.6% 277,967 5.6%
402,698 8.7% 410,832 8.4% 370,975 7.4%
4,641,029$ 100.0% 4,897,113$ 100.0% 4,984,430$ 100.0%
Campus Staff (All Funds)
Position 2013 2014 2015
Principal 1.00 1.00 1.00
Assistant Principals 2.00 3.00 3.00
Monitor/LAP 1.00 1.00 1.00
Counselor 2.00 2.00 2.50
Teachers 55.20 52.57 52.84
Diagnostician/Supv 0.60 0.50 0.60
Librarian 1.00 1.00 1.00
Occupational Therapists 0.06 0.08 0.08
Nurse 1.00 1.00 1.00
Social Worker 0.10 0.10 0.10
Speech Pathologist 0.35 0.55 0.55
ESL/Bilingual Strategists 0.25 0.25 0.25
Tech. Trainer - - 1.00
Clerks 4.00 5.00 5.00
Secretaries 1.00 1.00 1.00
Nurse Aides 1.00 1.00 1.00
Registrar 1.00 1.00 1.00
Bookkeeper 1.00 1.00 1.00
Teacher Aides 8.00 11.00 10.00
Attendance Officers 2.00 2.00 2.00
Library Clerks 1.00 1.00 1.00
P/I Liaison 1.00 1.00 1.00
Custodians 8.00 8.00 8.00
Total 92.56 95.05 95.92
2014/15 General Operating Budget by Object
Budget %
Payroll 4,613,455$ 92.6%
Contracted Services 276,890 5.6%
Supplies & Materials 75,835 1.5%
Other Operating Expenses 18,250 0.4%
Total 4,984,430$
2014/15 General Operating Budget by Program
Budget %
Regular Program 2,906,592$ 58.3%
Gifted & Talented 240 0.0%
Career & Technology 122,264 2.5%
Special Education 619,651 12.4%
Bilingual/ESL 89,009 1.8%
State Compensatory 494,423 9.9%
Athletics 58,741 1.2%
Undistributed 693,510 13.9%
Total 4,984,430$
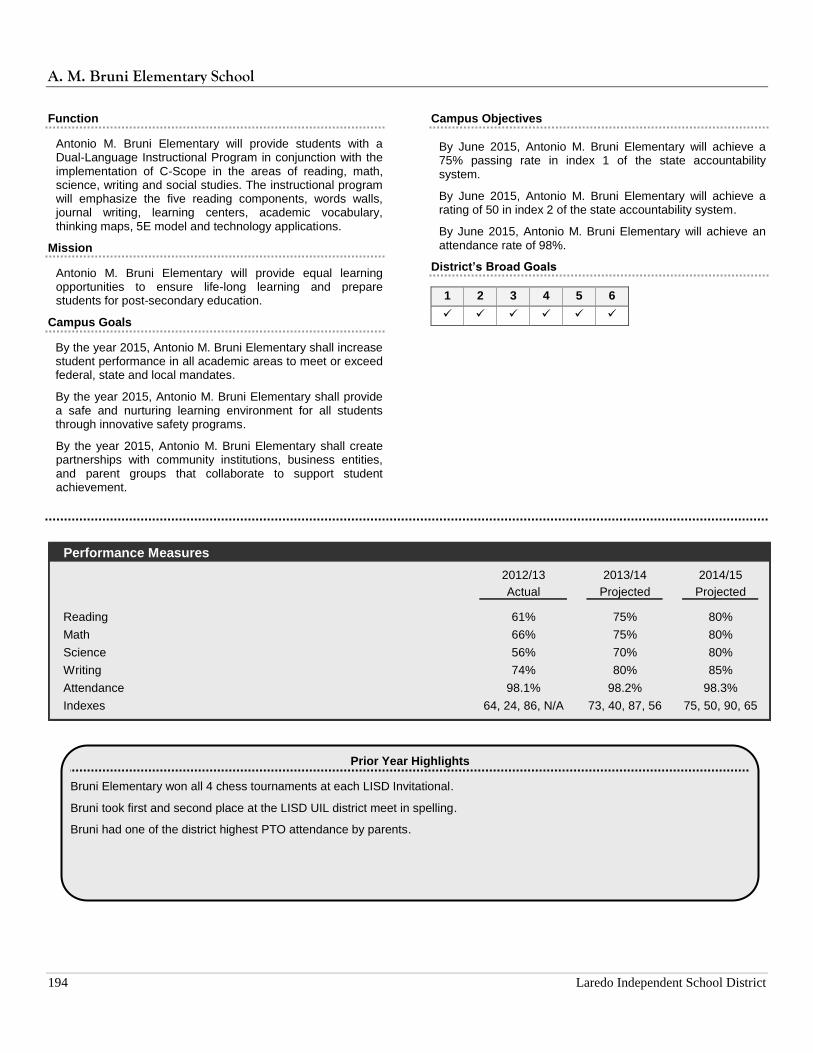
A. M. Bruni Elementary School
194 Laredo Independent School District
Function
Antonio M. Bruni Elementary will provide students with a Dual-Language Instructional Program in conjunction with the implementation of C-Scope in the areas of reading, math, science, writing and social studies. The instructional program will emphasize the five reading components, words walls, journal writing, learning centers, academic vocabulary, thinking maps, 5E model and technology applications.
Mission
Antonio M. Bruni Elementary will provide equal learning opportunities to ensure life-long learning and prepare students for post-secondary education.
Campus Goals
By the year 2015, Antonio M. Bruni Elementary shall increase student performance in all academic areas to meet or exceed federal, state and local mandates.
By the year 2015, Antonio M. Bruni Elementary shall provide a safe and nurturing learning environment for all students through innovative safety programs.
By the year 2015, Antonio M. Bruni Elementary shall create partnerships with community institutions, business entities, and parent groups that collaborate to support student achievement.
Campus Objectives
By June 2015, Antonio M. Bruni Elementary will achieve a 75% passing rate in index 1 of the state accountability system.
By June 2015, Antonio M. Bruni Elementary will achieve a rating of 50 in index 2 of the state accountability system.
By June 2015, Antonio M. Bruni Elementary will achieve an attendance rate of 98%.
District’s Broad Goals
1 2 3 4 5 6
Performance Measures
2012/13 2013/14 2014/15
Actual Projected Projected
Reading 61% 75% 80%
Math 66% 75% 80%
Science 56% 70% 80%
Writing 74% 80% 85%
Attendance 98.1% 98.2% 98.3%
Indexes 64, 24, 86, N/A 73, 40, 87, 56 75, 50, 90, 65
Prior Year Highlights
Bruni Elementary won all 4 chess tournaments at each LISD Invitational.
Bruni took first and second place at the LISD UIL district meet in spelling.
Bruni had one of the district highest PTO attendance by parents.

A. M. Bruni Elementary School
2014-2015 Annual Budget 195
General Operating Fund Expenditures
2012/13 % of 2013/14 % of 2014/15 % of
Actual Total Projected Total Budget Total
Attendance 672 700 669
Payroll Costs by Function
Instructional 2,542,483$ 75.1% 2,806,197$ 75.1% 2,964,823$ 75.9%
Leadership 259,354 7.7% 266,865 7.1% 279,867 7.2%
Support Services - Student Based 185,517 5.5% 162,312 4.3% 161,809 4.1%
Support Services - Non-Student Based 130,595 3.9% 143,409 3.8% 149,112 3.8%
Ancillary Services 1 0.0% - 0.0% - 0.0%
3,117,950 92.1% 3,378,783 90.4% 3,555,611 91.1%
Non-Payroll Costs by Function
Instructional 137,992 4.1% 181,952 4.9% 205,948 5.3%
Leadership 10,465 0.3% 7,671 0.2% 7,500 0.2%
Support Services - Student Based 1,701 0.1% 2,971 0.1% 800 0.0%
Support Services - Non-Student Based 118,605 3.5% 145,213 3.9% 134,061 3.4%
Debt / Capital Outlay - 0.0% 21,795 0.6% - 0.0%
268,763 7.9% 359,603 9.6% 348,309 8.9%
3,386,713$ 100.0% 3,738,386$ 100.0% 3,903,920$ 100.0%
Campus Staff (All Funds)
Position 2013 2014 2015
Principal 1.00 1.00 1.00
Assistant Principals 1.00 1.00 1.00
Counselor 1.20 1.20 1.20
Teachers 36.64 36.72 39.17
Diagnostician/Supv 0.30 0.50 0.40
Librarian 1.00 1.00 1.00
Occupational Therapists 0.17 0.01 0.01
Asst. Phy. Therapist 0.15 0.15 0.15
Nurse 1.00 1.00 1.00
Social Worker 0.10 0.10 0.10
Speech Pathologist 0.30 0.60 0.45
ESL/Bilingual Strategists 0.10 0.10 0.17
Inst. Spec./Intervention/Lit Coach 1.00 2.00 2.00
Clerks 3.00 3.00 3.00
Secretaries 1.00 1.00 1.00
Tech. Trainer - - 0.50
CEI/Computer Lab Manager 2.00 3.00 3.00
Nurse Aides 1.00 1.00 1.00
Teacher Aides 14.12 16.12 16.87
Attendance Officers 0.14 0.14 0.15
Library Clerks 1.00 1.00 1.00
Crossing Guards - - 5.00
P/I Liaison 1.00 1.00 1.00
Custodians 5.00 5.00 5.00
Total 72.22 76.64 85.17
2014/15 General Operating Budget by Object
Budget %
Payroll 3,555,611$ 91.1%
Contracted Services 162,355 4.2%
Supplies & Materials 170,250 4.4%
Other Operating Expenses 15,704 0.4%
Total 3,903,920$
2014/15 General Operating Budget by Program
Budget %
Regular Program 2,529,936$ 64.8%
Gifted & Talented 200 0.0%
Special Education 383,648 9.8%
Bilingual/ESL 175,601 4.5%
State Compensatory 419,507 10.7%
Undistributed 395,028 10.1%
Total 3,903,920$
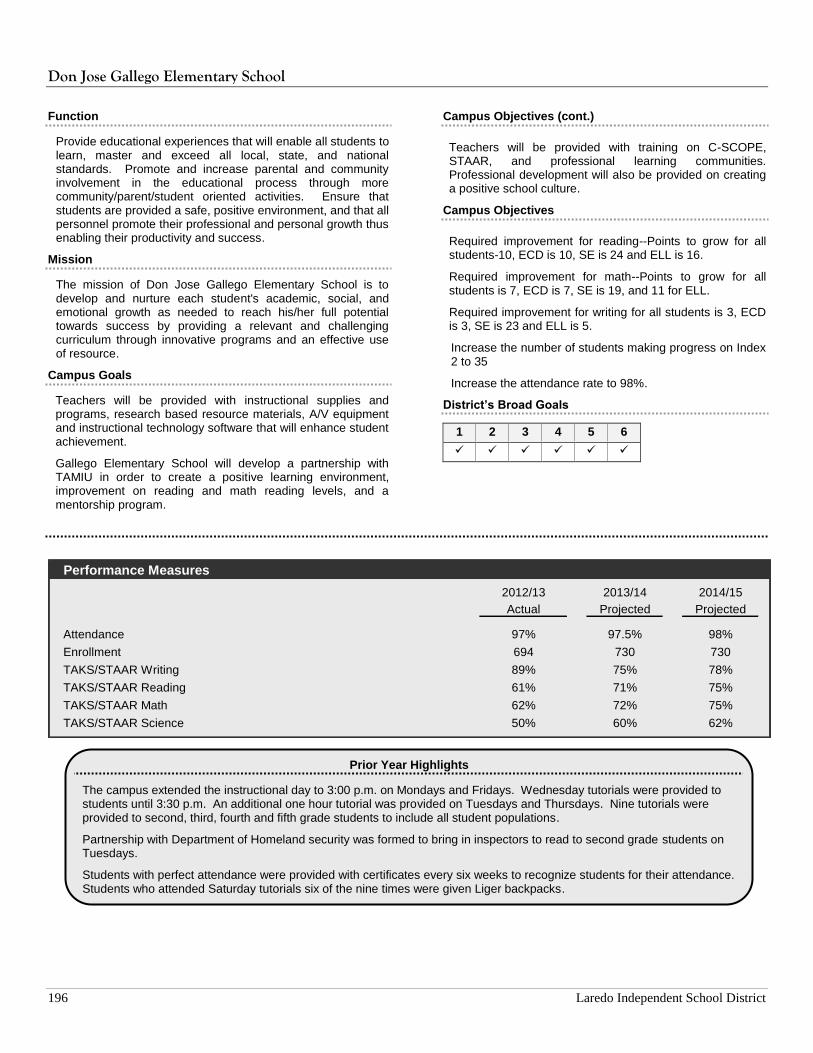
Don Jose Gallego Elementary School
196 Laredo Independent School District
Function
Provide educational experiences that will enable all students to learn, master and exceed all local, state, and national standards. Promote and increase parental and community involvement in the educational process through more community/parent/student oriented activities. Ensure that students are provided a safe, positive environment, and that all personnel promote their professional and personal growth thus enabling their productivity and success.
Mission
The mission of Don Jose Gallego Elementary School is to develop and nurture each student's academic, social, and emotional growth as needed to reach his/her full potential towards success by providing a relevant and challenging curriculum through innovative programs and an effective use of resource.
Campus Goals
Teachers will be provided with instructional supplies and programs, research based resource materials, A/V equipment and instructional technology software that will enhance student achievement.
Gallego Elementary School will develop a partnership with TAMIU in order to create a positive learning environment, improvement on reading and math reading levels, and a mentorship program.
Campus Objectives (cont.)
Teachers will be provided with training on C-SCOPE, STAAR, and professional learning communities. Professional development will also be provided on creating a positive school culture.
Campus Objectives
Required improvement for reading--Points to grow for all students-10, ECD is 10, SE is 24 and ELL is 16.
Required improvement for math--Points to grow for all students is 7, ECD is 7, SE is 19, and 11 for ELL.
Required improvement for writing for all students is 3, ECD is 3, SE is 23 and ELL is 5.
Increase the number of students making progress on Index 2 to 35
Increase the attendance rate to 98%.
District’s Broad Goals
1 2 3 4 5 6
Performance Measures
2012/13 2013/14 2014/15
Actual Projected Projected
Attendance 97% 97.5% 98%
Enrollment 694 730 730
TAKS/STAAR Writing 89% 75% 78%
TAKS/STAAR Reading 61% 71% 75%
TAKS/STAAR Math 62% 72% 75%
TAKS/STAAR Science 50% 60% 62%
Prior Year Highlights
The campus extended the instructional day to 3:00 p.m. on Mondays and Fridays. Wednesday tutorials were provided to students until 3:30 p.m. An additional one hour tutorial was provided on Tuesdays and Thursdays. Nine tutorials were provided to second, third, fourth and fifth grade students to include all student populations.
Partnership with Department of Homeland security was formed to bring in inspectors to read to second grade students on Tuesdays.
Students with perfect attendance were provided with certificates every six weeks to recognize students for their attendance. Students who attended Saturday tutorials six of the nine times were given Liger backpacks.

Don Jose Gallego Elementary School
2014-2015 Annual Budget 197
General Operating Fund Expenditures
2012/13 % of 2013/14 % of 2014/15 % of
Actual Total Projected Total Budget Total
Attendance 734 724 735
Payroll Costs by Function
Instructional 2,739,217$ 79.1% 2,920,599$ 75.8% 3,106,679$ 75.8%
Leadership 264,913 7.6% 280,841 7.3% 302,109 7.4%
Support Services - Student Based 83,964 2.4% 95,520 2.5% 154,765 3.8%
Support Services - Non-Student Based 120,872 3.5% 147,803 3.8% 166,083 4.0%
Ancillary Services 71 0.0% 150 0.0% - 0.0%
3,209,037 92.6% 3,444,912 89.4% 3,729,636 90.9%
Non-Payroll Costs by Function
Instructional 95,312 2.8% 221,240 5.7% 210,311 5.1%
Leadership 8,847 0.3% 4,997 0.1% 3,200 0.1%
Support Services - Student Based 15,384 0.4% 17,282 0.4% 15,500 0.4%
Support Services - Non-Student Based 135,751 3.9% 156,547 4.1% 142,239 3.5%
Debt / Capital Outlay - 0.0% 7,103 0.2% - 0.0%
255,294 7.4% 407,170 10.6% 371,250 9.1%
3,464,330$ 100.0% 3,852,082$ 100.0% 4,100,886$ 100.0%
Campus Staff (All Funds)
Position 2013 2014 2015
Principal 1.00 1.00 1.00
Assistant Principals 1.00 1.00 1.00
Counselor 1.05 1.05 1.05
Teachers 37.81 42.04 44.29
Diagnostician/Supv 0.30 0.50 0.50
Librarian 1.00 1.00 1.00
Occupational Therapists 0.09 0.18 0.18
Asst. Phy. Therapist 0.15 0.15 0.15
Nurse 1.00 1.00 1.00
Social Worker 0.10 0.10 0.10
Speech Pathologist 0.40 0.65 0.40
ESL/Bilingual Strategists 0.10 0.10 0.14
Tech. Trainer - - 0.50
Inst. Spec./Intervention/Lit Coach 2.00 2.00 2.00
Clerks 3.00 3.00 3.00
Secretaries 1.00 1.00 1.00
CEI/Computer Lab Manager 2.00 2.00 2.00
Nurse Aides 1.00 1.00 1.00
Teacher Aides 12.14 14.14 13.14
Attendance Officers 0.15 0.15 0.14
Library Clerks 1.00 1.00 1.00
Crossing Guards - - 1.00
P/I Liaison 1.00 1.00 1.00
Custodians 6.00 6.00 6.00
Total 73.29 80.06 82.59
2014/15 General Operating Budget by Object
Budget %
Payroll 3,729,636$ 90.9%
Contracted Services 158,021 3.9%
Supplies & Materials 184,729 4.5%
Other Operating Expenses 28,500 0.7%
Total 4,100,886$
2014/15 General Operating Budget by Program
Budget %
Regular Program 2,652,013$ 64.7%
Gifted & Talented 58,803 1.4%
Special Education 303,957 7.4%
Bilingual/ESL 192,894 4.7%
State Compensatory 473,234 11.5%
Undistributed 419,985 10.2%
Total 4,100,886$
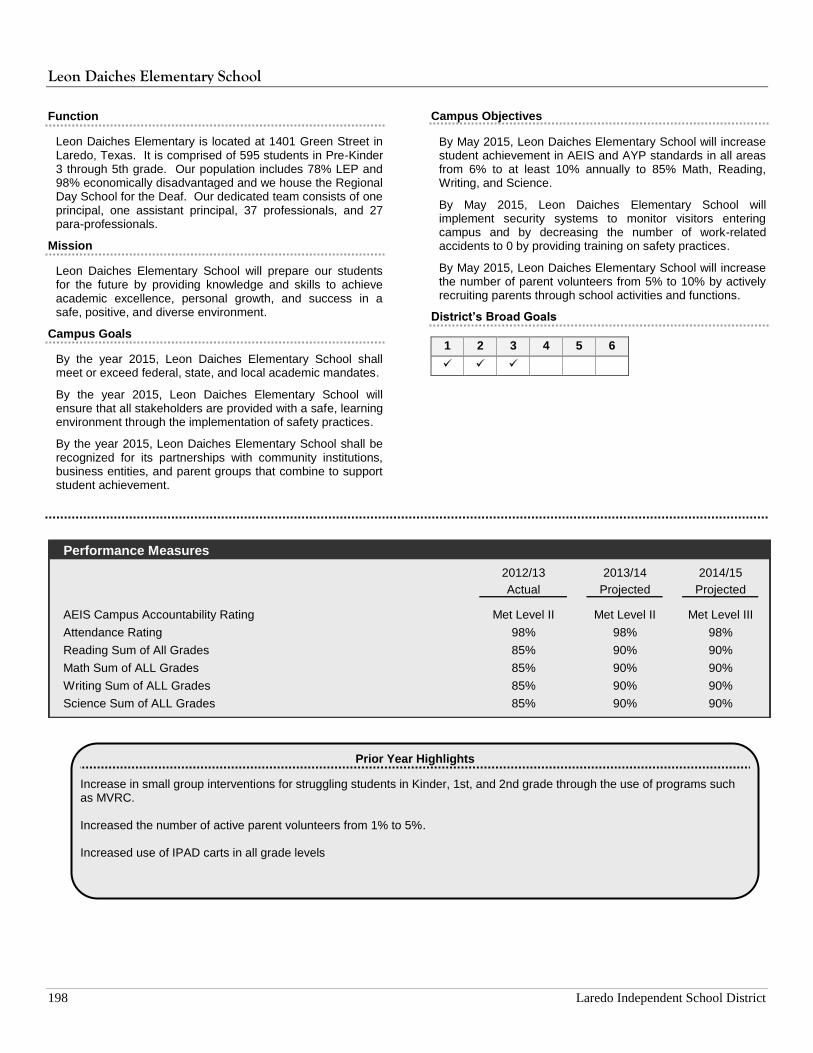
Leon Daiches Elementary School
198 Laredo Independent School District
Function
Leon Daiches Elementary is located at 1401 Green Street in Laredo, Texas. It is comprised of 595 students in Pre-Kinder 3 through 5th grade. Our population includes 78% LEP and 98% economically disadvantaged and we house the Regional Day School for the Deaf. Our dedicated team consists of one principal, one assistant principal, 37 professionals, and 27 para-professionals.
Mission
Leon Daiches Elementary School will prepare our students for the future by providing knowledge and skills to achieve academic excellence, personal growth, and success in a safe, positive, and diverse environment.
Campus Goals
By the year 2015, Leon Daiches Elementary School shall meet or exceed federal, state, and local academic mandates.
By the year 2015, Leon Daiches Elementary School will ensure that all stakeholders are provided with a safe, learning environment through the implementation of safety practices.
By the year 2015, Leon Daiches Elementary School shall be recognized for its partnerships with community institutions, business entities, and parent groups that combine to support student achievement.
Campus Objectives
By May 2015, Leon Daiches Elementary School will increase student achievement in AEIS and AYP standards in all areas from 6% to at least 10% annually to 85% Math, Reading, Writing, and Science.
By May 2015, Leon Daiches Elementary School will implement security systems to monitor visitors entering campus and by decreasing the number of work-related accidents to 0 by providing training on safety practices.
By May 2015, Leon Daiches Elementary School will increase the number of parent volunteers from 5% to 10% by actively recruiting parents through school activities and functions.
District’s Broad Goals
1 2 3 4 5 6
Performance Measures
2012/13 2013/14 2014/15
Actual Projected Projected
AEIS Campus Accountability Rating Met Level II Met Level II Met Level III
Attendance Rating 98% 98% 98%
Reading Sum of All Grades 85% 90% 90%
Math Sum of ALL Grades 85% 90% 90%
Writing Sum of ALL Grades 85% 90% 90%
Science Sum of ALL Grades 85% 90% 90%
Prior Year Highlights
Increase in small group interventions for struggling students in Kinder, 1st, and 2nd grade through the use of programs such as MVRC. Increased the number of active parent volunteers from 1% to 5%. Increased use of IPAD carts in all grade levels
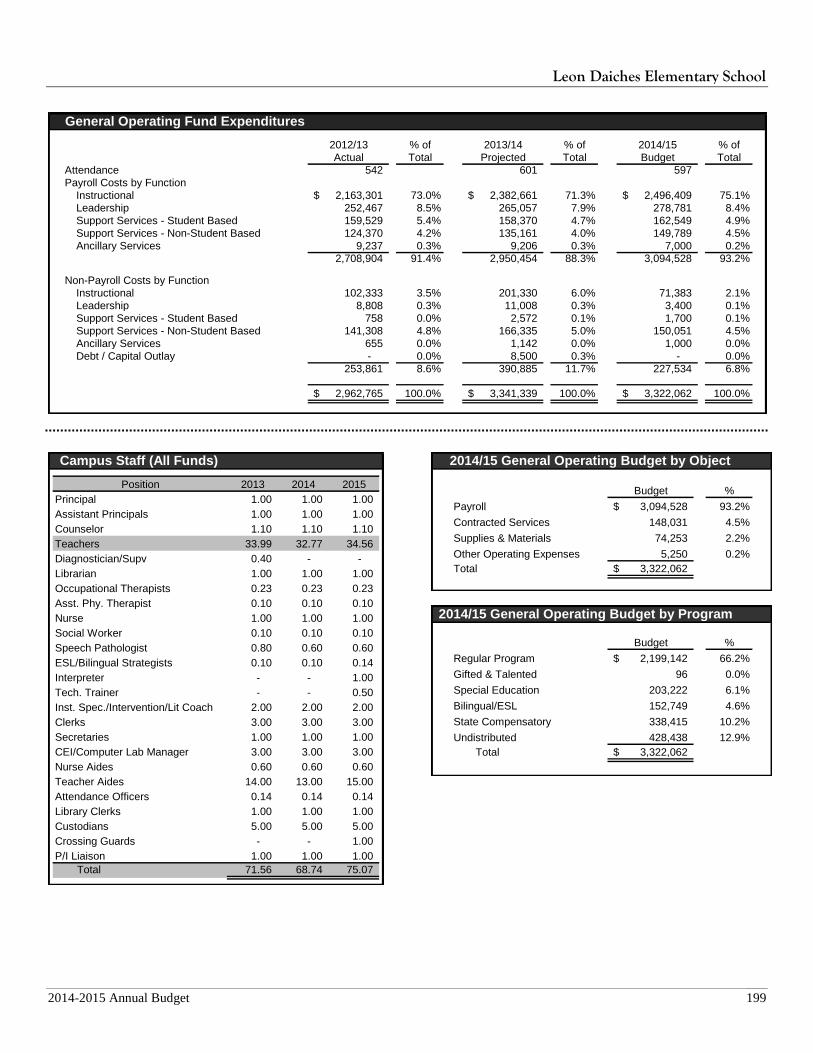
Leon Daiches Elementary School
2014-2015 Annual Budget 199
General Operating Fund Expenditures
2012/13 % of 2013/14 % of 2014/15 % of
Actual Total Projected Total Budget Total
Attendance 542 601 597
Payroll Costs by Function
Instructional 2,163,301$ 73.0% 2,382,661$ 71.3% 2,496,409$ 75.1%
Leadership 252,467 8.5% 265,057 7.9% 278,781 8.4%
Support Services - Student Based 159,529 5.4% 158,370 4.7% 162,549 4.9%
Support Services - Non-Student Based 124,370 4.2% 135,161 4.0% 149,789 4.5%
Ancillary Services 9,237 0.3% 9,206 0.3% 7,000 0.2%
2,708,904 91.4% 2,950,454 88.3% 3,094,528 93.2%
Non-Payroll Costs by Function
Instructional 102,333 3.5% 201,330 6.0% 71,383 2.1%
Leadership 8,808 0.3% 11,008 0.3% 3,400 0.1%
Support Services - Student Based 758 0.0% 2,572 0.1% 1,700 0.1%
Support Services - Non-Student Based 141,308 4.8% 166,335 5.0% 150,051 4.5%
Ancillary Services 655 0.0% 1,142 0.0% 1,000 0.0%
Debt / Capital Outlay - 0.0% 8,500 0.3% - 0.0%
253,861 8.6% 390,885 11.7% 227,534 6.8%
2,962,765$ 100.0% 3,341,339$ 100.0% 3,322,062$ 100.0%
Campus Staff (All Funds)
Position 2013 2014 2015
Principal 1.00 1.00 1.00
Assistant Principals 1.00 1.00 1.00
Counselor 1.10 1.10 1.10
Teachers 33.99 32.77 34.56
Diagnostician/Supv 0.40 - -
Librarian 1.00 1.00 1.00
Occupational Therapists 0.23 0.23 0.23
Asst. Phy. Therapist 0.10 0.10 0.10
Nurse 1.00 1.00 1.00
Social Worker 0.10 0.10 0.10
Speech Pathologist 0.80 0.60 0.60
ESL/Bilingual Strategists 0.10 0.10 0.14
Interpreter - - 1.00
Tech. Trainer - - 0.50
Inst. Spec./Intervention/Lit Coach 2.00 2.00 2.00
Clerks 3.00 3.00 3.00
Secretaries 1.00 1.00 1.00
CEI/Computer Lab Manager 3.00 3.00 3.00
Nurse Aides 0.60 0.60 0.60
Teacher Aides 14.00 13.00 15.00
Attendance Officers 0.14 0.14 0.14
Library Clerks 1.00 1.00 1.00
Custodians 5.00 5.00 5.00
Crossing Guards - - 1.00
P/I Liaison 1.00 1.00 1.00
Total 71.56 68.74 75.07
2014/15 General Operating Budget by Object
Budget %
Payroll 3,094,528$ 93.2%
Contracted Services 148,031 4.5%
Supplies & Materials 74,253 2.2%
Other Operating Expenses 5,250 0.2%
Total 3,322,062$
2014/15 General Operating Budget by Program
Budget %
Regular Program 2,199,142$ 66.2%
Gifted & Talented 96 0.0%
Special Education 203,222 6.1%
Bilingual/ESL 152,749 4.6%
State Compensatory 338,415 10.2%
Undistributed 428,438 12.9%
Total 3,322,062$
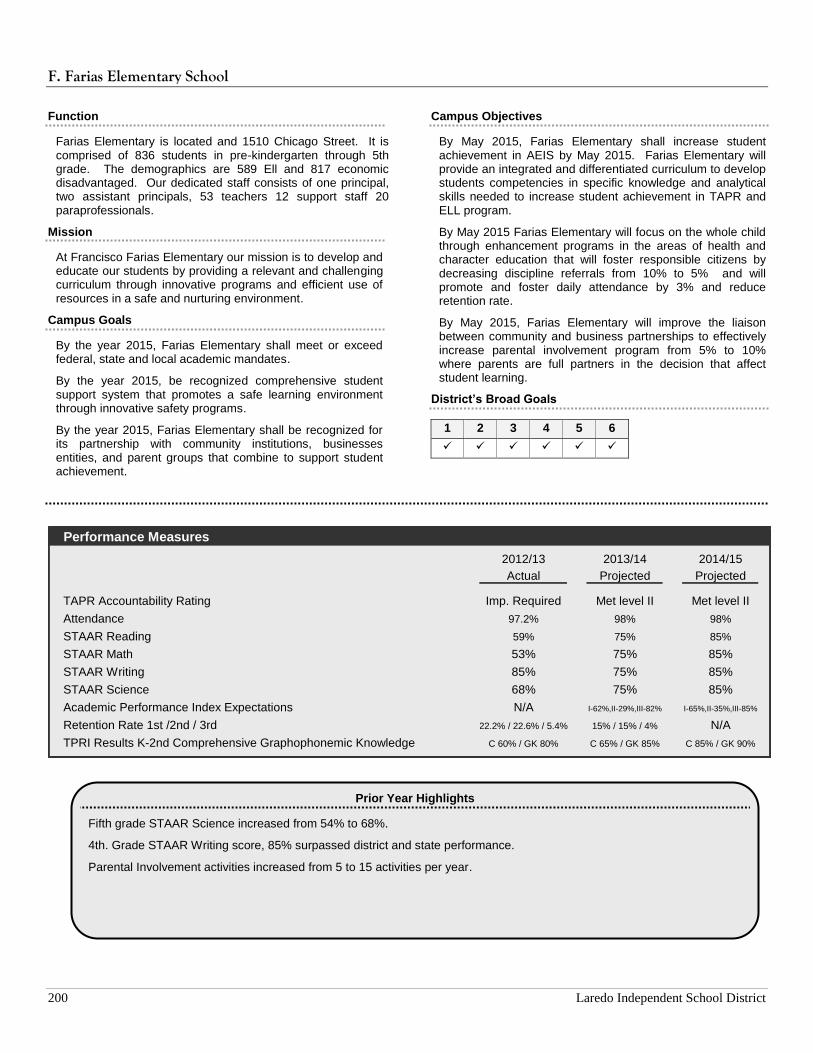
F. Farias Elementary School
200 Laredo Independent School District
Function
Farias Elementary is located and 1510 Chicago Street. It is comprised of 836 students in pre-kindergarten through 5th grade. The demographics are 589 Ell and 817 economic disadvantaged. Our dedicated staff consists of one principal, two assistant principals, 53 teachers 12 support staff 20 paraprofessionals.
Mission
At Francisco Farias Elementary our mission is to develop and educate our students by providing a relevant and challenging curriculum through innovative programs and efficient use of resources in a safe and nurturing environment.
Campus Goals
By the year 2015, Farias Elementary shall meet or exceed federal, state and local academic mandates.
By the year 2015, be recognized comprehensive student support system that promotes a safe learning environment through innovative safety programs.
By the year 2015, Farias Elementary shall be recognized for its partnership with community institutions, businesses entities, and parent groups that combine to support student achievement.
Campus Objectives
By May 2015, Farias Elementary shall increase student achievement in AEIS by May 2015. Farias Elementary will provide an integrated and differentiated curriculum to develop students competencies in specific knowledge and analytical skills needed to increase student achievement in TAPR and ELL program.
By May 2015 Farias Elementary will focus on the whole child through enhancement programs in the areas of health and character education that will foster responsible citizens by decreasing discipline referrals from 10% to 5% and will promote and foster daily attendance by 3% and reduce retention rate.
By May 2015, Farias Elementary will improve the liaison between community and business partnerships to effectively increase parental involvement program from 5% to 10% where parents are full partners in the decision that affect student learning.
District’s Broad Goals
1 2 3 4 5 6
Performance Measures
2012/13 2013/14 2014/15
Actual Projected Projected
TAPR Accountability Rating Imp. Required Met level II Met level II
Attendance 97.2% 98% 98%
STAAR Reading 59% 75% 85%
STAAR Math 53% 75% 85%
STAAR Writing 85% 75% 85%
STAAR Science 68% 75% 85%
Academic Performance Index Expectations N/A I-62%,II-29%,III-82% I-65%,II-35%,III-85%
Retention Rate 1st /2nd / 3rd 22.2% / 22.6% / 5.4% 15% / 15% / 4% N/A
TPRI Results K-2nd Comprehensive Graphophonemic Knowledge C 60% / GK 80% C 65% / GK 85% C 85% / GK 90%
Prior Year Highlights
Fifth grade STAAR Science increased from 54% to 68%.
4th. Grade STAAR Writing score, 85% surpassed district and state performance.
Parental Involvement activities increased from 5 to 15 activities per year.
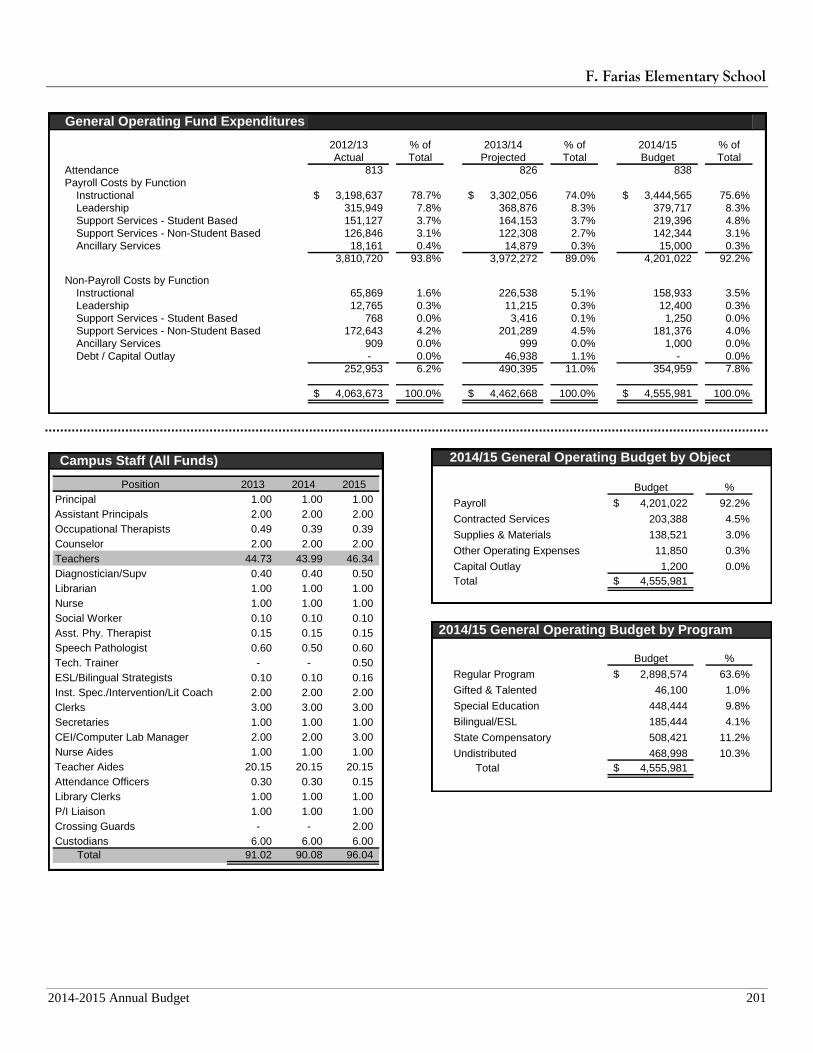
F. Farias Elementary School
2014-2015 Annual Budget 201
General Operating Fund Expenditures
2012/13 % of 2013/14 % of 2014/15 % of
Actual Total Projected Total Budget Total
Attendance 813 826 838
Payroll Costs by Function
Instructional 3,198,637$ 78.7% 3,302,056$ 74.0% 3,444,565$ 75.6%
Leadership 315,949 7.8% 368,876 8.3% 379,717 8.3%
Support Services - Student Based 151,127 3.7% 164,153 3.7% 219,396 4.8%
Support Services - Non-Student Based 126,846 3.1% 122,308 2.7% 142,344 3.1%
Ancillary Services 18,161 0.4% 14,879 0.3% 15,000 0.3%
3,810,720 93.8% 3,972,272 89.0% 4,201,022 92.2%
Non-Payroll Costs by Function
Instructional 65,869 1.6% 226,538 5.1% 158,933 3.5%
Leadership 12,765 0.3% 11,215 0.3% 12,400 0.3%
Support Services - Student Based 768 0.0% 3,416 0.1% 1,250 0.0%
Support Services - Non-Student Based 172,643 4.2% 201,289 4.5% 181,376 4.0%
Ancillary Services 909 0.0% 999 0.0% 1,000 0.0%
Debt / Capital Outlay - 0.0% 46,938 1.1% - 0.0%
252,953 6.2% 490,395 11.0% 354,959 7.8%
4,063,673$ 100.0% 4,462,668$ 100.0% 4,555,981$ 100.0%
Campus Staff (All Funds)
Position 2013 2014 2015
Principal 1.00 1.00 1.00
Assistant Principals 2.00 2.00 2.00
Occupational Therapists 0.49 0.39 0.39
Counselor 2.00 2.00 2.00
Teachers 44.73 43.99 46.34
Diagnostician/Supv 0.40 0.40 0.50
Librarian 1.00 1.00 1.00
Nurse 1.00 1.00 1.00
Social Worker 0.10 0.10 0.10
Asst. Phy. Therapist 0.15 0.15 0.15
Speech Pathologist 0.60 0.50 0.60
Tech. Trainer - - 0.50
ESL/Bilingual Strategists 0.10 0.10 0.16
Inst. Spec./Intervention/Lit Coach 2.00 2.00 2.00
Clerks 3.00 3.00 3.00
Secretaries 1.00 1.00 1.00
CEI/Computer Lab Manager 2.00 2.00 3.00
Nurse Aides 1.00 1.00 1.00
Teacher Aides 20.15 20.15 20.15
Attendance Officers 0.30 0.30 0.15
Library Clerks 1.00 1.00 1.00
P/I Liaison 1.00 1.00 1.00
Crossing Guards - - 2.00
Custodians 6.00 6.00 6.00
Total 91.02 90.08 96.04
2014/15 General Operating Budget by Object
Budget %
Payroll 4,201,022$ 92.2%
Contracted Services 203,388 4.5%
Supplies & Materials 138,521 3.0%
Other Operating Expenses 11,850 0.3%
Capital Outlay 1,200 0.0%
Total 4,555,981$
2014/15 General Operating Budget by Program
Budget %
Regular Program 2,898,574$ 63.6%
Gifted & Talented 46,100 1.0%
Special Education 448,444 9.8%
Bilingual/ESL 185,444 4.1%
State Compensatory 508,421 11.2%
Undistributed 468,998 10.3%
Total 4,555,981$
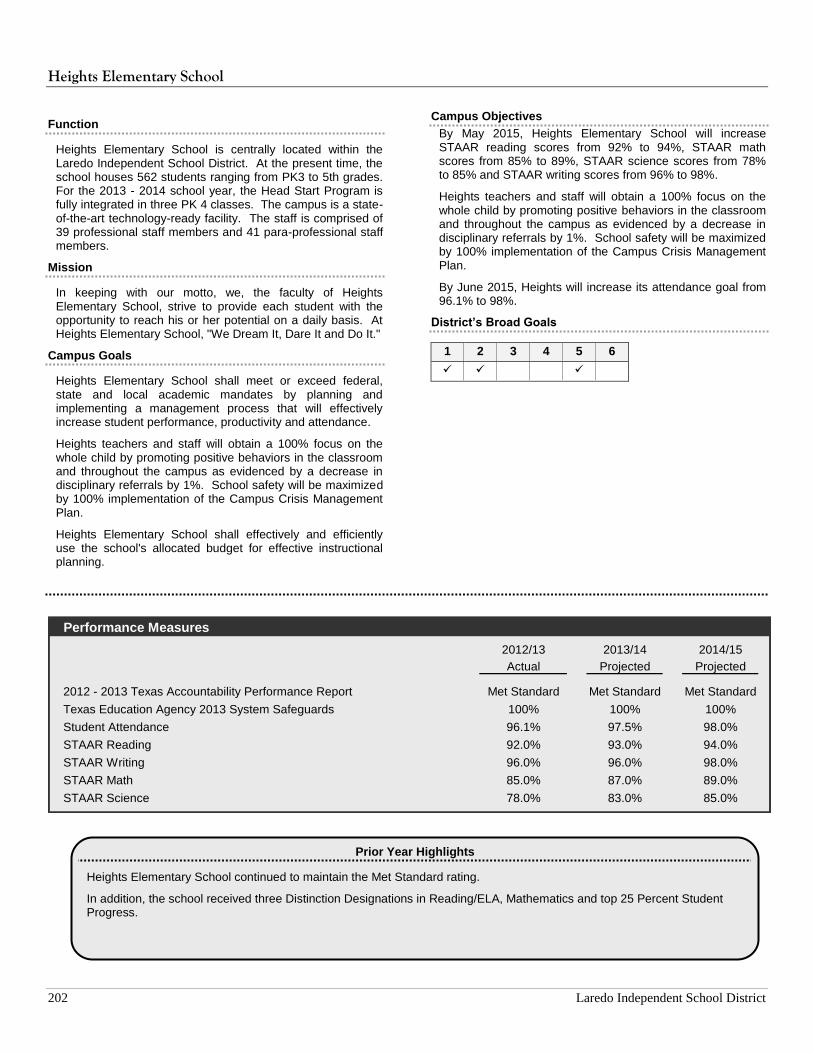
Heights Elementary School
202 Laredo Independent School District
Function
Heights Elementary School is centrally located within the Laredo Independent School District. At the present time, the school houses 562 students ranging from PK3 to 5th grades. For the 2013 - 2014 school year, the Head Start Program is fully integrated in three PK 4 classes. The campus is a state-of-the-art technology-ready facility. The staff is comprised of 39 professional staff members and 41 para-professional staff members.
Mission
In keeping with our motto, we, the faculty of Heights Elementary School, strive to provide each student with the opportunity to reach his or her potential on a daily basis. At Heights Elementary School, "We Dream It, Dare It and Do It."
Campus Goals
Heights Elementary School shall meet or exceed federal, state and local academic mandates by planning and implementing a management process that will effectively increase student performance, productivity and attendance.
Heights teachers and staff will obtain a 100% focus on the whole child by promoting positive behaviors in the classroom and throughout the campus as evidenced by a decrease in disciplinary referrals by 1%. School safety will be maximized by 100% implementation of the Campus Crisis Management Plan.
Heights Elementary School shall effectively and efficiently use the school's allocated budget for effective instructional planning.
Campus Objectives
By May 2015, Heights Elementary School will increase STAAR reading scores from 92% to 94%, STAAR math scores from 85% to 89%, STAAR science scores from 78% to 85% and STAAR writing scores from 96% to 98%.
Heights teachers and staff will obtain a 100% focus on the whole child by promoting positive behaviors in the classroom and throughout the campus as evidenced by a decrease in disciplinary referrals by 1%. School safety will be maximized by 100% implementation of the Campus Crisis Management Plan.
By June 2015, Heights will increase its attendance goal from 96.1% to 98%.
District’s Broad Goals
1 2 3 4 5 6
Performance Measures
2012/13 2013/14 2014/15
Actual Projected Projected
2012 - 2013 Texas Accountability Performance Report Met Standard Met Standard Met Standard
Texas Education Agency 2013 System Safeguards 100% 100% 100%
Student Attendance 96.1% 97.5% 98.0%
STAAR Reading 92.0% 93.0% 94.0%
STAAR Writing 96.0% 96.0% 98.0%
STAAR Math 85.0% 87.0% 89.0%
STAAR Science 78.0% 83.0% 85.0%
Prior Year Highlights
Heights Elementary School continued to maintain the Met Standard rating.
In addition, the school received three Distinction Designations in Reading/ELA, Mathematics and top 25 Percent Student Progress.
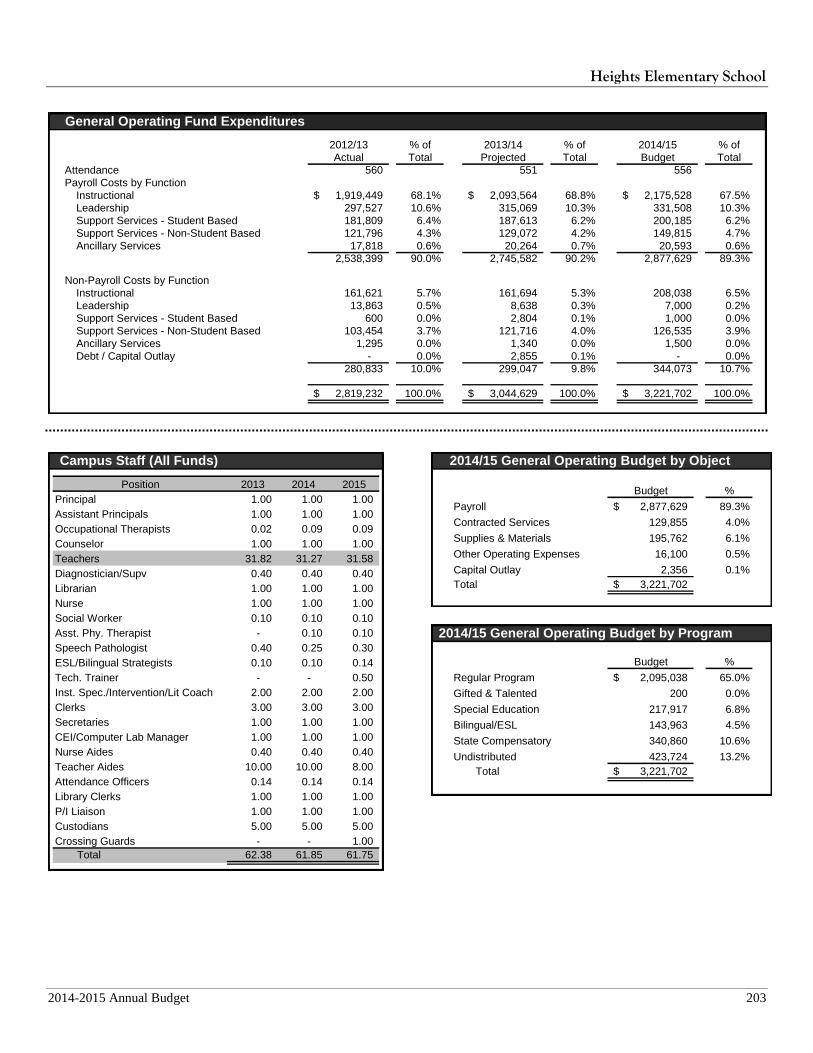
Heights Elementary School
2014-2015 Annual Budget 203
General Operating Fund Expenditures
2012/13 % of 2013/14 % of 2014/15 % of
Actual Total Projected Total Budget Total
Attendance 560 551 556
Payroll Costs by Function
Instructional 1,919,449$ 68.1% 2,093,564$ 68.8% 2,175,528$ 67.5%
Leadership 297,527 10.6% 315,069 10.3% 331,508 10.3%
Support Services - Student Based 181,809 6.4% 187,613 6.2% 200,185 6.2%
Support Services - Non-Student Based 121,796 4.3% 129,072 4.2% 149,815 4.7%
Ancillary Services 17,818 0.6% 20,264 0.7% 20,593 0.6%
2,538,399 90.0% 2,745,582 90.2% 2,877,629 89.3%
Non-Payroll Costs by Function
Instructional 161,621 5.7% 161,694 5.3% 208,038 6.5%
Leadership 13,863 0.5% 8,638 0.3% 7,000 0.2%
Support Services - Student Based 600 0.0% 2,804 0.1% 1,000 0.0%
Support Services - Non-Student Based 103,454 3.7% 121,716 4.0% 126,535 3.9%
Ancillary Services 1,295 0.0% 1,340 0.0% 1,500 0.0%
Debt / Capital Outlay - 0.0% 2,855 0.1% - 0.0%
280,833 10.0% 299,047 9.8% 344,073 10.7%
2,819,232$ 100.0% 3,044,629$ 100.0% 3,221,702$ 100.0%
Campus Staff (All Funds)
Position 2013 2014 2015
Principal 1.00 1.00 1.00
Assistant Principals 1.00 1.00 1.00
Occupational Therapists 0.02 0.09 0.09
Counselor 1.00 1.00 1.00
Teachers 31.82 31.27 31.58
Diagnostician/Supv 0.40 0.40 0.40
Librarian 1.00 1.00 1.00
Nurse 1.00 1.00 1.00
Social Worker 0.10 0.10 0.10
Asst. Phy. Therapist - 0.10 0.10
Speech Pathologist 0.40 0.25 0.30
ESL/Bilingual Strategists 0.10 0.10 0.14
Tech. Trainer - - 0.50
Inst. Spec./Intervention/Lit Coach 2.00 2.00 2.00
Clerks 3.00 3.00 3.00
Secretaries 1.00 1.00 1.00
CEI/Computer Lab Manager 1.00 1.00 1.00
Nurse Aides 0.40 0.40 0.40
Teacher Aides 10.00 10.00 8.00
Attendance Officers 0.14 0.14 0.14
Library Clerks 1.00 1.00 1.00
P/I Liaison 1.00 1.00 1.00
Custodians 5.00 5.00 5.00
Crossing Guards - - 1.00
Total 62.38 61.85 61.75
2014/15 General Operating Budget by Object
Budget %
Payroll 2,877,629$ 89.3%
Contracted Services 129,855 4.0%
Supplies & Materials 195,762 6.1%
Other Operating Expenses 16,100 0.5%
Capital Outlay 2,356 0.1%
Total 3,221,702$
2014/15 General Operating Budget by Program
Budget %
Regular Program 2,095,038$ 65.0%
Gifted & Talented 200 0.0%
Special Education 217,917 6.8%
Bilingual/ESL 143,963 4.5%
State Compensatory 340,860 10.6%
Undistributed 423,724 13.2%
Total 3,221,702$
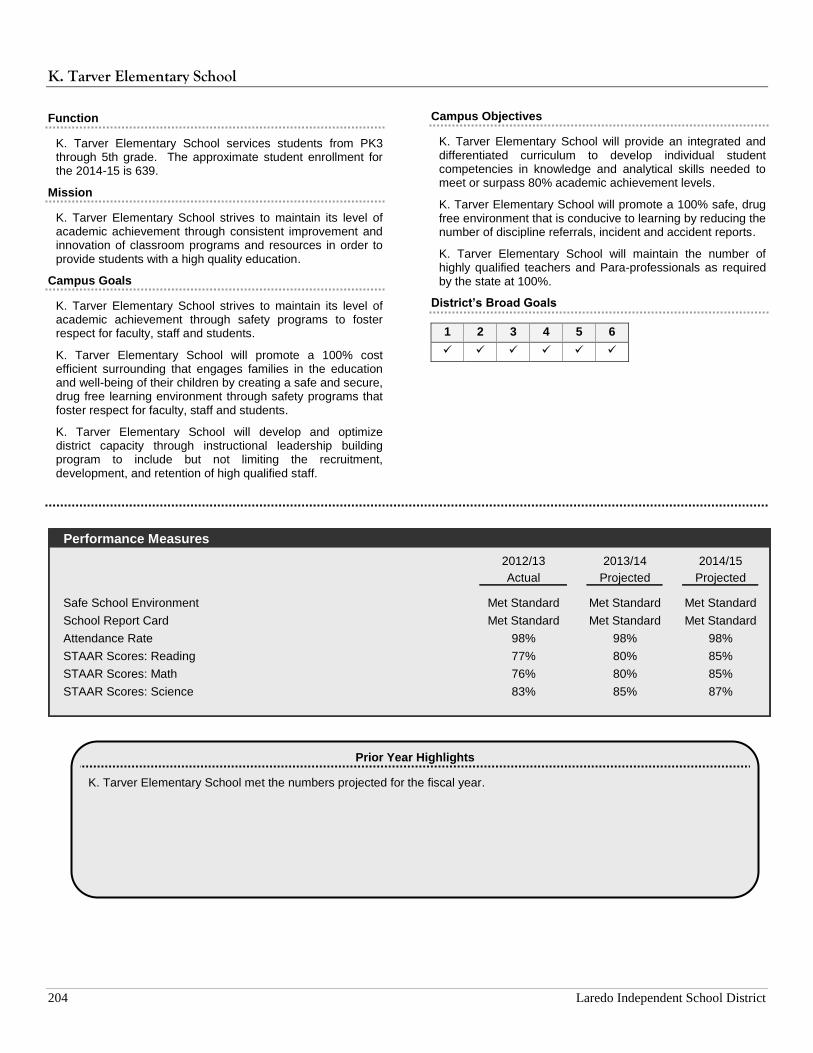
K. Tarver Elementary School
204 Laredo Independent School District
Function
K. Tarver Elementary School services students from PK3 through 5th grade. The approximate student enrollment for the 2014-15 is 639.
Mission
K. Tarver Elementary School strives to maintain its level of academic achievement through consistent improvement and innovation of classroom programs and resources in order to provide students with a high quality education.
Campus Goals
K. Tarver Elementary School strives to maintain its level of academic achievement through safety programs to foster respect for faculty, staff and students.
K. Tarver Elementary School will promote a 100% cost efficient surrounding that engages families in the education and well-being of their children by creating a safe and secure, drug free learning environment through safety programs that foster respect for faculty, staff and students.
K. Tarver Elementary School will develop and optimize district capacity through instructional leadership building program to include but not limiting the recruitment, development, and retention of high qualified staff.
Campus Objectives
K. Tarver Elementary School will provide an integrated and differentiated curriculum to develop individual student competencies in knowledge and analytical skills needed to meet or surpass 80% academic achievement levels.
K. Tarver Elementary School will promote a 100% safe, drug free environment that is conducive to learning by reducing the number of discipline referrals, incident and accident reports.
K. Tarver Elementary School will maintain the number of highly qualified teachers and Para-professionals as required by the state at 100%.
District’s Broad Goals
1 2 3 4 5 6
Performance Measures
2012/13 2013/14 2014/15
Actual Projected Projected
Safe School Environment Met Standard Met Standard Met Standard
School Report Card Met Standard Met Standard Met Standard
Attendance Rate 98% 98% 98%
STAAR Scores: Reading 77% 80% 85%
STAAR Scores: Math 76% 80% 85%
STAAR Scores: Science 83% 85% 87%
Prior Year Highlights
K. Tarver Elementary School met the numbers projected for the fiscal year.

K. Tarver Elementary School
2014-2015 Annual Budget 205
General Operating Fund Expenditures
2012/13 % of 2013/14 % of 2014/15 % of
Actual Total Projected Total Budget Total
Attendance 626 610 623
Payroll Costs by Function
Instructional 2,307,335$ 77.1% 2,598,271$ 75.2% 2,798,341$ 76.2%
Leadership 280,256 9.4% 302,702 8.8% 308,797 8.4%
Support Services - Student Based 78,453 2.6% 89,438 2.6% 148,948 4.1%
Support Services - Non-Student Based 118,798 4.0% 139,916 4.1% 152,782 4.2%
Ancillary Services 14,218 0.5% 15,298 0.4% 19,000 0.5%
2,799,060 93.5% 3,145,625 91.1% 3,427,868 93.4%
Non-Payroll Costs by Function
Instructional 59,435 2.0% 159,048 4.6% 107,534 2.9%
Leadership 7,019 0.2% 3,922 0.1% 2,350 0.1%
Support Services - Student Based 1,149 0.0% 2,739 0.1% 1,600 0.0%
Support Services - Non-Student Based 126,059 4.2% 140,959 4.1% 130,731 3.6%
Ancillary Services 915 0.0% 1,035 0.0% 1,000 0.0%
194,578 6.5% 307,703 8.9% 243,215 6.6%
2,993,638$ 100.0% 3,453,328$ 100.0% 3,671,083$ 100.0%
Campus Staff (All Funds)
Position 2013 2014 2015
Principal 1.00 1.00 1.00
Assistant Principals 1.00 1.00 1.00
Occupational Therapists 0.12 0.12 0.25
Counselor 1.00 1.00 1.00
Teachers 37.03 38.21 38.83
Diagnostician/Supv - 0.50 0.40
Librarian 1.00 1.00 1.00
Nurse 1.00 1.00 1.00
Social Worker 0.10 0.10 0.10
Speech Pathologist 0.40 0.60 0.60
ESL/Bilingual Strategists 0.10 0.10 0.14
Inst. Spec./Intervention/Lit Coach 2.00 2.00 2.00
Tech. Trainer - - 0.50
Clerks 3.00 3.00 3.00
Secretaries 1.00 1.00 1.00
CEI/Computer Lab Manager 2.00 2.00 2.00
Nurse Aides 0.60 1.60 0.60
Teacher Aides 13.10 14.10 17.10
Attendance Officers 0.14 0.14 0.14
Library Clerks 1.00 1.00 1.00
P/I Liaison 1.00 1.00 1.00
Custodians 5.00 5.00 5.00
Crossing Guards - - 3.00
Total 71.59 75.47 81.66
2014/15 General Operating Budget by Object
Budget %
Payroll 3,427,868$ 93.4%
Contracted Services 130,952 3.6%
Supplies & Materials 100,813 2.7%
Other Operating Expenses 11,450 0.3%
Total 3,671,083$
2014/15 General Operating Budget by Program
Budget %
Regular Program 2,293,873$ 62.5%
Gifted & Talented 59,114 1.6%
Special Education 366,072 10.0%
Bilingual/ESL 153,946 4.2%
State Compensatory 371,863 10.1%
Undistributed 426,215 11.6%
Total 3,671,083$
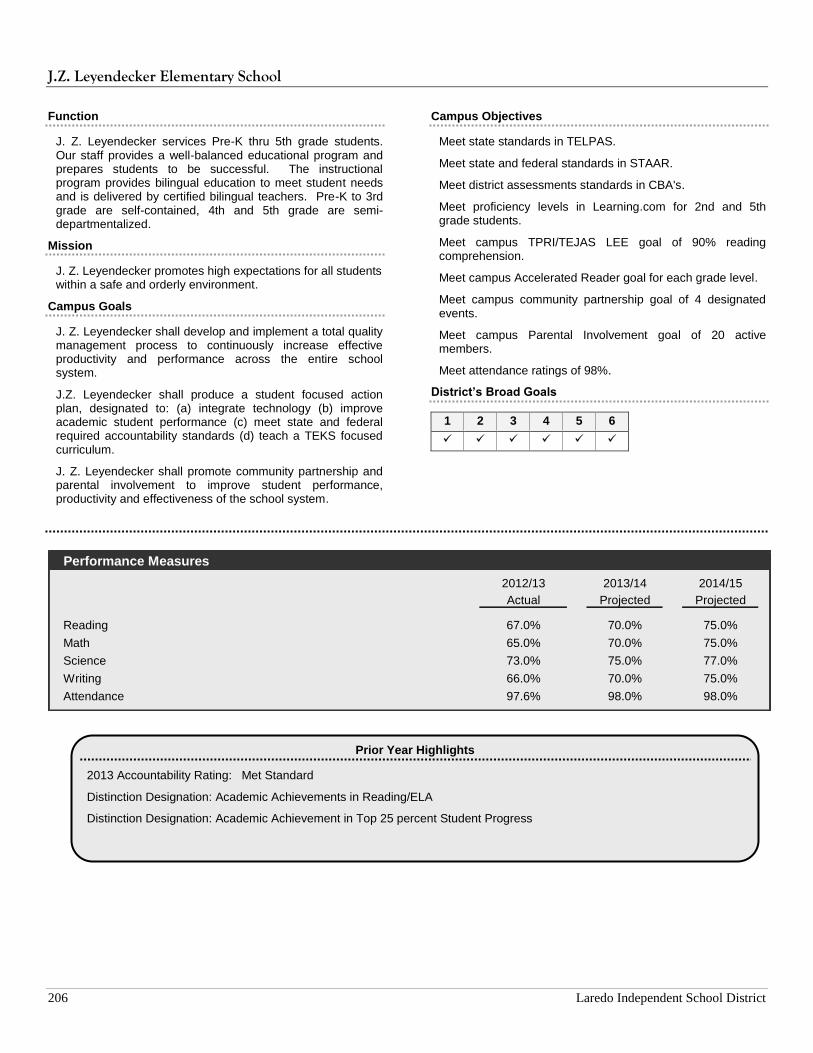
J.Z. Leyendecker Elementary School
206 Laredo Independent School District
Function
J. Z. Leyendecker services Pre-K thru 5th grade students. Our staff provides a well-balanced educational program and prepares students to be successful. The instructional program provides bilingual education to meet student needs and is delivered by certified bilingual teachers. Pre-K to 3rd grade are self-contained, 4th and 5th grade are semi-departmentalized.
Mission
J. Z. Leyendecker promotes high expectations for all students within a safe and orderly environment.
Campus Goals
J. Z. Leyendecker shall develop and implement a total quality management process to continuously increase effective productivity and performance across the entire school system.
J.Z. Leyendecker shall produce a student focused action plan, designated to: (a) integrate technology (b) improve academic student performance (c) meet state and federal required accountability standards (d) teach a TEKS focused curriculum.
J. Z. Leyendecker shall promote community partnership and parental involvement to improve student performance, productivity and effectiveness of the school system.
Campus Objectives
Meet state standards in TELPAS.
Meet state and federal standards in STAAR.
Meet district assessments standards in CBA's.
Meet proficiency levels in Learning.com for 2nd and 5th grade students.
Meet campus TPRI/TEJAS LEE goal of 90% reading comprehension.
Meet campus Accelerated Reader goal for each grade level.
Meet campus community partnership goal of 4 designated events.
Meet campus Parental Involvement goal of 20 active members.
Meet attendance ratings of 98%.
District’s Broad Goals
1 2 3 4 5 6
Performance Measures
2012/13 2013/14 2014/15
Actual Projected Projected
Reading 67.0% 70.0% 75.0%
Math 65.0% 70.0% 75.0%
Science 73.0% 75.0% 77.0%
Writing 66.0% 70.0% 75.0%
Attendance 97.6% 98.0% 98.0%
Prior Year Highlights
2013 Accountability Rating: Met Standard
Distinction Designation: Academic Achievements in Reading/ELA
Distinction Designation: Academic Achievement in Top 25 percent Student Progress

J.Z. Leyendecker Elementary School
2014-2015 Annual Budget 207
General Operating Fund Expenditures
2012/13 % of 2013/14 % of 2014/15 % of
Actual Total Projected Total Budget Total
Attendance 541 538 556
Payroll Costs by Function
Instructional 2,425,795$ 73.7% 2,503,267$ 71.7% 2,619,630$ 73.9%
Leadership 283,219 8.6% 299,291 8.6% 322,678 9.1%
Support Services - Student Based 166,842 5.1% 190,375 5.5% 200,534 5.7%
Support Services - Non-Student Based 138,273 4.2% 152,355 4.4% 168,654 4.8%
Ancillary Services 1 0.0% - 0.0% - 0.0%
3,014,131 91.6% 3,145,289 90.1% 3,311,496 93.4%
Non-Payroll Costs by Function
Instructional 138,237 4.2% 128,864 3.7% 96,006 2.7%
Leadership 9,815 0.3% 13,184 0.4% 6,500 0.2%
Support Services - Student Based 1,258 0.0% 4,081 0.1% 300 0.0%
Support Services - Non-Student Based 128,247 3.9% 153,889 4.4% 131,533 3.7%
Debt / Capital Outlay - 0.0% 46,984 1.3% - 0.0%
277,558 8.4% 347,002 9.9% 234,339 6.6%
3,291,688$ 100.0% 3,492,291$ 100.0% 3,545,835$ 100.0%
Campus Staff (All Funds)
Position 2013 2014 2015
Principal 1.00 1.00 1.00
Assistant Principals 1.00 1.00 1.00
Occupational Therapists 0.21 0.26 0.26
Counselor 1.00 1.00 1.00
Teachers 35.59 34.33 33.85
Diagnostician/Supv 0.40 0.50 0.50
Librarian 1.00 1.00 1.00
Nurse 1.00 1.00 1.00
Social Worker 0.10 0.10 0.10
Speech Pathologist 0.25 0.25 0.50
ESL/Bilingual Strategists 0.10 0.10 0.17
Inst. Spec./Intervention/Lit Coach 2.00 2.00 2.00
Tech. Trainer - - 0.50
Clerks 3.00 3.00 3.00
Secretaries 1.00 1.00 1.00
CEI/Computer Lab Manager 3.00 3.00 2.00
Nurse Aides 0.60 0.60 0.60
Teacher Aides 16.15 14.15 16.15
Attendance Officers 0.14 0.14 0.14
Library Clerks 1.00 1.00 1.00
P/I Liaison 1.00 1.00 1.00
Custodians 6.00 6.00 6.00
Total 75.54 72.43 73.77
2014/15 General Operating Budget by Object
Budget %
Payroll 3,311,496$ 93.4%
Contracted Services 129,282 3.6%
Supplies & Materials 97,657 2.8%
Other Operating Expenses 7,400 0.2%
Total 3,545,835$
2014/15 General Operating Budget by Program
Budget %
Regular Program 2,213,194$ 62.4%
Gifted & Talented 96 0.0%
Special Education 424,885 12.0%
Bilingual/ESL 139,036 3.9%
State Compensatory 333,631 9.4%
Undistributed 434,993 12.3%
Total 3,545,835$
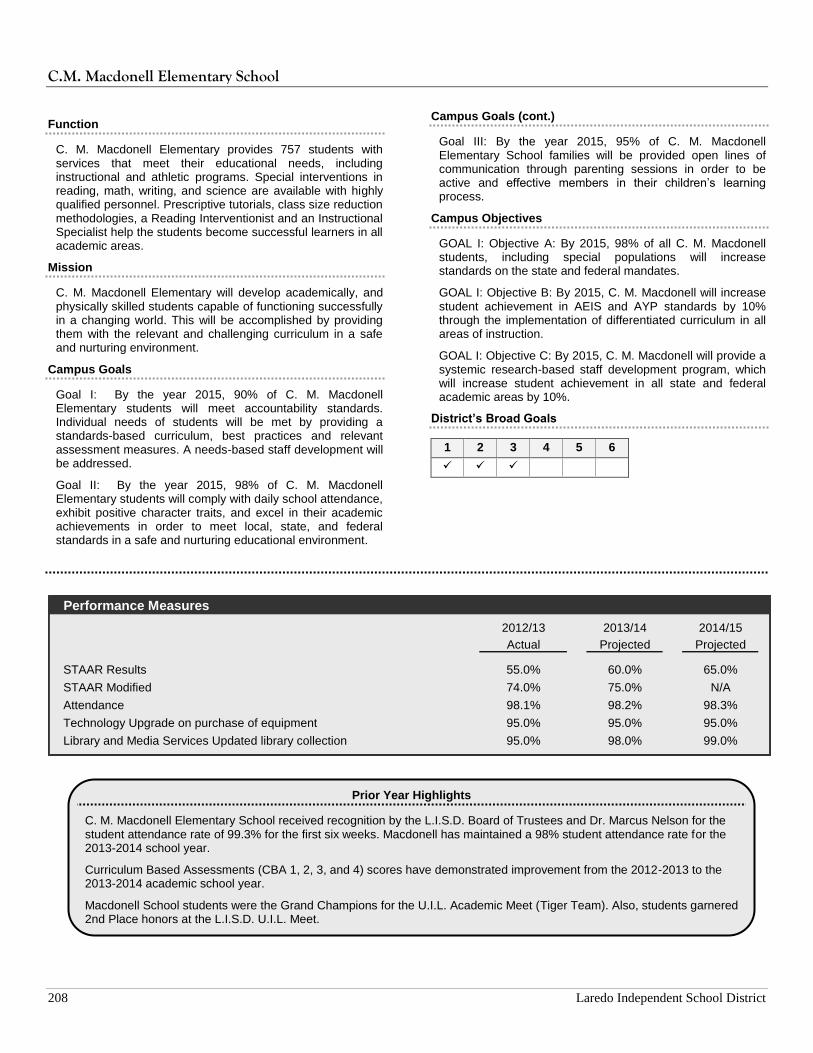
C.M. Macdonell Elementary School
208 Laredo Independent School District
Function
C. M. Macdonell Elementary provides 757 students with services that meet their educational needs, including instructional and athletic programs. Special interventions in reading, math, writing, and science are available with highly qualified personnel. Prescriptive tutorials, class size reduction methodologies, a Reading Interventionist and an Instructional Specialist help the students become successful learners in all academic areas.
Mission
C. M. Macdonell Elementary will develop academically, and physically skilled students capable of functioning successfully in a changing world. This will be accomplished by providing them with the relevant and challenging curriculum in a safe and nurturing environment.
Campus Goals
Goal I: By the year 2015, 90% of C. M. Macdonell Elementary students will meet accountability standards. Individual needs of students will be met by providing a standards-based curriculum, best practices and relevant assessment measures. A needs-based staff development will be addressed.
Goal II: By the year 2015, 98% of C. M. Macdonell Elementary students will comply with daily school attendance, exhibit positive character traits, and excel in their academic achievements in order to meet local, state, and federal standards in a safe and nurturing educational environment.
Campus Goals (cont.)
Goal III: By the year 2015, 95% of C. M. Macdonell Elementary School families will be provided open lines of communication through parenting sessions in order to be active and effective members in their children’s learning process.
Campus Objectives
GOAL I: Objective A: By 2015, 98% of all C. M. Macdonell students, including special populations will increase standards on the state and federal mandates.
GOAL I: Objective B: By 2015, C. M. Macdonell will increase student achievement in AEIS and AYP standards by 10% through the implementation of differentiated curriculum in all areas of instruction.
GOAL I: Objective C: By 2015, C. M. Macdonell will provide a systemic research-based staff development program, which will increase student achievement in all state and federal academic areas by 10%.
District’s Broad Goals
1 2 3 4 5 6
Performance Measures
2012/13 2013/14 2014/15
Actual Projected Projected
STAAR Results 55.0% 60.0% 65.0%
STAAR Modified 74.0% 75.0% N/A
Attendance 98.1% 98.2% 98.3%
Technology Upgrade on purchase of equipment 95.0% 95.0% 95.0%
Library and Media Services Updated library collection 95.0% 98.0% 99.0%
Prior Year Highlights
C. M. Macdonell Elementary School received recognition by the L.I.S.D. Board of Trustees and Dr. Marcus Nelson for the student attendance rate of 99.3% for the first six weeks. Macdonell has maintained a 98% student attendance rate for the 2013-2014 school year.
Curriculum Based Assessments (CBA 1, 2, 3, and 4) scores have demonstrated improvement from the 2012-2013 to the 2013-2014 academic school year.
Macdonell School students were the Grand Champions for the U.I.L. Academic Meet (Tiger Team). Also, students garnered 2nd Place honors at the L.I.S.D. U.I.L. Meet.

C.M. Macdonell Elementary School
2014-2015 Annual Budget 209
General Operating Fund Expenditures
2012/13 % of 2013/14 % of 2014/15 % of
Actual Total Projected Total Budget Total
Attendance 763 762 746
Payroll Costs by Function
Instructional 2,677,171$ 74.7% 3,018,244$ 73.6% 3,118,063$ 75.2%
Leadership 270,592 7.6% 280,838 6.8% 288,749 7.0%
Support Services - Student Based 185,943 5.2% 199,085 4.9% 202,039 4.9%
Support Services - Non-Student Based 141,227 3.9% 151,527 3.7% 163,617 3.9%
Ancillary Services 9 0.0% 700 0.0% - 0.0%
3,274,942 91.4% 3,650,394 89.0% 3,772,468 90.9%
Non-Payroll Costs by Function
Instructional 186,508 5.2% 259,708 6.3% 238,820 5.8%
Leadership 10,446 0.3% 9,202 0.2% 2,000 0.0%
Support Services - Student Based 1,938 0.1% 10,144 0.2% 2,900 0.1%
Support Services - Non-Student Based 108,281 3.0% 162,908 4.0% 132,228 3.2%
Debt / Capital Outlay - 0.0% 9,700 0.2% - 0.0%
307,173 8.6% 451,662 11.0% 375,948 9.1%
3,582,115$ 100.0% 4,102,056$ 100.0% 4,148,416$ 100.0%
Campus Staff (All Funds)
Position 2013 2014 2015
Principal 1.00 1.00 1.00
Assistant Principals 1.00 1.00 1.00
Occupational Therapists 0.13 0.13 0.13
Counselor 1.25 1.25 1.25
Teachers 39.85 40.65 42.18
Diagnostician/Supv 0.30 0.50 0.50
Librarian 1.00 1.00 1.00
Nurse 1.00 1.00 1.00
Social Worker 0.10 0.10 0.10
Speech Pathologist 0.40 0.50 0.60
ESL/Bilingual Strategists 0.10 0.10 0.16
Inst. Spec./Intervention/Lit Coach 2.00 2.00 2.00
Clerks 3.00 3.00 3.00
Secretaries 1.00 1.00 1.00
CEI/Computer Lab Manager 1.00 2.00 2.00
Tech. Trainer - - 0.50
Nurse Aides 1.00 1.00 1.00
Teacher Aides 12.00 13.00 12.00
Attendance Officers 0.14 0.14 0.14
Library Clerks 1.00 1.00 1.00
P/I Liaison 1.00 1.00 1.00
Custodians 5.00 5.00 5.00
Crossing Guards - - 1.00
Total 73.27 76.37 78.56
2014/15 General Operating Budget by Object
Budget %
Payroll 3,772,468$ 90.9%
Contracted Services 151,946 3.7%
Supplies & Materials 201,602 4.9%
Other Operating Expenses 22,400 0.5%
Total 4,148,416$
2014/15 General Operating Budget by Program
Budget %
Regular Program 2,702,802$ 65.2%
Gifted & Talented 200 0.0%
Special Education 415,635 10.0%
Bilingual/ESL 199,861 4.8%
State Compensatory 425,052 10.2%
Undistributed 404,866 9.8%
Total 4,148,416$
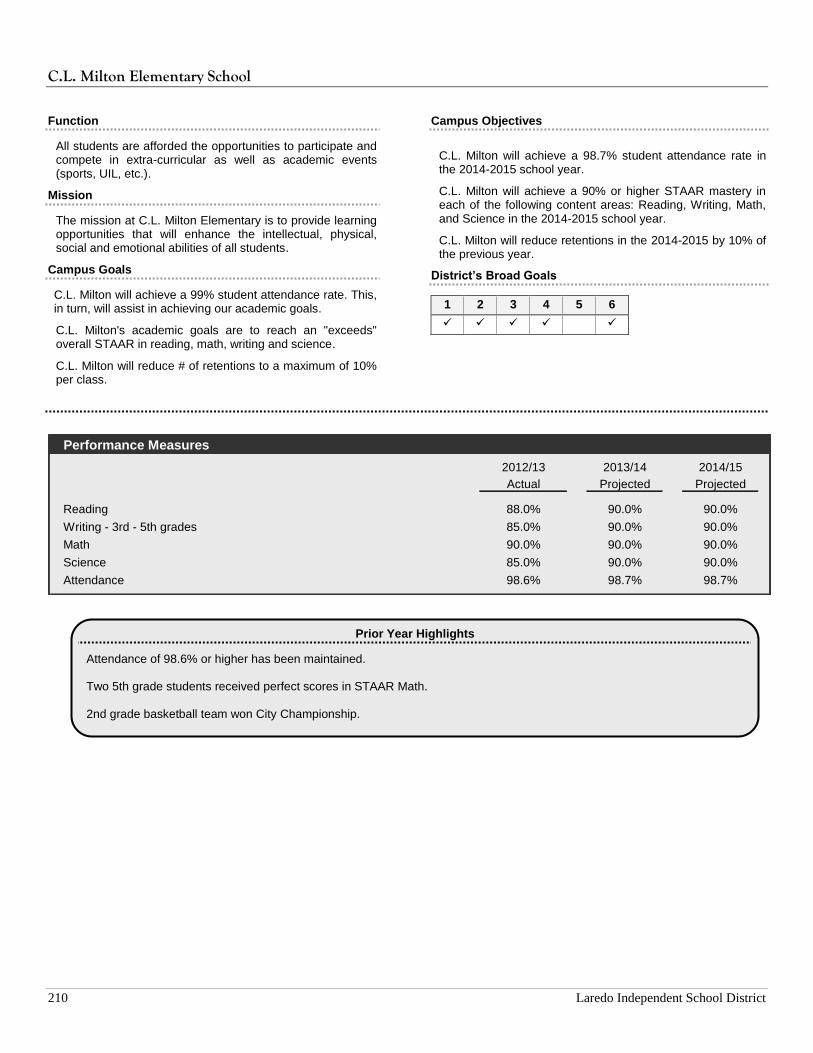
C.L. Milton Elementary School
210 Laredo Independent School District
Function
All students are afforded the opportunities to participate and compete in extra-curricular as well as academic events (sports, UIL, etc.).
Mission
The mission at C.L. Milton Elementary is to provide learning opportunities that will enhance the intellectual, physical, social and emotional abilities of all students.
Campus Goals
C.L. Milton will achieve a 99% student attendance rate. This, in turn, will assist in achieving our academic goals.
C.L. Milton's academic goals are to reach an "exceeds" overall STAAR in reading, math, writing and science.
C.L. Milton will reduce # of retentions to a maximum of 10% per class.
Campus Objectives
C.L. Milton will achieve a 98.7% student attendance rate in the 2014-2015 school year.
C.L. Milton will achieve a 90% or higher STAAR mastery in each of the following content areas: Reading, Writing, Math, and Science in the 2014-2015 school year.
C.L. Milton will reduce retentions in the 2014-2015 by 10% of the previous year.
District’s Broad Goals
1 2 3 4 5 6
Performance Measures
2012/13 2013/14 2014/15
Actual Projected Projected
Reading 88.0% 90.0% 90.0%
Writing - 3rd - 5th grades 85.0% 90.0% 90.0%
Math 90.0% 90.0% 90.0%
Science 85.0% 90.0% 90.0%
Attendance 98.6% 98.7% 98.7%
Prior Year Highlights
Attendance of 98.6% or higher has been maintained. Two 5th grade students received perfect scores in STAAR Math. 2nd grade basketball team won City Championship.
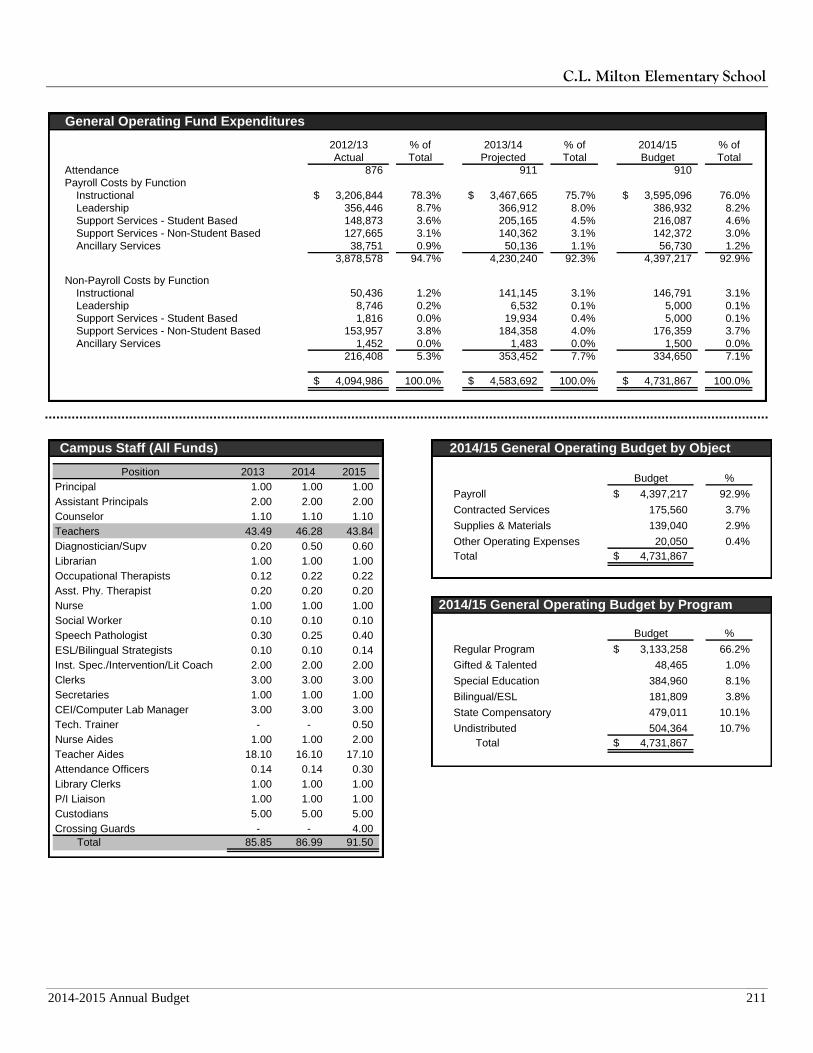
C.L. Milton Elementary School
2014-2015 Annual Budget 211
General Operating Fund Expenditures
2012/13 % of 2013/14 % of 2014/15 % of
Actual Total Projected Total Budget Total
Attendance 876 911 910
Payroll Costs by Function
Instructional 3,206,844$ 78.3% 3,467,665$ 75.7% 3,595,096$ 76.0%
Leadership 356,446 8.7% 366,912 8.0% 386,932 8.2%
Support Services - Student Based 148,873 3.6% 205,165 4.5% 216,087 4.6%
Support Services - Non-Student Based 127,665 3.1% 140,362 3.1% 142,372 3.0%
Ancillary Services 38,751 0.9% 50,136 1.1% 56,730 1.2%
3,878,578 94.7% 4,230,240 92.3% 4,397,217 92.9%
Non-Payroll Costs by Function
Instructional 50,436 1.2% 141,145 3.1% 146,791 3.1%
Leadership 8,746 0.2% 6,532 0.1% 5,000 0.1%
Support Services - Student Based 1,816 0.0% 19,934 0.4% 5,000 0.1%
Support Services - Non-Student Based 153,957 3.8% 184,358 4.0% 176,359 3.7%
Ancillary Services 1,452 0.0% 1,483 0.0% 1,500 0.0%
216,408 5.3% 353,452 7.7% 334,650 7.1%
4,094,986$ 100.0% 4,583,692$ 100.0% 4,731,867$ 100.0%
Campus Staff (All Funds)
Position 2013 2014 2015
Principal 1.00 1.00 1.00
Assistant Principals 2.00 2.00 2.00
Counselor 1.10 1.10 1.10
Teachers 43.49 46.28 43.84
Diagnostician/Supv 0.20 0.50 0.60
Librarian 1.00 1.00 1.00
Occupational Therapists 0.12 0.22 0.22
Asst. Phy. Therapist 0.20 0.20 0.20
Nurse 1.00 1.00 1.00
Social Worker 0.10 0.10 0.10
Speech Pathologist 0.30 0.25 0.40
ESL/Bilingual Strategists 0.10 0.10 0.14
Inst. Spec./Intervention/Lit Coach 2.00 2.00 2.00
Clerks 3.00 3.00 3.00
Secretaries 1.00 1.00 1.00
CEI/Computer Lab Manager 3.00 3.00 3.00
Tech. Trainer - - 0.50
Nurse Aides 1.00 1.00 2.00
Teacher Aides 18.10 16.10 17.10
Attendance Officers 0.14 0.14 0.30
Library Clerks 1.00 1.00 1.00
P/I Liaison 1.00 1.00 1.00
Custodians 5.00 5.00 5.00
Crossing Guards - - 4.00
Total 85.85 86.99 91.50
2014/15 General Operating Budget by Object
Budget %
Payroll 4,397,217$ 92.9%
Contracted Services 175,560 3.7%
Supplies & Materials 139,040 2.9%
Other Operating Expenses 20,050 0.4%
Total 4,731,867$
2014/15 General Operating Budget by Program
Budget %
Regular Program 3,133,258$ 66.2%
Gifted & Talented 48,465 1.0%
Special Education 384,960 8.1%
Bilingual/ESL 181,809 3.8%
State Compensatory 479,011 10.1%
Undistributed 504,364 10.7%
Total 4,731,867$
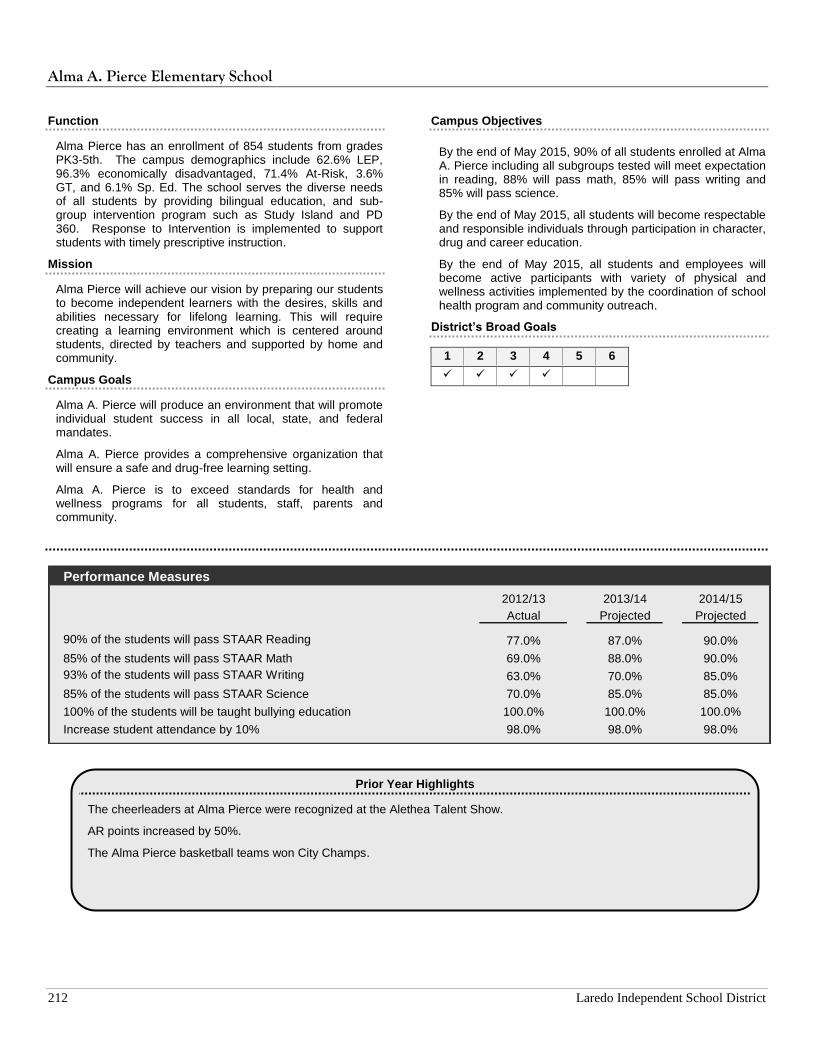
Alma A. Pierce Elementary School
212 Laredo Independent School District
Function
Alma Pierce has an enrollment of 854 students from grades PK3-5th. The campus demographics include 62.6% LEP, 96.3% economically disadvantaged, 71.4% At-Risk, 3.6% GT, and 6.1% Sp. Ed. The school serves the diverse needs of all students by providing bilingual education, and sub-group intervention program such as Study Island and PD 360. Response to Intervention is implemented to support students with timely prescriptive instruction.
Mission
Alma Pierce will achieve our vision by preparing our students to become independent learners with the desires, skills and abilities necessary for lifelong learning. This will require creating a learning environment which is centered around students, directed by teachers and supported by home and community.
Campus Goals
Alma A. Pierce will produce an environment that will promote individual student success in all local, state, and federal mandates.
Alma A. Pierce provides a comprehensive organization that will ensure a safe and drug-free learning setting.
Alma A. Pierce is to exceed standards for health and wellness programs for all students, staff, parents and community.
Campus Objectives
By the end of May 2015, 90% of all students enrolled at Alma A. Pierce including all subgroups tested will meet expectation in reading, 88% will pass math, 85% will pass writing and 85% will pass science.
By the end of May 2015, all students will become respectable and responsible individuals through participation in character, drug and career education.
By the end of May 2015, all students and employees will become active participants with variety of physical and wellness activities implemented by the coordination of school health program and community outreach.
District’s Broad Goals
1 2 3 4 5 6
Performance Measures
2012/13 2013/14 2014/15
Actual Projected Projected
90% of the students will pass STAAR Reading 77.0% 87.0% 90.0%
85% of the students will pass STAAR Math 69.0% 88.0% 90.0%
93% of the students will pass STAAR Writing 63.0% 70.0% 85.0%
85% of the students will pass STAAR Science 70.0% 85.0% 85.0%
100% of the students will be taught bullying education 100.0% 100.0% 100.0%
Increase student attendance by 10% 98.0% 98.0% 98.0%
Prior Year Highlights
The cheerleaders at Alma Pierce were recognized at the Alethea Talent Show.
AR points increased by 50%.
The Alma Pierce basketball teams won City Champs.
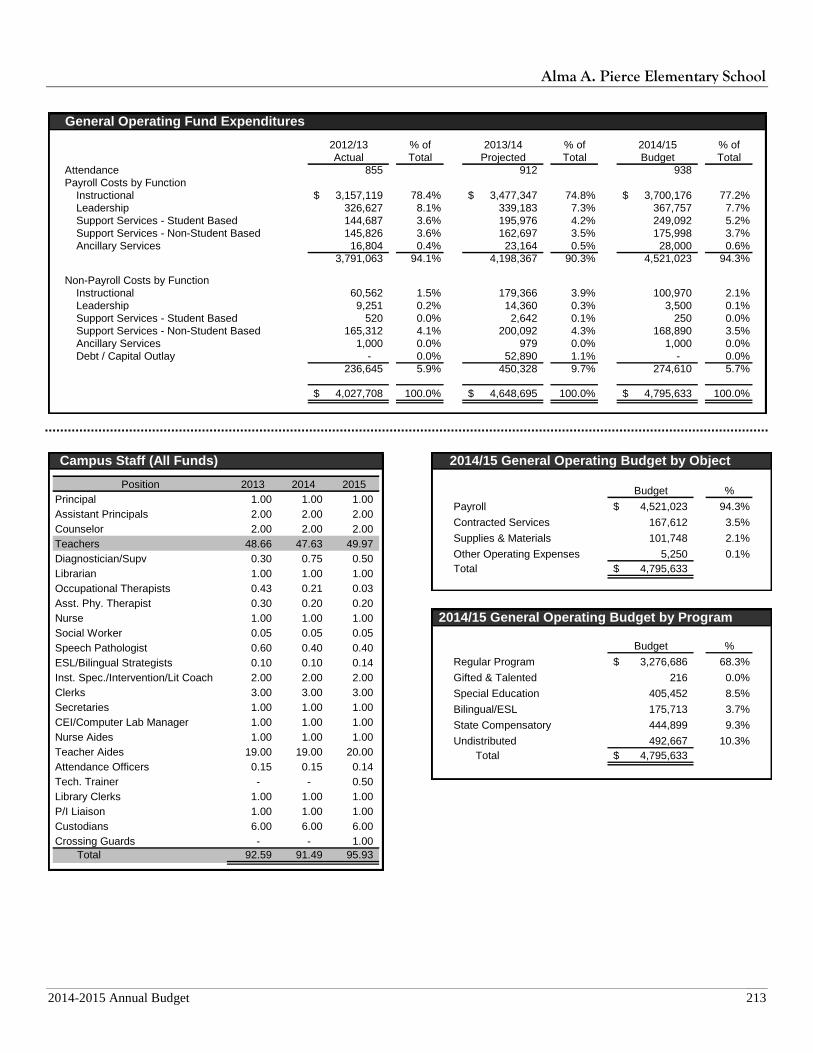
Alma A. Pierce Elementary School
2014-2015 Annual Budget 213
General Operating Fund Expenditures
2012/13 % of 2013/14 % of 2014/15 % of
Actual Total Projected Total Budget Total
Attendance 855 912 938
Payroll Costs by Function
Instructional 3,157,119$ 78.4% 3,477,347$ 74.8% 3,700,176$ 77.2%
Leadership 326,627 8.1% 339,183 7.3% 367,757 7.7%
Support Services - Student Based 144,687 3.6% 195,976 4.2% 249,092 5.2%
Support Services - Non-Student Based 145,826 3.6% 162,697 3.5% 175,998 3.7%
Ancillary Services 16,804 0.4% 23,164 0.5% 28,000 0.6%
3,791,063 94.1% 4,198,367 90.3% 4,521,023 94.3%
Non-Payroll Costs by Function
Instructional 60,562 1.5% 179,366 3.9% 100,970 2.1%
Leadership 9,251 0.2% 14,360 0.3% 3,500 0.1%
Support Services - Student Based 520 0.0% 2,642 0.1% 250 0.0%
Support Services - Non-Student Based 165,312 4.1% 200,092 4.3% 168,890 3.5%
Ancillary Services 1,000 0.0% 979 0.0% 1,000 0.0%
Debt / Capital Outlay - 0.0% 52,890 1.1% - 0.0%
236,645 5.9% 450,328 9.7% 274,610 5.7%
4,027,708$ 100.0% 4,648,695$ 100.0% 4,795,633$ 100.0%
Campus Staff (All Funds)
Position 2013 2014 2015
Principal 1.00 1.00 1.00
Assistant Principals 2.00 2.00 2.00
Counselor 2.00 2.00 2.00
Teachers 48.66 47.63 49.97
Diagnostician/Supv 0.30 0.75 0.50
Librarian 1.00 1.00 1.00
Occupational Therapists 0.43 0.21 0.03
Asst. Phy. Therapist 0.30 0.20 0.20
Nurse 1.00 1.00 1.00
Social Worker 0.05 0.05 0.05
Speech Pathologist 0.60 0.40 0.40
ESL/Bilingual Strategists 0.10 0.10 0.14
Inst. Spec./Intervention/Lit Coach 2.00 2.00 2.00
Clerks 3.00 3.00 3.00
Secretaries 1.00 1.00 1.00
CEI/Computer Lab Manager 1.00 1.00 1.00
Nurse Aides 1.00 1.00 1.00
Teacher Aides 19.00 19.00 20.00
Attendance Officers 0.15 0.15 0.14
Tech. Trainer - - 0.50
Library Clerks 1.00 1.00 1.00
P/I Liaison 1.00 1.00 1.00
Custodians 6.00 6.00 6.00
Crossing Guards - - 1.00
Total 92.59 91.49 95.93
2014/15 General Operating Budget by Object
Budget %
Payroll 4,521,023$ 94.3%
Contracted Services 167,612 3.5%
Supplies & Materials 101,748 2.1%
Other Operating Expenses 5,250 0.1%
Total 4,795,633$
2014/15 General Operating Budget by Program
Budget %
Regular Program 3,276,686$ 68.3%
Gifted & Talented 216 0.0%
Special Education 405,452 8.5%
Bilingual/ESL 175,713 3.7%
State Compensatory 444,899 9.3%
Undistributed 492,667 10.3%
Total 4,795,633$
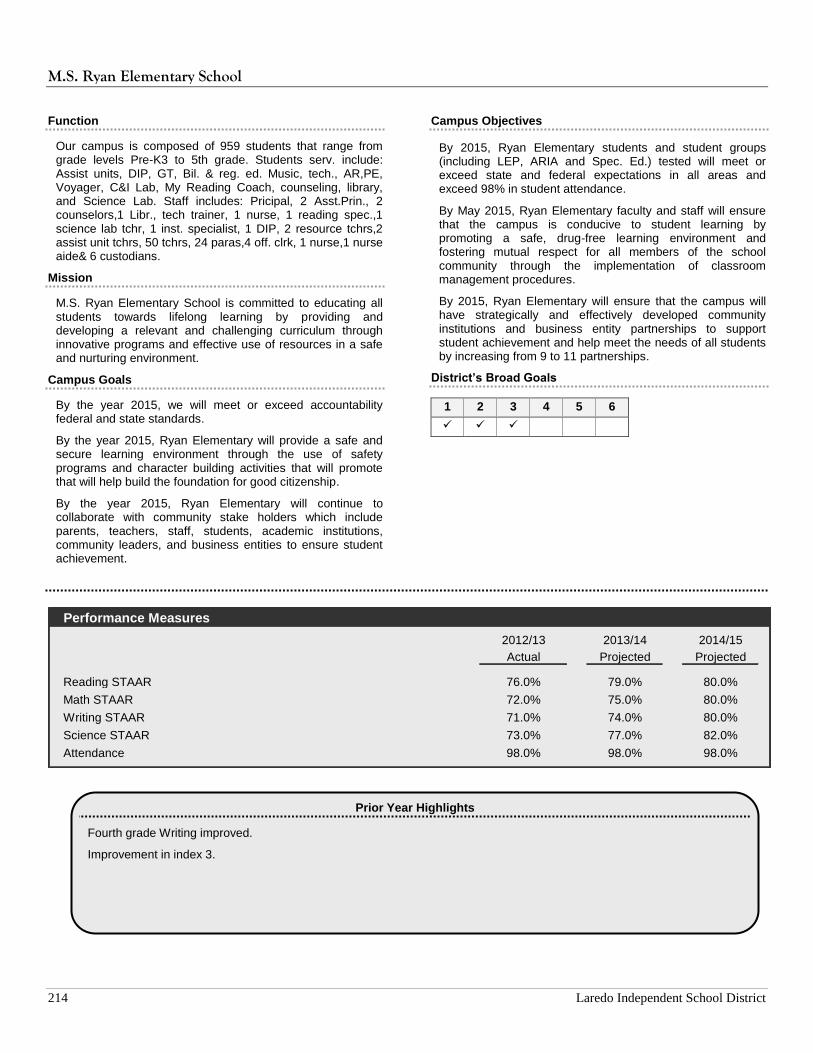
M.S. Ryan Elementary School
214 Laredo Independent School District
Function
Our campus is composed of 959 students that range from grade levels Pre-K3 to 5th grade. Students serv. include: Assist units, DIP, GT, Bil. & reg. ed. Music, tech., AR,PE, Voyager, C&I Lab, My Reading Coach, counseling, library, and Science Lab. Staff includes: Pricipal, 2 Asst.Prin., 2 counselors,1 Libr., tech trainer, 1 nurse, 1 reading spec.,1 science lab tchr, 1 inst. specialist, 1 DIP, 2 resource tchrs,2 assist unit tchrs, 50 tchrs, 24 paras,4 off. clrk, 1 nurse,1 nurse aide& 6 custodians.
Mission
M.S. Ryan Elementary School is committed to educating all students towards lifelong learning by providing and developing a relevant and challenging curriculum through innovative programs and effective use of resources in a safe and nurturing environment.
Campus Goals
By the year 2015, we will meet or exceed accountability federal and state standards.
By the year 2015, Ryan Elementary will provide a safe and secure learning environment through the use of safety programs and character building activities that will promote that will help build the foundation for good citizenship.
By the year 2015, Ryan Elementary will continue to collaborate with community stake holders which include parents, teachers, staff, students, academic institutions, community leaders, and business entities to ensure student achievement.
Campus Objectives
By 2015, Ryan Elementary students and student groups (including LEP, ARIA and Spec. Ed.) tested will meet or exceed state and federal expectations in all areas and exceed 98% in student attendance.
By May 2015, Ryan Elementary faculty and staff will ensure that the campus is conducive to student learning by promoting a safe, drug-free learning environment and fostering mutual respect for all members of the school community through the implementation of classroom management procedures.
By 2015, Ryan Elementary will ensure that the campus will have strategically and effectively developed community institutions and business entity partnerships to support student achievement and help meet the needs of all students by increasing from 9 to 11 partnerships.
District’s Broad Goals
1 2 3 4 5 6
Performance Measures
2012/13 2013/14 2014/15
Actual Projected Projected
Reading STAAR 76.0% 79.0% 80.0%
Math STAAR 72.0% 75.0% 80.0%
Writing STAAR 71.0% 74.0% 80.0%
Science STAAR 73.0% 77.0% 82.0%
Attendance 98.0% 98.0% 98.0%
Prior Year Highlights
Fourth grade Writing improved.
Improvement in index 3.
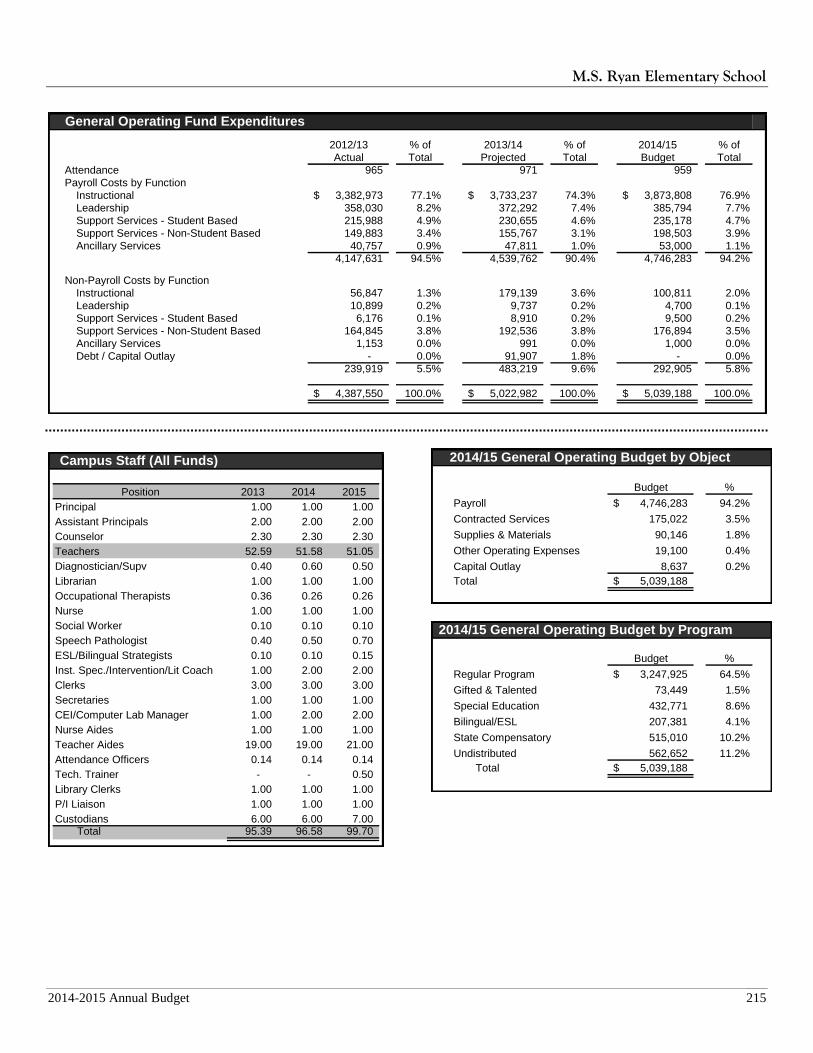
M.S. Ryan Elementary School
2014-2015 Annual Budget 215
General Operating Fund Expenditures
2012/13 % of 2013/14 % of 2014/15 % of
Actual Total Projected Total Budget Total
Attendance 965 971 959
Payroll Costs by Function
Instructional 3,382,973$ 77.1% 3,733,237$ 74.3% 3,873,808$ 76.9%
Leadership 358,030 8.2% 372,292 7.4% 385,794 7.7%
Support Services - Student Based 215,988 4.9% 230,655 4.6% 235,178 4.7%
Support Services - Non-Student Based 149,883 3.4% 155,767 3.1% 198,503 3.9%
Ancillary Services 40,757 0.9% 47,811 1.0% 53,000 1.1%
4,147,631 94.5% 4,539,762 90.4% 4,746,283 94.2%
Non-Payroll Costs by Function
Instructional 56,847 1.3% 179,139 3.6% 100,811 2.0%
Leadership 10,899 0.2% 9,737 0.2% 4,700 0.1%
Support Services - Student Based 6,176 0.1% 8,910 0.2% 9,500 0.2%
Support Services - Non-Student Based 164,845 3.8% 192,536 3.8% 176,894 3.5%
Ancillary Services 1,153 0.0% 991 0.0% 1,000 0.0%
Debt / Capital Outlay - 0.0% 91,907 1.8% - 0.0%
239,919 5.5% 483,219 9.6% 292,905 5.8%
4,387,550$ 100.0% 5,022,982$ 100.0% 5,039,188$ 100.0%
Campus Staff (All Funds)
Position 2013 2014 2015
Principal 1.00 1.00 1.00
Assistant Principals 2.00 2.00 2.00
Counselor 2.30 2.30 2.30
Teachers 52.59 51.58 51.05
Diagnostician/Supv 0.40 0.60 0.50
Librarian 1.00 1.00 1.00
Occupational Therapists 0.36 0.26 0.26
Nurse 1.00 1.00 1.00
Social Worker 0.10 0.10 0.10
Speech Pathologist 0.40 0.50 0.70
ESL/Bilingual Strategists 0.10 0.10 0.15
Inst. Spec./Intervention/Lit Coach 1.00 2.00 2.00
Clerks 3.00 3.00 3.00
Secretaries 1.00 1.00 1.00
CEI/Computer Lab Manager 1.00 2.00 2.00
Nurse Aides 1.00 1.00 1.00
Teacher Aides 19.00 19.00 21.00
Attendance Officers 0.14 0.14 0.14
Tech. Trainer - - 0.50
Library Clerks 1.00 1.00 1.00
P/I Liaison 1.00 1.00 1.00
Custodians 6.00 6.00 7.00 Total 95.39 96.58 99.70
2014/15 General Operating Budget by Object
Budget %
Payroll 4,746,283$ 94.2%
Contracted Services 175,022 3.5%
Supplies & Materials 90,146 1.8%
Other Operating Expenses 19,100 0.4%
Capital Outlay 8,637 0.2%
Total 5,039,188$
2014/15 General Operating Budget by Program
Budget %
Regular Program 3,247,925$ 64.5%
Gifted & Talented 73,449 1.5%
Special Education 432,771 8.6%
Bilingual/ESL 207,381 4.1%
State Compensatory 515,010 10.2%
Undistributed 562,652 11.2%
Total 5,039,188$
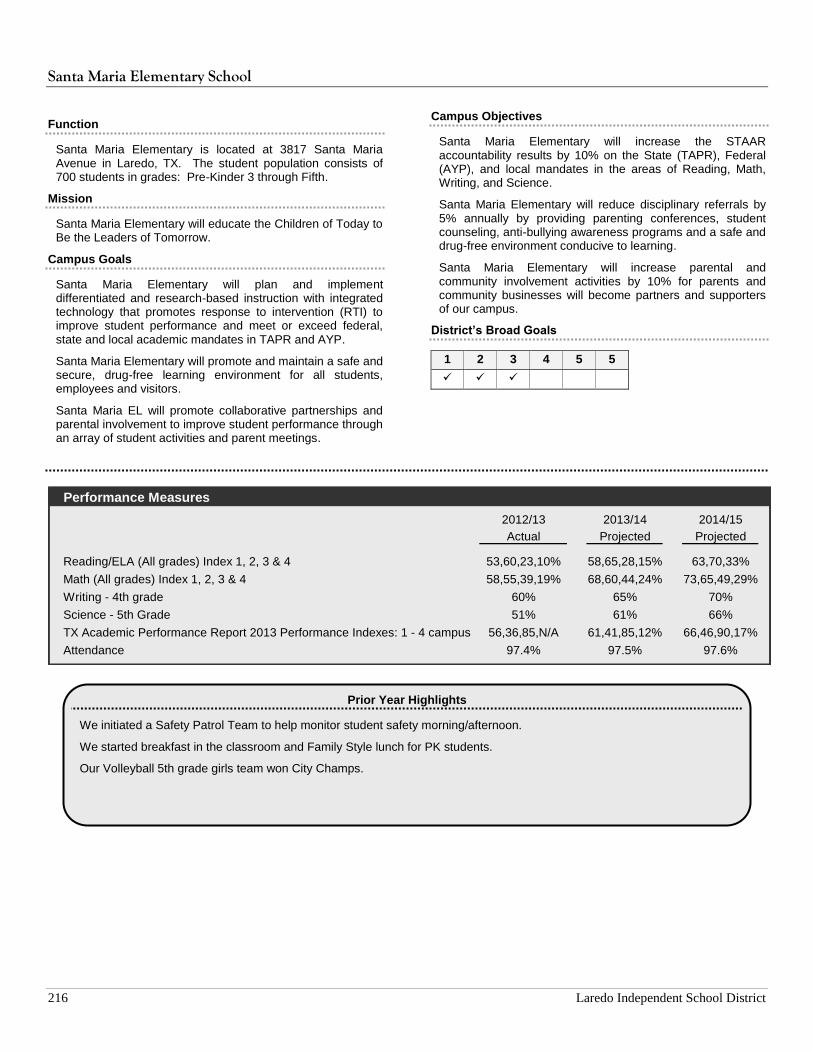
Santa Maria Elementary School
216 Laredo Independent School District
Function
Santa Maria Elementary is located at 3817 Santa Maria Avenue in Laredo, TX. The student population consists of 700 students in grades: Pre-Kinder 3 through Fifth.
Mission
Santa Maria Elementary will educate the Children of Today to Be the Leaders of Tomorrow.
Campus Goals
Santa Maria Elementary will plan and implement differentiated and research-based instruction with integrated technology that promotes response to intervention (RTI) to improve student performance and meet or exceed federal, state and local academic mandates in TAPR and AYP.
Santa Maria Elementary will promote and maintain a safe and secure, drug-free learning environment for all students, employees and visitors.
Santa Maria EL will promote collaborative partnerships and parental involvement to improve student performance through an array of student activities and parent meetings.
Campus Objectives
Santa Maria Elementary will increase the STAAR accountability results by 10% on the State (TAPR), Federal (AYP), and local mandates in the areas of Reading, Math, Writing, and Science.
Santa Maria Elementary will reduce disciplinary referrals by 5% annually by providing parenting conferences, student counseling, anti-bullying awareness programs and a safe and drug-free environment conducive to learning.
Santa Maria Elementary will increase parental and community involvement activities by 10% for parents and community businesses will become partners and supporters of our campus.
District’s Broad Goals
1 2 3 4 5 5
Performance Measures
2012/13 2013/14 2014/15
Actual Projected Projected
Reading/ELA (All grades) Index 1, 2, 3 & 4 53,60,23,10% 58,65,28,15% 63,70,33%
Math (All grades) Index 1, 2, 3 & 4 58,55,39,19% 68,60,44,24% 73,65,49,29%
Writing - 4th grade 60% 65% 70%
Science - 5th Grade 51% 61% 66%
TX Academic Performance Report 2013 Performance Indexes: 1 - 4 campus 56,36,85,N/A 61,41,85,12% 66,46,90,17%
Attendance 97.4% 97.5% 97.6%
Prior Year Highlights
We initiated a Safety Patrol Team to help monitor student safety morning/afternoon.
We started breakfast in the classroom and Family Style lunch for PK students.
Our Volleyball 5th grade girls team won City Champs.
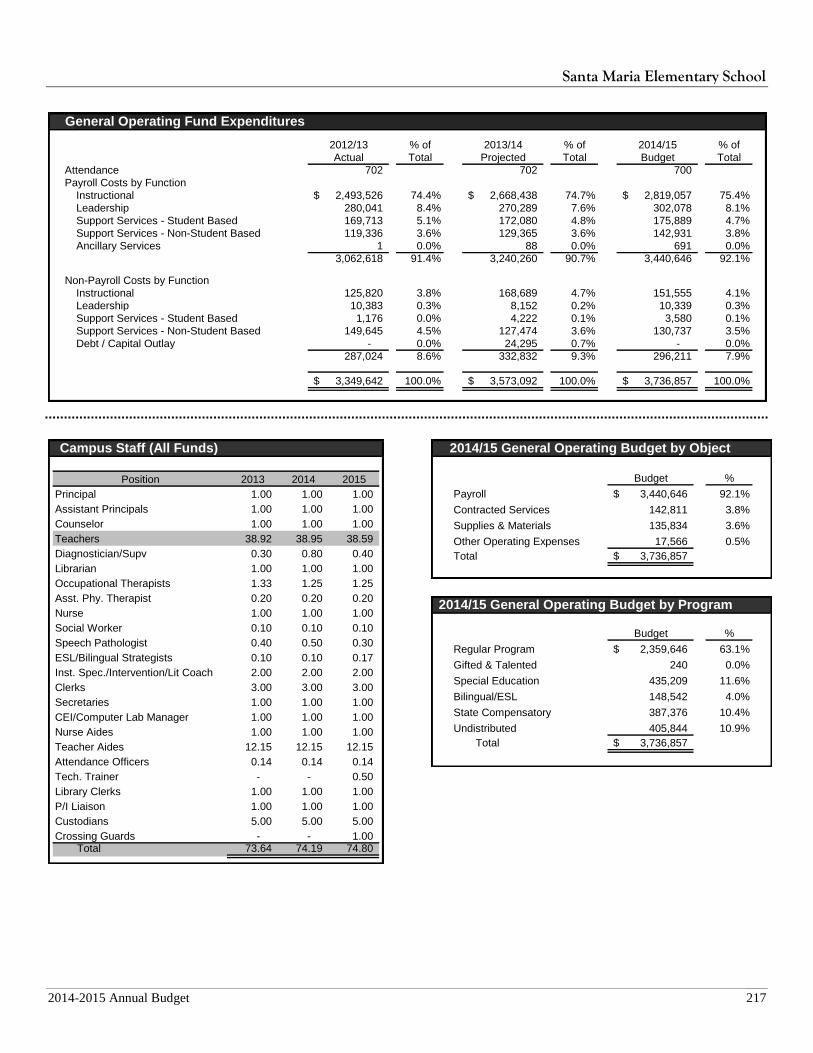
Santa Maria Elementary School
2014-2015 Annual Budget 217
General Operating Fund Expenditures
2012/13 % of 2013/14 % of 2014/15 % of
Actual Total Projected Total Budget Total
Attendance 702 702 700
Payroll Costs by Function
Instructional 2,493,526$ 74.4% 2,668,438$ 74.7% 2,819,057$ 75.4%
Leadership 280,041 8.4% 270,289 7.6% 302,078 8.1%
Support Services - Student Based 169,713 5.1% 172,080 4.8% 175,889 4.7%
Support Services - Non-Student Based 119,336 3.6% 129,365 3.6% 142,931 3.8%
Ancillary Services 1 0.0% 88 0.0% 691 0.0%
3,062,618 91.4% 3,240,260 90.7% 3,440,646 92.1%
Non-Payroll Costs by Function
Instructional 125,820 3.8% 168,689 4.7% 151,555 4.1%
Leadership 10,383 0.3% 8,152 0.2% 10,339 0.3%
Support Services - Student Based 1,176 0.0% 4,222 0.1% 3,580 0.1%
Support Services - Non-Student Based 149,645 4.5% 127,474 3.6% 130,737 3.5%
Debt / Capital Outlay - 0.0% 24,295 0.7% - 0.0%
287,024 8.6% 332,832 9.3% 296,211 7.9%
3,349,642$ 100.0% 3,573,092$ 100.0% 3,736,857$ 100.0%
Campus Staff (All Funds)
Position 2013 2014 2015
Principal 1.00 1.00 1.00
Assistant Principals 1.00 1.00 1.00
Counselor 1.00 1.00 1.00
Teachers 38.92 38.95 38.59
Diagnostician/Supv 0.30 0.80 0.40
Librarian 1.00 1.00 1.00
Occupational Therapists 1.33 1.25 1.25
Asst. Phy. Therapist 0.20 0.20 0.20
Nurse 1.00 1.00 1.00
Social Worker 0.10 0.10 0.10
Speech Pathologist 0.40 0.50 0.30
ESL/Bilingual Strategists 0.10 0.10 0.17
Inst. Spec./Intervention/Lit Coach 2.00 2.00 2.00
Clerks 3.00 3.00 3.00
Secretaries 1.00 1.00 1.00
CEI/Computer Lab Manager 1.00 1.00 1.00
Nurse Aides 1.00 1.00 1.00
Teacher Aides 12.15 12.15 12.15
Attendance Officers 0.14 0.14 0.14
Tech. Trainer - - 0.50
Library Clerks 1.00 1.00 1.00
P/I Liaison 1.00 1.00 1.00
Custodians 5.00 5.00 5.00
Crossing Guards - - 1.00 Total 73.64 74.19 74.80
2014/15 General Operating Budget by Object
Budget %
Payroll 3,440,646$ 92.1%
Contracted Services 142,811 3.8%
Supplies & Materials 135,834 3.6%
Other Operating Expenses 17,566 0.5%
Total 3,736,857$
2014/15 General Operating Budget by Program
Budget %
Regular Program 2,359,646$ 63.1%
Gifted & Talented 240 0.0%
Special Education 435,209 11.6%
Bilingual/ESL 148,542 4.0%
State Compensatory 387,376 10.4%
Undistributed 405,844 10.9%
Total 3,736,857$
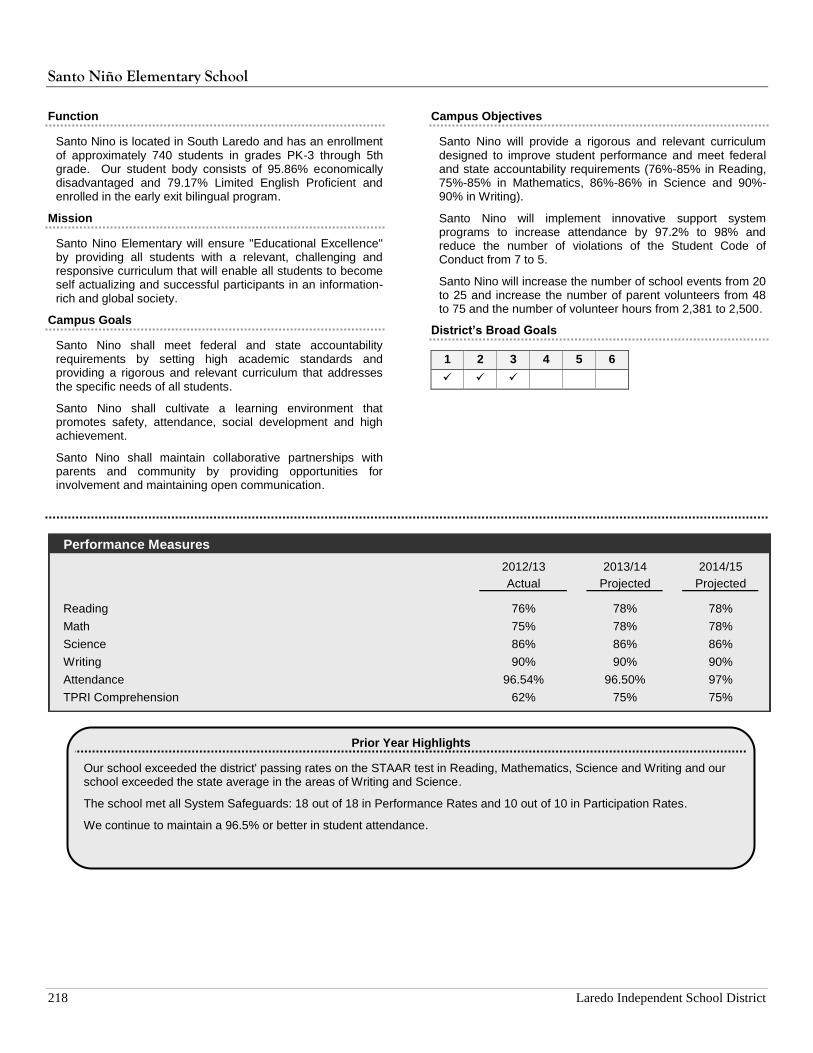
Santo Niño Elementary School
218 Laredo Independent School District
Function
Santo Nino is located in South Laredo and has an enrollment of approximately 740 students in grades PK-3 through 5th grade. Our student body consists of 95.86% economically disadvantaged and 79.17% Limited English Proficient and enrolled in the early exit bilingual program.
Mission
Santo Nino Elementary will ensure "Educational Excellence" by providing all students with a relevant, challenging and responsive curriculum that will enable all students to become self actualizing and successful participants in an information-rich and global society.
Campus Goals
Santo Nino shall meet federal and state accountability requirements by setting high academic standards and providing a rigorous and relevant curriculum that addresses the specific needs of all students.
Santo Nino shall cultivate a learning environment that promotes safety, attendance, social development and high achievement.
Santo Nino shall maintain collaborative partnerships with parents and community by providing opportunities for involvement and maintaining open communication.
Campus Objectives
Santo Nino will provide a rigorous and relevant curriculum designed to improve student performance and meet federal and state accountability requirements (76%-85% in Reading, 75%-85% in Mathematics, 86%-86% in Science and 90%-90% in Writing).
Santo Nino will implement innovative support system programs to increase attendance by 97.2% to 98% and reduce the number of violations of the Student Code of Conduct from 7 to 5.
Santo Nino will increase the number of school events from 20 to 25 and increase the number of parent volunteers from 48 to 75 and the number of volunteer hours from 2,381 to 2,500.
District’s Broad Goals
1 2 3 4 5 6
Performance Measures
2012/13 2013/14 2014/15
Actual Projected Projected
Reading 76% 78% 78%
Math 75% 78% 78%
Science 86% 86% 86%
Writing 90% 90% 90%
Attendance 96.54% 96.50% 97%
TPRI Comprehension 62% 75% 75%
Prior Year Highlights
Our school exceeded the district' passing rates on the STAAR test in Reading, Mathematics, Science and Writing and our school exceeded the state average in the areas of Writing and Science.
The school met all System Safeguards: 18 out of 18 in Performance Rates and 10 out of 10 in Participation Rates.
We continue to maintain a 96.5% or better in student attendance.
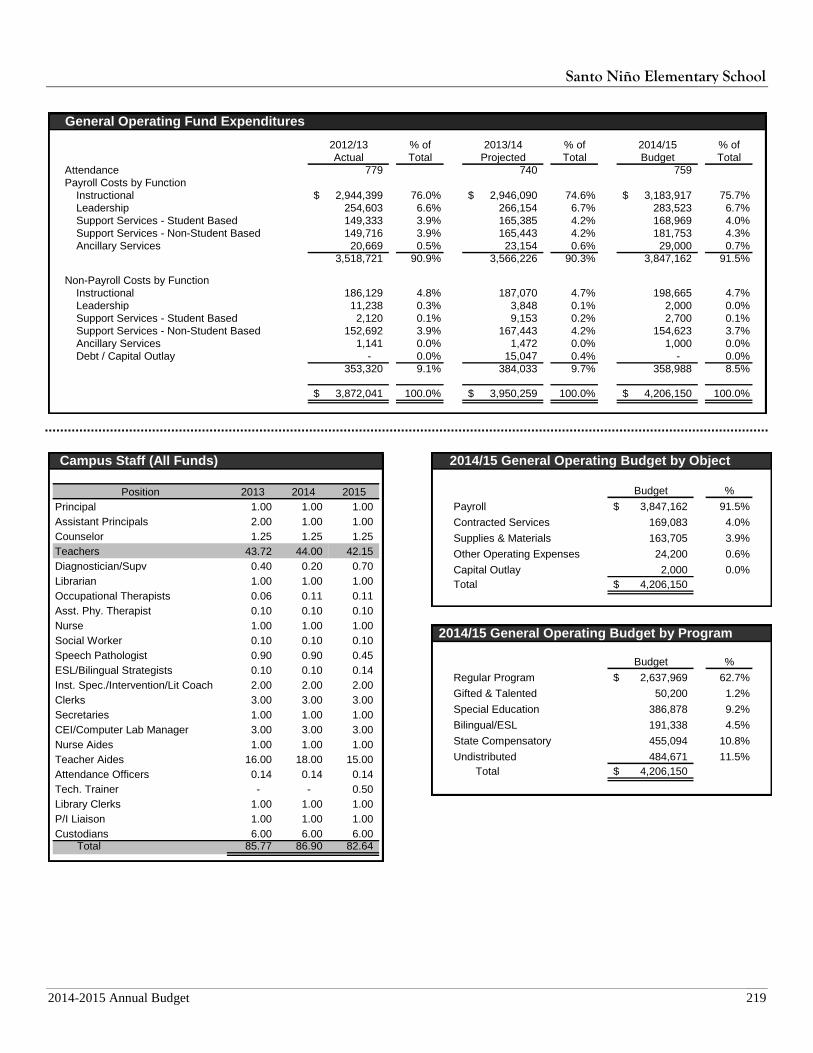
Santo Niño Elementary School
2014-2015 Annual Budget 219
General Operating Fund Expenditures
2012/13 % of 2013/14 % of 2014/15 % of
Actual Total Projected Total Budget Total
Attendance 779 740 759
Payroll Costs by Function
Instructional 2,944,399$ 76.0% 2,946,090$ 74.6% 3,183,917$ 75.7%
Leadership 254,603 6.6% 266,154 6.7% 283,523 6.7%
Support Services - Student Based 149,333 3.9% 165,385 4.2% 168,969 4.0%
Support Services - Non-Student Based 149,716 3.9% 165,443 4.2% 181,753 4.3%
Ancillary Services 20,669 0.5% 23,154 0.6% 29,000 0.7%
3,518,721 90.9% 3,566,226 90.3% 3,847,162 91.5%
Non-Payroll Costs by Function
Instructional 186,129 4.8% 187,070 4.7% 198,665 4.7%
Leadership 11,238 0.3% 3,848 0.1% 2,000 0.0%
Support Services - Student Based 2,120 0.1% 9,153 0.2% 2,700 0.1%
Support Services - Non-Student Based 152,692 3.9% 167,443 4.2% 154,623 3.7%
Ancillary Services 1,141 0.0% 1,472 0.0% 1,000 0.0%
Debt / Capital Outlay - 0.0% 15,047 0.4% - 0.0%
353,320 9.1% 384,033 9.7% 358,988 8.5%
3,872,041$ 100.0% 3,950,259$ 100.0% 4,206,150$ 100.0%
Campus Staff (All Funds)
Position 2013 2014 2015
Principal 1.00 1.00 1.00
Assistant Principals 2.00 1.00 1.00
Counselor 1.25 1.25 1.25
Teachers 43.72 44.00 42.15
Diagnostician/Supv 0.40 0.20 0.70
Librarian 1.00 1.00 1.00
Occupational Therapists 0.06 0.11 0.11
Asst. Phy. Therapist 0.10 0.10 0.10
Nurse 1.00 1.00 1.00
Social Worker 0.10 0.10 0.10
Speech Pathologist 0.90 0.90 0.45
ESL/Bilingual Strategists 0.10 0.10 0.14
Inst. Spec./Intervention/Lit Coach 2.00 2.00 2.00
Clerks 3.00 3.00 3.00
Secretaries 1.00 1.00 1.00
CEI/Computer Lab Manager 3.00 3.00 3.00
Nurse Aides 1.00 1.00 1.00
Teacher Aides 16.00 18.00 15.00
Attendance Officers 0.14 0.14 0.14
Tech. Trainer - - 0.50
Library Clerks 1.00 1.00 1.00
P/I Liaison 1.00 1.00 1.00
Custodians 6.00 6.00 6.00 Total 85.77 86.90 82.64
2014/15 General Operating Budget by Object
Budget %
Payroll 3,847,162$ 91.5%
Contracted Services 169,083 4.0%
Supplies & Materials 163,705 3.9%
Other Operating Expenses 24,200 0.6%
Capital Outlay 2,000 0.0%
Total 4,206,150$
2014/15 General Operating Budget by Program
Budget %
Regular Program 2,637,969$ 62.7%
Gifted & Talented 50,200 1.2%
Special Education 386,878 9.2%
Bilingual/ESL 191,338 4.5%
State Compensatory 455,094 10.8%
Undistributed 484,671 11.5%
Total 4,206,150$
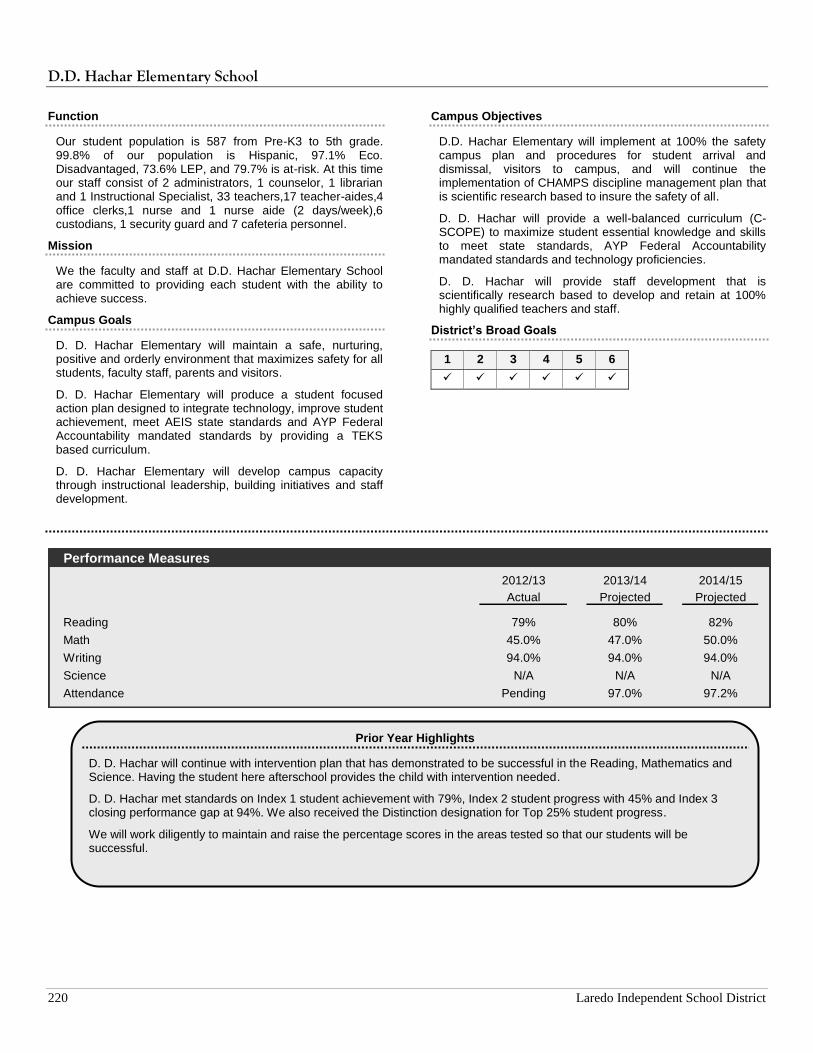
D.D. Hachar Elementary School
220 Laredo Independent School District
Function
Our student population is 587 from Pre-K3 to 5th grade. 99.8% of our population is Hispanic, 97.1% Eco. Disadvantaged, 73.6% LEP, and 79.7% is at-risk. At this time our staff consist of 2 administrators, 1 counselor, 1 librarian and 1 Instructional Specialist, 33 teachers,17 teacher-aides,4 office clerks,1 nurse and 1 nurse aide (2 days/week),6 custodians, 1 security guard and 7 cafeteria personnel.
Mission
We the faculty and staff at D.D. Hachar Elementary School are committed to providing each student with the ability to achieve success.
Campus Goals
D. D. Hachar Elementary will maintain a safe, nurturing, positive and orderly environment that maximizes safety for all students, faculty staff, parents and visitors.
D. D. Hachar Elementary will produce a student focused action plan designed to integrate technology, improve student achievement, meet AEIS state standards and AYP Federal Accountability mandated standards by providing a TEKS based curriculum.
D. D. Hachar Elementary will develop campus capacity through instructional leadership, building initiatives and staff development.
Campus Objectives
D.D. Hachar Elementary will implement at 100% the safety campus plan and procedures for student arrival and dismissal, visitors to campus, and will continue the implementation of CHAMPS discipline management plan that is scientific research based to insure the safety of all.
D. D. Hachar will provide a well-balanced curriculum (C-SCOPE) to maximize student essential knowledge and skills to meet state standards, AYP Federal Accountability mandated standards and technology proficiencies.
D. D. Hachar will provide staff development that is scientifically research based to develop and retain at 100% highly qualified teachers and staff.
District’s Broad Goals
1 2 3 4 5 6
Performance Measures
2012/13 2013/14 2014/15
Actual Projected Projected
Reading 79% 80% 82%
Math 45.0% 47.0% 50.0%
Writing 94.0% 94.0% 94.0%
Science N/A N/A N/A
Attendance Pending 97.0% 97.2%
Prior Year Highlights
D. D. Hachar will continue with intervention plan that has demonstrated to be successful in the Reading, Mathematics and Science. Having the student here afterschool provides the child with intervention needed.
D. D. Hachar met standards on Index 1 student achievement with 79%, Index 2 student progress with 45% and Index 3 closing performance gap at 94%. We also received the Distinction designation for Top 25% student progress.
We will work diligently to maintain and raise the percentage scores in the areas tested so that our students will be successful.
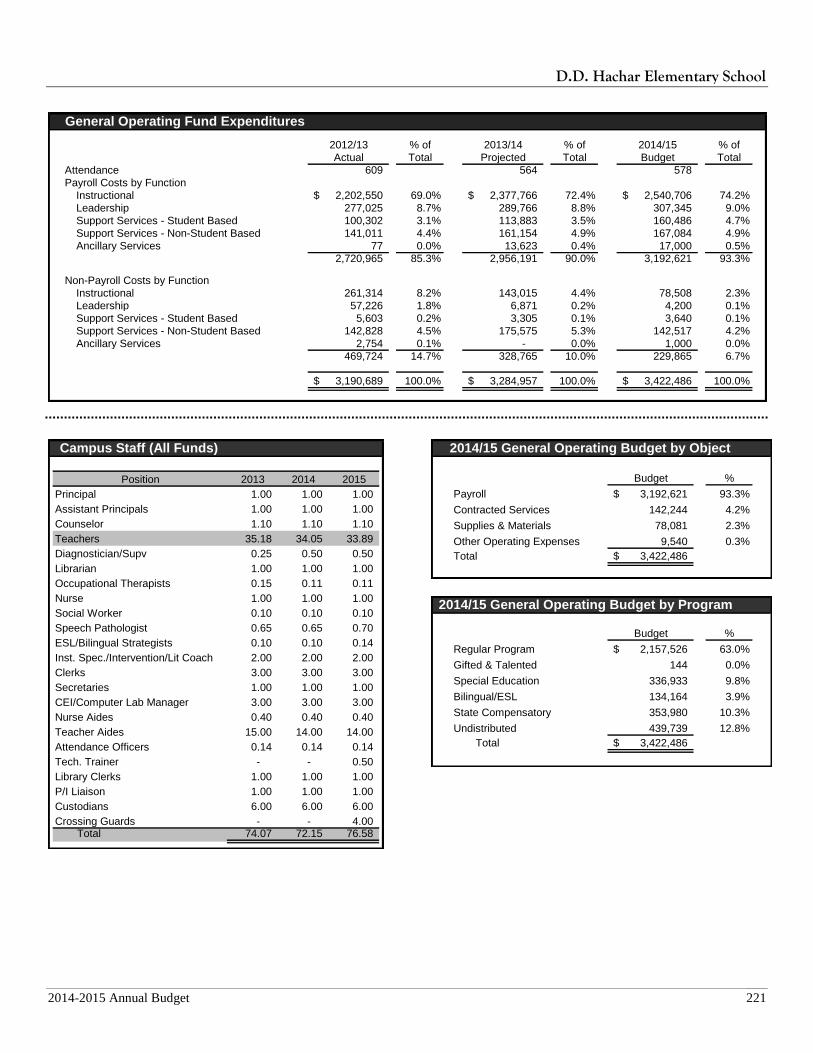
D.D. Hachar Elementary School
2014-2015 Annual Budget 221
General Operating Fund Expenditures
2012/13 % of 2013/14 % of 2014/15 % of
Actual Total Projected Total Budget Total
Attendance 609 564 578
Payroll Costs by Function
Instructional 2,202,550$ 69.0% 2,377,766$ 72.4% 2,540,706$ 74.2%
Leadership 277,025 8.7% 289,766 8.8% 307,345 9.0%
Support Services - Student Based 100,302 3.1% 113,883 3.5% 160,486 4.7%
Support Services - Non-Student Based 141,011 4.4% 161,154 4.9% 167,084 4.9%
Ancillary Services 77 0.0% 13,623 0.4% 17,000 0.5%
2,720,965 85.3% 2,956,191 90.0% 3,192,621 93.3%
Non-Payroll Costs by Function
Instructional 261,314 8.2% 143,015 4.4% 78,508 2.3%
Leadership 57,226 1.8% 6,871 0.2% 4,200 0.1%
Support Services - Student Based 5,603 0.2% 3,305 0.1% 3,640 0.1%
Support Services - Non-Student Based 142,828 4.5% 175,575 5.3% 142,517 4.2%
Ancillary Services 2,754 0.1% - 0.0% 1,000 0.0%
469,724 14.7% 328,765 10.0% 229,865 6.7%
3,190,689$ 100.0% 3,284,957$ 100.0% 3,422,486$ 100.0%
Campus Staff (All Funds)
Position 2013 2014 2015
Principal 1.00 1.00 1.00
Assistant Principals 1.00 1.00 1.00
Counselor 1.10 1.10 1.10
Teachers 35.18 34.05 33.89
Diagnostician/Supv 0.25 0.50 0.50
Librarian 1.00 1.00 1.00
Occupational Therapists 0.15 0.11 0.11
Nurse 1.00 1.00 1.00
Social Worker 0.10 0.10 0.10
Speech Pathologist 0.65 0.65 0.70
ESL/Bilingual Strategists 0.10 0.10 0.14
Inst. Spec./Intervention/Lit Coach 2.00 2.00 2.00
Clerks 3.00 3.00 3.00
Secretaries 1.00 1.00 1.00
CEI/Computer Lab Manager 3.00 3.00 3.00
Nurse Aides 0.40 0.40 0.40
Teacher Aides 15.00 14.00 14.00
Attendance Officers 0.14 0.14 0.14
Tech. Trainer - - 0.50
Library Clerks 1.00 1.00 1.00
P/I Liaison 1.00 1.00 1.00
Custodians 6.00 6.00 6.00
Crossing Guards - - 4.00 Total 74.07 72.15 76.58
2014/15 General Operating Budget by Object
Budget %
Payroll 3,192,621$ 93.3%
Contracted Services 142,244 4.2%
Supplies & Materials 78,081 2.3%
Other Operating Expenses 9,540 0.3%
Total 3,422,486$
2014/15 General Operating Budget by Program
Budget %
Regular Program 2,157,526$ 63.0%
Gifted & Talented 144 0.0%
Special Education 336,933 9.8%
Bilingual/ESL 134,164 3.9%
State Compensatory 353,980 10.3%
Undistributed 439,739 12.8%
Total 3,422,486$
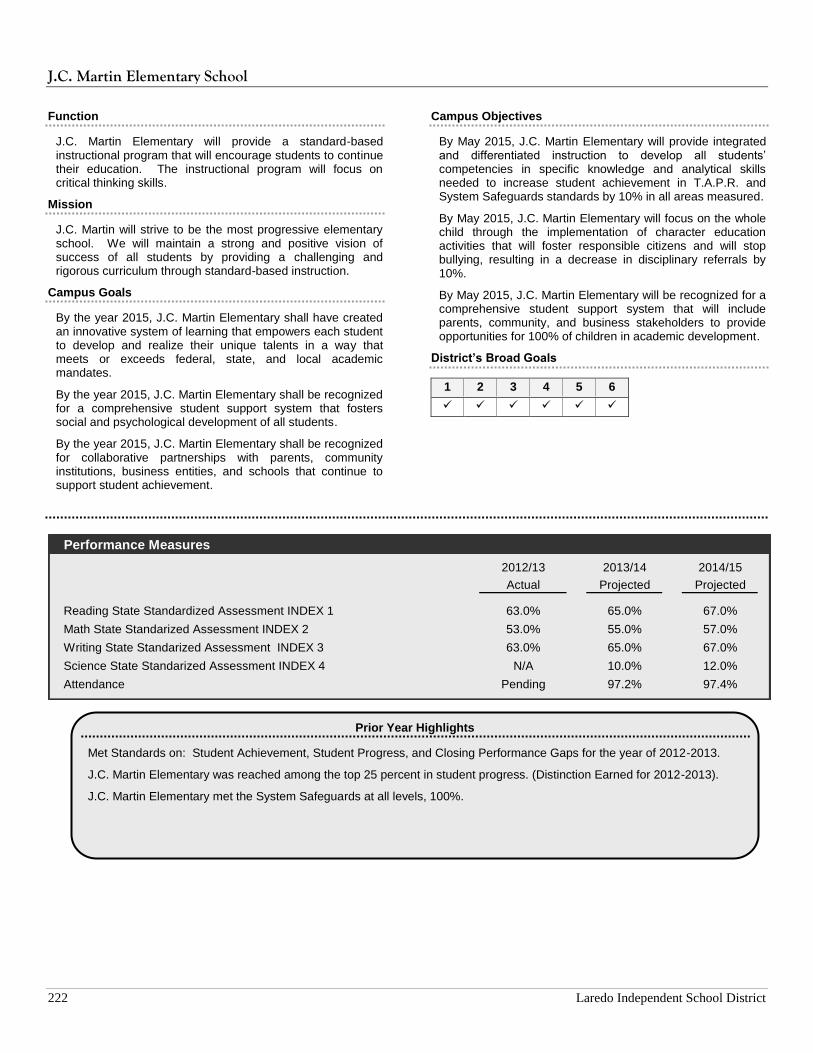
J.C. Martin Elementary School
222 Laredo Independent School District
Function
J.C. Martin Elementary will provide a standard-based instructional program that will encourage students to continue their education. The instructional program will focus on critical thinking skills.
Mission
J.C. Martin will strive to be the most progressive elementary school. We will maintain a strong and positive vision of success of all students by providing a challenging and rigorous curriculum through standard-based instruction.
Campus Goals
By the year 2015, J.C. Martin Elementary shall have created an innovative system of learning that empowers each student to develop and realize their unique talents in a way that meets or exceeds federal, state, and local academic mandates.
By the year 2015, J.C. Martin Elementary shall be recognized for a comprehensive student support system that fosters social and psychological development of all students.
By the year 2015, J.C. Martin Elementary shall be recognized for collaborative partnerships with parents, community institutions, business entities, and schools that continue to support student achievement.
Campus Objectives
By May 2015, J.C. Martin Elementary will provide integrated and differentiated instruction to develop all students’ competencies in specific knowledge and analytical skills needed to increase student achievement in T.A.P.R. and System Safeguards standards by 10% in all areas measured.
By May 2015, J.C. Martin Elementary will focus on the whole child through the implementation of character education activities that will foster responsible citizens and will stop bullying, resulting in a decrease in disciplinary referrals by 10%.
By May 2015, J.C. Martin Elementary will be recognized for a comprehensive student support system that will include parents, community, and business stakeholders to provide opportunities for 100% of children in academic development.
District’s Broad Goals
1 2 3 4 5 6
Performance Measures
2012/13 2013/14 2014/15
Actual Projected Projected
Reading State Standardized Assessment INDEX 1 63.0% 65.0% 67.0%
Math State Standarized Assessment INDEX 2 53.0% 55.0% 57.0%
Writing State Standarized Assessment INDEX 3 63.0% 65.0% 67.0%
Science State Standarized Assessment INDEX 4 N/A 10.0% 12.0%
Attendance Pending 97.2% 97.4%
Prior Year Highlights
Met Standards on: Student Achievement, Student Progress, and Closing Performance Gaps for the year of 2012-2013.
J.C. Martin Elementary was reached among the top 25 percent in student progress. (Distinction Earned for 2012-2013).
J.C. Martin Elementary met the System Safeguards at all levels, 100%.
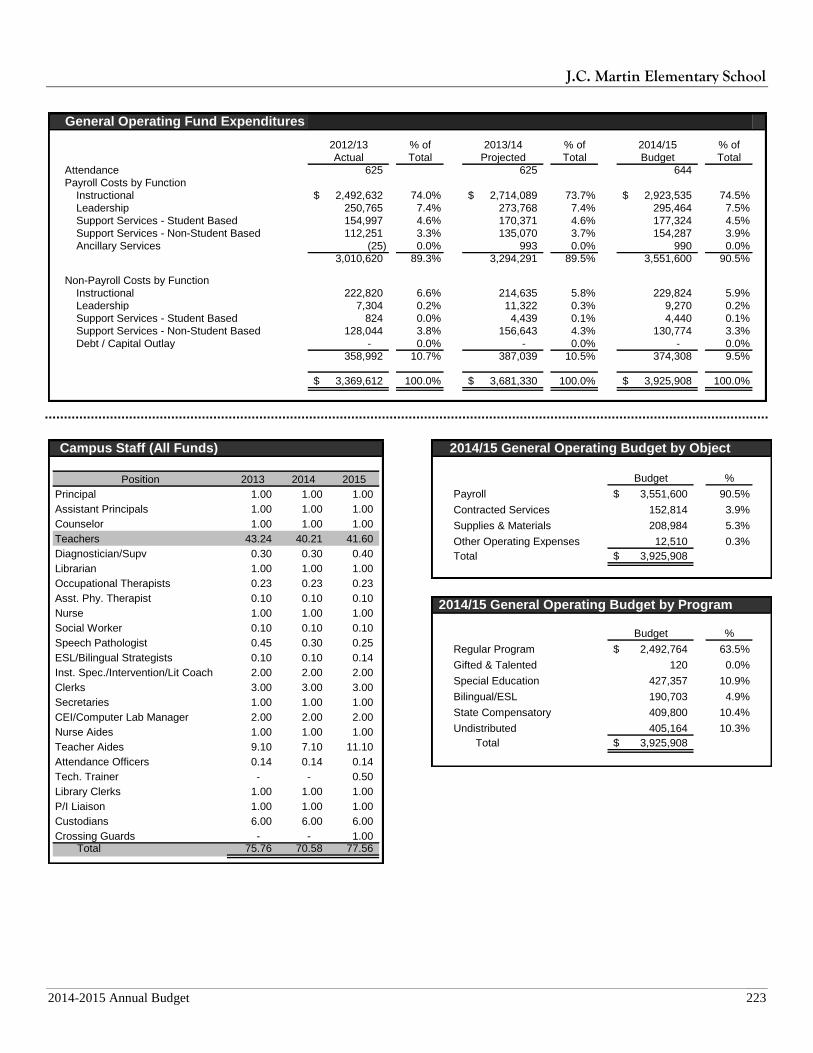
J.C. Martin Elementary School
2014-2015 Annual Budget 223
General Operating Fund Expenditures
2012/13 % of 2013/14 % of 2014/15 % of
Actual Total Projected Total Budget Total
Attendance 625 625 644
Payroll Costs by Function
Instructional 2,492,632$ 74.0% 2,714,089$ 73.7% 2,923,535$ 74.5%
Leadership 250,765 7.4% 273,768 7.4% 295,464 7.5%
Support Services - Student Based 154,997 4.6% 170,371 4.6% 177,324 4.5%
Support Services - Non-Student Based 112,251 3.3% 135,070 3.7% 154,287 3.9%
Ancillary Services (25) 0.0% 993 0.0% 990 0.0%
3,010,620 89.3% 3,294,291 89.5% 3,551,600 90.5%
Non-Payroll Costs by Function
Instructional 222,820 6.6% 214,635 5.8% 229,824 5.9%
Leadership 7,304 0.2% 11,322 0.3% 9,270 0.2%
Support Services - Student Based 824 0.0% 4,439 0.1% 4,440 0.1%
Support Services - Non-Student Based 128,044 3.8% 156,643 4.3% 130,774 3.3%
Debt / Capital Outlay - 0.0% - 0.0% - 0.0%
358,992 10.7% 387,039 10.5% 374,308 9.5%
3,369,612$ 100.0% 3,681,330$ 100.0% 3,925,908$ 100.0%
Campus Staff (All Funds)
Position 2013 2014 2015
Principal 1.00 1.00 1.00
Assistant Principals 1.00 1.00 1.00
Counselor 1.00 1.00 1.00
Teachers 43.24 40.21 41.60
Diagnostician/Supv 0.30 0.30 0.40
Librarian 1.00 1.00 1.00
Occupational Therapists 0.23 0.23 0.23
Asst. Phy. Therapist 0.10 0.10 0.10
Nurse 1.00 1.00 1.00
Social Worker 0.10 0.10 0.10
Speech Pathologist 0.45 0.30 0.25
ESL/Bilingual Strategists 0.10 0.10 0.14
Inst. Spec./Intervention/Lit Coach 2.00 2.00 2.00
Clerks 3.00 3.00 3.00
Secretaries 1.00 1.00 1.00
CEI/Computer Lab Manager 2.00 2.00 2.00
Nurse Aides 1.00 1.00 1.00
Teacher Aides 9.10 7.10 11.10
Attendance Officers 0.14 0.14 0.14
Tech. Trainer - - 0.50
Library Clerks 1.00 1.00 1.00
P/I Liaison 1.00 1.00 1.00
Custodians 6.00 6.00 6.00
Crossing Guards - - 1.00 Total 75.76 70.58 77.56
2014/15 General Operating Budget by Object
Budget %
Payroll 3,551,600$ 90.5%
Contracted Services 152,814 3.9%
Supplies & Materials 208,984 5.3%
Other Operating Expenses 12,510 0.3%
Total 3,925,908$
2014/15 General Operating Budget by Program
Budget %
Regular Program 2,492,764$ 63.5%
Gifted & Talented 120 0.0%
Special Education 427,357 10.9%
Bilingual/ESL 190,703 4.9%
State Compensatory 409,800 10.4%
Undistributed 405,164 10.3%
Total 3,925,908$
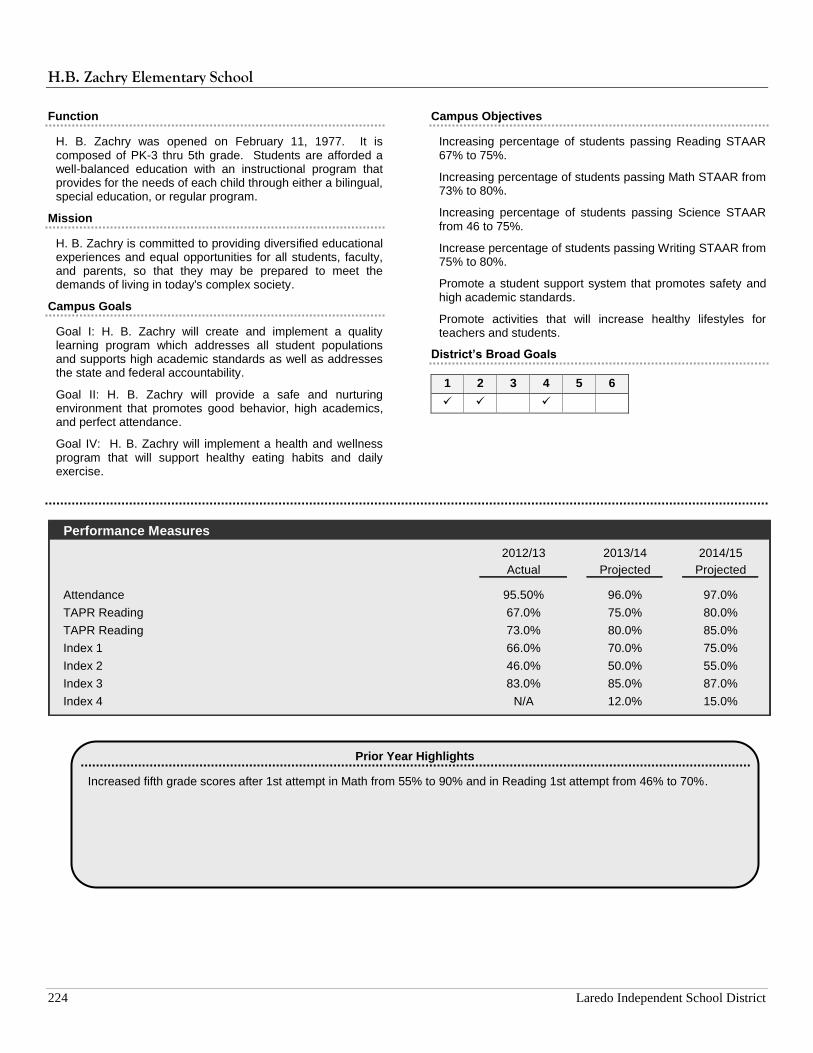
H.B. Zachry Elementary School
224 Laredo Independent School District
Function
H. B. Zachry was opened on February 11, 1977. It is composed of PK-3 thru 5th grade. Students are afforded a well-balanced education with an instructional program that provides for the needs of each child through either a bilingual, special education, or regular program.
Mission
H. B. Zachry is committed to providing diversified educational experiences and equal opportunities for all students, faculty, and parents, so that they may be prepared to meet the demands of living in today's complex society.
Campus Goals
Goal I: H. B. Zachry will create and implement a quality learning program which addresses all student populations and supports high academic standards as well as addresses the state and federal accountability.
Goal II: H. B. Zachry will provide a safe and nurturing environment that promotes good behavior, high academics, and perfect attendance.
Goal IV: H. B. Zachry will implement a health and wellness program that will support healthy eating habits and daily exercise.
Campus Objectives
Increasing percentage of students passing Reading STAAR 67% to 75%.
Increasing percentage of students passing Math STAAR from 73% to 80%.
Increasing percentage of students passing Science STAAR from 46 to 75%.
Increase percentage of students passing Writing STAAR from 75% to 80%.
Promote a student support system that promotes safety and high academic standards.
Promote activities that will increase healthy lifestyles for teachers and students.
District’s Broad Goals
1 2 3 4 5 6
Performance Measures
2012/13 2013/14 2014/15
Actual Projected Projected
Attendance 95.50% 96.0% 97.0%
TAPR Reading 67.0% 75.0% 80.0%
TAPR Reading 73.0% 80.0% 85.0%
Index 1 66.0% 70.0% 75.0%
Index 2 46.0% 50.0% 55.0%
Index 3 83.0% 85.0% 87.0%
Index 4 N/A 12.0% 15.0%
Prior Year Highlights
Increased fifth grade scores after 1st attempt in Math from 55% to 90% and in Reading 1st attempt from 46% to 70%.

H.B. Zachry Elementary School
2014-2015 Annual Budget 225
General Operating Fund Expenditures
2012/13 % of 2013/14 % of 2014/15 % of
Actual Total Projected Total Budget Total
Attendance 643 674 670
Payroll Costs by Function
Instructional 2,654,978$ 75.5% 2,807,692$ 75.5% 2,954,241$ 76.7%
Leadership 241,203 6.9% 248,060 6.7% 279,102 7.2%
Support Services - Student Based 172,714 4.9% 191,490 5.1% 197,719 5.1%
Support Services - Non-Student Based 121,993 3.5% 130,064 3.5% 139,411 3.6%
Ancillary Services 15,469 0.4% 15,235 0.4% 16,000 0.4%
3,206,358 91.2% 3,392,541 91.2% 3,586,473 93.1%
Non-Payroll Costs by Function
Instructional 164,897 4.7% 133,297 3.6% 99,732 2.6%
Leadership 12,348 0.4% 11,544 0.3% 5,000 0.1%
Support Services - Student Based 2,486 0.1% 2,926 0.1% 2,135 0.1%
Support Services - Non-Student Based 128,962 3.7% 170,782 4.6% 156,373 4.1%
Ancillary Services 983 0.0% 1,007 0.0% 1,000 0.0%
Debt / Capital Outlay - 0.0% 7,474 0.2% - 0.0%
309,677 8.8% 327,031 8.8% 264,240 6.9%
3,516,035$ 99.6% 3,719,572$ 99.6% 3,850,713$ 99.6%
Campus Staff (All Funds)
Position 2013 2014 2015
Principal 1.00 1.00 1.00
Assistant Principals 1.00 1.00 1.00
Counselor 1.00 1.00 1.00
Teachers 37.48 35.79 35.27
Diagnostician/Supv 0.40 0.40 0.50
Librarian 1.00 1.00 1.00
Occupational Therapists 0.16 0.23 0.23
Asst. Phy. Therapist 0.10 - -
Nurse 1.00 1.00 1.00
Social Worker 0.10 0.10 0.10
Speech Pathologist 0.70 0.80 0.80
ESL/Bilingual Strategists - 0.10 0.15
Inst. Spec./Intervention/Lit Coach 2.00 2.00 2.00
Clerks 4.00 4.00 4.00
Secretaries 1.00 1.00 1.00
CEI/Computer Lab Manager 3.00 3.00 3.00
Nurse Aides 1.00 1.00 1.00
Teacher Aides 14.00 15.00 13.00
Attendance Officers 0.15 0.15 0.15
Tech. Trainer - - 0.50
Library Clerks 1.00 1.00 1.00
P/I Liaison 1.00 1.00 1.00
Custodians 5.00 5.00 5.00
Crossing Guards - - 2.00
Total 76.09 75.57 75.70
2014/15 General Operating Budget by Object
Budget %
Payroll 3,586,473$ 93.1%
Contracted Services 154,763 4.0%
Supplies & Materials 100,392 2.6%
Other Operating Expenses 8,085 0.2%
Capital Outlay 1,000 0.0%
Total 3,850,713$
2014/15 General Operating Budget by Program
Budget %
Regular Program 2,393,154$ 62.1%
Gifted & Talented 152 0.0%
Special Education 492,601 12.8%
Bilingual/ESL 155,845 4.0%
State Compensatory 369,698 9.6%
Undistributed 439,263 11.4%
Total 3,850,713$
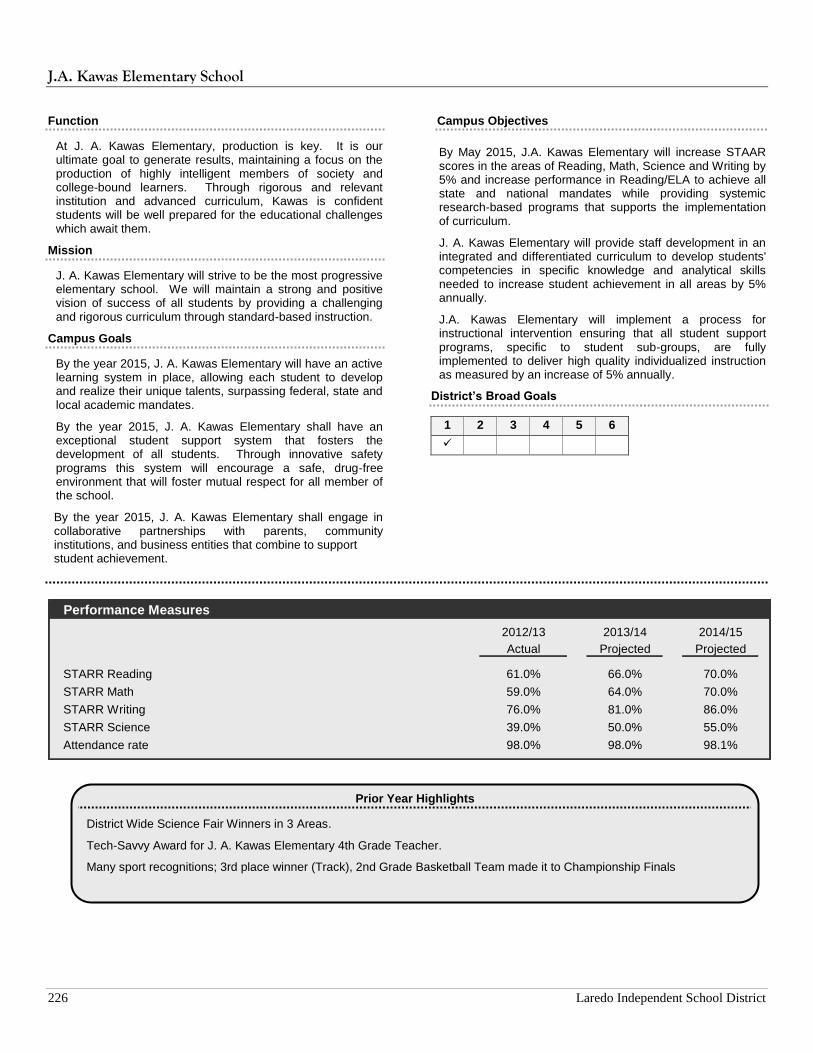
J.A. Kawas Elementary School
226 Laredo Independent School District
Function
At J. A. Kawas Elementary, production is key. It is our ultimate goal to generate results, maintaining a focus on the production of highly intelligent members of society and college-bound learners. Through rigorous and relevant institution and advanced curriculum, Kawas is confident students will be well prepared for the educational challenges which await them.
Mission
J. A. Kawas Elementary will strive to be the most progressive elementary school. We will maintain a strong and positive vision of success of all students by providing a challenging and rigorous curriculum through standard-based instruction.
Campus Goals
By the year 2015, J. A. Kawas Elementary will have an active learning system in place, allowing each student to develop and realize their unique talents, surpassing federal, state and local academic mandates.
By the year 2015, J. A. Kawas Elementary shall have an exceptional student support system that fosters the development of all students. Through innovative safety programs this system will encourage a safe, drug-free environment that will foster mutual respect for all member of the school.
By the year 2015, J. A. Kawas Elementary shall engage in collaborative partnerships with parents, community institutions, and business entities that combine to support student achievement.
Campus Objectives
By May 2015, J.A. Kawas Elementary will increase STAAR scores in the areas of Reading, Math, Science and Writing by 5% and increase performance in Reading/ELA to achieve all state and national mandates while providing systemic research-based programs that supports the implementation of curriculum.
J. A. Kawas Elementary will provide staff development in an integrated and differentiated curriculum to develop students' competencies in specific knowledge and analytical skills needed to increase student achievement in all areas by 5% annually.
J.A. Kawas Elementary will implement a process for instructional intervention ensuring that all student support programs, specific to student sub-groups, are fully implemented to deliver high quality individualized instruction as measured by an increase of 5% annually.
District’s Broad Goals
1 2 3 4 5 6
Performance Measures
2012/13 2013/14 2014/15
Actual Projected Projected
STARR Reading 61.0% 66.0% 70.0%
STARR Math 59.0% 64.0% 70.0%
STARR Writing 76.0% 81.0% 86.0%
STARR Science 39.0% 50.0% 55.0%
Attendance rate 98.0% 98.0% 98.1%
Prior Year Highlights
District Wide Science Fair Winners in 3 Areas.
Tech-Savvy Award for J. A. Kawas Elementary 4th Grade Teacher.
Many sport recognitions; 3rd place winner (Track), 2nd Grade Basketball Team made it to Championship Finals

J.A. Kawas Elementary School
2014-2015 Annual Budget 227
General Operating Fund Expenditures
2012/13 % of 2013/14 % of 2014/15 % of
Actual Total Projected Total Budget Total
Attendance 630 601 599
Payroll Costs by Function
Instructional 2,593,751$ 77.1% 2,524,598$ 73.1% 2,652,910$ 74.0%
Leadership 263,033 7.8% 266,520 7.7% 292,204 8.1%
Support Services - Student Based 157,257 4.7% 203,193 5.9% 215,617 6.0%
Support Services - Non-Student Based 112,818 3.4% 109,932 3.2% 135,290 3.8%
Ancillary Services 86 0.0% - 0.0% - 0.0%
3,126,945 93.0% 3,104,243 89.9% 3,296,021 91.9%
Non-Payroll Costs by Function
Instructional 64,705 1.9% 147,108 4.3% 137,916 3.8%
Leadership 7,807 0.2% 5,015 0.1% 10,000 0.3%
Support Services - Student Based 1,306 0.0% 2,732 0.1% 800 0.0%
Support Services - Non-Student Based 163,337 4.9% 185,240 5.4% 142,445 4.0%
Debt / Capital Outlay - 0.0% 9,700 0.3% - 0.0%
237,155 7.0% 349,795 10.1% 291,161 8.1%
3,364,100$ 100.0% 3,454,038$ 100.0% 3,587,182$ 100.0%
Campus Staff (All Funds)
Position 2013 2014 2015
Principal 1.00 1.00 1.00
Assistant Principals 1.00 1.00 1.00
Counselor 1.05 1.05 1.05
Teachers 39.89 37.84 35.38
Diagnostician/Supv 0.30 1.00 0.60
Librarian 1.00 1.00 1.00
Occupational Therapists 0.18 0.20 0.20
Asst. Phy. Therapist 0.20 0.20 0.20
Nurse 1.00 1.00 1.00
Social Worker 0.10 0.10 0.10
Speech Pathologist 0.55 0.30 0.35
ESL/Bilingual Strategists - 0.10 0.14
Inst. Spec./Intervention/Lit Coach 2.00 2.00 2.00
Clerks 3.00 3.00 3.00
Secretaries 1.00 1.00 1.00
CEI/Computer Lab Manager 3.00 3.00 3.00
Nurse Aides 1.00 1.00 1.00
Teacher Aides 14.00 12.00 10.00
Attendance Officers 0.15 0.15 0.15
Tech. Trainer - - 0.50
Library Clerks 1.00 1.00 1.00
P/I Liaison 1.00 1.00 1.00
Custodians 5.00 5.00 5.00
Crossing Guards - - 3.00
Total 77.42 73.94 72.67
2014/15 General Operating Budget by Object
Budget %
Payroll 3,296,021$ 91.9%
Contracted Services 161,937 4.5%
Supplies & Materials 114,924 3.2%
Other Operating Expenses 9,300 0.3%
Capital Outlay 5,000 0.1%
Total 3,587,182$
2014/15 General Operating Budget by Program
Budget %
Regular Program 2,307,897$ 64.3%
Gifted & Talented 216 0.0%
Special Education 335,916 9.4%
Bilingual/ESL 155,040 4.3%
State Compensatory 384,530 10.7%
Undistributed 403,583 11.3%
Total 3,587,182$
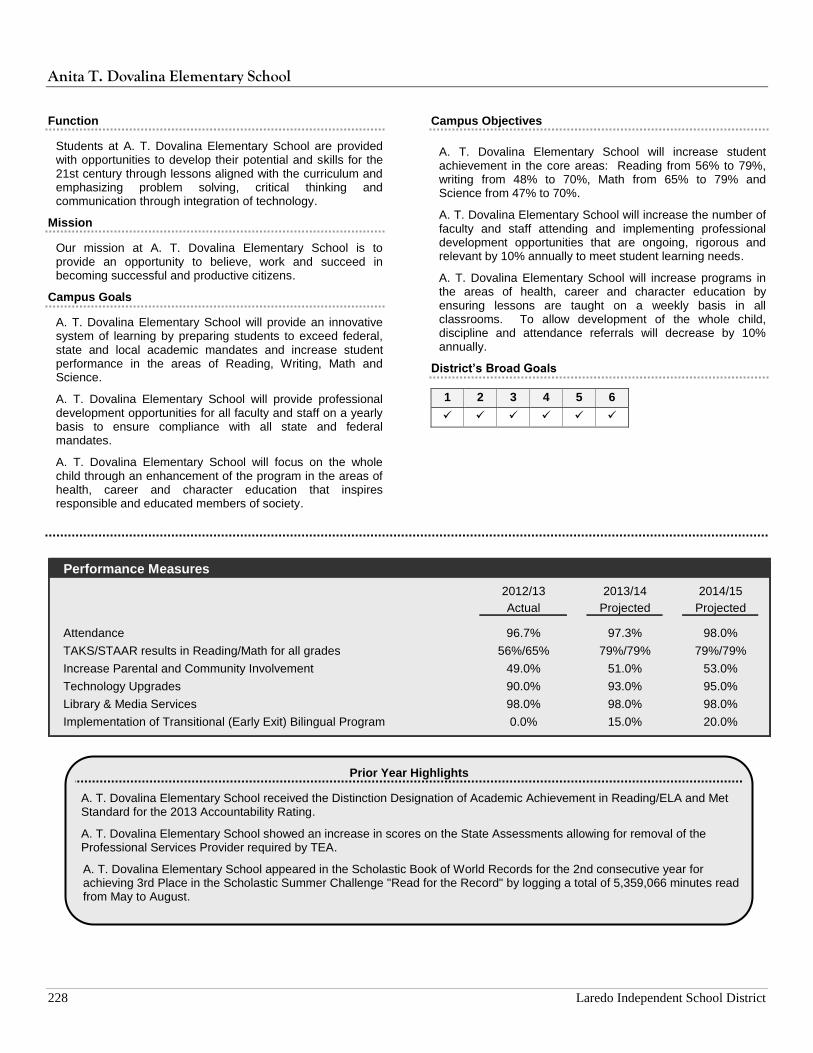
Anita T. Dovalina Elementary School
228 Laredo Independent School District
Function
Students at A. T. Dovalina Elementary School are provided with opportunities to develop their potential and skills for the 21st century through lessons aligned with the curriculum and emphasizing problem solving, critical thinking and communication through integration of technology.
Mission
Our mission at A. T. Dovalina Elementary School is to provide an opportunity to believe, work and succeed in becoming successful and productive citizens.
Campus Goals
A. T. Dovalina Elementary School will provide an innovative system of learning by preparing students to exceed federal, state and local academic mandates and increase student performance in the areas of Reading, Writing, Math and Science.
A. T. Dovalina Elementary School will provide professional development opportunities for all faculty and staff on a yearly basis to ensure compliance with all state and federal mandates.
A. T. Dovalina Elementary School will focus on the whole child through an enhancement of the program in the areas of health, career and character education that inspires responsible and educated members of society.
Campus Objectives
A. T. Dovalina Elementary School will increase student achievement in the core areas: Reading from 56% to 79%, writing from 48% to 70%, Math from 65% to 79% and Science from 47% to 70%.
A. T. Dovalina Elementary School will increase the number of faculty and staff attending and implementing professional development opportunities that are ongoing, rigorous and relevant by 10% annually to meet student learning needs.
A. T. Dovalina Elementary School will increase programs in the areas of health, career and character education by ensuring lessons are taught on a weekly basis in all classrooms. To allow development of the whole child, discipline and attendance referrals will decrease by 10% annually.
District’s Broad Goals
1 2 3 4 5 6
Performance Measures
2012/13 2013/14 2014/15
Actual Projected Projected
Attendance 96.7% 97.3% 98.0%
TAKS/STAAR results in Reading/Math for all grades 56%/65% 79%/79% 79%/79%
Increase Parental and Community Involvement 49.0% 51.0% 53.0%
Technology Upgrades 90.0% 93.0% 95.0%
Library & Media Services 98.0% 98.0% 98.0%
Implementation of Transitional (Early Exit) Bilingual Program 0.0% 15.0% 20.0%
Prior Year Highlights
A. T. Dovalina Elementary School received the Distinction Designation of Academic Achievement in Reading/ELA and Met Standard for the 2013 Accountability Rating.
A. T. Dovalina Elementary School showed an increase in scores on the State Assessments allowing for removal of the Professional Services Provider required by TEA.
A. T. Dovalina Elementary School appeared in the Scholastic Book of World Records for the 2nd consecutive year for achieving 3rd Place in the Scholastic Summer Challenge "Read for the Record" by logging a total of 5,359,066 minutes read from May to August.

Anita T. Dovalina Elementary School
2014-2015 Annual Budget 229
General Operating Fund Expenditures
2012/13 % of 2013/14 % of 2014/15 % of
Actual Total Projected Total Budget Total
Attendance 557 545 554
Payroll Costs by Function
Instructional 2,139,905$ 74.8% 2,346,538$ 73.3% 2,531,557$ 75.4%
Leadership 213,382 7.5% 252,633 7.9% 269,833 8.0%
Support Services - Student Based 113,338 4.0% 130,272 4.1% 191,099 5.7%
Support Services - Non-Student Based 101,979 3.6% 113,062 3.5% 123,678 3.7%
Ancillary Services 1 0.0% - 0.0% - 0.0%
2,568,604 89.8% 2,842,504 88.8% 3,116,167 92.8%
Non-Payroll Costs by Function
Instructional 164,769 5.8% 136,222 4.3% 101,532 3.0%
Leadership 9,429 0.3% 5,386 0.2% 7,914 0.2%
Support Services - Student Based 1,041 0.0% 3,297 0.1% 1,950 0.1%
Support Services - Non-Student Based 116,391 4.1% 145,375 4.5% 129,914 3.9%
Debt / Capital Outlay - 0.0% 69,934 2.2% - 0.0%
291,630 10.2% 360,214 11.2% 241,310 7.2%
2,860,234$ 100.0% 3,202,719$ 100.0% 3,357,477$ 100.0%
Campus Staff (All Funds)
Position 2013 2014 2015
Principal 1.00 1.00 1.00
Assistant Principals 1.00 1.00 1.00
Counselor 1.00 1.00 1.00
Teachers 35.21 35.85 36.54
Diagnostician/Supv 0.20 - 0.50
Librarian 1.00 1.00 1.00
Occupational Therapists 0.06 0.16 0.18
Asst. Phy. Therapist 0.10 0.10 0.10
Nurse 1.00 1.00 1.00
Social Worker 0.10 0.10 0.10
Speech Pathologist - - 0.20
ESL/Bilingual Strategists - 0.10 0.17
Inst. Spec./Intervention/Lit Coach 2.00 2.00 2.00
Clerks 3.00 3.00 3.00
Secretaries 1.00 1.00 1.00
CEI/Computer Lab Manager 3.00 3.00 3.00
Nurse Aides 0.40 0.40 0.40
Teacher Aides 9.14 8.14 8.14
P/I Liaison 1.00 1.00 1.00
Attendance Officers 0.14 0.14 0.14
Tech. Trainer - - 0.50
Library Clerks 1.00 1.00 1.00
Custodians 4.00 4.00 4.00
Parental Monitors - - 3.00
Total 65.35 64.99 69.97
2014/15 General Operating Budget by Object
Budget %
Payroll 3,116,167$ 92.8%
Contracted Services 134,199 4.0%
Supplies & Materials 88,661 2.6%
Other Operating Expenses 16,450 0.5%
Capital Outlay 2,000 0.1%
Total 3,357,477$
2014/15 General Operating Budget by Program
Budget %
Regular Program 2,125,805$ 63.3%
Gifted & Talented 120 0.0%
Special Education 318,863 9.5%
Bilingual/ESL 182,744 5.4%
State Compensatory 346,960 10.3%
Undistributed 382,985 11.4%
Total 3,357,477$
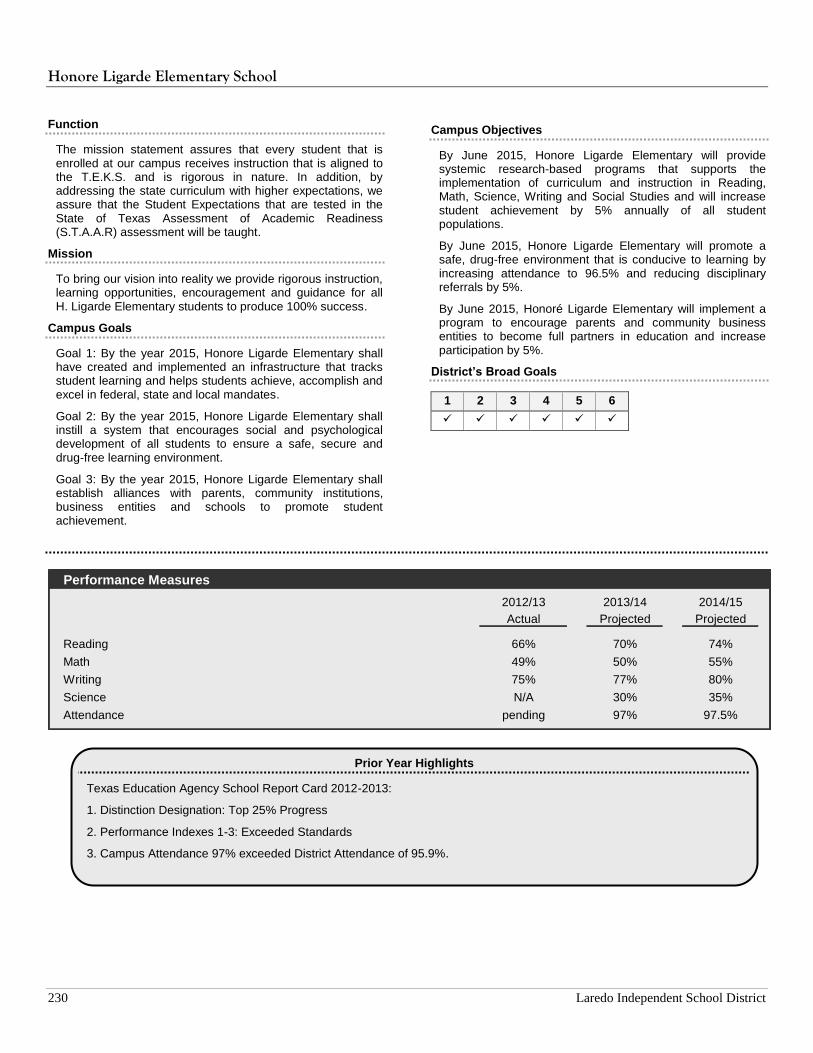
Honore Ligarde Elementary School
230 Laredo Independent School District
Function
The mission statement assures that every student that is enrolled at our campus receives instruction that is aligned to the T.E.K.S. and is rigorous in nature. In addition, by addressing the state curriculum with higher expectations, we assure that the Student Expectations that are tested in the State of Texas Assessment of Academic Readiness (S.T.A.A.R) assessment will be taught.
Mission
To bring our vision into reality we provide rigorous instruction, learning opportunities, encouragement and guidance for all H. Ligarde Elementary students to produce 100% success.
Campus Goals
Goal 1: By the year 2015, Honore Ligarde Elementary shall have created and implemented an infrastructure that tracks student learning and helps students achieve, accomplish and excel in federal, state and local mandates.
Goal 2: By the year 2015, Honore Ligarde Elementary shall instill a system that encourages social and psychological development of all students to ensure a safe, secure and drug-free learning environment.
Goal 3: By the year 2015, Honore Ligarde Elementary shall establish alliances with parents, community institutions, business entities and schools to promote student achievement.
Campus Objectives
By June 2015, Honore Ligarde Elementary will provide systemic research-based programs that supports the implementation of curriculum and instruction in Reading, Math, Science, Writing and Social Studies and will increase student achievement by 5% annually of all student populations.
By June 2015, Honore Ligarde Elementary will promote a safe, drug-free environment that is conducive to learning by increasing attendance to 96.5% and reducing disciplinary referrals by 5%.
By June 2015, Honoré Ligarde Elementary will implement a program to encourage parents and community business entities to become full partners in education and increase participation by 5%.
District’s Broad Goals
1 2 3 4 5 6
Performance Measures
2012/13 2013/14 2014/15
Actual Projected Projected
Reading 66% 70% 74%
Math 49% 50% 55%
Writing 75% 77% 80%
Science N/A 30% 35%
Attendance pending 97% 97.5%
Prior Year Highlights
Texas Education Agency School Report Card 2012-2013:
1. Distinction Designation: Top 25% Progress
2. Performance Indexes 1-3: Exceeded Standards
3. Campus Attendance 97% exceeded District Attendance of 95.9%.

Honore Ligarde Elementary School
2014-2015 Annual Budget 231
General Operating Fund Expenditures
2012/13 % of 2013/14 % of 2014/15 % of
Actual Total Projected Total Budget Total
Attendance 804 829 827
Payroll Costs by Function
Instructional 2,993,296$ 77.0% 3,153,324$ 73.7% 3,326,677$ 73.3%
Leadership 292,313 7.5% 344,375 8.0% 372,077 8.2%
Support Services - Student Based 142,062 3.7% 179,854 4.2% 184,315 4.1%
Support Services - Non-Student Based 152,215 3.9% 164,849 3.9% 166,383 3.7%
Ancillary Services 9,400 0.2% 16,733 0.4% 21,000 0.5%
3,589,286 92.4% 3,859,136 90.2% 4,070,452 89.7%
Non-Payroll Costs by Function
Instructional 138,544 3.6% 203,594 4.8% 293,690 6.5%
Leadership 10,826 0.3% 6,321 0.1% 8,000 0.2%
Support Services - Student Based 994 0.0% 3,150 0.1% 1,600 0.0%
Support Services - Non-Student Based 144,763 3.7% 158,746 3.7% 165,610 3.6%
Ancillary Services 960 0.0% 894 0.0% 1,000 0.0%
Debt / Capital Outlay - 0.0% 46,984 1.1% - 0.0%
296,087 7.6% 419,689 9.8% 469,900 10.3%
3,885,372$ 100.0% 4,278,825$ 100.0% 4,540,352$ 100.0%
Campus Staff (All Funds)
Position 2013 2014 2015
Principal 1.00 1.00 1.00
Assistant Principals 1.00 2.00 2.00
Counselor 1.00 1.00 1.00
Teachers 43.78 42.99 42.27
Diagnostician/Supv 0.30 0.15 0.50
Librarian 1.00 1.00 1.00
Occupational Therapists 0.03 0.19 0.19
Asst. Phy. Therapist 0.30 0.20 0.20
Nurse 1.00 1.00 1.00
Social Worker 0.10 0.10 0.10
Speech Pathologist 0.30 0.60 0.60
ESL/Bilingual Strategists 0.10 0.10 0.15
Inst. Spec./Intervention/Lit Coach 2.00 2.00 2.00
Clerks 3.00 3.00 3.00
Secretaries 1.00 1.00 1.00
CEI/Computer Lab Manager 3.00 3.00 3.00
Nurse Aides 1.00 1.00 1.00
Teacher Aides 16.00 16.00 16.00
Attendance Officers 0.14 0.14 0.14
Tech. Trainer - - 0.50
Library Clerks 1.00 1.00 1.00
P/I Liaison 1.00 1.00 1.00
Custodians 5.00 5.00 5.00
Crossing Guards - - 3.00
Total 83.05 83.47 86.65
2014/15 General Operating Budget by Object
Budget %
Payroll 4,070,452$ 89.7%
Contracted Services 198,114 4.4%
Supplies & Materials 243,736 5.4%
Other Operating Expenses 23,050 0.5%
Capital Outlay 5,000 0.1%
Total 4,540,352$
2014/15 General Operating Budget by Program
Budget %
Regular Program 2,875,459$ 63.3%
Gifted & Talented 160 0.0%
Special Education 445,061 9.8%
Bilingual/ESL 208,134 4.6%
State Compensatory 526,087 11.6%
Undistributed 485,451 10.7%
Total 4,540,352$
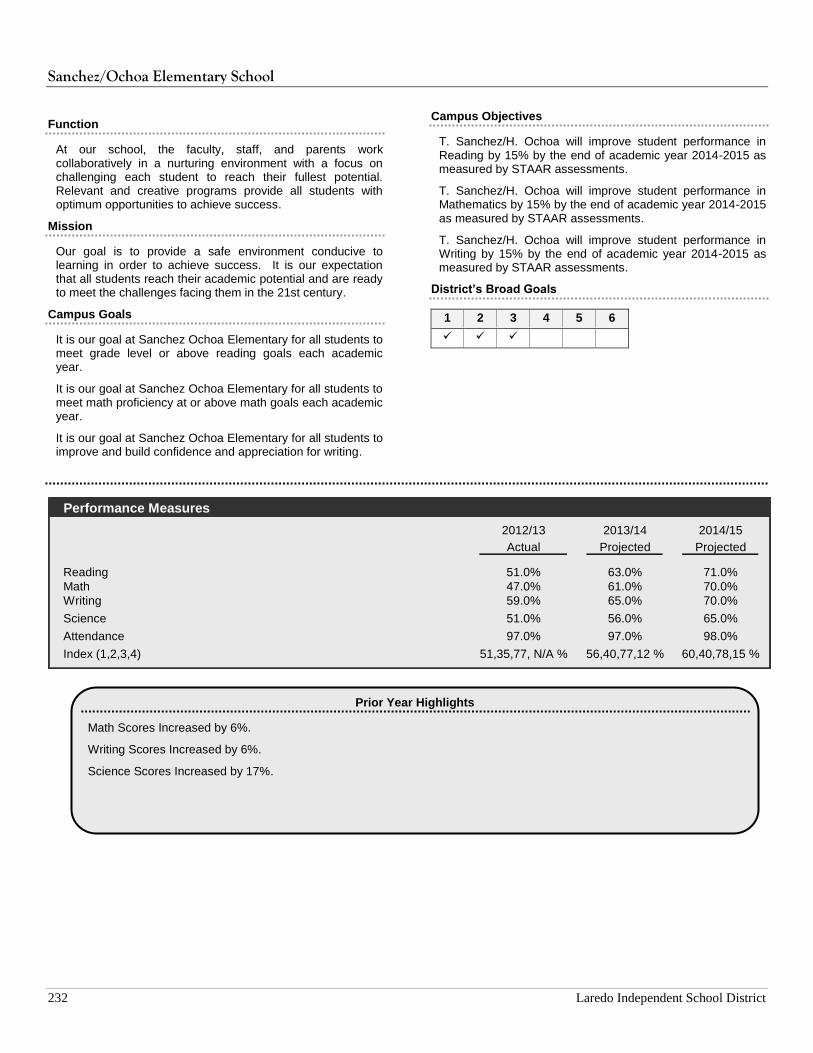
Sanchez/Ochoa Elementary School
232 Laredo Independent School District
Function
At our school, the faculty, staff, and parents work collaboratively in a nurturing environment with a focus on challenging each student to reach their fullest potential. Relevant and creative programs provide all students with optimum opportunities to achieve success.
Mission
Our goal is to provide a safe environment conducive to learning in order to achieve success. It is our expectation that all students reach their academic potential and are ready to meet the challenges facing them in the 21st century.
Campus Goals
It is our goal at Sanchez Ochoa Elementary for all students to meet grade level or above reading goals each academic year.
It is our goal at Sanchez Ochoa Elementary for all students to meet math proficiency at or above math goals each academic year.
It is our goal at Sanchez Ochoa Elementary for all students to improve and build confidence and appreciation for writing.
Campus Objectives
T. Sanchez/H. Ochoa will improve student performance in Reading by 15% by the end of academic year 2014-2015 as measured by STAAR assessments.
T. Sanchez/H. Ochoa will improve student performance in Mathematics by 15% by the end of academic year 2014-2015 as measured by STAAR assessments.
T. Sanchez/H. Ochoa will improve student performance in Writing by 15% by the end of academic year 2014-2015 as measured by STAAR assessments.
District’s Broad Goals
1 2 3 4 5 6
Performance Measures
2012/13 2013/14 2014/15
Actual Projected Projected
Reading 51.0% 63.0% 71.0%
Math 47.0% 61.0% 70.0%
Writing 59.0% 65.0% 70.0%
Science 51.0% 56.0% 65.0%
Attendance 97.0% 97.0% 98.0%
Index (1,2,3,4) 51,35,77, N/A % 56,40,77,12 % 60,40,78,15 %
Prior Year Highlights
Math Scores Increased by 6%.
Writing Scores Increased by 6%.
Science Scores Increased by 17%.

Sanchez/Ochoa Elementary School
2014-2015 Annual Budget 233
General Operating Fund Expenditures
2012/13 % of 2013/14 % of 2014/15 % of
Actual Total Projected Total Budget Total
Attendance 781 757 753
Payroll Costs by Function
Instructional 2,985,894$ 76.6% 3,191,725$ 75.2% 3,243,760$ 75.4%
Leadership 260,794 6.7% 284,074 6.7% 291,931 6.8%
Support Services - Student Based 168,262 4.3% 213,879 5.0% 217,592 5.1%
Support Services - Non-Student Based 149,322 3.8% 165,255 3.9% 177,931 4.1%
Ancillary Services 1 0.0% 9,558 0.2% 7,000 0.2%
3,564,272 91.5% 3,864,490 91.0% 3,938,214 91.6%
Non-Payroll Costs by Function
Instructional 157,276 4.0% 187,558 4.4% 185,679 4.3%
Leadership 10,226 0.3% 8,324 0.2% 5,539 0.1%
Support Services - Student Based 15,829 0.4% 17,388 0.4% 15,750 0.4%
Support Services - Non-Student Based 148,911 3.8% 167,415 3.9% 154,483 3.6%
Ancillary Services - 0.0% - 0.0% 1,000 0.0%
332,242 8.5% 380,685 9.0% 362,451 8.4%
3,896,514$ 100.0% 4,245,175$ 99.8% 4,300,665$ 99.8%
Campus Staff (All Funds)
Position 2013 2014 2015
Principal 1.00 1.00 1.00
Assistant Principals 1.00 1.00 1.00
Counselor 1.10 1.10 1.10
Teachers 46.18 44.75 46.39
Diagnostician/Supv 0.40 1.00 0.50
Librarian 1.00 1.00 1.00
Occupational Therapists 0.83 0.17 0.17
Nurse 1.00 1.00 1.00
Social Worker 0.10 0.10 0.10
Speech Pathologist 0.10 0.70 0.70
ESL/Bilingual Strategists 0.10 0.10 0.15
Inst. Spec./Intervention/Lit Coach 2.00 2.00 2.00
Clerks 3.00 3.00 3.00
Secretaries 1.00 1.00 1.00
CEI/Computer Lab Manager 3.00 3.00 3.00
Nurse Aides 1.00 1.00 1.00
Teacher Aides 19.50 18.50 15.50
Attendance Officers 0.14 0.14 0.14
Tech. Trainer - - 0.50
Library Clerks 1.00 1.00 1.00
P/I Liaison 1.00 1.00 1.00
Custodians 6.00 6.00 6.00
Crossing Guards - - 2.00
Total 90.45 88.56 89.25
2014/15 General Operating Budget by Object
Budget %
Payroll 3,938,214$ 91.6%
Contracted Services 149,172 3.5%
Supplies & Materials 183,740 4.3%
Other Operating Expenses 29,539 0.7%
Total 4,300,665$
2014/15 General Operating Budget by Program
Budget %
Regular Program 2,678,101$ 62.3%
Gifted & Talented 50,607 1.2%
Special Education 467,571 10.9%
Bilingual/ESL 182,445 4.2%
State Compensatory 452,094 10.5%
Undistributed 469,847 10.9%
Total 4,300,665$
Campus Section
234 Laredo Independent School District
Page left blank intentionally.
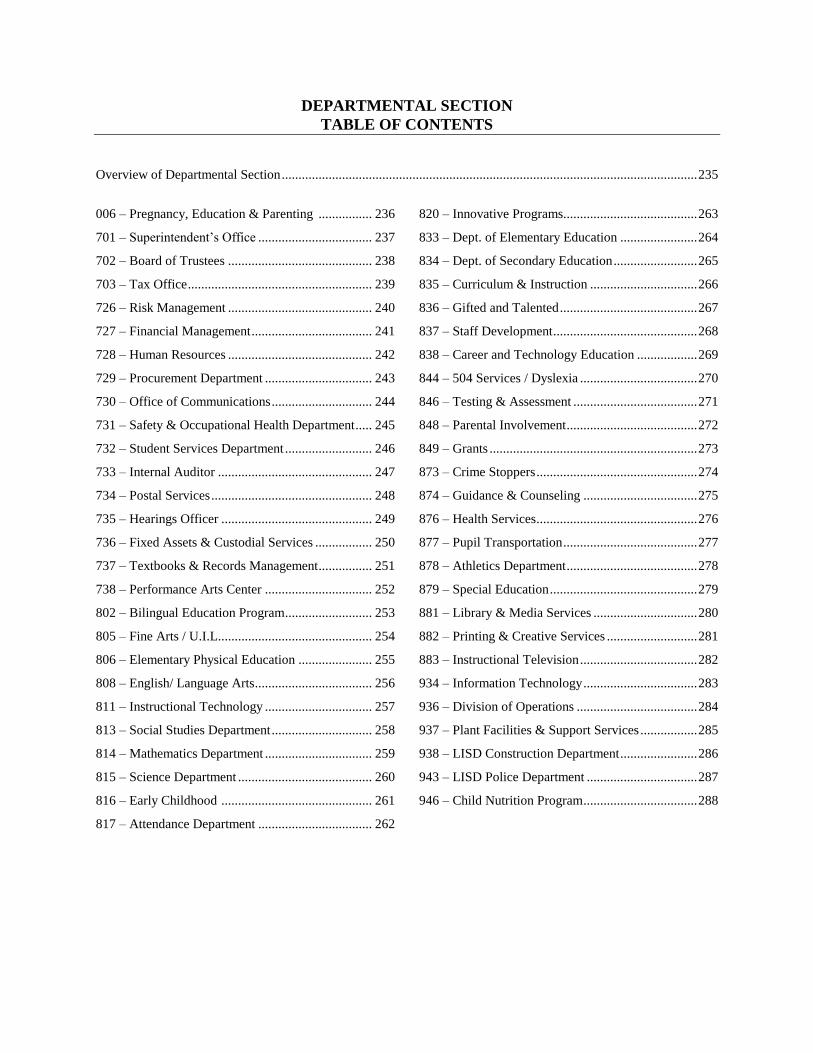
DEPARTMENTAL SECTION
TABLE OF CONTENTS
Overview of Departmental Section ............................................................................................................................ 235
006 – Pregnancy, Education & Parenting ................ 236
701 – Superintendent’s Office .................................. 237
702 – Board of Trustees ........................................... 238
703 – Tax Office ....................................................... 239
726 – Risk Management ........................................... 240
727 – Financial Management .................................... 241
728 – Human Resources ........................................... 242
729 – Procurement Department ................................ 243
730 – Office of Communications .............................. 244
731 – Safety & Occupational Health Department ..... 245
732 – Student Services Department .......................... 246
733 – Internal Auditor .............................................. 247
734 – Postal Services ................................................ 248
735 – Hearings Officer ............................................. 249
736 – Fixed Assets & Custodial Services ................. 250
737 – Textbooks & Records Management ................ 251
738 – Performance Arts Center ................................ 252
802 – Bilingual Education Program .......................... 253
805 – Fine Arts / U.I.L.............................................. 254
806 – Elementary Physical Education ...................... 255
808 – English/ Language Arts ................................... 256
811 – Instructional Technology ................................ 257
813 – Social Studies Department .............................. 258
814 – Mathematics Department ................................ 259
815 – Science Department ........................................ 260
816 – Early Childhood ............................................. 261
817 – Attendance Department .................................. 262
820 – Innovative Programs........................................ 263
833 – Dept. of Elementary Education ....................... 264
834 – Dept. of Secondary Education ......................... 265
835 – Curriculum & Instruction ................................ 266
836 – Gifted and Talented ......................................... 267
837 – Staff Development ........................................... 268
838 – Career and Technology Education .................. 269
844 – 504 Services / Dyslexia ................................... 270
846 – Testing & Assessment ..................................... 271
848 – Parental Involvement ....................................... 272
849 – Grants .............................................................. 273
873 – Crime Stoppers ................................................ 274
874 – Guidance & Counseling .................................. 275
876 – Health Services ................................................ 276
877 – Pupil Transportation ........................................ 277
878 – Athletics Department ....................................... 278
879 – Special Education ............................................ 279
881 – Library & Media Services ............................... 280
882 – Printing & Creative Services ........................... 281
883 – Instructional Television ................................... 282
934 – Information Technology .................................. 283
936 – Division of Operations .................................... 284
937 – Plant Facilities & Support Services ................. 285
938 – LISD Construction Department ....................... 286
943 – LISD Police Department ................................. 287
946 – Child Nutrition Program .................................. 288
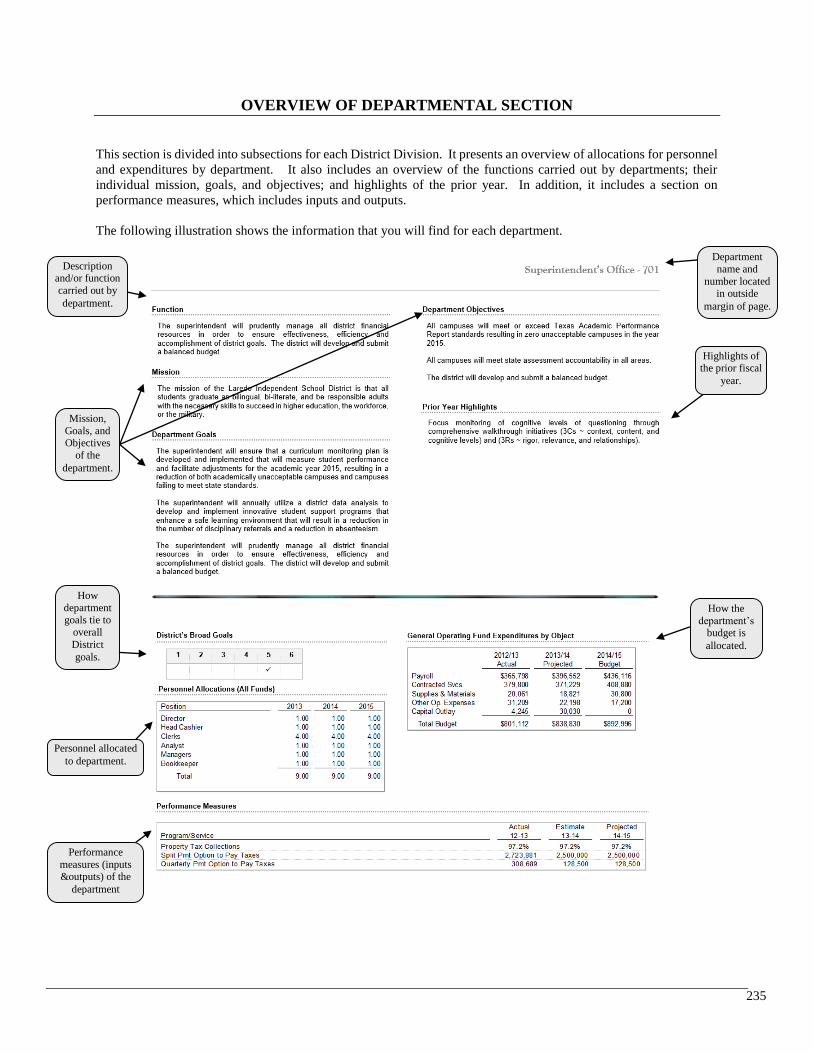
235
OVERVIEW OF DEPARTMENTAL SECTION
This section is divided into subsections for each District Division. It presents an overview of allocations for personnel
and expenditures by department. It also includes an overview of the functions carried out by departments; their
individual mission, goals, and objectives; and highlights of the prior year. In addition, it includes a section on
performance measures, which includes inputs and outputs.
The following illustration shows the information that you will find for each department.
Department
name and
number located in outside
margin of page.
Personnel allocated
to department.
Performance
measures (inputs &outputs) of the
department
How the
department’s budget is
allocated.
Highlights of the prior fiscal
year.
How
department goals tie to
overall
District
goals.
Description and/or function
carried out by
department.
Mission,
Goals, and Objectives
of the
department.
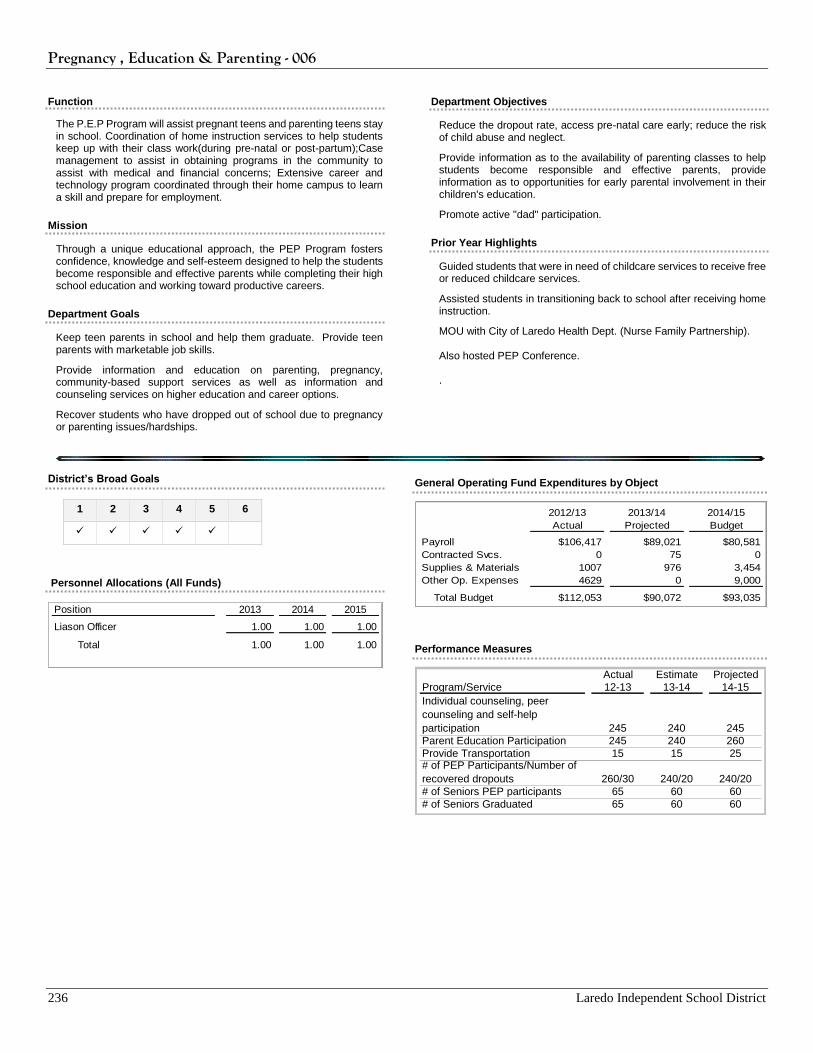
Pregnancy , Education & Parenting - 006
236 Laredo Independent School District
Function
The P.E.P Program will assist pregnant teens and parenting teens stay in school. Coordination of home instruction services to help students keep up with their class work(during pre-natal or post-partum);Case management to assist in obtaining programs in the community to assist with medical and financial concerns; Extensive career and technology program coordinated through their home campus to learn a skill and prepare for employment.
Mission
Through a unique educational approach, the PEP Program fosters confidence, knowledge and self-esteem designed to help the students become responsible and effective parents while completing their high school education and working toward productive careers.
Department Goals
Keep teen parents in school and help them graduate. Provide teen parents with marketable job skills.
Provide information and education on parenting, pregnancy, community-based support services as well as information and counseling services on higher education and career options.
Recover students who have dropped out of school due to pregnancy or parenting issues/hardships.
Department Objectives
Reduce the dropout rate, access pre-natal care early; reduce the risk of child abuse and neglect.
Provide information as to the availability of parenting classes to help students become responsible and effective parents, provide information as to opportunities for early parental involvement in their children's education.
Promote active "dad" participation.
Prior Year Highlights
Guided students that were in need of childcare services to receive free or reduced childcare services.
Assisted students in transitioning back to school after receiving home instruction.
MOU with City of Laredo Health Dept. (Nurse Family Partnership). Also hosted PEP Conference. .
District’s Broad Goals
1 2 3 4 5 6
Personnel Allocations (All Funds)
General Operating Fund Expenditures by Object
2012/13 2013/14 2014/15
Actual Projected Budget
Payroll $106,417 $89,021 $80,581
Contracted Svcs. 0 75 0
Supplies & Materials 1007 976 3,454
Other Op. Expenses 4629 0 9,000
Total Budget $112,053 $90,072 $93,035
Performance Measures
Actual Estimate Projected
Program/Service 12-13 13-14 14-15
Individual counseling, peer
counseling and self-help
participation 245 240 245
Parent Education Participation 245 240 260
Provide Transportation 15 15 25# of PEP Participants/Number of
recovered dropouts 260/30 240/20 240/20
# of Seniors PEP participants 65 60 60
# of Seniors Graduated 65 60 60
Position 2013 2014 2015
Liason Officer 1.00 1.00 1.00
Total 1.00 1.00 1.00

Superintendent’s Office - 701
2014-2015 Annual Budget 237
Function
The superintendent will prudently manage all district financial resources in order to ensure effectiveness, efficiency and accomplishment of district goals. The district will develop and submit a balanced budget.
Mission
The mission of the Laredo Independent School District is that all students graduate as bilingual, bi-literate, and be responsible adults with the necessary skills to succeed in higher education, the workforce, or the military.
Department Goals
The superintendent will ensure that a curriculum monitoring plan is developed and implemented that will measure student performance and facilitate adjustments for the academic year 2015, resulting in a reduction of both academically unacceptable campuses and campuses failing to meet state standards.
The superintendent will annually utilize a district data analysis to develop and implement innovative student support programs that enhance a safe learning environment that will result in a reduction in the number of disciplinary referrals and a reduction in absenteeism.
The superintendent will prudently manage all district financial resources in order to ensure effectiveness, efficiency and accomplishment of district goals. The district will develop and submit a balanced budget.
Department Objectives
All campuses will meet or exceed Texas Academic Performance Report standards resulting in zero unacceptable campuses in the year 2015.
All campuses will meet state assessment accountability in all areas.
The district will develop and submit a balanced budget.
Prior Year Highlights
Focus monitoring of cognitive levels of questioning through comprehensive walkthrough initiatives (3Cs ~ context, content, and cognitive levels) and (3Rs ~ rigor, relevance, and relationships).
District’s Broad Goals
1 2 3 4 5 6
Personnel Allocations (All Funds)
Position 2013 2014 2015
Superintendent 1.00 1.00 1.00
Clerks 1.00 1.00 1.00
Secretaries 1.00 1.00 1.00
Specialist 1.00 1.00 1.00
Total 4.00 4.00 4.00
General Operating Fund Expenditures by Object
Performance Measures
2012/13 2013/14 2014/15
Actual Projected Budget
Payroll $377,602 $403,842 $416,464
Contracted Svcs. 266,718 131,334 37,441
Supplies & Materials 6,848 6,103 8,000
Other Op. Expenses 29,716 35,904 38,700
Capital Outlay 0 4,617 0
Total Budget $680,884 $581,800 $500,605
Actual Estimate Projected
Program/Service 12-13 13-14 14-15
Reading/ELA 90%/80% 61% 90%
Mathematics 90%/80% 62% 90%
Writing 90%/80% 63% 90%
Social Studies 90%/80% 39% 90%
Science 90%/80% 55% 90%
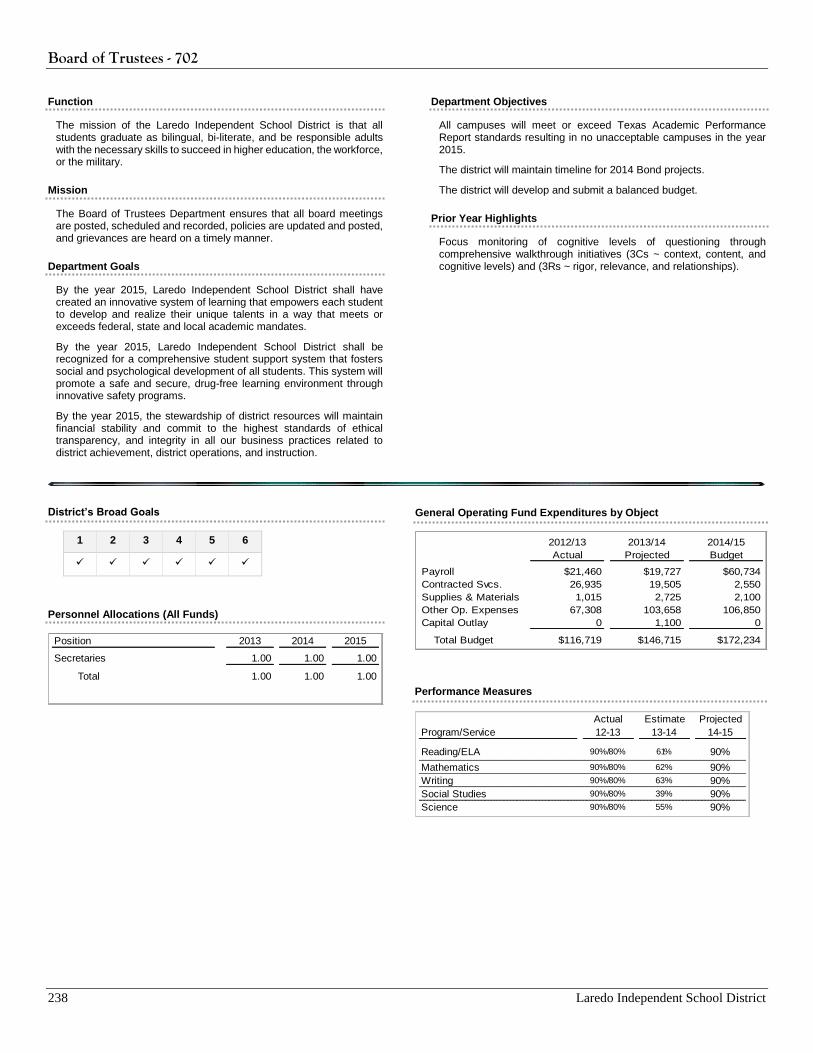
Board of Trustees - 702
238 Laredo Independent School District
Function
The mission of the Laredo Independent School District is that all students graduate as bilingual, bi-literate, and be responsible adults with the necessary skills to succeed in higher education, the workforce, or the military.
Mission
The Board of Trustees Department ensures that all board meetings are posted, scheduled and recorded, policies are updated and posted, and grievances are heard on a timely manner.
Department Goals
By the year 2015, Laredo Independent School District shall have created an innovative system of learning that empowers each student to develop and realize their unique talents in a way that meets or exceeds federal, state and local academic mandates.
By the year 2015, Laredo Independent School District shall be recognized for a comprehensive student support system that fosters social and psychological development of all students. This system will promote a safe and secure, drug-free learning environment through innovative safety programs.
By the year 2015, the stewardship of district resources will maintain financial stability and commit to the highest standards of ethical transparency, and integrity in all our business practices related to district achievement, district operations, and instruction.
Department Objectives
All campuses will meet or exceed Texas Academic Performance Report standards resulting in no unacceptable campuses in the year 2015.
The district will maintain timeline for 2014 Bond projects.
The district will develop and submit a balanced budget.
Prior Year Highlights
Focus monitoring of cognitive levels of questioning through comprehensive walkthrough initiatives (3Cs ~ context, content, and cognitive levels) and (3Rs ~ rigor, relevance, and relationships).
District’s Broad Goals
1 2 3 4 5 6
Personnel Allocations (All Funds)
General Operating Fund Expenditures by Object
2012/13 2013/14 2014/15
Actual Projected Budget
Payroll $21,460 $19,727 $60,734
Contracted Svcs. 26,935 19,505 2,550
Supplies & Materials 1,015 2,725 2,100
Other Op. Expenses 67,308 103,658 106,850
Capital Outlay 0 1,100 0
Total Budget $116,719 $146,715 $172,234
Performance Measures
Position 2013 2014 2015
Secretaries 1.00 1.00 1.00
Total 1.00 1.00 1.00
Actual Estimate Projected
Program/Service 12-13 13-14 14-15
Reading/ELA 90%/80% 61% 90%
Mathematics 90%/80% 62% 90%
Writing 90%/80% 63% 90%
Social Studies 90%/80% 39% 90%
Science 90%/80% 55% 90%
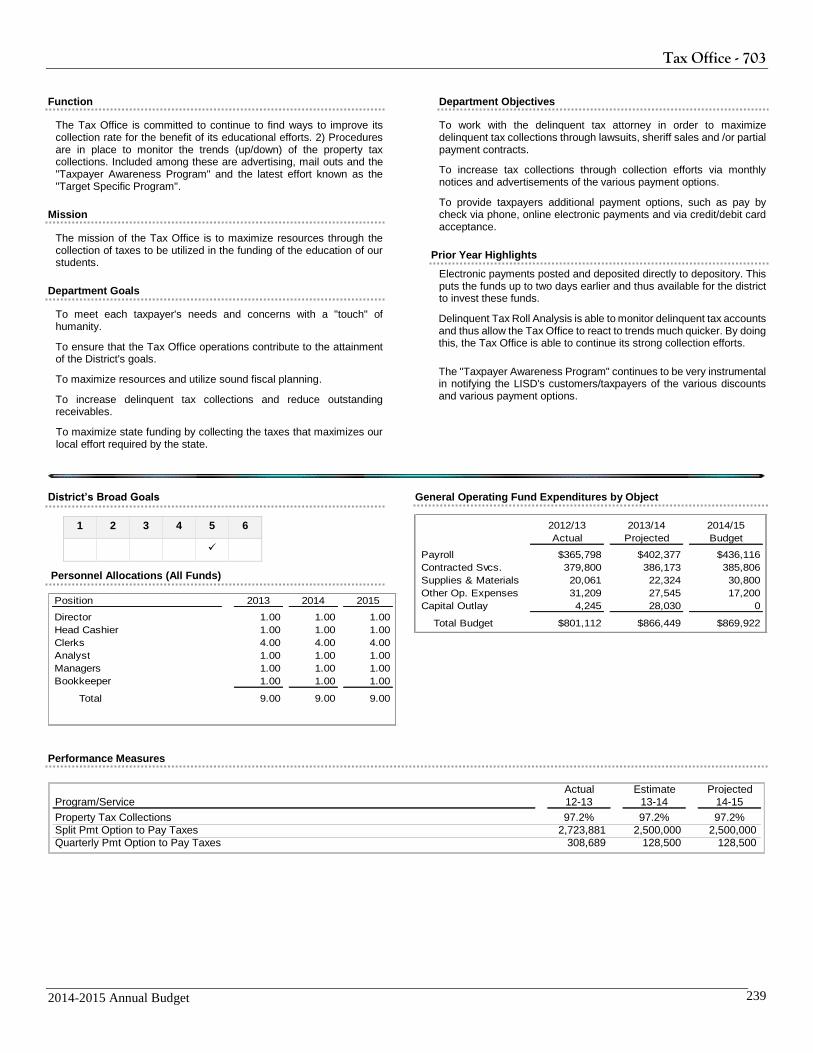
Tax Office - 703
2014-2015 Annual Budget 239
Function
The Tax Office is committed to continue to find ways to improve its collection rate for the benefit of its educational efforts. 2) Procedures are in place to monitor the trends (up/down) of the property tax collections. Included among these are advertising, mail outs and the "Taxpayer Awareness Program" and the latest effort known as the "Target Specific Program".
Mission
The mission of the Tax Office is to maximize resources through the collection of taxes to be utilized in the funding of the education of our students.
Department Goals
To meet each taxpayer's needs and concerns with a "touch" of humanity.
To ensure that the Tax Office operations contribute to the attainment of the District's goals.
To maximize resources and utilize sound fiscal planning.
To increase delinquent tax collections and reduce outstanding receivables.
To maximize state funding by collecting the taxes that maximizes our local effort required by the state.
Department Objectives
To work with the delinquent tax attorney in order to maximize delinquent tax collections through lawsuits, sheriff sales and /or partial payment contracts.
To increase tax collections through collection efforts via monthly notices and advertisements of the various payment options.
To provide taxpayers additional payment options, such as pay by check via phone, online electronic payments and via credit/debit card acceptance.
Prior Year Highlights
Electronic payments posted and deposited directly to depository. This puts the funds up to two days earlier and thus available for the district to invest these funds.
Delinquent Tax Roll Analysis is able to monitor delinquent tax accounts and thus allow the Tax Office to react to trends much quicker. By doing this, the Tax Office is able to continue its strong collection efforts.
The "Taxpayer Awareness Program" continues to be very instrumental in notifying the LISD's customers/taxpayers of the various discounts and various payment options.
District’s Broad Goals
1 2 3 4 5 6
Personnel Allocations (All Funds)
Position 2013 2014 2015
Director 1.00 1.00 1.00
Head Cashier 1.00 1.00 1.00
Clerks 4.00 4.00 4.00
Analyst 1.00 1.00 1.00
Managers 1.00 1.00 1.00
Bookkeeper 1.00 1.00 1.00
Total 9.00 9.00 9.00
General Operating Fund Expenditures by Object
2012/13 2013/14 2014/15
Actual Projected Budget
Payroll $365,798 $402,377 $436,116
Contracted Svcs. 379,800 386,173 385,806
Supplies & Materials 20,061 22,324 30,800
Other Op. Expenses 31,209 27,545 17,200
Capital Outlay 4,245 28,030 0
Total Budget $801,112 $866,449 $869,922
Performance Measures
Actual Estimate Projected
Program/Service 12-13 13-14 14-15
Property Tax Collections 97.2% 97.2% 97.2%
Split Pmt Option to Pay Taxes 2,723,881 2,500,000 2,500,000
Quarterly Pmt Option to Pay Taxes 308,689 128,500 128,500
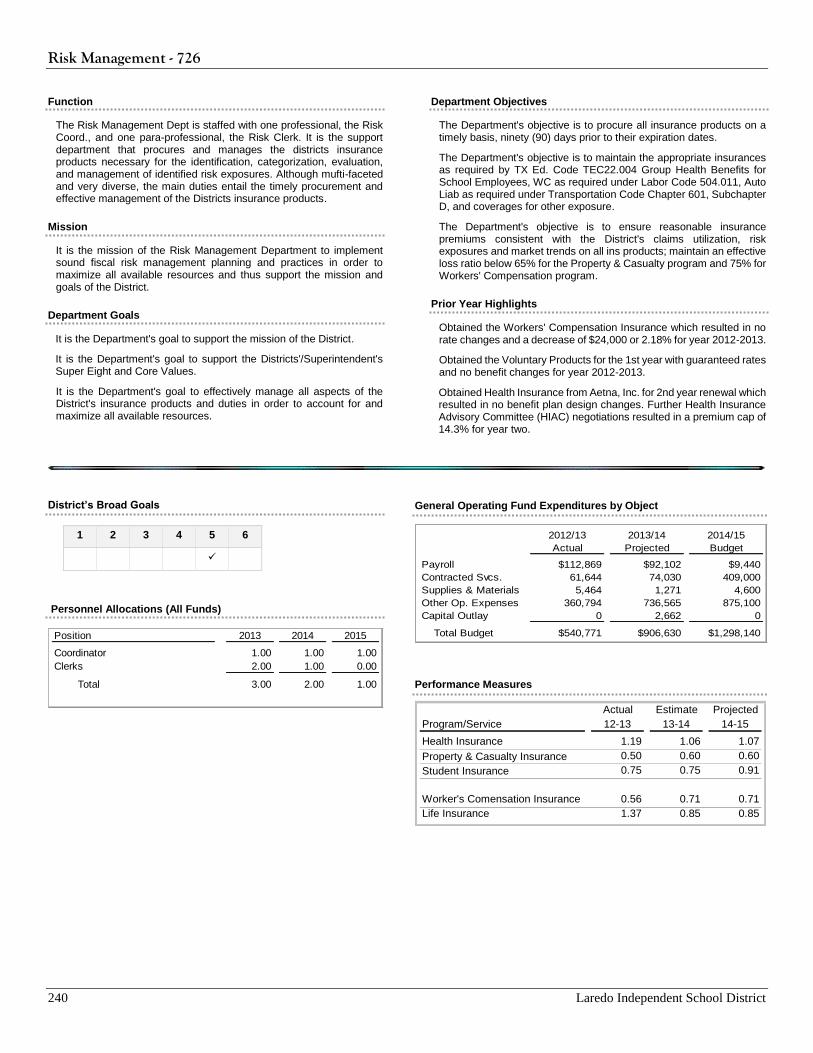
Risk Management - 726
240 Laredo Independent School District
Function
The Risk Management Dept is staffed with one professional, the Risk Coord., and one para-professional, the Risk Clerk. It is the support department that procures and manages the districts insurance products necessary for the identification, categorization, evaluation, and management of identified risk exposures. Although mufti-faceted and very diverse, the main duties entail the timely procurement and effective management of the Districts insurance products.
Mission
It is the mission of the Risk Management Department to implement sound fiscal risk management planning and practices in order to maximize all available resources and thus support the mission and goals of the District.
Department Goals
It is the Department's goal to support the mission of the District.
It is the Department's goal to support the Districts'/Superintendent's Super Eight and Core Values.
It is the Department's goal to effectively manage all aspects of the District's insurance products and duties in order to account for and maximize all available resources.
Department Objectives
The Department's objective is to procure all insurance products on a timely basis, ninety (90) days prior to their expiration dates.
The Department's objective is to maintain the appropriate insurances as required by TX Ed. Code TEC22.004 Group Health Benefits for School Employees, WC as required under Labor Code 504.011, Auto Liab as required under Transportation Code Chapter 601, Subchapter D, and coverages for other exposure.
The Department's objective is to ensure reasonable insurance premiums consistent with the District's claims utilization, risk exposures and market trends on all ins products; maintain an effective loss ratio below 65% for the Property & Casualty program and 75% for Workers' Compensation program.
Prior Year Highlights
Obtained the Workers' Compensation Insurance which resulted in no rate changes and a decrease of $24,000 or 2.18% for year 2012-2013.
Obtained the Voluntary Products for the 1st year with guaranteed rates and no benefit changes for year 2012-2013.
Obtained Health Insurance from Aetna, Inc. for 2nd year renewal which resulted in no benefit plan design changes. Further Health Insurance Advisory Committee (HIAC) negotiations resulted in a premium cap of 14.3% for year two.
District’s Broad Goals
1 2 3 4 5 6
Personnel Allocations (All Funds)
General Operating Fund Expenditures by Object
2012/13 2013/14 2014/15
Actual Projected Budget
Payroll $112,869 $92,102 $9,440
Contracted Svcs. 61,644 74,030 409,000
Supplies & Materials 5,464 1,271 4,600
Other Op. Expenses 360,794 736,565 875,100
Capital Outlay 0 2,662 0
Total Budget $540,771 $906,630 $1,298,140
Performance Measures
Actual Estimate Projected
Program/Service 12-13 13-14 14-15
Health Insurance 1.19 1.06 1.07
0.50 0.60 0.60
0.75 0.75 0.91
Worker's Comensation Insurance 0.56 0.71 0.71
Life Insurance 1.37 0.85 0.850.63
Property & Casualty Insurance
Student Insurance
Position 2013 2014 2015
Coordinator 1.00 1.00 1.00
Clerks 2.00 1.00 0.00
Total 3.00 2.00 1.00
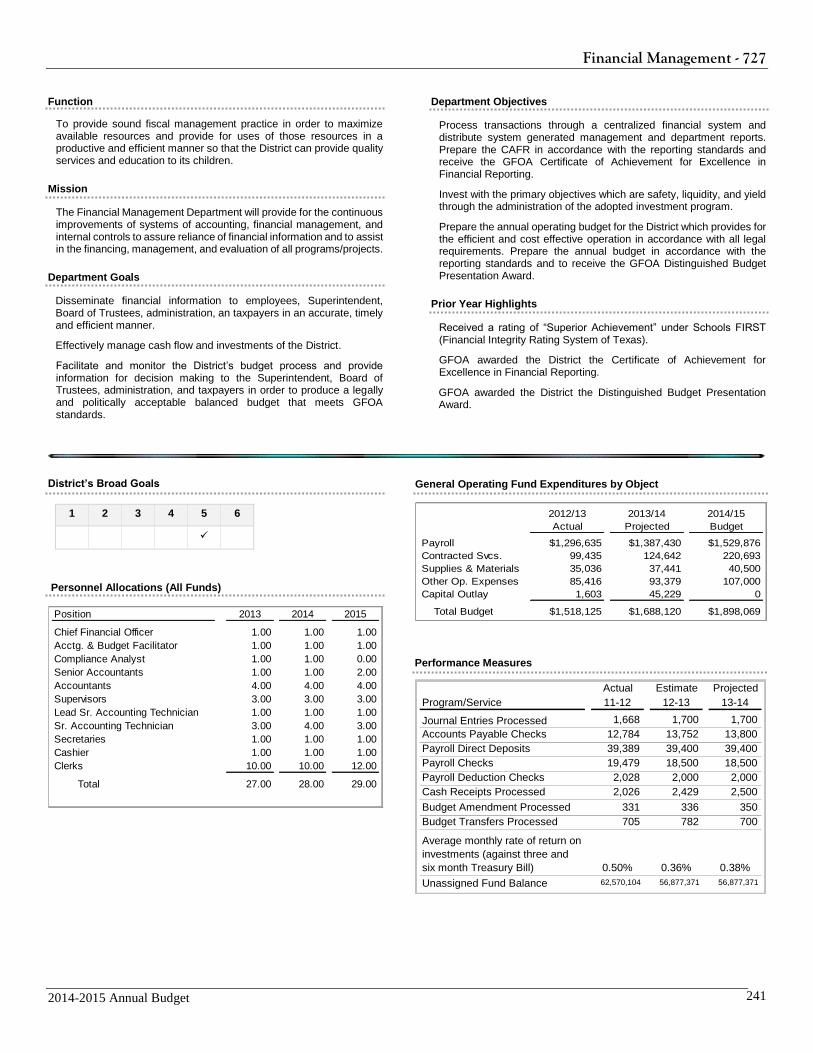
Financial Management - 727
2014-2015 Annual Budget 241
Function
To provide sound fiscal management practice in order to maximize available resources and provide for uses of those resources in a productive and efficient manner so that the District can provide quality services and education to its children.
Mission
The Financial Management Department will provide for the continuous improvements of systems of accounting, financial management, and internal controls to assure reliance of financial information and to assist in the financing, management, and evaluation of all programs/projects.
Department Goals
Disseminate financial information to employees, Superintendent, Board of Trustees, administration, an taxpayers in an accurate, timely and efficient manner.
Effectively manage cash flow and investments of the District.
Facilitate and monitor the District’s budget process and provide information for decision making to the Superintendent, Board of Trustees, administration, and taxpayers in order to produce a legally and politically acceptable balanced budget that meets GFOA standards.
Department Objectives
Process transactions through a centralized financial system and distribute system generated management and department reports. Prepare the CAFR in accordance with the reporting standards and receive the GFOA Certificate of Achievement for Excellence in Financial Reporting.
Invest with the primary objectives which are safety, liquidity, and yield through the administration of the adopted investment program.
Prepare the annual operating budget for the District which provides for the efficient and cost effective operation in accordance with all legal requirements. Prepare the annual budget in accordance with the reporting standards and to receive the GFOA Distinguished Budget Presentation Award.
Prior Year Highlights
Received a rating of “Superior Achievement” under Schools FIRST (Financial Integrity Rating System of Texas).
GFOA awarded the District the Certificate of Achievement for Excellence in Financial Reporting.
GFOA awarded the District the Distinguished Budget Presentation Award.
District’s Broad Goals
1 2 3 4 5 6
Personnel Allocations (All Funds)
General Operating Fund Expenditures by Object
2012/13 2013/14 2014/15
Actual Projected Budget
Payroll $1,296,635 $1,387,430 $1,529,876
Contracted Svcs. 99,435 124,642 220,693
Supplies & Materials 35,036 37,441 40,500
Other Op. Expenses 85,416 93,379 107,000
Capital Outlay 1,603 45,229 0
Total Budget $1,518,125 $1,688,120 $1,898,069
Performance Measures
Actual Estimate Projected
Program/Service 11-12 12-13 13-14
Journal Entries Processed 1,668 1,700 1,700
Accounts Payable Checks 12,784 13,752 13,800
Payroll Direct Deposits 39,389 39,400 39,400
Payroll Checks 19,479 18,500 18,500
Payroll Deduction Checks 2,028 2,000 2,000
Cash Receipts Processed 2,026 2,429 2,500
Budget Amendment Processed 331 336 350
Budget Transfers Processed 705 782 700
Average monthly rate of return on
investments (against three and
six month Treasury Bill) 0.50% 0.36% 0.38%
Unassigned Fund Balance 62,570,104 56,877,371 56,877,371
Position 2013 2014 2015
Chief Financial Officer 1.00 1.00 1.00
Acctg. & Budget Facilitator 1.00 1.00 1.00
Compliance Analyst 1.00 1.00 0.00
Senior Accountants 1.00 1.00 2.00
Accountants 4.00 4.00 4.00
Supervisors 3.00 3.00 3.00
Lead Sr. Accounting Technician 1.00 1.00 1.00
Sr. Accounting Technician 3.00 4.00 3.00
Secretaries 1.00 1.00 1.00
Cashier 1.00 1.00 1.00
Clerks 10.00 10.00 12.00
Total 27.00 28.00 29.00
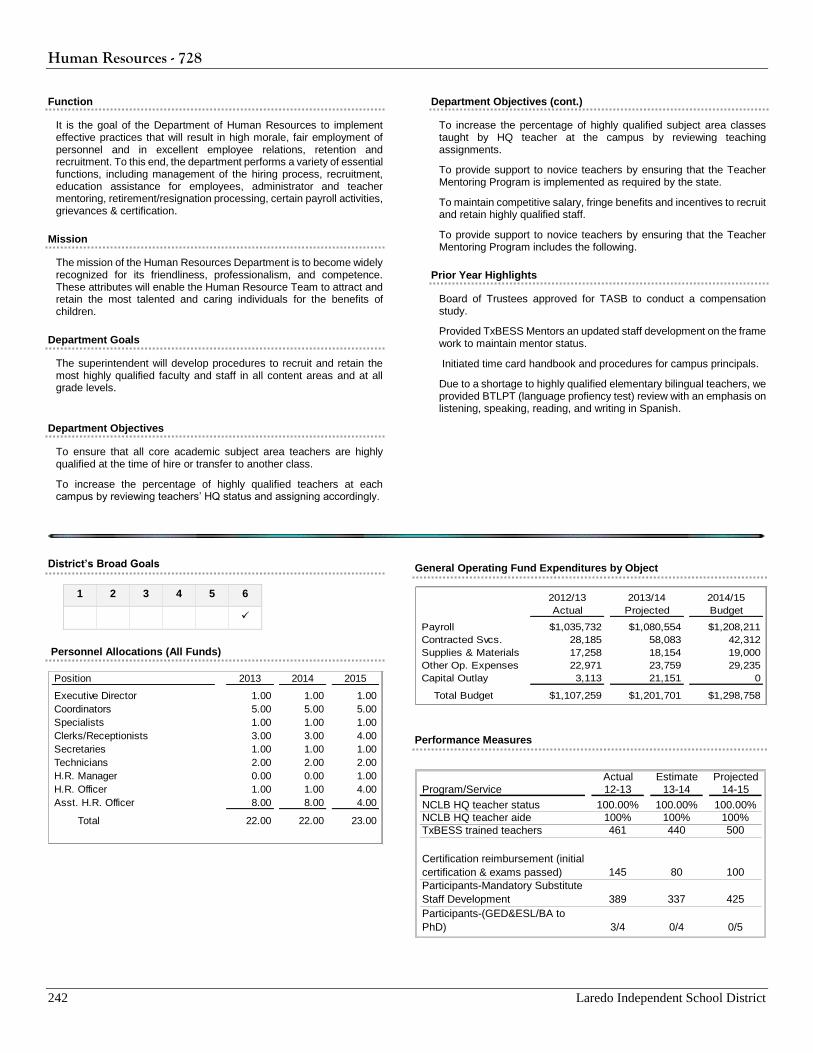
Human Resources - 728
242 Laredo Independent School District
Function
It is the goal of the Department of Human Resources to implement effective practices that will result in high morale, fair employment of personnel and in excellent employee relations, retention and recruitment. To this end, the department performs a variety of essential functions, including management of the hiring process, recruitment, education assistance for employees, administrator and teacher mentoring, retirement/resignation processing, certain payroll activities, grievances & certification.
Mission
The mission of the Human Resources Department is to become widely recognized for its friendliness, professionalism, and competence. These attributes will enable the Human Resource Team to attract and retain the most talented and caring individuals for the benefits of children.
Department Goals
The superintendent will develop procedures to recruit and retain the most highly qualified faculty and staff in all content areas and at all grade levels.
Department Objectives
To ensure that all core academic subject area teachers are highly qualified at the time of hire or transfer to another class.
To increase the percentage of highly qualified teachers at each campus by reviewing teachers’ HQ status and assigning accordingly.
Department Objectives (cont.)
To increase the percentage of highly qualified subject area classes taught by HQ teacher at the campus by reviewing teaching assignments.
To provide support to novice teachers by ensuring that the Teacher Mentoring Program is implemented as required by the state.
To maintain competitive salary, fringe benefits and incentives to recruit and retain highly qualified staff.
To provide support to novice teachers by ensuring that the Teacher Mentoring Program includes the following.
Prior Year Highlights
Board of Trustees approved for TASB to conduct a compensation study.
Provided TxBESS Mentors an updated staff development on the frame work to maintain mentor status.
Initiated time card handbook and procedures for campus principals.
Due to a shortage to highly qualified elementary bilingual teachers, we provided BTLPT (language profiency test) review with an emphasis on listening, speaking, reading, and writing in Spanish.
District’s Broad Goals
1 2 3 4 5 6
Personnel Allocations (All Funds)
General Operating Fund Expenditures by Object
2012/13 2013/14 2014/15
Actual Projected Budget
Payroll $1,035,732 $1,080,554 $1,208,211
Contracted Svcs. 28,185 58,083 42,312
Supplies & Materials 17,258 18,154 19,000
Other Op. Expenses 22,971 23,759 29,235
Capital Outlay 3,113 21,151 0
Total Budget $1,107,259 $1,201,701 $1,298,758
Performance Measures
Actual Estimate Projected
Program/Service 12-13 13-14 14-15
NCLB HQ teacher status 100.00% 100.00% 100.00%
NCLB HQ teacher aide 100% 100% 100%
461 440 500
145 80 100
Participants-Mandatory Substitute
Staff Development 389 337 425
Participants-(GED&ESL/BA to
PhD) 3/4 0/4 0/5
TxBESS trained teachers
Certification reimbursement (initial
certification & exams passed)
Position 2013 2014 2015
Executive Director 1.00 1.00 1.00
Coordinators 5.00 5.00 5.00
Specialists 1.00 1.00 1.00
Clerks/Receptionists 3.00 3.00 4.00
Secretaries 1.00 1.00 1.00
Technicians 2.00 2.00 2.00
H.R. Manager 0.00 0.00 1.00
H.R. Officer 1.00 1.00 4.00
Asst. H.R. Officer 8.00 8.00 4.00
Total 22.00 22.00 23.00
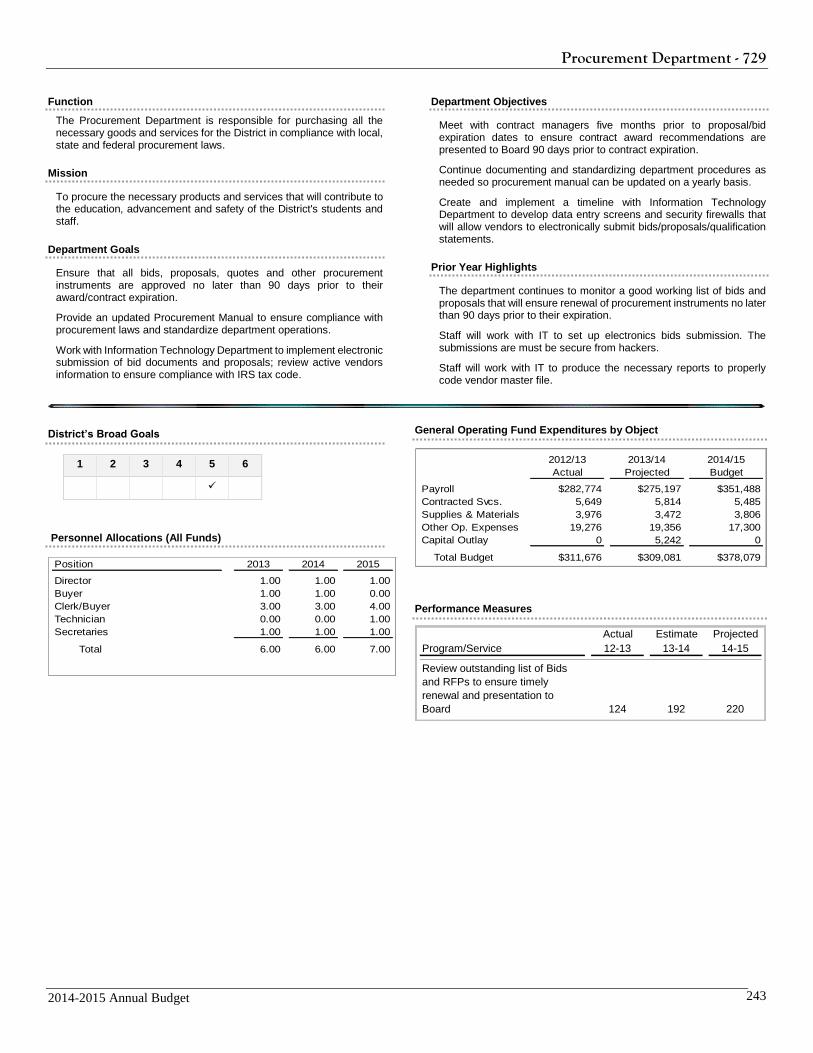
Procurement Department - 729
2014-2015 Annual Budget 243
Function
The Procurement Department is responsible for purchasing all the necessary goods and services for the District in compliance with local, state and federal procurement laws.
Mission
To procure the necessary products and services that will contribute to the education, advancement and safety of the District's students and staff.
Department Goals
Ensure that all bids, proposals, quotes and other procurement instruments are approved no later than 90 days prior to their award/contract expiration.
Provide an updated Procurement Manual to ensure compliance with procurement laws and standardize department operations.
Work with Information Technology Department to implement electronic submission of bid documents and proposals; review active vendors information to ensure compliance with IRS tax code.
Department Objectives
Meet with contract managers five months prior to proposal/bid expiration dates to ensure contract award recommendations are presented to Board 90 days prior to contract expiration.
Continue documenting and standardizing department procedures as needed so procurement manual can be updated on a yearly basis.
Create and implement a timeline with Information Technology Department to develop data entry screens and security firewalls that will allow vendors to electronically submit bids/proposals/qualification statements.
Prior Year Highlights
The department continues to monitor a good working list of bids and proposals that will ensure renewal of procurement instruments no later than 90 days prior to their expiration.
Staff will work with IT to set up electronics bids submission. The submissions are must be secure from hackers.
Staff will work with IT to produce the necessary reports to properly code vendor master file.
District’s Broad Goals
1 2 3 4 5 6
Personnel Allocations (All Funds)
Position 2013 2014 2015
Director 1.00 1.00 1.00
Buyer 1.00 1.00 0.00
Clerk/Buyer 3.00 3.00 4.00
Technician 0.00 0.00 1.00
Secretaries 1.00 1.00 1.00
Total 6.00 6.00 7.00
General Operating Fund Expenditures by Object
2012/13 2013/14 2014/15
Actual Projected Budget
Payroll $282,774 $275,197 $351,488
Contracted Svcs. 5,649 5,814 5,485
Supplies & Materials 3,976 3,472 3,806
Other Op. Expenses 19,276 19,356 17,300
Capital Outlay 0 5,242 0
Total Budget $311,676 $309,081 $378,079
Performance Measures
Actual Estimate Projected
Program/Service 12-13 13-14 14-15
Review outstanding list of Bids
and RFPs to ensure timely
renewal and presentation to
Board 124 192 220
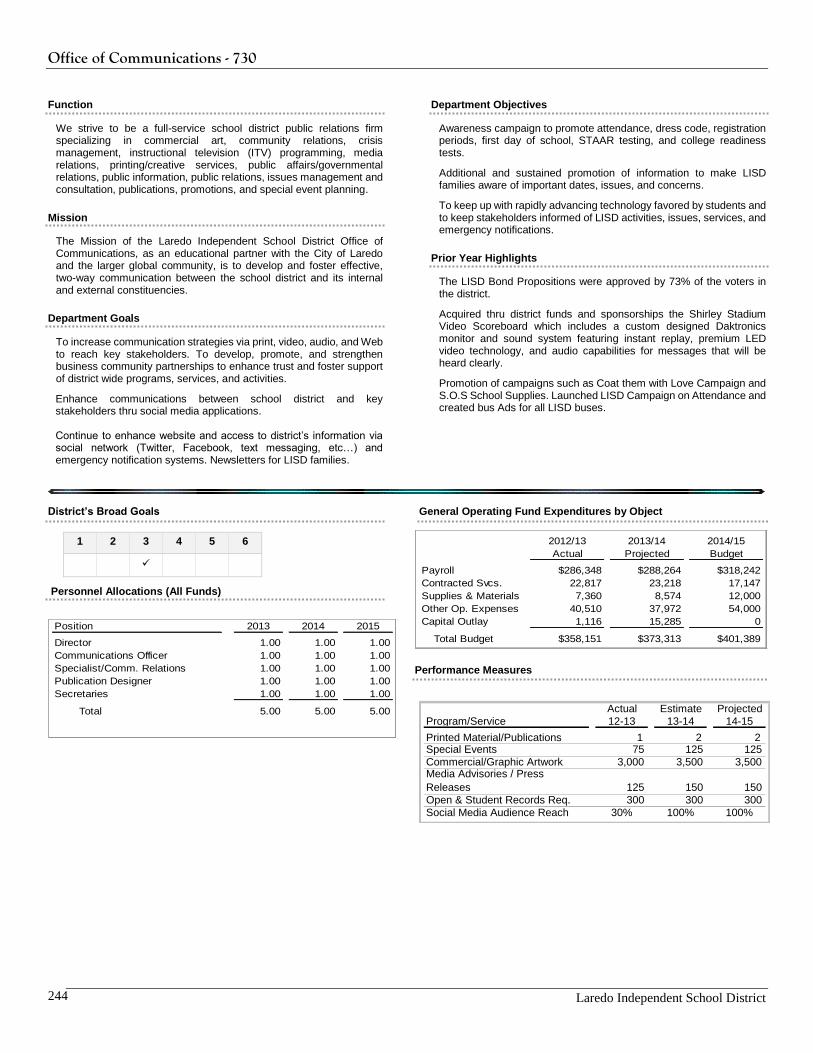
Office of Communications - 730
Laredo Independent School District 244
Function
We strive to be a full-service school district public relations firm specializing in commercial art, community relations, crisis management, instructional television (ITV) programming, media relations, printing/creative services, public affairs/governmental relations, public information, public relations, issues management and consultation, publications, promotions, and special event planning.
Mission
The Mission of the Laredo Independent School District Office of Communications, as an educational partner with the City of Laredo and the larger global community, is to develop and foster effective, two-way communication between the school district and its internal and external constituencies.
Department Goals
To increase communication strategies via print, video, audio, and Web to reach key stakeholders. To develop, promote, and strengthen business community partnerships to enhance trust and foster support of district wide programs, services, and activities.
Enhance communications between school district and key stakeholders thru social media applications. Continue to enhance website and access to district’s information via social network (Twitter, Facebook, text messaging, etc…) and emergency notification systems. Newsletters for LISD families.
Department Objectives
Awareness campaign to promote attendance, dress code, registration periods, first day of school, STAAR testing, and college readiness tests.
Additional and sustained promotion of information to make LISD families aware of important dates, issues, and concerns.
To keep up with rapidly advancing technology favored by students and to keep stakeholders informed of LISD activities, issues, services, and emergency notifications.
Prior Year Highlights
The LISD Bond Propositions were approved by 73% of the voters in the district.
Acquired thru district funds and sponsorships the Shirley Stadium Video Scoreboard which includes a custom designed Daktronics monitor and sound system featuring instant replay, premium LED video technology, and audio capabilities for messages that will be heard clearly.
Promotion of campaigns such as Coat them with Love Campaign and S.O.S School Supplies. Launched LISD Campaign on Attendance and created bus Ads for all LISD buses.
District’s Broad Goals
1 2 3 4 5 6
Personnel Allocations (All Funds)
Position 2013 2014 2015
Director 1.00 1.00 1.00
Communications Officer 1.00 1.00 1.00
Specialist/Comm. Relations 1.00 1.00 1.00
Publication Designer 1.00 1.00 1.00
Secretaries 1.00 1.00 1.00
Total 5.00 5.00 5.00
General Operating Fund Expenditures by Object
2012/13 2013/14 2014/15
Actual Projected Budget
Payroll $286,348 $288,264 $318,242
Contracted Svcs. 22,817 23,218 17,147
Supplies & Materials 7,360 8,574 12,000
Other Op. Expenses 40,510 37,972 54,000
Capital Outlay 1,116 15,285 0
Total Budget $358,151 $373,313 $401,389
Performance Measures
Actual Estimate Projected
Program/Service 12-13 13-14 14-15
Printed Material/Publications 1 2 2 Special Events 75 125 125
Commercial/Graphic Artwork 3,000 3,500 3,500 Media Advisories / Press
Releases 125 150 150
Open & Student Records Req. 300 300 300
Social Media Audience Reach 30% 100% 100%
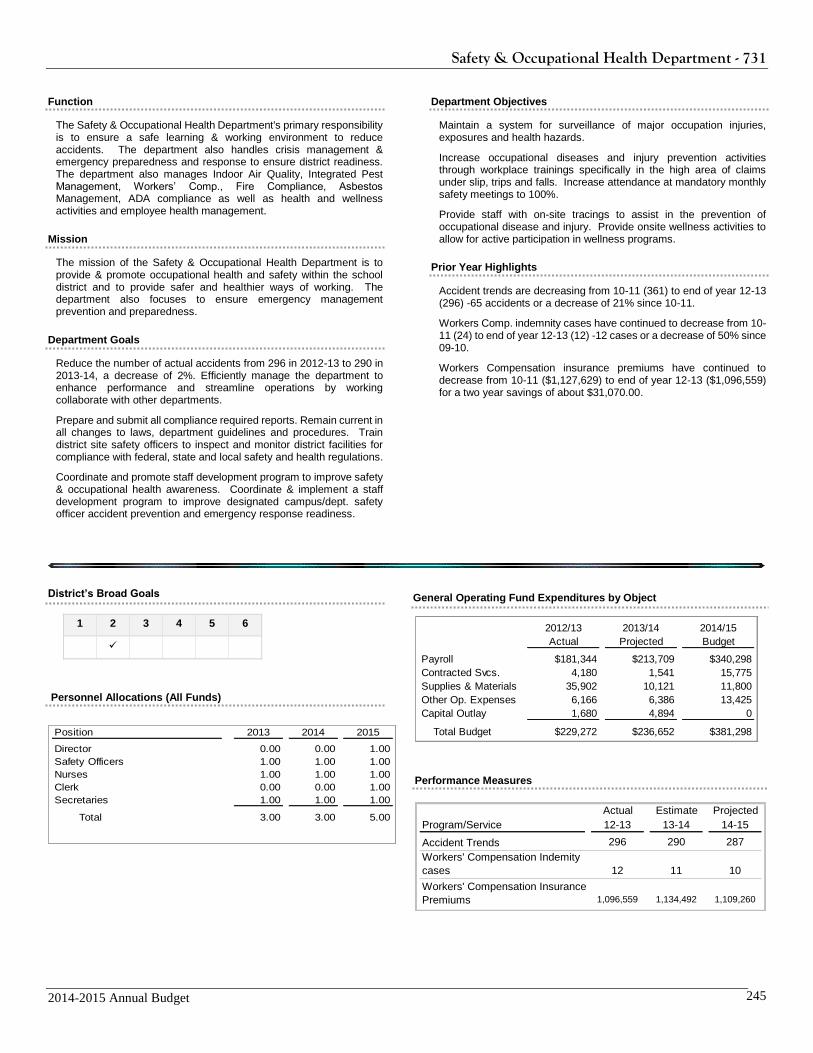
Safety & Occupational Health Department - 731
2014-2015 Annual Budget 245
Function
The Safety & Occupational Health Department's primary responsibility is to ensure a safe learning & working environment to reduce accidents. The department also handles crisis management & emergency preparedness and response to ensure district readiness. The department also manages Indoor Air Quality, Integrated Pest Management, Workers’ Comp., Fire Compliance, Asbestos Management, ADA compliance as well as health and wellness activities and employee health management.
Mission
The mission of the Safety & Occupational Health Department is to provide & promote occupational health and safety within the school district and to provide safer and healthier ways of working. The department also focuses to ensure emergency management prevention and preparedness.
Department Goals
Reduce the number of actual accidents from 296 in 2012-13 to 290 in 2013-14, a decrease of 2%. Efficiently manage the department to enhance performance and streamline operations by working collaborate with other departments.
Prepare and submit all compliance required reports. Remain current in all changes to laws, department guidelines and procedures. Train district site safety officers to inspect and monitor district facilities for compliance with federal, state and local safety and health regulations.
Coordinate and promote staff development program to improve safety & occupational health awareness. Coordinate & implement a staff development program to improve designated campus/dept. safety officer accident prevention and emergency response readiness.
Department Objectives
Maintain a system for surveillance of major occupation injuries, exposures and health hazards.
Increase occupational diseases and injury prevention activities through workplace trainings specifically in the high area of claims under slip, trips and falls. Increase attendance at mandatory monthly safety meetings to 100%.
Provide staff with on-site tracings to assist in the prevention of occupational disease and injury. Provide onsite wellness activities to allow for active participation in wellness programs.
Prior Year Highlights
Accident trends are decreasing from 10-11 (361) to end of year 12-13 (296) -65 accidents or a decrease of 21% since 10-11.
Workers Comp. indemnity cases have continued to decrease from 10-11 (24) to end of year 12-13 (12) -12 cases or a decrease of 50% since 09-10.
Workers Compensation insurance premiums have continued to decrease from 10-11 ($1,127,629) to end of year 12-13 ($1,096,559) for a two year savings of about $31,070.00.
District’s Broad Goals
1 2 3 4 5 6
Personnel Allocations (All Funds)
Position 2013 2014 2015
Director 0.00 0.00 1.00
Safety Officers 1.00 1.00 1.00
Nurses 1.00 1.00 1.00
Clerk 0.00 0.00 1.00
Secretaries 1.00 1.00 1.00
Total 3.00 3.00 5.00
General Operating Fund Expenditures by Object
2012/13 2013/14 2014/15
Actual Projected Budget
Payroll $181,344 $213,709 $340,298
Contracted Svcs. 4,180 1,541 15,775
Supplies & Materials 35,902 10,121 11,800
Other Op. Expenses 6,166 6,386 13,425
Capital Outlay 1,680 4,894 0
Total Budget $229,272 $236,652 $381,298
Performance Measures
Actual Estimate Projected
Program/Service 12-13 13-14 14-15
296 290 287
Workers' Compensation Indemity
cases 12 11 10
1,096,559 1,134,492 1,109,260
Workers' Compensation Insurance
Premiums
Accident Trends
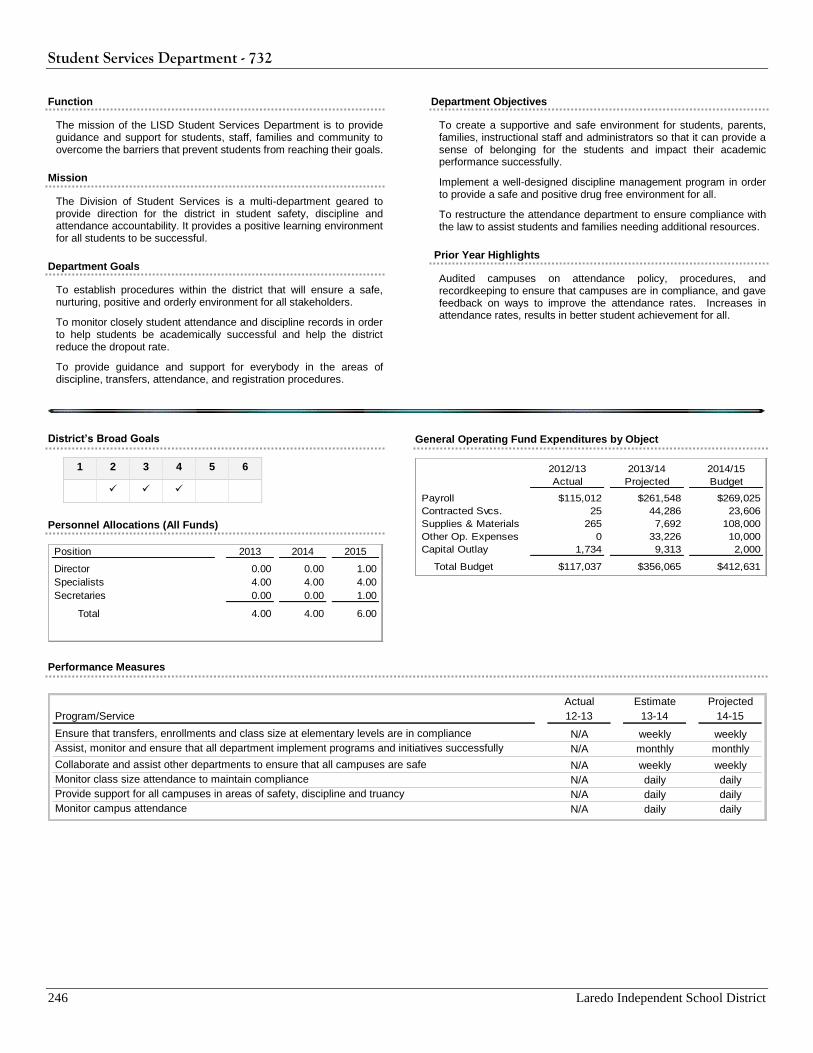
Student Services Department - 732
246 Laredo Independent School District
Function
The mission of the LISD Student Services Department is to provide guidance and support for students, staff, families and community to overcome the barriers that prevent students from reaching their goals.
Mission
The Division of Student Services is a multi-department geared to provide direction for the district in student safety, discipline and attendance accountability. It provides a positive learning environment for all students to be successful.
Department Goals
To establish procedures within the district that will ensure a safe, nurturing, positive and orderly environment for all stakeholders.
To monitor closely student attendance and discipline records in order to help students be academically successful and help the district reduce the dropout rate.
To provide guidance and support for everybody in the areas of discipline, transfers, attendance, and registration procedures.
Department Objectives
To create a supportive and safe environment for students, parents, families, instructional staff and administrators so that it can provide a sense of belonging for the students and impact their academic performance successfully.
Implement a well-designed discipline management program in order to provide a safe and positive drug free environment for all.
To restructure the attendance department to ensure compliance with the law to assist students and families needing additional resources.
Prior Year Highlights
Audited campuses on attendance policy, procedures, and recordkeeping to ensure that campuses are in compliance, and gave feedback on ways to improve the attendance rates. Increases in attendance rates, results in better student achievement for all.
District’s Broad Goals
1 2 3 4 5 6
Personnel Allocations (All Funds)
General Operating Fund Expenditures by Object
2012/13 2013/14 2014/15
Actual Projected Budget
Payroll $115,012 $261,548 $269,025
Contracted Svcs. 25 44,286 23,606
Supplies & Materials 265 7,692 108,000
Other Op. Expenses 0 33,226 10,000
Capital Outlay 1,734 9,313 2,000
Total Budget $117,037 $356,065 $412,631
Performance Measures
Actual Estimate Projected
Program/Service 12-13 13-14 14-15
Ensure that transfers, enrollments and class size at elementary levels are in compliance N/A weekly weekly
Assist, monitor and ensure that all department implement programs and initiatives successfully N/A monthly monthly
Collaborate and assist other departments to ensure that all campuses are safe N/A weekly weekly
Monitor class size attendance to maintain compliance N/A daily daily
Provide support for all campuses in areas of safety, discipline and truancy N/A daily daily
Monitor campus attendance N/A daily daily
Position 2013 2014 2015
Director 0.00 0.00 1.00
Specialists 4.00 4.00 4.00
Secretaries 0.00 0.00 1.00
Total 4.00 4.00 6.00
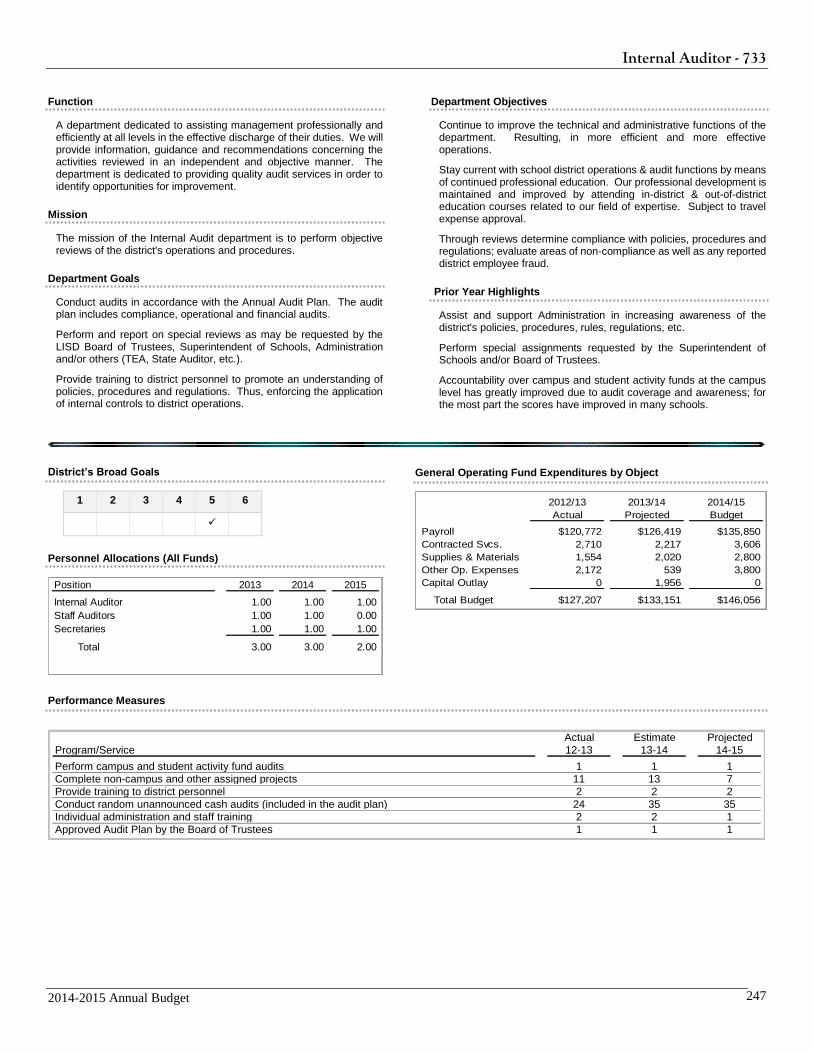
Internal Auditor - 733
2014-2015 Annual Budget 247
Function
A department dedicated to assisting management professionally and efficiently at all levels in the effective discharge of their duties. We will provide information, guidance and recommendations concerning the activities reviewed in an independent and objective manner. The department is dedicated to providing quality audit services in order to identify opportunities for improvement.
Mission
The mission of the Internal Audit department is to perform objective reviews of the district's operations and procedures.
Department Goals
Conduct audits in accordance with the Annual Audit Plan. The audit plan includes compliance, operational and financial audits.
Perform and report on special reviews as may be requested by the LISD Board of Trustees, Superintendent of Schools, Administration and/or others (TEA, State Auditor, etc.).
Provide training to district personnel to promote an understanding of policies, procedures and regulations. Thus, enforcing the application of internal controls to district operations.
Department Objectives
Continue to improve the technical and administrative functions of the department. Resulting, in more efficient and more effective operations.
Stay current with school district operations & audit functions by means of continued professional education. Our professional development is maintained and improved by attending in-district & out-of-district education courses related to our field of expertise. Subject to travel expense approval.
Through reviews determine compliance with policies, procedures and regulations; evaluate areas of non-compliance as well as any reported district employee fraud.
Prior Year Highlights
Assist and support Administration in increasing awareness of the district's policies, procedures, rules, regulations, etc.
Perform special assignments requested by the Superintendent of Schools and/or Board of Trustees.
Accountability over campus and student activity funds at the campus level has greatly improved due to audit coverage and awareness; for the most part the scores have improved in many schools.
District’s Broad Goals
1 2 3 4 5 6
Personnel Allocations (All Funds)
General Operating Fund Expenditures by Object
2012/13 2013/14 2014/15
Actual Projected Budget
Payroll $120,772 $126,419 $135,850
Contracted Svcs. 2,710 2,217 3,606
Supplies & Materials 1,554 2,020 2,800
Other Op. Expenses 2,172 539 3,800
Capital Outlay 0 1,956 0
Total Budget $127,207 $133,151 $146,056
Performance Measures
Actual Estimate Projected
Program/Service 12-13 13-14 14-15
Perform campus and student activity fund audits 1 1 1
Complete non-campus and other assigned projects 11 13 7
Provide training to district personnel 2 2 2
Conduct random unannounced cash audits (included in the audit plan) 24 35 35
Individual administration and staff training 2 2 1
Approved Audit Plan by the Board of Trustees 1 1 1
Position 2013 2014 2015
Internal Auditor 1.00 1.00 1.00
Staff Auditors 1.00 1.00 0.00
Secretaries 1.00 1.00 1.00
Total 3.00 3.00 2.00
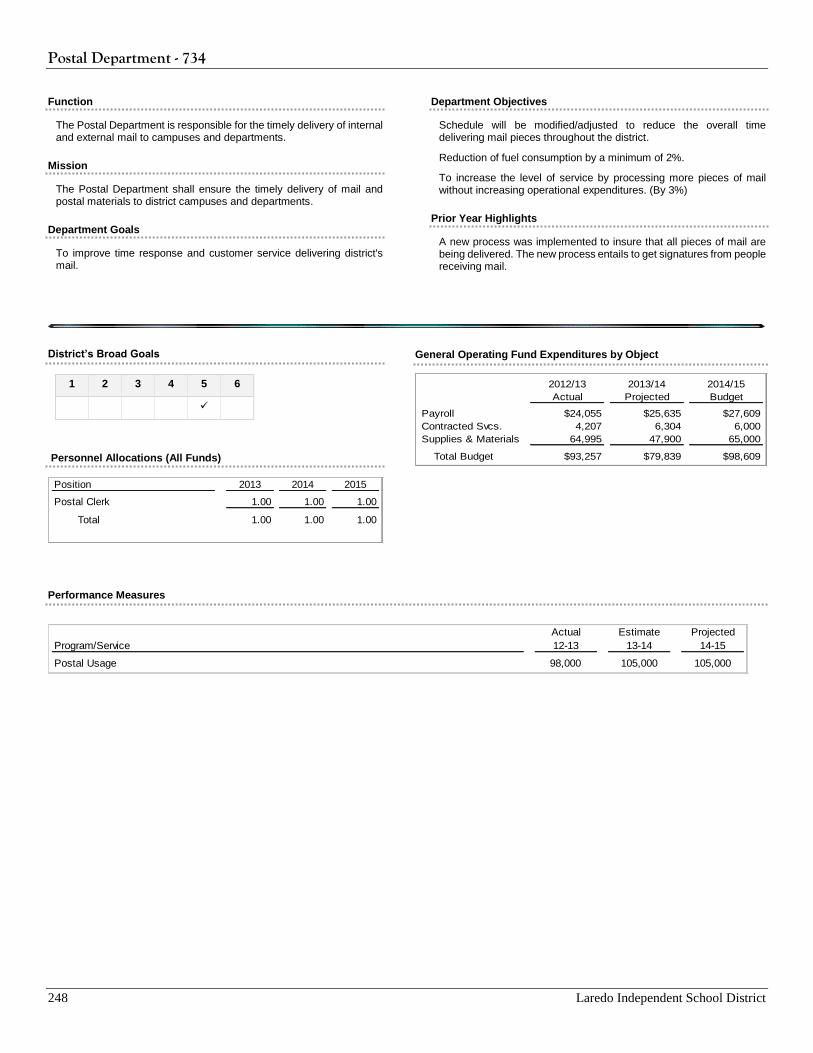
Postal Department - 734
248 Laredo Independent School District
Function
The Postal Department is responsible for the timely delivery of internal and external mail to campuses and departments.
Mission
The Postal Department shall ensure the timely delivery of mail and postal materials to district campuses and departments.
Department Goals
To improve time response and customer service delivering district's mail.
Department Objectives
Schedule will be modified/adjusted to reduce the overall time delivering mail pieces throughout the district.
Reduction of fuel consumption by a minimum of 2%.
To increase the level of service by processing more pieces of mail without increasing operational expenditures. (By 3%)
Prior Year Highlights
A new process was implemented to insure that all pieces of mail are being delivered. The new process entails to get signatures from people receiving mail.
District’s Broad Goals
1 2 3 4 5 6
Personnel Allocations (All Funds)
General Operating Fund Expenditures by Object
2012/13 2013/14 2014/15
Actual Projected Budget
Payroll $24,055 $25,635 $27,609
Contracted Svcs. 4,207 6,304 6,000
Supplies & Materials 64,995 47,900 65,000
Total Budget $93,257 $79,839 $98,609
Performance Measures
Position 2013 2014 2015
Postal Clerk 1.00 1.00 1.00
Total 1.00 1.00 1.00
Actual Estimate Projected
Program/Service 12-13 13-14 14-15
Postal Usage 98,000 105,000 105,000
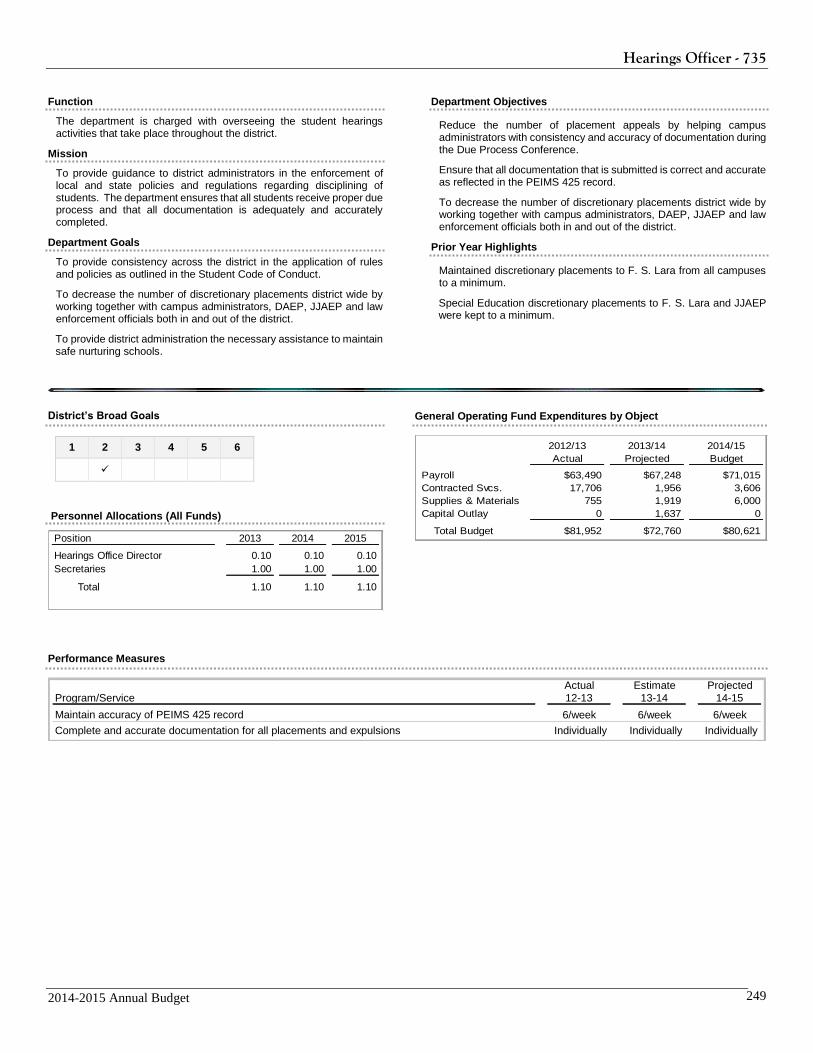
Hearings Officer - 735
2014-2015 Annual Budget 249
Function
The department is charged with overseeing the student hearings activities that take place throughout the district.
Mission
To provide guidance to district administrators in the enforcement of local and state policies and regulations regarding disciplining of students. The department ensures that all students receive proper due process and that all documentation is adequately and accurately completed.
Department Goals
To provide consistency across the district in the application of rules and policies as outlined in the Student Code of Conduct.
To decrease the number of discretionary placements district wide by working together with campus administrators, DAEP, JJAEP and law enforcement officials both in and out of the district.
To provide district administration the necessary assistance to maintain safe nurturing schools.
Department Objectives
Reduce the number of placement appeals by helping campus administrators with consistency and accuracy of documentation during the Due Process Conference.
Ensure that all documentation that is submitted is correct and accurate as reflected in the PEIMS 425 record.
To decrease the number of discretionary placements district wide by working together with campus administrators, DAEP, JJAEP and law enforcement officials both in and out of the district.
Prior Year Highlights
Maintained discretionary placements to F. S. Lara from all campuses to a minimum.
Special Education discretionary placements to F. S. Lara and JJAEP were kept to a minimum.
District’s Broad Goals
1 2 3 4 5 6
Personnel Allocations (All Funds)
General Operating Fund Expenditures by Object
2012/13 2013/14 2014/15
Actual Projected Budget
Payroll $63,490 $67,248 $71,015
Contracted Svcs. 17,706 1,956 3,606
Supplies & Materials 755 1,919 6,000
Capital Outlay 0 1,637 0
Total Budget $81,952 $72,760 $80,621
Performance Measures
Actual Estimate Projected
Program/Service 12-13 13-14 14-15
Maintain accuracy of PEIMS 425 record 6/week 6/week 6/week
Complete and accurate documentation for all placements and expulsions Individually Individually Individually
Position 2013 2014 2015
Hearings Office Director 0.10 0.10 0.10
Secretaries 1.00 1.00 1.00
Total 1.10 1.10 1.10
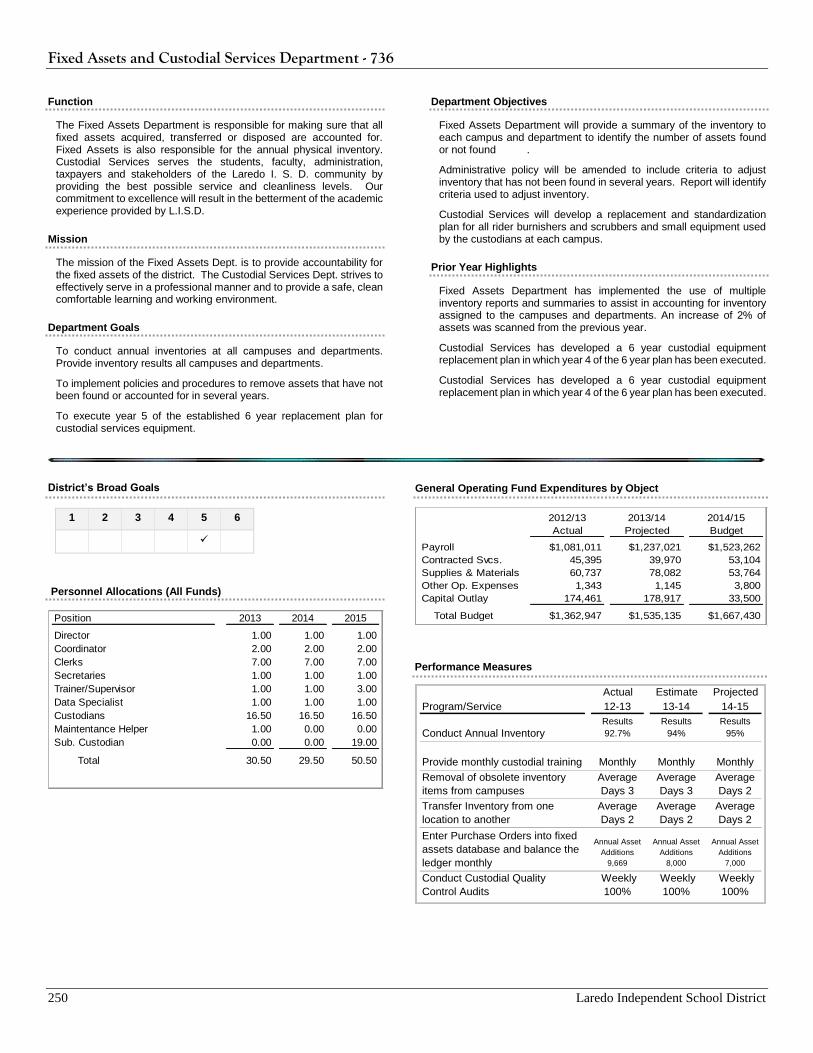
Fixed Assets and Custodial Services Department - 736
250 Laredo Independent School District
Function
The Fixed Assets Department is responsible for making sure that all fixed assets acquired, transferred or disposed are accounted for. Fixed Assets is also responsible for the annual physical inventory. Custodial Services serves the students, faculty, administration, taxpayers and stakeholders of the Laredo I. S. D. community by providing the best possible service and cleanliness levels. Our commitment to excellence will result in the betterment of the academic experience provided by L.I.S.D.
Mission
The mission of the Fixed Assets Dept. is to provide accountability for the fixed assets of the district. The Custodial Services Dept. strives to effectively serve in a professional manner and to provide a safe, clean comfortable learning and working environment.
Department Goals
To conduct annual inventories at all campuses and departments. Provide inventory results all campuses and departments.
To implement policies and procedures to remove assets that have not been found or accounted for in several years.
To execute year 5 of the established 6 year replacement plan for custodial services equipment.
Department Objectives
Fixed Assets Department will provide a summary of the inventory to each campus and department to identify the number of assets found or not found .
Administrative policy will be amended to include criteria to adjust inventory that has not been found in several years. Report will identify criteria used to adjust inventory.
Custodial Services will develop a replacement and standardization plan for all rider burnishers and scrubbers and small equipment used by the custodians at each campus.
Prior Year Highlights
Fixed Assets Department has implemented the use of multiple inventory reports and summaries to assist in accounting for inventory assigned to the campuses and departments. An increase of 2% of assets was scanned from the previous year.
Custodial Services has developed a 6 year custodial equipment replacement plan in which year 4 of the 6 year plan has been executed.
Custodial Services has developed a 6 year custodial equipment replacement plan in which year 4 of the 6 year plan has been executed.
District’s Broad Goals
1 2 3 4 5 6
Personnel Allocations (All Funds)
General Operating Fund Expenditures by Object
2012/13 2013/14 2014/15
Actual Projected Budget
Payroll $1,081,011 $1,237,021 $1,523,262
Contracted Svcs. 45,395 39,970 53,104
Supplies & Materials 60,737 78,082 53,764
Other Op. Expenses 1,343 1,145 3,800
Capital Outlay 174,461 178,917 33,500
Total Budget $1,362,947 $1,535,135 $1,667,430
Performance Measures
Actual Estimate Projected
Program/Service 12-13 13-14 14-15
Conduct Annual InventoryResults
92.7%
Results
94%
Results
95%
Provide monthly custodial training Monthly Monthly Monthly
Removal of obsolete inventory
items from campuses
Average
Days 3
Average
Days 3
Average
Days 2
Transfer Inventory from one
location to another
Average
Days 2
Average
Days 2
Average
Days 2
Enter Purchase Orders into fixed
assets database and balance the
ledger monthly
Annual Asset
Additions
9,669
Annual Asset
Additions
8,000
Annual Asset
Additions
7,000
Conduct Custodial Quality
Control Audits
Weekly
100%
Weekly
100%
Weekly
100% 100%
Position 2013 2014 2015
Director 1.00 1.00 1.00
Coordinator 2.00 2.00 2.00
Clerks 7.00 7.00 7.00
Secretaries 1.00 1.00 1.00
Trainer/Supervisor 1.00 1.00 3.00
Data Specialist 1.00 1.00 1.00
Custodians 16.50 16.50 16.50
Maintentance Helper 1.00 0.00 0.00
Sub. Custodian 0.00 0.00 19.00
Total 30.50 29.50 50.50
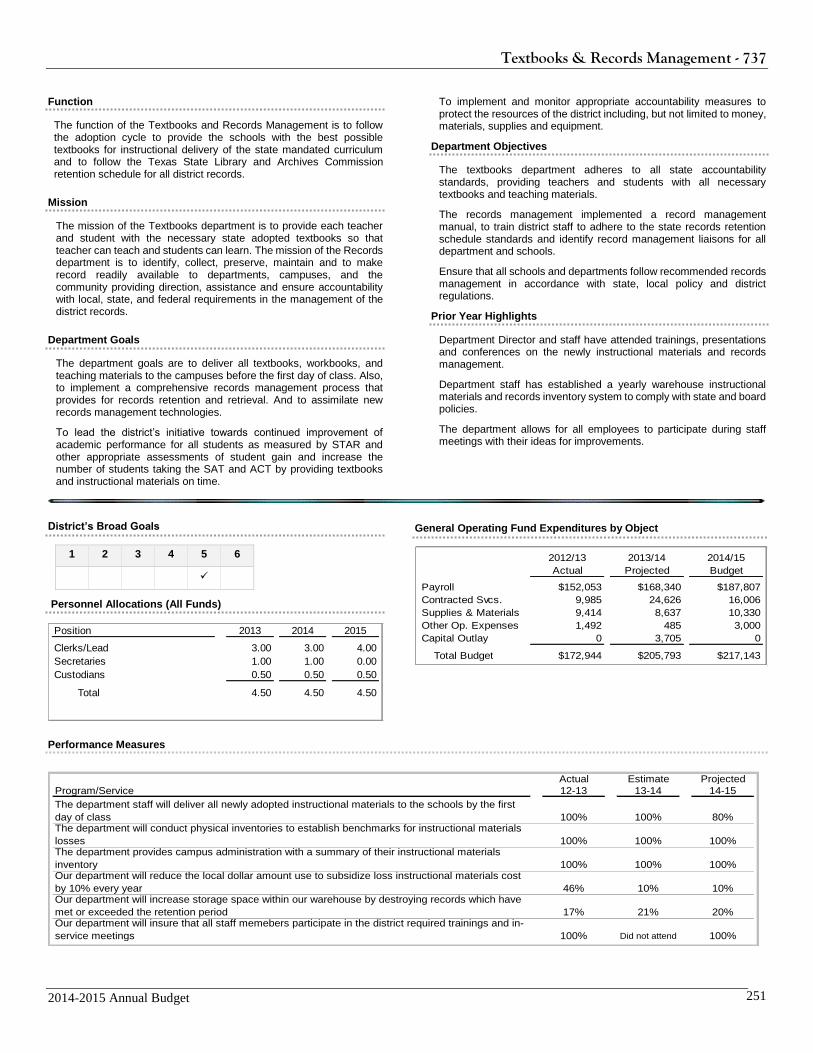
Textbooks & Records Management - 737
2014-2015 Annual Budget 251
Function
The function of the Textbooks and Records Management is to follow the adoption cycle to provide the schools with the best possible textbooks for instructional delivery of the state mandated curriculum and to follow the Texas State Library and Archives Commission retention schedule for all district records.
Mission
The mission of the Textbooks department is to provide each teacher and student with the necessary state adopted textbooks so that teacher can teach and students can learn. The mission of the Records department is to identify, collect, preserve, maintain and to make record readily available to departments, campuses, and the community providing direction, assistance and ensure accountability with local, state, and federal requirements in the management of the district records.
Department Goals
The department goals are to deliver all textbooks, workbooks, and teaching materials to the campuses before the first day of class. Also, to implement a comprehensive records management process that provides for records retention and retrieval. And to assimilate new records management technologies.
To lead the district’s initiative towards continued improvement of academic performance for all students as measured by STAR and other appropriate assessments of student gain and increase the number of students taking the SAT and ACT by providing textbooks and instructional materials on time.
To implement and monitor appropriate accountability measures to protect the resources of the district including, but not limited to money, materials, supplies and equipment.
Department Objectives
The textbooks department adheres to all state accountability standards, providing teachers and students with all necessary textbooks and teaching materials.
The records management implemented a record management manual, to train district staff to adhere to the state records retention schedule standards and identify record management liaisons for all department and schools.
Ensure that all schools and departments follow recommended records management in accordance with state, local policy and district regulations.
Prior Year Highlights
Department Director and staff have attended trainings, presentations and conferences on the newly instructional materials and records management.
Department staff has established a yearly warehouse instructional materials and records inventory system to comply with state and board policies.
The department allows for all employees to participate during staff meetings with their ideas for improvements.
District’s Broad Goals
1 2 3 4 5 6
Personnel Allocations (All Funds)
General Operating Fund Expenditures by Object
2012/13 2013/14 2014/15
Actual Projected Budget
Payroll $152,053 $168,340 $187,807
Contracted Svcs. 9,985 24,626 16,006
Supplies & Materials 9,414 8,637 10,330
Other Op. Expenses 1,492 485 3,000
Capital Outlay 0 3,705 0
Total Budget $172,944 $205,793 $217,143
Performance Measures
Actual Estimate Projected
Program/Service 12-13 13-14 14-15
The department staff will deliver all newly adopted instructional materials to the schools by the first
day of class 100% 100% 80%The department will conduct physical inventories to establish benchmarks for instructional materials
losses 100% 100% 100%The department provides campus administration with a summary of their instructional materials
inventory 100% 100% 100%Our department will reduce the local dollar amount use to subsidize loss instructional materials cost
by 10% every year 46% 10% 10%Our department will increase storage space within our warehouse by destroying records which have
met or exceeded the retention period 17% 21% 20%Our department will insure that all staff memebers participate in the district required trainings and in-
service meetings 100% Did not attend 100%
Position 2013 2014 2015
Clerks/Lead 3.00 3.00 4.00
Secretaries 1.00 1.00 0.00
Custodians 0.50 0.50 0.50
Total 4.50 4.50 4.50
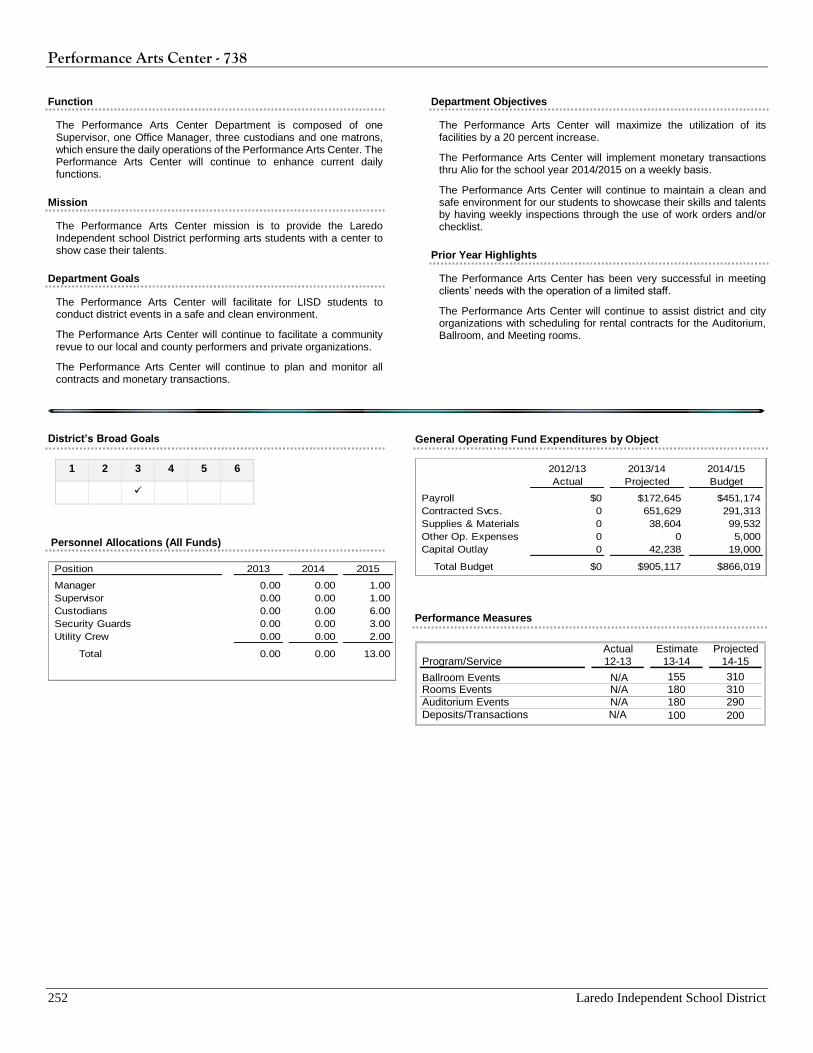
Performance Arts Center - 738
252 Laredo Independent School District
Function
The Performance Arts Center Department is composed of one Supervisor, one Office Manager, three custodians and one matrons, which ensure the daily operations of the Performance Arts Center. The Performance Arts Center will continue to enhance current daily functions.
Mission
The Performance Arts Center mission is to provide the Laredo Independent school District performing arts students with a center to show case their talents.
Department Goals
The Performance Arts Center will facilitate for LISD students to conduct district events in a safe and clean environment.
The Performance Arts Center will continue to facilitate a community revue to our local and county performers and private organizations.
The Performance Arts Center will continue to plan and monitor all contracts and monetary transactions.
Department Objectives
The Performance Arts Center will maximize the utilization of its facilities by a 20 percent increase.
The Performance Arts Center will implement monetary transactions thru Alio for the school year 2014/2015 on a weekly basis.
The Performance Arts Center will continue to maintain a clean and safe environment for our students to showcase their skills and talents by having weekly inspections through the use of work orders and/or checklist.
Prior Year Highlights
The Performance Arts Center has been very successful in meeting clients’ needs with the operation of a limited staff.
The Performance Arts Center will continue to assist district and city organizations with scheduling for rental contracts for the Auditorium, Ballroom, and Meeting rooms.
District’s Broad Goals
1 2 3 4 5 6
Personnel Allocations (All Funds)
Position 2013 2014 2015
Manager 0.00 0.00 1.00
Supervisor 0.00 0.00 1.00
Custodians 0.00 0.00 6.00
Security Guards 0.00 0.00 3.00
Utility Crew 0.00 0.00 2.00
Total 0.00 0.00 13.00
General Operating Fund Expenditures by Object
2012/13 2013/14 2014/15
Actual Projected Budget
Payroll $0 $172,645 $451,174
Contracted Svcs. 0 651,629 291,313
Supplies & Materials 0 38,604 99,532
Other Op. Expenses 0 0 5,000
Capital Outlay 0 42,238 19,000
Total Budget $0 $905,117 $866,019
Performance Measures
Actual Estimate Projected
Program/Service 12-13 13-14 14-15
Ballroom Events N/A 155 310
Rooms Events N/A 180 310
Auditorium Events N/A 180 290
Deposits/Transactions N/A 100 200
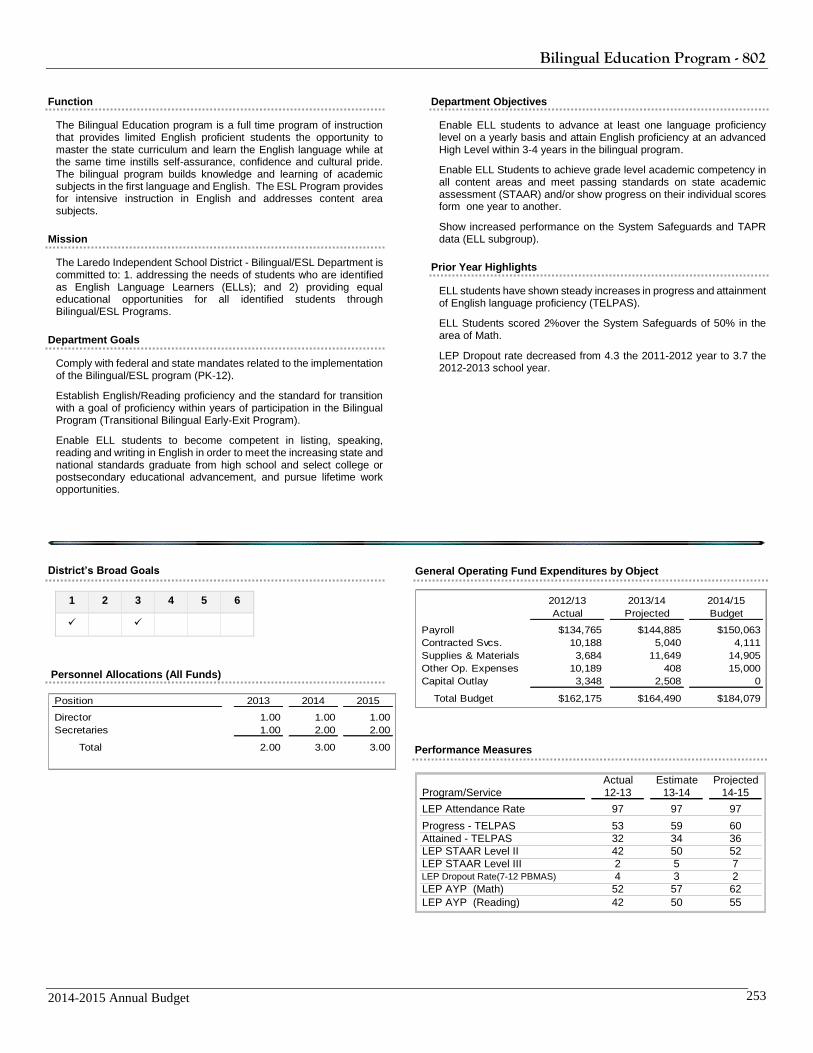
Bilingual Education Program - 802
2014-2015 Annual Budget 253
Function
The Bilingual Education program is a full time program of instruction that provides limited English proficient students the opportunity to master the state curriculum and learn the English language while at the same time instills self-assurance, confidence and cultural pride. The bilingual program builds knowledge and learning of academic subjects in the first language and English. The ESL Program provides for intensive instruction in English and addresses content area subjects.
Mission
The Laredo Independent School District - Bilingual/ESL Department is committed to: 1. addressing the needs of students who are identified as English Language Learners (ELLs); and 2) providing equal educational opportunities for all identified students through Bilingual/ESL Programs.
Department Goals
Comply with federal and state mandates related to the implementation of the Bilingual/ESL program (PK-12).
Establish English/Reading proficiency and the standard for transition with a goal of proficiency within years of participation in the Bilingual Program (Transitional Bilingual Early-Exit Program).
Enable ELL students to become competent in listing, speaking, reading and writing in English in order to meet the increasing state and national standards graduate from high school and select college or postsecondary educational advancement, and pursue lifetime work opportunities.
Department Objectives
Enable ELL students to advance at least one language proficiency level on a yearly basis and attain English proficiency at an advanced High Level within 3-4 years in the bilingual program.
Enable ELL Students to achieve grade level academic competency in all content areas and meet passing standards on state academic assessment (STAAR) and/or show progress on their individual scores form one year to another.
Show increased performance on the System Safeguards and TAPR data (ELL subgroup).
Prior Year Highlights
ELL students have shown steady increases in progress and attainment of English language proficiency (TELPAS).
ELL Students scored 2%over the System Safeguards of 50% in the area of Math.
LEP Dropout rate decreased from 4.3 the 2011-2012 year to 3.7 the 2012-2013 school year.
District’s Broad Goals
1 2 3 4 5 6
Personnel Allocations (All Funds)
Position 2013 2014 2015
Director 1.00 1.00 1.00
Secretaries 1.00 2.00 2.00
Total 2.00 3.00 3.00
General Operating Fund Expenditures by Object
2012/13 2013/14 2014/15
Actual Projected Budget
Payroll $134,765 $144,885 $150,063
Contracted Svcs. 10,188 5,040 4,111
Supplies & Materials 3,684 11,649 14,905
Other Op. Expenses 10,189 408 15,000
Capital Outlay 3,348 2,508 0
Total Budget $162,175 $164,490 $184,079
Performance Measures
Actual Estimate Projected
Program/Service 12-13 13-14 14-15
LEP Attendance Rate 97 97 97
Progress - TELPAS 53 59 60
Attained - TELPAS 32 34 36
LEP STAAR Level II 42 50 52
LEP STAAR Level III 2 5 7LEP Dropout Rate(7-12 PBMAS) 4 3 2
LEP AYP (Math) 52 57 62
LEP AYP (Reading) 42 50 55
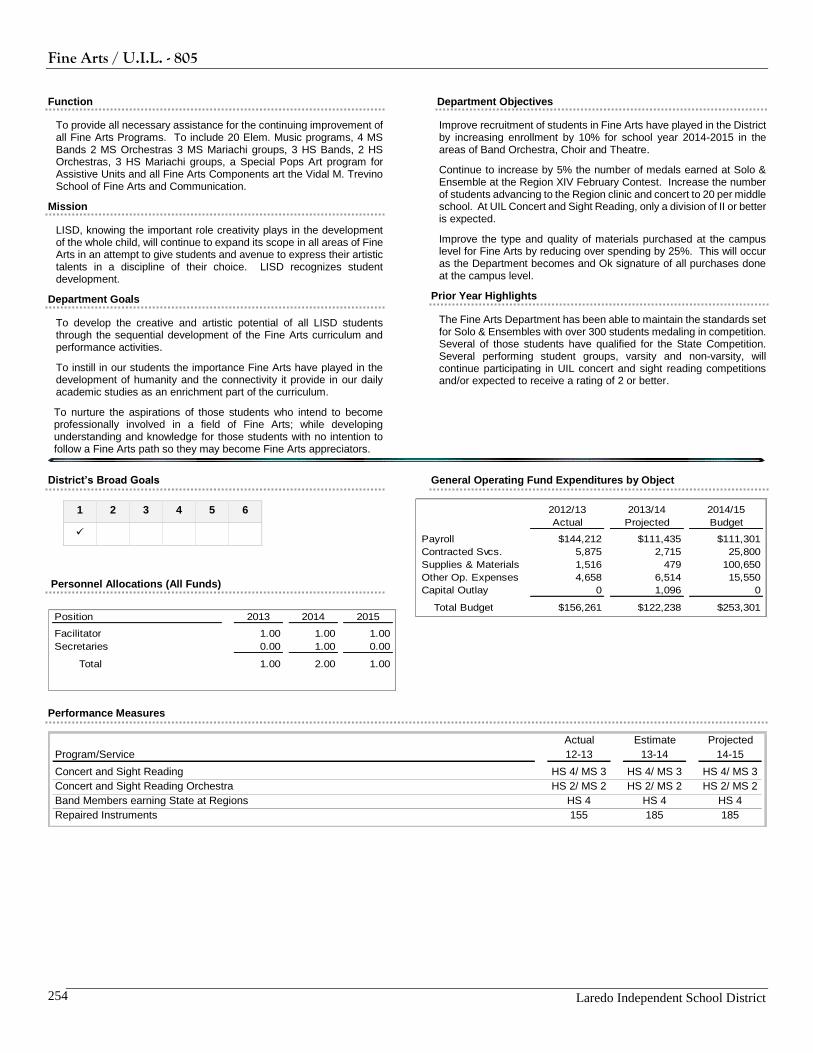
Fine Arts / U.I.L. - 805
Laredo Independent School District 254
Function
To provide all necessary assistance for the continuing improvement of all Fine Arts Programs. To include 20 Elem. Music programs, 4 MS Bands 2 MS Orchestras 3 MS Mariachi groups, 3 HS Bands, 2 HS Orchestras, 3 HS Mariachi groups, a Special Pops Art program for Assistive Units and all Fine Arts Components art the Vidal M. Trevino School of Fine Arts and Communication.
Mission
LISD, knowing the important role creativity plays in the development of the whole child, will continue to expand its scope in all areas of Fine Arts in an attempt to give students and avenue to express their artistic talents in a discipline of their choice. LISD recognizes student development.
Department Goals
To develop the creative and artistic potential of all LISD students through the sequential development of the Fine Arts curriculum and performance activities.
To instill in our students the importance Fine Arts have played in the development of humanity and the connectivity it provide in our daily academic studies as an enrichment part of the curriculum.
To nurture the aspirations of those students who intend to become professionally involved in a field of Fine Arts; while developing understanding and knowledge for those students with no intention to follow a Fine Arts path so they may become Fine Arts appreciators.
Department Objectives
Improve recruitment of students in Fine Arts have played in the District by increasing enrollment by 10% for school year 2014-2015 in the areas of Band Orchestra, Choir and Theatre.
Continue to increase by 5% the number of medals earned at Solo & Ensemble at the Region XIV February Contest. Increase the number of students advancing to the Region clinic and concert to 20 per middle school. At UIL Concert and Sight Reading, only a division of II or better is expected.
Improve the type and quality of materials purchased at the campus level for Fine Arts by reducing over spending by 25%. This will occur as the Department becomes and Ok signature of all purchases done at the campus level.
Prior Year Highlights
The Fine Arts Department has been able to maintain the standards set for Solo & Ensembles with over 300 students medaling in competition. Several of those students have qualified for the State Competition. Several performing student groups, varsity and non-varsity, will continue participating in UIL concert and sight reading competitions and/or expected to receive a rating of 2 or better.
District’s Broad Goals
1 2 3 4 5 6
Personnel Allocations (All Funds)
Position 2013 2014 2015
Facilitator 1.00 1.00 1.00
Secretaries 0.00 1.00 0.00
Total 1.00 2.00 1.00
General Operating Fund Expenditures by Object
2012/13 2013/14 2014/15
Actual Projected Budget
Payroll $144,212 $111,435 $111,301
Contracted Svcs. 5,875 2,715 25,800
Supplies & Materials 1,516 479 100,650
Other Op. Expenses 4,658 6,514 15,550
Capital Outlay 0 1,096 0
Total Budget $156,261 $122,238 $253,301
Performance Measures
Actual Estimate Projected
Program/Service 12-13 13-14 14-15
Concert and Sight Reading HS 4/ MS 3 HS 4/ MS 3 HS 4/ MS 3
Concert and Sight Reading Orchestra HS 2/ MS 2 HS 2/ MS 2 HS 2/ MS 2
Band Members earning State at Regions HS 4 HS 4 HS 4
Repaired Instruments 155 185 185
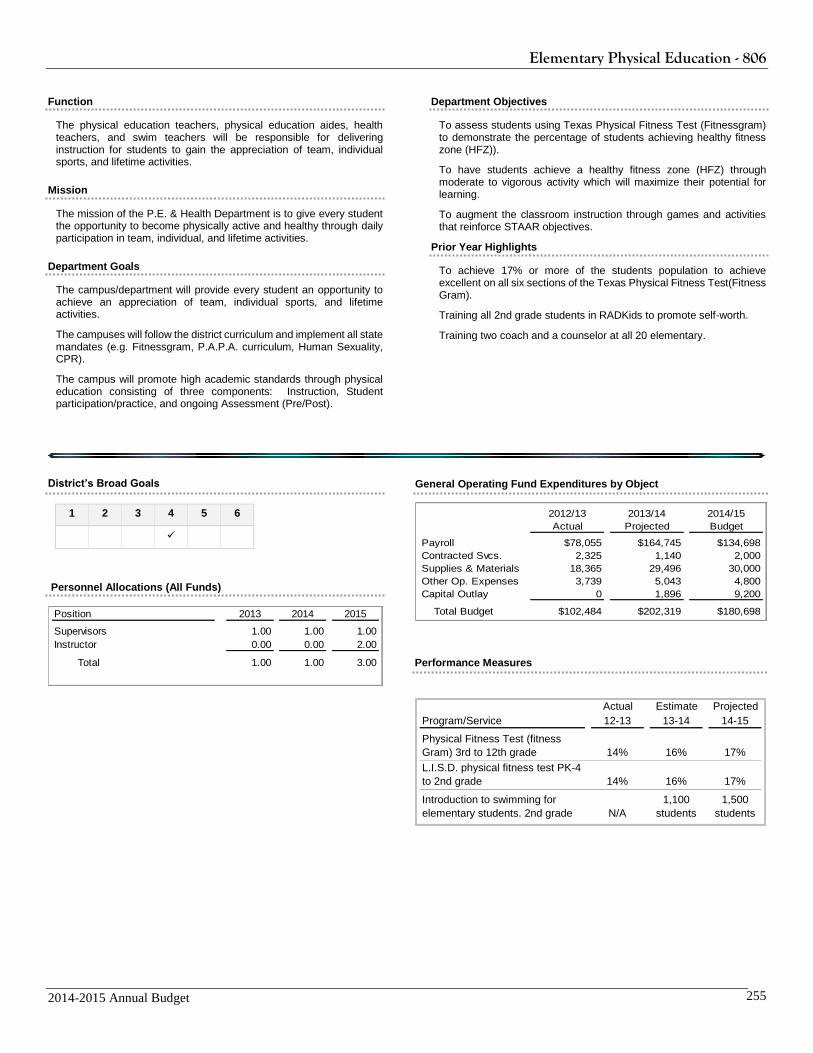
Elementary Physical Education - 806
2014-2015 Annual Budget 255
Function
The physical education teachers, physical education aides, health teachers, and swim teachers will be responsible for delivering instruction for students to gain the appreciation of team, individual sports, and lifetime activities.
Mission
The mission of the P.E. & Health Department is to give every student the opportunity to become physically active and healthy through daily participation in team, individual, and lifetime activities.
Department Goals
The campus/department will provide every student an opportunity to achieve an appreciation of team, individual sports, and lifetime activities.
The campuses will follow the district curriculum and implement all state mandates (e.g. Fitnessgram, P.A.P.A. curriculum, Human Sexuality, CPR).
The campus will promote high academic standards through physical education consisting of three components: Instruction, Student participation/practice, and ongoing Assessment (Pre/Post).
Department Objectives
To assess students using Texas Physical Fitness Test (Fitnessgram) to demonstrate the percentage of students achieving healthy fitness zone (HFZ)).
To have students achieve a healthy fitness zone (HFZ) through moderate to vigorous activity which will maximize their potential for learning.
To augment the classroom instruction through games and activities that reinforce STAAR objectives.
Prior Year Highlights
To achieve 17% or more of the students population to achieve excellent on all six sections of the Texas Physical Fitness Test(Fitness Gram).
Training all 2nd grade students in RADKids to promote self-worth.
Training two coach and a counselor at all 20 elementary.
District’s Broad Goals
1 2 3 4 5 6
Personnel Allocations (All Funds)
General Operating Fund Expenditures by Object
2012/13 2013/14 2014/15
Actual Projected Budget
Payroll $78,055 $164,745 $134,698
Contracted Svcs. 2,325 1,140 2,000
Supplies & Materials 18,365 29,496 30,000
Other Op. Expenses 3,739 5,043 4,800
Capital Outlay 0 1,896 9,200
Total Budget $102,484 $202,319 $180,698
Performance Measures
Actual Estimate Projected
Program/Service 12-13 13-14 14-15
Physical Fitness Test (fitness
Gram) 3rd to 12th grade 14% 16% 17%
L.I.S.D. physical fitness test PK-4
to 2nd grade 14% 16% 17%
Introduction to swimming for
elementary students. 2nd grade N/A
1,100
students
1,500
students
Position 2013 2014 2015
Supervisors 1.00 1.00 1.00
Instructor 0.00 0.00 2.00
Total 1.00 1.00 3.00
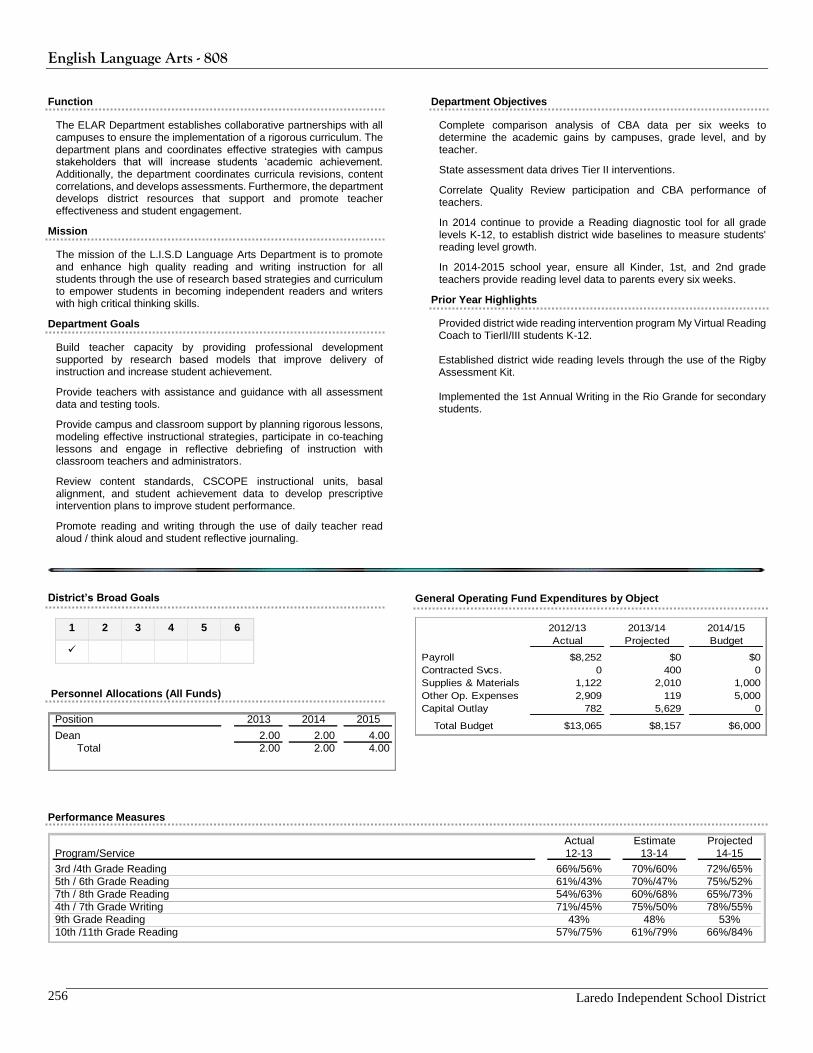
English Language Arts - 808
Laredo Independent School District 256
Function
The ELAR Department establishes collaborative partnerships with all campuses to ensure the implementation of a rigorous curriculum. The department plans and coordinates effective strategies with campus stakeholders that will increase students ‘academic achievement. Additionally, the department coordinates curricula revisions, content correlations, and develops assessments. Furthermore, the department develops district resources that support and promote teacher effectiveness and student engagement.
Mission
The mission of the L.I.S.D Language Arts Department is to promote and enhance high quality reading and writing instruction for all students through the use of research based strategies and curriculum to empower students in becoming independent readers and writers with high critical thinking skills.
Department Goals
Build teacher capacity by providing professional development supported by research based models that improve delivery of instruction and increase student achievement.
Provide teachers with assistance and guidance with all assessment data and testing tools.
Provide campus and classroom support by planning rigorous lessons, modeling effective instructional strategies, participate in co-teaching lessons and engage in reflective debriefing of instruction with classroom teachers and administrators.
Review content standards, CSCOPE instructional units, basal alignment, and student achievement data to develop prescriptive intervention plans to improve student performance.
Promote reading and writing through the use of daily teacher read aloud / think aloud and student reflective journaling.
Department Objectives
Complete comparison analysis of CBA data per six weeks to determine the academic gains by campuses, grade level, and by teacher.
State assessment data drives Tier II interventions.
Correlate Quality Review participation and CBA performance of teachers.
In 2014 continue to provide a Reading diagnostic tool for all grade levels K-12, to establish district wide baselines to measure students' reading level growth.
In 2014-2015 school year, ensure all Kinder, 1st, and 2nd grade teachers provide reading level data to parents every six weeks.
Prior Year Highlights
Provided district wide reading intervention program My Virtual Reading Coach to TierII/III students K-12. Established district wide reading levels through the use of the Rigby Assessment Kit. Implemented the 1st Annual Writing in the Rio Grande for secondary students.
District’s Broad Goals
1 2 3 4 5 6
Personnel Allocations (All Funds)
Position 2013 2014 2015
Dean 2.00 2.00 4.00
Total 2.00 2.00 4.00
General Operating Fund Expenditures by Object
2012/13 2013/14 2014/15
Actual Projected Budget
Payroll $8,252 $0 $0
Contracted Svcs. 0 400 0
Supplies & Materials 1,122 2,010 1,000
Other Op. Expenses 2,909 119 5,000
Capital Outlay 782 5,629 0
Total Budget $13,065 $8,157 $6,000
Performance Measures
Actual Estimate Projected
Program/Service 12-13 13-14 14-15
3rd /4th Grade Reading 66%/56% 70%/60% 72%/65%
5th / 6th Grade Reading 61%/43% 70%/47% 75%/52%
7th / 8th Grade Reading 54%/63% 60%/68% 65%/73%
4th / 7th Grade Writing 71%/45% 75%/50% 78%/55%
9th Grade Reading 43% 48% 53%
10th /11th Grade Reading 57%/75% 61%/79% 66%/84%85
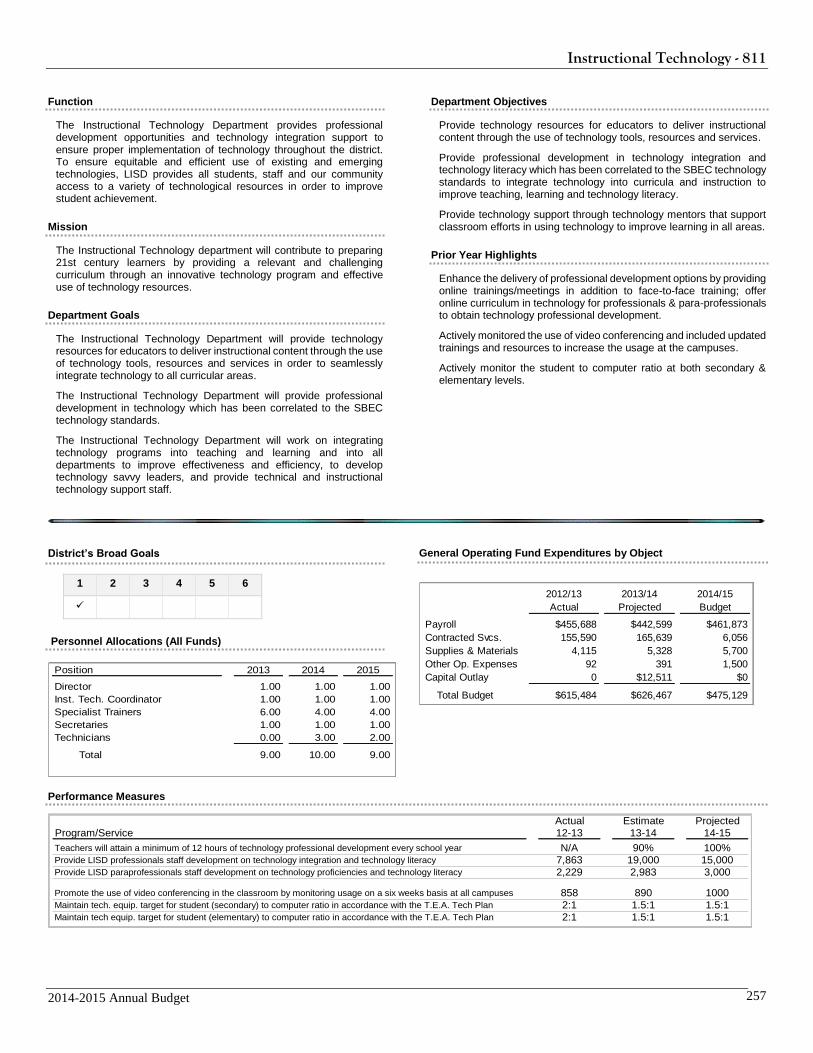
Instructional Technology - 811
2014-2015 Annual Budget 257
Function
The Instructional Technology Department provides professional development opportunities and technology integration support to ensure proper implementation of technology throughout the district. To ensure equitable and efficient use of existing and emerging technologies, LISD provides all students, staff and our community access to a variety of technological resources in order to improve student achievement.
Mission
The Instructional Technology department will contribute to preparing 21st century learners by providing a relevant and challenging curriculum through an innovative technology program and effective use of technology resources.
Department Goals
The Instructional Technology Department will provide technology resources for educators to deliver instructional content through the use of technology tools, resources and services in order to seamlessly integrate technology to all curricular areas.
The Instructional Technology Department will provide professional development in technology which has been correlated to the SBEC technology standards.
The Instructional Technology Department will work on integrating technology programs into teaching and learning and into all departments to improve effectiveness and efficiency, to develop technology savvy leaders, and provide technical and instructional technology support staff.
Department Objectives
Provide technology resources for educators to deliver instructional content through the use of technology tools, resources and services.
Provide professional development in technology integration and technology literacy which has been correlated to the SBEC technology standards to integrate technology into curricula and instruction to improve teaching, learning and technology literacy.
Provide technology support through technology mentors that support classroom efforts in using technology to improve learning in all areas.
Prior Year Highlights
Enhance the delivery of professional development options by providing online trainings/meetings in addition to face-to-face training; offer online curriculum in technology for professionals & para-professionals to obtain technology professional development.
Actively monitored the use of video conferencing and included updated trainings and resources to increase the usage at the campuses.
Actively monitor the student to computer ratio at both secondary & elementary levels.
District’s Broad Goals
1 2 3 4 5 6
Personnel Allocations (All Funds)
Position 2013 2014 2015
Director 1.00 1.00 1.00
Inst. Tech. Coordinator 1.00 1.00 1.00
Specialist Trainers 6.00 4.00 4.00
Secretaries 1.00 1.00 1.00
Technicians 0.00 3.00 2.00
Total 9.00 10.00 9.00
General Operating Fund Expenditures by Object
Performance Measures
Actual Estimate Projected
Program/Service 12-13 13-14 14-15
Teachers will attain a minimum of 12 hours of technology professional development every school year N/A 90% 100%Provide LISD professionals staff development on technology integration and technology literacy 7,863 19,000 15,000Provide LISD paraprofessionals staff development on technology proficiencies and technology literacy 2,229 2,983 3,000
Promote the use of video conferencing in the classroom by monitoring usage on a six weeks basis at all campuses 858 890 1000Maintain tech. equip. target for student (secondary) to computer ratio in accordance with the T.E.A. Tech Plan 2:1 1.5:1 1.5:1Maintain tech equip. target for student (elementary) to computer ratio in accordance with the T.E.A. Tech Plan 2:1 1.5:1 1.5:1
2012/13 2013/14 2014/15
Actual Projected Budget
Payroll $455,688 $442,599 $461,873
Contracted Svcs. 155,590 165,639 6,056
Supplies & Materials 4,115 5,328 5,700
Other Op. Expenses 92 391 1,500
Capital Outlay 0 $12,511 $0
Total Budget $615,484 $626,467 $475,129
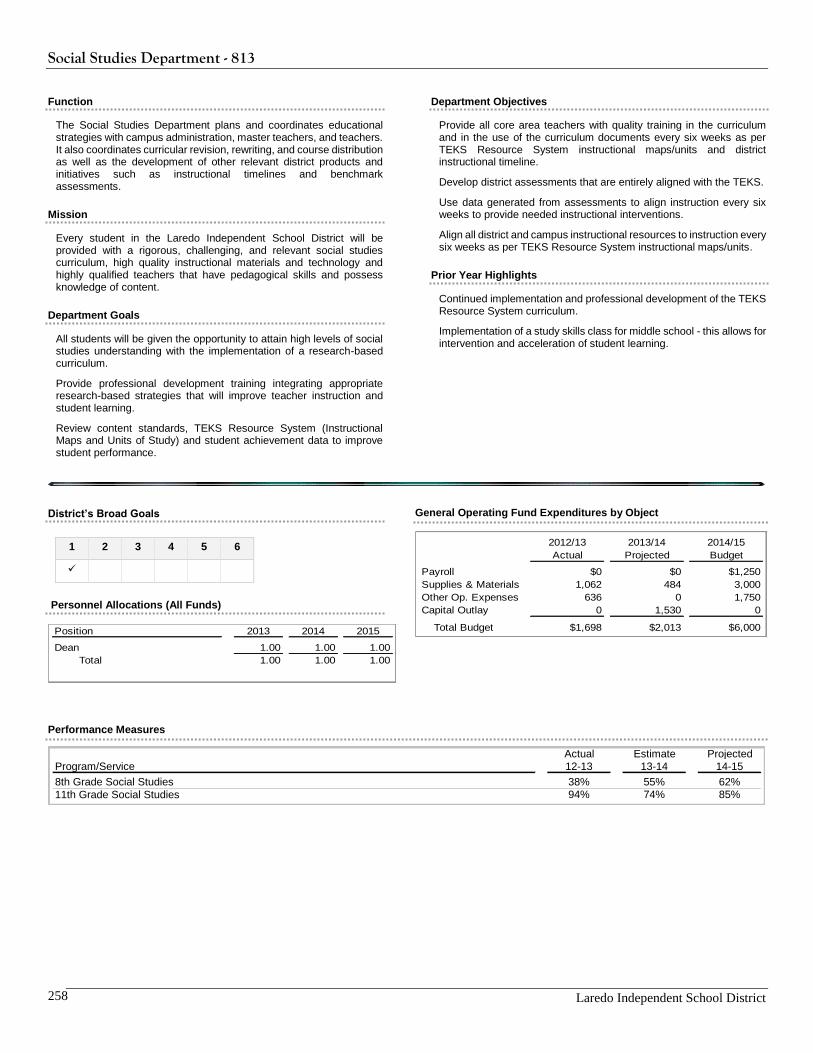
Social Studies Department - 813
Laredo Independent School District 258
Function
The Social Studies Department plans and coordinates educational strategies with campus administration, master teachers, and teachers. It also coordinates curricular revision, rewriting, and course distribution as well as the development of other relevant district products and initiatives such as instructional timelines and benchmark assessments.
Mission
Every student in the Laredo Independent School District will be provided with a rigorous, challenging, and relevant social studies curriculum, high quality instructional materials and technology and highly qualified teachers that have pedagogical skills and possess knowledge of content.
Department Goals
All students will be given the opportunity to attain high levels of social studies understanding with the implementation of a research-based curriculum.
Provide professional development training integrating appropriate research-based strategies that will improve teacher instruction and student learning.
Review content standards, TEKS Resource System (Instructional Maps and Units of Study) and student achievement data to improve student performance.
Department Objectives
Provide all core area teachers with quality training in the curriculum and in the use of the curriculum documents every six weeks as per TEKS Resource System instructional maps/units and district instructional timeline.
Develop district assessments that are entirely aligned with the TEKS.
Use data generated from assessments to align instruction every six weeks to provide needed instructional interventions.
Align all district and campus instructional resources to instruction every six weeks as per TEKS Resource System instructional maps/units.
Prior Year Highlights
Continued implementation and professional development of the TEKS Resource System curriculum.
Implementation of a study skills class for middle school - this allows for intervention and acceleration of student learning.
District’s Broad Goals
1 2 3 4 5 6
Personnel Allocations (All Funds)
Position 2013 2014 2015
Dean 1.00 1.00 1.00
Total 1.00 1.00 1.00
General Operating Fund Expenditures by Object
2012/13 2013/14 2014/15
Actual Projected Budget
Payroll $0 $0 $1,250
Supplies & Materials 1,062 484 3,000
Other Op. Expenses 636 0 1,750
Capital Outlay 0 1,530 0
Total Budget $1,698 $2,013 $6,000
Performance Measures
Actual Estimate Projected
Program/Service 12-13 13-14 14-15
8th Grade Social Studies 38% 55% 62%
94% 74% 85%11th Grade Social Studies
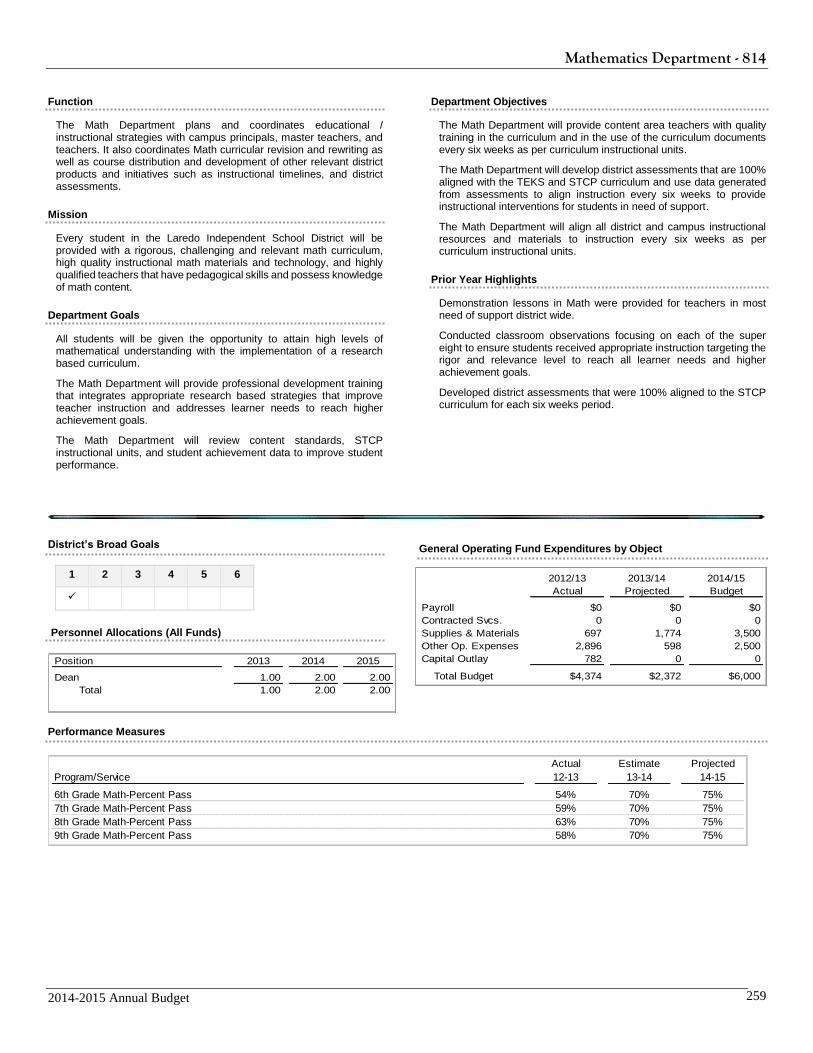
Mathematics Department - 814
2014-2015 Annual Budget 259
Function
The Math Department plans and coordinates educational / instructional strategies with campus principals, master teachers, and teachers. It also coordinates Math curricular revision and rewriting as well as course distribution and development of other relevant district products and initiatives such as instructional timelines, and district assessments.
Mission
Every student in the Laredo Independent School District will be provided with a rigorous, challenging and relevant math curriculum, high quality instructional math materials and technology, and highly qualified teachers that have pedagogical skills and possess knowledge of math content.
Department Goals
All students will be given the opportunity to attain high levels of mathematical understanding with the implementation of a research based curriculum.
The Math Department will provide professional development training that integrates appropriate research based strategies that improve teacher instruction and addresses learner needs to reach higher achievement goals.
The Math Department will review content standards, STCP instructional units, and student achievement data to improve student performance.
Department Objectives
The Math Department will provide content area teachers with quality training in the curriculum and in the use of the curriculum documents every six weeks as per curriculum instructional units.
The Math Department will develop district assessments that are 100% aligned with the TEKS and STCP curriculum and use data generated from assessments to align instruction every six weeks to provide instructional interventions for students in need of support.
The Math Department will align all district and campus instructional resources and materials to instruction every six weeks as per curriculum instructional units.
Prior Year Highlights
Demonstration lessons in Math were provided for teachers in most need of support district wide.
Conducted classroom observations focusing on each of the super eight to ensure students received appropriate instruction targeting the rigor and relevance level to reach all learner needs and higher achievement goals.
Developed district assessments that were 100% aligned to the STCP curriculum for each six weeks period.
District’s Broad Goals
1 2 3 4 5 6
Personnel Allocations (All Funds)
Position 2013 2014 2015
Dean 1.00 2.00 2.00
Total 1.00 2.00 2.00
General Operating Fund Expenditures by Object
2012/13 2013/14 2014/15
Actual Projected Budget
Payroll $0 $0 $0
Contracted Svcs. 0 0 0
Supplies & Materials 697 1,774 3,500
Other Op. Expenses 2,896 598 2,500
Capital Outlay 782 0 0
Total Budget $4,374 $2,372 $6,000
Performance Measures
Actual Estimate Projected
Program/Service 12-13 13-14 14-15
6th Grade Math-Percent Pass 54% 70% 75%
7th Grade Math-Percent Pass 59% 70% 75%
8th Grade Math-Percent Pass 63% 70% 75%
58% 70% 75%9th Grade Math-Percent Pass
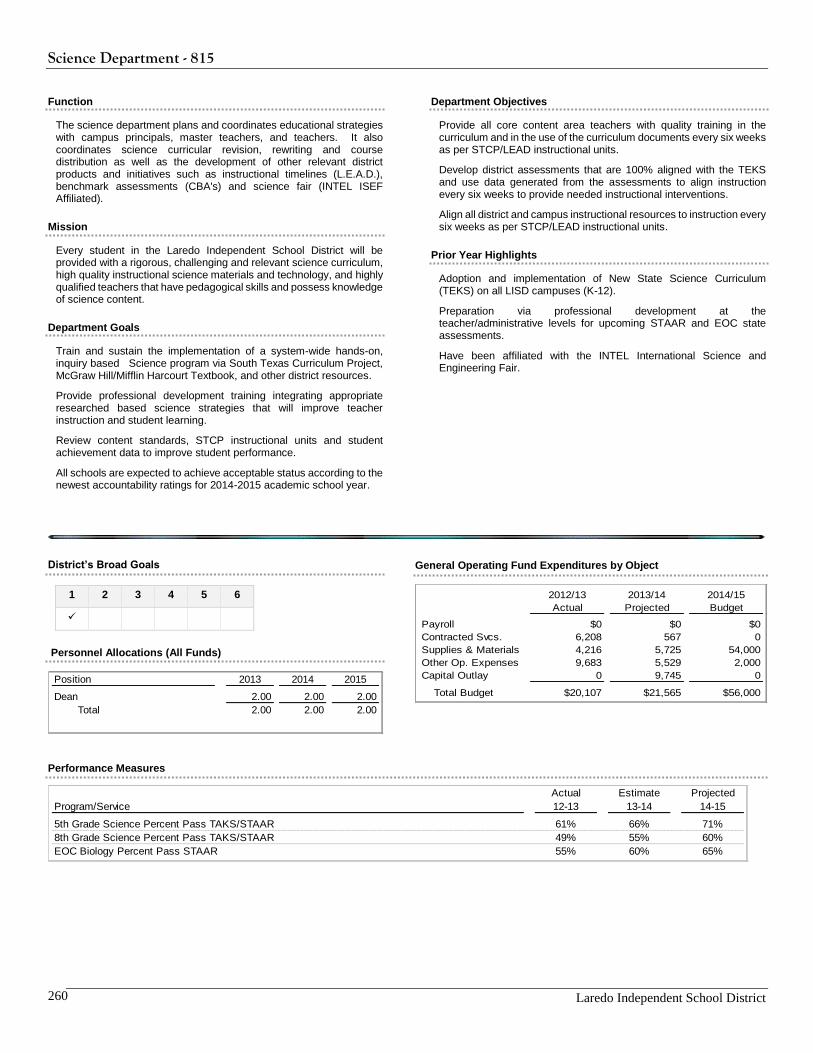
Science Department - 815
Laredo Independent School District 260
Function
The science department plans and coordinates educational strategies with campus principals, master teachers, and teachers. It also coordinates science curricular revision, rewriting and course distribution as well as the development of other relevant district products and initiatives such as instructional timelines (L.E.A.D.), benchmark assessments (CBA's) and science fair (INTEL ISEF Affiliated).
Mission
Every student in the Laredo Independent School District will be provided with a rigorous, challenging and relevant science curriculum, high quality instructional science materials and technology, and highly qualified teachers that have pedagogical skills and possess knowledge of science content.
Department Goals
Train and sustain the implementation of a system-wide hands-on, inquiry based Science program via South Texas Curriculum Project, McGraw Hill/Mifflin Harcourt Textbook, and other district resources.
Provide professional development training integrating appropriate researched based science strategies that will improve teacher instruction and student learning.
Review content standards, STCP instructional units and student achievement data to improve student performance.
All schools are expected to achieve acceptable status according to the newest accountability ratings for 2014-2015 academic school year.
Department Objectives
Provide all core content area teachers with quality training in the curriculum and in the use of the curriculum documents every six weeks as per STCP/LEAD instructional units.
Develop district assessments that are 100% aligned with the TEKS and use data generated from the assessments to align instruction every six weeks to provide needed instructional interventions.
Align all district and campus instructional resources to instruction every six weeks as per STCP/LEAD instructional units.
Prior Year Highlights
Adoption and implementation of New State Science Curriculum (TEKS) on all LISD campuses (K-12).
Preparation via professional development at the teacher/administrative levels for upcoming STAAR and EOC state assessments.
Have been affiliated with the INTEL International Science and Engineering Fair.
District’s Broad Goals
1 2 3 4 5 6
Personnel Allocations (All Funds)
General Operating Fund Expenditures by Object
2012/13 2013/14 2014/15
Actual Projected Budget
Payroll $0 $0 $0
Contracted Svcs. 6,208 567 0
Supplies & Materials 4,216 5,725 54,000
Other Op. Expenses 9,683 5,529 2,000
Capital Outlay 0 9,745 0
Total Budget $20,107 $21,565 $56,000
Performance Measures
Position 2013 2014 2015
Dean 2.00 2.00 2.00
Total 2.00 2.00 2.00
Actual Estimate Projected
Program/Service 12-13 13-14 14-15
5th Grade Science Percent Pass TAKS/STAAR 61% 66% 71%
8th Grade Science Percent Pass TAKS/STAAR 49% 55% 60%
55% 60% 65%EOC Biology Percent Pass STAAR
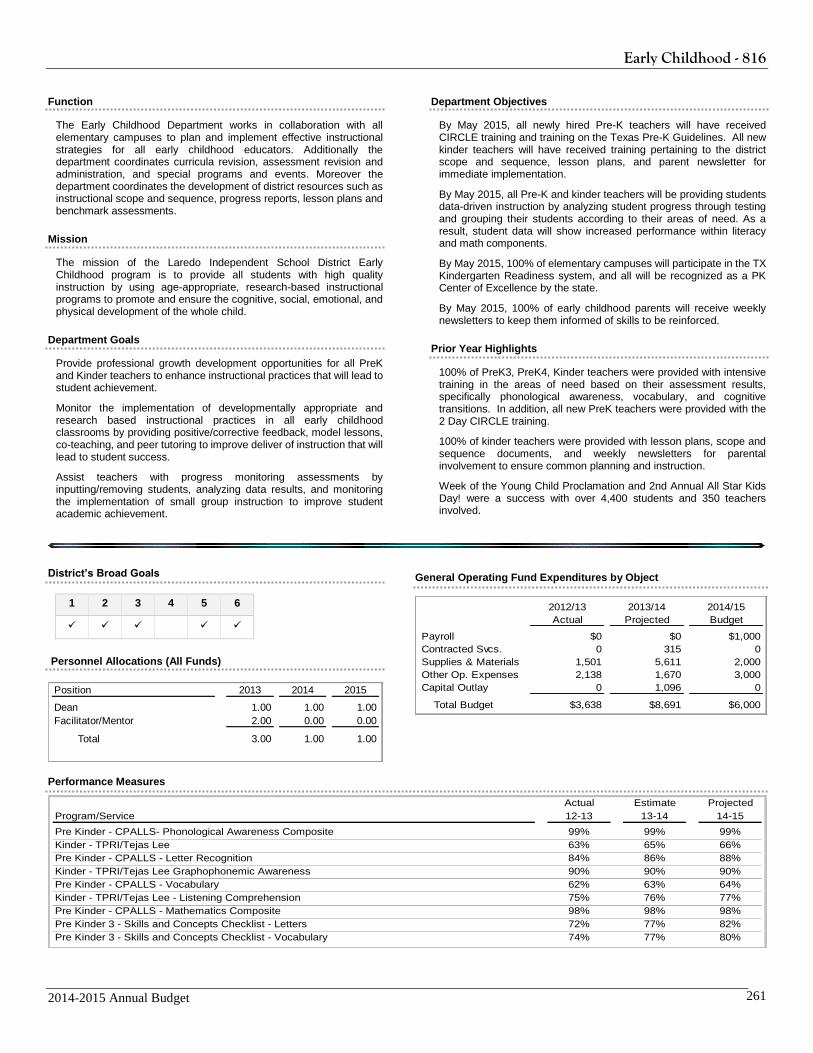
Early Childhood - 816
2014-2015 Annual Budget 261
Function
The Early Childhood Department works in collaboration with all elementary campuses to plan and implement effective instructional strategies for all early childhood educators. Additionally the department coordinates curricula revision, assessment revision and administration, and special programs and events. Moreover the department coordinates the development of district resources such as instructional scope and sequence, progress reports, lesson plans and benchmark assessments.
Mission
The mission of the Laredo Independent School District Early Childhood program is to provide all students with high quality instruction by using age-appropriate, research-based instructional programs to promote and ensure the cognitive, social, emotional, and physical development of the whole child.
Department Goals
Provide professional growth development opportunities for all PreK and Kinder teachers to enhance instructional practices that will lead to student achievement.
Monitor the implementation of developmentally appropriate and research based instructional practices in all early childhood classrooms by providing positive/corrective feedback, model lessons, co-teaching, and peer tutoring to improve deliver of instruction that will lead to student success.
Assist teachers with progress monitoring assessments by inputting/removing students, analyzing data results, and monitoring the implementation of small group instruction to improve student academic achievement.
Department Objectives
By May 2015, all newly hired Pre-K teachers will have received CIRCLE training and training on the Texas Pre-K Guidelines. All new kinder teachers will have received training pertaining to the district scope and sequence, lesson plans, and parent newsletter for immediate implementation.
By May 2015, all Pre-K and kinder teachers will be providing students data-driven instruction by analyzing student progress through testing and grouping their students according to their areas of need. As a result, student data will show increased performance within literacy and math components.
By May 2015, 100% of elementary campuses will participate in the TX Kindergarten Readiness system, and all will be recognized as a PK Center of Excellence by the state.
By May 2015, 100% of early childhood parents will receive weekly newsletters to keep them informed of skills to be reinforced.
Prior Year Highlights
100% of PreK3, PreK4, Kinder teachers were provided with intensive training in the areas of need based on their assessment results, specifically phonological awareness, vocabulary, and cognitive transitions. In addition, all new PreK teachers were provided with the 2 Day CIRCLE training.
100% of kinder teachers were provided with lesson plans, scope and sequence documents, and weekly newsletters for parental involvement to ensure common planning and instruction.
Week of the Young Child Proclamation and 2nd Annual All Star Kids Day! were a success with over 4,400 students and 350 teachers involved.
District’s Broad Goals
1 2 3 4 5 6
Personnel Allocations (All Funds)
General Operating Fund Expenditures by Object
2012/13 2013/14 2014/15
Actual Projected Budget
Payroll $0 $0 $1,000
Contracted Svcs. 0 315 0
Supplies & Materials 1,501 5,611 2,000
Other Op. Expenses 2,138 1,670 3,000
Capital Outlay 0 1,096 0
Total Budget $3,638 $8,691 $6,000
Performance Measures
Actual Estimate Projected
Program/Service 12-13 13-14 14-15
Pre Kinder - CPALLS- Phonological Awareness Composite 99% 99% 99%
Kinder - TPRI/Tejas Lee 63% 65% 66%
Pre Kinder - CPALLS - Letter Recognition 84% 86% 88%
Kinder - TPRI/Tejas Lee Graphophonemic Awareness 90% 90% 90%
Pre Kinder - CPALLS - Vocabulary 62% 63% 64%
Kinder - TPRI/Tejas Lee - Listening Comprehension 75% 76% 77%
Pre Kinder - CPALLS - Mathematics Composite 98% 98% 98%
Pre Kinder 3 - Skills and Concepts Checklist - Letters 72% 77% 82%
Pre Kinder 3 - Skills and Concepts Checklist - Vocabulary 74% 77% 80%
Position 2013 2014 2015
Dean 1.00 1.00 1.00
Facilitator/Mentor 2.00 0.00 0.00
Total 3.00 1.00 1.00
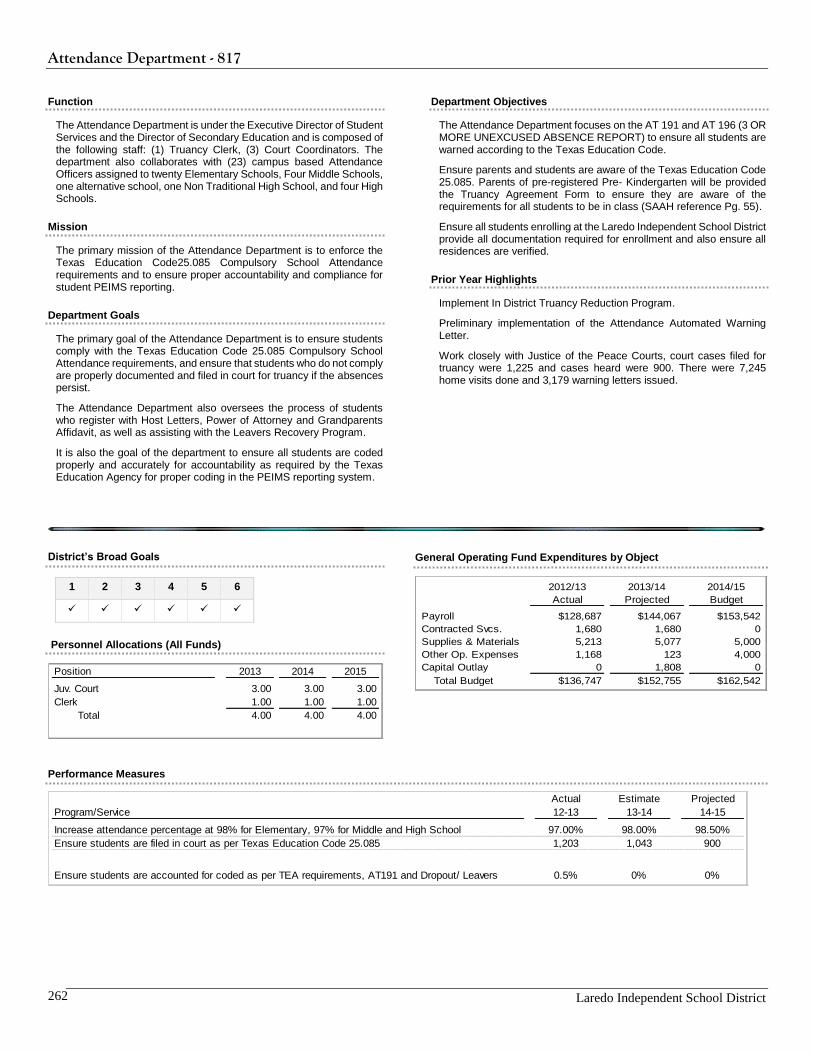
Attendance Department - 817
Laredo Independent School District 262
Function
The Attendance Department is under the Executive Director of Student Services and the Director of Secondary Education and is composed of the following staff: (1) Truancy Clerk, (3) Court Coordinators. The department also collaborates with (23) campus based Attendance Officers assigned to twenty Elementary Schools, Four Middle Schools, one alternative school, one Non Traditional High School, and four High Schools.
Mission
The primary mission of the Attendance Department is to enforce the Texas Education Code25.085 Compulsory School Attendance requirements and to ensure proper accountability and compliance for student PEIMS reporting.
Department Goals
The primary goal of the Attendance Department is to ensure students comply with the Texas Education Code 25.085 Compulsory School Attendance requirements, and ensure that students who do not comply are properly documented and filed in court for truancy if the absences persist.
The Attendance Department also oversees the process of students who register with Host Letters, Power of Attorney and Grandparents Affidavit, as well as assisting with the Leavers Recovery Program.
It is also the goal of the department to ensure all students are coded properly and accurately for accountability as required by the Texas Education Agency for proper coding in the PEIMS reporting system.
Department Objectives
The Attendance Department focuses on the AT 191 and AT 196 (3 OR MORE UNEXCUSED ABSENCE REPORT) to ensure all students are warned according to the Texas Education Code.
Ensure parents and students are aware of the Texas Education Code 25.085. Parents of pre-registered Pre- Kindergarten will be provided the Truancy Agreement Form to ensure they are aware of the requirements for all students to be in class (SAAH reference Pg. 55).
Ensure all students enrolling at the Laredo Independent School District provide all documentation required for enrollment and also ensure all residences are verified.
Prior Year Highlights
Implement In District Truancy Reduction Program.
Preliminary implementation of the Attendance Automated Warning Letter.
Work closely with Justice of the Peace Courts, court cases filed for truancy were 1,225 and cases heard were 900. There were 7,245 home visits done and 3,179 warning letters issued.
District’s Broad Goals
1 2 3 4 5 6
Personnel Allocations (All Funds)
General Operating Fund Expenditures by Object
2012/13 2013/14 2014/15
Actual Projected Budget
Payroll $128,687 $144,067 $153,542
Contracted Svcs. 1,680 1,680 0
Supplies & Materials 5,213 5,077 5,000
Other Op. Expenses 1,168 123 4,000
Capital Outlay 0 1,808 0
Total Budget $136,747 $152,755 $162,542
Performance Measures
Position 2013 2014 2015
Juv. Court 3.00 3.00 3.00
Clerk 1.00 1.00 1.00
Total 4.00 4.00 4.00
Actual Estimate Projected
Program/Service 12-13 13-14 14-15
Increase attendance percentage at 98% for Elementary, 97% for Middle and High School 97.00% 98.00% 98.50%
Ensure students are filed in court as per Texas Education Code 25.085 1,203 1,043 900
0.5% 0% 0%Ensure students are accounted for coded as per TEA requirements, AT191 and Dropout/ Leavers
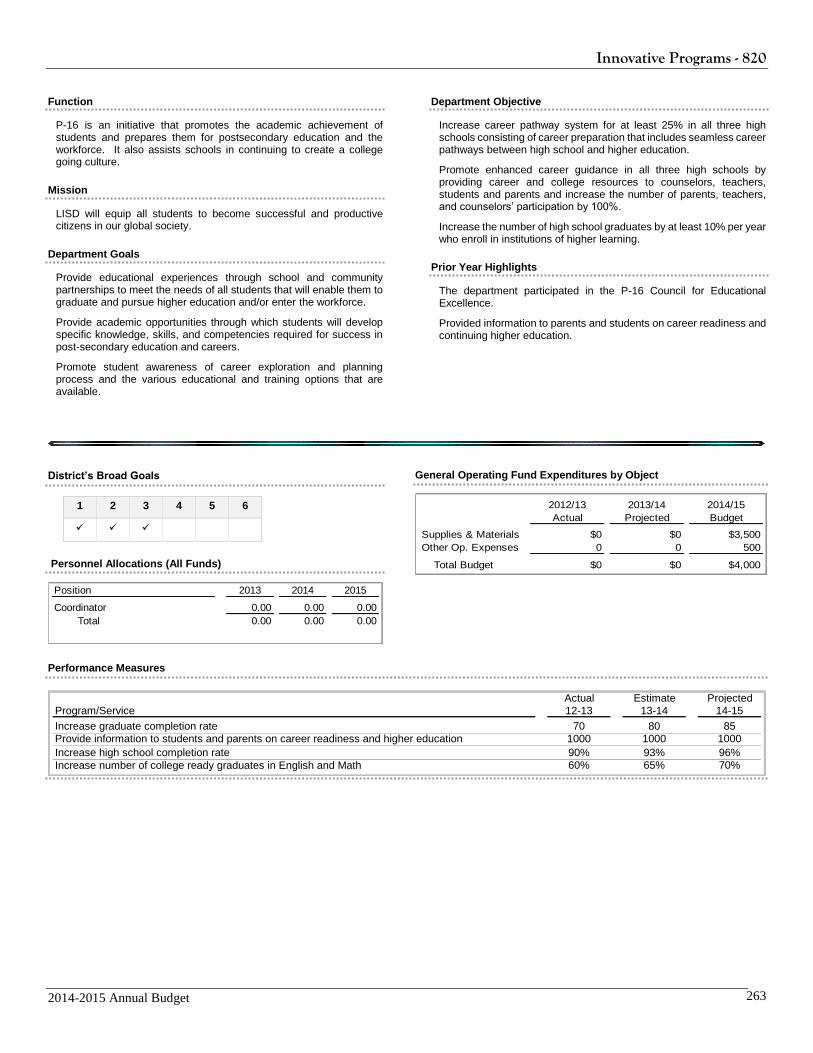
Innovative Programs - 820
2014-2015 Annual Budget 263
Function
P-16 is an initiative that promotes the academic achievement of students and prepares them for postsecondary education and the workforce. It also assists schools in continuing to create a college going culture.
Mission
LISD will equip all students to become successful and productive citizens in our global society.
Department Goals
Provide educational experiences through school and community partnerships to meet the needs of all students that will enable them to graduate and pursue higher education and/or enter the workforce.
Provide academic opportunities through which students will develop specific knowledge, skills, and competencies required for success in post-secondary education and careers.
Promote student awareness of career exploration and planning process and the various educational and training options that are available.
Department Objective
Increase career pathway system for at least 25% in all three high schools consisting of career preparation that includes seamless career pathways between high school and higher education.
Promote enhanced career guidance in all three high schools by providing career and college resources to counselors, teachers, students and parents and increase the number of parents, teachers, and counselors’ participation by 100%.
Increase the number of high school graduates by at least 10% per year who enroll in institutions of higher learning.
Prior Year Highlights
The department participated in the P-16 Council for Educational Excellence.
Provided information to parents and students on career readiness and continuing higher education.
District’s Broad Goals
1 2 3 4 5 6
Personnel Allocations (All Funds)
General Operating Fund Expenditures by Object
2012/13 2013/14 2014/15
Actual Projected Budget
Supplies & Materials $0 $0 $3,500
Other Op. Expenses 0 0 500
Total Budget $0 $0 $4,000
Performance Measures
Actual Estimate Projected
Program/Service 12-13 13-14 14-15
Increase graduate completion rate 70 80 85
Provide information to students and parents on career readiness and higher education 1000 1000 1000
Increase high school completion rate 90% 93% 96%
60% 65% 70%Increase number of college ready graduates in English and Math
Position 2013 2014 2015
Coordinator 0.00 0.00 0.00
Total 0.00 0.00 0.00
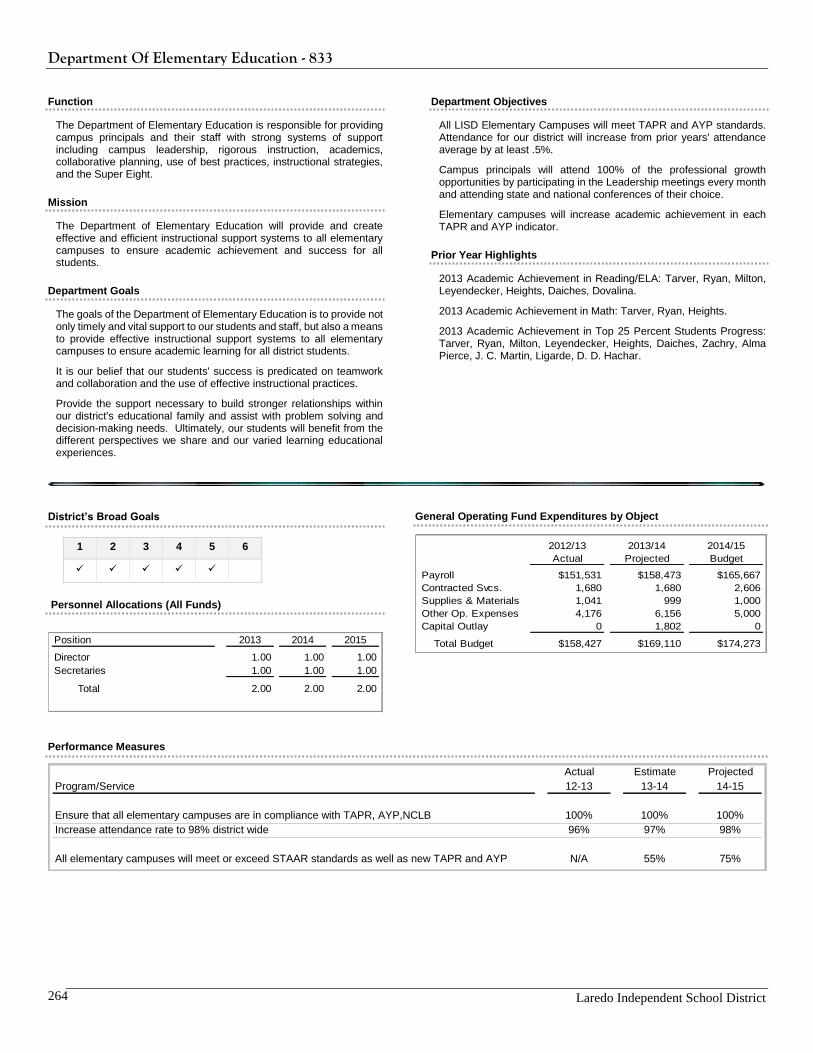
Department Of Elementary Education - 833
Laredo Independent School District 264
Function
The Department of Elementary Education is responsible for providing campus principals and their staff with strong systems of support including campus leadership, rigorous instruction, academics, collaborative planning, use of best practices, instructional strategies, and the Super Eight.
Mission
The Department of Elementary Education will provide and create effective and efficient instructional support systems to all elementary campuses to ensure academic achievement and success for all students.
Department Goals
The goals of the Department of Elementary Education is to provide not only timely and vital support to our students and staff, but also a means to provide effective instructional support systems to all elementary campuses to ensure academic learning for all district students.
It is our belief that our students' success is predicated on teamwork and collaboration and the use of effective instructional practices.
Provide the support necessary to build stronger relationships within our district's educational family and assist with problem solving and decision-making needs. Ultimately, our students will benefit from the different perspectives we share and our varied learning educational experiences.
Department Objectives
All LISD Elementary Campuses will meet TAPR and AYP standards. Attendance for our district will increase from prior years' attendance average by at least .5%.
Campus principals will attend 100% of the professional growth opportunities by participating in the Leadership meetings every month and attending state and national conferences of their choice.
Elementary campuses will increase academic achievement in each TAPR and AYP indicator.
Prior Year Highlights
2013 Academic Achievement in Reading/ELA: Tarver, Ryan, Milton, Leyendecker, Heights, Daiches, Dovalina.
2013 Academic Achievement in Math: Tarver, Ryan, Heights.
2013 Academic Achievement in Top 25 Percent Students Progress: Tarver, Ryan, Milton, Leyendecker, Heights, Daiches, Zachry, Alma Pierce, J. C. Martin, Ligarde, D. D. Hachar.
District’s Broad Goals
1 2 3 4 5 6
Personnel Allocations (All Funds)
General Operating Fund Expenditures by Object
2012/13 2013/14 2014/15
Actual Projected Budget
Payroll $151,531 $158,473 $165,667
Contracted Svcs. 1,680 1,680 2,606
Supplies & Materials 1,041 999 1,000
Other Op. Expenses 4,176 6,156 5,000
Capital Outlay 0 1,802 0
Total Budget $158,427 $169,110 $174,273
Performance Measures
Actual Estimate Projected
Program/Service 12-13 13-14 14-15
Ensure that all elementary campuses are in compliance with TAPR, AYP,NCLB 100% 100% 100%
Increase attendance rate to 98% district wide 96% 97% 98%
All elementary campuses will meet or exceed STAAR standards as well as new TAPR and AYP N/A 55% 75%
Position 2013 2014 2015
Director 1.00 1.00 1.00
Secretaries 1.00 1.00 1.00
Total 2.00 2.00 2.00
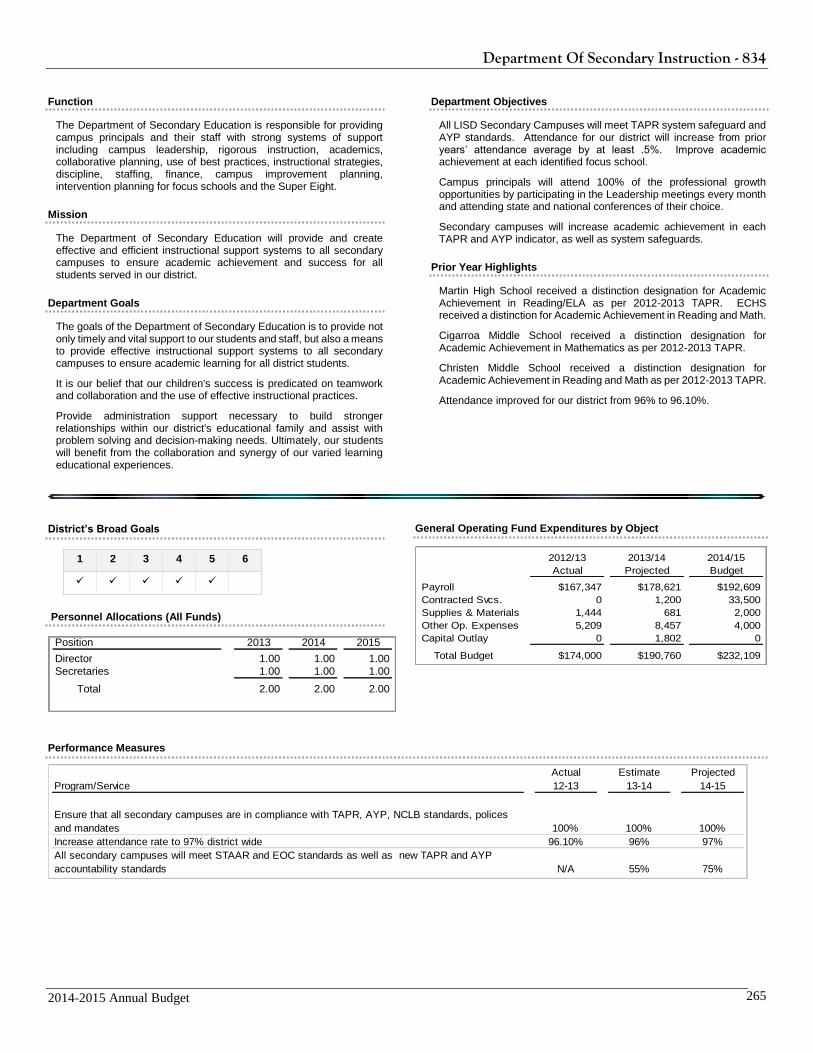
Department Of Secondary Instruction - 834
2014-2015 Annual Budget 265
Function
The Department of Secondary Education is responsible for providing campus principals and their staff with strong systems of support including campus leadership, rigorous instruction, academics, collaborative planning, use of best practices, instructional strategies, discipline, staffing, finance, campus improvement planning, intervention planning for focus schools and the Super Eight.
Mission
The Department of Secondary Education will provide and create effective and efficient instructional support systems to all secondary campuses to ensure academic achievement and success for all students served in our district.
Department Goals
The goals of the Department of Secondary Education is to provide not only timely and vital support to our students and staff, but also a means to provide effective instructional support systems to all secondary campuses to ensure academic learning for all district students.
It is our belief that our children's success is predicated on teamwork and collaboration and the use of effective instructional practices.
Provide administration support necessary to build stronger relationships within our district's educational family and assist with problem solving and decision-making needs. Ultimately, our students will benefit from the collaboration and synergy of our varied learning educational experiences.
Department Objectives
All LISD Secondary Campuses will meet TAPR system safeguard and AYP standards. Attendance for our district will increase from prior years’ attendance average by at least .5%. Improve academic achievement at each identified focus school.
Campus principals will attend 100% of the professional growth opportunities by participating in the Leadership meetings every month and attending state and national conferences of their choice.
Secondary campuses will increase academic achievement in each TAPR and AYP indicator, as well as system safeguards.
Prior Year Highlights
Martin High School received a distinction designation for Academic Achievement in Reading/ELA as per 2012-2013 TAPR. ECHS received a distinction for Academic Achievement in Reading and Math.
Cigarroa Middle School received a distinction designation for Academic Achievement in Mathematics as per 2012-2013 TAPR.
Christen Middle School received a distinction designation for Academic Achievement in Reading and Math as per 2012-2013 TAPR.
Attendance improved for our district from 96% to 96.10%.
District’s Broad Goals
1 2 3 4 5 6
Personnel Allocations (All Funds)
Position 2013 2014 2015
Director 1.00 1.00 1.00
Secretaries 1.00 1.00 1.00
Total 2.00 2.00 2.00
General Operating Fund Expenditures by Object
2012/13 2013/14 2014/15
Actual Projected Budget
Payroll $167,347 $178,621 $192,609
Contracted Svcs. 0 1,200 33,500
Supplies & Materials 1,444 681 2,000
Other Op. Expenses 5,209 8,457 4,000
Capital Outlay 0 1,802 0
Total Budget $174,000 $190,760 $232,109
Performance Measures
Actual Estimate Projected
Program/Service 12-13 13-14 14-15
Ensure that all secondary campuses are in compliance with TAPR, AYP, NCLB standards, polices
and mandates 100% 100% 100%
Increase attendance rate to 97% district wide 96.10% 96% 97%
All secondary campuses will meet STAAR and EOC standards as well as new TAPR and AYP
accountability standards N/A 55% 75%
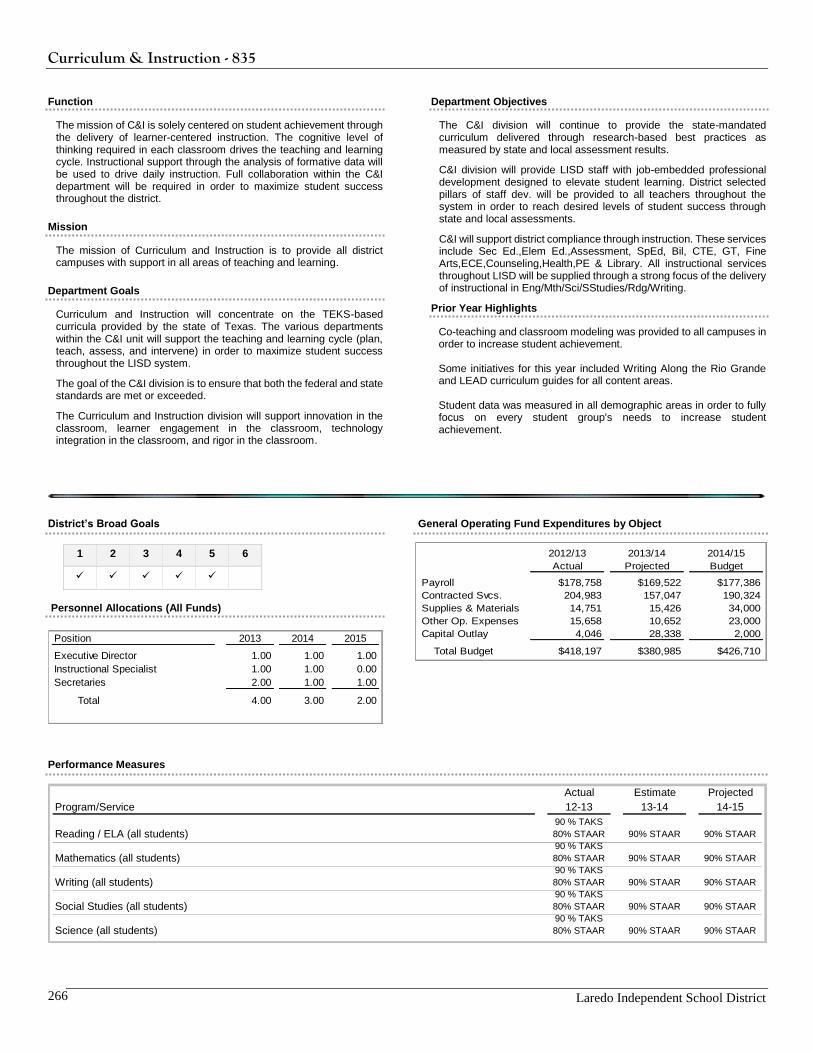
Curriculum & Instruction - 835
Laredo Independent School District 266
Function
The mission of C&I is solely centered on student achievement through the delivery of learner-centered instruction. The cognitive level of thinking required in each classroom drives the teaching and learning cycle. Instructional support through the analysis of formative data will be used to drive daily instruction. Full collaboration within the C&I department will be required in order to maximize student success throughout the district.
Mission
The mission of Curriculum and Instruction is to provide all district campuses with support in all areas of teaching and learning.
Department Goals
Curriculum and Instruction will concentrate on the TEKS-based curricula provided by the state of Texas. The various departments within the C&I unit will support the teaching and learning cycle (plan, teach, assess, and intervene) in order to maximize student success throughout the LISD system.
The goal of the C&I division is to ensure that both the federal and state standards are met or exceeded.
The Curriculum and Instruction division will support innovation in the classroom, learner engagement in the classroom, technology integration in the classroom, and rigor in the classroom.
Department Objectives
The C&I division will continue to provide the state-mandated curriculum delivered through research-based best practices as measured by state and local assessment results.
C&I division will provide LISD staff with job-embedded professional development designed to elevate student learning. District selected pillars of staff dev. will be provided to all teachers throughout the system in order to reach desired levels of student success through state and local assessments.
C&I will support district compliance through instruction. These services include Sec Ed.,Elem Ed.,Assessment, SpEd, Bil, CTE, GT, Fine Arts,ECE,Counseling,Health,PE & Library. All instructional services throughout LISD will be supplied through a strong focus of the delivery of instructional in Eng/Mth/Sci/SStudies/Rdg/Writing.
Prior Year Highlights
Co-teaching and classroom modeling was provided to all campuses in order to increase student achievement. Some initiatives for this year included Writing Along the Rio Grande and LEAD curriculum guides for all content areas. Student data was measured in all demographic areas in order to fully focus on every student group's needs to increase student achievement.
District’s Broad Goals
1 2 3 4 5 6
Personnel Allocations (All Funds)
General Operating Fund Expenditures by Object
2012/13 2013/14 2014/15
Actual Projected Budget
Payroll $178,758 $169,522 $177,386
Contracted Svcs. 204,983 157,047 190,324
Supplies & Materials 14,751 15,426 34,000
Other Op. Expenses 15,658 10,652 23,000
Capital Outlay 4,046 28,338 2,000
Total Budget $418,197 $380,985 $426,710
Performance Measures
Actual Estimate Projected
Program/Service 12-13 13-14 14-15
Reading / ELA (all students)90 % TAKS
80% STAAR 90% STAAR 90% STAAR
Mathematics (all students)90 % TAKS
80% STAAR 90% STAAR 90% STAAR
Writing (all students)90 % TAKS
80% STAAR 90% STAAR 90% STAAR
Social Studies (all students)90 % TAKS
80% STAAR 90% STAAR 90% STAAR
Science (all students)90 % TAKS
80% STAAR 90% STAAR 90% STAAR
Position 2013 2014 2015
Executive Director 1.00 1.00 1.00
Instructional Specialist 1.00 1.00 0.00
Secretaries 2.00 1.00 1.00
Total 4.00 3.00 2.00
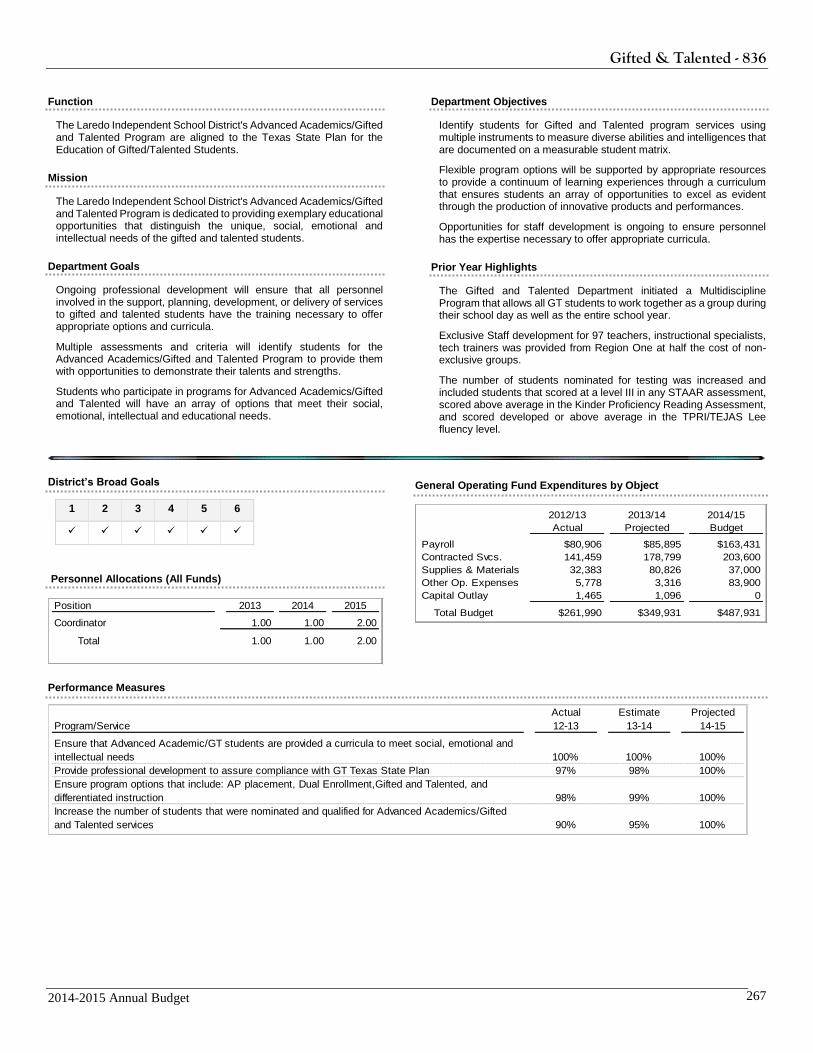
Gifted & Talented - 836
2014-2015 Annual Budget 267
Function
The Laredo Independent School District's Advanced Academics/Gifted and Talented Program are aligned to the Texas State Plan for the Education of Gifted/Talented Students.
Mission
The Laredo Independent School District's Advanced Academics/Gifted and Talented Program is dedicated to providing exemplary educational opportunities that distinguish the unique, social, emotional and intellectual needs of the gifted and talented students.
Department Goals
Ongoing professional development will ensure that all personnel involved in the support, planning, development, or delivery of services to gifted and talented students have the training necessary to offer appropriate options and curricula.
Multiple assessments and criteria will identify students for the Advanced Academics/Gifted and Talented Program to provide them with opportunities to demonstrate their talents and strengths.
Students who participate in programs for Advanced Academics/Gifted and Talented will have an array of options that meet their social, emotional, intellectual and educational needs.
Department Objectives
Identify students for Gifted and Talented program services using multiple instruments to measure diverse abilities and intelligences that are documented on a measurable student matrix.
Flexible program options will be supported by appropriate resources to provide a continuum of learning experiences through a curriculum that ensures students an array of opportunities to excel as evident through the production of innovative products and performances.
Opportunities for staff development is ongoing to ensure personnel has the expertise necessary to offer appropriate curricula.
Prior Year Highlights
The Gifted and Talented Department initiated a Multidiscipline Program that allows all GT students to work together as a group during their school day as well as the entire school year.
Exclusive Staff development for 97 teachers, instructional specialists, tech trainers was provided from Region One at half the cost of non-exclusive groups.
The number of students nominated for testing was increased and included students that scored at a level III in any STAAR assessment, scored above average in the Kinder Proficiency Reading Assessment, and scored developed or above average in the TPRI/TEJAS Lee fluency level.
District’s Broad Goals
1 2 3 4 5 6
Personnel Allocations (All Funds)
General Operating Fund Expenditures by Object
2012/13 2013/14 2014/15
Actual Projected Budget
Payroll $80,906 $85,895 $163,431
Contracted Svcs. 141,459 178,799 203,600
Supplies & Materials 32,383 80,826 37,000
Other Op. Expenses 5,778 3,316 83,900
Capital Outlay 1,465 1,096 0
Total Budget $261,990 $349,931 $487,931
Performance Measures
Position 2013 2014 2015
Coordinator 1.00 1.00 2.00
Total 1.00 1.00 2.00
Actual Estimate Projected
Program/Service 12-13 13-14 14-15
Ensure that Advanced Academic/GT students are provided a curricula to meet social, emotional and
intellectual needs 100% 100% 100%
Provide professional development to assure compliance with GT Texas State Plan 97% 98% 100%
Ensure program options that include: AP placement, Dual Enrollment,Gifted and Talented, and
differentiated instruction 98% 99% 100%
Increase the number of students that were nominated and qualified for Advanced Academics/Gifted
and Talented services 90% 95% 100%
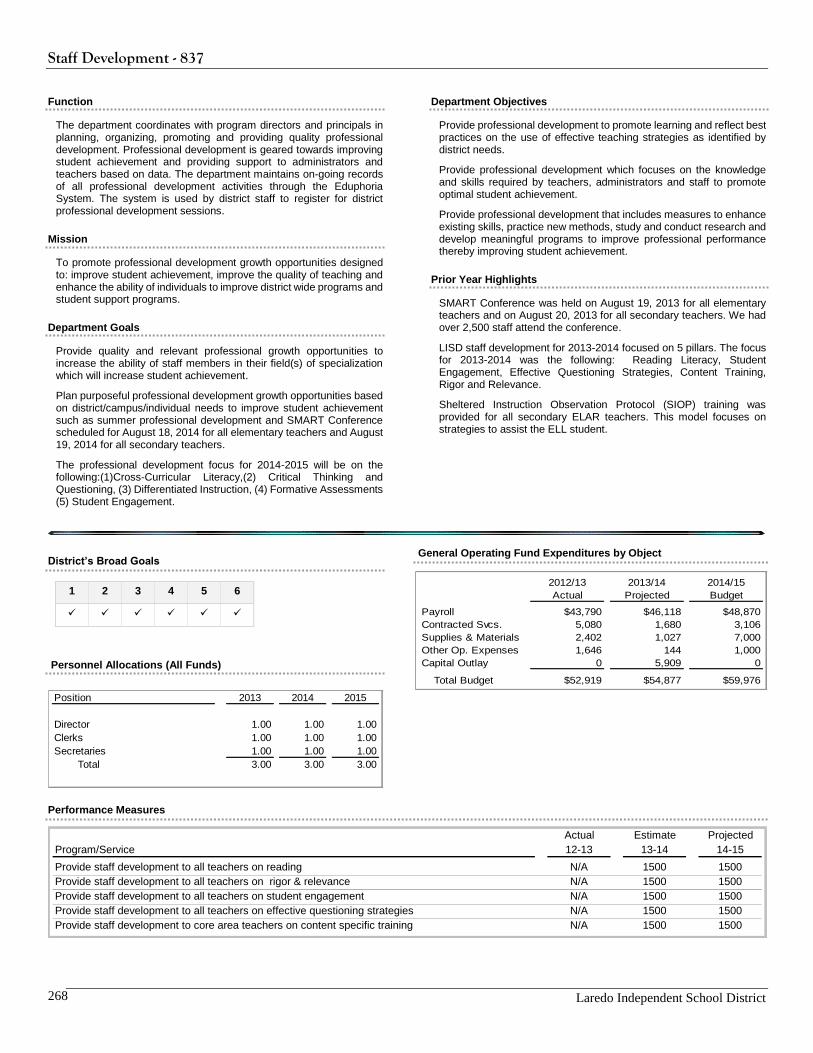
Staff Development - 837
Laredo Independent School District 268
Function
The department coordinates with program directors and principals in planning, organizing, promoting and providing quality professional development. Professional development is geared towards improving student achievement and providing support to administrators and teachers based on data. The department maintains on-going records of all professional development activities through the Eduphoria System. The system is used by district staff to register for district professional development sessions.
Mission
To promote professional development growth opportunities designed to: improve student achievement, improve the quality of teaching and enhance the ability of individuals to improve district wide programs and student support programs.
Department Goals
Provide quality and relevant professional growth opportunities to increase the ability of staff members in their field(s) of specialization which will increase student achievement.
Plan purposeful professional development growth opportunities based on district/campus/individual needs to improve student achievement such as summer professional development and SMART Conference scheduled for August 18, 2014 for all elementary teachers and August 19, 2014 for all secondary teachers.
The professional development focus for 2014-2015 will be on the following:(1)Cross-Curricular Literacy,(2) Critical Thinking and Questioning, (3) Differentiated Instruction, (4) Formative Assessments (5) Student Engagement.
Department Objectives
Provide professional development to promote learning and reflect best practices on the use of effective teaching strategies as identified by district needs.
Provide professional development which focuses on the knowledge and skills required by teachers, administrators and staff to promote optimal student achievement.
Provide professional development that includes measures to enhance existing skills, practice new methods, study and conduct research and develop meaningful programs to improve professional performance thereby improving student achievement.
Prior Year Highlights
SMART Conference was held on August 19, 2013 for all elementary teachers and on August 20, 2013 for all secondary teachers. We had over 2,500 staff attend the conference.
LISD staff development for 2013-2014 focused on 5 pillars. The focus for 2013-2014 was the following: Reading Literacy, Student Engagement, Effective Questioning Strategies, Content Training, Rigor and Relevance.
Sheltered Instruction Observation Protocol (SIOP) training was provided for all secondary ELAR teachers. This model focuses on strategies to assist the ELL student.
District’s Broad Goals
1 2 3 4 5 6
Personnel Allocations (All Funds)
General Operating Fund Expenditures by Object
2012/13 2013/14 2014/15
Actual Projected Budget
Payroll $43,790 $46,118 $48,870
Contracted Svcs. 5,080 1,680 3,106
Supplies & Materials 2,402 1,027 7,000
Other Op. Expenses 1,646 144 1,000
Capital Outlay 0 5,909 0
Total Budget $52,919 $54,877 $59,976
Performance Measures
Actual Estimate Projected
Program/Service 12-13 13-14 14-15
Provide staff development to all teachers on reading N/A 1500 1500
Provide staff development to all teachers on rigor & relevance N/A 1500 1500
Provide staff development to all teachers on student engagement N/A 1500 1500
Provide staff development to all teachers on effective questioning strategies N/A 1500 1500
Provide staff development to core area teachers on content specific training N/A 1500 1500
Position 2013 2014 2015
Director 1.00 1.00 1.00
Clerks 1.00 1.00 1.00
Secretaries 1.00 1.00 1.00
Total 3.00 3.00 3.00
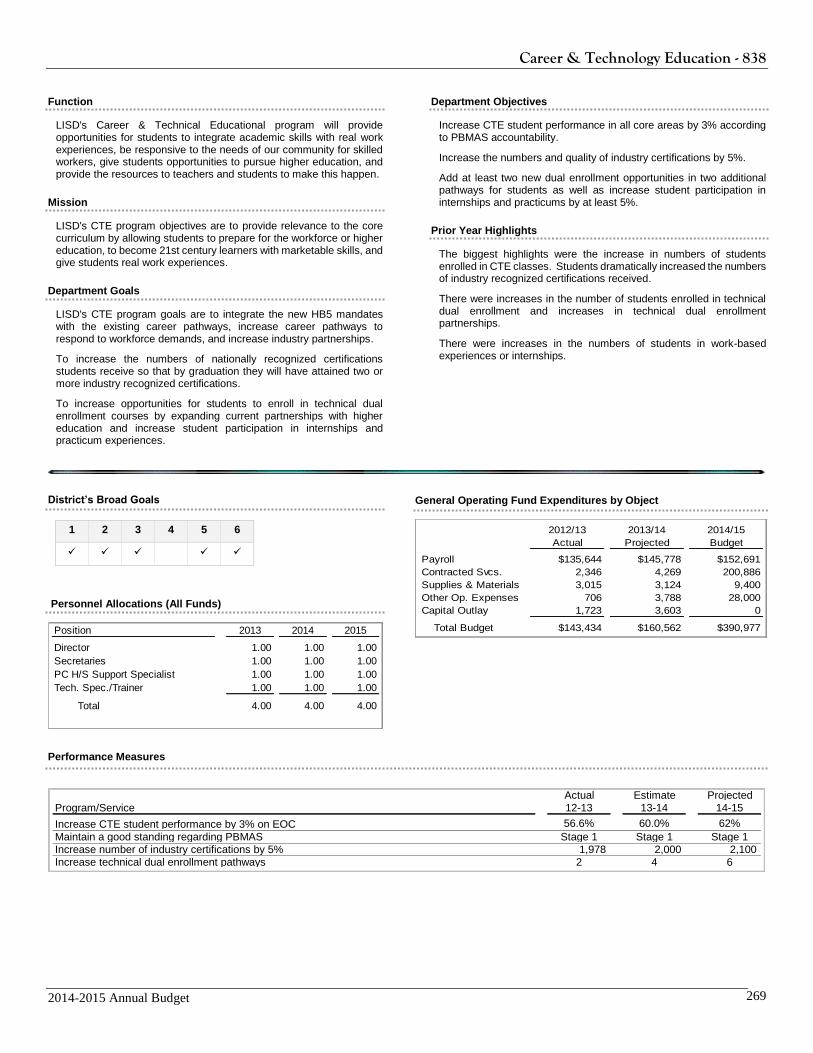
Career & Technology Education - 838
2014-2015 Annual Budget 269
Function
LISD's Career & Technical Educational program will provide opportunities for students to integrate academic skills with real work experiences, be responsive to the needs of our community for skilled workers, give students opportunities to pursue higher education, and provide the resources to teachers and students to make this happen.
Mission
LISD's CTE program objectives are to provide relevance to the core curriculum by allowing students to prepare for the workforce or higher education, to become 21st century learners with marketable skills, and give students real work experiences.
Department Goals
LISD's CTE program goals are to integrate the new HB5 mandates with the existing career pathways, increase career pathways to respond to workforce demands, and increase industry partnerships.
To increase the numbers of nationally recognized certifications students receive so that by graduation they will have attained two or more industry recognized certifications.
To increase opportunities for students to enroll in technical dual enrollment courses by expanding current partnerships with higher education and increase student participation in internships and practicum experiences.
Department Objectives
Increase CTE student performance in all core areas by 3% according to PBMAS accountability.
Increase the numbers and quality of industry certifications by 5%.
Add at least two new dual enrollment opportunities in two additional pathways for students as well as increase student participation in internships and practicums by at least 5%.
Prior Year Highlights
The biggest highlights were the increase in numbers of students enrolled in CTE classes. Students dramatically increased the numbers of industry recognized certifications received.
There were increases in the number of students enrolled in technical dual enrollment and increases in technical dual enrollment partnerships.
There were increases in the numbers of students in work-based experiences or internships.
District’s Broad Goals
1 2 3 4 5 6
Personnel Allocations (All Funds)
General Operating Fund Expenditures by Object
2012/13 2013/14 2014/15
Actual Projected Budget
Payroll $135,644 $145,778 $152,691
Contracted Svcs. 2,346 4,269 200,886
Supplies & Materials 3,015 3,124 9,400
Other Op. Expenses 706 3,788 28,000
Capital Outlay 1,723 3,603 0
Total Budget $143,434 $160,562 $390,977
Performance Measures
Actual Estimate Projected
Program/Service 12-13 13-14 14-15
Increase CTE student performance by 3% on EOC 56.6% 60.0% 62%
Maintain a good standing regarding PBMAS Stage 1 Stage 1 Stage 1
Increase number of industry certifications by 5% 1,978 2,000 2,100
Increase technical dual enrollment pathways 2 4 6
Position 2013 2014 2015
Director 1.00 1.00 1.00
Secretaries 1.00 1.00 1.00
PC H/S Support Specialist 1.00 1.00 1.00
Tech. Spec./Trainer 1.00 1.00 1.00
Total 4.00 4.00 4.00
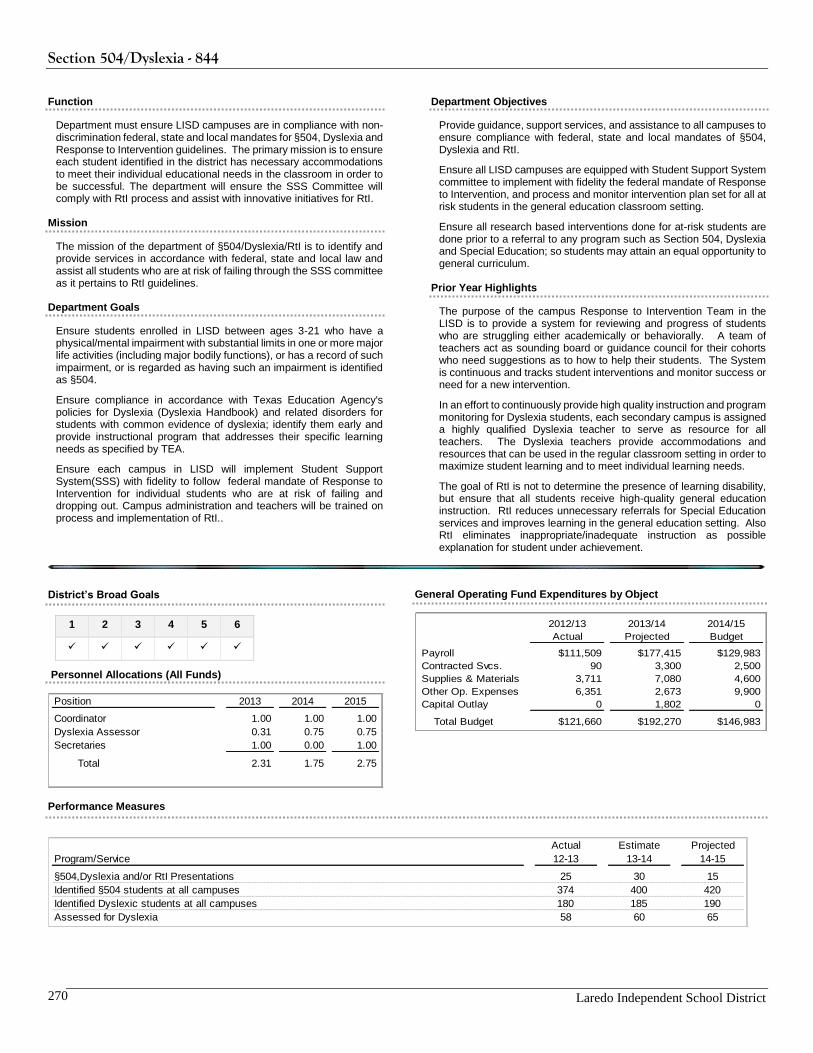
Section 504/Dyslexia - 844
Laredo Independent School District 270
Function
Department must ensure LISD campuses are in compliance with non-discrimination federal, state and local mandates for §504, Dyslexia and Response to Intervention guidelines. The primary mission is to ensure each student identified in the district has necessary accommodations to meet their individual educational needs in the classroom in order to be successful. The department will ensure the SSS Committee will comply with RtI process and assist with innovative initiatives for RtI.
Mission
The mission of the department of §504/Dyslexia/RtI is to identify and provide services in accordance with federal, state and local law and assist all students who are at risk of failing through the SSS committee as it pertains to RtI guidelines.
Department Goals
Ensure students enrolled in LISD between ages 3-21 who have a physical/mental impairment with substantial limits in one or more major life activities (including major bodily functions), or has a record of such impairment, or is regarded as having such an impairment is identified as §504.
Ensure compliance in accordance with Texas Education Agency's policies for Dyslexia (Dyslexia Handbook) and related disorders for students with common evidence of dyslexia; identify them early and provide instructional program that addresses their specific learning needs as specified by TEA.
Ensure each campus in LISD will implement Student Support System(SSS) with fidelity to follow federal mandate of Response to Intervention for individual students who are at risk of failing and dropping out. Campus administration and teachers will be trained on process and implementation of RtI..
Department Objectives
Provide guidance, support services, and assistance to all campuses to ensure compliance with federal, state and local mandates of §504, Dyslexia and RtI.
Ensure all LISD campuses are equipped with Student Support System committee to implement with fidelity the federal mandate of Response to Intervention, and process and monitor intervention plan set for all at risk students in the general education classroom setting.
Ensure all research based interventions done for at-risk students are done prior to a referral to any program such as Section 504, Dyslexia and Special Education; so students may attain an equal opportunity to general curriculum.
Prior Year Highlights
The purpose of the campus Response to Intervention Team in the LISD is to provide a system for reviewing and progress of students who are struggling either academically or behaviorally. A team of teachers act as sounding board or guidance council for their cohorts who need suggestions as to how to help their students. The System is continuous and tracks student interventions and monitor success or need for a new intervention.
In an effort to continuously provide high quality instruction and program monitoring for Dyslexia students, each secondary campus is assigned a highly qualified Dyslexia teacher to serve as resource for all teachers. The Dyslexia teachers provide accommodations and resources that can be used in the regular classroom setting in order to maximize student learning and to meet individual learning needs.
The goal of RtI is not to determine the presence of learning disability, but ensure that all students receive high-quality general education instruction. RtI reduces unnecessary referrals for Special Education services and improves learning in the general education setting. Also RtI eliminates inappropriate/inadequate instruction as possible explanation for student under achievement.
District’s Broad Goals
1 2 3 4 5 6
Personnel Allocations (All Funds)
General Operating Fund Expenditures by Object
2012/13 2013/14 2014/15
Actual Projected Budget
Payroll $111,509 $177,415 $129,983
Contracted Svcs. 90 3,300 2,500
Supplies & Materials 3,711 7,080 4,600
Other Op. Expenses 6,351 2,673 9,900
Capital Outlay 0 1,802 0
Total Budget $121,660 $192,270 $146,983
Performance Measures
Position 2013 2014 2015
Coordinator 1.00 1.00 1.00
Dyslexia Assessor 0.31 0.75 0.75
Secretaries 1.00 0.00 1.00
Total 2.31 1.75 2.75
Actual Estimate Projected
Program/Service 12-13 13-14 14-15
§504,Dyslexia and/or RtI Presentations 25 30 15
Identified §504 students at all campuses 374 400 420
Identified Dyslexic students at all campuses 180 185 190
Assessed for Dyslexia 58 60 65
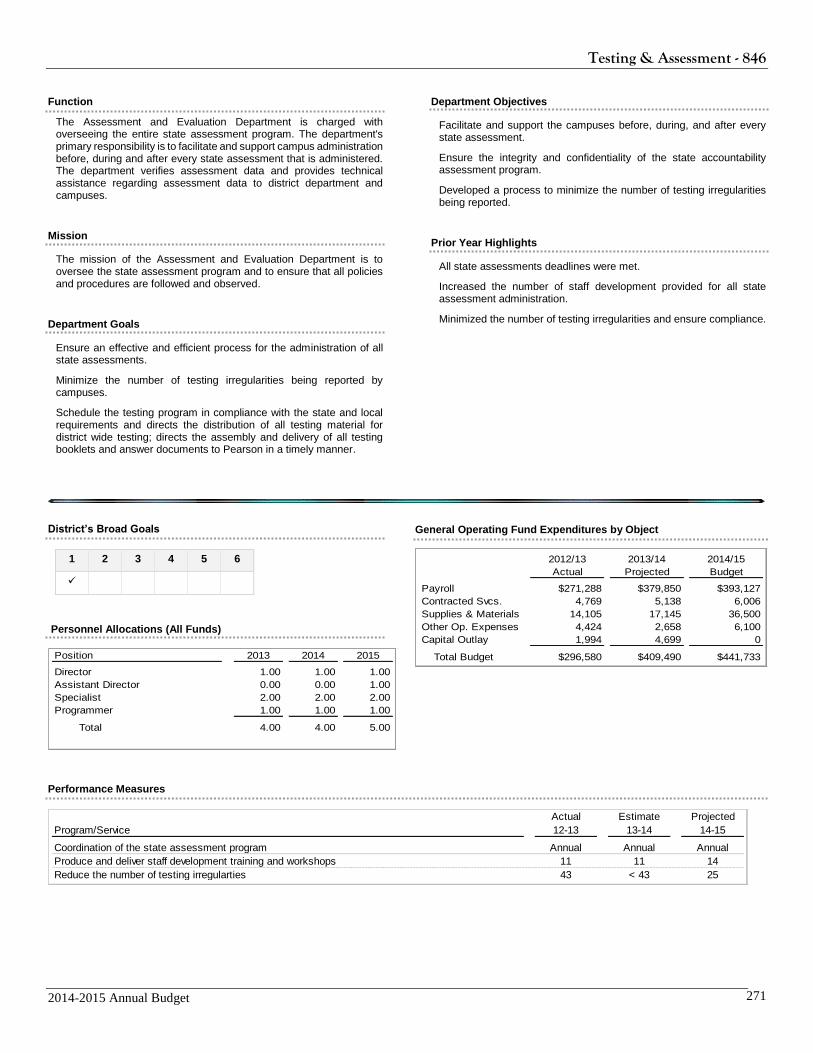
Testing & Assessment - 846
2014-2015 Annual Budget 271
Function
The Assessment and Evaluation Department is charged with overseeing the entire state assessment program. The department's primary responsibility is to facilitate and support campus administration before, during and after every state assessment that is administered. The department verifies assessment data and provides technical assistance regarding assessment data to district department and campuses.
Mission
The mission of the Assessment and Evaluation Department is to oversee the state assessment program and to ensure that all policies and procedures are followed and observed.
Department Goals
Ensure an effective and efficient process for the administration of all state assessments.
Minimize the number of testing irregularities being reported by campuses.
Schedule the testing program in compliance with the state and local requirements and directs the distribution of all testing material for district wide testing; directs the assembly and delivery of all testing booklets and answer documents to Pearson in a timely manner.
Department Objectives
Facilitate and support the campuses before, during, and after every state assessment.
Ensure the integrity and confidentiality of the state accountability assessment program.
Developed a process to minimize the number of testing irregularities being reported.
Prior Year Highlights
All state assessments deadlines were met.
Increased the number of staff development provided for all state assessment administration.
Minimized the number of testing irregularities and ensure compliance.
District’s Broad Goals
1 2 3 4 5 6
Personnel Allocations (All Funds)
Position 2013 2014 2015
Director 1.00 1.00 1.00
Assistant Director 0.00 0.00 1.00
Specialist 2.00 2.00 2.00
Programmer 1.00 1.00 1.00
Total 4.00 4.00 5.00
General Operating Fund Expenditures by Object
2012/13 2013/14 2014/15
Actual Projected Budget
Payroll $271,288 $379,850 $393,127
Contracted Svcs. 4,769 5,138 6,006
Supplies & Materials 14,105 17,145 36,500
Other Op. Expenses 4,424 2,658 6,100
Capital Outlay 1,994 4,699 0
Total Budget $296,580 $409,490 $441,733
Performance Measures
Actual Estimate Projected
Program/Service 12-13 13-14 14-15
Coordination of the state assessment program Annual Annual Annual
Produce and deliver staff development training and workshops 11 11 14
Reduce the number of testing irregularties 43 < 43 25
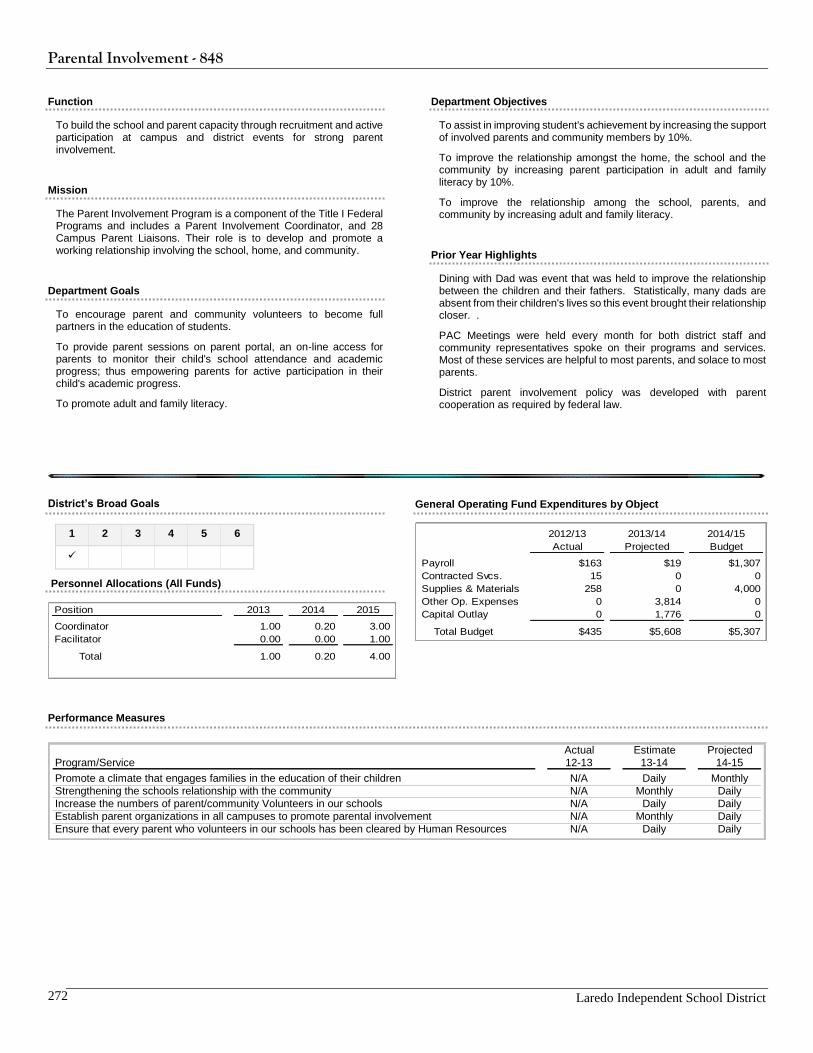
Parental Involvement - 848
Laredo Independent School District 272
Function
To build the school and parent capacity through recruitment and active participation at campus and district events for strong parent involvement.
Mission
The Parent Involvement Program is a component of the Title I Federal Programs and includes a Parent Involvement Coordinator, and 28 Campus Parent Liaisons. Their role is to develop and promote a working relationship involving the school, home, and community.
Department Goals
To encourage parent and community volunteers to become full partners in the education of students.
To provide parent sessions on parent portal, an on-line access for parents to monitor their child's school attendance and academic progress; thus empowering parents for active participation in their child's academic progress.
To promote adult and family literacy.
Department Objectives
To assist in improving student's achievement by increasing the support of involved parents and community members by 10%.
To improve the relationship amongst the home, the school and the community by increasing parent participation in adult and family literacy by 10%.
To improve the relationship among the school, parents, and community by increasing adult and family literacy.
Prior Year Highlights
Dining with Dad was event that was held to improve the relationship between the children and their fathers. Statistically, many dads are absent from their children's lives so this event brought their relationship closer. .
PAC Meetings were held every month for both district staff and community representatives spoke on their programs and services. Most of these services are helpful to most parents, and solace to most parents.
District parent involvement policy was developed with parent cooperation as required by federal law.
District’s Broad Goals
1 2 3 4 5 6
Personnel Allocations (All Funds)
Position 2013 2014 2015
Coordinator 1.00 0.20 3.00
Facilitator 0.00 0.00 1.00
Total 1.00 0.20 4.00
General Operating Fund Expenditures by Object
2012/13 2013/14 2014/15
Actual Projected Budget
Payroll $163 $19 $1,307
Contracted Svcs. 15 0 0
Supplies & Materials 258 0 4,000
Other Op. Expenses 0 3,814 0
Capital Outlay 0 1,776 0
Total Budget $435 $5,608 $5,307
Performance Measures
Actual Estimate Projected
Program/Service 12-13 13-14 14-15
Promote a climate that engages families in the education of their children N/A Daily Monthly
Strengthening the schools relationship with the community N/A Monthly Daily
Increase the numbers of parent/community Volunteers in our schools N/A Daily Daily
Establish parent organizations in all campuses to promote parental involvement N/A Monthly Daily
Ensure that every parent who volunteers in our schools has been cleared by Human Resources N/A Daily Daily

Grants - 849
2014-2015 Annual Budget 273
Function
The Grants Administration is intended to provide all stakeholders the support and tools necessary to be successful in grant program planning, development, design, and implementation through logical processes that insure total compliance with Local, State and Federal Laws. This Department provides all the necessary support, documented procedures, forms, applications and guidelines to be successful at grant development and administration.
Mission
Develop and sustain successful programs by actively seeking federal, state, local and foundation funding sources that support rigorous academic standards, provide high-quality instructional pedagogies and personal learning environments that enhance and support district educational goals and objectives.
Department Goals
Improve Academic Performance;
Increase the Use of Quality Data to Drive Instruction;
Increase Leadership Effectiveness;
Increase Learning Time;
Increase Parent/Stakeholder Involvement:
Improve School Climate;
Increase Teacher Quality;
Build Organizational Capacity and Sustainability.
Department Objectives
Number of grants submitted and number of grants awarded.
Amount of special revenues resources received by the district.
Number of academic programs supplemented through special revenues.
Number of projects for instructional programs/activities, construction, conservation (recycling, renewable energy), health/safety, and transportation.
Number of training sessions and resources available for all staff on grant writing opportunities.
Number of special projects requested by administration.
Prior Year Highlights
Actively submitted 29 grant application proposals and funding requests. Garnered $4,000,000.00 in school improvement funds through competitive grants for Lamar MS, and Cigarroa HS.
Secured an additional $391,034,865.00 for the district between 2008-2014 and currently have a total of $38,609,412.00 in grants currently active as of April 10, 2014.
Applied for 2014-2017 Educator Excellence Innovation Plan to increase organizational capacity, sustainability and to introduce performance based compensation systems at 5 elementary schools. Selected as Finalist.
District’s Broad Goals
1 2 3 4 5 6
Personnel Allocations (All Funds)
Position 2013 2014 2015
Grant Writer/Researcher 1.00 1.00 1.00
Clerk 0.00 0.00 1.00
Total 1.00 1.00 2.00
General Operating Fund Expenditures by Object
2012/13 2013/14 2014/15
Actual Projected Budget
Payroll $71,506 $86,225 $100,803
Contracted Svcs. 240 16 300
Supplies & Materials 1,874 2,867 3,700
Other Op. Expenses 800 0 2,000
Capital Outlay 0 2,244 0
Total Budget $74,420 $91,351 $106,803
Performance Measures
Actual Estimate Projected
Program/Service 12-13 13-14 14-15
Number of Grant Proposals Submitted 16 29 35
Number of Proposals that were Funded 12 19 32
Amount of special Revenues / resources received by the District 51,449,957 38,609,412 65,975,998
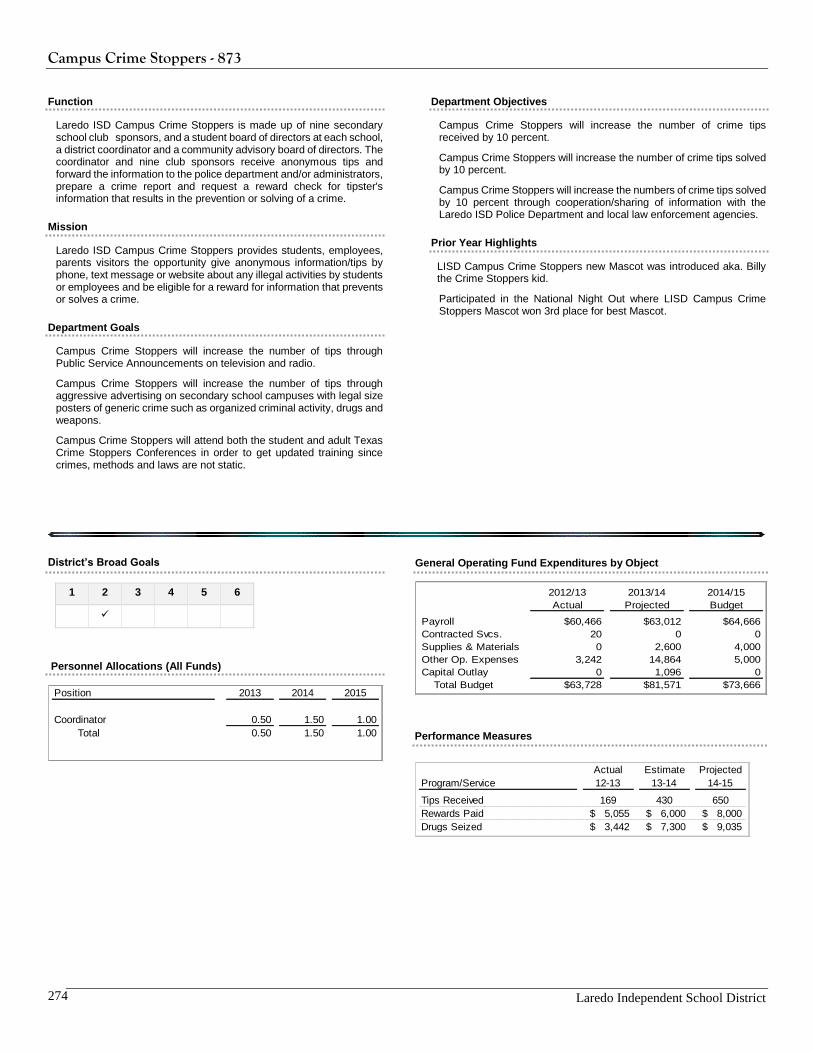
Campus Crime Stoppers - 873
Laredo Independent School District 274
Function
Laredo ISD Campus Crime Stoppers is made up of nine secondary school club sponsors, and a student board of directors at each school, a district coordinator and a community advisory board of directors. The coordinator and nine club sponsors receive anonymous tips and forward the information to the police department and/or administrators, prepare a crime report and request a reward check for tipster's information that results in the prevention or solving of a crime.
Mission
Laredo ISD Campus Crime Stoppers provides students, employees, parents visitors the opportunity give anonymous information/tips by phone, text message or website about any illegal activities by students or employees and be eligible for a reward for information that prevents or solves a crime.
Department Goals
Campus Crime Stoppers will increase the number of tips through Public Service Announcements on television and radio.
Campus Crime Stoppers will increase the number of tips through aggressive advertising on secondary school campuses with legal size posters of generic crime such as organized criminal activity, drugs and weapons.
Campus Crime Stoppers will attend both the student and adult Texas Crime Stoppers Conferences in order to get updated training since crimes, methods and laws are not static.
Department Objectives
Campus Crime Stoppers will increase the number of crime tips received by 10 percent.
Campus Crime Stoppers will increase the number of crime tips solved by 10 percent.
Campus Crime Stoppers will increase the numbers of crime tips solved by 10 percent through cooperation/sharing of information with the Laredo ISD Police Department and local law enforcement agencies.
Prior Year Highlights
LISD Campus Crime Stoppers new Mascot was introduced aka. Billy the Crime Stoppers kid.
Participated in the National Night Out where LISD Campus Crime Stoppers Mascot won 3rd place for best Mascot.
District’s Broad Goals
1 2 3 4 5 6
Personnel Allocations (All Funds)
General Operating Fund Expenditures by Object
2012/13 2013/14 2014/15
Actual Projected Budget
Payroll $60,466 $63,012 $64,666
Contracted Svcs. 20 0 0
Supplies & Materials 0 2,600 4,000
Other Op. Expenses 3,242 14,864 5,000
Capital Outlay 0 1,096 0
Total Budget $63,728 $81,571 $73,666
Performance Measures
Position 2013 2014 2015
Coordinator 0.50 1.50 1.00
Total 0.50 1.50 1.00
Actual Estimate Projected
Program/Service 12-13 13-14 14-15
Tips Received 169 430 650
Rewards Paid $ 5,055 $ 6,000 $ 8,000
Drugs Seized $ 3,442 $ 7,300 $ 9,035
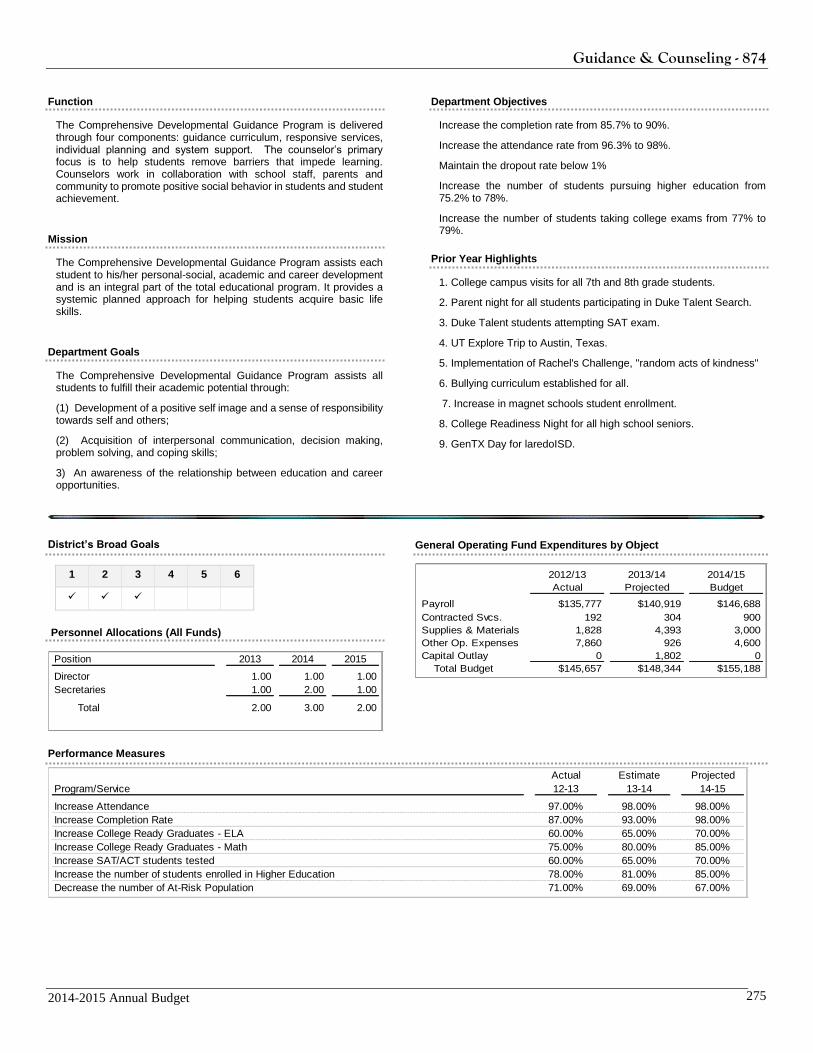
Guidance & Counseling - 874
2014-2015 Annual Budget 275
Function
The Comprehensive Developmental Guidance Program is delivered through four components: guidance curriculum, responsive services, individual planning and system support. The counselor’s primary focus is to help students remove barriers that impede learning. Counselors work in collaboration with school staff, parents and community to promote positive social behavior in students and student achievement.
Mission
The Comprehensive Developmental Guidance Program assists each student to his/her personal-social, academic and career development and is an integral part of the total educational program. It provides a systemic planned approach for helping students acquire basic life skills.
Department Goals
The Comprehensive Developmental Guidance Program assists all students to fulfill their academic potential through:
(1) Development of a positive self image and a sense of responsibility towards self and others;
(2) Acquisition of interpersonal communication, decision making, problem solving, and coping skills;
3) An awareness of the relationship between education and career opportunities.
Department Objectives
Increase the completion rate from 85.7% to 90%.
Increase the attendance rate from 96.3% to 98%.
Maintain the dropout rate below 1%
Increase the number of students pursuing higher education from 75.2% to 78%.
Increase the number of students taking college exams from 77% to 79%.
Prior Year Highlights
1. College campus visits for all 7th and 8th grade students.
2. Parent night for all students participating in Duke Talent Search.
3. Duke Talent students attempting SAT exam.
4. UT Explore Trip to Austin, Texas.
5. Implementation of Rachel's Challenge, "random acts of kindness"
6. Bullying curriculum established for all.
7. Increase in magnet schools student enrollment.
8. College Readiness Night for all high school seniors.
9. GenTX Day for laredoISD.
District’s Broad Goals
1 2 3 4 5 6
Personnel Allocations (All Funds)
General Operating Fund Expenditures by Object
2012/13 2013/14 2014/15
Actual Projected Budget
Payroll $135,777 $140,919 $146,688
Contracted Svcs. 192 304 900
Supplies & Materials 1,828 4,393 3,000
Other Op. Expenses 7,860 926 4,600
Capital Outlay 0 1,802 0
Total Budget $145,657 $148,344 $155,188
Performance Measures
Position 2013 2014 2015
Director 1.00 1.00 1.00
Secretaries 1.00 2.00 1.00
Total 2.00 3.00 2.00
Actual Estimate Projected
Program/Service 12-13 13-14 14-15
Increase Attendance 97.00% 98.00% 98.00%
Increase Completion Rate 87.00% 93.00% 98.00%
Increase College Ready Graduates - ELA 60.00% 65.00% 70.00%
Increase College Ready Graduates - Math 75.00% 80.00% 85.00%
Increase SAT/ACT students tested 60.00% 65.00% 70.00%
Increase the number of students enrolled in Higher Education 78.00% 81.00% 85.00%
Decrease the number of At-Risk Population 71.00% 69.00% 67.00%
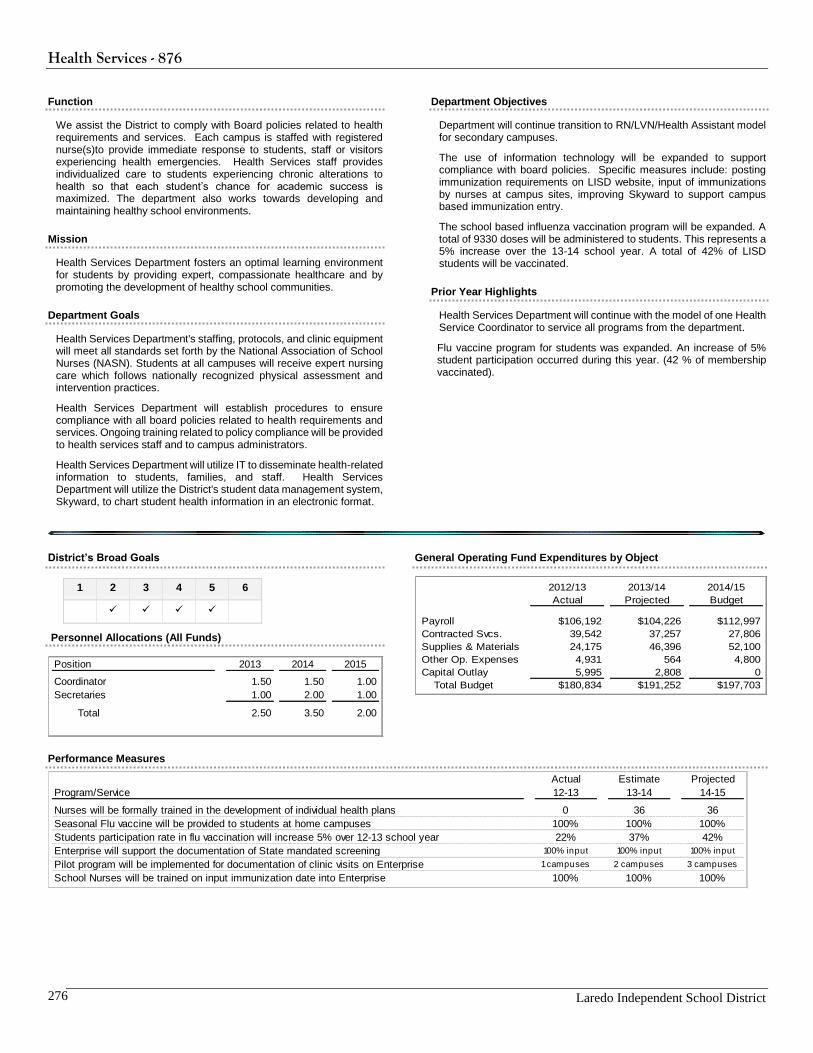
Health Services - 876
Laredo Independent School District 276
Function
We assist the District to comply with Board policies related to health requirements and services. Each campus is staffed with registered nurse(s)to provide immediate response to students, staff or visitors experiencing health emergencies. Health Services staff provides individualized care to students experiencing chronic alterations to health so that each student’s chance for academic success is maximized. The department also works towards developing and maintaining healthy school environments.
Mission
Health Services Department fosters an optimal learning environment for students by providing expert, compassionate healthcare and by promoting the development of healthy school communities.
Department Goals
Health Services Department's staffing, protocols, and clinic equipment will meet all standards set forth by the National Association of School Nurses (NASN). Students at all campuses will receive expert nursing care which follows nationally recognized physical assessment and intervention practices.
Health Services Department will establish procedures to ensure compliance with all board policies related to health requirements and services. Ongoing training related to policy compliance will be provided to health services staff and to campus administrators.
Health Services Department will utilize IT to disseminate health-related information to students, families, and staff. Health Services Department will utilize the District's student data management system, Skyward, to chart student health information in an electronic format.
Department Objectives
Department will continue transition to RN/LVN/Health Assistant model for secondary campuses.
The use of information technology will be expanded to support compliance with board policies. Specific measures include: posting immunization requirements on LISD website, input of immunizations by nurses at campus sites, improving Skyward to support campus based immunization entry.
The school based influenza vaccination program will be expanded. A total of 9330 doses will be administered to students. This represents a 5% increase over the 13-14 school year. A total of 42% of LISD students will be vaccinated.
Prior Year Highlights
Health Services Department will continue with the model of one Health Service Coordinator to service all programs from the department.
Flu vaccine program for students was expanded. An increase of 5% student participation occurred during this year. (42 % of membership vaccinated).
District’s Broad Goals
1 2 3 4 5 6
Personnel Allocations (All Funds)
General Operating Fund Expenditures by Object
2012/13 2013/14 2014/15
Actual Projected Budget
Payroll $106,192 $104,226 $112,997
Contracted Svcs. 39,542 37,257 27,806
Supplies & Materials 24,175 46,396 52,100
Other Op. Expenses 4,931 564 4,800
Capital Outlay 5,995 2,808 0
Total Budget $180,834 $191,252 $197,703
Performance Measures
Position 2013 2014 2015
Coordinator 1.50 1.50 1.00
Secretaries 1.00 2.00 1.00
Total 2.50 3.50 2.00
Actual Estimate Projected
Program/Service 12-13 13-14 14-15
Nurses will be formally trained in the development of individual health plans 0 36 36
Seasonal Flu vaccine will be provided to students at home campuses 100% 100% 100%
Students participation rate in flu vaccination will increase 5% over 12-13 school year 22% 37% 42%
Enterprise will support the documentation of State mandated screening 100% input 100% input 100% input
Pilot program will be implemented for documentation of clinic visits on Enterprise 1 campuses 2 campuses 3 campuses
School Nurses will be trained on input immunization date into Enterprise 100% 100% 100%
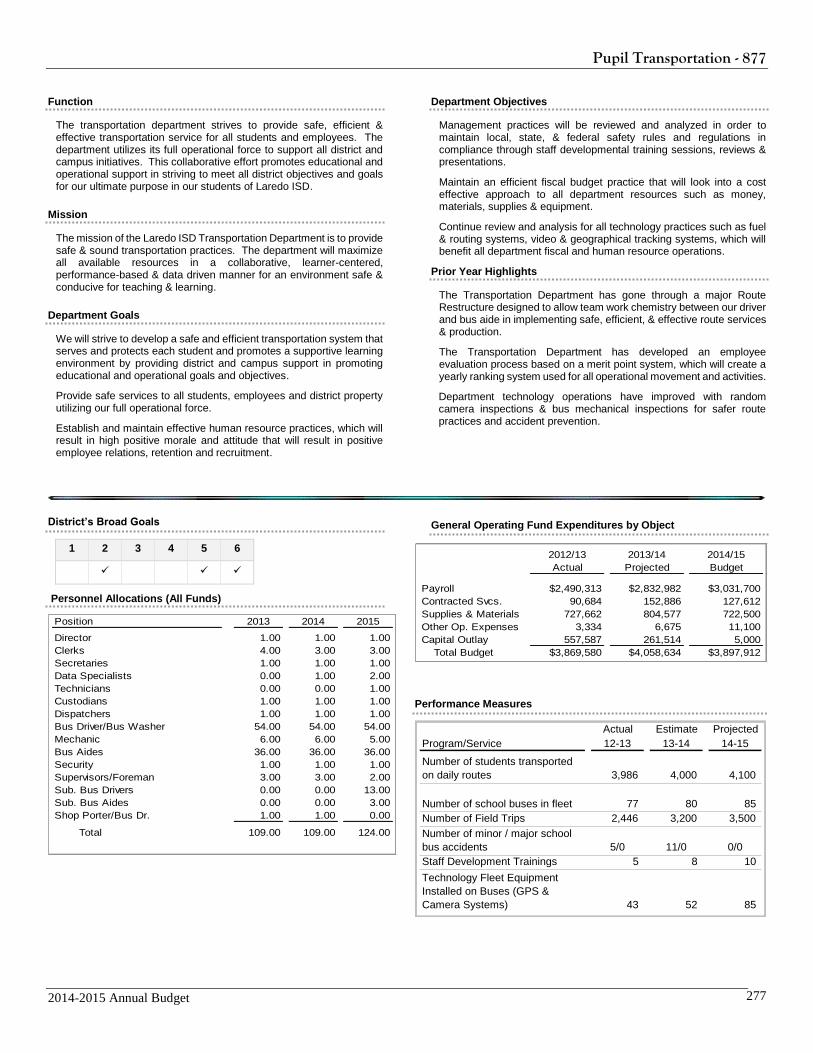
Pupil Transportation - 877
2014-2015 Annual Budget 277
Function
The transportation department strives to provide safe, efficient & effective transportation service for all students and employees. The department utilizes its full operational force to support all district and campus initiatives. This collaborative effort promotes educational and operational support in striving to meet all district objectives and goals for our ultimate purpose in our students of Laredo ISD.
Mission
The mission of the Laredo ISD Transportation Department is to provide safe & sound transportation practices. The department will maximize all available resources in a collaborative, learner-centered, performance-based & data driven manner for an environment safe & conducive for teaching & learning.
Department Goals
We will strive to develop a safe and efficient transportation system that serves and protects each student and promotes a supportive learning environment by providing district and campus support in promoting educational and operational goals and objectives.
Provide safe services to all students, employees and district property utilizing our full operational force.
Establish and maintain effective human resource practices, which will result in high positive morale and attitude that will result in positive employee relations, retention and recruitment.
Department Objectives
Management practices will be reviewed and analyzed in order to maintain local, state, & federal safety rules and regulations in compliance through staff developmental training sessions, reviews & presentations.
Maintain an efficient fiscal budget practice that will look into a cost effective approach to all department resources such as money, materials, supplies & equipment.
Continue review and analysis for all technology practices such as fuel & routing systems, video & geographical tracking systems, which will benefit all department fiscal and human resource operations.
Prior Year Highlights
The Transportation Department has gone through a major Route Restructure designed to allow team work chemistry between our driver and bus aide in implementing safe, efficient, & effective route services & production.
The Transportation Department has developed an employee evaluation process based on a merit point system, which will create a yearly ranking system used for all operational movement and activities.
Department technology operations have improved with random camera inspections & bus mechanical inspections for safer route practices and accident prevention.
District’s Broad Goals
1 2 3 4 5 6
Personnel Allocations (All Funds)
Position 2013 2014 2015
Director 1.00 1.00 1.00
Clerks 4.00 3.00 3.00
Secretaries 1.00 1.00 1.00
Data Specialists 0.00 1.00 2.00
Technicians 0.00 0.00 1.00
Custodians 1.00 1.00 1.00
Dispatchers 1.00 1.00 1.00
Bus Driver/Bus Washer 54.00 54.00 54.00
Mechanic 6.00 6.00 5.00
Bus Aides 36.00 36.00 36.00
Security 1.00 1.00 1.00
Supervisors/Foreman 3.00 3.00 2.00
Sub. Bus Drivers 0.00 0.00 13.00
Sub. Bus Aides 0.00 0.00 3.00
Shop Porter/Bus Dr. 1.00 1.00 0.00
Total 109.00 109.00 124.00
General Operating Fund Expenditures by Object
2012/13 2013/14 2014/15
Actual Projected Budget
Payroll $2,490,313 $2,832,982 $3,031,700
Contracted Svcs. 90,684 152,886 127,612
Supplies & Materials 727,662 804,577 722,500
Other Op. Expenses 3,334 6,675 11,100
Capital Outlay 557,587 261,514 5,000
Total Budget $3,869,580 $4,058,634 $3,897,912
Performance Measures
Actual Estimate Projected
Program/Service 12-13 13-14 14-15
Number of students transported
on daily routes 3,986 4,000 4,100
Number of school buses in fleet 77 80 85
Number of Field Trips 2,446 3,200 3,500
Number of minor / major school
bus accidents 5/0 11/0 0/0
Staff Development Trainings 5 8 10
Technology Fleet Equipment
Installed on Buses (GPS &
Camera Systems) 43 52 85
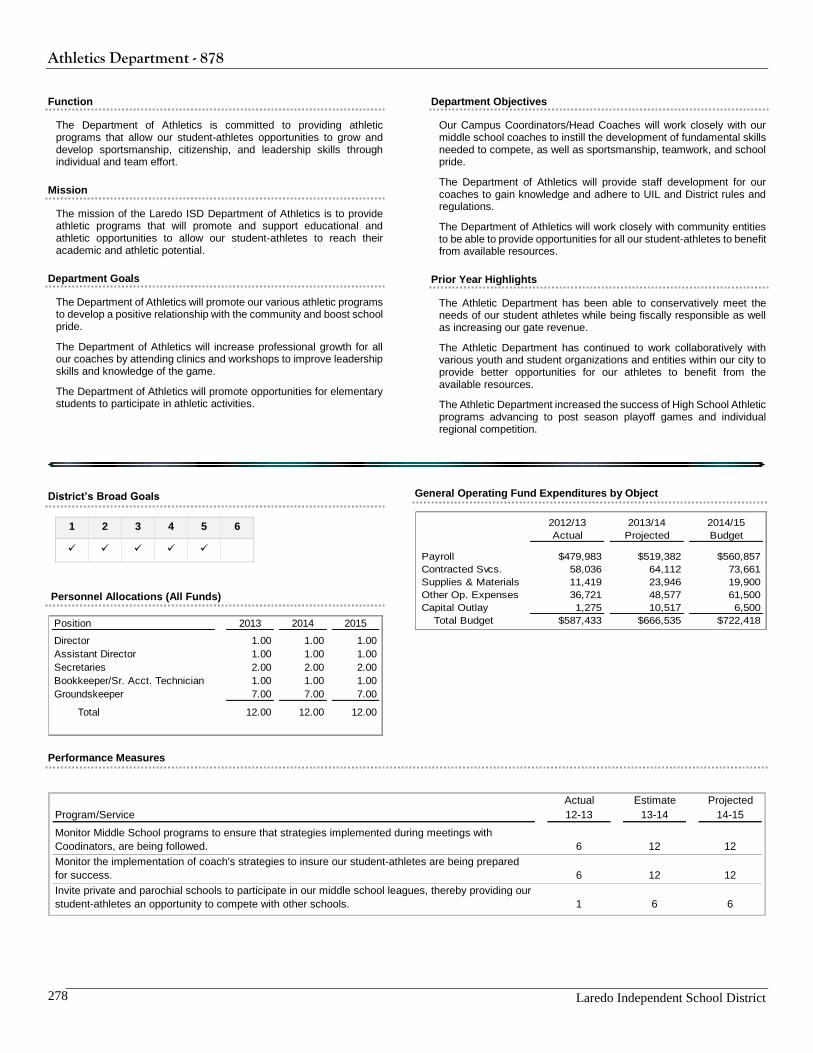
Athletics Department - 878
Laredo Independent School District 278
Function
The Department of Athletics is committed to providing athletic programs that allow our student-athletes opportunities to grow and develop sportsmanship, citizenship, and leadership skills through individual and team effort.
Mission
The mission of the Laredo ISD Department of Athletics is to provide athletic programs that will promote and support educational and athletic opportunities to allow our student-athletes to reach their academic and athletic potential.
Department Goals
The Department of Athletics will promote our various athletic programs to develop a positive relationship with the community and boost school pride.
The Department of Athletics will increase professional growth for all our coaches by attending clinics and workshops to improve leadership skills and knowledge of the game.
The Department of Athletics will promote opportunities for elementary students to participate in athletic activities.
Department Objectives
Our Campus Coordinators/Head Coaches will work closely with our middle school coaches to instill the development of fundamental skills needed to compete, as well as sportsmanship, teamwork, and school pride.
The Department of Athletics will provide staff development for our coaches to gain knowledge and adhere to UIL and District rules and regulations.
The Department of Athletics will work closely with community entities to be able to provide opportunities for all our student-athletes to benefit from available resources.
Prior Year Highlights
The Athletic Department has been able to conservatively meet the needs of our student athletes while being fiscally responsible as well as increasing our gate revenue.
The Athletic Department has continued to work collaboratively with various youth and student organizations and entities within our city to provide better opportunities for our athletes to benefit from the available resources.
The Athletic Department increased the success of High School Athletic programs advancing to post season playoff games and individual regional competition.
District’s Broad Goals
1 2 3 4 5 6
Personnel Allocations (All Funds)
General Operating Fund Expenditures by Object
2012/13 2013/14 2014/15
Actual Projected Budget
Payroll $479,983 $519,382 $560,857
Contracted Svcs. 58,036 64,112 73,661
Supplies & Materials 11,419 23,946 19,900
Other Op. Expenses 36,721 48,577 61,500
Capital Outlay 1,275 10,517 6,500
Total Budget $587,433 $666,535 $722,418
Performance Measures
Actual Estimate Projected
Program/Service 12-13 13-14 14-15
Monitor Middle School programs to ensure that strategies implemented during meetings with
Coodinators, are being followed. 6 12 12
Monitor the implementation of coach's strategies to insure our student-athletes are being prepared
for success. 6 12 12
Invite private and parochial schools to participate in our middle school leagues, thereby providing our
student-athletes an opportunity to compete with other schools. 1 6 6
Position 2013 2014 2015
Director 1.00 1.00 1.00
Assistant Director 1.00 1.00 1.00
Secretaries 2.00 2.00 2.00
Bookkeeper/Sr. Acct. Technician 1.00 1.00 1.00
Groundskeeper 7.00 7.00 7.00
Total 12.00 12.00 12.00
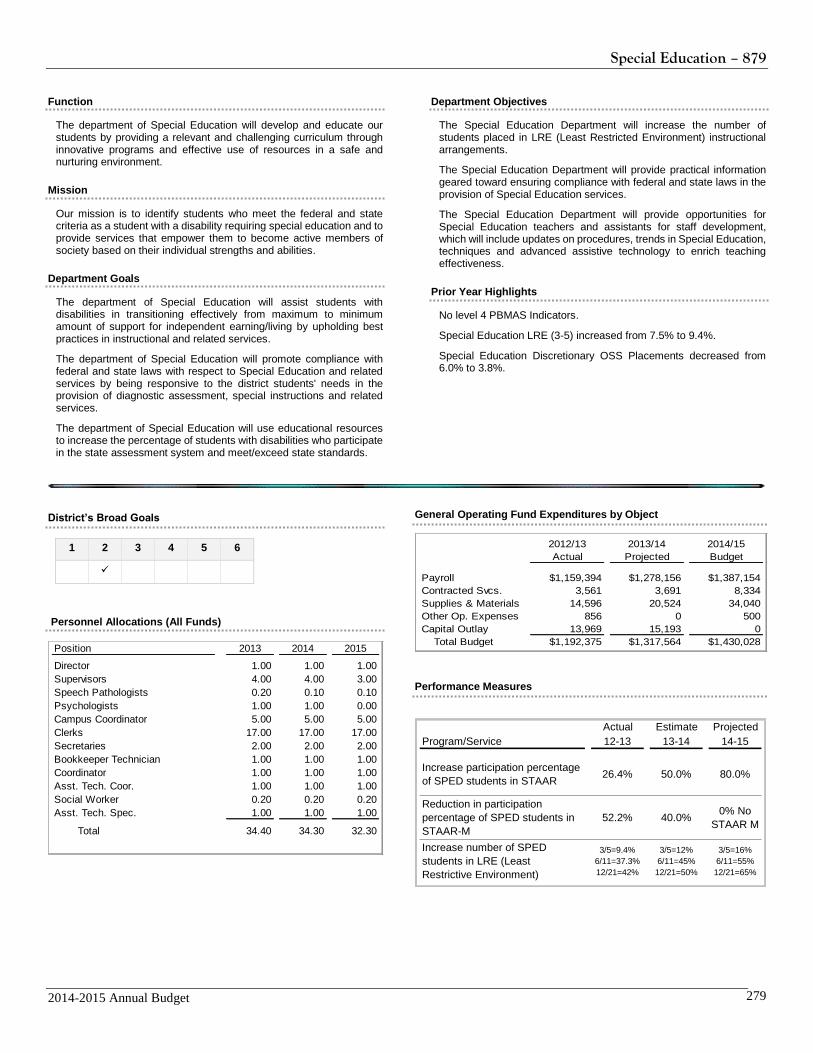
Special Education – 879
2014-2015 Annual Budget 279
Function
The department of Special Education will develop and educate our students by providing a relevant and challenging curriculum through innovative programs and effective use of resources in a safe and nurturing environment.
Mission
Our mission is to identify students who meet the federal and state criteria as a student with a disability requiring special education and to provide services that empower them to become active members of society based on their individual strengths and abilities.
Department Goals
The department of Special Education will assist students with disabilities in transitioning effectively from maximum to minimum amount of support for independent earning/living by upholding best practices in instructional and related services.
The department of Special Education will promote compliance with federal and state laws with respect to Special Education and related services by being responsive to the district students' needs in the provision of diagnostic assessment, special instructions and related services.
The department of Special Education will use educational resources to increase the percentage of students with disabilities who participate in the state assessment system and meet/exceed state standards.
Department Objectives
The Special Education Department will increase the number of students placed in LRE (Least Restricted Environment) instructional arrangements.
The Special Education Department will provide practical information geared toward ensuring compliance with federal and state laws in the provision of Special Education services.
The Special Education Department will provide opportunities for Special Education teachers and assistants for staff development, which will include updates on procedures, trends in Special Education, techniques and advanced assistive technology to enrich teaching effectiveness.
Prior Year Highlights
No level 4 PBMAS Indicators.
Special Education LRE (3-5) increased from 7.5% to 9.4%.
Special Education Discretionary OSS Placements decreased from 6.0% to 3.8%.
District’s Broad Goals
1 2 3 4 5 6
Personnel Allocations (All Funds)
General Operating Fund Expenditures by Object
2012/13 2013/14 2014/15
Actual Projected Budget
Payroll $1,159,394 $1,278,156 $1,387,154
Contracted Svcs. 3,561 3,691 8,334
Supplies & Materials 14,596 20,524 34,040
Other Op. Expenses 856 0 500
Capital Outlay 13,969 15,193 0
Total Budget $1,192,375 $1,317,564 $1,430,028
Performance Measures
Actual Estimate Projected
Program/Service 12-13 13-14 14-15
Increase participation percentage
of SPED students in STAAR26.4% 50.0% 80.0%
Reduction in participation
percentage of SPED students in
STAAR-M
52.2% 40.0%0% No
STAAR M
Increase number of SPED
students in LRE (Least
Restrictive Environment)
3/5=9.4%
6/11=37.3%
12/21=42%
3/5=12%
6/11=45%
12/21=50%
3/5=16%
6/11=55%
12/21=65%
Position 2013 2014 2015
Director 1.00 1.00 1.00
Supervisors 4.00 4.00 3.00
Speech Pathologists 0.20 0.10 0.10
Psychologists 1.00 1.00 0.00
Campus Coordinator 5.00 5.00 5.00
Clerks 17.00 17.00 17.00
Secretaries 2.00 2.00 2.00
Bookkeeper Technician 1.00 1.00 1.00
Coordinator 1.00 1.00 1.00
Asst. Tech. Coor. 1.00 1.00 1.00
Social Worker 0.20 0.20 0.20
Asst. Tech. Spec. 1.00 1.00 1.00
Total 34.40 34.30 32.30
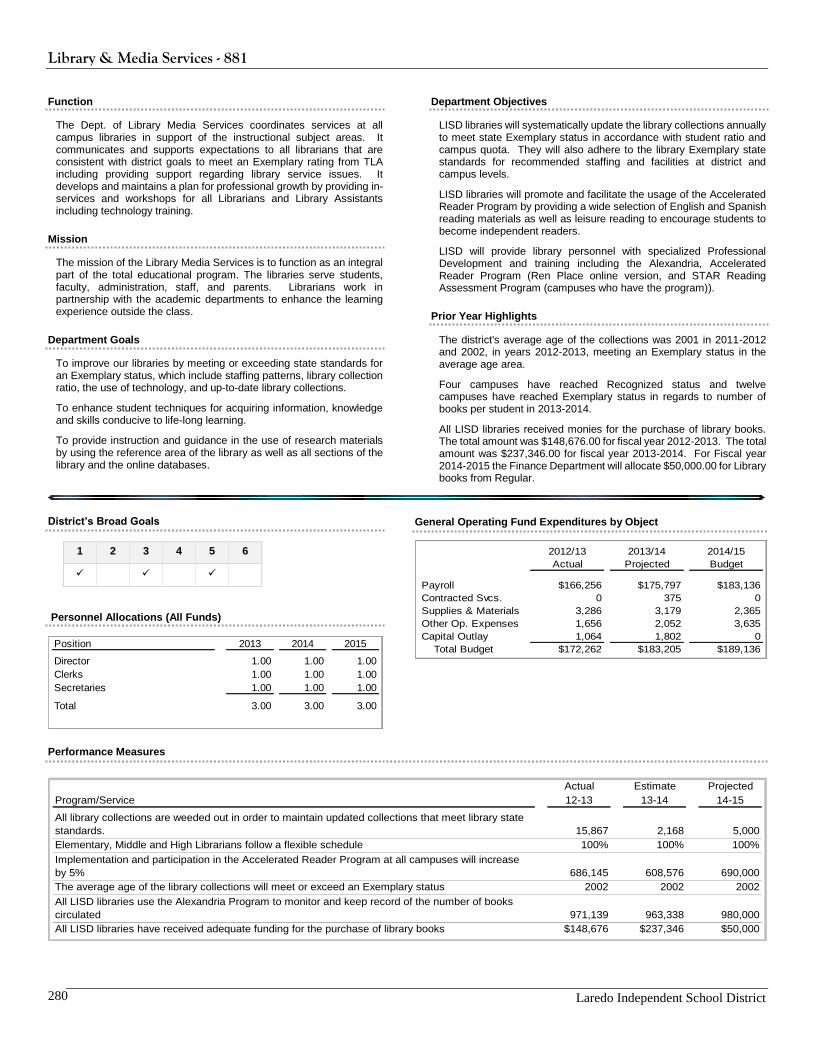
Library & Media Services - 881
Laredo Independent School District 280
Function
The Dept. of Library Media Services coordinates services at all campus libraries in support of the instructional subject areas. It communicates and supports expectations to all librarians that are consistent with district goals to meet an Exemplary rating from TLA including providing support regarding library service issues. It develops and maintains a plan for professional growth by providing in-services and workshops for all Librarians and Library Assistants including technology training.
Mission
The mission of the Library Media Services is to function as an integral part of the total educational program. The libraries serve students, faculty, administration, staff, and parents. Librarians work in partnership with the academic departments to enhance the learning experience outside the class.
Department Goals
To improve our libraries by meeting or exceeding state standards for an Exemplary status, which include staffing patterns, library collection ratio, the use of technology, and up-to-date library collections.
To enhance student techniques for acquiring information, knowledge and skills conducive to life-long learning.
To provide instruction and guidance in the use of research materials by using the reference area of the library as well as all sections of the library and the online databases.
Department Objectives
LISD libraries will systematically update the library collections annually to meet state Exemplary status in accordance with student ratio and campus quota. They will also adhere to the library Exemplary state standards for recommended staffing and facilities at district and campus levels.
LISD libraries will promote and facilitate the usage of the Accelerated Reader Program by providing a wide selection of English and Spanish reading materials as well as leisure reading to encourage students to become independent readers.
LISD will provide library personnel with specialized Professional Development and training including the Alexandria, Accelerated Reader Program (Ren Place online version, and STAR Reading Assessment Program (campuses who have the program)).
Prior Year Highlights
The district's average age of the collections was 2001 in 2011-2012 and 2002, in years 2012-2013, meeting an Exemplary status in the average age area.
Four campuses have reached Recognized status and twelve campuses have reached Exemplary status in regards to number of books per student in 2013-2014.
All LISD libraries received monies for the purchase of library books. The total amount was $148,676.00 for fiscal year 2012-2013. The total amount was $237,346.00 for fiscal year 2013-2014. For Fiscal year 2014-2015 the Finance Department will allocate $50,000.00 for Library books from Regular.
District’s Broad Goals
1 2 3 4 5 6
Personnel Allocations (All Funds)
General Operating Fund Expenditures by Object
2012/13 2013/14 2014/15
Actual Projected Budget
Payroll $166,256 $175,797 $183,136
Contracted Svcs. 0 375 0
Supplies & Materials 3,286 3,179 2,365
Other Op. Expenses 1,656 2,052 3,635
Capital Outlay 1,064 1,802 0
Total Budget $172,262 $183,205 $189,136
Performance Measures
Actual Estimate Projected
Program/Service 12-13 13-14 14-15
All library collections are weeded out in order to maintain updated collections that meet library state
standards. 15,867 2,168 5,000
Elementary, Middle and High Librarians follow a flexible schedule 100% 100% 100%
Implementation and participation in the Accelerated Reader Program at all campuses will increase
by 5% 686,145 608,576 690,000
The average age of the library collections will meet or exceed an Exemplary status 2002 2002 2002
All LISD libraries use the Alexandria Program to monitor and keep record of the number of books
circulated 971,139 963,338 980,000
All LISD libraries have received adequate funding for the purchase of library books $148,676 $237,346 $50,000
Position 2013 2014 2015
Director 1.00 1.00 1.00
Clerks 1.00 1.00 1.00
Secretaries 1.00 1.00 1.00
Total 3.00 3.00 3.00
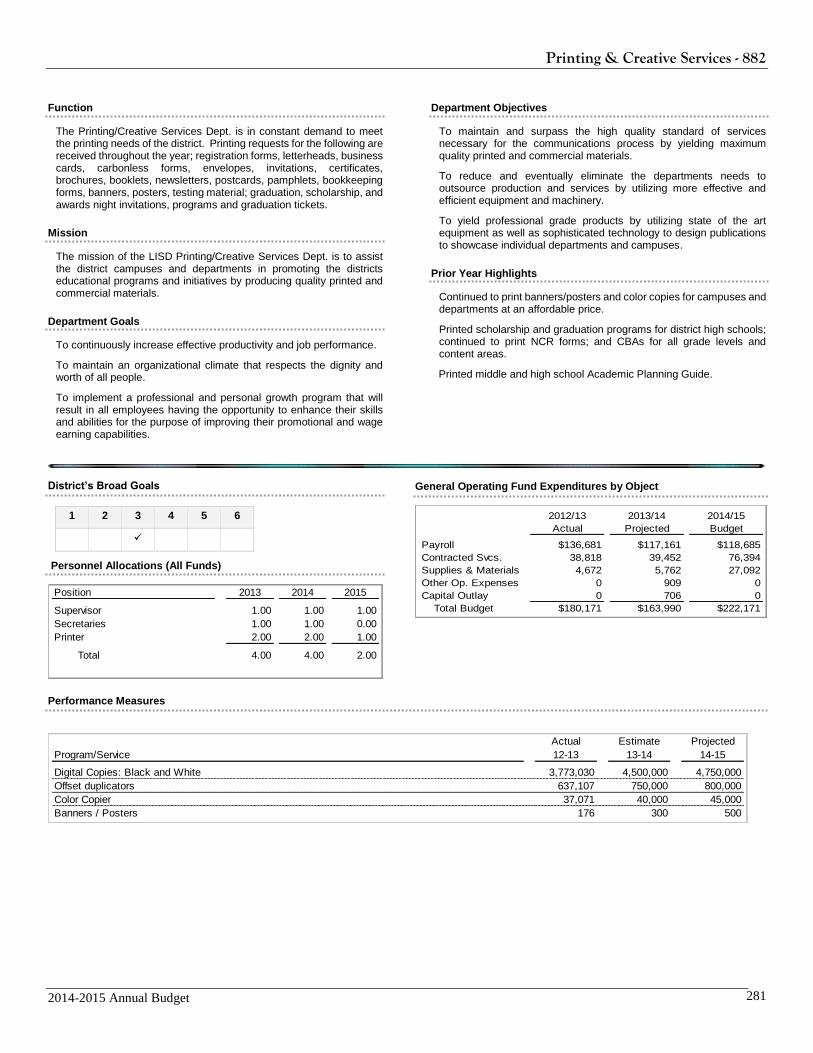
Printing & Creative Services - 882
2014-2015 Annual Budget 281
Function
The Printing/Creative Services Dept. is in constant demand to meet the printing needs of the district. Printing requests for the following are received throughout the year; registration forms, letterheads, business cards, carbonless forms, envelopes, invitations, certificates, brochures, booklets, newsletters, postcards, pamphlets, bookkeeping forms, banners, posters, testing material; graduation, scholarship, and awards night invitations, programs and graduation tickets.
Mission
The mission of the LISD Printing/Creative Services Dept. is to assist the district campuses and departments in promoting the districts educational programs and initiatives by producing quality printed and commercial materials.
Department Goals
To continuously increase effective productivity and job performance.
To maintain an organizational climate that respects the dignity and worth of all people.
To implement a professional and personal growth program that will result in all employees having the opportunity to enhance their skills and abilities for the purpose of improving their promotional and wage earning capabilities.
Department Objectives
To maintain and surpass the high quality standard of services necessary for the communications process by yielding maximum quality printed and commercial materials.
To reduce and eventually eliminate the departments needs to outsource production and services by utilizing more effective and efficient equipment and machinery.
To yield professional grade products by utilizing state of the art equipment as well as sophisticated technology to design publications to showcase individual departments and campuses.
Prior Year Highlights
Continued to print banners/posters and color copies for campuses and departments at an affordable price.
Printed scholarship and graduation programs for district high schools; continued to print NCR forms; and CBAs for all grade levels and content areas.
Printed middle and high school Academic Planning Guide.
District’s Broad Goals
1 2 3 4 5 6
Personnel Allocations (All Funds)
General Operating Fund Expenditures by Object
2012/13 2013/14 2014/15
Actual Projected Budget
Payroll $136,681 $117,161 $118,685
Contracted Svcs. 38,818 39,452 76,394
Supplies & Materials 4,672 5,762 27,092
Other Op. Expenses 0 909 0
Capital Outlay 0 706 0
Total Budget $180,171 $163,990 $222,171
Performance Measures
Position 2013 2014 2015
Supervisor 1.00 1.00 1.00
Secretaries 1.00 1.00 0.00
Printer 2.00 2.00 1.00
Total 4.00 4.00 2.00
Actual Estimate Projected
Program/Service 12-13 13-14 14-15
Digital Copies: Black and White 3,773,030 4,500,000 4,750,000
Offset duplicators 637,107 750,000 800,000
Color Copier 37,071 40,000 45,000
Banners / Posters 176 300 500
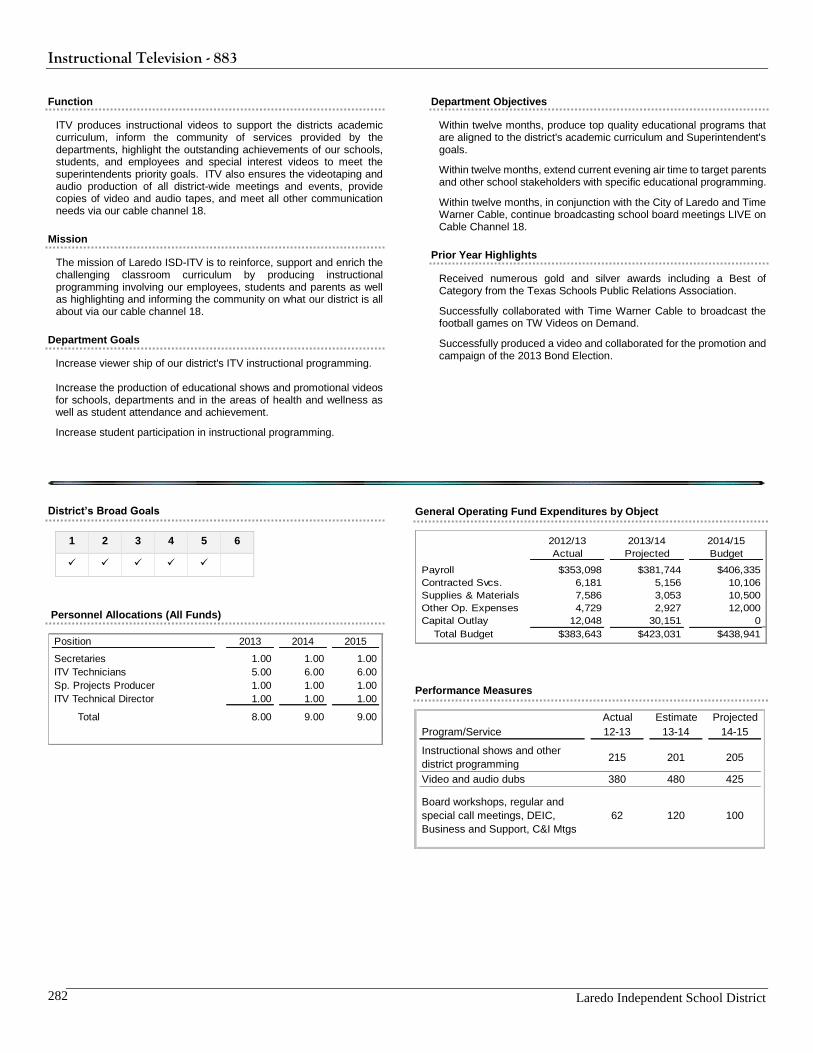
Instructional Television - 883
Laredo Independent School District 282
Function
ITV produces instructional videos to support the districts academic curriculum, inform the community of services provided by the departments, highlight the outstanding achievements of our schools, students, and employees and special interest videos to meet the superintendents priority goals. ITV also ensures the videotaping and audio production of all district-wide meetings and events, provide copies of video and audio tapes, and meet all other communication needs via our cable channel 18.
Mission
The mission of Laredo ISD-ITV is to reinforce, support and enrich the challenging classroom curriculum by producing instructional programming involving our employees, students and parents as well as highlighting and informing the community on what our district is all about via our cable channel 18.
Department Goals
Increase viewer ship of our district's ITV instructional programming.
Increase the production of educational shows and promotional videos for schools, departments and in the areas of health and wellness as well as student attendance and achievement.
Increase student participation in instructional programming.
Department Objectives
Within twelve months, produce top quality educational programs that are aligned to the district's academic curriculum and Superintendent's goals.
Within twelve months, extend current evening air time to target parents and other school stakeholders with specific educational programming.
Within twelve months, in conjunction with the City of Laredo and Time Warner Cable, continue broadcasting school board meetings LIVE on Cable Channel 18.
Prior Year Highlights
Received numerous gold and silver awards including a Best of Category from the Texas Schools Public Relations Association.
Successfully collaborated with Time Warner Cable to broadcast the football games on TW Videos on Demand.
Successfully produced a video and collaborated for the promotion and campaign of the 2013 Bond Election.
District’s Broad Goals
1 2 3 4 5 6
Personnel Allocations (All Funds)
General Operating Fund Expenditures by Object
2012/13 2013/14 2014/15
Actual Projected Budget
Payroll $353,098 $381,744 $406,335
Contracted Svcs. 6,181 5,156 10,106
Supplies & Materials 7,586 3,053 10,500
Other Op. Expenses 4,729 2,927 12,000
Capital Outlay 12,048 30,151 0
Total Budget $383,643 $423,031 $438,941
Performance Measures
Actual Estimate Projected
Program/Service 12-13 13-14 14-15
Instructional shows and other
district programming215 201 205
Video and audio dubs 380 480 425
Board workshops, regular and
special call meetings, DEIC,
Business and Support, C&I Mtgs
62 120 100
Position 2013 2014 2015
Secretaries 1.00 1.00 1.00
ITV Technicians 5.00 6.00 6.00
Sp. Projects Producer 1.00 1.00 1.00
ITV Technical Director 1.00 1.00 1.00
Total 8.00 9.00 9.00
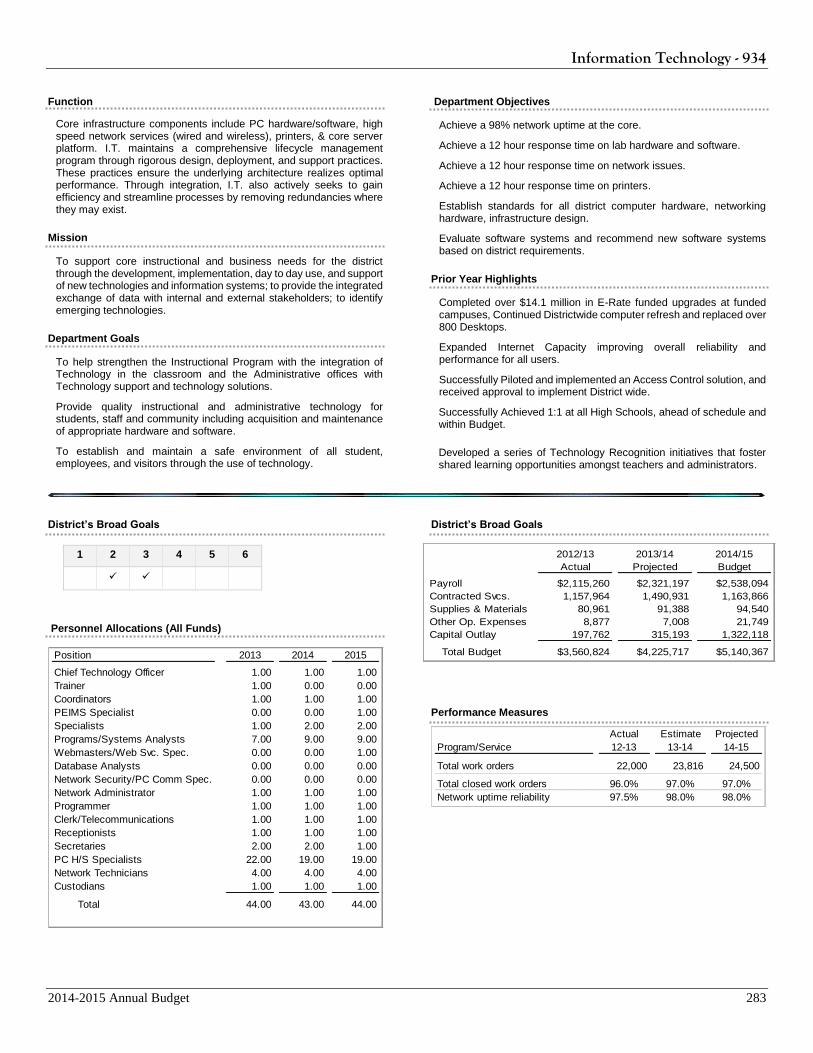
Information Technology - 934
2014-2015 Annual Budget 283
Function
Core infrastructure components include PC hardware/software, high speed network services (wired and wireless), printers, & core server platform. I.T. maintains a comprehensive lifecycle management program through rigorous design, deployment, and support practices. These practices ensure the underlying architecture realizes optimal performance. Through integration, I.T. also actively seeks to gain efficiency and streamline processes by removing redundancies where they may exist.
Mission
To support core instructional and business needs for the district through the development, implementation, day to day use, and support of new technologies and information systems; to provide the integrated exchange of data with internal and external stakeholders; to identify emerging technologies.
Department Goals
To help strengthen the Instructional Program with the integration of Technology in the classroom and the Administrative offices with Technology support and technology solutions.
Provide quality instructional and administrative technology for students, staff and community including acquisition and maintenance of appropriate hardware and software.
To establish and maintain a safe environment of all student, employees, and visitors through the use of technology.
Department Objectives
Achieve a 98% network uptime at the core.
Achieve a 12 hour response time on lab hardware and software.
Achieve a 12 hour response time on network issues.
Achieve a 12 hour response time on printers.
Establish standards for all district computer hardware, networking hardware, infrastructure design.
Evaluate software systems and recommend new software systems based on district requirements.
Prior Year Highlights
Completed over $14.1 million in E-Rate funded upgrades at funded campuses, Continued Districtwide computer refresh and replaced over 800 Desktops.
Expanded Internet Capacity improving overall reliability and performance for all users.
Successfully Piloted and implemented an Access Control solution, and received approval to implement District wide.
Successfully Achieved 1:1 at all High Schools, ahead of schedule and within Budget.
Developed a series of Technology Recognition initiatives that foster shared learning opportunities amongst teachers and administrators.
District’s Broad Goals
1 2 3 4 5 6
Personnel Allocations (All Funds)
District’s Broad Goals
2012/13 2013/14 2014/15
Actual Projected Budget
Payroll $2,115,260 $2,321,197 $2,538,094
Contracted Svcs. 1,157,964 1,490,931 1,163,866
Supplies & Materials 80,961 91,388 94,540
Other Op. Expenses 8,877 7,008 21,749
Capital Outlay 197,762 315,193 1,322,118
Total Budget $3,560,824 $4,225,717 $5,140,367
Performance Measures
Position 2013 2014 2015
Chief Technology Officer 1.00 1.00 1.00
Trainer 1.00 0.00 0.00
Coordinators 1.00 1.00 1.00
PEIMS Specialist 0.00 0.00 1.00
Specialists 1.00 2.00 2.00
Programs/Systems Analysts 7.00 9.00 9.00
Webmasters/Web Svc. Spec. 0.00 0.00 1.00
Database Analysts 0.00 0.00 0.00
Network Security/PC Comm Spec. 0.00 0.00 0.00
Network Administrator 1.00 1.00 1.00
Programmer 1.00 1.00 1.00
Clerk/Telecommunications 1.00 1.00 1.00
Receptionists 1.00 1.00 1.00
Secretaries 2.00 2.00 1.00
PC H/S Specialists 22.00 19.00 19.00
Network Technicians 4.00 4.00 4.00
Custodians 1.00 1.00 1.00
Total 44.00 43.00 44.00
Actual Estimate Projected
Program/Service 12-13 13-14 14-15
Total work orders 22,000 23,816 24,500
Total closed work orders 96.0% 97.0% 97.0%
Network uptime reliability 97.5% 98.0% 98.0%
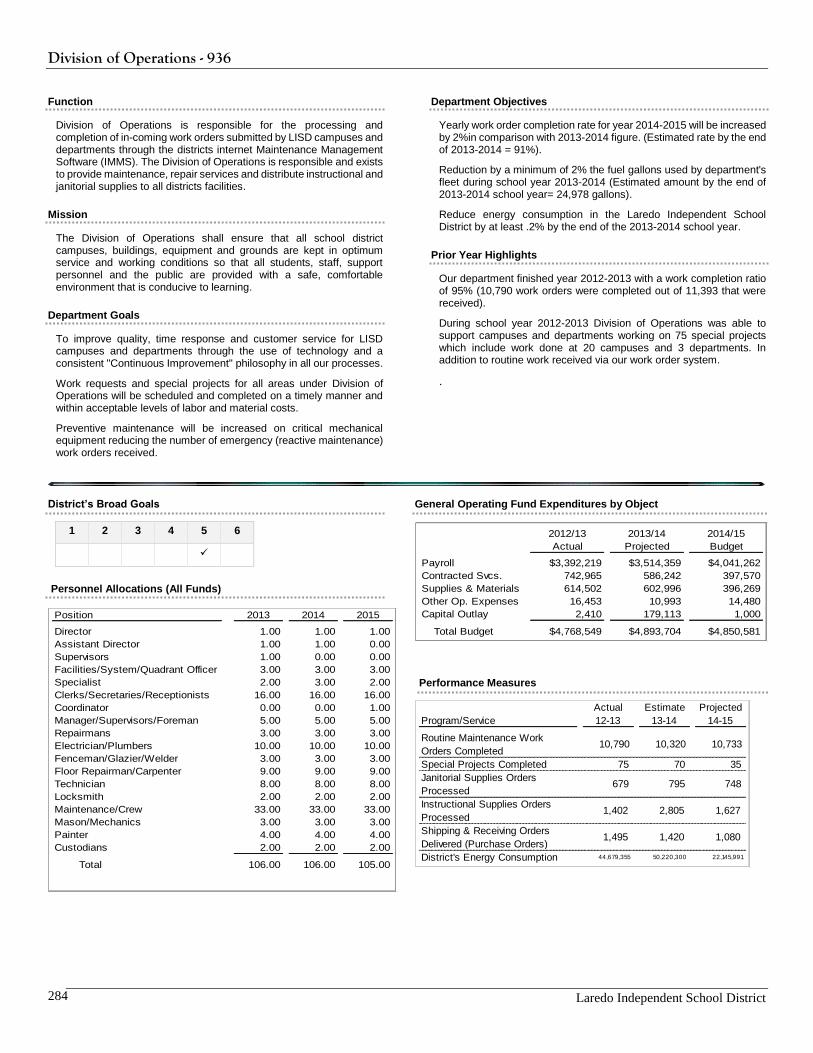
Division of Operations - 936
Laredo Independent School District 284
Function
Division of Operations is responsible for the processing and completion of in-coming work orders submitted by LISD campuses and departments through the districts internet Maintenance Management Software (IMMS). The Division of Operations is responsible and exists to provide maintenance, repair services and distribute instructional and janitorial supplies to all districts facilities.
Mission
The Division of Operations shall ensure that all school district campuses, buildings, equipment and grounds are kept in optimum service and working conditions so that all students, staff, support personnel and the public are provided with a safe, comfortable environment that is conducive to learning.
Department Goals
To improve quality, time response and customer service for LISD campuses and departments through the use of technology and a consistent "Continuous Improvement" philosophy in all our processes.
Work requests and special projects for all areas under Division of Operations will be scheduled and completed on a timely manner and within acceptable levels of labor and material costs.
Preventive maintenance will be increased on critical mechanical equipment reducing the number of emergency (reactive maintenance) work orders received.
Department Objectives
Yearly work order completion rate for year 2014-2015 will be increased by 2%in comparison with 2013-2014 figure. (Estimated rate by the end of 2013-2014 = 91%).
Reduction by a minimum of 2% the fuel gallons used by department's fleet during school year 2013-2014 (Estimated amount by the end of 2013-2014 school year= 24,978 gallons).
Reduce energy consumption in the Laredo Independent School District by at least .2% by the end of the 2013-2014 school year.
Prior Year Highlights
Our department finished year 2012-2013 with a work completion ratio of 95% (10,790 work orders were completed out of 11,393 that were received).
During school year 2012-2013 Division of Operations was able to support campuses and departments working on 75 special projects which include work done at 20 campuses and 3 departments. In addition to routine work received via our work order system.
.
District’s Broad Goals
1 2 3 4 5 6
Personnel Allocations (All Funds)
Position 2013 2014 2015
Director 1.00 1.00 1.00
Assistant Director 1.00 1.00 0.00
Supervisors 1.00 0.00 0.00
Facilities/System/Quadrant Officer 3.00 3.00 3.00
Specialist 2.00 3.00 2.00
Clerks/Secretaries/Receptionists 16.00 16.00 16.00
Coordinator 0.00 0.00 1.00
Manager/Supervisors/Foreman 5.00 5.00 5.00
Repairmans 3.00 3.00 3.00
Electrician/Plumbers 10.00 10.00 10.00
Fenceman/Glazier/Welder 3.00 3.00 3.00
Floor Repairman/Carpenter 9.00 9.00 9.00
Technician 8.00 8.00 8.00
Locksmith 2.00 2.00 2.00
Maintenance/Crew 33.00 33.00 33.00
Mason/Mechanics 3.00 3.00 3.00
Painter 4.00 4.00 4.00
Custodians 2.00 2.00 2.00
Total 106.00 106.00 105.00
General Operating Fund Expenditures by Object
2012/13 2013/14 2014/15
Actual Projected Budget
Payroll $3,392,219 $3,514,359 $4,041,262
Contracted Svcs. 742,965 586,242 397,570
Supplies & Materials 614,502 602,996 396,269
Other Op. Expenses 16,453 10,993 14,480
Capital Outlay 2,410 179,113 1,000
Total Budget $4,768,549 $4,893,704 $4,850,581
Performance Measures
Actual Estimate Projected
Program/Service 12-13 13-14 14-15
Routine Maintenance Work
Orders Completed 10,790 10,320 10,733
Special Projects Completed 75 70 35
Janitorial Supplies Orders
Processed 679 795 748
Instructional Supplies Orders
Processed 1,402 2,805 1,627
Shipping & Receiving Orders
Delivered (Purchase Orders) 1,495 1,420 1,080
District's Energy Consumption 44,679,355 50,220,300 22,145,991
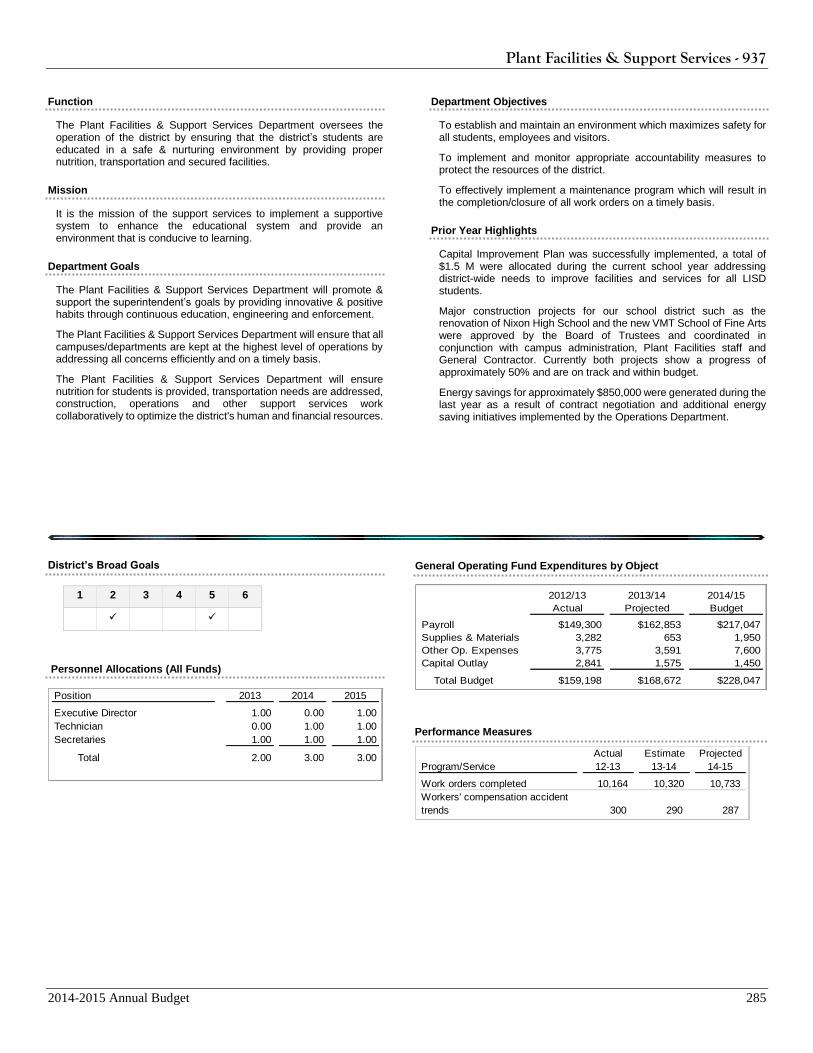
Plant Facilities & Support Services - 937
2014-2015 Annual Budget 285
Function
The Plant Facilities & Support Services Department oversees the operation of the district by ensuring that the district’s students are educated in a safe & nurturing environment by providing proper nutrition, transportation and secured facilities.
Mission
It is the mission of the support services to implement a supportive system to enhance the educational system and provide an environment that is conducive to learning.
Department Goals
The Plant Facilities & Support Services Department will promote & support the superintendent’s goals by providing innovative & positive habits through continuous education, engineering and enforcement.
The Plant Facilities & Support Services Department will ensure that all campuses/departments are kept at the highest level of operations by addressing all concerns efficiently and on a timely basis.
The Plant Facilities & Support Services Department will ensure nutrition for students is provided, transportation needs are addressed, construction, operations and other support services work collaboratively to optimize the district's human and financial resources.
Department Objectives
To establish and maintain an environment which maximizes safety for all students, employees and visitors.
To implement and monitor appropriate accountability measures to protect the resources of the district.
To effectively implement a maintenance program which will result in the completion/closure of all work orders on a timely basis.
Prior Year Highlights
Capital Improvement Plan was successfully implemented, a total of $1.5 M were allocated during the current school year addressing district-wide needs to improve facilities and services for all LISD students.
Major construction projects for our school district such as the renovation of Nixon High School and the new VMT School of Fine Arts were approved by the Board of Trustees and coordinated in conjunction with campus administration, Plant Facilities staff and General Contractor. Currently both projects show a progress of approximately 50% and are on track and within budget.
Energy savings for approximately $850,000 were generated during the last year as a result of contract negotiation and additional energy saving initiatives implemented by the Operations Department.
District’s Broad Goals
1 2 3 4 5 6
Personnel Allocations (All Funds)
General Operating Fund Expenditures by Object
2012/13 2013/14 2014/15
Actual Projected Budget
Payroll $149,300 $162,853 $217,047
Supplies & Materials 3,282 653 1,950
Other Op. Expenses 3,775 3,591 7,600
Capital Outlay 2,841 1,575 1,450
Total Budget $159,198 $168,672 $228,047
Performance Measures
Position 2013 2014 2015
Executive Director 1.00 0.00 1.00
Technician 0.00 1.00 1.00
Secretaries 1.00 1.00 1.00
Total 2.00 3.00 3.00 Actual Estimate Projected
Program/Service 12-13 13-14 14-15
Work orders completed 10,164 10,320 10,733
Workers' compensation accident
trends 300 290 287
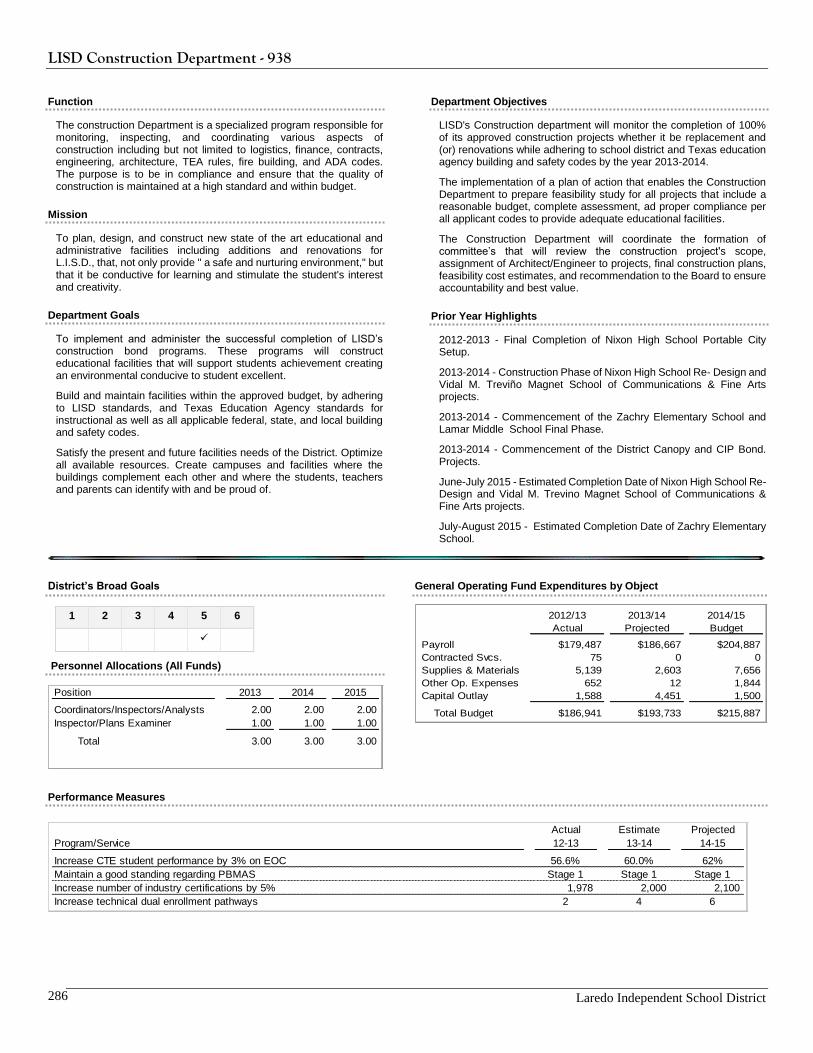
LISD Construction Department - 938
Laredo Independent School District 286
Function
The construction Department is a specialized program responsible for monitoring, inspecting, and coordinating various aspects of construction including but not limited to logistics, finance, contracts, engineering, architecture, TEA rules, fire building, and ADA codes. The purpose is to be in compliance and ensure that the quality of construction is maintained at a high standard and within budget.
Mission
To plan, design, and construct new state of the art educational and administrative facilities including additions and renovations for L.I.S.D., that, not only provide " a safe and nurturing environment," but that it be conductive for learning and stimulate the student's interest and creativity.
Department Goals
To implement and administer the successful completion of LISD’s construction bond programs. These programs will construct educational facilities that will support students achievement creating an environmental conducive to student excellent.
Build and maintain facilities within the approved budget, by adhering to LISD standards, and Texas Education Agency standards for instructional as well as all applicable federal, state, and local building and safety codes.
Satisfy the present and future facilities needs of the District. Optimize all available resources. Create campuses and facilities where the buildings complement each other and where the students, teachers and parents can identify with and be proud of.
Department Objectives
LISD's Construction department will monitor the completion of 100% of its approved construction projects whether it be replacement and (or) renovations while adhering to school district and Texas education agency building and safety codes by the year 2013-2014.
The implementation of a plan of action that enables the Construction Department to prepare feasibility study for all projects that include a reasonable budget, complete assessment, ad proper compliance per all applicant codes to provide adequate educational facilities.
The Construction Department will coordinate the formation of committee’s that will review the construction project's scope, assignment of Architect/Engineer to projects, final construction plans, feasibility cost estimates, and recommendation to the Board to ensure accountability and best value.
Prior Year Highlights
2012-2013 - Final Completion of Nixon High School Portable City Setup.
2013-2014 - Construction Phase of Nixon High School Re- Design and Vidal M. Treviño Magnet School of Communications & Fine Arts projects.
2013-2014 - Commencement of the Zachry Elementary School and Lamar Middle School Final Phase.
2013-2014 - Commencement of the District Canopy and CIP Bond. Projects.
June-July 2015 - Estimated Completion Date of Nixon High School Re-Design and Vidal M. Trevino Magnet School of Communications & Fine Arts projects.
July-August 2015 - Estimated Completion Date of Zachry Elementary School.
District’s Broad Goals
1 2 3 4 5 6
Personnel Allocations (All Funds)
General Operating Fund Expenditures by Object
2012/13 2013/14 2014/15
Actual Projected Budget
Payroll $179,487 $186,667 $204,887
Contracted Svcs. 75 0 0
Supplies & Materials 5,139 2,603 7,656
Other Op. Expenses 652 12 1,844
Capital Outlay 1,588 4,451 1,500
Total Budget $186,941 $193,733 $215,887
Performance Measures
Position 2013 2014 2015
Coordinators/Inspectors/Analysts 2.00 2.00 2.00
Inspector/Plans Examiner 1.00 1.00 1.00
Total 3.00 3.00 3.00
Actual Estimate Projected
Program/Service 12-13 13-14 14-15
Increase CTE student performance by 3% on EOC 56.6% 60.0% 62%
Maintain a good standing regarding PBMAS Stage 1 Stage 1 Stage 1
Increase number of industry certifications by 5% 1,978 2,000 2,100
Increase technical dual enrollment pathways 2 4 6
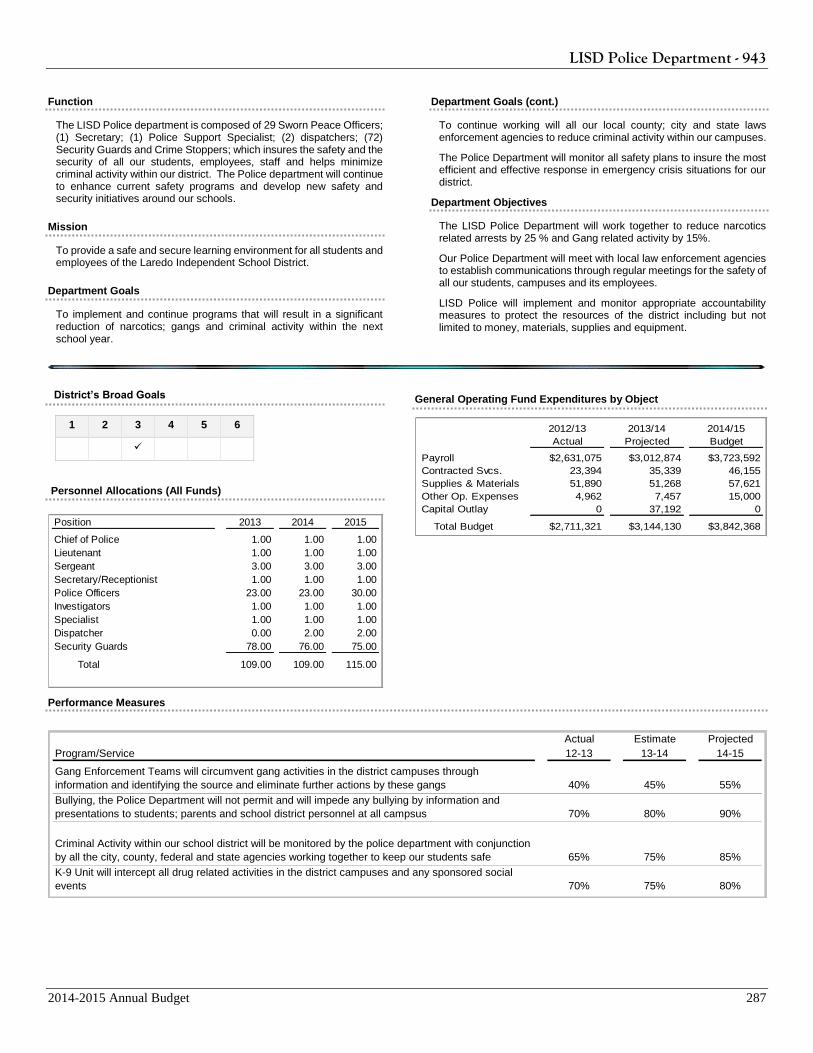
LISD Police Department - 943
2014-2015 Annual Budget 287
Function
The LISD Police department is composed of 29 Sworn Peace Officers; (1) Secretary; (1) Police Support Specialist; (2) dispatchers; (72) Security Guards and Crime Stoppers; which insures the safety and the security of all our students, employees, staff and helps minimize criminal activity within our district. The Police department will continue to enhance current safety programs and develop new safety and security initiatives around our schools.
Mission
To provide a safe and secure learning environment for all students and employees of the Laredo Independent School District.
Department Goals
To implement and continue programs that will result in a significant reduction of narcotics; gangs and criminal activity within the next school year.
Department Goals (cont.)
To continue working will all our local county; city and state laws enforcement agencies to reduce criminal activity within our campuses.
The Police Department will monitor all safety plans to insure the most efficient and effective response in emergency crisis situations for our district.
Department Objectives
The LISD Police Department will work together to reduce narcotics related arrests by 25 % and Gang related activity by 15%.
Our Police Department will meet with local law enforcement agencies to establish communications through regular meetings for the safety of all our students, campuses and its employees.
LISD Police will implement and monitor appropriate accountability measures to protect the resources of the district including but not limited to money, materials, supplies and equipment.
District’s Broad Goals
1 2 3 4 5 6
Personnel Allocations (All Funds)
General Operating Fund Expenditures by Object
2012/13 2013/14 2014/15
Actual Projected Budget
Payroll $2,631,075 $3,012,874 $3,723,592
Contracted Svcs. 23,394 35,339 46,155
Supplies & Materials 51,890 51,268 57,621
Other Op. Expenses 4,962 7,457 15,000
Capital Outlay 0 37,192 0
Total Budget $2,711,321 $3,144,130 $3,842,368
Performance Measures
Actual Estimate Projected
Program/Service 12-13 13-14 14-15
Gang Enforcement Teams will circumvent gang activities in the district campuses through
information and identifying the source and eliminate further actions by these gangs 40% 45% 55%
Bullying, the Police Department will not permit and will impede any bullying by information and
presentations to students; parents and school district personnel at all campsus 70% 80% 90%
Criminal Activity within our school district will be monitored by the police department with conjunction
by all the city, county, federal and state agencies working together to keep our students safe 65% 75% 85%
K-9 Unit will intercept all drug related activities in the district campuses and any sponsored social
events 70% 75% 80%
Position 2013 2014 2015
Chief of Police 1.00 1.00 1.00
Lieutenant 1.00 1.00 1.00
Sergeant 3.00 3.00 3.00
Secretary/Receptionist 1.00 1.00 1.00
Police Officers 23.00 23.00 30.00
Investigators 1.00 1.00 1.00
Specialist 1.00 1.00 1.00
Dispatcher 0.00 2.00 2.00
Security Guards 78.00 76.00 75.00
Total 109.00 109.00 115.00
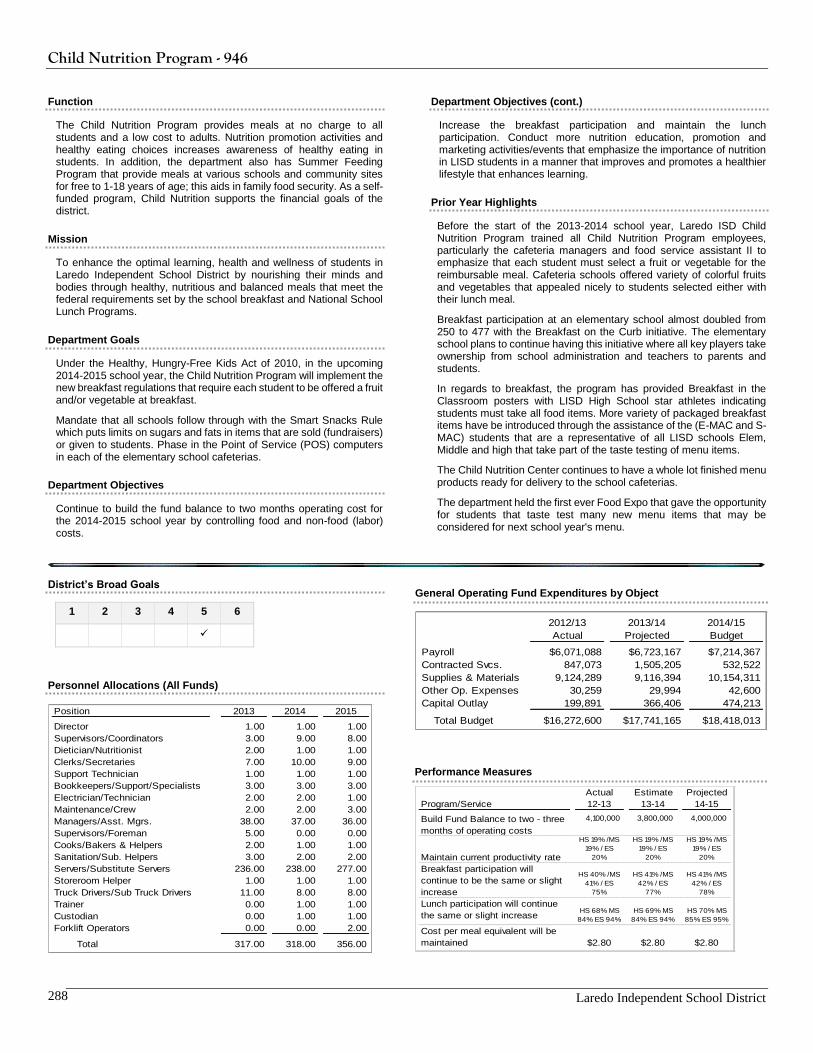
Child Nutrition Program - 946
Laredo Independent School District 288
Function
The Child Nutrition Program provides meals at no charge to all students and a low cost to adults. Nutrition promotion activities and healthy eating choices increases awareness of healthy eating in students. In addition, the department also has Summer Feeding Program that provide meals at various schools and community sites for free to 1-18 years of age; this aids in family food security. As a self-funded program, Child Nutrition supports the financial goals of the district.
Mission
To enhance the optimal learning, health and wellness of students in Laredo Independent School District by nourishing their minds and bodies through healthy, nutritious and balanced meals that meet the federal requirements set by the school breakfast and National School Lunch Programs.
Department Goals
Under the Healthy, Hungry-Free Kids Act of 2010, in the upcoming 2014-2015 school year, the Child Nutrition Program will implement the new breakfast regulations that require each student to be offered a fruit and/or vegetable at breakfast.
Mandate that all schools follow through with the Smart Snacks Rule which puts limits on sugars and fats in items that are sold (fundraisers) or given to students. Phase in the Point of Service (POS) computers in each of the elementary school cafeterias.
Department Objectives
Continue to build the fund balance to two months operating cost for the 2014-2015 school year by controlling food and non-food (labor) costs.
Department Objectives (cont.)
Increase the breakfast participation and maintain the lunch participation. Conduct more nutrition education, promotion and marketing activities/events that emphasize the importance of nutrition in LISD students in a manner that improves and promotes a healthier lifestyle that enhances learning.
Prior Year Highlights
Before the start of the 2013-2014 school year, Laredo ISD Child Nutrition Program trained all Child Nutrition Program employees, particularly the cafeteria managers and food service assistant II to emphasize that each student must select a fruit or vegetable for the reimbursable meal. Cafeteria schools offered variety of colorful fruits and vegetables that appealed nicely to students selected either with their lunch meal.
Breakfast participation at an elementary school almost doubled from 250 to 477 with the Breakfast on the Curb initiative. The elementary school plans to continue having this initiative where all key players take ownership from school administration and teachers to parents and students.
In regards to breakfast, the program has provided Breakfast in the Classroom posters with LISD High School star athletes indicating students must take all food items. More variety of packaged breakfast items have be introduced through the assistance of the (E-MAC and S-MAC) students that are a representative of all LISD schools Elem, Middle and high that take part of the taste testing of menu items.
The Child Nutrition Center continues to have a whole lot finished menu products ready for delivery to the school cafeterias.
The department held the first ever Food Expo that gave the opportunity for students that taste test many new menu items that may be considered for next school year's menu.
District’s Broad Goals
1 2 3 4 5 6
Personnel Allocations (All Funds)
General Operating Fund Expenditures by Object
2012/13 2013/14 2014/15
Actual Projected Budget
Payroll $6,071,088 $6,723,167 $7,214,367
Contracted Svcs. 847,073 1,505,205 532,522
Supplies & Materials 9,124,289 9,116,394 10,154,311
Other Op. Expenses 30,259 29,994 42,600
Capital Outlay 199,891 366,406 474,213
Total Budget $16,272,600 $17,741,165 $18,418,013
Performance Measures
Position 2013 2014 2015
Director 1.00 1.00 1.00
Supervisors/Coordinators 3.00 9.00 8.00
Dietician/Nutritionist 2.00 1.00 1.00
Clerks/Secretaries 7.00 10.00 9.00
Support Technician 1.00 1.00 1.00
Bookkeepers/Support/Specialists 3.00 3.00 3.00
Electrician/Technician 2.00 2.00 1.00
Maintenance/Crew 2.00 2.00 3.00
Managers/Asst. Mgrs. 38.00 37.00 36.00
Supervisors/Foreman 5.00 0.00 0.00
Cooks/Bakers & Helpers 2.00 1.00 1.00
Sanitation/Sub. Helpers 3.00 2.00 2.00
Servers/Substitute Servers 236.00 238.00 277.00
Storeroom Helper 1.00 1.00 1.00
Truck Drivers/Sub Truck Drivers 11.00 8.00 8.00
Trainer 0.00 1.00 1.00
Custodian 0.00 1.00 1.00
Forklift Operators 0.00 0.00 2.00
Total 317.00 318.00 356.00
Actual Estimate Projected
Program/Service 12-13 13-14 14-15
Build Fund Balance to two - three
months of operating costs
4,100,000 3,800,000 4,000,000
Maintain current productivity rate
HS 19% /MS
19% / ES
20%
HS 19% /MS
19% / ES
20%
HS 19% /MS
19% / ES
20%
Breakfast participation will
continue to be the same or slight
increase
HS 40% /MS
41% / ES
75%
HS 41% /MS
42% / ES
77%
HS 41% /MS
42% / ES
78%
Lunch participation will continue
the same or slight increaseHS 68% MS
84% ES 94%
HS 69% MS
84% ES 94%
HS 70% MS
85% ES 95%
Cost per meal equivalent will be
maintained $2.80 $2.80 $2.80
SUPPLEMENTARY SECTION
TABLE OF CONTENTS
TEA Summary of Finances (Release 5.0) Preliminary 2014-15 Estimate of State Aid Worksheet ........................... 289
Possible Function Groups for Aggregate Per-Student Spending .............................................................................. 295
Minimum Required Expense Analysis of the General Operating Fund for 2014-2015 ............................................. 296
Comparison of Peer Districts Operating Costs by Function using Refined Average Daily Attendance (ADA) ........ 297
2012-2013 Academic Excellence Indicator System ................................................................................................... 298
Resolution Levying a Tax Rate .................................................................................................................................. 302
Webb County Appraisal District Affidavit ................................................................................................................ 303
Webb County Appraisal District Valuation ............................................................................................................... 304
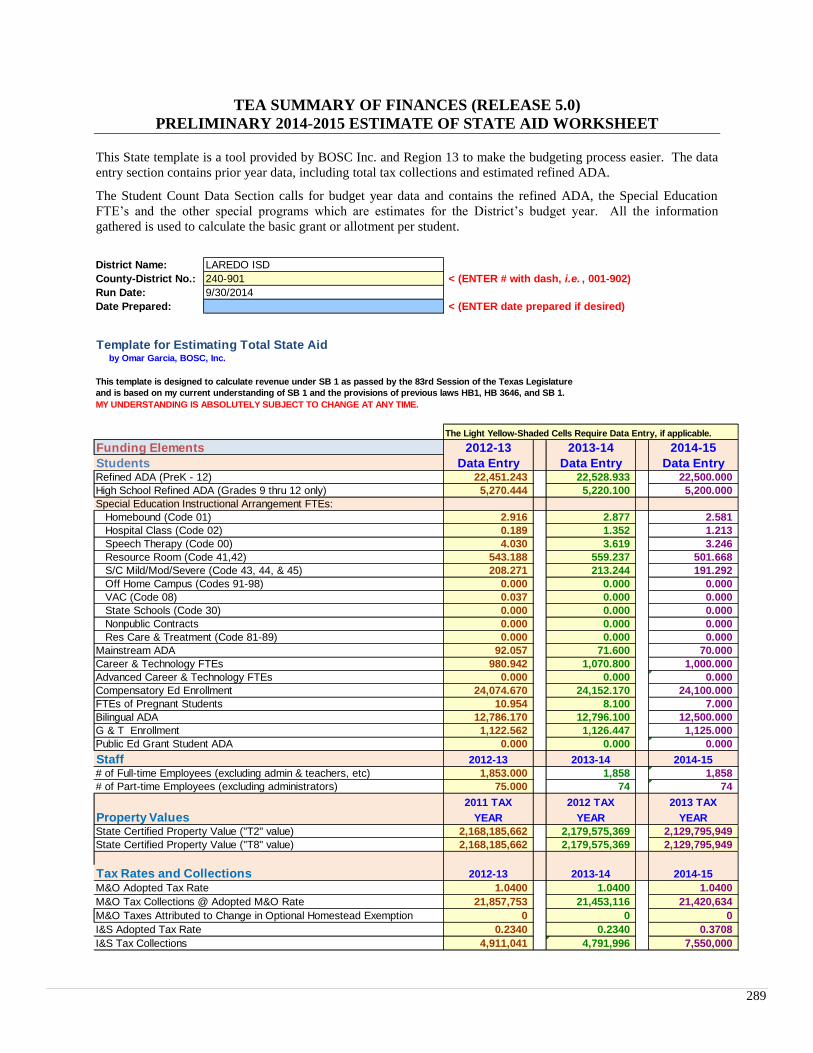
289
TEA SUMMARY OF FINANCES (RELEASE 5.0)
PRELIMINARY 2014-2015 ESTIMATE OF STATE AID WORKSHEET
This State template is a tool provided by BOSC Inc. and Region 13 to make the budgeting process easier. The data
entry section contains prior year data, including total tax collections and estimated refined ADA.
The Student Count Data Section calls for budget year data and contains the refined ADA, the Special Education
FTE’s and the other special programs which are estimates for the District’s budget year. All the information
gathered is used to calculate the basic grant or allotment per student.
District Name: LAREDO ISD
County-District No.: 240-901 < (ENTER # with dash, i.e. , 001-902)
Run Date: 9/30/2014
Date Prepared: < (ENTER date prepared if desired)
Template for Estimating Total State Aid by Omar Garcia, BOSC, Inc.
This template is designed to calculate revenue under SB 1 as passed by the 83rd Session of the Texas Legislature
and is based on my current understanding of SB 1 and the provisions of previous laws HB1, HB 3646, and SB 1.
MY UNDERSTANDING IS ABSOLUTELY SUBJECT TO CHANGE AT ANY TIME.
The Light Yellow-Shaded Cells Require Data Entry, if applicable.
Funding Elements 2012-13 2013-14 2014-15
Students Data Entry Data Entry Data EntryRefined ADA (PreK - 12) 22,451.243 22,528.933 22,500.000
High School Refined ADA (Grades 9 thru 12 only) 5,270.444 5,220.100 5,200.000
Special Education Instructional Arrangement FTEs:
Homebound (Code 01) 2.916 2.877 2.581
Hospital Class (Code 02) 0.189 1.352 1.213
Speech Therapy (Code 00) 4.030 3.619 3.246
Resource Room (Code 41,42) 543.188 559.237 501.668
S/C Mild/Mod/Severe (Code 43, 44, & 45) 208.271 213.244 191.292
Off Home Campus (Codes 91-98) 0.000 0.000 0.000
VAC (Code 08) 0.037 0.000 0.000
State Schools (Code 30) 0.000 0.000 0.000
Nonpublic Contracts 0.000 0.000 0.000
Res Care & Treatment (Code 81-89) 0.000 0.000 0.000
Mainstream ADA 92.057 71.600 70.000
Career & Technology FTEs 980.942 1,070.800 1,000.000
Advanced Career & Technology FTEs 0.000 0.000 0.000
Compensatory Ed Enrollment 24,074.670 24,152.170 24,100.000
FTEs of Pregnant Students 10.954 8.100 7.000
Bilingual ADA 12,786.170 12,796.100 12,500.000
G & T Enrollment 1,122.562 1,126.447 1,125.000
Public Ed Grant Student ADA 0.000 0.000 0.000
Staff 2012-13 2013-14 2014-15
# of Full-time Employees (excluding admin & teachers, etc) 1,853.000 1,858 1,858
# of Part-time Employees (excluding administrators) 75.000 74 74
2011 TAX 2012 TAX 2013 TAX
Property Values YEAR YEAR YEAR
State Certified Property Value ("T2" value) 2,168,185,662 2,179,575,369 2,129,795,949
State Certified Property Value ("T8" value) 2,168,185,662 2,179,575,369 2,129,795,949
Tax Rates and Collections 2012-13 2013-14 2014-15
M&O Adopted Tax Rate 1.0400 1.0400 1.0400
M&O Tax Collections @ Adopted M&O Rate 21,857,753 21,453,116 21,420,634
M&O Taxes Attributed to Change in Optional Homestead Exemption 0 0 0
I&S Adopted Tax Rate 0.2340 0.2340 0.3708
I&S Tax Collections 4,911,041 4,791,996 7,550,000
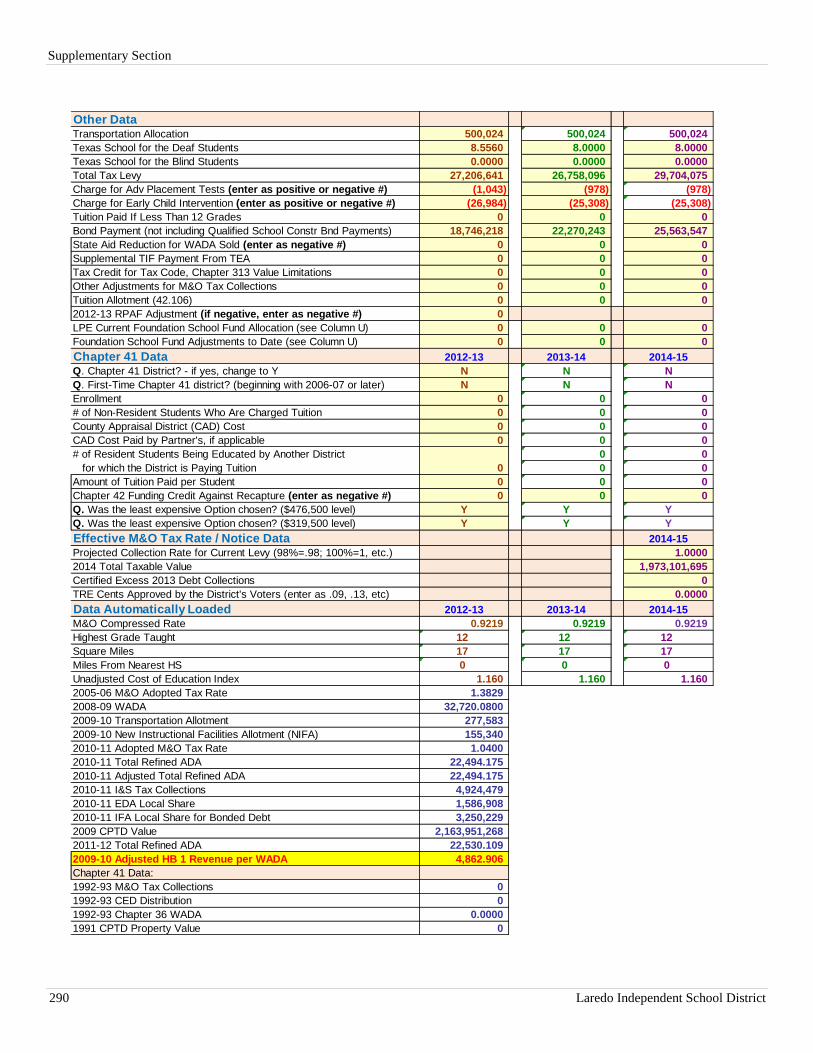
Supplementary Section
290 Laredo Independent School District
Other DataTransportation Allocation 500,024 500,024 500,024
Texas School for the Deaf Students 8.5560 8.0000 8.0000
Texas School for the Blind Students 0.0000 0.0000 0.0000
Total Tax Levy 27,206,641 26,758,096 29,704,075
Charge for Adv Placement Tests (enter as positive or negative #) (1,043) (978) (978)
Charge for Early Child Intervention (enter as positive or negative #) (26,984) (25,308) (25,308)
Tuition Paid If Less Than 12 Grades 0 0 0
Bond Payment (not including Qualified School Constr Bnd Payments) 18,746,218 22,270,243 25,563,547
State Aid Reduction for WADA Sold (enter as negative #) 0 0 0
Supplemental TIF Payment From TEA 0 0 0
Tax Credit for Tax Code, Chapter 313 Value Limitations 0 0 0
Other Adjustments for M&O Tax Collections 0 0 0
Tuition Allotment (42.106) 0 0 0
2012-13 RPAF Adjustment (if negative, enter as negative #) 0
LPE Current Foundation School Fund Allocation (see Column U) 0 0 0
Foundation School Fund Adjustments to Date (see Column U) 0 0 0
Chapter 41 Data 2012-13 2013-14 2014-15
Q. Chapter 41 District? - if yes, change to Y N N N
Q. First-Time Chapter 41 district? (beginning with 2006-07 or later) N N N
Enrollment 0 0 0
# of Non-Resident Students Who Are Charged Tuition 0 0 0
County Appraisal District (CAD) Cost 0 0 0
CAD Cost Paid by Partner's, if applicable 0 0 0
# of Resident Students Being Educated by Another District 0 0
for which the District is Paying Tuition 0 0 0
Amount of Tuition Paid per Student 0 0 0
Chapter 42 Funding Credit Against Recapture (enter as negative #) 0 0 0
Q. Was the least expensive Option chosen? ($476,500 level) Y Y Y
Q. Was the least expensive Option chosen? ($319,500 level) Y Y Y
Effective M&O Tax Rate / Notice Data 2014-15
Projected Collection Rate for Current Levy (98%=.98; 100%=1, etc.) 1.0000
2014 Total Taxable Value 1,973,101,695
Certified Excess 2013 Debt Collections 0
TRE Cents Approved by the District's Voters (enter as .09, .13, etc) 0.0000
Data Automatically Loaded 2012-13 2013-14 2014-15
M&O Compressed Rate 0.9219 0.9219 0.9219
Highest Grade Taught 12 12 12
Square Miles 17 17 17
Miles From Nearest HS 0 0 0
Unadjusted Cost of Education Index 1.160 1.160 1.160
2005-06 M&O Adopted Tax Rate 1.3829
2008-09 WADA 32,720.0800
2009-10 Transportation Allotment 277,583
2009-10 New Instructional Facilities Allotment (NIFA) 155,340
2010-11 Adopted M&O Tax Rate 1.0400
2010-11 Total Refined ADA 22,494.175
2010-11 Adjusted Total Refined ADA 22,494.175
2010-11 I&S Tax Collections 4,924,479
2010-11 EDA Local Share 1,586,908
2010-11 IFA Local Share for Bonded Debt 3,250,229
2009 CPTD Value 2,163,951,268
2011-12 Total Refined ADA 22,530.109
2009-10 Adjusted HB 1 Revenue per WADA 4,862.906
Chapter 41 Data:
1992-93 M&O Tax Collections 0
1992-93 CED Distribution 0
1992-93 Chapter 36 WADA 0.0000
1991 CPTD Property Value 0
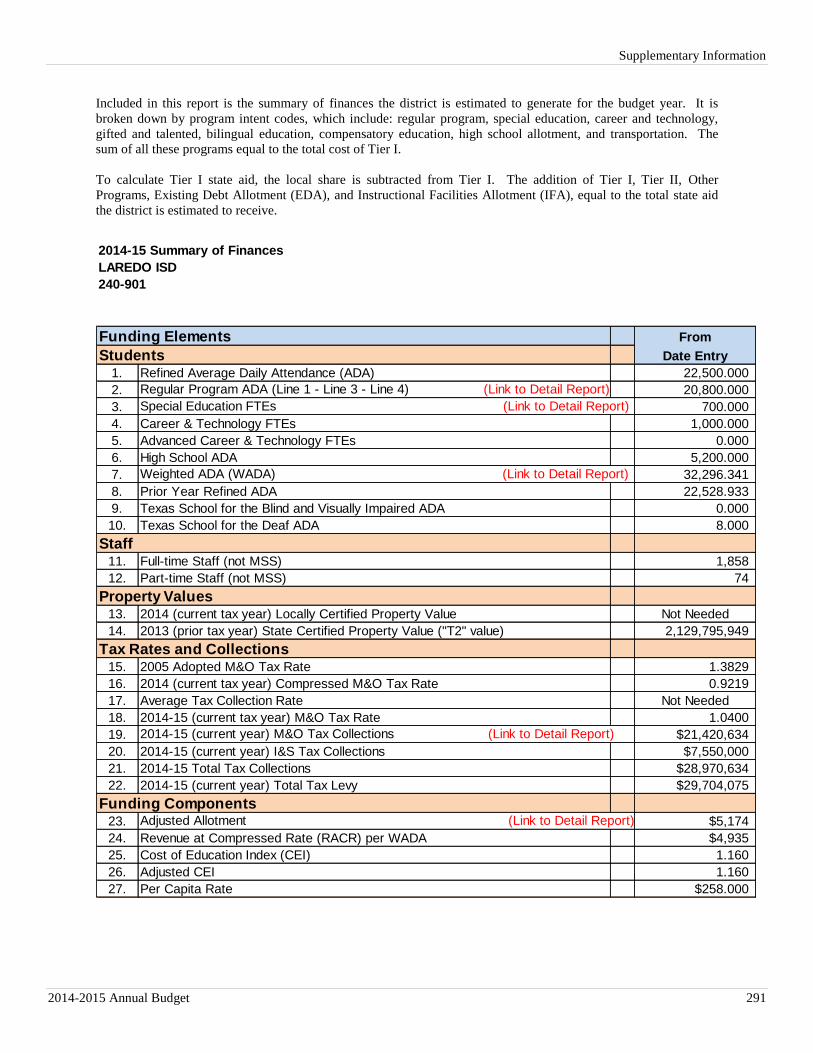
Supplementary Information
2014-2015 Annual Budget 291
Included in this report is the summary of finances the district is estimated to generate for the budget year. It is
broken down by program intent codes, which include: regular program, special education, career and technology,
gifted and talented, bilingual education, compensatory education, high school allotment, and transportation. The
sum of all these programs equal to the total cost of Tier I.
To calculate Tier I state aid, the local share is subtracted from Tier I. The addition of Tier I, Tier II, Other
Programs, Existing Debt Allotment (EDA), and Instructional Facilities Allotment (IFA), equal to the total state aid
the district is estimated to receive.
2014-15 Summary of Finances
LAREDO ISD
240-901
Funding Elements From
Students Date Entry
1. Refined Average Daily Attendance (ADA) 22,500.000
2. Regular Program ADA (Line 1 - Line 3 - Line 4) (Link to Detail Report) 20,800.000
3. Special Education FTEs (Link to Detail Report) 700.000
4. Career & Technology FTEs 1,000.000
5. Advanced Career & Technology FTEs 0.000
6. High School ADA 5,200.000
7. Weighted ADA (WADA) (Link to Detail Report) 32,296.341
8. Prior Year Refined ADA 22,528.933
9. Texas School for the Blind and Visually Impaired ADA 0.000
10. Texas School for the Deaf ADA 8.000
Staff11. Full-time Staff (not MSS) 1,858
12. Part-time Staff (not MSS) 74
Property Values13. 2014 (current tax year) Locally Certified Property Value Not Needed
14. 2013 (prior tax year) State Certified Property Value ("T2" value) 2,129,795,949
Tax Rates and Collections15. 2005 Adopted M&O Tax Rate 1.3829
16. 2014 (current tax year) Compressed M&O Tax Rate 0.9219
17. Average Tax Collection Rate Not Needed
18. 2014-15 (current tax year) M&O Tax Rate 1.0400
19. 2014-15 (current year) M&O Tax Collections (Link to Detail Report) $21,420,634
20. 2014-15 (current year) I&S Tax Collections $7,550,000
21. 2014-15 Total Tax Collections $28,970,634
22. 2014-15 (current year) Total Tax Levy $29,704,075
Funding Components23. Adjusted Allotment (Link to Detail Report) $5,174
24. Revenue at Compressed Rate (RACR) per WADA $4,935
25. Cost of Education Index (CEI) 1.160
26. Adjusted CEI 1.160
27. Per Capita Rate $258.000
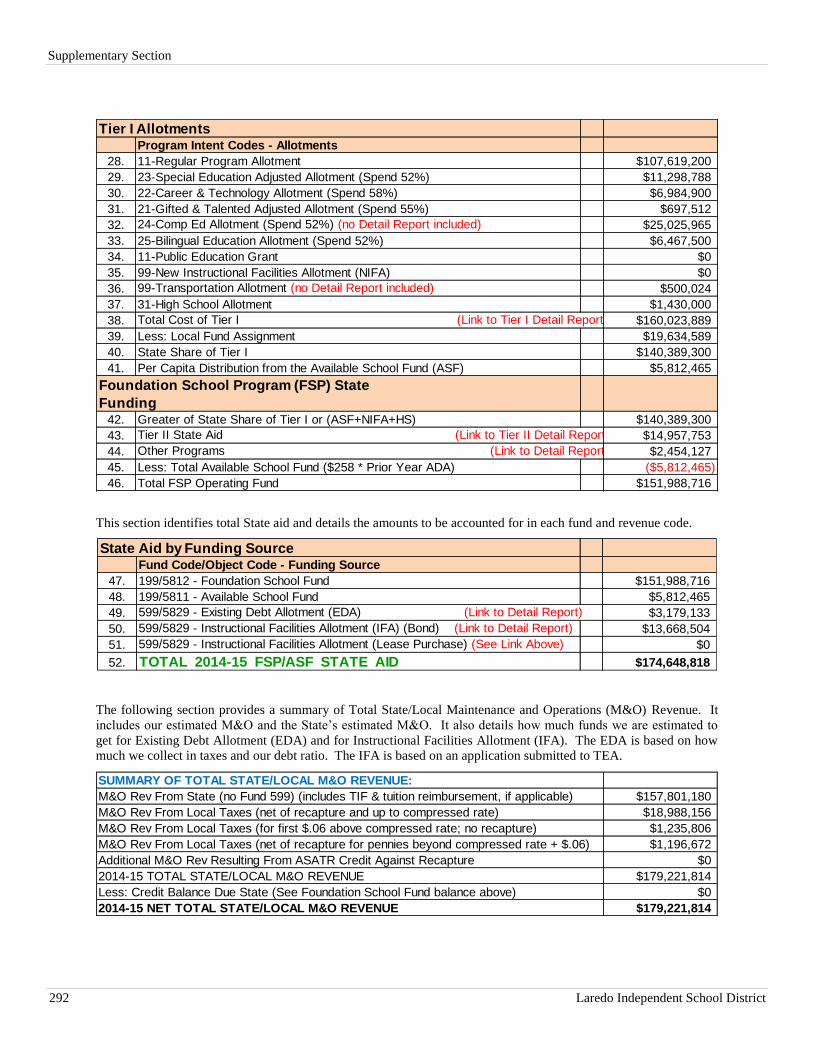
Supplementary Section
292 Laredo Independent School District
Tier I AllotmentsProgram Intent Codes - Allotments
28. 11-Regular Program Allotment $107,619,200
29. 23-Special Education Adjusted Allotment (Spend 52%) $11,298,788
30. 22-Career & Technology Allotment (Spend 58%) $6,984,900
31. 21-Gifted & Talented Adjusted Allotment (Spend 55%) $697,512
32. 24-Comp Ed Allotment (Spend 52%) (no Detail Report included) $25,025,965
33. 25-Bilingual Education Allotment (Spend 52%) $6,467,500
34. 11-Public Education Grant $0
35. 99-New Instructional Facilities Allotment (NIFA) $0
36. 99-Transportation Allotment (no Detail Report included) $500,024
37. 31-High School Allotment $1,430,000
38. Total Cost of Tier I (Link to Tier I Detail Report) $160,023,889
39. Less: Local Fund Assignment $19,634,589
40. State Share of Tier I $140,389,300
41. Per Capita Distribution from the Available School Fund (ASF) $5,812,465
Foundation School Program (FSP) State
Funding42. Greater of State Share of Tier I or (ASF+NIFA+HS) $140,389,300
43. Tier II State Aid (Link to Tier II Detail Report) $14,957,753
44. Other Programs (Link to Detail Report) $2,454,127
45. Less: Total Available School Fund ($258 * Prior Year ADA) ($5,812,465)
46. Total FSP Operating Fund $151,988,716
This section identifies total State aid and details the amounts to be accounted for in each fund and revenue code.
State Aid by Funding SourceFund Code/Object Code - Funding Source
47. 199/5812 - Foundation School Fund $151,988,716
48. 199/5811 - Available School Fund $5,812,465
49. 599/5829 - Existing Debt Allotment (EDA) (Link to Detail Report) $3,179,133
50. 599/5829 - Instructional Facilities Allotment (IFA) (Bond) (Link to Detail Report) $13,668,504
51. 599/5829 - Instructional Facilities Allotment (Lease Purchase) (See Link Above) $0
52. TOTAL 2014-15 FSP/ASF STATE AID $174,648,818
The following section provides a summary of Total State/Local Maintenance and Operations (M&O) Revenue. It
includes our estimated M&O and the State’s estimated M&O. It also details how much funds we are estimated to
get for Existing Debt Allotment (EDA) and for Instructional Facilities Allotment (IFA). The EDA is based on how
much we collect in taxes and our debt ratio. The IFA is based on an application submitted to TEA.
SUMMARY OF TOTAL STATE/LOCAL M&O REVENUE:
M&O Rev From State (no Fund 599) (includes TIF & tuition reimbursement, if applicable) $157,801,180
M&O Rev From Local Taxes (net of recapture and up to compressed rate) $18,988,156
M&O Rev From Local Taxes (for first $.06 above compressed rate; no recapture) $1,235,806
M&O Rev From Local Taxes (net of recapture for pennies beyond compressed rate + $.06) $1,196,672
Additional M&O Rev Resulting From ASATR Credit Against Recapture $0
2014-15 TOTAL STATE/LOCAL M&O REVENUE $179,221,814
Less: Credit Balance Due State (See Foundation School Fund balance above) $0
2014-15 NET TOTAL STATE/LOCAL M&O REVENUE $179,221,814
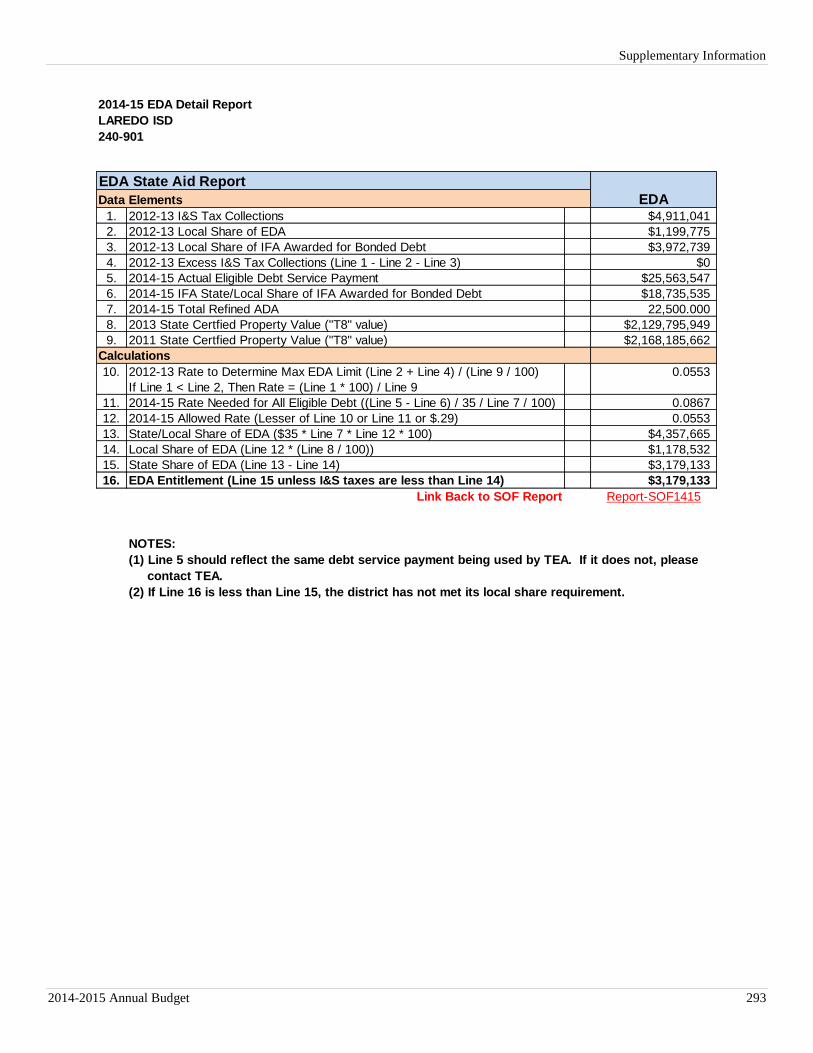
Supplementary Information
2014-2015 Annual Budget 293
2014-15 EDA Detail Report
LAREDO ISD
240-901
EDA State Aid Report
Data Elements EDA1. 2012-13 I&S Tax Collections $4,911,041
2. 2012-13 Local Share of EDA $1,199,775
3. 2012-13 Local Share of IFA Awarded for Bonded Debt $3,972,739
4. 2012-13 Excess I&S Tax Collections (Line 1 - Line 2 - Line 3) $0
5. 2014-15 Actual Eligible Debt Service Payment $25,563,547
6. 2014-15 IFA State/Local Share of IFA Awarded for Bonded Debt $18,735,535
7. 2014-15 Total Refined ADA 22,500.000
8. 2013 State Certfied Property Value ("T8" value) $2,129,795,949
9. 2011 State Certfied Property Value ("T8" value) $2,168,185,662
Calculations
10. 2012-13 Rate to Determine Max EDA Limit (Line 2 + Line 4) / (Line 9 / 100) 0.0553
If Line 1 < Line 2, Then Rate = (Line 1 * 100) / Line 9
11. 2014-15 Rate Needed for All Eligible Debt ((Line 5 - Line 6) / 35 / Line 7 / 100) 0.0867
12. 2014-15 Allowed Rate (Lesser of Line 10 or Line 11 or $.29) 0.0553
13. State/Local Share of EDA ($35 * Line 7 * Line 12 * 100) $4,357,665
14. Local Share of EDA (Line 12 * (Line 8 / 100)) $1,178,532
15. State Share of EDA (Line 13 - Line 14) $3,179,133
16. EDA Entitlement (Line 15 unless I&S taxes are less than Line 14) $3,179,133
Link Back to SOF Report Report-SOF1415
NOTES:
(1) Line 5 should reflect the same debt service payment being used by TEA. If it does not, please
contact TEA.
(2) If Line 16 is less than Line 15, the district has not met its local share requirement.
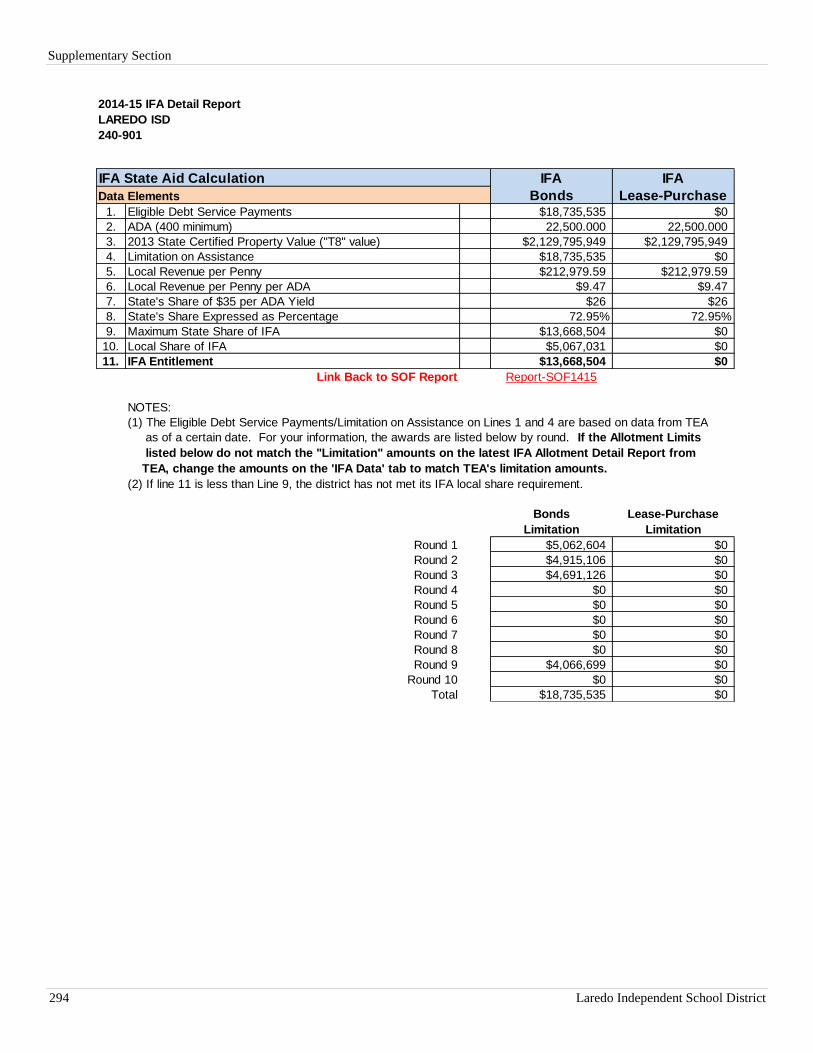
Supplementary Section
294 Laredo Independent School District
2014-15 IFA Detail Report
LAREDO ISD
240-901
IFA State Aid Calculation IFA IFA
Data Elements Bonds Lease-Purchase1. Eligible Debt Service Payments $18,735,535 $0
2. ADA (400 minimum) 22,500.000 22,500.000
3. 2013 State Certified Property Value ("T8" value) $2,129,795,949 $2,129,795,949
4. Limitation on Assistance $18,735,535 $0
5. Local Revenue per Penny $212,979.59 $212,979.59
6. Local Revenue per Penny per ADA $9.47 $9.47
7. State's Share of $35 per ADA Yield $26 $26
8. State's Share Expressed as Percentage 72.95% 72.95%
9. Maximum State Share of IFA $13,668,504 $0
10. Local Share of IFA $5,067,031 $0
11. IFA Entitlement $13,668,504 $0
Link Back to SOF Report Report-SOF1415
NOTES:
(1) The Eligible Debt Service Payments/Limitation on Assistance on Lines 1 and 4 are based on data from TEA
as of a certain date. For your information, the awards are listed below by round. If the Allotment Limits
listed below do not match the "Limitation" amounts on the latest IFA Allotment Detail Report from
TEA, change the amounts on the 'IFA Data' tab to match TEA's limitation amounts.
(2) If line 11 is less than Line 9, the district has not met its IFA local share requirement.
Bonds Lease-Purchase
Limitation Limitation
Round 1 $5,062,604 $0
Round 2 $4,915,106 $0
Round 3 $4,691,126 $0
Round 4 $0 $0
Round 5 $0 $0
Round 6 $0 $0
Round 7 $0 $0
Round 8 $0 $0
Round 9 $4,066,699 $0
Round 10 $0 $0
Total $18,735,535 $0
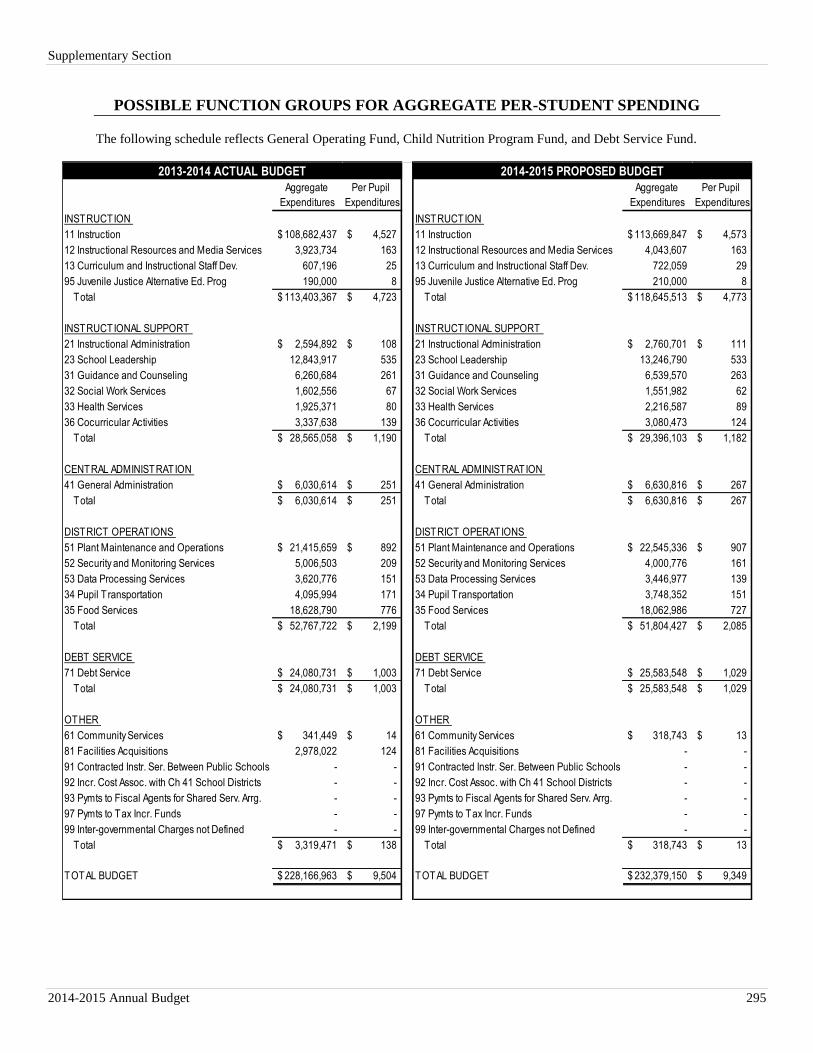
Supplementary Section
2014-2015 Annual Budget 295
POSSIBLE FUNCTION GROUPS FOR AGGREGATE PER-STUDENT SPENDING
The following schedule reflects General Operating Fund, Child Nutrition Program Fund, and Debt Service Fund.
Aggregate Per Pupil Aggregate Per Pupil
Expenditures Expenditures Expenditures Expenditures
INSTRUCTION INSTRUCTION
11 Instruction 108,682,437$ 4,527$ 11 Instruction 113,669,847$ 4,573$
12 Instructional Resources and Media Services 3,923,734 163 12 Instructional Resources and Media Services 4,043,607 163
13 Curriculum and Instructional Staff Dev. 607,196 25 13 Curriculum and Instructional Staff Dev. 722,059 29
95 Juvenile Justice Alternative Ed. Prog 190,000 8 95 Juvenile Justice Alternative Ed. Prog 210,000 8
Total 113,403,367$ 4,723$ Total 118,645,513$ 4,773$
INSTRUCTIONAL SUPPORT INSTRUCTIONAL SUPPORT
21 Instructional Administration 2,594,892$ 108$ 21 Instructional Administration 2,760,701$ 111$
23 School Leadership 12,843,917 535 23 School Leadership 13,246,790 533
31 Guidance and Counseling 6,260,684 261 31 Guidance and Counseling 6,539,570 263
32 Social Work Services 1,602,556 67 32 Social Work Services 1,551,982 62
33 Health Services 1,925,371 80 33 Health Services 2,216,587 89
36 Cocurricular Activities 3,337,638 139 36 Cocurricular Activities 3,080,473 124
Total 28,565,058$ 1,190$ Total 29,396,103$ 1,182$
CENTRAL ADMINISTRATION CENTRAL ADMINISTRATION
41 General Administration 6,030,614$ 251$ 41 General Administration 6,630,816$ 267$
Total 6,030,614$ 251$ Total 6,630,816$ 267$
DISTRICT OPERATIONS DISTRICT OPERATIONS
51 Plant Maintenance and Operations 21,415,659$ 892$ 51 Plant Maintenance and Operations 22,545,336$ 907$
52 Security and Monitoring Services 5,006,503 209 52 Security and Monitoring Services 4,000,776 161
53 Data Processing Services 3,620,776 151 53 Data Processing Services 3,446,977 139
34 Pupil T ransportation 4,095,994 171 34 Pupil T ransportation 3,748,352 151
35 Food Services 18,628,790 776 35 Food Services 18,062,986 727
Total 52,767,722$ 2,199$ Total 51,804,427$ 2,085$
DEBT SERVICE DEBT SERVICE
71 Debt Service 24,080,731$ 1,003$ 71 Debt Service 25,583,548$ 1,029$
Total 24,080,731$ 1,003$ Total 25,583,548$ 1,029$
OTHER OTHER
61 Community Services 341,449$ 14$ 61 Community Services 318,743$ 13$
81 Facilities Acquisitions 2,978,022 124 81 Facilities Acquisitions - -
91 Contracted Instr. Ser. Between Public Schools - - 91 Contracted Instr. Ser. Between Public Schools - -
92 Incr. Cost Assoc. with Ch 41 School Districts - - 92 Incr. Cost Assoc. with Ch 41 School Districts - -
93 Pymts to Fiscal Agents for Shared Serv. Arrg. - - 93 Pymts to Fiscal Agents for Shared Serv. Arrg. - -
97 Pymts to Tax Incr. Funds - - 97 Pymts to Tax Incr. Funds - -
99 Inter-governmental Charges not Defined - - 99 Inter-governmental Charges not Defined - -
Total 3,319,471$ 138$ Total 318,743$ 13$
TOTAL BUDGET 228,166,963$ 9,504$ TOTAL BUDGET 232,379,150$ 9,349$
2013-2014 ACTUAL BUDGET 2014-2015 PROPOSED BUDGET
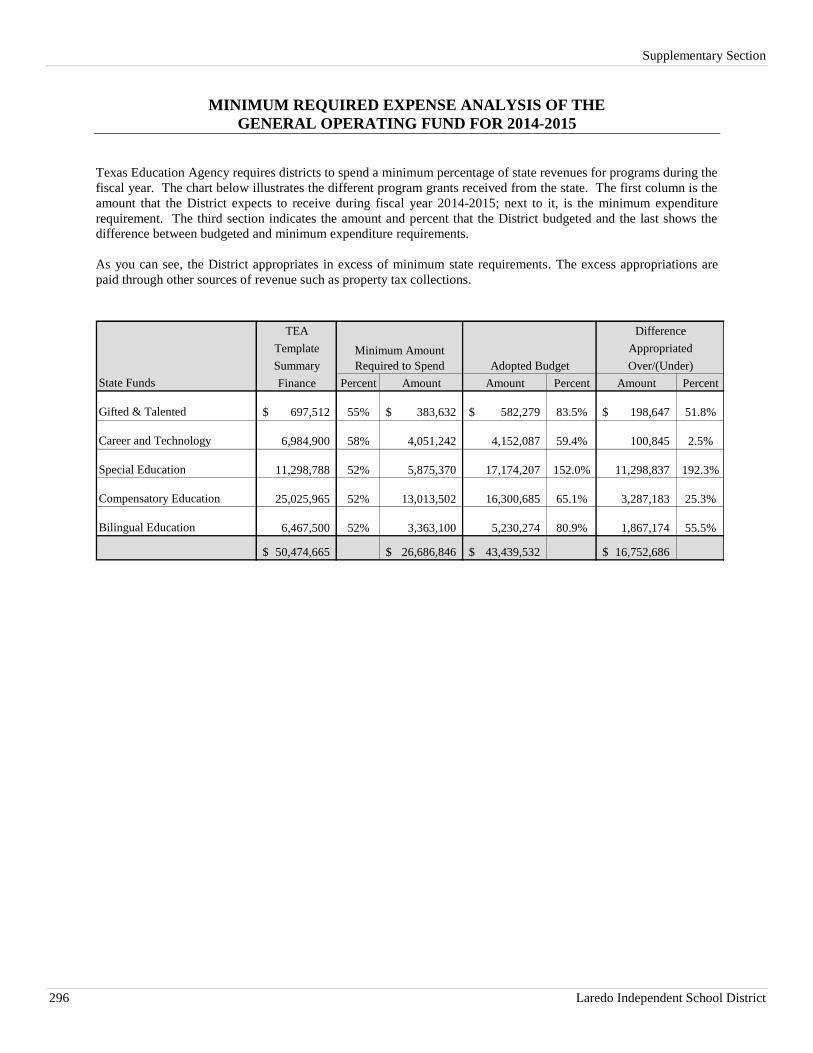
Supplementary Section
296 Laredo Independent School District
MINIMUM REQUIRED EXPENSE ANALYSIS OF THE
GENERAL OPERATING FUND FOR 2014-2015
Texas Education Agency requires districts to spend a minimum percentage of state revenues for programs during the
fiscal year. The chart below illustrates the different program grants received from the state. The first column is the
amount that the District expects to receive during fiscal year 2014-2015; next to it, is the minimum expenditure
requirement. The third section indicates the amount and percent that the District budgeted and the last shows the
difference between budgeted and minimum expenditure requirements.
As you can see, the District appropriates in excess of minimum state requirements. The excess appropriations are
paid through other sources of revenue such as property tax collections.
TEA
Template
Summary
State Funds Finance Percent Amount Amount Percent Amount Percent
Gifted & Talented 697,512$ 55% 383,632$ 582,279$ 83.5% 198,647$ 51.8%
Career and Technology 6,984,900 58% 4,051,242 4,152,087 59.4% 100,845 2.5%
Special Education 11,298,788 52% 5,875,370 17,174,207 152.0% 11,298,837 192.3%
Compensatory Education 25,025,965 52% 13,013,502 16,300,685 65.1% 3,287,183 25.3%
Bilingual Education 6,467,500 52% 3,363,100 5,230,274 80.9% 1,867,174 55.5%
50,474,665$ 26,686,846$ 43,439,532$ 16,752,686$
Minimum Amount
Required to Spend Adopted Budget
Difference
Appropriated
Over/(Under)
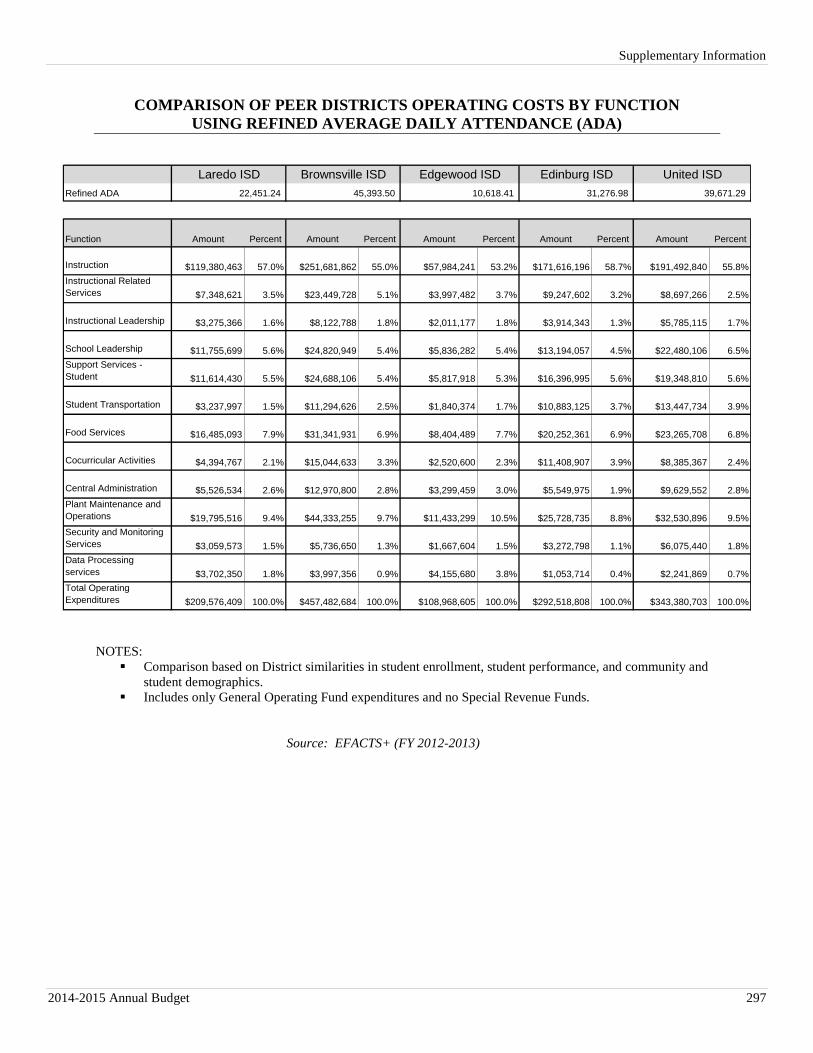
Supplementary Information
2014-2015 Annual Budget 297
COMPARISON OF PEER DISTRICTS OPERATING COSTS BY FUNCTION
USING REFINED AVERAGE DAILY ATTENDANCE (ADA)
Refined ADA
Function Amount Percent Amount Percent Amount Percent Amount Percent Amount Percent
Instruction $119,380,463 57.0% $251,681,862 55.0% $57,984,241 53.2% $171,616,196 58.7% $191,492,840 55.8%
Instructional Related
Services $7,348,621 3.5% $23,449,728 5.1% $3,997,482 3.7% $9,247,602 3.2% $8,697,266 2.5%
Instructional Leadership $3,275,366 1.6% $8,122,788 1.8% $2,011,177 1.8% $3,914,343 1.3% $5,785,115 1.7%
School Leadership $11,755,699 5.6% $24,820,949 5.4% $5,836,282 5.4% $13,194,057 4.5% $22,480,106 6.5%
Support Services -
Student $11,614,430 5.5% $24,688,106 5.4% $5,817,918 5.3% $16,396,995 5.6% $19,348,810 5.6%
Student Transportation $3,237,997 1.5% $11,294,626 2.5% $1,840,374 1.7% $10,883,125 3.7% $13,447,734 3.9%
Food Services $16,485,093 7.9% $31,341,931 6.9% $8,404,489 7.7% $20,252,361 6.9% $23,265,708 6.8%
Cocurricular Activities $4,394,767 2.1% $15,044,633 3.3% $2,520,600 2.3% $11,408,907 3.9% $8,385,367 2.4%
Central Administration $5,526,534 2.6% $12,970,800 2.8% $3,299,459 3.0% $5,549,975 1.9% $9,629,552 2.8%
Plant Maintenance and
Operations $19,795,516 9.4% $44,333,255 9.7% $11,433,299 10.5% $25,728,735 8.8% $32,530,896 9.5%
Security and Monitoring
Services $3,059,573 1.5% $5,736,650 1.3% $1,667,604 1.5% $3,272,798 1.1% $6,075,440 1.8%
Data Processing
services $3,702,350 1.8% $3,997,356 0.9% $4,155,680 3.8% $1,053,714 0.4% $2,241,869 0.7%
Total Operating
Expenditures $209,576,409 100.0% $457,482,684 100.0% $108,968,605 100.0% $292,518,808 100.0% $343,380,703 100.0%
39,671.29 22,451.24 45,393.50 10,618.41 31,276.98
United ISDLaredo ISD Edgewood ISD Edinburg ISDBrownsville ISD
NOTES:
Comparison based on District similarities in student enrollment, student performance, and community and
student demographics.
Includes only General Operating Fund expenditures and no Special Revenue Funds.
Source: EFACTS+ (FY 2012-2013)
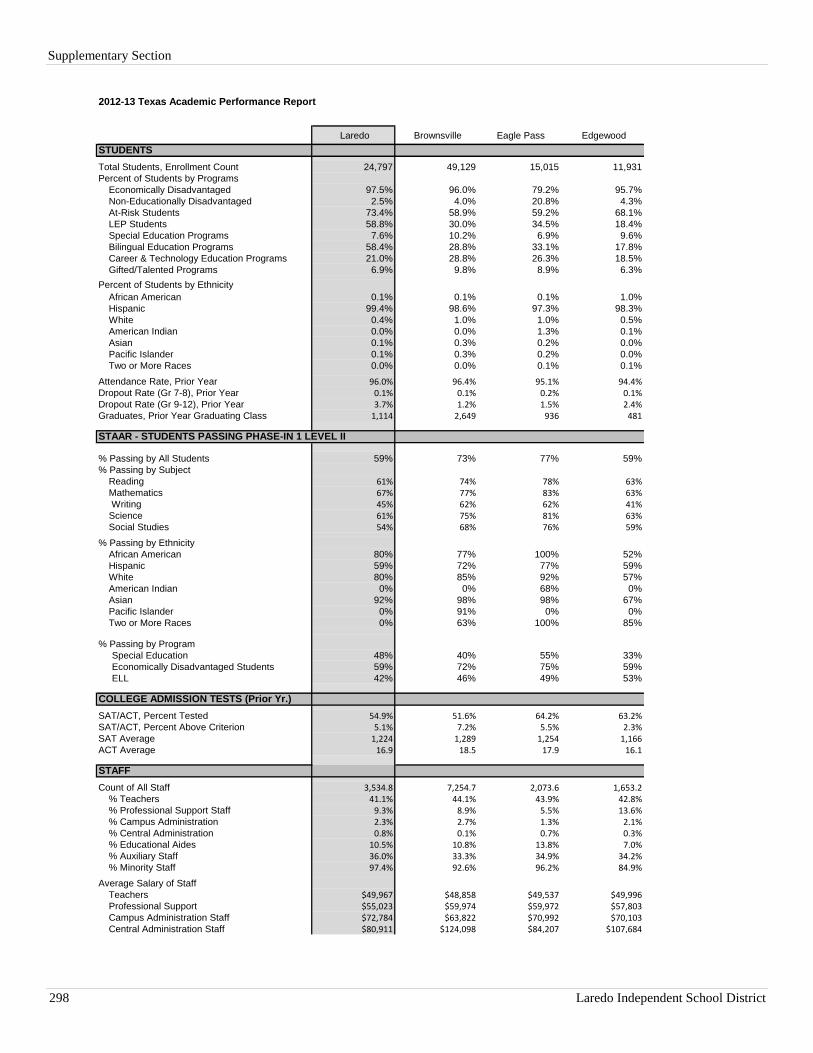
Supplementary Section
298 Laredo Independent School District
2012-13 Texas Academic Performance Report
Laredo Brownsville Eagle Pass Edgewood
STUDENTS
Total Students, Enrollment Count 24,797 49,129 15,015 11,931
Percent of Students by Programs
Economically Disadvantaged 97.5% 96.0% 79.2% 95.7%
Non-Educationally Disadvantaged 2.5% 4.0% 20.8% 4.3%
At-Risk Students 73.4% 58.9% 59.2% 68.1%
LEP Students 58.8% 30.0% 34.5% 18.4%
Special Education Programs 7.6% 10.2% 6.9% 9.6%
Bilingual Education Programs 58.4% 28.8% 33.1% 17.8%
Career & Technology Education Programs 21.0% 28.8% 26.3% 18.5%
Gifted/Talented Programs 6.9% 9.8% 8.9% 6.3%
Percent of Students by Ethnicity
African American 0.1% 0.1% 0.1% 1.0%
Hispanic 99.4% 98.6% 97.3% 98.3%
White 0.4% 1.0% 1.0% 0.5%
American Indian 0.0% 0.0% 1.3% 0.1%
Asian 0.1% 0.3% 0.2% 0.0%
Pacific Islander 0.1% 0.3% 0.2% 0.0%
Two or More Races 0.0% 0.0% 0.1% 0.1%
Attendance Rate, Prior Year 96.0% 96.4% 95.1% 94.4%Dropout Rate (Gr 7-8), Prior Year 0.1% 0.1% 0.2% 0.1%Dropout Rate (Gr 9-12), Prior Year 3.7% 1.2% 1.5% 2.4%Graduates, Prior Year Graduating Class 1,114 2,649 936 481
STAAR - STUDENTS PASSING PHASE-IN 1 LEVEL II
% Passing by All Students 59% 73% 77% 59%
% Passing by Subject
Reading 61% 74% 78% 63%Mathematics 67% 77% 83% 63% Writing 45% 62% 62% 41%Science 61% 75% 81% 63%Social Studies 54% 68% 76% 59%
% Passing by Ethnicity
African American 80% 77% 100% 52%
Hispanic 59% 72% 77% 59%
White 80% 85% 92% 57%
American Indian 0% 0% 68% 0%
Asian 92% 98% 98% 67%
Pacific Islander 0% 91% 0% 0%
Two or More Races 0% 63% 100% 85%
% Passing by Program
Special Education 48% 40% 55% 33%
Economically Disadvantaged Students 59% 72% 75% 59%
ELL 42% 46% 49% 53%
COLLEGE ADMISSION TESTS (Prior Yr.)
SAT/ACT, Percent Tested 54.9% 51.6% 64.2% 63.2%SAT/ACT, Percent Above Criterion 5.1% 7.2% 5.5% 2.3%SAT Average 1,224 1,289 1,254 1,166ACT Average 16.9 18.5 17.9 16.1
STAFF
Count of All Staff 3,534.8 7,254.7 2,073.6 1,653.2% Teachers 41.1% 44.1% 43.9% 42.8%% Professional Support Staff 9.3% 8.9% 5.5% 13.6%% Campus Administration 2.3% 2.7% 1.3% 2.1%% Central Administration 0.8% 0.1% 0.7% 0.3%% Educational Aides 10.5% 10.8% 13.8% 7.0%% Auxiliary Staff 36.0% 33.3% 34.9% 34.2%% Minority Staff 97.4% 92.6% 96.2% 84.9%
Average Salary of Staff
Teachers $49,967 $48,858 $49,537 $49,996Professional Support $55,023 $59,974 $59,972 $57,803Campus Administration Staff $72,784 $63,822 $70,992 $70,103Central Administration Staff $80,911 $124,098 $84,207 $107,684
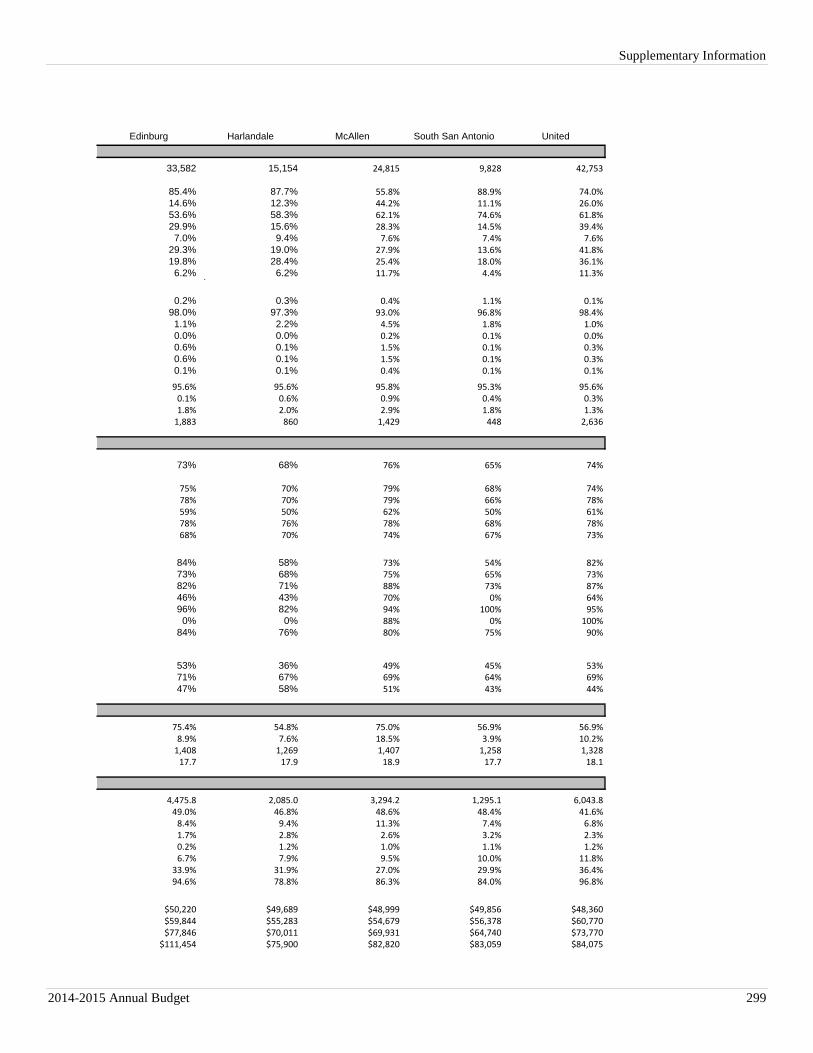
Supplementary Information
2014-2015 Annual Budget 299
Edinburg Harlandale McAllen South San Antonio United
33,582 15,154 24,815 9,828 42,753
85.4% 87.7% 55.8% 88.9% 74.0%14.6% 12.3% 44.2% 11.1% 26.0%53.6% 58.3% 62.1% 74.6% 61.8%29.9% 15.6% 28.3% 14.5% 39.4%7.0% 9.4% 7.6% 7.4% 7.6%
29.3% 19.0% 27.9% 13.6% 41.8%19.8% 28.4% 25.4% 18.0% 36.1%6.2% 6.2% 11.7% 4.4% 11.3%.
0.2% 0.3% 0.4% 1.1% 0.1%98.0% 97.3% 93.0% 96.8% 98.4%1.1% 2.2% 4.5% 1.8% 1.0%0.0% 0.0% 0.2% 0.1% 0.0%0.6% 0.1% 1.5% 0.1% 0.3%0.6% 0.1% 1.5% 0.1% 0.3%0.1% 0.1% 0.4% 0.1% 0.1%
95.6% 95.6% 95.8% 95.3% 95.6%0.1% 0.6% 0.9% 0.4% 0.3%1.8% 2.0% 2.9% 1.8% 1.3%1,883 860 1,429 448 2,636
73% 68% 76% 65% 74%
75% 70% 79% 68% 74%78% 70% 79% 66% 78%59% 50% 62% 50% 61%78% 76% 78% 68% 78%68% 70% 74% 67% 73%
84% 58% 73% 54% 82%73% 68% 75% 65% 73%82% 71% 88% 73% 87%46% 43% 70% 0% 64%96% 82% 94% 100% 95%0% 0% 88% 0% 100%
84% 76% 80% 75% 90%
53% 36% 49% 45% 53%71% 67% 69% 64% 69%47% 58% 51% 43% 44%
75.4% 54.8% 75.0% 56.9% 56.9%8.9% 7.6% 18.5% 3.9% 10.2%1,408 1,269 1,407 1,258 1,32817.7 17.9 18.9 17.7 18.1
4,475.8 2,085.0 3,294.2 1,295.1 6,043.849.0% 46.8% 48.6% 48.4% 41.6%8.4% 9.4% 11.3% 7.4% 6.8%1.7% 2.8% 2.6% 3.2% 2.3%0.2% 1.2% 1.0% 1.1% 1.2%6.7% 7.9% 9.5% 10.0% 11.8%
33.9% 31.9% 27.0% 29.9% 36.4%94.6% 78.8% 86.3% 84.0% 96.8%
$50,220 $49,689 $48,999 $49,856 $48,360$59,844 $55,283 $54,679 $56,378 $60,770$77,846 $70,011 $69,931 $64,740 $73,770
$111,454 $75,900 $82,820 $83,059 $84,075
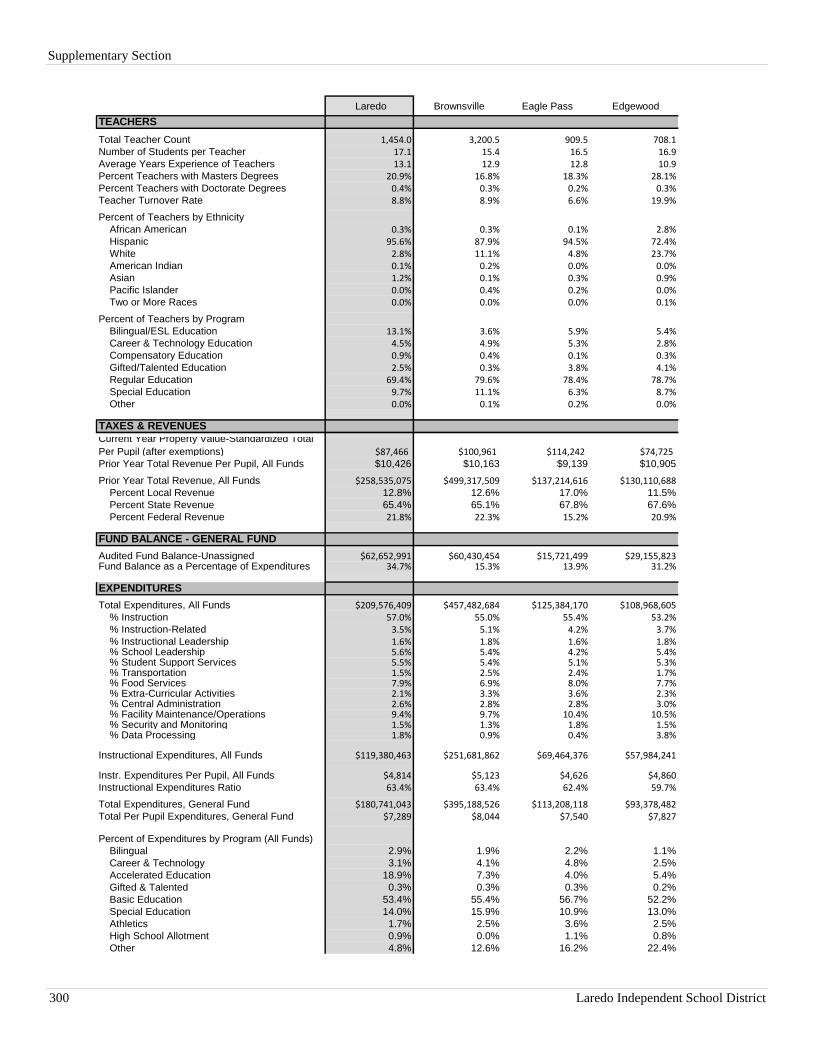
Supplementary Section
300 Laredo Independent School District
Laredo Brownsville Eagle Pass Edgewood
TEACHERS
Total Teacher Count 1,454.0 3,200.5 909.5 708.1Number of Students per Teacher 17.1 15.4 16.5 16.9Average Years Experience of Teachers 13.1 12.9 12.8 10.9Percent Teachers with Masters Degrees 20.9% 16.8% 18.3% 28.1%Percent Teachers with Doctorate Degrees 0.4% 0.3% 0.2% 0.3%Teacher Turnover Rate 8.8% 8.9% 6.6% 19.9%
Percent of Teachers by Ethnicity
African American 0.3% 0.3% 0.1% 2.8%Hispanic 95.6% 87.9% 94.5% 72.4%White 2.8% 11.1% 4.8% 23.7%American Indian 0.1% 0.2% 0.0% 0.0%Asian 1.2% 0.1% 0.3% 0.9%Pacific Islander 0.0% 0.4% 0.2% 0.0%Two or More Races 0.0% 0.0% 0.0% 0.1%
Percent of Teachers by Program
Bilingual/ESL Education 13.1% 3.6% 5.9% 5.4%Career & Technology Education 4.5% 4.9% 5.3% 2.8%Compensatory Education 0.9% 0.4% 0.1% 0.3%Gifted/Talented Education 2.5% 0.3% 3.8% 4.1%Regular Education 69.4% 79.6% 78.4% 78.7%Special Education 9.7% 11.1% 6.3% 8.7%Other 0.0% 0.1% 0.2% 0.0%
TAXES & REVENUES
Current Year Property Value-Standardized Total
Per Pupil (after exemptions) $87,466 $100,961 $114,242 $74,725Prior Year Total Revenue Per Pupil, All Funds $10,426 $10,163 $9,139 $10,905
Prior Year Total Revenue, All Funds $258,535,075 $499,317,509 $137,214,616 $130,110,688Percent Local Revenue 12.8% 12.6% 17.0% 11.5%
Percent State Revenue 65.4% 65.1% 67.8% 67.6%
Percent Federal Revenue 21.8% 22.3% 15.2% 20.9%
FUND BALANCE - GENERAL FUND
Audited Fund Balance-Unassigned $62,652,991 $60,430,454 $15,721,499 $29,155,823Fund Balance as a Percentage of Expenditures 34.7% 15.3% 13.9% 31.2%
EXPENDITURES
Total Expenditures, All Funds $209,576,409 $457,482,684 $125,384,170 $108,968,605% Instruction 57.0% 55.0% 55.4% 53.2%% Instruction-Related 3.5% 5.1% 4.2% 3.7%% Instructional Leadership 1.6% 1.8% 1.6% 1.8%% School Leadership 5.6% 5.4% 4.2% 5.4%% Student Support Services 5.5% 5.4% 5.1% 5.3%% Transportation 1.5% 2.5% 2.4% 1.7%% Food Services 7.9% 6.9% 8.0% 7.7%% Extra-Curricular Activities 2.1% 3.3% 3.6% 2.3%% Central Administration 2.6% 2.8% 2.8% 3.0%% Facility Maintenance/Operations 9.4% 9.7% 10.4% 10.5%% Security and Monitoring 1.5% 1.3% 1.8% 1.5%% Data Processing 1.8% 0.9% 0.4% 3.8%
Instructional Expenditures, All Funds $119,380,463 $251,681,862 $69,464,376 $57,984,241
Instr. Expenditures Per Pupil, All Funds $4,814 $5,123 $4,626 $4,860Instructional Expenditures Ratio 63.4% 63.4% 62.4% 59.7%
Total Expenditures, General Fund $180,741,043 $395,188,526 $113,208,118 $93,378,482Total Per Pupil Expenditures, General Fund $7,289 $8,044 $7,540 $7,827
Percent of Expenditures by Program (All Funds)
Bilingual 2.9% 1.9% 2.2% 1.1%
Career & Technology 3.1% 4.1% 4.8% 2.5%
Accelerated Education 18.9% 7.3% 4.0% 5.4%
Gifted & Talented 0.3% 0.3% 0.3% 0.2%
Basic Education 53.4% 55.4% 56.7% 52.2%
Special Education 14.0% 15.9% 10.9% 13.0%
Athletics 1.7% 2.5% 3.6% 2.5%
High School Allotment 0.9% 0.0% 1.1% 0.8%
Other 4.8% 12.6% 16.2% 22.4%
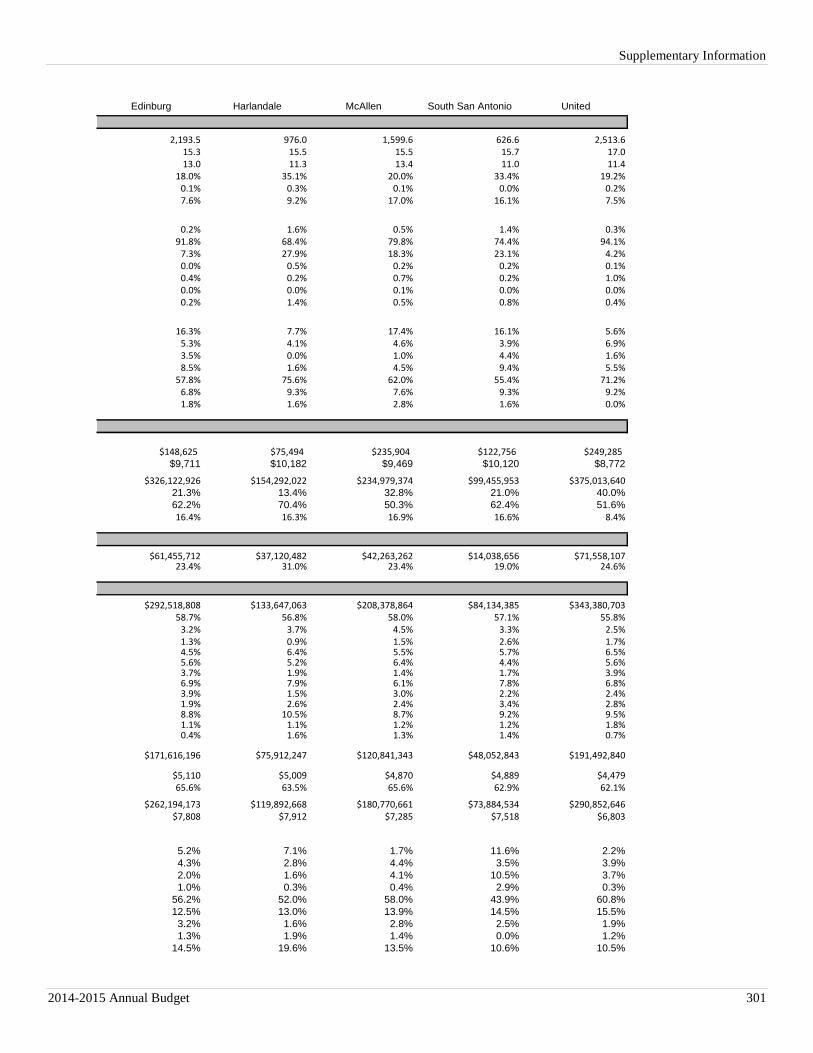
Supplementary Information
2014-2015 Annual Budget 301
Edinburg Harlandale McAllen South San Antonio United
2,193.5 976.0 1,599.6 626.6 2,513.615.3 15.5 15.5 15.7 17.013.0 11.3 13.4 11.0 11.4
18.0% 35.1% 20.0% 33.4% 19.2%0.1% 0.3% 0.1% 0.0% 0.2%7.6% 9.2% 17.0% 16.1% 7.5%
0.2% 1.6% 0.5% 1.4% 0.3%91.8% 68.4% 79.8% 74.4% 94.1%7.3% 27.9% 18.3% 23.1% 4.2%0.0% 0.5% 0.2% 0.2% 0.1%0.4% 0.2% 0.7% 0.2% 1.0%0.0% 0.0% 0.1% 0.0% 0.0%0.2% 1.4% 0.5% 0.8% 0.4%
16.3% 7.7% 17.4% 16.1% 5.6%5.3% 4.1% 4.6% 3.9% 6.9%3.5% 0.0% 1.0% 4.4% 1.6%8.5% 1.6% 4.5% 9.4% 5.5%
57.8% 75.6% 62.0% 55.4% 71.2%6.8% 9.3% 7.6% 9.3% 9.2%1.8% 1.6% 2.8% 1.6% 0.0%
$148,625 $75,494 $235,904 $122,756 $249,285$9,711 $10,182 $9,469 $10,120 $8,772
$326,122,926 $154,292,022 $234,979,374 $99,455,953 $375,013,64021.3% 13.4% 32.8% 21.0% 40.0%
62.2% 70.4% 50.3% 62.4% 51.6%
16.4% 16.3% 16.9% 16.6% 8.4%
$61,455,712 $37,120,482 $42,263,262 $14,038,656 $71,558,10723.4% 31.0% 23.4% 19.0% 24.6%
$292,518,808 $133,647,063 $208,378,864 $84,134,385 $343,380,70358.7% 56.8% 58.0% 57.1% 55.8%3.2% 3.7% 4.5% 3.3% 2.5%1.3% 0.9% 1.5% 2.6% 1.7%4.5% 6.4% 5.5% 5.7% 6.5%5.6% 5.2% 6.4% 4.4% 5.6%3.7% 1.9% 1.4% 1.7% 3.9%6.9% 7.9% 6.1% 7.8% 6.8%3.9% 1.5% 3.0% 2.2% 2.4%1.9% 2.6% 2.4% 3.4% 2.8%8.8% 10.5% 8.7% 9.2% 9.5%1.1% 1.1% 1.2% 1.2% 1.8%0.4% 1.6% 1.3% 1.4% 0.7%
$171,616,196 $75,912,247 $120,841,343 $48,052,843 $191,492,840
$5,110 $5,009 $4,870 $4,889 $4,47965.6% 63.5% 65.6% 62.9% 62.1%
$262,194,173 $119,892,668 $180,770,661 $73,884,534 $290,852,646$7,808 $7,912 $7,285 $7,518 $6,803
5.2% 7.1% 1.7% 11.6% 2.2%
4.3% 2.8% 4.4% 3.5% 3.9%
2.0% 1.6% 4.1% 10.5% 3.7%
1.0% 0.3% 0.4% 2.9% 0.3%
56.2% 52.0% 58.0% 43.9% 60.8%
12.5% 13.0% 13.9% 14.5% 15.5%
3.2% 1.6% 2.8% 2.5% 1.9%
1.3% 1.9% 1.4% 0.0% 1.2%
14.5% 19.6% 13.5% 10.6% 10.5%
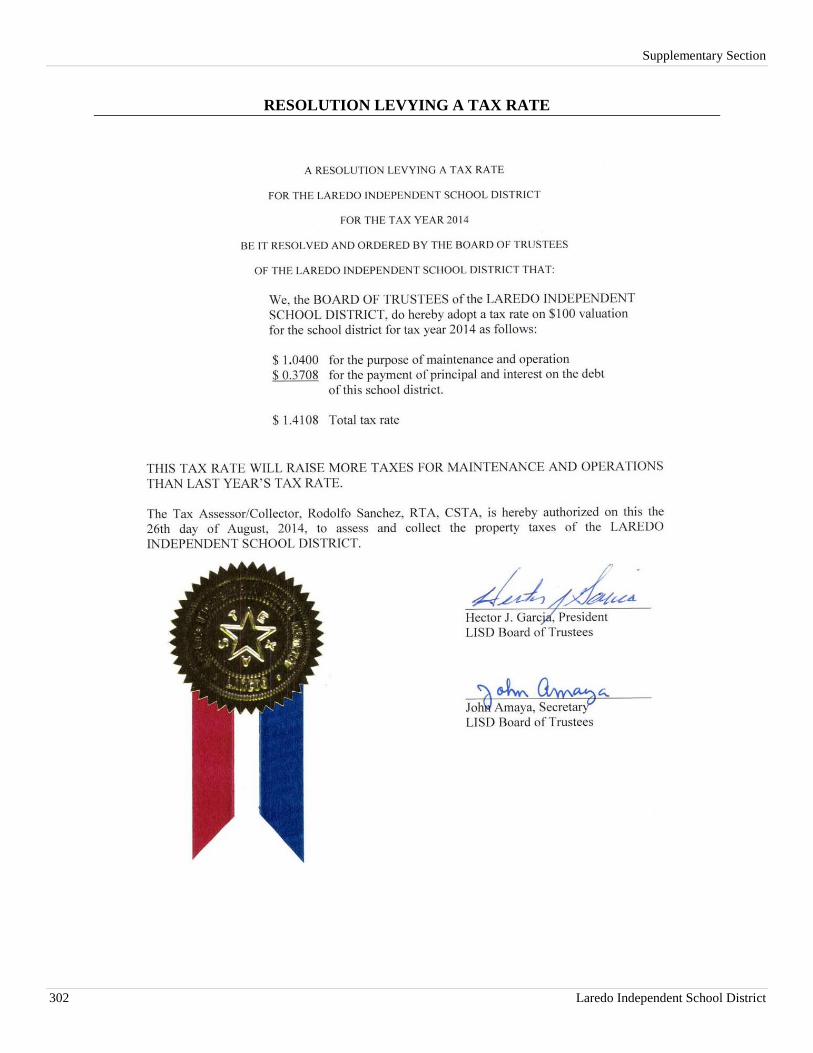
Supplementary Section
302 Laredo Independent School District
RESOLUTION LEVYING A TAX RATE
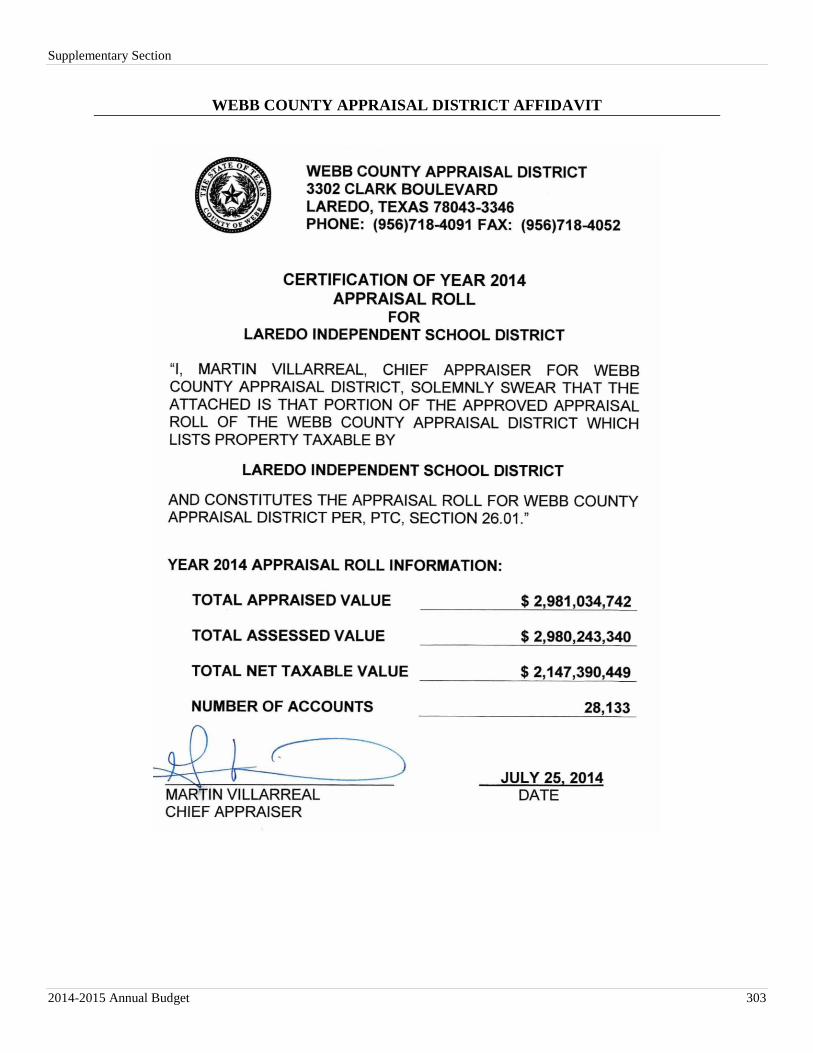
Supplementary Section
2014-2015 Annual Budget 303
WEBB COUNTY APPRAISAL DISTRICT AFFIDAVIT
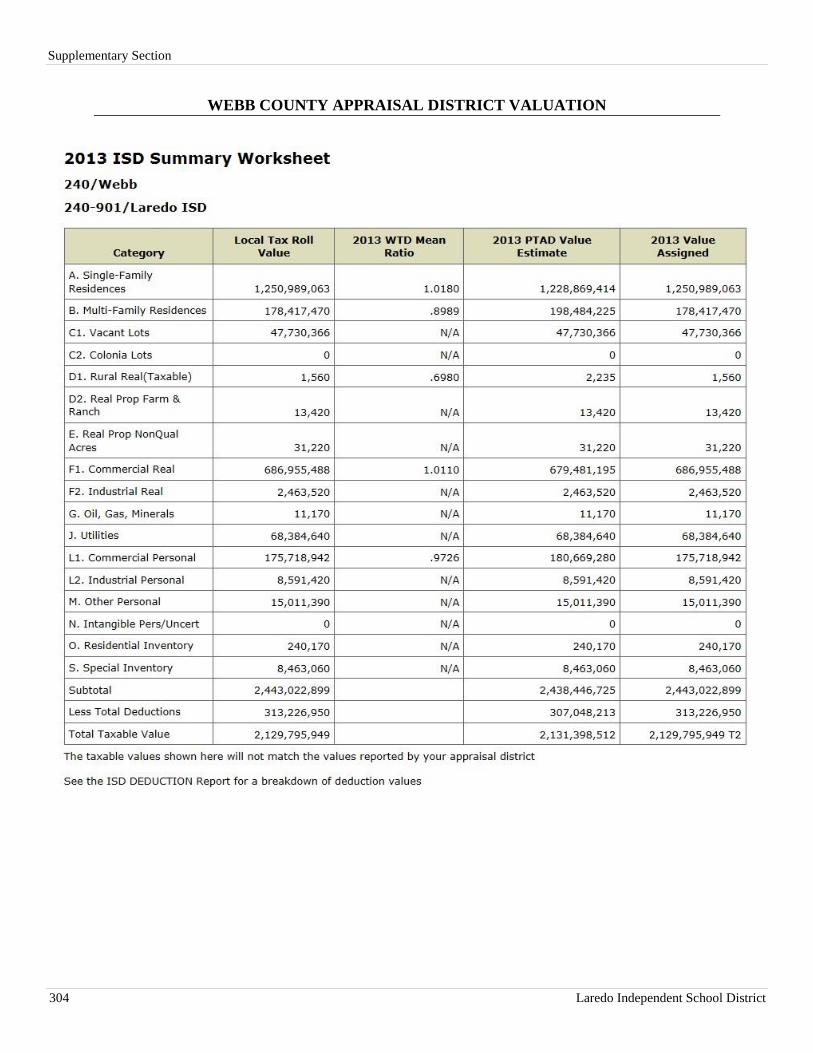
Supplementary Section
304 Laredo Independent School District
WEBB COUNTY APPRAISAL DISTRICT VALUATION

GLOSSARY SECTION
TABLE OF CONTENTS
Acronyms ................................................................................................................................................................... 305
Glossary ..................................................................................................................................................................... 307
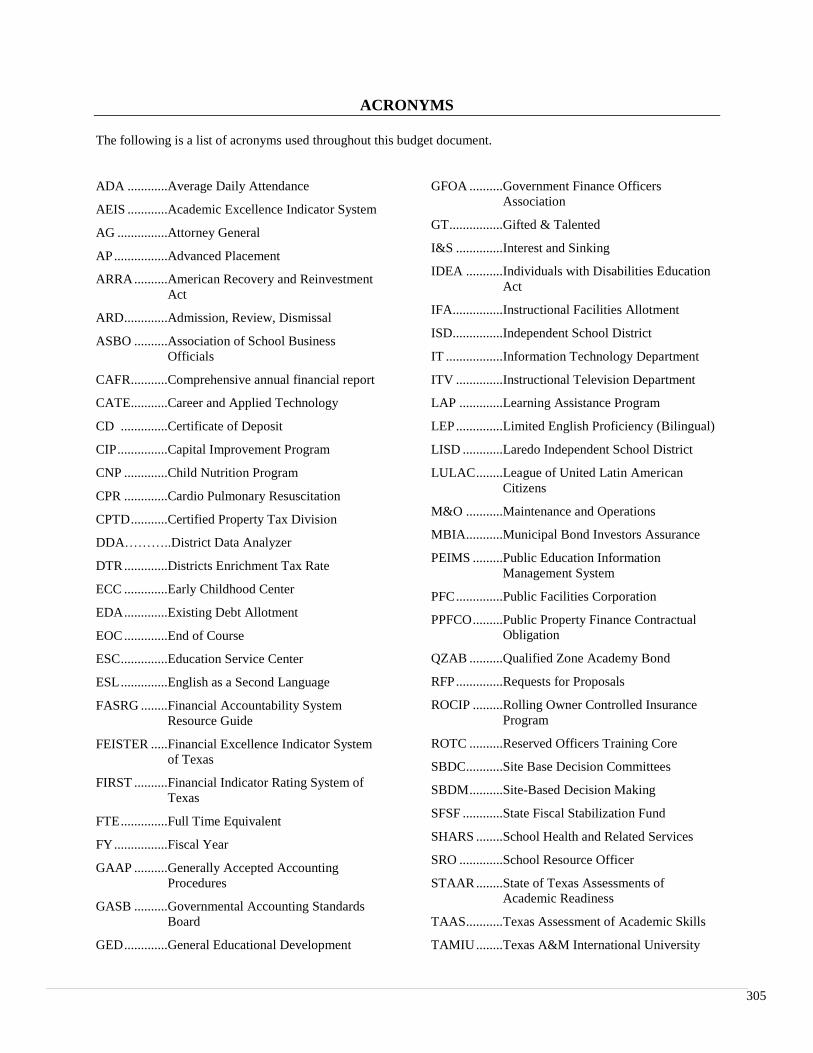
305
ACRONYMS
The following is a list of acronyms used throughout this budget document.
ADA ............Average Daily Attendance
AEIS ............Academic Excellence Indicator System
AG ...............Attorney General
AP ................Advanced Placement
ARRA ..........American Recovery and Reinvestment
Act
ARD .............Admission, Review, Dismissal
ASBO ..........Association of School Business
Officials
CAFR ...........Comprehensive annual financial report
CATE ...........Career and Applied Technology
CD ..............Certificate of Deposit
CIP ...............Capital Improvement Program
CNP .............Child Nutrition Program
CPR .............Cardio Pulmonary Resuscitation
CPTD ...........Certified Property Tax Division
DDA………..District Data Analyzer
DTR .............Districts Enrichment Tax Rate
ECC .............Early Childhood Center
EDA .............Existing Debt Allotment
EOC .............End of Course
ESC ..............Education Service Center
ESL ..............English as a Second Language
FASRG ........Financial Accountability System
Resource Guide
FEISTER .....Financial Excellence Indicator System
of Texas
FIRST ..........Financial Indicator Rating System of
Texas
FTE ..............Full Time Equivalent
FY ................Fiscal Year
GAAP ..........Generally Accepted Accounting
Procedures
GASB ..........Governmental Accounting Standards
Board
GED .............General Educational Development
GFOA ..........Government Finance Officers
Association
GT ................Gifted & Talented
I&S ..............Interest and Sinking
IDEA ...........Individuals with Disabilities Education
Act
IFA ...............Instructional Facilities Allotment
ISD ...............Independent School District
IT .................Information Technology Department
ITV ..............Instructional Television Department
LAP .............Learning Assistance Program
LEP ..............Limited English Proficiency (Bilingual)
LISD ............Laredo Independent School District
LULAC ........League of United Latin American
Citizens
M&O ...........Maintenance and Operations
MBIA ...........Municipal Bond Investors Assurance
PEIMS .........Public Education Information
Management System
PFC ..............Public Facilities Corporation
PPFCO .........Public Property Finance Contractual
Obligation
QZAB ..........Qualified Zone Academy Bond
RFP ..............Requests for Proposals
ROCIP .........Rolling Owner Controlled Insurance
Program
ROTC ..........Reserved Officers Training Core
SBDC ...........Site Base Decision Committees
SBDM ..........Site-Based Decision Making
SFSF ............State Fiscal Stabilization Fund
SHARS ........School Health and Related Services
SRO .............School Resource Officer
STAAR ........State of Texas Assessments of
Academic Readiness
TAAS ...........Texas Assessment of Academic Skills
TAMIU ........Texas A&M International University
Acronyms
306 Laredo Independent School District
TASB ...........Texas Association of School Boards
TEA .............Texas Education Agency
TAKS ...........Texas Assessment of Knowledge &
Skills
TEKS ...........Texas Essential Knowledge & Skills
TDA .............Texas Department of Agriculture
TRS ..............Teacher Retirement System
U.N.O ..........Unless noted otherwise
UIL ..............University Interscholastic League
WADA .........Weighted Average Daily Attendance
YTD .............Year-to-Date
2014-2015 Annual Budget 307
GLOSSARY
This glossary contains definitions of terms, both financial and non-financial, which have been used in this budget
document. This glossary is arranged alphabetically with proper cross-referencing as deemed necessary.
Academic Excellence Indicator System (AEIS): Texas Education Code 39.053 requires every district’s board of
trustees to: (a) publish an annual report describing the district’s educational performance on the AEIS (Academic
Excellence Indicator System) indicators, (b) hold a hearing for public discussion of the report, and (c) widely
disseminate the report within the district.
Accountability: The state of being obliged to explain one’s actions, to justify what one does. Accountability requires
governments to answer to the citizenry it represents, to justify the raising of public resources and the purpose for which
they are used.
Accounting Systems: The total set of records and procedures which are used to record, classify, and report
information on the financial status and operations of the school district.
Accrual Basis Accounting: Under this accounting method, transactions are recognized when they occur, regardless
of the timing of related cash receipts and disbursements.
Ad Valorem Taxes: Taxes imposed in proportion to the value of assessed property.
Admission, Review, Dismissal (ARD): A committee consisting of principals, parents, teachers, and diagnostician to
review services and the educational plan for students with disabilities.
Agency Fund: Any funds that a government or government unit holds on behalf of another.
Allocation: A part of a site-based appropriation that is designated for expenditure by specific organizational units
and/or for special purposes, activities, or objects.
Amortization: The reduction of the value of an asset by prorating its cost over a period of years. Payment of an
obligation in a series of installments or transfers.
Annual Budget: A budget applicable for a single year.
Appropriation: Budget dollars that have been set aside for a particular expenditure (salaries, instructional supplies,
capital outlay, etc.).
Appropriation Account: A budgetary account set up to record specific authorization to spend. The account is
credited with original and any supplemental appropriations and is charged with expenditures.
Arbitrage: The simultaneous purchase and sale of the same or an equivalent security in order to profit from price
discrepancies. In government finance, the common occurrence of arbitrage involves the investment of the proceeds
from the sale of tax-exempt securities in a taxable money market instrument that yields a higher rate, resulting in
interest revenue in excess of interest costs.
Assets: Property owned by the District which has monetary value.
Audit: A comprehensive examination as to the manner in which the government resources were actually utilized
concluding in a written report of its findings. (1) A financial audit is a review of the accounting system and financial
information to determine how government funds were spent and whether expenditures were in compliance with the
legislative body’s appropriations. (2) A performance audit consists of a review of how well the government met its
Glossary
Laredo Independent School District 308
stated goals. (3) An accounting audit is intended to ascertain whether financial statements fairly present financial
positions and results of operations.
Average Daily Attendance (ADA): Average Daily Attendance is the quotient of the sum of attendance for each day
of the minimum number of days of instruction as described under section 2501a divided by the minimum number of
days of instruction.
Balance Sheet: A financial statement that discloses the financial position of an entity by disclosing its assets,
liabilities, and equity as of a specific date.
Balanced Budget: is one in which total financial resources available, including prior year’s ending financial
resources plus projected resources, are equal to or greater than the budgeted expenditures/expenses.
Base Budget: An on-going expense for personnel, contractual services and the replacement of supplies and equipment
required to maintain service levels previously authorized by the Board of Trustees.
Beginning Balance: The beginning balance is the residual non-restricted funds brought forward from the previous
fiscal year or ending balance.
Board of Trustees: The elected or appointed body that has been created according to state law and vested with
responsibilities for educational activities.
Bond: A debt embodying a written promise to pay a specified sum of money, the face value or principal, at a specific
date or dates in the future (maturity date), together with periodic interest at a specified rate. The most common types
of bonds are general obligation and revenue bonds. Bonds are typically used for long-term debt to pay for specific
capital expenditures, e.g. buses, band equipment, and classroom furniture.
Budget: A plan of financial operation embodying an estimate of proposed expenditures for a given period or purpose
and the proposed means of financing them.
Budgetary Accounts: Those accounts necessary to reflect budget operations and conditions, such as estimated
revenues, appropriations, and encumbrances, the net balance, and other related information.
Capital Assets: District assets of significant value and having a useful product life of 10 years or more. These assets
are also known as fixed assets.
Capital Budget: A plan of proposed capital outlays and the means of financing them for the current fiscal period. It
is usually a part of the current budget. If a capital program is in operation, it will be the first year thereof. A capital
program is sometimes referred to as a capital budget.
Capital Expenditures: Expenditures used by a company to acquire or upgrade physical assets such as equipment,
property, buildings, etc. In accounting, a capital expenditure is added to an asset account (i.e. capitalized), thus
increasing the asset's basis.
Capital Improvement Program (CIP): The construction plan for the school district.
Capital Outlay: Expenditures that result in the acquisition of, or addition to, fixed assets. In this district, a fixed asset
is defined as a tangible item whose expected life is two or more years and whose value exceeds $500 per item.
Exceptions to value limitations are software ($1,500 or more per item) and catalogued library materials. The capital
items below $5,000 per item are changed to supplies before submission to the state as required by PEIMS guidelines.
Capital Program: A plan for capital expenditures to be incurred each year over a fixed period of years to meet capital
needs arising from the long term work program or otherwise. It sets forth each project or other contemplated
expenditure in which the local education agency is to have a part and specifies the full resources estimated to be
available to finance the projected expenditures.
Glossary
2014-2015 Annual Budget 309
Career and Technology Education (CATE): Career and Technology Education refers to a body of courses that are
designed to help students identify careers and build skills necessary for success in the world of work. Students who
graduate after participating in CT courses will be prepared to go directly to work, technical school, or attend two-year
or four-year colleges to continue their career preparation.
Cash Accounting-Cash Basis: A basis of accounting which recognizes revenues when received and expenditures
when paid.
Certificate Of Deposit: A negotiable or non-negotiable receipt for monies deposited in a bank or financial institution
for a specified period for a specified interest rate.
Certificate of Obligation: Debt instrument secured by the ad-valorem taxing power of a District. Short-term or
long-term debt, pending on the particular project, which is authorized by the Board of Trustees and does not require
prior voter approval.
Community Services: Those services which are provided to the community as a whole or some segments of the
community and which are not restricted to the public schools or adult education programs.
Compensatory Education: Program and instructional services designed for at-risk students. These programs and
services are funded with State Compensatory Education funds.
Contingency: A budgetary reserve set aside for emergencies or un-foreseen expenditures not otherwise budgeted.
Contractual Services: Goods and services acquired under which the District receives from an internal service fund
or an outside company. Professional services, utilities, rentals, and insurance are examples of contractual services.
Current Expenditures per Pupil: Current expenditures for a given period of time divided by a pupil unit of measure
(average daily membership, average daily attendance, etc.).
Current Year’s Tax Levy: LEVY Taxes levied for the current fiscal period.
Debt Service Fund: The fund which is used for the retirement of long-term debt and its interest. This fund is
sometimes referred to as a “Sinking Fund”.
Deficit: A deficit is the excess of expenditures over revenues during a single accounting period, in the case of
proprietary funds, the excess of expenses over income during an accounting period.
Delinquent Taxes: Taxes remaining unpaid on and after the date on which they become delinquent by statute.
Department: A major administrative division of the District that indicates overall management responsibility for an
operation or a group of related operations within a functional area.
Depreciation: (1) Expiration in the service life of capital assets attributable to normal wear and tear, deterioration
and in-adequacy or obsolescence. (2) That portion of the cost of a capital asset that is charged as an expense during
a particular period.
Disbursement: Payment for goods and services in the form of cash or by check.
Districts Enrichment Tax Rate (DTR): DTR of the school district which is determined by subtracting the amounts
specified in subsection B from the total amount of maintenance and operations taxes collected by the school district
for the applicable school year and dividing the difference by the quotient of the districts taxable value of property as
determined under subchapter M, chapter 403 government code or if applicable under section 42.2521, divided by 100.
Division: An organization unit within a department’s structure respecting the major functional divisions of work.
Glossary
Laredo Independent School District 310
Effective Tax-Rate: The rate which will generate the same tax levy next year from the properties on this year’s tax
roll.
Encumbrance: Funds which are set aside or committed for a future expenditure. Encumbrances include obligations
in the form of purchase orders, contracts or salary commitments which are chargeable to an appropriation and for
which a part of the appropriation is reserved
English as a Second Language (ESL): This is a program designed specifically for students who speak a language
other than English as their first language. It is intended to enhance the learning ability of limited English proficiency
students to the extent that they become competent in the comprehension, speaking, reading, and composition of the
English language.
Estimated Revenue: The amount of projected revenue to be collected during the fiscal year. It may also be defined
as the proposed financing sources estimated to finance the proposed projected expenditures.
Existing Debt Allotment (EDA): A grant from the Texas Education Agency for the purpose of financing the principal
and interest payments for eligible bonds issued in years prior to 1999.
Expenditure: Decrease in the use of net financial resources for the purpose of acquiring and providing goods and
services.
Expenses: Charges incurred, whether paid or unpaid, for operation, maintenance, or interest, and other charges that
are presumed to benefit the current fiscal period.
Fees: Charges for services rendered.
Fiduciary Funds: Fiduciary funds are used to account for assets held by the state in a trustee capacity, or as an agent
for others and that cannot be used to support the state's own programs. There are four types of fiduciary funds: private-
purpose, pension (and other employee benefit), and investment trust funds, and agency funds.
Financial Accountability System Resource Guide (FASRG): This is an accounting guide produced by TEA for
school districts to use as a reference.
Financial Excellence Indicator System of Texas (FEISTER): Used to provide financial, academic program
management, and resource allocation data.
Financial Indicator Rating System of Texas (FIRST): This is a rating system for school districts in the area of
finance.
Fiscal Year: The twelve-month period designated by the District signifying the beginning and ending period for
recording financial transactions. The District has specified September 1st and August 31st as its fiscal year.
Fixed Assets: Assets of a long-term nature that are intended to continue to be held or used such as land, buildings,
machinery, furniture, and other equipment.
Fixed Costs: A fixed cost, e.g. rent, which does not change with increases or decreases in the amount of services
provided.
Function: As applied to expenditures, this term has reference to an activity or service aimed at accomplishing a
certain purpose or end; for example, Instruction versus Plant Maintenance and Operation.
Fund: A sum of money or other resources set aside for specific activities of a school district. The fund accounts
constitute a complete entity and all of the financial transactions for the particular fund are recorded therein.
Glossary
2014-2015 Annual Budget 311
Fund Balance: The excess of assets of a fund over its liabilities and reserves. During the fiscal year prior to closing,
it represents the excess of the fund’s assets and estimated revenues for the period over its liabilities, reserves and
appropriations for the period.
Funding Source: A funding source is the specifically identified dollars allocated to meet budgeted requirements and
expenses.
General Fund: A fund used to finance the ordinary operations of the local education agency. It is available for a
legally authorized purpose and consists of money not specifically designated for some other particular purpose.
General Ledger: A file that contains a listing of the various accounts necessary to reflect the financial position and
results of operation of the government.
Generally Accepted Accounting Principles (GAAP): Uniform minimum standards of and guidelines to financial
accounting and reporting.
Gifted & Talented: Students participating in a Gifted & Talented program, which offers a challenging, differentiated,
and extended curriculum to develop higher-order thinking skills and encourage independence and decision-making.
Governmental Funds: Funds generally used to account for tax-supported activities. There are five different types of
governmental funds: the general fund, special revenue funds, debt service funds, capital projects funds, and permanent
funds.
Grant: A contribution, either money or material goods, made by and outside entity or a governmental unit to another
unit and for which the contributing unit expects no repayment. Grants may be for specific or general purposes.
Indirect Cost: A necessary expense for the functioning of the organization as a whole that cannot be directly assigned
to one service.
Instructional Facilities Allotment (IFA): A grant from the Texas Education Agency for the purpose of financing
the principal and interest payments for eligible bonds for the construction and repair of schools.
Interest and Sinking (I&S): The total amount expended or to be expended by a taxing unit from property tax
revenues to pay principal of and interest on debts or other payments required by contract to secure the debts and, if
the unit is created under Section 52, Article III, or Section 59, Article XVI, Texas Constitution, payments on debts
that the unit anticipates incurring in the next calendar year.
Inventory: A detailed listing of property currently held by the District showing quantities, descriptions, and values
of the property, and units of measure and unit prices.
Investments: Securities and real estate purchased and held for the production of revenues in the form of interest,
dividends, rentals and/or base payments.
Learning Assistance Program (LAP): This is a department that deals with in-school suspension for middle school
students.
Levy: (Verb) To impose taxes or special assessments. (Noun) The total of taxes or special assessments imposed by a
governmental unit.
Liability: Debt or other legal obligations arising out of transactions in the past, which must be paid, renewed or
refunded at some future date. The term does not include encumbrances.
Maintenance and Operations (M&O): Any lawful purpose other than debt service for which a taxing unit may
spend property tax revenues.
Glossary
Laredo Independent School District 312
Major Fund: Governmental fund or enterprise fund reported as a separate column in the basic fund financial
statements and subject to a separate opinion in the independent auditor’s report. The general fund is always a major
fund. Otherwise, major funds are funds whose revenues, expenditures/expenses, assets, or liabilities (excluding
extraordinary items) are at least 10 percent of corresponding totals for all governmental or enterprise funds and at least
5 percent of the aggregate amount for all governmental and enterprise funds for the same item.Any other government
or enterprise fund may be reported as a major fund if the government’s officials believe that fund is particularly
important to financial statement users. [SGAS 34]
Object: As applied to expenditures, this term has reference to an article or service received; for example, payroll
costs, purchased and contracted services, materials, and supplies.
Objective: Desired output-oriented accomplishments which can be measured and achieved within a given time frame.
Achievement of the objective advances the activity and organization toward a corresponding goal.
Official Budget: The annual budget as is adopted by the Board of Trustees.
Operating Budget: The portion of the budget that pertains to daily operations that provides basic service for the
fiscal year.
Personnel Services: All costs related to compensating employees of the District including employee benefit costs,
e.g. District contributions for retirement, social security, and health & life insurance.
Positions Authorized: Full-time and part-time positions budgeted in the personnel services category and included in
the Department “Man-Years.”
Program Improvement: The addition of new equipment, personnel or other expenditures aimed at improving the
level of service or expanding services.
Property Tax Rate: The property tax rate consists of two elements: (1) the maintenance and operation rate (M&O)
and (2) the debt service or interest and sinking rate (I&S).
Proprietary Fund: An account that shows actual financial position and operations as distinguished from budgetary
accounts, e.g. actual assets, liabilities, reserves, fund balances, and revenues & expenditures.
Public Education Information Management System (PEIMS): Each district shall provide a system of information
required for the administration of a uniform accounting system to be reported to the State of Texas.
Public Property Finance Contractual Obligation: Section 271 of the Local Government Code allows school
districts to issue contractual obligations for the acquisition of personal property. Section 271 also allows real property
or improvements to real property to be financed with personal property contractual obligations and through lease-
purchase agreements.
Purchase Order System: District’s system of using documents authorizing the delivery of specified merchandise or
services and making a charge for them.
Qualified Zone Academy Bond (QZAB): The purpose of paying all or a portion of the District’s costs incurred in
connection with the repair, rehabilitation, renovation, and replacement of school facilities at the Qualified Zone
Academy Bond which consists of Martin, Nixon, and Cigarroa High.
Reconcilement: A detailed analysis of changes of revenue or expenditure balances within a fund.
Requisition: A written request from a department to the purchasing office for specified goods or services. This action
precedes the authorization of a purchase order.
Retained Earnings: The equity accounting reflecting the accumulated earnings of the various funds.
Glossary
2014-2015 Annual Budget 313
Revenues: Increases in the net current assets of a government fund type from other than expenditure refunds and
residual equity transfers; increases in net total assets of a proprietary fund type from other than expenses, refunds,
capital contributions, and residual equity transfers. Included are such items as tax payments, fees from specific
services, receipts from other governments, fines, forfeitures, grants, shared revenues and interest income.
Risk Management: (1) An organized attempt to protect a governmental entity against accidental loss in the most
economical methods. (2) The liability, either realized or potential, related to the District’s day-to-day operations.
Rolling Owner Controlled Insurance Program (ROCIP): A program where the school district purchases
insurances for it’s construction projects and reduces the award of the construction contract in an effort to reduce
insurance costs over construction costs.
School Board: The elected or appointed body which has been created according to state law and vested with
responsibilities for educational activities in a given geographical area. These bodies are sometimes called school
boards, governing boards, boards of directors, school committees, school trustees, etc. This definition relates to the
general term and covers state boards, intermediate administrative unit boards, and local basic administrative unit
boards.
School Resource Officer (SRO): This is an officer (police department officer or sheriff officer) contracted by LISD
with the City of Laredo or Webb County to improve safety at the schools.
Site-Based Decision Making (SBDM): That process in which the most effective decisions are made by those who
will actually implement the decisions. The belief is that people involved at the campus level have a greater opportunity
to identify problems, develop problem resolution and change strategy than people located off-campus. Site-based
decision making concepts also recognize that people at the campus level are more likely to internalize change and to
support its implementation if they are involved in the decision making than if they are not. The objective of site-based
decision-making is to improve student performance and to enhance accountability. Each campus should have the
freedom to set its own educational objectives, consistent with the school district’s goals.
Special Revenue: A fund used to account for the proceeds of specific revenue sources, other than expendable trusts
or major capital projects, that are legally restricted to expenditure for specified purposes. GAAP only requires the use
of special revenue funds when and where they are legally mandated.
Tax Levy: The total amount of funds to be raised by general property taxes for operating and debt service purposes
specified in the Annual Tax Ordinance that is determined by the Webb County Appraisal District.
Tax Rate: The amount of tax levied for each $100.00 of assessed property valuation.
Tax Roll: The official list showing the amount of taxes levied against each taxpayer or property. Despite the tax roll
and the assessment roll, the official list showing the valuation placed those figures in the tax roll, being frequently
combined, each maintains its separate and distinguishable form.
Taxes: Compulsory charges levied by a governmental unit for the purpose of financing services performed for the
common benefit. The term includes licenses and permits. It does not include special assessments.
Teacher Retirement System (TRS): An agency of the state of Texas to establish a program of benefits for member
retirees and other beneficiaries of the retirement system and to establish rules for membership and the management
and operation of the system.
Texas Assessment of Academic Skills (TAAS): A statewide assessment program test and end-of-course
examinations. TAAS measures the statewide curriculum in reading and mathematics at grades 3 through 8 and the
exit level; in writing in grade 4-8, and the exit level; and in science and social studies at grade 8. Spanish version
TAAS test are administered at grades 3 through 6. Satisfactory performance on the TAAS exit level tests is
prerequisite to a high school diploma.
Glossary
Laredo Independent School District 314
Texas Assessment of Knowledge & Skills (TAKS): Texas Assessment of Knowledge and Skills. TAKS is an
examination for students in grades 3-11 that measures knowledge and skills taught in public schools, and which is
used to allow students to progress to the next higher grade.
Texas Education Agency (TEA): The purpose of TEA is to carry out the educational functions specifically delegated
under the following: (1) the agency shall administer and monitor compliance with education programs required by
federal or state law, including federal funding and state funding for those programs; (2) the agency shall conduct
research, analysis, and reporting to improve teaching and learning; (3) the agency shall conduct hearings involving
state school law at the direction and under the supervision of the commissioner; (4) the agency shall implement pilot
programs established by this title; (5) the agency shall carry out the duties relating to the investment capital fund under
Section 7.024; (6) the agency shall develop and implement a teacher retirement program as provided by Section
21.004; (7) the agency shall carry out duties under the Texas Advanced Placement Incentive Program under
Subchapter C, Chapter 28; (8) the agency shall carry out duties relating to adult education, driver education and
regional day school programs for the deaf; (9) the agency shall review budgets, audit reports, and other fiscal reports
as required.
Texas Essential Knowledge and Skills (TEKS): TEKS are standards established by TEA for teaching academic
subjects, and include details about the way in which information is presented to students in Texas schools.
Tier I: Tier I is each school district’s share of the foundation school program to be able to be eligible to receive
foundation school fund payment.
Tier II: Tier II is a guarantee yield component of the foundation school program which provides each school district
with the opportunity to provide the basic program and to supplement that program at a level of its own choice. Each
school district is guaranteed a specified amount per weighted student in state and local funds for each cent of tax effort
over that required for the districts local fund assignment up to the maximum specified by state law.
Transfer: Transfers are the authorized exchanges of cash or other resources between same functions.
Unit Cost: The cost required to produce a specific product or unit of service.
University Interscholastic League (UIL): The UIL is the governing body over inter-school contests in Texas. The
UIL organizes and supervises contests that assist in preparing students for citizenship. It aims to provide healthy,
character-building, educational activities carried out under rules providing for good sportsmanship and fair play for
all participants. Contests are supervised in the areas of academics, athletics, and music.
Voucher: A document indicating that a transaction has occurred. It usually contains the accounts related to the
transaction.
Weighted Average Daily Attendance (WADA): The number of students in weighted average daily attendance which
is calculated by dividing the sum of the school districts allotments under subchapter B and C less any allotment to the
district for transportation, any allotment under section 42.158 and 50% of the adjustment under section 42.102 by the
basic allotment for the applicable year.
Working Capital: Current assets minus current liabilities. Working capital measures how much in liquid assets a
company has available to build its business.
Yield: The rate of annual income returned on an investment, expressed as a percentage.