Embed Size (px)
Citation preview

Final Report Volume I Design of Regulators
20 Groundwater Simulation Analysis
20-1 Purpose of analysis and modeling approach
(1) Purpose of groundwater analysis
The NDGRs are set to be located 140 meters downstream of the existing regulators, while their
ponding area will spread further down towards the residential area. The canal water level will
increase by 2.7m1 once NDGRs are operational. After construction, upstream of NDGRs, the water
level will stay at 46.3m FWL, which is 0.3m higher than the current level.
Hydro-geologically, in some places, the canal water infiltrates the groundwater body, while in
others, groundwater gushes out into the canals2. This phenomenon may be affected by the water
head balance between canal water and groundwater. In general, changes in groundwater level take
place seven days after changes in canal water level3.
Improvement works have been implemented over the years as countermeasures against seepage
from canals and related rises in groundwater level. These improvements are: (1) the extension of
the Ibrahimia canal apron, (2) sheet piling, (3) protection of the canal bed in past constructions
(DGRs in 1872, Abo Gabal intake in 1935), (4) and repair works (Ibrahimia canal in 1962).
However, due to sewage effluence caused by recent urbanization, the groundwater level has been
rising year after year. In fact, the foot of the canal banks and the basements of houses located near
the DGRs, have shown signs of seepage.
In addition to this, the construction of NDGRs will result in a rise in canal water level, thereby
increasing the groundwater level towards the center of Dirout city and its public facilities, such as
mosques, stations, and highways, as well as its many private facilities such as shops, markets, and
houses. The worst-case scenario includes serious direct damage to their structures, the floating of
buildings, and the deterioration of structure foundations.
The aim of a groundwater simulation analysis is to predict and infer groundwater behavior after
NDGRs construction, and to evaluate its environmental impact, and provide data that is useful in
deciding on the necessity and scale of mitigation measures.
(2) Approaches for groundwater simulation analysis
In the case of groundwater simulation analysis with the purpose of developing an alternative
design for groundwater insulation works and local seepage control, the model grid should be at
least 1m. As regional hydro-geological information is scant, the model should cover as wide an
area as possible to maintain model accuracy. Ideally, a broad model area with fine gridding (in 3D)
is required to fulfill both purposes. However, in such a model, enormous amounts of input data and 1Annual lowest level of canal water observed was EL 43.7 in Ibrahimia canal from September 2015 to October 2016 not counting the winter-closure period (January to February 2015). When compared to the 46.3m of FWL after NDGRs construction, the difference is 2.7m. 2From the water level records measured at canal gauges and groundwater monitoring wells, it is considered that canal water flows (recharges) to groundwater body in the summer (high water season), while in the winter (low water level season), groundwater flows back (discharges) to canals. 3Aquifers in the Dirout area are regarded as “confined or semi-confined (multilayered) aquifer[s]” composed of a coning silty-clay surficial layer and permeable layers of sandy and gravely sediment. The changes in canal water level are therefore translated into pressure on groundwater.
Ⅰ-238

Detailed Design Study on the Project for Construction of the New Dirout Group of Regulators
complicated calculation processes are required to run the data continuously being produced with
every calibration-trial and case simulation. This may become an obstacle to the analysis, so to
overcome it, two different models should be prepared to ensure work efficiency and model
accuracy in the study. These are shown as follows.
Regional model (larger model): covers the center of Dirout city surrounded by DGRs and
NDGRs capable of dealing with regional groundwater flow.
Detailed model (sub-region/portion model): covers site of NDGRs and applies specific
seepage analyses to design groundwater control works of NDGRs.
In the first stage of the analysis, the regional model is constructed with the necessary calibrations
using monitoring records to evaluate groundwater flow near the NDGRs and the surrounding area.
The detailed model is then upgraded from the regional model, and refined to use grids small
enough to evaluate an alternative groundwater control plan. To this end, MODFLOW USG (ver3,
2015)4 is applied with a refined Quadtree grid5. The work steps of modeling are shown in Figure
20-1.1.
Figure 20-1.1 Approach for groundwater simulation analysis
4 MODFLOW-USG: An unstructured grid version of MODFLOW for simulating groundwater flow and tightly coupled processes using a control volume finite-difference formulation(http://water.usgs.gov/ogw/mfusg/) 5 “Quadtree” is a refining method which modifies the normal grid (uniformed spacing structured grid) into a fine and unstructured grid, capable of detailed control of in/output of model.
Ⅰ-239
Final Report Volume I Design of Regulators
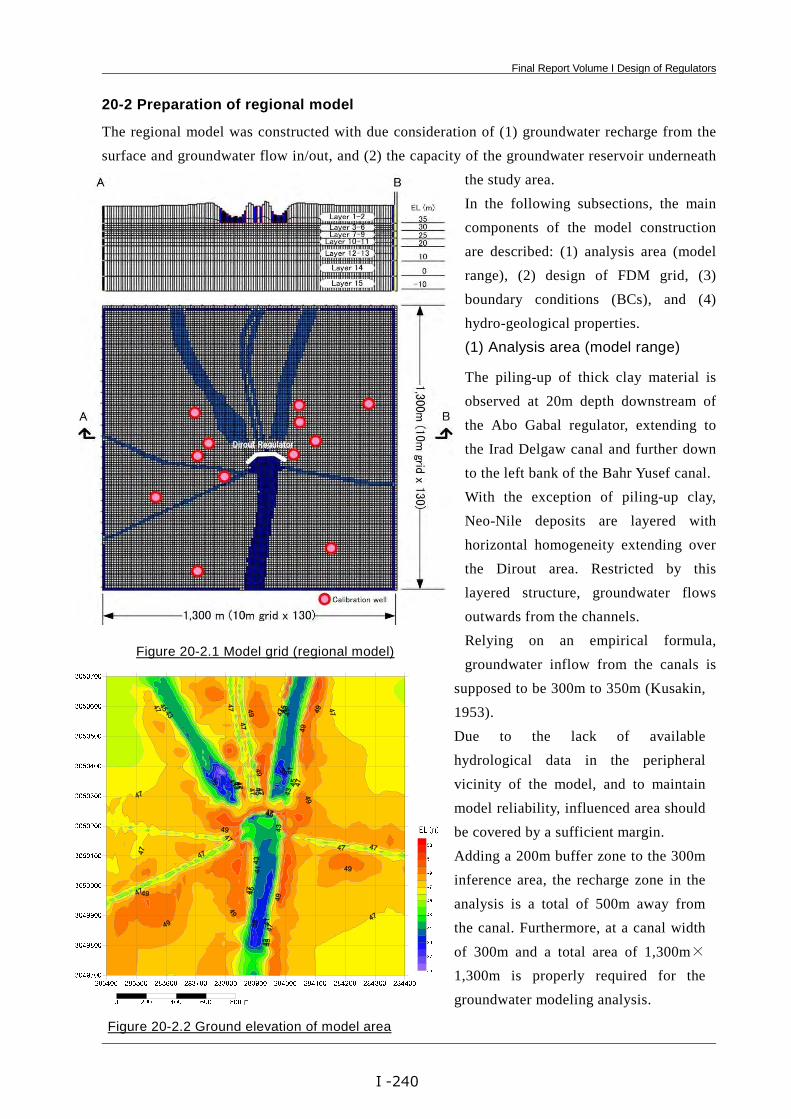
20-2 Preparation of regional model
The regional model was constructed with due consideration of (1) groundwater recharge from the
surface and groundwater flow in/out, and (2) the capacity of the groundwater reservoir underneath
the study area.
In the following subsections, the main
components of the model construction
are described: (1) analysis area (model
range), (2) design of FDM grid, (3)
boundary conditions (BCs), and (4)
hydro-geological properties.
(1) Analysis area (model range)
The piling-up of thick clay material is
observed at 20m depth downstream of
the Abo Gabal regulator, extending to
the Irad Delgaw canal and further down
to the left bank of the Bahr Yusef canal.
With the exception of piling-up clay,
Neo-Nile deposits are layered with
horizontal homogeneity extending over
the Dirout area. Restricted by this
layered structure, groundwater flows
outwards from the channels.
Relying on an empirical formula,
groundwater inflow from the canals is
supposed to be 300m to 350m (Kusakin,
1953).
Due to the lack of available
hydrological data in the peripheral
vicinity of the model, and to maintain
model reliability, influenced area should
be covered by a sufficient margin.
Adding a 200m buffer zone to the 300m
inference area, the recharge zone in the
analysis is a total of 500m away from
the canal. Furthermore, at a canal width
of 300m and a total area of 1,300m×
1,300m is properly required for the
groundwater modeling analysis.
Figure 20-2.2 Ground elevation of model area
Figure 20-2.1 Model grid (regional model)
Ⅰ-240

Detailed Design Study on the Project for Construction of the New Dirout Group of Regulators
As for the depth covered by the analysis, at least 50m of clearance is required for comparing the
design of the cut-off plate and bearing pile (see Figure 20-2.1).
(2) Design of FDM grid
In accordance with the purpose of the regional model, grid size is refined to 10m in plane (x, y) for
whole model range (1,300m×1,300m). While at depth (z), 15 layers are applied from the ground
level to EL -10m. There are 253,500 grids in total (130 in E-W direction × 130 in N-S direction ×
15 layers in depth).
(3) Boundary conditions (BCs)
The center of Dirout is located on the embankment area, and is 3 or 4m higher than the surrounding
farmland. The farmland extends along model borders and shows EL.46m to EL.47m, while the area
adjoining the DGRs is EL.50m high (see Figure 20-2.2). The groundwater level (or head) is
observed to be in the range of 1.5 to 8.5m below the ground surface.
Since the Dirout area suffers arid climate characterized by very little rainfall throughout the year,
the canals leakage to the aquifer is the main source of groundwater. Thus, the gradients of
groundwater heads decline from the city center (of regarded area from canals) towards the model
borders.
Regarding the groundwater usage in the study area, the groundwater is utilized as the
supplemental water resources for daily human activity. In fact, according to the inventory survey it
was found that eight wells exist along the Abo Gabal canal in the study area.
Taking hydro-geological condition of this range into account, three boundary conditions are
assigned to the regional model as shown in Table 20-2.1 and Figure 20-2.3.
Table 20-2.1 Boundary conditions (BCs) of groundwater model Type of BCs Description MODFLOW Package
Head-dependent flux boundaries between canal bottom and aquifer
In the canal, flow of water into or out of aquifer is dependent on difference between canal water level and groundwater head. If canal water level is higher than groundwater head, then the canal moves water to the aquifer.
River package (RIV)
Specified flux boundary to individual pumping wells
At pumping wells, a specified amount is extracted from the aquifers. In the model, observed values from five wells are given and extracted from sandy layers.
Well package (WEL)
Specified head boundary between model area and its outside.
Along model margin, flow of water from/out of model area is dependent on the difference between specified head and groundwater head in the model.
Time-Variant Specified-Head package (CHD)
When calculating the amount of seepage from canals (groundwater recharge and outflow), the
canals are first divided into eight sections: upstream and downstream of Ibrahimia canal, Bahr
Yusef, Abo Gabal, Irad Delgaw, Sahelyia, Diroutiah, and Badraman canals. Then, head-dependent
flux boundaries that consider canal conditions are drawn, and seepage is then calculated from: (1)
Ⅰ-241

Final Report Volume I Design of Regulators
the given values of canal water level, (2)
permeability and thickness of
channel-bed sediments, and (3) the
width and length of channels.
As for groundwater extraction, a
specified flux boundary is adopted with
the daily rate and screen position taken
from the well inventory survey
conducted in April 2016.
The exchange amount of water
flowing in/out of model range is
calculated with specified head boundary
taken from the groundwater potential
distribution based on the groundwater
monitoring carried out at each step of
the calculation.
(4) Model property
Input data for model property is
obtained through an analysis of
hydrostratigraphy of the model area,
involving both the surficial layer
(recharging zone: unsaturated zone) and
the aquifer (saturated zone). The
characteristics of the unsaturated and
saturated zones are described in the
following subsections.
1) Hydrostratigraphy
Non-marine alluvial and Pleistocene
deposits are within the model range. In
the boring survey (30m in depth), the
grading structure is observed through
beds and geologic members. The upper
layer (about 10m thick) is composed of
silty clay, but further down, it gradually
changes into sandy facies with gravel,
and further still it turns into coarse sand
with granular gravel or pebble, and
Figure 20-2.4 Land cover classification
Figure 20-2.3 Boundary condition
(MODFLOW PACKAGE)
Ⅰ-242

Detailed Design Study on the Project for Construction of the New Dirout Group of Regulators
finally into boring holes (EL.19m to EL.25m) at the very bottom.
This strata correlates to flood deposits during the past climate change after Middle Pleistocene
(40,000 years ago) and broadly covers the Nile Valley lowlands. It is generally referred to as
‘Neo-Nile deposit’ and is more thickly distributed along the Nile main channel and thins out the
further it gets away from it. From the boring survey, the layers have been found to thicken on the
right bank of the Ibrahimia canal, the side closer side to Nile main channel, and slightly thin out on
the left bank of the Bahr Yusef canal. The strata are also grouped into four layers; Nc, Nm, Ns, and
Ng, which are horizontally consistent with the model range.
Hydro-geological properties are classified into: (1) groundwater recharge at ground surface, (2)
aquifer properties controlling groundwater flow, and (3) artificial underground structure.
a) Properties of unsaturated zone (Groundwater recharge and evapotranspiration)
In the model range, the surficial to unsaturated zone is about 10m thick, and consists of
impervious silty-clay. Due to scant rainfall, natural recharge has hardly taken place in the model
range. Thus, groundwater recharge occurs exclusively by canal water leakage, sewage, the water
supply network, and surplus water from the irrigation field.
In Dirout city, the water supply system is constructed by the main stream of the Nile river and a
50 litre/day/cap6 of water is provided for 25,000 people within the model area (1,300m×
1,300m=169ha)7. Actually, 1,250 m3/day of water is utilized in the model range, and 90% of it was
discharged as sweage in the area.
However, some sewage is collected by tank truck, due to the insufficient capacity of sewage
treatment in Dirout city. Most sewage waste is disposed of in the surficial to unsaturated zone
through sewage inlets and the infiltration holes of individual residences and multi-apartment
buildings.
In the open spaces, playground, park, etc., the direct evaporation from shallow aquifer is
supposed to take place in the dry sunny season. In addition, some groundwater is lost through
transpiration and as a result of the trees planted along the roadsides and in the park.
In the farmland located outside the built-up area, irrigation water is supplied all year long, hence
some water is consumed by the crops and what remains is recharged to shallow aquifer.
According to land cover classification, the recharge/evaporation zone properties are classified
into three types, and their respective potentials are shown in Figure 20-2.4.
b) Property of saturated zone (aquifer property)
In the model range, there is aquifer in the deposits of thick Neo-Nile alluvium. The layer facies
are characterized by cohesive silt (Nc) on the upper horizon, changing to coarser sediments of silt
6 According to International Development Research Center (2007), design water supply amount is 52 lit/day/cap. If a
leakage rate of 32% is applied, the amount of water supply is estimated to be 78 lit/day/cap. 7 Population living in model range is estimated based on the Dirout city population of 72,856(492ha)sourced from
National Information Center (2006).
Ⅰ-243

Final Report Volume I Design of Regulators
(Nm), sand (Ns), and granular gravel (Ng) respectively toward the lower horizon. Hydraulically,
aquifers are classified by permeability and storativity. The layers are horizontally homogeneous,
each layer’s properties remaining consistent.
In the area from the Abo Gabal regulator to the Bahr Yusef canal, thick fill materials (F) pile up
on the clay (Nc) and silt (Nm) layer. These act as an aquiclude covering a sandy layer on the lower
horizon of the Neo-nile deposit. This hydro-geological structure confines the groundwater in the
model range. Regarding the aquifer condition, upper layers (F and Nc) act as ‘confining layers’,
while the lower layers (Nm, Ns, and Ng) are the ‘confined layers’ of the model.
The permeability of each layer is accounted for based on observation records. In the field survey,
30 permeability tests of the NDGRs’ foundation have been conducted so far. Of all the values, the
range of k=1.8×10⁻⁵ to 1.6×10⁻³cm/sec and the median value of 1.9×10⁻⁴ cm/sec8 are shown in
Figure 20-2.5.
As for the respective layers, fill deposit (F) is k=2.2×10⁻⁴ cm/sec in median value, k=5.6×10⁻⁵
cm/sec of Nc, k=4.2×10⁻⁴ cm/sec of Nm, k=4.2×10⁻⁴ cm/sec of Ns, and k=2.7×10⁻⁵ cm/sec of Ng
layer are as shown in Figure 20-2.6.
The permeability coefficient of each layer and the value corresponding to the depth-zone are used
to provide an initial value of the regional model9 (see Table 20-2.2).
8 Median value of permeability coefficient (1.9×10⁻⁴ cm/sec) is regarded as a common value of ‘unconsolidated sand with silt and finer layer’ (e.g. k=10-5~1.6×10⁻² is given by Freeza R.A. and Cherry (1979). 9 Specific yield and storage have not been observed by field survey, so a value corresponding to layer faces is allocated to respective depths (model layer) and specified area (coverage of impervious fill).
-5 -4 -3
0
2
4
6
8
Figure 20-2.5 Distribution of observed permeability Figure 20-2.6 Permeability of each layer
Ⅰ-244

Detailed Design Study on the Project for Construction of the New Dirout Group of Regulators
Layer No. Symbol
Type of Aquifer EL(m)
Permeability*1 Storage Coef.*2 Horizontal (x,y) Vertical
(z) Spec. Yield
Spec. Storage kx,y
(cm/sec) kx,y
(m/day) kz
(m/day) Fill (Silt/Clay/sand) F Unconfined
(confining) 0 30m 2.7.E-05 0.03 0.03 0.03 -
1 (Silt~Clay) Nc 0 35m 4.2.E-04 0.37 0.07 0.05 - 2 (Sand, loose, fine) Nm
Confined
35m 30m 1.2.E-03 1.06 0.21
0.1 0.001 3 (Sand, medium) Ns 30m 25m 3.2.E-04 0.28 0.06 4 (Sand, medium) Ns 25m 20m 2.7.E-04 0.24 0.05 5 (Sand, dense, coarse) Ng 20m 10m
4.5.E-04 0.39 0.08 6 (Sand, dense, coarse) Ng 10m 0m 7 (Sand, dense, coarse) Ng 0m -10m * 1: Permeability test did not consider horizontal and vertical direction, observed value is thus regarded as horizontal
permeability, and 1/5 of horizontal permeability is set as vertical permeability for the model’s initial value. * 2: Storage coefficient was not obtained by field test, and the value corresponding to facies is thus initially applied in the
model.
c) Underground structure
In the construction of DGRs, some countermeasures against canal seepage must be taken at the
very foundation. In 1962, improvement works were undertaken due to the rise in the water level
upstream of the DGRs. These improvements included the extension of the Ibrahimia canal apron,
wooden driven sheet piles, and canal bed protection works. However, no detailed records of the
locations or extent of those works exists today. Thus, based on the monitored water heads and their
distributions, the model assumed the construction range of the cut-off plate (the impervious wall
lining) was installed on the Sahelyia, Ibrahimia, Abo Gabal, and Irad Delgaw regulators, until the
depth of EL.35m.
(5) Assigned conditions to the model
The boundary conditions are arranged and classified for the concept model and then transferred
into a GIS data set and assigned to the model under a specified format of 10MODFLOW 2000
package. The applied packages are shown in Table 20-2.3.
10MODFLOW is the modular finite difference flow model developed by USGS. One of the features of MODFLOW is its available source code (free code). Given its transparency, and the data density of this project, the use of MODFLOW is superior in terms of accuracy and efficiency for the study to FEM.
Table 20-2.2 Average permeability by depth
Ⅰ-245

Final Report Volume I Design of Regulators
Table 20-2.3 Boundary condition and MODFLOW package
Boundary Condition (BCs) Location Type MODFLOW package
Boundary between model area and
outside
(groundwater in/out flow)
Model
margin
Constant head
boundary
Time-Variant Specified-Head
package (CHD)
Boundary between
canal bottom and aquifer
(seepage/groundwater inflow)
Waters of
canals
Head-depend
ent flux
boundaries
River package (RIV)
Wells
(groundwater extraction from aquifer) Well points
Constant flux
boundaries Well package (WEL)
Property (Pros) Location Type MODFLOW package
Recharge
(discharge sewage to aquifer)
City/built-up
area
Constant flux
boundaries The recharge package (RCH)
Evapotranspiration
(direct evaporation to groundwater)
open spaces
etc. - do -
Evapotranspiration package
(EVT)
Evapotranspiration
(Evapotranspiration from irrigation area)
Irrigation
farmland - do -
Evapotranspiration package
(EVT)
(6) Calibrating data
The model calibration was made
with monitoring records (groundwater
head) of 13 wells (see Figure 20-2.7).
Monitoring began in September 2015,
and minimum value was observed to
be EL.41.55m while maximum value
was EL.44.22m. The difference
between them is over 2.7m (see
Figure 20-2.8). The shallowest depth
was observed in the summer (high
water period) to be 1.75m at BH-N13.
The groundwater infiltration along
canals increases during the high water
period from June to August. For the
purpose of groundwater modeling,
and evaluating groundwater
interference caused by NDGRs, the
highest water level shall be applied for model calibration in the interest of safety.
In the period from September 2015 to February 2017, the target period disregarded was that from
20 June 2015 to 27 July 2016 (see Table 20-2.4 and Figure 20-2.8). For calibration records, the data
for 13 selected monitoring wells on 27 July 2016 was collected and appropriately allocated to
model layers with due reference to screen depth (see Table 20-2.5).
Figure 20-2.7 Calibration Point (Monitoring well)
Ⅰ-246

Detailed Design Study on the Project for Construction of the New Dirout Group of Regulators
Table 20-2.4 Maximum/Minimum groundwater head and depth (Sep 2015 to Feb 2017)
Figure 20-2.8 Change in groundwater head and canal water level (Sep 2015 to Feb 2017 )
Ⅰ-247

Final Report Volume I Design of Regulators
Table 20-2.5 Calibration data (record of 13 monitoring wells on 27 July 2016)
No
Location Groundwater Head
Monitoring Hole
X (UTM36, m)
Y (UTM36, m)
Z (EL.m)
Measurement Value
(EL.m)
Model Layer
1 BH-N7 283664 3050278 47.308 44.14 2 2 BH-N8 283741 3050126 47.509 44.08 2 3 BH-N9 283626 3050225 47.110 44.11 2 4 BH-N10 284076 3050375 48.835 44.20 1 5 BH-N11 284150 3050292 47.615 44.19 2 6 BH-N12 284043 3050222 50.913 44.18 1 7 BH-A2 283606 3050413 46.997 43.17 2 8 BH-A3 284074 3050454 49.593 44.22 1 9 BH-N13 283523 3050452 45.885 44.20 3 10 BH-N14 283437 3050038 46.841 44.06 3 11 BH-N15 283623 3049686 46.769 43.90 3 12 BH-N16 284212 3049791 46.530 43.71 3 13 BH-N17 284383 3050462 46.670 44.02 3
(7) Model calibration
For the automatic calibration, the observed permeability of the Nc to Nm layer was used as an
initial value11. At thresholds, initial values were adjusted to minimize residual error between the
observed and calculated values. Calibration results are shown in Table 20-2.6.
Table 20-2.6 Calibration summary for aquifer coefficients
11Model calibration was made mainly using Parameter Estimation and Uncertainty Analysis: PEST (http://wi.water.usgs.gov/models/pestplusplus/) and with 0.2~5.0 x observation value of thresholds.
Calibration Points Groundwater Head(ELm) No. Monitoring Hole Model Layer ①Observed ②Calculation ③Residual
27/July/2016 By Case 10 Dif=①-② 1 BH-N7 2 44.14 44.18 -0.04 2 BH-N8 2 44.08 44.09 -0.01 3 BH-N9 2 44.11 44.07 0.04 4 BH-N10 1 44.2 44.10 0.10 5 BH-N11 2 44.19 44.20 -0.01 6 BH-N12 1 44.18 44.11 0.07 7 BH-A2 2 44.17 44.27 -0.10 8 BH-A3 1 44.22 44.15 0.07 9 BH-N13 3 44.2 44.09 0.11 10 BH-N14 3 44.06 44.02 0.04 11 BH-N15 3 43.9 43.94 -0.04 12 BH-N16 3 43.71 43.79 -0.08 13 BH-N17 3 44.02 43.96 0.06 Average 0.02
Ⅰ-248

Detailed Design Study on the Project for Construction of the New Dirout Group of Regulators
Table 20-2.7 Comparison between observation records and calculation values
The calibrated aquifer coefficient is only slightly different from the initial value, in particular, the
aquifer coefficient of the Nm layer of loose fine sand located just below the regulator. Seepage
flow is not changed and remains at observation values.
The calculation results are acceptably different from observation values, less than 2cm on average
at 13 calibration points, with variations of 1cm to 11cm. The model can reproduce groundwater
flow and head in the vicinity of NDGRs. The model parameters are fixed and the current conditions
of groundwater head and flow flux are recalculated in case of 27 July 2016 (see Figure 20-2.9 of
case 10 of current model12).
The results shown are those of the monitoring survey. That is, groundwater flows down to model
borders in response to rise in canal water level, and disturbances are found as a result of the minor
variation of local rises and depressions influenced by partial recharge and evapotranspiration
caused by sewage disposal, pumpage and so on.
12 Due to the unavailability of annual highest level of groundwater in the B/D stage, the previous model (case 0) was
constructed with the data from 09 Dec 2015, before the 2015 winter closure. In the D/D stage, annual highest data from 27 July 2016 was applied to the current model as case 10.
Layer
No.
Symbol
Type of Aquifer
Depth Permeability
(Initial /before calibration.)
Permeability (calibrated)
Storativity (calibrated)
EL(m) Horizontal(Kx,y) Horizontal(Kx,y) Vertical(Kz) Specific
Yield Specific Storage
top bottom
cm/sec m/day cm/sec m/day m/day
1-5 F Un-Con. GL 30.0 2.7.E-05 0.03 2.9.E-05 0.03 0.025 0.03 - 1 Nc confining GL 36.0 4.2.E-04 0.37 5.6.E-05 0.05 0.035 0.05 - 2 Nc/m
Confined
36.0 35.0 1.2.E-03 1.06
1.2.E-03 1.06 0.182
0.1 0.001
3 Nm 35.0 33.8 1.2.E-03 1.06 0.182 4 Nm 33.8 32.5 1.2.E-03 1.06 0.182 5 Nm 32.5 31.3 1.2.E-03 1.06 0.182 6 Nm 31.3 30.0 1.7.E-04 0.15 0.065 7 Ns 30.0 28.8
3.2.E-04 0.28 1.7.E-04 0.15 0.065
8 Ns 28.8 27.5 1.7.E-04 0.15 0.065 9 Ns 27.5 25.0 4.6.E-04 0.40 0.08 10 Ns 25.0 22.5
2.7.E-04 0.24 4.6.E-04 0.40 0.08 11 Ns 22.5 20.0 9.3.E-04 0.80 0.16 12 Ng 20.0 15.0
4.5.E-04 0.39 9.3.E-04 0.80 0.16
13 Ng 15.0 10.0 9.3.E-04 0.80 0.16 14 Ng 100 0.0 9.3.E-04 0.80 0.16 15 Ng 0.0 -10 9.3.E-04 0.80 0.16
Ⅰ-249

Final Report Volume I Design of Regulators
Figure 20-2.9 Comparison between observation and calculation values
Ⅰ-250

Detailed Design Study on the Project for Construction of the New Dirout Group of Regulators
Figure 20-2.10 Contour map of groundwater head
(case 10, current model on 27 July 2016)
Ⅰ-251

Final Report Volume I Design of Regulators
20-3 Preparation of detail model
For the purpose of groundwater modeling, which predicts groundwater interference after NDGRs
construction, a regional model needed to be re-constructed to achieve a more precise simulation.
The alternative study for groundwater control works covers the embankment, steel sheet piles, and
so on. The detailed model has a small grid size capable of presenting the different dimensions of
alignment and depth. The detailed model is therefore rebuilt from a refined regional model on an
unstructured grid. In the following subsection, the process of making the detailed model is
described.
(1) Grid refining
The construction area of NDGRs is subjected to grid refining. Using the Quadtree method on a 10m
regional grid, a subdivision of 1/2 (5m), 1/4 (2.5m), and up to 1/8 (1.25m) are added on in order. In
the last division, the total grid number reaches 531,735 (35,449 grids x 15 layers). The gridding
structure of the detailed model is shown in Figure 20-3.1.
(2) Confirmation of model reliability (case 10 current condition)
The current groundwater status on 27 July 2016 of annual maximum water level is reproduced by
the detailed model. In Figure 20-3.2, the distribution of groundwater head and flux are shown.
Groundwater flowing east and west originated from DGRs (as a recharge source) with minor
disturbances reflected on the pathways to model edges. An exchange of water at
surface/groundwater systems, such as inflow of sewage, and loss by evaporation, are assumed
through the distribution of groundwater head and flux.
The hydraulic gradient is 1/750 at the east (Ibrahimia) side and 1/600 at the west (Bahr Yusef) side.
Due to the impervious silty clay overlain on the Irad Delgaw canals to the left bank of Bahr Yusef
canal, the Bahr Yusef side shows a steeper hydraulic gradient than the Ibrahimia side. The water
mass-balance in model range indicates 984m3/day of infiltration from canals as shown in Table
20-3.1.
Figure 20-3.1 Detailed model grid
Ⅰ-252

Detailed Design Study on the Project for Construction of the New Dirout Group of Regulators
Table 20-3.1 Summary of mass water balance in the model area (case 10, current condition)
Boundary Condition
Inflow Outflow Balance Remarks m3/day mm/day m3/day mm/day m3/day mm/day Canal 985 0.58 1 0 984 0.58 In/outflow, canals Model
boundary 147 0.09 403 0.24 -256 -0.15 In/outflow, model range
Recharge /evapotranspiration 435 0.26 1118 0.66 -683 -0.4 Inflow of sewage/
evapotranspiration Well
extraction - 45 0.03 45 0.03 Pump up from well
Total 1567 0.93 1567 0.93 0 0) -
Figure 20-3.2 Groundwater head and flow vector (case 10)
Ⅰ-253

Final Report Volume I Design of Regulators
20-4 Simulation study (Case 11, 12, and 13)
In the detailed analysis, case simulations are subjected to additional evaluation of seepage control
in conjunction with embankments and steel sheet piles and so on. Simulations determine the
acceptable measurements of components, areas, alignments, and amounts. Potential alternatives
and their components and various configurations, may contribute to groundwater fluxes; causing
seepage in unexpected directions and reducing groundwater inference. Groundwater simulations of
selected alternatives are carried out as shown in the following subsections.
(1) Case condition
The full water level of Ibrahimia canal is planned as EL.46.3m (FWL) to simulate substantial
influence by the NDGRs construction. Embankments and sheet pilings in revetment, bed protection
works, and others are also included in simulations, with four cases shown in Table 20-4.1.
Table 20-4.1 Conditions of simulation cases
Ⅰ-254

Detailed Design Study on the Project for Construction of the New Dirout Group of Regulators
(2) Result of simulation
The simulated groundwater head and flux of cases 11, 12, and 13 are delineated in in Figures
20-4.1, 20-4.2, and 20-4.3 respectively. Even though groundwater seepage is found in parts of Abo
Gabal and Irad Delgaw, their main directions (vectors) are seen as aligning outwards of (toward the
east and west) the main canals of Bahr Yusef and Ibrahimia.
The velocity of groundwater flow, is not so fast, with a range of 0.001~0.4 m/day, an avarege of
0.01m/day (about 4m/year). In the E-W section, groundwater is recharged from the bottom of the
canals and flows outside along layered aquifers, and the runoff in the model margin flows
horizontally and slightly downhill.
a) Case 11
Case 11 is prepared with a cut-off wall (or sheet piles) penetrating up to EL.25m along NDGRs’
axis. In the A-A’ section of groundwater, the equi-contour line moves downward and increases
seepage amount from the canals in comparison with current seepage level (case 10). Groundwater
is acted on by confined pressure from the impervious clay layer (Nc layer) overlain, and
groundwater head extends outside with almost same potential from top to bottom horizon.
b) Case 12
Case 12 is prepared under the same conditions as the ongoing bank protection works designed in
D/D stage, which are composed of steel sheet piles along regulator axes, upstream and downstream
of regulators, and embankments on both banks (see chapter 13). The penetration depth of sheet
piles is planned at EL.25m maximum at the upstream alignment, and EL.29m~EL.41m at the
downstream alignment. There are 31 piling sections classified into eight depths (EL.25m~
EL.41m). In the model, respective depths are given corresponding model layers.
In the section along regulator axis (A-A’), groundwater flow is defined by canal section, and
seepage amount is controlled at half of that in case 11.
c) Case 13
Case 13 is prepared as case 12 plus two additional features for bank protection: grouting and
seepage protection. Grouting is planned along both banks of NDGRs and seepage protection is
planned on the canal floor between NDGRs and DGRs. Both aim to close the gaps in the
impervious areas of the DGRs and NDGRs against infiltration.
In case 13, groundwater inference area is deduced, but its effect is much less than that in case 12.
Ⅰ-255

Final Report Volume I Design of Regulators
Figure 20-4.1 Groundwater head and flow vector (case 11)
Ⅰ-256

Detailed Design Study on the Project for Construction of the New Dirout Group of Regulators
Figure 20-4.2 Groundwater head and flow vector (case 12)
Ⅰ-257

Final Report Volume I Design of Regulators
Figure 20-4.3 Groundwater head and flow vector (case 13)
Ⅰ-258

Detailed Design Study on the Project for Construction of the New Dirout Group of Regulators
20-5 Evaluation of seepage control works
(1) Groundwater rise and interference
In simulation cases 11, 12, and 13 after NDGRs construction, the rise in canal water is given as
1.3m higher than before construction at Ibrahimia canal, and 0.52m higher than before construction
at Bahr Yusef canal (case 10). In the following subsections, groundwater rise and its inference is
described for respective cases.
a) Case 11
In response to the canal water rise in case 11, groundwater head rises up to 0.5m on the Ibrahimia
side and its influence extends with a radius of 400m from the edge of the canal water at Ibrahimia
and 350m on the Bahr Yusef side. In Figure 20-5.1, the groundwater rise caused by canal water is
shown as the difference between current conditions in case 10 and case 11.
Although estimated groundwater head in case 11 does not exceed ground surface, it reaches 1.25m
at the shallowest point of the model range in the northwest. This depth may soak the ground surface
through capillary action13. Areas adjoined to the canal banks, including blocks populated with
shops, the railway station, mosques, and residential buildings with basements and structures on
street corners are at particular risk of contact with groundwater.
b) Case 12
Case 12 is calculated under the condition of bank protection works designed in D/D and has
enough impact on groundwater to reduce seepage by almost half of what is exhibited in case 11. In 13 Most of the model area is covered by clay or silt, and the silt layer exhibits soaked ground. The theoretical value of
capillary rise is 150~375cm, and wet zone may exist when the groundwater head becomes shallower than 300cm in depth according to the inventory survey.
Figure 20-5.1 Groundwater rise
(case 11, Nm layer)
Ⅰ-259

Final Report Volume I Design of Regulators
Figure 20-5.2, the rise in groundwater (calculated as the difference in groundwater head between
current condition case 10 and case 12) is shown on a contour map.
Bank protection works achieved with piling works and embankments control seepage and limit a
rise in groundwater to 0.3m, and interference (of 5cm of groundwater rise) to 300m. Seepage is
particularly reduced on the Bahr Yusef side through sheet piling which penetrates to the impervious
horizon of the Bahr Yusef regulator’s foundation.
c) Case 13
Case 13 is applied to evaluate the impact of grouting work on banks and canal bed seepage control.
Therefore, model conditions and impervious properties14 on canal floor are applied to grouting
alignments.
The simulation shows that the impact of these additional works is limited and not much different
from those of case 12. The range of the groundwater rise is slightly reduced and its interference
range still extends to 300m, same as in case 12. The calculation results of the rise in groundwater
(calculated as the difference in groundwater head between current condition case 10 and case 12) is
shown in Figure 20-5.3.
14Improvement target of grouting is set as 1x10⁻⁵cm/sec since grouting section is mainly composed of sandy foundation.
The canal floor is also subjected to same condition of permeability.
Figure 20-5.2 Groundwater rise
(case 12, Nm layer)
Ⅰ-260

Detailed Design Study on the Project for Construction of the New Dirout Group of Regulators
(2) Comparison of seepage control works
The comparison Table 20-5.1 evaluates these two alternate plans; case 12 (bank protection work
with steel sheet pile) and case 13 (case 12 plus grouting and seepage control on canal floor).
Table 20-5.1 Comparison of the seepage control works
Case Feature of construction works Effectiveness
Additional works
Reliability for quality
Temporary works
Groundwater rise
Inference area
Seepage amount
Case 12 bank
protection
None ○
Done as bank protection
Certain ○
Sheet pile, embankment
None ○
Done as bank protection
0.09 m Avg. for
model area
300m (RB) 270m (LB)
39m3
/day Avg. from all canals
Case 13 bank
protection/ grouting/ seepage control
Necessary ×
(grouting, seepage control
for channel beds)
Uncertain △
(difficult target)
Necessary ×
Expanding construction
yard
0.06m Average for model area
300m (RB) 290m (LB)
33m3
/day Avg. from all canals
Figure 20-5.3 Groundwater rise
(case 13, Nm layer)
Ⅰ-261

Final Report Volume I Design of Regulators
Case 13 presents obstacles to the course of NDGRs construction. Practically, grouting work has to
be carried out after regulator construction to ensure sufficient workspace for construction. Also,
earth works on the canal floor require temporary bypassing work before construction. The cost of
construction therefore increases, and the construction period is extended.
Even if the works required in case 13 were completed, seepage control is much more effective in
case 12. As for the differences in the results between case 12 and case 13; groundwater rise
difference is only 0.03m, and difference in groundwater inference distance is 30m maximum and
seepage amount is 6m3/day. Case 13 is therefore considered an ineffective plan due to the high cost
of construction.
Although case 12 was solely designed for bank protection work, it also functions as groundwater
control (water rise can be suppressed by a maximum of 0.3m), and restricts the expansion of risk to
foundational and underground structures15 to less than 3% (see Figure 20-5.4).
From both an environmental and an economical perspective, analysis shows that case 12 is the
most feasible.
(3) Groundwater depth after NDGRs construction in case 12
In Dirout city, wet ground is caused by leakages from water supply pipes and sewage inlets.
However, it may also be indirectly facilitated by the rise in groundwater due to inflow from canals
and sewage water. In Dirout city, the underground structures of the most recent buildings are built
3m from the surface to avoid the harmful effects of shallow groundwater. Alternately, if
groundwater level is kept deeper than GL -3m16, negative environmental impacts can be evaded.
To check spatial distribution and risk inclination after the construction of the NDGRs (case 12),
risk area is calculated with management depth, defined as GL-3m, as shown in Figure 20-5.4. Risk
areas are spread widely at the low plains around NDGRs. In Figure 20-5.4 ‘blue’ indicates a risk
area in the current condition (case 10), while ‘red’ indicates an expanding area after NDGRs’
construction (case 12). However, these risks only present themselves from June to August, the
season with the highest water levels. As there are multiple factors influencing these phenomena,
groundwater monitoring is to be continued with the purpose of facilitating impact mitigation
projects, such as a public sewage system and so on.
15 The drawing shows a risk area for groundwater obstacle due to shallow groundwater head which is less than marginal depth (3m from GL) at highest season. The ‘blue’ areas are the current risk area (case 10), while ‘red’ shows an expanding risk area after NDGRs construction (case 12). 16 In general, management depth for underground facility is set as GL-3m to keep enough distance for controlling the groundwater rise by soil capillary action, and successive leaching.
Ⅰ-262

Detailed Design Study on the Project for Construction of the New Dirout Group of Regulators
.
Figure 20-5.4 Area of shallow groundwater head (less than 3m from GL)
Ⅰ-263

Volume II WATER MANAGEMENT SYSTEM
Page
1. Integrated Water Management System ··················································Ⅱ- 1 1-1 Background of integrated water management system ··························Ⅱ- 1 1-2 Concept of integrated water management system ······························Ⅱ- 2
2.Current Situation of Water Distribution System ········································Ⅱ- 3 2-1 Regulators along main canals ·····················································Ⅱ- 3 2-2 Small scale irrigation facilities (branch canal intake) ··························Ⅱ- 5 2-3 Current situation of gates on branch canals ········································Ⅱ- 6 2-4 Water management and distribution DGRs ······································Ⅱ- 7 2-5 Irrigation system schematic diagram ·············································Ⅱ- 8 2-6 Changes in water level of Lake Quarun ··········································Ⅱ- 8 2-7 Telemetry system ··································································· Ⅱ-9 2-8 Current monitoring and operating system ······································ Ⅱ-11 2-9 Current water management administration with organization chart ········· Ⅱ-14
3.Formulation of Integrated Water Management System ······························· Ⅱ-16 3-1 Setting up integrated water management system ······························ Ⅱ-16 3-2 New centralized management system ··········································· Ⅱ-26
4.Detailed Design ············································································ Ⅱ-29 4-1 Design of transmission systems and route ······································ Ⅱ-29 4-2 Design of gauging station ························································· Ⅱ-39 4-3 Wiring plan ············································································ Ⅱ-45 4-4 Gauging station plan ······························································ Ⅱ-47 4-5 Design of monitoring station ····················································· Ⅱ-47 4-6 Specifications for equipment ····················································· Ⅱ-49
5. Operation and Maintenance Plan for Integrated Water Management ·············· Ⅱ-59
List of Figures Figure 2-1.1 Location of regulators ·························································Ⅱ- 3 Figure 2-1.2 Regulators’ gate type ··························································Ⅱ- 4 Figure 2-1.3 Record of U/S and D/S water levels at regulators
along Bahr Yusef and Ibrahimia canals ·····································Ⅱ- 5 Figure 2-2.1 Gates with non-operational hoist and condition of branch canal ·········Ⅱ- 6 Figure 2-6.1 Water level changes of Lake Quarun ········································Ⅱ- 9 Figure 2-6.2 Lake Quarun and water level monitoring facility ··························Ⅱ- 9 Figure 2-7.1 Schematic diagram of existing water monitoring system ················ Ⅱ-10 Figure 2-7.2 Existing telemetry system, CDT in MWRI ································ Ⅱ-10 Figure 2-8.1 Organizations chart for the management of each regulator
and gate operation ···························································· Ⅱ-12 Figure 2-9.1 Existing water level monitoring system ···································· Ⅱ-14 Figure 2-9.2 Diagram of water management system of the CDT ······················· Ⅱ-15 Figure 2-9.3 Water level data transmission system developed by the CDT ··········· Ⅱ-15

Figure 3-1.1 Schematic diagram of the facilities to be monitored in water management system ················································ Ⅱ-20
Figure 3-1.2 New organization for the integrated water management ················· Ⅱ-24 Figure 3-1.3 Hierarchic diagram for the integrated water management system ······ Ⅱ-25 Figure 3-2.1 Data flow in the integrated water management system ··················· Ⅱ-26 Figure 3-2.2 Data flow for the integrated water management system ················· Ⅱ-28 Figure 4-1.1 System composition of GPRS communication ···························· Ⅱ-30 Figure 4-1.2 System composition using the TCP/IP method ···························· Ⅱ-30 Figure 4-2.1 Equipment composition for gauging station (1/2) ························ Ⅱ-41 Figure 4-2.2 Equipment composition for gauging station (2/2) ························ Ⅱ-41 Figure 4-3.1 Wiring plan of regulator and branch canal’s intake ······················· Ⅱ-46 Figure 4-3.2 Wiring plan of Central Monitoring House ································· Ⅱ-46 Figure 4-4.1 Gauging station································································ Ⅱ-47 Figure 4-5.1 Typical operation diagram of the master station ·························· Ⅱ-48 Figure 4-5.2 Typical operation diagram of the monitoring station ····················· Ⅱ-49 Figure 5-1.1 Position of strengthening program framework
and project road map (draft) ················································· Ⅱ-60 Figure 5-1.2 Organization chart of the new integrated water management
center ··········································································· Ⅱ-64 Figure 5-1.3 Schematic diagram of the facilities to be monitored
in water management system ················································ Ⅱ-68 Figure 5-1.4 Location map ·································································· Ⅱ-69 Figure 5-1.5 Data flow ······································································· Ⅱ-70 Figure 5-1.6 Hierarchic diagram for the integrated water management system ······ Ⅱ-71 Figure 5-1.7 Layout map of the target area (draft) ······································· Ⅱ-72 Figure 5-1.8 Layout of the monitored data at the target area (draft) ··················· Ⅱ-73 Figure 5-1.9 Output image of graph of water level data (draft) ························· Ⅱ-74 Figure 5-1.10 Output image of table of water level data (draft) ························ Ⅱ-75
List of Tables Table 1-2.1 Basic concept of water management system ·································Ⅱ- 2 Table 1-2.2 Three basic functions of the project ···········································Ⅱ- 3 Table 2-1.1 Regulators along the main canals ·············································Ⅱ- 3 Table 2-1.2 Challenges and future countermeasures for main canals ···················Ⅱ- 5 Table 2-2.1 Challenges and future countermeasures for minor irrigation facilities ···Ⅱ- 6 Table 2-3.1 Gate conditions at branch canal’s intake ·····································Ⅱ- 7 Table 2-4.1 Distributed water amount (average from 2010 to 2014) ····················Ⅱ- 8 Table 2-4.2 Distributed water amount at Bahr Yusef and Ibrahimia canals
(DGRs, average from 2010 to 2014) ··········································Ⅱ- 8 Table 2-7.1 Current conditions of telemetry sites in the project area ·················· Ⅱ-11 Table 2-8.1 Monitored items at each regulator and organization responsible
for the operation of each regulator ·········································· Ⅱ-12 Table 2-8.2 Challenges and countermeasures in the water management system ····· Ⅱ-13 Table 2-9.1 Issues and countermeasures in the design of
the water management organization ········································ Ⅱ-15 Table 3-1.1 Criteria for the selection of branch canals to be monitored ··············· Ⅱ-18

Table 3-1.2 Facilities targeted for monitoring (1/2) ······································ Ⅱ-19 Table 3-1.3 Facilities targeted for monitoring (2/2) ······································ Ⅱ-19 Table 3-1.4 Study on the monitoring and operational level ····························· Ⅱ-22 Table 3-1.5 Study on the management levels at regulators ······························ Ⅱ-23 Table 3-1.6 Study on the management level at the control center ······················ Ⅱ-23 Table 4-1.1 Calling modes ·································································· Ⅱ-31 Table 4-1.2 Transmission format ··························································· Ⅱ-33 Table 4-1.3 Data acquisition function ······················································ Ⅱ-34 Table 4-2.1 Location of gauging stations ·················································· Ⅱ-39 Table 4-2.2 Function of gauging station ··················································· Ⅱ-40 Table 4-2.3 List of equipment composed in the gauging station ······················· Ⅱ-42 Table 4-5.1 Function of the master station ················································ Ⅱ-47 Table 4-5.2 Equipment of the master station ·············································· Ⅱ-48 Table 4-5.3 Function of the monitoring station ··········································· Ⅱ-49 Table 4-5.4 Equipment of the monitoring station ········································ Ⅱ-49 Table 4-6.1 Technical specifications for GPRS modem ································· Ⅱ-50 Table 4-6.2 Technical specifications for RTU ············································ Ⅱ-51 Table 4-6.3 Technical specifications for data logger ····································· Ⅱ-52 Table 4-6.4 Technical specifications for water level sensor ····························· Ⅱ-53 Table 4-6.5 Technical specifications for server ··········································· Ⅱ-53 Table 4-6.6 Technical specifications for personal computer ···························· Ⅱ-54 Table 4-6.7 Technical specifications for LCD monitor ·································· Ⅱ-55 Table 4-6.8 Technical specifications for L2-SW ········································· Ⅱ-55 Table 4-6.9 Technical specifications for router ··········································· Ⅱ-56 Table 4-6.10 Technical specifications for laser printer ·································· Ⅱ-56 Table 4-6.11 Technical specifications for enclosure ····································· Ⅱ-57 Table 4-6.12 Technical specifications for computer rack ································ Ⅱ-57 Table 4-6.13 Technical specifications for LCD KVM switch ··························· Ⅱ-58 Table 4-6.14 Technical specifications for NTP server ··································· Ⅱ-59 Table 5-1.1 Program for strengthening of operation and maintenance
capacity (draft) ································································ Ⅱ-61 Table 5-1.2 Facilities targeted for monitoring (1/2) ······································ Ⅱ-67 Table 5-1.3 Facilities targeted for monitoring (2/2) ······································ Ⅱ-67 Table 5-1.4 Example of crop consumptive water use ···································· Ⅱ-76 Table 5-1.5 Inspection items (water level sensor) ········································ Ⅱ-77 Table 5-1.6 Inspection items (solar panel) ················································ Ⅱ-77 Table 5-1.7 Inspection items (measuring equipment) ···································· Ⅱ-78 Table 5-1.8 Inspection items (monitoring equipment) ··································· Ⅱ-79

Final Report Volume II Water Management System
Volume II–WATER MANAGEMENT SYSTEM
1. Integrated Water Management System
1-1 Background of integrated water management system
The DGRs distribute 9.6 billion m3 of irrigation water per year from the Nile River to approximately
600,000 hectares of land via the Ibrahimia canal. The water is distributed to the beneficiary areas by
seven canals originating at the group of regulators. Of the seven canals branching from the group of
regulators, the Bahr Yusef and Ibrahimia canals are 300km long, and as such are the main canals.
Bahr Yusef canal has four regulators (Lahoun, Mazoura, Sakoula, and Dahab) installed with grant aid
from Japan, and were upgraded between 1995 and 2010.
The DGRs were built in 1872, and the hydraulic functions of the facilities have declined significantly
since then due to age. If the group of regulators is upgraded to enable them to fulfill their essential
hydraulic functions, water can be properly distributed to the seven canals. The integrated operation of
the group of regulators and the four regulators already installed will improve irrigation in the middle
reaches of the Nile, leading to efficient water resource management in the area. Integrated operation
and management of the group of regulators and the major regulators, will allow for appropriate water
distribution in five governorates (Assiut, Giza, Beni Suef, Fayoum, and Minia).
Water management in the covered 600,000 hectares, is managed by the General Directorate for Water
Distribution (GDWD) in Assiut. This authority manages the DGRs and the regulators on the canals
that are located on the governorate boundaries. GDWD in Assiut monitors the regulator gates and
instructions on gate operation through the General Directorates of Irrigations (GDIs). GDI monitor
and instruct the gate operation to the intermediate regulators (not on the governorate boundaries) and
the branch canals for water distribution.
To ensure proper water distribution to the canals, upgrading the DGRs is vital to stabilize the water
level in the canals, with the aim of diverting the water taken in at the Ibrahimia Head regulators in the
seven directions with prescribed amounts. Water management is particularly important in stabilizing
water levels at canals over 300km long (Bahr Yusef and Ibrahimia canal), and diverting the
prescribed amounts of water to the branch canals upstream of the regulators.
Furthermore, in order to let the diverted water from the main canals to the branch canals reach to the
end fields, it is important to eliminate sediment blockage to the flow in the branch canals, and to let
even the minor irrigation facilities give adequate hydraulic functions. However, the deteriorated
minor irrigation facilities and gates do not adequately fulfill their hydraulic roles, resulting in
defective canals and irrigation facilities and causing water shortages at the fringes of the beneficiary
areas.
To ensure proper water management from the main canals to the ends of the branch canals across a
huge beneficiary area of approximately 600,000 hectares , it is important to break down the issues
and clearly define the steps necessary for: (1) upgrading the main regulators on the main canals, (2)
II-1

Detailed Design Study on the Project for Construction of the New Dirout Group of Regulators
introducing a water management system capable of providing centralized wide reaching water
management, and (3) upgrading the facilities to restore the hydraulic function of the canals and minor
irrigation facilities.
Downstream water level control system has generally been used to manage gate operation of
regulators in Egypt until now. Therefore, introducing a new water management method that
maintains stable water levels upstream and stable water distribution with an over-flow type gate, will
require a trial period and technical assistance. Considering these changes, the following steps can
promote fair water distribution in the areas concerned.
Step 1:
- Construction of new DGRs
- Introduction of an integrated water management system
Step 2:
- Technical assistance and aid for Integrated water management system
Step 3:
- Upgrading narrowed canal sections and minor irrigation structures to ensure proper water
distribution
1-2 Concept of integrated water management system
In order to distribute the diverted irrigation water to the beneficiary areas fairly and properly, an
integrated water distribution system should be established to monitor irrigation water diversion and
formulate a proper water diversion plan. The objectives of the integrated water distribution system
are the monitoring of water diversion and the evaluation of flow situation at (1) the new DGRs, (2)
regulators along the Bahr Yusef canal and the Ibrahimia canal, and (3) intake facilities of branch
canals, in order to formulate a real-time water distribution plan.
These things are realized by introducing unified management of the water distribution status at each
monitoring location utilizing the telemeter system through flexible water management, rational water
distribution based on the balance of supply and demand of water volume and fair water distribution
management. The concept of the integrated water management system to be introduced in the study
is consistent with that of the Central Directorate for Telemetry. With reference to the points above
mentioned, the concept of the water management system will be established by introducing
instruments and equipment that realize fairness, reliability, and flexibility of the system.
Table 1-2.1 Basic concepts of water management system Description Expected Accomplishment
Fairness -Fair water distribution management under the prescribed amounts of water Reliability -Effective water distribution management reflecting the arrival time of supply
-Appropriate water distribution based on the cropping schedule -Effective water distribution due to the reduction of management loss
Flexibility -Water management corresponding to a future’s change of cropping pattern -Flexible water management based on the balance between demand and supply
II-2

Final Report Volume II Water Management System
In order to realize the integrated water management system, it is important point that not only
installation of water distribution equipment but also human resource development for operating these
equipment. Since the operation and maintenance manual for water distribution instruments will be
prepared in the study, it will be utilized for future human resource development through the Technical
Cooperation Project, and as such must establish the following basic functions.
Table 1-2.2 Three basic functions of the project Item Contents
Real-time Water management
Real-time monitoring of water supply situation in NDGR, discharge situation of each regulator in canal and the main branch canal intake.
Water Balance Management
Realization of unified monitoring of the discharge at the regulators and branch canal intake. And that the water balance can be confirmed at the central monitoring room by comparing "difference discharge between upstream and downstream regulator" and "demand amount multiplied by unit water requirement and served area".
PDCA Cyclic management
Formulate an improved cycle: Plan, Do, Check, and Act of water distribution system cycle. Proper water distribution and the rapid improvement of evaluation results based on real time discharge data are expected.
2 Current Situation of Water Distribution System
2-1 Regulators along main canals
The locations and names of the regulators
on Bahr Yusef canal and Ibrahimia canal
are shown in Figure 2-1.1 and Table 2-1.1.
There are four regulators on Bahr Yusef
canal and eight on Ibrahimia canal.
The role of the regulators on the
governorate boundaries is to send the
obligatory discharge to the governorate
downstream. These play an important role
in water management on the long main
canals. The role of the other regulators except on governorate boundaries is to maintain water level at
the main canals and stabilize diversion to the branch canals. At the regulators located on governorate
boundaries, an H-Q curve is created on the downstream side of the regulator.
Table 2-1.1 Regulators along the main canals
Name of Canal
Regulator Location District Boundary
Gate Type (1) (2) (3)
Bahr Yusef canal
Dahab regulator Minia + Sakoula regulator Minia Beni Suef + Mazoura regulator Beni Suef + Lahoun regulators Beni Suef Fayoum +
Ibrahimia canal
New Hafez regulator Minia + New Minia regulator Minia + Matay regulator Minia + Maghagha regulator Minia Beni Suef +
Dahab
Sakoula
Mazoura
Lahoun
New Hafze
Matay
Maghagha
Dirout Group of
Regulators
EL Gandy
Ashmont
El Wasta
Ibrahimia Intake
Giza
Minya
Fayoum
BeniSuef
Minya
BeniSuef
North
EL Sharahna
New Minya
Bahr-Yusef canal
Ibrahimia canal
Dahab
Sakoula
Mazoura
Lahoun
New Hafze
Matay
Maghagha
Dirout Group of
Regulators
EL Gandy
Ashmont
El Wasta
Ibrahimia Intake
Giza
Minya
Fayoum
BeniSuef
Minya
BeniSuef
North
EL Sharahna
New Minya
Bahr-Yusef canal
Ibrahimia canal
Figure 2-1.1 Locations Figure 2-1.1 Locations of regulators
II-3

Detailed Design Study on the Project for Construction of the New Dirout Group of Regulators
El Sharahna regulator Beni Suef + El Gandy regulator Beni Suef + Ashmont regulator Beni Suef + EL Wasta regulator Beni Suef Giza +
Note: Gate Type (1) is double leaf gate, (2) is chain type, (3) is Fahmy Henien gate
Source: JICA Study Team (2015)
Double leaf gate Chain type gate F.H.(Fahmy Henien) gate
Figure 2-1.2 Regulators’ gate type
Regarding the water level condition of each regulator, the water level status at the time of F/S, which
became the background of implementation of the Project, is shown in Figure 2-1.3.
The regulator’s gate operation aims to maintain a consistent water level downstream of the regulators
along the Bahr Yusef and Ibrahimia canals. The typical fluctuations of water level at some regulators
are shown in Figure 2-1.3 as an example. At Sakoula and Mazoura regulators, upstream water level is
maintained in order to distribute water from the main canal to the branch canals. However, keeping
the water level stable except summer months has become impossible. As for the regulators along the
Ibrahimia canal, the upstream water level at the New Hafze Regulator is maintained high enough for
reliable diversion to the Serry canal located upstream of the New Hafze Regulator.
As for the other regulators along the Ibrahimia canal, there is no major difference in the water level
between the upstream and the downstream, as shown in the following figure (Matay regulator).
Figure 2-1.3 Record of U/S and D/S water levels at regulators along Bahr Yusef and Ibrahimia canals
31.0
32.0
33.0
34.0
Jan
Feb
Mar
Apr
May
Jun
Jul
Aug
Sep
Oct
Nov
Dec
Sakoula Reg. (2015)
U.S.
D.S.
27.0
28.0
29.0
30.0
Jan
Feb
Mar
Apr
May
Jun
Jul
Aug
Sep
Oct
Nov
Dec
Mazoura Reg. (2015)
U.S.
D.S.
34.0
35.0
36.0
37.0
Jan
Feb
Mar
Apr
May
Jun
Jul
Aug
Sep Oct
Nov
Dec
Matay Reg. (2015)
U.S.
D.S.
41.0
42.0
43.0
44.0
Jan
Feb
Mar
Apr
May
Jun
Jul
Aug
Sep
Oct
Nov
Dec
New Hafze Reg. (2008)
U.S.
D.S.
II-4

Final Report Volume II Water Management System
Based on the current situation above mentioned, the challenges and measures for better water
management along the main canals are shown in Table 2-1.2.
Through interviews with the GDWD in Assiut and GDIs, some of the regulators along the main
canals are operated to maintain upstream water level for the branch canal intakes.
On the other hand, other regulators especially those located along the Ibrahimia canal are operated to
maintain downstream water level. As will be described later, the GDWD in Assiut is located far from
the actual operation sites. Therefore, the GDWD in Assiut could not monitor the gate operation status
of the branch canal, such as whether or not the appropriate amount of water is distributed to the
branch canal. And interviewing through this survey, there are subsequent concerns regarding
excessive intake from the branch canal intake on the upstream side. For implementing appropriate
water distribution, it is GDIs that operate the regulator along the main canal directly, and the GDWD
in Assiut is the only institution that monitors the status of water distribution.
Table 2-1.2 Challenges and future countermeasures for main canals
Location Challenges Countermeasures Regulators along Bahr Yusef canal
Lacking gate operator monitoring and follow up activities causes big water level fluctuations at regulator upstream
Operational guidance of gate to stabilize the upstream water level, and supervise branch canal’s intake
Regulators along Ibrahimia canal
Because the difference between upstream and downstream water levels at regulator is small, the water intake to branch canal is not stable except at New Hafez regulator
Operational guidance for regulator’s gate operation along main canal, and supervision of branch canal’s intake
2-2 Small scale irrigation facilities (branch canal intake)
Under the current water management system, the roll of regulators located on the governorate
boundaries is to discharge the proper amount of water to the downstream governorates. However, the
quantities demanded for irrigation covered by each regulator are not distributed evenly to the branch
canals.
In order to establish a proper water management system, it is important to take proper amount of
water from the main canals to the branch canal and to operate the gates based on planned or actual
demand. However, some of the gears of intake gates in the branch canals have broken (caused by
deterioration and the theft of gear parts). As a result, the GDIs in charge of the gates operate the
intake gates using a makeshift temporary steel frame attached to a mobile hoist or lifts up the gates
by backhoe to divert water to the branch canals. There are some spots on the branch canals where the
flow capability declines due to sediment accumulation and discarded rubbish. In the future, measures
will be taken to ensure proper water distribution to the branch canals, such as installing water gauges
that enable remote checking of flow conditions of the branch canals.
II-5

Detailed Design Study on the Project for Construction of the New Dirout Group of Regulators
West Hafez Ganabia intake El Mansour intake Secondary canal after intake gate
The gear was broken. The gate is lifted and operated by chain crane and temporary steel frame.
The gear was broken. Lifting up the gates by backhoe as a temporary measure to divert water to the branch canal.
The flow capability declines due to sediment accumulation and discarded rubbish at the head of branch canal.
Figure 2-2.1 Gates with non-operational hoist and condition of branch canal
Table 2-2.1 Challenges and future countermeasures for minor irrigation facilities
Irrigation facilities Challenges Countermeasures Branch canal’s intake The gate has not been operated, partially
because some gears have been broken and others stolen. Irrigation district staff operates the gate by temporary mobile crane.
Replacement of the gate by Irrigation Directorate
Canals Cross section of canal has been narrowed by sedimentation of soil and garbage, and water flow has been obstructed by sediment soil. On the other hand, there are some branch canals where the cross sections are over dredged.
Reshaping of the branch canals cross section by Irrigation Directorate.
2-3 Current situation of gates on branch canals
The field survey of the branch canal intake on the Bahr Yusef and Ibrahimia canals had carried out.
The purpose of the survey was to clarify the current condition of the branch canal’s intake. The
branch canals surveyed were selected based on selection criteria described in section 3
In addition, the Minia and Beni Suef directorates had also implemented the current gate conditions of
the branch canal’s intake. These data were compared with the field survey result by D/D consultant
and updated in accordance with that of the D/D consultant.
According to the survey by the D/D consultant, deterioration is progressing with fifteen gates and it
is judged that all gates are in need of rehabilitation work for smooth and timely gate operation. The
evaluations are shown in Table 2-3.1. In the column “defect condition,” “A” means the stuck F.H.
gate with gear trouble, and “B” means that the gate is operated by a temporary mobile hoist.
The rightmost column in Table 2-3.1 shows the relationships of the selected 128 minor structures that
were inspected during the feasibility study of Dirout Group of Regulators in 2010. "-" in the column
means that the target branch canals to be monitored in this NDGRs project are not included in the
II-6

Final Report Volume II Water Management System
selected irrigation facilities at F/S which need rehabilitation.
During F/S study stage, the selected 128 minor structure had been prioritized for rehabilitation and
those rehabilitation works would have been implemented by RGBS, however, the rehabilitation
works are still under consideration at the moment. D/D consultant proposes to take up the following
15 intakes for reconstruction because they are important for the appropriate distribution of irrigation
water from the main canal to the branch canal.
Table 2-3.1 Gate conditions at branch canal’s intake
Name of Main Canal
Name of Branch Canal
Gate Type
Condition (Data from Directorate)
1: good 2: need
maintenance
Condition (Inspection)
1: good 2: need
maintenance
Defect condition
Selected 128
Minor structure
Bahr Yusef canal
Manshat EL-Dahab F.H. 1 2 A -
El-Hareka F.H. 1 2 A - El-Sabaa F.H. 1 2 A - Quftan F.H. 2 2 A - Wesh El-Bab F.H. n/a 2 A - El Giza D.L. n/a 1 - - Hassan Wasef D.L. n/a 1 - - New Kamdeer P.S. Pump n/a 1 - - New Terfa P.S. Pump n/a 1 - - Old Terfa P.S. Pump n/a 1 - - Old Sakoula P.S. Pump n/a 1 - - Mazoura P.S.(2) Pump n/a 1 - -
Ibrahimia canal
Irad El Maharak F.H. n/a 2 A - El Kosia F.H. n/a 2 A - East Hafez F.H.(with crane) 1 2 B - West Hafez F.H.(with crane) 2 2 B - Adkak F.H.(with crane) 1 2 B - Gendia F.H.(with crane) 2 2 B - EL Soultany F.H. 2 2 A - Tansa F.H. 1 1 - - EL Azhary F.H. 2 2 A - Bosh F.H. 2 2 A - El Mansour F.H. 2 2 A - Serry Weir Weir - - - - Maghagha Weir Weir - - - - Abo Shosha Weir Weir - - - - Bani Hader Weir Weir - - - -
F.H. Fahmy Henien gate D.L.: Double leaf gate F.H. (with crane): The gate which is lifted up by chain crane.
2-4 Water management and distribution at DGRs
According to the interview with the CDWD during the F/S stage in 2010, water management and
distribution for each governorate are based on the Agreement of Water Distribution approved by the
governorates in 2002. However, it is clarified that this Agreement has not been taken into account for
II-7

Detailed Design Study on the Project for Construction of the New Dirout Group of Regulators
recent years. The water distribution is evaluated based on the data recorded by CDWD. Table 2-4.1
and Table 2-4.2 show the distributed amount of water and intake ratios from Bahr Yusef and
Ibrahimia canals.
Table 2-4.1 Distributed water amount (average from 2010 to 2014)
Distributed Area Discharge (MCM) * Ratio (%) Ibrahimia Head regulator 8,969 100% Bahr Yusef at DGR 4,566 51%
Ibrahimia at DGR 3,399 38% Source: CDWD’s daily recorded data arranged by JICA Survey Team
*: Total discharge from February to November during 2010-2014
Table 2-4.2 Distributed water amount at Bahr Yusef and Ibrahimia canals
(DGRs, average from 2010 to 2014)
No Directorate Bahr Yusef canal Ibrahimia canal
Discharge (MCM) * Ratio (%) Discharge (MCM) * Ratio (%) DGR 4,566 100% 3,399 100%
Minia (1) 808 18% (5) 1,871 55% Beni Suef (2) 601 13% (6) 1,528 45% Fayoum (3) 2,493 55% Giza (4) 664 15%
Source: CDWD’s daily recorded data arranged by JICA Survey Team
*: Total discharge of February to November during 2010 – 2014
(1)= 4,566MCM (Discharge at DGR)-3,758MCM (Sakoula)
(2) = 3,758MCM (Sakoula)-1,461MCM (Lahoun)-1,032MCM (Hassan Wasef)
(3) =1,461MCM (Lahoun)+1,032MCM (Hassan Wasef), (4) = 664MCM (Giza Intake)
(5) = 3,399MCM (Discharge at DGR)-1,528MCM (Maghagha Weir)
(6) = 1,528MCM (Maghagha Weir) for Beni Suef and Giza
2-5 Irrigation system schematic diagram
In order to grasp the water distribution condition on the branch canals, a review was made on the
command area of each branch canal surveyed during the F/S stage. The irrigation system schematic
diagram is shown in the appendix.
2-6 Changes in water level of Lake Quarun
Figure 2-6.1 shows the record of water level of Lake Quarun in Fayoum Governorate. The lake is
situated at the end of Bahr Yusef canal and the canal is only the lake’s water source. Therefore, the
cause of lake’s water level rise are thought to be due to ineffective discharge from Bahr Yusef canal.
According to the water level data from 2010 through 2011 the rise in water level was temporarily
curbed. However, since 2012 the level has begun to rise again. As there are hotels on the shore of
Lake Quarun, water level rise should be avoided. In order to curb the rise, it is necessary to reduce
ineffective discharge from Bahr Yusef canal and to use irrigation water more effectively.
II-8

Final Report Volume II Water Management System
Figure 2-6.1 Water level changes of Lake Quarun
Quarun Lake Water Level Monitoring Facility
Figure 2-6.2 Lake Quarun and water level monitoring facility 2-7 Telemetry system
(1) MWRI’‘s Policy of telemetry system
The CDT of MWRI has implemented a telemetry system since 2009. The purpose of the telemetry
system is to “transmit water level data at regulators, pump status, discharge data and meteorological
data to the departments and agencies concerned with water distribution in real-time” and to “evaluate
distribution to each governorate.” The system aims to compare actual and planned water distribution
in each governorate according to CDT policy, and to set up the system to adjust the water distribution
in each canal based on the monitoring data. The main function of supervisory in the telemetry system
is located in the CDT as the main station. At present, 219 gauging stations have been established. The
equipment of the gauging station is composed with a water level sensor, a data logger with RTU, a
GPRS modem, a solar panel, a charging controller and battery. The water level, voltage, and
temperature data are transmitted to the main server every hour and then automatically sent to the
GDWD and the GDI in each governorate in hourly text-typed e-mails. The water level data is also
sent to the MWRI. In the future, MWRI plans to (1) increase the number of gauging stations to 450
with it’s five year plan, (2) add discharge and flow velocity data to the transmitted water data, and (3)
upgrade the system capable of optimizing water distribution to each governorate by evaluating the
water balance between supply and demand.
The outline of the telemetry project (the water management system diagram formulated by the CDT)
is shown in Figure 2-7.1.
-44.0
-43.5
-43.0
-42.5
-42.0
1999 2000 2001 2002 2003 2004 2005 2006 2007 2008 2009 2010 2011 2012 2013 2014
Quarun Lake(1999-2014)
Average WL
Qarun Lake Observation Well
II-9

Detailed Design Study on the Project for Construction of the New Dirout Group of Regulators
The vast quantity of data collected through the telemetry monitoring equipment should be taken into
a system as simple as possible. This should enable non-professional persons to grasp changes in
water levels and other conditions easily.
Telemetry system in Cairo Schematic Diagram of Dirout Area
Figure 2-7.2 Existing telemetry system, CDT in MWRI
(2) Telemetry sites in the project area
CDT has laid out the telemetry system in the project area. Table 2-7.1 indicates the names of
telemetry sites which have been installed by CDT. Eleven sites have the H-Q curve equation for
converting discharge based on downstream water level
Figure 2-7.1 Schematic diagram of existing water monitoring system
II-10

Final Report Volume II Water Management System
Table 2-7.1 Current conditions of telemetry sites in the project area
Irrigation facilities Name of the target facilities Water Level H-Q
Curve
Number
Up Dw WL H-Q
Dirout group of regulators Bahr Yusef regulator
Ibrahimia regulator
+
+
+
+
+
+ 2 2
Bahr Yusef canal
Dahab regulator
Sakoula regulator
Mazoura regulator
Lahoun regulator
Abo El Shekok regulator
Regulator km39
+
+
+
+
+
+
+
+
+
+
+
+
+
+
+
6 3
Ibrahimia canal New Hafze regulator + + 1 0
Bahr Yusef canal
Intake El Giza + + + 1 1
Weir Hassan Wasef Weir + + + 1 1
Ibrahimia canal Weir Maghagha Weir + + + 1 1
Ibrahimia main canal Ibrahimia Head regulator + + + 1 1
Lake Quarun Lake + 1 0
Total 14 9
Source: Central Directorate for Telemetry
2-8 Current monitoring and operating system
(1) Current method of water management
The current water management method is the same as that of generally used in Egypt, and local
expertise on water management has accumulated for many years. On the other hand, it has become
difficult to respond flexibly to the current water demand, caused by the diversification of farmland
operation, and for real-time adjustment of water distribution based on the demand, for effective use
of water resources and swift mobility for necessities in the ages
In addition, the demand for visual water distribution management has been raised with the increase of
demand and interest of farmers and a strong need for an equal and appropriate water distribution
system that responds to water demands in real time. This can be made possible with the development
of highly-extensible and low-cost telemetry stations set up by MWRI.
(2) Organization responsible for water management system
The organization mentioned below is served for the monitoring of (1) water levels at the regulators
along the main canal in the project area, and (2) the operation of regulator gates.
i) General Directorate for Water Distribution (GDWD) in Assiut
ii) General Directorates for Irrigation (GDIs) in Assiut, East Minia, West Minia, Beni Suef,
Bra
nch
cana
l R
egul
ator
II-11

Detailed Design Study on the Project for Construction of the New Dirout Group of Regulators
Fayoum, and Giza
iii) Gate operators of each regulator
Figure 2-8.1 shows the instruction flowchart on gate operation of each responsible organization. Also,
Table 2-8.1 shows the monitoring items at each regulator and the responsible organization of each
regulator.
Table 2-8.1 Monitored items and organization responsible for the operation at each regulator
Dahab Reg.
Sakoula Reg.
Mazoura Reg
Lahoun Group Reg
El Sharahna Reg
El Genedy Reg
Ashmano Reg
Water Distribution
in Assuit
Maghagha Weir
Ibrahimia H.R.
Dirouo Group of Regulaoors
El Wasoa Reg.
New Hafze Reg.
Maoay Reg.
Maghagha Reg.
East Minia
G.D.
West Minia
G.D.
Beni Suef
G.D.
Monitoring Instruction Organization
Water Level
Dis-charge
WDin Assuit
EastMinia
WestMinia
BeniSuef
Ibrahimia Head Regulator + + +
Dirout Group of Regulator + + +
Bahr
Yusef
Dahab + +
Sakoula + + +
Mazoura + +
Lahoun group + + +
Ibrahimia New Hafze + +
Matay + +
Maghagha + +
Maghagha Weir + + +
El Sharahna +
El Gendy +
Ashmant +
: Boundary Regulaoor: Inoernal Regulaoor
: Organizaoion: Flow of Insorucoion
<Index>
Figure 2-8.1 Organizations chart for the management of each regulator and gate operation
II-12

Final Report Volume II Water Management System
As shown in Table 2-8.1, GDWD in Assiut is responsible for water distribution in the project area.
The regulators between the governorates are monitored by the telemetry system and data are
transmitted to the CDWD, the GDWD in Assiut, and the GDIs on time. At the other regulators on the
main canals, Bahari, i.e. the gate operator, reads the water levels upstream and downstream of the
regulators three times a day, and reports to the GDIs via mobile phone. After receiving the reports
from the gate operators, GDIs informs the GDWD in Assiut of the water level data via mobile phone.
Then, the GDWD issues instructions on the water level settings only on the downstream side of the
regulators at the governorate boundaries (boundary regulators) to GDIs and the gate operators of
these regulators adjust the gates in accordance with the instructions
GDIs decide on the water levels at the intermediate regulators (not on governorate boundaries)
independently, and issue instructions to the gate operators. Observed water level data is converted to
discharge (by H-Q curves) only at the boundary regulators along the Ibrahimia and Bahr Yusef canals.
GDWD in Assiut prepares and maintains these H-Q curves.
GDWD in Assiut and GDIs in the governorates in the project area are the organizations directly
involved in water distribution. On the other hand, CDT is responsible for the measurement and
centralized monitoring of water levels at major regulators along the main canals, HAD, Lake Quarun,
pump stations, main drain outlet, and some online discharge measurement facilities. The water level
readings made by the CDT help check the water levels observed by GDWD, which are used to
generate instructions on regulator gate operation.
Table 2-8.2 Challenges and countermeasures in the water management system
Item Challenges Countermeasures Water level The routine water distribution process is that
the gate operator for the non-governing regulators reads the water levels observed by staff, then gauges and informs Water Distribution in Assiut by mobile phone. Therefore, it is not possible to rapidly evaluate and judge water distribution based on water level data because of the time gate operator takes to inform Water Distribution in Assiut by mobile phone of hand copied data.
The pressure-type water level sensor will be installed in each regulator to observe water levels in real time, and transmit the observed data to a water monitoring system at one site.
Instructions on water distribution
Water Distribution in Assiut does not decide on all water distribution in the project area. Only the regulators located on the border between districts is operated by Water Distribution. Therefore, it isn't possible to confirm the state of distributed water at one site because the regulators that are not on a border are operated at a local irrigation district level.
A new water distribution inspectorate will be established so that the instructions and judgment of equal water distribution will be evaluated by one organization.
Feedback for monitoring
The observed water level data is transmitted to the Water Distribution in Assiut three times a day. Therefore Water Distribution does not know the water level immediately after the operation of the gate, or whether the gate obeyed the instruction from Water Distribution.
For gathering a wide range of scattered water level data at one monitoring site, equipment must be installed to transmit, gather, record, visualize, evaluate, and store data at a central monitoring
II-13

Detailed Design Study on the Project for Construction of the New Dirout Group of Regulators
Water level data is transferred by voice through mobile phones and is then recorded by hand at Water Distribution. Therefore, it takes time to evaluate the distributed water situation and errors are likely when recording and transmitting data. In addition, evaluations cannot be made by visual charts and graphs.
house.
2-9 Current water management administration with the organization chart
The water management system consists of the above-mentioned three major organizations: 1)
GDWD, 2) GDIs, and 3) gate operator (see Figure 2-8.1). Information on water level operation is
centrally collected at GDWD in Assiut. However, because the operation of the intermediate
regulators are managed by the GDIs of respective governorates, it is not possible for GDWD in
Assiut or the GDIs of other governorates to verify whether the water levels in the main canals in the
governorate concerned are being appropriately managed. Therefore, suspicions regarding water
distribution may arise between GDWD in Assiut and the GDIs.
As mentioned above, the water level data monitored by the CDT is used as reference data to indicate
water distribution instructions by GDWD in Assiut. Three different types of water level gauges
shown in Figure 2-9.1, are used for monitoring of water levels at the regulators.
Because the water levels in canals are measured by the CDT in accordance with MWRI policy, the
water level data obtained at these stations are utilized by GDWD as reference only. The water levels
are also monitored at the gate control houses at regulators along Bahr Yusef canal. However, these
water level data are not utilized to decide water distribution.
One of the issues of the water level monitoring equipment related to the regulators along the Bahar
Yusef canal is the lack of maintenance of the water level sensor and the lack of instruction on the gate
operation from GDWD and GDIs. Daily maintenance of the water level sensor is important from the
viewpoint of sustainability utilization of these equipments. The responsible organization for the
maintenance of these equipments is IIS. Figures 2-9.2 and 2-9.3 show the outline of the water level
monitoring system introduced by the CDT.
Water Level gauging staff (New Minia regulator)
Data transfer by telemetry (Dahab regulator)
Dahab control house (Dahab regulator)
Figure 2-9.1 Existing water level monitoring system
(left: a station at the Water Distribution, center: a station of the CDT, right: IIS)
II-14

Final Report Volume II Water Management System
Table 2-9.1 Issues and countermeasures in the design of the water management organization
Item Design problem Countermeasure Ensuring that water level observation is monitored by each organization individually.
Water Distribution in Assiut is monitored on a marble water level meter indicating the same water level data monitored by CDT. However, GDWD’s monitored data is recorded manually. And furthermore, the water level monitoring equipment is poorly maintained.
Integration of water level for monitoring and evaluating by a unified set of water level data.
Figure 2-9.2 Diagram of water management system of the CDT
Figure2-9.3 Water level data transmission system developed by the CDT
II-15

Detailed Design Study on the Project for Construction of the New Dirout Group of Regulators
3. Formulation of Integrated Water Management System
3-1 Setting up integrated water management system
(1) Effectiveness of the integrated water management system
Each facility in the irrigation system consists of water diversion facilities, regulators, main canals,
intakes for branch canals, branch canals, farm land and drainage canals. In order to efficiently
distribute water to 600,000ha-irrigation area in accordance with irrigation system requirements, each
facility must fulfill its function satisfactorily. The scope of integrated water management system shall
include not only the four regulators on the Bahr Yusef canal constructed through the grant aid from
Japan, but also the irrigation facilities on the main canals under the supervision of the GDWD in
Assiut of MWRI and that of GDIs. The irrigated area of the the main canal of the Project is a large
area of 600,000 ha and the extension of the main canal is as long as 300 km. Therefore, it is
indispensable to construct a system capable of unified monitoring of the water distribution status
from the remote area. The following factors are considered as the necessity of introducing the water
management system.
・Correction of the disparity in water distribution among the governorates
・Implementation of water distribution without surplus or shortage which is actually allocated
based on the amount of water supplied data from the Ibrahimia head Regulator
・Efficient use of irrigation water by eliminating ineffective discharge
・Stabilization of water levels in the main canals
・Improvement of the transparency of the water distribution system
・Improvement of the safety of the system
・Utilization of collected data through upgrading of the management system
In view of the characteristics of each project area, the effect through the introduction of an integrated
water management system is listed below.
・Rational water distribution
The following items are expected; (1) the discharge in the main canals at the regulators, (2) the
amounts of water distributed for irrigation between the regulators, (3) appropriate water
distribution without surplus or shortage, and (4) equitable distribution of water in accordance
with the agreement on water rights of each governorate in the area. The water allocation
should be appropriately allocated by each weir based on the amount of water actually supplied
from Ibrahimia. This leads to fair water management.
・Better understanding of the water distribution
Using a system of centralized monitoring of water distribution and a visual display of water
levels at multiple locations, enables anyone to confirm actual water distribution and the state
of water distribution. An integrated water management system with a visual display function
II-16

Final Report Volume II Water Management System
allows governorates with conflicting water usage interests to verify that the limited water
supplied to the irrigation system is distributed equitably among them, hence the introduction
of the system is expected to improve transparency of water distribution.
・Timely instructions on water distribution
This system allows for the centralized collection of monitoring data and the use of this data to
guide instructions for water distribution to a wide area. This function of the system is expected
to support the person in charge of water distribution in deciding on which water distribution
instructions to issue
・Improvement of operation/maintenance of the irrigation facilities
As the system monitors water levels at the major irrigation facilities scattered over a wide area,
abnormal water level data detected by the system show the identification of malfunction
facilities and inappropriate water distribution. Therefore, this function is expected to enable
timely and improved operation/maintenance of the irrigation facilities.
(2) Target facilities to be covered with integrated water management system
In order to distribute effectively the limited water resources in a large irrigation area, an integrated
water management system that enables centralized management of irrigation facilities scattered
across the region is necessary. The system to be introduced in the project area is for the monitoring of
the irrigation facilities along the main canals, which are the mainstay of the economic activities in the
area.
The target facility in water management covers the beginning facility of the main canal such as head
regulator, the important facility for management along the main canal, and the branch canal intake
with the large amount of water distribution from the main canal to the branch canal. In this area,
targeted facilities are selected according to the following policies.
i) Regulators
Ibrahimia Head Regulator, New Dirout group of regulators, regulators on the Bahr Yusef
canal and the Ibrahimia canal
ii) Intakes for major branch canals
The Technical Guidelines for the Water Management and Controlling Systems (Ministry of
Agriculture, Forestry and Fisheries of Japan, 2013) indicate as a method of determining the target
facilities for monitoring in a branch canal intake by using a distributed water amount grasping rate. In
this method, in the case of the large and small branch canal intakes are irregularly scattered at
locations, the range of the management target is selected based on the one with the larger amount of
water distribution from the main canal to the branch canal. It is generally considered that the grasping
rate of the targeted facilities is about 70 to 80% of the total amount of discharge. In this Project, the
grasping rate of the monitoring facilities is set at 80%, and facilities that exceed 10,000 feddans are
also monitored. Because the amount of distributed water into each branch canal is considered to be
II-17

Detailed Design Study on the Project for Construction of the New Dirout Group of Regulators
proportional to the size of the command area for each branch canal in the Project area, the branch
canals to be monitored by the monitoring system are selected based on the size of the command
areas.
In the F / S stage, the selection of the top 80% of the monitoring target was examined in the Bahr
Yusef canal and Ibrahimia canal, respectively. However, in this D/D stage, facilities that are included
in the grasping ratio of 80% of the beneficiary area of the Ibrahimia Head Regulator (1,565,100 fed)
were selected as irrigation facilities to be monitored. Through this review, a branch canal intake with
a larger command area will be added to the targeted monitoring facilities, which will contribute to
grasping the water distribution status more widely.
In F/S, the top 80% of the branch canals in the irrigation areas of the Bahr Yusef and Ibrahimia canals
were selected for monitoring. Meanwhile, in the D/D, the selection of the top 80% was made from
the entire 1,565,100 feddans irrigated by the water diverted by the Ibrahimia Head regulator. This
re-selection not only resulted in the inclusion of branch canals with larger beneficiary areas in the
system, but was also expected to improve the monitoring of water distribution.
Table 3-1.1 Criteria for the selection of branch canals to be monitored
F/S D/D
The range of the top 80% of the grasp rate was carried out for each of the Bahr Yusef canal (808,000 fed) and Ibrahimia canal (576,700 fed). - Grasp rate of more than 80% along the Bahr Yusef canal - Grasp rate of more than 80% on the Ibrahimia canal
The range of the top 80% of the grasp rate was carried out for all beneficiary area (1,565,100 fed). - Grasp rate of more than 80% for whole area
Table 3-1.1 shows the result of comparing the numbers at measuring points in F/S and D/D. At the
time of reselecting the branch canals to be monitored, (1) the beneficiary area of the Bhbashen
branch canal was revised from 23,000 feddans in F/S to 2,300 feddans in D/D, and (2) the beneficiary
areas of the five small regulators in the DGRs was included in the beneficiary area used in the
selected 80% of branch canals.
In addition to the size of irrigated areas selected, it is also necessary to evaluate the importance of
irrigation facilities from the viewpoint of water management. In consultation with GDWD, the
inclusion of an irrigation facility that was considered important to the water management of the
facilities was selected for monitoring. Table 3-1.2 and Figure 3-1.1 show the facilities to be
Nil
e R
ive
r
Ira
dD
elg
aw
Ab
oG
ab
al
Ba
dra
ma
n
Da
iro
tia
h
Sa
he
lyia
Bahr Yusef IbrahimiaBahr Yusef Ibrahimia
Nil
e R
ive
r
Ira
dD
elg
aw
Ab
oG
ab
al
Ba
dra
ma
n
Da
iro
tia
h
Sa
he
lyia
Nile River
Canal
Command Area (Non-Targeted)
Command Area(Targeted)
Target Area for Selection of Monitoring Location
- Index -
II-18

Final Report Volume II Water Management System
monitored. A comparison table showing the difference in the facilities selected for the monitoring in
this survey and those in F/S are shown in the appendix.
Table 3-1.2 Facilities targeted for monitoring (1/2)
Irrigation facilities Name of tne Target facilities No.
Banr Yusef canal Danab Regulator
Sakoula Regulator
Mazoura Regulator
Lanoun Regulator
Abo El Snekok Regulator
Regulator km39
6
Ibranimia canal New Hafze Regulator
Matay Regulator
Magnagna Regulator
Snaranna Regulator
El Gandy Regulator
Asnmont Regulator
6
Banr
Yusef
canal
Intake Mansnat EL Danab
El Hareka
El Sabaa
Quftan
Wesn El-Bab
EL-Giza
6
Weir Hassan Wasef Weir 1
Pump New Kamdeer P.S.
New Terfa P.S.
Old Terfa P.S.
Old Sakoula P.S.
Mazoura P.S.(2) 5
Ibranimia
canal
Intake Irad El Manarak
El Kosia
East Hafze
West Hafze
Adkak
Gendia
Abo Snosna
EL Soultany
Tansa
El Mansour
10
Weir Serry Weir Magnagna Weir 2
Ibranimia main canal Ibranimia Head Regulator 1
Lake Quarun Lake 1
Total 38
Table 3-1.3 Facilities targeted for monitoring (2/2)
Irrigation facilities Name of tne Target facilities No.
Dirout Group of Regulators Banr Yusef Regulator
Ibranimia Regulator
Irad Delgaw Regulator
Abo Gabal Regulator
Badraman Regulator
Dairotian Regulator
Sanelyia Regulator 7
Total 7
Bra
nch
cana
l R
egul
ator
II-19

Detailed Design Study on the Project for Construction of the New Dirout Group of Regulators
Figure 3-1.1 Schematic diagram of the facilities to be monitored in water management system
Wesh El-Bab El Mansour
Tansa
Qufoan
Mazoura Pump Soaoion (2) El Souloany
Old Sakoula Pump Soaoion Abo Shosha
Gindia
El Sabaa
El Hareka
Old Telfa Pump Soaoion Adkak
New Terfa Pump Soaoion
New Kamdeer Pump Soaoion
Weso Hafze Easo Hafze
Manshao El Dahab Serry Weir
RegulatorWeirBranch canal intakeDirout Control house /Central Monitoring & Operating House
Control House (Existing)
~ Target Facilities for Monitoring
~ New Dirout Group of Regulators
Sakoula Reg.
Maghagha Reg.
Hassan Wasef Weir El-Giza
Ibrahimia (Dirouo)
Bahr Yusef(Dirouo)
New Hafze Reg.
New Minya Reg.
Maoay Reg.
Maghagha Weir
EL Sharahna Reg.
EL Gandy Reg.
Ashmono Reg.
El Wasoa Reg.
Dahab Reg.
Mazoura Reg.
Garza Reg.Kafer Amar Reg.
Meat Al-Kaaed Kafershehata Reg.
Irad Delgaw Abo Gabal Badraman Dairooiah Sahelyia
IbrahimiaHead Regulaoor
AssiuoBarrage N
ile R
iver
Lahoun Reg.
Dirout Group of Regulators
Conorol House(Exisoing)
- Dirouo Conorol House
- Cenoral Moniooringand operaoing House
1
3
4
5
15
17
8
9
10
11
12
13
36
29
Conorol House(Exisoing)
Conorol House(Exisoing)
20 19
Lake Quarun
38Conorol House(Exisoing)
Target Facilities for Monitoring
23
25
24
26
27
Irad El Maharak
El Kosia
30
31
32
33
34
3518
Abo El Shokok
Regulaoor km39
37
22
21
16
7
6
2
3
14
28
4 1 25 6 7
1 38
1 7
II-20

Final Report Volume II Water Management System
(3) Plan for the central monitoring and operating house
The development of the telemetry system has progressed significantly since F/S stagein 2010. The
establishment of a central monitoring house in Beni Suef Governorate was recommended during F/S
stage. The establishment of a central house in Minia Governorate and in Dirout was discussed during
B/D stage. The realization of equitable water distribution requires the establishment of an
“independent organization” that is not influenced by the requests of governorates for water
distribution, and so there is a plan to establish a Central Monitoring and Operating House.
The D/D consultant recommends that the Central Monitoring and Operating House be responsible for
unbiased distribution of water beyond governorate boundaries. And in the near future, the consultant
also considers it important to develop the Central House into a highly sophisticated facility that, for
example, performs water distribution based on forecasts of the size of irrigation areas and cropping
patterns that are made using satellite imagery. MWRI can use this data to develop new farmlands and
achieve the effective water distribution that their policies stipulate. For the development of such a
facility, the consultant recommends the establishment of the Central House in an area where
specialists in irrigation engineering, agriculture, and communication will be available.
In B/D, a plan to construct the Central Monitoring and Operating House in Dirout, adjacent to the
NDGRs Control House or Irrigation District office was discussed within the framework of the
activities of the water management working group. RGBS finally recommended and confirmed that
Central Monitoring and Operating House will be constructed together with NDGRs control house in
Dirout together with NDGRs control house.
(4) New categorization of monitoring and operating levels
Classifications pertaining to monitoring and controlling focus mainly on (1) what kind of information
shall be measured, monitored, and operated at each irrigation facility and (2) how various collected
information shall be classified, stored, and processed, and (3) how processed information shall be
displayed, recorded, and controlled. The recommendation for categorizing monitoring level is
described in Table 3-1.4 with the “Target facilities for integrated water management system”
mentioned above.
As shown in Table 3-1.4, the gates of regulators in the project area shall not be controlled remotely
from the Central Monitoring and Operating House. Only water levels shall be monitored remotely as
planned in F/S stage, and the gates shall be operated onsite by a gate operator. The reason for not
implementing the remote control is that, if the gate of a regulator is operated from a location
100-300kms from the regulator, opportunities for confirming the safety of the gate operation and the
early detection of malfunction in the event of signs of abnormality during gate operation will be lost.
Discussions in the water management working group concluded that telecontrol of the gates was not
recommended from a safety perspective, or in the interest of promoting daily inspection and
maintenance of the facilities.
II-21

Detailed D
esign Study on the P
roject for Construction of the N
ew D
irout Group of R
egulators
Table 3-1.4 Stud
y on the monitoring and operational level
II-22

Final Report Volume II Water Management System
Tables 3-1.5 and 3-1.6 show the monitoring and controlling levels of the Central Monitoring and
Operating House and the regulators along the Bahr Yusef and Ibrahimia canals, respectively. In
addition to its remote monitoring function, the Central Monitoring and Operating House shall be
equipped with a calculation function that allows it to evaluate water balance by comparing the supply
and demand for discharge. This calculation function is a tool intended to support the person in charge
of decision-making regarding water distribution.
Table 3-1.5 Study on the management levels at regulators
Monitoring Recording Operation/Control Data Processing
Ons
ite O
pera
tion
Dis
play
Pan
el
Min
i-Gra
phic
Pan
el
CR
T D
ispl
ay
Dai
ly L
og R
ecor
ding
Ana
log
Rec
orde
r
Rec
ordi
ng (
Prin
ter)
Man
ual O
pera
tion
from
O
pera
tion
room
Ons
ite M
anua
l Ope
ratio
n
Man
ual C
ontr
ol w
ith P
rese
t V
alue
s
Aut
omat
ic C
ontr
ol
Sup
ervi
sory
and
W
arni
ng P
roce
ssin
g
Cal
cula
tion
Pro
cess
ing
For
ecas
ting
Pro
cess
ing
B ○ ○ ○ ○ ○
I ○ ○ ○ ○
B:Regulators along Bahr Yusef canal I:Regulators along Ibrahimia canal
Table 3-1.6 Study on the management level at the central monitoring center
Supervisory Recording Operation/Control Data Processing
Dis
play
Pan
el
Min
i-Gra
phic
Pan
el
CR
T D
ispl
ay
Ana
log
Rec
orde
r
Rec
ordi
ng (
Prin
ter)
Rem
ote
Con
trol
Man
ual C
ontr
ol w
ith
Pre
set V
alue
s
Aut
omat
ic C
ontr
ol
Sup
ervi
sory
and
W
arni
ng P
roce
ssin
g
Cal
cula
tion
Pro
cess
ing
For
ecas
ting
Pro
cess
ing
Central Monitoring and
Operating House
○ ○ ○ ○ ○
II-23

Detailed Design Study on the Project for Construction of the New Dirout Group of Regulators
(5) New water management organization
The establishment of a new organization consisting of representatives from the governorates
impacted by the project areas is recommended to ensure an appropriate integrated water management
system after the construction of the new DGRs. Figure 3-1.2 shows the planned composition of this
new organization. GDWD approved the establishment of this new organization in the consultation at
the B/D stage.
Figure 3-1.3 shows a conceptual diagram of the new water management system.
Figure 3-1.2 New organization for the integrated water management
- Assuit- West Minya- East Minya- Beni Suef- Fayoum
Inspector
- Assuit- West Minya- East Minya- Beni Suef- Fayoum
- Assuit- West Minya- East Minya- Beni Suef- Fayoum
Water Distribution Section (5)
Telemetry Section (5)
Irrigation Facility Section (5)
Administration(2)
II-24

F
inal Report V
olume II W
ater Managem
ent System
Figure 3-1.3 H
ierarchic diagram for the integrated w
ater managem
ent system
II-25
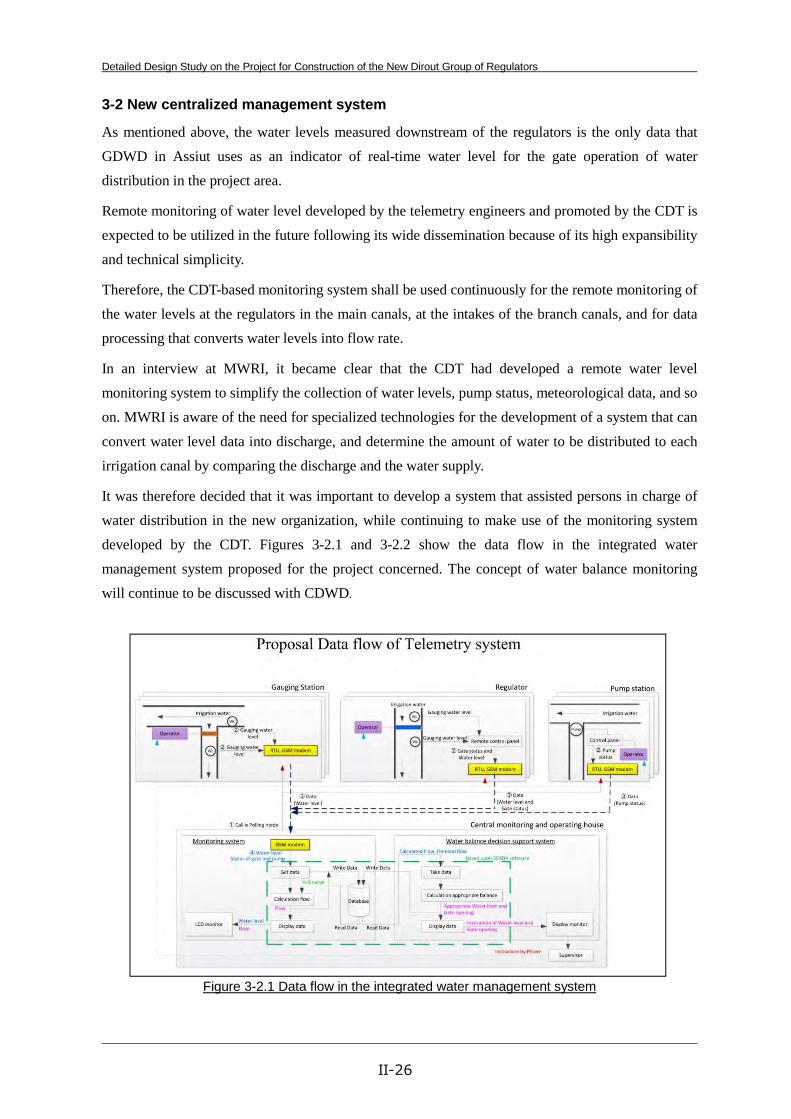
Detailed Design Study on the Project for Construction of the New Dirout Group of Regulators
3-2 New centralized management system
As mentioned above, the water levels measured downstream of the regulators is the only data that
GDWD in Assiut uses as an indicator of real-time water level for the gate operation of water
distribution in the project area.
Remote monitoring of water level developed by the telemetry engineers and promoted by the CDT is
expected to be utilized in the future following its wide dissemination because of its high expansibility
and technical simplicity.
Therefore, the CDT-based monitoring system shall be used continuously for the remote monitoring of
the water levels at the regulators in the main canals, at the intakes of the branch canals, and for data
processing that converts water levels into flow rate.
In an interview at MWRI, it became clear that the CDT had developed a remote water level
monitoring system to simplify the collection of water levels, pump status, meteorological data, and so
on. MWRI is aware of the need for specialized technologies for the development of a system that can
convert water level data into discharge, and determine the amount of water to be distributed to each
irrigation canal by comparing the discharge and the water supply.
It was therefore decided that it was important to develop a system that assisted persons in charge of
water distribution in the new organization, while continuing to make use of the monitoring system
developed by the CDT. Figures 3-2.1 and 3-2.2 show the data flow in the integrated water
management system proposed for the project concerned. The concept of water balance monitoring
will continue to be discussed with CDWD.
Figure 3-2.1 Data flow in the integrated water management system
II-26

Final Report Volume II Water Management System
The following steps show the data flow for measuring water level, and for collecting, transmitting,
calculating, storing, and evaluating data. These steps are formulated based on the monitoring
software which matches that of the existing telemetry system assembled by CDT.
1) Polling from the central monitoring house to the irrigation facilities to connect with central
monitoring house and irrigation facilities such as regulators and branch canal intakes,
2) Gauging upstream and downstream water levels using pressure-type water level gauge at each
irrigation facility,
3) Transmitting data from irrigation facilities to the central monitoring house via GPRS
communication module,
4) Receiving water level data from irrigation facilities to the central monitoring house via GPRS
communication module and storing the received data in the database server,
5) Calculating discharge at each regulator using H-Q curve which is saved on database server,
6) Storing the calculated discharge data onto database server,
7) Displaying water level data at each irrigation facility on an LCD monitor,
8) Reading the discharge data from upstream and downstream regulators, and requesting data from
database server,
9) Comparing the difference in discharge between upstream and downstream regulators and
requesting data from each regulator,
10) Calculating the appropriate amount of water for effective distribution and correct water level, and
relaying gate operations from the central monitoring house to each gate operator onsite.
II-27

Detailed Design Study on the Project for Construction of the New Dirout Group of Regulators
Figure 3-2.2 Data flow for the integrated water management system
Polling from central house to irrigation facilities
Gauging water level at each irrigation facilities
Data transmitting from irrigation facilities to the central
monitoring and operating house
Receive the water level data at monitoring system and
stored the data in database
Calculation of discharge based on H-Q curve stored in
database
Stored discharge data in database
Display data on the LCD monitor Read discharge and demand data
from database
Comparison between discharge and
demand data
Calculate appropriate water
distribution and water level
Display data on the LCD monitor
Instruct water level from central
house to gate operator by phone
II-28

Final Report Volume II Water Management System
4. Detailed Design
4-1 Design of transmission system and route
4-1-1 Date transmission network and protocol
In this chapter, the communication methods for water measurement in the integrated water
management, data transmitting method, composition of gauging and monitoring stations and
specification of equipments for each station are considered. The existing water management system
is using the GPRS communication network system. And, the data transmission method is the TCP/IP
method. The access point (APN (Access Point Name)), that is, the facility for implementing TCP/IP
data transmission by GPRS communication, is managed by MWRI.
As described before, the integrated water management system uses the same communication method
and data transmission method in order to integrate with the current telemetry system, and uses the
same facility of APN.
GPRS communication has wide coverage area as a mobile phone network in Egypt. All the water
level monitoring stations are located under this GPRS coverage area, which means securing
communication coverage.
The TCP/IP method applying as a data transmission method is widely used in the internet and
intranet networks. TCP/IP method has features of the detection of data transmission errors that is
occurred when the communication network is unstable, and the function of retransmitting the data
when an error occurred (securing data reliability).
The main function of the APN is to give an IP address to access the internet network. This IP address
changes each time when the APN is requested to give an IP address. That is, it is very unlikely to
communicate using the same IP address among each water level gauging stations. This makes it
possible to avoid access from outside and attacks using IP addresses illegally (securing security).
Figure 4-1.1 and Figure 4-2.2 show the system composition using the GPRS communication method,
and the system composition using the TCP/IP method respectively.
II-29

Detailed Design Study on the Project for Construction of the New Dirout Group of Regulators
Figure 4-1.1 System composition of GPRS communication
Figure 4-1.2 System composition using the TCP/IP method
4-1-2 Telemetry sub-system
Telemetry sub-system shall compose with Data acquisition server, RTU and relevant network
equipment which are NTP server, GPRS modem, L2-SW and Router mainly. GPRS modem is
connected to the GPRS network based upon IP (Internet Protocol) according to SIM card set up
beforehand in this modem. The connection with this GPRS network is begun from RTU by the
incoming connection.
GPRS NETWORK
LEGEND
EXISTING GAUGING STATION(CANAL, REGULATOR, WEIR AND LAKE)
NEW MONITORING STATION (MONITORING ROOM IN MINIA DISTRICT)
EXISTING EQUIPMENTEXISTING CABLE
ROUTER
INTERNET
NEW MASTER STATION (CONTROL MONITORING ROOM IN NEW DIROUT GROUP OF REGULATORS)
L2-SW
LASER PRINTER
ROUTER
MOUSE
KEYBOARD
MONITOR
GPRS MODEM
ANTENNA
SOLAR CELLS PANEL
BATTERY
CONTROLLER
RTU
NEW GAUGING STATION(CANAL, REGULATOR, WEIR AND LAKE)
WATER LEVEL SENSOR
DATA LOGGER
WL
NEW CABLE (SIGNAL)
NEW EQUIPMENT
WITH MWRI APN
SERVER (DATA ACQUISITION)
SERVER (WEB AND MAIL)
SERVER (WATER MANAGEMENT)
LCD KVM SWITCH
UPS
GPRS MODEM
ANTENNA
PERSONAL COMPUTER
LCD MONITOR
COMPUTER RACK
MOUSE
KEYBOARD
DISPLAY
PERSONAL COMPUTER
LCD MONITOR
IN-OUT PANEL FOR NEW DIROUT
EXISTING MASTER STATION(TELEMETRY DIRECTORATE IN MWRI)
SERVER ROUTERLCD MONITOR
GPRS MODEMDATA LOGGER
WATER LEVEL SENSOR
WL
ANTENNA
GROUP OF REGULATORS (OTHER PACKAGE)
POWER CHARGE
ENCLOSURE
NEW CABLE (POWER)
GPRS MODEM
INTRANET
INTRANET
INTRANET
ANTENNA
WITH RTU
GPRS MODEM
ANTENNA
BATTERY
CONTROLLER
RTU
NEW GAUGING STATION(PUMP STATION)
DATA LOGGER
POWER CHARGE
ENCLOSURE
PUMP CONTROL PANEL
PANELPOWER DISTRIBUTE
TERMINAL BLOCK
POWER SWITCH
GPS ANTENNA
INTERNET
Application firmware (Client)
Application firmware (Client)
Application software (Server)
Gauging station Master station
Application software (Client)
Monitoring station
APN INTRANETAPN INTRANET
GPRS GPRS ROUTER ROUTER
TCP/IPTCP/IP
Modbus (client) Modbus (master)
TCP/IP
Modbus (client)
TCP/IP
II-30

Final Report Volume II Water Management System
The main incoming connection shall consist of the continuous connection and a regular time
connection. Router shall be connected to the Internet through the ADSL provider or the broadband
provider by the continuous connection. All the data from the gauging stations shall be gathered and
processed at the master station. In Data acquisition server, the data is collected from 1024 RTUs or
less.
The collected and processed of measurement data shall be stored in data base for ten (10) years and
more, and shall be transferred to another computer system. This data will be collected by the data
transmission function. All function to prevent unlawful access must be installed as a network security
precaution.
4-1-3 Data transmission method
Telemetry sub-system corresponds to two data transmission methods of the autonomous transmission
and call transmission.
(1) The autonomous transmission
The gauge station shall begin the data transmission autonomous when becoming set time. This
transmission shall have the autonomous mode.
1) Autonomous mode
This transmission shall be started automatically by a clock of the gauging station. This clock will be
implemented in RTU. And, this local clock is regularly corrected. A local clock synchronizes with the
clock server of the master station, and this correction is completed. The protocol used by this clock
synchronization will be NTP. Moreover, a local clock will be NTP client, and the clock server will be
NTP server.
Data acquisition server of the master station shall always receive the data from all of the gauging
station consecutively.
(2) The call transmission
In case of the call transmission, the data collection command will be activated from the master
station mainly. The gauging station is called in a moment anytime when required. This transmission
shall have the calling modes and the respond modes.
1) Calling modes
The system shall have the following four (4) kinds of calling mode.
Table 4-1.1 Calling modes
Calling modes Description Automatic calling Automatic calling mode by a clock of Data acquisition server. There are seven intervals
such as 15 minutes, 30 minutes, 1 hour, 3 hours, 6 hours, 12 hours and 24 hours. Manual calling This calling shall be started manually and be directed to the selected telemetry gauging
stations by individual calling. Manual calling to individual
This calling shall be started manually at any manually time, and shall be used for manual measurements, calling any of the stations manually selected.
II-31

Detailed Design Study on the Project for Construction of the New Dirout Group of Regulators
Re-calling The station called fails to respond or if any erroneous code has been detected in the data code received from the station called shall automatically recall the station once more. If there is still an erroneous code, or the station recalled fails to respond again, the system shall then shift to the next procedure, actuating visual and audible alarms to the operator.
a) Automatic calling
This calling shall be started automatically by a clock of Data acquisition server, and shall call each
gauging stations consecutively. The calling shall be made at one of the following seven (7)
intervals: fifteen (15) minutes, thirty (30) minutes, one (1) hour, three (3) hours, six (6) hours, twelve
(12) hours and twenty-four (24) hours.
The automatic calling shall have priority over another calling: i.e. one (1) minutes before the
scheduled calling, manual calling shall be automatically done until the end of the observation. The
calling time intervals shall be able to be selected optionally, and the automatic calling shall have an
operational priority under normal conditions over other modes of calling listed above. The priority
control of the automatic calling system shall be able to be released in case of an emergency. The
designated calling time interval is one (1) hour.
b) Manual calling
This calling shall be started manually and be directed to all the selected telemetry gauging stations by
individual calling. And it shall be used for manual measurements, calling all stations one by one in
the present order.
c) Manual calling to individual
This calling shall also be started manually at any manually time, and shall be used for manual
measurements, calling any one of the stations manually selected.
d) Re-calling
The station called fails to respond or if any erroneous code has been detected in the data code
received from the station called shall automatically recall the station once more. If there is still an
erroneous code, or the station recalled fails to respond again, the system shall then shift to the next
procedure, actuating visual and audible alarms to the operator.
Moreover, re-calling shall be actuated only for the individual gauging station after the completion of
the automatic calling. The maximum time required for calling and response to one gauging station
shall be less than 20 seconds.
e) Response modes
The gauging station called by the master station shall send the data which is composed with the
measuring data, status and warning immediately.
II-32

Final Report Volume II Water Management System
4-1-4 Transmission format
(1) General
The basic transmission format shall be as shown below. The Contractor shall propose the data format
of the data acquisition referring to following items
1) Flag sequence
Flag sequence shall comprise 8 bits. It shall indicate the start or end of a frame.
2) Address bit
Address shall be used to represent station No., system No., group No., and area code. Address shall
comprise 24 bits.
3) Control field
Control field shall indicate the function of transmission code such as automatic calling or individual
calling or response. This field shall comprise 16 bits.
4) Information field
Information field shall be used present measured data, measured time data, flag data, etc. This field
shall comprise 98 bits x n.
5) Frame check sequence
Frame check sequence shall comprise 16 bits.
Table 4-1.2 Transmission format
System Specification Flag sequence 8 bits Address bit 24 bits (Station No., System No., Group No., Area code) Control field 16 bits Information field 98 bits x n Frame check sequence 16 bits
(2) Calling signal format
Calling signal format for calling shall consist of as follows:
Flag sequence, Address bit, Control field, Information field, Frame check sequence and Flag
sequence.
(3) Response signal format
The frame and word configuration of the response signal shall consist of as follows:
Flag sequence, Address bit, Control field, Information field, Frame check sequence and Flag
sequence.
4-1-5 Data acquisition function
Data acquisition function shall be installed in the master station. Data acquisition function consists of
the Server (Data acquisition), GPRS modem and Network function. Main function is shown below,
Data transmission function
II-33

Detailed Design Study on the Project for Construction of the New Dirout Group of Regulators
Time control function
Operation and status indication function
Simplification database function
Data acquisition function shall collect all the information which is measurement data from the
gauging station by call with data transmission function. Call is carried out through GPRS modem by
the data acquisition function. This calling interval shall be set in the operation and maintenance
screen of the data acquisition function. Data collected are stored in data base.
Table 4-1.3 Data acquisition function
No Function Contests 1 Data
transmission seven (7) intervals: fifteen (15) minutes, thirty (30) minutes, one (1) hour, three (3) hours, six (6) hours, twelve (12) hours and twenty-four (24) hours.
2 Time control and calibration
RTU, Data acquisition server and another server shall be connected to NTP server for calibrating a clock time by itself.
3 Time schedule management
Data acquisition server as a time management shall manage the transmission time of each gauging station
4 Registration and deletion
Registration and the deletion of the gauging station shall be done with the data acquisition server.
5 System monitoring
Data acquisition server shall supervise the status and condition of the communication
6 Data transfer Data from the gauging station is transmitted by LAN interface from Data acquisition server to an outside database server
7 Screen display The gauging data collected from the gauging station shall be displayed 8 Operation and
status indication Data acquisition server shall have functions for system monitoring and maintenance of gauging station on it display contents.
9 Simplification database
Data acquisition server shall include simplification database to store the received data such as present water level, status of equipment in the gauging station for temporary.
10 Other The measuring capacity shall be expandable to a maximum 1024 gauging stations
(1) Data transmission function
As the call transmission, the automatic calling for data transmission function shall be conducted at
seven (7) intervals: fifteen (15) minutes, thirty (30) minutes, one (1) hour, three (3) hours, six (6)
hours, twelve (12) hours and twenty-four (24) hours. And, the manual calling shall be started
manually and be directed to all the selected gauging station by individual calling.
As the autonomous transmission, data acquisition function shall always receive the data from all of
the gauging station consecutively.
If any error code has been detected in the data from the gauging station, or if there is no response
from the gauging station, that gauging station shall be automatically re-called once more. If there is
an error code or a called the gauging station failed to respond again, a visible and audible alarm shall
be actuated and the relative system shall shift to the next operation. The maximum time required
for calling and response to one (1) gauging station shall be less than 20 seconds. This function shall
have the following functions also:
Selection of gauging stations
Selection of calling time interval
Selection of calling mode, automatic or manual calling
II-34

Final Report Volume II Water Management System
(2) Time control function and calibration function
RTU, Data acquisition server and another server shall be connected to NTP server for calibrating a
clock time by itself. A clock time can be regularly corrected by NTP protocol. A clock time
synchronizes with NTP server in the master station, and will be highly accurate. Therefore, NTP
client shall be installed in RTU, Data acquisition server and another server for calibrating a clock
time.
NTP server shall be connected GPS antenna, and shall provide year, month, day, hour and minute
data. The time and date of NTP server shall be calibrated automatically, and the number of days on
month shall be maintained automatically by an internal calendar program. The accuracy of a clock
time shall be within one (1) seconds per day.
(3) Time schedule management function
Data acquisition server as a time management shall manage the transmission time of each gauging
station, and the interval time between the gauging stations, and the switching time of the
communication line, and the transmission schedule. The communication line switch time is required
time to the communication line switch from the router route to the GPRS route.
The above-mentioned time management is registered in the time schedule management function.
(4) Registration and the deletion function
Registration and the deletion of the gauging station shall be done with the data acquisition server.
Moreover, the observation stop setting of the gauging station is also possible.
(5) System monitoring function
Data acquisition server shall supervise the status and condition of the communication between the
gauging station and the master station, and of the transmission between servers, and the gauging
station. When abnormally generated, generation time and an abnormal content, etc. are accumulated
as a history for thirty (30) days or more.
(6) Data transfer function
Data from the gauging station is transmitted by LAN interface from Data acquisition server to an
outside database server which means the external server. Data acquisition server shall include
simplification database to store the received data such as present water level, status of equipment in
the gauging station for temporary.
The data received from all Gauging station shall store for 30 days in the simplification database. Data
acquisition server shall have the function of reading data collected and processed by database through
the LAN network.
(7) Screen display function
Data acquisition server shall have Screen display function. The gauging data collected from the
gauging station shall be displayed the following items on the screen.
II-35

Detailed Design Study on the Project for Construction of the New Dirout Group of Regulators
1) Present data and status
The current state of the collected gauging data is displayed. The visible alarm and sound are
generated in this function when it receives information that the warning and the event information is
detected.
2) Time schedule management
A time management which is composed with the transmission time of each gauging station and the
interval time between the gauging stations and the switching time of the communication line and the
transmission schedule is displayed.
3) Registration and the deletion
Registration and the deletion of the gauging station is for configured on display. Moreover, the
observation stop setting of the gauging station is also for configured on display.
4) System monitoring
The status and condition of the communication between the gauging station and the master station
and of the transmission between servers, and the gauging station is displayed. A history of the
generation time and an abnormal content is displayed.
(8) Operation and status indication function
Data acquisition server shall have functions for system monitoring and maintenance of gauging
station on it display contents. This server shall have, but not limited to, the following functions:
1) Operation
Manual measurement
Measurement interval change
Missing data supplementation
CSV save (for back up)
CSV load (for loading from gauging station external media)
Data correction
Operation reset
Alarm off
2) Monitoring
Latest condition
Received data
(9) Simplification database
Data acquisition server shall include simplification database to store the received data such as present
water level, status of equipment in the gauging station for temporary. The data received from all
Gauging station shall store for 30 days. Data acquisition server shall have the function of reading
data collected and processed by database through the LAN network.
II-36

Final Report Volume II Water Management System
(10) Other
The measuring capacity shall be expandable to a maximum 1024 gauging stations, when required
with minor modifications.
4-1-6 Computer Sub-system
Computer sub-system shall be composed of Water management function, Database function, Web &
Mail function and Monitoring function. Computer sub-system shall be installed in the master station
and the monitoring station. The monitoring station shall have Monitoring function only.
Computer sub-system shall have high quality graphics which shall be mounted within the
“WINDOW” environment in order to be more accessible to the common user.
To spread an information and communication, the router shall be provided in the master station, and
government authorities are connected each other using internet communication. When available
capacity of Database and DAS will be less than the configured threshold, the alarm is displayed.
All function to prevent unlawful access must be installed.
(1) Water management function
Water management function consists of Server (Water management) and Network function.
When the data in Database is updated, the Flow and discharge are calculated on the water
management function. And then, the water management function records the quantity of flow and
discharge in Database. Main function is shown below,
Database
Flow and discharge calculation
Operation and maintenance screen
1) Database
Water management function shall transfer the storage data from the Simplification database to
Database by synchronization. And, Database shall provide the demand data to Web & Mail function.
Database software is preferably SQL or equivalent, which shall be possible to convert to usual
database format such as Excel or Access or CSV file. The collected data and processed data in
database shall be converted to any file format and shall be storage to CD/DVD or equivalent.
Water management server shall have the function of reading data collected and processed by data
base through the LAN network.
2) Flow and discharge calculation
Water management function calculates the Flow and discharge in Database.
3) Operation and maintenance screen
Operational screen in the table form and the graph is made by using the data operated with data base,
and disseminates it to external LCD monitor.
II-37

Detailed Design Study on the Project for Construction of the New Dirout Group of Regulators
Operation and maintenance screen shall be composed with the information of water management
which includes the name of gauging station, the item of measurement, the measurement data, time,
and date, status of equipment, reporting and printing.
(2) Web & Mail function
Web & Mail function consists of Server and Network function.
Web & Mail function shall provide the web page including that information to give an accurate
situation. The related government only can access this server by using browser. This access must
demand ID and Password. And, between this server and web browser in clients the strong security
device must be installed such as a firewall and router.
Web & Mail server shall have the function of reading data collected and processed by data base
through the LAN network. Web file in the table form and the graph is made by using the data
operated with data base, and disseminates the web file to LCD monitor, monitoring terminal by the
function of the web opening to the public.
Mail with Report which is made in the water management server is sent by Mail function. The sender
method used by the mail function shall be selected from E-mail and / or a short message (SMS). The
report of water management will be transmitted to the registered addressee. The transmission cycle
can be arbitrarily set.
(3) Monitoring function
Monitoring function consists of Personal Computer LCD monitor and Network function.
Monitoring function shall be used to control and connect to the web server for monitoring measured
data and processing data. Monitoring function shall have function to update display data
automatically using Java language or equivalent and shall be installed at the master station and the
monitoring station.
LCD monitor shall display the screen from the monitoring terminal. Laser printer shall print out the
all necessary documents required from the LAN network.
(4) Network function
Network function consists of Router, L2-SW, LAN cable, Laser printer and Intranet. Network
function shall be suitable to Ethernet and protocol shall be based on TCP/IP.
L2-SW shall be the hub where the switching facility is added. The switching hub shall learn the
physical address (MAC address) of the Ethernet device connected to each port, and link port required
for intelligence directly and enable it exchange data.
Router shall be the router equipped with the connection function conformed to existing intranet
which is able to use internet line. Moreover, router, server and terminal shall have the function of
security which means Malware inspection and Anti-virus. The computer virus and related malware
must be completely excluded from the network and the relating equipment.
II-38

Final Report Volume II Water Management System
4-2 Design of gauging station
4-2-1 Location and function of gauging station
(1) Location of gauging stations
Gauging stations under the master station are shown on Table 4-2.1. The table shows the latitude and
longitude coordinates of each gauging station, the provisional installation position of the water level
sensor (the distance from the gate to the sensor), and the depth of the canal.
Table 4-2.1 Location of gauging stations
Latitude LongitudeUpstream(Distance
before gate)
Downstream(Distanceafter gate)
Deapthof
Canal1 Ibrahimia Head Regulator 27° 11' 44 .7" 31° 11' 07.8" 47 40 102 Regulator Bahr Dahab Regulator 27° 59' 45.5" 30° 41' 25.84" 6 93 83 Yusef Sakoula Regulator 28° 39' 22.8" 30° 41' 15.7" 10 88 84 Canal Mazoura Regulator 28° 53' 48.2" 30° 48' 43.8" 10 85 85 Lahoun Regulator 29° 12' 22.0" 30° 58' 15.7" 14 36 86 Abo El Shekok Regulator 29° 19' 34.86" 31° 07' 52.16" 15 27 87 km39 Regulator 29° 27' 23.7" 31° 11' 52.52" 9 20 88 New Hafze Regulator 27° 48' 49.02" 30° 42' 15.5" 8 32 59 Canal Matay Regulator 28° 24' 56.1" 30° 47' 15.1" 16 40 5
10 Maghagha Regulator 28° 38' 54.9" 30° 50' 14.3" 15 32 511 Sharahna Regulator 28° 51' 07.88" 30° 54' 48.29" 6 17 412 El Gandy Regulator 29° 05' 36.00" 31° 06' 29.03" 8 24 413 Ashmont Regulator 29° 11' 25.2" 31° 09' 49.9" 3 15 414 Branch Bahr Intake Manshat El Dahab 27° 59' 52" 30° 41' 12.5" 2 25 315 Canal Yusef El Hareka 28° 34' 54.32" 30° 40' 40.7" 2 20 316 Canal El Sabaa 28° 34' 53.9" 30° 40' 39.2" 4 16 317 Quftan 28° 53' 41.4" 30° 48' 14.74" 6 20 318 Wesh El Bab 29° 03' 07.07" 30° 54' 50.81" 5 6 319 El-Giza 29° 12' 22.00" 30° 58' 15.7" 30 30 420 Weir Hassan Wasef Weir 29° 12' 26.31" 30° 57' 42.11"3m before weir - 421 Ibrahimia Intake Irad El Maharak 27° 22' 25.7" 30° 54' 14.1" 2 18 422 Canal El Kosia 27° 26' 56.5" 30° 49' 33.0" 3 18 323 East Hafze 27° 48' 29.9" 30° 48' 26.7" 85 13 324 West Hafze 27° 48' 28.7" 30° 48' 23.3" 10 15 425 Adkak 28° 23' 20.7" 30° 46' 09.7" 3 55 426 Gendia 28° 38' 07.1" 30° 49' 39.13" 2 12 427 Abo shosha 28° 49' 54.14" 30° 54' 23.09" 3 30 428 El Soultany 28° 51' 05.37" 30° 54' 46.45" 3 16 429 Tansa 29° 00' 34.56" 31° 01' 14.01" 7 18 430 El Mansour 29° 11' 22.2" 31° 09' 48.5" 3 30 331 Weir Serry Weir 27° 49' 17.2" 30° 47' 37.2" 10m before weir - 432 Maghagha Weir 28° 39' 30.2" 30° 50' 45.1" 2m before weir - 4
33 Pump Bahr New Kamdeer PS 28° 9' 25.41" 30°39' 53.91" 25 60 5 *)
34 Station Yusef New Terfa PS 28°21'23.32" 30°37'40.31" 25 65 5 *)
35 Canal Old Terfa PS 28°21'22.01" 30°37'39.99" 25 65 5 *)
36 Old Sakoura PS 28°37'13.43" 30°40'43.50" 25 40 5 *)
37 Mazoura PS 28°50'57.71" 30°48'2.64" 35 40 5 *)
38 Lake Quarun Lake 29° 28' 1.08" 30° 42' 6.69" observation well - 2NOTE; New Dirout Group of Regulators : Other package
*) Assumed value
Ibrahimia Main Canal
Ibrahimia
Position of water level sensor (m)
No. Irrigation facilities Name
Coordinate
II-39

Detailed Design Study on the Project for Construction of the New Dirout Group of Regulators
(2) Function of gauging station
Functions of gauging stations are shown in Table 4-2.2.
Table 4-2.2 Function of gauging station
4-2-2 Function of gauging station at branch canal intake
(1) Monitoring function
The central monitoring house will monitors the status of the power supply system of the gauging
station at branch canal intake.
For the commercial power supply, it is possible to know the status of the gauging station by the
information of black out. However, since the power supply system of the gauging station consists of
a solar panel and a battery, it is necessary to monitor the power status from master station.
1) Power supply status
Power supply status which is consisted of solar panel and battery will be monitored.
(2) Measuring function
The measurements of upstream and downstream water levels in the main canal at the regulator are
monitored. The data will be used to understand the amount of distributed discharge to manage the
regulators at the main canal in the near future.
1) Water level data
The measurements of upstream and downstream water levels at the head of branch canal’s intake are
monitored.
(3) Operation / Control
1) Branch canal’s gate : On-site control, No tele-control from remote site
No. Function Specification Remarks
1 Measuring water levelThe pulse of the water level is detected continuously and aproper water level can be obtained.
2 Measuring discharge flowThe existing On/Off state of the power switch at Pumpcontrol panel is detected, and a proper discharge flow canbe calculated in the server of the master station.
3 CommunicationThe communication transmission line by GPRS isestablished between the gauging station and masterstation.
4 TransmissionThe water level, the state of the battery, and the state ofthe device are transmitted to the master station.
5 Solar power All devices work by the photovoltaic generation.
6 Power savingPower consumption excluding active works of the waterlevel measurement and the data transmission becomesminimum.
II-40

Final Report Volume II Water Management System
(4) System diagram
Equipment composition and function composition are shown in Figure 4-2.1.
Figure 4-2.1 Equipment composition for gauging station (1/2)
Figure 4-2.2 Equipment composition for gauging station (2/2)
II-41

Detailed Design Study on the Project for Construction of the New Dirout Group of Regulators
Almost of all equipment shall operate in DC 12V (or 24V) which is fed from Storage battery.
Power charge controller makes the electric power from the solar panel a fixed voltage, and charges
the battery.
The water level sensor shall be measured in the input interface of RTU. The water level measured
shall be recorded as measurement data in the data logger. The water level shall be recorded
according to the setting of interval time in the data logger. And, all data can be monitored in the
data logger.
The discharge flow shall be measured in the digital input interface of RTU. This interface shall
connect to the existing spare points as a power switch interface on the terminal block in the Pump
control panel. The discharge flow is calculated by the cycle of state (On / off) on the power switch.
The existing power switch interface on the terminal block in the Pump control panel as the dedicated
interface shall be prepared by MED before the connecting of this system.
Usually GPRS modem shall begin operating after it is called from the master station. GPRS modem
called transmits the water level which is measured in input interface of RTU and also transmits the
status of equipment at the same time.
Almost equipment shall be set up in an appropriate enclosure. And, the enclosure shall be mounted
on the desk table or pole.
These functions to prevent unlawful access must be installed. And, function to prevent vandalizing
also must be installed. Main function of gauging station is shown below table (Table 4-2.3).
Table 4-2.3 List of equipment composed in the gauging station
4-2-3 Regulator
(1) Monitoring function
For the commercial power supply, it is possible to know the status of the gauging station by the
No. Equipment Quantity Remarks1 GPRS modem 12 RTU with Data logger 13 Charge controller 14 Battery 15 Solar panel 16 Water level sensor 27 Enclosure 28 Pole 19 Foundation 1
10 Junction box 111 Protection pipe 112 Frame of solar panel 113 Frame of enclosure 114 Wiring cable -
II-42

Final Report Volume II Water Management System
information of black out. However, since the power supply system of the gauging station consists of
a solar panel and a battery, it is necessary to monitor the power status from master station.
1) Power supply status
Power supply status which is consisted of solar panel and battery will be monitored.
(2) Measuring function
The measurements of upstream and downstream water levels at the head of branch canal’s intake are
monitored. The data will be used to understand the amount of distributed discharge to manage the
regulators at the main canal in the near future.
1) Water level data
The upstream and downstream water levels at the regulator are measured. The telemetry system
installed through this project will be the compatible system with the one which have been installed
nation-widely and maintained by Egyptian government. Therefore, the system to be introduced in the
project shall be technically maintained and managed by the CDT itself
The water level monitoring equipment installed by the Japanese Grant Aid Project at regulators such
as Lahoun, Mazoura, Sakoula, and Dahab is using as a Regulator’s gate operation index. Therefore, it
is not easy for the CDT to maintain and manage said system systematically. Based on the above
points, the introducing type of gauging station through this project will follow the same design
concept that CDT has a lot of installation experience. In addition, gauging station will be newly
installed on the upper and lower sides of each regulator, and monitoring from a master station
remotely will be carried out.
(3) Operation / control
1) Regulator’s gate : On-site control, No tele-control from remote site
(4) System diagram
Description of equipment composition and function composition is omitted because the system is the
same as that of the branch canal.
4-2-4 Weir
(1) Monitoring function
The central monitoring house will monitors the status of the power supply system of the gauging
station at weir. For the commercial power supply, it is possible to know the status of the gauging
station by the information of black out. However, since the power supply system of the gauging
station consists of a solar panel and a battery, it is necessary to monitor the power status from master
station.
1) Power supply status
Power supply status which is consisted of solar panel and battery will be monitored.
II-43

Detailed Design Study on the Project for Construction of the New Dirout Group of Regulators
(2) Measuring function
The measurements of upstream water level in the canal at the weir are monitored. The data will be
used to understand the amount of distributed discharge to manage the regulators at the main canal in
the near future.
1) Water level data
The measurements of upstream water level in the canal at the weir are measured.
(3) System diagram
Description of equipment composition and function composition is omitted because the system is the
same as that of the branch canal.
4-2-5 Pump station
(2) Monitoring function
The central monitoring house will monitors the status of the power supply system of the gauging
station at pump station. However, since the power supply for the gauging station will be connected to
the distribution power board of the pump station, it is about the power supply status of the pump
station such as black out that will be monitored by the master station.
(3) Measuring function
The measurements of upstream (suction tank) and downstream (discharge tank) water levels in the
canal at the pump station are monitored. Also, the operation status (On/Off) of each pump is
measured, and the operation time is calculated and recorded based on the operation cycle. This data
will be used to understand the amount of distributed discharge, and manage the pump station’s
operations in the future.
1) Water level data
The measurements of upstream (suction tank) and downstream (discharge tank) water levels in the
canal at the pump station are monitored.
2) Pump station’s status
The pumping station where the gauging station is installed is operated and managed by the MED. In
this project, the modification work on the pumping station is out of scope. Therefore, the measuring
equipment that recognizes the pump operation status (On/Off) and the output connection terminal on
the control panel for each pump shall be modified by MED. The pumped discharge is calculated as
the theoretical discharge amount by multiplying the pump operation time by the designed pumping
ability of each pump.
(4) Operation / control
1) Pump station : On-site control, No tele-control from remote site
II-44

Final Report Volume II Water Management System
(5) System diagram
Description of equipment composition and function composition is omitted because the system is the
same as that of the branch canal.
Lake
(1) Monitoring function
The central monitoring house will monitors the status of the power supply system of the gauging
station at Quarun Lake. For the commercial power supply, it is possible to know the status of the
gauging station by the information of black out. However, since the power supply system of the
gauging station consists of a solar panel and a battery, it is necessary to monitor the power status
from master station.
1) Power supply status
Power supply status which is consisted of solar panel and battery will be monitored.
(2) Measuring function
The measurements of water level in the monitoring well of Quarun Lake are monitored. The data will
be used to understand the amount of distributed discharge to manage the regulators at the main canal
in the near future.
1) Water level data
The measurements of water level in the monitoring well are measured.
(3) System diagram
Description of equipment composition and function composition is omitted because the system is the
same as that of the branch canal.
4-3 Wiring plan
Wiring plan of Regulators and Branch canal intake, and wiring plan of central monitoring house are
shown in Figure 4-3.1 and Figure 4-3.2 respectively.
II-45

Detailed Design Study on the Project for Construction of the New Dirout Group of Regulators
Figure 4-3.1 Wiring plan of regulator and branch canal’s intake
Figure 4-3.2 Wiring plan of Central Monitoring House
W
aoer Level Sensor
Waoer Level S
ensor
Solar C
ells Panel
Grounding R
od
Surge P
rooecoive Device
Surge P
rooecoive Device
GP
RS
Modem
Anoenna
GP
RS
Modem
Pow
er Charge C
onoroller
Daoa Logger
RTU
Soorage B
aooery
Grounding Term
inal
Surge P
rooecoive Device
In-O
uo Panel for ND
GR
s
LCD
Monioor
Laser Prinoer
Personal Com
puoer
Server (Daoa G
aohering)
GPR
S M
odem
GPR
S M
odem Anoenna
Server (Web & M
ail)
Rouoer
L2-SW
LCD
KVM Sw
ioch
UPS
L2-SW for Inoraneo
Server (Waoer M
anagemeno)
Power D
isoribuoion Panel
CV4.0sq-2C CV3.5sq-2C
CV4.0sq-2C
CVVS1.25sq-2C
ACCESSORY CABLE
CVVS1.25sq-2C
CVVS1.25sq-2C
CVVS1.25sq-2C
ACCESSORY CABLE
ACCESSORY CABLE ACCESSORY CABLE
ACCESSORY CABLE
ACCESSORY CABLE
IV4.0sq
IV4.0sq
IV4.0sq
IV4.0sq IV4.0sq
IV4.0sq
IV4.0sq
IV4.0sq
HDMI CABLE
UTP-CAT5E
CV4.0sq-2C
ACCESSORY CABLE
IV4.0sq
ACCESSORY CABLE ACCESSORY CABLE ACCESSORY CABLE
ACCESSORY CABLE
ACCESSORY CABLE
ACCESSORY POWER CABLE ACCESSORY POWER CABLE ACCESSORY POWER CABLE
ACCESSORY POWER CABLE
UTP-CAT5E UTP-CAT5E UTP-CAT5E UTP-CAT5E UTP-CAT5E UTP-CAT5E UTP-CAT5E
II-46

Final Report Volume II Water Management System
4-4 Gauging station plan
Construction of the gauging station in this area follows the existing
telemetry station method. Each gauging station is mainly consists of
enclosure, poles and fences.
The gauging station is planned to install along the road side except
the location of Regulators. Therefore, in order to prevent theft or
mischief at the gauging station, each device is fixed in an enclosure
and surrounded by a fence. Devices such as GPRS modem, RTU, data
logger, power controller, battery, surge protector are stored in the
enclosure.
Figure 4-4.1 Gauging Station
4-4-1 Lightning countermeasure
Gauging stations are constructed in various places such as remote areas and nearby canals. Therefore,
countermeasures against lightning and external noise are required. However, since the height of the
gauging station's pole is 3m to 5m, it is not the height directly receiving lighting, so the function of
lightning protection is only measures against induced lighting. Induction lightning is discharged to
the ground through a surge protector.
4-5 Design of monitoring station
4-5-1Central monitoring station (Master station)
The central monitoring station (master station) will be installed in the same building of the control
house for NDGRs. Table 4-5.1, Figure 4-5.1, and Table 4-5.2 show the function of central monitoring
station, typical operation diagram of the master station and equipment in the master station,
respectively.
Table 4-5.1 Function of the master station
No. Function Specification Remarks
1 Data acquisitionCollected all the information which is measurement datafrom the gauging station by call.
2 Water managementMaking a report of all operation and management screens.And, installing the flow calculation
3 Data baseData base, data indication, data transferring, data store andrestore
4 Web serverThe basis of the Water management screen is web display.This server provide the Water management screen to theWEB client.
5 Mail serverThe data are delivered to the mail address registeredbeforehand as information allows adding and removeaddresses, address grouping... Etc.
6 Monitoring Monitoring the web screen. And, Print out.7 Network LAN network
II-47

Detailed Design Study on the Project for Construction of the New Dirout Group of Regulators
Figure 4-5.1 Typical operation diagram of the master station
Table 4-5.2 Equipment of the master station
No. Equipment Quantity Remarks1 GPRS modem 12 Router 13 L2-SW 14 Data acquisition server 15 Water management server 16 Web & E-mail server 17 NTP server 1 GPS antenna8 KVM Switch 19 KVM Monitor 110 Keyboard & Mouse 111 UPS 212 Computer rack 113 Monitoring terminal 114 Laser printer 115 LCD Monitor 1
II-48

Final Report Volume II Water Management System
4-5-2 Minia monitoring station
Minia monitoring station will be set in telemetry office in Minia district. Table 4-5.3, Figure 4-5.2,
and Table 4-5.4 show the function of monitoring station, typical operation diagram of monitoring
station and equipment in the monitoring, respectively.
Table 4-5.3 Function of the monitoring station
Figure 4-5.2 Typical operation diagram of the monitoring station
Table 4-5.4 Equipment of the monitoring station
4-6 Specifications for equipment
4-6-1 GPRS modem
GPRS model shall be plug-in type and have moisture-proof type. The GPRS modem is a device for
using the GPRS service of the mobile phone network and has a function for connecting to this
network. The GPRS modem connects to the communication network of the mobile company of the
built-in SIM card. The GPRS modem modulates data such as the water level from the RTU into a
signal for GPRS communication and sends a modulation signal to the mobile phone network. Also,
the modulated signal from the mobile phone network is received by the GPRS modem and then
demodulated into predetermined data. The functions of the GPRS modem are shown in Table 4-6.1.
The detailed contents are described in the technical specification.
No. Function Specification Remarks1 Monitoring Monitoring the web screen. And, Print out.2 Network LAN network
No. Equipment Quantity Remarks1 Router 12 L2-SW 13 UPS 2
4 Monitoring terminal 15 LCD Monitor 1
II-49

Detailed Design Study on the Project for Construction of the New Dirout Group of Regulators
Table 4-6.1 Technical specifications for GPRS modem
4-6-2 RTU
RTU shall be plug-in type and have moisture-proof type construction, and consist of the following
function, serial interface, I/O interface (external signal input / output), I/O interface controller and
data exchange. This controller shall control these interface and functions according to user program.
RTU shall have the following function,
a) Transmission control
To transmit the measured data and/or alarm and status data to Data acquisition server
through GPRS modem.
To receive control signal from Data acquisition server through GPRS modem.
b) I/O signal interface
To read the analogue input signal value from the water level sensor, the range of the
analogue input signal shall be 0 - 5 Volt or 4- 20 mA.
To read the digital input signal status, the input signal shall be high / low condition (0
volt/5 volt) or open / close state. The input interface shall be electronically isolated.
The spare port of I/O interface shall remain around 25% at all number of port.
c) Clock synchronizes
The internal clock is regularly corrected. An internal clock synchronizes with NTP server
in the master station, and this correction is completed.
The protocol used by this clock synchronization shall be NTP. Moreover, NTP client shall
be installed in RTU for calibrating an internal clock.
d) Data memory
To store the data measured (analogue or digital) in the data logger to be retrieved when
needed.
Cellular interface GSM / GPRSFrequency Dual-band or more
2) SIM Card Two (2) slots or more3) Antenna interface External Antenna
Data interface One (1) port or moreType Serial port (RS232) or equivalentBaud rate 110 to 38,400 bps or more
5) Command AT commands or equivalent6) Health and Status monitoring LED indicator7) Power DC 12 V +/- 2V8) Standard IP65 or more9) Mounting method DIN rail or Screw mount
10) Auxiliary External antenna, The dedicated cable between modem and antenna11) Operating Temperature 10° to 55°C
1)
4)
II-50

Final Report Volume II Water Management System
e) Power supply
To supply the electrical power to each sensor. The voltage shall be 12VDC.
f) Data convert
The data measured is received with Analog signal input port will be corrected according
to meteorological conditions and a geographic condition. The measurement value after
it corrects it is converted into the water level.
g) Internal control program
The controller shall control these interface and functions according to user program. The
Contractor shall prepare the user program which must work all function.
The specification is shown in Table 4-6.2. The detailed contents are described in the technical
specification.
Table 4-6.2 Technical specifications for RTU
4-6-3 Data logger
Data logger shall consist of data logging and serial interface. Data logger enables to build it into
RTU. Data logger shall fully satisfy the following function;
a) Data logging and display
The converted water level data and current time are stored in the internal memory, and
displayed on LCD display too by automatically or manually. The displayed time will be
synchronized with internal clock or equivalent. For manual control, some buttons and
LCD display must be located on the outlet of RTU. These data from internal memory is
read, and displayed on LCD display too.
b) Clock synchronizes
The internal clock is regularly corrected. An internal clock synchronizes with NTP server
Communication interface (for GPRS modem) One (1) port or moreType Ethernet (RJ45) or Serial port (RS232) or equivalentSpeed 10/100 Base @ Ethernet, 110 to 38,400 bps @ Serial port or more
External data interface (for Datalogger) One (1) port or moreType Ethernet (RJ45) or Serial port (RS232) or equivalentBaud rate 10/100 Base @ Ethernet, 110 to 38,400 bps @ Serial port or more
I/O Interface Spare port shall be set 25%.Analog signal input 8 ports or more,
Analog (4-20mA, 0-5V), Isolation or line arrester shall be providedDigital signal input 12 ports or more,
High/Low condition or Open/Close state (0 volt / 5 volt) or BCD 4 digits.Isolation or line arrester shall be provided
Digital signal output 8 ports or more,High/Low condition or Open/Close state (0 volt / 5 volt) or BCD 4 digits.
4) Protocol IP, TCP, SNMP, NTP or more5) Health and Status monitoring LED indicator6) Power DC 12V +/- 2V7) Standard IP65 or more8) Mounting method DIN rail or Screw mount9) Operating Temperature 10° to 55°C
3)
1)
2)
II-51

Detailed Design Study on the Project for Construction of the New Dirout Group of Regulators
in the master station, and this correction is completed. The protocol used by this clock
synchronization shall be NTP. Moreover, NTP client shall be installed in RTU for
calibrating an internal clock.
c) Backup to external memory
The external memory shall be back up for internal memory. Backup of internal memory
will automatically execute a few times a day. Also, this backup can manually execute
when it requires. Moreover, anytime this external memory shall be taken and setup. The
data format stored must be Standard ASCII/CSV/XML. The data will be stored as
permanent nonvolatile data. The storage period shall be for one (1) year and more.
d) Data memory
To store the data measured (analogue or digital) from RTU and other to be retrieved when
needed. The data will be stored as permanent non volatile data. The storage period shall
be for one (1) year or more.
The specification is shown in Table 4-6.3. The detailed contents are described in the technical
specification.
Table 4-6.3 Technical specifications for data logger
4-6-4 Water level sensor
Water level sensor shall be equipped a semi-conductor type pressure sensor which converts a
pressure into a voltage or current. Water level sensor shall compose the sensor which is pressure
type and the dedicated cable which shall be covered by the suitable pipe and fixed on the concrete
structure or other approved method.
Water level sensor shall be designed to be protected from a lightning surge. Output signal shall be
of the Analog 4 to 20 [mA] or equivalent for RTU.
Protective device with box to prevent the sensor and RTU from the lightning surge shall be provided
at both end (when the distance between the water level sensor and RTU is short, one protective
device is acceptable).
The specification is shown in Table 4-6.4. The detailed contents are described in the technical
specification.
External data interface (for RTU) One (1) port or moreType Ethernet (RJ45) or Serial port (RS232) or equivalentSpeed 10/100 Base @ Ethernet, 110 to 38,400 bps @ Serial port or more
2) Internal memory One (1) Gbyte or more3) External memory SD-Card FAT-16 or equivalent4) Protocol IP, TCP, SNMP, NTP or more5) Maintenance port One (1) port or more, Serial port (RS-232) or equivalent6) LCD display Two (2) lines or more7) Health and Status monitoring LED indicator8) Power DC 12V +/- 2V9) Standard IP65 or more
10) Mounting method DIN rail or Screw mount11) Operating Temperature 10° to 55°C
1)
II-52

Final Report Volume II Water Management System
Table 4-6.4 Technical specifications for water level sensor
4-6-5 Server
Server is manufactured based on the latest computer technology and ensure the trouble-free
operation.
The basic component shall be composed of processor, serial interface, Local Area Network (LAN)
interface, keyboard, color display monitor, Operating Software (OS) and shall be of the hot-standby
system due to improve the system reliability.
The processor of computer shall be quad core and more.
Server shall be connected on LAN and shall prepare a necessary interface for peripheral devices.
Main memory shall be prepared a sufficient capacity, at least more than ten (10) years of data storage,
and shall perform all process tasks without mutual interface and shall be provided efficient execution
of all programs supplied by the Contractor and to cater for future expansion of the system.
LAN interface shall be suitable to Ethernet and protocol shall be based on TCP/IP (Transmission
Control Protocol / Interface Protocol).
Operating System (OS) shall be selected from the “De Facto Standard” such as Windows, or Linux
etc. Programming language shall be workable in the Windows, or Linux etc., which have used
widely in the world. Anti-virus and screen saver software shall be provided to the server.
The specification is shown in Table 4-6.5. The detailed contents are described in the technical
specification.
Table 4-6.5 Technical specifications for server
1) Type Pressure sensitive diffusion type semi-conductor or equivalent2) Measuring range According to site specification3) Cable length According to site specification4) Accuracy ± 0.10 % at F.S. at constant temperature,
± 0.2% over 35°F to 70°F(1.37° to 21.1°C) range5) Output signal Analogue signal 0-5 volt or 4 - 20 mA or equivalent6) Sensor element Titanium7) Sensor body Stainless steel
1) Type Computer rack mount2) CPU Intel Xeon E5 or more3) Memory 16.0 GB or more4) HDD 8.0 TB (RAID5/Hot plug) or more5) RAID RAID level 5 or more6) External drive DVD-ROM/DVD-RW/DVD-R or equivalent7) Buck up System Hot-Standby system
Two or more ports - 10/100/1000 BASE-TXTwo or more ports - Serial port (RS232C)Four or more ports - USB 3.0
9) Power AC 230V +/-10 %, 50 Hz +/- 2 Hz, Dual supply/Hot plug10) OS Windows Server 2016 English version or equivalent11) Apprication software Apprication software that satisfies a specified function and the performance must be
installed with OS.12) Waranty 5years13) Operating Temperature 10° to 55°C
8) I/O Interface
II-53

Detailed Design Study on the Project for Construction of the New Dirout Group of Regulators
4-6-6 Personal Computer
Personal Computer (PC) shall be factory automation (FA) type PC and shall be used to control and
connect to Server via, Network.
The basic component shall be composed of processor, serial interface, Local Area Network (LAN)
interface, keyboard, color display monitor and Operating Software (OS).
The processor of computer shall be quad core and more. It shall be connected on LAN and shall
prepare a necessary interface for peripheral devices.
Main memory shall be prepared a sufficient capacity, at least more than ten (10) years of data storage,
and shall perform all process tasks without mutual interface and shall be provided efficient execution
of all programs supplied by the Contractor and to cater for future expansion of the system.
LAN interface shall be suitable to Ethernet and protocol shall be based on TCP/IP (Transmission
Control Protocol / Interface Protocol).
Operating System (OS) shall be selected from the “De Facto Standard” such as Windows, or Linux
etc. Programming language shall be workable in the Windows, or Linux etc., which have used
widely in the world. It shall have function to update display data automatically using Java language
or equivalent. Anti-virus and screen saver software shall be provided to the server.
The specification is shown in Table 4-6.6. The detailed contents are described in the technical
specification.
Table 4-6.6 Technical specifications for personal computer
4-6-7 LCD monitor
The LCD monitor is a device for displaying observed data such as schematic diagram of integrated
water management system, measured water level sensor, gauging station with abnormal power
supply status and etc. LCD monitor can be set up as follows, wall mounting, the self-stand mounting,
and the ceiling mounting.
The specification is shown in Table 4-6.7. The detailed contents are described in the technical
specification.
1) Type Factory Automation Type2) CPU Intel Core i7, 2.0 GHz or more3) Memory 4.0 GB or more4) HDD 1.0 TB or more5) External drive DVD-ROM/DVD-RW/DVD-R
Two or more ports - 10/100/1000 BASE-TXTwo or more ports - Serial port (RS232C)Four or more ports - USB 3.0
7) Power AC 230V +/-10 %, 50 Hz +/- 2 Hz8) OS Windows 8.1 Pro English version or equivalent9) Apprication software Apprication software that satisfies a specified function and the performance must be
installed with OS.10) Auxiliary Cable, TFT LCD monitor (21inch or more), Keyboard & Mouse11) Waranty 5years12) Operating Temperature 10° to 55°C
6) I/O Interface
II-54

Final Report Volume II Water Management System
Table 4-6.7 Technical specifications for LCD monitor
4-6-8 L2-SW
L2-SW shall be hub where the switching facility is added, and shall learn the MAC address of
Ethernet device connected to each port, and link port required for intelligence directly and enable it
exchange data.
The specification is shown in Table 4-6.8. The detailed contents are described in the technical
specification.
Table 4-6.8 Technical specifications for L2-SW
4-6-9 Router
Router shall be equipped with the connection function conformed to intranet provided for accessing
to internet. Router shall be connected when transmission with an external network between Master
station and other government office.
1) Display size 60 inch or more2) Display type Liquid Crystal Display3) Resolution 1,280 x 1,024 dot or more4) PC interface Analogue RGB (mini D-sub 15 pin ) x 1 or equivalent
(Input) NTSC x1 or equivalent(Input) HDMI x3(Output) NTSC x1 or equivalent(Output) HDMI x1
6) Installation The wall mounting, the self-stand mounting, and the ceiling mounting7) Power AC230 V +/-10 %, 50 Hz +/- 2 Hz8) Operating Temperature 10° to 55°C
5) Video interface
1) LAN interface 10BASE-T/100BASE-TX x 8 ports or more2) LAN protocol TCP/IP, IP multi-cast, etc3) Layer 2 switching Shall be Provided4) Maximum VLAN Approx. 63 or more5) VLAN trunk Shall be Provided6) Spanning tree Shall be Provided7) Multicast IGMP etc8) Connector RJ-45 jacks9) Network management SNMP
10) Power AC230 V +/-10 %, 50 Hz +/- 2 HzFrame forwarding ability is 10.0 Mbps or moreSwitching method shall be Store and-forwardThe priority control of traffic must be possible based on COS, TOS, and the DSCP value ofpriority control IEEE802.1p.Several 127 to which the VLAN function can be set VLAN or more of each port can be setand tag VLAN (IEEE802.1Q) should be able to be set.Independent spanning tree protocol operation (Tag VLAN is contained) at each troubledetour VLAN MSTP (IEEE802.1s) and RSTP (IEEE802.1w).The multicast packet is forwarded only to a necessary multicast port (IGMP Snoopingequivalent function).Possess the function (Storm Control equivalent function) to suppress a large amount ofBroadcast, Multicast, and Unicast by the traffic control each other port.Management protocol SNMP (v1,v2,v3)Remote access function by remote triggering TelnetLimitation access. By passwordPreservation, remote maintenance, and the log output of composition definition informationby the set management text form must be possible.Power On automatically after it electrical power failure.
14) Operating Temperature 10° to 55°C
13) Operation and maintenance function
12) Management function
11) Switching Function
II-55

Detailed Design Study on the Project for Construction of the New Dirout Group of Regulators
The specification is shown in Table 4-6.9. The detailed contents are described in the technical
specification.
Table 4-6.9 Technical specifications for router
4-6-10 Laser printer
A laser printer is a device for outputting information processed by integrated water management.
The specification is shown in Table 4-6.10. The detailed contents are described in the technical
specification.
Table 4-6.10 Technical specifications for laser printer
4-6-11 Enclosure
Enclosures for equipment shall be wall mounting, rigid welded steel frames, completely enclosed by
metal sheets and suitable for outdoor installation. It shall have provisions for lifting and ample
strength to withstand all stresses incidental to shipping, installation and operation without distortion
or other damage. Enclosure in the gauging station shall be set up the following equipment;
GPRS modem with antenna
1) IP routing protocol RIP, RIPv2Number of route entries is 5000 or more
2) WAN protocol To be suitable internet line provided by communication companyPPP, PPPoE, IPv4Number of PPPoE session is 100 or more
3) LAN protocol IPv4, TCP, UDP, Multicast4) LAN ports RJ45 type
10BASE-T/100BASE-TX8 ports or more, (all port supports MDI/MDI-X)
5) WAN ports To be suitable intranet and internet line provided6) Throughput 50 Mbps or more7) NAT descriptor function NAT, IP masquerade, Static NAT, DMZ, PPTP pass through,
IPsec pass throughNumber of NAT session is 10,000 or more
8) Quality of Control (QoS) function Priority control, Traffic control (Dynamic traffic control),Support for CBQ, WFQ,
9) VPN function IPsec (NAT traversal, XAUTH)Encryption; AES, DES (Hardware processing)IKE/IKEv2, PPTP
10) Authentication function PAP/CHAP,MS-CHAP/MS-CHAPv2 or more11) Firewall function IP address, Protocol, Destination / Source, Port number
Number of static session filter is 1000 or moreIDS detection, SYN flag attacking is blocked automatically
12) Security function URL filteringMAC address filtering
13) Management function Management protocol SNMP(v1,v2,v3)Remote access function by remote triggering Telnet
14) Operation and maintenance function Limitation access. By passwordPreservation, remote maintenance, and the log output of composition definition informationPower On automatically after it electrical power failure.
15) Power AC230 V +/-10 %, 50 Hz +/- 2 Hz16) Operating Temperature 10° to 55°C
1) Printing method Electro photographic laser beam scanning2) Data process resolution 600 x 600 dpi or more3) Paper size A4, A3 or more4) Network connection 10BASE-T/100BASE-TX5) Power AC230 V +/-10 %, 50 Hz +/- 2 Hz6) Operating Temperature 10° to 55°C
II-56

Final Report Volume II Water Management System
RTU
Data logger
Power charge controller
Storage battery
Surge protector The specification is shown in Table 4-6.11. The detailed contents are described in the technical
specification.
Table 4-6.11 Technical specifications for enclosure
4-6-12 Computer rack
Computer rack shall be IP20 degree of protection and be dead-front, floor mounting, rigid welded
steel frames, completely enclosed by steel plates. It shall have provisions for lifting and ample
strength to withstand all stresses incidental to shipping, installation and operation without distortion
or other damage. Computer rack shall be set up the following equipment;
GPRS modem with antenna
Data acquisition server
Water management server
Web & Mail server
L2-SW
Router
UPS
KVM switch, monitor, keyboard and mouse
Extension Tap The specification is shown in Table 4-6.12. The detailed contents are described in the technical
specification.
Table 4-6.12 Technical specifications for computer rack
4-6-13 LCD KVM switch
LCD KVM switch integrates a LCD panel, full keyboard and touchpad into a streamlined, 1U
housing of the computer rack. This shall be rack mount type. LCD KVM switch allows a user to
1) Construction Outdoor pole-mounting2) Material Steel plate, and it shall be coated with anti-corrosive paint3) Dimension W600 x D200 x H600 mm or equivalent4) Locking system Key5) Standard IP65 or more6) Operating Temperature 10° to 55°C
1) Construction Indoor self-standing (19 inch rack)2) Material Steel plate3) Dimension W600 x D600 x H2,000 mm or equivalent4) Thickness of plate 1.6 mm or more5) Operating Temperature 10° to 55°C
II-57

Detailed Design Study on the Project for Construction of the New Dirout Group of Regulators
control multiple Server and/or Computers from one or more sets of Keyboards, VGA monitors and
Mousse. Although multiple Server and /or Computers are connected to KVM switch.
LCD panel capable of full HD video incorporates the YUV video format for greater compatibility
with high-definition signals (e.g. NVR sources). Similarly, this is also High-Bandwidth Digital
Content Protection (HDCP) compatible.
The specification is shown in Table 4-6.13. The detailed contents are described in the technical
specification.
Table 4-6.13 Technical specifications for LCD KVM switch
4-6-14 NTP server
NTP server shall provide accurate year, month, day, hour and minute data via LAN network. GPS
receiver shall be built into NTP server, and shall be connected to the external GPS antenna. GPS
receiver in NTP server shall receive the signal from several GPS satellites in the sky, and GPS
receiver shall get own present location and time.
GPS satellite is a semi-synchronous satellite that rounds and moves highly of about 20,000km in
about 12 hours. And this is not a fixed satellite. In view of the point on a certain earth, GPS satellite
changes the position hour by hour. Therefore, the error margin can be leveled on the all earth.
However, the number of GPS satellites that can be received is according to the region on the earth
and there are always few places, too.
Information on the data of time from the atomic clock installed in the GPS satellite and the
astronomical ephemeris of the satellite are included in the signal from the GPS satellite to GPS
receiver. GPS receiver in NTP server shall receive the wave from GPS satellite, and measures the
sending time. GPS receiver shall calculate the distance from GPS satellite by using the speed of the
wave (the same 300,000km/second as the speed of optical light) for the difference of a time of the
transmission and the reception.
The clock installed by GPS receiver is using Quarts. Therefore, this clock is not accurate. For
1) Server (Computer) connection 8 [nos]2) Port selection OSD, Hotkey, Pushbutton
Connectors
4) Emulation (Keyboard / Mouse) USB or PS/2LCD panelScreen size 17 inch or moreSupport color 262144 colorsLuminance 300 cd/m² or moreResponse time less than 8 ms
6) Video 1920 x 1080 or more7) Scan Interval 1 to 255 sec.8) Mount type Computer rack mount9) Power AC230 V +/-10 %, 50 Hz +/- 2 Hz
10) Operating Temperature 10° to 55°C
USB type A (Female) 2 ports (or PS/2 (Female) 2 ports), Stereo Mini Jack (Female) 1 port,DVI-I (Female) 1 port (or VGA (Female) 1 port)USB type A (Female) 4 ports (or PS/2 (Female) 4 ports), Stereo Mini Jack (Female) 4 ports,DVI-I (Female) 4 ports (or VGA (Female) 4 ports)
3)
External ports
KVM Ports
5)
II-58

Final Report Volume II Water Management System
example, the error margin of the calculated distance becomes about 300m when the error margin of
GPS receiver at time is 1/1,000,000 seconds. To secure the accuracy of this clock, GPS receiver
receives the wave from four GPS satellites, and calculates accurate reception time and the receiver
coordinates by the measurement calculation.
GPS time shall be UTC which began a start time from January 6, 1980 (standard time). Moreover,
the leap second adjustment is not executed like UTC. The difference data of the time between GPS
time and UTC is included in GPS receiving data. Therefore, NTP server is outputting the accurate
UTC calibrated by using difference data. And, there is an offset signal to which this time difference is
corrected up to 255 (eight bits). This means that it is possible to use it until 2300yr without trouble in
case of the leap second insertion of current state correction.
The specification is shown in Table 4-6.14. The detailed contents are described in the technical
specification.
Table 4-6.14 Technical specifications for NTP server
5. Operation and Maintenance Plan for Integrated Water Management
The purpose of introducing the integrated water management system is to monitor the irrigation
facilities such as the regulators, the branch canal intakes and the pump stations, etc. in a centralized
monitoring, thereby making effective use of irrigation water in the beneficially area, rational water
allocation, securing safety of irrigation facilities, and reducing operation and maintenance cost of
each facility. As irrigation facilities are widely scattered in the Project area, operation and
maintenance manuals of the integrated water management system are necessary for these effective
operations.
In addition, it is needed the certain level of training of data gathering, data evaluation and data
utilization at the one site via the remote monitoring system and gate operation techniques for
establishing the appropriate gate operation of NDGRs which was constructed this project, resolving
the unbalanced water distribution at each site along Ibrahimia and Bahr Yusef canal with a length of
more than 300 km.
The contents of technical cooperation for operation and maintenance for establishment of the
appropriate operation in the near future are described below. And following figure mentions the
position of strengthening program framework after the completion of this project.
1) GPS receiver Built-in, 6-channel GPS C/A-code receiver or equivalent2) GPS antenna External3) Accuracy (time) less than 1 ms GPS synchronized,4) Accuracy (frequency) less than 1E-11 GPS synchronized, avg, over 24 hours5) Output 10/100 Base Ethernet6) LAN interface RJ45, One (1) port or more7) Serial interface One (1) port or more8) Supported network protocol NTP(V2, v3, v4), SNMP(v3,v4), IP, DHCP(client), Secured protocol9) Health and Status monitoring LED indicator
10) Mount type Computer rack mount or Standalone11) Accessory Surge arrestor, The dedicated cable between the receiver and antenna12) Power AC230 V +/-10 %, 50 Hz +/- 2 Hz13) Operating Temperature 10° to 55°C
II-59

Detailed Design Study on the Project for Construction of the New Dirout Group of Regulators
Figure 5-1.1 Position of strengthening program framework and project road map (draft)
The following proposal could be arisen as operation and maintenance activity in this project, which
should be supposed as improvement of technical skills of Egyptian engineers. To achieve these
outcomes, the draft technical topics and strengthening program contents are shown in Table 5-1.1.
(1) Through the project, the operation rules of NDGRs are formulated together with CP, and
technical transfer will be carried out.
(2) Discharge measurement at the downstream of NDGRs and technical transfer of water distribution
method will be carried out.
(3) In the NDGRs, a manual for gate operation and integrated water management method will be
formulated together with CP
・NDGRs consorucoion
・Training for NDGRs gaoe operaoion
・Training for operaoion of
Inoegraoed Waoer Managemeno
Bahr Yusef
Mainoenance and engineering level
for irrigaoion facilioies
Bahr Yusef・Ibrahimia Wide・Branch Canal
1st Step
2nd Step
3rd Step
Scope level for achieving appropriaoe waoer disoribuoion
・Uoilizaoion of paroicipaoory waoer managemeno oechnique
・Expansion of Inoegraoed Waoer Managemeno sysoem
・ Renewal of four
Regulaoors by grano
aid projeco
・Insoallaoion of Inoegraoed Waoer
Managemeno
・ Evaluaoion of minor sorucoures wioh soock managemeno’s evaluaoion
・Developmeno of wide area’s waoer managemeno sysoem
II-60

Final Report Volume II Water Management System
Table 5-1.1 Program for strengthening of operation and maintenance capacity (draft)
Topics Contents of strengthening program Example of specialized Japanese
skilled expert
Gate operation technique for
NDGRs
Training of gate operation skills for
establishment of appropriate water
distribution for seven canals
Irrigation development, Irrigation
facility operation, Operation and
maintenance, Electrical and
mechanical
Maintenance skills of gate
facilities for NDGRs
Maintenance skill’s support for
mechanical engineers due to
conversion from human power driven
gate operation to mechanical driven
gate operation
Operation and maintenance,
Electrical and mechanical,
Telecommunication
Improvement of discharge
measurement technique in major
regulator and branch canal’s
intake
Technical and measuring equipment
support for creating H~Q rating curve
(relationship between water level and
discharge)
Irrigation, Operation and
maintenance, Hydraulics
Expansion of integrated water
management technique
Technical support for gate operation
of NDGRs and proper water
distribution method at the regulators
along the two main canals and branch
canal’s intake
Irrigation planning, Water
management, Telemetry, Irrigation
facility operation ( Canal, Minor
structure), etc.
Operational support for
stakeholder meetings for
appropriately operation of
integrated water management
technique
Cooperation with the Ministry of
Agriculture and other governmental
organizations such as MED related to
latest irrigation area and cropping
information.
Irrigation planning, Agriculture,
Water management, GIS, Remote
sensing
II-61

Detailed Design Study on the Project for Construction of the New Dirout Group of Regulators
Operation and Maintenance Manual of Integrated Water Management System
1. Purpose of the Manual
The manual is prepared for rational water management and proper water distribution at the NDGRs,
primary canals, main canals and main branch canal’s intakes by integrated water management
system.
2. Concept of Water Management in the Area
Irrigation water of 9.6 billion m3, taken from the Nile River, is diverted to the Ibrahimia Primary
Canal. The water will be diverted from the NDGRs to the seven canals, and it is finally distributed
among the 600,000ha beneficiary area by the Project. It means that proper water distribution to the
seven canals will be implemented due to recovery of original functions of the Regulators.
Out of seven canals, the Bahr Yusef Canal and Ibrahimia Canal are very long, exceeding 300 km in
length. By means of integrated management of scattered regulators in such wide area, effective water
distribution targeting the five beneficiary Governorates, namely, Assiut, Giza, Beni Suef, Fayoum
and Minia can be implemented. The Project establishes a monitoring system to operate water
distribution in centralized manner for the purpose of dissolution of current imbalanced one.
In the integrated water management system to be installed by the Project, not only discharge at
regulators which are located on the boundary of Governorates but also that at other regulators and
branch canal intakes will be observed. In addition to establishment of such a centralized system in the
remote areas, H-Q curve (water level – discharge) is to be prepared, and it is possible to estimate
water volume by measured water level at regulators and branch canal intakes. It means that
centralized data collection system makes it possible to evaluate the water discharge data and to give
instruction for gate operation, which leads to proper and even water distribution at the level of main
canal.
Expected outcomes by the integrated water management system are as follows:
・Rational water distribution
Identification of discharge in the main canal at the regulators, data collection of discharge from main
canals to branch canals, just enough and proper water distribution, even water distribution based on
water rights in governorates can be implemented. Water allocation is based on the amount of water
actually supplied, which leads to fair water management.
・Awareness improvement of water distribution
It is possible for the third party to check the actual water distribution by centralized water
II-62

Final Report Volume II Water Management System
management system and visual presentation of water level and water distribution conditions at plural
sites. Moreover, some governorates, which interfere, can share the same data by the new visualized
system, which leads to improve transparency of water distribution.
・Speed-up of giving instruction for water distribution
Since measured data collection is done in the centralized manner and instruction of water distribution
is given based on the collected data, speedy instruction will be given.
・Improved operation & maintenance of irrigation facilities
Since water level discharge of targeted main irrigation facilities can be measured even in the remote
area, it is possible to identify any accidents of facilities and improper water distribution immediately,
when trouble and failure in water level data are observed. Due to the new system, repair at early stage
and daily maintenance can be practiced.
3. Target Facilities
The target water management facilities are mainly 1) monitoring systems in the remote area to be
installed by the Project, which are listed in Table 5-1.2 and Table 5-1.3, 2) the integrated water
management system in the central control house at NDGRs, and 3) the monitoring room to be
installed in Minia Governorate.
Specific targeted facilities are 1) Ibrahimia head regulator at the intake point from the Nile River, 2)
NDGRs which diverts water from the Ibrahimia Primary Canal to the seven canals, 3) Regulators at
Ibrahimia Canal and Bahr Yusef Canal, 4) branch canal’s intake at Ibrahimia canal and Bahr Yusef
canal including pump stations, 5) weirs for discharge observation at main canals and branch canals,
and 6) lake at the end of the Bahr Yusef Canal. In addition, 7) integrated water management system
in the central control house at NDGRs, which centralizes measured water level in the remote areas,
and 8) monitoring room in Minia Governorate are also targeted.
4. Administration Structure
The newly established “Integrated Water Management Center” will be in charge of management of
the target facilities mentioned above. The center is under the Central Directorate for Water
Distribution (CDWD) in Assiut, and it will be responsible for centralized operation and maintenance
of the facilities.
The center is to be installed at the NDGRs control house. Under the center, four sectors shall be
established and each sector manages East Minia, West Minia, Beni Suef and Fayoum, respectively. It
is possible for the staff to double plural sections.
II-63

Detailed Design Study on the Project for Construction of the New Dirout Group of Regulators
Figure 5-1.2 Organization chart of the new integrated water management center
5. Roles and Responsibility of the Integrated Water Management Center
Roles and responsibility of the Integrated Water Management Center are stipulated in the manual.
The Center will be in charge of following matters:
(1) Operation and maintenance of the facilities
(2) Operation of facilities by close communication with CDWD in Assiut, and speedy and proper
implementation based on the instruction by the CDWD
(3) Close monitoring of the canal conditions and handling of any issues as required
(4) Works for water distribution
1) Observation of water level in the facilities listed in Table 1
2) Decision of discharge at the regulators and discharge to be distributed to the branch canal
intakes
3) Instruction of gate operation at the regulators
4) Instruction of gate operation at the branch canal intakes
5) Instruction of pump station operation
6) Others
(5) Works for operation & maintenance
1) Cleaning and adjustment of the remote area observation equipment (water level meter, data
logger, transmitter and so on)
2) Cleaning and adjustment of the integrated water management system equipment in the
Central monitoring & operating house and the Minia monitoring room
3) Prevention of damage to the facilities
4) Early identification of damage to the facilities and immediate repair
- Assiut- West Minia- East Minia- Beni Suef- Fayoum
Inspector
- Assiut- West Minia- East Minia- Beni Suef- Fayoum
- Assiut- West Minia- East Minia- Beni Suef- Fayoum
Water Distribution Section (5)
Telemetry Section (5)
Irrigation Facility Section (5)
Administration(2)
Central Directorate for Water Distributionin Assiut
II-64

Final Report Volume II Water Management System
5) Thief proof of equipment
6) Control of excessive irrigation water use at the target facilities
7) Others
6. Works for Water Distribution
Works for water distribution mentioned in 5(4) are as follows:
(1) Any other organizations except those under the General Directorates of Irrigations (GDIs) shall
not touch the gate operation.
(2) Integrated Water Management Center shall confirm whether water is distributed at regulators
and branch canals as planned. (H-Q curve will be formulated gradually from the 3rd year after
the start of NDGRs construction, and the draft H-Q curve will be tried after the completion of
construction works.)
(3) Discharge at the regulators and water volume to be distributed to the branch canals are to be
determined based on “Water Distribution Regulation”.
(4) Integrated Water Management Center basically shall confirm three times per day whether
water is distributed through the integrated water management system as planned. According to
necessity, it shall give instruction to GDIs regarding operation adjustment at regulators and
branch canal intakes.
(5) Main gates at regulators and branch canal intakes shall be locked to prevent from illegal water
diversion.
7. Works for Operation & Maintenance
Works for operation & maintenance mentioned in 5(5) are as follows:
(1) If minor issues are identified, the staff shall handle them.
(2) If there are some issues which cannot be managed in previous item, namely, 7 (1), the staff
shall report them to the superiors and follow the instructions.
8. Water Distribution Methodology
Water volume to be distributed at the irrigation facilities are determined based on the Water
Distribution Plan prepared by the NDGRs Project.
II-65

Detailed Design Study on the Project for Construction of the New Dirout Group of Regulators
9. Record of Works
Integrated Water Management Center shall record the observed water level in the monthly report and
submit it to the CDWD in Assiut.
10. Countermeasures against Water Shortage at the Ibrahimia Head Regulator
If water intake volume at Ibrahimia Main Canal from the Nile River is limited, which results in water
shortage in the command area, the Integrated Water Management Center shall discuss with GDIs to
take countermeasures against the issue.
11. Maintenance
Facilities and equipment mentioned in “3. Target facilities” shall be regularly maintained to keep
original functions.
At the branch canal intakes and branch canals, adequate hydraulic functions could not be
implemented due to deteriorated intake gate condition and sediment blockage of water flow along the
branch canal. These minor irrigation facilities such as branch canal intakes and branch canals shall be
regularly maintained to keep original functions.
12. Inspection
For the purpose of functioning of the Integrated Water Management System, daily inspection and
regular check shall be implemented. These works shall be done following the criteria:
1) Daily check: Minimized check for daily operation
2) Regular inspection: The staff shall monitor the equipment regularly to identify any errors
from outside and implement operation tests, trial measurement, exchange of spare parts,
repair, adjustment, cleaning and so on to recover the original functions of the equipment. The
inspection frequencies are quarterly, biannually and annually depending on the inspection
items.
II-66

Final Report Volume II Water Management System
Table 5-1.2 Facilities targeted for monitoring (1/2)
Irrigation facilities Name of tne Target facilities No.
Banr Yusef canal Danab Regulator
Sakoula Regulator
Mazoura Regulator
Lanoun Regulator
Abo El Snekok Regulator
Regulator km39
6
Ibranimia canal New Hafze Regulator
Matay Regulator
Magnagna Regulator
Snaranna Regulator
El Gandy Regulator
Asnmont Regulator
6
Banr
Yusef
canal
Intake Mansnat EL Danab
El Hareka
El Sabaa
Quftan
Wesn El-Bab
EL-Giza
6
Weir Hassan Wasef Weir 1
Pump New Kamdeer P.S.
New Terfa P.S.
Old Terfa P.S.
Old Sakoula P.S.
Mazoura P.S.(2) 5
Ibranimia
canal
Intake Irad El Manarak
El Kosia
East Hafze
West Hafze
Adkak
Gendia
Abo Snosna
EL Soultany
Tansa
El Mansour
10
Weir Serry Weir Magnagna Weir 2
Ibranimia main canal Ibranimia Head Regulator 1
Lake Quarun Lake 1
Total 38
Table 5-1.3 Facilities targeted for monitoring (2/2)
Irrigation facilities Name of tne Target facilities No.
Dirout Group of Regulators Banr Yusef Regulator
Ibranimia Regulator
Irad Delgaw Regulator
Abo Gabal Regulator
Badraman Regulator
Dairotian Regulator
Sanelyia Regulator 7
Total 7
Bra
nch
cana
l R
egul
ator
II-67

Detailed Design Study on the Project for Construction of the New Dirout Group of Regulators
Figure 5-1.3 Schematic diagram of the facilities to be monitored in water management system
Wesh El-Bab El Mansour
Tansa
Qufoan
Mazoura Pump Soaoion (2) El Souloany
Old Sakoula Pump Soaoion Abo Shosha
Gindia
El Sabaa
El Hareka
Old Telfa Pump Soaoion Adkak
New Terfa Pump Soaoion
New Kamdeer Pump Soaoion
Weso Hafze Easo Hafze
Manshao El Dahab Serry Weir
RegulatorWeirBranch canal intakeDirout Control house /Central Monitoring & Operating House
Control House (Existing)
~ Target Facilities for Monitoring
~ New Dirout Group of Regulators
Sakoula Reg.
Maghagha Reg.
Hassan Wasef Weir El-Giza
Ibrahimia (Dirouo)
Bahr Yusef(Dirouo)
New Hafze Reg.
New Minya Reg.
Maoay Reg.
Maghagha Weir
EL Sharahna Reg.
EL Gandy Reg.
Ashmono Reg.
El Wasoa Reg.
Dahab Reg.
Mazoura Reg.
Garza Reg.Kafer Amar Reg.
Meat Al-Kaaed Kafershehata Reg.
Irad Delgaw Abo Gabal Badraman Dairooiah Sahelyia
IbrahimiaHead Regulaoor
AssiuoBarrage N
ile R
iver
Lahoun Reg.
Dirout Group of Regulators
Conorol House(Exisoing)
- Dirouo Conorol House
- Cenoral Moniooringand operaoing House
1
3
4
5
15
17
8
9
10
11
12
13
36
29
Conorol House(Exisoing)
Conorol House(Exisoing)
20 19
Lake Quarun
38Conorol House(Exisoing)
Target Facilities for Monitoring
23
25
24
26
27
Irad El Maharak
El Kosia
30
31
32
33
34
3518
Abo El Shokok
Regulaoor km39
37
22
21
16
7
6
2
3
14
28
4 1 25 6 7
1 38
1 7
II-68

Final Report Volume II Water Management System
Figure 5-1.4 Location map
II-69

Detailed Design Study on the Project for Construction of the New Dirout Group of Regulators
Figure 5-1.5 Data flow
Polling from central house to irrigation facilities
Gauging water level at each irrigation facilities
Data transmitting from irrigation facilities to the central
monitoring and operating house
Receive the water level data at monitoring system and
stored the data in database
Calculation of discharge based on H-Q curve stored in
database
Stored discharge data in database
Display data on the LCD monitor Read discharge and demand data
from database
Comparison between discharge and
demand data
Calculate appropriate water
distribution and water level
Display data on the LCD monitor
Instruct water level from central
house to gate operator by phone
II-70

F
inal Report V
olume II W
ater Managem
ent System
Figure 5-1.6 H
ierarchic diagram for the integrated w
ater managem
ent system
II-71

Detailed D
esign Study on the P
roject for Construction of the N
ew D
irout Group of R
egulators
Figure 5-1.7 La
yout map of the target area (draft)
Regulaoor
Weir
Gaoe for Branch CanalQuarun Lake
Waoer Level (up)
Waoer Level (down)
Pump Soaoion
Name of FacilioyCommane Area (fed)Plan of Disorbuoed Waoer
Irad Delgaw Abo Gabal Bahar Yusef Dahab Regulaoor Sakoula Regulaoor Mazoura Regulaoor LahounRegulaoor
El Giza
Badraman Abo El Shekok km39Regulaoor Regulaoor
Dairuoiah
Ibrahimia New Hafze Maoay Maghagha Maghagha Sharahna EL Gandy AshmonoSahelyia Regulaoor Regulaoor Regulaoor Weir Regulaoor Regulaoor Regulaoor
IbrahimiaHead Regulaoor
Nile River Assiuo Regulaoor Nile River
Manshao El-Dahab
Schematic Diagram for Water Management (Draft) 12:00 / 01 / July / 2022
24,000 (fed) 14,000 (fed)
68,000 fed25.769 m3/s 11.748 m3/s 4.547 m3/s
31,000 fed 31,000 fed
Prino1,565,000 (fed)
BackForward
422 576 614 573
10,000 fed 11,000 fed 19,000 fed 48,000 fed 25,000 fed 10,000 fed110,000 fed 23,000 fed
Menu
El Hareka
11.748 m3/s
El Sabaa
Lahoun251,000 fed95.118 m3/s
Qufoan Hassan Wasef Weir
57.223 m3/s
El Giza140,000 fed
Wesh El Bab0 fed
12,000 fed 151,000 fed
New Kamdeer PS
21,000 fed7.958 m3/s
Old Terfa PS16,000 fed6.063 m3/s
New Terfa PS
16,000 fed
TansaGendia Abo Shekok El SouloanyAdkak
6.063 m3/s
Old Sakoula PS
6,000 fed
0.000 m3/s
0.000 m3/s
Mazoura PS33,000 fed
12.506 m3/s
270 311 361
Irad El Maharak
3.411 m3/s
Easo Hafze
4.547 m3/s 423
3.790 m3/s 4.169 m3/s 7.200 m3/s41.685 m3/s
Weso Hafze
8.716 m3/s
Serry Weir
15,000 (fed)
12,000 fed
Group of
Regulaoors
388Average
Jan Feb Mar Apr May
698 952 1,015 947 863 737522 446 252 235
0.605i.e. 446 514 597 699Irrigaoion Inoerval 1 days
Jun Jul Aug Sep Oco Nov
417
NameArea
Discharge
##########
##########
DecCUM/fed
9.474 m3/s
El Mansour
3.790 m3/s18.190 m3/s
42,000 (fed)
9,000 fed 20,000 fed 30,000 (fed)
Dirouo
53.054 m3/sEl Kosia
7.579 m3/s
W
Wd
W
Wd
W
Wd
W
Wd
W
W
Wd
W
Wd
W
Wd
W
Wd
W
Wd
W
Wd
W
Wd
W
W
Wd
W
Wd
W
Wd
W
Wd
W
Wd
W
Wd
W
W Wd W Wd
W WdW WdW Wd
W Wd
W Wd
W WdW Wd W Wd W Wd W Wd W W WdW
Wd
W Wd W Wd
W
Wd
W
Wd
PP P P P
P
W
W
Wd
W
Wd
W
Wd
W
Wd
W
Wd
W
Wd
II-72

F
inal Report V
olume II W
ater Managem
ent System
Figure 5-1.8 La
yout of the monitored data at target area (draft)
RegulaoorNew Kamdeer PS
Weir
Old Terfa PS Old Sakoula PSGaoe for Branch Canal
Quarun Lake
Waoer Level (up) New Terfa PS Mazoura PS
Waoer Level (down)Manshao El-Dahab El Hareka El Sabaa Qufoan Hassan Wasef Weir
Pump Soaoion
Irad Delgaw Abo Gabal Bahar Yusef Dahab Regulaoor Sakoula Regulaoor Mazoura Regulaoor LahounRegulaoor
El Giza
Wesh El Bab
Irad El Maharak El Kosia Abo El Shekok km39Badraman Regulaoor Regulaoor
Dairuoiah
Serry Weir Weso Hafze Adkak Gendia Abo Shosha El Souloany Tansa El Mansour
Ibrahimia New Hafze Maoay Maghagha Maghagha Sharahna EL Gandy AshmonoSahelyia Regulaoor Regulaoor Regulaoor Weir Regulaoor Regulaoor Regulaoor
Easo Hafze
IbrahimiaHead Regulaoor
Nile River Assiuo Regulaoor Nile River
280
260
270
240
250
220
230
200
210
180
190
110
160
170
140
150
40 50 80 906010 20 30 70 120
130
100
Schematic Diagram for Water Management (Draft) 12:00 / 01 / August / 2022
PrinoBack
ForwardMenu
Dirouo
Group of
Regulaoors
m3/s
m m
m
m
m3/s
m3/s
m 3/s
m
m
m
m
m 3/s
m m
m
m
m3/s
m 3/s
m3/s
m m
m
m 3/s
m
m
m3/s
m
m
m
m
m
m
m
m
m
m
m
m
m
m3/s
m
m
m
m 3/s
m
m
m3/s
m3/s m 3/s m 3/s m3/s
m3/s
m 3/s
m 3/s
m3/s
m3/sm 3/s
m3/s
m 3/s
m
m
m
m m
m
m 3/s
m
m
m 3/sm 3/s m 3/s m 3/s
m
m
m 3/s
m
m
m3/s
m 3/s
m
m
m3/s
m
m
m 3/s
m
m 3/s
m
m
m3/s
m
m
m 3/s
m
m
m
m
m
m
m
mm
m
m
m 3/s
m
m
m 3/s
m
m 3/s
m
m
m 3/s
W
Wd
W
Wd
W
Wd
W
Wd
W
W
Wd
W
Wd
W
Wd
W
Wd
W
Wd
W
Wd
W
Wd
W
W
Wd
W
Wd
W
Wd
W
Wd
W
Wd
W
Wd
W
W Wd W Wd
W WdW WdW Wd
W Wd
W Wd
W WdW Wd W Wd W Wd W Wd W Wd W WdW
Wd
W Wd W Wd
W
Wd
W
Wd
PP P P P
P
W
m
m
m 3/s
m
m
m 3/s
W
Wd
W
Wd
W
Wd
W
Wd
W
Wd
W
Wd
m
m
m
m
m
m
m
m
m
m
II-73

Detailed D
esign Study on the P
roject for Construction of the N
ew D
irout Group of R
egulators
Figure 5-1.9 O
utput image of graph of w
ater level data (draft)
Water Level Graph 12:00 / 01 / August / 2022
Bahr Yusef ▼
24 Hours
2 Weeks
TIME
WL: m
WL: m
WL: m
WL: m
WL: m
WL: m
WL: m
Scale
0 3 6 9 12 15 18 21
Locaoion of Waoer Level :
Waoer Level (Up soream)
Waoer Level (Down soream)
PrinoBack
ForwardMenu
24
II-74

F
inal Report V
olume II W
ater Managem
ent System
Figure 5-1.10 O
utput image of table of w
ater level data (draft)
19:00
20:00
21:00
22:00
23:00
TIME
Water Level (1)
Ibrahimia
Head Regulaoor
Irad El Maharak
Canal
El Kosia
Canal
Downsoream
WL WL
(m) (m)
X.XX X.XX
Upsoream Downsoream
12:00 / 01 / August / 2022
00:00
01:00
02:00
03:00
04:00
05:00
06:00
07:00
08:00
09:00
10:00
11:00
12:00
13:00
14:00
15:00
16:00
17:00
18:00
MenuPrino Back Forward
Upsoream Downsoream
WL WL
(m) (m)
X.XX X.XX
WL WL
X.XX
(m)
WL
Upsoream Downsoream
WL
(m)
X.XX
Upsoream
(m) (m)
X.XX X.XX
Upsoream Downsoream
WL WL
(m) (m)
X.XX X.XX
Upsoream Downsoream
WL WL
(m) (m)
X.XX X.XX
Upsoream Downsoream
WL WL
(m) (m)
X.XX X.XX
II-75

Detailed D
esign Study on the P
roject for Construction of the N
ew D
irout Group of R
egulators
Table 5-1.4 Exam
ple of crop consumptive w
ater use
Jan Feb Mar Apr May Jun Jul Aug Sep Oco Nov Dec
Wheao 265.44 328.02 557.34 485.10 70.98 47.46 242.34
Long berseem 247.80 352.80 541.80 663.60 550.20 231.60 252.00
Sugar beeo 258.32 335.83 615.35 932.06 1,195.49 603.60 135.51
Legums 272.16 302.40 500.22 101.60 142.80 248.64
Vegeoables 117.60 67.20 71.40 58.80 29.40 210.00 394.80 373.80 285.60
Ooher crops 420.00 399.00 273.00 146.00
Shoro berseem 247.80 352.80 235.20 256.20
Rice 21.00 130.20 1,289.40 1,457.40 1,423.80 369.60
Maize 205.80 638.40 640.80 680.40 147.00
Sorghum 194.30 620.10 930.00 660.80 140.00
Oil crop 575.40 945.00 890.40 176.40
Vegeoables 92.40 142.80 260.40 697.20 432.60 201.60 184.80 197.40 117.60
Ooher crops 147.00 520.80 609.00 537.60 474.60 113.40
Maize 252.00 663.60 751.80 529.20 163.40
Sorghum 241.30 650.20 740.00 515.10 110.20
Vegeoables 21.00 100.80 260.40 403.20 344.40 277.00 197.40
Ooher crops 298.00 449.40 478.80 520.80 600.60 680.40 659.40 453.00
Sugar cane 195.30 294.00 428.40 516.60 716.10 768.60 859.32 950.46 894.60 690.06 541.80 312.48
Coooon 127.68 390.60 664.02 806.40 915.18 429.66 207.60
Fruio orees 403.00 364.00 465.00 490.00 527.00 510.00 527.00 518.00 480.00 496.00 390.00 356.00
Source: MWRI (as for fruio orees, daoa of sprinkler in deloa is used)
Waoer Duoies (CUM/fed)
Permaneno
Season
Winoer
Summer
Nile
Crop
II-76

Final Report Volume II Water Management System
Table 5-1.5 Inspection items (water level sensor)
No Outline Scope of inspection works
Inspection interval
Eve
ryda
y
one
mon
th
thre
e m
onth
six
mon
th
twel
ve
mon
th
1 Status of installation Check the installation status of the sensors ○
2
Confirmation of outdoor facilities and cleaning of protective pipe
Confirmation of the status of outdoor facilities such as water level sensor’s protective pipe, pull box, conduit and mounting parts with deformation, damage, abnormal rusting, corrosion and paint peeling etc. Confirmation of loosening and dropping of screws and bolts.
Remove sediments such as mud and sand accumulated in the lower part of the water level sensor’s protective pipe and inside the pipe.
○
3 Comparative test Compare and check the level of staff gauge and water level displayed on the remote and master station.
Confirm the water level by the sensor submersion test. ○
4 Confirmation of connection status
Check the connection status of connection cable, connector and terminal etc. ○
5 Cleaning of sensor Clean the inner and outer of the equipment body. ○
6 Confirmation of documents
Confirm that the documents and drawings are organized and kept. ○
Table 5-1.6 Inspection items (solar panel)
No Outline Scope of inspection works
Inspection interval
Eve
ryda
y
one
mon
th
thre
e m
onth
six
mon
th
twel
ve
mon
th
1 Confirmation of charging status Check on remote station or master station that it is being charged every day
○
2 Solar panel
Inspection of appearance
Confirmation of the status of outdoor facilities such as solar panel and mounting parts with deformation, damage, abnormal rusting, corrosion and paint peeling etc. Confirmation of loosening and dropping of screws and bolts.
○
Confirmation of connection cable
Confirmation of cable deterioration and cable laying status.
○
Sunshine condition
The surrounding environment at the installation direction of the solar panel. Confirm that there is no obstructing the sunlight for solar panel by tree growth etc.
○
4 Confirmation of connection status Check the connection status of connection cable, connector and terminal etc.
○
5 Cleaning of solar panel Clean the inner and outer of the solar panel ○
6 Confirmation of document Confirm that the documents and drawings are organized and kept.
○
II-77

Detailed Design Study on the Project for Construction of the New Dirout Group of Regulators
Table 5-1.7 Inspection items (measuring equipment)
No Outline Scope of inspection works
Inspection interval
Eve
ryda
y
one
mon
th
thre
e m
onth
six
mon
th
twel
ve m
onth
1 Measurement of
Voltage Measure (check) the circuit voltage etc. at the remote station of master station.
○
2 Operation confirmation
Whether the water level sensor is correct or not, confirmed by the displayed present water level data through the monitoring device and the water level trend (operation log).
○
3 Battery checking
Check the replacement cycle of the storage battery and replace the target one.
○
Confirmation of the status of facilities such as battery and mounting parts with deformation, damage, abnormal rusting, corrosion and paint peeling etc. Replacement of the target one.
○
Check that the voltage etc. are normal. Replace targeted items. ○
4 Cable checking
Inspection of appearance
Confirmation of the status of outdoor facilities such as cables and mounting parts with deformation, damage, abnormal rusting, corrosion and paint peeling etc. Confirmation of loosening and dropping of screws and bolts.
○
Confirmation of cable
Confirmation of cable deterioration and cable laying status. ○
5 Enclosure checking
Confirmation of the status of outdoor facilities such as enclosure and mounting parts with deformation, damage, abnormal rusting, corrosion and paint peeling etc. Confirmation of loosening and dropping of screws and bolts.
○
6 Confirmation of connection status
Check the connection status of connection cable, connector and terminal etc.
○
7 Cleaning of equipment
Clean the inner and outer of the equipment body and filter. ○
8 Confirmation of document
Confirm that the documents and drawings are organized and kept ○
II-78

Final Report Volume II Water Management System
Table 5-1.8 Inspection items (monitoring equipment)
No Outline Scope of inspection works
Inspection interval
Eve
ryda
y
o ne
mon
th
t hre
e m
onth
s ix
mon
th
t wel
ve
mon
th
1 Server
Confirmation of voltage etc.
Check the power supply voltage etc. with the check terminal ○
Replacement of battery
Check the replacement cycle of the backup battery and replace the target battery.
○
Confirmation of CRT display
Check brightness and color etc and check that there is no abnormality status.
○
Confirmation of hard disk
Check operating time and bad sector status ○
Confirmation of function of black out and power supply recovery
Confirm that power failure detection, data save processing at power failure detection, etc. are normally performed by interlocking with the uninterruptible power supply.
○
Confirm that automatic startup processing at power recovery is performed normally.
○
Check file protection function, backup function, etc ○
Operation check
Use the test program to check the operation status as a server.
○
Confirmation of event log
Check the OS event log (system and application) and confirm that there are no logs showing symptoms or occurrence of hardware abnormality or OS abnormality.
○
Confirmation of connection status
Confirmation of connection cable, connecter, connection status of terminals and loosening of plug-in.
○
Cleaning of equipment
Clean the outer of the equipment body ○ Confirmation and cleaning of keyboard and mouse etc. ○ Cleaning of fun and filter ○ Check the status of equipment installation. ○
2
System operation (confirmation of monitoring display)
Display of status of remote station
Confirm that the equipment status of the node (water level measurement data and detailed node information) is displayed.
○
Display of current water level
Confirmation of displaying the latest water level data ○
Display of water level trend
Confirmation of historical water level data ○
Display of historical record
Confirmation of display of historical event data ○
Data recording
Confirmation of recorded data ○
3 Confirmation of document
Confirm that the documents and drawings are organized and kept
○
II-79

Volume Ⅲ CONSTRUCTION PLANNING & COST ESTIMATION
Page
1.Temporary Works ··········································································Ⅲ- 1 1-1 Outline of the project ·······························································Ⅲ- 1 1-2 Working condition ··································································Ⅲ- 3 1-3 Construction planning ······························································Ⅲ- 4 1-4 Preparation planning ·······························································Ⅲ- 7 1-5 Procurement planning ····························································· Ⅲ-11
2.Construction of the NDGRs and Water Management Facilities ····················· Ⅲ-18 2-1 Construction of Bahr Yusef regulator ··········································· Ⅲ-19 2-2 Construction of Badraman regulator ············································ Ⅲ-26 2-3 Construction of Diroutiah regulator ············································· Ⅲ-32 2-4 Construction of Ibrahimia regulator ············································· Ⅲ-37 2-5 Construction of Abo Gabal regulator ············································ Ⅲ-46 2-6 Construction of Sahelyia regulator ·············································· Ⅲ-51 2-7 Construction of water management system ······································· Ⅲ-57
3.Work Schedule ············································································· Ⅲ-60 3-1 Criteria on work schedule ························································ Ⅲ-60 3-2 Formulation of work schedule ··················································· Ⅲ-60 3-3 Construction schedule ································································ Ⅲ-88
4.Project Cost Estimation ··································································· Ⅲ-90 4-1 Criteria and manual of cost estimation ·········································· Ⅲ-90 4-2 Estimation of the project cost ···················································· Ⅲ-91

List of Figures Figure 1-1.1 Layout plan of temporary works ·············································Ⅲ- 2 Figure 1-1.2 Cross section of at the new Ibrahimia regulator
during temporary works ·······················································Ⅲ- 3 Figure 1-1.3 Cross section of the new Bahr Yusef regulator
during temporary works ·······················································Ⅲ- 3 Figure 1-4.1 Location of temporary yards ··················································Ⅲ- 8 Figure 1-4.2 Prospective temporary yards around the site ·······························Ⅲ- 9 Figure 1-5.1 Quarry sites in Assiut ························································· Ⅲ-13 Figure 1-5.2 Locations of borrow site, quarry site and spoil bank site
near Dirout ····································································· Ⅲ-13 Figure 1-5.3 Location of quarry sites in Minia and Dirout ······························ Ⅲ-14 Figure 2-1.1 Regulator construction flow ················································· Ⅲ-18 Figure 3-1.1 Work procedure ······························································· Ⅲ-61
List of Tables Table 1-1.1 Outline of the project ···························································Ⅲ- 1 Table 1-2.1 Soil classification ·······························································Ⅲ- 4 Table 1-3.1 Cofferdam method ······························································Ⅲ- 6 Table 1-4.1 Assignment of security guards ················································Ⅲ- 7 Table 1-4.2 Temporary yards near the construction site ··································Ⅲ- 8 Table 1-4.3 Prospective temporary yards around the site ·································Ⅲ- 9 Table 1-4.4 Temporary facilities ·····························································Ⅲ- 9 Table 1-4.5 Construction management equipment ······································· Ⅲ-10 Table 1-4.6 Quality control ·································································· Ⅲ-10 Table 1-5.1 Personnel expenses ···························································· Ⅲ-12 Table 1-5.2 Procurement of construction materials ······································ Ⅲ-16 Table 1-5.3 Procurement of construction machines ······································ Ⅲ-17 Table 2-7.1 Location of the construction of water management system ··············· Ⅲ-57 Table 3-2.1 Critical pass work (Bahr Yusef) (1/5) ········································ Ⅲ-63 Table 3-2.2 Critical pass work (Bahr Yusef) (2/5) ········································ Ⅲ-64 Table 3-2.3 Critical pass work (Bahr Yusef) (3/5) ········································ Ⅲ-65 Table 3-2.4 Critical pass work (Bahr Yusef) (4/5) ········································ Ⅲ-66 Table 3-2.5 Critical pass work (Bahr Yusef) (5/5) ········································ Ⅲ-67 Table 3-2.6 Critical pass work (Ibrahimia) (1/5) ········································· Ⅲ-68 Table 3-2.7 Critical pass work (Ibrahimia) (2/5) ········································· Ⅲ-69 Table 3-2.8 Critical pass work (Ibrahimia) (3/5) ········································· Ⅲ-70 Table 3-2.9 Critical pass work (Ibrahimia) (4/5) ········································· Ⅲ-71 Table 3-2.10 Critical pass work (Ibrahimia) (5/5) ········································ Ⅲ-72 Table 3-2.11 Critical pass work (Badraman) (1/4) ······································· Ⅲ-74 Table 3-2.12 Critical pass work (Badraman) (2/4) ······································· Ⅲ-75 Table 3-2.13 Critical pass work (Badraman) (3/4) ······································· Ⅲ-76 Table 3-2.14 Critical pass work (Badraman) (4/4) ······································· Ⅲ-77 Table 3-2.15 Critical pass work (Diroutiah) (1/4) ········································ Ⅲ-78 Table 3-2.16 Critical pass work (Diroutiah) (2/4) ········································ Ⅲ-79

Table 3-2.17 Critical pass work (Diroutiah) (3/4) ········································ Ⅲ-80 Table 3-2.18 Critical pass work (Diroutiah) (4/4) ········································ Ⅲ-81 Table 3-2.19 Critical pass work (Abo Gabal) (1/3) ······································ Ⅲ-82 Table 3-2.20 Critical pass work (Abo Gabal) (2/3) ······································ Ⅲ-83 Table 3-2.21 Critical pass work (Abo Gabal) (3/3) ······································ Ⅲ-84 Table 3-2.22 Critical pass work (Sahelyia) (1/3) ········································· Ⅲ-85 Table 3-2.23 Critical pass work (Sahelyia) (2/3) ········································· Ⅲ-86 Table 3-2.24 Critical pass work (Sahelyia) (3/3) ········································· Ⅲ-87 Table 3-3.1 Construction schedule (large regulators) ···································· Ⅲ-88 Table 3-3.2 Construction schedule (small regulators) ··································· Ⅲ-89 Table 4-2.1 Construction and project cost estimation ···································· Ⅲ-92 Table 4-2.2 Ratio for STEP loan ···························································· Ⅲ-93 Table 4-2.3 Summary of the project estimation ·········································· Ⅲ-94 Table 4-2.4 Bill of quantities (1/12) ························································ Ⅲ-95 Table 4-2.5 Bill of quantities (2/12) ························································ Ⅲ-96 Table 4-2.6 Bill of quantities (3/12) ························································ Ⅲ-97 Table 4-2.7 Bill of quantities (4/12) ························································ Ⅲ-98 Table 4-2.8 Bill of quantities (5/12) ························································ Ⅲ-99 Table 4-2.9 Bill of quantities (6/12) ······················································ Ⅲ-100 Table 4-2.10 Bill of quantities (7/12) ···················································· Ⅲ-101 Table 4-2.11 Bill of quantities (8/12) ···················································· Ⅲ-102 Table 4-2.12 Bill of quantities (9/12) ···················································· Ⅲ-103 Table 4-2.13 Bill of quantities (10/12) ··················································· Ⅲ-104 Table 4-2.14 Bill of quantities (11/12) ··················································· Ⅲ-105 Table 4-2.15 Bill of quantities (12/12) ··················································· Ⅲ-106

Final Report VolumeⅢ Construction Planning & Cost Estimation
Volume Ⅲ - CONSTRUCTION PLANNING & COST ESTIMATE
1 Temporary Works
1-1 Outline of the project
The construction site is located in an urban area, and the national railway and the national road run
on the east and west sides, respectively, of the construction site. Both the temporary work plan and
the construction plan were formulated using the field survey, the existing condition survey, and the
construction equipment and materials survey, and take the actual conditions around the site into
consideration.
The project consists of the following two components.
(a) Construction of the NDGRs 140 m downstream from the existing DGRs.
(b) Improvement of the communications facilities pertaining to the construction of the water
distribution system.
Components (a) and (b) are formulated based on the principle that (1) the DGR renovation plan and
(2) improvement of the system environment to support daily water management policy are
inseparable if the original capabilities of the existing dysfunctional DGRs are to be restored. RGBS
is the main agency responsible for the execution of this project.
The two sub-projects consist of the following works.
Table 1-1.1 Outline of the project
Item Structures
(1) New Dirout Group of Regulators
(a) Construction of new regulators Construction work on six regulators
(b) Installation of gates
Bahr Yusef W 6.0 m × H 6.55 m, total 4 vents
Ibrahimia W 6.0 m × H 6.55 m, total 4 vents
Abo Gabal W 2.0 m × H 2.95 m, total 4 vents
Badraman W 2.0 m × H 2.65 m, total 2 vents
Diroutiah W 2.0 m × H 2.35 m, total 3 vents Sahelyia W 2.0 m × H 3.55 m, total 2 vents
(c) Improvement of peripheral facilities Construction parallel bridge
Improvement of retaining walls
(d) Cofferdam works Single and double cofferdams of steel sheet pile
(2) Integrated Water Management
(a) Main canal gates management system
(b) Branch canal intake management system
(c) Establishment of integrated water management centre
Monitoring system installation work
Monitoring system installation work Construction of centre building
Ⅲ-1

Detailed Design Study on the Project for Construction of the New Dirout Group of Regulators
The applied reference criteria and manual used in the study are:
1. Manual for double steel sheet pile method, Ministry of Land, Infrastructure, Transport and Tourism.
2. Guidelines for temporary structures in road works, Japan Road Association.
Figures 1-1.1, 1-1.2 and 1-1.3 show the drawings for the construction plan and the cross-sectional
map of the two large regulators (new Bahr Yusef and Ibrahimia regulators).
Fig
ure
1-1
.1 L
ayo
ut
pla
n o
f te
mpo
rary
wo
rks
Ⅲ-2

Final Report Volume Ⅲ Construction Planning & Cost Estimation
1-2 Work conditions
(1) Construction Period
Due to the volume of work to be done, the planned construction period of the New Dirout Group of
Regulators is 51 months.
Start of construction: February 2018
Completion of construction: April 2022
(2) Work Days
The work on the New Dirout Group of Regulators involves mainly earth works (excavation,
embankment etc.) and concrete work. The work days are the number of days less the days no work is
possible due to weather (temperature or rainfall etc.) and holidays. The weather is unlikely to influence
the construction, because the temperature at the construction site is 3°C or higher throughout the year
Figure 1-1.2 Cross section of the new Bahr Yusef regulator during temporary works
Figure 1-1.3 Cross section of the new Ibrahimia regulator during temporary works
Ⅲ-3

Detailed Design Study on the Project for Construction of the New Dirout Group of Regulators
and rainfall is less than 1 mm; thus, the non-working coefficient is 1.35, which is the normal value for
construction works.
Nonworking coefficient (1.35)
General works: 1.35
Working days per year: 270 days (365/1.35)
Working days per month: 270 days/12 months = 22.5 days
Working hours: 8:00~17:00 (9 hours): 8 working hours per day plus 1 rest hour.
(3) Soil Classifications
The soil classifications applied for the New Dirout Group of Regulators are as follows:
Table 1-2.1 Soil classification
Soil & Geology Classification
Soil Classification Applicable name After excavation
Top soil Clay - Clay
River bed deposits Sand (with gravel) Sand (with
gravel) Sand (with
gravel) Purchased material Sand and gravel Sand and gravel Sand and gravel
1-3 Construction plan
(1) Temporary bridge
The DGR crosses the upstream Ibrahimia canal and is used as the bridge for the local main road
as there are few bridges crossing the Ibrahimia canal in this area. Heavy trucks weighing more
than 20 tonnes are prohibited from passing over the bridge; therefore, a temporary bridge strong
enough to withstand heavy construction vehicles is needed. A temporary bridge cannot be built
on the Ibrahimia canal because the railway goes along the right bank of the Ibrahimia canal.
The conditions for a temporary bridge over the Bahr Yusef canal are discussed below.
(a) Location
The location of the temporary bridge will be selected in accordance with the following
conditions:
1) Land acquisition will not upset the lives of residents.
2) Location is near the construction site, without obstacles preventing access to the construction
yards.
Candidate sites for the temporary bridge are proposed upstream and downstream of the Bahr
Yusef regulator. The upstream site is not as wide as the downstream site, and is too close to the
DGRs. Therefore, the downstream site is better for the construction of the temporary bridge. In
order to ensure road access for construction vehicles, the temporary bridge will be designed to
extend over the entire width of the Bahr Yusef canal.
Ⅲ-4

Final Report Volume Ⅲ Construction Planning & Cost Estimation
(b) Length
The temporary bridge will be 100 m long to span the Bahr Yusef canal, as construction vehicles
are prohibited from crossing the DGR bridge. The location of the temporary bridge was moved
slightly upstream (closer to the downstream end of the double cofferdam) to avoid a water pipe
discovered in the original location during the field survey.
(c) Design load
The design load of the temporary bridge should be more than 20 tonnes, which is the general
traffic load of construction vehicles, machinery and cars. The maximum design load at the time
of the installation of the gate is assessed as the weight of a truck crane, which can carry a load of
up to 80 tonnes.
(d) Width
The construction of the temporary bridge will begin on the left side of the canal, and the H-steel
bridge piers will be driven into the pier at 6 m intervals using heavy machinery. The driver
machine will drive in the H-steels moving along the temporary bridge from the left side of the
canal to the right side. The width of the temporary bridge is designed to be 8 m.
Since the temporary bridge will also be used by construction vehicles, the width of the temporary
bridge will be 8 m to allow for two-way traffic.
(e) Span length
The pier spacing for the temporary bridge is planned to be 6 m, as the pier interval is usually set
between 5 m and 6 m.
(2) Temporary cofferdam
The steel double sheet pile method, which is widely used in Japanese engineering projects, shall
be applied on account of its high water cut-off performance- and smaller working area. Because
the construction site is situated in the centre of Dirout City, vibration and noise must be kept to a
minimum.
The reasons for use of the steel double sheet pile method are as follows:
1) The construction site is in a canal with flowing surface water, hence a high level of
water-tightness is required to keep the worksite dry.
2) A temporary bypass canal cannot be used during construction because of the urban location of
the works.
3) A multiple-stage diversion method will be adopted to ensure that water distribution through
the canals is not stopped during the construction of the NDGRs. The work area in the canals
should be kept as small as possible, and the steel double sheet pile method can help minimize
Ⅲ-5

Detailed Design Study on the Project for Construction of the New Dirout Group of Regulators
the size of the work area.
4) The steel double sheet pile is considered appropriate for the water depth.
There are three main cofferdam methods for the construction of temporary works: (1) the fill
materials embankment method, (2) the single steel sheet pile method, and (3) the steel double
sheet pile method. The method is chosen according to the water depth of the worksite, in this case
about 7 m.
The maximum water depths for each method are shown in Table 1-3.1. The fill materials
embankment method is suited to depths of around 3 m; the single steel sheet pile method to depths
of around 5 m: and the steel double sheet pile method to depths of around 10 m. Therefore, the
steel double sheet pile method will be adopted for the design water depth of 7 m.
Table 1-3.1 Cofferdam method
Method Embankment Single sheet pile Steel sheet pile
Overview
Maximum Water Depth Up to 3 m Up to 5 m Up to 10 m Design Water Depth 7 m 7 m 7 m
Assessment
NG (7 m > 3 m) Design depth is more than maximum water depth
NG (7 m > 5 m) Design depth is more than maximum water depth
OK (7 m < 10 m) Design depth is less than maximum water depth
Steel double sheet pile cofferdams have already been successfully used in the Dahab and the
Sakoula regulators, which are on a similar scale to the NDGRs. The work process is as follows:
1) Construction of temporary bridge substructure (H-steel bearing piles)
2) Reinforcement work (strut or brace)
3) Construction of temporary bridge superstructure (W=6 m)
4) Steel sheet piling
5) Reinforcement work (waling)
6) Tie rod and waling work
7) Ground improvement and banking
8) Removal of temporary bridge
9) Filling embankment
The use of a hydraulic piledriver and electric water jet to drive the steel sheet piling is planned
because the N value of the foundation layer is higher than 20.
The filling soil used in the steel double sheet pile will be brought from the borrow site located
Ⅲ-6

Final Report Volume Ⅲ Construction Planning & Cost Estimation
19 km from the construction site. The filling soil is for the banking of the regulator and should be
removed immediately after the removal of the first cofferdam, stored temporarily, and then moved
to be used as filling soil for another cofferdam.
And the type of revetment works is planned by sheet pile with tie rods binding. After construction
of the stage for heavy equipment with pre-embankment performing, the sheet piles drive by
vibro-hammer. The tie rods set after embankment and excavation trench for the tie rod portion,
and then backfilling of the trench for the tie rods.
1-4 Preparation plan
(1) Transport and packing plan
Transport from Japan and third countries
The transportation route is from a port in Japan through the Indian Ocean and the Suez Canal to
Alexandria. Packing and customs clearance in Japan will take two weeks, and then it will take
about one month to reach Alexandria Port. It will take another two weeks to unload and pass
through customs at Alexandria Port, and two days to travel inland from Alexandria to the Dirout
site by truck or trailer.
Domestic transport
The construction materials and machinery from Cairo City, Minia city and surrounding suburbs
will be transported on trucks or trailers. The large construction materials (steel sheet piles, H
steel, gate equipment, large machinery, etc.) will be transported on large trucks and trailers, and
will be brought into the site from the left bank.
Preparation works are planned at the start of construction, during the construction period, and
during the cleaning-up stage after completion of the works.
(2) Preparation Work
The preparation works planned include preparation at the start of construction and during
construction, clearing-up and clean-up after the completion of the works.
(3) Security
Security precautions such as the erection of a fence around the construction site and the hiring of
guards are planned. The fence around the site will be of wooden stakes (l=2.5 m) and barbed
wire (B=1.25 m).
Table 1-4.1 Assignment of security guards
Traffic control Temporary road 2 persons × 20 months Security guards Temporary yard Day and night shift 2 persons × 3 locations × 21
months Site office Day and night shift 2 persons × 21 months
Ⅲ-7

Detailed Design Study on the Project for Construction of the New Dirout Group of Regulators
(4) Temporary yards
The temporary yards will accommodate a workshop (rebar/formwork), a warehouse (for general
materials and cement), a testing laboratory, a concrete plant and a yard for the storage and
assembly of steel materials and gate equipment. A batching plant and temporary storage yard will
also be necessary near the construction site. The required area of the temporary yards as follows.
Batching plant: 2,500 m2 Material stockyard: 4,000 m2 (sheet piles, foundation piles, etc.) Material stockyard: 2,000 m2 (backfill materials, etc.) Workshop yard: 1,000 m2 (reinforcing bars, formwork, etc.) Heavy equipment yard: 2,000 m2 Office and parking: 500 m2 Total 12,000 m2
It is planned to locate the temporary yards close to the construction site but if there is not enough
space other prospective sites will be prepared in the area around the site.
Table 1-4.2 Temporary yards near the construction site
No. Temporary Yard Area (m2) Remarks ① Irrigation Department 2,300 Batching plant ② Irrigation Department 700 Administration office ③ Irrigation Engineering 1,700 ④ Irrigation Department 1,100 ⑤ Irrigation Department 600 Construction road ⑥ Bahr Yusef left bank 450 Materials stock yard ⑦ " 350 Materials stock yard ⑧ " 600 Former site of Mosque ⑨ " 450 Materials stock yard ⑩ Bahr Yusef right bank 500 Materials stock yard
Total 8,570
Figure 1-4.1 Location of temporary yards
Ⅲ-8

Final Report Volume Ⅲ Construction Planning & Cost Estimation
Table 1-4.3 Prospective temporary yards around the site
Temporary yard
Location Distance (km)
Area (m2)
Condition Remarks
1 Near Cotton Factory 0.5 15,000 Residential area
2 Beside ring road 3 5,000 Field 3 Beside ring road 4 4,000 Field 2 areas 4 Beside Badraman Canal 1 4,000 Field 5 Beside Badraman Canal 2 4,000 Field
Figure 1-4.2 Prospective temporary yards around the site
(5) Temporary facilities
The temporary facilities will be built in the temporary yards as follows:
Table 1-4.4 Temporary facilities
Temporary Facility Purpose Area Site office Consultant and contractor office for construction
management About 200 m2
Work shop Preparation of reinforcing bars and formwork, 25 persons About 200 m2 Warehouse Storage of tools, small machinery, materials and
mechanical and electrical equipment About 200 m2
Cement warehouse Storage of cement, volume 100 tonnes (maximum concrete casting volume: 250 m3/day)
40 m2
Laboratory Testing of concrete and soil 40 m2 Toilet / Shower room For workers 3 m2 Break room For workers 40 m2 Workers’ camp Accommodation for skilled construction labourers
employed away from home About 200 m2
(6) Power plan
During the construction period, electric power can be provided from an electric power source
(150 kVA) beside the main road to the construction site. However, as power outages occur
frequently in the area, electric generators will be kept on standby at the site. A major
Temporary yard 2
Temporary yard 1
Temporary yard 3
Temporary yard 4
Temporary yard 5
Ⅲ-9

Detailed Design Study on the Project for Construction of the New Dirout Group of Regulators
construction accident could occur if the power were to stop in the middle of steel sheet pile
driving work or deep well work where power is needed for short concentrated periods.
Electricity will be needed constantly over the long term in the temporary yards, for tools,
lighting, the workers’ camp, and the concrete plant. A backup power generator (1 unit, 80 kVa)
will be installed.
(7) Construction management
(a) Materials
The office equipment used to prepare management reports on the quality control and volume of
earth work, foundation work, concrete work, pavement work, mechanical and electrical work,
etc., and survey, drafting and photographic equipment etc., will be appropriated.
Table 1-4.5 Construction management equipment
Item Equipment Quantity Survey Auto level 2
Total station 1 Photo Camera (including compact camera 1) 2 Office Personal computer 2 Copy machine 2
(b) Quality control
Quality control will be carried out for the earth work, concrete work, pavement work, and the
mechanic and electrical work.
Table 1-4.6 Quality control
Work Control item Method Measurement Basement Soil condition
Width, Height Bearing capacity
Visual Measurement Flat-plate load test
Per main section Per main section Once per main structure
Banking Compaction Site density Every 400 m2 Concrete Aggregate
Cement Fresh concrete Strength
Grain size test Physical / chemical test Slump / air / chloride / alkali aggregate reaction test Compression strength test
Every 3,000 m3 Every 1,000 tonnes Each casting Each cast section or Every 200 m3
Reinforcing bar Strength bar arrangement
Tension strength test Check of condition
Every 200 tonnes Each cast section
Completed structure Completed dimensions
Dimensional measurement Each main member
Mechanical equipment
Installation precision Performance
Installation position measurement Load operation test
All equipment All equipment at test Operation
Ⅲ-10

Final Report Volume Ⅲ Construction Planning & Cost Estimation
(8) Building and maintenance
(a) Site office
The plan is to build the site offices of the consultants and the contractor in the temporary yard
and to lease a liaison office in Cairo City. This is because the construction site in Dirout is 500
km from Cairo City, which is well situated to relay the procurement and transportation of
construction equipment between Alexandria and Dirout.
(b) Lodging
A rented house near the temporary yard will house the Japanese engineers, and the skilled
labourers and workers from Cairo or elsewhere will reside in a specially-built concrete block
building with wood trusses and galvanized iron roofing.
1-5 Procurement plan
(1) Workforce
(a) Engineers and labourers
Ordinary workers, security guards and clerical staff can be procured from Dirout City and towns
and villages close to the construction site.
Other employees, such as engineers, drivers, skilled workers such as carpenters, rodmen and
plasterers shall also be hired. Shortages of skilled and short-term labour during the construction
peak period will be hired from Cairo.
(b) Labour benefits
In addition to severance pay, social insurance and bonuses, government offices and private
companies in Egypt must pay workers who cannot commute from home overtime pay, remote
location allowance, commuting allowance and accommodation allowance. Thus, all these
benefits will be paid with the exclusion of the accommodation allowance, as labourer
accommodation in the temporary yard is already planned.
As ordinary workers, security guards, and clerical staff will be hired from Minia City and towns
and villages close to the construction site, a commuting allowance to cover transport from their
residence will be paid but there are no plans to pay the remote location allowance.
The workers to be paid daily and the workers to be paid monthly under this plan are as follows:
Ⅲ-11

Detailed Design Study on the Project for Construction of the New Dirout Group of Regulators
Table 1-5.1 Personnel expenses
Work Overtime
Remote location
Commuting Remark
Paid daily
Manager ○ ○ - Special worker ○ ○ - Ordinary worker ○ - ○ Hired from local area Scaffold worker ○ ○ - Steel worker ○ ○ - Special driver ○ ○ - Driver ○ ○ - Carpenter ○ ○ - Masonry worker ○ ○ - Painter ○ ○ - Welder ○ ○ - Electrician ○ ○ - Mechanic ○ ○ - Plumber ○ ○ - Security guard ○ - ○ Hired from local area
Paid monthly
Civil engineer A ○ ○ - 15 years of experience or more Civil engineer B ○ ○ - 10 years of experience or more Surveyor ○ ○ - Assistant surveyor ○ ○ - CAD operator ○ ○ - Accountant ○ ○ - Office worker ○ - ○ Hired from local area Driver ○ ○ - Mechanical engineer ○ ○ - Electrical engineer ○ ○ -
Standard working hours in Egypt is 7 hours, but an 8-hour workday (9 hours less one rest hour)
is planned for this project; hence one hour of overtime should be paid. Overtime pay in the case
of work in excess of 7 hours/ weekday in Egypt is as follows:
3 hours’ overtime 135%
Night shift work 150%
Holidays and Fridays 200%
Severance pay shall be paid only to those local employees who are employed by the Japanese
contractor and are paid on a monthly basis. The normal rate for severance payment in Egypt is
25% of the total amount paid.
(2) Construction materials
(a) General Construction Materials
A stable supply of most of the construction materials such as cement, reinforcing bars, wood,
steel products, joinery and ventilation and lighting equipment can be procured in Egypt and
transported to the site from Cairo. The reinforcing bars are available only from a factory in
Alexandria City.
Ⅲ-12

Final Report Volume Ⅲ Construction Planning & Cost Estimation
(b) Filling materials, aggregate and stone materials
Borrow sites for the filling material and quarry sites for the aggregate and stone materials will
be situated near the construction site.
Filling materials: The borrow site at Dirout on the desert road, about 19 km from the
construction site.
Rubble, masonry: The quarry site at Assiut, about 60 km from the construction site.
Coarse aggregate: The quarry site at Dirout, about 30 km from the construction site.
Fine aggregate: The quarry site at Minia about 100 km from the construction site.
Figure 1-5.1 Quarry sites in Assiut
Figure 1-5.2 Locations of borrow site, quarry site and spoil bank site near Dirout
Quarry Site
Quarry Site
Borrow Site
Spoil Bank Site
Ⅲ-13

Detailed Design Study on the Project for Construction of the New Dirout Group of Regulators
Figure 1-5.3 Location of quarry sites in Minia and Dirout
Quarry site
The quarry site for coarse aggregate is located 30 km from the NDGRs. This quarry site is
managed by a private company and has alternate layers of sand and gravel. The company
excavates directly at the exposed sand and gravel layer, and screens the excavated materials
by machine.
The quarry site for fine aggregate is located at Minia.
Borrow site
The borrow site is located near the junction of the desert road. Backfill material can be
provided from the site. The distance from the NDGR is approximately 19 km. The road is
wide enough for a dump truck to pass along. The geological conditions are the same as
those at the quarry site, with alternate layers of sand and gravel.
Spoil bank site
The spoil bank site is located near the junction of the desert road and the borrow site.
Ⅲ-14

Final Report Volume Ⅲ Construction Planning & Cost Estimation
(c) Steel materials
H-steel of up to H-250 mm can be procured from the local market, whereas H-steel of H-300 mm
and more must be imported. This is because H-300 mm H-steel is not produced in Egypt but is
imported through an import agent. It is therefore difficult to ensure the timely procurement of
sufficient quantities of the imported material (H-steel of 300 mm or more).
Therefore, it is planned to procure H-steel of up to 250 mm locally and to procure larger size
H-steel materials from Japan.
(d) Scaffolding and formwork
Most of the local construction companies use wooden scaffolding and loose-plank formwork
materials, so wooden materials can be procured. However, the local plywood formwork is of low
quality and cannot be used repeatedly, and the low mould accuracy reduces the quality of the
finished concrete structure, making it of lower quality than that of the regulators of Lahoun,
Mazoura, and Sakoula.
Thus, plywood formwork, steel scaffolding and support materials are to be procured from Japan,
while the wooden scaffolding, support materials and square timber will be procured locally.
(e) Special materials
Special materials such as steel sheet piles, large steel materials and plywood formwork material
are to be procured from Japan to alleviate anxiety regarding delivery and to ensure sufficient
quantities. The high-tension tie rods, bridge bearings and expansion equipment will be procured
from Japan, because quality is of particular importance for these special materials.
(f) Gate materials
The gates to be installed in the weirs are of the double leaf gate type. These gate sets are to be
procured from Japan in consideration of the excellent production technology, track record, and
quality.
Ⅲ-15

Detailed Design Study on the Project for Construction of the New Dirout Group of Regulators
Table 1-5.2 Procurement of construction materials
Item Equipment Local Japan Third country
Remarks
Construction materials
H-steel ○ 100~250 mm H-steel
○ 300 mm or more cannot be
procured locally Steel sheet pile
○ Comparison of procurement
cost Deck plate ○ Cannot be procured locally Barbed wire ○ Deformed bar ○ High-tension tie rod ○ Cannot be procured locally Cement ○ Fine aggregate ○ Coarse aggregate ○ Water reducing agent ○ Banking soil ○ Rubble, masonry ○ Crushed stone ○ Square timber ○ Plywood formwork ◯ Cannot be procured locally Steel scaffolding support ◯ Cannot be procured locally Straight asphalt ○ Bridge bearing stretcher ○ Cannot be procured locally Step/ bridge railing ○ Gasoline, diesel oil ○ Cement board ○ Water stop ○ High voltage incoming panel
○
Equipment and Facilities
Gate machinery ○ See “Gate materials” above. Gate distribution/ control equipment
○ See “Gate materials” above.
(3) Construction machinery
(a) General purpose machinery
Most general-purpose machinery is owned by the local construction companies. It is also
possible to rent from local leasing companies. General-purpose machinery includes: backhoe,
bulldozer, truck, trailer, truck with crane, crawler crane, rough terrain crane, truck crane, wheel
loader, tire roller, vibration roller, mixer truck, rebar processing machine, emergency power
generator, etc.
(b) Special machines
The steel sheet pile drivers (vibro-hammer and water jet) and the soil improvement machine will
be brought from Japan, as issues relating to the site soil mean that special technologies and
operating skills are needed.
Ⅲ-16

Final Report Volume Ⅲ Construction Planning & Cost Estimation
(c) Concrete plant
A concrete plant will be installed to produce concrete. Although construction companies and
ready mix concrete companies in Egypt own concrete batchers, they are not rented out. The
concrete batching plant will be procured from Japan and its rent accounted for, because the
concrete batching plant affects the concrete quality and the construction period. It is necessary to
arrange immediate procurement once the construction contracts are secured, as the installation of
the plant and the concrete mixing test will take time. The concrete plant can be procured through
a local agency.
Table 1-5.3 Procurement of construction machines
Purpose Machine Local Japan Remarks Construction Machine
Bulldozer (15 t) ○ Backhoe (0.8 m3) ○ Dump truck (10 t) ○ Truck with crane (4 t/2.9 t) ○ Truck (11t), Trailer (20 t) ○ Crawler crane (50 t), ○ Rough terrain crane (25 t) ○ Truck crane (50 t) ○ Wheel loader (2.1 m3) ○ Tire roller (8-20 t) ○ Vibration roller (10 t) ○ Vibration hammer (hydraulic) ○
Procurement must be done in a short time, and it is difficult for Japanese engineers to operate the Egyptian-made machinery.
Water jet (14.7 MPa, 325 l/min) ○
Procurement must be done in a short time, and it is difficult for Japanese engineers to operate the Egyptian-made machinery.
Concrete plant (30 m3/hr) ○ Mixer truck (4.4 m3) ○ Generator (75 kVA) ○ Generator (200 kVA)
○
To be used for the sheet pile driving in the early construction work; procurement must be done in a short time, and it is difficult to obtain a large generator in Egypt.
Ⅲ-17

Final Report VolumeⅢ Construction Planning & Cost Estimation
2. Construction of the NDGRs and Water Management Facilities
In the construction of the New Dirout Group of Regulators, the construction of Bahr Yusef
regulator on the downstream side will begin first and next, the construction of Ibrahimia regulator
will start. The construction of the other regulators, Badraman and Diroutiah, and on the upstream
side, Abo Gabal and Sahelyia, will be performed in parallel with the construction of Bahr Yusef
and Ibrahimia.
The construction flow of Bahr Yusef, Ibrahimia and the other regulators is as follows:
Figure 2-1.1 Regulator construction flow
The construction will start after the relocation of the mosque is completed by the Egypt side.
Preparation work Temporary bridge Double sheet coffer dam Removal of existing
facilities, Excavation inside site Foundation piles and waterstop sheet piles Construction of
regulator structure Installation of gates and trial operation Removal of double sheet piles and
switching diversion Revetment work and appurtenant work (road works and electrical work)
Integrated trial operation/Operation training Finishing/Clearing
The manufacture and transport of the gates, machinery and electrical equipment, the building work
and the revetment work proceed in parallel with the construction of the structures and the
installation and trial operation of the gates.
Ⅲ-18

Detailed Design Study on the Project for Construction of the New Dirout Group of Regulators
2-1 Construction of Bahr Yusef Regulator
The construction of the Bahr Yusef regulator begins after the relocation and demolition of the
mosque by Egypt side.
(1) Preparation work
In the preparation work, preparations for the construction, investigation, surveying, staking,
clearing and cutting, stumping and land grading are performed. The period of the preparation work
is one month.
(2) Temporary Bridge
The temporary bridge for the Bahr Yusef regulator is constructed on the downstream side of the
regulator and connects the road on the left bank and the double sheet coffer dam. The temporary
bridge is 43 m long and 8 m wide. The temporary bridge is made of steel and the construction work
is divided into superstructure and substructure. The bridge piers are constructed first as the
substructure and the superstructure is constructed.
(a) Superstructure
① Installation work Weight of steel: 48.8 tons, crawler crane with 50 tons tonne lift
capacity
② Deck plate work Area: 336.0 m2, crawler crane with 50 tons lift capacity
③ Handrail installation Length: 86 m, crawler crane with 50 tons lift capacity
(b) Substructure
① Pier pile driving work
・Driving length: 9.3 m
Machine: Maximum N value N max < 50
Driving length 9.3 m < 25 m (H350 steel)
Extraction length 9.3 m < 25 m Hydraulic vibratory hammer
Ancillary machine: Crawler crane with 50 tons lift capacity (Hydraulic vibratory hammer)
③ Installation of pier piles Weight of steel: 92.9 tons, crawler crane with 50 tons lift
capacity
(3) Temporary Cradle
After the construction of the temporary bridge, the temporary cradle (width 6 m) is constructed.
The sheet piles of the double sheet coffer dam are driven in from the temporary cradle. The
temporary cradle is constructed first together with the driving in of the sheet piles. The temporary
cradle is 210 m long and 6 m wide. The temporary cradle is made of steel and the construction
work is divided into superstructure and substructure. The cradle piers are constructed first as the
substructure and the superstructure is constructed.
Ⅲ-19

Final Report VolumeⅢ Construction Planning & Cost Estimation
(a) Superstructure
① Installation work Weight of steel: 179.8 tons, crawler crane with 50 tons lift capacity
② Deck plate work Area: 1,260 m2, crawler crane with 50 tons lift capacity
③ Handrail installation Length: 420 m, crawler crane with 50 tons lift capacity
(b) Substructure
① Pier pile driving work
・Driving length: 9.3 m
Machine: Maximum N value N max < 50
Driving length 9.3 m < 25 m (H400 steel)
Extraction length 9.3 m < 25 m Hydraulic vibratory hammer
Ancillary machine: Crawler crane with 50 tons lift capacity (Hydraulic vibratory hammer) 20
piles
② Installation of pier piles Weight of steel: 510.1 tons, crawler crane with 50 tons lift
capacity
(4) Double Sheet Coffer Dam
The installation of the double sheet coffer dam is performed together with the temporary cradle
work. Driving and extraction of the sheet piles are carried out by hydraulic vibratory hammer.
Sheet pile driving work
Driving length: 11 m
Construction method: Hydraulic vibratory hammer
Machine: Maximum N value N max < 50
Driving length 11 m < 15 m
Ancillary machine: Crawler crane with 50 tons lift capacity
Connection of the sheet piles, PU28+1 (equivalent of Type IVw), is performed on the temporary
cradle. The number of piles installed per day is 20 at less than 12 m in length (including the
connection work).
(5) Double Sheet Coffer Dam Embankment Work and Removal of Temporary Cradle
After the installation of the double sheet coffer dam, the embankment is constructed and the
temporary cradle is removed. The embankment volume is 14,280 m3 and the transport distance is
19 km from the borrow site. The combination of loading and transport is backhoe loading 1.4 m3 +
10 t dump truck.
The double sheet coffer dam embankment is constructed by 10 tons vibrating roller. The finished
thickness is 40 cm and the number of compactions is 6. The embankment material is brought from
the borrow site directly.
(6) Demolition of Slope on Right Bank
The demolition and removal of the slope on the right bank are carried out by backhoe and the
Ⅲ-20

Detailed Design Study on the Project for Construction of the New Dirout Group of Regulators
generated rubble is loaded by backhoe and transported by dump truck. The rubble is reused for
temporary riverbed protection work.
(7) Sheet Pile Revetment Work on Right Bank
The sheet pile revetment is constructed on the right bank and the revetment type is anchorage by
H-steel. The sheet piles and H-steel piles for the revetment are driven in by hydraulic vibratory
hammer.
① Construction Machine
Driving work: Driving length: sheet pile 4 m, H-250 2.25 m
Machine: Hydraulic vibratory hammer
Maximum N value N max < 50
Driving length L < 15 m
Ancillary machine: Crawler crane with 50 tons lift capacity
② Driving work (sheet pile PU28+1 (equivalent to Type IVw): 244 piles, driving length: 4 m)
Sheet pile PU28+1 (equivalent to Type IVw)
Driving work: the number of piles installed per day is 38 at less than 4 m in length.
③ Driving work (H-250 steel pile: 83 piles, driving length: 2.25 m)
Driving work: the number of piles installed per day is 48 at less than 4 m in length.
(8) Drainage Work
Drainage of the percolation from the foundation surface of the double steel sheet piles is conducted
using the pump drain method and well point method, both separately and in combination. The
construction site of the double steel sheet piles is surrounded by canal water and it is therefore
necessary to select a drainage method that ensures the smooth progress of construction work, as
the foundation surface of the excavation is highly permeable.
As the foundation conditions are such that there are thick geological layers with high permeability
(silty clay and sand etc.), the combination of pump drain and well point methods is selected for the
drainage work at the site. It is necessary to check the turbidity of the drainage water to prevent
piping.
① Installation and removal of well points (length 360 m, interval 3 m, 120 well points)
② Installation and removal of well-point pumps (2 pumps, 2 spare pumps)
(9) Excavation Work and Embankment Work for Temporary Road
During the enlargement of the cross section of the canal by the installation of double steel sheet
piles, underwater excavation is performed by backhoe (0.8 m3) to a water depth of 6 m. Beyond 6
m, excavation is performed by clamshell. The embankment work uses the sand and gravel soil
from the borrow pit and compacts it by vibrating roller.
It is difficult to obtain clay materials, because all the borrow sites around the site contain sand. The
sand is embanked by sprinkling with water to ensure the strength of the embankment. The borrow
site is located 19 km from the construction site near the spoil bank site.
Ⅲ-21

Final Report VolumeⅢ Construction Planning & Cost Estimation
① Excavation
・In double sheet coffer dam
The transport distance is 0.1 km within the site area.
The combination of loading and transport is backhoe loading 1.4 m3 + 10t dump truck.
・Riverbed area
The transport distance is 0.1 km within the site area.
The combination of loading and transport is backhoe loading 1.4 m3 + 10t dump truck.
② Embankment of temporary road
The embankment is constructed by 10 tons vibrating roller. The finished thickness is 40 cm
and the number of compactions is 6. The embankment material is brought from the borrow
site directly.
The combination of loading and transport is backhoe loading 1.4 m3 + 10t dump truck.
(10) Bed Protection Work
The bed protection and riprap works are planned under dry conditions before removing the double
steel sheet piles. However, in the riprap work on the downstream side, which is outside the double
steel sheet piles, the rock material will be cast into the water during the removal of the double steel
sheet piles. The riprap material will be brought from the quarry site for the riprap and masonry
work near Assiut.
The transport distance is 60 km.
The combination of loading and transport is backhoe loading 1.4 m3 + 10t dump truck.
Spreading of the riprap material is carried out by 21 tons bulldozer.
(11) Foundation Pile Work
Cast-in-place concrete piles are planned for the foundation of the regulator and the bored pile
method is applied as the construction method. Excavation is carried out by earth auger and
bentonite is used to secure the walls of the hole. The boring machine is used by Bore pile machine
and the base machine is used by a 42 tons crawler crane and the construction capacity is 3 piles per
day.
(12) Waterstop Sheet Piles
The waterstop sheet piles are driven in by hydraulic vibratory hammer
Driving work: Driving length: sheet pile 4.5 m, 6 m, 12 m
Machine: Hydraulic vibratory hammer
Maximum N value N max < 50
Driving length 4.5 m, 6 m, 12 m < 15 m
Ancillary machine: Crawler crane with 50 tons lift capacity
(13) Concrete Work
The NDGR is a mass concrete structure with a high concrete placement volume. A method to
ensure a high quality, stable supply of mass concrete shall be considered in order to prevent
Ⅲ-22

Detailed Design Study on the Project for Construction of the New Dirout Group of Regulators
temperature cracks caused by heat of hydration.
Concrete placing conditions:
1) Ensuring quality: Unit concrete placement volume, concrete curing method
2) Ensuring a stable supply (production method): Procurement from an existing ready-mixed
concrete plant or production by concrete batching at construction site
(a) Concrete production
Two concrete plants are located in this area, one in Minia and the other in Assiut, both within a
radius of 100 km and a distance of one hour from the construction site, but they cannot be relied
upon. In the construction plan, the contractor needs to cast 6,000 m3 of concrete in 8 months, so
a large volume of concrete of stable quality must be provided. There is a scheduled plan to
install a concrete plant with 30 m3/hr production capacity in the temporary yard adjacent to the
construction site. This will produce a volume of 250 m3/day.
(b) Concrete casting
The contractor determines the appropriate segment block for concrete casting and uses a
Japanese reusable plywood formwork when placing the concrete, taking into account the
structural stress, construction joints, water-tightness, and concrete production and casting ability.
Considering that the summer temperature in Egypt reaches 40ºC, concrete casting should be
done during the night when the temperature drops. It is necessary to take into account cracks and
hot weather concrete during concrete casting of the weir apron and the bridge abutment as they
are mass concrete structures.
(c) Outline of Construction
The gate is a long structure on the upstream side with a length of 27.9 m and on the downstream
side with a length of 23.5 m. The total volume of concrete is 6,065 m3.
(d) Basic Conditions
① Specifications of concrete
Concrete is produced at the batching plant and transported to the site. The maximum size of the
coarse aggregate is 40 mm, and the slump value is 8~12 cm.
② Concrete casting
The maximum lift height is 3.5 m.
④ Casting method
The casting is done by 50 tons crane and the placement volume per day is 200 m3.
④ Formwork
The formwork is made of wood.
(e) Casting schedule
① Casting schedule
Ⅲ-23

Final Report VolumeⅢ Construction Planning & Cost Estimation
The casting schedule is decided based on the following conditions:
The maximum volume of concrete placement is approximately 200 m3 per day.
The maximum height of one lift is 3.0 m.
The concrete joints are treated by green cutting, etc.
The casting schedule is decided by the structure scale and the concrete casting is divided
into 5 parts.
Base of gates on upstream side
Piers of gates on upstream side
Bridge area of gates on upstream side
Base of apron on downstream side
Wall of apron on downstream side
② Casting capacity
The volume of concrete per block is approximately 200 m3 and the casting capacity including
preparations is as follows:
Casting: one day including preparations
Demoulding: four days for cross section formwork
2 days
Base, bridge area: 1day, Pier: 2 days
1 day
2 days
The workable days are considered except the curing days.
No. of days per cycle for casting (except curing) =2+1+1 = 4 days (base, bridge area)
=2+2+1 = 5 days (pier area)
After completion of the casting at the pier, work starts on the next block and the number of curing
days is decided as 2 days.
The casting interval is normally a cycle of 5+2=7 days.
(14) Embankment on Right Side
The embankment on the right side is constructed after completion of the concrete work for the
regulator. The volume of the embankment on the right side is 7,200 m3 by 10 tons vibrating roller.
The finished thickness is 40 cm and the number of compactions is 6. The embankment material is
brought from the borrow site directly.
Reinforcement placing
Formwork
Casting
Curing
Ⅲ-24

Detailed Design Study on the Project for Construction of the New Dirout Group of Regulators
(15) Installation of Gates and Trial Operation
The installation of the gates takes 2 months for the 4 guide frames and another 2 months for the 4
gates and 4 hoisting devices.
After the installation of the gates, trial operation is performed before removal of the coffer dam,
and the operation and control conditions are confirmed. After the removal of the coffer dam and
the flow of water through the gates, trial operation and instruction in operation are conducted.
(16) Double Sheet Coffer Dam Excavation and Embankment on Left Bank
The soil for the double sheet coffer dam is excavated and transported, and the embankment on the
left bank is constructed.
① Excavation
The transport distance is 0.3 km within the site area.
The combination of loading and transport is backhoe loading 1.4 m3 + 10t dump truck.
② Embankment on left bank
The embankment is constructed by 10 tons vibrating roller. The finished thickness is 40 cm and
the number of compactions is 6. The embankment material is brought directly.
(17) Removal of Double Sheet Coffer Dam
The double sheet coffer dam is removed by hydraulic vibratory hammer.
① Machine
Extraction length: 11m
Construction method: Hydraulic vibratory hammer
Machine: Maximum N value N max < 50
Extraction length 11 m < 15 m
Ancillary machine: Crawler crane with 50 tons lift capacity
② Extraction work (outside: 400 piles, length 11 m, inside: 350 piles, length 10 m)
The number of extracted piles per day is 50 at less than 12 m in length.
(18) Sheet Pile Revetment Work
The sheet pile revetment work is performed by hydraulic vibratory hammer.
Machine
Driving work
Construction method: Hydraulic vibratory hammer
Machine: Maximum N value N max < 50
Extraction length L < 15 m
Ancillary machine: Crawler crane with 50 tons lift capacity
(19) Embankment on Left Bank
The embankment on the left bank is constructed.
Ⅲ-25

Final Report VolumeⅢ Construction Planning & Cost Estimation
① Excavation
The transport distance is 19 km from the borrow site.
The combination of loading and transport is backhoe loading 1.4 m3 + 10t dump truck.
② Embankment on left bank
Filling-in of the double sheet coffer dam: 14,280 m3
The embankment is constructed by 10 tons vibrating roller. The finished thickness is 40 cm and
the number of compactions is 6. The embankment material is brought from the borrow site
directly.
(20) Removal of Temporary Bridge
The superstructure work includes installation, deck plate work and handrail installation and the
machine used is a crawler crane with 50 tons lift capacity.
The substructure work is performed by crawler crane with 50 tons lift capacity and hydraulic
vibratory hammer, and the pier piles are extracted.
Machine: Maximum N value N max < 50
Extraction length 9.3 m < 25 m (H350 steel)
Ancillary machine: Crawler crane with 50 tons lift capacity (Hydraulic vibratory hammer)
(21) Building Work
The integrated water management centre is built on the premises of the Egyptian Irrigation
Department, A two-storey building is constructed.
2-2 Construction of the Badraman Regulator
The Badraman regulator is constructed at the same time as construction of the Bahr Yusef
regulator.
(1) Preparation Work
In the preparation work, preparations for construction, investigation, surveying, staking, clearing
and cutting, stumping and land grading are performed. The period of the preparation work is one
month.
(2) Entrance Road Embankment on Upstream Side
First of all, work on the embankment of the entrance road on the upstream side starts.
① Transportation from borrow site
The transport distance is 19 km from the borrow site.
The combination of loading and transport is backhoe loading 1.4 m3 + 10t dump truck.
② Embankment of entrance road
The embankment is constructed by 10 tons vibrating roller. The finished thickness is 40 cm
and the number of compactions is 6. The embankment material is brought from the borrow
Ⅲ-26

Detailed Design Study on the Project for Construction of the New Dirout Group of Regulators
site directly.
(3) Sheet Pile Work on Upstream Side
The sheet piles are driven in the upstream embankment.
① Machine
Sheet pile driving work (driving length 6 m)
Construction method: Hydraulic vibratory hammer
Machine: Maximum N value N max < 50
Driving length 6 m < 15 m
Ancillary machine: Crawler crane with 50 tons lift capacity
② Driving work (46 piles, driving length 6 m)
The number of piles installed per day is 31 at less than 6 m in length.
(4) Entrance Road Embankment on Downstream Side
The embankment of the entrance road on the downstream side is constructed.
① Transport from borrow site
The transport distance is 19 km from the borrow site.
The combination of loading and transport is backhoe loading 1.4 m3 + 10t dump truck.
② Embankment of entrance road
The embankment is constructed by 10 tons vibrating roller. The finished thickness is 40 cm
and the number of compactions is 6. The embankment material is brought from the borrow
site directly.
(5) Sheet Pile Revetment Work (Downstream)
The sheet pile revetment is constructed on the downstream side and the revetment type is
anchorage by H-steel. The sheet piles and H-steel piles for the revetment work are driven in by
hydraulic vibratory hammer.
① Construction Machine
Driving work: Driving length: sheet pile 6 m, H-250 3.7 m
Machine: Hydraulic vibratory hammer
Maximum N value N max < 50
Driving length L < 15 m
Ancillary machine: Crawler crane with 50 tons lift capacity
② Driving work (sheet pile: 53 piles, driving length: 6 m)
Sheet pile, PU28+1 (equivalent to Type IVw)
Driving work: the number of piles installed per day is 31 at less than 6 m in length.
③ Driving work (H-250 steel pile: 17 piles, driving length: 3.7 m)
Driving work: the number of piles installed per day is 44 at less than 6 m in length.
(6) Sheet Pile Work on Downstream Side (Straight line)
The sheet piles are installed on the downstream side and the sheet pile type is anchorage by H-steel.
Ⅲ-27

Final Report VolumeⅢ Construction Planning & Cost Estimation
The sheet piles and H-steel piles are driven in by hydraulic vibratory hammer.
① Construction Machine
Driving work: Driving length: sheet pile 6 m, H-250 3.7 m
Machine: Hydraulic vibratory hammer
Maximum N value N max < 50
Driving length L < 15 m
Ancillary machine: Crawler crane with 50 tons lift capacity
② Driving work (sheet pile: 34 piles, driving length: 6 m)
Sheet pile, PU28+1 (equivalent to Type IVw)
Driving work: the number of piles installed per day is 31 at less than 6 m in length.
③ Driving work (H-250 steel pile: 12 piles, driving length: 3.7 m)
Driving work: the number of piles installed per day is 44 at less than 6 m in length.
(7) Temporary Bridge
The embankment coffer dam for the Badraman regulator is constructed on the upstream side and a
temporary bridge is also constructed at the Diroutiah canal. The embankment coffer dam and the
temporary bridge are used as the construction road across the Badraman canal. The temporary
bridge is 30 m long and 8 m wide. The temporary bridge is made of steel and the construction work
is divided into superstructure and substructure. The construction of the bridge piers as the
substructure is advanced first and the superstructure is constructed.
(a) Superstructure
② Installation work Weight of steel: 24.0 tons, crawler crane with 50 tons lift capacity
② Deck plate work Area: 240.0 m2, crawler crane with 50 tons lift capacity
③ Handrail installation Length: 60 m, crawler crane with 50 tons lift capacity
(b) Substructure
① Pier pile driving work
・Driving length: 5.3 m
Machine: Maximum N value N max < 50
Driving length 5.3 m < 25 m (H300 steel)
Ancillary machine: Crawler crane with 50 tons lift capacity (Hydraulic vibratory hammer) 28
piles
② Installation of pier piles
Weight of steel: 29.7 tons, Machine: Crawler crane with 50 tons lift capacity
(8) Excavation and Embankment
The excavation and embankment works on the construction site are performed. The excavated soil
is stocked on the construction site and used for backfill.
① Excavation
Ⅲ-28

Detailed Design Study on the Project for Construction of the New Dirout Group of Regulators
The transport distance is 0.1 km within the site area.
The combination of loading and transport is backhoe loading 1.4 m3 + 10t dump truck.
② Backfill embankment
The embankment is constructed by 10 tons vibrating roller. The finished thickness is 40 cm
and the number of compactions is 6. The embankment material is brought directly.
(9) Sheet Pile Revetment Work (Gate Structure)
The sheet pile revetment for the Badraman regulator is constructed. The sheet piles are driven in
by hydraulic vibratory hammer.
① Construction Machine
Driving work: Driving length: sheet pile 6.5 m, 7.95 m
Machine: Hydraulic vibratory hammer
Maximum N value N max < 50
Driving length 6.5 m, 7.95 m < 15 m
Ancillary machine: Crawler crane with 50 tons lift capacity
② Driving work
Sheet pile, driving length 7.95 m, PU18 (equivalent to Type IIIw) 11 piles
Driving work: the number of piles installed per day is 29.
Sheet pile, driving length 6.5 m, PU12 (equivalent to Type IIw) 6 piles
Driving work: the number of piles installed per day is 33.
(10) Waterstop Sheet Pile (Gate Structure)
The waterstop sheet piles for the Badraman regulator are installed. The sheet piles are driven in by
hydraulic vibratory hammer.
① Construction Machine
Driving work: Driving length: sheet pile 2.0 m
Machine: Hydraulic vibratory hammer
Maximum N value N max < 50
Driving length 2.0 m < 15 m
Ancillary machine: Crawler crane with 50 tons lift capacity
② Driving work
Sheet pile, driving length 2.0 m, PU12 (equivalent to Type IIw) 28 piles
Driving work: the number of piles installed per day is 55.
(11) Concrete Work
The NDGR is a mass concrete structure with a high concrete placement volume. A method to
ensure a high quality, stable supply of mass concrete shall be considered in order to prevent
temperature cracks caused by heat of hydration.
Concrete placing conditions:
Ⅲ-29

Final Report VolumeⅢ Construction Planning & Cost Estimation
1) Ensuring quality: Unit concrete placement volume, concrete curing method
2) Ensuring a stable supply (production method): Procurement from an existing ready-mixed
concrete plant or production by concrete batching at the construction site
(a) Concrete production
Two concrete plants are located in this area, one in Minia and the other in Assiut, both within a
radius of 100 km and a distance of one hour from the construction site, but they cannot be relied
upon. In the construction plan, the contractor needs to cast 6,000 m3 of concrete in 8 months, so
a large volume of concrete of stable quality must be provided. There is a scheduled plan to
install a concrete plant with a 30 m3/hr production capacity in the temporary yard adjacent to the
construction site. This will produce a volume of 250 m3 per day.
(b) Concrete casting
The contractor determines the appropriate segment block for concrete casting and uses a
Japanese reusable plywood formwork when placing the concrete, taking into account the
structural stress, construction joints, water-tightness, and concrete production and casting ability.
Considering that the summer temperature in Egypt reaches 40ºC, concrete placement should be
done during the night when the temperature drops. It is necessary to take into account cracks and
hot weather concrete during casting of the weir apron and bridge abutment as they are mass
concrete structures.
(c) Outline of Construction
The gate structure is 28.2 m in length and the total volume of concrete is 770 m3.
(d) Basic Conditions
① Specifications of concrete
The concrete is produced at the batching plant and transported to the site. The maximum size of
the coarse aggregate is 40 mm and the slump value is 8~12 cm.
② Concrete casting
The maximum lift height is 3.5 m.
③ Casting Method
The casting is done by 50 tons crane and the casting volume per day is 200 m3.
④ Formwork
The formwork is made of wood.
(e) Casting schedule
① Casting schedule
The casting schedule is decided based on the following conditions:
The maximum casting volume is approximately 200 m3 per day.
Ⅲ-30

Detailed Design Study on the Project for Construction of the New Dirout Group of Regulators
The maximum height of one lift is 3.0 m.
The concrete joints are treated by green cutting, etc.
The casting schedule is decided by the structure scale and the casting is divided into 3 parts.
Base of gates
Piers of gates
Bridge area of gates
② Casting capacity
The volume of concrete per block is approximately 150 m3 and the casting capacity including
preparations is as follows:
Concrete casting: one day including preparations
Demoulding: four days for cross section formwork
2 days
2 days
1 day
2 days
The number of workable days is considered except the curing days.
Number of days per cycle (except curing) =2+2+1=5 days (pier area)
After completion of the casting at the pier, work starts on the next block and the number of curing
days is decided as 2 days.
The casting interval is normally a cycle of 5+2=7 days.
(12) Bed Protection Work on Downstream Side
The riprap material is brought from the quarry site for the riprap and masonry work near Assiut.
The transport distance is 60 km.
The combination of loading and transport is backhoe loading 1.4 m3 + 10t dump truck.
The riprap material is spread by 21 tons bulldozer.
(13) Installation of Gates and Trial Operation
The installation of the gates takes 2 months for the 4 guide frames and another 2 months for the 4
gates and 4 hoisting devices.
After the installation of the gates, trial operation is performed before the removal of the coffer dam,
and the operation and control conditions are confirmed. After the removal of the coffer dam and
the flow of water through the gates, trial operation and instruction in operation are planned.
Reinforcement placing
Formwork
Casting
Curing
Ⅲ-31

Final Report VolumeⅢ Construction Planning & Cost Estimation
(14) Removal of Temporary Bridge
The superstructure and substructure are removed.
(15) Sheet Pile Removal on Upstream Side
The sheet piles are removed by hydraulic vibratory hammer and crawler crane with 50 tons lift
capacity.
(16) Removal of Sheet Pile Revetment Downstream
The sheet piles are removed by hydraulic vibratory hammer and crawler crane with 50 tons lift
capacity.
2-3 Construction of the Diroutiah Regulator
The construction of the Diroutiah regulator is performed after the construction of the Badraman
regulator.
(1) Preparation work
In the preparation work, preparations for construction, investigation, surveying, staking, clearing
and cutting, stumping and land grading are performed. The period of the preparation work is one
month.
(2) Entrance Road Embankment on Upstream Side
The embankment of the entrance road on the upstream side is constructed with embankment
material from the Badraman work.
① Transport from the Badraman embankment
Embankment on the upstream side: 2,100 m3
The transport distance is 0.1 km within the site area.
The combination of loading and transport is backhoe loading 1.4 m3 + 10t dump truck.
② Embankment of entrance road
Embankment: 2,100 m3
The embankment is constructed by 10 tons vibrating roller. The finished thickness is 40 cm and
the number of compactions is 6. The embankment material is brought from the Badraman site
directly.
(3) Sheet Pile Work on Upstream Side
The sheet piles are driven into the upstream embankment.
① Machine
Sheet pile driving work (driving length 6 m)
Construction method: Hydraulic vibratory hammer
Machine: Maximum N value N max < 50
Driving length 6 m < 15 m
Ⅲ-32

Detailed Design Study on the Project for Construction of the New Dirout Group of Regulators
Ancillary machine: Crawler crane with 50 tons lift capacity
② Driving work (46 piles, driving length 6 m)
The number of piles installed per day is 31 at less than 6 m in length.
(4) Entrance Road Embankment on Downstream Side
The embankment of the entrance road on the downstream side is constructed first.
① Transport from Badraman site
Embankment on the downstream side: 336 m3
The transport distance is 0.1 km within the site area.
The combination of loading and transport is backhoe loading 1.4 m3 + 10t dump truck.
② Embankment on the downstream side
Embankment: 336 m3
The embankment is constructed by 10 tons vibrating roller. The finished thickness is 40 cm and
the number of compactions is 6. The embankment material is brought from the Badraman site
directly.
(5) Sheet Pile Revetment Work (Downstream)
The sheet pile revetment is constructed on the downstream side and the revetment type is
anchorage by H-steel. The sheet piles and H-steel piles for the revetment are driven in by hydraulic
vibratory hammer.
① Construction Machine
Driving work: Driving length: sheet pile 6 m, H-250 3.7 m
Machine: Hydraulic vibratory hammer
Maximum N value N max < 50
Driving length L < 15 m
Ancillary machine: Crawler crane with 50 tons lift capacity
② Driving work (sheet pile: 53 piles, driving length: 6 m)
Sheet pile, PU28+1 (equivalent to Type IVw)
Driving work: the number of piles installed per day is 31 at less than 6 m in length.
③ Driving work (H-250 steel pile: 17 piles, driving length: 3.7 m)
Driving work: the number of piles installed per day is 44 at less than 6 m in length.
(6) Temporary Bridge
The embankment coffer dam for the Diroutiah regulator is constructed on the upstream side and a
temporary bridge is also constructed over the Badraman canal. The embankment coffer dam and
the temporary bridge are used as the construction road across the Badraman canal. The temporary
bridge is 30 m long and 8 m wide. The temporary bridge is made of steel and the construction work
is divided into superstructure and substructure. The construction of the bridge piers as the
substructure is advanced first and the superstructure is constructed.
Ⅲ-33

Final Report VolumeⅢ Construction Planning & Cost Estimation
(a) Superstructure
② Installation work Weight of steel: 24.0 tons, crawler crane with 50 tons lift capacity
② Deck plate work Area: 240.0 m2, crawler crane with 50 tons lift capacity
③ Handrail installation Length: 60 m, crawler crane with 50 tons lift capacity
(b) Substructure
① Pier pile driving work
・Driving length: 5.3 m
Machine Maximum N value N max < 50
Driving length 5.3 m < 25 m (H-300 steel)
Ancillary machine: Crawler crane with 50 tons lift capacity (Hydraulic vibratory hammer) 28
piles
② Installation of pier piles
Weight of steel: 29.7 tons, Machine: Crawler crane with 50 tons lift capacity
(7) Excavation and Embankment
The excavation and embankment works on the construction site are performed. The excavated soil
is stocked on the construction site and used for backfill.
① Excavation
The transport distance is 0.1 km within the site area.
The combination of loading and transport is backhoe loading 1.4 m3 + 10t dump truck.
② Backfill embankment
The embankment is constructed by 10 tons vibrating roller. The finished thickness is 40 cm
and the number of compactions is 6. The embankment material is brought directly.
(8) Sheet Pile Revetment Work (Gate Structure)
The sheet pile revetments on the right and left banks of the Badraman regulator are constructed.
The sheet piles are driven in by hydraulic vibratory hammer.
① Construction Machine
Driving work: Driving length: sheet pile 6.65 m, 7.10 m
Machine: Hydraulic vibratory hammer
Maximum N value N max < 50
Driving length 6.65 m, 7.10 m <15 m
Ancillary machine: Crawler crane with 50 tons lift capacity
② Driving work
Sheet pile, driving length 6.65 m, PU12 (equivalent to Type IIw) 7 piles
Driving work: the number of piles installed per day is 33.
Sheet pile, driving length 7.1 m, PU12 (equivalent to Type IIw) 11 piles
Driving work: the number of piles installed per day is 33.
Ⅲ-34

Detailed Design Study on the Project for Construction of the New Dirout Group of Regulators
(9) Waterstop Sheet Piles (Gate Structure)
The waterstop sheet piles are installed for the Diroutiah regulator. The sheet piles are driven in by
hydraulic vibratory hammer.
① Construction Machine
Driving work: Driving length: sheet pile 2.0 m
Machine: Hydraulic vibratory hammer
Maximum N value N max < 50
Driving length 2.0 m < 15 m
Ancillary machine: Crawler crane with 50 tons lift capacity
② Driving work
Sheet pile, driving length 2.0 m, PU12 (equivalent to Type IIw) 19piles
Driving work: the number of piles installed per day is 55.
(10) Concrete Work
The NDGR is a mass concrete structure with a high concrete placement volume. A method to
ensure a high quality, stable supply of mass concrete shall be considered in order to prevent
temperature cracks caused by heat of hydration.
Concrete placement conditions:
1) Ensuring quality: Unit concrete placement volume, concrete curing method
2) Ensuring a stable supply (production method): Procurement from an existing ready-mixed
concrete plant or production by concrete batching at construction site
(a) Concrete production
Two concrete plants are located in this area, one in Minia and the other in Assiut, both within a
radius of 100km and a distance of one hour from the construction site, but they cannot be relied
upon. In the construction plan, the contractor needs to cast 6,000m3 of concrete in 8 months, so a
large volume of concrete of stable quality must be provided. There is a scheduled plan to install
a concrete plant with 30m3/hr production capacity in the temporary yard adjacent to the
construction site. This will produce a volume of 250m3 per day.
(b) Concrete casting
The contractor determines the appropriate segment block for concrete casting and uses a
Japanese reusable plywood formwork when placing the concrete, taking into account the
structural stress, construction joints, water-tightness, and concrete production and casting ability.
Considering that the summer temperature in Egypt reaches 40ºC, concrete casting should be
done during the night when the temperature drops. It is necessary to take into account cracks and
hot weather concrete during casting of the weir apron and bridge abutment as they are mass
concrete structures.
Ⅲ-35

Final Report VolumeⅢ Construction Planning & Cost Estimation
(c) Outline of Construction
The gate structure is 27.7 m in length and the total volume of concrete is 987 m3.
(d) Basic Conditions
① Specifications of concrete
The concrete is produced at the batching plant and transported to the site. The maximum size of
the coarse aggregate is 40 mm and the slump value is 8~12 cm.
② Concrete casting
The maximum lift height is 3.5 m.
③ Casting method
The casting is done by 50 tons crane and the volume of casting per day is 200 m3.
④ Formwork
The formwork is made of wood.
(e) Casting schedule
① Casting schedule
The casting schedule is decided based on the following conditions:
The maximum volume of concrete casting is approximately 200 m3 per day.
The maximum height of one lift is 3.0 m.
The concrete joints are treated by green cutting, etc.
The casting schedule is decided by the structure scale and the casting is divided into 3 parts.
Base of gates
Piers of gates
Bridge area of gates
② Casting capacity The volume of concrete per block is approximately 150 m3 and the casting
capacity including the preparations is as follows:
Casting: one day including preparations
Demoulding: four days for cross section formwork
2 days
2 days
1 day
2 days
Reinforcement placing
Formwork
Casting
Curing
Ⅲ-36

Detailed Design Study on the Project for Construction of the New Dirout Group of Regulators
The number of workable days is considered except the curing days.
Number of days per cycle (except curing) = 2+2+1 = 5 days (pier area)
After completion of the pier casting, work starts on the next block and the number of workable
days for curing is decided as 2 days.
The casting interval is normally a cycle of 5+2 = 7 days.
(11) Bed Protection Work on Downstream Side
The riprap material is brought from the quarry site for the riprap and masonry work near Assiut.
The transport distance is 60 km.
The combination of loading and transport is backhoe loading 1.4 m3 + 10t dump truck
The riprap material is spread by 21 tons bulldozer.
(12) Installation of Gates and Trial Operation
The installation of the gates takes 2 months for the 4 guide frames and another 2 months for the 4
gates and 4 hoisting devices.
After the installation of the gates, trial operation is performed before the removal of the coffer dam,
and the operation and control conditions are confirmed. After the removal of the coffer dam and
the flow of water through the gates, trial operation and instruction in operation are planned.
(13) Removal of Temporary Bridge
The superstructure and substructure are removed.
(14) Removal of Sheet Piles on Upstream Side
The sheet piles are removed by hydraulic vibratory hammer and crawler crane with 50 tons lift
capacity.
(15) Removal of Sheet Pile Revetment Downstream
The sheet piles are removed by hydraulic vibratory hammer and crawler crane with 50 tons lift
capacity.
2-4 Construction of Ibrahimia Regulator
The construction of the Bahr Yusef regulator begins after the relocation and demolition of the
mosque on the left bank.
(1) Preparation work
In the preparation work, preparations for the construction, investigation, surveying, staking,
clearing and cutting, stumping and land grading are performed. The period of the preparation work
is one month.
Ⅲ-37
Final Report VolumeⅢ Construction Planning & Cost Estimation
(2) Entrance Road Embankment on Upstream Side
The entrance road embankment on the upstream side is constructed with embankment material
from the Diroutiah work. The borrow site is located 19 km from the construction site near the spoil
bank site.
・Diroutiah
The transport distance is 0.1 km within the site area.
The combination of loading and transport is backhoe loading 1.4 m3 + 10t dump truck.
・Embankment material deficiency
The transport distance is 19 km from the borrow site.
The combination of loading and transport is backhoe loading 1.4 m3 + 10t dump truck.
・Entrance road embankment
The embankment is constructed by 10 tons vibrating roller. The finished thickness is 40 cm and
the number of compactions is 6. The embankment material is brought directly.
(3) Excavation and Embankment Work (Railway Side)
The embankment material for the sheet pile work on the railway side is the excavated material
from the riverbed portion.
・Excavation of riverbed portion
The transport distance is 0.1 km within the site area.
The combination of loading and transport is backhoe loading 1.4 m3 + 10t dump truck.
・Embankment
The embankment is constructed by 10 tons vibrating roller. The finished thickness is 40 cm and
the number of compactions is 6. The embankment material is brought directly. The remaining
excavated material is used for the embankment on the downstream side.
(4) Sheet Pile Work on Railway Side
The sheet piles on the railway side are driven in by hydraulic press-in machine.
① Machine
Sheet pile driving work (driving length 8 m)
Construction method: Hydraulic vibratory hammer
Machine: Maximum N value N max < 50
Driving length 8 m < 15 m
Ancillary machine: Crawler crane with 50 tons lift capacity
② Driving work (PU28+1 (equivalent to Type IVw) 195 piles, driving length 8 m)
The number of the piles installed per day is 25.
(5) Bed Protection Work
The riprap material is brought from the quarry site for the riprap and masonry work near Assiut.
Ⅲ-38

Detailed Design Study on the Project for Construction of the New Dirout Group of Regulators
The transport distance is 60 km.
The combination of loading and transport is backhoe loading 1.4 m3 + 10t dump truck.
(6) Entrance Road Embankment on Downstream Side
The entrance road embankment on the downstream side is constructed with the excavated
material and embankment material on the railway side. The material from the railway side is used
after completion of the sheet pile work.
① Excavation
The transport distance is 0.1 km within the site area.
The combination of loading and transport is backhoe loading 1.4 m3 + 10t dump truck.
② Embankment on the downstream side
Embankment: 3,273 m3
The embankment is constructed by 10 tons vibrating roller. The finished thickness is 40 cm and
the number of compactions is 6. The embankment material is brought directly.
(7) Temporary Cradle
After the construction of the temporary bridge, work goes ahead on the temporary cradle (width
6 m). The double sheet coffer dam sheet piles are driven in from the temporary cradle. The
temporary cradle is constructed first and driving of the sheet piles is performed at the same time.
The temporary cradle is 215 m long and 6 m wide. The temporary cradle is made of steel and the
construction work is divided into superstructure and substructure. The cradle piers are constructed
first as the substructure, and the superstructure is constructed.
(a) Superstructure
② Installation work Weight of steel: 184.9 tons, crawler crane with 50 tons lift capacity
② Deck plate work Area: 1,296 m2, crawler crane with 50 tons lift capacity
③ Handrail installation Length: 430 m, crawler crane with 50 tons lift capacity
(b) Substructure
① Pier pile driving work
・Driving length: 7.5 m
Machine: Maximum N value N max < 50
Driving length 7.5 m < 25 m (H400 steel)
Extraction length 7.5 m < 25 m Hydraulic vibratory hammer
Ancillary machine: Crawler crane with 50 tons lift capacity (Hydraulic vibratory hammer) 148
piles
② Installation of pier piles Weight of steel: 291.4 tons, crawler crane with 50 tons lift
capacity
Ⅲ-39

Final Report VolumeⅢ Construction Planning & Cost Estimation
(8) Double Sheet Coffer Dam
The double sheet coffer dam is installed along with the temporary cradle work. The sheet pile
driving and extraction work is performed by hydraulic vibratory hammer.
① Machine
Sheet pile driving work
Driving length: 11 m
Construction method: Hydraulic vibratory hammer
Machine: Maximum N value N max < 50
Driving length 11 m < 15 m
Ancillary machine: Crawler crane with 50 tons lift capacity
② Driving work
Sheet pile (PU28+1 (equivalent to Type IVw), outside: 381 piles, driving length 11 m, inside:
331 piles, driving length 10 m)
Connection of the sheet piles is performed from the temporary cradle. The number of piles
installed per day is 20 at less than 12 m in length (including the connection work).
(9) Double Sheet Coffer Dam Embankment and Removal of Temporary Cradle
After the installation of the double sheet coffer dam, the double sheet coffer dam embankment is
constructed and the temporary cradle is removed.
① Embankment material
The transport distance is 19 km from the borrow site.
The combination of loading and transport is backhoe loading 1.4 m3 + 10t dump truck.
② Double sheet coffer dam embankment
The embankment is constructed by 10 tons vibrating roller. The finished thickness is 40 cm and the
number of compactions is 6. The embankment material is brought from the borrow site directly.
(10) Excavation Work on Lower Left Side
The excavation work on the lower left side is performed and the excavated material is stocked on
the left embankment of the Bahr Yusef regulator.
The transport distance is 0.3 km within the site area.
The combination of loading and transport is backhoe loading 1.4 m3 + 10t dump truck.
The embankment at the stock pile is compacted by 10 tons vibrating roller.
(11) Sheet Pile Revetment Work on Lower Left Side
The sheet pile revetment on the lower left side is constructed and the revetment type is anchorage
by H-steel. The revetment sheet piles and H-steel piles are driven in by hydraulic vibratory
hammer.
① Construction Machine
Driving work: Driving length: sheet pile 8 m, H-250 4.1 m
Machine: Hydraulic vibratory hammer
Ⅲ-40

Detailed Design Study on the Project for Construction of the New Dirout Group of Regulators
Maximum N value N max < 50
Driving length 8 m < 15 m
Ancillary machine: Crawler crane with 50 tons lift capacity
② Driving work (sheet pile PU28+1 (equivalent to Type IVw): 200 piles, driving length: 8 m)
Sheet pile, PU28+1 (equivalent to Type IVw)
Driving work: the number of piles installed per day is 25 at less than 9 m in length.
③ Driving work (H-250 steel pile: 68 piles, driving length: 4.1 m)
Driving work: the number of piles installed per day is 37 at less than 6 m in length.
(12) Excavation Work on Upper Left Side
The excavation work on the upper left side is performed and the excavated material is stocked on
the left embankment of the Bahr Yusef regulator.
The transport distance is 0.3 km within the site area.
The combination of loading and transport is backhoe loading 1.4 m3 + 10t dump truck.
The embankment at the stock pile is compacted by 10 tons vibrating roller.
(13) Sheet Pile Revetment Work on Upper Left Side
The sheet pile revetment on the upper left side is constructed and the revetment type is anchorage
by H-steel. The sheet piles and H-steel piles for the revetment are driven in by hydraulic vibratory
hammer.
① Construction Machine
Driving work: Driving length: sheet pile 3 m, H-250 2.5m
Machine: Hydraulic vibratory hammer
Maximum N value N max < 50
Driving length 3 m < 15 m
Ancillary machine: Crawler crane with 50 tons lift capacity
② Driving work (sheet pile PU28+1 (equivalent to Type IVw): 223 piles, driving length: 3 m)
Sheet pile, PU28+1 (equivalent to Type IVw)
Driving work: the number of piles installed per day is 223 at less than 3 m in length.
③ Driving work (H-250 steel pile: 68 piles, driving length: 3.0 m)
Driving work: the number of piles installed per day is 48 at less than 4 m in length.
(14) Demolition of Slope on Left Bank
The demolition and removal of the slope on the left bank are performed by backhoe and the
generated rubble is loaded by backhoe and transported by dump truck. The generated rubble is
stocked on the left embankment of the Bahr Yusef regulator.
(15) Drainage Work
The drainage of the percolation from the foundation surface of the double steel sheet piles is
conducted using the pump drain method and well point method, both separately and in
Ⅲ-41

Final Report VolumeⅢ Construction Planning & Cost Estimation
combination. The construction site of the double steel sheet piles is surrounded by canal water and
it is therefore necessary to select a drainage method that ensures smooth progress of the
construction work, as the foundation surface of the excavation is highly permeable
As the foundation conditions are such that there are thick geological layers with high permeability
(silty clay and sand etc.), the combination of the pump drain and well point methods is selected for
the drainage work on the site. It is necessary to check the turbidity of the drainage water to prevent
piping.
① Installation and removal of well-points (length 360 m, interval 3 m, 120 well points)
② Installation and removal of well-point pumps (2 pumps, 2 spare pumps)
(16) Excavation Work
The excavation work in the site area is performed. The excavated material is loaded on the dump
truck by backhoe and stocked on the left embankment of the Bahr Yusef regulator.
The transport distance is 0.3 km within the site area.
The combination of loading and transport is backhoe loading 1.4 m3 + 10t dump truck.
The embankment at the stock pile is compacted by 10 tons vibrating roller.
(17) Foundation Pile Work
Cast-in-place concrete piles are planned for the foundation of the regulator and the bored pile
method is applied as the construction method. The excavation is done by earth auger and bentonite
is used to secure the walls of the hole. The bore hole machine is used by Bore pile machine and the
base machine is used by a 42 tons crawler crane and the construction capacity is 3 piles per day.
(18) Waterstop Sheet Piles
The sheet piles are driven in by hydraulic vibratory hammer.
① Machine
Sheet pile driving work (driving length 4.5 m, 6 m, 12 m)
Construction method: Hydraulic vibratory hammer
Machine: Maximum N value N max < 50
Driving length 4.5 m, 6 m, 12 m < 15 m
Ancillary machine: Crawler crane with 50 tons lift capacity
② Driving work
Sheet pile, PU12 (equivalent to Type IIw), outside: 60 piles, driving length 4.5 m
The number of piles installed per day is 40.
Sheet pile, PU12 (equivalent to Type IIw), outside: 59 piles, driving length 6.0 m
The number of piles installed per day is 40.
Sheet pile, PU12 (equivalent to Type IIw), outside: 60 piles, driving length 12.0 m
The number of piles installed per day is 40.
Ⅲ-42

Detailed Design Study on the Project for Construction of the New Dirout Group of Regulators
(19) Concrete Work
The NDGR is a mass concrete structure with a high concrete placement volume. A method to
ensure a high quality, stable supply of mass concrete shall be considered in order to prevent
temperature cracks caused by heat of hydration.
Concrete placing conditions:
1) Ensuring quality: Unit concrete placement volume, concrete curing method
2) Ensuring a stable supply (production method): Procurement from an existing ready-mixed
concrete plant or production by concrete batching at construction site
(a) Concrete production
Two concrete plants are located in this area, one in Minia and the other in Assiut, both within a
radius of 100km and a distance of one hour from the construction site, but they cannot be relied
upon. In the construction plan, the contractor needs to cast 6,000 m3 of concrete in 8 months, so
a large volume of concrete of stable quality must be provided. There is a scheduled plan to
install a concrete plant with 30 m3/hr production capacity in the temporary yard adjacent to the
construction site. This will produce a volume of 250 m3 per day.
(b) Concrete casting
The contractor determines the appropriate segment block for concrete casting and uses a
Japanese reusable plywood formwork when placing the concrete, taking into account the
structural stress, construction joints, water-tightness, and concrete production and casting ability.
Considering that the summer temperature in Egypt reaches 40ºC, concrete casting should be
done during the night when the temperature drops. It is necessary to take into account cracks and
hot weather concrete during concrete casting of the weir apron and bridge abutment as they are
mass concrete structures.
(c) Outline of Construction
The gate is a long structure on the upstream side with a length of 27.9 m and on the downstream
side, with a length of 23.5 m. The total volume of concrete is 6,022 m3.
(d) Basic Conditions
① Specifications of concrete
Concrete is produced at the batching plant and transported to the site. The maximum size of the
coarse aggregate is 40 mm, and the slump value is 8~12 cm.
② Concrete casting
The maximum lift height is 3.5 m.
③ Casting method
The casting is done by 50 tons crane and the casting volume per day is 200 m3.
Ⅲ-43

Final Report VolumeⅢ Construction Planning & Cost Estimation
④ Formwork
The formwork is made of wood.
(e) Casting schedule
① Casting schedule
The casting schedule is decided based on the following conditions:
The maximum casting volume is approximately 200 m3 per day.
The maximum height of one lift is 3.0 m.
The concrete joints are treated by green cutting, etc.
The casting schedule is decided by the structure scale and the casting is divided into 5 parts.
Base of gates on upstream side
Piers of gates on upstream side
Bridge area of gates on upstream side
Base of apron on downstream side
Wall of apron on downstream side
② Casting capacity
The volume of concrete per block is approximately 200 m3 and the casting capacity including the
preparations is as follows:
Casting concrete: one day including preparations
Demoulding: four days for cross section formwork
2 days
Base, bridge area 1day, Pier 2 days
1 day
2 days
The workable days are considered except curing days.
1 casting cycle (except curing) =2+1+1=4 days (base, bridge area)
=2+2+1=5 days (pier area)
After completion of the casting at the pier, work on the next block starts and the number of
workable days for curing is decided as 2 days.
The interval for concrete casting is normally a cycle of 5+2=7 days.
Reinforcement placing
Formwork
Casting
Curing
Ⅲ-44

Detailed Design Study on the Project for Construction of the New Dirout Group of Regulators
(20) Embankment on Left Side
The embankment on the left side is constructed after the concrete work for the regulator. The
embankment is compacted by 10 tons vibrating roller. The finished thickness is 40 cm and the
number of compactions is 6. The embankment material is brought directly.
(21) Installation of Gates and Trial Operation
The installation of the gates takes 2 months of the 4 guide frames and another 2 months for the 4
gates and 4 hoisting devices.
After the installation of the gates, trial operation is performed before the removal of the coffer dam,
and the operation and control conditions are confirmed. After the removal of the coffer dam and
the flow of water through the gates, trial operation and instruction in operation are planned.
(22) Excavation for Double Sheet Coffer Dam and Embankment on Left Bank
The excavation and transport of soil for the double sheet coffer dam are performed and the
embankment on the right bank is constructed.
① Excavation
The transport distance is 0.3 km within the site area.
The combination of loading and transport is backhoe loading 1.4 m3 + 10t dump truck.
② Embankment on right bank
The embankment is constructed by 10 tons vibrating roller. The finished thickness is 40 cm and
the number of compactions is 6. The embankment material is brought directly.
(23) Removal of Double Sheet Coffer Dam
The double sheet coffer dam is removed by hydraulic vibratory hammer.
① Machine
Extraction length: 11 m
Construction method: Hydraulic vibratory hammer
Machine: Maximum N value N max < 50
Extraction length 11 m < 15 m
Ancillary machine: Crawler crane with 50 tons lift capacity
② Extraction work (outside: 381 piles, length 11 m, inside: 331 piles, length 10 m)
The number of piles extracted per day is 50 at less than 12 m in length.
(24) Sheet Pile Revetment Work
The sheet pile revetment work is performed by hydraulic vibratory hammer.
① Machine
Driving work
Construction method: Hydraulic vibratory hammer
Machine: Maximum N value N max < 50
Extraction length L < 15 m
Ⅲ-45

Final Report VolumeⅢ Construction Planning & Cost Estimation
Ancillary machine: Crawler crane with 50 tons lift capacity
(25) Embankment on Right Bank
The embankment on the right bank is constructed with material from the stock pile and the backfill
from the double sheet coffer dam.
① Excavation
The transport distance is 0.3 km within the site area.
The combination of loading and transport is backhoe loading 1.4 m3 + 10t dump truck.
② Embankment on left bank
The embankment is constructed by 10 tons vibrating roller. The finished thickness is 40 cm and
the number of compactions is 6. The embankment material is brought directly.
2-5 Construction of the Abo Gabal Regulator
The construction of the Abo Gabal regulator is performed after the construction of the Diroutiah
regulator.
(1) Preparation Work
In the preparation work, the preparations for construction, investigation, surveying, staking,
clearing and cutting, stumping and land grading are performed. The period of the preparation work
is one month.
(2) Entrance Road Embankment
The material for the embankment work for the entrance road is transported from the borrow site.
① Transport from the borrow site
The transport distance is 19 km from the borrow site.
The combination of loading and transport is backhoe loading 1.4 m3 + 10t dump truck.
② Embankment of entrance road
The embankment is constructed by 10 tons vibrating roller. The finished thickness is 40 cm and
the number of compactions is 6. The embankment material is brought from the borrow site
directly.
(3) Diversion Canal Sheet Pile Work
The sheet piles or the diversion canal are constructed.
① Machine
Sheet pile driving work (driving length 5 m)
Construction method: Hydraulic vibratory hammer
Machine: Maximum N value N max < 50
Driving length 5 m < 15 m
Ⅲ-46

Detailed Design Study on the Project for Construction of the New Dirout Group of Regulators
Ancillary machine: Crawler crane with 50 tons lift capacity
② Driving work (PU28+1 (equivalent to Type IVw) outside 92 piles, inside: 75 piles, driving
length 6 m)
The number of piles installed per day is 31 at less than 6 m in length.
③ Excavation
The excavation is performed inside the sheet piles and the excavated soil is used for backfill
for the double sheet coffer dam.
The transport distance is 0.1 km within the site area.
The combination of loading and transport is backhoe loading 1.4 m3 + 10t dump truck.
④ Superstructure
・Installation work Weight of steel: 3.9 tons, crawler crane with 50 tons lift capacity
・Deck plate work Area: 54 m2,crawler crane with 50 tons lift capacity
・Handrail installation Length: 39 m, crawler crane with 50 tons lift capacity
(4) Double Sheet Coffer Dam Embankment
Backfilling of the double sheet coffer dam is advanced first.
① Excavation and transport
The transport distance is 19 km from the borrow site.
The combination of loading and transport is backhoe loading 1.4 m3 + 10t dump truck.
② Backfilling of the double sheet coffer dam
The spreading and compaction of the embankment material is done by 11 tons bulldozer.
(5) Double Sheet Coffer Dam
The double sheet coffer dam is constructed. The sheet pile driving and extraction work is done by
hydraulic vibratory hammer.
① Machine
Sheet pile driving work
Driving length: 5 m
Construction method: Hydraulic vibratory hammer
Machine: Maximum N value N max < 50
Driving length 5 m < 15 m
Ancillary machine: Crawler crane with 50 tons lift capacity
② Driving work
Sheet pile, PU28+1 (equivalent to Type IVw), outside: 116 piles, driving length 5 m, inside: 80
piles, driving length 5 m)
The connection of the sheet piles is performed from the temporary cradle. The number of piles
installed per day is 31 at less than 6 m in length.
Ⅲ-47

Final Report VolumeⅢ Construction Planning & Cost Estimation
(6) Excavation Work
The excavation work is performed. The excavated material is stocked in the site area and used for
backfill.
Excavation: 1,510 m3
The transport distance is 0.1 km within the site area.
The combination of loading and transport is backhoe loading 1.4 m3 + 10t dump truck.
(7) Backfilling
The embankment is constructed and the embankment is compacted by 4 tons vibrating roller. The
finished thickness is 40 cm and the number of compactions is 6. The embankment material is
brought directly.
(8) Sheet Pile Revetment Work (Gate Structure)
The sheet pile revetments on the right and left banks of the Abo Gabal regulator are constructed.
The sheet piles are driven in by hydraulic vibratory hammer.
① Construction Machine
Driving work: Driving length: sheet pile 4.6 m, 5.0 m
Machine: Hydraulic vibratory hammer
Maximum N value N max < 50
Driving length 4.6 m, 5.0 m < 15 m
Ancillary machine: Crawler crane with 50 tons lift capacity
② Driving work
Sheet pile, driving length 4.6 m, PU12 (equivalent to Type IIw) 75 piles
Driving work: the number of piles installed per day is 33.
Sheet pile, driving length 5.0 m, PU12 (equivalent to Type IIw) 72 piles
Driving work: the number of piles installed per day is 33.
(9) Waterstop Sheet Piles (Gate Structure)
The waterstop sheet piles for the Abo Gabal regulator are constructed. The sheet piles are driven in
by hydraulic vibratory hammer.
① Construction Machine
Driving work: Driving length: sheet pile 2.0 m
Machine: Hydraulic vibratory hammer
Maximum N value N max < 50
Driving length 2.0 m < 15 m
Ancillary machine: Crawler crane with 50 tons lift capacity
② Driving work
Sheet pile, driving length 2.0 m, PU12 (equivalent to Type IIw) 24 piles
Driving work: the number of piles installed per day is 55.
Ⅲ-48

Detailed Design Study on the Project for Construction of the New Dirout Group of Regulators
(10) Concrete Work
The NDGR is a mass concrete structure with a high concrete placement volume. A method to
ensure a high quality, stable supply of mass concrete shall be considered in order to prevent
temperature cracks caused by heat of hydration.
Concrete placing conditions:
1) Ensuring quality: Unit concrete placement volume, concrete curing method
2) Ensuring a stable supply (production method): Procurement from an existing ready-mixed
concrete plant or production by concrete batching at construction site
(a) Concrete production
Two concrete plants are located in this area, one in Minia and the other in Assiut, both within a
radius of 100 km and a distance of one hour from the construction site, but they cannot be relied
upon. In the construction plan, the contractor needs to cast 6,000 m3 of concrete in 8 months, so
a large volume of concrete of stable quality must be provided. There is a scheduled plan to
install a concrete plant with 30 m3/hr production capacity in the temporary yard adjacent to the
construction site. This will produce a volume of 250 m3 per day.
(b) Concrete casting
The contractor determines the appropriate segment block for concrete casting and uses a
Japanese reusable plywood formwork when placing the concrete, taking into account the
structural stress, construction joints, water-tightness, and concrete production and casting ability.
Considering that the summer temperature in Egypt reaches 40ºC, concrete casting should be
done during the night when the temperature drops. It is necessary to take into account cracks and
hot weather concrete during casting of the weir apron and bridge abutment as they are mass
concrete structures.
(c) Outline of Construction
The gate structure is 27.9 m in length and the total volume of concrete is 1,441 m3.
(d) Basic Conditions
① Specifications of concrete
The concrete is produced at the batching plant and transported to the site. The maximum size of
the coarse aggregate is 40 mm, and the slump value is 8~12 cm.
② Concrete casting
The maximum lift height is 3.5 m.
③ Casting method
The casting is done by 50 tons crane and the casting volume per day is 200 m3.
④ Formwork
The formwork is made of wood.
Ⅲ-49

Final Report VolumeⅢ Construction Planning & Cost Estimation
(e) Casting schedule
① Casting schedule
The casting schedule is decided based on the following conditions:
The maximum volume of cast concrete is approximately 200 m3 per day.
The maximum height of one lift is 3.0 m.
The concrete joints are treated by green cutting, etc.
The casting schedule is decided by the structure scale and the casting is divided into 3 parts.
Base of gates
Piers of gates
Bridge area of gates
② Casting capacity
The volume of concrete per block is approximately 150 m3 and the casting capacity including the
preparations is as follows:
Casting: one day including preparations
Demoulding: four days for cross section formwork
2 days
2 days
1 day
2 days
The workable days are considered except curing days.
1 casting cycle (except curing) =2+2+1=5 days (pier area)
After completion of the casting at the pier, work starts on the next block and the number of
workable days for curing is decided as 2 days.
The casting interval is normally a cycle of 5+2=7 days.
(11) Installation of Gates and Trial Operation
The installation of the gates takes 2 months for the 4 guide frames and another 2 months for the 4
gates and 4 hoisting devices.
After the installation of the gates, trial operation is performed before the removal of the coffer dam,
and the operation and control conditions are confirmed. After the removal of the coffer dam and
Reinforcement placing
Formwork
Casting
Curing
Ⅲ-50

Detailed Design Study on the Project for Construction of the New Dirout Group of Regulators
the flow of water through the gates, trial operation and instruction in operation are planned.
(12) Excavation for Double Sheet Coffer Dam and Removal of Sheet Piles
The excavation and transport of backfill for the double sheet coffer dam are performed and stocked
on the left bank of Bahr Yusef.
① Excavation
The transport distance is 0.3 km within the site area.
The combination of loading and transport is backhoe loading 1.4 m3 + 10t dump truck.
② Stockpile
The spreading and compaction of the embankment are done by 11 ton bulldozer.
③ Removal of Sheet Piles
Extraction length: 11m
Construction method: Hydraulic vibratory hammer
Machine: Maximum N value N max < 50
Extraction length 11 m < 15 m
Ancillary machine: Crawler crane with 50 tons lift capacity
(13) Removal of Diversion Canal and Backfilling
Removal of diversion canal (sheet piles and superstructure)
Backfill: The spreading and compaction of the embankment are done by 11 tons bulldozer.
(14) Removal of Entrance Road
The transport distance is 0.3 km within the site area.
The combination of loading and transport is backhoe loading 1.4 m3 + 10t dump truck.
The spreading and compaction of the embankment are done by 11 tons bulldozer.
2-6 Construction of the Sahelyia Regulator
The construction of the Sahelyia regulator is performed after the construction of the Abo Gabal
regulator.
(1) Preparation Work
In the preparation work, preparations for the construction, investigation, surveying, staking,
clearing and cutting, stumping and land grading are performed. The period of the preparation work
is one month.
(2) Entrance Road Embankment
The embankment material for the entrance road is transported from the borrow site.
① Transport from the borrow site
The transport distance is 19 km from the borrow site.
The combination of loading and transport is backhoe loading 1.4 m3 + 10t dump truck.
Ⅲ-51

Final Report VolumeⅢ Construction Planning & Cost Estimation
② Embankment of entrance road
The embankment is constructed by 10 tons vibrating roller. The finished thickness is 40 cm and
the number of compactions is 6. The embankment material is brought from the borrow site
directly.
(3) Diversion Canal Sheet Pile Work
The sheet piles for the diversion canal are installed.
① Machine
Sheet pile driving work (driving length 5 m)
Construction method: Hydraulic vibratory hammer
Machine: Maximum N value N max < 50
Driving length 5 m < 15 m
Ancillary machine: Crawler crane with 50 tons lift capacity
② Driving work (PU28+1 (equivalent to Type IVw) outside: 89 piles, inside: 76 piles, driving
length 6 m)
The number of piles installed per day is 31 at less than 6 m in length.
③ Excavation
The excavation is performed inside the sheet piles and the excavated soil is used for backfill
for the double sheet coffer dam. (Excavation 307 m3)
The transport distance is 0.1 km within the site area.
The combination of loading and transport is backhoe loading 1.4 m3 + 10t dump truck.
④ Superstructure
・Installation work Weight of steel: 7.8 tons, crawler crane with 50 tons lift capacity
・Deck plate work Area: 108 m2, crawler crane with 50 tons lift capacity
・Handrail installation Length: 72 m, crawler crane with 50 tons lift capacity
(4) Embankment of Double Sheet Coffer Dam
The backfilling of the double sheet coffer dam is advanced first.
① Excavation and transport
The transport distance is 19 km from the borrow site.
The combination of loading and transport is backhoe loading 1.4 m3 + 10t dump truck.
② Backfilling of the double sheet coffer dam
The spreading and compaction of the embankment material are done by 11 tons bulldozer.
(5) Double Sheet Coffer Dam
The double sheet coffer dam is constructed. The sheet pile driving and extraction work is done by
hydraulic vibratory hammer.
① Machine
Sheet pile driving work
Ⅲ-52

Detailed Design Study on the Project for Construction of the New Dirout Group of Regulators
Driving length: 5 m
Construction method: Hydraulic vibratory hammer
Machine: Maximum N value N max < 50
Driving length 5 m < 15 m
Ancillary machine: Crawler crane with 50 tons lift capacity
② Driving work
Sheet pile, PU28+1 (equivalent to Type IVw), outside: 115 piles, driving length 5 m, inside: 77
piles, driving length 5 m)
The connection of the sheet piles is performed from the temporary cradle. The number of piles
installed per day is 31 at less than 6 m in length.
(6) Excavation Work
The excavation work is performed. The excavated material is stocked in the site area and used for
backfill.
The transport distance is 0.1 km within the site area.
The combination of loading and transport is backhoe loading 1.4 m3 + 10t dump truck.
(7) Backfilling
The embankment is constructed and compacted by 4 tons vibrating roller. The finished thickness is
40 cm and the number of compactions is 6. The embankment material is brought directly.
(8) Sheet Pile Revetment Work (Gate Structure)
The sheet pile revetments on the right and left banks of the Abo Gabal regulator are constructed.
The sheet piles are driven in by hydraulic vibratory hammer.
Construction Machine
Driving work: Driving length: sheet pile 5.75 m, 5.0 m
Machine: Hydraulic vibratory hammer
Maximum N value N max < 50
Driving length 5.75 m, 5.0 m < 15 m
Ancillary machine: Crawler crane with 50 tons lift capacity
② Driving work
Sheet pile, driving length 5.75 m, PU12 (equivalent to Type IIw) 32piles
Driving work: the number of piles installed per day is 33.
Sheet pile, driving length 5.0 m, PU12 (equivalent to Type IIw) 32 piles
Driving work: the number of piles installed per day is 33.
(9) Waterstop Sheet Piles (Gate Structure)
The waterstop sheet piles for the Abo Gabal regulator are constructed. The sheet piles are driven in
by hydraulic vibratory hammer.
① Construction Machine
Ⅲ-53

Final Report VolumeⅢ Construction Planning & Cost Estimation
Driving work: Driving length: sheet pile 2.0 m
Machine: Hydraulic vibratory hammer
Maximum N value N max < 50
Driving length 2.0 m < 15 m
Ancillary machine: Crawler crane with 50 tons lift capacity
② Driving work
Sheet pile, driving length 2.0 m, PU12 (equivalent to Type IIw) 14 piles
Driving work: the number of piles installed per day is 55.
(10) Concrete Work
The NDGR is a mass concrete structure with a high concrete placement volume. A method to
ensure a high quality, stable supply of mass concrete shall be considered in order to prevent
temperature cracks caused by heat of hydration.
Concrete placing conditions:
1) Ensuring quality: Unit concrete placement volume, concrete curing method
2) Ensuring a stable supply (production method): Procurement from an existing ready-mixed
concrete plant or production by concrete batching at construction site
(a) Concrete production
Two concrete plants are located in this area, one in Minia and the other in Assiut, both within a
radius of 100 km and a distance of one hour from the construction site, but they cannot be relied
upon. In the construction plan, the contractor needs to cast 6,000 m3 of concrete in 8 months, so
a large volume of concrete of stable quality must be provided. There is a scheduled plan to
install a concrete plant with 30 m3/hr production capacity in the temporary yard adjacent to the
construction site. This will produce a volume of 250 m3 per day.
(b) Concrete casting
The contractor determines the appropriate segment block for concrete casting and uses a
Japanese reusable plywood formwork when placing the concrete, taking into account the
structural stress, construction joints, water-tightness, and concrete production and casting ability.
Considering that the summer temperature in Egypt reaches 40ºC, concrete casting should be
done during the night when the temperature drops. It is necessary to take into account cracks and
hot weather concrete during concrete casting of the weir apron and bridge abutment as they are
mass concrete structures.
(c) Outline of Construction
The gate structure is 28.8 m in length and the total volume of concrete is 752 m3.
Ⅲ-54

Detailed Design Study on the Project for Construction of the New Dirout Group of Regulators
(d) Basic Conditions
① Specifications of concrete
The concrete is produced at the batching plant and transported to the site. The maximum size of
the coarse aggregate is 40 mm, and the slump value is 8~12 cm.
② Concrete casting
The maximum lift height is 3.5 m.
⑤ Casting method
The casting is done by 50 tons crane and the casting volume per day is 200 m3.
④ Formwork
The formwork is made of wood.
(e) Casting schedule
① Casting schedule
The casting schedule is decided based on the following conditions:
The maximum casting volume is approximately 200 m3 per day.
The maximum height of one lift is 3.0 m.
The concrete joints are treated by green cutting, etc.
The casting schedule is decided by the structure scale and the casting is divided into 3 parts.
Base of gates
Piers of gates
Bridge area of gates
② Casting capacity
The volume of concrete per block is approximately 150 m3 and the casting capacity including the
preparations is as follows:
Casting concrete: one day including preparations
Demoulding: four days for cross section formwork
2 days
2 days
1 day
2 days
The workable days are considered except curing days.
Reinforcement placing
Formwork
Casting
Curing
Ⅲ-55

Final Report VolumeⅢ Construction Planning & Cost Estimation
1 casting cycle (except curing) =2+2+1=5 days (pier area)
After completion of the casting at the pier, work starts on the next block and the number of
workable days for curing is decided as 2 days.
The interval for concrete casting is normally a cycle of 5+2=7 days.
(11) Installation of Gates and Trial Operation
The installation of the gates takes 1 month for the 2 guide frames and another month for the 2 gates
and 4 hoisting devices.
After the installation of the gates, trial operation is performed before the removal of the coffer dam,
and the operation and control conditions are confirmed. After the removal of the coffer dam and
the flow of water through the gates, trial operation and instruction in operation are planned.
(12) Excavation for Double Sheet Coffer Dam and Removal of Sheet Piles
The excavation and transport of backfill for the double sheet coffer dam are performed and stocked
on the left bank of Bahr Yusef.
① Excavation
The transport distance is 0.3 km within the site area.
The combination of loading and transport is backhoe loading 1.4 m3 + 10t dump truck.
② Stockpile
The spreading and compaction of the embankment is done by 11 tons bulldozer.
③ Removal of Sheet Piles
Extraction length: 11 m
Construction method: Hydraulic vibratory hammer
Machine: Maximum N value N max < 50
Extraction length 11 m < 15 m
Ancillary machine: Crawler crane with 50 tons lift capacity
(13) Removal of Diversion Canal and Backfilling
Removal of diversion canal (sheet piles and superstructure)
Backfill: The spreading and compaction of the embankment are done by 11 tons bulldozer.
(14) Removal of Entrance Road
The transport distance is 0.3 km within the site area.
The combination of loading and transport is backhoe loading 1.4 m3 + 10t dump truck.
The spreading and compaction of the embankment are done by 11 tons bulldozer.
Ⅲ-56

Detailed Design Study on the Project for Construction of the New Dirout Group of Regulators
2-7 Construction of water management sysytem
(1) Location of construction
The contractor conducts a field survey before construction and confirms construction conditions
(installation path of vehicle, installation site of equipment, machinery and equipment necessary for
construction etc.). The installation location shall be the location shown in the table below.
Table 2-7.1 Location of the construction of water management system
Irrigation facilities Name of the Target facilities No.
Bahr Yusef canal Dahab Regulator
Sakoula Regulator
Mazoura Regulator
Lahoun Regulator
Abo El Shekok Regulator
Regulator km39
6
Ibrahimia canal New Hafze Regulator
Matay Regulator
Maghagha Regulator
Sharahna Regulator
El Gandy Regulator
Ashmont Regulator
6
Bahr Yusef
canal
Intake Manshat EL Dahab
El Hareka
El Sabaa
Quftan
Wesh El-Bab
EL-Giza
6
Weir Hassan Wasef Weir 1
Pump New Kamdeer P.S.
New Terfa P.S.
Old Terfa P.S.
Old Sakoula P.S.
Mazoura P.S.(2) 5
Ibrahimia
canal
Intake Irad El Maharak
El Kosia
East Hafze
West Hafze
Adkak
Gendia
Abo Shosha
EL Soultany
Tansa
El Mansour
10
Weir Serry Weir Maghagha Weir 2
Ibrahimia main canal Ibrahimia Head Regulator 1
Lake Quarun Lake 1
Total 38
(2) Contents of construction works
The construction will be the new construction works of 38 observation stations, one central
monitoring station and one monitoring station, mainly consisting of the following contents.
Installation and adjustment of the central monitoring station ( Server, Laptop, Network
facilities, Display panel, etc. )
② Installation and adjustment of the monitoring station ( Server, Laptop, Network facilities,
Display panel, Dater logger, Modem, etc.)
③ Installation and adjustment of the monitoring equipments ( Fence, Pole, Water level sensor,
Solar panel,
④ Installation of wiring and conduit
Bra
nch
ca
na
l R
eg
ula
tor
Ⅲ-57

Final Report VolumeⅢ Construction Planning & Cost Estimation
(3) Flow of construction works
General items
This construction will be implemented according to the civil works specifications and electrical
works specifications in Egypt.
② Overall plan
The main procedures from field survey to completion of construction are as follows.
(4) Test and adjustment
Inspection
In the completion inspection, the necessary personnel, materials, equipment, measuring
instruments, etc. shall be prepared by the contractor.
② Test
Various test adjustments shall be carried out under supervision staff witnessing. However, if
supervisory staff could not attend, the contractor shall submit a report of the test results with
photographs.
Filed survey
Condition of construction
Submission of drawings
Arrangement and delivery of materials and machinery
Civil works
Test and adjustment
Cleaning of construction site
Completion test
Instruction
Approval
Wiring and conduit installation
Equipment installation
Ⅲ-58

Detailed Design Study on the Project for Construction of the New Dirout Group of Regulators
(5) Construction period
Based on the construction contents and method described above, the standard periods of
construction in each process are as follows.
Planning and designing : Two months
② Equipment procurement, material arrangement and loading, acceptance inspection : Three
months
③ Civil works : Two months
④ Electrical works : Two months
⑤ Planning and designing : Two months
From the above, the total period for this construction works will be 9.5 months. In addition, in
parallel with the above civil works and electrical works, software development will be carried out.
The construction period for software development will be assumed to be 10 months.
Assuming simultaneous execution of civil engineering works, electrical work and software
development period, the period of water management construction complete shall be 12.5 months.
Ⅲ-59

Final Report Volume Ⅲ -Construction Planning & Cost Estimation
3. Work Schedule
3-1 Criteria on work schedule
(1) Critical path work
Bahr Yusef construction work is to be carried out first, followed by Ibrahimia construction work.
In order to even out the work volume and reduce the project cost; temporary material and heavy
machinery such as double sheet piles and temporary bridges are to be reutilized in each
construction.
(2) Work procedure
The work procedure is shown in Figure 3-1.1.
(3) Conditions of project period
- Working days coefficient1: 1.35
- Yearly working days: 270 days/year (=365/1.35)
- Monthly working days: 22.5 days/month (=270/12)
- Daily working time: 8:00-17:00 (working hours: 8 hours/day, excluding one hour break)
3-2 Formulation of work schedule
The critical path schedule has set the Bahr Yusef construction work first, followed by Ibrahimia.
Other works at Badraman, Abo Gabal, and Saheliya are scheduled based on the principle that
work volume can be leveled throughout the construction period. The critical path work for Bahr
Yusef and Ibrahimia construction work are as follows.
(1) Critical path work
Preparatory work → Temporary bridge and Platform for Driving Sheet pile inside of Coffer
Dam→ Temporary double sheet pile coffer dam work →Embankment for Temporary Road &
Hardening for Soft Soil→ excavation inside dam → Foundation pile work & cut-off sheet pile
→ Structure concrete work → Installation work of gate facility and commissioning →
Removal work of temporary bridge and coffer dam and changing water flow → Embankment
and Sheet pile for Bank protection and gabion and permanent road etc. → Overall integrated
test operating and operation training → Finishing and clearance→Handover.
1 Actual days for each work day considering holidays and days where no work is possible
Ⅲ-60

Detailed Design Study on the Project for Construction of the New Dirout Group of Regulators
Figure 3-1.1 Work procedure
Prooecoion sheeo for waoerpolluoion
Dewaoering of inside dam
Earoh work for inside dam
Cuo-off sheeo pile
Sorucoure Concreoe work
Consorucoion of Conorol house
Insoallaoion of ohe gaoe
Invesoigaoion of ohe gaoe/Trial operaoion
Supply Waoer inoo inside of coffer dam
Removal ofTemporary Double Sheeo Pile
Sheeo piling for Bank prooecoion
Changing frome oemporary road oo Parmaneno
Removal of Temporary Bridge
Removal of Temporary facilioies
Finishing/Clearance
Rubble soone for Riverbed
Waoer-level gauge
Concreoe block for Riverbed prooecoion
Temporary Double Sheeo Pile
Temporary works of Direco work
Rubble soone for Riverbed Prooecoion
Handover
Embankmeno/Road work
Temporary Bridge(River crossing and inside of Sheeo pile)
Design for Gaoe facilioy/ApprovalPreparaoory works
Procuremeno of Maoerialsand manufacoure
Transporoaoion
Filling of inside dam + Removal of Temporary Bridge
Foundaoion Pile work
Embankmeno
Inoegraoion orial operaoion/Operaoion
Ⅲ-61

Final Report Volume Ⅲ -Construction Planning & Cost Estimation
Works on the manufacturing of mechanical and electric facilities for gates, transportation,
construction of the control house, and river bed protection work etc, will proceed in parallel with
the structure concrete work, gate facility installation work, and commissioning, etc.
The work schedule of this critical path is found to be the shortest and most economical given the
above conditions, the construction period, and standard daytime work conditions.
The overall project period is set for 51 months (Bahr Yusef, 25.5 months, and Ibrahimia, 25.5
months) based on the final design and quantity.
Ⅲ-62

Detailed Design Study on the Project for Construction of the New Dirout Group of Regulators
Table 3-2.1 Critical pass work (Bahr Yusef) (1/5) Bahr-YusefNumber of days for each work item
each work itemwork
quantityunit
workvolumea day
no.ofparty
workingdays
Workingdays
coefficient
period ofexcecution
critical passdays
gate manufacture design・approval 1 lot 90 1 90 -material procurement 1 lot 60 1 60 -manufacture・inspection at factory 1 lot 135 1 135 -
preparatory work 1 lot 150 1 150 90 90Direct temporary work setting barge for dredging for diversion canal m3 190 2 0.0 1.35 0 - 0
dredging for diversion canalstone riprap for riverbedremoving barge for dredging for diversion canal
across the canal erection of temporary bridge 143preparation 1 lot 3 1 3 3driving H-beam (driving L less 6m)L=14.5 25 pcs 20 1 1.3 1.35 2 2driving H-beam (driving L less 16m)L=21.5 15 pcs 7 1 2.1 1.35 3 3erection for platform 56.5 t 8.3 1 6.8 1.35 9 9installation for steel top deck 336 m2 111 1 3.0 1.35 4 4
inside of double sheet driving H-beam (driving L less 6m)L=14.5 20 pcs 20 1 1.0 1.35 1 1driving H-beam (driving L less 16m)L=21.5 124 pcs 7 1 17.7 1.35 24 24erection for platform 209.5 t 8.3 1 25.2 1.35 34 34installation for steel top deck 1,260 m2 111 1 11.4 1.35 15 15
filling for inside double sheet 14,280 m3 410 1 34.8 1.35 47 47driving steel sheet pile for cofferdam 129
Ⅳ-type (driving L less 12m)j oint 750 pcs 8 1 93.8 1.35 127 127(PU28+1 W=0.6m L=20.0m)installation for tie-rod 1 lot 2
Bank protection work Bank protection by sheet pile(upstream,downstream at right bank)front Ⅲw (riving L less 15m) L=18m C2 15 pcs 10 1 1.5 1.35 2 Ⅳw (driving L less 12m) L=20m C1 6 pcs 11 1 0.5 1.35 1frontⅢw (driving L less 9m) L=12m BR2 15 pcs 29 1 0.5 1.35 1 Ⅳw (driving L less 12m) L=18m BR1 8 pcs 11 1 0.7 1.35 1backⅡw (driving L less 6m) L=6m PU12 21 pcs 39 1 0.5 1.35 1
detail of each work
0
procurement/temporary office/temporary yard/transportation
Ⅲ-63

Final Report Volume Ⅲ -Construction Planning & Cost Estimation
Table 3-2.2 Critical pass work (Bahr Yusef) (2/5)
backⅡw (driving L less 6m) L=6m PU12 21 pcs 39 1 0.5 1.35 1 Ⅱw (driving L less 6m) L=6m PU12 23 pcs 39 1 0.6 1.35 1installation for tie-rod pcs 40 1 0.0 1.35 0capping concrete 1 lot 30 1.35 41 -
temporary workembankment for access road (upstream & downstream) 7,382 m3 410 2 9.0 1.35 12 12embankment for temporary road on bottom area 705 m3 190 1 3.7 1.35 5 5backfill for structure 740 m3 190 1 3.9 1.35 5 5hardening of soft soil(road and structure area) 1,676 m3 190 1 8.8 1.35 12 12curing 3dewatering of inside dam 1 lot 2 1 2 2
temporary dewatering wellpoint 1 lot
removal for ex. structure all removal (inside coffer dam) 0.00 m3 63 2 0.0 1.35 0 -earth work preparation 3
excavation for structure inside coffer dam 4,790.00 m3 190 2 12.6 1.35 17 17embankment inside coffer dam(right bank) 7,200.00 m3 300 1 24.0 1.35 32backfill 2,900.00 m3 350 2 4.1 1.35 6 -
riverbed protection driving cut-off sheet pileⅣw (driving L less 12m) L-12.0m PU-12 60 pcs 28 1 2.1 1.35 3 3Ⅱw (driving L less 6m)L=6.0m PU-12 59 pcs 39 1 1.5 1.35 2 2 (driving L less 4m)L=5.0m PU-12 60 pcs 39 1 1.5 1.35 2 2Ⅳw (driving L less 12m) L-22.0m PU-28 1 pcs 8 1 0.1 1.35 0 0Ⅳw (driving L less 9m) L-20.0m PU-28 1 pcs 9 1 0.1 1.35 0 0Ⅳw (driving L less 9m) L-18.0m PU-18 1 pcs 12 1 0.1 1.35 0 0Ⅳw (driving L less 4m) L-12.0m PU-18 1 pcs 42 1 0.0 1.35 0 0
cast-inplace concrete pileφ1000 L=13.50m 72 pcs 3 1 24.0 1.35 32 32φ1000 L=7.50m 32 pcs 3 1 10.7 1.35 14 14
removing for temporary embankmentremoving for temporary embankment 1,445 190 2 3.8 1.35 5 5
Concrete work main structure lean concrete 153.3 m3 38.3 1 4.0 1.35 5 5 183base scaffolding 476 m2 71 1 6.7 1.35 9 4re-bar 268.92 t 3.3 3 27.2 1.35 37 37
39
20
7
52
Ⅲ-64

Detailed Design Study on the Project for Construction of the New Dirout Group of Regulators
Table 3-2.3 Critical pass work (Bahr Yusef) (3/5) scaffolding 476 m2 71 1 6.7 1.35 9 4
re-bar 268.92 t 3.3 3 27.2 1.35 37 37formwork 694.36 m2 30 1 23.1 1.35 31 8placing concrete 2,987.97 m3 182.6 1 33 1.35 45 -pierscaffolding 2,816.33 m2 71 1 39.7 1.35 54 4re-bar 233.11 t 3.3 3 23.5 1.35 32 32formwork 2,983.47 m2 30 3 33.1 1.35 45 8placing concrete 2,590.14 m3 84 1 24 1.35 32 1other concrete(support bridge etc)re-bar 22.35 t 3.3 2 3.4 1.35 5 5formwork 402.90 m2 30 3 4.5 1.35 6 3placing concrete 248.30 m3 84 1 3.0 1.35 4 1curingremoval of form & supportpassagescaffolding 0 m2 71 1 0.0 1.35 0 0support 651.9 m3 71 1 9.2 1.35 12 6re-bar 4.1 t 3.3 1 1.3 1.35 2 2formwork 192.0 m2 30 1 6.4 1.35 9 9placing concrete 45.8 m3 48 1 1.0 1.35 1 1curing 1 lot 14 1 14 14removal of form & support 3,680.40 m3 71 6 8.6 1.35 12 -maintenance bridgescaffolding 388.4 m2 71 2 2.7 1.35 4support 2,700.00 m3 71 4 9.5 1.35 13re-bar 46.3 t 3.3 2 7.0 1.35 9 9formwork 759.4 m2 30 2 12.7 1.35 17placing concrete 231.8 m3 153.8 1 6 1.35 8 8curing 1 lot 14 1 14 14removal of form・support 3,847.80 m3 71 6 9.0 1.35 12 12
Gate facility work groove 1 lot 30.0 1 30installation for Gate
assemble 1 lot 15 1.35 20 20
installation 1 lot 4 1.35 5 5Concrete work upper pier
26
Ⅲ-65

Final Report Volume Ⅲ -Construction Planning & Cost Estimation
Table 3-2.4 Critical pass work (Bahr Yusef) (4/5) installation 1 lot 4 1.35 5 5Concrete work upper pier
scaffolding 463 m2 71 2 3.3 1.35 4 2re-bar 9.82 t 3.3 1 3.0 1.35 4 1formwork 319.99 m2 30 2 5.3 1.35 7 2placing concrete 109.14 m3 2 2.0 1.35 3 1platform for operationsuppoort 937.75 m2 71 2 6.6 1.35 9 2re-bar 7.07 t 3.3 1 2.1 1.35 3 1formwork 205.52 m2 30 2 3.4 1.35 5 2placing concrete 78.58 m3 2 2.0 1.35 3 1curing 1 lot 71 2 14 14removal for form, scaffolding & support 1,143.27 m2
Gate facility work installation for groove 1 lot 40 1.35 54 - 0lifting gear assemble/installation/adjustment
assemble 1 lot 15 1.35 20 20
installation 1 lot 4 1.35 5 5
control house 1 lot 160 1 160 - 0riverbed protection concrete block 494 pcs 5 2 49.4 1.35 67 - 0
riprup 1,998.00 m2 58.8 1 34 1.35 46 -
temporary work removal of temporary access road(ramp) 7,382 m3 300 1 24.6 1.35 33 33fire-flow inside cofferdam 1 lot 1 1 1 1 1removal for steel sheet pile
Ⅳw-type (driving L less 12m) 750 pcs 40 1 18.8 1.35 25 25Ⅲw-type (driving L less 15m) pcs 43 1 0.0 1.35 0 -tie-rod 1 lot 2
removal for ex. structure removal for outside of coffer dam 0 m3 63 1 0.0 1.35 0 0Bank protection embankment 40,800.00 m3 350 2 58.3 1.35 79 79
driving sheet pile outside coffer dam Type-A
Ⅳw型 (driving L less 23m) L=22.0m 111 枚 6 1 18.5 1.35 25 25Ⅲw型 ((driving L less 6m) L=6.0m 94 枚 39 1 2.4 1.35 3 3capping concrete for steel sheet pile 1 lot 38 1.35 51 26
1 lot 30 1.35 41 -curing 1 lot 5 1 5 -
26
26
27
Ⅲ-66

Detailed Design Study on the Project for Construction of the New Dirout Group of Regulators
Table 3-2.5 Critical pass work (Bahr Yusef) (5/5) 1 lot 30 1.35 41 -
curing 1 lot 5 1 5 -driving sheet pile outside coffer dam Type-BL
Ⅳw type (driving L less 12m) L=12.0m 5 pcs 28 1 0.2 1.35 0 4Ⅲw type (driving L less 6m) L=5.0m pcs 35 1 0.0 1.35 0capping concrete for steel sheet pile 1 lot 38 1.35 51 26
1 lot 30 1.35 41 -curing 1 lot 5 1 5 -
Gate facility work water level indicator setting/adjustment 1 lot 7 1.35 9 -appurtenant work embankment for left bank & road work 7,013.73 m3 250 2 14.0 1.35 19
curbstone work 625.34 m 22.5 2 13.9 1.35 19base course t=20cm 1,766.29 m2 1,110 1 1.6 1.35 2sub-base courset=20cm 1,766.29 m2 1,110 1 1.6 1.35 2paving(surface)t=5cm 1,766.29 m2 2,300 1 0.8 1.35 1paving(sublayer)t=6cm 1,766.29 m2 2,300 1 0.8 1.35 1Footpathbase course t=15cm 306.44 m2 268 1 1.1 1.35 2paving(surface) t=5cm 306.44 m2 940 1 0.3 1.35 0
commissioning・inspection commissioning・operation training 30 1 30 -temporary work removal for temporary bridge 0temporary bridge(across river) removal H-beam (driving L less 6m)L=14.5 25 pcs 39 1 0.6 1.35 1
removal H-beam (driving L less 16m)L=21.5 15 pcs 22 1 0.7 1.35 1removal for platform 56.5 t 8.3 1 6.8 1.35 9removal for steel top deck 336 m2 111 1 3.0 1.35 4
removal for inside coffer dam soil 14,280 m3 300 1 47.6 1.35 64cleaning・handover 22 1.35 30
Critical pass days= 768 days 768Critical pass month= 25.6 months ≒ 25.5months 25.6
Ⅲ-67

Final Report Volume Ⅲ -Construction Planning & Cost Estimation
Table 3-2.6 Critical pass work (Ibrahimia) (1/5)
IbrahimiaNumber of days for each work item
each work itemwork
quantityunit
workvolumea day
no.ofparty
workingdays
Workingdays
coefficient
period ofexcecution
critical passdays
Direct temporary work setting barge for dredging for diversion canaldredging for diversion canalstone riprap for riverbedremoving barge for dredging for diversion canal
inside of double sheet erection of temporary bridgedriving H-beam (driving L less 8m)L=14.5 H350 24 pcs 16 1 1.5 1.35 2 2driving H-beam (driving L less 8m)L=14.5 H400 124 pcs 13 1 9.5 1.35 13 13erection for platform 215.5 t 8.3 1 26.0 1.35 35 35installation for steel top deck 1,296 m2 111 1 11.7 1.35 16 16
driving steel sheet pile for cofferdamⅣ-type (driving L less 12m) joint 712 pcs 8 1 89.0 1.35 120 120(PU28+1 W=0.6m L=20.0m)installation for tie-rod 1 lot 2filling for inside double sheet 14,620 m3 410 1 35.7 1.35 48 48
Bank protection work Bank protection by sheet pile(upstream,downstream at left bank) 0frontⅢw (driving L less 9m) L=16m D1PU18 6 pcs 12 1 0.5 1.35 1 Ⅳw (driving L less 9m) L=10m D2 PU12 9 pcs 33 1 0.3 1.35 0frontⅢw (driving L less 9m) L=14m E1 5 pcs 16 1 0.3 1.35 0 Ⅳw (driving L less 12m) L=8m E2 3 pcs 11 1 0.3 1.35 0backⅡw (driving L less 6m) L=6m PU12 6 pcs 39 1 0.2 1.35 0 Ⅱw (driving L less 6m) L=6m PU12 5 pcs 39 1 0.1 1.35 0installation for tie-rod pcs 40 1 0.0 1.35 0capping concrete 1 lot 30 1.35 41 -
temporary workembankment for access road (upstream & downstream) 6,545 m3 410 2 8.0 1.35 11 11embankment for temporary road on bottom area 492 m3 190 1 2.6 1.35 3 3backfill for structure 740 m3 190 1 3.9 1.35 5 5hardening of soft soil(road and structure area) 1,514 m3 190 1 8.0 1.35 11 11curing 3dewatering of inside dam 1 lot 2 1 2 2
detail of each work
170
35
Ⅲ-68

Detailed Design Study on the Project for Construction of the New Dirout Group of Regulators
Table 3-2.7 Critical pass work (Ibrahimia) (2/5) curing 3
dewatering of inside dam 1 lot 2 1 2 2temporary dewatering wellpoint 1 lot
removal for ex. structure all removal (inside coffer dam) 0.00 m3 63 2 0.0 1.35 0 -earth work preparation 3
excavation for structure inside coffer dam 13,540.00 m3 190 2 35.6 1.35 48 48embankment inside coffer dam(right bank) 1,200.00 m3 300 1 4.0 1.35 5backfill 3,700.00 m3 350 2 5.3 1.35 7 -
riverbed protection driving cut-off sheet pileⅣw (driving L less 12m) L-12.0m PU-12 60 pcs 28 1 2.1 1.35 3 3Ⅱw (driving L less 6m)L=6.0m PU-12 59 pcs 39 1 1.5 1.35 2 2Ⅱw (driving L less 4m)L=5.0m PU-12 60 pcs 39 1 1.5 1.35 2 2Ⅳw ((driving L less 9m) L-18.0m PU-18 1 pcs 12 1 0.1 1.35 0 0Ⅳw (driving L less 6m) L-16.0m PU-18 1 pcs 13 1 0.1 1.35 0 0Ⅳw (driving L less 6m) L-14.0m PU-12 1 pcs 17 1 0.1 1.35 0 0Ⅳw (driving L less 4m) L-10.0m PU-12 pcs 42 1 0.0 1.35 0 0
cast-inplace concrete pileφ1000 L=15.00m 56 pcs 3 1 18.7 1.35 25 25φ1000 L=7.00m 32 pcs 3 1 10.7 1.35 14 14
removing for temporary embankmentremoving for temporary embankment 1,232 190 1 6.5 1.35 9 5
Concrete work main structure lean concrete 154.6 m3 38.6 1 4.0 1.35 5 5 221base scaffolding 476 m2 71 1 6.7 1.35 9 4re-bar 269.03 t 3.3 2 40.8 1.35 55 55formwork 694.36 m2 30 1 23.1 1.35 31 8placing concrete 2,989.22 m3 182.6 1 33 1.35 45 -pierscaffolding 2,686.54 m2 71 1 37.8 1.35 51 4re-bar 226.40 t 3.3 2 34.3 1.35 46 46formwork 2,712.47 m2 30 3 30.1 1.35 41 8placing concrete 2,515.56 m3 84 1 24 1.35 32 1other concrete(support bridge etc)re-bar 25.51 t 3.3 2 3.9 1.35 5 5formwork 391.87 m2 30 3 4.4 1.35 6 8placing concrete 283.45 m3 84 1 3.4 1.35 5 1curing
51
7
45
Ⅲ-69

Final Report Volume Ⅲ -Construction Planning & Cost Estimation
Table 3-2.8 Critical pass work (Ibrahimia) (3/5) placing concrete 283.45 3 84 1 3.4 1.35 5 1
curingremoval of form & supportpassagescaffolding 0 m2 71 1 0.0 1.35 0 0support 637.5 m3 71 1 9.0 1.35 12 6re-bar 4.1 t 3.3 1 1.3 1.35 2 2formwork 192.0 m2 30 1 6.4 1.35 9 9placing concrete 45.8 m3 48 1 1.0 1.35 1 1curing 1 lot 14 1 14 14removal of form & support 3,680.40 m3 71 6 8.6 1.35 12 -maintenance bridgescaffolding 388.4 m2 71 2 2.7 1.35 4support 2,700.00 m3 71 4 9.5 1.35 13re-bar 46.3 t 3.3 2 7.0 1.35 9 9formwork 759.4 m2 30 2 12.7 1.35 17placing concrete 231.8 m3 153.8 1 6 1.35 8 8curing 1 lot 14 1 14 14removal of form・support 3,847.80 m3 71 6 9.0 1.35 12 12
Gate facility work groove 1 lot 30.0 1 30installation for Gate
assemble 1 lot 15 1.35 20 20
installation 1 lot 4 1.35 5 5Concrete work upper pier
scaffolding 463 m2 71 2 3.3 1.35 4 2re-bar 9.82 t 3.3 1 3.0 1.35 4 1formwork 319.99 m2 30 2 5.3 1.35 7 2placing concrete 109.14 m3 2 2.0 1.35 3 1platform for operationsuppoort 937.75 m3 71 2 6.6 1.35 9 2re-bar 7.07 t 3.3 1 2.1 1.35 3 1formwork 205.52 m2 30 2 3.4 1.35 5 2placing concrete 78.58 m3 2 2.0 1.35 3 1curing 1 lot 71 2 14removal for form, scaffolding & support 1,143.27 m2
26
12
Ⅲ-70

Detailed Design Study on the Project for Construction of the New Dirout Group of Regulators
Table 3-2.9 Critical pass work (Ibrahimia) (4/5) removal for form, scaffolding & support 1,143.27 m2
Gate facility work installation for groove 1 lot 40 1.35 54 - 0lifting gear assemble/installation/adjustment
assemble 1 lot 15 1.35 20 20
installation 1 lot 4 1.35 5 5
control house 1 lot 160 1 160 - 0riverbed protection concrete block 494 pcs 5 2 49.4 1.35 67 - 0
riprup 1,998.00 m2 58.8 1 34 1.35 46 -temporary work fire-flow inside cofferdam 1 lot 1 1 1 1 1
removal for steel sheet pileⅣw-type (driving L less 12m) 712 pcs 40 1 17.8 1.35 24 24Ⅲw-type (driving L less 15m) pcs 43 1 0.0 1.35 0 -tie-rod 1 lot 2
removal for inside coffer dam soil 14,620 m3 300 2 24.4 1.35 33 7removal for ex. structure removal for outside of coffer dam 0 m3 63 1 0.0 1.35 0 0Bank protection embankment 28,300.00 m3 350 2 40.4 1.35 55 55 20
Gabion 800.00 pcs 4 5 40.0 1.35 54 54 54driving sheet pile outside coffer dam Type-F
Ⅳw-type (driving L less 23m) L=18.0m 121 pcs 9 1 13.4 1.35 18 3.5Ⅲw-type(driving L less 6m) L=6.0m 104 pcs 39 1 2.7 1.35 4 2.5capping concrete for steel sheet pile 1 lot 38 1.35 51 25.5
1 lot 30 1.35 41 -curing 1 lot 5 1 5 -
driving sheet pile outside coffer dam Type-GⅣw type (driving L less 12m) L=10.0m 5 pcs 28 1 0.2 1.35 0 3.5Ⅲw type (driving L less 6m) L=5.0m pcs 35 1 0.0 1.35 0capping concrete for steel sheet pile 1 lot 38 1.35 51 25.5
1 lot 30 1.35 41 -curing 1 lot 5 1 5 -
Gate facility work water level indicator setting/adjustment 1 lot 7 1.35 9 -appurtenant work embankment for left bank & road work 2,469.03 m3 250 2 4.9 1.35 7 7
curbstone work 164.84 m 22.5 2 3.7 1.35 5 5base course t=20cm 583.65 m2 1,110 1 0.5 1.35 1 1sub-base courset=20cm 583.65 m2 1,110 1 0.5 1.35 1 1
26
33
18
Ⅲ-71

Final Report Volume Ⅲ -Construction Planning & Cost Estimation
Table 3-2.10 Critical pass work (Ibrahimia) (5/5)
sub-base courset=20cm 583.65 m2 1,110 1 0.5 1.35 1 1paving(surface)t=5cm 4,075.00 m2 2,300 1 1.8 1.35 2 2paving(sublayer)t=6cm 4,075.00 m2 2,300 1 1.8 1.35 2 2Footpath 0base course t=15cm 82.42 m2 268 1 0.3 1.35 0 0paving(surface) t=5cm 82.42 m2 940 1 0.1 1.35 0 0
trial operation Trial operation・operation training 30 1 30 30 30temporary work removal for temporary platform 0inside of Coffer dam removal H-beam (driving L less 6m)L=14.5 24 pcs 39 1 0.6 1.35 1
removal H-beam (driving L less 16m)L=21.5 124 pcs 22 1 5.6 1.35 8removal for platform 215.5 t 8.3 1 26.0 1.35 35removal for steel top deck 1,296 m2 111 1 11.7 1.35 16
cleaning・handover 22 1.35 30 15 15Critical pass days= 765 days 765Critical pass month= 25.5 months ≒ 25.5months 25.5
18
Ⅲ-72

Detailed Design Study on the Project for Construction of the New Dirout Group of Regulators
(2) small regulators
The number of days for each work item is shown from Table 3-2.11 to 3-2.24. The construction
period is:
- Badraman: 9 months
- Diroutiah: 10 months
- Abo Gabal: 11 months
- Sahelyia: 10 months
Ⅲ-73

Final Report Volume Ⅲ -Construction Planning & Cost Estimation
Table 3-2.11 Number of days for work item (Badraman) (1/4)
BadramanNumber of days for each work item
each work itemwork
quantityunit
workvolumea day
no.ofparty
workingdays
Workingdays
coefficient
period ofexcecution
critical passdays
Preparation 1 lot 3 3 3Temporary closure Embankment(upstream) 1,768.20 m3 190 1 9.3 1.35 13 13 13
Embankment(downstream) 802.20 m3 190 1 4.2 1.35 6 6 6sheet pile(single upstream)drivung L less 12m L-10m PU-28+1 46 pcs 20 1 2.3 1.35 3 3sheet pile(double downstream) drivung L less 9m L=8m 53 pcs 25 1 2.1 1.35 3 3support Hbeam for diversion canal driving L less 6m L=5m 17 pcs 31 1 0.5 1.35 1 1sheet pilefor diversion canal drivung L less 9m L=8m 34 pcs 25 1 1.4 1.35 2 2support Hbeam for diversion canal driving L less 6m L=5m 12 pcs 31 1 0.4 1.35 1 1
embankment at right bank temporary road for excavation
Temporary work hardening of soft soil 500 m3 190 1 2.6 1.35 4 4curing 1 lot 5 5
earth work preparation 3excavation inside coffer dam 1,030 m3 190 1 5.4 1.35 7 7embankment at left bank inside coffer dam 160 m3 300 1 0.5 1.35 1 1embankment at right bank inside coffer dam 180 m3 300 1 0.6 1.35 1 1back fill 710 m3 190 1 3.7 1.35 5 5earth foundation grading 500 m2 100 1 5.0 1.35 7 7
riverbed protection driving cut-off sheet pileⅣw (driving L less 2m) L-2m PU-12 upstream 14 pcs 55 1 0.3 1.35 0 0 1Ⅳw (driving L less 2m) L-2m PU-12 downstream 14 pcs 55 1 0.3 1.35 0 0Ⅱw (driving L less 4m)L=10m PU-18 2 pcs 42 1 0.0 1.35 0 0Ⅳw (driving L less 4m) L-8.0m PU-12 2 pcs 45 1 0.0 1.35 0 0
concrete work main structure lean concrete 154.6 m3 38.6 1 4.0 1.35 5 5 95base scaffolding 111.6 m2 71 1 1.6 1.35 2 2re-bar 31.07 t 3.3 1 9.4 1.35 13 13formwork 160.14 m2 30 1 5.3 1.35 7 4placing concrete 345.17 m3 86 1 4.0 1.35 5 -pierscaffolding 634.00 m2 71 1 8.9 1.35 12 4
detail of each work
9
9
24
Ⅲ-74

Detailed Design Study on the Project for Construction of the New Dirout Group of Regulators
Table 3-2.12 Number of days for work item (Badraman) (2/4) scaffolding 634.00 m2 71 1 8.9 1.35 12 4
re-bar 24.45 t 3.3 1 7.4 1.35 10 10formwork 559.62 m2 30 2 9.3 1.35 13 4placing concrete 271.68 m3 45 1 6.0 1.35 8 1other concrete(support bridge etc)support m3re-bar 11.08 t 3.3 1 3.4 1.35 5 5formwork 313.20 m2 30 2 5.2 1.35 7 2placing concrete 123.11 m3 30 1 4.1 1.35 6 1curing 1.00 lotremoval of form & supportpassagescaffolding 0 m2 71 1 0.0 1.35 0 0support 45.8 m3 71 1 0.6 1.35 1 1re-bar 0.7 t 3.3 1 0.2 1.35 0 0formwork 32.0 m2 30 1 1.1 1.35 1 1placing concrete 7.6 m3 7.6 1 1.0 1.35 1 1curing 1 lot 14 1 14 14removal of form & support 3,680.40 m3 71 6 8.6 1.35 12 -maintenance bridgescaffolding 42.7 m2 71 1 0.6 1.35 1 1support 298.00 m3 71 1 4.2 1.35 6 3re-bar 5.0 t 3.3 1 1.5 1.35 2 2formwork 71.4 m2 30 1 2.4 1.35 3 4placing concrete 34.1 m3 17 1 2.0 1.35 3 1curing 1 lot 14 1 14 14removal of form・support 412.10 m3 71 6 1.0 1.35 1 1
Gate facility work groove 1 lot 30.0 1 30installation for Gate
assemble 1 lot 15 1.35 20 20
installation 1 lot 4 1.35 5 5concrete work upper pier
scaffolding 103 m2 71 1 1.4 1.35 2 2re-bar 1.25 t 3.3 1 0.4 1.35 1 1formwork 57.33 m2 30 1 1.9 1.35 3 3placing concrete 13.86 m3 2 2.0 1.35 3 1platform for operation
26
12
Ⅲ-75

Final Report Volume Ⅲ -Construction Planning & Cost Estimation
Table 3-2.13 Number of days for work item (Badraman) (3/4) placing concrete 13.86 m3 2 2.0 1.35 3 1
platform for operationsuppoort 75.16 m3 71 1 1.1 1.35 1 2re-bar 0.85 t 3.3 1 0.3 1.35 0 1formwork 24.20 m2 30 1 0.8 1.35 1 1placing concrete 9.45 m3 9.45 1 1.0 1.35 1 1curing 1 lot 14 14removal for form, scaffolding & support 99.36 m2
Gate facility work installation for groove 1 lot 40 1.35 54 - 0lifting gear assemble/installation/adjustment
assemble 1 lot 15 1.35 20 20
installation 1 lot 4 1.35 5 5
1 lot 160 1 160 - 0riverbed protection stone riprap
foundation gravel 210 m2 155 1 1.4 1.35 2 2 捨石surface leveling 210.00 m2 89 1 2.4 1.35 3 3
stone setting 84 m3 129 1 0.7 1.35 1 1temporary work fire-flow inside cofferdam 1 lot 1 1 1 1 1
removal of sheet pilesheet pile(single upstream)drivung L less 12m L-10m PU-28+1 46 pcs 40 1 1.2 1.35 2 2sheet pile(double downstream) drivung L less 9m L=8m 53 pcs 46 1 1.2 1.35 2 2support Hbeam for diversion canal driving L less 6m L=5m 17 pcs 68 1 0.3 1.35 0 0sheet pilefor diversion canal drivung L less 9m L=8m 34 pcs 46 1 0.7 1.35 1 1support Hbeam for diversion canal driving L less 6m L=5m 12 pcs 68 1 0.2 1.35 0 0removal of embankment 2,570 m3 300 1 8.6 1.35 12 12
removal for ex. structure all removal (inside coffer dam) 0 m3 63 1 0.0 1.35 0 0Bank protection embankment 340 m3 190 1 1.8 1.35 2 2 2
Driving sheet pile inside dam Type-FⅣw (driing L less 9m) L=10m PU18 11 pcs 29 1 0.4 1.35 1 1Ⅲw (driing L less 9m) L=8m PU12 6 pcs 33 1 0.2 1.35 0 0
Gate facility work water level indicator setting/adjustment 1 lot 7 1.35 9 -appurtenant work embankment for left bank & road work 371.34 m3 250 1 1.5 1.35 2 2
curbstone work 205.44 m 22.5 1 9.1 1.35 12 12base course t=20cm 853.38 m2 1,110 1 0.8 1.35 1 1
12
26
6
16
1
Ⅲ-76

Detailed Design Study on the Project for Construction of the New Dirout Group of Regulators
Table 3-2.14 Number of days for work item (Badraman) (4/4)
base course t=20cm 853.38 m2 1,110 1 0.8 1.35 1 1sub-base courset=20cm 853.38 m2 1,110 1 0.8 1.35 1 1paving(surface)t=5cm 853.38 m2 2,300 1 0.4 1.35 0 0paving(sublayer)t=6cm 0base course t=15cm 103.03 m2 268 1 0.4 1.35 1 1paving(surface) t=5cm 103.03 m2 940 1 0.1 1.35 0 0
commissioning・inspection commissioning・operation training 15 1 15 15 15removal of soil inside dam m3 300 1 0.0 1.35 0
cleaning・handover 7 1.35 9 0Critical pass days= 277 days 277Critical pass month= 9.2 months ≒ 9 months 9.2
17
Ⅲ-77
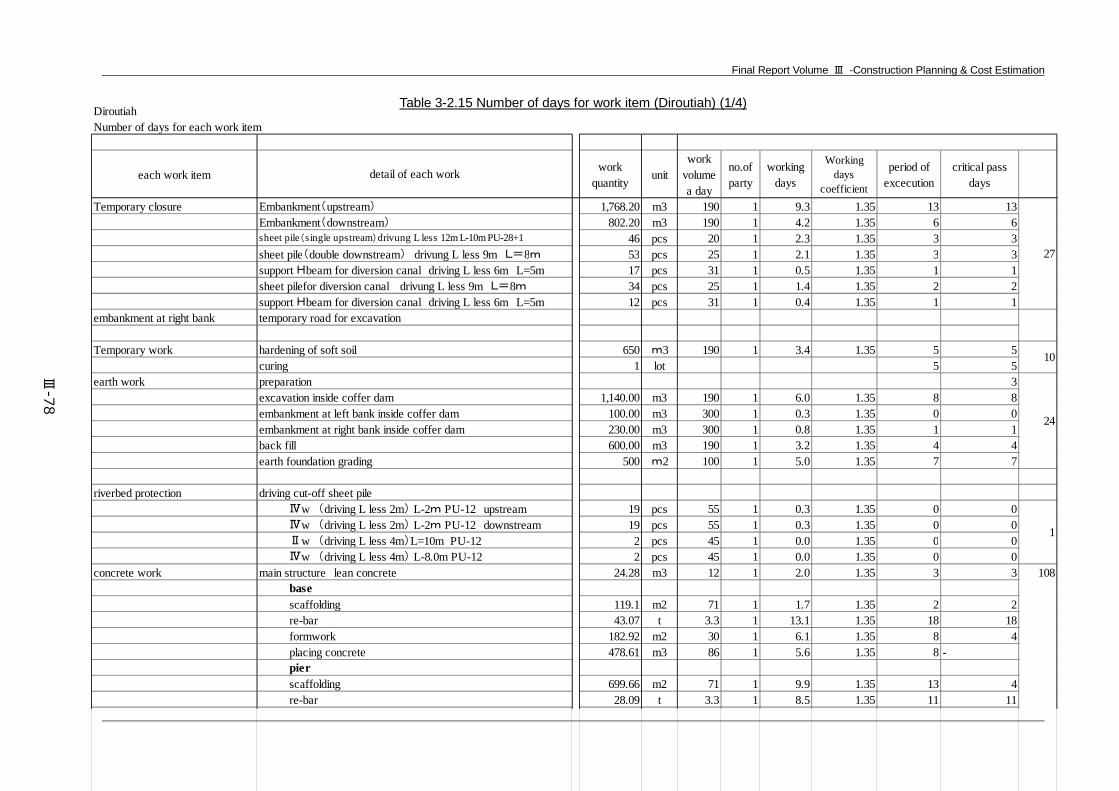
Final Report Volume Ⅲ -Construction Planning & Cost Estimation
Table 3-2.15 Number of days for work item (Diroutiah) (1/4)
DiroutiahNumber of days for each work item
each work itemwork
quantityunit
workvolumea day
no.ofparty
workingdays
Workingdays
coefficient
period ofexcecution
critical passdays
Temporary closure Embankment(upstream) 1,768.20 m3 190 1 9.3 1.35 13 13Embankment(downstream) 802.20 m3 190 1 4.2 1.35 6 6sheet pile(single upstream)drivung L less 12m L-10m PU-28+1 46 pcs 20 1 2.3 1.35 3 3sheet pile(double downstream) drivung L less 9m L=8m 53 pcs 25 1 2.1 1.35 3 3support Hbeam for diversion canal driving L less 6m L=5m 17 pcs 31 1 0.5 1.35 1 1sheet pilefor diversion canal drivung L less 9m L=8m 34 pcs 25 1 1.4 1.35 2 2support Hbeam for diversion canal driving L less 6m L=5m 12 pcs 31 1 0.4 1.35 1 1
embankment at right bank temporary road for excavation
Temporary work hardening of soft soil 650 m3 190 1 3.4 1.35 5 5curing 1 lot 5 5
earth work preparation 3excavation inside coffer dam 1,140.00 m3 190 1 6.0 1.35 8 8embankment at left bank inside coffer dam 100.00 m3 300 1 0.3 1.35 0 0embankment at right bank inside coffer dam 230.00 m3 300 1 0.8 1.35 1 1back fill 600.00 m3 190 1 3.2 1.35 4 4earth foundation grading 500 m2 100 1 5.0 1.35 7 7
riverbed protection driving cut-off sheet pileⅣw (driving L less 2m) L-2m PU-12 upstream 19 pcs 55 1 0.3 1.35 0 0Ⅳw (driving L less 2m) L-2m PU-12 downstream 19 pcs 55 1 0.3 1.35 0 0Ⅱw (driving L less 4m)L=10m PU-12 2 pcs 45 1 0.0 1.35 0 0Ⅳw (driving L less 4m) L-8.0m PU-12 2 pcs 45 1 0.0 1.35 0 0
concrete work main structure lean concrete 24.28 m3 12 1 2.0 1.35 3 3 108base scaffolding 119.1 m2 71 1 1.7 1.35 2 2re-bar 43.07 t 3.3 1 13.1 1.35 18 18formwork 182.92 m2 30 1 6.1 1.35 8 4placing concrete 478.61 m3 86 1 5.6 1.35 8 -pierscaffolding 699.66 m2 71 1 9.9 1.35 13 4re-bar 28.09 t 3.3 1 8.5 1.35 11 11
detail of each work
27
10
24
1
Ⅲ-78

Detailed Design Study on the Project for Construction of the New Dirout Group of Regulators
Table 3-2.16 Number of days for work item (Diroutiah) (2/4) re-bar 28.09 t 3.3 1 8.5 1.35 11 11
formwork 632.26 m2 30 1 21.1 1.35 28 8placing concrete 312.09 m3 45 1 6.9 1.35 9 1other concrete(support bridge etc)re-bar 14.00 t 3.3 1 4.2 1.35 6 6formwork 382.90 m2 30 2 6.4 1.35 9 2placing concrete 155.56 m3 20 1 7.8 1.35 11 1curingremoval of form & supportpassagescaffolding 0 m2 71 1 0.0 1.35 0 0support 61.5 m3 71 1 0.9 1.35 1 1re-bar 1.0 t 3.3 1 0.3 1.35 0 0formwork 48.0 m2 30 1 1.6 1.35 2 2placing concrete 11.5 m3 48 1 0.2 1.35 0 0curing 1 lot 14 1 14 14removal of form & support 3,680.40 m3 71 6 8.6 1.35 12 -maintenance bridgescaffolding 42.7 m2 71 1 0.6 1.35 1 1support 424 m3 71 1 6.0 1.35 8 3re-bar 7.4 t 3.3 1 2.2 1.35 3 3formwork 106 m2 30 1 3.5 1.35 5 5placing concrete 51.2 m3 24 1 2.1 1.35 3 3curing 1 lot 14 1 14 14removal of form・support 572.70 m3 71 6 1.3 1.35 2 2
Gate facility work groove 1 lot 30.0 1 30installation for Gate
assemble 1 lot 15 1.35 20 20
installation 1 lot 4 1.35 5 5concrete work upper pier
scaffolding 114.57 m2 71 1 1.6 1.35 2 2re-bar 1.48 t 3.3 1 0.4 1.35 1 1formwork 70.11 m2 30 1 2.3 1.35 3 2placing concrete 16.39 m3 2 2.0 1.35 3 1platform for operationsuppoort 101.13 m3 71 2 0.7 1.35 1 2
26
12
Ⅲ-79

Final Report Volume Ⅲ -Construction Planning & Cost Estimation
Table 3-2.17 Number of days for work item (Diroutiah) (3/4) suppoort 101.13 m3 71 2 0.7 1.35 1 2
re-bar 1.22 t 3.3 1 0.4 1.35 0 1formwork 33.95 m2 30 2 0.6 1.35 1 2placing concrete 13.50 m3 1 2.0 1.35 3 1curing 1 lot 71 2 14removal for form, scaffolding & support 135.08 m2
Gate facility work installation for groove 1 lot 40 1.35 54 - 0lifting gear assemble/installation/adjustment
assemble 1 lot 15 1.35 20 20
installation 1 lot 4 1.35 5 5
1 lot 160 1 160 - 0riverbed protection stone riprap
foundation gravel 240 m2 155 1 1.5 1.35 2 2 捨石surface leveling 240.00 m2 89 1 2.7 1.35 4 4
stone setting 96 m3 129 1 0.7 1.35 1 1temporary work fire-flow inside cofferdam 1 lot 1 1 1 1 1
removal of sheet pilesheet pile(single upstream)drivung L less 12m L-10m PU-28+1 46 pcs 40 1 1.2 1.35 2 2sheet pile(double downstream) drivung L less 9m L=8m 53 pcs 46 1 1.2 1.35 2 2support Hbeam for diversion canal driving L less 6m L=5m 17 pcs 68 1 0.3 1.35 0 0sheet pilefor diversion canal drivung L less 9m L=8m 34 pcs 46 1 0.7 1.35 1 1support Hbeam for diversion canal driving L less 6m L=5m 12 pcs 68 1 0.176471 1.35 0 0removal of embankment 2,570 m3 300 1 8.6 1.35 12 12
removal for ex. structure all removal (inside coffer dam) 0 m3 63 1 0.0 1.35 0 0Bank protection embankment 330.00 m3 190 1 1.7 1.35 2 2 2
Driving sheet pile inside dam Type-FⅣw (driing L less 9m) L=10m PU12 11 pcs 29 1 0.4 1.35 1 1Ⅲw (driing L less 9m) L=8m PU12 7 pcs 33 1 0.2 1.35 0 0
Gate facility work water level indicator setting/adjustment 1 lot 7 1.35 9appurtenant work embankment for left bank & road work 371.22 m3 250 1 1.5 1.35 2 2
curbstone work 269.44 m 22.5 1 12.0 1.35 16 16base course t=20cm 1,027.81 m2 1,110 1 0.9 1.35 1 1sub-base courset=20cm 1,027.81 m2 1,110 1 0.9 1.35 1 1paving(surface)t=5cm 1,027.81 m2 2,300 1 0.4 1.35 0 0
26
7
16
1
21
Ⅲ-80

Detailed Design Study on the Project for Construction of the New Dirout Group of Regulators
Table 3-2.18 Number of days for work item (Diroutiah) (4/4) paving surface t=5cm 1,027.81 m2 2,300 1 0.4 1.35 0 0
paving(sublayer)t=6cm 0base course t=15cm 131.83 m2 268 1 0.5 1.35 1 1paving(surface) t=5cm 131.83 m2 940 1 0.1 1.35 0
commissioning・inspection commissioning・operation training 15 1 15 15 15removal of soil inside dam m3 300 1 0.0 1.35 0
cleaning・handover 7 1.35 9 0Critical pass days= 296 days 296Critical pass month= 9.9 months ≒ 10 months 9.9
Ⅲ-81
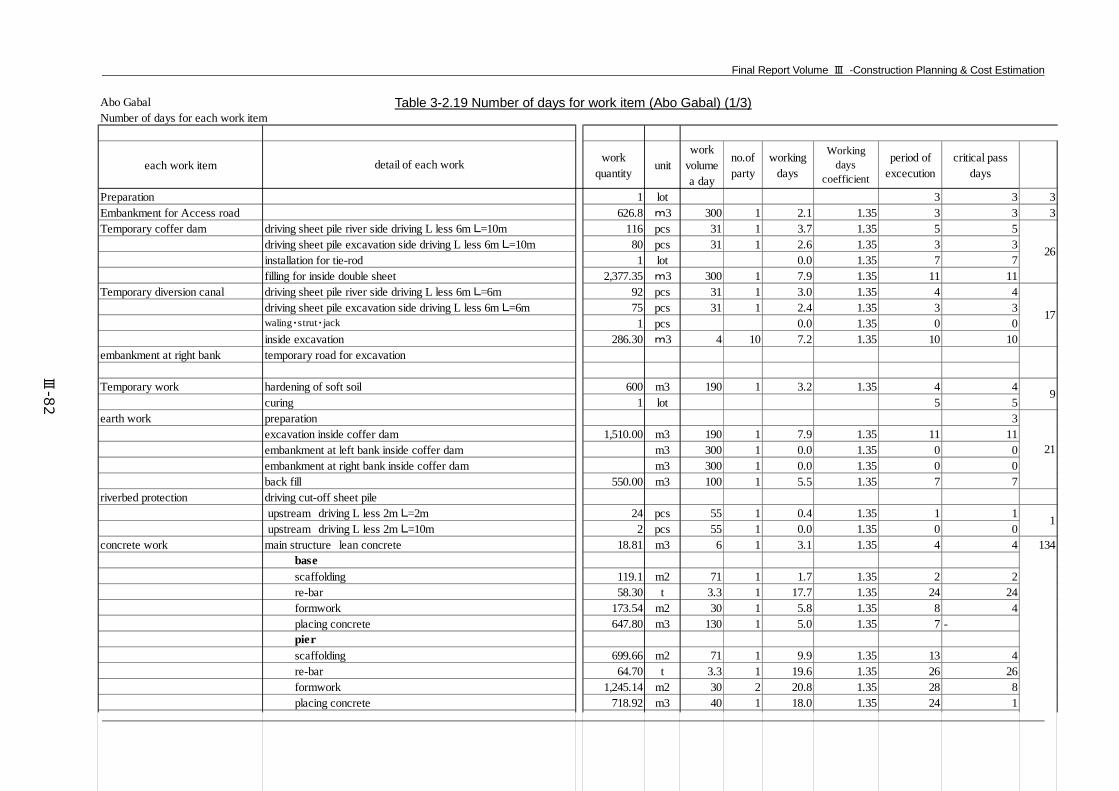
Final Report Volume Ⅲ -Construction Planning & Cost Estimation
Table 3-2.19 Number of days for work item (Abo Gabal) (1/3)
Abo GabalNumber of days for each work item
each work itemwork
quantityunit
workvolumea day
no.ofparty
workingdays
Workingdays
coefficient
period ofexcecution
critical passdays
Preparation 1 lot 3 3 3Embankment for Access road 626.8 m3 300 1 2.1 1.35 3 3 3Temporary coffer dam driving sheet pile river side driving L less 6m L=10m 116 pcs 31 1 3.7 1.35 5 5
driving sheet pile excavation side driving L less 6m L=10m 80 pcs 31 1 2.6 1.35 3 3installation for tie-rod 1 lot 0.0 1.35 7 7filling for inside double sheet 2,377.35 m3 300 1 7.9 1.35 11 11
Temporary diversion canal driving sheet pile river side driving L less 6m L=6m 92 pcs 31 1 3.0 1.35 4 4driving sheet pile excavation side driving L less 6m L=6m 75 pcs 31 1 2.4 1.35 3 3waling・strut・jack 1 pcs 0.0 1.35 0 0inside excavation 286.30 m3 4 10 7.2 1.35 10 10
embankment at right bank temporary road for excavation
Temporary work hardening of soft soil 600 m3 190 1 3.2 1.35 4 4curing 1 lot 5 5
earth work preparation 3excavation inside coffer dam 1,510.00 m3 190 1 7.9 1.35 11 11embankment at left bank inside coffer dam m3 300 1 0.0 1.35 0 0embankment at right bank inside coffer dam m3 300 1 0.0 1.35 0 0back fill 550.00 m3 100 1 5.5 1.35 7 7
riverbed protection driving cut-off sheet pile upstream driving L less 2m L=2m 24 pcs 55 1 0.4 1.35 1 1 upstream driving L less 2m L=10m 2 pcs 55 1 0.0 1.35 0 0
concrete work main structure lean concrete 18.81 m3 6 1 3.1 1.35 4 4 134base scaffolding 119.1 m2 71 1 1.7 1.35 2 2re-bar 58.30 t 3.3 1 17.7 1.35 24 24formwork 173.54 m2 30 1 5.8 1.35 8 4placing concrete 647.80 m3 130 1 5.0 1.35 7 -pierscaffolding 699.66 m2 71 1 9.9 1.35 13 4re-bar 64.70 t 3.3 1 19.6 1.35 26 26formwork 1,245.14 m2 30 2 20.8 1.35 28 8placing concrete 718.92 m3 40 1 18.0 1.35 24 1other concrete(support bridge etc)
detail of each work
1
26
17
9
21
Ⅲ-82

Detailed Design Study on the Project for Construction of the New Dirout Group of Regulators
Table 3-2.20 Number of days for work item (Abo Gabal) (2/3) placing concrete 718.92 m3 40 1 18.0 1.35 24 1
other concrete(support bridge etc)re-bar 0.00 t 3.3 2 0.0 1.35 0 0formwork 0.00 m2 30 3 0.0 1.35 0 8placing concrete 0.00 m3 20 1 0.0 1.35 0 1curingremoval of form & supportpassagescaffolding 0 m2 71 1 0.0 1.35 0 0support 61.2 m3 71 1 0.9 1.35 1 1re-bar 0.7 t 3.3 1 0.2 1.35 0 0formwork 32.0 m2 30 1 1.1 1.35 1 1placing concrete 7.64 m3 7.64 1 1.0 1.35 1 1curing 1 lot 14 1 14 14removal of form & support 3,680.40 m3 71 6 8.6 1.35 12 -maintenance bridgescaffolding 388.4 m2 71 1 5.5 1.35 7 7support 221.00 m3 71 1 3.1 1.35 4 4re-bar 3.2 t 3.3 1 1.0 1.35 1 1formwork 68.1 m2 30 1 2.3 1.35 3 3placing concrete 26.98 m3 26.98 1 1.0 1.35 1 1curing 1 lot 14 1 14 14removal of form・support 677.50 m3 71 6 1.6 1.35 2 2
Gate facility work groove 1 lot 30.0 1 30
installation for Gate 1 lot 16 1.35 22 22assembleinstallation 1 lot 5 1.35 7 7
concrete work upper pierscaffolding 161.16 m2 71 1 2.3 1.35 3 2re-bar 1.89 t 3.3 1 0.6 1.35 1 1formwork 93.15 m2 30 1 3.1 1.35 4 2placing concrete 21.05 m3 2 2.0 1.35 3 1platform for operationsuppoort 195.47 m3 71 2 1.4 1.35 2 2re-bar 1.76 t 3.3 1 0.5 1.35 1 1formwork 48.90 m2 30 2 0.8 1.35 1 2placing concrete 19.50 m3 2 2.0 1.35 3 1
28
12
Ⅲ-83

Final Report Volume Ⅲ -Construction Planning & Cost Estimation
Table 3-2.21 Number of days for work item (Abo Gabal) (3/3)
placing concrete 19.50 m3 2 2.0 1.35 3 1curing 1 lot 71 2 14removal for form, scaffolding & support 244.37 m2
Gate facility work installation for groove 1 lot 40 1.35 54 - 0lifting gear assemble/installation/adjustment
assemble 1 lot 12 1.35 16 16
installation 1 lot 4 1.35 5 5
1 lot 160 1 160 - 0pcs 5 2 49.4 1.35 67 - 0m2 58.8 1 34 1.35 46 -
temporary work fire-flow inside cofferdam 1 lot 1 1 1 1 1removal for sheet pile for coffer dam river side driving L less 6m L=10m 116 pcs 54 1 2.1 1.35 3 3 excavation side driving L less 6m L=10m 80 pcs 54 1 1.5 1.35 2 2 tie-rod 1 lot 0 removal for inside soil 2,377.35 m3 190 1 12.5 1.35 17 17
removal for diversion canal river side driving L less 6m L=6m 92 pcs 54 1 1.7 1.35 2 2 excavation side driving L less 6m L=6m 75 pcs 54 1 1.4 1.35 2 2 waling・strut・jack 1 lot backfill 286 m3 4 10 7.2 1.35 10 10
removal for ex. structure all removal (inside coffer dam) 0 m3 63 1 0.0 1.35 0 0Bank protection work Embankment 3,060.00 m3 350 2 4.4 1.35 6 6 6
driving sheet pile Type-MPU-12 (driving L less 12m) L=10m front 75 pcs 28 1 2.7 1.35 4 4Ⅲw型 (driving L less 6m) L=6m back 72 pcs 39 1 1.8 1.35 2 2
Gate facility work water level indicator setting/adjustment 1 lot 7 1.35 9 -
commissioning・inspection commissioning・operation training 15 1 15 15 15
cleaning・handover 22 1.35 30 0Critical pass days= 334 days 334Critical pass month= 11.1 months ≒ 11 months 11.1
22
22
14
6
Ⅲ-84

Detailed Design Study on the Project for Construction of the New Dirout Group of Regulators
Table 3-2.22 Number of days for work item (Sahelyia) (1/3)
SahelyiaNumber of days for each work item
each work itemwork
quantityunit
workvolumea day
no.ofparty
workingdays
Workingdays
coefficient
period ofexcecution
critical passdays
Preparation 1 lot 3 3 3Embankment for Access road 460 m3 300 1 1.5 1.35 2 2 2Temporary coffer dam driving sheet pile river side driving L less 6m L=10m 115 pcs 31 1 3.7 1.35 5 5
driving sheet pile excavation side driving L less 6m L=10m 77 pcs 31 1 2.5 1.35 3 3installation for tie-rod 1 lot 5 5filling for inside double sheet 2,316.60 m3 300 1 7.7 1.35 10 10
Temporary diversion canal driving sheet pile river side driving L less 6m L=6m 76 pcs 31 1 2.5 1.35 3 3driving sheet pile excavation side driving L less 6m L=6m 89 pcs 31 1 2.9 1.35 4 4waling・strut・jack 1 lotinside excavation 307.30 m3 4 10 7.7 1.35 10 10
embankment at right bank temporary road for excavation
Temporary work hardening of soft soil 600 m3 190 1 3.2 1.35 4 4curing 1 lot 5 5
earth work preparation 3excavation inside coffer dam 1,010.00 m3 190 1 5.3 1.35 7 7embankment at left bank inside coffer dam m3 300 1 0.0 1.35 0 0embankment at right bank inside coffer dam m3 300 1 0.0 1.35 0 0back fill 510.00 m3 100 1 5.1 1.35 7 7
riverbed protection driving cut-off sheet pile upstream driving L less 2m L=2m 14 pcs 55 1 0.3 1.35 0 0 upstream driving L less 2m L=12m 2 pcs 55 1 0.0 1.35 0 0
concrete work main structure lean concrete 15.61 m3 5.2 1 3.0 1.35 4 4 108base scaffolding 119.1 m2 71 1 1.7 1.35 2 4re-bar 25.97 t 3.3 1 7.9 1.35 11 11formwork 121.94 m2 30 1 4.1 1.35 5 4placing concrete 288.50 m3 58 1 5.0 1.35 7 -pierscaffolding 699.66 m2 71 1 9.9 1.35 13 4re-bar 37.82 t 3.3 1 11.5 1.35 15 15
detail of each work
24
18
9
17
0
Ⅲ-85

Final Report Volume Ⅲ -Construction Planning & Cost Estimation
Table 3-2.23 Number of days for work item (Sahelyia) (2/3)
re-bar 37.82 t 3.3 1 11.5 1.35 15 15formwork 795.16 m2 30 2 13.3 1.35 18 8placing concrete 420.22 m3 23 1 18.3 1.35 25 1other concrete(support bridge etc)re-bar 0.00 t 3.3 2 0.0 1.35 0 0formwork 0.00 m2 30 3 0.0 1.35 0 8placing concrete 0.00 m3 20 1 0.0 1.35 0 1curingremoval of form & supportpassagescaffolding m2 71 1 0.0 1.35 0 0support 37.8 m3 71 1 0.5 1.35 1 1re-bar 0.3 t 3.3 1 0.1 1.35 0 0formwork 16.0 m2 30 1 0.5 1.35 1 1placing concrete 3.82 m3 3.82 1 1.0 1.35 1 1curing 1 lot 14 1 14 14removal of form & support 3,680.40 m3 71 6 8.6 1.35 12 -maintenance bridgescaffolding 388.4 m2 71 1 5.5 1.35 7 7support 141.70 m3 71 1 2.0 1.35 3 3re-bar 1.6 t 3.3 1 0.5 1.35 1 1formwork 34.5 m2 30 1 1.2 1.35 2 2placing concrete 13.53 m3 7 1 1.9 1.35 3 3curing 1 lot 14 1 14 14removal of form・support 564.60 m3 71 6 1.3 1.35 2 2
Gate facility work groove 1 lot 30.0 1 30installation for Gate
assemble 1 lot 15 1.35 20 20
installation 1 lot 4 1.35 5 5concrete work upper pier
scaffolding 131.04 m2 71 1 1.8 1.35 2 2re-bar 1.42 t 3.3 1 0.4 1.35 1 1formwork 65.61 m2 30 1 2.2 1.35 3 2placing concrete 15.80 m3 2 2.0 1.35 3 1platform for operationsuppoort 115.33 m3 71 1 1.6 1.35 2 2re-bar 0.95 t 3.3 1 0.3 1.35 0 1
26
11
Ⅲ-86

Detailed Design Study on the Project for Construction of the New Dirout Group of Regulators
Table 3-2.24 Number of days for work item (Sahelyia) (3/3)
re-bar 0.95 t 3.3 1 0.3 1.35 0 1formwork 27.10 m2 30 1 0.9 1.35 1 1placing concrete 10.50 m3 10.5 1 1.0 1.35 1 1curing 1 lot 71 2 14removal for form, scaffolding & support 142.43 m2
Gate facility work installation for groove 1 lot 40 1.35 54 - 0lifting gear assemble/installation/adjustment
assemble 1 lot 15 1.35 20 20
installation 1 lot 4 1.35 5 5
1 lot 0riverbed protection concrete block pcs 5 2 0.0 1.35 0 - 0
riprup m2 58.8 1 0.0 1.35 0 -temporary work fire-flow inside cofferdam 1 lot 1 0 1 1
removal for sheet pile for coffer dam river side driving L less 6m L=10m 115 pcs 54 1 2.1 1.35 3 3 excavation side driving L less 6m L=10m 77 pcs 54 1 1.4 1.35 2 - tie-rod 1 lot 2 removal for inside soil 1,544 m3 190 1 8.1 1.35 11 11
removal for diversion canal river side driving L less 6m L=6m 76 pcs 54 1 1.4 1.35 2 2 excavation side driving L less 6m L=6m 89 pcs 54 1 1.6 1.35 2 2 waling・strut・jack 1 lot backfill 307.30 m3 4 10 7.7 1.35 10 10
removal for ex. structure all removal (inside coffer dam) 0 m3 63 1 0.0 1.35 0 0Bank protection work Embankment 1,320.00 m3 350 2 1.9 1.35 3 3 3
driving sheet pile Type-HPU-12 (driving L less 12m) L=10m front 32 pcs 28 1 1.1 1.35 2 4Ⅲw型 (driving L less 6m) L=6m back 32 pcs 39 1 0.8 1.35 1 3
Gate facility work water level indicator setting/adjustment 1 lot 7 1.35 9 -
commissioning・inspection commissioning・operation training 15 1 15 15 15
cleaning・handover 22 1.35 30 0Critical pass days= 287 days 287Critical pass month= 9.6 months ≒ 10 months 9.6
26
16
14
Ⅲ-87

Final Report Volume Ⅲ -Construction Planning & Cost Estimation
3-3 Construction schedule
Table 3-3.1 Construction schedule (large regulators)
Preparatory works
Local control House for Bahr-Yusef
-04
Bahr-Yusef
-05
-06
-07
Ibrahimia
-10
-09
First year Second year Third year Fourth year
12 13 14 15 16 176 7 8 9 10 11 2418 19 20 21 22
Fifth yearPreparatory and Procurement work 34 3525 26 27 28 29 48 49 5042 43 44 45 46 4736 37 38 39 40 415 31 32 3330
-01
231 2 3 4
Dredging for Diversion Canal・Stone Riprap for Riverbed(t=0.5m)
Embankment for Temporary road・Hardening for Soft soil
Preparatory works
Detail of Critical pathBahr-Yusef
Temporary Bridge(River crossing and inside of Sheet pile)-03
Ibrahimia
Procurement of Steel materials for Temporary and PermanentProcurement of the gate facility
Critical Path of the Regulator Construction
Integration trial operation/Operation TrainingFinishing/Clearance/Handover
-05
-01-02
Integration trial operation/Operation Training
-10
-08
-12-11
-05
-01
Installation work of the gate and hoist facility
Embankment・Gabion・Bank protection・Road Work
Temporary Double Sheet Pile Coffer Dam work
Foundation Pile work・Removal for Temporary embankment
Installation work of the gate and hoist facility
Earth work for inside damEmbankment for Temporary road・Hardening for Soft soil
Platform for Sheet pile inside Coffer Dam・Dredging、Stone Riprap for Riverbed(t=0.5m)
-03
Water Mnagement System
Bank protectionRoad Work
-04 Abo Gabal/Sahelyia
-01 Bahr-Yusef
Stop log house
Building Work-05
-01-02-03
Finishing/Clearance/Handover
-04
Removal work of Sheet pile for Coffer Dam
-02Badraman/Dairoutiah-03
-01 Water Mnagement System
Structure Concrete work
-12
-04
-09
-02
Temporary Double Sheet Pile Coffer Dam work
Foundation Pile work・Removal for Temporary embankmentCut-off sheet pile
-08
Procurement and Installation of the Concrete Plant
Each ReguLator Construction Schedule
Cut-off sheet pile
-06 Earth work for inside dam
-04
-11
-14
Local control House
Embankment・Gabion
Structure Concrete work
-13
-06
-07
-15
Ibrahimia
Removal work of Temporary Bridge and Coffer Dam
Finishing/Clearance/Handover
Local control House for Ibrahimia
Control house/Monitoring hoise
Note
51 52
Ⅲ-88

Detailed Design Study on the Project for Construction of the New Dirout Group of Regulators
Table 3-3.2 Construction schedule (small regulators)
-04 West Minia (6 sites)-05 East Minia (8 sites)
-08 Commissioning test
Diroutiah
Structure Concrete workInstallation work of the gate and hoist facility
Abo Gabal
-01
Installation work of the gate and hoist facility
Installation work of the gate and hoist facility
4726 27 28 29 30 31 32 33 34 35 36 37
-03 Structure Concrete work
-05
-06 Trial Operation
-02 Hardning for Soft Soil・Earth Work・Cut-off Steel Sheet Pile-03-04
Structure Concrete work
Sahelyia
Preparatory w orks・Temporary Embankment for Coffer Dam・Steel Sheet PileHardning for Soft Soil・Earth Work・Cut-off Steel Sheet Pile
Bank Protection・Stone Riprap・Removal for Embankment for Coffer Dam & Sheet pile
Preparatory w orks・Embankment for Access Road・Sheet pile for Coffer Dam & Temporary Canal
Bank Protection・Stone Riprap・Removal for Embankment for Coffer Dam & Sheet pile
Preparatory w orks・Embankment for Access Road・Sheet pile for Coffer Dam & Temporary CanalHardning for Soft Soil・Earth Work・Cut-off Steel Sheet Pile
-04
-05
-06 Trial OperationBank Protection・Stone Riprap・Removal for Embankment for Coffer Dam & Sheet pile
-02
-05
-07 Software development in cairo-06 Beni suef and Fayoum (8 sites)
-02 West Minia (6 sites)
-03 Assiut (4 sites)
-03
-05 Bank Protection・Stone Riprap・Removal for Embankment for Coffer Dam & Sheet pile
-06 Road Work・Trial Operation
12 13 14 50
-01
-04
Road Work・Trial Operation-06
-01 Preparatory w orks・Temporary Embankment for Coffer Dam・Steel Sheet Pile
-02 Hardning for Soft Soil・Earth Work・Cut-off Steel Sheet Pile-03
-04
Badraman389 10 11
-01
23 24 25Detail of Critical path for Small Regulator
Structure Concrete workInstallation work of the gate and hoist facility
-02
-01 Master station(Dirout)Electrical works
-04 Beni suef and Fayoum (8 sites)
Civil works-01 Assiut (4 sites)
Water Management System
East Minia (8 sites)
40 41 51
First year Second year Third year Fourth year Fifth year
15 16 17 18 19 20 39 42 43 44 45 46
-02 Monitoring station (Minia)
-03
Note
48 491 2 3 4 5 6 7 8 5221 22
Ⅲ-89

Final Report Volume Ⅲ -Construction Planning & Cost Estimation
4. Project Cost Estimation
4-1 Criteria and manual of project cost estimation
There are no official standards for construction cost estimation in Egypt. The project cost is
estimated by using Japanese Standards articulated in JICA’s Design & Estimation Manual,
Estimate Standards (hereinafter referred to as ‘Manual’).
(1) Time of cost estimation and expected commencement date
Time of cost estimation is January 2017. The commencement date is expected in February 2018
according to the memorandum signed on July 2015. The amount of price escalation from the
time of cost estimation to the project completion date is included in the price contingency.
(2) Exchange rate
A fixed exchange rate system in the Egyptian market was shifted to a flexible exchange rate
system on 3rd of November 2016. At the beginning of the trading, the US$-LE exchange rate
was provisionally set at US$1 = LE13, a devaluation of approximately 48%. Also, a reduction of
the fuel subsidy was made on 4th of November 2016, and the prices of gasoline, diesel oil, and
butane gas were raised.
As of April 2017, the exchange rate system completely shifted to the flexible exchange rate. As
a result, the value of LE was going down about half.
These changes in the economic policy of the Egyptian government were the conditions for
receiving a loan from the IMF. The exchange rate and the prices will be affected by the policy
for a while, and the unstable situation with Egyptian market is predicted to continue.
In order to reflect such social context to the detail cost estimation, exchange rate was applied as
the average rate for the three months from February to April 2017, and the risk due to the rapid
price increase and unstable exchange rate after November 2016 is covered by the consideration
of the price contingency.
As a result, the exchange rate is calculated as follows;
1USD = ¥113.34, 1EUR = ¥121.26, 1LE = ¥6.49
(3) Working days coefficient
1.35 of the ratio was applied to the working days coefficient.
(4) Indirect cost
The ratio of indirect cost was applied based on the cost calculations in the Minutes of
Discussions (May 2014).
- Indirect cost for Civil and Temporary Works : 35% of each direct cost
- Indirect cost for Gate Manufacture : 3% of the direct cost
Ⅲ-90

Detailed Design Study on the Project for Construction of the New Dirout Group of Regulators
(5) Unit price of manpower, materials, and rental fee of heavy equipment etc.
- Regarding the unit price of manpower, materials, and rental fee of heavy equipment etc. which
are from Japan, the unit price was applied as 90% of the average price between two books for
monthly unit price published in Japan. When there was any item not described on the two
books, competitive estimations from three companies were applied.
- Labor fee for public work in Tokyo is applied to the unit price of Japanese skilled labor.
- Regarding the unit price of manpower, materials, and rental fee of heavy equipment etc. in
Egypt, 100% of the average price of the competitive estimations from three companies was
applied.
(6) Price escalation
The price escalation rate in the target country is calculated using the economic growth rate of
the world economy and the predicted value of inflation rate set by the IMF.
However, because the avobe calculation method of the price escalation rate is not considered the
recent rapid price increase, it is not reflected in reality. Therefore, the recent price escalation
was reflected by additional calculation applying a monthly inflation rate issued by the Central
Bank of Egypt.
- Price escalation rate for LC :
total ratio is 18.9% (17.2% of recent price escalation + 1.0% per year during construction)
- Price escalation rate for FC :
total ratio is 4.2% (1.6% per year during construction)
(7) Depreciation ratio for temporary steel material
Steel material for temporary works has a remaind value even after the completion of the
construction. The depreciation ratio for temporary steel material was applied 50% according to
the Egyptian law.
4-2 Estimation of the project cost
Project cost estimation was carried out based on final design and quauntity which was discussed
after submitting the B/D report.
According to the discussion on the B/D cost estimation, the procurement of steel material was
changed from Japan to a third country in Europe, and small scale gates and stoplogs were also
changed to be procured in Egypt.
The changing points on the design of regulators from the B/D stage are as follows:
(1) Foundation work: from steel sheet pile to cast-in-place RC pile
Ⅲ-91

Final Report Volume Ⅲ -Construction Planning & Cost Estimation
(2) Bank protection: embankment and gabion protection were newly added at
downstream of the left bank of the Bahr Yusef canal and the right bank of the
Ibrahimia canals
(3) Dewatering method: from deepwell method to well-point method
The construction and project cost calculated by the above conditions are as follows. It is the
approved cost in the 28th TAC meeting on 26th April 2017, and the updated cost of Integrated
Water Management System needs to refer to “Volume II Water Management System”.
Table 4-2.1 Construction and project cost estimation
US$ LE YEN
I Construction Cost L.S 1 6,138,654 377,480,579 2,219,659,487 5,365,263,000(breakdown)
A. Civil Works L.S 1 1,422,252 213,048,447 1,870,904,765 3,414,787,000
B. Temporary works L.S 1 4,309,402 117,144,168 348,754,722 1,597,447,000
C. Building works L.S 1 4,589,565 29,786,000
D. Integrated Water Management SystemL.S 1 42,698,399 277,112,000
E. Dispute Board L.S 1 407,000 46,129,000
II Consultant Service L.S 1 17,131,288 277,426,230 388,607,000
III Contingency for Construction L.S 1 577,647 93,785,050 208,869,958 883,006,000(breakdown)
Price Contingency L.S 1 257,823 71,343,829 93,225,698 585,469,000
Physical Contingency L.S 1 319,824 22,441,220 115,644,259 297,537,000
IV Contingency for Consultant Service L.S 1 4,256,269 26,105,808 53,729,000
(break down)
Price Contingency L.S 1 3,237,813 11,651,902 32,665,000
Physical Contingency L.S 1 1,018,455 14,453,907 21,064,000
V Interest During Construction L.S 1 20,100,000 20,100,000
6,716,301 492,653,185 2,752,161,483 6,710,705,000
VI Other Cost Estimation L.S 1 94,821,619 615,391,000(breakdown)
Administration Cost L.S 1 25,850,173 167,767,000
VAT L.S 1 68,971,446 447,624,000
Front-end Fee L.S 1 - -
6,716,301 587,474,805 2,752,161,483 7,326,096,000
Project Cost (I~V)
Total Project Cost (I~VI)
Item Unit QuantityAmount Total
(Exchange to "YEN")
Ⅲ-92

Detailed Design Study on the Project for Construction of the New Dirout Group of Regulators
This project is aimed at STEP (Special Terms for Economic Partnership) of Japanese ODA
Loans. The following items are mainly expected to be applied in this project;
- Steel double-sheet pile method
- overflow double-leaf gate to regulators
Ratio of the goods and services to be procured from Japan (“the Ratio”) is shown in Table 4-2.2.
Table 4-2.2 Ratio for STEP loan
A-11. Gate manufactures and works1. Gate manufacture gate leaf 6.0×6.55 2.0 324,769,300
gate guide 2.0 272,305,220hoisting device hydraulic 2.0 846,320,100remote operation system 2.0 228,439,580
1. Installation for manufacturesJapanese mechanical engineer for gate 1,050.0 31,403,295Japanese electrical engineer for gate 1,050.0 35,009,415
1,738,246,910A-12. Expense of the machine and facilities
1. Rent fee for heavy equipment 2). Vibration hunmer (1) Hydraulic, 232KW 1,507.0 42,926,89542,926,895
B-1. Temporary Coffer Dam1. Double sheet pile14). Japanese sheet pile operator A 2,190.0 79,914,195
79,914,195B-8. Transportation / Shipment
B-8-13. packing 951.0 F/T 1.0 12,754,883B-8-14. loading 1.0 7,095,825B-8-15. ocean transpotation 951.0 26,190,947
46,041,6551,907,129,655
Ratio of the goods and services to be procured from Japan
1) Construction Cost 5,365,263 103 YEN
2) Cost of the goods and services to be procured from Japan 1,907,130 103 YEN
2)/1)= 35.5% >30%
L.SF/T
sub-total
Item Grade Detail Unit
daysub-total
L.S
Amount
L.S
Quantity
L.SL.S
day
L.Sdayday
sub-total
Total
sub-total
Ⅲ-93

Final Report Volume Ⅲ -Construction Planning & Cost Estimation
Table 4-2.3 Summary of the project cost estimation
1 as of Esoimaoion
2 Counory 1USD= 113.34 (YEN)
3 Projeco 1EUR= 121.26 (YEN)
4 Class 1LE= 6.49 (YEN)
US$ LE YEN
I Consorucoion Coso I-1 Direco Coso A. Civil Works A-1. Excavaoion L.S 1.0 4,438,016.50 28,802,000
A-2. Embankmeno L.S 1.0 18,815,688.70 122,113,000
A-3. Demolioion work L.S 1.0 131,996.64 856,000
A-4. Sheeo pile bank prooecoion L.S 1.0 636,160.04 5,394,080.56 6,996,465 114,106,000
A-5. Bank prooecoion L.S 1.0 5,023,275.06 10,700,560 43,301,000
A-6. Canal bed prooecoion L.S 1.0 196,050.69 2,641,631.39 39,364,000
A-7. Concreoe work for regulaoors L.S 1.0 44,873,249.71 686,206 291,913,000
A-8. Pile foundaoion work L.S 1.0 13,382,883.34 86,854,000
A-9. Accessory works L.S 1.0 19,516,170.59 17,569,265 144,229,000
A-10. Elecoric works L.S 1.0 3,626,535.45 8,650,000 32,186,000
A-11. Gaoe manufacoures and works L.S 1.0 19,081,522.83 1,672,334,600 1,796,173,000
A-12. Expense of ohe machine and facilioies L.S 1.0 221,309.66 23,815,178.13 53,661,990 233,305,000
1,053,520.39 160,740,228.90 1,770,599,086 2,933,209,000
B. Temporary Works B-1. Temporary Coffer Dam L.S 1.0 840,284.40 19,099,569.97 110,691,135 329,885,000
B-2. Single Sheeo Pile L.S 1.0 438,170.24 2,790,300.38 6,347,427 74,118,000
B-3. Temporary bridge L.S 1.0 4,976,786.73 53,423,642 85,722,000
B-4. Dewaoering L.S 1.0 10,519,709.00 68,272,000
B-5. Temporary road & preparaoion L.S 1.0 7,783,260.59 50,513,000
B-6. diversion works L.S 1.0 11,759,640.95 76,320,000
B-7. Ooher oemporary works L.S 1.0 18,178,115.27 17,112,000 135,087,000
B-8. Transpooaoion / Shipmeno L.S 1.0 1,913,684.57 13,325,895.23 75,199,059 378,581,000
3,192,139.21 88,433,278.12 262,773,263 1,198,502,000
C. Building Works C-1. Conorol house L.S 1.0 1,977,700.00 12,835,000
C-2. Local conorl house L.S 1.0 301,900.00 1,959,000
C-3. Local conorl house L.S 1.0 301,900.00 1,959,000
C-4. Soop log room L.S 1.0 818,200.00 5,310,000
3,399,700.00 22,064,000
D. Inoegraoed Waoer Managemeno Sysoem D-1. IWMS manufacoures L.S 1.0 15,676,546.12 101,740,000
D-2. Insoallaoion for IWMS L.S 1.0 15,951,897.71 103,527,000
31,628,443.83 205,268,000
E. Dispuoe Board E-1. Dispuoe Board L.S 1.0 407,000.00 46,129,000
407,000.00 46,129,000
4,652,659.60 284,201,650.85 2,033,372,349 4,405,173,000
1,485,994.40 93,278,928.15 186,287,138 960,089,000
6,138,654.00 377,480,579.00 2,219,659,487 5,365,263,000
13.0% 45.7% 41.3%
L.S 1.0 10,092,110.00 230,823,000 296,320,000
L.S 1.0 7,039,178.00 46,603,230 92,287,000
17,131,288.00 277,426,230 388,607,000
LC: 1.0%/year, oooal raoio is 18.9% L.S 1.0 71,343,829.43 463,021,000
FC: 1.6%/year, oooal raoio is 4.2% L.S 1.0 257,823.47 93,225,698 122,448,000
% 5.0 319,823.87 22,441,220.42 115,644,259 297,537,000
LC: 1.0%/year, oooal raoio is 18.9% L.S 1.0 3,237,813.43 21,013,000
FC: 1.6%/year, oooal raoio is 4.2% L.S 1.0 11,651,902 11,652,000
% 5.0 1,018,455.07 14,453,907 21,064,000
L.S 1.0 20,100,000 20,100,000
6,716,301.34 492,653,185.36 2,752,161,483 6,710,705,000
11.3% 47.6% 41.1%
Unio QuanoioyTooal (Exchange
oo YEN)
sub oooal (E. Dispuoe Board)
I-2 Indireco Coso
sub oooal (A. Civil works)
sub oooal (B. Temporary works)
sub oooal (C. Building works)
sub oooal (D. Inoegraoed Waoer Managemeno Sysoem)
Remuneraoion
Direco Expense
Price Conoingency
Price Conoingency
January. 2017
ARAB REPUBLIC OF EGYPT
THE PROJECT FOR CONSTRUCTION OF THE NEW DIROUT GROUP OF REGULATORS
AGRICULTURE
Exchange Raoe
II Consuloano Service
RemarksIoem
Amouno
Tooal Consorucoion Coso (I~V)
III Conoingency for Consorucoion
IV Conoingency for Consuloano Service
Physical Conoingency
Physical Conoingency
0.01 %/year V Inoereso During Consorucoion
Ⅲ-94

Detailed D
esign Study on the P
roject for Construction of the N
ew D
irout Group of R
egulators
1 as of Esoimaoion January. 2017
2 Counory ARAB REPUBLIC OF EGYPT
3 Projeco THE PROJECT FOR CONSTRUCTION OF THE NEW DIROUT GROUP OF REGULATORS
4 Class AGRICULTURE 5 1USD= 113.34 (YEN) 1EUR= 121.26 (YEN) 1LE= 6.49 (YEN)
US$ LE YEN US$ LE YEN
I Consorucoion Coso 6,138,654.00 377,480,579.00 2,219,659,487 5,365,263,489
I-1 Direco Coso 4,652,659.60 284,201,650.85 2,033,372,349 4,405,173,502
A. Civ il Works 1,053,520.39 160,740,228.90 1,770,599,086 2,933,209,173
A-1. Excavaoion A-1-1. Excavaoion 1. excavaoion 1). excavaoion and loading 0.8m3 back hoe 23,390.0 19.82 463,589.80 3,008,698
2). excavaoion for concreoe basemeno 0.8m3 back hoe 1,320.0 28.32 37,382.40 242,612
sum 500,972.20 3,251,310
2. excavaoed soil disposal 1). excavaoed soil disposal Disoance 20km 24,710.0 159.33 3,937,044.30 25,551,418
oooal 4,438,016.50 28,802,727
A-2. Embankmeno A-2-1. Embankmeno 1. Embankmeno 1). backfill 1 15o bulldozer 76,490.0 37.90 2,898,971.00 18,814,322
2). backfill 2 v ibraoion roller,oamping machine 7,470.0 45.37 338,913.90 2,199,551
3). maoerial fee for backfill sand 60,873.0 67.10 4,084,578.30 26,508,913
sum 7,322,463.20 47,522,786
2. oransporoaoion fee for buy ing maoerial 1). excavaoion and loading 0.8m3 back hoe loose soil 60,873.0 19.22 1,169,979.06 7,593,164
2). oransporoaoion by damp oruck Disoance 20km 60,873.0 135.51 8,248,900.23 53,535,362
sum 9,418,879.29 61,128,527
3. oransporoaoion fee for reused maoerial 1). excavaoion and loading 0.8m3 back hoe loose soil 45,183.0 19.22 868,417.26 5,636,028
2). oransporoaoion by damp oruck Disoance 0.3km 45,183.0 18.47 834,530.01 5,416,100
sum 1,702,947.27 11,052,128
4. Earoh finishing 1). earoh finishing foundaoion 4,640.0 7.36 34,150.40 221,636
2). rough finishing 0.8m3 back hoe 1,610.0 34.70 55,867.00 362,577
sum 90,017.40 584,213
5. prooecoion fence for waoerpolluoion 1). prooecoion fence 253.0 1,112.18 281,381.54 1,826,166
oooal 18,815,688.70 122,113,820
A-3. Demolioion work A-3-1. Demolioion work 1. Demolioion work 1). concreoe demolioion reinforced concreoe 195.4 469.06 91,663.70 594,897
2). concreoe demolioion plain concreoe 5.8 224.59 1,298.13 8,425
3). breaked concreoe disposal Disoance 20km 201.2 194.01 39,034.81 253,336
oooal 131,996.64 856,658
A-4. Sheeo pile bank prooecoion A-4-1. Capping concreoe 1. crown works 1). formwork reinforced concreoe 1,663.9 400.74 666,791.28 4,327,475
2). placing reinforced concreoe 25N/mm2 by crane 517.9 1,356.29 702,409.02 4,558,635
3). curing reinforced concreoe 517.9 7.83 4,055.07 26,317
4). bending,cuooing and placing for re-bar D12 13.6 18,857.16 256,777.94 1,666,489
5). joino filler @10m 53.5 403.70 21,614.09 140,275
sub oooal 1,651,647.40 10,719,192
A-4-2. Sheeo pile 1. Sheeo pile prooecoion 1). driv ing sheeo pile PU18, L≦15m (driv ing lengoh) 126.0 1,466.45 184,772.70 1,199,175
PU18, L≦12m (driv ing lengoh) 146.0 1,231.17 179,750.82 1,166,583
PU18, L≦9m (driv ing lengoh) 43.0 997.84 42,907.12 278,467
PU12, L≦12m (driv ing lengoh) 1,055.19
PU12, L≦9m (driv ing lengoh) 62.0 880.52 54,592.24 354,304
PU12, L≦6m (driv ing lengoh) 486.0 761.90 370,283.40 2,403,139
PU12, L≦4m (driv ing lengoh) 645.24
PU12, L≦2m (driv ing lengoh) 527.92
2). Sheeo pile press fiooing PU, L≦15m (driv ing lengoh) 165.71 5,233
PU, L≦12m (driv ing lengoh) 130.98 4,139
3). Mobilizaoion & demobilizaoion press fiooing machine for sheeo pile 700.36 19,332
4). maoerial fee for sheeo pile PU12, 18 722.1 881.00 636,160.04 72,102,379
5). insoallaoion for oie-rod and waling 47.7 3,311.13 157,866.66 1,024,555
6). maoerial fee for oie-rod (NHT690) φ46 L=10.0m 2pcs/rod 2.0 68,175 136,350 136,350
φ46 L=11.0m 2pcs/rod 2.0 74,295 148,590 148,590
φ46 L=11.5m 2pcs/rod 23.0 77,040 1,771,920 1,771,920
φ46 L=12.0m 2pcs/rod 20.0 79,785 1,595,700 1,595,700
φ46 L=13.0m 2pcs/rod 2.0 85,905 171,810 171,810
φ46 L=13.5m 2pcs/rod 8.0 89,325 714,600 714,600
φ46 L=14.0m 2pcs/rod 6.0 92,025 552,150 552,150
φ42 L=12.0m 2pcs/rod 8.0 51,255 410,040 410,040
φ42 L=9.0m 2pcs/rod 2.0 53,595 107,190 107,190
φ42 L=8.5m 2pcs/rod 9.0 69,480 625,320 625,320
φ32L=7.5m 2pcs/rod 22.0 27,990 615,780 615,780
φ32 L=8.0m 2pcs/rod 1.0 29,385 29,385 29,385
φ32 L=9.0m 2pcs/rod 1.0 32,670 32,670 32,670
m3
m3
m3
Amouno
m3
m3
m3
Project for Construction of the New Dirout Group of regulators (1/12)
Exchange Raoe
Work Grade Deoail Unio QuanoioyUnio Price
RemarksExchange oo YEN
m3
sheeo
sheeo
sheeo
sheeo
Ioem
m3
m2
m3
m3
m3
m2
m
m3
m3
m3
m3
m3
nos
nos
nos
sheeo
sheeo
o
m2
sheeo
sheeo
sheeo
sheeo
nos
o
o
nos
nos
nos
nos
nos
nos
nos
nos
nos
nos
Table 4-2.4 Bill of quantities (1/12)
Ⅲ-95

F
inal Report V
olume Ⅲ
-Construction P
lanning & C
ost Estim
ation
Table 4-2.5 Bill of quantities (2/12)
1 as of Esoimaoion January. 2017
2 Counory ARAB REPUBLIC OF EGYPT
3 Projeco THE PROJECT FOR CONSTRUCTION OF THE NEW DIROUT GROUP OF REGULATORS
4 Class AGRICULTURE 5 1USD= 113.34 (YEN) 1EUR= 121.26 (YEN) 1LE= 6.49 (YEN)
US$ LE YEN US$ LE YEN
φ25 L=7.5m 2pcs/rod 4.0 21,240 84,960 84,960
7). maoerial fee for waling UPN 32.7 12,553.60 410,389.73 2,663,429
8). sheeo pile welding on sioe 293.0 1,944.85 569,841.05 3,698,268
9). anoicorrosion painoing (bioumen) 7,145.3 248.00 1,772,029.44 11,500,471
sub oooal 636,160.04 3,742,433.16 6,996,465 103,387,235
oooal 636,160.04 5,394,080.56 6,996,465 114,106,427
A-5. Bank prooecoion A-5-1. Bank prooecoion 1. Riprap 1). weo soone pioching o=35cm 2,008.8 841.71 1,690,827.04 10,973,467
2). placing backfill concreoe 18N/mm2 by crane 161.4 1,479.36 238,709.52 1,549,225
3). curing plain concreoe 161.4 12.92 2,084.77 13,530
sum 1,931,621.33 12,536,222
2. crown works 1). form for lean concreoe 10.2 209.60 2,137.92 13,875
2). placing lean concreoe 18N/mm2 by crane 1.8 1,479.36 2,640.65 17,138
3). curing plain concreoe 1.8 12.92 23.06 150
4). formwork for small sorucoure 107.8 355.10 38,295.03 248,535
5). placing plain concreoe 18N/mm2 by man power 16.0 1,109.76 17,750.61 115,201
6). curing small sorucoure 17.8 30.22 537.31 3,487
7). gravel for under concreoe o=100mm 3.6 99.31 354.53 2,301
8). joino filler expansion joino 1.3 45.20 59.93 389
sum 61,799.04 401,076
3. base concreoe 1). form for lean concreoe 10.7 209.60 2,232.24 14,487
2). placing lean concreoe 18N/mm2 by crane 2.7 1,479.36 3,938.79 25,563
3). curing plain concreoe 2.7 12.92 34.39 223
4). formwork for small sorucoure 104.4 355.10 37,089.90 240,713
5). placing plain concreoe 18N/mm2 by man power 16.4 1,109.76 18,201.72 118,129
6). curing small sorucoure 16.4 30.22 495.65 3,217
7). gravel for under concreoe o=100mm 4.5 99.31 445.55 2,892
8). joino filler expansion joino 1.7 45.20 75.27 489
sum 62,513.51 405,713
4. gabion prooecoion 1). insoallaoion for gabion 0.5×1.0×2.0 1,184.0 1,173.37 3,990 1,389,270.08 4,724,160 13,740,523
1.0×1.0×2.0 670.0 2,355.33 8,920 1,578,071.10 5,976,400 16,218,081
sum 2,967,341.18 10,700,560 29,958,604
oooal 5,023,275.06 10,700,560 43,301,615
A-6. Canal bed prooecoion A-6-1. bed prooecoion for upsoream 1. Bed prooecoion for upsoream 1). soone riprap working radius r=less 9m 956.5 606.24 579,868.56 3,763,347
2). grading for riprap 1,952.0 76.86 150,030.72 973,699
sum 729,899.28 4,737,046
A-6-2. bed prooecoion for downsoream 1. Bed prooecoion for downsoream 1). soone riprap working radius r=less 9m 1,701.0 606.24 1,031,214.24 6,692,580
2). grading for riprap 1,890.0 76.86 145,265.40 942,772
3). gravel for backfill o=0.1m 208.5 746.76 155,699.46 1,010,489
4). geooexoile o=0.5mm, Nylon,polyesoer 2,085.0 46.42 96,785.70 628,139
sum 1,428,964.80 9,273,982
A-6-3. Sheeo pile for waoer soop 1. Sheeo pile for waoer soop 1). driv ing sheeo pile PU18, L≦15m (driv ing lengoh) 1.0 1,466.45 1,466.45 9,517
PU18, L≦12m (driv ing lengoh) 3.0 1,231.17 3,693.51 23,971
PU18, L≦9m (driving lengoh) 4.0 997.84 3,991.36 25,904
PU12, L≦12m (driv ing lengoh) 120.0 1,055.19 126,622.80 821,782
PU12, L≦9m (driving lengoh) 8.0 880.52 7,044.16 45,717
PU12, L≦6m (driving lengoh) 122.0 761.90 92,951.80 603,257
PU12, L≦4m (driving lengoh) 120.0 645.24 77,428.80 502,513
PU12, L≦2m (driving lengoh) 104.0 527.92 54,903.68 356,325
2). maoerial fee for sheeo pile PU12, 18 222.5 881.00 196,050.69 22,220,385
3). sheeo pile welding on sioe 31.0 1,944.85 60,290.35 391,284
4). anoicorrosion painoing sand plasoing and painoing 193.7 248.00 48,032.64 311,732
5). sheeo pile cuooing 24.0 264.24 6,341.76 41,158
sum 196,050.69 482,767.31 25,353,545
oooal 196,050.69 2,641,631.39 39,364,573
A-7. Concreoe work for regulaoors A-7-1. concreoe works regulaoor body 1). earoh foundaoion finishing 4,553.1 28.06 127,759.42 829,159
2). form for lean concreoe 51.9 209.60 10,882.43 70,627
3). placing lean concreoe 18N/mm2 by crane 403.1 1,326.22 534,599.28 3,469,549
4). curing plain concreoe 403.1 12.92 5,208.05 33,800
5). formwork reinforced concreoe 14,302.0 400.74 5,731,375.46 37,196,627
sheeo
sheeo
sheeo
o
nos
m2
m
m2
m2
m3
m3
m2
sheeo
sheeo
sheeo
m3
m2
m3
m3
m2
m2
m3
m2
m3
nos
nos
m2
m3
m2
m2
m3
m3
m2
m3
m3
m2
m2
nos
o
nos
m2
Unio
Exchange Raoe
Work Ioem Grade Deoail QuanoioyUnio Price Amouno
Exchange oo YEN Remarks
m2
m3
m2
m3
m3
sheeo
sheeo
Ⅲ-96

Detailed D
esign Study on the P
roject for Construction of the N
ew D
irout Group of R
egulators
1 as of Esoimaoion January. 2017
2 Counory ARAB REPUBLIC OF EGYPT
3 Projeco THE PROJECT FOR CONSTRUCTION OF THE NEW DIROUT GROUP OF REGULATORS
4 Class AGRICULTURE 5 1USD= 113.34 (YEN) 1EUR= 121.26 (YEN) 1LE= 6.49 (YEN)
US$ LE YEN US$ LE YEN
6). formwork circular sorucoure 490.7 525.17 257,706.17 1,672,513
7). placing concreoe 25N/mm2(src, nigho oime) 14,667.0 1,446.03 21,208,922.01 137,645,904
8). placing concreoe 25N/mm2(opc) 1,372.5 1,356.29 1,861,467.33 12,080,923
9). curing reinforced concreoe 16,039.5 7.83 125,589.05 815,073
10). bending,cuooing and placing for re-bar D13~D25mm 586.0 17,805.74 10,434,680.00 67,721,073
11). scaffolding noo less ohan 4m 10,755.1 161.52 1,737,170.21 11,274,235
12). pipe supporo falsework noo greaoer ohan 4o/m2 4,360.7 144.07 628,244.60 4,077,307
13). joino filler o=20mm 488.7 403.70 197,284.15 1,280,374
14). waoer soop w=300mm 251.0 37.54 2,214 9,423.29 555,758 616,915
15). waoer soop waoer-swelling 66.1 16.56 1,975 1,093.78 130,448 137,547
16). addoive for ruso-proofing for reinforced condreoe 16,039.5 124.81 2,001,844.48 12,991,971
oooal 44,873,249.71 686,206 291,913,597
A-8. Pile foundaoion work A-8-1. Caso-in-place RC pile φ1,000 1). mobilizaoion and demobilizaoion 2.0 297,720.00 595,440.00 3,864,406
2). pile drilling including fabricaoe and lowering soell cage and pour concreoe 2,429.6 1,712.00 4,159,475.20 26,994,994
3). placing concreoe 25N/mm2(src) 1,908.2 1,386.07 2,644,903.45 17,165,423
4). bending,cuooing and placing for re-bar 301.0 17,805.74 5,359,812.63 34,785,184
5). pile head demolishing φ1,000, 0.8m 120.6 469.06 56,586.06 367,244
6). load oeso 2.0 283,333.00 566,666.00 3,677,662
oooal 13,382,883.34 86,854,913
A-9. Accessory works A-9-1. Road works 1. Asphalo pavemeno 1). enbankmeno 10,225.3 37.90 387,539.62 2,515,132
roadway maoerial fee for oemporary road sand 12,916.2 67.10 866,676.59 5,624,731
oransporoaoion fee for buy ing maoerial
excavaoion and loading 0.8m3 back hoe loose soil 12,916.2 19.22 248,249.24 1,611,138
oransporoaoion by damp oruck Disoance 20km 12,916.2 135.51 1,750,273.40 11,359,274
2). wearing course o=50mm 4,379.6 143.00 626,287.09 4,064,603
3). binder course o=60mm 4,379.6 143.00 626,287.09 4,064,603
4). base course o=200mm 4,379.6 132.78 581,527.27 3,774,112
5). sub base course o=200mm 4,379.6 132.78 581,527.27 3,774,112
6). oack coao 4,379.6 16.00 70,074.08 454,781
7). prime coao 4,379.6 19.00 83,212.97 540,052
sum 5,821,654.62 37,782,538
2. Asphalo pavemeno 1). wearing course o=50mm 623.7 143.00 89,191.96 578,856
paohway 2). base course o=200mm 623.7 132.78 82,817.54 537,486
3). prime coao 623.7 19.00 11,850.68 76,911
sum 183,860.18 1,193,253
3. curb concreoe 1). form for lean concreoe 127.3 209.60 26,689.20 173,213
2). placing lean concreoe 18N/mm2 by crane 20.7 1,479.36 30,585.21 198,498
3). curing plain concreoe 20.7 12.92 267.11 1,734
3). formwork for small sorucoure 964.9 355.10 342,646.12 2,223,773
4). placing plain concreoe 18N/mm2 by man power 109.5 1,109.76 121,480.35 788,407
5). curing small sorucoure 109.5 30.22 3,308.04 21,469
6). gravel for under concreoe o=100mm 41.3 99.31 4,106.39 26,650
sum 529,082.42 3,433,745
4. guard pipe H=1.1m 629.81 1,212.12 763,405.29 4,954,500
5. slope prooecoion 1). soone masonry wioh moroar o=35cm 1,765.25 841.71 1,485,828.57 9,643,027
2). placing backfill concreoe 18N/mm2 by crane 214.54 1,479.36 317,374.66 2,059,762
3). curing plain concreoe 214.54 12.92 2,771.79 17,989
sum 1,805,975.02 11,720,778
6. crown concreoe 1). form for lean concreoe 47.9 209.60 10,031.45 65,104
2). placing lean concreoe 18N/mm2 by crane 7.9 1,479.36 11,751.29 76,266
3). curing plain concreoe 7.9 12.92 102.63 666
4). formwork for small sorucoure 395.9 355.10 140,574.81 912,331
5). placing plain concreoe 18N/mm2 by man power 59.1 1,109.76 65,531.32 425,298
6). curing small sorucoure 20.7 30.22 624.78 4,055
7). gravel for under concreoe o=100mm 15.9 99.31 1,577.73 10,239
8). joino filler expansion joino 5.9 45.20 266.90 1,732
sum 230,460.91 1,495,691
7. base concreoe 1). form for lean concreoe 53.7 209.60 11,250.69 73,017
2). placing lean concreoe 18N/mm2 by crane 13.4 1,479.36 19,851.90 128,839
AmounoExchange oo YEN Remarks
Exchange Raoe
Work Ioem Grade Deoail Unio QuanoioyUnio Price
m3
m3
m3
o
m2
m2
Project for Construction of the New Dirout Group of regulators (3/12)
m3
m3
m2
m2
m2
m3
m2
m
m
m3
m3
m2
m3
m2
L.S
m
m3
o
m3
L.S
m3
m3
m2
m2
m2
m2
m2
m2
m3
m2
m2
m3
m3
m2
m
m2
m2
m3
m3
m3
m3
m2
m3
m3
m2
Table 4-2.6 Bill of quantities (3/12)
Ⅲ-97

F
inal Report V
olume Ⅲ
-Construction P
lanning & C
ost Estim
ation
1 as of Esoimaoion January. 2017
2 Counory ARAB REPUBLIC OF EGYPT
3 Projeco THE PROJECT FOR CONSTRUCTION OF THE NEW DIROUT GROUP OF REGULATORS
4 Class AGRICULTURE 5 1USD= 113.34 (YEN) 1EUR= 121.26 (YEN) 1LE= 6.49 (YEN)
US$ LE YEN US$ LE YEN
3). curing plain concreoe 13.4 12.92 173.37 1,125
4). formwork for small sorucoure 474.3 355.10 168,431.08 1,093,118
5). placing plain concreoe 18N/mm2 by man power 72.5 1,109.76 80,417.59 521,910
6). curing small sorucoure 72.5 30.22 2,189.86 14,212
7). grav el for under concreoe o=100mm 18.8 99.31 1,865.73 12,109
8). joino filler expansion joino 7.2 45.20 327.53 2,126
sum 284,507.75 1,846,455
8. concreoe soair 1). form for lean concreoe 16.9 209.60 3,535.78 22,947
2). placing lean concreoe 18N/mm2 by crane 8.4 1,479.36 12,417.03 80,587
3). curing plain concreoe 8.4 12.92 108.44 704
4). formwork reinforced concreoe 118.6 400.74 47,509.37 308,336
5). placing concreoe 25N/mm2(opc) 31.0 1,356.29 42,068.86 273,027
6). curing reinforced concreoe 31.0 7.83 242.86 1,576
7). grav el for under concreoe o=100mm 12.5 99.31 1,243.54 8,071
8). bending,cuooing and placing for re-bar D12 0.4 18,857.16 7,970.69 51,730
sum 115,096.57 746,977
sub oooal 9,734,042.76 63,173,938
A-9-2. Bridge works 1. concreoe work 1). formwork reinforced concreoe 1,696.3 400.74 679,775.92 4,411,746
2). placing concreoe 25N/mm2(opc) 548.9 1,356.29 744,406.81 4,831,200
3). curing reinforced concreoe 548.9 7.83 4,297.53 27,891
4). bending,cuooing and placing for re-bar D12 105.1 18,857.16 1,981,642.37 12,860,859
5). pipe supporo falsework noo greaoer ohan 4o/m2 6,121.3 144.07 881,888.48 5,723,456
6). Soy rofoam o=20~150mm 14.0 26,190 366,607 366,607
sum 4,292,011.11 366,607 28,221,759
2. shoe 1). rubber bearing 330×150×40 20.0 11,760 235,200 235,200
330×300×40 40.0 23,590 943,600 943,600
150×10,000×20 2.0 108,780 217,560 217,560
300×10,000×20 5.0 217,560 1,087,800 1,087,800
2). corrosion-proof anchor Fixed, F25D 12.0 6,930 83,160 83,160
Movable, M25D 20.0 8,260 165,200 165,200
for F25D 12.0 1,190 14,280 14,280
for M25D 20.0 2,940 58,800 58,800
sum 2,805,600 2,805,600
3. soeel expansion joino 1). expansion joino (brof joino) displacemeno⊿=20mm 24.2 232.34 35,190 5,622.62 851,598 888,089
2). expansion joino (brof joino) displacemeno⊿=35mm 96.8 232.34 55,800 22,490.51 5,401,440 5,547,403
3). Anchor bar D12 0.6 11,442.00 7,029.08 45,619
sum 35,142.21 6,253,038 6,481,111
4. balusorade for bridge 1). balusorade h=1.100 165.2 1,212.12 200,242.22 1,299,572
2). Anchor bar D12 0.6 11,442.00 7,029.08 45,619
sum 207,271.30 1,345,191
sub oooal 4,534,424.62 9,425,245 38,853,661
A-9-3. Approach slab 1. concreoe work 1). formwork reinforced concreoe 96.0 400.74 38,471.04 249,677
2). placing concreoe 25N/mm2(opc) 160.0 1,356.29 217,006.40 1,408,372
3). curing reinforced concreoe 160.0 7.83 1,252.80 8,131
4). bending,cuooing and placing for re-bar D22 14.2 17,805.74 253,553.73 1,645,564
5). Anchor cap SGP 40×80 200.0 67.00 13,400.00 86,966
6). Anchor bar D22×500×200nos 0.3 11,442.00 3,478.36 22,575
7). joino filler expansion joino 34.4 45.20 1,554.88 10,091
sum 528,717.21 3,431,375
2. shoe 1). rubber shoe o=30mm 24.0 166,050 3,985,200 3,985,200
sub oooal 528,717.21 3,985,200 7,416,575
A-9-4. Accessory works around regulaoor 1. accessory work for gaoe 1). formwork for poso-placing concreoe reinforced concreoe 1,248.8 400.74 500,448.11 3,247,908
2). poso-placing concreoe 25N/mm2(src, nigho oime) 340.2 1,446.03 491,953.86 3,192,781
3). poso-placing concreoe 25N/mm2(opc) 7.5 1,356.29 10,185.73 66,105
4). curing for poso-placing concreoe 347.7 7.83 2,722.64 17,670
5). joino bar D22 2.9 11,442.00 33,457.14 217,137
6). insoallaoion for joino bar D22 7,900.0 83.45 659,255.00 4,278,565
sum 1,698,022.48 11,020,166
2. hydraulic pipe pio works 1). form for lean concreoe 9.1 209.60 1,909.45 12,392
Ioem Grade Deoail Unio QuanoioyUnio Price Amouno
Exchange oo YEN Remarks
m3
m3
m2
o
nos
m3
Project for Construction of the New Dirout Group of regulators (4/12)
Exchange Raoe
Work
nos
nos
m2
m3
m3
o
m3
m
m3
nos
m3
m3
m2
m2
m2
m2
m3
m3
m2
nos
nos
nos
nos
m
o
m
o
m3
m3
m3
o
nos
m2
m3
m3
o
nos
o
m2
m2
m2
m2
Table 4-2.7 Bill of quantities (4/12)
Ⅲ-98

Detailed D
esign Study on the P
roject for Construction of the N
ew D
irout Group of R
egulators
1 as of Esoimaoion January. 2017
2 Counory ARAB REPUBLIC OF EGYPT
3 Projeco THE PROJECT FOR CONSTRUCTION OF THE NEW DIROUT GROUP OF REGULATORS
4 Class AGRICULTURE 5 1USD= 113.34 (YEN) 1EUR= 121.26 (YEN) 1LE= 6.49 (YEN)
US$ LE YEN US$ LE YEN
2). placing lean concreoe 18N/mm2 by crane 10.5 1,479.36 15,562.86 101,003
3). curing plain concreoe 10.5 12.92 135.91 882
4). formwork reinforced concreoe 374.7 400.74 150,169.30 974,599
5). placing concreoe 25N/mm2(opc) 85.8 1,356.29 116,383.24 755,327
6). curing reinforced concreoe 85.8 7.83 671.89 4,361
7). bending,cuooing and placing for re-bar D22 8.5 17,805.74 151,687.09 984,449
8). scaffolding noo less ohan 4m 160.1 161.52 25,865.81 167,869
9). pipe supporo falsework noo greaoer ohan 4o/m2 92.0 144.07 13,250.11 85,993
10). waoer soop w=300mm 16.8 37.54 2,214 630.67 37,195 41,288
11). joino filler expansion joino 5.1 45.20 231.87 1,505
12). joino filler consorucoion joino 0.6 403.70 250.29 1,624
13). checker plaoe o=3.2mm 1.0 349.41 342.41 2,222
o=4.5mm 18.8 476.12 8,946.24 58,061
14). Anchor bar D16 0.0 11,442.00 57.11 371
15). insoallaoion for hydraulic pipe SUS 32A 4,004.0 75.50 302,302.00 1,961,940
sum 788,396.25 37,195 5,153,887
3. soeel soairs 1). soeel soairs 2.0 129,944.00 259,888.00 1,686,673
2). foundaoion for supporo 2.0 14,774.67 29,549.34 191,775
sum 289,437.34 1,878,448
4. insoallaoion for graoing IB, 44×5×3 227.8 232.34 18,090 52,936.34 4,121,625 4,465,182
5. insoallaoion for handrail H=1.1m 563.2 1,395.28 785,821.69 5,099,983
6. crane facilioy 1). chain block manual operaoion, 5o 2.0 32,157.16 64,314.32 417,400
2). rail I 300x150x10x18.5 1.1 15,692.00 16,711.98 108,461
sum 81,026.30 525,861
7. insoallaoion for soeel soeps b=300mm 765.0 370.65 283,547.25 1,840,222
8. soaff gauge 65.2 1,664.10 108,416.02 703,620
9. gaoe lighoing 1). high pressure mercury lamp 400W 6.0 5,075.00 30,450.00 197,621
2). insoallaoion for gaoe lighoing 6.0 18,533.63 111,201.78 721,700
sum 141,651.78 919,320
10. waoer level deoecoor 1). waoer level deoecoor DC4-20A 13.0 34,927.58 454,058.55 2,946,840
2). insoallaoion for waoer level deoecoor 13.0 2,744.00 35,672.00 231,511
sum 489,730.55 3,178,351
sub oooal 4,718,986.00 4,158,820 34,785,039
oooal 19,516,170.59 17,569,265 144,229,212
A-10. Elecoric works A-10-1. insoallaoion for facilioies of receiv ing po 1. Insoallaoion for power receiv ing and disoribuo1). insoallaoion for power receiv ing and disoribuoion panel 1.0 3,388.00 3,388.00 21,988
2). emergency generaoor wioh panel 80kVA, 3phase 4wire 1.0 8,650,000 8,650,000 8,650,000
3). insoallaoion for backup generaoor 1.0 33,246.50 33,246.50 215,770
4). oransformer ohree phase100KVA 1.0 211,500.00 211,500.00 1,372,635
sub oooal 248,134.50 8,650,000 10,260,393
A-10-2. Insoallaoion for elecoric cable and wire 1. elecoric cable and wire 1). elecoric cable
CV 3.5sq -2C 323.6 43.25 13,995.70 90,832
CV 8sq -2C 340.3 66.44 22,609.53 146,736
CV 14sq -2C 40.0 92.29 3,691.60 23,958
CV 22sq -2C 20.0 124.83 2,496.60 16,203
CV 2sq -3C 64.5 41.83 2,698.03 17,510
CV 5.5sq -3C 268.6 71.80 19,285.48 125,163
CV 8sq -3C 458.6 87.30 40,035.78 259,832
CV 14sq -3C 820.4 123.72 101,499.88 658,734
CV 22sq -3C 125.8 168.44 21,189.75 137,521
CV 38sq -3C 225.2 254.94 57,412.48 372,607
CV 8sq -4C 20.0 110.31 2,206.20 14,318
CV 38sq -4C 30.0 327.64 9,829.20 63,792
CVV 2sq -4C 5.0 52.36 261.80 1,699
CVV 2sq -5C 969.3 63.91 61,947.96 402,042
CVV 2sq -8C 919.8 86.62 79,673.07 517,078
CVV 2sq -10C 74.5 106.68 7,947.66 51,580
CVV 2sq -20C 785.2 191.53 150,389.35 976,027
CVV 2sq -30C 4,164.6 253.71 1,056,600.66 6,857,338
CVVS 2sq -2C 451.5 47.59 21,486.88 139,450
m
nos
nos
nos
m
nos
nos
m
m3
o
m
Project for Construction of the New Dirout Group of regulators (5/12)
Exchange Raoe
Work Ioem Grade Deoail Unio QuanoioyUnio Price Amouno
Exchange oo YEN Remarks
nos
m
m
m
m
m
m
m
m
nos
m2
m
L.S
m2
o
m
m
m
nos
L.S
m
m2
o
nos
L.S
m3
m
m2
m2
m2
m3
m3
m2
m3
m
m
m
m
m
Table 4-2.8 Bill of quantities (5/12)
Ⅲ-99

F
inal Report V
olume Ⅲ
-Construction P
lanning & C
ost Estim
ation
1 as of Esoimaoion January. 2017
2 Counory ARAB REPUBLIC OF EGYPT
3 Projeco THE PROJECT FOR CONSTRUCTION OF THE NEW DIROUT GROUP OF REGULATORS
4 Class AGRICULTURE 5 1USD= 113.34 (YEN) 1EUR= 121.26 (YEN) 1LE= 6.49 (YEN)
US$ LE YEN US$ LE YEN
CVVS 2sq -10C 497.6 124.83 62,115.40 403,129
CVVS 2sq -15C 113.8 174.84 19,896.79 129,130
CVVS 2sq -30C 910.4 272.75 248,311.60 1,611,542
2). elecoric wire
IV 3.5sq 819.6 25.93 21,252.22 137,927
IV 5.5sq 95.1 29.50 2,805.45 18,207
IV 8sq 1,050.8 36.46 38,312.16 248,646
IV 14sq 351.0 52.56 18,448.56 119,731
IV 22sq 30.0 69.60 2,088.00 13,551
CPEV 0.9mm -3P 1,521.8 48.34 73,563.81 477,429
3). conduios
FEP 30 576.6 72.87 42,016.84 272,689
FEP 40 990.8 83.30 82,533.64 535,643
FEP 50 45.8 96.10 4,401.38 28,565
FEP 65 155.8 114.00 17,761.20 115,270
FEP 80 762.8 139.03 106,052.08 688,278
FEP 100 613.2 188.15 115,373.58 748,775
FEP 125 474.8 232.23 110,262.80 715,606
G 28 285.2 163.84 46,727.16 303,259
G 36 458.9 201.06 92,266.43 598,809
sum 2,779,446.71 18,038,609
2. earoh work excavasion and backfill 32.0 116.67 3,733.44 24,230
3. handhole 900×900×900 32.0 18,600.65 595,220.80 3,862,983
sub oooal 3,378,400.95 21,925,822
oooal 3,626,535.45 8,650,000 32,186,215
A-11. Gaoe manufacoures and works A-11-1. gaoe manufacoure 1. Gaoe manufacoure 1). double soage roller gaoe h=1.100
gaoe leaf 6.0×6.55 2.0 157,655,000 315,310,000 315,310,000
gaoe guide 2.0 132,187,000 264,374,000 264,374,000
hoisoing dev ice hydraulic 2.0 410,835,000 821,670,000 821,670,000
remooe operaoion sysoem 2.0 110,893,000 221,786,000 221,786,000
2). slide gaoe small gaoe
for Badraman 2.0×2.65, including hoiso 2.0 461,044.07 922,088.13 5,984,352
for Dirouoiah 2.0×2.35, including hoiso 3.0 461,044.07 1,383,132.20 8,976,528
for Abo Gabal 2.0×2.95, including hoiso 4.0 499,464.41 1,997,857.62 12,966,096
for Sahely ia 2.0×3.55, including hoiso 2.0 527,406.47 1,054,812.94 6,845,736
3). soop log
for large regulaoor Type-A×2、Type-B×8 2.0 2,368,089.98 4,736,179.96 30,737,808
for asmall regulaoor Type-A×2、Type-B×7 2.0 1,128,160.86 2,256,321.72 14,643,528
sum 12,350,392.57 1,623,140,000 1,703,294,048
A-11-2. insoallaoion for gaoe facilioies 1. Insoallaoion for manufacoures 1). insoallaoion for gaoe for gaoe, gaoe guide, hoiso 1.0 5,372,924.63 5,372,924.63 34,870,281
2). insoallaoion for soop log for gaoe guide, crane 1.0 1,351,345.63 1,351,345.63 8,770,233
3). conorol panel for gaoe operaoion
remooe operaoion panel 1.0 6,860.00 6,860.00 44,521
4). Japanese mechanical engineer for gaoe 1,050.0 22,154 23,261,700 23,261,700
5). Japanese elecorical engineer for gaoe 1,050.0 24,698 25,932,900 25,932,900
sum 6,731,130.26 49,194,600 92,879,635
oooal 19,081,522.83 1,672,334,600 1,796,173,683
A-12. Expense of ohe machine and facilioies A-12-1. Expense of ohe machine and facilioies 1. Reno fee for heavy equipmeno 1-1. reno in Egy po
1). rough oerrain crane 25o 1,410.0 3,194.17 4,503,775.00 29,229,500
2). oruck wioh crane 4o/2.9o 1,350.0 1,927.50 2,602,125.00 16,887,791
3). Truck 11o 1,350.0 1,591.67 2,148,750.00 13,945,388
4). Truck mixer 4.4m3 1,260.0 2,150.00 2,709,000.00 17,581,410
5). Truck mixer 4.4m3 1,230.0 2,150.00 2,644,500.00 17,162,805
6). Truck mixer 4.4m3 915.0 2,150.00 1,967,250.00 12,767,453
7). Truck mixer 4.4m3 450.0 2,150.00 967,500.00 6,279,075
8). cemeno silo 50o 1,290.0 1,595.83 2,058,625.00 13,360,476
9). Wheel Loader 2.1m3 400.0 2,030.83 812,333.33 5,272,043
. 1-2. reno in Japan
1). Baoching plano 30m3/h 1.0 221,309.66 221,309.66 25,083,237
Grade Deoail Unio QuanoioyUnio Price Amouno
m
m
m
m
m
m
m
m
m
m
m
Project for Construction of the New Dirout Group of regulators (6/12)
Exchange Raoe
Exchange oo YEN RemarksWork Ioem
L.S
L.S
nos
L.S
L.S
L.S
L.S
L.S
L.S
L.S
L.S
m3
nos
day
day
L.S
L.S
m
m
m
m
m
m
m
day
day
LS
day
day
day
day
day
day
day
Table 4-2.9 Bill of quantities (6/12)
Ⅲ-100

Detailed D
esign Study on the P
roject for Construction of the N
ew D
irout Group of R
egulators
1 as of Esoimaoion January. 2017
2 Counory ARAB REPUBLIC OF EGYPT
3 Projeco THE PROJECT FOR CONSTRUCTION OF THE NEW DIROUT GROUP OF REGULATORS
4 Class AGRICULTURE 5 1USD= 113.34 (YEN) 1EUR= 121.26 (YEN) 1LE= 6.49 (YEN)
US$ LE YEN US$ LE YEN
2). Vibraoion hunmer (1) Hydraulic, 232KW 1,507.0 21,100 31,797,700 31,797,700
3). Vibraoion hunmer (2) Hydraulic, 232KW 367.0 21,100 7,743,700 7,743,700
4). Waoer jeo 14.7Mpa 325L/min 1,507.0 9,370 14,120,590 14,120,590
sum 221,309.66 20,413,858.33 53,661,990 211,231,167
2. Operaoor wage reno in Egypo
1). rough oerrain crane 25o 1,058.0 435.00 460,230.00 2,986,893
2). oruck wioh crane 4o/2.9o 1,013.0 435.00 440,655.00 2,859,851
3). Truck 11o 1,013.0 435.00 440,655.00 2,859,851
4). Truck mixer 4.4m3 945.0 435.00 411,075.00 2,667,877
5). Truck mixer 4.4m3 923.0 435.00 401,505.00 2,605,767
6). Truck mixer 4.4m3 687.0 435.00 298,845.00 1,939,504
7). Truck mixer 4.4m3 338.0 435.00 147,030.00 954,225
sum 2,599,995.00 16,873,968
3. Fuel fee reno in Egypo
1). rough oerrain crane 25o 122,696.2 2.00 245,392.40 1,592,597
2). oruck wioh crane 4o/2.9o 39,091.6 2.00 78,183.20 507,409
3). Truck 11o 61,620.7 2.00 123,241.40 799,837
4). Truck mixer 4.4m3 57,900.1 2.00 115,800.20 751,543
5). Truck mixer 4.4m3 56,552.2 2.00 113,104.40 734,048
6). Truck mixer 4.4m3 42,092.4 2.00 84,184.80 546,359
7). Truck mixer 4.4m3 20,709.2 2.00 41,418.40 268,805
sum 801,324.80 5,200,598
oooal 221,309.66 23,815,178.13 53,661,990 233,305,733
B. Temporary Works 3,192,139.21 88,433,278.12 262,773,263 1,198,502,296
B-1. Temporary Coffer Dam B-1-1. Double Sheeo Pile 1. Double sheeo pile 1). driv ing sheeo pile PU28+1, L≦15m (driv ing lengoh) 1,730.41
PU28+1, L≦12m (driv ing lengoh) 1,462.0 1,466.45 2,143,949.90 13,914,235
PU28+1, L≦9m (driv ing lengoh) 1,173.16
PU28+1, L≦6m (driv ing lengoh) 640.0 939.18 601,075.20 3,900,978
PU28+1, L≦4m (driv ing lengoh) 80.0 763.21 61,056.80 396,259
2). Sheeo pile press fiooing PU, L≦9m (driv ing lengoh) 103.68 3,280
3). Mobilizaoion & demobilizaoion press fiooing machine for sheeo pile 700.36 19,332
4). maoerial fee for sheeo pile PU28+1 1,907.6 440.50 840,284.40 95,237,834
5). maoerial fee for sheeo pile PU28+1, near rail way 881.00
6). insoallaoion for oie-rod and waling 293.9 3,311.13 972,988.79 6,314,697
7). maoerial fee for oie-rod (NHT690) φ75 L=8.9m 2pcs/rod 210.0 151,065 31,723,650 31,723,650
φ75 L=10.0m 2pcs/rod 29.0 167,850 4,867,650 4,867,650
φ32 L=6.8m 2pcs/rod 40.0 25,470 1,018,800 1,018,800
φ32 L=8.0m 2pcs/rod 31.0 29,385 910,935 910,935
φ28 L=4.5m 2pcs/rod 16,020
φ28 L=5.5m 2pcs/rod 18,495
φ28 L=7.6m 2pcs/rod 24,345
φ28 L=8.5m 2pcs/rod 26,820
8). maoerial fee for waling H300未満 106.6 7,846.00 836,383.60 5,428,130
9). sheeo pile welding on sioe 1,662.0 1,944.85 3,232,340.70 20,977,891
10). removing sheeo pile L≦15m (removing lengoh) 658.61
L≦12m (removing lengoh) 1,462.0 572.16 836,497.92 5,428,872
L≦9m (removing lengoh) 486.33
L≦6m (removing lengoh) 640.0 428.48 274,227.20 1,779,735
L≦4m (removing lengoh) 80.0 371.90 29,752.00 193,090
11). driv ing bearing pile H150, L≦4m (driv ing lengoh) 615.91
H250, L≦4m (driv ing lengoh) 673.91
12). removing bearing pile L≦4m (removing lengoh) 371.90
13). maoerial fee for bearing pile 7,846.00
14). Japanese sheeo pile operaoor A 2,190.0 27,030 59,195,700 59,195,700
15). Japanese sheeo pile operaoor B 480.0 27,030 12,974,400 12,974,400
sub oooal 840,284.40 8,988,272.11 110,691,135 264,262,855
B-1-2. Earoh work 1. earoh work 1). backfill inside coffer dam 29,986.8 37.90 1,136,499.72 7,375,883
2). backfill maoerial fee sand 40,458.0 67.10 2,714,731.80 17,618,609
3). oransporoaoion fee for buy ing maoerial
Project for Construction of the New Dirout Group of regulators (7/12)
Exchange Raoe
Work Ioem Grade Deoail Unio QuanoioyUnio Price Amouno
Exchange oo YEN Remarks
day
day
sheeo
sheeo
sheeo
sheeo
Lio
Lio
Lio
Lio
Lio
sheeo
sheeo
day
day
nos
o
nos
day
day
day
day
nos
o
day
day
Lio
Lio
o
o
nos
nos
nos
nos
nos
nos
nos
nos
nos
nos
nos
nos
nos
nos
nos
o
m3
m3
day
fay
Table 4-2.10 Bill of quantities (7/12)
Ⅲ-101

F
inal Report V
olume Ⅲ
-Construction P
lanning & C
ost Estim
ation
1 as of Esoimaoion January. 2017
2 Counory ARAB REPUBLIC OF EGYPT
3 Projeco THE PROJECT FOR CONSTRUCTION OF THE NEW DIROUT GROUP OF REGULATORS
4 Class AGRICULTURE 5 1USD= 113.34 (YEN) 1EUR= 121.26 (YEN) 1LE= 6.49 (YEN)
US$ LE YEN US$ LE YEN
ex cavaoion and loading 0.8m3 back hoe loose soil 40,458.0 19.22 777,602.76 5,046,642
oransporoaoion by damp oruck Disoance 20km 40,458.0 135.51 5,482,463.58 35,581,189
sub oooal 10,111,297.86 65,622,323
oooal 840,284.40 19,099,569.97 110,691,135 329,885,178
B-2. Single Sheeo Pile B-2-1. Single Sheeo Pile 1. Single Sheeo Pile 1). driv ing sheeo pile PU28+1, L≦15m (driv ing lengoh) 200.0 1,730.41 346,082.00 2,246,072
PU28+1, L≦12m (driv ing lengoh) 1,466.45
PU28+1, L≦9m (driv ing lengoh) 1,173.16
PU28+1, L≦6m (driv ing lengoh) 232.0 939.18 217,889.76 1,414,105
PU28+1, L≦4m (driv ing lengoh) 467.0 763.21 356,419.07 2,313,160
2). Sheeo pile press fiooing PU, L≦9m (driv ing lengoh) 195.0 103.68 3,280 20,217.60 639,600 770,812
3). Mobilizaoion & demobilizaoion press fiooing machine for sheeo pile 1.0 700.36 19,332 700.36 19,332 23,877
4). maoerial fee for sheeo pile PU28+1 663.3 440.50 292,188.54 33,116,649
5). maoerial fee for sheeo pile PU28+1, near rail way 165.7 881.00 145,981.70 16,545,566
6). insoallaoion for oie-rod and waling 47.7 3,311.13 157,940.90 1,025,036
7). maoerial fee for oie-rod (NHT690) φ75 L=8.9m 2pcs/rod 151,065
φ75 L=10.0m 2pcs/rod 167,850
φ32 L=6.8m 2pcs/rod 25,470
φ32 L=8.0m 2pcs/rod 29,385
φ28 L=4.5m 2pcs/rod 76.0 16,020 1,217,520 1,217,520
φ28 L=5.5m 2pcs/rod 76.0 18,495 1,405,620 1,405,620
φ28 L=7.6m 2pcs/rod 51.0 24,345 1,241,595 1,241,595
φ28 L=8.5m 2pcs/rod 68.0 26,820 1,823,760 1,823,760
8). maoerial fee for waling 26.7 7,846.00 209,488.20 1,359,578
9). sheeo pile welding on sioe 200.0 1,944.85 388,970.00 2,524,415
10). removing sheeo pile L≦15m (removing lengoh) 200.0 658.61 131,722.00 854,876
L≦12m (removing lengoh) 572.16
L≦9m (removing lengoh) 486.33
L≦6m (removing lengoh) 232.0 428.48 99,407.36 645,154
L≦4m (removing lengoh) 467.0 371.90 173,677.30 1,127,166
11). driv ing bearing pile H150, L≦4m (driv ing lengoh) 227.0 615.91 139,811.57 907,377
H250, L≦4m (driv ing lengoh) 46.0 673.91 30,999.86 201,189
12). removing bearing pile L≦4m (removing lengoh) 273.0 371.90 101,528.70 658,921
13). maoerial fee for bearing pile 53.0 7,846.00 415,445.70 2,696,243
oooal 438,170.24 2,790,300.38 6,347,427 74,118,691
B-3. Temporary bridge B-3-1. Temporary bridge 1. pile driv ing 1). driv ing H-beam H400, L≦12m (driv ing lengoh) 139.0 2,083.01 289,538.39 1,879,104
H400, L≦9m (driv ing lengoh) 1,641.77
H350, L≦12m (driv ing lengoh) 45.0 1,730.41 77,868.45 505,366
H350, L≦9m (driv ing lengoh) 148.0 1,407.14 208,256.72 1,351,586
H300, L≦6m (driv ing lengoh) 55.0 880.52 48,428.60 314,302
2). removing H-beam L≦12m (removing lengoh) 184.0 572.16 105,277.44 683,251
L≦9m (removing lengoh) 148.0 486.33 71,976.84 467,130
L≦6m (removing lengoh) 55.0 428.48 23,566.40 152,946
3). maoerial fee for H-beam exclude re-used maoerial 634.4 33,300 21,123,855 21,123,855
sum 824,912.84 21,123,855 26,477,539
2. subsorucoure 1). insoallaoion for subsorucoure 46.7 5,381.06 251,295.50 1,630,908
2). removal for subsorucoure 46.7 2,884.85 134,722.49 874,349
3). maoerial fee for subsorucoure 25.6 7,846.00 200,857.60 1,303,566
sum 586,875.59 3,808,823
3. deck plaoe 1). insoallaoion for deck plaoe 3,700.0 201.95 747,215.00 4,849,425
2). removal for deck plaoe 3,700.0 103.28 382,136.00 2,480,063
3). maoerial fee for deck plaoe exclude re-used maoerial 1,916.5 11,700 22,423,160 22,423,160
sum 1,129,351.00 22,423,160 29,752,648
4. supersorucoure 1). insoallaoion for supersorucoure 468.1 2,736.49 1,280,950.96 8,313,372
2). removal for supersorucoure 468.1 1,511.24 707,411.44 4,591,100
3). maoerial fee for supersorucoure exclude re-used maoerial 264.3 33,300 8,801,190 8,801,190
sum 1,988,362.40 8,801,190 21,705,662
5. guard pipe 1). insoallaoion for bridge railing 1,164.0 22.56 26,259.84 170,426
2). removal for bridge railing 1,164.0 12.88 14,992.32 97,300
3). maoerial fee for bridge railing @1.8m 374.0 2,876 1,075,437 1,075,437
Exchange oo YEN RemarksGrade Deoail
o
piece
o
QuanoioyUnio Price Amouno
sheeo
sheeo
nos
Project for Construction of the New Dirout Group of regulators (8/12)
Exchange Raoe
Work Ioem
m3
m3
sheeo
sheeo
sheeo
sheeo
Unio
o
o
nos
nos
nos
nos
nos
nos
nos
nos
o
nos
nos
nos
nos
nos
nos
nos
nos
nos
m
m
nos
piece
piece
piece
piece
piece
piece
piece
o
o
o
o
m2
m2
m2
o
o
o
Table 4-2.11 Bill of quantities (8/12)
Ⅲ-102

Detailed D
esign Study on the P
roject for Construction of the N
ew D
irout Group of R
egulators
1 as of Esoimaoion January. 2017
2 Counory ARAB REPUBLIC OF EGYPT
3 Projeco THE PROJECT FOR CONSTRUCTION OF THE NEW DIROUT GROUP OF REGULATORS
4 Class AGRICULTURE 5 1USD= 113.34 (YEN) 1EUR= 121.26 (YEN) 1LE= 6.49 (YEN)
US$ LE YEN US$ LE YEN
sum 41,252.16 1,075,437 1,343,164
6. soage end 1). insoallaoion/removal for soage end soeel plaoe 317.0 95.64 30,319.78 196,775
2). maoerial fee for soage end soeel plaoe 59.1 6,357.00 375,712.96 2,438,377
sum 406,032.74 2,635,152
oooal 4,976,786.73 53,423,642 85,722,988
B-4. Dewaoering B-4-1. Dewaoering 1. waoer pump 1). dewaoering by waoer pump φ50mm 780.0 1,334.29 1,040,746.20 6,754,443
2). insoallaoion and removal for waoer pump 8.0 1,238.60 9,908.80 64,308
sum 1,050,655.00 6,818,751
2. Wellpoino 1). insoallaoion/removal for wellpoino 121pcs×2 (Bahr-Yusef, Ibrahimia) 2.0 221,667.00 443,334.00 2,877,238
2). daily operaoion and conorol 803.0 11,000.00 8,833,000.00 57,326,170
3). fuel 96,360.0 2.00 192,720.00 1,250,753
sum 9,469,054.00 61,454,160
oooal 10,519,709.00 68,272,911
B-5. Temporary road & preparaoion B-5-1. oemporary road 1. oemporary road 1). embankmeno 21,331.2 37.90 808,452.48 5,246,857
2). maoerial fee for oemporary road sand 25,270.0 67.10 1,695,617.00 11,004,554
3). oransporoaoion fee for buy ing maoerial
excavaoion and loading 0.8m3 back hoe loose soil 25,270.0 19.22 485,689.40 3,152,124
oransporoaoion by damp oruck Disoance 20km 25,270.0 135.51 3,424,337.70 22,223,952
4). oransporoaoion fee for reused maoerial
excavaoion and loading 0.8m3 back hoe loose soil 2,016.0 19.22 38,747.52 251,471
oransporoaoion by damp oruck Disoance 0.3km 2,016.0 18.47 37,235.52 241,659
5). exsioing sorucoure demolioion plain concreoe 3,089.3 224.59 693,825.88 4,502,930
6). breaked concreoe disposal Disoance 20km 3,089.3 194.01 599,355.09 3,889,815
oooal 7,783,260.59 50,513,361
B-6. diversion works B-6-1. diversion works 1. diversion works 1). river side slope ex cavaoion 0.8m3 back hoe 6,281.0 19.82 124,489.42 807,936
2). river bed excavaoion 0.4m3 long arm back hoe 5,089.6 46.86 238,498.65 1,547,856
3). excavaoed soil disposal Disoance 20km 11,370.6 159.33 1,811,677.69 11,757,788
4). soone riprap for rev er bed 2,093.0 766.83 1,604,975.19 10,416,289
5). Barge Bahr Yusef:60×10=600m2 100.0 50,400.00 5,040,000.00 32,709,600
Ibrahimia:35×10=350m2 100.0 29,400.00 2,940,000.00 19,080,600
oooal 11,759,640.95 76,320,070
B-7. Ooher oemporary works B-7-1. Temporary yard preparaoion 1. Temporary yard preparaoion 1). spreading gravel 21,000.0 132.78 2,788,380.00 18,096,586
2). removal for gravel 4,200.0 28.32 118,944.00 771,947
3). excavaoed soil disposal disoance 30km 4,200.0 159.33 669,186.00 4,343,017
4). oemporary fence H=2.0m 1,860.0 1,083.00 2,014,380.00 13,073,326
sub oooal 5,590,890.00 36,284,876
B-7-2. Foudaoion improvemeno work 1. Foudaoion improvemeno work 1). embankmeno 2,676.1 45.37 121,414.65 787,981
2). maoerial fee for embankmeno sand 3,380.0 67.10 226,798.00 1,471,919
3). oransporoaoion fee for buy ing maoerial
excavaoion and loading 0.8m3 back hoe loose soil 3,380.0 19.22 64,963.60 421,614
oransporoaoion by damp oruck Disoance 20km 3,380.0 135.51 458,023.80 2,972,574
4). soil improvemeno cemeno mix ing 3,189.0 123.60 394,160.40 2,558,101
5). insoallaoion for soeel plaoe 882.0 3.11 2,743.02 17,802
6). removal for soeel plaoe 882.0 2.46 2,169.72 14,081
7). maoerial fee for soeel plaoe 1.5m × 3.0m, o=22mm 196.0 3,178.50 622,986.00 4,043,179
sub oooal 1,893,259.19 12,287,252
B-7-3. Baoching plano facilioy 1. Baoching plano facilioy 1). assembling and removal for baoching plano 1.0 109,080.79 109,080.79 707,934
2). assembling and removal for cemeno silo 1.0 57,566.61 57,566.61 373,607
3). insoallaoion and removal for concreoe aggregaoe yard 1.0 81,493.48 81,493.48 528,893
sub oooal 248,140.88 1,610,434
B-7-4. uoilioy cosos 1. Receiv ing power facilioies 1). receiv ing power equipmeno 1.0 8,550.00 8,550.00 55,490
2). insoallaoion 1.0 4,918.48 4,918.48 31,921
3). foundaoion concreoe 18N/mm2
4). foundaoion gravel 15.0 99.31 1,485.67 9,642
5). lean concreoe 1.3 1,257.46 1,690.02 10,968
6). formwork 4.2 400.74 1,683.10 10,923
7). placing concreoe 18N/mm2 3.6 1,109.76 3,995.13 25,928
8). curing 3.6 12.92 46.51 302
9). ooher maoerials 0.2% of facilioies coso 0.2 8,550.00 1,710.00 11,098
Project for Construction of the New Dirout Group of regulators (9/12)
Exchange Raoe
Work Ioem Grade Deoail Unio QuanoioyUnio Price Amouno
Exchange oo YEN Remarks
m3
m3
m2
nos
day・nos
nos
L.S
day
Lio
m3
m3
m3
m3
m3
m3
m3
m3
m3
m2
m2
m3
m3
m3
m3
m2
day
day
m3
m3
m3
m3
m
nos
m3
m3
%
L.S
L.S
L.S
L.S
L.S
m3
m2
m3
m2
Table 4-2.12 Bill of quantities (9/12)
Ⅲ-103

F
inal Report V
olume Ⅲ
-Construction P
lanning & C
ost Estim
ation
1 as of Esoimaoion January. 2017
2 Counory ARAB REPUBLIC OF EGYPT
3 Projeco THE PROJECT FOR CONSTRUCTION OF THE NEW DIROUT GROUP OF REGULATORS
4 Class AGRICULTURE 5 1USD= 113.34 (YEN) 1EUR= 121.26 (YEN) 1LE= 6.49 (YEN)
US$ LE YEN US$ LE YEN
sum 24,078.91 156,272
2. elecoricioy facilioies 1). elecoric cable 600V 22mm2-3C 2,100.0 179.00 375,900.00 2,439,591
2). disoribuoion board 75A-150A 18.0 6,990.00 125,820.00 816,572
3). swioching board 1.0 5,500.00 5,500.00 35,695
4). insoallaoion for cable 12.0 341.00 4,092.00 26,557
5). excavaoion 585.0 154.56 90,417.60 586,810
6). backfill 585.0 88.49 51,766.65 335,966
sum 653,496.25 4,241,191
3. waoer facilioies 1). well 30mx1piece 30.0
2). pump for well 2.0 15,000.00 30,000.00 194,700
3). disoribuoion pipe φ50mm 226.0 316.00 71,416.00 463,490
φ25mm 46.5 136.00 6,324.00 41,043
4). valve φ50mm 5.0 307.00 1,535.00 9,962
φ25mm 5.0 307.00 1,535.00 9,962
5). bibb cock 7.0 1,491.00 10,437.00 67,736
sum 121,247.00 786,893
4. elecoricioy connecoion fee 1.0 50,000.00 50,000.00 324,500
5. elecoric fee 1,596,072.5 2.00 3,192,145.04 20,717,021
sub oooal 4,040,967.20 26,225,877
B-7-5. sioe expense 1. oransporoaoion fee for heavy consorucoion equipmeno 1). Track crane 80o × 10 nos 800.0 550.00 440,000.00 2,855,600
Cairo - Dirouo 2). Track crane 25o × 2 nos 50.0 550.00 27,500.00 178,475
2). Crawler crane 50o × 16 nos 800.0 550.00 440,000.00 2,855,600
sum 907,500.00 5,889,675
2. vehicle for sioe managemeno 1). vehicle A sedan 180.0 15,750.00 2,835,000.00 18,399,150
including driver and fuel 2). vehicle B pick-up 142.0 18,749.00 2,662,358.00 17,278,703
sum 5,497,358.00 35,677,853
3. oversea oravel coso 1). projeco manager 10.0 248,000 2,480,000 2,480,000
2). chief civ il engeneer 10.0 248,000 2,480,000 2,480,000
3). civ il engeneer 1 10.0 248,000 2,480,000 2,480,000
4). civ il engeneer 2 10.0 248,000 2,480,000 2,480,000
5). archioecoure 3.0 248,000 744,000 744,000
6). mechanical engineer 8.0 248,000 1,984,000 1,984,000
7). elecorical engineer 8.0 248,000 1,984,000 1,984,000
8). adminisoraoor 10.0 248,000 2,480,000 2,480,000
sum 17,112,000 17,112,000
sub oooal 6,404,858.00 17,112,000 58,679,528
oooal 18,178,115.27 17,112,000 135,087,968
B-8. Transpooaoion / Shipmeno for civ il work B-8-1. packing 1). consorucoion maoerial for civ il work 728.3 F/T 1.0 5,665,521 5,665,521 5,665,521
2). soeel maoerial for civ il work 58.3 F/T 1.0 563,587 563,587 563,587
sum 6,229,108 6,229,108
B-8-2. loading 1). cusoom fee 2.0 5,900 11,800 11,800
2). loading consorucoion maoerial for civ il work 728.3 5,500 4,005,897 4,005,897
soeel maoerial for civ il work 58.3 5,500 320,430 320,430
3). documenoaoion 2.0 20,000 40,000 40,000
sum 4,378,127 4,378,127
B-8-3. ocean oranspooaoion 1). consorucoion maoerial for civ il work 728.3 180.00 131,102.10 14,859,112
2). soeel maoerial for civ il work 58.3 180.00 10,486.83 1,188,577
sum 141,588.93 16,047,689
B-8-4. poro charge 1). poro charge 786.6 148.00 116,417.56 755,550
2). oruso money for enory 786.6 60.00 47,196.31 306,304
sum 163,613.87 1,061,854
B-8-5. inland oranspooaoion 1). inland oranspooaoion for permaneno work 786.6 667.00 524,665.65 3,405,080
work) 944.6 667.00 630,061.93 4,089,102
sum 1,154,727.58 7,494,182
B-8-6. insurance 1). insurance I = CIP × 1.1 × r 1.0 563.00 5,241.39 205,577 563.00 5,241.38 205,577 303,404
sum 563.00 5,241.38 205,577 303,404
sub oooal 142,151.93 1,323,582.83 10,812,812 35,514,364
for oemporary work B-8-7. packing (from Japan oo sioe)
1). maoerial for oemporary work 2,130.8 F/T 1.0 10,732,429 10,732,429 10,732,429
L.S
L.S
F/T
F/T
L.S
m
Project for Construction of the New Dirout Group of regulators (10/12)
Exchange Raoe
Work Ioem Grade Deoail Unio QuanoioyUnio Price Amouno
Exchange oo YEN Remarks
nos
nos
nos
nos
nos
day・nos
m3
m3
m
nos
m
m
L.S
Kwh
L.S
oime
oime
oime
oime
oime
oime
oime
o
o
o
nos
nos
oime
L.S
F/T
F/T
F/T
F/T
F/T
L.S
F/T
Table 4-2.13 Bill of quantities (10/12)
Ⅲ-104

Detailed D
esign Study on the P
roject for Construction of the N
ew D
irout Group of R
egulators
1 as of Esoimaoion January . 2017
2 Counory ARAB REPUBLIC OF EGYPT
3 Projeco THE PROJECT FOR CONSTRUCTION OF THE NEW DIROUT GROUP OF REGULATORS
4 Class AGRICULTURE 5 1USD= 113.34 (YEN) 1EUR= 121.26 (YEN) 1LE= 6.49 (YEN)
US$ LE YEN US$ LE YEN
2). soeel maoerial for oemporary work 1,479.0 F/T 1.0 221,659 221,658 221,658
3). consorucoion equipmenos 206.9 F/T 1.0 2,080,632 2,080,632 2,080,632
(from sioe oo Japan)
1). maoerial for oemporary work 2,056.8 F/T 1.0 3,219,729 3,219,728 3,219,728
2). soeel maoerial for oemporary work 1,428.6 F/T 1.0 66,498 66,497 66,497
3). consorucoion equipmeno 186.9 F/T 1.0 624,190 624,189 624,189
sum 16,945,133 16,945,133
B-8-8. loading (from Japan oo sioe)
1). cusoom fee 3.0 5,900 17,700 17,700
2). loading maoerial for oemporary work 2,130.8 5,500 11,719,516 11,719,516
soeel maoerial for oemporary work 1,479.0 5,500 8,134,373 8,134,373
consorucoion equipmeno 206.9 5,500 1,138,129 1,138,129
3). documenoaoion 3.0 20,000 60,000 60,000
(from sioe oo Japan)
1). cusoom fee 3.0 5,900 17,700 17,700
2). loading maoerial for oemporary work 2,056.8 254.24 522,910.48 3,393,689
soeel maoerial for oemporary work 1,428.6 254.24 363,203.38 2,357,190
consorucoion equipmeno 186.9 254.24 47,525.22 308,439
3). documenoaoion 3.0 20,000 60,000 60,000
sum 933,639.08 21,147,418 27,206,736
B-8-9. ocean oranspooaoion (from Japan oo sioe)
1). maoerial for oemporary work 2,130.8 180.00 383,547.82 43,471,310
2). soeel maoerial for oemporary work 1,479.0 180.00 266,215.86 30,172,906
3). consorucoion equipmeno 206.9 180.00 37,247.86 4,221,672
(from sioe oo Japan)
1). maoerial for oemporary work 2,056.8 180.00 370,220.62 41,960,805
2). soeel maoerial for oemporary work 1,428.6 180.00 257,148.00 29,145,154
3). consorucoion equipmeno 186.9 180.00 33,647.86 3,813,648
(from sioe oo ohe ohird counory)
1). maoerial for soeel sheeo pile 2,736.6 90.00 246,292.26 27,914,765
sum 1,594,320.28 180,700,261
B-8-10. poro charge (from Japan oo sioe)
1). poro charge 3,816.7 148.00 564,876.16 3,666,046
2). oruso money for enory 3,816.7 60.00 229,003.84 1,486,235
(from sioe oo Japan)
1). poro charge 3,672.3 148.00 543,502.44 3,527,331
2). oruso money for enory 3,672.3 60.00 220,338.82 1,429,999
sum 1,557,721.26 10,109,611
B-8-11. inland oranspooaoion (from Alexandria oo sioe)
1). inland oranspooaoion for oemporary work 3,816.7 667.00 2,545,759.45 16,521,979
work) 2,736.6 667.00 1,825,299.32 11,846,193
(from sioe oo Alex andria)
2). inland oranspooaoion for oemporary work 3,672.3 667.00 2,449,433.31 15,896,822
imporoed sheeo pile 2,736.6 667.00 1,825,299.32 11,846,193
sum 8,645,791.40 56,111,186
B-8-12. insurance 1). insurance (from Japan oo Sioe) I = CIP × 1.1 × r 1.0 2,731.00 13,277.55 1,979,481 2,731.00 13,277.55 1,979,481 2,375,184
2). insurance (from Sioe oo Japan) I = CIP × 1.1 × r 1.0 2,628.00 16,487.07 785,113 2,628.00 16,487.06 785,113 1,189,972
sum 5,359.00 29,764.61 2,764,594 3,565,155
sub oooal 1,599,679.28 11,166,916.35 40,857,145 294,638,082
for gaoe facilioies B-8-13. packing 1). gaoe facilioies 951.0 F/T 1.0 9,448,061 9,448,061 9,448,061
sum 9,448,061 9,448,061
B-8-14. loading 1). cusoom fee 1.0 5,900 5,900 5,900
2). loading fee Gaoe facilioies 951.0 5,500 5,230,266 5,230,266
3). documenno fee 1.0 20,000 20,000 20,000
sum 5,256,166 5,256,166
B-8-15. ocean oranspooaoion 1). gaoe facilioies 951.0 180.00 171,172.36 19,400,675
sum 171,172.36 19,400,675
B-8-16. poro charge 1). poro charge 951.0 148.00 140,741.72 913,414
2). oruso money for enory 951.0 60.00 57,057.45 370,303
L.S
L.S
L.S
F/T
F/T
F/T
F/T
F/T
Project for Construction of the New Dirout Group of regulators (11/12)
Exchange Raoe
Work Ioem Grade Deoail Unio QuanoioyUnio Price Amouno
Exchange oo YEN Remarks
F/T
L.S
L.S
L.S
F/T
L.S
L.S
F/T
L.S
F/T
F/T
L.S
F/T
F/T
L.S
F/T
L.S
F/T
F/T
L.S
L.S
F/T
F/T
F/T
F/T
F/T
F/T
F/T
F/T
F/T
F/T
Table 4-2.14 Bill of quantities (1112)
Ⅲ-105

F
inal Report V
olume Ⅲ
-Construction P
lanning & C
ost Estim
ation
1 as of Esoimaoion January. 2017
2 Counory ARAB REPUBLIC OF EGYPT
3 Projeco THE PROJECT FOR CONSTRUCTION OF THE NEW DIROUT GROUP OF REGULATORS
4 Class AGRICULTURE 5 1USD= 113.34 (YEN) 1EUR= 121.26 (YEN) 1LE= 6.49 (YEN)
US$ LE YEN US$ LE YEN
sum 197,799.17 1,283,717
B-8-17. inland oranspooaoion 1). inland oranspooaoion 951.0 667.00 634,288.72 4,116,534
sum 634,288.72 4,116,534
B-8-18. insurance 1). insurance I = CIP × 1.1 × r 1.0 681.00 3,308.17 8,824,875 681.00 3,308.16 8,824,875 8,923,529
sum 681.00 3,308.16 8,824,875 8,923,529
sub oooal 171,853.36 835,396.05 23,529,102 48,428,682
oooal 1,913,684.57 13,325,895.23 75,199,059 378,581,128
C. Building Works 3,399,700.00 22,064,053
Building works C-1. Conorol house 1.0 1,977,700.00 1,977,700.00 12,835,273
C-2. Local conorl house Bahr Yusef 1.0 301,900.00 301,900.00 1,959,331
C-3. Local conorl house Ibrahimia 1.0 301,900.00 301,900.00 1,959,331
C-4. Soop log room 1.0 818,200.00 818,200.00 5,310,118
oooal 3,399,700.00 22,064,053
D. Inoegraoed Waoer Managemeno Sysoem 31,628,443.83 205,268,600
Inoegraoed Waoer Managemeno Sy soem D-1. IWMS manufacoures 1. IWMS manufacoures 1). Gauging soaoion Type-A & B 1.0 14,102,971.29 14,102,971.29 91,528,284
2). Cenoral moniooring room in Dirouo 1.0 1,387,148.88 1,387,148.87 9,002,596
3). Moniooring room in Minia 1.0 186,425.96 186,425.96 1,209,904
sub oooal 15,676,546.12 101,740,784
. D-2. Insoallaoion for IWMS 1. Insoallaoion for IWMS 1). insoallaoion for Gauging soaoion Type-A & B 1.0 15,816,762.91 15,816,762.90 102,650,791
2). insoallaoion for Moniooring room in Dirouo and Minia 1.0 135,134.81 135,134.81 877,025
sub oooal 15,951,897.71 103,527,816
oooal 31,628,443.83 205,268,600
E. Dispuoe Board 407,000.00 46,129,380
Dispuoe Board E-1. Dispuoe Board 1. regular Sioe Visio 1). Monohly Reoainer Fee US$3,000/day 45.0 3,000.00 135,000.00 15,300,900
2). Monohly Reoainer Fee during DNP US$2,000/day 12.0 2,000.00 24,000.00 2,720,160
3). Daily Fee 2day for Sioe Visio ×10nos 20.0 3,000.00 60,000.00 6,800,400
3day for oravel ×10nos 30.0 3,000.00 90,000.00 10,200,600
4). Expenses Air oickeo, eoc. 10.0 5,000.00 50,000.00 5,667,000
sum 359,000.00 40,689,060
2. supposed referrals 1). Addioional Daily Fee 2.0 3,000.00 6,000.00 680,040
2). Reviewing Submission and Drafoing Decision (3+4 day s)×2 14.0 3,000.00 42,000.00 4,760,280
sum 48,000.00 5,440,320
oooal 407,000.00 46,129,380
I-2 Indireco Coso 1.00 1,485,994.40 93,278,928.15 186,287,138 960,089,987
Project for Construction of the New Dirout Group of regulators (12/12)
Exchange Raoe
Work Ioem Grade Deoail Unio QuanoioyUnio Price Amouno
Exchange oo YEN Remarks
L.S
L.S
L.S
L.S
L.S
F/T
L.S
L.S.
L.S.
day
day
oime
L.S.
oime
oime
L.S.
L.S.
monoh
monoh
Table 4-2.15 Bill of quantities (12/12)
Ⅲ-106

Final Report Volume Ⅲ -Construction Planning & Cost Estimation
4. Project Cost Estimation
4-1 Criteria and manual of project cost estimation
There are no official standards for construction cost estimation in Egypt. The project cost is
estimated by using Japanese Standards articulated in JICA’s Design & Estimation Manual,
Estimate Standards (hereinafter referred to as ‘Manual’).
(1) Time of cost estimation and expected commencement date
Time of cost estimation is January 2017. The commencement date is expected in February 2018
according to the memorandum signed on July 2015. The amount of price escalation from the
time of cost estimation to the project completion date is included in the price contingency.
(2) Exchange rate
A fixed exchange rate system in the Egyptian market was shifted to a flexible exchange rate
system on 3rd of November 2016. At the beginning of the trading, the US$-LE exchange rate
was provisionally set at US$1 = LE13, a devaluation of approximately 48%. Also, a reduction of
the fuel subsidy was made on 4th of November 2016, and the prices of gasoline, diesel oil, and
butane gas were raised.
As of April 2017, the exchange rate system completely shifted to the flexible exchange rate. As
a result, the value of LE was going down about half.
These changes in the economic policy of the Egyptian government were the conditions for
receiving a loan from the IMF. The exchange rate and the prices will be affected by the policy
for a while, and the unstable situation with Egyptian market is predicted to continue.
In order to reflect such social context to the detail cost estimation, exchange rate was applied as
the average rate for the three months from February to April 2017, and the risk due to the rapid
price increase and unstable exchange rate after November 2016 is covered by the consideration
of the price contingency.
As a result, the exchange rate is calculated as follows;
1USD = ¥113.34, 1EUR = ¥121.26, 1LE = ¥6.49
(3) Working days coefficient
1.35 of the ratio was applied to the working days coefficient.
(4) Indirect cost
The ratio of indirect cost was applied based on the cost calculations in the Minutes of
Discussions (May 2014).
- Indirect cost for Civil and Temporary Works : 35% of each direct cost
- Indirect cost for Gate Manufacture : 3% of the direct cost
Ⅲ-107

Detailed Design Study on the Project for Construction of the New Dirout Group of Regulators
(5) Unit price of manpower, materials, and rental fee of heavy equipment etc.
- Regarding the unit price of manpower, materials, and rental fee of heavy equipment etc. which
are from Japan, the unit price was applied as 90% of the average price between two books for
monthly unit price published in Japan. When there was any item not described on the two
books, competitive estimations from three companies were applied.
- Labor fee for public work in Tokyo is applied to the unit price of Japanese skilled labor.
- Regarding the unit price of manpower, materials, and rental fee of heavy equipment etc. in
Egypt, 100% of the average price of the competitive estimations from three companies was
applied.
(6) Price escalation
The price escalation rate in the target country is calculated using the economic growth rate of
the world economy and the predicted value of inflation rate set by the IMF.
However, because the avobe calculation method of the price escalation rate is not considered the
recent rapid price increase, it is not reflected in reality. Therefore, the recent price escalation
was reflected by additional calculation applying a monthly inflation rate issued by the Central
Bank of Egypt.
- Price escalation rate for LC :
total ratio is 18.9% (17.2% of recent price escalation + 1.0% per year during construction)
- Price escalation rate for FC :
total ratio is 4.2% (1.6% per year during construction)
(7) Depreciation ratio for temporary steel material
Steel material for temporary works has a remaind value even after the completion of the
construction. The depreciation ratio for temporary steel material was applied 50% according to
the Egyptian law.
4-2 Estimation of the project cost
Project cost estimation was carried out based on final design and quauntity which was discussed
after submitting the B/D report.
According to the discussion on the B/D cost estimation, the procurement of steel material was
changed from Japan to a third country in Europe, and small scale gates and stoplogs were also
changed to be procured in Egypt.
The changing points on the design of regulators from the B/D stage are as follows:
(1) Foundation work: from steel sheet pile to cast-in-place RC pile
Ⅲ-108

Final Report Volume Ⅲ -Construction Planning & Cost Estimation
(2) Bank protection: embankment and gabion protection were newly added at
downstream of the left bank of the Bahr Yusef canal and the right bank of the
Ibrahimia canals
(3) Dewatering method: from deepwell method to well-point method
The construction and project cost calculated by the above conditions are as follows. It is the
approved cost in the 28th TAC meeting on 26th April 2017, and the updated cost of Integrated
Water Management System needs to refer to “Volume II Water Management System”.
Table 4-2.1 Construction and project cost estimation
US$ LE YEN
I Construction Cost L.S 1 6,138,654 377,480,579 2,219,659,487 5,365,263,000(breakdown)
A. Civil Works L.S 1 1,422,252 213,048,447 1,870,904,765 3,414,787,000
B. Temporary works L.S 1 4,309,402 117,144,168 348,754,722 1,597,447,000
C. Building works L.S 1 4,589,565 29,786,000
D. Integrated Water Management SystemL.S 1 42,698,399 277,112,000
E. Dispute Board L.S 1 407,000 46,129,000
II Consultant Service L.S 1 17,131,288 277,426,230 388,607,000
III Contingency for Construction L.S 1 577,647 93,785,050 208,869,958 883,006,000(breakdown)
Price Contingency L.S 1 257,823 71,343,829 93,225,698 585,469,000
Physical Contingency L.S 1 319,824 22,441,220 115,644,259 297,537,000
IV Contingency for Consultant Service L.S 1 4,256,269 26,105,808 53,729,000
(break down)
Price Contingency L.S 1 3,237,813 11,651,902 32,665,000
Physical Contingency L.S 1 1,018,455 14,453,907 21,064,000
V Interest During Construction L.S 1 20,100,000 20,100,000
6,716,301 492,653,185 2,752,161,483 6,710,705,000
VI Other Cost Estimation L.S 1 94,821,619 615,391,000(breakdown)
Administration Cost L.S 1 25,850,173 167,767,000
VAT L.S 1 68,971,446 447,624,000
Front-end Fee L.S 1 - -
6,716,301 587,474,805 2,752,161,483 7,326,096,000
Project Cost (I~V)
Total Project Cost (I~VI)
Item Unit QuantityAmount Total
(Exchange to "YEN")
Ⅲ-109

Detailed Design Study on the Project for Construction of the New Dirout Group of Regulators
This project is aimed at STEP (Special Terms for Economic Partnership) of Japanese ODA
Loans. The following items are mainly expected to be applied in this project;
- Steel double-sheet pile method
- overflow double-leaf gate to regulators
Ratio of the goods and services to be procured from Japan (“the Ratio”) is shown in Table 4-2.2.
Table 4-2.2 Ratio for STEP loan
A-11. Gate manufactures and works1. Gate manufacture gate leaf 6.0×6.55 2.0 324,769,300
gate guide 2.0 272,305,220hoisting device hydraulic 2.0 846,320,100remote operation system 2.0 228,439,580
1. Installation for manufacturesJapanese mechanical engineer for gate 1,050.0 31,403,295Japanese electrical engineer for gate 1,050.0 35,009,415
1,738,246,910A-12. Expense of the machine and facilities
1. Rent fee for heavy equipment 2). Vibration hunmer (1) Hydraulic, 232KW 1,507.0 42,926,89542,926,895
B-1. Temporary Coffer Dam1. Double sheet pile14). Japanese sheet pile operator A 2,190.0 79,914,195
79,914,195B-8. Transportation / Shipment
B-8-13. packing 951.0 F/T 1.0 12,754,883B-8-14. loading 1.0 7,095,825B-8-15. ocean transpotation 951.0 26,190,947
46,041,6551,907,129,655
Ratio of the goods and services to be procured from Japan
1) Construction Cost 5,365,263 103 YEN
2) Cost of the goods and services to be procured from Japan 1,907,130 103 YEN
2)/1)= 35.5% >30%
L.SF/T
sub-total
Item Grade Detail Unit
daysub-total
L.S
Amount
L.S
Quantity
L.SL.S
day
L.Sdayday
sub-total
Total
sub-total
Ⅲ-110

Final Report Volume Ⅲ -Construction Planning & Cost Estimation
Table 4-2.3 Summary of the project cost estimation
1 as of Esoimaoion
2 Counory 1USD= 113.34 (YEN)
3 Projeco 1EUR= 121.26 (YEN)
4 Class 1LE= 6.49 (YEN)
US$ LE YEN
I Consorucoion Coso I-1 Direco Coso A. Civil Works A-1. Excavaoion L.S 1.0 4,438,016.50 28,802,000
A-2. Embankmeno L.S 1.0 18,815,688.70 122,113,000
A-3. Demolioion work L.S 1.0 131,996.64 856,000
A-4. Sheeo pile bank prooecoion L.S 1.0 636,160.04 5,394,080.56 6,996,465 114,106,000
A-5. Bank prooecoion L.S 1.0 5,023,275.06 10,700,560 43,301,000
A-6. Canal bed prooecoion L.S 1.0 196,050.69 2,641,631.39 39,364,000
A-7. Concreoe work for regulaoors L.S 1.0 44,873,249.71 686,206 291,913,000
A-8. Pile foundaoion work L.S 1.0 13,382,883.34 86,854,000
A-9. Accessory works L.S 1.0 19,516,170.59 17,569,265 144,229,000
A-10. Elecoric works L.S 1.0 3,626,535.45 8,650,000 32,186,000
A-11. Gaoe manufacoures and works L.S 1.0 19,081,522.83 1,672,334,600 1,796,173,000
A-12. Expense of ohe machine and facilioies L.S 1.0 221,309.66 23,815,178.13 53,661,990 233,305,000
1,053,520.39 160,740,228.90 1,770,599,086 2,933,209,000
B. Temporary Works B-1. Temporary Coffer Dam L.S 1.0 840,284.40 19,099,569.97 110,691,135 329,885,000
B-2. Single Sheeo Pile L.S 1.0 438,170.24 2,790,300.38 6,347,427 74,118,000
B-3. Temporary bridge L.S 1.0 4,976,786.73 53,423,642 85,722,000
B-4. Dewaoering L.S 1.0 10,519,709.00 68,272,000
B-5. Temporary road & preparaoion L.S 1.0 7,783,260.59 50,513,000
B-6. diversion works L.S 1.0 11,759,640.95 76,320,000
B-7. Ooher oemporary works L.S 1.0 18,178,115.27 17,112,000 135,087,000
B-8. Transpooaoion / Shipmeno L.S 1.0 1,913,684.57 13,325,895.23 75,199,059 378,581,000
3,192,139.21 88,433,278.12 262,773,263 1,198,502,000
C. Building Works C-1. Conorol house L.S 1.0 1,977,700.00 12,835,000
C-2. Local conorl house L.S 1.0 301,900.00 1,959,000
C-3. Local conorl house L.S 1.0 301,900.00 1,959,000
C-4. Soop log room L.S 1.0 818,200.00 5,310,000
3,399,700.00 22,064,000
D. Inoegraoed Waoer Managemeno Sysoem D-1. IWMS manufacoures L.S 1.0 15,676,546.12 101,740,000
D-2. Insoallaoion for IWMS L.S 1.0 15,951,897.71 103,527,000
31,628,443.83 205,268,000
E. Dispuoe Board E-1. Dispuoe Board L.S 1.0 407,000.00 46,129,000
407,000.00 46,129,000
4,652,659.60 284,201,650.85 2,033,372,349 4,405,173,000
1,485,994.40 93,278,928.15 186,287,138 960,089,000
6,138,654.00 377,480,579.00 2,219,659,487 5,365,263,000
13.0% 45.7% 41.3%
L.S 1.0 10,092,110.00 230,823,000 296,320,000
L.S 1.0 7,039,178.00 46,603,230 92,287,000
17,131,288.00 277,426,230 388,607,000
LC: 1.0%/year, oooal raoio is 18.9% L.S 1.0 71,343,829.43 463,021,000
FC: 1.6%/year, oooal raoio is 4.2% L.S 1.0 257,823.47 93,225,698 122,448,000
% 5.0 319,823.87 22,441,220.42 115,644,259 297,537,000
LC: 1.0%/year, oooal raoio is 18.9% L.S 1.0 3,237,813.43 21,013,000
FC: 1.6%/year, oooal raoio is 4.2% L.S 1.0 11,651,902 11,652,000
% 5.0 1,018,455.07 14,453,907 21,064,000
L.S 1.0 20,100,000 20,100,000
6,716,301.34 492,653,185.36 2,752,161,483 6,710,705,000
11.3% 47.6% 41.1%
Unio QuanoioyTooal (Exchange
oo YEN)
sub oooal (E. Dispuoe Board)
I-2 Indireco Coso
sub oooal (A. Civil works)
sub oooal (B. Temporary works)
sub oooal (C. Building works)
sub oooal (D. Inoegraoed Waoer Managemeno Sysoem)
Remuneraoion
Direco Expense
Price Conoingency
Price Conoingency
January. 2017
ARAB REPUBLIC OF EGYPT
THE PROJECT FOR CONSTRUCTION OF THE NEW DIROUT GROUP OF REGULATORS
AGRICULTURE
Exchange Raoe
II Consuloano Service
RemarksIoem
Amouno
Tooal Consorucoion Coso (I~V)
III Conoingency for Consorucoion
IV Conoingency for Consuloano Service
Physical Conoingency
Physical Conoingency
0.01 %/year V Inoereso During Consorucoion
Ⅲ-111

Detailed D
esign Study on the P
roject for Construction of the N
ew D
irout Group of R
egulators
1 as of Esoimaoion January. 2017
2 Counory ARAB REPUBLIC OF EGYPT
3 Projeco THE PROJECT FOR CONSTRUCTION OF THE NEW DIROUT GROUP OF REGULATORS
4 Class AGRICULTURE 5 1USD= 113.34 (YEN) 1EUR= 121.26 (YEN) 1LE= 6.49 (YEN)
US$ LE YEN US$ LE YEN
I Consorucoion Coso 6,138,654.00 377,480,579.00 2,219,659,487 5,365,263,489
I-1 Direco Coso 4,652,659.60 284,201,650.85 2,033,372,349 4,405,173,502
A. Civ il Works 1,053,520.39 160,740,228.90 1,770,599,086 2,933,209,173
A-1. Excavaoion A-1-1. Excavaoion 1. excavaoion 1). excavaoion and loading 0.8m3 back hoe 23,390.0 19.82 463,589.80 3,008,698
2). excavaoion for concreoe basemeno 0.8m3 back hoe 1,320.0 28.32 37,382.40 242,612
sum 500,972.20 3,251,310
2. excavaoed soil disposal 1). excavaoed soil disposal Disoance 20km 24,710.0 159.33 3,937,044.30 25,551,418
oooal 4,438,016.50 28,802,727
A-2. Embankmeno A-2-1. Embankmeno 1. Embankmeno 1). backfill 1 15o bulldozer 76,490.0 37.90 2,898,971.00 18,814,322
2). backfill 2 v ibraoion roller,oamping machine 7,470.0 45.37 338,913.90 2,199,551
3). maoerial fee for backfill sand 60,873.0 67.10 4,084,578.30 26,508,913
sum 7,322,463.20 47,522,786
2. oransporoaoion fee for buy ing maoerial 1). excavaoion and loading 0.8m3 back hoe loose soil 60,873.0 19.22 1,169,979.06 7,593,164
2). oransporoaoion by damp oruck Disoance 20km 60,873.0 135.51 8,248,900.23 53,535,362
sum 9,418,879.29 61,128,527
3. oransporoaoion fee for reused maoerial 1). excavaoion and loading 0.8m3 back hoe loose soil 45,183.0 19.22 868,417.26 5,636,028
2). oransporoaoion by damp oruck Disoance 0.3km 45,183.0 18.47 834,530.01 5,416,100
sum 1,702,947.27 11,052,128
4. Earoh finishing 1). earoh finishing foundaoion 4,640.0 7.36 34,150.40 221,636
2). rough finishing 0.8m3 back hoe 1,610.0 34.70 55,867.00 362,577
sum 90,017.40 584,213
5. prooecoion fence for waoerpolluoion 1). prooecoion fence 253.0 1,112.18 281,381.54 1,826,166
oooal 18,815,688.70 122,113,820
A-3. Demolioion work A-3-1. Demolioion work 1. Demolioion work 1). concreoe demolioion reinforced concreoe 195.4 469.06 91,663.70 594,897
2). concreoe demolioion plain concreoe 5.8 224.59 1,298.13 8,425
3). breaked concreoe disposal Disoance 20km 201.2 194.01 39,034.81 253,336
oooal 131,996.64 856,658
A-4. Sheeo pile bank prooecoion A-4-1. Capping concreoe 1. crown works 1). formwork reinforced concreoe 1,663.9 400.74 666,791.28 4,327,475
2). placing reinforced concreoe 25N/mm2 by crane 517.9 1,356.29 702,409.02 4,558,635
3). curing reinforced concreoe 517.9 7.83 4,055.07 26,317
4). bending,cuooing and placing for re-bar D12 13.6 18,857.16 256,777.94 1,666,489
5). joino filler @10m 53.5 403.70 21,614.09 140,275
sub oooal 1,651,647.40 10,719,192
A-4-2. Sheeo pile 1. Sheeo pile prooecoion 1). driv ing sheeo pile PU18, L≦15m (driv ing lengoh) 126.0 1,466.45 184,772.70 1,199,175
PU18, L≦12m (driv ing lengoh) 146.0 1,231.17 179,750.82 1,166,583
PU18, L≦9m (driv ing lengoh) 43.0 997.84 42,907.12 278,467
PU12, L≦12m (driv ing lengoh) 1,055.19
PU12, L≦9m (driv ing lengoh) 62.0 880.52 54,592.24 354,304
PU12, L≦6m (driv ing lengoh) 486.0 761.90 370,283.40 2,403,139
PU12, L≦4m (driv ing lengoh) 645.24
PU12, L≦2m (driv ing lengoh) 527.92
2). Sheeo pile press fiooing PU, L≦15m (driv ing lengoh) 165.71 5,233
PU, L≦12m (driv ing lengoh) 130.98 4,139
3). Mobilizaoion & demobilizaoion press fiooing machine for sheeo pile 700.36 19,332
4). maoerial fee for sheeo pile PU12, 18 722.1 881.00 636,160.04 72,102,379
5). insoallaoion for oie-rod and waling 47.7 3,311.13 157,866.66 1,024,555
6). maoerial fee for oie-rod (NHT690) φ46 L=10.0m 2pcs/rod 2.0 68,175 136,350 136,350
φ46 L=11.0m 2pcs/rod 2.0 74,295 148,590 148,590
φ46 L=11.5m 2pcs/rod 23.0 77,040 1,771,920 1,771,920
φ46 L=12.0m 2pcs/rod 20.0 79,785 1,595,700 1,595,700
φ46 L=13.0m 2pcs/rod 2.0 85,905 171,810 171,810
φ46 L=13.5m 2pcs/rod 8.0 89,325 714,600 714,600
φ46 L=14.0m 2pcs/rod 6.0 92,025 552,150 552,150
φ42 L=12.0m 2pcs/rod 8.0 51,255 410,040 410,040
φ42 L=9.0m 2pcs/rod 2.0 53,595 107,190 107,190
φ42 L=8.5m 2pcs/rod 9.0 69,480 625,320 625,320
φ32L=7.5m 2pcs/rod 22.0 27,990 615,780 615,780
φ32 L=8.0m 2pcs/rod 1.0 29,385 29,385 29,385
φ32 L=9.0m 2pcs/rod 1.0 32,670 32,670 32,670
m3
m3
m3
Amouno
m3
m3
m3
Project for Construction of the New Dirout Group of regulators (1/12)
Exchange Raoe
Work Grade Deoail Unio QuanoioyUnio Price
RemarksExchange oo YEN
m3
sheeo
sheeo
sheeo
sheeo
Ioem
m3
m2
m3
m3
m3
m2
m
m3
m3
m3
m3
m3
nos
nos
nos
sheeo
sheeo
o
m2
sheeo
sheeo
sheeo
sheeo
nos
o
o
nos
nos
nos
nos
nos
nos
nos
nos
nos
nos
Table 4-2.4 Bill of quantities (1/12)
Ⅲ-112

F
inal Report V
olume Ⅲ
-Construction P
lanning & C
ost Estim
ation
Table 4-2.5 Bill of quantities (2/12)
1 as of Esoimaoion January. 2017
2 Counory ARAB REPUBLIC OF EGYPT
3 Projeco THE PROJECT FOR CONSTRUCTION OF THE NEW DIROUT GROUP OF REGULATORS
4 Class AGRICULTURE 5 1USD= 113.34 (YEN) 1EUR= 121.26 (YEN) 1LE= 6.49 (YEN)
US$ LE YEN US$ LE YEN
φ25 L=7.5m 2pcs/rod 4.0 21,240 84,960 84,960
7). maoerial fee for waling UPN 32.7 12,553.60 410,389.73 2,663,429
8). sheeo pile welding on sioe 293.0 1,944.85 569,841.05 3,698,268
9). anoicorrosion painoing (bioumen) 7,145.3 248.00 1,772,029.44 11,500,471
sub oooal 636,160.04 3,742,433.16 6,996,465 103,387,235
oooal 636,160.04 5,394,080.56 6,996,465 114,106,427
A-5. Bank prooecoion A-5-1. Bank prooecoion 1. Riprap 1). weo soone pioching o=35cm 2,008.8 841.71 1,690,827.04 10,973,467
2). placing backfill concreoe 18N/mm2 by crane 161.4 1,479.36 238,709.52 1,549,225
3). curing plain concreoe 161.4 12.92 2,084.77 13,530
sum 1,931,621.33 12,536,222
2. crown works 1). form for lean concreoe 10.2 209.60 2,137.92 13,875
2). placing lean concreoe 18N/mm2 by crane 1.8 1,479.36 2,640.65 17,138
3). curing plain concreoe 1.8 12.92 23.06 150
4). formwork for small sorucoure 107.8 355.10 38,295.03 248,535
5). placing plain concreoe 18N/mm2 by man power 16.0 1,109.76 17,750.61 115,201
6). curing small sorucoure 17.8 30.22 537.31 3,487
7). gravel for under concreoe o=100mm 3.6 99.31 354.53 2,301
8). joino filler expansion joino 1.3 45.20 59.93 389
sum 61,799.04 401,076
3. base concreoe 1). form for lean concreoe 10.7 209.60 2,232.24 14,487
2). placing lean concreoe 18N/mm2 by crane 2.7 1,479.36 3,938.79 25,563
3). curing plain concreoe 2.7 12.92 34.39 223
4). formwork for small sorucoure 104.4 355.10 37,089.90 240,713
5). placing plain concreoe 18N/mm2 by man power 16.4 1,109.76 18,201.72 118,129
6). curing small sorucoure 16.4 30.22 495.65 3,217
7). gravel for under concreoe o=100mm 4.5 99.31 445.55 2,892
8). joino filler expansion joino 1.7 45.20 75.27 489
sum 62,513.51 405,713
4. gabion prooecoion 1). insoallaoion for gabion 0.5×1.0×2.0 1,184.0 1,173.37 3,990 1,389,270.08 4,724,160 13,740,523
1.0×1.0×2.0 670.0 2,355.33 8,920 1,578,071.10 5,976,400 16,218,081
sum 2,967,341.18 10,700,560 29,958,604
oooal 5,023,275.06 10,700,560 43,301,615
A-6. Canal bed prooecoion A-6-1. bed prooecoion for upsoream 1. Bed prooecoion for upsoream 1). soone riprap working radius r=less 9m 956.5 606.24 579,868.56 3,763,347
2). grading for riprap 1,952.0 76.86 150,030.72 973,699
sum 729,899.28 4,737,046
A-6-2. bed prooecoion for downsoream 1. Bed prooecoion for downsoream 1). soone riprap working radius r=less 9m 1,701.0 606.24 1,031,214.24 6,692,580
2). grading for riprap 1,890.0 76.86 145,265.40 942,772
3). gravel for backfill o=0.1m 208.5 746.76 155,699.46 1,010,489
4). geooexoile o=0.5mm, Nylon,polyesoer 2,085.0 46.42 96,785.70 628,139
sum 1,428,964.80 9,273,982
A-6-3. Sheeo pile for waoer soop 1. Sheeo pile for waoer soop 1). driv ing sheeo pile PU18, L≦15m (driv ing lengoh) 1.0 1,466.45 1,466.45 9,517
PU18, L≦12m (driv ing lengoh) 3.0 1,231.17 3,693.51 23,971
PU18, L≦9m (driving lengoh) 4.0 997.84 3,991.36 25,904
PU12, L≦12m (driv ing lengoh) 120.0 1,055.19 126,622.80 821,782
PU12, L≦9m (driving lengoh) 8.0 880.52 7,044.16 45,717
PU12, L≦6m (driving lengoh) 122.0 761.90 92,951.80 603,257
PU12, L≦4m (driving lengoh) 120.0 645.24 77,428.80 502,513
PU12, L≦2m (driving lengoh) 104.0 527.92 54,903.68 356,325
2). maoerial fee for sheeo pile PU12, 18 222.5 881.00 196,050.69 22,220,385
3). sheeo pile welding on sioe 31.0 1,944.85 60,290.35 391,284
4). anoicorrosion painoing sand plasoing and painoing 193.7 248.00 48,032.64 311,732
5). sheeo pile cuooing 24.0 264.24 6,341.76 41,158
sum 196,050.69 482,767.31 25,353,545
oooal 196,050.69 2,641,631.39 39,364,573
A-7. Concreoe work for regulaoors A-7-1. concreoe works regulaoor body 1). earoh foundaoion finishing 4,553.1 28.06 127,759.42 829,159
2). form for lean concreoe 51.9 209.60 10,882.43 70,627
3). placing lean concreoe 18N/mm2 by crane 403.1 1,326.22 534,599.28 3,469,549
4). curing plain concreoe 403.1 12.92 5,208.05 33,800
5). formwork reinforced concreoe 14,302.0 400.74 5,731,375.46 37,196,627
sheeo
sheeo
sheeo
o
nos
m2
m
m2
m2
m3
m3
m2
sheeo
sheeo
sheeo
m3
m2
m3
m3
m2
m2
m3
m2
m3
nos
nos
m2
m3
m2
m2
m3
m3
m2
m3
m3
m2
m2
nos
o
nos
m2
Unio
Exchange Raoe
Work Ioem Grade Deoail QuanoioyUnio Price Amouno
Exchange oo YEN Remarks
m2
m3
m2
m3
m3
sheeo
sheeo
Ⅲ-113

Detailed D
esign Study on the P
roject for Construction of the N
ew D
irout Group of R
egulators
1 as of Esoimaoion January. 2017
2 Counory ARAB REPUBLIC OF EGYPT
3 Projeco THE PROJECT FOR CONSTRUCTION OF THE NEW DIROUT GROUP OF REGULATORS
4 Class AGRICULTURE 5 1USD= 113.34 (YEN) 1EUR= 121.26 (YEN) 1LE= 6.49 (YEN)
US$ LE YEN US$ LE YEN
6). formwork circular sorucoure 490.7 525.17 257,706.17 1,672,513
7). placing concreoe 25N/mm2(src, nigho oime) 14,667.0 1,446.03 21,208,922.01 137,645,904
8). placing concreoe 25N/mm2(opc) 1,372.5 1,356.29 1,861,467.33 12,080,923
9). curing reinforced concreoe 16,039.5 7.83 125,589.05 815,073
10). bending,cuooing and placing for re-bar D13~D25mm 586.0 17,805.74 10,434,680.00 67,721,073
11). scaffolding noo less ohan 4m 10,755.1 161.52 1,737,170.21 11,274,235
12). pipe supporo falsework noo greaoer ohan 4o/m2 4,360.7 144.07 628,244.60 4,077,307
13). joino filler o=20mm 488.7 403.70 197,284.15 1,280,374
14). waoer soop w=300mm 251.0 37.54 2,214 9,423.29 555,758 616,915
15). waoer soop waoer-swelling 66.1 16.56 1,975 1,093.78 130,448 137,547
16). addoive for ruso-proofing for reinforced condreoe 16,039.5 124.81 2,001,844.48 12,991,971
oooal 44,873,249.71 686,206 291,913,597
A-8. Pile foundaoion work A-8-1. Caso-in-place RC pile φ1,000 1). mobilizaoion and demobilizaoion 2.0 297,720.00 595,440.00 3,864,406
2). pile drilling including fabricaoe and lowering soell cage and pour concreoe 2,429.6 1,712.00 4,159,475.20 26,994,994
3). placing concreoe 25N/mm2(src) 1,908.2 1,386.07 2,644,903.45 17,165,423
4). bending,cuooing and placing for re-bar 301.0 17,805.74 5,359,812.63 34,785,184
5). pile head demolishing φ1,000, 0.8m 120.6 469.06 56,586.06 367,244
6). load oeso 2.0 283,333.00 566,666.00 3,677,662
oooal 13,382,883.34 86,854,913
A-9. Accessory works A-9-1. Road works 1. Asphalo pavemeno 1). enbankmeno 10,225.3 37.90 387,539.62 2,515,132
roadway maoerial fee for oemporary road sand 12,916.2 67.10 866,676.59 5,624,731
oransporoaoion fee for buy ing maoerial
excavaoion and loading 0.8m3 back hoe loose soil 12,916.2 19.22 248,249.24 1,611,138
oransporoaoion by damp oruck Disoance 20km 12,916.2 135.51 1,750,273.40 11,359,274
2). wearing course o=50mm 4,379.6 143.00 626,287.09 4,064,603
3). binder course o=60mm 4,379.6 143.00 626,287.09 4,064,603
4). base course o=200mm 4,379.6 132.78 581,527.27 3,774,112
5). sub base course o=200mm 4,379.6 132.78 581,527.27 3,774,112
6). oack coao 4,379.6 16.00 70,074.08 454,781
7). prime coao 4,379.6 19.00 83,212.97 540,052
sum 5,821,654.62 37,782,538
2. Asphalo pavemeno 1). wearing course o=50mm 623.7 143.00 89,191.96 578,856
paohway 2). base course o=200mm 623.7 132.78 82,817.54 537,486
3). prime coao 623.7 19.00 11,850.68 76,911
sum 183,860.18 1,193,253
3. curb concreoe 1). form for lean concreoe 127.3 209.60 26,689.20 173,213
2). placing lean concreoe 18N/mm2 by crane 20.7 1,479.36 30,585.21 198,498
3). curing plain concreoe 20.7 12.92 267.11 1,734
3). formwork for small sorucoure 964.9 355.10 342,646.12 2,223,773
4). placing plain concreoe 18N/mm2 by man power 109.5 1,109.76 121,480.35 788,407
5). curing small sorucoure 109.5 30.22 3,308.04 21,469
6). gravel for under concreoe o=100mm 41.3 99.31 4,106.39 26,650
sum 529,082.42 3,433,745
4. guard pipe H=1.1m 629.81 1,212.12 763,405.29 4,954,500
5. slope prooecoion 1). soone masonry wioh moroar o=35cm 1,765.25 841.71 1,485,828.57 9,643,027
2). placing backfill concreoe 18N/mm2 by crane 214.54 1,479.36 317,374.66 2,059,762
3). curing plain concreoe 214.54 12.92 2,771.79 17,989
sum 1,805,975.02 11,720,778
6. crown concreoe 1). form for lean concreoe 47.9 209.60 10,031.45 65,104
2). placing lean concreoe 18N/mm2 by crane 7.9 1,479.36 11,751.29 76,266
3). curing plain concreoe 7.9 12.92 102.63 666
4). formwork for small sorucoure 395.9 355.10 140,574.81 912,331
5). placing plain concreoe 18N/mm2 by man power 59.1 1,109.76 65,531.32 425,298
6). curing small sorucoure 20.7 30.22 624.78 4,055
7). gravel for under concreoe o=100mm 15.9 99.31 1,577.73 10,239
8). joino filler expansion joino 5.9 45.20 266.90 1,732
sum 230,460.91 1,495,691
7. base concreoe 1). form for lean concreoe 53.7 209.60 11,250.69 73,017
2). placing lean concreoe 18N/mm2 by crane 13.4 1,479.36 19,851.90 128,839
AmounoExchange oo YEN Remarks
Exchange Raoe
Work Ioem Grade Deoail Unio QuanoioyUnio Price
m3
m3
m3
o
m2
m2
Project for Construction of the New Dirout Group of regulators (3/12)
m3
m3
m2
m2
m2
m3
m2
m
m
m3
m3
m2
m3
m2
L.S
m
m3
o
m3
L.S
m3
m3
m2
m2
m2
m2
m2
m2
m3
m2
m2
m3
m3
m2
m
m2
m2
m3
m3
m3
m3
m2
m3
m3
m2
Table 4-2.6 Bill of quantities (3/12)
Ⅲ-114

F
inal Report V
olume Ⅲ
-Construction P
lanning & C
ost Estim
ation
1 as of Esoimaoion January. 2017
2 Counory ARAB REPUBLIC OF EGYPT
3 Projeco THE PROJECT FOR CONSTRUCTION OF THE NEW DIROUT GROUP OF REGULATORS
4 Class AGRICULTURE 5 1USD= 113.34 (YEN) 1EUR= 121.26 (YEN) 1LE= 6.49 (YEN)
US$ LE YEN US$ LE YEN
3). curing plain concreoe 13.4 12.92 173.37 1,125
4). formwork for small sorucoure 474.3 355.10 168,431.08 1,093,118
5). placing plain concreoe 18N/mm2 by man power 72.5 1,109.76 80,417.59 521,910
6). curing small sorucoure 72.5 30.22 2,189.86 14,212
7). grav el for under concreoe o=100mm 18.8 99.31 1,865.73 12,109
8). joino filler expansion joino 7.2 45.20 327.53 2,126
sum 284,507.75 1,846,455
8. concreoe soair 1). form for lean concreoe 16.9 209.60 3,535.78 22,947
2). placing lean concreoe 18N/mm2 by crane 8.4 1,479.36 12,417.03 80,587
3). curing plain concreoe 8.4 12.92 108.44 704
4). formwork reinforced concreoe 118.6 400.74 47,509.37 308,336
5). placing concreoe 25N/mm2(opc) 31.0 1,356.29 42,068.86 273,027
6). curing reinforced concreoe 31.0 7.83 242.86 1,576
7). grav el for under concreoe o=100mm 12.5 99.31 1,243.54 8,071
8). bending,cuooing and placing for re-bar D12 0.4 18,857.16 7,970.69 51,730
sum 115,096.57 746,977
sub oooal 9,734,042.76 63,173,938
A-9-2. Bridge works 1. concreoe work 1). formwork reinforced concreoe 1,696.3 400.74 679,775.92 4,411,746
2). placing concreoe 25N/mm2(opc) 548.9 1,356.29 744,406.81 4,831,200
3). curing reinforced concreoe 548.9 7.83 4,297.53 27,891
4). bending,cuooing and placing for re-bar D12 105.1 18,857.16 1,981,642.37 12,860,859
5). pipe supporo falsework noo greaoer ohan 4o/m2 6,121.3 144.07 881,888.48 5,723,456
6). Soy rofoam o=20~150mm 14.0 26,190 366,607 366,607
sum 4,292,011.11 366,607 28,221,759
2. shoe 1). rubber bearing 330×150×40 20.0 11,760 235,200 235,200
330×300×40 40.0 23,590 943,600 943,600
150×10,000×20 2.0 108,780 217,560 217,560
300×10,000×20 5.0 217,560 1,087,800 1,087,800
2). corrosion-proof anchor Fixed, F25D 12.0 6,930 83,160 83,160
Movable, M25D 20.0 8,260 165,200 165,200
for F25D 12.0 1,190 14,280 14,280
for M25D 20.0 2,940 58,800 58,800
sum 2,805,600 2,805,600
3. soeel expansion joino 1). expansion joino (brof joino) displacemeno⊿=20mm 24.2 232.34 35,190 5,622.62 851,598 888,089
2). expansion joino (brof joino) displacemeno⊿=35mm 96.8 232.34 55,800 22,490.51 5,401,440 5,547,403
3). Anchor bar D12 0.6 11,442.00 7,029.08 45,619
sum 35,142.21 6,253,038 6,481,111
4. balusorade for bridge 1). balusorade h=1.100 165.2 1,212.12 200,242.22 1,299,572
2). Anchor bar D12 0.6 11,442.00 7,029.08 45,619
sum 207,271.30 1,345,191
sub oooal 4,534,424.62 9,425,245 38,853,661
A-9-3. Approach slab 1. concreoe work 1). formwork reinforced concreoe 96.0 400.74 38,471.04 249,677
2). placing concreoe 25N/mm2(opc) 160.0 1,356.29 217,006.40 1,408,372
3). curing reinforced concreoe 160.0 7.83 1,252.80 8,131
4). bending,cuooing and placing for re-bar D22 14.2 17,805.74 253,553.73 1,645,564
5). Anchor cap SGP 40×80 200.0 67.00 13,400.00 86,966
6). Anchor bar D22×500×200nos 0.3 11,442.00 3,478.36 22,575
7). joino filler expansion joino 34.4 45.20 1,554.88 10,091
sum 528,717.21 3,431,375
2. shoe 1). rubber shoe o=30mm 24.0 166,050 3,985,200 3,985,200
sub oooal 528,717.21 3,985,200 7,416,575
A-9-4. Accessory works around regulaoor 1. accessory work for gaoe 1). formwork for poso-placing concreoe reinforced concreoe 1,248.8 400.74 500,448.11 3,247,908
2). poso-placing concreoe 25N/mm2(src, nigho oime) 340.2 1,446.03 491,953.86 3,192,781
3). poso-placing concreoe 25N/mm2(opc) 7.5 1,356.29 10,185.73 66,105
4). curing for poso-placing concreoe 347.7 7.83 2,722.64 17,670
5). joino bar D22 2.9 11,442.00 33,457.14 217,137
6). insoallaoion for joino bar D22 7,900.0 83.45 659,255.00 4,278,565
sum 1,698,022.48 11,020,166
2. hydraulic pipe pio works 1). form for lean concreoe 9.1 209.60 1,909.45 12,392
Ioem Grade Deoail Unio QuanoioyUnio Price Amouno
Exchange oo YEN Remarks
m3
m3
m2
o
nos
m3
Project for Construction of the New Dirout Group of regulators (4/12)
Exchange Raoe
Work
nos
nos
m2
m3
m3
o
m3
m
m3
nos
m3
m3
m2
m2
m2
m2
m3
m3
m2
nos
nos
nos
nos
m
o
m
o
m3
m3
m3
o
nos
m2
m3
m3
o
nos
o
m2
m2
m2
m2
Table 4-2.7 Bill of quantities (4/12)
Ⅲ-115

Detailed D
esign Study on the P
roject for Construction of the N
ew D
irout Group of R
egulators
1 as of Esoimaoion January. 2017
2 Counory ARAB REPUBLIC OF EGYPT
3 Projeco THE PROJECT FOR CONSTRUCTION OF THE NEW DIROUT GROUP OF REGULATORS
4 Class AGRICULTURE 5 1USD= 113.34 (YEN) 1EUR= 121.26 (YEN) 1LE= 6.49 (YEN)
US$ LE YEN US$ LE YEN
2). placing lean concreoe 18N/mm2 by crane 10.5 1,479.36 15,562.86 101,003
3). curing plain concreoe 10.5 12.92 135.91 882
4). formwork reinforced concreoe 374.7 400.74 150,169.30 974,599
5). placing concreoe 25N/mm2(opc) 85.8 1,356.29 116,383.24 755,327
6). curing reinforced concreoe 85.8 7.83 671.89 4,361
7). bending,cuooing and placing for re-bar D22 8.5 17,805.74 151,687.09 984,449
8). scaffolding noo less ohan 4m 160.1 161.52 25,865.81 167,869
9). pipe supporo falsework noo greaoer ohan 4o/m2 92.0 144.07 13,250.11 85,993
10). waoer soop w=300mm 16.8 37.54 2,214 630.67 37,195 41,288
11). joino filler expansion joino 5.1 45.20 231.87 1,505
12). joino filler consorucoion joino 0.6 403.70 250.29 1,624
13). checker plaoe o=3.2mm 1.0 349.41 342.41 2,222
o=4.5mm 18.8 476.12 8,946.24 58,061
14). Anchor bar D16 0.0 11,442.00 57.11 371
15). insoallaoion for hydraulic pipe SUS 32A 4,004.0 75.50 302,302.00 1,961,940
sum 788,396.25 37,195 5,153,887
3. soeel soairs 1). soeel soairs 2.0 129,944.00 259,888.00 1,686,673
2). foundaoion for supporo 2.0 14,774.67 29,549.34 191,775
sum 289,437.34 1,878,448
4. insoallaoion for graoing IB, 44×5×3 227.8 232.34 18,090 52,936.34 4,121,625 4,465,182
5. insoallaoion for handrail H=1.1m 563.2 1,395.28 785,821.69 5,099,983
6. crane facilioy 1). chain block manual operaoion, 5o 2.0 32,157.16 64,314.32 417,400
2). rail I 300x150x10x18.5 1.1 15,692.00 16,711.98 108,461
sum 81,026.30 525,861
7. insoallaoion for soeel soeps b=300mm 765.0 370.65 283,547.25 1,840,222
8. soaff gauge 65.2 1,664.10 108,416.02 703,620
9. gaoe lighoing 1). high pressure mercury lamp 400W 6.0 5,075.00 30,450.00 197,621
2). insoallaoion for gaoe lighoing 6.0 18,533.63 111,201.78 721,700
sum 141,651.78 919,320
10. waoer level deoecoor 1). waoer level deoecoor DC4-20A 13.0 34,927.58 454,058.55 2,946,840
2). insoallaoion for waoer level deoecoor 13.0 2,744.00 35,672.00 231,511
sum 489,730.55 3,178,351
sub oooal 4,718,986.00 4,158,820 34,785,039
oooal 19,516,170.59 17,569,265 144,229,212
A-10. Elecoric works A-10-1. insoallaoion for facilioies of receiv ing po 1. Insoallaoion for power receiv ing and disoribuo1). insoallaoion for power receiv ing and disoribuoion panel 1.0 3,388.00 3,388.00 21,988
2). emergency generaoor wioh panel 80kVA, 3phase 4wire 1.0 8,650,000 8,650,000 8,650,000
3). insoallaoion for backup generaoor 1.0 33,246.50 33,246.50 215,770
4). oransformer ohree phase100KVA 1.0 211,500.00 211,500.00 1,372,635
sub oooal 248,134.50 8,650,000 10,260,393
A-10-2. Insoallaoion for elecoric cable and wire 1. elecoric cable and wire 1). elecoric cable
CV 3.5sq -2C 323.6 43.25 13,995.70 90,832
CV 8sq -2C 340.3 66.44 22,609.53 146,736
CV 14sq -2C 40.0 92.29 3,691.60 23,958
CV 22sq -2C 20.0 124.83 2,496.60 16,203
CV 2sq -3C 64.5 41.83 2,698.03 17,510
CV 5.5sq -3C 268.6 71.80 19,285.48 125,163
CV 8sq -3C 458.6 87.30 40,035.78 259,832
CV 14sq -3C 820.4 123.72 101,499.88 658,734
CV 22sq -3C 125.8 168.44 21,189.75 137,521
CV 38sq -3C 225.2 254.94 57,412.48 372,607
CV 8sq -4C 20.0 110.31 2,206.20 14,318
CV 38sq -4C 30.0 327.64 9,829.20 63,792
CVV 2sq -4C 5.0 52.36 261.80 1,699
CVV 2sq -5C 969.3 63.91 61,947.96 402,042
CVV 2sq -8C 919.8 86.62 79,673.07 517,078
CVV 2sq -10C 74.5 106.68 7,947.66 51,580
CVV 2sq -20C 785.2 191.53 150,389.35 976,027
CVV 2sq -30C 4,164.6 253.71 1,056,600.66 6,857,338
CVVS 2sq -2C 451.5 47.59 21,486.88 139,450
m
nos
nos
nos
m
nos
nos
m
m3
o
m
Project for Construction of the New Dirout Group of regulators (5/12)
Exchange Raoe
Work Ioem Grade Deoail Unio QuanoioyUnio Price Amouno
Exchange oo YEN Remarks
nos
m
m
m
m
m
m
m
m
nos
m2
m
L.S
m2
o
m
m
m
nos
L.S
m
m2
o
nos
L.S
m3
m
m2
m2
m2
m3
m3
m2
m3
m
m
m
m
m
Table 4-2.8 Bill of quantities (5/12)
Ⅲ-116

F
inal Report V
olume Ⅲ
-Construction P
lanning & C
ost Estim
ation
1 as of Esoimaoion January. 2017
2 Counory ARAB REPUBLIC OF EGYPT
3 Projeco THE PROJECT FOR CONSTRUCTION OF THE NEW DIROUT GROUP OF REGULATORS
4 Class AGRICULTURE 5 1USD= 113.34 (YEN) 1EUR= 121.26 (YEN) 1LE= 6.49 (YEN)
US$ LE YEN US$ LE YEN
CVVS 2sq -10C 497.6 124.83 62,115.40 403,129
CVVS 2sq -15C 113.8 174.84 19,896.79 129,130
CVVS 2sq -30C 910.4 272.75 248,311.60 1,611,542
2). elecoric wire
IV 3.5sq 819.6 25.93 21,252.22 137,927
IV 5.5sq 95.1 29.50 2,805.45 18,207
IV 8sq 1,050.8 36.46 38,312.16 248,646
IV 14sq 351.0 52.56 18,448.56 119,731
IV 22sq 30.0 69.60 2,088.00 13,551
CPEV 0.9mm -3P 1,521.8 48.34 73,563.81 477,429
3). conduios
FEP 30 576.6 72.87 42,016.84 272,689
FEP 40 990.8 83.30 82,533.64 535,643
FEP 50 45.8 96.10 4,401.38 28,565
FEP 65 155.8 114.00 17,761.20 115,270
FEP 80 762.8 139.03 106,052.08 688,278
FEP 100 613.2 188.15 115,373.58 748,775
FEP 125 474.8 232.23 110,262.80 715,606
G 28 285.2 163.84 46,727.16 303,259
G 36 458.9 201.06 92,266.43 598,809
sum 2,779,446.71 18,038,609
2. earoh work excavasion and backfill 32.0 116.67 3,733.44 24,230
3. handhole 900×900×900 32.0 18,600.65 595,220.80 3,862,983
sub oooal 3,378,400.95 21,925,822
oooal 3,626,535.45 8,650,000 32,186,215
A-11. Gaoe manufacoures and works A-11-1. gaoe manufacoure 1. Gaoe manufacoure 1). double soage roller gaoe h=1.100
gaoe leaf 6.0×6.55 2.0 157,655,000 315,310,000 315,310,000
gaoe guide 2.0 132,187,000 264,374,000 264,374,000
hoisoing dev ice hydraulic 2.0 410,835,000 821,670,000 821,670,000
remooe operaoion sysoem 2.0 110,893,000 221,786,000 221,786,000
2). slide gaoe small gaoe
for Badraman 2.0×2.65, including hoiso 2.0 461,044.07 922,088.13 5,984,352
for Dirouoiah 2.0×2.35, including hoiso 3.0 461,044.07 1,383,132.20 8,976,528
for Abo Gabal 2.0×2.95, including hoiso 4.0 499,464.41 1,997,857.62 12,966,096
for Sahely ia 2.0×3.55, including hoiso 2.0 527,406.47 1,054,812.94 6,845,736
3). soop log
for large regulaoor Type-A×2、Type-B×8 2.0 2,368,089.98 4,736,179.96 30,737,808
for asmall regulaoor Type-A×2、Type-B×7 2.0 1,128,160.86 2,256,321.72 14,643,528
sum 12,350,392.57 1,623,140,000 1,703,294,048
A-11-2. insoallaoion for gaoe facilioies 1. Insoallaoion for manufacoures 1). insoallaoion for gaoe for gaoe, gaoe guide, hoiso 1.0 5,372,924.63 5,372,924.63 34,870,281
2). insoallaoion for soop log for gaoe guide, crane 1.0 1,351,345.63 1,351,345.63 8,770,233
3). conorol panel for gaoe operaoion
remooe operaoion panel 1.0 6,860.00 6,860.00 44,521
4). Japanese mechanical engineer for gaoe 1,050.0 22,154 23,261,700 23,261,700
5). Japanese elecorical engineer for gaoe 1,050.0 24,698 25,932,900 25,932,900
sum 6,731,130.26 49,194,600 92,879,635
oooal 19,081,522.83 1,672,334,600 1,796,173,683
A-12. Expense of ohe machine and facilioies A-12-1. Expense of ohe machine and facilioies 1. Reno fee for heavy equipmeno 1-1. reno in Egy po
1). rough oerrain crane 25o 1,410.0 3,194.17 4,503,775.00 29,229,500
2). oruck wioh crane 4o/2.9o 1,350.0 1,927.50 2,602,125.00 16,887,791
3). Truck 11o 1,350.0 1,591.67 2,148,750.00 13,945,388
4). Truck mixer 4.4m3 1,260.0 2,150.00 2,709,000.00 17,581,410
5). Truck mixer 4.4m3 1,230.0 2,150.00 2,644,500.00 17,162,805
6). Truck mixer 4.4m3 915.0 2,150.00 1,967,250.00 12,767,453
7). Truck mixer 4.4m3 450.0 2,150.00 967,500.00 6,279,075
8). cemeno silo 50o 1,290.0 1,595.83 2,058,625.00 13,360,476
9). Wheel Loader 2.1m3 400.0 2,030.83 812,333.33 5,272,043
. 1-2. reno in Japan
1). Baoching plano 30m3/h 1.0 221,309.66 221,309.66 25,083,237
Grade Deoail Unio QuanoioyUnio Price Amouno
m
m
m
m
m
m
m
m
m
m
m
Project for Construction of the New Dirout Group of regulators (6/12)
Exchange Raoe
Exchange oo YEN RemarksWork Ioem
L.S
L.S
nos
L.S
L.S
L.S
L.S
L.S
L.S
L.S
L.S
m3
nos
day
day
L.S
L.S
m
m
m
m
m
m
m
day
day
LS
day
day
day
day
day
day
day
Table 4-2.9 Bill of quantities (6/12)
Ⅲ-117

Detailed D
esign Study on the P
roject for Construction of the N
ew D
irout Group of R
egulators
1 as of Esoimaoion January. 2017
2 Counory ARAB REPUBLIC OF EGYPT
3 Projeco THE PROJECT FOR CONSTRUCTION OF THE NEW DIROUT GROUP OF REGULATORS
4 Class AGRICULTURE 5 1USD= 113.34 (YEN) 1EUR= 121.26 (YEN) 1LE= 6.49 (YEN)
US$ LE YEN US$ LE YEN
2). Vibraoion hunmer (1) Hydraulic, 232KW 1,507.0 21,100 31,797,700 31,797,700
3). Vibraoion hunmer (2) Hydraulic, 232KW 367.0 21,100 7,743,700 7,743,700
4). Waoer jeo 14.7Mpa 325L/min 1,507.0 9,370 14,120,590 14,120,590
sum 221,309.66 20,413,858.33 53,661,990 211,231,167
2. Operaoor wage reno in Egypo
1). rough oerrain crane 25o 1,058.0 435.00 460,230.00 2,986,893
2). oruck wioh crane 4o/2.9o 1,013.0 435.00 440,655.00 2,859,851
3). Truck 11o 1,013.0 435.00 440,655.00 2,859,851
4). Truck mixer 4.4m3 945.0 435.00 411,075.00 2,667,877
5). Truck mixer 4.4m3 923.0 435.00 401,505.00 2,605,767
6). Truck mixer 4.4m3 687.0 435.00 298,845.00 1,939,504
7). Truck mixer 4.4m3 338.0 435.00 147,030.00 954,225
sum 2,599,995.00 16,873,968
3. Fuel fee reno in Egypo
1). rough oerrain crane 25o 122,696.2 2.00 245,392.40 1,592,597
2). oruck wioh crane 4o/2.9o 39,091.6 2.00 78,183.20 507,409
3). Truck 11o 61,620.7 2.00 123,241.40 799,837
4). Truck mixer 4.4m3 57,900.1 2.00 115,800.20 751,543
5). Truck mixer 4.4m3 56,552.2 2.00 113,104.40 734,048
6). Truck mixer 4.4m3 42,092.4 2.00 84,184.80 546,359
7). Truck mixer 4.4m3 20,709.2 2.00 41,418.40 268,805
sum 801,324.80 5,200,598
oooal 221,309.66 23,815,178.13 53,661,990 233,305,733
B. Temporary Works 3,192,139.21 88,433,278.12 262,773,263 1,198,502,296
B-1. Temporary Coffer Dam B-1-1. Double Sheeo Pile 1. Double sheeo pile 1). driv ing sheeo pile PU28+1, L≦15m (driv ing lengoh) 1,730.41
PU28+1, L≦12m (driv ing lengoh) 1,462.0 1,466.45 2,143,949.90 13,914,235
PU28+1, L≦9m (driv ing lengoh) 1,173.16
PU28+1, L≦6m (driv ing lengoh) 640.0 939.18 601,075.20 3,900,978
PU28+1, L≦4m (driv ing lengoh) 80.0 763.21 61,056.80 396,259
2). Sheeo pile press fiooing PU, L≦9m (driv ing lengoh) 103.68 3,280
3). Mobilizaoion & demobilizaoion press fiooing machine for sheeo pile 700.36 19,332
4). maoerial fee for sheeo pile PU28+1 1,907.6 440.50 840,284.40 95,237,834
5). maoerial fee for sheeo pile PU28+1, near rail way 881.00
6). insoallaoion for oie-rod and waling 293.9 3,311.13 972,988.79 6,314,697
7). maoerial fee for oie-rod (NHT690) φ75 L=8.9m 2pcs/rod 210.0 151,065 31,723,650 31,723,650
φ75 L=10.0m 2pcs/rod 29.0 167,850 4,867,650 4,867,650
φ32 L=6.8m 2pcs/rod 40.0 25,470 1,018,800 1,018,800
φ32 L=8.0m 2pcs/rod 31.0 29,385 910,935 910,935
φ28 L=4.5m 2pcs/rod 16,020
φ28 L=5.5m 2pcs/rod 18,495
φ28 L=7.6m 2pcs/rod 24,345
φ28 L=8.5m 2pcs/rod 26,820
8). maoerial fee for waling H300未満 106.6 7,846.00 836,383.60 5,428,130
9). sheeo pile welding on sioe 1,662.0 1,944.85 3,232,340.70 20,977,891
10). removing sheeo pile L≦15m (removing lengoh) 658.61
L≦12m (removing lengoh) 1,462.0 572.16 836,497.92 5,428,872
L≦9m (removing lengoh) 486.33
L≦6m (removing lengoh) 640.0 428.48 274,227.20 1,779,735
L≦4m (removing lengoh) 80.0 371.90 29,752.00 193,090
11). driv ing bearing pile H150, L≦4m (driv ing lengoh) 615.91
H250, L≦4m (driv ing lengoh) 673.91
12). removing bearing pile L≦4m (removing lengoh) 371.90
13). maoerial fee for bearing pile 7,846.00
14). Japanese sheeo pile operaoor A 2,190.0 27,030 59,195,700 59,195,700
15). Japanese sheeo pile operaoor B 480.0 27,030 12,974,400 12,974,400
sub oooal 840,284.40 8,988,272.11 110,691,135 264,262,855
B-1-2. Earoh work 1. earoh work 1). backfill inside coffer dam 29,986.8 37.90 1,136,499.72 7,375,883
2). backfill maoerial fee sand 40,458.0 67.10 2,714,731.80 17,618,609
3). oransporoaoion fee for buy ing maoerial
Project for Construction of the New Dirout Group of regulators (7/12)
Exchange Raoe
Work Ioem Grade Deoail Unio QuanoioyUnio Price Amouno
Exchange oo YEN Remarks
day
day
sheeo
sheeo
sheeo
sheeo
Lio
Lio
Lio
Lio
Lio
sheeo
sheeo
day
day
nos
o
nos
day
day
day
day
nos
o
day
day
Lio
Lio
o
o
nos
nos
nos
nos
nos
nos
nos
nos
nos
nos
nos
nos
nos
nos
nos
o
m3
m3
day
fay
Table 4-2.10 Bill of quantities (7/12)
Ⅲ-118

F
inal Report V
olume Ⅲ
-Construction P
lanning & C
ost Estim
ation
1 as of Esoimaoion January. 2017
2 Counory ARAB REPUBLIC OF EGYPT
3 Projeco THE PROJECT FOR CONSTRUCTION OF THE NEW DIROUT GROUP OF REGULATORS
4 Class AGRICULTURE 5 1USD= 113.34 (YEN) 1EUR= 121.26 (YEN) 1LE= 6.49 (YEN)
US$ LE YEN US$ LE YEN
ex cavaoion and loading 0.8m3 back hoe loose soil 40,458.0 19.22 777,602.76 5,046,642
oransporoaoion by damp oruck Disoance 20km 40,458.0 135.51 5,482,463.58 35,581,189
sub oooal 10,111,297.86 65,622,323
oooal 840,284.40 19,099,569.97 110,691,135 329,885,178
B-2. Single Sheeo Pile B-2-1. Single Sheeo Pile 1. Single Sheeo Pile 1). driv ing sheeo pile PU28+1, L≦15m (driv ing lengoh) 200.0 1,730.41 346,082.00 2,246,072
PU28+1, L≦12m (driv ing lengoh) 1,466.45
PU28+1, L≦9m (driv ing lengoh) 1,173.16
PU28+1, L≦6m (driv ing lengoh) 232.0 939.18 217,889.76 1,414,105
PU28+1, L≦4m (driv ing lengoh) 467.0 763.21 356,419.07 2,313,160
2). Sheeo pile press fiooing PU, L≦9m (driv ing lengoh) 195.0 103.68 3,280 20,217.60 639,600 770,812
3). Mobilizaoion & demobilizaoion press fiooing machine for sheeo pile 1.0 700.36 19,332 700.36 19,332 23,877
4). maoerial fee for sheeo pile PU28+1 663.3 440.50 292,188.54 33,116,649
5). maoerial fee for sheeo pile PU28+1, near rail way 165.7 881.00 145,981.70 16,545,566
6). insoallaoion for oie-rod and waling 47.7 3,311.13 157,940.90 1,025,036
7). maoerial fee for oie-rod (NHT690) φ75 L=8.9m 2pcs/rod 151,065
φ75 L=10.0m 2pcs/rod 167,850
φ32 L=6.8m 2pcs/rod 25,470
φ32 L=8.0m 2pcs/rod 29,385
φ28 L=4.5m 2pcs/rod 76.0 16,020 1,217,520 1,217,520
φ28 L=5.5m 2pcs/rod 76.0 18,495 1,405,620 1,405,620
φ28 L=7.6m 2pcs/rod 51.0 24,345 1,241,595 1,241,595
φ28 L=8.5m 2pcs/rod 68.0 26,820 1,823,760 1,823,760
8). maoerial fee for waling 26.7 7,846.00 209,488.20 1,359,578
9). sheeo pile welding on sioe 200.0 1,944.85 388,970.00 2,524,415
10). removing sheeo pile L≦15m (removing lengoh) 200.0 658.61 131,722.00 854,876
L≦12m (removing lengoh) 572.16
L≦9m (removing lengoh) 486.33
L≦6m (removing lengoh) 232.0 428.48 99,407.36 645,154
L≦4m (removing lengoh) 467.0 371.90 173,677.30 1,127,166
11). driv ing bearing pile H150, L≦4m (driv ing lengoh) 227.0 615.91 139,811.57 907,377
H250, L≦4m (driv ing lengoh) 46.0 673.91 30,999.86 201,189
12). removing bearing pile L≦4m (removing lengoh) 273.0 371.90 101,528.70 658,921
13). maoerial fee for bearing pile 53.0 7,846.00 415,445.70 2,696,243
oooal 438,170.24 2,790,300.38 6,347,427 74,118,691
B-3. Temporary bridge B-3-1. Temporary bridge 1. pile driv ing 1). driv ing H-beam H400, L≦12m (driv ing lengoh) 139.0 2,083.01 289,538.39 1,879,104
H400, L≦9m (driv ing lengoh) 1,641.77
H350, L≦12m (driv ing lengoh) 45.0 1,730.41 77,868.45 505,366
H350, L≦9m (driv ing lengoh) 148.0 1,407.14 208,256.72 1,351,586
H300, L≦6m (driv ing lengoh) 55.0 880.52 48,428.60 314,302
2). removing H-beam L≦12m (removing lengoh) 184.0 572.16 105,277.44 683,251
L≦9m (removing lengoh) 148.0 486.33 71,976.84 467,130
L≦6m (removing lengoh) 55.0 428.48 23,566.40 152,946
3). maoerial fee for H-beam exclude re-used maoerial 634.4 33,300 21,123,855 21,123,855
sum 824,912.84 21,123,855 26,477,539
2. subsorucoure 1). insoallaoion for subsorucoure 46.7 5,381.06 251,295.50 1,630,908
2). removal for subsorucoure 46.7 2,884.85 134,722.49 874,349
3). maoerial fee for subsorucoure 25.6 7,846.00 200,857.60 1,303,566
sum 586,875.59 3,808,823
3. deck plaoe 1). insoallaoion for deck plaoe 3,700.0 201.95 747,215.00 4,849,425
2). removal for deck plaoe 3,700.0 103.28 382,136.00 2,480,063
3). maoerial fee for deck plaoe exclude re-used maoerial 1,916.5 11,700 22,423,160 22,423,160
sum 1,129,351.00 22,423,160 29,752,648
4. supersorucoure 1). insoallaoion for supersorucoure 468.1 2,736.49 1,280,950.96 8,313,372
2). removal for supersorucoure 468.1 1,511.24 707,411.44 4,591,100
3). maoerial fee for supersorucoure exclude re-used maoerial 264.3 33,300 8,801,190 8,801,190
sum 1,988,362.40 8,801,190 21,705,662
5. guard pipe 1). insoallaoion for bridge railing 1,164.0 22.56 26,259.84 170,426
2). removal for bridge railing 1,164.0 12.88 14,992.32 97,300
3). maoerial fee for bridge railing @1.8m 374.0 2,876 1,075,437 1,075,437
Exchange oo YEN RemarksGrade Deoail
o
piece
o
QuanoioyUnio Price Amouno
sheeo
sheeo
nos
Project for Construction of the New Dirout Group of regulators (8/12)
Exchange Raoe
Work Ioem
m3
m3
sheeo
sheeo
sheeo
sheeo
Unio
o
o
nos
nos
nos
nos
nos
nos
nos
nos
o
nos
nos
nos
nos
nos
nos
nos
nos
nos
m
m
nos
piece
piece
piece
piece
piece
piece
piece
o
o
o
o
m2
m2
m2
o
o
o
Table 4-2.11 Bill of quantities (8/12)
Ⅲ-119

Detailed D
esign Study on the P
roject for Construction of the N
ew D
irout Group of R
egulators
1 as of Esoimaoion January. 2017
2 Counory ARAB REPUBLIC OF EGYPT
3 Projeco THE PROJECT FOR CONSTRUCTION OF THE NEW DIROUT GROUP OF REGULATORS
4 Class AGRICULTURE 5 1USD= 113.34 (YEN) 1EUR= 121.26 (YEN) 1LE= 6.49 (YEN)
US$ LE YEN US$ LE YEN
sum 41,252.16 1,075,437 1,343,164
6. soage end 1). insoallaoion/removal for soage end soeel plaoe 317.0 95.64 30,319.78 196,775
2). maoerial fee for soage end soeel plaoe 59.1 6,357.00 375,712.96 2,438,377
sum 406,032.74 2,635,152
oooal 4,976,786.73 53,423,642 85,722,988
B-4. Dewaoering B-4-1. Dewaoering 1. waoer pump 1). dewaoering by waoer pump φ50mm 780.0 1,334.29 1,040,746.20 6,754,443
2). insoallaoion and removal for waoer pump 8.0 1,238.60 9,908.80 64,308
sum 1,050,655.00 6,818,751
2. Wellpoino 1). insoallaoion/removal for wellpoino 121pcs×2 (Bahr-Yusef, Ibrahimia) 2.0 221,667.00 443,334.00 2,877,238
2). daily operaoion and conorol 803.0 11,000.00 8,833,000.00 57,326,170
3). fuel 96,360.0 2.00 192,720.00 1,250,753
sum 9,469,054.00 61,454,160
oooal 10,519,709.00 68,272,911
B-5. Temporary road & preparaoion B-5-1. oemporary road 1. oemporary road 1). embankmeno 21,331.2 37.90 808,452.48 5,246,857
2). maoerial fee for oemporary road sand 25,270.0 67.10 1,695,617.00 11,004,554
3). oransporoaoion fee for buy ing maoerial
excavaoion and loading 0.8m3 back hoe loose soil 25,270.0 19.22 485,689.40 3,152,124
oransporoaoion by damp oruck Disoance 20km 25,270.0 135.51 3,424,337.70 22,223,952
4). oransporoaoion fee for reused maoerial
excavaoion and loading 0.8m3 back hoe loose soil 2,016.0 19.22 38,747.52 251,471
oransporoaoion by damp oruck Disoance 0.3km 2,016.0 18.47 37,235.52 241,659
5). exsioing sorucoure demolioion plain concreoe 3,089.3 224.59 693,825.88 4,502,930
6). breaked concreoe disposal Disoance 20km 3,089.3 194.01 599,355.09 3,889,815
oooal 7,783,260.59 50,513,361
B-6. diversion works B-6-1. diversion works 1. diversion works 1). river side slope ex cavaoion 0.8m3 back hoe 6,281.0 19.82 124,489.42 807,936
2). river bed excavaoion 0.4m3 long arm back hoe 5,089.6 46.86 238,498.65 1,547,856
3). excavaoed soil disposal Disoance 20km 11,370.6 159.33 1,811,677.69 11,757,788
4). soone riprap for rev er bed 2,093.0 766.83 1,604,975.19 10,416,289
5). Barge Bahr Yusef:60×10=600m2 100.0 50,400.00 5,040,000.00 32,709,600
Ibrahimia:35×10=350m2 100.0 29,400.00 2,940,000.00 19,080,600
oooal 11,759,640.95 76,320,070
B-7. Ooher oemporary works B-7-1. Temporary yard preparaoion 1. Temporary yard preparaoion 1). spreading gravel 21,000.0 132.78 2,788,380.00 18,096,586
2). removal for gravel 4,200.0 28.32 118,944.00 771,947
3). excavaoed soil disposal disoance 30km 4,200.0 159.33 669,186.00 4,343,017
4). oemporary fence H=2.0m 1,860.0 1,083.00 2,014,380.00 13,073,326
sub oooal 5,590,890.00 36,284,876
B-7-2. Foudaoion improvemeno work 1. Foudaoion improvemeno work 1). embankmeno 2,676.1 45.37 121,414.65 787,981
2). maoerial fee for embankmeno sand 3,380.0 67.10 226,798.00 1,471,919
3). oransporoaoion fee for buy ing maoerial
excavaoion and loading 0.8m3 back hoe loose soil 3,380.0 19.22 64,963.60 421,614
oransporoaoion by damp oruck Disoance 20km 3,380.0 135.51 458,023.80 2,972,574
4). soil improvemeno cemeno mix ing 3,189.0 123.60 394,160.40 2,558,101
5). insoallaoion for soeel plaoe 882.0 3.11 2,743.02 17,802
6). removal for soeel plaoe 882.0 2.46 2,169.72 14,081
7). maoerial fee for soeel plaoe 1.5m × 3.0m, o=22mm 196.0 3,178.50 622,986.00 4,043,179
sub oooal 1,893,259.19 12,287,252
B-7-3. Baoching plano facilioy 1. Baoching plano facilioy 1). assembling and removal for baoching plano 1.0 109,080.79 109,080.79 707,934
2). assembling and removal for cemeno silo 1.0 57,566.61 57,566.61 373,607
3). insoallaoion and removal for concreoe aggregaoe yard 1.0 81,493.48 81,493.48 528,893
sub oooal 248,140.88 1,610,434
B-7-4. uoilioy cosos 1. Receiv ing power facilioies 1). receiv ing power equipmeno 1.0 8,550.00 8,550.00 55,490
2). insoallaoion 1.0 4,918.48 4,918.48 31,921
3). foundaoion concreoe 18N/mm2
4). foundaoion gravel 15.0 99.31 1,485.67 9,642
5). lean concreoe 1.3 1,257.46 1,690.02 10,968
6). formwork 4.2 400.74 1,683.10 10,923
7). placing concreoe 18N/mm2 3.6 1,109.76 3,995.13 25,928
8). curing 3.6 12.92 46.51 302
9). ooher maoerials 0.2% of facilioies coso 0.2 8,550.00 1,710.00 11,098
Project for Construction of the New Dirout Group of regulators (9/12)
Exchange Raoe
Work Ioem Grade Deoail Unio QuanoioyUnio Price Amouno
Exchange oo YEN Remarks
m3
m3
m2
nos
day・nos
nos
L.S
day
Lio
m3
m3
m3
m3
m3
m3
m3
m3
m3
m2
m2
m3
m3
m3
m3
m2
day
day
m3
m3
m3
m3
m
nos
m3
m3
%
L.S
L.S
L.S
L.S
L.S
m3
m2
m3
m2
Table 4-2.12 Bill of quantities (9/12)
Ⅲ-120

F
inal Report V
olume Ⅲ
-Construction P
lanning & C
ost Estim
ation
1 as of Esoimaoion January. 2017
2 Counory ARAB REPUBLIC OF EGYPT
3 Projeco THE PROJECT FOR CONSTRUCTION OF THE NEW DIROUT GROUP OF REGULATORS
4 Class AGRICULTURE 5 1USD= 113.34 (YEN) 1EUR= 121.26 (YEN) 1LE= 6.49 (YEN)
US$ LE YEN US$ LE YEN
sum 24,078.91 156,272
2. elecoricioy facilioies 1). elecoric cable 600V 22mm2-3C 2,100.0 179.00 375,900.00 2,439,591
2). disoribuoion board 75A-150A 18.0 6,990.00 125,820.00 816,572
3). swioching board 1.0 5,500.00 5,500.00 35,695
4). insoallaoion for cable 12.0 341.00 4,092.00 26,557
5). excavaoion 585.0 154.56 90,417.60 586,810
6). backfill 585.0 88.49 51,766.65 335,966
sum 653,496.25 4,241,191
3. waoer facilioies 1). well 30mx1piece 30.0
2). pump for well 2.0 15,000.00 30,000.00 194,700
3). disoribuoion pipe φ50mm 226.0 316.00 71,416.00 463,490
φ25mm 46.5 136.00 6,324.00 41,043
4). valve φ50mm 5.0 307.00 1,535.00 9,962
φ25mm 5.0 307.00 1,535.00 9,962
5). bibb cock 7.0 1,491.00 10,437.00 67,736
sum 121,247.00 786,893
4. elecoricioy connecoion fee 1.0 50,000.00 50,000.00 324,500
5. elecoric fee 1,596,072.5 2.00 3,192,145.04 20,717,021
sub oooal 4,040,967.20 26,225,877
B-7-5. sioe expense 1. oransporoaoion fee for heavy consorucoion equipmeno 1). Track crane 80o × 10 nos 800.0 550.00 440,000.00 2,855,600
Cairo - Dirouo 2). Track crane 25o × 2 nos 50.0 550.00 27,500.00 178,475
2). Crawler crane 50o × 16 nos 800.0 550.00 440,000.00 2,855,600
sum 907,500.00 5,889,675
2. vehicle for sioe managemeno 1). vehicle A sedan 180.0 15,750.00 2,835,000.00 18,399,150
including driver and fuel 2). vehicle B pick-up 142.0 18,749.00 2,662,358.00 17,278,703
sum 5,497,358.00 35,677,853
3. oversea oravel coso 1). projeco manager 10.0 248,000 2,480,000 2,480,000
2). chief civ il engeneer 10.0 248,000 2,480,000 2,480,000
3). civ il engeneer 1 10.0 248,000 2,480,000 2,480,000
4). civ il engeneer 2 10.0 248,000 2,480,000 2,480,000
5). archioecoure 3.0 248,000 744,000 744,000
6). mechanical engineer 8.0 248,000 1,984,000 1,984,000
7). elecorical engineer 8.0 248,000 1,984,000 1,984,000
8). adminisoraoor 10.0 248,000 2,480,000 2,480,000
sum 17,112,000 17,112,000
sub oooal 6,404,858.00 17,112,000 58,679,528
oooal 18,178,115.27 17,112,000 135,087,968
B-8. Transpooaoion / Shipmeno for civ il work B-8-1. packing 1). consorucoion maoerial for civ il work 728.3 F/T 1.0 5,665,521 5,665,521 5,665,521
2). soeel maoerial for civ il work 58.3 F/T 1.0 563,587 563,587 563,587
sum 6,229,108 6,229,108
B-8-2. loading 1). cusoom fee 2.0 5,900 11,800 11,800
2). loading consorucoion maoerial for civ il work 728.3 5,500 4,005,897 4,005,897
soeel maoerial for civ il work 58.3 5,500 320,430 320,430
3). documenoaoion 2.0 20,000 40,000 40,000
sum 4,378,127 4,378,127
B-8-3. ocean oranspooaoion 1). consorucoion maoerial for civ il work 728.3 180.00 131,102.10 14,859,112
2). soeel maoerial for civ il work 58.3 180.00 10,486.83 1,188,577
sum 141,588.93 16,047,689
B-8-4. poro charge 1). poro charge 786.6 148.00 116,417.56 755,550
2). oruso money for enory 786.6 60.00 47,196.31 306,304
sum 163,613.87 1,061,854
B-8-5. inland oranspooaoion 1). inland oranspooaoion for permaneno work 786.6 667.00 524,665.65 3,405,080
work) 944.6 667.00 630,061.93 4,089,102
sum 1,154,727.58 7,494,182
B-8-6. insurance 1). insurance I = CIP × 1.1 × r 1.0 563.00 5,241.39 205,577 563.00 5,241.38 205,577 303,404
sum 563.00 5,241.38 205,577 303,404
sub oooal 142,151.93 1,323,582.83 10,812,812 35,514,364
for oemporary work B-8-7. packing (from Japan oo sioe)
1). maoerial for oemporary work 2,130.8 F/T 1.0 10,732,429 10,732,429 10,732,429
L.S
L.S
F/T
F/T
L.S
m
Project for Construction of the New Dirout Group of regulators (10/12)
Exchange Raoe
Work Ioem Grade Deoail Unio QuanoioyUnio Price Amouno
Exchange oo YEN Remarks
nos
nos
nos
nos
nos
day・nos
m3
m3
m
nos
m
m
L.S
Kwh
L.S
oime
oime
oime
oime
oime
oime
oime
o
o
o
nos
nos
oime
L.S
F/T
F/T
F/T
F/T
F/T
L.S
F/T
Table 4-2.13 Bill of quantities (10/12)
Ⅲ-121

Detailed D
esign Study on the P
roject for Construction of the N
ew D
irout Group of R
egulators
1 as of Esoimaoion January . 2017
2 Counory ARAB REPUBLIC OF EGYPT
3 Projeco THE PROJECT FOR CONSTRUCTION OF THE NEW DIROUT GROUP OF REGULATORS
4 Class AGRICULTURE 5 1USD= 113.34 (YEN) 1EUR= 121.26 (YEN) 1LE= 6.49 (YEN)
US$ LE YEN US$ LE YEN
2). soeel maoerial for oemporary work 1,479.0 F/T 1.0 221,659 221,658 221,658
3). consorucoion equipmenos 206.9 F/T 1.0 2,080,632 2,080,632 2,080,632
(from sioe oo Japan)
1). maoerial for oemporary work 2,056.8 F/T 1.0 3,219,729 3,219,728 3,219,728
2). soeel maoerial for oemporary work 1,428.6 F/T 1.0 66,498 66,497 66,497
3). consorucoion equipmeno 186.9 F/T 1.0 624,190 624,189 624,189
sum 16,945,133 16,945,133
B-8-8. loading (from Japan oo sioe)
1). cusoom fee 3.0 5,900 17,700 17,700
2). loading maoerial for oemporary work 2,130.8 5,500 11,719,516 11,719,516
soeel maoerial for oemporary work 1,479.0 5,500 8,134,373 8,134,373
consorucoion equipmeno 206.9 5,500 1,138,129 1,138,129
3). documenoaoion 3.0 20,000 60,000 60,000
(from sioe oo Japan)
1). cusoom fee 3.0 5,900 17,700 17,700
2). loading maoerial for oemporary work 2,056.8 254.24 522,910.48 3,393,689
soeel maoerial for oemporary work 1,428.6 254.24 363,203.38 2,357,190
consorucoion equipmeno 186.9 254.24 47,525.22 308,439
3). documenoaoion 3.0 20,000 60,000 60,000
sum 933,639.08 21,147,418 27,206,736
B-8-9. ocean oranspooaoion (from Japan oo sioe)
1). maoerial for oemporary work 2,130.8 180.00 383,547.82 43,471,310
2). soeel maoerial for oemporary work 1,479.0 180.00 266,215.86 30,172,906
3). consorucoion equipmeno 206.9 180.00 37,247.86 4,221,672
(from sioe oo Japan)
1). maoerial for oemporary work 2,056.8 180.00 370,220.62 41,960,805
2). soeel maoerial for oemporary work 1,428.6 180.00 257,148.00 29,145,154
3). consorucoion equipmeno 186.9 180.00 33,647.86 3,813,648
(from sioe oo ohe ohird counory)
1). maoerial for soeel sheeo pile 2,736.6 90.00 246,292.26 27,914,765
sum 1,594,320.28 180,700,261
B-8-10. poro charge (from Japan oo sioe)
1). poro charge 3,816.7 148.00 564,876.16 3,666,046
2). oruso money for enory 3,816.7 60.00 229,003.84 1,486,235
(from sioe oo Japan)
1). poro charge 3,672.3 148.00 543,502.44 3,527,331
2). oruso money for enory 3,672.3 60.00 220,338.82 1,429,999
sum 1,557,721.26 10,109,611
B-8-11. inland oranspooaoion (from Alexandria oo sioe)
1). inland oranspooaoion for oemporary work 3,816.7 667.00 2,545,759.45 16,521,979
work) 2,736.6 667.00 1,825,299.32 11,846,193
(from sioe oo Alex andria)
2). inland oranspooaoion for oemporary work 3,672.3 667.00 2,449,433.31 15,896,822
imporoed sheeo pile 2,736.6 667.00 1,825,299.32 11,846,193
sum 8,645,791.40 56,111,186
B-8-12. insurance 1). insurance (from Japan oo Sioe) I = CIP × 1.1 × r 1.0 2,731.00 13,277.55 1,979,481 2,731.00 13,277.55 1,979,481 2,375,184
2). insurance (from Sioe oo Japan) I = CIP × 1.1 × r 1.0 2,628.00 16,487.07 785,113 2,628.00 16,487.06 785,113 1,189,972
sum 5,359.00 29,764.61 2,764,594 3,565,155
sub oooal 1,599,679.28 11,166,916.35 40,857,145 294,638,082
for gaoe facilioies B-8-13. packing 1). gaoe facilioies 951.0 F/T 1.0 9,448,061 9,448,061 9,448,061
sum 9,448,061 9,448,061
B-8-14. loading 1). cusoom fee 1.0 5,900 5,900 5,900
2). loading fee Gaoe facilioies 951.0 5,500 5,230,266 5,230,266
3). documenno fee 1.0 20,000 20,000 20,000
sum 5,256,166 5,256,166
B-8-15. ocean oranspooaoion 1). gaoe facilioies 951.0 180.00 171,172.36 19,400,675
sum 171,172.36 19,400,675
B-8-16. poro charge 1). poro charge 951.0 148.00 140,741.72 913,414
2). oruso money for enory 951.0 60.00 57,057.45 370,303
L.S
L.S
L.S
F/T
F/T
F/T
F/T
F/T
Project for Construction of the New Dirout Group of regulators (11/12)
Exchange Raoe
Work Ioem Grade Deoail Unio QuanoioyUnio Price Amouno
Exchange oo YEN Remarks
F/T
L.S
L.S
L.S
F/T
L.S
L.S
F/T
L.S
F/T
F/T
L.S
F/T
F/T
L.S
F/T
L.S
F/T
F/T
L.S
L.S
F/T
F/T
F/T
F/T
F/T
F/T
F/T
F/T
F/T
F/T
Table 4-2.14 Bill of quantities (1112)
Ⅲ-122

F
inal Report V
olume Ⅲ
-Construction P
lanning & C
ost Estim
ation
1 as of Esoimaoion January. 2017
2 Counory ARAB REPUBLIC OF EGYPT
3 Projeco THE PROJECT FOR CONSTRUCTION OF THE NEW DIROUT GROUP OF REGULATORS
4 Class AGRICULTURE 5 1USD= 113.34 (YEN) 1EUR= 121.26 (YEN) 1LE= 6.49 (YEN)
US$ LE YEN US$ LE YEN
sum 197,799.17 1,283,717
B-8-17. inland oranspooaoion 1). inland oranspooaoion 951.0 667.00 634,288.72 4,116,534
sum 634,288.72 4,116,534
B-8-18. insurance 1). insurance I = CIP × 1.1 × r 1.0 681.00 3,308.17 8,824,875 681.00 3,308.16 8,824,875 8,923,529
sum 681.00 3,308.16 8,824,875 8,923,529
sub oooal 171,853.36 835,396.05 23,529,102 48,428,682
oooal 1,913,684.57 13,325,895.23 75,199,059 378,581,128
C. Building Works 3,399,700.00 22,064,053
Building works C-1. Conorol house 1.0 1,977,700.00 1,977,700.00 12,835,273
C-2. Local conorl house Bahr Yusef 1.0 301,900.00 301,900.00 1,959,331
C-3. Local conorl house Ibrahimia 1.0 301,900.00 301,900.00 1,959,331
C-4. Soop log room 1.0 818,200.00 818,200.00 5,310,118
oooal 3,399,700.00 22,064,053
D. Inoegraoed Waoer Managemeno Sysoem 31,628,443.83 205,268,600
Inoegraoed Waoer Managemeno Sy soem D-1. IWMS manufacoures 1. IWMS manufacoures 1). Gauging soaoion Type-A & B 1.0 14,102,971.29 14,102,971.29 91,528,284
2). Cenoral moniooring room in Dirouo 1.0 1,387,148.88 1,387,148.87 9,002,596
3). Moniooring room in Minia 1.0 186,425.96 186,425.96 1,209,904
sub oooal 15,676,546.12 101,740,784
. D-2. Insoallaoion for IWMS 1. Insoallaoion for IWMS 1). insoallaoion for Gauging soaoion Type-A & B 1.0 15,816,762.91 15,816,762.90 102,650,791
2). insoallaoion for Moniooring room in Dirouo and Minia 1.0 135,134.81 135,134.81 877,025
sub oooal 15,951,897.71 103,527,816
oooal 31,628,443.83 205,268,600
E. Dispuoe Board 407,000.00 46,129,380
Dispuoe Board E-1. Dispuoe Board 1. regular Sioe Visio 1). Monohly Reoainer Fee US$3,000/day 45.0 3,000.00 135,000.00 15,300,900
2). Monohly Reoainer Fee during DNP US$2,000/day 12.0 2,000.00 24,000.00 2,720,160
3). Daily Fee 2day for Sioe Visio ×10nos 20.0 3,000.00 60,000.00 6,800,400
3day for oravel ×10nos 30.0 3,000.00 90,000.00 10,200,600
4). Expenses Air oickeo, eoc. 10.0 5,000.00 50,000.00 5,667,000
sum 359,000.00 40,689,060
2. supposed referrals 1). Addioional Daily Fee 2.0 3,000.00 6,000.00 680,040
2). Reviewing Submission and Drafoing Decision (3+4 day s)×2 14.0 3,000.00 42,000.00 4,760,280
sum 48,000.00 5,440,320
oooal 407,000.00 46,129,380
I-2 Indireco Coso 1.00 1,485,994.40 93,278,928.15 186,287,138 960,089,987
Project for Construction of the New Dirout Group of regulators (12/12)
Exchange Raoe
Work Ioem Grade Deoail Unio QuanoioyUnio Price Amouno
Exchange oo YEN Remarks
L.S
L.S
L.S
L.S
L.S
F/T
L.S
L.S.
L.S.
day
day
oime
L.S.
oime
oime
L.S.
L.S.
monoh
monoh
Table 4-2.15 Bill of quantities (12/12)
Ⅲ-123

Volume IV DRAFT BIDDING DOCUMENTS
Page
1. Contents of Works for the Preparation of Bidding Documents ··························· IV- 1
1-1 Regulation and framework of procurement of public works from the Egyptian government ························································ IV- 1
1-2 Differences between regulations of Egyptian government and JICA’s guidelines for procurement under Japanese ODA Loans ····················· IV- 1
1-3 Framework of the procurement process of NDGRs project ·························· IV- 3
2. Preparation of Draft Bidding Documents ··················································· IV- 7
2-1 Contents of draft bidding documents ··················································· IV- 7
2-2 Contents of discussions and understanding with Egyptian side on draft bidding documents (except technical specifications) ······················ IV- 7
2-3 Draft bidding documents (technical specifications) ·································· IV- 8
List of Tables
Table 1-2.1 Comparison between laws in Egypt and JICA’s procurement guideline ··· IV- 1
Table 1-4.1 Procurement process and necessary time for NDGRs project in MWRI ·· IV- 4
Table 2-2.1 Major issues discussed on draft bidding documents during 8th and 9th field survey in Egypt (February 2017) ················· IV- 9
Table 2-3.1 Major comments from JICA and RGBS on draft bidding documents, and reflection on the final version ············································ IV- 11

Final Report Volume IV Bidding Document
Volume IV –DRAFT BIDDING DOCUMENTS
1. Contents of Works for the Preparation of Bidding Documents
1-1 Regulation and framework of procurement of public works in the Egyptian
government
In Egypt, procurement of public works is made based on the Law No.89 of 1998 and its implementation regulations (Ministerial Decree No. 1367 of 1998), commonly referred to as “Tenders Law”. Based on this law, executing agencies of public works prepare bidding documents, and execute pre-qualification, tendering and evaluation, and contract negotiations and signing.
The relevant agencies involved in procurement of public works and their tasks are as follows.
(1)Ministry of Finance: Policy making, issuing decrees on public procurement policy.
(2) Public Service Authority: Regulating and monitoring public contracts.
(3) Public Contracting Office (under MOF): Handling complaints from contractors/suppliers.
(4) Central Auditing Authority: Conducting independent auditing.
According to the assessment of the procurement process of public works in Egypt, in the “Public Procurement Sector Assessment Review of Laws and Practice in the SEMED Region,” which was published by EBRD in 2013, there is no independent authority to handle claims related to public works, and there is also no single entity to formulate policies and execute government procurement process/procedures, even though transparency and efficiency are somewhat secure.
1-2 Differences between the regulations of the Egyptian government and JICA’s
guidelines for procurement under Japanese ODA Loans
From the ‘7th Assignment’ started in November 2016, series of works and discussions for the preparation of draft Bidding Documents for NDGRs project were started. Firstly, on the ‘7th Assignment’, the differences between laws and regulations related to procurement in Egypt and JICA’s Procurement Guideline (Handbook: Guideline for Procurement under Japanese ODA Loans April 2012) were discussed. The results are summarized in Table 1-2.1.
Table 1-2.1 Comparison between laws in Egypt and JICA’s procurement guideline
JICA Guideline Egyptian Laws And Regulations
Article Contents Law No./ Article Contents
1.08 All documents relating to the procurement shall be made in one of the languages; Japanese, English, French, or Spanish.
Ministerial Decree No.1367(1998) Article 7
The book of conditions, the lists, and the specifications shall be translated in case the invitation of tenders and bids in the adjudications is announced abroad, along with mentioning that tne Arabic text snall be
IV-1

Detailed Design Study on the Project for Construction of the New Dirout Group of Regulators
tne one relied upon.
3.02 In case only one applicant is pre-qualified as a result of the evaluation, the Borrower should reject this PQ process.
Ministerial Decree No.1367(1998) Article 27
Tne adjudication may be cancelled in any of tne following cases: (a) If one tender only is submitted in tne adjudication, or…… 5.10 In case only one bidder
submits a bid, it does not mean lack of competition. “Single Bid” is only the result of bidding and different from direct contracting.
4.03 The limitation of guarantor banks to those in the Borrowers country is not acceptable.
Ministerial Decree No.1367(1998) Article 70
If the bid and performance bond is in the form of a letter of guarantee, it shall be issued by one of the accredited local banks.
4.06 If specific national standards are cited, the bidding documents shall state that Japan Industrial Standards or other internationally accepted standards will also be accepted.
Ministerial Decree No.1367(1998) Article 3
Launching adjudications for submission of tenders hall be done on the basis of precise and detailed technical specifications as set by the Technical Committee having experience in the required items and works. It is conditional to observe Egyptian Standard Specifications and tne Specifications of governmental Supplies and otner specifications to be issued or approved by tne concerned Tecnnical Entities.
5.06 Any procedure, under which bids above or below a predetermined value are automatically disqualified, is not permitted.
Law No.89 (1998) Article 15
It may also be cancelled in any one of the following cases: If the value of the least tender would exceed the estimated value.
Ministerial Decree No.1367(1998) Article 27
Tne adjudication may be cancelled in any of tne following cases: If tne amount of tne lowest tender exceeds tne estimated value.
IV-2

Final Report Volume IV Bidding Document
In Article 4.7 of the Minutes of Discussions dated 21 May 2014 on the Loan Agreement for NDGRs, it was agreed that JICA Guidelines shall be applied for the procurements in this project. For the preparation of draft Bidding Documents, the issues identified on this table shall be taken into consideration. While JICA Guideline shall prevail, requests from RGBS to follow the Egyptian laws shall be also reflected in the documents as much as possible.
1-3 Framework of the procurement process of the NDGRs project
As stated above, necessary approvals shall be secured within the Ministry, i.e. Head of Irrigation Department for pre-qualification process, issuance of bidding documents, result of tender evaluations (technical and financial), and contracting. Also, legal review by the State Council is necessary for the contract preparation and/or signing. Necessary approvals and time needed for the process is summarized in Table 1-4.1 in the table next page.
IV-3

Detailed Design Study on the Project for Construction of the New Dirout Group of Regulators
Table 1-4.1 Procurement process and necessary time for NDGRs project in MWRI Bidding Process Japanese Side Egyptian Side
Within MWRI Outside MWRI
JICA concurrence Necessary?
Approval necessary? Expected Days
Approval necessary? Expected Days
Prepare PQ Documents
Submit PQ Draft for concurrence YES/NO YES/NO If "YES": (Name of Office)
(Head, Irrigation Department)
Maximum 7 days
YES/NO If "YES": (Name of Office)
( )
Prepare the Bid Documents
Submit PQ Draft for concurrence YES/NO YES/NO (Head, Irrigation Department)
YES/NO ( )
Advertise the procurement on newspapers (Invitation for PQ) YES/NO YES/NO (Head, Irrigation Department)
YES/NO ( )
Receive the PQ Documents from applicants
Evaluate PQ Documents to select bidders
Submit the PQ result for concurrence YES/NO YES/NO ( )
YES/NO (Public Notification Period)
7 days
Send Bid Documents to selected bidders
Receive Bid Documents
Open and Evaluate the Technical Proposal
Submit Evaluation result on Technical Proposal for Approval YES/NO YES/NO (Head, Irrigation Department)
Maximum 7 days
YES/NO ( )
Open the Price Bids only for Eligible Bidders for Technical Proposal
Prepare the Bid Evaluation Report (Both Tech & Price)
Obtain Concurrence on the Evaluation Report YES/NO YES/NO (Head, Irrigation Department)
Maximum 7 days
YES/NO (Public Notification Period)
7 days
IV-4

Final Report Volume IV Bidding Document
Approval for Contract Signing YES/NO YES/NO (Head, Irrigation Department)
YES/NO (State Council)
(Contract can be signed and started. If any comments are made by Council, it shall be reflected later.)
Signing of the Contract
Obtain Concurrence on the Signed Contract YES/NO YES/NO ( )
YES/NO (State Council)
Issue Notice to Proceed, and commence the Contract YES/NO YES/NO ( )
YES/NO ( )
IV-5

Detailed Design Study on the Project for Construction of the New Dirout Group of Regulators
As for the actual record of procurement process in international bidding under RGBS, case of “New Assiut Barrage and Hydropower Plant (Lot 1: Civil Works)” can be referred as sample of International Competitive Bidding under RGBS. On this bidding, procurement process was made on the timeframe indicated below:
- Newspaper Advertisement for PQ: February 2010
(PQ process took 5 months)
- Distribution of Tender Documents: October 2010
(Submission deadline was 90 days from the date of invitation)
- Tender close: January 2011
- Commencement of evaluation: March 2011
- Awarding and negotiation: April 2011
- Completion of negotiation: August 2011
- Approval from KfW : December 2011
- Commencement of construction: May 2012
IV-6

Final Report Volume IV Bidding Document
2. Preparation of Draft Bidding Documents
2-1 Contents of draft bidding documents
As stated in Chapter 1-2, the purpose of the series of meetings with RGBS on ‘7th Assignment’ was to ensure a basic understanding of the procurement system under Japan’s ODA as it is the first time for RGBS. Therefore, only explanations of Standard Bidding Documents under Japanese ODA Loans October 2012 were made at the time.
During the ‘7th Assignment’, RGBS made opinions to include (1) number of engineers and construction equipment possessed by applicants as a capacity criteria, and (2) list of contractors debarred by the Egyptian government as a non-eligibility criteria. These requests were taken into consideration on the preparation of draft Bidding Documents during the ‘8th Assignment’ in January 2017.
Also during the ‘7th assignment’, RGBS made request to JICA to change the procurement process so as to combine the pre-qualification and bidding process to be made simultaneously, and bidding documents shall be made as “PQ-embedded bidding documents”. This request was based on their intention to shorten the procurement process on the civil works contract. The team considered this issue as appropriate request, however the final decision shall be made by the direct discussion between RGBS and JICA. Under such circumstance, two patterns of draft Bidding Documents (PQ-embedded Documents, and separated PQ/Bidding Documents) were presented on ‘8th Assignment’ period, however discussions thereafter were made basically on PQ-embedded Documents.
2-2 Contents of discussions and understanding with Egyptian side on draft
bidding documents (except technical specifications)
On ‘8th assignment’, substantial discussions on the Bidding Documents to be used for NDGRs project were started. Simultaneously with the discussions, various data and information were conveyed from JICA Egypt Office on their existing samples on bidding documents on STEP under Yen-Loan, particularly on Greater Cairo Metro Line No.4 Project. During the ‘8th Assignment’, RGBS revealed its intention to delay commencement of civil works contract by February 2019, one year delay from the original schedule in February 2018. Though a detail of this idea is not yet thoroughly discussed between RGBS and JICA, RGBS considers that this idea would give more time for procurement process.
For this issue, RGBS requested the Study Team to maintain both patterns (though discussions were made on PQ embedded Documents) for the decision in future. Therefore, PQ embedded Documents are adopted as the final product as part of the Final Report, and separated PQ/Bidding Documents are also submitted but only in electric file.
During the ‘9th Assignment’, series of discussions were made mainly on the comments from JICA on the draft Bidding Documents submitted in February. By reflecting results of the discussion, revised version of the Documents were consolidated, as the final for the Assignment in Egypt, and submitted to both RGBS and JICA on 24 April 2017
The contents of discussions during ‘8th Assignment’ and ‘9th Assignment’ on draft Bidding
IV-7

Detailed Design Study on the Project for Construction of the New Dirout Group of Regulators
Documents, including initial presentation from the team, comments from RGBS, information from JICA Egypt Office, conclusion as of 24 February and conclusion as of 24 April, are summarized in Table 2-2.1.
After the completion of ‘9th Assignment’, comments were provided by RGBS on 10 May 2017 and by JICA on 19 May 2017. By reflecting these comments, draft Bidding Documents are finalized as part of the Final Report of the Study. The summary of said comments and reflection on the final Bidding Documents are summarized in Table 2-2.2.
2-3 Draft bidding documents (technical specifications)
As for the technical specifications, an integral part of draft Bidding Documents, discussions with RGBS were started on ‘8th Assignment’ in February 2017. After the confirmation of structure and contents, actual works on the preparation of technical specifications were started.
The contents of technical specifications are as follows:
1) General Provisions
2) General Technical Specifications
- Civil Works
- Mechanical and Electrical Works
3) Particular Technical Specifications
- Civil Works
- Mechanical and Electrical Works
For the preparation of technical specifications, attentions were paid on the consideration of fair risk allocation among contract parties, and also consistency with contents of general conditions of contract.
The background of discussions with Egyptian side on the technical specifications are as follows:
1) On 7 February 2017, immediately after the start of the ‘8th Assignment’, table of contents of the technical specifications was presented to RGBS and the items listed were discussed and confirmed.
2) Based on the results of a series of discussions with RGBS, 1st version of the technical specifications were prepared and submitted to RGBS on 24 February 2017, immediately before the end of the ‘8th Assignment’.
3) 1st version of the technical specifications were revised taking into consideration the comments from JICA and the results of the series of discussions with RGBS during the ‘9th Assignment’, and the 2nd version was submitted to RGBS on 24 April 2017, immediately before the end of ‘9th Assignment’.
4) After the completion of the ‘9th Assignment’, comments on the 2nd version of the technical specifications were provided by JICA on 30 April and 3 May 2017, and by RGBS on 10 May 2017. After that, the technical specifications was finalized taking into consideration those comments.
IV-8

Detailed Design Study on the Project for Construction of the New Dirout Group of Regulators
Table 2-2.1 Major issues discussed on draft bidding documents during 8th and 9th field surveys in Egypt
General Issue:
Issue
RGBS Comments
Draft Tender Documents
(as of 24 February 2017)
JICA Comments (March – April)
Draft Tender Documents (as of Draft Final Report
PQ/Bidding shall be separated, or combined. .
Since when the bidding is to be made has not yet been decided, possibility of time saving by combining PQ and BD is uncertain. Thus, 2 patterns of documents shall be maintained.
2 patterns (PQ/BD separated, or PQ/BD combined) are made.
Combined type is attached as hard copy and soft copy, but separate type are submitted only in soft copies.
Specific Issues on Draft Bidding Documents:
Page Items Contents Point of Discussion RGBS Comments Information from JICA Egypt Office (Feb)
Draft Tender Documents
(as of 24 February 2017)
JICA Comments (March – April)
Draft Tender Documents (as of Draft Final Report
IFB-2 - Price of Bid Documents
Minimum price to cover printing cost.
25,000 L.E. in Assiut Barrage. (approx. US$1,500)
In Metro project, it was $10,000. (5,000 pages of drawings and 1,000 pages of documents)
1,000 U.S.Dollars may be appropriate. (Approx.300 pages of drawings and 500 pages of documents.) However, it shall be blank in Draft Bidding Documents at this point of time.
Shall be $1,000 1,000 U.S.Dollars
IFB-2
- Amount of Bid Security
About 2% of expected contract amount (as per JICA Guideline). This time, 48.8 Million USD is expected, thus 1 Million USD shall be adequate amount.
Between 0.5% to 2 %. %It shall be in 2% 2% may be appropriate, however only range (between 0.5% to 2%) shall be indicated to Draft Bidding Documents at this point of time.
2% Approximately 2% (1.1 Million US$)
IFB-2 - Submission Deadline
Normally 60 days in JICA’s Yen Loan projects, but longer time is necessary for large projects.
90 days in Assiut Barrage Project.
90 days in Metro Project 90 days - No change (90 days)
BDS-2 ITB 10.1
Language: English
As per JICA Guideline. English but some part shall be Arabic.
- English (some part will be translated to Arabic for internal process in MWRI). Bidder shall not be required to submit bids in Arabic.
English English, however some part of draft bidding documents are translated and submitted to RGBS (not as part of Report) in soft copy.
IV-9

Final Report Volume IV Bidding Document
Page Items Contents Point of Discussion RGBS Comments Information from JICA Egypt Office
Draft Tender Documents
(as of 24 February 2017)
JICA Comments (March – April)
Draft Tender Documents (as of Draft Final Report
BDS-3 ITB 18.1
Bid Validity JICA Guideline recommends 120 days, however, DD team proposes 180 days for safety.
In Assiut Barrage Project, it was 270 days.
In Metro, Bid validity period shall be 120 days including the day of the latest submission date.
270 days (9 months) 120 days Additional explanations were made to JICA to insist 270 days. Awaiting JICA’s approval.
EQC -6
2.3.2 Required Annual Turn-Over
As per JICA Guideline (twice of annual average of expected contract amount.)
Depending on the project cost.
- Temporarily 24 Million U.S. Dollar is set (twice of annual average of construction cost in Loan Agreement), however it shall be revised upon actual issuance of Bid Documents.
- $26 Million, based on the modified expected contract amount.
EQC -9
2.4.2(b) Required Similar Experience
JICA Guideline says about 80% of construction volumes expected by the subject Project. However, DD Team suggests 60%, to have more bidders.
Depending on the project cost.
- Temporarily 60% of work volumes are set (earth works, concrete works, gate size and depth of sheep pile of coffer dam), however it shall be revised upon actual issuance of Bid Documents.
- (no change)
EQC-11
2.5.1 Financial Resources
As per JICA Guideline (half of annual average of expected contract amount.)
Depending on the project cost.
- Temporarily 6 Million U.S. Dollar is set (half of annual average of construction cost in Loan Agreement), however it shall be revised upon actual issuance of Bid Documents.
$6.7 Million based on the modified expected contract amount.
BF-57 Form of Bid Security
Bank Guarantee This format is OK or not (shall strictly follow this form, or not.)
Bid Security shall be in the form of “Unconditional Letter of Credit”.
In Metro Project, Bank Guarantee was used for bid security. Letter of Credit is opened in case of procurement goods.
Unconditional Bank Guarantee.
It is not accepted to limit form of bid security.
Additional explanations were made to JICA, showing same limitation in RFP of SV consultant selection. Awaiting JICA’s consideration.
PC-4 20.3 Appointment (if not agreed) to be made by
Examples of other past projects are requested.
- - Cairo Regional Centre for International Commercial Arbitration
It shall not be in Egypt, in terms of fairness.
Awaiting result of MWRI-JICA discussion on the same issue for RFP of SV Consultant selection.
IV-10

Detailed Design Study on the Project for Construction of the New Dirout Group of Regulators
Table 2-2.2 Major Comments from JICA and RGBS on the Draft Bidding Documents, and reflection on the Final Version
No. Items Comments from RGBS (on 10 May 2007) Comments from JICA (on 19 May 2007) Notes/Descriptions on the Final Version of
Draft Bidding Documents 1 General Comments Bidding Documents could be modified in the next
stage under management of RGBS by S/V consultant with the concurrence of JICA)
RGBS requests to support the Japanese Contractor by Egyptian Contractor as a joint venture.
- Even after the submission of draft Bidding Documents as final product of DD Study this time, it shall be continuously revised by RGBS until the date of actual invitation (bidding).
This issue shall be also considered after the finalization of draft Bidding Documents as final product of DD Study.
2 In case of failure to agree on the composition of the DB, the appointing entity shall appoint this member of the DB.
Place of arbitration shall be in Cairo. Considering the Contractor may be foreign, entity in Cairo is not adequate to make appointment in terms of neutrality. FIDIC is recommended.
The appointing entity to appoint this member of the DB shall be FIDIC.
3 Temporary Yard The Contractor shall lease 3 Feddans (in the expense of the RGBS) for a period of three years.
- Included this issue in Technical Specifications. However, lease shall be made by RGBS as per instructed by JICA.
4 Legal Review on the Contract by State Council The Contract shall be subject to the legal review of Egyptian Council of State according to laws of the Arab Republic of Egypt.
(Accepted) No change from bidding documents attached to the Draft Final Report. (as proposed by RGBS)
5 Bid Validity (JICA Guideline recommends 120 days)
(It shall be 270 days.) (Accepted) No change from bidding documents attached to the Draft Final Report. (as proposed by RGBS)
6 Eligibility of MWRI (not having been declared ineligible by NWRI) is included in 2.1.4 of “2.1 Eligibility” of qualification.
(Eligibility of MWRI shall be included in PQ criteria.) Such additional ineligible condition that is not specified in the Guidelines is not permitted in principle, because of concerns to transparency and arbitrariness.
Followed descriptions in JICA’s Standard Bidding Documents.
7 In 19.2 of Instruction to Bidders, four (4) forms for demand guarantee are indicated as Bid Security.
(Only Unconditioned Guarantee shall be allowed.) Note 3, Section 4.03 of the Guidelines states as below: "It is not acceptable to prohibit bidders from submitting their securities in internationally accepted forms, such as bank guarantees or letters of credit. Such requirements would discourage suitable bidders from participating".
Followed descriptions in JICA’s Standard Bidding Documents.
IV-11

Volume V ENVIRONMENTAL AND SOCIAL CONSIDERATION
Page
1.Environmental and Social Consideration ················································· V- 1
1-1 Project components that impact environmental and society ···················· V- 1 1-2 Environmental and social conditions of the project area ························ V- 1 1-3 Institutional and legal frameworks of Environmental
and Social Consideration ·························································· V- 4 1-4 Examination of alternatives ······················································· V-10
2.Review of Environmental Impact Assessment ·········································· V-11
2-1 Change of environmental conditions after the F/S ······························ V-11 2-2 Progress of Environmental Management Plan and
Environmental Monitoring Plan ·················································· V-13 2-3 Monitoring results of groundwater level and water quality check ············ V-14 2-4 Review of environmental evaluation ············································· V-19
3.Environmental Management Plan and Monitoring ····································· V-22
3-1 Environmental Management Plan and cost ······································ V-22 3-2 Environmental Monitoring Plan ·················································· V-23 3-3 Establishment of Security Management Committee (SMC) ··················· V-34

List of Figures Figure 1-1.1 Location map of the regulators ·············································· V- 1 Figure 1-3.1 Organization chart of EEAA ················································· V- 5 Figure 1-3.2 Departments in charge of EIA review ······································· V- 6 Figure 1-4.1 Preliminary layout of NDGRs’ axis ········································ V-10 Figure 2-1.1 Location of mosques to be relocated and illegal café
around the regulators ························································· V-13 Figure 2-3.1 Location of the piezometers ················································· V-15 Figure 2-3.2 Seasonal change of groundwater head and canal water level ··········· V-15 Figure 2-3.3 Seasonal change of EC ······················································ V-16 Figure 2-3.4 Seasonal change of pH ······················································· V-16 Figure 2-3.5 Seasonal change of DO ······················································ V-17 Figure 2-3.6 EC distribution trend (14th April 2016) ···································· V-17 Figure 3-2.1 Location of the 13 piezometers for groudnwater ························· V-30
List of Tables Table 1-3.1 Maximum limits of outdoor air pollutions ···································· V- 8 Table 1-3.2 Maximum permissible limits for noise intensity
in the different areas ····························································· V- 8 Table 1-3.3 Maximum permissible limits for drained water quality into
fresh water body ·································································· V- 9 Table 1-3.4 Maximum permissible limits for drinking water ····························· V- 9 Table 1-4.1 Examination of the alternative plans ·········································· V-10 Table 1-4.2 Comparison of alternative plans for Environmental
and Social Considerations ······················································ V-11 Table 2-3.1 Maximum/minimum groundwater level/depth ······························ V-15 Table 2-3.2 Results of groundwater quality check ········································ V-18 Table 2-4.1 Revised environmental evaluation ············································ V-19 Table 3-1.1 Environmental Management Plan ············································· V-22 Table 3-2.1 Environmental monitoring items for pre-construction stage ··············· V-24 Table 3-2.2 Environmental monitoring items for construction stage ···················· V-25 Table 3-2.3 Environmental monitoring items for operation stage ······················· V-26 Table 3-2.4 Environmental monitoring items for pre-construction stage ··············· V-27 Table 3-2.5 Environmental monitoring items for construction stage ···················· V-28 Table 3-2.6 Environmental monitoring items for operation stage ······················· V-29

Final Repot Volume V Environmental and Social Consideration
Volume V – ENVIRONMENTAL AND SOCIAL CONSIDERATIONS
1. Environmental and Social Considerations
1-1 Project components that impact environment and society
The NDGRs Project is to construct new regulators at 140m downstream of the existing DGRs,
which are located almost at the center of Dirout city. More than 100 years ago, the DGRs were
located at the edge of the city, however, the annual urban expansion brought the DGRs to the
center of the city.
The DGRs consist of two large regulators, namely, Bahr Yusef regulator and Ibrahimia
regulator, and three relatively small scale regulators, namely, Abo Gabal regulator, Badraman
regulator and Sahelyia regulator. Due to the recent deterioration of the DGRs, they have not
functioned well, however, the DGRS will be preserved as a road, a bridge and a historical
monument even after the NDGR construction. New Bahr Yusef regulator and New Ibrahimia
regulator will be constructed about 140 m downstream of the current site, while other small
scale gate structures will be reconstructed beside the existing ones. Locations of canals
concerned and existing/new regulators are illustrated in Figure 1-1.1.
Figure 1.1 Location map of regulators
Figure 1-1.1 Location map of the regulators
1-2 Basic environmental and social conditions
(1) General conditions around the regulators
The regulators are located on the center of Dirout City, just beside of Dirout Railway Station,
N
S
FLOW
Abo Gabal Canal
Irad Delgaw Canal
Sahelyia Canal
Ibrahimia Canal Bahr Yusef Canal
Badraman Canal Diroutiah Canal
Ibrahimia Canal
New Regulators
Existing Regulators
V-1

Detailed Design Study on the Project for Construction of the New Dirout Group of Regulators
it is used as a bridge and a road by many people (See photo below). Also, there are many shops
and buildings around the regulators. Farmlands stretch over the beneficial area and no virgin
natural area such as marsh and forest is identified.
According to the law in Egypt, it is prohibited to construct any structures within the river bed,
which means that there are no private lands to be affected by the project. However, there is an
illegal café on upstream of Abo Gabal regulator as shown in following pictures, which was
constructed after the F/S. Construction works can be done without the relocation of the café, it
will be dusty and noisy for the café in the construction period, though.
There are three mosques to be affected by the construction works of the NDGRs. The Mosque
No.1 and Mosque No.2 are under the management of the Ministry of Awqaf of Egypt (Ministry
of Awqaf), while the Mosque No.3 belongs to the MWRI, which means under the control of
Illegal Café (view from the Bahr Yusef regulators) Entrance of the Illegal Café (“Lawyers Club”)
Existing Bahr Yusef Regulator
V-2

Final Repot Volume V Environmental and Social Consideration
MWRI. Apart from those structures, there are no buildings to be affected by the construction
works.
(2) Social Status of the Command Area
1) Population
The Project covers five Governorates, namely, Beni Suef, Minia, Assuit, Fayoum and Giza.
Still, beneficial area in Assuit Governorate is very small and negligible. Based on the population
New Ibrahimia Regulator
Mosque No.2
Flow
Mosque No.1
Flow
Mosque No.3 owned by MWRI
New Bahr Yusef Regulator
V-3

Detailed Design Study on the Project for Construction of the New Dirout Group of Regulators
data on 20141, the total population in the beneficiary area of DGRs is estimated to be 18.25
million inhabiting an area of 6,828 km2. The population density is, therefore, 2,673person/km2.
This figure is equivalent to 31 times of the national average one, which means the command
area is very densely populated.
The population census in 2006 showed that the urban population in the beneficiary area was
4.78 million, while the rural population was 7.3 million. Based on the same data, the numbers of
households in urban and rural areas are 1.18 million and 1.59 million, respectively. The family
size of the urban and rural areas is 4.0 and 4.6 person/household, respectively.
2) Living conditions
According to the UNDP Human Development Report 2010, the average GDP per capita in
the five Governorates, namely, Beni Suef, Minia, Assuit, Fayoum and Giza, is 8,482 LE
equivalent to around 83% of the national average (10,246 LE/person). The national
unemployment rate is 8.9%, while those are 11.7% and 7% are in urban and rural areas,
respectively. However, the rates in the five Governorates are much lower, from 2.9% to 6.7%.
On the other hand, the national poverty rate is 21.6%, while the rates are higher in the five
Governorates, from 23.0% to 41.5%.
3) Meteorological Conditions
The project area is located in northern Egypt where annual rainfall is closed to zero. In the
summer season, maximum daytime temperature sometimes can exceed 50oC and drop to below
25 oC during night time. In the winter season, maximum daytime temperature reaches 20oC at
most, and drops from 6 to 8 oC during night time. During the hot season, any measures should
be taken to prevent from heart attack those involved in construction works.
In this area, there is a constant north to north-westerly wind. In April and May, however, a
southeasterly sand-storm usually attacks the area. It continues for 2 to 3 days, during which cars
need head light even in the daytime. According to the inhabitants, sandstorms may occur several
times a year. During that time, construction works are preferably stopped.
1-3 Institutional and legal frameworks of Environmental and Social Consideration
in Egypt
(1) Institutional framework
In June 1997, Ministry of Environmental was established as stated in the Presidential Decree
No. 275/1997. From thereon, the new Ministry has focused on defining environmental policies,
preparing the necessary plans for environmental protection and environmental development
projects, and implementing initiatives within a context of sustainable development. Egyptian
Environment Environmental Affairs Agency (EEAA) is the highest authority in Egypt, which is
1 source: CAPMAS Statistic Year Book 2014
V-4

Final Repot Volume V Environmental and Social Consideration
responsible for promoting and protecting the environment, and coordinating adequate responses
to environmental issues.
EEAA, established by virtue of Law No.4 in 1994, is to replace the Agency established by
Presidential Decree No. 631 of the year 1982, in all its rights and obligations. At present, EEAA
has many missions, for instance, prepares draft laws and decrees related to protection of the
environment and implements studies on the state of the environment, formulate the national
plan with the projects included for the protection of the environment, and prepare budgets for
necessary activity. It also takes responsibility for classification of projects (screening), review
and evaluate EIA reports prepared by proponents, and approve the EIA reports. Under the CEO
Deputy Chairman of EEAA, there are five sectors including Environment Management Section
as illustrated in Figure 1-3.1.
Source: Homepage of Ministry of Environment (updated in January 2014)
EIA Central Department, under the Environmental Management Sector, is in charge of EIA
review and has around 50 staff as of February 2017. There are five departments under the
Central EIA Department as shown in Figure 1-3.2, Infrastructure Project Department is in
Figure 1-3.1 Organization chart of EEAA
V-5

Detailed Design Study on the Project for Construction of the New Dirout Group of Regulators
charge of EIA for the project.
Figure 1-3.2
*Prepared through the hearing from the official personnel of Central EIA Department
(1) Legal Framework
Concerning EIA legal framework
Environmental Law No. 4, 1994,
and Procedures for Environmental Impact Assessment
1) Laws, regulations and guidelines related to
Law 4 (1994, revised in 2009)
Law No. 4 states that the environmental impact of certain establishments or projects must be
evaluated before any construction
administrative authority or licensing authority.
Guidelines of Principles and Procedures for Environmental Impact Assessment
revised in 2009)
Any projects are classified into three groups
environmental impact assessment
as follows:
- The "A" list projects for establishments/projects with minor environmental impact.
- The "B" list projects for establishments/projects which may result in substantial
environmental impact.
- The "C" list projects for establishments/projects which require complete EIA due to
their potential impacts.
The Project of NDGRs is categorized in
project was prepared in 2010, and it was approved
6 years has passed after the EIA r
of the EIA report in any laws. M
case of modification of approved EIA reports
Detailed Design Study on the Project for Construction of the New Dirout Group of Regulators
.2 Departments in charge of EIA review
*Prepared through the hearing from the official personnel of Central EIA Department
legal framework in Egypt, two main laws should be based, namely,
, which was amended in 2009, and “Guidelines of Principles
and Procedures for Environmental Impact Assessment”, in 2001, that was revised in 2009.
Laws, regulations and guidelines related to environmental impact assessment
Law No. 4 states that the environmental impact of certain establishments or projects must be
evaluated before any construction works are initiated or a license is issued by the competent
hority or licensing authority.
and Procedures for Environmental Impact Assessment
projects are classified into three groups or classes reflecting different levels of
environmental impact assessment in accordance with severity of possible environmental impact
The "A" list projects for establishments/projects with minor environmental impact.
projects for establishments/projects which may result in substantial
The "C" list projects for establishments/projects which require complete EIA due to
is categorized into “C” requires EIA, therefore, the EIA report
and it was approved on 9th September 2010 by EEAA.
report approval, and there is no mention to the validity period
Moreover, there is no statement about necessary procedures in
of modification of approved EIA reports. Therefore, the meeting with official personnel of
*Prepared through the hearing from the official personnel of Central EIA Department
two main laws should be based, namely,
Guidelines of Principles
was revised in 2009.
assessment
Law No. 4 states that the environmental impact of certain establishments or projects must be
works are initiated or a license is issued by the competent
and Procedures for Environmental Impact Assessment (2001,
or classes reflecting different levels of necessary
severity of possible environmental impact
The "A" list projects for establishments/projects with minor environmental impact.
projects for establishments/projects which may result in substantial
The "C" list projects for establishments/projects which require complete EIA due to
EIA report of the
by EEAA. More than
and there is no mention to the validity period
procedures in
official personnel of
V-6

Final Repot Volume V Environmental and Social Consideration
EEAA was held on 28th February 2017 to confirm whether the approved EIA report should be
revised on.
At the meeting, it was confirmed that it is not necessary to revise the EIA report for further
approval from EEAA, as far as the project location, structure, scale and so on are not changed
after the approval, and the EIA Report is still valid. Moreover, it is possible to modify some
parts of monitoring items depending on the current conditions in and around the regulators
without obtaining the approval from EEAA again.
EIA Source Book
The EIA Source Book was published by MWRI in October 2001 for aiming at guiding the
process of EIA study for any projects by MWRI. The projects are classified into 1) New
irrigation projects, 2) Irrigation improvement projects, 3) Drainage projects, 4) Dams, barrages,
reservoirs and flash flood projects, and 5) Shore protection projects.
2) Other laws and regulations related to environmental consideration
Law 48 (Protection of the River Nile against Pollution & Drainage of Liquid Waste, 1982)
This law aims to protect the River Nile and waterways from pollution, and to ban dumping of
wastes (solid, liquid or gaseous) from ships, commercial and industrial establishments, tourism,
drains and municipal waste management in streams and other water without permission of
MWRI.
Law No. 10 (Expropriation of Real Estate for Public Utility, 1990)
Law No.10 deals with the expropriation for public utilities, such as, energy, water, sanitation,
construction, bridges, streets and transport projects. According to the Article 6, assessment of
compensation is discussed by a committee formed in each governorate, consisting of
representative of the survey authority (president), and other members from each of the
directorate. The compensation amount will be decided based on the market prices at the time of
the expropriation decision. The land owners who are to be expropriated can get all the
compensation in kind or some of it according to the agreement of the owners.
Law No. 117 (Promulgating the Antiquities’ Protection Law as Amended by Law No. 3 of
2010)
According to the Article 1 of the Law No.117, any creations on the Egyptian land which has
been constructed more than 100 years before are considered as antiquities. Moreover, the
owners shall be liable for preservation (Article 2) and cannot renovate the characteristics
without license from the Minister of Culture (Item 4 of Article 13).
Environmental Standards
The Law 4 (1994) stipulates a series of tolerance limitations, for air quality, noise/vibration
and so on. Maximum permissible limitation for ambient air quality in Egypt is as shown below:
V-7

Detailed Design Study on the Project for Construction of the New Dirout Group of Regulators
Table 1-3.1 Maximum limits of outdoor air pollutants
(Unit: microgram per cubic meter)
Pollutant Maximum Limit Exposure Period Sulphur Dioxide (SO2) 350 1 hr 150 24 hrs 60 1 year Carbon Monoxide (CO) 30 milligrams/cubic meter 1 hr 10 milligrams/cubic meter 8 hr Nitrogen Dioxide (NO2) 400 1 hr 150 24 hrs Ozone 200 1 hr 120 8 hr Suspended Particles Measured (SPM) as Black Smokes
150 60
24 hrs 1 year
Total Suspended Particles (TSP) 230 24 hrs 90 1 year Respirable Particles (PM 10) 70 24 hrs Lead 1 1 year
Source: Law 4 Annex (5)
Permissible limits of sound intensity and periods of safe exposure thereto in Egypt are as
shown in following table:
Table 1-3.2 Maximum permissible limits for noise intensity in the different areas Intensity Decibel (A)
Type of Area Day Evening Night From To From To From To Commercial, administrative and downtown areas
55 65 50 60 45 55
Residential areas in which can be found some workshops or commercial establishments or which are located on a main road
50 60 45 55 40 50
Residential areas in the city 45 55 40 50 35 45 Residential suburbs with low traffic 40 50 35 45 30 40 Residential rural areas, hospitals and gardens 35 45 30 40 25 35 Industrial areas (heavy industries) 60 70 55 65 50 60 *Day: from 7 a.m. to 6 p.m. Evening: from 6 p.m. to 10 p.m. Night: from 10 p.m. to 7 a.m.
Source: Law 4 Annex (6)
There are various water quality standards in Egypt depending on the environmental situations
and project components. Given that the project can discharge mud water into the downstream in
the canals in the construction stage, “Regulations, Standards and Specifications regarding the
Draining of Processed Liquid Wastes into Waterways” of Article 60 in Law 48 is to be applied
as the permissible surface water quality limitation. The maximum permissible limits are shown
in following table:
V-8

Final Repot Volume V Environmental and Social Consideration
Table 1-3.3 Maximum permissible limits for drained water quality into fresh water body
Statement Standards and Specifications
(milligram/liter unless otherwise mentioned) Color <100 degrees
Total Suspended Solid <500 mg/l Temperature Five degrees above the average
DO (Dissolved Oxygen) >5 mg/l pH 7-8.5
BOD (Biological Oxygen Demand) <6 mg/l COD (Chemical Oxygen Demand) <10 mg/l
Organic nitrogen <1 mg/l Ammonia <0.5 mg/l
Grease and oils <0.1 mg/l
Regarding water quality of groundwater, considering that some people use the groundwater
for drinking in Dirout city, “Egyptian Standards for Drinking Water 2007” can be applied for the
project. The maximum permissible level for drinking water is as shown below:
Table 1-3.4 Maximum permissible limits for drinking water
[General Specification]
Parameter Minimum Permissible Limit Maximum Permissible Limit Color by cobalt platinum method
10 units 50 units
Turbidity by Jackson Candle method
5 units 25 units
[Chemical specification]
Parameter Maximum Permissible Limit Lead 0.05 mg/l Selenium 0.2 mg/l Arsenic 0.05 mg/l Hexavalent chromium 0.01 mg/l Fluoride 5 mg/l Nitrates 40 mg/l
[Chemicals that affect the validity of the use of water]
Parameter Minimum Permissible Limit Maximum Permissible Limit Dissolved solid 500 mg/l 1200 mg/l Iron 0.3 mg/l 1 mg/l Manganese 0.1 mg/l 1 mg/l
Copper 1 mg/l 1.5 mg/l
Zinc 5 mg/l 15 mg/l
Magnesium 50 mg/l 150 mg/l
Calcium 75 mg/l 200 mg/l
Sulphate 200 mg/l 400 mg/l
Chlorides 200 mg/l 600 mg/l
pH 7-8.5 6.5-9.2
Phenolic compounds 0.001 mg/l 0.002 mg/l
V-9

Detailed Design Study on the Project for Construction of the New Dirout Group of Regulators
Bacteriological properties :
- It must not exceed the total coli in sterile water for 1/100ml
- It must not exceed the total coli in untreated water for 10/100ml
1-4 Examination of alternatives
Alternative plans for the location of new regulators were examined and evaluated. The
alternative plans consist of: Plan-A (rehabilitation of the existing regulators at the original
alignment); Plan-B (new regulator at upstream); and Plan-C (new regulators at downstream) as
illustrated in Figure 1-4.1. As the examination result is shown in Table 1-4.1, Plan –C has the
highest score among the alternatives in terms of various factors including cost, technical
difficulties, stability and so on.
Table 1-4.1 Examination of the alternative plans Item Plan-A Plan-B Plan-C
Hydraulic Performance 1 2 3 Stability of Structure 1 3 3 Ease of Construction 1 1 3
Operation & Maintenance
1 3 3
Heritage and View 1 1 2 Environmental 3 2 1
Comprehensive Evaluation
8 12 15
Working Life 40 yrs 100 yrs 100 yrs Navigation Lock Existing Not possible Possible
Hydropower Plant Not possible Not possible Possible
Evaluation Category; 1:Low、 2:Medium、 3:High
The examination of three alternatives in view of environmental and social consideration is as
shown in Table 1-4.2. Plan-A gets the highest scores in terms of that point, while Plan-C gets the
highest scores for the other factors (engineering, project life and the rest). Taking into
consideration various conditions, Plan-C was finally selected.
Figure 1-4.1 Preliminary layout of NDGRs’ axis
V-10

Final Repot Volume V Environmental and Social Consideration
Table 1-4.2 Comparison of alternative plans for Environmental and Social Considerations Item Plan A Plan B Plan C
Heritage and View
In case of electrifying the existing gates, installation of switching devices on the existing structures will spoil the landscape of DGR. Point:+1
Since the new regulators are constructed at the upstream side and feeder canals are constructed from the new regulators to the existing DGR, the landscape of the upstream side of DGR will be drastically changed. Point:+1
Because the new regulators are constructed at the downstream side, the view of the downstream side of the existing DGR will be changed. Point:+2
Environment There will be no land acquisition or relocation of houses/structures. Point:+3
There will be no land acquisition or relocation of houses/structures. However, if hydro-power plant and navigation lock are to be constructed, land acquisition for those facilities is necessary. Point:+2
There is a mosque on the left bank of Bahr Yusef. This mosque is requested to relocate in construction work Point:+1
2. Review of Environmental Impact Assessment
The EIA report on the project, which has been approved on 9th September 2010 by EEAA,
was reviewed taking into consideration current conditions, focusing on mainly the
environmental evaluation, environmental management plan and environmental monitoring plan.
Environmental WG under the RGBS also participated in the process. Moreover, present
progress of environmental monitoring as of February 2017 was also confirmed through
discussion with ECRI which was in charge of the EIA report preparation in 2010.
2-1 Change of environmental conditions after the F/S
Given that there are some environmental changes in and around the construction sites
between 2010 and 2016, it is needed to review the EIA report.
“JICA Guidelines for Environmental and Social Considerations” (hereinafter referred as to
“JICA Guidelines”) was revised in April 2010, and the new one mentions the necessity to
minimize deviation between the international standards and laws of the recipient counties, if
there is a significantly big gap. In Egypt, it is not necessary to provide compensation to illegal
occupants/residents, if involuntary resettlement and land acquisition are caused and affected
persons are illegal, there is a gap between the JICA Guidelines and Egyptian laws. On the other
hand, there is no change of laws/regulations related to EIA and environmental standards in
Egypt since 2010.
The largest changes in Egypt are democratization in 2011 and introduction of floating rate
system in 2016 after the approval of the EIA report in September 2010. However, they are
political and economic change, and not natural, industrial and demographic change in and
V-11

Detailed Design Study on the Project for Construction of the New Dirout Group of Regulators
around DGRs. Agriculture is still an important industry for the command area.
There are some minor changes of the surrounding conditions, such as construction of illegal
café within the dry river bed at just upstream of the regulators, which refuses relocation for the
project. Still, the construction works nearby the café can be implemented without the relocation;
impacts such as dust and noise/vibration for the café are expected, though.
Concerning relocation of mosques, in the Minutes of Discussion (M/D) of this Loan, three
mosques of them should be relocated to other sites, prior to the construction works. Parts of area
around the construction sites, namely, spaces between Bahr Yusef Canal and Badraman canal,
and Diroutiah canal and Ibrahimia canal, belong to the MWRI. Therefore, those three mosques
can be shifted to neighboring areas as shown in Figure 2-1.1.
Originally, it was planned to set the stockyard including the batcher plant in the farmland 2-3
km upstream of the regulators at F/S stage. However, the farmland cannot be leased, since the
consensus on the compensation rate with the land owners has not been obtained. Instead of that,
the batcher plant will be constructed within the land owned by MWRI just downstream of the
NDGRs. However, it is needed to secure additional site for the temporary stockyard, around 1
feddan (=0.42ha) for two years at longest. There are some available lands that the owners have
willingness to rent, which are not far from the DGRs (see photos below). MWRI has a plan to
apply bidding system for the land tenancy for the temporary yard. Based on the contract to be
exchanged between MWRI and the land owner, the rental fee shall be paid, the rate has yet to be
fixed, though.
Available land
Candidate for stockyard (1): app. 0.5ha around 0.5km away from the construction site
Land is not used for any purposes as of Feb 2017.
Available land
Candidate for stockyard (2): app. 0.4ha around 1 km away from the construction site Land is used as a farmland as of Feb. 2017.
V-12

Figure 2-1.1 Location of mosques to be
2-2 Progress of Environmental Management Plan and
Plan
The EIA report, which was approved by EEAA
for pre-construction stage, construction stage and operation stage.
water quality, land use, noise, vibration, health,
items. Actually, groundwater quality check and groundwater level measurement
implemented in D/D stage, while other items have not been done. Moreover, it is not clear
which organization is responsible
EIA Report. Therefore, this point was discussed at the 25
and it was agreed that the S/V
pre-construction stage.
According to the official personnel of
level and groundwater quality according to the
2 Air emission is not listed up as one of monitoring items for pregiven that air pollution should be monitored emission even pre-construction stage.
Final Repot Volume V Environmental and Social Consideration
osques to be relocated and illegal café around the regulators
Progress of Environmental Management Plan and Environmental Monitoring
which was approved by EEAA, stipulates environmental monitoring items
construction stage, construction stage and operation stage. 16 items2 including s
water quality, land use, noise, vibration, health, waste, growth of weed and so on are listed up as
Actually, groundwater quality check and groundwater level measurement
D/D stage, while other items have not been done. Moreover, it is not clear
for the monitoring, especially for pre-construction
. Therefore, this point was discussed at the 25th TAC meeting on 20th February 2017,
ed that the S/V consultant will be responsible for the monitoring
According to the official personnel of EEAA, it is surely needed to monitor groundwater
level and groundwater quality according to the recommendation in the letter which approved the
is not listed up as one of monitoring items for pre-construction stage in the EIA Report. However, given that air pollution should be monitored in the construction stage, it is recommended to implement monitor air
and Social Consideration
egulators
Monitoring
stipulates environmental monitoring items
including surface
waste, growth of weed and so on are listed up as
Actually, groundwater quality check and groundwater level measurement have been
D/D stage, while other items have not been done. Moreover, it is not clear
stage in the
ebruary 2017,
will be responsible for the monitoring in
, it is surely needed to monitor groundwater
which approved the
construction stage in the EIA Report. However, the construction stage, it is recommended to implement monitor air
V-13

Detailed Design Study on the Project for Construction of the New Dirout Group of Regulators
EIA report by the EEAA. On the other hand, if other monitoring items are judged as unpractical,
it is possible to skip or change such items as far as the reasons are clearly mentioned in the
motoring report. Moreover, it is not needed to take any procedures to get approval of the EIA
report again.
Based on the consensus mentioned above, the existing Environmental Management Plan and
Environmental Monitoring Plan are revised (refer to chapter 2-4).
2-3 Monitoring results of groundwater level and water quality check
The canal water level between DGRs and NDGRs will rise up to 2m after the construction of
NDGRs. Moreover, canal water level will be controlled on EL.46.3m whereas the current
maximum water level is approximately EL.46.0m. Those changes in canal water level will
affect the groundwater head around those areas. As the current condition, some basements of
houses located near the DGRs, have already shown signs of seepage; therefore, it is necessary to
grasp the extent of the negative impact on those seepages. Moreover, groundwater is still
utilized as the drinking water in some areas, when the tap water system is cut off; so that the
impact on the groundwater quality also should be carefully assessed.
Groundwater monitoring aiming at recording the baseline of the hydrological data was carried
out two to three times per month at thirteen piezometers from October 2015 to April 2017 for
groundwater head and its quality (EC, pH and DO), and two times at two points (BH-N7 and
BH-N10 beside the new axis line) for the detailed water quality test (refer to Figure 2-3.1). The
detailed result of the groundwater monitoring is attached in the Appendix.
(1) Groundwater head
Groundwater head increased from June to August when the water demand is highest (the
shallowest water level from the surface ground was 1.75m), and compared with the peak level,
it decreased by 2.2m to 2.3m during the winter closure which shows the lowest canal water
level. Those changes clearly indicate the groundwater head will correspond to the surface water
level (refer to Figure 2.3-2 and Table 2-3.1).
Moreover, the aquifer can be partly recharged by the surface water because the groundwater
head was basically higher at the piezometers close to the canals than the other piezometers,
which also indicate the rise in canal water level will have the negative impact on the
groundwater head (evaluation of the mitigation measures for the rise in groundwater head is
discussed in the “Volume I Design of Regulators, ‘Chapter 20. Groundwater Simulation
Analysis’).
V-14

Final Repot Volume V Environmental and Social Consideration
Figure 2-3.1 Location of the piezometers
Figure 2-3.2 Seasonal change of groundwater head and canal water level
(Oct. 2015-Apr. 2017)
Table 2-3.1 Maximum/Minimum Groundwater Level/Depth (Oct. 2015- Apr.2017)
MonitoringWell / Canal
Max. Depth(m)
Min. WL(EL.m)
dateMin. Depth
(m)Max. WL(EL.m)
date
BH-N7 5.38 41.93 18/1/2017 ~ 3.17 44.14 27/7/2016BH-N8 5.62 41.93 18/1/2017 ~ 3.46 44.09 17/8/2016BH-N9 5.06 41.88 18/1/2017 ~ 2.83 44.11 27/7/2016
BH-N10 6.88 41.88 18/1/2017 ~ 4.56 44.20 27/7/2016BH-N11 5.64 41.89 18/1/2017 ~ 3.34 44.19 27/7/2016BH-N12 8.82 41.90 18/1/2017 ~ 6.54 44.18 27/7/2016BH-N13 3.93 42.02 18/1/2017 ~ 1.75 44.20 27/7/2016BH-N14 4.81 42.03 18/1/2017 ~ 2.77 44.07 17/8/2016BH-N15 4.96 41.84 18/1/2017 ~ 2.90 43.90 10/8/2016BH-N16 4.78 41.55 18/1/2017 ~ 2.60 43.71 10/8/2016BH-N17 4.83 41.66 18/1/2017 ~ 2.47 44.02 27/7/2016BH-A2 5.00 42.00 18/1/2017 ~ 2.83 44.17 27/7/2016BH-A3 7.56 41.83 18/1/2017 ~ 5.17 44.22 27/7/2016
U/S Ibrahimia - 46.08 23/6/2016 ~ - 42.65 12/1/2016D/S Ibrahimia - 45.13 11/6/2016 ~ - 41.60 12/1/2016
D/S Bahr Yusef - 45.82 16/6/2016 ~ - 42.17 18/1/2017
V-15

Detailed Design Study on the Project for Construction of the New Dirout Group of Regulators
(2) Groundwater Quality
Figure 2-3.3 to Figure 2-3.5 show the trend of the groundwater quality. It can be evaluated
that the impact on change of water level does not have direct relation with water quality,
considering that the groundwater quality were not changed very much between the highest
(Irrigation Season) and lowest (Winter Closure) water level periods. In regard to the Electric
Conductivity, abrupt change was observed at certain sampling points and dates, which seems to
be caused by the sewage intrusion to the aquifer. Figure 2-3.6 shows the EC values around
Dirout, giving the followings; 1) high EC values were observed in the town area, and 2) low EC
values on the right bank of the Ibrahimia regulator. Those facts indicate 1) sewage intrusion
from the resident area, and 2) aquifer recharge from the canal water3 on the right bank of the
Ibrahimia regulator.
Figure 2-3.3 Seasonal Change of EC (Nov 2015-Apr.2017)
Figure 2-3.4 Seasonal Change of pH (Nov.2015-Apr.2017)
3 EC of the canal water is approximately 300µS/cm, showing distinct difference in EC value of groundwater (1,000
to 2,000µS/cm)
Irrigation Season
Irrigation Season
V-16

Final Repot Volume V Environmental and Social Consideration
Figure 2-3.5 Seasonal Change of DO (Nov.2015-Apr.2017)
Figure 2-3.6 EC distribution trend (14th April 2016) ※Balloon symbols with W in the figure show the location of the hand pump well found by the inventory survey
Table 2-3.2 shows the result of the detailed water quality test at two sampling points (BH-N7
and BH-N10). Compared to the Egyptian standards for the drinking water, total (fecal) coliform
and the excessive concentration of the manganese ion were detected. At BH-N7 (the left bank of
the Bahr Yusef regulator), high concentrations of sodium and chloride ions were also detected,
which can be considered as the sewage origin. The existence of the Sulfur which gives
unpleasant odor to the groundwater was also identified, which also indicates aquifer is in a
reduced state.
Irrigation Season
V-17

Detailed Design Study on the Project for Construction of the New Dirout Group of Regulators
Given that those all results are seemingly caused by the sewage water, it is difficult to
improve the groundwater quality unless the current sewage treatment system is improved.
Therefore, not only from the aspect of prevention measures of the seepage, but also the aspect of
the groundwater quality, the improvement in the sewage water treatment system is essential.
Table 2-3.2 Results of groundwater quality check
V-18

Final Repot Volume V Environmental and Social Consideration
2-4 Review of environmental evaluation
As mentioned before, it is not necessary to drastically modify the environmental evaluation of
the EIA Report, which has been prepared at F/S stage, since there is no significant change in
terms of environmental conditions in and around the regulators. Therefore, parts of description
in the environmental evaluation were revised as shown in Table 2-4.1.
As for “No.5 Groundwater level” was described as “Groundwater quality” in the original
report. However, it pays attention to rise of groundwater level, thus, the title is changed to
“Groundwater level”, and “Groundwater quality” is newly added as No.6. Concerning “No.9
Land use and land tenure”, description of “reasons” is changed based on the current conditions.
As for “No.18 Odor”, original evaluation was B, however, it is not caused by the Project, and it
is re-evaluated as D. Moreover, regarding “No.17 Safety of the regulators”, it is possible to
prevent from water inflow to the construction site by installation of sheet piles, which leads to
no damage to soil and the regulators. Therefore, the evaluation for the item is also changed into
D. The revised Environmental Evaluation is as shown below:
Table 2-4.1 Revised environmental evaluation
No Items Evaluation
Reasons Construction Stage
Operation Stage
1 Topography and
geology D D
The project scale is not very large to affect topographic and geological conditions.
2 Weather and
climate D D
The Project does not cause any changes of weather and climate.
3 Air Emission B F
Construction stage Due to increase of vehicle numbers for the construction works, dust can be generated. Moreover, the batcher plant which processes concrete materials will generate powder dust. However, such situations are limited to only construction stage. Operation stage No air pollution is expected after the completion.
4 Surface Water
Quality B D
Construction stage Effluent containing cement can be discharged from the batcher plant, and oil might get out of. Operation stage No effect of water quality is expected in operation period.
5 Groundwater
Level B B
Construction stage Groundwater level can be increased by the construction works, however, it is acceptable level, which does not give damage to existing structures considering the groundwater level simulation result. Operation stage Groundwater level can be increased after completion of the construction works, however, it is acceptable level, which does not give damage to existing structures based on the groundwater simulation result.
6 Groundwater
Quality C C
Construction stage According to the groundwater quality monitoring, sewage seems to intrude to groundwater. Since parts of people in
V-19

Detailed Design Study on the Project for Construction of the New Dirout Group of Regulators
No Items Evaluation
Reasons Construction Stage
Operation Stage
Dirout city use groundwater as drinking water, it is needed to monitor groundwater quality continuously. Still, current issue is caused by improper sewage treatment system, and it is thought that the Project will not cause water quality deterioration directly. Operation stage As the same in the construction stage, continuous water quality check is necessary.
7 Water Flow and
River Morphology B D
Construction stage Due to setting of the temporary cofferdam in the canals, water flow can be changed to some extent, however, the same water discharge will be kept for irrigation in downstream, and the period is limited to the construction period. Operation stage After the completion of construction works, no impact on the water flow is expected.
8 Archeological
Treasure D D
It is proposed to preserve the current DRG as a historical monument and main structure of the DRG will not be spoiled. Therefore, the construction works does not give damage to the antiquities.
9 Land Use and Land Tenure
B D
Construction stage It is needed to lease land for temporary stockyard from some private land owners under the contract after the bidding. In case of lease of farmland, the land shall be recovered to the original condition after the construction works. It is, thus, needed to avoid lease of farmland as much as possible. Operation stage After the completion of works, no impact is expected.
10 Fishery B D
Construction stage Fishermen who have license for fishing around the regulators have not been identified. In addition, due to the effluent containing cement from the batcher plant, fish larvae, benthic organism and planktons can be affected. However, a sedimentation pond at the plant can minimize the issue, and the impacts on the fishery will be very limited. In case there are any complaints by fishermen, RGBS staff in Dirout will receive and handle the complaints. Operation stage After the completion of works, no impact is expected.
11 Income F F
Construction stage The construction works will create the new job opportunities (e.g. restaurant, cafeteria, etc.), which will increase the income of some citizens, as well as workers coming from nearby villages. Operation stage After the completion of works, stable irrigation water can be supplied to the command area, which leads to income improvement of the beneficiaries.
12 Access to the B D Construction stage
V-20

Final Repot Volume V Environmental and Social Consideration
No Items Evaluation
Reasons Construction Stage
Operation Stage
Project Site Transportation of the construction material by heavy machines might cause traffic jam. Operation stage After the completion of works, traffic jam by the NDGR is not expected.
13 Noise B D
Construction stage Using heavy equipment and increase of vehicle numbers may generate noise, however, it is temporary. Operation stage After the completion of works, noise is not expected.
14 Vibration B D
Construction stage Vibrations can be caused by the sheet pile installation and movements of heavy machines. However, it is limited to only construction stage. Operation stage After the completion of works, vibration is not expected.
15 Health and safety B D
Construction stage Accident by the construction works, traffic accident and infectious diseases can be caused due to use of construction vehicles, increase of number of vehicles and employment of many workers. Operation stage After the completion of works, no health and safety issue by the NDGR Project is expected.
16 Labor
accommodation camps
D D No accommodation camp for the labors is to be constructed, since they will come from nearby villages.
17 Safety of the
regulators D D
Construction stage A temporary cofferdam will be put by using of sheet piles, which prevents from water inflow. In such case, any damages to on soil and the regulators are not given. Operation stage After the completion of works, no impact on the safety of the regulators is expected.
18 Odor D D The odor may be caused by accumulated algae and dead animals in the water ways. However, the odor is not generated by the construction works.
19 Sediment D D A large quantity of sediment is not expected, since dredging is carried out regularly as a routine work.
20 Solid Waste B D
Construction stage Wastes materials are generated by the construction activities. Therefore, it is needed to Operation stage No impact is expected in operation stage.
Evaluation category: A: Serious impact is expected B: Some impact is expected C: Extent of impact is unknown D: No impact is expected. EIA is not necessary F: Positive impact *Highlighted cells show that negative impacts are expected in the parameters.
V-21

Detailed Design Study on the Project for Construction of the New Dirout Group of Regulators
3. Environmental Management Plan and Monitoring
3-1 Environmental Management Plan and Cost
Based on the revised Environmental Evaluation discussed above, the original EMP in the EIA
Report is also revised as shown in Table 3-1.1. The table shows mitigation measures for the
items respectively which are evaluated as “B” and “C” in Table 2-4.1. Moreover, the mitigation
cost is included in the construction cost in the construction stage in general, while the cost in
operation stage is covered by the MWRI.
Table 3-1.1 Environmental Management Plan
No *1
Environmental Items
Mitigation measure Implementation agency
Responsible agency
Cost
Pre-construction stage 9 Land use and
Land tenure To exchange land lease agreement on the
temporary yard To avoid lease of farmland as much as
possible since it is needed to recover the farmland to the original condition
MWRI*2 MWRI Budget of MWRI*2
Construction stage 3 Air Emission*3 Installation of a dust extractor at the
batcher plant Water spray around the construction site Regular maintenance of construction
vehicles
Contractor MWRI Included in construction
cost
4 Surface Water Quality
Set-up of a sedimentation basin at the concrete batcher plant to prevent effluent containing cement from discharging to the downstream
Contractor MWRI Included in construction
cost
5 Groundwater Level
Regular monitoring of groundwater level Contractor MWRI Included in construction
cost 6 Groundwater
quality Regular monitoring of groundwater quality
Improvement of existing sewage system
Contractor
Holding Company for
Water & Waste water (HCWW)
MWRI
MWRI
Included in construction
cost Regular
budget of HCWW
7 Water flow and river
morphology
Keeping the same discharge to the downstream as planned
Contractor MWRI Included in construction
cost 9 Land use and
land tenure Whether payment to the land owners has
been done should be confirmed MWRI*2 MWRI Budget of
MWRI*2 10 Fishery Setting of sedimentation basin at the
concrete batcher plant to prevent effluent water to downstream
Employ persons with high priority who depend on fishery for livelihood
Contractor MWRI Included in construction
cost
12 Access to the Project Site
Preparation of a vehicle operation schedule which deconcentrates utilization of vehicle
Contractor MWRI Included in construction
cost 13 Noise To refrain from the construction works at
night in the residential areas as much as Contractor MWRI Included in
construction
V-22

Final Repot Volume V Environmental and Social Consideration
No *1
Environmental Items
Mitigation measure Implementation agency
Responsible agency
Cost
possible Silent piler machine is to be used for
piling to minimize noise around densely populated area and railway while hydraulic hammer is used in other areas
cost
14 Vibration To refrain from the construction works at night in the residential areas as much as possible
Silent piler machine is used for piling to minimize noise around densely populated area and railway while hydraulic hammer is used in other areas
Contractor MWRI Included in construction
cost
15 Health and safety
Paying attention to the workers’ health condition, and if there is a possibility of incident of infectious diseases taking place, immediately inform the Ministry of Health.
Request the Ministry of Health to carry out awareness creation on HIV/AIDS among the workers and recommend them to voluntary check the status of HIV/AIDS.
To identify if there is too tight operation schedule or not, and if so rectify it.
Place traffic control staff along the construction roads.
To explain contents of the work to the workers with necessary care taking for their safety prior to the start of the work, and make daily confirming safe meeting before starting the work.
Contractor MWRI
Included in construction
cost
20 Solid waste Re-use excavated soils Disposal of waste generated from the
construction site to the dumping site.
Contractor MWRI Included in construction
cost Operation stage
5 Groundwater Level
Monitoring of groundwater level
MWRI MWRI Included in regular
budget of MWRI
6 Groundwater quality
Monitoring of groundwater quality MWRI MWRI Included in regular
budget of MWRI
*1: Numbers in the table are the same ones which hare illustrated in Table 2-4.1. *2: It is tentatively set as MWRI, however, it is to be discussed at biding and contract exchange. *3: It is newly added as an environmental item, since EEAA recommended monitoring groundwater quality
in 2010.
3-2 Environmental Monitoring Plan
As mentioned before, it is needed to re-examine existing monitoring items and to propose a
new monitoring plan depending on the current conditions. Regarding “groundwater quality”, it
will not be influenced by the project; however, considering that high concentration of chloride,
sodium, manganese were detected in the groundwater as mentioned in Table 2-3.2 and EEAA
V-23

Detailed Design Study on the Project for Construction of the New Dirout Group of Regulators
recommends to monitor the groundwater quality, this item is also included. The revised
monitoring items by stage are as shown in from Table 3-2.1 to Table 3-2.3.
Table 3-2.1 Environmental monitoring items for pre-construction stage (to be covered by the S/V Consultant)
Items (proposed in the EIA Report)
Decision of implementation Reasons
1. Air emission To be implemented Air emission is not included in the monitoring items in the EIA Report. However, it is needed to include the item, since air pollution is expected in the construction period.
2. Surface water quality To be implemented as planned 3. Groundwater quality To be implemented as planned 4. Groundwater level To be implemented as planned 5. Noise To be implemented as planned 6. Vibration To be implemented as planned 7. Water flow and river
morphology Not to be implemented Due to cofferdam, conditions of water flow would
be changed, however, the same amount of water discharge to the downstream is kept, which will not result in damage to the farming in the downstream. Moreover, it is difficult to evaluate the change quantitatively.
8. Land use and land tenure
Progress of contract exchange of the 1) land lease and 2) transfer of mosques which are under control of the Ministry of Awqaf is to be checked.
9. Fishery
Number of fishermen and legalities of them shall be identified.
10. Income Not to be implemented Since negative impacts on incomes of neighboring people and beneficial farmers are not expected, monitoring of income is not necessary.
11. Access to the Project Site
Not to be implemented There is no quantitative regulation/standard related to transportation, and monitoring of transportation is not necessary. Moreover, since there are no limitation of number of vehicles in the roads, “access to the Project site” cannot be assessed. It is noted that an operation schedule of construction vehicle should be prepared to avoid traffic jam in construction stage.
12. Health and safety Not to be implemented Since there is no infectious diseases or accidents before construction works, monitoring of the item is not needed.
13. Safety of regulators Not to be implemented Cofferdam is put by using pile sheets, and such construction works will not cause damage to the existing regulators. It is, thus, not necessary to monitor the safety, especially in pre-construction stage.
14. Solid waste Not to be implemented Since no waste is generated before construction works and quantitative measurement is difficult, monitoring of waste is not implemented.
15. Odor Not to be implemented Regardless of implementation of construction works, dead animal and solid waste are thrown
V-24

Final Repot Volume V Environmental and Social Consideration
Items (proposed in the EIA Report)
Decision of implementation Reasons
away to the canal, which does not have direct relationship with the Project.
16. Sedimentation Not to be implemented Quantitative measurement and evaluation are difficult.
17. Growth of weeds Not to be implemented Quantitative measurement and evaluation are difficult. Moreover, there is no mention to the growth of weeds by the Project in the EIA Report, and there is no clear relation between the Project and growth of weeds.
Following table shows the monitoring items in construction stage. “Odor” will not be caused
by the Project, sill, the problem could be caused by bad habitat such as throwing away garbage
to the canals. However, it is mentioned that “Odor” is to be monitored in construction stage and
monitoring stage in M/D in 2014. MWRI has a duty to dredge canals biannually as a routine
work, and it can be assessed by confirmation of dredging implementation.
Table 3-2.2 Environmental monitoring items for construction stage (to be covered by the contractor under the supervision of MWRI)
Items (proposed in the EIA Report)
Decision of implementation Reasons
1. Climate and weather Not to be implemented Any impacts by the construction works are expected. According to the Checklist in the EIA Report, it is evaluated as “D” for this item.
2. Air emission To be implemented as planned
3. Surface water quality To be implemented as planned
4. Groundwater quality To be implemented as planned
5. Groundwater level To be implemented It is not included in the monitoring items in the EIA Report, however, it is to be monitored since it is recommended by EEAA in 2010.
6. Noise To be implemented as planned
7. Vibration To be implemented as planned
8. Water flow and river morphology
To be implemented as planned.
It is needed to keep same discharge to the downstream for farming.
9. Land use and land tenure Whether payment to the land owners for the stockyard has done shall be checked.
10. Fishery
Instead of impact on the fishery, whether mud water is treated is monitored. Surface water quality check can substitute.
Since there is a possibility that waste water containing cement form the batcher plant can give damage to ecosystem in the river, the monitoring focuses on the waste water treatment. In case of complaints from the fishermen, it can be managed by employment of them as construction labors.
11. Income Not to be implemented Since negative impacts on incomes of neighboring people and beneficial farmers are not expected, monitoring of income is not
V-25

Detailed Design Study on the Project for Construction of the New Dirout Group of Regulators
Items (proposed in the EIA Report)
Decision of implementation Reasons
necessary. 12. Access to the Project Site Whether the schedule
management of construction vehicles for decentralization is prepared can be regarded as an indicator of monitoring for access to the project site.
13. Health and safety To be implemented as planned
14. Safety of regulators Not to be implemented Cofferdam is put by using pile sheets, and such construction works will not cause damage to the existing regulators. It is, thus, not necessary to monitor the safety.
15. Solid waste To be implemented as planned
16. Odor It can be assessed by frequency of canal dredging. It is done as a routine work of MWRI since odor will not be generated by the Project.
17. Sedimentation Not to be implemented Quantitative measurement and evaluation are difficult.
18. Growth of weeds Not to be implemented Quantitative measurement and evaluation are difficult. Moreover, there is no mention to the growth of weeds by the Project in the EIA Report, and there is no clear relation between the Project and growth of weeds.
19. Complaints To be implemented
Following table illustrates monitoring items in operation stage. “Odor” and “Solid waste” are
not caused by the Project directly, instead, those problems could be caused by bad habitat such
as throwing away garbage to the canals as well as in construction stage. MWRI will dredge
canals biannually as a routine work instead of as one of project works, and it can be assessed by
confirmation of dredging implementation. Some items, namely, water flow and river
morphology, surface water quality, noise, vibration are not included in the EMP. However, they
are to be monitored in terms of Environmental Auditing.
Table 3-2.3 Environmental monitoring items for operation stage (to be covered by MWRI)
Items (proposed in the EIA Report)
Decision of implementation Reasons
1. Surface water quality To be implemented 2. Groundwater quality To be implemented 3. Groundwater level To be implemented 4. Noise To be implemented 5. Vibration To be implemented 6. Water flow and river
morphology To be implemented
7. Fishery
Not to be implemented Effluent water that can damage to fishery will not be generated after the completion of construction works, and impacts on the fishery is not expected.
V-26

Final Repot Volume V Environmental and Social Consideration
Items (proposed in the EIA Report)
Decision of implementation Reasons
8. Safety of the regulators Not to be implemented No concern about safety of the regulators is expected.
9. Solid waste It is not implemented, since it is a routine works of MWRI, and out of scope of the Project.
Solid waste will not be generated after the completion of construction works, and it is difficult to evaluate quantitatively. Neighboring people sometimes throw away garbage to the canals, such waste is dredged as a routine work of MWRI.
10. Odor It is not implemented within the Project. It can be done by frequency of canal dredging. However, it is a routine works of MWRI, and out of scope of the Project.
11. Sedimentation Not to be implemented Quantitative measurement and evaluation are difficult.
12. Growth of weeds Not to be implemented Quantitative measurement and evaluation are difficult.
13. Complaints Complaints will be handled, if any (as planned).
Based on the proposed monitoring items, the actual monitoring activities shall be done. It is
noted that implementation organizations of monitoring varies by stage. Monitoring cost in
pre-construction stage is included in the fee of S/V consultant. On the other hand, that in
construction stage is included in the construction cost, while it is covered by the general budget
of MWRI in the operation stage. Any statements of dissatisfaction or complaints from the
neighbor villagers are to be received by MWRI official personnel at the site. The documented
reports related to the issues should be submitted RGBS in Cairo to be reviewed. Following table
shows the recommended monitoring plan.
Table 3-2.4 Monitoring Plan (pre-construction stage) Item Parameter Measurement Point Done by Responsible
organization 1. Air emission SO2, NO2, CO,
SPM,CO2 1) In front of the illegal café 2) Railroad crossing 3) In front of the school which located
on opposite of Mosque No.1(Port Side Street)
4) In front of the Dirout Water Distribution office
S/V Consultant
MWRI
2. Surface water quality
One set* 1) Upstream of current regulators (just upstream of Abo Gabal Canal)
2) Just downstream of the new Ibrahimia regulator
3) Just downstream of the new Buhl Yusef Cana
S/V Consultant
MWRI
3. Groundwater quality
One set*1 BH-N7 and BH- N10 (2 points) in Figure 3-2.1 for covering one set of water quality check (EC, pH and DO are to be monitored at all of 13 points.)
S/V Consultant
MWRI
4. Groundwater Water level All 13 points in Figure 3-2.1 S/V MWRI
V-27

Detailed Design Study on the Project for Construction of the New Dirout Group of Regulators
Item Parameter Measurement Point Done by Responsible organization
level Consultant
5. Noise Noise 1) In front of the illegal café 2) Railroad crossing 3) In front of the school which located
on opposite of Mosque No.1(Port Side Street)
4) In front of the Dirout Water Distribution office
S/V Consultant
MWRI
6. Vibration Vibration 1) In front of the illegal café 2) Railroad crossing 3) In front of the school which located
on opposite of Mosque No.1(Port Side Street)
4) In front of the Dirout Water Distribution office
S/V Consultant
MWRI
7. Land use and land tenure
Securement of land for the temporary yard (confirmation of agreement with land owner) and confirmation of mosque transfer
-
MWRI*2 MWRI
8. Fishery Number of fishermen and their legalities
The targets are those who catch fish from 300m upstream of DGRs to 500 m downstream of NDGRs (around 1,000m distance).
S/V Consultant
MWRI
*1: Water quality check parameters: pH, TDS, COD, BOD, DO, TSS, Turbidity, EC, CO3, HCO3, Total Alkalinity, Ca, Mg, Na, K, Cl. NO3, NO2, PO4, S, SO4 Temperature, Cr, Fe, Cu, Mn, Ni, Pb, Zn
*2: It is tentatively set as MWRI, however, it is to be discussed at the biding.
Table 3-2.5 Monitoring Plan (construction stage) Item Parameter Measurement Point Frequency Done by Responsible
organization 1. Air emission SO2, NO2, CO,
SPM,CO2 1) In front of the illegal café 2) Railroad crossing 3) In front of the school which
located on opposite of Mosque No.1 ( Port Side Street)
4) In front of the Dirout Water Distribution office
Monthly Contractor MWRI
2. Surface water quality
One set*1 1) Upstream of current regulators (just upstream of Abo Gabal Canal)
2) Just downstream of the new Ibrahimia regulator
3) Just downstream of the new Buhl Yusef Cana
Once per 2 months
Contractor MWRI
3. Groundwater quality
One set*1 BH-N7 and BH- N10(2 points)in Figure 3-2.1 for covering one set of water quality check (EC, pH and DO are to be monitored at all of 13 points.)
Once per
2 months
Contractor MWRI
4. Groundwater level
Water level All 13 points illustrated in Figure 3-2.1
Monthly Contractor MWRI
V-28

Final Repot Volume V Environmental and Social Consideration
Item Parameter Measurement Point Frequency Done by Responsible organization
5. Noise Noise 1) In front of the illegal café 2) Railroad crossing 3) In front of the school which
located on opposite of Mosque No.1 ( Port Side Street)
4) In front of the Dirout Water Distribution office
Monthly Contractor MWRI
6. Vibration Vibration 1) In front of the illegal café 2) Railroad crossing 3) In front of the school which
located on opposite of Mosque No.1 ( Port Side Street)
4) In front of the Dirout Water Distribution office
Monthly Contractor MWRI
7. Land use and land tenure
Confirmation of payment to the landowners
- MWRI*2 MWRI
8. Water flow and river morphology
Water discharge Regular water level measurement point of Ibrahimia Canal and Bahr Yusef Canal beside Dirout Office of Water Distribution Section
Every day MWRI MWRI
9. Fishery Complaints from the fishermen
- - MWRI MWRI
10. Access to the Project Site
Check of car arrangement schedule
- Every day Contractor MWRI
11. Health and safety
- Health check - Assignment
of traffic control
- Proper car arrangement
- Monthly Every day
Every day
Contractor MWRI
12. Waste Frequency of waste management
Around the construction site Weekly Contractor MWRI
13. Complaint Frequency of complaint from the people
- - MWRI MWRI
*1: Water quality check parameters: pH, TDS, COD, BOD, DO, TSS, Turbidity, EC, CO3, HCO3, Total Alkalinity, Ca, Mg, Na, K, Cl. NO3, NO2, PO4, S, SO4 Temperature, Cr, Fe, Cu, Mn, Ni, Pb, Zn
*2: It is tentatively set as MWRI, however, it is to be discussed at the biding.
Table 3-2.6 Monitoring Plan (operation stage) Item Parameter Measurement Point Frequency Done by Responsible
organization 1. Groundwater
level Water level All 13 points illustrated in
Figure 3-2.1 Twice per
year MWRI MWRI
2. Surface water quality
One set* 1) Upstream of current regulators (just upstream of Abo Gabal Canal)
Twice per year
MWRI MWRI
V-29

Detailed Design Study on the Project for Construction of the New Dirout Group of Regulators
Item Parameter Measurement Point Frequency Done by Responsible organization
2) Just downstream of the new Ibrahimia regulator
Just downstream of the new Buhl Yusef Canal
3. Groundwater quality
One set* BH-N7 and BH- N10(2 points)in Figure 3-2.1 for covering one set of water quality check (EC, pH and DO are to be monitored at all of 13 points.)
Twice per year
MWRI MWRI
4. Noise Noise 1) In front of the illegal café 2) Railroad crossing 3) In front of the school which
located on opposite of Mosque No.1(Port Side Street)
4) In front of the Dirout Water Distribution office
Twice per year
MWRI MWRI
5. Vibration Vibration 1) In front of the illegal café 2) Railroad crossing 3) In front of the school which
located on opposite of Mosque No.1(Port Side Street)
4) In front of the Dirout Water Distribution office
Twice per year
MWRI MWRI
6. Water flow and river morphology
Water discharge
Regular water level measurement point of Ibrahimia Canal and Bahr Yusef Canal beside Dirout Water Distribution Office
Twice per year
MWRI MWRI
7. Complaint Frequency of complaint from the people
- - MWRI MWRI
Based on the M/D on 21st May 2014, the monitoring period is set at one year since the operation is started.
* One set of water quality check parameter: pH, TDS, COD, BOD, DO, TSS, Turbidity, EC, CO3, HCO3, Total Alkalinity, Ca, Mg, Na, K, Cl. NO3, NO2, PO4, S, SO4 Temperature, Cr, Fe, Cu, Mn, Ni, Pb, Zn
Figure 3-2.1 Location of the 13 piezometers for groundwater
Monitoring
Points for groundwater quality measurement
V-30

Final Repot Volume V Environmental and Social Consideration
Based on the monitoring plan mentioned above, actual monitoring is to be done. It is
recommended to use the monitoring form as shown below:
(1) Pre-construction stage
1) Response and actions by the government Monitoring Item Monitoring Results in Report Period
Number and contents of responses from the people Actions taken by the government based on the complaints from the people
2) Pollution
- Air Pollution
Item Unit Measured
Value (Mean)
Measured Value (Max)
Country’s Standards
Referred International Finance Cooperation
(IFC) Guidelines
Remarks (Measurement Point, Frequency, Method,
etc.)
SO2 [µg/m3]
hr 24 hr
<350µg/m3 <150µg/m3
- <20µg/m3
Once per month
NO2 [µg/m3]
1 hour 24 hours
<400µg/m3 <150µg/m3
<200µg/m3 -
Once per month
CO [mg/m3]
1 hour 8 hours
<30mg/m3
<10mg/m3
20ppm/hr (Japanese standard) -
Once per month
SPM [µg/m3]
24hr
<150µg/m3
<0.1mg/m3(Japanese standard)
Once per month
- Noise / Vibration
Item Unit Measured
Value (Mean) Measured
Value (Max) Country’s Standards
Referred IFC Guidelines
Remarks (Measurement Point,
Frequency, Method, etc.)
Noise/ Vibration
dB
<65 (downtown in
daytime)
<55 (downtown in
night)
<55 (daytime)
<45 (night)
Once per month
*It is needed to pay consideration to minimize noise for the illegal café.
- Water pollution (surface water and groundwater)
Item Unit Measured
Value (Mean) Measured
Value (Max) Country’s Standards
Referred IFC Guidelines
Remarks (Measurement Point, Frequency, Method,
etc.) One set of water quality parameters*
Once per 2 months
*Parameters of water quality check: pH, TDS, COD, BOD, DO, TSS, Turbidity, EC, CO3, HCO3, Total Alkalinity, Ca, Mg, Na, K, Cl. NO3, NO2, PO4, S, SO4 Temperature, Cr, Fe, Cu, Mn, Ni, Pb, Zn Table 1-3.3 and Table 1.3.4 are to be referred as the standards for those water quality parameters. 3) Natural environment
Environmental parameter Monitoring results Measures taken Monitoring date
Groundwater level - Depth of groundwater level
4) Social environment
Environmental parameter Monitoring results Measures taken Number of complaint about land lease/completion of land lease contract and payment
V-31

Detailed Design Study on the Project for Construction of the New Dirout Group of Regulators
Environmental parameter Monitoring results Measures taken Relocation of the mosques Number of fishermen and their legalities
(2) Construction stage
1) Response and actions by the government Monitoring Item Monitoring Results in Report Period
Number and contents of responses from the people Actions taken by the government based on the complaints from the people
2) Pollution
- Air Pollution
Item Unit Measured
Value (Mean)
Measured Value (Max)
Country’s Standards
Referred International Finance
Cooperation (IFC) Guidelines
Remarks (Measurement
Point, Frequency, Method, etc.)
SO2 [µg/m3]
hr 24 hr
<350µg/m3 <150µg/m3
- <20µg/m3
Once per month
NO2 [µg/m3]
1 hour 24 hours
<400µg/m3 <150µg/m3
<200µg/m3 -
Once per month
CO [mg/m3]
1 hour 8 hours
<30mg/m3
<10mg/m3
20ppm/hr (Japanese standard) -
Once per month
SPM [µg/m3]
24hr
<150µg/m3
<0.1mg/m3(Japanese standard)
Once per month
- Noise / Vibration
Item Unit Measured
Value (Mean) Measured
Value (Max) Country’s Standards
Referred IFC Guidelines
Remarks (Measurement Point,
Frequency, Method, etc.)
Noise/ Vibration
dB
<65 (downtown in
daytime)
<55 (downtown in
night)
<55 (daytime)
<45 (night)
Once per month
*It is needed to pay consideration to minimize noise for the illegal café.
- Water pollution (surface water and groundwater)
Item Unit Measured
Value (Mean) Measured
Value (Max) Country’s Standards
Referred IFC Guidelines
Remarks (Measurement Point,
Frequency, Method, etc.) One set of water quality parameters*
Once per 2 months
*Parameters of water quality check: pH, TDS, COD, BOD, DO, TSS, Turbidity, EC, CO3, HCO3, Total Alkalinity, Ca, Mg, Na, K, Cl. NO3, NO2, PO4, S, SO4 Temperature, Cr, Fe, Cu, Mn, Ni, Pb, Zn Table 1-3.3 and Table 1.3.4 are to be referred as the standards for those water quality parameters. 3) Natural environment
Environmental parameter Monitoring results Measures taken Monitoring date
Groundwater level Solid wastes Water flow and morphology Odor* Impact on ecosystem, if any
- Depth of groundwater level - Removal and disposal of waste - Measurement of water level of the canals
and estimation of discharge - Confirmation of frequency of dredging by
MWRI - Complaints about damage to ecosystem
in the construction site
*Based on the M/D in 2014, odor can be checked by means of confirmation of implementation of dredging.
V-32

Final Repot Volume V Environmental and Social Consideration
4) Social environment
Environmental parameter Monitoring results Measures taken Number of complaint about land lease and payment
Number of complaint about traffic jam
Number of complaint about noise/vibration
Number of complaint about impact on fishery
5) Working environment (Include working safety)/ Accident
Environmental parameter Monitoring results Measures taken Monitoring date Safety check for carrying the heavy machineries into the work area.
First time of the construction work
Safety check for refueling car accessing the work sites.
Everyday
Safety check for carrying-out of the heavy machineries from the work sites.
Last time of the construction work.
Assignment of traffic control staff Everyday
Checking of the heavy machineries if keeping correct routes and speed.
Everyday
Installation of project sign board around the field.
First time of the construction work
6) Hazards (Risk) of Infectious diseases such as HIV/AIDS
Environmental parameter Monitoring results Measures taken Monitoring date
Pay attention to the workers’ health condition. Every day
Arrange with the Local Unit office /Ministry of Health to carry out awareness creation on HIV/AIDS among the workers.
Once half a year
(3) Operation stage
1) Response and actions by the government Monitoring Item Monitoring Results in Report Period
Number and contents of responses from the people (including impacts on fishery) Actions taken by the government based on the complaints from the people
2) Pollution
- Noise / Vibration
Item Unit Measured
Value (Mean) Measured
Value (Max) Country’s Standards
Referred IFC Guidelines
Remarks (Measurement Point,
Frequency, Method, etc.)
Noise/ Vibration
dB
<65 (downtown in
daytime)
<55 (downtown in
night)
<55 (daytime)
<45 (night)
Twice per year
*It is needed to pay consideration to minimize noise for the illegal café.
- Water pollution (surface water and groundwater)
Item Unit Measured
Value (Mean) Measured
Value (Max) Country’s Standards
Referred IFC Guidelines
Remarks (Measurement Point,
Frequency, Method, etc.) One set of water quality parameters*
Twice per year
*Parameters of water quality check: pH, TDS, COD, BOD, DO, TSS, Turbidity, EC, CO3, HCO3, Total Alkalinity, Ca, Mg, Na, K, Cl. NO3, NO2, PO4, S, SO4 Temperature, Cr, Fe, Cu, Mn, Ni, Pb, Zn Table 1-3.3 and Table 1.3.4 are to be referred as the standards for those water quality parameters.
V-33

Detailed Design Study on the Project for Construction of the New Dirout Group of Regulators
3) Natural environment Environmental parameter Monitoring Item Monitoring Results and Dates
Groundwater level Water flow and morphology Odor and Waste*1 Impact on ecosystem, if any*2
- Depth of groundwater level - Measurement of water level of the canals and
estimation of discharge - Confirmation of frequency of dredging by
MWRI - Complaints about damage to ecosystem in
the construction site
*1: Based on the M/D in 2014, odor and waste can be monitored through confirmation of implementation of dredging.
*2: Particular ecosystem in the construction site is not identified, therefore, just in case of any complaints from the
residents.
3-3 Establishment of Security Management Committee (SMC)
For the duration of the Project, it is proposed to establish the Security Management
Committee, which coordinates, assesses, approves various issues to maintain security of the
project. The Committee meeting will be held monthly to share the monitoring results, and if
some problems such as violation of the Egyptian environmental standard are identified,
measures to be taken should be discussed at the meeting. Furthermore, the ad hoc SMC
meetings will be organized according to necessity. Moreover, the committee will handle any
complaints of the people during the Project period. Proposed constitute and roles of the
committee are as follows:
1 Committee consists of RGBS staff of Dirout and Cairo, S/V consultant and Contractor.
2 Roles of the committee are as shown below:
(1) Supervision of monitoring and examination of monitoring result,
(2) Taking measures if some problems are identified during the monitoring activities, for
instance, a result varies from the standard
(3) Handling of complaints from the people
(4) Identification and counting of those who catch fish around the DGRs regardless of with or
without of license, and taking measurement as required
(5) Reporting, recording and information sharing, especially, any issues identified and
measured taken
V-34

Volume VI MATHEMATICAL MODEL ANALYSIS
Page
1.Water Surface Profile Analysis on NDGRs VI - 1
1-1 Objective and metnod of analysis VI - 1
1-2 Evaluation of analysis results VI -18
2.Matnematical Model Analysis VI -25
2-1 Objective and metnod of analysis VI -25
2-2 Evaluation of analysis results VI -49
3.Integrated Evaluation of Hydraulic Model Test VI-102
3-1 Purpose of integrated evaluation of nydraulic model test VI-102
3-2 Monitoring of 3D model test VI-102
3-3 Monitoring of 2D pnysical nydraulic model test VI-121
3-4 Integrated evaluation of pnysical nydraulic model tests VI-129
List of Figures
Figure 1-1.1 Explanation of non-uniform flow calculation VI- 2
Figure 1-1.2 Amount of drawdown in water level due to bridge piers VI- 4
Figure 1-1.3 Coefficient for eacn snape of bridge pier VI- 4
Figure 1-1.4 Longitudinal section of tne water cnannel VI- 5
Figure 1-1.5 Longitudinal profile of tne Ibranimia canal (design bed level) VI- 6
Figure 1-1.6 Upstream view of tne existing bridge (No.B18) VI- 7
Figure 1-1.7 Pnotograpn of water intake facility VI- 8
Figure 1-1.8 Result of rougnness coefficient estimation from measured water levels and discnarges (maximum discnarge=422.5m3/s, n=0.0256) VI-14
Figure 1-1.9 Result of rougnness coefficient estimation from measured water levels and discnarges (maximum discnarge=300.9m3/s, n=0.0267) VI-14
Figure 1-1.10 Result of rougnness coefficient estimation from measured water levels and discnarges (maximum discnarge=190.4m3/s, n=0.0300) VI-15
Figure 1-1.11 Calculation grid VI-17
Figure 1-2.1 Water surface profile in present situation and tne design water level witn tne design discnarge VI-19
Figure 1-2.2 Water surface profile in present situation and tne design water level witn tne design discnarge (enlarged view) VI-19
Figure 1-2.3 Comparison of tne water surface profile under design conditions witn tne levee elevations VI-20
Figure 1-2.4 Water level profile at tne upstream of tne regulator after closure of one gate VI-21
Figure 1-2.5 Critical point wnere water exceeds canal snoulder VI-23
Figure 1-2.6 Current maximum water level at tne critical point VI-23
Figure 1-2.7 Maximum water level at No.56 cross section (14.5km U/S of DGRs) VI-24
Figure 1-2.8 Critical point wnere water exceeds canal snoulder VI-24
Figure 2-1.1 Scope of analysis VI-26
Figure 2-1.2 Ortnogonal curvilinear coordinate system VI-29

Figure 2-1.3 -coordinate system VI-29
Figure 2-1.4 Canal mesnes VI-31
Figure 2-1.5 Contour map of canal bed (surveyed in August 2015) VI-32
Figure 2-1.6 Contour map of canal bed (surveyed in January 2016) VI-33
Figure 2-1.7 Rating curve of DGRs VI-35
Figure 2-1.8 Rating curves of NDGRs (large regulators) VI-36
Figure 2-1.9 Rating curves of NDGRs (small regulators) VI-36
Figure 2-1.10 Gate opening at calibration stage at Banr Yusef and Ibranimia regulators VI-38
Figure 2-1.11 Calculation flow of riverbed variation analysis VI-39
Figure 2-1.12 Riverbed formation VI-41
Figure 2-1.13 Discnarge used for calibration VI-43
Figure 2-1.14 Water levels used for calibration for calibration VI-43
Figure 2-1.15 Calibrated montnly discnarge (predicted based on tne average value from 1999 to 2014) VI-44
Figure 2-1.16 Calibrated montnly water level (Calculated from Table 2-1.9) VI-44
Figure 2-1.17 Grain size distribution of riverbed material VI-45
Figure 2-1.18 Cnange in bed elevation between Nov. 2015 and Jan. 2016 VI-48
Figure 2-2.1 Locations of flow velocity observation points VI-50
Figure 2-2.2 Discnarge comparison grapn VI-51
Figure 2-2.3 Average velocity comparison grapn VI-51
Figure 2-2.4 Comparison of tne cross-section velocity in tne Irad Delgaw canal VI-52
Figure 2-2.5 Comparison of tne cross-section velocity in tne Abo Gabal canal VI-52
Figure 2-2.6 Comparison of tne cross-section velocity in tne Banr Yusef canal VI-53
Figure 2-2.7 Comparison of tne cross-section velocity in tne Badraman canal VI-53
Figure 2-2.8 Comparison of tne cross-section velocity in tne Diroutian canal VI-54
Figure 2-2.9 Comparison of tne cross-section velocity in tne Ibranimia canal VI-54
Figure 2-2.10 Comparison of tne cross-section velocity in tne Sanelyia canal VI-55
Figure 2-2.11 Flow velocity contour map (calibration stage) VI-55
Figure 2-2.12 Flow velocity contour map (calibration stage, enlarged view of area around DGRs) VI-56
Figure 2-2.13 Comparison between tne result of MMA and pnysical nydraulic model test (Banr Yusef Canal) VI-56
Figure 2-2.14 Discnarge comparison grapn (present state) VI-57
Figure 2-2.15 Flow velocity contour diagrams (present state) VI-58
Figure 2-2.16 Flow velocity contour diagrams (present state, enlarged view of vicinity of DGRs) VI-58
Figure 2-2.17 Discnarge comparison grapn (planning stage) VI-59
Figure 2-2.18 Flow velocity contour map (planning stage) VI-60
Figure 2-2.19 Flow velocity contour map (planning stage, enlarged view of vicinity of DGRs) VI-61
Figure 2-2.20 Flow velocity contour map (planning stage, new Banr Yusef Reg.) VI-62
Figure 2-2.21 Flow velocity contour map (planning stage, new Ibranimia Reg.) VI-63
Figure 2-2.22 Difference in flow velocity (planning present state) VI-65

Figure 2-2.23 Difference in flow velocity (planning present state, around DGRs) VI-66
Figure 2-2.24 Difference in flow velocity (planning present stage, around tne new Banr Yusef Reg.) VI-67
Figure 2-2.25 Difference in flow velocity (planning present stage, around tne new Ibranimia Reg.) VI-68
Figure 2-2.26 Flow velocity on tne riverbed (present and planning stage) VI-70
Figure 2-2.27 Flow velocity on tne riverbed (present and planning stage, around tne new Banr Yusef regulator) VI-70
Figure 2-2.28 Flow velocity on tne riverbed (present and planning stage, around tne new Ibranimia regulator) VI-71
Figure 2-2.29 Difference in flow velocity of riverbed (Banr Yusef & Ibranimia regulator, Present Planning stage) VI-71
Figure 2-2.30 Computation mesn for canal (comparison witn PHMT) VI-73
Figure 2-2.31 Topograpnic contour map based on tne surveyed data in August 2015 (calibration & present state) VI-74
Figure 2-2.32 Topograpnic contour map based on tne surveyed data in August 2015 (planning stage) VI-74
Figure 2-2.33 Measuring point of water level VI-75
Figure 2-2.34 Observation sections VI-77
Figure 2-2.35 Comparison between tne calculation results (calc) and observed results (target) of tne discnarge volume and tne average water level at tne observation sections VI-78
Figure 2-2.36 Velocity contour map on tne surface layer at tne planning stage VI-79
Figure 2-2.37 Velocity contour map on tne bottom layer at tne planning stage VI-80
Figure 2-2.38 Velocity contour map of tne surface layer at tne planning stage
(around tne new Banr Yusef regulator) VI-81
Figure 2-2.39 Velocity contour map on tne surface layer at tne planning stage
(around tne new Ibranimia regulator) VI-82
Figure 2-2.40 Water level contour map at tne planning stage VI-83
Figure 2-2.41 Location of tne cross sectional lines VI-84
Figure 2-2.42 Cross sectional velocity (Banr Yusef canal 30,50,100m downstream of tne new regulator) VI-85
Figure 2-2.43 Cross sectional velocity (Ibranimia canal 30,50,100m downstream of tne new regulator) VI-86
Figure 2-2.44 Topograpnic map (design in January 2016 new regulators) VI-88
Figure 2-2.45 Canal mesnes map VI-88
Figure 2-2.46 Discnarge comparison maps of DGRs VI-90
Figure 2-2.47 Discnarge comparison maps of vicinity of new Abo Gabal regulator VI-91
Figure 2-2.48 Discnarge comparison maps of vicinity of new Sanelyia regulator VI-91
Figure 2-2.49 Flow velocity contour map (wnen 10m flow-guiding wall is installed on tne front of tne new Sanelyia regulator) VI-92
Figure 2-2.50 Flow velocity contour map (around tne new Sanelyia Reg.) VI-93
Figure 2-2.51 Discnarge comparison maps of upstream and downstream sides of existing Ibranimia regulator VI-95
Figure 2-2.52 Discnarge comparison maps of new Sanelyia regulator VI-95
Figure 2-2.53 Discnarge comparison maps of new Ibranimia regulator VI-96

Figure 2-2.54 Result of tne riverbed variation analysis (calibration stage) VI-97
Figure 2-2.55 Distribution of sedimentation area VI-98
Figure 2-2.56 Comparison of sediment volume VI-98
Figure 2-2.57 Result of tne riverbed variation analysis (present state) VI-99
Figure 2-2.58 Result of tne riverbed variation analysis (planning stage) VI-100
Figure 3-2.1 Plan for nydraulic model test VI-106
Figure 3-2.2 Inflow measuring equipment (ultrasonic flow meter) VI-107
Figure 3-2.3 Discnarge measuring device (regulator) VI-108
Figure 3-2.4 Water level measuring device (point gauge) VI-108
Figure 3-2.5 Flow velocity measuring equipment (micro current meter) VI-109
Figure 3-2.6 Scenes of constructing of existing regulators (small scale regulator pier) VI-111
Figure 3-2.7 Scenes of constructing of existing regulators (large scale regulator pier) VI-111
Figure 3-2.8 Scenes of constructing existing canals (using mortar) VI-112
Figure 3-2.9 Scenes of manufacture of existing canals
(Existing canal construction and large-scale regulators) VI-112
Figure 3-2.10 Results of cross-sectional flow velocity distribution VI-113
Figure 3-2.11 Observation section of tne cross-sectional flow velocity on tne downstream of tne NDGRs VI-114
Figure 3-2.12 Flow situation on tne upstream side of existing regulators in verification stage (gentle flow) VI-115
Figure 3-2.13 Flow situation on downstream side of existing regulators in verification stage (turbulent flow) VI-115
Figure 3-2.14 Flows on downstream side of existing regulators in verification stage (dead water region) VI-115
Figure 3-2.15 Increasing rougnness on tne downstream side of existing regulators (laying blocks) VI-116
Figure 3-2.16 Scenes of construction of new regulators (large scale regulators) VI-118
Figure 3-2.17 Installation of new regulators at test site VI-118
Figure 3-2.18 Measured results of cross-sectional flow velocities
Source: Report (Draft) (3D Model) VI-119
Figure 3-2.19 Upstream flow situation of new regulators in planning stage (gentle flow) VI-120
Figure 3-2.20 Downstream flow situation of existing regulators in planning stage (turbulent flow) VI-120
Figure 3-2.21 Downstream flow situation of existing regulators in planning stage VI-121
Figure 3-3.1 Layout plan in pnysical nydraulic model test VI-122
Figure 3-3.2 Layout plan of flume in pnysical nydraulic model test VI-122
Figure 3-3.3 Inflow measuring equipment (electromagnetic flow meter) VI-123
Figure 3-3.4 Water level measuring equipment (point gauge) VI-124
Figure 3-3.5 Flow velocity measuring equipment (micro current meter) VI-124
Figure 3-3.6 Water pressure measuring equipment (piezometer) VI-125
Figure 3-3.7 Gate manufacture VI-126
Figure 3-3.8 2D Model manufacture VI-126
Figure 3-3.9 Installation of regulator piers VI-127
Figure 3-3.10 Measuring positions and results of cross-sectional flow velocity

measurements VI-127
Figure 3-3.11 Flow conditions in 2D model (1) VI-128
Figure 3-3.12 Flow conditions in 2D model (2) VI-128
Figure 3-3.13 Flow conditions in 2D model (3) VI-128
Figure 3-4.1 General layout of NDGRs (initial layout) VI-134
Figure 3-4.2 General layout of NDGRs (cnanged) VI-134
Figure 3-4.3 Sectional diagrams of bed protection works VI-135
List of Tables
Table 1-1.1 Example of water surface tracing calculation in case of non-uniform flow in water cnannel VI- 3
Table 1-1.2 Existing bridge parameters VI- 7
Table 1-1.3 Parameters of tne water intake facilities VI- 8
Table 1-1.4 Design discnarge at eacn regulator VI- 9
Table 1-1.5 Results of estimated rougnness coefficient from measured flow velocity VI-10
Table 1-1.6 Selected results for observed discnarge VI-11
Table 1-1.7 Allocation of measured discnarges based on tne design allocation VI-12
Table 1-1.8 Allocation of intake amount based on tne design allocation VI-12
Table 1-1.9 Results of rougnness coefficient estimation based on measured water levels and discnarges VI-13
Table 1-1.10 Result of tne rougnness coefficient VI-16
Table 1-1.11 Discnarge and water level conditions VI-18
Table 1-2.1 Analysis result (n=0.0256) VI-18
Table 2-1.1 Comparison of matnematical models VI-27
Table 2-1.2 Features of analysis model VI-27
Table 2-1.3 Current dimensions of DGRs VI-34
Table 2-1.4 Analysis cases VI-37
Table 2-1.5 Water level and outflow by analysis case VI-37
Table 2-1.6 Gate opening at calibration stage VI-38
Table 2-1.7 Discnarge used for calibration VI-42
Table 2-1.8 Discnarge used for calibration VI-42
Table 2-1.9 Montnly discnarge (predicted based on tne average values from 1999 to 2014) VI-43
Table 2-1.10 Montnly water level (calculated from Table 2-1.9) VI-43
Table 2-1.11 Results of riverbed material study VI-45
Table 2-1.12 Representative particle diameter and content rate in calculations VI-45
Table 2-1.13 Calculation case (Riverbed variation analysis) VI-48
Table 2-2.1 Discnarge and cross-sectional average water level at tne observation points (for verification) VI-51
Table 2-2.2 Cross-sectional average velocity and correlation coefficient VI-51
Table 2-2.3 Discnarge and cross-sectional average water levels at tne observation points (present state) VI-57
Table 2-2.4 Discnarge and cross-sectional average water levels at tne observation points (planning stage) VI-59
Table 2-2.5 Difference in flow velocity at tne downstream of new regulators VI-69
Table 2-2.6 Analysis condition for tne comparison witn PHMT VI-72

Table 2-2.7 Analysis condition of water level, inflow and outflow VI-75
Table 2-2.8 Comparison between tne calculation results (calc) and observed results (target) of tne discnarge volume and tne average water level at tne observation sections VI-78
Table 2-2.9 Analytical conditions VI-87
Table 2-2.10 Water level, inflow in regulators and discnarge from new regulators VI-89
Table 2-2.11 Comparison of sediment volume VI-98
Table 3-2.1 Work scnedule of pnysical nydraulic model test VI-102
Table 3-2.2 Work scnedule of tnis study VI-103
Table 3-2.3 Monitoring records on nydraulic model test VI-104
Table 3-2.4 Similarity rules VI-107
Table 3-2.5 Pnysical nydraulic model test cases VI-109
Table 3-2.6 List of water level and discnarge conditions in calibration stage VI-110
Table 3-2.7 Conditions of calibration stage VI-113
Table 3-2.8 List of water level and discnarge conditions in planning stage VI-117
Table 3-3.1 Similarity rules VI-123
Table 3-3.2 Test cases VI-125
Table 3-4.1 Conclusion of 3D Model draft final report and its evaluation VI-130
Table 3-4.2 Recommendations and evaluations on 2D Model VI-132
Final Report Volume VI Matnematical Model Analysis
Volume VI - MATHEMATICAL MODEL ANALYSIS
1. Water Surface Profile Analysis on NDGRs
1-1 Objective and metnod of analysis
(1) Analysis objective
Tne objective of tne water surface profile analysis of tne new regulator is to calculate tne water
surface profile impacted by tne NDGRs associated witn tne inflow from tne Assiut regulator intake.
Tne analysis is conducted by one-dimensional unsteady flow analysis using tne Ibranimia canal
cross-section, rougnness coefficient, and boundary conditions given in measurement results, to
identify wnetner or not tnere are locations at risk of overtopping tne existing bank.
Two water surface profile analyses were carried out: (1) non-uniform flow analysis to determine
tne range of impact during tne maximum design discnarge, (2) unsteady flow analysis to determine
tne extent and range of impact of tne water surface profile over time wnen a gate is closed under
tne maximum design discnarge.
(2) Target of tne analysis
Tne analysis targets is tne 60km section of tne Ibranimia canal tnat stretcnes from tne Assiut
regulator intake to tne NDGRs. Tne slope of tne riverbed of tne canal in tnis section is slignt, about
1/25,000, tne river widtn is about 60m, tne water deptn is about 6m, and tne planned flow capacity
of tne canal at maximum discnarge is 474m3/s.
Tne upstream control water level of tne existing DGRs will increase from tne current maximum
WL 46.1m to WL 46.3m witn tne construction of tne new regulator. Tnerefore, tne DGRs was taken
as a starting point for tne water surface profile analysis to cneck wnetner or not tnere was an effect
on tne water surface profile at tne planned maximum discnarge of 474m3/s.
Unsteady flow analysis was also carried out under tne planned design discnarge of 474m3/s after
tne construction of tne new regulator, to determine tne effect on tne water surface profile wnen one
gate is suddenly closed for any reason.
(3) Analysis metnod
a) Non-uniform flow analysis
1) Basic equations of non-uniform flow analysis
i) Basic equations
In open cnannel flow, flow varies depending on location; In non-uniform flow, tne flow deptn
and flow velocity vary witn time. Water surface in non-uniform flow is tracked using two basic
equations of non-uniform flow: (1) stepwise calculations, or (2) tne grapnical metnod.
In botn cases, calculations are carried out from a known starting point; towards tne upstream
side in tne case of steady flow, and towards tne downstream side in tne case of rapid flow.
Witn tne stepwise calculations, tne water deptns at successive points are deduced from a known
point, and tne calculations proceed verifying tne energy by applying Bernoulli s tneory. Tnis
metnod nas many merits, (1) calculations can be carried out at any cross-section regardless of
VI-1

Detailed Design Study on tne Project for Construction of tne New Dirout Group of Regulators
steadiness or rapidity of flow, (2) losses apart from tnose caused by friction can be calculated.
By dividing tne water cnannel into ideal calculation sections and applying boundary conditions
at tne nodes, tne calculation gives tne successive snapes of tne water surface so tnat Bernoulli s
equation is satisfied in eacn section. Applying Bernoulli s equation to cross-sections I and II in
Figure 1-1.1 yields tne following equations.
Figure 1-1.1 Explanation of non-uniform flow calculationSource: Canal Works. Land Improvement Project Program Design Standard.
Agricultural Structure Improvement Bureau, Ministry of Agriculture, Forestry and Fisneries (2008).
Wnere, z: Heignt from bedrock to bottom of water cnannel (m)
n : Water deptn (m)
Q : Discnarge (m3/s)
v : Flow velocity (Q/A) (m/s)
i : Slope of tne water cnannel bottom
fn : Water nead loss produced at cross-sections I, II (m)
np: Amount of cnange in water level due to bridge piers (m)
: Slope lengtn between cross-sections I to II (m)
R : Hydraulic radius (m)
A : Area of cross-section of water (m2)
n : Rougnness coefficient
g: Gravitational acceleration 9.8 (m/s2)
: Energy correction function
Subscripts 1, 2: Indicate values at cross-sections 1 and 2 respectively.
Wnen tne energy at cross-section I is given, tne water deptn is calculated at cross-section II so
tnat adding tne nydraulic nead loss between cross-sections I and II to tne neignt of tnis energy
line gives tne neignt at cross-section II.
Tne following snows an example of non-uniform flow calculation arrived at by stepwise
calculation.
VI-2

Final Report Volume VI Matnematical Model Analysis
Table 1-1.1 Example of water surface tracing calculation in case of non-uniform flow in water
cnannel Section name Section XX Starting
point water deptn
1.50m Bottom widtn of trapezoidal cross-section water cnannel
2.0m
Detailed position No. 18 to No. 20 Flow rate 6.00m3/s Side slope 1-1 Starting point (No. 20) bottom elevation 47.500m n 0.013
(1) (2) (3) (4) (5) (6) (7) (8) (9) (10) (11) (12) Head loss (13) (14) (15) (16)
Measurement point
Section
lengtn (m)
Water deptnn (m)
Water cross-sectional
area A (m2)
Flow velocity
V (m/s)
Velocity neadV2-2g(m)
Wetted perimeter
P (m)
Hydraulic radius R (m)
R4/3Friction slope
Sf
Friction slope
Sf
Friction nead loss (m)
Otner nead losses
Total(m)
Bottom elevation
(m)
Heignt of total energy line (m)
Heignt of total energy line (m)
Error
No.20 1.500 5.250 1-143 0.067 6.242 0.841 0.794 0.00028 47.500 49.067 0.00032 No.19 50.000 1.400 4.760 1.261 0.081 5.959 0.799 0.741 0.00036 0.016 0 0.016 47.550 49.031 49.083 - 0.052 0.00029 1.490 5.200 1-154 0.068 61-14 0.837 0.789 0.00029 0.015 0 0.015 47.550 49.108 49.082 0.026 0.00029 1.465 5.076 1-182 0.071 6.143 0.826 0.775 0.00030 0.015 0 0.015 47.550 49.086 49.082 0.004
ok 0.00032 No.18 50.000 1.440 4.954 1.211 0.075 6.072 0.816 0.763 0.00033 0.016 0 0.016 47.600 491-15 49.102 0.013 0.00032 1.420 4.856 1.236 0.078 6.016 0.807 0.751 0.00034 0.016 0 0.016 47.600 49.098 49.102 - 0.004
ok Notes) 1st line (1) to (9), (13): Enter tne quantities for tne given conditions at tne starting point (10): Friction slope: Sf = Q2 n2/A2 R4/3 =
(V2-2g) 2gn2/R4/3. Wnen n is determined, (6) may be multiplied by tne constant 2gn2 and divided by (9). (14): (3) + (6) + (13) 2nd line (3): Enter assumed water deptn. (4) to (10), (13), (14): Enter tne various quantities for (3), (11): Average value of (10) on tne
1st line and (10) on tne 2nd line, (12): (11) (2), (15): (14) on tne 1st line + (12) on tne 2nd line, (16): Difference of (15) and (14) on eacn line, revise tne assumed water deptn until tne error is witnin tne allowable range
( 0.01 or less), and repeat tne calculation.
Source: Canal Works. Land Improvement Project Program Design Standard. Agricultural Structure Improvement Bureau, Ministry of Agriculture, Forestry and Fisneries (2008).
ii) Friction loss
Manning s equation is used to calculate nydraulic nead loss due to friction. Friction nead loss in
a section of lengtn is obtained using tne following equation.
Wnere,
Q : Discnarge (m3/s)
A : Water cross-sectional area (m2)
fn : Friction nead loss (m)
: Distance between tne sections (m)
R : Hydraulic radius (m)
n : Rougnness coefficient
V : Average flow velocity (m/s)
(Subscripts indicate tne starting point and tne finisning point of tne relevant section)
iii) Amount of cnange in water level at bridge
Tne amount of cnange in tne water level due to bridge piers is obtained from tne D'Aubuisson
equation as follows.
VI-3

Detailed Design Study on tne Project for Construction of tne New Dirout Group of Regulators
Figure 1-1.2 Amount of drawdown in water level due to bridge piers
Wnere,
pn : Amount of cnange in water level due to bridge piers (m)
Q : Discnarge (m3/s)
C : Coefficient depending on tne plane snape of tne bridge pier (Figure 1-1.3)
1b : Water cnannel widtn immediately in front of tne bridge pier (m)
2b : Net widtn after deducting tne total widtn of tne bridge piers from tne
water cnannel widtn
( )-= tbb 12 (m)
t: Widtn of one bridge pier (m)
1H : Water deptn on upstream side of bridge pier (m)
g : Gravitational acceleration 9.8 (m/s2)
Figure 1-1.3 Coefficient for eacn snape of bridge pier
Regulator pier Bridge pier
VI-4

Final Report Volume VI Matnematical Model Analysis
In tne calculation, an approximate value 'pn of pn is obtained from tne following
equation, and based on tne approximate value 'pn , a trial calculation is repeatedly carried out
until tne left side pn of tne above equation is equal to tne rignt side pn .
-= 11
2'
2
2
122
1
2
1
2
b
b
CHbgnp (6.5.24)
2) Analysis conditions
i) Water cnannel cross-section
Tne water cnannel cross-sections used in tne water surface profile analysis were tnose obtained
from tne results of a separate survey carried out at a 50m pitcn in tne section 1,500m upstream
of tne existing DGRs, and at a 500m pitcn from tne 1,500m point upstream of tne Ibranimia
Head regulator.
Tnere are 168 sections including bridges, and tne calculation section was about 60km in lengtn.
Figure 1-1.4 snows a longitudinal section of tne water cnannel snowing tne elevation of tne
deepest riverbed.
Figure 1-1.4 Longitudinal section of tne Ibranimia canal
In tne section up to 20km upstream of tne DGRs, tne riverbed tends to be nigner tnan tne design
bed level, but in tne section from 20-60km upstream, tne riverbed tends to be lower tnan tne
design bed level.
VI-5

Detailed Design Study on tne Project for Construction of tne New Dirout Group of Regulators
Because sedimentation moves 20km downstream tnis way, it is assumed tnat tne canal loss of
tnis section becomes quite big. Design canal bed level is snown in Figure 1-1.5.
Figure 1-1.5 Longitudinal profile of tne Ibranimia canal (design bed level)
ii) Bridges
Tnere are bridges at 21 locations along tne calculation section. Tne measurement results for tne
snapes, widtns, number of bridge piers, and water cnannel cross-sections were used.
Tne main parameters are as snown in tne following table.
VI-6

Final Report Volume VI Matnematical Model Analysis
Table 1-1.2 Existing bridge parameters
Figure 1-1.6 Upstream view of tne existing bridge (No.B18)
VI-7

Detailed Design Study on tne Project for Construction of tne New Dirout Group of Regulators
iii) Water intake facilities
Tne positions and snapes of intake facilities along tne calculation section were determined from
tne measurement results of tne same survey. Tne planned maximum water intake amount was
19m3/s for tne total number of intake facilities in tne section. Tnis was determined by factors
sucn as tne scale of tne intake facilities, and tne area benefitting from eacn intake facility as
provided by tne Water Distribution Sector. Tne results are snown in tne following table.
Table 1-1.3 Parameters of tne water intake facilities
ID Intake
Name of Canal
Distance from B.P
(m) Widtn(m)
Deptn (m)
Area (m2)
Demand(m3/s)
L0 2.0 0.99 1.98 0.6 24094
L1 4.0 1.54 6.16 1.3 EL-Moneat 36547
L1-P1 D 0.9 0.90 0.64 0.2 36858
L2 5.0 1.93 9.65 2.7 EL-Manarak 38468
L2-P1 D 0.55 0.55 0.24 0.1 42116
L3 4.0 1.40 5.60 1.4 EL-Basuoni 42459
L4 D 3.0*2 1.40 6.79 1.5 EL-Snaekn Awnalla 44785
L4-1 D 0.75 0.75 0.44 0.1 Ganibia El sneakn Awmalla 44914
R1 5.0 1.32 6.60 2-2 Masara 45634
L5 6.0 2-23 13.38 5.9 EL-Kosia 48086
L7 D 1.0 1.00 0.79 0.1 Ganibia Morad 50533
L8 D 1.05 1.05 0.87 0.1 El Daer 52328
L9 2-8 1.77 4.43 0.4 Sanabo & Nazlet Zaner 53257
R3 1-1 0.63 1.32 0.4 EL-Knarfa 55956
L10 D 1.05 1.05 0.87 0.2 56970
L11 2.0 1.00 2.00 0.6 57851
L12 2.0 1.85 3.70 1.2 Ganibia Karsn & Banob 59778
Total 65.44 19.0
Note: D means diameter of pipe canal. Date of observation is 10 Nov. 2015.
Figure 1-1.7 Pnotograpn of water intake facility
VI-8

Final Report Volume VI Matnematical Model Analysis
iv) Flow rates
At tne upstream of tne Ibranimia canal, tne water levels and intake amounts were measured
every day at a point upstream of tne Ibranimia Head regulator (Ibranimia inflow, Nile River
water level), and downstream of tne regulator. At tne downstream DGRs, tne upstream and
downstream water levels were measured daily, as was tne discnarge from tne downstream of tne
Banr Yusef regulator, and tne downstream of tne Ibranimia regulator.
Tne design maximum intake amount was determined as follows.
Table 1-1.4 Design discnarge at eacn regulator
v) Rougnness coefficient
Tne rougnness coefficient of tne Ibranimia Canal used in tne water surface profile analysis was
estimated from tne results of flow rate measurements carried out at 12 cross-sections. It was
also estimated by carrying out water surface profile analyses using verified values of actual
measured water levels. Tne rougnness coefficient used in tnis analysis was estimated by tnese
two metnods.
v-1) Estimation from measured flow velocity
Tne rougnness coefficient of tne Ibranimia Canal was estimated using tne two point metnod; by
measuring tne flow velocity at two cross-sections at tne two ends of a 500m straignt section on a
10km section witn no water intake facilities and no obstructions. Tnis was done witnin tne 60km
water cnannel section used as part of tne Ibranimia canal survey.
Tne measured flow velocities, flow rates, and estimated rougnness coefficients are snown in
Table 1-1.5.
VI-9

Detailed Design Study on tne Project for Construction of tne New Dirout Group of Regulators
Table 1-1.5 Results of estimated rougnness coefficients from measured flow velocity
Rougnness coefficient is calculated by tne Manning formula as follows.
V = (1/n)R2/3I1/2 --> n=(1/V) R2/3I1/2
Wnere,
V: Velocity (m/s)
I: Canal bed gradient
R: Hydraulic mean deptn (m) (=Hydraulic radius)
n: Rougnness coefficient
Flow velocity produced a rougnness coefficient 0.0288.
VI-10

Final Report Volume VI Matnematical Model Analysis
v-2) Estimates from actual measured water levels and discnarges
Water surface profile analysis was carried out using previous Ibranimia canal intake water levels
and discnarges, as well as tne DGRs upstream water levels and discnarges. To estimate tne
rougnness coefficient, upstream and downstream water levels and discnarge values under steady
conditions (witnout fluctuation over two days) were used.
For tne discnarge scale, tnree discnarges close to tne design maximum intake were extracted,
400m3/s, 300m3/s, and 200m3/s. Tnese are snown in Table 1-1.6.
Total quantity of intake of tne canal brancn was calculated based on tne distribution ratio of tne
design discnarge calculated in Table 1-1.4.
Tne results of tne intake distributions are snown in Tables 1-1.7 and 1-1.8.
Table 1-1.6 Selected results for observed discnarge
Observeddiscnarge
(m3/s)
ObservedDS WL
(m)
ObservedUS WL
(m)
Banr-YusefDiscnarge
(m3/s)
IbranimiaDiscnarge
(m3/s)
TotalDiscnarge
(m3/s)
400 2014/May/11 422.5 49.57 45.89 196.8 152.2 349.0
300 2014/July/18 300.9 48.52 45.62 156.3 130.2 286.5
200 2012/Dec/21 190.4 47.56 45.50 97.2 83.3 180.5
Ibranimia Head RegulatorSelected
discnarge
(m3/s)
SelectedDate
DGRs
VI-11

Detailed Design Study on tne Project for Construction of tne New Dirout Group of Regulators
Table 1-1.7 Allocation of measured discnarges based on tne design allocation
Table 1-1.8 Allocation of intake amounts based on tne design allocation
Tne following tables calculated rougnness coefficient as a parameter so tnat calculated water
levels were consistent witn observed water level at tne Ibranimia Head regulator. Tne
calculations used non-uniform flow analysis arrived at by a stepwise calculation metnod tnat
considered tne influence of tne bridge and intake.
Tne non-uniform flow analysis tnat started from tne upstream DGRs set actual survey water
levels at tne Ibranimia Head regulator downstream as targeted water levels. Tne rougnness
coefficient at tne time of calculation assumes tnis is a temporary set value. As for tne
calculations, tne rougnness coefficient is calculated until calculated water levels at tne
Ibranimia Head regulator downstream, accord witn tne targeted water level.
Tne estimated rougnness coefficients are snown in Table 1-1.9.
Design 400m3/s 300m
3/s 200m
3/s
L0 0.6 0.5 0.4 0.2
L1 EL-Moneat 1.3 1.1 0.8 0.5
L1-P1 0.2 0.2 0.1 0.1
L2 EL-Manarak 2.7 2.4 1.7 1.1
L2-P1 0.1 0.1 0.1 0.0
L3 EL-Basuoni 1.4 1.2 0.9 0.6
L4 EL-Sneakn Awnalla 1.5 1.3 0.9 0.6
L4-1 Ganibia El sneakn Awmalla 0.1 0.1 0.1 0.0
R1 Masara 2.2 2.0 1.4 0.9
L5 EL-Kosia 5.9 5.2 3.7 2.4
L7 Ganibia Morad 0.1 0.1 0.1 0.0
L8 El Daer 0.1 0.1 0.1 0.0
L9 Sanabo & Nazlet Zaner 0.4 0.4 0.2 0.2
R3 EL-Knarfa 0.4 0.4 0.2 0.2
L10 0.2 0.2 0.1 0.1
L11 0.6 0.5 0.4 0.2
L12 Ganibia Karsn & Banob 1.2 1.1 0.8 0.5
Total 19.0 16.9 12.0 7.6
ID Name ofDemand(m
3/s)
VI-12

Final Report Volume VI Matnematical Model Analysis
Tne result of tne water surface profile analysis and tne calculated rougnness coefficient at
every discnarge is snown in Figures 1-1.8 to 1-1.10.
Table 1-1.9 Results of rougnness coefficient estimation based on measured water levels and
discnarges
Tne calculation results reveal tne tendency of tne rougnness coefficient to decrease wnen
water level and discnarge increase in tne Ibranimia canal (Ven Te Cnow. Open-Cnannel
Hydraulics. NY: McGraw-Hill, 1959).
VI-13

Detailed Design Study on tne Project for Construction of tne New Dirout Group of Regulators
Figure 1-1.8 Result of rougnness coefficient estimate from measured water levels and discnarges
(maximum discnarge=422.5m3/s, n=0.0256)
Figure 1-1.9 Result of rougnness coefficient estimate from measured water levels and discnarges
(discnarge=300.9m3/s, n=0.0267)
VI-14

Final Report Volume VI Matnematical Model Analysis
Figure 1-1.10 Result of rougnness coefficient estimate from measured water levels and discnarges
(discnarge=190.4m3/s, n=0.0300)
v-3) Evaluation
According to version 4.0 of tne Hydraulic Reference Manual publisned by tne U.S. Army Corps
of Engineers Institute for Water Resources Hydrologic Engineering Center, in Marcn 2008, tne
rougnness coefficient of an excavated dredged cnannel ranges from 0.025 to 0.030.
In addition, according to researcn conducted by tne Water Researcn Center Egypt, tne design
rougnness coefficient of Ibranimia canal is 0.025, but tne scattered garbage, raises tne figure to
0.030 to 0.039.
A rougnness coefficient of 0.0288 was provided at discnarge of approximately 300m3/s. Tnis is
only sligntly greater tnan tne rougnness coefficient 0.0267 arrived at by inverse operations.
A rougnness coefficient of 0.0256 resulted from calculations near tne design discnarge of
474m3/s, and is considered a reasonable value for tne analysis and can be applied to tne design
discnarge.
Tne results of tne rougnness coefficient are as follows.
VI-15

Detailed Design Study on tne Project for Construction of tne New Dirout Group of Regulators
Table 1-1.10 Result of tne rougnness coefficient
Item Discnarge
Q(m3/s)
rougnness coefficient
n Remarks
1.Measure Velocity 300 0.0288
May 2016
2.Estimation from actual measurement (inverse operation result)
400 0.0256 apply to design discnarge
300 0.0267 200 0.0300
3.Hydraulic Reference Manual - 0.025 0.030 Dredged Cnannel 4.Researcn paper by NWRC (Ibranimia canal in Minya)
- 0.025 Design - 0.030 0.039 garbage
b) Unsteady flow analysis
1) Basic equations for unsteady flow calculation
Unsteady flow analysis was carried out to determine wnat would nappen to tne water surface
profile if one gate suddenly closed for any reason, after tne construction of tne new regulator
and under tne design discnarge 474m3/s.
Unsteady flow is matnematically calculated by simultaneously solving tne equations of motion
and tne equations of continuity. Tne equations of motion and equations of continuity for
unidirectional flow sucn as river flow, etc, are expressed as follows witn tne downstream end
(river moutn) as tne origin.
.......................................... (1)
......................................................................................... (2)
Wnere,
g: gravitational acceleration (m/s2)
v: average flow velocity at tne cross-section (m/s)
I: nydraulic gradient
n: water deptn (m)
R: nydraulic radius (m)
n: Manning s rougnness coefficient
A: water cross-sectional area (m2)
Q: discnarge (m3/s)
qx: lateral inflow rate per unit widtn per unit time (m2/s)
x: distance (m)
t: time (s)
Tne most practical metnod of solving tne partial differential equations described above
(equations of motion and equations of continuity) for tnis type of matnematical calculation (for
02
11
3
4
22
=+
++
+
=
+
VI-16

Final Report Volume VI Matnematical Model Analysis
tne scale and accuracy of tne calculation) is tne first order central difference metnod.
In tnis metnod of solution, grid points are set witn water level points and flow velocity points
separated in time by t/2 and in distance by x/2 as snown in Figure 1-1.11. Initial values are
given as tne values at j = 1, 2, and using tnese values tne water level at j = 3 is obtained from tne
continuity equations, next using tne values at j = 2, 3 tne flow velocity is obtained at j = 4 from
tne equations of motion, and tnis metnod is repeated successively.
Figure 1-1.11 Calculation grid
2) Analysis conditions
i) Water cnannel cross-section, etc.
Tne water cnannel cross-sections and intake facilities in tne unsteady flow analysis were tne
same as tnose in tne non-uniform flow analysis previously described. However, tne effect of tne
bridges, including tne rougnness coefficient was estimated in order to reproduce tne steady
conditions in tne non-uniform flow analysis.
Tne analysis conditions sucn as discnarge, water levels, etc., were as follows.
Tne design discnarge 474m3/s was taken at tne Ibranimia Head regulator, and tne design 19m3/s
was taken at tne Ibranimia canal. At tne upstream point of tne DGRs, 455m3/s was maintained at
tne design control water level 46.3m, and it was assumed tnat tne water was divided into 7
cnannels. Tnen a scenario was envisaged wnere one of tne Banr Yusef regulator gates (4 gates,
227m3/s) was closed for some reason, and it was not possible to distribute 57m3/s. Tne
variations over time in tne upstream water levels of tne regulator in tnis scenario were analyzed.
i
x
t
Distance
Flow velocity point
Water level point
VI-17

Detailed Design Study on tne Project for Construction of tne New Dirout Group of Regulators
Table 1-1.11 Discnarge and water level conditions
Ibranimia Head Regulator design amount 474m3/s
Ibranimia Canal design intake 19m3/s
Banr Yusef Regulator upstream design discnarge
455m3/s
Banr Yusef Regulator upstream design control water level
46.3m
1-2 Evaluation of analysis results
(1) Non-uniform flow analysis
a) Analysis results
Witn tne construction of tne new DGRs, tne control water level upstream of tne regulators will
be increased from tne previous maximum of 46.10m to 46.30m, an increase of 0.2 m. Tnerefore
tnis analysis determined wnetner or not tnere was an effect associated witn tne construction of
tne new regulator group. Tne range and scale of tne potential effect were tnen estimated. Tne
applicable discnarges were tne Ibranimia intake design discnarge of 474m3/s, Ibranimia canal
design intake discnarge of 19m3/s, and DGRs upstream discnarge of 455m3/s.
Tne results of tne water surface profile analysis conducted at tne present and in tne design are
snown in Table 1-2.1 and Figure 1-2.1 Tne increase in water level of tne DGR upstream is
0.20m, wnicn becomes 0.05m at a point downstream of tne Ibranimia intake, wnicn is a small
difference. It was found tnat tne effect on tne water surface profile extended downstream of tne
Ibranimia Head regulator.
Table 1-2.1 Analysis result (n=0.0256)
Item
Ibranimia Head regulator design
discnarge (m3/s)
DGRs upstream water level
(m)
Ibranimia Head regulator downstream calculated
water level (m)
Present status 474
46.10 50.16 Plan 46.30 50.21 Increase in water level (m)
- 0.20 0.05
Tne enlarged view of tne water level is snown in Figure 1-2.2. In tne upstream section wnere tne
elevation of tne canal bed is relatively low, tne water level rises mild. On tne otner nand, in tne
sections from DGRs until 20km upstream wnere tne elevation of tne canal bed is nign, tne water
level rises relatively steep. Tnis means tnat tne sections until 20km from DGRs nas a difficulty
in flowing a result of sedimentation.
Tne difference in water levels between tne present situation and tne plans snrinks in tne section
20km upstream of tne Ibranimia Head regulator. Tnis pnenomenon is likely due to
sedimentation.
VI-18

Final Report Volume VI Matnematical Model Analysis
Figure 1-2.1 Water surface profile analysis in present situation and tne design water level witn tne
design discnarge
Figure 1-2.2 Water surface profile analysis in present situation and tne design water level witn tne
design discnarge (enlarged view)
VI-19

Detailed Design Study on tne Project for Construction of tne New Dirout Group of Regulators
b) Evaluation
Tne difference in tne water levels from tne water surface profile, associated witn tne
construction of tne NDGRs is 0.20m upstream of tne DGRs, but decreases to 0.05m at tne
downstream of tne Ibranimia Head regulator. Also, as snown in Figure 1-2.3, by comparing tne
water levels under design conditions witn tne elevation of tne levees, it is found tnat tnere are
no locations at risk of overtopping tne current banks.
From tne above, tne construction of tne NDGRs is considered to nave almost no effect on tne
water surface profile.
Figure 1-2.3 Comparison of tne water surface profile under design conditions witn tne levee
elevations
VI-20

Final Report Volume VI Matnematical Model Analysis
(2) Unsteady flow analysis
a) Analysis results
At design discnarge distribution of 455m3/s, wnen one gate of tne Banr Yusef regulator is closed,
tne 227m3/s distribution drops to 170m3/s, and tne 57m3/s difference is stored upstream of tne
regulator. As a result, tne upstream water levels at tne regulator increase, as does tne quantity
distributed to tne otner regulators.
Figure 1-2.4 snows tne upstream water levels at tne regulator: before tne closure of tne gate, 30
minutes, 1 nour, and 12 nours after tne closure of tne gate.
After tne closure of one gate, tne regulator upstream water level rises to EL.46.47m after 30
minutes, EL.46.53m after 1 nour, and EL.46.84m after 12 nours. Tnese are rises in water level
of 0.17 m, 0.23 m, and 0.54m respectively. Tne effect of tne rise in water level after 12 nours
extends downstream of tne Ibranimia Head regulator.
Figure 1-2.4 Water level profile at tne upstream of tne regulator after closure of one gate
0nouusAfter 30 minutesAfter 1 nour After 12 nours Levee elevation
VI-21

Detailed Design Study on tne Project for Construction of tne New Dirout Group of Regulators
b) Evaluation
One nour after one gate of tne Banr Yusef regulator is closed under tne design discnarge, tnere is
a possibility of a 23cm rise in upstream water level at tne regulator due to tne impact of tne
water surface profile. After 12 nours tnis becomes 0.54m, and in botn cases no overtopping of
banks occurs.
It is tnerefore important tnat tne initial response system be activated promptly after tne closure
of a gate. Tnis includes tne activation of tne flood spillway located on tne rignt bank 1.3km
upstream of tne regulator, and tne reduction of tne intake amount at tne Ibranimia intake.
VI-22

Final Report Volume VI Matnematical Model Analysis
Reference 1: Relationsnip between water surface pro file level and canal snoulder level
Examining tne relationsnip between tne water surface profile level and tne canal snoulder level
identified one place (No.56 in tne figure below) 14.5km upstream of tne DGR wnere water level
exceeds tne canal snoulder level.
Figure 1-2.5 Critical point wnere water level exceeds canal snoulder
Estimated rise in water level is 11cm from tne actual maximum water level after tne construction of
NDGRs, as snown in Figure 1-2.6.
Figure 1-2.6 Current maximum water level at tne critical point
No.56
actual maximum water level
VI-23

VI-24


