Embed Size (px)
Citation preview

SPINE Volume 25, Number 2, pp 147–157©2000, Lippincott Williams & Wilkins, Inc.
1999 Young Investigator Research Award WinnerPrognostic Factors for Time Receiving Workers’ CompensationBenefits in a Cohort of Patients With Low Back Pain
Greg McIntosh, MSc,*† John Frank, MD, MSc,*‡ Sheilah Hogg-Johnson, PhD,*‡Claire Bombardier, MD, MSc,‡** and Hamilton Hall, MD, FRCSC†
Study Design. Prospective inception cohort study.Objective. To develop a prognostic model that pre-
dicts time receiving workers’ compensation benefits forlow back pain claimants.
Summary of Background Data. As the cost and diffi-culty of managing low back pain escalate, any predictor ofoutcome is advantageous.
Methods. To obtain the outcome and predictor vari-ables, patient data from two separate databases werelinked: a clinical database and an administrative (Ontarioworkers’ compensation) database. Claimants injured be-tween January 1 and December 31, 1994, were includedand observed for 1 year from the date of accident. Theoutcome variable was cumulative number of calendardays receiving benefits.
Results. Multivariable Cox proportional hazards re-gression (forward stepwise) showed eight significant pre-dictors; five were associated with increased time receiv-ing benefits compared with their reference groups: 1)working in the construction industry, 2) older age, 3) lagtime from injury to treatment, 4) pain referred into the leg,and 5) three or more positive Waddell nonorganic signs.Three predictors were associated with reduced time re-ceiving benefits: 1) higher values of questionnaire score,2) intermittent pain, and 3) a previous episode of backpain. A predictive score was calculated to categorizeclaimants as at high or low risk for chronicity. When anarbitrary cutoff point was set at the 75th percentile ofpredictive score, negative predictive value was 94%.
Conclusion. This research identified eight factors fortime receiving workers’ compensation benefits amongclaimants with low back pain. This model discriminatesbetween high- and low-risk claimants. Few low-risk claim-ants continued to receive benefits for more than 3months. [Key words: back pain, Cox regression, incep-tion, prognosis, workers’ compensation] Spine 2000;25:
147–157
As the cost and complexity of managing low back painescalate, and all opportunities for primary and secondaryprevention of disability are seized, any predictor of out-come is advantageous. Most people with occupationallow back pain recover quickly.20 Yet, predicting futurechronic cases, shortly after symptom onset, is valuable,because this group accounts for a disproportionate frac-tion of the associated costs; the 7.4% of Quebec patients
with low back pain lasting longer than 6 months in 1981accounted for 73% of the medical costs and 76% ofcompensation and indemnity payments.1,52 The QuebecTask Force on Spinal Disorders57 concluded that, “Prog-nosis has become a matter of opinion and not of fact.Accordingly, the prudent clinician should be consciousof the need to identify, as early as possible, factors likelyto lead to chronic distress and chronic functional disabil-ity. Research into these factors is essential if managementstrategies are to succeed.”
The purpose of this study was to develop and validatea prognostic model, using survival analysis methods thatpredicts time that patients with low back pain receivedworkers’ compensation benefits. The research questionwas: Using patient information collected from a clinicaldatabase and manually linked with variables from anadministrative (workers’ compensation) database, whatare key predictors of time receiving benefits in this occu-pationally injured cohort?
Methods
Study Design. In this prospective prognosis study, an incep-tion cohort of 2007 Ontario Workers’ Safety & InsuranceBoard (WSIB)—formerly WCB—claimants was analyzed. Toobtain an inception cohort, subjects were sought once theybecame accepted lost-time claimants, reported for rehabilita-tion and were observed for 1 year after the accident date. In-clusion criteria focused on claimants who began treatment in arehabilitation program while in the acute or subacutestage.17,20 Chronic cases were omitted to avoid developing amodel based on cases in which the outcome had already oc-curred and thereby biasing the prediction of chronicity.33
Those with a previous history of spine surgery were excluded.Table 1 lists the inclusion criteria.
To obtain the outcome and predictor variables, patient datafrom two separate databases were linked. The clinical data-base, from the Canadian Back Institute (CBI), contained pa-tient data for routinely collected variables, obtained by eitherphysiotherapy assessment or patients’ self-reports. The admin-istrative database, from the WSIB Corporate Data Services,contains injured workers’ lost-time claims information. Theclaim number was the common field in both databases andallowed for linkage between the two. The WSIB database is thebest single source of information on work-related injuries inOntario; however, similar to many administrative databases, itlacks the clinical detail desirable for epidemiologic research.4
Therefore, linkage with the clinical database provided an op-portunity to enrich this investigation of claims-based data.
From the *Department of Public Health Sciences, University of To-ronto; †Canadian Back Institute; ‡Institute for Work and Health; and**Clinical Epidemiology and Health Care Research Program, Univer-sity of Toronto, Toronto, Ontario, Canada.Acknowledgment date: January 8, 1999.Acceptance date: May 27, 1999.Device status category: 1.
147

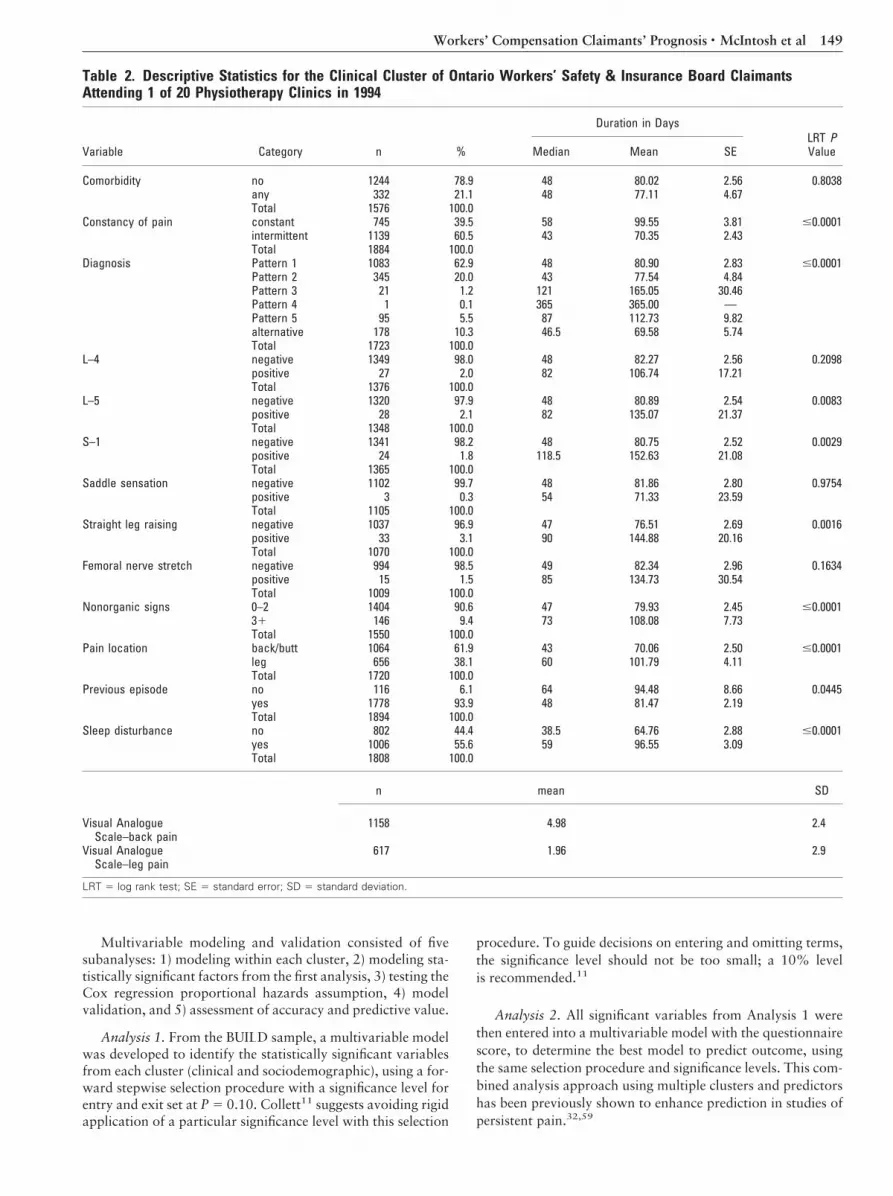
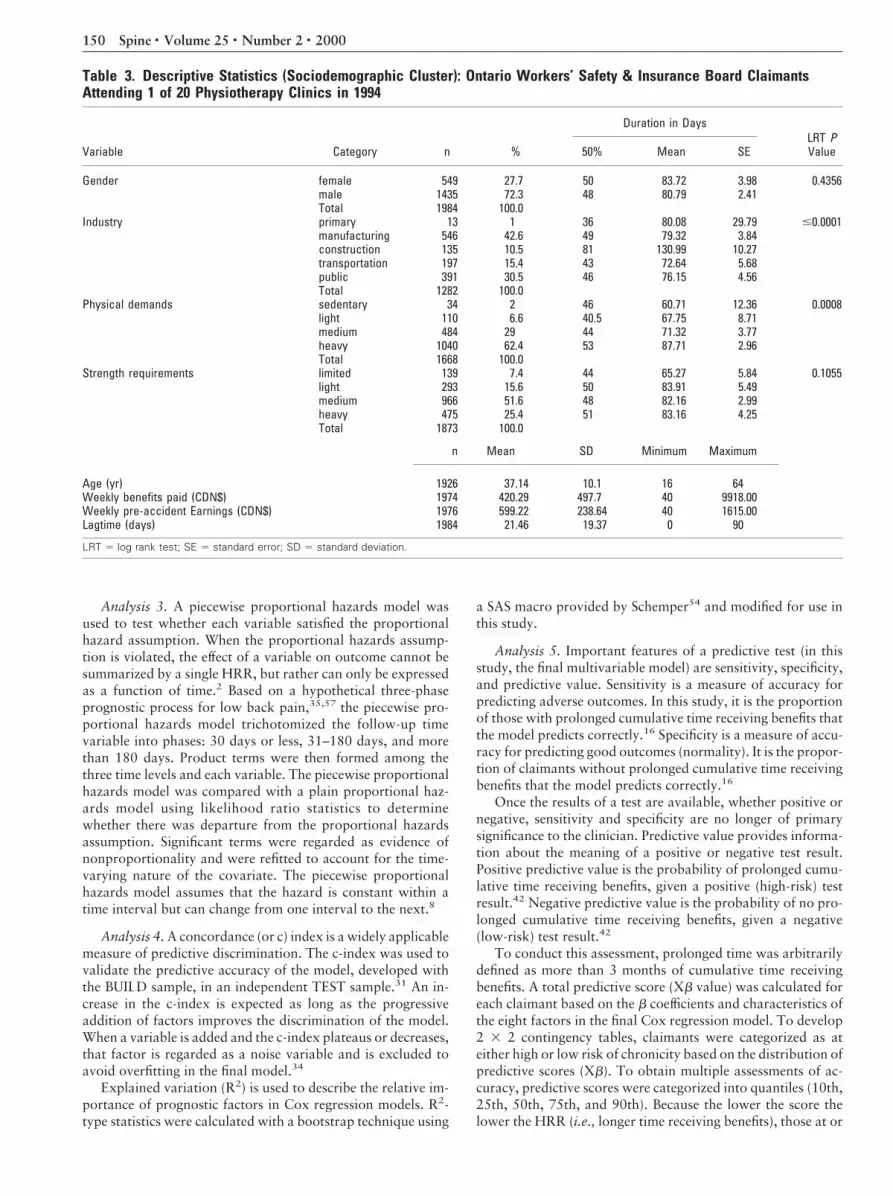
Variables. Twenty-four explanatory variables were analyzedfrom both databases. To assist with multivariable analysis, theexplanatory variables were grouped into three clusters8: clini-cal (15 variables), sociodemographic (8 variables), and a lowback pain questionnaire (1 variable). Tables 2 and 3 display thefrequency distributions and descriptive statistics for these inde-pendent variables.
The questionnaire responses were analyzed as a single vari-able, the total score for 18 patient self-report items based on apreviously published instrument, the Low Back OutcomeScore.24 The questionnaire was modified for use in this study toinclude other important questions (such as mechanism of in-jury, litigation, and smoking status) as determined by two ofthe authors (GM, HH; Appendix A). The scoring of the com-plete questionnaire resulted in a minimum score of 6 and amaximum of 100. The higher the score, the greater the per-ceived level of function.
The outcome variable was cumulative number of calendardays that a claimant received benefits for 1 year from the dateof accident. Cumulative time receiving benefits was not mea-sured beyond 1 year after accident. This reflects WSIB’s admin-istrative policy of routinely examining claims that have notclosed at 1 year, after which a complex adjudication process forwage replacement begins, related to permanent disabilityawards. That is, claimants may move from temporary totaland/or temporary partial benefits to longer-term payments.
Sample Size. Of the 2007 claimants, administrative data fromWSIB records were not available for 23 patients. This reducedthe sample size to 1984. There were 1326 of the 2007 patients(66.1%) who completed the entire questionnaire; 330 (16.4%)did not answer one of the questions, 119 (5.9%) missed twoquestions, and 232 (11.6%) missed more than two. Question-naire scores were proportionally rescaled for those who missedone or two items (n 5 449) and were included with the com-pleted questionnaires to allow for data analysis that included asmany patients as possible (n 5 1775; 88%). The 12% whomissed more than two questions were excluded from the anal-ysis (n 5 232). Thus, the final sample size for analysis includingquestionnaire data was 1752 (or 87% of the original 2007).
Ethics. In 1990, the International Epidemiology Association37
concluded that, “It is not feasible to obtain the consent, in-formed or otherwise, of all individuals whose records havebecome part of a large database such as a nationwide system oflinked records, or the archival records of a general hospital. Inthese and similar situations, informed consent to use suchrecords for epidemiological study may reasonably be delegatedto an ethics review committee.”
In accordance with these guidelines, ethical issues of thisstudy’s data linkage were approved by the Ethics Review Com-mittee at the University of Toronto. Before analysis and after
verification of matches, patient data were rendered anonymouswith the exception of WSIB claim number. Using methods de-signed to protect the confidentiality of all claimants understudy, the clinical data were merged with relevant claim-specific WSIB data under a legal Freedom of Information agree-ment between the employer of the second, third, and fourthauthors and the Ontario WSIB. No patient was contacted.
Imputation. Because it is wasteful of information, deletingthose subjects with missing information from the analysis isoften inappropriate. Miettinen’s49 indicator method of impu-tation was used as a suitable alternative. This modeling ap-proach draws the regression information from those subjectsfor whom the information is available, while denoting othersubjects with dummy variables. The result is a b coefficientsadjusted for missing values.
Treatment. Canadian Back Institute clinics provide activephysiotherapy, primarily for mechanical spinal pain of muscu-loskeletal origin. They are secondary-care rehabilitation facili-ties that focus on pain control in acute, subacute, and chronicambulatory populations. The rare patients with back pain whohave suspected systemic disease and those who have sustainedtrauma sufficient to produce severe bony injury or major neu-rologic sequelae are referred elsewhere.
All patients follow a structured protocol of active exercise.The WSIB patients in 1994 were treated daily for 1 to 3 hoursfor a maximum of 30 days. Treatment progressed throughthree stages of recovery: pain control, recovery of movement,and physical conditioning. The number of treatment hours perday, the number of days in each stage, and the total treatmenttime were adapted to the needs of each patient. Both treatingstaff and patients had the option to conclude the program atany time that return to work or normal activities of daily livingbecame possible.
Statistical Analysis. Outcomes were assessed using survivalanalysis, calculated by the methods of Cox proportional haz-ards regression (SAS System for Windows, ver. 6.12; SAS In-stitute, Cary, NC) to find the best multivariable model(s) pre-dicting outcome. The Cox model uses more information—thesurvival times—than the logistic model, which considers a bi-nary-type outcome and does not account for time to an event.38
In true studies of survival, in which the outcome is death,failure is a negative experience. In this study, the fewer thecumulative days collecting WSIB benefits, the more positive theoutcome in terms of health. Thus, hazard rate ratios (HRR) lessthan 1 indicate an increased risk of time receiving benefits.
The outcome, time receiving benefits, is a cumulative mea-sure and the concept of an actual endpoint event is ill-defined inthis case; however, survival analysis has been used previouslyfor non–time-to-event data. Dudley et al15 concluded that withCox regression, it is possible to overcome problems of highlyskewed data, arbitrary judgments in dichotomizing the out-come, and assumptions about the underlying distribution ofthe response variable. Thus, Cox proportional hazards meth-ods were deemed appropriate for this outcome.
A data-splitting technique29,30 was used to develop and testthe multivariable models. Data-splitting is a method for obtain-ing a nearly unbiased internal assessment of accuracy. With thistechnique, a 50% random sample of the full dataset (datasetsplit in half) was used for model development (BUILD sample)and the entire dataset (TEST sample) for validation.
Table 1. Patient Inclusion Criteria
Received Workplace Safety & Insurance Board (WSIB) lost timebenefits for a work injury (accepted claim)
Injured between January 1, 1994 and December 31, 1994Assessed for primary complaint of low back pain at any one of the 20
physiotherapy clinics in OntarioNo history of spine surgeryLess than 91 days between reported WSIB injury date (first day of lost
time) and first day of physiotherapy treatment
148 Spine • Volume 25 • Number 2 • 2000
Multivariable modeling and validation consisted of fivesubanalyses: 1) modeling within each cluster, 2) modeling sta-tistically significant factors from the first analysis, 3) testing theCox regression proportional hazards assumption, 4) modelvalidation, and 5) assessment of accuracy and predictive value.
Analysis 1. From the BUILD sample, a multivariable modelwas developed to identify the statistically significant variablesfrom each cluster (clinical and sociodemographic), using a for-ward stepwise selection procedure with a significance level forentry and exit set at P 5 0.10. Collett11 suggests avoiding rigidapplication of a particular significance level with this selection
procedure. To guide decisions on entering and omitting terms,the significance level should not be too small; a 10% levelis recommended.11
Analysis 2. All significant variables from Analysis 1 werethen entered into a multivariable model with the questionnairescore, to determine the best model to predict outcome, usingthe same selection procedure and significance levels. This com-bined analysis approach using multiple clusters and predictorshas been previously shown to enhance prediction in studies ofpersistent pain.32,59
Table 2. Descriptive Statistics for the Clinical Cluster of Ontario Workers’ Safety & Insurance Board ClaimantsAttending 1 of 20 Physiotherapy Clinics in 1994
Variable Category n %
Duration in DaysLRT PValueMedian Mean SE
Comorbidity no 1244 78.9 48 80.02 2.56 0.8038any 332 21.1 48 77.11 4.67Total 1576 100.0
Constancy of pain constant 745 39.5 58 99.55 3.81 #0.0001intermittent 1139 60.5 43 70.35 2.43Total 1884 100.0
Diagnosis Pattern 1 1083 62.9 48 80.90 2.83 #0.0001Pattern 2 345 20.0 43 77.54 4.84Pattern 3 21 1.2 121 165.05 30.46Pattern 4 1 0.1 365 365.00 —Pattern 5 95 5.5 87 112.73 9.82alternative 178 10.3 46.5 69.58 5.74Total 1723 100.0
L–4 negative 1349 98.0 48 82.27 2.56 0.2098positive 27 2.0 82 106.74 17.21Total 1376 100.0
L–5 negative 1320 97.9 48 80.89 2.54 0.0083positive 28 2.1 82 135.07 21.37Total 1348 100.0
S–1 negative 1341 98.2 48 80.75 2.52 0.0029positive 24 1.8 118.5 152.63 21.08Total 1365 100.0
Saddle sensation negative 1102 99.7 48 81.86 2.80 0.9754positive 3 0.3 54 71.33 23.59Total 1105 100.0
Straight leg raising negative 1037 96.9 47 76.51 2.69 0.0016positive 33 3.1 90 144.88 20.16Total 1070 100.0
Femoral nerve stretch negative 994 98.5 49 82.34 2.96 0.1634positive 15 1.5 85 134.73 30.54Total 1009 100.0
Nonorganic signs 0–2 1404 90.6 47 79.93 2.45 #0.000131 146 9.4 73 108.08 7.73Total 1550 100.0
Pain location back/butt 1064 61.9 43 70.06 2.50 #0.0001leg 656 38.1 60 101.79 4.11Total 1720 100.0
Previous episode no 116 6.1 64 94.48 8.66 0.0445yes 1778 93.9 48 81.47 2.19Total 1894 100.0
Sleep disturbance no 802 44.4 38.5 64.76 2.88 #0.0001yes 1006 55.6 59 96.55 3.09Total 1808 100.0
n mean SD
Visual AnalogueScale–back pain
1158 4.98 2.4
Visual AnalogueScale–leg pain
617 1.96 2.9
LRT 5 log rank test; SE 5 standard error; SD 5 standard deviation.
149Workers’ Compensation Claimants’ Prognosis • McIntosh et al
Analysis 3. A piecewise proportional hazards model wasused to test whether each variable satisfied the proportionalhazard assumption. When the proportional hazards assump-tion is violated, the effect of a variable on outcome cannot besummarized by a single HRR, but rather can only be expressedas a function of time.2 Based on a hypothetical three-phaseprognostic process for low back pain,35,57 the piecewise pro-portional hazards model trichotomized the follow-up timevariable into phases: 30 days or less, 31–180 days, and morethan 180 days. Product terms were then formed among thethree time levels and each variable. The piecewise proportionalhazards model was compared with a plain proportional haz-ards model using likelihood ratio statistics to determinewhether there was departure from the proportional hazardsassumption. Significant terms were regarded as evidence ofnonproportionality and were refitted to account for the time-varying nature of the covariate. The piecewise proportionalhazards model assumes that the hazard is constant within atime interval but can change from one interval to the next.8
Analysis 4. A concordance (or c) index is a widely applicablemeasure of predictive discrimination. The c-index was used tovalidate the predictive accuracy of the model, developed withthe BUILD sample, in an independent TEST sample.31 An in-crease in the c-index is expected as long as the progressiveaddition of factors improves the discrimination of the model.When a variable is added and the c-index plateaus or decreases,that factor is regarded as a noise variable and is excluded toavoid overfitting in the final model.34
Explained variation (R2) is used to describe the relative im-portance of prognostic factors in Cox regression models. R2-type statistics were calculated with a bootstrap technique using
a SAS macro provided by Schemper54 and modified for use inthis study.
Analysis 5. Important features of a predictive test (in thisstudy, the final multivariable model) are sensitivity, specificity,and predictive value. Sensitivity is a measure of accuracy forpredicting adverse outcomes. In this study, it is the proportionof those with prolonged cumulative time receiving benefits thatthe model predicts correctly.16 Specificity is a measure of accu-racy for predicting good outcomes (normality). It is the propor-tion of claimants without prolonged cumulative time receivingbenefits that the model predicts correctly.16
Once the results of a test are available, whether positive ornegative, sensitivity and specificity are no longer of primarysignificance to the clinician. Predictive value provides informa-tion about the meaning of a positive or negative test result.Positive predictive value is the probability of prolonged cumu-lative time receiving benefits, given a positive (high-risk) testresult.42 Negative predictive value is the probability of no pro-longed cumulative time receiving benefits, given a negative(low-risk) test result.42
To conduct this assessment, prolonged time was arbitrarilydefined as more than 3 months of cumulative time receivingbenefits. A total predictive score (Xb value) was calculated foreach claimant based on the b coefficients and characteristics ofthe eight factors in the final Cox regression model. To develop2 3 2 contingency tables, claimants were categorized as ateither high or low risk of chronicity based on the distribution ofpredictive scores (Xb). To obtain multiple assessments of ac-curacy, predictive scores were categorized into quantiles (10th,25th, 50th, 75th, and 90th). Because the lower the score thelower the HRR (i.e., longer time receiving benefits), those at or
Table 3. Descriptive Statistics (Sociodemographic Cluster): Ontario Workers’ Safety & Insurance Board ClaimantsAttending 1 of 20 Physiotherapy Clinics in 1994
Variable Category n %
Duration in DaysLRT PValue50% Mean SE
Gender female 549 27.7 50 83.72 3.98 0.4356male 1435 72.3 48 80.79 2.41Total 1984 100.0
Industry primary 13 1 36 80.08 29.79 #0.0001manufacturing 546 42.6 49 79.32 3.84construction 135 10.5 81 130.99 10.27transportation 197 15.4 43 72.64 5.68public 391 30.5 46 76.15 4.56Total 1282 100.0
Physical demands sedentary 34 2 46 60.71 12.36 0.0008light 110 6.6 40.5 67.75 8.71medium 484 29 44 71.32 3.77heavy 1040 62.4 53 87.71 2.96Total 1668 100.0
Strength requirements limited 139 7.4 44 65.27 5.84 0.1055light 293 15.6 50 83.91 5.49medium 966 51.6 48 82.16 2.99heavy 475 25.4 51 83.16 4.25Total 1873 100.0
n Mean SD Minimum Maximum
Age (yr) 1926 37.14 10.1 16 64Weekly benefits paid (CDN$) 1974 420.29 497.7 40 9918.00Weekly pre-accident Earnings (CDN$) 1976 599.22 238.64 40 1615.00Lagtime (days) 1984 21.46 19.37 0 90
LRT 5 log rank test; SE 5 standard error; SD 5 standard deviation.
150 Spine • Volume 25 • Number 2 • 2000

below the quantile were categorized as high risk; those abovewere low risk. Using five categories of predictive score, sensi-tivity, specificity, and predictive value were calculated over arange of predictor score cutoff points.
Results
Because distribution of survival times tends to be posi-tively skewed, the median is the preferred summary mea-sure.11 For the 1984 claimants with cumulative time re-ceiving benefits information, the median survival timeusing Kaplan–Meier estimates was 48 days (95% confi-dence limits, 46–50 days). That is, there was a 50%chance that a claimant would continue to receive benefits(survive) for 48 days or more. The mean (6SD) survivaltime for the entire cohort was 81.65 6 91.95 days. Forthose with completed or rescaled questionnaires, themean time receiving benefits (81.68 6 91.99 days) wasnot significantly different than the mean for those miss-ing more than two questionnaire items (81.24 6 91.89days; t 5 0.069; df 5 1982; P , 0.945).
The log rank test was used to test the null hypothesisthat the survivor functions across categorical levels of avariable were no different for the clinical cluster (Table2A) and the sociodemographic cluster (Table 3A).
Only 2.3% of the cohort received benefits for all 365days; 12.2% accumulated 6 months or more time receiv-ing benefits. Figure 1 displays the Kaplan–Meier estimateof the survival time distribution for this cohort. Thesteepness of the curve in the first 90 days indicates thatsymptoms of many claimants with acute low back painpotentially improved promptly, similar to results in otherstudies.34,35,55 There was the usual general flattening ofthe survival curve from approximately 200 to 365 daysindicating the possible onset of chronicity.
Analysis 1Of those with a documented outcome (n 5 1984), anapproximate 50% random sample (n 5 1000) was usedfor multivariable model development (BUILD sample).In the clinical cluster, there were seven significant predic-tors: pain referred into the leg, three or more positive
nonorganic signs, intermittent (vs. constant) pain, a pre-vious episode of low back pain, any comorbidity, posi-tive S1 neurologic signs, and sleep disturbance. In thesociodemographic cluster, there were four significantpredictors: working in the construction industry, age, lagtime from injury to treatment, and light strength require-ments of the job (as determined by patients’ perceptionsof their job tasks).
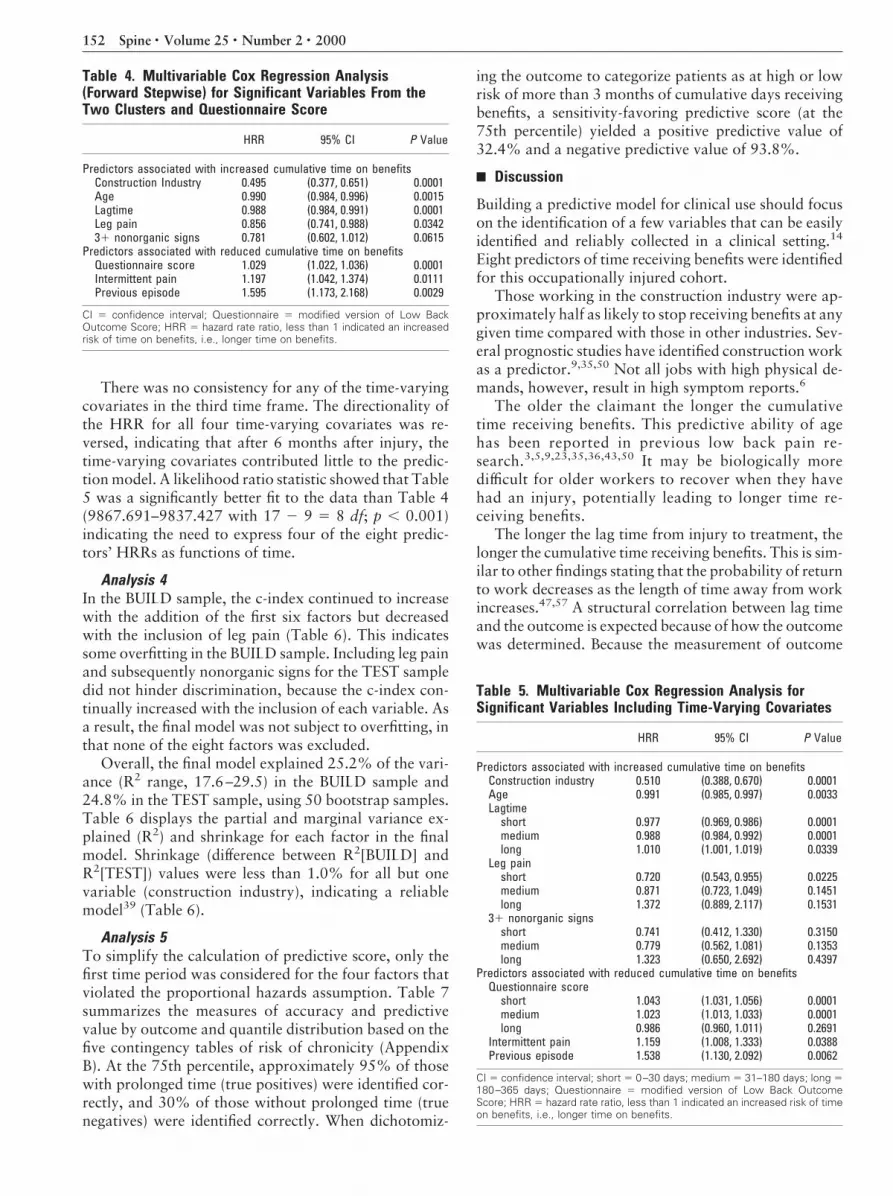
Analysis 2Sleep disturbance from the clinical cluster was not in-cluded in this analysis, because of a similar item in thequestionnaire. Multivariable Cox proportional hazardsregression showed eight significant predictors. Five wereassociated with longer time receiving benefits comparedwith their reference groups: 1) working in the construc-tion industry, 2) older age, 3) lag time from the date ofinjury to the first day of physiotherapy treatment, 4) painreferred into the leg, and 5) three or more positive Wad-dell61 nonorganic signs; three predictors were associatedwith reduced time receiving benefits: 1) higher values ofpatient questionnaire score, indicating better function, 2)intermittent pain, and 3) a previous episode of low backpain (Table 4).
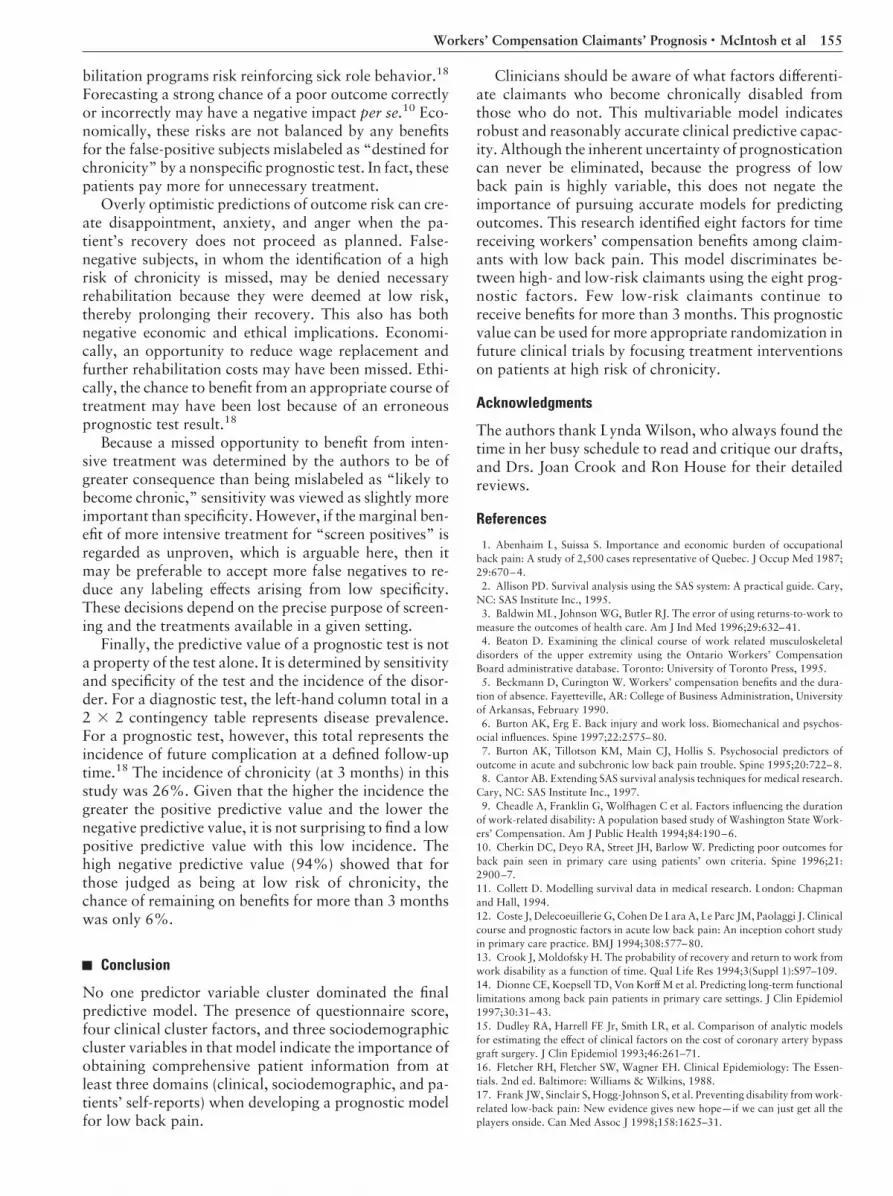
Analysis 3On completion of the model selection process, the fourfactors that showed initial evidence of nonproportional-ity (lag time, leg pain, three or more positive nonorganicsigns, and questionnaire score) were refit to account forviolation of the proportional hazards assumption (Table5). Refitting the model did not change the direction orstatistical significance of the HRR for the four time-independent variables. Refitting resulted in somechanges in the time-varying covariates. For lag time andquestionnaire score, the HRRs had a waning effect withtime: The first two time intervals (short and medium)were statistically significant. Thus, these factors showedan association with time receiving benefits in these timeperiods, but after 6 months after injury, they contributedlittle to the prediction model. For leg pain, the HRRs hada more rapidly waning effect with time: The associationbetween leg pain and the outcome was strongest in thefirst interval, 0–30 days, and negligible for the remainderof the follow-up period.
Nonorganic signs maintained the same directionalityof its effect but was no longer statistically significantwhen the time-varying component was included. Be-cause of this absence of statistical significance, Table 5was refitted to help determine the effect of nonorganicsigns on the final model. Likelihood ratio statisticsshowed that categorizing nonorganic signs as a binarytime-independent variable (9838.107–9837.427 with17 2 15 5 2 df; 0.5 , P , 0.75) and then omitting itentirely (9840.909–9837.427 with 17 2 14 5 3 df;0.25 , P , 0.5) provided no significantly better fit thanthe model presented in Table 5. Therefore, nonorganicsigns was maintained as a time-varying covariate in thefinal model.
Figure 1. Kaplan–Meier estimate of the cumulative time receivingbenefits (survival time distribution) for 1752 Ontario Workers’Safety & Insurance Board claimants attending one of 20 physio-therapy clinics in 1994.
151Workers’ Compensation Claimants’ Prognosis • McIntosh et al
There was no consistency for any of the time-varyingcovariates in the third time frame. The directionality ofthe HRR for all four time-varying covariates was re-versed, indicating that after 6 months after injury, thetime-varying covariates contributed little to the predic-tion model. A likelihood ratio statistic showed that Table5 was a significantly better fit to the data than Table 4(9867.691–9837.427 with 17 2 9 5 8 df; p , 0.001)indicating the need to express four of the eight predic-tors’ HRRs as functions of time.
Analysis 4In the BUILD sample, the c-index continued to increasewith the addition of the first six factors but decreasedwith the inclusion of leg pain (Table 6). This indicatessome overfitting in the BUILD sample. Including leg painand subsequently nonorganic signs for the TEST sampledid not hinder discrimination, because the c-index con-tinually increased with the inclusion of each variable. Asa result, the final model was not subject to overfitting, inthat none of the eight factors was excluded.
Overall, the final model explained 25.2% of the vari-ance (R2 range, 17.6–29.5) in the BUILD sample and24.8% in the TEST sample, using 50 bootstrap samples.Table 6 displays the partial and marginal variance ex-plained (R2) and shrinkage for each factor in the finalmodel. Shrinkage (difference between R2[BUILD] andR2[TEST]) values were less than 1.0% for all but onevariable (construction industry), indicating a reliablemodel39 (Table 6).
Analysis 5To simplify the calculation of predictive score, only thefirst time period was considered for the four factors thatviolated the proportional hazards assumption. Table 7summarizes the measures of accuracy and predictivevalue by outcome and quantile distribution based on thefive contingency tables of risk of chronicity (AppendixB). At the 75th percentile, approximately 95% of thosewith prolonged time (true positives) were identified cor-rectly, and 30% of those without prolonged time (truenegatives) were identified correctly. When dichotomiz-
ing the outcome to categorize patients as at high or lowrisk of more than 3 months of cumulative days receivingbenefits, a sensitivity-favoring predictive score (at the75th percentile) yielded a positive predictive value of32.4% and a negative predictive value of 93.8%.
Discussion
Building a predictive model for clinical use should focuson the identification of a few variables that can be easilyidentified and reliably collected in a clinical setting.14
Eight predictors of time receiving benefits were identifiedfor this occupationally injured cohort.
Those working in the construction industry were ap-proximately half as likely to stop receiving benefits at anygiven time compared with those in other industries. Sev-eral prognostic studies have identified construction workas a predictor.9,35,50 Not all jobs with high physical de-mands, however, result in high symptom reports.6
The older the claimant the longer the cumulativetime receiving benefits. This predictive ability of agehas been reported in previous low back pain re-search.3,5,9,23,35,36,43,50 It may be biologically moredifficult for older workers to recover when they havehad an injury, potentially leading to longer time re-ceiving benefits.
The longer the lag time from injury to treatment, thelonger the cumulative time receiving benefits. This is sim-ilar to other findings stating that the probability of returnto work decreases as the length of time away from workincreases.47,57 A structural correlation between lag timeand the outcome is expected because of how the outcomewas determined. Because the measurement of outcome
Table 4. Multivariable Cox Regression Analysis(Forward Stepwise) for Significant Variables From theTwo Clusters and Questionnaire Score
HRR 95% CI P Value
Predictors associated with increased cumulative time on benefitsConstruction Industry 0.495 (0.377, 0.651) 0.0001Age 0.990 (0.984, 0.996) 0.0015Lagtime 0.988 (0.984, 0.991) 0.0001Leg pain 0.856 (0.741, 0.988) 0.034231 nonorganic signs 0.781 (0.602, 1.012) 0.0615
Predictors associated with reduced cumulative time on benefitsQuestionnaire score 1.029 (1.022, 1.036) 0.0001Intermittent pain 1.197 (1.042, 1.374) 0.0111Previous episode 1.595 (1.173, 2.168) 0.0029
CI 5 confidence interval; Questionnaire 5 modified version of Low BackOutcome Score; HRR 5 hazard rate ratio, less than 1 indicated an increasedrisk of time on benefits, i.e., longer time on benefits.
Table 5. Multivariable Cox Regression Analysis forSignificant Variables Including Time-Varying Covariates
HRR 95% CI P Value
Predictors associated with increased cumulative time on benefitsConstruction industry 0.510 (0.388, 0.670) 0.0001Age 0.991 (0.985, 0.997) 0.0033Lagtime
short 0.977 (0.969, 0.986) 0.0001medium 0.988 (0.984, 0.992) 0.0001long 1.010 (1.001, 1.019) 0.0339
Leg painshort 0.720 (0.543, 0.955) 0.0225medium 0.871 (0.723, 1.049) 0.1451long 1.372 (0.889, 2.117) 0.1531
31 nonorganic signsshort 0.741 (0.412, 1.330) 0.3150medium 0.779 (0.562, 1.081) 0.1353long 1.323 (0.650, 2.692) 0.4397
Predictors associated with reduced cumulative time on benefitsQuestionnaire score
short 1.043 (1.031, 1.056) 0.0001medium 1.023 (1.013, 1.033) 0.0001long 0.986 (0.960, 1.011) 0.2691
Intermittent pain 1.159 (1.008, 1.333) 0.0388Previous episode 1.538 (1.130, 2.092) 0.0062
CI 5 confidence interval; short 5 0–30 days; medium 5 31–180 days; long 5180–365 days; Questionnaire 5 modified version of Low Back OutcomeScore; HRR 5 hazard rate ratio, less than 1 indicated an increased risk of timeon benefits, i.e., longer time on benefits.
152 Spine • Volume 25 • Number 2 • 2000

and lag time begin at the same time, all or a portion of thelag time is included in the measurement of cumulativetime receiving benefits. Nevertheless, lag time was animportant variable to assess and control for in the mul-tivariable analysis, in that it predicted the outcome andproxied for differing clinical-predictor assessment timesat baseline, which may have altered the predic-tors’ values.
Claimants with leg pain had a higher probability ofincreased time receiving benefits compared with the ref-erence patients with back pain only. Burton et al.7 re-ported that leg pain was a predictor of poor RolandMorris disability score among acute primary care pa-tients observed for 1 year after injury. This association isclinically intuitive. Referred or radicular pain indicates amore widespread injury with possible neural compro-mise that may contribute to prolonged symptoms and,subsequently, longer time receiving benefits.
The identification of nonorganic signs as a significantpredictor in this study confirms the hypothesis of Gatchelet al.22 that chronic low back pain disability and ex-tended duration of benefits reflect more than just a purephysical disorder or single personality trait. There ap-pears to be a significant psychosocial component con-tributing to prolonged time receiving benefits.
The higher the questionnaire score (functional status),the shorter the time receiving benefits. The results of themultivariable analysis confirm that this instrument can
discriminate prognosis between groups of patients whodiffer in disability levels when seen early in their course.
The probability of increased time receiving benefitswas lower for those with intermittent pain at assessmentcompared with the reference, constant pain. No reportsof pain constancy as a predictor were found in the backpain literature, although this association is clinically in-tuitive. Intermittent pain reflects symptoms of a mechan-ical nature, in which resolution is expected more quicklythan in the chronic state,48 in which nonmechanical fac-tors, both psychological and physiologic,21 may contrib-ute to prolonged symptoms and, subsequently, longertime receiving benefits.
Claimants with a previous episode had a lower prob-ability of increased time receiving benefits than the ref-erence subjects with no previous episodes. This contra-dicts results in several studies in the back painliterature6,12,58. Burton and Erg6 state that a previoushistory of back pain is the most consistent predictor offuture trouble. Troup et al.58 observed 2891 workersduring 1 year in Britain and concluded that a history ofprevious back problems was the strongest risk factor offuture low back pain recurrence (not duration, as in thisstudy) among an industrial cohort. Coste et al.12 discov-ered that previous episodes of low back pain was predic-tive of lower probabilities of both return to work and re-covery.
The counter-intuitive finding in this cohort may indi-cate a learning effect among physiotherapy attendees,whereby those who have encountered back pain in thepast may have better pain-coping skills during futureepisodes. They may have more future trouble6 but inshorter episodes. Hazard et al.33 suggested that thosewho have survived previous episodes of pain with rela-tively little trouble are at reduced risk of future disabilitythan those with first-time occupational injuries and thosewith more severe prior episodes.
In a clinical setting of secondary care, the difficulty inobtaining an inception cohort is complicated by the ex-istence of three possible “zero-times”: claim inception,reported pain inception and start of treatment, and clin-ical data collection. In a prognosis study of claims data,
Table 6. Concordance (c) Index, R2, and Shrinkage* for the BUILD and TEST Samples
Factor
c Index (%)BUILD sample
(n 5 872)
c Index (%)TEST sample
(n 5 1752)
Partial R2
BUILD sample(%)
Partial R2
TEST sample(%)
Shrinkage(%)
Questionnaire score 60.2798 60.945 6.45 6.45 0.00Lagtime 64.9717 65.9125 6.34 7.27 20.93Construction work 65.8942 66.4543 2.57 1.35 1.22Age 66.208 66.7049 0.77 0.60 0.17Intermittent pain 66.4037 66.891 0.44 0.52 20.08Previous episode 66.8103 67.0817 0.75 0.25 0.50Point where c index stopped increasing in the BUILD sampleLeg pain 66.7644 67.1431 1.07 0.85 0.22Nonorganic signs 66.9396 67.3033 0.56 0.51 0.05
* Shrinkage values for the difference between R2 in the BUILD and TEST samples.
Table 7. Sensitivity, Specificity, and Predictive Value byPredictive Score (Xbeta) Distribution for OutcomeDefined as >3 Months of Cumulative Time onWorkplace Safety & Insurance Board Benefits(Chronicity >3 Months)
Percentile Sensitivity Specificity PPV NPV
10th 26.1 95.5 66.7 78.725th 50.1 83.7 51.7 82.850th 75.3 58.8 38.9 87.275th 94.0 31.6 32.4 93.890th 98.2 12.8 28.2 95.4
PPV 5 positive predictive value; NPV 5 negative predictive value.
153Workers’ Compensation Claimants’ Prognosis • McIntosh et al

new claimants must be sought by ensuring that studyparticipation occurs on the first disability day or usesconsistently short lag times. An inception cohort designwas used in which the inception point was the accidentdate according to WSIB records, which usually equatesto the date of first lost time from work in the currentepisode. There is no waiting period for benefits in On-tario. All clinical and questionnaire data were capturedon the first day of clinic attendance. All claimants had alag time of less than 91 days. The mean lag time was 3weeks, and the median was 2 weeks; 90% of the samplehad lag times of less than 8 weeks; thus, claimants wereat similar acute stages of recovery, helping to reduce anyassembly bias.
The search to reduce costs of occupational injuries hasled to the use of return to work as a readily availablemeasure of medical care effectiveness.3 The quality ofmany epidemiologic studies relies heavily on the accuratemeasurement of the dependent variable, but this infor-mation is not always readily available. Because employ-ers and/or patients have to be contacted frequently forwork-verification status, actual return to work is a costlyand time-consuming outcome to determine. To over-come these problems, the present outcome measure (cu-mulative time receiving benefits) was abstracted from theWSIB administrative database, as in other low back painprognosis studies.25,34,35 Although it is an indirect mea-sure of return to work, cumulative time receiving benefitsis routinely and accurately collected throughout the firstyear of follow-up after claim inception in what appearsto be an unbiased way for all lost-time claimants. Returnto work often assumes complete recovery from injury,yet as many as 60% of workers are unable to remain atwork after their initial return.3 Important prognostic in-formation may be lost in studies that rely on only onereturn to work assessment after injury without furtherfollow-up for the reinitiation of lost time,3,13 using thismore complex outcome variable helped capture the epi-sodic and recurrent nature of back pain.
In this study setting, there was little variation in actualtreatment, thereby reducing the possibility of confound-ing by treatment regimen, because of the extensive stepstaken by CBI clinics to ensure a standardized protocolfor all patients.26–28 A limitation of many database-typestudies is the investigators’ inability to control the qual-ity of data collected and treatment provided. Using clin-ics, as in this study, that are fully integrated, with thesame centrally coordinated data collection tools and phi-losophy of treatment, reduces the potential for poor dataquality of this sort.
Approximately 2.5% of the working population losetime from work annually because of low back pain.56,60
Frank et al.21 state that a major limitation of etiologic orprognostic studies of occupational low back pain is thatthey are restricted to reported and WSIB-accepted work-place claims. This is also a limitation of this study. Someworkers may have chosen to work while in pain rather
than take time off or may have taken time off and re-ceived compensation by other disability insurance plans.
Selection bias due to referral, for example, mostlytends to result in narrowed ranges for predictor variables(increased subject homogeneity) and bias the results to-ward the null hypothesis.53 Because the clinical databaseis dependent on physician referral, there may be centrip-etal bias. Physicians do not refer all their patients to asingle clinic or clinic system in Ontario; thus, only certainpatients with back pain may gravitate toward this type oftreatment. The more severe or mildly injured may notseek treatment in an active rehabilitation program, caus-ing a referral filter or spectrum (severity) bias. Recentevidence from an Institute for Work and Health pilotproject of rehabilitation providers,51 however, showedthat the CBI clinics used in this study have patients withpain severity and functional status measures similar tothose in six other independent physiotherapy clinicsin Ontario.
Overall, this model explains 25.2% of the outcome’svariance. When explained variation was calculated forthe test sample, R2 values were generally slightly reducedbut similar to those of the BUILD sample. Higher R2
values have been reported in other prognostic studies.34
Hogg–Johnson and Cole34 studied a variety of soft tissueinjuries and used a combination of two questionnaires,administered at baseline and at 4 weeks lost time, in theirfinal model, with a resultant R2 5 39%. In the currentstudy, adopting a more narrow definition of soft tissueinjury (low back pain), determined at only one baselineinterview and examination and focusing on multivari-able Cox regression to determine significant predictorsmay have reduced the amount of explained variation inthe outcome.21 Because time receiving benefits is affectedby factors beyond the scope of any health-care interven-tion,19 the outcome studied here may have been influ-enced by factors other than physical recovery. Subtlepsychological factors may codetermine and/or confoundthe results.7,14,40 Motivation, emotional reaction, cul-tural milieu, local–sectoral unemployment rate, claimadjudication, and job satisfaction may override im-proved physical function in a patient’s decision to con-tinue receiving benefits.44–46 Other factors such as phy-sician attitudes and treatment styles may influenceoutcome.41 Therefore, rehabilitation is only one of sev-eral influences on a worker’s postinjury chances of re-turning to employment.
A highly sensitive predictive test identifies all theclaimants with prolonged lost time but may result inmistakenly labeling some of those with shorter time(prognostic false positives) as prolonged. Thus, a highlysensitive test should be chosen only when there is animportant consequence in missing a future chronic case.Low specificity leading to a low positive predictive valuehas potentially both negative ethical and economic im-plications. In the context of this study, false-positivecases, labeled as chronic, may receive more intensivetreatment than necessary. Ethically, some intensive reha-
154 Spine • Volume 25 • Number 2 • 2000
bilitation programs risk reinforcing sick role behavior.18
Forecasting a strong chance of a poor outcome correctlyor incorrectly may have a negative impact per se.10 Eco-nomically, these risks are not balanced by any benefitsfor the false-positive subjects mislabeled as “destined forchronicity” by a nonspecific prognostic test. In fact, thesepatients pay more for unnecessary treatment.
Overly optimistic predictions of outcome risk can cre-ate disappointment, anxiety, and anger when the pa-tient’s recovery does not proceed as planned. False-negative subjects, in whom the identification of a highrisk of chronicity is missed, may be denied necessaryrehabilitation because they were deemed at low risk,thereby prolonging their recovery. This also has bothnegative economic and ethical implications. Economi-cally, an opportunity to reduce wage replacement andfurther rehabilitation costs may have been missed. Ethi-cally, the chance to benefit from an appropriate course oftreatment may have been lost because of an erroneousprognostic test result.18
Because a missed opportunity to benefit from inten-sive treatment was determined by the authors to be ofgreater consequence than being mislabeled as “likely tobecome chronic,” sensitivity was viewed as slightly moreimportant than specificity. However, if the marginal ben-efit of more intensive treatment for “screen positives” isregarded as unproven, which is arguable here, then itmay be preferable to accept more false negatives to re-duce any labeling effects arising from low specificity.These decisions depend on the precise purpose of screen-ing and the treatments available in a given setting.
Finally, the predictive value of a prognostic test is nota property of the test alone. It is determined by sensitivityand specificity of the test and the incidence of the disor-der. For a diagnostic test, the left-hand column total in a2 3 2 contingency table represents disease prevalence.For a prognostic test, however, this total represents theincidence of future complication at a defined follow-uptime.18 The incidence of chronicity (at 3 months) in thisstudy was 26%. Given that the higher the incidence thegreater the positive predictive value and the lower thenegative predictive value, it is not surprising to find a lowpositive predictive value with this low incidence. Thehigh negative predictive value (94%) showed that forthose judged as being at low risk of chronicity, thechance of remaining on benefits for more than 3 monthswas only 6%.
Conclusion
No one predictor variable cluster dominated the finalpredictive model. The presence of questionnaire score,four clinical cluster factors, and three sociodemographiccluster variables in that model indicate the importance ofobtaining comprehensive patient information from atleast three domains (clinical, sociodemographic, and pa-tients’ self-reports) when developing a prognostic modelfor low back pain.
Clinicians should be aware of what factors differenti-ate claimants who become chronically disabled fromthose who do not. This multivariable model indicatesrobust and reasonably accurate clinical predictive capac-ity. Although the inherent uncertainty of prognosticationcan never be eliminated, because the progress of lowback pain is highly variable, this does not negate theimportance of pursuing accurate models for predictingoutcomes. This research identified eight factors for timereceiving workers’ compensation benefits among claim-ants with low back pain. This model discriminates be-tween high- and low-risk claimants using the eight prog-nostic factors. Few low-risk claimants continue toreceive benefits for more than 3 months. This prognosticvalue can be used for more appropriate randomization infuture clinical trials by focusing treatment interventionson patients at high risk of chronicity.
Acknowledgments
The authors thank Lynda Wilson, who always found thetime in her busy schedule to read and critique our drafts,and Drs. Joan Crook and Ron House for their detailedreviews.
References
1. Abenhaim L, Suissa S. Importance and economic burden of occupationalback pain: A study of 2,500 cases representative of Quebec. J Occup Med 1987;29:670–4.2. Allison PD. Survival analysis using the SAS system: A practical guide. Cary,
NC: SAS Institute Inc., 1995.3. Baldwin ML, Johnson WG, Butler RJ. The error of using returns-to-work to
measure the outcomes of health care. Am J Ind Med 1996;29:632–41.4. Beaton D. Examining the clinical course of work related musculoskeletal
disorders of the upper extremity using the Ontario Workers’ CompensationBoard administrative database. Toronto: University of Toronto Press, 1995.5. Beckmann D, Curington W. Workers’ compensation benefits and the dura-
tion of absence. Fayetteville, AR: College of Business Administration, Universityof Arkansas, February 1990.6. Burton AK, Erg E. Back injury and work loss. Biomechanical and psychos-
ocial influences. Spine 1997;22:2575–80.7. Burton AK, Tillotson KM, Main CJ, Hollis S. Psychosocial predictors of
outcome in acute and subchronic low back pain trouble. Spine 1995;20:722–8.8. Cantor AB. Extending SAS survival analysis techniques for medical research.
Cary, NC: SAS Institute Inc., 1997.9. Cheadle A, Franklin G, Wolfhagen C et al. Factors influencing the duration
of work-related disability: A population based study of Washington State Work-ers’ Compensation. Am J Public Health 1994;84:190–6.10. Cherkin DC, Deyo RA, Street JH, Barlow W. Predicting poor outcomes forback pain seen in primary care using patients’ own criteria. Spine 1996;21:2900–7.11. Collett D. Modelling survival data in medical research. London: Chapmanand Hall, 1994.12. Coste J, Delecoeuillerie G, Cohen De Lara A, Le Parc JM, Paolaggi J. Clinicalcourse and prognostic factors in acute low back pain: An inception cohort studyin primary care practice. BMJ 1994;308:577–80.13. Crook J, Moldofsky H. The probability of recovery and return to work fromwork disability as a function of time. Qual Life Res 1994;3(Suppl 1):S97–109.14. Dionne CE, Koepsell TD, Von Korff M et al. Predicting long-term functionallimitations among back pain patients in primary care settings. J Clin Epidemiol1997;30:31–43.15. Dudley RA, Harrell FE Jr, Smith LR, et al. Comparison of analytic modelsfor estimating the effect of clinical factors on the cost of coronary artery bypassgraft surgery. J Clin Epidemiol 1993;46:261–71.16. Fletcher RH, Fletcher SW, Wagner EH. Clinical Epidemiology: The Essen-tials. 2nd ed. Baltimore: Williams & Wilkins, 1988.17. Frank JW, Sinclair S, Hogg-Johnson S, et al. Preventing disability from work-related low-back pain: New evidence gives new hope—if we can just get all theplayers onside. Can Med Assoc J 1998;158:1625–31.
155Workers’ Compensation Claimants’ Prognosis • McIntosh et al

18. Frank JW, Hudak PL, Cole DC. Using prognosis research ethically. Toronto,Canada: Institute for Work & Health working paper, 1998.19. Frank JW, Brooker AS, Demaio S, et al. Disability resulting from occupa-tional low back pain. Part I. What do we know about primary prevention? Areview of the scientific evidence on prevention before disability begins.Spine 1996;21:2908–17.20. Frank JW, Brooker AS, Demaio S, et al. Disability resulting from occupa-tional low back pain. Part II : What do we know about secondary prevention? Areview of the scientific evidence on prevention after disability begins. Spine 1996;21:2918–29.21. Frank JW, Pulcins IR, Kerr MS, Shannon HS, Stansfeld SA. Occupationalback pain-an unhelpful polemic. Scand J Work Environ Health 1995;21:3–14.22. Gatchel R, Polatin PB, Kinney RK. Predicting outcome of chronic back painusing clinical predictors of psychopathology: A prospective analysis. Health Psy-chol 1995;14:415–20.23. Gluck JV, Oleinick A. Claim rates of compensable back injuries by age,gender, occupation, and industry. Do they relate to return-to-work experience?Spine 1998;23:1572–87.24. Greenough CG, Fraser RD. Assessment of outcome in patients with low backpain. Spine 1992;17:36–41.25. Haidar H. Expressing effect estimates of predictors of return to work. To-ronto: University of Toronto Press, 1997.26. Hall H, McIntosh G, Melles T. A different approach to back pain diagnosis:Identifying a pattern of pain. Can J Continuing Med Educ 1994;6:31–42.27. Hall H. A simple approach to back-pain management. Patient Care 1992;15:77–91.28. Hall H. Examination of the patient with low back pain. Bull RheumDis 1983;33:1–8.29. Harrell FE, Lee KL, Mark DB. Tutorial in biostatistics: Multivariable prog-nostic models: Issues in developing models, evaluating assumptions and ade-quacy, and measuring and reducing errors. Stat Med 1996;15:361–87.30. Harrell FE, Lee KL, Califf RM, Pryor DB, Rosati RA. Regression modelingstrategies for improved prognostic prediction. Stat Med 1984;3:143–52.31. Harrell FE, Califf RM, Pryor DB, Lee KL, Rosati RA. Evaluating the yield ofmedical tests. JAMA 1982;247:2543–46.32. Hasenbring M, Marienfeld G, Kuhlendahl D, Soyka D. Risk factors of chro-nicity in lumbar disc patients: A prospective investigation of biologic, psycho-logic, and social predictors of therapy outcome. Spine 1994;19:2759–65.33. Hazard RG, Haugh LD, Reid S, Preble JB, MacDonald L. Early prediction ofchronic disability after occupational low back injury. Spine 1996;21:945–51.34. Hogg–Johnson S, Cole DC. Early prognostic factors for duration on benefitsamong workers with compensated occupational soft tissue injuries. Toronto,Canada: Institute for Work & Health, unpublished Working Paper #64, 1998.35. Hogg–Johnson SA, Frank JW, Rael E. Prognostic risk factor models for lowback pain: Why they have failed and a new hypothesis. Toronto, Canada: Insti-tute for Work and Health, Working paper 19, 1994.36. Indahl A, Velund L, Reikeraas O. Good prognosis for low back pain whenleft untampered: A randomized clinical trial. Spine 1995;20:473–7.37. International Epidemiological Association. Council for International Orga-nizations of Medical Sciences. Ethics and epidemiology: International guidelines.Int J Epidemiol 1990;19:226–30.38. Kleinbaum DG. Survival Analysis: A Self Learning Text. New York:Springer–Verlag, 1996.39. Kleinbaum DG, Kupper LL, Muller KE. Applied Regression Analysis andOther Multivariable Methods. Boston: PWS-Kent Publishing Co., 1988.40. Klenerman L, Slade PD, Stanley M et al. The prediction of chronicity inpatients with a acute attack of low back pain in a general practice setting.Spine 1995;20:478–84.41. Lehmann TR, Spratt KF, Lehmann KK. Predicting long term disability in lowback injured workers presenting to a spine consultant. Spine 1993;18:1103–12.
42. Lilienfeld DE, Stolley PD. Foundations of Epidemiology. New York: OxfordUniversity Press, 1994:68–71.43. Lynch M. The duration of invalidity benefits claims: A proportional hazardmodel. Appl Econ 1991;23:1043–52.44. Mayer TG, Gatchel RJ, Mayer H, Kishino N, Keeley J, Mooney V. A pro-spective two year study of functional restoration in industrial low back injury.JAMA 1987;258:1763–67.45. Mayer TG, Gatchel RJ, Kishino ND, et al. A prospective short term study ofchronic low back patients using a novel objective functional measurement.Pain 1986;25:53–68.46. Mayer TG, Gatchel RJ, Kishino N, Keeley J, Mooney V. Objective assess-ment of spine function following industrial injury: A prospective study withcomparison group and 1 year follow up. Spine 1985;10:482–93.47. McGill CM. Industrial back problems: A control program. J OccupMed 1968;10:174–78.48. McKenzie R. The Lumbar Spine Mechanical Diagnosis and Therapy. Waika-nae, New Zealand: Spinal Publications Ltd., 1981.49. Miettinen OS. Theoretical Epidemiology. John Wiley & Sons NewYork, 1985:231–3.50. Oleinick A, Gluck JV, Guire KE. Factors affecting first return to work fol-lowing a compensable occupational back injury. Am J Ind Med 1996;30:540–55.51. Quality Management System for Soft Tissue Injuries (QMS-STI). A jointpilot project with rehabilitation providers in Ontario and the Institute for Workand Health. Toronto, Canada: Institute for Work and Health, 1998.52. Rossignol M, Suissa S, Abenhaim L. Working disability due to occupationalback pain: Three year follow up of 2,300 compensated workers in Quebec. JOccup Med 1988;30:502–5.53. Sackett DL. Bias in analytical research. J Chron Dis 1979;32:51–63.54. Schemper M. The relative importance of prognostic factors in the study ofsurvival. Stat Med 1993;12:2377–82.55. Sinclair S, Hogg–Johnson SA, Mondloch MV, Shields SA. The effectivenessof an early active intervention program for workers with soft-tissue injuries:Early claimant cohort study. Spine 1997;22:2219–31.56. Spengler DM, Bigos SJ, Martin NA, et al. Back injuries in industry: A retro-spective study. I. Overview and cost analysis. Spine 1986;11:241–5.57. Spitzer WO, Leblanc FE, Dupuis M. Scientific approach to the assessmentand management of activity-related spinal disorders: A monograph for clinicians.Report of the Quebec task force on spinal disorders. Spine 1987;12:1–59.58. Troup JDG, Foreman TK, Baxter CE, Brown D. The perception of back painand the role of psychophysical tests of lifting capacity. Spine 1987;12:645–57.59. Uomoto JM, Turner JA, Herron LD. Use of the MMPI and MCMI in pre-dicting outcome of lumbar laminectomy. J Clin Psychol 1988;44:191–97.60. Waddell G. A new clinical model for the treatment of low back pain.Spine 1987;12:632–44.61. Waddell G, Mcculloch JA, Kummel E, Venner RM. Non organic physicalsigns in low backpain. Spine 1980;5:117–25.
Address reprint requests to
Greg McIntosh153 Oliver Place
Oakville, OntarioCanada L6H 1K9
E-mail: [email protected]
156 Spine • Volume 25 • Number 2 • 2000

Appendix A
Patient QuestionnaireNote that question 1 is not included in the calculation of questionnaire score. The result is an 18-item survey.
Appendix B
Frequencies for Calculating Sensitivity, Specificity,and Predictive Value
Table a. Frequencies of risk of chronicity for the 10th
percentile (Xbeta 5 20.133) of predictive score:>3 months of cumulative time on Workplace Safety &Insurance Board (WSIB) benefits?
Yes No Total
Predictive High risk 118 59 177Test Low risk 335 1240 1575
Total 453 1299 1752
Table b. 25th percentile (Xbeta 5 0.600) of predictivescore: >3 months of cumulative time on WSIB benefits?
Yes No Total
Predictive High risk 227 212 439Test Low risk 226 1087 1313
Total 453 1299 1752
Table c. 50th percentile (Xbeta 5 1.207) of predictivescore: >3 months of cumulative time on WSIB benefits?
Yes No Total
Predictive High risk 341 535 876Test Low risk 112 764 876
Total 453 1299 1752
Table d. 75th percentile (Xbeta 5 1.693) of predictivescore: >3 months of cumulative time on WSIB benefits?
Yes No Total
Predictive High risk 426 888 1314Test Low risk 27 411 438
Total 453 1299 1752
Table e. 90th Percentile (Xbeta 5 2.139) of predictivescore: >3 months of cumulative time on WSIB benefits?
Yes No Total
Predictive High risk 445 1132 1577Test Low risk 8 167 175
Total 453 1299 1752
157Workers’ Compensation Claimants’ Prognosis • McIntosh et al


