Embed Size (px)
Citation preview

XA05C0001-ÍC3
Q»
° V £
REGIONAL CONGRESS
Radiation "Protection in JlieignbouAing Countries in Cental?
JožefStefanInstitute
INIS-XA-C-071
Symposiem onRADIATION PROTECTION IN NEIGHBOURING COUNTRIES IN
CENTRAL EUROPE -1995
Portorož, SloveniaSeptember 4-8,1995
Edited by Denis Glavič-Cindro

The material in this book has been supplied by the authors and has not beencorrected by the Programme Committee of the Symposium. The views expressedremain the responsibility of the named authors. In particular, neither theProgramme Committee nor any other organization or body sponsoring thismeeting can be held responsible for any material reproduced in this book.
SPONSORS
The Organizing Committee greatly acknowledge donations from thefollowing sponsors:
Slovenian Ministry of Science and TechnologySlovenian Ministry of HealthSlovenian Nuclear Safety AdministrationAdministration for Civil Protection and Disaster ReliefKrško Nuclear Power PlantInstitute of Occupational SafetyŽirovski vrh Mine

PROCEEDINGS
RADIATION PROTECTION INNEIGHBOURING COUNTRIES IN
CENTRAL EUROPE -1995
Portorož, SloveniaSeptember 4 - 8,1995
Edited by
Denis Glavič-Cindro/. Stefan Institute, Ljubljana, Slovenia
January 1996Printed by Jure Erjavec, TIPOGRAFIJA, Ljubljana, Slovenia


b \ y~Š- ^«:*.»-
Portorož, September 4,1995


O R Í . V M / A I I O N
Radiation Protection Association of SloveniaJ. Stefan Institute, Ljubljana, Slovenia
in cooperation with:
Austrian Association for Radiation ProtectionCroatian Radiation Protection Association
Czech Society for Radiation ProtectionHealth Physics Section (Roland Eötvös Physical Society) of Hungary
Italian Radiation Protection AssociationSlovak Society of Nuclear Medicine and Radiation Hygiene
I ' K O C K W I M I C O M M I i i l l
Rafael MARTINČIČ, President (Slovenia)Bogdan PUCELJ, Vice President (Slovenia)
Andor ANDRASI (Hungary)Argeo BENCO (Italy)
Klaus E. DUFTSCHMID (Austria)Zdenko FRANIČ (Croatia)
Emil KUNZ (Czech Republic)Stipe LULIČ (Croatia)
Denisa NIKODÉMOVA (Slovakia)Sándor PELLET (Hungary)
Janez STEPIŠNIK (Slovenia)Norbert VANA (Austria)
()R<;\\I/I\<. C'OMMII I M
HONORARY MEMBERS
Božidar Vouč, M.D. Ph. D., Minister, Republic of Slovenia, Ministry of HealthProf. Dr. Matjaž RODE, Dr. stom. Vice President of Medical Chamber of Slovenia
Stane ROŽMAN, B.Sc, Director General, Nuclear Power Plant KrškoAssist. Prof. Dr. Danilo ZAVRTANIK, Director, J. Stefan Institute
Rafael MARTINČIČ, PresidentBogdan PUCELJ, Vice president
Alfred HEFNER and Ferdinand STEGER, AdvisorsStanko ARH, Secretary
Miloš BUDNAR, TreasurerMeta ANČIKRudi ERMAN
Denis GLAVIČ-CINDROJanez MAROLT
Marjan RAVNIKARBranko VODENIKSonja WOSTNER
PREFACE
The 1995 Symposium on Radiation Protection in Neighbouring Countries in Central Europe was acontinuation of a series of conferences held by radiation protection societies and/or associations inCentral Europe to promote the knowledge in radiation protection and to exchange scientific informationand experience between countries in this region. Radiation hazards present a small part of all hazardsto which the mankind is exposed these days. However, radiation protection do have a leading role increating a strategy to minimize and regulate practices where various hazards are involved.
This time the symposium was organized by Radiation Protection Association of Slovenia and J. StefanInstitute in cooperation with Austrian Association for Radiation Protection, Croatian RadiationProtection Association, Czech Society for Radiation Protection, Health Physics Section (Roland EötvösPhysical Society) of Hungary, Italian Radiation Protection Association and Slovak Society of NuclearMedicine and Radiation Hygiene. It was held in Portorož, Slovenia. 112 papers were contributed as oralor poster presentations by 194 authors from 15 countries and two international organizations. Papersand posters covered a wide range of subjects, including: radiation protection at work place, naturalradioactivity, nuclear instrumentation and dosimetry, emergency exposure situations, wastemanagement, radiation protection principles and policies, radiation protection infrastructure, education,training and public relations and non-ionizing radiation.
The well being of humans and other biota is tied in a very fundamental way to the environment, whichmake the environment a primary target for protection. That's why we believe that the activities of ourSocieties in future should be aimed at the protection of the environment in general, through a globaland multi-disciplinary approach and the symposium demonstrated that there is a clear need forinternational communication and co-operation.
The symposium was sponsored by Slovenian Ministry of Science and Technology and cosponsored bySlovenian Ministry of Health, Slovenian Nuclear Safety Administration, Administration for CivilProtection and Disaster Relief, Krško Nuclear Power Plant, Institute of Occupational Safety andŽirovski vrh Mine. Their contributions are greatly appreciated. I am also indebted to many people fortheir help in organizing the symposium. Special thanks are due to members of the ProgrammeCommittee for the work they have done and to IRPA which kindly granted the IRPA RegionalCongress status.
I hope that the symposium helped in exchanging ideas and stimulating further collaboration betweenscientists working in the above mentioned fields. I also hope that the results of the symposiumpresented here will encourage the readers to participate in the next symposium presumably in 1997.
Rafael Martinčič

TABLE OF CONTENTS
INVITED PRESENTATIONS
IPI Hundred Years of RadiologyA. Hefner 3
IP3 Recent Developments in the European Union Radiation Protection PolicyJ. M. Courades : . 8
1P4 The Question of Health Effects From Exposure to Electromagnetic FieldsM. Grandolfo 13
SPl Fifty Years After Hiroshima and NagasakiY. Nishiwaki 17
SP2 Present Radiological Situation at the Semipalatinsk Nuclear Test SideP. Stegnar 27
SESSION I:RADIATION PROTECTION AT WORKPLACE
OPI The Central Registries of Occupational and Medical Exposure in the Czech RepublicK. Petrová, Z. Prouza 33
OP2 Radiation Protection Aspects for a 40 MeV Cyclotron PlantP. Ragni, R. Horn-Orni 37
OP3 Dose Measurements and LET-Determination in Space Station MIR During the Russian LongTerm Flight RLF
N. Vana, W. Schöner, M. Fugger, Y. Akatov, V. Shurshakov 41OP4 Patient Surface Doses in Computerized Tomography Examinations
B. Vekić, S. Kovačević, M. Ranogajec-Komor, N. Duvnjak, P. Marušić, P. Anić, P. Dolenčić . 45OPS Methods to Improve Radioprotection for Baita-Plai (Romania) Uranium Miners
S. Ramboiu 49
p PI Measurement of C-14 Inside the Krško Nuclear Power PlantB. Vokal, J. Burger, T. Mohar, and M. Franko 53
PP3 Health Surveillance of Medical Personnel Occupationally Exposed to Ionizing RadiationSources: Biomonitoring and Dosimetry
V. Brumen, I. Prlič, Ž. Radalj, D. Horvat and H. Cerovac 56PP5 Radiation Protection in Chest Radiography in Children Under One Year
C. Fulea, S. Ramboiu 59
SESSION II:NATURAL RADIOACTIVITY
OP6 Radon Risk Classification of Foundation Soils - Some RemarksM. Neznal, M. Neznal, J. Šmarda 63
op9 A Survey of Indoor Radon Concentrations in Dwellings in SloveniaM. Križman, R. Ilič, J. Skvarč, Z. Jeran 66
OP12 Perculiar Radon Spot in HungaryG. Marx, E. Tóth 71
OPI3 Local Deposition Patterns of Inhaled Radon Progeny in Human Bronchial AirwaysT. Heistracher, W. Hofmann and I. Balásházy 74
OPU Cellular Dosimetry for Radon Progeny Alpha Particles in Bronchial TissueA. Mohamed , W. Hofmann and I.Balásházy 77
PORTOROŽ 95 Í
TABLE OF CONTENTS PROCEEDINGS
OP15 Lung Cancer Risk Among Czech Miners Exposed to RadonL. Tomášek, V. Plaček 81
OP n Assessment of Radon-Daughter Deposition in the Respiratory TractS. Oberstedt, H. Vanmarcke 84
PP6 Preliminary Study on the Rate of Broncho-Pulmonary Cancer in a Romanian Department(Bihor) for the Estimation of Radon Risk Exposure
T. Vaida, C. Cosma, V. Pacurar, Fl. Maghiar, D. D. Ristoiu, S. Ramboiu, A. Poffijn 89PP7 Radon Exposures in Caves in Hungary
I. Csige, I. Hunyadi, J. Hakl, G. Géczy, A. Várhegyi, L. Lénárt and I. Töröcsik 92PP8 Content of 226Ra in Tap and Mineral Waters of the Republic of Croatia and Possible Health
EffectsG. Marovič, J. Senčar 96
PP2 Natural Radioactivity around the Coal-Fired Power PlantJ. Kováč, M. Bajlo 99
ppil Methodology of Ambient Radon Daughter MeasurementsR. Winkler, W. Hofmann and R. Rolle 101
PP12 Deposition of Inhaled Radionuclides in Bronchial Airways: Implications for ExtrapolationModeling
I. Balásházy, W. Hofmann and T. Heistracher 105PPI3 A New Method for the Determination of the Propension of a Soil to Produce Rn-222
M. Andjelov, J. Cloute-Cazalaa, M. Janot, P. Jovanovič, I. Kobal, J.F. Pineau, P. Zettwoog . 109PP15 Correlation Between Radium and Radon-in-Soil Gas in Slovenian Soils
M. Andjelov and D. Brajnik 112PP16 Measurement of the Ambient Neutron Background with a High-Resolution y-Ray
SpectrometerM. Korún, R. Martinčič, B. Pucelj, M. Ravnik 116
PP18 Radon Mitigation in SoilsD. D. Ristoiu, C. Cosma, T. Ristoiu, J. Miles 119
PP19 Survey of Radon Activity at Ground Level in Village Houses of HungaryE. Toth, D. Selmeczi 123
PP21 Calibration of a Dosimeter for Detection of Radon Activity in AirM. Caresana, V. Cattaneo 126
PP22 Dose and Radon Measurements Inside Houses Containing Ash as Building MaterialR. Bodnár, Z. Lendvai, C. Németh, J. Somlai 131
PP23 Lung Cancer Risk among Czech Miners Exposed to Radon Related to Histological TypesT. Müller, L. Tomášek, V. Plaček 134
PP25 The Spatial Distribution of 222Rn "Indoor" in Slovenia as a Stochastic Multifractal ProcessG. Salvadoři, S.P. Ratti, G. Belli, E. Giroletti, I. Kobal, J. Vaupotič 137
PP26 Scanning Electron Microscopy of Rat Throat and Trachea Following the Effects of RadonDecay Products
J. Rode, J. Vaupotič, K. Drašlar, I. Kobal 142PP28 GUIDLINES FOR TREATMENT OF SOLID WASTES WITH ENHANCED NATURAL RADIOACTIVITY IN POLISH COAL INDUSTRY
B. Michalik, S. Chałupnik, J. Skowronek, J. Lebecka 145
SESSION III:RADIATION PROTECTION AND ENVIRONMENT
OP18 Krško NPP Ecological Information SystemA. Kováč, B. Breznik 153
OP19 A Gas Scintillation Monitor for Tritium Gas in Argon or in NitrogenF. Campi, C. Mascherpa, C. Sterlini, P. Pacenti, S. Terrani 157
PORTOROŽ 95

TABLE OF CONTENTS PROCEEDINGS
OP20 Evulation of Low-Level Solid Radioactive Waste Generated by a Large Hospital and Disposedof with Ordinary Refuse
L. Conte, G. Pedroli, M. Monciardini, L. Bianchi, R. Novario, A. Beretta 162OP21 A Fractal View of Chernobyl Fallout in Northern Italy and Europe
G. Salvadoři, S.P. Ratti, G. Belli, E. Quinto 166OP2Z Off-Site Emergency Planning in Czech Republic
Z. Prouza, D. Drábová 171OP23 Rapid Determination of Soil Contamination by Helicopter Gamma Ray Spectrometry
I. Winkelmann, H. Buchröder, M. Thomas 174OP24 Recent Developments in the Atmospheric Dispersion Models to Be Used for Regulatory
Purposes and in Risk EvaluationG. Graziani 177
OP25 Biophysical Model for Thorotrast-Induced Liver CancersM. Nösterer, W. Hofmann and S.G. Andreev 181
OP26 Monitoring of Natural Radioactivity in SlovakiaD. Nikodémova, M. Vladár, I. Gomola 185
OP27 Effect of Different Treatments on 11OmAg Plant Uptake in Various Soil TypesP. Szerbin and E. Koblinger-Bokori 188
OP29 Radioactive Waste Repository and Radiation ProtectionM. Stepišnik, O. Jarh, I. Mele 192
OP30 Nuclear Disaster Management - The Murmansk ExerciseC. Schmitzer 197
PP31 Activity Levels of Cs-137 and K-40 in the Gastro-Intestinal Tract of a CowH. Rabitsch, E. Pichl, J. Pletz, G. Kahr 201
PP33 Radiation Monitoring Network of the Czech RepublicD. Drábová, I. Malátová, Z. Prouza, I. Bučina 205
PP34 The Effect of Morphometric Scaling on Deposition and Clearance of Inhaled RadionuclidesR. Bergmann, W. Hofmann and L. Koblinger 209
PP35 Radioactive Fallout Nuclides in a Peat-Bog EcosystemG. Pausch, W. Hofmann, F. Steger and R. Turk 213
PP36 Measurements of Plutonium in Environmental SamplesF. d'Alberti, L. Risposi 216
PP37 The Applicability of Lichens as Retrospective Biomonitors of the Radioactive Contaminationin a Mountain Ecosystem
M. Gastberger, W. Hofmann and R. Turk 220PP38 Some Aspects of Cesium Deposition in Transilvania (Romania)
C. Cosma, I. Pop, I. Cosmuta, C. Mícu and S. Ramboiu 223PP39 Analysis of Responses from an Environmental Air Monitoring System
P. Zagyvai, Á. Fehér, L. Nemes, H. Bitt, K. Kautny, S. Vinkovics 227PP41 The Concentration of Radioactive Strontium and Total Strontium in Some Sava River
SamplesK. Košutic, Z. Grahek, S. Lulié 230
PP42 Radioactive Contamination of Animal Bones by '"SrZ. Franič, M. Maračič 233
PP43 Mobile Radiological Laboratory - Regular Exercises and Intercomparison MeasurementsB. Pucelj, M. Korún, R. Martinčič, M. Ravnikar 236
PP45 INDOOR RADON CONCENTRATION IN POLANDK.Mamont-Cieśla, J.Jagielak, S.W.Rosiński, A.Sosińska, M.Bysiek, J.Henschke 238
PP46 Field Measurements on High Altitude Alpine Areas of AustriaA. Andrási, H. Lettner, E. Lovranich, F. Steger, J. Urban, E. Urbanich and P. Zombori 242
PP47 Environmental Monitoring of 137Cs in the Vardar River Catchment AreaT. Anovski, L. Cvetanovska-Nastevska, N. Jovanovski 246
PORTOROŽ 95 iii

TABLE OF CONTENTS PROCEEDINGS
PP48 Environmental Radioactivity Around the Former Coal Mine in Kočevje (Slovenia)M. Križman, B. Pucelj, D. Konda, J. Smrke 248
PP50 Study on Determination of Plutonium Isotopes in Soils From Lublin Region (Poland)A. Komosa 252
PP5I Studies of the Presence of Gamma Emitters in the Natural Environment of Eastern PolandS. Chibowski, J. Szczypa, J. Zygmunt 255
PP52 Natural and Artificial Radionuclides in Lichens as Air Pollution MonitorsZ. Jeran, R. Jacimovič, F. Batič, A. Prosenc 259
PP53 Environmental Radioactivity Due to Fly-Ash Disposal - Results of a Monitoring ProgrammeL. Mljač and M. Križman 262
PP54 Radiation Warning System in Slovenia (ROSS)S. Arh 265
PP55 U7Cs in Northeren Adriatic SedimentsD. Barišič, S. Luljč, N. Vdovič, A. Vertačnik and M. Juračič 268
SESSION IV:NUCLEAR INSTRUMENTATION AND DOSIMETRY
OP31 Characterization of TL Dosimeters for Determination of the Gamma Component in a Mixedn+Y Radiation Field
M. Ranogajec-Komor, S. Miljanič, M. Osvay, S. Ferek, I. Dvornik 273OP32 Calculated Alpha Counting Efficiency of a Sample/Detector Geometry for Ambient Radon
Progeny MeasurementR. Rolle, H. Lettner, W. Hofmann, R. Winkler 277
OP33 Measurement of Dissolved Radon and Radium Content of Water Samples by Track EtchTechnique
J. Hakl, I. Hunyadi, I. Csige, A. Vásárhelyi, J. Somlai, G. Faludi 281OP34 TSEE Characteristics of LiF:M,C,P Detectors
G. Uchrin 285OP35 Equivalent Dose Measurements in Aircrafts with TLD's Under Consideration of the Peak
Height RatioM. Noll, N. Vana, W. Schöner, M. Fugger, H. Brandl 289
OP40 In-Situ Gammaspectrometry Intercomparison Exercise in Salzburg / AustriaF. Steger, H. Lettner, A. Andrasi and E. Lovranich 293
OP41 The Importance of Localisation Within I31J-Retention MeasurementsG. Greifeneder, H. Aiginger, F. Steger, J. Flores 298
OP42 Quality Assurance of Activity Measurement in Radiation Monitoring Network of CzechRepublic
I. Malátová, D. Drábová 302
PP29 QUALITY ASSURANCE SYSTEM IN GAMMA SPECTROMETRYLABORATORYA. Mielnikow, B. Michalik, S. Chałupnik, J. Lebecka 306
PP57 Determination of the Self-Absorption in Enviromental Samples of Marinelli-Geometry andHPGe-Detectors Using Monte-Carlo-Simulations
H. Russold, Hj. Müller, H. Rabitsch, W. Ninaus 313PP61 Environmental Dose Measurement with Microprocessor Based Portable TLD Reader
S. Deme, I. Apathy, I. Fehér 317PP62 Onion Root Tip Cell System for Biodosimetry?
J. Paradiž, B. Druškovič, J. Škrk and M. Lovka 320PP63 A Wholebody Counter with Semiconductor Detectors for Radiation Protection Measurements
E. Lovranich, L. Riedlmayer, H. Jany, F. Steger, A. Andrási 324
PORTOROŽ 95 iv

TABLE OF CONTENTS PROCEEDINGS
PP64 Daily and Seasonal Variations of Outdoor Alpha-Activity Concentration in SalzburgCity/Austria
H. Lettner, A.K. Hubmer, R. Rolle, R. Winkler, F. Steinhäusler 328PP67 Improvement of Personal Dosimetry - Digital Pocket Dosemeter
Ž. Radalj, Z. Cerovac, I. Prlic, H. Cerovac, V. Brumen 331PP70 SARAD EQF 3020 a New Microsystem Based Monitoring System for the Continuous
Measurement of Radon and the Attached and Unattached Fraction of the Radon ProgenyT. Streil, G. Holfeld, V. Oeser, Ch. Feddersen and K. Schönefeld 334
PP71 Low-Level Gammaspectrometry with Germanium-Detectors: Experience with a NewCalibration Method
P. Jachs, F. J. Maringer, M. Tschurlovits 338PP72 Method for Determination of Radionuclides Concentrations in Ground Level Air Using the
ASS-500 Volume SamplerJ. Jagielak, M. Biernacka, R. Zarucki, K. A. Isajenko 342
PP74 Calculation of the Electric Field Inside Electret Ionisation Chambers - Influence on theResponse Function
H. Stadtmann, L. Breitenhuber, P. Kindl 344PP77 A Method for Calculating the Spatial Distribution of Radioactivity Measured by a Whole
Body CounterG. Greifeneder, H. Aiginger, F. Steger, E. Unfried, L. Riedlmayer, H. Havlik, H. Bergmann . 348
PP78 ACREM: A New Air Crew Radiation Exposure Measuring SystemP. Beck, K. Duftschmid, A. Großkopf, St. Kerschbaumer, Ch. Schmitzer, Ch. Strachotinsky,N. Winkler 351
SESSION V:NON-IONIZING RADIATION
OP44 High Voltage Power Lines in Italy: Quantitation of Exposure and Health Risk EvaluationC. Petřini, A. Polichetti, P. Vecchia 357
OP45 Assessment of Magnetic Fields Exposure from AC Power Lines in an Italian Residential AreaS. Tofani, G. d'Amore, G. Fiandino, M. Tasso 361
PP81 The Italian National Archive of Radio and TV Broadcasters: Preliminary Evaluations ofHealth and Environmental Impact
V. Lepori, A. Polichetti, P. Vecchia 365PP82 Evaluation of Recommendations on Limits of Exposure to Ultraviolet Radiation on the Basis
of Data From the Austrian PopulationG. Keck, G. Schauberger, A. Cabaj 369
PP83 Secondary Hazards of High Power Laser Beam WeldingK. Schulmeister, C. Schmitzer, K. Duftschmid, G. Liedl, K. Schröder and D. Schuöcker 373
SESSION VI:RADIATION PROTECTION AND THE SOCIETY
OP49 Radioactivity Monitoring Programme of Krško Nuclear Power PlantR. Martinčič, U. Miklavžič, M. Kanduč, S. Lulič, J. Kováč, B. Breznik 379
OP50 Radiation Protection Programme At Krško Nuclear Power PlantB. Breznik 385
OP51 Environmental Radiological Monitoring Around Reactor CentreB. Pucelj, M. Ančik, E. Bašič, Z. Kreft 390
OP52 Emergency Preparedness in SloveniaR. Martinčič, M. Korun, B. Pucelj, B. Ušeničnik 393
PORTOROŽ 95

TABLE OF CONTENTS PROCEEDINGS
OP54 Radiometrie Monitoring of Contaminated Scrap Metals Imported in Italy. Technical andRegulatory Features
F. Dobici, S. Piermattei, A. Susanna 397OP55 A Case of A Found Radiographic Source
B. Pucelj, M. Korún, D. Kavšek, Z. Kreft, M. Križman, R. Martinčič, M. Rosman, T. Šutej . 402
PP85 A Possible Approach to Assess Compliance with a Limit by MeasurementsM. Tschurlovits 406
OP56 The Regulatory System of Monitoring Workers in Germany for Intakes of RadioactivityA. Dalheimer, K. Henrichs 409
OP57 Radiological Protection in a Non-Nuclear CountryC. Hone 413
OP58 Combined Low- and High-Dose Irradiation and its Interpretation from the Point of View ofRadiation Protection
M. Beno 415OP59 Radioactivity in the Scrap Recycling Process: Radiation Protection Aspects and Experimental
Monitoring ProblemsD. Sacco, F. Ruggeri, G. Bindi, A. Bonanni, S. Casciardi, R. Delia, A. Loppa, P. Rossi,L. Venturini 419
OP61 Recent Developments in RadioecologyM. Tschurlovits 427
OP63 A Proposal How to Take into Account Inhomogeneous Radiation Fields in RadiationProtection
M. Tschurlovits 431OP64 New Organizational Framework of the Radiation Protection in the Czech Republic
V. Klener 434OP65 The Laboratory-Type Data Input and Processing Subsystem of the Country-Wide
Environmental Radiation Monitoring System in HungaryB. Kanyár, N. Fííló'p, N. Glavatszkih, Á. Németh 436
OP66 An Outlook to Radiation Protection DevelopmentR. Martinčič, P. Strohal 439
LIST OF PARTICIPANTS 445
AUTHOR INDEX 461
PORTOROŽ 95 VI

INVITED PRESENTATIONS
CIIAÍR:
K. E. DuŕrschiviidPRESidENTS Of
ORQANÍZÍNqSOCÍETÍES


XA05C0002INVITED PRESENTATIONS PROCEEDINGS
HUNDRED YEARS OF RADIOLOGY
A. Hefner
Austrian Research Centre Seibersdorf, Radiation Protection Department, Austria
Wilhelm Conrad RÖNTGEN, as was his custom, was working alone in his laboratory on Friday, November8. 1895, when he first made a discovery that would have an enormous impact on physical and medicalscience and, indeed, upon all mankind. Let us have a short look on the personal record of Röntgen.
Wilhelm Conrad Röntgen was born in Lennep (today a suburb of Remscheid, Germany) on March 27, 1845to Friedrich Conrad Röntgen, a distinguished cloth manufacturer, and his wife Charlotte Constanz, neeFrowein. The Röntgen family was well known at Lennep. They had been weavers, cloth manufacturers andmerchants there for many generations. His mother was of Dutch origin. In 1848 many European countries,including Germany, were shattered by revolutions. W.C.Röngen's parents sold their house in Lennep andemigrated to Apeldoorn, The Netherlands. W.C.Röntgen attended primary school there, and later a privateboarding school, until 1861 when he left home to continue his studies in Utrecht. He spoke fluent Dutch,and when he submitted his thesis to the University of Zürich (Switzerland) in 1869 he wrote to the frontpage "Wilhelm Röntgen von Apeldoorn (Holland)". He must have felt very much at home in this Dutchtown. He received his doctorate from the University of Zürich and then became an assistant to Prof. Kundt.Röntgen followed Kundt to Würzburg in 1870 and to Strasbourg in 1872 where he became "Privatdozent"in 1874. He was appointed Professor of Physics at Hohenheim in 1875, at Strasbourg in 1876, and atGiessen in 1879 where he was also Director of the Institute of Physics. In 1885 he was appointed Professorat the Julius-Maximilian University of Würzburg where he later became rector.
W.C. Röntgen's scientific work encompassed many different fields of physics such as specific heat of gases,elasticity, compressibility, capillarity, heat conduction in crystals, absorption of infra-red in vapors andgases, piezoelectricity, electromagnetic effects of dielectric polarisation and convective electric currents.
Coming back on Friday, November 8, 1895. Like many other physicists of his time, Röntgen wasexperimenting on cathode rays based on the research of Heinrich Hertz and P. Lenard. But on that date,he noticed a new phenomenon that all other physicists had disregarded previously. It was the radiation,unknown until then, which he named "X-rays" (to distinguish them from other rays already known).
For the next seven weeks, Röntgen remained secluded in his laboratory, concentrating on a number ofexperiments. He worked in secrecy, determined to validate his observations until he was able to offer theresults to other scientists for confirmation or refutation. After extensive experimentation, Röntgen wasconvinced that he was dealing with an entirely new kind of ray, unlike all others. He prepared a shortmanuscript, "On a New Kind of Rays.a Preliminary Communication", which he presented to the secretaryof the Würzburg Physical Medical Society on December 28,1895. In his manuscript, Röntgen described thegeneration of X-rays, noting that almost all materials were transparent to the X-rays. He wrote, "Paper isvery transparent: I observed that the fluorescent screen still glowed brightly behind a bound book of about1,000 pages; the printer's ink had no noticeable effect". He concluded that "the transperency of varioussubstances assumed to be of equal thickness depends primarily upon their density". He made the importantdistinction between X-rays and cathode rays, and noted that they were not ultraviolet rays. To get the wordout about his amazing discoveries, Röntgen sent copies of the article and prints of his X-ray pictures to anumber of well-known physicists. News of the discovery spread, bringing an end to Röntgen's peacefulobscurity.
As news of Röntgen's discovery spread throughout the world, the quiet professor of physics became acelebrity of sorts. "Our domestic peace is gone", Mrs. Röntgen was reported saying to a friend as theinternational praise, condemnation and curiosity descended upon the couple's residence.
Röntgen received more than 1000 pieces of mail during the first week alone after his discovery of the X-rayswas announced. As word spread, newspaper speculations on the possible medical use of X-ray photographs
PORTOROŽ 95

INVITED PRESENTATIONS PROCEEDINGS
led to experiments verifying the value of the new procedure. Within months, major medical and otherscientific journals printed X-ray illustrations and articles on the value of X-rays in medicine. In all of 1986,more than 1000 papers relating to X-rays were published. Disdaining the growing tide of publicity, Röntgenexclaimed, "they blew the trumpet out of proportion".
The first public demonstration of X-rays before a scientific body occured January 23, 1896, when Röntgenaddressed the Würzburg Physical Medical Society. During his presentation, Röntgen invited a colleague,Albert von Kölliker, to have his hand photographed by the X-rays. Later, an X-ray picture of his hand wasdisplayed. Von Kölliker declared the new rays to henceforth be called "Röntgen-Rays". The lecture turnedout to be the only formal lecture Röntgen gave on the subject of X-rays during his life.
Among the honours bestowed on Röntgen were the gold Rumford medal from the Royal Society in London,The Eliot-Cresson medal of the Franklin Institute in Philadelphia, and the Barnard medal awarded byColumbia University. He also became Honorary member of the Röntgen Society London, Röntgen SocietyBerlin, German Röntgen Society, Swiss Röntgen Society, New York Röntgen Society and NordiskFoerening for Med. Radiology.
Röntgen published his second paper on the subject on March 9, 1896. The third and final paper, titled"Further Observations on the Property of the X-rays", appeared in May 1897.
In 1901, Röntgen became the first recipient of the Nobel Prize for Physics. He gave the prize money, 50.000kronen, to support scientific research at the University of Würzburg, the site where he made his discovery.
In 1900, at the special request of the Bavarian government, Röntgen became Professor of Physics at theUniversity of Munich. Although slowed by age, Röntgen continued his life's work. In his latter years he wasdirector of the Institute of Physics at the University of Munich.
In 1919, Röntgen's beloved wife Bertha died following a long illness. After nearly 50 years together, theloss affected him greatly. He retired as professor of Physics in 1920, but continued his work in twolaboratories that were set aside for his use. Three years later, at age 78, he was still carrying outexperimental investigations despite failing sigth and health. On February 10, 1923, the discoverer of the X-rays died in Munich. Rudolph Grashey, a colleague, presented one of many eulogies, stating,
" Immortal is his work; immortal his name".
Now as an example let us follow some milestones in the development within 100 years of X-rays in medicaldiagnostics:
8.November 1895Wilhelm Conrad Röntgen discovers X-rays in Würzburg
28.December 1895G.Kaiser of Vienna develops the first radiogram for medical purposes
13.Januaryl896W.C. Röntgen reports to the German Emperor Wilhelm II in Berlin on his recent discovery
17.January 1896E. Haschek and O. Lindenthal, both from Vienna, inject Teichmann's solution into the arteries ofan amputated hand, thus enabling them to obtain the first angiogram
23.January 1896W.C. Röntgen delivers his only public lecture on the occasion of a special meeting of the Societyfor Medical Physics in Würzburg. In the presence of the attendees he produces a radiogram of thehand of one of the members - the anatomist Geheimer Rat Prof. R. von Kölliker
February & March 1896J. Maclntyre from Scotland succeeds in radiographing a live heart, respectively demonstratesmovement of a frog's leg by X-ray moving pictures
March 1896In Aberdeen, J. Mackenzie-Davidson radiographs head and pelvis for the first time
April 1896F.H. Williams in Boston pioneers in showing the first breast X-ray
1896 X-ray used therapeutically for the first time1897 Based on the ideas of Strauss, E. Linemann in Hamburg is the first to visualize the stomach by
introducing a metal spiral into the gastric cavity
PORTOROŽ 95 4

INVITED PRESENTATIONS PROCEEDINGS
1897 A. Beclere, "Father of Radiology in France", starts weekly conferences on radiology at HospitalFenon
1897 T. Rumpel uses bismuth nitrate for visualizing the esophageal passage1900 F. Moritz develops orthoradiography1901 W.C. Röntgen receives the Nobel Price for Physics1901 Use of radiation therapy for the treatment of breast cancer is reported by G.W. Hopkins1901 L.E. Schmidt and D. Kolischer of Chicago suceed in retrograde visualising ureters and kidneys1902 G.E. Pfahler and C.K. Mills present the first radiogram of a cranial tumour1903 E.A.O. Pasche designs a shield for suppressing scattered rays1903 H. Albers-Schönberg of Hamburg develops a compression shield1904 H. Rieder of Munich makes a live demonstration with a test person, exploring the gastrointestinal
tract in stages following the administration of a bismuth meal1905 F. Voelker and A. von Lichtenberg succeed in visualising the kidneys1910 M. Curie publishes "Theory of Radioactivity"1910 P. Krause, C. Bachern and H. Günther introduce barium sulphate as a contrast medium1911 J. Lilienfeld, a physicist fron Leipzig, designs the first gas-free X-ray tube1911 B. Sabat develops kymography in Warsaw1913 G. Bucky designs the grid for scatter radiation1913 W.D. Coolidge, an engineer from Massachusetts, designs the first high-vacuum hot cathode tube1916 C.V.S. Patterson produces intensifying screen1918 W.E. Dandy develops insufflation encephalography1921 A.E.M. Bocage from France introduced a patent for a tomographic device, mainly used for diseases
of the chest1922 J.A. Sicard and J. Forestier of Paris develop myelography1923 E.A. Graham and W. Cole carry out the first angiography of the brachial artery1924 J. Gorian in Trieste and E. Weber in Vienna develop the high-voltage X-ray technology1927 E. Monis carries out the first cerebral angiography1929 R. Dos Santos in Lisbon sucéeds in doing the first aortography by direct puncture1929 W. Forssmann conducts his famous auto experiment by inserting a catheter into his own heart1929 M. Wick of Berlin develops a new contrast medium, Uroselectan, which is used for visualising
kidney and urinary tract1929 A. Bouwers, a physicist of Eindhoven invented the rotating tube1930 A. Vallebona of Genoa develops the stratigraph, a precursor of tomography1930 H. Franke of Erlangen develops the first automatic exposure control1930 E. Lysholm of Stockholm develops the fine grid method1931 B. Ziedses des Plantes develops the subtraction method and later seriescopy1931 R. Janker of Bonn starts his comprehensive work on X-ray cinematography1935 P. Seleny of Budapest establishes the basics of xeroradiography1936 First film for direct X-ray exposure marketed1936 M. de Abreau of Rio de Janeiro conducts the first mass X-ray screening tests, setting up an index
for pulmonary tuberculosis1937 R. Janker of Bonn develops pneumoencephaltomography1938 T. Ichikawa of Japan is the first to do a catheter aortography1938 J.V. Coltman pioneers with image intensifier1944 Introduction of the contrast agent Pantopaque1946 First succesfull demonstrations of nuclear magnetic resonance1950 A, Bouwers designs the first screen image camera1951 Polytome, an improved tomographic device with complex motions is developed by Massiot of
France1956 I. Donald and T. Brown are pioneers in developing ultrasonography1958 I. Donald is propably the first to examine a fetus using ultrasound1960 Rocca and Rosadini publish their work on angiotomography1972 Sir Godfrey Hounsfield introduces the first clinical prototype EMI head scanner - Mark I
(Computed tomography)
PORTOROŽ 95

INVITED PRESENTATIONS PROCEEDINGS
1973 Based on the work of Bloch and Purcell on nuclear magnetic resonance (NMR), P. Lauterburdevelops magnetic resonance (MR)
1974 Von Ramm and colleagues describe real-time, 2-D ultrasound1976 The Kiel working group under P.H. Heintzen publish their results in digital subtraction angiography1977 Gruentzing develops a catheter for angioplasty1981 Reports of the first patients studied using NMR techniques are published1988 Clinical approval of first MR contrast agent1989 First implementation of magnetic resonance angiography (MRA)1989 Invention of Spiral Computer Tomography1989 So-called high resolution CT of the chest1990 Invention of ultrafast MR imaging1990 Functional MRI of the brain
At least I also want to give some words and examples on the development in our special field, namelyRadiation Risks and Radiation Protection in the last centenary.
In the first two to three years following the use of X-rays, there was almost a complete lack of radiationprotection, due to an ignorance of the hazards involved. However, when the injurious effects started tobecome apparent, described in 1904 as a Röntgen light burn of the second degree, some national attemptsbegan to be made in some, but not in all countries. For example, the British Röntgen Society's proposals in1898 for a Committee on X-ray injuries, the following questions to be answered by the Committee:
1. Nature of injurious effects.2. Description of case radiographed.3. Part exposed to rays.4. Condition of subject:
a. Well nourished or emaciated.b. Temperature, nervous or phlegmatic.c. Diathesis of patient.d. Local conditions of part exposed.
5. Did the patient complain of any feeling of warmth, tingling, or other sensation during orafter exposure?
6. Duration of effects, temporary or permanent.7. Apparatus employed, influence machine or induction coil, spark lenght, voltage or amperage
used.8. Form of tube: lenght from terminal to terminal.9. Distance from patient's body.lO.Number of exposures: interval, if any, between exposures; duration of each exposure.11 .Situation of tube with regard to body or limb of patient, i.e. position of anode or cathode.12.What covering or garment, if any, was used?
a. Material of which it was composed.b. Rough or smooth.c. Colour if dyed.
In America in 1903 a Protection Committee was proposed within the American Röntgen Ray Society byS.U. Monell.
Let us now have a look on some of the other milestones in the development of radiation protectionstandards:
1911 Adoption of an international radium standard and the curie as a unit of activity.1915 Röntgen Society in London adopts protection recommendations.1921 British X-ray and Radium protection Committee adopts radiation protection
recommendations.1921 Maximum Tolerance Dose principle stated for X-rays as "A sort of grand average of the
protective measures could be gleaned from the working conditions of a number ofexperienced radiologists who had escaped injury and still enjoyed normal health".
PORTOROŽ 95 6

INVITED PRESENTATIONS PROCEEDINGS
1922 American Röntgen Ray Society adopts radiation protection rules.1925 The first tolerance dose proposed: 0.01 skin erythema dose per month.1926 Dutch Board of Health adopts the first regulatory exposure limit:
1 skin erythema dose per 90.000 working hours.1928 Röntgen unit (R) adopted for exposure to X-rays.1928 International X-ray and Radium Committee (ICXRP, now ICRP) formed and its first
recommendations published.1929 U.S. Advisory Committee on X-ray and Radium Protection (USACXRP) formed, which
later (1946) is reorganised into the National Committee on RadiationProtection (NCRP).
1931 USACXRP recommends exposure limit of 0.2 R per day.1931 A League of Nations report recommends a limit of 10 mikroR per second for 8 hours.1934 ICXRP recommends a limit of 0.2 R per day.1934 USACXRP recommends a seperate limit of 5 R per day for hands.1936 USACXRP reduces the recommended exposure limit from 0.2 to 0.1 R per day.1949 NCRP lowers the maximum permissible dose for radiation workers to 0.3 R per week
and introduces the risk-benefit concept.1950 ICRP adopts a basic occupational maximum permissible dose of 0.3 R per week.1953 ICRU introduces the concept of a absorbed dose.1954 NCRP puts forward the ALARA concept: "as low as reasonably achievable".1955 NCRP recommends 5 rem per year as the basic maximum permissible dose for
occupational exposure.1956 United National Scientific Committee on the Effects of Atomic Radiation (UNSCEAR)
organised.1959 ICRP Publication I issued, stating ALARA concept and recommending a limit of
genetically significant dose to the general population of 5 rem in 30 years.1966 IRPA (International Radiation Protection Association ) was founded,
First International Congress held in Rome.
Later on a significant amount of publications from ICRP, ICRU, NCRP, UNSCEAR and IAEA giving newdirections, directives, guidelines and recommendations for Radiation Protection every year was produced.
REFERENCES
1. P.E. Peters: W.C. Röntgen - An European Scientist. Wien ECR'95.2. ECR-Office : Radiology in Europe - A century in review. Wien ECR' 95.3. ICRU NEWS 1/95 , Publisher ICRU, Bethesda USA.4. R.F. Mould : A Century of X-rays and Radioactivity in Medicine.Published by Institute of Physics Publishing. ISBN
0-7503-0224-0.
PORTOROŽ 95
XA05C0003INVITED PRESENTATIONS PROCEEDINGS
RECENT DEVELOPMENTS INTHE EUROPEAN UNION RADIATION PROTECTION POLICY
Jean-Michel Courades
Radiation Protection Unit - Directorate-General XI "Environment, Nuclear Safety and Civil Protection"European Commission,
Rue de la Loi 200, B-1049 Bruxelles, Belgique
On behalf of the European Commission I am pleased in this IRPA Seminar to present the RecentDevelopments in the European Union Radiation Protection Policy.
I. EURATOM TREATY PROVISIONS
All activities in the field of radiation protection are based on the Euratom Treaty. Both the Single EuropeanAct and the Maastricht Treaty leave the Euratom Treaty practically unchanged.
So far the Commission has considered that the provisions of the Euratom Treaty, in particular its Chapter HI- health and safety, give enough competence to the Community, and an acceptable level of safety is reachedthrough the carrying out of a number of duties incumbent on the Community institutions and the MemberStates.
It is to be noted that the task of the Euratom Treaty, as set out in its Article 1, is to "create the conditionsnecessary for the speedy establishment and growth of nuclear industries". However, for several years, theCommission has recognised that the major contribution it could make to achieve the task of the Treaty isby ensuring a high level of protection and safety in all activities concerned with radioactivity and nuclearenergy.
The following is a list of the major provisions of the Treaty on which activities in the field of radiationprotection are based.
Article 2b Euratom Treaty requires the Community to establish uniform safety standards to protect thehealth of workers and of the general public and ensure that they are applied. The meaning andthe procedure for such standards is given in Articles 30-32 of the Treaty
Article 33 of the Euratom Treaty sets out that draft national regulations on radiation protection arecommunicated to the Commission which may wish to issue recommendations within threemonths.
Article 35 imposes on Member States the establishment of facilities to carry out the environmentalmonitoring of radioactivity and to ensure compliance with the basic safety standards. It alsogives the Commission the right of access to such facilities.
Article 37 requires Member States to provide the Commission with such general data on any plan for thedisposal of radioactive waste as will make it possible to evaluate its possible impact on anotherMember State. The Commission shall give its opinion on the plan within six months.
II. RADIATION PROTECTION POLICY SITUATION
A. Regulatory Achievements
1) A Council directive laying down the basic safety standards for the health protection of the generalpublic and workers against the dangers of ionizing radiation exists since 1959 and it has been revisedseveral times, the last time in 1984. It applies to "any activity which involves a hazard arising fromionizing radiation".
PORTOROŽ 95 8

INVITED PRESENTATIONS PROCEEDINGS
It applies at present to approximately one million workers throughout the European Union and to thewhole population.
In 1984 the Basic Safety Standards Directive, which today still remains the major Communityinstrument in the field of protection against ionizing radiation, was complemented by another directivelaying down basic measures for the radiation protection of persons undergoing medical examinationor treatment.
2) Following the Chernobyl accident in 1986, additional legislation covering specific aspects wasproduced:
A series of regulations on the conditions governing the import of agricultural products originating inthird countries following the Chernobyl accident. These regulations are specific to cope with theconsequences of the Chernobyl accident and have limited duration.
A series of regulations laying down maximum permitted levels of radioactive contamination offoodstuff following a possible future nuclear accident.
A 1987 Council decision on Community arrangements for the early exchange of information in theevent of a nuclear accident or radiological emergency.
A 1989 Council directive on informing the public about health protection measures to be applied andsteps to be taken in the event of a radiological emergency.
The Commission was charged by Council conclusions of 1989 to regularly convene representatives ofthe national competent authorities responsible for requesting and granting assistance in the event of anuclear accident.
3) Following the TransNuklear affair on movements of radioactive waste, which in 1988 caused theestablishment of a Committee of Enquiry by the European Parliament, the following directives wereproduced, also based on Article 31 of the Euratom Treaty:
- 1990 Council Directive on the operational protection of outside workers exposed to ionizingradiation;
- Council Directive 92/3/EURATOM of 3 February 1992 on the supervision and control of shipmentsof radioactive waste
This directive establishes a system of strict control and prior authorization for shipments of radioactivewaste.
This Directive requires that, in case of shipments from the Union territory to the CEEC, the lattercountries have at their disposal the technical, legislative and administrative resources needed for thesafe management of radioactive waste (see Article 11 of the Directive)
Where waste is to enter the European Union from a third country and the country of destination is aMember State of the Union, the consignee shall submit an application for authorization to thecompetent authorities of that Member State.
For the purpose of the shipments a standard document has to be used..
4) For the single market of the European Union two actions in the field of radiation protection werenecessary, one adopting a regulation covering the movement of radioactive materials in the newsituation of no frontier controls and customs procedures, and the other proposing to reduce theflexibility left to Member States within the reporting and authorization regulatory framework for theproduction and marketing or radioactive sources.
In relation to the removal of intra-Community border controls Council Regulation (Euratom) 1493/93of 8 June 1993 on shipments of radioactive substances between Member States was adopted to allowthe authorities in the Member States to be informed about radioactive substances entering theirterritory. A System of prior declaration and information has been established.
A distinction is made between sealed sources and other relevant sources. In the case of sealed sourcesthe holder who intends to carry out a shipment shall obtain a prior written declaration by the consignee
PORTOROŽ 95

INVITED PRESENTATIONS PROCEEDINGS
to the effect that he has complied, in the Member State of destination with all applicable nationalprovision implementing the Basic Safety Standard Directives. This declaration is sent by the consigneeto the competent authority of destination.
5) Taking into account that natural radiation sources are the largest contributors to the exposure toionizing radiation of the Community's citizens, the Commission published, in 1990, a recommendationon the protection of the public against indoor exposure to radon.
B. Current Regulatory Activities
1) Revision of the 1980 Basic Safety Standards Directive
A proposal for a revision of the Basic Safety Standards Directive, aims at strengthening radiationprotection in accordance with progress made in scientific knowledge (ICRP Recommendations inPublication 60). The proposal was approved by the Commission in 1992; a final proposal which takesinto account the opinion of the European Parliament was submitted to the Council in July 1994. It isexpected that the Council may adopt the directive in 1996.
The proposal is consistent with the International Basic Safety Standards for Protection against IonizingRadiation sponsored by FAO/IAEA/ILO/NEA-OECD/WHO.
This revision of the Basic Safety Standards presently still under discussion will include a number ofmajor modifications:
- for members of the public the dose limit will be reduced from 5 to lmSv per year; this limit may beexceeded provided the average dose over five years doe s not exceed lmSv annually,
- provisions for protection of workers against exposure from naturally occurring radionuclides areintroduced for the first time
- occupational dose to workers will be reduced to 20mSv annually; The limit shall be 100 mSv in aconsecutive five year period, with a maximum single annual exposure of 50 mSv.
2) Revision of the 1984 "Patient" Directive (Radiation Protection of Persons undergoing MedicalExamination and Treatment)
The requirements of the 1984 "Patient" Directive need to be reformulated taking into account thescientific and technical progress.lt is envisaged to enlarge the scope of the Directive to includevolunteers in research and individuals helping in the support and comfort of patients. The proposal willset out specific requirements for a better application of the justification and optimisation principles.Quality assurance programmes and processes for audit will be required.
3) Verification of Member State monitoring of environmental radioactivity under Article 35 of theEuratom Treaty
The Commission decided in December 1989 to resume the verifications to the facilities in MemberStates under the terms of Article 35 of the Euratom Treaty.
On average some 3-4 visits are made annually.
4) Opinions on radioactive effluents having an impact on the territory of other Member states
Activities related to the application of Article 37 are well established. Their importance wasrecognised by the Court of Justice in 1987 which stated that the Commission's opinion must be broughtto the notice of the Member State submitting the general data on plans for the disposal of radioactivewaste before the issue of any authorization to carry out such plans.
A 1990 Commission Recommendation which takes into account this judgement gives guidance on theapplication of Article 37.
Since 1987 the opinions of the Commission are published in the Official Journal of the EC
Two opinions under Article 37 were given in 1991, five in 1992, three in 1994.
PORTOROŽ 95 10

INVITED PRESENTATIONS PROCEEDINGS
5) Radioactive waste management
The Council has adopted in December 1994 a resolution which supports elements of a strategy in thefield of radioactive waste management. In particular, the resolution takes the view that each MemberState is responsible for the proper management of radioactive waste produced on its territory whileleaving open the possibility of cooperation between Member States.
6) Support Activities
A number of support activities aim at following the practical situation in the Member States and ateasing the uniform application of the Community provisions. These support activities include notably:
- Training courses for operators- Scientific seminars- Exchange of information with representatives of the competent national authorities- Information seminars, specific interested groups, including trade unions- Permanent actions on technical subjects such as job related doses and dosimetry.
7) International Cooperation
a) Cooperation with IAEA AND OECD/NEA
International action is developed with a view to maintaining and furthering the unity of doctrine andpractical approach. This implies cooperation with international organisations such as the IAEA andthe OECD/NEA. The proposal for a Council decision approving the conclusion by the Commissionof the 1994 Nuclear Safety Convention will be discussed at Council level.
b) Cooperation with CEECs : The White Paper on the Preparation of the Associated Countries ofCentral and Eastern Europe for Integration into the Internal Market of the European Union
The purpose of the White Paper, approved by the European Commission on 3 May 1995, is to preparethe CEECs for integration into the Internal Market. The White Paper contains recommendations aboutwhich measures should be tackled first and describe the administrative and organisational structureswhich should be put into place to make the legal framework work properly.
Product related provisions of EU radiation protection legislation are included in these key measures:In this field mention has been made to EU legislation on radioactive contamination of foodstuffs incase of accident, on shipment of radioactive waste and to the 1980 Basic Safety Standards Directive.
According to this Directive economic activities which involve the use of products that emit ionizingradiation are subject to a reporting or authorization requirement.
The White Paper is intended to guide the CEECs in the complexities of EC internal market legislationand its functioning and to help them to align with the Member States of the Union.
It is addressed to six countries of Central and Eastern Europe which already have associationagreements with the European Union (Poland, Hungary, the Czech Republic, Slovakia, Bulgaria andRomania) and to those with whom agreements will also be concluded soon (Estonia, Latvia, Lithuaniaand Slovenia).
The White Paper emphasizes in particular the importance of the radiation protection infrastructures(presence of the necessary enforcing authorities with administrative powers of authorization,surveillance and inspection).
A new technical assistance information exchange office will be set up financially supported by a multicountry PHARE programme.
The European Council gave it support to the White Paper at the Cannes Summit on 26 and 27 June1995. The European Commission will help the CEECs to establish or modify their nationalprogrammes for approximation in the light of the White Paper, to conduct their work and reinforce theirstructures.
PORTOROŽ 95 11

INVITED PRESENTATIONS PROCEEDINGS
The acceptance of the "acquis communautaire" as a whole is the precondition for accession but willnot automatically open the EU door to the CEECs. The Commission will nevertheless take into accountthe progress made by the CEECs in the light of the White Paper when examining a request for theopening of accession negotiations.
III. PROSPECTS
The following priority regulatory actions are envisaged in the future:
the preparation of a Communication setting out the rationale of the provisions of the modified BasicSafety Standards Directive;
the establishment of a coherent European Union regulatory framework taking into account the revisionof the Basic Safety Standards Directive.
PORTOROŽ 95 12
INVITED PRESENTATIONS XA05C0004 PROCEEDINGS
THE QUESTION OF HEALTH EFFECTS FROM EXPOSURETO ELECTROMAGNETIC FIELDS
M. Grandolfo
National Institute of Health, Physics DepartmentViale Regina Elena, 299, 00161 Rome, Italy
INTRODUCTION
The question of health effects related to exposures from non-ionizing and non-optical electromagnetic fieldsis currently concentrated in two frequency ranges: extremely low frequency (ELF) electric and magneticfields, mainly at the overhead high-voltage power line frequencies of 50/60 Hz, and radiofrequency (RF)radiation, encompassing the frequency range from a few kilohertz to 300 GHz. The part between 300 MHzand 300 GHz is also usually named microwaves (MW); from this point of view, microwaves are part of thewhole RF spectrum.
The following brief overview is aimed at evaluating the state of knowledge regarding the question of healtheffects associated to exposures to ELF and RF/MW fields.
ELF ELECTRIC AND MAGNETIC FIELDS
The possibility of health consequences of exposure to 50/60 Hz electric and magnetic fields has beeninvestigated and evaluated for several decades (1'2). Such consequences are reasonably well understood interms of certain acute effects, and this understanding is further assisted by the identification of interactionmechanisms such as induced currents, electric charge developed on the body surface, and functionalchanges in excitable tissues (3).
Many epidemiological studies have been carried out in the last fifteen years to investigate the correlationof exposure to power-frequency magnetic fields with cancer. Several reviews and evaluation of this workhave been published, the most recent by Hendee and Boteler(4) and by Knave (5). Of the possible cancer risksdiscussed today, leukaemias in children living near power lines are best documented. The most recentstudies show in fact some consistency in indicating a correlation between childhood leukaemia and someindicators of exposure to 50/60 Hz magnetic fields. The results of studies on residential exposure of adults,on the contrary, are less consistent and controversial because of uncontrolled confounders and questionableexperimental methodology. Also the studies of occupational exposure to electromagnetic fields are ratherinconclusive because exposure measurements have generally not been obtained and confounders are notconsidered.
Epidemiological data are generally given in terms of relative risk (RR), i.e. the probability of a given healtheffect for exposed people with respect to non-exposed. A major shortcoming of studies on electromagneticfields is the lack of a clear definition of exposure. Only in a few cases have the magnetic fields beenexperimentally measured, and have been found to correlate with cancer cases less than surrogate indicatorssuch as the electric wire configuration(6), or the distance from power lines<7).
Relative risks for childhood leukaemia typically range between 1 and 3. An odd ratio of 1.9 was found forexample by Savitz et al.(6) using a cut-off score of 0.2 uT to identify exposed children. More recently, acase-control study performed in Sweden(8) yielded a risk of leukaemia in children that shows a certainincrease with increasing exposure to magnetic fields estimated by historical residential proximity to 220-400kV utility lines. A risk ratio of 2-3 was determined for average annual exposures above 0.2 uT, with the riskincreasing as a function of exposure intensity.
The data have been pooled with those of similar studies performed in Denmark and Finland(9). Consideringthe very large population under study, this represents the most reliable data set presently available for riskevaluation. The pooled analysis gave a relative risk of childhood leukaemia of 2.1 (95% ConfidenceInterval: 1.1-4.1).
PORTORO2 95 13

INVITED PRESENTATIONS PROCEEDINGS
However, relative risks are not a measure of health impact, which also requires information on the size ofthe exposed population. Only recently have estimates of collective impact been performed, based on roughestimates of exposure.
In Sweden, it is estimated that one case per year of childhood leukaemia can be ascribed to power lines, ifa causal relationship with exposure actually exists (5).
Recently in Italy(l0), a total of 306,400 persons, corresponding to 0.54% of the entire population (about 57million) was estimated to be exposed above 0.2 uT.
Assuming as the most reliable value for RR the result of the pooled analysis of the Nordic epidemiologicalstudies, i.e., RR = 2.1 (95% Confidence Interval: 1.1 - 4.1), it was obtained an excess incidence of 2.5 (95%Confidence Interval: 0.2 - 7.0) cases per year, and an excess mortality of 1.1 (95% Confidence Interval:0.1 - 2.9) cases per year.
In conclusion, the most realistic estimate of health impact from power lines in Italy, if any, amounts to lessthan 3 extra cases of childhood leukaemia per year, one of which would be fatal, while the assumption ofworst-case conditions raises the excess incidence to 3.9 cases per year and the excess mortality to 1.6 casesper year.
RADIOFREQUENCY RADIATION
The inherent risks to health from RF exposures are directly linked to the absorption and distribution ofenergy in the body, and the absorption and distribution are strongly dependent on the size and orientationof the body and the frequency and polarisation of the incident radiation. Both theory and experiment showthat RF specific absorption rate (SAR) in prolate spheroid models approaches a maximum value when thelong axis of the body is both parallel to the electric field vector and approximately equal to four-tenths ofthe wavelength of the incident RF field00.
Three categories of effects are sufficiently well understood to be considered for health hazard assessment,i.e., (i) the evidence that absorption of radiofrequency energy causes tissue heating; (ii) currents can beinduced in humans by physical contact with ungrounded metallic objects at frequencies below about 100MHz; and (iii) direct stimulation of nerve and muscle cells can occur at frequencies below about 2-3 MHz.
Many of the biological effects of acute (non stochastic) exposure to radiofrequency and microwave radiationare consistent with responses to induced heating, resulting either in frank rises in tissue or body temperatureof about 1°C or more, or in responses for minimising the total heat load. Most responses have been reportedat SARs above about 1-2 W/kg in different animal species (particularly primate) exposed under variousenvironmental conditions. These data indicate the sort of responses that are likely to occur in humanssubjected to a sufficient heat load.
Healthy subjects at rest in light clothing and in ambient conditions of around 21-22°C and relative humidityof around 50% with adequate ventilation seem able to dissipate radiofrequency power at SARs of 1 W/kg,and to up to 4 W/kg for short periods. Sweating and an increase in heart rate have been seen in volunteersin response to whole-body SARs in the upper part of this range after exposure for about 20 min. It is likelythat adverse environmental conditions, such as high temperature or humidity, and moderate physicalexercise will restrict this range of tolerable SAR. In addition, people under medication or with conditionswhich impair thermoregulation, including pregnancy, may also be limited to lower values of SAR.Conversely, heat tolerant or acclimatised people in low environmental temperatures may endure higherSARs.
Some individual tissues, moreover, may be particularly sensitive to the heating effects of radiofrequencyand microwave radiation, mainly because of their lack of blood supply, and consequent limited coolingability. From this point of view, the lens of the eye and the testis can be potentially regarded as criticalorgans.
When a person touches a metallic object such as a car, van, or bus situated in an RF field, large currents mayflow through the body that are considerably in excess of those that would cause perception, pain, and evenburns in some cases. Rogers"2' has quantified the thresholds for these effects in 50 volunteers at frequenciesbetween 2 and 20 MHz. The conclusion was that 200 mA was the maximum tolerable current that couldbe drawn through finger-contact with objects in RF fields. However, these effects depend on the currentdensity in tissue, rather than on the current value. It has been noted that burns will occur when currentdensities in the skin exceed 3-4 kA/m2. The adverse consequences of indirect effects of exposure to RF
PORTOROŽ 95 14

INVITED PRESENTATIONS PROCEEDINGS
fields may be avoided by engineering or administrative controls or by limiting the external field or thecontact current.
The evidence suggests that RF and microwave radiation is not mutagenic and is therefore unlikely to initiatecancer; however, very few cancer-related studies are available(13). The evidence for a co-carcinogenic effector an effect on tumour promotion or progression is not convincing, but surely these issues deserve furtherinvestigation. .
The few epidemiological studies that have been carried out on populations exposed to RF fields have failedto produce significant associations between such exposures and outcomes of shortened life span, or excessesin particular causes of death. Such studies tend to suffer, however, from poor exposure assessment and poorascertainment of other risk factors.
Among the various, possible effects of interference induced by radiofrequency and microwave radiation,the effects of cellular phones on pacemaker patients play an outstanding role. Recently, studies conductedin Italy and in Switzerland (14) show that cardiac pacemaker implanted in patients can be affected byelectromagnetic field from cellular telephones.
The Italian study was conducted with 2 analogue and 2 digital cellular phone models. The digital modelswere working with the new European standard GSM; the analogue ones worked with the TACS standard.Both standards operate in the 900 MHz range. The electromagnetic fields radiated by the phones interferedwith 15 out of 27 and 10 out of 25 pacemakers tested in vitro with the GSM and the TACS signal,respectively; GSM interference was detected also in 26 out of 101 pacemaker patients. Specifically, pulseinhibition, asynchronous pacing, synchronisation, undersensing and oversensing effects were detected. Theeffect, however, was observed only when the phone antenna was positioned straight over the pacemakerhead, up to a distance of 13 cm in vitro and 10 cm in vivo. Once the phone was removed, in no case therewas permanent malfunctioning or reprogramming of the pacemakers. The results indicate that pacemakerpatients can found themselves in potentially hazardous situation (15) if they carry a cellular phone in closeproximity of the implant, for instance in the inner pocket of the jacket.
CONCLUSION
Our electromagnetic environment has changed greatly during the past several hundred years. Among manychanges that have been caused by our own human activities, power-frequency electric and magnetic fieldsare products of technological advances to which virtually everyone is exposed.
Possible links between exposure to 50/60 Hz electric and magnetic fields and increased cancer risks havebecome an important issue for the scientific community, environmental groups, and the electric utilityindustry, as well as for the general public.
The quantitative results of the health risk assessment should be taken into account, besides other factorsentering the issuing of standards, such as socio-economical and environmental considerations. Decision-makers and politicians should put in the right perspective all above information, defining actions andpriorities.
The rapidly expanding industrial and home uses of radiofrequency and microwave radiation also contributeto a steady increase in "electromagnetic pollution" of the environment. The number of devices, which bydesign emit electromagnetic waves into the atmosphere, such as radar, radiotelecommunication links andrepeaters, television and radio broadcasting stations and cellular phones, is growing from day to day. Thepower of individual installations is also rapidly increasing.
REFERENCES
1. Grandolfo, M, Michaelson, S. M., and Rindi, A., eds., 1985, "Biological Effects and Dosimetry of Static and ELFElectromagnetic Fields," Plenum Press, New York and London.
2. Ueno, S., ed., 1995, "Biological Effects of Magnetic and Electromagnetic Fields," Plenum Press, New York and London.3. Tenforde, T.S., 1993, Cellular and molecular pathways of extremely low frequency electromagnetic field interactions
with living systems, in "Electricity and Magnetism in Biology and Medicine," M. Blank, ed., San Francisco Press, SanFrancisco.
PORTOROŽ 95 15

INVITED PRESENTATIONS PROCEEDINGS
4. Hendee, W. R., and Boteler, J. C , 1994, The question of health effects from exposure to electromagnetic fields,Health Phys., 66:127.
5. Knave, B., 1994, Electric and magnetic fields and health outcomes - an overview, Scand. J. Work Environ. Health, 20special issue: 78.
6. Savitz, D. A., Wachtel, H., Barnes, F. A., John, E. M., and Tvrdik, J. G., 1988, Case-control study of childhood cancerand exposure to 60-Hz magnetic fields, Am. J. Epidemiol. 128:21.
7. Tomenius, L., 1986,50-Hz electromagnetic environment and the incidence of childhood tumors in Stockholm County,Bioelectrotnagnetics 7:191.
8. Feychting, M., and Ahlbom, A., 1993, Magnetic fields and cancer in children residing near Swedish high-voltage powerlines, Am. J. Epidemiol. 138:467.
9. Ahlbom, A., Feychting, M., Koskenvuo, M, Olsen, J.H., Pukkala, E., Schulgen, G., and Verkasalo, P., 1993,Electromagnetic fields and children cancer, Lancet 342:1295.
10. Anversa, A., Battisti, S., Carreri, V., Conti, R., D'Ajello, L., d'Amore, G., Fumi, A., Grandolfo, M., Munafb, E., Tofani,S., and Vecchia, P., Power frequency fields, buildings and the general public: exposure levels and risk assessment,Proceedings of Healthy Buildings '95, Milan 10-14 September 1995, in press.
11. Franceschetti, G, Gandhi, O P, and Grandolfo, M, (Eds), 1989, "Electromagnetic Biointeraction: Mechanisms, SafetyStandards, Protection Guides," Plenum Press, New York and London.
12. Rogers, S J, 1977, RF Shock/burn Hazards in the MF/HF Band. Portsmouth, Admiralty Surface Weapons Establishment.WP/XSA/7503.
13. National Radiological Protection Board, 1992. Electromagnetic Fields and the Risk of Cancer Documents of theNRPB 3 (1). Chilton, National Radiation Protection Board.
14. Eicher, B., Ryser, H., Knafl, U., Burkart, F., Naegeli, B., Deola, M., Babotai, I., Kuster, N., 1994. Effects of TDMA-modulated hand-held telephones on pacemakers. Abstract Book of the Sixteenth Annual Meeting of theBioeleclromagnetics Society (BEMS), Copenhagen.
15. Barbaro, V., Bartolini, P., Donate, A., Militello, C, Altamura, G., Ammirati, E., Santini, M., 1995, Do European GSMmobile cellular phones pose a potential risk to pacemaker patients? Pace 18:1218.
PORTOROŽ 95 16

XA05C0005INVITED PRESENTATIONS PROCEEDINGS
FIFTY YEARS AFTER HIROSHIMA AND NAGASAKI
Y. Nishiwaki
Prof. Emeritus, Tokyo Institute of Technology, Tokio, JapanHon.Prof. der Universität Wien, Institut fir Medizinische Physik, Universität Wien, Wien, Austria
Fifty years ago, in 1945, the first three atomic bombs in human history were produced by the United States;one of these bombs was exploded experimentally at the testing ground in the desert 80 km fromAlamogordo, New Mexico, on 16 July. The remaining two were used against Japan; the one called "LittleBoy", using Uranium 235 was dropped on Hiroshima on 6 August, the other "Fat Man", using Plutonium239 on Nagasaki on 9 August, 1945.
In the early morning, at 1:30 a.m. of 6 August 1945, a United States Army weather observation plane tookoff from the Tinian air base in one of the Mariana Islands in the Pacific towards Japan. As the planeapproached Hiroshima, at an altitude of about 10,000 metres, it sent a message to the B-29 "Enola Gay"loaded with an atomic bomb, which was following it, "fair weather, ready for air raid." The "Enola Gay"took off from Tinian Island at 2:45 a.m. together with two observation planes on both sides, and invadedHiroshima from the northeast and dropped the atomic bomb at 8:15:17 a.m., (Tinian time 9:15:17 a.m.),at an altitude of 9,600 metres. Records on the time of explosion range from 8:15 to 8:18 a.m., dependingon the source of information. However, according to the Hiroshima City, the official time of explosion wasannounced to have been 8:15 a.m. The whole city was covered by a bluish-white glaze. The central part ofthe city was completely destroyed instantaneously.
The altitude of the explosion and the location of the hypocentre were estimated by the extrapolation of thelines connecting the shadows and the corresponding objects that were exposed to strong thermal radiation.The height of the epicentre was about 580 ± 15 m and the hypocentre at about longitude 132°27'29" E andlatitude 34°23'29" N. This is on the ground of Shima Surgical Hospital, about 160 m southeast from thecentre of the Atomic Bomb Dome, which is considered a symbol of Hiroshima at present.
Dr. Shima, a graduate of Osaka University, the then director of the Shima Hospital, was my personal friendand whenever I went to Hiroshima I used to stay at his home next to the hospital. The night before theatomic bombing, Dr. Shima visited his family evacuated to the outskirts of Hiroshima, and missed the lasttrain back to Hiroshima because he was playing mahjong (a kind of Chinese card playing - small squaretiles) with his friend until late at night. Because Dr. Shima was late he, fortunately, escaped the atomicbombing.
Dr. Shima, the current director of the hospital, is one of the former students of mine when I was the headof the radiation biophysics laboratory, School of Medicine of Osaka City University many years ago. Hisyounger brother is also a medical doctor from Hiroshima University. About ten years ago he was studyingat the Max Planck Institut für Hirnforschung in Köln with Humboldt Stiftung and visited me in Vienna withhis family because his immediate boss in Köln was a graduate of the University of Vienna.
News of the atomic bombing was briefly announced at 6 p.m. by the Japan Broadcasting Corporation:"August the 6th. Hiroshima was attacked by B-29's this morning at about 8:20. The planes have turned backafter dropping incendiary bombs. Damage is now being investigated." The news of the bombing wasdispatched from Osaka, because mass media in Hiroshima were completely destroyed and did not function,and reported by newspapers throughout Japan on the following day. The first report appeared in the OsakaAsahi Newspaper was a relatively small article at about the centre of the front page.
There was also a shortwave radio news from the U.S. to the effect that President Truman had announcedthat an atomic bomb was dropped on Hiroshima.
It was a hot morning in Nagasaki on 9 August 1945. Two planes, B-29 "Bockscar" loaded with an atomicbomb and a weather observat ion plane, left the Tinian airbase early in the morning at 2:45 a.m. At 9:50a.m. the plane flew into the sky above Kokura, the first bombing target, which is in the northeast ofFukuoka Prefecture on the island of Kyushu. It circled three times for about 10 minutes, but could not locatethe target because of heavy clouds, and abandoned the first target for lack of fuel. It then turned towards
PORTOROŽ 95 17

INVITED PRESENTATIONS PROCEEDINGS
Nagasaki, the second bombing target. Taking a round-about way, it flew southward from Kokura viaKumamoto and the Shimabara peninsula and reached Nagasaki at 10:58 a.m. The sky over Nagasaki, wasalso covered by clouds and visibility was very poor. They prepared to drop the bomb using radar. Theobservation plane dropped a "sonde" by parachute..Just at this moment, the clouds opened up and the hugeNagasaki Mitsubishi Plant appeared. The atomic bomb was dropped at an altitude of about 9,000 m. Theplane changed course immediately, and after confirming the flash and shock wave at 11:02 a.m. escapedto Okinawa, the closest base then occupied by the U.S. forces. The plane landed in Okinawa at 1 p.m. withonly a few gallons of fuel left. The height of explosion in Nagasaki is estimated at about 503 + 10 m andthe hypocenter at longitude 129°51'56"4E and latitude 32°46'12"6 N. This site is about the place where theHypocenter Monument is located at present at Heiwa Kôen (Peace Park) in Nagasaki.
My colleague, Prof. Hasegawa, the then professor of otorhinolaryngology of the Nagasaki University wasstaying in Osaka at the time of the atomic bombing on Hiroshima. On hearing about the atomic bombingon Hiroshima he hurried back to Nagasaki through Hiroshima on the following day and met the atomicbombing in Nagasaki. However, at the time of the atomic explosion he was in the toilet of the heavyconcrete main building which is apparently well shielded from radiation, and, fortunately, he survived. Helater became professor of otorhinolaryngology of Osaka University.
Next to the heavy concrete main building of the Nagasaki University Hospital there was a large woodenlecture hall. All students present at the lecture at the time of the atomic bombing were killed. Even now, inthe list of the graduates of the Nagasaki Medical University there is a large blank space in the correspondingyear and it is written "all died by the atomic bombing on Nagasaki in 1945".
The Nagasaki University Hospital was about 700 m southeast of the Hypocenter. At about 500 m northeastof the hypocenter there was a large Urakami Cathedral, the largest catholic church in Japan with amembership of about 14,000. The church was completely destroyed by the atomic bombing. Father SaburoNishida and the parishioners present in the church were all killed. Only a part of the walls were standingin the ruins.
The atomic bomb differs from conventional explosions in that besides the shock wave or bomb blast it isaccompanied by intense heat and radiation, with the dissipation of energy in the approximate ratio of bombblast (50%), heat (35%), and radiation (15%).
Towards the end of the last war I was assistant professor of physics at the Osaka University of Science andEngineering (at present, Faculty of Science and Engineering of Kinki University).
Since the air raid on industrial areas was gradually intensified, one of the branch laboratories of the NishinaResearch Project on nuclear energy was evacuated to the Yao High School near the university. I wasassisting them in a preliminary study on the separation of uranium isotopes together with my students. Whenwe heard about the atomic bombing, the liaison officer immediately flew to Hiroshima and Nagasaki by anex-Japanese army plane. Although it was not possible to enter the central part of the city, we knew that itwas the atomic bomb because all roentgen films stored in the basement of the Hiroshima Red Cross Hospitalwere exposed to radiation and unusable.
The explosion creates an extremely high pressure at the point of detonation equal to several hundredthousand atmospheres; the surrounding air expands greatly to form the bomb blast. It attains a velocity of280 m/sec around the hypocenter and a velocity of 28m/sec at a point 3.2 km. The front edge of the bombblast advances as a shock wave, which travels a distance of approximately 3.7 km in about 10 seconds, andreaches a distance of about 11 km after 30 seconds. The shock wave spreads outwards; at the instant whenthe wind abates, a blast blows inwards from the outside due to the reduced pressure at the hypocenter.
A fireball is created in the air at the same time as the explosion. At the instant of detonation the temperatureat the center is estimated to correspond to several million degrees centigrade, with the temperature on thesurface of the fireball about 7,000° C after 0.3 seconds; the heat energy is estimated at 99.6 cal/cm2 in thevicinity of the hypocenter, and 1.8 cal/cm2 at a point 3.5 km. Within 3 seconds of the explosion, 99% of thethermal radiation emitted by the fireball may affect the surface of the ground.The heat caused the scorchingof wood for a distance of about 3 km. At the distance of 3.5 km the burning of human skin that was notcovered with clothing was caused. The burns resulting from exposure to the strong thermal radiation provedfatal to any unprotected people within about 1.2 km; 20 -30% of the total deaths may be due to these burns.
PORTOROŽ 95 18

INVITED PRESENTATIONS PROCEEDINGS
It is possible to classify the radiation released by the atmospheric atomic explosion into two categories: theinitial radiation, which was emitted within one minute of the explosion and which accounts forapproximately 5% of the total energy, and the residual radiation, which was released later at ground levelover a long period of time and which accounts for approximately 10% of the total energy.
The initial radiation was composed primarily of gamma rays and neutrons. Several estimates have in the pastbeen advanced for the initial dose of radiation. The tentative T65D dose estimates (established in 1965)were revised in July 1987 by the US-Japan Committee for Reassessment of Atomic Bomb RadiationDosimetry in Hiroshima and Nagasaki, and the new DS86 dosimetry system was adopted. However, theremay still be various uncertainties involved.
The uncertaintes under emergency conditions, in particular, the uncerataintes in estimating dose-effect,relationships in Hiroshima and Nagasaki have been repeatedly discussed by professor Nishiwaki since thefirst meeting on the medical and pathological effects of atomic bombings held at the Department ofPathology of the late Professor Ryojun Kinoshita, the then Professor of pathology, Faculty of Medicine ofOsaka University in 1945.
The survivors and those who visited Hiroshima immediately after the atomic bombing could have beensubjected in a number of other possible noxious effects in addition to atomic radiation. Hospitals,laboratories, drugstores, chemists, pharmaceutical works, storehouses of chemicals, factories, etc. that weresituated close to the hypocenter were all completely destroyed and various mutagenic, carcinogenic orteratogenic substances must have been released. There was no medical care and no food in the region ofhigh dose exposure and the drinking water was contaminated. There would have been various possibilitiesof infection. Mental stress would also have been much higher in the survivors closer to the hypocenter. Itis confusing which factor played a dominant role. In addition, there would be problems in accuratelyrecording the position of the exposed persons at the time of the atomic bombing and also in estimating theshielding factors. There may be considerable uncertainty in human memory under such conditions. It is alsopossible that there could have been a large storage of gasoline to be used for transportation of the armycorps in Hiroshima. Therefore there is a possibility that various toxic substances, mutagenic or carcinogenicagents such as benzopyrene and other radiomimetic substances could have been released from variousfacilities which were destroyed at the time of the atomic bombing.
The enormous difference in dose rates between the atomic bombings and the radiation sources used forcalibration experiments may also have some effect on some dosimetric systems or on some biologicalsystems. Although it may be difficult to quantify some of these uncertainties, it is extremely important tokeep all these uncertain factors in mind when analysing the atomic bomb effects of Hiroshima and Nagasaki.
In Japan, medical X-ray examination is compulsory in schools, factories and companies. With certaindiseases such as tuberculosis and some diseases of the lung and digestive systems extensive X-rayexaminations may be conducted and periodically repeated. Survivors with a relatively low dose of high doserate atomic bomb radiation must also have received some relatively low dose of low dose rate medical X-rayradiation. In other words, they must have received both high dose rate radiation and low dose rate radiation.There is a possibility of non-probabilistic uncertainties involved in estimation of the relative proportion ofthe two types of radiation and even greater uncertainties would be involved in the estimation of the organdoses. In these uncertainties both randomness and fuzziness may be involved.Under such situation it maybe important to consider application of fuzzy theory for the analysis of cause-effect relationships.
In exploding an atomic bomb, in addition to ionizing radiation, strong non-ionizing radiations, such asinfrared, ultraviolet light, visible light, electromagnetic pulse radiation, as well as heat and shock waves areproduced.
Therefore, the possibility of the combined effects of all these direct factors and the indirect factors such asthose mentioned above must be considered in interpreting the effect of the atomic bombing, instead ofascribing all the effects solely to ionizing radiation. (1-10)
P.S.: Soon after the outbreak of the Pacific War in December 1941, we heard that the late AdmiralYarnamoto of the ex-Japanese Navy was very angry when he heard that the transmission of thedeclaration of war from Japan to the United States was delayed at the Japanese Embassy inWashington D.C. and that he strongly opposed against the plan to bomb the pacific coast of the
PORTOROŽ 95 19

INVITED PRESENTATIONS PROCEEDINGS
United States following the attack on Pearl Harbour during the Christmas holiday season for thereason that it is an important religious holiday in U.S.A.
At about this time, we received a special Japanese navy information via Argentina that the UnitedStates had decided to establish a research project to develop atomic bomb because they were afraidthat Germany might produce the atomic bomb first.
The Japanese Navy asked us a question whether it would be possible in the United States to developan atomic bomb before the end of the war. After some discussion it was replied that it is theoreticallypossible but it would not be possible even in the United States to develop an atomic bomb before theend of the war.
From 1939 to 1940, Mr. Tadayoshi Hikosaka, a graduate of Tohoku Imperial University was avisiting scientist at the department of physics of Osaka Imperial University and made the followingoral presentation at the colloquium meeting on nuclear physics. The absorption of slow neutrons bythe absorption band of U-238 would be greatly reduced if the reactor is made heterogeneous, nuclearfuel and moderator, so that the neutron reaches the uranium fuel rod after the neutron velocity isslowed down sufficiently low in the moderator.
Mr. Hikosaka also presented a paper at one of the nuclear physics meetings in November 1944 on"a method of utilization of nuclear energy" in which a possibility of fast neutron reactor wasdiscussed. This paper was submitted to Prof. Takahashi of Tohoku University as a doctoral thesis,but the original documents were burnt down by the air-raid during the war. Mr. Hikosaka thenbecame a professor at the Ryojun Institute of Technology in Port Arthur, Manchuria, in May 1945,and returned to Japan in October 1949, but passed away some years ago. However, because of thesepresentations and discussions, we saw a real possibility of peaceful utilization of nuclear energy infuture at that time, but never thought that the atomic bomb would be produced in the United Statesbefore the end of the war and dropped on Japan.
After the aromic bombing on Hiroshima, the U.S. plane distributed bills written in Japanese to thefollowing effects:
"The U.S. invented a powerful new atomic bomb. If you have any doubt about it, you shouldinvestigate the effects of a single atomic bomb on Hiroshima. One atomic bomb has the powerequivalent to all bombs carried by 2,000 B-29 bombers. You should ask your emperor to stop thisuseless war by accepting 13 terms honorary capitulation.
Unless Japan gives up military resistance immediately, the U.S. are determined to use thesebombs and other superior weapons to terminate the war quickly and powerfully."
After the atomic bombing on Nagasaki, an English letter addressed to Prof. Sagane was recoveredby an ex-Japanese navy officer. It was hidden in the "radiosonde" dropped by parachute at the timeof atomic bombing which came down about 50 minutes later at Isahaya City 20 km northeast-eastof Nagasaki. Prof. Sagane used to work at the Radiation Laboratory of the University of Californiabefore the war. The letter was hand-written. No signature, but it was written "from three colleagues".
The letter requests immediate stop of war by Japan and said to the effect that as scientists they regretthat their beautiful scientific work was used for such a purpose as atomic bombing, but unless Japansurrenders immediately, more and more atomic bombs will continue to be dropped all over Japan infury. The Japanese Government immediately protested about the atomic bombing to the headquartersof the International Red Cross in Switzerland for the reason that it is more inhumane than thechemical and biological weapons.
After the war, when Dr. Compton (brother of Dr. Arthur H. Compton of Compton Effect), the thenpresident of the University of Washington in Seattle visited Japan, Prof. Sagane asked him to findout the three colleagues. Later, it was found that they are Dr. Louis W. Alvarez and two otherscientists of the Radiation Laboratory. Prof. Sagane later became a member of the Board of Directorsof the Japan Atomic Power Co. When he was a member of the Radiation Council of Japan, whichis an advisory group to the prime minister on matters related to radiation, I was full professor of theNuclear Reactor Research Laboratory of Tokyo Institute of Technology and also a member of thesame Radiation Council. I used to cooperate with Prof. Sagane in the field of radiation protection.Unfortunately, he passed away already some years ago in Tokyo.
PORTOROŽ 95 20

INVITED PRESENTATIONS PROCEEDINGS
"LITTLE BOY" (Hiroshima) (13 5 6)
(Gun-type, U-235, 12-20 kt TNT equivalent)3 m in length
0.7 m in diameter4 tons in weight
Dropped at an altitude of about 9,600 m at 8:15 a.m.
Exploded 43 seconds later at an altitude of 580 ± 15 meters on 6 August, 1945.
The hypocenter is estimated at longitude 132°, 27' 29" E and latitude 34°, 23' 29" N.(a difference in radius of about 15 meters)
This site is on the ground of the Shima Hospital, 160 meters southeastfrom the center of the Atomic Bomb Dome in Hiroshima.
"FAT MAN" (Nagasaki) (i'X5-6)
(implosion-type, Pu-239, 22 ± 2 kt TNT equivalent)3.5 m in length
1.5 m in diameter4.5 tons in weight
Exploded at 11:02 a.m. at an altitude of 503 ± 10 meters on 9 August, 1945.
The hypocenter is estimated at longitude 129°, 51' 56" 4 E and latitude 32°, 46' 12" 6 N.(a difference in radius of about 7 meters)
This site is about where the Hypocenter Monument at Heiwa Koen (peace Park) is located at present inNagasaki.
EPICENTER
Exploilve Propellant
Subcrltlcal Massei/ 1
Critical MBÍJ
Bafore Firing Immediately After Firing
GUN ASSEMBLY DEVICE (msOSHIMA)
Subcrltlcal Mat»
ChemicalExplosive
Compretted Critical Matt
O '• IS ~
g.fore Firing Immediately After Firing
IMPLOSION • TYPE DEVICE (NAGASAKI)
Schematic illustrating a gun-assembly nuclear device and an implosion-type nuclear device. < i-3)
(Angle at the time of explosion in Hiroshima)
Fig. 1: Schematic illustrating a gun-assembly nuclear device and an implosion type nuclear device (13)
PORTOROŽ 95 21
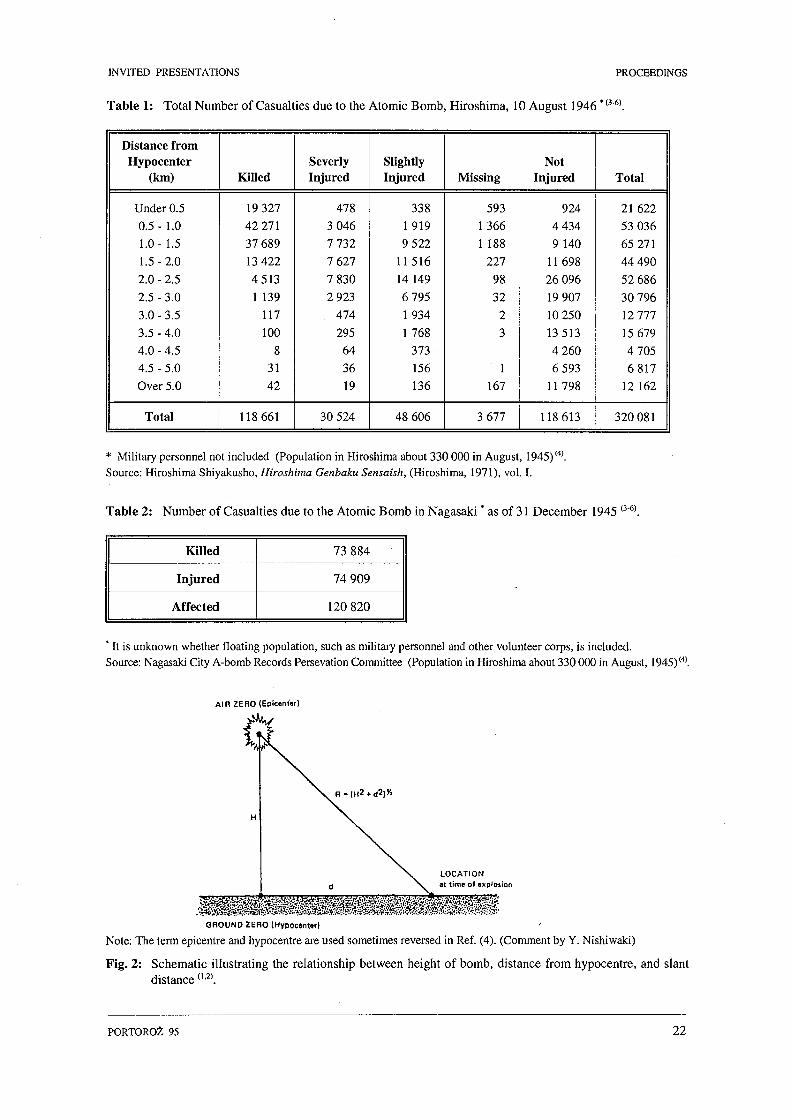
INVITED PRESENTATIONS PROCEEDINGS
Table 1: Total Number of Casualties due to the Atomic Bomb, Hiroshima, 10 August 1946 'm).
Distance fromHypocenter
(km)
Under 0.5
0.5- 1.0
1.0- 1.5
1.5-2.0
2.0 - 2.5
2.5 - 3.0
3.0-3.5
3.5-4.0
4.0 - 4.5
4.5 - 5.0
Over 5.0
Total
Killed
19 327
42 271
37 689
13 422
4513
1 139
117
100
8
31
42
118 661
SeverlyInjured
478
3 046
7 732
7 627
7 830
2 923
. 474
295
64
36
19
30 524
SlightlyInjured
338
1919
9 522
11516
14 149
6 795
1934
1768
373
156
136
48 606
Missing
593
1366
1 188
227
98
32
2
3
1
167
3 677
NotInjured
924
4 434
9 140
11698
26 096
19 907
10 250
13 513
4 260
6 593
11798
118613
Total
21 622
53 036
65 271
44 490
52 686
30 796
Mill
15 679
4 705
6 817
12 162
320 081
* Military personnel not included (Population in Hiroshima about 330 000 in August, 1945)(4).Source: Hiroshima Shiyakusho, Hiroshima Genbaku Sensaish, (Hiroshima, 1971), vol. I.
Table 2: Number of Casualties due to the Atomic Bomb in Nagasaki * as of 31 December 1945 (3-6)
Killed
Injured
Affected
73 884
74 909
120 820
' It is unknown whether floating population, such as military personnel and other volunteer corps, is included.Source: Nagasaki City A-bomb Records Persevation Committee (Population in Hiroshima about 330 000 in August, 1945)(4).
AIR ZERO (Epieamu)
LOCATIONat time of expioiion
GROUND ZERO [Hypottnwl
Note: The term epicentre and hypocentre are used sometimes reversed in Ref. (4). (Comment by Y. Nishiwaki)
Fig. 2: Schematic illustrating the relationship between height of bomb, distance from hypocentre, and slantdistance ( U ) .
PORTOROŽ 95 22

INVITED PRESENTATIONS PROCEEDINGS
Table 3: Initial radiation doses (DS86)<4).
Distance from epicentre
(m)
Q HiroshimaNagasaki
<rnri Hiroshima5 U U Nagasaki
i nnn Hiroshima1 0 0 ° Nagasaki
i snn Hiroshima1 5 0 ° Nagasaki
i r>r\r\ Hiroshima1UUU Nagasaki
o c(\(\ Hiroshima13UU Nagasaki
Distancefrom
hypocentre(m)
580503
766709
1 1561 119
16081582
2 0822 062
2 5662 550
Gamma-raydose(Gy)
35.078.5
3.937.83
0.4870.893
0.0710.127
0.0120.021
Neutron dose(Gy)
6.043.31
0.2270.143
0.0080.006
0.00.0
0.00.0
N.B. Since the above values are the mid-air doses, they can be deemed appropriate as values of the radiation doseabsorbed by surface human skin in unshielded victims. For the effect on internal organs such as the bone marrow,it is necessary to convert the dose measured in grays into Sieverts, taking into account of the dose reduction byshielding and radiosensitivity. Studies are still in progress with respect to distances greater than 2000 m from thehypocentre.
100
10
g ÍO1
lO - 1
10'
105
500
Hiroshima too
10
DS86— T65Ü
DS86---T65D
Gamma rays
Neutrons
10
10-
10-'
10
10-
Nagasaki
— DS86— T65I)— DS86- - -T65D
Gamma ravs
Neutrons
1.000 1.500 2.000
Distance from hypocenter (m)
2.500 50(1 1.00(1 1.500 2.000
Distance from hypocentcr (ml
2.50(1
Fig. 3: Comparison of DS86 and T65D values of the free-in-air kerma of gamma rays and neutrons (4)
PORTOROŽ 95 23

INVITED PRESENTATIONS PROCEEDINGS
10-3
500 1.000 1,500Distance from hypocenter (m)
2,000 2.500
Fig. 4: Comparison of ESR-determined doses for Nagasaki atomic bomb survivors with calculated T65D andDS86 free-in-air tissue kermas <4). (Gamma rays)The solid lines represent calculated values; other symbols indicate shielding conditions:o = no shielding,® = shielding by trees or brick walls,n = inside wooden structure,A = inside munitions factory with roofs of slates supported by iron frames etc.,• = inside reinforced concrete structure.The specimen for which there was a large margin of error in the distance (specimen No.2) was obtainedfrom an individual who died within a week of the explosion from acute radiation illness, thus renderingascertainment of the precise point of exposure impossible.
1945 195» 1955 I960 1965 1970 1975 1980
Fig. 5: Number of leukemia cases among Hiroshima atomic bomb survivors by year of onset (exposed within2 000 m). Proportion of chronic myelocytic leukemia was high among Hiroshima survivors.(4)
PORTOROŽ 95 24

INVITED PRESENTATIONS PROCEEDINGS
15h
10-
4;I
2!101
Leukemia
Colon cancer
Breast cancer
Lung cancerGastric cancer
0.01 0.06 0.10 0.20 0.50 1.0S 1 S S \ i
0.05 0.09 0.19 0.49 0.99 1.99Organ dose (Gy)
2.0 +
Fig. 6: Estimated relative risks for various malignant tumors observed in atomic bomb survivors (in comparisonwith the non-exposed (0 Gy) population) (4).
1945
1950 19601
Leukemia
1970 1980t i
Increase observed at 5%significance levelIncrease suspected
Thyroid cancer
Breast cancer
Lung cancer
Gastric cancer
Colon cancer
Multiple myeloma
Fig. 7: Year of development of maligant tumors ( ' .
PORTOROŽ 95 25

INVITED PRESENTATIONS PROCEEDINGS
REFERENCES
1. US-Japan Joint Workshop for Reassessment of Atomic Bomb Radiation Dosimetry in Hiroshima and Nagasaki, RERF,Feb. 1983.
2. Glasstone, S. Dolan, P. J.: The Effects of Nuclear Weapons, US Dept. of Defense, US Dept. ot Energy, 1979.3. The Committee for the Compilation of Materials on Damage caused by the Atomic Bombs in Hiroshima and Nagasaki:
Hiroshima and Nagasaki, Iwanami Shoten, Tokyo, 1981.4. Hiroshima International Council for Medical Care of the Radiation Exposed (edited by 1. Shigematsu, et al): Effects of
A-Bomb Radiation on the Human Body, Bunkodo, Tokyo, 1995; A-Bomb Radiation Effects Digest, Bunkodo, Tokyo,1993.
5. Film jointly made by Hiroshima and Nagasaki: The Harvest of Nuclear War, Iwanami Shoten, Tokyo, 1982.6. The Records of the Atomic Bombing in Nagasaki, The City of Nagasaki, Nagasaki Foundation of Promotion of Peace,
Nagasaki, 1994.7. Nishiwaki, Y.: Discussions in the IAEA International Symposium on Late Biological Effects of Ionizing Radiation,
Vienna, 13-17 March, 1978. Nishiwaki, Y. et al: Uncertainties under Emergency Conditions and Possible Applicationof Fuzzy Set Theory, IAEA Intl. Conf. on Radiation Protection in Nuclear Energy, Sydney, 18-22 April 1988. Proc. Vol.I pp. 391-411, IAEA-CN-51/8.
8. Allen, T.B., Polmer, N.: "Unclassified Information on USA plan to attack Japan with Gas." Shukan-Asahi (JapaneseWeekly Journal) August 18-25 issue, Asahi Shimbun-sha, Tokyo, 1995. This is the information released by the USGovernment 50 years after the war. The war ended on 15 August 1945, but if it continued, US were planning to attack25 major cities with gas weapons on the occasion of the planned landing on the Main Island of Japan. Five million deathsand many injuries were expected by calculation.
9. Kawai, H., private communication: At Ohkuno Island, about 50 km south-east-east of Hiroshima, the following chemicalweapons were produced: Yellow No. 1 Yperite, Yellow No. 2 Lewsite, Brown No. 1 Hydrogen Cyanide Gas, Red No. 1Diphenyl-Cyanoarsine, Green No. 1 Chloro-Acetophenone. At the end of the war, all stores were buried undergroundat the neighbouring island of Ohmi-jima.
10. Nishiwaki, Y., private communications with General Fukuda, et al: Towards the end of the war there was an unconfirmedinformation that the US might use chemical weapons on attacking Japan Mainland. Preparing for such case, the GasOfficer, a graduate of Narashino Chemical School, was assigned to each brigade and larger units. It seems to be highlyprobable that some chemical weapons were stored at the military headquarters about 700 m from the hypocentre inHiroshima and were released by breakage of storehouse at the time of atomic bombing. If we use the data, which arecorrelated only with radiation, as a basis of radiation protection standard, it may be considered on a safer side, althoughexact quantitative estimation of all non-radiation effects and combined effects would be difficult.
PORTOROŽ 95 26

INVITED PRESENTATIONS PROCEEDINGS
PRESENT RADIOLOGICAL SITUATION ATTHE SEMIPALATINSK NUCLEAR TEST SIDE
P. Stegnar
IAEA, Vienna, AustriaXA05C0006
In July 1994, the IAEA led a team of international experts (two each from France, the Russian Federation,the United Kingdom and the USA, and one from Kazakhstan) to investigate the current radiologicalsituation within and in the vicinity of the former USSR nuclear test site called Semipalatinsk, which lies 120km west of the large city of the same name. The visit followed a mission earned out some six months earlier,under the IAEA/UNDP Initiative for Strengthening Nuclear Radiation Safety Insfrastructures in Countriesof the Former Soviet Union. Both were part of a project, launched at the request of the Government ofKazakhstan, to make a preliminary assessment of the radiological situation in terms of its potential effectson the health of people living in the area today, rather than to reconstruct doses and health effects of thenuclear experiments to people in the past.
The test site, shaped like an irregular polygon and familiarly called the polygon, is a 19 000 km2 zone inthe northeast of the newly independent Republic of Kazakhstan, 800 km north of the Kazakh capitalAlma-Ata. The zone lies southwest of the Irtysh River which flows into Kazakhstan from China and whichfor a short stretch, where it veers sharply northwards on its way to join the Ob River in Siberia, forms partof the polygon boundary. The USSR conducted 465 nuclear tests at three locations called 'technical areas'within the polygon over a period of 40 years (1949-1989) for military and peaceful purposes.
The earliest tests were above ground (atmospheric and surface) and were carried out in the northerntechnical area, otherwise called Ground Zero. There were 118 of these explosions in 1949-1962. Ofparticular concern were the 30 explosions carried out on the surface, especially five which wereunsuccessful and resulted in the dispersion rather than the fissioning of the plutonium in the devices. Theother 346 test explosions were underground, in the widely separate technical areas in the south (223 between1961 and 1989) and east (123 from 1968 to 1989). In addition, an explosion designed to build a dam acrossthe small Tchagan River, close to the eastern technical area, was miscalculated and resulted in a lake, about0.5 km in diameter and about 100 m deep with above ground cliffs up to 100 m high called Lake Balapan(Fig. 1).
r'"'
Fig. 1: Lake Balapan, Kazakhstan.
PORTOROŽ 95 27

INVITED PRESENTATIONS PROCEEDINGS
The only habitations within the polygon during the 40 years were the custom built town of Kurchatov (codenamed Semipalatinsk-21) north of Ground Zero, dedicated to servicing the test site, and the small settlementof Akzhar on its northern edge. Neither was radiologically affected by the tests. Recently, semi-nomadicfarmers and herders have formed small scattered 'settlements' near two test areas, notably a farm about 12km south of Ground Zero and another some 10 km east of Lake Balapan. There are some 15 and about 100people using the two areas respectively, but as yet not throughout the year. The principal settlements ofconcern to the Government and the project are outside but close to the test site boundary, along its southernand eastern borders. They lie in the path of the radioactive plumes caused by the above ground explosions.Russian records show that the plumes travelled south from the northern technical areas, beyond thesouthern border, then veered sharply east and again sharply north before dispersing beyond the Irtysh.
The project estimated that 30 000 to 40 000 people now live along the plume path, though only some of thesettlements were visited to assess the current hazards from living in the area. The assessments were madeby measuring external dose rates, making measurements of radionuclide concentrations in many materialsand assessing the usage that people make of the environment. From data of this type the doses to peoplecan be assessed and the corresponding risk estimated. The precise objectives were to corroborate the levelsof environmental contamination arrived at by recent Russian and Kazakh studies and to make a preliminaryradiological assessment of the situation in the settlements and in the area.
The corroboration of environmental contamination levels obtained by independent equipment andmeasurements of the team was generally good, the best being with recent Russian and Kazakh data usinggamma dose rate measurements. Acceptable corroboration was observed for gamma emitting radionuclidesin food and environmental samples. The preliminary results on plutonium levels in soil samples fromcontaminated sites in the polygon showed values comparable with the data reported by Russian scientists.
The major sites selected for field work by the team were the settlements around the polygon of Kainar(population of about 10 000) in the south, Sharzhal (2000) and Karaul (5000) in the east, and Dolon (2000)just north of the Irtysh. Akzhar, within the polygon just south of the river, was used as a reference site.Inside the polygon the efforts were concentrated in the Lake Balapan area including the semipermanent farmaround Ground Zero, and a selection of sampling sites along the plume paths of atmospheric and aboveground explosions.
Nuclide
Sr-90
Cs-137
Pu-238
Pu-239
Pu-240
Am-241
Soil activity concentration (Bq/kg)
Settlement
40
40
0.5
1.0
1.0
0.2
LakeBalapun
25 000
35 000
6 000
14 000
14 000
2 300
GroundZero
20 000
30 000
5 000
10 000
10 000
2 000
Sr-90 in milk from the settlements: < 0.5 Bq/1Sr-90 in drinking water: < 0.2 Bq/1Sr-90 in Lake Balapan water: 10 Bq/1Cs-137 in meat: < 1 Bq/kg
Table 1: Contamination Levels Assumed in Dose Assessment.
PORTOROŽ 95 28

INVITED PRESENTATIONS PROCEEDINGS
The operations carried out in the field included: gamma dose rate measurements; in situ gammaspectrometry; and the collection of samples of grass, meat, milk, offal, vegetables and soil, as well asbiological indicators such as animal bones, mushrooms and moss.
The levels of contamination in the soil at the locations specified are shown in Table 1. The contaminationby '"Sr in milk, drinking water and the lake water was also measured, together with results for 137Cs inmeat. The external gamma dose rates in settlements and in the polygon, excluding the Lake Balapan andGround Zero areas, were around 0.1 uGy per hour, against rates of up to 40 uGy per hour around LakeBalapan and Ground Zero. The dose assessment included consideration of all relevant pathways, of whichthe most important were external gamma exposure from material on or in the ground, inhalation of materialresuspended from the ground and consumption of contaminated foods.
These pathways were taken into account in assessing the doses to people in the identified settlements andthe other areas. For the assessment of current doses it was assumed that people lived all year round in thesettlements, that those in the vicinity of Lake Balapan spent one hour per day close to the lake and that thosein the vicinity of Ground Zero spent one hour per day at the location. It was also assumed that meat, offaland milk are consumed from animals that take 10% of their total feed from the lake area or Ground Zeroarea. The results of this assessment of annual doses are shown in Table 2.
The preliminary conclusions are:
No more detailed assessment of the radiological situation is required, because the doses today to localpopulations in the settlements are very low;
Access to land with high dose rates within the polygon, namely Lake Balapan and Ground Zero,should be restricted in order to prevent reoccupation;
Further specific and systematic studies are needed on the plutonium levels in the soil around LakeBalapan and Ground Zero, and on the levels of radionuclides in drinking water sources of thesettlements outside the polygon.
Exposurepathway
Externalgamma
Inhalation
Ingestion
Total dose
Estimated annual adult dose (mSv)
Settlement
0.009
0.001
0.043
0.053
Lake Italapan
10.95
0.79
2.19
13.9
Ground Zero
10.95
0.59
1.84
13.4
Table 2: Estimated Annual Doses to Local Population.
The second of these studies is recommended because, though the expert team was told that the explosionwhich created Lake Balapan was set off on hard rock, which would make it unlikely that radioactivenuclides would leach into the ground-water sources of the settlements, this drinking water issue is not yetsolved. Similarly, the measurements and data gathered in the project were inadequate to establish the risksof plutonium from the five failed above ground tests being resuspended and inhaled. Actinide were alsoreleased by nuclear tests conducted below the ground, and the directions and deposition patterns of theirplume paths have not been identified. Plutonium doses to individuals today depend on their habits andparticularly on the time they spend in contaminated areas. So the levels of radiation and radioactivityconcentrations which would correspond to an intervention level of 5 mSv in a year using a 100 % occupancyfactor are of interest.
PORTOROŽ 95 29

INVITED PRESENTATIONS PROCEEDINGS
While the project obtained a reasonable understanding of the gamma dose rate situation, only limitedinformation on actinide is available. An intervention level of 5 mSv a year corresponds to a dose rate of0.5 uSv per hour, assuming 100% occupancy. Restriction to land with higher dose rates should be relativelystraightforward, and could apply to Ground Zero and Lake Balapan. An appropriate criterion for limitingexposure to plutonium might be to restrict access to land contaminated above a few becquerels per gram.More restrictive standards are likely to result in unnecessary expenditure and possibly cause unnecessaryanxiety among the local populations. The recommendation is that a systematic study be made of plutonium(and other actinide) in the soil outside a I km radius of the site of the above ground tests.
PORTOROŽ 95 30

SESSION I:
RADIATION PROTECTION ATWORKPLACE
ChAÍR:
B. BREZNÍIC
S. RAMboiu


SESSION I PROCEEDINGS
THE CENTRAL REGISTRIES OF OCCUPATIONAL ANDMEDICAL EXPOSURE IN THE CZECH REPUBLIC
K.Petrová'U.Prouza» XA05C0007
" National Institute of Radiation Protection, Šrobárova 48, 100 00 Prague 10, Czech Republic2) State Office of Nuclear Safety, Slezská 9, 120 29 Prague 2, Czech Republic
ABSTRACT
This paper is intended to provide some insight into the recent situation in the Czech Republic concerning theregistration and evaluation of occupational and medical radiation exposures. Since 1993 the creation of theCentral (national) Registries of Occupational (CROE) and Medical Exposure (CRME) has been started. Oneof the main functions of these registries will be to provide statistics to guide policy making on a national basis.Authors give more detailed information on the structure of creating programs and discuss some actual arisingproblems.
INTRODUCTION
The actions leading to the creation of CROE and CRME were opened in 1994 by Radiation Hygiene Centreof National Institute of Public Health under the financial participation of the Ministry of Industry andTrade and Ministry of Health. In accordance with the changes in the structure of radiation protection in ourrepublic this year, registries are now created in new National Institute of Radiation Protection which issupervised by State Office of Nuclear Safety.
Creating central registries, Czech Republic (CZ) follows the international recommendation and world-widetrends in the evaluation of occupational exposures (OE). This registration system enable us to follow andcontrol not only the individual doses of workers, but also to follow a radiation history of workers, estimatecollective doses in different occupational categories, operational activities on the national level (datarequested by UNSCEAR), determine time trends for the individual worker's occupational categories,compare the radiation occupational exposure for different practices, evaluate the efficiency of the ALARAmethods applied into the practice, help to find groups of workers significant from the point of view ofradiation protection and collect data for epidemiological studies.
CROE - RECENT SITUATION
The basis of the registration and evaluation of OE is the individual monitoring of classified workers. Theemployer's duty, covered by the Regulation No.5 /1979 in our country, is to secure individual monitoringof radiation workers and record results of monitoring.
At present there are five dosimetry services, about twenty thousand monitored workers and one thousandregistered employers in CZ. Distribution of workers according to four basic occupational groups is givenin Tab. 1. Personal dosimetry for external irradiation is based on the film dosimeter, TLD is used now forextremities and operative dosimetry in NPP, internal dosimetry is based on the measurements of ambientdose equivalent and time spent in a given workplace or on whole - body counting in a special cases .
As it has been already mentioned the creation of central registration system has been started since 1994and following steps have been already done: the choice of the company for software covering of the system,the start of the co-operation with all our dosimetric services, methodology unification of OE dosimetricevaluation in our country (1).
The database system is using ORACLE and operating in HP computers. The CROE databases are -personal, utilities (employers), dosimetric services, values of the personal dosimetric quantities , accidents,cumulative five years values.
PORTOROŽ 95 33

SESSION I PROCEEDINGS
Occupationalgroup
Uran, industry[)
General industry2)
Medicine 2)
Npp3)
Year
1975
11,20
3,5
3,7
1980
10,30
5,4
5,6
1985
10,30
6,8
7,1
1990
7,90
7,80
8,20
1,50
1993
3,3
5,7
11,10
2,6
'-1 Dosimetry Service of Uranium Industry2) National service of Personal Dosimetry, Ltd.3) Dosimetry Service of NPP Dukovany
Table 1: Numbers of monitored workers (in thousands) for four basic occupational groups in the CzechRepublic.
Databases contain detailed identification of employers including their activity categories (Tab.2) andthe dose records for all monitored workers with details of their age, sex, occupational category(Tab.3), type of handling radiation source. The data will be reorganized annually and individual doseassessment will be maintain for the current year and previous five years. Earlier data will be archived.The system uses special identification number for workers (birth number) and employers (randomnumber) and all data are treated as confidential. Recently the registration cards serving for a contactbetween CROE and dosimetric services and employers are created. The cards will provide for CROEentrance data of all radiation workers in CZ and any changes in their registration.
1.0. Health service
1.1. Hospitals
1.2. Other medical facilities
1.3. Special medical facilities
2.0. Education, research
3.0. Energetics
3.1. NPP Dukovany
3.2. NPP Temelín
3.3. Others
4.0. General industry
4.1. Engineering
4.2. Chemical
4.3. Mining
4.4. Building
5.0. Uranium industry
6.0. Defence
7.0. Agriculture, food
8.0. Transport
9.0. Specialized facility
9.1. Customs, inspectorates, supervision
9.2. Services, repair work, tests
Table 2: Employer's activity categories in CROE.
The contact with the International System on Occupational Exposure was also opened up in 1994 andthe created national system of ORE registration is built in the harmony with the recommendations anddemands of this international system. This is a reason for instance for such detailed structure ofoccupational categories in NPP.
The start of routine work of CROE is planned for next year. CROE will have a number of functions- to provide the new employer with summarized information of an individual's dose history, to
PORTOROŽ 95 34

SESSION I PROCEEDINGS
guarantee a right annual dose calculation for workers with two or more employers, to provide statisticsto national regulatory authorities.
1.0.
2.0.
3.0.
4.0.
Defectoscopy (2)
Well logging (2)
Radioisotopes (7)
Uranium industry (5)
5.0.0.
5.1.0.
5.2.0.
5.3.0.
5.4.0.
5.5.0.
5.6.0.
NPP (6)
Inspection, control (3)
Radiation protection (3)
Operation, maintenance (8)
Chemistry (3)
Fuel handling (1)
Waste disposal (1)
6.0.0
6.1
6.2
6.3
6.4.0
7.0.
. Medicine (4)
.0. Radiodiagnostics (4)
.0. Nuclear medicine (3)
.0. Radiotherapy (5)
. Veterinary medicine (1)
The others specialized
workers (4)
Table 3: Occupational categories in CROE (the number of items for each category in parentheses).
CRME - RECENT SITUATION
The survey and evaluation of medical radiation exposure (MRE) exists as a part of all reports ofUNSCEAR from 1958. The aim of these world-wide studies is an estimation of world-wide dose,analyse of frequencies and dose distributions and determination of time trends in this area. Thisinformation enables us to evaluate the regional differences in the use of sources of ionizing radiation(SIR) in medicine and to determinate topics of interest on this field. They enable us also to estimatea health detriment from MRE and compare it with the detriment from other sources. Results of thesestudies help to find reasons for regional differences in doses for the same procedures, search the wayfor decreasing patient's exposure and their effectiveness evaluation, determine the age and sexdistribution of the patients for individual procedures. It is assumed that the results of these analyses willserve as a quantitative input of optimization studies carried on by governments and radiation protectionauthorities. It is well known that the main problem of world-wide evaluation of MRE is the lack ofnecessary data in many countries. There are many sources of uncertainties for the correct assessmentof collective dose from ME:
estimates of countrywide values are often based on extensive extrapolations from small samples,varying definitions and different ways of categorisation of individual procedures,age distribution of patients does not fit an age distribution of population for which risk factorswere determined,patients have often changed health status with different metabolic and physiologic processes.
The solution of these problems is the topic of interest of many authors. Concerning the problem withthe collection of data there are several ways used in different countries - organization of nationalsurveys, co-operation with hospitals, universities, health insurance companies (2, 3). Concerning theproblem with the evaluation of MRE - one of possibilities is to take account of age and sex differencesin risk coefficient and use a new quantity for evaluation of detriment from MRE (4). Generally it ispossible to say that taking account of age and sex of patients, a detriment is significantly decreasing.This estimation depends of course also on demographic structure of individual countries.
We are taking account of all these problems and we would like to avoid them creating the nationalregistration system in our country. In CZ there are recently 350 radiodiagnostic, 52 nuclear medicineand 40 radiotherapy workplaces. There was performed about 9.5 mil radiodiagnostic, 250 ths nuclearmedicine and 22 ths radiotherapy procedures (numbers from Institute of Health Information Systemsof Ministry of Health of CZ, in 1993). This is big amount of data and it is impossible to sort all of themaccording to all demanded parameters . There are three main sources of data :
the regular annual statistic survey of Ministry of Health which is managed by Institute of HealthInformation Systems (IHIS), but there is no possibility to sort patients according to their age andsex, IHIS collects only the numbers of procedures and there is also problem with the cleardefinition of individual examinations,
PORTOROŽ 95 35
SESSION I PROCEEDINGS
the organization of a national survey and use information systems of individual health utilities -there is problem with co-operation and organization of this survey,the co-operation with health insurance companies - there are twenty companies in CZ now, but oneof them - General Health Insurance Comp. (GHIC) is the biggest one which cover about 80% ofour population.
Database GHIC obtains birth number of each patient from that it is possible to determine age and sexof patient and GHIC has unified list of all examination - so this is exceptional opportunity to obtainstatistically significant data for MRE evaluation in our country. We will obtain only part of birthnumber of patient, the system will not operate with confidential personal data, it will be anonymous,but before this modification of data the system will identify each patient as individual - it means wewill be able to say not only how many procedures were performed but also how many patients wereexamined. In principle we would like to collect data by both way in co-operation with GHIC and withselected representatives health utilities . The data from IHIS which are collected on the national levelwe can use for better approximation of collected data to a national level.
GHIC provided us with first data which are related to the region with 1,2 mil inhabitants (app. 10 milinhabitants live in CZ now) in 1994. The analyze of these data shows first results - there was performed17 exam, in nuclear medicine and 500 exam, in radiodiagnostics per 1000 inhabitants . Both numbersare lower than numbers representing CZ in UNSCEAR Report 1993. The proportion of females tomales is 1,2 for both type of procedures. This result fits perfectly the sex distribution of inhabitantin the higher age groups in our country. We have to put of course these first results to detailed analysisand to compare and to complete them with data from other sources. To create a methodology forregular collection of data is our main goal for near future.
REFERENCES
1. Prouza, Z. and col.: Occupational Radiation Exposure in the Czech and Slovak Republic, Rad.Prot.Dos., Vol.54, Nos3/4, pp.333-336 (1994).
2. Beentjes, L.B., Timmermans, C.W.M.: Age and sex specific population doses due to nuclear medicine procedures inthe Netherlands, Nucl.Med.Biol.17,261-268 (1990).
3. Wall, B.F.: British Medical X Ray Statistics and Their Relevance for Radiation Protection Policies, Rad.Prot.Dos.36,(1991).
4. Huda, W.. Bews, J.: Population Irradiation Factors in Diagnostic Medical Dosimetry, Health Phys.59, 345-347 (1990)5. Beninson, D., Sowby, D.: Age and Sex Dependent Weighting Factors for Medical Irradiation, Rad.Prot.Dos. 11, 57-60
(1985).
PORTOROŽ 95 36

SESSION I PROCEEDINGS
RADIATION PROTECTION ASPECTS FOR A 40 MEV CYCLOTRON PLANT
P. Ragni l\ R. Horn-Orni2>
1} Istituto di Chimica Nucleare, Area della Ricerca C.N.R., CP 10 Monterotondo Scalo (RM), Italia2)Ufficio di Sicurezza e Prevenzione del C.N.R., Via di Pietralata 190, Roma, Italia
INTRODUCTION XA05C0008Inside the new C.N.R. Research Area of Tor Vergata, 20 km from Rome and near to the 2nd University ofRome and its Medical Center, the Italian National Research Council (C.N.R.) intends to build a Center inwhich a 40 MeV cyclotron and a PET (Positron Emitter Tomography) facility will be installed. It will bethe first cyclotron, devoted to research purposes of biomedical size (> 20 MeV) in Italy (at the moment 5"baby" cyclotron with energy less than 17 MeV are employed for medical purpose) and also in theMediterranean Area.
The two main research areas for the cyclotron plant are chemistry and medicine; the Center will beencharged also to support for the radiopharmaceutical needs (in particular l8F and 123I compounds) fourmain roman hospitals: the estimated radionuclidic production is as following (Tab. I).
Reaction
14N (p,4He)
16O (p,4He)
14N (d, n)
18O (p,n)
20Ne(d, 4He)
124Xe(p,2n)
Other radioisotopes
Isotope
l i e
Í3N
ISO
J8F
J8F
1231
Half-Life
20.30 m
9.96 m
2.02 m
109.80 m
109.80 m
13.00 h
Activity(Tbq)
45.5
4.8
6.8
34.6
2.1
2.3
43.0
Current(mA)
30
20
20
20
20
40
20
Yield(Ci/h)
2.33
0.9
1.3
1.5
0.6
0.32°
0.3
Production*hours/week
11
3
3
13
2
4
8
2 working shifts for a total of 12 hours/day.5 days/week,48 weeks/year. 16 hours will be devoted to maintenance,targetry, testing and start up.Value estimated of 6 hours after the end of production.
Table I: Estimated yearly radionuclides production.
CYCLOTRON CENTER PLANT
The Center plant will be built on two levels: the first floor, partially underground, includes three differentareas. The first one (Fig.l) is devoted to the cyclotron vault and two target bunkers: in each of the bunkersthere will be a beam-line for the production of very short half-lives "physiological" radioisotopes ("C, 13N,15O, l8F) for the P.E.T. and another beam-line devoted to other radioisotope productions, starting with the123I target.
The second area includes the radiochemical labora-tories for manipulation of radioisotopes, quality radio-pharmaceutical control room, "hot workshop" and irradiated solid and liquid wastes; the third area, whichis a "cold" zone, includes chemical laboratories, health physics hall and facility rooms (power supply,cooling water, e tc . ) . The second-floor will be devoted to the P.E.T. facility and to the offices area.
PORTOROŽ 95 37

SESSION I PROCEEDINGS
Fig. 1: Cyclotron Plant: the vault and the two bunkers.
This distribution was proposed both to achieve different air depressure values, according to differentoperational hazards and to minimize interactions, during the movement and manipulation of radioactivematerials.
The following building characteristics will be also provided:
1) underground tunnels for cyclotron pipes and cables running under the floating floor (useful also tofacilitate the under-survey of the cyclotron and the water collection if an accidental overflow occurs)in the vault and in the bunkers;
2) a direct connection between bunkers and manipulation and labelling laboratories and from there to thequality control room in order to send the isotopes via a pneumatic system;
3) a shielded direct vertical-connection from the quality control room and the P.E.T. area in order to sendthe radiopharmaceutical compounds in a prompt and safety way;
4) a special solid target trasportation system realised with an electrically-driven shielded wagon runningon a monorail (suspended from the roof) and connecting both the bunkers with the hot radiochemicallaboratory.
SHIELDINGS
A 40 MeV cyclotron can accelerate various light particles (p, d, 3He, 4He) and it can be utilized to producemany different radioisotopes; a first rough shielding calculation (taking into account the equivalent-doselimits consistent with italian law prescriptions and EU suggestions) requires an analysis of neutron andphoton fluxes into the vault and the bunkers. They are generated by nuclear reactions subsequent to thecollision of the accelerated particle beams with various cyclotron parts along the pathway and with thetarget.
PORTOROŽ 95 38

SESSION I PROCEEDINGS
The suitable shielding level necessary to avoid a worker receiving a dose-equivalent higher than 1 mSv/hbeyond the shielding walls was calculated with a large overestimate: this value is 1/10 ofthat recommendedby ICRP nr. 60 for a professionally exposed worker.
As a consequence a shielding barrier with a linear density of about 550 gr/cm^ was determined, andtherefore, using ordinary concrete (whose density is of about 2,35 gr/cm3), a shielding thickness of about235 cm was evaluated. For the wall thickness an overestimated value of 250 cm of renforced concrete wassuggested, with a density of at least 2.35 gr/cm3 and with a minimum water content level of 5.5% (both forthe relatively low cost and the high hydrogen and low-Z aggregates contents, useful for shielding neutrons).Also suggested was the preparation of the concretewith an addition of 1 % of boráte materials.
Of course particular building criteria will be adopted to avoid both skyshine and groundshine effects, inorder to assure radiation safety in neighbouring areas; then it was suggested a particular design for the doorsin order to avoid any possibility of radioactive leaks.
A lower shielding level (about 50 cm of concrete) has to be projected also for the hot radiochemicallaboratories in which all the hazardous operations will be done in suitable shielded boxes, with automaticprocedures.
To allow for electrical, water cooling, radioactive effluent defluction and air conditioning connections itis necessary to realize a certain number of hole liners inside the vault and the bunkers shielded walls,through which the ducts have to pass. These liners present a double trouble: a shielding power loss of thebarriers and a direct connection between radiation source and shield exterior. In relation to the same, themain problem can be ascribed to neutronic radiation; a careful study of the course, the dimension and theshielding of these liners was carried out.
RADIOACTIVE GASEOUS EFFLUENTS
The airborne radioactivity, that is one of the most important sources of exposure for the workers and forthe population, comes mainly from the interaction of primary and secondary particles with the nucleipresent in the air, but also from the dust produced by natural erosion of work on cyclotron components.
For this, as well as for climatic reasons, it is necessary to provide the vault and the bunkers with an aircirculation system (0.5-1 time/h during the run and 8-10 after the decay time). Any way, because of theshort half-lives of radioisotopes (see Tab II, only 41Ar has an half-life greater than 10'), in few minutes theradioisotopic concentration of the air naturally decays and, due to air circulation, the double effect of itsdiluition with inactive air and partial emission of contaminated air is achieved.
REACTION
14 N (n,2n)16O (n,2n)16O (n,p)40Ar (n,4He)40Ar (n,p)40Ar (n, g)
ISOTOPE
1 3 N
15Q
1 6 N
37S40Cj
41 Ar
HALF-LIVE
9.96 m
122 s
7.20 s
5.06 m
1.40 m
1.83 h
TYPE OF DECAY
(energy
ß+
ß+
ß+.Yß+
ß"ß",Y
MeV)
(1.25)
(1.7)(var.)(4.8)(7.5)(var.)
Table II: Main isotopes contributing to airborne radioactivity.
Finally, we have to take care of the radioactive liquid waste presence in many Center sites; a first hazardsource would arise from the possibility of accidental releases from the cooling water circuit. A secondradioactive liquid source is the radiochemical laboratory (whose liquid long-lived radioisotopes radioactivewastes must be send away in shielded tanks with an authorized transportation firm). Then also to beconsidered is the radioactive liquid waste produced in the P.E.T. Department, coming from the patientstreated with radiopharmaceutical products.
PORTOROŽ 95 39

SESSION I PROCEEDINGS
The radioactive liquid waste disposal (for water losses and patient waste) will be projected with several(almost three) tanks placed parallel to be completely independent each one from the other, in order toeliminate decanting troubles and to allow both a separate disposal and sample drawing, and a separatechemical treatment if it occurs. After the suitable decay time and the analysis of radioactive levels (bysamples measurement), the liquid will be discharged in the ordinary sewer.
MAIN REFERENCES
1. AMERICAN NATIONAL STANDARD INSTITUTE : "Radiological Safety in the design and operation of ParticleAccelerators". NBS Handbook 107 Washington (1977).
2. Birattari C , Bonardi M., Ferrari A., Silari M.: "II progetto ciclotrone per usi biomedici di Miláno: valutazionisull'attivazione indotta nell'aria" II Convegno Annuale Soc. Ita. Ricerche sulle Radiazioni; Fermo (AP) 5-7/IXF84.
3. Chilton A.B., Shultis J.K., Faw R.E.: "Principles of radiation shielding". Pratice Hall, Englewood Cliffs New Jersey(1984). . . . . . .
4. ICRP nr.60 : "Recomandations of the International Commission on Radiological Protection". Pergamon Press NewYork (1990).
5. NUCLEAR COUNCIL ON RADIATION PROTECTION AND MEASUREMENT: "Protection against neutronradiation". NCRP nr.38, Washington (1971).
6. NUCLEAR COUNCIL ON RADIATION PROTECTION AND MEASUREMENT: "Radiation protection designguidelines for 0,1-100 MeV particle accelerator facilities". NCRP nr.51, Washington (1977).
7. Patterson W.H., Thomas R.H.: "Accelerator Health Physics".Accademic Press, New York (1973).8. Thomas R.H, Stevenson G.R.: "Radiological Safety aspects of the operation of proton accelerators". IAEA Technical
Reports Series nr. 283, Wien (1988).
PORTOROŽ 95 40

SESSION I
XA05C0009
PROCEEDINGS
DOSE MEASUREMENTS AND LET-DETERMINATIONIN SPACE STATION MIR DURING THE RUSSIAN LONG TERM FLIGHT RLF *
N. Vana ", W. Schöner l\ M. Fugger l\ Y. Akatov2) , V. Shurshakov2)
0 Atominstitute of the Austrian Universities, Schiittelstrasse 115, A-1020 Vienna, Austria2) Institute for Biomedical Problems (IMBP), Choroshovskoje shosse 76 A, 123 007 Moscow, Russia
ABSTRACT
For determination of the absorbed dose and the dose equivalent in complex mixed radiation fields, newmethods were developed in the frame of the Austrian-Soviet space mission AUSTROMIR in October 1991. Themethod utilizes the changes of peak height ratios in thermoluminescence glowcurves. Peak height ratiosdepend on the linear energy transfer (LET) of absorbed radiation. This effect was calibrated in differentradiation fields (alpha-, beta-, gamma-, neutron fields and heavy charged particle beams). The method wasapproached for dose measurements during several space programs (DOSIMIR, BION-10, PHOTONS).During the Russian long term flight RLF six dosemeter packets were exposed in three different periods. Twopositions with different shielding (the working area and the cabin of the board engineer) were chosen for theexposition of the dosemeters during each period in order to measure the variation of absorbed dose as wellas the variation of average LET of absorbed radiation within the habitable part of space station MIR. Theseresults will be compared with the results during two former periods of measurements on space station MIR(AUSTROMIR/DOSIMIR) and results obtained inside of biosatellite BION-10 and during the space shuttlemission STS-60.
INTRODUCTION
In space respectively in a space station humans and matter are exposed to charged particles as well as toelectromagnetic ionizing radiation (X-rays and gamma radiation) with various energies. The radiationenvironment in space results from three main components: galactic cosmic radiation, solar particle-eventradiation and geomagnetically trapped radiation. Interaction processes with matter transform this primaryspace radiation into secondary radiation consisting of charged particles, neutrons, gamma- and X-rays. Aconsiderable part of the resulting radiation is characterized by a high linear energy transfer (LET). Thedoserate and the LET-spectrum within a spacecraft depend on the orbit parameters, the time (solar flares)and the shielding conditions. Shielding conditions for the trapped proton fluxes depend also on theorientation of the spacecraft because neither the proton flux nor the mass distribution around the positionof a detector within a spacecraft is isotropic. For determination of the biologically relevant equivalent dose,beside the knowledge of the absorbed dose, information about the LET-spectrum is required. Up to nowdifferent types of detectors have to be used simultaneously for an estimation of the equivalent dose:Thermoluminescent dosemeters or active dosemeters and counters for the measurement of sparely ionizingradiation and different types of particle and neutron detectors like nuclear track detectors, emulsions incombination with fission foils and particle spectrometers. Nowadays some measurements were carried outwith LET spectrometers, based on tissue equivalent proportional counters (TEPC).
MEASUREMENT OF AVERAGE LET WITH THERMOLUMINESCENT DOSEMETERS (TLDs)
In standard TL-dosimetry with LiF dosemeters for absorbed dose measurement the light emission attemperatures below about 240 °C is analysed. The intensity of the dominant peak (peak 5) in the glowcurveappearing at about 200 °C is linear over a wide range of absorbed dose. For evaluation of absorbed doseeither peak amplitude or peak integral is used. Peak ratios are more or less constant at low doses after beta
Work supported by the Austrian Federal Ministry for Science, Research and Arts, and the AustrianSociety for Aerospace Medicine, ASM
PORTOROŽ 95 41

SESSION I PROCEEDINGS
or gamma irradiation. After absorption of radiation with higher LET, peak ratios change significantly. Ingeneral high temperature peaks (HTP) arising from recombination of thermally more stablethermoluminescence centers are enhanced after absorption of high LET radiation. These peaks appear inthe temperature range from 240 to 350 °C. In our former investigations we calibrated this effect with testirradiations of different LET (1, 2, 3 and 7). Irradiations with high energetic heavy charged particles(fluorine- and carbon-ions with energies up to 3.65 GeV/n) were carried out in the accelerator center inDubna. As parameter for the average LET of absorbed radiation we used the ratio of the intensity of TL-light in the high temperature region (HTR) to the intensity of emission in the same temperature range afterCo-60 (gamma) irradiation. The intensity of the dominant peak 5 was normalized before calculation of theHTR-ratio.
EXPERIMENTAL
The experiment ADLET was carried out on space station MIR during the Russian-Austrian joint projectRLF (Russian Long Duration Flight). Six dosemeter packets designed for a former experiment (2) wereused for measurements. Absorbed dose and average LET was recorded over three periods (RLF-1:8.1.1994- 9.7.1994, duration 183 d; RLF-2: 8.1.1994 -4.11.1994, duration 300 d and RLF-3: 8.1.1994 - 22.3.1995,duration 437 d). During each period packets were exposed in the cabin of the board engineer, position 1(minimum shielding, packets nos. 9,11,12); and in the central working area, position 2 (maximum shielding,packets nos. 10,13,14), in order to measure the variations of doserate and average LET respectively, qualityfactor within the habitable area of the space station MIR. The positions of the dosemeter packets areindicated in the scheme of space station MIR (Fig. 1).
Normalized on peak 5
alpha 155 keV/um
F-19102keV/um
F-19 30kev/um
MIR
Co-60 gamma
50 100 150 200 250 300 350 400 450Temperature (deg C)
Fig. 1: Scheme of space station MIR used forcalculation of mass distribution. Thepositions of dosemeters are indicated.
Fig. 2: Crystal F (150 ppm Mg, 11.5 ppm Ti)irradiated with various LET radiations.
All TL-dosemeters were read out with the labor-made read-out system TL-DAT-II using a Thorn Emi9635QB photomultiplier and evaluated by a specifically developed software (4).
RESULTS
For the measurement of the absorbed dose the height of peak 5 in LiF-dosemeters was used. All dosemeterswere calibrated with Co-60 gamma radiation. Gathered data show that the measured average doseratedepends strongly from the position of the detectors in the space station. During period RLF-1 the ratio of
PORTOROŽ 95 42

SESSION I PROCEEDINGS
measured absorbed dose in the two positions was 1.48. This difference depends on exposure period inspace. During period RLF-2 the ratio was only 1.27. The absorbed doserate varied from 0.205+0.01 mGy/d(RLF-1 pos.2) to 0.302±0.01 mGy/d (RLF-1 pos.l). Austrian and Russian results are in good agreement.
For evaluation of average LET of absorbed radiation, the method of HTR was approached (1,2,3,7).Glowcurves from LiF-TLDs exposed on space station MIR show a significantly enhanced high temperatureTL-emission compared to glowcurves after Co-60 irradiation (Fig.2). According to LET-calibration, amaximum variation of average LET from 5.8±0.2 keV/um (RLF-2 pos.l) to 7.1±0.1 keV/um in tissue(RLF-1 pos.2) was measured.
These values were obtained from TLD-100. In general, average LET is lower at the position with weakershielding and higher behind stronger shielding. The values obtained by TLD-600 are higher because of theevidence of thermal neutrons. For the evaluation of the quality factor, the relation between LET and Qproposed in ICRP-26 was used because „average LET" is only meaningful using ICRP 26. Contrarily ICRP60 demands assessment of the various components of the radiation field. A summary of results includingformer measurements on space station MIR, satellite BION-10 and space shuttle STS-60 is shown inTable 1.
Parameters
Duration (d)
Dose -ATI (mGy tissue)Dose -MBP (mGy tissue)
Doserate -ATI(mGy/d)av.LET(keV/um) tissue
Quality FactorEquivalent Dose (mSv)
Equiv. Doserate (mSv/d)
Parameters
Duration (d)
Dose -ATI (mGy tissue)Dose -IMBP (mGy tissue)
Doserate (mGy/d)av. LET (keV/nm) tissue
Quality FactorEquivalent Dose (mSv)
Equiv. Doserate (mSv/d)
Parameters
Duration (d)
Dose -ATI (mGy tissue)Dose -IMBP(mGy tissue)
Doserate -ATI(mGy/d)av. LET(keV/um) tissue
Quality FactorEquivalent Dose (mSv)
Equiv. Doserate (mSv/d)
DOSIMIRPh.l
145
Phase 1
34.2+1.1-
0.240 ±0.0086.2 ±0.3
1.861.6 + 2
0.432 ±0.01
DOSIMIR Ph.2
8
Phase 2
1.61 ±0.021.74 ±0.08
0.201 + 0.0036.5 ± 0.3
1.93.06 ± 0.04
0.382 ± 0.006
RLF Phase 1
182
Position 1
55 ±1.859.1 ±5.0
0.302 ±0.017 ±0.1
2110±3.7
0.604 ± 0.020
Position 2
37.3 ± 1.737.15 ±3.1
0.205+0.017.1 ±0.1
2.178.2 ±3.7
0.431 ±0.019
RLF Phase 3
437
Position 1
125.7 ±4.5130.5 + 9.0
0.288 ±0.016.4 + 0.1
1.8226 ±8.1
0.517+0.02
Position 2
96.0 ±4.3100.2 ±4.4
0.220 ±0.016.7±0.2
1.9182 ±8.2
0.416+0.02
BION-1012
TLD-600
3.04 ±0.1-
0.253 ±0.01214.3 ±2.5
3.510.6 ±0.5
0.89 ± 0.04
TLD-700
3.12 ±0.2-
0.260 ±0.01510.5 ±0.8
2.57.8 ±0.5
0.65 ± 0.04
RLF Phase 2
300
Position 1
90.3 ± 3.483.5 ±1.9
0.301 ±0.015.8 ±0.2
1.65148.9 ± 5.7
0.497 + 0.018
Position 2
70.8 ±4.769.6 ± 4.3
0.236 + 0.026.8 ± 0.4
1.9134.6 ± 8.9
0.448 ± 0.030
STS-60
8.3
TLD-600
1.37+0.09-
0.165 ±0.01210.6 ±0.6
2.83.84 ±0.25
0.46 ± 0.03
TLD-700
1.24 ±0.08-
0.149 + 0.016.5 + 0.4
1.82.23 ±0.15
0.27 ± 0.02
Table 1: Summary of dose measurements during space missions.
PORTOROŽ 95 43

SESSION I PROCEEDINGS
Due to the heavier shielding of the space shuttle compared to space station MIR the contribution ofsecondary neutrons to the absorbed dose is higher. Because of the high sensitivity of TLD-600 againstthermal neutrons, average LET and quality factor obtained by TLD-600 (Q=2.8) are overestimated. Thequality factor obtained by TLD-700 (Q=1.8) is neglecting the thermal neutron component. The valueobtained by the NASA tissue equivalent proportional counter (TEPC) in a comparable geometry wasQ=2.55 (ICRP 26) and 2.66 (ICRP 60).
ANALYSES OF MEASURED DATA IN COMPARISON WITH DOSE CALCULATIONS
In order to compare the measured dose rates with results obtained by trapped radiation belt models (AP8)(5) it is necessary to analyse the conditions of exposition. On the first look the variation of the orbitparameters of the space station MIR during the RLF-mission do not explain the differences in the measureddose rates on the same place within the station during the different periods. Monte Carlo simulations of themass (shielding) distributions of the 2 positions reveal a significant difference. In pos.l there are solidangles with a shielding weaker than 10 g/cm2 in opposite to pos.2. This difference might explain thedifferences of the measured dose rate and average LET depending on position. More detailed analyses areunder progress.
CONCLUSION
The method of LET-determination with TLDs on space station MIR was very successful. Absorbed doserate and average LET respectively quality factor within the space station depend strongly from the massdistribution around the position of the detectors. The small TLD-detectors allow the measurement of doserate distribution as well as the position sensitve determination of average LET. This opens a wide field ofapplications. The results regarding average LET respectively quality factor are in excellent agreement withformer measurements with LET spectrometers based on proportional counters (6). Data gathered duringthis experiment might be important to improve radiation models in low earth orbits.
REFERENCES
1. Vana, N., Schöner, W., Fugger, M. and Akatov, Y., DOSIMIR- a new experimental approach in dose equivalentdetermination on space station MIR, Proceedings of IAF/IAA symposion, Graz, Austria (1993).
2. Vana, N., Schöner, W., Fugger, M. and Akatov, Y., DOSIMIR- Radiation measurements inside the Soviet space stationMIR -first results, Proceedings of the European "International Space Year Conference", Munich, Germany (1992).
3. Vana, N., Schöner, W., Fugger, M. and Akatov, Y., DOSIMIR- Radiation measurements inside the Soviet space stationMIR, Health from Space Research, Springer Verlag, Vienna (1992).
4. Vana, N., Erlach, R., Fugger, M., Gratzl, W. and Reichhalter, I., A computerised TL-readout system for dating andphototransfer measurements, Nucl. Tracks Radiat. Meas., 14,1/2,181-184 (1988).
5. Sawyer, D.M., Vette, J.I., AP-8 Trapped proton enviroment for solar maximum and solar minimum, National DataCenter, Goddard Space Flight Center, NSSDC/WDC-A-R&S 76-06 (1976).
6. Nguyen, V.D., Bouisset, P., Akatov, Y. et al., Measurements of quality factors and dose equivalents with CIRCE insideof the Soviet space station MIR, Radiat. Prot. Dosim., 31,1/4, 377-382 (1990).
7. Vana, N., Schöner, W., Fugger, M. and Akatov,Y., Absorbed dose measurement and LET determination with TLD'sin space, 11th International Conference on Solid State Dosimetry, July 10-14,1995, Budapest, Radiat.Prot.Dosim.(1995) in print.
PORTOROŽ 95 44
lllllllilllllll p™ o s
XA05C0010
PATIENT SURFACE DOSES INCOMPUTERIZED TOMOGRAPHY EXAMINATIONS
B. Vekic1*, S. Kovačevič l), M. Ranogajec-Komor ] ), N. Duvnjak2), P. Marušic2 ),P. Anič 3 ), P. Dolenčič 3 )
" Ruder Boskovic Institute, P.O.Box 1016, 10000 Zagreb, Croatia2> University Hospital "Dúbrava", Zagreb, Croatia3) University Hospital "Merkur", Zagreb, Croatia
INTRODUCTION
The diagnostic value of computerized tomography has increased due to very rapid technical advances inboth equipment and techniques(1>2). When the CT scanners were introduced, a significant problem for thespecification of the radiation dose imparted to the patient undergoing CT examination has been created.In CT, the conditions of exposure are quite different from those in conventional X-ray imaging. CTprocedure involves the continuous tomography of thin layers. Some of these layers touch each other whileothers overlap. The radiation doses received by patients can vary considerably. In addition to the radiationfrom the collimated primary beam, patients are exposed to significant scattered doses in unpredictableamounts.
Every effort should be made to keep these doses to a reasonable minimum, without sacrificing the imagequality. The aims of this work were to determine the surface doses delivered to various organs of patientsduring various computerized tomography examinations (head, thorax, kidney, abdomen and pelvis).Particular attention was directed to the precise determination of doses received by the eyes (during CT ofhead) and gonads (during CT of pelvis and lower abdomen) since these organs can be near or even in theprimary X-ray beam.
MATERIALS AND METHODS
Selected TL dosemeters were used for all dose measurements. These are the most frequently used devicesfor dose measurements in computerized tomography(38>. For the measurements of the distribution ofsurface doses during computerized tomography, LiF:Mg, Ti TL dosemeters (manufactured at the Institutefor Nuclear Physics, Krakow, Poland) and TLD-700 (Harshaw) were emplyed. During the measurementof the patient doses, all TL dosemeters were placed in pairs of two in rubber holders 3 mm thick. Only TLdosemeters for the eye lens were wrapped in dark foil, without rubber holders.
Reading was performed on a TOLEDO 654 reader (Pitman/Winten). The energy dependence and othercharacteristics of the dosemeters used have been described in previous publications (9-10).
Computerized tomography was performed using two quite different CT units: (i) The first CT unit wasSOMATOM DR-H (manufactured by Siemens), version HC-1, third generation. This equipment wasinstalled in 1987 at the University Hospital "Dúbrava", Zagreb, where measurements on 71 patients wereperformed; (ii) The second CT unit used in this study was SCT-4500TE (manufactured by Shimadzu). Theequipment was installed in 1994 at the University Hospital "Merkur", Zagreb, where measurements on 24patients were performed.
RESULTS AND DISCUSSION
During various computerized tomography examinations, surface radiation doses received by 95 patientswere measured (i) in the primary X-ray beam region and (ii) outside of the primary X-ray beam (mostlyscattered radiation).
According to the literature, the absorbed doses received by the organs vary considerably from one CTscanner to another ( '"3 6 ). These differences may be due to the differences in the size of the focus, theeffective atomic number of the target material, quality of the filter materials and so on ( 3 ).
PORTOROŽ 95 45

SESSION I PROCEEDINGS
During computerized tomography of the whole abdomen, surface radiation doses received by 10 patients(2 groups of 5 on each machine) were measured in the primary beam at the upper, middle and lower sectionof the examined organ and for eye, thyroid and chest, as well as for the right and left gonads. The averagedresults for all patients of any one unit are given in Table 1. The doses measured in the primary X-ray beamat the examined organ are the maximum surface doses received by a patient during CT of the wholeabdomen. Using SOMATOM DR-H equipment surface radiation doses received by the whole abdomenranged from 8 to 47 mGy, while using SCT-4500TE unit surface doses renged from 15 to 58 my.
Similar doses in the primary beam were measured during CT examination of other organs. The surface doseduring CT examination of upper abdomen varied from 7 to 54 mGy for SOMATOM DR-H unit, and from17 to 56 mGy for SCT-4500TE unit. During CT of kidney the surface doses varied from 17 to 71 mGy forSOMATOM DR-H unit, and from 29 to 85 mGy for SCT-4500TE unit. The surface radiation dose duringCT examination of thorax and pelvis were measured using only SOMATOM DR-H equipment. Themaximum surface dose was 24.59 mGy during CT of thorax and 74.16 mGy during CT of pelvis.
The doses absorbed by different organs during the diagnostic CT examination depend on the technicalparameters such as the number of scans, the thickness of scans, scan times, couch increment, tube voltage,total mAs and other characteristics of the equipment, as well as on the type and severity of illness. Clinicalparameters, such as patient size and composition and patient cooperation with regard to control and motion,also influence the dose and image quality.
All our measurements were performed on actual patients. This must be borne in mind, especially whenconsidering doses received in the primary beam, since the slightest movement during tomography (e. g. theblink during CT of the brain) can significantly affect the dose. Furthermore, the beam angle in the case ofactual patients is always adjusted to the optimum diagnostic requirements; this can contribute significantlyto the total dose of scattered radiation(ll6) as well as to the dose in the primary beam.
The absorbed dose for a given examination in computerized tomography varies by a factor of 3 in NewZealand, and a factor of 5 in Sweden and in the United Kingdom(2>. In Japan, the effective dose equivalentfor the same examination varies by a factor of 3.5, depending on CT scanner unit(2'3). All these dose weremeasured mostly on a hypothetical average adult (phantom), although actual patients can vary significantly.In this study, the surface dose measured on actual patients undergoing the same examination varied by afactor between 2 and 6. At the same time, the number of scans and the total mAs with actual patients variedby a factor of 2 for the same examination. There were no significant differences between two different CTsystems.
The surface radiation doses outside of primary beam received by the eyes, thyroid, and chest, as well asthe left and right gonads during CT examination, involving a narrow, highly collimated X-ray beam directedexclusively to the examined areas, result from scattered radiation. The ratio of the minimum to themaximum of the measured surface doses from scattered radiation varies by a factor of 2 to 7. This isunderstandable if we consider the following: (i) these doses originated from scattered radiation, whichvaried according to the position, size and shape of patients' bodies; (ii) among the 95 patients were littlechildren (approximately 7 years of age), as well as both very thin and very corpulent adults; therefore, thedistance of the primary X-ray beam from the organ being measured for dose received significantly variedfrom one patients to antoher, (iii) the number of scans varied by a factor of 2.6 (from 13 to 34); (iv) thetotal mAs also varied by a factor of approximately 2.
During CT examination of pelvis and lower abdomen the gonads can be found near or even in the primaryX-ray beam. The surface dose received by gonads results from both scattered and direct radiation. Thesurface dose to gonads during CT examination of whole abdomen varied from 11 up to 40 mGy; duringCT of pelvis the doses to gonads were from 20 to 43 mGy. Taking into account the high tissue weightingfactor for gonads (0.20) this fact can create a serious radiation protection problem and special attention hasto be directed to both, the justification of the procedure, as well as to carefull planning of the examinationprocedure (optimization of radiation protection).
PORTOROŽ 95 46

SESSION I PROCEEDINGS
CT unit SOMATOM DR-H (Siemens) SCT-4500TE (Shimadzu)
Tube voltage (kV)
No. of scans
Scan thickness (mm)
Scan time (sec.)
mAs
125
27-30
8500-9300
120
21-33
10
4.5
8200-12600
No. of patients
Surface dose(mGy) on
Lowestvalue
Highestvalue
Lowestvalue
Highestvalue
In primary beam - upper part of examined organFront
Right side
Back
Left sideIn primary beam - middleFront
Right side
Back
Left side
8.36
11.14
10.46
9.41part of examined
27.49
10.97
10.55
10.45
40.70
47.24
42.12
41.28organ
47.57
31.30
28.53
43.54In primary beam - lower part of examined orean
Right side
Left sideOutside of primary beamBase of nose (eye)
Thyroid
Chest
Right gonad
Left gonad
9.41
10.33
0.20
0.45
0.76
15.23
11.23
40.84
47.09
0.46
1.04
5.48
37.98
39.14
20.7715.81
20.92
39.65
31.13
10.66
17.44
15.08
0.25
0.34
0.13
0.56
1.89
0.61
0.64
58.3046.43
53.80
56.10
51.08
45.91
46.83
54.46
1.84
1.05
0.43
1.45
8.41
1.61
1.87
Table 1: Distribution of surface radiation doses (mGy) received by various organsduring whole abdomen CTexamination by 2 different scanners.
CONCLUSION
The distribution of surface radiation doses received by patients during CT examination can be successfullymeasured using TL dosemeters. In this study, the srface dose measured on several patients undergoing thesame examination varied by a factor ranging from 2 to 6. There were no significant differences betweentwo different CT systems. Since computerized tomography is an increasingly common diagnosticprocedure, and sine various equipment is used, such measurements should be performed for all equipment.This would provide the following benefits; (i) facilitate the control of CT equipment; (ii) identify equipmentrequiring additional safety measures; (iii) facilitate patients risk assessment; and (iv) aid in directing effortstowards reducing the total radiation doses. From the point of view of radiation protection of patiens, anoptimum procedure for CT examination should be decided by considering not only the image quality butalso the absorbed dose resulting from CT examination. One of the main objectives in CT examination isto obtain an optimum image quality with a minimum radiation dose. In attempting to reduce the dose, it isimportant to realise that this is not only possible by technical improvement, but is even more effective bycareful advance planning of the examination and by reducing the number of slices.
PORTOROŽ 95 47

SESSION I PROCEEDINGS
ICRP 60 suggests the introduction of the concept of dose constraints also in the medical field, so that bothdose calculations and dose measurements should equally serve to establish the reference values as acriterion of good radiological practice<12). International Basic Safety Standards(13) suggest for diagnosticradiology, including computerized tomography examinations, wide scale quality surveys, which includeentrance surface doses. This study is in accordance with these international recommendations. SeveralEuropean countries are at present collaborating on the development of the quality assurance measures toreduce the variability in doses from comparable computerized tomography examinations ( 2 ).
LITERATURE
1. United Nations Scientific Committee on the Effects of Atomic Radiation (UNSCEAR). Sources, Effects and Risks ofIonizing Radiation. 1988 Report to the General Assembly, with Annexes (New York: UN) (1988).
2. United Nations Scientific Committee on the Effects of Atomic Radiation (UNSCEAR). Sources and Effects of IonizingRadiation. UNSCEAR 1993 Report to the General Assembly, with Scientific Annexes (New York: UN) (1993).
3. Nishizawa, K., Maruyama, T., Takayama, M., Okada, M., Hachiya, J. and Furuya, Y. Determinations of Organ Dosesand Effective Dose Equivalents from Computed Tomographie Examination. Br. J. Radiol. 64, 20-28 (1991).
4. Huda, W. and Sandison, G.A. CTDosimetry and Risk Estimates. Radiat. Prot. Dosim. 12, 241-249 (1985).5. Yalcintas, M.G. and Nalcioglu, O. A Method for Dose Determination in Computerized Tomography. Health Physics
37,543-548(1979).6. Shope, T.B., Morgan, T.J., Showalter, C.K., Pentlow, K.S., Rothenberg, L.N., White, D.R. and Speller, R.D. Radiation
Dosimetry Survey of Computed Tomography Systems from Ten Manufacturers. Br. J. Radiol. 55, 60-69 (1982).7. Faulkner, K. and Moores, B.M. Scattered Radiation Distributions around Computed Tomography Scanners and the
Associated Radiation Hazard to Personnel. Br. J. Radiol. 55,70-74 (1982).8. Fearon, T. and Vucich, J. Normalized Pediatrie Organ-Absorbed Doses from CT Examinations. AJR 148, 171-174
(1987).9. Ranogajec-Komor, M. and Osvay, M. Dosimetric Characteristics of Different TL Phosphors. Radiat. Prot. Dosim. 17,
379-384 (1986).10. Ranogajec-Komor, M., Muhiy-Ed-Din, F., Milkovič, D. and Vekič, B. Thermoluminescence Characteristics of Various
Detectors for X Ray Diagnostic Measurements. Radiat. Prot. Dosim. 47, 529-534 (1993).11. Vekic, B., Duvnjak, N. and Ranogajec-Komor, M. Determination of Patient Surface Doses from Computerized
Tomography Examination of Head. Proc. Austrian-Italian-Hungarian Radiation Protection Symposium: RadiationProtection in neighbouring countries in Central Europe, Obergurgl/Tyrol, 28-30. April 1993., N. Vana, A. Hafner(Editors), Vienna, 193-196 (1994).
12. ICRP Publication 60. 1990 Recommendations of the International Commission on Radiological Protection. PergamonPress, Oxford (1991).
13. IAEA . International Basic Safety Standards for Protection against Ionizing Radiation and for the Safety of RadiationSources. Interim Edition, Safety Series No. 115-1, International Atomic Energy Agency, Vienna (1994).
PORTOROŽ 95 48

II III I III I I I I I III I I I I IXA05C0011
METHODS TO IMPROVE RADIOPROTECTION FOR BAITA-PLAI(ROMANIA) URANIUM MINERS
S. Ramboiu
Medical Center, Health Services and Management, 3400 Cluj-Napoca, Str. Pasteur nr. 6, Romania
INTRODUCTION
Workers in uranium mine are subjected to the risk of internal contamination induced by Radon-222 andespecially Radon-222 short-lived progeny inhalation III. The radiation exposure levels are related to theradon concentration in the atmosphere which is known to vary in the same place and is different from onearea to another 111. The knowldege of these variations in the atmosphere of a mine is helpful to estimatethe mean cumulative dose, as well as to develop effective control methods for reducing the radiation hazardto acceptable levels.
The paper presents some methods to improve radioprotection of workers in "Avram Iancu" uranium mine,on the basis of simultaneous measurements of Radon-222 and its progeny concentration in the undergroundair. In Romania all mines have a laboratory of dosimetry with the aim to measure the radioactivecontaminations of air and the external gamma dose rate.
The individual risk for uranium miners induced by internal and external irradiation is evaluated by theCummulative Factor (C. F.) defined as:
, D(Gy)FC
03(WL) x 25.5 4(Gy) '
where:
Ep - potential energy of alpha short-lived Radon-222 progeny, calculated by multiplying the meanvalue for Radon-222 concentration with the equilibrium factor between Rn-222 progeny andRn-222 gas;
WL - Working Level;0.3 (WL) - maximum permitted value in occupational exposure / 1 / ;25.5 - number of working days per month;D - external gamma radiation dose per month;4 - maximum admitted monthly gamma radiation dose in occupational exposure.
If the radioprotection is a good one, the Cummulative Factor, calculated per month should be under 1.Surveillance of radioactive contamination of working places is done by the laboratory of radioprotection,by weekly measurements of Radon-222 concentrations in air, and gamma dose rates, and half-yearlydeterminations of Radon-222 progeny. Using these values, the equilibrium factor between Radon-222progeny and Rn-222 itself for each working places and the mean value for the mine atmosphere arecalculated. The Ep values in C.F. calculation are obtained by multiplying the mean equilibrium factor of30% with the value of Radon-222 air concentration measured each week.
MATERIALS AND METHODS
The first aim of the paper was to compare the real values of Radon-222 daughter concentrations for eachworking place with the calculated one in Avram Iancu uranium mine. The determinations were done in90% of working places from Avram Iancu uranium mine, twice a year. In each working place it wasmeasured:
the Radon-222 concentrations in air using Kusnetz method /31;the Radon-222 progeny concentrations with Rock's method 141.
PORTOROŽ 95 49

SESSION I PROCEEDINGS
These data were used to calculate the equilibrium factor for each working place.
The Rock's method takes into account the possible presence of both thoron (Radon-220) and Radon-222progeny in mine atmosphere. The method is based on the measurement of the alpha activity of Radon-220and Rn-222 daughters mixture collected on a filter paper. The importance of performing this separation isemphasized by the fact that thoron daughter presence in the air may affect the values obtained for Radon-222 progeny. The alpha activity of the filter was measured 40-90 minutes after sampling for Radon-222daughters, and 5-17 hours after sampling for Radon-222 progeny. The Rn-222 concentration in water wasalso measured 151.
RESULTS AND DISCUSSION
Radon-222 concentrations in air varies in very large limits, from 10 pCi/1 (370 Bq/cub m) to 1004 pCi/1(37148 Bq/cub m) depending on the horison and working place. Radon-222 progeny concentrations aresituated between 0,2 WL and 6,3 WL, being higher for upper horisons, as a consequence of in seriesventilation system used in "Avram Iancu" mine. The mine water does not contribute considerable to theair values of Radon-222 air concentrations. Our concomitent measurements of Radon-222 and Radon-222progeny demonstrated that the real values for equilibrium factors are higher than 30%, ranging between5-90%, the values of equilibrium factor of 60-80% being more frequent. This finding is very importantbecause in uranium mine atmosphere there are many working places where the Radon-222 and Radon-222progeny concentratons are higher than the maximum permissible values (30 pCi/1 or 1110 Bq/cub m of air,and 0.3 WL, respectively) /6/. The real values of Radon-222 progeny were compared with the calculatedones.
1
2
3
4
5
6
7
8
Workingplaces
(horison)
1024
1024
1024
1024
1024
1024
Dibarz
Dibarz
Radon-222 concentration(measured)
pCi/1
1004
371
338
725
651
203
602
542
Bq/m3
37148
13727
12506
26825
24087
7511
22274
20054
Rn-222measuredprogeny
(WL)
1.96
2.12
2.35
7.04
5.89
1.63
0.64
0.54
Equilibrium factor(%)
real
19
57
69
83
90
80
10
11
mean
30
30
30
30
30
30
30
30
Rn-222calculatedprogeny
(WL)
3.012
1.113
1.014
2.175
1.953
0.609
1.806
1.626
Table 1: Comparison between real and calculated Radon-222 progeny concentrations.
The data presented reveals:
for the 1024 horison the calculated values for Radon-222 progeny are 2 to 3.5 times lower than the realones;in the Dibarz horison the real values are much lower than the calculated ones.
The errors that occur in the calculations of Cumulative Factor determine sometimes higher values than thereal ones and more frequent, underevaluation of the real risk. This observation is very important becausethe value of C.F. decides the miner's change of working place.
Our previous studies 111 regarding radioactive contamination of "Avram Iancu" uranium mine atmospheredemonstrated that, as a consequence of in series ventilation system used, the values for equilibrium factorsare strongly related with the mine horison.
PORTOROŽ 95 50

SESSION I PROCEEDINGS
In the aim to obtain reliable information about the miner's internal exposure, we divided the mine into 6area with the similar values of equilibrium factor. For all these areas the mean value of equilibrium factorwas separately calculated. The mean value obtained for each horison was used to calculate the Radon-222progeny concentrations for all working places. A new comparison between real and calculated values arepresented in Table 2 for two extreme conditions: mean equilibrium factor of 11.5% and 66%, respectively.
1
2
3
4
5
6
7
8
Workingplaces
(horison)
1024
1024
1024
1024
1024
1024
Dibarz
Dibarz
Radon-222 concentration(measured)
pCi/1
1004
371
338
725
651
203
602
542
Bq/m3 J
37148
13727
12506
26825
24087
7511
22274
20054
Rn-222measuredprogeny
(WL)
1.96
2.12
2.35
7.04
5.89
1.63
0.64
0.54
Equilibriumfactor (%)
mean
66
66
66
66
66
66
11.5
11.5
Rn-222calculatedprogeny
(WL)
6.62
2.44
2.23
4.01
4.79
1.33
0.60
0.54
Table 2.
Data analysis demonstrates that using a mean value for each horison, a good concordance between the realRadon-222 progeny concentrations and the calculated ones is obtained.excepting for the dead-end works.The high values of Radon-222 progeny concentrations and for equilibrium factors in "Avram Iancu"uranium mine are caused by:
1. in series ventilation system used;2. the low airflow in the main ventilation system;3. the break of ventilation system overnight.
The "Avram Iancu" uranium mine is too large to obtain rapid improvement of radioprotection. The firstmethod proposed was to avoid the break in ventilation system. The maintenance of ventilation system hasan important place in determining radiation exposure, because the growth of progeny underground overa 8 hours period without ventilation requires a considerable time to obtain the same values as before. Byapplying the maintenance of ventilation system, the values for equilibrium factors for about 80% from theworking places were reduced to half of initial values.
CONCLUSION
1. The estimation of individual risk for miners on the basis of the calculated values for Radon-222progeny by multiplying the measured Radon-222 concentration with the mean value of equilibriumfactor of 30% determines an underevaluation of the internal exposure;
2. By using the mean equilibrium factor for each horison.a good concordance between the calculated andreal values of cumulative factors were obtained;
3. The main causes of the high radioactive contamination of the air with Radon-222 progeny are: in seriesventilation system and the break of ventilation overnight;
4. The maintenance of ventilation system reduces the Radon-222 progeny concentrations with a factorof two in almost all working places.
PORTOROŽ 95 51

SESSION I PROCEEDINGS
REFERENCES
1. UNSCEAR Report 1994, p. 112-134.2. Cosma C, Mastan I., Cacovean A. - "Radon and Thoron Measurements from Ground Using Gamma-Spectrometry",
Studia UBB Phisics, 130, p. 72-75,1985.3. Kusnetz H. L., 1956, "Radon Daughters in Mine Atmosphere, A Field Method for Determining Concentrations", Am.
Ind. Hyg. Asoc. Quat. 17,87.4. R. L. Rock, D. K. Walker, R. W. Dalzell and E. J. Harris, Controlling Employee Exposure to Alpha Radiation in
Underground Uranium Mines, Vol. I and II. U. S. Bureau of Mines Handbook (1970 and 1971).5. Cosma G, Ristoiu D., Cezar O. - "Radon Exhalation from Ground in Two Areas from Romania", Proceedings of Indoor
Air'93, Helsinki, vol. 4, p. 505-510.6. C. S. E. N. - Norme de secuntate nucleara pentru activitatile de cercetare geologica, extractie si prelucrare a materiilor
prime nucleare, Bucuresti, 1975.7. Ramboiu Stela - The Effective Dose Equivalent from Radon-222 Short-Lived Decay Products for Uranium Miners,
Proceedings of the Symposium on "Methods, Models and Techniques in Physics and Related Fields, Sept. 26-27 1986,Cluj-Napoca, Romania.
PORTOROŽ 95 52

SESSION I
XA05C0012PROCEEDINGS
MEASUREMENT OF C-14 INSIDE THE KRSKO NUCLEAR POWER PLANT
B. Vokal, J. Burger, T. Mohar and M. Franko
Jozef Stefan Institute, Jamova 39, Ljubljana, Slovenia
ABSTRACT
One of the most important radionuclides released to the environment from nuclear power plants is carbon-14(C-14). C-14 is mainly released to the environment in stack gas. However, uncontrolled releases of C-14 canalso occur during maintenance and various repair work inside the nuclear power plant. For this reason theobjective of our work was to monitor C-14 inside the Krško Nuclear Power Plant. Air was continuously takenat several locations inside the plant by a CO/CH4 sampler-for two week periods. Sample activities weremeasured by liquid scintillation counting (LSC) after precipitation of carbonate with BaCl2. Variations inradioactive CO2 and hydrocarbon concentrations in air at various locations inside the plant are reported. C-14 levels inside the Krško Nuclear Power Plant are generally below 15 Bq-m3, but increases in two weekaverages C-14 concentration of up to 1900 Bq-m'3 were occasionally observed. However, all average two-weekC-14 concentrations were significantly lower than the minimum permitted C-14 concentrations f or the workingenvironment (40,000 Bq-m'3).
INTRODUCTION
C-14 enters the environment via three production routes: nuclear reactions induced by cosmic rays in theupper atmosphere, nuclear weapon tests and nuclear installations including nuclear power plants. It istherefore present in the air and in all biological materials.
C-14 is one of the most important radionuclides released to the environment from nuclear power plants [1].It is produced primarily (i) in the fuel by the reactions 17O(n,cc)14C and 14N(n,p)I4C, (ii) in core structuralmaterials, including stainless steel, where the source of C-14 is nitrogen in this material, and (iii) in thecooling water where the sources of C-14 are oxygen and nitrogen containing substances.
C-14 is released to the environment mainly via the stack. C-14 discharges with liquid and solid wastes areless than 5% of the gaseous release. The dominating chemical forms of radiocarbon released from light-water cooled reactor are carbon dioxide and to a lesser extent hydrocarbons.
In addition to the releases mentioned above, which are subject to the regular monitoring, uncontrolledreleases of C-14 can also occur during maintenance and various repair work inside the nuclear power plant.Thus, the aim of our work was to examine the potential C-14 sources and the concentrations of C-14 insidethe nuclear power plant.
METHODS
A differential C-14 sampler [2] shown on Figure 1, which enables measurement of C-14 in the chemicalforms of CO2 and CO2 plus hydrocarbons, was used in this work. It consists of two parallel lines for airsampling. A single membrane pump maintains a continuous air flow at a cate of 2.5-10"4 m3min"' througheach of the lines. The air in the first line passes a potassium hydroxide trap where CO2 is absorbed. In thesecond line hydrocarbons are converted to CO2 on a Pd catalyst at 600°C and are led through a secondpotassium hydroxide trap to absorb CO2 originating from hydrocarbons. Every two weeks the traps werereplaced by new ones.
Absorbed carbon dioxide was precipitated as BaCO3 by adding BaCl2 solution [3]. Two grams ofprecipitate were mixed with 0.80 g of CAB-OSEL M-5 and 20 cm3 of Instagel scintillation cocktail wasadded to the scintillation vial. Beta activity was measured with a liquid scintillation analyzer (PackardTricarb 2550TR A/B).
Eighteen determinations of two-week average C-14 concentrations inside the plant were performed in the
PORTOROŽ 95 53

SESSION I PROCEEDINGS
period between 1 April, 1994 and 3 January, 1995. The C-14 air sampler was placed at different locationsinside the plant, where increased C-14 levels were expected.
Samples were collected in the fuel handling building (three measurements) and in the reactor containmentat four different elevations: EL 94 (three measurements), EL 100 (six measurements), EL 107 (twomeasurements) and EL 115 (four measurements).
We also measured C-14 at the time of the regular refit of the plant from 20 August, to 5 October, 1994.
At the sites where increased C-14 levels were observed, measurements were repeated several times.
AIR IN AIR OUT
AIR OUT
REGULATINGVALVE
PUMPľ-i =
ip rijr
,r ' ' ! F1 !!r !
C.H«-»CO,CONVERTER
TRAP
Fig. 1: Schematic diagram of a differential C-14 sampler used in this work.
RESULTS AND DISCUSSION
Results of two-week average C-14 concentrations in CO2 and the total C-14 concentrations (CO2 + hydro-carbons) are shown in Figure 2. As can be seen, occasional increases of C-14 concentrations inside theKrško Nuclear Power Plant were observed. Values for C-14 never exceeded 5 Bq-m"3 in the fuel handlingbuilding and 3.5 Bq-m"3 in the reactor containment at EL 94. Over ten times higher C-14 concentration thanthis were measured in the containment at EL 107 (from 1 June, to 1 July, 1994) and in the containment atEL 115 (from 17 May, to 1 June, 1994 and from 1 December, 1994 to 3 January, 1995). Substantiallyhigher C-14 levels were determined in the containment at EL 100 between 1 July and 16 July, 1994 (1900Bq-m"3) and in the containment at EL 115 between 16 November, and 1 December, 1994 (190 Bq-m"3).
Comparison of the total C-14 activity and C-14 activity from CO2 (Figure 2.) shows that the majority of C-14 is contained in CO2. With the exception of measurements performed in the period from 3 May, till 18July, 1994 and from 16 August, till 1 September, 1994, the difference between C-14 activity in CO2 andtotal C-14 activity was small and did not exceed the uncertainty of the measurements, which was typicallyabout 10% of the measured values.
CONCLUSIONS
Occasionally increased concentrations of C-14 inside the Krško Nuclear Power Plant can be attributed tomaintenance and various repair work inside the plant. However, we must point out that during the regularrefit of the plant from 20 August, to 5 October, 1994, when the reactor was shut down, no increases of C-14concentrations inside the plant were observed.
The highest two-week average C-14 concentration (1900 Bq-m"3) was significantly lower than permittedC-14 concentrations for the working environment (40,000 Bq-m"3) [4]. However, instantaneous C-14
PORTOROŽ 95 54

SESSION I PROCEEDINGS
concentrations may well exceed 40,000 Bq-m"3. Namely, we can calculate that emission of the same activitythat results in a two week average C-14 concentration of 1900 Bq-m"3 could give a twelve hour averageconcentration of approximately 50,000 Bq-m'3.
sso
4 s «ž j 3 a J
3 4 S 3 3 ň 3date (location)
Fig. 2: Two week average C-14 concentrations inside the Krško Nuclear Power Plant.
It is evident that actual instantaneous increases of C-14 concentrations inside the Krško Nuclear PowerPlant could only be determined by shorter sampling periods on the site during maintenance and variousrepair work. These, along with the C-14 measurements in the fuel handling building during replacementof the fuel elements, are the objectives of our future work.
ACKNOWLEDGEMENTS
We gratefully acknowledge the financial support of the Slovenian Nuclear Safety Administration.
REFERENCES
1. Uchrin G., Csaba E., Volent G., Chyly P., Slavik O., Miklavžič U., Kobal I. and Mohar T.: Carbon-14 measurementsat three PWR type nuclear power plants, Proc.of Austrian-Italian-Hungarian Radiation Protection Symposium in coo.with the Radiation Protection Association of Slovenia and the Croatian Radiation Protection Association, RadiationProtection in neighbouring countries in Central Europe, Obergurgel-Tyrol, 1993.
2. Air sampler developed at Institute of Isotopes Budapest, Hungary.3. Južnič A., Mohar T., Fedina Š. and Kobal I.: Method of C-14 determination in air, J. Stefan Institute Report,
US DP-6371, January, 1992.4. Trampuž M., Radiation Protection, Book of Yugoslav regulations, published by Institute of Occupational Safety,
Ljubljana, 1989.
PORTOROŽ 95 55

SESSION I • llllllllllllllllllllllilllHIIIIIflillll PROCEEDINGSXA05C0013
HEALTH SURVEILLANCE OF MEDICAL PERSONNEL OCCUPATIONALLYEXPOSED TO IONIZING RADIATION SOURCES:
BIOMONITORING AND DOSIMETRY
V. Brumen, I. Prlič, Ž. Radalj, D. Horvat and H. Cerovac
Institute for Medical Research and Occupational Health Zagreb,2 Ksaverska street, POB 291, 10000 Zagreb, Croatia
ABSTRACT
The aim of this work is to present the complete results of periodical health surveillance of medical personneloccupationally exposed to ionizing radiation sources, conducted according to established law regulations inCroatia. The report comprises a total of 21 examinees (11 female, 10 male), mean age 43,19 ± 9,85 years,originating from different professional groups and working in a radiation zone 14,7 ± 8,27 years on theaverage. Within the framework of this study, the results of their biomonitoring, including haematologicalparameters (whole blood count), ophthalmological findings (fundus oculi), cytogenetic test (conventionalstructural chromosomal aberration analysis) and peripheral blood flow survey (capillaroscopy anddermothermometry) will be presented. Filmdosimetric data for the referred period will also be reported.
INTRODUCTION
Since ionizing radiation was first recognized as having harmful effects, efforts have been made to reduceit's noxious impact on human health. Among other radiation protection measures, health surveillance ofprofessional groups at risk became regular. This report is aimed at presenting the results of such a healthsurvey in the group of radiological workers from one of the Croatian regional medical centers. The surveywas designed in accordance to the valid Croatian law regulations (1).
SUBJECTS AND METHODS
Twenty-one subject (11 women, 10 men), mean age 43.19 (± 9.85) years, occupationally exposed toionizing radiation sources for 14.70 (± 8.27) years on the average, were included into the program.
Prior to the examination, a detailed questionnaire was fulfilled comprising data on personal, family andoccupational background of each subject. Data on extraoccupational exposures were also recorded. Thedata provided on confounders were as follows:
a) There were 8 smokers and 13 nonsmokers in the group.b) Nine subjects underwent some of the common radiodiagnostic procedures within one year prior to the
survey.c) Four subjects were on some of the common drugs within one year prior to the survey.d) One of the subjects suffered from viral hepatitis six months prior to the survey.
The health survey program comprised:
1. Standard physical examination;2. Standard haematology (whole and differential white blood count);3. Ophthalmological examination (fundus oculi);4. Conventional structural chromosomal aberration analysis according to the standard protocol (2);5. Peripheral blood flow survey via serial application of wide-field nailfold capillaroscopy and
dermothermometry according to the own protocol (3).
Since all the subjects are constantly equipped with personal monitoring film (KODAK type 2),filmdosimetric data for the relevant period are also reported.
PORTOROŽ 95 56

SESSION I PROCEEDINGS
RESULTS AND COMMENTS
Overall results of haematological examination, cytogenetic testing outcome and peripheral blood flowsurvey are presented in Tables I - III. Data on personal filmdosimetric monitoring are provided for eachsubject in Table IV. Other findings were within physiological boundaries.
The principal aim of this report was to point out that even among common groups of radiological workers,under regular workplace conditions, certain bioindicators can still reveal preclinical changes in their healthstatus. Therefore, constant dosimetric and health surveilance of these groups becomes necessary.Nevertheless, personal background of the exposed subjects, kind of professional activity, workplaceconditions and exposure regimens should always be taken into account when estimating an individualhealth risk related to occupational radiation exposure.
No. of subjectshaving findings
within NLR
I NLR
T NLR
E
17
4
0
L
17
0
4
Eo
12
0
9
Baso
21
0
0
Seg
4
11
6
Non-seg
19
2
0
Ly
4
1
16
Mo
19
2
0
Legend: No = numberNLR = normal laboratory range1 = belowT = beyondE = erythrocytesL = leucocytes
Standards ("IMI" - Haematological lab):
Eo = eosinophilesBaso = basophilesSeg = segmented leucocytesNon-seg = non-segmented leucocytesLy = lymphocytesMo = monocytes
(male)(female)(male)(female)
4.4 - 5.8 x 10¹²/L3.8 - 4.9 x 10¹²/L3.5 - 8.0 x 10⁹/L4.0 -10.0 xlO9/L
EoBasoSegNon-segLyMo
1 - 3 %1%54 - 62 %3 - 5 %25 - 33 %3 - 7 %
Table I: Haematology (whole and differential white blood count) - overall findings.
TNo of subjectsanalyzed
21
Normal
No
16
findings
%
76
Aberrant
No
5
findings
%
24
TNo of cellsanalyzed
4200
total
AB (%)
2.42
S
TNo
36
SB
%
0.85
D
TNo
30
SB
%
0.71
A
TNo
31
c
%
0.73
D
TNo
5
i c
%
0.11
Legend: No = numberTNo = total numberAB =aberration
SSB = single-strain breakDSB = double-strain breakAc = accentricDie = dicentric
Table II: Cytogenetic testing outcome.
PORTOROŽ 95 57

SESSION I PROCEEDINGS
No of subjects having
both findings normal
only capillaroscopic findingaltered
only thermometric findingaltered
both findings altered
No
3
6
1
11
%
14.2
28.5
4.7
52.3
Table III: Peripheral blood flow survey - overall results.
Subject
123456789
101112131415161718192021
TRD (uGy)/NIF
0/050/10/00/00/0
360/5480/4
0/080/1
240/40/0
400/680/10/00/00/00/00/00/0
50/10/0
Legend: TRD = Total radiation dose received within 1 year prior to the surveyNIF = Number of irradiated films in the reffered period
Footnote: Doses reported as "0" are actually doses below 0.03 mGy i.e. below the sensitivity of"KODAK Type 2" personal dosemeter.
Table IV: Data on personal filmdosimetric monitoring.
REFERENCES
1. Zákon o preuzimanju saveznih zákona iz oblasti zdravstva koji se u Republici Hrvatskoj primjenjuju kao republički zakoni.Národne Novine 53/1991.
2. Biological dosimetry, Chromosomal aberration analysis for dose assessment, TRS 260, IAEA, Vienna, 1986.3. Brumen V., Horvat D., Bonič L: Evaluation of serial application of capillaroscopy, photoplethysmography and
dermothermometry in diagnosis and prevention of radiolesions of peripheral microvessels. Microvasc. Res. 1994; 47(2):270-8.
PORTOROŽ 95 58

íl HM in m n m i n li pRocEEDiNGs
XA05C0014
RADIATION PROTECTION IN CHEST RADIOGRAPHYIN CHILDREN UNDER ONE YEAR
C. Fulea, S. Ramboiu
Medical Center and Health Services and Management, Cluj-Napoca, Romania
INTRODUCTION
The level of radiation exposure in patiens during diagnostic radiology has been influenced by severalphysical factors, mainly the geometry of incident fascicle and its force of penetrating the human tissues.Special emphasis has been placed on beam collimator responsible for both the radiation dose intensity andfor the radiographic image quality /1,4/.
The use of insuficiently collimated beams has led to the irradiation of larger tissue areas surrounding thetarget organ and consequently to higher doses in neighbouring organs; another important effect has beenthe presence of a considerable quantity of scarttered radiation cansidered to be the main cause of thereducing contrast in radiographic technique /3,5/. The drawbacks consisted in the extent of irradiated regionbeyond the limits of X-ray equipment 121.
The paper presents a practical system of supplementary collimation of X-Ray utile fascicle providingradiological protection during the pulmonary radiography effectuated in children.
MATERIALS AND METHODS
The study was performed in the Pediatrie Policlinic - Cluj provided with a large X-ray Diagnostic Service.The purpose of the survey was to establish the particular place of chest radiography among other X-rayexaminations by monitoring the yearly distribution of diagnostic radiography performed in children - ondifferent anatomical regions, by applying a retrospective statistic inquiry. In order to reveal the mostexposed age groups the chest X-ray examinations were age and sex-related. An experimental collimatorscatter was proposed to eliminate unuseful radiation beam during chest radiography in children aged 0-1year. To confirm the efficiency of the proposed design the radiation doses were comparatively evaluatedwith and without lead collimator.
RESULTS AND DISCUSION
From the distribution of the diagnostic X-ray examinations performed in children within a year interval onecan conclude that from the total number of investigations the chest radiography presented the highestpercentage - 15.5% .
Dis1ribu1ion o1 chest radiographyon age ond sex groups The age distribution illustrates that 30% of the chest radiographs
were done in children aged 0-3 years, 50% of the overallexamination being conducted in infants under one year, owing totheir increased receptivity towards different diseases.The wide use of diagnostic chest X-ray examination mainly duringthe children's first year of life has requiered the adoption of newpractical means that would result in the limitation of the utile beamwithin the anatomical region to be investigated. The drawbacks ofcurrenty applied chest radiographs consist in undesirableexposures because of the extent of irradiated area round the target
M F organ. The aim of our study was to achieve an effective reductionjmmniní -I-7Yeľrs EEZHB-soýlľre °f scatter by constructing a device using narrow collimated beams.M-moi« F-femoi« The design characteristics consist in a 0.5 mm aluminium plate
Fig. 1.
PORTOROŽ 95 59

SESSION I PROCEEDINGS
Lead collímotorfor eliminating the scattered radiation
20 5
I
overlapping a 0.5 mm thick lead layer plate stuck on the diaphragm of X-ray tube. The infant is laied onthe radiographic support provided with a (13x18) cm2 sized X-ray cassette, applied exclusively topulmonary radiography in this age group (Fig. 1). The X-ray tube is inserted taking into account that thefocus-film distance should be of 95 cm, corresponding to a length of 59 cm from the dyaphragm of X-ray
device. This positioning ensures a proper design of16 cm between the lower edge of the proposed designand the radiographic mass considered to be suitablefor its practical use in children aged 0-1 year (Fig. 2).By means of this device one can ensure a 12x17 cm2
area of X-ray beams, i.e. the processed film presenta 1 cm of non-exposed band, according to the currentstandards /5/. It must be emphasized that the brightcentre of X-ray device coincides with the X-ray fieldcentre of fascicle according with the geometricalcentre of the X-ray cassette (Fig. 2). The efficiencyachieved by the proposed design provided with leadcollimator consists in the reduction of undesirableradiation to the anatomical region to be investigated.The following effects were obtained: reduction of theX-ray beams area to the radiological filmdimensioning of 13x18 cm2, diminishing by threetimes the radiation doses in the neighbouring organs(thyroide, gonads, active bone narrow, lungs), byeliminating the scattered radiation, considered to bethe main cause of the reduced contrast. Theefficiency of the proposed design has beendemonstrated by the dosimetric measurements donein children submitted to chest X-ray examinationswith and without lead collimator.
Vertical «action A-A »action
Ql u miniumOiS mm
lead 0i5 mm
Horizontal section
Fig. 2.
CONCLUSIONS
The use of supplementary collimator for radiation beam in chest radiography for children under one yearhas the following advantages:
1. radiation dose reduction in the neighbouring organs;2. increasing of image quality of X-ray beam by elimination of scattered radiation.
The lead collimator is a practical and efficient system recommended in the X-ray diagnostic services ofpediatrie units.
PRACTICAL DEVICE TO REDUCE THE DOSES IN CHEST RADIOGRAPHY - SUMMARY
A practical system of suplementary collimating of scattered radiation in the aim of radiation protectionduring chest radiography in children under one year is presented. Noticeable advantages have beenregistered in terms of narrowing the beam radiation to the strictly film dimensioning, a three timesreducement of the radiation doses penetrating the neighbouring organs of the checked area (thyroide,gonads, active bone marrow, lungs) as well as increasing the radiographic image quality by elimination ofthe scattered radiation.
REFERENCES
1. Contento G., and all, The Brit. J. of Radiol., 61, 143-152, 1988,2. Corina Fulea, Stela Ramboiu, Probleme de radiobiologie si medicina nucleara, vol. I, CIuj-Napoca, 186-190, 1977,3. Laws P. W., Rosenstein H., Dhew, Publication (FDA), 80-8107,1980,4. Leitz W. K., and all, The Brit. J. of Radiol., 63, 33-40,1990,5. Marshall N. W., Faulkner K., The Brit. J. of Radiol., 65, 44-49, 1992,6. XX Norme republicane de securitate nucleara, Regimul de lucru cu surse de radiatii nucleare, CSEN, 1976.
PORTOROŽ 95 60

SESSION II:
NATURAL RADIOACTIVITY
ChAÍRS:
S. LuLičD. BRAJNÍIC
M. BENOM. KRÍŽMAN
I. KobAlV. KIENER


SESSION H PROCEEDINGS
XA05C0015
RADON RISK CLASSIFICATION OF FOUNDATION SOILS -
SOME REMARKS
Martin Neznal, Matěj Neznal, J. Šmarda
RADON v.o.s. Corporation, Za koncem 1380, 289 22 Lysá nad Labem, Czech Republic
INTRODUCTION
The infiltration of radon from the ground is usually the predominant source of indoor radon pollution.Since 1990, the uniform method for radon risk classification of foundation soils has been used in theCzech Republic to prevent radon entry into new buildings. The first proposal of the method was givenby the Czech Geological Survey Praha [1]. In 1991, the Decree of the Ministry of Health of the C. R. onthe requirements for limiting radiation exposure due to radon and other natural radionuclides wasaccepted and detailed radon measurements became obligatory for all areas of urban planning. A fouryears experience has resulted in several modification of the origin proposal of the classificationmethod [2].
The classification is based on soil-gas radon concentration determination at each measured point of thearea investigated in the grid 10 x 10 m and on permeability classification of foundation soils. Otherparameters, including vertical and horizontal changes in soil and rock profile, are also taken intoconsideration. Three cathegories of risk are defined - low, medium and high risk of radon infiltration fromthe ground (See Table 1).
CATEGORY
low risk area
medium risk area
high risk area
RADON CONCENTRATION IN THE SOIL GAS (kBq-nr3)
soil permeability
low
<30
30-100
>100
medium
<20
20-70
>70
high
<10
10-30
>30
Table 1: Radon risk classification of foundation soils.
SOIL-GAS RADON CONCENTRATION MEASUREMENTS
As for the soil-gas radon concentration measurements, there is only one sampling and measuringtechnique that is commonly used nowadays [3]. The equipment for soil-gas sample collection consistsof a small-diameter hollow steel probe. Samples of soil-gas are collected by using a syringe and introducedinto Lucas cells.
Several research projects resulted in a better understanding of factors that might influence measurementresults - temporal and spatial variability of soil-gas radon concentration etc. The results can be summarizedas follows:
a) The soil-gas radon concentration may vary, often very greatly, over a small distance and theoccurence of inhomogenities often indicates the presence of faults or tectonic zones. To ensurea better reliability of the results, it is required to make at least 15 soil-gas sample measurementswhen a building site for one family house is evaluated [4].
b) The sampling depth of 0.8 m represents a relatively good compromise between the requiredreduction of weather effects and the practicability of the method under field conditions [5].
PORTOROŽ 95 63
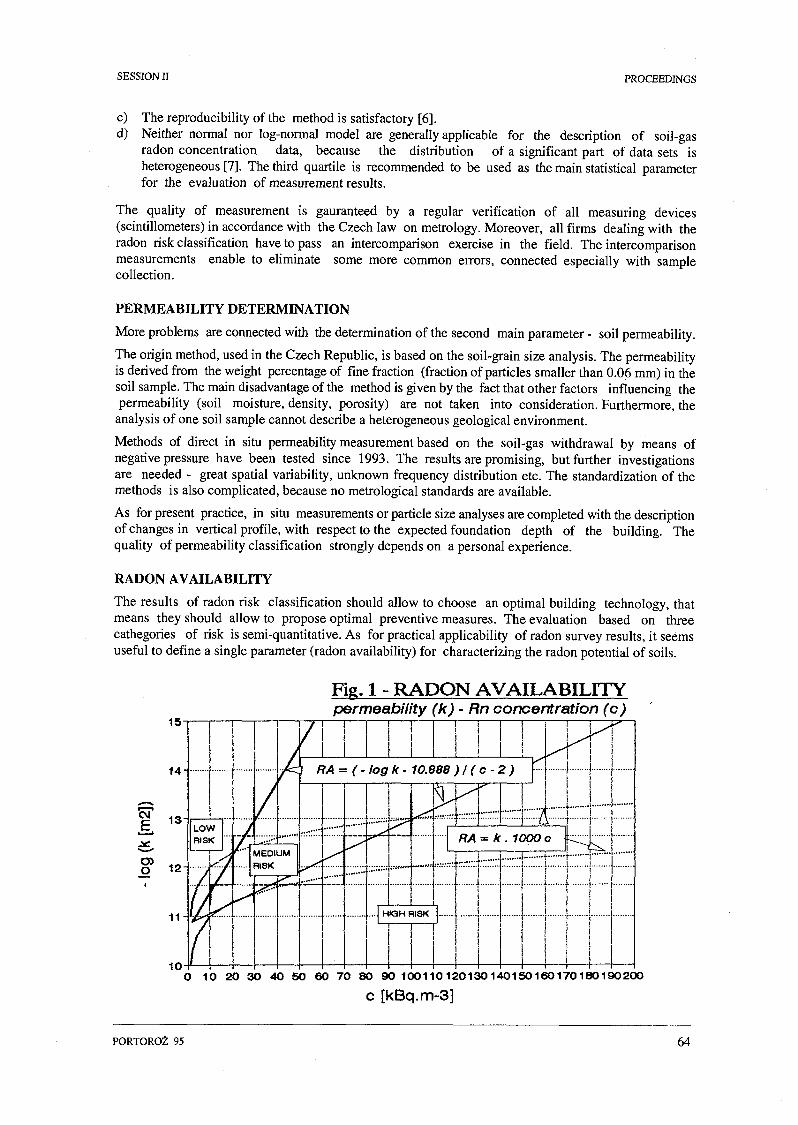
SESSION II PROCEEDINGS
c) The reproducibility of the method is satisfactory [6].d) Neither normal nor log-normal model are generally applicable for the description of soil-gas
radon concentration data, because the distribution of a significant part of data sets isheterogeneous [7]. The third quartile is recommended to be used as the main statistical parameterfor the evaluation of measurement results.
The quality of measurement is gauranteed by a regular verification of all measuring devices(scintillometers) in accordance with the Czech law on metrology. Moreover, all firms dealing with theradon risk classification have to pass an intercomparison exercise in the field. The intercomparisonmeasurements enable to eliminate some more common errors, connected especially with samplecollection.
PERMEABILITY DETERMINATION
More problems are connected with the determination of the second main parameter - soil permeability.
The origin method, used in the Czech Republic, is based on the soil-grain size analysis. The permeabilityis derived from the weight percentage of fine fraction (fraction of particles smaller than 0.06 mm) in thesoil sample. The main disadvantage of the method is given by the fact that other factors influencing thepermeability (soil moisture, density, porosity) are not taken into consideration. Furthermore, the
analysis of one soil sample cannot describe a heterogeneous geological environment.
Methods of direct in situ permeability measurement based on the soil-gas withdrawal by means ofnegative pressure have been tested since 1993. The results are promising, but further investigationsare needed - great spatial variability, unknown frequency distribution etc. The standardization of themethods is also complicated, because no metrological standards are available.
As for present practice, in situ measurements or particle size analyses are completed with the descriptionof changes in vertical profile, with respect to the expected foundation depth of the building. Thequality of permeability classification strongly depends on a personal experience.
RADON AVAILABILITY
The results of radon risk classification should allow to choose an optimal building technology, thatmeans they should allow to propose optimal preventive measures. The evaluation based on threecategories of risk is semi-quantitative. As for practical applicability of radon survey results, it seemsuseful to define a single parameter (radon availability) for characterizing the radon potential of soils.
Fig. 1 - RADON AVAILABILITYpermeability (k) - Rn concentration (c)
(-logk- 10.888 )}(c-2)
O 10 20 30 40 50 60 70 80 90 100110120130140150160170180190200
c [kBq.m-3]
PORTOROŽ 95 64

SESSION II PROCEEDINGS
The radon availability (RA) can be defined in accordance with the limits that separate risk categoriesgiven in Table 1. The procedure is illustrated in Figure 1. Two broken lines characterize the limits givenin Table 1. A couple of straight lines is derived by fitting these broken lines in a semi-logarithmicscale. The radon availability is then expressed by the equation:
^ _ ( - l o g * - 10.888)(c - 2 )
where k [m2] is the in situ permeability and c [kBqm3] is the soil-gas radon concentration. Values of RAgreater than 0.075 correspond to the low risk cathegory, values of RA lower than 0.0214 correspondto the high risk of radon infiltration from the ground.
Another approach was presented by H. Surbeckin 1991 [8]. The radon availability was defined by asimple multiplication of the permeability (k [m2]) and of the soil-gas radon concentration (c [Bq-m"3]).This approach is illustrated by a couple of curves. As can be seen, there is a substantial difference, inparticular in the region of low permeability.
It is obvious that the concept of radon availability requires further investigations and discussion.
REFERENCES
1. I. Bamet etal., A Proposal ofthe Radon Risk Classification of Foundation Soils, Radon Investigation in CS, Vol. 1,Geological Survey Praha, 1990, p. 24.
2. I. Barnet, Radon Risk Classification for Building Purposes in the Czech Republic, Radon Investigation in CR, Vol. 5,Geological Survey Praha, 1994, p. 18.
3. M. Neznal et al., Reconnaissance Technique for Radon Risk Classification of Foundation Soils, Proceedings of theCongress I.R.P.A. 8, Vol. 1, Montreal, 1992, p. 1359.
4. M. Matolfn et al., Statistical Significance of Radon Determination in Soil Air, Radon Investigation in CS, Vol. 2,Geological Survey Praha, 1991, p. 20.
5. M. Neznal et al., Variability of Radon with Depth in Various Soil Profiles, Radon Investigation in CR, Vol. 5,Geological Survey Praha, 1994, p. 55.
6. M. Neznal et al., Temporal Variations of Soil Gas Radon Concentration, Radon Investigation in CS, Vol. 3,Geological Survey Praha, 1992, p. 6.
7. M. Neznal et al., Evaluation of Soil-gas Radon Concentration Data - Some Remarks, Radon Investigation in CR, Vol.5, Geological Survey Praha, 1994, p. 37.
8. Surbeck H. et al. - Radon in Switzerland, Proceedings of the Int. Symposium on Radon and Radon ReductionTechnology, Philadelfia, 1991.
PORTOROŽ 95 65

SESSION II PROCEEDINGS
XA05C0016
A SURVEY OF INDOOR RADON CONCENTRATIONSIN DWELLINGS IN SLOVENIA
M. Križman, R. Ľič, J. Skvarč, Z. Jeran
Jožef Stefan Institute, Jamova 39, Ljubljana, Slovenia
ABSTRACT
The first systematic radon survey in Slovenia was performed in winter period 1993-94. From a total of 1000randomly selected homes, radon in 892 homes was measured using CR-39 track-etch detector. A median radonconcentration of 54 Bq/m3 was found as an annual average of radon in Slovenian dwellings. Some areas inthe country - mainly in the Dinaric region - could be classified as radon prone areas. Indoor radon in theurban environment was found to be considerably lower than in rural regions. An action level of 400 Bq/m3 inexisting houses was derived from the data obtained and 200 Bq/m3 for future buildings is proposed.
INTRODUCTION
Indoor radon in some specific localities in Slovenia has been already measured, using various methods,before the national radon programme started. In the winter 1993/94 systematic long term measurementsof indoor radon began: concentrations were measured in 892 (out of 1000) randomly selected dwellings,covering the entire territory of Slovenia. Due to very different geological structure and climatic conditions,and due to various construction styles and materials, a broad range of radon values was expected. The aimof the paper is to present a summary of the results obtained (1), together with a radon map of the country.
EXPERIMENTAL
Measurements in this survey were performed using a passive radon device, with a CR-39 etched trackdetector. The latent image of tracks in the detector foil (TASL, GB) was transformed to visible tracks byan electrochemical etching technique, while track density was determined by the TRACOS automatic imageanalysis system (2).
Locations of measuring points were distributed quite uniformly over the country (Fig 2.). Compared to atotal number of buildings in Slovenia, approximately every 520th house was examined. Detectors wereregularly located in living-rooms.
RESULTS AND DISCUSSION
All results were obtained in the winter period and actually do not reflect the real annual average of radonconcentrations. Data were then modified for seasonal correction according to a common practice (3) andstatistically evaluated. A summary of statistic results is presented in Table 1 and graphically on a log-normal diagram in Fig.l.
No. ofmeas.dwell.
892
AM (Bq/m3)
86.9
1 SD (Bq/m3)
110
GM (Bq/m3)
59.6
1GSD(Bq/m3)
2.23
Median(Bq/m3)
54.0
AM = arithmetic mean, SD = standard deviation,GM = geometric mean, GSD = geometric standard deviation, Median = median value.
Table 1: Summary statistics for radon-222 in dwellings in Slovenia.
PORTOROŽ 95 66

SESSION II PROCEEDINGS
99.9999.9
~ 99g,r 90
8.
O
705030
10
1
0.10.01
s
T
t
10 100
Radon-222 concentration (Bq/m3)
1000
Fig. I : The log-normal distribution of indoor radon concentrations in Slovenia.
Maps of indoor radon concentrations in Slovenia were constructed in different formats, including those ofgrid squares (5 km x 5 km and 10 km x 10 km) and one with radon concentration isocontours (Fig.3). Amap with average annual concentrations in all administrative districts (communities) was also elaborated,showing much smaller differences between regions. A high number of measurements enables also toelaborate a radon map of Ljubljana, tha capital. Six classes of concentrations in all maps were used withfractile values derived from the actual distribution (percentiles: <10, 10-30, 30-50, 50-70, 70-90, >90 andcorresponding radon concentration classes in Bq/m3: 0^-24, 24-38, 38-54, 54-81, 81-174, 174-Cmax). Themaximum value of annual average concentration was found to be 1325 Bq/m3, and the lowest value ofabout 8 Bq/m3.
Town
LjubljanaMariborCeljeKranjVelenjeNovo mestoJeseniceTrbovljeNova GoricaMurska SobotaŠkofja LokáDomžalePtujIzolaKamnikKočevje
Average/Total
AM(Bq/m3)
61.464.664.1145
72.285.761.545.742.865.3138
60.194.232.294.4109
71.2
1SD(Bq/m3)
62.852.697.915080.461.559.131.025.138.7162
41.412713.830.484.2
78.1
GM(Bq/m3)
45.850.041.089.846.869.944.140.035.457.890.949.957.030.289.786.3
50.7
Median(Bq/m3)
44.045.739.068.949.166.630.433.639.761.186.345.442.328.695.479.3
46.3
No.ofinhabit.
276.2108.141.337.327.722.819.017.414.914.112.511.611.510.69.89.5
644.3
No.ofmeasure.
163662318181895121211
915458
396
Table 2: Radon in urban environment - in sixteen biggest towns in Slovenia (more than about 10,000inhabitants).
PORTOROŽ 95 67

SESSION II PROCEEDINGS
A detailed analysis of the data showed that radon concentrations in the urban environment (in bigger towns)are lower than in rural regions (Tab.2 and Tab.3.). The difference is significant: the median value calculatedfor all towns in the country with more than 10,000 inhabitants (a half of the measured data and one thirdof the total population) is 46.3 Bq/m3, while for the remaining dwellings the median value is 62.9 Bq/m3).From the radon map of Ljubljana town, it can also be seen that much higher values appeared in thesuburbs (1).
Fig. 2: Map of Slovenia showing the uniform distribution of sampling points.
Fig. 3: Map of indoor radon in Slovenia (percentile values in Bq/m3).
PORTOROŽ 95 68

SESSION II PROCEEDINGS
In the 50 biggest settlements in Slovenia - with the number of inhabitants greater than 4,000 - the mean of473 dwellings is 69.4 Bq/m3. In this case for rural regions (419 dwellings) the mean of 106.6 Bq/m 3exceedsthe previous value by about 50 %. These figures are not much different if we choose another urban limit(see summary statistics in Table 4).
Higher concentrations were found especially in old detached houses, usually due to the lack of concretebase slabs and poor ventilation.
Indoorenvironment
Urban env.
Rural env.
No. ofmeasur.
396
496
AM(Bq/m3)
71.2
99.2
1SD(Bq/m3)
78.1
128
GM(Bq/m3)
50.7
67.6
1GSD(Bq/m3)
2.28
2.40
Median(Bq/m3)
46.3
62.9
Table 4: Summary statistics for indoor radon-222 in the urban and rural environment.
The radon maps of Slovenia also reflect the findings of the map of natural radioactivity of the country (4):regions of the highest uranium-radium content in soil mostly coincide with enhanced levels of indoor radon.This is the case in the southern part of Slovenia (Karst, some parts of Lower and Inner Carniola) where thehighest levels of indoor radon were observed. As an example of these above average levels of radon wechose a set of smaller towns of about 5.000 inhabitants mostly located in Dinaric regions rich in uranium-radium content in soil. The mean values of radon are 2-3 times higher than those of the overall nationallevel.
Town
Sežana
Vrhnika
Logatec
Idrija
Grosuplje
Ilirska Bistr.
Average/Total
AM(Bq/m3)
671
200
167
124
119
100
199
1SD(Bq/m3)
623
266
138
65
48
27
277
GM(Bq/m3)
407
111
136
108
109
97
122
Median(Bq/m3)
604
67
101
137
138
111
115
No.ofinhabit.
4.800
6.800
6.200
6.200
5.700
4.900
34.6
No.ofmeasur.
3
5
3
4
4
5
24
Table 4: Radon in rural environment (in towns with about 5.000 inhabitants), with considerable enhancedlevels of annual average concentrations.
CONCLUSIONS
Based on a methodology of dose assessment, following the ICRP 50 publications, an average annualeffective dose equivalent due to inhalation of indoor radon and its short-lived progeny was estimated. It wasfound to be 2.0 mSv per year (5), so the total dose from natural sources approaches the value of 3 mSv peryear. This is nearly the same value as found in neighbouring countries (6).
The intervention level for indoor radon, based on statistical analysis of the results of indoor radonconcentrations and the criterion for radon prone areas according to ICRP 65 recommendations (7), wasderived. About 1 % of the measured data are higher than 400 Bq/m3 and remedial action should be takenwhen radon levels exceed this value (8). It is estimated that radon in 4000-5000 houses in Slovenia is higher
PORTOROŽ 95 69

SESSION II PROCEEDINGS
than this level. A further attention will be focused to radon-prone regions of the country. In future dwellingsradon concentrations should not be greater than 200 Bq/m3. This proposal is still under governmentaldiscussion.
ACKNOWLEDGEMENT
The authors wish to express their thanks to Mr. M.Humar for detector evaluation and to Mr. R.Šajn, M.Sc.for computer evaluation of the results and elaboration of variant maps with radon data. The work wassupported by Ministry for Health under the contract U1-BL-K3-147/93.
REFERENCES
1. Humar M, Skvarč J., Ilič R., Križman M., Jeran Z., Šajn R., Indoor radon Concentrations in Slovenia, internal reportUS DP-7164/95, Ljubljana, January 1995 (in Slovene).
2. Skvarč J., Automatic Image Analysis System TRACOS, Information MIDEM 23 (pp.2O5-21O, Ljubljana, 1993.3. Miles J.C.H., Green B.M.R., Lomas p.R. and Cliff K.D., Radon Affected Areas: Cornwall and Devon, Documents of
the NRPB, Vol.1, No.4, HMSO, London, 1990.4. Andjelov M., Results of Radiometrie and Geochemical Measurements and a Map of Natural radioactivity in Slovenia,
Geologija, Vol.36, pp.223-248, Ljubljana, 1994 (in Slovene).5. Križman M., Mljač L., Methodology of Radon Dose Estimation, internal report, US DP-7074/94, Ljubljana, September
1994 (in Slovene).6. ICRP 65, Protection Against Radon-222 at Home and at Work, ICRP Publication 65, Pergamon Press, Oxford, 1994.7. Green B.M.R., Hughes J.S., Lomas P.R., Radiation Atlas - Natural Sources of Ionising Radiation in Europe, CEC,
Luxembourg, 1991.8. Križman M., Proposal of Intervention Levels for Indoor Radon, internal report, US DP-7102/94, Ljubljana, November
1994 (in Slovene).
PORTOROŽ 95 70

SESSION II PROCEEDINGS
XA05C0017
PECULIAR RADON SPOT IN HUNGARY
G. Marxl),E. Tóťh2)
Dept. of Atomic Physics, Eötvös University, Budapest, Hungary2 ) Lauder School, Budapest, Hungary
ABSTRACT
For the public, radon in homes is the main source of exposure. Mostly rather steady radon exhalations havebeen experienced from rocks or building materials rich in uranium. But in a village of North-East Hungaryhigh indoor radon concentrations have been observed, varying in time, due to the peculiar geochemicalconditions.
Plate tectonics, driven by the heat released by the radioactivity deep in our planet, results in seismic andvolcanic activity at the collision of continental plates. Such a faultage runs though Hungary from SWtowards NE. In the Northern Parád-Recsk-Mátraderecske triangle copper deposits, CO2, CH4 and H2S richsprings, frequent mild quakes indicate this geophysical activity. The region is covered by volcanic andesite,layered on limestone and partly covered by clay, none of them having uranium concentrations above theworld average (4 ppm).
In this region, on the Northern slope of the Matra hills there is a small village of 2500 people, calledMatraderecske, where George Uchrin discovered rather high radon concentrations in farmer houses, up to10 kBq/m3, in 1992. These indoor activity concentrations were carefully studied by the Research Team ofthe Lauder School by different means (ionization chambers, active charcoal, CR39 track detectors etc) infour seasons through 3 years. After having measured the majority of buildings, the present yearly averagein living rooms at pillow level is 300 Bq/m3, even the median is 240 Bq/m3, above the British action level.Over 20% of the houses are above 400 Bq/m3, about 10% are above 600 Bq/m3, and 3% are above 800Bq/m3. The distribution has a lognormal character (Figure 1). These high values are surprizing becauseneither the basic rocks nor the clay used for building the houses are enhanced in uranium. In the interestof the health of the population, to be able to extrapolate in time and in geography, it is desirable tounderstand: where is radon coming from? After years of collecting thousands of data, as a result of detailedgeochemical-radiological research, an interesting model emerges.
18%Average: 302 Bq/m3
Median: 242 Bq/m3
Number of houses: 234
0 %
A á é,m o m oi - n - r>J
radon activity concentration (Bq/m3)
PORTOROŽ 95 71

SESSION II PROCEEDINGS
Eocenic volcanism produced andesite lava flows of 400 m thickness above the triassic limestone deposits.The ash thrown into the air was deposited as tuff, the ash thrown into the sea made tuffite. On seashore,the waves disintegrated the tuffite grains, washed the lighter components off, thus the seashore becameenriched in heavy elements, like iron, copper, uranium, even gold. This description is supported by theobservation that in the thin tuffite layer on the surface the uranium concentration is ten times higher thanbelow 3 m depth, in the solid andesite. (Uranium concentrations were measured by neutron activatedfissions at nuclear reactor. Radium concentrations were measured by radiochemistry. Radiumconcentrations have been found to be in radioactive equilibrium with the local uranium concentrations.)
Later on, clay pillows of several meters thickness were deposited upon the andesite by the oligocene sea.When the sea disappeared, under the oxygene-rich atmosphere, rainwater dissolved the uranium in formof soluble uranii compounds. On the other hand, due to geothermal heat, CO2 is emanating from the deep
1816141210
Average: 540Median: 419
1992 Autumn
1.44mm/day
Average: 371Median: 323
1993 Autumn
Illllll io o o o o o o o o o vo o o o o o o o o o oV Ô Ó Ó Ô Ô Ô Ô Ó T ľ ° -
o o o o o o o o o
2.24mm/day
18 :16 i141210
Average: 597Median: 417
1994 Autumn
Illl-llllllo o o o o o o o o o vo o o o o o o o o o o^ - o j c o " 3 - i o < o r * - a > o > o o
0.69mm/day
O O O O O O O O Vo o o o o o o o o* - < M c o ^ t n ( x > r ^ o o o
Ol Bq/m3
Fig. 2.
PORTOROŽ 95 72

SESSION II PROCEEDINGS
limestone. The plate tectonic motion has produced fractures in the andesite and through these faults, CO2
emanates to the surface. Between the clay and andesite, on the border of oxidizing and reducing layers,UO2
++ and CQ"" ions meet and insoluble uranii carbonate is deposited. This results in further uraniumenhancement in the vicinity of faults, at the edges of clay pillows. Well, the village has been build just insuch a peculiar region.
Uranium decay results in radon gas. The radon is able to diffuse into the farmer houses, which don't havefirm concrete foundations. (Due to CO2 causalities, building cellars has been discouraged by the localauthority. The last victim of CO2 died in this August.) In contrast to a previous hypothesis, there is noclear-cut correlation between CO2 and radon entrance, therefore the radon is not collected in the deep bythe outflow of CO2. The radon diffusion is especially intensive along the tuffite deposits, at the edge of theclay pillows, and - during periods of drought - through the fractures of clay.
This complex model is supported by several observations. The activity concentrations in the soil air (0.7m deep) differ dramatically, e.g. from 30 kBq/m3 upto 900 Bq/m3within a horizontal distance of 10 meters.Neighbouring houses - even neighbouring rooms within the same building - show very different radonconcentrations. The indoor radon concentrations vary strongly year by year even in the very same housesin the very same season, in anticorrelation with the amount of actual precipitations. E.g. in the autumnsof 1992, 1993, 1994 the average daily precipitations were 1.4 mm, 2.2 mm, 0.7 mm. The correspondingindoor radon concentrations were 540 Bq/m3, 370 Bq/m3, 600 Bq/m3, respectively. (Three-months averagevalues were measured in the same 56 houses. Figure 2.) Such a strong variability can be explained only bythe variations in the porosity of the clay pillows. In the 1990es the Hungarian climate shows a tendencyof gradual warming (and drying). Stephan Oberstedt's estimations of the indoor radon concentrations in ahouse of Mátraderecske over the past decades (obtained by measuring the activity of deposited long-livedradon progenies) also indicate, that the radon concentration was considerably lower in the past than it isnow.
This peculiar dynamics brings important duties with. One has to measure radon practically house by house,at the very critical spots even room by room. Radon exhalation has to be surveyed season by season, evenyear by year! The Matra hills have a fresh air, not polluted chemically, the health situation in Mátraderecskeis not bad. But there can be no doubt that the houses around 1000 Bq/m3 yearly average must be mitigatedimmediatelly, in accordance with WHO and ICRP recommendations. (Underpressurizing the basement hasbeen found to be more efficient and economic than using expensive protecting paints.) This work has beenperformed in several houses successfully, but not yet everywhere. And there is still an alarming possibilitythat the good health statistics (low cancer incidence rate) is due to the fact that the enhanced radonexhalation is a relatively recent - but still increasing - phenomenon. The interrelation of indoor radonactivity concentration and cancer aboundance is being studied carefully by us.
In Hungary there are strict limits on "artificial" doses, but there are no legal action limits yet on "natural"exposures like indoor radon activity. This means that most of the measurements, information and mitigationhave to be performed independetly from the local health authorities. In the field work, in explaining thefacts to the people and in convincing them about the importance of ventillation and mitigation, thecooperation of physics teachers and their students has played the central role.
The work has been supported by the Rad Foundation, by D&D Consulting Company, by the OTKA-T6703project, and by the OMFB.
REFERENCES
1. E.Tóth, D.Boros, L.Samuelsson, F.Deák, G.Marx, Cs.Sükösd: High Radon Activity in NE Hungary, Physica Scripta,Stockholm 30 (1989) 177.
2. E.Tóth, D.Selmeczi, G.Horváth, G.Marx: Low Cost Mitigation in Hungary, 2nd Internat'l Symp.onEnvir.Contamination in Central Europe.Budapest (1994) 770.
3. E.Tóth: Varying Radon Concentration in Mátraderecske, Harmonization of E-W Radioactive Pollutant Measurements,Budapest (1994) 106.
PORTOROŽ 95 73

SESSION II PROCEEDINGS
XA05C0018
LOCAL DEPOSITION PATTERNS OF INHALED RADON PROGENY INHUMAN BRONCHIAL AIRWAYS
T. Heistracher '>, W. Hofmann '> and I. Balásházy U )
0 Institute of Physics and Biophysics, University of Salzburg, Hellbrunner Str.34, A-5020 Salzburg, Austria2> KFKI Atomic Energy Research Institute, Health Physics Department, H-1525 Budapest 114, Hungary
INTRODUCTION
The local distribution of radon decay products deposited within bronchial bifurcations, particularly theformation of hot spots, may be more relevant for the determination of cellular doses in bronchial tissue thanthe commonly computed deposition efficiency, which is conceptually equivalent to the assumption of auniform nuclide distribution. It is well known that the initial states of lung cancer in humans preferablyoccur in upper airways close to the carinal location. In this study we use a recently developed geometricapproach of a physiologically realistic bifurcation to demonstrate the site sensitivity of radon progenydeposition for two particle sizes, which are representative of the unattached and attached fraction of radonprogeny.
METHOD
For the calculation of the local deposition sites of radon progeny in bronchial airway bifurcations we applya three step procedure: First of all, the geometry of the lung bifurcation has to be defined as a numericalmesh. This is done by applying a two-parametric iteration procedure (Heistracher and Hofmann, 1995) toget an unstructured, distorted mesh with about 50.000 node points. Secondly, the air velocity field iscomputed by applying the computational fluid dynamics (CFD) package FIRE® (AVL-List GmbH, Graz,Austria), which uses a finite volume approach to solve the Navier-Stokes and continuity equations forcompressible flows (Heistracher and Hofmann, 1993). Thirdly, the inertial and gravitational forces actingon the particles are modeled by the Basset-Boussinesq-Oseen equation (Hofmann and Balásházy, 1991;Balásházy et al., 1991), whereas the effects of Brownian motion are considered by using the Fokker-Plankequation and Maxwell's velocity distribution of the kinetic gas theory. The effect of interception is takeninto account by a prismatic intersection technique.
RESULTS
In Fig. 1 the isoline representation of the velocity field in the main plane (plane of bifurcation) forinspiration (601 min"1 minute volume; left panel) reveals practically no changes in the parabolic characterof the flow in the parent branch up to the middle of the central zone (that is the region where the twodaughter branches merge), whereas a distinct asymmetry predominates the flow in the daughter branches.Strong secondary motions (which are the velocity components normal to the prevailing flow direction)seem to maintain this situation downstream to the end of the daughter branches.
Parabolic flow dominates the daughter branch regions for expiration (60 1 min"1; right panel of Fig. 1),whereas for the central zone a rather complicated flow situation exists, which leads to the characteristicbulk-shape of the velocity profile across the upstream end of the central zone, extended toward the proximalend of the parent branch.
In this study, we present deposition results for particle sizes of 1 nm (unattached fraction of 222Rn progeny)and 0.2um (attached fraction of 222Rn progeny).
Fig. 2 shows the deposition patterns for particles with a geometric diameter of 1 nm for inspiration in anarrow bifurcation model, which has a distinct transition from the parent branch to the central zone (leftpanel), and in a physiologically realistic bifurcation (PRB) model (right panel).
PORTOROŽ 95 74

SESSION II PROCEEDINGS
Fig. 1: Isoline representation of the velocity field (20 isolines) in the main plane of bifurcation for inspiration(left panel) and expiration (right panel; for parameters used, see Table 1).
As diffusion is the dominant physical process for deposition for this particle size, little enhanced depositionshould be found in this case. Due to the very high velocity of inhalation chosen in this study, however,distinct sites of enhanced deposition can be found for inhalation: (i) on the inner sides of the daughterbranches close to the carinal ridge, and, (ii) on the upper and lower parts of the central zone. The localminimum of deposition density in the narrow bifurcation model on the outer side of the central zone canbe related to the 'dead water zone' immediately after the onset of the central zone.
For exhalation, the sites of enhanced deposition of 1 nm particles are: (iii) upper and lower side of theparent branch, and, (iv) inner and outer side of the daughter branches. The former region has a distinctlinear extension in axial direction of the parent branch, whereas the latter is less pronounced.
0,004
0,002
g 0,000N -0,002
-0,004
-
-
1 . » . 1 • 1
0,004
0,002
£ 0,000
"-O.002
•0,004
-
-
, 1 , 1 , 1 t i
ift)0,000 0,005 0,010 Q015 0,020 0,025
0,010
0,005
ľ 0,000x
-0,005
•O.O10
-
-
: i i i 1 i —
A.»i * *
• .
/5
|
v
. 1 .
-0,006 0,000 0,005 0,010 0,015 0,020 0,025
0,015
0,010 •
-0,005 0,000 0,005 0,010 0,015 0.CQ0 0,025
y [m]
-0,0150,000 0,006 0,010 0,015 0,020 0,025
y [m]
Fig. 2: Deposition pattern for 1 nm particles, which are characteristic of the unattached fraction, forinspiration in a narrow bifurcation model (left panel) and for a PRB model (right panel; forparameters used, see Table 1).
PORTOROŽ 95 75

SESSION H PROCEEDINGS
For particles with 200 nm geometric diameter the situation is completely different. Due to the well knownminimum of the deposition efficiency in this particle size range (Hofmann et al, 1990), a distinctenhancement of deposition cannot be found. The deposition efficiency is reduced by about an order ofmagnitude compared with the 1 nm particle size. The sites of enhanced deposition for inspiration areon the inner side of the daughter branches close to the carinal ridge and for expiration on the upper andlower side of the parent branch.
CONCLUSIONS
The local hot spots close to the carina in Fig. 2 emphasize the importance of considering the localdistribution of particles deposited in bronchial airway bifurcations. Not only the size of the particles andthe breathing conditions, but also the geometric boundary conditions (narrow versus PRB approach) haveeffect on deposition patterns. Due to the additional fact, that mucociliary clearance is reduced at these sitesof enhanced deposition (Hofmann et al., 1990), these findings may have an important impact on riskassessment studies. Further studies have to be conducted to obtain high resolution local deposition densitydata.
Parameter
Branching angleParent branch lengthParent branch radiusDaughter branch lengthsDaughter branch radiiCarinal ridge curvature*Branching curvature*Averaged inspiratory velocityAveraged expiratory velocityNumber of particles selectedDeposition efficiencyDeposition efficiency*
Symbol
<PL P
R P
URd
c,, cb
V eníl
Unit
degmmmm--
ms"1
ms"1
---
Value
35°7.6E-32.8E-312.7E-32.25E-3
0.13.010.215.5
10.0000.10660.0945
Table 1: Parameters of bifurcation models used for this study and deposition efficiency results. An asteriskdenotes items for the PRB model only.
ACKNOWLEDGMENTS
This work was funded by the Austrian Fonds zur Förderung der wissenschaftlichen Forschung, ProjectP10426-ÖME.
REFERENCES
1. Balásházy, I., Hofmann, W., Marionen, T.B. (1991) Inspiratory Particle Deposition in Airway Bifurcation Models,J.AerosoLSci. 22; No.l, pp 15-30, 1991.
2. Heistracher, T., and Hofmann, W. (1995) Physiologically realistic models of bronchial airway bifurcations. J. Aerosol.Sei. 26: 497-509.
3. Hofmann, W., and Balásházy, I. (1991) Particle Deposition Patterns within Airway Bifurcations - Solution of the 3DNavier-Stokes Equation. Radiation Protection Dosimetry Vol. 38, No. 1/3, pp. 57-63.
4. Hofmann, W., Martonen.T.B., and Ménache, M. G. (1990) A Dosimetric Model for Localised Radon ProgenyAccumulations at Tracheobronchial Bifurcations. Radiation Protection Dosimetry, Vol.30, No. 4, pp. 245-259.
5. T. Heistracher T., and Hofmann, W. (1993) Airflow in bronchial bifurcations: Development of secondary motions. J.Aerosol Sei., 24, Suppl. 1, pp. S89-S90.
PORTOROŽ 95 76

sEssioNn • • • • • l i l i u PROCEEDINGS
XA05C0019
CELLULAR DOSIMETRY FOR RADON PROGENY ALPHA PARTICLES INBRONCHIAL TISSUE
A. Mohamed », W. Hofmann '> and I. Balásházy U )
0 Institute of Physics and Biophysics, University of Salzburg, Hellbrunner Str.34, A-5020 Salzburg, Austria2) KFKI Atomic Energy Research Institute, Health Physics Department, H-1525 Budapest 114, Hungary
INTRODUCTION
Inhaled radon progeny are deposited in different regions of the human bronchial tree as functions of particlesize and flow rate. Following deposition and mucociliary clearance, the sensitive bronchial basal andsecretory cells are irradiated by two different alpha particle sources: (i) radon progeny in the sol and/or gelphase of the mucous layer, and (ii) radon progeny within the bronchial epithelium.
In the case of internally deposited radionuclides, direct measurement of the energy absorbed from theionizing radiation emitted by the decaying radionuclides is rarely, if ever, possible. Therefore, one must relyon dosimetric models to obtain estimates of the spatial and temporal patterns of energy deposition in tissuesand organs of the body. When the radionuclide is uniformly distributed throughout the volume of a tissueof homogeneous composition and when the size of the tissue is large compared to the range of theparticulate emissions of the radionuclide, then the dose rate within the tissue is also uniform and thecalculation of absorbed dose can proceed without complication. However, if non-uniformities in the spatialand temporal distributions of the radionuclide are coupled with heterogeneous tissue composition, then thecalculation of absorbed dose becomes complex and uncertain. Such is the case with the dosimetry ofinhaled radon and radon progeny in the respiratory tract.
There are increasing demands to obtain a definitive explanation of the role of alpha particles emitted fromradon daughters in the induction of lung cancer. Various authors have attempted to evaluate the dose to thebronchial region of the respiratory tract due to the inhalation of radon daughters (e.g. Altshuler et al , 1964;Haque, 1967; Harley and Pasternack, 1972; Hofmann, 1982; Hofmann et al.,1990; James, 1987; Al-AffanandHaque, 1989).
COMPUTATIONAL METHOD
To evaluate the dose received by the respective populations of secretory or basal target cells from eachdecay of 218Po or214 Po, it is necessary to represent the positions of the source and the targets by ageometrical model. The geometry of each bronchial or bronchiolar airway is approximated by a cylindricaltube. In the model, the inner surface of the tube is considered to be lined by a thin layer, or sheath, of fluidrepresenting mucous ("gel phase")- This inner sheath of mucous is separated from the underlyingepithelium by a band of hair-like cilia, which are responsible for clearing the mucous in the direction ofthe trachea. The cilia are bathed in an aqueous fluid that forms a second, thin layer of shielding material("sol phase"). Both fluid layers have the protective effect of absorbing some of the energy from radonprogeny alpha particles.
Both secretory and basal cells in the bronchial epithelium and, to a lesser extent, secretory cells in thebronchioles were identified as the principal target cells for lung cancer induction. The location andvolumetric densities of these cells, provided by Mercer et al. (1991), were used in the present work toevaluate cell-specific doses.
An analytical method has been developed to compute the local energy deposition of 218Po and 214Po alphaparticles in 1 urn spheres located at different depths in bronchial epithelium. In order to reach the target,alpha particles travel either through tissue alone ("near wall dose") or through air and tissue ("far walldose").
A computer program has been written, which, firstly, computes the dose within the epithelium at differentdepths (that is at different layers supposing that all activity is homogeneously distributed along the surface
PORTOROŽ 95 77

SESSION II PROCEEDINGS
of the epithelium or of the mucous layer) and, secondly, it calculates the dose in these layers by supposingthat the activity is distributed in these layers. The distribution of the activity among these layers ischaracterized by weighting factors. For the computation of doses from radionuclides within the bronchialepithelium, two assumptions have been made: (i) nuclides are either uniformly distributed ("uniform case"),or (ii) they decrease linearly with depth in tissue ("linear case"). Then a "realistic distribution" was definedas 70% of activity is in the mucous layer and 30% of it is within the epithelium.
RESULTS
Figure 1 shows the comparison of near wall, far wall, and total (i.e., near + far wall) dose for the 2I4Podistribution in mucous and epithelium. It can be seen that the contribution of the near wall is higher thanthat of the far wall as fewer alpha particles will reach the target from the far wall.
~ 300
10 20 30
Depth (urn)
40
Fig. 1: Comparison of near wall, far wall and total dose in airway generation 4 for a realistic distribution of214Po nuclides in mucous and epithelium.
600
1-gel phase2-sol phase3-top of epithelium4-linear5-uniform
10 30Depth (fjrn)
Fig. 2: Total (near + far wall) dose in airway generation 4 for 218Po nuclides: comparison of surfacedistribution (mucous, cilia, and boundary) with volume distribution (linear, uniform).
PORTOROŽ 95 78
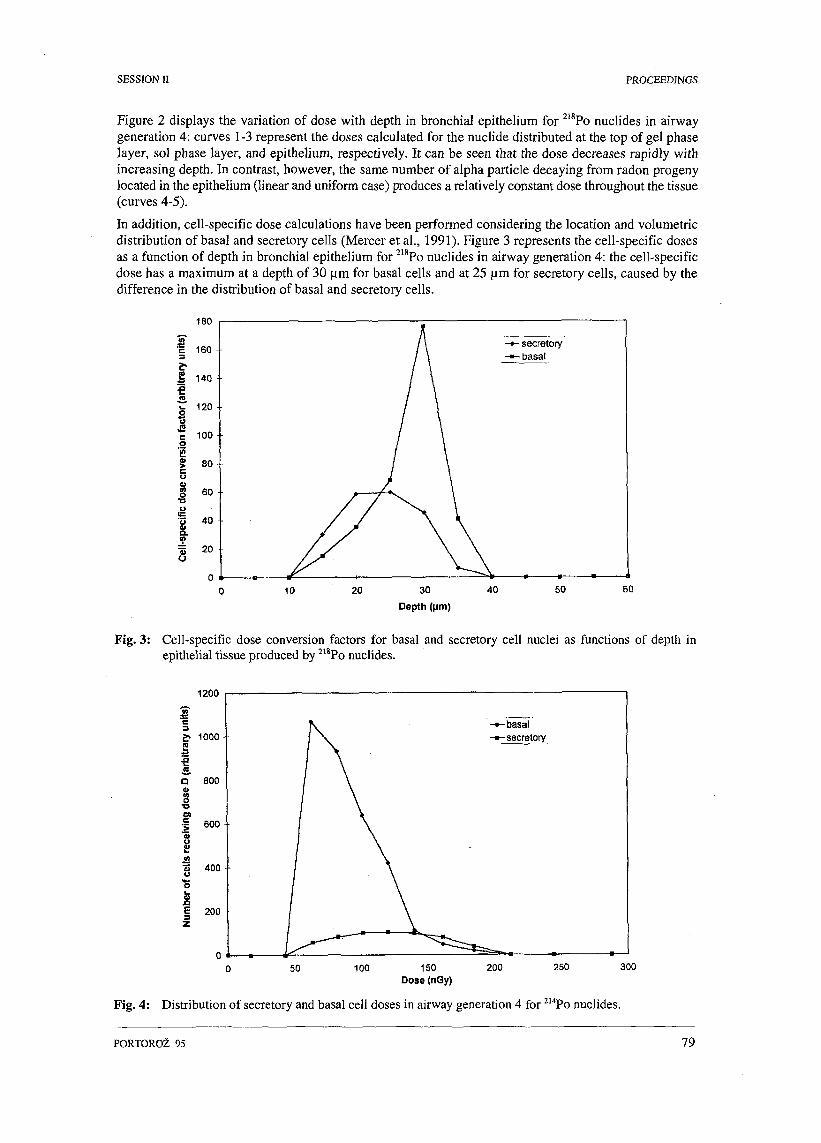
SESSION II PROCEEDINGS
Figure 2 displays the variation of dose with depth in bronchial epithelium for 2i8Po nuclides in airwaygeneration 4: curves 1-3 represent the doses calculated for the nuclide distributed at the top of gel phaselayer, sol phase layer, and epithelium, respectively. It can be seen that the dose decreases rapidly withincreasing depth. In contrast, however, the same number of alpha particle decaying from radon progenylocated in the epithelium (linear and uniform case) produces a relatively constant dose throughout the tissue(curves 4-5).
In addition, cell-specific dose calculations have been performed considering the location and volumetricdistribution of basal and secretory cells (Mercer et al., 1991). Figure 3 represents the cell-specific dosesas a function of depth in bronchial epithelium for 218Po nuclides in airway generation 4: the cell-specificdose has a maximum at a depth of 30 jam for basal cells and at 25 urn for secretory cells, caused by thedifference in the distribution of basal and secretory cells.
180
c 1603
2 140
«r 120
c 100-
I>o
S.«i»
60
40
-•- secretory-"- basal
30
Depth (Mm)
50 60
Fig. 3: Cell-specific dose conversion factors for basal and secretory cell nuclei as functions of depth inepithelial tissue produced by 218Po nuclides.
1200
100 150Dose (nGy)
200 250 300
Fig. 4: Distribution of secretory and basal cell doses in airway generation 4 for 2I4Po nuclides.
PORTOROŽ 95 79

SESSION II PROCEEDINGS
Figure 4 shows the distribution of doses in secretory and basal cells for 214Po alpha particles in airwaygeneration 4. Considering their relative frequencies at a given depth in tissue, the mean dose is 120 nGyfor secretory cells and 64 nGy for basal cells.
ACKNOWLEDGMENTS
This research was supported by the Jubiläumsfonds of the Austrian Nationalbank, Project No. 4624 andby the Austrian-Egyptian Channel System (A.M.).
REFERENCES
1. Al-Affan, I. A. M. and Haque, A. K. M. M. Phys. Med. Biol. 34, 97-105 (1989).2. Altshuler, B., Nelson, N. and Kuschner, M. Health Phys. 10,1137-1162 (1964).3. Haque, A. K. M. M. Br. J. Appl. Phys. 18, 657-662 (1967).4. Harley, N. H. and Pasternack, B. S. Health Phys. 23, 771-782 (1972).5. Hofmann, W. Health Phys. 43, 31 -44 (1982).6. Hofmann, W., Martonen, T. B. and Ménache, M. G. Radiat. Prot. Dosim. 30, 245-259 (1990).7. James, A. Symposium on Occurrence, Properties and Health Effects (ed. P. Hopke), 400-418 (1987).8. Mercer, R.R., Rüssel, M.L. and Crapo, J.D. Health Phys. 61, 117-130 (1991).
PORTOROŽ 95 80

SESSION II PROCEEDINGS
XA05C0020
LUNG CANCER RISK AMONG CZECH MINERS EXPOSED TO RADON
L. Tomášek, V. Plaček
National Radiation Protection Institute, Šrobárova 48, Prague, Czech Republic
INTRODUCTION
Studies of underground miners of uranium and other substances are at present the principal source ofinformation on the effects of exposure to radon and its progeny. One of the largest such studies is that ofuranium miners in West Bohemia (Jáchymov). This study, sometimes referred to as the S cohort, was setup in 1970 by the late Josef Sevc. About ten years later, two further cohorts were delineated by him. Oneof uranium miners (N) who worked under improved conditions mostly in the Pribram mines, and the secondone of burnt clay miners (L) located in the Rakovník district. Brief characteristics of the cohorts are givenbelow (Tab. 1).
Study
SLN
Since
195219601969
Size
4320915
5628
Cases
7084230
O/E
5.061.731.57
Died
56%32%
6 %
WLM
22824
6
Dur
8146
Table 1: Czech miners studies by 1990.
METHODS
The study population of the S cohort was established by means of a search of the employment records atthe Jáchymov and Horni Slavkov mines. The criteria for inclusion were: start of underground work in theperiod 1948-59, duration at least four years, and available details of miners' employment. A total of 4320men satisfied these criteria. The cohort comprised workers from all over the country, and after the closureof the mines, many of the men moved away from the locality. Therefore the national rather than localmortality data for calculation of expected numbers were used.
During the decade up to 1990, follow-up of the cohort mainly relied on the national population registry atthe Ministry of the Interior. In order to improve the follow-up, a series of additional checks were conducted:in the files of the Czech and Slovak Pensions Offices, by local enquiries, and by direct correspondence(Tomasek et al, 1994b). These additional efforts resulted in an increase of more than 10% in the numbersof men known to have died or emigrated.
An exceptional feature of the S study is the large number of measurements of radon concentrations madein each mine-shaft (mean number of measurements per year and shaft was 223 in the period 1949-60). Eachman's annual exposures to radon progeny in terms of working levels were estimated combiningmeasurement data with the men's employment details. Recent data revisions revealed that for some of themen (about 10%), exposures at other Czech mines had not previously been taken into account (Tomaseket al, 1994a). In the most recent revision of exposures, appropriate adjustments were made for individualjob categories (miners, other manual professions, supervisors, and exploratory workers) using informationon exposure levels in different work places (stope, drift, cross-cut, and raise).
Generally, person-years at risk were calculated for each man, starting at four years after enteringunderground employment at the mines and ending at the earliest of date of death, emigration, 85th birthday,loss to follow-up, or 1 January 1991. The person-years were cross-classified by attained age, cumulatedexposure in windows formed by time-since exposure, exposure-rate, and age-at-exposure factors.
PORTOROŽ 95 81

SESSION II PROCEEDINGS
Poisson regression models for excess relative risk (ERR) were fitted by maximum likelihood method. It wasassumed that the number of deaths observed in each cell had mean in the form
E c ( 1 + ERR(w,x)),
where E is the number expected from national rates, ERR is excess relative risk, w and x denote exposurehistory and modifying variable, and c is an intercept term that allows the mortality rate for 'unexposed1
cohort to differ from that in the general population.
RESULTS AND DISCUSSION
The increased mortality (O/E=1.58) in the cohort is largely affected by mortality from lung cancer.Nevertheless the mortality from violence and accidents is also increased, namely in the first part offollow-up, whereas the mortality from other causes increases after 20 years since first exposure (Tab.2).
Timesince 1st
exposure4-4.95-9.910-14.915-19.920 - 24.925 - 29.930 - 34.935-
Lungcancer
2.565.54 *9.28 *8.34 *6.06 *4.49 *3.36 *2.72 *
Violentdeaths
3.54 *1.41 *1.58 *1.87 *1.181.391.391.13
Othercauses
0.260.861.101.091.34 *1.17 *1.17 *1.23 *
The asterisk represents one-sided test at 5% significance.
Table 2: S cohort - time and cause specific mortality.
The same time pattern is observed in some groups of diseases associated with tobacco consumption(Tab.3). When the S cohort was identified in 1970, information on the smoking habits in the cohorts couldnot be recorded. The proportion of smokers among miners is 76% (L&N studies), a survey (conducted inthe 1970s) estimated 66% smokers in general Czech population.
CAUSE
Respiratory diseases
Circulatory diseases
Cancers excl lung
Time since 1st exposure0 - 9 10-19 20-29 30 -
0.35 1.07 1.42* 1.27*
0.86 1.10 1.24* 1.12*
0.81 0.93 1.15 1.28*
Table 3: Time and cause specific mortality (all cohorts).
As the increase in mortality from cancers other than lung cancer is not likely to be associated with radonexposure (Darby et al, 1995), the data on smoking in cohorts N and L together with the above mortalitypatterns (Tab.3) indicate that the smoking in the S cohort might be different from the general population.
Most of the miners' studies demonstrated the linear relationship between relative risk and cumulativeexposure (Lubin et al, 1994). In a simple model in which the excess relative risk increases linearly withtotal 5 year lagged cumulative exposure, two parameters are estimated: the coefficient of ERR/WLM andintercept. The overall ERR/WLM estimate 0.013 for the most recent data is higher than the comparableestimates previously reported for the study: 0.0034 - (Lubin et al, 1994) and 0.0064 (Tomasek et al, 1994).The corresponding intercept is 2.43 (CI:1.73-3.41).
Factors known to influence the excess relative risk per unit exposure were analyzed. Similarly as in theBEIRIV report (1988), the strong influence of time since exposure was found, for instance the effect ofmore distant exposures (25-34 years previously) was estimated to have about 7% of the exposures received
PORTORO2 95 82

SESSION II PROCEEDINGS
5-14 years previously. In addition, the effect of exposure rate was analyzed. Originally, in three categories(0-1.9,2-3.9,4+), but as there were no differences between the first two categories in the analyses (Tomasek,1994a), these were combined. Therefore, cumulative lagged exposures in the three TSE windows were splitinto two windows according to their radon daughter concentrations (0-3.9, 4+). It was found that theERRAVLM estimate corresponding to higher exposure rates was significantly lower.
The effect of age was found in almost all miner studies (Lubin, 1994). In the present analyses, the effectwas investigated in the same way as the other exposure modifiers, that is by the methods of windows.Therefore, further windows defined by age-at-exposure were constructed. The estimates for the model withall the exposure modifiers are given in Tab.4 . The confidence interval for the intercept in the last modelis narrower in comparison to other models. Further investigations of the intercept showed that when agefactors were present in the model as continuous variables, the age-dependent intercept remained nearlyconstant (close to 1.5) suggesting that in the absence of exposure to radon, the estimated mortality fromlung cancer in the cohort would be about 1.5 times higher than in the general population.
InterceptERRAVLMTSE:
5-1415-2425-34
Exp. Rate0-3.94-
Age-at-exp-29
30-3940-
Estimate
1.460.124
10.260.07
10.47
10.600.28
95 % CI
1.00 -0.077 -
0.11 -0.02 -
0.21 -
0.36 -0.18 -
2.140.199
0.410.13
0.72
0.850.38
Chi-Sq
69.53
8.69
52.07
DF
2
1
2
Table 4: Effect of TSE, exposure rate, and age.
If this estimated baseline lung cancer mortality in the study were true, the ERRAVLM coefficient relatedto simple cumulative exposure would be about 0.015 (95%CI: 0.0135-0.0165).
ACKNOWLEDGMENTS
Research supported by the Ministry of Health Internal Grant Agency - Reg. No. 18591-3.
REFERENCES
1. National Research Council, Committee on Biological Effects of Ionizing Radiation. Health risk of radon and otherinternally deposited alpha-emitters (BEIRIV). National Academy Press, Washington DC, 1988.
2. Sevc J, Kunz E, Tomášek L, Plaček V, Horaček J. Cancer in man after exposure to Rn daughters. Health Phys 54:27-46(1988).
3. Tomášek L, Darby SC, Fearn T, Swerdlow AJ, Plaček V, Kunz E. Pattern of lung cancer mortality among uraniumminers in West Bohemia with varying rates of exposure to radon and its progeny. Radiat Res 137:251-261 (1994a).
4. Tomášek L, Swerdlow AJ, Darby SC, Plaček V, Kunz E. Mortality in uranium miners in West Bohemia: a long termcohort study. Occup Environ Med 51:308-315 (1994b).
5. Lubin JH, Boice JD, Hornung RW, Edling C, Howe GR, Kunz E, Kusiak RA, Morrison HI, Radford EP, Samet JM,Tirmarche M, Woodward A, Xiang TS, Pierce DA. Radon and lung cancer risk: a joint analysis of 11 undergroundminers studies. Natl Inst Hlth, NIH Publ 94-3644, (1994).
6. Darby SC, Whitley E, Howe GR, Hutchings SJ, Kusiak RA, Lubin JH, Morrison HI, Tirmarche M, Tomasek L, RadfordEP, Roscoe RJ, Samet JM, Yao SX. Radon and cancers other than lung cancer in underground miners: a collaborativeanalysis of 11 studies. JNCI, Vol 87:378-384 (1995).
PORTOROŽ 95 83

SESSI0N" llllillllllllillllllilllllílllll ^ C E E D . N G SXA05C0021
ASSESSMENT OF RADON-DAUGHTER DEPOSITIONIN THE RESPIRATORY TRACT
S. Oberstedt, H. Vanmarcke
Studiecentrum voor Kernenergie SCK • CEN, Boeretang 200, B - 2400 Mol, Belgium
ABSTRACT
Since some decades it is known, that most of the radiation dose to the lung is due to the inhalation of theshort-lived decay products of 222Rn. Their deposition in the respiratory tract strongly depends on theattachment rate to aerosol-particles present in the indoor air and their plate-out rate to the surfaces, insteadof measuring the activity size distribution of the airborne decay products, knowledge on the respiratory tractretention has been incorporated in the design of a measurement system, called bronchial dosemeter, to assessthe lung dose directly. The simulation of the deposition characteristics of the short-lived radon daughters inthe nasal cavity and the bronchial tree is based on the comparison of the model of the respiratory tract withresults from screen penetration theory. A bronchial dosemeter consisting of three sampling heads has beenbuilt and calibrated. Additionally, an outline of future activities will be given.
INTRODUCTION
During the last decade the radon issue has become one of the major problems in radiation protection.Already 40 years ago it was found, that the lung dose in uranium miners is not due to radon (222Rn) but tothe inhalation of its short-lived decay products 2l8Po, 2I4Pb and214Bi (214Po) [1,2,3]. The airborne decayproducts of radon deposit in the respiratory tract leading to a radiation dose to the lung. In the indoorenvironment this deposition strongly depends on the attachment rate of the freshly formed decay productsto aerosol-particles and on the plate-out rate to indoor surfaces. Since it is known that the unattachedfraction of the decay products is a major contributor to the radiation dose, several attempts have been madeto measure the activity size distribution of the unattached fraction. These measurements on the basis ofwire-screen methods were only partially successful, because there are intrinsic problems to separate theunattached fraction completely from the rest of the activity size distribution [4].
Therefore, it has been suggested to simulate the deposition characteristics of the short-lived radon daughtersin the nasal and bronchial regions and measure the deposited activity directly. According to the theoreticalconcept of such a measurement system [5] a so-called bronchial dosemeter has been built at the BelgianNuclear Research Center, SCK'CEN. In the following the design and the efficiency determination of thisbronchial dosemeter will be reported.
CONCEPT OF THE BRONCHIAL DOSEMETER AND EFFICIENCY DETERMINATION
Basically, it is assumed that the deposition characteristics of the nasal cavity and the bronchial tree maybe simulated by different numbers of screens [6,7]. Their respective sizes and numbers are determined bycomparing models of the respiratory tract with results from the screen penetration theory. For an averagenasal inspiration flow rate of 30 1/min, a 400 mesh screen operated at a face velocity of about 12 cm/sprovides a rather good approximation to the nasal absorption characteristics [8]. Adding up four suchscreens provides a good approximation to the bronchial tree [9,10].
The bronchial dosemeter consists basically of two different units. The first unit is the sampling section,which is used to collect the airborne radon decay products. This part of the dosemeter consists of threedifferent sampling channels:
1. The sampling head of the first channel consists of an open-faced polycarbonate membrane filterwith a pore size of 0.4 urn, which collects the total airborne activity.
2. In the second head the filter is covered by a 400 mesh screen in order to collect the activitypenetrating the nasal cavity. The activity deposited in the nasal cavity is then given by thedifference between the activity collected on filter (1) and filter (2).
PORTOROŽ 95 84

SESSION II PROCEEDINGS
3. The filter of the third sampling head is covered by five 400 mesh screens to collect the differencebetween the airborne activity and what deposits in the nasal cavity plus bronchial tree. From thedifference between the activity collected on filters (2) and (3) the activity absorbed in the bronchialtree is obtained.
Open facedfilter
One screencovering the filter
Five screenscovering the filter
Alpha chamber
partial vacuum
Fig. 1: Sampling section of the bronchial dosemeter. The open diameter of one sampling channel is 4 cm. Theflow rate at standard atmospheric conditions is 9.1 1/min leading to a face velocity of 12 cm/s.
The sampling section of the bronchial dosemeter is shown in Fig.l. For further details it is referred toref. [11].
The second unit of the bronchial dosemeter is the alpha-spectrometer section which consists of threeseparate a-detectors. After sampling the filters remain mounted on their sampling heads in order to keepthe counting geometry reproducible. The sampling heads are put into the vacuum chambers, where the filteractivities due to the a-decay of 218Po and214 Po are measured. From the peak areas obtained in twosubsequent measurements the decay product concentrations of 2I8Po, 214Pb, and 2l4Bi (2l4Po) collected onthe filters can be calculated.
0.18
0.16
0.14
0.12
€a.2€a,3
= 0.1492
{
= 0.1620
= 0.1517
±0.0016
-
{ -±0.0017
±0.0010
2 3 4run id#
Fig. 2: Efficiency of sampling channel (1) obtained at a distance of 0.7 cm from the detector. The full lineindicates the weighted average of the data.
PORTOROŽ 95 85

SESSION II PROCEEDINGS
The efficiency of the bronchial dosemeter is determined by the efficiency of one sampling channel and theintercomparison of all three channels. The efficiency of one sampling channel is determined by measuringthe a-activity from 218Po and 214Po and the y-activity following the ß-decay of 214Bi.
During the efficiency determination the sampling section of the bronchial dosemeter was placed in achamber with a volume of about 6 m3. The radon activity concentration c^ varied between 26 kBq/rrfand 10 kBq/m3. The sampling time was 10 min. After sampling the filters were transferred to the vacuumchambers within 1 min. The cc-activity of all sampling heads were measured for 5 min and then for 15 min.Afterwards, the sampling head of channel (1) was transferred to a germanium detector. The y-activity offilter (1) and the cc-activities of filter (2) and (3) were measured for 30 min. From the area under the y-peakat Ey = 609.3 keV, the photon branching ratio and the y-detection efficiency the expected number ofcc-particles Na
e from 214Po is determined. The detection efficiency for cc-particles ea of this samplingchannel is then the ratio between the number of cc-particles extrapolated from the a-measurements,and N„ .
pling
The efficiency of sampling channel (1), e a l , obtained from six measurements is indicated in Fig. 2 togetherwith the respective data. From these data the efficiency of the other two sampling channels, ea2 and e a 3,were determined by intercomparing the equilibrium equivalent radon concentrations (EEC). The results arealso given in Fig. 2. Their relative uncertainty on the mean value is less than 1.1 % at one standarddeviation.
0.7
0.6
0.5
0.4
0.3
0.2 -
0.11 2 3 4 5
cRn (kBq/m3)
Fig. 3: Equilibrium factor F as a function of the radon concentration cRn. The average value for F - 0.39 witha relative standard deviation less than 11%.
•
I
t
1 . . . . 1 . .
F =
t
0.39 ±0.04
-
• •
FIRST EXPERIMENTAL EXPERIENCE
Under laboratory conditions test measurements with the complete system were performed. In the beginningthe radon concentration was about 4.5 kBq/m3 and drops to about 1.5 kBq/m3 at the end of the test period.The sampling period was 5, 6 or 7 min. The filter activities were measured during two periods for 10 minand 35 min, respectively.
From the open-faced filter of sampling channel (1) the EEC in air was obtained. Division of an EEC-valueby its corresponding radon activity concentration cRn gives the equilibrium factor F, which gives acharacterization of the aerosol-concentration present (see e.g. ref. [12]). In Fig. 3 F is shown as a functionof cRn. The average equilibrium factor throughout the test measurements was 0.39 with a relativeuncertainty less than 11 % at one standard deviation, which indicates rather stable atmospheric conditionsduring the measurement campaign.
PORTOROŽ 95 86

SESSION II PROCEEDINGS
The obtained fractional deposition of the short-lived decay products in the nasal cavity (fn) as well as in thebronchial tree (fb) is shown as a function of F in Fig, 4 for each nuclei separately. Although the data showsome fluctuations^! is still_valid to define average fractional depositions for the different decay products.Average values fn and fb taken from the data of ten measurements are summarized in Tab. 1.
1050
- 5
-10
' 2 1 8Po
Í! flP 1 I 1
1
—4
0.3 0.35 0.4 0.45 0.5
F
fc?
- 4
0.3 0.35 0.4 0.45 0.5
F
Fig. 4: Fractional deposition of the short-lived radon decay products 2l8Po, 2l4Pb, 214Bi and the equivalent radonconcentration (EEC) as a function of the equilibrium factor F. The left part shows the fraction of decayproducts deposited in the nasal cavity (fn), and the right part shows the fractional deposition in thebronchial tree (fb).
Avarage fractional deposition
Nasal cavity fn
Bronchial tree fb
2.8po
io-2
1.3 ±1.3
4.4 ±1.0
214pb
io-2
-0.3 ± 2.2
1.1 ±1.6
2,4Bi
io-2
0.5 ±1.9
2.5 ± 2.0
EECio-2
0.4 ± 0.7
1.9 ±0.5
Table 1: Average fractional Reposition of the short-lived radon decay products in the nasal cavity fn andthe bronchial tree fb . The values are averaged over nine measurements with equilibrium factorsF = 0.39 ± 0.04.
PORTOROŽ 95 87

SESSION II PROCEEDINGS
CONCLUSION
According to the conceptual design of a multiple wire screen sampler in ref. [5] a bronchial dosemeter hasbeen built. First test measurements were performed under laboratory conditions. It turned out, that thebronchial dosemeter is a suitable facility to individually assess deposition characteristics of the differentshort-lived radon decay products in the nasal cavity as well as in the bronchial tree. However, theinterpretation of the data strongly depends on the underlying model of the respiratory tract, whichinfluences the choice of the mesh size as well as the number of screens used for the sampling heads. Forinstance, according to recent model calculations [14] the nasal absorption might be better simulated by ascreen with a 100 mesh grid.
REFERENCES
1. Shapiro J., Univ. of Rochester Rep. UR-298 (1954).2. Aurand P., W. Jacobi and A. Schraub, Sonderband für Strahlentherapie 35 (1955) 237.3. Bale W. F. and J. V. Shapiro, Proceedings of the First International Conference on Peaceful Use of Atomic Energy,
Geneva Vol. 13 (1955), 233, United Nations (1956).4. Ramamurthi, M. and P. H. Hopke, Health Physics 56 (1989) 189.5. Hopke P. H., M. Ramamurthi and E. O. Knudson, Health Physics 58 (1990) 291.6. Cheng Y. S. and H. C Yeh, J. Aerosol Sei. 11 (1980) 313.7. Cheng Y. S., J. A. Keating and G. M. Kanapilly, J. Aerosol Sei. 11 (1980) 549.8. Cheng Y. S., Y. Yamamda, H. C Yeh and D. L. Swift, J. Aerosol Sei. 19 (1988) 741.9. James A. C , Radon and its Decay Products (edited by P. K. Hopke) ACS Symposium Series 331 (1987), 400.10. James A. C , Radon and its Decay Products in Indoor Air (edited by W. W. Nazaroff and A. V. Nero) Wiley-Intersience
(1988) 259.11. Oberstedt S. and H. Vanmarcke, Rad. Prot. Dosim. 59 (1995) 285.12. Porstendörfer J., Fifth International Symposium on the Natural Radiation Environment (tutorial sessions), edited by
the Commission of the European Communities, EUR 14411 EN (1993) 69.13. Wilkening M., Studies in Enviromental Science 40 (Radon in the Environment), Elsevier (1990) 126.14. George A. C. and E. O. Knutson, Radiat. Prot. Dosim. 45 (1992) 689.
PORTOROŽ 95

SESSION II PROCEEDINGS
XA05C0022
PRELIMINARY STUDY ON THE RATE OF BRONCHO-PULMONARYCANCER IN A ROMANIAN DEPARTMENT (BIHOR) FOR THE
ESTIMATION OF RADON RISK EXPOSURE
T.Vaida '>, C.Cosma2), V.Pacurar3), Fl.Maghiar !), D.Ristoiu 2\ S. Ramboiu 2\ A.Poffijn4)
" University of Oradea, Medicine Faculty, 3700 Oradea, Romania2) University " Babes - Bolyai " Dept. of Physics, 3400 Cluj, Romania
3) Oncologic Center, Oradea, 3700 Oradea, Romania4) University of Gent, 9000 Gent, Belgium
ABSTRACT
The purpose of this paper is a retrospective estimation on the rate of lung cancer at the population in theBihor district (Romania) in two years (1993 -1994) and the potential bronchopulmonary cancer risk fromindoor radon. In this time were found 473 cases with primary bronchopulmonary cancer: 400 men (84.5%)and 73 women (15.4%). Most cases ( 64.4%) were from rural environment while the other 35.5% were fromurban environment. Preliminary study on the potential lung cancer risk from indoor radon encompassed 40cases and 66 non-cancer controls in the period march -July 1995.
INTRODUCTION
There is an intensive evidence that considers indoor radon to be one of the most serious environmentalcarcinogens to which the public is exposed. A number of case-control studies of residential exposure toradon, have been conducted to demonstration that increased exposure to radon in homes is associated withelevated lung cancer mortality ( 1.2.3).
In Romania there are not sufficient epidemiologie data from studies of residential radon exposure. In ourstudy we have selected for the Common European project a region in which the range of indoor exposurelevels is quite large ( 75 - 646 Bq/mc). But an important fraction of the population is living in high radonhouses (>325 Bq/mc). Our study on the potential lung cancer risk from indoor radon including onlyhospitalized cases with lung cancer and control resident for at least 25 years at their present address.Patients fulfilling this criterium were interviewed during their hospital stay by a co -worker about other lungcancer determinants as occupational exposure, active and passive smoking and psycho - social factors.Thecancer register constitutes the basic material for epidemiological research.
CASES
!
No.
cas
250
200-
150
10O-
50-
192
JEMÜÜH
ls§fl
JlfW1993(3«)
208
i A H
1 ^SP1994(237)
• Women
• Men
In two years were found 473 caseswith primary bronchopulmonarycancer : 400 men (84.5%) and 73women (15.4%). In 1993 werediagnosticated 236 new cases (44women and 192 men) while in1994 were 237 cases (29 womenand208 men)-Fig. 1.
Fig. 1: Number of the cases takenin study in two years.
PORTOROŽ 95 89

SESSION II PROCEEDINGS
For the epidemiological study were selected up to the present 30 cases and 50 cases - control, after theywere interviewed during their hospital stay. Shortly after the questionning an alpha track-etch detector wasinstalled in the living or bedroom of the patients and will be left in the place for a period of six months.
RESULTS
Preliminary measurements of indoor radon made in 110 houses prove median concentration of indoor radonwas between 75 - 646 Bq/mc, in many places high indoor concentrations of radon have been found(between 325 - 646 Bq/mc) - table I.
No.
1.
2.
3.
4.
5.
Place
Oradea
Nufarul (Oradea)
Nucet
Baita sat
Baita plai
Number ofinhabitants
255,450
63,400
11,200
827
180
No.ofhouses
35
5
30
20
20
Radonconcentrations
(Bq. me)
115/124*
120
75
325
646
* arithmetic mean in winter period (integrating measurements) for 5 dwellings
Table I: Indoor radon concetrations in some Bihor places
Year
1993
1994
TOTAL
TOTAL
No. cases
236
237
473
U / R
URBAN
<45
8
9
17
10.1%
45-64
42
56
98
58.3%
169
35.5%
>64
31
22
53
31.5%
RURAL
<45
9
7
16
5.2%
45-64
95
63
158
51.8%
305
64.4%
>64
51
80
131
42.9%
Table D: Cases with lung cancer in 1993 and 1994 in Bihor department.
Following the age of the illpersons with primary broncho-pulmonary cancer (table II ), wehave found 168 cases ( 35.5% ) inurban and 305 cases ( 64.4% ) inrural environment ( Fig.2 and 3 )measurements are instantaneousby Kusnets methods usingscintilation flasks but for a correctestimation of indoor radonexposure will be mostmeasurements using integratingdetectors. In urban environmentthe most cases were at 45 - 64years, while in rural number of illswas increasing also over 64 years.
Fig. 2: The distribution of the lung cancer cases in respect of diseased age in urban and rural area.
PORTOROŽ 95 90

SESSION II PROCEEDINGS
Fig. 3: The distribution of the lung cancer cases in respect of diseased age in urban and rural area.
Our study like that the other evidence ( 2, 4 ) have demostrated geographical difference in lung cancerincidence, probable due to differences in the prevalence of causal factors as smoking, environmentalpollution, occupational exposure etc. The results of some studies ( 1,4) indicate a significant increase inrisk for the group of the exposed ( > 100 Bq / me ) current smokers and non - smokers compared to the non- exposed reference groups while for ex - smokers, no effect was observed.
Another studies (5,6,7 ) have also been reposted from other countries an increase rate of the lung cancerat women, but our data proved a small number of cases with bronchopulmonary cancer in comparison withmen.
The major conclusion from this preliminary study is the necessity to continue and to extend this researchconcerning health effects of indoor exposure to radon.
REFERENCES
1. Poffijn A., On the role of radon in the etiology of lung cancer - Annales de ľ Association beige de Radioprotection,1990, 15(3): 441-447.
2. Poffijn A., Tirmache M., Kreienbrook L., Kayser P., Darby., Radon and lung cancer: Protocol and procedures of themulticentre studies in the Ardemes - Eifel region, Brittany and the massif central region. Radiation ProtectionDosimetry, 1992,45, (1,4): 651-656.
3. SCHMIDT A., Epa's approach to radon risk assessment - Journal of radioanalytical and nuclear Chemistry, 1992,161(1): 283-291.
4. I. van Meerbeek, Joos G. - The epidemiology of lung cancer. Annales de ľ Association beige de Radioprotection, 1990,15 (3): 437-440.
5. Axelson O., Andersson S. K., Desai G. et al. - A case - referent study on lung cancer, indoor radon and active andpassive smoking. Scand.J. Work Environ health, 1998,14:286- 292.
6. Axelson O.- Management of the radon problem in Sweden. Annal. Assoc. beige de Radioprot., 1990,15 (3):453-468.
PORTOROŽ 95 91

SESSIONI1 III Mil; I llľl f ill I III MI HM ľ II P R 0 ™ G S
XA05C0023
RADON EXPOSURES IN CAVES IN HUNGARY
I. Csige '>, I. Hunyadi °, J. Hakl '>, G. Géczy2), A. Várhegyi3), L. Lénárt4) and I. Töröcsik5)
" Institute of Nucl. Research of the Hungarian Academy of Sciences, H-4001 Debrecen, POB 51, Hungary2> Eötvös Lorant University Department of Physical Geography, H-1083 Budapest, Ludovika tér 2, Hungary
3) Mecsekurán Ore Mining Ltd., H-7614 Pecs, POB. 65, Hungary4) University of Miskolc, Department of Hydrogeology and Engineering Geology, H-3515Miskolc, Hungary
5) University of Medical School, Institute of Forensic Medicine, H-4012 Debrecen, POB 25, Hungary
ABSTRACT
We have measured radon exposures and estimated effective doses from inhaled radon and its decay products(according to the proposals of the ICRP65) for different groups visiting Hungarian karstic caves. We havefound highest doses are received by staff members of therapeutic treatments, tour guides in some caves andby the most active cavers.
INTRODUCTION
People visit caves for different purposes, however, they all do it in hope of gaining some sort of benefit ofit. At the same time they are taking also risks, one of them (probably not the highest) is due to inhalationof short-lived radon daughter particles. Higher doses of inhaled radon daughters are known to be causativefactor in inducing fatal lung cancer in miners (ICRP-47). Smaller doses are still under extensiveinvestigation, there is, however, growing evidence, that elevated indoor radon levels (>400 Bqm"3) caninduce excess lung cancer mortality rate (Pershagen et al. 1994). Risk is assumed to be proportional toradon exposure (or more precisely to equilibrium equivalent radon (EER) exposure or in other words topotential alpha energy (PAE) exposure), which is the integral of radon concentration (of EERC or ofPAEC) to which a person is exposed over a given time period. Typical radon levels in caves are between1 an 10 kBqm"3, about 100 times higher than typical levels in homes. People, however, usually do not spendto much time in caves since stone age. Most people do not go to cave at all, so no risk for them (neitherbenefit, however). Most people, who go to caves, do it occasionally as a tourist. They spend there very shorttime, may be a few hours in a year. Their effective doses from inhalation of radon daughters in caves arenegligible comparing to annual effective doses they receive from other natural sources (including indoorradon). Other groups of cave visiting people, however, usually spend longer periods in caves, therefore,are exposed to higher radon doses. These groups include cavers, tour guides and other staff members. Somecaves are used for therapeutic treatment of patients, suffering from asthma. These patients and the staffmembers of the therapy are also concerned taking higher risk than tourists. These groups benefit verydifferent ways and probably very different amount from visiting the caves. When making decision onvisiting the cave risk/benefit should be balanced. This paper does not deal with such a balancing. We givehere, however, estimates of risk of fatal lung cancer due to inhalation of short live radon daughters in caveair for different groups visiting some Hungarian caves.
EXPERIMENTAL METHODS
We have measured radon activity exposures in caves using track etch and semiconductor based radonmonitors. The track etch technique is usually used to measure spatial distribution of radon in a given cave.It is also used to measure long term temporal variation. Usually 3-20 measuring sites were established ineach cave investigated, spaced equidistantly mostly in the main passage of the caves. The track etchdetectors were changed approximately in every 30 days over at least a 3-4 year period. As track detector,earlier we used LR-115-11 (Kodak-Pathe), recently we use CR-39 (TASTRAK). LR-115 is used in aninverted open diffusion cup, 12 cm in height and 7 cm in diameter. CR-39 is used in a personal radondosimeter (called Radamon) developed at the Institute of Nuclear Research. The cup and Radamon tracketch radon monitors both have been calibrated in different radon chambers. The relative error of radon
PORTOROŽ 95 92

SESSION II PROCEEDINGS
measurements in caves with track etch monitors is usually found to be less than 25% at 95% confidencelevel.
Since 1991 we started to use Dataqua type "real time" radon monitors. The Dataqua radon monitor is basedon a semiconductor (Hamamatshu photodiode or PIPS) detector. It has been developed at the Dataqua Ltd.(Balatonalmádi, Hungary) with the contribution of the Mecsek Ore Mining Ltd. and the Institute of NuclearResearch. The sensitivity of Dataqua allows to measure radon activity concentration >300 Bqm 3 at 1 hourtime resolution. We use Dataqua to measure fast (diurnal, daily) temporal variation of radon atcharacteristic sites. Some of our Dataqua instruments are also equipped with air temperature, pressure,relative humidity and water level measuring capabilities to study interrelationships between theseparameters.
EFFECTIVE DOSE ESTIMATION
To calculate the effective dose due to inhaled short-lived radon daughters, we used our radon measurementsand detailed records of people who have visited the caves. First we calculated radon exposures usingDataqua radon records. If Dataqua radon records were not available at a given site or time period thenearest track etch radon record was used. To obtain equilibrium equivalent radon exposure we usedequilibrium factor of F=0.4 between radon and its short-lived daughters. This value was chosen becauseof the findings on equilibrium factor in Postojna cave measured by Butterweck et al. (1992) and Jovanovičet al. (1992) and in Royal Cave (Australia) measured by Solomon et al. (1992). These authors also foundunattached fraction of daughters to be relatively high (f=0.1) when comparing it to mine or indooratmospheres (f=0.01), leading 1.4-2.5 times higher effective doses in caves. This effect was not consideredin our estimation of effective dose. We used conversion factor between potential alpha energy exposureand effective dose as given in ICRP-65 for members of the public (1 mJm~3h is equivalent to an effectivedose of 1.10 mSv). The detriment per unit effective dose is 7.3-10"5 per mSv for the general public (ICRP-60). The principal detriment due to the inhalation of radon and its progeny is that associated with the fatallung cancer.
RESULTS
Since 1978 we have performed radon measurements in more than 25 Hungarian karstic caves. Main outlineof these measurements is given in Hakl et al. (1992). As most remarkable result, seasonal variation of radonin horizontal caves is observed, which is explained by chimney effect in Géczy et al. (1989). Figure 1 showsan example of measured radon time series in the Szent István cave (Miskolc, Hungary).
Currently we are continuously monitoring radon in more than 15 caves, including all five caves, wheretherapeutic treatment of asthma patients is going on. Earlier we have reported effective doses of patientsreceived in the Szemlö-hegy cave between 1990-1992 and estimated according to ICRP-50 (Hunyadi et al.1995). These data now are revised according to ICRP-65 dose estimation. In the case of the other fourtherapeutic caves effective doses of patients are determined for 1994. Some caves open to tourists are alsomonitored. In the case of the best known of these (Baradla cave), we have estimated doses of tour guidesbetween 1990-1994. Summary of results is presented in Table I.
Annual effective dose, mSv
Cave name
AbaligetBékeSzemlö-hegy*Szent IstvánTapolcaBaradla
Period
19941994 summer1990-1992199419941990-1994
Samplesize
127 patients56 patients
229 patients360 patients481 patients
12 tour guides
*In the case of Szemlö-hegy cave cumulative effective dosesTable I: Summary
PORTOROŽ 95
of results.
Mean (Range)
0.54 (0.03-1.26)1.91 (1.86-1.97)0.85 (0.10-5.00)0.06 (0.01-0.17)0.87 (0.04-2.19)2.66 (0.12-5.55)
over 1990-1992 are
Geometric mean(Geometric STD)
0.40 (0.77)1.91 (0.02)0.62 (0.76)0.04 (0.88)0.45 (1.32)2.13 (0.80)
given in mSv.
93

SESSION II PROCEEDINGS
Miskolc, Szent István cave, Therapy
-90 Jan-92 Jan-94Time
Jan-96
Fig. 1: Temporal variation of radon activity concentration at the therapeutic part of the Szent István cave(Miskolc, Hungary).
Based on their internal working time reports, annual effective doses for staff members of therapy are about0.4 mSv in Abaliget cave, 0.12 mS v in Szent István cave, 6 mSv in Béke cave. Tour guides in Abaliget cavereceive about 12 mSv annualy.
Cavers and researchers visit caves for very different reasons. Some of them go to the same cave regularly,others visit as many different caves as they can. Most active cavers may spend in caves up to a few hundredof hours annually, therefore they may be exposed to higher doses. Using a personal radon dosimeter, oneof the authors (J. Hakl) has measured his own annual effective dose while working in different caves, andfound it was higher than 30 mSv in 1992.
CONCLUSIONS
1. All caves should be tested against radon at least for a one year period before opening to public ortherapeutic treatment or used frequently by the same group of people.
2. Action should be taken to ensure risk/benefit is properly balanced for all cave visitors.3. People at higher risks should be informed. Their annual effective doses should be limited rather than
time annually allowed to spend in caves.4. Personal radon dosimetry is highly recommended for the most active cavers.
ACKNOWLEDGMENT
This work was supported in part by the National Scientific Research Fund Contract Nos. T 016 558 andT 017 560.
PORTOROŽ 95 94

SESSION II PROCEEDINGS
REFERENCES
1. Butterweck, G.; Porstendörfer, J.; Reineking, A.; Kesten, J. (1992) Unattached fraction and the aerosol size distributionof the radon progeny in a natural cave and mine atmospheres. Radiation Protection Dosimetry Vol. 45 No. 1/4 pp. 167-170.
2. Géczy, G.;Csige,I.; Somogyi, G. (1989) Air circulation in caves traced by natural radon. Kosa, A. ed. Proc. of the 10thInt. Cong, on Speleology. Vol. 2. Budapest: Hungarian Speleological Society; pp. 615-617.
3. Hakl, J.; Hunyadi I.; Csige I.; Géczy, G.; Lénárt, L.; Töröcsik, I. (1992) Outline of natural radon occurrence on karsticterrains of Hungary. Radiation Protection Dosimetry Vol. 45 No. 1/4 pp. 183-186.
4. Hunyadi I.; Csige I.; Géczy, G.; Hakl, J. (1995) Radon doses received in speleotherapy courses in Hungary. RadiationMeasurements, Vol. 25, Nos 1-4, pp. 655-656.
5. ICRP-47. (1986) Radiation Protection of Workers in Mines. Annals of the ICRP 16 (1).6. ICRP-60. (1991) 1990 Recommendations of the International Commission on Radiological Protection. Annals of the
ICRP 21 (13).7. ICRP-65. (1993) Protection against radon-222 at home and at work. Annals of the ICRP, December 1993 issue.
Pergamon.8. Jovanovič, P.; Kanduč, M.; Kuhar, B. (1992) Dose estimates due to 222Rn concentrations in Postojna cave. Radiation
Protection Dosimetry Vol. 45 No. 1/4 pp.191-192.9. Solomon, S. B.; Cooper, M. B.; O'Brien, R. S.; Wilkinson, L. (1992) Radon exposure in a limestone cave. Radiation
Protection Dosimetry Vol. 45 No. 1/4 pp. 171-174.10. Pershagen, G.; Akerblom, G.; Axelson, O.; Clavensjö, B.; Damber, L.; Desai, G.; Enŕlo, A.; Lagarde, F.; Mellander,
H.; Svartengren, M.; Swedjemark, G. A. (1994) Residential radon and lung cancer in Sweden. New England Journalof Medicine, 330, pp. 159-164.
PORTOROŽ 95 95

SESSION II ''""'''"Illlllllllllllllllllllllll1 1 1 1 1 1 1 1 1 1 1 PROCEED1NGSXA05C0024
CONTENT OF 2 2 6Ra IN TAP AND MINERAL WATERS OF THE REPUBLIC OFCROATIA AND POSSIBLE HEALTH EFFECTS
G. Marovič, J. Senčar
Institute for Medical Research and Occupational Health, ZagrebDepartment of Radiation Protection, HR-41001 Zagreb, Ksaverska cesta 2, P.O.Box 291, Croatia
ABSTRACTThe paper describes the study of the content of226Ra in drinking water of Croatia: tap water from the publicsupply system of several major urban centres and bottled mineral water from two mineral water springs. 226Rawas determined by alpha-spectrometric measurement after radiochemical separation. The study showed that226Ra concentrations for investigated categories of waters are below the levels at which any unacceptable dosedue to ingestion would arise.
Key terms: natural radioactivity, radioactive contamination, radiotoxicity, health risk, effective dose.
Radium (226Ra) was identified as a significant environmental pollutant and radium pollution of water(surface and groundwater) has been detected in many places around the world. The studies revealed thatin human exposure the critical pathways for 226Ra are ingestion through food chains and drinking water[1,2,3].
The presence of 226Ra in drinking water has always been considered of major importance from theviewpoint of the health risks associated with its exceptional radiotoxicity and its long half-life(T i a=1.622 years) [1,4].
Once deposited in bone tissue it continually irradiates human skeleton for many years and potentiallyinduces bone sarcoma and therefore the most important aspect of radium protection is the prevention ofits entry into the human body [2,5].
The aim of this paper was to determine the levels of 226Ra in the samples of tap and mineral waters andestimate possible dose contribution from ingestion of these water categories in the ratio assumed on basisof the dietary habits of the Croatian population. 2 2 6Ra specific activity was determined in the samples oftap water from several towns and mineral water from two natural mineral water springs in the Republic ofCroatia. The radiation doses from ingestion of public system tap water were compared to the doses receivedfrom ingestion of bottled mineral water.
MATERIAL AND METHODS
The samples of tap water were collected in public water supply systems in several major urban centres ofCroatia. Great number of samples were analysed for the city of Zagreb. They were collected in the amountof 1 L daily and an aliquot of summary sample per month was radiochemically analysed.
The samples of bottled mineral water were randomly collected from the two natural mineral water springsin the territory of Croatia.
After radiochemical separation 2 2 6Ra was determined by alpha spectrometric measurements using Si(Li)surface barrier detector ORTEC [6]. The counting time for each measurement was 60.000 sec or longer.
RESULTS AND DISCUSSION
Figure 1 shows normal distribution density function of 2 2 6Ra activity in the tap water from public watersupply system of the city of Zagreb and several major urban centres in Croatia.
The mean value of 226Ra concentration in tap water was 2.04 ± 1.26 Bqm"3 (95% confidence interval formean: 2.04 ± 0.42).
PORTOROŽ 95 96

SESSION II PROCEEDINGS
10C©T3
0.4
0.3-
Activity (B q m )
Fig. 1: Normal distribution density function of 226Ra activity in tap water.
Activity of 226Ra determined in bottled mineral water from two natural mineral springs was several timeshigher than in tap water from public supply system. The mineral waters that are generally consideredexceptionally good for its mineral content are bottled and commercially sold in the country and abroad.Table 1 shows 226Ra activities determined in the samples of mineral water from two most popular naturalmineral water springs in Croatia.
226Ra activity in mineral water /Bqm"3
lg|il|f||l!|II;:. Mediáni : i m-
yiMaximiíni:; 'mwW¥m ľ!:"-
:;:: $tändälá:deviátipn :--:;::iiii;:í::;iiľ
92.6
91.9
144.5
51.3
30.7
218.8
230.9
303.1
110.1
97.7
Table 1: 226Ra activity in mineral water.
Considering the dietary habits of the Croatian population and statistical data on water consumption ingeneral, we estimated that a person drinks 0.2 L of bottled mineral water per day. The assumed annualintake of 2 L water daily involves 0.2 L of mineral and 1.8 L of public system tap water.
The annual effective dose received by an individual from drinking mineral water in the respective ratio (0.2L mineral: 1.8 L tap water) was found to be 6 and 12 times higher at two investigated sites, respectively,than the dose from tap water alone.
PORTOROŽ 95 97

SESSION II PROCEEDINGS
In view of the results obtained we may conclude that under normal environmental conditions the relativecontribution of 226Ra from tap and mineral waters in the assumed ratio presents no significant risk for theCroatian population.
REFERENCES
1. Iyengar, M.A.R. The Natural Distribution of Radium. In: The Environmental Behaviour of Radium, Vienna; IAEA1990; 1:59-128.
2. Wrenn M.E., Durbin P.W., Howard B., Lipsztein J., Rundo J., Still E.T.,Willis D.I. Metabolism of Ingested U and Ra.Health Phys 1985; 48: 601-633.
3. Rowland R.E. Low-Level Radium Retention by the Human Body: A Modification of the ICRP Publication 20 RetentionEquation. Health Phys 1993; 65: 507-513.
4. Marovič G., Senčar J., Bauman A.: 226Ra in Drinking Water in the Republic of Croatia. Arh hig rada toksikol, 1994;45: 151-159.
5. Schlenker R.A., Keane A.T., Holtzman R.B. The Retention of 226Ra in Human Soft Tissue and Bone; Implications forthe ICRP 20 Alkaline Earth Model. Health Phys 1982; 42: 671-693.
6. Radioassaý Procedure for Environmental Samples. US Department of Health, Education and Welfare PHS No.999-RH-27. Washington DC. 1967.
7. UNSCEAR. Sources and Effects of Ionizing Radiation. United Nations Scientific Committee on Effects of AtomicRadiation, United Nations, New York. 1993.
8. World Health Organization (WHO). Guidelines for Drinking-water Quality. Recommendations. WHO Geneva, 1993.9. Recommendations of the International Commission on Radiological Protection. ICRP Publication 60, Oxford,
Pergamon Press. 1993.
PORTOROŽ 95 98

SESSIONn IIIIIIIIIIIl l l l l i l l l l l l l l lH PR0CEEDINGS
XA05C0025
NATURAL RADIOACTIVITY AROUND THE COAL-FIRED POWER PLANT
J. Kováč, M. Bajlo
Institute for Medical Research and Occupational Health, Department for Radiation Protection,Ksaverska cesta 2, P.O.Box 291, HR-10000 Zagreb, Croatia
ABSTRACT
By far the greatest part of the radiation received by the worlds population comes from natural sources, insome situations the exposure to natural radiation sources is enhanced as a result of technologicaldevelopments. Burning of coal is one source of enhanced radiation exposure to naturally occurring elements,particularly radium, thorium and uranium. Extensive investigations have been performed in the coal-firedpower plant (CFPP) Plomin in Croatia, using an anthracite coal with a higher than usual uranium contentand normal thorium content. A network of TL dosimeters (TLD), working levels (WL) measurements, airpollution monitoring and monitoring of waste pile were organized. Some of the measurements have beenrepeated, and the results have shown decreased contamination.
INTRODUCTION
One of the first sources of uranium and thorium which were detected not being connected with the nuclearindustry, was found during energy production using fossil fuels [1,2]. Coal is burned in CFPP at about 1700°C, and the activity is redistributed from the underground (where the impact on humanity is nill) andliberated into the environment. Most of the radioactive substances are concentrated in the ash and slag,which are heavy and drop to the bottom of a furnace. Lighter fly ash is carried up the chimney andirradiates the environment. The bottom ash and slag are usually deposited to the waste pile, from wheresome activity may leach into aquifer, or be dispersed by wind.
METHODS
Air samples for determination of total alpha activity were collected on Schneider-Poelman filters with theaid of an air pump.
At the same sampling stations, the fallout samples were collected. One litre from the monthly sample wasevaporated to dryness for determination of total alpha activity.
Determination of total alpha activity was performed by using a surface barrier Si detector and 1 K analysingsystem [3,4].
To obtain the monthly mean concentrations of gamma emitters in surface air, the airborne particles werecollected on glass fibre filters (with a normal collection efficiency of 99.9 % for 0.3 urn particles) bymeans of a high-volume air sampler at a flow rate of 2000 m3 in 24 hours.
The activities of natural radionuclides were measured by use of Ge(Li) detector jointed to 4 K channelanalysing system and connected on line with the computer [3,4].
Radiation surveys of the working area inside the CFPP were made with a Victoreen Thyac III gamma-betasurvey meter, with a detector held one metre above the surface. Later on a network of TL dosimeters wasorganized.
Our investigations on WL measurements, at the beginning were performed using the Holmgren's method[5], but later on we find more convenient the field method developed by Scott [6].
RESULTS AND DISCUSSION
Monthly mean values of total alpha activities in surface air showed fluctuations through the year. Themaximum value was obtained in winter (2.4 E-5 Bq-m"3) at the location 1.5 km far from CFPP, SEE
PORTOROŽ 95 99

SESSION II PROCEEDINGS
direction. The lowest values were in summer (less than 3.0 E-6 Bq-m"3, with the maximum of 2.4 E-6Bq-m"3).
The maximum value of total alpha activity was determined in monthly fallout sample from September(2.7 E+l Bq-m"3), what was in direct connection with the amount of rain.
Specific activities of 238U, 226Ra and 40K in surface air samples are presented in Table 1.
238U 226Ra 40K
Around CFPP 4.0 E-6 2.8 E-7 6.2 E-7Northern Hemisphere 2.6 E-8 3.0 E-9 3.1E-5[7]
Table 1: Specific Activities in Surface Air (Bq-m"3).
It is obvious that the activity levels around the CFPP exceed the values in Northern Hemisphere by factorsof hundred.
The external level of natural radiation around working places at the time of measurement varied from 13to 39 nC-kg^-h"1. The highest value was 129 nC-kg"'-h'\ obtained on one occasion under the ash hopper.The background of the surrounding countryside showed fluctuations between 1-2 nC-kg'-h"1.
Five different workplaces inside the CFPP were chosen for WL measurements. The highest data wereobtained at fresh waste pile and beside the bottom ash (83 raWL). The work places listed according todecreasing contamination, calculated on the bases of 170 working hours per month were:
Fresh waste pile (13.6 WLM) > Below the ash hopper (10.2 WLM) >> Coal conveyor belt (2.6 WLM) >• Steam generator building (1.0 WLM) >>• Under the stack (0.9 WLM)
On site places with good ventilation had 0.9 - 2.6 WLM.
WLM data did not differ from two measurement points - one 500 m distance from the CFPP (officebuilding) and the other 10 km SW from the CFPP. On both locations we measured 0.5 WLM.
More recently some of the measurements were repeated, and all the results have shown decreasedcontamination. The reason for that probably is use of the coal with low concentration of uranium. The oldwaste pile has been covered with 0.5 m thick level of soil and grass was sawed on, so that is another reasonfor decreased contamination at surrounding area.
CONCLUSION
It seems that covering the waste pile with soil was good solution for reducing radioactive contaminationin the environment and to keep the possible risk to the surrounding population under permanent control.However, it is necessary to control the radioactivity of coal used for combustion, slag and ashes depositedon new waste pile. WL measurements should be conducted at least once a year.
REFERENCES
1. M.Eisenbud, H.G.Petrow: Radioactivity in the Atmospheric Effluents of Power Plants that use Fossil Fuel. Science 144(1964) 288.
2. H.L.Beck, et.al.: Perturbations on the Natural Radiation Environment due to the Utilization of Coal as an EnergySource. In: Natural Radiation Environment III. CONF-780422, 2 (1980) 1521.
3. HASL-300, EML Procedures Manual (Ed. J.H.Harley), U.S. Atomic Energy Commission, N.Y. (1971).4. IAEA, Measurements of Radionuclides in Food and the Environment, Tech.Rep.Ser. No. 295, Vienna (1989).5. R.M.Holmgren: Working Levels of Radon Daughters in Air Determined from Measurements of RaB+RaC. Health Phys.
27 (1974) 141.6. A.G.Scott: A Field Method for Measurement of Radon Daughters in Air. Health Phys. 41 1981) 403.7. UNSCEAR, Ionizing Radiation Sources and Biological Effects. UN., N.Y. (1982).
PORTOROŽ 95 100

SESSION II Illlllllllllllllllllllllllllllllllillllllllllllllllllll PROCEEDINGSXA05C0026
METHODOLOGY OF AMBIENT RADON DAUGHTER MEASUREMENTS
R. Winkler, W. Hofmann and R. Rolle
Institute for Physics and Biophysics, University of Salzburg, Hellbrunnerstraße 34,A-5020 Salzburg, Austria
ABSTRACT
The radiation doses delivered to the bronchial epithelium upon inhalation of radon and its short-lived decayproducts are caused primarily by the alpha-emitting radon daughters 2lsPo and 2l4Po. Thus the reliability ofany dose estimate for risk assessment purposes depends on the accuracy with which these concentrations canbe determined in ambient air. In the following study, different measurement techniques have been compared:(i) gross alpha quasi-continuous sampling measurements with a Pylon WL-meter, with varying time intervalsof sampling and measurement and with varying time intervals between sampling and measurement, (ii)spectrometric alpha grab sampling measurements with a filter device and subsequent analysis of the alphaspectra compared with gross alpha analysis. The results of this study indicated improved accuracy for alphaspectrometric measurements.
INTRODUCTION
Many studies about empirical calculations for different measurement methods and their accuracy areavailable, which assume various standardised activity ratios of the radon daughters. These empiricalcalculations are mostly tested by measurements using grab sampling procedures [1,2,3].
In this study the main interest was to use the quasi continuous mode for the measurements, i.e. ameasurement consists of a sampling interval, a few decay intervals and this is iterated for at least a fewhours. Data were analysed using the method of R. Rolle [4]. Main aspects of this method are describedlater. Experimental data of Rn daughter measurements indoors were used for the analysis. A method forgross alpha quasi continuous sampling measurements should be found, that allows simple operation forcontinuous monitoring of Rn-daughters in ambient air, as well as high accuracy.
EXPERIMENTAL METHODS
The instruments used for measurements of gross alpha activity were two ZnS(Ag) scintillation counters,Pylon AB-5 with the AEP-47 filter device, where the Rn-daughters are collected on a polycarbonate filter(0,8 /urn pore size; effective area seen by the detector: 9,44 cm2; distance between filter and detector: 12,5mm; flow rate: 3,21/min, i.e. the maximum available internal flow rate). The manufacturer quotes that alphaparticles over the energy range of 4,5 MeV and 9 MeV are detected. The measurements were done in quasicontinuous mode, having constant intervals, as programmed by the user, during the whole measurement;before each measurement the background was determined. The background count rates have been assumedto be constant during the whole measurement and are included in the calculations.
For the spectrometric measurements an ion implanted Si detector was used, EG&G Ortec Ultra series. TheRn daughters were sampled for a specific time on a polycarbonate filter and then measured at a distanceof 14,9 mm in vacuum.
The efficiency for the Pylon instrument was calculated by means of solid angle absorption geometry as13,3% for2I8Po, and 14,4% for 214Po alphas and for the spectrometric measurements 17,9% for bothisotopes.
Continuous monitoring of the Rn-concentration in the ambient air was done using an ionisation chamber,AlphaGuard from Genitron Instruments.
PORTOROŽ 95 101
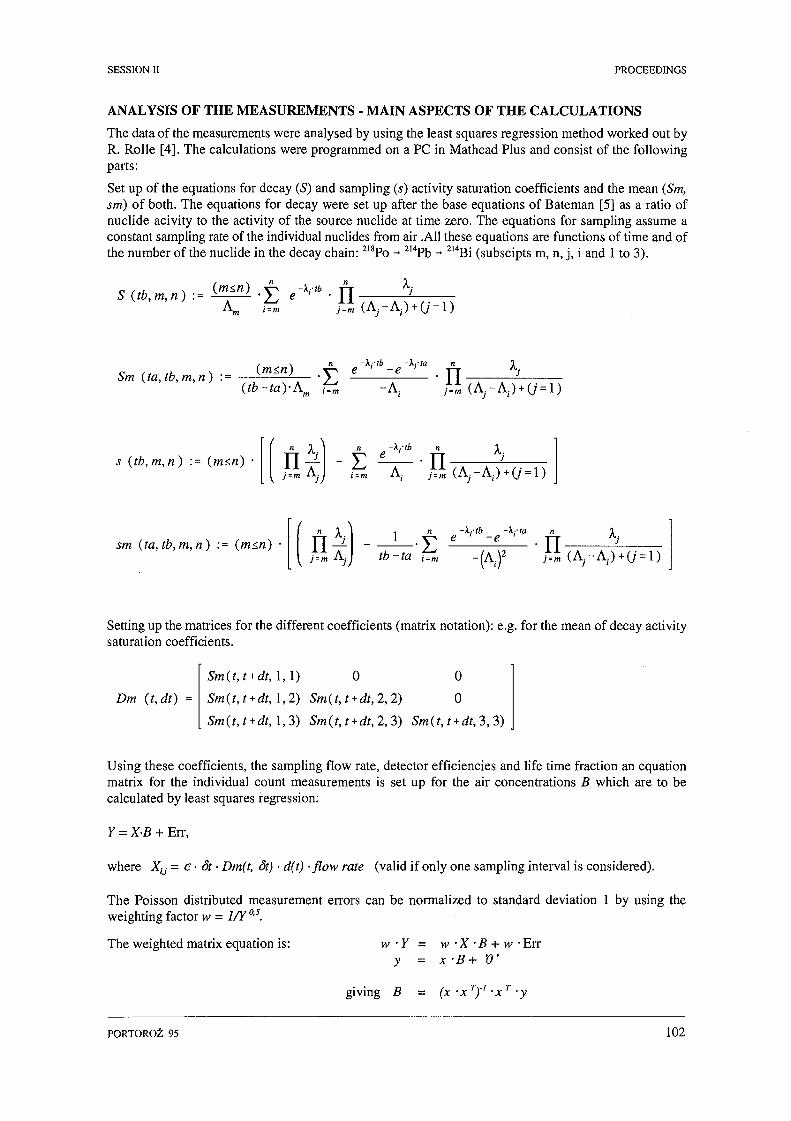
SESSION II PROCEEDINGS
ANALYSIS OF THE MEASUREMENTS - MAIN ASPECTS OF THE CALCULATIONS
The data of the measurements were analysed by using the least squares regression method worked out byR. Rolle [4]. The calculations were programmed on a PC in Mathcad Plus and consist of the followingparts:
Set up of the equations for decay (5) and sampling (s) activity saturation coefficients and the mean (5m,sm) of both. The equations for decay were set up after the base equations of Bateman [5] as a ratio ofnuclide acivity to the activity of the source nuclide at time zero. The equations for sampling assume aconstant sampling rate of the individual nuclides from air .All these equations are functions of time and ofthe number of the nuclide in the decay chain: 2 I 8Po - 214Pb - 214Bi (subscipts m, n, j , i and 1 to 3).
S (tb,m,n) : = (mšn) , y e -x-ib . A
A . i = m i = m
Sm (ta, tb,m,n) : =-i.j-ta n
(tb-ta)-Am fťm -A,. fit (A.-A.)
(tb, m,n) := {m<.n) •(n hA. Ť e
i-m
-Xj-tb
A,-
nnj = m
(A, "A,-) + C/' = l )
sm (ta,tb,m,n) :=-Xrlb -X,-tu
E e ,:•„ -nl^j.iAJ (fc-M ftí -(A.)2 /4(A r A,)t(; .
Setting up the matrices for the different coefficients (matrix notation): e.g. for the mean of decay activitysaturation coefficients.
Dm (t,dt) =
Sm(t,t + dt, 1,1) 0 0
Sm(t,t + dt, 1,2) Sm(t,t + dt, 2,2) 0
Sm(t, t + dt, 1,3) Sm(t,t+dt,2,3) Sm(t,t + dt,3,3)
Using these coefficients, the sampling flow rate, detector efficiencies and life time fraction an equationmatrix for the individual count measurements is set up for the air concentrations B which are to becalculated by least squares regression:
ľ = XB + Err,
where X y = e • ôt • Dm(t, St) • d(t) -flow rate (valid if only one sampling interval is considered).
The Poisson distributed measurement errors can be normalized to standard deviation 1 by using theweighting factor w = 1/Y °'5.
The weighted matrix equation is: w -Y = w -X -B + w -Errv = x -B+ V
giving B = (x-x7)'1-xT-y
PORTOROŽ 95 102

SESSION U PROCEEDINGS
Estimation for the standard deviation (sd) is given by:
sd -
The first part of the equation for the standard deviation is supposed to take on the value 1 or very close toone, for Poisson distributed counting errors. Strongly deviating values of this term from 1 indicatesystematic errors.
Variables used here:
ta/tb = t - start/end time of measurement inteval,Y/y - observed counts/weighted counts per interval = cpm,ôt - duration of one measurement interval,A. =A - decay constant [min"1],B - concentrations of RaA, RaB, RaC in dpm per litre,Err - unknown measurement error,e - efficiencies,p - number of sampling and measurement intervals.
The advantage of this type of calculation is that any combination of time intervals for sampling and decaycan be analysed, as well as superimproved samples in (quasi) continuous modes. The only restriction in theamount of collected data is given by the memory capacity of the PC. Moreover an estimation of thereliability of the calculated values is given due to the standard deviation.
RESULTS
In Fig. la and lb typical results from an experimental run are shown. It can be seen that the standarddeviations are decreasing if the activities of the radon daughters are increasing.
30000
25000 -
•& 20000 -B
J 15000
g 10000 -
8 5000 -
0 -
vv •
A
70
c 60 -.SI 50 -
í 40 -
H£ 20 -J
per 10 -
0 -
A
m m- A • •
• 2'«Po• >"PbA 2'íp0
V
5 10 15 20 25 30
tíme (h]10 15 20
tím é [h]
25i
30
Fig. la. Fig. Ib.
At low activities of Rn daughters in air (mean 222Rn content during measurements: 30 to 130 Bq/m3) bestresults concerning the standard deviations were found, when using 20min sampling intervals at the givenflow rate of 3,2 1/min and a post sampling measurement time of at least 100 min. Standard deviations for218Po varied between 24 and 50% (mean: 60 and 30 Bq/m3), between 13 and 24% (mean: 34 and 13Bq/m3) for 214Pb and between 24 and 45% (mean: 27 and 10 Bq/m3) for 214Po (=214 Bi). In Fig. 2 thefrequency of percent standard deviations of 20min sampling and any shorter sampling times can becompared. This shows that shorter periods can still give acceptably accuracy.
At high activities of Rn daughters in air (mean 222Rn content during the measurements 600 Bq/m3) loweststandard deviations were given for a sampling period of 10 min and a decay period of 50, 90 and 110 min;for 2I8Po there is hardly any difference in the standard deviations if 50 min decay or longer decay periodswere taken. In all cases the standard deviations for 2l8Po are between 4 and 8% for mean values of 2l8Po
PORTOROŽ 95 103

SESSION II PROCEEDINGS
between 1000 and 3000 Bq/ m3. The standard deviations for 214Pb where 4 to 11% for a decay period of110 min and 5 to 16% for decay periods of 50min. For 214Pb there is an improvement in the standarddeviation of about 30 % if the decay period is lengthened from 50 to 110 minutes (Fig. 3). Deviding thesampling and the decay periods in more intervals e.g. 2x5min did not give significant lower standarddeviations.
2144=bsZ)2144* sSIO
21&ft>S»21&«>s5flO
214-Po1h cycle214-Po cylcle >1h
214-Pti Ihcyclo214-Pbcycl«>1h
21«-Po1hcycl«21Í-Po cylc«>1h
ptrctnl lUndird dtvlitlon
Fig. 2. Fig. 3.
The standard deviations for the alpha spectrometric measurements for the three radon daughters were:2,1%; 1,7%; 3,8% with 4500; 2400; 1200 Bq/m3 as mean for 218Po, 214Pb, 2l4Po (=2M Bi) using 15minsampling intervals and 30x2min measurement intervals.
CONCLUSIONS
The manufacturer recommends a cycle period for quasi continuous monitoring of two hours, at this longperiod influence from previous samples can be neglected. We have shown however that much shorter cycleperiods as low as 1 hour still give acceptable results with proper calculation of intersample effects.Calculations have indicated that a beta alpha spectrometric procedure with a suitable air monitor can offergreatly improved accuracy and time resolution in Rn daughter measurements. A prototype of suchinstrument has been developed.
REFERENCES
1. Martz, D. E., Holleman, D. R.McCurdy, D. E., Schiager, K. J. (1969): Analysis of atmospheric concentrations of RaA,RaB, and RaC by alpha spectroscopy. Health Phys. 17: 131-138.
2. Raabe, O. G., Wrenn, M. E. (1969): Analysis of the activity of radon daughter samples by weighted least squares.Health Phys. 17: 593-605.
3. Durkin, J.(1981): The error in working-level hour calculations when the a-energy from the radon daughters is notdiscriminated. Health Phys. 41: 477-481.
4. Rolle, R., Lettner; H. (1995): An analysis of efficient measurement procedures for Radon progeny. Proceedings: SixthInternational Symposium on the Natural Radiation Environment, June 5-9,1995, Montreal, Québec, Canada (in press).
5. Friedlander, G., Kennedy, J. W. (1962): Lehrbuch der Kern- und Radiochemie.
PORTOROŽ 95 104

SESSION O PROCEEDINGS
XA05C0027
DEPOSITION OF INHALED RADIONUCLIDES IN BRONCHIAL AIRWAYS:IMPLICATIONS FOR EXTRAPOLATION MODELING
I. Balásházy 12), W. Hofmann ° and T. Heistracher l)
l) Institute of Physics and Biophysics, University of Salzburg, Hellbruner Str. 34, A-5020 Salzburg, Austria2) KFKI Atomic Energy Research Institute, Health Physics Department,
P.O.Box 49, H-1525 Budapest, Hungary
INTRODUCTION
The laboratory rat has frequently been used as a human surrogate to estimate potential health effectsfollowing the inhalation of radioactive aerosol particles. Interspecies differences in biological response arecommonly related to interspecies differences in particle deposition efficiencies. In addition, the documentedsite selectivity of bronchial carcinomas suggests that localized particle deposition patterns within bronchialairway bifurcations may have important implications for inhalation risk assessments.
Interspecies differences in particle deposition patterns may be related primarily to differences in airwaymorphometries. Thus the validity of extrapolating rat deposition data to human inhalation conditionsdepends on their morphometric similarities and differences. It is well known that there are significantstructural differences between the human —rather symmetric— and the rat —monopodial— airwaysystems.
In the present approach, we focus on localized deposition patterns and deposition efficiencies in selectedasymmetric bronchial airway bifurcations, whose diameters, lengths and branching angles were derivedfrom the stochastic airway models of human and rat lungs (Koblinger and Hofmann, 1985;1988), whichare based on the morphometric data of Raabe et al. (1976).
The effects of interspecies differences in particle deposition patterns are explored in this study for twoasymmetric bifurcation geometries in segmental bronchi and terminal bronchioles of both the human andrat lungs at different particle sizes. In order to examine the effect of flow rate on particle deposition in thehuman lung, we selected two different minute volumes, i.e., 10 and 60 1 min"1 , which are representativeof low and heavy physical activity breathing conditions. In the case of the rat we used a minute volume of0.234 1 min'1 (Hofmann et al., 1993).
PARTICLE DEPOSITION PATTERNS
The present simulations of particle deposition patterns within airway bifurcations are based on our recentlydeveloped numerical model for the calculation of air velocity fields and aerosol particle trajectories in athree-dimensional bifurcation model (Balásházy and Hofmann, 1993a,b, 1995): First of all, airflow iscomputed by solving the Navier-Stokes equations with a finite difference technique. In the next step,trajectories of aerosol particles entrained in the airstream under the simultaneous effects of inertialimpaction, gravitational settling, Brownian motion, and interception are simulated by Monte Carlo methods.Finally, the resulting particle deposition pattern is determined by the intersection of individual particletrajectories with the walls of the bifurcation. .
The effects of particle deposition patterns ~ one thousand randomly selected particles at the inlet - oninterspecies inhalation risk extrapolation upon inspiration and expiration were examined for 0.01, 1.0 and10 yum diameter, unit density, spherical particles. Here, only a few computed deposition patterns duringinhalation are presented.
The deposition sites of 10 /urn diameter particles in generation 4-5 and 15-16 human bronchial bifurcationsare plotted in Fig. 1 for both the 10 and 60 1 min"1 minute volumes, revealing distinct
PORTOROŽ 95 105

SESSION II PROCEEDINGS
HUMAN 4 - 5
Q=10 (min- i
1 cm.
. XHUMAN 15-16
Q=10 í min
J I I t_
HUMAN 4-5
1 cm
HUMAN 15-16
Q=60 «min
1 mm
INHALATION
Fig. 1: Distribution of deposition sites of 10 /xm unit density particles in upper (generations 4-5) and lower(generations 15-16) human bronchial airway bifurcations at low and high minute volumes (10 and 601 min"1) during inhalation. The axes of the parent and daughter branches lie in one horizontal plane.Deposition efficiencies are: 8.5 and 21.1 % in generations 4-5 and 39.8 and 40.2 % in generations 15-16, at low and high flow rates.
differences in deposition patterns between the upper and the lower generations. In the generation 4-5bifurcation model, inspired particles create an intense "hot spot" at the carinal ridge for both flow rates.
The higher deposition efficiency at the higher flow rate is caused by the increased effectiveness of inertialimpaction. On the other hand, the effect of gravity is practically negligible for both inhalation conditions.The situation is significantly different in generations 15-16. Here, at the low flow rate, there is practicallyno hot spot, but the deposition efficiency is about five times higher than that in the upper airway for the
PORTOROŽ 95 106

SESSION II PROCEEDINGS
same minute volume. The x-z projection of the bifurcation effectively illustrates that gravitational settlingis the dominant deposition mechanism at low flow rates in the peripheral bronchial airways. At the higherflow rate, however, the additional effect of impaction produces again a hot spot in the vicinity of the carinalridge.
While the x-y projections of the deposition patterns of ultrafine and large particles in bifurcation 15-16exhibit similar structures, the corresponding x-z projections of these figures are significantly different. Incontrast to the simulations for 10 /urn particles (Fig. 1), there is no perceptible role of the gravitational forcefor 0.01 /urn because of the negligibly small terminal settling velocity relative to the average Brownianvelocity.
Corresponding simulations of deposition patterns of 10, 1, and 0.01 ptm diameter particles in large andsmall bronchial airway bifurcations in the rat lung were also performed.
The most striking difference to the corresponding human case is that deposited particles are rather diffuselydistributed in generations 4-5 of the rat lung (Fig. 2), while distinct hot spots are formed at the carinal ridgeof the respective human bifurcation for both large and ultrafine particles. This difference in localizeddistributions, i.e., hot spots vs. diffuse distribution, may be significant for extrapolation modeling.
In general, asymmetric deposition in the two daughters is reversed for exhalation: Upon expiration, themajority of particle deposition sites can be found in the smaller daughter branch (note that deposition ishighest in the parent branch during exhalation), while most particles are being deposited in the majorbranch upon inspiration.
RAT 4-5 (Q=0.234 t min"1)
1 mm
INHALATION
Fig. 2: Deposition patterns of 10 ßm and 0.01 ßm unit density particles in upper bronchial airway bifurcationsof the rat lung during inhalation. The axes of the airways lie in one horizontal plane. Depositionefficiencies are: 15.3 % for large and 3.7 % for ultrafine particle sizes.
PORTOROŽ 95 107

SESSION II PROCEEDINGS
DISCUSSION
Commonly used morphometric models of the human lung assume symmetry with respect to branchingangles, diameters and lengths of major and minor daughter airways. Because of the relatively moderatedegree of asymmetry observed in morphometric measurements, symmetric branching may indeed representa viable compromise between accuracy and convenience of computation for particle deposition in thehuman lung. However, such a compromise is not justified for the rat airway system because of thepronounced asymmetry of its monopodial branching pattern. Thus any comparison of deposition patternsand efficiencies between human and rat bronchial airways for extrapolation purposes requires thesimulation of particle deposition in asymmetric bifurcation models, characteristic for each species.
Comparing human 4-5 and 15-16 generations, inspiratory deposition of 10 /^m particles produces a moreintense hot spot in the upper airway juncture at both flow rates (Fig. 1). Corresponding simulations for 0.01yum particles reveal that deposition in large bronchi of the human lung is again enhanced at the carinalridge, particularly at the higher flow rate. In contrast, deposition in rat bronchial bifurcations is lessenhanced at the airstream divider as compared to the corresponding human cases, for both small and largeparticle sizes. This finding supports the earlier contention of Pritchard et al. (1988) that carinal depositionmay be higher in human than in rat bronchial bifurcations. If such localized doses within bronchialbifurcations can be correlated with the occurrence of bronchial diseases, say bronchial tumors, then we mayexpect a preferential occurrence of bronchial carcinomas in human upper bronchial airways. Indeed, sucha site-selectivity of bronchial carcinomas has been observed in cigarette smokers and in uranium minersexposed to ambient radon progeny (NRC, 1988), while tumors in the rat lung are more uniformlydistributed throughout the bronchial tree (Cross, 1988). Thus differences between the localized distributionsof the deposition sites in human and rat airways may partly explain these pathological findings.
ACKNOWLEDGEMENTS
This project was funded in part by the Austrian Fonds zur Förderung der wissenschaftlichen Forschung,Project P10426-ÖME, and in part by the Austrian Ministerium für Wissenschaft und Forschung, ProjectGZ45.180/4-46a/92.
REFERENCES
1. Balásházy, L, and Hofmann, W. (1993a). J. Aerosol Sei. 24:745-772.2. Balásházy, L, and Hofmann, W. (1993b). J. Aerosol Sei. 24:773-786.3. Balásházy, L, and Hofmann, W. (1995). J. Aerosol Sei. 26:273-292.4. Cross, F.T. (1988). Radon Inhalation Studies in Animals, Report DOE/ER-0396. US Department of Energy,
Washington, DC.5. Hofmann, W., Ménache, M.G., and Graham, R.C. (1993). Health Phys. 64:279-290.6. Koblinger, L., and Hofmann, W. (1985). Phys. Med. Biol. 30:541-556.7. Koblinger, L., and Hofmann, W. (1988). Anat. Rec. 221:533-539.8. National Research Council (NRC) (1988). BEIRIV: Health Risks of Radon and Other Internally Deposited Alpha
Emitters. National Academy Press, Washington, DC.9. Pritchard, J.N., McAughey, J.J., and Black, A. (1988). J. Aerosol Sei. 19:1117-1120.10. Raabe, O.G., Yeh, H.C., Schum, G.M., and Phalen, R.F. (1976). Tracheobronchial Geometry: Human, Dog, Rat,
Hamster, Report LF-53. Lovelace Foundation, Albuquerque, NM.
PORTOROŽ 95 108

SESSION II PROCEEDINGS
XA05C0028
A NEW METHOD FOR THE DETERMINATIONOF THE PROPENSION OF A SOIL TO PRODUCE Rn-222
M. Andjelov !), J. Cloute-Cazalaa2), M. Janot2), P. Jovanovič3),I. Kobal4), J.F. Pineau 2\ P. Zettwoog5)
0 Geological Survey Ljubljana, Institute of Geology, Geotechnology and Geophysics,Dimičeva 14, 61000 Ljubljana, Slovenia
2) ALGADE - BP 46 - 87250 BESSINES, France3> Institute of Occupational Safety of the Republic of Slovenia, p.p. 27,
Bohoričeva 22a, 61105 Ljubljana, Slovenia4) Jožef Stefan Institute, Jamova 39, POB 100, 61111 Ljubljana, Slovenia
5) CERTAC, S.A., France
ABSTRACT
We describe hereafter a new method based on differential gamma spectrometry for rapid and precise mappingof radon emanation potential of large soil surfaces.
This method uses a HPGe gamma detector installed inside a lead collimator.
By studying the differential absorption of different gamma lines of the U decay chain, it is possible to comeback to the radon profile in the soil under investigation.
The first experiments, conducted both in France and in Slovenia, show interesting results, even with a smallvolume detector.
An implementation of this method will be done, to allow it to be used on a car - or airborne platform.
INTRODUCTION
The propension of a soil to produce radon may be defined in two ways depending upon the particularfeature to be studied.
In the case of the study of the loading of the outdoor atmosphere by the radon escaping from the soil (i.e.studies on the effects of uranium mines tailings), the common way is to measure the radon flux through thesoil surface (expressed in atoms • m'2 • s'1), using the well known accumulation method. This method isbased on the assumption that the flux is due only to a diffusive process, and therefore proportional to thegradient of the concentration of radon between the deep soil and the atmosphere.
In the case of the study of the production of soil radon able to entry inside a building, we have to take intoaccount, not only the radon flux due to the diffusive process, but also the amount of radon which is ableto penetrate the above mentioned building by a convective process due to the pressure gradient existingbetween the soil and the indoor atmosphere. In this case the knowledge of the radon flux itself is notsufficient, and information's concerning the radon profile inside the soil and the permeability of the soilalong this profile are necessary.
In order to avoid the heavy costs of the screening of a country in respect to the radon hazard by large scaleradon in homes monitoring, the proposed method should be able to screen large land areas in respect to thepropension of the soil to generate radon inside buildings in a short amount of time and low moneyexpenses, allowing to spend more efforts on the small zones assumed, after this screening, to be able to be«radon prone area».
To make this screening possible, a method able to use an airborne platform seems to be mandatory.
The new method described here should fulfill these conditions .
PORTOROŽ 95 109

SESSION II PROCEEDINGS
DIFFERENTIAL GAMMA SPECTROSCOPY METHOD
The differential gamma spectroscopy method (DGSM) is based on the differential absorption of the gammalines emitted by the radon decay products whose are present with radon in the studied soil.
We suppose that the soil is homogeneous regarding the concentration of 226Ra down to a deep greater thanthe one seen by the detector, say over 50 cm. In the case of 222Rn is escaping the soil, a desiquilibriumbetween 226Ra and its decay products 2HBi and 214Pb appears, which is related to the exhalationcoefficient and to the deep at which the gamma ray is emitted. This desiquilibrium may be detected usingthe measured variations of the photopeaks areas of the 214Bi and of the 214Pb compared with thetheoretical one obtained by calculation from the value of the constant 226Ra.
Let the following figure 1 show the shape of different radon concentration profile in a soil:
Radon Concentration
PermeabilityLowMediumHigh
Atmosphere
Soil surfacel-E
Soil
Fig. 1.
The typical gamma spectrum, obtained using a HPGe detector with a lead collimator and at a height of 3meters above soil, is shown in the figure 2.
6000
4000 -
I I I I I I I I I
2111)0 -
CO" 4'1C- 600 X(H) 100(1 1200 1400 1600 I SIX' 2000
hnergi (kliv)
Fig. 2.
PORTOROŽ 95 110

SESSION II PROCEEDINGS
The gamma lines used for the calculations are :
- 186.2 keV of 2 2 6Ra and 2 3 5U used as a constant reference line,-242 keVof 2 1 4Pb,-295.2 keVof 2 1 4Pb,-351.9 keVof 2 1 4Pb,-609 keVof 2MBi,- 1120 keVof 214Bi,
and -1765 keV of 2 ] 4Bi;
the 1001 keV line of 2 3 4Pa is used for the assessment of 2 3 8U and further of 2 3 5U.
One can calculate the photon flux 3* through the surface of the soil seen by the collimated detector for eachgamma line ť, and thereafter the value of E and HD, respectively the emanation coefficient and therelaxation length of 2 2 2Rn, knowing the 2 2 6Ra activity in the soil A226 and the angle of collimator 6.
d2 f s i n 9 .g "cose .dQ.dz _ £ r s i n 9 . e "I c o s 9
J COS0 J COS0o o
•dQ-dz
From the above data, the radon flux can be evaluated as
CONCLUSION
It has been demonstrated that it is possible to make distant measurements of the ability of soil to produceradon at its interface to the atmosphere. This new possibility may offer in the near future a good tool forthe rapid mapping of mine tailing containing high 226Ra concentrations.
ACKNOWLEDGEMENTS
This research program is conjointly supported by the French Foreign Office and the Slovenian Ministry forScience and Technology, inside the frame of a bilateral collaboration named PROTEUS (contractn° 19590).
REFERENCES
1. F. Y. Yokel, A. B. Tanner, Site Exploration for Radon Potential, NIST report, NISTIR 5135, 1992.2. P. Zettwoog, Sur la mesure des flux d'exhalaison des gaz du sol d'origine convective, 2eme Colloque International sur
la Géochimie des Gaz (2ěme CIGG), Universitě de Franche Comté, 5 Septembre 1993, Besancon, France.3. N. Fourcade, W. Miller, Y. Vauzelle, P. Zettwoog, Impact atmosphérique ďune anomálie d'exhalaison de 222Rn en
zone tropicale, 2eme Colloque International sur la Géochimie des Gaz (2eme CIGG), Universite de Franche Comté,5 Septembre 1993, Besancon, France.
4. M. Andjelov, Results of radiometric and geochemical measurement for the natural radioactivity map of Slovenia,Geologija 36, 223-248 (1993), Ljubljana 1994.
PORTOROŽ 95 111

SESSION II PROCEEDINGS
XA05C0029
CORRELATION BETWEEN RADIUM AND RADON-IN-SOIL GAS INSLOVENIAN SOILS
M. Andjelov1} and D. Brajnik 2 3 )
"Geological Survey Ljubljana, Dimičeva 16, 61 113 Ljubljana, Slovenia2) Jožef Stefan Institute, Jamova 39, 61111 Ljubljana, Slovenia
3) Faculty of Electrical Engineering and Computer Sciences, University of Ljubljana, Tržaška 25, Slovenia
ABSTRACT
A map of natural radioactivity of Slovenia, based on Nal-spectrometer measurements in a 5 km x 5 km gridwas presented elsewhere [1], [2]. In this work relation between radon-in-soil gas and radium in soilconcentrations is studied. Use of gamma spectrometrical data for the estimation of radon exhalation is alsopresented.
Gammaspectrometric measurements of uranium in Slovenia
6 . 3
4. d
3.1
V1.8
1.4
I . I
P P "
> 7.0
- 7.0
- 6.9
- 4 . «
- 3.1
- 2.4
- l.B
- 1.4
< 1.1
eU
•msaS3
••
•
- • . . .
'je® '' *.
. . . , >•
Distribution of DNC determined uranium in soils of Slovenia
Fig. la : Regional distribution of the eU concentrations of soils in Slovenia.Fig. lb : Map of U-concentrations of soils, determined by the chemical analysis of the soil samples.
PORTOROŽ 95 112
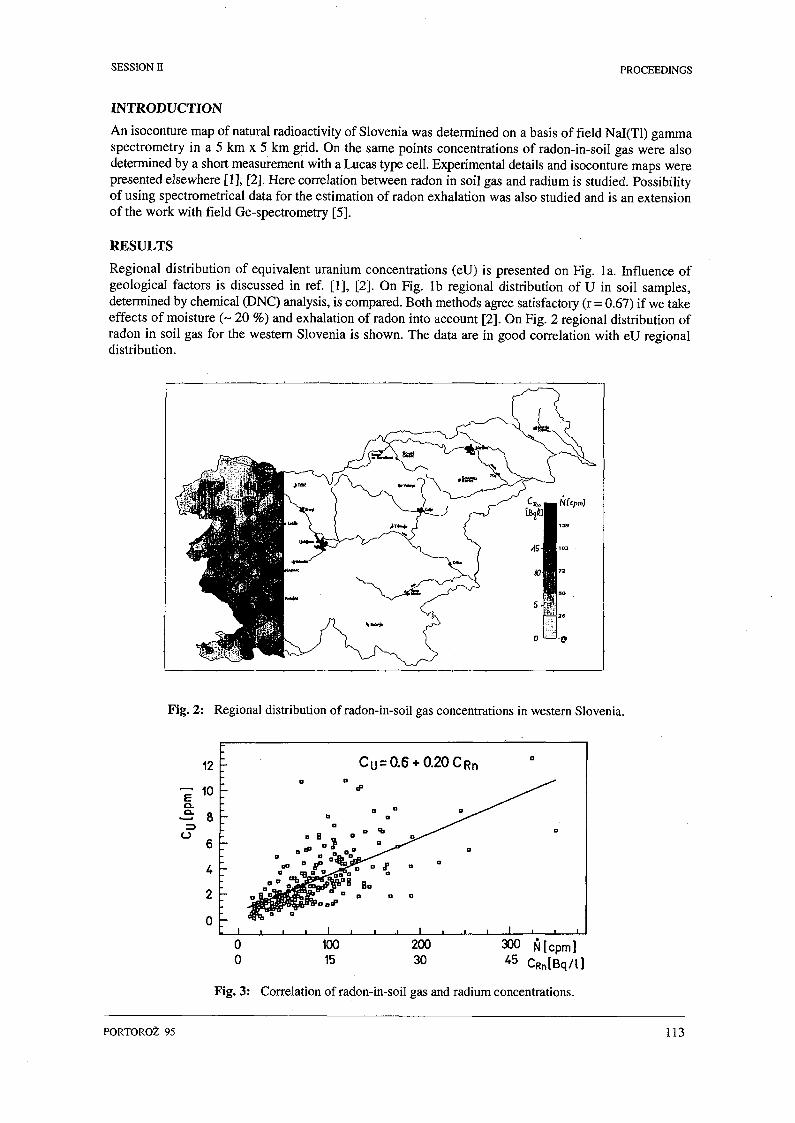
SESSION II PROCEEDINGS
INTRODUCTION
An isoconture map of natural radioactivity of Slovenia was determined on a basis of field Nal(Tl) gammaspectrometry in a 5 km x 5 km grid. On the same points concentrations of radon-in-soil gas were alsodetermined by a short measurement with a Lucas type cell. Experimental details and isoconture maps werepresented elsewhere [1], [2]. Here correlation between radon in soil gas and radium is studied. Possibilityof using spectrometrical data for the estimation of radon exhalation was also studied and is an extensionof the work with field Ge-spectrometry [5].
RESULTS
Regional distribution of equivalent uranium concentrations (eU) is presented on Fig. la. Influence ofgeological factors is discussed in ref. [1], [2]. On Fig. lb regional distribution of U in soil samples,determined by chemical (DNC) analysis, is compared. Both methods agree satisfactory (r = 0.67) if we takeeffects of moisture (~ 20 %) and exhalation of radon into account [2]. On Fig. 2 regional distribution ofradon in soil gas for the western Slovenia is shown. The data are in good correlation with eU regionaldistribution.
Fig. 2: Regional distribution of radon-in-soil gas concentrations in western Slovenia.
Edd]
o
12
10
8
6
2
0
Ĺ Cu = 0.6 + 0.20CRr
D O
ŕ
- n • o
- - B ° " D * 3 ^ ^ ^r * -í . - ^ ^ ^• - °„ " ' ^ ^ ^ ^
: i i i i i i • i t . •
i
, i
o
D
1 • 1
0o
10015
20030
300 Ň [ c p m ]4 5 C R n [ B q / l ]
Fig. 3: Correlation of radon-in-soil gas and radium concentrations.
PORTOROŽ 95 113

SESSION n PROCEEDINGS
Correlation between the both sets of data, shown on Fig. 3, gives a rather high correlation coefficientr = 0.67. The radon-in-soil gas concentration Crn can be related to the specific activity of radium Ara
by a straight line:
Crn = a.Ara (1)
with a = 0.35 x 10³kgrn3.
Yokel and Tanner [3] suggest the following relation between the saturated radon-in-soil gas concentrationCrn(max) and the specific activity of radium Ara:
Crn(max) = fr.p.A„/n (2)
with a recommended ratio between the emanation coefficient fr and porosity n:
f r/n = 0.8-0.9 (3)
In this case the relation (2) can be rewritten as:
Crn(max) = b.Arn (4)
with b = 0.8.P = 1.28 x 10³ kg/m3.
From the comparison of equations (2) and (4) for the measured and saturated concentration of radon in soilgas we can conclude that the measured and saturated concentrations agree with an exponential distributionfor depth z = 0.3 m and diffusion length zdif = 1 m [4], [5].
On Fig. 4 the profile in the NS direction from Julian Alps on the north to the Karst on the south is shown.As discussed in [2] the radon and eU data in karstic soils lay systematically higher in comparison to theuranium content of the soil.
250
180
Location No.
185
Fig. 4: Typical profile in N-S direction through Julian Alps and Karstic region.
GAMMA SPECTROMETRY IN ESTIMATION OF RADON EXHALATION
Field Ge-spectrometry can be successfully used in estimation of the exhalation coefficient fr [5] and in animproved collimated version [6] in simultaneous determination of fr and diffusion length zdif.
In this work we tried to use the Nal-spectrometer for the same purpose. By observing the ratio of Ara/Ak
or/and A^A,,, in stable dry and stable wet weather conditions the emanation coefficient can be estimated.
Preliminary measurements on tailings and soil gave value fr = 0.03 ± 0.02 for the fly-ash tailing in Velenje,
PORTOROŽ 95 114

SESSION II PROCEEDINGS
fr = 0.06 ± 0.02 for the U-tailing in rather wet conditions and fr = 0.2 ± 0.1 for the brown soil.
Further work on this subject is necessary.
CONCLUSION
Reasonably good correlation was found between radon-in-soil gas concentrations and eU(Bi-214)-concentrations of soil.
Possibility of using Nal-spectrometer data in dry and wet period for the estimation of the exhalation ofradon gave promising initial results.
ACKNOWLEDGEMENTS
Authors would like to thank Z. Kljajic for assisting the field measurements, Dr. R.L. Grasty for fruitfuldiscussions and calibration of gamma spectrometer, Dr. J. Vaupotič for the calibration of Lucas cells andMgr. L. Mljač for assisting in measurements on fly-ash tailing.
REFERENCES
1. M. Andjeloy, Results of radiometric and geochemical measurements for the natural radioactivity map of Slovenia,Geologija 36, 223-248 (1993).
2. M. Andjelov and D.Brajnik, Map of natural radioactivity and emanation of radon of Slovenia, EnvironmentInternational (in press in 1996).
3. F.I. Yokel and A.B. Tanner, Site exploration for radon potential, NIST Rep. 5135 (1992).4. UNSCEAR, Report to the General Assembly, New York (1982).5. D. Brajnik, U. Miklavzič and J. Tomšič, Map of natural radioactivity in Slovenia and its correlation to the emanation
of radon, Rad. Protection Dosim., 45, 273-276 (1992).6. P. Zettwoog, Sur la mesure des flux..., 2eme CIGG, Universite de Franche Comte, Besancon, France (1993).
PORTOROŽ 95 115
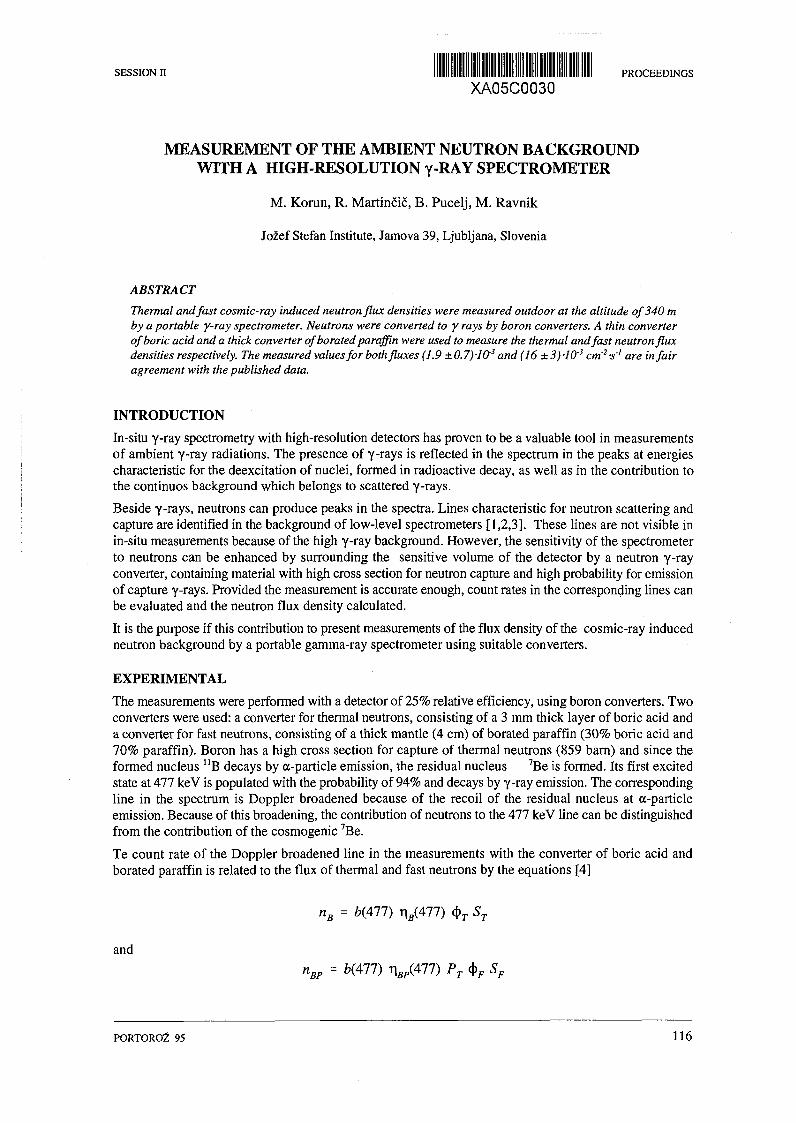
SESSION II PROCEEDINGS
XA05C0030
MEASUREMENT OF THE AMBIENT NEUTRON BACKGROUNDWITH A HIGH-RESOLUTION y-RAY SPECTROMETER
M. Korún, R. Martinčič, B. Pucelj, M. Ravnik
Jožef Stefan Institute, Jamova 39, Ljubljana, Slovenia
ABSTRACT
Thermal and fast cosmic-ray induced neutron flux densities were measured outdoor at the altitude of 340 mby a portable y-ray spectrometer. Neutrons were converted to y rays by boron converters. A thin converterof boric acid and a thick converter of borated paraffin were used to measure the thermal and fast neutron fluxdensities respectively. The measured values for both fluxes (1.9 ±0.7)-lO3 and (16 ±3)-10'3 cm'2-s~' are in fairagreement with the published data.
INTRODUCTION
In-situ Y-ray spectrometry with high-resolution detectors has proven to be a valuable tool in measurementsof ambient y-ray radiations. The presence of y-rays is reflected in the spectrum in the peaks at energiescharacteristic for the deexcitation of nuclei, formed in radioactive decay, as well as in the contribution tothe continuos background which belongs to scattered y-rays.
Beside y-rays, neutrons can produce peaks in the spectra. Lines characteristic for neutron scattering andcapture are identified in the background of low-level spectrometers [1,2,3]. These lines are not visible inin-situ measurements because of the high y-ray background. However, the sensitivity of the spectrometerto neutrons can be enhanced by surrounding the sensitive volume of the detector by a neutron y-rayconverter, containing material with high cross section for neutron capture and high probability for emissionof capture y-rays. Provided the measurement is accurate enough, count rates in the corresponding lines canbe evaluated and the neutron flux density calculated.
It is the purpose if this contribution to present measurements of the flux density of the cosmic-ray inducedneutron background by a portable gamma-ray spectrometer using suitable converters.
EXPERIMENTAL
The measurements were performed with a detector of 25% relative efficiency, using boron converters. Twoconverters were used: a converter for thermal neutrons, consisting of a 3 mm thick layer of boric acid anda converter for fast neutrons, consisting of a thick mantle (4 cm) of borated paraffin (30% boric acid and70% paraffin). Boron has a high cross section for capture of thermal neutrons (859 barn) and since theformed nucleus n B decays by a-particle emission, the residual nucleus 7Be is formed. Its first excitedstate at 477 keV is populated with the probability of 94% and decays by y-ray emission. The correspondingline in the spectrum is Doppler broadened because of the recoil of the residual nucleus at a-particleemission. Because of this broadening, the contribution of neutrons to the 477 keV line can be distinguishedfrom the contribution of the cosmogenic 7Be.
Te count rate of the Doppler broadened line in the measurements with the converter of boric acid andborated paraffin is related to the flux of thermal and fast neutrons by the equations [4]
nB = 6(477) Tifl(477) 4>T ST
andnBP = 6(477) ^ ( 4 7 7 ) PT $F SF
PORTOROŽ 95 116

SESSION II PROCEEDINGS
where b(All) denotes the probability for the population of the first excited state, r|B(477) and 1^(477)denote the counting efficiencies for the deexcitation y-rays from the boric acid and borated paraffinconverters respectively, (f>T and (j>F the flux densities of thermal and fast neutrons respectively, ST and SF
are the area of the outer surface and the cross section of the boric acid and borated paraffin convertersrespectively and PT the probability for thermalization of fast neutrons in the borated-paraffin converter. Inthe equations it is supposed that the thermalization of fast neutrons in the boric acid converter and thecounting efficiency for y-rays from capture of thermal neutrons in the borated-paraffin converter arenegligible.
The counting efficiencies for the deexcitation y-rays from both converters were measured by measuringthe counting efficiencies of samples of reference materials in identical geometry. For the boric acidconverter the IAEA reference material S-8 [5] was used and for the borated paraffin converter an internalsoil standard was produced. The efficiency at the energy 477 keV was obtained by interpolation betweenenergies, where lines, belonging to radionuclei of the 238U series occur. The efficiencies were found to be2.3 ± 0.1 % and 0.85 ± 0.05 %.
The probability for the thermalization of fast neutrons was estimated from the comparison of the responseof the borated paraffin converter and another borated paraffin converter with thickness of 2 cm to neutronfission spectrum. The probability for the thermalization of the 2 cm thick converter was calculated by theMonte-Carlo method [4]. On the basis of comparison of the responses of both converters to the fissionspectrum and the measured counting efficiency of the 2 cm converter (1.70 ± 0.03) the probability for thethermalization was estimated to 0.59 ± 0.06. The same probability was assumed for the spectrum of thecosmic-ray induced neutron background since this spectrum is similar to the fission spectrum [4,6].
It should be noted that the deexcitation line occurs at the energy where the Compton edge of the 661 keVline, which belongs to the decay of 137Cs, lies. Since this isotope is widely distributed in the environment,the in-situ measured spectra exhibits an uneven background at that energy. Because the deexcitation lineis Doppler broadened, the shape of the background can influence the calculated area of the deexcitationline. Therefore, the response of the detectorto the rays from !37Cs (normalized to thearea of the 661 keV line in the in-situmeasured spectrum) was subtracted fromthe spectrum channel-by-channel. Theresponse of the detector was measured witha point source, positioned in the detectoraxis. Therefore, the possible dependence ofthe response on the angle between thedetector axis and the direction of y-rays wasneglected in that subtraction.
The measurements were performed on aroof of a 12-storey building, to diminish thebackground of y-rays, especially 661 keVrays from 137Cs. The location was about 340m above the sea level. The measuring timewas approximately 24 hours for eachspectrum. To prevent accumulation ofmoisture on the preamplifier, it waspermanently heated by a hair dryer. Thespectra, measured with the boric acid andborated paraffin converters are presented onFigs, la and lb. In the spectra displayed, thecontribution of 137Cs was subtracted. On theDoppler broadened deexcitation line, thenarrow line, belonging to the decay ofnaturally occurring 7Be is superimposed.The area in the deexcitation line wascalculated assuming linear background
4000
3500 -
j0 3000
$ 2500-
2000 -
1500 -
2000 -
1S00 -
1000 -
-
—
i•
1
A** *
i
(a) -
—
(b)
650 700
Fig. 1:
Channels
The spectra measured with the boric acid (a) andborated paraffin converters are presented. Thecontribution of 137Cs was subtracted.
PORTOROŽ 95 117

SESSION II PROCEEDINGS
under the Doppler broadened line and linear background under the narrow line. For the full width of thenarrow line four channels were supposed. The fluxes of thermal and fast neutrons were estimated to be(1.7 ± O.9)-1O"3 cm"2-s"' and (16 ± 3)-10"3 c r n V respectively.
DISCUSSION
The flux' densities of cosmic-ray induced neutron radiation in open space at low altitudes are reported tobe in the range from 1.1 to 3.3 • 10 3 cm'V 1 [3,7] for thermal neutrons and from 6.2 to 7.5 • 10"3 cm2 -s1
for fast neutron flux [6,7,8]. Since the shape of the neutron spectrum weakly depends on the altitude [6]the values at 340 m altitude can be estimated. The flux densities about 3 • 10"3 cm'2-s"' for thermal and 9.5 •10"3 cm~2-s"' for fast neutrons were obtained.
The smaller measured value for thermal neutrons may be explained by the absence of the ground in thevicinity of the spectrometer. The ground causes namely an increase in the flux density of thermal neutrons[6], which is due to the production and backscattering of neutrons. On the other hand, we have noexplanation for the higher value for fast neutrons at present.
CONCLUSION
It has been shown that flux densities as small as cosmic-ray induced neutron background can be measuredby in-situ y-ray spectrometry. However, the measurements are long ad require special arrangements tomaintain the reliability of the measurements.
REFERENCES
1. G. Heusser, Cosmic Ray Interaction Study with Low-Level Ge-Spectrometry, Proceedings of the InternationalSymposium on Radionuclide Metrology and its Applications, 15-19 May 1995, Paris, to be published in NIM.
2. G. P. Skoro, I. V. Aničin, A. H. Kukoč, Dj. Krmpotič, P. Adžič, R. Vukanovié and M. Županič, NIM A316 (1992) 333.3. R. Wordel, D. Mouchel, T. Altzitoglou, G. Heusser, B. Quintana Arnes and P. Meynendonckx in: Proceedings of the
International Symposium on Radionuclide Metrology and its Applications, 15-19 May 1995, Paris, to be published inNIM.
4. M Korun, R. Martinčič, B. Pucelj and M. Ravnik, NIM A368, (1996) 431-436.5. Analytical Quality Control Group, Certificate of Reference Sample S-8, IAEA, 1975.6. NCRP Report No. 94 (1987), NCRP Publications, Bethseda, MD 20814, USA.7. G. Heusser, NIM B17 (1986) 418.8. G. Heusser, Low Radioactivity Background Techniques, to be published in: Annual Review of Nuclear and Particle
Science, 45 (1996).
PORTOROŽ 95 118

SESSIONn H i l l Mil I I M M U N III PR0CEEDINGS
XA05C0031
RADON MITIGATION IN SOILS
D. D. Ristoiu °, C. Cosma ", T. Ristoiu2), J.Miles3)
" University Babes-Bolyai, Ro 3400, CIuj-Napoca, Romania2) Technical University, Ro 3400, Cluj-Napoca, Romania
3) NRPB, Chilton, Didcot, Oxon, OX11 ORQ, UK
INTRODUCTION
Radon is produced in soil by radium decay, Ra-226 for radon (Rn-222) and Ra-224 for thoron (Rn-220).The radium content is about 40 Bq.kg"1 in crustal rocks and soils, 70 Bq.kg1 in granite and only about 8Bq.kg1 in limestone.
Being the heaviest gas in atmosphere, radon presents high concentration at surface and it is accumulatingin closed or poorly ventilated places, both in underground cavitys (caves or mines) and in dwelling. Incomparison with the average radon concentration in atmospheric air of 8 Bq.m3, the average indoor radonconcentration reaches 10-100 Bq.m'3 [1]. International statistics indicate that radon contribution on naturalirradiation is about 60%. The main sources of indoor radon are: radium content of the soil and of theconcretes, water supply and natural gases.
RADON TRANSPORT IN SOIL
Processes involved in the transport of the radon from soil to the surface are related to the size andconfiguration of the spaces occupied by the soil gas. These spaces may vary from molecular interstices tolarge underground caverns. The openings may be isolated, interconnected or deadened. All thesecharacteristics are important to the radon mitigation problem.
The near surface transport processes can be broken down into two major categories: macroscopic processesin which flow occurs through cracks, fissures and underground channels, and microscopic processes inwhich diffusive and pressure-induced flow are dominant.
Knudsen diffusion occurs in compact, fine-grained soils having capillaries radius r < 0.01 um, hence theratio between capillaries radius and the radon mean free path (X = 0.1 urn) is r/A < 0.1. This type transportis unproper to terrestrial condition, but it prevails in selener soils.
Molecular diffusion is the main transport mechanism in porous soils with equivalent capillary radius r <lum, hence the ratio r/X < 10. In the mean time, according to the measurements of radon diffusioncoefficients it has been shown that diffusion is important in radon transport through residential concrets[2].
The radon flow rate due to diffusion Jd is given by Fick's law:
Jd = -D VC (1)
where D is the diffusion coefficient and C is radon concentration.
The diffusion coefficient depends on temperature T, pressure p and molecular mass of diffusing gas M asit follows: D = A.T3/2.p-'.M-1/2.
Another parameter for diffusion is diffusion length defined by the relation: L = (D/T|A)1/2, A being the radonradioactive decay constant. Diffusion length is about 1.6 m for radon, but only about 2 cm for thoron [1],which indicate that much of the Rn-220 decays before reaching the earth surface.
Pressure induced flow prevails in soil fine cracks soils with fissure radius r > 0.001 mm, hence r > X. Thetransport through cracks contributes also to indoor radon concentration, the main access being the floor-wall joint. The lower indoor pressure compared with soil gas pressure induces an inward radon flow.
PORTOROŽ 95 119

SESSION II PROCEEDINGS
Pressure induced flow rate is given by Darcy's law:
Ja = Cv , where v = - ( | ) V P ( 2)
where: k is the soil permeability, v is the transport velocity of soil gas, ô is the dynamic viscosity and p isthe pressure.
The velocities resulted by using laminar viscous flow model are low, about 10"6 m.s"1, so the distancescovered in a halflife are quite short.
The radon produced in crust may reach earth surface also through large openings like natural or artificialunderground tunnels (mine or subway nets) and caves. In this cases the radon transport is due to pressuregradients, generally induced by winds, and also to temperature gradients caused by diurnal and seasonalvariations of atmospheric temperature. This way radon covers long distances, of tens and hundreds meters,the flow is turbulent and great masses of air are displaced.
THE CALCULATION OF RADON FLOW RATE DUE TO DIFFUSION
Generally all these processes are simultaneous, the prevalence of each being related to the studied soilmorphologic structure. The analysis that follows is based on the following assumptions [3]:
a) the soil surface is plane;b) flow of gas takes place perpendicularly to the surface of the medium, i.e., one-dimensional problem
(the z-axis is chosen perpendicular to earth surface with negative direction inward;c) the medium through which the gas flows is itself a source of gas;d) the medium is homogeneous and isotropic.
The rate of change in the number of radioactive gas atoms in a bulk volume of a porous medium where gasproduction, gas decay, and diffusion and pressure-induced flow take place is given by continuity equation:
^ Wd Ja)AC Swhere T| is the porosity of thfPmedium and S is the radioactive gas production rate.
Substituting relations (1) and (2) in equation (3) we have:
If only steady-state conditions are considered, hence ôc/ôt = 0, and we assume diffusion prevails, so thatpressure induced flow can be ignored; V(Cv) = 0, equation (4) becomes:
( - ) V 2 C - A C + S = 0 (5)
Noting u the inverse of the diffusion length: \x2 = r\A / D we obtain equation (5) as:
C = -£S (6)
Equation (6) is resolvable if we know the boundary conditions which can be establish taking into accountphysical considerations. Radon concentration in atmospheric air is much lower than in soil gas, so that wecan consider radon concentration at soil surface null. On the other hand at an "infinite" depth we canassume no transport phenomena takes place, so we obtain from equation (5) C = S/A. Hence the boundaryconditions are:
C (z =0,0 = C (0,ř)=0
C(z = -°°,0=C(-~0 = 4 ' ( 7 )
AThe solution of equation (6) with the boundary conditions (7) is:
| ( l - e ^ ) (8)
PORTOROŽ 95 120

SESSION H PROCEEDINGS
Substituting the result (8) in Fick's law we obtain radon flow rate due to diffusive flow as a function ofdepth z:
" " " " . e - * (9)
The radon flow at earth's surface, Jo, can be calculated by setting z=0 in equation (9).
(10)
THEORETICAL RESULTS AND DISCUSSION
We made a computer programme to model radon concentration and flow rate as a function of soilcharacteristics. This programme allows us to modify simultaneous or in turn the parameters whichcharacterise soil properties and also to plot the corresponding graphics.
The figures la and lb show the variation of normalised concentration C(z)/(S/A) as a function of the depthz for different values of u, for radon and thoron respectively. The used values of u cover all types of soils,from sands to hard rocks.
1000 1EO0
O*pth, CM
Fig. la : Normalized radon concentration vs. depth. Fig. lb: Normalized thoron concentration vs. depth.
We can see that radon and thoron concentrations increase with increasing depth until a constant maximumvalue is attained. This depth is considerably lower for thoron (16-48 cm) than for radon (6-24 m) becauseof the shorter thoron diffusion length compared with that of radon. We can also notice that with the increaseof u, maximum concentration depth increase.
5
ii
ä
í1
>e
6
1
2
4 vVi\• ť.\
'v0 I
0
\
\ >\
\
BOO
\
^ - ^ ^ ^
^ ^ * • * ' * •
tOOO 100O
O*pth, ca
-
-
-
^
2000 20
... v- 0.002
— y 0.004
„ . y 0.006
_ y 0.008
m y 0.010
oo
?S•Í
í
e
6
+
2
0
l\í\\ «5 \ \Í;\ \ \
10
\
\
^ - ^ J . "20 30
-
-
^ - ^
-to s
... y aioo
_ j j- a2O0
... >•• 0.400
- y - O.6OO
. y- 1.000
0
Fig. 2a: Normalized radon flow rate vs. depth. Fig. 2b: Normalized thoron flow rate vs. depth.
PORTOROŽ 95 121

SESSION II PROCEEDINGS
Taking into account the expression of u, it results that the maximum concentration depth is lower for higherporosity soils or for lower diffusion coefficient soils.
The figures 2a and 2b show radon and respectively thoron normalized flow rate as a function of depth. Wecan clearly see that there is no diffusive flow at great depth.
The relatively low maximum concentration depth for radon and thoron brings the problem of radoninfiltration in buildings through basements. The depth of this basements often corresponds to over 50%maximum concentration which leads to high radon concentrations in basements and from here to dwellings,the most exposed being the inhabitants of the first floors. It is the same situation for subways and mines.Since 1924 Luedwing and Lorenster [4] suggested already a correlation between lung cancer and radonexposure for mines. This has been confirmed by statistics and recent studies [5].
As conclusion, the radon mitigation from soil to air is a very complex process, implying differentmechanisms and depending on soil characteristics on one hand and on meteorological condition on theother hand. A complete mathematical description of the radon transport through soil taking into accountall there parameters is quite impossible, but there are some particular situations like the one exposed abovein which the prevalence of a single type of transport process and the constant maintenance of the otherenvironmental factors, allows quantitative evaluations of radon concentrations and flow-rate. Thetheoretical model presented above was elaborated to be used at the interpretation of radon flow ratemeasurements carried out in different geological areas from Transilvania [6].
REFERENCES
1. M.Wilkering, Radon in the Environment, Elsevier, Oxford, 1993.2. V.C.Rogers, K.K.Nielson, R.B.Holt, R.Snoddy, Radon Diffusion Coefficients for Residential Concretes, Health
Physics, vol.67/111, p.261-265,1994.3. J.Bigu, Theoretical Consideration Regarding the Migration of 222Rnand2WRnfrom Uranium- and Thorium-Bearing
Underground Environments, Health Physics, vol.67/1, p.60-69, 1994.4. P. Luedwing, E. Lorenster., Z.Physik,22,178,1924.5. H.Smith, Protection Against Radon-222 at Home and at Work, Pergamon, Didcot, 1993, p.29.6. C.Cosma, A.Poffijn, D.Ristoiu, The radon in various environmental samples in Hersulane Spa from Cerna Valley
(Romania). Environ. International, 1995, in press.
PORTOROŽ 95 122

SESSION II
XA05C0032PROCEEDINGS
SURVEY OF RADON ACTIVITY AT GROUND LEVELIN VILLAGE HOUSES IN HUNGARY
E. Tóth, D. Selmeczi
Lauder Research Group of RAD Foundation, Budapest, Logodi 48, H-1012, Hungary
Our national survey in Hungary began in 1992, in the most beautiful European village: Mátraderecske.In the dwellings of Mátraderecske there is a wide range of radon activity concentration from 50 Bq/m3
to 2600 Bq/m3 in yearly average. In the first two years we have learnt the whole process of themeasurement in this village: how to communicate with the local people with the help of the localstudents and their physics teacher, how to handle CR 39 track detectors in a reliable way, and how toevaluate the detectors by a home made semi-automaton.
The results in this village encouraged us to extend our survey to find a much wider statistics to seebetter the correlation between cancer cases and low dose radiation.
40%
35% --
Radon in Hungary 1994/95Yearly Average in
3339 dwellings
(without Mátraderecske)AM: 120GM: 90GSD: 2.06
Median: 87
hBq/m*
In A
0%
Bq/m'
Fig. 1.
During the three years our survey of Mátraderecske we have found the well-known daily and seasonalvarying of radon, but something more came up: there are long term variations year by year, or maybethere was a sudden jump in the last few years. It is an interesting question whether these changes are
PORTOROŽ 95 123

SESSION II PROCEEDINGS
characteristic only for Mátraderecske, or for the whole country.
And we have learnt in Mátraderecske how to mitigate houses in different and inexpensive ways withsuccess.
Mátraderecske prepared our group to carry out a ten times wider survey in the Hungarian villages allover in the country. Our co-workers are the local students and their teachers. When we distributed thedetectors, the students of the Lauder Research Group visited the local students, and taught some nuclearphysics and radiation protection for them.
The detectors were placed in the bedrooms at pillow level in three seasons (Autumn, Winter andSpring). We calculated the yearly average taking into account the time of exposure and estimated theSummer radon level as fifth of the Autumn-Winter value.
The CR 39 (from NRPB, England) were etched in 25 % NaOH solution at 86°C for 6 hours. The trackswere counted by the semi automatic system, which were built up by Elektronika 77, Budapest, and thesoftware was developed by our group. For the calibration we got help from Jon Miles, NRPB, England.In the case of our detector's arrangement 1 track in 1 mm2 means 37 Bq/m3 month.
In 1994/95 we measured the radon in more than 3700 houses in Hungary, we were able to calculate theyearly average in 3573 dwellings. Our sample represents the radon activity concentration at the groundlevel of houses in the Hungarian villages. It is quite interesting that together with Mátraderecske themean value of the Hungarian yearly average is 132 Bq/m3, but without this village this is only 120Bq/m3.
One can predict the percentage of the houses of higher activity concentration based upon the lognormaldistribution of the measured houses in the previous year. (This was suggested to us by Jon Miles,NRPB, England.)
We tested this method on two villages by choosing randomly 20,40 and 80 houses from the previouslymeasured few hundred dwellings. Then we compared the real percentage and the predicted ones by thelognormal distribution.
The applicability of the method is shown in the following table.
Mátraderecske
(from 470 houses)
Dunántúl
(from 248 houses)
number ofselectedhouses
20
40
80
20
40
80
over 40((9
prediction
12-57
12-41
19-33
0.1-9.9
0.4-7.5
1.1-8.7
) Bq/m3
i)
reality
22
3.6
over 80C
prediction
0-26
0-11
2-8
0-2.3
0-1.3
0-1.2
) Bq/m3
reality
6
0
Table 1.
We found houses with higher radon level not only in Mátraderecske, but in 8 other villages in Hungary.In the year 1995/96 our survey continues
• in Mátraderecske,• in the 8 villages of higher radon to get more data for the cancer research,• in many villages enter the project in 1995,• in some previously measured villages to follow the radon varying in time.
Thanks for the Engineers for Environment Foundation, for the Deák & Deák Financial Advisory Office,
PORTOROŽ 95 124

SESSION II PROCEEDINGS
for the OMFB, Elektornika 77 and for the OTKA Project of Atomic Physics Department, EötvösUniversity to sponsor the RAD Foundation, giving the financial background of our work.
Thanks to George Marx and to Jon Miles for their professional patronage and thanks the patience andthe love of the world's most beautiful village, Mátraderecske.
REFERENCES
1. High Radon Activity in North East Hungary, E.Tóth, Dezsô Boros Lauder Yavne School, Budapest, LennartSamuelsson, Department of Physics, University of Linköping, Ferenc Deák, George Marx, Csaba Sükösd, Departmentof Atomic Physics, Eötvös University, Budapest, Phjysica Scripta, Vol. 50, p. 726-730, 1994.
2. Variations of Activity in a Hungarian Village, Eszter Tóth, Radon in the Human Environment, Proceedings of IAEA,Research Coordination Meeting, December, 1994.
3. Low Cost Mitigation in Hungary, Esther Tóth, David Selmeczi, Peter Zöldi, Gabi Horváth, George Marx, Lauder YavneSchool, Department of Atomic Physics, Budapest, 1995.
4. Nuclear Literacy, Eszter Tóth, in Wonder and Delight, Essays in Science Education, ed. B. Jennison, J. Ogborn,Institute of Physics, Bristol, Philadelphia, 1994, pl27-133.
5. Nuclear Democracy, Esther Tóth, GIREP Newsletter, 1993.
PORTOROŽ 95 125

SESSION II PROCEEDINGS
XA05C0033
CALIBRATION OF A DOSIMETER FOR DETECTIONOF RADON ACTIVITY IN AIR
M. Caresana, V. Cattaneo
Dipartimento di Ingegneria Nucleare, Politecnico di Miláno, Miláno, Italy
INTRODUCTION
The purpose of this work is to illustrate the calibration of a ionization chamber to be used for thecalibration of a cellulose nitrate LRl 15 based dosimeter for radon gas monitoring.
During the work the radon was obtain from a source of radium salt of few tens kBq of activity.
The calibration factor obtained for the ionization chamber is 3,77xlO15 ± 0.32X10¹⁵ Bq/nf A. For whatconcern the dosimeter the calibration factor is 4/ľxlO"4 ± 1.5X10"4 tr/cm2/Bq-h/m3.
Keyword: radon, ionization camber (CI), transfer camber (CT)
IONIZATION CHAMBER CALIBRATION
Figure 1 shows the drawing of CI. The power supply of-1500V is connected between the external electrodeand the ground, current is measured between the internal electrode and the ground.
1.2.3.4.5.6.7.8.9.
external coveringflangeexternal electrodePVC ringguard ringinternal electrodevacuometertapBNC connector, signalandHV
Fig. 1.
CI was calibrated using two different methods, both of them employ CT, shown in figure 2.
Fig. 2.
PORTOROŽ 95 126
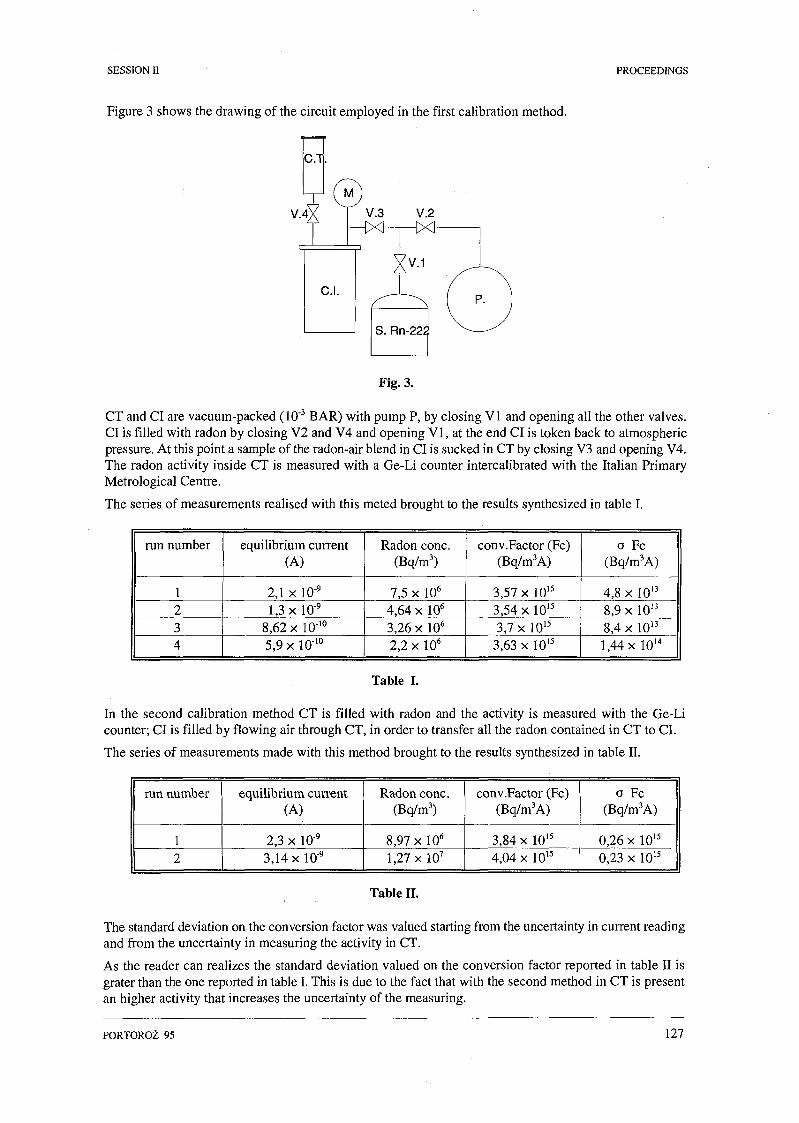
SESSION II PROCEEDINGS
Figure 3 shows the drawing of the circuit employed in the first calibration method.
C.T
V.4> V.3 V.2
C.I.
Yv.1
S. Rn-22Í
Fig. 3.
CT and CI are vacuum-packed (10'3 BAR) with pump P, by closing VI and opening all the other valves.CI is filled with radon by closing V2 and V4 and opening VI, at the end CI is token back to atmosphericpressure. At this point a sample of the radon-air blend in CI is sucked in CT by closing V3 and opening V4.The radon activity inside CT is measured with a Ge-Li counter intercalibrated with the Italian PrimaryMetrological Centre.
The series of measurements realised with this meted brought to the results synthesized in table I.
run number
1234
equilibrium current(A)
2,1 x 10"9
1,3 x 10"9
8,62 x lO"10
5,9x10'°
Radon cone.(Bq/m3)
7,5 x 10⁶
4,64 x 10⁶
3,26 x 10⁶
2,2 x 10⁶
conv.Factor (Fc)(Bq/m3A)
3,57 x 10'5
3,54 xlO15
3,7 x 10'5
3,63 x 10'5
o Fc(Bq/m3A)
4,8 x 10¹³
8,9 x 10¹³
8,4 x 10¹³
1,44 x lO ' 4
Table I.
In the second calibration method CT is filled with radon and the activity is measured with the Ge-Licounter; CI is filled by flowing air through CT, in order to transfer all the radon contained in CT to CI.
The series of measurements made with this method brought to the results synthesized in table II.
run number
12
equilibrium current(A)
2,3 x 10"9
3,14 xlO"9
Radon cone.(Bq/m3)
8,97 x 10⁶
1,27 x 10⁷
conv.Factor (Fc)(Bq/m3A)
3,84 xlO15
4,04 x 10¹⁵
o Fc(Bq/m3A)
0,26 x 10¹⁵
0,23 x 10¹⁵
Table II.
The standard deviation on the conversion factor was valued starting from the uncertainty in current readingand from the uncertainty in measuring the activity in CT.
As the reader can realizes the standard deviation valued on the conversion factor reported in table II isgrater than the one reported in table I. This is due to the fact that with the second method in CT is presentan higher activity that increases the uncertainty of the measuring.
PORTOROŽ 95 127

SESSION U PROCEEDINGS
In both the methods the critical point in the measuring is due to the efficiency in transferring the radon-airblend from CI to CT or vice versa. With the first method a transfer efficiency < 100% bring to anunderestimating of the radon concentration in CI and so an underestimating of the conversion factor Fc.With the second method a transfer efficiency < 100% bring to an overestimating of the radon concentrationin CI and so an overestimating of the conversion factor Fc. For this reason the conversion factor is valuedas the arithmetic mean between the greater of the ones reported in table I and the smallest of the onesreported in table II.
transf.effal __ 1,96x10" __ 27
3 3 (1)
The systematic error due to the transfer efficiency is characterised by two extreme values given by theconversion factors employed for the determination of the mean conversion factor.
Considering a constant distribution of probability internal to the interval defined above, the variance isgiven by the (1) where a is the difference between the extreme values of the interval.
The variance associated to the mean conversion factor is calculated compounding the variance reported in(1) with the square of the standard deviation reported in the third line of table I and in the first line of tableII. The variance result to be:
o 2F c = 2 , 5 2 x l O M (2)
Using a covering factor K=2 we obtain the following conversion factor, expressed in Bq/m3A, is:
Fc = 3,77xl0' 5±0,32xl0 1 5 (3)
CALIBRATION OF THE IONOGRAPHIC METHOD
The ionographic dosimeter is shown in figure 4.
Cover
dosimeter"body
Polyaibonate
\Iit-115 films
Cover Aluminium
Fig. 4.
During the utilization the dosimeter is termically sailed in a gas permeable polyethylene envelope. Thisassure both the radon toron discrimination and radioactive equilibrium of radon with daughters.
The dosimeters are exposed up to 8 inside CI. The exposure times range between 1 and 2 days. Themeasurements of radon concentration inside CI is made at the end of the exposure. The exposure iscalculated according to the (4):
E =Cf-eh
Ĺht
- 1) Bq-h(4)
PORTOROŽ 95 128

SESSION U PROCEEDINGS
Where Cf is the radon concentration inside CI at exposure end, X is the radon decay constant expressed inh'1 and t is the exposure time expressed in h.
The films are read using the spark-counter technique after a chemical etching of 90 in a solution of NaOHat 10% at the temperature of 333 K.
The spark-counter track density reading is normalized to a residual thickness of 6.5 /im, according tothe (5):
D.Dmis
(1-0,296(5-5^))(5)
where D mTm is the normalized track density, Dmiss is the track density measured with the spark-counter, Sis the residual film thickness and S rif is the reference thickness to which the track density is normalized;in our case S rif=6.5 }J.m.
The numerical coefficient 0.296 is experimental [1]
The variance associated to D norm measurement is given by the (6)
a1
D.[l-0,296-(S-S„7)]
2
0 , 2 9 6 - D , - amis " S
1-0,296-(5-5^(6)
o2Dmis is the variance of track density; considering a Poisson distribution of track densitycr2
Dmis = D mis.
a2s is the variance associated to the residual thickness measurement. The digital length gauge employed
for the measurement has a step of 0,5 £im; we assume that the true value will fall inside an interval 0,5width with constant probability inside this interval. a2
s is given by (7):
a25 = 9zĹ = 0,083 »m2 (7)
Table III shows the efficiency calculated in 2 different series of exposures.
n° exposure
12
efficiency
4.75x10"4
4.65x10"4
a efficiency
3,74xlO"5
7,72x10⁵
Table III.
D norm measurements, for every single film compounding the 8 dosimeters used in every exposure, arestatistically compatible, according to the variance calculated with (6); this assures an exposure uniformityinside CI. Dosimeter efficiency ďis calculated according to the (8).
e =norm norm (8)
where D nom is the arithmetic mean of Dnorm values of all the 16 films (2 for every dosimeters)compounding a single exposure.Values reported in third column in table HI are calculated according to the (9), compounding the varianceof D mrm with the uncertainty associated to the exposure measurement.
o\ =ň + o"2
B (D - B )unom "nom \ norm norm j 4 2 (9)
PORTOROŽ 95 129

SESSION II PROCEEDINGS
2Dnorm j s calculated starting from the measurements of D norm according to the (10)
16a2_ _ V^
Dmrm
B norm is the normalized track density for unexposed films; it is experimentally valued in 25 ± 5tr/cm2.
(11)A*
2®E is the variance associated with exposure measurement it is calculated starting from the uncertainty
of the conversion factor Fc given by (3), according to the (11).Where / is the current measured in CI at exposure end.
CONCLUSION
As the reader can see in table III the method has a very good reproducibility, affected by an uncertaintyvaluable at about 30%. The mean error source is the uncertainty due to the measurement of the residualthickness.
The efficiency value reported in the introduction is obtained making a mean of the values reported in tableIII; the uncertainty is valued as 2 times the maximum standard deviation reported in the third column intable III.
As a comparison the NRPB calibration of 1989 gives an efficiencye = 4,95- 10^ ±9,1 • 10- 5tr/cm 2/Bq-h/m 3 .
REFERENCE
1. L. Carpa: "Metodo ionografico per la determinazione delľattivitä alfa in aria", Graduation thesis, Institute of Physics,University of Milan.
PORTOROŽ 95 130
SESSION II llllinillllHllllllllllllllllllllllllllllillllllll PROCEEDINGSXA05C0034
DOSE AND RADON MEASUREMENTS INSIDE HOUSESCONTAINING ASH AS BUILDING MATERIAL
R. Bodnár3), Z. Lendvai !), C. Németh2), J. Somlai[)
" University of Veszprém, Department of Radiochemistry, Veszprém, Hungary2) University of Veszprém, Department of Physics,Veszprém, Hungary
3) Foundation for Radioecological Cleanness
ABSTRACT
Radon concentration and external dose have been measured in dwellings that contain by-products of coal-burning for building materials. The concentrations ofmK, 232Th, 23SU and 226Ra have been determinated in thematerials. The date are analyzed according to indices frequently used for decision of utilizing the by-products.The observed daily fluctuation of the radon concentration in dwellings might exceed a factor of 5.
INTRODUCTION
In the region of the Transdanubian Middle Mountains in Hungary there are spots where the concentrationsof radionuclide 2 3 8U in rocks and mineral coals may exceed ten to twenty-fold of the world average. Theburning up of the coal increses the radioactive concentration in the slags and fly-ashes 40-60 timesadditionally. A few decades ago frequently and even recently -. in spite of the official limitation - the slagsand ashes of boilers and home stoves have been used as backfill or insulation in floors mainly in privatehouses.
Around the city of Ajka the overwhelming part of the waste is limestone; due to self-flammation this limeburnt out of the waste-heap and the burnt lime was carried away to make mortar.
In most cases the elevated concentrations of 2 3 8U in the building materials could be detected by externaldose measurements provided inside the houses. Additional information is gained from sampling andradionuclide determination of the building elements.
Samples have been taken from the broken waste-heaps and the slags used as backfill or insulation in thehouses monitored. These samples were closed in aluminium Marinelli-beaker for 20 days prior to radiationmeasurements in order to gain equilibrium caused by radon emanation.
METHODS
The concentration of 40K, 232Th, 2 3 8U and with respects of radiation impact the most significant daughterelement 226Ra, have been determined by gamma-spectrometric system of "N"-type Tennelec HPGedetector.
An uranium ore sample, certified by the National Authority Office of Measures, was used as calibrationsource.
For dose limitation control the international practice provides the 226Ra, ^ T h and 40K concentration in unitsof Bq/kg with several indeces with respect to the quality of the building materials. Therefore we have usedthe following ones:
Radium-index = R a ~ 2 2 6
200
Gamma-index = S™ S*Ľ™ E™*L+ +
10000 1000 700
PORTOROŽ 95 131
SESSION II PROCEEDINGS
Tj K-40 , ^Ra-226íl = +-
•"Th-232
1500 1500 100
According to the regulations the upper limits of the introduced indices is 1 for building materials.
In addition to the former indices the Radium-equivalent concentration is defined as:
+ 0,086 CK.4O
According to the regulations the upper limits of the introduced indices is 1 for building materials.
For building houses the C^Aw value is recommended only below 370. Between 370-740 the industry, over740 only roads and railways can use them. Above 3700 it's forbidden to be used for building elements.
RESULTS
The calculated results of the refuse materials from waste-heap used for house buildings and the slagsamples of the measured buildings are got in di shown in table No.I.
Table I. gives some results of the indices fferent samples that are taken from building materials and slagsnear to the cities Ajka and Tatabánya.
Sample
refuse from city Ajka
refuse from city Ajka
refuse from city Ajka
refuse from city Ajka
refuse from city Ajka
refuse from city Ajka
refuse from city Ajka
refuse from city Ajka
refuse from city Ajka
slag from city Tatabánya
slag from city Tatabánya
slag from city Ajka
slag from city Ajka
slag from city Ajka
slag from city Ajka
slag from city Ajka
Ra-index
1,79
1,92
2,12
2,50
7,44
7,61
7,67
9,76
10,20
4,96
7,85
3,56
3,87
11,60
13,30
14,50
Gamma-index
0,386
0,428
0,430
0,510
1,50
1,53
1,56
1,99
2,07
1,04
1,62
0,763
0,809
2,33
2,69
2,92
H
0,426
0,548
0,331
0,397
1,09
1,08
1,20
1,59
1,53
0,962
1,42
0,819
0,755
1,65
1,95
1,98
p^ R a ckv.
382
422
429
509
1501
1529
1556
1989
2069
1031
1621
756
805
2330
2689
2918
Table I: Includes for different samples calculated.
We measured gamma dose in rooms containing materials like these. Depending on the size of the roomswe measured the dose between 10 to 20 spots at different heights (floor level, 0.4m and 1.0 m above floorand on the ceiling) and it differed between 200-900 nGy/h, hence in some cases it considerably exceededthe average values of 80-120 nGy/h.
The other source of radiation dose is the 222Rn emanating from materials containing 226Ra in highconcentration. This element and its decay products increase internal radiation dose.
Although we have measured 150-200 rooms by using grab-sampling method and 20% was found to be
PORTOROŽ 95 132

SESSION II PROCEEDINGS
relatively high, the achieved dosemeasurements.
can only be calculated after evaluating results of continuous
Several times continuous measurements were performed lasting for days or weeks by using the devices ofPYLON AB-5 set equipped with PCRD detector, which stores the hourly values. Fig. 1. shows a graphindicating the process of change in radon concentration.
50 100
Time [hours]
150 200
Fig. 1: The change of radon concentration in a house.
As far as the measurements are concerned we can claim that the tenants who lived in buildings made fromthese building materials, have achieved larger dose than the world average of 2.4 mSv /a. It derives partlyfrom the increased outer gamma radiation (0.8 - 2.4 mSv/a extra dose with a daily 12 hours spent inside).On the other hand, the internal radiation dose mostly from the inhalation of radon and its decay productscan exceed even 10 mSv /a.
CONCLUSION
The results clearly show that unfortunately not only the regulatory proved materials were used in thebuildings. Therefore the dose from the elevated concentration of natural radioisotopes in the buildingmaterial contributes to the population living in the investigated dwellings.
More effective propaganda should be introduced to stop people using unproved by-products of coals forbuilding for building materials.
REFERENCES
1. H. A. Das, I, Journal of Radioanalytical Chemistry, Vol. 79. No. 2 (1983) 325-328.2. G. S. Islam, M A. Islam, S. M. Farid, A. Rahman, Nucl. Tacks Radiat. Meas., Val. 15. No. 1-4. (1988) 551-5543. I. S. Neuberjen, C. F. Lyrick, B. C. Kross, R. W. Field, R. F. Wodson, Health Physics, Vol. 66. Num. 3. (1994)
263-269.
PORTOROŽ 95 133

SESSI0Nn II Ml I I M M I II INI I I I I PR0CEEDINGS
XA05C0035
LUNG CANCER RISK AMONG CZECH MINERS EXPOSED TO RADONRELATED TO HISTOLOGICAL TYPES *
T. Müller, L.Tomášek, V. Plaček
National Radiation Protection Institute, Prague, Czech Republic
Long term exposure to radon and its progeny is one of the most important health problems. Epidemiologicalstudies have demonstrated that exposure of miners to radon in a mine atmosphere can cause lung cancer.It has been recognized that lung cancer risk in uranium miners is associated with increased incidence ofcertain histological types, especially epidermoid and small cell.
Recent results showed that the basic dependence of the relative risk for the two main histological types islinear with cumulative exposure. However, there is a suggestion that time and age modifiers of thedependence may be different for the two types.
The aim of the study was firstly to verify the assumed differences in incidence of histological types of lungcancer for the studied cohort and general population and secondly to characterize the relation of histologicaltypes specific incidence to different exposure patterns.
The study is based on data of the oldest Czechoslovak cohort, which belongs among the largest ones withthe longest follow-up. The cohort includes 4320 former uranium miners who started their work in uraniummines in West Bohemia in the period 1948-59, and were working at least for 4 years and their completepersonal and anamnestic data were available.
The study method is long-term prospective follow-up. The cohort was divided in two groups according toexposure rate pattern in order to analyze the impact of exposure conditions on main histological typesincidence. The exposure rate never exceeded the level of 5 WL since the third year of exposure in the group1 (cumulation exposure type 1) while the exposure rate exceeded at least once the level of 5 WL in group2 (cumulation exposure type 2). The first two years of exposure had not been taken into consideration inorder to confirm hypothesis about the inhibitory effect of high exposure rate levels. Consequently it couldinfluence lung cancer risk level caused by previous exposures.
The basic method of the study is an analysis of observed frequencies of lung cancer death cases and theirhistological type specification in relation to expected standardized frequencies (age and time period) fromCzechoslovak statistics of the period 1953-90. In accordance to WHO classification and from previous dataanalysis (Sevc et al., 1989), lung cancer cases were divided into four groups:
1 - epidermoid2 - small cell3 - adenocarcinoma4 - other histological types
RESULTS
A total of 705 lung cancer cases were recorded by 31 December 1990. The ratio of observed and expectednumbers was 5.11. There was no significant difference in the first 5 years since the first exposure.Morphological diagnoses were available in 458 cases. This represents histological type specification in 65%of lung cancer cases in the cohort as showed in Table 1.
Histological types could not been specified in 41% of all recorded lung cancer cases (i.e. 287 cases). Thereare available morphological findings in 40 cases (code 5), but it is impossible to specify reliably histologicaltype by these findings. It is impossible to obtain any information to specify histological type in 46 cases(code 9).
Research supported by the Ministry of health Internal Grant Agency - Reg.No. 18591-3.
PORTOROŽ 95 134

SESSION II PROCEEDINGS
Histological type
no informationepidermoidsmall celladenocarcinomaother typesunspecifiedno material
Total
Code
0123459
-
Cases
20117318531294046
705
%
28.524.526.24.44.15.76.5
100.0
Table 1: Distribution by histological types.
Type
Age
-4445-5455-6465-84
Total
Small cell
0
24716525
185
O/E
35.0211.974.272.65
5.91
Epidermoid
O
7398146
173
O/E
10.647.2
5.393.79
5.20
Table 2: Age and histologie type specific mortality.
Table 2 summarizes observed (O) and expected (E) death frequencies in dependence on attained age forboth main histological types. The decrease of relative risk with age is apparent in both histological types.A more detailed analysis shows that decrease of relative risk in epidermoid type is less rapid than in smallcell type. From this fact follows that the risk of lung cancer will be significantly lower in small cellcarcinoma than in epidermoid one in higher age of former miners. This is the contrary of situation inyounger age groups of miners.
Table 3 demonstrates dependence of relative risk on cumulated exposure (lagged by 5 years) for mainhistological types. Level of relative risk reaches similar values in the same groups of exposure in relationto cumulated lagged exposure.
Type
Exposure (WLM)
0-99
100-199
200 - 299
300 - 399
400-
Small cell
O
18
69
48
21
29
O / E
2.72
5.03
8.36
7.72
11.68
Epidermoid
O
17
62
42
21
31
O / E
2.42
4.26
6.98
7.07
11.52
Table 3: Exposure and histologie type specific mortality.
RISK MODELS
Analysis of epidemiological studies showed that time since exposure and attained age considerablyinfluence excess relative risk of lung cancer. In this study the BEIR IV model (1988) has been applied inthe form:
RR(a) = 1 + b(wl + qw2) g(a),
PORTOROŽ 95 135

SESSION II PROCEEDINGS
where wl is the exposure experienced 5-14 years ago, w2 is the exposure experienced 15+ years ago,b(=ERR/WLM) is excess relative risk per WLM, g(a) is age modifier.
Due to duration of the study, it was possible to extend time since exposure (TSE) categories into 4 timeintervals.
We have studied influence of the basic variable - cumulated exposure and main factors modifying theexposure - effect relationship:
1) time since exposure (TSE)2) age at exposure (AM)3) time pattern (TP)
The estimated values of model parameters show important differences (Table 4).
ERR/WLM
Epidermoid
0.0661
Small cell
0.3286
TSE
5- 115- 225-3435-
AMTP
1.0000.9260.150-0.016
-0.03380.708
1.0000.1100.0140.008
-0.08780.534
Table 4: Relative risk model parameters for histological types.
The ERR/WLM was 6.6% in epidermoid and 32.9% in small cell type (5 times higher). The effect of timepattern was found significant in small cell type and not in epidermoid type, which confirm hypothesis aboutparallel inhibitory effect of alpha radiation on small cell type of lung cancer. Significant negative valuesof the AM parameter confirm theory about decrease of lung cancer risk with age at exposure. This trendis more apparent in small cell type.
SUMMARY
The recent results of the study confirmes linear dependence of exposure and relative risk, decrease of alpharadiation effect with time since exposure and decrease of effect in older age categories.
More detailed analysis of exposure - effect relationship in main histological types of lung cancer confirmeshypothesis formulated by J. Ševc about parallel inhibitory effect of alpha radiation in higher exposure rateswhich followed after period of initiation of malignant process of bronchial epithelium cells. Thisphenomenon was observed in small cell type of lung cancer. These conclusions are based on applicationof proportional risk model.
REFERENCES
1. Tomášek L., Swerdlow A.J., Darby S.C., Plaček V., Kunz E.: Mortality in uranium miners in West Bohemia: a longterm cohort study, Occup. Environ. Medicine 1994; 51:308-315.
2. Tomášek L.„ Darby S.C., Fearn T., Swerdlow A.J., Plaček V., Kunz E.: Patterns of lung cancer mortality amonguranium miners in West Bohemia with varying rates of exposure to radon and its progeny, Radiation Research 1994;137:251-261.
3. Ševc J., Plaček V.,Tomášek L., Kunz E., Horáček J.: Radiobiologicke aspekty dlouhodobé epidemiologické studiezhoubného novotvaru plic, Pracov. Lek. 1989; 41:415-423.
4. Ševc J., Kunz E., Tomášek L., Plaček V., Horáček J.: Cancer in man after exposure to Rn daughters,. Health Phys.1988; 54:27-46.
PORTOROŽ 95 136

SESSION II PROCEEDINGS
XA05C0036
THE SPATIAL DISTRIBUTION OF 222RN "INDOOR" IN SLOVENIAAS A STOCHASTIC MULTIFRACTAL PROCESS
G. Salvadoři]), S.P. Ratti ° , G. Belli ! ), E. Giroletti2), L Kobal3), J. Vaupotič3)
0 University of Pavia, Department of Nuclear and Theoretical Physics, Via A. Bassi, 6,1- 27100 Pavia, Italy2 ) University of Pavia, Servizio di Fisica Sanitaria, Via S. Epifanio, 12,1- 27100 Pavia, Italy
3 ) Jožef Stefan Institute, Jamova 39, P.O.Box 100, 61111 Ljubljana, Slovenia
INTRODUCTION
The problem of exposure to radon indoor is the subject of many scientific investigations, since the radiationabsorbed by human bodies might be the cause of tumours or leukaemia. In almost all Countries, samplingcampaigns of 222Rn have been started with the purpose of monitoring its distribution and evaluatingexposure risk levels. The radon is a gas that diffuses in the soil and penetrates into the buildings followingmultiple pathways. Indeed, many factors influence its migration, both of geological and atmospheric nature,and even anthropic. Therefore, it is evident that the presence of radon in the environment belongs to thatclass of complex phenomena that has originated the research on fractals (see, e.g., Mandelbrot, 1975, 1983;Falconer, 1988, 1990; Feder, 1989; Edgar, 1990). The possibility of modelling natural phenomena bymeans of fractals has recently been improved introducing the concept of multifractals, studying the fractalproperties shown by the different intensity levels of a phenomenon (e.g., analysing the different fractalfeatures of increasing concentrations of radon). In our case, given the complexity of the radon diffusionprocess, we shall adopt the stochastic formalism of Universal Multifractals, as introduced by Schertzer andLovejoy (see, e.g., Schertzer and Lovejoy, 1983, 1987, 1989, 1991, 1992, 1993).
THE DATA
The principal sources of radon are soil, rocks, construction materials, water and air. We shall analyse 222Rndata collected in Slovenia by the "J. Stefan" Institute in Ljubljana (Kobal et al., 1988a) in buildings suchas schools and nurseries (see Fig. 1).
The measurement techniques of 222Rn air concentration are based on the detection of a-particles producedby the radioactive decay (Kobal et al., 1988b); measurements have been performed within buildings madeof wood or concrete a few hours before their opening and after the rooms have been closed for 1-2 days.
Radon "indoor" (Slovenia) |
Ljubljana . . . , . :%\\ \tj
•••>•
1.....
i • » •
Network |
Fig. 1. The sampling network of all the available data.
PORTOROŽ 95 137

SESSION II PROCEEDINGS
The available samples are subdivided into three subsets depending on the construction material of thebuilding where the measurements are collected, which is one of the variables influencing the radonemission: the label "T" identifies the whole data set, the label "M" identifies the data collected in buildingsmade of wood, and the label "Z" identifies the data collected in buildings made of concrete. In Tab. I weshow the number of available data, the range of the values (in Bq/m3), their average and standard deviation;in column "FD" is reported the fractal dimension of the network, in column "h" the hyperbolic exponentof the data, and in columns "a" and "Cj" the universal multifractal parameters (see later).
Type
"Z"
"M"
Min Max Av. S.D.
1269
1015
254
7
710
5750
5750
1306
135.5
147.9
85.9
362.9
397.8
150.7
= 1.62
= 1.60
= 1.55
= 1.3
= 1.3
= 1.1
0.58±0.02
0.56±0.01
0.38±0.01
0.
0.
1.
95±0
98±0
17±0
.01
.01
.01
Table I. Features of the available data (see text).
THE FRACTAL APPROACH
The radon emission features a strong variability, both in space and in time. We shall investigate theavailable data in an original way (Missineo, 1994) using both fractal and multifractal techniques, suitableto analyse phenomena originated by the non-linear interaction of many factors.
The dangerousness of radon may depend upon its in situ concentration; however, the presence of "hot spot"may not be detected due to averaging procedures or to insufficient spatial and/or (fractal) dimensionalresolution of the sampling network (see Fig. 1). In our case (Missineo, 1994), the networks are fractal (seeTab. I and Fig. 2), indicating the presence of gaps at all scales: indeed, since the networks are not plane-filling (their fractal dimension is always less than two, the dimension of the plane), the sampling of theradon emission is necessarily inhomogenous and not-uniform.
zVO)o
3 . 0 -
2 . 0 -
1 .0-
0.0-í
Radon "indoor" (Sloveniq)Network Fractal Dim. DF
. - " • • "
0.0
Dim. Fr.N(R) « R
The slope of the interpolatingline is an estimate of the FractalDimension of the Network
0.5l
2.01.0 1.5
Log R
Fig. 2: Estimate of the Fractal dimension DF of all the available data.
THE HYPERBOLIC ANALYSIS
The presence of "hot spots" can be regarded as the appearing of anomalous fluctuations in the dynamicsof a phenomenon (the "Joseph Effect" and the "Noah Effect" described by Mandelbrot, 1975, 1983).Indeed, in our case the analysis of Tab. I (Missineo, 1994) shows that the radon concentration spans threeorders of magnitude, and the variance is always large, indicating the presence of strong fluctuations. Suchevents may be interpreted by means of the Self-Organised Criticality theory (see, e.g., Schertzer et al.,
PORTOROŽ 95 138

SESSION n PROCEEDINGS
1995, for a concrete case study) and suggest the use of specific (asymptotic) hyperbolic probabilitydistributions (characteristic of fractal processes):
Pr (V> v) « v"h (v » 1) (1)
where A is a positive parameter called hyperbolic exponent. Such distributions assign a not-negligibleprobability even to very large fluctuations (i.e., asymptotically, for v » l ) which, on the contrary, wouldbe impossible adopting other probabilistic models (e.g., Gaussian).
In Fig. 3 we show the (asymptotic) estimate of the hyperbolic exponent h of all the available data; theresults are reported in Tab. I. The results show that the radon concentration follows, at least asymptotically,a hyperbolic behaviour, which is a fingerprint of multifractality.
* o -A> - l i
0.a - 2 H
The linear behaviour ona log-log scale shows thehyperbolic distributionof the data considered
Radon "indoor" (Slovenio)Hyperbolic Distribution
The slope of the fit estimates h |
I1.0 1.5
v} » v
ľ!ľv1
2.0Log v ( Bq /
I2.5m )
i3.0
I3.5
Fig. 3. Estimate of the hyperbolic exponent h of all the available data.
UNIVERSAL MULTIFRACTALS
As already mentioned, multifractals are more powerful than monofractals, since they are able to investigatethe full spectrum of fractal properties shown by a system. Multifractals are characterised by the presenceof a hierarchy of structures; they feature a strong space-time variability and show the multiscaling property,i.e. a precise scaling (power law) relationship between the intensity of a given event and its probability ofoccurrence (see, e.g., Schertzer and Lovejoy, 1987, 1993).
For a (stochastic) multifractal field at resolution A the following (multiscaling) relation holds (Schertzerand Lovejoy, 1983, 1987):
Pr (2)where ek is the field intensity (in our case, the measured radon concentration), y is the order of singularityand C(Y) is the codimension function describing both the "sparseness" of the field intensities and theprobability of given events. Thus, eq. (2) relates the intensity of the field ex to its probability of occurrencethrough the function c(y): since c(y) is a convex increasing function, the strongest events are also the rarest.
In the limit of large A, the corresponding law for the statistical moments ( eqx ) is obtained via a Laplace
transform and a saddle point approximation:
max{?y-c(Y))(3)
where K(q) is the moment scaling function and q is the order of moment. Formula (3) also shows that c(y)and K(q) form a Legendre transformation pair (Parisi and Frisch, 1985).
PORTOROŽ 95 139

SESSION U PROCEEDINGS
The statistical description of multifractal processes may be greatly simplified considering universalmultifractals (Schertzer and Lovejoy, 1987). In this case, c(y) and K(q) have the following parametricexpressions:
í «» i \ ď
(4)
C(Y) = Cj e ^1 cc = l
C , cc , >K(q) = [qa - q) a * l
a (5)#(#) = Cx q \og{q) a = l
where — + — = l , 0 í a s 2 and C^O. The parameter a (called the Levy index) represents the degree of
multifractaluý of the process (e.g., the case a = 0 corresponds to a monofractal process) and determinesits probability class; the parameter C j is the codimension of the average field and measures its sparsenessand inhomogeneity. Based on the value of a (Schertzer and Lovejoy, 1992), a classification of universalmultifractals has been provided: for a s 1 we have unconditionally hard multifractals (i.e. the processshows divergence of moments above a critical order qD, where qD is defined by K(qD) - ZJf , -1) and Dis the dimension of the embedding space); for a < 1 we have conditionally soft/hard multifractals (i.e. forlarge enough but finite values of the dimension D all the moments converge).
The estimate of the multifractal parameters a and C, for all the available data can be carried out by meansof the Double Trace Moments (DTM) technique (Lavallée, 1991; Schertzer and Lovejoy, 1993; see alsoSalvadoři (1993) and Salvadoři et al. (1994) for concrete case studies and the Software Note). Here we onlydiscuss the results obtained (Missineo, 1994), summarised in Tab. I.
The multifractal parametrization of the data "T" and "Z" is almost identical, but differs from the one of thedata "M": actually, the subset "M" represents only about 20% of the total data, and its extraction does notseem to have altered the global probabilistic structure. In all cases, the radon distribution shows evidentfeatures of multifractality: since a < 1, we may classify the radon concentration as a "conditionallysoft/hard" multifractal process. The value of Q-1.2 for the subset "M" compared to the value C,~ 1 for thedata "T" and "Z" indicates a greater sparsity of the average level of pollution.
It is worth noting that the value of a characterises the "phenomenology" of type "M" and the different oneof type "Z": in other words, it provides a probabilistic classification of the radon distribution in buildingshaving distinct features (wood or concrete), an experimental fact that may have relevant implications forepidemiological purposes and risk assessment.
CONCLUSIONS AND PERSPECTIVES
The present work shows that fractals and (stochastic) universal multifractals represent a propermathematical framework for characterising the spatial distribution of radon indoor, at small as well as atlarge scales, without introducing ad hoc data smoothing and preserving the original intrinsic features of thephenomenon.
The fractal nature of the networks shows that the sampling is inhomogenous and indicates that some"information" is almost surely lost in the gaps of the network; in particular, it is possible that some "hotspot" regions are not (correctly) sampled, spoiling further operations of risk analysis and assessment.Indeed, the (asymptotic) hyperbolic distribution of the data indicates the probable presence of strongfluctuations (i.e. the "hot spot"). The estimate of the multifractal parameters a and C, leads to aclassification of the radon concentration as a "conditionally soft/hard" multifractal process; the value ofthe Levy index distinguishes between data of type "M" (wood) and "Z" (concrete). Such a parametrizationmay open new research perspectives, since the possibility of simulating and interpolating arbitrary
PORTOROŽ 95 140

SESSION n PROCEEDINGS
multifractal processes is the object of recent studies and we foresee useful and interesting results in the nearfuture.
SOFTWARE NOTE
K free software for the multifractal analysis of ID and 2D data is available upon request. The program runsboth on the standard 68K Macintosh and on the new PowerPC platform. For further information, pleasecontact the author G. Salvadoři (phone: +39 - 382 - 507438; fax: 526938; E-mail: [email protected]).
REFERENCES
1. Edgar, G.A., Measure, Topology and Fractal Geometry, Springer-Verlag, New York, 1990.2. Falconer, K.J., The Geometry of Fractal Sets, Cambridge University Press, Cambridge (UK), 1988.3. Falconer, K.J., Fractal Geometry, J.Wiley & Sons, Chichester (UK), 1990.4. Feder, J., Fractals, Plenum Press, New York, 1989.5. Kobal, L, J.Vaupotič, and J.Burger, Preliminary measurements of indoor radon in Ljubljana (Yugoslavia), Rad. Prot.
Dosim., 24, 547, 1988a.6. Kobal, L, J.Vaupotič, and J.Burger, A method for determination of indoor radon concentrations using alpha-
scintillation cells, Environ. Inst., 14, 345, 1988b.7. Lavallée, D., Multifractal Analysis, Simulation Techniques and Turbulent Fields, Ph.D. Thesis, McGill Univ., Physics
Dept., Montreal (Canada), 1991.8. Mandelbrot, B.B., Les Objets Fractals: Forme, Hasard et Dimension, Flammarion, Paris, 1975.9. Mandelbrot, B.B., The Fractal Geometry of Nature, Freeman, S. Francisco, 1983.10. Missineo, F., Analisi Multifrattale dell'Emissione di Radon Indoor in Slovenia, Universita degli Studi di Pavia,
Dipartimento di Fisica Nucleare e Teorica, Tesi di Laurea, A.A. 1992/93, 1994.11. Parisi, G., and U.Frisch, A Multifractal Model of Intermittency, In, Turbulence and Predictability in Geophysical Fluid
Dynamics and Climate Dynamics, Eds. M.Ghil et al„ North Holland, New York, 84, 1985.12. Salvadoři, G., Multifrattali Stocastici: Teória e Applicazioni, Tesi di Dottorato di Ricerca, Biblioteca Nazionale di
Roma, Diss. 93/1316; Biblioteca Nazionale di Firenze, TDR.1993.1278; 1993.13. Salvadoři, G., S.P.Ratti, G.Belli, S.Lovejoy, and D.Schertzer, Multifractal Objective Analysis of Seveso Ground
Pollution, Toxicological and Environmental Chemistry, 43, 63, 1994.14. Schertzer, D., and S.Lovejoy, Elliptical Turbulence in the Atmosphere, Proc. 4th Symp. on Turbulent Shear Flows,
University of Karlsrhue (West Germany), 11.1, 1983.15. Schertzer, D., and S.Lovejoy, Physical Modelling and Analysis of Rain and Clouds by Anisotropie Scaling
Multiplicative Processes, J. Geophys. Res., 92, 9693, 1987.16. Schertzer, D., and S.Lovejoy, NonLinear Variability in Geophysics: Multifractal Simulations and Analysis, In, Fractals:
Their Physical Origins and Properties, Ed. L.Pietronero, Plenum Press, New York, 49, 1989.17. Schertzer, D., and S.Lovejoy, Non-Linear Variability in Geophysics, Eds. D.Schertzer and S.Lovejoy, Kluwer
Academic Publishers, Dordrecht, 1991.18. Schertzer, D., and S.Lovejoy, Hard and Soft Multifractal Processes, Physica A, 185, 187, 1992.19. Schertzer, D., and S.Lovejoy, Scaling and Multifractal Processes, Lecture Notes prepared for NVAG3, Cargěse,
Corsica, Sept. 10-17, 1993.20. Schertzer, D., Y.Chigirinskaya, S.Lovejoy, S.P.Ratti, G.Salvadori, and G.Belli, Multifractal Analysis of Chernobyl
Fallout: Self-organized Criticality and "Hot Spots", Proc. Mathematics and Computations, Reactor Physics, andEnvironmental Analyses, Portland (Oregon), April 30 - May 4, 1995, American Nuclear Society Publisher, Illinois,p. 743,1995.
PORTOROŽ 95 141

S E S S I O N n NUN Illllll IJlillllJIIÍII! HU llflílirilíllIMlillll! P R O C E E D I N G SXA05C0037
SCANNING ELECTRON MICROSCOPY OF RAT THROAT AND TRACHEAFOLLOWING THE EFFECTS OF RADON DECAY PRODUCTS
J. Rode '>, J. Vaupotič2>, K. Drašlar3), I. Kobal2>
" Institute of Biology, Karlovška 19, 61 000 Ljubljana, Slovenia2) Jozef Stefan Institute, Jamova 39, 61 111 Ljubljana, Slovenia
3) Department of Biology, Biotehnical Faculty, University of Ljubljana,Večná pot 111, 61 000 Ljubljana, Slovenia
ABSTRACTIn two preliminary experiments, five laboratory rats were exposed in a small chamcer to radon-rich air. Inboth experiments the exposure was about 0.9 WLM. The surface of throat and trachea was examined byscanning electron microscope.
INTRODUCTION
Previous experiments with albino rats exposed during six consecutive winter heating seasons in years 1988- 1994 in Zasavje, an industrial and mining area of central Slovenia, had enabled us to study the responseof the epithelium surface of the respiratory tract to a mixture of agents in polluted air. Animals wereexposed outdoors to the mixture of pollutants characteristic for air pollution in this region. The surface ofthe respiratory epithelium in throat and trachea was used as a model target tissue. Changes observed weredivided into groups according to their appearance and severity. They indicated insult by pollutants but nochange could be ascribed to one single pollutant (1). Certain changes characterised by single cell lesion anddisruption (Fig 1) was present in the first two seasons and appeared again in the last season. It resembledchanges observed in laboratory experiments with PuO2 (2). A possibility of contact radiation injury at theexposure site existed, because fly ash from coal combustion with increased U and daughter nuclide contentis one of constituents of air pollution in this area. Experiments and modelling of cancer risk have indicatedthat radon also causes changes on the surface of the respiratory epithelium (3). Thus in the present studywith low exposure to radon decay products we wanted to check whether the injuries of the epitheliumobserved in the experimental animals exposed in Zasavje might be explained by radiation damage.
MATERIALS AND METHODS
Five Han WHIST white rats obtained from the Lek pharmaceutical plant in Ljubljana were exposed toradon-rich air in two preliminary experiments. Animals from the same source were used as controls. Ratswere exposed in experimental chamber with 0.25 m3 of volume. The source of radon was dry, finely grounduranium ore in a glass dessicator outside the chamber. Fresh air was pumped through the dessicator intothe chamber at a flow rate of 1 dm3min''. Concentrations of radon and its decay products were followedusing AlphaGuard (Genitron) and System 30 (Scintrex) continuous instruments. In the first experiment, tworats were exposed for 14 days. The total exposure was 0.91 WLM resulting from a radon decay productsconcentration varying from 1000 Bqm"3 to 15000 Bqm"3. In the second run, three rats were exposed for 6days. The total exposure was 0.88 WLM, the radon decay products concentration being more constant thanin the first experiment, ranging from 2000 Bqm"3 to 6000 Bqm"3.
After exposure the animals were sacrificed. Tissues from the nose, throat and trachea were dissected andused for measurement of the superficial radioactivity or prepared for scanning electron microscopy by FA-GA fixative and postfixation with OsO4 followed by ligand mediated binding of additional osmium.Specimens were dehydrated and dried in CO2at the critical point, mounted and coated. The surface wasexamined by a Jeol JMS 840A scanning electron microscope.
In addition, the radioactivity of the tissue was measured by alpha scintillation, gamma spectrometry andradiography.
PORTOROŽ 95 142

SESSION II PROCEEDINGS
Fig. 1: Single cell lesions and disruption on specimen exposed in Trbovlje, Bar=10jjm.Fig. 2: An example of first type of respiratory epithelium response, Bar=10(jm.Fig. 3: The surface of affected epithelium under the vocal cord, Bar=100|jm.Fig. 4: Collapsed cells on respiratory epithelium surface, Bar=10|im.Fig. 5: Polyps in the throat composed of uneven cells, Bar=10jim.Fig. 6: The crack in the epithelium surface with leucocytes, Bai-lOjjm
PORTOROŽ 95 143

SESSION II PROCEEDINGS
RESULTS
The target tissue of throat and trachea showed two different types of response. The first type was similarto one generally observed in animals exposed in Zasavje. It consisted of a folded surface, piled andsloughed epithelial cells, irritation changes and areas of unsynchronous cilia.
The second type was characterised by an area with an increased number of single cell lesions and disruptionunder the vocal cord. Single collapsed cells present here were not present on the surface of the controlanimal epithelium. Polyps found in the throat consisted of unequal cells.
Both types were present on all specimens. One of specimens exposed for 14 days showed a predominanceof the first type, but in all others the extent of the first type was moderate and the second type of responsewas more evident.
In the cracks of the epithelium caused by preparation we identified infiltrated leukocytes, indicatinginflammatory processes. There were few leftovers of mucus, particles or microorganisms.
Now enhanced radioactivity of the exposed tissues was found in comparison to the non-exposed ones.
DISCUSSION
Our experiments with only five animals indicated that with the method used it was not possible to confirmthat the changes observed were caused only by radiation. The presence of other changes indicated insultby other agents in the environment of the chamber. Namely, the first type of changes could be ascribed toa non-specific response of the respiratory epithelium surface, also seen in exposure to polluted air (4) orsingle pollutants (5).
Single cell lesions, disruptions or collapse were present in some cases also on the surface of respiratoryepithelium of animals exposed in Trbovlje. Our laboratory experiment could not confirm that these kindsof changes were caused only by contact with radioactive particles. However, the specific site at which thelesions were seen could indicate that. This is the area of mucus accumulation due mucociliary clearance.As was shown by Hilding (6), since this is one of "bottlenecks" of mucus transport, the case is somewhatsimilar to mucus accumulation on the bifurcations of the respiratory ways. Cancer risk modelling predictedan increased risk of cancer due to accumulation of mucus containing particles. This is in accordance alsowith epidemiological data (7).
In order to show that single cell disruption and lesions are a result of contact injury caused by sedimentedradioactive particles more experiments will be necessary. Modifications must be made to eliminateaccumulation of ammonia and other noxious products causing irritation to respiratory tract and minimiseother possibilities of irritation by care litter constituents etc. On the other hand, the concentrations of radondecay products has to be greater and more controllable to cause acute response. The epitheliumcompensates injuries with a relative high degree of regeneration and longer period of exposure result in astate intermediate between destruction and recovery.
The radioactivity measurements were not satisfactory and if they are to be used for such low exposure theyshould be designed more carefully.
REFERENCES
1. Drašlar K., J. Rode, T. Vahtar, R. Zupan (1992) Electron microscopy 92, vol.3, 831-832.2. Saunders C.L., K.E. Lauhala, K.E. McDonald (1989) Scanning microscopy (AMFOHare) vol.3, no.3, 907-918.3. Hofmann W., H. Lettner, DJ. Crawford-Brown (1992)Radiat. Prot. Dosim. vol.45, no. 1/4, 635-638.4. Rode J., K. Drašlar, T. Vahtar, R Zupan (1993) Dreilandertagung elektron mikroskopie, Zurich 1993.5. Hulbert W.C., S.F.P. Man, M.K. Rosynchuk, G. Braybrook, J.G. Metha (1989) Scanning microscopy (AMF OHare),
vol.3,no.l, 378-396.6. Hilding A. C. (1957) American Journal of physiology, vol.191, no.2,404-410.7. Hofmann W., D.J. Crawford - Brown, M.G. Menache, T.B. Martonen (1991) Radiat. Prot. Dosim. vol.38, no.l,
91-98.
PORTOROŽ 95 144

iXA05C0038
GUIDLINES FOR TREATMENT OF SOLID WASTES WITH ENHANCEDNATURAL RADIOACTIVITY IN POLISH COAL INDUSTRY
B. Michalik, S. Chałupnik, J. Skowronek, J. Lebecka
Central Mining Institute, Katowice, Poland
ABSTRACT
In Polish coal mines there are some waste materials of high radioactivity. Enhanced natural radioactivity ofthese wastes is caused by saline waters which often contain radium isotopes and barium ions. From suchwaters radium and barium are coprecipitäted out by sulphates in underground workings or on the surface.Radioactive deposits sometimes cause radiation hazard for underground crews, serious technical problem inexploitation of pumps and pipelines and radioactive contamination on the surface, mainly in the vicinity ofsettlement ponds and alongside the river banks. Deposits of RaSO4 + BaSO^ in which concentration of 226Ramay reach even 400000 Bq/kg, sometimes are a source of radiation hazard for mining crews. Elevatedradiation doses may be obtained mainly during cleaning of gritters, settlement tanks and storage ofradioactive deposits.
Radioactive wastes cause also contamination of the natural environment. Radium and barium sulphates aresometimes precipitated in settlement pond and rivers. Moreover, from radium-bearing waters which do notcontain barium ions, radium can be removed from water by adsorption on bottom sediments in rivers.Concentration of 226Ra in such sediments is usually lower than 1000 Bq/kg, but enhanced radiumconcentrations were found many kilometres from the discharge points.
It was necessary to prepare guidelines for treatment of materials with enhanced natural radioactivity. Suchguidelines have been worked out during past few years and applied in all coal mining industry. On the otherhand, it is a common practice in Poland, that ashes from power plants are stored underground and suchguidelines are also very useful for this purpose.
INTRODUCTION
One of the most serious problems occurring during coal extraction in Upper Silesia in Poland are inflowsof water with very high salinity. These waters often contain high concentrations of natural radionuclides,mainly radium isotopes. Although the dominating radioisotope in these waters was radium-226, a memberof uranium series, in some waters concentration of 2 2 8Ra from thorium series is higher. Concentration of226Ra in Upper Silesian brines is usually between 1 and 100 kBq/m3, with the maximum value 390 kBq/m3,while concentration of 2 2 8Ra reaches 200 kBq/m3 [1,2].
Natural waters with similarly high radium concentration were also observed by other authors [3,4],especially in oil fields. Hot springs in Iran, described by Khademi [5], contained up to 330 kBq/m3 of 226Ra.Also in a coal mines in Germany [6] occurred radium-bearing waters with 226Ra concentration up to 63kBq/m3. Although there are several publications on elevated 22<Ra concentration in water, there is much lessknown about radium isotopes from thorium series - 2 2 8Ra and 2 2 4Ra, since these isotopes are much moredifficult to measure. We have investigated 228Ra and 226Ra in radium-bearing mine waters and deposits fromthe Upper Silesian Coal Basin and their influence on the natural environment in mining areas [7,8].
We found two different types of radium-bearing waters in coal mines in Poland [2]. First type, so calledA type, contains radium and barium ions but no sulphates. The second type (B), in contrary, containsradium and sulphate ions, but no barium. The presence of barium is very important for the furtherbehaviour of radium as barium is a carrier for radium. Radium is immediately coprecipitäted with bariumfrom waters type A when mixed with waters containing sulphate ions. By this means radioactive depositsare formed in underground galleries, in the settlement ponds on the surface and even in small streams orrivers. The places of precipitation or deposition of radioactive scaling can be easily identified by
PORTOROŽ 95 145

SESSION II PROCEEDINGS
measurement of gamma radiation, because radium concentration in deposits may reach even 400 000Bq/kg. Such deposits must be treated as a source of radiation hazard for miners, due to their gammaradiation and possibility of internal contamination. The highest value of gamma dose rate measuredunderground in one water gallery reached nearly 20 uGy/h [8].
Different situation is observed in case of waters type B, there is no carrier for radium - and no precipitationoccurs. All radium is carried with waters to the surface. Only dilution in rivers and sorption on bottomsediments take place. Therefore radium concentration in sediments from settlement ponds or river bedsseldom exceeds 1000 Bq/kg. But contamination of river waters and bottom sediments is observed in adistance of many kilometres downstream from the discharge point [7].
Due to spontaneous precipitation of radium and applied mitigation measures, approximately 275 MBq of226Ra and 145 MBq of 228Ra per day remain underground in Polish coal mines [8]. In the past most of thedeposits were dumped on tailing piles with other waste products, causing contamination of theenvironment.
For mentioned above reasons, the problem of radioactive deposits in underground non-uranium mines andin the natural environment in their vicinity must be carefully investigated, especially in mines, whereinflows of saline waters are observed.
SYSTEM OF RADIATION MONITORING IN POLISH COAL MINES
A system of routine monitoring of radiation hazard was established in Polish coal mines in 1989 [9].According to this system measurements of gamma doses, gamma dose rates and measurements of thenatural radioactivity of deposits are required as well as monitoring of potential alpha energy of radondaughters in air and radium concentration in waters. Each year an annual report on radiation hazard in coalmines is issued. Also a system of routine monitoring of the radioactive contamination in the vicinity of coalmines has been developed and implemented [10]. This system requires on mining areas measurements ofradium concentration in mine effluents, in river waters, in bottom sediments from settlement tanks andrivers and in tailings dumped on the piles located on the ground surface as well as gamma dose-rates andradon daughters concentrations in air in the neighbourhood of the piles. Therefore became very importantto solve the problem how to avoid storage of radioactive wastes on the surface.
DEPOSITS WITH ENHANCED NATURAL RADIOACTIVITY - MINING REGULATIONS
Our mining regulations are based primary on the recommendation of the Polish National Atomic Agency(PAA). PAA has set a permissible level for radioactive wastes as 10 000 Bq/kg for alpha emitters [11]. Thisvalue was applied in mining regulations, which require, that radioactive deposits with concentration ofradium isotopes (226Ra+228Ra) over 10 kBq/kg must be treated as radioactive wastes. Each undergroundworking place in which are deposited radioactive wastes is stated as a place with radiation hazard.Moreover, it is forbidden to dump radioactive wastes on the surface therefore such deposits must be storedunderground. As radioactive deposits are a source of gamma radiation, measurements of gamma doses orgamma dose rates must be done with a certain frequency. For this purpose a special personal dosimeter,called GAMMA-31, with thermoluminescent detectors, has been developed [12]. This device fulfils thesafety requirements for underground coal mines. If gamma dose rate exceeds 3 uGy/h that place is treatedas a gallery with radiation hazard. A maximum permissible level was set as high as 12 uGy/h.
The problem of radioactive deposits and enhanced gamma radiation is caused by radium-bearing waters,especially A type. From our experience, in mines, where radium-bearing waters with radium concentration(226Ra+228Ra) above 1 kBq/rh are present, gamma radiation and radioactivity of deposits should bemeasured because permissible levels of radium concentration in deposits or gamma dose rates may beexceeded [8]. We found such waters in forty three out of sixty five mines operating in the Upper SilesianCoal Basin (USCB). These waters were of different salinity and radium concentration.
Radioactive deposits (226Ra+228Ra > 10 kBq/kg) have been discovered in 19 coal mines. The highestconcentration of radium isotopes was as high as 378 kBq/kg of 226Ra and 182 kBq/kg of 228Ra.
According to the ICRP recommendations, the additional annual dose for general public resulting from anykind of activity (as mining) must not exceeds 1 mSv per year [13]. Therefore dumping on the surface
PORTOROŽ 95 146

SESSION II PROCEEDINGS
tailings with enhanced concentration of natural radionuclides should be treated as a source of radiationhazards for population. It means, that not only waste materials with radium concentration exceeding 10kBq/kg cannot be stored on the ground surface but also storage of waste materials with lower radiumconcentration must be controlled.
ENVIRONMENTAL IMPACT
The dose for inhabitants and workers, employed on the work places on the ground surface could be causedmainly by radon daughters (as a result of radon emanation from piles) and by gamma radiation. Ingestionand inhalation are less important, except certain places with dust content over 2 mg/m3. Theoreticalconsideration can be made only for gamma doses near waste piles, basing on natural radionuclidesconcentrations in stored waste materials. In case of radon progeny we used results of measurements, donein such places.
The highest value of potential alpha energy concentration nearby places, where radioactive deposits havebeen stored, was of about 0.06 uJ/m3. Taking into account occupation time 2000 hours per year, it givesus annual dose 0.4 mSv. Because the annual dose from all sources must be lower than 1 mSv, so additionaldose from gamma radiation has to be lower than 0.6 mSv/year.
We applied equations from UNSCEAR reports [14], which correlate gamma doses with radionuclidesconcentrations in an infinitive source, for calculation of maximum permissible levels of 22iRa and 228Ra intailings:
D = a - K - t
where:
D - dose;a - activity of 226Ra or 228Ra in wastes [Bq/kg];K - coefficient [Gy • kg/Bq • h];t - occupation time, 2000 h/year.
Of course, coefficient K has different value for uranium and thorium series.
For 226Ra (uranium series) KRa = 4.27 • 10"8 Gy • kg/Bq • hFor 228Ra (thorium series) KTh = 6.62 • 10'8 Gy • kg/Bq • h
To simplify our considerations we assumed, that doses from uranium series and thorium series are similarand equal to 0.3 mSv/year. Now we can calculate permissible concentrations of radium isotopes as:
aRa.226 = 350 Bq/kg= 230 Bq/kg
If concentrations of radium isotopes in wastes are higher, there is a possibility to exceed a dose 1 mSv/yearfor people working or living in the vicinity of such pile. Therefore deposits, in which 226Ra concentrationis higher than 350 Bq/kg or 228Ra concentration above 230 Bq/kg, can be stored on the ground surface onlyby special permission. This is now the recommendation for all underground mines in Poland.
APPLICATION FOR OTHER WASTE MATERIALS
We would like to apply our recommendations for other types of waste materials in Poland. For instance,power industry is producing huge amounts of ashes with enhanced radioactivity. There are two ways ofutilisation of such waste materials:
- low radioactive wastes can be used for construction materials;- ashes with higher radioactivity should be stored underground.
Now in Poland approximately 30% of ashes produced in coal-fired power plants have been stored in oldunderground workings.
PORTOROŽ 95 147

SESSION II PROCEEDINGS
In case of radioactive deposits precipitated out of radium-bearing waters the decision of their storage mustbe considered very carefully. An example of technical problem, caused by radioactive deposits, is a pipelinesystem „OLZA", transporting saline waters from eleven coal mines in the southern part of coal basin. Theaim of this system was to protect small rivers from salt carried with discharged waters from coal mines. Theaverage salinity of these waters is of about 50 kg/m3. During 10 years of exploitation of about 20 000tonnes of radium and barium sulphates have been deposited in the pipeline with average 226Ra concentrationof about 30 000 Bq/kg and total activity of about 600 GBq [15]. The scaling caused a serious obstructionfor water flow as the internal diameter of the pipes has been diminished from 400 mm to 260 mm on a longdistance (a few kilometres). Mining authorities considered a decision of cleaning this pipeline, but weadvised not to do it. The main reason was that cleaning process would cause heavy contamination of thenatural environment, while in present situation the pipeline is covered by thick layer (2m) of soil and noinfluence on the surface can be observe. Therefore a new part of the pipeline was built in parallel and oldpart was left underground.
CONCLUSIONS
1. Wastes with enhanced natural radioactivity can be produced in non-uranium mining, primary as aresult of deposition of radium isotopes from radium-bearing waters. In a such way high radioactivematerials, with Ra-226 concentration up to 400 kBq/kg, could be a possible source of radiation hazardfor miners and a source of radioactive contamination of the natural environment.
2. Mining regulations concerning waste products have been prepared on the basis of the ICRPrecommendation and domestic Atomic Law. Wastes with radium concentration (Ra-226+Ra-228) aretreated as radioactive wastes and must be stored underground.
3. Waste materials with Ra-226 concentration over 350 Bq/kg or Ra-228 concentration over 230 Bq/kgcan be stored on the surface only by special permission.
4. In our opinion, underground storage of various waste- and by-products with enhanced naturalradioactivity is the best way of the protection of the natural environment. But all such decisions mustbe done very carefully, using a cost-benefit rule.
REFERENCES
1. Tomza I., Lebečka J., Radium Bearing Waters in Coal Mines. Proc of Int. Conf. on Radiation Hazard in Mining.Golden, Colorado, USA, 1981.
2. Lebečka J. et al., Radioactivity of Mine Waters in Upper Silesian Coal Basin and Its Influence on Natural Environment,Mine Water Congress, Nottingham, 1994.
3. Gucalo L.K., O niekotorych zakonomiernostiach raspredielenija radia w podziemnych wodach sredniej czastiDnieprowsko-Donieckoj Wpadliny, Gieochimja, 12,1305-1312 (in Russian).
4. DicksonB. L., et. al. - Evaluation of the Radioactive Anomalies Using Radium Isotopes in Groundwaters -J. ofGeochemical Exploration, Vol. 19, p. 195.
5. Khademi A., Alemi A.,A., Nassen A., Transfer of radium of soil to plants in an area of high natural radioactivity inRamsar, Iran, Proc. of Conf. on Natural Radiation Environment III, Bethseda, Maryland, USA, CONF-780422,1980.
6. Gans I. et al, Radium in waste water from coal mines and other sources in FRG. Proc. of the Second SpecialSymposium on Natural Radiation Environment, held in Bhabha Atomic Research Center, Bombay, India, 1981.
7. Lebečka J., et. al. - Radium in mine waters in Poland: occurrence and impact on river waters - Natural RadiationEnvironment NRE-VI, Montreal 1995.
8. Michalik B., et. al. - Radioactivr deposits in Polish coal mines and it's influence on the natural environment - NaturalRadiation Environment NRE-VI, Montreal 1995.
9. Ministry of Mining and Energy - Guidelines for classification of underground working places and safety of miners inmines with radiation hazard caused by natural radionuclides - Katowice 1988 (in Polish).
10. Ministry of Mining and Energy - Guidelines for monitoring of the radioactive contamination of the natural environmentcaused by coal mines - Katowice 1986 (in Polish).
11. Polish Atomic Energy Agency - Instruction of classification of radioactive wastes, 19 May 1989 - Monitor Polski nr18 poz. 125, Warszawa 1989 (in Polish).
PORTOROŽ 95 148

SESSION II PROCEEDINGS
12. Lebečka J., et al. - Monitoring of Radiation Exposure from Different Natural Sources in Polish Coal Mines - Int.Conference on Occupational Safety in Mining, Vol.2 p.408, Toronto 1985.
13. International Committee on Radiological Protection - Recommendations of the ICRP -Publication 60, Pergamon Press,1991.
14. UNSCEAR 1982 - Report on Effects of Ionising Radiation, United Nations, New York, 1992.15. Lebečka I.ChalupnikS., SliwkaM., -Results of investigation of radium behaviour during it's transport in pipelines
on example of „OLZA" pipeline - Wiadomošci Górnicze, no. 5, 1992 (in Polish).
PORTOROŽ 95 149

SESSION II PROCEEDINGS
PORTOROŽ 95 150
SESSION III:
RADIATION PROTECTION ANDENVIRONMENT
CkAÍRS:
A. SUSSANAv
T. SUTEJ
S. D E M EA. KovAČ
I. M E I EB. VEICÍČ

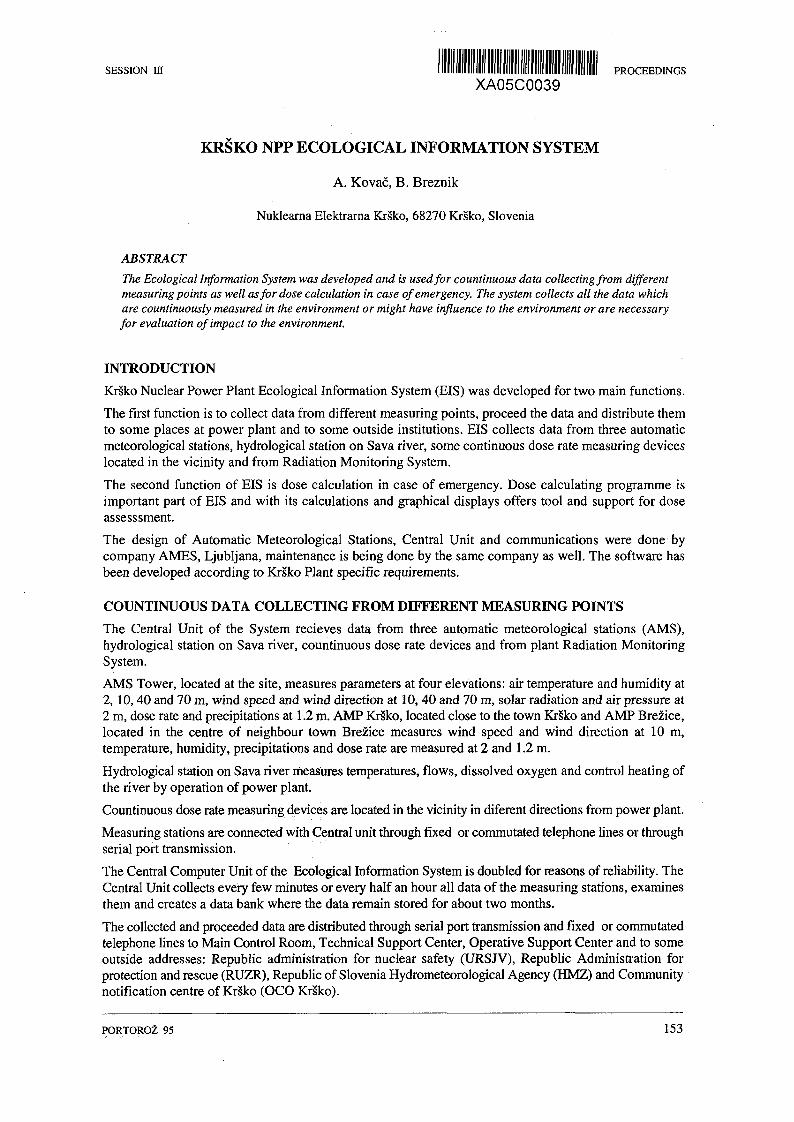
S E S S I O N m i um mini im mil mill llll Hill Ulli Hill Illl Uli P R O C E E D I N G SXA05C0039
KRŠKO NPP ECOLOGICAL INFORMATION SYSTEM
A. Kováč, B. Breznik
Nukleárna Elektrárna Krško, 68270 Krško, Slovenia
ABSTRACT
The Ecological Information System was developed and is used for countinuous data collecting from differentmeasuring points as well as for dose calculation in case of emergency. The system collects all the data whichare countinuously measured in the environment or might have influence to the environment or are necessaryfor evaluation of impact to the environment.
INTRODUCTION
Krško Nuclear Power Plant Ecological Information System (EIS) was developed for two main functions.
The first function is to collect data from different measuring points, proceed the data and distribute themto some places at power plant and to some outside institutions. EIS collects data from three automaticmeteorological stations, hydrological station on Sava river, some continuous dose rate measuring deviceslocated in the vicinity and from Radiation Monitoring System.
The second function of EIS is dose calculation in case of emergency. Dose calculating programme isimportant part of EIS and with its calculations and graphical displays offers tool and support for doseassesssment.
The design of Automatic Meteorological Stations, Central Unit and communications were done bycompany AMES, Ljubljana, maintenance is being done by the same company as well. The software hasbeen developed according to Krško Plant specific requirements.
COUNTINUOUS DATA COLLECTING FROM DIFFERENT MEASURING POINTS
The Central Unit of the System recieves data from three automatic meteorological stations (AMS),hydrological station on Sava river, countinuous dose rate devices and from plant Radiation MonitoringSystem.
AMS Tower, located at the site, measures parameters at four elevations: air temperature and humidity at2, 10,40 and 70 m, wind speed and wind direction at 10,40 and 70 m, solar radiation and air pressure at2 m, dose rate and precipitations at 1.2 m. AMP Krško, located close to the town Krško and AMP Brežice,located in the centre of neighbour town Brežice measures wind speed and wind direction at 10 m,temperature, humidity, precipitations and dose rate are measured at 2 and 1.2 m.
Hydrological station on Sava river measures temperatures, flows, dissolved oxygen and control heating ofthe river by operation of power plant.
Countinuous dose rate measuring devices are located in the vicinity in diferent directions from power plant.
Measuring stations are connected with Central unit through fixed or commutated telephone lines or throughserial port transmission.
The Central Computer Unit of the Ecological Information System is doubled for reasons of reliability. TheCentral Unit collects every few minutes or every half an hour all data of the measuring stations, examinesthem and creates a data bank where the data remain stored for about two months.
The collected and proceeded data are distributed through serial port transmission and fixed or commutatedtelephone lines to Main Control Room, Technical Support Center, Operative Support Center and to someoutside addresses: Republic administration for nuclear safety (URSJV), Republic Administration forprotection and rescue (RUZR), Republic of Slovenia Hydrometeorological Agency (HMZ) and Communitynotification centre of Krško (OCO Krško).
PORTOROŽ 95 153

SESSION III PROCEEDINGS
AMSSTOLP
AMSKRSKO
AMSBREZICE
HYDROLOG1CALSTATION
ENV. DOSERATE DEVICES
RADIATIONMONITORS
CENTRALUNIT
IN-SITELOCATIONS
OUTSIDEINSTITUTIONS
Fig. 1: Ecological Information System - connections among measuring stations, Central Unit and users of data.
On request of the operator in the Central Unit it is possible to get temporary data, data of previous days forall data stored in data bank. The applicable software offers to the user a large choice of alphanumerical andgraphical displays of data which can be printed out as well.
All the single data are completed with validity code. At basic display the colour indicates the status ofsingle station or parameter.
Fig. 2: The basic display of Ecological Information System.
PORTOROŽ 95 154
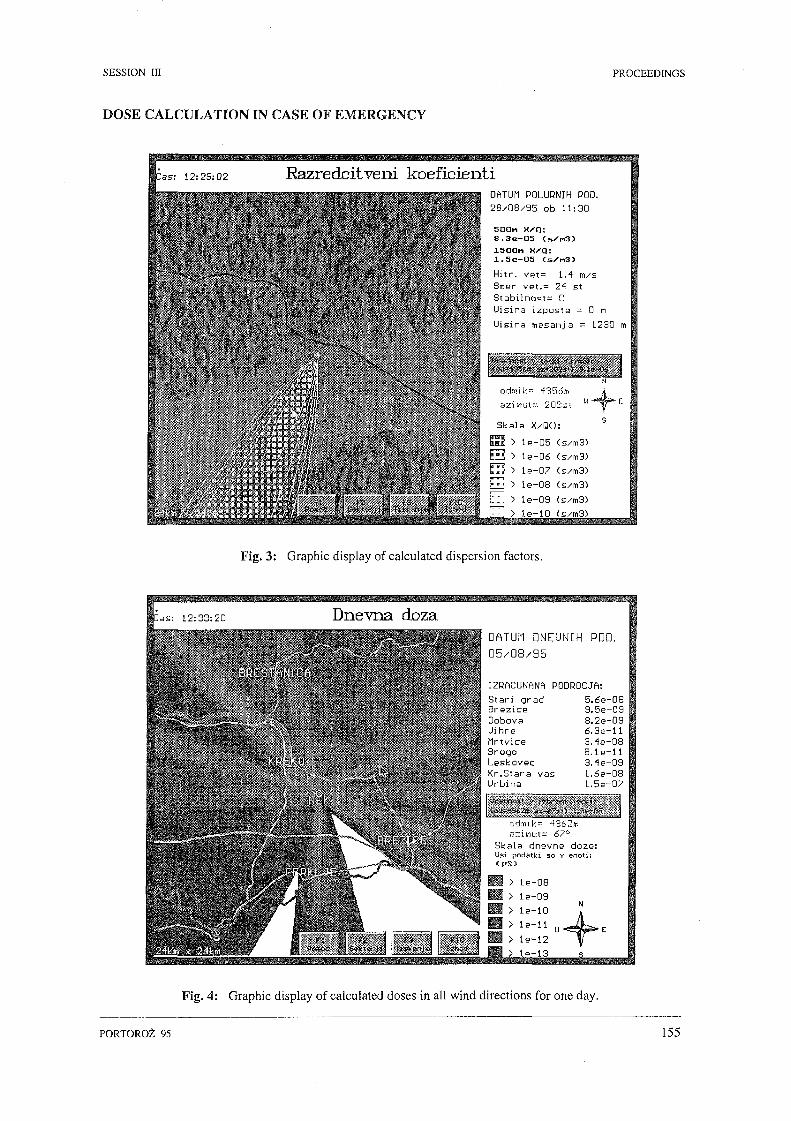
SESSION III PROCEEDINGS
DOSE CALCULATION IN CASE OF EMERGENCY
iias: 12:29:02 R a z r e d c i t v e n i
, • ' , -. ,ŕ .'t
* ť ' l f ' 1 1; "" "* "s , ^
* ' -
; - •
»
í ' •
' + ', . *. }\ J j + * 1»
,. J. i. J. * ,, *
koeficientii1
UHlUn k'ULUWNÍH PUU.28/08/95 ob 11:30
5OO« x/q:8.3e-OS (s/n3)lSODn X^Q:JL.Se-O5 Cs/'nS)HiTr. vet= l."i m/sSmer vet.= 2*t EtStabilnost= CUisina izpusta = 0 mUisina mesanj a = 1230 m
1 J * . ' l ' t , » , ( l • S
1 1
Skala X/QO: S
ES3 > le-05 (s/m3)S > le-06 (s/m3)H > le-07 (s/m3)(H] > le-08 (s/rn3)FH > le-09 (s/m3)• > le-10 (s/m3)
Fig. 3: Graphic display of calculated dispersion factors.
Dnevna dozai.n I .111 DNEUNIH POD.
J8/95
mäm& ,; - f ť . fJ'-fZ : • • f'i • :. ř:c í
UNftNA PODROCJň:5.ée-089.5e-098.25-09ó.3e-ll3.le-08
.le-113.le-091.6e-081.5e-07
dmik= 4362m-.irnu;t=
^i'-'.a dnevne doze:U-: i-odatki so v enoti:í pi. í
Fig. 4: Graphic display of calculated doses in all wind directions for one day.
PORTOROŽ 95 155

SESSION HI PROCEEDINGS
The Gaussian model dose calculation programme is installed at all computers of Ecological InformationSystem.
Dose calculation in case of emergency is one of the input to decision making required by the utilityEmergency Plan [ref. 2]. Essential data for on-line dose calculation are atmospheric dispersion factors,noble gas activity concentration in effluents and plant vent release rate.
For a simple use and early warning to the operators the preselected dose levels from plant emergency doserate scale are provided on the computer screen with the dose graphic display. Calculation of dose due toairborne radionuclides and particulates is possible by manual data input.
There is also a possibility to use RASCAL [ref. 3] programme from the computer menu.
CONCLUSION
Krško Nuclear Power Plant Ecological Information system offers with its 95 % reliability of data basecurrent information about countinuously measured parameters in environment and with installed dosecalculation programmes it would be used in case of emergency.
REFERENCES
1. Vgradnja Ekološko informacijskega sistema v NE Krško, projekt št. B050/21, marec 1993, Elektroprojekt Ljubljana.2. NPP Krško Radiological Emergency Response Plan.3. RASCAL User's Guide, NUREG/CR.
PORTOROŽ 95 156

i i i i i i i i i i i n i i i i i i i pRocEEDiNcs
XA05C0040
A GAS SCINTILLATION MONITORFOR TRITIUM GAS IN ARGON OR IN NITROGEN
F. Campi 0, C. Mascherpa2), C. Sterlini l\ P. Pacenti 2), S. Terrani °
" CESNEF- Nuclear Engineering Dept, Polytechnic of Milan, Via Ponzio 34/3, 20133 Milan, Italy2) JRC Euratom, Institute for Safety Technology, 21020 Ispra (VA), Italy
The aim of the work here presented is to determine the prospects for the realization of a new type ofmonitoring system, mainly dedicated to the measurement of gas activity in the isolation space of doublecontainers for high activity tritium. This monitoring system should have sufficient sensitivity, quickresponse and should be easily decontaminated.
Looking at the data in the literature, we reached the conclusion that gas scintillation, produced by thepassage of ionizing particles in a gas, could be successfully exploited for the measurement of the specificactivity of tritium in gaseous form, mixed in streams of given gas carrier.
Preliminary experiments were carried out in a very simple apparatus which consists of a cylindricaldetection chamber, made of stainless steel, with polished internal walls. Two connectors (VCR metal gasketface seal fittings Cajon1) were soldered at the top of the chamber, in order to realize a vacuum seal. At thebase of the chamber a UV-grade quartz view port was optically coupled to a photomultiplier tube (PMT);in this way it is possible to reveal the scintillating events that occur in the chamber.
Signals coming from the PMT are first amplified, then analyzed with a multichannel analyzer (MCA) andfinally recorded thanks to an electronic counter on a personal computer.
Several experiments were carried out, using either argon or nitrogen as scintillating gas to which puregaseous tritium had been added. The detector response was tested at various values of gas total pressureand total activity.
The conclusions of this preliminary study are:
• gas scintillation produced by tritium beta particles is observable. Argon proved to have betterscintillation properties than nitrogen;
• the quartz view port gives rise to a scintillation caused by those beta particles that are emitted closeto the quartz (Me Keever 1984). Considering the modest volume of the detection chamber, thisscintillation contribute is not negligible;
• the detector response is, within the range tested during the experiment, a linear function of the gasmixture specific activity;
• small quantities of oxygen within the gas mixture produce a degradation in the luminescence. Thiseffect is known in the literature as 'quenching' phenomenon (Grün 1954, Birks 1964).
According to these preliminary results, a new detection apparatus was built. In this case, a sphericalgeometry was chosen in order to increase the ratio between the scintillating gas volume and the quartz areaand minimize the relative amount of the solid scintillation.
Furthermore, two PMTs were used for photon collection; in this way it was possible to obtain maximumlight yield, summing the PMT outputs, or minimize background electrical noise thanks to the coincidencetechnique.
The new detector prototype, depicted in Fig. 1, consists of a spherical, stainless steel detection chamber ofabout 250 mm in diameter, with two connectors for gas inlet and outlet (VCR metal gasket face seal fittingsCajon). The chamber is provided with two UV-grade quartz view ports, optically coupled to two inches
1 Swajelok Co., Solon, Ohio, U.S.A.
PORTOROŽ 95 157

SESSION HI PROCEEDINGS
diameter UV PMTs (Philips 56 DUVP2). To improve light collection, the internal metal surface wasaccurately polished.
DETECTION CHAMBER
METALLICPMT CASE
PHGTÜMULTIPLIER
TUBE
Fig. 1: Detection apparatus. Second detector prototype.
The pulses are first amplified and transformed in logical signals (TTL) by an electronic module and thensent to a coincidence unit. Finally, an electronic counter card on a personal computer records both TTLsignals and the coincidence TTL output. The scheme of the electronic circuit is represented in Fig. 2.
HIGHVOLTAGE
HIGHVOLTAGE
PHOTOMULTIPLIER
AMPLIFIER
PHOTOMULTIPLIER
COINCIDENCEUNIT
ELECTRONICCOUNTER
CARD
AMPLIFIER
Fig. 2: Scheme of the electronic circuit.
The testing procedure of the new monitor prototype was analogous to that followed for the previousprototype. Several tests were carried out in order to establish the detector response at different values ofgas total pressure, tritium specific activity and at different concentrations of gas impurities. Argon has beenutilized as scintillating gas with the addition of small, precisely measured, quantities of tritiated gas (tritium-nitrogen from a tritium calibrator, Johnston Laboratories model CL-13, specific activity 9.8xlO7 Bqm"3).
Philips, Eindhoven, the Netherlands
Johnston Laboratories, Townson, Maryland, U.S.A.
PORTOROŽ 95 158

SESSION HI PROCEEDINGS
To increase the total gas pressure, argon was injected in the detection chamber in several steps. Thevariation of the counts versus total pressure is reported in Fig. 3, which shows that gas scintillation due totntium beta particles is a function of pressure. This can be explained considering two main opposingphenomena, namely the increase in light emission due to the presence of more scintillating molecules andthe decrease in light collection due to the self-adsorbtion of the emitted photons by the gas itself. In thisparticular configuration the detector gave a roughly constant response for the pressure interval 0.67x10"-2.7xlO4 Pa (50-200 mmHg).
2200210020001900180017001600150014001300
, - "~T T
i..."t ".. \ ...
T_r.T._T; T -T--L- : I T T
i
i
1
i
!
i
x i J-
-1 ±- --—_ 1— ^ -j
0+ +
10 15 20 25pressure (kPa)
30 35 40
Fig. 3: Detector response curve (PMT's total counts (10s)) versus total gas pressure.
When atmospheric pressure was attained, the detection sensitivity diminished to 60% of the maximumvalue. Once the optimal pressure range was found, the detector response to changing specific activity wasdetermined. Total counts vary linearly with increasing activity, as shown in Fig. 4.
1800 -
o 1500 -
| 1200 -
| 900-
« 600 -
Ü 300 -
0 '
r T T
_. ._. _J
fi^
1 1
»-:—1 • • 1
o 500 1000 1500 2000activity (Bq)
2500 3000
Fig. 4: Detector response curve (PMT's total counts (10s)) versus total activity.
PORTOROŽ 95 159

SESSION in PROCEEDINGS
The influence of impurities on the scintillation process was also investigated. Several experiments with themost common impurities present in tritium plants were carried out: the effect of different concentrationsin argon of oxygen, air and helium was studied.The quenching effect due to oxygen (which may be presentas an impurity) was studied. A reduction of 30% in the total net counts was noticed at an oxygenconcentration of less than 1%. This operation was repeated using air and helium as impurities. When theimpurity was air, the results are in agreement with the previous experiment, according to the percentageof oxygen in air, whereas, when the impurity was helium, such strong quenching effect was not observed,confirming the good scintillating properties of this noble gas (Birks).
RESULTS
According to the experimental results, it emerges that the optimal operating pressure, corresponding to themaximum detector sensitivity, is 1.6xlO4 Pa, although the sensitivity varies only by 5% in the range0.67xl04-2.7xl04 Pa.
Considering the following quantities:
a) sum of the two photomultiplier net counts,b) coincidence net counts,
it is possible to evaluate the detector sensitivity for both cases:
a.l) 0.073 cps-Bq1 pqb.l) 7.8xlO"4 cps-Bq-1 6.24xlO6 cps-m3-Bq'
The lower limit of detection (LLD), based on a 95% confidence level, was also calculated. By applyingPasternack's formula for 10 s counting rate, the following LLD values were found:
a.2) LLD=14.8 cpsb.2) LLD=1.13cps
Considering the LLD values and the detector sensitivities it has been possible to estimate the minimumdetectable specific activities for this monitor prototype. With 10 s counting time and background count ratesof 100, 95,0.25 cps, respectively for the two photomultiplier tubes and the coincidence circuit, the resultingminimum detectable (specific) activities are as follows:
a.3) 202.5 Bq (5.5 nCi) 2.53xlO4Bq-m"3 (0.68 uCinť3)b.3) 1444 Bq (39 nCi) 1.8xl05 Bq-m3(4.9 uCim"3)
According to these values, it is evident that the sum of the PMT outputs gives better results.
It was found that the minimum detectable specific activity in 10 s is about 30 times below the concentrationlimit for tritium in the oxidized form (that is 8xlO5 Bqm 3 ; the limit for the gaseous form is about 25000times greater, Gazzetta Ufficiale delle Comunitä Europee, 1984). The sensitivity of the prototype gasscintillation detector is satisfactory, so that it is possible to use this new method for on-line tritium detectionin the inert atmosphere of tritium handling glove boxes or in the space of double containers.
The major advantages of this monitor consist principally in a rapid response time in case of tritium releaseinto the argon atmosphere (as previously seen, 10 s is chosen as the measuring time, therefore the responsedelay to a varied tritium concentration would be about this order of magnitude) and in a very low 'memoryeffect'. Indeed, after every experiment, the chamber was evacuated and subsequently purged with pureargon, but no increase in the background counts, due to tritium retention within the detection chamber, wasever observed.
PORTOROŽ 95 160

SESSION m PROCEEDINGS
REFERENCES1. Birks J.B., The Theory and Practice of Scintillation Counting, 574, 1964.2. Birks J.B., The Theory and Practice of Scintillation Counting, 594,585,1964.3. Conde C.A.N., Policarpo J.P.L., Nucl. Inst. and Meth., 53, 7-12, 1967.4. Eggler C , Huddlestone CM., Rev. Sei. Instr., 95, 600 A, 1954.5. Gazzetta Ufficiale delle Comunita Europee L625, 5 ottobre 1984.6. Grün A.E., SchopperE., Zeits. f. Naturfor., 6a, 698,1951.7. Grün A.E., Schopper E., Zeits. f. Naturfor., 9a, 134,1954.8. Me Keever S.W.S., Radiation Protection Dosimetry, vol. 8, n. 1/2, 81-98,1984.9. Palmer H.E., IEEE trans, on nucl. science, vol. NS-22, 100, 1975.10. Pasternack B.S., Harley N.H., Nucl. Instr. and Meth., 91, 533, 1971.11. Rodrigo L., Miller J.M. et al., Tritium measurement monitoring in experimental and process control, Report F. 82003,
October 1982.12. Sayres A., Wu C.S., Rev. Sei. Inst., 28, 758,1957.
PORTOROŽ 95 161

SESSION in ''"'''''"lllfllllllllH F PROCEEDINGSXA05C0041
EVULATION OF LOW-LEVEL SOLID RADIOACTIVE WASTE GENERATEDBY A LARGE HOSPITAL AND DISPOSED OF WITH ORDINARY REFUSE
L. Conte2), G. Pedroli3), M. Monciardini °, L. Bianchi °, R. Novario l), A. Beretta °
" Department of Health Physics - "Circolo Hospital" - Varese2) II Faculty of Medicine, Pavia University - Varese
3) Department of Health Physics - "S. Gerardo Hospital" - Monza
In the Lombardy region some hospitals have recently been reported to the local authorities because of thepresence of radioactivity in hospital refuse sent to the municipal tips for incineration.
On various occasions the refuse collectors coming from the hospitals had to return with their refuse astraces of radioactivity were detected at the entrance to the tips equipped with monitoring systems.
Hospitals administering radioactive substances for diagnostic or therapeutic purposes produce radioactivewaste mainly in solid and liquid form. This waste is principally present in patient excreta and incontaminated materials. Radioactive waste present in patient excreta is normally disposed of through thesewage system provided that the concentration limits and annual activity stipulated by law are respected.The contaminated materials coming from the departments that carry out radioisotopic investigations andtherapy with unsealed sources can be collected separately and sent to a tip after a period of storage topermit radioactive decay.
However, part of the radioactive waste escapes all checks and inevitably mixes with normal refuse or withspecial hospital refuse that is not considered radioactive. This occurs in the case of:
1. excreta from patients who are not hospitalised after a radioisotopic investigation and materialscontaminated by the excreta;
2. excreta from hospitalised patients which are eliminated outside the nuclear medicine andradiotherapy departments;
3. contaminated materials produced with unsealed sources in hospital departments other than thoseof nuclear medicine and radiotherapy;
The waste indicated in point 1 is probably the main problem in ecological terms as the patients who arenot hospitalised eliminate radioactive excreta into domestic sewage systems and can also contaminatematerials that are disposed of with normal household refuse. In this case any solution to the problem wouldseriously affect diagnostic activities carried out in the nuclear medicine department.
The patient excreta mentioned in point 2 are mainly disposed of through the hospital sewage system andcan be monitored but are difficult to collect in the decay tanks as the whole hospital complex is involved.
The solid waste specified in point 3 undergoes the same procedure as the solid waste disposed of by thehospital departments and is therefore collected in specific containers for non radioactive special refuseand taken to tips for incineration.
Our work is concerned with that part of radioactivity which is administered for diagnostic purposes tohospitalised patients at the "Circolo Hospital" in Varese, disposed of with hospital refuse and sent to theincinerator. The "Circolo Hospital" in Varese is a 1000-bed teaching hospital where radioactive materialsare used for diagnosies and the treatment of patients.
METHOD AND RESULTS
Hospital refuse containers usually contain syringes, test tubes, biological samples, leftover food, materialsused for medication, etc. Every year about 65000 containers weighing a total of approximately 270000 kgare sent to the incinerator.
PORTOROŽ 95 162

SESSION ID PROCEEDINGS
The average weight of each container is 4.15 kg and in the majority of cases the containers are cardboardboxes with a dimension of 55x28x38 cm3.
Table I shows the main radionuclides used in the "Circolo Hospital" in Varese with their physicalcharacteristics.
TC-99m1-131
Tl-201In-I l l1-125
ÉiiiÉ6.02h8.04 d73.1h2.8 d
60.14 d
llliieiyeŕiéjif'Océft
140.5364.5
68.9-70.8-80-167171-245
27.2-27.5-31-35.5
::i:WoioMiyMdí:;p)!i
88.981.2
27.2-46.2-20.7-10.090.2-94
39.8-74.1-25.6-6.7
Table I.
Table II shows the number of tests carried out with each radionuclide and the radioactivity administeredin 1994. The solid radioactive waste present in the containers is basically a small fraction of theradioactivity indicated in the last column of Table II.
lilii•i- •ť^iiiiE:
TC-99m1-131
Tl-201In-1111-125
7225969469
622
320000011500036000500
5
:; \ M inp iě:híS:;í3MEB(jj)::::.::::P;::;-. •:
11000004000025004201.4
Table II.
To calculate this fraction, a preliminary screening was carried out on a limited number of containerschosen at random. 1820 measurements were taken with a 2" x2" sodium iodide gamma scintillator meterconnected to a G-Silena Snip 204 portable multichannel analyser with 4096 channels.
s!
1000
100
i 0
0,01
-r— —
- = =
^ =
^ ^
š ^
=«."
——
E «
— •
1
^f U s' • •
=
i '
— -
• H M
• H
S E
•• IM
•e
— M
gs
•-- * -—«—— o -
• Tc-99m•1-1311-125ln-111
MSi - i .•
m =^5S- 1
1 =
10 15Cm
20 25 30
Fig. 1.
PORTOROŽ 95 163

SESSION HI PROCEEDINGS
The measuring technique consisted of two counts of one minute each in the photopeak area with the meterpositioned to touch the two opposite sides of the box (a distance of 28 cm) in the maximum count-rateposition.
A simple calibration method for determining the radioactivity inside the container was also elaborated.Sources of small dimensions with known activity were used for this purpose and placed inside thecontainer at various points along the axis of the meter.
Figure 1 shows the trends of the detection efficiency in function of the source-meter distance expressedin cps/kBq. Since the measurements were taken with empty container the efficiency values were correctedtaking the attenuation into account and based on the assumption that inside the container there was theequivalent of 4 kg of water.
In the least favourable conditions (i.e. with the source in the middle of the container ) and with themeasurements of one minute each taken opposite each other, the minimal detectable activity was betweenabout ten and just over a hundred kBq (Table III).
•;flÜpliTC-99m
1-131Tl-201In-1111-125
IIĚÉ2043
120*7
21
(* interpolated value)
Table HI.
The measurements carried out on the 1820 boxes detected the presence of Tc-99m in 90 cases. In onlyten boxes was there radioactivity that was far above the minimal detectable activity. In the other casesthe radioactivity was close to the minimal detectable activity. Altogether, approximately 20 MBq ofradioactivity was measured in about one month. Thus the annual quantity of Tc-99m present in thecardboard boxes (about 65000 per year) can be estimated at approximately 0.7 GBq (19 mCi). The ratioof the activity administered to inpatients is 0.065 %, that is to say less than 10"3.
The measurements taken did not reveal the presence of any radionuclide apart from Tc-99m. There are tworeasons for this: firstly the sample so far examined is very small and secondly far more tests are carriedout with Tc-99m (90% more) than with other isotopes. However, a ratio of 10"3 between radioactivitydisposed of as solid waste and aministered radioactivity can quite reasonably be attributed to the otherradionuclides, too.
CONCLUSIONS
The limited number of measurements carried out makes it impossible to have a more accurate idea of theamount of solid radioactive waste that the hospital departments dispose of every year. It is however in theregion of 10'3. The result obtained can be verified by increasing the number of samples examined andimproving the measuring method. With a 2" x2" sodium iodide gamma scintillator meter connected toa multichannel analyser it is possible to identify the radionuclide and the activity present in the box witha sufficient approximation. The sensitivity of the detection system also turned out to be sufficient forverifying whether the limits of radioactive concentration laid down by law were respected or not.
Finally, it should be remembered that the problem of radioactive hospital waste does not only concern solidwaste disposed of by hospital departments. A more comprehensive evaluation must also take into accountliquid waste and the production of radioactive waste by those patients who return home after aradioisotopic investigation.
PORTOROŽ 95 164

SESSION ffl PROCEEDINGS
The problem of radioactive hospital waste has been the subject of discussion formany years. However,the application of radioactive isotopes in the field of medicine is in continual evolution and so evaluationmust be updated. In addition, local regulations and the particular conditions existing in the activities of theindividual hospitals cannot be ignored.
REFERENCES
1. R.Emery, M.Jeannette, D.Sprau, Characterization of low-level radioactive waste genrated by a large university/hospitalcomplex, Health Phys. 62(2): 183-185, 1992.
2. Shih-Yin Ho, D.R. Shearer, Radioactive contamination in hospitals from nuclear medicine patients, Health Phys. 62(5):462-466, 1992.
3. R.J. Vetter, Incineration of biomedical low-level radioactive waste, Health Phys. February 1992.4. J.C.Hung, M.E. Wilson, T.B. Valley, Regulations for releasing patients who receive radiopharmaceuticalHealth
Phys. October 1992, vol. 63 n.4,467-468.5. B.M. Methe', Managing radioactively contaminated infectious waste at a large biomedical facility, Health Phys. 64(2):
187-191, 1993.6. V. Evdokimoff, C.Cash, K. Buckley, A. Cardenas, Potentential for radioactive patient excreta in hospital trash and
medical waste, Health Phys. 66(2): 209-211, 1994.
PORTOROŽ 95 165

SESSION III PROCEEDINGS
XA05C0042
A FRACTAL VIEW OF CHERNOBYL FALLOUTIN NORTHERN ITALY AND EUROPE
G. Salvadoři, S.P. Ratti, G. Belli, E. Quinto
Universita degli Studi di Pavia, Dipartimento di Fisica Nucleare a Teorica,Via A. Bassi 6,1-27100 Pavia, Italy
INTRODUCTION
Fractals (Mandelbrot 1983; Falconer 1988,1990; Feder 1989) are associated with irregularity and representa powerful tool for investigating phenomena featuring a complex behaviour, as it is the case of theatmospheric processes playing a role in spreading the radioactive pollution of Chernobyl in theenvironment. The introduction of fractals in environmental sciences is quite recent (see, e.g., Belli et al.1989, 1991; Salvadoři 1989, 1993; Missineo 1994; Quinto 1994; Salvadoři et al. 1994; Salvadoři et al.1995c). Fractals may account for the presence of strong fluctuations and for the high variabilitycharacterising the natural events involved in the Chernobyl fallout: the geographical sparseness of pollutantand the presence of "hot spots" make it advisable to use fractals as a theoretical framework for modelling(see, e.g., Schertzer et al., 1995).
THE 1 3 7Cs AIR CONCENTRATION IN NORTHERN ITALY
The REM (Radioactivity Environmental Monitoring) data bank (Bertozzi et al. 1987), organised by the JointResearch Centre (JRC) of Ispra (Italy), contains a few thousands radiological measurements collected byseveral Laboratories in Europe beginning April 26th, 1986, when the Chernobyl nuclear accident occurred.The research described in this first part is focused on the analysis of B7Cs air concentration in NorthernItaly (a data base of a few hundreds measurements) where an empirical parametrization of the radioactivitytemporal trend is known in ten Provinces out of fifty (Salvadoři 1989; Quinto 1994; Salvadoři et al.1995ab). The. function interpolating the available data of radioactivity is the following:
(1)
where: x is the half life of the radionuclide under investigation (here 137Cs); A is the effective rate of theexponential disappearing of the nuclide concentration (characteristic of a given element but independentof geographical variables); B accounts for the local intensity of the pollution; C is related to the arrival timeof the polluting cloud in a given location; K is the radioactive background.
Our purpose is to devise a procedure able to estimate the radioactive concentration also in sites where nomeasurements are available. For the reasons mentioned above, given the high complexity of thephenomenon, we try a fractal approach; the parametrization provided by the empirical function (1)represents a source of experimental information to be properly exploited. The fractal model is based on theFractal Sum of Pulses theory (Lovejoy and Mandelbrot 1985; Lovejoy and Schertzer 1985). The basic ideais to consider the value of a certain quantity (e.g. radioactive pollution), in a given region at a given time,as the sum of primary pulses, whose intensity, time duration and geometrical spread are random variablesproperly distributed and generated according to a precise strategy. Depending on the choice of suchprobability distributions, we may reproduce some physical features of the phenomenon under investigation,such as the presence of strong fluctuations (i.e. the "hot spots"). Our "embedding" space E=E(x,y,t) is 3D,i.e. two spatial coordinates (e.g. longitude and latitude) and the time (the unity is in days after theChernobyl accident). Each primary pulse has a "volume" V generated according to a hyperbolic law:
Pr ( V > v ) <* - (2)
PORTOROŽ 95 166

SESSION III PROCEEDINGS
The contribution Z of each single pulse to the global (additive) process is then related to its volume V bymeans of the formula:
Z(r)=± f(r)V l/D(3)
where D-1.67 (Lovejoy and Mandelbrot 1985; Lovejoy and Schertzer 1985) is called intermittencyexponent, V is the volume of the pulse and f (r) is a regular function (e.g. Gaussian) of the distance | r |between the generic pulse point r and the origin Co of the pulse.
8 days after. An empirical strategy (Quinto 1994; Salvadoři et al. 1995b) to placethe primary pulses in the embedding space E is to try and simulate thedistribution of the experimental data. In our case, the only source ofavailable information is represented by the actual distribution F(x,y,t)of pollutant; basically, the function F(x,y,t) takes the value ofconcentration estimated at time t in the Province closest to the point(x,y). This scheme generates "basins of attraction" specific for eachProvince; the greater the value of F in a region of E (as given by theexperimental data) the more the fractal algorithm "works" in such aregion.
Fig. 1: Fractal simulation on May 4th.
The contributions (positive and negative) of all the pulses are added; then, the numerical output is properlynormalised so that the total amount of radioactivity estimated in a certain region at a given time equals thevalue obtained by (spatially) integrating F(x,y,t) over the corresponding area. In other words, we onlyrequire an agreement in a "wide" sense, putting a constraint that affects the simulation only at a globallevel, leaving untouched all the local fluctuations. Practically, we start out from a flat distribution in each"basin of influence", we introduce fractal fluctuations and eventually we obtain a fully detailed simulationof the original phenomenon.
Using the Italian data, we provided (Quinto 1994, Salvadoři et al. 1995b) an estimate of 137Cs concentrationin large unsampled areas covering all Northern Italy; the time interval ranges from 4 to 12 days after theaccident with a temporal resolution of one day (the radioactivity has reached Italy only about 5-6 days afterthe accident (Casali et al. 1986), taking its maximum around the 8th day and then fading away). Fig. 1shows a 3D simulation on May 4th, 1986: the range is 0-2 Bq/m3'
E 4.0-
S 3.0-
i 2°-c 0.0-
Miláno
A .
• REM dataA Fractal est.
' T4
T86 7 8 9 10
Days after the Chernobyl accident1 1 12
Fig. 2: Fractal simulation and REM data of 137Cs air concentration in Miláno.
Before discussing quantitatively the goodness of the fractal model, it is worth mentioning that experimentaldata are collected (Bertozzi et al. 1987; Salvadoři et al. 1995ab) by means of filters, having an exposuretime of about 8h (or, often, of a whole day), exploiting different (or even unknown) sampling techniques:this puts an uncertainty of about one day on the sampling date. Also, almost half of the "input information"are "pseudo-measurements", covering only =15% of Northern Italy. The comparison with the available data
PORTOROŽ 95 167

SESSION HI PROCEEDINGS
can be performed (Quinto 1994; Salvadoři et al. 1995b) by plotting on the same graph the fractal estimatesand the original measurements. In fig. 2 we show the situation in Miláno. The disagreement never exceedsa factor of two and the guess of the arrival time is empirically acceptable; moreover, we find the samescenario in all the other Provinces.
THE 137CS CUMULATIVE SOIL DEPOSITION IN SEVERAL EUROPEAN COUNTRIES
The research described in this second part is focused on the analysis of I37Cs cumulative soil depositionmeasurements collected in several European Countries after the Chernobyl accident. As before, the datacome from the REM data bank (Bertozzi et al. 1987), and are presented in Tab. I for some of theinvestigated Countries: we show the number of certified data, their range (in KBq/m2), and the value of thehyperbolic exponent ô (see below).
Country
AustriaCzechoslovakiaGermanyItalyPoland
#data
97105293383349
min
0.7400.2200.4510.0010.790
max
91.5817.5342.0858.2371.69
ô1.733.421.752.042.51
Table I: Features of the available data (see text).
This work has two main purposes: first, we study the possible geometrical (multi)fractal (Feder 1989;Falconer 1990) behaviour of the radioactivity measured in the environment; second, making use of suchan information, we devise a multifractal model able not only to describe the overall distribution of theradioactive pollutant, but also to estimate it in sites where no data are available; our aim is then to providea procedure (based on the theory of geometrical multifractals) able to simulate the actual (multi)fractalfeatures of the measured pollution and to estimate its concentration in regions not sampled by the existingmonitoring networks (Quinto 1994; Salvadoři et al. 1995c). Most of all, this task is carried out starting onlyfrom the information about position and "intensity" of the available monitoring stations. At present, we mayonly show preliminary results, since several refinements are still needed.
We analyse the data on a Country-by-Country basis. The multifractal analysis involves two different butcomplementary operations (Quinto 1994; Salvadoři et al. 1995c): on the one hand we investigate thegeographical sparseness of the pollution, on the other hand we estimate its statistical distribution. Theformer step is accomplished by calculating the fractal dimensions D^T) (Mandelbrot 1983; Falconer 1988,1990; Feder 1989) of the set of stations measuring a value greater than a given threshold T; then, DF(T)represents the dimension function, i.e. the "spectrum" of the fractal dimensions as a function of differentlevels of pollution. Thus, DF(T) gives the multifractal features of the cumulative deposition; clearly, amultifractal approach is more sensitive and accurate than a monofractal one, as it may account for the factthat low contaminated regions are expected to be more uniformly distributed in space than possible "hotspots". Fig. 3a shows, as an example, the multifractal spectrum DF(T) as calculated for the data set ofCzechoslovakia: the fractal dimension decreases with increasing threshold T, i.e. the data show a differentfractal behaviour for different radionuclide concentrations. In particular, we see that the "hot spot" regioncorresponds to high levels of pollutant very "sparse" in space (i.e. having the lowest fractal dimension).
The statistical analysis of the data aims to look for a hyperbolic distribution of the concentration R:P r ( R > r ) « r " ô , for R large enough; ô>0 is called the hyperbolic exponent, i.e. to investigate whether,at least asymptotically, R is hyperbolically distributed. A hyperbolic law is a "natural" choice for fractalphenomena, since it leads to the appearance of large "anomalous" values ("hot spots"). In Fig. 3b we showthe asymptotic hyperbolic behaviour for the data set of Czechoslovakia. A scenario similar to the onepresented in Figs. 3 is found in all the other Countries (Quinto 1994; Salvadoři et al. 1995c), indicating themultifractal nature of the cumulative soil deposition; the estimated values of ô are shown in Tab. I. As a
PORTORO2 95 168

SESSION m PROCEEDINGS
consequence, these results may support the use of (multi)fractal techniques to simulate the radioactivedeposition.
c 1.4-g 1.2-Q)
E 1.0-Q 0 . 8 -«to 0.6-2u. 0.4-
B
I • DF(T) I \
Czechoslovakia
- 0 . 0 -
- 0 . 4 -
4 6»1
4 610
- 2 . 0 -
• — " • • • * • * • • . ,
Pr{R>r}
Czechoslovakia
Threshold (KBq / m2)
1 I I I- 0 . 5 0.0 0.5 1.0
Log r ( KBq / m2)
Fig. 3: Dimension function and hyperbolic distribution of the REM data in Czechoslovakia.
Briefly, the multifractal algorithm works as follows (Quinto 1994; Salvadoři et al. 1995c). First we generatea set of pulses (as for the monofractal model) having intensities hyperbolically distributed, where ô isestimated from real data; then we arrange such pulses on an arbitrary grid taking into account theinformation given by the function DF(T): pulses having intensities larger than T are distributed over a"network" having fractal dimension DF(T), where such networks are generated by means of "pseudo LevyFlights". The link between the actual geographical distribution of pollution and its use in our modelrepresents an original innovation. The basic idea is that each measurement has an "influence" on thesimulation proportional to its intensity; such effect is not concentrated onto a single point in space, butspreads over a whole "basin". A simple way to model it is to use "spatial potentials" V:V(x) = V0(l -\x\/L), | * | <L; V(jc)=O,| jt |>L ; where V(ac)is the value of the potential at position
x from the location of the station; Vo is the value of radioactivity measured by the station and L is a(constant) free parameter tuning the influence of the station over the neighbouring space. The overallpotential is simply given by the (spatial) integral (over the chosen grid) of all the single potentials; then,the global potential is exploited to "drift" any purely random network (generated by means of "pseudo LevyFlights") toward a spatial configuration closer to the actual distribution of pollution. Finally, each numericalrealisation of the process is added to the previous ones and the field (properly normalised) is compared tothe actual intensity of pollution: if some criterion of convergence is satisfied the simulation stops, otherwiseit produces more and more fields.
As a general comment (results are not shown here - see Quinto 1994; Salvadoři et al. 1995c), the modelis able to estimate the radioactive concentration in locations not sampled by the networks and the "hotspots" are almost always correctly reproduced. Similar results have been obtained for all the otherCountries and further constraints in the model might improve their accuracy. Some tests performedneglecting a fraction of the input data have shown that the quality of the outputs is not too much affected,indicating a fairly good "stability" of the model.
CONCLUSIONS
The proposed (multi)fractal approaches show that it is possible to study both the 137Cs air concentration and .cumulative soil deposition using (multi)fractal techniques. The algorithms are able to estimate the amountof pollutant even in regions where no experimental data are available and during time intervals when theno sampling operations were performed, taking into account both the data sparseness and the presence of"hot spots". The results agree fairly well with the available data, especially considering the intrinsicuncertainties of the experimental measurements, and hence they might be of interest both for nuclear andatmospheric physicists and for epidemiological purposes and risk assessment.
PORTOROŽ 95 169

SESSION ID PROCEEDINGS
ACKNOWLEDGEMENTS
The authors wish to thank the Commission of the European Communities - D.G. XII for having supportedthe present work within the Radiation Protection Programme (Contracts BI6*-0241-I(A), BI7*-CT90-0062-MNLA and H3P-CT93-0077).
REFERENCES
1. Belli, G., et al., An Attempt to Provide a Fractal Model for the Description of the TCDD Distribution in all the Territoryaround Seveso (Milan, Italy), Chemosphere 20, 1567, 1989.
2. Belli, G., S.P.Ratti, and G.Salvadori, An Empirical Fractal Model for the TCDD Distribution on Seveso (Milan, Italy)Territory, Toxicological and Environmental Chemistry, 33, 201, 1991.
3. Bertozzi, C, et al., R.E.M. Data Bank: Development, Application and Perspective, JRC-Ispra Technical Note 1.87.77PER 1333/87, 1987.
4. Casali, F., et al., Riflessioni su Chernobyl, II Nuovo Saggiatore, 4/1986/2,40-64, Bologna (Italy), 1986.5. Falconer, K.J., The Geometry of Fractal Sets, Cambridge University Press, Cambridge (UK), 1988.6. Falconer, K.J., Fractal Geometry, J.Wiley & Sons, Chichester (UK), 1990.7. Feder, J., Fractals, Plenum Press, New York, 1989.8. Lovejoy, S., and B.Mandelbrot, Fractal properties of rain and a fractal model, Tellus, 37A, 209,1985.9. Lovejoy, S., and D.Schertzer, Generalized Scale Invariance in the atmosphere and fractal models of rain, Water Res.
Res., 21, 8,1233,1985.10. Mandelbrot, B., The Fractal Geometry of Nature, Freeman, S. Francisco (1983).11. Missineo, F., Analisi Multifrattale dell'Emissione di Radon Indoor in Slovenia, Universita di Pavia, Dip. di Fisica
Nucleare e Teorica, Tesi di Laurea, A.A. 1992/93, 1994.12. Quinto, E., Modelli Mono e Multifrattali per lo Studio della Distribuzione di Inquinanti in Aria e al Suolo, Universita
di Pavia, Dip. di Fisica Nucleare e Teorica, Tesi di Laurea, A.A. 1993/94, 1994.13. Salvadoři, G., Modelli Matematici per lo Studio della Radioattivitä in Italia Indotta dall'Incidente Nucleare di
Chernobyl, Universita di Pavia, Dip. di Matematica, Tesi di Laurea, A.A. 1987/88,1989.14. Salvadoři, G., Multifrattali Stocastici: Teória e Applicazioni, Tesi di Dottorato di Ricerca, Biblioteca Nazionale di
Roma, Diss. 93/1316; Biblioteca Nazionale di Firenze, TDR. 1993.1278; 1993.15. Salvadoři, G., S.P.Ratti, G.Belli, S.Lovejoy, and D.Schertzer, Multifractal Objective Analysis of Seveso Ground
Pollution, Toxicological and Environmental Chemistry, 43, 63, 1994.16. Salvadoři, G., et al., An Analysis of Time-Dependance for Chernobyl Fallout in Italy, 1995a; Modelling the Chernobyl
Radioactive Fallout (I), 1995b; Modelling the Chernobyl Radioactive Fallout (II), 1995c (all subm. to Health Physics).17. Schertzer, D., et al., Multifractal Analysis of Chernobyl Fallout: Self-organized Criticality and "Hot Spots", Proc.
Mathematics and Computations, Reactor Physics, and Environmental Analyses, Portland (Oregon), April 30 - May 4,1995, American Nuclear Society Publisher, Illinois, p. 743,1995.
PORTOROŽ 95 170

iiiiiiiiiiXA05C0043
OFF-SITE EMERGENCY PLANNING IN CZECH REPUBLIC
Z. Prouza, D. Drábová
State Office for Nuclear Safety, Slezská 9, 120 29 Prague 2, Czech Republic
INTRODUCTION
In the Czech Republic, the NPP Dukovany - PWR 440/213-type (4 blocks) is currently in operation(from 1985) and NPP Temelin - PWR 1OOO (2 blocks) is under construction. Radiation accident on theNPP is defined as an unexpected or unintentional event in a facility with a potential of off-siteconsequences. The principles of emergency planning in Czech Republic now are based on thephilosophy and principles described in the ICRP Publication 4 0 and the IAEA Safety Series No. 55,72, and includes already the post Chernobyl experiences. Nevertheless, Czech Republic legislationexperiences an extensive reconstruction. The Atomic Act, which will be based from point of view thestructure, philosophy and principles on new International Basic Safety Standards [1], alreadybeing elaborated. That acts and related laws should solve our legislative problems on field ofemergency planning and preparedness.
EMERGENCY PREPAREDNESS
System of off-site emergency planning in the Czech Republic is based on the assumptions that when:
- the upper limit of the intervention level (IL) interval for given protective measure (PM) isexceeded, the implementation of that PM is regarded as necessary,
- the lower limit of the EL interval is exceeded, the optimization is provided with respect to theextent, feasibility and price of the given PM. Till the time when the "Atomic Act" will comeinto force, the recommendation issued by the Chief Hygienic Officer of the Czech Republic isvalid, where the IL presented in the Regulations [2] are approved, provided that:
- the IL will be expressed in the term of projected or averted dose, depending on type of PM,
- for carrying out the urgent PM (sheltering, iodine administration and temporary evacuation),interval values of the IL determined in [2] are refined as the generic optimized interventionlevels as follows for:
• sheltering, the averted effective dose equivalent 1O mSv for a period of no more than 2 days,• iodine profylaxis, the committed absorbed dose to the thyroid due to radioiodine 100 mGy,• temporary evacuation, the averted effective dose equivalent 5 0 mSv for a period no more
than 1 week.
Site specific IL may be higher or in some case lower than the presented DL due to considered off-site orsituation specific factors, e.g. the presence of special populations (hospital patients, school's children,etc.) the existence of hazardous weather conditions or competing hazards (chemicals), the transportproblems (high density populations, large city).
At nuclear power plants (NPP) urgent PM are planned through the Emergency Planning Zone (EPZ).It is assumed up to 30 km from the NPP (NPP Dukovany has a radius of the EPZ of 20 km), detailedplans of protecting provisions are elaborated. For the other areas up to 60 km the plans contain onlya list of personnel resources and means assigned for providing the preliminarily specifiedcountermeasures.
In EPZ, general notification and warning is carried out and it is extended to a further area with respectto the assumed and actual development of the accident. In the course of the NPP accident, notificationis carried out in two stages; at first stage particularly components active in the monitoring areactivated. This stage starts at the pre-release phase (already in the presence of a suspicion that the given
PORTOROŽ 95 171

SESSION ffl PROCEEDINGS
unusual event could result in an accident with off-site consequences). A higher risk of the false positiveevaluation of the event is also assumed. Notification resulting in the activation of the whole emergencypreparedness system is carried out at the beginning of the release or in the case of a high probabilityof the suspicion that it may occur. At this second stage, the false positive risk should be reasonablewith respect to economic costs resulting from false notification. Two stages method of notificationmakes it possible to timely acquire results of monitoring and it simultaneously prevents a false negativeconsideration of the event by the NPP Shift Supervisor.
Several urgent PM (sheltering, iodine profylaxis) are planned and carried out in the course of an accidentthrough the EPZ immediately after warning and without waiting for result of monitoring the actualradiation situation and without waiting fora decision of Regional Commission for Radiation Accidents(RCRA). In accordance with the monitoring results, urgent PM are then refined, cancelled or possiblyextended to further areas. The evacuation of inhabitants is planned and prepared in surroundings up to10 km from the NPP, and is provided in agreement with results of monitoring (however, without uselesswaiting for these results) based on a decision of RCRA. The other PM are implemented and refinedbased on monitoring results, actual course of accident and on the decision of RCRA based on using ofoptimization procedures.
The emergency planning structure in Czech Republic demonstrated on Fig. 1 is divided in two parts,local and national. On national level Governmental Commission for Radiation Accident (GCRA) isresponsible for coordination of all practice related to liquidation of accident consequencesrecommendation on global PM for state authorities. At GCRA Expert Advisory Group (EAG), whichensures an evaluation of course of acident and proposals of recommendation on PM and liquidation ofaccident consequences for GCRA, is working.
At the State Office for Nuclear Safety (SONS) Coordination Crisis Centre (CCC) was established. Itperforms the function of the Contact point SONS and ensures the emergency management and technicalsupport of GCRA.
FOREIGN COUNTRIES CZECH REP.GOVERNMENT
FOREIGN ORG .(IAEA,WH0,WM0,..)
PUBLIC
GCRA
CRMN
EAGRESORTS
SONSCONT.POINT
CCC RCRADISTR.OFFICE
IKES RMN ASC
OEG
EPZ-PUBLIC NPP
Fig. 1: The emergency planning structure in the Czech Republic.
PORTOROŽ 95 172

SESSION IQ PROCEEDINGS
On the basis of the Chernobyl experiences Czech Government decided in July, 1986 to set up theCzech Radiation Monitoring Network (RMN). Centre of RMN(CRMN) constituted [3] at SONS collectsand evaluates data, provides state authorities with interpreted monitoring data, communicates interpreteddata to GCRA, EAG, applies in' RMS desirable operation modes, coordinates actions of RMN. CRMNis responsible for international exchange of emergency data by the means of Integrated MonitoringInformation System (IMIS) which was constituted in cooperation of the Czech Republic and the FederalRepublic of Germany.
As special division at Nuclear Research Institute in Řež Analytic Service Centre (ASC) is working assupport for CCC and for NPP's on field in-site emergency planning. Integrated Rescue System (IRS)created special parts of Police, Fire-brigades, Medical Life-saving Service and Civil Defence is responsiblefor notification and warning on territory of republic and managment and implementation of PM toreduce or avert accident consequences.
In the case of an occurring or suspected radiation accident on territory of republic, the operator of thefacility involved must particularly provide notification of authorities, institutions and warning of thepopulation through EPZ of facility (NPP). NPP is responsible for initial assessment of probable courseof accident and cooperation with local authorities (District Office) in assessment, prediction ofaccident consequences for decision of RCRA on PM. Simultaneously with notifying, the monitoringstarts to be developed as an activity necessary for the determination and assessment of the accident. DistricOffice and their Regional (Distric) Commissions for Radiation Accidents (RCRA) are responsible foremergency preparedness, planning and for implementation of off-site PM and liquidation of accidentconsequences on managed district. The role of EAG on local level fulfils the OperationalEmergency Group (OEG) which responsible for the regional coordination of monitoring, evaluationof radiation situation, proposals of recommendation om PM in EPZ for RCRA.
CONCLUSION
The emergency planning and preparedness in the Czech Republic has been based from the beginningon the same principles as in the other developed countries operating nuclear power facilities. It ispossible to tell that from the technical as well as personnel standpoint, it is essentially provided at arelevant level. There are, however, problems particularly in the field of the legislation (organization,structure, responsibilities of different components of emergency planning system). Due to changes inthe economic sphere (privatization) and in the organizational structure of state administration, certainparts of this system must be reestablished or reorganized. After completion in 1995-97 the overallsystem will be able to assure measurement of radiation fields, processing of measured data, predictionof potenciál course of the radiation situation and communication to the competent authorities forproposal and recommendation of protective measures.
For the whole problem, it is, however, of importance to complete the legislative problems as soonas possible - the Atomic Act and related laws, which will define the competences and responsibilitiesof particular components of the system with providing fulfilment of its functions from all thestandpoints, including the economic one.
REFERENCES
1. International Basic Safety Standards for Protection Against Ionizing Radiation and for the Safety of Radiation Sources,Safety Series, No.l 15, IAEA, Vienna (1994).
2. Protection of Population and Countermeasures in National Economy after Radiation Accident of Nuclear PowerFacilities, Regulations of Czechoslovak Atomic Energy Commission, Federal Ministry of Defense and Ministryof Health Czech Republic, CO-2-19, Prague (1989).
3. Drábová, D., Malátová.I., Prouza, Z., Bučina.L: Radiation Monitoring Network of Czech Republic, Symp. onRad.Prot.in Neighbouring Countries in Central Europe, Portorož, Sept.4-8,1995.
PORTOROŽ 95 173

II Ml 1 III Ml IIIÍII INI P R 0 ™ G S
XA05C0044
RAPID DETERMINATION OF SOIL CONTAMINATIONBY HELICOPTER GAMMA RAY SPECTROMETRY
I. Winkelmann, H. Buchröder, M. Thomas
Bundesamt für Strahlenschutz, Waldowallee 117, D-10318 Berlin, Germany
ABSTRACT
Nuclide specific aerial measurements of surface soil contamination were performed after the Chernobylreactor accident in the southern part of Germany. For these measurements, a helicopter equipped with agamma ray spectrometer system including a HPGe detector (50 % relative efficiency) and 3 NaI(Tl)-detectors(volume 12 I) was used. The paper describes the complete measuring system in detail which can be used fornuclide specific measurements of soil contamination as well as for the detection of sources of gammaradioactivity. At an altitude of 100 m, a soil contamination of several kBq/m2 for134 Cs and137 Cs can bemeasured with a HPGe-detector by a measuring time of 60 s (helicopter speed 100 km/h). For the detectionof gamma rays emitting point sources, the 12 I NaI(Tl)-detector is used. Assuming line spacing of 300 m anda speed of 100 km/h, an area of about 30 km2 can be surveyed per hour. Thus60 Co-sources of some GBqactivity can be detected. The system was practically applied the first time by measuring the deposition ofartificial radionuclides in the southern part of Germany after the Chernobyl reactor accident. The aerialmeasuring system was also tested in the former USSR, in a region north of Chernobyl, with nuclide depositionvalues of up to 2 MBq/m2. The results of aerial measurements in selected areas are presented.
INTRODUCTION
An important task following an accidental release of radioactive substances from a nuclear power plant arerapid nuclide specific measurements of soil contamination over large areas. Aerial radiation measurementswith a helicopter can contribute to the accomplishment of this task. A further important purpose to usehelicopters is the detection of radiation sources as, for example, radioactive fragments of satellites orradioactive gamma-emitters lost in transport.
MEASURING SYSTEM
The aerial measuring system to be installed in an Alouette u type helicopter consists of several componentsthat can be separately installed in the helicopter. The central unit is a computerized gamma ray spectrometerwith two different detector systems. For the nuclide specific measurement of soil contamination, a highpurity Ge-semiconductor detector is used with a relative efficiency of 50 % (with a 1.2 1 dewar for LN2).For detecting radioactive point sources, three NaI(Tl)-scintillation detectors are employed with a totalvolume of 12 1.
The computer is equipped with spectrometric cards fitting each the high voltage and the supply of voltagefor the detectors and, further, the main amplifiers and the analog-digital-converters. The adjustment of theindividual measurement parameters is computer aided, as well as the recording of all measurement valuesshown in flight on a monochrome screen and continuously stored on a hard disk.
The power is supplied via the 28-V-net on board of the helicopter with a power consumption of 180 VA.A GPS-satellite navigation system integrated in the measuring system is determining the position of thehelicopter. A CCD-video camera with a wide angle lens allows for continuous recording on magnetic tapeand on-line-displaying the flight route on a screen for viewing by the technician. Pointing forward, thecamera is fitted to the instrument panel in front of the pilot. The altitude is continuously measured by radaraltimeter. The indicator gauge instrument is likewise fitted to the instrument panel for easy in-flight viewingby the pilot. The technician's remarks are recorded on the video magnetic tape, too.
Altogether, five helicopters of the type Alouette have so far been properly refitted to house the measuringdevice. The instrument console was refitted to hold the indicator system of the radar altimeter. Refitting
PORTOROŽ 95 174

SESSION III PROCEEDINGS
included also the integration of a radar altimeter with antennas, cabling and the necessary power outletsin the cell wall. Likewise refitted were mountings and power cables for the video camera.
The entire measuring device can be installed or removed from properly refitted machines by two personswithin approximately 30 minutes. The equipment has a weight of 120 kg. The expenses for procurement,including refitting costs, are about 400,000 DM per unit.
At a measuring time of 60 s soil contaminations of some kBq/m2 due to 134Cs and I37Cs can be measuredfrom an altitude of 100 m (flying speed 100 km/h). With the NaI(Tl)-detectors sources of gamma radiationof an activity of some GBq can be detected (altitude 100 m, line spacing 300 m, flying speed 100 km/h).Under these conditions an aerea of about 30 km2 to be covered per hour.
In case of a widespread distribution of radionuclides, relatively large distances may be chosen for theindividual flight routes (e.g. line distance of 10 km and more) for early orientation measurements. Whentracing individual radioactive emitters of source strengths in the range of some GBq, the line distances mustbe kept as narrow as possible on account of the strong attenuation of gamma radiation (<. 300 m). This taskrequires the employment of a larger number of properly equipped helicopters. Figure 1 shows the schemeof the arangement of the individual components in the cabin of the Alouette II type helicopter.
ScreenGPS antenna
Videocameia
Radar antenna
HPGe-deiNal (tl)-detectors
Fig. 1: Scheme of the individual components of the device for aerial measurements in an Alouette II typehelicopter.
The 1.2 1 dewar of the high purity Ge-semiconductor detector fitted into a shaft in the helicopter floor isshown in the foreground, while the 3 NaI(Tl)-detectors are shown in the rear, mounted next to each otherin a metal box close to the floor of the helicopter. Above is the 19" rack, containing the computer,electronics, screen and GPS-navigation system.
MEASUREMENTS
The measuring system was initially employed for nuclide specific measurements of soil contamination insouthern Germany after the reactor accident in Chernobyl. The region between Danube and the Alps wasflown in parallel routes, keeping distances of each 10 km, and at a flying speed of approximatelly 100 km/h.The average altitude was 100 m above ground level. The region was flown in several missions within 12hours. A deviation from this flight course occurred only near the Alps due to the structure of the terrain.In order to keep the statistical uncertainty of the 137Cs photopeak count rate below 15 %, a measuring timeof 60 s was chosen for each individual spectrum. Under these conditions, each of the measured valuesrepresents a mean soil contamination value for nearly a 1.7 km distance. For evaluating the spectra, a 137Csactivity distribution in soil was used as it had been determined from soil sample measurements in areas
PORTOROŽ 95 175

SESSION ni PROCEEDINGS
monitored by flights. In most cases, fields (unknown activity distribution) and smaller wooded areas wereof negligible influence.
Figure 2 shows the results from measurement flights determining the soil contamination in the south-eastof Germany. As an example three flight routes were selected over areas with differently high soilcontamination. The distance between each flight route was 20 km.
Along the flight route from Munich in the direction of Burghausen at the Austrian border (Fig. 2a), a l37Cssoil contamination ranging between 5kBq/m2 and 17 kBq/m2 was measured. The 137Cs soil conta-mination measured on parallel flight routes 20 km (Fig. 2b) and 40 km (Fig. 2c) south of flight routenumber 1 (Fig. 2a) is slightly higher and reaches values up to about 40 kBq/m2.
a) Route number 1: München - Burghausen
10 20 30 40Flying distance [km]
50
b) Route number 2: 20 km south of route 1
20 30 40Flying distance [km]
50 60
c) Route number 3:40 km south of route 1 (Rosenheim - Bad Reichenhall}
10 20 30 40Flying distance [km]
Fig. 2: 137Cs soil contamination along the three parallel flight routes in south-east Germany.
The measurement uncertainty was estimated to be 30 %. Apart from the uncertainties in determining thephotopeak count rate, inhomogeneities in the distribution of activity in soil and variations in the altitudeabove ground level contribute essentially to the measurement uncertainty. Due to the unknown distributionof Cs-activity in soil, some spectra could not be evaluated. However, the activity distribution ofradionuclides in soil is of only minor importance when measuring the soil contamination immediately afterthe release of radioactive substances from a nuclear installation - the latter being the main case in whichthis method is intended to be applied.
PORTOROŽ 95 176

SESSIONm llllllllllXA05C0045
RECENT DEVELOPMENTS IN THE ATMOSPHERIC DISPERSION MODELSTO BE USED FOR REGULATORY PURPOSES AND IN RISK EVALUATION
G. Graziani
Environment Institute, JRC Ispra, 21020 Ispra, Italy
INTRODUCTION
Climatological models and those most widely used for risk evaluation are generally based on theclassification of atmospheric turbulence according to the Pasquill-Gifford categories, and use the Gaussiansolution of the dispersion equation. One of their main limitations is that they deal only with continuous orinstantaneous (puff) emission. Furthermore, a discretisation in the definition of atmospheric turbulence isperformed according to the Pasquill-Gifford categories. This can generate uncertainties, since partialinformation on the state of the atmosphere at the time of emission can lead to the choice of one categoryrather than another and consequently to select wrong dispersion parameters. Some of these limits, such asthe assumption of flat or slowly varying terrain, and the choice of constant atmospheric conditions duringthe duration of the release, are intrinsic to the schematization required by these models. Other limitations,such as the finite duration of the emissions and the continuous variation of the physical quantitiesdescribing the effect of turbulence on dispersion parameters, can be overcome. This paper describes thepossible improvements which can be made in the dispersion models used in regulating emissions in theatmosphere and to calculate the associated risk. In particular the turbulence is based on the definition ofsome physical quantities varying with continuity which can be easily deduced from simple observationsat the meteorological station at release site. It then analyses the application of this approach to a simpledispersion model, which can take into account the finite and non-zero durations of accidental emissions.
ATMOSPHERIC TURBULENCE, THE WIND AND ITS FLUCTUATIONS
The fluctuations u', v' and w' depend on the atmosphere thermal states, which are roughly classified as"stable", "neutral" or "unstable", depending on vertical temperature gradient.
The atmosphere's stability or instability depends on solar irradiation which acts differently on theatmosphere and on the ground below. The soil's properties thus influence the atmosphere's turbulence; theycan thus be evaluated through the following quantities:
z„ roughness length, ie the height below which the average wind is zero because of the obstacles whichcover the terrain. The value of z0 varies from a few mm (ice) to several m (soil covered by forests orhigh buildings).friction velocity u,, which depends on the vertical transfer of horizontal momentumthe Monin-Obukhov length L, defined as a function of the vertical heat flux H , as follows:
= _u*
kg H (kgdJT)
with cp specific heat of the air at constant pressure, T the absolute temperature, g the acceleration due togravity, k Von Karman's constant. In the second formulation of L given above, the definition of the quantity0, appears, which is the scale temperature for the turbulent heat transfers. In defining the length L therelative weight of the wind-induced turbulence and the heat flux-induced turbulence play an important role.One in fact notes that L is negative for unstable atmospheres, positive for stable atmospheres and infinitefor neutral atmospheres when the heat flux H tends to zero. To describe turbulence, the Lagrangian timescales TL must be defined as the time scales of fluctuations correlations.
PORTOROŽ 95 177

SESSION ffl PROCEEDINGS
The quantities L, u, and ZQ can be used in describing the variation of average wind intensity with elevationfrom soil. Assuming that the turbulent flux terms u'w' are proportional (through the exchange coefficientKm) to the scalar wind gradient, it is possible to obtain the the well known logarithmic wind profile withheight. When the atmosphere near the ground is not neutral, the previous equation must be generalised toinclude the air buoyancy. This is obtained by the introduction of a correction factor that modifies thevertical gradient equation:
j ? * d]nf ] = T I ln--1M7>+1MT) ]" T [ j ? ( **> f ] T Ik ZQ J V L L k Z0
The correction parameter for the wind's logarithmic profile is usually calculated on the basis of the Busingerformulation for stable (z/L > 0) and unstable (z/L < 0) atmospheres.
TAYLORS STATISTICAL THEORY
Assuming homogeneous turbulence, it is possible to determine the standard deviation of all the possibletrajectories, with respect to the average trajectory which follows the average wind. Since the motion of theparticles which form each parcel is made up of two parts: one due to the average wind (u, y and w) and oneto the turbulent motion (u',v' and w'), an expression can be found for the square of the trajectories deviation:
•.«»•rTdtľRLJo Jo
This equation indicates that trajectories mean deviations are proportional to mean wind deviations relativeto the direction considered. If the time T defined above is small, the auto-correlation is high and thus closeto 1. The double integral is thus T2/2. If, instead, the time considered is large, the boundary of both thefirst and second integrals tends to infinity. The innermost integral is thus by definition the Lagrangian timeTL and thus the double integral is thus equal to T for TL. In general:
o2x =
DEPENDENCE OF THE ox, ay, az AND TL
The relation describing the standard deviations of the trajectories of the material released continuously froma point source, requires the determination of the standard deviations of the wind components. Thesequantities are the integral of the turbulence spectra and the Lagrangian time scales, and are not normallymeasured. It is in fact easier to measure the Eulerian turbulence, i.e. with respect to a fixed reference, thanthe Lagrangian turbulence relative to a reference frame following the emitted plume. The components ofthe turbulence energy and the expressions of the Lagrangian time scales can be parametrized as a functionof a few quantities such as the friction velocity, the Monin-Obukhov length and the height of the mixinglayer. A classic parametrization can be found in the literature (Hanna, 1982).
DETERMINATION OF u. AND L
While there are tables giving values of the roughness length z0 as a function of the type of terrain, u, andL must be measured in the time interval in which one wishes to simulate the evolution in air of thesubstance studied. The values of u, and L are obtained accurately from their definition, if one has availablethe spectrum of the fluctuations with respect to the average value of the horizontal and vertical windcomponents and an accurate measurement of the heat flux upwards, i.e. if one has a sonic anemometer-termometer. When these instruments are not available, approximate though reasonably correct values ofthe friction velocity and the Monin-Obukhov length can be obtained with two methods described below.
PORTOROŽ 95 178

SESSION III PROCEEDINGS
Temperature profile method:Knowing air temperature T(z) and horizontal wind speed U(z) at height z and its vertical gradient [ôT/ôx]2e
together with zO, then one can determine u, and L. In fact, assuming the heat flux at the surface H (K m/s)proportional to the temperature gradient, by means of the turbulent conductivity Kh (m
2/s) and taking alinear expression for it, one obtains an expression for L as a function of u, and the quantities measured:
özlz° e
where the difference between the temperature gradient ô0/ôz and ôT/ôz is -0.01 K/m (gradient of theadiabatic). To define the representative height where the gradient must be measured, one can use thegeometric mean between the two heights in which the temperature is measured (unstable or neutralsituations), or the arithmetic mean between the two heights (stable situations). The relations for L and forthe wind profile form a non-linear system of two equations in the two unknowns L and u,, which can besolved by iteration.
Energy balance method:In most situations information is not available on the temperature differences along the vertical. One thenstarts with the information available on the energy balance at the surface:
H + IE = Q*- G
where H is the heat flux to the surface already defined, the product A E is the latent heat flux (X is the latentheat for evaporation and E is the flux of water which evaporates), Q* is the net radiation and G the flux ofheat in the ground. In this equation, if unknown terms can be parametrized as a function of easilydetermined quantities, such as the total sky cover, the solar elevation, the air temperature and as a functionof the same quantities to be determined (ut, 0, and L), one can obtain an expression for 0, which, coupledto the wind profile for similarity and to the L-definition equation, forms a non-linear system of threeequations in three unknowns which can be solved by iteration (Van Ulden and Holstag, 1985).
SIMULATION OF THE MIXING LAYER DEPTH
During the night, or in general in stable conditions, the height of the mixing layer is generally calculatedusing the well known Zilintinkevich model (1988). This relation can be used to determine the layer height,once L and u, are known. In neutral conditions, one may assume that if there is no inversion layer whichlimits the mixing layer to a high level, Z; is given by the expression: Z; = 0.3 (u,/f). A model for convectiveatmosphere (Gryning and Batchvarova, 1990) can be used starting on the description of convective motionsgenerated by the flow of heat from below, which generates the development of the mixing layer. This modelassumes horizontal homogeneity, (only vertical dimension is considered) and that the mixing layer islimited above by a thin layer characterized by a positive gradient of the potential temperature. Above thislayer (called the Entrance Zone, EZ), the atmosphere is considered stable and stratified. The equation,derived by the model's authors, equals the reduction of the potential and kinetic energy due to the input ofcold air from above the inversion layer to the production of thermal and mechanical energy inside the PBL.
The integration of this equation starting from the stable conditions of the night before, allows thedetermination of mixing layer depth, using only the physical quantities u, and L.
h2 Cul T dh
(\+2A)h-2BkL + yg((l +A)h-BkL) dt
PORTOROŽ 95 179

SESSION III PROCEEDINGS
A NON GAUSSIAN MODEL FOR ATMOSPHERIC DISPERSION
The MRBT [STRM] model (Short-Term Release Model) follows the evolution in time of the concentrationfield determined by transport and turbulent diffusion of primary pollutants emitted in the low atmosphereand subject to a possible chemical and physical decay in the presence of a mixing layer with finitethickness. The model's structure is based on the special analytical solution for the case of constant releaseof finite duration t from a point source, derived from the more general solution proposed by Bianconi andTamponi (1993) for the non-steady atmospheric dispersion equation. The mathematical expression of thesolution adopted by MRBT which supplies the concentration field at t, in each point of domain is reportedin Andretta et al.(1993). This solution describes the time evolution of the concentration field for a pollutantemitted from a point source at height h during a release of duration t r. The finite thickness of the mixinglayer is taken into account and the possible chemical and physical decay of pollutant emitted is considered.The wind speed is supposed constant in the model and is determined assuming an average value of itsvertical profile, from the ground to the source height, according to the parametrization previously describedhere. The model can also evaluate the effective source height following the rising of fumes because of thebuoyancy force and the momentum. The model is presently in development stage. One of the moreimportant model characteristics is that the exposure defined as the integral of concentration between ^ andto + T has still an analytical expression.
REFERENCES
1. Andretta M., Bianconi R., Flospergher W. and Tamponi M, (1993), The MRBT model: an analytical dispersion modelin a finite mixing layer, Sensitivity analysis and validation against tracer measurements, Atmos. Environ., 27(A): 1665-1672.
2. Batchvarova E. and Gryning S.E.: Applied model for the growth of the daytime mixed layer, Boundary Layer Meteor.56.261-274,1991.
3. Bianconi R. and Tamponi M. (1993), A mathematical model of diffusion from a steady source of short duration in afinite mixing layer, Atmos. Environ., 27(A): 781-792.
4. Hanna S.R. (1982), Applications in air pollution modelling, In: Atmospheric Turbulence and Air Pollution Modelling,Ed. by F.T. Nieuwstadt and H. Van Dop), Reidel, Dordrecht.
5. Van Ulden A.P., Holstag A.A.M. (1985): Estimation of atmospheric boundary layer parameters for diffusionapplications, J. of Clim. and Appl. Meteor., 24, 11, pp 1196-1207.
6. Zilitinkevich S.S. (1988): Velocity profiles, the resistance law and dissipation rate of mean flow kinetic energy in aneutrally and stably stratified planetary boundary layer, Boundary Layer Meteor.,46, pp 367-387.
PORTOROŽ 95 180

SESSION HI PROCEEDINGS
XA05C0046
BIOPHYSICAL MODEL FOR THOROTRAST-INDUCED LIVER CANCERS
M. Nösterer0, W. Hofmann1* and S.G. Andreev2)
" Institute of Physcis and Biophysics, University of Salzburg,
Hellbrunner Str. 34, A-5020 Salzburg, Austria2) Institute of Chemical Physics, Russian Academy of Sciences,
Kosygina str. 4, Moscow, GSP-1, 177977, Russia
INTRODUCTION
In Germany between 1930 and 1950, an estimated 10,000 to 20,000 patients received Thorostrastinjections, mostly for angiographic examinations (van Kaick et al , 1984; 1989; 1995). About 59% of theintravascularly injected Thorotrast was retained by the liver. Based on a mean injected volume of 25 mland an average exposure time of about 40 years, Thorotrast patients received a mean liver dose of about9.5 Gy. As a consequence, about 20% of the 2,326 Thorotrast patients examined in the German ThorotrastStudy died of liver tumors, while only 2 cases of primary liver tumors were observed in the 1,890 controlpatients (van Kaick et al., 1995).
BIOPHYSICAL CARCINOGENESIS MODEL
Our present analysis of primary liver tumors in Thorotrast patients is based on a recently developedbiophysical model of radiation-induced in vitro transformation and in vivo carcinogenesis (Crawford-Brownand Hofmann, 1990; 1993; Hofmann et al., 1995). The transitions between the various stages in thisinititation-promotion model correspond to experimentally observable cellular radiation effects, such as theformation of single and double strand breaks or cellular inactivation. In our multi-stage carcinogenesismodel, a sequence of eight states is assumed in the development of a cell from the initial undamaged level(state 0) to a fully transformed cell with uninhibited growth leading to a detectable solid tumor (state 7)(Fig. 1). The intermediate successive steps are: production of an unspecific DNA single strand break (state0 to 1); production of a second specific (i.e., relevant for oncogenic transformation) DNA single strandbreak (state 1 to 2); interaction of both single strand breaks to form a double strand break (state 2 to 3);direct formation of DNA double strand breaks (state 0 to 3); division-related fixation of the DNA doublestrand break (state 3 to 4); promotional mechanisms, such as reversible (state 4 to 5) and irreversible (state5 to 6, and state 4 to 6, respectively) down-regulation of gap-junctional intercellular communication,triggered by the fraction of damaged surrounding cells (this effect is presently modeled by a binomialdistribution); and clonal expansion to an observable tumor (state 6 to 7). Reverse transitions may be broughtabout by adaptive mechanisms and repair processes (states 1 to 0 and 2 to 1) or by remodeling processes(state 5 to 4). Cells in individual states may be removed by radiation-induced cell death, apoptosis, terminaldifferentiation, or formation of a benign tumor, while spontaneous and stimulated mitosis may increase thenumber of cells in a given state. All radiation-induced transition rates are expressed as the sum of aspontaneous background rate and a radiation-dependent term, which is an explicit function of the meandose rate delivered to the liver.
Ionizing radition is assumed to have properties of both initiation and promotion. While the transition ratesof the initiation part of the model (states 0 to 4) can be directly derived from in vitro transformationexperiments with low and high LET radiations (Crawford-Brown and Hofmann, 1990), the promotionmechanisms of radiation-induced liver cancers (state 4 to 6) is assumed to be qualitatively identical to thoseoccurring in chemical carcinogenesis. In accordance with the in vivo rat liver experiments withphenobarbital (Schulte-Hermann et al., 1990), the promotional role of radiation is modeled here as aradiation-induced reversible or irreversible shift in phenotype expression of initiated cells to relatively non-communicating forms with a lower rate of programmed cell death. The final step, progression into amalignant liver tumor is assumed to be independent of the presence of a promotor, i.e., the process of clonalexpansion is no longer affected by the cell killing and promotional properties of radiation.
PORTOROŽ 95 181

SESSION DI PROCEEDINGS
Fig. 1: Biophysical multi-stage model for radiation-induced carcinogenesis, consisting of an initiation phase(state 0 to 4), a subsequent promotion phase (state 4 to 6) and, finally, progression into a frank tumor(state 6 to 7).
LIVER CANCERS IN GERMAN THOROTRAST PATIENTS
The patients in the German Thorotrast Study suffering from liver cancer were divided into three groupsaccording to the injected Thorotrast volume. Mean dose rates in each group were (van Kaick et al., 1984):100 mGy yr"1 (N = 133), 180 mGy yr1 (N = 237), and 300 mGy yr1 (N = 207). If the resulting cumulativeincidences for primary liver tumors are plotted as functions of the cumulative exposure time, twoobervations can be made: (i) The cumulative incidence in each dose rate group rises steeply with increasingcumulative exposure after a mean latency period of about 26 years, and (ii) a higher dose rate leads to ahigher cumulative incidence at the same cumulative exposure time, caused by a steeper incidence functionand a shorter latency period. However, if the reported liver tumor incidences are plotted as functions ofcumulative dose, then an „inverse dose rate effect" can be observed.
10 11 |2
Fig. 2: Cumulative liver cancer incidence in German Thorotrast patients as a function of total dose for threedifferent dose rates. Epidemiological data are denoted by symbols, while full lines refer to the modelpredictions for the corresponding dose rates.
One of the most significant features of our biophysical carcinogenesis model is that radiation-inducedtransition rates are formulated explicitly as functions of dose rate. Thus, a very sensitive test of the validityof our model is whether it can reproduce the epidemiologically observed inverse dose rate dependence. Thecomparison between our theoretical predictions and the epidemiological liver cancer data is plotted in
PORTOROŽ 95 182

SESSION in PROCEEDINGS
Fig. 2. Consistent with the epidemiological evidence, the model correctly predicts an inverse dose rateeffect, suggesting that this effect may eventually disappear at sufficiently high doses.
Recent studies of low dose effects of ionizing radiation have revealed that adaptive response mechanismsmay be activated above a given threshold dose (Kondo, 1993). In line with general observations, we haveassumed that an adaptive response is induced at 2 mGy, then rises linearly to a maximum efficiency at 5Gy, remains level at this saturation value up to a dose of 10 Gy, and finally decreases linearly to zero at adose of 20 Gy. The effect of the above defined adaptive response function on liver cancer incidence isillustrated in Fig. 3 for three different cases of pre-irradation: (i) below a dose of 2 mGy where no adaptiveresponse is operating at the onset of the exposure to alpha particles, (ii) in the linearly increasing portionof the efficiency curve, and, (iii) at the plateau value of the adaptive response function. Though higher pre-irradiation doses increase the carcinogenic risk at earlier times of the Thorotrast exposure, the effect isactually reversed at later times. Thus, if we assume a latency period of about 20 to 30 years, liver cancerincidence will be lower for the higher pre-irradiation doses.
CONCLUSIONS
A biophysical multi-stage model of radiation-induced carcinogenesis has been developed, which utilizesexperimental information on in vitro cellular radiation effects and theoretical considerations ofmodifications of these results under in vivo exposure conditions. In the present paper, this model has beensuccessfully applied to the occurrence of liver tumors in German Thorotrast patients. Consistent with theepidemiological data, our model correctly predicts the inverse dose rate dependence of liver cancers.Incorporation of adaptive response mechanisms into the model reveals that pre-exposure to othercarcinogenic substances, such as ionizing radiation or chemicals, may actually reduce the carcinogenic riskby subsequent alpha particle irradiation. Such an observation questions the generally accepted validity ofthe „linear extrapolation" in the low dose range.
•H - 7
3 4. 10
<«M
I4
-7
-72. 10
-7
u•HC!VO
5 1. 10UuDO
5 10 15 20
Cumulative exposure time (years)
25
Fig. 3: Cumulative liver cancer incidence versus cumulative exposure time for three different pre-irradiationregimes: (i) no pre-irradiation (full line), (ii) pre-irradation dose in the range of the linearly increasingadaptive response function (dotted line), and (iii) pre-irradiation at the plateau value of the adaptiveresponse efficiency (dashed-line).
ACKNOWLEDGEMENTS
This research was supported in part by the Forschungsinstitut Gastein-Tauernregion, Project K 57 (S.G.Andreev).
PORTOROŽ 95 183

SESSION UI PROCEEDINGS
REFERENCES
1. Crawford-Brown, D.J. and Hofmann, W. (1990) A generalized state-vector model for radiation-induced cellulartransformation. Int. J. Radiat. Biol. 57:407-423.
2. Crawford-Brown, D.J. and Hofmann, W. (1993) Extension of a generalized state-vector model of radiation-inducedcarcinogenesis to consideration of dose rate. Math. Biosci. 115:123-144.
3. Hofmann, W., Nösterer, M., Eckl, P. and Crawford-Brown, D.J. (1995) Biophysical model of liver carcinogenesis inThorotrast patients. In: Health Effects of Internally Deposited Radionuclides: Emphasis on Radium and Thorium (G.van Kaick, A. Karaoglou and A.M. Kellerer, eds), World Scientific, Singapore, p. 361-364.
4. Kondo, S. (1993) Health Effects of Low-level Radiation, Kinki University Press, Osaka. Schulte-Hermann, R.,Timmermann-Trosiener, I., Barthel, G. and Bursch, W. (1990) DNA synthesis, apoptosis, and phenotypic expressionas determinants of growth of altered foci in rat liver during phenobarbital promotion, Cancer Res. 50:5127-5135.
5. van Kaick, G., Muth, H. and Kaul, A. (1984) The German Thorotrast Study. Report EUR 9504 EN, Commission ofthe European Communities, Luxembourg.
6. van Kaick, G., Wesch, H., Liihrs, H., Liebermann, D., Kaul, A. and Muth, H. (1989) The German Thorotrast Study -report on 20 years follow-up. In: Risks from Radium and Thorotrast, BIR Report 21 (D.M. Taylor, C.W. Mays, G.B.Gerber and R.G. Thomas, eds), British Institute of Radiology, London, p. 98-103.
7. van Kaick, G., Wesch, H., Liihrs, H., Liebermann, D. and Kaul, A. (1995) Epidemiological results and dosimetriccalculations - an update of the German Thorotrast Study. In: Health Effects of Internally Deposited Radionuclides:Emphasis on Radium and Thorium (G. van Kaick, A. Karaoglou and A.M. Kellerer, eds), World Scientific, Singapore,p. 171-175.
PORTOROŽ 95 184

SESSION m PROCEEDINGS
XA05C0047
MONITORING OF NATURAL RADIOACTIVITY IN SLOVAKIA
D. Nikodémova, M. Vladár, I. Gomola
Institute of Preventive and Clinical Medicine, Limbová 14, 833 01 Bratislava, Slovakia
INTRODUCTION
The Commission of the European Communities (CEC) published recently a compilation of the level ofnatural radiation measurement in Member States of CEC, in a form of Radiation Atlas [l].The objectiveof our work was to supplement the surveyed data with an information about radiation load of Slovakpopulation from natural sources of ionizing radiation. We review the results compiled in the years 1993 and1994.
METHODS
The paper deals with two main natural sources of human exposure, i.e. the outdoor photon dose equivalentrate, Hx, and the indoor radon volume activity [Bq/m3]. The estimation of the radiation load from outdoorphoton radiation was based on continuous measurements of dose equivalent rates using:
a/ TLD. types TLD 700 (LiF, Harshaw) in a territorial monitoring network, consisting of 66 stations overSlovakia, where integral values are collected for 3 months.
b/ Intelligent Environmental Dose Equivalent Proportional Detector, FHZ621B, [2] in an InternationalRadiation Information System (IRIS). The system consists of 26 stations (16 working) over the wholeSlovakia, situated uniformly at existing hydrometeorological stations (Fig.l). In standard operation aset of average dose equivalent rate, Hx, are transferred every 24 hours into the central database of IRIS[3].
Poland
Czech Republic
Austri
Fig.l: Hx in IRIS Network in Slovakia.
For the measurements of equilibrium equivalent radon concentration (EEC) solid state track detectors typeCR-39 (Pershore.UK) were used, exchanged in a period of 6 month during the heating season. The surveyof the distribution of EEC of radon in Slovakia is given in Fig.2.
The survey covers random sample of EEC measurements in 1832 dwellings uniformly located over theSlovakia [4].
The annual effective doses, E, from external exposure were estimated by the procedure given in UNSCEAR1993 [5]. Conversion coefficients for radon and radon progeny were taken from Basic Safety Standards [6],UNSCEAR 93, and CEC, assuming an indoor radon occupancy of 7000 hours/year and an equilibriumfactor of 0.4.
PORTOROŽ 95 185

SESSION m PROCEEDINGS
] 6q/rr.3! I 1 M.00 to 25.00
25.00 ic 35.0035.00 to 50.0050.00 to 80.00 j80.00 to 100.00100.CO to '53.00
Fig. 2: Equivalent Radon Concentration in Slovakia.
RESULTS
The values of Hx estimated from TLD and IRIS network are given in Tab.l. The obtained results werecompared with older data of air kerma rate, K,, measured in 139 localities of Slovakia using combinationof 6 area GM tubes type STS6, by Spumy at all [7].
The average Hx value from the IRIS network is 124 nSv/hour and from the TLD network only 82.5nSv/hour. The annual effective dose is equal to 811 uSv and 537 uSv, resp.
SOURCES
Spurný (1977)IRIS (1994)TLD (1994)
H x
[nSv-rr1]
124.8124.082.5
Ka
[nGy-h1]
108.4107.871.7
E[mSv/a]
816811537
USED DEVICES
GM Tube STS 6FAG 621 B
7LiF
Table 1: Estimation of EL in Slovakia.
KM HtTHtnOIOrizntOUIMtMbTl»
Btix.ni»
1M v ~
X* 1 —
ok"
- i ^ U- 'JHaBk J I Éŕ :
j— i -
!
ILLe» n m
II Mv ft]
HA COMMMIOIOrilHtOlflMtAIDTlb•BMOM
aIMt
ltd»»Ifwt
Mai»O
o H»tfc»rMfvMa
1 •• 1
!
• • • " • '^ '; !
« r« ti i« tu «tb Mvftj
Fig. 3: Distribution of Hx from IRIS and TLD Network. Fig. 4: Comparison of Hx measured by TLD andIRIS Network.
PORTOROŽ 95 186

SESSION III PROCEEDINGS
The Hx distribution from both networks are given in Fig.3. Fig.4 shows the differences of Hx measured byTLD and IRIS, in the individual regions of Slovakia. At present we are investigating the reasons ofdiscrepancy between the results of two monitoring systems used. In this connection the energy dependenceof detectors, influence of scattered radiation and the influence of buildings located near the measuringpoints, will be followed.
The Tab.2 gives the EEC of radon in different regions of Slovakia, together with the highest measuredvalues. The geometric mean of EEC from 1832 dwellings is about 40 Bq/m3 (it is 100 Bq/m3 of radon gasconcentration).
REGION
SlovakiaBratislavaW. SlovakiaM. SlovakiaE. Slovakia
NUMBEROF HOUSES
1832244537583468
GEOM. MEAN[Bq-m3]
4010295865
MAX. VALUE[Bq-m3]
1493906104212131489
Table 2: EEC of radon in different regions SR.
The effective dose caused by the annual radon concentration of 100 Bq/m3 is given in Tab.3. The valuesof E ranges from 1.7 to 5.0 mSv/year, depending on the used calculation procedure and publishedconversion factors. The mean radon concentration may be probably overestimated due to the fact, that themeasured dwellings were not always strictly selected randomly.
A a )
Ay
[Bq-m3]
100100100
EDCF[uSv-a1 / Bq-m3]
17.126.850.0
E[uSv-a1]
171026805000
Ref.
B SS (94)UNSCEAR (93)
CEC (93)
Table 3: Comparison of effective dose from radon in dwellings.
CONCLUSIONS
Annual values of the effective doses from above given natural sources of radiation in Slovakia range from1.2 mSv to 3.2 mSv/year. This broad range is caused mainly by uncertaintes in calculation procedures ofradon effective doses. The effective dose due to exposure to radon calculated taking into account, that anannual radon gas concentration of 20 Bq/m3 is 1 mSv seems to be a very overestinated value. Therefore forprotective measures we use the lower value of the above given range. This calculation methods are actuallyunder scrutiny.
REFERENCES
1. Radiation Atlas: Natural Sources of Ionizing Radiation in Europe, CEC, EUR 14470, 1993.2. Rieck, W., Fritz, J.,at all in Proc. of Symp. IRPA "Rad.Prot. in Neighb. Countries in Central Europe, Austria 1993.3. Tatara, M..Vladár, M.,in Proc. of Workshop " Harmonization of East - West Rad. Pollutant Measurement "Budapest,
Hungary, 1994.4. Nikodémova, D.,Viěanová, M., Durěík, M.,Havlík, F. in : "Umweltradioaktivität, Radiookologie, Strahlenwirkungen".
Verlag TUV, Rheinland, Germany, 1994.5. UNSCEAR 1993 "Sources, Effect and Risks of Ionizing Radiation" UN, New York 1993.6. International Basic Safety Standards for Protection against Ionizing Radiation, IAEA, Vienna 1994.7. Spurný, Z.,Kovář, Z.,Minárik, F. Jaderná Energie, 23,1977, 3, 98.
PORTOROŽ 95 187

SESSION Úl PROCEEDINGS
XA05C0048
EFFECT OF DIFFERENT TREATMENTS ON 11OmAg PLANT UPTAKEIN VARIOUS SOIL TYPES
P. Szerbin and E. Koblinger-Bokori
"Frederic Joliot-Curie" National Research Institute for Radiobiology and Radiohygiene,POB 101, Budapest, 1775, Hungary
INTRODUCTIONnOraAg contamination may occur as a result of atmospheric release either during normal operation of nuclearpower plants or in accidental circumstances [1,2]. The gamma peaks of 11OmAg and radiocaesium are veryclose, and not every laboratory could make distinction between them. Therefore very few references areavailable on 1IOmAg environmental behaviour and plant uptake.
In the present study plant uptake of 11OmAg from four different types of soil was investigated, and the resultsare presented in relation to major soil characteristics. In addition, effects of two different treatments(phosphate and organic matter fertilizations) are determined in each type of soil. Our study clearlydemonstrates that a carefully selected post-accident treatment can significantly reduce the environmentalconsequences of radioactive releases. Methods to be developed on bases of such studies could be used forremedial actions of agricultural lands polluted with radioactive substances.
SOIL TYPES AND CHARACTERISTICS
Most typical Hungarian soils were selected for the experiments carried out under laboratory conditions.
soil types
location
pH (KC1)
organic matter (%)
cation exchange capacityT(me/100g)
changeable K (me/100g)
changeable Ca (me/100g)
coarse sand (%)*
fine sand (%)*
silt (%)*
clay (%)*
leached Ramannforest soil
Gödöllö
5.0
1.05
8.98
0.35
1.43
32.9
41.0
17.8
8.3
alluvial soil
Fokto
7.5
1.53
11.3
0.37
8.57
0.4
50.0
43.1
6.5
chernozem lightsandy soil
Orbottyán
7.6
1.26
11.00
0.12
4.09
11.9
79.4
49
3.8
calcareouschernozem soil
Nagyhörcsök
7.8
3.40
32.2
0.28
10.32
0.8
15.7
60.4
23.1
* percent of mineral content
Table 1: Physical and chemical characteristics of soils.
METHODS
Soils were labelled with ll0mAgNO3 (0.081 mol/1 AgNQ in HNQ with an activity concentration of 44MBq/ml). Each pot was filled with 1 kg labelled soil. From each type of soil 3 pots of control and 3 potsof treated soil were prepared. Yellow leguminous bean was selected for the investigations and plants weresampled 3-times during the experiment.
Plant samples were dried at 100°C. HOmAg activity concentrations were measured in the roots and stirps,
PORTOROŽ 95 188

SESSION III PROCEEDINGS
separately. Measurements were performed by NK-350 type gamma-spectrometer (Gamma Works) with aNa(Tl) scintillation detector.
The concentration factor (Bv) characterizing the uptake is given by
where Cp and Q are the activity concentrations in the plant (by wet weight) and soil (by dry weight),respectively.
It is known from the literature that silver uptake is influenced by organic matter content of the soil [3]. Onthe other hand, uptake of phosphate depends on the silver content [4].
In our experiment soils were treated with compost and phosphate fertilizer. In the first case compost wasmixed with two parts of soil. This treatment is equivalent to a 200 Mg/ha fertilization, which is about 20times higher than usual in agricultural practice.
In the case of phosphate treatment, fertilizer was mixed into the uppermost 5 cm soil layer leading to afertilization of 1.25 Mg/ha. This is a typical fertilization in Hungary.
RESULTS11OmAg plant uptake in various types of soil
15.0-
12 5-
§ 1š —
Orbottyán
lsbrpscrop
Nagyhurceök Nagyhörcsök
sampling site
Fig. 1: 11OmAg distribution in plant. Fig. 2: ' 1OraAg concentration factor in plant.
Results of the experiments show, that 11OmAg concentration in the root was one order of magnitude higherthan in the other part of the plant.
Concentration factors, calculated from the activity concentrations measured in the soil and the plant, varybetween (0.91 ± 0.04).10"2 and (2.52 ± 0.45). 10"2. The smallest concentration factor is found in the soilwith the largest organic matter content.
Effect of compost treatment on UOmAg plant uptake
1.50n
:B£«<H
h/fo.50-
0.25-
000
15.0-
1
ESScortrol
i m corrpost
IĚ £.
5.O
FoWä
samj>Eng cite
IOrbottyán
ii
3 compost treatnant
agyhircsö Gbdollfi Orbottyán agyhörcsö
Fig. 3 : 11OmAg concentration in stirps.sampängsite
Fig. 4: I1OmAg concentration in root.
PORTOROŽ 95 189

SESSION III PROCEEDINGS
Compost treatment decreased the llOmAg uptake in all soil types investigated. The treatment did not changethe radiosilver distribution within the plants.
0.03-1 -T-
controlcompost treatment
0.00 Gödölle FolctfS Ôrbottyán
sampling siteNagyhörcsök
Fig. 5: Effect of compost treatment on 11OmAg concentration factor of plants grown on different soil types.
From the results shown in Figure 5. can be concluded, that the concentration factor can be reduced by afactor of 1.5 - 4 by application of compost treatment. The highest effect of treatment was observed in thesoil with lowest original organic matter content. Results show, that the 11OmAg uptake is strongly correlateswith organic matter content of the soils investigated. Compost treatment had unambigous effect on plantradiosilver uptake.
Effect of phosphate treatment on the plant uptake
0.04-1
0.00-
control
phosphate treatment
Gödölli FoktS Orbottyán
sampling site
Nagyhörcsök
Fig. 6: "OraAg concentration factor in control and phosphate treated plant.
Phosphate treatment increased slightly the UOmAg uptake in the case of soil with the smallest originalorganic matter content. No significant effect was observed in other soil types.
PORTOROŽ 95 190

SESSION III PROCEEDINGS
SUMMARY
• The "OmAg uptake of the plants varied with the soil type:
leached Ramann forest soil > chernozem light sandy soil >alluvial soil > calcareous chernozem soil.
• Organic matter treatment reduced the uptake by a factor of 1.5-4, depending on the original organicmatter content of soil.
• The treatment with phosphate increased the 1IOmAg uptake of the plants from the leached Ramann forestsoil. No such effect was found in other soils.
• The "OmAg concentrations in the stirps and crops were one order of magnitude lower than in the roots.The applied treatments had no effect on the 11OmAg distribution.
REFERENCES
1. Gentili, A., Gremigni, G. & Sabbatini, V., 1991. Ag-1 IOm in fungi in central Italy after the Chernobyl accident, J.Environ. Radioactivity, 13,75-78.
2. Virágh, E., 1994. 1993 Report of Radiation Protection Dept. of NPP Paks, Paksi Atomerômu RT., Paks, (in Hungarian).3. Szabó, GY., Guczi, J., Kerekes, A. & Bulman, R.A., 1993A. Investigation into the nature of binding of 11OmAg, K, Ca,
Al and Fe in soil, Sei. Total Environm., 130/131, 395-374.4. Koontz, H. V., & Karen, L. B., 1980 Silver uptake, distribution and effect on calcium, phosphorus and sulfur uptake,
Plant Physiol., 65 336-339.
PORTOROŽ 95 191

SESSION in Illllllllllllllllllllllllllllllllllllllllllllllllllllll PROCEEDINGSX A 0 5 C 0 0 4 9
RADIOACTIVE WASTE REPOSITORY AND RADIATION PROTECTION
M. Stepišnik, O. Jarh, I. Mele
Agency for Radwaste Management, Parmová 53, 61 000 Ljubljana, Slovenia
ABSTRACT
Radioactive waste in Slovenia comes not only from nuclear power plant Krško but also from industry, medicineand research activities. These wastes can potentially present risks to health and environment if they are notmanaged adequately. Therefore the primary work of Agency for Radwaste Management is oriented towardsthe construction of low and intermediate level waste (LILW) repository in compliance with the validlegislation.
INTRODUCTION
Exposure to ionizing radiation can be harmful to living organisms. The main concern with radioactive wasteis the radiological risk, which exists for a long time depending on the decay time of the radionuclides. Themain goal of radioactive waste management is to dispose of waste in such a way that associated radiologicalrisks remain as low as reasonably achievable.
Disposal is the last step in waste management process after the collection, treatment, conditioning, storageand transportation of waste to the final repository. The Agency for Radwaste Management is responsiblefor providing the final disposal of radioactive wastes in Republic of Slovenia. Slovenia has no finaldisposal facility for any kind of radioactive wastes. At present the radioactive wastes are stored more orless on sites where they are produced.
Since most of the waste is classified as low and intermediate level - short lived waste at present our workis oriented towards the construction of low and intermediate level waste (LILW) repository. A variety ofwaste management strategies with regard to technological processes and disposal options exist. Nearsurface repository and underground repository are two disposal options carefully studied.
This paper describes some important dilemmas that have to be considered in order to define the optimaldisposal option by taking into account radiological protection, economic and social factors.
RADIOACTIVE WASTE
Radioactive waste produced in a wide range of activities can vary in form, activity and type ofcontamination. It may be solid, liquid or gaseous. Different steps of nuclear fuel cycle are the mostimportant producers of radioactive waste. They refer to activities associated with supply of fuel andmanagement of radioactive material in power generation. Other sources of the radioactive waste come fromindustry, medicine and research.
In Slovenia 98% of radioactive waste is produced by Krško nuclear power plant which generates about 20%of Slovenian electricity. Operational waste represents the largest amount of all wastes produced. It isclassified as low or intermediate level radioactive waste (LILW) and it is stored on site. At present 10.279standard 205 liter drums (~2100m3) have been produced. Relevant radionuclides that can be found inprimary cooling system of a nuclear power plant and therefore in operational radwaste are': I129, Tc", Ni59,pu239/pu240j N b94 t ^ 2 4 1 ^ jjj«^ p ^ ^ i l ^ g , » ^ 2 4 ^ j ^ C ( ) a p ^ S b 125 ^134 g ^ j j ^ ^ Q f j o n g
lived radionuclides are also included.
Spent fuel is produced at Krško NPP and at Research reactor TRIGA Mark II. We have 442 spent fuelassemblies from NPP and approximately 130 TRIGA fuel elements. Spent fuel from both reactors ispresently stored on sites in spent fuel pools.
PORTOROŽ 95 192

SESSION ni PROCEEDINGS
The remaining radioactive waste comes from research organizations, industry and medical institutions.These wastes are stored in the interim storage at TRIGA research center. They contain 165 spent sealedradiation sources (Co60, Cs137) and waste contaminated with Co60, Cs137, Eu152, Ra226, Am241. Total volumeof this radwaste is approximately 30 m3 and it is classified as LĽLW. There is also about 25 m3 of low levelwaste (LLW) contaminated with Ra2 2 6 stored in an old military barrack at Zavratec.
There is a rough estimation that operation and decommission of Krško NPP and TRIGA research centerand waste from industry and medical profession will accumulate about 20.000m3 of LILW. The volumeof the waste in Slovenia is extremely low compared with some European counties. For instance: France hasan annual production of 30.000 m3. Nevertheless the waste has to be disposed of in a way that will notpresent risk to our health and to environment.
WASTE CLASSIFICATION
Radioactive wastes include materials with different physical, chemical and radiological properties. Thediversity of radioactive wastes results in different potential hazards to environment and therefore it issuitable from a management point of view to group the wastes with similar characteristics. Classificationsystem recommended by International Atomic Energy Agency separates radioactive waste into fivegroups2:
VI. Exempt waste (EW),V, Low level waste - short lived (LLW- SL),IV. Intermediate level waste - short lived (ILW-SL),III. Low level waste - long lived (LLW-LL),IL Intermediate level waste - long lived (ĽLW-LL) andL High level waste (HLW).
The differentiation between the long and short lived radionuclide content is made to assist in the choice ofthe appropriate type of repository. To know the half-life of radionuclides contained in radwaste is importantin order to estimate the duration of potential risk.
Waste categorization in Slovenia is determined by Regulations on the Mode of Collection, Accounting,Processing, Storing, Final Disposal and Release of Radioactive waste into the Environment3. Solidradioactive wastes are defined as substances having specific activity greater then 108 Bq/m3 for ß and yemitters, or greater then 107 Bq/m3 for a emitters. Only solid radioactive waste can be finally disposed. Allliquid wastes have to be solidified. Categorization of solid radioactive wastes according to Slovenianlegislation separate waste into three categories:
UL Low level waste (LLW),IL Intermediate level waste (ILW) andL High level waste (HLW).
Low level and Intermediate level waste are also subdivided into wastes with a emitters and ß/A emitters.It is also stated that wastes categorized as II. and III. (according to Slovenian legislation) may be finallydisposed of in above ground or shallow ground repositories in compliance with geological and otherrequirements specified for siting, construction, commissioning and operation of final repository. It shouldbe mentioned that other disposal options are not clarified.
By comparing our legislation and IAEA recommendations it becomes evident that present legislationconcerning radwaste is in many aspects out of date and does not meet all IAEA standards. However newlaw concerning radwaste is in preparation and the Agency for Radwaste Management will adapt futurework according to new regulations.
Radioactive waste classification systems are, however, those intended to meet the requirements of theparticular waste management strategy. In countries practicing near surface disposal (France, Spain,..) andintending to dispose of some of its waste deep underground a differentiation between long lived and shortlived waste is done in the same manner as in IAEA recommendation. From a safety point of view onlywastes classified as IV. and V. are acceptable for near surface disposal. In countries considering onlygeological disposal (Germany) there is no need for distinction between short and long lived waste. They
PORTOROŽ 95 193

SESSION EI PROCEEDINGS
apply a differentiation between heat-emitting wastes and other wastes, since the heat emitting wastes arenot acceptable in all geological media.
RADIONUCLIDE DECAY
The selection of the proper disposal option for LELW repository in Slovenia depends mainly on accuratedata on radionuclide inventory of Slovenian wastes. The majority are short lived wastes containingradionuclides that emit ß and y radiation with the half life of 30 years at most. This category of wastes haveprimarily Co60, Cs137 and Sr90. In 300 years or less, radioactivity of short lived waste will becomecomparable with the natural background and therefore it will pose negligible risk. It can be disposed of withrelatively simple methods widely used in the world. Short lived waste must not contain more than smalltraces of long lived radionuclides if it is to become harmless in 300 years. By respecting this limit disposalsite will be safe for use and even for human residence after this period. That is why the identification andtracking of short lived waste is an important component of their overall management.
In contrast to short lived wastes, some low and intermediate level wastes (i.e. spent sources) need specialconsideration. Very long lived Am241 and Ra226 pose a potential future radiological threat, and deservespecial attention when developing waste acceptance criteria. For such sources geological or deep geologicaldisposal should be considered. There is a possibility that such sources may be treated as high-level wastesince they will contribute insignificantly to the overall volume4.
RADIATION PROTECTION
Radiological protection principles for dose control of workers and the general public during normaloperation of facilities handling radioactive materials are well established5. They are commonly expressedin terms of justification, optimization of protection and individual dose limitation.
Principle of justification is applicable to waste disposal since an effective net benefit of radioactive wastedisposal system comes through the energy production cycle and other uses of radioactive substances.
Optimizing protection reflects the principle that all exposures should be kept as low as reasonablyachievable, economic and social factors being taken into account. In practice optimization of protection isoften used to decide between different courses of action or disposal options and to facilitate the decisionif further design improvements for dose reduction are still reasonable.
For disposal system it is necessary to consider all the phases, from construction, through operational phaseto the post-operational phase. These principles can be directly applied to the construction and operationalphase of the repository. On the other hand a probabilistic approach needs to be applied to post-operationalconditions. Two aspects of the post-operational phase must be considered: time scale over which protectionmust be ensured and the wide range of scenarios for radionuclides release into the environment includingtheir probabilities of occurring. A large part of repository safety assessment is concerned with evaluationof unlikely circumstances and associated risk.
DISPOSAL CONCEPTS
The objective of radioactive waste disposal is to ensure that man and other living species will not receiveunacceptable detriments at present and in future time. An essential requirement of a proper waste disposalsystem is that the disposal method and characteristics of the waste should be matched. Waste categoriesare based on general characteristics of these wastes and possible disposal options. The conditioning andwaste treatment together with disposal system should provide the appropriate degree of protection andisolation. The containment of radionuclides and therefore safety of the disposal system depends on its threefundamental barriers. They can be either natural or engineered.
The first barrier is properly conditioned waste package. The LILW is usually stabilized in a concrete matrixto remove free-standing liquid, to minimize the probability for chemical reaction and to immobilize theradionuclides that it contains. The waste is packaged into containers such as metal drums or casks.
The second barrier is an engineered concrete structure referred as monolith in which waste packages arebuilt in. These disposal facilities must be built to withstand earthquakes and to comply with design criteria
PORTOROŽ 95 194

SESSION HI PROCEEDINGS
applicable to all nuclear facilities. They should prevent the infiltration of water into the disposal units,which could damage the waste package and lead to migration of radionuclides.
The third barrier is geological media surrounding the disposal facility. It is more important for HLW andlong-lived waste then for LILW since there is no proof that engineered barriers can give complete isolationof radionuclides for several thousands of years.
At present no repository for the disposal of spent fuel and other types of HLW exists. HLW disposalconcept that is presently studied in the world is the disposal in deep underground geological repository(category I.). The evidence that geological settings exist which have not undergone significant changes formajor periods of geological time indicate that such a disposal system can be appropriate. This will providelong-term isolation of the waste.
In Slovenia two well developed disposal types for ILW and LLW are carefully studied4'6. Shallow grounddisposal refers to the emplacement of solid or solidified radwaste near the ground surface in the depth notexceeding few tens of meters. It has been practiced in several countries such as France (Centre de laManche, Centre de l'Aube). This option is considered to be suitable only for short-lived waste (waste IV.and V. by IAEA classification) where radioactivity will decay to acceptable level within a period of timefor which institutional control of the repository site can be expected (France). Slovenian legislation requiresonly 5 years of institutional control in the post closure period.
Underground disposal in rock cavities refers to emplacement of solid LLW and ĽLW in man-made, naturalor specially excavated cavities for waste disposal. Rock cavity disposal is an approach that falls betweenshallow ground disposal and deep geological disposal. It is recommended that waste categories II, III, IVand V (IAEA classification) may be disposed of by this method. Depending on the degree of isolationprovided by the overall disposal system institutional control my not be required in the post-operationalphase of such a repository. This concept is applied in several European countries like Germany.
RADIOLOGICAL MONITORING
It is essential for the continuous safety of the environment that initial state measurements are initiated inthe pre-operational phase'. They represent an important reference date for future environmental monitoringand will allow better evaluation of possible changes in the operational and post-operational phase. Theobjective is also to define various critical radionuclide pathways to man. The most delicate objective isinformation to general public, by which we can reduce the possibility of later speculation about the safetyof the repository.
Initial state measurements are very important if natural radionuclides from uranium and thorium series willbe contained in the repository, specially if we anticipate a higher influence of natural background in theenvironment. On the other hand if it is assumed that strictly man-made radionuclides will be collected inthe final repository this measurements are less important since only artificial radionuclides representingglobal contamination can be traced (Cs137, Sr^and Pu-isotopes). Our present legislation demands that bothartificial as well as natural sources have to be measured in the pre-operational phase.
In operational and post-operational phase a routine monitoring of environment both on and off site, mustbe carried out 7. This includes: surface contamination and groundwater samples, soil samples from thesurface and at relevant depth, samples of vegetation, air samples collection and monitoring of externalradiation levels. An off-site surveillance has to be performed, to detect radionuclides that have beeninadvertently released to the environment from repository site and to ensure that the site is performing aspredicted. The purpose of post-operational monitoring is to ensure that the various degrees of confinementof radioactivity predicted by the safety assessment are being achieved.
CONCLUSION
For different origins and types of wastes a very large choice of waste management strategies with regardto technological processes and disposal option exist. To ensure that the right disposal is chosen we haveto balance between safety and economical aspects. Since majority of the waste is LILW-short lived withsome of the waste defined as LILW-long lived, shallow ground repository and underground repository aretwo disposal options that can be adopted. Present legislation concerning radioactive waste does not cover
PORTOROŽ 95 195

SESSION ID PROCEEDINGS
all possibilities of waste disposal and all IAEA safety recommendations that is why new legislationconcerning radioactive waste is necessary.
REFERENCES
1. U. Miklavžič, R. Martinčič, Predobratovalne meritve rádioaktívnosti v okolju odlagališč nizko in srednje radioaktivnihodpadkov, Ljubljana (1995).
2. IAEA, Classification of Radioactive Waste, Safety Series No. 111-G-l.l, Vienna (1994).3. M. Trampuž, Varstvo okolja pred ionizirajoěimi sevanji, Závod SR Slovenije za varstvo pri delu, Ljubljana (1989).4. The Scientific and Regulatory Basis for the Geological Disposal of Radioactive Waste, Chichester (1995).5. 1990 Recommendations of the ICRP, ICRP Publication 60, Oxford (1991).6. IAEA, Acceptance Criteria for Disposal of Radioactive Wastes in Shallow Ground and Rock Cavities, Safety Series
No. 71, Vienna (1985).7. IAEA, Shallow Ground Disposal of Radioactive Wastes, Safety Series No. 53, Vienna (1981).
PORTOROŽ 95 196

SESSION in i um mini im inn HIHI im um lim lim im mi PROCEEDINGS
XA05C0050
NUCLEAR DISASTER MANAGEMENTTHE MURMANSK EXERCISE
C. Schmitzer
Austrian Research Centre Seibersdorf, Dept. of Radiation Protection, A-2444 Seibersdorf, Austria
ABSTRACT
Jointly initiated by NATO Partnership for Peace and UN Department for Humanitarian Affairs, the EXERCISE'95 took place on the Kola peninsula near Murmansk, Russia. Organised by the Russian ministry for disastermanagement, the trigger incident was supposed to be an explosion in a nuclear power plant, similar toChernobyl.
Different international teams participated in an effort to determine the extent and implications of the incident,gauge radiation levels in the environment, study relief procedures, and estimate the applicability ofrecommended protection measures. The exercise was organised in three time scenarios, starting with the thirdday after the accident up to one month after the accident.
The system developed by the Research Centre and employed by the Austrian NBC defense group encompassesa scenario analysis tool based on three-dimensional dispersion calculations and forecasting capability, GPS-based acquisition of radiation data by mobile teams, and permanent site monitoring instrumentation.Additionally, a robust Nalfood stuff probe was used to measure food and soil samples.
INTRODUCTION
It has become customary to conduct disaster preparedness exercises and training under the guidelines ofthe UN Department of Humanitarian Affairs, Geneva (DHA). Various organisations have already stagedsuch international events. The EXERCISE '95 was organised by the Russian ministry for disastermanagement (EMERCOM), simulating a major accident in an atomic power plant located at Polyarnye Zorion the Kola peninsula.
The general goals of this exercise comprise assessment of the overall situation and elaboration of protectionmeasures and strategies pertaining to individual game times. This was accomplished in cooperation withinternational experts. Both practical field missions and expert discussions were employed throughout theexercise and validated by international observers. Thus an improvement of information exchange andassistance on an international level might be expected.
Furthermore, the practical skills of the field teams may be verified under near realistic conditions. Startingwith a call for international assistance, various teams are called in and expected to be operational withina short time frame. The training effect does not only cover practical deployment of field teams on specificmissions, but also general requirements such as communication with local authorities, exchange oftechnical and strategic information, command structures, data evaluation in the field, and so forth. It isassumed that only a rudimentary infrastructure is available in the area affected by the disaster. Thus, fieldteams are required to be self supporting as much as possible and rely basically on their own resources.
Field teams and experts from Austria, Finland, France, Norway, Russia, Sweden, and Switzerland wereparticipating. Additionally, a number of observers from UN, NATO, IAEA and various nationalorganisations and ministries were present.
SCENARIO
The technological scenario was modelled as a major accident in a pressurized water reactor (VVER-230/213). After depressurization in the vapor generator a general malfunction of the emergency powersystems was assumed, resulting in failure of the emergency core cooling system. As a consequence ofpressure build-up in the system and an additional failure in the main isolating shut-off, radioactivity was
PORTOROŽ 95 197

SESSION III PROCEEDINGS
released into the environment through a safety valve that was wedged in the OPEN position. Afterapproximately 9 minutes auxiliary power can be restored by the reactor personnel, the safety valve isclosed, core cooling initiated, and the reactor attains a safe state.
A significant portion of the uncovered core is released as radioactive vapor into the atmosphere as asupersonic jet from the stack. Initial assumptions rate the magnitude of the total release up to roughly 10%of core activity, with a characteristic distribution regarding noble gases, iodines, and heavier elements. Inthe present case this could amount to 5 1018 Bq, resulting in major contamination of the surrounding areas.The game-weather assumed predominantly easterly winds, causing trans-border effects as the radioactivecloud is blown towards the Finnish border. Thus international assistance was justified by the scale of theaccident.
Preliminary action of DHA was geared towards setting up of an On-Site Operations Control Centre(OSOCC) to coordinate the international efforts and serve as a head quarter for communication to localauthorities. All participating teams were supposed to furnish at least one liaison officer to facilitate thecommunication of requests to the team and results back to OSOCC. International observers weremonitoring the results achieved by each team on various missions as well as the recommendations of theexpert groups. The overall objective was to simulate the procedures after a nuclear accident as closely aspossible.
OBJECTIVES
Within the exercise different objectives were to be pursued, both on the scale of international cooperationand particular to every team, respectively. Foremost:
• Checking applicability of disaster preparedness and overall readiness to perform specific missions incontaminated areas (e.g. reconnaissance, decontamination).
• Assessing possibilities of international scientific and engineering support for decision making onmatters of radiation protection. Determining the extent of the incident and providing the relevantinformation for the decision making process.
• Investigating the mechanism of international cooperation in case of a nuclear accident with trans-border consequences. Developing of practical strategies to cooperate in an effort to render urgent helpin highly contaminated areas.
• Providing an opportunity of practical work for experts and field teams concerning counter measuresin nuclear accident situations. Study of practical experience regarding organisation and implementationof emergency measures.
THE AUSTRIAN TEAM
Among other nations, Austria was present with a team of AFDRU (Austrian Forces Disaster Relief Unit),manned by 30 members of Austrian NBC-forces and specialists from the Research Centre Seibersdorf.Approximately 20 tons of equipment were air-lifted to the affected area on the Kola peninsula, comprisingof 3 search troops with vehicles, heavy decontamination equipment, command post and evaluation centre,and all associated ancillary equipment, including power generators and medical supplies.
The composition of the team was carefully selected to sustain prolonged operation in the field. Medicalcare, decontamination strategies as well as dosimteric coverage of the personnel were considered, to namejust a few items. Experts from Seibersdorf assisted with special tasks regarding radiation protection andscenario analysis.
SYSTEM CONCEPT
The systems to be deployed in the field were selected in support of the mission objectives. They shouldallow for a self-consistent operation of the team and fulfil the following requirements:
• Monitoring of environmental radiation levels at the camp and surrounding areas• Determination of local weather• Possibility of measuring food stuffs or soil samples, determine nuclide composition• Autonomous mobile reconnaissance system
PORTOROŽ 95 198

SESSION m PROCEEDINGS
• Flexible command and evaluation centre• Scenario analysis and forecasting tool (data interpretation & temporal development)• Communication utility to obtain extended data
All of the above functions were implemented to some degree: a satellite telephone and computer hook-upserved as communication utility to supplement the local weather information, which was constrained to thecamp site; a Nal-based food stuff probe was also used for approximate determination of nuclidecomposition in soil samples, because a HPGe-detector was not considered feasible for extended fielddeployment.
The mobile reconnaissance system was a prototype development, bringing together recent trends fromvarious fields. The diagram gives an overview of the individual functions integrated into the system. Alaptop computer monitors and profiles ambient radiation levels as determined by the radiation survey meter(SSM-1) and high sensitive probe (LPS/2) in use with the Austrian military. A satellite based GPS systemis used for on-line position detection. The current position is registered on the laptop and all measurementsare annotated with positional and timing (UTC) coordinates. A shortwave RF-transceiver digitallybroadcasts position and measurements as well as messages to the headquarter and relays commands to thefield team. The headquarter may track up to 3 field teams simultaneously and communicate up to a distanceof approximately 40 km. All data are stored internally in case of communication failure.
MOBILE RECONNAISSANCE SYSTEMCOMPONENT OVERVIEW
mmĚk•Iftssí-t
• • ; : .
LPS/2 Laptop RF transceiver
Fig. 1: Mobile reconnaissance system component overview.
A scenario analysis tool (MIDAS by PLG, Inc.) was used to correlate the space/time annotated radiationmeasurement data and interpret them within the framework of the overall situation. Based on current andgame-specific weather data, actual reports or projections of the radiation situation could be calculated andfor instance heavily affected areas selected for immediate remedial action (evacuation, etc). The sampleprintout shows a 60 hour projection of integrated dose based on game-weather, resulting in a rain inducedhot spot in the Kovdor region close to the Finnish border. This forecast was used in mission planning fora reconnaissance trip to the Kovdor region on the third day after the accident.
Various inputs simulate the accident (source term, physical properties, local weather). A complexdispersion algorithm tracks individual elements of the release through a 3D wind field. If available, upperair data may be utilized to define wind shear layers aloft. Transfer factors within the model allowcalculation such as estimated ground deposition or air-borne iodine. All results are superimposed on adigitized map of the environment, allowing even demographic analysis (population affected, calculationof man-Sv).
PORTOROŽ 95 199

SESSION III PROCEEDINGS
Fig. 2.
CONCLUSION
The Austrian team and their systems used throughout the EXERCISE '95 were highly acclaimed by theinternational community. All tasks could be covered by the systems selected for the field mission. Thescenario analysis - refined with results of simulated measurements - proved to be consistent with Russianmodel calculations used in preparation of the simulation and thus will be adopted as a valuable tool.
The mobile reconnaissance system - and specifically the automatic data acquisition and correlation ofmeasured data with geographical position - significantly contributed to the overall success in forming aclear picture of the large scale situation. This might even be more important in a realistic scenario, wherestress and human error can introduce additional problems with data integrity.
PORTOROŽ 95 200

SESSION IH '''''''''''lllllllllllllllllHI111111111111 PROCEEDINGSXA05C0051
ACTIVITY LEVELS OF CS-137 AND K-40 IN THEGASTRO-INTESTINAL TRACT OF A COW
H. Rabitsch!), E. Pichl '>, J. Pletz 2\ G. Kahr'>
l) Abteilung für Strahlenphysik, Institut für Theoretische Physik,Technische Universität Graz, Petersgasse 16, A-8010 Graz, Austria
2) Fachabteilung für Veterinärwesen der Steiermärkischen Landesregierung, Graz, Austria
INTRODUCTION
In comparison to single intakes it is of particular interest to study the distribution of radionuclides in thebody of domestic animals after continuous ingestion of radionuclides. We performed a study to determinethe activity concentrations of Cs-137 and of the naturally occuring K-40 throughout the whole gastro-intestinal tract of a cow.
The cow was born one year after the fallout following the Chernobyl accident. Therefore the activity levelin the cow resulted from the activity originating from the mother-cow and the activity due to chronicallyingestion of highly contaminated forage during four years. The cow was slaughtered in November 1992and dissected in anatomical parts/1, 21. Samples of the whole digestive apparatus were taken to determinethe activities.
Further analysis of measured data will be used to develope and to describe models for continuous ingestion.
EXPERIMENTAL PROCEDURES
All samples were taken during or immediately after the slaughtering of the cow. Activities of Cs-137 andK-40 in the samples were determined simultaneously by gamma counting with the help of semiconductor-detectors and the usual software. As containers for the samples we used Marinelli-beakers or smallcylindrical containers consisting of perspex.
The activities of the contents from the forestomachs, abomasum and the guts were determined immediatelyafter sampling. Other samples of tissues or organs had to be deep-frozen and were thawed beforemeasuring. We performed mechanical procedures to separate the samples from complex structures incorrespondence to their anatomical sites and their physiological function.
Some samples containing fat and vascular systems were molten to obtain the activities of pure fat.
EXPERIMENTAL RESULTS
All activities are related to November 14,1992, the day of slaughtering. Values in the Tables are presentedwith a confidence level of 2o.
Rank of tissues and organs with high specific activities (> 200 Bq/kg) of Cs-137:Glandula parotis > Lymph nodes (head) > Tongue (upper part) > Pancreas > Musculus mylohyoideus> Glandula mandibularis > Pillars (rumen).
Samples of tissues with low specific activities (< 40 Bq/kg) of Cs-137:Pure fat < Omentum majus < Omentum minus < Gall bladder (wall) < Mesenterium commune < Smallintestine (wall) < Colon (wall).
High specific activities (> 90 Bq/kg) of K-40 were found in:Pancreas > Tongue (upper part) > Lymph nodes (head).
Samples with low specific activities (< 12 Bq/kg) of K-40:Pure fat < Omentum minus < Omentum majus.
Among the samples of the gastro-intestinal tract the highest values for the ratio of the activity
PORTOROŽ 95 201

SESSION in PROCEEDINGS
concentrations of Cs-137 and K-40 were found for the glandula parotis (R = 4.88 ±0.81) and the mucosaof the reticulum (R = 3.65 ± 0.70). The lowest values for the ratio R are valid for the contents in rumen +reticulum (R = 1.17 ± 0.15) and for the liquid in the rumen (R = 1.21 ± 0.15).
Glands:
Glandula parotis
Glandula mandibularis
Liver
Gall bladder
Pancreas
Activ.conc. Cs-137 (Bq/kg)
351.6 + 33.0
254.5 ± 22.8
194.1+5.4
43.8 ± 2.2
274.6 ± 24.6
Activ.conc. K-40 (Bq/kg)
72.1 ±9.3
76.4 ± 10.8
102.9 ±4.2
25.3 ± 2.0
106.3 ±13.0
Table 1: Activity concentrations of glands.
Table 1 shows a summary of activity concentrations in the glands of the digestive tract. As mentionedabove, we observed the highest activity concntration of Cs-137 for the glandula parotis. The liver as thegreatest gland had a moderate activity concentration. Considering the amount of single samples to the totalactivities results in the fact, that the liver (mass: 5.67 kg) makes 18.8 % of the total activity of Cs-137(5 867 Bq) in the Gl-tract.
Muscle tissues:
Buccae
Tongue
Muse, mylohyoideus
Pharynx
Muse, oesophagus
Pillars (rumen)
Activ.conc. Cs-137 (Bq/kg)
216.5 ±19.4
319.9 ±14.2
271.1 ±32.8
214.9 ±26.0
220.2 + 19.8
235.7 ± 9.0
Activ.conc. K-40 (Bq/kg)
62.8 ±7.9
131.1 ±14.2
71.2 ±15.9
67.2 ±16.0
76.8 ±11.1
78.0 + 5.0
Table 2: Activity concentrations of muscle tissues.
In tissues similar to muscle tissues (Table 2) the highest concentration of Cs-137 was found for the tongue.The pillars of the rumen showed also considerable concentrations of Cs-137.
Fatty tissues and lymph nodes:
Rumen:
Fat+vascular system
Lymph nodes
Omentum majus:
Fat+vascular system
Omentum minus:Fat+vascular system
Lymph nodes (mixed)
Mesenterium commune:
Fat+vascular system
Lymph nodes
Activ.conc. Cs-137 (Bq/kg)
101.7 ±3.4
160.3 ± 14.2
22.1 ± 1.2
25.9 ± 3.4
142.8 ± 17.0
33.4 ±1.9
89.9 ± 7.6
Activ.conc. K-40 (Bq/kg)
31.5 ±1.8
77.7 ± 8.4
11.9 + 1.4
11.0 ±3.0
85.9 ± 13.8
19.1 ±1.8
64.3 ±7.3
Table 3: Activity concentrations of fatty tissues and lymph nodes.
PORTOROŽ 95 202

SESSION m PROCEEDINGS
The activity concentrations of Cs-137 and K-40 in both omenta were very low (Table 3). The lymph nodesembedded in the structures showed high activity concentrations. Samples of the omenta and mesenteriumwere also molten and then the activities of the pure fat were measured. Activity levels of Cs-137 and K-40for the pure fat were found to be at the detection limits of the spectrometers (0.5 Bq - 1.0 Bq).
Other samples:
Blood
Milk
Urine
Faeces
Activ.conc. Cs-137 (Bq/kg)
16.2 ±1.0
116.0 ±7.0
195.4 ±11.5
347.1 ±20.8
Activ.conc. K-40 (Bq/kg)
22.1 ±2.2
50.2 ±5.0
497.9 ±49.8
77.3 ± 7.7
Table 4: Activity concentrations of other interesting samples.
In Table 4 values for the activity concentrations of some other interesting samples are given.The values forthe activity concentrations of blood and urine lead to Ratios R < 1 (blood: R = 0.73 ± 0.08; urine: R = 0.39± 0.05). In comparison to these values the ratios for milk and faeces are R = 2.31 ± 0.27 and R = 4.49 ±0.52, respectively.
Fig. 1 illustrates the activity concentration of Cs-137 and K-40 in the walls surrounding the compartmentsof the GI-tract. Concerning the activity concentration of Cs-137 we can observe a decreasing tendencythroughout the tract, whereas the activity concentration of K-40 shows moderate variations. The ratio Rremains to a high degree constant throughout the tract.
eo
250
200
150
8 íoo
150
• Cs-137D K-40
ms-m
+ EífE .y
= U
o
Fig. I: Activity concentrations of Cs-137 and K-40 in the walls of the Gl-tract.
In Fig. 2 the activity concentrations of Cs-137 in the contents, mucosae and the muscle walls of the tractare compared. It can be seen that the activity concentrations of Cs-137 in the contents of the compartmentsincrease throughout the tract. All activity concentrations are related to wet weight. Great variations of theactivity concentration occur in the mucosae and the muscle walls. A remarkable tendency of the activityconcentrations can be observed for the structures of the both compartments rumen+reticulum andabomasum.
PORTOROŽ 95 203
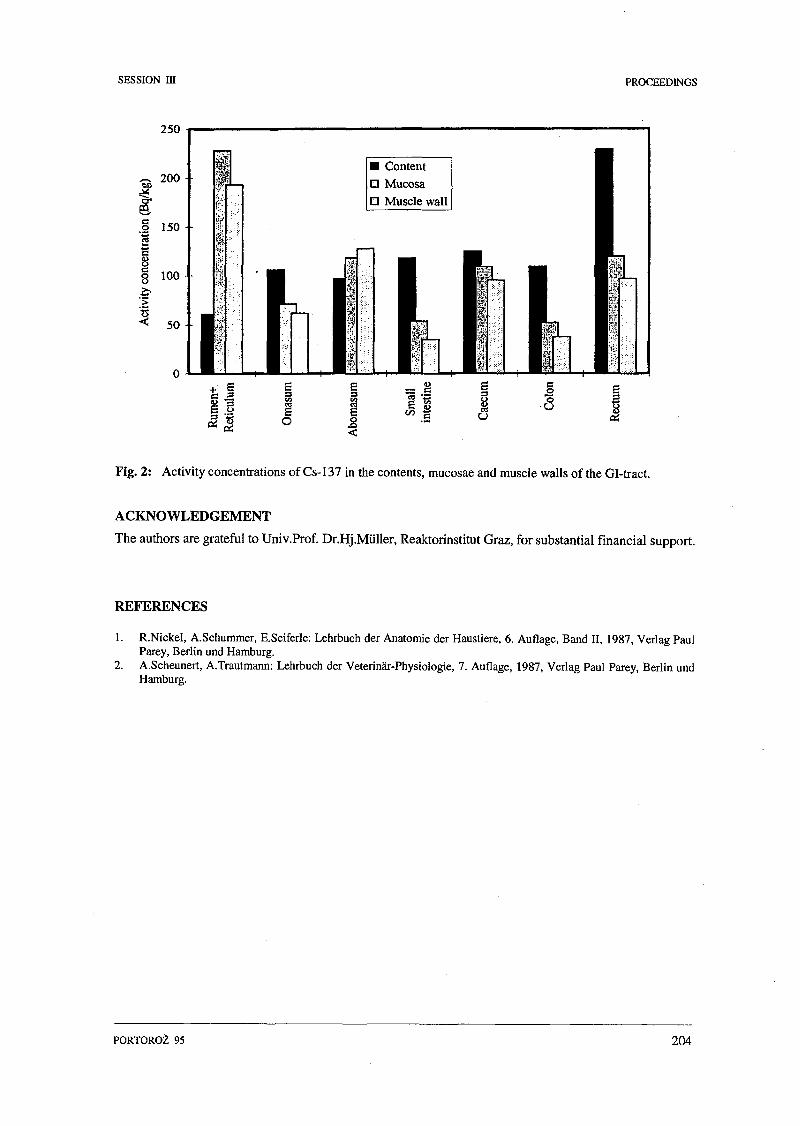
SESSION m PROCEEDINGS
250
• Content• MucosaQ Muscle wall
Fig. 2: Activity concentrations of Cs-137 in the contents, mucosae and muscle walls of the Gl-tract.
ACKNOWLEDGEMENT
The authors are grateful to Univ.Prof. Dr.Hj.Müller, Reaktorinstitut Graz, for substantial financial support.
REFERENCES
1. R.Nickel, A.Schummer, E.Seiferle: Lehrbuch der Anatomie der Haustiere, 6. Auflage, Band II, 1987, Verlag PaulParey, Berlin und Hamburg.
2. A.Scheunert, A.Trautmann: Lehrbuch der Veterinär-Physiologie, 7. Auflage, 1987, Verlag Paul Parey, Berlin undHamburg.
PORTOROŽ 95 204

SESSION m IIIIIIIIIIIIllIIIIIIHIIIllIIIIPIIIIlllll PROCEEDINGSXA05C0052
RADIATION MONITORING NETWORK OF THE CZECH REPUBLIC
D. Dráhová^, L Malátová2), Z. Prouza1), I. Bučina2)
1} State Office for Nuclear Safety, Slezská 9, 120 29 Praha 2, Czech Republic2) National Radiation Protection Institute, Šrobárova 48, 100 00 Praha 10, Czech Republic
SUMMARY
Radiation Monitoring Network of the Czech Republic (RMN) was established after the Chernobyl accident.It consists of technical centers, laboratories and monitoring groups of State Office for Nuclear Safety, NationalRadiation Protection Institute, nuclear power plants, hydrometeorological service, army and Civil Defense,research institutes and other institutions. The structure of RMN, its basic components and responsibleinstitutions are described.
INTRODUCTION
Together with putting the first PWR type NPP in former Czechoslovakia into operation in 1979 the plansof measures concerning the protection of public in the case of a radiation accident on the NPP wereintroduced (1). These plans from the very beginning took into account the possibility of the maximumcredible (over-project) accident with the melting of the core and almost complete release of radioactivematerials from reactor into the environment. Supervision in the field of emergency planing is carried outby the Governmental Commission for Coordination of the Measures in Case of a Radiation Accident(GCRA). By the Directive of the GCRA Instruction for emergency monitoring directed at both the case ofmaximum credible accident and accident of smaller scale and their consequences were approved in March1986. The existence of this Instruction and corresponding professional and technical of institutionsresponsible for monitoring manifested its positive impact especially in the situation after the Chernobylaccident. National and international experience gained after the Chernobyl accident led to someimprovement and measures in the organization of the radiation monitoring and to the more precisedefinition of its conception.
The Chernobyl accident has clearly demonstrated how important it is to have adequate early warning andmonitoring systems that provide competent authorities with timely information on any changes in radiationsituation and that enable them to take appropriate protective measures and to inform the public. Theeffectiveness of such systems depends on the organisation and the skills of the competent authorities as wellas on the provision of adequate instrumentation for measurement, data transmission and data analysis.
On the basis of the Chernobyl experience the Czechoslovak government decided in July 1986 to set up theCzechoslovak Radiation Monitoring Network. The Centre of Radiation Hygiene (CRH) of the Institute ofHygiene and Epidemiology in Prague was charged with the running of the headquarters of RMN i.e. Centreof Radiation Monitoring Network (CRMN). After the secession of the state in 1992 the CRMN is runningthe Radiation Monitoring Network of the Czech Republic. In 1995 the responsibility for radiationprotection in CR was transferred from the Ministry of Health to the State Office for Nuclear Safety (SONS)and National Radiation Protection Institute (NRPI) was created on the basis of CRH. The EmergencyResponse Depatment of SONS is now running the CRMN with the support of NRPI in the provision ofadequate means for measurement, data transmission and data analysis.
STRUCTURE OF RMN
The structure of RMN, its basic components and responsible institutions are schematically shown in Fig. 1.There are two modes of operation of RMN, that is routine operation in normal situation aimed at earlydetection of possible accident and intensive operation aimed at evaluation of consequences of such anaccident. The routine operation is ensured by permanent components of RMN, in intensive operation also
PORTOROŽ 95 205

SESSION HI PROCEEDINGS
inrtftuts
— W.12MWC
třel. D riítfffl i IM tá Lj
— Ccrtnri LitaritoriM of RfcW
flftS IMKVCZ)
— ElrtrW»rifpNshwrK10 Minul
— FatAlltorr» Group
ttoboni RadMm
— TLONrtucrtt
— btöls Gnu» find
AW». O l M«nc»
— M««jrimPdrtionFtir«lBn
d Food Confriirafo
— Sucotenental IT
1 — WmliiBooV Counter
Fig. 1: Structure of Radiation Monitoring Network in the Czech Republic.
the standby components are involved and the mobile groups equipped by permanent components areactivated.
The CRMN is planning and coordinating the activities of a network consisted of laboratories andmonitoring groups of State Office for Nuclear Safety (SONS), National Radiation Protection Institute(NRPI), nuclear power plants, hydrometeorological service, research institutes and other institutions. Theenvironmental radiation levels are in normal situation monitored in principleby several subnetworks inwhich some or all permanent components of RMN participate:
1. Network of Measuring Points of Air Contamination (MPAC) consisting up to now of 10 stations ofNRPI and stations of of NPP's (4 in Dukovany and 8 in Temelín) - has two main functions:
continuous direct measurement of gamma dose rate as a part of Early Warning Network (EWN)continuous aerosols and iodine sampling by high volume air samplers with changing of filters oncea weekfallout sampling with sampling period of one month.
2. By the end of 1995 the fully automated EWN with 48 measuring points (38 stations of CzechHydrometeorological Institute- CHMI and MPACs of NRPI - see Fig.2) ensuring continuous gammadose rate measurements will be operating and on-line connected to the central computer in NRPI. Inthe second phase about 15 additional measuring stations of Czech Army and Civil Defence will beequipped for continuous gamma dose rate measurements and connected to EWN.
Teledosimetry systems around NPP's including 20 to 48 measuring points operated by environmentallaboratories of each NPP will continuously measure and evaluate gamma dose equivalent rate. Datatransfer to central computer in NRPI is planned.
3. Territorial TL-dosemeters network (TLD) -183 measuring points distributed on the whole territory ofCR (see Fig. 3). The monitoring interval is in normal situation 3 months. Besides it a more densenetwork is deployed around each NPP (altogether 82 dosemeters for 2 NPP's) with the samemonitoring interval.
PORTOROŽ 95 206

SESSION III PROCEEDINGS
Fig. 2 Early Warning Network (EWN) in the Czech Republic
CHMI
NRPI
\ / planned Army MaGISl.l an. 3010-1.1-CZCreated by: ÚRMS ČR
Fig. 3 TLD Network in the Czech Republic
NRPI
NPPMaGISI.1 s.n. 3010-1.1-CZCreated by: ÚRMS ČR
PORTOROŽ 95 207

SESSION ffl PROCEEDINGS
4. Network of 12 laboratories equipped with gamaspectrometry (mainly with semiconductor HPGedetectors) and some of them with alfaspectrometry and radiochemistry that provide the data concerningthe specific activity of radionuclides in various environmental entities.
Laboratory measurements of samples of food and feeding stuff are performed on the basis ofpredefined sampling programs. The samples are collected if possible at the production sites. The mostimportant difference between routine and intensive operation is the frequency of sampling, e.g.monthly sampling in routine operation versus daily sampling during intensive operation.Theavailablelaboratory capacities (including standby components of the RMN) enable the increase of thesampling and measurement frequency by about two orders of magnitude. During intensive operationadditional samples are* collected at stores to verify and enforce necessary food bans that may have tobe applied.
To determine dose due to internal contamination of people in the most possible direct way with theminimum assumptions, the whole body counters in NRPI and NPP's are used.
CONCLUSION
Conformable with similar networks abroad, Radiation Monitoring Network (RMN) in Czech Republic isconceived as integrated system of a number of components that serve for:
• continuous monitoring of radiation situation on the territory of the Czech Republic• detecting an abnormal radiological situation due to domestic source and raising the alert• detecting a nonnotified accident abroad with consequences on the territory of the Czech Republic
and raising the alert• monitoring the evolution, determining the components of any radioactivity discharge• first express estimation of accident extent• forecasting of accident development and of dispersion of radionuclides in the vicinity of source• acquisition of groundwork for decision upon evacuation and other countermeasures and remedial
actions• assessment and forecast of contamination for regulation of food and water consumption• review of enforced countermeasures based on actual monitoring data and refined forecast.
The data on radiation situation obtained by the all components of RMN are collected and evaluated by theCRMN and presented as the Annual Reports on the Radiation Situation on the Territory of CR.
REFERENCE
I. Bučina, I., Kunz, E., Metke, E., Morávek, J. Osnovnyje položenija monitoringa okružajuščej sredy v slučajeradiacionnoj avariji na AES v ČSSR, in Emergency Planning and Preparedness for Nuclear Facilities, IAEA-SM-280/69, Vienna, 1985.
PORTOROŽ 95 208

SESSION HI Illllllllllllllllllllllllllllllllllllllllllllllllllllll PROCEEDINGSXA05C0053
THE EFFECT OF MORPHOMETRIC SCALING ON DEPOSITIONAND CLEARANCE OF INHALED RADIONUCLIDES
R. Bergmann " , W. Hofmann !) and L. Koblinger2)
" Institute of Physics arid Biophysics, University of Salzburg, Hellbrunnerstr. 34, A-5020 Salzburg, Austria2) Health Physics Department, KFKI Atomic Energy Research Institute,
P.O.Box 49, H-1525 Budapest, Hungary
INTRODUCTION
The linear dimensions of present lung models are based on morphometric measurements on fully inflatedlungs (e.g. Horsfield et al.,1971; Raabe et al., 1976). To simulate deposition and clearance of inhaledradionuclides in human lungs under normal breathing conditions, airway diameters and lengths have to bescaled down to the smaller dimensions at functional residual capacity of about 3000 ml (Yu and Diu, 1982).
METHODS
The commonly applied linear scaling procedure (e.g. Yu and Diu, 1982) is based on the assumption thatall linear dimensions vary with the cube root of the total lung volume (Hughes et al., 1972). However,recent measurements of the biomechanical properties of bronchial and alveolar epithelial tissue havesuggested a different scaling procedure (Habib et al., 1994): While the airway lengths are scaled from theHorsfield et al. (1971) airway geometry at total lung capacity by a constant scaling factor (i.e., all airwaylengths are multiplied by the same linear factor), airway diameters are scaled by both a constant scalingfactor and a generation-dependent sigmoidal curve (i.e., the relative changes of the airway diametersincrease with progression through the airway system).
In the present study, deposition patterns of inhaled particles in a stochastic morphometric model of thehuman lung (Koblinger and Hofmann, 1985) are simulated by a Monte Carlo transport and deposition code(Koblinger and Hofmann, 1990; Hofmann and Koblinger, 1990). Since the morphometry of this lung modelis based on the Raabe et al. (1976) data obtained at total lung capacity, we have defined another scalingprocedure, which is based on the Habib et al. (1994) model, but normalized to the Raabe et al. (1976)geometry.
The mucociliary clearance model of Koblinger and Hofmann (1995), which has recently been added to theMonte Carlo deposition program is used here to simulate the effect of morphometric scaling on mucociliaryclearance in the human lung. The corresponding effects on the retention patterns of inhaled radionuclidesin bronchial airways are illustrated here for two radionuclides: Tc-99m (half-life of 8 days), and J-131 (half-life of 0.25 days). For the average transport time of a particle through the bronchial tree a value of 10 hoursis used (Stahlhofen, 1989).
RESULTS AND DISCUSSION
The effects of these three scaling procedures on total, regional and local deposition patterns have beeninvestigated for a wide range of particles sizes (0.001 - 10 urn), for resting (tidal volume TV = 1000 ml andbreathing frequency f = 15 s"1) and heavy breathing (TV = 2000 ml and f = 25"'s ) conditions. Thesedeposition data are compared to those obtained with the originally reported lung morphometry at total lungcapacity. The results displayed in Fig. 1 indicate: (i) In general, the various scaling procedures increasetotal and regional deposition (except acinar deposition of very small and large particles) relative to thecorresponding simulations based on the original morphometric data; (ii) the novel scaling proceduresuggested by Habib et al. (1994) generally yields higher deposition fractions than the commonly adoptedlinear scaling procedure; and, (iii) the effects of the different scaling procedures on total and regionaldeposition are practically the same for resting and heavy breathing conditions.
PORTOROŽ 95 209

SESSION m PROCEEDINGS
LOO-,
0.80
0.60
0.40
0.20 •
0.00 J
1.00 -i
0.80
0.001 0.010 0.100 1.000 10.000
Particle diameter QjmJ
0.5 -
0.4 -
0.3 -
0.2 -
ľt 4
r
ít*n
' C
\
nJ1 \
0
1.00 n
0.80
0.60
0.40
0.0
0.001 0.010 0.100 -1.000
ParSde diameter ftim]
0.20
0.00 J
10.000
0.010 0.100 1.000
Partide diameter [pm]
10.000
0.001 0.010 0.100 1.000
Partide diameter fljmj
10.000
Fig. 1: Total (panel A), bronchial (panel B) and acinar (panel C) deposition under resting breathing conditionsfor the original Raabe et al. (1976) morphometry at total lung capacity (o) and three scaled downmorphometries assuming a constant scaling factor (D) and the Habib et al. (1994) scaling proceduresnormalized to the Horsfield et al. (1971) model (0) and to the Raabe et al. (1976) data (V). Totaldeposition under heavy breathing conditions is displayed in panel D for the four morphometric models.
If deposition is plotted as a function of the generation number (Fig.2), one can hardly see any differencebetween the data based on a constant scaling factor and those without any scaling. Comparing these twodata sets with those, which are received by applying the scaling method of Habib et al. (1994), the differentbehaviors of the deposition patterns are obvious:
The scaling method devised by Habib et al. (1994) increases particle deposition in the range of airwaygenerations 10 to 20 relative to the linear scaling method and the original morphometry.
The analysis of the diameters and velocities reveals that the scaling procedure devised by Habib et al.(1994) results in smaller diameters in peripheral airways compared to the other scaling procedures,therefore producing higher deposition by diffusion in this region. Generally, a slight shift of depositiontowards smaller generation numbers can be seen.
PORTOROŽ 95 210

SESSION III PROCEEDINGS
0.05
0.00 •
15 20Generation
Fig. 2: Deposition by generation for particle diameters d = 1.0 um (panel A) and d = 0.01 um (panel B) underresting breathing conditions for the original Raabe et al. (1976) morphometry at total lung capacity (o)and three scaled down morphometries assuming a constant scaling factor (D) and the Habib et al. (1994)scaling procedures normalized to the Horsfield et al. (1971) model (0) and to the Raabe et al. (1976)data (V).
«5T}
io
Time [h]
10 15Time [h]
Fig. 3: Retention patterns for Tc-99m (d - 1.0pm) (panel A) and J-131 (d = 0.5um) (panel B), nuclides inhaledunder resting breathing conditions based on a total tracheobronchial transport time of 10 hours(Stahlhofen, 1989) . The curves show the original Raabe et al. (1976) morphometry at total lungcapacity (o) and three scaled down morphometries assuming a constant scaling factor (D) and the Habibet al. (1994) scaling procedures normalized to the Horsfield et al. (1971) model (0) and to the Raabeet al. (1976) data (V).
Figure 3 shows that clearance is increased by using the scaling method of Habib et al. (1994). In theclearance model of Koblinger and Hofmann (1995) it is assumed that the clearance velocity in a givenbronchial airway is proportional to the diameter in that airway and a proportionality factor, which is afunction of airway diameters and lengths in all bronchial generations. Calculations have indicated that theusage of the Habib et al. (1994) procedure leads to a higher clearance velocity in the upper airways becauseof their relatively larger diameters. Due to the combination of this effect with the above mentioned shift
PORTOROŽ 95 211

SESSION ID PROCEEDINGS
of deposition to smaller generation numbers the deposited particles are faster cleared from the thoracicregion. This joint effect is displayed in Fig. 3. The shorter bronchial retention of Tc-99m (Fig. 3 panelA) compared to that of 1-131 (Fig. 3 panel B) is caused by the faster decay of Tc-99m during the clearanceprocess.
In conclusion, the different scaling methods generally lead to a higher total, bronchial and acinardeposition. An increased clearance occurs if the scaling method is used, which was developed by Habibet al. (1994), whereas a rescaled lung morphometry with a constant factor for airway lengths and diametershas practically no influence on the clearance behavior.
ACKNOWLEDGMENTS
This work was funded by the Jubiläumsfonds of the Austrian Nationalbank, Project No. 4624.
REFERENCES
1. Habib, R.H., Ghalker, R.B., Suki, B. and Jackson, A.C. (1994) Airway geometry and wall mechanical propertiesestimated from subglottal input impedance in humans. 3. Appl. Physiol. 77,441-451.
2. Hofmann, W. and Koblinger, L. (1990) Monte Carlo modeling of aerosol deposition in human lungs. Part II: Depositionfractions and their sensitivity to parameter variations. J. Aerosol Sei. 21, 675-688.
3. Horsfield, K., Dart, G., Olson, D.E. and Cumming, G. (1971). Models of the human bronchial tree. J. Appl. Physiol.31,207-217.
4. Hughes, J.M.B., Hoppin, F.G., Jr. and Mead, J. (1972) Effect of lung inflation on bronchial length and diameter inexcised lungs. J. Appl. Physiol. 32, 25-35.
5. Koblinger, L. and Hofmann, W. (1985) Analysis of human lung morphometric data for stochastic aerosol depositioncalculations. Phys. Med. Biol. 30, 541-556.
6. Koblinger, L. and Hofmann, W. (1990) Monte Carlo modeling of aerosol deposition in human lungs. Part I: Simulationof particle transport in a stochastic lung structure. J. Aerosol Sei. 21, 661-674.
7. Koblinger, L. and Hofmann, W. (1995) Stochastic model of particle deposition and mucociliary clearance in humanbronchial airways. J. Aerosol Sei. (in press)
8. Raabe, O.G., Yeh, H.C., Schum, G.M. and Phalen, R.F. (1976) Tracheobronchial Geometry: Human, Dog, Rat,Hamster, Lovelace Foundation Report LF-53, Albuquerque, NM, USA.
9. Stahlhofen, W. (1989) Human lung clearance following bolus inhalation of radioaerosols, in J.D. Crapo (Ed.),Extrapolation of Dosimetric Relationships for Inhaled Particles and Gases, Academic Press, San Diego, CA, 153-166.
10. Yu, C.P. and Diu, C.K. (1982) A comparative study of aerosol deposition in different lung models. Am. Ind. Hyg.Assoc. J. 43, 54-65.
PORTOROŽ 95 212

SESSION III PROCEEDINGS
XA05C0054
RADIOACTIVE FALLOUT NUCLIDES IN A PEAT-BOG ECOSYSTEM
G. Pausch ]), W. Hofmann !), F. Steger2) and R. Turk3)
" Institute for Physics and Biophysics, University of Salzburg,Hellbrunnerstraße 34, A-5020 Salzburg, Austria
2) Division for Radiation-Protection, Austrian Research Center Seibersdorf, A-2444 Seibersdorf, Austria3) Institute for Plantphysiology, University of Salzburg, Hellbrunnerstraße 34, A-5020 Salzburg, Austria
INTRODUCTION
The Province of Salzburg belongs to the regions with the highest contamination from the Chernobyl-falloutoutside the former USSR. The peat-bog investigated in this study is situated in Koppl, east of Salzburg. Apeat-bog is a special example of an ecosystem, which is generally not disturbed by human activities becauseit is under strict nature-conservation and whose soil structure is not affected by animal activities from molesand earthworms. Peat-bogs are characterized by acidic soils which are high in organic material and low inclay mineral content. A number of previous studies have demonstrated that especially in peat-bogs andespecially in the Koppl-peat-bog very high amounts of radioactive fallout nuclides from the Chernobylaccident and from the bomb-testings could be found (Attarpour, 1988; Eckl et al., 1984; Hofmann et al.,1988; Lettner et al., 1994).
METHODS137Cs activities from the Chernobyl-fallout were measured in the different components of the vegetation(lichens, mosses, barks, fruits, berries) and in different soil-layers of the peat-bog, together with soilparameters, such as humidity, density and pH-value. Especially the pH-value is supposed to influence the137Cs distribution in the soil. The soil samples were taken at six different points with a standardized soilsampler, which cuts out a cylinder with 8 cm diameter and 16 cm length. To get the soil-depth-distributionthe cylinder was subdivided in 2 cm high disks. All samples were dried for 24 hours at 105°C. The driedsamples were analysed by using a high purity germanium detector. The measuring-time was 12 hours foreach sample. Radionuclide concentrations were determined by automatic peak fitting using twospectroscopy applications software packages from EG&G Ortec. The detectors were calibrated using acommercial standard from PTB in Brunswick, Germany.
The pH-value was measured against water with an electronic pH-electrode. The humidity was determinedby weighing the samples before and after drying. The density was determined with the known volume andthe weight.
RESULTS
In earlier investigations some mushrooms and some typical bog-plants out of the Koppl-peat-bog showedmuch higher values for 137Cs than plants from the same kind not growing in a peat-bog. This typical bogplants are members of the family of the Ericaceae. For example, Cranberries and Blueberries belong to thisfamily. The mean value of the Ericaceae for 137Cs measured 1994 is 5 kBq per kg dry matter. Anotherbelonging to the family of the Ericaceae is also a typical bog-plant: It is the little bush heather which,showed a high value of 11 kBq 137Cs per kg dry matter. The reason for this high uptake of 137Cs may betheir symbiotic association with mycorrhizal fungi, which furnish nutrient minerals to the roots. Becauseof the similarities between cesium and potassium in metabolic processes, the mycorrhizal fungi alsotransport radioactive cesium into the plant.
Compared with some other berries typically growing in a bog, for example rowan-berries, one can see thatactivities of 137Cs are much lower than in the Ericacae however the activities of "°K are much higher thanin the Ericacae. The reason for this is again their adaption on very nutrient poor places. The ratio between'"'K and I37Cs in Ericacae lies between 1:29 and 1:73. The ratio in the other plants is much lower, between1:2 and 1:10.
PORTOROŽ 95 213

SESSION m PROCEEDINGS
During the vegetation period, the plant stores these nutrients in leaves, stems and fruits. In autumn, anutrient transport process from the yellow leaves to the roots takes place. Therefore it is very important thatwithered plants, especially grass, show specific 137Cs activities which are lower by about a factor of seven(Bunzl & Kracke, 1986). This nutrient transport is most effective for plants growing in a nutrient-poor soilsuch as a bog. The other interesting plant group are the mushrooms. The highest values for 137Cs inmushrooms can be found in bogs. Under normal conditions, 137Cs is fixed by soil-clay-minerals. But theclay mineral content of bog soils is very low. Cesium is weakly bound and plants can take it up easily.
The soil-depth distribution of 137Cs in a peat-bog is also interesting. In grassland soils and mountain soilsmost of the cesium is bound in the upper four centimeters. In most cases the depth-distribution has anexponential shape. In the Koppl-peat-bog the depth distribution has a linear shape (Fig.l).
Another interesting correlation can be detected between the specific 137Cs acivity and the soil-pH-value.The pH-value in bog-soils is low because of the high amount of organic material. The pH-value decreaseswith the soil-depth. One has to bear in mind that an increase of one pH means a ten times increase ofhydrogen-ions. The correlation between 137Cs and the pH-value is good as can be seen in Fig.2.
O 1000 2000
Activity (B^kg)
3000 4000 5000 6000 7000
SQ.O
0-2
2-4
4-6
6-8
8-10
10-12
12-14
14-16
1
I - -
.. .....
i- I
1—
II
1 1 1I 1
Fig. 1: Specific Cs soil-activity in the Koppl-peat-bog with single standardeviation.
•U
4,9
4,8
-e 4,7
S 4,6
T 4,5f 4,4Q- 4,3
4,2
4,1
4
12-14 cm
-"ÍO-i^a
1 > -
^,01**+ 6-8cm
- * • 8-10 cm
m
1 1 1 h
0-2 cm•
,^<*2^4crn
1 1
0 500 1000 1500 2000 2500 3000 3500 4000 4500
Activity (Bcykg)
Fig. 2: Correlation between pH-value and 137Cs-activity in the Koppl-peat-bog (because of a clear presentationwithout standardeviation).
PORTOROŽ 95 214

SESSION ni PROCEEDINGS
DISCUSSION
Radioecological measurements in such unmanaged areas like a peat-bog provide a very good picture ofradioactive contamination in nature-preserve-areas. Especially in peat-bogs, plants are known to accumulateradioactive fallout very effectively. They may therefore be used as biological indicators for the radioactivefallout. Because of their specific physiology, lichens, mosses and mushrooms may be considered as themost appropriate biological fallout monitors.
REFERENCES
1. Attarpour, N. M. (1988): Untersuchungen über den Gehalt an künstlichen und natürlichen Radionukliden in denniederen und höheren Pflanzen vor und nach dem Reaktorunfall in Tschernobyl. Dissertation, University of Salzburg.
2. Bunzl, K. and Kracke, W. (1986): Accumulation of fallout l37Cs in some plants and berries of the family Ericaceae.Health Phys. 50: 540-542.
3. Eckl, P., Hofmann, W. and Turk, R. (1984): Uptake of natural an man-made radionuclides by lichens and mushrooms.Radiat. Environ. Biophys. 25: 43-54.
4. Hofmann, W., Attarpour, N. M. and Turk, R. (1988): Verteilung von 137Cs in Wald-Ökosystemen im BundeslandSalzburg (Österreich), Symposium 1988, Vienna, 269-271.
5. Lettner, H., Bossew, P. and Hubmer, A. K. (1994): Kontamination durch radioaktiven Fallout im Bundesland Salzburg-und in den angrenzenden Teilen von Oberösterreich. UBA (Umweltbundesamt)-Reports 94-101.
PORTOROŽ 95 215

SESSION Hl PROCEEDINGS
XA05C0055
MEASUREMENTS OF PLUTONIUM IN ENVIRONMENTAL SAMPLES
F. d'Alberti, L. Risposi
Instituto di Fisica Applicata, University of Milan, Italy
INTRODUCTION
Within the activities connected with the start up of the PETRA Laboratory (Processo per l'Estrazione diTerre Rare ed Attinidi, i.e. process for extraction of rare earths and actinides), the Radiation Protection Unitof the J.R.C.-Ispra has carried out a well planned set of experimental measurements aimed at evaluatingthe zero point of the isotopes of plutonium in environmental samples by alfa spectrometry. After theInternational Moratorium in 1963, no release of plutonium has occurred in the environment apart from theburn up of SNAP 9A satellite in April 1964. Since then the plutonium concentration in air and in falloutsamples has been continuously decreasing requiring, therefore, optimization of both instrumentation andexperimental measurement procedures in order to obtain better sensibilities. In this work, the experimentalmethodology followed at the J.R.C.-Ispra for measurementes of plutonium concentration in air, depositionand soil is described and the plutonium behaviour in these samples is reported and discussed starting from1961.
SAMPLE COLLECTION AND TREATMENT
The environmental surveillance of plutonium in the region surrounding the J.R.C.-Ispra is accomplishedby measurements carried out on samples of soil, air and depositions. Soil samples are collected twice peryear in four sites (Ispra, Cadrezzate, Brebbia, Barza) located in correspondence to the cardinal pointsaround the J.R.C.-Ispra at a distance of about 2 km. For each site, the soil sampling is carried out by a usualcore lifter penetrating the soil down to 15 cm. The collected soil is subdivided in three parts consisting ofthe soil amounts included between the depths 0-5 cm, 5-10 cm and 10-15 cm and 50 g of each part are usedas samples to be treated. Air and deposition samples are collected by devices placed over the building ofthe Radiation Protection Unit of the J.R.C.-Ispra. Air sampling is carried out by collecting for one monthatmospheric dust over a fixed filter with a surface of 0.25 m2 through which 110 m3-h"' of air is pumped.Deposition samples are monthly collected in four caissons each one with a surface of 1 m2 and with acolumn containing a cotton filter and an ion exchange resin (which is used for a preliminary separation ofdeposition radionuclides in the following chemical treatment). Depending on the type of sample, a differentphysical pre-treatment [1] is carried out to prepare the sample for the next chemical procedure. Thechemical preparation of the sample to be analyzed plays a fundamental role in the measurement procedure.It consists of three steps:
• separation of plutonium and iron (chemically similar) from all other compounds (silicates, Ca and Srsalts, );
• separation of plutonium from iron and heavy metals by strong anionic resins type DOWEX 1-X8 Cl ;• electrodeposition of plutonium over a titanium disc, working also as a support for the measurement.
Details of this procedure are given elsewhere [2]. The electrodeposition facilitates in obtaining a very thinlayer of sample avoiding, therefore, autoabsorption of a-particles.
EXPERIMENTAL APPARATUS AND PROCEDURE
Because of the low activities of plutonium involved in environmental samples, measurements have to becarried out over a long period of time (about one week). This requires high stability of the detector during
PORTOROŽ 95 216

SESSION ID PROCEEDINGS
the measurement period. For this reason, it was decided to use a solid-state detector instead of an ionizationchamber, this latter exhibiting spectrum shifting and, consequently, a decrease in resolution over longperiods of measurement. The requirement of detector stability for this type of measurements is soimportant to overcome the disadvantages of low efficiency and small sample volumes connected with theuse of a solid-state detector. Prior to the beginning of each measurement, a vacuum pump is used for arough evacuation (10 Pa) of an aluminium chamber (11.4 cm wide by 16 cm high by 15.7 cm deep)supplied by EG&G ORTEC containing an ion implantation silicon semiconductor detector also suppliedby EG&G ORTEC with the following operating characteristics:
resolution at 5.4856 MeVactive areadepletion regionbackground noise
<900 mm2
300 urn
25
20
keV
keV
The sample to be analyzed is placed in the detection chamber at a distance of about 2 cm from the detector.This distance, together with the pre-evacuation of the detection chamber, was found to be an optimalsolution in order to obtain a remarkable improvement of the detection efficiency. A detection efficiencyof 21% was thus obtained. The detection chamber is polarized with 50 V positive and connected to apreamplifier mod. 142 supplied by ORTEC in series with an amplifier mod. 7612/L supplied by SILENÁ,an ADC mod. 7411/S supplied by SELENA and a multichannel analyzer (MCA) type LIVIUS 16K suppliedby SILENÁ. Preliminary calibrations have indicated that an optimal spectrum resolution is obtained byoperating the MCA at 5 keV/channel.
BACKGROUND EVALUATION AND MINIMUM DETECTABLE ACTIVITY (MDA)
Prior to a set of measurements, background was evaluated taking into account the following sources:
• instrument background, corresponding to the measurement of a "blank" support disc, i.e. a support discwithout electrodeposition of the sample;
• background with reagents, evaluated by placing in the detection chamber a support disc over whichthe chemical reagents used for the separation of plutonium were electrodeposited;
• background with reagents plus filter, obtained by measuring the activity of a sample prepared byelectrodeposition of the filter used for the collection of the air samples burned and treated with theabove said chemical reagents.
Obviously, the last background term includes the second one which, in turn, includes the instrumentbackground. The background with reagents is taken into account for activity measurement of soil anddeposition samples, while background with reagents plus filter is considered for measurements of airsamples. The background values obtained for the above mentioned sources are reported in Table I .
Backgroundsource
instrument
reagents
reagents + filter
Sample type
-
soil and deposition
air
Pu-239+240
(8.69±1.80) 10"6
(2.07±0.30) 10"5
(2.28±0.42) 10"5
Pu-238
(l.ll±0.20)(1.19*0.44)
(1.44±0.66)
io-5
io-5
io-5
Unit
counts •
counts •
counts •
s"1
s"1
s"1
Table I : Background values for measurements of enviromental samples.
In evaluating the background for air and deposition samples, account must also be taken of the presenceof Po-210. This radionuclide comes from the readioactive decay chain of Pb-210 (always present in air)and is an a-emitter with a 100% emission at 5304 keV. Even if the Pb-210 concentration in the sampleunder measurement is reduced by a factor 103 by the chemical treatment for the separation of the plutonium,
PORTOROŽ 95 217

SESSION in PROCEEDINGS
the remaining Pb-210 generates an amount of Po-210 in the air sample which, after a few months from thesample preparation, can become even higher than plutonium present in the sample. The presence of aremarkable amount of Po-210 affects the measurement of Pu-239+240 (which shows an emission peak atabout 5156 keV), because of the overlapping between the peak tail of Po-210 and the peak area of Pu-239+240. It has been estimated by measurements performed in our laboratories that this phenomenon canbe, on average, taken into account by increasing the background value in the area of Pu-239+240 by anamount equal to 0.75% of the Po-210 present in the sample. For these reasons, measurements of plutoniumin environmental samples should be carried out as soon as possible after the sample preparation in orderto minimize the effect of the presence of Po-210.
The Minimum Detectable Activity (MDA) has been calculated as twice the standard deviation from themean background value, representing 95.4% of the gaussian curve associated with background counts:
MDA =e %-chemical yield %• sample volume
where e is the detection efficiency and a 100% emission at 5156 keV and 5499 keV were taken for Pu-239+240 and Pu-238, respectively. The MDA values for the three different types of environmental samplesare reported in Tab. II. One observes that the experimental metodology previously described for the MDAof air and deposition samples has been improved of a factor 102 with respect to the values previouslyreported [1].
sample type Pu-239+240 Pu-238 Unit
airdepositionsoil
1.13-10"9
3.94-10"5
1.60-10"3
7.69-1010
2.32-10"5
1.21-10"3
Bq-nV3
Bq-m"2
Bq-kg1
Table II: Minimum Detectable Activity in environmental samples.
RESULTS AND DISCUSSION
Experimental measurements of plutonium in environmental samples of air and deposition around the JRC-Ispra have been carried out monthly since 1960 according to the procedure described above..In Fig. 1, theresults of measurements for Pu-239+240 and Pu-238 in air samples are reported, each experimental pointcorresponds to the annual average of the monthly measurements. Both the radionuclides show a sharp risewhich corresponds to the nuclear explosions which occurred between 1960 and 1970. Moreover, thebehaviour of Pu-238 exhibits a rise which again corresponds to the burn-up of SNAP 9A satellite whichtook place in April 1964. After these events, Pu-239+240 and Pu-238 concentrations continuously decrease,denoting the absence of measurable releases of plutonium into the atmosphere. This suggests that thecontribution to the plutonium concentration in the environment coming from nuclear plants is negligible.Trends for both the radionuclides approached an asymptotic behaviour at about 8-10'° Bq-m~3 between1980 and 1990, representing the old value of MDA. The values obtained after 1992 are 2 orders ofmagnitude lower and essentially of the same order of the MDA reached with the experimental apparatusdescribed here (Tab. II). This would indicate that plutonium concentration in air has approached theminimum measurable level and an improvement has been made in measurement sensibility in this field.The behaviour of the radionuclides under examination in deposition samples is very similar to that obtainedfor air samples. Correlations between plutonium concentration and rainfall have been studied but theresults are so far unsatisfatory. This can be explained by the fact that the radionuclides come from thestratosphere while rain comes from the troposphere.
PORTOROŽ 95 218

SESSION III PROCEEDINGS
- e — Pu-339+240- A - P u - 2 3 8
1971 1981 1991year
Fig. 1: Pu-239+240 and Pu-238 in air 1961-1995.
BREBBIA
CADREZZATE
ISPRA
0+5 cm5+10 cm10+15 cm
0+5 cm54-10 cm10+15 cm
0+5 cm5+10 cm10+15 cm
Pu-239+240
(4.22±0.24) -101
(6.36±0.37) -10-1
(5.83±0.36)-101
(5.18±0.31) -101
(5.02±0.30)-10-'
(2.30+0.16) -10'
(2.32±0.18)-10-]
(4.78±0.26)-10'(6.74±0.46) -101
Pu-238
(1.07+0.19) -10-2
(1.79±0.34)-10"2
(1.55±0.35)-102
(1.57±0.29)-102
(1.48±0.30)-10"2
(9.15+0.24)-10"2
(1.05±0.34)-10"2
(1.52+0.18)-10"2
(2.56±0.64)-10"2
The measurements of soil samples from the BARZA site gave unsatisfactory results.
Table III: Concentrations of Pu-239+240 and Pu-238 in soils [Bq -kg1].
REFERENCES
1. G. Dominici et al.: Annuari di Radioattivitä Ambientale 1960-1990 J.R.C. Ispra.2. M. De Bortoli: "Radiochemical determination of plutonium in soil and other environmental samples", Analitycal
Chemistry vol. 39, nr. 3, March 1967.
PORTOROŽ 95 219

SESSION m PROCEEDINGS
XA05C0056
THE APPLICABILITY OF LICHENS AS RETROSPECTIVE BIOMONITORS OFTHE RADIOACTIVE CONTAMINATION IN A MOUNTAIN ECOSYSTEM
M. Gastberger1}, W. Hofmann ° and R. Turk2)
" Institut für Physik und Biophysik, Universität Salzburg, Austria2) Institut für Pflanzenphysiologie, Universität Salzburg, Austria
INTRODUCTION
A number of previous studies have demonstrated that lichens are suitable and inexpensive biologicaldetectors of the local fallout pattern (ECKL et al. 1984, HOFMANN et-al. 1993, BERG et al. 1992).Lichens are usually highly contaminated and their contamination correlates well with the soil depositiondata. One of their major advantages is that samples can easily be collected from quite large areas, therebygetting an average contamination of this area. Especially in mountain ecosystems, lichens could gain greatimportance as biomonitors, because many lichens grow in this area and, moreover, the collection of soilsamples may be very difficult in these elevated regions. On the other hand, particularly in mountainousregions, the deposited radionuclide activities may vary considerably from site to site due to specific localmeteorological conditions, which may also affect the growth of lichens and their uptake of radionuclides.Thus the goal of this study was to find out, whether lichens are still suitable biological detectors of the localradioactive contamination pattern several years after the initial deposition event.
MATERIAL AND METHODS
In this study, soil and lichen samples were collected from the Stubnerkogel in the Gastein valley, in thesouth of the province of Salzburg, Austria. The samples were taken in the summer of 1993 from 10locations situated between the peak (2240m above sea level) and the timberline (about 1800m above sealevel) of the Stubnerkogel.
While at most of the locations three soil samples were taken, the number of lichen samples per locationdepended on the amount of lichens available and varied between 1 and 4. Since Cetraria islandica,Cetraria cucullata, Cladonia arbuscula, Cladonia rangiferina and Alectoria ochroleuca were the mostcommon species in the examined area, mainly samples of these species were collected.
5000 -
4000 -
3000 -
2000 -
1000
altitude and number of samples
Fig. 1: Mean values with standard deviation and some single values, respectively, of the specific 137Cs activityin Cetraria islandica at different sampling locations.
PORTOROŽ 95 220

SESSION Ul PROCEEDINGS
Each liehen sample had a dry weight of about 2-10 g. The soil samples had the shape of a zylinder with adiameter of 8 cm and a hight of 10 cm. Basically the whole l37Cs activity was found in the top 10 cm soillayer; hence the taken samples allowed us to determine the area contamination of the 10 locations.
All samples were dried at a temperature of 105° C for 24 h and then homogenized. They were measuredwith a high purity germanium detector from EG&G Ortec (relative efficiency: 20 %). The measuring timewas at least 20.000sec, resulting in an overall statistical uncertainty of the I37Cs activity (1 standarddeviation) of about 10 % for most of the soil and lichen samples.
60.000 -
10.000
altitude and number of samples
Fíg. 2: Mean values with standard deviation and some single values, respectively, of the I37Cs areacontamination at different sampling locations.
6.000 -
g 5.000 -m~ 4.000 -Ä*•>
8o 3.000 -
2.000 -
1.000
C«tnaria Wandiea
Cetraria eucullota
Ctadon'B arbuscub
Cladoota ranglŕerína
Aladorta ochrotauca
1 2
sampling area
Fig. 3: Specific I37Cs activities (Bq per kg dry weight) of 5 different lichen species at 3 small sampling areas.
PORTOROŽ 95 221

SESSION III PROCEEDINGS
RESULTS
The measured lichen samples had 137Cs activities between 400 and 5000 Bq per kg dry weight. Figure 1shows the 137Cs contamination of Cetraria islandica, which is the most common species in this area. Incomparison to the lichen samples, the I37Cs contamination of the soil was much more homogeneous (seeFigure 2). For all locations the calculated 137Cs concentration per unit surface area was between 20 and 40kBq/m2.
One sampling location allowed the collection of different lichen species from 3 very restricted areas. Eacharea had the size of about 0.5 m2 and samples from 5 lichen species were collected from each of these areas.As Figure 3 shows, quite significant differences exist in the 137Cs contamination between the variousspecies. All three samples of Cetraria islandica were significantly higher contaminated than thecorresponding Cetraria cucullata samples. Cetraria cucullata on the other hand contained about two timesmore 137Cs per kg dry weight than Alectoria ochroleuca. The two Cladonia species are closely related toeach other; consequently they show very similar contamination levels.
DISCUSSION
The results of this survey show that because of their long life expectancy lichens can be used asbiomonitors for a radioactive contamination which happened a few years ago. Cetraria islandica, Cladoniaarbuscula and Cladonia rangiferina had the highest contamination levels. These three species are verycommon in alpine regions and thus seem to be especially suitable as biomonitors of the radioactive fallout.
In this study, the soil contamination, i. e. the t37Cs activity per unit surface area, did not show significantdifferences between the various sampling locations. On the other hand the activities per unit lichen dryweight differed significantly between some of the locations. This discrepancy can partly be caused bydifferent growth rates of the lichens, which may lead to different dilutions of the specific activities. GAARE(1987) concluded that differences in the radiocesium content of lichens can also be due to a differentmoisture content at the time when the fallout occurred: "A dry sponge may absorb more water andcontamination than a wet one. And lichens work very much like sponges in this respect." It also has to beconsidered that lichens were not only contaminated directly by the Chernobyl fallout, but they may alsohave absorbed radionuclides from the soil after the initial exposure. Depending on the amount of contactthey had with the soil, this may also alter the initial lichen contamination to some extent.
The results of our study suggest that lichens can be used as retrospective biomonitors of the radioactivecontamination even a few years after the fallout event. However, the initial contamination pattern of lichensmay be modified by several factors in the years following the radioactive fallout. Hence, only lichens fromsites with similar growth conditions should be considered.
ACKNOWLEDGMENTS
The authors gratefully acknowledge financial support by the Umweltbundesamt Wien.
REFERENCES
1. Berg, G. J.; Tyssen, T. P. M.; Ammerlaan, M. J. J.; Volkers, K. J.; Woroniecka, U. D.; Debruin, M. and Wolterbeek,H. T. (1992): Radiocesium and lead in the lichen species Parmelia sulcata, sampled in three regions around Chernobyl:Assessment of concentrations in 1990. J. Environ. Radioactivity 17: 115-127.
2. Eckl, P.; Hofmann, W. and Turk, R. (1984): Natural and man-made radionuclide concentrations in lichens at severallocations in Austria. Nord. J. Bot. 4: 521-524.
3. Gaare, E. (1987): The Chernobyl accident." Can lichens be used to characterize a radiocesium contaminated range?Rangifer 7: 46-50.
4. Hofmann, W.; Attarpour, N.; Lettner, H. and Turk, R. (1993): Cesium-137 concentrations in lichens before and afterthe Chernobyl accident. Health Physics 64: 70-73.
PORTOROŽ 95 222

SESSION in IINIIIIIIIIIIIIIIIIIIHUIIIIIIIIIIIIINNI PROCEEDINGSXA05C0057
SOME ASPECTS OF CESIUM DEPOSITIONIN TRANSILVANIA (ROMANIA)
C.Cosma", I.Pop 2), I. Cosmuta l\ C.Micu °, S. Ramboiu 3)
University Babes-Bolyai, Faculty of Physics, 3400-Cluj Napoca, Romania2) Technical University, 3400-Cluj Napoca, Romania
3 ) Institute of Hygiene and Public Health, 3400-Cluj Napoca, Romania
INTRODUCTION
Following the accident of the Chernobyl atomic electric power station, a great quantity of radionuclides(-100MCÍ) escaped from the reactor [1]. It was estimated that 13% of the inventory activity of cesiumrepresenting 1.5-2 MCi left the reactor [1-2].
The radioactive deposits were very nonuniform for the same distance and in the same direction fromČernobyl nuclear center having a close dependence upon direction and speed of wind and pluviometricconditions. The rains, especially the storms, spectacularly increased the radioactive fallout [3-5].
Although, for the first two-three days, subsequent to accident, the meteorological conditions were favorablefor Romania, after April 29/30, because of the changing in the wind direction on SW (initial it was N andNW) the countries were on this direction-Romania, Bulgaria, Greece, former Yugoslavia-began to beintensely contaminated with radioactive fallout [6,7].
In Romani a.the radioactive cloud passing coincided with abundant rains, especially on the directionmentioned above. On this direction, the cesium deposits are of 8-12 times larger than other Romanianregions.
The torrential rain which fell on May 1-st 1986, in the western side of Cluj Napoca town caused an intensecontamination especially with short-life isotopes as Te, I, Ba, La, Mo. Medium and long-life isotopes asRu, Zr, Cs, Sr were present in large quantities in this area.too.For the total contribution the value obtainedwas 1130 kBq/m2, much larger than the average in Romania [5].
This work presents data about cesium content of pollen samples gathered daily between 1-30 May 1986;cesium deposits in five areas and some measurements in connection with cesium mitigation in soils.
EXPERIMENTAL METHOD
Quantitative cesium determinations were made using a NP424 four-channel gamma spectrometer (Hungary)coupled to a Nal(Tl) detector of large dimensions (D=76mm, H=45mm). The samples were measured eitherin Marinelli geometry (0.51) or in cylindrical boxes (0.181) directly seated on the Nal(Tl) scintillator. Thecalibration of these volume-samples was at first made using point-source of Cs-137 (Romanian standards)and after that, also, volume-standards obtained in the frame of Environmental Radioactivity Seminar(Romania). In both cases, the measurements were made using the full energy peak for Cs-137 (662keV).
In the case of our detector, because of low resolution (about 50keV), the Cs-134 contribution at 605keVenergy must be considered by the introducing of a correction factor depending of the elapsed time after theČernobyl accident [8].
The soil samples were gathered from undisturbed soils a depth of 15cm. On this depth must be foundroughly the total quantity of Cs deposition.
In order to eliminate the eventually Rn-222 contribution (at 609.5keV), the samples, which were gatheredfrom different places, were heated at 100°C during an hour and then measured.
The pollen samples, daily gathered between 1-30 May 1986, were measured in the cylindrical boxes, thestandard sample being placed in the same conditions.
PORTOROŽ 95 223

SESSION m PROCEEDINGS
RESULTS AND DISCUSSION
Cesium in pollen samples
TIME
Fig. 1: Daily evolution of cesium in pollen samples.
Fig.l presents the obtained results for Cs-137 content in pollen samples measured two years later thesamples were gathered. The daily evolution presents two maxima, in 1 and 7 May, according to them ofthe released of radionuclides from the damaged Černobyl station, in 26 April respectively 5 May [1]. Thefive days delay corresponding to the first maximum were caused by the fact that the first three days afterthe accident the wind blew towards N and NW, then changing the direction to SW [9].
The second maximum for 7 May was registered at only two days after the maximum of radionuclidesrelease from 5 May because, in this time, the wind blew in SW direction constantly.
These maxima were rediscovered also, on this direction, in air samples measured in Albania in May 3respectively in May 9 [7].
On the other hand, these two maxima prove that the contamination of pollen grains happens during the latertransport from the gather place to the beehive; these pollen grains keeping like a filter the radionuclidespresent in air. This thing speaks about the fact that the pollen could be used to monitoring of some possibleradioactive substances deliverance, in close vicinity of nuclear equipments.
These maxima for air radioactivity from Romania were observed in the case of 1-131 content, for exactlythe same time: 1 May respectively 7 May, too [4].
Cesium deposits N
TOWARDSCHERNOBYL
Fig. 2: Cesium deposits in different region on SW direction.
PORTOROŽ 95 224

SESSION m PROCEEDINGS
Fig.2 shows the Cs-137 deposits for five areas from Romania located in the NE-SW direction. The averagecesium deposits, for regions out of this direction are presented on this figure, too.
It can be observed that the values of cesium deposits on NE-SW direction are more high that those ofregions located in the NW and SE side of Romania and, also, of 3-4 times higher that the average value forRomania [6].
A large value was found for Alba region (>40 kBq/m2), this fact being linked with the abundant rains inthis zone in the first May decade.
Cesium mitigation
12
Bq/mz,103
LAPUSDEPRESSION
12
d (cm)
Bq/m2,1O3
8 12 16
SUCEAVAREGION
d (cm)8 12 16 20
Fig. 3: Cesium mitigation in depth for two samples.
Fig.3 shows the cesium content dependence for two samples gathered in the Lapus depression, respectivelyin Alba region(May 1994). For the first simple, the maximum of deposit was obtained for the first fourcentimeters (40% of the total deposition) but for the second sample this maximum is draw down betweenthree and six centimeters (35% of the total deposition). The penetration rate in soil depth is different byclose depending of the type of the soil and the pluviometric conditions in all the years that followedChernobyl accident [10].
As result of combined effects of erosion and mitigation, the cesium deposit on different slopes can bedifferent for the same site. Fig.4 shows the cesium content for two differently slope shapes.
57.637
Fig. 4: Slope shape of cesium in two cases (great and small slope).
PORTOROŽ 95 225

SESSION in PROCEEDINGS
In both cases there is an accumulation process to the base of the slope. Also it can be seen that for greatslopes there is more small deposits, probably in direct connection with the initial deposition.
REFERENCES
1. A.A.Abaghian et al., Atomnaia Energia, 61, 301 (1986).2. IAEA.Sum Rep on the Chernobyl post-accident.Saf Ser,No.75-lNSAG-1,1986.3. G.Kossl, W.Warburg, PTB Mitteilungen, 96, 249 (1986).4. N. Paunescu, I. Vata, J. Radioanal. Nucl. Chem, 126, 97 (1988).5. C. Cosma.M.Salagean, A.Pantelica, Studia UBB, Physica, 33, 65 (1988).6. I.Osvath, C. Doolete, Proc IRPA Congress, Montreal 1992, pg. 1545.7. M.Kedhi, J.Radioanal. Nucl. Chem. Lett., 145, 115 (1990).8. C. Cosma, Fresenius J.Anal. Chem (to be published).9. E. Dycker, The Chernobyl accident and its impact, Royal Meteorological Institute of Belgium, Brussels, 1986.10. K.R.Price, Radiochimica Acta, 54, 145 (1991).
PORTOROŽ 95 226
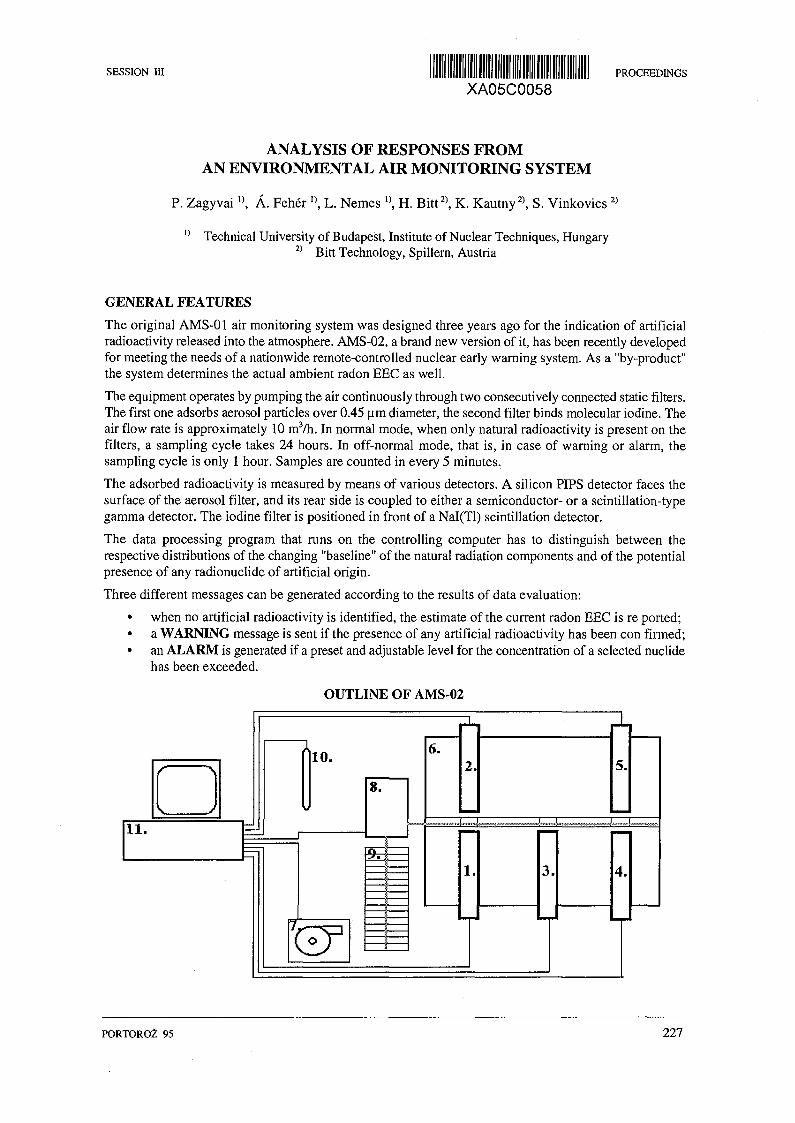
SESSION III PROCEEDINGS
XA05C0058
ANALYSIS OF RESPONSES FROMAN ENVIRONMENTAL AIR MONITORING SYSTEM
P. Zagyvai '>, Á. Fehér •>, L. Nemes l\ H. Bitt2), K. Kautny2), S. Vinkovics2)
0 Technical University of Budapest, Institute of Nuclear Techniques, Hungary2) Bitt Technology, Spillern, Austria
GENERAL FEATURES
The original AMS-01 air monitoring system was designed three years ago for the indication of artificialradioactivity released into the atmosphere. AMS-02, a brand new version of it, has been recently developedfor meeting the needs of a nationwide remote-controlled nuclear early warning system. As a "by-product"the system determines the actual ambient radon EEC as well.
The equipment operates by pumping the air continuously through two consecutively connected static filters.The first one adsorbs aerosol particles over 0.45 urn diameter, the second filter binds molecular iodine. Theair flow rate is approximately 10 mVh. In normal mode, when only natural radioactivity is present on thefilters, a sampling cycle takes 24 hours. In off-normal mode, that is, in case of warning or alarm, thesampling cycle is only 1 hour. Samples are counted in every 5 minutes.
The adsorbed radioactivity is measured by means of various detectors. A silicon PIPS detector faces thesurface of the aerosol filter, and its rear side is coupled to either a semiconductor- or a scintillation-typegamma detector. The iodine filter is positioned in front of a Nal(Tl) scintillation detector.
The data processing program that runs on the controlling computer has to distinguish between therespective distributions of the changing "baseline" of the natural radiation components and of the potentialpresence of any radionuclide of artificial origin.
Three different messages can be generated according to the results of data evaluation:
• when no artificial radioactivity is identified, the estimate of the current radon EEC is re ported;• a WARNING message is sent if the presence of any artificial radioactivity has been con firmed;• an ALARM is generated if a preset and adjustable level for the concentration of a selected nuclide
has been exceeded.
OUTLINE OF AMS-02
11.
10.
8.
6.2.
1. 3.
PORTOROŽ 95 227

SESSION m PROCEEDINGS
1. Aerosol filter + a/b detector2. Aerosol filter + g detector3. Iodine filter + g detector4. a/b detector ( optional)
5. g detector ( optional)6. Lead shielding7. Air flow pump8. Manipulator
9. Storage racks10. Dose rate meter11. Computer
PARTS OF AMS-02
Type 1.IBM PC compatible computer
(486DX2-66);with built-in measurement units:
Ik MCA's ( 5 pieces);40 channel A/D converter;
Type 2.IBM PC compatible computer
(486DX2-66);with built-in measurement units:
Ik MCA's (4 pieces);- 8k MCA;
40 channel A/D converter;
Manipulator;Sample holding cartridges and filters;Air pump;
Nal(Tl) (2"x2") detector (2 for cycle, 1 for optionaloff-cycle measurement);PIPS a/b detector (1 for cycle, 1 for op tionaloff-cycle measurement);
Nal(Tl) (2"x2") detector (1 for cycle, 1 foroptional off-cycle measurement);HPGe detector with electric cooling (1 for cyclemeasurement);PIPS a/b detector (1 for cycle, 1 for op tional off-cycle measurement);
Lead shielding;Pressure and temperature meters;Dose rate meter;
SOFTWARE FUNCTIONS
1. Start-up procedure:
• initialising data transfer;• input of configuration file;• input of filter database from archive disc;• initialising MCA cards;• initialising A/D card;• initialising interrupts;• sending status report to the communication centre;
2. Measurement cycles:
• displaying the status of ongoing measurement(s);• actions responding local or remote operator commands;• transmitting commands of the appropriate operations (e.g. air pump switch on/off, change filter,
etc.);• sending status reports to the remote centre;• updating filter database on archive disc;• acquisition, evaluation, display and archival of data from nuclear detectors;• acquisition, evaluation and display of pressure and temperature meters;
PORTOROŽ 95 228

SESSION DI PROCEEDINGS
SENSITIVITY OF THE SYSTEM
For an ambient radon EEC of 20 Bq/m3 the following detection limits (given in Bq/m3) were determined:
Sampling time
Aerosol filter
Iodine filter
I37Cs/HPGe det.
a /PIPS det.
b /PIPS det.131I/NaI(Tl) det.
5 min
4.0
1.0
1.5
6.0
30 min
0.7
0.5
0.7
0.5
12 h
0.05
0.04
0.05
0.04
The sensitivity for Rn was determined as 0.6 Bq/m for a sampling period of 15 minutes.
PORTOROŽ 95 229

SESSION Úl Illllllllllllllllllllllllllllllllllllllllllllllllllllll PROCEEDINGSX A 0 5 C 0 0 5 9
T H E C O N C E N T R A T I O N O F R A D I O A C T I V E S T R O N T I U MA N D T O T A L S T R O N T I U M IN S O M E SAVA RIVER S A M P L E S
K. Košutič, Ž. Grahek, S. Lulič
"Ruder Boskovic" Institute, Center for Marine Research, Bijenička 54, HR-10 000 Zagreb, Croatia
INTRODUCTION
The bioaccumulation factor for fresh water organisms can be defined as a ratio of the concentration of anelement in the organisms to its concentration in the water where the organisms live. It is an importantparameter for calculating the transfer of toxic elements or radioisotopes from the river ecosystem intohuman organisms via food pathway. The physico-chemical state in which a particular element or itsradioisotope is found is important for the uptake of some substances by the organisms.
The special interest of this paper is bearing upon the stable element strontium and its isotope, strontium-90(arising in uranium fission process from a nuclear power plant) owing to its radiotoxicity.
It is known that 80-90% of ^Sr is in the soluble form (1). For this reason, aquatic ecosystem plays asignificant role in radionuclides transfer.
In this paper are presented some of the results about strontium and calcium concentration and aboutbioaccumulation factors for stable strontium and radioactive strontium for some species of fish in the Savariver.
EXPERIMENTAL
The samples were collected during the period 1993-1994 as a part of monitoring program.
The samples of sediment and fish were collected in the same area as water samples. The samples for theanalyses were prepared accordingly, as necessary for the specific kind of sample.
Sediment was dried in an oven regulated to 105°C, then it was passed through a 2 mm sieve to removeplants, roots and pebbles.
Water was evaporated to dryness.
Fish samples were weighed each sample, and placed into a porcelain dish. After carbonization, the samplewas ashed in an electric muffle furnace.
The total concentration of strontium and calcium was determined by using the atomic absorptionspectrometer (Model PERKIN ELMER 3110).
Radioactive strontium was measured following several separation procedures ( 2 3 ).
Radioactive strontium in equilibrium with its daughter '"Y<4) was detected in the ß-low-level countinganticoincident system by using gas flow detector (CANBERRA model 2400). Background rate was lessthan 1 cpm and eff. for »Sr-^Y was 33-37%.
The activity of 90Sr was calculated from the ratio of ^Sr activity in the sample to 90Sr activity in thestandard (150,9 dpm/ml solution). Corrections for the efficiency and for chemical yield were applied.
RESULTS AND DISCUSSION
The bioaccumulation factor (1,5,6) has been calculated for stable and radioactive strontium supposing thatthe uptake of an element by a simple aquatic organism follows the equation
~ =--Cw-rC (1)dt m
PORTOROŽ 95 230

SESSION III PROCEEDINGS
where: Cw = concentration in waterC = concentration in organismIw = intake ratem = mass of the organismr = biological elimination rate of the element by the organism.
if t- °° , the solution of equation (1) is:
C(t) Iw concentration in organism Rp
Cw mr concentration in water
where: C(t) = equil ibrium concentration in organism.
For radionuclides, the equation 2 can be expressed asJ
BF =
(2)
m(X + r)(3)
where r is replaced by r + X , representing the biological elimination rate of the radionuclide by theorganism, X is decay constant rate.
Assuming that: a) "fish is a simple organism", and b) X«r for 90Sr, it follows from the equations (2) and(3) that:
BF r + X~* 1 (4)
The results of measurements for total and radioactive strontium, and also for total calcium in the fish, waterand sediment are presented in Table 1.
Sample
PERCHPercafluviatilis
BARBEL
Barbus barbusGOLDFISH
Carassius auratusBREAM
Abramis bramaCHUB
Leuciscus cephalusWATER
SEDIMENT
Total strontium*
7.1-10"6
7.5-10-*
1.4-10"5
5.6-10"6
2.7-lO"6
1.6107
1.3-10"4
Total calcium*
4.3-10"4
1.3-10"3
1.3-10"3
5.4-10"3
7.2-10"4
5.4-10"5
-
Activity MSr*
0.20 0.03
0.32 0.03
0.54 0.06
0.33 0.05
0.13 0.06
4.10 0.020.94 0.01
* For fish results in g/g wet weight or mBq/g wet weightFor water results in g/ml or mBq-10 VmlFor sediment results in g/g dry or mBq/g dry weight
Table 1: Results of determination strontium, calcium and '"Sr i some river samples.
The measured concentrations for stable strontium (Table 1) do not indicate to the significant differencesregarding the particular species of fish. There are some differences observed in the case of total calcium.They can be attributed to the share of bones in the total mass offish organism since calcium is known tobe the main component in the bones (7>.
By determining 90Sr activity in various species of fish, an attempt was made to see whether some species
PORTOROŽ 95 231

SESSION III PROCEEDINGS
of fish accumulate more radioactive strontium than some others, given that they are living in the sameecosystem although with different mobility and different way of alimentation (using vegetable food,keeping to the river bed, etc.).
Sample
PERCHPerca fluviatilis
BARBELBarbus barbus
GOLDFISHCarassius auratus
BREAMAbramis brama
CHUBLeuciscus cephalus
mBq ^Sr/mg Sr
33.8
42.7
110.2
75.0
48.1
mBq ^Sr/mg Ca
0.46
0.25
0.43
0.08
0.18
BF
44.4
46.9
87.5
35.0
17.0
BFr
48.8
78.0
131.7
80.5
31.7
Table 2: Results of calculated value mBq 90Sr/mg Sr, mBq 90Sr/mg Ca, BF and BFr.
The results presented in Table 2 indicate to some differences reflecting in different contribution of ^Sr intotal strontium. Considering that ^Sr is a radioisotope with long half-life time, bioaccumulation factors BFand BFr should be approximately the same (according to the eq. 4 ), which is not the case with somespecies of fish (Table 2). This can be explained by the variations in concentrations of total calcium andstrontium in a particular ecosystem during the life-time of a fish, resulting in the differences in radioactivestrontium accumulation, giving as a result an enhanced bioaccumulation factor BFr.
CONCLUSION
Previous considerations showed that bioaccumulation factor for ^Sr, if expressed as
C( 9 0Sr) water
and calculated from the results of measurements for a stohastically selected sample of fish from some realsystem (ecosystem), can serve as a rough estimate of ^Sr transfer. Furthermore, the expression BF ~ BFr,derived from the simple one-compartment model, is valid for a limited number of situations. If thuscalculated bioaccumulation factor is used for the estimate of ^Sr uptake by a human organism through foodpathway, it must be necessarily taken into account that the obtained result is a rough approximative value.
SUMMARY
The objective of this paper was to determine total strontium and calcium, also radioactive strontium in astohastically selected sample of fish organisms (various species of fish). From thus measured valuesbioaccumulation factors for stable strontium and for radioactive strontium were calculated. The equationused for BF and BFr calculation represents the simple one-compartment model for the transfer of 90Srthrough food pathway.
REFERENCES
1. T. Harold, Peterson, Jr., Radiological Assessment: A Textbook on Environmental Dose Analysis. NUREG/CR-3322-Par t lof2 , 1983 p. 5-1.
2. Ž. Grahek et al., 1995, Journal of Radioanalytical and Nuclear Chemistry, 189(1) (1995) 141-146.3. Technical Reports IAEA, Series No. 295,1989.4. B. Al-Deen etal., XI Jug. Symp. of HDZZ, 1981, p. 99.5. B.L. Cohen, Health Physics, 49(6) (1985) 1290-1294.6. B. Kahn, K.S. Turgeon, Health Physics, 46(2) (1984) 321 -333.7. Radioactivity Survey Data in Japan, ISSN 044,1-2516, NIRS-RSD-105, 1994.
PORTOROŽ 95 232

SESSION HI
XA05C0060PROCEEDINGS
RADIOACTIVE CONTAMINATION OF ANIMAL BONES BY 90Sr
Z. Franič, M. Maračič
Institute of Medical Research and Occupational Health, Department for Radiation ProtectionKsaverska cesta 2, HR-10001 Zagreb, P.O. Box 291, Croatia
INTRODUCTION
'"Sr has been regarded as the fission product of great potential hazard to living things because of the uniquecombination of its 28-y long half-life, the very energetic beta particle of its ^Y daughter, and its generalresemblance to calcium in metabolic processes. Therefore, due to chemical and metabolic similarity tocalcium, bone is the critical organ for radioactive isotopes of strontium.
The Department of Radiation Protection of the Institute for Medical Research and Occupational Health,has carried out radioactivity measurements of the food chain as part of an extended monitoring programme,since 1963 (1,2). This includes systematic, long-term measurements of'"Sr in long bones of some domesticanimals (cows and pigs) while data on lamb bones exist for the very beginning of the investigated period,and for the period after the Chernobyl nuclear accident.
MATERIAL AND METHODS
Measurements of ^Sr activity were performed on the long bones of some domestic animals (lambs, pigsand cows). The adhering flash was cleaned from the bone. The weighed sample was placed in a dish of purevitreous quartz and ashed in the oven at 800 °C overnight. Amount of thus ash obtained was about 15-20%of the initial sample. Extraction with tributylphosphate was used to obtain ^ , the decay product of ^Sr(3). The radioactivity of ^Sr was therefore performed by beta counting of M Y in a low-background,anti-coincidence, shielded Geiger-Müller counter.
RESULTS AND DISCUSSION
Long term-data on ^Sr activities (Bq-kg'1) in long bones of cows, pigs and lambs) are graphically presentedin Figure 1.
7.
6
5
4 -
j -3 -
2 -
1
O -
-1
Fit Lamb
1965 1980Years
1995
•* Pig • Lamb • Cow
Fig. 1: ^Sr activities in pig, lamb and cow bones.
PORTOROŽ 95 233

SESSION III PROCEEDINGS
Cow bones systematically exhibit highest activities compared to those of pig and lamb bones. However,variations of activity are lowest in lamb bones, following regular exponential decay. Over the entire studyperiod, the maximum and minimum activities for the respective species are presented in Table 1. Thecorresponding year is in brackets.
Lamb bones
Cow bones
Pig bones
Maximum activity
47.7
437.2
165.7
(1963)
(1968)
(1964)
Minimum
0.6
7.7
1.7
activity
(1993)
(1994)
(1994)
Table 1: Maximum and minimum ^Sr activities in bones (Bqkg1)
As a refractory component of the radioactive debris originating in the Chernobyl nuclear accident,strontium was not subjected to global dispersion processes, being mainly deposited around the accident site.As bones of young animals in which growing process is not finished are more sensitive for incorporationof bone seeking nuclides, the Chernobyl nuclear accident caused the slight increase in MSr activity only inlamb bones. The bones of cows and pigs remained practically unaffected, except for the variations inactivity. This is in agreement with previous investigations (4). Therefore, activity ratio for cow and pigbones for the pre-Chernobyl period is 3.2±3.0 and 9.3±7.1 for post-Chernobyl period, reflecting highervariations of activity in cow bones, especially for the post-Chernobyl period. Those variations can beexplained by different type of food for respective species.
The ^Sr activities in lamb, cow and pig bones exhibiting exponential decay were fitted (5) to the equation:
N(t) = N(0) e -kt
where:
A(t) is time dependant 90Sr activity in bone (Bq-kg"1),A(0) is initial activity (Bq-kg"1),k effective constant representing the decrease in activity, i.e. '"Sr turnover rate in bone (y"1).
Effective residence time of ^Sr in bones of respective species is defined as:
The results for Teff are shown in Table 2.
T = 1'ff y
Lamb bones
Cow bones
Pig bones
Time interval
1963 - 1967
1986-1993
1964 - 1994
1964 - 1994
2.3
2.8
10.6
7.8
Table 2: Effective residence time of '"Sr in bones (years).
PORTOROŽ 95 234

SESSION ni PROCEEDINGS
From Table 2 it follows that the effective residence time for cow bones is approximately three times higherthan that for lamb bones.
Effective residence times for lamb bones are similar for pre-Chernobyl and post-Chernobyl periods.
REFERENCES
1. Popovič, V. (Editor):Environmental radioactivity in Yugoslavia 1962 - 1977. Belgrade: Federal Committee for Labour, Health and SocialWelfare; Summary reports 1962 - 1977. (In Croatian).
2. Bauman, A.; Cesar, D.; Franič, Z.; Koyač, J.; Lokobauer, N.; Marovič, G.; Maračié, M.:Results of environmental radioactivity measurements in the Republic of Croatia 1978 - 1994. Zagreb: Institute forMedical Research and Occupational Health, Zagreb. Summary reports 1978 -1994. (In Croatian).
3. Harley J.J. (Editor):HASL Procedures Manual, USAEC Report HASL-300, 1970.
4. Maračič, M., Baumstark M. and Bauman A.:The effect of the nuclear accident at Chernobyl on 90Sr levels in animal bones. In: Current Problems and concerns inthe Field of Radiation Protection, Proceedings of XIV Regional IRPA Congress, Kupari, 107-110;1987.
5. Neider, J.A. and Mead, R.:A Simplex method for function minimization. Computer Journal 7:308-313;1965.
PORTOROŽ 95 235

SESSION ni PROCEEDINGS
XA05C0061
MOBILE RADIOLOGICAL LABORATORY -REGULAR EXERCISES AND INTERCOMPARISON MEASUREMENTS
B. Pucelj, M. Korun, R. Martinčič, M. Ravnikar
Jozef Stefan Institute, Jamova 39, Ljubljana, Slovenia
INTRODUCTION
Mobile Radiological Laboratory (MRL) was established in early eighties when our first nuclear power plantwas commissioned. The main aim was to provide skilled manpower and equipment to perform fieldmeasurements in case of nuclear or radiological emergency. From the very beginning MRL has conductedseveral exercises per year to train teams and to test the equipment. As a part of the republic emergencypreparedness programme the team visits three times per year the nuclear power plant and its surrounding.Several field intercomparison measurements of liquid and atmospheric samples are made with the NPPlaboratories and its mobile laboratory. MRL has also taken part at several international intercomparisonfield exercises and has been engaged in some small scale emergencies.
EQUIPMENT
MRL is equipped with various equipment which makes possible to perform different kinds of fieldradiological and other measurements. Additionally there is personal protective equipment.
Radiological equipment
• portable monitors for dose-rate and surface contamination measurements• high pressure ionization chamber Reuter-Stokes RSS-112 coupled to global positioning system GPS• GM system for continuous measurement and alarming• fixed germanium detector with analyser• in-situ germanium detector with analyser• equipment for sample collection and preparation• portable air pumps for collection of aerosols and iodine
Meteorological station
MRL has its own meteo station with sensors for measuring wind speed, wind direction, temperature andhumidity. The information is analysed, displayed and stored in a PC.
Personal protection
There are protective clothes, gloves, shoe covers, breathing masks. Personal doses are controlled by TLDsbut additionally members are equipped with electronic alarm dosimeters.
Communication equipment
• Mobitel with fax• Two radio connections (republic system and emergency headquarters)
REGULAR VISITS TO THE NPP
According to emergency preparedness plan MRL makes three visits per year to the NPP and its vicinity.There are several aims of these three-days visits:
• To perform measurements of different liquid and atmospheric samples taken from the NPP. The resultsare compared with those obtained in the NPP laboratory.
• To get familiar with roads and fixed measuring points of the regular monitoring programma (air pumps,TLD locations).
PORTOROŽ 95 236

SESSION III PROCEEDINGS
• To train teams and to test the equipment.
Till now there have been 38 visits performed in 13 years.
Fig. 1: MRL on one of the regular exercises around Krško Nuclear Power Plant.
OTHER ACTIVITIES
• International intercomparison field exercises
MRL has taken part in several international intercomparison field exercises in various radiologicallyinteresting place:
• Preparedness for a case of an accident in the NPP
MRL actively participated in two field exercises where republic emergency preparedness plan for caseof emergency in the NPP was tested (Posavje 1882 and Posavje 1993)
0 Radiological emergencies
MRL has had two interventions related to lost sealed sources. In both cases 13? Cs was involved.
In one case the source was burnt in en electric furnace and traces were found in the filter.In the second case a lost radiographic source (30 GBq) was recovered by emergency team.
• Special measurements
The Reuter-Stokes response was measured during helicopter flight and possibilities for search of a lostsource were tested.
CONCLUSIONS
Regular exercises and intercomparison measurements are crucial for efficient emergency preparedness.
PORTOROŽ 95 237

SESSION III PROCEEDINGS
XA05C0062
INDOOR RADON CONCENTRATION IN POLAND
K.Mamont-Cieśla, J.Jagielak, S.W.Rosiński, A.Sosińska, M.Bysiek, J.Henschke
Central Laboratory for Radiological Protection, Konwaliowa St. 7, PL-03-194 Warsaw, Poland
INTRODUCTION
Preliminary survey of Rn concentration indoors by means of track detectors and y-ray dose rate with theuse of TLD in almost 500 homes in selected areas of Poland was performed in the late 1980s [1]. It wasconcluded that radon contributes 1.16 mSv i.e. about 46 per cent of the total natural environment ionizingradiation dose to the Polish population.
Comparison of the average radon concentrations in 4 seasons of a year and in 3 groups of buildings:masonry, concrete and wood, revealed that the ground beneath the building structure is likely the dominantsource of radon indoors.
Since the National Atomic Energy Agency in its regulations of 1988-03-31 set up the permissible limit ofthe equilibrium equivalent concentration of radon in new buildings (equal 100 Bq/m3), the nation-scalesurvey project for radon in buildings has been undertaken. These regulations were supposed to take effectin 1995-01-01.
The project has 3 objectives:
to estimate the radiation exposure due to radon daughters received by Polish populationto identify radon-prone areas in Polandto investigate dependence of the indoor radon concentrations on such parameters as: type ofconstruction material, presence (or absence) of cellar under the building, number of floor.
So far the measurements have been made in 5 macroregions of Poland:
l.Bialystok, 2.Gdynia, 3.Katowice, 4.Warszawa, 5.Wroctaw (Fig. 1).
Fig. 1: Distribution of meteorological stations. Marked area was covered by the survey.
PORTOROŽ 95 238

SESSION m PROCEEDINGS
POPULATION SAMPLING
On the basis of our previous experience we assessed that distribution of radon detectors by mailing themto randomly selected people would be not effective in our country. Therefore we decided to make use ofthe network of 340 meteorological/climatological stations of the Institute of Meteorology and WaterManagement uniformly covering an area of the country. The station staff distributed radon dosemeters andquestionnaires in 15 homes in the vicinity of each station and also took care about the outdoormeasurements of Rn in the stations. Such distribution system gives a stochastic rather than a random sampleof housing stock but owing to it only 14 per cent of the detectors were lost.
The radon survey questionnaire contains the following questions on:
1. type of house (one family house, multiple family dwelling, multi-storey block)2. presence (or absence) of cellar in the house3. type of construction material (wood, red brick, hollow-ash fly brick, prefabricate-concrete technology)4. year of construction5. the floor at which the surveyed dwelling was located6. number of people living in the dwelling.
The meteorological staff who distributed the dosemeters wrote down the date of start, end of the exposureand the dosemeter number.
METHOD
An integrating method of solid state track detector based on the Pershore CR-39 foil placed at thebottom of the Karlsruhe type diffusion chamber with a diffusion barrier (Schleicher & Schüll filter) hasbeen used. The time of exposure was 6 or 12 months. After exposition, CR-39 detectors were chemicallyetched in 10 N NaOH solution at 70°C for 8 hours. The alpha-tracks were counted by means of anautomatic computerized reader [2], designed and developed at our laboratory, in an area of 4.16 mm2
corresponding to 16 fields of view.
The method is calibrated using a barrel-shaped chamber of 320 dm3 and dry Pylon 226Ra source of activityof 3.71 106 pCi, with the error of 4 % at 99 % confidence level. On the basis of 10 calibration exposuresthe sensitivity k = (29.6 ± 0.7) kBqhm'Vtr.mm"2 was found, with the average background track densityequal 1.6 ± 1.4 tr.mm"2 (range: 0.2 - 3 tr.mm2). Low level detection limit of this method, assumed as 3standard deviations of the background track density, is estimated to be 34 kBqhm"3 which corresponds, foran exposure time of 12 months, to the radon concentration of 4 Bq m3.
Track density is converted to Bqm3 by means of the formula: E = -48.05 + 29.6 N where E is an exposurein kBqm"3 and N is a gross number of tracks per mm2.
For the exposure time of 6 months (4380 h) we obtain: SRn = -0.011 + 0.007 N . The method wasverified in the First International IAEA-US EPA Passive Radon Detector Intercomparison (October1991) with the average performance ratio equal 1.07 and in the Second International IAEA-US EPAIntercomparison (July-September 1994) with the participant to BOM target ratio equal 1.0 (inthe Twilight Mine, Colorado) and the participant-to EPA target ratio equal 0.89 (at the EPA Las Vegas
Laboratory).
RESULTS AND CONCLUSIONS
Presented results of radon concentration indoors refer to 5 macroregions: Katowice, Bialystok, Gdynia,Warsaw and Wroclaw which constitute about 46 per cent of the area of Poland and are inhabited by about60 per cent of Polish population. In these regions above 2000 dwellings were covered with the survey.
The results are shown in Figs 2-5.
The lognormal distribution is a good approximation of the distribution of radon concentration with ageometrical mean of 32 Bq/m3 and an arithmetical mean of 41 Bq/m3 corresponding to an effective doseof about 1 mSv/y [3]. The highest values in the range from 200 to 500/m3 constitute about 2 per cent of allresults. Most of them appear in 2 voyvodships: Walbrzych (with arithm. mean of 71 Bq/m3) and JeleniaGóra (with arithm. mean of 69 Bq/m3) in the southern part of the Wroclaw region.
PORTOROŽ 95 . 239

SESSION III PROCEEDINGS
5 macroregions:Bialystok,Gdynia,KatowiceWarszawa, Wroclaw
ArltliRtstta main IEq/rn3| ALL FLOORS
K&lowico Wroclaw BlaiyaioK Warnaw* Odynt* S raglona
Roglon
Typa of buildings
• Nocallir E3*JI
Fig.2. Rn conc.vs.type of building(with cellar, without cellar, all)
5raglons:BlaIy«tok,Gdynla,Katowlc8.War»ziiwa,Wroclaw
Houses with cellars, liret Iloor dwell.
Rn ewe. [9q/m3l
Mlhmillo u u 1
W/B Wet< R Bffl H waft 'nlii mm
t l í SÍ.S 511 48.6 -ti.8 47.3 41i ?3.«
Type ol material
F i q . ^ . R n e o n o . va. typa ci matarlaJ
5 macroľegions.-Blalyatok.Gdynia.KatowiceWarszawa, Wroclaw
Wltlinallo rnsan lBq/rr.3| FIRST FLOOR
Kslowlcs Wroclaw SliJyiuk Warauvs Odynl« S region«
Region
Typa ol
M wuti csilír ESNOCONSÍ O A I I
rig-3 Rn conc.vs.type of building{with cellar, without collar, ctl)
£
Rn
«0
ID
40
30
30
10
maororegionsßlalystok.Gdynia.KatowicBWarszawa.Wroclaw
Mfl&UrlthJTU
Fig, 5.
m) !Bq/m3]
1 ľ"""
H-f+ii 1Hitth:f: : :;
ľ•ito
•1(0
-Í30
-{SO
IťNumber of floor
with colljr EUwlltaulDolIu
Rn concentration vs. floor
Fig. 2 - Fig. 5.
Number of flats
Arithmetic mean
Geom. mean
Area [km2]
Area [%]
Population x 103
Population [%]
Total
2081
41.2
32.0
123087
46
23573
60.4
Katowice
326
45.5
34.9
17477
6.5
5554
4.2
Wroclaw
429
47.3
32.2
30454
11.4
3863
9.9
Bialystok
306
47.1
31.6
40272
15.0
2097
5.4
Warszawa
727
39.8
32.7
30454
11.4
10446
26.8
Gdynia
281
28.0
23.2
4430
1.7
1613
4.1
Table 1: Radon concentration indoors [Bq/m3]. Statistical information.
PORTOROŽ 95 240
SESSION HI PROCEEDINGS
The mean values for non-cellar buildings are significantly higher than for cellar buildings (Figs 2-3). Cellarsthemselves were not tested because they are usually not inhabitable in Poland.
Radon concentration decreases when number of floor increases (Fig.5). It is true for each of 5 „type ofmaterial" groups of buildings.
The mean value is the highest in the group of buildings constructed of wood and red brick and is thelowest in the group of concrete buildings (called „prefabricate").
ACKNOWLEDGEMENT
This work was partly supported by IAEA under contract N° 6161/R.
REFERENCES
1. Biernacka M., Henschke J., Jagielak J., Koczyúski A., Mamont-CieslaK.: Preliminary measurements of the naturalionization radiation in three types of buildings in Poland, Postepy Fizyki Medycznej, 26,1-2, (1991) 55-66.
2. Rosinski S.W.: A computerized track detector reader, Nukleonika 38, 2, (1993) 57-66.3. UNSCEAR1993.
PORTOROŽ 95 241

SESSION UI PROCEEDINGS
XA05C0063
FIELD MEASUREMENTS ON HIGH ALTITUDE ALPINE AREAS OF AUSTRIA
A. Andrási °, H. Lettner 2>, E. Lovranich3), F. Steger3), J. Urban '>,E. Urbanich3) and P. Zombori '>,
" KFKI Atomic Energy Research Institute, P.O.B. 49, H-1525 Budapest, Hungary2) University of Salzburg, Hellbrunner Str. 34, A-5020 Salzburg, Austria
3) Austrian Research Centre Seibersdorf, A-2444 Seibersdorf, Austria
INTRODUCTION
Austrian-Hungarian common action was organised by three teams to investigate the radiologicalsituation using mobile environmental monitoring laboratories in some selected regions in Salzburg andin high altitude Alpine areas in 1993.
In situ gamma spectrometric and dose rate measurements were performed in the following three placesof different site characteristics
1. Krauthügel (Salzburg), undisturbed grassy meadow,2. Nassfeld (near Badgastein), Alpine meadow,3. Kringsalm (Obertauern), Alpine meadow.
The main aims of the action were
• confirm the high fallout radionuclide concentration of Chernobyl origin previously observed by soilsample measurements having quite different depth distribution characteristics of the caesiumradionuclides in the soil,
• to investigate the suitability of these sites for larger scale international intercomparison exercise ofmobile laboratories in 1994,
• to test a new method of in situ gamma spectrometry with collimated detector arrangement and tocompare it with traditional uncollimated wide area monitoring method,
• to compare the results obtained by the three participating teams using uncollimated in situ gammaspectrometry,
• to test the recently established on route monitoring system.
METHODS
The following methods were used in the course of the action:
• In situ gamma spectrometry• Dose rate measurement• Soil sampling and activity concentration measurement• On-route monitoring of dose rates applying Global Positioning System
RESULTS
The vertical distribution of l37Cs activity concentration in the soil on the three investigated locationsdetermined by sample measurements are shown in Fig. 1.
The results of intercomparison measurements in terms of activity concentrations in the soil and doserates lm above the ground for 137Cs and natural radionuclides are summarized in Table 1.
PORTOROŽ 95 242

SESSION III PROCEEDINGS
100
fi 10B
0.1
Distribution of Cs-137
• ' ' • • • : ! : : ; y : Ľ í i - . • .'•i : • ; : r : : . . : •" . . : ; ; : : ; Í : : ; . : : ; : : : : : ; " . . : " ; : : " : • : " : : | . : :::::|..:;
-Salzburg-Badgasiein-Obertauem
5 10
Depth (cm)
15
Fig. 1: Total deposition of Cs-137.
Salzburg
Nuclide
K-40Th-232U-RaCs-137
ÖFZS
34022
1635
Act. cone.
Uni. S.
449
29.229.736
KFKI38423.4
18.330
Unit
Bq/kgBq/kgBq/kg
kBq/m2
Dose rate (nGy/h)
Total
ÖFZS16.7
16.58.1
34.776.0
Uni. S. KFKI
16.515.28.1
18.0
57.8
Badgastein
Nuclide
K-40Th-232
U-RaCs-137
ÖFZS375314027
Act. cone.
Uni. S.463385425
KFKI36323.126.524.6
Unit
Bq/kgBq/kg
Bq/kgkBq/m2
Total
Dose rate (nGy/h
ÖFZS18.523.2
20.326.8
88.8
Uni. S.
)
KFKI15.215.2
11.829.4
71.6
Obertauern
Nuclide
K-40Th-232
U-Ra
Cs-137
ÖFZS
2404.7
1645
Act. cone.Uni. S.
2407.124
32
KFKI
2786.7
19.232.1
Unit
Bq/kgBq/kg
Bq/kgkBq/m2
Total
Table 1.
Dose rate (nGy/h)ÖFZS
11.83.5
81.144.668.0
Uni. S. KFKI12.1
4.48.5
38.063.0
PORTOROŽ 95 243

SESSION III PROCEEDINGS
The total deposition of Cs measured by the three teams on the three locations are illustrated also in Fig. 2.
45-,
40
5 35-Ž »•Ä 25
•i » 151 10O 5-
0
iú1
Total
. : : : • • : : • : : • .
^^^^B :. i.
Salzburg
deposition
: • ; : ; . ; • : V - . . ; . . - ' : : - : • • : • . . .
. :• j \ j :.•;. : : ' . . : : \ : • : . :
Badgasiein
Location
ofCs»137
••WĚĚĚĚĚIKĚ'' '•
9H- ;; :FĚ^H-
;; ;lti' 'iiiiiiiEiiiiii'' 'Hm
Obertauem
BÖFZS• Uni. S.D KFW
Fig. 2: Total deposition of Cs-137.
The variability of pulse rates of peaks corresponding to different energies measured with collimateddetector in comparison with uncollimated measurements at three different sites and at three points aroundone selected measuring point (appr. 2m) at Obertauern area are illustrated in Fig. 3 and Fig. 4 respectively:
Rslative puise rates of eollimated defector measurementsa 5 0 T « 1 8 ,.:::•:::•
0.45-
0.40-
0.35,
0.30-
0.25-
0.20
0.15
0.10-
0.05-
0.00-
[ •• w ^ ^•;;•.,.•,••: ; : : ; . : r ; i ; í
'.ill)':) •;
,;; ,/ 'J
• ' • • " • ' • ;
: - ^
«.if"iill:il
583 609
: : • : • : - . : . •
• ] : • • - :
;- : • ; . ; . ; i i
• :- f i ?
I1--'-!- B:-.!.:!, k*?B::J. : i : 0x
X.l,
•|Sii
í V;
!••::^ # -
• Badgastein
• Obertauem
652 1460
Fig. 3: Relative pulse rates of collimated detector measurements.
Great variation of dose rates along the route of the mobile unite was observed due to the variation of naturalradioactivity in the soil and the differences of cosmic ray contribution especially in the vicinity ofBadgastein.
PORTOROŽ 95 244

SESSION III PROCEEDINGS
Relative pulse rates around a place
D Middle• 1st point• 2nd point• 3rd point
Fig. 4: Relative pulse rates around a place.
CONCLUSIONS
The following main conclusions can be drawn from the results:
• The total deposition of 137Cs due to the Chernobyl accident in all investigated sites were highenough to be suitable for a larger scale of intercomparison exercise but one of the two Alpineterrains is sufficient due to the similar depth distribution characteristics.
• The depth profiles of I37Cs activity concentration in the soil showed in all three locations depletedlayer in the surface of the ground.
• The depth distribution of 137Cs activity concentration were similar at Badgastein and Obertauernbut differed considerably from that found in Salzburg. The depleted layers were found to bethinner in the high Alpine areas compared to that at the selected grassy meadow in Salzburg.
• In most cases the activity concentration and dose rate values obtained by the participants showacceptable agreement for given radionuclides, however in few cases great differences were foundprobably due to the differences in conversion factors used.
• Considerable local non-uniformity was obtained from the collimated detector measurements. Theeffect of the difference in depth distribution was found to be not significant in terms of thereduction of the peak intensities.
• On-route monitoring proved to be a very effective method for the detection of fluctuations in theenvironmental radiation level.
PORTOROŽ 95 245

SESSION III PROCEEDINGS
XA05C0064
ENVIRONMENTAL MONITORING OF 137CS INTHE VARDAR RIVER CATCHMENT AREA
T. Anovski l\ L. Cvetanovska-Nastevska2), N. Jovanovski2)
0 Faculty of Technology and Metalurgy, Univ. "Sv. Kiril & Metodij",P.O.box 580, 91000 Skopje, Macedonia
2) Center for Application of Radioisotopes in Science and Industry, P.O.Box 274, 91000 Skopje, Macedonia
ABSTRACT
Distribution ofCs-137, as one of the most important anthropogenic radioactive pollutant on the environment,in various samples within the Vardar river catchment area has been determined.
By application of adequate radioecological model, an effective equivalent dose for different transfer media andexposure pathways as a contribution ofCs-137 to the total exposure of man of different age, were calculated.
INTRODUCTION
Having in mind the fact that a man is permanently exposed to the natural radiation coming from thesun,space and radioactive material as sources of a, ß and y radiation present into the human environment,it becomes a part of our life.
Increased radioactive pollution of the environment as a result of thermonuclear explosion testing for theperiod 1952-1963, as well as due to several accident on various nuclear power plants,the last of which"Chernobyl disaster", in April 1986, made the largest interregional influence, determination the distributionand the behaviour of individual radioisotopes and in particular of Cs-137 with half life of 30 years,gainedin its importance.
In this sense, by application of y-spectrometry, determination of the Cs-137 concentration in varioussamples (surface and underground water flows, sediments, cultivated and uncultivated soils, food stuff etc.)from the Vardar river basin.as well as calculations for determination of an effective dose equvalent for anadult and children for the period 1989-1991, have been performed.
RESULTS AND DISCUSSION
200
180
160
140
120
100
80
60
40
20
o• H:;.
1986
wK
BIi1 flL
1987 1988 1989
Year of observation
mCs-137inuncultivated soilsample in Bq/kg
El Cs-137 in grass inBq/kg
1990 1991
Fig. 1: Concentration of Cs-137 in uncultivated soil and grass samples from the locality of Krivolak, centralpart of Macedonia.
PORTOROŽ 95 246
SESSION HI PROCEEDINGS
Apart from the concentration of Cs-137 in surface and underground water samples, showing valuesbetween 0,01 and 0,13 Bq/1 with seasonal fluctuation (higher values in spring time, were observed) for theperiod 1989-1992,its concentrations in Vardar river sediments for the same period of observation were inthe range of 20-50 Bq/kg.While, lucerne, cultivated and uncultivated soil samples follow the Cs-137concentration in river sediments with general trend for decreasing and by time approaching the level of preChernobyl disaster, see Fig.l, human food shows values lower than 20 Bq/kg or 1. For milk even below0,75 Bq/l.This is of grate importance and especially having in mind that 90% of the internal exposure inpost Chernobyl region, was coming from the milk consumption contaminated with Cs-137''2).
By application of adequate radioecological model3) (taking into account various possible pathways of Cs-137 transport through food chain) the effective equivalent dose, received by ingestion have been calculatedfor the period 1989-1991 and values of 52 uSv for adults and 37,5 uSv for children per year were obtainedthat are several times lower than those received in 1986 4).
CONCLUSION
By determination the Cs-137 distribution in selected ecosystem as well as by studying the habit of the localpopulation and developing of adequite radioecological model, the effective equivalent dose on an efficientway can be evaluated.
Performed calculation for ingestion pathway showed that cereals, fruits and vegetables are dominantcontributers in receiving of 52 uSv and 37,5 uSv as an effective dose equivalent for adults and children,respectively.
REFERENCES
1. Exposure from the Chernobyle accident, UNSCEAR, United Nations, New York, 1988.2. IAEA, Newsbriefs, Vol.7, No.2 (54), Vienna, April/May, 1992.3. T.Anovski, "Appl.of isotope techniques in study of water flows pollution" Doctor"s Thesis, Fac.of Technology &
Metallurgy, Univ. of Skopje, 1984.4. T.Anovski et al. "Radioecology of Vardar river" Report to the Project 09-202/1; 08-1078/1, Fund of the Republical
Comunity for Science, Skopje, 1988.
PORTOROŽ 95 247

SESSION PROCEEDINGS
XA05C0065
ENVIRONMENTAL RADIOACTIVITY AROUND THE FORMER COAL MINE
IN KOČEVJE (SLOVENIA)
M.Križman, B.Pucelj, D.Konda, J.Smrke
Jozef Stefan Institute, Jamova 39, SI-61 111 Ljubljana, Slovenia
ABSTRACT
Radioactivity in the environment arising from the high uranium content of brown coal from the former coalmine in Kočevje was investigated. Enhanced levels of gamma dose-rate and radionuclide content were foundon the tailings and in deposited coal, respectively. Outdoor radon concentrations were found to be probablythe highest in the country, due to the high radon potential in background soil and in the coal tailings area, aswell as the topographical and climatic characteristics of the site. The radioactivity of surface waters (lake,seepage) is well above the levels found in unpolluted waters.
INTRODUCTION
Soon after World War II it was recognized (1) that brown coals from the Lower Carniola region (coal minesin Kočevje, Kanižarica, Vremski Britof) contain quite high amounts of uranium, up to ten times more thanother coals in Slovenia. Enterprises were obliged to collect coal ash; it was intended for further processingand yellow cake production, but due to an insufficient content of uranium these plans were never realized.
In Kočevje, the coal mine was in operation from 1803 and ceased production in 1972. In parallel to anaverage annual production of about 100,000 tonnes in this century, huge amounts of coal mining wastesand coal ash were freely disposed of on an area (1.25 km2) between the town of Kočevje and the nearbyvillage of Šálka vas (Fig.l). Self-ignition of coal residues often occurs, leading to a smoky atmosphere inthe valley. Excavated underground shafts collapsed and a lake with an area of 0.25 km2 appeared in thevicinity of the town.
Fig. 1: Map of the site.
PORTOROŽ 95 248

SESSION III PROCEEDINGS
A pilot research study was performed recently concerning the levels of radioactivity in the mineenvironment. The aim of this work was to establish overall radiation levels in the abandoned mine area anddisposal site and to ascertain the possible environmental impact of the former mining activities.
EXPERIMENTAL
Radiation measurements were performed covering the following items: measurements of gamma dose-ratelevels on the coal and ash tailings of the disposal area, analysis of radionuclide content in depositedmaterials, radon measurements in houses located in the mining area, radon and radon daughtersconcentrations outdoors, and finally, radioactivity of the lake and seepage water and sediments.
Gamma radiation was surveyed over the whole depository using a scintillation counter with a plastic andNaI(Tl) crystal (0 5cm x 5cm). The contents of natural radionuclides (U, 226Ra, 232Th and 40K) in samplesof deposited material, were analyzed by gamma-spectrometry with a HPGe detector. Results were correctedfor self-absorption.
Levels of indoor radon were measured using charcoal adsorbers, and radon daughter concentrations weredetermined by a continuous sampler with an alpha-spectrometer. Uranium in water was determined byradiochemical neutron activation analysis, while radium concentrations were measured by the sorption-emanation method.
RESULTS AND DISCUSSION
Results showed that radioactivity in the disposal terrain is not uniformly distributed (Tab.l); in central partsof the depository gamma dose-rates up to 0.3-0.4 uGy/h were measured. Values of 0.15-0.25 uGy/h werefound in most parts of total area (2).
Location
Open-pit mine
Depository
Lake shore
Šálka vas,Trdnjava
Šálka vas,Mlaka
Detailed description ofsampling point
E side of the lake
NE from the lake
E side of the lakeW.NWsideofthe
village farmyardvillage garden
villages,N and NE of Kočevje
Sample
coal, ash
slag, ash
slag, ashcoal, soil
soil, ash, coalsoil, ash, coal
soil (grassland)
Absorbed dose-rate(nGy/h)
0.20,0.15-0.30
0.20
0.20-0.250.10-20
0.20-0.25, 0.40.10-0.12,0.3
0.10,0.10-0.12
Table 1: Gamma dose-rate levels on the coal and ash depository at Lake Kočevje.
The highest radiation levels (up to 0.40 uGy/h) were found on the eastern side of the lake, at the site aroundthe open pit mine, old coal-tailings depository and on hot spots with coal-ash. Absorbed dose rate (in air)was low along the western side of the lake, namely 0.10-0.20 uGy/h. Since most of the houses are madeof local clay bricks, indoor gamma dose rates were also expected to be enhanced; we found values mostlyaround 0.15 uGy/h.
All coal samples and its mixtures with ash or soil contain considerable quantities of uranium and radium.Great variations were found in contents of natural radionuclides (U-nat, 226Ra): mainly in the range of 400-1200 Bq/kg, but in some places (at Šálka vas: on coal tailings, in the courtyard) even more than 4000 Bq/kg(Tab.2). Contents of thorium and potassium in most samples are in the normal range (50-70 Bq/kg for 232Th,250-350 Bq/kg for 4 0K).
PORTOROŽ 95 249

SESSION III PROCEEDINGS
Indoor radon concentrations were measured in numerous houses situated within the mining area. Winterdaily radon levels in houses with an average of 200 Bq/m3 were above normal national level (median valueof 54 Bq/m3); in one case it reached 2,600 Bq/m3 in the living-room, while in a cellar concentrations in onecase reached 3,150 Bq/m3. Measurements within the national survey programme of indoor radon inSlovenia (3,4) showed enhanced concentrations in the region of Kočevje; the mean annual indoorconcentration of radon in the entire community is 160 Bq/m3, and in the town nearby 120 Bq/m3. Moremeasurements will be needed to confirm if this region could be classified as radon prone area.
Sample andsampling location
ash, coal - E lake side
ash, coal - NW lake side
ash, coal - SW lake side
ash, coal - W lake side
soil, coal - Šálka vas
coal sample - mine
field soil - (Šálka vas)
U-238Bq/kg
2168 ±59
328 ±18
1236 ±94
1794 ± 115
4130 ±154
1146 ± 64
75.0 + 7.7
Ra-226Bq/kg
2315 ± 8
313±3
1258 ± 10
1739 ±15
4519 ±20
1861 ± 8
80.6 ± 0.9
Pb-210Bq/kg
1393 ±49
248 ± 18
1475 ± 87
1374 ± 99
3229 ±138
1667 ±48
73.4 ±7.1
Th-232Bq/kg
56.1 ±2.5
52.2 ±1.6
46.0 ±4.6
60.9 ±5.4
50.0 ± 7.4
59.0 ±3.8
61.5 ±0.8
K-40Bq/kg
228 ± 2
337 ± 18
358 ±51
296 ± 64
160 ± 64
168 ±40
374 + 9
Table 2: Radionuclide content in deposited material (coal, ash).
Relatively high indoor concentrations are to some extent also the consequence of the unusually highoutdoor radon concentrations. Namely, the town of Kočevje is situated in a closed circular valleysurrounded by hills with heights up to a thousand metres. In the period of strong temperature inversionswe measured relatively high radon and radon daughter concentrations.
In winter time, in a period of stable weather, daily average radon concentrations are about 80 Bq/m3, withearly morning maxima even up to 150 Bq/m3. Even in summer, peaks of equilibrium-equivalentconcentrations (EEC) exceed levels of 100-110 Bq/m3 (Fig.2).
These are surprisingly high figures when compared to simultaneously measured values in the area of theuranium mine at Žirovski vrh (maximum values of 50-55 Bq/m3 were observed at a moderate distance froman area radon source).
Similar high levels of 222Rn were reported only (5) for uranium mining regions in Thuringia and Saxonia.The uranium content in soil in the Kočevje region considerably exceeds the national average level. Thisfeature, together with climatic characteristics and the deposition of millions of tonnes of waste coal tailingsand ash, are obviously together the main reasons for the occurrence of highest levels of outdoor radon.
Samples
Lake Kočevje
Seepage water (from depository)
River Rinža (above lake)
River Rinža (downstream of lake outflow)
Uranium(mg/m3)
13.2 ±0.6
3.9 ±0.2
0.84 ± 0.09
0.99 ±0.13
Ra-226(Bq/m3)
30.7 ±4.7
27.5 ±4.4
9.4 ± 4.5
15.7 ±5.5
K-40(Bq/m3)
106 ± 2
131 ± 1
37.9 ± 2.4
31.8 ±0.3
Table 3: Concentration of 238U, 266Ra and 40K in water samples.
PORTOROŽ 95 250

SESSION m PROCEEDINGS
120
100
© 60
18.7. 19.7. 23.7.
Fig. 2:
20.7. 2.',.7.Time (hours)
U-mine environment —•— Kočevje town
Outdoor radon progeny concentrations in the centre of Kočevje town and at Gorenja Dobrava (U-mine environment).
Due to leaching of excavated materials by precipitation, the radioactivity of lake water (and also seepagewater) is evidently higher than in other surface waters, i.e. at least by an order of magnitude: 226Ra 30Bq/m3, and 2 3 8U 160 Bq/m3 Concentration of ""K in the lake and in seepage water - determined by theatomic absorption method - are three times higher as the normal range for surface waters, i.e. 30 Bq/m3.Some measurements (radionuclide content in sediment samples) are still in progress.
CONCLUSION
Enhanced levels of radiation on the site of the former coal mine in Kočevje are definitely confirmed in air,ground and water. There is no satisfactory explanation for the high outdoor radon concentration in the townarea; there is no evident relation between the outdoor concentration of radon and its emission from the coaltailings depository, and further measurements will necessary elucidate this question.
ACKNOWLEDGEMENTS
The authors are thankful to Ms.M.Čahuk and her students (from the Kočevje Grammar-school) who firstfound enhanced radiation levels in the surroundings of Lake Kočevje, and to Dr. M.Korun who made thefirst gamma-spectrometric evaluation of enhanced radium content in coal tailings. Thanks are also due toMs.P.Dujmovič for measurement of radium concentration in water samples.
REFERENCES
1. Omaljev V.A., Prospecting for Radioactive Rocks in Slovenia, Geologija-Razprave in poročila, Vol.14, p. 161-186,Ljubljana, 1971 (in Slovene).
2. Konda D., Radioactivity of the ground in the region of the former Kočevje coal mine, (in Slovene), internal report, USDP-7212/95, Ljubljana, May 1995 (in Slovene).
3. Humar M., Skvarč J., Ilič R., Križman M., Jeran Z., Šajn R., Indoor Radon Concentrations in Slovenia, internal reportUS DP-7164, Ljubljana, 1995 (in Slovene).
4. Križman M., Ilič R., Jeran Z., Skvarč J., A Survey of Indoor Concentrations in Dwellings in Slovenia, (paper presentedat this symposium).
5. Rönsch W., Przyborowski S., Ettenhuber E., Investigation and Evaluation of the Radiation Exposure Situation inUranium Mining Areas of Eastern Germany, Rad.Prot.Dos., Vol.45, No.1/4, pp. 127-132, Nucl.Technol.Publ., 1992.
PORTOROŽ 95 251

SESSION HI PROCEEDINGS
XA05C0066
STUDY ON DETERMINATION OF PLUTONIUM ISOTOPES IN SOILSFROM LUBLIN REGION (POLAND)
A. Komosa
Department of Radiochemistry and Colloid Chemistry, Maria Curie-Sklodowska University,PI.M.C.Sklodowskiej 3, 20-031 Lublin, Poland
INTRODUCTION
Plutonium isotopes were introduced to the environment mainly as a fallout from nuclear weapons testscarried out intensively in 1954 - 1963 and occasionally later. It was estimated that about 1.2-1016 Bq of239,240pu ancj about 8-10 l4Bqof 238Pu was spread in the atmosphere. Another source of plutoniumisotopes, which caused local contamination were liquid releases from nuclear facilities, fallout fromnuclear-powered satellites burnt up in the atmosphere, accidents of airplanes carrying nuclear missiles oraccidental releases such as from Chernobyl in 1986. The latter, which caused the most extensivecontamination, especially in Europe, introduced to the atmosphere about 2-1014 Bq of 239i240pu [1,2]. Mostof plutonium isotopes was spread in the stratosphere, from where it falls down continuously on the Earthsurface.
Region of Lublin (in eastern part of Poland) has not come yet within monitoring of soil contamination byalpha emitting isotopes like plutonium, while the large contaminations with Chernobyl originatedradioisotopes were observed [3].
In our Department we have taken up a study on determination of contamination level of soil by alphaemitting nuclides and, as a result of a cooperation with J.Stefan Institute in Ljubljana (Slovenia), we havedeveloped methods for plutonium isotopes separation.
MATERIALS AND METHODS
Soil samples were collected in October-November '93 and in March '94 according to the methodrecommended by IAEA [4] from a surface layer (0-2 cm) on open, flat, noncultivated areas. Localizationof these places are marked on the map in Fig. 1.
Fig. 1: Localization of soil sample collection places.
PORTOROŽ 95 252

SESSION m PROCEEDINGS
Different methods of plutonium separation from various matrix are known [5,6]. We have tested severalmethods and have chosen the procedure which consists of: dry ashing, leaching in 6M HC1 solution (afteraddition of M2Pu tracer), co-precipitation with metal hydroxide (adding ammonia to pH 8), next withcalcium oxalate, dry ashing of the precipitate and co-precipitation of transuranides with iron hydroxide afterdissolution in 8M HNO3.
Purification of plutonium isotopes was performed by anion exchange column with Dowex 1 x8 from 8MHNO3 solution, according to Holm and Ballestra [4]. After adsorption of Pu(III) on the column uraniumand thorium were removed with 8M HNO3 and concentrated HC1, and Pu(IV) was eluted with 0. IM NHJin concentrated HC1.
Finally, the source for alpha spectrometry measurements was prepared by electrodeposition on stainlesssteel plate from 0.4M ammonium oxalate in 0.3M HC1 solution, according to Puphal and Olsen [7].
Alpha activity of plutonium isotopes was measured using a Canberra Alpha Spectrometer Model 7401 witha System 100 MCA Master Board for PC, together with the software S100 and Alpha SpectroscopyPackage, which enable a calculation of plutonium contents. We use Partially Depleted PIPS detectorPD300-19-100AM with a resolution, measured using AMR.43 standard source (Amersham) equal to20 keV FWHM (at 239Pu 5.16 MeV peak). Background measured in the ^ 9 - 2 4 ^ peak region was about0.007 cpm. Calculated efficiency of the detector was 46.5 ± 2%. M2Pu standard solution produced by AEAFuel Services (U.K.) was used as a tracer for radiochemical yield monitor.
Minimum detectable amount (MDA) of plutonium isotopes was calculated according to Boecker [8]. In ourmeasurement conditions we have found that MDA for m 2 4 0Pu was 5 ± 2 mBq/kg and for 238Pu was 3 ± 1mBq/kg.
With the aim to ensure the analytical quality of the results obtained we have analyzed the IAEA ReferenceMaterial Soil-6. Using a Student's i-test we found that a difference between 239240Pu activity obtained (1.088± 0.093 Bq/kg) and a certified value (1.036 ± 0.074 Bq/kg) is statistically insignificant.
RESULTS
The results of Pu isotopes contents in soil samples from Lublin region are presented in Table 1.
No
la
lb
2
3
4
5
6
7
8
9
Mass[g]
108
108
103
108
125
104
103
104
104
104
239.240pu±lo
[Bq/kg]
0.218 ±0.011
0.076 ± 0.006
0.155 ±0.004
0.315 ±0.007
0.282 ± 0.006
0.161 ±0.005
0.142 ±0.006
0.154 ±0.007
0.232 ± 0.009
0.337 ±0.010
2 3 8Pu±lo[Bq/kg]
0.036 ± 0.004
0.010 ±0.003
0.008 ±0.001
0.016 ±0.001
0.023 ± 0.003
0.010 ±0.001
0.003 ± 0.001
0.026 ± 0.003
0.024 ± 0.003
0.024 ± 0.004
Yield[%]
13
14
55
60
52
58
34
25
18
49
S*[%]
35
26
4
4
11
7
0
30
15
8
239'240Pu fromChernobyl
[Bq/kg]
0.075
0.020
0.008
0.016
0.036
0.012
0
0.055
0.042
0.034
* fraction of Chernobyl 239'240Pu contents in total 239'240pu activity.
Table 1: Activity of plutonium isotopes in soil from Lublin region
PORTOROŽ 95 253

SESSION ni PROCEEDINGS
On the basis of our results we try, according to Reponen [9], to calculate a percent of plutonium activityoriginating from Chernobyl fallout in total plutonium activity (coefficient 5). The calculation wasperformed taking into account that the ratio of 238Pu to 2 3 9 ' 2 4 0 p u in global fallout is equal to 0.03 [9], and inChernobyl fallout 0.42 [10].
It is seen also that plutonium isotopes contents in soil samples does not vary in a big extend, independentlyof type of soil. Mean value of m 2 4 0 P u determined is 0.214 ± 0.079 Bq/kg and 238Pu 0.017 ± 0.024 Bq/kg.We have found poor correlation between plutonium activity in the samples and the organic matter contents,pH of soil and different elements contents in samples. The highest correlation coefficients are as follows:m 2 4 0 P u contents/percent of organic matter = 0.27; m 2 4 0 P u contents / 137Cs contents [11] = 0.32;239,24opu c o n t e n t s / C a c o n t e n t s = o.42; 2 3 9 ' 2 4 O p u contents / pH of soil = 0.22.
Typical alpha spectra of soil samples: No.lb and No.3 are presented in Fig.2.
3 0 n
2 0 ^
oo
sample 1bmass: 0.1088 kgPiotrowice WielkiePu-242: 0.0812 Bqdetermined:Pu-239.240: 0.076 Bq/kgPu-238: 0.10 Bq/kgefficiency: 13.8 56measuring time: 7000 min
10Ť
3 . 0 4 . 0 4.5 5.0 5.5 6.0 6.5 7.0Energy (MeV)
1 5 0 ^
100 t
3o
sample 3mass: 0.1079 kgPodgorz k/GoregoPu-242: 0.078 Bqdetermined:Pu-239,240: 0.315 Bq/kgPu-238: 0.016 Bq/kgefficiency: 59 %measuring time: 7000 min
3.0 3.5 4.0 4.5 5.0 5.5 6.0 6.5 7.0Energy (MeV)
Fig. 2: Typical alpha spectra of soil samples: No. lb and No.3.
REFERENCES
1. B.F.Myasoedov and F.I.Pavlotskaya - Analyst, 114(1989)255-263.2. G.Rosner - Mensch und Umwelt, 6 (1989) 15-18.3. A.Pietruszewski and R.Bojanowski - Proc.Int.Symp.Post-Chernobyl Environmental Radioactivity Studies in East
European Countries, Kazimierz, Poland 1990, 118-126.4. Measurement of Radionuclides in Food and the Environment. A Gidebook. IAEA Tech.Rep.Ser.No.295, Vienna 1989.5. EML Procedures Manual, 26th Edition, H.L.Volchok and G. de Planque (Eds.), U.S.Department of Energy, New York
1982.6. A.R.Byrne - Radiochemical Techniques and Suggested Procedures for Transuranides. IJS Report, Ljubljana 1980.7. K.W.Puphal and D.R.Olsen - Anal.Chem. 44 (1972) 284-289.8. B.Boecker at al. - Health Phys. 60 (1991) 45-100.9. A.Reponen at al. - J.Environ.Radioactivity 21 (1993) 119-130.10. K.Bunzl and W.Kracke - J.Radioanal.NuclearChem., Articles 138 (1990) 83-91.11. S. Chibowski and A. Mitura - Studies of the rate of migration of radiocesium in some types of soil of Eastern Poland.
Sei. Total Environ. (1995).
PORTOROŽ 95 254

SESSION III PROCEEDINGS
XA05C0067
STUDIES OF THE PRESENCE OF GAMMA EMITTERS IN THE NATURALENVIRONMENT OF EASTERN POLAND
S. Chibowski, J. Szczypa, J. Zygmunt
Department of Radiochemistry and Colloid Chemistry, Faculty of Chemistry,Maria Curie Sklodowska University, M. Curie-Sklodowska Sq. 3, 20-031 Lublin, Poland
INTRODUCTION
Radioactive pollution of natural environment is produced by continual fall out of dusts and aerosolscontaining radioactive isotopes. These isotopes come to atmosphere as a result of coal combustion, nuclearexplosions and nuclear incidents.[1,2] The level of contamination is increased by activity of man, who
. employs isotopes in industry, agriculture, science and medicine. Traditional power industry, based on coalfuel, is a source of uranium and thorium series. So, all in all, contamination of territory is a sum of all aboveelements.
THE STUDY AND SAMPLING AREA
The examined area was limited from north, east and south by Polish border and from west by the line ofWisloka, San and Wisla rivers to Deblin city than Siedlce, Ostrofeka, Ketrzyn cities up to the north border.On this whole territory 334 samples of surface layer of the soil were taken in points of 15 km network.Samples were taken according to procedure recommended by IAEA.[3]
Soil sample was sieved through 1 mm sieve, dried than placed in Marinelli type container to measure theamount of natural and artificial gamma emitters. Silená gamma spectrometer with germanium IGC-13Princeton Gamma Tech. (GPT) detector and 4096 canal analyzer was used.
Resolution of the detector was 1,75 keV for 1.33MeV peak (60Co) and its capacity was equal to 15%.SIMCAS n version 4.11 software by Silená was applied to compute the data. All figures were plotted bySurfer program.
RESULTS AND DISCUSSION
Total radioactivity level of soil from examined territory is formed by natural isotopes results from the decayof 2 3 8U,2 3 5U,2 3 2Th series and 40K, as well as, by artificial radionuclides such as ' "Cs.^Cs^Sr originatedfrom economic and military activity of man.
Total ActivityActivity oř C«-137. Ca-134 Bq/m2.
5*.o
a ^ 5 1 ^
Fig. 1: Total y-radioactivity of soil samplesin the studied area.
Fig. 2: Contamination of the soil samples in theStudied area with radiocesium.
PORTOROŽ 95 255

SESSION in PROCEEDINGS
Results of measurements of natural and artificial isotope concentration in surface layer of the soil (0-10 cm)are presented in Table I, and Figs 1 and 2. Table I presents total, 40K, and 137Cs,134Cs activities for several,selected from 334 points, where a soil and plant samples were taken.
Samplepoint
number
2
5
12
22
60
98
121
135
146
164
200
203
218
239
278
312
317
334
Activity [Bq/kg]
total
1023
624
467
700
686
428
723
351
800
468
366
971
450
814
187
772
434
1178
K-40
725
407
374
552
482
327
505
212
443
225
219
589
234
509
132
437
296
729
Cs-134
0.7
5.0
0.3
1.3
2.6
0.2
2.3
2.2
. 11.7
3.9
4.3
2.3
1.5
0.6
0.7
1.0
0.2
0.7
Cs-137
12.4
71.9
4.2
21.4
48.3
5.4
43.5
67.1
124.7
67.1
55.0
43.0
25.0
13.0
16.3
25.3
1.30
12.9
Cs(134+137)surfaceactivity[Bq/m2]
812
4690
307
1319
2682
383
2482
4429
8716
2719
4430
2441
1391
794
1258
1252
90
713
K40activity
participation[%]
70.9
65.3
80.0
79.0
70.2
76.4
69.8
60.3
55.4
48.0
59.8
60.7
52.0
62.6
70.0
56.6
68.2
61.9
Csl34+Csl37activity
participation[%]
r 1.312.3
4.0
3.2
7.4
1.3
6.3
19.1
17.1
15.2
16.2
4.7
5.9
1.6
9.0
3.4
0.3
1.2
Table I: Gamma-ray activity of soil samples from Eastern Poland region.
The concentration of natural radioisotopes in examined soil ranges 200-1200 Bq/kg of the soil. It dependson geochemical processes that lead to formation of mother rock from which the soils are formed mineralscontained in these rocks, as well as, the soil forming processes related to pH of the soil, dissolution andwashing out the components of the soil by the soil solution.[4]
The amount of natural radionuclides is changing in a surface layer, because of fall out from atmosphere andadsorption processes. The main reason for the fall out is industrial emission to atmosphere from fossil fuelscombustion and accumulation on the surface, wastes from various mines. Dusts from coal combustion cancontain even 1500Bq/kg of different radioactive elements. [5] Because of that, in industrial area theobserved radioactivity from natural isotopes, in surface layer of the soil was higher.
As can be seen from the data, the amount of 40K makes a majority i.e. 50-80% of the whole radioactivityof the samples.
Some natural isotopes of uranium and thorium series (214Bi, 226Ra, 234Th, 228Ac, 212Bi, 212Pb, 224Ra, 228Th,208Tl) produce 17-39% of the total radioactivity.
Another factor, having influence on the total activity of the soil is the presence of artificial radioisotopesl34Cs, '"Cs.^Sr, results from nuclear explosions and nuclear plants incidents.
Exemplary amounts of 134Cs and 137Cs refers to 1993 are presented in Table I and Fig 2.
As can be seen from these data, the contamination of surface layer of the examined soil by these elementsis 1-19% of the total radioactivity.
PORTOROŽ 95 256

SESSION ni PROCEEDINGS
The most important factor, having influence on the isotope distribution in the upper layer of the soil, isquality of the soil. [6]
The migration rate of cesium in the soil depends on mineral composition. The greatest vertical rate forexamined samples ranged from 1,0 cm/year for brown soil turned into podsoil to 3,13 cm/year for mediumand fine sands. The average migration rate was 0,38-0,43 cm/year respectively.The greatest and averagemigration rates refers to cesium from Czernobyl fall out.
Cesium from world fall out revealed lower migration rate and ranged 0,78 -1 cm/year maximum and 0,31-0,14 cm/year average for the same soil [7].
The contribution of cesium from Czernobyl and world fall out in soil was established by decay law andl34Cs to 137Cs ratio in Czernobyl break-down. According to literature )34Cs/'37Cs on 6.05.1986 was 0,528[8].
Obtained results lead to a conclusions that Czernobyl originate 137Cs, for the most examined soils, waslocated in upper, few centimeter layer of the soil and its share in total contamination of these layer bycesium was about 77%.
Additionally to estimate the level of radioactive pollution of Eastern Poland the measurements of grassradioactivity were taken from the same points. The summary activity of grass varied from 15 to 1375 Bq/kgof the dry sample. As was analyzed on the spectrometer, following isotopes form the radioactivity 40K,212Pb, 2I4Pb, 226Ra, 134Cs, l37Cs. Lead and radium isotopes were very scattered and their activity didn't exceedone percent. Prevailing isotope in the grass samples was ^K, which average activity come up to 85% of thetotal activity of the sample. The activity of the grass arises from 137Cs ranged from 1 to 172 Bq/kg of thedry sample and depends markedly on the kind of the soil the sample was taken and potassium contents init. Similar dependence for 137Cs was not observed i.e. the radioactivity of the grass sample was independentfrom 137Cs content in the soil.
This conclusion follows from the analysis of the values of cesium transfer factor (TF) from soil to grassfor 137Cs calculated for different sampling points.
This coefficient is defined as:
„ „ _ Cs activity in grass (Bq/kg)
Cs activity in soil (Bq/kg)
#
1
2
3
4
5
6
7
8
9
10
11
Gammaemitter
Ra-226
Pb-212
Pb-214
Be-7
TI-208
Cs-134
Bi-214
Cs-137
Bi-212
Ac-228
K-40
Total gammaactivity of air
[MBq/m3]
Month's average gamma activity of the ground layer of atmosphere [nB/m3]
01.94
<6.2
32.5
0.85
1360.8
11.8
<0.4
1.3
0.9
37.5
<1.5
19.0
1472.8
02.94
<6.3
22.15
1.0
1453.8
6.4
<0.4
0.9
3.4
20.3
<1.9
14.0
1530.6
03.94
<7.2
26.3
0.9
1299.0
13.1
<0.4
0.9
1.2
45.0
<1.23
14
1409.2
04.94
<6.8
171.5
1.0
1698.2
61.4
<0.4
1.1
1.6
209.7
<1.5
24.2
2177.4
05.94
<10.4
280.1
1.6
2289.0
119.7
<0.4
2.5
1.6
393.0
<2.2
13.0
3113.5
06.94
<6.9
197.3
1.0
2099.8
70.2
<0.34
0.9
0.9
241.2
<1.6
14.0
2634.1
07.94
<10.2
244.9
1.3
2741.8
127.4
<0.4
1.4
2.7
302.7
6.1
18.7
3456.8
08.04
<8.1
168.0
1.3
2469.9
60.6
<0.4
1.3
2.5
204.4
<1.8
21.5
2939.8
09.94
<6.9
205.1
7.5
2470.6
81.4
<0.4
2.0
1.9
271.7
2.2
26.0
3075.7
10.94
<6.6
109.9
1.1
1712.6
34.7
<0.4
1.2
2.0
132.8
1.6
19.4
2022.3
11.94
<6.6
78.13
<0.49
1707.
28.37
<0.4
<1.0
1.9
94.57
<1.8
22.94
1943.2
12.94
<6.6
30.88
<1.31
11.64
11.35
<0.4
1.88
1.11
38.36
<1.84
18.75
1276.4
Table II: Total gamma activity in the ground layer of atmosphere in Lublin region and contributions ofparticular gamma emitters (month's averages).
PORTOROŽ 95 257

SESSION m PROCEEDINGS
Calculated values range from 0,03 to 21 and for the most samples TF for 137Cs decreases while TF for 4 0Kincreases.
The measurement of radioactivity level in the ground layer of the air is necessary to obtain entire view ofradioactive contamination of the natural environment. Such studies have been carried out using a highsensitive, flow type, early radioactivity warning station ASS-500 (aerosol sampling station). Air activitymeasurements from 1994 are demonstrated in Table II. where a mean values of the week longmeasurements are presented. The level of the air radioactivity in 1994 was rather weak and ranges froml,2to3,4mBq/m3
Results presented in this paper suggest that during 1994 no particular radioactive fall out was noticed onthe East Poland territory.
REFERENCES
1. M. Siemiňski - Fizyka zagrožeň árodowiska, Wydawnictwo Naukowe PWN, Warszawa 1994.2. Sources Effects and Risks of Ionizing Radiation UN SCE AR Report to UN General Assembly, United Nations New
York 1988.3. Measurement Radionuclides in Food and the Environment - Technical Reports, Series No 295, IAEA, Vienna 1989,
5,27.4. G.H.Bolt (Ed.), Soil Chemistry, B. Physico Chemical Models, Elsevier, New York, 1982.5. Z. Kozak, L. Pawtowski, J.Szczypa (Eds), Chemiczne zagroženie šrodowiska w Polsce, Maria Curie-Sklodowska
University, Lublin, Poland, 1987.6. K. Bunzl, H. Förster, W Kracke, W. Schimmack, - J. Environ. Radioactivity 22, 11-27,1994.7. S. Chibowski, A. Mitura, Sei. Total Environ. 170,193-198,1995.8. G. Kirchner, D. Baumgartner, Analyst, 117, 475-479, 1992.
PORTOROŽ 95 258

SESSION ID PROCEEDINGS
XA05C0068
NATURAL AND ARTIFICIAL RADIONUCLIDES IN LICHENSAS AIR POLLUTION MONITORS
Z. Jeran ", R. Jačimovič l\ F. Batič2), A. Prosenc1}
l) Jozef Stefan Institute, Jamova 39, 61111 Ljubljana, Slovenia2> Biotechnical Faculty, Department of Agronomy, Jamnikarjeva 101, 61111 Ljubljana, Slovenia
ABSTRACT
In 1992 a national biomonitoring programme was initiated covering the whole territory of Slovenia to measurethe levels of some natural (2WPb, 40K, U, Th) and artificial (l37Cs, 134Cs) radionuclides in the epiphytic lichenHypogymnia physodes L. (Nyl.) in order to obtain information on their levels in the environment.210Pb, ^K, m-'37Cs were determined by direct counting of dry samples using gamma spectrometry, while U andTh were determined by the k0-standardisation method of instrumental neutron activation analysis (INAA).
The results are presented as geographical isocontours of radionuclide activity on a national scale.
INTRODUCTION
Lichens were early demonstrated to retain appreciable amounts of various radionuclides which aredeposited from the air. Their remarkable accumulative capacity for pollutants is based on their intrinsicbiology as they lack roots and protective organs, such as stomata and cuticle, against the substances derivedfrom the atmosphere. The uptake of fallout by lichen is rapid and non-selective, also allowing theimmediate determination of short-lived isotopes(1). Investigations using lichens to obtain information aboutthe levels of the long-lived natural (210Pb) and anthropogenic ( l 3 7Cs, w Sr,2 3 9 Pu) radionuclides in theenvironment were very extensive in subarctic ecosystems since the 1960s when atmospheric nuclear bombtesting was common, and where fallout contributed significantly to the radiation burden of people livingon reindeer meet as a result of the lichen-reindeer-man food chain(2). Studies using lichens as biomonitorsfor radionuclide contamination were expanded again in many countries in Europe and also in Canada afterthe Chernobyl accident in 1986(3"7).
The objectives of the present paper are to present the results of our biomonitoring programme using theepiphytic lichen Hypogymnia physodes, and to demonstrate the applicability of lichens for monitoring thedeposition of natural and anthropogenic radionuclides to obtain information about natural radioactivity inSlovenia and also about the degree of radioactive pollution occurring after the Chernobyl accident.
MATERIALS AND METHODS
SamplingHypogymnia physodes L.(Nyl.), an epiphytic lichen, was collected in the period from September toNovember 1992 at a regular 16 x 16 km bioindication grid covering the whole territory of Slovenia. Thesampling sites were located on open habitats or in forest glades, at least 300 m away from main roads andat least 100-200 m away from any road or dwelling. Each individual sample was composed of severalhealthy lichen thalii of different sizes which were taken from the same tree and likewise from 3-5 nearbytrees. The sampling positions were 1.5 - 2 m above ground, and where possible the lichen material wastaken from all around the tree to reduce the influence of relative source position.
Sample preparationIn the laboratory lichens were not washed, but only moistened with distilled water to allow the adheringbark particles to be easily removed from the lichen. The lichens were dried at 30° C to constant weight. Drysamples were embrittled by immersion in liquid nitrogen and then crushed and ground in a zirconia mortarwith a ZrO2 ball in a Fritch vibration micro-pulverizer.
PORTOROŽ 95 259

SESSION HI PROCEEDINGS
Sample analysisFor direct gamma spectrometry of natural (2l0Pb, 40K) and artificial (134>137Cs) radionuclides 2 - 5 grams ofdry, powdered lichen material were weighed into 10 ml plastic containers. A Ge well-type detector withthe active volume of 230 cm3 and the resolution 2.5 keV at the 1332 y line of ^Co, connected to a Canberra80 series multichannel analyser was used for analysis. The counting time of each sample varied between1 2 - 3 0 hours in order to achieve a statistical counting error of below 10 - 15 % for the lowestaccumulated photopeak. The 210Pb activity was measured at 46.5 kev, the 40K activity at 1460.8 keV.137Cs was determined from the peak area at 661 keV, but the activity of 134Cs was measured at 604.4 and795.8 keV and calculated as a weighted mean of both peaks. The activity of both caesium isotopes wascorrected for physical decay (T1/2(
134Cs) = 2.1 y; T1/2(137Cs) = 30 y) and expressed as activity in Bq g"1 on
2ndMay, 1986.
For efficiency calibration of the Ge well-type detector for the gamma rays associated with each of theradionuclides, different calibration standards were used as follows: a) IAEA -152 Milk powder for ""K, and134' 137Cs, b) a 210Pb standard prepared from a normal grade Whatman cellulose powder as matrix and spikedas a slurry with a known solution of 5.8 Bq 210Pb g"1. The density of all standards and their geometry wasequivalent to that for lichens.
The U and Th content was determined using kg-INAA(8'9). Pressed lichen tablets were irradiated togetherwith an Al- 0.1 % Au alloy wire and a Zr foil, serving as comparator and fluence monitor, respectively, for20 hours in the TRIGA Mark II reactor of the J. Stefan Institute, at a thermal neutron fluence rate of 1.1x 10¹⁶ m2 š' . Gamma spectrometric measurements were carried out with calibrated HPGe detectorsconnected to a Canberra 90 multichannel analyser(9ll0).
RESULTS AND DISCUSSION
Table 1 summarises the results for 210Pb, 40K, U, Th and 134J37Cs in Hypogymnia physodes expressed asmaximum, minimum and average levels and their standard deviation as obtained from analysis of 85samples from the 16 x 16 km bioindication grid of Slovenia. In the last column of the table the coefficientof variation is presented.
Radionuclide
210pb
4 0 K
I34Cs137Cs
U
Th
N
85
85
85
85
86
86
min
57
65
107
225
0.04
0.11
max
1898
292
5700
10554
0.31
0.82
mean
594
145
865
1746
0.12
0.29
std
413
44
837
1599
0.06
0.15
CV (%)
69.5
30.3
96.8
91.6
47.4
52.1
CV coefficient of variance (%).
Table 1: Levels of 210Pb, 40K, 134Cs, 137Cs (mBq g 1 dry weight) and U, Th (ug g1) in H. physodes, collectedin 1992 from regular grid of Slovenia.
Each of the radionuclides analysed has its own geographical distribution pattern as a consequence of itsorigin (Fig. 1). 210Pb is a long lived radionuclide produced in the atmosphere by radioactive decay of itsgaseous parent 222Rn. 40K, U and Th are natural radionuclides contained in the lithosphere, butl37+134 Cswere released to the atmosphere during the Chernobyl accident and in earlier atmospheric nuclear tests.
As can be seen from Table 1, the activity level of 40K, expressed in m B q g is the lowest amongradionuclides analysed (the range between 65 - 290 mBq g"1), and in agreement with literature values fordifferent lichen species collected in Austria(ll>. Its low coefficient of variance suggest that there is no greatdifference in "^K levels in lichens collected at different locations; however, somewhat elevated levels werefound in NW and W parts and at some locations in the east of Slovenia.
PORTOROŽ 95 260

SESSION III PROCEEDINGS
a)
Pb-210
Fig.l: The geographical activity patterens of a) 210Pb and b) 137Cs, obtained from lichen data, divided into 7classes according to percentile values (10, 30, 50, 70, 90, 95 %) and mapped using the Surferprogramme.
The mean value of 2 1 0Pb was about 600 mBq g"1 and comparable with some literature valueá1 '1 2 1 5 ). Thehighest activity levels up to 1900 mBq g'! (Fig. la) were found in lichens collected in the southern, Dinaricregion and in the NW parts of Slovenia. Elevated levels in the Dinaric region coincides with naturallyelevated levels of uranium (precursor of 2 l 0Pb) in soil(16) and with the structure of the terrain (caves andother karst formations). The high concentration of 210Pb in lichens in the NW part coincides with the regionsof Slovenia receiving the highest amounts of precipitation. Therefore the explanation for elevated levelsof 2 l 0Pb in NW parts could be that its patterns in this region reflect the movement of global air masses andincreased washout or rainout of this radionuclide from the atmosphere.
The U and Th levels in lichens were low, as expected, with a mean value of 0.12 and 0.29 ug g"1,respectively. Both radionuclides are soil or crust derived and are distributed in the atmosphere byresuspension of soil particles. They are than delivered to the lichens as wet or dry deposition. This isconfirmed by the geographical distributions of these two radionuclides in lichens, which are very similarto the distribution of these radionuclides in soil(16).
The highest activity of both Cs-isotopes were found in samples from the north and north-west parts ofSlovenia (Fig.lž»), which are known to have received the highest amounts of precipitation during the periodfollowing the Chernobyl accident. The lichen 137Cs map is also in agreement with the results of the modelprediction of ground contamination by 137>134Cs which was constructed using precipitation data in the periodbetween April, 30 and May, 9 for 300 locations all over Slovenia, and the results of radioactivity inprecipitation at the sampling point in Ljubljana(17).
REFERENCES
1. Ellis, K.M., Smith, J.N. (1987). J.Environ. Radioactivity 5 185-208.2. James, P.W. (1973). In: Air Pollution and Lichens, (ed. Ferry, B.W., Baddeley, M.S., Hawksworth, D.L.) The Athlone
Press, 143T175.3. Hofmann, W., Attarpour, N., Lettner, H., Turk, R. (1993). Health Phys. 64, 1 70-73.4. Seaward, M.R.D., Heslop, J.A., Green, D., Byliriska, E.A. (1988). J. Environ. Radioactivity 7 123-129.5. Sawidis, T. (1988). Environmental Pollution 50 317-324.6. Sloof, J.E., Wolterbeek, H.Th. (1992). / Environ. Radioactivity 16 229-242.7. Smith, J.N., Ellis, K.M. (1990) J. Environ. Radioactivity 11 151-168.8. Simonits, A., De Corte, F., Hoste, J. J. (1975) Radioanal. Chem 24 31-46.9. Smodiš, B. (1992). Vesln. Slov. Keni. Drus. 39 (4) 503-519.10. Smodiš, B., Jačimovič, R., Stegnar, P., Jovanovič, S. (1992). J. Radioanal. Nucl. Chem., Articles 160 (1) 101-108.11. Eckl, P., Hofmann, W., Turk, R. (1986). Radial. Environ. Biophys. 25 43-54.12. Holtzman, R.B. Nature (London) 210 (1966) 1094-1097.13. Sheard, J.W. (1986). Can. J. Bot. 64 2446-2452.14. Pettersson, H.B.L., Hallstadius, L., Hedvall, R., Holm, E. (1988). J. Environ. Radioactivity 6 25-40.15. Thomas, P.A., Sheard, J.W., Swanson, S. (1994). Health Phys. 66 (6) 666-677.16. Andjelov, M. (1993). Geologija 36 , Ljubljana 1994, 223-248.17. Urbančič, J., Jeran, Z. (1988). Proceeding of the EURASAP Conference on Evaluation of Atmospheric Dispersion
Models after Chernobyl, Vienna, November 1988, 159-165.
PORTOROŽ 95 261

SESSION III PROCEEDINGS
XA05C0069
ENVIRONMENTAL RADIOACTIVITY DUE TO FLY-ASH DISPOSALRESULTS OF A MONITORING PROGRAMME
L.Mljač ° and M.Križman2)
" ERICo, Velenje, Slovenia2) Jozef Stefan Institute, Jamova 39, Ljubljana, Slovenia
ABSTRACT
Environmental radiation monitoring has been performed in recent years in the surroundings of the fly ashdisposal of the biggest coal-fired power plant in Slovenia. The results presented show very local radiologicalimpact due to radioactivity present in fly ash, and the main impact is observed in surface water contamination.
INTRODUCTION
The Šoštanj coal-fired power plant (750 MWel) has been in operation for more than 20 years and currentlyproduces almost a million tonnes of coal ash per year. Fly ash with a U content of 25-30 mg/kg istransported as a slurry to the disposal site of an area of 0.50 km2. The coal fly ash depositiry is located onthe edge of Lake Velenje. The landfill area includes wet ponds and the dry part of the disposal site, ispartly covered with a soil layer and recultivated.
Radioactive materials from the ash disposal site at Velenje are dispersed into the environment andtransferred through various pathways, leading to external and internal human exposure. A short termsurveillance programme was already conducted in last two years to investigate these routes.
The programme covered radioactivity in air (long lived radioactivity in dust particles, radon and its shortlived progeny), in lake and river water (U, 226Ra), in water sediments (U, 226Ra, 2 l 0Pb, n*Th, ^K), radio-nuclide content in deposited materials and in soil, external radiation, and radon exhalation rate. Samplingpoints were chosen on the depository and in the nearby surroundings.
EXPERIMENTAL
The concentrations of long lived radionuclides in dust particles were estimated via mass concentrations inair supposing that all the dust originated from fly ash. Radon concentrations outdoors were measured byCR-39 solid state nuclear track detectors (long term concentrations) and with charcoal adsorbers (for shortperiods). Radon exhalation rates from the ground were also determined by charcoal adsorbers. Radondaughter concentrations were measured by a continuous sampler with an alpha spectrometer (EDA, WLM-30).
Water samples and bottom sediments of Lake Velenje and the river Paka were analyzed. Sampling pointswere selected at reasonable intervals along the main recipient watercourse, including points above andbelow the inflow of efluent water from the lake. Grab water samples were taken at different depths of thelake and in the middle of the stream. Radiochemical methods were used for analyzing water radioactivity:for uranium neutron activation analysis and for radium a sorption-emanation method. The sediments werecollected by sediment traps and by grab sampling. The specific activity of radioisotopes in solid sampleswas determined by gamma spectrometry with a Ge detector (Canberra, 25 %, 1.8 keV).
The contents of natural radionuclides in soil and in deposited fly ash were also determined by gammaspectrometry. Gamma dose rate was surveyed over the whole disposal site and its surroundings using ascintillation counter with a plastic crystal ( 0 5x5 cm).
RESULTS AND DISCUSSION
Airborne radioactivity originates mainly from the dry uncovered surfaces of the disposal site: the
PORTOROŽ 95 262

SESSION DI PROCEEDINGS
important pathways are inhalation of dust particles with long-lived radioactivity, and inhalation of radonwith its short-lived progeny. Occasionally high concentrations of air dust particles due to wind erosionof bare areas were observed at moderately distant locations. The annual average air mass concentrationwas 27 ug/m3 on the depository, and 31 ug/m3 in the prevailing wind direction (Škále), which means onaverage about 10 uBq/m3 of 238U and 226Ra. Superficial radioactive contamination of grass was alsotaken into account and measurements are still in progress.
LuCiltMUS
fly-ash disposal
surroundings
\uHlheTllfmi a\urrmilnh
23
28
Xnthnu'tic imaniliij.'m'i
9.4 ± 4.5
10.1 ±3.4
Mediantllq/m'i
9.5
9.5
tn'iiinciuv mi ani /<•/ m !
8.5
9.6
Table 1: Concentrations of radon 222Rn over the fly-ash disposal and its surroundings.
Date: 11.-18.08. 1995
Fig. I: Concentrations of radon daughters on the fly-ash depository.
The average concentrations of radon and its daughters over the landfill were very similar to those in itsnearby vicinity. There is no significant difference between the two average values, namely 9.4 Bq/m3 wasmeasured on site in the period 1991-95 and 10.1 Bq/m3 off site in the same period (see Table 1). Thereason for this is the very low exhalation rate from deposited fly-ash (on average 5-14 mBq/m2.s on fly-ashand 20 - 60 mBq/m2.s on soil). Attention was focused on short term measurements of radon progeny,preferably in very stable weather condititions (see Fig. 1): equilibrium-equivalent radon concentration(EEC) maxima could reach up to 20 Bq/m3 on site and at distant points.
Leaching of radionuclides by lake and rain water and pile drainage water are the main sources ofradioactive contamination of the lake, its outflowing waters and sediments. The high alkalinity of lake
PORTOROŽ 95 263

SESSION HI PROCEEDINGS
water due to the presence of fly ash (the pH was 11-12) strongly influences the solubility and therefore theradionuclide concentrations: a very low concentration of uranium (0.02 mg/m3) was measured, whileradium (226Ra) was present in concentrations (up to 70 Bq/m3) which are an order of magnitude higher thanin other uncontaminated waters (Fig. 2). River water and sediments also showed increased radioactivityeven at longer distances from the discharge points: the content of radium in sediments is twice as high asin unpolluted water, while radium in the river Paka remains enhanced 3-4 times along the rest of itswatercourse.
CONCENTRATIONS OF URANIUM IN WATER
3 * 5 6 7Sampling points
10
CONCENTRATIONS OF Ra-226 IN WATER
40
5 6 7 íSampling points
10
Fig. 2: Radioactivity in water along the watercourse of the river Paka. Sampling point No. 3 belongs to theoutflow from the polluted lake.
Results showed enhanced gamma radiation: dose-rate levels are significantly higher, mainly within thearea of the uncovered deposited material (0.19 -0.24 uGy/h) compared to background levels (0.09 - 0.13jiGy/h).
CONCLUSIONS
The radiological impact to the environment is obviously limited mainly to the close vicinity of the fly ashdisposal. Only in the case of dissolved or suspended radioactivty are enhanced concentrations measurable,not only in the lake but up to ten kilometres downstream from the discharge point. Based on all theseresults, an extended programme will be carried out next year to ensure a more complex evaluation of theenvironmental impact.
The future programme will also include radioactivity measurements of local precipitation, continuousmeasurements of radon and its daughters over a year, and extended measurements of radon exhalation ratesfrom the disposal site and the surrounding area. It will ensure the present state of radioactive contaminationon the site and its environment is precisely defined and later, to assess possible positive effects ofremediation measures and restoration of the site.
REFERENCES
1. Kobal L, Vaupotič J., Mitic D., Kristan J., Ančik M., Jerančič S., Škofljanec M. Natural Radioactivity of Fresh Watersin Slovenia, Yugoslavia; Environmental International, Vol.16, pp.141-154, 1990.
2. Stropnik B., Byrne A. R., Smodiš B., Jačimovič R., Air Pollution Monitoring in the Šálek Valley, Part 2: ElementalComposition of Size-Fractionated Lignite Coal-Combustion Particles during Šoštanj TPP Operation, Acta ChimicaSlovenica, 41/1, pp. 65-82,1994.
3. Mljač L., Križman M. Radioactive contamination of surface waters from a fly-ash depository at Like Velenje(Slovenia). Paper presented on International Symposium on the Natural Radiation Environment (NRE VI), Monteral,Quebec, Canada, June 1995.
4. Beneš P, The Environmental Behaviour of Radium in (Continental) Surface Water, Vol. 1, International Atomic EnergyAgency, Vienna, 1990.
PORTOROŽ 95 264

XA05C0070
RADIATION WARNING SYSTEM IN SLOVENIA (ROSS)
S. Arh
Slovenian Nuclear Safety Administration, Vojkova 59, 61 000 Ljubljana, Slovenia
INTRODUCTION
Recognizing that a radiological accident may have a widespread effect, the Slovenian government hasdecided to establish an early warning system. The aim of it is to detect any incident (domestic or foreign)involving radioactivity as fast as possible, to initiate appropriate measures, and to give immediate warningto the population.
RADIOLOGICAL EARLY WARNING SYSTEM OF SLOVENIA (ROSS)
The primary objective of the project is to establish a reliable system that can monitor the radioactivity inthe environment. Local stations are on-line connected to the central computer, where the measured data arecollected and processed. From there, they are provided to the government authorities and to the publicinformation system. In case of an abnormal situation (accident) it would automatically and immediatelywarn the emergency centre of Slovenia and competent authorities.
The radiological early warning system of Slovenia is consisted of three subnetworks:
- Krško NPP Ecological Information System (EIS NEK)Radiological Alarm Monitoring System (RAMS)Radiological Early Warning System (ROS)
Only EIS NEK is completed, other two are in construction.
KRŠKO NPP ECOLOGICAL INFORMATION SYSTEM (EIS NEK)
EIS NEK(1) is designed to monitor the environment impact of the nuclear power plant and to provide theadequate statistical and emergency data on radiological pollution. It was established in 1987 after theChernobyl accident. In 1995 it was upgraded and renewed. It consists of 3 automatic meteorologicalstations and 14 continuous dose rate measuring stations in the vicinity of Krško NPP. The hydrologicalstation on the Sava river is included too. Data are collected automatically on every half an hour. Softwarewas developed by Slovenian producer AMES.
Gamma dose rate is measured by Multifunctional Gamma Monitor MFM-202, AMES<2). It is a portableinstrument with two energy compensated GM probes of different ranges (from 50 nSv/h to 100 mSv/h).A microprocessor controlled digital instrument is equipped with a double line digital-analog LCD and asmall printer. It autonomously displays, processes and prints out all information and trigger alarm on theplace. At the same time it sends the data to the central unit of the network. Those sensors have a facilityfor automatic call the centre if a defined threshold is reached.
All probes are installed 1.25 m high above ground in the open air, usually on meadows, far from trees andbuildings.
RADIOLOGICAL ALARM MONITORING SYSTEM (RAMS)
RAMS is designed for radiation monitoring after accident in a nuclear facility as a redundant system. Itwould help Slovenian Nuclear Safety Administration (SNSA) at evaluation and decision making duringaccident situations even if other systems break down. It will comprehend 10 continuous dose ratemeasuring stations in the vicinity of the nuclear facilities and at the places where potential radioactivecontamination exists. The stations will be connected on-line to the two central data collecting computers.Besides radioactivity, meteorological data will be collected on every half an hour.
PORTOROŽ 95 265

SESSION III PROCEEDINGS
•PORTOROŽ
Fig. 1.: ROS gamma monitors on meteorological stations. Sign o marks stations in operation.
The four stations in the vicinity of Krško NPP are a part of EIS NEK and are planned to be a part of RAMS.The planed locations for other six stations are: research reactor, former uranium mine, and cities Ljubljana,Murska Sobota and Nova Gorica.
The later six stations will be equipped with intelligent radiation detection probe RD-02, ALNOR(3). ProbeRD-02 has two GM tubes of different ranges (from natural background to 10 Sv/h). ALNOR AreaRadiation Monitoring System AAM-95 with three probes RD-02 is in testing stage. The PC-program AAM-95 calls probes, stores the measurement data, shows radiation levels and trends, and triggers preset alarms.The user may alter programme parameters if needed.
The main role of RAMS would be to provide the SNSA with the data in all situations, also during the blackout of electricity network or troubles in telephone lines. The main difference compared to ROS would bein high priority for maintenance and they would have different redundant connections with the centralcomputers (leased telephone lines, radio lines, mobile telephone lines or satellite communications).
RADIOLOGICAL EARLY WARNING SYSTEM (ROS)
ROS is designed for continuous radiation monitoring all over Slovenia. It will consist of 21 continuousdose rate measuring stations which will be located at the existing meteorological stations. Places areshowed on the map in Fig. 1. Advantage of this solution is that indication of possible correlations (seeFig. 2) between local dose rates and meteorological parameters become available and the meteorologicalnetwork could be used for transmission of the data. Also two automatic stations for continuous measuringthe concentration of radioactive aerosols will be included (Krško and Ljubljana). Data will be automaticallycollected on every half an hour through the public switched telephone network at the central computer atthe Hydrometeorological Institute, Ljubljana. The appropriate software is being developed at the Institute
ROS programme started in 1991. At the moment there are independent gamma monitors (MFM-202) on11 meteorological stations operating in automatic mode providing data and on-site triggering alarms. Dataare locally numerically and graphically recorded on a small printer and manually collected atHydrometeorological Institute, Ljubljana, once a day by phone call to the sites. On two stations in Ljubljanaa data-transmission network is tested at present. Eight stations are planed to be connected on-line to thecentral data collecting computer at the beginning of 1996.
PORTOROŽ 95 266

SESSION in PROCEEDINGS
a.
9 10 11 12 13 14 15 16 17 18 19 20 21 22 23 0 1 2 3i Š é 728.08.96 03:25
b.•
. --SS--
- . 5 - - -
~ «
35
. 3—--JJ--
~~.S...
~ ' • * J
— ,
_ 0.51 b p
v>g -
/
j precipitation
•t]- ] • - * • -\k-tJfe-
y
A\V/A
M
! J "
V
\' v.
^—•—•—r1
A 1^ ^
\ !radioactivity
00:30atx«30
Fig. 2: The dose rate rise caused by precipitationa. detected by RD-02,b. detected by MFM-202.
DATA DISTRIBUTION
All data of the subsystems would be collected on two computers at SNSA where they would be checked,analysed, processed, stored, interpreted and presented to the users in the requested form. Software isdeveloped by AMES. Data users asAdministration for Civil Protection and Disaster Relief, HealthInspectorate, will be directly connected to the computers at SNSA through telephone lines. A part of thedata would be published daily in TELETEX (Slovenian TV).
The ROSS system will be compatible with early warning systems in the neighbouring countries and theexchanging of the data is planed.
CONCLUSION
The radiological early warning system of Slovenia is consisted of three subnetworks: EIS NEK, RAMS andROS. The subsistems are in different stages of development and testing. The ROSS system is planed to becompleted in five years.
REFERENCES1. Kováč A., Breznik B.: Krško NPP Ecological Information System, in this Proceedings.2. AMES. Multifunctional Gamma Monitor MFM-202. Leaflet.3. ALNOR, Rados Technology: Area Radiation Monitoring System Software AAM-95, User's guide.
PORTOROŽ 95 267

SESSION III lHHHHlllllllllllllllllllllllllllli1111111'111 PROCEEDINGSX A 0 5 C 0 0 7 1
1 3 7 Cs I N N O R T H E R E N A D R I A T I C S E D I M E N T S
D. Barišié '>, S. Lulič ", N. Vdovič ", A. Vertačnik », M. Juračič 2 )
1 Center forMarine Research - Department Zagreb, "Ruder Boskovic" Institute,Bijenička 54, Zagreb, Croatia
Department of Geology, Faculty of Natural Sciences, University of Zagreb, Croatia
ABSTRACT
The activity of'37Cs in shallow northern Adriatic sediments was obtained on the basis of measurement resultsfrom 25 sediment box cores, sampled during the Adriatic Scientific Cooperation Program (ASCOP) 16 cruisein the summer 1990. U7Cs was determined in surface sediments (0-3 cm) and 12-15 cm-deep sediment. It wasfound that the lowest caesium concentrations correspond to sands, which are spread along the Croatian coast.Parallel to the Italian coast, 137Cs concentrations in pelites are the highest. It seems that the influence ofPoRiver is significant for I37Cs activities in recent marine sediments along Italian coast south ofPo River delta.Significantly higher l37Cs activities in 0-3 cm sediment layer can be attributed to the deposition caused byChernobyl accident.
INTRODUCTION
The shallowness of the continental shelf, which hardly overcomes 60 meters among Trieste, Venezia,Ancona, Zadar and Pula, and the great quantity of waters flowing from Po and other minor Italian andCroatian rivers, strongly determine the grain size distribution and sedimentation rate in this semi-closedsystem. The chemistry of northern Adriatic as well as the cycling of nutrients and the fate of pollutantswithin the ecosystem are influenced by sedimentation characteristics. The countries surrounding northernAdriatic are reasonably contaminated by 137Cs during Chernobyl accident (1, 2, 3, 4).
The distribution of mean grain sizes, sediment types and main sediment characteristics in the open northernand central Adriatic sea are generally known (5). The research of 137Cs distribution in sediments of Gradoand Marano lagoons (6) showed the influence of river input and grain-size distribution on caesium activitiesin recent marine sediments relatively near shore. The similar observation results are found in the broaderRhone mouth area (7). Concerning caesium solubility in sea water and significant input of terrestrialmaterial (carried by rivers), the amounts and caesium distribution into recent marine sediments of opennorthern Adriatic is of special interest.
MATERIALS AND METHODS
The cores investigated in this work were sampled as a part of broader international and multidisciplinaryresearch programme ASCOP, during the ASCOP 16 cruise in the summer 1990. Sediment samples weretaken at 33 stations along seven different transects stretching between the borders of the Croatian andItalian territorial waters in the northern and central Adriatic Sea. The sediments were collected by boxcorer. After sampling, the sediments were sliced, frozen at -18 °C and kept until further use. Surfacesediment (0-3 cm) and 12-15 cm-deep sediment samples collected at 25 stations along five transects in thenorthern Adriatic sea were prepared for gamma-spectrometric analyses.
Before the analyses, the samples were thawed at room temperature and dried at 106 °C to the constantweight. Dried samples were stored in 125 cm3 counting vessels. The activity of 137Cs in each sample wasdetermined by gamma-spectrometry method using calibrated low background HP Ge detector systemcoupled to a 4096 channel analyzer. Spectra were recorded 80 000 seconds. l37Cs activities were calculatedfrom the 661.6 keV peak and the data were recalculated at May 1st, 1990.
RESULTS AND DISCUSSION
The distribution of the material, caried by the Po River and other Italian and Croatian rivers, on the sea
PORTOROŽ 95 268

SESSION III PROCEEDINGS
bottom of open northern Adriatic sea is the result of the sedimentation processes and the effect of thedominant sea currents. That fact s evident in 137Cs activities in measured sediment cores. 137Cs wasdetected in all surface sediment samples (0-3 cm) as well as in 12-15 cm-deep sediment samples.
The highest caesium activities are found in surface sediments taken at stations located in the Po Riverprodeltaic area (25.6 ± 0.8 Bq kg'' dry weight at station 108 and 10.9 ± 0.3 Bq kg"1 dry weight at station101). Along Italian coast south of Po River delta, the measured caesium activities in surface sediments arehigh too, about 10 Bq kg"1 dry weight generally. These two areas corespond with main sedimentation areaof material caried by Po River. The bottom sediment composition in these two areas is made mostly byclayey sand, clayey silt, silt and cly (5) and has higher organic matter contents (8).
The lowest caesium activities measured in surface sediments (less than 2.0 Bq kg"1 dry weight generally)are found in samples collected at stations along Croatian coast as well as at stations located in middle partand in north-east part of Corsini Port-Pula and Riccione-Porer Island transects. In this area, the organicmatter content in the bottom sediment, composed of sand mainly, is the lowest (5).
The similar spatial distribution of caesium activities was found in the 12-15 cm-deep sediment samples,but measured values were significantly lower generally. The exceptions are stations 108 and 201 with10.2 ± 0.5 Bq kg"1 dry weight and 9.6 ± 0.4 Bq kg"1 dry weight respectively. Relatively very high caesiumactivities in 12-15 cm-deep cores at locations 108 and 201 indicate high sedimentation rate in this area. Thelowest caesium activities in the 12-15 cm-deep cores are found in samples collected at stations located inmiddle part and in north-east part of sampled transects. Inspite sediment mixing, which is caused bybioturbation, that fact indicates significantly lower sedimentation rate in middle and north-east part ofnorthern Adriatic vs. in west and south-west Adriatic. Significantly higher 137Cs activities in 0-3 cm vs.12-15 cm-deep open sea bottom sediment layer can be attributed to the deposition caused by Chernobylaccident.
LEGEND
< 500 Bq/m2
500-1000 Bq/m2
111 III 1000-1500 Bq/m2
\rSJi 1500-2000 Bq/m2
ksS^I 2000-2500 Bq/m2
H I 2500-3000 Bq/m2
> 3000 Bq/m2
Fig. 1: Activities of 137Cs in the first 15 cm of open northern Adriatic sea bottom sediment.
PORTOROŽ 95 269

SESSION III PROCEEDINGS
Activities of 137Cs in the first 15 cm of open northern Adriatic sea bottom sediment (fig. 1) were estimatedon the basis of measured activities in recent sea bottom sediment (0-3 cm) and older, 12-15 cm-deepsediment cores. It is evident that northern Adriatic marine sediments with high caesium content corespondwith main deposition area of suspended matter carried by Po River.
REFERENCES
1. Battiston G.A., Degetto S., Gerbasi R-, Sbrignadello G. and Tositti L. (1988): Fallout distribution in Padua andnortheast Italy after Chernobyl nuclear reactor accident. J. Environ. Radioactivity, 8, 183-191.
2. Barišič D. and Lulič S. (1991): The estimation of 137Cs deposition and vertical distribution in undisturbed soils inRepublic of Croatia. In: Radionuclide migration mechanisms in geosphere, (Final Report, Res. Contr. No. 5243/RB),IAEA, Vienna.
3. Gattavecchia E., Ghini S. and Tonelli D. (1989): Fallout from Chernobyl in Bologna and its environs - radioactivityin airborne, rain water and soil. J. Rad. Nucl. Chem.-Art., 133:2, 407-419.
4. Urbančič J. and Jeran Z. (1989): A model for radioactive ground contamination analysis. In: Evaluation of atmosphericdispersion models applied to the release from Chernobil, Osterreichische Beitrage zu Meteorologie und Geophysik,159-164, Vienna.
5. Vdovié N and Juračič M. (1993): Sedimentological and surface characteristics of the northern and central Adriaticsediments. Geol. Croat. 46/1,157-163.
6. Giovani C, Godeassi M., Mattassi G., Padovani R. and Zanello A. (1995): l37Cs distribution in sediments of Grado andMarano lagoons (Northern Adriatic). In European Commission Report: Radiation Protection 70., eds. A. Cigna, R.Delfanti, R. Serro, 291-301.
7. Charmasson S., Arnaud M. and Bouisset P. (1995): Distribution of 137Cs and 134Cs in sediment near the mouth of theRhone river (Gulf of Lions - Mediterranean sea). In European Commission Report: Radiation Protection 70., eds. A.Cigna, R. Delfanti, R. Serro, 269-279.
8. Triluzi C, Tassi Pelati L., Nonnis Marzano F. and Jelisavčič O. (1995): Radioecological researches in the Adriatic seain the framework of the ASCOP programme. In European Commission Report: Radiation Protection 70., eds. A. Cigna,R. Delfanti, R. Serro, 303-317.
PORTOROŽ 95 270

SESSION IV:
NUCLEAR INSTRUMENTATION ANDDOSI METRY
ChAÍRS:
A. BENCOR. Ilie
A. ANCIRÁSÍU. MikUv/ič
M. KORUNF.


SESSION IV PROCEEDINGS
XA05C0072
CHARACTERIZATION OF TL DOSIMETERS FOR DETERMINATION OF THEGAMMA COMPONENT IN A MIXED n+y RADIATION FIELD
M. Ranogajec-Komor1', S. Miljanič l\ M. Osvay2), S. Ferek0,1. Dvornik0
0 Ruder Boskovic Institute, P.O.B. 1016, 41000 Zagreb, Croatia2 ) Institute for Isotopes, P.O.B. 77, 1526 Budapest, Hungary
INTRODUCTION
In the International Intercomparison of the Criticality Accident Dosimetry Systems organized by theCommision of European Communities at SILENE Reactor in Valduc, France, 1993, the Ruder BoskovicInstitute (RBI) measured the total neutron and gamma tissue absorbed dose (Dn+V) at the body surfaceirrespective of neutron and gamma energy spectra variations using the chemical dosimeters DL-M40). Forderiving the neutron dose i.e recoil dose, Dn, from the differences Dn = D n + Y - D,, the total gamma dose(D^) has to be measured with highest accuracy. The determination of the gamma dose in a mixed field iscomplicated because TL dosimeters are sensitive both to neutrons and gammas. Besides, the radiation dosesand energy spectra varry because of scattering and absorption in the body or phantom. Therefore dosimeterswith different sensitivities, energy dependences and encapsulations have to be used.
In this paper only the study of some characteristics of various TL detectors, such as sensitivity, linearity,supralinearity and fading, for measurement of the gamma component are described. These investigationswere carried out in RBI before and after the Valduc intercomparison experiments. The encapsulations, TLresponse corrections for thermal and fast neutron effects as well as the discussion of Valduc results willbe published later.
MATERIALS AND METHODS
The TL detectors investigated and the parameters of readout and annealing time (t) and temperature (T) arelisted in Table 1. The measurements were carried out on a Toledo 654 (Pitman) reader without adjustableintegration of the glow curves. The heating rate was 10°C/s. During the Vladuc intercomparisonexperiments there was no possibility for external preheat and annealing. Therefore in all measurements atthe RBI only internal preheat and annealing was used. For gamma irradiations a previously calibrated'2'Gammacell 220 ^Co radiation source of the RBI was used. In RBI measurements each of the detectors wasencapsulated in 0.1 mm polyethylene foil placed in 3.5 mm thick rubber holder.
Code of detector
MaterialDopingOrigin
Preheat, T/tRead-out, T/tAnnealing, T/t
TLD-700
Li7FMg,TiHarshaw
120°C/12s280°C/25s400°C/40s
TLD-100
LiF (nat)Mg,TiHarshaw
120°C/12s280°C/25s400°C/40s
CaF2
CaF2
MnUS*
120°C/12s320°C/32s400°C/40s
A12O3
A1AMg,YII*
120°C/12s280°C/25s400°C/40s
* US: Institute Jožef Stefan, Ljubljana, Slovenia;II: Institute for Isotopes, Budapest, Hungary
Table 1: Characteristics of TL detectors and evaluation parameters.
PORTOROŽ 95 273

SESSION IV PROCEEDINGS
RESULTS AND DISCUSSION
Individual sensitivityAll readings were corrected for individual sensitivity(3) of the particular detector. The standard deviation(SD) of the TL responses of the detectors after irradiation with a reference dose of 1 Gy was determinedto characterize the batch uniformity. TLD-100 detectors show the best uniformity, (SD= 4.2%), while A12O3
has high standard deviation (SD= 27.4%). The reason was that 25 A12O3 detectors were obtained fromdifferent batches. Using the individual sensitivity correction factor the SD value for A12O3 was improvedto 4.5%. The individual sensitivities of TLD-100 detectors change as a consequence of high thermalneutron dose irradiation and the SD of the batch uniformity becomes 27.4%. TLD-700 (SD= 5-6%) andCaF2 (SD= 5-7%) had stable batch uniformity during all measurement cycles.
Linearity and sensitivityThe dose response curves of the dosimeters investigated are linear in the dose range 0-4 Gy. The correlationcoefficients for the curves in Figure 1. obtained by the method of least squares fitting are 1.00.
The relative sensitivities calculated from the curves relative to TLD-700 have been found to be 8.6, 0.9,and 0.3 for CaF2, TLD-100 and AL,O3, respectively.
After neutron irradiation the recalibration of the response to gamma rays was performed. No change ofsensitivity after neutron irradiation could be observed with TLD-700 and CaF2:Mn detectors. Thereproducibility of Al2O3:Mg,Y detectors deteriorated somewhat, with no systematic change of sensitivity.The change of TLD-100 sensitivity observed is attributable to the high thermal neutron doses (responseequivalent to about 100 Gy gamma dose).
3001
wcoQ.t/1
200-
Fig. 1: The dose response curves of the TL dosimeters investigated. 1. CaF2; 2. TLD-700; 3. TLD-100; 4.A12O3.
SupralinearityThe supralinearity was measured in the dose range 1-8 Gy. In this range CaF2 and Al, Q do not showsupralinearity. The corrections of TLD-700 signal for supralinearity between 5.5 and 6.5 Gy were 2 to 4%.
Fading24 TL detectors were irradiated with a dose of 1 Gy and subsequently stored at room temperature. Threedetectors of each type were read at different time during 48 hours. A second measurement cycle was carriedout for the determination of the fading up to about 400 hours after an irradiation with a dose of 2 Gy. Thesummarized results normalized to the TL respone measured 24 hours after irradiation are shown inFigure2.
PORTOROŽ 95 274

SESSION IV PROCEEDINGS
The results obtained for CaF2 and A12O3 are in accordance with our earlier three weeks long fadinginvestigations*4'. The larger fading of TLD-100 and TLD-700 dosimeters is caused by peak 3(5) whichduring the read-out without glow curve analysis could not be eliminated. The measurement cycle up to 400hours was performed only with detectors already exposed to high neutron doses (up to 5 Gy of fast neutrondose and up to 7x10" thermal neutrons per cm2). The increased fading of TLD-100 detectors (up to 35%after 265 hours) could be the consequence of the thermal neutron effect which produced also the decreasedsensitivity and reproducibility of these detectors.
0.40 100 200 300 400
Time/hours
Fig. 2: Effect of storage on the relative TL signal. The TL response measured 24 hours after irradiation is takenas 1.0.1. CaF2; 2. TLD-700; 3. TLD-100; 4. A12O3.
CONCLUSIONS
Detailed measurements of sensitivity, linearity, supralinearity and fading of the TLD-100, TLD-700,CaF2:Mn and Al2O3:Mg,Y detectors were carried out to asses the suitability of these detectors formeasuring total gamma dose and improve the accuracy of gamma dose measurements in a mixed n+gammairradiation field during the Valduc International Intercomparison of the Criticality Dosimetry Systems.
The linearity of the dose response of the detectors investigated was excellent, the effect of correction forsupralinearity even for TLD-700 was less than 4%.
The results of fading determinations described in this paper show the importance of fading correction forthe precision of measurements. After mixed field irradiation, some detectors were read at Valduc, othersat the Ruder Boskovic Institute. The readings with fading correction have shown the agreement betweenthe Valduc and RBI gamma field calibrations. After neutron irradiation the recalibration of the responseto gamma rays was performed. No change of sensitivity after neutron irradiation could be observed withTLD-700 and CaF2:Mn detectors. The reproducibility of Al2O3:Mg,Y detectors deteriorated somewhat,with no systematic change of sensitivity. The sensitivity of TLD-100 detectors changed after neutronirradiation due to thermal neutron component.
The sensitivity of all detectors used is adequate for nuclear accident dosimetry. The combination ofdetectors with different photon energy dependences and different fast and thermal neutron sensitivitiesapplied together to every position of measurement (in free air or on the phantom) increases the accuracyand reliability of corrections for neutron effects. With adequate combinations of encapsulation thecombined TL detectors can give accurate enough gamma doses in the fields of unknown spectrum. Ourresults of gamma dose measurements at the Valduc criticality dosimetry intercomparison have shown verygood agreement with reference data and the mean values of all participating teams'6'.
PORTOROŽ 95 275

SESSION IV PROCEEDINGS
REFERENCES
1. D. Ražem, S: Miljanič, I. Dvornik: Chemical Dosimetry, in Ionizing Radiation: Protection and Dosimetry, G. Paic ed.,CRC Press, Boca Raton, Fl, USA. ISBN 0-8493-6713-1,157-186 (1988).
2. S. Miljanié, D. Ražem, M. Ranogajec-Komor: Dosimetric Calibration of an Annular 60Co Gamma Ray Source, J.Radioanal. Nud. Chem. Ar. 185,101 -108 (1994).
3. Gy. Uchrin, M. Ranogajec-Komor: Thermoliminescence Dosimetry, in Ionizing Radiation: Protection and Dosimetry,G. Paič ed., CRC Press, Boca Raton, FI, USA. ISBN 0-8493-6713-1,123-156 (1988).
4. M. Ranogajec-Komor, M. Osvay: Dosimetric Characteristics of Different TL Phosphors, Radiat. Prot. Dos. 17, 379-384(1986).
5. M. Sprunck, D. Regulla, U. Fill: Advanced Precision in Clinical Dosimetry by Computerised Glow Curve Analysis,Radiat. Prot. Dos., to be published (1996).
6. H. J. Delafield, R. Medioni: An International Intercomparison of Criticality Accident Dosimetry Systems at the SILENEReactor, Valduc, Dijon, France, 7-18 June 1993. Report HPS/TR/H/95, CEC DG11, Luxembourg, (1995).
PORTOROŽ 95 276

SESSIONIV II IIIXA05C0073
CALCULATED ALPHA COUNTING EFFICIENCY OF A SAMPLE/DETECTORGEOMETRY FOR AMBIENT RADON PROGENY MEASUREMENT
R. Rolle, H. Lettner, W. Hofmann, R. Winkler
Institute of Physics and Biophysics, University of Salzburg, Austria
ABSTRACT
Alpha measuring instruments for ambient radon progeny are usually calibrated by comparison measurementsin an official radon chamber. An alternative, or additional way of calibration is the calculation of theefficiency from specifications of the measuring geometry.
In a preliminary study calculated and measured efficiencies showed good agreement under varied measuringgeometries. The use of the calculation method of calibration could complement the more costly radon chambercalibration of radon progeny instruments and should assist in better quality assurance in the assessment ofpublic radiation exposure.
INTRODUCTION
More than ten million radon gas measurements have been made in the USA, but it is the alpha decay of theshort-lived progeny of radon in air to which about a third of the radiation dose to man can be ascribed. Thecurrently simpler gas measurement represents the dose-relevant potential alpha energy of the progeny onlypoorly (Rolle et al., 1995). Worldwide there are very few official chambers in which radon progenymeasuring instruments can be calibrated. Often a single efficiency calibration is provided for an instrument,suitable for a specific potential alpha energy procedure with limitations in application, rather thanefficiencies for individual progeny isotopes of the decay chain shown below:
tm = 3.05 min 26.8 min 19.9 min \64ßs( 2 2 2Rn - ) 2 1 8Po _ 2 1 4Pb - 2 1 4Bi - 2 1 4Po
6 MeV a ß ß 7.68 MeV a
Most often progeny are collected on filters and their alpha activity is measured in air in a compactmeasuring geometry. The alpha particles lose energy in a straight path through the air and a light tightwindow before reaching the detector. The residual energy detected depends on the initial energy and onthe lengths of the particular path in the different absorbers. In particular geometries for some of the longerpaths the residual energy of the more energetic 7.68MeV alpha particles from 214Po may register a countabove an instrument's detection threshold whereas 6MeV particles from 2l8Po may not. This results indifferences in gross-alpha detection efficiencies for the two isotopes. If this is not taken into account, thensignificant systematic errors can be introduced in measurement conditions of different progeny ratios orusing different procedures.
In the following derivation of the counts/disintegration efficiency first a circular planar detector facing apoint source in vacuum is considered, then planar absorption layers are considered for spectrometricefficiencies and finally the per energy channel spectrometric efficiencies are integrated over the sourceelements of extended circular, planar sources.
EFFICIENCY OF A DETECTOR FACING A POINT SOURCE IN VACUUM
Alpha particles are emitted isotropically. Consider the point source at the centre of a hypothetical, sphericalsurface of unit radius and surface area 4TT. The 'shadow' or (point source-) projected area S of a detectoronto the unit sphere's surface, divided by the total surface of the sphere is the probability that an alphaparticle will be detected, i.e. the source-detector efficiency Eff = S/4it; S on a unit sphere is also referredto as the solid angle at the source subtended by the detector (units: steradians).
PORTOROŽ 95 277

SESSION IV PROCEEDINGS
For a point source at a distance H from the surface of a circular, planar detector and at a distance x fromthe detector axis the solid angle S can be obtained as follows (see Figure 1):
lieV
Mylar
Po-218
Energy
Fig. 1: Source/detector geometry. Fig. 2: Range of alpha particles.
Take the point source as the apex of a hollow cone, of half angle <j> and angular differential thickness Acj),on an axis parallel to the axis of the detector. The solid angle of such a hollow cone, i.e. the intersectionwith a unit sphere's surface, is 27tsin(J) A({> (which integrated over <|) from 0 to % covers the whole shell andyields ATZ). The sector angle 26 of a hollow cone intersected by the detector of radius r is given by thetriangle relationship:
r2 = x2 - 2x(H tanc|>)cos8 + (H tan(j>)2 with: 0 = 71 f o r x < d - H tancj) and0 = 0 f o r x > d + H tancj) and for ()> > TC/2,
and this conical shell sector intersects only an area s = 20sind> A(j> of the unit spherical shell. Thesource/detector efficiency is thus:
Eff = S/47t =(l/47i:)0Jnsd(t> = (l/4n)0/"29sm<l>d<l>
For a point source on the axis of the detector: x = 0 and 6 = TT for (|)< arctan r/H while 6 = 0 at greater (b.The integral then reduces analytically to: Eff = V2 - '/2cos(arctan r/H). For x > 0 the integral can be computednumerically, with accuracy improving as A(f) tends to 0.
SPECTROMETRIC EFFICIENCY OF A POINT SOURCE/DETECTOR GEOMETRY WITHABSORPTION LAYERS
Alpha particle ranges in different materials, such as shown in Figure 2., can be readily obtained from acomputer programme TRIM (Ziegler and Biersack, 1985/92). Because of vast differences in densities ofabsorbers it is often convenient to express alpha ranges in units of length x density,i.e. lenght x mass/length3 = mass/length2 , surface density mg/cm2; geometric calculations, however, needto be conducted in units of length.
Consider a point source with absorption layers of thickness h; in front of the detector. An alpha particleemitted at energy Eo at an angle (j> to the detector axis passes through a length of h,/cos(j> of the firstabsorber. From the energy/range relationship of the first absorber the energy E, of the particle exiting thefirst layer can be calculated at the range,(E0) - h/coscj), and sequentially the E, exit energy from the i'thlayer at the range^E^) - hi/cosc]) to obtain the residual energy Ed at the detector plane; the total lengthof the absorption path to the detector plane is H/cos(f>. This calculation loop can be repeated for an arbitrary
PORTOROŽ 95 278

SESSION IV PROCEEDINGS
selection (say 20 equidistant points) of total length H/cos(j> values between H and H/cos(arctan((x+r)/H)),i.e. between <f> values of 0 and arctan((x+r)/H), to obtain a curve (function and its inverse) betweenmaximum and minimum Ed values vs. total absorption length.
Alpha energy spectra are normally recorded at constant channel width AE. Therefore, the (positive) energyspan of the foregoing curve is subdivided with energy boundaries at rational values (at least 20), and thecorresponding total lengths, resp. (|>'s, are calculated using the foregoing curve; rational subdivision of the4> or the lenght spans would yield irrational energy channel widths. Using the mean (fy and Acjjj of an energychannel j ' s boundaries the spectrometric channel efficiency Effj, as before, is given by the intersection ofthe conical sector with the detector:
Effj = s/4ir = (l/47t)20sin(|)j Afy
with accuracy improving at smaller AE, resp. A(j>.
SPECTROMETRIC EFFICIENCY OF DISC SOURCE/DETECTOR WITH ABSORPTIONLAYERS
For a thin disc source of radius R, having an axis common with the detector, source elements lie at x <, R.As before, first a curve of residual energy Ed vs. total absorption length is calculated to span the extremelengths from H to H/sin(arctan((R+r)/H)), and from this the c|) values for selected, rational Ed boundariesare calculated.
The source can now be divided into (at least 20) rings of mean radius xk and width Axk. The spectrometricefficiency Effjk at each xk is then weighted by the area ratio of ring/disc and summed for all rings -
Effj = ]T Effjk 2uxk Axk/TtR2
The above calculations, for each emitted alpha energy, suffice for most common radon progeny alphameasuring instruments, including spectrometric analysers. They can be adapted for any source and detectorshape in a planar absorption geometry, including thick sources combined as multiple-layer thin sources.Spectral subdivision to constant etching depth or incident angle, instead of residual energy, is moreappropriate in track etch applications with passive detectors.
When source and detector radii do not match, i.e. r * R, retaining rings usually shield a significant part ofthe peripheral rays and orifices of this type need to be taken care of in the 0 evaluation.
Different forms of electronic pulse summing that can affect the spectrometric peak shapes, such as(delayed) coincident ßct decay, can also be taken care of in the calculation.
RESULTS AND DISCUSSION
Distance
[mm]
5.2 vac5.2 air13.2 vac25.2 vac25.2 air37.2 vac37.2 air
gross
calculated
0.3170.3170.150.06048.06046.03096.02979
alpha efficiencies
measured
0.32340.32270.1543.06130.06131.03096.03103
calc/meas0.9800.9820.9720.9870.9861.00*0.96
* normalized
Table 1: Efficiencies of an Am-241 source/adetector; diameters 10mm and27.64mm resp.
10000 r
Counts "'
5"Pb/BI-212
100
0 2 4 6 8MeV Ttf
Fig. 3: Measured and calculated spectrum.
PORTOROŽ 95 279

SESSION IV PROCEEDINGS
In Table I calculated efficiencies show good agreement with preliminary measurements of a 'certified'24lAm source. Initial analysis of the same data had indicated measured efficiencies which exceeded thecalculated ones by about 7%. Closer scrutiny revealed that at all of the distances the measured valuessimilarly exceeded the solid angle fraction of a point source, to which the calculations converged frombelow for discs of decreasing diameter. Therefore, because an increase of activity since certification dateis impossible, the incorrectly certified activity of the source was adjusted upward to normalize theefficiencies at the largest distance measured in vacuum.
Figure 3 shows a high count spectrum of Rn-220 progeny on a filter measured in air. Efficiency spectra,calculated purely from instrumental geometry and absorption parameters and a time-concentration factor,have been superimposed. The spectral shape, particularly the low intensity part is rather sensitive to theabsorber thicknesses and the calculations here show a good fit to the measured peak shape over about threeorders of magnitude. The thickness of light-tight and protective windows is not always correctly specifiedby detector manufacturers and can be evaluated by spectral shape analysis.
CONCLUSION
A way of calculating alpha spectral efficiencies purely from instrumental parameters and absorption datawas shown. The numerical analytical procedure outlined here attains high accuracy faster then a MonteCarlo procedure would. The few examples presented show good agreement with measured data. The'certified' source example illustrates that conventional certification can also be incorrect, and, without sucha convenient procedure to uncover it, such an error would in most instances surreptitiously propagate.
Calibration of radon progeny instruments in radon chambers can be rather costly and could becomplemented or even replaced by calculated efficiencies form specified source/absorber/-detectorparameters. Even for non-spectrometric instruments comparison measurements of suitably designed thicksources of long-lived alpha emitters could adequately serve for alpha efficiency calibration in lieu of radonchamber calibration using short-lived, higher energy emitting progeny.
The efficiency calculation procedure has been used to optimise the design parameters of a new portableair radiation monitor. A wire screen and filter separate unattached and attached aerosol size fractions ofprogeny. The efficiency for 6(+) isotopes is required in each of 4 energy windows (1 ß and 3 a) to allowcontinuous sampling and measuring of radon progeny or quasi-continuous sampling for radon + thoronprogeny. Such spectrometric procedures have a much improved sensitivity per unit time for radon progenyover conventional procedures (Rolle and Lettner, 1995).
The efficiency calculation outlined here can be applied in very diverse fields and should become a powerfultool in alpha spectrometry.
REFERENCES
1. Rolle R., Hofmann W. and Lettner H., 1995. Measurement challenges in dose monitoring of radon progeny. INDOORAIR, An Integrated Approach. Ed. Morawska L., Bofinger N.D., and Maroni M., Elsevier, 1995, ISBN 0-08-041917-8.International Workshop, Gold Coast, QLD, Australia, 27 Nov. - 1 Dec. 1994.
2. J.F.Ziegler and J.P. Biersack (1985). The stopping and range of ions in solids. Pergamon Press, New York (1985)ISBN-0-08-021603-X. Computer Code TRIM92 (1992).
3. Rolle R. And Lettner H., 1995. An analysis of efficent measurement procedures for radon progeny. Presented at SixthInternational Symposium on the Natural Radiation Environment, June 5-9, 1995, Montreal, Canada. Accepted forpublication in The Science of the total Environment, to appear early 1996.
PORTOROŽ 95 280

SESSION IV PROCEEDINGS
XA05C0074
MEASUREMENT OF DISSOLVED RADON AND RADIUM CONTENT OFWATER SAMPLES BY TRACK ETCH TECHNIQUE
J. Hakl ", I. Hunyadi]), I. Csige", A. Vásárhelyi °, J. Somlai2), G. Faludi2),
1 Institute of Nuclear Research of the Hungarian Academy of Sciences,H-4001 Debrecen, POB 51, Hungary
2 Department of Radiochemistry, University of Veszprém, H-8200 Veszprém, Egyetem út 10, Hungary
ABSTRACT
We have developed a method to determine the dissolved radon and radium content of water samples usingtrack etch type radon monitors. The device is an immersed, small volume radon monitor with CR-39 track etchdetector. The monitor is sealed from the water by a thin radon permeable rubber foil. The dissolved radonand/or the radium content of water samples can be determined from two independent radon exposures by usingthe solutions of a non steady state differential equation which describes the temporal variation of radoncontent of water and by using an experimantally determined calibration coefficient.
KEYWORDS
Radon, radium, water, CR-39 track etch detector.
INTRODUCTION
During the last decades several types of track etch detector based radon monitors were developed andutilized in large scale radon measuring programmes. In these 'track etch linked' environmental studies theradon concentration was examined mostly in gases (in air or soil gas). On the other hand, with increasingconcerns about our natural radiation environment, the interest in radon and radium concentrations of watersis also rising. Numerous methods based on different procedures to separate radon and radium from waterhave been developed to fulfil this task. Direct application of a bare track etch detector for this purpose israrely considered, because of the sensitivity decrease by three orders of magnitude of these detectors inwater. In field circumstances, however, the application of procedures based on chemical or other separationmethods is often difficult or expensive when large number of samples has to be measured. Therefore, wehave developed a method using sealed track etch radon monitors to measure radon and radium content ofwater samples.
GENERAL CONSIDERATIONS
Let us consider an air bubble in water. The radon concentration of the air inside the bubble (CA) isgoverned by the following differential equation:
dC* - • - c -c I m
where X is the decay constant of radon, y is a factor characteristic for the time necassary for radon to crossthe water-air interface, T| is the partition coefficient of radon between water and air phases and Cw is theradon concentration of water at the water-air interface.
The solution of eq. (1) depends on Cw, which is, in general a function of time. The radon concentrationinside the bubble also depends on the time necessary for a radon atom to pass the water-air interface («1/y).For constant Cw and CA(0) = 0,
y T](2)
PORTOROŽ 95 281

SESSION IV PROCEEDINGS
which shows the effect of both factors. As the time necessary for passing through the interface is usuallyshort (eg. \ly«\IX) (Nazaroff 1988), the value of CA will be equal to Cw/r). However, because ofdiffusion a concentration gradient of radon around the bubble in the water is formed, so there may beconsiderable difference between the Cwand the mean radon concentration of water. This phenomenon maysignificantly affect the sensitivity of the method (track density rate / mean radon concentration in water).For spherical symmetry the delay (T) attributed to this effect is (Boeker 1994):
T = (3), (3)AD W
where R is the radius of the bubble and D is the diffusion constant of radon in water. Substituting value forthe diffusion coefficient (10"9mV, Nazaroff 1988), the obtained delay time is of the order of few days(depending on the bubble radius). Taking into account this effect the radon concentration in water at thewater-air interface can formally be written as:
w —Cw a j ~ m Cw' <4)
where Cw is the mean radon concentration in water and Rw is the thickness of an effective water volumewhich communicates with the bubble. Rw in one dimensional approximation equals to the diffusion length,in higher dimension its value is genarally lower. Taking Rw = 2 cm (ie. equal with the diffusion length),the sensitivity reduction effect finally is estimated to be in the range of 0.7-0.9 largely depending on thebubble radius.
CALIBRATION EXPERIMENT
The obtained formula suggests us to use small volume detectors and, if possible, to introduce eddy diffusionin order to increase the communicating effective water volume. In our experiments we used cylindrical 30mm xl5 mm size radon monitors (RADAMON), which were sealed in 15 urn thin rubber bag. Theexposures were performed inside a refrigerator. In this way the thermal stability of the experiment as wellas regular shaking of water samples due to normal operation of the refrigerator was also insured.
The method can be used for simultaneous determination of radium and radon content of natural waters.As the radon activity content of natural waters (Cw) consist of a radium bounded (Q^) and aradium decayunsupported (Cu) parts, sealing the sample in field the temporal variation of radon concentration in thewater is Cw(t)=CRa+Cue"Xt, while sealing a degassed sample results in Cw(t) = Q^O-e"**). Integrating forthe exposure times and rearranging the formulas we obtain:
1CRa = -ZRa G
and
Cu =( -^ Pi - ''i c *« l T ^ ' (5)- e
G is the experimentally determined calibration coefficient, T, and T2 are the exposure times and p, andp2 are the measured track densities, respectively.
The calibration of the method was performed in two parallel series of measurements. Calibrated RaCl2
solutions (0.1-1-10-100 kBqm"3) were prepared and divided into two parts. In order to have well definedinitial conditions the solutions were carefully degassed by N2 gas for 10 minutes. The exposure time was60 days.
For the examined concentration range we found good linear relationship between the detector response(track density rate measured in track/(cm2day)) and the dissolved radium concentration of water (see Figure1.). For the value of the considered factor we obtained G=24.1 track/(cm2day) / kBqm"3. The result is ingood accordance with the theoretical expectations, that the response of our sealed and immersedRADAMON radon monitor under water is about 60% of that which is valid in air environment. The LLD
PORTOROŽ 95 282

SESSION IV PROCEEDINGS
of the method largely depend on the background of the track detectors, its best value for 10-30 days longexposure times is in the order of 0.01 kBqm"3 both for radon and radium.
10000
S
to
53
1000
0.01 0.1 1 10 100 1000Radium concentration, [kBqm'3]
Fig. 1: The track density rate response of sealed track etch radon monitor for radium in water.
APPLICATION OF THE METHOD IN FIELD CIRCUMSTANCES
The applicability of the method was tested in a series of measurements performed as part of aenvironmental isotope study of four karst systems in Spain and Croatia. The lowest radon concentrationwas found in surface (0.02 Bq/1) whereas the others were in the range 1.7- 13.9 Bq/1. The mean radiumcontent of samples was in the range 10-27 mBq/1 (Hertelendi et al. 1994). The second series of applicationwas performed during in situ field measurements in studying spatial variability of dissolved radon contentof subsurface waters at a geologically active area in the village of Matraderecske, Hungary (Vásárhelyi atal. 1995). In this case we examined simultaneously radon content of water in 200 draw wells during 5-7days long time period. The found radon activity concentration values ranged from 0.34 kBqm3 to 781kBqm"3 (mean 40 kBqm3) with the highest values corresponding to the intersection of two maingeological faults.
CONCLUSIONS
These measurements showed, that the newly developed method allows a simultaneous and low costexamination of a large number of samples. The method can be applied as well for in situ integratingmeasurement of dissolved radon.
ACKNOWLEDGEMENT
This work was supported in part by the National Scientific Research Fund contract Nos. 3005 andTO 16558.
REFERENCES
1. Boeker, E.; van Grondelle, R. Environmental Physics. Chichester: John Wiley & Sons; 1994:272.2. Hertelendi, E; Veres, M; Mikó, L; Futó,I; Lénárt, L; Hakl, J.; Svingor, É. Environmental isotope study of karst systems.
Hertelendi, E; Lénárt, L; Svingor, É., eds. Proc. of ISOKARST '94 international workshop on environmental isotope
PORTOROŽ 95 283

SESSION IV PROCEEDINGS
REFERENCES
1. Boeker, E.; van Grondelle, R. Environmental Physics. Chichester: John Wiley & Sons; 1994:272.2. Hertelendi, E; Veres, M; Mikó, L; FutóJ; Lénárt, L; Hakl, J.; Svingor, É. Environmental isotope study of karst systems.
Hertelendi, E; Lénárt, L; Svingor, É., eds. Proc. of ISOKARST '94 international workshop on environmental isotopestudy of karst systems. Miskolc: Department of Hydrogeology and Engineering Geology University of Miskolc;1994:36-179.
3. Nazaroff, W.W.; Moed, B.A.; Sextro, R.G. Soil as a source of indoor radon: generation, migration, and entry. Nazaroff,W.W.; Nero. A.V. Jr. eds. Radon and its decay products in indoor air. New York: John Wiley & Sons; 1988:77.
4. Varga, K.; Hunyadi, I.; Hakl, J.; Uzonyi, L; Bacsó, J. Gross alpha radioactivity and chemical trace element content ofthermal waters measured by SSNTD and XRF methods. Radiation measurements, 25: 577-580; 1995.
5. Vásárhelyi, A.; Csige, I.; Hakl, J.; Hunyadi, I. The study of radon content of groundwater and soil air at Mátraderecske.(to be published).
PORTOROŽ 95 284

SESSION IV Illllllllllllllllllllllllllllllllllllllllllllllllllllll PROCEEDINGSXA05C0075
TSEE CHARACTERISTICS OF LiF:M,C,P DETECTORS
G. Uchrin
Institute of Isotopes of the Hungarian Academy of Sciences, H-1525 Budapest, P.O.Box 77, Hungary
INTRODUCTION
LiF based thermoluminescence detectors are most attractive amongst various thermoluminescent dosimetricmaterials because of their low energy dependence and near tissue equivalence. The ultra sensitiveLiF:Mg,Cu,P detectors now are available on commercial scale and widely used for personal dosimetric andenvironmental monitoring purposes. The Chinese type GR-200 and MCPN LiF:Mg,Cu,P IPN, Krakow TLdetectors are similar in their main characteristics. The effective atomic number is 8.2, the emissionspectrum maxima is 4000 A, typical sensitivity at 60Co relative to TLD-100 is 15-50, the overresponseat 30 keV/60Co is 1.06 and the fading is negligible, less 5 % / year. The useful dose range of this materialis 1 uGy-10 Gy. The high sensitivity of this material allow to prepare thin sensitive layers by which nearlyenergy independent beta dose measurement can be performed.
LiF:MCP detectors are very delicate regarding their heat treatment. Typically 10 mins at 240°C is theannealing suggested eventhough annealing up to 27O0C may give good reproducibility, too. Up to 12-15% loss in sensitivity was observed on repeated measurements up to 50 cycles using 10 mins annealing at240°C [1]. Annealing up to 400°C for 2 hrs resulted the shift of the main dosimetric peak together witha significant decrease of sensitivity [2].
LiF based dosimetric materials besides TL exhibit thermally stimulated exoelectron emission, TSEE,phenomenon, too. The analysis of TL and TSEE glow curve structure may reveal interrelation betweenpeaks therefore the physical process responsible for emissions. The main purpose of present work was tomeasure and investigate both TL and TSEE responses of LiF:Mg,Cu,P detectors using different heattreatment.
EXPERIMENTAL
LiF:Mg,Cu,P detectors from Poland LiF MCP-Ns IPN, Krakow and GR-200 from China were investigated.LiF MCP-Ns consists of two layers: a thin active part bonded to a thick base made of unactivated LiF towhich 2 % of graphite is added in order to suppress any spurious luminescence. Diameter of the detectoris 4.5 mm overall thickness about 0.6 mm and the effective thickness of the detector estimated to be about8.5 mg'Cm"2 [3]. A Daybreak TL reader utilizing photon counting was applied for TL measurements whileTSEE readings were carried out with a reader developed at Fontenay-aux-Roses, France. This later has amulti needle GM detector and PC aided. The TSEE reader operates with methane as counting gas whilenitrogen gas atmosphere was used during TL readings. Typical heating-rate applied for both TL and TSEEread-out was 3°C- s"1. The irradiations of samples investigated were done bý47 Pm204 Tff Sřr? Y and106Ru/106Rh extended area beta sources of which dose-rates were determined by extrapolation ionchamber.Doses in experiments varied between 5 and 50 mGy. There was no additional annealing to that of theannealing during the read outs which was 1 min for TSEE measurements.
RESULTS AND DISCUSSION
Detector type LiF MCP-Ns were selected from a larger batch and their sensitivities did not differ more than5 % from the mean value.
TL sensitivity and energy dependence were determined using I47Pm, 2O4T1, ^Sr/^Y and 10<Ru/1Q<Rh sources,see Fig.l. The lover detection limit, LDL, is equal to 10 nGy-s"1 if LDL is set to 3o of the 2nd reading andthe integration is done only for the main dosimetric peak and the irradiation time is equal to 10 mins. Thebeta energy dependence is approximately 50 % at low, Eß r a a x 0.2 MeV, energy but using a thinner, about3 mg-cm"2 thick window nearly energy independent response achievable for the whole, 0.2-3.5 MeV, energy
PORTOROŽ 95 285

SESSION IV PROCEEDINGS
range.
Figure 2 shows the TL glow curve of LiF MCP-Ns. The main dosimetric peak is at 200°C while lesspronounced peaks are at 60°C, 103°C and 150°C, respectively.
140
0 0.S 1 1.5 2 2.5 3 3.5 4
Beta energy, MeV
T L R E S P O N S E
-
r !
1
|
i
A.U.)! •
h
jj1 '• '
il!í• '• i i
•; i:
v'
• \ '
; : :
; ' • •
i : '
j ;
i : .
i;.
— •
flů
• . i i
li. • ! :
;;
:•!
; i.
ii
i1!1!
i ijí|j[!
i!i <
•i : •
Temperature
it1
IIIi1
íi.
1 1 ! •
1 •
lí
1-• , ^
200
j i í :l i l :!:!.
. i ; :
• • • .
\ ' ' \ '
: . ; !
! 1 i :
i l ľ
.:!!
: i '
Fig. I: The beta energy dependence ofLiF:M,C,P TL detector. For comparisonsimilar curves are given for TLD-100and a for a graphite mixed (0.85 % C)cold pressed LiF chip, too.
Fig. 2: TL glow curve of LiF MCP-Ns.Heating rate is 3°C-s1.
TL RESPONSE (A.U.)
'. 1st reading
j/ťŤi."*1-*!-100 • 200
~ Temperature,'Č300
Fig. 3: TSEE glow curves of LiF MCP-Ns. The heating rate is 3 °C
PORTOROŽ 95 286

SESSION IV PROCEEDINGS
Special heat treatment has been used to investigate the effect of higher maximum temperature than 240°C.TL and TSEE, from each 10 detectors were irradiated and read out up to 500°C. There was additionalannealing except 1 min in the TSEE reader. The dose delivered from a Sr/ ^Y source was 3 mGy. Thiscycle was repeated for ten times. Figures 4 and 5 show some of the TL and TSEE glow curves from theseseries.
6000
6000
4000
3000 -
2000 -
1000 -
TSEE RESPONSE (A.U)1000
- 800
- 600
- 400
- 200
00001 **\ I"*=-I 1 1 1 ^ ľ ' 050 100 150 200 260 300 350 400 460
Tsmperature,*C
Fig. 4: TL glow curves of LiF MCP-Ns detectors heated up 500°C. Heating rate 3°C- s"'. For comparison glowcurve of TLD-100 is also illustrated.
TSEE RESPONSE (A.U.)
50 100 160 200 260 300 360 400 460Temperature.'C
Fig. 5: TSEE glow curves of LiF MCP-Ns detectors heated up to 500°C. Heating rate 3°G s'1. For comparisonTSEE of TLD-100 is also given.
PORTOROŽ 95 287

SESSION IV PROCEEDINGS
The TSEE sensitivity decreases with repeated read outs and after 10 cycles its value is only 30 % of thevirgin sample. There is a strong, appr. 35 % drop in sensitivity after the first annealing up to 500°C andfollowed by smaller gradient about 6 % / cycle. Besides the sensitivity loss the shape of TSEE curve alsochanged but again this change is significant only at the first reading at high temperature.
The TL sensitivity of LiF MCP-Ns during the repeated read outs up to 500°C drops sharply at the first threeread outs but it remains nearly constant, approximately 9 % of the original, later on. The shape of TL glowcurve shifts towards higher temperature from 200°C to 257°C.
Results show that definite interrelation between TL and TSEE characteristics of LiF MCP detectors exitbut further investigation needed to reveal this relation in more detail.
ACKNOWLEDGEMENT
This work was partly supported by EC Contract N° ERBFI13CTP 920032.
REFERENCES
1. P. Bilski et al., Properties of thin layer LiF:Mg,Cu,P TL detectors for beta dosimetry, 1 lth SSD Conference, 10-14 July,Budapest, to be published in Radiat.Prot.Dosim.
2. J. Fesquet et al., Thermoluminescence of LiF:Mg,Cu,P (GR-200 A) TLD after different thermal treatment, 1 lth SSDconference, 10-14 July, Budapest, to be published in Radiat.Prot.Dosim.
3. P. Bislki et al., Ultra-thin LiF:Mg,Cu,P detectors for beta dosimetry, in Proc. LUDMETR'94 Symp., Tallin, Sept. 1994,Radiat.Meas (1995) in press.
PORTOROŽ 95 288

XA05C0076
EQUIVALENT DOSE MEASUREMENTS IN AIRCRAFTS WITH TLD'S UNDERCONSIDERATION OF THE PEAK HEIGHT RATIO
M.N0II l\ N.Vana1'2', W.Schöner 2), M.Fugger2), H. Brandl3)
0 Institute for Space Dosimetry, Döblinger Hauptstraße 7, A-l 190 Vienna, Austria2) Atominstitute of the Austrian Universities, Schüttelstraße 115,A-1020 Vienna, Austria
3) Institute of the German Airforce, D-82242 Fiirstenfeldbruck, Germany
ABSTRACT
For dose measurements in unknown mixed (n, yj-fields in aircrqfts thermoluminescence dosemeters were usedembeded in pofystyrol or polyethylen of varying thickness (25 cm diameter spheres, 40 mm polystyrol, 3 mmpolystyrol). Beside the determination of the absorbed dose the evaluation of the linear energy transfer (LET)with the method of the peak height ratio was determined. Furthermore the peak height ratio method opens thepossibility for the determination of the different fractions induced by gammas, thermal neutrons or other high-LET radiation depending on the polystyrol thickness.
For evaluation of the fraction of thermalized neutrons and fast neutrons (including protons and other chargedparticles) of the equivalent dose the neutron energy dependence of the TL-response was measured using TLDsembeded in polyethylen spheres (diameter 25 cm) in a special arrangement. The calibration was performedwith several neutron sources (thermal, Pu-Be, Am-Be and 14 MeV neutrons).
The results show that with the applied method information of the fraction of the different kind of radiationdepending on the geometry can be obtained.
INTRODUCTION
Interest in radiation protection measurements in mixed (n,Y)-fieIds as they occure in high altitude aircraftshas increased with improved knowledge of the biological effectiveness of some of the components. Themixed radiation field induced by solar and galactic cosmic radiation consists of a broad spectrum ofdifferent particles (protons, neutrons, electrons, gamma-quants,..) with varying energy and LET. Besideabsorbed dose measurements particular investigations for the evaluation of the LET-spectrum of the mixedradiation field have been made using LET-spectrometers (1). Furthermore increased efforts are madeconcerning neutron dosimetry in aircrafts (2) because about half of the equivalent dose is caused byneutrons of various energies. Since most of the applied systems are very complex, unwieldy and heavy,especially for radiation protection purpose investigations based on TLDs are of particular interest.
TLDs are mainly used to obtain the absorbed dose of the ionising component of the mixed radiation field(3, 4). Analysing the high temperature region (5) the average LET can be evaluated in addition. Besidedetermination of the equivalent dose using the high temperature ratio (HTR), the neutron inducedequivalent dose was measured with a calibrated neutron detector.
MEASUREMENTS IN AIRCRAFTS
Measurements in aircrafts were performed with TLDs in different absorbing layers to evaluate detailedinformation about the depth dependence of the neutron flux and the absorbed doserate. Beside thecalibrated neutron detector additional TLD-packets with different absorber thickness (packet 1: TLDs instandard packets = 3 mm thickness, packet 2: TLDs in standard packets with 20 mm polystyrol in addition)were applied. Each packet included TLD-600, TLD-700 and TLD-200. The dosemeters were exposedduring three flights Köln - Washington - Köln. The exposure time was 60.25 h in a latitude between32 - 52°N in 10 - 11 km altitude.
PORTOROŽ 95 289

SESSION IV PROCEEDINGS
DETERMINATION OF THE EQUIVALENT DOSERATE CAUSED BY NEUTRONS
For tissue equivalent dose measurements of the neutron doserate a neutron detector consisting of TLDsembeded in the centre of a Bonner sphere with 25 cm diameter was used. This sphere enables nearlyneutron energy independent measurements in the energy region between approximately 0.025 eV and 10MeV. In the centre of the moderator sphere a special inset containing the TLDs was developed to improveneutron shielding of the TLD-700 particular against thermal neutrons: TLD-700 situated in the centre ofthe compartment are surrounded by TLD-600.
To determine the equivalent doserate caused by neutrons in mixed (n,Y)-fields the pair method is appliedto discriminate between the neutron- and the y-component (6)- TLD-700 was used to measure they-doserate. The TLD-600 glowcurve is caused by composition of the y- and the thermal neutroncomponent. Therefore the glowcurve caused by neutrons can be obtained by subtraction of the y-fractionof the total glowcurve (figure 1). Analysing the peak 5 maximum of this neutron glowcurve an energydependent calibration was performed using different neutron sources (thermal neutrons, Am-Be-, Pu-Be-source, 14 MeV neutrons).
i100 200 300 4M
temperature rO7500
Fig. 1: Composition of a TLD-600 glowcurve irradiated in a mixed thermal neutron-y field, y-dose wasmeasured with TLD-700.
The neutron equivalent doserate measured in the aircraft with the calibrated neutron detector was3.7 ± 0.5 uSv/h. For the calculation a mean calibration factor of 1473 ± 221 cts/mSv was used. The totalequivalent doserate of 5.7 ± 0.5 uSv/h was obtained by addition of the TLD-700 absorbed doserate(including y- and proton component) measured with TLD-700.
DETERMINATION OF THE TOTAL EQUIVALENT DOSERATE
The absorbed doserate in the aircraft was measured with TLD-700 and TLD-200. Depending on theabsorber layer an increase was determined (table 1). This increase is the result of the production ofsecondary protons by neutrons penetrating the absorbing material. This is also indicated by the dependenceof the neutron flux on the absorbing layer (table 1).
In addition the total equivalent doserate was evaluated applying the HTR-method. This method comparesthe high temperature region of the glowcurves with a Co-60 irradiation, normalized on the peak 5maximum. Since this ratio correlates with the energy deposition, a LET-calibration allows the determinationof the average LET of unknown mixed radiation fields (5). The method was used to analyse the neutronglowcurves of TLD-600 and to evaluate the LET of the TLD-700 glowcurves of the measurements in theaircraft. Since the HTR correlates with the LET information about the neutron energy is available, e.g. athermal neutron glowcurve gives a HTR of about 10.
PORTOROŽ 95 290

SESSION IV PROCEEDINGS
The increase of the high temperature region of TLD-700 is shown in figure 2. According to themeasurements of the neutron flux, an increase of the LET respectively the equivalent dose with absorberthickness was obtained (table 2).
packet 1
packet 2
sphere 1
sphere 2
doserate[uGy/h]
TLD700
1.504 ±0.087
1.686 ±0.039
2.002 ± 0.034
TLD200-1
0.757 ± 0.044
0.707 ± 0.016
TLD200-2
0.939 ± 0.021
1.056 ±0.068
1.188 ±0.043
thermal n-flux[n/cm2s]
TLD-600
0.61 ±0.20
1.67 ±0.15
106 ± 22
122 ±8
Table 1: Dependence of the y-doserate (measured with TLD-700 and TLD-200) and the thermal neutron fluxon the absorbing layer. TLD-200 were taken from different groups. For calculation of the neutron fluxthe peak 5 maximum was analysed after subtraction of the y - component.
packet 1
packet 2
sphere 1
HTR
4.37 ± 0.77
3.23 ± 0.59
6.58 ± 1.77
LETaverageICRP26[keV/um]
18.0 + 3.6
15.0 ±2.3
25.4 ±7.1
^caverage
4.05 ± 0.43.50 ±0.85.40+ 1.3
H[nSv/h]
8.3 ±1.6
7.4 ± 1.5
15.4 + 4.6
Table 2: Evaluation of the average LET and the equivalent doserate using the HTR-method. The increase ofthe high temperature region of the TLD-700 glowcurves is shown in figure 2. LETaverage is onlymeaningfull using ICRP 26 because ICRP 60 demands the assessment of the various components ofthe mixed radiation field.
I.2?
10000 -
5000 -
0 -
IJ' "7—i
a.. sphere 1b.. packet 2c.. packet 1
i/-a
r I I100 200 300 400 500
Temperature ("C]
Fig. 2: Comparision of the TLD-700 glowcurves obtained in an aircraft (a, b, c) with the corresponding Co-60calibration (a*, b*, c*). Glowcurves are normalized on peak 5 maximum.
PORTOROŽ 95 291

SESSION IV PROCEEDINGS
DISCUSSION
Comparision of the results shows a higher equivalent doserate of 15.4 ± 4.6 uSv/h with the HTR-methodas 5.7 ± 0.5 uSv/h measured with the Bonner spheres. This difference is caused by the proton componentwhich is excluded in the measurements with the neutron detector. The increased high temperature regionof the TLD-700 as well as the increase of the absorbed doserate with absorbing layer indicate that thiscomponent cannot be neglected. Taking this into consideration the two methods are in good agreement.
The results were furthermore compared with former measurements (7, 8). The decrease of the absorbeddoserate from 2.3 ± 0.2 uGy/h (1989) (7) to 1.5 ±0.09 pGy/h (1995) as well as the increase of the neutronflux from 0.17 ± 0.05 n/cm2s to 0.61 ± 0.20 n/cm2s and the equivalent doserate from 5.2 ± 0.22 uSv/h to8.3 ± 1.6 uSv/h correlates with the variation of the solar acitivity. In 1989 a solar maximum reduced theprimary proton and neutron component compared with the situation of 1995 (minimum in solar acitivity).A neutron flux of 0.36 n/cm2s and an equivalent doserate of 5.5 uSv/h measured in 1974 (8) wereperformed after a solar mimimum.
CONCLUSION
The measurements of the two detector systems show that the HTR-method considering all components ofthe mixed radiation field results in a significantly higher equivalent doserate. Furthermore a dependenceon the absorber thickness can be evaluated.
The deviation of all the investigated parameters compared with former measurements correlates with thevariation of the solar activity. It can be seen that the composition of the mixed radiation field in aircraftsis significantly influenced by the solar acitivity. Since these variations cannot be predicted continousmeasurements of the absorbed dose and the LET are proposed.
Using TLD-700 not only the absorbed doserate can be determined but also the evaluation of the averageLET is possible. The dependence of the equivalent doserate on the absorber thickness has to be investigatedin more detail because the developement of TLD-700 packets in adequate absorbing layers opens thepossibility for an efficient personnel dosemeter system in aircrafts.
LITERATURE
1. Nguyen, V.D. et al. A New Experimental Approach in Real Time Determination of the Total Quality Factor in theStratosphere, Rad. Prot. Dosim.44(l) 41-46 (1993).
2. Schalen, D. and Scharmann, A. In-flight Measurements at High Latitudes: Fast Neutron Doses to Aircrew, Rad. Prot.Dosim. 44(1) 85-93 (1993).
3. Spumy F. et al. Dosimetric Characteristics of Radiation Fields on Board Czechoslovak Airlines 'Aircraft as Measuredwith Different Acitve and Passive Detectors, Rad. Prot. Dosim. 44(1) 73-78 (1993).
4. Wilson, O.J., Young, B.F. and Richardson, C.K. Cosmic Radiation Doses Recieved by Australian Commercial FlightCrews and the Implications oflCRP 60, Health Pys. 66(5) 493-502 (1994).
5. Vana, N., Schöner, W., Fugger, M. and Akatov, Yu. DOSIMIR - Radiation Measurements Inside the Soviet SpaceStation MIR - First Results, International Space Year Conference Munich 193 (1992).
6. Horowitz, Y.S. Thermoluminescence and Thermoluminescent Dosimetry II, 90, CRC Press (1984).7. Vana, N., Schöner, W., Fugger, M. and Akatov, Yu. Radiation Measurements on Board of High Altitude Aircrafts,
Proc. of the 41st Intern.Congress of Aviation and Space Medicine, Hamburg (1993).8. Akatov, Yu. Some Results of Dose Measurements Along Civil Airways in the USSR, Rad. Prot. Dosim.44(l) 59-64
(1993).
PORTOROŽ 95 292

SESSION IV PROCEEDINGS
XA05C0077
IN-SITU GAMMASPECTROMETRYINTERCOMPARISON EXERCISEIN SALZBURG / AUSTRIA
F. Steger ", H. Lettner2), A. Andrasi3) and E. Lovranich])
l) Austrian Research Center Seibersdorf, Department Radiation Protection, Austria2) Institute of Physics and Biophysics, University of Salzburg, Austria
3) Health Physics Department, KFKI Budapest, Hungary
ABSTRACT
In-situ gamma-spectrometry has become a useful method of assessing the nuclide concentrations of man-madeand natural gamma-emitters in the soil. For the quality assurance of the measurements, periodically conductedintercomparison exercises are essential. Therefore exercises were organized in different European countriessince 1990, the last one was conducted in Salzburg /Austria in September 1994. The participation of 24measurement-teams from all over Europe emphasizes the importance of the intercomparison. Salzburg wasselected because the Province of Salzburg /Austria was among the most heaviliy contaminated regions outsidethe former USSR by the Chernobyl fallout. Two different typical sites were selected for the measurements: Site1 was inside the urban area of Salzburg on intensively used grassland which had not been tilled since thedeposition of the fallout. This site is representative for intensively used agricultural regions in the Provinceof Salzburg. Site 2 was in the mountainous regions of the Hohe Tauern at an elevated altitude of 1600 m,representing the agricultural soil- and contamination conditions of the Alpine regions in the Tauern. The twosites differ significantly in terms of soil characteristics, a crucial parameter for the evaluation of in-situgamma-spectra. The participants used different approaches for the evaluation of the gamma-spectra in termsof considering the depth distribution. In the paper the results from the 24 European teams are presented.
INTRODUCTION
In-situ gamma-spectrometry has become an important method for the rapid detection of radionuclides inthe environment and nuclide specific doserate calculation since its development in the late sixties [1]. Thedevelopment of semiconductor detectors improved the usefulness of this method for the quantitativedetermination of natural and artificial radionuclides. After the reactor accident in Chernobyl periodicalintercomparison exercises applying in-situ gamma-spectrometry have been organised by differentinstitutions of the EU member states and neighbouring countries in order to improve the scientific basis ofthe method, for information interchange of the scientific community and of increasing importance also todevelop methods and to gain a good basis for quality assurance. In-situ gamma-spectrometry is used by anincreasing number of radiation protection institutions, governmental and provincial environmentalmonitoring laboratories and authorities, health physicists of nuclear power plants and scientific institutions.The great importance is documented by the ever increasing number of participants at the in-situintercomparison exercises in the past.
In-situ gamma spectrometry can be applied for the measurement and doserate calculation of natural andfor artificial gamma-ray emitters as well. In terms of the measurement task artificial and naturalradionuclides have to be treated differently in order to consider their basically different soil depthdistribution. The photon flux of the gamma-emitters in the soil is a function of soil parameters (density,humidity), the radionuclide of soil-depth distribution (z-coordinate) and the spatial variation of the falloutwithin the affected area (x and y axis).
IMPLEMENTATION, MEASUREMENT TASKS AND INSTRUMENTATION
The intercomparison exercise was implemented in the Province of Salzburg at two different sites. Threereasons determined the selection of these sites:
PORTOROŽ 95 293

SESSION IV PROCEEDINGS
1) The contamination by the Chernobyl fallout in the province of Salzburg was rather high [2] varyingbetween 10 kBq/m2 and 80 kBq/m2 at the time of the fallout deposition in April 1986.
2) The contamination on site 1 / (Krauthuegel, city of Salzburg) was studied in detail [2].
3) The sites selected represent two different specific environments in the Province of Salzburg:Site 1 (Krauthuegel, city of Salzburg) is typical for low-lying land used intensively for agriculturalpurposes; site 2 (Nassfeldalm, Badgastein) represents mountainous environment with extensiveseasonal usage for agriculture.
The specific task of this exercise was the calculation of the specific activities for natural and man-madegammaemitters and their contribution to the dose rate. For the artificial nuclides 134Cs and 137Cs the specificcontamination was to be calculated assuming three scenarios: real distribution, plain- and uniformdistribution. For the calculation of real distribution a soil-depth profile, derived from an experimentalinvestigation, was handed out to the participants.
An additional task was to calculate the activity of two ^Co point sources buried under a few cm of soil. Theresults of dose rate calculation, the calculation of 134Cs and of the 60Co measure-ments will not be treatedin this paper.
The participants used HpGE-detectors exclusively (3 n-type and 21 p-type detectors), mounted lm aboveground, with relative effficiencies ranging from 10% to 54% of relative efficiency. At measurement site 113 positions and at measurement site 2 15 positions were predefined for gamma-spectrometricmeasurements. Each position was marked and numbered, on average between 6 and 8 measurements ofapproximately 1/2 hour aquisition time were made.
RESULTS AND DISCUSSION
Soil depth profiles for 137Cs for both sites were distributed to the groups, only a few participants used thisinformation as a basis for the calculation of the site-specific photon flux. Not all participants informed theauthors about the methods they used. Out of those who provided this information most of them used forthe calculation assuming real distribution appropriate a /p factors ( a = reciprocal of the relaxation lengthof the assumed exponentially distributed source activity with depth, cm"1.p is the soil density, g.cm"3) foran exponential distribution derived by Beck [1] or factors recommmended in the ICRU report [3]. Only afew applied other methods including double exponential distribution, assuming Lorentz-distribution orcalculation of the flux based on the experimentally derived depth distribution. For 137Cs and134Cs theparticipants were expected to calculate the site-specific activity per unit area assuming real distribution andplane distribution, and the activity per unit mass assuming uniform distribution. For the calculation of thenatural radionuclides uniform distribution was assumed.
Statisticalparameter
Mean
SD
SD [%]
Number n
Min
Max
Site 1/Krauthuegel, SalzburgAssumed distribution
Real[Bq.m-2]
33609
4855
14,4
24
24857
40286
Plane[Bq.m-2]
5661
846
14,9
24
4653
8201
Uniform[Bq.kg1]
182
17
9,3
24
154
225
Site 2/ Nassfeldalm, BadgasteinAssumed distribution
Real [Bq.m"2]
41599
7665
19,2
24
27017
57367
Plane[Bq.m"2]
15577
3933
25,2
24
1755
24700
Uniform[Bq.kg1]
524
51
9,7
24
440
618
Table 1: Results of the intercomparison exercise for 137Cs.
PORTOROŽ 95 294

SESSION IV PROCEEDINGS
The results of the calculation for 137Cs for the two measurement sites are shown in table 1 and on fig. 1 (Aand B). For each group a mean value was calculated from the results obtained from the differentmeasurement positions of that measurement site. The mean values of each laboratory for a measurementsite are the data-basis for the calculation of the statistical parameters. The mean value calculated for site1 (33.6 kBq.rrv2) is insignificantly lower than the mean value determined for this site based on soil analysisof the top 14 cm soil layer being 34.05 kBq.nv2 at t<, = October 1994. (This value increases to 38.5 kBq.m"2
if the estimated soil contamination below 14 cm soil depth is considered).
IO 10* :
103
" 10!-
Real distribution
. , , . . A A A
Plane distribution
Uniform distribution!
» TT * T T T ' T
T T T T
4 8 12 16 20 24
Laboratory Code
10=
Real distribution!
Plane distribution |
T T - T - - T y
Uniform distribution!
4 8 12 16 20 24
Laboratory Code
Fig. lA: Mean values for 137Cs calculated from allpoints measured by each group for themeasurements site 1 / Krauthuegel, cityof Salzburg; Mean values are shown ashorizontal lines, mean value for l37Csfrom soil sample analysis on site 1 isdrawn as dashed line.
Fig. IB: Mean values for 137Cs calculated from allpoints measured by each group for themeasurements site 2 / Nassfeldalm,Badgastein. Mean values are shown ashorizontal lines.
For site 2 Nassfeldalm / Badgastein the results are significantly different. The soil-depth distribution forradio-caesium of this site is much steeper than for site 1. The major part of the contamination is still in theupper soil layers which usually are of low soil density due to the specific soil conditions in thismountainous region. The low attenuation at site 2 causes comparatively small differences between theresults obtained for plain and real distribution. For both distributions - real and plain - the standarddeviations are significantly higher than the standard deviations for the corresponding measurements of site1 / Krauthuegel. The larger scattering of the data from site 2 can be explained by the larger variation insurface roughness, soil thickness and soil conditions in the alpine terrain where flat areas most suitable forin-situ measurements are almost impossible to be found.
Assuming the distribution is homogenous on the surface (plane distribution) a mean value of 5.67 kBq.m"2
with standard deviation of SD = 0.85 kBq.m'2 for site 1 being almost exactly the same as for realdistribution is obtained. The comparatively low value obtained when assuming plain distribution reflectsthe progressing migration of radio-caesium into the soil resulting in high attenuation, which gives a lowvalue for the activity per unit area when plain distribution is assumed. The standard deviation for theactivity per unity mass obtained assuming uniform distribution is lowest of all (SD = 17 Bq.kg"'). This canbe explained by the defined procedure of calculation which necessarily will give comparable results andthe deviations are dominated by the uncertainty in the calibration factors of the different detectors used.
For site 2 Nassfeldalm / Badgastein the results are significantly different (Table 1 and Fig. IB). The soil-depth distribution for radio-caesium of this site is much steeper than for site 1. The major part of thecontamination is still in the upper soil layers which usually are of low soil density due to the specific soilconditions in this mountainous region. The low attenuation at site 2 causes comparatively small differences
PORTOROŽ 95 295

SESSION IV PROCEEDINGS
between the results obtained for plain and real distribution. For both distributions - real and plain - thestandard deviations are significantly higher than the standard deviations for the correspondingmeasurements of site 1 / Krauthuegel. The larger scattering of the data from site 2 can be explained by thelarger variation in surface roughness, soil thickness and soil conditions in the alpine terrain where flat areasmost suitable for in-situ measurements are almost impossible to be found. At least for plain and uniformdistribution the deviation of the results from the calculated mean value for most of the participants /laboratories is reflecting systematic deviations in the calculation of the calibration factors.
11 600-
Ž1 500-•au< 400oÍ 300 J
CO
iCO 100 n
á 50H
CO
Site 1: Krauthügel / Salzburg |
" • — • •
a?Th-S8ries
m m m
D
Ol
r 100 r;ž"
h50 1
L o .y
226Ra-Series
u • n a -a- n a a
8 12 16
Laboratory Code
20 24
m600 -
500 -
400-
300 J
CO
="100-i
50
j Site 2: Na Bf eld / Badgastein |
«K
232Th-Series
G 238y 226 R a . S e r i e s
a g a D n
O)
r 100 =•ž-
- 5 0 ••=
Lo
a u D a D " D a o • a a
o ' i i • i i
8 12 16
Laboratory Code
20 24
CO
Fig. 2: Mean values for the natural radionuclides calculated from all points measured by each group for themeasurement sites. Upper graph: site 1, Krauthuegel / city of Salzburg; lower graph: site 2, Nassfeldalm/ Badgastein. Mean values are shown as horizontal lines.
PORTOROŽ 95 296

SESSION IV PROCEEDINGS
Statisticalparameter
Mean
SD
SD [%]
Number n
Min
Max
Site 1/Krauthuegel, Salzburg
238 u /226R a
Series
36,2
7,6
21,0
24
24,9
68,4
232Th-Series
30,5
9,5
31,1
24
20,5
73,8
40K
398,5
45,1
11,3
24
326,0
565,7
Site 2/ Nassfeldalm, Badgastein
238U/226RaSeries
49,5
17,5
35,4
24
30,2
103,2
232Th-Series
27,8
6,3
22,7
24
20,0
55,6
4 0 K
386
39,3
10,2
24
300,0
516,5
Table 2: Results of the intercomparison exercise for natural radionuclides [Bq.kg1].
For the natural radionuclides (Table 2 and Fig. 2) the standard deviations for the U/Ra-series and forThorium-series for both measurement sites in general is high ranging from 21 percent to 35 percent withoutany marked tendency neither for site 1 nor for site 2. The differing results cannot be attributed to a singlefactor alone: Besides errors in the calibration factors the assumption of uniform distribution for theseradionuclide series is problematic. Counting uncertainty is larger than for 137Cs, which produces generallythe most prominent gamma-peak, but for the most abundant lines of the Radon decay products used forcomputation of both series it is rarely more than ± 5 percent. Airborne Radon decay products and theirdiurnal variation contribute to the gammaspectra in a way that cannot be quantified easily. As the naturalradionuclides are only trace elements inhomogeneous distribution can be another important source for theobserved deviation.
For 40K, which is chemically more abundant than the other natural radionuclides, the standard deviationat both sites are drastically lower: 10.2% for site 2 / Nassfeldalm and 11.3% for site 1 / Krauthuegel.
CONCLUSIONS
The intercomparison exercise has demonstrated that there are still many sources of errors that essentiallyinfluences the data evaluation from in-situ gamma-spectra. For a given soil-depth distribution of a test sitethat was most suitable for in-situ gamma-spectrometric measurements, the results obtained from the aquiredin-situ spectra was in good agreement with the results of the soil sample analysis. In-situ gamma-spectrometry has to be improved in terms of developing methods to derive parameters from the spectraabout the underlying soil depth distribution of the radionuclides in question.
The periodical organization of intercomparison exercises will be an acceptable basis for quality assuranceby providing a unique opportunity for the participants to check the reliability of their calibration andcalculations, which will be most important for the control and safeguards of nuclear power plants andofficial authorities.
REFERENCES
1. Beck et al, I. DeCampo and C. Gogolak (1972): In-situ Ge(Li) and NaI(Tl) Spectrometry. USAEC HASL-258. 1992-20/K.
2. Lettner, H., P. Bossew and A.K. Hubmer (1994) Kontamination durch radioaktiven Fallout in Salzburg undangrenzenden Teilen Oberösterreichs. Forschungsbericht des Umweltbundesamtes / Wien: UBA-94-101.
3. ICRU 53. International Commission on Radiation Units and Measurements. Gamma-ray Spectrometry in theEnvironment. ICRU Report 53, Bethesda, Maryland, 1994.
PORTOROŽ 95 297

SESSION IV PROCEEDINGS
XA05C0078
THE IMPORTANCE OF LOCALISATION WITHIN131J-RETENTION MEASUREMENTS
G. Greifeneder °, H. Aiginger1*, F. Steger2), J. Flores3)
" Atominstitute of the Austrian Universities, Schiittelstr. 115, A-1020 Vienna, Austria2) Austrian Research Center Seibersdorf, A-2444 Seibersdorf, Austria
3) Department of Nuclear Medicine, University of Vienna, A-1090 Vienna, Austria
INTRODUCTION
A widely used method to investigate thyroid gland carcinomas, but also disorders of the thyroid gland isthe measurement of the l31J-retention behaviour using a high-sensitivity whole-body counter (HWBC).Normally just the retention of oral administered Radioiodine is controlled. However, it is possible tovisualize the distribution of 131J (using a modified profilescantechnique) beside the retention in the humanbody and this provides much better information on human metabolism as will be demonstrated in thefollowing.
MATERIALS AND METHODS
DB SCANNING DIRECTION
(CRANIAL)
-> V
COUCH
COLLIMATEDDETECTOR
geometrical parameters: u = 360 m m** V = 280 m m
Fig.l: Detector configuration.
To demonstrate the power of the high sensitive profilescantechnique we investigated 28 patients with totalthyroid gland ectomy before and after I31J-therapy. To ensure the absence of new metastasis and to localizeremains of thyroid gland oral dosis with 20 uCi of radioactive Jodine has been provided. One hour and 72hours after administration linear profile scan measurements relative to a comparative standard have beendone by the HWBC. Thereby each patient was placed at a fixed position on the bed. The profile of countrates was measured by the profile scanning system using a special detector configuration shown in Fig. 1.The profile scanning system used consists of four 8"x4" NaJ(Tl)-crystals with multi-slit focused collimatorsinside a massive shielding chamber. The scanning motion (scanning time 600 s, scanning length 190 cm)and the data aquisitation was controlled separatly for each detector by a central computer.
To study the rate of accumulation of 131J in the human body after its oral administration the retention valuehas been calculated from the measured count rates and a correction of background and patient activity hasbeen done.
PORTOROŽ 95 298

SESSION IV PROCEEDINGS
500-1PROFILE SCAN PROFILE SCANSPECTRUM SPECTRUMDETECTOR OA DETECTOR DB
PROFILE SCANSPECTRUMDETECTOR DC
PROFILE SCANSPECTRUMDETECTOR DD
512 1024 1536CHANNEL
SCANNING LENGTH = 512 CHANNEL
2048
Linear profile scan 1 hafter administration
1 bladder2 stomach3 region of the neck
50- PROFILESCAN PROFILE SCAN PROFILE SCAN PROFILE SCANSPECTRUM SPECTRUM SPECTRUM SPECTRUMDETECTOR DA DETECTOR DB DETECTOR DC DETECTOR DO
512 1024 1536 2048CHANNEL
SCANNING LENGTH = 512 CHANNEL
500-, PROFILE SCAN PRORLE SCAN PROFILE SCAN PROFILE SCANSPECTRUM SPECTRUM SPECTRUM SPECTRUMDETECTOR DA DETECTOR DB OETECTOR DC DETECTOR DD
I ' ľ
1024CHANNEL
1536 2048
SCANNING LENGTH = 512 CHANNEL
Lmearprofilescan72hafter administration
3 region of the neck
localization
Linear profile scan 1 hafter administrationcompared to linearprofile scan 72 h afteradministration
1 bladder2 stomach3 region of the neck
Fig.2: Patient with total thyreoid ectomy before 13IJ-therapy, retention value: 2.32 %.
PORTOROŽ 95 299

SESSION IV PROCEEDINGS
500nPROFILE SCAN PROFILE SCAN PROFILESCAM PROFILE SCANSPECTRUM SPECTRUM SPECTRUM SPECTRUMDETECTOR OA DETECTOR DB DETECTOR DC DETECTOR DO
5 0 H
40-
CHMNEL
SCANNING LENGTH = 512 CHANNEL
PROFILE SCAN PROFILE SCAN PROFILE SCAN PROFILE SCANSPECTRUM SPECTRUM SPECTRUM SPECTRUMDETECTOR DA DETECTOR DB DETECTOR DC DETECTOR DD
1024CHANNEL
1536 2048
500-1
400H
SCANNING LENGTH = 512 CHANNEL
PROFILE SCAN PROFILE SCAN PROFILE SCAN PROFILE SCANSPECTRUM SPECTRUM SPECTRUM SPECTRUMDETECTOR DA DETECTOR DB DETECTOR DC DETECTOR DD
1536 2048CHANNEL
SCANNING LENGTH = 512 CHANNEL
Linear profile scan 1 hafter administration
1 bladder2 stomach3 region of the neck
Linear profile scan 72 hafter administration
dislocalization
Linear profile scan 1 hafter administrationcompared to linearprofile scan 72 h afteradministration
1 bladder2 stomach3 region of the neck
Fig. 3: Patient with total thyreoid ectomy after 131J-therapy, retention value: 7.58
PORTOROŽ 95 300

SESSION IV PROCEEDINGS
f» - LWR S..R = -22h * . 100 • —1± [%]
Pi b count rates I h after administration (patient)S] h count rates 1 h after administration (standard)P72h count rates 72 h after administration (patient)S72 h count rates 72 h after administration (standard)LWp patient activityLWR background activity
The profiles thus obtained for each scanning detector represents the longitudinal localization of the 13lJ-dis-tribution. To achieve the three-dimensional portrayal of the 131J-distribution by the linear profile scanmeasurements a computational model1 has been used. The model based on the special detectorconfiguration allows to determine the distribution of radioactivity in the human body from the measuredcounts (beside the 131J-retention behaviour). So count rates can be directly atrributed to organs of the humanbody.
RESULTS
After oral administration of 13IJ, the inorganic iodide is absorbed from the gastrointestinal tract within onehour and is completely transformed to plasma and extraiodide pool. Major portion of the total iodinecontent is taken up by metastasis, most of which is in the form of iodinated aminoacids and the rest of theportion is excreted by the kidney. Normally a retention value of more than 3 % after 72 hours afteradministration is interpreted as a possible of metastasis. Regarding the spatial J131-distribution in additiona decision between localisation and dislocalisation is possible. Thereby it turned out that one of 10 patientswith total thyroid gland ectomie before 131J-therapy showed a retention value of 2.32 % although a localiza-tion could be detected shown in Fig.2. On the other side none of the patients after 131J-therapy showed upa localization indicating a metastasis even 25 % had a retention value of more than 3 %. Looking just atthe retention values the possibiltiy of disorders cannot be excluded of certainty but regarding the three-dimensional distribution in addition a decision between localization and dislocalization is possible (Fig.3).So the physiological or pathalogical meaning of the retention value can be easily interpreted without furtherinvestigations by a gammacamera with much higher dosis (20 mCi).
REFERENCE1. A method for calculating the spatial distribution of radioactivity measured by a whole body counter, G. Greifeneder,
H. Aiginger, F.Steger, E. Unfried, L. Riedlmayer, H. Havlik, H. Bergmann, Symposium on radiation protection inneighbouring countries in central Europe (1995).
PORTOROŽ 95 301

SESSION IV Illllllllllllllllllllllllllllllllllllllllllllllllllllll PROCEEDINGSXA05C0079
QUALITY ASSURANCE OF ACTIVITY MEASUREMENT IN RADIATIONMONITORING NETWORK OF CZECH REPUBLIC
LMalátová '>, D.Drábová2)
!) National Radiation Protection Institute, Šrobárova 48, 100 00 Prague, Czech Republic2> Present address: State Office for Nuclear Safety, Prague, Czech Republic
In Czech Republic, altogether 11 laboratories, equipped by semiconductor gamma spectrometry supplyregularly to the Centre of Radiation Monitoring Network (1) the measured data about the radionuclideactivity concentration in different environmental samples, participating thus in monitoring of radiationsituation in the country. The Centre of Radiation Monitoring Network (RMN) of Czech Republicperiodically organizes through its reference laboratories interlaboratory comparison tests ensuring thusquality of the measurement within the radiation monitoring network. For the laboratories involved in RMN,participation in intercomparison is obligatory, participation of other laboratories, esp. from Slovakia, iswelcome. As a rule, no results are accepted into the central data-base unless the laboratory successfullyparticipated in the intercomparison test.
National reference laboratory for internal exposure of National Radiation Protection Institute (NRPI)(former Centre of Radiation Hygiene of National Institute of Public Health), which is responsible forradionuclide activity determination in samples, participates regularly in international comparison exercisesorganized by IAEA, WHO, CEC and other international organizations.
Besides the evaluation of radionuclide concentration in samples of different origin, also results ofspecialized measurement are subject of interest of radiation monitoring network. Special importance hasthe whole body counting of people and the in situ gamma spectrometry. For these methods usuallyinternational intercomparisons are organized by ad hoc groups of specialists from different countries onvoluntary base. Whole body counting laboratory of NRPI and mobile group of NRPI took part in many suchintercomparisons.
Intercomparisons of radionuclide activity determination by semiconductor gamma spectrometry within theRMN have been organized since Chernobyl accident. Three intercomparison runs were organized alreadyin 1986 because some new laboratories were founded this time. Overview of 6 intercomparisons from years1986 to 1989 was presented earlier (2). One of the important tasks of gamma spectrometric laboratoriesin the case of radiation accident of any type is to be able to evaluate quickly the radionuclide mixturecomposition and to estimate activity of radionuclides in samples in non-standard shape. Twointercomparison exercises were organized (1989,1992) in which simulated samples with a complex mixtureof radionuclides were shipped to individual laboratories. The staff of laboratories was asked to respond asquickly as possible (by phone or by fax) and later on, to report more precise results within 24 hours. Finalresults were expected during one week.
In the intercomparison in 1989, simulated aerosol-filters with 133Ba, 60Co, 137Cs and small activity of 210Pbwere used. From 12 participants, 10 were able to identify first three radionuclides in less than 6 hours. Theaccuracy of the quick estimation (within 24 hours) of activities of these 3 radionuclides in 9 laboratorieswas better than by factor of two. There were some problems connected with the finding of peak of 210Pbin most laboratories, therefore next training programme for RMN laboratories was aimed at improving skillsconcerning evaluation of low-energy part of gamma spectra and improvment finding natural radionuclides,too.
Intercomparison in 1992 was organized in similar way as in 1989. Discs from filter paper with mixture of134Cs, 159Gd and 65Zn simulating thus planar source were used. They were measured in NRPI as to checkthe activity before putting them into plastic 200 ml cylindrical bottles. Discs closed into polyethylene foilwere placed between dry granules of an anorganic detergent (Synalod), rest empty place was filled bycotton-wool. Nor position of radionuclide source, neither the composition of material was known byparticipating laboratories. They were told to measure sample as a whole, only after one week they were
PORTOROŽ 95 302

SESSION IV PROCEEDINGS
instructed how to open bottle and to measure sample in more accurate way. Altogether 20 laboratories tookpart in this intercomparison, 14 laboratories were able to report first estimates in less than 3 hours. Onlytwo laboratories failed to find all three radionuclides immediately. Finally reported results given as ratioto real activity in individual samples are in fig.l. All estimates are within a range given by a factor of 2.
Intercomparison 1992Ratio of reported to real activity
Cs134 • Gd153 • Zn 65
2.22
1.81.6
I 1 4
CĹ 1.2
10.80.60.4
. • *
* i'
*'lr f *ľ"'"»™ w^.-^..m
•• .^—.~ m m g . , j m....m--.m
" *' ""*' iH 1 1 1 i 1 i 1 1 1 1 1 1 1 1 1 1 1 h2 3 4 5 6 7 8 9 10 11 12 13 14 15 16 17 18 19 20
Laboratory No
Fig. 1: Intercomparison 1992: Ratio of reported to real activity.
..Noíáiaé.í'*
AgllOmCe 141 • ;Ce 144' "Co 5? -,Co 58Co60, . ;Cr-51 -' ,Cs 134 ;-;
'C&13T.. -'• Fe59 .:;•"
HfÍ8Íi' :
-U3iv .:
Mn 54-; , "Nb95--' :Rul03 .Sk ITA ,Se 75. '
->:Sn;ii3;;;;. -!
'7A6$-"T;'-':
Zr95-. ŕ'-:
a293.3
3.2122.6
555.8474.3311.850.570.547.21.7
18.24.5
325.275.119.920.60.61.8
15.945
- I290
3213
556490296
. 707050
173
330
20200.7
11650
•.."3 --'"
2922.310.12.8537488287496847
116
4.333177
19.321
1.515.448
42803.4203
5374903055270480.9173.3330802020
1.21544
53052.314.12.8
556.5480.4285.8
635547
15.8A3
330.5
19.321
15.345.9
6300.5
2.3142.8
556.5488
285.859.868
47.3
15.83.2
330.5
19.321
15.448.4
'7 .
302.12.310.22.8557
487.5282.1
5068.147.4
116.14.3
330.767.419.420.8
1.515.547
8291
55849830349.970.260.4
25.9
33172
19.120.9
24.647.3
92953.310.5
355548030152
70.848
117.33.333075
19.921.20.71.2
15.248.2
Table 1: Intercomparison 1993-1994: Activity of radionuclides [Bq] in test spectrum.
PORTOROŽ 95 303

SESSION IV PROCEEDINGS
In the intercomparison run 1993-1994, individual laboratories were supplied by the spectrum of aerosolfilter from ventilation stack from a nuclear power plant measured in NRPI Prague. Participants ofintercomparison also obtained with it energy and efficiency calibration. The aim of this exercise was notonly to test skill of the user, but also to test the computer routine used for the spectra evaluation. The resultsof intercomparison are in tab.l, empty places mean that the radionuclide was not found.
In the intercomparison test 1994-1995, samples of pulverized concrete breeze-block containing fly-ash withnatural radionuclides were used. From the point of view of monitoring network, the good knowledge of thenatural radionuclides spectra is important when soil and other environmental samples are measured. Priorto measurement, 101 samples were measured in in NRPI to ensure homogeneity. Samples in the volumeabout 21 were at the same time shipped to the participating laboratories. Results are in tab.2 and exampleof reported values of 2 3 5U activity by individual laboratories is in fig.2.
FI82 Intercomparison 1994-1995U 235 in pulverized concrete breeze block
— arithmetic mean
— confidence interval 95%
8CM 9 10 8 2
Laboratory No
Fig. 2: Intercomparison 1994 -1995: U-235 in pulverized concrete breeze block.
Nuclide
K 40
Ac 228
ľ 235
Ka226
Pb210
Number oflaboratories
10
10
10
10
6
Arithmeticmean IBq/kgl
386
62
5.5
79
54
Range ofmeasure values
[Bq/kgl
360-413
53-78
3.0-8.9
69-91
13-89
Confidenceinterval (a=().O5)
[Bq/kgj
373-399
56-67
4.1-6.6
74-83
33-75
Table 2: Intercomparison 1994-1995: Summary of reported radionuclide activity concentration in pulverizedconcrete breeze block.
A ring intercomparison test was organized in 1994. The piece of steel rather highly contaminated by ^Cowas used. The shape of sample was a conical cylinder. The activity as estimated by individual laboratoriesare in fig.3. In spite of shape of the sample and problems with correction on the self- absorption, resultsfrom all laboratories, done in short time (less than one week), are satisfactory for the purposes of radiationprotection.
PORTOROŽ 95 304

SESSION IV PROCEEDINGS
c
8
8Soo
The ring intercomparison 1994Co 60 of steel
— arithmetic mean
"-- confidence interval 95%
4 5 6
Laboratory No
Fig. 3: The ring intercomparison test - 1994. Co-60 of steel.
At present time, the content of artificial radionuclides in environmental samples is very low and to testaccuracy of measurement of individual laboratories is extremely difficult. Control of quality of aerosol andfall-out measurements in individual laboratories of RMN network is done through measurement of activityof 7Be and 2l0Pb (3). When an outlayer from the set is found, it is a signal for investigation.
Results of all intercomparison tests show that all laboratory of RMN of Czech republic are well preparedfor any emergency situation.
REFERENCES
1. Drábová, D. et al.: Radiation Monitoring Network of the Czech Republic, this symposium.2. Malátová, I. et al.: Quality Assurance of Gamma Spectrometry in Monitoring Network of CSFR, Proc.Intern. Symp.
on Post-Chernobyl Environmental Radioactive Studies in East European Countries, Kazimierz, Poland, 1990,pp. 104-107.
3. Report on the Radiation Situation on the territory of Czech Republic 1994, National Radiation Protection Institute,Prague (in Czech).
PORTOROŽ 95 305

S E S S I O N i v I Hill Illllll Uli Hill HIHI Uli Hill Hill Hill Uli Ml P R O C E E D I N G SXA05C0080
QUALITY ASSURANCE SYSTEM IN GAMMA SPECTROMETRYLABORATORY
A. Mielnikow, B. Michalik, S. Chałupnik, J. Lebecka
Central Mining Institute, Katowice, Poland
ABSTRACTOn basis of guidelines for development of QUALITY SYSTEM for a testing laboratory (European StandardSeries EN 45000) a quality assurance system was implemented in gamma spectroscopy laboratory, whereroutine measurements of natural (mainly Ra-226, Ra-228, Ra-224, K-40) and artificial (mainly Cs-137 andCs-134) isotopes are performed. We measure a variety of samples, but mainly coal, vaste rock, ashe, deposits,vegetation and air filters.
Laboratory of gamma spectroscopy in Central Mining Institute has three HPGe detectors. There is one coaxialdetector with 45% relative efficiency, one detector for low energy region and one detector with extendedrange). We have also two Ge(Li) detectors from former Czechoslovakia. Shielding is made mainly of steel (40cm) with the interior covered with lead and copper. The electronics and software (Genie-PC) was bought at„Canberra" and „Silená".
The paper describes not only the system of quality assurance but also main problems met by itsimplementation and results of intercomparison measurements. The QAS has been introduced in 1992. In1993 the Accreditation Certificate of Testing Laboratory for our Laboratory has been obtained from thePolish Bureau of Research and Certification as a fifth laboratory in Poland.
INTRODUCTION
Quality assurance is one of the most important requirements of unification of testing laboratories indifferent countries, according to EN 45000 standarts. It is especially important for testing and researchlaboratories, dealing with environmental and workplace monitoring, because there is an increasing demandfor assessment of data quality in environmental monitoring of natural radioactivity. The data from thesemeasurements are used not only for assessment of health effects but also for enforcement activities, theestablishment of guides or standards. Therefore the precision and accuracy of the data must be assured sothat desicions concerning environmental or occupational impact are based on data of known reliability.
Each laboratory providing environmental radiation measurements should have an internal quality assuranceprogram in operation to ensure, that instrumantation is calibrated properly and applied analytical proceduresare being carried out properly as well. Such program also includes continuous monitoring ofinstrumentation, frequent analysis of replicate samples to check precision and regular measurements ofsamples with known activity, to check the accuracy of the system. A very important role in QAS plays alsothe procedure of internal and interlaboratory intercomparison runs.
Central Mining Institute (CMI) is located in Katowice, the capital of Upper Silesia, an industrial area withmore than 60 coal mines, many coal-fired power plant, metallurgy factories etc. It is also the area withenhanced natural radioactivity, caused mainly by waste water and waste rock from underground coal mines.Laboratory of Radiometry in the Central Mining Institute is making measurements of the naturalradioactivity in coal mines and in the natural environment. Our work is aimed mainly to the radiationprotection of miners, monitoring of radioactive contamination of the natural environment and remedialactions, if necessary. We are also making measurements and testing of building materials and other samplesincluding foodstoof. We are also making measurements of radon concentration in mines, dwellings, soiletc.
PORTOROŽ 95 306

SESSION IV PROCEEDINGS
We have started to implement the quality assurance system in the 1990 according to EN 45000 standardand the ISO/IEC Guide No. 25. The formal application for the accreditation have been send in 1992 andthe accreditation has been granted in December 1993 by the Polish Bureau of Research and Certification.Our Accreditation Certificate of the Testing Laboratory is No 5 in Poland.
The scope of the accreditation is as follows:
measurements of concentration of radionuclides Ra-226, Ra-228, Ra-224, Pb-210 in liquidsamples, water and aqueous solutions;measurements of concentration of gamma-emitting radionuclides in solid samples;measurements of gamma doses and gamma dose-rates;measurements of potential alpha energy concentration of radon progeny in air;calibration of portable instrumentation for measurements of potential alpha energy concentrationin the air.
We would like to share our experience and present problems occurring during implementation andmaintaining of the quality assurance system. Our laboratory uses mainly three techniques: liquidscintillation spectrometry, gamma spectroscopy and thermoluminescent (TL) dosimetry. We would like toconcentrate on some problems only, with special emphasis on the gamma spectroscopy technique.
ORGANISATION
Laboratory of Radiometry (LR) employs fifteen people, divided into four groups. Three groups are doingmeasurements and testing. They are independent from another group doing expertise.
The main technique used in LR is liquid scintillation counting, which is used by first group for:
• determination of 226Ra, 228Ra and 224Ra in water and aqueous solutions;• determination of 210Pb in water and aqueous solutions;• measurements of 222Rn in air;• measurements of radon daughter products in air (as a reference method for calibration of other
instrumentation);
All listed above methods, but measurements of 222Rn in air are accredited.
Another group is making measurements of radon daughters concentration and gamma doses. For thesemeasurements TLD technique is applied. Only calibration of instruments for radon daughters measurementsis done by liquid scintillation counting.
The third group is doing measurements of concentration of gamma emitting natural and artificialradionuclides in solid samples such as:
• ashes and slags from power plants• coal• rocks and sediments• soil• river bottom sediments• • air filters• building materials• raw materials and industrial products• industrial waste products• foodstaff.
Measurements are done by gamma spectroscopy in energy range from 5 to 2000 keV, using HPGe andGe(Li) detectors.
Wide range of techniques gives used in our laboratory gives the opportunity to compare results, accuracyand precision obtained by different techniques of measurements.
PORTOROŽ 95 307

SESSION IV PROCEEDINGS
EQUIPMENT AND INSTRUMENTATION
The general director of the Institute declared to provide all necessary funds to maintain the top, updatedlevel of instrumentation and equipment and to make possible appropriate training of the staff. Thereforeour laboratory is very well equiped. The equipment and the system of quality assurance in the LSC part ofour laboratory is described elsewhere [1].
In our laboratory of gamma spectroscopy there are following detectors:
HPGe from PGT - with 45% relative efficiency• HPGe from Canberra for low energy region• HPGe from Silená - extended range detector, 28% relative efficiency• two Ge(Li) detectors from former Czechoslovakia.
Shielding is made mainly of steel (small pieces of stell scrap in boxes - total thickness 40 cm) with liningmade of lead and copper. Two HPGe detectors are coupled with electronics and software (Genie-PC) fromCanberra, another HPGe detector is connected with electronics and software from Silená. Ge(Li) detectorsare coupled with multichanel analysers NOKIA-POLON manufactured in Poland and equipped with ourown software for gamma spectroscopy analysis.
This instrumentation and software enables for example measurements of Ra-226 concentration as low as1 Bq/kg.
LABORATORY PROCEDURES
High quality of our test and measurements is assured by strict following laboratory procedures:
• receiving and registration of samples• preliminary preparatory of samples• measurements by gamma spectrometers• reports• calibration (calibration is made at least once a week)• internal tests (double measurements are required for at least 10% of samples)• interlaboratory tests ( must be performed at least once in a year)• preservation of samples and results after measurements (samples are kept at least one year)• audits• and other general procedures.
INTERNAL AND INTERLABORATORY TESTS
Internal test are often made and the results are carefully analysed on regular basis. The schedule andrequirements of internal tests is given in laboratory procedures.
Even more importance is given to interlaboratory tests [2]. There is a special procedure describing therequirements and responsibility for interlaboratory tests. Each interlaboratory test is concluded by astandard report, containing all information about participants and the test as well, in which the result isevaluated. In case the results are not satisfactory there is an analysis of possible errors and measures to betaken.
Although LR makes internal and interlaboratory tests in all subjects covering the described above activityof Laboratory of Radiometry, we will here give only some examples of determinations, made by gammaspectroscopy technique.
Internal tests
According to the laboratory procedure internal tests have to be done for at least 10% of all samples. Itincludes replicate measurements of the same sample on the same detector as well as measurements of thealiquots on the different detectors with applying of different software for data processing. Also cross-checking with liquid scintillation counting technique have been provided for radium isotopes in solid andliquid samples.
PORTOROŽ 95 308

SESSION IV PROCEEDINGS
If one of the results of double samples differs more then the accepted error, this case is analysed forpossible reasons and two additional measurements of such sample have to be made.
Results obtained for reference, standard and background samples are also stored and controlledperiodically, for monitoring long term stability of the instrumentation. Although standard and backgroundsamples give rather stable results, to avoid errors caused by fluctuactions of these parameters, three monthsaverage values are used for calculations of radioisotopes concentrations in analysed samples. Results ofmeasurements of a standard sample prepared from standard uranium ore provided by NBL mixed with coalof low natural radioactivity are given in Fig.2. These results cover a two years period. The concentrationof 226Ra calculated from a value declared by NBL is 1225 Bq/kg. The average measured value basing on186 keV line of 226Ra is 1227 Bq/kg with the standard deviation 36 Bq/kg. The average concentration ofthis isotope measured basing on 2I4Pb lines was 1255 Bq/kg with the S.D. 39 Bq/kg.
Fig. 1. BACKGROUND
oa
5
• Ra-226
m Ac-228
A K-40
X Cs-137
"—"trend for K-40
— trend for Ra-226
• — t r e n d for Cs-137
""•"•"" trend for Ac-228
8 10 11 12 13 14 15 16 17 18 19
number of measurement
Fig. 2. Uranium standard
1500
1400
• Ra-226
m Pb-214
—&— nominal activity
1 3 5 7 9 11 13 15 17 19 21 23 25 27 29 31 33 35 37 39 41 43
number of measurement
PORTOROŽ 95 309

SESSION IV PROCEEDINGS
Results of measurements of background using as a sample an empty container are given in Fig.l.Results obtained in the area of lines of most often measured radioisotopes are given in this figure.Correlations of results of double measured samples are shown on Fig.3a and 3b.
Fig.3a. Results of measurement of replicate samplesRa-226
10000
N
c 1000
: loo
u
101
===EEEE=ÍEEi3E=
; i i. i v - i i
1 : I I - ; 1
»h-
:x'::*::::'::.::".:
i::::::::::::::::::::::: : • : •
A
•:±>
-;-:
?•'-"•
,•.•••• ••:.:.!..v-.v
:
...
-
: :
.tí
M
v
i!•f!; ;
=-Í;OI2(
ť =0.95
1íSíä> i j j [i
i : |
f
• results
linear regression
10 100 1000
measurement 1
10000 100000
Fig. 3b. Results of measurement of replicate samplesRa-228
100000
• esu*ttieacgessňn
ipi: ooo
measurement 1
Interlaboratory tests
Our laboratory participated on regular term in two international intercomparison programmes:
1. Intercomparison organised by IAEA, which includes determination of different isotopes in diferentmaterials, as sea sediments, soils, fish, milk etc. In this programme all results are compared with thegrand average obtained by all participants, but outlayers [3].
2. Intercomparison organised by US EPA - within this programme samples are distibuted regularly. Weparticipated particularly in determination of gamma emitting isotopes and radium isotopes in water.Results are compared with a known value and with a grand average. In this programme results aregiven very fast, during the couple of months [4,5,6].
We also participate occasionally in other bilateral interlaboratory test in Poland and with our foreignpartners. The results of one of intercomparison runs performed within EPA programme are shown on Fig.4.
PORTOROŽ 95 310

SESSION IV PROCEEDINGS
According to our Quality Manual interlaboratory tests must be done at least once a year for each certifieddetermination. The only exception is measurements of radon daughters in air, because organisation of suchintercomparison is difficult.
Fig.4. Results of intercomparison measurement
EPA "Gamma in Water" exercise 10.06.94
300
250
200
150
100
50
concentration [pci/1]
Zn-65
Ba-133
Co-60 Ru-106 Cs-134 Cs-137
•-T- • ~ T " • • ±2Z* • £ • •
*¥* *¥* <^v<"
AUDITS
Complete internal audits are carried out at least once a year. In any circumstances, when changing any partsof the procedures or introducing new members of staff or even during holiday replacements we are makingadditional internal audits. Our special concern is a friendly and open relationship and trust between thehead of the laboratory and scientific and technical staff as well as among the entire group. To maintain aclose contact every day get together with a briefing and coffee are held. On this briefings all currentproblems are discussed and main decision are given.
Once a year a general audit by a scientific director of the institute is done. At this occasion the plan of workand general trends of our activity as well as basic needs are discussed. Also results of interlaboratory testare presented. Each year an audit by auditors from Polish Bureau of Research and Certification has to bemade. All certified activities are controlled during the external audit, with a special emphasis on onespecific type of measurements. Last time the gamma spectroscopy laboratory was checked.
MAIN PROBLEMS IN IMPLEMENTATION AND MAINTENANCE OF QAS
The first problem, which we faced during implementation of quality assurance system in our laboratorywas connected with psychological aspects of this system. We had to change our minds in aspectsconcerning sample preparation, data acquisition, sample storage and reporting of the results.
Another problem concerns reference materials and intercomparison runs. The best intercomparison run (inour opinion) - the EPA programme - has been temporary ceased for foreign participants since 1994. TheIAEA programme is good due to very wide variety of different samples but sometimes not very convenient- reporting of results one year or more after measurements is not very helpful for participants. The lack ofdomestic intercomparison programme forced us to make some intercomparison measurements based onprivate contacts. We feel an urgent need of such programme in Poland.
PORTOROŽ 95 311

SESSION IV PROCEEDINGS
We think, that many problems which we found during implementation of QAS in our laboratory would beavoided if we could learn from someone elses experience in this subject. Therefore it would be very helpfulto establish a close contact between laboratories with implemented QAS system.
Now the main problem consists in overloading with work, because there is difficult to predict the need fortests and provide appropriate training of new staff and sufficient space in the laboratory.
CONCLUSIONS
European norms EN 45000 and the ISO guide are very helpful in introducing of quality assurance in atesting laboratory. However, because of the specific field of activity and conditions, most arising problemsmust be solved by the laboratory head and personnel. From our experience there is clear that only veryclose and good co-operation of the all personnel allows introducing and maintaining quality assurance.
We found that international intercomparison runs and exchange of reference materials is especially helpfulin constant proving and maintaining the quality of tests and measurements. Additionally, these tests givethe opportunity to get new scientific contacts and co-operation.
One of the main difficulties consists in keeping a rhythmic work of the laboratory. This is caused bychanging and unpredictable needs for research and test from the industry and authorities. On the other handit is more difficult for an accredited laboratory to be flexible, because the selection and the training of thestaff must be more careful and the laboratory must fulfil a certain standard.
Up to now we have not a contact with other accredited gamma spectroscopy laboratories, so all arisingproblems must be solved ourselves.
Concluding we can say that after two years of experience all the personnel of the laboratory is very satisfiedof achieved level of work, even those who were rather reluctant at the beginning of the process.
REFERENCES
1. Chalupnik, S., Lebečka, J., Mielnikow, A., Michalik, B., Skubacz, K. and Lipowczan, A., 1994, Results ofintercomparison measurements in radiometric laboratory with implemented quality assurance system. Nukleonika, (inpress).
2. Lebečka, J. et. al., 1994, Quality Assurance System in the Central Mining Institute LSC laboratory, IV Int. Conferenceon Advances in Liquid Scintillation Counting, Glasgow (in press).
3. IAEA, 1993, Report on the Intercomparison Run IAEA-135 "Radionuclides in Irish Sea Sediment", IAEA/AL/063,Vienna.
4. EPA, 1994, Blind-A Performance Evaluation Study 19-Oct-1993, Report EPA 600/R-94/15A, Las Vegas.5. EPA, 1994, Uranium - Radium in Water Performance Study 1 l-Feb-1994, Report EPA 600/R-94/078, Las Vegas.6. EPA, 1994, Gamma in Water Performance Study 10-Jun-1994, Report EPA 600/R-94/168, Las Vegas.
PORTOROŽ 95 312

SESSION EV PROCEEDINGS
XA05C0081
DETERMINATION OF THE SELF-ABSORPTION IN ENVIROMENTALSAMPLES OF MARINELLI-GEOMETRY AND HPGe-DETECTORS
USING MONTE-CARLO-SIMULATIONS
H. Russold, Hj. Müller, H. Rabitsch, W. Ninaus
Abteilung für Strahlenphysik, Institut für Theoretische Physik,Technische Universität Graz, Petersgasse 16, A-8010 Graz, Austria
INTRODUCTION
Measuring smallest activities requires high efficiencies and large sample volumes. Both demands are wellaccomplished by a Marinelli-beaker geometry. Because of the relative long mean path lengths comparedto the mean free paths of photons in the sample material the measurement is affected by the self-absorptionin the volume source.
It is the purpose of this study to calculate self-absorption correction factors CSA making use of the Monte-Carlo-transport-code EGS4 simulating Marinelli-geometry and HPGe-detectors for photon energies in therange from 20 keV to.2 MeV. Fitting the results of the Monte-Carlo-calculations yielded an analytical termwhich covers the desired energy range as well as arbitrary chemical compositions and densities ofenvironmental samples from 0.1 g/ccm to 2.0 g/ccm.
THEORY AND BASIC FORMULAS
The self-absorption correction factor is defined as the ratio of efficiencies of the sample (s) and thereference (rej) material for a certain photon energy E
e (E)c OFor a fixed geometry and a reference material CM depends only on the sample material. To show this, wedivide the measuring system into the three components : source, attenuation, and active detector. Thesource is the sample material containing homogeneous destributed radio nuclides. We call active detectorthe active volume of the Ge-detector crystal. All materials that photons have to pass on their way from thesource to the active detector are accounted to the attenuation. These attenuating materials are essentiallythe Aluminium end cap and the inactive layer of the detector crystal. The efficiency contains, apart fromthe geometry factor, three more special factors which characterize these above mentioned components :
e(ns,E,g,nD) =fG(g)- PeSc(S^s) • t(£,HD) • e (E, g) (2)
fc(g) Geometry factor: The part of the photons in direction of the active detector. It is onlygeometry dependent (parameter g).
Pesc(g,nJ Escape-propability : The part of the photons flying to the active detector whichescape the source unattenuated. It depends on the geometry g and on the linearattenuation coefficient fis of the sample material.
t(g,pD) Transmission-coefficient The part of the photons flying in the direction of the activedetector which penetrate the attenuation without any lost. It depents on the geometryg and on the attenuation materials / i o .
e(E,g) Efficiency of the active detector: The part of the photons entering the active detectorwhich contribute to the peak efficiency . It depends on the geometry g and on thephoton energy E.
Using the separation form of eq.(2) for the efficiency it is possible to prove that CM depends only on thesource specific term Pesc(fis) provided for identical geometry g for sample and reference materials:
PORTOROŽ 95 313

SESSION IV PROCEEDINGS
valid for &ref (3)
With the aid of the exponential attenuation law (J(x) ... unattenuated photon current in direction to thedetector after the penetration of a medium /is of the thickness x;J0... original photon current in directionto the detector)
J{x) =
it can also be shown that Pesc for a line source (length Ľ) and with a point detector is given by :
(4)
(5)
The same result can be obtained for a spherical-shaped volume source (thickness L) and with a centric pointdetector (O. Sima, 1992 ). For that reason eq.(5) is the basic term in fitting the numerical data of Pesc.
The Monte-Carlo-transport-code EGS4 simulates the photon and electron transport through differentmaterials in three dimensional geometries. The unattenuated photon current and the energy depositionswere calculated in defined zones. For the sake of simplicity in the geometry description of the program theslightly conical Marinelli-beaker was transformed into a cylindrical beaker of the same volume 1000 ccm
Al-End cap(attenuation)
Inactive Ge-Layer(attenuation)
Active Volume(active detector)
Crystal Hole
Fig. 1: Geometry used for the simulation with EGS4 (HI = 7.17 cm, H2 = 9.58 cm, Rl = 4.34 cm, R2 = 6.94cm).
THEORETICAL AND EXPERIMENTAL RESULTS
A) Comparision of Experiments and Simulations:
The efficiencies of three volume sources in Marinelli-geometry with known chemical compositions andactivities were measured and the self-absorption coefficients relating to water were calculated using eq.(l).These experiments were also simulated with EGS4 and CSA was calculated relating to water using a) theunattenuated photon current i.e. Pesc (eq.(3)) and b) the energy deposition (eq.(l)). The results are comparedin fig.(2).
PORTOROŽ 95 314

SESSION IV PROCEEDINGS
1.81.61.41.21.0
° 80.60.40.20.0
10
-f-fi
! i r-\ j f
•44-
4+í4-4-i-rOh >
4-1
..u.i I
111
POLYSTYROL - WATER p = 0.37 g/ccm
J ]j
. . . j i....|4
- -f - j- i- \—-\ j—-f—f •
........ni. _ i i M i
í ...L i I...... QUARZSAND - WATER
i•4 4 - j I-4-4
i i i i i i! I I I ! '
p = 1.99 g/ccm ! i4 1 U-
i i ! i
100 1000PHOTON ENERGY [ keV ]
10000
Fig. 2.a: Self-absorption coefficients calculated by the unattenuated photon current compared to experimentalresults (squares are experimental results).
1.41.21.0
E 0.8
0.60.40.20.0
3-i—M-
i4 i f-4-4-4i j !...i..j í.
i ! i
POLYSTYROL -WATER p = 0.37 g/ccm
asp ....LfTT
i •! I-1 ;I I I I I I I
QUARZSAND -WATER p = 1.99 g/ccm
i !f I I I ITT
.i.-..! i L.I I I 1 !
10 100 1000PHOTON ENERGY [keV]
10000
Fig. 2.b: Self-absorption coefficients calculated by the photon energy deposition compared to experimentalresults (squares are experimental results).
B) Analytical term for Pesc:
The escape-probability for Marinelli-geometry was simulated for a linear attenuation coefficient up to 5cm"'. This corresponds to SiO2 with a density of 2.0 g/ccm and a photon energy of 20 keV.
With regard to eq.(5) and the exponential attenuation law eq.(4) we found the following analytical term forPex by fitting the calculated escape-probabilities using EGS4 :
1 -• e (6)
CONCLUSIONS
We report a good agreement of simulated and experimental results for the self-absorption coefficients CSA.The calculation of CSA by simulating the escape-probability (eq.(3)) must be prefered because it requiresmuch less computation time for the same accuracy as by simulating the photon energy deposition in thedetector crystal.
Eq.(5) reflects the general behaviour of the escape-probability versus the linear attenuation coefficient,however it is only useful for small values of fis (fig.(3)). The additional factors in eq.(6) allow a very goodfit of Pesc(ns) for linear attenuation coefficients up to 2 cm"1.
Finally, the known analytical term eq.(6) allows to define a self-absorption correction curve for a certainphoton energy E as it is shown in figure (4) for K 40 and Cs 137. If the photon energy, the chemicalcomposition, and the density are known, it is possible to find the corresponding self-absorption coefficientCSA with the linear attenuation coefficient /JS and the function Pesc (ps ) . Examples of self-absorptioncoefficients for some environmental samples were calculated in table (1).
PORTOROŽ 95 315

SESSION IV PROCEEDINGS
UM
S.
1.00.90.80.70.60.50.40.30.20.10.0
0
H
"i
11!i
~T r; i „
í 1f-ri i1 11 i! !..... ...
rr
L i
,J
! i
1tt
!
11J...Ln
. —j-...i_4...i_
i IM
!
.ztm i
._ .-.-..^ -j ^1 !1
1"T
i
" RJŇC...„...._...,
——
! !ÍTÍ i
M
! !n"i Í
i ;
i t
itid.M3
JJ-iľí'T
—rii
~ "Ť"í
p
i
i— j
~ii
1 1 M
i m1 TTti 1 M
nrrM i l
FUNC 2
. . . 7 7 ^ ,
1
i l l !i M i
1 1
rriÍT
Ms
j j
r í•4-
01 0-10 p[1/cm] 100 10.00
Fig. 3: Calculated escape-probabilities Pesc versus the linear attenuation coefficient \i of the sample materialcompared to analytical functions found by fitting.(FUNC 1 = eq.(5) with : a] = 2.966 cm; FUNC 2 = eq.(6) with:a[ = 3.573 cm, a2 = 3.613 cm, a3 = 0.368 cm, a4 = 1.251 cm)
O.O1 0.10 p [1/cm] 1.00
Fig. 4: Correction curves for the self-absorption coefficient relating to the reference medium water and for thephoton energies of Cs 137 and K 40 calculated by eq.(3).
Water
SilicondioxidMannose
Muscle striated
Honey (15% H2O)Soil (try)
Plant (try)
Densityg/cm3
1.01.60.81.01.31.80.2
Csl37: 661.66 keVu/p
cm2/g
0.08621
0.077690.08274
0.085430.083260.07494
0.08231
MI/cm
0.08621
0.12430
0.066190.085430.108240.134890.01646
CSA-
1.0000.952
1.0271.0010.9720.940
1.099
K 40 : 1460.83 keVp/p
cmVg
0.05858
0.052770.056230.058040.056580.050870.05490
MI/cm
0.058580.08444
0.044980.058040.073560.091570.01098
CSA-
1.0000.966
1.0181.0010.9800.957
1.067
Table 1: Examples of environmental samples with their densities and calculated self-absorption coefficientsCSA for the nuclides Cs 137 and K 40 relating to water.
REFERENCE
1. SIM A Octavian; Photon attenuation for samples in Marinelli beaker geometry: an analytical computation. Health Phys.62(5): 445-449; 1992.
PORTOROŽ 95 316

SESSION IV
XA05C0082PROCEEDINGS
ENVIRONMENTAL DOSE MEASUREMENT WITH MICROPROCESSORBASED PORTABLE TLD READER
S. Déme, I. Apáthy, I. Fehér
KFKI Atomic Energy Research Institute, P.O.Box 49, H-1525, Budapest, Hungary
INTRODUCTION
Application of TL method for environmental gamma-radiation dosimetry involves uncertainty caused bythe dose collected during the transport from the point of annealing to the place of exposure and back to theplace of evaluation. Should an accident occur read out is delayed due to the need to transport to a laboratoryequipped with a TLD reader.
A portable reader capable of reading out the TL dosemeter at the place of exposure ("in situ TLD reader")eliminates the above mentioned disadvantages. We have developed a microprocessor based portable TLDreader for monitoring environmental gamma-radiation doses and for on board reading out of doses on spacestations. The first version of our portable, battery operated reader (named Pille - "butterfly") was made atthe beginning of the 80th [1,2]. These devices used CaSO4 bulb dosemeters and the evaluation techniquewas based on analogue timing circuits and analogue to digital conversion of the photomultiplier currentwith a read out precision of 1 uGy and a measuring range up to 10 Gy. The measured values were displayedand manually recorded. The version with an external power supply was used for space dosimetry as anonboard TLD reader [3].
RESULTS OF RECENT DEVELOPMENT
Based on a microprocessor an up to date version of the battery operated portable reader was developed in1994-95 at the Atomic Energy Research Institute. The main results of the development were:
1. Increased sensitivity of the reader by one order of magnitude.2. Improved precision of the measurement using automatic correction of the individual dosemeter
sensitivity and of the temperature dependence.3. Programmable heating current profile, e.g. to product a quasilinear temperature increase up the
bulb heating plate.4. Automatic data processing and subsequent storage on a memory card of the processed data, date,
time, dosemeter identification number, dose, the digital glow data and environmental temperature.5. Possibility of the programmed automatic read out of a dosemeter placed in the reader to measure
the time distribution of the dose rate.
CONSTRUCTION
The new system consists of a set of TL bulb dosemeters with built in memory chips, and the microprocessorbased reader. The CaSO4:Dy bulb dosemeter is the same as the earlier one [1].
A block diagram of the reader is given in Fig. 1. The TLD bulb has a common case with the memory chipcontaining the identification number and individual readout characteristics (sensitivity, time limits ofintegration and background) of the bulb.
The DC/DC converter type heating supply as well the high voltage supply for photomultiplier tube arecontrolled via digital-analogue converters by the microprocessor thereby providing the possibility toprogram the time dependence both of the heating current (e.g. to obtain quasilinear or steplike temperatureprofiles) and of the high voltage (to change the sensitivity of the photomultiplier tube in autorange mode).
PORTOROŽ 95 ' 317

SESSION IV PROCEEDINGS
ROM c h i p •—••— ROM r e a d e r
TLD bulb • -» P M T
Heatingsupply
nReference
lightsource
DAC
• RS-232
Removablememorycard
Carddriver
Microcontroller (Intel 80C31)
Power Timer ADC — « — Thermometer
Fig. 1: Simplified block diagram of the reader.
The light output of the bulb dosemeter is measured by a photomultiplier, a wide range I/U converter, anda digital voltmeter. (The range of the light detecting system exceeds 8 orders of magnitude.) The built in,stabilized LED light source controls the light sensitivity of the reader in each measuring cycle.
The four digit alphanumeric LED display indicates the measured dose in exponential form, the possibleerror codes and the menu/submenu points of the setup. The removable memory card can store up to 4000measured data sets (dose, identification number, date and time, and digital glow curves).
The front view of the reader is to be seen in Fig.2. The mass of the battery operated version of the readeris about 2.5 kg, its dimensions are 190 x 155 x 70 mm. The rechargeable battery (10.8 V) provides capacityfor about 200 read-outs. The reader also works from a 12 V or 24 V car battery in buffer mode. The spaceversion is supplied by 27 V d.c.
The glow curve of a CaSO4:Dy bulb irradiated with 0.5 mGy dose of gamma-radiation is given in Fig.3.At higher doses the glow curve is distorted by high temperature peaks. This effect requires nonlinearitycorrection, performed by the software of the reader.
X. x X n
DDDDREP MDE MNU
(S) (S) ©SUB SET ENT Pille' 94E(o) (o) (o) KFK1AEK1
Charge on o
Battery low O
orBattery
190 mm
Fig. 2: The front view of the reader.
PORTOROŽ 95 318

SESSION IV PROCEEDINGS
F 1 lenAnBI act« nDataT i r*«Bulb l aBulb Ätn
«suribwr-
ng IDo r t ID
C H «< d «
»x >I C )
g l u O 3 1 6 . d a t2 1 O9S.OS.±S.
OOOOOO1EE993S
Evaluationi_« r t c=u tNaxinun atMor-r» . f «etc
2O Evaluation length : 5O6 .6X Right cut : 59 .5X56 M-Mxinur» v — lu*» ľ 12.989OOO.O Dos« : 364.4OllľQ
Fig. 3: The glow curve of a CaSO4:Dy bulb irradiated with 0.5 mGy dose and additional data stored inmemory card.
The environmental temperature influences both the position and the area of the glow curve. Using the builtin digital thermometer this effect can be taken into account.
The lower limit of the dose measurement with o = 10% is equal to 3 uGy, i.e. an environmental dose ofone or two days.
The dosemeter has low light sensitivity: it can be evaluated in a room having moderate illumination fromfilament lamps, or in scattered daylight of low intensity.
APPLICATIONS
The system is utilizable both for environmental monitoring and measurement of doses on board mannedand unmanned space vehicles.
Environmental doses can be measured using in situ read out of the dosemeters. The wide measuring rangeof the system (3 uGy -10 Gy) provides the possibility to measure dose values from natural background upto very large accidental doses. The in situ measurement makes it possible to avoid the transit dose whenmonitoring the normal environmental gamma radiation and to obtain the dose values immediately in caseof an accident.
CONCLUSIONS
The development of an up to date microprocessor based portable battery operated reader was completedduring 1994-1995. The lower limit of measurement with o = 10% is equal to 3 uGy, at higher doses up to10 Gy, the reproducibility is in the range of 1-2%. The measured data together with digital glow curves arestored in the removable memory card of the reader. With a portable TLD system the transport dose - thatnormally gives a systematic error during environmental dosimetry - is avoided and the data availabilityaccelerated in the event of a nuclear accident.
REFERENCES
1. Szabó, P.P., Fehér, I., Deme, S., Szabó, B., Vágvolgyi, J., Germán, E., Environmental monitoring with a portable TLDsystem. Radiat. Prot. Dosim. 6(1-4) 100-103 (1983).
2. Szabó, P.P., Fehér, I., Deme, S., Szabó, B., Vágvolgyi, J., Dosimetrical properties of the portable wide dose rangeTLD reader "PILLE". Radiat. Prot. Dosim.. 17(1-4) 279-282 (1986).
3. Akatov, Yu. A., Arkhangelsky, V.V., Aleksandrov, A.P., Fehér, I., Deme, S., Szabó, B., Vágvolgyi, J., Szabó, P.P.,Csôke, A., Ranky, M., Farkas, B., Thermoluminescent dose measurements on-board Salyut type orbital stations. Adv.Space Res. 4(10) 77-80 (1984).
PORTOROŽ 95 319

SESSION IV ll<l^<l<>l|||||||||||Illlllllll|l<lllllKII PROCEEDINGSXA05C0083
ONION ROOT TIP CELL SYSTEM FOR BIODOSIMETRY?
J. Paradiž °, B. Druškovič l>, J. Škrk2) and M. Lovkal)
l) National Institute of Biology Ljubljana, Karlovška 19, POB 141, 61000 Ljubljana, Slovenia2 ) Institute of Oncology, Department of Radiobiology, Zaloška 2, 61000 Ljubljana, Slovenia
KEYWORDS: AUium cepa L., gamma ray irradiation, cytogenetic dosimetry
INTRODUCTION
Methodology for radiation dose assessment based on chromosomal damage to plant cells has no yet beenestablished, although root meristems have been the pioneer cytogenetic materials and profound analysesof irradiated meristematic cells of horse bean (Viciafaba L.) (1) had been performed. Onion (Allium cepaL.) root tips frequently used for radiation cytogenetic studies (2), are recently considered to be one of themost promising plant test system for the detection of genotoxic environmental pollutants (3). We studiedthe possibility of using cytogenetic analyses of irradiated onion cells to determine the effective biologicaldose of ionizing radiation.
The dose-effect relationships for chromosomal damages to onion meristematic cells were established afterplants had been irradiated and subsequently grown in both laboratory and field conditions.
MATERIAL AND METHODS
Onions were irradiated with ^Co gamma rays in two sets of experimental plants. In the first, 10 equallysized onion bulbs were placed in tap water for rooting at a room temperature of about 20 °C. The water waschanged daily. 2-3 cm long roots were irradiated with 1 Gy, 3 Gy, 5 Gy or 8 Gy at a dose rate of 1.6Gy/min. Samples for cytogenetic analyses were taken at intervals of 6, 12,24, 30,48, 54,72 and 78 hoursafter each irradiation. In the second series, groups of 10 dormant onions bulbs were irradiated with 10 Gy,20 Gy or 30 Gy at a dose rate of 1.8 Gy/min. Roots for cytogenetic analyses were sampled 6, 8, 11, 15 and20 days after the irradiated bulbs were planted in clay pots and grown in field conditions.
Squash-slides of onion root tips were prepared for cytogenetic analyses using standard methods: fixationin 3:1 ethanol-acetic acid, hydrolysis in 3N HCL at 60 °C for 3 minutes, staining by the Feulgen method,and maceration in aceto-carmine. In each sample, the mitotic indices (MI), frequency of chromosomallyaberrant cells (AC) in the anaphase and early telophase, as well as the frequency of interphase cells withmicronuclei (MN) were determined. The average MI and MN values were obtained from the analyses of5-6 slides (500-2000 cells per slide) for each experimental group and time of sampling. Generally 100anaphases and 50 telophases were analyzed from each of the two slides of an experimental group and timeof sampling.
RESULTS
In the controls, MI had a more or less constant value of 6.0-7.7%. But in irradiated root tips the averageMI value indicated a dose dependent mitotic delay. After irradiation with 1 or 3 Gy, MI values did notsignificantly differ from the controls till 78 hours after treatment, while after irradiation with 5 or 8 Gy, MIvalues decreased with the increasing doses and prolonged sampling intervals (Fig. 1).
The control samples had the low rate of 0.3-0.4% of aberrant cells in the anaphase and early telophase. Inirradiated roots, the highest AC values were recorded 6 hours after irradiation. All AC were to be dosedependent except those analyzed after 30 hours (Fig. 2).
PORTOROŽ 95 320

SESSION IV PROCEEDINGS
6 h 12 h 24 h 30 h 48 h 54 h 72 h 78 h
Fig. I: Laboratory: Percentage of mitotic indices (MI) in irradiated onion tip meristems compared to thecontrols.
D Controlü 1 Gyü3Gy• 5Gy• 8Gy
S h 12 h 24 h 30 h 48 h 54 h 72 h 78 h
Fig. 2: Laboratory: Percentage of chromosomally aberrant cells (AC) in irradiated onion tip meristemscompared to the controls.
D ControlH 1 Gy• 3Gy• 5Gy• 8 Gy
6 h 12 h 24 h 30 h 48 h 54 h 72 h 78 h
Fig. 3: Laboratory: Percentage of interphase cells with micronuclei (MN) in irradiated onion tip meristemscompared to the controls.
PORTOROŽ 95 321

SESSION IV PROCEEDINGS
In control plants, cells with micronuclei were present in very low frequencies (0.01-0.02%). Theiroccurrence increased with time after irradiation and were also dose-dependent (Fig. 3).
In field conditions, MI values in control plants were 7.6-9.4% in all sampling intervals, while the averageMI value in onions irradiated with doses higher than 10 Gy decreased with the dose and longer samplinginterval. Dose of 20 Gy or 30 Gy led to a complete mitotic blockade in 15 days in all samples analyzed(Fig. 4).
14O U ControlM 10 Gy• 20 Gy• 30 Gy
6 days 8 days 11 days 15 days 20 days
Fig. 4: Field conditions: Percentage of mitotic indices (MI) in root tip meristems of irradiated onoion bulbscompared to the controls.
In field conditions, in control plants no more than 1% of AC in the anaphase and early telophase wereobserved during the 20 day growth period. In irradiated onions, the highest AC values were recorded in thefirst 10 days and were dose-dependent. With 10 Gy AC tended to decrease with time after irradiation (Fig.5).
D ControlM 10 Gy• 20 GyO• 30 Gy
0.215 0.93
6 days 8 days 11 days 15 days 20 days
Fig. 5: Field conditions: Percentage of chromosomally aberrant cells (AC) in root tip meristems of irradiatedonoion bulbs compared to the controls.
PORTOROŽ 95 322
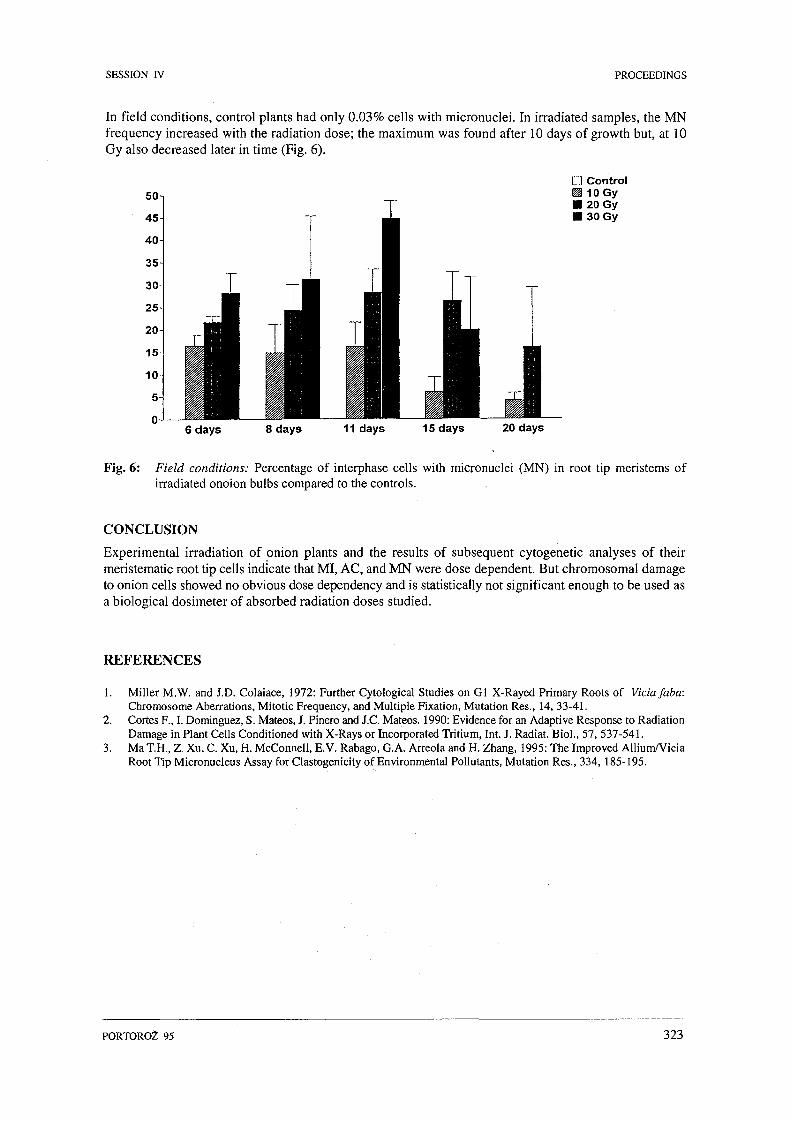
SESSION IV PROCEEDINGS
In field conditions, control plants had only 0.03% cells with micronuclei. In irradiated samples, the MNfrequency increased with the radiation dose; the maximum was found after 10 days of growth but, at 10Gy also decreased later in time (Fig. 6).
LI ControlM 10 Gy• 20Gy• 30Gy
6 days 8 days 11 days 15 days 20 days
Fig. 6: Field conditions: Percentage of interphase cells with micronuclei (MN) in root tip meristems ofirradiated onoion bulbs compared to the controls.
CONCLUSION
Experimental irradiation of onion plants and the results of subsequent cytogenetic analyses of theirmeristematic root tip cells indicate that MI, AC, and MN were dose dependent. But chromosomal damageto onion cells showed no obvious dose dependency and is statistically not significant enough to be used asa biological dosimeter of absorbed radiation doses studied.
REFERENCES
1. Miller M.W. and J.D. Colaiace, 1972: Further Cytological Studies on Gl X-Rayed Primary Roots of Viciafaba:Chromosome Aberrations, Mitotic Frequency, and Multiple Fixation, Mutation Res., 14, 33-41.
2. Cortes F., I. Dominguez, S. Mateos, J. Pinero and J.C. Mateos. 1990: Evidence for an Adaptive Response to RadiationDamage in Plant Cells Conditioned with X-Rays or Incorporated Tritium, Int. J. Radiat. Biol., 57, 537-541.
3. Ma T.H., Z. Xu, C. Xu, H. McConnell, E.V. Rabago, G.A. Arreola and H. Zhang, 1995: The Improved Allium/ViciaRoot Tip Micronucleus Assay for Clastogenicity of Environmental Pollutants, Mutation Res., 334, 185-195.
PORTOROŽ 95 323

SESSION IV PROCEEDINGS
XA05C0084
A WHOLEBODY COUNTER WITH SEMICONDUCTOR DETECTORS FORRADIATION PROTECTION MEASUREMENTS
E. Lovranich '>, L. Riedlmayer ", H. Jany '>, F. Steger '>, A.Andrási2)
0 Austrian Research Center Seibersdorf, Department Radiation Protection, Seibersdorf, Austria2) Atomic Energy Research Institute, Health Physics Department, Budapest, Hungary
ABSTRACT
At the Austrian Research Centre Seibersdorf a Wholebodycounter with semiconductor detecors was designedand installed. The measurement geometry is the 'Scan-Geometry'. Two high-purity germanium detectors (each30% relative efficiency) are scanning across the person, one below and the other above the person. Bothdetectors are shielded with a lead-shield. The wall-thickness is between 2 and 4 cm. It is also possible to useadditional lead-collimators in different shapes. Physical characteristics as longitudinal, transversal andvertical variations of efficiencies were measured. Calibration measurements were done with the BGA-Phantomin different sizes and lower limits of detection were calculated. This Wholebodycounter is very convenient forradiation protection measurements, although the shielded room where it is situated has not extremely goodlow-level conditions.
í ..
.«•' i
V í
i» -
• ; • :
' * ' ^
Fig. 1: HPGe-Wholebodycounter Seibersdorf
PORTOROŽ 95 324

SESSION IV PROCEEDINGS
INTRODUCTION
For the measurement of incorporated gamma-ray emitting radionuclides with Wholebody-counters eventoday mainly NaI(Tl)-Detectors are used. These type of detectors were introduced in the fifties and theywere a great progress for the gamma-spectroscopy in this years. ([1],[2],[3]) NalCTty-Detectors wereproduced in almost any shape and size, but the energy-resolution was limited by the physics. Therefore onecould built high-sensitive Wholebodycounter in connexion with heavy shieldings, but, because of the poorenergy-resolution, the precise separation of gamma-lines in the spectrum in the case of incorporation of aradionuclide-mixture was aggravated. These experience could be made by any Wholebodycounter-Operatorimmediately after the reactor accident of Chernobyl in April/May-1986, when gamma-spectra mainlyconsists of overlayed peaks, which needs excellent software and great experience for peak deconvolutionand evaluation. Since this time we considered to use semiconductor detectors with our Wholebodycounter.We were corroborated in our intention by other colleagues, who made already use of this option and builtdifferent types of bodycounters with this detector-type. ([4],[5]) At the end of 1986 we got for In-Situ-Measurements a portable HPGe-Detektor with a 2-litre-dewar and we integrated this detector in our oldChair-Type-Wholebodycounter. Since 1987 we take measurements in addition to the four NaI(Tl)-detectorswith the semiconductor detector. Due to the excellent energy-resolution (< 2 keV) and the size of thedetector (about 30% relative efficiency) the lower limits of detection were near the values of thescintillation detectors (4 pcs. 3"x3" Nal(Tl)). In the year 1991 we got a second HPGe-detector, this fixedour decision to build a Wholebodycounter equipped only with semiconductor detectors.
FEATURES OF THE NEW WHOLEBODYCOUNTER (Fig. 1)
• Detectors, Measurement Hardware & Software• two portable HPGe-Detectors, 30% relative efficiency, 7-litre-dewar• upper detector „n-type" for measuring low gamma energies (e.g. t2SI)• lower detector „p-type"• via Ethernet controlable electronics (Canberra)
Detector-High-Voltage Power SupplyLinear AmplifierAnalog-to-Digital ConverterAquisition-Interface-Module (Multichannelanalyzer)
PC with Operating System OS/2Genie-PC Software Package for control (settings and function) of the hardware-modules, high-resolution gamma spectroscopy measurement and evaluation(Canberra)Data storage and managementQuality assuranceControl software for the detector scanning system
• Mechanics• Scan geometry (size of the bed 210 x 60 cm)• linear scan in the longitudinal direction of the person• one detector below the bed, fixed in height• one detector above the bed, variable in height• bed adjustable in height in 2cm steps• detectors with lead-shielding• movement of the detector scanning system with Steppermotor and spindle• adjustable scan speed (0.1 - 30.0 mm/s)
• Shielding• „Outer Shield" with 30cm low activity concrete, 7 cm steel on.the floor, 1 cm steel on the
walls and ceiling• detector shielding with lead of 2 cm to 4 cm wall-thickness, the shielding is open towards
the person with an area of 22 x 30 cm• slotted collimators with slot sizes of 2 cm, 4 cm and 8 cm
PORTOROŽ 95 325

SESSION IV PROCEEDINGS
; . ; . , . . ; . : . : : : ; ; : • ; :
Fig. 2: Calibration measurements (Bottle-Phantom)
1. Calibration of the Wholebodycounter (Fig. 2)
The calibration for homogenous distributed radionuclides were performed with a Bottle-Phantom(Andrasi-type) and I6firaHo with a halflife of 1200 years. Fig. 3 shows the results.
Wholebodycounter - PeakefficiencyHomogenous distributed activities in Bottle-Phantom
Distance Detector-Phantom: upper 9 cm, lower 7,5 cmPeakefficiency x10-4
100Energy (keV)
HPGe WholebodycounterSEIBERSDORF
+40 kg Phantomh-70 kg Phantom+90 kg Phantorrf PE.kg-1 .drn
Fig. 3: Peak efficienies for different bodyweights.
PORTOROŽ 95 326

SESSION IV PROCEEDINGS
2. Lower limits of detection (GMFA)
The lower limits of detection were calculated according to [6] (3a, 1000s measuring time). Table 1gives the results.
60keV
662 keV
1332 keV
40 kg60
35
35
70 kg90
50
50
100 kg100
55
60
Table 1: Lower limits of detection [Gamma-Bq].
DISCUSSION
The results demonstrate, that the lower limits of detection are equal to that of NaI(Tl)-Detectors. Due totheir excellent energy-resolution HPGe-Detectors are superior compared to NaI(Tl)-Detectors, especiallyin case of unknown radionuclides.
LITERATURE
1. Marinelli L.D., Miller C.E., Gustafson P.F., Rowland R.E.: The Quantitative Determination of Gamma-Ray EmittingElements in living Persons. Amer.J.RoentgenoI. 73 (1955) 661-671.
2. Rundo J.: Determination of Radio-Caesium Content of Contemporary Man. Meas. on Subjects at Harwell.Brit.J.Radiol.Supp. 7 (1956) 125-127.
3. Miller C.E.: The Human Spectrometer. ANL-5829 (1959) 144-166.4. Workshop on the use of Germanium detectors for Wholebody and Organ Burden Analysis. EG&G Ortec April 1982.5. Rahola T.,Suomela M., Hentelä R., Ojala J.: Advantage of using semiconductor detector for determining the internal
radioactive contamination in nuclear power plant workers. Proc. Symp., Paris 19-23.Nov. 1984, IAEA, Vienna 1985.6. ÖNORM S5220: Überwachung von Personen hinsichtlich inkorporierter Radionuklide, Entwurf, 1988.
PORTOROŽ 95 327

SESSION IV PROCEEDINGS
XA05C0085
DAILY AND SEASONAL VARIATIONS OF OUTDOOR ALPHA-ACTIVITYCONCENTRATION IN SALZBURG CITY/AUSTRIA
H. Lettner, A. K. Hubmer, R. Rolle, R. Winkler, F. Steinhäusler
Institute for Physics and Biophysics, University of Salzburg, Salzburg, Austria
ABSTRACT
Long-term continuous measurements of the atmospheric outdoor alpha-activity concentration have beenperformed by using a radioaerosol-monitor, roof-mounted 20 m above ground. The alpha-activityconcentration was identified to be predominantly attributed to radon progeny. The total alpha-activity coversa range of two orders of magnitude.
Three different components of variations could be identified with regard to temporal variations: Short-termdiurnal component (daily variation), mid-term component (days to weeks) and long-term component (seasonalvariation).
Continuous measurements have been recorded since the end of 1993. The results of continuous measurementsof the outdoor alpha-activity concentration over a time span from January 1994 to June 1995 are presented.
MATERIAL AND METHODS
The continuous measurements of the gross alpha and beta-activities have been carried out with aradioaerosol-monitor, which is part of the local early warning system for radioactive contamination of thecity of Salzburg. (Instrument: FAG Iodine-Aerosol-Monitor, Eberline Instruments / Germany). Theradioaerosol unit consists of a dry vacuum pump with a constant flowrate of 6.8m3/h, a 5cm wide glass fibrefilter and a ZnS coated plastic scintillation counter (BICRON Be 408,0.25mm thickness, 50 mm diameter).The glass fibre filter tape is transported stepwise under the detector 0.5cm every 30 minutes. Calibrationfor alpha and beta is done with 241Am and ^Sr sources. The detection range lies between 1 Bq/m3 and105 Bq/m3. For the detection of the Alpha-activity, which was assumed to be exclusively of natural originon the basis of the Alpha/Beta ratio, continuous 300min and a 30min Alpha-concentration values areavailable in combination with a ratemeter activity value in Bq, which is updated every two seconds. Forthis investigation the 30min alpha concentration value was used.
The instrument is situated in the 3rd floor of the university building at a height of 14m above ground level,the height of the inlet hole of a vertically fixed stainless steel tube of 4m length for aerosol sampling is 20mabove ground level.
RESULTS
The results of 1.5 year recording are shown in Figure 1 revealing a large scattering of the data. The meanvalue recorded over this period was 9.8 Bq/m3, the maximum 48.4 Bq/m3 and the minimum level was belowthe detection limit of 1 Bq/m3.
Three components of the temporal variations could be identified:(1) diurnal variation,(2) day to week variation and(3) seasonal variation.
The diurnal component is the most pronounced, exceeding both the day to week and seasonal variation.The highest ratios of maximum to minimum gross-alpha activities are produced by the diurnal variationsreaching close to ten during week-long high pressure periods. During windy and cloudy weather conditions,especially in low pressure time periods, outdoor gross-alpha activities tend to be low with correspondinglysmall maximum to minimum ratios of the diurnal variation (Fig.2a). Strong diurnal variations are bestestablished in time periods with good weather conditions, when low turbulent air exchange with night
PORTOROŽ 95 328

SESSION IV PROCEEDINGS
inversion layers occurs (Porstendörfer et al, 1994). These periods occur mainly during summer and autumnproducing a well defined periodical alpha-activity pattern (Fig.2b). Maximum to minimum ratios goes ashigh as ten. The maximum outdoor alpha-activities occur in the early morning hours when turbulent airexchange is lowest whilst the minimum activities can be observed in the (late) afternoon after turbulentmixing during daytime.
01.01.1994 03.05.1994 02.09.1994 02.01.1995
Date
04.05.1995
Fig.l.: Time dependent pattern of daily variation of the outdoor alpha-activity concentration recorded betweenJanuary 1994 and June 1995. Small insert displays monthly averages.
35
30
ß 25
"'S 20
l "a 10
15.CH1»» (BOO 17.0119M0Q0O 22.07.19W 00:00 2207.19W CttOO 24O7.1S9400t(X
Fig.2a: Outdoor gross-alpha activity recordedduring a low pressure period with heavyrainfalls and windy weather conditions.
Fig.2b: Outdoor gross-alpha activity recordedduring a high pressure period with hightemperature during daytime and lowturbulent mixing during night time.
PORTOROŽ 95 329
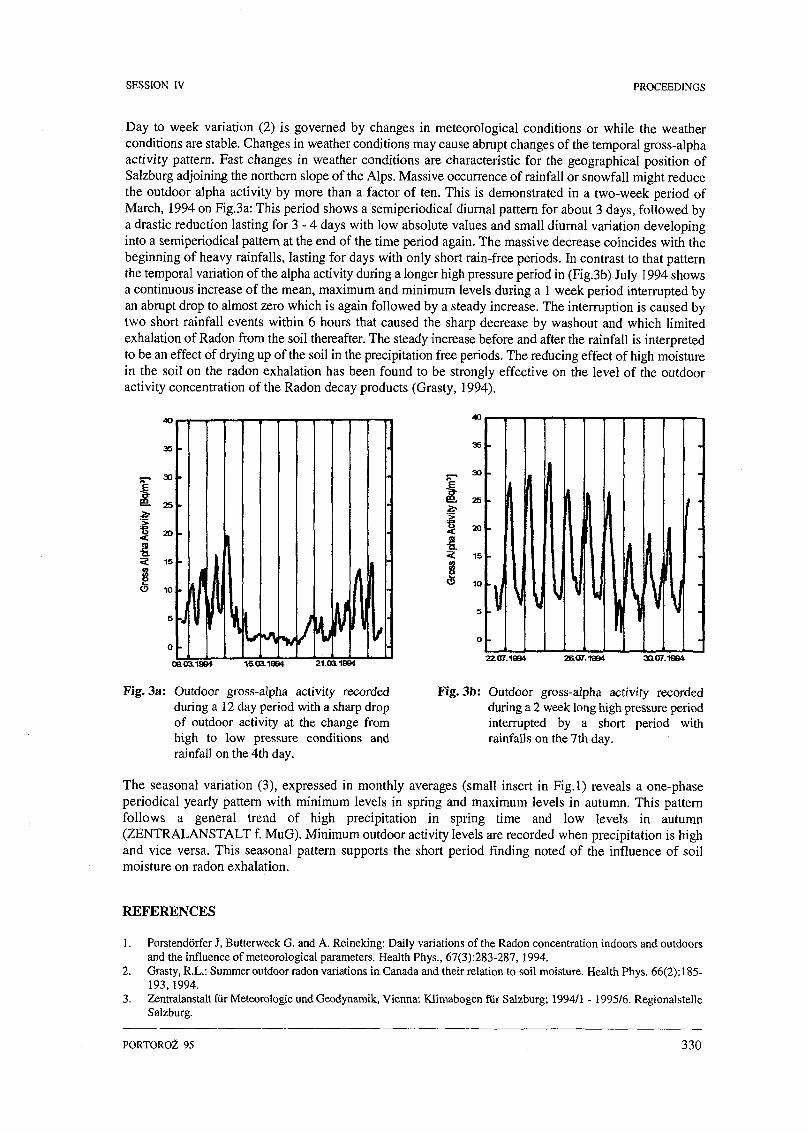
SESSION IV PROCEEDINGS
Day to week variation (2) is governed by changes in meteorological conditions or while the weatherconditions are stable. Changes in weather conditions may cause abrupt changes of the temporal gross-alphaactivity pattern. Fast changes in weather conditions are characteristic for the geographical position ofSalzburg adjoining the northern slope of the Alps. Massive occurrence of rainfall or snowfall might reducethe outdoor alpha activity by more than a factor of ten. This is demonstrated in a two-week period ofMarch, 1994 on Fig.3a: This period shows a semiperiodical diurnal pattern for about 3 days, followed bya drastic reduction lasting for 3 - 4 days with low absolute values and small diurnal variation developinginto a semiperiodical pattern at the end of the time period again. The massive decrease coincides with thebeginning of heavy rainfalls, lasting for days with only short rain-free periods. In contrast to that patternthe temporal variation of the alpha activity during a longer high pressure period in (Fig.3b) July 1994 showsa continuous increase of the mean, maximum and minimum levels during a 1 week period interrupted byan abrupt drop to almost zero which is again followed by a steady increase. The interruption is caused bytwo short rainfall events within 6 hours that caused the sharp decrease by washout and which limitedexhalation of Radon from the soil thereafter. The steady increase before and after the rainfall is interpretedto be an effect of drying up of the soil in the precipitation free periods. The reducing effect of high moisturein the soil on the radon exhalation has been found to be strongly effective on the level of the outdooractivity concentration of the Radon decay products (Grasty, 1994).
o -
•a onset
o •
1503.199422.07.1994 2fi.O7.1994 XI07.1964
Fig. 3a: Outdoor gross-alpha activity recordedduring a 12 day period with a sharp dropof outdoor activity at the change fromhigh to low pressure conditions —'rainfall on the 4th day.
and
Fig. 3b: Outdoor gross-alpha activity recordedduring a 2 week long high pressure periodinterrupted by a short period withrainfalls on the 7th day.
The seasonal variation (3), expressed in monthly averages (small insert in Fig.l) reveals a one-phaseperiodical yearly pattern with minimum levels in spring and maximum levels in autumn. This patternfollows a general trend of high precipitation in spring time and low levels in autumn(ZENTRALANSTALT f. MuG). Minimum outdoor activity levels are recorded when precipitation is highand vice versa. This seasonal pattern supports the short period finding noted of the influence of soilmoisture on radon exhalation.
REFERENCES
1. Porstendörfer J, Butterweck G. and A. Reineking: Daily variations of the Radon concentration indoors and outdoorsand the influence of meteorological parameters. Health Phys., 67(3):283-287, 1994.
2. Grasty, R.L.: Summer outdoor radon variations in Canada and their relation to soil moisture. Health Phys. 66(2): 185-193,1994.
3. Zentralanstalt für Meteorologie und Geodynamik, Vienna: Klimabogen für Salzburg; 1994/1 - 1995/6. RegionalstelleSalzburg.
PORTOROŽ 95 330
SESSION IV PROCEEDINGS
XA05C0086
IMPROVEMENT OF PERSONAL DOSIMETRY -DIGITAL POCKET DOSEMETER
Ž. Radalj", Z. Cerovac2), I. Prlic ", H. Cerovac!), V. Brumen °
1} Institute for Medical Research and Occupational Health Zagreb, 2 Ksaverska street,POB 291, HR-10000 Zagreb, Croatia
2 ) ALARA Instruments LTD, 4 Veslačka street, HR-10000 Zagreb, Croatia
KEYWORDS: radiation protection, film dosimetry, TLD, pocket dosemeter
INTRODUCTION
Physical dosimetric surveillance of professional groups working with various radiation sources is a regularprocedure in Croatia, established almost 40 years ago. Data available point out that the majority ofprofessionals under surveillance are those employed in medical facilities, most of them working with X-raysources. Depending on the nature of professional activities, personnel occupationally exposed to radiationsources are obliged to wear either film badge, TLD or film+TLD badge. Unfortunatelly, due to the line of dataprocessing, all standard dosemeters have the same disadvantage i.e. up to 40 days delay in dose reporting,regarding the time of actual exposure. The significance of such a delay raises in cases when radiation dose wasreceived within the short time or when technical failure on the operating unit(s) is suspected. Bearing this inmind, the additional dosimetric monitoring becomes an imperative. Therefore, we decided to introduce a paletteof digital pocket dosemeters, meant to be used in different workplaces in the radiation zone, each of them beingajusted to the specificities of a particular workplace.
DIGITAL POCKET DOSEMETER-GENERAL IDEA,TECHNICAL FEATURES AND BASIC PERFORMANCES
Several types of pocket dosemeters are already available on the market, but all constructed in such a mannerthat they measure irradiation doses from a broad and/or mixed energy spectra. Consequently, a considerablelack of accuracy of the obtained results should be expected, especially when it commes to the X-ray spectrum.If performed, the measurement of irradiation doses from that spectrum requires recalibration and recalculationof the obtained data. In attempt to avoid all those problems, we constructed a palette of digital pocketdosemeters, calibrated in accordance to the main specificities of a workplace i.e. the energies a particularradiation source is emitting and the exposure regimens.
All of our dosemeters contain Geiger-Müller tube as an active electronic element, but each type has a specificsoftware, enabling data processing in accordance to the workplace items.
Main parameters such devices are able to measure are the following:
1. Irradiation dose ranging from 0,10 to 19990 |jGy (with the existing possibility of resetting the dose).The purpose of such a measurement is to establish a radiation dose received within a particularprofessional activity (Figure 1.);
2. Dose-rate ranging from 10 to 19990 uGy /hour ;3. Cumulative irradiation dose ranging from 0,10 to 19990 uGy (with nonexisting possibility of
resetting the dose). The data obtained by this measurement could serve as a basis for comparison tothe results obtained by standard dosemeters (Figure 2.);
4. Duration of exposure in the radiation field having dose-rate over 10 uGy per hour (Figure 3.);5. Time that was consumpted for the cumulation of the dose described in the above item 3.
PORTOROŽ 95 331

SESSION IV PROCEEDINGS
\ i* • » 1
* t
• tt \ti ' .,.::
* < • .
• • • • t
- r , „ t
Fig. 1: Irradiation dose received within a particularprofessional activity.
Fig. 2: Cumulative irradiation dose (possibility ofresetting the dose non-existing).
r - *
i
• í,ííf
-
•
-
* -
*' Ĺi '<
•o
'«t -
f -,
-•
i
*
ťi
- ', V •
Fig. 3: Duration of exposure in the radiation fieldhaving dose-rate over 10 (iGy/h.
Fig. 4: One of the possible dose limit settings,beyond which the alarm device can beactivated.
PORTOROŽ 95 332

SESSION IV PROCEEDINGS
Each of our digital pocket dosemeters contains a watch showing the user the actual time of the day, but, what'smore important, one can set the device to make an alarm sound when the user remains working in the radiationfield after the dose limit had been exceeded (Figure 4.). The limit value dose can be picked out of the doserange from 50 to 10000
CONCLUDING REMARKS
Pocket dosemeters are to be considered the addition to the common state dosimetry, able to complete theinformation on occupational radiation exposure. In case of any irregularities, the information on the issue ispromptly obvious to the user and can be instantly reported to the health officer in charge, so that the cause canbe efficiently eliminated. Besides, on the grounds of data provided for a particular professional activity, someof the radiological procedures applied in the daily routine might as well be adjusted to the lower dose levels.That would represent a remarkable contribution to the efforts constantly made in radiation protection i.e. thereduction of noxius impact of ionizing radiation on the exposed individuals.
REFERENCES
1. Instrumentation and monitoring methods for radiation protection. NCRP Publication No 57, 1978.2. Radiation protection for medical and allied health personnel. NCRP Publication No 105, 1989.
PORTOROŽ 95 333

SESSION IV PROCEEDINGS
XA05C0087
SARAD EQF 3020 A NEW MICROSYSTEM BASED MONITORING SYSTEMFOR THE CONTINUOUS MEASUREMENT OF RADON AND THE ATTACHED
AND UNATTACHED FRACTION OF THE RADON PROGENY
T. Streil, G. Holfeld, V. Oeser, Ch. Feddersen and K. Schönefeld
SARAD GmbH , Cunnersdorfer Str. 12, D-01705 Freital, Germany
INTRODUCTION
Due to the large differences in the dose factors for radon and radon daughters it's recommended to measureboth, but monitors for the continuous and simultaneous measurement of radon and radon progenyconcentrations are too expensive to be widely used if they are built from individual components. Integratingdetector, readout electronics, memory and an A/D converter on a single chip offers far lower prices at least ifthis silicon microsystem can be produced in large quantities. It is known that dRAM cells of commercialavailable memories are sensitive to alpha particles, but even if one accepts unstable operating conditions (Ucc< 4 V), detection efficiencies are below 20%. As we have shown (Streil et al. 1991) it is possible to increasethe detection efficiency of dRAMs considerably by improving the collection of electron hole pairs created bythe alpha particles. Integrating a high efficiency dRAM sensor, readout electronics and memory on a single chiphas led to a compact low cost radon detector with an effective sensor area of 36 mm2. Further developmentwith special PMOS-transistors in a floating n-well as sensor cells has resulted in an alpha particlespectrometric microsystem with an effective sensor array of 40 mm2. Alternative for higher resolution wedeveloped PiN -structures with more than 100 mm2 sensor area with integrated preamplification.
PRINCIPLE OF SENSOR OPERATION
n« tán ui t»r4Tm uu* s—cAlpha particles incident in a silicon substrate generateelectron hole pairs along their track. The alphaparticles lose an average energy of about 3.6 eV pergenerated electron hole pair at room temperature. Thecharge generated near or across a pn-junctionprovides a current in the electric field at the pn-junction . Using special PMOS-transistors in afloating n-well as sensor cells it is possible to createan alpha particle spectroscopic sensor array. ThesePMOS - transistor has the advantage of a selfamplification (Erlebach et. al. 1995 ). This result ina good signal to noise ratio for the alpha particledetection. These sensor cells are combined with a resetcircuit. 1024 sensor cells, the preamplifiers, the analogmemories, the DA-conversion of the bias signals andthe reset system are integrated on a single chip. Thechip area is 46 mm2 and the effective sensor area is 40mm2. The chip was fabricated in a 2,0 ^m n-well 12VCMOS technology. The reset system was tested upto 100 kHz. The layout of the chip is shown in fig. 1.
The alpha spectrum of the 1 cm2 PiN hybride of radon gas in the EQF 3020 without charge collection isshown in fig. 3. The energy resolution of the plated out radon progeny is better than 50 KeV.
EXPERIMENTAL DATA OF THE SENSOR
We have measured the energy resolution of the alpha spectrometric sensor cells including the preamplification,analog storage and the adress coding system at room temperature. Fig. 2 show the spectum of a Pu-Am-Cm
.•••« •«•••»•tiaaiiaasiai >•• * • • • • • • • • t«
Fig. 1: Layout of the sensor array.
PORTOROŽ 95 334

SESSION IV PROCEEDINGS
source with 10 mm distance on air between source and sensor array.The sensor signal is in the order of 150mV. Fig. 3 show the energy resolution for a radon spectrum ollected in the radon chamber without chargecollectionfor the 113 mm2 PiN structure with intergrated preamplifier. The continuum of the radon gas andthe plate out of the Po218 and Po214 on the detector surface is shown. The energy resolution is better than50 KeV.
Fig. 2: Alpha spectra of a Pu-Am-Cm source measured with our sensor array (d = 10 mm).
90 100 110 120 1J0 140 1» 160 170 l«0 1M 200 110 220 2J0 140 2M
Fig 3: Alpha spectra of radon gas in the measuring chamber (10 min measuring time).
THE PRINCIPLE OF EQUILIBRIUM FACTOR RADON AND PROGENY MONITOR
By combination of this sensor chip with a single chip microcontroller and a display it is possible to realize aradiation monitoring system. A radon / radon progeny equilibrium factor monitor system SARAD EQF 3020was developed having a measuring chamber with electrostatic radon progeny collection on the sensor chip anda second chip to detect the progeny collected on a filter in the entrance of the chamber. The microcontrolledinstrument works quasi continuously with a time resolution of 2 hours. The system pumps air for 6 minthrough the monitor and collects the progeny on the entrance filter and then we analyse the decay curve of theprogeny for 2 h. The filtered air we analyse also in the radon measuring chamber.
PORTOROŽ 95 335

SESSION IV PROCEEDINGS
Using three sensors in two automatically swivelling seperated measurement heads and a radon measuringchamber was constructed the SARAD EQF 3020 monitor for the quasi continuous measurement of the attachedand unattached fraction of the radon progeny with respect to the 218-Po and 214-Po nuclides and also theradon concentration. Fig. 4 shows a continuous measurement of the radon and progeny concentrationrespectively the attached and unattached fraction. The results are in a good agreement in the order of the errorswith the reference measurements obtained by Ullmann and Schmidt [ Ullmann 95].
This new devices are suitable for the assessment of contamination for persons being occupationally exposedto radiation, e.g. in waterworks, mines or caves and the registration of the contamination in flats, offices andproduction halls.
FIRST APPLICATION OF THE RADON AND PROGENY MONITOR
The SARAD EQF 3020 was tested under real conditions on a workplace in a cellar of a school in a high radonrisk area of the town Dresden ( Germany ). The continuous measurement of the radon gas and progenyconcentration is shown in Fig. 5. Fig. 6 shows the time variation of the attached and unattached fraction of theprogeny concentration. A very interest result, shown in Fig. 7, is the variation and correlation of theequilibrium factor F and the unattached Fraction fp. The factor fp is in increasing by decreasing of F.
10000
1000
1
EQF equiv. radon unattached
* rcf. equiv. radon attached' ret equiv. radon unattached
-i 1 1 1 1 1 1 1 1 1 1 1 1 1 1 1 1 1 h -\ 1 1 1 H
22.05. 22.05. 23.05. 23.05. 23.05. 23.05. 23.05. 23.05. 23.05. 23.05. 23.05. 23.05. 24.05. 24.05.1995 1995 1995 1995 1995 1995 1995 1995 1995 1995 1995 1995 1995 199517:00 21:00 01:00 05:00 08:00 10:00 12:15 13:30 15:00 16:30 19:00 23:00 03:00 07:00
measuring time
Fig. 4: Radon and radon progeny concentration measurement respectively the attached and unattached fraction bya test in a radon chamber. The ventilation rate and the aerosol concentration was changed. For the referencemeasurement was used the methode of collection of the progeny on a screen and on the filter and a alphaspectrometrical analysis.
This effect is correlated to the radon source in this cellar. In the time of the increase of the factor fp fresh radongas is transported by convection from the soil in the cellar. Therefore the unattached fraction is higher, becausethe higher radon current from the soil. Further exist a correlation between the air exchange rate and theequilibrium factor. The small fp factor <0.1 and the equilibrium factor F 0.7...0.95 show also that the aerosolconcentration in this cellar is high. Further investigations in buildings with other radon sources and aerosolconcentrations is our work in the future. By the contiuous measurement of the attached and unattached fractionof the radon progeny it is possible to get better information of the real lung dosis on workplaces and inbuildings.
PORTOROŽ 95 336
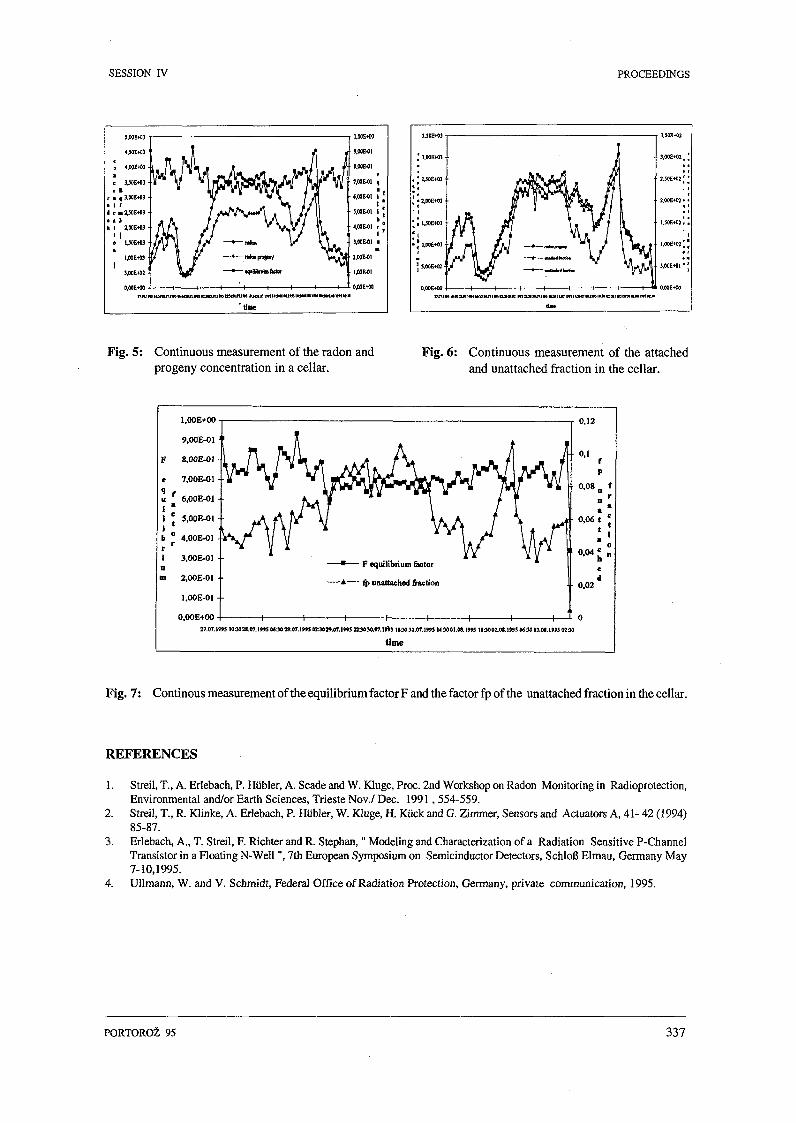
SESSION IV PROCEEDINGS
'tine
Fig. 5: Continuous measurement of the radon andprogeny concentration in a cellar.
Fig. 6: Continuous measurement of the attachedand unattached fraction in the cellar.
1,UUDTW ~
9.00E-01 '
8.00E-O1 •
7.00E-O1 •
6.00E-01 •
5.00E-O1 •
4.00E-01 •
3.0OE-O] •
2,00E-0l •
l.OOE-01 •
0.0OE+00 -
/Mr \ /
J^A ftirWl
• — F equilibfium 6clor
* jp unattached fraction JL
11 i 1 1 1 1 1 1 1
0,12
0,1
0,08,
0,06 Il
i
0.04'
4
0,02*
01.M.I99S 103002.011995OS30D3.0t.19»0230
time
Fig. 7: ContinousmeasurementoftheequilibriumfactorFandthefactorfpofthe unattached fraction in the cellar.
REFERENCES
1. Streil, T., A. Erlebach, P. Hübler, A. Scade and W. Kluge, Proc. 2nd Workshop on Radon Monitoring in Radioprotection,Environmental and/or Earth Sciences, Trieste Nov./ Dec. 1991, 554-559.
2. Streil, T., R. Klinke, A. Erlebach, P. Hübler, W. Kluge, H. Kück and G. Zimmer, Sensors and Actuators A, 41- 42 (1994)85-87.
3. Erlebach, A., T. Streil, F. Richter and R. Stephan," Modeling and Characterization of a Radiation Sensitive P-ChannelTransistor in a Floating N-Well", 7th European Symposium on Semicinductor Detectors, Schloß Elmau, Germany May7-10,1995.
4. Ulimann, W. and V. Schmidt, Federal Office of Radiation Protection, Germany, private communication, 1995.
PORTOROŽ 95 337

SESSION IV l> l l l l l l l l lnill|lllilllllllllllll l l l l l l l l l l> PR0CEEDINGS
XA05C0088
LOW-LEVEL GAMMASPECTROMETRY WITH GERMANIUM-DETECTORS:EXPERIENCE WITH A NEW CALIBRATION METHOD
P. Jachs ]), F. J. Maringer °, M. Tschurlovits 2)
1 BFPZ Arsenal, Geotechnisches Institut, Faradaygasse 3, A-1020 Vienna, Austria2 Atomic Institute of Austrian Universities, Schüttelstraße 115, A-1020 Vienna, Austria
ABSTRACT
A new method to obtain the efficiency of a Ge-coaxial-detector in relation to the gamma-ray energy and of therelative source-to-detector position is presented. Because of the geometry (detector and sample are ofcylindrical shape) ring-shaped sources of various radii were used. Standard sources in the energy region of 80to 2000 keV were prepared and measured at different positions by using detector-insets with adjustable height.
The peak- and the total-efficiency in relation to the energy and the source-to-detector distance was obtainedby numerous measurements. In order to get a mathematical expression computer aided parameter fitting wascarried out.
A function of 27 parameters was found to describe the spatial dependencies of peak-efficiency. An analogousfunction (25 parameters) describes the total-efficiency-dependencies. Both approaches agree reasonably wellwith the measured data; the found functions represent the measured efficiency data with an accuracy of only3 % in the energy range 100-2000 keV.
This new method offers the advantage that the functions for efficiency-calibration can be generalized to anyother coaxial-detector of similar measuring geometry; for fitting the parameters only a few measurements withcalibration sources will be necessary.
INTRODUCTION
Recently the assessment of radioactivity in environmental samples gained increasing interest in radioecologyand for the public. The measuring techniques are going to become improved and developed. High puritygermanium detectors are frequently used because of their excellent properties and are subject of thisinvestigation. Since the germanium crystal detects only a fraction of the emitted gamma photons, thedetermination of efficiency has to be done before starting routine measurements. Many parameters such as thephysical construction of the detector, the radiation energy, as well as shape and structure of the samplecontribute to the efficiency, therefore an individual calibration under given conditions has to be carried out.
In order to make generalized efficiency calibration of physically comparable germanium detectors easier amethod was evolved to describe the dependencies on emission energy and relative position of source to detectorof both peak efficiency and total-efficiency by only one formula respectively.
METHODS
The absolute efficiency of a germanium detector for a certain radionuclide and its gamma-energy is determinedby measurement of radioactive standards which emit gamma-rays of the energy of interest. The detector for ourstudies is a p-type intrinsic germanium coaxial detector with closed end and 33.7 % relative efficiency. Becauseof the cylindrical shape of the detecting crystal and the sample container only the distance of the source to thedetector axis (=radius) and its surface (=height) are considered for the description of the spatial efficiencydependencies (Fig.l).
To obtain the radial dependence, ring-shaped sources of different radii were produced by means of thin plasticfoils which were equipped with small discs of filter paper bearing radioactive standard solutions. As thedetector is used for activity measurement of environmental samples the energy region of 80 keV
PORTOROŽ 95 338

SESSION IV PROCEEDINGS
ring-shaped
\
end cap s
virtualdetector
\
3pint
:Ge-de
•
ů U h
s
Fig.l: Cylindrical geometry of detector andring-shaped source.
Q)" ü
I03(UQ.
0,06
0,05
0,04
0,03
0,02
0,01
•
i
v-i1
5-....
•T '"- * • ' - .
-f..
•
*
*
0
*
ČÍ:f
..í,
•±.
r =r =r st —r =
; - |
'•í
OrrSnr12 iTol24 I30136 i
mmnmM I H
nmnmnm
•
r
0 5 10 15 20 25 30 35
h/mm
Fig.2: Peak-efficiency dependence of thesource-to-detector distance forCs-137 (661.7 keV).
to 2 MeV is of interest. Thus we used 6 differentstandard solutions containing the following nuclides:Cd-109 (88.0 keV), Co-57 (122.1 and 136.5 keV), Cs-137 (661.7 keV), Mn-54 (834.8 keV), Zn-65(1115.6 keV), Co-60 (1173.2 and 1332.5 keV). Toimprove the peak-efficiency determination a mixture ofCe-139 (165.9 keV), Be-7 (477.6 keV) and Y-88(898.0 and 1836.1 keV) was applied in addition to allother sources.
The radii of the ring-sources varied from 0 to 54 mm insteps of 6 mm for each standard solution. To determinethe efficiency at different distances of the sources tothe germanium crystal a detector-inset with adjustableheight was manufactured. Again the distance from onemeasuring height to the next was 6 mm, 72 mm beingthe largest source-to-detector distance (dependent onthe sample containers).
The analysis of the measured spectra was done by acommercially available software, the recording andmanagement of all data were performed by a databasesystem. Using a basic-Iike language programs for thecalculation of all efficiency values were developed.
In order to find functions for the association of theefficiency and its variables: gamma-energy, radius, andmeasuring height of the ring-source, all calculatedefficiency data were represented graphically in thesethree dependencies. (Fig.2)
RESULTS AND CONCLUSIONS
The peak-efficiency € in relation to the emitted energyE can be described by the following formula [MAR84]:
6 ( £ ) = a, E 1 - e
The part ax E"2 of the expression (1) shows the linearefficiency-energy-connection of a log-log-plot, the termin parentheses describes the decrease of the efficiencywith diminishing gamma-energy.
Now the spatial dependencies of the efficiency have tobe taken into account; the four parameters a, to a4 willbe dependent of radius r and height h of the source(Fig.l).
PORTOROŽ 95 339

SESSION IV PROCEEDINGS
After many attempts carried out by means of a curve fitting program (least squares estimation byMarquardt-Levenberg algorithm) a function of 12 parameters was able to describe the first, linearefficiency-term appropriately. The parameters a, and ^ turned out to depend on the distance d betweensource and a virtual point - characterizing the detector -, the angle ô - included by the detector axes and d-, and the gamma-energy E as the virtual detector-point varies with different energies. A 15 parameterscontaining function in d, ô, and E was found to express the decrease of the peak-efficiency at lowerradiation energies.
A similar function of 25 parameters - there is no energy dependence of a, and aj in the region of higherenergies - describes the course of the total efficiency. The knowledge of the total efficiency is necessaryfor the coincidence summing correction.
1.000
0,100
I0,010
0.001
á£
* « *
»ran
10 m n
• « . . ' • •
uäá _12 m n
S 3 8 SEOtev)
§§ §
Fig. 3: Calculated (lines) and measured (symbols)efficiency values of a ring-shaped sourceof 18 mm radius for different heights.
n
t
19
2*
30
ft
»
4»M
mm
•V' • • . \
\
\
^ -
1>:
Be-
^s- a
Übt».
7.6 keV
ÍSBE
1
KM
Fig. 4:
0 10 20 30 40 50 60 70 80 90 100
h/mm
Calculated peak-efficiency for severalradii and source-to-detector distances(=heights) at 477.6 keV (Be-7).
For ring-source radii extending that of the detector the calculated efficiency values deviate from themeasured data at low distances from the detector surface. Under these angles intruding radiation loosesobviously more energy on its passage through the detector end cap. Thus the sample container diametersshould be smaller than the one of the germanium detector.
The obtained functions for both peak- and total efficiency describe the efficiency dependencies within theenergy region 100 - 2000 keV deviating only 3 % from the measured values on average (Fig.3).
Although the presented method of efficiency calibration of a Ge-coaxial-detector is a very time-consumingone it offers the advantage of obtaining universal functions which can be applied to nearly every cylindricalsample geometry.
Another advantage would be the possibility of calibrating any other Ge-coaxial-detector of similar physicalconstruction as the efficiency functions are applicable to other detectors by only a few measurements todetermine the parameters.
PORTOROŽ 95 340

SESSION IV PROCEEDINGS
LITERATURE
[MAR84] Maringer F.J., Nachweisvermögen eines Reinstgermaniumdetektors zur Gammaspektrometrie niederaktiverProben (Diplomarbeit Techn. Univ. Wien, 1984).
[GUN92] Gunnink R. and Prindle A.L., Nonconventional Methods for Accurately Calibrating Germanium Detectors(Journal of Radioanalytical and Nuclear Chemistry, Articles, Vol.160, No.2, 1992).
[KOR92] Korun M. and Martinčič R., Efficiency Calibration of Gamma-Ray Spectrometers for Volume-source Geometrie(Appl. Radiat. Isot. Vol. 43, No. 1/2, pp. 29-35, 1992, Great Britain).
[KOR93] Korun M. and Martinčič R., Determination of the Total Efficiency for Point Sources in Volume SampleGeometries in Gamma-Ray Spectrometrie (US Report, 1993, Laibach).
PORTOROŽ 95 341

SESSION P/ PROCEEDINGS
XA05C0089
METHOD FOR DETERMINATION OF RADIONUCLIDES CONCENTRATIONSIN GROUND LEVEL AIR USING THE ASS-500 VOLUME SAMPLER
J.Jagielak, M. Biemacka, R. Zarucki, K. A. Isajenko
Central Laboratory for Radiological Protection, Konwaliowa 7, PL-03-194 Warsaw, Poland
INTRODUCTION
A quantitative measurement method was elaborated for monitoring of the radioactive ground level aircontamination [1]. The ASS-500 station is aimed on the monitoring of air contamination in both normal andemergency situations. Collection of aerosols from the air volume of the order of tens of thousends m3 enablesaccurate spectrometric measurements of natural and artificial radionuclides in the wide range of theirconcentrations, starting from 0.5 uBq/m3 for l 3 t s . Collection is carried out in changing atmospheric conditionsof temperature, pressure, humidity, dustiness, etc.
FILTER MATERIAL AND SAMPLING METHOD
The ASS-500 type sampler is a stand alone instrument for continuous air aerosol collection (Fig. 1). ThePetrianov FPP-15-1.5 type filter with high collection efficiency is routinely used. Its aerosol collectionefficiency is from 96 to 99 per cent for aerosols of diameter ranging from 0.3 to 1.25 um at a linear flow ratevarying from 0.25 to 4 m/s with pressure drop at the filter Ap from 500 to 9300 Pa. The infrared heaters areinstalled above the filter to keep it dry during sampling period. In the normal situation a weekly sampling isroutinely accepted.
Fig. 1: Aerosol Sampling Station type ASS-500.
The air volume to be sampled ranges from 50 000 to 90 000 m3. The flow and quantity of air flowing throughthe installation are measured by the vortex shedding flowmeter. The principle of operation of the vortex meteris the use of the formation of the vortices.
In the case of the increase of the air radioactivity or other reasons for intensification of measurements thesampling frequency should be increased with the decrease of the sampling period to as low as a dozen or soof minutes (like during Charnobyl accident).
PORTOROŽ 95 342

SESSION IV PROCEEDINGS
The operation data concerning sampling procedure for ASS-500 station are the following:
periodical sampling on the filter cartridgeheight of sampling: 1.5 m above the ground
- type of filter: FPP-15-1.5collection area: about 0.2 m2
filter dimensions: 440 mm x 440 mmnominal volume flow rate 500 m3/h (adjusted with a valve)inlet to outlet distance: 3.5 mambient temperature range: from -40 to +50°C
MEASUREMENT PROCEDURE
The high resolution gamma spectrometry using HPGe detector is applied for the quantitative measurements.A sample prepared to the main measurement has a shape of a cylinder of diameter of about 51 mm. To provideproper geometrical conditions of the measurement a semi-conductor HPGe detector of diameter close or biggerthan the sample diameter and of the relative efficiency not less than 15 per cent is applied. The multiplecharacter of the investigated gamma radiation spectra makes necessary the resolution of the spectrometer benot worse than 2.5 keV for^Co (Ey = 1.33 MeV). Photon energy of the investigated radionuclides ranges from40 to 2620 keV. 210Pb has a gamma energy line of 46.5 keV and208Tl - 2614.5 keV. It is desired that thespectrometer enable measurements in such a vide range. A coaxial N-type HPGe detector protected from theface side with a window of very low absorption for photons of 10 keV is very suitable. The detector is placedin a low background shielding house that decreases the gamma background at least two orders of magnitude.This requirement is met by a shielding house of three layer wall: outer one of 100 mm Pb, middle layer of 1mm Cd and inner one of 2 mm Cu. Such shielding house also absorbs characteristic X rays induced in itsmaterial and the soft component of the cosmic radiation.
Each sample is measured twice. The preliminary measurement of the sample lasting 3000 s is performeddirectly upon termination of sampling. The aim of this measurement is detection of artificial radionuclides, ifpresent in air, with LLD of about 20 - 50 uBq/m3. The results of the preliminary measurement are availablewithin 1.5 h from the termination of sampling and removal of the filter.
If the preliminary measurement does not reveal enhanced activity of artificial radionuclides, the mainmeasurement should be made 2 days after sampling has been completed to allow radon daughters to decay.Occurence of them on the filter is undesirable because they influence the low level detection limit for otherradionuclides. Besides, during the 2 day period the humidity of the filter comes back to the value close to thatof new filter. The aerosol sample mass is calculated as a difference between the mass of filter after samplingand before.
Preparation of the aerosol sample for the main measurement consists on the detachment of the fiber part ofthe Petrianov filter with the deposited aerosol sample from the gauze basis layer and on pressing it to a diskof 51 mm diameter and from 4 to 8 mm thick dependently on the amount of dust collected on the filter.
In order to estimate radionuclides concentrations in samples of different thickness three calibrationmeasurements using standard source are performed to obtain three efficiency curves of the detector forthickness: 3.2 , 6.4 and 9.6 mm [2].
A pulse height analyser co-working with a computer is equipped with software allowing determination ofconcentration of radionuclides occuring in an investigated sample. The computer programs should define thelow level detection (LLD) for contamination with possible artificial and natural radionuclides.
On the basis of the main measurement the concentration of each radionuclide in air is determined. The reportson the measurement results are prepared on weekly basis.
REFERENCES
1. D.Arnold, J.Jagielak, W.Kolb, A.Pietruszewski, H.Wershofen, R.Zarucki: Practical Experience in and Improvements toAerosol Sampling for Trace Analysis of Airborne Radionuclides in Ground Level Air, PTB-Ra-34, 1994.
2. J.Jagielak, M.Biernacka, M.Bysiek, R.Zarucki: Method of the Investigation of the Airborne Radioactive ContaminationUsing ASS-500 Station, CLRP Report, 1993.
PORTOROŽ 95 343

SESSION IV PROCEEDINGS
XA05C0090
CALCULATION OF THE ELECTRIC FIELD INSIDE ELECTRET IONISATIONCHAMBERS - INFLUENCE ON THE RESPONSE FUNCTION
H. Stadtmann ]), L. Breitenhuber2), P. Kindl2)
n Austrian Research Centre Seibersdorf, Austria2) Technical University Graz, Austria
ABSTRACT
The use ofelectret ion chambers for gamma dose and radon exposure measurement was increasing rapidly inthe last years. In contrast to conventional ion chambers, the electric field in these detectors is not constantduring the exposure time. Both field-strength and direction are changing due to inhomogeneous decrease ofthe electret surface charges.
Data of numerical field calculations inside cylindrical electret Ionisation chambers are given. The change ofthe field-strength distribution with respect to electret discharge is described. The influence on the responsefunction is discussed and experimentally verified.
INTRODUCTION
Electret Ion Chambers (EIC) are passive integrating detectors for ionising radiation. A detector consists of thecharged electret enclosed in the conducting dosimeter capsule forming the ion chamber. Charge carriersgenerated in the chamber air are separated in the electric field and attracted to the electret surface were theydischarge it. The output signal of these detectors is the decay of the electret surface charge. It is measured bya special read-out instrument, sometimes called surface voltmeter.
COMMON TYPES OF ELECTRET ION CHAMBERS
Electret ion chambers are widely used as passive detectors for radon. In this case the chamber capsule servesas a diffusion chamber. Radon diffuses in the chamber - ions generated mainly by the alphas of radon and itsshort lived decay products lead to the electret discharge.
open
Shutter
Electret
currentintegrator1
Fig. 1: Read-out instrument for the measurement of the electret surface charge or the mean electret voltage (therelationship between electret charge and voltage is dependent of the thickness, the area and the material(e) of the electret).
MAIN DIFFERENCE TO CONVENTIONAL ION CHAMBERS
In contrast to normal ion chambers the output signal is not the charge generated inside the chamber but thecharge measured by the read-out instrument. In addition, the electric field in these detectors is not constantduring the exposure time. Due to the electret discharge the field strength decreases with exposure. Usually
PORTOROŽ 95 344

SESSION IV PROCEEDINGS
electrets are not covered with conducting layers (this would result in a decreased charge stability). Thereforedifferent regions of the charged surface can show different potentials. Depending on the geometric conditionsand the dynamics of the discharge process (which ions are collected to which part of the electret) the fielddirection too can change with exposure.
Decreasing field strength leads to recombination effects. Inhomogeneous electret discharge and change of thefield direction results in problems when reading out the electrets since the conversion factor for electret chargeand output charge depends on the charge distribution on the surface. Both described effects lead to deviationfrom a linear response function.
FIELD CALCULATIONS
The potential and field in cylindrical electret ion chambers was calculated by numerical methods. The electretcharge was assumed to be homogeneous (constant) before exposure. Figure 2 shows the results. Both lines ofconstant potential and field lines are displayed.
Charged electret with homogeneoussurface charge ( 0 % discharge)
chamber »
SO % discharged
Fig. 2: Diagram of the calculated electric field (field lines and 3 dimensional description) inside an cylindricalelectret ion chamber with respect to electret discharge due to exposure (assumed constant ion densityinside the chamber).
SIMULATION OF AN EXPOSURE
To simulate an exposure of the chamber, a constant ion density was assumed within the camber volume. Bothhomogenous exposure to photon radiation and exposure to radon containing air fulfil this assumption to a goodextent. Depending on the calculated field lines these ions are attracted to certain regions of the electret and
PORTOROŽ 95 345

SESSION IV PROCEEDINGS
discharge it. This leads to a decreased potential in this region. Subsequent field calculations and exposurecalculation simulates the dynamics of the electret discharge with respect to exposure. Figure 2 shows the fieldof partly discharged (exposed) electret ion chambers. Recombination effects however were not considered inthis model.
DISCUSSION ON THE DYNAMICS OF THE DISCHARGE AND READ OUT PROCESS
The central parts of the electret are discharged first due to the initial field conditions. This leads to a „remainingcharge ring" on the electret surface (Figure 2 right side). When reading out (determining the mean voltage)this electret, the output signal of the read-out instrument is dependent on the field lines between the measuringprobe and the electret (Figure 3). Only field lines reaching the probe contribute to the signal. Thereforedifferent charge distributions on the electret (homogeneous surface charge, charge ring etc.) lead to differentconversion factors for electret charge and output charge. Figure 4 shows a calculated conversion factor fordifferent electret charges. Experimental results with exposed electret ion chambers show a similar behaviourto the response function.
80%
Fig. 3: Diagram of the electric field inside a read-out instrument (see Fig.l) with respect to electret discharge.Only field lines reaching the measuring probe contribute to the read out signal.
0
7
6
«;
<
20% 40% 60% 80% 100%
Electret voltage
Fig. 4: Calculated conversion factor for the electret charge to the reader output charge (used parameters: electretthickness = 2 mm, electret area = 7 cm2, e = 2.2, distance between probe and surface = 4 mm).
PORTOROŽ 95 346

SESSION IV PROCEEDINGS
OPTIMISATION OF THE SYSTEM
The described non-linear effect can be minimised by an optimised chamber geometry (leading to a morehomogeneous electret discharge) and a better reader geometry (minimised distance between electret surface andprobe).
RESULTS
Commonly observed non linearities in the response function of electret ion chambers are not only caused byrecombination effects, but also by inhomogeneous discharge of the electret surface. This effect is mainly causedby the ion chamber and read out design.
LITERATURE
1. Kotrappa et. al.:"An electret passive environmental Rn-222 monitor based on ionizatio measurements" Health Phys. 54 (1),47-56 (1988).
2. H. Stadtmann: "Passive integrating radon monitor using an electret ionisation chamber", Radiat. Prot. Dosim. Vol. 34 No1/4 pp 179-182 (1990).
3. H. Stadtmann:"Elektretionisationskammern zur Bestimmung der Radonkonzentration in Luft - Theoretische undexperimentelle Untersuchungen" Thesis, Technical University Graz (1994).
PORTOROŽ 95 347

SESSION IV PROCEEDINGS
XA05C0091
A METHOD FOR CALCULATING THE SPATIAL DISTRIBUTION OFRADIOACTIVITY MEASURED BY A WHOLE BODY COUNTER
G. Greifeneder l\ H. Aiginger]), F. Steger 2\ E. Untried l\ L. Riedlmayer2),H. Havlik3), H.Bergmann3)
" Atominstitute of the Austrian Universities, Schüttelstraße 115, A-1020 Vienna, Austria2) Austrian Research Center Seibersdorf, A-2444 Seibersdorf, Austria
3) Department of Biomedical Engineering and Physics, University of Vienna, A-1090 Vienna, Austria
INTRODUCTION
In nuclear medical research and diagnosis it is often important to be able to localize small amounts ofradioactivity in the human body. A complete representation of the distribution of a radioisotope in a region ofthe body would require a three-dimensional portrayal, but most scanning devices are limited to plane portrayal.Thus, scans in two orthogonal planes are necessary. In some cases, a single representation will suffice or analternative technique may be used to obtain information concerning the distribution in the third dimension.
DESCRIPTION OF THE EXPERIMENTAL EQUIPMENT
The detector system of the high-sensitivity whole-body counter (HWBC) used for the measurements consistsof four 8" x 4" NaJ(Tl)-crystals. Two of these linear scanning detectors are placed above and two below thebed and can be arranged independently in three dimensions. For an accurate measurement of the spatialdistribution of the radioactivity specially focussing lead collimators were designed. These multi-slit collimatorscan easily be brought into position in front of the four NaJ(Tl)-detectors when required. This equipment isplaced in a closed massive shielding chamber (total weight of the order of 74 t) to ensure a low backgroundactivity and thus a high sensi-tivity of the system. A central computer controls the scanning motion and the dataaquisition separatly for each detector, the evaluation of energy spectra, the storage of data and the output ofresults.
Presdwoodphantom é &
Presdwoodphantom
collimateddetector
radioisotope
geometrical parameters:u = 360 mm a = 130 mmv = 280 mm b = 170 mm
c = 500 mm
collimateddetector
scanning direction
Fig. 1: Measuring arrangement using a Presdwood phantom.
PORTOROŽ 95 348

SESSION IV PROCEEDINGS
1,5x10"5i
II 5,0x10*o
0.0-
radioisotope: 1 3 1 J (364 keV)
transversal location: x = O cm
-15 -10 -6 0 5 10vertical source location z [cm]
• upper detectors
upper detectors (model)
* lower detectors
lower detectors (model)
* sum
sum (model)
* geometric mean
geometric mean (model)
T arithmetic mean
arithmetic mean (model)
15
radioisotope: 1 3 1J (364 keV)
transversal location x = 4 cm
-15 -10 -5 0 5 10 15
vertical source location z [cm]
• upper detector DAupper detector DA (model)
" upper detector DBupper detector DB (model)
• lower detector DCtower detector DC (model)
• lower detector DDlower detector DD (model)
5en2.
2O
2.5X10⁻⁵-
2.0X10⁵-
1,0x1 (ŕ-
5,0x10*-
0,0-
radioisotope:131 J (364 keV)
transversal location x = 8 cm
2,0x10*
S 1.5x10*
í. LOxior5
-15 -10 -5 0 5 10vertical source location z [cm]
• upper detector DAupper detector DA (model)
° upper detector DB- upper detector DB (model)
• tower detector DClower detector DC (model)
0 tower detector DDlower detector DD (model)
Ücö
5,0x10*-
15
0.0
radioisotope: 1 3 1 J (364 keV)
transversal location x = 12 cm.
.-•''*• *V
-10 -5 0 5 10vertical source location z [cm]
« upper detector DAupper detector DA (model)
o upper detector DBupper detector DB (model)
• lower detector DClower detector DC (model)
0 lower detector DDlowe detector DD (model)
Fig. 2: Lower and upper detector efficiencies and their combinations as a function of vertical point source locationwith/without transversal displacement within the Presdwood phantom.
PORTOROŽ 95 349

SESSION IV PROCEEDINGS
PROFILESCANTECHNIQUE
To achieve spatial resolution a special detector configuration was chosen shown in Fig.l. Various pointsources [l33Ba (355 keV), 131J (364 keV), 22Na (511 keV), 137Cs (662 keV), 60Co (1173 keV, 1333 keV)] ofknown activity were used to measure the counting efficiency systematically for different point source positions.Thereby each radioisotope was placed at fixed positions inside an elliptical cylindric Presdwood phantom(major axis 34 cm, minor axis 26 cm, height 50 cm). This phantom was positioned on the bed, and the profileof count rates was measured (scanning time 600 s, scanning length 190 cm) by the profile scanning systemusing a special measuring arrangement. The profiles thus obtained for each scanning detector expressed in cpsBq1 represents the efficiencies vs. the longitudinal localization of the point source. Based on the countedefficiencies by different vertical and transversal point source positions a computational model to estimatespatial positions was developed, in which the inverse square law and the attenuation factor due to the ab-sorbtion and scattering processes of gamma rays in body tissue equivalent medium were taken into account.So the energy peak efficiencies for each detector can be approximated by the expression:
eD(x,z) = — - — • e-^Eysix-l)
r(x,z)2
eD. . . detector efficiencyC. . . scaling factorr.. . distance between probe and detectoru(E).. attenuation factors. . . . thickness of the scattering medium (Preswood phantom).
This model allows to determine the unknown position of a point source inside the Presdwood phantom and itsaccuracy was verified for various radionuclides over a wide gamma energy range. The energy peak efficienciesof the detectors for l3lJ (364 keV) are shown in Fig.2 as a function of vertical point source locationwith/without transversal displacement within the phantom. Also the geometrical and arithmetic means areindicated and it can be seen that a almost complete independence of response on the depth of the point sourcewas obtained for the geometric mean. The variation of sensitivity with depth is largly compensated by the useof opposite detectors. Because of the attenuation, when a radioisotope in a tissue equivalent phantom isscanned, the sum of the counts from all detectors gives a minimum for the source at the mid point of thephantom. Similar results have been obtained for other gamma energies but the absolute values of the averagedenergie peak efficiencies may differ considerably.
DISCUSSION
By usually used method (linear "scanning") only the distribution of radioactivity in one dimension can bevisualized. Perpenticular to this plane there is no resolution. To achieve a complete representation ofdistribution in the human body a model based on the detector configuration was developed. The computationalmodel presented in this paper was crosschecked for various radionuclides over a wide gamma energy range.Because of the excellent agreement between the measured and the model calculated efficiency values and thefact that the geometrical mean of the efficiency values for all detectors is almost independent from the actualposition of the distribution of radioactivity it is possible to calculate the centre of the radioactivity from thedetected counts.
The importance for medical applications of this method follows from the combination of the possibility tolocalize radioactivity and the typical characteristics of the HWBC. So count rates can be directly attributed toorgans of the human body and it is possible to study the metabolism. In this connection the HWBC over a wideenergy range (60 keV - 2 MeV) ensures a very high accuracy even when lowest activities are provided.
PORTOROŽ 95 350

SESSION IV PROCEEDINGS
XA05C0092
ACREM: A NEW AIR CREW RADIATION EXPOSURE MEASURING SYSTEM*
P. Beck!), K. Duftschmid ' \ A. Großkopf2\ St. Kerschbaumer0, Ch. Schmitzer0,Ch. Strachotinsky1*, N. Winkler2'
0 Austrian Research Centre Seibersdorf, A-2444 Seibersdorf, Austria2) Allgemeine Unfallversicherungsanstalt, Vienna, Austria
INTRODUCTION
Cosmic radiation has already been discovered in 1912 by the Austrian Nobel Laureate Victor F. Hess [1]. AfterHess up to now numerous measurements of the radiation exposure by cosmic rays in different altitudes havebeen performed, however, this has not been taken serious in view of radaition protection..Today, with the fastdevelopment of modern airplanes, an ever increasing number of civil aircraft is flying in increasing altitudesfor considerable time. Members of cilvil aircrew spending up to 1000 hours per year in cruising altitudes andtherefore are subject to significant levels of radiation exposure.
In 1990 ICRP published its report ICRP 60 with updated excess cancer risk estimates, which led tosignificantly higher risk coefficients for some radaition qualities. An increase of the radiation weighting factorsfor mean energy neutron radiation increases the contribution for the neutron component to the equivalent doseby about 60%, as compared to the earlier values of ICRP26. This higher risk coefficients lead to therecommendation of the ICRP, that cosmic radiation exposure in civil aviation should be taken into account asoccupational exposure. Numerous recent exposure measurements at civil airliners in Germany, Sweden, USA,and Russia show exposure levels in the range of 3 -10 mSv / year. This is significantly more than the averageannual dose of radiation workers (in Austria about 1.5 mSv / year).
Up to now no practicable and economic radiation monitoring system for routine application on board exits.A fairly simple and economic approach to a practical, active in-flight dosimeter for the assessment of individualcrew exposure is discussed in this paper.
COSMIC RADIATION
A continuous rain of energetic photons, protons and other atomic nuclei enters the Earth's atmosphere fromouter space. Although its origin is not really known, it is clear, that the largest contribution stems from outsidethe solar system (galactic cosmic radiation), a smaller contribution is caused by the sun (solar cosmicradiation). The flux density of the cosmic particles is about 1000 per m2 per second. The particles are ionisednuclei, about 90 % protons, 9% alphas and the rest heavier nuclei, distinguished by there high energies up to102u eV. The most part is within of 10 8eV to 10 "eV [2]. This so called primary cosmic rays collides with thenuclei of atoms in the upper atmosphere and produce showers of secondary particles. In addition to theinfluence of the 11 year cycle of solar activity in cosmic radiation solar particle events change the dose rate inaircraft altitudes. In the case of solar flares it can increase for some minutes to hours by a factor of 100.
ACREM APPROACH
The exposure of aircrew can be measured with different methods [3]. In principle by active or passivedosimeters. Because of the independence of the ambient dose as well as the individual absorbed dose for eachcrew member, of the location in the airplane, individual dosimetry is not necessary. The individual dose ratecan assigned according to flight schedule or other methods.
An other way is to calculate the absorbed does for certain flights using appropriated computer codes. Thereare some publications based on a cosmic transport code called LUIN [4]. Even though the calculations are in
Developed under Research Contract by Allgemeine Unfallversicherungsanstalt, Vienna Patentspending.
PORTOROŽ 95 351

SESSION IV PROCEEDINGS
good agreement with measurement results, they can not account for any statistical events like solar particleevents.
An economical and simple method to assess the radiation exposure, presently being developed in ourlaboratory, is realised with ACREM (Air Crew Radiation Exposure Measuring) system [5]. ACREM is basedon a combination of measurement of the ionising component (GM-counter) and calculation of the neutroncomponent. For this the LUIN-code is applied for the momentary position of the aircraft, determined by anintegrated GPS (global positioning system). A principle schematic of the Air Crew Radiation Monitor(ACREM) is shown in fig.l.
Fig.l: Principle schematic of the ACREM system
A wide-range gamma doserate meter, based on two GM-detectors and microprocessor controlled electronic,special designed for Austrian military and civil protection, is used to measure real-time, continuously theequivalent dose / rate of gamma radiation in the airplane.
The mentioned LUIN code for cosmic ray transport provides the neutron as well as the ionised component ofabsorbed dose at each position of the aircraft. The relation of the total calculated absorbed dose to thecalculated ionising component gives a so called conversion factor for a certain aircraft position. This factoris tabulated for suitable values in altitude and grid distances and stored in a database of a micro computersystem. This makes a fast data access possible.
The measured ionising component is weighted with the calculated conversion factor and provide an estimationof the ambient dose equivalent / rate in typical time intervals of some 10 Seconds, for a momentary flightposition. The result is stored in real-time mode and direct readable on a display. A warning system tells aboutunusual high dose rates. Dose assessment to crew members is achieved by personal chipcard.
TEPC MEASUREMENTS
For verifying the ACREM system we will use as reference instrument a low pressure tissue-equivalentproportional counter (TEPC) on board an aircraft. This type of dosemeter enables the absorbed dose in tissue-equivalent (TE) material, nearly independent of the type of radiation. TEPC looks like the most suitedinstument for cosmic radiation measurements, but up to now they are very complex systems, need qualifiedpersonnel and periodical service. Fundamental principles of dosimetry with a TEPC and its use in radiationexposure measurements have already been described in more detail [6,7,8].
Our TEPC dosemeter consists of a spherical proportional counter with an inner diameter of 12.55 cm and awall (TE-plastic) thickness of 2.13 mm. An outer housing cylindrical in shape is made from 1.27 mm thick
PORTOROŽ 95 352

SESSION IV PROCEEDINGS
aluminium and grounded to serve as electrostatic shield. The TE-gas chamber simulates a diameter of 2 |amof a tissue volume with a density of 1 g/cm3. For data acquisition we use usual micro channel analyser (MCA)and linear as well logarithmic amplifier.
In - flight measurements with a TEPC reference instrument are under preparation, ground studies were doneat the SPC - facility of CERN. Fig.2 shows a TEPC spectrum measured in a mixed high energy radiation fieldat the cosmic radiation facility of CERN: A secondary beam extracted from the SPS accelerator (about 200GeV, positively charged particle) entered into collision with a copper target located inside of a concreteshielding. The TEPC instrument was located behind the shielding. This simulates nearly the condition ofcosmic radiation in aircraft altitudes [9]. The absorbed dose yd(y) in fig.2 was calculated from the measuredfrequency distribution as a function of the lineal energy y. The dose equivalent yh(y) is obtained bymultiplication with a quality factor using the ICRP21 as well as the ICRP60 Q/L definition [10,11]. The meanquality factor for this measurement was calculated to 3,60 for the ICRP21 and 4,25 for the ICRP60 definition.
aoi
s
I
Q01
12
10
Q8
Q6
Q4
02
n n
-
-
Q1
y*<Ky)y*h(y)y iKy?
1
ICRP21 1icRpeo |
. —'—
10
I
I
, . . .
1001 -
_ 1
1 j
1000
-
ij.....
~J —
ľľhľr-1-^-,-^-J.. iQ1 1 10
yin keV/ pm100 XC0
12
to
Q8
Q6
Q4
02
qo
Fig. 2: Absorbed dose yd(y) and dose equivalent yh(y) for ICRP21 and ICRP60 - Q/L definition, as afunction of lineal energy y measured in a mixed high energy radiation field in the SPS-facility ofCERN.
CONCLUSION
ACREM is a simple and economical solution for active airborne dosimetry. This method takes also accountof the contribution of solar particle events, changing flight pattern and altitude, as well as additional exposureby unforeseen incidents during transport of radioactive material.
REFERENCES
1. Hess, V.F. Physikalische Zeitschrift, Vol. 13., No.21/22, p.1048,1912.2. Gaisser, T.K., Cosmic Rays and Particle Physics, Cam. Univ. Press, 1990.3. Bartlett, D.T., Radiation Protection Dosimetry, Vol.48 No.l, pp93-100,1993.4. O'Brien, K., W.Friedberg, F.E. Duke, L.Snyder, E.B.Darden, h and H.H. Sauer, RPD, Vol 45 No.1/4 pp. 145-162, 1992.5. Duftschmid K., OEFZS--4717, OEFZS Report May 1994.
' 6. Micodosimetry, ICRU Report 36, December 1983.7. Schuhmacher, H., Schrewe, U.J., PTB-Bericht, PTB-N-13, March 1993.8. Strahlenschutzkommission des Bundesministeriums für Umwelt, Naturschutz und Reaktorsicherheit, SSK, Gustav Fischer
Verlag Stuttgart, March 1995.9. Aroua, A., M.Höfert and V.Sannikov, CERN / TIS-RP / IR 93-45, CERN report, October 1993.10. ICRP21, ICRP Publication 21, Radiation Protection, Pergamon Press Oxford, 1973.11. ICRP60, ICRP Publication 60, Radiation Protection, Pergamon Press Oxford, 1990.
PORTOROŽ 95 353


SESSION V PROCEEDINGS
XA05C0093
HIGH VOLTAGE POWER LINES IN ITALY:QUANTITATION OF EXPOSURE AND HEALTH RISK EVALUATION
C. Petřini, A. Polichetti, P. Vecchia
Physics Laboratory, National Institute of Health, Viale Regina Elena 299, 00161 Rome, Italy
INTRODUCTION
In Italy, as in most developed countries, a lively debate has been raised in the last years on possible long-termhealth effects of exposure to power frequency magnetic fields. Though the exposure is quite ubiquitous, dueto the large presence of electric sources in any domestic, work, and urban environment, most of the concernregards fields generated by overhead high-voltage lines. Several epidemiological studies have in fact indicatedan increase of cancer, in particular childhood leukaemia, within the population residing near power lines.
The quantitative evaluation of the health risk associated with power lines is obviously of crucial importance,in particular for decision makers, in view of the future development of the electric network. Reliable data onthe dimension of the health impact of power lines may in fact help in finding some consensus between theAuthorities and the general public, and hopefully to overcome the present controversies.
DISTRIBUTION OF THE POPULATION NEAR POWER LINES IN ITALY
The Italian electric grid is composed by transmission lines operated at 380, 220, and 132/150 kV, and bydistribution lines operated at lower voltages. The total length of the network is reported in Table 1.
Operation voltage (kV)
380220
132/150
Length (km)
9 10013 20040 400
Source: ENEL (1994)
Table 1: Extension of the Italian electric grid (as for December 31, 1993).
Most lines are operated by the national electric utility, ENEL. More precisely, it manages about 100%, 82%,and 80% of the 380,220, and 132/150 kV lines, respectively. A substantial contribution (15%) to the 132/150kV grid is given by the National Railways, FS, which is responsible for most of the lines feeding its ownconversion substations. A minor fraction of the grid is operated by local utilities.
To evaluate the health and environmental impact of power lines, the size of the exposed population is essential.Sparse data existing in the literature (1>2) indicate that in general 1% or less of the population lives near thelines.
In Italy, a law enforced in 1992 requires minimum distances of residential buildings from high-voltageconductors. To identify situations which require remedial actions, a very extensive survey has been carried outon the Italian electric network. A complete and detailed (and probably unique in the world) census of thebuildings close to the lines is therefore available. From the number of buildings, the residing population canbe evaluated in a quite reliable way, by means of suitable factors provided by the Italian Statistical Institute(ISTAT). The data are reported in Table 2.
PORTOROŽ 95 357


SESSION V PROCEEDINGS
CONCLUSIONS
The question of whether or not exposure to power frequency magnetic fields plays a role in the developmentof tumours is still open. Much research is needed, in particular to identify possible interaction mechanisms thatgive biological plausibility to the hypothesis of carcinogenesis.
However, from the results of large epidemiological studies and from population data it is possible to estimate,with good confidence, the dimension of health risks.
The present analysis shows that the risk of childhood leukaemia, if any, is small. These results can be comparedwith similar estimates performed in Sweden(5), where the excess incidence from overhead power lines ispresumed to be about 2 cases per year, and in Denmark(6), where 1 excess case in five years is estimated.
The procedure adopted in this analysis, as well as the population data, may be used for similar evaluations ofother pathologies that may be hypothesized, e.g. brain tumours.
This approach, and the data it provides, are particularly useful for decision makers, in setting a policy for thedevelopment of electricity compatible with health and environment requirements.
REFERENCES
1. M.P. Coleman, CM. J. Bell, H.L. Taylor, and M. Primic-Zakelj, 1989. Leukaemia and residence near electricity transmissionequipment: a case-control study. Br. J. Cancer 60: 793-798.
2. J.H. Olsen, A. Nielsen and G. Schulgen, 1993. Residence near high voltage facilities and the risk of cancer in children.B.MJ. 307:891-895.
3. A. Ahlbom, M Feychting, M. Kosvenkuo, J.H. Olsen; E. Pukkala, G. Schulgen, and P. Verkasalo, 1993. Electromagneticfields and childhood cancer. Lancet 342: 1295-1296.
4. S.D. Walter, 1978. Calculation of attributable risks from epidemiological data. Int. J. Epidemiol. 7: 175-182.5. B. Knave, 1994. Electric and magnetic fields and health outcomes: an overview. ScandJ. Work Environ. Health 20 (special
issue): 78-89.6. J.H. Olsen. Private communication.
PORTOROŽ 95 360

SESSION V PROCEEDINGS
XA05C0094
ASSESSMENT OF MAGNETIC FIELDS EXPOSURE FROM AC POWER LINES
IN AN ITALIAN RESIDENTIAL AREA
S. Tofani, G. d'Amore, G. Fiandino, M. Tasso
Servizio di Fisica Sanitaria, Azienda USL 9, 10015 Ivrea (TO), Italy
INTRODUCTION
Human exposure to extremely low-frequency (ELF, 30-300 Hz) magnetic fields have recently been suspectedof increasing the risk of cancer and leukaemia [1,2].
The main difficulty in interpreting the available epidemiological data is the assessment of long term exposureto magnetic fields in the ELF range. This assessment of long-term cumulative exposure can be influenced bymany factors among which the diurnal and seasonal variations in the electric power use by the line and fieldspatial variation.
To take into account of these factors, different ways of assessing exposure, based on spot measurements orfixed site monitorings, have been used [3,4].
Because of the importance given by some studies to the frequency dependance of biological effects in the ELFrange [5], the knowledge of magnetic field harmonic contents is of interest to fully characterize the magneticfield exposure. The measurement of the harmonic content is suggested also by the ANSI-IEEE standard [6] tocontrol the possible negative influence of high level harmonic content in the response accuracy of the magneticfield meter.
In this work we made a complete characterization of the exposure in a particular italian residential area byusing different instrumental chains.
The influence of some parameters (spatial and harmonic components of the field, domestic use of the electricpower, temporal variability of the field) on the accuracy of the exposure assessment was evaluated.
INSTRUMENTS AND METHODS
Measurements have been carried out in an area close to a 380 kV double-circuit transmission line where about20 houses are in series dislocated close to the line on one side of it. The geometry of the transmission linerelative to the houses is illustred in fig. 1.
IJ» O O IM• O O •
-IN O O -IM
n
. 3.
00
. 2.
50
Fig. 1.
PORTOROŽ 95 361

SESSION V PROCEEDINGS
Measurement points were chosen around and inside the houses. The inside measurements were performed inthe center of any room. In some houses measurements with and without the electric power usage (this lastcondition was obtained by turning off the power supply switch) were made in order to verify the influence ofthe electric appliances on the magnetic field exposure at the test location. The outside measurements were madein the sidewalk of the houses, one test location for each house, about 2 meter far from the house front door.
All the measurements were spot (one time measurements) performed using a broad-band field meter HoladayHI 3600-02. The meter probe is a loop antenna with a diameter of 20.3 cm and made up by several hundredturns of fine gage wire. For the measurements, the field meter was mounted on a wood stand.
The field was directly given by the meter as rms magnitude of the Magnetic Flux Density (MFD) componentperpendicular to the loop antenna plane. So the three orthogonal field components (MFDX, MFDy and MFDJwere measured by rotating the antenna in three mutually orthogonal directions. For each test locationmeasurements were made placing the probe at an height of 150 cm from the ground or from the floor.
Other sets of measurements were performed using a narrow-band measurement apparatus made up by anEMCO model-7604 coil antenna, a Hewlett-Packard model-3561A spectrum analyzer and a personal computer(PC). The antenna has an outside diameter of 13.3 cm and is composed of 36 turns of electrostatically shieldedlitz wire. This measurement apparatus was used to provide data on MFD harmonic components. Forcomparison with broad band measurements, the EMCO antenna was placed in the same test locations alreadychosen for Holaday antenna measurements, both outside and inside the houses. The analysis of frequencydomain data (harmonic component amplitude and its contribution to total field) was made by a PC connectedwith spectrum analyzer.
By narrow-band measurement apparatus, the time variation of the field was also analyzed in only one testlocation chosen inside the house closest to the power line (house A), in the center of the room located at thethird floor. The spectrum analyzer, piloted by the PC, made a set of measurements each 3 minutes during aweek long period in the frequency range from 0 to 500 Hz. All the 3360 spectra were recorded and processedto obtain the hourly and daily maxima, minima and averages of the vertical component of the MFD.
The broad- and narrow-band measurement systems were calibrated in accordance with the ANSI/IEEE Standard[6].
The estimated total rss accuracy in our measurements is ±8% and ±6% for the broad- and narrow-bandmeasurements respectively.
All the measurements have been carried out during a period of time lasted 3 months (from October todecember). During this period we had all the possible different weather conditions, from sunny to snowy days.During the measurement we took note of the corresponding weather conditions.
For courtesy of the Italian Electric Energy Agency (ENEL) we received, for each line circuit, the current flowingin three different times of the day (3 am, 11 am and 5 pm) for all the period we made the measurements.Additional informations regarding the line loading during all the year long were also supplied. By using ENELdata as input for our calculation code [7], a theoretical evaluation of the MFD produced by the line at eachmeasurement point has been also provided.
RESULTS
The results of the broad-band measurements performed outside (front door test location) and inside the housesare reported in table 1 together with the calculated values. In table 1 we report only total MFD value as anaverage of all the MFD values obtained in each room of the same floor.
It is interesting to observe from table 1 that the fields measured in the front door and in all three floors aregenerally the same, in fact the averages of these fields for most of the houses (i.e. when they are not too closeto the line) have a standard deviation inside the estimated measurement accuracy (8%). As the house gets closeto the line, because of the more sensible variation of the field with the height from the ground, the MFDincreases with the floor level. Therefore, the standard deviation of the house MFD average increases too (seehouses A and B). In these cases the assessment of exposure by making only the front door measurement canbe affected by additional errors, depending on the number of floor levels and on the closeness of the house tothe line.
No differences were obtained between measurements made with and without turning off the power supply
PORTOROŽ 95 362

SESSION V PROCEEDINGS
switch. The agreement between experimental and theoretical data (within 10 %) confirms that the measuredfields are due to the nearby transmission line.
The narrow-band measurements have resulted to be in good agreement with the broad-band one. In fact theobtained differences in the same measurement points were always within the estimated measurements accuracy(8%).
HOUSE(distance,m)
A (35)
B (47)
C (56)
D (74)
E (93)
F (92)
G (67)
H (53)
FRONTDOOR
3.40(3.14)
2.37(2.36)
1.67(1.77)
1.21(1.22)
0.45(0.49)
0.58(0.55)
1.00(0.99)
1.31(1.35)
1°FLOOR
3.41(3.2)
2.27(2.32)
1.76(1.78)
1.210.13)
0.48(0.52)
0.55(0.56)
1.08(0.99)
1.23(1.23)
2°FLOOR
3.55(3.49)
2.36(2.45)
1.76(1.87)
1.36(1.17)
0.48(0.52)
0.60(0.57)
1.06(1.02)
1.28(1.28)
3°FLOOR
3.94(3.8)
2.56(2.49)
1.81(1.96)
1.31(1.21)
0.48(0.54)
0.60(0.59)
1.14(1.05)
1.26(1.35)
AVERAGE
3.58 ±0.25(3.41±0.30)
2.39 ±0.12(2.41 ±0.08)
1.75 ±0.06(1.85±0.09)
1.27 ±0.08(1.18±0.04)
0.47 ± 0.02(0.52+0.02)
0.58 ± 0.02(0.59±0.02)
1.07 ±0.06(1.01+0.03)
1.27 ±0.03(1.30±0.06)
1E+01
Table 1: Measured and calculated MFD values in uT. The calculated values are in brackets. The houses areindicated in figure 1.
The harmonic components of the field were low and the maximum harmonic components (always the fifthcomponent at 250 Hz) has never exceded 37 dB (1.3 %) the fundamental. A typical spectrum of the measuredfield is reported in fig. 2.
As a result of the continuous measurements performed in a fixed test position located in the third floor of thehouse A, the hourly and daily averages are reported in fig. 3. The minimum and maximum values measuredover 3 minutes are also reported.
We can observe that, in the considered case, themaximum deviation of the hourly averages curvefrom the daily averages is 16%. This value can betaken as an error in making measurements lastingabout one hour to test all the room in every house,like we did, if we suppose that the best parameterfor assessing the exposure is the daily average. Inthe same way supposing that for assessing theexposure inside the house we make only onemeasurement in the side walk (lasting for example3 minutes) the possible maximum and minimumestimation (on a week base) in respect to the dailyaverage are about 25%.
From our survey lasted 3 months it results that the o a» «o eoo «»average of the daily mean MFD values during the FREQUENCY (Hz)week resulted similar to the average of themonthly mean values. The different weather
Fig. 2.
1E-041000
PORTOROŽ 95 363

SESSION V PROCEEDINGS
conditions had not any influence in the MFD exposure.
CONCLUSIONS
The estimated measurement accuracy of 8% has been confirmed by the agreement between the broad- andnarrow-band measurement results.
The agreement between calculated and measured MFD values has always resulted within 10 %, that iscomparable to the measurement accuracy.
In our case, the mean MFD exposure inside the houses is not influenced by the household wiring and electricalappliances. This result is confirmed also from the agreement between calculated and measured MFD values.
The measurements of the MFD at the front door is generally resulted to be a good estimation (within themeasurement accuracy) of the MFD being inside the house except for the houses located very close to the line(at a distance less than 20 m) where the MFD increases significantly with the floor level.
The magnetic field harmonic content was very low. The maximum harmonic component (5th harmonic) hasbeen always below 37 dB (1.3 %) the fundamental.
Maximum time variation of the MFD exposure resulted equal to about 25 %.
3.8
3.6
3.4
3.2
3.0
2.8
2.6
2.4
2.2
2.0
MFD (uT)
— Hourly Avg»
0 Min and Max Values
* • Oally Avgs (Tue-Mon)
24 48 72 96
time (hours)120 144 168
Fig. 3.
REFERENCES
1. Hendee W.R., Boteler J.C. (1994): The Question of Health Effects from Exposure to Electromagnetic Fields. Health Physics66:127-36.
2. Feychting M. and Ahlbom A. (1993): Magnetic Fields and Cancer in Children Residing near Swedish High-Voltage PowerLines. American Journal of Epidemiology 138:467-481.
3. IEEE Magnetic Fields Task Force Paper (1991): Measurements of Power Frequency Magnetic Fields Away from PowerLines. IEEE Trans, on Power Delivery 6:901-910.
4. Kavet R., Silva M. and Thornton P. (1992): Magnetic Field Exposure Assessment for Adult Residents of Maine Who LiveNear and Far Away from Overhead Transmission Lines. Bioelectromagnetics 13:35-55.
5. Morgan M.G., Nair I. (1992): Alternative Functional Relationships Between ELF Field Exposure and Possible HealthEffects. Bioelectromagnetics 13:335-350.
6. ANSI (1987): American National Standard Institute-IEEE standard procedures for measurement of power frequency electricand magnetic fields from AC power lines. ANSI/IEEE Std 644.
7. Tofani S., d'Amore G., Bonazzola G.C., and Fiandino G. (1992): Computational Method for Power Line Magnetic FieldEvaluation. Applied Computational Electromagnetics Society Journal 7:148-161.
PORTOROŽ 95 364

SESSION V I Hill Illllj JU UJÍ mm 1 1 | || Um p i Hü Hü PROCEEDINGSXA05C0095
THE ITALIAN NATIONAL ARCHIVE OF RADIO AND TV BROADCASTERS:PRELIMINARY EVALUATIONS OF HEALTH AND ENVIRONMENTAL
IMPACT
V. Lepori l), A. Polichetti 2\ P. Vecchia 2>
0 Prevention and Protection Service, USSL 5, Via Italia Libera 19, 22100 Como, Italy2) Physics Laboratory, National Institute of Health, Viale Regina Elena 299, 00161 Rome, Italy
INTRODUCTION
Several health effects of exposures to radiofrequency and microwave electromagnetic fields are well known anddocumented by a wide scientific literature. Although doubts still exist about the possibility of long-term effectsof chronic exposure to low intensity fields, a vast agreement has been reached in the scientific community aboutthe pathologies associated to exposures to relatively intense fields.
On the basis of this consensus, protection norms and guidelines have been issued, either by internationalorganizations(!-2> or by health Authorities of individual Countries. In Italy, a regulation in this area has beenurged for years by health operators, by scientists, and even by the industry. At the moment, two nationalCommissions, set up by the Ministry for the Environment and the Ministry of Health, are developing standardsfor the protection of the general population and workers, respectively.
In the meantime, some Regions (Pedmont, Latium, Abruzzo and Venetia) have enforced own regional laws,to face in particular the problems posed by the exposure of the public to electromagnetic fields radiated by radioand TV broadcasters.
A number of surveys carried out by various agencies have shown in fact that these plants give rise, in severalcircumstances, to fields exceeding the limits recommended by international organizations. That is due eitherto the proximity of individual antennas to houses or residential areas, or to the concentration of severalbroadcasters at the same site.
Since the space distribution of the power radiated by an antenna can be calculated theoretically, detailedinformation on the siting and the technical characteristics of each plant would allow an a priori evaluation ofpossible exposures and help to identify critical situations.
RADIO AND TV BROADCASTING IN ITALY
Differently from most other Countries, no strict limits have been posed in the last decades to the private activityin broadcasting, the only licencing procedure being related to the assignment of transmission frequencies. Atthe same time, no specific policy has been adopted, neither at the governmental nor at the local level, for thesiting of antennas.
As a consequence of such deregulation, a large proliferation of antennas, for both local and long-rangebroadcasting, has taken place. For obvious reasons, plants are preferentially located at most favourable sites,such as hills and other panoramic areas. Large clusters of antennas frequently occur, which may give rise toa relevant environmental and health impact.
The fact that the only licencing procedure is under the responsibility of the Ministry of Telecommunicationsmakes the control of these plants difficult. Environment and health Authorities may in fact be not aware of thetechnical characteristics, and sometimes even of the existence, of individual broadcasters.
To face these problem, a national archive of radio and TV broadcasters has been created, specifically aimedat health and environment impact evaluations.
PORTOROŽ 95 365

SESSION V PROCEEDINGS
THE NATIONAL ARCHIVE OF BROADCASTERS
A pilot database has been first realized by the Department of Physics and Environment Protection of theHygiene and Prevention Service (PMIP) of the Province of Como (Lombardy).
Information on the siting and the technical characteristics of individual plants was obtained by on-siteinspections, or provided by the local technical service of the Ministry of Telecommunications.
The database turned out to be a very useful tool for the identification of critical situations in the Province.
Based on the results of this experience, a national project was started in cooperation between the PMIP ofComo and the National Institute of Health (ISS), aimed at developing a nationwide archive of radio and TVbroadcasters.
Input data, regarding all licensed plants, were kindly provided by the Ministry of Telecommunications.
According to the project, subsets of the database have been realized and are being distributed, together withthe management software, to each of the 20 Italian Regions. These will operate in tight connection with ISS,for a continuous update of the information and for global analyses, while the identification of critical situationsand the consequent actions are the responsibility of local Authorities.
The archive is included in the National Statistical Plan of the Italian Statistical Institute (ISTAT).
ORGANIZATION OF THE ARCHIVE
The national database is installed on a computer Apple Macintosh and is managed by a special software basedon the application program FileMaker Pro. Regional archives can be managed by the same software, either inMacintosh or in DOS-Windows environment.
Broadcasters are classified by Region, and further subdivided by Province. Each data set is divided in turn intotwo parts, for radio and TV emitters, respectively.
In each record, identification data, including the location of the plant, are separated by technical data, whichcontain the information relevant for the distribution of electromagnetic fields.
The dimension and structure of the archive are summarized by the following figures:
number of records 56101
number of fields per recordtextnumeric (input)numeric (calculated)summary data
storage requirement
DATA ANALYSIS
109174645
1
150 MB
A global evaluation of data indicates that 56101 broadcasting plants have been licensed, almost equally dividedinto TV (28769) and radio (27332) stations. The distribution of broadcasters by Region is shown in Figs. 1and 2.
We are not aware of similar data for other Countries, and no direct comparison is therefore possible. However,based on the sparse indications in the literature, it appears that the number of emitters in Italy is extremely high,and possibly unprecedented in the world.
In spite of remarkable, and well known, social differences among different areas of the Country, there is noclear distinction in the distribution of broadcasters in northern or southern Regions. That is even more apparentif the density of antennas is considered, with respect to the population or to the area of individual Regions.
Taking into consideration the total number of emitters (radio and TV), the number of antennas for 1000inhabitants ranges from 0.66 in Campania to 3.39 in Trentino - Alto Adige and even to 8.95 in Valle d'Aosta,whereas the number of emitters per square kilometer ranges from 0.07 in Sardinia to 0.68 in Liguria.
PORTOROŽ 95 366

SESSION V PROCEEDINGS
The differences among individual regions seem to be mainly related to geographic conditions, and to orographyin particular. That accounts for the high number of antennas in the Alpine Regions such as Valle d'Aosta.
Fig. 1: Distribution of radio broadcasters over the Italian territory.
Fig. 2: Distribution of TV broadcasters over the Italian territory.
PORTOROŽ 95 367

SESSION V PROCEEDINGS
In Fig. 3, the distribution of emitters according to the nominal radiated power is shown. Although the data arenot completely reliable, and require to be carefully checked, they clearly indicate that a relevant number of verypowerful stations exists, which may give rise to significant exposures of the population if not adequatelydesigned and located.
I"Čit
O
Z
10*
10*
vfi
102
10'
RadioTVTotal
PslkW lkW<Ps5kW 5kW<Ps tOJcW WkW<Ps 50kW
Power
Fig. 3: Distribution of broadcasters according to the radiated power.
FUTURE DEVELOPMENTS
As already mentioned, subsets of the database have been created and are being distributed to the individualRegional Authorities. The Regions which have so far joined the project cover about half of the Country.
In the meantime, improvements of the application software are being realised or planned. In particular, a linkof the database to a national archive of population is under test. A research program, involving differentinstitutions, has been proposed for the development of computer programs that allow the real-time calculationof the power distribution around the antennas, using as input data the technical information in the data base.
The archive is expected to be a useful tool not only for the identification of specific situations requiringremedial actions, but also for the development of a new policy in the field of broadcasting, that takes intoadequate consideration the protection of the environment and of the human health.
ACKOWLEDGEMENTS
We wish to thank Mr. M. Sabatini for his invaluable help in data presentation.
REFERENCES
2.
IRPA/INIRC, 1988. Guidelines on Limits of Exposure to Radiofrequency Electromagnetic Fields in the Frequency Rangefrom 100 kHz to 300 GHz. Health Phys., 54:115-123.IEEE, 1991. IEEE standard for safety levels with respect to human exposure to radio frequency electromagnetic fields, 3kHzto 300GHz. Report IEEE C95.1.1991 (Revision of ANSI C95.1 -1982). IEEE, New York.
PORTOROŽ 95 368

SESSION V PROCEEDINGS
XA05C0096
EVALUATION OF RECOMMENDATIONS ON LIMITS OF EXPOSURE TOULTRAVIOLET RADIATION ON THE BASIS OF DATA FROM THE
AUSTRIAN POPULATION
G. Keck, G. Schauberger, A. Cabaj
Institut für Medizinische Physik, Veterinärmedizinische Universität Wien,Josef Baumann - Gasse 1, A-1210 Vienna, Austria
INTRODUCTION
For the application of solaria at present the following international recommendations on limits of exposureexist, which differ strongly:
1. IRPA/INIRC (1991): 30 MED/a (i.e. 7.5 kJ/a) (1)2. E C 335-2-27 (1978, 1989): 25 U/m2/a for each region of the body, that ist 100 MED/a (2)
On the basis of our data from the Austrian population we give an evaluation of these recommendations for theentire population. This evaluation shows that 100 MED/a is much too high, it seduces rather to use solaria thanto restrict their application.
METHODS
Assessment of UV-exposure was done for the entire Austrian population older than 16 years using a semi-quantitative method. The relevant information concerning the population was collected from a statistically-representative survey of about 1500 people. The survey covered behavioural patterns in the four fields ofeveryday life: occupation, leisure time and holidays for solar UV, and the use of solaria and sunbeds forartificial UV sources. On the basis of these data, the mean exposure per year was calculated for nine bodysurface regions for each of the 1500 subjects.
For solar UVR (3,4) the following parameters were taken into account: season, time of day, seasonal courseof ozone concentration, latitude and angle of inclination of the receiving surface, i.e. the skin of the nine bodyregions. To consider the biological relevance of UVR the action spectrum of erythema (5) was used which isalso assumed to apply for non-melanom skin cancer (6). Exposure was normalized by the Minimal ErythemaDose of 250 J/m2 (MED). From the behavioural patterns of those people interviewed, the following parameterswere derived for different outdoor activities: skin protection from covering by clothing and hair, and time spentoutdoors (or in the solarium). For the quantification of some of these parameters, the results of varous fieldstudies were used which measure the UV-exposure for different subpopulations by personal dosimeters (7, 8).
For each individuum of the survey, the calculated UV-exposure of the nine body regions is the basis for themean exposure per year for the whole body surface D (weighted by the area of the nine regions) as sum of theexposure of the four fields of everyday life: occupation - leisure time - holidays and the use of solaria. Thepartitioning of the subpopulations was done according to demographic categories and to different behaviouralpatterns (Fig. 1).
The connection between UVR and skin cancer is well documented (6, 9, 10). The incidence of NMSC (basalcell and squamous cell carcinomas with a mortality of about one per cent) depends on the mean UV-exposure(skin dose) per year and on age. For the entire population the calculated relative risk (RR) was normalized tounity. To determine the influence of solaria and sunbed usage, the relative risk was calculated on theassumption that neither solaria nor sunbeds were used, i.e. UV exposure from solaria and sunbeds in zero.These data were also analyzed using demographic methods.
PORTOROŽ 95 369

SESSION V PROCEEDINGS
120-1
O
Q 100LU
Q
d)
3V)Oa.x
OJ
i
coCD
OccupationLeisure TimeHolidaysSolaria
r4.0
-3.0 cc
coh 2.0 ir
CD
-1.0
L0.0
CD
80-
60-
40-
20-
0 J
ab abcde abcdef abc ab ab ab ab
1 2 3 4 5 6 7 8
Subpopulation - Category
Fig. 1: UV-exposure D (mean yearly UV-exposure MED/a of the whole body, normalised by 250 J/m2 per MED-Minimal Erythema Dose) and relative risk RR of NMSC for some sub-populations of the Austrianpopulation. Mean value of the UV-exposure D of the whole population is 53 MED/a; relative risk isnormalised to unity for the whole population.
Differentiation of UV-exposure in using the following demographic features: 1 sex (a male, b female); 2 age(a 16 - 29 years, b 30 - 39 years, c 40 - 49 years, d 50 - 59 years, e 60 years and older); 3 occupational category(a semiskilled worker, b skilled worker, c clerk/civil servant, d senior clerk/senior civil servant,e selfemployed/professional, f farmer) 4 occupation (a indoor worker, less than 1 h outdoors; b occupationbetween 1 hr and 4 hrs outdors; c outdoor worker, more than 4 hrs outdoors. 5 exposure during leisure time(a no exercise of summer-sports or swimming, b swimming and summer-sports during leisure time); 6 holiday-destination the Mediterranean area (a no summer holidays in the Mediterranean area, b summer holidays in theMediterranean area); 7 holiday-destination: Winter holidays in the tropics (a no winter holidays in the tropics,b winter holidays in the tropics); 8 utilization of solaria (a no utilization of solaria, b utilization of solaria).
RESULTS
For the Austrian Population older than 16 years we found for 1990 a mean UV-exposure of nearly 53 MED(22 MED for work outdoors, 29 MED for leisure time and holidays, 1.5 MED for sunbeds). The demographicanalysis shows, that the mean UV-exposure of more than % of the Austrians is below 38 MED/a. Highlyexposed groups are outdoor workers (>4 h/d) with 125 MED/a, persons spending their holidays at theMediterranean (79 MED/a) and the user of solaria (79 MED/a). But only 9.8% of the Austrian population usesunbeds. Based on the comprehensive data about the relative risk for non melanoma skin cancer, relative risksfor different applications of sunbeds were determined (Tab. 1).
One can see that the subpopulation of the users of sunbeds (with a current risk of 1.44) would have, evenwithout the use of sunbeds, an increased risk (1.11) compared to the whole population. If persons of thesesubpopulations would receive 30 MED/a from artificial tanning (IRPA/INIRC) the relative risk would increaseto 1.65, but with 100 MED/a (EC) to 3.70.
A frequency distribution of skin dose shows, that 80% of the users of solaria do not reach 30 MED/a, less than1% exeed 100 MED/a. The recommendation of the IEC therefore is much to high, it seduces rather to usesolaria than to restrict their application (Fig. 2).
PORTOROŽ 95 370

SESSION V
Population
whole populationmalefemaleindoor workeroutdoor worker (>4/hd)summer holidays (Mediterrean)summer sports outdoorsuser of sunbeds
no applicationactual (15.3 MED/a)IRPA (30 MED/a)IEC (100 MED/a)
Share of thepopulation
10045.554.573.811.522.638.4
9.8
UVExposure(MED/a)
53584838
1257970
637989
149
PROCEEDINGS
RelativeRisk
1.001.230.810.494.091.441.34
1.111.441.653.70
Tab. 1: Relative Risk of UV-Exposure.
150-1
100o
•a
5
NORMEINTERNATIONALE
INTERNATIONALSTANDARD
CEIICE
335-2-27AMEND€MENT2
AMENDMENT 2
HEALTH » S U E S OF ULTRAVIOLET "A" SUN BEOS USEO FORCOSHETICH PURPOSES
A s u m « by «o International ItofvJwilzha R*dbrtoii C o m « « 'ofthoTncematicnal Raduticn PiotKuon Auociatlon
10 20 30 40 50 60 70 80 90 100
entire population (%)
Fig. 2: UV-exposure of the Austrians caused by the use of solaria.
We recommend to adapt the international standard IEC 335-2-27 to the IRPA/INIRCrecommendations, so that irradiation schedules on the basis of an annual dose of 7.5 kj/m2 and skinarea (that is 30 MED/a) should be drawn up.
SUMMARY
On the basis of data of the UV-exposition of the Austrian population from occupation, leisure time, holidaysand the use of solaria we can show that the recommendations of the EEC to limit the UV-exposition in solariawith 25 kJ/mVa (100 MED/a) is much too high and should be altered.
PORTOROŽ 95 371

SESSION V PROCEEDINGS
REFERENCES
1. IRPA/INIRC (1991): Health Issues of Ultraviolet „A" Sunbeds used for Cosmetic Purposes. Health Physics 61, 285-288.2. IEC 335-2-27 (1978,1989).3. Bener P. Approximate values of intensity of natural radiation for different amounts of atmospheric ozone. London: European
Research Office US Army, 1972.4. Diffey BL. The calculation of the spectral distribution of natural ultraviolet radiation under clear day conditions. Physics in
Medicine and Biology 1977; 2: 309-316.5. CIE. A reference action spectrum for ultraviolet induced erythema in human skin. CIE Research Note, CIE Journal 1987;
6: 17-22.6. van der Leun JC. UV-Carcinogenesis. Photochemistry and Photobiology 1984;39: 861-86.7. Diffey BL, Larkö O, Swanbeck G. UV-Dosis received during different outdoor activities and UV-B treatment of psoriasis.
British Journal of Dermatology 1982;106: 33-41.8. Holman CDJ, Gibson IM, Stephenson M, Armstrong BK. Ultraviolet irradiation of human bodysites in relation to
occupational and outdoor activities: Field study using personal UVR dosimetry. Clin Exp Dermatol 1983; 8: 69-277.9. Fears TR, Scotto J, Schneiderman MA, Mathematical models of age and ultraviolet effects on the incidence of skin cancer
among whittles in the United States. American Journal of Epidemiology 1977; 105: 420-427.10. Slaper H, van der Leun JC. Human exposure to ultraviolet radiation: Quantitative modelling of skin cancer incidence, In:
Passchier WF, Bosnajakovic BFM. (eds) Human exposure to ultraviolet radiation - risk and regulations. Amsterdam:Excerpta Medica, International Congress Series 744, 1987.
PORTOROŽ 95 372

SESSION V PROCEEDINGS
XA05C0097
SECONDARY HAZARDS OF HIGH POWER LASER BEAM WELDING
K. Schulmeister l), C. Schmitzer '>, K. Duftschmid '>, G. Liedl2),K. Schroder2) and D. Schuöcker2)
" Department of Radiation Protection, Austrian Research Centre, A-2444 Seibersdorf2) Institute for High Power Beam Technology, TU Vienna, Arsenal Obj. 207, A-1030 Wien
ABSTRACT
Hazardous UV-radiation and short-wavelength visible (blue) light is emitted by the high temperature plasmaabove the welding-keyhole. Ozone and NOX is produced due to UV-induced photodissociation of oxygen andhigh temperature gas-phase reactions. Spectral measurements of the plasma emission show that the alloweddose for UV-radiation and blue light exposure per work day can be exceeded in as short as a few seconds.Similarly, measurements and models of the ozone and NOX concentration show that the maximum workplaceconcentrations might be reached quickly if no appropriate exhaust and filter system is installed.
INTRODUCTION
With laser materials processing, direct exposure to the laser beam is usually not the main hazard. The highpower laser beam is enclosed up to the surface of the workpiece and is usually directed towards the ground.Errant beams can be caused by uncontrolled reflections off the workpiece surface, however this happens rarelyand protection is generally afforded by shields around the workstation. Secondary hazards such as UV-radiation, ozone and fume produced by the laser-workpiece interaction are more serious due to the every-day,long term exposure of the worker.
In this paper, hazards associated with the plasma of CO2 laser beam welding are discussed. In laser beam deeppenetration welding, a keyhole is formed throughout the base metal. The keyhole is held open by the vapourpressure of the vaporised base metal. Due to laser radiation-induced ionisation of the metal vapour, a plasmai s formed above the keyhole. On the one hand the plasma enables efficient absorption of the laser beam energy,on the other hand it is a source of hazardous UV- and blue-light radiation. Model calculations indicate aplasma temperature of about 10,000 to 13,000 K, therefore a substantial part of the optical radiation is emittedin the ultraviolet and blue region of the spectrum.
The damage mechanism of short wavelength optical radiation is photochemical in nature. A common effectof UV-C and UV-B radiation (200 nra to 320 nm) on the skin is reddening (erythema, sunburn). As UV-C andUV-B radiation is absorbed by the outer parts of the eye, adverse effects are photokeratitis (inflammation ofthe cornea) and cataracts (clouding of the lens). Visible blue light (400 nm to 500 nm) on the other handreaches the retina and induces photoretinitis (sunburn of the retina) which can lead to permanent loss of vision.As is characteristic for photochemical effects, the absorbed dose (J/m2) is the important hazard figure as thereis a reciprocity between irradiance (W/m2) and exposure duration. The same injury can be produced by a lowirradiance lasting for a prolonged period of time or by a high irradiance lasting for only a short time.
As a result of the high-temperature plasma and the UV radiation emitted by the plasma, Ozone and NOX isproduced due to UV-induced photodissociation of oxygen and high temperature gas-phase reactions. Radiationin the wavelength region below 200 nm is strongly absorbed by oxygen and is highly effective in producingozone by photodissociation of oxygene. As the toxic limit for ozone is quite small, it may be exceeded rapidlywhen the exhaust system is not efficient. Additionaly, nitrogen oxides are produced by high-temperaturereactions in and near the plasma, however NOX production is not as critical as ozone production as thethreshold limit value for nitrogen oxides are at least a factor of 30 above the value for ozone.
PORTOROŽ 95 373
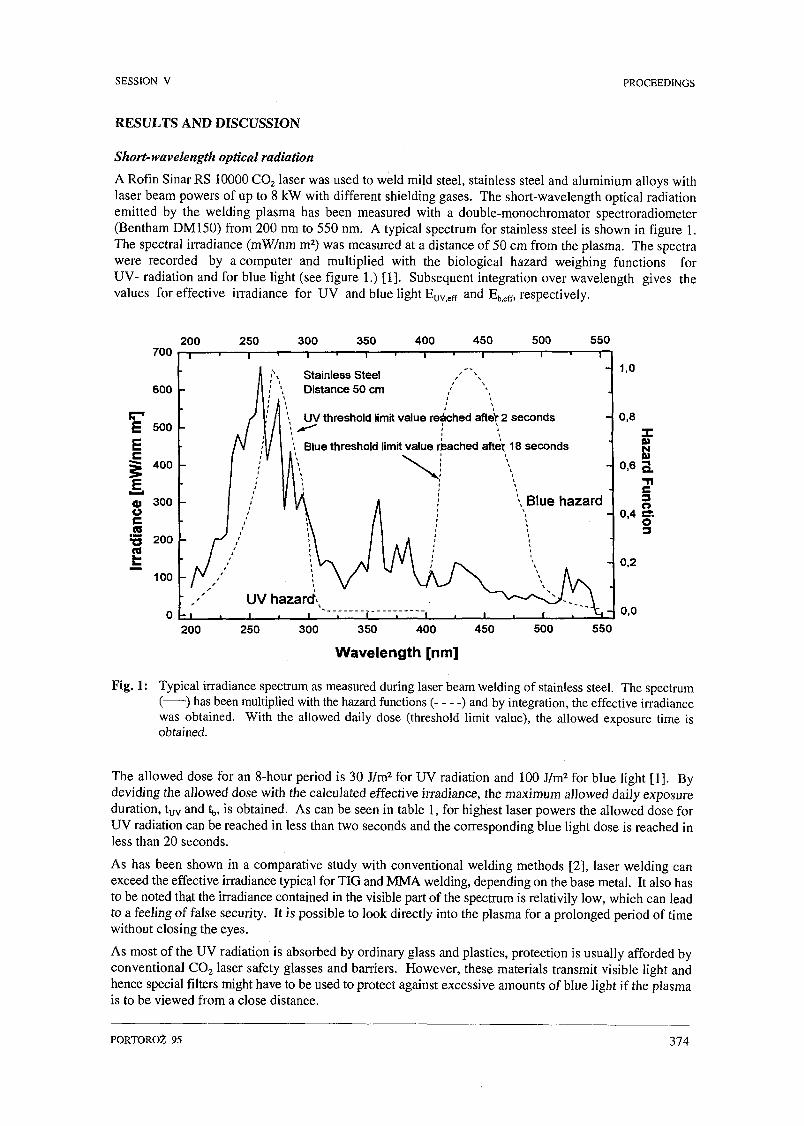
SESSION V PROCEEDINGS
RESULTS AND DISCUSSION
Short-wavelength optical radiation
A Rofin Sinar RS 10000 CO2 laser was used to weld mild steel, stainless steel and aluminium alloys withlaser beam powers of up to 8 kW with different shielding gases. The short-wavelength optical radiationemitted by the welding plasma has been measured with a double-monochromator spectroradiometer(Bentham DM150) from 200 nm to 550 nm. A typical spectrum for stainless steel is shown in figure 1.The spectral irradiance (mW/nm m2) was measured at a distance of 50 cm from the plasma. The spectrawere recorded by a computer and multiplied with the biological hazard weighing functions forUV-radiation and for blue light (see figure 1.) [1]. Subsequent integration over wavelength gives thevalues for effective irradiance for UV and blue light EUVeff and Ebeff, respectively.
200 250 300 350 400 450 500 550
Stainless Steel / \
Distance 50 cm /
UV threshold limit value reached after 2 seconds
'. Blue threshold limit value reached after 18 seconds
\ Blue hazard
1,0
0,8
I0,6 3.
-n
0,4 ÄO
0,2
0,0
200 250 300 350 400 450
Wavelength [nm]
500 550
Fig. 1: Typical irradiance spectrum as measured during laser beam welding of stainless steel. The spectrum( ) has been multiplied with the hazard functions ( ) and by integration, the effective irradiancewas obtained. With the allowed daily dose (threshold limit value), the allowed exposure time isobtained.
The allowed dose for an 8-hour period is 30 J/m2 for UV radiation and 100 J/m2 for blue light [1]. Bydeviding the allowed dose with the calculated effective irradiance, the maximum allowed daily exposureduration, tuv and t,,, is obtained. As can be seen in table 1, for highest laser powers the allowed dose forUV radiation can be reached in less than two seconds and the corresponding blue light dose is reached inless than 20 seconds.
As has been shown in a comparative study with conventional welding methods [2], laser welding canexceed the effective irradiance typical for TIG and MMA welding, depending on the base metal. It also hasto be noted that the irradiance contained in the visible part of the spectrum is relativily low, which can leadto a feeling of false security. It is possible to look directly into the plasma for a prolonged period of timewithout closing the eyes.
As most of the UV radiation is absorbed by ordinary glass and plastics, protection is usually afforded byconventional CO2 laser safety glasses and barriers. However, these materials transmit visible light andhence special filters might have to be used to protect against excessive amounts of blue light if the plasmais to be viewed from a close distance.
PORTOROŽ 95 374

SESSION V PROCEEDINGS
BaseMetal
SS
ssSS
ssmS
mS
mS
Al
Al
Al
Al
SS
Thickness (mm)
3
3
3
3
3
3
3
5
5
6
6
3
Shielding Gas(l/min)
Ar 20
He 20
Ar 20
Ar 20
Ar 20
He 20
Ar 20
Ar 20
He 20
Ar5/Hel5
ArlO/Hel5
Ar 20
LaserPower(kW)
2,5
2,5
2,5
4
2,5
2,5
4
4
4
6
8
8
Eeff,uvW/m2
2,7
1,3
4,2
10,8
2,5
2,2
4,1
7,3
3,0
3,6
5,4
19,3
(See.)
11,1
22,73
7,1
2,8
12,0
13,6
7,3
4,1
10,0
8,3
5,6
1,6
EefT.bW/m2
0,46
0,25
0,69
3,38
0,57
0,45
0,50
1,23
0,46
0,75
0,79
5,63
(See.)
217
400
145
30
175
222
200
81
217
133
127
18
Table 1: UV and blue light emissions as measured at a distance of 50 cm from the welding plasma. For highestlaser powers, the allowed daily dose for UV irradiation is reaches in less than 2 seconds, the alloweddose for blue light is reached in as short as 18 seconds.
Ozone and NOx
In order to measure the ozone and nitrogen oxide emissions during laser beam welding, the processing stationwas hermetically enclosed with a plastic foil. The nitrogen oxides were measured with a chemiluminesceneanalyser and the ozone was measured with a UV-photometer. The experiments were performed with a laserbeam power of 2.5 kW and mild steel and aluminium alloy as base metals. The ozone and NOx emissions weremeasured as function of time. The dependence of the emissions on time was found to be linear and thecorresponding emission rate is shown in Table 2.
Material
Steel
Al
NOx (mg/s)
0.88
3.6
O3 (mg/s)
0.21
0.72
Table 2: Nitrogen oxides and ozone emission rates as measured during laser beam welding with a laser beam of2.5 kW.
In occupational hygene, the Nominal Air Requirement, NAR, is frequently used to compare different emissionswith respect to their toxicity. This number gives the amount of air per unit time (m3/h) which is necessary todilute the respective constituent to the defined threshold limit value. The NAR for processing of steel and alu-minium as obtained with the above experimental parameters are given in Table 3.
The emissions of ozone and nitrogen oxides are in the range where the threshold limit values are quicklyreached in the air surrounding the laser processing station. Therefore exhaust and filtration systems must bedesigned which can effectively remove these constituents. It should be pointed out, that efficient filtrationsystems are already widely used in order to remove metallic fumes such as Chromium, which are emitted duringlaser beam processing, however these filters might not be effective in removing Ozone and NOX.
PORTOROŽ 95 375

SESSION V PROCEEDINGS
Material
Steel
Al
NAR for NOx(m3/h)
530
2200
NAR for O3(mVh)
3800
13000
Table 3: Nominal Air Requirement for laser beam welding of stainless steel and aluminium alloy with a laserbeam power of 2.5 kW. The threshold limit value for NO2 and for ozone equals 6 mg/m3 and 0,2 mg/m3,respectively [3].
ACKNOWLEDGEMENTS
The financial support by the Austrian "Fonds zur Förderung der wissenschaftlichen Forschung' Project 8621is gratefully acknowledged.
REFERENCES
1. ACGIH, Documentation of the threshold limit values for physical agents in the work environment. Vol III, PA 35 and71 (1993).
2. Hump K., Glandolm A., Hietanen M., von Nandelstadh P., and Schroder K., in Proc. of Industrial Laser Safety Forum,91, Copenhagen 1995 (1995).
3. K. Schröder, K. Schulmeister, and G. Liedl, in Proc. of Industrial Laser Safety Forum, 317, Copenhagen 1995 (1995).
PORTOROŽ 95 376

SESSION VI:
RADIATION PROTECTION AND THESOCIETY
CLIAÍRS:
S. ARIIN. VANA
B. PUCELJP. STEqNAR


V. IlllllllllllllllllUllllllllllllllllllllllli PROCEEDINGSXA05C0098
RADIOACTIVITY MONITORING PROGRAMMEOF KRŠKO NUCLEAR POWER PLANT
U. Miklavžič 0, R. Martinčič l\ M. Kanduč2>, S. Lulič3 ), J. Kováč4 ), B. Breznik5 )
0 Jozef Stefan Institute, Jamova 39, Ljubljana, Slovenia2) Institute of Occupational Safety, Bohoričeva 22a, Ljubljana, Slovenia
3) "Ruder Boskovic" Institute, Centre for Marine Research, Bijenička 54, Zagreb, Croatia4) Institute for Medical Research and Occupational Health, Ksaverska cesta 2, Zagreb, Croatia
5 ) Krško Nuclear Power Plant, Vrbina 12, Krško, Slovenia
INTRODUCTION
As a successor to the preoperational surveillance programme, the regular offsite radioactivity monitoringprogramme (RMP) of the Krško Nuclear Power Plant (NPP) was implemented in 1982, when the powerplant formally commenced operating. Observations collected during the first years of its operation werelater also the basis for setting up the official "Regulatory guide on monitoring of nuclear installations",issued not earlier than in 1986. The basic criterion which governed the selection of measuring methods,sampling techniques and locations, was the extent to which the data obtained could serve for the realisticassessment of the committed dose to a member of the population, and later on to members of arepresentative (critical) group. To be able to differentiate the radioactivity released through the liquid andgaseous effluents of the NPP from other radiation sources (natural radioactivity, global contamination), andespecially because of the varying radiotoxicity of different radionuclides, in principle monitoring in theenvironment, as at the source, had to provide activity data for each individual radionuclide appearing in theeffluents. Therefore, as early as 1982 the programme attributed the main weight to high resolution gammaspectrometry, combined with specific radiochemical analytical methods (e.g. ^Sr/^Sr, 3 H , 1 4 C, alphaspectrometry of Pu isotopes) which together made feasible determination of individual specific activitiesof the most significant man-made and natural radionuclides.
By weighting the specific activities of the radionuclides identified and measured in the media surveyed bydose factors for intake, the quantity " B " - the so-called "radiological burden", was calculated andintroduced in the yearly-summary tables. Expressed in relative units, from which the committed dose couldbe readily calculated, the burden B very lucidly disclosed the relative importance of different artificialpollutants and natural radioactivity present in the environment, and could also be extended to the mediawhich are not directly "consumed" by man (e.g. sediments).
Presently the RMP includes monitoring of "undiluted" liquid and gaseous effluents at source performedby NPP staff, and an extensive offsite surveillance programme, jointly performed by four independentauthorised institutions. To maintain an acceptable overall agreement of data supplied by five differentlaboratories, special attention is devoted to realistic estimates of measurement uncertainties which arerequired for all raw data and to analytical intercomparison runs, both on the international level (such asorganised by the IAEA) and between the laboratories engaged. The results of intercomparison runs arepublished as a part of the yearly monitoring Report' in which all measured data are evaluated through doseestimates over different pathways for the reference (critical) groups of the population.
EMISSION MONITORING
The inventory of released radionuclides obtained through the monitoring of "undiluted" gaseous and liquideffluents at source may serve in many cases (when the activities of the measured media are below thedetection limit) as the only available and reliable data source for dose estimates. In such cases the dosecalculations are done by mathematical modelling of the dispersion and transfer characteristics of the media.Such is the case for airborne effluents from the stack, where emission monitoring comprises continuouson-line measuring of the noble gases by a solid state gamma spectrometer, continuous sampling of
PORTOROŽ 95 379

SESSION VI PROCEEDINGS
(i) FILTERED WATER
RADIO -NUCLIDE
U (Th-234)Ra - 226Pb-210Th (Ra-228)Th - 228K - 40Be- 7I - 131Cs- 134Cs - L37Co- 58Co- 60Cr- 51Mn- 54Zn- 65Nb- 951 - 125Sb-125Ag - 110mSr-9O/Sr-89H - 3
SB artificialradionuclides
2 B total
KRŠKO
A(Bq.m-3)
5.7E+001.7E+00
< 2.8E+001.0E+00
5.3E-013.6E+01
< 1.9E+001.9E+0I
< 2.1E-01
3.7E+OO1.7E+O3
B(rel.units)
5.7E+O12.4E+01
5.2E+01
3.6E+009.4E - 041.9E+01
5.2E - 02
3.7E+005.7E-01
23
160
ES Water Inlet
A(Bq.rn3)
< 3.6E+01< 1.5E+00
6.9E-011.1E+00
< 1.1E+004.6E+01
< 3.5E+OO1.6E+01
<4.3E-01
4.5E+002.0E+03
B(rel. units)
3.6E+022.1E+01
5.5E+01
4.6E+001.7E-03I.6E+01
1.1E-0I
4.5E+006.5E-01
22
464
ES Water
A(Bq.m3)
< 7.8E+00< 1.4E+00
6.7E - 01< 2.0E+00< 6.2E - 01
4.1E+016.1E-01
< 1.3E+011.3E+002.8E+001.2E-0I4.8E - 02
< 1.8E+001.2E+01
4.6E+006.2E+05
Discharge
B(rel.units)
7.8E+012.1E+01
1.0E+02
4.1E+003.1E-041.3E+0I4.2E - 016.9E - 012.5E - 036.8E - 03
2.5E-011.7E-01
4.6E+002.0E+02
222
425
BREŽICE
A(Bq.m-3)
4.5E+00< 1.3E+00
1.8E+00< 1.6E+00
1.2E+004.0E+011.0E+002.2E+01
<4.5E-011.7E-02
< 1.6E-01
4.2E+001.9E+03
B(rel.units)
4.5E+011.8E+01
8.2E+01
4.0E+005.1E-042.2E+01
LIE - 013.4E-04
2.3E-03
4.2E+006.4E-0I
27
176
JESENICE
A(Bq.m-3)
4.2E+001.1E+00
9.1E-017.1E-014.1E+01
< 2.6E+001.8E+01
<2.3E-01<3.7E-01
<6.2E-02
2.4E+007.4E+04
B(rel.units)
4.2E+011.6E+01
4.6E+01
4.1E+001.3E-O31.8E+01
7.4E - 029.3E - 02
7.4E - 04
2.4E+002.4E+01
45
152
(ii) FILTER
RADIO -NUCLIDE
U (Th-234)Ra - 226Pb-210Th (Ra-228)Th - 228K - 40Be- 7I -131Cs-134Cs-137Co- 58Co- 60Cr- 51Mn- 54Zn- 65Nb- 95I - 125Sb- 125Sb- 124Sr-90/Sr-89
SB artificialradionuclides
S B total
RESIDUE
KRŠKO
A(Bq.m-3)
< 7.7E+OO3.3E-01
< 2.6E+002.5E-013.3E-016.5E+009.6E - 01
<3.1E-01
< 2.0E - 01
B(rel.units)
7.7E+014.7E+00
1.3E+01
6.5E-014.8E - 04
7.8E - 02
2.0E-01
0.3
95
ES Water Inlet
A(Bq.m"3)
< 5.1E+00< I.1E+00< 2.8E+00< 1.8E+00< 1.3E+00< 1.5E+01
3.4E+00< 2.3E+OO
< 1.1E+00
<4.1E-01
B(rel.units)
5.1E+011.5E+01
8.8E+O1
1.5E+001.7E-032.3E+00
2.8E-01
4.1E-01
3
158
ES Water
A(Bq.m-3)
< 8.5E+0O< 2.1E+00
4.2E+00< 3.0E+00
2.5E+003.4E+01
< 5.8E+003.0E+005.1E+009.6E+00
<3.2E-018.0E-01
2.2E+00< 2.6E+00
< 4.2E - 01
Discharge
B(rel.units)
8.5E+012.9E+01
1.5E+02
3.4E+002.9E - 033.0E+001.7E+002.4E+006.4E - 031.1E-01
2.2E+003.7E - 02
4.2E-01
10
276
BREŽICE
A(Bq.m-3)
< 4.5E+OO< 1.3E+00< 3.2E+00< 1.4E+00
1.7E+001.7E+011.3E+003.3E+O0
< 1.0E+00
< 3.7E-01
B(rel.units)
4.5E+011.8E+01
6.9E+01
1.7E+006.3E-043.3E+00
2.5E-O1
3.7E-01
4
138
JESENICE
A(Bq.m-3)
6.2E+001.7E+00
I.8E+002.3E+002.6E+019.7E+005.6E+OO
< 2.IE-012.8E+00
< 1.0E-01
<1.9E-01
<4.5E-01<3.0E-0l
B(rel.units)
6.2E+O)2.4E+0I
9.0E+01
2.6E+004.9E-035.6E+007.0E - 027.0E-012.0E - 03
2.3E-03
2.3E - 023.0E-01
7
186
(ES - Essential Service Water)
Table 1: Filtered water and filter residue from the river Sava in 1994."A" is yearly average activity;"B" is relative contribution to the committed effective equivalent dose H^Q. Assuming a waterconsumption of 0.8 m3, the yearly contribution to the committed effective equivalent dose of thereference man can be calculated as follows: HE50 - 4E-2.SB (^iSv).
PORTOROŽ 95 380
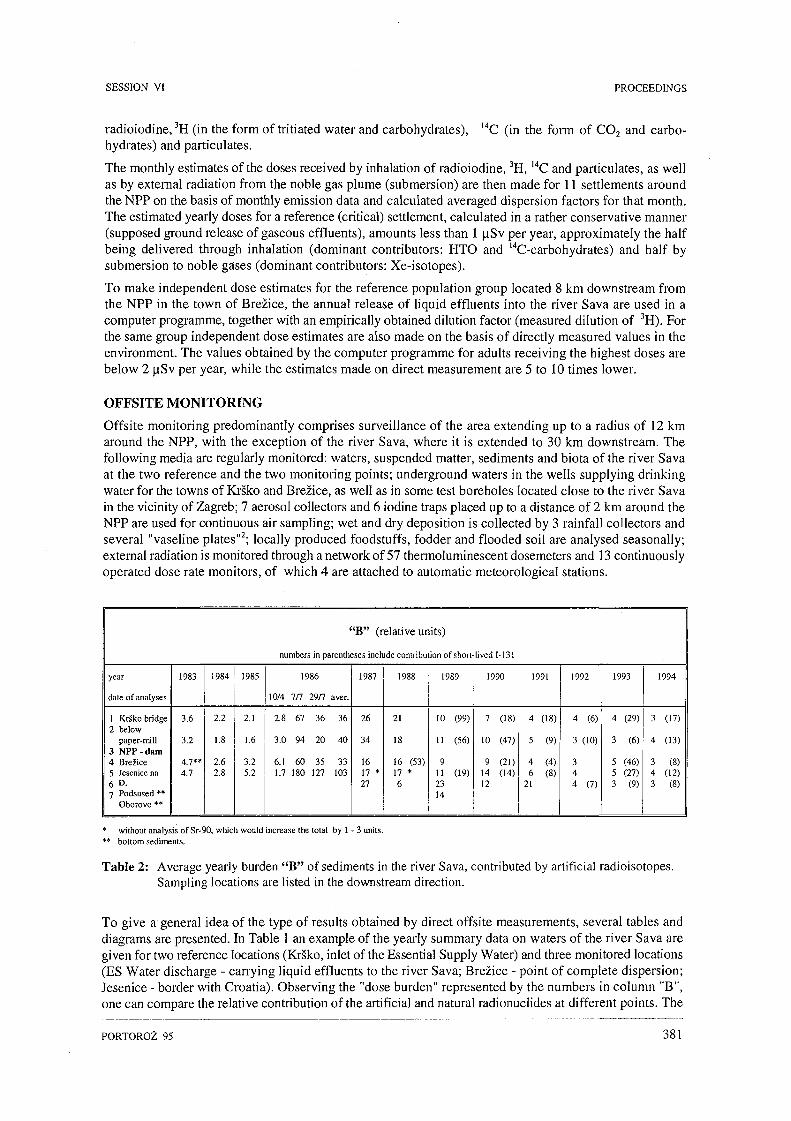
SESSION VI PROCEEDINGS
radioiodine, 3H (in the form of tritiated water and carbohydrates), 14C (in the form of CO2 and carbo-hydrates) and particulates.
The monthly estimates of the doses received by inhalation of radioiodine, 3H, MC and particulates, as wellas by external radiation from the noble gas plume (submersion) are then made for 11 settlements aroundthe NPP on the basis of monthly emission data and calculated averaged dispersion factors for that month.The estimated yearly doses for a reference (critical) settlement, calculated in a rather conservative manner(supposed ground release of gaseous effluents), amounts less than 1 uSv per year, approximately the halfbeing delivered through inhalation (dominant contributors: HTO and '"C-carbohydrates) and half bysubmersion to noble gases (dominant contributors: Xe-isotopes).
To make independent dose estimates for the reference population group located 8 km downstream fromthe NPP in the town of Brežice, the annual release of liquid effluents into the river Sava are used in acomputer programme, together with an empirically obtained dilution factor (measured dilution of 3H). Forthe same group independent dose estimates are also made on the basis of directly measured values in theenvironment. The values obtained by the computer programme for adults receiving the highest doses arebelow 2 uSv per year, while the estimates made on direct measurement are 5 to 10 times lower.
OFFSITE MONITORING
Offsite monitoring predominantly comprises surveillance of the area extending up to a radius of 12 kmaround the NPP, with the exception of the river Sava, where it is extended to 30 km downstream. Thefollowing media are regularly monitored: waters, suspended matter, sediments and biota of the river Savaat the two reference and the two monitoring points; underground waters in the wells supplying drinkingwater for the towns of Krško and Brežice, as well as in some test boreholes located close to the river Savain the vicinity of Zagreb; 7 aerosol collectors and 6 iodine traps placed up to a distance of 2 km around theNPP are used for continuous air sampling; wet and dry deposition is collected by 3 rainfall collectors andseveral "vaseline plates"2; locally produced foodstuffs, fodder and flooded soil are analysed seasonally;external radiation is monitored through a network of 57 thermoluminescent dosemeters and 13 continuouslyoperated dose rate monitors, of which 4 are attached to automatic meteorological stations.
year
date of analyses
12
34567
Krško bridgebelowpaper-millNPP- damBrežiceJesenice naD.Podsused **Oborovo **
1983
3.6
3.2
4.7**4.7
1984
2.2
1.8
2.62.8
1985
2.1
1.6
3.25.2
" B " (relative units)
numbers in parentheses include contribution of short-lived 1-131
10/4
2.8
3.0
6.11.7
1986
7/7
67
94
60180
29/7
36
20
35127
aver.
36
40
33103
1987
26
34
1617 *27
1988
21
18
16 (53)17 *6
1989
10
II
9112314
(99)
(56)
(19)
1990
7
10
91412
(18)
(47)
(21)(14)
1991
4
5
46
21
(18)
(9)
(4)(8)
1992
4
3
344
(6)
(10)
(7)
1993
4
3
553
(29)
(6)
(46)(27)
(91
3
4
343
1994
(17)
(13)
(8)(12)(8)
* without analysis of Sr-90, which would increase the total by 1 - 3 units.** bottom sediments.
Table 2: Average yearly burden "B" of sediments in the river Sava, contributed by artificial radioisotopes.Sampling locations are listed in the downstream direction.
To give a general idea of the type of results obtained by direct offsite measurements, several tables anddiagrams are presented. In Table 1 an example of the yearly summary data on waters of the river Sava aregiven for two reference locations (Krško, inlet of the Essential Supply Water) and three monitored locations(ES Water discharge - carrying liquid effluents to the river Sava; Brežice - point of complete dispersion;Jesenice - border with Croatia). Observing the "dose burden" represented by the numbers in column "B",one can compare the relative contribution of the artificial and natural radionuclides at different points. The
PORTOROŽ 95 381

SESSION VI PROCEEDINGS
regularly observed difference between the two reference points (Krško and the inlet of the ESW) is causedby the undispersed effluents of the Videm paper-mill, discharged to the river Sava a few km upstream fromthe NPP. In particular, the increase in natural radioactivity is caused by tailings coming from the ash of thepaper-mill's small coal-fired thermal power plant, and the increase of artificial radionuclides has beenobserved after the Chernobyl accident as a result of contamination of the raw material (wood). At bothreference points one can also observe the presence of iodine-131 brought by waters of the river Sava fromthe hospitals in Ljubljana and Celje. The situation described is not an exceptional one and is furtherillustrated in Table 2, where the contribution of all artificial radionuclides to the "B"- value of sedimentsover several years is recorded. The influence of Chernobyl contamination in 1986 can be clearly followed.
Similar tables also exist for all wells supplying drinking water to the above mentioned towns andneighbouring settlements. In fact the only direct pathway causing a quantitatively negligible, but stilldetectable dose increase for the reference population group at Brežice, was the observed increase in tritiumconcentration in drinking water, approximately by a factor of 2 to 3 as compared to Krško. It was provento be caused by natural migration of waters from the river Sava to the underground water reservoir ofBrežice. In the second half of 1990 this pathway was broken by the use of a new deeper well, supplyingdrinking water with a much lower tritium concentration than found on the average in Slovenia. It isinteresting to note that Chernobyl contamination observed in the river Sava during 1986 was neverthelessefficiently filtered and has not been detected in drinking water.
[fiSv/month]400
300
200-
100 -
o-1 I *1986 (2) 1987 1988 1989 1990
year
1991 1992 1993 1994
JH location No. 42 - KrSko H mean of 50-57 TLD locations f j location No. 12-Sp. Stari grad
* in 1986 data for 3-months exposures are shown, except at (2), where 2-months period from 29.04. to 05.07.1986 is presented
Fig. 1: External gamma radiation at the Krško NPP. Average monthly dose during 4-month (or 6-months)exposures in the corresponding year (bars above and to the right of the year-mark) measured with TLdosemeters.
In the diagram of Fig. 1 the doses caused by external gamma radiation recorded with TL dosemetersin 4-month periods since the beginning of 1986 (Chernobyl accident) are presented. Together with theaverage dose value for 57 locations around the Krško NPP, the doses of the "hottest" and the "coldest"location are also shown. So far no variation in doses recorded with TLDs could be ascribed to theinfluence of airborne releases from the NPP. Moreover, systematically the lowest doses (up to 9dosemeters not included in the diagram) were always recorded at the fence of the NPP - obviously onaccount of the lower radioactivity (natural and general contamination) of the artificially built groundof the plant in comparison with the natural soil in the vicinity.
An illustrative example of external radiation dose rate changes is given in the diagrams of Fig. 2showing records of 5 continuous dose rate monitors. In all diagrams the recorded dose rate "trip" (ofthe kind also observed in other remote locations), has no correlation with the airborne emissions of the
PORTOROŽ 95 382

SESSION VI PROCEEDINGS
Krško NPP and is caused by wash-down of natural radioactivity with rain (radon decay products 214Pb,2l4Bi). In contrast, the region on the two diagrams marked CP, taken during increased airborne emission(containment purge), shows no increase in the dose rate, as expected. Continuous monitors (MFM-202of AMES Co.) with an automatically adjustable time constant supplied data with a statistical uncertaintyof 2o = 5.4%. Thirteen such monitors around the NPP, which are on-line connected over MOBITELto a central computer, together with 12 others installed at different meteorological stations distributedover Slovenia (so far operating autonomously) form the basis of an early warning system now underconstruction.
2.8 —2.6 —Z4 -2.2 -2.0 -1.8 -1.6 —1.4 —1.2 —1.0 —0.8 — 1 1 1 1
AIlili
— •-— M*ríbúT—•— Ceíje
0 4 9 12 1« 20 24 28 32 36 40 44 48 52 56 60 64 68 72 7« SO 84 88 92 96 1001O4 108112 11« 120
-— N P P T o w e r— P u p e r M i l l V i d e m
I I I 1 I I I I I I I 1 I I I I I I I f I I I I I I I12 16 20 24 28 32 36 40 44 48 52 36 60 64 68 72 76 80 84 88 »2 9Í 10010410811211« 120
Brežice
1 I I I I I f I I I 1 I i I I I 1 I I I 1 I I I i I I I 1O 4 8 12 16 20 24 28 32 36 40 44 4« 52 56 60 64 <8 72 76 80 84 88 92 96 100104 108112 116120
T i m e [hours]I 22.08.1994 I 23.08.1994 I 24.08.1994 IC.P. - containment purge at Krřko NPP
2S.08.1994 26.08.1994
Fig. 2: Relative dose rates - MFM 202 (Slovenia, August 22, 23, 24, 25, 26, 1994).
198619871988198919901991199219931994
unweightedaverage
162.40.60.30.30.30.30.20.1
Foodstuffs
maximum
90842.62.1
11.30.81.00.80.7
(wheat)(milk)(milk)
(pork meat)(pork meat)
(beef)(beef)
(pork meat)(poultry)
average
(12.7)'9.80.810.460.370.380.280.140.03
Milk
maximum
(92)'842.61.71.4
0.640.620.360.1
values are not comparable with the other foodstuffs since unknown amounts ofuncontaminated fodder were used instead of grazing by different milk producers.
Table 3: l37Cs activity in foodstuffs after Chernobyl contamination in Bq.kg1.
PORTOROŽ 95 383

SESSION VI PROCEEDINGS
In Table 3 the averaged and maximum concentration of 137Cs found in locally grown foodstuffscollected after Chernobyl contamination in the autumn each year is presented. It should be mentionedthat although in May and April of 1986 the caesium concentration in many plants (leafy vegetables,grass, bilberries, etc.) reached up to values of several thousand Bq.kg"1 - this increase was actuallycaused by foliar contamination of deposited caesium, and was already found to be much lower in theautumn of the same year, as can be seen in Table 3.
In the diagram of Fig. 3 a transfer of Chernobyl l37Cs from the grass to the 0 -15 cm soil layer and fromthere to deeper layers has been followed in uncultivated soil. Because of differing soil densities, theconcentration of l37Cs is given as a ratio to the concentration of natural 40K.
Besides the Chernobyl increase of artificial radioactive contamination in foodstuffs, the only increase,though slight, which could be detected and connected to the operation of Krško NPP, was observedprior to 1986 in fish. Since Chernobyl contamination, the content of caesium isotopes in fish practicallydid not differ from other protein food. In general during the first few years after Chernobylcontamination the contribution of the NPP l37Cs in the Sava River could only be roughly estimated fromthe different ratios of 137Cs/134Cs originating from the two sources.
CONCLUSION
All monitored and quantitatively evaluated radiationburdens in the environment due to emissions from theKrško NPP in the past 14 years have been in compliancewith the licensed values, and well below the authorizedlimits specified by the competent authorities *. With acertain safe conservatism the estimated dose burdensreceived by members of the reference population group,and obtained from directly measured activities in theenvironment, as well as model - calculated on the basis ofthe emission values, amounted to values of committedeffective dose equivalent smaller than 10 uSv per year ofoperation. This value represents less than 0.5 % of theannual dose received on average from natural andartificial sources by a member of the general public in thenormal loaded environment. According to these data, theradiological impact on the environment of the Krško NPPfor the last fourteen years of operation could be
55 {g j ; jj jj jj jj J2 53 54 considered of minor significance and of a comparableorder of magnitude to other radiological impacts in theKrško - Brežice region, caused by non-nuclear activities
Fig. 3: CS-137/K-40 specific activity ratio. (paper - mill industry, hospitals, etc).Uncultivated soil: 0-15 cm layer inthe vicinity of Krško.
0.6-
0.5
11.1
0.3
0.2-
0.1
CHERNOBYL FLOOD
V *T
m! I : ' j
ill-
11 1 ! 1
-
1
• • •
i
-
If
1
-
T
1 1
r—i
1
- '•• -
1
REFERENCES
1. U. Miklavžič et al., Offsite Monitoring of Krško Nuclear Power Plant - Report for the yearl982 to 1994, in Slovenianlanguage.
2. U. Miklavžič et al., Rapid Assessment of Chernobyl Deposition by Gamma Spectrometry of Vaseline Samples,Proceedings of XIV Regional Congress of 1RPA, Kupari, September 1987, 279, 1987.
According to the site permit, issued by the Republican Secretariat for Urban Planning in 1974, thelimiting annual dose for Krško NPP outside the protected zone was specified as 50 uSv/year.
PORTOROŽ 95 384

SESSION VI PROCEEDINGS
XA05C0099
RADIATION PROTECTION PROGRAMMEAT KRŠKO NUCLEAR POWER PLANT
B. Breznik
Nukleárna Elektrárna Krško, 68270 Krško, Slovenia
ABSTRACT
Krško NPP, a Westinghouse two-loop PWR of 632 M We power, is in commercial operation since 1982.Reduction of radioactive releases to the enviroment and the reduction of doses to workers is the basic goal inthe plant radiological protection. The radiation protection programme is established to ensure that theradiation exposures to workers and members of the public are minimized according to the As Low AsReasonably Achievable approach and controlled in accordance with international safety standards andSlovenian regulations.
The basis for the operational and technical measures has been provided according to the industrial goodpractice. The effluent control is based on the Standard Radioactive Effluent Technical Specifications, andenviromental surveillance is established according to the programme defined by the regulations. The doseconstraints and performance indicators are used to assure the effectiveness of the radiation protectionprogramme and provide a convenient follow-up tool.
The monitoring programme results of each year show that there is no measurable dose to the public due toradioactive releases. The commitment to the dose burden of any member of a critical group is assessed to bebelow the dose constraint. Individual and collective doses of the workers are within a range typical for thePWR's of a similar type.
INTRODUCTION
Krško NPP, a Westinghouse two-loop PWR of 632 MWe power, is in commercial operation since 1982.Reduction of radioactive releases to the environment and the reduction of doses to workers is the basic goalin the plant radiological protection. Minimization of the professional exposures and radioactive effluentsto the environment is an important part of the plant's policy.
The regulatory basis for radiological protection is provided by Act of Constitution1 of the Republic ofSlovenia which specifies regulations being applied also before its adoption. Additionally the plant uses asthe reference the ICRP Publication 60, IAEA Safety Standards and Recommendation on RadiationProtection2. The operative programme is prepared according to the industrial good practices which can befound in the publications of Institute of Nuclear Power Operations (INPO)3 , Electric Power ResearchInstitute (EPRI) and in some others4.
RADIATION PROTECTION PROGRAMME
Radiological protection controls are required by the Plant Technical Specifications and have been definedand developed by means of the manuals and written procedures.
The programme includes the following:
- operational controls- exposure reduction techniques- effluent controls- environmental monitoring
The basis for the plant operational radiological control of the professional exposure is provided by theRadiation Protection Manual and the written procedures. The Manual describes the radiation protectionprogramme objectives and implementation of the radiation control standards, required to maintain
PORTOROŽ 95 385

SESSION VI PROCEEDINGS
necessary control over individual external and internal exposures. Minimization of the external and internaldoses, collective dose, minimization of contamination of areas, equipment, personnel, and reduction ofsolid radioactive waste means that proper action shall be taken to get as low as reasonably achievable levelof radiation exposures (ALARA).
ALARA programme as defined in the ALARA Manual is established for radiation exposure reductiontechniques which include preliminary planning and scheduling, radiological engineering, primary waterchemistry, maintenance activities, operational control and radiation field control. Radiation exposure goalsand follow-up programme are established to involve all station groups in reducing radiation exposures.
The effluent control is based on the Standard Technical Specifications5 for the Westinghouse type ofpressurized water reactors. Radiological Effluent Technical Specifications are developed with respect tothe specific dose constraints for Krško NPP.
Finally, the enviromental surveillance is established according to the programme defined by the specificregulation and according to the regulatory body recommendations. During twelve years of operation theradiological enviromental monitoring programme has been performed by off-site institutes.
Operational Exposure Controls
External Radiation
Administrative dose control is provided by Radiation Work Permit. The dose level up to 1 mSv is underadministrative control of the Radiation Protection Department, up to 20 mSv is under control of the leadengineer and the superintendent. The usual operative annual dose limit is 20 mSv. The limit of 100 mSvfor five years has been accepted since 1990. All plant individual exposures are held below 25 mSv peryear. The level from 20 to 50 mSv should be approved by the superintendent and the technical director.
Personal monitoring for external radiation is provided by electronic dosimeters and thermoluminiscencedosimeter (TLD) badge. Additional TLD backup dose data are provided by the external institution.
Radiation surveys are conducted to identify and control radiation sources associated with operation of thenuclear station. The Radiologically Controlled Area shall be posted by the warning labels and generalsurvey maps. A colour code posting is used as an information about the area or room dose rate level: green(< 0.05 mSv/h), yellow (0.05 -1 mSv/h), red (> 1 mSv/h). A room with dose rate over 10 mSv/h should benormally locked or attended.
Internal Radiation
Individual internal exposure from airborne radionuclides is controlled to as low as reasonably achievablelevels far below regulatory limits defined as Annual Limit of Intake (ALI). Cases with planned internalexposure are very infrequent. The operative limit set by the plant is one percent of the legal limit. Theairborne activity concentration in the plant buildings or rooms are under administrative control and timeintegrated concentration during the work should be known.
Nearly all internal exposures could be prevented by using engineered controls and by controllingcontamination at the source.
Based on radionuclide quantities, two action levels of measured internal contamination are used, where rootcauses shall be investigated and corrective actions taken.
For example, whole-body counts that exceed 400 Bq of Co-60 shall be recorded and tracked. If theactivities are ten times higher, an investigation is required and the technical director should be informed.For comparison, the ALI value through inhalation is a million Bq, and the DAC value for Co-60 is 500Bq/m3.
Air sampling and monitoring equipment is used for identification and control of airborne radioactivity. Thesamples suspected to have more than 0.1 DAC shall be isotopic analyzed.
For situations in which engineered controls such as ventilation, decontamination, source control, are notpractical, workers use respirators to minimize internal exposure.
PORTOROŽ 95 • 386

SESSION VI PROCEEDINGS
Control of Radioactive Contamination
Control of radioactive contamination is provided by:
- establishing boundaries for contaminated areas- limiting contamination level and monitoring the contamination- planning and performing work including use of tents- monitoring personnel
The primary means of preventing the spread of contamination is to contain contamination at the source andto minimize the number of contaminated areas and amount of loose surface radioactivity contained in thecontaminated areas.
Exposure Reduction
The ALARA acronym is used for the radiation exposure reduction activities. It means that collectiveradiation exposure should be maintained as low as reasonably achievable.
These activites are included or defined in the following:
- preliminary planning and scheduling- radiological engineering- guidelines and procedures- radiation exposure goals and follow-up program
Work involving radiation exposure should be planned as far in advance as practical. During the planningstage, each step should be analyzed, unnecessary work should be avoided, radiation and radioactivity levelsin work areas should be determined, and collective exposure estimates should be made. Administrativeevaluation and planning of work should be applied according to a planning procedure at the action levelof 50 mSv collective dose or 5 mSv personal dose for total activity.
Several industrial techniques can be applied to support reduction of time for work, to provide distance fromradioactive source, shielding, removal of the source and control of contamination.
Design changes and plant modifications are evaluated at the conceptual stage and exposure reductiontechniques are integrated in the detailed engineering design. For developing design inputs a dedicatedprocedure is used.
Cobalt-60 is the major cause of the plant components post shutdown radiation field. The origin of Co-60is a neutron activation of Co-59. The use of low cobalt content alloys in mechanical components andreplacement parts is a generic technique to be used together with maintaining fuel integrity, foreign materialexclusion, optimization of reactor water purification system, decontamination and some others.
Plant primary water chemistry is maintained according to EPRI-Westinghouse guidelines6.
Controlling oxygen and adjusting pH of the coolant is a procedure of plant chemistry preventing corrosionand controlling transport of activated corrosion products. Operational control includes degassing of primarysystem, reducing of airborne activity by means of the ventilation system, supporting initial shutdownchemistry specifications and primary water radioactivity control. Operative radioactivity limits for theprimary coolant are used to ensure ALARA during refueling.
Radioactive Effluent Control
The radiological effluent controls are established in accordance to the Standard Technical Specifications5.Plant specific specifications define operational controls and surveillance requirements for radioactive liquidand gaseous effluent monitoring instrumentation. The radioactive liquid and gaseous waste sampling andanalyses programme for batch and continuous releases are providing isotopic concentration and inventorydata of the effluents.
In accordance with the dose constraint defined in the licensing location criteria for Krško NPP the annual(calendar year) dose or dose commitment to any member of the public due to releases of radioactivity shallbe limited to less than or equal to 50 uSv.
PORTOROŽ 95 387

SESSION VI PROCEEDINGS
The instantaneous dose rate due to radioactive material release is limited based on the general annual doselimits for the public such as 5 mSv external dose per year and by controlling airborne activityconcentrations not to exceed the normalized value based on the DACs.
Additional limits of the Health Inspectorate are used for total radioactivity released in liquid and gaseouseffluents in a calendar quarter and a year. In a calendar year the iodine activity in gaseous effluents islimited to 18.5 GBq. The same limit is for the particulates with half-life greater than 8 days. The limit forthe total liquid releases is 20 TBq of tritium, and 200 GBq of the beta/gamma emitters (tritium, carbon 14,alpha emitters and dissolved gasses are not included).
Performance Indication
Professional Exposures
The collective dose in a calendar year is controlled to be at maximum level of 2 manSv, the goal level andlong term average should be below 1.5 manSv. The major part of the dose is due to outage activities. Theoutage activities include refueling, steam generator plugging actions and non-destructive examinations ofthe steam generators. Radiation exposure goals for each major plant activity is set primarly by thoseresponsible for performing the work and developed by means of the planning procedure.
The maximum individual doses are controlled to be at the level of 20 mSv per year. The average doseshould be far below 5 mSv. The expected average dose value is from 2 to 3 mSv in a year.
During the last ten years, from 1985 to 1994, the mean collective dose is 1.48 manSv. About the half of itis due to the steam generator maintenance activities. It is expected that this part of the dose can besignificantly reduced with the future steam generators replacement. Furthermore, low-cobalt content ofsteam generator tubes will consequently reduce the radiation level on the field.
Fig. 1, Fig. 2 and Table 1 show performance indicators such as annual collective dose, average personaldose in a year, and numbers of individuals selected according to the received annual dose during the lastten years. Individual and collective doses of the workers are within a range typical for the PWR's of asimilar type 7 .
ANNUAL COLLECTIVE DOSE
Fig. 1: Annual collective dose.
MAXIMUM AND AVERAGE PERSONAL DOSE IN A YEAR (mSv)
YEAR
AVER
MAX.
82
2.3
28.45
83
4.4
27.10
84
1.2
18.90
85
1.9
17.65
86
1.8
20.35
87
1.8
22.85
88
1.9
20.65
89
1.8
17.15
90
2.6
22.50
91
0.9
8.15
92
2.6
20.50
93
2.4
21.00
94
1.1
10.72
Table 1: Maximum and average personal dose in a year (mSv).
PORTOROŽ 95 388

SESSION VI PROCEEDINGS
NUMBER OF EXPOSED INDIVIDUALS PERANNUAL DOSE RECEIVED, 1985 • 1994
4000'
3000
£ 2000HS
1000
Éteulili•[:.[: ::':-•;•.:•:-..: jý. lý.
0.01-1 1.01-5 5.01-10 10.01-15DOSE INTERVAL (mSv)
Fig. 2: Number of exposed individuals per annual dose received, 1985 -1994.
Public Exposure
The total activity of radioactive material in the effluents is within a few percent of the annual operativelimits required by the Health Inspectorate for airborne iodine, airborne particulates, or fission and activationproducts in liquid effluents. The level of Tritium in liquid effluents reaches about 70% of the limit.
The result of each year's assessment based on the enviromental sampling and monitoring programme showthat there is no measurable dose to the public due to radioactive releases. The commitment to the doseburden of any member of a critical group is assessed to be below 10 ja S v per year. The calculations basedalso on total liquid and gaseous effluent releases give the result of about 2 uSv per year.
The annual dose due to radiation from radioactive waste storage building, including the whole plant, isbelow the constraint of 200 uSv at the site boundary.
REFERENCES
1. Act of Constitution of Republic of Slovenia - "4. člen ustavnega zákona za izvedbo Temeljne ústavne listine - Ur.l.-1/91-1".
2. Basic Safety Standards for Radiation Protection, IAEA, Vienna, 1982; and International Basic Safety Standards forProtection Against Ionizing Radiation and for the Safety of Radiation Sources, S S No. 115-1, Interním Edition, IAEA,Vienna, 1994.
3. Guidelines for Radiological Protection at Nuclear Power Stations, INPO 91-014 Report, Atlanta, 1991.4. Manual of Recent Techniques for LWR Radiation Field Control, EPRI, NP-4505 SR, Palo Alto, 1986; and
Occupational Dose Reduction and ALARA at Nuclear Power Plants, NUREG/CR-4254, 1985.5. NUREG 0452, Rev.5, SFTS for Westinghouse PWR; and Standard Radiological Effluent Control for PWR, NUREG-
1301.6. PWR Primary Water Chemistry Guidelines: Rev. 2, EPRI, Palo Alto, 1990.7. Third Annual Report, Occupational Exposures at Nuclear Power Plants 1969-1993, OECD, Paris, 1995.
PORTOROŽ 95 389

SESSION VI PROCEEDINGS
XA05C0100
ENVIRONMENTAL RADIOLOGICAL MONITORINGAROUND REACTOR CENTRE
B. Pucelj, M. Ančik, E. Basic, Z. Kreft
Jozef Stefan Institute, Jamova 39, Ljubljana, Slovenia
INTRODUCTION
Reactor Centre Podgorica is located about ten kilometres east of Ljubljana. The main facilities, concerningsources of radiation, are: experimental reactor TRIGA Mark II, radiochemical laboratories and thetemporary storage facility for low and intermediate radioactive waste. The environmental radiologicalinfluence of the centre is estimated from measurements according to a special monitoring programme. Thebackbone of the programme are two kinds of measurements: the control of emissions and imissions. It isestimated that the highest dose to the nearby population is lower then about one uSv for athmospheric andliquid releases.
FACILITIES AND ENVIRONMENTAL RELEASES
The main facilities, contributing to environmental releases, are :
• The experimental reactor TRIGA Mark II is a reactor with maximum thermal power of 250 kW ina steady-state operation - it can be also operated in a pulsed mode. The reactor is used for training,research, production of isotopes and for activation of samples in activation analysis. During steady-state full power operation about 250 kBq/s of 41Ar are released through the ventilation outlet to theatmosphere. There are no liquid radioactive releases due to the operation of the reactor.
• Radiochemical laboratories and hot cells are located adjacent to the reactor. Irradiated samples aretransferred from the reactor to the laboratories by use of a pneumatic system. In radiochemicalprocedures contaminated liquids are produced, containing mostly activation products (24Na, 60Co, 65Znand others). They are collected in a tank and released once per week to the nearby river Sava. Totalannual activity of released gamma emitters is of the order of magnitude of MBq/a - trends for therecent period are shown in Fig. 1.
1987 1992 1993
Fig. 1: Annual releases of liquid effluents.
PORTOROŽ 95 390

SESSION VI PROCEEDINGS
• Temporary storage facility is used for temporary storage of low and intermediate radioactive wastefor small users in Slovenia (hospitals, industry). The contaminated items are stored in 200 1 metaldrums and spent sealed sources are kept in original protective containers. About 7000 GBq have beencollected - the main activity is due to several sealed sources. There are some nonsealed pieces of wastecontaining 226Ra and because of radon emanation there are several thousand becquerels of radon perm3 of air when the ventilation is not in operation. During the ventilation of the facility small amountsof Rn are released to the atmosphere. No liquid waste is allowed to be stored in the facility.
ENVIRONMENTAL MONITORING PROGRAMME
A special monitoring programme with the main goal to estimate the exposure of the population is in force.It consists of on-the-source measurements {control of emissions) to provide information on atmosphericand liquid radioactivity releases. The data collected are directly used, with help of proper models, for thedose estimates. Additionally, relevant field measurements are performed {control of missions) to check theinfluence of on-site releases and of any off-site events (like Chernobyl contamination).
• Control of radioactivity in air
The aerosols in the stack of the reactor are continuously collected. The concentration of 41Ar in thestack is directly proportional to the power of the reactor and the samples are taken periodically. In bothcases the activity and isotopic composition is measured by germanium detector.222Rn daughters concentration is periodically monitored in the temporary radwaste storage facility.Some waste containing 226Ra is stored and since all of it is not sealed several kBq/m3 of Rn is presentin the atmosphere when the ventilation system is turned off.
The control of imissions is performed by spectrometric analysis of aerosols taken at a control pointwithin the fence of the Reactor Centre.
• Liquid releases
Liquids containing radioactive materials are released exclusively from radiochemical laboratories.Prior to release a sample from the collection tank is analysed on a germanium detector.
Additionally several samples are controlled periodically to follow the radiological situation of somepotential sources of liquid releases: primary and secondary water of the reactor, water in the spent fuelpool.
Control of imissions is performed by analysis of precipitation, ground water from the nearby well andsediments taken up and down-stream from the release point in the Sava river.
• External Radiation
External radiation is measured monthly at two places within the fence of the Reactor Centre by meansof TLDs. Additionally, dose-rate is continuously measured at one location by use of a GM tube.
ENVIRONMENTAL IMPACT
• External dose due to 41Ar cloud
Radioactive noble gas 41Ar is continuously released to the atmosphere during the operation of the reactorat a rate of 250 kBq/s. The submersion dose was calculated by use of the Gaussian dispersion model. Arough estimate of the order of magnitude of exposure is based on the procedure from [IA82] and thefollowing conservative assumptions:
• the ground release was assumed, althoug the actual stack height is 10 m,• the calculation was done for annual operation of the reactor at full power,• dose was estimated at a closest distance of 100 m from the release point,• dose conversion factor for 4IAr from [IA82] was used (DCF = 8.10'2 (Gy/a)/(Bq/s).
PORTOROŽ 95 391

SESSION VI PROCEEDINGS
The annual dose was calculated by use of the following expression:
É£. = dQ x DCF = 250 kBqls x 8-10"12 (Gy/a)/(Bq/s) = 0.2 \iGyla = 0.2 \xSvladt dt
where dQ/dt denotes the rate of release of the activity and DCF is the dose conversion factor.
• Ingestion Dose due to Liquid Releases
About 1 MBq of activation products are released annually to the nearby river Sava. The potential dose dueto drinking of the river water is based on the following, mostly conservative assumptions:
an individual consumes exclusively the water from the river taken during one of the weekly releases,the released activity is diluted in the average flow of the river d) = 58 m3/a,annual consumption of water is 0.73 mVa,common ingestion dose conversion factor for activation products is 10"8 Sv/Bq,the duration of release is t^, = 2 h.
Annual effective dose is calculated from the following relation:
E = A x VAx DCFing x t = lQ7 Bq/a x 0.73 nv'la x IQ'8 SvIBq x l a = Q
<t> x trei 58 m3/s x 7200 s •
In both cases conservatively estimated annual dose is 500 times lower than the annual dose limit for amember of population.
CONCLUSIONS
1. There are three sources of radioactive atmospheric and liquid releases to the environment:
• the main contributor to atmospheric releases is reactor TRIGA with discharges of 4lAr through theventilation system,
• liquid radioactive releases to the river Sava come from radiochemical laboratories and containmainly activation products,
• the atmospheric releases of Rn from temporary storage facility for radwaste occur in smallquantities only occasionally and are negligible.
2. The monitoring program covers all main aspects of exposure pathways: external radiation, radioactivityof air and liquids. It is performed by control of emissions and imissions.
3. The exposure of population is conservatively estimated to be smaller than about uSv per year foratmospheric or liquid pathway.
REFERENCE
[IA82] Generic Models and Parameters for Assessing the Environmental Transfer of Radionuclides from RoutineReleases, Safety Series No. 57, International Atomic Energy Agency, Vienna, 1982.
PORTOROŽ 95 392

SESSION VI PROCEEDINGS
XA05C0101
EMERGENCY PREPAREDNESS IN SLOVENIA
R. Martinčič1}, M. Korún]), B. Pucelj '>, B. Ušeničnik2)
[ ) Jožef Stefan Institute, Jamova 39, Ljubljana, Slovenia2 ) Administration for Civil Protection and Disaster Relief, Ljubljana, Slovenia
SPECIAL BODIES FOR MANAGEMENT OFPROTECTION AND RESCUE
COMMANDERS FOR CIVIL PROTECTIONHEADQUARTERS FOR CIVIL PROTECTION
INTRODUCTION
Slovenia has a two-loop PWR, 632 MW electric power at Krško and a research reactor (TRIGA, 250 kW)near Ljubljana. Construction at the Krško site began in early 1975 and the plant was synchronized to thenational grid in October 1981. In Slovenia we had also an uranium mine at Žirovski vrh which is at presentin the decommissioning stage. There are more than 400 radiation sources with activities between 100 MBqand 10 GBq and a few between 1 and 10 TBq in use in Slovenia.
Changes that occurred in Slovenia as a result ofindependence required a new assessment of thesituation in the field of disaster protection, aswell as the coordination of policies and goals.Slovenia is at present in the process ofreconstructing its system of protection againstnatural and other disasters. In this generalcontext nuclear or radiological accidents fallunder industrial accidents which in turn aretreated as "other disasters".
BASIS FOR SAFETY AND RADIATIONPROTECTION
The system for protection and rescue isorganized as an overall system established forthe protection and rescue of people, materialand other goods in the case of natural and otherdisasters, in war and in other extraordinarycircumstances. Civil protection and otherdisaster protection activities are humanitarianand non-military in nature.
Protection against disasters is undertaken bythose bodies, services and organizations, whoseregular activities already include suchoperations. If these are not sufficient, additionalforces and means for protection, rescue andrelief are brought in. These are mostly forcesand means of Civil Protection (CP) which areorganized as a special, designated section of theoverall safety an protection system in thecountry. The Slovenian system of disasterprotection is shown in Fig. 1.
Protection and rescue plans are based on riskassessments, studies of the vulnerability of theliving environment and other studies and
OFFICERS FOR CIVIL PROTECTION
UNITS AND SERVICES FOR PROTECTION,• ; : : J RESCUE AND RELIEF i :. ; \-\\
VOLUNTARY M PROFESSIONAL!PROTECTION
PROTECTIVE ACTIONS
Ä*fer ,<4«rV
INDIVIDUAL AND COLLECTIVE PROTECTION
: MEANS FOR PROTECTION A N p : R E S C U ^ ; : l :
Fig. 1: The system of disaster protection.
PORTOROŽ 95 393

SESSION VI PROCEEDINGS
investigations relevant to protection and rescue. All of the above information is used to determine whichlocal communities or economic associations or other organisations require protection and rescue plans.Forces of protection, rescue and relief at the state level are shown in Fig. 2.
EMERGENCY PLANNING ANDRESPONSE
Measures to be taken in emergency situationsare stipulated in a number of plans, from thenational level to the local community level andthe plant itself.
According to the law Administration for CivilProtection and Disaster Relief (ACPDR) isresponsible for planning and preparedness off-site at the national level. The ACPDR prepared,amended and maintains Emergency Plan in theEvent of a Nuclear Accident at Krško NPP. Theplan postulates three emergency planning zones(EPZ): (I) urgent protective actions EPZ within10 km radius, (ii) food-chain and long termprotective actions EPZ within 25 km radius and(iii) general preparedness EPZ covering thewhole Slovenia.
Emergency response strategy in early phase ofthe accident is shown on Fig. 3.
MOUNTAIN: ; : i
;-; SERVICE i: i: ~, \
CAVE RESCUE": .... SERVICE .
i ECOLOGICAL^LABORATORY
'.:• • .MOBILE .. •" . . HOSPITAL
: -UNIT FOR : :
• IDENTIFICATION6
; ENGINEERINGi
' Unexploded land nother devices
Fig. 2: Forces of protection, rescue and reliefof the Republic of Slovenia.
:<::Evä!&atión;of:j|í ti l ^^i|i lis i
Ví""- f
Fig. 3: Emergency response in early phase of the accident.
PORTOROŽ 95 394

SESSION VI PROCEEDINGS
EMERGENCY MONITORING PROGRAMMES
The overall monitoring programme in Slovenia consists of three major parts:
i. a general monitoring programme of the radioactivity in the country,ii. three specific monitoring programmes in the surroundings of the Krško NPP, research reactor and
Mine at Žirovski vrh,iii. emergency monitoring programmes.
The aim of National (general)Monitoring Programme is to controlthe external radiation and the specificconcentrations of radionuclides in theenvironment and foodstuffs, specificmonitoring programmes are performedin the surroundings of nuclearfacilities while emergency monitoring(Fig. 4 and 5) consists of an earlywarning system and monitoring inEPZ.
Specific monitoring programmearound NPP Krško offers also a soundbasis for emergency monitoring. Itsupports a network of fixed measuringpoints, a three circle network of TLdosimeters and a network of automaticmeteorological stations with built-ingamma dose rate meters. The threebasic networks are further supportedby a network of accidental TLdosimeters, a network of falloutsample collection (Vaseline plates)and a network of potential,predetermined measuring points.
FsHajtsarrfiingro
Fig. 4: Off-site emergency monitoring programme structure.
fifiiiliS
J Maat, rrilk, eggs,~| rrilk pradiete
Fig. 5: Emergency food-chain monitoring.
PORTOROŽ 95 395

SESSION VI PROCEEDINGS
Continuous monitors (MFM-202 of AMES Co.) with an automatically adjustable time constant supply datawith a statistical uncertainty of 2o = 5.4%. Thirteen such monitors around the NPP, which are on-lineconnected over MOBITEL to a central computer, together with 12 others installed at differentmeteorological stations distributed over Slovenia (so far operating autonomously) form the basis of an earlywarning system now under construction.
CONCLUSION
• Slovenia has Civil Protection for coping with the emergencies.• The CP Headquarters at national level established highly professional emergency units in different
fields of emergency response.• Additional efforts to increase the preparedness of the CP staff and units to cope with radiological
emergencies have paid off handsomely and have led to a general improvements of the performanceof CP, also for other types of emergencies.
• All monitored and quantitatively evaluated radiation burdens in the environment in the past 15 yearshave been in compliance with the licensed values, and well below the authorized limits specified bythe competent authorities.
• According to these data, the radiological impact on the environment of the Krško NPP for the lastfourteen years of operation could be considered of minor significance and of a comparable order ofmagnitude to other radiological impacts in the Krško - Brežice region, caused by non-nuclear activities(paper - mill industry, hospitals, etc).
Finally, a reasonable degree of preparedness has been achieved. However, there always remain somequestions and problems yet to be answered and solved. Among these one might choose the following ones.In near future Slovenia has to:
i. complete its own regulations,ii. implement a new national early warning system,iii. improve adequate and effective mean for public information andiv. update the equipment and training of CP in dealing with radiological emergencies.
PORTOROŽ 95 396

SESSION VI Illlllllllllllllllllllllllllllllllllllllllllllllllll PROCEEDINGSXA05C0102
RADIOMETRIC MONITORING OF CONTAMINATED SCRAP METALSIMPORTED IN ITALY.
TECHNICAL AND REGULATORY FEATURES
F. Dobici "\ S. PiermatteiHi), A. Susanna iv)
National Agency for Environment Protection, ANPA, Roma, Italy
ABSTRACT
During these last ten years there have been occasional reports of mishaps from trafficking of contaminatedscraps or containing radioactive sources. Recently an increase of events indicated that the problem becomesmore important as to generate possible consequences, from a radiation protection standpoint, for workers andgeneral public.
Following the detection of contaminated metal scraps in some recycling industries and in some consignmentsentering the Italian borders, the competent Authorities laid down rules to put the matter under control.
In this paper technical and regulatory features are discussed.
INTRODUCTION
In April 1990, during a routine monitoring of Po river waters it was discovered an increase of Cs-137concentration. This increase could not be attributed to a release from the Caorso nuclear power plant as thesame results were obtained upstream and downstream the plant itself, nor to the Chernobyl fallout as theratio Cs-137/Cs-134 was well above a factor 2. The Cs-137 concentration detected in river water is reportedin Fig. 1.
Systematic monitoring of sediments was undertaken along the path of the Po river down to a small tributaryLura (see Fig. 2), where the source of contamination was found. A foundry factory located in Rovello Porro(Regione Lombardia) dealing with aluminium metal scraps was found to be contaminated with cesiuminside and in the courtyard where the incoming scraps were temporarily stored.
The investigations carried out by the local Authorities (Presidio Multizonale di Igiene e Prevenzione dellaRegione Lombardia) showed that a joint firm, which used the materials from the first factory, wascontaminated although to a lesser extent.
Inspections were carried out by ANPA inspectors in most of the factories which received materials by thetwo contaminated ones.
Only two firms located in Northern Italy were found to be contaminated by cesium and radioactivitycontaminated metal scraps were also found in some toxic waste repositories nearby.
The episode had no health consequences both for the workers and general public, but it resulted in a largewaste of working time and money, due to the decontamination activities. Great concern was also createdin workers and population living in the surrounding.
Efforts, made at international level to single out the country of origin of the material, did not allow toidentify the primary shipper, but it appeared that the material was imported from Eastern countries.The total activity estimated around 4000 MBq supported the hypothesis of the presence of a therapy orindustrial source in the scraps.
n) Head of Radioisotopes and Accelerating Machines Division
"0 Head of Environmental Radioactivity Divisionlv) Director of "Environmental and Radiation Protection Department"
PORTOROŽ 95 397

SESSION VI PROCEEDINGS
It appeared clear to the Italian Authorities that, in the future, radiation protection regulations should requirea registration system for dismissed radioactive sources as well as that the users of scraps have to monitorthe incoming materials.
Z £ O OUJ < < 3O E S -i
1989-1991
Fig. 1: Cs-137 in Po River.
Fig. 2: Schematic view of contamination diffusion through waterway.
SYSTEMATIC CONTROLS OF IMPORTED SCRAPS AT THE ITALIAN BORDERS
Two years after the cesium contamination in Lombardia Region, the Ministry of Health was informed aboutthe import in Sweden of ferrous materials, slightly contaminated, and on the possibility that potentialcontaminated materials could be introduced in Italy. The country of origin of the material was ex-URSS.Great was the concern of Health Authorities, which decided to alert the Health Offices existing at theborders, in order to carry out monitoring on all the incoming shipments of metal scraps from non EUcountries.
PORTOROŽ 95 398

SESSION VI PROCEEDINGS
First measurements carried out by various institutions (ANPA, ISPELS and Regional EnvironmentalRadioactivity Laboratories) showed the existence of CO-60 contaminated scraps coming from EasternCountries either by sea but mainly by rail.
The experience gained after three months of monitoring showed that around 1 % of incoming cargoesresulted to contain scraps contaminated with Co-60, Cs-137, Ra-226. The countries of origin of thematerial were usually Eastern Countries. The range of contamination was of the order of some Bq/kg tosome thousands; moreover only a small part of the cargo was contaminated (around 100 kg over 40 - 50tons).
The concentration of artificial radionuclides was of no health significance either for the workers and forthe public. No resuspension took place and the external radiation levels were also rather low. However thepsychological impact could not be neglected, as well as the potential risk connected with the possibleexistence of dismissed radioactive sources or highly contaminated pieces in scraps.
REGULATORY PROVISIONS
For the above mentioned reasons, the Italian Ministry of Health issued a circular on June 29, 1993 (1),concerning the procedures to be adopted to allow the ingress of metal scraps.
The presence of radioactivity in metal scraps was considered not justified and therefore no clearance levelshave been established. All the shipments showing external radiation levels higher than the naturalbackground shall not be allowed to enter the Italian territory and are sent back to the shipper.
This procedure, however, cannot exclude the presence of radioactive sources inside the cargo, owing to theshielding properties of the material, nor the presence of a or ß sources. In the same time monitoring ofincoming materials at the borders can cause the slowing down of the traffic and it is very expensive in termsof manpower. A change in the policy adopted appears necessary. Monitoring shall be carried out at thereceiving point i.e. at the factory, although this procedure might cause difficulties when the material hasto be sent back.
The installation of automatic control systems at the borders should also be foreseen.
Place
OpičinaRabuieseFernettiScalo LegnamiGoriziaF.S.Gorizia S. AndreaUdineOsoppoTarvizio (Autoroute)Tarvisio CoccauTarvisio (Railway)PontebbaS. Giorgio NogaroSea-port
Total
Interventions
74399
21
1884312932
1031522
411
Wagons, Trucks(number)
9961546
364117198787
2113244
686645518
11608
Shipment not admitted(number)
———
85
—
4
31——
41——
—
89
Table 1: Results of monitoring carried out at the North-East border in the period May 1993 - December 1994.
PORTOROŽ 95 399

SESSION VI PROCEEDINGS
After one year of experience the data of monitoring at the border confirmed that around 1% of theincoming cargoes show a contamination in the range 1 -1000 Bq/kg (in one case 8500 Bq/kg were foundin a single piece). In the table are summarized the data collected at North Eastern borders.
Three Regional Authorities emanated their own provisions and imposed the recipients of the materials tocarry out the controls at the factory before any use of the materials (2, 3, 4).
The Ministry of Health also required the advice of National Health Council.
The views of the Council can be summarised as follows:
1. Materials shall be certified at the place of origin as free of contamination;2. The receiving firms shall carry out the monitoring of incoming materials;3. Monitoring shall be carried out by the Local Authorities in the framework of their routine
inspection activities (random controls).
In the meantime, the Ministry of Health, through an agreement with the Ministry of Industry, planned toinstall automatic detectors in some custom points where in the future all the imported scraps shall beconvened.
The financial support has recently been granted and in the near future it will be possible to have suchapparatuses.
A workshop on "Radiation protection problems connected with the import of contaminated metal scraps"was organized by the Italian Radiation Protection Association on May 1995. The audience was very largeand eterogeneous: technicians, operators, detection equipment dealers, etc.
It appeared from the discussion the need of clear regulations, of uniform procedures and of avoidingduplication of work.
NEW RADIATION PROTECTION REGULATIONS
From January 1, 1996 new radiation protection regulations will enter into force. This will impose importantchanges.
At present to be exempted from radiation protection regulations two conditions shall be fulfilled at thesame time. Both the activity concentration and the total activity shall not exceed given values (5).
In the new decree (6) if the activity concentration levels are below fixed values of no health significance,the regulations do not apply, independently of the total quantity. This means to introduce, de facto, anexemption level which is established at 1 Bq/g.
A provision (ex art. 157) is expressely devoted to radiometric surveillance of metal scraps. The operators,who melt scraps or other metallic materials for industrial purposes, shall monitor the materials to detectthe presence of dismissed radioactive sources. The same provisions also apply to those who collect or storemetal scraps.
A Directive, concerning the ways according to which monitoring activities on metal scraps shall be carriedout, is being prepared by a working group set out by the Ministry of Health. This Directive is of particularimportance as it will assure uniform procedures in checking the incoming scraps.
The provisions contained in the preliminary draft require that each metal scrap shipment coming from nonEU countries shall be accompanied by a document certifying that the external radiation levels are withinthe fluctuations of the natural radiation background.
Shipments entering Italy shall be registered as well as the results of the monitoring activities.
The receiver of the scrap materials from whatsoever origin, shall verify that artificial radioactiveconcentration, if any, shall be less than 1 Bq/g.
It has to be underlined that these represent only proposals and have to be discussed by all the interestedparties.
PORTOROŽ 95 400

SESSION VI PROCEEDINGS
CONCLUSIONS
The problem of the diffusion of contaminated metal scraps is undoubtly increased during these last years.
Till now no serious health problems have been created, but the concern of general public, workers andunions becomes greater and greater, mainly for the attention that mass media devote to the problemsconnected with radiations.
It is our opinion that efforts are needed at international level to reach a common policy towards to theintroduction of these materials in the countries and in the same time a system of notification whencontaminated materials are received shall be established about their circulation at least among EUcountries.
One of the problems which could pose difficulties, is the ambiguity which exists in the concepts ofclearance and exemption levels. It is our opinion that in order to avoid misunderstanding the two levelsshall be the same. In any case, the international scientific community should face the problem and try toreach a general consensus.
As the circulation of low contaminated materials during the years will spread out, it is of vital importancethat all the countries have a common approach similar to that reached for the transport of radioactivematerials.
REFERENCES
1. Ministero Sanita - Circolare n. 30 del 29.06.1993.2. Regione Veneto - Circolare prot. n. 22260/20311 del 30.05.1994.3. Regione Friuli-Venezia Giulia - Circolare prot. 16684/IG.9 del 30.09.1993.4. Regione Piemonte - Ordinanza del Presidente Giunta Regionale prot. 11398 del 17.12.1993.5. Decreto del Presidente delia Repubblica del 13.02.1994 n. 185: "Sicurezza degli impianti eprotezione sanitaria dei
Iavoratori e delle popolazioni contro i pericoli delle radiazioni ionizzanti derivanti dalľimpiego pacifico delľenergianucleare".
6. Decreto legislativo del 13.06.1995 n. 230: "Decreto Legislativo di Recepimento delle Direttive Euratom n. 80/836,84/467, 84/466, 89/618,90/641,92/3 in matéria di sicurezza degli impianti e protezione sanitaria dei lavoratori e deliapopolazione contro i pericoli delle radiazioni ionizzanti derivanti dalľimpiego pacifico delľenergia nucleare".
PORTOROŽ 95 401

SESSION VI PROCEEDINGS
XA05C0103
A CASE OF A FOUND RADIOGRAPHIC SOURCE
B. Pucelj '>, M. Korún l\ D. KavSek », Z. Kreft l\ M. Križman »,R. Martinčič l\ M. Rosman l\ T. Šutej2 )
0 Jozef Stefan Institute, Jamova 39, Ljubljana, Slovenia2 ) Health Inspectorate of Republic Slovenia, Ljubljana, Slovenia
INTRODUCTION
High dose-rate levels were detected outdoors in the vicinity of a bunker used for storage of radiographicsources in a plant which manufactures metallic products. The investigation revealed that radiation was dueto a buried sealed radiographic source, containing 28 GBq of 137Cs. A special republic radiologicalemergency team removed the source in a carefully planned operation. There was no evidence foroverexposure of the population or of radiographic and other workers of the plant. The highest dose to therecovery team was 50 uSv.
CHRONOLOGY OF EVENTS
March 15,1995
Republic health inspector was performing a routine annual control of radiation practices in a plant thatmanufactures metallic products and performs its own radiography. During the visit he detected high doserates in the vicinity of a bunker used for storage of radiographic sources. He immediately notifiedEcological Laboratory with a Mobile Unit (Mobile Radiological Laboratory) which is responsible for fieldmeasurements in radiological or nuclear emergencies in Slovenia.
12000
10000 -
1
rate
Dos
e
8000
6000
4000
2000
0
I
-
I 1 1 1 1
137Cs662 keV
1 1 1 1 1 1 1 1
excavation
-
Pb shield
0 5 10 15 20 25 30 35 40 45 50 55 60 65 70 75 80
t (min)
Fig. 1: In-situ gamma spectrum and dose rate during excavation.
PORTOROŽ 95 402

SESSION VI PROCEEDINGS
The emergency team confirmed high local dose rates: about 20 mSv/h at ground level and 1 mSv/h at onemetre above ground. In-situ gamma spectrometry showed that radiation was due to 137Cs (Fig. 1). Aplausible explanation was that a sealed source of unknown origin with the activity of several ten GBq wasburied in the soil. Since high radiation levels were measured only on a quite limited area there was noimmediate health hazard to the population or to the workers of the plant. Therefore there was no need forquick and improvised removal of the source and it was decided to gather additional information and toremove the source in a carefully planned action.
March 16,1995
Republic health inspector checked the inventory of sealed sources in Slovenia. He discovered that aradiographic 137Cs was purchased by the plant under consideration in 1957 (activity 110 GBq). It was inuse till 1970 and was stored in the bunker after that. Since 1975 the source was unaccounted-for.
March 17,1995
Emergency team performed detailed measurements of radiation field around the "hot spot". The resultsconfirmed that the activity was about that of the unaccounted-for source. It was estimated that the sourcewas buried about 10 to 20 cm deep. Photos were taken to help in planning for the removal of the source.
March 18 - 22,1995
There was no need for an urgent removal of the source and emergency team carefully planned the actionto keep exposures as low as possible and to minimize the possibility of environmental contamination. Theduties of each member of the team were thoroughly defined, the equipment selected, the course and thetiming of the action determined. Special care was taken to the possibility that the capsule might have beendamaged what presented the possibility of environmental or personal contamination. The excavation wasplanned in such a way as to minimize the possibility to damage the capsule in the course of the removal.Special attention was paid to personal dosimetry.
March 23,1995
The sealed source was successfully removed according to the plan. The recovery team consisted of sixpeople: the leader, three members directly involved in recovery of the source, one for logging the operationand one for performing in-situ gamma spectrometry. The whole operation took about one hour. Themajority of the time was spent for preparational tasks: reconfirmation of radiological situation, placementsof instruments, partial shielding of the "hot spot", removal of grass and dry branches. The excavation andtransfer of the capsule to lead container took about five minutes. The whole operation is reflected in thetime dependence of the dose rate measured by Reuter-Stokes ionization chamber located about 10 m fromthe "hot" spot (Fig. 1). After the recovery operation the place was carefully inspected by in-situ gammaspectrometry and no traces of contamination were found. The source was taken to the temporary republicstorage facility for low and intermediate radwaste in Reactor Centre Podgorica in Ljubljana.
April 4,1995
The integrity of the capsule was inspected visually in the hot cell at the TRIGA reactor. It was obvious thatthe capsule was considerably corroded and it was decided to encapsule it additionally to prevent anyleakage in the future.
The activity of the source was determined by measuring the dose rates. The activity was found to be 28GBq what is about 60% less than the declared value, taking into account radioactive decay.
April 6,1995
A meeting with radiographic workers of the plant was held to identify the possibility of their overexposure.Their personal dose records were examined for the same reason. Chief republic health inspector requestedspecial medical examination for the radiographic workers employed after the unaccountancy period of theisotope.
PORTOROŽ 95 403

SESSION VI PROCEEDINGS
RADIOLOGICAL CONSEQUENCES
A sealed source 137Cs with activity of 28 GBq produces a dose rate 2.3 mSv/h at one metre and several tensGy/h at "contact". A yearly dose limit of 1 mSv for a member of public is obtained in less than one hourat one metre while local skin burns can be caused by carrying the source in pocket for about the sameperiod. It is obvious that the source could produce significant radiation exposure in unfavourableconditions. Therefore, a thorough examination of possible past exposure of population and radiologicalworkers of the plant was made. The emergency team itself was in stringent dosimetric control during itsaction.
1. Exposure of the population
The source was unaccounted-for since 1975 when it was last time reported to be stored in a container inthe bunker. During investigation it was not possible to find out when the source was removed from thecontainer and how it found its way to the vicinity of the bunker. However there is some evidence that ithappened in 1991. There is no evidence that after its removal the source has been likely to be present atany other location. When found, the radiographic source was buried 10 to 20 cm deep in a deepeningwhich banks efficiently reduced the influence of the radiation to the adjacent area of about 100 m2. Noelevated radiation levels were measured at a public road beyond the fence of the plant. For these reasonsit is believed that no member of the public was exposed to radiation from radiographic source.
Another group of people which should be treated as members of the public are nonradiation workers ofthe plant. In principle they could approach the "hot spot". But the relative remoteness and difficult accessto the place make it quite improbable that any of them could be exposed to radiation beyond the limits formembers of the public. However, some additional exposure cannot be excluded for some individuals fromthis group.
2. Exposure of radiographic workers of the plant
In the period after the most probable moment of removal of the source from the bunker radiographicworkers reportedly seldom entered the area. Therefore, similar conclusions as those for nonradiationworkers of the plant are valid for them. However, the source has been physically removed by unidentifiedindividual(s). He (they) inevitably received some extra dose, though it could be masked by the professionaldose. The personal dose records do not show any exposure above professional dose limits.
3. Doses to emergency team
One of the main goals of the recovery operation was to prevent any unnecessary exposure of the team. Theprotection measures were carefully planned and special attention was paid to personal dosimetry. Ratherinhomogeneous radiation fields were expected in the vicinity of the source. To access realistically the rangeseveral TLDs were worn: on breast, hip, knee, in a shoe and on both hands. Individual "intervention" levelswere set in advance: the first alarm level was set to 1 mSv and the second one to 2 mSv - in case ofreaching the second level the member of the team should be exchanged by another member. Both levelswere controlled by electronic dosimeters.
Actually the exposures were much bellow the "intervention" levels, the highest "breast" dose being 46 uSvand "hand" dose 270 uSv. The overall collective dose to the team (two measurement missions and recoveryoperation) was 0.27 man.mSv.
PUBLIC AND MEDIA REACTIONS
Like any real or suspected radiological emergency the event aroused overreactions, fear and anxiety inpopulation and mass media. Immediately after the discovery of the source the public was informed aboutthe findings. Great uneasiness and anxiety was felt mostly in the nearby population (a town with more than100 000 inhabitants). Even cases of hostile attitude toward particular workers of the plant were recorded.During the course of the time there were frequent communications between mass media and RepublicHealth Inspectorate and many technical questions were addressed directly to the headquarters of theemergency team. The date of the recovery operation was not announced in media in order to prevent
PORTOROŽ 95 404

SESSION VI PROCEEDINGS
disturbances which might be caused by too numerous attendance. However the date was not kept secretto those media that addressed directly to the emergency tern leader. The final action was thus attended bythe national TV and local newspaper. After the recovery of the source a joint report was released byRepublic Health Inspectorate and Ecological Laboratory with a Mobile Unit. The uneasiness in populationgradually settled down though the event triggered the suspicion of additional similar cases in other partsof the country.
CONCLUSIONS
1. The negligence of internal control of radiographic sources in the plant and the lack of properadministrative control by authorized organizations and authorities lead to a loss of control over aradiographic source.
2. In 1982 the national Radiological Mobile Laboratory was established with the main goal to performfield measurements and give advice to the authorities in case of nuclear or radiological emergency. Theexistence of highly trained and skilled team proved to be of crucial importance during all phases whichfollowed the discovery of discarded radiographic source.
3. Because of lucky circumstances there was no exposure of the population. Additionally there is noevidence of overexposure of the radiographic sources that might have been involved.
4. Careful planning and execution of the recovery operation resulted in very low exposure of the recoveryteam.
PORTOROŽ 95 405

IIIXA05C0104
A POSSIBLE APPROACH TO ASSESS COMPLIANCE WITH A LIMIT BYMEASUREMENTS *
M.Tschurlovits
Atominstitute of Austrian Universities, Schüttelstraße 115, A-1020 Vienna, Austria
ABSTRACT
A proposal is made to permit compliance with a limit by radioactivity measurements, taking into account thestatistical nature ofradioactivy. The proposal has also some influence to the quality of the measurement undergiven conditions.
PROBLEM
Very frequently, figures are set in standards /IAEA 1994/ or by authorities with the objective to controldoses. These figures are intended to be used in emergency cases, but also for chronic exposure situationsand for routine releases. Such figures might be called guidelines, reference levels, action levels, limits etc.,and have to be conceptually in terms of dose. For practical reasons and therefore more frequently,however, derived quantities are used as activity concentration for a given radionuclide i in a givenmaterial, e.g. in foodstuffs or in air. In the following, the activity concentration Aci is denoted as A. Furtherit is assumed that the uncertainty of the sample mass or volume is negligible.
In any case, an apparently very precise figure is established, and the compliance with this number isachieved by checking whether the assessed activity concentration is below or above this figure. This canbe done by calculations and by measurements.
When calculations are the basis for checking compliance with a limit, a deterministic model leads to afigure with the same properties. Applying stochastic models, a probability distribution results.
In the most frequent case, the assessment of the activity concentration by measurement, a statisticalquantity results.
In the latter cases, unfortunately two different kind of figures have to be compared: a
• deterministic and a• statistical quantity.
When measurements are the basis of decision, some problems obviously arise. This is because legal issueshave to be compared with an statistical quantity.
The figures are:
a) a preset limit, indicated by a singular figure, usually expressed with one or two significant digits, e.g.0,2 kBq/kg
b) a statistical quantity, to be expressed by a mean and a variance.
The following consideration is limited to the case that measurements of activity are the basis of judgement.
When samples are subject of measurements, a question as
" can you assure (or even guarantee) that the sample complies with "
concept developed and discussed in working group " Low Level Measurements" in committee " RadiationProtection" of the Austrian Standards Institute (ÖNORM):H. Friedmann, E. Henrich, C. Hübsch ( secretary), P. Kindl, A. Leitner,F.J. Maringer, F. Steger, M. Tschurlovits (chairman), E. Unfried, G. Winkler.
PORTOROŽ 95 406

SESSION VI PROCEEDINGS
is raised by authorities, by media and by the public. From a scientific point of view, striktly spoken, apositive answer can not be given at all. This is because radioactive decay does not behave to fulfil theproperties of a deterministic quantity. However, the question is still asked frequently, although being anunscientific one by definition. Although a foolish question usually deserves a foolish answer, a realisticapproach which might satisfy nonscientific formalists and being acceptable from scientists is presentedbelow.
BASIC CONSIDERATIONS
The fulfilment of the condition, say
A < L (1)
where: A... activity, L... limit
can be stated only with an additional information, namely the confidence interval of the assessment.Therefore, the correct statement is
A < L , with a given probability (2)
linking three values:
a) mean A ( estimated from the measurements)b) uncertainty o ( estimated from the measurements )c) limit L ( constant)
Taking into account the well known properties of statistical distributions, a statement:
A < L , with 100 % probability
can not be achieved by definition, although being required by some groups who think that the setting oflimits solves all problems.
PROPOSAL
In the following, a possible solution of the question raised above is presented.
In order to obtain a resonable answer, the question on the purpose of the assay of radioactivity has to beformulated in a more precise form.
1. Formulation of the questions
There are three possible questions, which have to be clearly expressed in advance:
a) what is the activity concentration?b) is the activity concentration of the sample lower than a given value and hence in compliance with an
upper limit (e.g. a possibly contaminated food sample )?c) is the activity concentration of the sample higher than a given value and hence in compliance with a
lower limit? ( not considered in detail here)
2. Answers
ad a) The first question is answered by measurements, the answer being an activity (concentration) A anda standard deviation a expressing the statistical uncertainty:
A ± o
This formulation of the question is not associated with compliance with limits, but rather with theassessment of the activity as such.
ad b) This is the most frequent case, namely to check whether an activity in a sample is less than or equalto a preselected figure.
It is proposed to consider a sample in compliance with the limit when the following condition isfulfilled:
PORTOROŽ 95 407
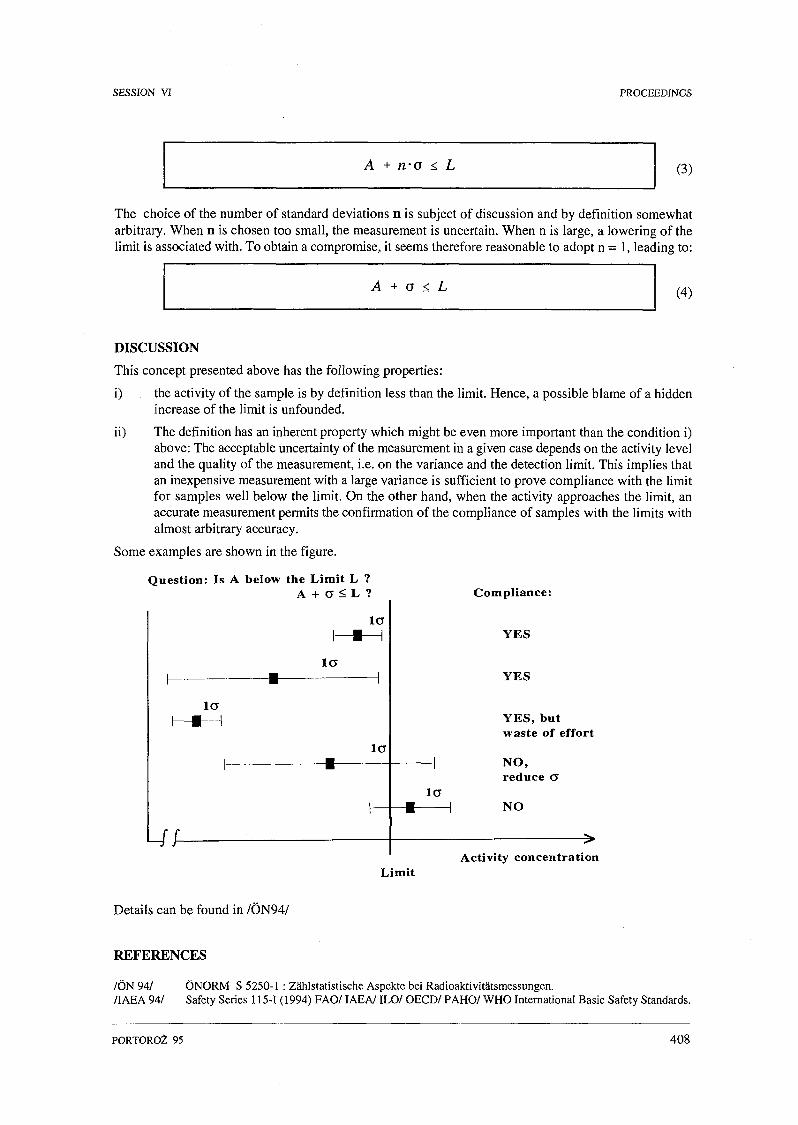
SESSION VI PROCEEDINGS
A + n-a < L (3)
The choice of the number of standard deviations n is subject of discussion and by definition somewhatarbitrary. When n is chosen too small, the measurement is uncertain. When n is large, a lowering of thelimit is associated with. To obtain a compromise, it seems therefore reasonable to adopt n = 1, leading to:
(4)
DISCUSSION
This concept presented above has the following properties:
i) the activity of the sample is by definition less than the limit. Hence, a possible blame of a hiddenincrease of the limit is unfounded.
ii) The definition has an inherent property which might be even more important than the condition i)above: The acceptable uncertainty of the measurement in a given case depends on the activity leveland the quality of the measurement, i.e. on the variance and the detection limit. This implies thatan inexpensive measurement with a large variance is sufficient to prove compliance with the limitfor samples well below the limit. On the other hand, when the activity approaches the limit, anaccurate measurement permits the confirmation of the compliance of samples with the limits withalmost arbitrary accuracy.
Some examples are shown in the figure.
Question: Is A below the Limit L ?A + 0 < L ?
l a
l a
l a
Ur/-
Compliance:
YES
YES
l a
YES, butwaste of effort
NO,reduce a
NO
Activity concentrationLimit
Details can be found in /ÖN94/
REFERENCES
/ON 94/ ÖNORM S 5250-1 : Zählstatistische Aspekte bei Radioaktivitätsmessungen./IAEA 94/ Safety Series 115-1 (1994) FAO/ IAEA/ ILO/ OECD/ PAHO/ WHO International Basic Safety Standards.
PORTOROŽ 95 408

• • • • I l l rao™os
XA05C0105
THE REGULATORY SYSTEM OF MONITORING WORKERS IN GERMANYFOR INTAKES OF RADIOACTIVITY
A. Dalheimer!), K. Henrichs2)
!) Federal Office of Radiation Protection, Institute of Radiation Hygiene,D-85764 Oberschleißheim, Germany
2) Siemens AG, Corporate Office for Radiation Protection, D-81730 München, Germany
ABSTRACT
In Germany, the working group "Incorporation Monitoring" of the German-Swiss Radiation ProtectionAssociation defined a new standard for the monitoring of workers occupationally exposed to radioactivematerial. During the last two years this draft has been accepted by the German government in the form of threeguidelines.
The purpose of the approach was the installation of a consistent state-of-the-art system:
defining clear criteria for the necessity of routine and special monitoring programs,giving guidelines for monitoring programs ensuring that dose assessments are as reliable as necessarywith the lowest possible expenses,standardizing as far as possible the procedures of dose assessments, andguaranteeing the necessary quality standards.
The scientific basis of this regulatory system are the publications 30 and 54 oflCRP.
GUIDELINE FOR PHYSICAL RADIATION PROTECTION SURVEILLANCE
Necessity of Monitoring Programs
Although the guidelines distinguish routine monitoring and special monitoring, the criteria for theirnecessity are identical. They are necessary, if the incorporation of more than 10 % of the nuclide specificannual limit of intake (ALI) can not be excluded. This percentage corresponds to the dose level definingthe occupationally exposed person in Germany. For the handling of nuclide mixtures each contribution isto be taken into account.
The guideline gives practical help to check this criterion. The simplest case is that of manipulating unsealedactivity on a laboratory desk. In this case routine monitoring is necessary, if the maximum activity handledduring a working day exceeds 2000 • ALI/n (n = number of exposure days per year). Other methodsproposed to check the criteria for the necessity of monitoring programs make use of local long-term expe-rience with earlier monitoring programs or the results of air activity measurements.
Action Levels
It was one objective, to avoid unjustified work and expenses at activity levels which are irrelevant for thehealth of the worker or under legal aspects. Therefore, two action levels define the necessity of additionalmeasures.
The lowest one is the so-called interpretation level, at 3 % of the annual limit of intake. This level roughlycorresponds to the detection limit characterizing the external dosimetry; it takes into account theuncertainties arrising from the lacking knowledge concerning the exact date of incorporation.
The result of each routine measurement is compared with a nuclide specific tabulated value (Table 1):
If the measured acitivity or activity concentration does not exceed this value (reference value), it meansthat the expected annual intake is well below 3 % of the ALI, taking into account the method ofmeasurement (monitoring procedure), its frequency (monitoring interval) and assuming an intake at
PORTOROŽ 95 409

SESSION VI PROCEEDINGS
the beginning of the monitoring interval. In this case there is no need for any further action, even anycalculation of doses and intakes is not required.
Above the interpretation level, intake and dose must be assessed, but with a very simple and standardi-zed method, described in the second guideline as reference method.
NuclideCompound,Inhalation
class
ALI
(Bq)
MonitoringProcedure
MonitoringInterval
(d)
Reference Value
(Bq, Bq/d, Bq/m3)
Co-60
1-131
Cs-137
Th-232
...
WY
D
D
W
Y
4-106
4-105
1 -106
6-106
3-10'
6- 10'
WBCWBC
ThyroidU
WBC
AM+
U + F(LC)AM
+U + F(LC)
180180
1414
180
3-103
1 • 103
2-103
10
3-10"
4-10-4
8 • ÍO"4
Table 1: Extract of the table for routine monitoring (Guideline for Physical Radiation ProtectionSurveillance), defining monitoring procedure, monitoring interval and reference value forradioisotopes and its compounds (WBC = whole body counter, LC = lung counter, AM = air activi-ty measurement, U = urine analysis, F = feces analysis).
The second action level is called investigation level, at 30 % of the annual limit of intake:
As long as the intake for the calender year expected on the basis of the available measurements isbelow 30 % of the ALI, there is no need for further assessments and measurements.If the investigation level is exceeded, additional measurements and investigations are required untilthey ensure a sufficiently reliable dose assessment, described in the second guideline as individualassessment.
Requirements for the Monitoring Procedure
If any monitoring procedure is necessary, it must ensure the detection of an annual intake of less than 3% of the ALL
Three factors influence the methods and frequencies applied for this procedure:
the physical characteristics of the radionuclide;the biokinetics of the incorporated compound; andthe sensitivity of the equipment (eg detection limit).
As a result, the guideline defines for about 90 radioisotopes and its different compounds the method(s) tobe applied and the length of the monitoring intervals (Table 1). Two aspects were taken into account when
PORTOROŽ 95 410

sgI
2
Reference Procedure Individual assessment
ineninin
1
assessment d Intake/doseby means of
reference proceduře
recalculation 04 the Intaketaking Into accountindividual Information aboutdates, routes or Intakes,compound. AMAO,...
assessment of organ doseby means of
the Integration method
development of a newmodel, recalculation o) retention,
Intakes and doses
Recordingof measured
activitiesRecording of measured activities, intakes, effective dose, organ dose
as well as model/data underlying the interpretationn
oQ

SESSION VI PROCEEDINGS
fixing these intervals:it must be sure, that the method applied allows the detection of 3 % of the ALI; andthe uncertainty of the date of the possible incorporation requires an estimate for this parameter. In theconcept, it is assumed, that the incorporation took place in the middle of the monitoring interval.Though this assumption means on the average an overestimation of the possible intakes, it does notexclude possible underestimations in individual cases. To avoid unacceptable uncertainties, the lengthof the interval was chosen so that the maximum factor of underestimation ist limited to a value of three.Together with the definition of the investigation level this definition avoids that dose limits areexceeded without being recognized.
GUIDELINE FOR ASSESSMENT OF EXPOSURE BY INCORPORATED RADIATIONEMITTERS
As already stated above, one of the main objectives was the standardization of the dose assessmentprocedures. This means, that for all results (intakes and doses) below the investigation level, there shouldbe a well defined nearly unchangeable method for the interpretation of the measured values. Only for thesmall fraction of cases above the investigation level it seems justified to deviate from this procedure andto introduce as much individual information as necessary or as available. Figure 1 shows the correspondingscheme of decision:
Below the interpretation level, there is no interpretation at all.Above this level, the measured activity or activity concentration is divided by a tabulated value, thusgiving a first estimate of the incorporated activity by using the so-called reference procedure, Figure1. These table values are the retention functions or excretion rates resulting from the biokinetic modelsof the ICRP publication 30 and 54.
The next step is the comparison of this estimated intake with the investigation level:
As long as this level is not exceeded, the intake estimate and the resulting doses are recorded.As soon as the level is exceeded, in a first step it must be checked, wether better information isavailable about the possible dates of the incorporation, about the chemical compound and the AMAD.By means of this information, a new intake and dose is estimated, still based on the tabulated retentionsof ICRP. It is titled the individual assessment in Figure 1.If the investigation level is still exceeded, measurements of the individual retention characteristics areto be performed enabling a comparison with the ICRP retention models. If there are no substantialdeviations, the calculated intakes and doses are recorded. If there are considerable differences, theindividual retention must be measured and modeled as far as physically possible, and a new dosecalculation must be based on these measurements including the calculation of new dose conversionfactors.
GUIDELINE FOR DEMANDS CONCERNING MEASURING LABORATORIES
The directives mentioned already are complemented by a third one for the measuring or service labora-tories performing the analysis and being responsible for the assessment of intakes and doses. It definesrecognition criteria to ensure that these laboratories:
are sufficiently well equipped with state-of-the-art instruments;have the same scientific know how necessary for the dose assessment, based on the ICRP publications30 and 54; andtake part in adequate quality assurance programs, which will be organized by a governmental in-stitution.
SUMMARY
The three guidelines establish a consistent system of regulations to monitor occupationally exposed personsin Germany for intakes of radioactivity. It shall contribute to an adequate protection of the workers andensure the comparability of dosimetric informations from different institutions.
PORTOROŽ 95 412

SESSION VI PROCEEDINGS
XA05C0106
RADIOLOGICAL PROTECTION IN A NON-NUCLEAR COUNTRY
C. Hone
Radiological Protection Institute of Ireland, Dublin, Ireland
Since 1977 Ireland has operated a licensing system to regulate the use of ionising radiation in medicine,industry and education/research. The system extends to all sources from irradiators containingpetabecquerels of cobalt-60 to veterinary x-ray units.
Licences in respect of radioactive materials and irradiating apparatus are issued by the RadiologicalProtection Institute of Ireland which is the national competent authority for matters relating to radiologicalprotection. The licences include conditions which must be upheld by the licensee. These conditions placean obligation on the licensee to, among other things, maintain and service licensed items, calibrate dosemeasuring equipment, investigate and report to the institute all doses in excess of prescribed action levels(which are always lower than statutory limits). They also specify limits for radioactive waste disposal.The Institute carries out inspections of licensees to ensure compliance with these conditions and otherregulations pertaining to ionising radiation.
The following aspects of the Institute's surveillance programme are considered;
ENSURING QUALITY CONTROL IN MEDICAL APPLICATIONS
The Institute and its predecessor the Nuclear Energy Board has carried out surveys of diagnostic radiologyand nuclear medicine practice in Ireland. In common with other countries these surveys have indicateda significant number of cases of poor equipment performance as shown in the table below: (NEB 1988).The regulatory service of the Institute requires hospitals to continuously monitor equipment performanceand will withdraw a licence in respect of any piece of equipment, the performance of which is deemed tobe significantly substandard.
X-RAY UNIT ASSESSMENT RESULTS
PARAMETER
1. kV accuray against dial kV
2. Kv accuracy against currentvariation
3. Total filtration
4. Focal spot Size
(a) Broad Focus
(b) Fine Focus
5. Radiation Output
(a) Consistency
(b) Magnitude
(c) Variation with mA
(d) Variation with mAs
(e) Variation with kV
6. Collimation and alignment
N.B. It was not possible to test all thesome unites it was not possible to
PORTOROŽ 95
NUMBER OF X-RAY UNITS
GOOD NORMAL POOR
16
15
55
22
17
44
9
12
20
38
36
25
7
25
30
13
34
19
9
47
20
14
5
5
4
2
13
8
3
8
10
% OF UNITSASSESSEDAS POOR
28
26
8
10
9
3
23
20
9
15
21
parameters listed in 1-6 on all the units examined. For example, onvary the tube current and timer settings independently.
413

SESSION VI PROCEEDINGS
RADIOACTIVE WASTE DISPOSAL
Countries with nuclear power reactors will normally have at least limited waste management facilitieswhich can be utilised for the disposal of low level waste arising from medical, research and industrialapplications.
It can prove very difficult, as it has to date in Ireland, to convince either the public or authorities thatcountries without nuclear power need waste management facilities as well; albeit on a much smaller scale.
For example in Ireland it was estimated (Fenton et al 1994) that there are approximately 7,600 sealedsources with a total nominal activity of 4737 Gigabecquerels which require long term storage.
THE USE OF X-RAY EQUIPMENT BY PRACTITIONERS OF ALTERNATIVE MEDICINE
A mini survey has indicated that the situation in EU member states and other european countries, as wellas worldwide, varies significantly. In some countries such use is explicitly permitted; in others it isexplicitly forbidden; while in a third group the law is somewhat imprecise on the matter.
Regulatory authorities need to establish a coherent policy on this matter which both ensures the protectionof the public but at the same time does not prevent access to alternative medical treatment.
PUBLIC PERCEPTION
Finally mention should be made of the problem of public perception of radiation hazards in non nuclearcountries. While it is probably true that the public is universally concerned with regard to the hazards ofionising radiation, those who live in a non nuclear country are often especially concerned particularly if,as is the case in Ireland, a neighbouring country has an extensive nuclear programme. Regulatoryauthorities must be sensitive to these concerns and at the same time apply standards which are based onthe best available scientific knowledge.
REFERENCES
1. Survey of Diagnostic Radiology in the Republic of Ireland, J.D. Cunningham, D . Howett, C . Hone and C . Mulholland(NEB 1988).
2. An Inventory of Disused Sealed Radioactive Sources in Ireland, D .M . Fenton, C .P . Hone, F J . Turvey (RPII 1994).
PORTOROŽ 95 414

SESSION VI PROCEEDINGS
XA05C0107
COMBINED LOW- AND HIGH-DOSE IRRADIATION AND ITSINTERPRETATION FROM THE POINT OF VIEW OF RADIATION
PROTECTION
M.Beno
Institute of Preventive and Clinical Medicine, Limbová 14, 83301 Bratislava, Slovakia
INTRODUCTION
During the last decade some "stimulating" or "hormetic" effects have been ascribed to low-levels ofradiation. The adaptive response was a phenomenon recently used as an argument among others advertisingsuch "hormetic" effects of low dose irradiation (Luckey, 1991).
Human peripheral blood lymphocytes may show a decrease of chromosomal aberrations (CA) after highdoses of ionizing radiation if they have been previously irradiated by small doses of internally depositedtritium from labelled thymidine (Olivieri et al. 1984; Bosi et al. 1989), or by small doses of X-rays(Shadley et al. 1987a,b; Wolff et al. 1988; Fan et al. 1990). This response looks as if some adaptationwould take place to the low-dose irradiation and was called "adaptive response" (AR). It was attributed torepair mechanisms elicited by damaging the lymphocyte DNA by small doses of radiation (Wolff et al.1990) so that after the high dose, delivered at times when higher levels of repair proteins and othermolecules are still present in cells, a lower damaging effect may be expressed.
Our work was aimed at gaining information about the frequency distribution of the responses to acombination of low-dose irradiation with tritium and high-dose irradiation with gamma rays and atcomparing two endpoints : counts of CA with counts of micronuclei (M) in lymphocytes from the samedonors in a human population sample.
METHODS
Lymphocytes from healthy adult donors of age from 20 to 59 years, of both sexes (24 males and 20females) were isolated from blood by centrifugation and after washing they were divided into four samplesdesignated as :
K) control, unirradiated ;T) irradiated from tritium incorporated during in vitro incubation in phytohemagglutinin
(Wellcome)-containing medium with tritium labelled thymidine (3HTdR, specific activity 1950GBq/mM, UVVVR Praha). Lymphocyte samples of six groups of donors served forexperiments differing in either incubation-time or in the concentration of 3HTdR (see chap.Results).
G) irradiated after 44 hours of incubation by a ^Co gamma source, the absorbed dose being 1.5Gy at a dose-rate of 0.115 Gy/min.;
TG) irradiated first by tritium as in T) and then also with the gamma-source as in G).
The CA and M were counted in at least 200 metaphases or 2000 nucleated cells, respectively, on eachslide.
The type of response of the lymphocytes to the combined irradiation was determined by testing thedifference: (TG - K) - (T - K) - (G - K) = K + TG - T - G where the characters represented counts of CAor M in appropriate samples. The c-test based on Poisson approximation of a normal distribution has beenused to test the significance of the above difference:
K + TG - T - GC* =
+ TG + T
PORTOROŽ 95 415

SESSION VI PROCEEDINGS
RESULTS
Generally, three types of response were found. A negative value of the difference accompanying a valueof c Š -1.96 revealed a statistically significant adaptive response. A positive value of the differenceaccompanied with c ž 1.96 revealed a statistically significant synergic response. Values of c fallingbetween these two limits have been interpreted as additive response.
In the first group where lymphocytes of 14 donors were preirradiated in vitro by 45 hours incorporationof 3HTdR (4 kBq/ml), four AR and 4 synergic types of response were found after CA counting. Aftercounting of M only 1 AR and 1 synergic response has been observed, both were found in lymphocytes ofdonors giving the same type of response after CA counting.
In group 2, lymphocytes were preirradiated by 24 hours incorporation of 3HTdR (4 kBq/ml), 3 AR and 2synergic responses have been observed after CA counting. After counting of M four of the samplesresponded adaptively, no synergic response has been observed. A concomitance in the response type wasfound only in two of the samples.
In group 3, lymphocytes were preirradiated by 15 hours incorporation of 3HTdR (4 kBq/ml), one AR andone synergic response has been observed after CA counting and the same after counting M. Only oneconcomitance was found.
In group 4, lymphocytes were preirradiated by 7 hours 3HTdR incorporation (4 kBq/ml), two of thelymphocyte samples showed a synergic response after CA counting, one AR has been found after countingM, but no sample showed concomitance in type of response.
In group 5, lymphocytes were preirradiated by 24 hours 3HTdR incorporation (0.4 kBq/ml), every of thetwo endpoints showed in two samples the synergic response, but only one concomitance was found.
In group 6, lymphocytes were preirradiated by 12 hours 3HTdR incorporation (0.05 kBq/ml), one AR andone synergic response has been found by CA counting. Only one synergic response was found by countingM. No concomitance was found.
The within-group results of testing, did not show a preponderance of any of he extreme (adaptive orsynergic) response type. The Kruskal-Wallis test was applied to grouped values of c. It showed as atcounting CA, as well as at counting M that the values of c belonging to samples from every group aredistributed by chance (p > 0.05) so that any of the six irradiation schedules could not be preferred inwilling to achieve one of the extreme types of response. An overall concomitance of CA- and M-resultswas in 7 from 16 extremely responding samples of CA and M series, respectively. The distribution of cvalues at both endpoints was close to normal (Fig.l and 2). Altogether in 44 donors at counting CA nineadaptive and 11 synergic and at counting M seven adaptive and 5 synergic types of response have beenfound.
DISCUSSION
The majority of authors interpret the presence of the AR after one-dose testing like a binary phenomenon -as an alternative its absence is considered. Only Bosi and Olivieri (1989) found synergic type of responsein four of 18 donors. Others (Olivieri et al. 1984, Shadley et al. 1987a,b, Wolff et al. 1988,1989,Bauchinger et al. 1989, Fan et al. 1990) did not observe any synergic response in testing lymphocytesamples of a few donors.
Our results of testing show that at every schedule of irradiation used at least two types of response couldbe demonstrated. The grouped c-values of both endpoints strongly suggest, that actually the distributionof the differences K + TG - T - G and of the c-values in a group of samples from various donors may havea shape close to the Gaussian. This would require a revision of the up to this time "binary" interpretationin the sense that after combined irradiation with two doses the adaptive and synergic responses are at thetails of a normal distribution of responses the majority of which is additive. The question of the conditionsin vivo, or in vitro that must be present at revealing each of the extreme cell response types remains open.We demonstrated that changing concentration of tritium in the incubation medium through two orders ofmagnitude (from 4 kBq/ml to 0.05 kBq/ml) still made possible to reveal the extreme types of response.
PORTOROŽ 95 416

SESSION VI PROCEEDINGS
99.9
j 95
2 503
£3
« 5
0.1
•
ADAP.r
p = 0.12
A D D I T I V Ei . . . i
i ^
S Y N E R G I Ci . . . i
-3 -1 1c
99.9
** 95
i 503
£o
0.1
p = 0.52
/^ADAPTIVEi . . . i . ,
ADDIT.i
SYNERGIC1 . . . 1
-9 -5 -1c
Fig. 1: Normal probability plot of c - values forCA.
Fig. 2: Normal probability plot of c - values formicronuclei.
Every healthy cell should have capacity for repairing clastogenic damage the expression of which may varyduring cycling (Aghamohammadi and Savage, 1991). In healthy, unimpaired cells the expression of thiscapacity should vary only slightly around a "normal" level that could be revealed by the testing methodused here as an additive response. If the tissue repair capacity would express broad variation, this,especially in case of prolonged expression of synergism, would be of interest for radiation protection asall radiation protection limits of exposure are based upon the premise of an additive effect of low doses.The above interpretation allows to describe semiquantitatively both of the extreme tails of the responsedistribution - the adaptivity and synergism. From the point of view of radiation protection the adaptivityto the clastogenic harm is a phenomenon causing less concern than the synergism as the former reflectsa status of radioresistance. The possibility of a synergic response, moreover after low-dose irradiation, maycause serious concern if it actually appears in frequencies as was shown here, as it expressesradiosensitivity. It should attract attention of further search for its causes. Especially, the question if it takesplace also in vivo after combined low and high-dose irradiation, or combined low dose irradiation and highdose chemical clastogen exposure should be solved preferentially. Both these modes are actually takingplace at various professional exposures. At the relatively low counts of probands which we have used herethe unexpectedly relatively high frequency of synergic response still might be shown by chance.
CONCLUSIONS
Combined irradiation of human lymphocyte samples with two doses, a low-dose from tritium and a highdose from gamma ^Co, when CA and M are followed as endpoints of effect, leads to a distribution ofresponses that strongly resembles a shape close to normal. The majority of responses is additive, withadaptive and synergic responses at the tails of this distribution. This shows that the supposed "hormetic"effect of low dose irradiation in vitro, represented by an adaptive response, is an extreme phenomenon atleast at such in vitro conditions as have been used in reported experiments, and, on the other side it has acounterpart in synergism. Unlike adaptation, the synergism may cause concern in the field of radiationprotection as all exposure limits are based upon the premise of additive effects of multiple doses of ionizingradiation.
Only low degree of intraindividual concomitance in any of the extreme types of response between the twoendpoints - chromosomal aberrations and micronuclei counting has been found.
PORTOROŽ 95 417

SESSION VI PROCEEDINGS
REFERENCES
1. Aghamohammadi, S. Z. et al., 1991, Mutat. Res. 251, 133-141.2. Bauchinger, M. et al., 1989, Mutat. Res. 227,103 -107.3. Bosi, A. et al., 1989, Mutat. Res. 211, 13-17.4. Fan, S. et al., 1990, Mutat. Res. 243, 53-56.5. Ikushima, T. ,1989, Mutat. Res. 227,241-246.6. Luckey, T.D., 1991, Radiation Hormesis, p.85, C.R.C. Press Inc., 306 pp.7. Olivieri, G.J. et al.,1984, Science 223, 594-597.8. Shadley, J. et al., 1987a, Radiat. Res. 111,511-517.9. Shadley, J.D. et al., 1987b, Mutagenesis 2, 95-96.10. Wolff, S. et al., 1990, Mutation and the Environment, Part B, p. 397-405, Wiley-Liss, Inc.11. Wolff, S. et al, 1988, Int.J.Radiat.Biol. 53, 39-48.
PORTOROŽ 95 418

SESSION VI PROCEEDINGS
XA05C0108
RADIOACTIVITY IN THE SCRAP RECYCLING PROCESS: RADIATIONPROTECTION ASPECTS AND EXPERIMENTAL MONITORING PROBLEMS
D.Sacco, F.Ruggeri, G.Bindi, A.Bonanni, S.Casciardi, R. Delia,A.Loppa, P.Rossi, E.Venturini
Ministry of Health, ISPESL (Superior Institute of Protection and Work Safety)Via di Fontana Candida n° 1,00040 Monteporzio Catone, (Rome) Italy
ABSTRACT
The steel scrap recycling by steel mill is increasing moved by profits and by pourpose of protection ofenvironmental resources. Besides the use of radioactive sources in several fields (medical, industrial and inscientific reserches) on one hand, and the disposal of made radioactive materials from nuclear reactors onthe other one, makes the likelihood no more negligible that some radionuclides could be found, accidentalyor fraudulently, in steel recycling scrap. Radiation protection problems for surveillance both employees in theproduction cycle and of people and environment in general arose.
First of all, we characterize different type of radioactive materials that can found in scraps, pointing out thepotential hazards from exposure of workers and people and from environmental contamination, related tophysical and chemical specifications of the involved radionuclides.
Some suitable monitoring equipements for scrap recycling facilities are discussed, related to the different stepof production cycle {transport, storage, manipulation and melting).
At last experimental data, taken in some periods of the monitoring campaign made at the kalian border onimported scraps, are presented.
INTRODUCTION
Possible Scrap Component
Aircraft devices, luminousAir ionizing devicesAutomobile shift quadrantsCompass,marine:navigational equipementDewpoint gaugesElectron & vacuum tubesFire/smoke detectorsGauges (thickness, calibration, porcess controlllevel measurement)Ice detectorIndustrial radiography sourcesIrradiators.self-containedLightning rodsLock illuminators, automobileLuminous signsMedical devices (brachytherapy, teletherapy)Radiation leak detectorsRefractoryShipping containers, shieldedSpark gap irradiators (fuel oil burners)Static eliminatorsThermostat (dials, pointers)Well logging toolsTimepieces
Possible Radioactive Material
H-3 Pm-147 Ra-226 Sr-90 Kr-85H-3 Po-21, Ra-226 Am-241H-3H-3 Ra-226Ra-226 ThH-3 Co-60 Ni-63 Kr-85Cs-137 Pm-147 Ra-226 ThU Ra-226 Am-241Am-241 Am-241/Be, Sr-90, Cs-137, Co-60Ra-226 Kr-85 Ra-226/Be Ir-192Sr-90Co-60 Ir-192 Ra-226Co-60 Cs-137Ra-226 ThH-3 Pm-147 C-14H-3 Pm-147 Kr-85 Ra-226Am-241 Co-60 Cs-137 Ga-67Ir-192I-125 Ra-226 Sr-90Kr-85Co-60Cs-137 Ra-226 Ir-192 Am-241Co-60Am-241 Po-210 Ra-226H-3 Pml47Cs-137 Ra-226 Ra226/Be Am-241/BeTh H-3 Pm-147 Ra-226
Table 1 : Scrap bearing sealed radioactive materials.
PORTOROŽ 95 419

SESSION VI PROCEEDINGS
Although the use and disposal of the radioactive material is usually regulated in every industrializedcountry, the likelihood that radioactive sources and/or contaminated metals can enter the recycling processas scrap cannot be overlooked also if we exclude completely the fraudulent hypothesis.
A further reflection arises from tab.l, where some radioactive industrial devices or gauges are identified(a several thousand of licences/year in every industrialized contry) meanwhile the summary of knownincidents occurred in the world with their cost of decontamination is presented in tab.2 [1] [2].
Year & location
1983-New York1083 - Mexico1984-Alabama1984-Tawain1985-Brazil1985 - California1985-Alabama1987-Tennessee1987-Indiana (Al)1988 - Missouri (Cu)1988-California (Pb)1989-Louisiana1989-Italy1989- Pennsylvania1989-U.S.S.R. (Al)1990-Italy1990-Ireland1990-Utah1991 - Tennessee (Al)1991 -India1992-Kentucky1992 - Virginia (Al)1992-Texas1992-Russia (Cu)1992-Illinois1993-New York1993 - Kentucky1993- Georgia (Zn)1993 - Kazakhstan
Radionuchde
Co-60Co-60Cs-137CO-60Co-60Cs-137Cs-137Cs-137Ra-226Accel. Prod.Cs-137Cs-137Cs-137Th?Cs-137Cs-137Cs-137ThCo-60Cs-137Ra-226Cs-137Co-60Cs-137Cs-137Cs-137UCo-60
Activity(lOexplO) Bq
93150037-19037-74?5.6.037-. 19.093.074?.074-.09319110???7?9
.74-191.2?
.74?
?3.7.749
•C.074
ProbableOrigin
ind. g-grap.Ter.g-grapGauge ?GaugeFurn. wallGaugeGaugeGaugeGauge?GaugeGauge ??charge?Gauge ?Gauge ?Gauge?779
Gauge ???Gauge ?Gauge ?U castings7
Decont. costMilion ( $ )
4777?1.50.60.21 (*)77?0.05 (*)7
?777Ó.172 (*)
app. 1(*)9
7app. 2(*)app. 2(*)77
Comments
.02-375 mR/h (°)
.08 mR/h O96 Bq/g C)
18200 Bq/g insoil contamination
(*) Costs of disposal of flue dust not included(°) Activity and/or exposition in final product
Table 2: Incidents.
IDENTIFICATION OF RADIOACTIVE SCRAP
Radioactive materials can enter the scrap recycling process in different ways:
inherently radioactive scrap, in which the radioactivity is an integral part of the metal and cannot beremoved. This is the case of:
a) metals (Fe, Co, Mn, Ni) activated by nuclear reactors or accelerators;b) industrial thoriated products made by adding the NORM (Naturally Occuring Radioactive
Material) Thorium to usual components in order to improve mechanical, electrical and termicalperformances;
c) products coming from furnaces where a radioactive source was previously melted;
scrap bearing sealed radioactive materials, i.e. radioactive sources inside the industrial devices orgauges, or shielded/unshielded sealed sources among the pieces of scrap;
scrap contaminated with radioactive material, when the scrap becomes "dirty" with some radioactive
PORTOROŽ 95 420

SESSION VI PROCEEDINGS
material which is not chemically fixed to it, but can be dispersed by chemical and physical agents(oxidation, fuming, wind ). This is the case of:
a) damaged unsealed sources come accidentally to scrap;b) pipes and equipments coming from some industrial processes such as the extraction of gas.oil and
minerals, which have deposited NORM radioactive material on internal walls.
WHICH ARE THE MOST PROBABLE RADIONUCLIDES IN THE SCRAP?
Tab. n°l presents a list of several type of " gadget" which have a radioactive source inside, from morefamiliar therapeutic and medical devices or commercial applications in the form of smoke detector, tillmore precisely industrial applications like gauges to measure the thickness and/or the moisture in rolledproducts, the level or the specific gravity of liquids, or to weight accurately materials which are hot,abrasive, corrosive or difficult to weigh (on belt conveyor).This table individuates 20 differentsradionuclides which it is possible to find in iron scrap in principle, but only few of them offer the combinedsuitableties of long half-life and large enough number of sources in use to make their entry in a steel -industry more probable.
Among them, the greatest potential hazard is represented by the following radionuclides: Co-60, Cs-137,Am-241,Ra-226, Sr-90.
Year & location
1984 - Pennsylvania1985 -Wahington NORM1985 -Pennsylvania1985 - Pennsylvania1985-Florida1986-Texas1986-Texas1986-Texas1986-Florida1986-Wisconsin1987 -Pennsylvania
1987-Pennsylvania1987-Pennsylvania
Radionuchde
?NORMNORMNORM?Sr-90
Ra-226, Th
Ra-226, ThNORM
Origin
shield box of medic, diagn. devicescale ol well casingshield boxstainless steel tubesscrap steel from phospate plantwater softener housing in scrapscale in oil well casingpipe in scrapsource found in empty rail carindus. radiog.shieldstain.s.pipes containing scale
stain.s.pipes from phospate p.p.stain.s.pipes containing scale
Comments
symbol °
symbol °.7mR/h at contactlOmR/h3mR/h.045mR/h " "
800mR/h " "symbol °1480Bq/g-Ra999Bq/g -Th0.5 mR/h at contact1 mR/h " "
Table 3: Radioactive material and suspected objects findings.
TYPE OF SCRAPSName
Sheared 1Sheared 2 (light conduit)Busheling (residue from punch)Bundles 1 (light scrap compressed)Bundles 2 (car and mix compressed)TurningsPlate and Structural (demolition)SlitterShredded (Frag)Cast Borings (small chips)Cut Plate, Foundry and Ship ScrapPacked Bars
Density (g/cm*3)
0.48-0.560.80-0.9610.48-1.200.64-1.121.12-1.440.80-1.280.96-1.120.96-1.281.04-1.21.44-2.242.40-2.722.88-4.00
"probable "radioactive devices inside
level gauges on tank wall, st.- eliminator
less trascurable, because they catch-all
indust.g-ray device,medical, NORM
level gauges on tank wall, St.- eliminator
Table 4: Typical scrap.
The grade of scrape used in steel mill depends on different factors:a) size and type of furnaces;b) kind and quantity of final product;c) market-price.
PORTOROŽ 95 421

SESSION VI PROCEEDINGS
All different metal scrap can be catalogued by size, component and by their origin, as listed in tab. 4 where,the name is associated with the density and industrial radioactive gadgets. This table points out that scrap'sdensity has a quite large variability interval ((0.6 — 4)g/cm*3), keeping almost always lower than the steel'shalf density (steel density = 7.84 g/cm*3).
RADIATION PROTECTION ASPECTS OF RADIOACTIVE MATERIAL SCRAP
The way a radioactive material enters a scrap streamline, together to radionuclide involved and its quantity,determines the degree of detectability, the potential hazard to employees and customers, and the likelihoodof causing widespread contamination, with the final cost of the decontamination.
Once contaminated scrap is entered the consequences can be very different: environmental impact couldextend not only to steel mill but also to outside areas, such as to cause internal and/or external expositionto workers and customers but also to population.
Obviously scrap-plant workers, handling metal scraps, are potentially at more risk to external exposition,because they could come to direct contact with g-radioactive gadgets; while internal exposition could resultfrom rupture of sources's seal and from spreading of radioactive material in the workplace. In the last casea worker should unknowingly contaminate other areas either inside or outside the scrap facility ( Mexicanincident).
A sort of probability that a type of radioactive material, rather than another one, by chance enter the scrap,can be defined by examining the happened incidents, the type of radioactive scraps found in these pastyears, also considering the amount of radioactive devices into circulation, and the involved radionuclide.Furthermore, this "type of probability" can be also connected to the scrap type, grade, nature and origin.
In this view, it is more likely to find an industrial g-ray device, or scraps contaminated by NORMradioactive material in heavy scraps loads rather than a static-eliminator. This last one has the greatestchance to enter the cut plate scraps, either at the original condition, or pressed packages , sheared orshredded. From this point of view, the scraps coming from steel waste process (chips, punchings,turnings,plates)should offer less risks in principle.
If a radioactive material is melted, the nature of a specific radionuclide involved will determine thepotential hazard and its consequences because it will react chemically with steel, other metals andimpurities, and flux the same as its stable, non radioactive element.
Concerns about radionuclides listed above, and their likely pathways due to the melting are [1] [2]
Element pathway traceCobalt Finished product (98.9%) slag (1%), flue dust (.1%)Cesium flue dust (89.9%) +slag (10%) finished product (.1%)Americium, Radium, slag flue dustThorium, Strontium
As regards material with uniformly distributed radioactivity is to be expected a minimal superficialcontamination during the scrap handling phases, a not relevant external exposition for workers and a lowradioactivity level on final products.
EXPERIMENTAL ASPECTS IN RADIOACTIVITY CONTROL IN SCRAPS
Before starting technical considerations, we would emphasize the importance of visual identification ofsuspect object, in scrap monitoring. Table 3 clearly shows the positive and encouraging results of thispractice.
The main goal in scrap monitoring is maximize of the probability of g-emitting source detection, whicheverposition inside a load, activity, and shieled by means of lead or transportation box. In order to perform this,we have to identify the worst experimental conditions and the suitable instrumentation.
The first problem is that scrap itself is an "important" shield for gamma radiation, which energy isdegradated due to the interations with the metal meets during its pathway.
The following table presents results on the energy degradation of a Cs-137, from tests with a gamma beam
PORTOROŽ 95 422

SESSION VI PROCEEDINGS
penetrating different steel, lead and scrap thickness (scrape density (.48-.8) g/cm*3, and thicknessexpressed in meter).
THICKNESS
Cs-137 PEAK
none
(primary)100%
.00625steel
75%
.0094steel
68%
.915scrap
11%
1.5-1.8scrap totallydegradate8%
.05lead
In this example the upper limit for scrap thikness allowing a significant chance of detection, is 1.2 m about,a value close to the halfwidth of a rail wagon or a TIR (2.7 m approximately).
Further a radioactive material still could be inside the housing shield. A bad enough situation (lowradioactivity) can be simulated by a gauging device containing radioactive material covered by scrap; infact a de facto standard exists for a such type of devices which limits the radiation emitted through thehousing walls to 5 mR/h or less a distance of 0.3 m, from external surface, so that few centemetre tenthickness of scrap will reduce the exposition level to the background one [4].
1000
NET CnuNVS PER HIKUTE
Fig. 1: Shielded/unshielded 2"x2" sodium iodide detector with ratemeter based circuit.
In fig. 1 data from a such type of simulation are presented; in this test has been used a shielded/unshielded2x2 inches sodium iodide counting ratemeter, with an alarm threshold set at 2 times the backgrounnd one.
At last we have to note that positive factor is made instead by the presence of air inside the scrap, thisallowing "radiation streamer " detection.
TECHNICAL FEATURES OF DETECTION EQUIPMENTS
The starting point in scrap monitoring is to have the chance to measure radioctivity level of the order ofnatural background, on a large amount of material (until 59 ton/railtruck).
An ideal system should have the following features:1) high detection efficency;2) large solid angle;3) sensibility enabling to appreciate background variations (.01 mSv/h; .01 mGy/h);4) the system would be shielded to consent the lowest alarm threshold. In such sense the results of
the test in fig. 1 are enlightening.5) short response time (order of second)6) continous monitoring of background: in fact it may change with atmospherical conditions, with
presence of building material nearby and for the checked load itself shield effects.7) alarm threshold easily programmable during background measurements.
PORTOROŽ 95 423

SESSION VI PROCEEDINGS
8) low probability of false alarm, in order to not interfere with production line, and to avoid loss oftrust from control personnel.
The individuation of the most available "scenarios" for the measurements of matter, is one of the mostcomplex problems to define, involving not only technical aspects, but legal and economical too; in thiscontext we mean as "scenario" both the site inside a factory (the weight and stocking places etc.), and theconditions in which the scrap is (inside TIR or rail-truck, loose, during the load-unload operations).
In order to simplify the analisys of the problem, let us identify two opposite measure scenarios, that is thecontrol on the whole load and on loose material, examining of both advantages and disadvantages.
In the case of monitoring of a whole load still placed above the rail-truck, TIR, or container:
1 adv.) it is possible to prevent steel plant contamination;2 adv.) there is no interference with factory producting cycle, because for example the
measurement operation may take place at the moment of the entrance of material in thefactory, in the weigh place area ;
3 adv.) one has memory of the origin place of the scrap;4 adv.) it is possible to return scrap to the sender.
On the contrary:
1 dis.) there is maximun scrap shield, and minimum probability of detecting emerging radiation
2 dis.) it should require the use of a fixed detection system, computerized and expensive one, inorder to maximize the detection of strongly shielded sources;
As what regards the loose material:
1 adv.) the shielding effect of the scrap is minimum;2 adv.) it is possible to carry out at the same time the measurements and the visual recognition of
suspect material;3 dis.) portable instrumentation is available, with relatively low cost.
On the contrary:
1 dis.) the control is too much depending on human factor, both during measure execution, and inresults interpretation. In this case it is of basic importance the technical training of assignedpersonnel about all the aspects of measure operations;
2 dis.) control interferes with the production cycle;3 dis.) one loses memory of origin place of scrap;4 dis.) it is unpracticable the return to the sender of possible contaninated material.
The opportunity of monitoring the loose scrap during some of the phases of a foundry or steel millproduction cycle, is nowadays in Italy one of the most controversial matters , and one of the less acceptedby manufacturers.
The place in which to carry out the control cannot be defined "a priori", as it strongly depends on thespecific steel production reality, on the kind of scrap it employes, on the load/unload techiniques for scraps(crampon, electromagnet, etc.), on the kind of kiln supplying (belt-convoyer, hopper, etc.), and so on; itshould be studied case by case.
A further step of the control in the factory, is the radioactivity monitoring at the last stage of the productionchain, monitoring the finished product and flue dust, respectively by a gamma spectrometry measuresmentson fusion tests, and the radioactivity measurements on the fume knocking down system.
FIXED INSTRUMENTATION
Since 1989 the manifacturers of the field have been commercialized fixed systems "ad hoc", aimed to theradioactivity detection on scraps still placed on the transportation mean, (rail-trucks, TIR).
The most recent products use few plaste scintillators (2 - 4) of great dimensions (3700 - 7500 cm3
approximatly), whose signals are managed and processed by a sophisticated software .The computer system
PORTOROŽ 95 424

SESSION VI PROCEEDINGS
is able to manage data while the load is moving, subtracting the background level, taking into account theshielding effect of the vehicle by measurements carried out before the load itself has passed through thedetectors [3]. The software provides the calculus of the speed of the vehicle too, self-diagnosis tests, andthe paper recording and monitor display of data relative to each scintillator, most of all in case of alarm.
ISPESL S CONTROL ACTIVITY ON BORDER
Since december 1993 ISPESL's radiation laboratory is engaged on radioactive monitoring of extra-Europeorigin scrape; it has operated ( and it is operating now) by Tarvisio (Udine) and Villa Opičina (Trieste)customs for what concerns rail-truck, Coccau (Udine), Fernetti (Trieste), Gorizia custom for TIR andtrucks.
Railtrucks/day -1994Villa Opičina
Railtrucks/day -1995Villa Opičina
days days
Railtrucks/week -1994Villa Opičina
1Railtrucks/week -1995
Villa Opičina
imiinimiiininimm1 4 7 10 13 16 19 22 25 28 31 34 37 40 43 46 49 S2
weeks
| 150
°g 100
°c so0
I l l11B H g IS IBIS 80 Dli 19m 1.1 ISf IIBJL3 5 7 9 11 13 IS 17 19 21 23 25 27 29 31 33
weeks
Novem bef December J a n u a r y ,5 % 4 *
Railtrucks/month1 8 % 1994-Villa Opičina
Railtrucks/month A u g u s l J a n u a i v
1995-Vil la Opičina 6% e%
page 6
AprilMay 1 2 *
1994Railt. Total Number
1995
AcceptedReturned
AcceptedReturned
231230.13 %
2124912
Villa Opičina
Tarvisio
AcceptedReturned
189730.16
0.06 %
Fig. 2.
Fig.2 shows the number of for railtrucks/day, railtrucks/week during 1994 and 1995 in Villa Opičina, withthe percentage of rejected ones. Some time, the big number of railtrucks/day.plus severe conditions fordetection equipment and for workers (climatic conditions, rough ground, rail-truck moving, loud noise,large) make the control a flard work.
PORTOROŽ 95 425

SESSION VI PROCEEDINGS
The protocol foresees a background measurement with an alarm threshold equal to background doublevalue, checking both the sides of rail-truck with fixed or continuous measurements but in a time that sureto value the background level variation.
Experience made for so long a time, by monitoring so big a number of scrap loads, suggests us a numberof "ergonomie features" which, together to the technical one's reported above, are usefull for a portabledetector dedicated to radioactive monitoring of scraps, especially if it is used in a steel mill where moresevere work conditions exist.
The "ergonomie features" are the following:1) a large, well-lighted and visible display;2) sound either for alarm, or to listen to counting rate, plus a headset to use in the case of loud noise;3) possibility to fix the portable detector to the body with some special belt to have free hands;4) possibility, to select instrument functions simply and fast (threshold regulation, physical quantity
selection, batteries substitution, etc..)by external switches, neither using screwdriwer norremoving covers;
5) availability of a 3-4 m long telescopic rod, solid and not heavy at the same time, whose parts canbe attached simply and fast (for example a bajonet base);
6) a relatively not heavy detector to fix to the rod's extremity;7) possibility to fix the rod to the body with a ad-hoc belt;
A last a technical function seems to be very usefull ,that is the possibility to have background mean levelon preselectable time intervals, (also short as few seconds),so to allow a simple and fast mapping of themeasurement place.
CONSIDERATIONS ON BACKGROUND MEASURE RESULTS
In Villa Opičina custom place, the rail-trucks parking area presents an interesting tipology in which it ispossible to identify several areas characterized by rather different values of background, due to thepresence of building materials, penthouses and tuff, in some places and not in others.
By means of a sensible and fast counting ratemeter (as for example a 2x2 inches sodium iodide scintillationcounter), it is possible to get a fast background map of these areas, and to select for each one the suitablealarm threshold. Right by means of such an instrument, we have measured sistematically differentbackground mean values for each one of the defined areas, ranging from a minimum of 40 countings/s toa maximum of 120 countings/s, during a few minutes time interval.
With such a detector it is possible to check a high number of rail-truck, taking a reasonably brief time,however a'ssuring a some meaning to the measurements.
As the last goal of scrape control is to discriminate the emission of the this material respect to thebackground, that is a performing relative measurement, we don't think important the instrument tonecessarily provide the free air dose or equivalent dose rate, but it should be better to make reference tothe primary quantity measured by itself, expressed as countings per time interval. The measurement ofdifferent radiation protection quantity would be left to further investigations, only in case of real alarm .
BIBLIOGRAPHY
1. "Radioactivity in the Scrap Recycling Process: Reccomended practice and Procedure", by Institute of Scrap RecyclingIndustries, Inc. .January 12,1992.
2. " What to do when the alarm goes off:a suggested procedure for checking contamined metal products", by J.G.Yusko,(Pa. Department of Environmental Resources Bureau on Radiation Protection), and J.O.Lubenau (U.S.NuclearRegulatory Commission State Programs).
3. "Materiále radioattivo nelle scorie metalliche", by J.G.Bellian, HARSHAW/BICRON, 6801 Cochran Road, Solon Ohio44139.USA.
4. "Radioactivity material in steel scrap: its occurences, consequences and detection", by Lamastra, Health PhysicsAssociates, inc., REV 03/89.
PORTOROŽ 95 426

ininiXAn5C0109
RECENT DEVELOPMENTS IN RADIOECOLOGY
M.Tschurlovits
Atominstitute of Austrian Universities, Schüttelstraße 115, A-1020 Vienna, Austria
ABSTRACT
The international development of the field "radioecology" in the last decade with a short glance to earlierperiods is shown. Present activities are discussed. Both assessment and modelling approaches are going tobecome more developed. The present developments lead to the conclusion the existing problems can be solvedonly by cooperation of measurements and modelling. This collaboration is important for not to leave thefield to groups, directed by politicians seeking for short term gain, in order to give retrospective justificationin a specious manner of decisions not be based on objective analysis.
INTRODUCTION
Radioecology is considered to be one of the younger fields in radiation protection, but the roots go backto the dawn of the development of radiation protection in general.
Definition and terminology
radio.. derived from Mdm Curies initial definition
ecology.. greek access ( house, immediate environment of man; coined by Heckel (1834-1919 ),medical practitioner in Jena. Later established by Worrming.
Present scientific definition (not identical with political interpretation): relation between mankind andenvironment.
Radioecology: 1956 as Radiation ecology coined (USA, USSR )
Today the term "radioecology" is interpreted as:• understanding the behaviour of radioactive material in the environment (Ts 84)• science of the effects of ionizing radiation to living and non living environment ( Bo 93)
These definitions are very general. Therefore, a further specification is required, which is only possible bydefinition of a purpose. It has therefore to be distinguished between scientific and practical objectives ofthe programmes. Further it is possible to distinguish between different types of programmes:
1) MONITORING PROGRAMMES: demonstration of compliance with limits (assessment of activityin a given compartment (e.g. activity concentration in air independent from the source), recently alsodose estimates ( e.g. Lo /9 Iff/)
2) RADIOECOLOGICAL PROGRAMMES: basic criteria for the transfer of radioactive materials inenvironmental compartments, investigations on transfer parameters, development of models forretrospective dose estimation and prediction of doses for different conditions ( e.g acute and chronicreleases ) (e.g /IA 93,94/)
3) ECOLOGICAL PROGRAMMES: assessment of risk factors from empirically assessed exposureconditions ( e.g health effects from radon ) (e.g.St 93 )
The results of programs attributable to the first two groups lead are usually reliable and consistent, takinginto account inherent variability. Ecological programmes lead at present only under particular conditionsto proved results. This is mainly because too many parameters are needed for evaluation, but only a feware sufficiently well known. Therefore the conclusions may depend rather on the assumption of parametersthan on real parameters. ( see St /93/ for the relation between Radon and lung cancer).
In general, the programmes are established for different purposes and can not be consistent. When data areused for another purpose as they were established, misleading conclusions may result.
PORTOROŽ 95 ' 427

SESSION VI PROCEEDINGS
DEVELOPMENT OF RADIOECOLOGY
The development in time can more or less arbitrarily separated into five phases and a precursor. Thephases are obviously in close relation to the general development in the fields of physics ( mainlydevelopment of radiation detectors ), radiation biology and epidemiology ( risk factors ), radiationstandards ( organs of interest) etc. A few examples are shown below.
Precursor:
epidemiological studies before discovery of radioactivity /Hä 79/; /Sc 93/reports even on much earlierreports on miners diseases as by Paracelsus 1567
measuring approaches: determination of Ra-A in air and water (Ba 07, Sc 13), cosmic rays ( He 29 ).
phase 1 (until 1960)• assessment of activity concentration in environmental materials• source: nuclear weapons test• mainly used detector: gross beta• results: activity concentration gross beta• presentation of results:tables , no interpretation• development: dose commitment ( Lindeil, UNSCEAR 1958)• selective measurements: mainly based on chemical separation ( Sr-9o)
phase 2 (about 1960 -1970 )• development of research programs , mainly in relation to use of nuclear energy, use of
radionuclides• recognition of natural background
phase 3 pre Chernobyl ( about 1970-1986)• advent of environmental awareness• improvement of measuring techniques ( spectroscopy, low level measurements)• dose assessment• development of prediction models• improvement of conceptual background• increase of public interest by political influences of "quasicritical" groups with a background in
contradiction to scientific basic• assessment of natural background
phase 4 past Chernobyl (immediately after 1986)• avalancing increase of the number of "experts" in radioecology, number in the meantime decayed
to pre-Chernobyl level• interaction between political and scientific issues• development of scientific basis for decision makers overruled by political influences• dose predictions
phase 5 present developmentAmong other activities, the following large programs are in progress:
empirical dose assessmentsa) retrospective dose assessments of previous emissions
Hanford, Wismut, Maralinga&Emu, Kyshtym, Nevada test site (IAEA 94) Semipalatinsk (ST 95)b) doses assessment after Chernobylc) Radon programmes
model developmentd) improvement of modelse) model validationf) predictive modelsh) default parameter sets of environmental parameters
PORTOROŽ 95 428
SESSION VI PROCEEDINGS
Some examples• Estimation of the doses of Wismut workers/ Ei 93/: annual doses of uranium miners were in the
early years ( to 1955 ) in the range of 30-300 WLM, later decreasing. ( 10 WLM=»50 mSv)
• Hanford Dose reconstruction project / Na 93/: the routine releases in the Columbia river 1955 bis1959 were in the order of 1015 Bq (gross beta activity). The migration of these radionuclides isinvestigated.
• Dose reconstruction in nuclear test sites e.g: Maralingu and Emu (Australia ) /Wi 94, Ha 94/: Thearea was contaminated with Pu-isotopes and is still occupied by aborigines. The dose by inhalationis the most important pathway.
• Continuation of model development and parameter assessment
IAEA Handbook on Parameter values for prediction of Radionuclide transfer in temperate environments(1994)
Model validation
IAEA: VAlidation of Model Predictions ( VAMP), The International Chernobyl Project
BIOMOVS: BlOsperic MOdel Validation Study ( CDN,SP,SW)an international study to test models designed to predict the environmental transfer andbioaccumulation of radionuclides and trace substances
IUR: International Union of Radioecology : scientific basis, collaboration with CECCEC: support of projects to provide a scientific basis for decision making in accidental cases.
CONCLUSIONS
It can be seen that substantial effort is put into both model development and measuring programs. Even ifwe consider only institutions which have the aim of an objective judgement of the environmental situation,neither the progressive modelists nor the pragmatic measuring engineer can solve the existing problemsalone. Uncertainty assessment and sensitivity analysis may keywords. Both groups need the interactionwith the other to prevent irrationalism.
This collaboration is also important for not to leave the field to groups directed by politicians seekingfor short term gain in order to give retrospective justification in a specious manner of decisions not be basedon objective analysis.
REFERENCES
/Ba 07/ M.Bamberger: Beiträge zur Radioaktivität der Mineralquellen Tirols Sitzungsberichte der Österr. Akademieder Wissenschaften Vol CXVI Dez. 1907.
BIOMOVS II Progress reports, Technical reports, Newsletter/Bo 93/ H. Bonka: Entstehung des Begriffes RadioökologieWissenschaft und Umwelt 1/93 p.31.
/Ei 93/ G.G.Eigenwillig et al: FV für Strahlenschutz: Strahlenexposition und strahleninduzierte Berufskrankheitenam Beispiel Wismut FS-92-62/2-AKURA (1993).
/Ha 94/ S.M.Haywood, J.G.Smith: Assessment of Potential Doses at the Maralinga and Emu Test Sites IAEATECDOC-755(1994).
/Hä79/ F.H.Haertling, W.Hesse: Der Lungenkrebs, die Bergkrankheit in den Schneeberger GrubenVierteljahresschrift f. gerichtliche Medizin Vol XXX 1879 ( 3 parts).
/He 07/ V.F.Hess, R.Steinmaurer: Neuere Ergebnisse der Registrierung der kosmischen Ultrastrahlung auf demSonnblick Helv.Phy.Acta III (1929).
/IA 93/ IAEA 93: Validation of Environmental Model Predictions (VAMP) program outline./IA 94/ IAEA 94:: Assessing the radiological impact of past nuclear activities and events: IAEA TECDOC-755
(1994)./IA 94/ IAEA 94: Handbook of Parameter Values for the Prediction of Radionuclide Transfers in Temperate
Environments (Technical Series 364) 1994./IA 94 BSS/ Basic Safety Standards Safety Series 115 1 (1994)./IAEA 95?/ Safety series 57: new edition in progress./Lo 91/ H. Loosli et al:30 Bericht der Eidg. Kommission zur Überwachung der Radioaktivität 1987-88 (1991).
PORTOROZ 95 429

SESSION VI PROCEEDINGS
/Na 93/ B.A. Napier et a(: Environmental Modelling for the Hanford Environmental Dose Reconstruction Project(1993) BN-SA-HEDR.
/Sc 13/ E.Schrödinger: Beiträge zur Kenntnis der atmosphärischen Elektrizität LI Sitzungsberichte der Österr.Akademie der Wissenschaften Vol CXXII Dez.1913.
/Sc 93/ W.Schüttmann.Historical perspectives in occ. Medicine Am.J.Ind.Med 23 (1993)355./Si 93/ C.Stidley: A review of ecological studies of lung cancer and indoor radon Health Physics 65 (1993)235-25./St 95/ P.Stegnar: Radiol. situation at the Semipalatinsk nuclear test site, this meeting./Ts 84/ M.TschurlovteLecture notes, TU Wien Radioökologie, 1984 ff./TS 95/ M.Tschurlovits, G.Winkler: On the use of a deterministic model for prediction of radionuclide concentration
in water Proc.IAEA SM 339/128, in press.U.I.R: Newsletter Quarterly 1991 ff,, Information Bulletin, Textbook in preparation./Wi 94/ G.A. Williams: Dose assessment studies at former nuclear weapons test sites in Australia 1993 IAEA
TECDOC-755(1994).
PORTOROŽ 95 430

• • • • • • I p"™sXA05C0110
A PROPOSAL HOW TO TAKE INTO ACCOUNT INHOMOGENEOUSRADIATION FIELDS IN RADIATION PROTECTION
M.Tschurlovits
Atominstitute of Austrian Universities, Schüttelstraße 115, A-1020 Vienna, Austria
ABSTRACT
External radiation fields exposing the human body inhomogenously are not considered neither in radiationprotection standards nor in recent ICRU recommendations, but appear frequently in practical radiationprotection. A proposal to solve this question is given taking into account both a conceptual and a metrologicalapproach. The proposal suggests that a mean over an area of about loo cm2 can be taken as reference areafor compliance with limits in terms of effective dose.
INTRODUCTION
Radiation protection standards define clearly figures limiting the radiation exposure of groups, e.goccupationally exposed persons, in terms of the quantity E (effective dose), being a quantity defined byICRP for risk estimation.
Regarding external exposure, measurements have to be done by means of operational quantities as definedby ICRU. / IA 94/
There is still a dichotomy between the two lines of development, and some discussions on this issue wascarried out /De 94, Le 93/.
Another issue is, however, not discussed at all in present considerations: a possible spatial inhomogeneityof the radiation field. This problem is existing in many practical cases as inhomogeneous shieldingconstruction, beam dimensions occasionally larger than primary beam shielding, slits in walls etc.
No information is available from standards on the size of radiation field to be considered in a radiationsurvey and to set in relation with the limiting quantity. Disregarding this question might lead to asubstantial departure from the optimization of protection, in this case of the shielding.
Since detectors suitable to measure dose rates as low as to environmental levels have to be used, a certaindetector volume is required. This leads to a large active area exposed by the incident radiation. This in turnleads to the question how to interpret measurements not fulfilling the formal requirements of measuringconditions as to be applied under calibration conditions. In particular, the question what response has tobe expected from the detector when only a part of the detector is expose arise.
This problem of inhomogeneous radiation fields lead therefore to two aspects:
a) is the reading of the meter sufficiently correct for radiation protection requirements?
Definition of requirements: show compliance with a ( derived ) limit rather than measuring a figure(i.e E < 30 uSv rather than E = 12±3 (iSv )
b) which limit has to be used as reference
This paper is concerned with two approaches to assess compliance with limits for spatialinhomogeneous exposure conditions. One approach is based upon judgment of measuring results, theother with the compliance with limits.
ILLUSTRATION OF THE PROBLEM AND SOME EXAMPLES
Openings in shielding as slits where less or not attenuated radiation can pass the shielding might beacceptable in some cases for unavoidable technical reasons (e.g between doorframe and door,
PORTOROŽ 95 431

SESSION VI PROCEEDINGS
mammography equipment between primary beam aperture and film holder assembly), or occasionally(fluoroscopy unit used for large size radiography), but not because of slipshod work at installing leadshielding in walls or improper adjustment of the equipment.
In both cases, an spatial inhomogeneous radiation field results and the radiation field might expose persons.
RADIATION PROTECTION APPROACH
Limiting values are based on organs doses in terms of equivalent dose. When more than one organ isexposed, the well known quantity "effective dose £", is used, defined as
E = £ wr • HT
where E ... effective dose [Sv]wT ... tissue weighting factorHT ... equivalent dose in organ T
Since this quantity by definitions can not verified by measurements, some approaches are required. Whenthe total body is exposed, E is approached by measurements in terms of operational quantities H*(d) orHp(d), respectively, and the conditions defined for measurement apply.
However, there is no information available what size of radiation field has to be in compliance with a limitand how this limit is defined.
Overcautious authorities relate erroneously a small radiation field to a dose quantity associated to theeffective dose. Therefore they require a shielding barrier for the maximimum dose, irrespective from thesize of the field. This is a clear departure from optimization and lead to overdesign of shielding barriers.This might not be very important (except for the costs ) for fixed shielding ( e.g. a lead layer in wall), butis important when the shielding is moved in normal operation ( e.g. in a door).
If the human body is exposed inhomogeneously in space, it might be required for compliance with limitsto consider the exposed area (size of the radiation field) in relation to the cross section of organs.Therefore, the limiting quantity is an (effective ) organ dose rather than an effective dose.
Therefore, two issues have to be discussed:
a) (minimum) area of the radiation fieldb) maximum intensity in the considered area
a) to be associated with the organ size. Areas as about 100 cm2 have to be taken into account, rangingfrom a less than a few cm2 for the thyroid and some 100 cm2 as for the lung.
Further it must be taken into account that a human body does not remain in a defined fixed positionduring work. Therefore it might be justified to consider the area even larger than the physical organsize as reference area. It seems therefore appropriate to adopt for a first approach an area of 100 cm2
for the radiation field.
b) to be associated with tissue weighting factors
Since the weighting factors range from 0,2 to 0,025 ( skin and bone surface can be excluded in thisconsideration), the exclusive exposure of single organs might lead to a limit higher than a factor of5 ( gonads ) to 40 ( remainder) compared with the numerical value of the effective dose.
This might apply provided that the detector reports a arithmetic mean over the area.
MEASURING APPROACH
The response of dose rate meters designed for radiation protection purposes is specified for operation inconditions that the fluence rate is the same at any position of the detector volume. Calibration is carriedout in these conditions. In the present case, however, the response of detectors have to be checked inconditions that the radiation field is smaller than the exposed area of the detector. This was done for
PORTOROŽ 95 432

SESSION VI PROCEEDINGS
different fractions of the active area of the detectors (5-100 %) by /Sp94 /. No significant departure of thereading was found in relation to the reading under regular conditions for three different detector types(scintillation detector, proportional counter and ionisation-chamber). Own preliminary investigations witha ionisation-chamber show similar results.
CONCLUSIONS
It can be concluded that small radiation fields (smaller than the active area of the detector, but of unknowndimensions), when unavoidable, do not require particular attention when the measured figure assessed witha detector of about 100 cm2 is in compliance with derived limits of effective dose. An inhomogeneity ofabout 10 in terms of dose rate within the area provides that an average single organ is not exposed abovethe limit for the organ dose, provided that only one organ is exposed.
Another factor of ten might be considered as to be acceptable for beams with a very small but known crosssection. This can be justified by taking into account that radiation protection standards have to proveprotection of persons, who are moving during work and not of a lifeless area. A moving person is unable,even under very pessimistic assumptions, to become exposed exactly the same area of the body duringwork.
The detectors have to be checked for their response to inhomogeneous radiation fields.
REFERENCES
/De 94/ J.A.Dennis, R.V.Griffith: Rad.Prot.Dos. 54 (1994)373./Le 93/ A.Leitner, M,Tschurlovits: Proc. Au-Hu-It Radiation Protection Symp. ObergurgI (1993), Vol III p.386./SP94/ H.Spreizer, E.Plantosar: private communication (1994)./IC 93/ ICRU Report 51: Quantities and Units in Radiation Protection Dosimetry (1993)./IC 91 / 1990 ICRP Publication 60: Recommendations of the ICRP./IA 94/ FAO-IAEA-ILO-OECD-PAHO-WHO: IAEA Safety Series 115-1: International Basic safety Standards for
Protection against Ionizing Radiation and the Safety of Radiation Sources (1994).
PORTOROŽ 95 433

iiiiniiiiniiiiiiini p ™ o s
XA05C0111
NEW ORGANIZATIONAL FRAMEWORK OF THE RADIATION PROTECTION
IN THE CZECH REPUBLIC
V. Klener
National Radiation Protection Institute, Šrobárova 48, CZ-100 00 Prague, Czech Republic
RADIATION PROTECTION IN THE CZECH REPUBLIC - HISTORICAL REMARKS
The first administrative acts concerning Radiation Protection were issued on the territory of today's CzechRepublic already in the times when it was part of the then Austro-Hungarian Empire. They delt with theregulation of the medical application of radon waters and radioactive mud used in spaas. Between theWorld War I and the World War II the activities related to Radiation Protection covered only someparticular facets of the challenge. Two outstanding personalities contributing to the progress in this fieldare worth mentioning. Prof. Teisinger, founder of occupational medicine in Czechoslovakia with highreputation also in the then Yougoslavia, started to follow-up the health status in radiation workers andstrongly supported the idea of personnel monitoring. Prof. František Běhounek - physicist and well knownparticipant of the general Nobile's expedition to the North Pole - performed investigations in dosimetricmethods and started to study the radon problems in uranium mines.
A systematic approach to Radiation Protection has been adopted from the early nineteen-fifties. In 1956the Department of Radiation Hygiene was established within the Institute of Industrial Hygiene andOccupational Diseases, headed by Prof. Teisinger. The staff of this Department increased during years from30 to almost a hundred, and finally, in 1965 an autonomous Research Institute of Radiation Hygiene wascreated.
New tasks related to Radiation Protection arose also at the regional level and not all of them could behandled from this central establishment. Following the model of the Soviet Hygiene Service theCzechoslovak Ministry of Public Health set up in 1957 a network of Stations of Hygiene and Epidemiologyin the country. At the level of Regions - the higher level of administrative areas that time - the groups forRadiation Protection were formed to conduct the daily work at workplaces and in their environment.
Special tasks were connected with the supervision of Health Authorities in many plants of UraniumIndustry, especially at the time when all these activities were considered top secret. For this purpose theInstitute of Occupational Hygiene in Uranium Industry was established in 1960.
From all what was said is apparent, that Radiation Protection in the Czech Republic was from the verybeginning managed by the Health Authorities and this continued till 1989 when the political situationchanged. The existing system of Hygiene Service was exposed to a severe criticism, lost the confidence ofthe public and entered the process of principal transformation.
MOTIVATIONS AND REASONS FOR ORGANIZATIONAL TRANSFORMATION
The position of Radiation Protection within the future organization of Public Health was discussed andalternative models for its appropriate management and structure were looked for abroad. One option wasto follow the German example, i.e. to consider Radiation Protection as part of the environmental affairs andestablish for both fields one Competent Authority. For this solution there was not found enough politicalwill. Another option which seemed more consistent and suitable for our conditions was to adopt the Finnishmodel, where the joined agenda of Nuclear Safety and Radiation Protection is entrusted to the FinnishCentre for Radiation and Nuclear Safety. This solution found reasonable support and was explored in moredetail.
The final decision was made in April 1995, when the Czech Parliament adopted the Act No. 85 whichassigned Radiation Protection to be within the competence of the State Office of Nuclear Safety. One cantry now retrospectively to identify the motivations and reasons leading to this development.
PORTOROŽ 95 434
SESSION VI . PROCEEDINGS
One important point was the increasing feeling of the professionals working in Radiation Protection, thatthe Ministry of Health was loosing, during the last years, interest in this branch of hygiene and was notwilling to continue to cover the costs indispensable for operation of an effective system of RadiationProtection. Such attitude of the Health Authorities was to some extent understandable in the times, whenpolitical pressure was focused on availability of basic medical care and on its budget.
Another problem was related to the changing professional profile of radiation protectionists. Formerly inthe Czech Republic medical doctors formed a considerable proportion of the staff of radiation protectiongroups. Nowadays the implementation of new sophisticated systems of radiation monitoring and extensiveapplication of computer technology and electronic communication channels require involvement ofprofessionals of different profiles. The experience showed, that physicists are more open to absorb basicbiophysical knowledge and to become familiar with Radiation Protection philosophy and principles thanthe medical people are willing to enter more deeply in dosimetry and electronics.
Some concepts of new Basic Safety Standards adopted by international community in 1994 (InterimEdition) played also a certain stimulating role in our considerations. The idea to harmonize both the controlof sources and the tasks of Radiation Protection and to consider these aspects more or less jointly couldperhaps easier be fulfilled in new united Competent Authority.
This transformation was also a political issue and had to be approved by the Parliament. The time foradopting the new Act was favorable indeed because the Czech coalition government supports thefinalization of a the new NPP in Temelin (South Bohemia) and there appears a tendency among themembers of the Parliament to have both the supervisory boards under one umbrella.
PRESENT ORGANIZATION OF RADIATION PROTECTION AND NUCLEAR SAFETY IN THECZECH REPUBLIC
The State Office of Nuclear Safety (SONS) has been reorganized. The staff of SONS increased afterincluding some top experts from Radiation Protection. The Division of Radiation Protection has been setup headed by the Deputy Chairman of SONS and divided into three sections: sources in medicine andindustry, natural sources and radiation protection in nuclear plants. Emergency preparedness is dealt within an autonomous unit, which reports directly to the Chairman of SONS.
The expertise and technical support for the tasks of this executive body is provided by the NationalRadiation Protection Institute in Prague newly founded on the basis of the former Centre of RadiationHygiene of the National Institute of Public Health. Supervisory tasks in the field are carried out by theRegional Centres of SONS. Their executive officers belong to the staff of SONS, while the supportinglaboratories in the regions are the parts of the National Radiation Protection Institute.
PORTOROŽ 95 435

SESSION VI PROCEEDINGS
XA05C0112
THE LABORATORY-TYPE DATA INPUT AND PROCESSING SUBSYSTEM OFTHE COUNTRY-WIDE ENVIRONMENTAL RADIATION MONITORING
SYSTEM IN HUNGARY
B. Kanyár", N. Fú'ló'p2), N. Glavatszkih2), Á. Németh2)
0 University of Veszprém, Department of Radiochemistry, Veszprém, Hungary2) National Research Institute for Radiobiology and Radiohygiene, Budapest, Hungary
INTRODUCTION
The countrywide radiation monitoring activity in Hungary is shared among the national networks asagriculture, environmental protection and public health ones. They are mostly involved in theenvironmental sampling and laboratory type determinations of the radioactive pollution, meanwhile theorganisations mainly from the Army and Civil Defence are responsible to the early warning system [1]. Amoderately effective collaboration is established only around the Nuclear Power Plant Paks. Based on morethan 10 years experience in collaboration around the NPP the Hungarian Atomic Energy Commissioninitiated some centralism in the countrywide monitoring activity as well. As the first step the NationalResearch Institute for Radiobiology and Radiohygiene has been charged to establish an Information Centerfor laboratory-type data collection, processing, analysis and informing regurarly the proper organizationson the results. The Information Centre is equipped with a computer type of SUN SPARCserver-20 and thelaboratories are planned to be linked on line by PC stations [2]. The main user programs for datacollection, control and restricted processing are written in INGRES data manager software. The semi-processed results can be transformed in a readable form for general statistical etc. packages.
FUNCTIONS OF THE USER SOFTWARE LAARFE (acronym from the Hungarian meaning oflaboratory type data collection and processing)
Fig. I: The main menu of the program for data input, processing and database service.
PORTOROŽ 95 436

SESSION VI PROCEEDINGS
The main menu of the software written in INGRES is given in Fig. 1. There are five different keys for datainput depending on the type of environmental data. Namely the Environmental sample (excluded riverrelated one), the River sample, the Dose determination, the Release from nuclear installation and the Whole-body determinations need different data sheets fór input and they all have different file structures. Thesame variation is used for selection data records. Even the selected data might be transformed to a form forinput to other software packages. We had introduced some procedures, mainly for verifying the reliabilityof data, as main statistics (mean value, standard deviations, ranges etc.), time-series drafting, scatter plot(included linear regression) and a map presentation only for the county detailes in Hungary. „Env.Options"means the service of the thesaurus, redefine values, parameters like for detecting of the outliers moresensitive.
S GREEN FOR DATA INPUT
tongít;j19-10 [ - , \ x Height ; 1 2 - 0 , [»* Ó
&Kf «tete oí sampJfng:
month. 3J dajfíR^l h<Hír:i14.01
OSS3LEVAER
r
Á
f?A0fOLOC!CAt DATA
3 ® I -' >* ,OV\^. ^ ' , > > •
Vaiue 1.90e-003 Bq/kg (sz)
0SS3LEVAER1
Fig. 2: The screen for data input in case of environmental sample.
The Fig. 2. shows the sheet for data input in case of environmental samples. The data are devided into twomain parts namely into a sampling one and a nuclear (or radiological) one. The two parts belong to twodifferent structured files because to one sample could be attached more than one nuclear determinations(gross beta, Sr-90, spectrometric etc). The linking between the proper records is solved by automaticcopying of the first data row in the sheet - as a sampling identification information - to the nuclear part too.The first data (No.) is mainly a serial number of the sample with maximum 5 characters. The abbreviation„M.syst" marks the different monitoring networks (agricultural, public health, local nuclear institute etc.).The code of sample means aerosol, gas, soil, hay, apple, bread, pork, milk etc. in 11 main groups. The typegives information on whether the sample is an individual one or a mixed one from more places and moredates. The sampling place is given by the geographycal coordinates and the name of settlement could beadded. The „place character" means some specialities eg. in case of food samples whether they areproducted ones or bought from shops.
PORTOROŽ 95 437

SESSION VI PROCEEDINGS
The nuclear determination can be provided by another lab as was the sampling one. Therefore the code oflab etc. are to be given in the nuclear part of the sheet. The time delay means the duration from the endingof sampling. Preparatin refers to drying, extraction etc.
Similar sheets are in function for river samples (only by different coding of the sampling place), for theradioactive releases, for dose measurements and for whole body counting. In the last cases the numbers ofdata to be typed in are less than for the given example.
By clicking to the quatation mark followed by the data space a thesaurus can be listed to choose the properitem. The ikons are used mostly for processing the screen.
DATA PROCESSING AND OUTPUT
File' r AM t
^ r -
AtiiiGV í
a *»stsn ha * ŕ<5S-l-ť* 1-ťí 1 j f
' O i - Ô l j j
o'-íft htttftť. I O . O O Í M OOO
ťťakpfc. .•oUťiilelňr.-jl.
i -»loví!'»!, 'i síín " , *jÍ ľ-er kr '^.••i|iľ-si
Fig. 3: An example of the output.
The main function is the selection of the data according to the grouping defined by the user. Selections canbe provided both for the sampling and radiological types of data. The output results refer to the filesproduced from the selection procedure.
Fig. 3. presents an example (with not realistic data and not translated from Hungarian) on the geographycaldistribution of the radioactive pollution. The simple software can draw the selected data only in a lessdetailed map, as averaged values to the the different Hungarian counties. The basic statistic outputs theresults in a table form, the time series and regression provide plots.
REFERENCES
1. J. Gáspár, J. Hulej: The Nuclear Monitoring System of Hungarian Army. In: Proc. Austrian-Italian-Hungarian Rad. Prot.Symp., Obergurgl/Au., 28-30. April, 1993, pp 253-256.
2. B. Kanyár, M. Ivó, S. Tarjän and L.B. Sztanyik: informational System of Environmental Radiation MonitoringNetworks in Hungary. In: Proc. of a Workshop on Harmonization of East-West Radioactive Pollutant Measurements,Standardisation (ed. B.R. Orton, UK), 28"1 Aug. - 2nlJ Sept., Budapest, pp 232-234.
PORTOROŽ 95 438

SESSION VI PROCEEDINGS
XA05Oni13
AN OUTLOOK TO RADIATION PROTECTION DEVELOPMENT
R. Martinčič ! ), P. Strohal 2 )
: ) Jožef Stefan Institute, Jamova 39, Ljubljana, Slovenia2) Zagreb, Croatia
INTRODUCTION
Radiation protection is a term applied to concepts, requirements, technologies and operations related toprotection of people against health effects of ionizing radiation. A scope of radiation protection is shownin Figure 1 [1].
••:'•] SpaceFlight.J:;::;::
Fig. 1: Scope of Radiation Protection [1].
Radiation protection and safety have developed over many decades as the effects of ionizing radiation havebeen better and better understood. Some events in the last decade had essential impact on radiationprotection policy/philosophy and related safety standards. Among them are available data of some longterm radio-epidemiological studies of populations exposed to radiation. Investigations of the survivors ofthe atomic bombing of Hiroshima and Nagasaki illustrated that exposure to radiation has also a potentialfor the delayed induction of malignancies. They also showed that irradiation of pregnant women may resultwith certain mental damage in foetus. Several big radiation accidents which appeared in the last decade alsohad an impact on developments in radiation protection philosophy and practices. A well known Chernobylaccident showed that limited knowledge was available at the time of the accident on transfer ofradionuclides in a specific environment, radioecological effects and pathways of highly radioactiveatmospheric precipitation generated during the accident on various components of the environment. Newscientific data indicated also that in some parts of human environment there are measurable effects ofchronic exposure resulting from natural radiation. UNSCEAR is periodically publishing the most valuableset of data as compilation, and disseminates information on the health effects of radiation and on levels ofradiation exposure due to different sources. These data are also the best guidelines for the necessaryimprovements and updating of radiation protection practices and philosophies. The latest ICRP-60publication [2] and recently issued International Basic Safety Standards for Protection Against Ionizing
PORTOROŽ 95 439

SESSION VI PROCEEDINGS
Radiation and for the Safety of Radiation Sources [3] are reflecting many of the above mentioned findings.
On the other hand the use of radiation sources is increasing day by day, and many new facilities applyingradiation in radiotherapy, radiodiagnostic, nuclear medicine, industry, agriculture and hydrology wereestablished. This, of course, increases the number of people involved in radiation practices and requiresadditional attention to regulators. To illustrate the diversity and magnitude of some applications of radiationsources, an estimated overview is presented in Table 1. The authors would like to draw attention to figuresindicating estimated number of applications to patients. Studying these estimated figures and taking intoaccount collective dose received by patients worldwide, one can easily argue why additional efforts areneeded to improve radiation protection of this significant group of population.
RADIATION PROTECTION AS A MODEL HOW TO DEAL WITH HAZARDS
Mankind is exposed to various hazards and radiation being just one of them. The effects of radiation werealways of big concern, not only for scientists but also for the general public. Very strong criticism andcontinuous impact of the public on some facilities based on ionizing radiation contributed - among othertechnical and scientific anxieties - to a systematic approach in establishing safety standards and practicesbased on these standards. Good and reliable measures and practices for radiation protection were developedbased on a large number of extensive systematic investigations. A reasonably good infrastructure forradiation protection was established worldwide. Based on this good and effective practice for radiationprotection, similar activities have started for other types of hazards (toxic chemicals, heat, noise, etc.). Fromthis fact one may conclude that the approach applied to radiation hazards was evaluated positively and thatthere is a strong tendency to adapt it to other hazards. On the other hand this trend shows positive impactof the general public. Radiation hazards present a small part of all hazards to which the mankind is exposedthese days. Radiation protection having a leading role in creating a strategy how to minimize hazards andregulate practices where various hazards are involved, also demonstrated that radiation hazards present justa small fraction of all hazards to which we are exposed. Therefore, a future trend in radiation protectioncould be expected to include comparison of these hazards with others and evaluation of all of them jointly.This also implies that one may expect further efforts in systematic improvement of our knowledge on thefate of radionuclides in the environment, effects of radiation to living organisms and future generationsas well as the synergetic effects of various hazards. By applying the approach, tested in radiation protectionto other hazards, a recognition was demonstrated showing that such an approach is acceptable and a reliablemethod in assurance of handling and use of hazardous materials. Therefore we may foresee that furtherinvestigations and improvements will follow keeping the leading role of radiation protection methodologyamong hazardous materials.
RADIO-EPIDEMIOLOGICAL STUDIES
The area of radiation protection which requires more investigations is radio-epidemiology. The Chernobylaccident showed that our knowledge on chronic exposures resulting from contamination from accidents,past practices or inadequate discharges/deposition of radioactive materials is rather scarce. Therefore wemay foresee radio-epidemiological investigations not only in the Chernobyl affected areas, but also in otherlargely contaminated or potentially contaminated areas such as Kyrgyzstan area, Northsea, Sea of Japan,areas around underground nuclear weapon testing sites, abandoned military weapon sites, some inadequateradioactive waste depositary sites, etc. To these examples should be added accidentally contaminated areas(e.g. Goiania) and those where exists chronic exposure resulting form natural radiation. As indicated bymany professionals, the results of the many radio-epidemiological studies conducted throughout the worldon groups of workers and members of the public are affected by significant uncertainties and practicaldifficulties such as accounting for confounding factors and need for sufficient follow-up. It is therefore ouropinion that radio-epidemiological studies will be one of the key activities in radiation protection in theforthcoming period. They are also expected to shad more light on some other aspects of radiation protectionwhere increased knowledge and data are needed, such as the non-threshold and linear dose-effectrelationship.
INTEGRATED APPROACH TO RADIOLOGICAL RISK
The new International Basic Safety Standards for Radiation Protection [3] based on ICRP-60
PORTOROŽ 95 440

SESSION VI PROCEEDINGS
recommendations [2] indicated the need for anintegrated approach to radiological risk. Thismeans that not only protection againstexposures, which has likely been the case inthe past, will be applied but also potentialexposures. Consequently this means that futuredevelopments in radiation protection willinclude tasks regarding developing practicalmethodologies for the assessment andregulation of situations where there is apotential for exposure. A potential exposure isunderstood as an exposure that is not expectedto be delivered with certainty, but which canresult form an accident at a source or due to anevent or sequence of events of a probablenature, including equipment failures andoperating errors.
However, there could be some difficulties inapplication of this radiological riskmanagement concept and investigations willindicate how it can be applied. Probabiliticsafety assessment (PSA) methodology which isapplied in nuclear power industry can possiblybe employed to identify, quantify and managethe risk.
MEDICAL EXPOSURES
As it can be seen from Table 1 there is a wideuse of ionizing radiation in various medicalpractices. Millions of patients undergo annuallyX-Ray diagnostic investigations and/orradiotherapy treatment. Therefore the newbasic safety standards pay due attention tooptimize these applications avoiding unnecessary irradiations. Therefore the application of these newstandards require improvement of operational radiation protection. Much more efforts will be needed toassure that in all radio-therapy units, calculation of individual doses for patients undergoing radiotherapytreatment will be done, that (when necessary) shielding of other parts of the patient body will be managed,and that an adequate dosimetry regarding the (distribution of) absorbed dose is assured. According to thedata available at present in a large number of countries, these requirement are not yet included into theregular radiotherapy procedure. Being aware of this, one may assume, that a lot of effort will be needed toprovide an adequate radiation protection training to both medical and paramedical staff involved inradiotherapy practices.
MODELLING OF ENVIRONMENTAL TRANSPORT OF RADIONUCLIDES
The Chernobyl accident showed how important is to elaborate environmental models for transport ofradionuclides in a local and/or regional environment. In the absence of such models environmentalemergency actions were delayed and in most cases were not adequate. On the other hand the Chernobylaccident provided in its later stage an opportunity to test and validate some of models prepared elsewherefor other local environments. Generally, it was demonstrated that there are limitations of knowledge,especially regarding the impact of radiological processes and local environmental characteristics on the fateof radiocontaminants as well as on the long-term contamination of the local environment.
It seems that in the years to come modelling will be focused to the following two aspects: (i) validitationof models elaborated to cover the most general needs of day-to-day radiation protection of the public, and
llfflililIlliÖilS;: : " ^ ; . - > • . . « • < , • : : . m :-.<• , . : : - . . . : : :
ÄÖÖe;W)3!i
HlöSoiS
í.i;:20é+04:i;
SM+Ö3;;;
Ü)6c+Ü<V;
1 Number
1.21)0+1)9
.*.5C)e+08
3.00e+07
6.(K)ŕ+0f)
fPq weŕ^aci:pŕs:|:;p(pl | ! f V *: H • í : •: 1 -. .'L.: - ;i
l&és^&č^Réactors ľ^níi/Mj Lü ;Q;;Ti; • •'
^^eUtŕOT:Ge^ŕators;;;:£;;:; Í-}ÍM::A\- ; '.'••- - •.
i ílarge iGahima; Iiíääiätbrs W\ i: i :~l rf: T'1"'
• É i e c t r b n B e ä m A c c e l e r a t o r s :• '.*•..li• '"::•': •
"/Äcčél^rätOŕs ;in jhdusťriäl Applications
Industrial R^iothéŕäpý Devices^ O ť
•Orä^ný&räpýJou^ •;
•vThéÍetherápýi;ÍĎe.Viceš;:::4:íí; fi-h:tó"-- í J í • -:•
X-Ray Machine* :
Applications '•
X-Ray Controls Annually )
Dental X-Ray Controls Annually j
Nuclear Medicine Applications Ann. j
Radiotherapy Treatments Annuity
Table 1: Diversity and Magnitute (approximately)of Nuclear Applications Worldwide.
PORTOR0Ž 95 441

SESSION VI PROCEEDINGS
(ii) elaboration and validation of new models taking care of possible nuclear and radiocontaminationaccidents including the residues of military nuclear activities. In any case these activities will requireresearch to collect more data from local environment.
OTHERS
These are some most evidently radiation protection required activities in the future. There are many moreof them, which will also shape the trend of radiation protection practices. Among them are radiationprotection aspects of waste storage and deposition, decommissioning and dismantling of nuclear reactors,nuclear fuel cycle and nuclear military installations.
Research activities on a number of tasks will continue. The risk of radiation effects on the developing brainof the embryo/foetus is not yet completely known and some questions regarding mental retardation requireadditional investigation. Also more data are needed regarding the effects of radiation in some localenvironments. It is expected that new types of instruments will be made available for thedetection/measurement of radiation, primarily those which may allow in-situ prompt measurements ofvarious pollutants. Etc.
CONCLUSION
In conclusion we may stress that there is an evidence that radiation protection is entering new tasks andidentifying new priorities. However, even so, we have to be aware that there is still a large number of thedeveloping states having not satisfactory radiation protection infrastructure, which is a precondition forgood radiation protection management. Therefore, for many countries, radiation protection activities willcontinue to be focused on strengthening vital components of infrastructure such as regulation, licensing,inspection and man-power development.
REFERENCES
1. Radialion Protection Today and Tomorrow, Nuclear Energy Agency, OECD 1994.2. 1990 Recommendations of the International Commission on Radiological Protection, ICRP Publication 60, Annals
of the ICRP, Volume 21 No 1-3, Pergamon Press, First edition 1991.3. International Basic Safety Standards for Protection against Ionizing Radiation and for teh Safety of Radiation Sources,
Safety Series No 115-1, IAEA, Vienna, 1994.
PORTOROŽ 95 442

LIST OF PARTICIPANTS
AUTHOR INDEX


LLST OF PARTICIPANTS
AIGINGER Hannes
BALASHAZY Imre
BERGMANN Ralph
DUFTSCHMID Klaus E.
GASTBERGER Michael
GREIFENEDER Gabriele
GUPPER Hans Georg
AtominstitutÖsterreichischen UniversitätenSchuettel str. 115A-1020 ViennaAUSTRIA
Institute of Physics and BiophysicsUniversity of SalzburgHellbrunner Str. 34A-5O2O SalzburgAUSTRIA
Institute of Physics and BiophysicsUniversity of SalzburgHellbrunner Str. 34A-5020 SalzburgAUSTRIA
Department of Radiation ProtectionAustrian Research Centre SeibersdorfA-2444 SeibersdorfAUSTRIA
Institute of Physics and BiophysicsUniversity of SalzburgHellbrunner Str. 34A-5020 SalzburgAUSTRIA
Atominstitute of Austrian UniversitiesSchiittelstr. 115A-1020 ViennaAUSTRIA
Amt der Kärntner LandesregierungAbteilung 14A-9020 KlagenfurtAUSTRIA
AUSTRIA
Tel.:Fax-e-mail:
Tel.:Fax::e-mail:
Tel.:Fax::e-mail:
Tel.: +43 2254 780 2500Fax:: +43 2254 74060e-mail: [email protected]
Tel.: +43 662 8044 5718Fax:: +43 662 8044 5704e-mail:
Tel.: +43 1 72701 278 (H. Aiginger)Fax: +43 1 7289 220e-mail:
Tel.: +43 463 538 2298Fax::e-mail:
HEFNER Alfred
HEISTRACHER Thomas
HELLER Josef
HOFMANN Werner
HUBER Erich
Hauptabteilung Strahlenschutz,Österreichisches Forschungszentrum SeibersdorfA-2444 SeibersdorfAUSTRIA
Institute of Physics and BiophysicsUniversity of SalzburgHellbrunner Str. 34A-5020 SalzburgAUSTRIA
BERTHOLDAmeisgasse 49A-l 140 ViennaAUSTRIA
Institute of Physics and BiophysicsUniversity of SalzburgHellbrunner Str. 34A-5020 SalzburgAUSTRIA
BMAUSFreestennes 9A-l 140 ViennaAUSTRIA
Tel.: +43 2254 780 2500Fax: +43 2254 74060e-mail:
Tel.:Fax:e-mail:
Tel.: +43 222 914 2251Fax: +43 222 914 225185e-mail:
Tel.:Fax:e-mail:
Tel.:Fax:e-mail:
PORTOROŽ 95 445

LIST OF PARTICIPANTS PROCEEDINGS
JACHS Petra
KECK Gertrude
KERSCHBAUMEK Stefan
LETTNER Herbert
LOVRANICH Ernst
MOHAMED Amer
NISHIWAKI Yasushi
NOLL Margit
OWCZAREK Krzysztof
PAUSCH Gerhard Richard
PICHL Elke
RABITSCH Herbert
RIEDLMAYER Leo
ROLLE Rainer
Bundesforschungs-und Prüfzentrum ArsenalArsenal 08J.214A-1030 ViennaAUSTRIA
Institut für Med. Physik derVeterinärmedizinischen UniversitätLinke Bahngasse 11A-1030 ViennaAUSTRIA
Austrian Research Centre SeibersdorfA-2444 SeibersdorfAUSTRIA
Institute of Physics and BiophysicsHellbrunnerstr. 34A-5020 SalzburgAUSTRIA
Department for Radiation ProtectionAustrian Research Centre SeibersdorfA-2444 SeibersdorfAUSTRIA
Institute of Physics and BiophysicsUniversity of Salzburg
Tel.:Fax:e-mail:
+43 2 79747 517
Tel.: +43 171155 460Fax: +43 1 7149103e-mail:
Tel.:Fax:e-mail:
Tel.: +43 662 8044 5702Fax: +43 662 8044 5704e-mail: [email protected]
Tel.: +43 2254 780 2505Fax: +43 2254 74060e-mail: [email protected]
Hellbrunnerstr. 34A-5020 SalzburgAUSTRIA
Institut für Medizinische Physik, Univesität WienPrivate address:Jagdschlossgasse 91A-l 130 ViennaAUSTRIA
Institute of Space DosimetryDöblinger Hauptstr. 7A-l 190 ViennaAUSTRIA
Gruener Weg 2A-2432 SchwadorfAUSTRIA
Institute of Physics and BiophysicsUniversity of SalzburgHeJlbrunner Str. 34A-5020 SalzburgAUSTRIA
Technical University Graz
AUSTRIA
Technical University GrazPetersgasse 16A-8010 GrazAUSTRIA
Austrian Research Centre SeibersdorfA-2444 SeibersdorfAUSTRIA
Institut für Physik und BiophysikUniversität SalzburgHellbrunnerstr. 34A-5020 SalzburgAUSTRIA
Tel.: +43 662 8044 5720Fax: +43 662 8044 5704e-mail:
Tel.: +43 1 876 4259Fax: +43 1 876 4259e-mail:
Tel.: +43 13187132 77Fax:e-mail: [email protected].
Tel.:Fax:e-mail:
Tel.: +43 662 8044 5718Fax: +43 662 8044 5704e-mail:
Tel.:Fax:e-mail:
Tel.:Fax:e-mail:
Tel.:Fax:e-mail:
Tel.: +43 662 8044 5709Fax: +43 662 8044 5704e-mail:
PORTOROŽ 95 446

LIST OF PARTICIPANTS PROCEEDINGS
RUSSOLD Hubert
SAIDLER Christian
SCHMITZER Christian
SCHOENER Wolfgang
STADTMANN Hannes
STEGER Ferdinand
TSCHURLOVTTS Manfred
UNFRIED Ernst
VANA Norbert
WINKLER Renate
Technical University GrazPetersgasse 16A-8046 GrazAUSTRIA
Berthold-Anaty. Instrumente Vem. GmbHAmeisgasse 49-511030 ViennaAUSTRIA
Austrian Research Centre SeibersdorfRadiation ProtectionA-2444 SeibersdorfAUSTRIA
Atominstitut Österreichischen UniversitätenSchüttelstreet 115A-1020 ViennaAUSTRIA
Austrian Research Centre SeibersdorfA-2444 SeibersdorfAUSTRIA
Austrian Research Centre SeibersdorfDepartment for Radiation ProtectionA-2444 SeibersdorfAUSTRIA
Atominstitut Österreichischen UniversitätenSchüttelstr. 115A-1020 ViennaAUSTRIA
Tel.:Fax:e-mail:
Tel.:Fax:e-mail:
Tel.: +43 2254 780 2500Fax: +43 2254 74060e-mail: [email protected]
Tel.: +43 1 72701 293Fax:e-mail: [email protected]
Tel.: +43 2254 780 2506Fax: +43 2254 74060e-mail: [email protected]
Tel.: +43 2254 780 2506Fax: +43 2254 74060e-mail: [email protected]
Tel.: +43 1 72701 282Fax: +43 1 72 89 220e-mail: [email protected]
Atominstitut de OE. UniversitySchuettel str. 115A-1020 ViennaAUSTRIA
Atominstitut Österreichischen UniversitätenSchüttelstreet 115A-1020 ViennaAUSTRIA
Institute of Physics and BiophysicsUniversity of SalzburgHellbrunnerstr. 34A-5020 SalzburgAUSTRIA
Tel.:Fax:e-mail:
Tel.:Fax:e-mail:
Tel.:Fax:e-mail:
+43 1 727 01 275
+43 1 72701 277+43 1 [email protected]
+43 662 8044 5718+43 662 8044 5704
BELGIUM
MEESEN Geert
OBERSTEDT Stephan
I.N.W. Nuclear Physics LaboratoryUniversity GentProeftuinstr. 86B-9000 GentBELGIUM
SCK.CENBoeretang 200B-2400 MolBELGIUM
Tel.: +32 9 264 65 40Fax: +32 9 264 66 99e-mail: [email protected]
Tel.: +32 14 332814Fax: +32 14 321056e-mail: [email protected]
CROATIA
BARIŠIČ Delko Ruder Boskovic InstituteBijenička 54, P.O.Box 1016HR-10000 ZagrebCROATIA
Tel.: +385 1 4561 067Fax: +385 1 425 747e-mail:
PORTOROŽ 95 447

LIST OF PARTICIPANTS PROCEEDINGS
BRUMEN Vlatka
FRANIČ Zdenko
GRAHEK Željko
LOKOBAUER Nevenka
LULIČ Stipe
PRLIČ Ivica
RANOGAJEC-KOMOR Mária
VEKIČ Branko
Institut za medicínska istraživanja1 medicínu radaKsaverska c. 2, P.O.Box 291HR-10000 ZagrebCROATIA
Institute for Medical Research and Occupational Health2 Ksaverska street, P.O.Box 291HR-10000 ZagrebCROATIA
Ruder Boskovic InstituteBijenicka 54, P.O.Box 1016HR-10000 ZagrebCROATIA
Institute for Medical Research and Occupational HealthKsaverska c. 2, P.O.Box 291HR-10000 ZagrebCROATIA
Ruder Boskovic InstituteCenter for Marine ResearchBijenicka 54, P.O.Box 1016HR-10000 ZagrebCROATIA
Lab for Radiation Protection and DosimetryKsaver 2HR-10000 ZagrebCROATIA
Ruder Boskovic InstituteBijenicka 54, P.O.Box 1016HR-10000 ZagrebCROATIA
Ruder Boskovic InstituteBijenicka 54, P.O.Box 1016HR-10000 ZagrebCROATIA
Tel.: +385 1 434188Fax: +385 1 274572e-mail:
Tel.: +385 1 434 188Fax: +385 1 274 572e-mail: [email protected]
Tel.: +385 1 4561 060Fax: +385 1 425 747e-mail:
Tel.: +385 1 434 188Fax: +385 1 274 572e-mail: [email protected]
Tel.: +385 1 425 747Fax: +385 1 425 747e-mail: [email protected]
Tel.: +385 1434 188Fax: +385 1 274 572e-mail: [email protected]
Tel.: +385 1 4561 156Fax: +385 1 424 794e-mail: [email protected]
Tel.: +385 1 4561 071Fax: +385 I 424794e-mail:
CZECH REPUBLIC
DRÁBOVÁ Dana
FRÖHLICH Ivan
HOBZOVA Lenka
KLENER Vladislav
KROUTILÍKOVÁ Daniela
State Office for NuclearSafetySlezská 9C-12029 PrahaCZECH REPUBLIC
RADON v.o.s. corporationZa koncem 1380C-28922 Lysá nad LabemCZECH REPUBLIC
National Institute of Radiation Protection PragueNa CihlářceC-l 5000 PragueCZECH REPUBLIC
National Radiation Protection InstituteŠrobárova 48C-10000 Praha 10CZECH REPUBLIC
National Institute of Radiation ProtectionŠrobárova 48C-10000 PrahaCZECH REPUBLIC
Tel.: +42 2 24172 458Fax: +42 2 24172 024e-mail:
Tel.: +42 2 829024Fax: +42 2 828259e-mail:
Tel.: +42 2 517 380Fax: +42 2 542 025e-mail:
Tel.: +42 2 67311239Fax: +42 2 67311410e-mail: [email protected]
Tel.: +42 2 67311366Fax: +42 2 67311410e-mail:
PORTOROŽ 95 448

LIST OF PARTICIPANTS PROCEEDINGS
MALÁTOVÁ Irena
MÜLLER Tomas
NEZNAL Martin
PETROVA Karla
PLAČEK Václav
PROUZA Zdeněk
TOMÁŠEK Ladislav
National Radiation Protection InstituteŠrobárova 48C-10000 PrahaCZECH REPUBLIC
National Radiation Protection InstituteŠrobárova 48C-10000 PragueCZECH REPUBLIC
RADON v.o.s. corporationZa koncem 1380C-28922 Lysä nad LabemCZECH REPUBLIC
National Institute of Radiation ProtectionŠrobárova 48C-10000 PragueCZECH REPUBLIC
Department of Radiation ProtectionInstitute of Occupational Hygiene in Uranium IndustryÚstav Hygieny Práce v UranovémPrúnyslu, PŕibramC-262 31 KamennáCZECH REPUBLIC
State Office of Nuclear Safety (SOWS)Slezská 9C-12029 PragueCZECH REPUBLIC
National Radiation Protection InstituteŠrobárova 48C-10000 PragueCZECH REPUBLIC
Tel.: +42 2 67313089Fax: +42 2 67311410e-mail:
Tel.: +42 2 6708 2706Fax: +42 2 67311410e-mail: [email protected]
Tel.: +42 2 828259Fax: +42 2 829024e-mail:
Tel.: +42 2 6731 1366Fax: +42 2 6731 1410e-mail: [email protected]
Tel.: +42 306 21187Fax: +42 306 21187e-mail:
Tel.: +42 2 2417 2736Fax: +42 2 2417 2024e-mail:
Tel.: +42 2 6708 2329Fax: +42 2 6731 1410e-mail: [email protected]
FRANCE
LEMOINE Philippe
PINEAU Jean Frangois
RENIER Sylvie
Electricite de France13-27 Esplanade Charles-de GaulleCEDEX 57F-92060 Paris la DefenseFRANCE
ALGADERN 20, P.O.Box BP 46F-87250 BessinesFRANCE
EDFVNucI. Operát. Div.-Dep. of Safety6, rue Ampere-B.P. 114F-93203 St. DenisFRANCE
Tel.: +33 I 49020924Fax: +33 1 49020695e-mail:
Tel.: +33 55 605000Fax: +33 55 605059e-mail: [email protected]
Tel.:Fax:e-mail:
GERMANY
DALHEIMER Andreas
DOERFEL Hans
Institut für StrahlenhygieneBundesamt fur StrahlenschutzIngolstädter Landstr. 1D-85764 OberschleißheimGERMANY
Karlsruhe Research CenterP.O.Box 3640D-76021 KarlsruheGERMANY
Tel.: +49 89 31603 143Fax: +49 89 31603 111e-mail: [email protected]
Tel.: +49 7247 822083Fax: +49 7247 822054e-mail:
PORTOROŽ 95 449

LIST OF PARTICIPANTS PROCEEDINGS
FELLINGER Jürgen
FIETZ Jürgen
MAJEWSKI Manfred
PORSTENDÖRFER Justin
SCHMITZ Jürgen
STREIL Thomas
WINKELMANN Ingolf
BICRON Technologies Vertriebs - GmbHViktoria str. 5D-42929 WermelskirchenGERMANY
Research Center Rossendorf Inc.Institute for Safety ResearchP.O. Box 51 01 19D-01314 DresdenGERMANY
BICRON Technologies Vertriebs - GmbHViktoria str. 5D^2929 WermelskirchenGERMANY
Isotope Laboratory for Biological andMedical Research, Göttingen UniversityBurckhardtweg 2D-37077 GöttingenGERMANY
Forschungszentrum KarlsruheP.O.Box 3640D-76021 KarlsruheGERMANY
SARAD GmbHCunnérsdorfer Str. 12D-01705 FreitalGERMANY
Federal Office for Radiation ProtectionWaldowalleell7D-10318 BerlinGERMANY
Tel.: +49 2196 72280Fax: +49 2196 722824e-mail:
Tel.: +49 03515912287Fax: +49 03515913651e-mail:
Tel.: +49 2196 72280Fax: +49 2196 722824e-mail:
Tel.: +49 551398101Fax: +49 551398110e-mail:
Tel.: +49 7247 82 2088Fax: +49 7247 3854e-mail:
Tel.: +49 351658070Fax: +49 351412 4582e-mail:
Tel.: +49 30 50922 401Fax: +49 30 50922 300e-mail:
GREAT BRITAIN
BARNARD David
CATTO CraemeWilliam Irvine
GREAT BRITAIN
GC TechnologyWaidischerstr. 21A-9170FerlachGREAT BRITAIN
Tel.:Fax:e-mail:
Tel.: +44 4227 3278Fax: +44 4227 4012e-mail:
HUNGARY
ANDRÁSI Andor
BALLAY Laszlo
CSIGE Istvan
KFKI Atomic Energy Research InstituteP.O. Box 49H-1525 BudapestHUNGARY
National Research Institute forRadiobiology and RadiohygieneAnna u. 5, P.O.Box 101H-1775 BudapestHUNGARY
Institute of Nuclear ResearchHungarian Academy of SciencesP.O.Box 51H-4001 DebrecenHUNGARY
Tel.: +36 11699 499Fax: +36 1 1552 530e-mail: [email protected]
Tel.:Fax:e-mail:
Tel.: +36 52 417266Fax: +36 52 416181e-mail: [email protected]
PORTOROŽ 95 450

LIST OF PARTICIPANTS PROCEEDINGS
PORTOROŽ 95 451
DAJKÖ Gábor Institute of Nuclear Research of theHungarian Academy of SciencesP.O.Box 51 Tel.: +36 52 417266H-4001 Debrecen Fax: +36 52 416181HUNGARY e-mail:
DEME Sándor KFKI Atomic Energy Research InstituteP.O.Box 49 Tel.: +36 1160 2191H-1525 Budapest Fax: +36 1155 2530HUNGARY e-mail: [email protected]
ERDÉLYI Katalin Microvacuum LTDKerékgyártó u. 10 Tel.: +36 1 252 1991H-l 147 Budapest Fax: +36 1184 3326HUNGARY e-mail:
FEHÉR Ákos Institute of Nuclear Techniques of TUBXI. Műegyetem RKP 9-11 Tel.: +36 1 463 1969H-1521 Budapest Fax: +36 1 463 1954HUNGARY e-mail: [email protected]
FEHÉR István KFKI Atomic Energy Research InstituteKonkoly Thege 29-33 Tel: +36 11696 558H-1525 Budapest Fax: +36 11696 567HUNGARY e-mail:
HAKL Jozef Institute of Nuclear ResearchHungarian Academy of SciencesBemterl8/C, P.O.Box 51 Tel.: +36 52 417266H-4001 Debrecen Fax: +36 52 416181HUNGARY e-mail: [email protected]
KANYAR Béla Dept. Radiochemistry, University VeszprémEgyetemu.10 Tel.: +3688427681H-8202 Veszprém Fax: +36 88 426 016HUNGARY e-mail: [email protected]
LAKATOS Mihály Institute of Isotopes Co., Ltd.Konkoly Thege M. U. 29-33 Tel.: +36 1 169 7922H-l 121 Budapest Fax: +36 1 169 5087HUNGARY e-mail:
MARX George Department of Atomic Phyisic, Eötvös UniversityPuskin utca 5 Tel.: . +36 1 266 79021088 Budapest Fax: +36 1 266 0206HUNGARY e-mail: [email protected]
NEMES László Institute of Nuclear Techniques of TUBXI. Műegyetem RKP 9-11 Tel: +36 1 463 1969H-1521 Budapest Fax: +36 1 463 1954HUNGARY e-mail: [email protected]
OSVAY Margit Institute of IsotopesP.O.Box 77 Tel.: +36 1 1699 499H-1525 Budapest Fax: +36 1 156 50 45HUNGARY e-mail:
PELLET Sándor National Research Institute forRadiology and RadiohygieneAnna u. 5, P.O.Box 101 Tel: +36 1 2266 148H-1775 Budapest Fax:HUNGARY e-mail:
SELMECZI David Lavder SchoolTárogató 2-4 Tel.: +3611762735H-1021 Budapest Fax:HUNGARY e-mail:
SZENDROE István Tel:Fax:
HUNGARY e-mail:

LIST OF PARTICIPANTS PROCEEDINGS
IRELAND
HONE Christopher Radiological Protection Institute of Ireland3 Clonskeagh Square, Clonskeagh RoadEI-... Dublin 14IRELAND
Tel: +353 1 2697766Fax: +353 1 2697437e-mail:
PORTOROŽ 95 452
SZERBÍN Pável "Frederic Joliot-Curie" Naü. Inst.for Radiobiol.& Radiohygiene Tel.: +36 1 227 0368H-1775 Budapest Fax: +36 1 226 6531HUNGARY e-mail:
TEMESI Aifreda Tel.:Fax:
HUNGARY e-mail:
UCHRIN György Institute of IsotopesHungarian Academy of SciencesP.O.Box 77 Tel.: +36 1 552 694H-1525 Budapest Fax: +36 156 50 45HUNGARY e-mail:
URBAN János KFKI Atomic Energy Research InstituteP.O. Box 49 Tel: +36 11699 499H-1525 Budapest Fax: +36 11552 530HUNGARY e-mail: [email protected]
VOLENT Gábor Nuclear Environmental Safety DepartmentPaks Nuclear Power PlantP.O.Box 71 Tel: +36 753 17734H-7100Paks Fax: +36 753 12248HUNGARY e-mail:
ZAGYVÁI Péter Institute of Nuclear Techniques of TUBXI. Műegyetem RKP 9-11 Tel: +36 1 463 1567H-1521 Budapest Fax: +36 1 463 1954HUNGARY e-mail: [email protected]
ZOMBORI Péter KFKI Atomic Energy Research InstituteP.O.Box 49 Tel: +36 11699 499H-1525 Budapest Fax: +36 11552 530HUNGARY e-mail: [email protected]
ITALY
BELLI Guiseppe Università di Pavia, Dip. di Fisica Nucleare e TeoricaVia Bassi 6 Tei.: +39 382 507438I- Pavia Fax: +39 382 526938ITALY e-mail: [email protected]
BENCO Argeo University of Milano, A.I.R.P.Via Novellina 42 Tei.: +39 332 4901011-21100 Varese (VA) Fax: +39 332 789413ITALY e-mail:
CAMPI Fabrizio Politecnico di MilanoPonzio 34/3 Tei. : +39 2 2399 63001-20133 Milano Fax: +39 2 2399 6309ITALY e-mail:
CARESANA Marco Politecnico di MilanoVia Ponzio 34/3 Tei.: +39 2 2399 63041-20133 Milano Fax: +39 2 2399 6309ITALY e-mail:
CIPRIANI Elena Tel.:Fax:
ITALY e-mail:

LIST OF PARTICIPANTS , PROCEEDINGS
PORTOROŽ 95 453
CONTE Leopoldo Servizio di Fisica Sanitaria Ospedale di CircoloViale Bordi 57 Tei.: +39 332 278 4591-21100 Varese Fax: +39 332 278 459ITALY e-mail:
D'ALBERTI Francesco Joint Research Centre, Building 51 Tel.: +39 332 78 56561-21020 Ispra (VA) Fax: +39 332 78 9413ITALY e-mail:
D'AMORE Giovanni Servizio di Fisica SanitariaVia Lago San Michele 11 Tei. :I-lOOlSìvrea Fax:ITALY e-mail:
GRANDOLFO Martino National Institute of Health Physics LaboratoryViale Regina Elena, 299 Tei. : +39 6 4456 2661-00161 Roma Fax: +39 6 4462 872ITALY e-mail: [email protected]
GRAZIANI Giovanni Tei.:Fax:
ITALY e-mail:
HORNI Raimondo C.N.R.Via di Pietralata, 190 Tei.:1-00158 Roma Fax:ITALY e-mail:
MARCONI Gabriella Tei.:Fax:
ITALY e-mail:
MASCHERPA Castina Joint Research Centre-EURATOM Tei.-. +39 332 789 141Ispra Fax:ITALY e-mail:
OSIMANI Celso Centrale Nucleare di TrinoStrada Statale 3Ibis Tei.:1,13039 Trino Fax:ITALY e-mail:
PARISI Antonio Italian Radiation Protetcion AssociationVia Urbana 167 Tel.:1-00184 Roma Fax:ITALY e-mail:
RAGNI Pietro C.N.R.Via di Pietralata, 190 Te\.-.1-00158 Roma Fax:ITALY e-mail:
SACCO Donatella ISPESLFontana candidanti Tel.: +39 6 94 1814401-00040 Monteporzio'catone Fax: +39 6 948 1421ITALY e-mail:
SALVADORI Gianfausto Università di Pavia - Dept. Nucl. Theor. Phys.Via Bassi 6 Tel.: +39 382 507 4381-27100 Pavia Fax: +39 382 52 69 38ITALY e-mail: [email protected]
SUSANNA Antonio ANPAV. Brancati 48 Tel. : +39 6 500 728601-00144 Rome Fax: +39 6 500 72856ITALY e-mail:

LIST OF PARTICIPANTS PROCEEDINGS
POLAND
PORTOROŽ 95 454
POLAND
BIERNACKA Małgorzata Central Laboratory for Radiological ProtectionUI. Konwaliowa? Tel.: +48 22 11 00 11 ext.138PL-03194 Warsaw Fax: +48 22 11 16 16POLAND
e-mail: [email protected]ŁUPNIK Stanisław Central Mining Institute
PI. Gwarków 1 Tel.: +48 32 592 380P-40166 Katowice Fax: +48 32 596 533POLAND email:
CHIBOWSKI Stanisław Faculty of ChemistryMaria Curie-Sklodowska UniversityPi. M.C. Skłodowskiej 3 Tel.: +48 81 32811PL-20031 Lublin Fax: +48 81 32811POLAND e-mail:
KOMOSA Andrzej Maria Curie-Sklodowska UniversityFaculty of ChemistryPI. M.C. Skłodowskiej 3 Tel.: +48 81 32811PL-20031 Lublin Fax: +48 81 32811POLAND e-mail:
MAMONT-CIEŚLA Kalina Central Laboratory for Radiological ProtectionUl. Konwaliowa 7 Tel.: +48 22 11 00 11 ext.138PL-03194 Warsaw Fax: +48 22 11 16 16POLAND e-mail: [email protected]
MICHALIK Bogusław Central Mining InstitutePI. Gwarków 1 Tel.: +48 32 592380P-40166 Katowice Fax:POLAND e-mail:
ROMANIA
COZMUTA Ioana University Babeş-Bolyai, Physics DepartmentKogalniceanu No.l Tel.:CIuj-Napoca Fax:ROMANIA e-mail:
CUCULEANU V. National Institute of Meteorology and HydrologyŞos. Bucureşti - Ploieşti 97 Tel.:R-71552 Bucharest Fax:ROMANIA e-mail:
PUSCALAU Mirela-Angela Institute of Atomic PhysicsInstitute for Physics and Nuclear Engineering(EFIN-Lab.7)P.O.Box MG-6 Tel.: +40 1 7807040 1573R-76900 Bucharest-Magurele Fax: +40 13122245ROMANIA e-mail: [email protected]
RAMBOIU Stela Medical Centre and Health Servicesand ManagementStr. Pasteur Nr. 6 C.P. 63 Tel.: +40 64 194252R-3400 Cluj-Napoca Fax: +40 64 193112ROMANIA e-mail:
RISTOIU Delia Universitatea Babes BolyaiStr. M.Kogainiceanu Nr.l Tel.:R-3400 Cluj-Napoca Fax:ROMANIA e-mail:
VAIDA Teodor Faculty of MedicineStr. 1 Decembrie No. 10 Tel.: +40 91 59 11 8813; 2834R-3700 Oradea Fax:ROMANIA e-mail:

LIST OF PARTICIPANTS PROCEEDINGS
SLOVAKIA
ADÁMEK Pavol
AUXTOVA Ludmila
BENO Milan
NIKODÉMOVA Denisa
Radiation Protection DepartmentSpecialized State Institute of Public HealthCesta k nemocnici ISK-97556 Banska'BystricaSLOVAKIA
Environmental Radioactivity SectionSpecialized State Institute of Public HealthCesta k nemocnici 1SK-97556 Banska'BystricaSLOVAKIA
Radiobiology LaboratoryInstitute of Preventive and Clinical MedicineLimbová 14SK-83301 BratislavaSLOVAKIA
Radiation Dosimetry DepartmentInstitute of Preventive and Clinical MedicineLimbová Str. 14SK-833 01 BratislavaSLOVAKIA
Tel.: +42 88 405 713Fax: +42 88 742 501e-mail:
Tel.: +42 88 405 7 HFax: +42 88 742 501e-mail: [email protected]
Tel.: +42 7 373560,373581Fax: +42 7 377 374e-mail: [email protected]
Tel.: +42 7 377 374Fax: +42 7 377 374e-mail:
SLOVENIA
AMBROŽ Sonja
ANČIK Meta
ARH Stanko
BELIČIČ-KOLŠEK Alenka
BILBAN Marjan
BOGOVČIČ Terezija
BRAJNIK Dušan
BREZNIK Borut
Institute of Occupational SafetyBohoriceva 22SI-61000 LjubljanaSLOVENIA
Radiation Protection ServiseI. Stefan InstituteJamova 39, P.O.Box 100SI-61000 LjubljanaSLOVENIA
Slovenian Nuclear Safety AdministrationVojkova 59SI-61000 LjubljanaSLOVENIA
Slovenian Nuclear Safety AdministrationVojkova 59SI-61000 LjubljanaSLOVENIA
Institute of Occupational SafetyBohoriceva 22SI-61000 LjubljanaSLOVENIA
Krško Nuclear Power PlantVrbina 12Sl-68270 KrškoSLOVENIA
J. Stefan InstituteJamova 39, P.O.Box 100SI-61111 LjubljanaSLOVENIA
Krško Nuclear Power PlantVrbina 12SI-68270 KrškoSLOVENIA
Tel: +386 61 1320 253Fax: +386 61312 262e-mail:
Tel.: +386 61 1885 450Fax: +386 61374 919e-mail:
Tel.: +386 61172 1131Fax: +386 61172 1199e-mail: [email protected]
Tel.: +386 61172 1130Fax: +386 61172 1199e-mail:
Tel.: +386 611320 253Fax: +38661312 262e-mail:
Tel.: +386 0608 21621Fax: +386 0608 21528e-mail:
Tel.: +386 61 177 3900Fax: +386 61 219 385e-mail: [email protected]
Tel.: +386 0608 21621Fax: +386 0608 21006e-mail:
PORTOROŽ 95 455

LIST OF PARTICIPANTS
BUBEN Krešimir
BUDNAR Miloš
CEVC Primož
ČADEŽ Zvone
DIALLO Bano
DUJMOVIČ Petra
ERMAN Rudi
FORTUNA Tomaž
GLAVIČ-CINDRO Denis
GRMEK Marko
ILIČ Radomir
JERAN Zvonka
JOVANOVIČ Peter
KOBAL Ivan
Canberra-Packard C.E.Gubčeva 11SI-68270 KrškoSLOVENIA
J. Stefan InstituteJamova 39, P.O.Box 100SI-61111 LjubljanaSLOVENIA
Cetron d.o.o.Zlatek61SI-61000 LjubljanaSLOVENIA
Training Centre for Civil Protection and Disaster ReliefAdministration for Civil Protection and Disaster ReliefMinistry of DefenceSI-61000SLOVENIA
AMESJamova 39SI-61000 LjubljanaSLOVENIA
J. Stefan InstituteJamova 39, P.O.Box 100SI-61111 LjubljanaSLOVENIA
Krško Nuclear Power PlantVrbina 12SI-68270 KrškoSLOVENIA
Institute of Occupational SafetyBohoričeva 22SI-61000 LjubljanaSLOVENIA
J. Stefan InstituteJamova 39, P.O.Box 100SI-61111 LjubljanaSLOVENIA
Zaloška7SI-61000 LjubljanaSLOVENIA
PROCEEDINGS
Tel.:Fax:e-mail:
Tel.: +386 61177 3900Fax: +386 61219 385e-mail: [email protected]
Tel.: +386 61159 0292Fax:e-mail:
Tel.:Fax:e-mail:
Tel.: +386 6I 177 3900Fax: +386 61 157 087e-mail:
Tel.: +386 61 177 3900Fax: +386 61 219 385e-mail: [email protected]
Tel.: +386 0608 2I621Fax: +386 0608 21006e-mail:
Tel.: +386 611320 253Fax: +386 61312 262e-mail:
Tel.: +386 61 177 3900Fax: +386 61219385e-mail: [email protected]
Tel.: +386 61316 855Fax: +386 61132 7272e-mail:
Department of Reactor PhysicsJ. Stefan InstituteJamova 39, P.O.Box 100SI-61111 LjubljanaSLOVENIA
J. Stefan InstituteJamova 39, P.O.Box 100SI-61111 LjubljanaSLOVENIA
Institute of Occupational SafetyBohoričeva 22SI-61000 LjubljanaSLOVENIA
Department of Environmental SciencesJ. Stefan InstituteJamova 39, P.O.Box 100SI-61111 LjubljanaSLOVENIA
Tel: +386 61 1885 450Fax: +386 61374919e-mail:
Tel.: +386 61 188 5450Fax: +386 61374 919e-mail:
Tel.: +386 611320 253Fax: +386 61312 262e-mail:
Tel.: +386 61 177 3900Fax: +386 61 219 385e-mail: [email protected]
PORTOROŽ 95 456

LIST OF PARTICIPANTS PROCEEDINGS
KONDA Dušan
KORUN Matjaž
KOVÁČ Ana
KOŽELJ Matjaž
KRIŽMAN Milko
KUHAR Borut
LESJAK Martin
LIKAR Andrej
LIPOGLAVŠEK Matej
LOGAR Zmago
LOVINČIČ Davor
MAROLT Janez
MARTINČIČ Rafael
MELE Irena
J. Stefan InstituteJamova 39, P.O.Box 100SI-61 111 LjubljanaSLOVENIA
J. Stefan InstituteJamova 39, P.O.Box 100SI-61111 LjubljanaSLOVENIA
Krško Nuclear Power PlantVrbina 12SI-68270 KrškoSLOVENIA
J. Stefan InstituteJamova 39, P.O.Box 100SI-61111 LjubljanaSLOVENIA
J. Stefan InstituteJamova 39, P.O.Box 100SI-61111 LjubljanaSLOVENIA
Institute of Occupational SafetyBohoričeva 22SI-61000 LjubljanaSLOVENIA
AMESJamova 39SI-61111 LjubljanaSLOVENIA
J. Stefan InstituteJamova 39, P.O.Box 100SI-61111 LjubljanaSLOVENIA
J. Stefan InstituteJamova 39, P.O.Box 100SI-61111 LjubljanaSLOVENIA
Tel.: +386 61 1885 450Fax: +386 61374 919e-mail:
Tel: +386 61177 3900Fax: +386 61219 385e-mail:
Tel.: +386 0608 21621Fax: +386 0608 21006e-mail:
Tel.: +386 61 1885 450Fax: +386 61374 919e-mail:
Tel.: +386 6I 1885 450Fax: +386 61374 919e-mail:
Te\.: +3Ž6 6V 1320253Fax: +386 61312 262e-mail:
Tel.: +386 61 1773 900Fax: +386 61 157 087e-mail:
Tel.: +386 61177 3900Fax: +386 61219 385e-mail: [email protected]
Tel.: +386 61 177 3900Fax: +386 61 123 21 20e-mail: [email protected]
Zirovski vrh Mine
SLOVENIA
Slovenian Nuclear Safety AdministrationVojkova 59SI-61000 LjubljanaSLOVENIA
Institute of OncologyZaloška2SI-61000 LjubljanaSLOVENIA
Department for Low and Medium Energy PhysicsJ. Stefan InstituteJamova 39, P.O.Box 100SI-61111 LjubljanaSLOVENIA
Agency for Radwaste Management - RAOParmová 53SI-61000 LjubljanaSLOVENIA
Tel.:Fax:e-mail:
Tel.:Fax:e-mail:
Tel.:Fax:e-mail:
Tel.:Fax:e-mail:
Tel.:Fax:e-mail:
+386 61 172 U 30+386 61 172 1199
+386 61323 063+386 61 1314 180
+386 61 177 3493+386 61 123 21 [email protected]
+386 61 132 5269+386 61 132 5112
PORTOROŽ 95 457

LIST OF PARTICIPANTS PROCEEDINGS
MIKLAVŽIČ Uros
MITIČ Dragan
MLJAČ Liljana
NIKOLIČ Radivoje
OMAHEN Gregor
OMLADIČ Sergej
PARADIŽ Jasná
PUCELJ Bogdan
RAVNIKAR Marjan
ROJC Jože
RUPNIKZdravko
ŠKRKJanez
STEPIŠNIK Matjaž
STEPIŠNIKJanez
Department for Low and Medium Energy PhysicsJ. Stefan InstituteJamova 39, P.O.Box 100SI-61111 LjubljanaSLOVENIA
HMZVojkova lbSI-61000 LjubljanaSLOVENIA
ERICO VelenjeKoroška 64, P.O.Box 22SI-63320 VelenjeSLOVENIA
Zdravstveni dom Škofja lokáStará cesta 10SI-64220 Škofja lokáSLOVENIA
Institute of Occupational SafetyBohoričeva 22SI-61000 LjubljanaSLOVENIA
Institute of Occupational SafetyBohoričeva 22SI-61000 LjubljanaSLOVENIA
Inšitut za biologijoKarlovška 19SI-61000 LjubljanaSLOVENIA
Radiation Protection ServiceJ. Stefan InstituteJamova 39, P.O.Box 100SI-61 111 LjubljanaSLOVENIA
J. Stefan InstituteJamova 39, P.O.Box 100SI-61111 LjubljanaSLOVENIA
RŽV
SLOVENIA
AMESJamova 3961 111 LjubljanaSLOVENIA
Onkološki institutZaloška2SI-61000 LjubljanaSLOVENIA
Agency for Radwaste Management - RAOParmová 53SI-61000 LjubljanaSLOVENIA
J. Stefan InstituteJamova 39SI-61000 LjubljanaSLOVENIA
Tel.: +386 61 177 3900Fax: +386 61219 385e-mail:
Tel.: +386 6I327 461Fax: +386 61 133 1396e-mail:
Tel.:Fax:e-mail:
Tel.: +386 64 634 634Fax: +386 64 632 611e-mail:
Tel.: +386 611320 253Fax: +386 61312 262e-mail:
Tel.: +386 611320 253Fax: +386 61312 262e-mail:
Tel.: +386 61211744Fax:e-mail:
Tel.: +386 61 177 3333Fax: +386 61219 385e-mail: [email protected]
Tel.: +386 61 177 3900Fax: +386 61219 385e-mail:
Tel.:Fax:e-mail:
Tel.: +386 61 1773 900Fax: +386 61157 087e-mail:
Tel.: +386 61323 063Fax: +386 61 1314 180e-mail:
Tel.: +386 61 1256216Fax: +386 611257271e-mail:
Tel.: +386 61 177 3900Fax: +386 61219 385e-mail: [email protected]
PORTOROŽ 95 458

LIST OF PARTICIPANTS PROCEEDINGS
STRITAR Andrej
ŠUTEJ Tomaž
VALANTIČ Bojan
VAUPOTIČ Janja
VODENIK Branko
VOKAL Barbara
ZDEŠAR Urban
ŽINKO Aleksandra
Nuclear Training CentreJ. Stefan InstituteJamova 39, P.O.Box 100SI-61 111 LjubljanaSLOVENIA
Ministry of Health-Health InspectoratsParmová 33SI-61000LljubljanaSLOVENIA
Institute of Occupational SafetyBohoričeva 22SI-61000 LjubljanaSLOVENIA
J. Stefan InstituteJamova 39, P.O.Box 100SI-61111 LjubljanaSLOVENIA
J. Stefan InstituteJamova 39, P.O.Box 100SI-61 111 LjubljanaSLOVENIA
J. Stefan InstituteJamova 39, P.O.Box 100SI-61111 LjubljanaSLOVENIA
Institute of Occupational SafetyBohoričeva 22SI-61000 LjubljanaSLOVENIA
Krško Nuclear Power PlantVrbina 12SI-68270 KrškoSLOVENIA
Tel.: +386 6I 1885 450Fax: +386 61374 919e-mail:
Tel.: +386 61322 343Fax: +386 61 132 32 75e-mail:
Tel.: +386 61 1320 253Fax: +386 61312 262e-mail:
Tel.: +386 61 177 3900Fax: +386 61219 385e-mail: [email protected]
Tel.: +386 61177 3900Fax: +386 61219 385e-mail: [email protected]
Tel.-. +386 61 177 3900Fax: +386 61219 385e-mail: [email protected]
Tel.: +386 61 1320 253Fax: +386 61312 262e-mail:
Tel.: +386 0608 21621Fax: +386 0608 21006e-mail:
SUISSE
GOETZ Ernst Gotele AGSchoenenhofstr. 198500 FrauenfeldSUISSE
Tel.:Fax:e-mail:
CEC
COURADES Jean Michel Commission of the European CommunitiesRue de La Loi 200L-1049 BrusselsBELGIUM
Tel.:Fax:e-mail:
IAEA
HARTMANN Reinhard
STEGNAR Peter
Laboratory SeibersdorfIAEAWagramerstrasse 5, P.O.Box 100A-1400 ViennaAUSTRIA
Division of Nuclear SafetyIAEAWagramerstrasse 5, P.O.Box 100A-1400 ViennaAUSTRIA
Tel.: +43 2254 72251504Fax: +43 2254 72251577e-mail:
Tel.: +43 12060 22711Fax: +43 1 20607e-mail:
PORTOROŽ 95 459

LIST OF PARTICIPANTS PROCEEDINGS
PORTOROŽ 95 460

AľlHOKINDI-X
AAiginger, H 298, 348Akatov, Y 41d'Alberti,F 216d'Amore, G 361Ančik, M 390Andjelov, M 109, 112Andrási, A 242,293,324Andreev, S. G. 181Anič, P 45Anovski, T 246Apáthy, 1 317Arn, S 265
B
Bajlo, M 99Balásházy, 1 74, 77, 105Barišic.D 268Basic, E 390Batič, F 259Beck, P 351Belli, G 137, 166Beno, M 415Beretta, A 162Bergmann, R 209Bergmann, H 348Bianchi, L 162Biernacka, M 342Bindi, G 419Bitt, H 227Bodnár, R 131Bonanni, A 419Brajnik, D 112Brandl, H 289Breitenhuber, L 344Breznik, B 153, 379, 385Brumen, V 56, 331Buchröder, H 174Bučina, 1 205Burger, J 53Bysiek, M . 2 3 8
CCabaj,A 369Campi, F 157Caresana, M 126Casciardi, S 419Cattaneo, V 126Cerovac, H 56, 331Cerovac, Z 331Chalupnik, S 145, 306Chibowski, S 255Cloute-Cazalaa, J 109
Conte, L 162Cosma, C 89, 119, 223Cosmuta, 1 223Courades, J. M 8Csige.1 92,281Cvetanovska-Nastevska, L 246
D
Dalheimer, A 409Delia, R 419Deme, S 317Dobici, F 397Dolenčič, P 45Drábová, D. 171, 205, 302Drašlar, K 142Druškovič, B 320Duftschmid, K 351, 373Duvnjak, N 45Dvornik, 1 273
FFaludi, G 281Feddersen, Ch 334Fehér, Á 227Fehér, 1 317Ferek, S 273Fiandino, G 361Flores, J 298Franič, Z 233Franko, M 53Fugger, M 41,289Fulea, C 59Fülöp, N 436
GGastberger, M. 220Géczy, G 92Giroletti, E 137Glavatszkih, N 436Gomola, 1 185Grahek, Z 230Grandolfo, M 13Graziani, G 177Greifeneder, G 298, 348Großkopf, A 351
HHakl, J 92,281Havlik, H 348Hefner, A 3Heistracher, T 74, 105Henrichs, K 409
PORTOROŽ 95 461

TABLE OF CONTENTS PROCEEDINGS
Henschke, J 238Hofmann, W
. . . . 74, 77, 101, 105, 181, 209, 213, 220, 277Holfeld, G 334Hone, C 413Horn-Orni, R 37Horvat, D 56Hubmer, A. K 328Hunyadi.1 92,281
I
Ilič, R 66Isajenko, K. A 342
JJachs, P 338Jačimovič, R 259Jagielak, J 238, 342Janot, M 109Jany, H 324Jarh, 0 192Jeran, Z 66, 259Jovanovič, P 109Jovanovski, N 246Juračič, M 268
K
Kahr, G 201Kanduč, M 379Kanyár, B 436Kautny, K 227Kavšek, D 402Keck, G 369Kerschbaumer, St 351Kindl, P 344Klener, V 434Kobal, 1 109, 137, 142Koblinger, L 209Koblinger-Bokori, E 188Komosa, A 252Konda, D 248Korun, M 116,236,393,402Košutič, K 230Kováč, J 99, 379Kováč, A 153Kovačevič, S 45Kreft, Z 390, 402Križman, M 66, 248, 262, 402
L
Lebečka, J 145, 306Lénárt, L 92Lendvai.Z 131
Lepori, V 365Lettner, H 242, 277, 293, 328Liedl, G 373Loppa, A 419Lovka, M 320Lovranich, E 242, 293, 324Lulič, S 230,268,379
M
Maghiar, Fl 89Malátová, 1 205, 302Maračič, M 233Maringer, F. J 338Marovič, G 96Martinčič, R 116, 236, 379, 393,402, 439Marušič, P 45Marx, G 71Mascherpa, C 157Mele, 1 192Michalik, B 145, 306Micu, C 223Mielnikow, A 306Miklavžič, U 379Miles, J 119Miljanic, S 273Mljač, L 262Mohamed, A 77Mohar, T 53Momont-Ciesla, K 238Monciardini, M 162Müller, T 134Müller, Hj 313
NNemes, L 227Németh.C 131Németh, Á 436Neznal, Martin 63Neznal, Matej 63Nikodémova, D 185Ninaus,W 313Nishiwaki, Y 17Noll, M 289Nösterer, M 181Novario, R 162
OOberstedt, S 84Oeser, V 334Osvay, M 273
PPacenti, P 157
PORTOROŽ 95 462

TABLE OF CONTENTS PROCEEDINGS
Pacurar, V 89Paradiž, J 320Pausch, G 213Pedroli, G 162Petřini, C 357Petrová, K 33Pichl.E 201Piermattei, S 397Pineau, J. F 109Plaček, V 81, 134Pletz, J 201Poffijn, A 89Polichetti,A 357,365Pop, 1 223Prlič.1 56,331Prosenc, A 259Prouza.Z 33, 171,205Pucelj,B 116,236,248,390,393,402
QQuinto, E 166
R
Rabitsch, H 201,313Radalj.Ž 56,331Ragni, P 37Ramboiu, S 49, 59, 89, 223Ranogajec-Komor, M 45, 273Ratti, S. P 137,166Ravnik, M 116Ravnikar, M 236Riedlmayer, L 324, 348Risposi, L 216Ristoiu, T 119Ristoiu, D. D 89, 119Rode, J 142Rolle, R 101, 277, 328Rosiňski, S. W 238Rosman, M 402Rossi, P 419Ruggeri, F 419Russold, H 313
SSacco, D 419Salvadoři, G 137, 166Schauberger, G 369Schmitzer, C 197, 351, 373Schönefeld, K 334Schöner, W 41, 289Schröder, K 373Schulmeister, K 373Schuöcker, D 373Selmeczi, D 123
Senčar, J 96Shurshakov, V 41Skowronek, J 145Skvarč, J 66Smrke, J 248Somlai, J 131,281Sosiňska, A. 238Stadtmann, H 344Steger, F 213, 242, 293, 298, 324, 348Stegnar, P 27Steinhäusler, F 328Stepišnik,M 192Sterlini, C 157Strachotinsky, Ch 351Streil, T 334Strohal, P 439Susanna, A 397Szczypa, J 255Szerbin, P 188
ŠŠkrk, J 320Šmarda, J 63Šutej, T 402
T
Tasso, M 361Terrani, S 157Thomas, M 174Tofani, S 361Tomášek, L 81, 134Töröcsik, 1 92Tóth.E 71, 123Tschurlovits, M 338, 406, 427, 431Turk, R 213, 220
U
Uchrin, G 285Unfried, E 348Urban, J 242Urbanich, E 242Ušeničnik, B . 3 9 3
VVaida, T 89Vana, N 41, 289Vanmarcke, H 84Várhegyi, A 92Vásárhelyi, A 281Vaupotič, J 137, 142Vdovič, N 268Vecchia, P 357, 365Vekič, B 45
PORTOROŽ 95 463

TABLE OF CONTENTS PROCEEDINGS
Venturini, L 419Vertačnik, A 268Vinkovics, S 227Vladár, M 185Vokal, B 53
wWinkelmann, 1 174Winkler, R 101,277,328Winkler, N 351
ZZagyvai, P 227Zarucki, R 342Zettwoog, P 109Zombori, P 242Zygmunt, J 255
PORTOROŽ 95 4 6 4


![FINAL edited[1]](https://img.dokumen.tips/doc/110x75/63593309e1cb36a96f0ab645/final-edited1.jpg)


