Embed Size (px)
Citation preview
Depanmem d as Irmsurvonftmao ROUGIMUG semoce
Margamt ME= 111chardsolloConunissioner
Mcoweo P. BoomDeputy Commissioner
ROD MMIMdChief Compliance Officer
Balmlso F. SUOU17Acting Director, Statistics of Income
-1.Mzv-
91
C=3
k9k5-3b
f,
I
Department of the TreasuryInternal Revenue ServicePublication 1136 (Rev. 10-94)Catalog No. 46996F
Sol 111luErlmA Quarterly Statistics of Income Report
Volume 14, Number 2
The Statistics ofIncome (SOI) Bulletin is issued quarterly,in July, October, January and April, by Statistics ofIncome of the Internal Revenue Service. The reportprovides the earliest published annual financial statisticsobtained from the various types of tax and informationreturns filed, as well as information from periodic orspecial analytical studies of particular interest to studentsof the U.S. tax system, tax policyrnakers and tax adminis-trators. It also includes personal income and tax data byState and historical data for selected types of taxpayers, inaddition to data on tax collections and refunds and onother tax-related items.
Information on the availability of supplemental data onthe topics included in this issue, special tabulations under-taken on a reimbursable basis, or other SOI subjects, maybe obtained by telephoning the SOI Statistical InformationServices office (202-874-0410), or by writing to theActing Director, Statistics of Income CP:R:S, InternalRevenue Service, P.O. Box 2608, Washington, D.C.20013-2608.
Robert Wilson and Beth Kilss of Statistics of Incomeare the technical editors of the Bulletin. Wendy Alvey,Clementine Brittain, Bettye Jamerson, Ruth Schwartz, andLisa Smith made major contributions in the production ofthis issue. Views expressed in the articles are those of theauthors and do not necessarily represent the views of theTreasury Department or the Internal Revenue Service.
Suggested CitationInternal Revenue ServiceStatistics of Income BulletinFall 1994Washington, D.C. 1994
For sale by theSuperintendent of DocumentsP.O. Box 371954Pittsburgh, PA 15250-7954
Featured Articles:
Individual Income Tax Returns, 1993:Early Tax EstimatesBy Michael E. Weber
I I
Sole Proprietorship Returns, 1992 34By Michael Strudler and Marty Shiley
Partnership ReMms, 1992 75By Timothy D. Wheeler
Individual Foreign-Eamed Income andForeign Tax Credl% 1991By Lissa Redmiles
Seff-Employed Nonfilers, Post-Audit,Tax Year 1988By Laura Rosage
Data Release
113
123
Charities and Other Tax-ExemptOrganizations, 1990 132
Bulletin Board 2
Revision to the Spring 1993 issue . 7
Selected Historical and Other Data 139
SOI Sampling Methodology andData Limitations - Appendix
SOI Projects and Contacts
203
206
Publications and Tapes 210
Index - Previously PublishedArticles and Data Releases Inside Back Cover
Bulletin'Board
This Issue at a Glance-
lndhddual Income-Tax Returns, 11991 Early Taxmates
By MichaelE. Weber. For Tax Year. 1993j- taxpayers filed 106.8, million-indi-yidiial,incorne tax-,retums b*y the end of April 1994, withanother 7.7,million e'xpecie,d-by. year end.-. Early. estimatesfor 1993,-. based- on the' returns filed- through April" revealthat "adjqstedgrpsis i.ncome,"grew'~byj2:3,percentr'over.the,e~rly'e-titiiAte--for.,1992,1~.from-$3,254 billion, to43;328,,billion'. Taxable ih~omp
.grew 2
.
.246rc.ent, from $2,103,
billion to $2,150 billion, While total income tax -increased4.9 percent, from $408 billion'to, $428 billion. Much ofthe increase in tax ieflects.the im
.pact of the new marginal
tax rates applicable to,high-income taxpayers. ~. Of the
$42.9 billion. This increase continued the t'rend that ,
began after enactment of the Tax Reform Act of 1986, atrend that was reinforced for 1992 by the improving'economy after the recession of 1990-199 1. Prior to 1986,partqersliipslwlere characterized by.annual overall losses,due mostly to their use as "tax shelters." With thedisappearance of tax incentives that encouraged thisusage, partnership investments seemed to increasinglytum'to,ptofit-seeking-altematives,.~,as~pvi,denced,by- the,44~..s in profits~rthe res'61f6fbbili,ahlincrease inpositive net income and a decrease in negative net income,Le.-, ~-net deficit. The latter4as e'speclall~ noticeableamong real estate operators and lessors ofbuildin s, theindustry that had been the main:vehicle, for. creating' the"tax losses" that enabled partners to "sheltee, otfier-`-income from taxation prior. to~ 1986.
sources of income orted for 1993, tikable.interestI I repincome 'Was down by 16.6 p~riqentj reflectin Indliddual foreign-Earned Income and Foreign Taxg decliningintere rates.-*hile-,tin6mr)lov-rfi~nt:ci-) ri ation dr6pni-rl_~_'Cre' dl%-! '991
.byl4-.2pqrddnt,~-refl6ctiiigthdde'clirie~intlienAtionaIpne
Ilo ment rate. -The number~of taxpavers itemizin'IMP, y 9
deductions and the total amoiint'claimed were each aboutthe same~as~~ 1992,-although the interest paid deductiondecreased 4.1'percent.
Sale Prop Returnsi. . TietorshipBy Michael Strudler and Marty ~Shiley'Nonf4rm sole proprietorship 6rofiis for 1992 increasedfrom $141.5 billion for,19~f to $154.0 billion. This 8.8percent increas:e"Te'flects the recovery from the recessionthat began
.late in 4 99Q.. Thpgrowth in profits was led by
construction and finance,.insurance,. a
.nd real estate.
Aniong th~servke industries,- which a,ccounted,for morethan 60'oeirceni 6t'~ll'sold-piborietorship-lprofiis; legal,services'showed the largest increase. However, profits formedical'and: health services exp&ienced their. lowestincrease~si&6 ~ 1.981,1despite -the - fact,' that this group led theservices divisjo'n'in profits, for
.the year. The 1992
depreciation' deductidn.r6ported by nonfarm.propneiorshipsJ nkreased slightly overJ9911 the first such.increase since 1988, -but, with the kradual. decline'in thededuction that beean after enactment Of the Tax ReformAct of 1986, thededu6tionfor. 1992 was still less than'1984 levels,.
Partnership Returns, 1,992By Tiniothy D. WheelerFOrTax~ Year 19.92, partnerships reporped -the largest -increase in profits in recent tistory,~as net,income (lessdeficit) mort than doubled, from,$2 1.4 billion for 1991 to
By Lissa RedthilesFor Tax -Year'1991" U.S. taxpayers'excIdded'inore: than$9.7.biHiofi of foreign-eatned in'6orh*e and employer-provided 1liousing expenses'fr6ril "adjusted1'rossincome".on 220,000 individual income tax returns, and. credited$1.8 billion of foreign, taxes.against U.S. income tax on873,000 returns. - The hbusihg~dedu6tion, reipo~rt'ed, -onabout:3,000 returns for "excess".housing expenses,reduced. adjusted gross income by another $43.5 million.U.S'., taxpayers, living at home 6rabroad reported about$15 billion- of f6reign-source income
.i W'hile-a'n additional
$14 billion -of foreigii-eamed income was reported bytaxpayers living, abroad. The United Kingdom, Canada,and'Japan we~re die countries,.with the largest proportionsof fbitigh-earned ihcorne',and,foreign-sour
,ce
Iincome:
Taxpayers'living in,th6,Unite'd Kingdpmfiad~ the highest.average.foi
SelfrEmployed Nonfilers, Post-Audi%.1988.By Laura Rosage.ForTaxYear 1988, an estimated 1.5 million.delinquentfarni'and nonfarm sole proprietorship returns were,secured through enforcement efforts. These returns,showed $22.2 billion in "total-ificome (less loss)" from allsources, an average of $15 per return, and 68_1000 Yercentof them showed an income tax liability. Nonfarm businessprofits amounted-t6 $0.9 billio'n,'wh'ile farm profitsrecorded a net loss of $0.1 billion. However, after audit
ad J 'by the Internal Revenue Service, , justments were madeon, 8.7 percent of these returns. Total income increased to$30.5 billion, an average of nearly $2 1,W0 per return and
2

Bulletin Board
82 percent of the returns showed a tax liability. Nonfarmbusiness profits increased to $16.0 billion and farmprofits, to $0.6 billion.
Charities and Other Tax-Exempt Organizations,1990Data Release
Some Observations and Insights
We are always looking for newways to broaden our scope. Thisyear it seems Sol has goneinternational! While wehave always welcomed visitorsfrom other countries - or evenour own- it seems that recently
we have had more foreign guests than usual. Thissummer we kicked things off by hosting a delegation offive South Korean tax officials. Since then, we have alsomet with representatives from a number of EasternEuropean countries- two statisticians from Poland, 16tax officials from Bulgaria, and 12 delegates from theState Tax Inspectorate ofBelarus. Officials from Russiaare expected later this fall. (Delegates from Armenia andHungary were here last year.)
Most of these visits are part of an orientation pro-gram, run by the IRS International staffs Tax Adminis-tration Advisory Services office, as part of joint effortssponsored by Treasury and the State Department'sAgency for International Development. None of thesecountries has statistical programs to support tax research.Sol's role is to provide a brief overview of our statisticalprograms. This is often supplemented by a demonstrationof one of our on-line processing systems. Efforts aremade to tailor the presentations to the specific interests ofthe visitors, often drawing in subject matter specialists toanswer questions. Despite language barriers - and theneed to sometimes rely. on translators - the exchangesinvariably prove as interesting to us as we hope they are toour visitors. The guests are usually sent home with anarmful of our publications.
Behind the Scenes
As has been our tradition for the past 14 years, Sol onceagain sent a small but strong delegation of statisticiansand economists to the Joint Statistical Meetings. Theconference, which marked the 154th annual meeting ofthe American Statistical Association, was held August
13-18, 1994, in Toronto, Ontario, Canada. It drew about4,500 people from the U.S., Canada, and many othercountries.
As in previous years, Sol was involved in a numberof different activities- from presenting methodologicalpapers of work-in-progress and exchanging ideas andinformation with fellow statisticians, to attending special-interest committee meetings, business meetings, and awide spectrum of contributed and invited paper sessions.Topics of interest ranged from applied sampling problemsto methodological issues affecting Government statisticsand ethical concerns involving privacy and confidentialityof Federal data.
There were 10 technical papers presented by Statisticsof Income staff-
M Alternative Imputation Techniques for Propor-tions of Income Variables for IRS ComplianceModeling, by William Wong, co-authored withChih-Chin Ho of IRS, Compliance Research;
Linking Individuals on a Capital Gains Panelfor Tax Policy Analysis, by Susan Hostetter;
N Inverse Sample Design Algorithms, presentedby Fritz Scheuren, on detail to IRS CriminalInvestigations, co-authored with SusanHinkins;
E Quality Review Consistency Study, by GlennWhite;
N Estimating the Internal Revenue Service Tele-phone Demand, by Robin Lee;
The 1994 Taxpayer Compliance MeasurementProgram (TCMP) Sample Design: A CaseStudy, by Wendy Rotz, co-authored with JeriMulrow and Eric Falk;
The Challenges of Preparing Sensitive Data forPublic Release, a poster presentation, donejointly by Leuise Woodburn and co-author,Gerhard Fries, of the Federal Reserve Board;
0 How Sales of CapitalAssetsWere Affected by the TaxReform Act of 1986, byBarbara Longton, co-authored with Pete Sailerand Janette Wilson; 3
Bulletin Board
a Self-Employed Nonfilers: The Accuracy-ofEnforcement-Secured Tax Returns, by LauraRosage; and
N Statistics of Income Partnership Studies: Evalua--tion of Preliminary Estimates, by PaulMcMahon.
In addition, Mary.Batcher gave-a.discu,ssion of.fourpapers on Data Collection Issues for Government Surveysand Censuses, Ellen Legel led a roundtable discussion on-Megatrendsfor Wom, en - The Revolution'of Women.Leaders; and Wendy Alvey and Beth Kilss spoke at theWorkshop on Improving Statistical Presentations.
Two other particularly relevant presentations were:
Income Stratification i.n-Panel Surveys: Issues in'Design and Estimation, by John Czajka,
auzeina- Ion work he is doing for SOI on the Sales ofCapital-Assets Panel study;~ and
0 Creating Desktop'Doc.umentation: IndividualIncome Tax Return Microdata, Statistics ofIncom
Ie, by Martin David, of theUniversity of
-Wisconsin, who has been working with SOItodevelop a "metadata system."'
We expect all of these papers to appear in the next issue.of
our Methodology Reports 'series Statistics, ofIncome:Turning Administrative Systems Into InformationSystems ----; 1994, to be published later this year. Theywill also be published in the 1994American StatisticalAssociation Proceedings" due out early next year.
Although we have wound down our anniversarycelebration, we promised to continue to publishspecial feature,articles from time to time, for thoseprograms we missed, as their 80th year of data becomeavailable. This issue we are pleased to bring you two sucharticles:
M Sole Proprietorship Returns, 1992, by MichaelStrudler and Marty Shiley; and
M.' Partnership Returns, 1992, by Tim Wheeler.
41We hope you will enjoy these presentations of our data.
k
Upcoming Features
The following are some of the articles planned forinclusion in upcoming issues of the S61 Bulletin:
0 Environmental Excise Taxes, 1992;
i ".Fordiin Controlled Domestic Corporationsi,_rl: 199 1';~77"K"
i'-~,Hiih'-Iti~drii7e~'lhdividual~Inceithe,Tak~RdtuiTis,,,:,,199 1;
n Corporate Foreign Tax Credit by'Country, 1990-1and
N Projections of Returns to be Filed, 1995-2001.
-Ffftffr-eddtY-releases1ficlUde:
M Corporate Foreign Tax Credit, 199 11; and
m Private. Foundations and Charitable Trusts, 1991.,
Subuription Problems?Have you. had trouble receiving your subscription copies.of the SOI Bulletin? We understand that some of youwho have subscribed through the Government PrintingOffice. (GPO) have not been receiving your Bulletins atall or in a timely fashion. If you do experience anyproblems along these lines, pleaselet us know-- give the . StatisticalInformation Services staffa call at(202) 874-0410. We'll be glad totook into the problem for you.
Now Messap SystmYou can now add AUDIX to your Iist of Governmentalphabet soup.acronyms ~ Sol has just installed a newAUDIX Voice Messaging System. While everybodyhates to talk to answering machines, we figured that thiswas better than not reaching us at all. We are committedto making every effort to have a "real person" answereach call, but at times that'is, not'possible. So, if you call aspecific SOI staff member and he or she is not available,do not be surprised to hear the phone answered byAUDIX. Please leave a message - we'll get back toyou as soon as we can.
Bulletin Board
The advantage ofAUDIX over our old answeringmachine is that, when you call someone who isn't in, youcan leave a message for that specific person. The message issent directly to the employee's personal telephone, where agreen light will indicate that there is a message in his or hermailbox. Calls to the general Statistical InformationServices number- (202) 874-0410- will continue to beanswered by a regular answering machine, if no one isavailable to handle your call. We will continue to checkfrequently for messages and get back to you as soon aspossible. We hope that this new system will help us be moreresponsive to your needs. Let us know how it works!
E4ftilIt's coming! The SOI Technical Team has been workingon a way to give us e-mail access to Internet, so that wecan communicate with you electronically. We hope tohave good news to report in the Winter Bulletin.
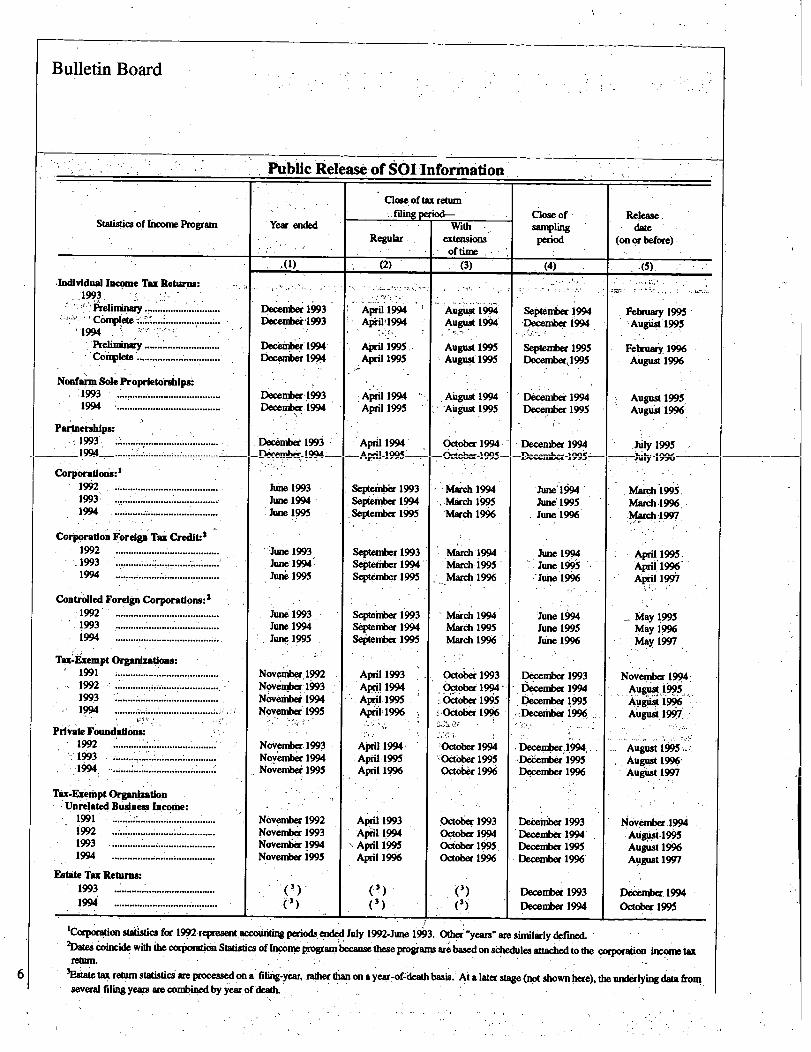
Data Release DatesFor the fourth year, now, we are publicizing the dates
when data for the major SOI programs will be released tousers, ahead of their formal publication. The listingincludes some of the critical dates that precede the datareleases, to help show some of the constraints under whichwe must operate in order to make data available on atimely basis. While it isn't always possible to meet allcompletion dates, we continue to strive to release thetimeliest and most accurate data possible.
Since SOI is an annual program, many of its datarequirements are unchanged from year to year. Every newyear, nevertheless, brings changes and new challenges. Ahigh priority is, therefore, assigned to continually improv-ing our operations, while adapting to the changing andgrowing research and data requirement needs of our maincustomers- tax policyrnakers at Treasury and in Con-gress and the national income economists in Commerce;the evolving tax law and resulting tax return formchanges; and the constantly improving tax administrationsystem, itself.
5
Public, Rek~ of S01 Infonnation.
Statistics of Income Program
-Individual Income Tax Returns:1993
Preliminary ........C6mplete ...................... . ........
Preliminaiy ....................... . ...Couipl~ete ............... .........
Nonfarm Sole Proprietorshipr.1993 ................... ......................1994 ..........................................
Partnerships:..................................... .
1994 ........... .......................
C0rP0Md0mi:'l9k, . ........................................1993 .....................................19.94 ........................................
Corporation Foreign Tax CreWL-21992 .........................................
-1993 ................... t ........... ! .........1994 ......................... . I........ .
Controlled Foreign Corporadons:21992 ........................................1993 ........................................1994 .......................................1.
r
TU-Exempt Organizations:1991 ;........................................1992 ......... I.........................1993 ........................................... .1994 ............I............................
Private Foundations:im .1 ...............I ......o ...................103 .1
. ..: ~......!................................1994 . ............ .............................
Tax-Eximpt OrganizationUnrelated Btisiness Income:
19911 . .........I.,..............................1992 .......................................1993 ........................................1994 ........................................
Estate Tax Returns:1993
1994...... .................. .............. .
.........................................
Year ended
December 1993Decembei,1993
December 1994December 1994
Decenim.1993December 1994
December 1993_De4cemkk-_l9%_
June 1993June 1994June 1995
lune 1993June-1994"June 1995
June 1993June 1994June 1995
November.1992November 1093November 1994November 1995
November 1993November 1994November 1995
November 1992November 1993November 1994November 1995
Closeof tax return. filing paW-
Regular
(2)
April 1994Api*1994
April 1995.April 1995
April 1994April 1995
April 1994_A~,w;..r..1-1995-
September 1993September 1994September 1995
September 1993Septeffiber 1994September 1995
Septeniber 1993September 1994September 1995
April 1993April 1994April,1995ApriH996
AjXil
April-1995April 1996
April 1993April 1994April 095April 199~
(3)(1)
Withextmsionsof time.
(3)
August 1994August 1904
August 1995August 1995
Clow ofsamplingperiod
(4)
September 1994Decemlier,1994
September 1995Dwember,1995
August 1994 December 1994-August 1995 December 1~95
October 1994 1301cember 1994-Octob-a-1995-1-7
March 1994March 1995March IM
Junel094June 1995June 1996
March 1994March 1995March 1996
Mardi 1994March 1995Mardi 1996
October 1993October 1994,October 1995Woberl906
: October 1994'% October 1995Octot,4 1996
October 1993October 1904October 19~5.October 1996
June 1994June 15~~
.'June 19~6
'June 1994June 1995June 1996
December 1993December 1994December 1.995
?,December 1996
Decenher,1994,,!,D&em~er'1995December 1996
December 1993'December 1994DoWinber 1945December 1996
December 1993December 1994
Release,date
(on or before)
45Y
Feliniary 1995Aug" 19915
February 1996August 1996
August 1995August 1996
July 1995~Juzy -1-776
March 1995.March-1996March 1997
April 1995April 1996A 1997
May 1995May 1996May 1~97
November 1994August 1995
'9k.-Pstl.,.August: 1997
August 1995August 1996,August 1997
November.1994Augusi-1995August 1906August 1997
December 1994October 1995
'Corporation statistics for 1992 represent.wAxitinting pe.no(4 ended July 1992-Junie 1993. Othei"years" are similarly defme~l.2DaW c'ou*icide with the corporation Statistics of Income program because these programs are based on schedules attached to the corporation incometaxreturn.
313staie, tax return statistics are processed.on a'1114-year, rather thanon a year-of-death basis. Ata later stage (not shown here). the underlying data fromseveral filing years are combined by yearof death.
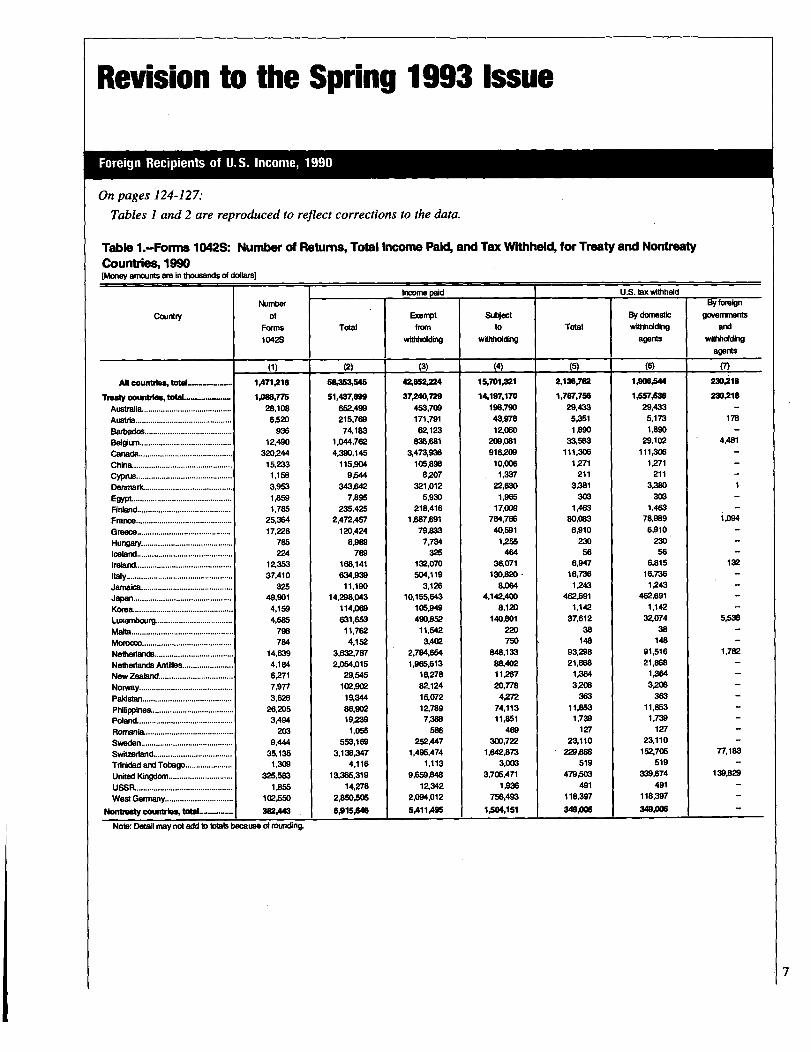
Revision to the Spring 1993 Issue
Foreign Recipients of U. S. Income, 1990
On pages 124-127.-Tables I and 2 are reproduced to reflect corrections to the data.
Table I.-Forms 1042S: Number of Fleturris, Total Income Paid, and Tax VVIthheld, for Treaty and NontreatyCountde% 19W[Money amounts are in thousands of dollars]
Income paid U.S. tax withheld
Number By foreign
Counlry Of Exempt Subject By domestic governments
Forms Total from to Total withholding and
1042S withholding withholding agents withholdingagents
(1) (2) (3) (4) (5) (6) M
All countries, total ------------- IA71,218 58,=545 42,662.n4 15,701,321 2,136,762 1 ~Mls" 230,218
Treety counbles, total------------- 1Mr/5 SIA37,099 37~M729 14,197,170 1,797,755 1'WAW 230,218
Australia ......................................... 28,108 652,499 453,709 198,790 29,433 29,433 -
Austria ............................................. 6,52D 215,769 171,791 43,978 5,351 5,173 178
Barbados......................................... 936 74.183 6ZI23 IZO60 1,890 1,89D -
Belgium ........................................... 12,490 1,044,762 835,681 209,081 33,583 29.102 4,481
Canada............................................ 320,244 4,390,145 3,473,936 91%M 1 11,306 11113W -
China. .............................................. 15,233 115,904 105,898 10,OD6 1,271 1,271
Cyprus............................................. 1,158 9-s" 8,207 1,337 211 211
Denmark ......................................... 3,953 343,642 321,012 2ZS30 3,381 3,M 1
Egypt .............................................. 1'&59 7,895 5,930 1,965 303 303 -
Finland............................................ 1,785 235,425 218,416 17,W9 1,463 1,463 -
France............................................. 25,364 2,472AW 1 A87.691 784,766 80,083 78,989 1,094
Greece ............................................ 17,226 120,424 79,833 40,591 6,910 6,910, -
Hungary .......................................... 785 8,989 7,734 1= 230 230 -
Iceland ............................................. 224 789 325 464 56 56 -
Ireland............................................. 1Z353 168,141 132,070 36,071 6,947 6.816 132
Italy.................................................. 37,410 634,939 504,l19 13D~M - 16.736 16,736
Jamaica ........................................... 325 11,190 3,126 8,064 1243 1.243
Japan.............................................. 49,901 14,298,043 10,155,643 4,142,400 462,691 462,691
Korea .............................................. 4,159 114,069 105,949 8,120 1,142 1,142
Lacembourg ................................... 4,685 631,653 49DA% 14001 37,612 3Z(F74 5,5W
Malta ................................................ 798 11,762 11,542 22D 38 38
Morocco .......................................... 784 4,152 3,402 750 148 148 -
Netherlands..................................... 14,639 3,632,787 2,784,654 848,133 93,298 91,516 1,782
Netherlands Antilles........................ 4,184 2,054,015 1,965,03 88,402 21,868 21,868 -
NowZealand .................................. 6g7l 29,545 la278 ll,%7 1 1W 1,W -
Norway............................................ 7,977 102,902 82,124 20,778 3908 3208 -
Paldstan .......................................... 3,626 19,344 15,072 4,272 363 363 -
Philippines ...................................... 26,2D5 86,902 IZ789 74,113 11,863 11,853 -
Poland............................................. 3,494 19,239 7,388 11.861 1,739 1,739 -
Flornania.......................................... 203 1,055 586 469 127 127 -
Sweden ........................................... 9,444 553,169 252,447 30D,722 23,110 23,110 -
Switzerland.................................... 35,135 3,138,347 1,495,474 1,642,873 229AN 152,705 77,183
Trinidad and Tobago...................... 1,309 4,116 1.113 3,003 519 519 -
United Kingdom .............................. 325,583 13,365,319 9.659" 3,705,471 479= 339,674 139,829
USSR............................................. 10% 14,278 IZ342 1,936 491 491 -
WestGermany................................ 102,550 2,&W5M 2,094,012 756,493 118,397 118,397
Nontresty countries, 382A43 6,915AM 5,411 AN 1,-44,151 34%= 34%=
Note: Detail may not add to tDtals because of rounding.
7

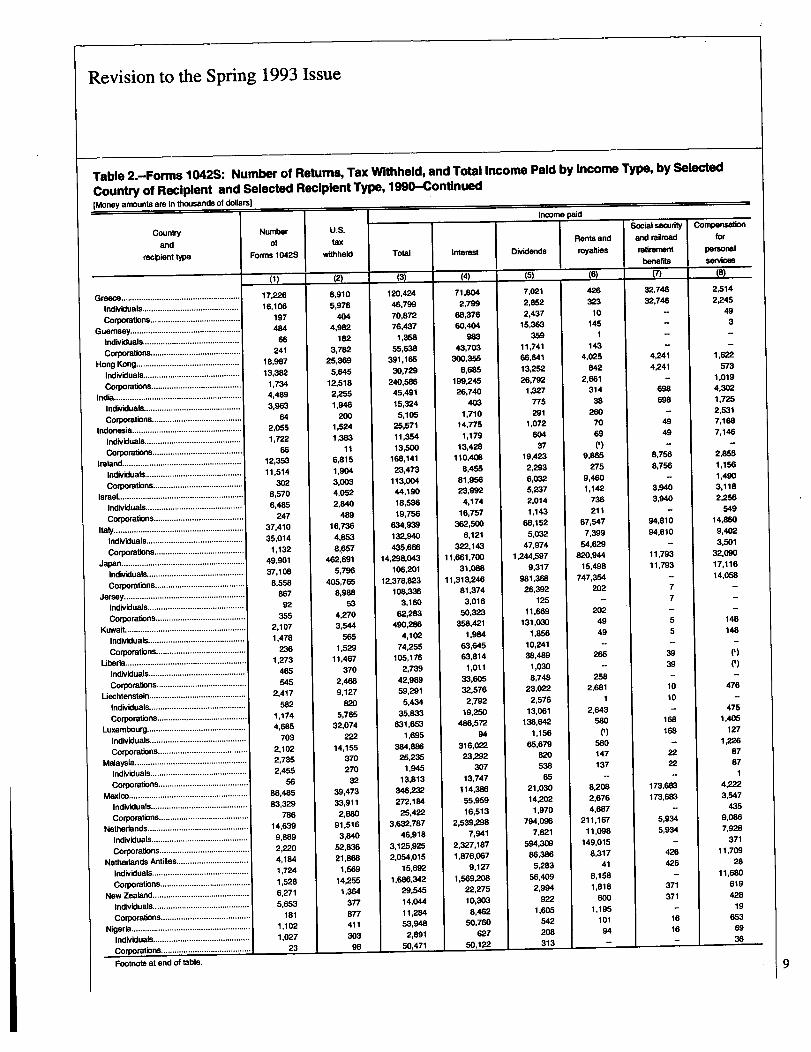
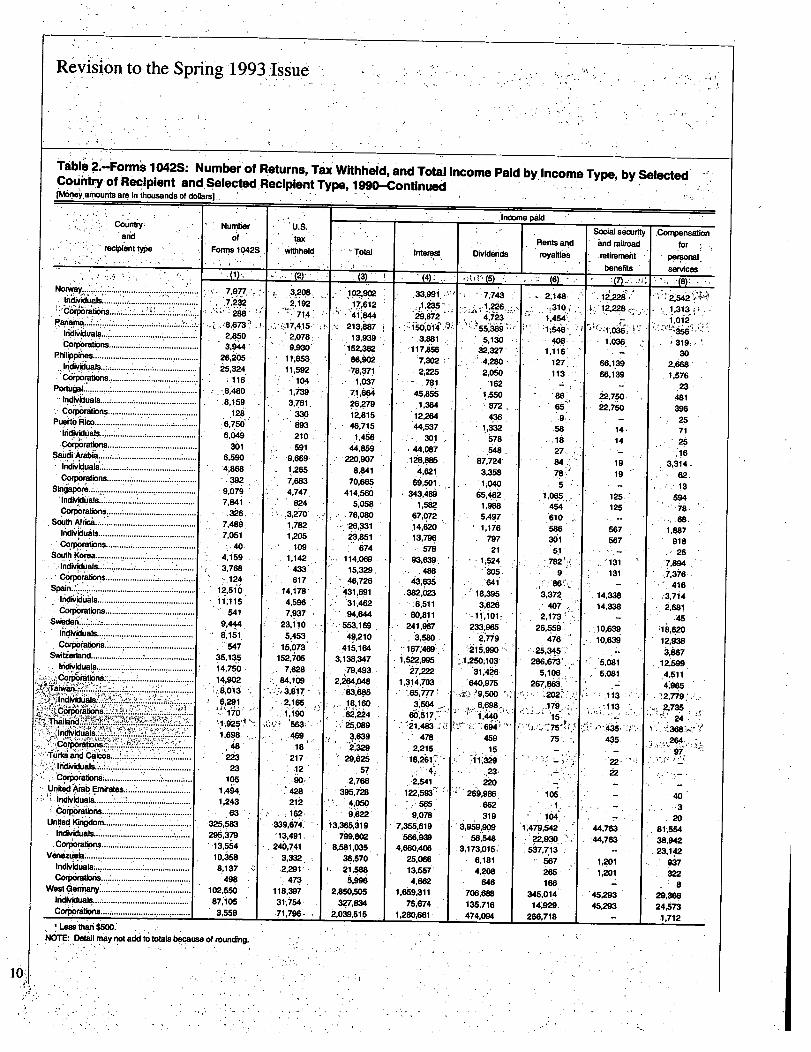
Revision to the Spring 1993 Issue
Table 2.-7Forms 1042S: Number of Returns, Tax Withheld, and Total Income Paid by Income Type, by SelectedCountry of Recipient and Selecied Recipient Type, 1990[Money amounts are in thousands of dollars)
Income paidCountry Number b.s. Social security~ Compensation
and Of tax Rentsand and railroad forrecipient type FoffnsIO42S withheld Total Interest Dividends royalties refirement personal-
benefits services(2) (3) i-_~ (4) (6) (7) (8)
All countirles, total........ ................. 1,471,218 1,w6A" 58,if-%S~5 ~39,144,494 ,.,11,842,067 3,738,459 946,110 496,091~-:xj;,
IndtMLials, total..: ...... .......... _1,242,561 257,608 '3,747,46,11
:276,10 _,.!.IS0519~6 A 50,3155 946,110 304,MCorpoirstions.tatal................... 102,996 1.226AM 38,75%427 30;1590.6~0 ~,J 7,M 2,434AN
Argeniina ...........................I ...................... 11,44 1 3,25~5 33,753 17,705 4, 3~7 4,802-Individuals........................................... 9,927 2.695 28,101 .14,155 4,043 4,802 1,458Corporations........................................ 136 94 1,557 1,299 139 107 - 7
Australia.................................................. 28,108 29,433 652,499 432.689. 142,275 41,643 5,135 9,231Iridividuals........................................... 23,7819 4
'039 46,525 1.9,931 6,078. 2,403 5.135 6,365
Corporations........................................ 2.276 13,277 457,711 .364,908 60.882 30,737 - 1,393Austria ..................................................... 6,520 5,173 215,769 172,813 28,887 1,544 3,305 2,895
lndividuals.~.......................................... 3,489 1,376 12.038 - T75 2,031 373' 3,305 2,360Corporations ......................................... 1,910 2,778 467,580 143,716 20,815 894 7 99
Bahamas ................................................ 4,623 27,784 347,299 254,816 86,889 937 742 .423Individuals........................................... 1,784 3.084. 35.998, 25,096 8,655 4 742 252Corporations ........................................ 1,618 18,504 242,784 184,094 55,965 876 - 109
Bahrain.................................................... 762 878 100,399 91,702 4.980 17 8 -
Individuals ........................ .................. 560 99 582 '211 320 8CoiporatiDnis ........................................ 126 687 78,420
.72,509 2,345 4 -
Barbados................................................. 936 i.890 74,183 62,478 9,940 27 1,339 24Individuals ........................................... 696 254 2,222 M 242 27 1,339 ~4Corporations ......................:................. 110 948 37,985 31,968 6,017, - - -
Belgium ............................. : ..................... 12,490 29,102 1,044,762 869,874 119,052- 39,734 2,347 4,099Individuals ........................................... 10,017 2,160 27,180 4,399 '5,529 7,230 2,347 3,567Corporations........................................ 1,162 22,449 358,699 233,709 92,712 30,010 _209-
Bermuda~................. ; ............................... 3,424 -16,043 339,627 -244,718 37,582 6,000 651 20,254Individuals............................. : ............. 1,508 799 6,822 3,591 1,511 76 551 428Corporations.................................... 788 11,257 219,408 139,866 5,922 19,819
Brazil.................................... I.................... 6,842 3,24i 18,487 4,273 792 3,565 4,047
Individuals........................................... 5,739 2.537 18,224 4.509 3,216 3,565 3,238Corporations ........................................ 200 278 9.216 8,201 425 387 163
British Virgin Islands ................................ 4,331 10,067 187,701 151,253 35,231 16 84Individuals................. 4 .................. :1..... 721 666 7.427 4,431 2,807 1 -
Corporations ........................................ 2,272 6.5032 128,498 106.000 22,025 a 84Brunei.................................. I..................... 120 20 93,508 .79,224 14,260 -
Individuals........................................... 94 9 so 12 2iCorporation& ................................... 4 23 9 -
Can"_. 320,244 111,3Or3 4,390,145 2,711,247 1,004,183 100,393 223.745 ~8,3iOIndividuals........................................... 277.180 29,017 461,721 40,859 75068 22,988 223,745 -~21:2&~;Corporations ................. ........ 181,185 68,007 b'.287,653 ?,374,817 -, - 617:604 65,289 - 29, ~MO
Caymah Islands ....................................... .3,909 23;809 525,164 '~45,06
. ,
75,65 741 358Individuals..: ........................................ 632 1,059 9.640 5,766 31460 47' 358Corporations ........................................ 2,302
..17,286 358,924 303,232 53,i~4 694 - 16§
China ................................................. 15,233 1,271 '1 15,904 20,395 2jil 55 51 67;494Individuals .................... ............... 14,412 860. 92,702, 228 1,031 42 51 65,996
Corporations ........................................ 98 182 15,458 15,073 343 5 38
Denmark .................................................. 3,953 3,380 343,642 291,089 17.127 11,658 3,667 1,977Individuals ........................................... 3,332 .909 9,586 -2,683 820 294 3,667 649Corporations ........................................ 327 1,205 172,409 148,8U7 7,979 11,178 1,238'
Finland..................................................... 1,785 1,463 2~5,425 197,193 14,415 3,281 2,047 1,668
Individuals ........................................... .1,407 455 4,624 202 '190 25, 2,047 1,325
corporations ........................................ 210 862 .150,057 128,329 13,323 3,113 - 41,
France..................................................... 25,364 78,989 2,472,457 1,551,741 594,381 223,401 12,709 20,581
Individuals .......................................... 18,620 7,941 114,349 21,790 26,623 22,142 12,709 17,820
Corporations ........................................ 3,808 53,168 1,937,450 1,271,567 440.099 191,817 787
Gibrafter .................................................... 188 453 41,182 39,6M 1,507 20 -
Individuals ........................................... 68 24 126 35 7~1 20Corporations ........................................ 62 112 1 38,308 37,944 364
Footnote at end of table.
8
ON
IaI00cSolC0
cc.cV-cc
Cc0
=(1)
'ffz
-0
4i
NM.LD
00
LL
B
C-i
Z,Cc0(.)i
00
Lq
OD
A?
.C
tIt
-:C
liji
Ci
C.jV
~:
Ai
KK
ci
Cl)CIA
Z0;
C6g
1,
.07li
0)
ci
[I
E8E
V
A
a,r1
:3.9
6~
!sI
II
I~
:;Ii
91
gis
Iaa
CILP't
P't
st
gi
ItaD
OD
ci
ci
9
06w
C6
cj
rZw
clico
GoCl)
C)M'0
~C"C-i
0;CD
0I
90)It
R
-1
2A
I~
1~21
MM
1~3
F41
99-
Nci
cli
MM
Na)
clsR
lk-Ic"
NV
S-:,.i
%6
2N
r~4NF
c%i
Ld
gC
6ccolj
6
cjmo.6
c;ci
Diq
lq~%
cQci
4d
cac6
lzc6
!2v
-v
%co
cocm
-Z;
-Ln
9;;
loLq
.cq
Izcm
"-
-
~;l
'nR
t~N
N0
Aa
4§
;zM
CQ0
V:
r-CQ
Cc,K
Ncq
eq-~
k:
dci
Mr§
~-
~;:
~§
:;0
§?
~g
C54a
vR
aE3
.R
kqIZ
C,%n
Ld'dui
C6C6
-i'i
ci0
vIn
r.N
1-0C-D:
91
COMcoy
F6
NM
NC
i'i
vi
ci-7
;!v
-- t2ts22E
aI-~-~~
-~-~~-
-~ %-r, ~§~22
gs-tRA
~~~R8
cmN
al
Lq
qcl
v
I-kR
-"t
LqR
qr1
tR
P't
rIt(3
iL
q't
cow
wci
.ici
c6~
ww
Gi
L6ci
.1ici
ci
It
ck
142v
mcoo
~m
cmg
tog
mo
oo
ov
w;z
mN
Imco
01-
PA
'r-~
!,
-N
p--
R!
~t
ct
4~
,cNt
coLD
Rci
a;
wq
Ict
RN
vIt-w
ocm
to"!k
Av
qV
o-
oA
(Ilt,919
rsIts
cq
~z
-~i
ci
ci
cyM
a)
00aD
rItPIL
12Z
1212
V&
J
CcC
cd
2LL
Wa
Ll2:
.2:EL
LL13
.00
x10
01
M0
'00
ALM
(0,D
AS
OB
8s
L)-S
ECO
do
00
M
wco
II
Cl)
Cl)
LO
Rcq
n.6
a--f
c0r
0b
soLL
0%
v0,
zz
z
9-
.G)
1?5
13..voll-
-
-A
.-
-N
io,
:.4
~4
(D."
-Cl
d)
cz-
NCD
cn~4
PQ00
CnC
.)O
D(D
5Z
~w
-W
,9
8"
'D. s
'"ll
CD(D
w-4
9D-9
)7~4
bt~
--
--
j"r-
50
_.
~jg
0
:1:1
~~.:
4.
(A.1
,:4
W,to
'4-
tR
CRc.
cocb
,SD
CR,
4,C5
ODN
;;~
.k-
$9,4
r_0'
'~
)'.
r
tg_V=1
1 --=tt
9t.
..
..
..
!Q:4
-4CA
2.2
se.
sn10
!:,
-W:
1.-4
r-
-4r,
WU
;:~
84;3
S
9
m co
49
Indbridual IncomeTax Returns, 1993:EadyTax Estimatesby Michael E. Weber
E
arly estimates for Tax Year 1993, whichare basedon individual income tax returns filed through April1994, show that between 1992 and 1993 "adjusted
gross income" (AGI) grew by2.3 percent, from $3,254billionto $3,328billion; "taxable income" grewby 2.2percent, from $2,103 billion to $2,150billion; and totalincome tax increased by 4.9percent, from $408 billion to .$428 billion. Much of the increase in total income tax.reflects the impact of the new marginal tax rates of 36 and39.6 percent applicable to higher incomes. Of the sourcesof income, salaries and wages increased by 2.8 percent,roughly matching the 3.0 percent annual rate of inflation;taxable interest income fell 16.6 percent, reflecting thedecline in interest rates; and dividend income increased by7.4 percent. Itemized deductions remained essentiallyunchanged. The amount of "earned income credif'(EIC)claimed increased 17.4 percent, from$12.4billion to $14.6billion, at least partially reflecting a statutory liberalizationof theEIC.
Data for this article were derivedfrom the "Early TaxEstimates," or ETE, a subset of returns included in the fullsample used for Statistics of Income-4ndividual IncomeTax Returns for 1993. The ETE sample was developed inorder toprovide reliable estimates expeditiously followingthe close of the regular tax return filing season. Eachreturn in the ETE sample represents approximately 5,000returns in the population. In contrast to the estimated106,000 individual tax returns selected for the full Statisticsof Income (SOI) sample, the size of the 1993 ETEsubsample of returns filed through the end of April 1994was only 21,196. Although 1993 represents only thesecond time this sample has been used for early data, thetaxpayers included in the ETE sample have been includedin the Statistics of Income samples each year since TaxYear 1979, provided that the taxpayer filed a return for thegiven year.
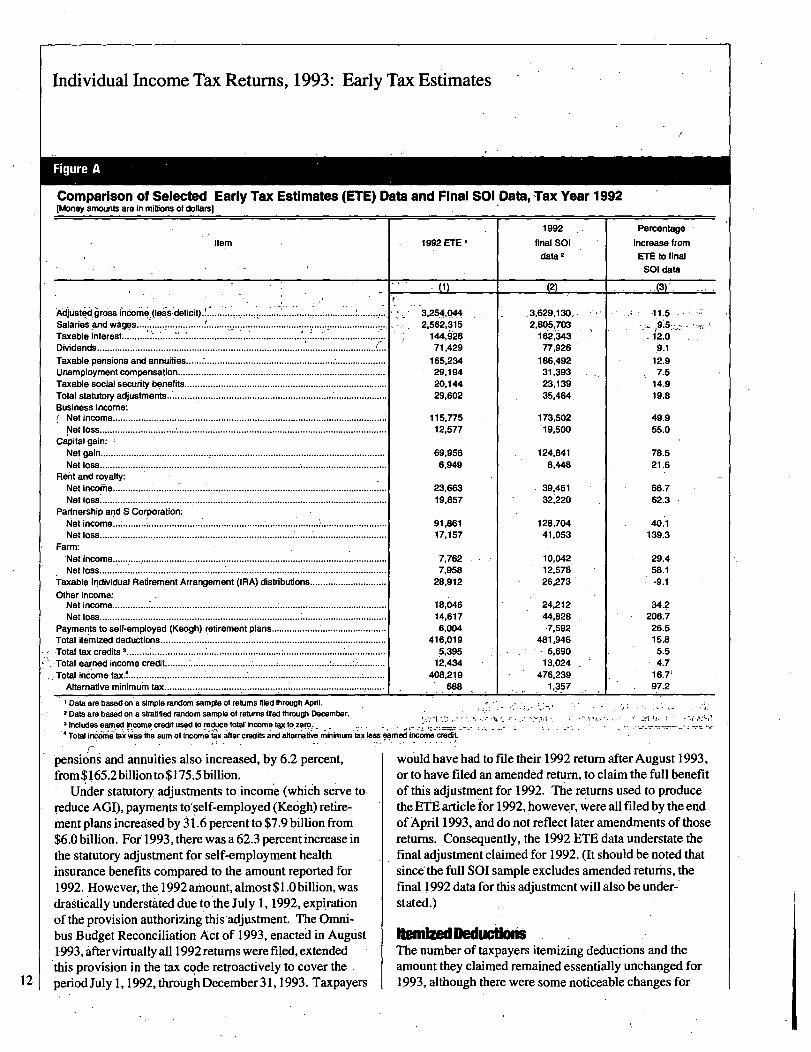
To provide some insights into how the ETE subsampleof returns filed through April relates to the full-year SOIsample, Figure A compares estimates of key income andother items from both samples for TaxYear 1992. Formanyitems the ETE subsample of returns filedthrough Aprilprovides reliable data. An example is salaries and wages,for which there is only a 9.5 percent difference between theestimates from the two samples. For other items, however,the ETE subsample does not provide reliable data. Anexampleof an unreliable item is netcapital gain, forwhich
Michael E. Weber is an economist with the IndividualStatistics Branch. This article was prepared under thedirection ofPeter Sailer, Chief, Individual SpecialProjects Section.
there is a 78.5 percent difference between the estimates forthe two samples. Other items for which the ETE subsampleprovides unreliable'data are: partnership, S Corporationand sole proprietorship net income or loss, and alternativeminimum tax. These items are often reported in sizable butvarying amounts on returns filed after April. Returns filedafter April are mainly those for which filing extensionshave been taken, and many of these returns are for high-income taxpayers. As a result, early estimates for the itemslisted above (and also for high-income returns in general)should be used with caution.
A second problem with the estimates from high-incomereturns is the relatively high sampling variability. Since theETE subsample is a simple random sample not stratified tofavor these taxpayers, there may not be a sufficient numberof returns to present an accurate picture of this part of theindividual income tax return population. The discussionthat follows focuses only on those tax return items andthose taxpayer characteristics for which the ETEsubsample offers reliable estimates.
Selected Sources of Income and StatutoryAdjustments"Adjusted gross income" (AGI) grew by 2.3 percent from$3,254 billionfor 1992 to$3,328 billionfor 1993 eventhough the number of returns filed increased by only 0.5percent (Figure B). Salaries and wages, the principalincome source, increased by 2.8 pgcent from$2,562billionfor 1992 to $2,635 billion. Both the rate ofAGI growth andsalary growth were less than the 3.0 percent annual rate ofinflationfor1993 [1].
The principal componentsof AGI and "statutory adjust-ments" to AGI are shown inTables 2 and 3, respectively. Inaddition to the increase insalaries and wages, there weresignificant changes in severalother components from 1992 to1993 (Figure B). Falling interest
otal income tax
increased by 4.9
percent, reflecting the
effect of the two new
marginal tax rates.
rates were a principal cause ofa 16.6 percent decline inreported taxable interest income. Unemployment compen-sation income also decreased by 14.2 percent. This wasrelated to the decline in the national unemployment ratefrom 7.4 percent for 1992 to 6.8 percent for 1993 [2]. Onthe other hand, dividend income rose by 7.4 percent.
Taxable incomefrom retirement plans increased as well.Taxable IndividualRetirement Arrangement (IRA) distribu-tions increased by 15.0 percent, from$28.9billion for 1992to $33.3 billion. This followed a 35-percent increase, from$21.4billionfor 1991 to $28.9billion, for 1992. Taxable 11
Individual Income Tax Returns, 1993: Early Tax Estimates
Figure A
Comparison of Selected Early Tax Estimates (ETE) Date and Final S01 Data, -Tax Year 1992(Money amounts are in millions of dollars]
Item 1992 ETE
1992
final SOIdata 2
Percentage
increase fromETE to final
SOI data
(1) (2) (3)'t;
Adjusted -gross income. (lais Aeficii) .............................I......*............ ............ ........... 3,254,044 .3,629,130,. 11.5,Salaries And wages .......................... ............. .............. ................... 2,562,315 2,805,703 i9.5:-,,-Taxable interest........................................................................... 1 ........................... 144,928 162,343Dividends ................................................................................................................. 71,429 77,926 9.1Taxable pensions and annuities ...... : ....................................................................... 165,234 186,492 12.9Unemployment compensation ................................................................................. 29,194 31,393 7.5Taxable social security benefits ............................................................................... 20,144 23,139 14.9Total statutory adjustments ....................................................................................... 29,602 35,464, 19.8Business income:
Not income ........................................................................................................... 115,775 173,502 49.9Net loss ................................................................................................................. 12,577 19,500 55.0
C4ital gain: INet gain ......................................................................................... !..................... 69,956 124,841 78.5Net loss ................................................................................................................ 6,949 8'"s 21.6
Refit and royalty:Net income........................................................................................................... 23,663 39,451 66.7Not loss ................................................................................................................ 19,857 32,220 62.3
Partnership and S Corporation:Not income ................................................................................. .......................... 91,861 128,704 40.1Net loss ........................................................................... ......:............................. 17,157 41,053 139.3
Farm:Net income ........................................................................................................... 7,762 10,042 29.4Net loss ............................................................................................................... 7,958 12,578 58.1
Taxable Individual Retirement Arrangement (IRA) distributions .............................. 28,912 26,273 -9.1Other income:Net income............................................................................................................ 18,046 24,212 34.2Net loss ............................................................................... 14,617 44,828 206.7
Payments to self-employed (Keogh) retirement plans............................................. 6,004 7,592 26.5Total itemized deductions ....................................................................... 416,019 481,946 15.8Total tax credits 3 ......... : ................................... ; .............. : ........................................ 5,395 5,690 5.5,Total earned income credit ................................................................. ...................... 12,434 13,024 4.7Total income tax.!.................................................................................................... 408,219 476,239 16.7'
Alternative minimum tax.............................. ................................................ .688 97.2
12
I2
3
4
Data are based on a simple random sample of returns filed through April.
Data are based on a stratified random sample of returns filed through December.A -"C'
Includes earned income credit used to reduce UAW income tax to zero. .
Totai inccimetair;~as the sum of income tax after credits and afterriativ'a minimum tax less earned income credit.
. rpensions and annuities also increased, by 6.2 percent,from $165.2 billion to$175.5billion.
Under statutory, adjustments to income (which serve toreduce AGI), payments to'self-employed (Keogh) retire-ment plans increased by 31.6 percent to $7.9 billion from$6.0 billion. Fof 1993, there was a 62.3 percent increase inthe statutory adjustment for self-employment healthinsurance benefits compared to the amount reported for1992. However, the 1992 amount, Almost $ 1.0billion, wasdrastically understated due to the July 1, 1992, expi
'ration
of the provision authorizing this adjustment. The Omni-bus Budget Reconciliation Act of 1993, enacted in August1993, Aftervirtuallyall 1992 returns were filed, extendedthis provision in the tax code retroactively to cover theperiodJuly 1, 1992, through December31, 1993. Taxpayers
would have had to file their 1992 return after August 1993,or to have filed an arnended return, to claim the full benefitof this adjustment for 1992. The returns used to producethe ETE articlefor 1992, however, were all filed by the endofApril 1993, and do not reflect later amendments of thosereturns. Consequently, the 1992 ETE data understate thefinal adjustment claimed for 1992. (It should be noted thatsince the full SOI sample excludes amended returns, thefinal 1992 data for this adjustment will also be under-stated.)
ftmmkedDWud1oMThe number of taxpayers itemizing deductions and theamount they claimed remained essentially unchanged for1993, although there were some noticeable changes for

Individual Income Tax Returns, 1993: Early Tax Estimates
Figure B
Comparison of Total and Selected Sources of Income and Statutory Adjustments, Tax Years 1992and 1993[Number of returns is In thousands-money amounts are in millions of dollars]
1992 ETE 1993 IETEI Percentage
Number Number increase
Item Of Amount Of Amount inreturns returns amount
(1) (2) (3) (4) (5)
Adjusted gross Incorne (loss deficit)..................................... ..... 106,= 3,Z4,0" 106,769 3,3U,8U 7-3
Total income (less loss) 2 ..................................................................... 106,262 3,283,646 106,769 3,358,306 2.3
Salaries andwages.......................................................................... 90,243 2,562,315 91,650 2,635,278 2.8
Taxable interest ............................................................................... 62,089 144,928 59,916 120,822 -16.6Dividends ... ...................................................................................... 21,358 71,429 22,014 76,728 7.4Taxable Individual Retirement Arrangement (IRA) distributions..... (3) 28,912 (1) 33,255 15.0Taxable pensions and annuities...................................................... 16,560 165,234 17,088 175,519 6.2Unemployment compensation.......................................................... 9,701 29,194 8,808 25,052 -14.2
Less: total statutory adjusimentS 2....................................................... 14,356 29,602 14,483 30,458 2.9
Payrnent to self-employed (Keogh) retirement plans...................... 538 6,004 601 7,902 31.6Self-employed health insurance deduction...................................... 2,165 1
947 1 2,215 11,537
162.3
I Data are based on the Early Tax Estimates (ErE) subsampies of returns used for statistics of Income-Individuall Income Tax Returns.
2 Includes amounts not shown below.3 Not tabulated.NOTE: All data are for returns filed through April.
specific deductions, such as for interest paid and forcharitable contributions (Figure Q. Falling interest ratesin 1993 agai,n contributed to a decline in interest deduc-tions, which fell 4.1 percent to $168.7 billion. Deductionsfor charitable contributions increased by 7.9 percent to$58.4 billion. Additional data on itemized deductionsclassified by size of adjusted gross income are presentedin Table4.
Figure C
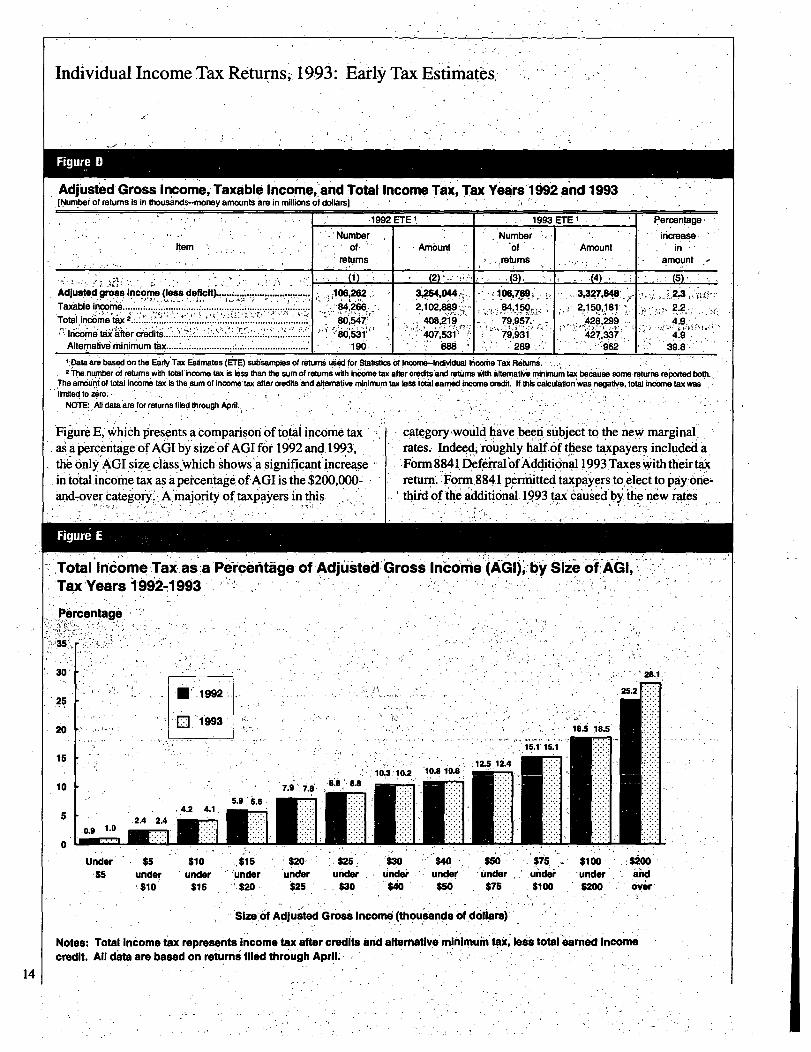
Taxable Income and Total Income TaxThe 2.3 percent growth in AGI was roughly matched by
a 2.2 percent increase in "taxable income" (Figure D).However, total income tax, the sum of income tax aftercredits and the alternative minimumtax (AMT), increased4.9 percent. A substantial portion of this increase wascaused by the new marginal tax rates of 36 and 39.6 percentapplicable to higher levels of income. As can be seen from
Returns with itemized Deductions: Comparison of Adjusted Gross Income and Selected ItemizedDeductions, Tax Years 1992 and 1993[Number ot returns is in thousands--money amounts are in Millions Ot dollars]
1992 ETE 1993 ETE' Percentage
Number Number increase
Item Of Amount Of Amount in
returns 2 returns 2 amount
(1) (2) (3) (4) (5)
Adjusted gross Income (loss deficit) ..................................... 29,253 1,886,978 29,211 1,907,618 1.1
Itemized deductions 3.................................................................. 29,253 416,019 29,211 417,973 0.5
Medical and dental expense ................................................... 4,974 22,119 5,028 22,830 3.2
Total interest paid deduction 3 ................................................ 24,295 175,947 24,286 168,704 -4.1
Home mortgage interest:Paid to financial institutions............................................ 23,373 163,024 23,556 157,791 -3.2
Paid to individuals........................................................... 2,334 6,681 2,043 6,174 -7.6
Contributions deduction .......................................................... 26,8001
54,116 126,530
158,392
17.9
I Data are based on the Early Tax Estimates (ETE) Subsample of returns used for statistics of Income-Individual income Tax Returns.
2 Returns with no adjusted gross income are not inckided in the clachiction counts. For this reason, the sum of returns with total itemized deductions after limitation and returns withtotal
standard deduction is less than the total number of returns for all filers.
3 Includes amounts not shown separately below.
NOTE: Ali data are for returns filed through April.
13
Individual IncorneTax Retumsi. 1993: Eakly Tax Estirn*s:
Figure D11
Adjiust6d Gross.Income, Taxable Income,.'and Total Income Tax, Tax Years 1992 and 1993[Nuff"r of returns is in thous~nds-money amounts
.are in millions of dollars)
-1992ETE 1993 ETE F!ercentage:
Number Number
Item of. "bunt of Amount inreturns .,returns amount
(2) (3). (4)
Adjusted jr~is Income (less deficlt~.-~...., ............ 106,262 3,21P1,044.,_Taxable income ........................ ........................................... 84,266. 2,102,889 84 150- 2,150,11811~
%W
Total incorne tax .................................................................... .80,547, 408,219, 79,957,, 428299 4-9-,1666nie'taii-aiiteir credits ... ...................... ........................ 53 -407,531 79,93i. '427,337 4.9Altemafivd minimum tax.......... ................. ....................
I........... i%6 289 -;..962 39.8
'.Data a4based on the Earty'.Tax Estimates (ErE) subsemples of returns used for statistics of inoome-Individual kunrixe Tax Returns'.~rhe number of returns with total income tax is hiss than the sum Of returns with Income tax after credits and returns with afternati4i minimum tax bemuse some returns reported bOVL
The amount-of total Ino
Iome tax is the,sum of in
Ioome tax after oreditsand afternative minimum tax less total earned Income credit. If this calculation'was negative, total income tax was
qatqgory4oU1d hawbeeri, subject to the new marginal,,rates. Indeed, r~ughly halfof these taxpams; included aForm 884 1. Deki.Tal ofAdditional 1993Taxes w~ ith their taxreturn.:Form.8841 permitted taxpayers to elect to pay. one-thiid of the a
Idditi6nal 1993 tax,caused
.b' enew ratesy~ I . 1 1.
Under''. $5 $10 $20 $25 $30 $40 $W $100 $200
14
NOTE:,All data'are for returns filed through April.
Figure E, which presents a comparison of total income taxaia pen:~~nita' e of AGI by size'of AGI for 1992 and 19939 1 .the only AGI size classwhich shows'a siRnificant increaseint6tal inc~ometaix' as A'p'eicentag&ofAG1 is the $200,000-and7over, category. 1 AqmaJoT4 of taxpayers in this
Figure E
Total Income Taxas~a 126rd6fitAge o
.. tax Years -ivtPz-!v
.$5 under I under 'under under under under under . under under . under and$10 $15 !'.$20 $25 $30 $40 $50 $75 $100 $200 over
Size Adjusted Gross Income (thousands of.doll.ars)
Notes: Total Income tax represents Income tax after credits and alternative minimum tax, less total earned Incomecredit. All data are based on returns filed thro
.ugh A rilP
Individual Income Tax Returns, 1993: Early Tax Estimates
W
with their 1994 return andone-third with their 1995 return.(See 1993 Tax LawChanges for additional information.)The final statistics for 1993 will undoubtedly show largernumbers of returns in these two categories because manyhigh-income returns are filed afterApril.
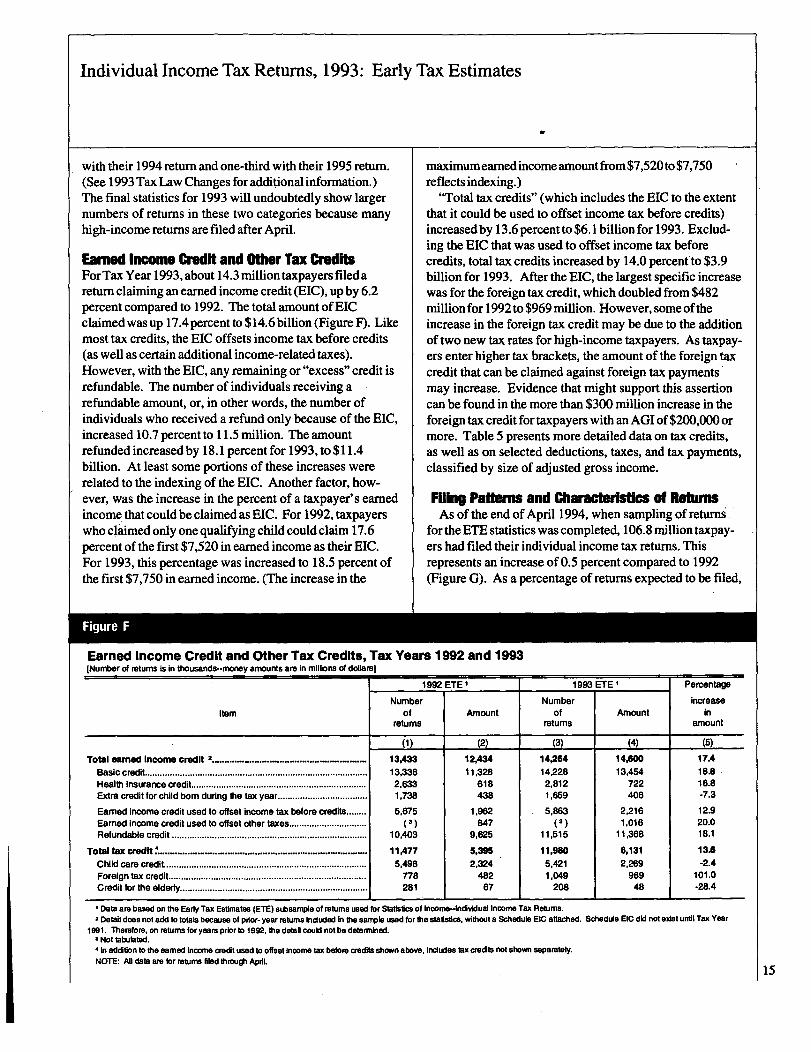
Eamed Income Credit and Mer Tax CWibFor Tax Year 1993, about 14.3 million taxpayers filedareturn claiming an earned income credit (EIC), upby 6.2percent compared to 1992. The total amountofEICclaimedwas up 17.4 percent to $14.6 billion (Figure F). Likemost tax credits, the EIC offsets income tax before credits(as well as certain additional income-related taxes).However, with the EIC, any remaining or "excess" credit isrefundable. The number of individuals receiving arefundable amount, or, in other words, the number ofindividuals who received a refund only because of the EIC,increased 10.7 percent to 11.5 million. The amountrefunded increased by 18.1 percent for 1993, to $11.4billion. At least some portions of these increases wererelated to the indexing of the EIC. Another factor, how-ever, was the increase in the percent of a taxpayer's earnedincome. that could be claimed as EIC. For 1992, taxpayerswho claimedonly one qualifyingchild could claim 17.6percent of the first $7,520 in earned income as their EIC.For 1993, this percentage was increased to 18.5 percent ofthe first $7,750 in earned income. (The increase in the
Figure F
maximumearned income amount from$7,520 to$7,750reflects indexing.)
"Total tax credits" (which includes the EIC to the extentthat it could be used to offset income tax before credits)increased by 13.6 percent to $6. 1 billion for 1993. Exclud-ing the EIC that was used to offset income tax beforecredits, total tax credits increased by 14.0 percent to $3.9billion for 1993. After the EIC, the largest specific increasewas for the foreign tax credit, which doubled from $482million for 1992 to $969 million. However, some of theincrease in the foreign tax credit may be due to the additionof two new tax rates for high-income taxpayers. As taxpay-ers enter higher tax brackets, the amount of the foreign taxcredit that can be claimed against foreign tax payments'may increase. Evidence that might support this assertioncan be found in the more than $300 million increase in theforeign tax credit for taxpayers with an AGIof$200,000 ormore. Table 5 presents more detailed data on tax credits,as well as on selected deductions, taxes, and tax payments,classified by size of adjusted gross income.
Filing Patierns and Characteristics of RehmAs of the end of April 1994, when sampling of returns
for the ETE statistics wascompleted, 106.8 million taxpay-ers had filed their individual income tax returns. Thisrepresents an increase of0.5 percent compared to 1992(Figure G). As a percentage of returns expected to be filed,
Earned Income Credit and Other Tax Credits, Tax Years 1992 and 1993[Number of returns Is in thousands--money amounts are in millions of dollars]
1992 ETE 1993 ETE Percentage
Number Number increaseItem of Amount of Amount in
retums returns amount
(1) (2) (3) (4) (5)
Total earned Income CMdIt 2...................................................... 13,433 12,434 14,264 14~W 17A
Basic credit ......................................................................................... 13,336 11,328 14~228 13,454 18.8Health insurance credit ...................................................................... 2,633 618 2,812 722 16.8Extra credit for child born during the tax year .................................... 1,738 438 1,659 406 -7.3
Earned Income credit used to offset income tax before credits........ 5,675 1.962 5,863 2.216 12.9Eamed income credit used to offset other taxes............................... (3) 847 (3) 1,016 20.0Refundable credit .............................................................................. 10.403 9,625 11,515 11,368 18.1
Total tax credit ~......................................................................... 11,477 5,395 11,980 6,131 13.6
Child care credit ................................................................................ 5,498 2,324 5,421 2,269 -2.4Foreign tax credit............................................................................... 778 482 1,049 969 101.0Credit for the elderly........................................................................... 281 67 208 48 -28.4
Date are based on the Early Tax Estimates (ETE) subsample of returns used for Statistics of Income.-Individual Income Tax Returns.Detail does not add to totals because of prior- year returns Included In the sample used for the statistics, without a Schedule Etc attached. Schedule EIC did not exist until Tax Year
1991. Therefore, on returns for years prior to 1992, the detail could not be cletannined.Not tabulated.In adclition to the earned Income credit used to offset Income tax before credits shown above, includes tax creclits not shown separately.
NOTE: AD data are for returns filed through April.15
Individual Income Tax Returns, 1993: Early Tax Estimates
Figure. G
Number of Returns Filed, Tax Years 1988-1993[Number of returns Is in thousands)
Returns
filed
Returns filed through April of the filing year .................................
Returns filed through December of the filing year .......................Returns filed through April as a percentage of returns
filed through December ............................................................
1989
(2) -
104,314
112,136
93.0,
1992
(5)
106.262
113,75.4 r
93.4
1993
T6)_
106,769
114,5401
93.22
Returns filed in Tax Year
1990
(3)
106,465
113,470
93.8
1991
J4)
107,140
113,795
94.2
Projected total by the IRS Compliance Research of Forms 1040, 1040A. 1040EZ. and electronically-filed Peturns; as,adjusted for Statistics of Income.2Estimated on the basis of projections for Tax Year 1993.
r - revised.NOTE: All data are for ratums.filed through April.
1988
(1)
102,228
109,708
93.2
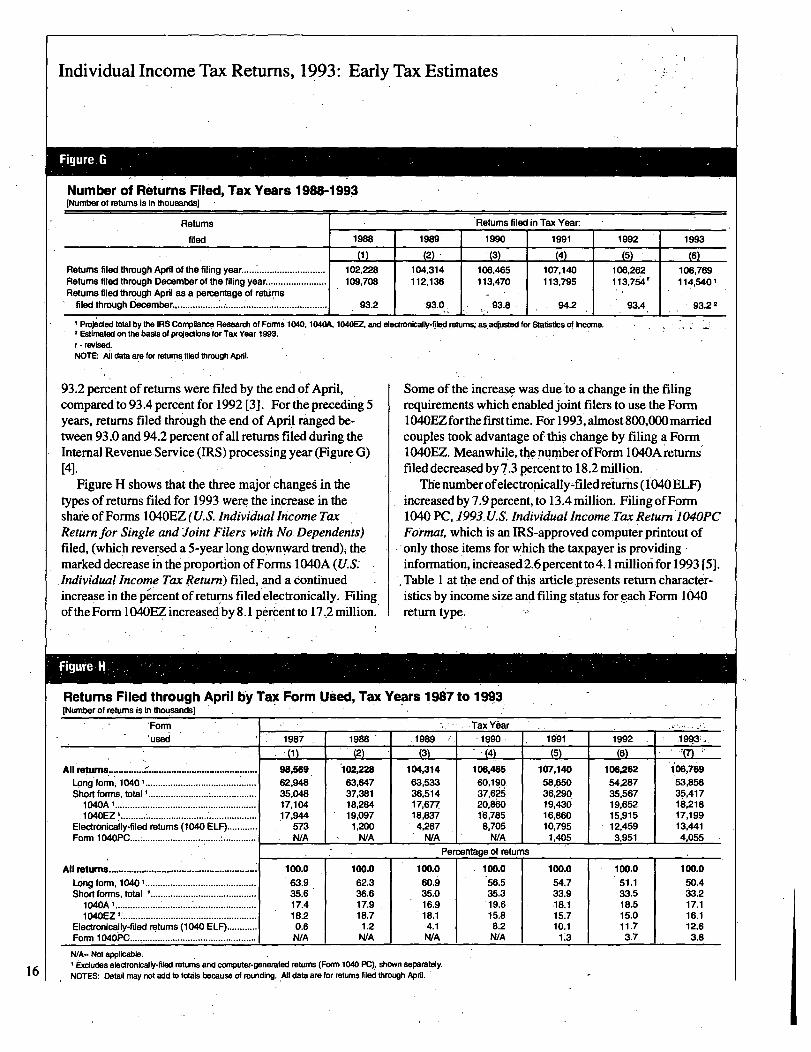
93.2 percent of returns were filed by the end ofApril,compared to 93.4 percent for 1992 [3]. For the preceding 5years, returns filed through the end of April ranged be-tween 93.0 and 94.2 percent.ofall returns filed during theInternal Revenue Service (IRS) processing year (Figure G)[4].
- Figure H shows that the three major changes in thetypes of returns filed for 1993 were the increase in theshare ofForms 1040EZ (U.S. Individual Income TaxReturn for Single and Joint Filers with No Dependents)filed, (which reversed a 5-year long downward trend), themarked decrease in the proportion ofForms 1040A (U.S.,Individual Income Tax Return) filed, and a continuedincrease in the pe'rcent of returns filed electronically. Filingof the Form 1040EZ increased by 8.1 percent to 17..2 million.
Some of the increase was due'to a change in the filingrequirements which enabledjoint filers to use the Form1040Morthefirst time. For 1993
., almost 800,000 married
couples took advantage of this change by filing a Form1040EZ. Meanwhile,the number ofForm 1040A returnsfiled decreased by7.3 percent to 18.2 million.
The numberofelectronically~filed returns (1040 ELF)increased by 7.9 percent, to 13.4 million. Filing ofForm1040 PC, 1993. U.S. Individual Income Tax Return 104OPCFormat, which is, an IRS-approved computer printout ofonly those items for which the taxpayer is providinginformation, increased 2.6 percent to 4. 1 million for 1993 [5].Table I at the end of this articlepresents return character-istics by income size and filing status foreach Form 1640return type.
Returns Filed through April by Tax Form Used, Tax Years 1987 to 1993[Number of retims is in thousands]
Form
usei:i 1987 1988
All retums.............. ..........................................
Long form, 10401 ............................................
Short forms, total 1 ............................................
1040A I ........................................................
1WEZ1.......................................................
Electronically-filed returns (1040 ELF) ............
Form 104OPC .... ; ............................... ...........
All retums..........................................................
Long form, . 1M 1 ............................................
Short forms, total I ..........................................
1040A I ........................................................
1040EZ I......................................................
Electronically-filed returns (1040 ELF) ............
Form 104OPC ..................................................
0)
98,569
62,94835,04817,10417,944
573
N/A
100.0
63.935.617.418.2
0.6N/A
L2)
102=8
63,647
37,38118,28419,097
1,200
NIA
100.0
62.336.617.918.7
1.2NIA
1989
(3)
104,314
63,533
36,51417,67718,837
4,267
N/A
100.0
60.935.016.918.14.1
N/A
Tax Year
.1990
U4
106,465
60,190,
37,62520,8W16,785
8,705
N/A
1991
ts)
107,140
58,650
36,29019,43016,86010,795
1,405
Percentage of returns
1 00.0
56.535.319.615.88.2
NIA
100.0
54.733.9.18.1
15.710.1
1 *.3
1992
US
106,262
54,287
35,56719,65215.91512,459
3,951
100.0
51.133.518.515.011.7
3.7
1993
'7(7)
iO6,769
53,856
35,41716,21817,19913,441
4,055
100.0
50.433.217.116.1
12.63.8
N/A- Not applicable.I Excludes electronically-filed returns and computer-generated returns (Form 1040 PC), shown separately.
161, NOTES: Detail may not add to totals because of rounding. AJI data are for returns filed through April.
Individual Income Tax Returns, 1993: Early Tax Estimates
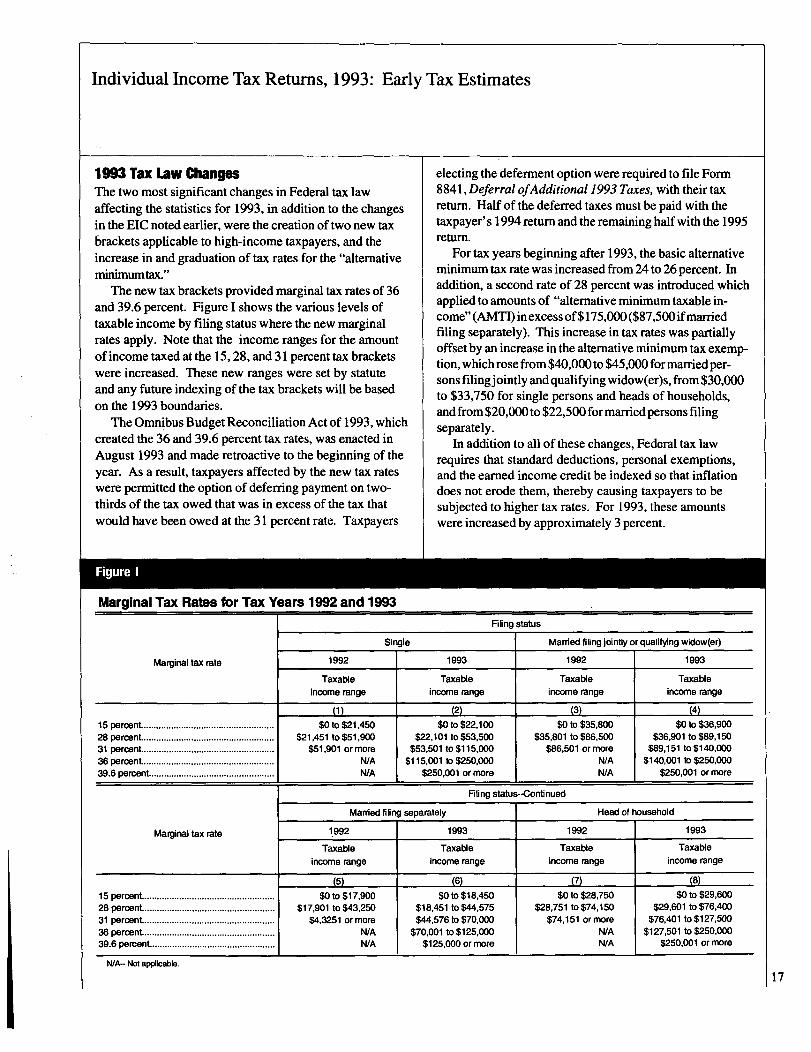
1993 Tax Law ChangesThe two most significant changes in Federal tax lawaffecting the statistics for 1993, in addition to the changesin the EIC noted earlier, were the creation of two new taxbrackets applicable to high-income taxpayers, and theincrease in and graduation of tax rates for the "alternativeminimunitax."
The new tax brackets provided marginal tax rates of 36and 39.6 percent. Figure I shows the various levels oftaxable income by filing status where the new marginalrates apply. Note that the income ranges for the amountof income taxed at the 15, 28, and 31 percent tax bracketswere increased. These new ranges were set by statuteand any future indexing of the tax brackets will be basedon the 1993 boundaries.
'Me Omnibus BudgetReconciliation Actof 1993, whichcreated the 36 and 39.6 percent tax rates, was enacted inAugust 1993 and made retroactive to the beginning of theyear. As a result, taxpayers affected by the new tax rateswere permitted the option ofdeferring payment on two-thirds of the tax owed that was in excess of the tax thatwould have been owed at the 31 percent rate. Taxpayers
Figure I
Marginal Tax Rates for Tax Years 1992 and 1993
electing the deferment option were required to file Form8841, Deferral ofAdditional 1993 Taxes, with their taxreturn. Halfof the deferred taxes must be paid with thetaxpayer's 1994 return and the remaining half with the 1995return.
For tax years beginning after 1993, the basic alternativeminimum tax rate was increased from 24 to 26 percent. Inaddition, a second rate of 28 percent was introduced whichapplied to amounts of "alternative minimum taxable in-come" (AMTI) inexcessof$175,000 ($87,500 ifmarriedfiling separately). This increase in tax rates was partiallyoffsetby an increase in the alternative minimum tax exemp-tion, which rose from $40,000 to $45,000 formarried per-sons filingjointly and qualifying widow(er)s, from $30,000to $33,750 for single persons and heads of households,and from$20,000 to $22,500 formarriedpersonsfilingseparately.
In addition to all of these changes, Federal tax lawrequires that standard deductions, personal exemptions,and the earned income credit be indexed so that inflationdoes not erode them, thereby causing taxpayers to besubjected to higher tax rates. For 1993, these amountswere increased by approximately 3 percent.
Filing status
Single Married filing jointly or qualifying widow(er)
Marginal tax rate 1992 1993 1992 1993
Taxable Taxable Taxable Taxableincome range income range income range income range
(1) (2) (3) (4)
15 percent..................................................... $0 to $21,450 $0 to $22,1 00 $0 to $35,800 $0 to $36,90028 percent .................................................... $21,451 to $51,900 $22,11 01 to $53,500 $35,801 to $86,500 $36,901 to $89,15031 percent..................................................... $51,901 or more $53,501 to $115,000 $86,501 or more $89,151 to $140,00036 percent .................................................... N/A $115,001 to $250,000 N/A $140,001 to $250,00039.6 percent .................................................. N/A $250,001 or more N/A $250,001 or more
Filing statu"ontinued
Married filing separately Head of household
Marginal tax rate 1.992 1993 1992 1993
Taxable Taxable Taxable Taxable
income range income range income range income range
(5) (6) (7) (8)
15 percent..................................................... $0 to $17,900 $0 to $18,450 $0 to $28,750 $0 to $29,60028 percent ..................................................... $17,901 to $43,250 $18,451 to $44,575 $28,751 to $74,150 $29,601 to $76,400
31 percent.................................................... $4,3251 or more $44,576 to $70,000 $74,151 or more $76,401 to $127,50036 percent.................................................... N/A $70,001 to $125,000 N/A $127,501 to $250,00039.6 percent .................................................. N/A $125,000 or more N/A $250,001 or more
N/A- Not applical:i1e.
1 17
Individual Income Tax Retums, 1-993: Early Tax,,Estimates,
DabSources andUndtationsThe statistics presented-in this article were derived from asample ofall individual tax returns received inthe ten IRSservicecenter mailrooms from January 1, 1994, throughApril 29, 1994. The gain le was. selected based on the
. 1. , ".. .' '
.'
ppri,mary socia'I security number (SSN). (i.e., the SSN of theprimary" or first listed taxpayer,in'the'case ofjpint -
returns) Qing in"one of two pre'-dehtitedord'e'ri for "thes u* Ldigita,I iio'r s. Specifically', twbjhi~ffib6i's between 0
,000i. 1 ~ . ~ t '' .1-1 - ~, ~,.:f Iand 9999. were chosen, so thiti'alf re'tiiffi'~ending ifi'one of
these two numbers were sampled. Electronically-filedreturns with'a primary SSN ending in one of these. twofour-digit combinations were also included in the sample.This method of sampling provides the same results as arandom'sample. The returns studied for the' ETE statisticsare a subset of the returns included in the sample used forStatistics ofIncome -- Individual Income Tax Returns.
Since two SSN endings out ofa possible 1.0,000 wereselected, each return represented "One out of 5,000 returnsin the-population.-The size of the entire ETE subsamplefrom January 1 through April 29, 1994, was 21,196 returns.Weights were adjusted for returns identified,as missingfrom the sample.
Since the data presented in this article are estimatesbased on a: sample, they are.subject to sampling (as-Well as.non-sampling) error. Non-sampling error may be higher forETE data than for other SOI data because approximately 20to 25 percent of the returns included had not yet beensubjected to any of the regular IRS return-processingsteps, which would hav~'corrected many taxpayer report-ing Offors. These returns showed a tax due at time of filingand are typically processed after April 15th, to permitrefund returns to be given a higher priority. Sample re-turns with. tax due were identified when they were receivedat the IRS centers and forwarded for,SOI processing priorto regular IRS processing. During SOI processing theywere tested for internal consistency, however, so that themore obvious taxpayer omissions and math errors werecorrected
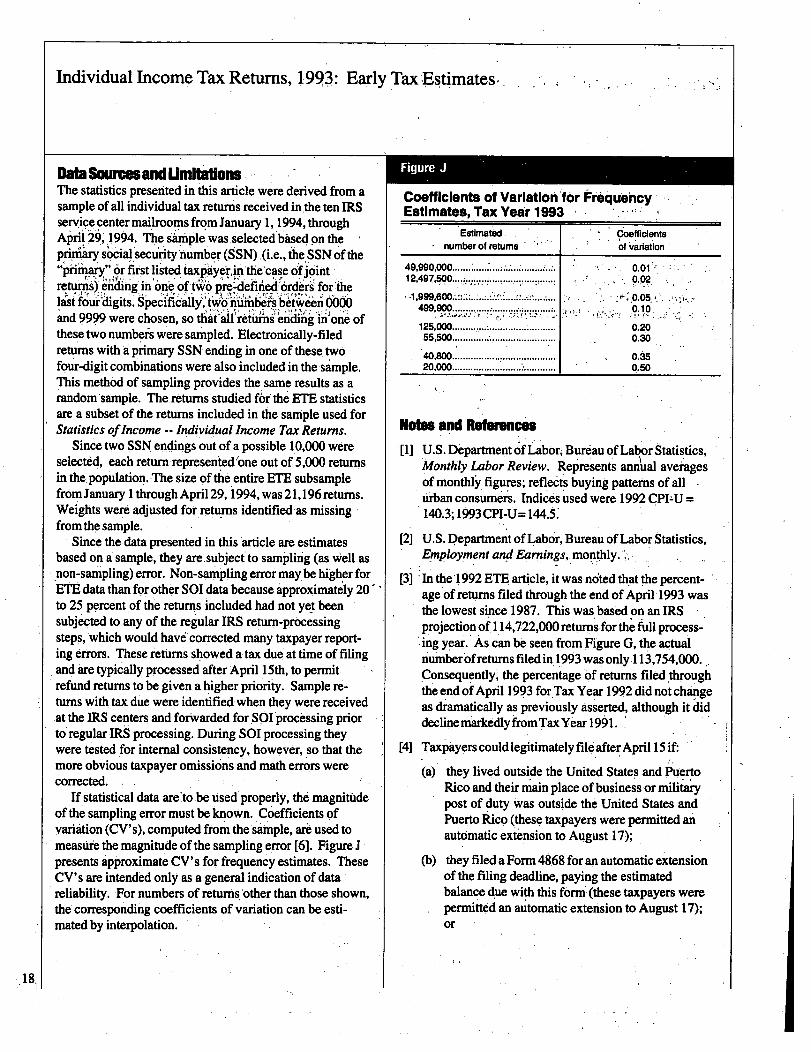
If statistical data are:to be used properly, the magnitudeof the sampling error must be known. Coefficients ofvariation (CV's), computed from the sample, are used tomeasure the magnitude of the sampling error [6]. Figure Jpresents approximate CV's for frequency estimates. TheseCV's are intended only as a general indication of datareliability. For numbers of returrisother than those shown,the corresponding coefficients of variation can be esti-mated by interpolation.
I Figure J
Coefficients of Varlatiohlbr Pedqu6heyEstimates, Tax Year 1993
Estimatednumber of returns
49,990,000........12,497,500.... ; ............................
499.900 ........................... ;...........
125,000 .......... .............. : ..........55,500 .................. I .....................
40,800 .......................................20,000 ........................................
Coefficients~f Variation
0.010.02~
0.200.30
0.350.50
Notes and References
[1] U.S. Department ofLabori Bureau ofLabor Statistics,Monthly Labor Review. Represents annual averagesof monthly figures; reflects buying patterns of allurban consumers. Indices used were 1992 CP1-U140.3; 1993 CP1-U= 144.5.'
[2] U.S. Department ofLabor, Bureau ofLabor Statistics,E~mployment and Earnings, mop
'
thly.
[3] 'In the'1992 ETE article, it was noted that the percent-age ofreturns filed through the end ofApril 1993 wasthe lowest since 1987. This was based on an IRSprajection of 1, 14,722,000 returns for the full process-ing year. As can be seen from Figure G, the actualn
.umberofreturns filed in 1993 wasonly 113,754,000.
Consequently,' the percentage of returns filed throughthe end ofApril 1993 for,Tax Year 1992 did not changeas dramatically as previously asserted, although it diddeclinemarkedlyfromTax Year 190 1.
[4] Taxpayers could legitimately file after April 15 if-
-(a) they lived outsi'de the United State
's and Puerto
Rico and their main place of business or miliia~ypost of duty was outside the United States andPuerto Rico (these taxpayers were permitted anautomatic extension to August 17);
(b) they fileda Form 4868 for an automatic extensionof the filing deadline, paying the estimatedbalance due with this form'(these taxpayers werepermitted an automatic extension to August 17);or I
Individual Income Tax Returns, 1993: Early Tax Estimates
c) they filed a Form 2688 foran additional extensionof time to file (these taxpayers were granted anextension of2 ormore additional months, pro-vided that there was a good reason why theprevious 4-month extension was inadequate).
[5) Form 104OPC returns arecomputer-generated returnswhich contain only line numbers and data entries.Only those lines of the tax form which contain an entryappearon the FormlO40PC, resulting in a return
containing fewer pages than if the same return hadbeen prepared using the standard IRS form andschedules.
(61 The coefficient of variation is the ratio of the standarderror of the estimate to the estimate itself. For moreinformation on the coefficient ofvariation and how touse it in interpreting ETEdata, see "SOI SamplingMethodology andData Limitations," in the Appendixto this issue of the Bulletin.
19
Individual Income Tax Returns, 1993: Early Tax Estimate's
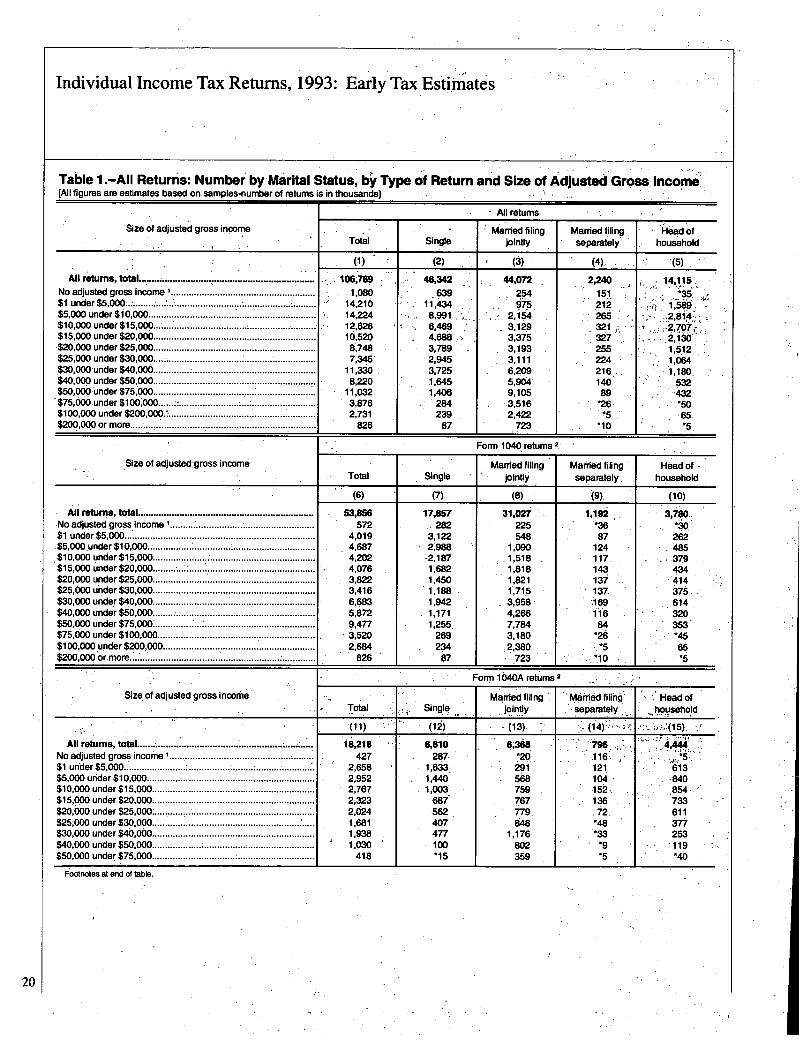
Table I.-All Returns: Number by Marital Status, b~ Type of Return and Size of Adjusted Gross lncoFw_[An figures are estimates based on samples-number of returns is in thousands)
I AJI returns
Size of adjusted gross income Married filing Married filing Head ofTotal Single jointly separately household
(2) (3) (4). (5)
All returns, total... ..................................................... I....... 106,769 46,342 44,072 2,240 14,115,No adjusted gross income ....................................................... 1,080 639 2 151$1 under ..............................'$5,000~.: ............. ................... 14,210 1 1,4,U 975. 212 1,589,$5,000 under $10,000. ..................................... 14,224 8,991 2; 1 ~4. 265 ~,~?t8l,4-;$10,000 under $15,000................................ .......................... 12,626 6,469 3,129 321 _;,2,707;,$15,000 under $20,006............................................................... 16,520 4,688 3,3~5 3~7420,000 under $25,600............................................................... 6,748 3,789 3,193 255 1.512$25,000 under $30,000............................................................... 7,345 2,945 3,111 224 1,0ii4$30,000 under $40,000............................................................... 11,330'. 3,725 6,209 216. 1,180.$40,000 under $50,000 ................. ........................................ 8,220 1,645 5,904 140 532$50,000 under $75,000............................................................... 11,032 1,406 9,105 89$75,600. under $1OO'(= ...... ....................... ............ ........... 3,876 284 3,516 *26$100,000 under $200,000 ............................................................ 2,731 239 2,422 -5 65$200,00.0 or. more .......................................... ........................ 826, U 723 *10 -5.
Form 1040 returns 2
Size of adjusted,gross income Married filing Married filing Head ofTotal Single -jointly separately, household
(6) .(7) (8) (9) (10)
All returns, total .................................................................... 53,856 17,857 31,027 1,192 3,780No adjusted gross income I ............................ ........................... 572 282 225 _'36$1 under $5,000 .......................... :***"**'*'***"**"*'***"**...... *"*** ....... 4,019 3,122 548 87 262.$5,000 under $10,000 .................................................................. 4,687 2,988 .1,090 124 485$10,000 under $15,000 ..................... :......................................... 4.202 2,187 -1,518 117, 379$15,000 under, $20,000 ................................................................
.. 4,076 1,682 1,818 143 434
$20,000 under $25,000 .............................................................. 3.822 1,450 1,821 13~ 414$25,000 under $30,000 ................................................... ......* .... 3,416 1,188 1,715 137 375$30,000 under $40,000 ....... ............... ........ 6,683 1,942 3,958, ~1 69 614$40,000 under $50,000 ................................................................ 5,872 1,171 4,266 1i6 320$50,000 under $75,000 ................................................................. 9,477 1,255 7,784 84 353$75,000 under $100,000...................................... ...................... 3,5120 269 3,180 :-45$100,000.under $200,000........................................................... 2,684 234 2,380 *5 65$200,000 or more........................................................................ 826 87 .723 *10 *5
MS2Form 1640A retu
Size. of adjusted gross income Marriedfiling 'Married filing' Head ofTotal Single
-jointly
--separately household
(11) (12)-------
(13), 04) 05).
All returns, total ...................................................................... 18,218 6,610 0,368 '7W.No adjusted gross income I ......................................................... 427 287, *20 116 .5,,$1 under $5,000 ..............................................
............2,658 1,633 291, 121 613
$5 000 under $10,000................................................................. 2,952 1,440 568 104 ~840$16,000 under $15,000............................................................... 2,767 1,003 759 M.,$15,000 under $20,000............................................................... 2,323 687 767 136 733$20,606 under $25,000 ............... ............................................... 2,624 562 779~ 611$25 000 under $30,000.. ............................................................
*:1,681 407 848 *48 377
$30:OOP under $40,ObO.. ............................................ ........ 1,938 477 1,176 '33 253,$40,000 under $50,000............................................................... 1,030 100 802 *9 119$50,000 under $75,000................................... *-* ........ **............. 418 *15 359 -5
1~6otriotes at end of table.
20

Individual Income Tax Returns, 1993: Early Tax Estimates
Table 1.-All Returns: Number by Marital Status, by Type of Return and Size of Adjusted Gross Income
-Continued[All figures are estimates based on samples-number of returns is in thousands]
Form 1040EZ returns 2
Size of adjusted gross income Married filing Married filing Head ofTotal Single jointly separately household
(16) (17) (18) (19) (20)
All returns, total.................................................................... 17,199 16,426 773 WA N/A
No adjusted gross income I ........................................................ *41 *41 N/A N/A
$1 under $5,000 .......................................................................... 5,849 5,829 *20 N/A N/A
$5,000 under $10,000................................................................. 3,418 3,362 56 N/A N/A
$10,000 under $15,000............................................................... 2,312 2,246 66 N/A N/A
000 under $20,000...............................................................$15 1,770 1,679 92 N/A NIA,
$20,000 under $25,000 ............................................................... 1.412 1,348 65 N/A N/A
$25,000 under $30,000 ............................................................... 1,000 915 85 N/A N/A
000 under $40,000 ...............................................................$30 1,020 811 209 N/A N/A,
$40,000 under $50,000 ............................................................... 321 181 140 N/A N/A
$50,000 under $75,000 ............................................................... 1 55 15 N/A N/A
Electronically filed returns
Size of adjusted gross income Married filing Married filing Head ofTotal Single jointly separately household
(21) (22) (23) (24) (25)
All returns, total.................................................................... 113,"1 3,734 4,045 129 5,533
No adjusted gross income I ........................................................ *152781
*10521
-589 668
$1 under $5,000 ..........................................................................000 under $10,000 .................................................................$5
,2,673 873 346 *10 1,444
,000 under $15,ODO ...............................................................$10 2,783 750 583 1,414
,ODO under $20,000...............................................................$15 1,951 422 569 930
,000 under $25,000...............................................................$20 1,113 309 368 *15 420
,000 under $30,000...............................................................$25 949 326 331 *25 267
,$30,000 under $40,000............................................................... 19174 321
119571461
*5*10
27774
$40,000 under $50,000............................................................... 663654 62 558 W
$50,000 under $75,000 ...............................................................* *5
$75,000 under $1100,000............................................................. 163 15 143
$100,000 under $200,000 ........................................................... *25 -5 '20
$200,000 or more........................................................................
Form 104OPC returns
Size of adjusted gross income Married filing Married filing Head of
Total Single jointly separately household
(26) (27) (28) (29) (30)
All returns, total.................................................................... 4,055 1,716 1,859 123 357
No adjusted gross income I ........................................................ *25 *20 *5*27 -5 '46
$1 under $5,000.......................................................................... 407494
329328 94 *27 *46
$5,000 under $10,000.................................................................000 under $15,000 ...............................................................$10 561 283 202 *16 '60
,$15,000 under $20,000 ............................................................... 400 219 130
160*17*31 '66
$20,000 under $25,000............................................................... 377299
120109 131 *14 *45
$25,000 under $30,000...............................................................000...............................................................000-under $40$30 515 174 295 *9 *37
*,,$40,000 under $50,000............................................................... 334 75 236 *5 18
-5$50,000 under $75,000............................................................... 428 60 364
$75,000 under $100,000............................................................. 193 193
$100,000 under $200,000.............................................. ............*22 '22
$200,000 ormore.................................................................
I Includes returns with adjusted gross defidt2 Excludes electronically-filed returns and computer-generated returns (Form 1040 PC), shown separately.
Estimate should be used with caution because of the small number of sample returns on which it is based.
N/A - Not applicable.NOTES: Detail may riot add to totals because of rounding. All data are based on returns fled through April.
21
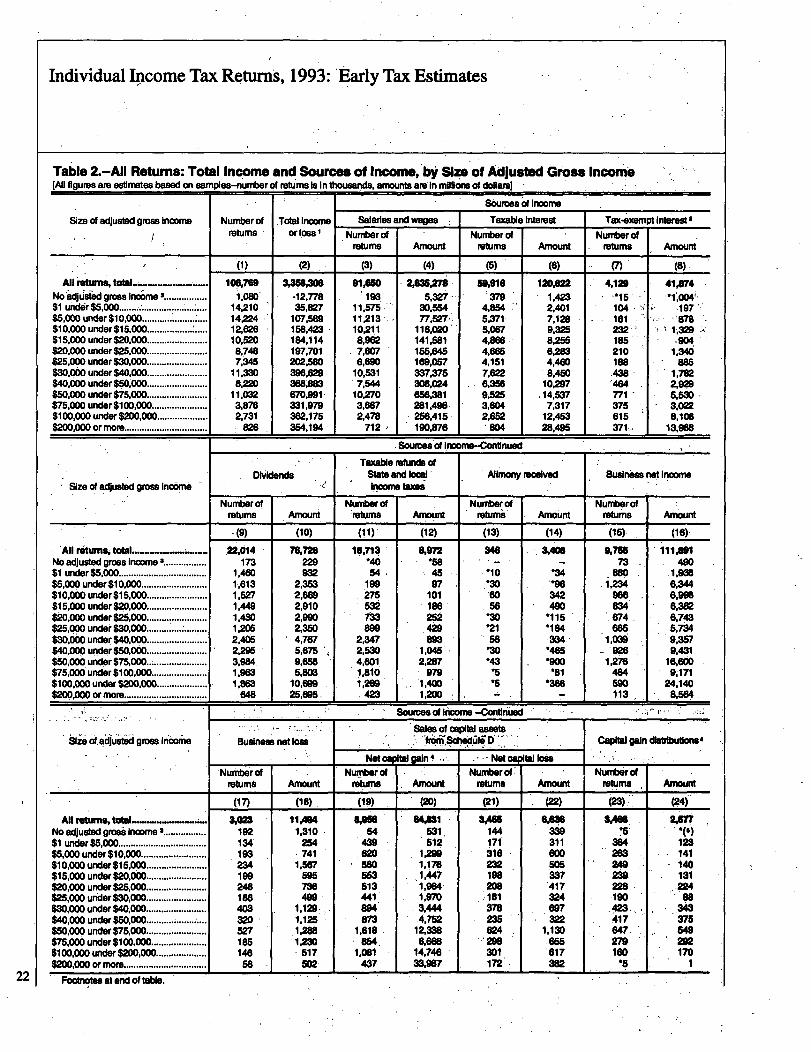
Individual Income Tax Returns, 1993: 'Early Tax Estimates
Table 2.-All Returns: Total Income and Sources of Income, W Size of Adjusted Gross Income[All figures are estimates based on samples-numberof retums.19 inVoussiuls. amounts are in millo'ne of dollars]
22
Sources of Income
Sze of adjusted gross Income Number of Total Income Salaries and wages Tw(able Interest Tax-exempt Interestreturns or loss Number~of Number of I . . Number of
returns Amount returns Amount returns AAMM
(1) (2) (3) (4) (5) (6) (7) (6)
All isbans, 100'M 3XB,= 91,650 2AM,27S 59,916 12OAn 4,129 41 A74No adidsied gross income 3................. j,080' -12,776 '193' 5.327- 379 1.423 --I',00C$1 uhddr$5,000
*.......................... : .... 14,210 35,827 11,575 30,654 4054 2,401 104 %197 '
$5,000 under $101000'........................... 14,224 107-5M 11,213 77,527-: 5,371 7,128 161 M$10,000 under $15,000........................ 12,626 158,423 IOR11 116,020 6,067 9.325 232- .1,329$15,000 under $20.ODO........................ 10,520 184,114 8,962 141.581 4.868. km 185 .904$20,000 under $25.000........................ 8,748 197,701 7,W7 155,846 4,855 6,PM 210
,1,340
$25,000 under $30,000........................ 7,345 202JW 6,690 169,067 4,151 4,460 Ise 865$30,060 under $40,000........................ 11,330 396,629 10,531 7,622 8,450 438 1,782$40,000 under $50,ODO........................ 8,22D 368,883 7,544 308,024 6,358 IOA7 `464 2,929$60,000 under $75,000........................ 11,032 970.991- 10,270 856,381 9,525 .14,107 771 5,530.$75,000 under $100,000...................... 3,876 331,979 3,W7 281AN 3.604 7.317 375 3.022$100,000 under $2W.000.................... 2.731 362,175 2.478 256,415 2,652 12,453 615 8,106$200,000 or more................................. 3M,194 712 190,876 - W4 1 28,05 371~. 13,968
Sources of Incoms-rContinued
Taxable refunds ofDividends State and local' Alimony received Business not I
Size of adjusted gross-income income taxes
Numberof Number of Numberof Numberofrebjms Amount returns Amount returns Amount
returnsAmount
-(9) (10) (11) (12) (13) (14) (15) (16)
'Ali rqit~ ...... 22,014 76,728 15,71; 8,972 346 3AW 9i755 1IIJMNo adjusted gross Income 3................. 173 220 *40 *58 - 73 400$1 under $5,000................................... 1,480 932 64 45 *10 *34 am .1,938$5,000 under $10,000.......................... 1,613 2,353 199 97 ..30 ~.% 11,234
.6.344
$10,000 under $15,001)........................ 1.527 2,6W 275 101 60 342 968 6,998$15,060 under $20,000........................ 1,449 2,910 53~ Ise 56 490 834 6,382$0,900 under $26,000........................ 1,430 2,990 M 252 '30 *115 674 6,743$25,000 under $30,000........................ 1.205 2,350 M 429 *21 *184 685 5.7~14$30,660 under $40,OW........................ 2,405 4,767 2,347 893 56 1.039 9,357$40,OOP under $50,000........................ 2.206 5,675 2.5W 1,045 *30 *465 -926 9,431$50,000 under $75,000..;..................... 3.9K 9,658 4.1011, 2,297 *43 *900 1,276 16,WO$75,ObO under $100,000...................... 1,963 5,803 1,810 979 *5 *81 484 9,171$100,000 under $2DO,000 .................... I'M 11011399 1,269 1.400 *5 M 590 24,140$200,000 ormore................................. "S 25,695 4M 1,2W 113 8,5"
Sales of capital assets631ii oiadiust6d gross incoine Business not lose Capital gain distributions 4
Net Capital gain 4 NWW tal IoseNumber of Number of Numberof Number of
returns Amount returns Amount returns Amount returns Amount
(17) (18)(19) (2D) (21) (22) (23).- (24)
All raUffna, total ...... 3,On IIAN 111.= MAI 3AW %= SAM, UnNo adjusted grosi Income ................. 192 1.310 54 531, 144 339 *5$1 under $5,000................................... 134 254 439 612 171 311 364 123$5,000 under $10,000.......................... 193 620 1,2M ~16 800 283 141$10,000 under $15,090 ........................ 234 1,667 560 1.176 232 605 249 140$15,000 under $20,000 ........................ 199 695 563 .1,447 lee 337 239 131$~0,000 under $25,000 ........................ 248 736 513 1,954, 208 417 226 .224$25,000 under $30,000 ........................ Ise 499 441
'1,970 324 .190 " $6,
$30,000 under $40,000 ........................ 403 1,120 894 3,444 378 ..343$40,000 under $50,000 ........................ 320 1.126 873
14,752 235 322 417 375
$50,000 under $75,000 ........................ 527 IM 1,618 12,338 624 1,130 647. 549$75,000 under $100,000 ...................... 185 1"0 8". 8.6W M W5 V9 W2$100,000 under $2DO,000.................... 148 5117- 1,081 14,746 301, 617 .160 170$200,000 or more ............... ................. so 502 437 33,987 172 382 *5 1
Footnotes at end of table.
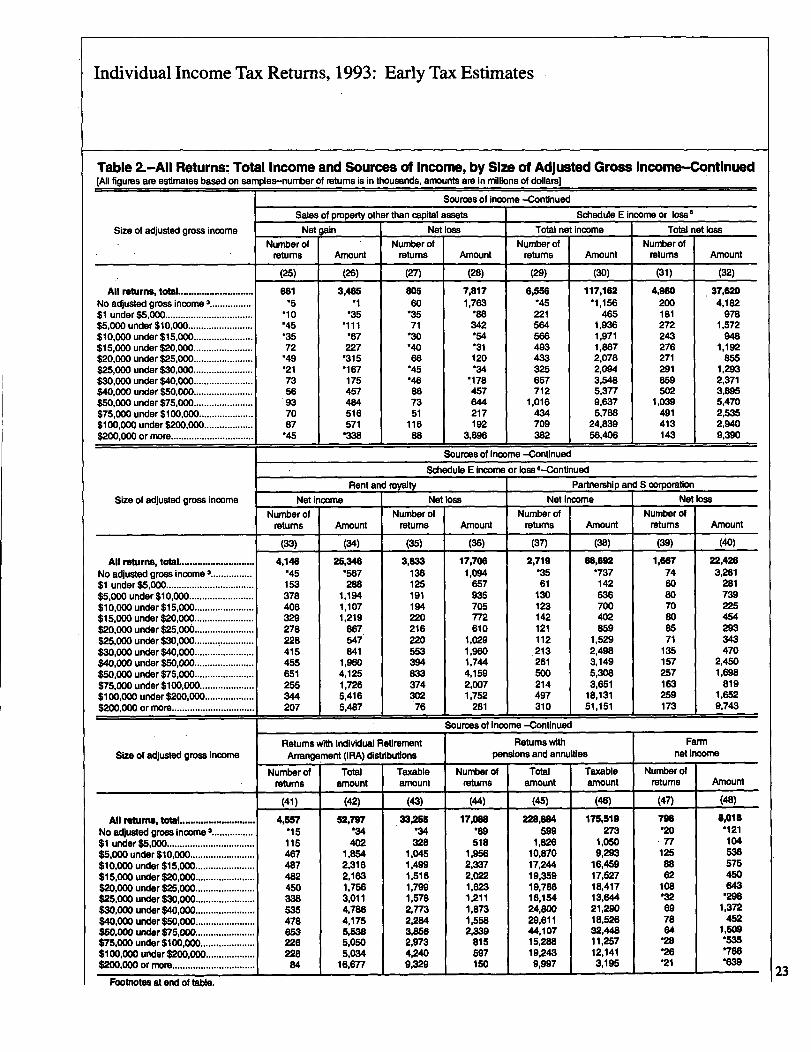
Individual Income Tax Returns, 1993: Early Tax Estimates
Table 2.-All Returns: Total Income and Sources of Incorm, by Size of Adjusted Gross Income-Continued[All figures are estimates based on samples-number of returns is in thousands, amounts are In millions of dollars]
Sources of Income -Continued
Sales of property other than capital assets Schedule E income or loss'
Size of adjusted gross income Not gain Net loss Total not income Total net loss
Number of Number of Number of Number of
returns Amount returns Amount returns Amount returns Amount
(25) (26) (27) (28) (29) (30) (31) (32)
All rebirris, total ............................. 661 3,465 805 7,817 6,556 117,162 4,9W .37,620
No adjusted gross income 3 ................ -5 .1 60 1.763 *45 -1,156 200 49182
$1 under $5,000.................................. *10 '35W .88 221 465 181 978
$5,000 under $10,000......................... *45 *111 71 342 564 1,936 272 1,572
$10,000 under $15,000....................... *35 '67 *W '54 566 1,971 243 948$15,000 under $20,000....................... 72 227 *40 *31 493 1,867 276 1,192
$20,000 under $25,000....................... *49 *315 66 120 433 2,078 271 855
$25,000 under $30,000....................... *21 *167 *45*M
325 2,094 291 1,293
$30,000 under $40,000....................... 73 175 '46 *178 657 3,548 659 2,371
$40,000 under $50,000....................... 56 457 86 457 712 5,377 502 3,895
$50,000 under $75,000 ....................... 93 484 73 6" 19016 9,637 1,039 59470
$75,000 under $100,000 ..................... 70 516 51 217 434 5,788 491 2,535
$100,000 under $200,000................... 87 571 116 192 709 24,839 413 2,940
$200,000 or more................................ *45 *338 88 3,696 382 1 569406 1 143 1 9,390
Sources of Income -Continued
Schedule E income or loss O-Continued
Rent and royalty Partnership a S corporation
Size of adjusted gross income Net income Not loss Net income Net loss
Number of Number of Number of Number of
returns Amount returns Amount returns Amount returns Amount
(33) (34) (35) (36) (37) (38) (39) (40)
All returns, total............................. 4,146 25,348 3,633 17,706 2,719 88,892 1,W7 22,426
No adjusted gross income 3................ '415 '567 136 1,094 M *737 74 3,261
$1 under $5,000 .................................. 153 288 125 657 61 142 60 281
$5,000 under $10,000......................... 378 1,194 191 935 130 636 80 739
$10,000, under $15,000....................... 406 1,107 194 705 123 700 70 225
$15,000 under $20,000 ....................... 329 1,219 220 772 142 402 80 454
$20,000 under $25,000....................... 278 867 216 610 121 859 85 293
$25,000 under $30,000....................... 228 547 220 1,029 112 19529 71 343
$30,000 under $40,000....................... 415 841 653 1,960 213 2,498 135 470
$40,000 under $50,000....................... 455 1.960 394 1,744 261 3,149 157 Z450
$50,000 under $75,000....................... 651 4,125 833 4,159 500 5,308 257 19698
$75,000 under $100,000..................... 255 1,726 374 29007 214 3,651 163 819
$100,000 under $200,000................... 344 59416 302 1,752 497 189131 259 1.652
$200,000 or more ................................ . 207 5,487 76 281 310 51,151 173 9,743
Sources of Income -Continued
Returns with Individual Retirement Returns with Farm
Size of adjusted gross Income Arrangement (IRA) distributions pensions and annuities net Income
Number of Total Taxable Number of Total Taxable Number of
returns amount amount returns amount amount returns Amount
(41) (42) (43) (44) (45) (46) (47) (48)
All raturns, total ............................. 4,657 62,797 33,M 17,068 228,604 175,519 798 8,018
No adjusted gross Income 3................ *15 '34 -34 .89 599 273 -20 *121
$1 under $5,000.................................. 115 402 328 5118 19826 11050 77 104
$5,000 under $10,000 ......................... 467 1,864 19045 1,956 10,870 9,293 125 536
$10,000 under $15,000 ....................... 487 2,316 19499 2,337 17,244 16,459 88 575
$15,000 under $20,000 ....................... 482 2,163 1,616 2.022 19,359 17,527 62 450
$2D,000 under $25,000 ....................... 450 1,756 1,796 1,623 19,786 18,417 108 643
$25,000 under $30,000 ....................... 338 3,011 1,678 1,211 16.154 13,644 -32 *298
$30,000 under $40,000 ....................... 635 4,786 2,773 19873 24,8W 21,290 69 1,372
$40,000 under $50,000 ....................... 478 4,175 2,284 11.558 29,611 18,526 78 452
$50,000 under $75,000....................... M 6,538 3,856 2.339 44,107 32,448 64 1,609
$75,000 under $100,000 ..................... 226 51050 2,973 815 15,288 119257 *28 M
$100,000 under $200,000 ................... 228 5,034 4,240 697 19,243 12,141 *26 *786
$200,000 or more................................ 84 16,677 9.329 150 9,997 39195 *21 '63923
Footnotes at end of table.

Individual Income'Tax Returns, 1993: - Early Tax Estimates
Table 2.-All Returns:-Total Income and Sources of Income, by Size-of. Adjusted Gross Income-.-Continued[All figures are estimates based on samples--number of returns is in thousands, amounts are in millions of dollars)
Sources of income--Continued
N
Size of adjusted gross income Farm net losses Returns with-taxable social security benefitsNumber of Number of Total Taxable
returns Amount returns. benefits amount
(49) (50) (51) (62) (53)
All returns, total........................ ......... 1,121 8,284 0,564 102,927- 21,933No adjusted gross income 3 ....................... *30 *665 90 992 53,$1,under$5,000....................... ............
156 359 ~'640 5,226 15
$5,000 under'$10,000..`........................... 115 471*
1,276- 12,079- 61$10,006 under $15,660- ......................... 65 338 1,201', 11~1~36 i 154$15,000'under $20,000............................ 89 .414 745 '8,050 94$20,000 under $25,000............................. 105 963 873- 10,099$25,00O.under $30,000............................ 83' 647 756- 8,339 1 247$30,000 under.$40,000............................ 161 873- 1,166 12,703 3,862$40,000 under $50,000 ................... .......... 148 694 965 10,164 4,655$50,000 under $75,000............................ 164 1,060 1,082 12,271 6,111$75,600 under $100,000 ........... t.............. .49 *263 .367 4,469 -2,234$100,600 under $200,000 ........................ *3.6 -490 308 3,859$200,000 or more..................................... _*21 -1,108 94~ 1,938 969
Sources of incomem:-Con*tinuedSize of adjusted gross income Unemployment compensation, Other income
Number of 'Number ofreturns Amount returns- Amount
(54) (55) (56)All returns, total .................................. ........ ............................ 8,808 25,052 4,421 23,i87
No adjusted gross income 3 ........ 4 ......................... : ........................ *10 *32 *30 '64$1 under $5,000............................................................................. .338 .565 269 452$5,000 under $10,000 ..................................................................... ~,226 316 585$10,006 under $15,000 ................................................................... .1,21V 3,784, 314 674,$15,000 under $20,0o6 ..................... ............... ................................ 1,056 -3;121 309 710$20,606 under $25,006..................................................................... 819 2,275 357 543$25;000 under $30,000 ................................................................... 703 2,159 315 817$30,000 under $40,000................................. ......................... 1,195 3,497 501, 1,179$40,000 tinder $50,000
................... : ........................ 839 2,578 446 993
$50,000 under$75,000.....'.... .... ......................... .......................
956 2,913 747 .2,547,$75,'000 under $100,000......... 1 ....................................................... 238 660 317 .1,944$100,000 under $200,000 ... : ...........................................................
-78 216 363 ~,778
$200'000 or more ... :... ................... ................................................ *16 *28L . : 138 10,003Sources of income--Continued
Size of adjusted'gross income Otherloss Less: Foreign earn d incorne exclusionNumber of 'Numbbf Of
returns ... Amount returns Arn~uunt'(580 :(59) Y~
All returns, total.,.;r........ ..............................1
387- 17,595. .....w._11 J q_'..,
No adjusted gross income 3 .................................................... ......... .160'
13,011 ;:~ ~-'3 *1',299$1 under $5,000........................ ......... '40 *06, *1.415'$5,000 under $10,000................ .............. : ...................................... *40 *147 *5 *317$10,000 under $15,000 ..................................................... ............. *20 *65 *5 *52$15,000,under,$20,000 .................................. : ............ ! .................... *5 *18 *15 *193U0,000 under $25,000 ....................... ................................... ........ *16 *117 - -$25,000 under $30,000; ................................................................. *10 *900$30,000 under $40,000 ...................................... ........................... *30 *212 *10 *56gr$40,000 under $50,000.o ................................................................ *10 -7$50,000 under $75,000 .................................................................. -15, *11,171$75,000 under $100,000 .............. ................................................. 0 *574 .10 .*259$160,000 under $200,000 .............. .................................... M.......... *16 *958$200,006 orniore ............................................................................ *15 *107 *5 -.*345
I The sum of all sources of income less loss, before reduction by statutory adjustments. Total income minus statutory adjustments equals adjusted gross Income.2 Not included in total income or adjusted grcris income.3 Returns with adjusted gross deficit.4 Not ~afoital gain (columns 19-20) excludes capital gain distAbutions (columns 23-24).
Less then $500!000.
Includes estate or Mist net income not shown separately.
Estimate sh
'
ould be used with caution because of the small number of sample returns on which it is based.
NOTES: Detail may not add to totals beca-use'of rouncQg. All data are.based on returns filed through April.
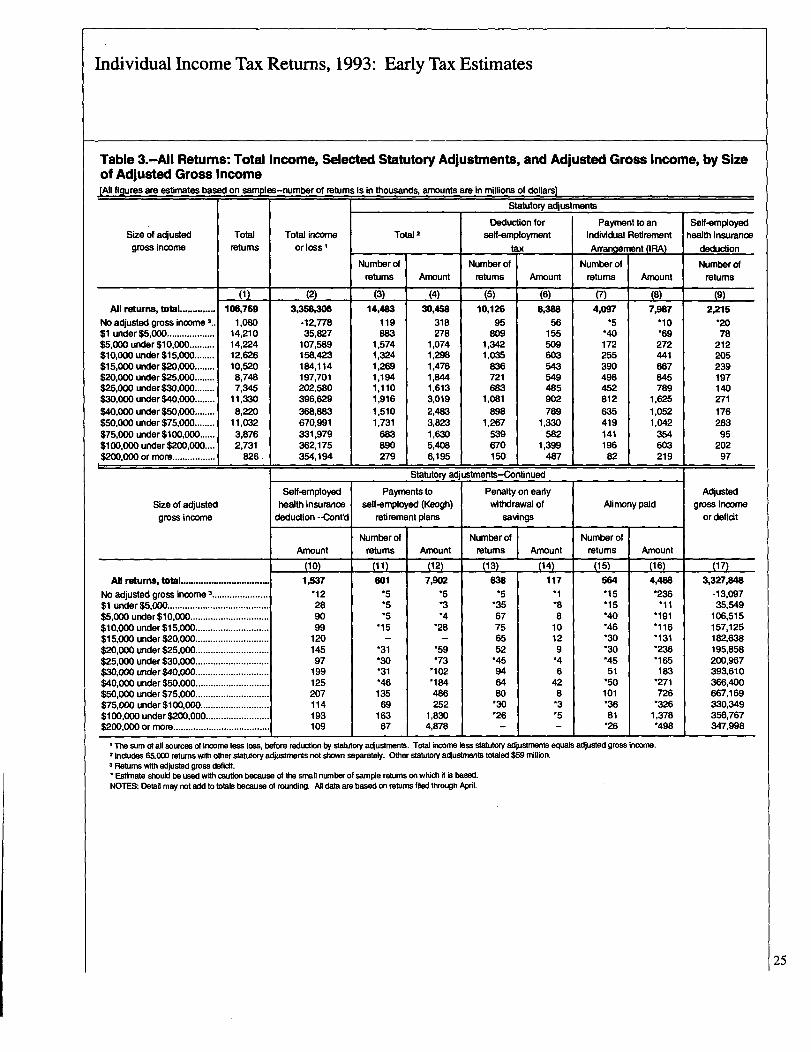
Individual Income Tax Returns, 1993: Early Tax Estimates
Table 3.-All Returns: Total Income, Selected Statutory Adjustments, and Adjusted Gross Income, by Sizeof Adjusted Gross Income[All figures am estimates based on mples-numberof retumsis in thousands, amounts are in millions of dollars)
Statutory adjustments
Deduction for Payment to an Soft-employedSize of adjusted Total Total income Total 2 self-employment Indi-vidual Retirement health insurance
gross income returns or loss tax Am~wae ent ORAI deduction
Number of Number of Number of Number ofreturns Amount returns Amount returns Amount returns
(1) (2) (3) (4)
::~4
(5) (6) V) (8) (9)All returns, total.............. 106,769 39358,306 14,483 30,468
[
10,126 8,388 4,097 7,91V 2,215No adjusted gross income 3.. 1,080 -12,778 119 318
8
95 56 -5 .10 *20$1 under $5,ODO................... 14,210 35,827 883 278
7809 155 '40 *69 78
$5,000 under $10,000.......... 14,224 107.589 1,574 1 074 1,342 509 172 272 212$10,000 under $15,000........ 12,626 158,423 1,324 1,298 1,035 603 255 441 205$15,000 under $20,000........ 10,520 184,114 1,269 1,476 836 543 390 667 239$20,000 under $25,000........ 8,748 197,701 1,194 1,844 721 549 498 845 197$25,000 under $30,000........ 7,345 202,580 1,110 1,613 683 485 452 789 140$30,000 under $40,000........ 11,330 396,629 1,916 3,019 1,081 902 812 1,625 271$40,000 under $50,000........ 8,220 368,883 1,510 2,483 898 789 635 1,052 176$50,000 under $75,000........ 11,032 670,991 1,731 3,823 1,267 1,330 419 1,042 283$75,000 under $1 00,0DO...... 3,876 331,979 683 1,630 539 582 141 354 95$100,000 under $200,000.... 2,731 362,175 890 5,408 670 1,399 196 603 202$200,000 or more ................. 826, 354,194 279 6,195 150 487 82 219 97
Statutory adjustments-Continued
Self-employed Payments to Penalty on early AdjustedSize of adjusted health insurance self-employed (Keogh) withdrawal of Alimony paid gross income
gross income deduction --Cont'd rob rement plans sa%dngs or deficit
Number of Number of Number ofAmount returns Amount returns Amount returns Amount
(10) (11) (12) (13) (14) (15) (16) (17)
All returns, total .................................. 1,537 601 7,902 638 117 564 4,468 3,327,848
No adjusted gross income 3....................... *12 -5 -5 -5 .1 *15 *236 -13,097$1 under $5,000........................................ 28 *5 -3 '35 .8 *15 *11 35,549$5,000 under $10,000............................... 90 *5 *4 67 8 W *191 106,515$10,000 under $15,000 ............................. 99 *15 *28 75 10 *46 *116 157,125$15,000 under $20,000 ............................. 120 - - 65 12 '30 *131 182,638$20,000 under $25,000 ............................. 145 *31 *59 52 9 *30 *236 195,858$25,000 under $30,000 ............................. 97 *'W *73 *45 *4 *45 *165 200,967$30,000under $40,000 ............................. 199 *31 *102 94 6 51 183 393,610$40,000 under $50,000 ............................. 125 *46 IM 64 42 *50 *271 366,400$50,000 under $75,000 ............................. 207 135 486 80 8 101 726 667,169$75,000 under $100,000 ........................... 114 69 252 M *3 *36 *326 330,349$100,000 under $200,000 ......................... 193 163 1,8M *26 *5 81 1,378 356,767$200,000 ormore...................................... 109 67 4,878 - - *26 *498 347,998
I The sum of all sources of income less loss, before reduction by statutory adjustments. Total income less Statutory adjustments equals adjusted gross income.2 Includes ftOOD returns with other statutory adjustments not~ separately. Other statutory adjustments totaled $59 million.3 Returns with adjusted gross defictt.* Estimate should be used with caution because of the small number of sample returns on which it is based.NOTES: Detail may not add to totals because of rourKling. All data are based on returns filed through April.
25
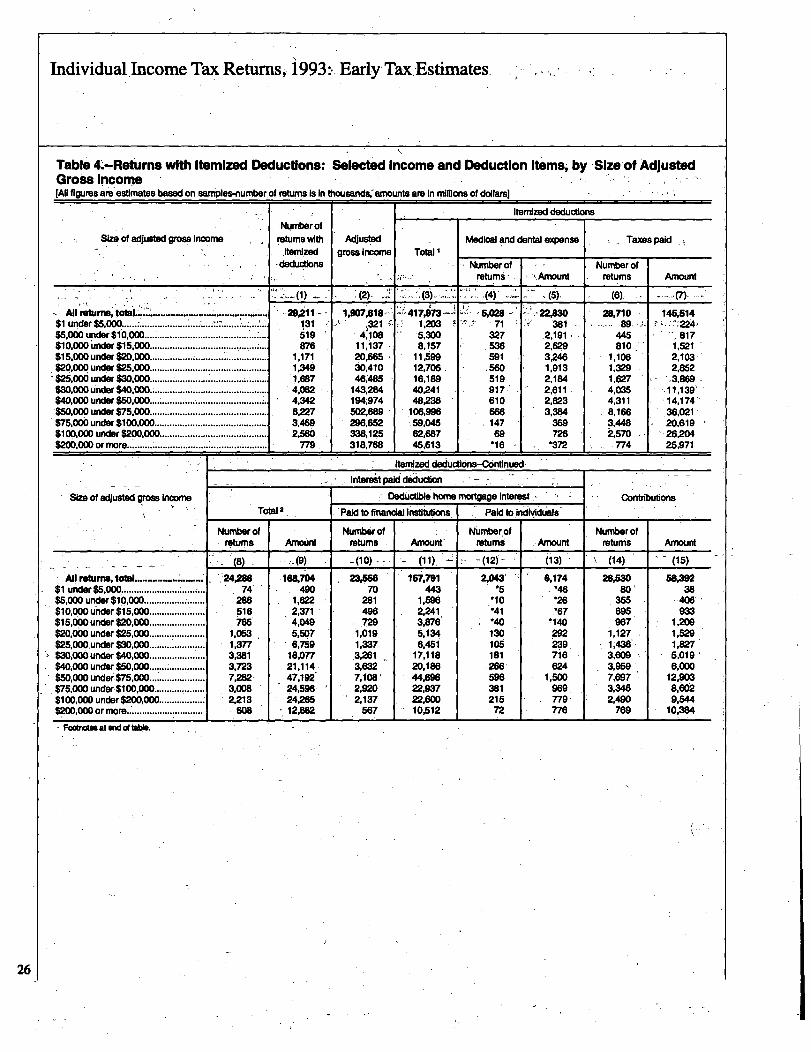
IIndividualincorne Tax Retums, 1993-.. Early-TaxEstimates.
Table 4.-"Returns with Itemized Deductions: SeloIcted Income and Doduction Items- by Size of Adjusted
Gross Income[All figures are estimates based on samples-number of returns Is In ttmeands;amounts are In millions of dollars]
Iternized deductionsNumber of
Size of adjusted gross income returns vWth Adjusted Medical and dental expense Taxes paiditernized gross Income Total
-deductPons Number of Number ofreturns .Amount returns Amount
'(2), pjI (4JI AS). (6)
.... ......All returns, total.-....,........ ..................... 1,9071618.1. .-1417,973 ---t -5,028 22,BW 28,710 145,514..$1 under $5,000.............................. ................ 1.31 3211 1,203 71 381 89 M4,$5,000 under $10,000................................................ 519 4JOB 5,~00 327 .2,191. 445 817$10,000 6nder $15,000................................................ 876 111,137 8,157 536 2,629 810 1,521$16,000 under $2D,000 ................................................. 1,171 20,665 11,599 591 %246 1,106 2,103%$20,OOP under $26,0DO ....................... 1,349 30,410 12,706, 560 1,913 1,329 2,852$25,000 under $30,000 ..................................... ........ 1,687 46,485 16,189 Sig 2,184 1,627 .3,869 -$30,000 under $40,000.; ............................................ 4,082 M284 40.241 917 2,611 4,035 11.139"$40,000 under $50.ODO.......................... I ................... 4,342 194;974 48"S 610 2,623 4,311 .14.174'W," urxler VS,=.............................................. 8.227 502,689 1106,966 666 3,384 8,166 36,021$75,60b under $100,000.......................................... 3,469 2D6,652 69,045 147 369 3,448 20,619$100,000 under $200,000 ......................................... 2,581) 338,125 62,687 69 726 ~,570' - 26A2N$200,000 ormore.......... ................................... .....
779 318,768L 46,613 .16 -372 774 25,9711
fternized deductions-40onflnued
Anterest paid deduction
Size of adjusted gross Income DeducW34e home mortgage Interest ContributionsTotal 2 Pald 10 financial institutions Paid tDindiVIC16818-
Number of Number of Number of Number ofreturns Amount returns Arnourd- returns Amount returns Amount
(8) (9) -(10)-- -(12)- (13) (14) (15Y
All returns, total....................... . ..Am168,704 23.5513 157,791 2,043' 6,174 26,5XI Sol=
$1 under $5,000................................. 74 4W 70 "3 .5 *46 80 38$5,000 under $10,000........................ 286 1,622 281 11696 *10 *26 355 406$10,000urider$15,000...................... SIB 2,371 496 2,241 *41 *67 695 933$15,000under $2D,000...................... 765 4,049 729 3,876 *40 *140 967 1"9$20,ObO under $25,000...................... 1.053 S,5D7
.1;019 5,134 130 292 i,127 1,529
$25,000,under $30,000...................... 1,377 6,759 1,337 6,451 105 ~39: 1,438'. 1,827$30,000under $40,000...................... 3,381 18,077 .3XI 17,118 1181 7i6 3,609 6,019$40,000 under $50,000...................... 3,723 21,114 3,632 20,186 266 624 3,959 6,000$50,000 under $75,000...................... 7,282, 47,192 7,108' ",age 596 1,500 7,697 12,903$76,000 under $100,000.................... 3,008 24,596 2,920 22,937 381 969. 3,346 8.602$100,000 under $200,000
'. *.......
*...... 2,213 24.2SS 2,137 22,600 215 779- 2,490 9,544
s2bo,000 ormore............................... 608 12,662 567 10,512 72 776 769 10,384
. Footnotes at w4dt".
26

Individual Income Tax Returns, 1993: Early Tax Estimates
Table 4.-Ratume with Itemlived Deductions: Selected Income and Deduction items, by Size of AdjustedGross Income-Continued[All figures are estimates based on sarnples-number of returns Is In thousands, amounts are In rnfillons of dollars]
Sim of a4usted gross income
$1 under $5,000.................................$5,000 under $10,000 ........................$10,000 under $15,000......................$15,000 under $20,000......................$20,000 under $25,000......................$25,000 under $30,000......................$30,000 under $40,000......................$40,000 under $50,000......................$50,000 under $75,000......................$75,000 under $100,000 ...................$100,000under $2DO,000..................$200,000 or more ..............................
Casualty or thelt loss
Number ofreturns Amount
(10)135
-5*10*10*1528
*15*19*15
*15*5
(17)
11AW
'25'64
*3*67
*215*63*80
Ism
fternized deductions-CorwUnued
Moving expenses
Number ofratUms Amount
(18)see.1046
5*15*15'2587
11016213997
*16
~ (19)
Miscellaneous deductionsafter reduction by 2 peroent
of aclusted gross Inoome
Number ofreturns Amount
(21)
3AW.17*9
*48W.59*41245478763am585348
(20)
6086060
123200338289412
1,1021.0511,782
844479lei
24,54
223468859727
1,1482,7983,4465,7823,6412,7292.630
mlsoallaneo
Number ofreturns
(22)
714
.11*40'45*19*4910682
1738573
*31
I For married persons NbV separately, hunIzed decluctkins cmW have been Irntled I aquelad Wass lr=m exceedled $54= for all other Wpayers, H adjusted gmes Inownsexceeded $108,450. Total kamind deduedons, IxA rot the detalled decludlons, We dkw ton 11M
Includes ded We pokes and Inveaftwo Interest' not shown separably.Esfirnate dxwW be Load wlth cautlan becaum d the arnall number of semple rakers on~It Is
NOTES* Detall may rot add to totals because of romuft All dela we based! on returns Aled ftough April.
Otherus deductions
Amount
(23)
1,917
*8*125*100'52
*147290121444422185'24
27
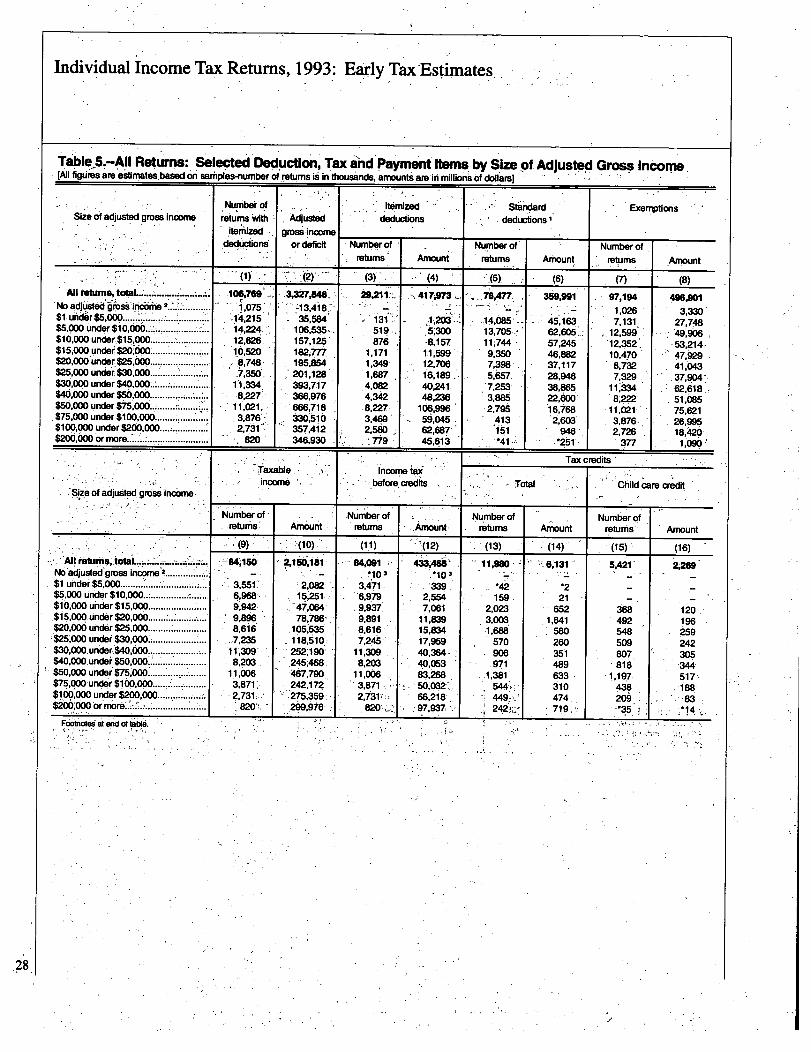
Individual Income Tax Returns, 1993: Early TaxEstimates.
Table S.-All Retums: Selected Deduction, Tax and Payment.Items. by Size of Adjusted Gross Income.
[Ail igurie's 'are *6itimatesbased on saMple's-number of returns Win thousands, amountswe in million's of dollers]
Number of Itemized S rd ExemptionsSiiia of adjusted gross income returns'with Adjusted deductions deductions
ftekzed gross incomedeductions or deficit Number of Number of Number of
returns Amount, returns Amount returns Amount
(3) (4) (5) (6) (7) (8)Ail rebAma, total............. .........1..-. 106,769 3,W,846- 29M 1::,. 4117~m 76,477~ 359,991 97,194 496,901
'No adjusted gross incorhie ............. ~ . .
.. 1,075 A 3,41 8 1,026 3 330'$1 ui~r$5,000..... . .; ... ..... ................ 14,215 35,584 13f~. 1,203:-' -.14,085- 45.163 7,131
,27 748
$5,000 under $10,000-1 ..................... 14,224 106,5351- 519- 1 31705 62,605..: _12,599,
49,9~6$16,000 under $15,000...........
12,626. 157,125 876 -8,157.
1 1;744 - 57,245 12,352 53 214.,$15,000,undai $26,600.............. ..... *526 1182,777 1,171 11,599 9,350 46,882 10,470.
47 929$2010PP under
-$25,000
.......................§,744,
'195,854
'1,349 12,706 7,398 37,117 8,732
,41 043
$25,000 under $30,000 ....................... -7,350 . 201,128 1,687 16,189 5,~,W, 28,946 7,329,
.37.904,$30,000 under $40,000..~ ...... ............... 1-1,334., 393,717 4,082 40,241 7253 38,865 11-,3,34 62 618 .$40,000 under $50,000..
.-8,2V 366.976 4,342 48,236 3:M 22,600 81222
, ,51 685
.$50,000 under $~5,000 .......... M........ ... 11021 686718 8.2171 106,998 16,768 .11,021,
75,621$75,000 under $100,000... ............ 3:876-
330:6163,469 59,045 413 '2,603 3,876- 26 995
$1 00-000.under $200,000............. 2,7.31 357,412 2,580 62,687 151 946,
2,726,
18,420$200,000 or more 820 346,930 779 01~45 ~-4,1 *251 377 1,OM
Tax credits'Taxableincome iai.
'income creditsbefore Total Child care credit
Size of adjusted gross income
Number Of - Number of Number of Number ofreturns Amount - returns ~,Amount, returns Amount returns, Amount
"(10) (11) (12) (13) (1 4~ :(15) (16)All returns, total ................
.~--SAIASO ?,150,181 84,091 433~M' 11,91M - 6 131 5,421 2,269
No adjusted gross income 2...........*10 3, 1V
$1 uncler$5,000............................ 3,551.' 2,082 - 3,471. 339 *42 -2$5,000 under $10,000..;......................., . . 6,968- 15251~ 6,979 2,554 159 21$11 0,000 under $15,000..
. .. ............6,9421 4~:064 9,937, 7,061 2,023 652 3
168 uO
$15,000 under $20,000................... 9,896 78,786- 6,891 1.1,
1839 3,003 1,641 492 196
$20,000 under $25,000....................... 6,616 105,5W 8,616 15,834 1,686.
580 548 259$25,000 under $30,000.; ..................... 118,510.: 7,245 17,959 570 260 506 242$30,000. under, $40,000....................... 11,309 252;190 11,309 40,364- 906 351 807 305$40,000.undee $50,000 ...................... 8 203 . 245,468- 8,203 40,053 .971 489
,.816 ~344
$50,000 under $75.000 ......... 7-1-1-1 11:006 467,790., 1 1,OD6 83,268 1,381 633 .1 ,197 517%$75,000 under $100,ODO......................
*~1,871. 242,172 3,871 M ~
544'~: wo1
438 i88000 under $200,000.................o,do, ; ?,731,, 275,359. 2,7311;~ 66,218., 449,,,--' 474, 209 83~, -i M..~ ...... .$200 000 or rnore~. ................. I
. 8?0 1, M,976 20: -,1 ~ ~7,9217:v 42, 19 *::!~, 14
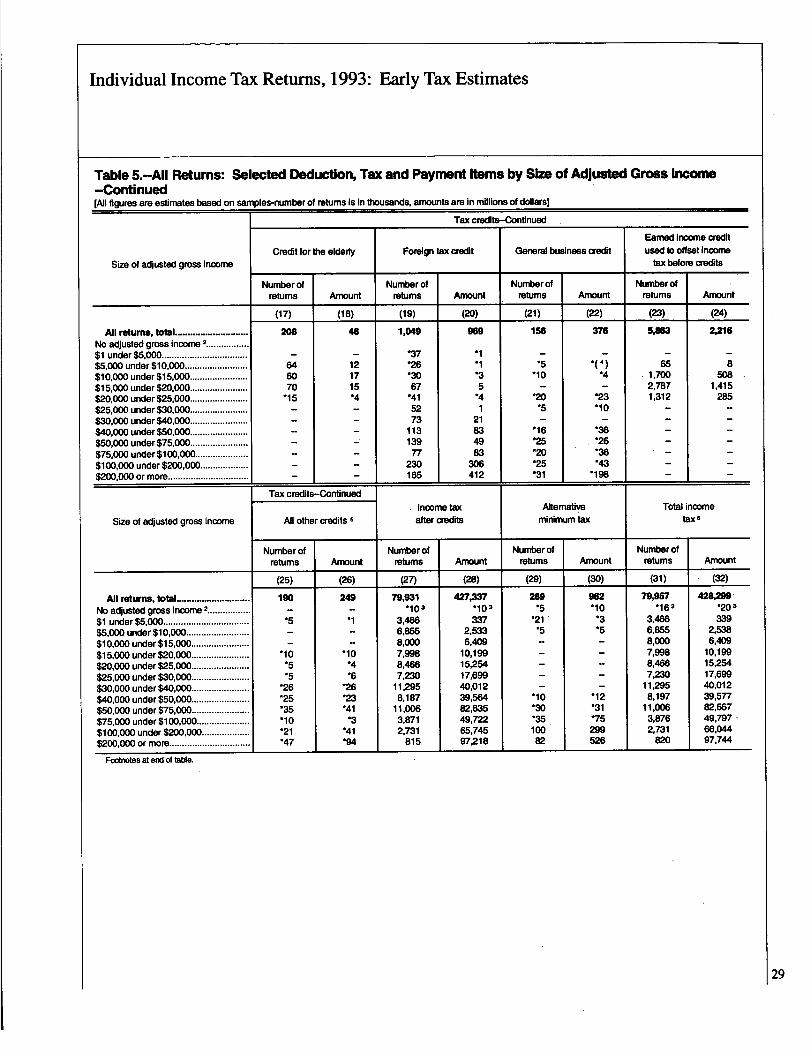
Individual Income Tax Returns, 1993: Early Tax Estimates
Table S.-All Returns: Selected Deduction, Tax and Payment Items by Size of Adjusted Gross Income-Continued[All figures are estimates based on samples-number of returns is in thousands, annsounts are in millions of dollars]
Tax credits-Confinued
Size of adjusted gross income
All returns, total............................
No adjusted gross income 2.................
$1 under $5,000..................................
$5,000 under $10,000 .........................
$10,000 under $15,000 .......................
$15,000 under $20,000 .......................
$20,000 under $25,000 .......................
$25,000 under $30,000 .......................
$30,000 under $40,ODO .......................
$40,000 under $50,ODO .......................
$50,000 under $75,000.......................
$75,000 under $100,000 .....................
$100,000 under $200,000...................
$200,000 or more................................
Size of adjusted gross income
AM returns, total.............................No adjusted gross income 2.................
$1 under $5,000 ..................................$5,000 under $10,000 .........................$10,000 under $15,000 .......................$15,000 under $20,000 .......................$20,000 under $25,000 .......................$25,000 under $30,000.......................$30,000 under $40,000.......................$40,000 under $50,000.......................$50,000 under $75,000.......................$75,000 under $100,000 .....................$100,000 under $200,000 ...................$200,000 or more................................
Footnotes at end of table.
Credit for the elderly
Numberofreturns Amount
(17)
208
-646070
*15-
(18)
48
-121715-4-
Tax credlits-Continued
All other credits 5
Number ofreturns Amount
(25)
190-
-5--
*10-5-5
'26*25'35*10*21*47
(26)
249
-*1--
*10*4-6
*26*23*41
-3*41*19
Foreign tax credit
Number ofreturns Amount
(19)
1,049
'37*26M
67*415273
113139T7
230165
(20)
969
.1
.1
*35
*41
21834983
306412
Income taxafter credits
Number ofreturns Amount
(27)
79,931*103
3,4666.8558,ODO7,9988,4667,230
11,2958,187
11,0063,8712,731
815
(28)
427,337*103337
2,5336,409
10,19915,25417,69940,01239,56482,63549,72265,74597,218
General business credit
Number ofreturns Amount
(21)
156
--5
*10-
M
-5-
*16*25'20*25*31
(22)
376
-
11)-4
-'23*10-
.'36
.'26
'36*43
*198
Alternativen-dnimurn tax
Number ofreturns Amount
(29)
289-5
*21-5-
-*10w
'3510082
(30)
962*10
-3*5-
-*12*31*75299526
Earned income creditused W offset income
tax before credits
Number ofreturns Amount
(23)
Sim
651,7002,7871,312
-
Total i
Number ofreturns
(31)
79JW*163
3,4666,8558,0007,9988,4667,230
11,2958,197
11,0063,8762,731
820
(24)
2,06
a508
1,415285
-
come
Amount
(32)
428,M-2D 3339
2,5386,409
10,19915,25417,69940,01239,57782,66749,797,66,04497.7"
29

Individual Income Tax Retums, 1993: Earl TakEstimatesY
30
Total tax Income tax TaxvAlItteld overpaid
Size of adjusted gross income
Number of Number of Number ofI"Me Amount returns Amount returns
(33Y 34),-)~~ j(35 (36) (37)
All rattinw, total ....................... .......... ... ....... '8197" 4%714f:. -:-92.W 311killn 77,721No adjusted dross income 2................................r Iola 159 647-$1 under $5,000........ ...........I............................ 4.078 596 -10,307 1,796 10,723$5,000 under $10.000............................................ ............ 7,363 -~3.221) .10,937 5,789 It=$10,000 under $15,000.................................. B.M 7.299 10.576 10,476 10,119$15,000 under $20,000................... ...................... 8,304 11,088 9,417 14,530 8.397$20,
000 under $25,000................... ...............-.7.......... 8,655 MW 8,030. 18,024 6568$25,000 under $30.0W
.......................... ...........7,251 18,071 6,943 20.373, 5:534
$30,000 under $40,000 A1268 411,775 110.~78 43,5M 7,083$40,000 under $50.000.............. I ........................................ 8,1183 41,138 '7,722 41,479 5.929$60,000 under $75,000............................................... ........ 10,992 85XA 10,469 81,641 7.112D.$75,000 under $100,000..................................................... 3,876. 51,148 3,696 45,146 .2,055$100,000 under $2W,000
........................... 2,1~1 6,066 2.1509 1501038 1.46191
$200,006 or more............ ................................................. .. 926 .98,711 707 19,4229 - 30
Tax overpaid Earned Inc" credit 6 Tax due at-Continued time of filing
Size of adjusted gross Income
Number o,f Number ofAmount returns Amount returns Amount
(39) (40) (41) (42)
All returns, total.................................... I.................. $7,611 11,515 MM 25.M 42~111106No adjusted gross income 2 ................................................. 772 *25. *16 71 76$1 under $5,000................................. ................................ 2.898 Z157 1,159 1.973 370$5,000 under $10.000 ............................................... 7-* ....
8,762 3,611 4,537 2,013 823$10,000 under $15,000....................................................... . 10.A14 3,574 4,490 2,226 1,217$15,000 under $20,000.................. 7.702 2,029 1,142 2.045 1,250$20,000 under $25,000...................... .................... ........... :5,354 119 25 2,150 I.8D7$25.000 under $30',ooo........................................................ 5= 1,801 1,527$30,000 under $40,000.............. ; ....................... : ................ 9.243 7 3,387 3,612$40,000 under $50,000....................................................... . 8,345 2,288 2,770,$50.000 under $75,000........................................................ .12,977 .3,887 6,658$75,000 under $100,000............................... I......... ............ .4,647 1,821 4,902$100,000 under $200,000..... .......;...................................
76,5711 1,276 61589
$200,000 ormore......... ..................................;................... 4,799 435 11,305
Table S.-All Returns: Selected Deduction, Tax and Payme.nt Items- by Size of Adjusted Gross Income-Continued[All figures are estimates based on samples-number of returns Is In V~x arniounta are in millions of dolianal
Includes.both the regular standard deduction and the additional standard dedmodon for age 65 or overor for '2 Includes returns wfth adjusted gross dsW.3 Includes tax from speolal corroftlon&. .,Less than $500.000.
Income tax after credits plus any additional Wass. Well 88 aftems" MkdMUM ta~. mWenplippmt tax, tax from mcepture of prior"ar investment credits. sodal security tax Woartain tip, Inoome not reputed to employseand tax on Irdividual IFIselternent Arrengenments (IRA), lassany am md' ma a credit used to offeat these additional Ones.
Tax overpaid Includes refundable portion of earned lnoorn6 am dL
Estirnate should be used vAth caution because of the WWI nurnber Of SaMpIS WAIMS.an which it b based
NOTES: Detall may rat add to totals bewu drourdkV.AidNawebmWonmWmfkdlftoughAPrIL-
5 Includes credit for prior-yew rridnimurn tm credit for I a 1 q on 69fth hum mortgagm and olfw - POln r. n m a tex After ore cuts plus alternative minimum UPL
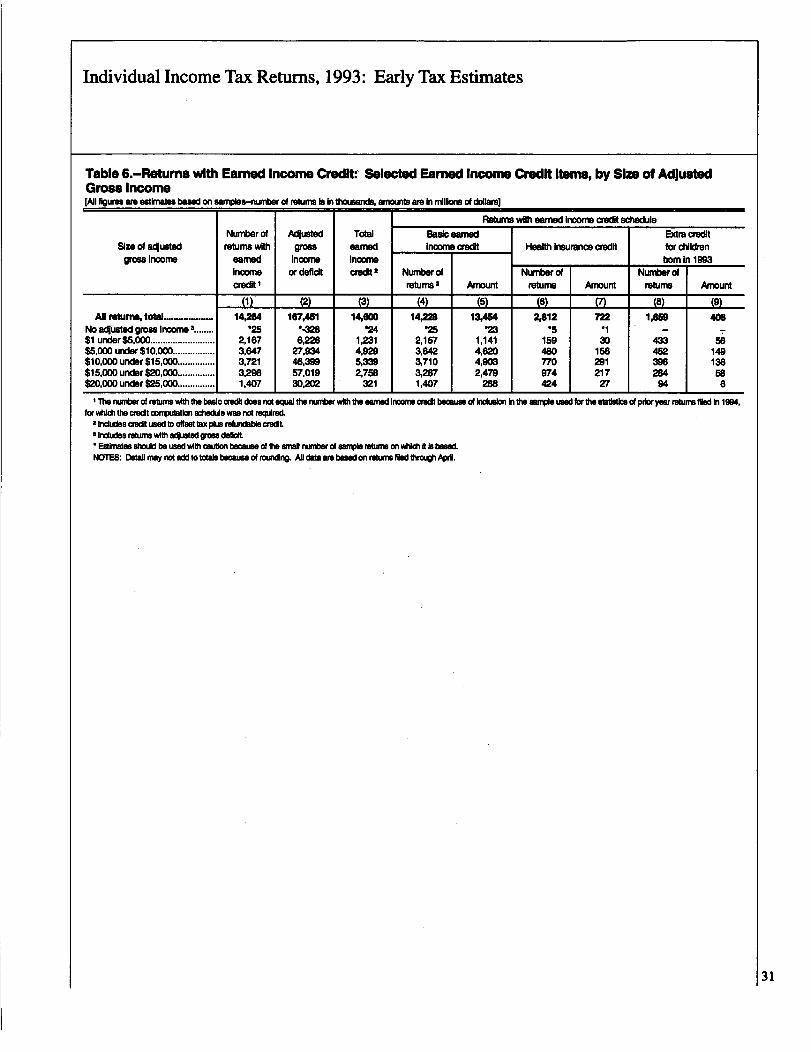
Individual Income Tax Returns, 1993: Early Tax Estimates
Table 6.-Returns with Earned Income Credit-, Selected Earned Income Credit Items, by Size of AdjustedGross Income[All figures am estimates based on samples-number d returns is in Ovusarxis, amounts are In Millions of dDlIers)
PAturns with earned Income credit scliedule
Number of Adjusted Total Basic earned Extra creciltSze of adjusted returns with gross earned Income credit Health Insurance credit for Wdren
gross I me earned Income Income born In 1993Income or deficit cram a Numberd Number of Number ofcredit I
IrgWMS 2 Ammint retums Amount returns Amount
(1) (2) (3) (4) (5) (6) (7) (8) (9)All relluims, total .............. 14,254 167,451 14,800 14=0 11301" 2,812 722 1,659 406
No adjusted gross Income 3 ....... .2s *-Me '24 '25 *23 .5 .1
$1 under$5,000.......................... 2,167 6,226 1.231 Z157 1,141 159 30 433 56$5,000 under $10,000 ................. 3,647 27,934 4,920 3~642 4,8M 480 156 452 149$10,000 under $15,000 3721 46,399 5.330 %710 4.9W 770 291 396 136$15,000 under $20.000::::~:::::::::: 3:298 57,019 2.758 3,267 2.479 974 217 284 58$20,000 under $25,000............... 1,407 30,202 321 1,407 288 424 27 94 6
I The nurnkm of returns with the basic orsdit does not equal the modw wbift earned Income credit because of Inclusion In ft sample used for ftstatistics ofpft you mum filed in 1994,for YAch ft credit oDmputation whad a was riot required
2 hXkXJSS MOM used to OffW taX plus rshniabla Cndit$ holudes returns vAtha**Wgrow deficit* Ealmates should be used Willi caullon bece, of to small nundw of sample rewms on wtich it Is basedNKrW: Detall may not add to totals becai of rounding. Ali data am based on returns fled thrmo Awl.
31
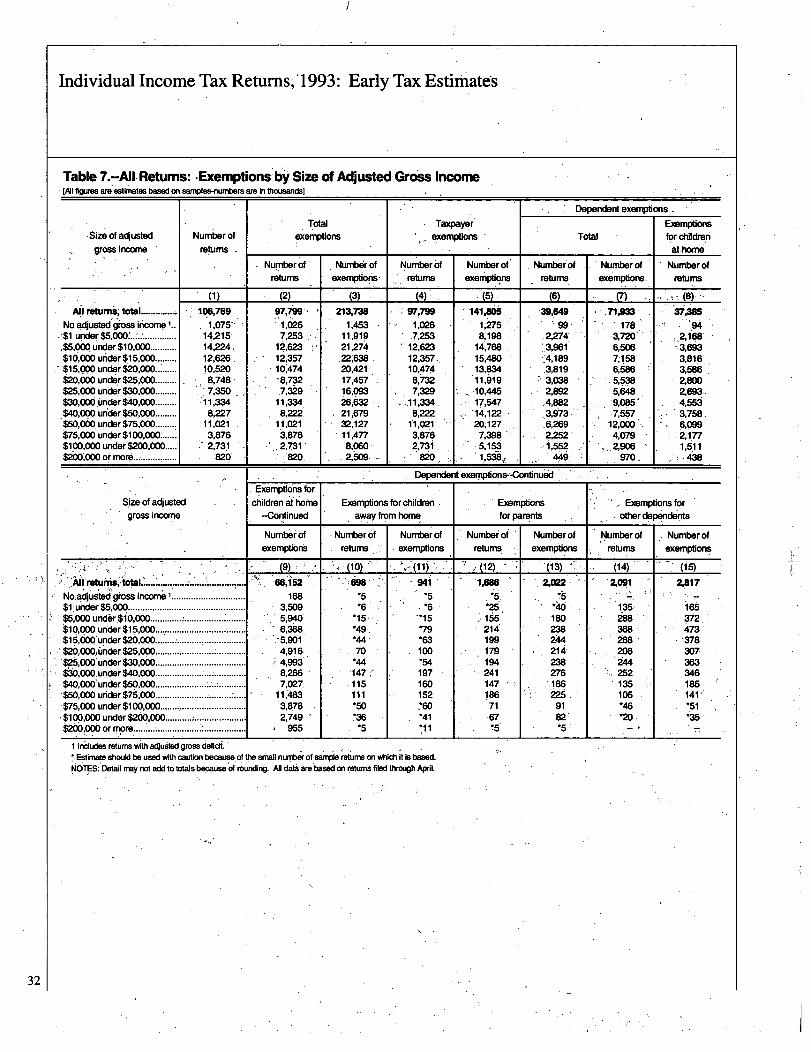
I
Individual Income Tax Returns,`1993: EarlyTaxEstimates
Table 7.-All Returns: Exemptions by Size of Adjusted-Gross Incon-e[All figures we estffrades based an sarriples-nurribers am h thousands]
DepenclentexemprtionsTotal Taxpayer Exemptions
-Size of adjusted Number of exemptions axemptions Total for childrengross income returns at home
' 'Numberof' Number of N umber of r ofNumbe Number of Number of Number ofreturns exemptions, returns exemptions returns axe
.mptions returns
(2) (3) (4) -(5) (6) (7) (8Me', total ........Ail retu 106, 769 97,799 213,738 97,799 141,80~ :39,649 :71,933 37,=
No adjusted gross income 1,075-- 1,026 1,453 1,026 1,275 90 178 1 '94$1 under $5,000... .............. 14,215 71253 11,919 7,253 81198 .2,274 3,-=' 2J68
,$5,000 under $10,000........... 14,224 12,623 21,274 12,623 14,768 '3,961 6,506 3,693$I 6,ODO ufide.r $16,000......... 12,626, 12,357 M,638 12,357., 15,480 4,189 T158 3,816$15,ODO under $20,000...*....... 10,520 10,'474 20,421 10,474 13,834 3,819 6,~86 3,586$20,000 under $25,000......... 8,7~48 -8,732 17,457 8,732 11,919 3,038 .5,538 2,800$25,0DO under $30,000......... 7,350 7,329 16,093 7,329 10,45 2,86~ 5,648 2,693.$30,00d under $40,000 11,334 11,334 26.632 11,334, 17,W 4,882 9,085' 4,55i$40,000 under $50,000 8,227 8,222 il,679 8,22~ '14,122 3,673 7,557. 3,758,$50,060 under $75,000 11,021 11,021 32,127 11,021 20,127 6,269 12,000 6,099$76,OD6 under $100,000....... 3,876 3,876 11.477 3,876 7,398 2,252 4,079 2,177$100,000 under $200,000 2,731 2,731 8,060 21731 5,153 1,M2 2,M 1,511-$200,000 or more.................. 820 820. 2,509. 820. '1,W,, 4",g 970, ?-4W
Dependent exemptions--Continu~d
Exemptions forSize of adjusted children at'home Exemptions for children Exemptions Exemptions for
gross income -40onfinued a~vay trom home for parents other dependents
Number of Number of Number of Numbee of Numberof Number of Number ofexemptions retums exemptions returns. exemptions returns exemptions
(9) ~(10) (13) (1 4) (15)
Ah MUMS iota[ .......I......................... ,. ~ ! " ,66,Jw :11in 941' 1,686. 2,022 Z817
I1No adjusted gross income .............................. -5
..-5 -5, 5
$1 under $5,000........................................... 3,509 -6 -6 *25 *46 1 35 165
$5,000 undir $iO,000............. :.......................... 5,940 '15- -15 1~5' ISO.288 372,
$10,000 under $15,000....................................... 6,368~ .0 *79 214M
368 473$1 5,CiDO,'uncler $20,OPO.....
......5,901 .,U W 199 244 288
..................................$26,00a. under $25,000.. 4,916 70 100 179 214 208 307$26,000'under $30,000.................................... 4,993 U M lim 238 363$30,000.under$40,000 .................... I................. 8,266 147 r 197 241 :276 252 346,$40,000'under $50,000 ..................... .......... 7,027 .115 147 '186 135 185$50,000 under $75,000 ................ : .............. : .... . 11,483 ill 152 186 225. 106 141'$75,000 under $100,000.................................. 3,878 '50 .60 71 91, *46 *51$100,006 under $200,000........... ;.................... 2,749 *36 *41 .67 82' '20 *35$200,000 or more............................. : ................ 955 -5 *11 5 -5
I Includes returns with agusted gross deficit.Fstirnate should be used with caution because. of the small nurriber of sarriple returns on which it is b
.ased.
N07S: Detal may not acid to totals because of rounding. All data are based on returns filed through April.
32
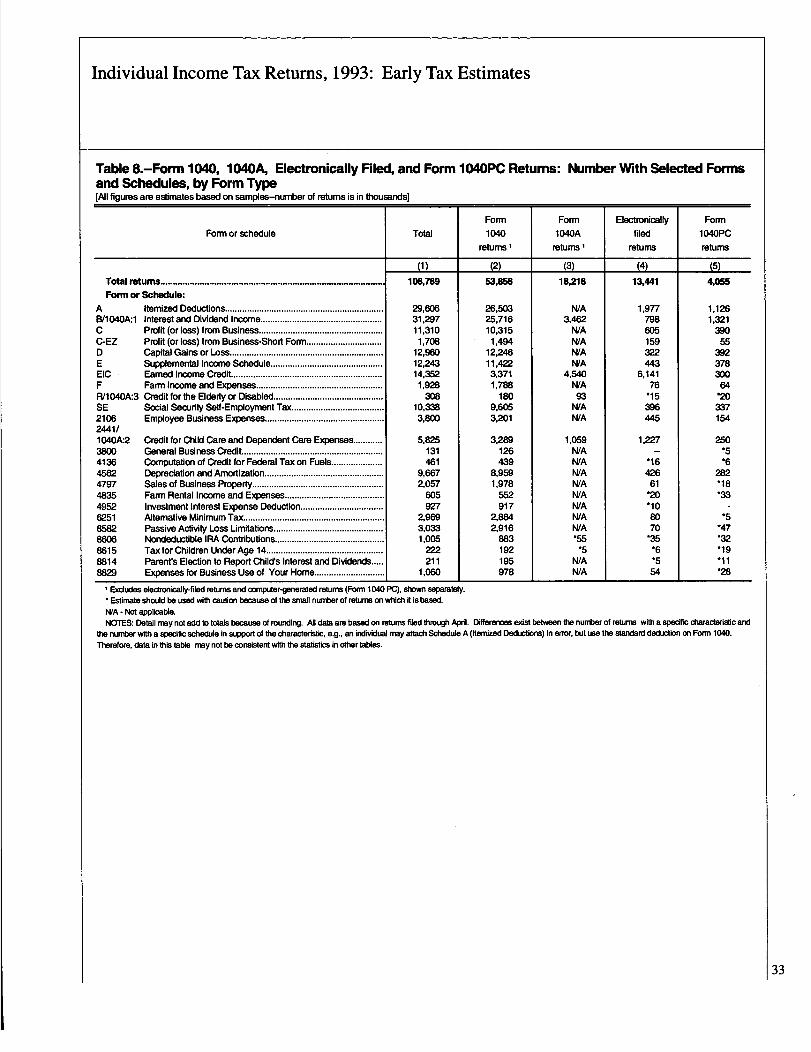
Individual Income Tax Returns, 1993: Early Tax Estimates
Table 8.-Form 1040, 1040A, Electronically Filed, and Form 104OPC Returns: Number With Selected Formsand Schedules, by Form Type[AJI figures are estimates based on samples-number of returns is in thousands)
Form or schedule Total
Form
1040returns
Form
1040Areturns
Electronically
filedreturns
Form
104OPCreturns
(1) (2) (3) (4) (5)
Total retums............................................................................... ........ . 106,769 53,856 18,218 113,"1 4,055Form or Schedule:
A ternized Deductions.................................................................:
29,606 26,503 N/A 1,977 1,126nterest and Dividend lrxx)me ..................................................Bt1040A:1 31,297 25,716 3,462 798 1,321
C Profit (or loss) from Business................................................... 11,310 10,315 WA 605 390C-EZ Profit (or loss) from Business-Short Form............................... 1,708 1,494 WA 159 55D Capital Gains or Loss ............................................................... 12,960 12,246 NA 322 392E Supplemental Income Schedule .............................................. 12.243 11,422 NIA 443 378EIC Earned Income Credit .............................................................. 14,352 3,371 4,540 6,141 300F Farm Income and Expenses.................................................... 1,928 1,788 NIA 76 64R/11040A:3 Credit for the Elderly or Disabled............................................. 308 180 93 *15 '20SE Social Security Self-Employment Tax...................................... 10,338 9,605 N/A 396 3372106 Employee Business Expenses ................................................. 3,800 3,201 NIA 445 15424411/1040A:2 Credit for Child Care and Dependent Care Expenses............ 5,825 3,289 1,059 1,227 2503800 General Business Credit.......................................................... 131 126 NIA - *54136 Computation of Credit for Federal Tax on Fuels..................... 461 439 NIA *16 *64562 Depreciation and Amortization ................................................. 9,667 8,959 NIA 426 2824797 Sales of Business Property ...................................................... 2,057 1,978 N/A 61 *184835 Farm Rental Income and Expenses......................................... 605 552 N/A *20 *,W
4952 Investment Interest Expense Deduction .................................. 927 917 N/A *10 -6251 Alternative Minimum Tax.......................................................... 2,969 2,884 WA 80 .58582 Passive Activity Loss Limitations............................................. 3,033 2,916 WA 70 *478606 Nondeductible IRA Contributions ............................................. 1,005 883 *FZ W K
8615 Tax for Children UnderAge 14................................................ 222 192 *5 *6 *198814 Parent's Election to Report Child's Interest and Dividends..... 211 195 NIA -5 *118a2q Expenses for Business Use of Your Home............................. 1,060 978 NIA 54 '28
Excludes electronically-filedreturns and computer-generatedreturns (Form 1040 PC), shown separately.Estimate should be used with caution because of the small number of returns on which it is based.
N/A - Not applicable.NOTES: Detail may not add to totals because of rourxfirig. All data are based on retums filed through April. Differences exist between the number of returns wfth a specific, characbarisficarid
the rtumber with a specific schedule in support of the characteristic, e.g., an indk4dual may attach Schedule A (ftentized Deductions) in error, but use the standard deduction on Form 1040.
Therefore, data in this table may not be consistent with the statistics in other tables.
33

J
Sole Propde.Wrship ReMms, 1992by Michael Strudler and Marty Shiley
3
bn4arrifsole Oroprietoi~ship profits for1992 in--creased
-from$141.5 billion
.to$154.6 billion (Figure
A). This 8.8 percent in~rease reflects.the recoveryfrom-the recession that began in,the third quarter of 1990.For 1992,' b6th-receiP:ts and deductions also increased, butreceipts grew at a slightly faster rate, enabling profits toincrease by a larger percentage than either receipts ordediktions; rec
.eipts increased by 3.4 Oercent to $737. 1'
bi&n and deductions increased by-2:1 percent to $5 8~3. 1
billion. The gi-owth in profits was led by firms in"theconstruction and finance, -insurance, and real estateindustries.: The services division" th
16 largest industrial
division for sole propnietorships, also dis'played a majorincrease in profits for -1992. Among services, whichincluded over 60 percent ofall sole proprietorship profits,the medical and health service industries continued toaccount fb,i the largest amount of profits, $32.4 billion for1992. However, the 4.7 percent rate of growth in profits forthis group lagged behind that for.other industrial groups,with:the,percentage increase rep
Iresenting the lowest for
this group since 1981. On the other hand,, profits reportedfor legal services ($11.2 billion) were up sharply, nearly 14.percent, comparedto 199 1.
The number of individual income tax returns reporting non-farm sole proprietorship activity for 1992 rose2. 1 percentfrom 1991, to 15.5 million 11. Soleproprietorship totalpeceipts (the sumtof "income from sales and operations'! -and"other income") increased from $712.6 billionto $737.1billion over this period ~3.4 percent) [2]. For 1992, allof theSole.,pioprietorship indus.tr,ial*.divisions,reported increases ,_
,1n receipts; except for mining. Most reported moderate..gains,,wiiii'thel ~1,argest re ative increase being the 16.6
Hpercent recorded ormanufacturing-.. gwevqr, manu ac-.iiiridii~'i~iiiWI-iiidtigtiial-divigibnAs'far"golepro-~'pridtorships are concerned. Of the major sole-proprietoi-ship industrial divisions, services experienced the largestgrowth irft6tal receipts,^ increasing 5.1 percent from $246.9billion to $259.5billion. -
Profits f6r 1992 increased 8.8 percent over 1991, from$141.5 billion'tb $154.0billion [3]. This increase repre-sented a rebound from the small increase (0. 1 percent) for1991. When inflation is taken into account, 1991 profitsactually decreased by 4.0 percent, while 1992 profits wentup by ~.6 percent (Figure B) [4]. Using the inflation-
Michael Strudler and Marty Shiley are both economists with theIndividual StatisticsBranck This article wasprepared under thedirection ofJeffHamok, Chief, Individual Returns Analysis
I; . .. - . -'adjusted figures, 1952 was characterized by the largest ,increase in soli proprietorship net income less.deficit since1988
'After the economy recoveYed fromthe recession of-
the early 1980'&, sole pioprietbiship profits had risen~harply each year from 1983 through 1988, as receipts grewmore rapidly than.deductions. Since 1989 the.growth inreceipts slowed
'in terms ofconstant dollarsi resulting in a
small increase or decrease, in each year (Figure CJ. For1992, receipts grew b 'just 0.' - 6nt in constant
,d6llai-g.'y ~ 4 perc
Further, despitethe apparent rebound for'1992, inflation7-adjusted levels forreceipts were still below 1987 levels',Figure D, which presents profits as a percentage of busi-ness -receipts, showsthat since 1983, profits had graduallyincreased as a percentage of receipts. This trend co,ntin-ued for 1992, with the strongest increase in profits- as apercentage of receipts.since 1988.
MUCOOMNW1Business deductions, (business expenses,. plus 'expenses'for-a home office*, plus cost of sales and operations)increased 2.1 percent to $583.1 billionfor 1992 (FigureE)[5]. Most of this gain can be attributed to~ah increase of3.5. percent in business expenses, which accounts for a
The 8.8 percent
increase in non-farm
profits reflects the
recovery from the
1990-1991 recession.
1: increased only slightly for - -~
little more than halfof totalbusiness deductions, from$295.6 billion for 1991 to$306.0billion for 1992.'Costof sales - and operations,, -which typically acc
'ount for
most of the other half of totalbusiness deductions,
1992 (0.6percent) to$274.2billion. Homeoffice6xperisesincreased by2.4percent frorii.2.9' billion for 1991 to $3,.b.,billion. In constant dollars, total deductions decreas'edby0.9 percent for 1992 (figure Q. Thiswasthe fourth, -c
Ionsecutiv6
..deplihe for-sole
.-propri
Ietbr~shiP' deduW&s.(ifi~_
constant dollars) since 1988.The depreciation deduction increased by only 0.9
percent, the first increase since 1988. The deductionbegan to de~cline for 1987, following enactment of the Tax'Reform Actof 1986 (TRA). The Act reduced the allowabledepreciation deduction by lengthening the cost recoveryperiods and changing the depreciation methods forproperty placed in service after 1986. Depreciation fell 3.0percent for 198.7, the first such decrease since 1961. Afterincreasing slightly for 1988,'its decline resumed. The 1992amount, $23.3 billion, accounted for4.0 percent of totaldeductions. For. 1986, the last yearprior to TRA, deprecia-tion was $26.4 billion and accounted for 5.6 percent of totalde~ductioins. Even with die' increase in 00re~piatioii
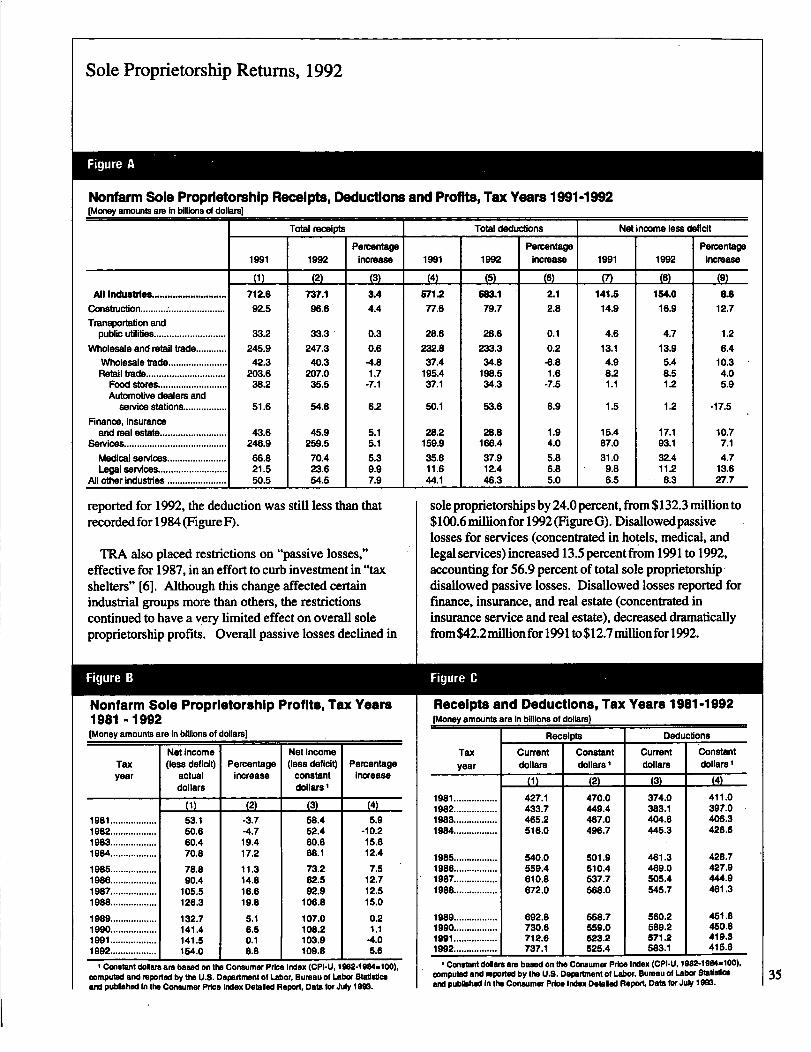
Sole Proprietorship Returns, 1992
Figure A
Nonfarm Sole Proprietorship Receipts, Deductions and Profits, Tax Years 1991-1N2[Money amounts are In billions of dollars]
Total receipts Total deductions Not income less deficit
Percentage Percentage Percentage1991 1992 Increase 1991 1992 increase 1991 1992 increase
(1) (2) (3) (4) (5) (6) (7) (a) (9)All Industries............................. 712.6 737.1 3.4 571.2 583.1 2-1 141.5 154.0 U
Construction ................................. 92.5 96.6 4.4 77.6 79.7 2.8 14.9 16.9 12.7Transportation and
public utilities............................ 33.2 33.3 0.3 28.6 28.6 0.1 4.6 4.7 1.2Wholesale and retail trade............ 245.9 247.3 0.6 232.8 233.3 0.2 13.1 13.9 6.4
Wholesale trade....................... 42.3 40.3 -4.8 37.4 34.8 -6.8 4.9 5.4 10.3Retail trade ............................... 203.6 207.0 1.7 195.4 198.5 1.6 8.2 8.5 4.0
Food stores ........................... 38.2 35.5 -7.1 37.1 34.3 -7.5 1.1 1.2 5.9Automotive dealers and
service stations ................. 51.6 54.8 6.2 50.1 53.6 6.9 1.5 1.2 -17.5Finance, insurance
and real estate.......................... 43.6 45.9 5.1 28.2 28.8 1.9 15.4 17.1 10.7Services. ....................................... 246.9 259.5 5.1 159.9 166.4 4.0 87.0 93.1 7.1
Medical services ....................... 66.8 70.4 5.3 35.8 37.9 5.8 31.0 32.4 4.7Legal services .... 21.5 23.6 9.9 11.6 12.4 6.8 9.8 11.2 13.6
Al other Industries 50.5 54.5 1 7.9 44.1 1 46.3 5.0 6.5 8.3 27.7
reported for 1992, the deduction was still less than thatrecorded for 1984 (FigureF).
TRA also placed restrictions on "passive losses,"effective for 1987, in an effort to curb investment in "taxshelters" [6]. Although this change affected certainindustrial groups more than others, the restrictionscontinued to have a very limited effect on overall soleproprietorship profits. Overall passive losses declined in
Figure B
Nonfarm Sole Proprietorship Profits, Tax Years1981-1992(Money amounts are In billions of dollars]
Taxyear
Net Income(less deficit)
actualdollars
Percentageincrease
Net Income(less deficit)
constantdollars
PercentageIncrease
(1) (2) (3) (4)
1981 .................. 63.1 -3.7 58.4 5.91982 .................. 50.6 -4.7 52.4 -10.21983 .................. 60.4 19.4 60.6 16.61984 .................. 70.8 17.2 68.1 12.4
1985 .................. 78.8 11.3 73.2 7.61986.................. 90.4 14.8 82.5 12.71987.................. 105.5 16.6 92.9 12.51988.................. 126.3 19.8 106.8 15.0
1989.................. 132.7 5.1 107.0 0.21990.................. 141.4 6.5 108.2 1.11991 .................. 141.5 0.1 103.9 -4.01992 .................. 1 154.0 1 8.8 1 109.8 1 5.6
I Constant dollars are based on the Consumer Price Index (CPI-U, 1982-1984-100),computed and reported by the U.S. Department of Labor, Bureau of Labor Statisticsand published In the Consumer Price Index Detailed Report, Dats for July I 9W.
sole proprietorships by24.0percent, from $132.3 million to$100.6 million for 1992 (Figure G). Disallowedpassivelosses for services (concentrated in hotels, medical, andlegal services) increased 13.5 percent from 1991 to 1992,accounting for 56.9 percent of total sole proprietorshipdisallowed passive losses. Disallowed losses reported forfinance, insurance, and real estate (concentrated ininsurance service and real estate), decreased dramaticallyfrom$42.2million for 1991 to$12.7 millionfor1992.
Figure C
Receipts and Deductions, Tax Years 1981 -1992(Money amounts are In billions of dollars)
Taxyear
1981 .................1982.................1983.................1984.................
1985.................1986.................1987.................1988.................
1989.................1990.................1991 .................1992.................
Receipts
Currentdollars
Constantdollars I
EI)427.1433.7465.2516.0
540.0559.4610.8672.0
692.8730.6712.6737.1
12)
470.0449.4467.0496.7
501.9510.4537.7668.0
568.7559.0523.2525.4
Deductions
Currentdollars
Constantdollars I
-[3)
374.0383.1404.6.445.3
461.3469.0505.4545.7
560.2589.2571.2583.1
"4
411.0397.0406.3428.6
428.7427.9444.9461.3
451.8460.8419.3416.6
I Constant dollars are based on the Consumer Price Index (CPI-U, 1982-1984-100).computed and reported by the U.S. Department of Labor, Bureau of Labor Statisticsand published In the Consumer Price Index Detailed ReporL Date for July 1M.
35
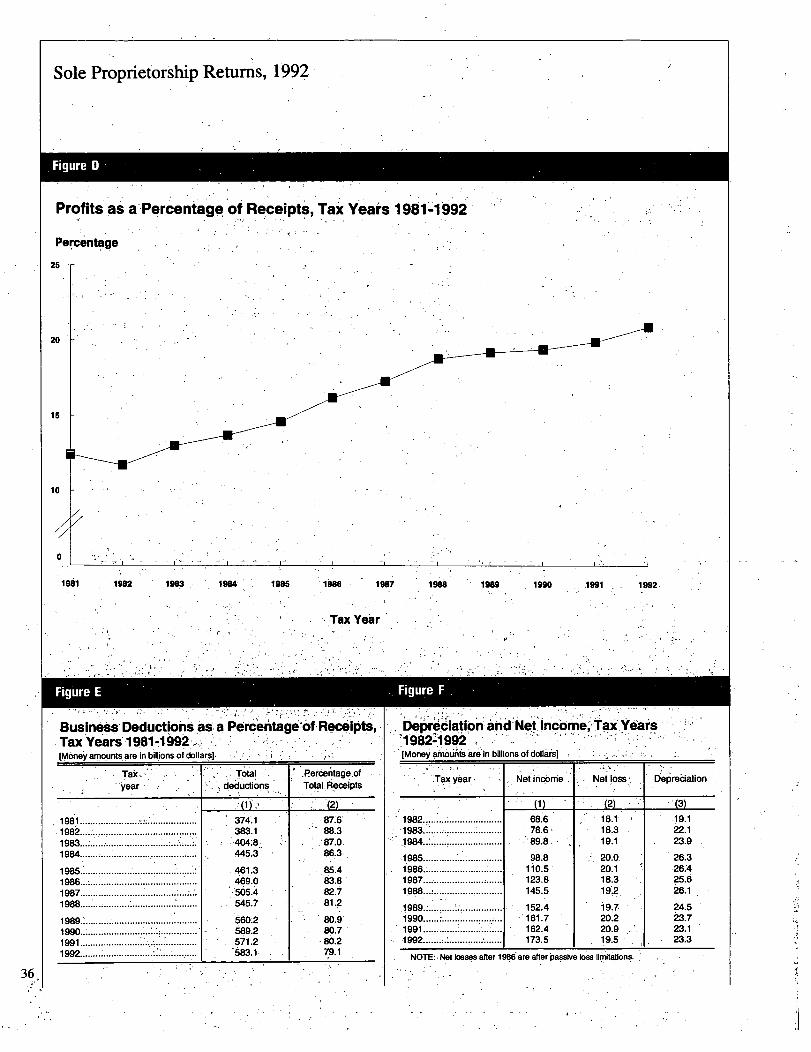
Sole Proprietorship Retums, 1992 -
. Figure D -
Profits as a'Percentagq of Receipts, TAi Years 1981-1992,
Percqntage
25 r-
10
1961 1982 1983 1984 1985 1 986 1987
Tax Year
36,
IFigure E
Business, Deductions As,~a Pertefitage'of Recd,ipts', Tax Years1981-1992-.;.,
[Mone~y amounts are in biuions of dollars]
- ~ear
1981 .
.........19821983
........ ........404:8.445.3-1984 1.
. ,, Total ,..deductions
1985 .................... 7 ................ 4161.31986.................. ............................ 469.01987.............................................. 505.41988........ ; ........................... ........ 545.7
1989.: ........................................... 560.21990........................ ....... 589.2
. ........... ~5711.21991 .............................1992....................................... '583. 1,
87.688.3
86.3
,,85.483.882J
80.980.7
.80.2,79.1
1968 1989 1990 1991 1992,
.' Figure F ,
'drN t,,nrq
.dme,:,tax','Y66eS
IDeoreclation an e
(Monev amounts are in billions of dollaml
Tax year, Net income . Net loss bep'redation
(2) (3)
1982 .............................. 68.6 18.1, 19.1.1983 ....... .................... 78.6, 18.3 22.11 984..: ........................... '89.8 - 19.1 23.9,
1985 .............................. 98.8 20.0. 26.31986.: ............................. 110.5 20.1 26A1987 .................. ...... 123.8 18.3 25.61988 ... ; .......................... 145.5 19i2 *.1
....................... 152.4 19.7 24.51990...................... 161.7 20.2 23.71991 ............. ................ 162.4 20
*9 23
*I
.............................1992.. 173.5 19.5 23.3t
NOTE: ~ Not losses after 1986 are after passive loss limitations,
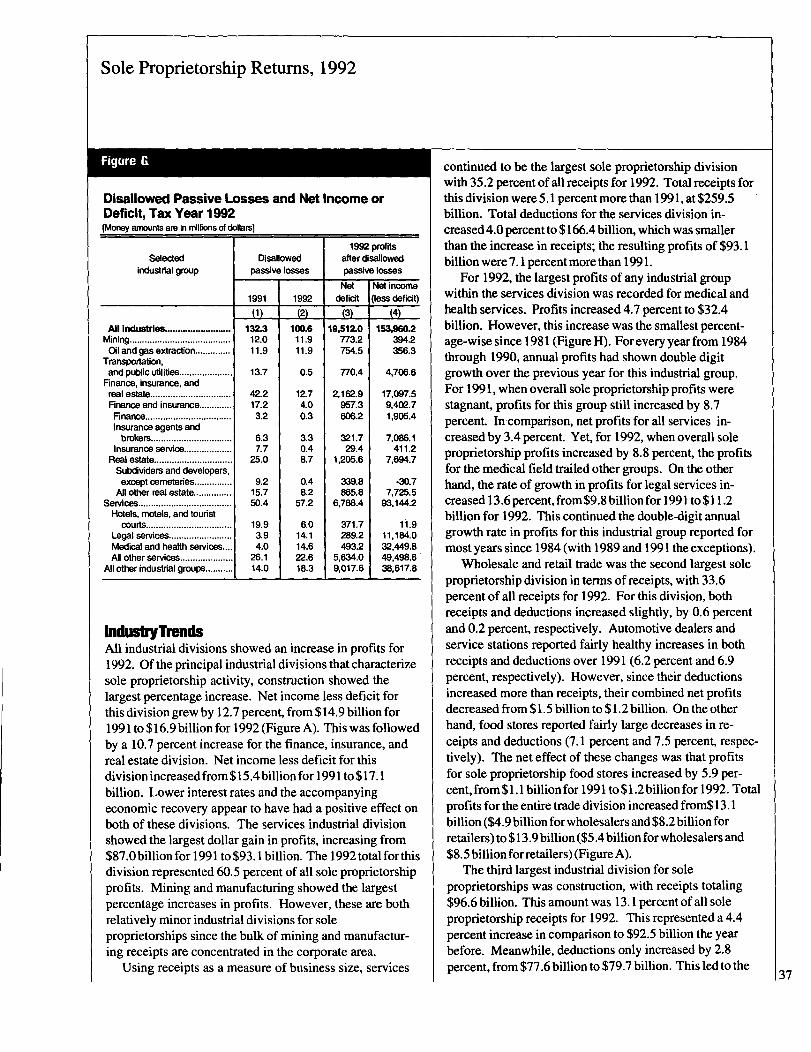
Sole Proprietorship Returns, 1992
Figure G
Disallowed Passive Losses and Net Income orDeficit, Tax Year 1992(Money amounts are in millions of dollars]
Selectedindustrial group
All industrle& .........................Mining........................................
Oil and gas extraction ..............Transportation,
and public utilities .....................Finance, insurance, andreal estate ................................Fmance and insurance.............Finance..................................Insurance agents andbrokers................................
Insurance service...................Real estate ...............................
Subdividers and developers,except cemeteries...............
All other real estate...............Services .....................................
Hotels, motels, and touristcourts :* .... * ...*--'--'-11-1
Legal services .........................Medical and health services....AJI other services.....................
All other industrial groups...........
Disallowedpassive losses
1991
-0)132.3
12.011.9
1992121
100.611.911.9
13.7
42.217.2
3.2
6.37.7
25.0
9.215.750.4
19.93.94.0
26.114.0
0.5
12.74.00.3
3.30.48.7
0.48.2
57.2
6.014.114.622.618.3
19M profitsafter disallowedpassive losses
Notdeficit
U3
19,512-0773.2754.5
Not income(less deficit)
(4)
153,9W.2394.2356.3
770.4
Z162.9957.3606.2
321.729.4
1,205.6
339.8865.8
6,788.4
371.7289.2493.2
5,634.09,017.6
4,706.6
17,097.59,402.71,905.4
7,086.1411
'2
7,694.7
-30.77,725.5
93.144.2
11.911,184.032,449.849,498.638,617.8
Indus"TimidsAll industrial divisions showed an increase in profits for1992. Of the principal industrial divisions that characterizesole proprietorship activity, construction showed thelargest percentage increase. Net income less deficit forthis division grewby 12.7 percent, from $14.9 billionfor1991 to $16.9billion for 1992 (Figure A). This was followedby a 10.7 percent increase for the finance, insurance, andreal estate division. Net income less deficit for thisdivision increased from $15.4billion for 1991 to$17.1billion. Lower interest rates and the accompanyingeconomic recovery appear to have had a positive effect onboth of these divisions. The services industrial divisionshowed the largest dollar gain in profits, increasing from$87.0billion for 1991 to $93. 1 billion. The 1992 total for thisdivision represented 60.5 percent of all sole proprietorshipprofits. Mining and manufacturing showed the largestpercentage increases in profits. However, these are bothrelatively minor industrial divisions for soleproprietorships since the bulk of mining and manufactur-ing receipts are concentrated in the corporate area.
Using receipts as a measure of business size, services
continued to be the largest sole proprietorship divisionwith 35.2 percent ofall receipts for 1992. Total receipts forthis division were 5.1 percent more than 199 1, at $259.5billion. Total deductions for the services division in-creased4.0 percent to $166.4 billion, which wassmallerthan the increase in receipts; the resulting profits of $93.1billion were 7. 1 percent more than 1991.
For 1992, the largest profits ofany industrial groupwithin the services division was recorded for medical andneauh services. Profits increased 4.7 percent to $32.4billion. However, this increase was the smallest percent-age-wise since 1981 (Figure H). For everyyear from 1984through 1990, annual profits had shown double digitgrowth over the previous year for this industrial group.For 1991, when overall sole proprietorship profits werestagnant, profits for this group still increased by 8.7percent. In comparison, net profits for all services in-creased by 3.4 percent. Yet, for 1992, when overall soleproprietorship profits increased by 8.8 percent, the profitsfor the medical field trailed other groups. On the otherhand, the rate of growth in profits for legal services in-creased 13.6 percent, from $9.8billionfor 1991 to $11.2billion for 1992. This continued the double-digit annualgrowth rate in profits for this industrial group reported formost years since 1984 (with 1989 and 1991 the exceptions).
Wholesale and retail trade was the second largest soleproprietorship division in terms ofreceipts, with 33.6percent ofall receipts for 1992. For this division, bothreceipts and deductions increased slightly, by 0.6 percentand 0.2 percent, respectively. Automotive dealers andservice stations reported fairly healthy increases in bothreceipts and deductions over 1991 (6.2 percent and 6.9percent, respectively). However, since their deductionsincreased more than receipts, their combined net profitsdecreased from $1.5 billion to $1.2 billion. On the otherhand, food stores reported fairly large decreases in re-ceipts and deductions (7.1 percent and 7.5 percent, respec-tively). The net effect of these changes was that profitsfor sole proprietorship food stores increased by 5.9 per-cent, from$1.1 billionfor 1991 to $1.2billionfor 1992. Totalprofits for the entire trade division increased from$13.1billion($4.9billion for wholesalers and$8.2 billionforretailers) to $13.9 billion($5.4billion forwholesalers and$8.5billion forretailers) (FigureA).
ne third largest industrial division for soleproprietorships was construction, with receipts totaling$96.6 billion. This amount was 13.1 percent of all soleproprietorship receipts for 1992. This represented a 4.4percent increase in comparison to $92.5 billion the yearbefore. Meanwhile, deductions only increased by 2.8percent, from $77.6 billion to $79.7 billion. This led to the
37
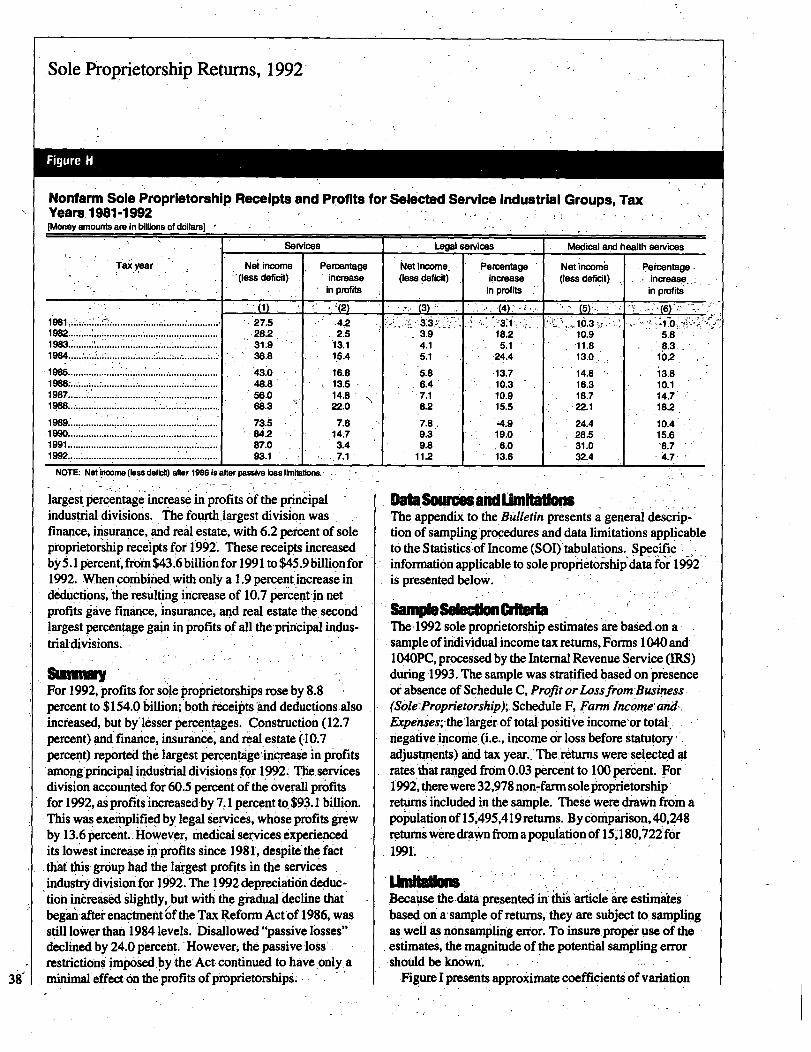
.Sole Proprietorship Retums, 1992,
Figure H
Nonfarm Sole Proprietorship Receipts and Profits for Selected Service Industrial Groups, TaxYears 1981-1992[Money amounts are in billions of doildrs)
Services Legal services Medical and health services
7:ax year Nei income percentage Net income. Percentage Net income Percentage -deficit) increase (less deficit) Increase (less deficit) increase..
in profits in profits in profits
~(2) (3) (4).'(5)
(6)
1981.. .............. 27.5- .4.2 3.i 10.3 0.1982......... ................................................ .28.2 2.5 3.9 18.2 10.9 5.81983. 31.9 13.1 4.1 5.1 11.8 .8.31984 ..... ... .. ......... .... ............. ... 36.8 1.5.4 -1.S. 24.4 13.0 1b21985 ................................................... 43.0 16.8 5.8 -13.7 14.8 13.81986..;.- ....... ;............. 48.8 13.5 6.4 10.3 16.3 10.11987 ... ........................... : ...................... 56.0 14*8 .7.1 10.9 18.7 14.7:19W ............................................................ 66.3 22.0 82 15.5 -.22.1 18.2
1989 .................. ....................................... 73.6 7.8 4.9 241 10.41990........................ : ................................. 14.7 9.3 19.0 28.5 15.61991 .......................................................... 87.0 3.4 9.8 '6.0 31.0 -8.71992 ...........................................
193.1 7.1 11.2 13.6 ~2.4 4.7-
38
NOTE: Not hoome (less deficit) after 1986 19'after passive lose Ilmliations.
largest percentage increase in profits of the principalindustrial divisions. The fourth.Iggest division was..finance, insurance, and real estate, with 6.2 percent of soleproprietorship receipts for 1992'. These receipts increasedby 5.1 percent, ftin$43.6billionfor 1991 to $45.9billion for1992. When. combined, with only A 1.9 percent increase indeductions
.Ahe resulting increase of 10.7 percent in net
profits give finance, insurance, and real estate the, secondlargest percentage gain in profits of all the-principal indus-trial divisions.
SOMMYFor 1992., profits for sole proprietorships rose by ~.8percent to $.154.0 billion; both-itceiotsand deductions also,increased, but by'16sser percentages. Construction (12.7percent) and finance, inwra]n~e', and re'alestate (10.7percent) reported the* largest perpentage4ricrease in profitsamong principal industrial divisions for 1992.. The servicesdivision accounted for 60.5 percent of the overall profitsfor 1992, asprofits
rincreased,by T. I percent to.$93.1 billion.
This was exemplified by legal gervices,whose profits grewby 13.6 percent.. However, medical services experiencedits lowest increase in profits since 1981, despite the factthat this- group had the largest profits. in the servicesindustry division for 1992. The. 1992 depyeciation deduc-tion in6reased 'slight
Ily, but with the gradual decline that
beg=after enactment of the -Tax Reform Actof 1986, wasstill lower than 1984 levels. Disallowed "passive losses"declined by 24.0 percent. - Howeveri the passive, loss',restrictions imp6s'ed.by the, Act continued to have only, aminimal effect-6n theprofits ofproprietorships. - -
DablourmandUmNadwThe appendix to the Bulletin presents a general descrip.-tion of sampling procedures and data limitations applicableto the Statistics-,of Income (SOI)'tabulations. Specificinformation applicable to sole proprietorship data for 1992is presented below.
S011101113111111111com CdbmbThe 1992 sole proprietorship estimates are based,on asampleof individual income tax returns, Forms 1040 and104OPC, processed by the Internal Revenue Service (IRS)during -1993. The sample was stratified based on presenceor absence ofSchedule C, Profit or Lossfrom Business(Sole' rietorship);. Schedule F, Farm Income,and,.PropExpenses;,the'largerof total positiv'eincome,ortotAllnegative.iricome (i.e., income or loss before statutory,adjustments) and tax year..'The,
-returns were selected at
rates that ranged from,0.03 percent to 100 percent. For1992, there were 32,978 non7farm.soleproprietorshipreturns
,included in the sample. These were drawn from a
population of 15,495,419 returns. Bycomparison, 40,248returns weredrawn from a population of 15380,722 f6i
1 1991.
MIAMI=Because the data presented
I'in'"" 'art"icle are estimates
based on wsample ofreturns, they are subject to samplingas well as rionsampling error. To insure.proper use of theestimates, the magnitude of the potential sampling errorshould be know'if.
Figure I presents approximate coefficients ofvariation
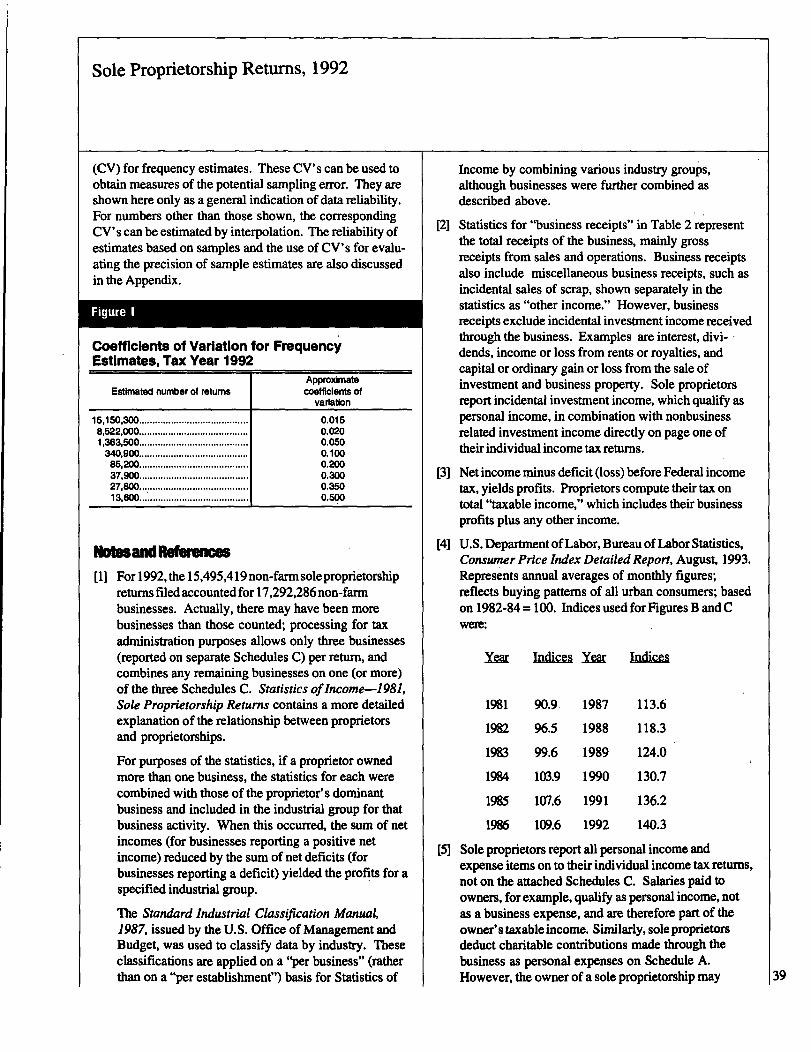
Sole Proprietorship Retums, 1992
(CV) for frequency estimates. These CV's can be used toobtain measures of the potential sampling error. They areshown here only as a general indication of data reliability.For numbers other than those shown, the correspondingCV's can be estimated by interpolation. The reliability ofestimates based on samples and the use ofCV's for evalu-ating the precision of sample estimates are also discussedin the Appendix.
Figure I
Coefficients of Variation for FrequencyEstimates, Tax Year 1992
Estimated number of returnsApproximate
coefficients ofvariation
15,150,300 .........................................8,522,000.........................................1,363,500 .........................................340,900.........................................85,200.........................................37,900 .........................................27,800.........................................13,600 .........................................
0.0150.0200.0500.1000.2000.3000.3500.5W
NoWwWReUmnim
[11 For1992, the 15,495,419 non-farm soleproprietorshipreturns filed accounted for 17,292,286 non-farmbusinesses. Actually, there may have been morebusinesses than those counted; processing for taxadministration purposes allows only three businesses(reported on separate Schedules Q per return, andcombines any remaining businesses on one (or more)of the thwe Schedules C. Statistics of Income-1981,Sole Proprietorship Returns contains a more detailedexplanation of the relationship between proprietorsand proprietorships.
For purposes of the statistics, if a proprietor ownedmore than one business, the statistics for each werecombined with those of the proprietor's dominantbusiness and included in the industrial group for thatbusiness activity. When this occurred, the sum of netincomes (for businesses reporting a positive netincome) reduced by the sum of net deficits (forbusinesses reporting a deficit) yielded the profits for aspecified industrial group.
The Standard Industrial Classification Manual,1987, issued by the U.S. Office of Management andBudget, was used to classify data by industry. Theseclassifications are applied on a "per business" (ratherthan on a "per establishment! ') basis for Statistics of
Income by combining various industry groups,although businesses were further combined asdescribed above.
[2] Statistics for "business receipts" in Table 2 representthe total receipts of the business, mainly grossreceipts from sales and operations. Business receiptsalso include miscellaneous business receipts, such asincidental sales of scrap, shown separately in thestatistics as "other income." However, businessreceipts exclude incidental investment income receivedthrough the business. Examples are interest, divi-dends, income or loss from rents or royalties, andcapital or ordinary gain or loss from the sale ofinvestment and business property. Sole proprietorsreport incidental investment income, which qualify aspersonal income, in combination with nonbusinessrelated investment income directly on page one oftheir individual incometax returns.
[3] Net income minus deficit (loss) before Federal incometax, yields profits. Proprietors compute their tax ontotal "taxable income," which includes their businessprofits plus any other income.
[4] U.S. Department ofLabor, Bureau ofLabor Statistics,Consumer Price Index Detailed Report, August, 1993.Represents annual averages of monthly figures;reflects buying patterns of all urban consumers; basedon 1982-84 = 100. Indices used for Figures B and Cwere:
I= Indices Yrz Indices
1981 90.9 1987 113.6
1982 96.5 1988 118.3
1983 99.6 1989 124.0
1994 103.9 1990 130.7
1985 107.6 1991 136.2
1986 109.6 1992 140.3
[5) Sole proprietors report all personal income andexpense items on to their individual income tax returns,not on the attached Schedules C. Salaries paid toowners, for example, qualify as personal income, notas a business expense, and are therefore part of theowner's taxable income. Similarly, soleproprietorsdeduct charitable contributions made through thebusiness as personal expenses on Schedule A.However, the owner of a sole proprietorship may 39
Sole Proprietorship Retums, 1992
choose to deduct any foreign taxes paid as a businessexpense, unless the owner elects to claim these taxes
-as a credit against U.S..incomie tax.
[6] Losses generated by any flow-through businessactivity in which the taipa~er did not '"materiallyparticipate" (i.e .,,was not involved regularly and,substantially in the o~eratic.ins of the activity)'quali-fled as passive activity lossm The Tax Reform Act of
1986 (TRA) gradually eliminated the use of passivelosses as a means to offset nonpassive income, suchas'Wages or dividends. TRA provided for Ei 5-year~phase-in of the-limitations on passive losses forinvestments made prior to 1987; for 1992, the restrictions applied to all passive losses. However,exceptions up to $25,000 were made' for certain realestate losses. Under prior law,'passive losses werefullydeductible.
40
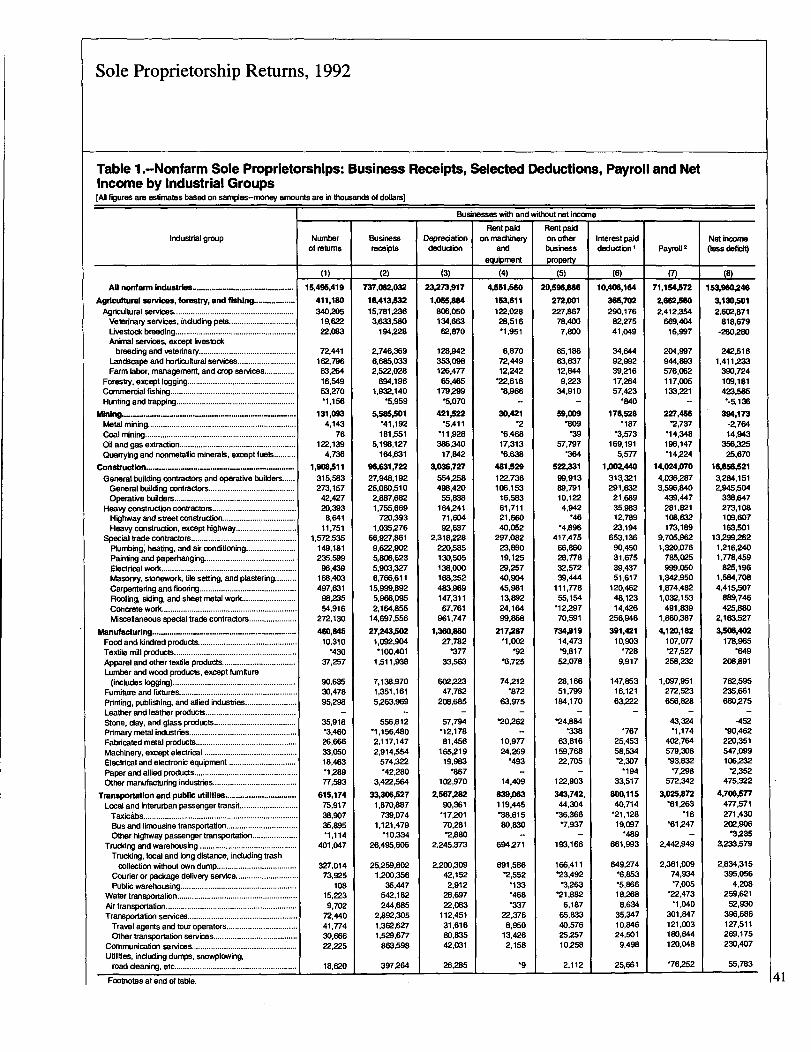
Sole Proprietorship Returns, 1992
Table I.-Nonfarm Sole Proprietorships: Business Receipts, Selected Deductions, Payroll and NetIncome by Industrial Groups[All figures are estimates based on samples-money amounts are in thousands of dollars]
Businesses with and without not income
Industrial group
All nonfarm
Agricultural services, fore", and fishing ....... .........
Agricultural services........................................................Veterinary services, including pets...............................
Livestock breading ........................................................Animal services, except livestock
breeding and veterinary.............................................Landscape and horticulture] services...........................Farm labor, management, and crop services..............
Forestry, except logging ..................................................
Commercial fishing ..........................................................
Hunting and trapping.......................................................
Metal mining.....................................................................Goal mining ......................................................................
Oil and gas extraction ......................................................
Quarrying and nonmetallic minerals, except fuels ..........
General building contractors and operative builders
General building contractors........................................
Operative builders ........................................................Heavy construction contractors.......................................Highway and street construction..................................
Heavy construction, except highway............................
Special trade contractors .................................................Plumbing heating, and air conditioning .......................Painting ~~ paperhanging .........................................
Electrical work...............................................................
Masonry, stonework. tie setting, and plastering..........
Carpentering and flooring .............................................
Roofing siding, and sheet metal work.........................
Concrete work ..............................................................Miscellaneous special trade contractors ......................
Manufacturing.................................... .........................
Food and kindred products ..............................................Textile mill products .........................................................
Apparel and other textile products..................................Lumber and wood products, except furniture
(includes logging) .........................................................Furniture and fixtures.......................................................
Printing, publishing, and allied industries........................Leather and leather products..........................................
Stone, day, and glass products ......................................Primary metal industries..................................................
Fabricated metal products...............................................
Machinery, except electrical ...........................................Electrical and electronic equipment ...............................
Paper and allied products ................................................Other manufacturing industries .......................................
Transpoftflon and public utilities......... ....................Local and interurban passenger transit...........................
Taxicibs ........................................................................
Bus and limousine transportation .................... I............
Other highway passenger transportation .....................
Trucking and warehousing .............................................Trucking, local and long distance, including trash
collection without own dump .....................................Courier or package delivery service.............................
Public warehousing ......................................................Water transportation ........................................................
Air transportation ....:**** ...........
Transportation services ...................................................Travel agents and tour operators.................................
Other transportation services.......................................Communication services.................................................Utilities, including dumps, snowplowing,road cleaning, etc.........................................................
Footnotes at end of table.
Numberof returns
(1)
15,496,419
411,180
340,20519,62222,083
72,441162,79663,25416,54953.270-1,156
131,0934,143
76122,139
4,736
1,908,511315,583273,15742,42720,393
8,64111,751
1,572,535149,181235,59996,439
168,403497,631
98,23554,916
272,130
460,84510,310
*43037,257
90,63530,47895,298
-35,918-3,46026,66633,05018,463*128977,593
615,17475,91738,90735,895-1,114
401,047
327,01473,925
10815,2239,702
72,44041,77430,66622,225
18.620
Businessreceipts
(2)
737,062,032
18,413,53215,781,236
3~633,580194,228
2.746,3696~685,0332,522.028
694,1961,932,140
-5,959
5,585,501'41,192181,551
5,198.127164,631
96,631,72227,948,19225,060,510
2,887,6821,755,669
720,3931,035,276
66,9Z7,8619,622,9025,M,6235,903,3276,766.611
15,999,8925,966,0952,164,855
14,697,556
27,243,5021,092,904'100,401
1,511,938
7,138,9701,351,1615,263,969
556,812-1,156.4802,117,1472,914,554
574.322'42,280
3,422.564
33,306,S271,870,887
739,07411,11211,479
*10,33426,495,606
25,259,8021,200,356
35,447542,182244.685
2,892,3051,362,6271,529,677
863,598
397,264
Depredationdeduction
(3)
23,273,917
1,055AM806,050134,66362,870
11211,942353,098126,47765,465
179.299-5.070
421,522-5,411
'11,928386,340
17,842
3,036,727554,258498,420
55,838164,24171,6D492,637
2,318,22822D,585130,5D5138,000168,352483,969147,31167,761
961.747
1,360AN27,782
*37733,563
602.22347,762
208,685
-57.794-12,17881,456
165,21919,983
*867102,970
Z567,28290,361
-17,20170,281-2,880
2,245.373
2,200,30942,1522,912
211,69722,083
112,45131,61680,83542.031
26,285
Rent paidon machinery
and
equipment
(4)
051r5so
153,611
122.02828,516*11.951
6,87072,44912,242
-22,616-8,966
3D,421-2
-6,46817,313-6,6U
481,529122,736106,153
16,58361,71121,66040,052
297,08223,89019,12529,25740,90445,98113,89224,16499,868
217,287-1.002
*92
74,212
63,975
--
10,97724,269
*493-
14,409
839,063119.445*38,61580,830
-
694,271
691,586-2,552
*133*468
22,3768,950
13,4262,158
.9
Rent paidon otherbusiness
property
(5)
20,59SAM
272,001227,86778,400
7,8DO
65,18663,63712,8449.223
34,910-
59,009
57,797
522,33199,91389,79110,1224,942
-4,896417,475
66,86028.77832,57239,444
111,77855,154
-12.29770,591
734,91914,473
52,078
28,16651,799
184,170--
-24,884
63,816159,76822,705
-
122.903
343,742.44.3D4
-36,366-7.937
-193,166
166,411'23,492*3,263
'21,8826,187
65.83340,57625,25710.258
2,112
Interest paiddeduction I
(6)
10AW,164
365,702290,176OZZ7541,049
34,6449Z99239,21617,26457,423
-8,10
176,528*187
-3,573169,191
5,577
1,00Z440
313,321291,632
21,68935,9831Z78923,194
653,13690,45031,67539,43751,617
120,46248,12314,426
256,946
391,42110,903
*7289,917
147,85316,12163,222
-
25,45358,534-2,307
33,517
800,11540,714
-21,12819,097
*489661.993
649,274
18,2688.634
35,34710,84624,501
9,498
25,661
Payroll 2
M
71,154,572
Z662-9802,412,354
669.40416,997
204,997944,893576.062117,005133,221
227,456-2,737
'14,348196,147-14,224
14,024,070
4,036,2873,596,840
439.447281,821108,632173,189
9,705,9621,3213,076
785,025999,050
1,342,9501,874,4821.032,153
491,8391,860,387
4,120,182107,077*27,527258,232
1,097,951272,523656.828
-
43324*11:174
402,764579,308*93=-7,298
572,342
3,025,872*61263
*61,247-
2,442,949
2,361,00974,934*7,005
*22,473-1,040
301,847121,003180,844120,048
*76.252
Not income(loss deficit)
(8)153,960,246
3,130,5012,602,871
818,679-260,280
242,5161,411=
390,724109,181423,W
'~-5,1136
394,173-2,76414,943
356,32525,670
1%856,5213,284,1512.945-5-04
338,647273,108109,607163,501
13,299,2621,216,2401,778,459
825,1961,584,7084,415,507
M,746425,880
2,163,527
3,506AW178,965
*649208,891
762,595235,661680.275
-
-452
22D,351547,099106=
475,322
4JOBJ5TY477,571271,430202.906
*3,2353,233,579
2.834,315395,056
4,208259,621
52,930396,686127,511269,175230,407
55,783
41
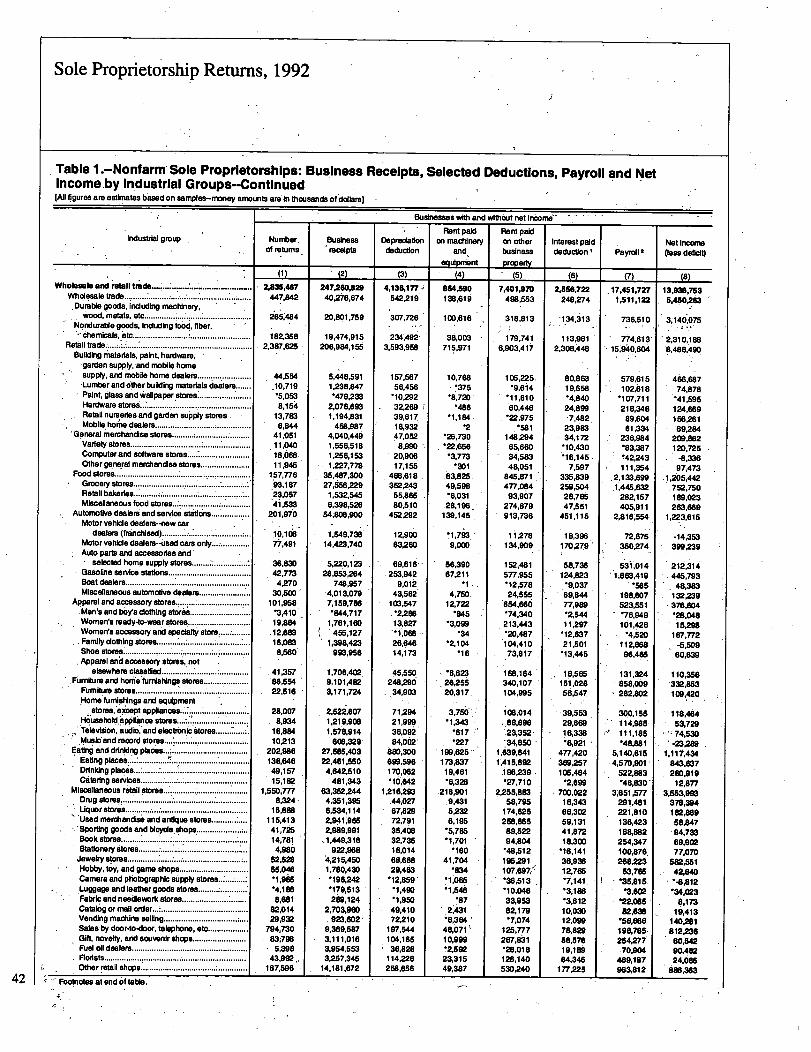
Sole Proprietorship Returns, 1992
Table I.-Nonfarm Sole Proprietorships: Business Receipts, Selected Deductions, Payroll and NetIncome.by Industrial Groups-Continued(AjI figures are estirnates based on aamples-money amounts are In thousands of dollars)
Businesses with and without net inoorn6'
42
Industrial group
Wholesale and retail trade ............................. ............Wholessletrads..................
........
.Durable goods, Including machinery,wood, metals, etc.............. ...........................
Nondurable goods, Including food, fiber,chemicals,
-etc .....................................................
Retail trade.~....... :.
.........................................................Building materials, paint, hardware,
garden supply. and mobile homesupply, and mobile horns dealers........................
'Lumber and other building materials dealem ......Paint glass and wallpaper stores........................Hardware stores ............ . ...................................Retail numedes and garden supply stores .
.
Mobile home dealers...........................................'General merchandise stores..........; .............. .........
Variety stores ................................ ......................Computer and software stores:............................Other general merchandise atoms ......................
Food stores ............ ! ........................................... -Grocery stores............. ................ ! ...................... .Retail bakeries........... ;...........................................Miscellaneous food stores.....................................
Automotive dealers and service stiticins *.............Motor vehicle dealem-new car
dealers (franchilsed) ............I........................ s ...Motor vehicle dealers-used cam only..................Auto parts and accessories and
selected home supply stores...........................Gasoline service stations.....................................Boat dealers................I
- -- ....* .............. ;Miscellaneous automotive dealers ........................Apparel and accessory stores., ... ............................,Men's and boy's clothing stores ............................Women's ready-to-wear stores.............................Women's accessory and specialty store: ..............Firindly clothing atoms .............. : ............ : ...............shoo atoms............... ..........................................
Apparel and accessory stores, notelsewhere classified........................... .............
Furniture and horhe furnishings stores ....................Furniture stoma.......................... ..........................
..............
and:~
.
...
................H
afu 8M
"MTeEn, udia, and I=n~l. stor
.. ...............
off m' ~gaHousah. appW- atcre ................tappilMusic
.and record stores ~.: ..........................
Eating and drinking pieces.......................................Eating places.. ..................................... .............Drinking placesCatering services............ .....................................
Miscellaneous retail stores .......................................Drug atoms...........................................................Uquorstoresi........................................................Used merchandise and antique atoms...........Sporting goods and bicycle."ps .....................
Book stores ........................ ........................Stationary stores .......................................
Jewelry stoma .............. ...................................... ;..Hobby, toy, and game shops ...............................Camera and photographic supply stores ...............Luggage and leather goods stoma ............
Fabric and needlework stores ..............................Catalog or mail order .......................................Vending machine selling ; ........................;Sales by door-to-door, telephone, etc..................Gift, novelty, and souvenir shape..................Fuel oil dealers ..............................................Florists................................... i ..........................Othermtell shops................................... : .............
Footnotes at end of table.
Number,of re
.turns.,
11
2,835,467447,842
265,484
182.3582,387,625
44,554~110,719-5,0538,154
13,7836,844
41,051.11,04018,06811,945
1157,77693,18723,067.4,5XI
201,970
10,10671F.49l
.36,83D-42,773
1 4,27030,600
101,958-3,41019,88412,68316,083,8.560
'86,55422,516
2:,007934
16,88410,213
202,9118138,84649,15715,182
1,550.7778.324
15,688115,41341,72514.7814,980
52,62855,046-1,9i6-4,1888,681
82,014.29,932
794,7301 !711
43,992,..187,596
Business
receipts
(2)
247,280,82940,V6,674
20,801,759
19,474,915206,984,156
5,448,5911,238,847'479,233
2,076,6931,194,831
458,9874,040,4491,556,5181,256,1531,227,778
35,487,30027,566,2291,532,5456,398,528
54,808,900
1,549,73814,423,740
5,22012328,8W:i;4
748,957~4,013,0797,159,786'8".717
1,761,1W456,127
1,398.423993,956
1,708,4029,101,4823,171,724
2,522,6071,219,908I.V8,9141
608,32927,585,40322,461,550
4,642,510481,343
63,352,2444,351,3956,534.1142,9.41.9652,989,9911.449,316
922,9684,215,4501,780,430'196,242'179,513289,124
2,703,960
,
923,602-9,369,5873,111,0163,954,503,2.S7,345
14.181,672
Depreciationdeduction
_A3)
4,136,177,542,219
307,726
234,4923,593,958
157,56756,456
'102923Z26939,61718,93247,0528,990
20,90617,155
488,618352,243
55,86580,510
452,292
12,90063,260
69,616.253,942
-9,012.43,562
103,547-2,28613,827-lma26,W14,173
45,550248296
34,903
71,29421,999,36,0W84,002'
880,300699,596170,062'10,642
1,216.29344,027
- 67,82072,79135,40832,73518,01468,68829,463
-12,859-1,490-1,95049,41072,210
197,544104,16536,828
114,226258,656
Rant paidon machinery
and,equipment
(4)
854,590138,616
100,616
38.003715.971
10,768.!3758,72D*486
-1,184*2
'28,730-22,656-3,773
*30183,82549,598-6,03128,196,
139,145
-1,793,9,000
56,39067,211
.1
4,750.12,722
*845
-3,099-34
-2,104*18
*8,62326,25~20,317.
3,756-1,343
*617'227
199,625-173,83719,461-6,328
218,9019,4315=6,195
-5,785-1,701
*16041,704
eu
.1,0651,5Q
- 78.2,431-6,36448.67110,999*2,592
23.31549,387
Rent paidan otherbusiness
_pwerty' (5)
7,401,970498,553
318,813
179,7416,903,417
105,225,!9,614
-11,61060,446
'22,975
148,29465,66034,58348,051
8415,871477,08493,907
274.879913,736
11,278134,909
152,461577,955*12,57824,555
654,660'74,34021~1,443'20,487104,41073,817
168,164340,107104,995
108,014.68,896
23,352-'34,850
1,i3g,6411,415,692
i 96,239'27,710
2,255,88358,795
174,625258,865$9,52294,SD4
-48.512
195291
107:697''38,513-10,04633.96362,179-7,074
125,777267,8~1128018
;26:140530,240
Interest paiddeduction'
(6)
2,06,722248,274
-134,313
113,9612,308,448
80,86319,658-4,84024,899-7,482,
23,08334,172
.10,430-16,145.
7,697335,839259,50428,78547,551
451,115
18,396,170,279
58,736124,823
*9,03769,W77,989-2,54411,297
'12,63721,501
'13,445
16,565151,028 '156,547
39,55329,66916,338*8,921
477,420369.2671 015,464
-2,69970D,022
16,34366,30259,13141,87218,300
-16,14136,93812,765.7,141-3,186-3,61210,03012,09978,82956,57610,18964,346
177.225
Payrd12
(7)
.17,451,7271,511,122
736,510
774,61315',94'0,604
579.615102,618
'1107,711218,348
89,60401,334
236,984-83,387~42,243111,354
2,133,6991,445,632
282,157405,911
2,818.554
72,875350,274
53i,01141,663,419
'565198,607523,551*76,949101,426
'4,~20112,86896,465
131,324858,009282,802
300,155114,985111,185-48,881
5,140,8154,570,901
522,883-46,830
3,651,577291',481221.810136,423168,882254,347100,876,268,223
53,765-35,815
*3.602*2408582,6W
'56,068196,785254,27770,904
489,187
Not Income(less deficit)
18)
13AM,7535,450,263
31140,075
2,310,11888,486,490
466,68774,878
'41,595124,66ig156.26169,284
209,88212D,725
-8,33897,473
.1,2b5,442.752,750189,023263.669
1,223,615
-14,353399,239
212,314.446,793
48,383132,239376,004*28.04815,298
A 67,772~5,509
60,639
110,356332,853100,420
118,46453,729
'-23,2891.117,434
843,637260,91912,877
3,653,993378,394182ASO58,84794,73369,90277,070
582,55144840--8,812e34,023
8,17319,413
140,261.812,23680"90,48224,086
888,383
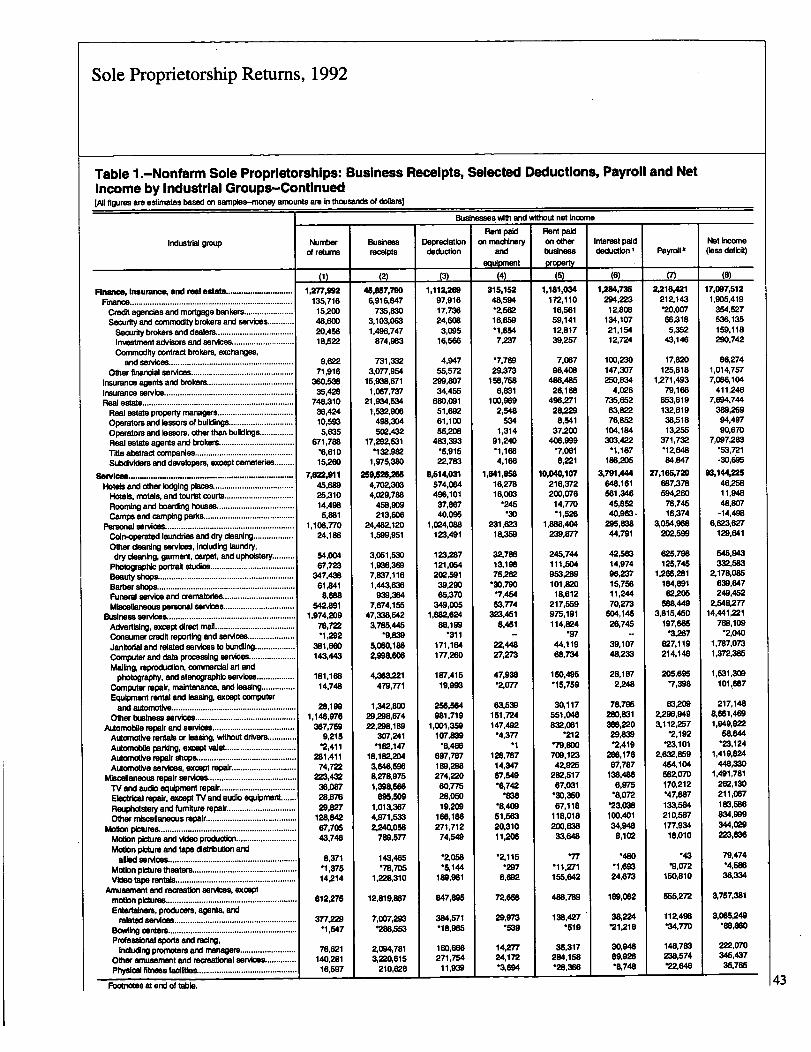
XC
ER
mfn
rr>
>>
>f
m0)
--1m
00
mi
Fta
ig
ori)
0m
lm
lI
11
11m
laarm
l,
M-.'
-'-~I
aJ
SI
28
it=
12
is
,all
F
-!j
I'S0
-8
II!
6,I
rL5
W9.
I-
~l
a'
-;j8j
jI
1F.
F
-a
ill:
0221
,95
oS
.a
ut
g
Is
It5-
a
EL
1
8. Cr
WV
~T
WS
WtR
tl
i;.g
isE
tW
,j
-Zj1.
11)b
--4Ut
b--P
,,,
98
9-0
91
2B
80-88
88
Po5
a1~
PS9
Wh3
a,
.06M
CA
Wt-
4-4-0
-W
-D,
Pl30
P ED.
PS
!3r.
3P
3-
--
--
--a
40
C.4
S14
1~
2.
II
nS
.A
9531till-
ca
cdM~
54-4
wGo
CA:4
.~p
En8
`0-1
9-1-8
-AV
tc
~4
t2"
3t
-8W
4V
9t
t
CD*
C;
rs-I
"Ji
W4
r"
fb
s-OC
f-St
E4
itv
t-g
21'A
'S18099'81
DC"
--
-
.-
toC"
-w
c;i-
1:12
pT
g;N
]pP
:4fS
iA-cb
--
--
--
--
-CA
ic9
coa
F-IC,.o
EE1
239
-9=
1a"I
Ig
-
ID12
Oc=
Vz9-4
1"S
paj
;98
C-n9
31~p
N".
i;8-
~!I
p.4
r.-'S
-0-4
~RJG
9iS
5rs
--
--
80,
ro-:4
8A4
-aw-6-;
-got-
-2:31
'60t
2=-4
-CaDlt
W:l
vIA
D-Fo
s'g
o'V
10'
-8-
IS,
-w-t
't-'
!!4
0;18
t!
al
iO
DW
a.9-
I"s
21
9-
99
iW
v!D
t0-0
--
---
--
--
-'
-p
Ap
-4p
--
-
-.
ZI!d
-04EtNa
-IN8
EfS
ttt
18.
SmCR
))§4
"i3
:~&
S.
§R'3
gig
:.q:
t0
'S"a
a~4
CS:2
U,
C,4
h)In
'mb)
b)b
4.0
-002
w0,
-4fl
)w
-4
US
cvt
-4a
gC
iI
r2 MN rg
so
so
9)
roa
~4
-4'4
:t8
-§2-.
4-OrH
-W-:
-4-4
ca
kA
=itf
99
..
SD
:4-
-
--
--
--
--
'b
'.
.
8T
M-
-l
-H
isI
TO
e.IS
Va8
413
9t,
JA
EO
-4
gH
-E5;
1'1
8L
7
Cr
1-C
Z
83C
l
202
00
ffcm
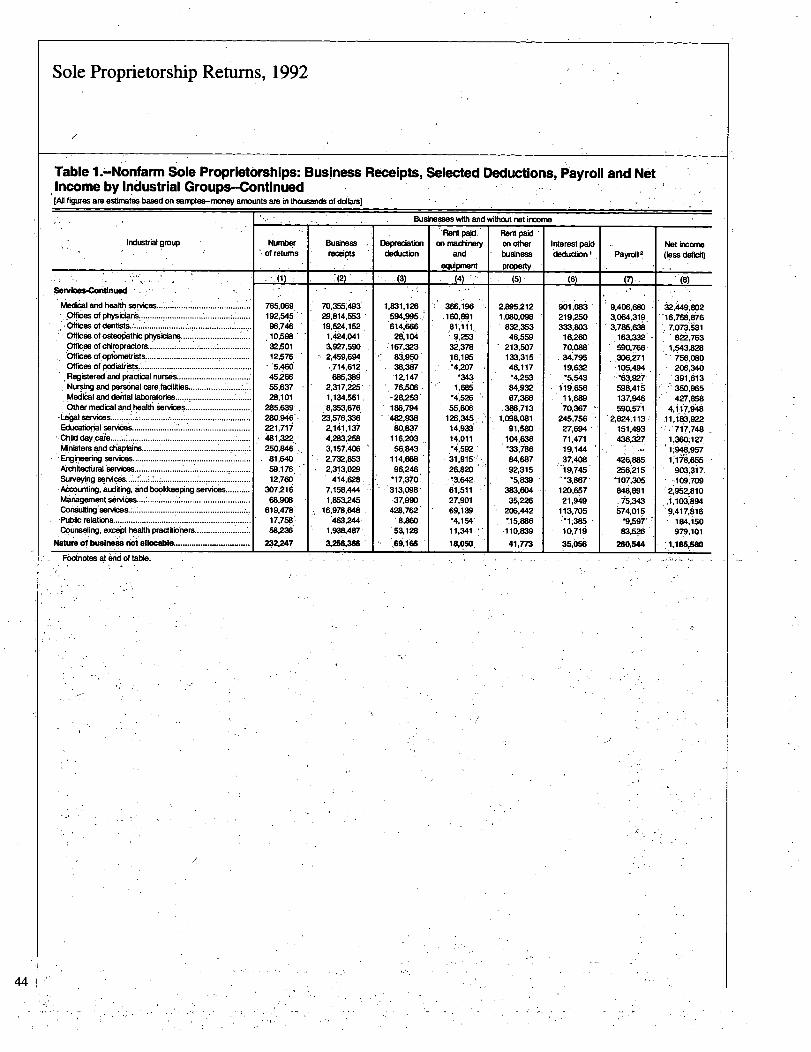
KZ
-~@
=.a
IIs
NJ
itA.
;,
SL
-8.1
9~.
~~
5tv
ii
im
i.-
':;,
':6,
':':
i
co
-4CO
C8D
8.18
0f0d
C20(80
~2180
19'jCIO
toe)
-4CA
Tto
~4t
C4ca
m0
PO8
~45~
1-01
-4CO
(A-4
-4
M
F,
aX
:~tS
?Gtd
?;S@
~r.
Z5LI
jj~:~
~~is
!~!N
r)r)
rila
Kr.
rl"
01--o
*o
Ik 9
.a, ra
T
LT3
R9.4
a
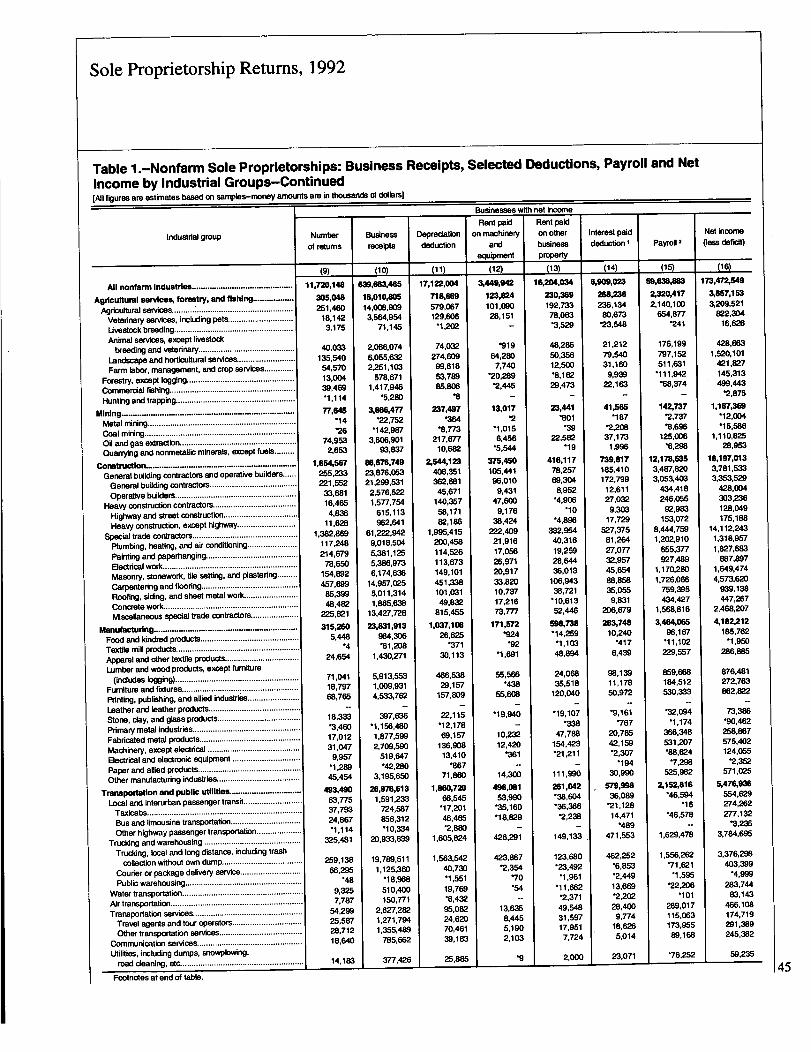
mR
m6
Var
Sfb
=~
C'.
m<R
.0
R'ii
qI
-c
3.8
1.~
5g
2~
PF
T-
.R 0.
82
9-ff
@El
i-2-
-8
I(D
aH
,g.
-MW-
~CL
Gu
59
-to
(Da
Cl.m
050
CDS.
.1`0
5-K
II
ggI
F11
8.2
iaJ,
-88
22
iG
iFL
r9
mg8
0CL
CL0
CLC=L
S.
5'CD
:0
CLn
SDC
L.
Cj-
7CL
RR-
4-.
;Z;,
(Im
R2
InM
0E
0=
0)
=-
-K9
'D5
--
CD.
5.
CPa.
CL
CL(D
to--0
'mso
RL4
8a
pi
:(D,
R-2
~R
11
?C
LSL
:Ot
q,:
..
CRg
dE
~,.8
0;
&i
i.
a.
~':
612
i.:
-~:
toi
.@
-:
M.
Fip
5'.
3:
::
::I
::
-;a
:~:
CL
0:
5C
L18
r'
rDm
w
3Fa
aC
L:0
00
0:
CL
SLz
CL
5 to t
..
I.
..
Ln
'-4
b'r
o'-
4'c
a0,
-fla
--§
I-
,~
I'W
'-S
$-I
~~2
:,'9t
,'-
a'~
'FE
'§':
iI
~A-I.
!2~
123
8!~
R.4
s9
~:0,
-!'
~8
,,
,,
,,
8's
§-
AA
roPl
cncn
:i:0,
U,
m'D
coP4
14-tn
-0cn
,4o
al~
-:4
V.4
M~
§g
~-
M
rs
-4'W
g"P
It'-
4=
ag
~~
8Id
-4CO
a4T
-8C2
,t
'-s
Tn
's'w
ais
8,6
45.
w-
CO
(0N
pPD
soall
c"
:Ctn9
rsC,
8393
G8
tis
J;~
20
rz6
'srA
.I
isY
.-
ca.91
Ej.
..
..
.cm'0
-cot
poc"
CS'01
foIT
N0
FO
1
08
9W
Np
p0--
-"--
--'-
4'-
40,
b--
4'.P
,-rQ
'o'R
-.4
D3
=iw
lto
54
V,w
roCA
:19D
coco
al
:3E
gg
I-4
C,
wo
o0
coL"
w91
F.
'-4
"DtI
-42
1
5 R a q 0 10
B 7-HCL
1-53
C7
0 a g's
5
SOt8,
-4,
.~m
T;
P.
(Aro
CAn
rsD.
CA.,4
bi
'm"
g'R
t'§
'8A"
gIii-
0§
rdca
ECO
-4to
w-4
Vt
sbi
4~4
0 0cr CD
CD--
471 0
CL c
ID'
CL
wCO
)fo-0
.1G
)u
U-1 0
'a9
C-%
-00
05
00
C'a
.P.
LA
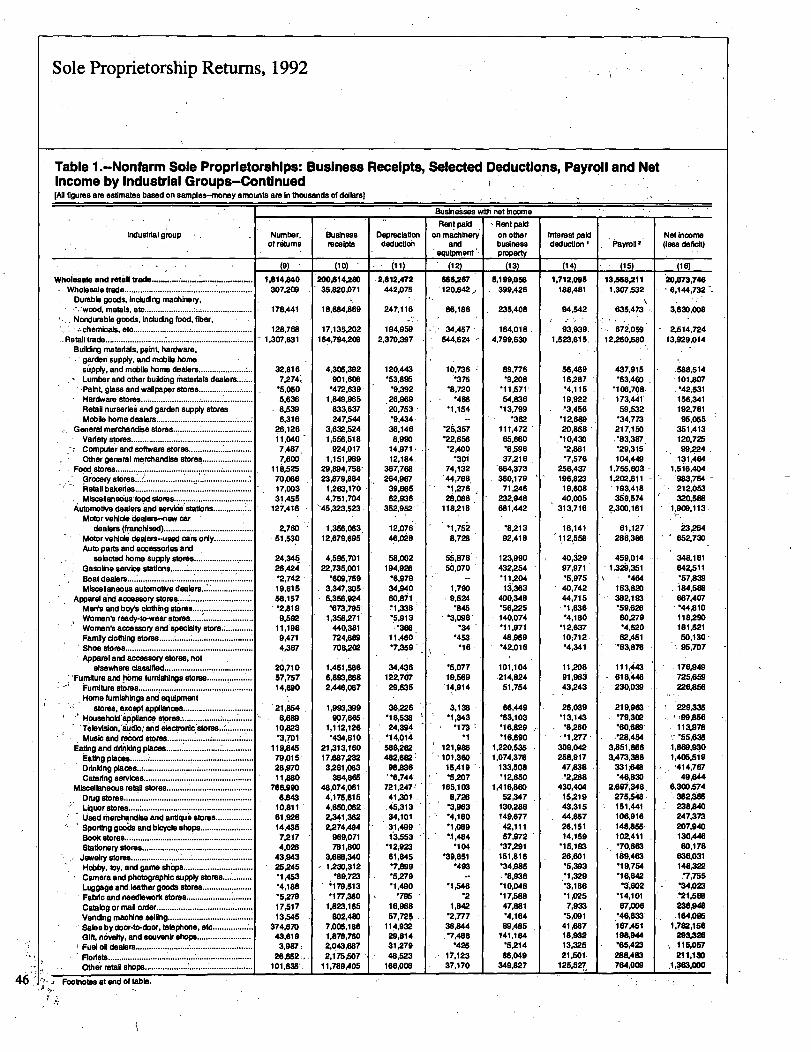
Sole Proprietorship Returns, 1992
Income by Industrial Groups-Continued[All figures am esamates based on samples-money amounts are In thousands of dollars)
Table 1.-Nonfarm Sole Proprietorships: Business Receipts, Selected Deductions, Payroll and Not
Industrial group
Wholesale and retail trade ..........................................Wholesaletrade. .......................................................
Durable goods, Including machhery,wood, metals, etc........... I..........:..; ......................
Nondurable goods, Including food, fiber,
~'.~chemicala, etc.....................................................Retail trade ..............
*....................................................
Building materials, paint hardware,
garden supply, and mobile homesupply, and mobile home dealers.........................Lumber and other building materials dealersPaint, glass and wallpaper stoma........................Hardware stores ... ..............................................Retail nurseries and garden supply storesMobile home dealers...................................
General merchandise stores...................................
Variety stores.........................................Computer and software stores ............................
Other general merchandise stores......... ............Food stores ...................................... :.~ .....................
Grocery stores.'..~ ......................................Retail bakeries....................................................
Misceflanedus food stores ....................................Automotive dealersand servi6a stations..............
Motor vehicle dealers-new cardealers (franchised) ........................................
Motor vehicle dealers-used cars only .................Auto pans and accessories and
selected home supply stores ..........................Gasoline service stations............................. :
Boatclealers : ...................................................Miscellaneous automotive dealers..:....................
Apparel and accessory stores, .......................... .....Men's and boy's clothing stores...........................
Women's ready-to-wear stores ............................Women's accessory and specialty store..........Family clothing stores ................ !.....................
1
Shoo stores..........................................................
Apparel and accessory stores, notelsewhere classified.......................................
'Furniture and home furnishings stoma ....................
Furniture stores ..................................... ! .............
Home furnishings and equipmentstores, except appllanc6s ................................
H~pusehold appliance Stores'Television, iiudlo; and electrordcstores..:............
Music and record stores .................... ..................gating and drirtking places .......................................
Eaflng places.................Drinking places..~ .................. E ........................
..............................................Catering services..Miscellaneous retail stores......................................
Drug stores .........................................................
Liquor stores .................................................
Used merchandise and anticitis stores................
Sporting goods and bicycle shops.......................
Book stores.........................................................Stationary stores .................................................
Jewelry stores.............Hobby, toy, and game .....................
Camera and photographic supply stoma.............
Luggage and leather goods stores............. :
Fabric and needlework stores .............................Catalog or mall order...........................................Vending machine selling......................................
Sales by door4o-door, telephone, etc ...................Gift, novelty, and souvenir shops ........................
Fuel all dealers .....................................................
Florists ................................................................
Other retall shops ....................z............................
Number,of returns
(9)
1,614.840307.209
178,441
128,7681,307,831
32,8167,274,
-5,0505,6368,5396,316
26,12611.0407,497,7,600
118,52570,06617,00331.455
W.4116
2,76061,53.0
24,34526,42i-2,74219,61558,157-2,8199,592
11,1989,4714,397
20.710'57,75714,890
21,8548,689
10,823-3,701
119,84579,01528,970I I'm
766,99D8,843
10,81101,92814,4357,2174,025
43,94325,245-1.453-4,186-5,M17.51713,545
374,67043,819
3,997;26,852r-
101,635
Businessreceipts
(10)
200,614,28035,820A71
18,684,869
17,135.202164,794,209
4,305,392901,606
-472,639-1,849,965
833,637247,544
3,632,5241,556.518
924,0171.151,989
29.894.758-M,879AS4
1,263,1704,751.704
-45,323,523
1.356,063.1 2,679,695
4,595,70122,735,001
'609,7593,347.3055,356,924-673,795
1,358,271440,381724,689708,202
1,451,5866.893,8682,440,067
1,993,399907,665
1,112,126'434,610
21,313,16017,687,232
3,261,063364,865
48,074,0614.175,8154,850,0622,341,3622,2i4,494
969.071781,800
3,688,3401,23D,312
. *89,723-179,513*177X0
1,823,165SOZ48D
7,005.1861,878,7602,043,6872,175,507
11,789.40S
Depreciationdeduction
"1
.2,812A72442P75
247.116
194,9592,370,397
120,443-53,895-9,39226,969
.20,753-9,434-36,1468,990
14,971.12,184,
367,768264,967
39,86562,936
352,952
12,0764~6,028
58,002194,928
-6,97934,94060,871'11.338-.5,913
*366.11,460-7,359
34,438122,767:29,S35
38,226*18,53824,394
'14.014588,262482,682:
98.836-6,744721,247-41,301
.45,31334,1013
'1,499
13,5153'12,92361,S45-7,899*5,279-1,490
'79516,96857,725
114,93224,81431,27948,623
160,008
Businesses with net income
Rent paidon machinery
andequipment'
665,267120.842,
86,188
34,457544,624
10.736*375
-8,720*486
-1,154-
'25,367-22,656-2,400
'30174,6244,768--1.27628,088
118.218
.1.75i8,728
, Rent paidon otherbusiness
. property
(13)
5,199,056399,426
235,408
40184,79963016 :
89,778-9,208
'11,57154,836
'13,799
111,47265,660.8A9637,216
'664,373360,179
71,246232,948681,442
*8.21392,418
55,87856,070
1,79D.9,524
-3.098-34
*453*is
-5,07719.56914,914
3,138-1,343*173
121,986
1BA19*5,207
165,1038,728
-3,983-4,180-1,0891,484
'104-39,851
*493
-1.546-2
1,842*2,77736,844-7,486
*42517,12337,170
123,990432,254'11,2041S,363
400,348'56,225140,074'11,97148059
'42,016
1011,104214,82451,754
66,449'63,103'16,829-16,690
1,220,6351,074,376
133,508'12,650
1,416,86052,347
130,288149,67742,11157,972
'37,291151,816'34,985.'8.936-10,046'17,58847,881-4,16489,485
141,184*5Z486,049
349,827
Interest paiddeduction
j(L14)
1,712,095188,481
94,542
93,939.1,523,615.
56,46916,287-4,11519,922-3,456
'12,68920,868
-10,430-2,861-7,576
256,437196,82319.60840,005
313,716
18,1411112,558
40,32997,971*5,975
40,74244,715-1,636-4,180
'12,63710j712--4,341
11,20891,98343,243
26,039'13,143-8,280-1,277
309,042258,91747,838-2,288
430,40415,21943,31544.85726,16114,159
-15,19326,601-5,393
..1,329-3,188'1 A)257,933
'15,091410718,93213,32521,501~
125,527.
Payroll
(15)
13 21111~3081~"
635.473
672,05912-"0,680
437,915-63,46D
-106,708173,44159,532
'34.773217,150-83.387'29.3115104,449
1,755,6031,202,611
193,418359,574
2,300.161
61,127286.385
459,0141,329.351
*464163,820382,193*59.62880,279-4,52D62,451
-63,876
111,443.618,446230,039
219,963-79,302-60,889~-28,04
3,851,8683.473,388-
331,641-46,830
2,697,346,275"151,441106,916148,8551OZ411-70,683.189,483'19,754-16,642
*3,602'14,10167,006
..46,633167A511198,944-85,423288,483764,000
Not Income(loss deftft)
( 16).20,073,746
6,144,732
3,630.008
2,514,72413,929,014
.588,514.101,807.-42.531158,341192,78195455
351,413120,72599,224
131,48411.516,404483,76421 Z0533i0,588
1,909,113.
M.264652,73D
348,18184ZSII'57,839184,588667,407
-44.810118,29D181,52160,130-95,707
176,949725.659226,858
229,335-99,856113,976*55,635
1,869,9301,405.519
414,76749,044
6,300,574382~M238,840247,373207,940130.44080.178
638,031148,322
-7,755'34,023-21,668238,948
.164,0951,782,156
293,3281115,0157211,13D
'1 13M.000
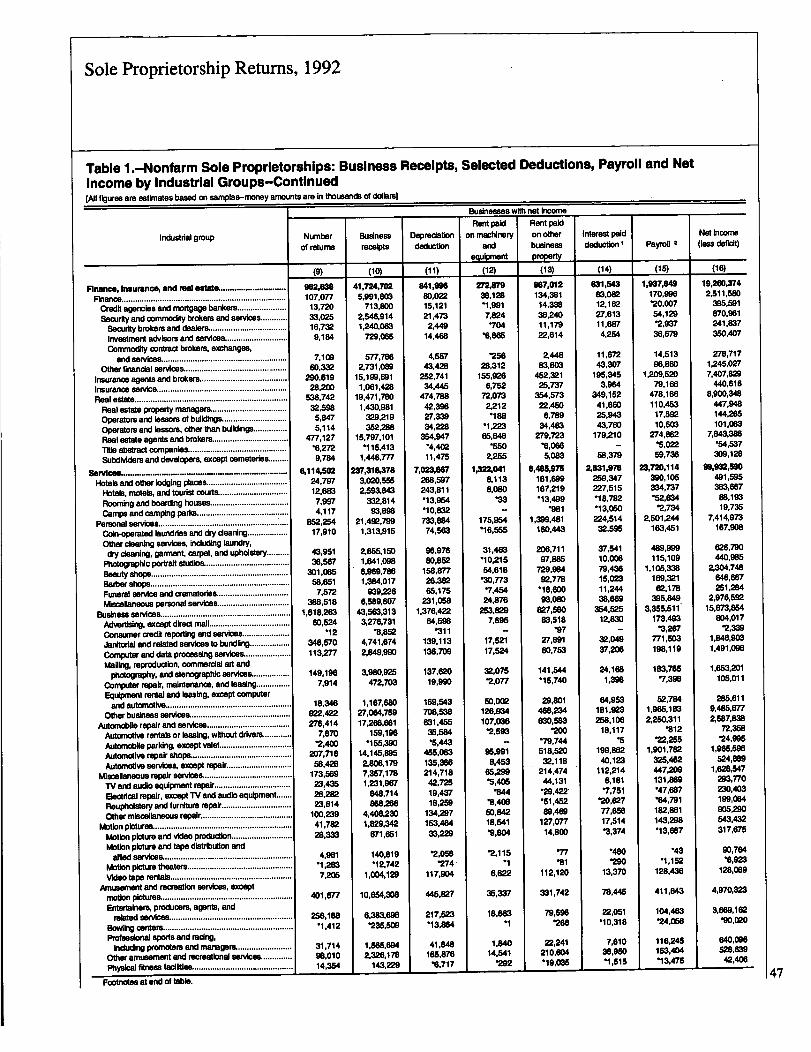
-URU5~04-.M
"i9
tI
10
M911
ECS,I
is"I
IR
ES
991
29A
W
$D
$A
b)
aDg
gl
H-H
al
19U21
912
9a"!
l:t8l"
9,D
-ltM
9W
:M
La- P-
9
Zj§ 3 0 if hl
4'4
Htit!HimlAglunsnm
Witigi
tnasgin
H-8
v
IJ
caE
t-M
AIM
EIRE
~3:4
-4
E2
1
JJ~
9:4
gig
10log
.0,
2i"
89-3
p
--M
g@
:~bS
EA
&=
-v,=
!3zs
qi;
fdvc
aW
-91
c"T
:38Is
'oii,
138
ca8199
:aJ
ca
ZA,
T8
.-
.
-A
n.
14,
14,1
A9
-9-
1-9
v-0
:,:,
,-
--
--
-nS
Tn
§"
vi
lpH
iG
Hg
wa
tL
Iz
MT
a3
;5=c
3a;-
-j5.9
8R
j0
N_
!t919%
go
u%
UT
inro
sr,
a,.qm
Im-4
ro01
Im&
-SF-
1 orr
CD -ZZ,
150
CL c 0 cr
OF
cc C) 09
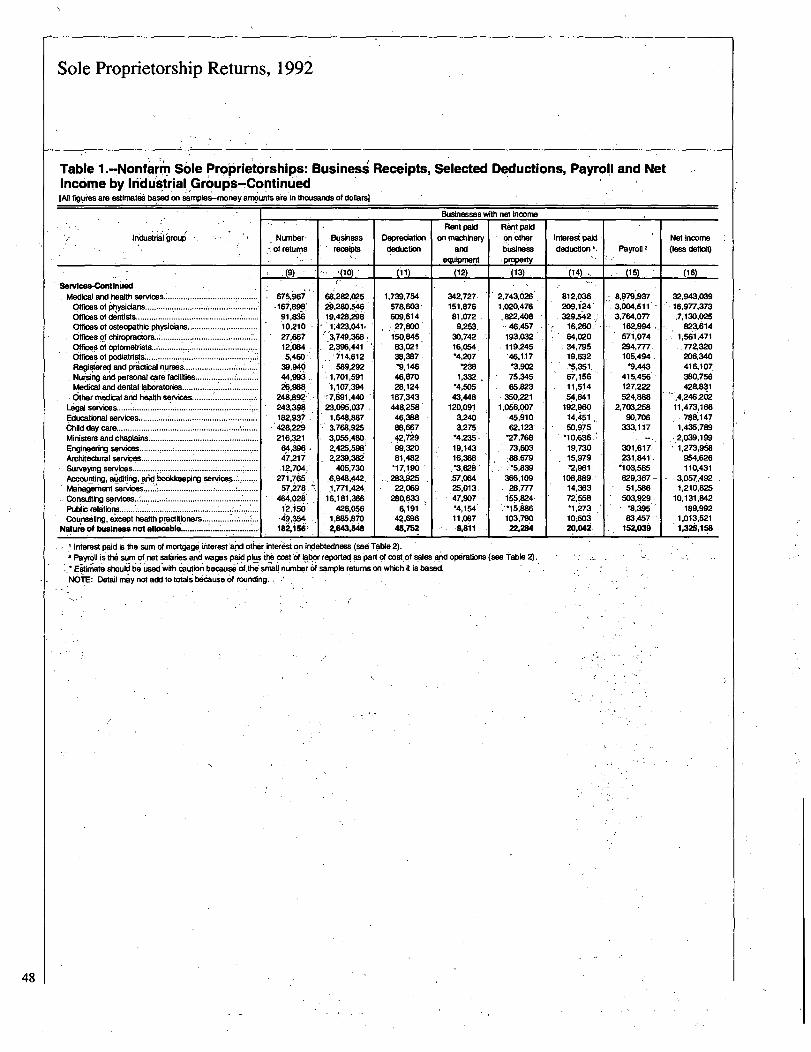
Sole Proprietorship Returns, 1992
Table l.-Nonfarm Sole Proprietdrships: Business' Receipts, Selected Deductions, Payroll and NetIncome by Ifidustrial,lGroup
.s-Continu'ed
(AD figuies, are estimaies based on samples-money arrigunts are in thousands of dollars)
industriail group
Services-ContinuedMedical and health services ................................Offices of physicians ...................................................offices of de~nijsts........................................................offices of osteopathic.physicians. ...............................Offices of chiropiractom.: ........................................Offices of optometrists................. ................................Offices Of podiatrists.............................................Registered and practical nuraiiis...................... ..........
Nursing and personal Care facilities ................. ...........Medical and dental laboratories ..................................Other medical and health STVC-es;.............................
Legal services ...................................................Educational services............. ;.....................................Child day care ....................................................... ~;Ministers and chaplains .................................................Engineering services :............................................Architectural services....................................................Surveying services...................................... ;...........A,ccounting, auditing. and bookkeeping services.:
Management services ........................
. .......................Consulting services..:Public relations ................................................................
Counseling, except health p!actftioners ....................Nature of business not allocable ................................
Number.
of returns
~ (9) -
675,967,167,898.
91,83610,21027,136712,084
5,461)39,94.644,993,26,988.
248,892243,396182,937428,224216,32164,396~i,217.12,704,*
27i.765',57,278,
44026~12.150
lazisw
Businessreceipts
'00) ,
68,282,02529,280,64619,428,298
1,423,1)41~~~'3,749,368
.2,3196,441
589,2921.701,5911,167,394
~7,891,44023,095,037
1,648,8873,766,9253,055,480,2,425,5982,239,382
405,7306,901,442
-1,771,424
16,181,366426,056
1,885,8702,643,548
Depreciationdeduction
1,739,754578,6103'609,61427,8DO
150,84583,02138,387-9,146
46,87028,124
167,343448,25846,3B888,66742,72969,32081,482
283,92522,069
280,6336,191
42,69645,752
Businesses with not income
Rent paidon machinery
andequipment
(12)
342,727.151,87681,0729,253,
30,74216,054,4,207*238
1,332-4,50543,448
120,0913,2403,275
*4,23519,14316,368*3.62857,064
.25,013,47.967*4,15411,0879,811
Rent paidon other
business
property
(13) -
2,743.0261.020,476,822,408
46,457193,032119,245'46,117*3,90275,34565,823
.350,221106,007
45,91062,123
-27,76873,60388,679`5,839
366,10928,777
155,824-15,886103,79022,284
Interest paid is the sum of mortgage interest and other interest on indebtedness (see Table 2).
2 Payroll is the sum ofnet salaries and wages paid plus the cost of labor reported as part of oost.of.sales and operations (see Table 2).
Eitimate should- be' usedwilth caution' because'of,th; smau number ~f sample returns on which it is based.NOTE: Detail may not add to totals because of rounding. .
Interest paid
deduction'.
(14) -
812,036209,1 24329,542
16,26064,020
.34. 79519,63.2-5,351_67,15611,514
19zg6014,~51 ,50.975
*I 0,63ii19,73015,979-2,961
108,88914,36372,558-1,27310,50320,042
Payroll 2
(15)
3,004,5113,764.077
162.994571,074294,777105,494
-9,443415,456127,222,524,888
2,703,25890,706
333,117
301,617.231.841i 03,585829,367-51,586
503,929-8,695
83,457152,039
Not income
(less deficit)
(16)
32,943,03916,977,373.7,130.025
823,6141;561.471
2D6,340416,107380,756428,831
4,246,26211,473,166
~.788,1471,435,789
.2,039,1991,273,958
954,626110,431
3,057,4921,210,825
10,131,842189,992
1,013,5211,32058
48
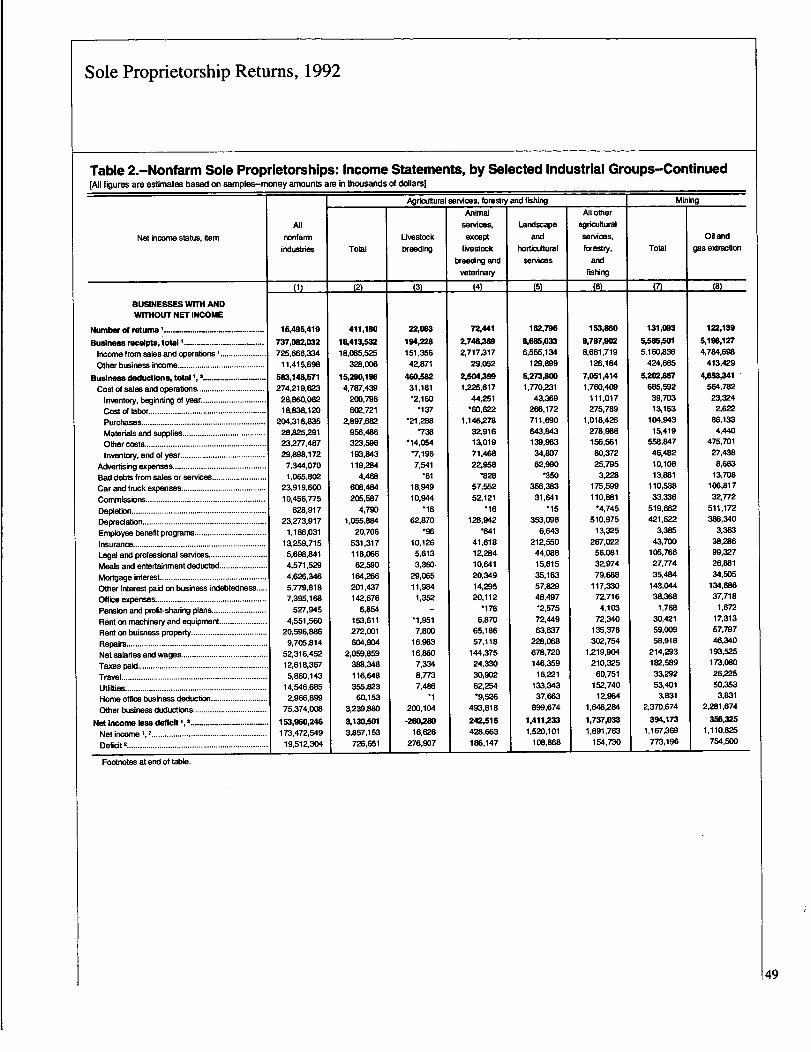
Sole Proprietorship Retums, 1992
Table 2.-Nonfarm Sole Proprietorships: Income Statements, by Selected Industrial Groups-Continued[All figures are estimates based on samples--money amounts are in thousands of dollars]
Agricultural services, forestry and fishing MiningAnimal All other
Ail services, Landscape agriculturalNet income status, dam nonfarm Livestock except and services, Oil and
industries Total breeding livestock horticultural forestry, Total gas extractionbreeding and services and
veterinary fishing
(2) (3) (4) (5) (6) (7) (8)
BUSINESSES WITH ANDWTIrHOUT NET INCOME
Number of returns ...................................... 15,495,419 411,180 4083 72,441 162,796 153,860 131,093 122,139
Business receipts, total I ............ .................... 737,082,032 18,413,532 194,228 2,746,W 6.685= 8,787= 5.585AM S'198'1z7Income from sales and operations I ..................... 725,666,334 18,085,525 151.356 2,717,317 6,555,134 8,661,719 5,160,836 4,784,698Other business income........................................ 11.415,698 328,006 42,871 29,052 129,899 126,184 424,665 413,429
Business deductions, total 1, 2.......................... 583,146,571 15,290,196 460,582 2,504,399 5,273AM 7,051,414 5=,867 4,853,341Cost of sales and operations............................... 274,219,623 4,787,439 31,181 1,225,617 1,770.231 1,760,409 685,592 564.782
Inventory, beginning of year .............................. 28,860,062 200,796 -2,160 44,251 43,369 111,017 39,703 23,324Cost of labor ...................................................... 18,838,12D 602,721 '6D,622 266,172 275,789 13,163 2,622
Purchases......................................................... 204,316,835 2,897,682 -21,288 1,146.278 711,690 1,018,426 104,943 86,133
Materials and supplies...................................... 28,825,291 956,486 '738 32,916 643,843 278,988 15,419 4.440
Other costs........................................................ 23,277,487 323,596 -14,054 13,019 139,963 156,561 558.847 475,701Inventory, arid of year....................................... 29,898,172 193,843 -7,196 71,468 34,807 80,372 46,482 27,438
Advertising expenses ........................................... 7,344,070 119,2B4 7,541 22,958 62,990 25,795 10,108 8,663
Bad debts from sales or services......................... 1,065,802 4,468 3,228 13,881 13.708Car and truck expenses....................................... 23,919,600 608,484 18.949 57,552 356,383 175,599 110,538 106,817Commissions....................................................... 10,456,775 205,587 10,944 52,121 31,641 110,881 33,336 32,772
Depletion .............................................................. 628,917 4,790 *16 *15 *4,745 519,662 511,172
Depredation......................................................... 23,273,917 1,055,884 62,870 128,942 353,098 510,975 421,522 386,340Employee benefit program................................. 1,186,031 20,706 *96 *641 6,643 13,325 3,385 3,363
Insurance ............................................................. 13,259,715 531,317 10,126 41.618 212,550 267,022 43,700 38,286Legal and professional services ........................... 5,698,841 118.066 5.613 12,2B4 44,088 56,081 105,766 99,327
Meals and entertainment deducted ...................... 4,571,529 62,590 3,360 10,641 15,615 32,974 27,774 26,881
Mortgage interest................................................. 4,626,346 164,266 29,065 20,349 35,163 79,688 35,484 34,505
Other interest paid on business indebtedness 5.779,818 201,437 11,984 14,295 57,829 117,330 143,044 134,686
Office expenses................................................... 7,395,168 142,676 1,352 20,112 48,497 72,716 38,368 37,718
Pension and profit-sharing plans......................... 527.945 6,854 - *176 -2,575 4,103 1,768 1,672
Rent on machinery and equipment ...................... 4.551,560 153,611 -1,951 6,870 72,449 72,340 30,421 17,313
Rent on buisness property ................................... 20.596,886 272,001 7,800 65,186 63,637 135,378 59,009 57,797
Repairs................................................................. 9,705,814 604,9D4 16,963 57,118 228.068 302,754 58,918 46,340
Net salaries and wages........................................ 52,316,452 2,059,&99 16.860 144,375 678,720 1,219,904 214,293 193,525
Taxes paid ............................................................ 12,618,367 388,348 7,334 24,330 146,359 210.325 182,589 173,080
Travel................................................................... 5,860,143 116,648 8,773 30,902 16,221 60,751 33,292 26,225
utilities ................................................................. 14,546,685 355,823 7,486 62,254 133,343 152,740 53,401 50,353
Home office business deduction.......................... 2,966,899 60,153 .1 -9,526 37,663 12,964 3,831 3,831
Other business ducluctions .................................. 75,374,008 3,239.880 200,104 493,818 899,674 1,646,284 2,370,674 2,281.674
Not Income less deficit 1,21
3,130,Wl -260,280 242,516 1,411,233 1,737AW 394,173 355,3251,2 ........................................Net income 1.472: .~
1
3,857,153 16,626 428,663 1,520,101 1,891,763 1.167,369 1,110,825
Defidt2................................................................. 19,512,304 726.651 276,907 186,147 108,868 154,730 773,196 754.500
Footnotes at arid of table.
49
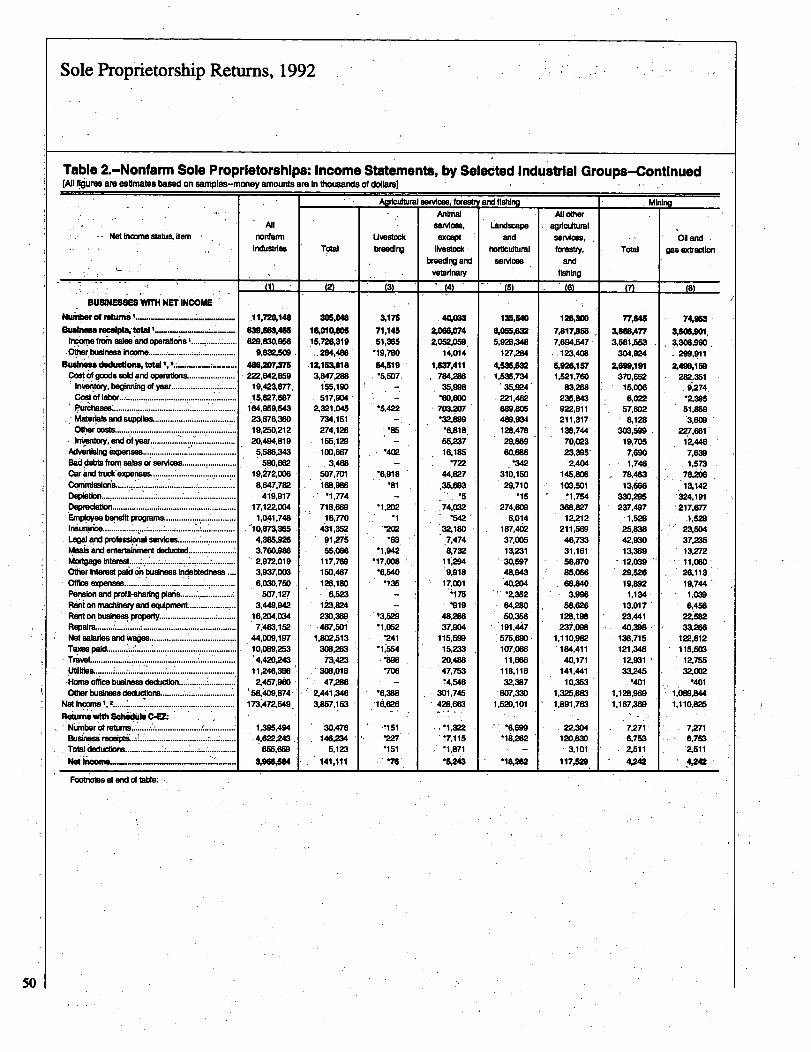
gig
05
ar.t
'c
gi
.a
?9
g18
01
t!3*
Ulu
C
T9t
ITO IlL
Z
-0:
8t
-4'5
;CO
j.S.
j.S.
-40
-4to
tt
120tt
08,i"st
tto
tt
g4~
-4-4
0
t(18
5~J:
=L'-4
4,g
fS-"t
-GDI
d3
Z,p
cnp
:L
gI
~~j
!qb,
99
919
1tt
.
C.)so
r4fs
,.
j3''
-A
CP.j rQ
ID
10
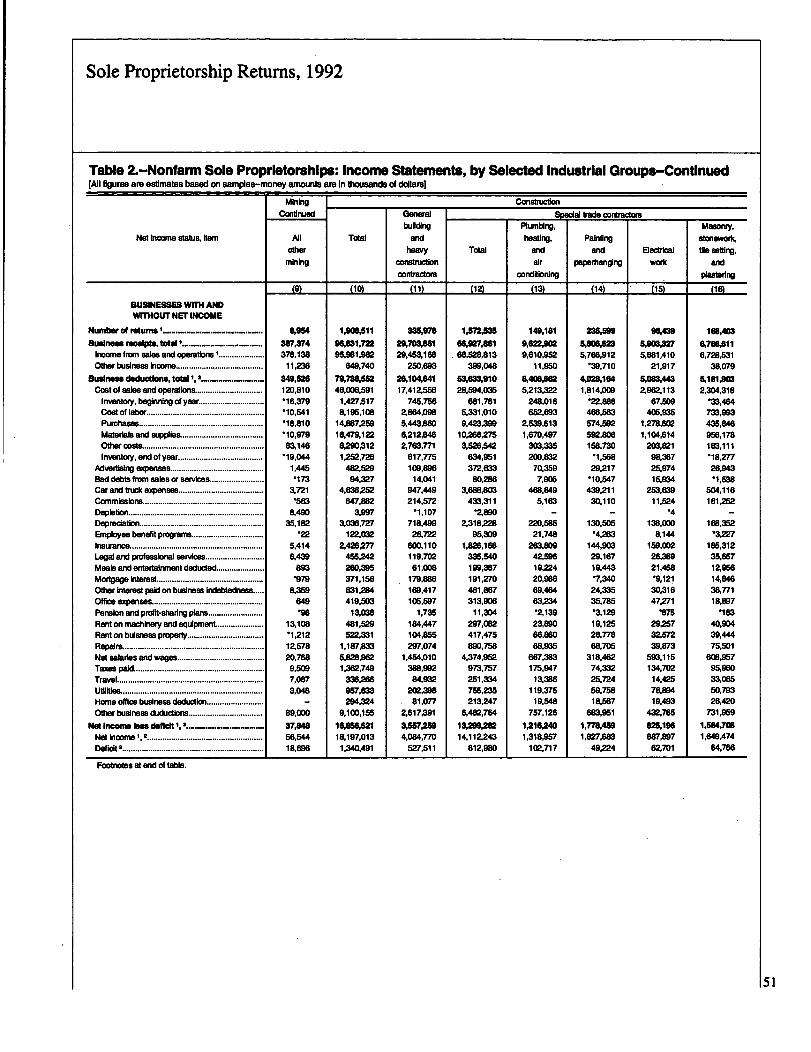
w0
zi
gu
m5
rF1
BYEF
2Lar
HI
a!1
~-
wi
a
SZ1 t
.i1
fall
0i
CL
re
s.19
pLa
i"38
A'S
Oz-jA
t018,H
-RV
OS
tC
IO
I
Z,
Z-A
AP
X.
tt
IItt
v~
'r~,23
tt4
'9t
"9t
NP
PN
~30
!8N
h)
jo
tv
iiv
P1i5-
cooa
"0c
..
p.
.
4~3
a53
)9
~1
1-14
NI
19
9~f
1143
TO- 8
CMD
~81
XVvp-A%%i4g
Nil
Alsv
ig.g
.g
I44
to12~
124
1t
103t
v
Z,
:1N
p
p I
a ir !F 0rw_
9II59t
2 K
,h
au
9
RIN 3,
!r9
-q;
L03
d3
F9
fSa
.i;
9,A
E'lTa
t9R
8~i
.je
:9ia~
tI
a.6
'9"D
gI
-g-gI
§f
§d
II
ttt
~t
~-Ia
43R
P,0
10
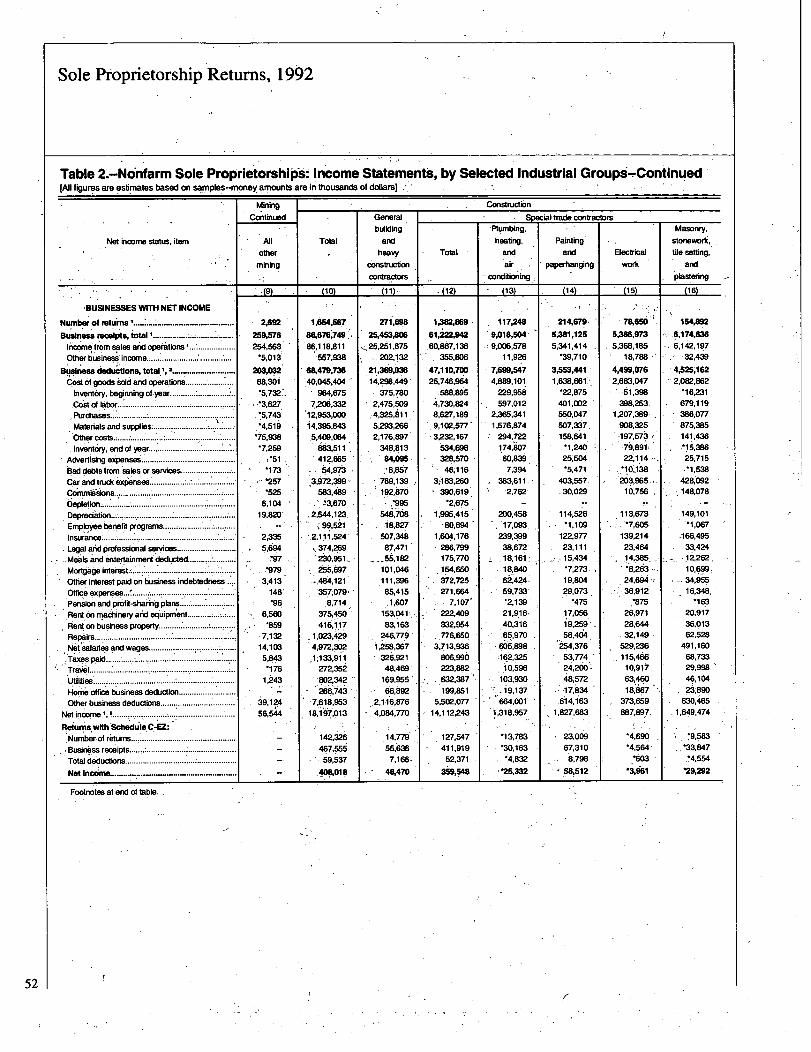
Sole Ptoprietorship Retums, 1992
Table 2. Ncinfarm Sole Proprietorshlo~s- Income Statements, by Selected Industrial Group6-m-Continued[All figures are estimates based on samples-money amounts are in thousands of dollars]
. Mining6~tinuscl
Not income status, itern
:BUSINESSES VATH NET INCOME
Number of returns .............. ..................
Business r,ecelpts, total I............
Incomisirom sales and operations.. .........
Other business inoome.~......................................
Business deductions, total 1, 2......................
C6st of goods sold and operations............... . ......
Inventory, beginning of year...........................
,Cost of labor.................................................
Purchase a .................................................
Materials and supplies ........... 7 ................ -I-: ........
C"r costs.; ............................................. ...........
Inventory, end of year .....................................
Advertising expenses...........................................
Bad debts from sales or services ........................
Car and truck expenses.................... ................
Commissions .........................................................
6epletion............... p ........................................
Depreciation...........................................................
Employee benefit programs....................................
Insurance ............................................. .I
Legal arid professional services ...........................
..Meals and entertainment deducted ..............
Mortgage interast.~ .............................I..... ..... .....
Other interest paid on business indebtedness
-Office expenses.......... . .......................Pension and profit-sharing plans ....................
Rent on maci~nery 'arid equipmant .................
Rent on business property.......... :............ L ...........Repai.rs................................. ................................
Nit'salaries" wages ................................
'Taxes paid............. ! ........................................
Travel ....................................................................
Utilities ............................ :..........................
Home office business deduction......................
Other business deductions ............... ...........
.Net income .................. ......................IRat
.um with Schedule C-EZ:1. Ts' . . I
-Numberr of returns................................................
Business race ipts .........................................
Total deductions................................. I..................
Footnotes at end of tabW
All
other
mining
49)
2,692
259,576254,563
-5,013
203,032
88.301
... *3.627-5,743.4,519
-75,938
-7,259
*173
*257*525
6,104
19,820
2,335
5.6 94W
...*979
3,413148*96
6,560
.7,13214.103
5,843*176
1,243
39,'12456,544
Total
(10)
1 AM,567
85,676,74986,11.8,811
557,938
68,479,736
.40,045,404964,675
7206,332
12,953,0001 4,395,8435.409,064
883,51141ZEW3554,973
-3.972,399-583,489
:3.670
.2-944,12399,521
2,1111,524
374.2.69
255,697.,484,121
357,074-.6,714
375,460
416,11.7.1.023,4294,972,302
272,352
802,342266,743
-7,618,95318,197,013
142,326
467,55559,537
11001018
Generalbuilding
and
heavy
construction
contractorsI (11)
271,698
25,453AM
,25,251,675202,132
21,369A'3614.298,449
375.7802,475.509
5,293,2662,176,897
348,813
4095~,8,857
789,139.192,870
*995548.708,.18,8Z7
507,34887,471
__5082101,046111,396
85,415~ 1,607
153.04 1',
83,163246.779
1 Z%,367326,92148,469
169.9,5566,892
.2.116.876
14,77955,636
7,166
48,470
Total
~ (12)
1=1869
61=JM
60,867,136
. 355,806
47,1110,70025,746,954
588,8954,730,8248,627,189
AlW,577.3,232,167
534,698
328,57046,116
3;183,260- 390,619
-2,6751,995,415
.80,694
1,604,176286.799175,770
372,725271,664
7,107'222,409332,954776,650,
3.713,9368D6,990223,882632,387
199,8515_5M,077
127,547411,919
52,371
359,548
Construction.. Special trade contractors
Plumbing,
heating,
andair
conditioning ,
Paintingand
paperhangingElectrical
work
(13)
117,248
9,018,504,
9.006.57811,926
7,699,5474,889,101
'229,958597,012
2,365,341
.1,576,874294,7221.74,807
60,8397,394
383,6112,762
200,45817,093.
239,3.9938,672
.18,161,
18.84062,42459,733
21,9.16,40,31665,970
605,898-:162,3125
103,930
19,137664,001
1,318,957
-13.783-30,163-4,832
*25,332
J"4
2K679.
5,381,125
5,341,414-39,710
3,553,441-1,638,661...
-22,875401.002550,047
507,337158,641
*1,24025~504
-5,471403.55730,029
114,526*1,109
122,97723,11115,434
*7,273:19,80429,073.
*47517,056
19,25958,404
254,376
53,774.24,200.48,572
17,8346i 4, ir.3
1,827,683
23,00967,310
58,512
tl 5)
78,656
5,W,973
5,368,18518,788
4,499,0762,683,047
51,398398,253
1,207,389
908,3251971673
79,891~22,114-
-:10,138203,965~i,10,756
.7,605
139,21423,46414,385
24,694.r36,912
26,9T1
28,64,4.32,149529,236
115,46610,917
63,460
18,867373,659887,897.
-4,690
*4,564'*603
-3,661
Masonry,stonework,tile setting.
andplastering
(16)
154,892
6,174,636
6,142,197"32,439
.4,525,162
.2,082,862
-16,231679,119386,077
875,385141,436:'15,38625,715
-1,538428,092148,078
149,101*1,067
,166,49533,424
1.0-699~...34,955
1 6,34k*163
20,917
36,01362,528
491,16068,73329,998
46,104
23,890630,465
1,649,474
..-33,847
*29,292
52
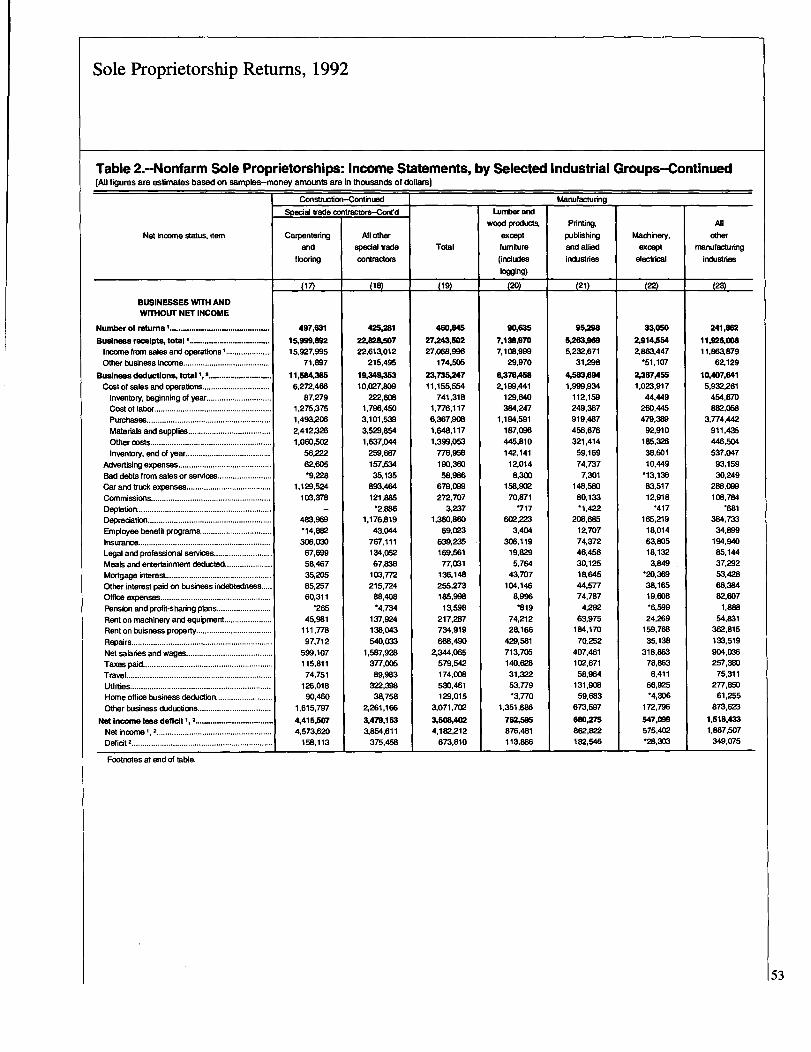
Sole Proprietorship Retums, 1992
Table 2.-Nonfarm Sole Proprietorships: Income Statements, by Selected Industrial Groups-Continued[All figures are estimates based on samples--money amounts are in thousands of dollars)
ConWuction--Continued
Not income status, item
_Sp-*aJ trade oontr8FtD--C-t`d
Carpenteringand
flooring
BUSINESSES WITH ANDWITHOUT NET INCOME
Number of returns I ......................................
Business receipts, total I ........... .............. ......
Income from sales and operations I .....................
Other business income ........................................
Business deductions, total 1, 2 .................. .......
Cost of sales and operations ...............................
Inventory, beginning of year..............................
Cost of labor ......................................................
Purchases.........................................................
Materials and supplies......................................
Other costs........................................................
Inventory, end of year.......................................
Advertising expenses ...........................................
Bad debts from sales or services .........................
Car and truck expenses .......................................
Commissions.......................................................
Depletion .............................................................
Depreciation .........................................................
Employee benefit programs.................................
Insurance ............................................................
Legal and professional services ...........................
Meals and entertainment deducted ......................
Mortgage interest.................................................
Other interest paid on business indebtedness
Office expenses...................................................
Pension and profit-sharing plans .........................
Rent on machinery and equipment......................
Rent on buisness property...................................
Repairs.................................................................
Net salaries and wages ........................................
Taxes paid............................................................
Travel...................................................................
Utilities .................................................................
Home office business deduction..........................
Other business duductions..................................
Not Income less deficit 1, ...............
Net income 1, 2 .....................................................
Deficit 2 ............... _.............................
Footnotes at end of table.
-M
497,631
15,999,89215,927,995
71,897
11,584,3856,272.466
87.279
1,275,3751,493,2062,412,326
1,060,50256,222
6Z605-9,228
1,129,524
103,378
483,969
-14,882306,030
67,699
58,46735,20585,25760,311
*265
45.981111.778
97,712
599,107115,81174,751
126,01890,460
1,615,797
4,415,5074,573,620
15B,113
All otherspecial trade
contractors
(18)
425,261
2Z828,50722,613,012
215,495
19,34%35310.027,809
222,6081,796,4503,101,5393,529,854
1,637,044259,687
157,53435,135
893,464
121,885'2,8W
1,176,819
43,044767,111134,052
67,838103,772215,724
88,408
-4.734137,924138.043
540,0331,587,928
3T7,00589,9B3
322,39838,758
2,261,166
3,479,1533,854,611
375,458
Total
(19)
460,845
27,243,50227,068,996
174,505
23,735,24711,155,554
741,3181,776,117
6,367,9081,648,117
1,399,053776,958
190,36058,986
679,099
272,7U73,237
1,360,860
69,023639,235169,56177,031
136.148255,273185,998
13,598217,287734,919
668,4902,344,065
579,542
174,008SW,461129,015
3,071,702
3,508,4024,182,212
673,810
Lumber and
wood
products,
except
furniture
(includeslogging)
(20)
90,635
7,13BA707,108,999
29,970
%376A582J99,441
129,840384.247
1,194,591197,096
445,810142.141
12,0148,300
158,902
70,971
602,223
3AD4306,119
19,8295.764
43,707104.146
8,996
74,21228,166
429,581713,705140,628
31,32253,T79-3,T70
1,351,686
762,595876.481113,886
Manufacturing
Printing,
publishingand allied
industries
(21)
95,298
5,263~1101
5,232,67131,298
4,583,6941,999,934
112,159249,367
919,487456,676
321,41459,169
74,7377,301
148,580
80,133-1,422
208,685
12,70774,37246,45630,125
18~64544,57774,787
4,29263,975
184,17070,252
407,461102,671
58,964131.90859,6B3
673,597
6W,275862,822182,546
Machinery,except
electrical
(22)
33,050
Z914jSS4
Z863,447-51,107
2,367AW
1,023.91744,449
260,445479,389
92,910
185,32638,60110,449
'13,13683,517
12,918
165.21918,014
63,80518,1323,849
-20,369
38,1651908-6,599
24,269159,768
35,138318,863
78,8638,411
66,925-4,3D6
172,796
547,099575,402'28,303
All
othermanufacturing
industries
(23)
241,862
11,926,00811,863,979
62,129
10,407,6415,932,261
454,870
882,0583,774,442
911,435
446,5D4537,047
93,15930,249
288,099
108,784*681
384,73334,899
194,940
85.14437,29253.428
68,38482,607
1,888
54,831362,815
133,519904,036257,380
75,311277,850
61,255873,623
1,518,433
1.867,507349,075
53

CL
_0C
LGL
S'0
:2
553
p33
zj8
is8
Is:
9a
9?,w
EDal
Z:T
co1-1t
:1$Ap
P,
JAb
gig
0~
4C
DP
,-
1,-
I'
c=l
'Iola
';"A
9t
~4CO
m
lfsn1
9
1C"H
2 ~_-
m6
5A
Mp
4p
-P
fAk
al&
3eA
M.R
34v
k,,fit
$aj
30It
-Ww
I.-
--
bDin
'14
cn-
i~In
m9
a18
;%!2
~4W
T:l
jT
S8--
aS
9fS
:a
A 9
Z1.P
ttI
tit
v9t
t
g-g
j3Is
18
~!T
I5D
5 Sm
IIt
IN 0
;.':
.:
k!
-!t
a-
dI
a,31
a.i
a-
a0
., .
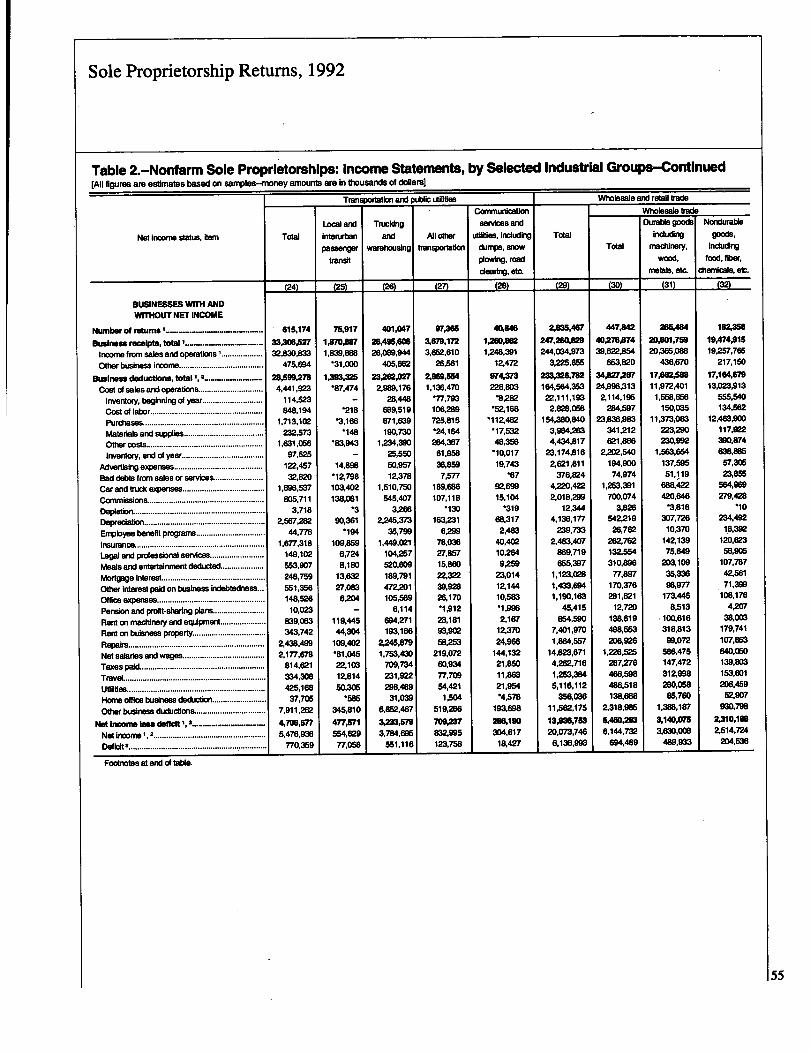
cr
cr8
ff
SL
3
Snp
PN
!Q
'JIB"st,
0C
4-4
Ccl
208
8-4
'o-24
co
co:qC
o
0
CL
La.
11
822
9R
AIB3
V
08.
sn:1
P,~p
l:1
:q-P,
rop.
v,c.)
r4lp
T2
ab
-`
-)
i-
Ig
49t
Ig
o
P E-8
-gI
8ss
irCm
rgllt
gig
CN
W-4
co
.0
'9
~I
'o~
~t!'1
1-
"-
-'-
'r
pa
-
a
-,I
i9t 0
4a
scr-
Ottt
to8-
-0a
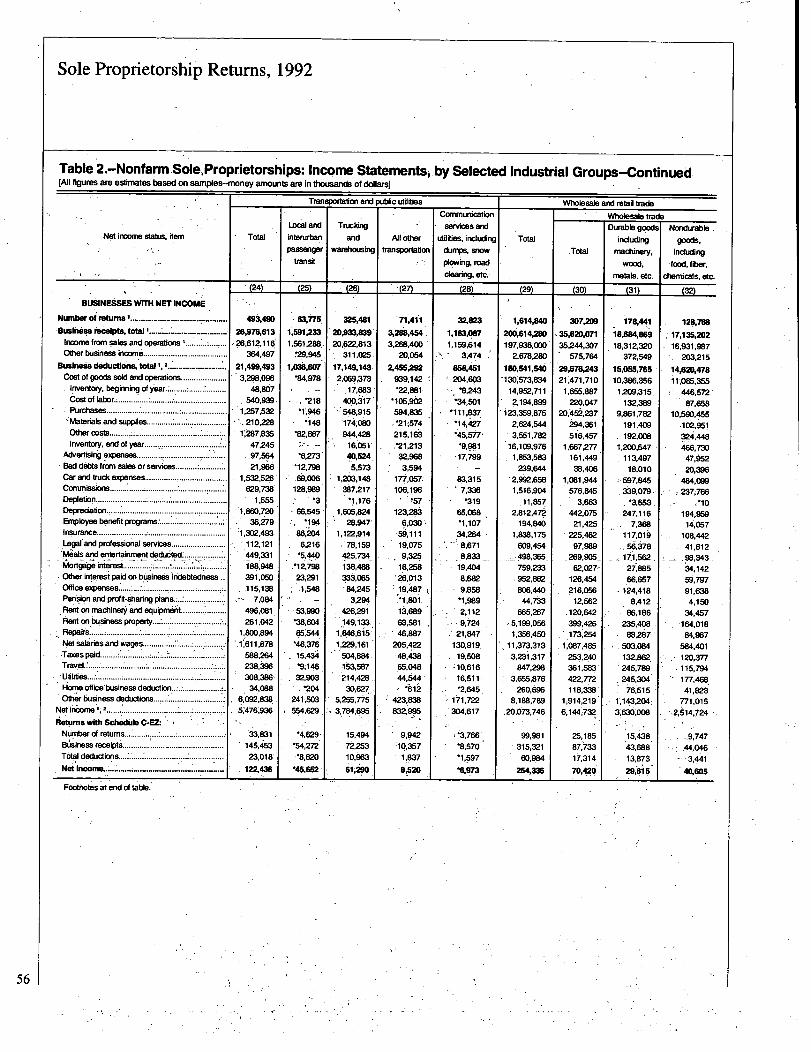
Z--
IZ
--1-4
ZM
mm
wz
R.SL
me-
5C,
g .0CL
SJ
10i
$6.
CA,G
)ca
908D
9
''
gig
0t
Vw
Cal
kx
9E
g§
EId
§8,
T69
PI)A
pg
E
CA
gt
is6
Tcl
83~,g
.4W
las
L9
-4&
(AZJ
13
'1
40
81
ISON
6;
ID8.0
-0)
09.
P
I-
I
--
--
--
-N
--
9~D
~Ps
,1
2,
D.
coT
PS('D
N0
caIt
'CDO-D
-4-4
b,b,
93~4
CD~4
10m
Is
0 -I,
t1
,,4~
rON
ID-
--
--
-'
'~O
-Ca
Ca-4
ODg
giH
§0
'p,
b)
r0~
18
8p
0j
p0
t2
(NO~'4
ruS,
'N'
''D
0,0
u
mm4
IJ~4
A8
~tt
NEs
'84
N,0
CAGo
caI
i~.
8-
-,
:=
,2!
,cn
:14
:4:4
%R
~?p
..
..
..
.T
5.
FD8
cnco
ODCD
ERR
B3§
8:t
0)ro
01~4
MCD
CO0)
co-
1!2
ERL"
0)cn
P3t
-400
CA-4
-i;~
I?C-T
gCD Z 0
8U
-I
FV-
-uCD
-1 0
0 t9 cr4 CL 0
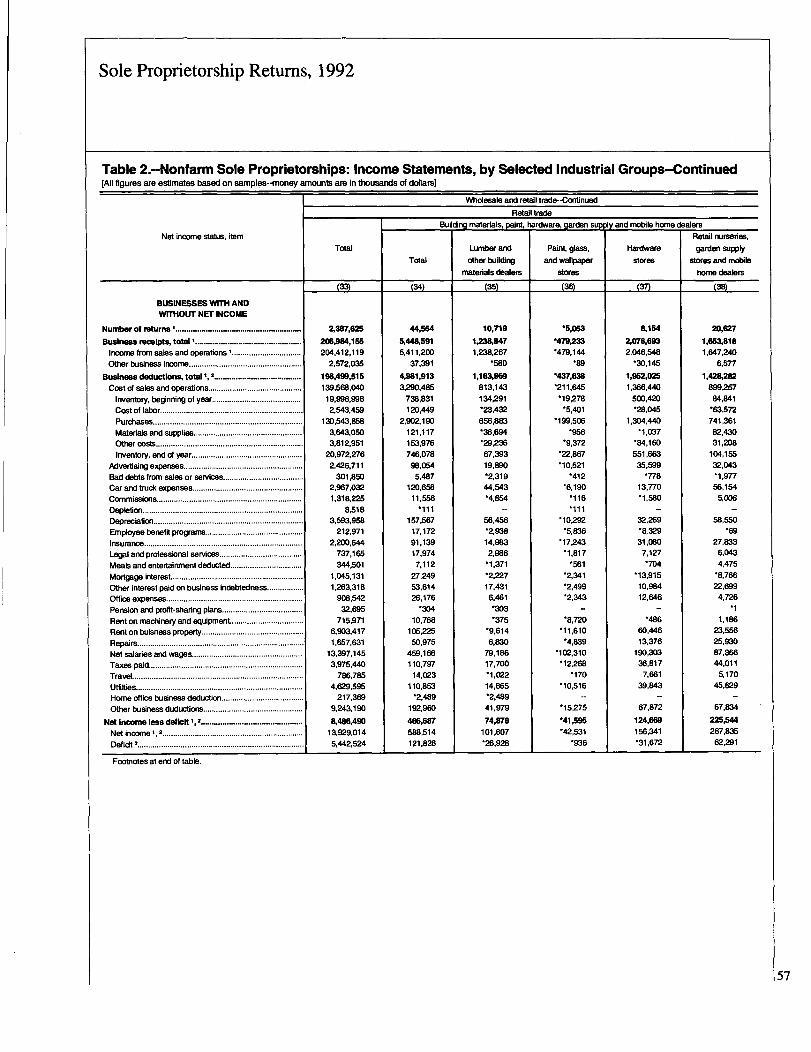
Sole Proprietorship Retums, 1992
Table 2.-Nonfarm Sole Proprietorship: Income Statements, by Selected Industrial Groups-Continued[All figures are estimates based on samples.-money amounts are in thousands of dollars]
Not income status, item
BUSINESSES WITH ANDWITHOUT NET INCOME
Number of returns I .................................................
Business receipts, total I.............................. ....... .....
Income from sales and operations I ................................
Other business income ....................................................
Business deductions, total 1, 2..................................
Cost of sales and operations...........................................
Inventory, beginning of year.........................................
Cost of labor..................................................................
Purchases .....................................................................
Materials and supplies..................................................
Other costs ....................................................................
Inventory, end of year...................................................
Advertising expenses.......................................................
Bad debts from sales or services .....................................
Car and truck expenses...................................................
Commissions ...................................................................
Depletion..........................................................................
Depreciation.....................................................................
Employee benefit programs.............................................
Insurance.........................................................................
Legal and professional services ......................................
Meals and entertainment deducted.................................
Mortgage interest. ............................................................
Other interest paid on business indebtedness .................
Office expenses ...............................................................
Pension and profit-sharing plans .....................................
Rent on machinery and equipment.................................
Renton buisness property ...............................................
Repairs.............................................................................
Net salaries and wages...................................................
Taxes paid .......................................................................
Travel...............................................................................
Utfiffies.............................................................................
Home office business deduction......................................
Other business ducluctions ..............................................
Not Income less deficit 1, 2 ................ ..........................
Net income 1, 2 .................................................................
Deficit 2.............................................................................
Footnotes at and of table.
Total
(33)
2,387,625
206,984,155
204,412,1192,572,035
198,499,515139,568,040
19,996,9982,543,459
130,543,858
3,643,0503,812,951
20,972,276
2,426,711301,850
2,967,032
1,318,2258,518
3,593,958212.971
2,2DO,644737,165344,501
1,045,1311,263,318
908,542
32,695715,971
6,903,417
1,657,63113,397,1453.975,440
786,785
4,629,595217,369
9,24a 190
8,486,49013,929.014
5,44ZS24
Total
(34)
44,554
5,448,591
5,411,20037,391
4,981,913
3,290,485738,831
120,4492,902,190
121,117153,976746,078
98,0545,487
120,658
11,556*111
157,56717,172
91,13917,9747,112
Z7,24953,61426,176
10,768105=
50,975459,166110,797
14,023
110,853*2,489
192,960
466,687588,514
121,828
Wholesale and retail trad"oritinued
Retail VedaBuilding materials, paint, hardware, garden supply and mobile home
Lumber and
other building
materials dealers
Paint glass,and wallpaper
stores
Hardware
stores
(35)
10,719
IXM8471,238,267
*580
1,163,969
813,143134,291
656,883
'36,694-29,23667,393
19,890-2,31944,543-4,864
56.456Wu
14,983
2,986-1,371
-2,22717,4316,461
*303*375
6,830
79,18617,700-1,022
14,865-2,48941.979
74,678101,807.n'9'%
C361
-5,053
'479,233-479,144
.89
*437,638
*211,645'19,278
-5,401*199,506
*956*9,372
*22,867
-10,521
-6.190*116
*10,292-5,M
'17243
*1,817*561
-2,341
-2,499-2,343
-8,720-11,610
*4,839
'102,310'12268
-10,516
-15275
'41,596
-42,531
(37)
8,154
2,076,6932,046,548
-30,M
1,95ZO25
1,366,440500,42D
*28,0451,304,440
*1,037
'84,160551,663
35,599*778
13,770-1,580
32,269-8.32931,0807.127
*704-13,91510,984
12,646
60.44613,376
190,30336,817
7,66139,843
67,872
124,669156,341
'31,672
alersRetail nurseries,garden supply
stores and mobilehome dealers
(38)
2D,627
1,653,818
1,647,2406,577
1,428,282
899,25784,841
*63,572741,36182,430
31,208104,155
32,043
56,1545.006
58.650.69
27,8336,0434,475
-8,766
22.6994,726
*1
1,186
23,55625,93097,36644,011
5,17045,629
67,834
225r5"287,835
62,291
57
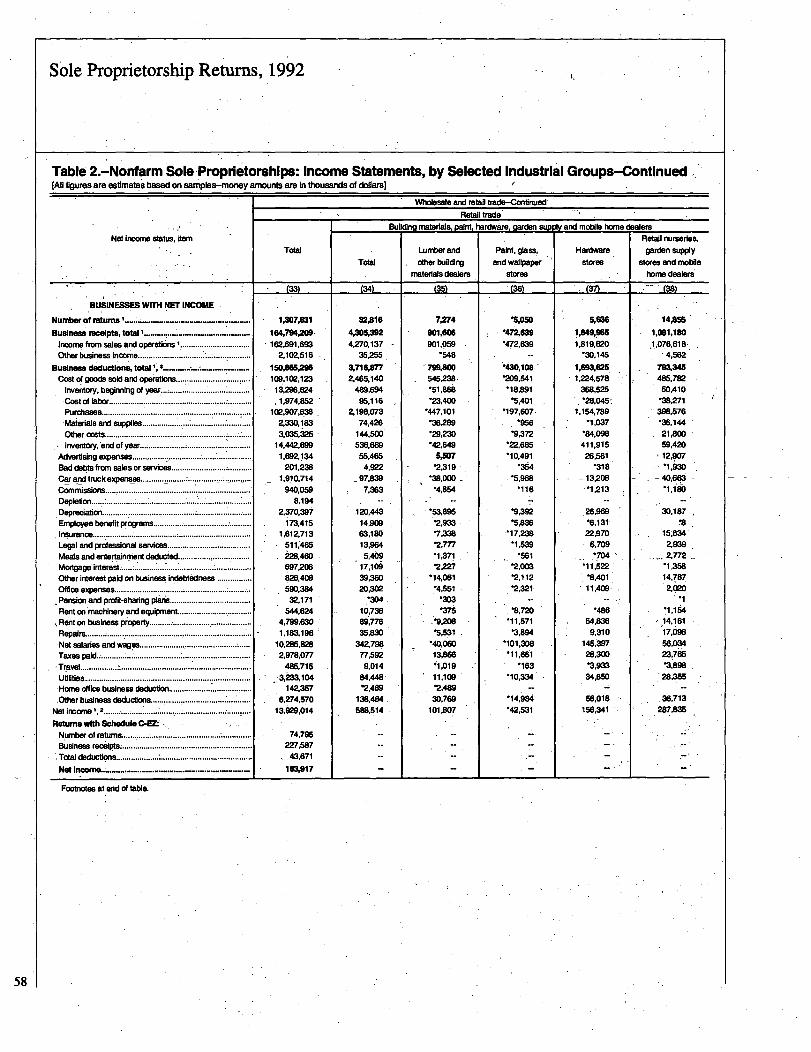
Sole Proprietorship Returns, 1992
Table 2.-Nonfarm Sole Proprietorships: Income Statements, by Selected Industrial Groups-Continued(AJI figures are estimates based on samples-money amounts are In thousands of dollars)
Not Income status, item
BUSINESSES WrrH NET INCOME
Number of returns ...........................
Business receipts, total I ...................................
Income from sales and operations I ................................
Other business Income............................... ~--; ..................
Business dicluctloM total ........ ............ ; .....
Cost of goods sold and operations ................
Inventory, beginning of yew.........................................
Cost of labor ...................................................... ;...........
Purchases .................................................. 7.............
Materials and supplies ...................I : ............................
Other costs ................................... I.....................I
Inventory, end of year .................... ; .............................
Advertising expenses............... ...................... ........... ....
Bad debts from sales or services ......................... ...........
Cara!nd truck expenses..................... ;.................. ...... . ...
Comrnisslons..........I ................................. .......................
Depletion ......................................................................
Depredation ............ : .......................................................
Employee benefit programs................................... .........
Insurance ...................................... ;.................................
Legal and professional services ......................................
Meals and entertainment deducted ............... .................
Mortgage interest ............................................. .................
Other Interest paid on business indebtedness ...............................................Office expenses.................................
Pension and profit-sharing plans .....................................
Rent on machinery and equipment .................................
Rent on business property...............................................
Repairs. ;.... ... ....I ........................................................
Not salaries and wages ....................................................
Taxes pald.~ ............... :........................... : *** - ******-Travel................................................................................
Utilities....................................
.................Home office business deduction ......................................*'*"*** ...............:
,Other business clackidlons. .............................................
Net Income 1, 2 ............ ..............................................
Returns with Schedule C-EX .., : ~
.Number of returns.............................................................
Business receipts.............................................................
'Total CISCIUCtims............................................................
Footnotes at end of table.
Wholesale and retail trade-Continued'
Retail trade
TotalTotal
Building materle[s, paint, hardware, garden supply and mobile home
Lumber and
other building
materials dealers
. (33)
1,307,631
184,794,M,
162A91,6932,10Z516
150AWIM
109,102,12313 296,824.1.974,852
102,907,13PS
Z330,1833,035,325
14,442,699
1,69ZI34201,238
1,910,714940,059
S,194
Z370,397173,415
1,61Z71351 1,465
697,206626,400
590,38432,171
5414,6244,799,630
1,183,19610,285,828
485,715..3,233,104
14Z3576,274,570
13,929,014
74.7962Z7,W43,671
14917
"34
32,816
4X%3924,270,137
35,255,
3,716,VnZ465,140
489,69495,116
Z198,073
74,426144,500536.669
55,4654,922
97.839
7,363
12D,44314,90963,18013,964
5,46917,10639,36020=
'304
10,73686~776
35AW34Z79877,5929,014
84,44&'2,489
138,484
SM.514
(35)
Paint, glass,and wallpaper
stores
A361
Hardware
stores
. . (37)
7,V4
901,606901,059
.548
545,238,
-51,8W'23,400
-447,101-X289
*29,23D-42.649
12,319'38,000
-4,&54
'53,895*2.9337,338-2,777-1,371
*2.227-14,061
*4,551
V5
.92M*5.5.31
11,109-2,48930,769
101,807
-5,050
*472,639'472,639
'430,108VD9,541-18,891
-5,401-197,607
.9w
*9.372-22,685
'10,491.364
--5,968
*116
-9,392
-5AW'17,238
*1;539*561
-2,003-2,112-2,321
-8,720'11,571-3,894
-101X8*11,661
*163
*10,334
-14,984'42,531
5,636
1,849,9651,819,820
'30,145
1,693,6251,224,578
368,525*28,045~
11154,789-1,037
'84,098411,915
26,561*318
-13,208
*1,213
26,969
T,13122070
6,709
- .7N , -
-11,i22
-8,40111,409
*48664AW9,310
145,397
28,30D-3,93334A50
56,018156,341
starsRetail nurseries,
garden supply
stores and mobile
horns dealers
-- * (38)
14AS
1,081,180.1,076,618-
,4,562
793,345485.78250,410
-38,271398,576'36,144
21,80059,42D12,W7
-1,93040,663
-1,1.81)
30,187
15,M2,939Z772.1=
14,7872,020
.1
*1,1
17,&656,034
23,765-3,89828,355
36,713297,&%
58
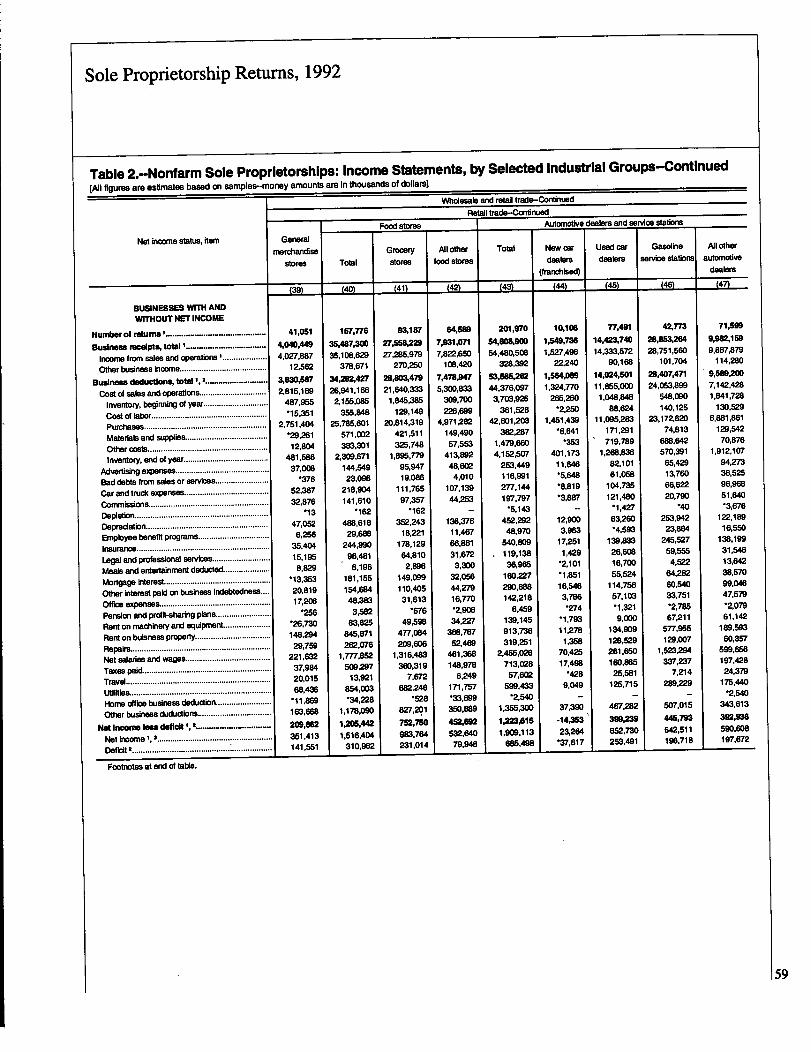
ac0U)E
SC
L
OE0C
L
0h
a-
CDCLr
U)E0
EZC
4ol
rDI
tis
II~~
R9
.9P
'Da'I19ORI
S
!189t2-5fI.31I
toLq
coStq
Mn
RestM~t
Uk
vg
gg-
8S
pv
gS
lV
(DLf)
-I
--
Ck
orG
iOF
f~:-~
w-
Fa
8Aa-
-8
v-
§M
8F48
pa
j-
RRRRG8;:-
gaH
n,v
F"
OrIq
wco
Rr.-
CLCIL
C%L9
Lqrlt
§8
gr-tU)
Kq
,~D;-:
ag
gg
r..R
a~:I
~Rcgoip
11zo! g
,kRlat
PRLP
SKC
'LqP%
Nq
"i~z
dC6
V)is
vzd
16C6
cdN
V)rl
IzC11
C'j
C'.
'MUMM.cli
08~
4a
9Z
V -:$
u cljci
;:Ln
CS,wk~i99§
9FI~
C%L6
a
C,e
.q V
.S§1q
~"!"9p~-R
kZF
cRED
R(D
clico
(D(D
coV
33ru
IR
Et-2
Lqco
cj
C PM~&FE-S,8~0Aag
Oakct
Rq*
qR
qK.
fltV
~IIa
oc%l
-e.i
C-Fci
a
..
..
..
..
..
..
..2
FA,:
Ii
:.D
43S
0S
.'a
kf
9-
I.
:.
:-S
0:
C,0
'PJ'
i2
Eh..G
.:
02
::?
~i
j23
-0:
..:
cc.2
1M
CD5
'd1:
rr
10=-to
so'a
1-1
11
CL2
-S79
At!
AM
'Sm
84
Q0!
c?92
&:2
g~-
51
Is2
es5-
3-

mz
Imz
;F2
2P
TV
919
F?00
a3
(Dor
43,
aCL
C,
(D.,
aa
IR
c;-P
iaI
-CDLo
5'
SL
v0-0
a:
rl)
coca
sa
"(0CD
ca-(
0'-4
--4'-
4t
08
tOW
A-4
CN*
S;
COW
Eg
cow
cot
CAot
9,
NP
::-
jp'.
P,p
pP
.N
-4-4
=8
2g
IS-4
-o
-OD
-4!~")
is
(0CD
rON
--4ro
Got
co,
10co
-1~
toIs
'o'n
Cl)
wW
~w-4
0-i
~'-
'9b
4W
(808
1WW
caN
A
M N1.0
C.)PD
W4-4
'1
'CO
'410
caOwl.
R;ps
rCO)24
0jQ
zN:4
'tN)
0)
4b
)Et
a
cn:q
h;to
C,;%
An-3f
co:4
'v-N
t00
0N
N
CLC
:
CL
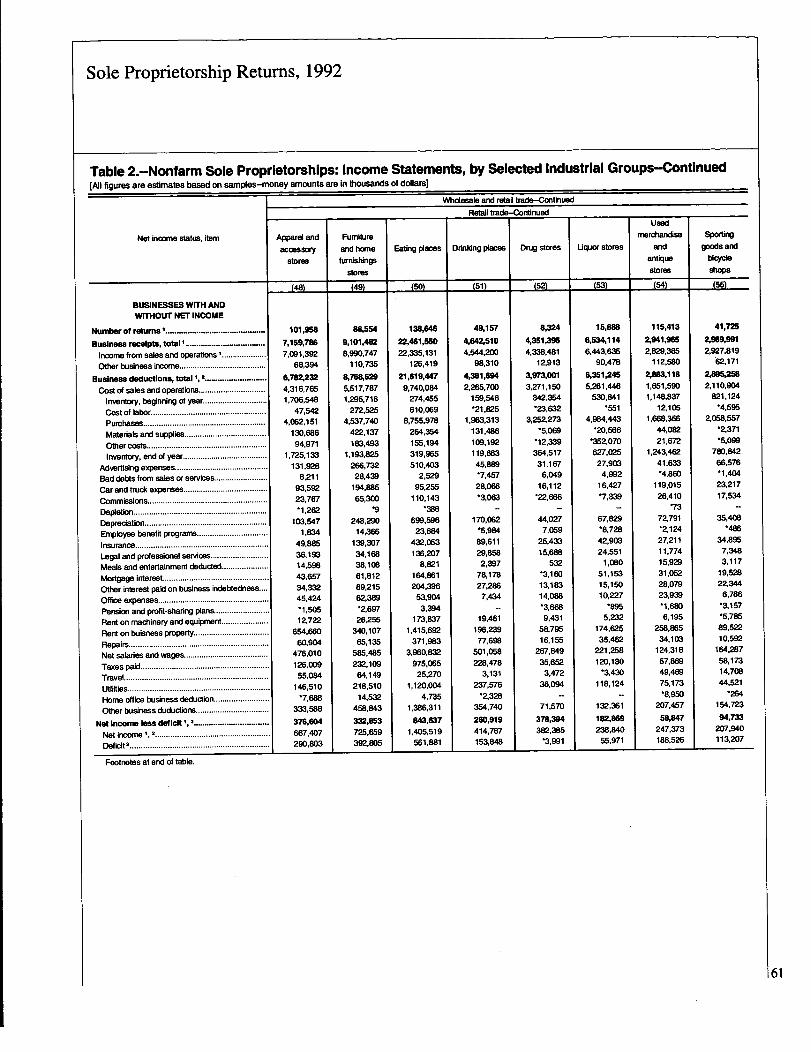
LD
o
vU)
C)0
cmLn
I;z Ik "9
~;z9C,6&t~A_r
a-ig
d9
%cq
.t
c; Nexa
ci
M
coN
cqo
cici
t~:w
ico
dc6
(df6
16cy
r,cm
cyR
LaN
czcm
-7
:!~
p":log
og
ig
t~f~
:,*c6
r.:d
ci
dd
Le
c6
oF
wcq
oLn
IN
af
cdo
fw
i
cliZq
'dIn
ct
IqLd
rzc6
dw
m9
r,In
cQm
efc6cl
g8
R38-
jIn
cmco
wr-
119j
co-3i
(qw
ci
,fa
.6cr~!
gc6
cqg
'rg
ga;
wi
.6c6
Ncq
PN
Iv
V~
8cm
fcq
Ir
os,9
RRq
Io
9c',
soA
12,Rol99
RNc:l:)
..
..
..6
c's
Lncj
a;
c;
Ldaj
cdc6
c6'd
6'i
Rc-j
coLn
z9
8
?i
9z
oi
ci
c'T-6
-rsl
c8lioc,
IDco
Wcu
WN
)
cdo
ftd
r~8
RS
of~
cl)cl)N
r~c!Iq
c!vk
c6
cdG
id
zc4
9"i
LdR
8v
A46
c-4Z9
98
of
-i
I MulmunFam
vi~
Lqrt
1~I%
6i
66
iai
Cco
~?c
Gcd
c!
ISS
SA
EM
[LMs-a
,20-
:21-288
AI
1912
CT&;z
:28
z
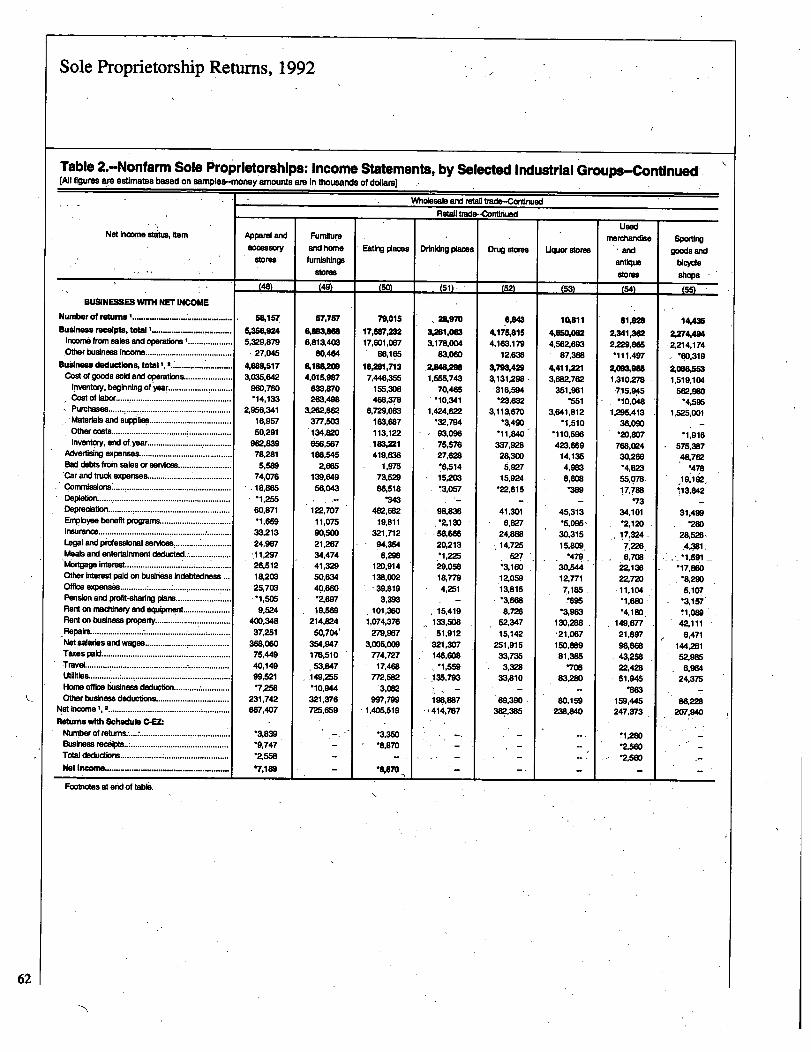
.ZIT
G-1
-19
11
57E-
LF,
11
-L
8.CL
:OR
-7
CL
9F
wz 1
5g
ffF
SLg
R,
ja.8
IBC
L
fa
S&cs
C"24
C-n:,S
AP
.P
,P
:4P
TIM
999142
999
9)P
PA
P.
:9!5
isP
jgt
je8
;ss
jg.04
'Aw
co
0-4
C;
soca
J.
(bA
13-
Ar,-
ti
=9
;~9
9i
iH
ii
g--
b~
9b
-W
-~4
f4CR
X's
cs
e,
al
P.
aa:
F.
-C~
42La
g
cacap
4,ZF~
cnSD
:-PNPPpNA
41
CD
TOURITAVIgHTIMM8
b"Pt"pli-SH
i5
i
ra
!2t
ca.
ca
coIn
-C.t
24jo
t?8
13x
tIs
TIs
--
--
19
9V
0;rs
&D-~
-g
[a-
N~4
a:-
",
P8
R-1 Rl IS: Er.
Fr
cD5
dSC
L
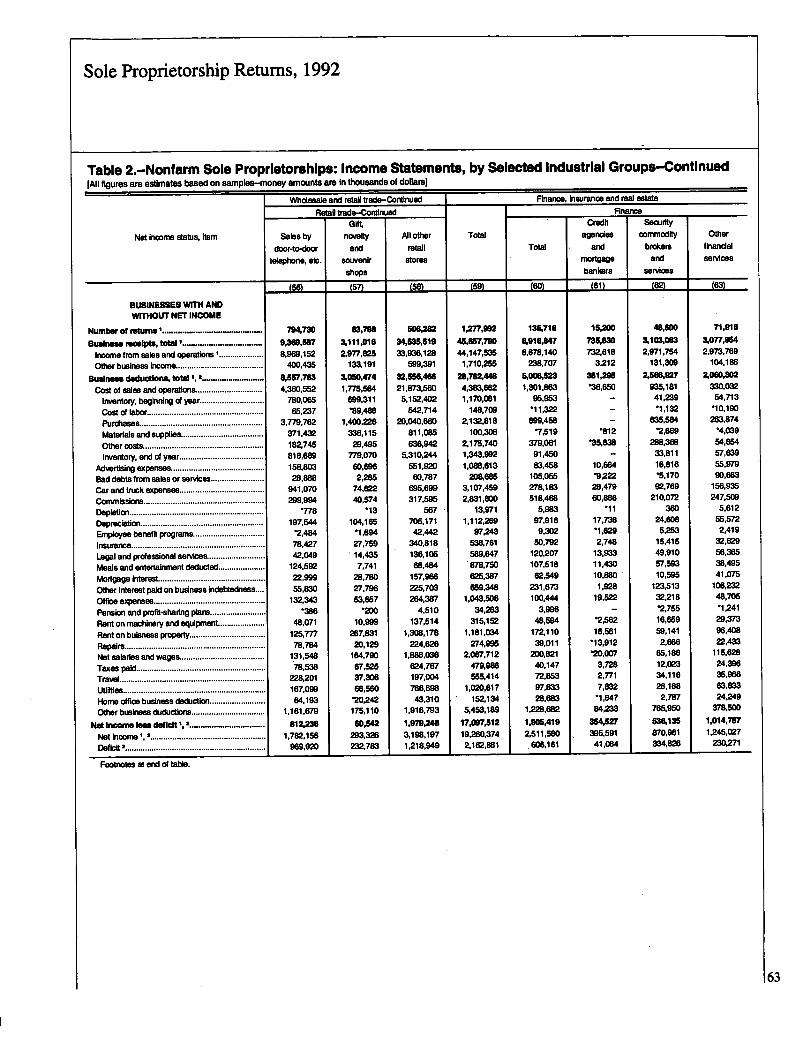
!rJ3
.28
rlCL
0rn
C-L0
11,
A-V
R:
:F,
::
:z;
SL9
0C
M!-
2al
-NA
al
.3
-49
1EII
J-a
-Ab
9
opts~
~?N
OO
~3
Pi
ZQ-
8V
a
99
19
99
A§1
'11i
9
T
I-t
a'-
4giZ
86~
at
!2g
--
--
--
--
--
-I-
.i2
11
19~
91
591A
mIZ-;Ig
Ii
s-Ia
iiI
~N
Z,:1
:.-V.
P.C
U'll
gag
8-12M
V-t
mi
je$1
it5;
W18
812
aDb
,is
=0So
24to"
102
ctnal
8=
tb
t"tt
ov,8
8
$0-&
pCD
p
0 05 0 0 I
9
ET I
CL0
P-
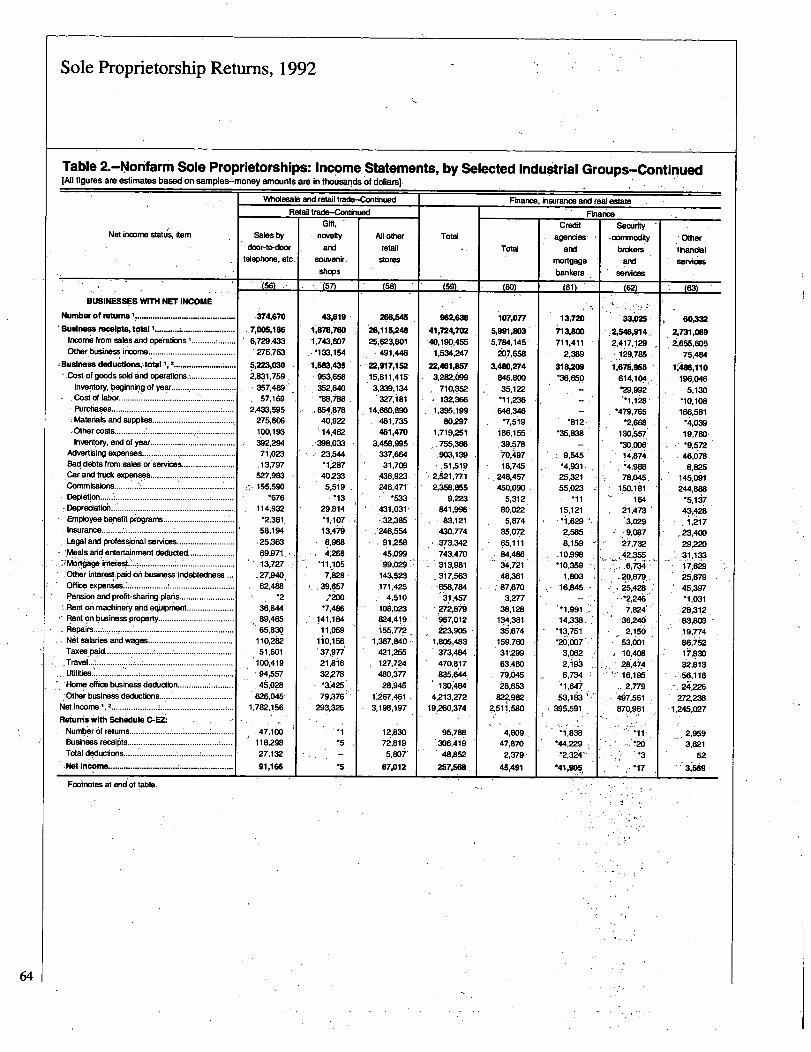
mZ
.,z
8CL
cr0
cr-0
169
i1
S,0
ClSL
31
9:1
1-Ii
cr-
IL
aa*[~
'or
0C
iJ-
Fc
0
0g,
080)
com
roa,
:49D
:4S
.p
0(n
toN
-40
(nco
(ap
D30 g3
4A
ERW
E-co
o
D3~4
C.0co
Wp
(.5"
8.
W-4
4.
C~-O
D'o
..
..
..
M60
318
ztR
T0
-4CD
0-4
(A4
0.4
4'S
-0-2
Soco
cn0)
-40
Co0
tN
cac~
rS60
DI
D)N
coPi
8t
g~
-.ca
pSn
N-4
SIN
Na
12W
~g,je
Eg0*
&.W
l_?
EREg
ODC.
wco
10A
-N)
~4CD
co@
~fa
~2g
-'I'g
ps-S
-ti~2
~2-!g
ca0
co4
Al
pN~
:-54
I19
roPO
coS
A.:4'-
t
6i8
0-'M
~Q"M
'-4.:
..
..
..
..
..
..
..
.
Er-
0-3 :L
Uto
cr %C
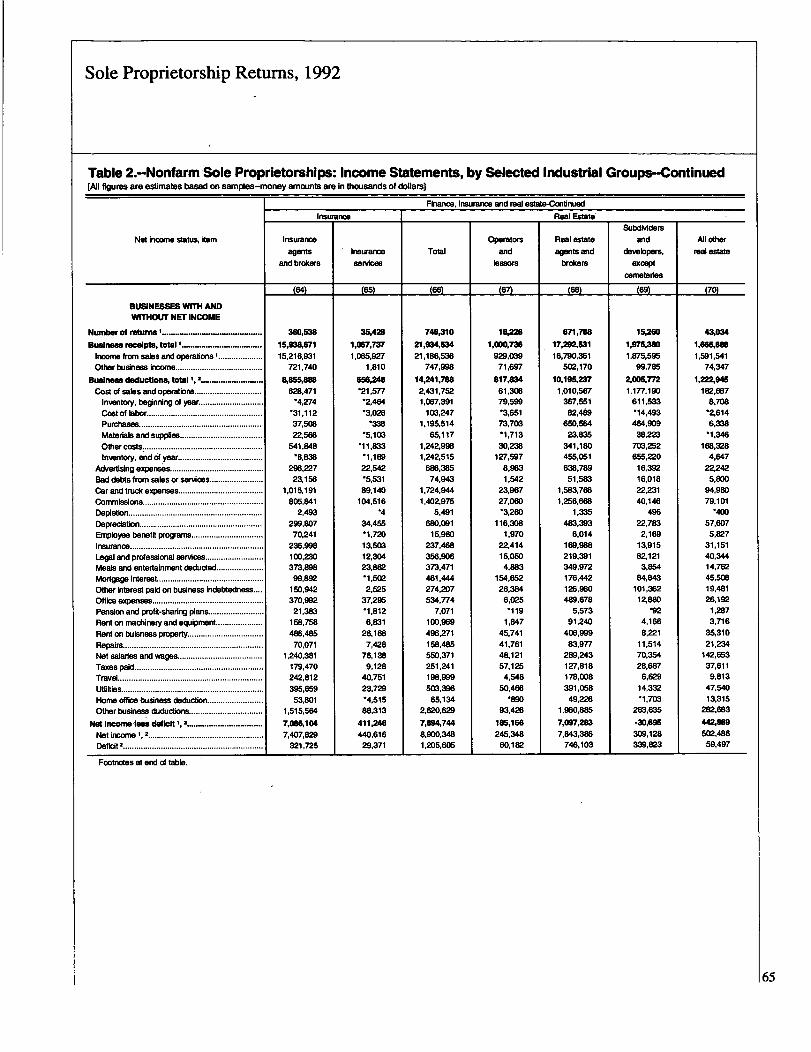
11
I(s
,I
9~1
18"~cio~91~C44gama_§~
§_GiRI~yIm"p
2~9~2 9
CV)9
a§
8t;
r-U
)C
l)Cl)
-e
I
cl)o
cljLf)
Or
I
GvD
C'iLO
46c;IZ
IZ
t.SO
9PP
P2c8m1`
9"
~§
8A
gi
4j
Wp
42
Ra
C6R
.4.
_k~
-vi
-79
co-
9,6g
gC6g
gg
r~P.
NItlw
to0
-
Icm
wcm
FZC6
cm
aC2
:1NR
A9
§N
~2
~~
~~~
~,v
xg
gIq
cia
wfz6
a6ci9
_rd(dzddg9:1
mr,
Y,
owlcQ
cyV
a
q5
§Ra~g
-V §Ia:cw,.
Cgo06
eL6
qg
dg
gg
CMm
Cjcm
lco6uG~in
Ldd
-7PZ
rz
I-uId
0.0
CDC,n
IAR
1:1
'RC..
c1,55:1--.1
1t8-gIa
0-9
-83
E1
.2@
5'2
.10
0
38'
zm
m
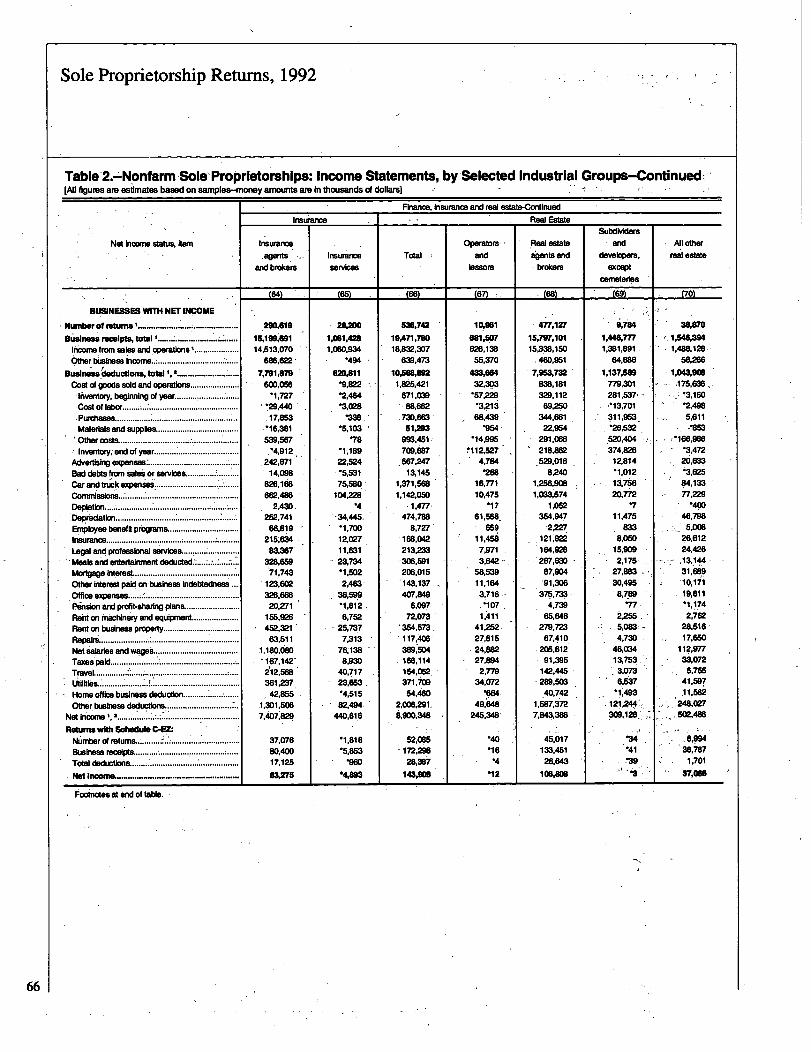
CA
'20
Igoii
-8ii
si
iiii
I
.:1
m~
r~.
w.
ro--
.6
8-4
..
..8
ss
~im1.
~i:~
~:;
1~~,
~-b
.~
R'i
i;E
4i
it4
~I'a
21it
E90
8DIt
V
91
T9
tSO
w-4
am-1
511-rdl
tt
-4A
(AT
-85
4'0
--4i
-0
OD
ID
IT:
.1 I
9a.
cr '131 a
F9 0 EA; Er. IlLo
I
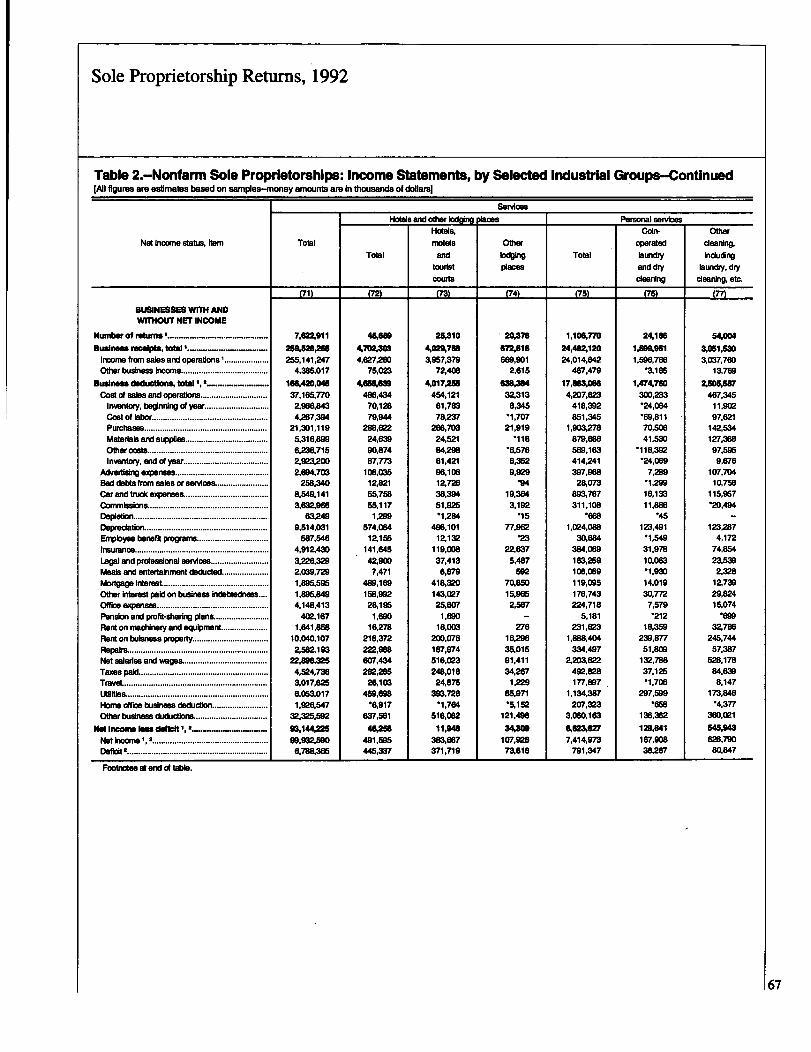
..............
...
09
11
1W.
Iv
~i
1!2
A9
1
091
~2s;?
WM
,P~
~vpi
s~3
P%
mg;.2
-*.9
lJpy
0141
ClI
I~
I"ID
4~
22,32
8=
j~~j
~4W
Mis
C.)(A-
01
:4p
so:,
v:.
--
~.:3
T2
-
10g
IIi
g1
2~
ggI
E-9
'91
-F999
1
!Y
2 99
sI
gIII
iSp
2. 5
CLB
ICL -c
l2.
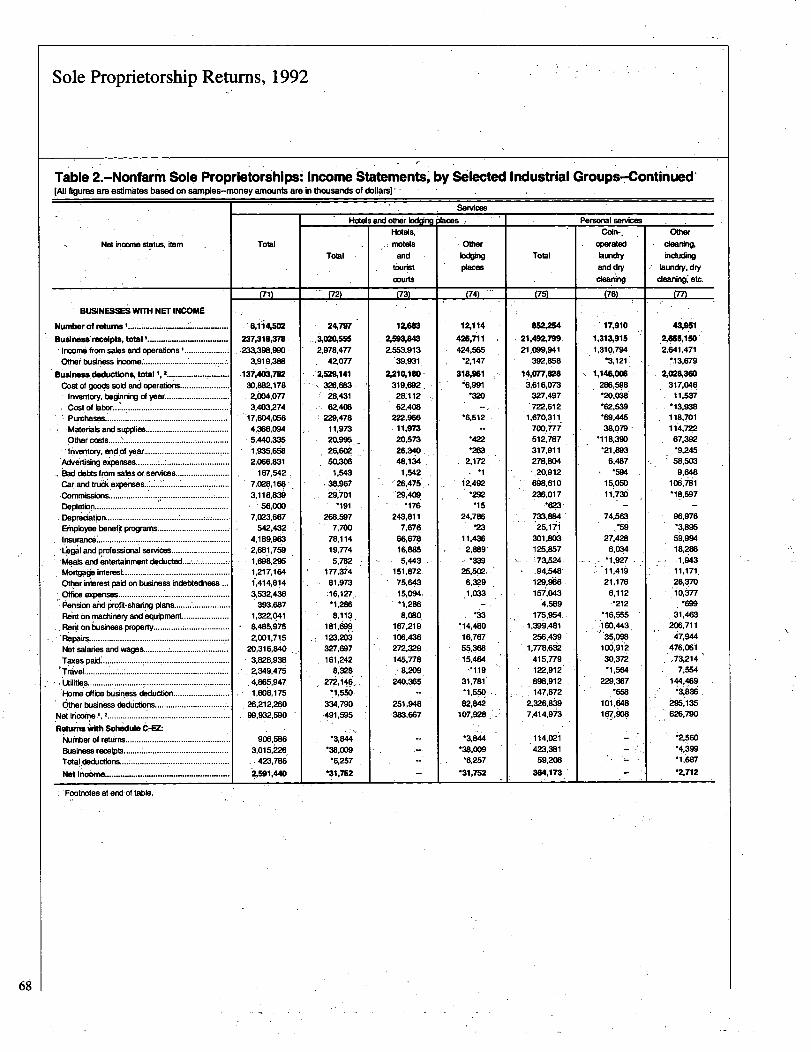
Sole Proprietorship Retums, 1992
Table 2.-Nonfarm Sole ProprietorshipsAncome Statements'. by Selected Industrial G.roup"ontinued'
(All figures are estimates based on samples-money amounts are in thousands of dollars], -
ServicesHotels and other lodging places ,
Not income status, item
BUSINESWil wrrH NET INCOME
Number of returns ........................... .......
Buslrwss~recelpts, total I.................................
Incorn.6 from sales and operations ....................
Other business brome ......................................
Business deductions, total .........................
cost Of goods sold and operations......................
Inventory, beginning of year ........................ ;
Cost.of labor .............................................
Purchases.., ......................
*** ..........Materials and supplies.....................................
Other costs .........................................
inventory, and.of year......................................
Advertising expenses.......... ;..i............................
Bad debts from sales or services........................
Car and truck expenses..:......................................
Commissions .................................................
Depletion............................................................
Depreciation................................. : .......... ;~~ ........
Employee benefit programs.......................... :
Insurance............................................................
i~gal and professional services ..........................
Meals and entertainment deducted ............
Mortgage interest ...............................................
Other interest paid on business indebtedness
Office expenses~.................................................
Pension and profit-sharing plans * ................
Rerd on machinery and equipment .....................
Rant on business property............. ; ....................
'Repairs ...............................................................
Net'salaries and wages ..........................
Taxes paid: .................. : ......................................
"Travel................... ..............................................
Utilities................................................................
Home office business deduction.........................
Other business deductions.................................
Net income .......................................................
Returns ivith Schedule d-EZ.-
Number of returns...............................................
Business receipts ...............................................
Total deductions ............................................
Not InconwL........................... ..........................
Total
(71)
sji4,sw237,318,378233,398,990
3,919,388137,403,78230,88Z1782,004,0773,403,274
17,6D4.056
5,440,3351,935,6682,066,831
167,5427,028,1683,118,839
~ 56,0007,023,667
542,4324,189,9632.661,7591.698,295
1,414,8143'632,436
393.6871,322.0418,485,6752,001,715
2D.316,8403,828,9382,349,476
1,606,17526,212,26099,932,590
906,586
3,015,L'~S- 423,78i
Z591,440
Total
921
24,797
_A020,5562,978,477
42,077
ZSM141326,611328,431
6Z408229,478
11,97320.995
26,60i'50,306
1,54338,967
26,701
268,5977.700
78,11419.774
5,782IT7,374
81,973.16,127.,-1,286
8,113.161,699123.203327,697
161,2428,328
272,146~-1,550
334,790491,595
-3,844*38,OD9
-6,257
'31,752
Hotels,
motels
andtouristcourts
(73)
12,6832,593,802,553,913
39,9312,21%180-
319,692,.28.1126Z408.
222,96611,97320,57326,34048,1341,542
26,475.29,409
.176243,811
7,67666,67816,8855,443
151.97275,64315,094-1,2868,080
167,219106,436272,329145,778
1 8.2D9.240,365
251,948
Other
"ing
places
(74)
12,114
426,711
424,565-2,147
318,961-6,991
-6,512.
2,172,
12,492.M
.1524.786
'23
11.4362,88.9-
25=,
6,329
*33*14,00
16,76755,368
15,464r~*119
31,781*1,550
82,842107,928.
-3,844*38,009-6,2S7
-31,752
I ' Footnotes at arid of table.
Total
t751
OU,M4
21,49Z?99.
21,099,941392,858
14,UT7,828
~1,616,073327,497722,61 2
1,670.311-700,777512,1787317,911278,8134
20,912698,610236,017
. '623,733,88425,171
301,8W125,85773,52494,540
129,966
15~,()434,589
175,9541,399,481
256,439
1,778,6J2415,779122.912
898,912147,872
2,326,8~19
7,414,973
114,021423,381
59.208
364,173
Personal servicesCdn-,
operatedlaundryand dryclearing
P61
17,910
1,313,9151,310,794
-3,121:
1,146,006
286,598-2D.038*62,539
-69,"538,079
'118,390-21,893
6,487
'59415,05D11,736
74,563~ *59
27,4286,034
-1,9Z7
21,176
6,112
.16,555
-160,443.-
35.0f)(3
10d,91'230,372
229,367*658
101,648
1 (57*8
Other
clearing,
inducing
laundry, dry
cleardng~ etc.
Im
43,951
A655,150
Z641,471*13,679
2,028,360
317,04611.537
'13,938118,701
114,72267,392-9,24558,503
9.648106,761'18,597
96,976-3,8%59.99416,286
1,64311,171.26,370
10,377
31,463206,711.~7,944
476,061.73,214
7554
295,135626,790
*2.560
.099-1,687
-2,712
68
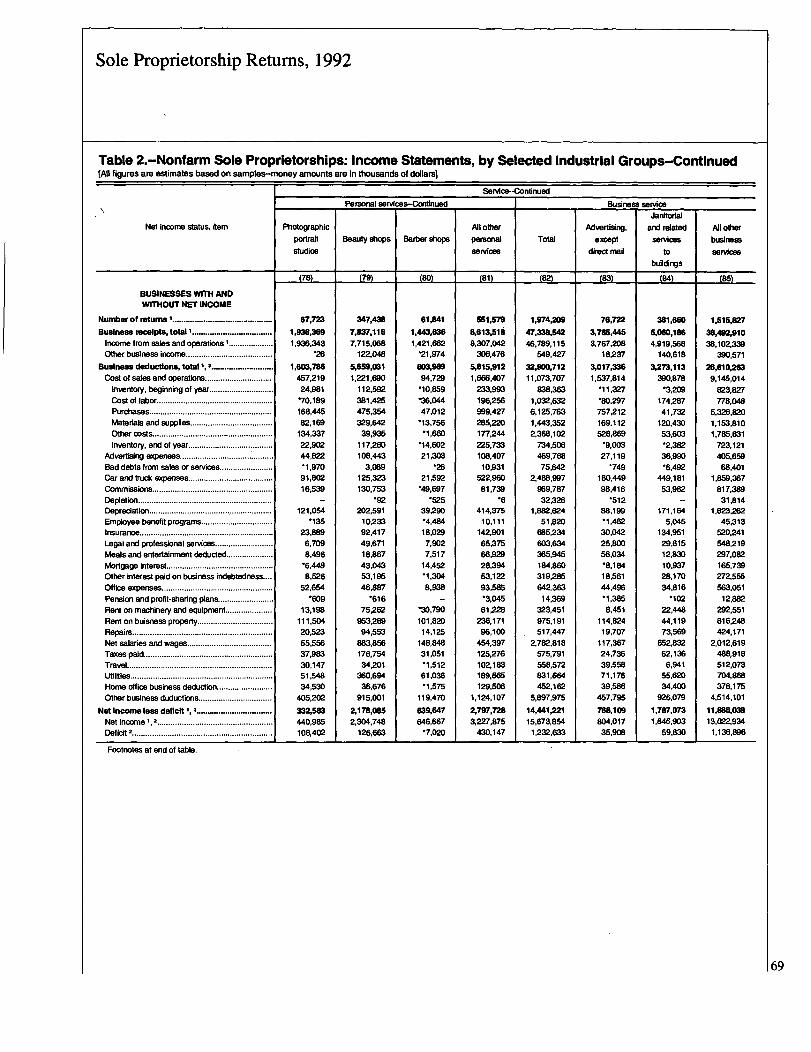
oz m
0 O~
ic0
PD
9p
SM(A
co.9~
~41b
,co
..
..
..
..
.
~.
a,
-gg
--4g
al
HE
4,8
'st-
3S
5911
052
gps
A9
,~~
ts
:1in
:4:4
C-0
toN
-53
"-:1
4W
-~0
8t
Et
!RT
t-1-
B'R
I'-st
:~j
EsEs
to'S
-'EW
A'tt
MsH
:~A
SIRD
so:
:MI
:C-4
AD
8-
91
-4C.
4i
f2-P
Cd44
'9
-ob
1,1
99
9,
9F
8S
.,
5"$0
p SeaP
,
tt
""
.0,2
ag
~s8
NT
vC2t
VI
zg"
TI
ilk
0-4
N11
10
-4'.P
,
;jT
a8
W8
N-4
82
9Z
ti
i~
Z-
p
e,
i~4
-0C-
0-4
:::1
P-ji
PD
C-A
f.
0-1
1-
-$W
g§
~419
*~
24
p:4
50
--
--
--
-0
'-4
--4
8-4
sIM,4M8,2'!
124
24
tnC-0
--
--
--
--
--
--
coo
4~-
W0
MS
-~
N
'meT OTO
cc01
Isa?
-
9 p
D.
a
9 I ET0
1H
b I
I15
a-;2:-~~
~~-T'E
RgI'SZ
-8~C~~o~
.~Ei9
8.9~
trI
I.II
---
--i
-~ii
---is
--1-41
ea1.
g
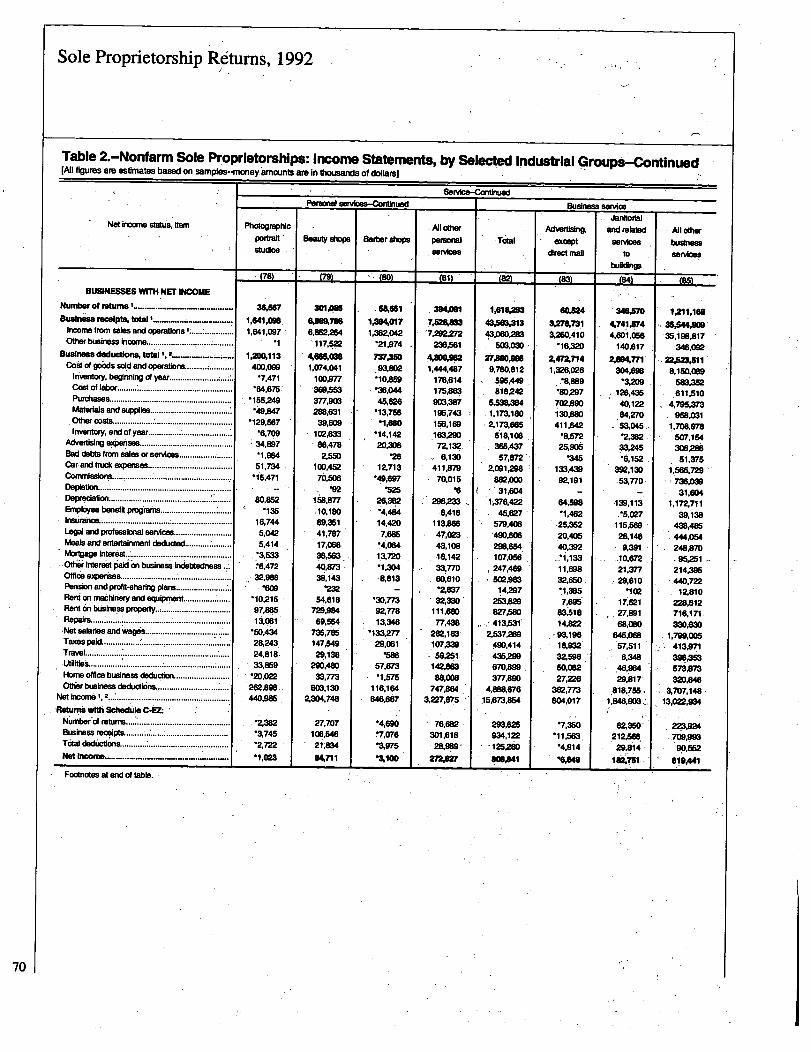
H:2
91fA
m,~
~§M
Vs~tv
-Vt-t
~-
949
a9
Cal
!~Z;
9§1
1-.0
~3IS.P
S~Js
Pt
itM
41
P-3
IVt
9A2
awla-a
V1~3
.;S
aj~
PN
LA
1.0E
jjrj!p
piss1@
4J.
2
.0eta
~ttw
sI
b,H
in-M
bLan
u-
P. La I CT Ia
Erk
LP
En
0 0--
CD
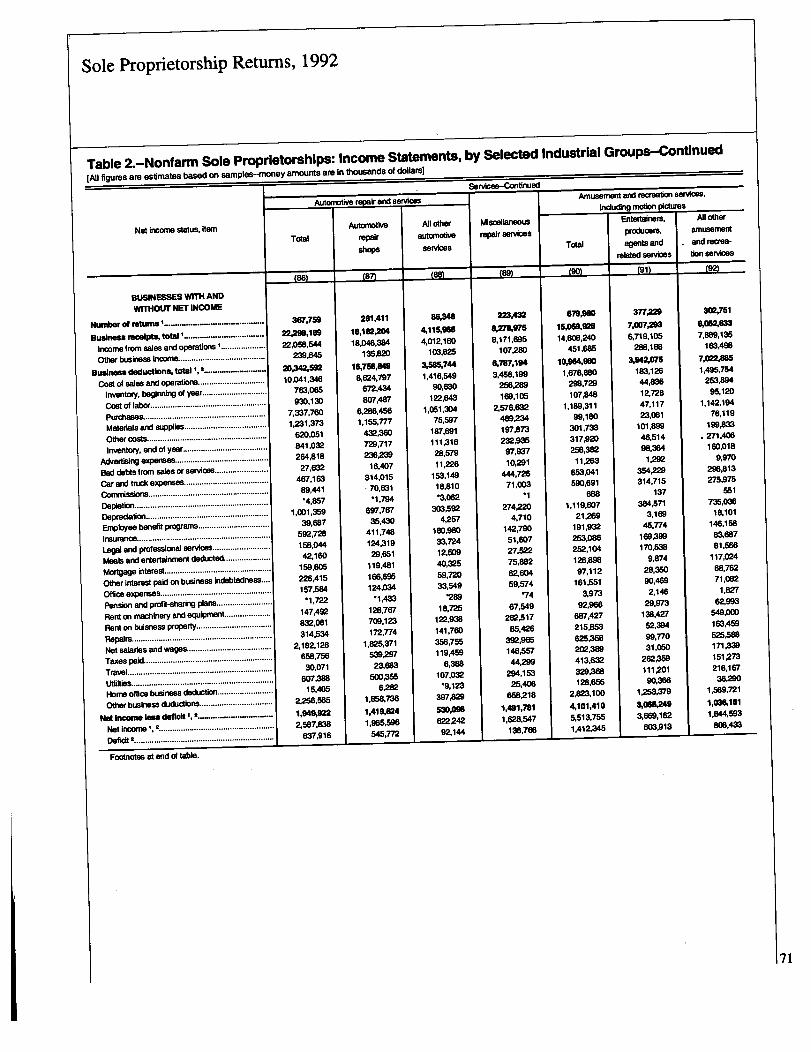
wZ
C-n
crj
CL
CL SL
m
sis
PSIt
-4T cc
Istt
-40
CD
-4
41
i;r.
IT"-N
b,so'MH
1-i
g'8
402
,8
80
cn
-4O
D
-gb
b)'g
41g
88
sp8 -

fa§
qI
13,i
a11
FCD
m.
-R
I.i
I,
IL~
S~
I-
CL8
8R
91,-
~I 0
c5L
CL
:
,
:'.
0C
A
FL
ro0)
roIN,
ro-f
_a
caa
T
:749t
g. m
Jro
10P'
IB0,
092
co
4
'52
9E
19
19
1
~4-4
w4
_D3_:t
54"-P,
wEs
cn 89
99
W99
'0'p3
b,.b
Db,
CAw
OD
CD
Cc
889'
ca:(
a-4-
'81
9:911
9L~
roC
Lv
h)
CD
wz
_s
'N9,
a. I
8z
go
aI
~O 1.0
0
I
,
12
6;.6
.9
R-4 9
3ff
(Da
(j)E
La
'99 9 M CL .5 CL
5
A. 9 K

wz c
'nT
i,w
igjjw
wg
pg
~5
RK
2R
52
-
2-'
Ra
aa
V9
~-
sa
aI
I,I
1-
05*
!5ll~
ar0
5-
a01
,,
E@*
33
.-
NsR
P.0,
-SR
C-2.
1-2,1.
1.20
CL
0C
L
zm
S.'8
S.~
0-0
1ORii
iiI
!im,1
=9-8
:m
2:
::
::
:
Fc
CDrn
V
17-
:450
-4W
-A
izjg
lab co
coro
CAg
w(A
-4CD
b.
Igt
ig'Id
g
-j~
N~4
wca
A!3
S~jG
31~g
'alto
0i6
;::4
1
CY)
Un
?--
10
il
--~
-t
vR
81
-8pt
--
a~
11
coto
-4"
co
coCA
CA
-.p,
--4
-CO
to~
i
f R I a 9
I9
It 6- Es go
I
Es
0-4
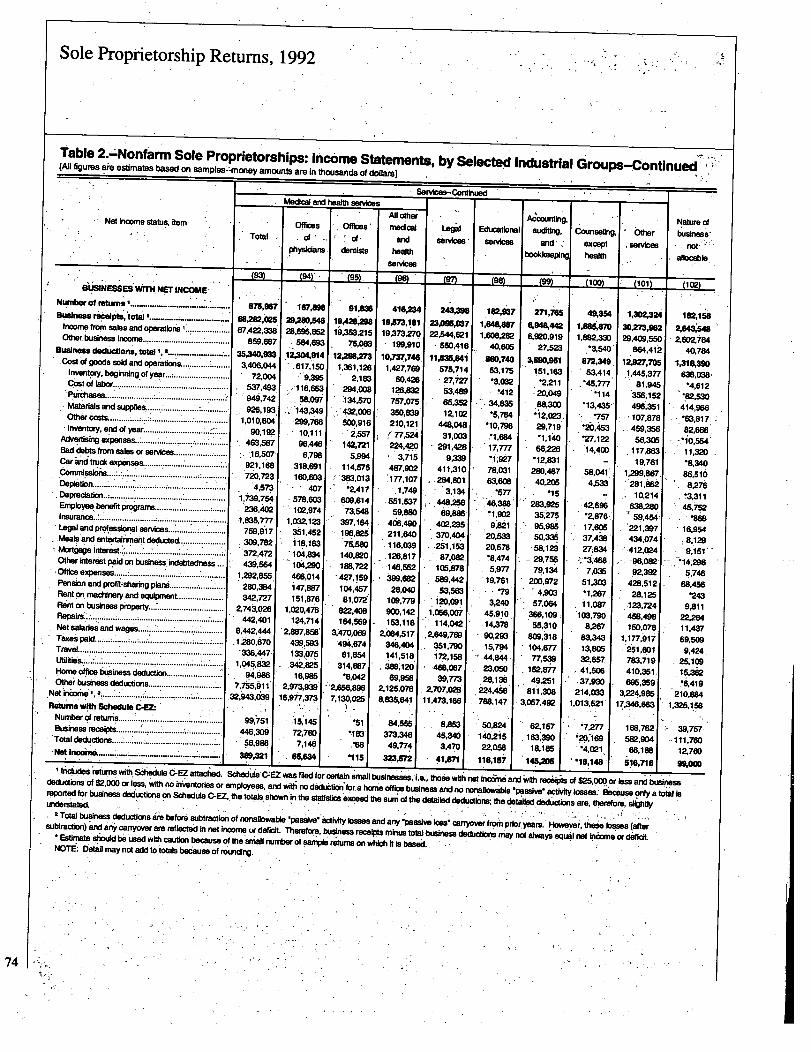
mz
ZA
CDa'
EL
Ka.
i~L
SL itC
La
Ji
CL :
8ic
.
.
..
..
..
.aT
rn
N
fa
rs
I9L
47go
r
9t
Av
',
s-&
6;a~
380?
As
b,
It4n
.4
-4-y
-4-
to-4
boN
:-
Tb:l
so:-
~34
Z4cn :4
rAgj
-4i
4-1
:tl
--04-
Icn
-4M
,:~ i
~gIK,
ii
§;
IIt
9.~
IA
R~9MI
9
CDp
piz
-~4
22
wt
41.
59
g
4,
b,
co
ME
L)Iii-r2iH
11
0r
SL
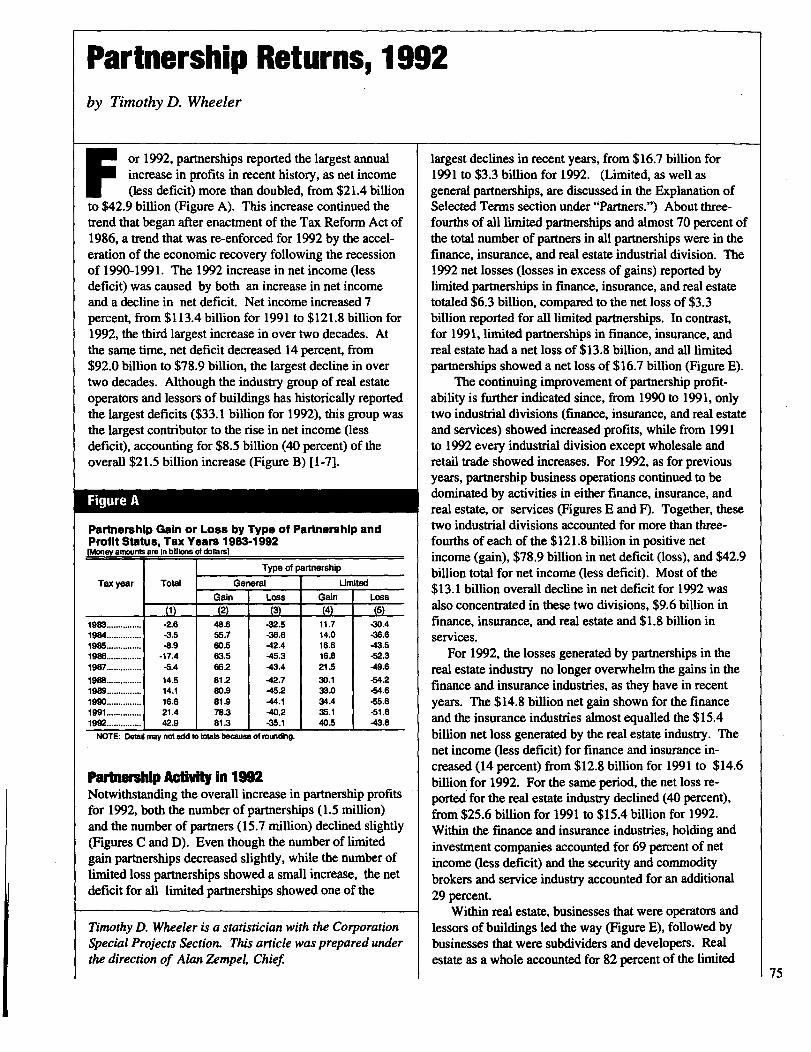
Partnership Returns, 1992by Timothy D. Wheeler
F
or 1992, partnerships reported the largest annualincrease in profits in recent history, as net income(less deficit) more than doubled, from $21.4 billion
to $42.9 billion (Figure A). This increase continued thetrend that began after enactment of the Tax Reform Act of1986, a trend that was re-enforced for 1992 by the accel-eration of the economic recovery following the recessionof 1990-1991. The 1992 increase in net income (lessdeficit) was caused by both an increase in net incomeand a decline in net deficit. Net income increased 7percent, from $113.4 billion for 1991 to $121.8 billion for1992, the third largest increase in over two decades. Atthe same time, net deficit decreased 14 percent, from$92.0 billion to $78.9 billion, the largest decline in overtwo decades. Although the industry group of real estateoperators and lessors of buildings has historically reportedthe largest deficits ($33.1 billion for 1992), this group wasthe largest contributor to the rise in net income (lessdeficit), accounting for $8.5 billion (40 percent) of theoverall $21.5 billion increase (Figure B) [1-7].
Figure A
Partnership Gain or Loss by Type of Partnership andProfit Status, Tax Years 1983-1992Way amounts are in billions of dollarsl
Tax year
1983 ...............1984 ...............
Total
-i-2.6-3.5-8.9
-17.4-6.414.514.116.621.442.9
GainL2)
48.655.76DS63.566281280.981.978.381.3
Type of partnership
GeneralLoss Gain
Urnited
(3)
-32.5-36.6-42.4-45.3-43.4-42.7-45.2-44.1-40.2-35.1
NOTE: Detall may not add to totals because of rounding.
(4)
11.714.016.616.821.6
3D.133.034A35.140.5
Loss
(5)-30A-36.6-43.5-52.3-49.6
-54.2-54.6-55.6-51.8-43.8
Parbwnship Aefift In 1992Notwithstanding the overall increase in partnership profitsfor 1992, both the number of partnerships (1.5 million)and the number of partners (15.7 million) declined slightly(Figures C and D). Even though the number of limitedgain partnerships decreased slightly, while the number oflimited loss partnerships showed a small increase, the netdeficit for all limited partnerships showed one of the
Timothy D. Wheeler is a statistician with the CorporationSpecial Projects Section. This article was prepared underthe direction of Alan Zempel, Chie.f
largest declines in recent years, from $16.7 billion for1991 to $3.3 billion for 1992. (Limited, as well asgeneral partnerships, are discussed in the Explanation ofSelected Terms section under "Partners.") About three-fourths of all limited partnerships and almost 70 percent ofthe total number of partners in all partnerships were in thefinance, insurance, and real estate industrial division. The1992 net losses (losses in excess of gains) reported bylimited partnerships in finance, insurance, and real estatetotaled $6
'3 billion, compared to the net loss of $3.3
billion reported for all limited partnerships. In contrast,for 1991, limited partnerships in finance, insurance, andreal estate had a net loss of $13.8 billion, and all limitedpartnerships showed a net loss of $16.7 billion (Figure E).
The continuing improvement of partnership profit-ability is further indicated since, from 1990 to 1991, onlytwo industrial divisions (finance, insurance, and real estateand services) showed increased profits, while from 1991to 1992 every industrial division except wholesale andretail trade showed increases. For 1992, as for previousyears, partnership business operations continued to bedominated by activities in either finance, insurance, andreal estate, or services (Figures E and F). Together, thesetwo industrial divisions accounted for more than three-fourths of each of the $121.8 billion in positive netincome (gain), $78.9 billion in net deficit (loss), and $42.9billion total for net income (less deficit). Most of the$13.1 billion overall decline in net deficit for 1991 wasalso concentrated in these two divisions, $9.6 billion infinance, insurance, and real estate and $1.8 billion inservices.
For 1992, the losses generated by partnerships in thereal estate industry no longer overwhelm the gains in thefinance and insurance industries, as they have in recentyears. The $14.8 billion net gain shown for the financeand the insurance industries almost equalled the $15.4billion net loss generated by the real estate industry. Thenet income (less deficit) for finance and insurance in-creased (14 percent) from $12.8 billion for 1991 to $14.6billion for 1992. For the same period, the net loss re-ported for the real estate industry declined (40 percent),from $25.6 billion for 1991 to $15.4 billion for 1992.Within the finance and insurance industries, holding andinvestment companies accounted for 69 percent of netincome Oess deficit) and the security and commoditybrokers and service industry accounted for an additional29 percent.
Within real estate, businesses that were operators andlessors of buildings led the way (Figure E), followed bybusinesses that were subdividers and developers. Realestate as a whole accounted for 82 percent of the limited
75
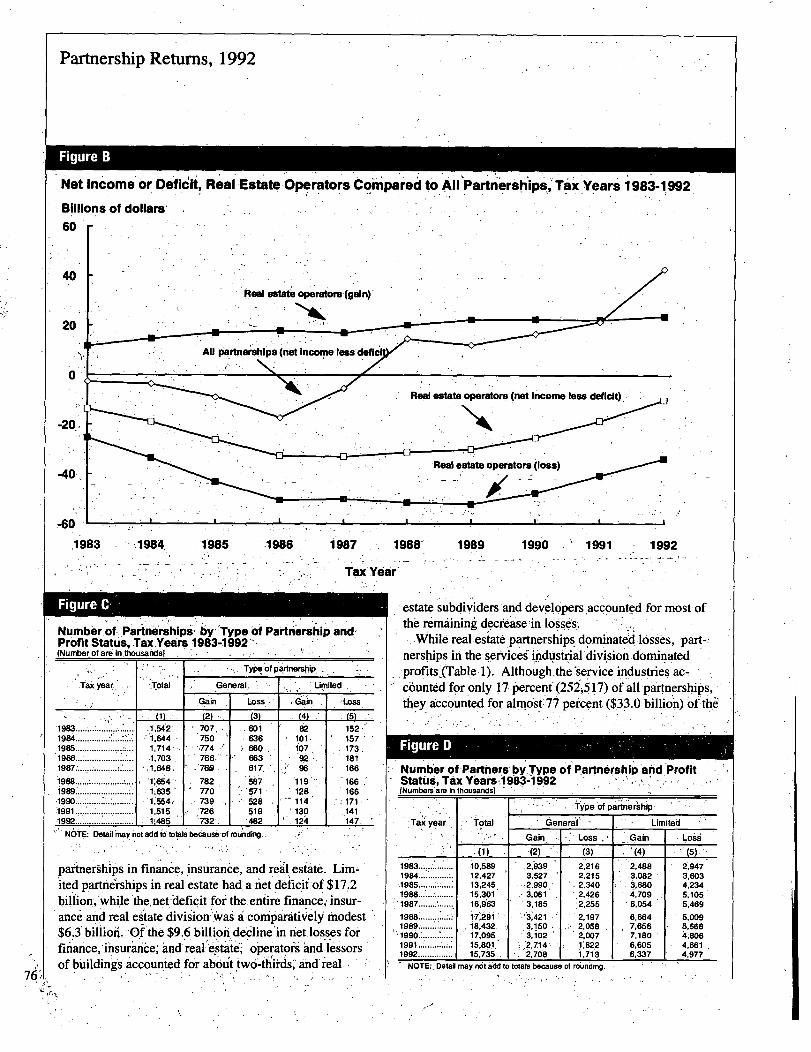
Partnership Returns, 1992
Figure B
Net Incorne'or Defl6lt, Real Estate. Operators Com, rtpared to All Pa nershipp,'Tax Years 1983-1.992
Billions of dollars,60 r
Tax'Y69r,
7
. Figure C
Number of. Partnerships", by- Type of Partnership andPr6fitStattis,.Tax.YeEirs,1983-1992--,-(Number of are in thousands] '! , . - I
Tax, yea
1983 .........................1984 ..............
.1985_-***-..........1986 ......................
1987 .......... :.I
i988 ..............1989
... .........'1992
.........................
.Totai ,
M,~1,6421,6441,714.1,703,
11.646.
1;6541,6351,554,
-1,515I , 1e486
Type of p.qdnersoip, ,
General,
Gain
(2)
707,750
766766
782770739
732
Lim
I D)
. Ga in I
636660663617,iiv571528519462
NOTE: Detail may not add to totals because of rounding..
82101197w46
128.-.114
130124
ted
'Loss
(5)152-157173,181166166166171
147
,paitnershi's in finance, insurance, and real estate. Lim-pited partnerships in real estate had. a net deficii of $17,.2billion,'while the, net-deficit for the entire finance; msur-ance and real estate divisionwas, a
.comparatiVely modest
$6.3 billioh. -O.f'the $9.6 billion dec-line'in net losses forfinance,'insurance," and real"estate
-operators.4nd 16ssors
of blildings ac'coun,ted for abb~t Itwo'-*t'hird2s,` And r*eal
.estate subdividers and dev.elopers.accounte.d for mosuofthe remainink dectease:in lo§sds.
While real estate partnerships donuinated losses, paI17:nerships in the serVicei iJidqstr.ial division dominated,profits,(Table 1). Although,the'ser,vice industries ac-counted for only 17 percent- (252j517) of all paqrt~rshios,they Accounted for almost: 77 percent ($33.0 billion) 'of thei
Numtier of,Partners by Type of Partnership and Profit.Statius, Tax YearsI 903~-'l 992(Numbers are in thousandsl
Jax year.. . Total
M
T,ype of pa~inarehip
'General'
Gain ' ',(2)
Loss
(3)
1983- ............ 10,589 2,939 2,216
1984 ............... 12,427 3,527 2,215
t,985 ........... 13,245 2,990 2,3401986 ....... 15,301 3,061 -~2,426
q. 1987 ................ 16,463 3.185 2.2~5
1988............ 17,291 '3,421 2,1971 :49............... .. 18,432 .3,150 2,0581 90.......... 17,095 ~1,1102 2,007
1991 ............... 15.601,' 1 2,714 .1~822
1992 ............. :. 15,735- 1,713
NOTE:, Detail may not add to totals because of r6unding.
Gain
ited - ' '
Losg(5)
Lim
. '(4) '
2,4883,0823,6804,7096,054
6,6647,656
2,9473,6034,2345,1055,469
5,0095,568
7,180 4; 06.6,605 4,:616,337 4,977

Partnership Returns, 1992
Figure E
Limited Partnerships and General Partnerships: Selected Items for Selected Industrial Groups[All figures are estimates based on samples--money amounts are in thousands of dollars]
Tax year, industrial group
1992All Industries' ....................................................
Agriculture, forestry, and fishing..............................
Oil and gas extraction ..........................................
Construction............................................................Manufacturing..........................................................Transportation and public utilities............................Wholesale and retail trade .......................................Finance, insurance, and real estate.........................
Real estate..........................................................Operators and lessors of buildings..................
1991All Industries' ....................................................
Agriculture, forestry, and fishing..............................
Oil and gas extraction..........................................
Manufacturing ..........................................................Transportation and public utiltites ............................Wholesale and retail trade.......................................
Finance, insurance, and real estate .........................
Real estate..........................................................Operators and lessors of buildings ..................
Numberof returns
-0)
270,7488,576
15,14514,0252,4781,6314,103
12,649203,587167,424133,369
22,576
270,6819,780
16,29515,1491,4061,9463,797
13,640201,502162,890134,481
22,232
Limited partnerships
Numberof partners
(2)
Net income(loss deficit)
D)
-3,277,692-43,585
2,040,0281,990,619-150,226411,136
-240,277765,383
-6,289,429-17,186,165-13,579,304
217,371
11,313,483172,616
1,196,9781,170,310
28,772170,319448,26884,962
7,762,8985,470,9514,890,2731,448,645
11,265,537219,931
1,198,2401,162,041
28,003126,447439,268
96,7797,674,1675,218,0114,736,7831,481,958
ITotwal i cludes partnerships whose principal business activity could riot be deternune .
net income (less deficit) for all partnerships. Over half ofthe net income (less deficit) for partnerships classified inservices was attributable to legal services, with medicaland health services a distant second ($7.3 billion), fol-lowed by accounting, auditing, and bookkeeping services($4.2 billion). Profits for all of these groups were up for1992.
Real Estate Operatom and Lessom of Buildingsand Rental Real Estate IncomeAlthough its impact on total partnership losses haslessened, the real estate operators and lessors of build-ings industry still remains the most important overallindustry for these partnership statistics, accounting for 38percent of the total assets for all partnerships (Figure F).In addition, almost one-third of all partnerships andalmost one-half of all partners are classified in thisindustry. Even though the number of partnerships in thisindustry remained relatively constant over the 1983-1992decade at between 32 and 36 percent of all partnerships,1992 marked the fourth consecutive year for which their
.16,702,278-242,252
1,790,2791,840,527-312,608-614,965
-2,177,849378,997
-13,769,218-22,224,989-17,978,664
-1,754,293
Numberof returns
(4)
1,214,004115,988
21,25417.79456,93322,44319,433
149,823593,736490,381400,344229,941
1,244,665117,293
22,72819,03155,78922,02822,309
157,342602,335506,077410,722238,217
General partnershi
Numberof partners
(5)
4,421,208331,701191,629173,556129,162
54,58179,082
340,4192,565,2241,815,7151,452,535
717,999
4,535,511331,784216,247197,487123,68948,71079,874
351,0552,642.3481,883,4821,489,667
724,531
s
Not income(less deficit)
(6)
46,194,3402,270,624-1,031,403-1,270,6912,056,0121,458,6771,293,8761,787,4085,537,5721,825,7633,445,910
32,786,982
38,108,8851,981,930
-1,010,792-1,201,3811,806,3801,519,294
746,5092,249,053
982,822-3,395,851
-619,36829,790,360
number declined (Table 5).This same group, which historically accounted for a
dominant portion of the losses recorded for all partner-ships, was responsible for almost 40 percent ($8.5 billion)of the total increase in profits ($21.5 billion) for all part-nerships (Figure A). Real estate operators and lessors ofbuildings, as a group, accounted for 19 percent of the gainsand 43 percent of the losses reported by all partnerships.Gains alone for the group rose, for 1992, to $23.7 billion,up $1.6 billion, or 7 percent. Losses dropped dramatically(17 percent) for 1992, from $40.7 billion, for 1991, to$33.8 billion, continuing the trend of declining losses thatstarted in 1990. Losses declined 8 and 15 percent for theperiods 1989-1990 and 1990-1991, respectively (1989,$52.2 billion; 1990, $47.8 billion).
The 1992 increase in the net profits for this industrywas largely due to a 41 percent ($11.7 billion) increase inreal estate rental income (less loss), from $-28.6 billion for1991 to $46.9 billion for 1992. Over three-fourths of thisincrease was attributable to partnerships classified in thereal estate operators and lessors of buildings industry. 77
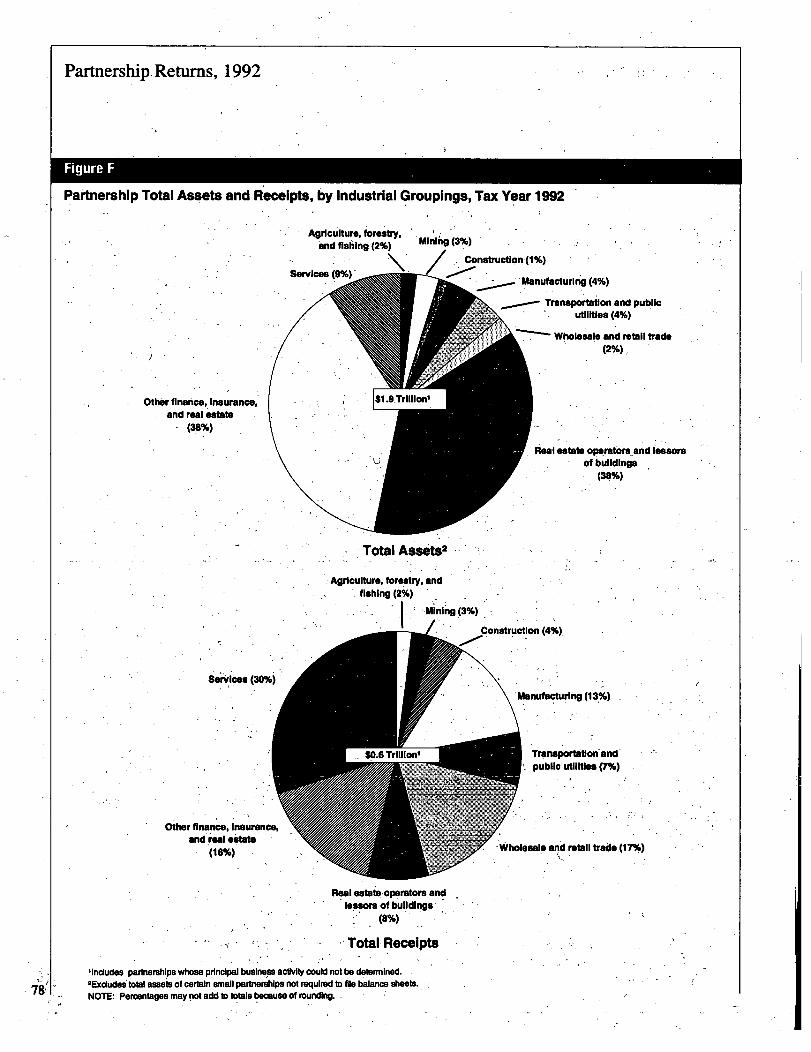
Partnership.Retums, 1992
Figure F
Partnership Total Assets and Receipts, by Industrial Groupings, Tax Year 1992
Agriculture, forestry'and fishing (2%) Mining (3%)
Construction (1%)Serviciews (9%)'
. Agriculture, forestry, and~ fishing (2%)
Real estate operators andlessore of bulldl"s,
(8%)
Total Receipts
'includes partnerships whose principal business activity could not be determined.2Exdudei total assets of certain small partnerships not required tD file balance sheets.NOTE: Peroenta6es may not add to totals bemuse of rounding.
Manufacturing (41%)
Transportation and publicutilities (41%)
Wholesale and retail trade(2%) z
Partnership Returns, 1992
VVhile net rental income for all partnerships went up from$20.2 billion in 1991 to $22.2 billion in 1992, it was thedrop in net rental loss, from $48.7 billion in 1991 to $39.1billion in 1992 that was most significant. The majority ofthis increase in net rental income (less loss) was caused bya $5.6 billion increase in gross rental income, from $148.0billion for 1991 to $153.6 billion. Also contributing tothis increase was a $4.8 billion decrease in the interestdeduction, from $65.2 billion in 1991 to $60.4 billion in1992 (Table 3). The number of partnerships reportingrental income on Forms 8825 dropped from 634,309 for1991 to 624,512 for 1992, a decline of 1.5 percent, afterhaving dropped by 7 percent over the entire previous 3years. (Rental real estate income and expenses items arereported on the Form 8825, Rental Real Estate Incomeand Expenses ofa Partnership or an S Corporation,attached to partnership returns.)
Total Assob and Total RecelptsTable 2 presents balance sheet data by industrial groupand by profit status for partnerships required to filebalance sheets with their returns. Approximately 7percent of partnerships -- generally partnerships with bothtotal receipts and total assets of less than $250,000 -- werenot required to file balance sheets. Over the 1980-1989period, reported total assets grew in 7 of the 9 years.Almost 80 percent of the overall growth during that periodoccurred in finance, insurance, and real estate. While onlymodest annual growth rates occurred for 1990 (1 percent)and for 1991 (2 percent), for 1992 total assets for allpartnerships grew by 5 percent ($90.8 billion) to $1.9trillion. Nearly 60 percent of the 1992 increase occurredin the finance, insurance, and real estate division. Most ofthis increase was concentrated within the security andcommodity brokers and service industry, as well as theholding and investment company industry.
Total receipts increased slightly over 6 percent or$37.2 billion, to $648.8 billion (see the Explanation ofTerms section for the definition of total receipts). Most ofthe increase was due to "business receipts," i.e., grossreceipts from sales and operations, especially in theservices division ($13.3 billion), manufacturing ($12.8billion), wholesale and retail trade ($8.1 billion), andtransportation and public utilities ($4.5 billion). Thereceipts in services accounted for 30 percent of thepartnership total. Business receipts for finance, insurance,and real estate were not significant in the statistics becausemost of the operating income of these partnerships is notincluded in business receipts, but in other types of incomesuch as rental income.
DlsfflbuUons to ParWorsPartnerships are not taxed. Instead, their income, credits,and deductions flow through to the partners who are liablefor the tax. Partners may be individuals, corporations,other partnerships, tax-exempt organizations, nominees, orother legal entities. Table 4 presents data on the distribu-tions (or allocations) of partnership income (or losses) tolimited and general partners by industrial division. Thesedata were obtained from Schedule K of the partnershipreturn which reports the partners' shares of each sepa-rately allocable component of the partnership'sdistributive income, deductions, and tax credits, as totalsand by type of partner. The amounts distributed orallocated reflect the ownership shares of partnershipincome (or loss) by the various types of partners.
For 1992, the total amount of income (less loss)available for distribution -- without regard to separatelyallocable deductions -- increased 34 percent, from $68.6billion to $91.6 billion. Deductions increased by $0.5billion to $22.9 billion. The difference betweeq theincome (less loss) and deductions resulted in $68.7 billionavailable for distribution or allocation to partners. Of thisamount, $59.6 billion (87 percent) was actually identifiedby type of partner. The difference was due to partnershipswhich failed to report distributions or allocations by typeofpartner.
Individuals who were general partners were the princi-pal category of income recipients for every industrialdivision except mining and transportation and publicutilities. For n-Lining, distributions or allocations weremostly to general partners that were corporations and tolimited partners that were partnerships. For transportationand public utilities corporate general partners and tax-exempt organization general partners predominated.
Even though the real estate industry group producedlosses for its partners, general partners who were individu-als received positive income of nearly $7.0 billion, upfrom $2.5 billion for 199 1. Individual limited partnerswere still characterized by net losses. For 1992, these netlosses amounted to $2.3 billion, a one-third increase overthe $1.7 billion reported for individual limited partners for1991.
SunnnaryAlthough both the number of partnerships and partnersdeclined slightly for 1992, net income (less deficit)doubled to $42.9 billion, the largest increase in recentyears (Table 5). This increase was the net result of an$8.4 billion increase in positive net income and a $13.4billion decrease in the net deficit. Real estate operatorsand lessors of buildings, an industry group prominent in
79
80
Partnership Returns, 1992
"tax sheltering", activities'6f the earl to inid71980's;-accounted'for* 40 r~erc' n't 6f the $24.5 billion in-crease intotal Oaktnership hetincome. (less deficit). The increase inthe* overall ~rofits of partneishi6s for 1992 wd's inainlycaused by.incieased. real:estate rental revenues, aIs well asb 'the deci ed in
.ter6st.-deductiorts assodiatedvith thesey reits
revenues.- I-n ad
Iditi6n, the ser
.vice's division continued.
,to
p.receipts, tintingdominite-the statistics for partn6rshi accofor 3,0*06rc.ent of thetotal.
Most of the Pre7tax reform tax shelter activityoccurredthrough us6 of limited partnerships. Although thenimberoflinut6d partnerships-'remained fai.rly.co,nstant, theyacco fited f6k.63.p~6rc6itt of the.increase in net income(less deficit) for the year.
Sahiple Selection -Tax:~Year - 1992 statistics are estimates based on a stratified'probability -sample of slightly over 29,000 returns selectedfrom.,a p6pulati6n,of
.a
,pproxirfiately 1'.~ ~mfliion p̀artner
-ships,.- Tax,Year i992 covers 'returns processed by- the
Internal Revenue'- Service.during Calendar, Year, 1993. All
partnerships engaged in business in, or hdving.jncomefro "in- sources within, the-United States, we
.r
Ie
"required to
Al -'a ~6rm ~ 1065, U.S. Partnership. Retum.bfMcome,.to
-rep6rt.iricoMeor:16ss,ded6ct.ions, -tax .6;relditsand other,tax-related items generated- by. the partnership,., TheStAtistics.areonly for -active partnerships.Awbich~.ar'e'defined as those that reported any items of income ordeduction derived from a'trdde'or_-bus'iness,.or fromsental .:or portfolio,: inc,,ome.,'rhp
sample was stratified. intOrclasses~based'on sizeOf total assets, receipts, net income (or deficit) a:nd indus-tr~.:'Returns Were selected from these classes at various~p
.robabilkies ranging from 0.12'percelit, t6 percent,
and were weighted to represent the'total population.Or6ximate y perc of he' reittims, selected4or this .Ap ~nt ' t'
sarnple~w-ere* not'in'c'luded in, the tabulations ~b6cause theyreptesented.iriactivei, partnerships orbebauS6 multiple
'been freturns had Red by the same partnership-,Because the data presented- in this article- are based
on a sample of returns, they.,are subject to: s,ampling error.To--propprly,usel the'data, the magnitude of the potentialIsam ling effor:needs to be-known. Coefficients of varia-.tion (CV's) are used,to rheasure this magnitude. Figure Gpresents the' coefficients.of Viiriation-for certain:moneyamounts, for selected industrial groups. The smaller thecoefficient of variation, the, more reliable the estimate isjudged to be-[8].
ExplaMtlon of'Selected',Terms.."A
.ssas and Liabilittes.7-`B.alance sheet. informati
Ion' had..
: be provided, in generato nilylif the p,artnership, had total
Figure G
Indushisl Groups irid Items, Tax.Year 1992
CDeff icients of variation
Industrial group.Total
Tot
salariesassets
t
and waglesdeduction
NI Industflal dMslons............. . ............. .... 0.0704 0.007
Agricufture~fonastry, and lishjng..;~ ......................... 0.041 0.091
Mining.................................................... ; .................... 0.020 0.073
Construction..~..... ............ : .................................... 0.045 0.074
Manufacturing..:: ..................................................... 0.007 .0.015
Transportation and public utilities.; ........................ 0.013 0.022
W-iolirsale and retail trade...................................... 0.017 0.023
~Rnance, insurance. and real estate:
'Real estate operators and lessors of
........................................buildings......... 0.009 0.104
Otherfinance, insurance, and real estate
(except operators and lessorsIofbuild" 0.006 . 0.024
Services .......................... ...................... 0.010 0.010
Coefficients.of
item vahatidn--ccntinued
(3) -
Number of. partnershps ......................................... :0.005
Nurnber of partn ers7--*
0.024.
:Receipts 0.003
Portfolio 6.015
Cost of sales and operations ................................. 0.005'
Depredation............... ............................................ 0.007
Taxes paid dedti6ti6n .................... ;.t: ..................... _01007
Not incorne ............. .......................................... 0.007
Nit deficit....................................... : ....................... .
~
0.016
,r&.ceipts a0d.toW assets of $250,000 or more. No attempt
was-made -to.estimate the assets andiiabilities of those notre,quired"to.proVide this information Although effortswere~made to ov'dr6o' the0fects of-nonuniforni,MeTeliorting, especially by firms t.hat,used balance sheets of.their own design instead of that provided on the return,certain anomalies - were acciepied;"e.g.,1wh6n a.negativeamountwas,repoited for an asset ouliabilityr account.
Tartners.-- Partners can',be, indiIviduals, comorations,
other parinerships,'"o"r. any 6ther legal entiiy.. Partners areclassified as'either general or limited. General partnersar
.e.those'who.'as§ume liability for, the partnership" s debts
and losses. Limited~pa;q'nersdrIe thosewhose liability. in
die partnership' does notI, exceed their in-vestment, By
definition, a~ partnership must. have atleast two partners, atleast one of which
,hill
.st.be a g
Ie"nieral partner. A general
pa.Irtnership is composed, entirely
Iof partners who arep
general partners. A limited partnershi'o, has at least onegeneral partner and one or more limited partners.
Partrierships.-- A partnership is the relationship be-tween two or more entities or. persons which join to carryon a,.trade or business, with,e6ch.pildner contributingmoney; property, labor, ~or skilfhndekh expecting to
.-share in the Profits and losses.'..Every partnership that
Partnership Returns, 1992
engages in a trade or business or has income from sourcesin the United States must file an annual informationreturn, Form 1065, U.S. Partnership Return of Income,with the Internal Revenue Service, showing thepartnership's taxable income or loss for the year. Apartnership must file even if its principal place of businessis outside the United States or if all its members arenonresident aliens.
Partnership Net Income (Less Deficit), Through TaxYear 1986 partnership net income (less deficit) represents"ordinary income" (loss). Beginning with Tax Year 1987(because of tax law changes and form revisions), a similarnet income (less deficit) figure has been computed forStatistics of Income as the sum of. ordinary income or lossfrom trade or business, portfolio income distributeddirectly to partners (excluding net short-term and long-term capital gains and losses and other portfolio income),net income or loss from rental real estate activities, andnet income or loss from other rental activities. The sum ofthese components is a comprehensive measure of overallpartnership profits which enables comparisons to be madewith amounts of net income (less deficit) reported foryears prior to 1987. The profit status of partnerships isdetermined as the sum of the gains or losses from the fouractivities listed above. Partnerships with a breakevenbetween gains and losses are included with loss partner-ships.
Receipts, Total receipts, for this article, is defined asthe positive income (negative amounts or losses are notincluded) received by partnerships for the specific itemslisted below. For 1992, total receipts of partnershipsconsisted of. gross receipts or sales less returns andallowances, i.e., "business receipts" in the statistics;ordinary income from other partnerships and fiduciaries;net farm profit; net ordinary gain from sales of businessproperty; other income from a trade or business; netincome from rental real estate activities; net income fromother rental activities; portfolio interest income; portfoliodividend income; portfolio royalty income; net short-termcapital gain; net long-term capital gain; other portfolioincome; net gain from sales or exchanges of property usedin a trade or business (Internal Revenue Code section1231); and other income except that from trade or busi-ness. Therefore, total receipts differs from the totalreceipts presented in Table 11 in the Selected Historicaland Other Data section of this issue in that certain incomeand deductions distributed or allocated directly to partnersis excluded in the latter.
Notes and References[11 For information about partnerships for other recent
years, see Wheeler, Timothy D., "PartnershipReturns, 1991," Statistics of Income Bulletin, Fall1993, Volume 13, Number 2; Shekhter, Elaina,"Partnership Returns, 1990," Statistics of IncomeBulletin, Summer 1992, Volume 12, Number 1;Petska, Tom, "Partnerships, Partners, and TaxShelters after Tax Reform, 1987-1989," Statistics ofIncome Bulletin, Summer 1992, Volume 12, Number1; and Zempel, Alan, "Partnership Returns, 1989,"Statistics of Income Bulletin, Fall 1991, Volume 11,Number 2.
[21 U.S. Congress, Joint Committee on Taxation, Tax
[31
Reform Proposals: Tax Shelters and Minimum Tax(JCS-34-85), August 7, 1985, page 2.
Nelson, Susan, "Taxes Paid by High-Income Taxpay-ers and the Growth of Partnerships, 1983," Statisticsof Income Bulletin, Fall 1985, Volume 5, Number 2.
[4] Dworin,'Lowell, "An Analysis of PartnershipActivity, 1981-83," Statistics of Income Bulletin,Spring 1986, Volume 5, Number 4.
[5] U.S. Congress, Joint Committee on Taxation,General Explanation of the Tax Reform Act of 1986(H.R. 3838, 99th Congress; Public Law 99-514), May4,1987.
[61 Nelson, Susan, "Noncorporate Business Taxation:
[71
Before and After the Tax Reform Act of 1986," OTAPaper 59, Office of Tax Analysis, U.S. Department ofthe Treasury, May 1988.
For further information about passive losses and theeffects of the Tax Reform Act, see Petska, Tom,"Further Examinations of Tax Shelters in the Post-Reform World," 1991 Proceedings of the AmericanStatistical Association, Section on Survey ResearchMethods; Petska, Tom and Nelson, Susan, "Partner-ships and Tax Shelters: An Analysis of the Impact ofthe 1986 Tax Reform," 1990 Proceedings of theAmerican Statistical Association, Section on SurveyResearch Methods; Nelson, Susan and Petska, Tom,"Partnerships, Passive Losses, and Tax Reform,1981-1987," Statistics of Income Bulletin, Winter1989-1990, Volume 9, Number 3.
[8] For details on the sample design, see McMahon, Paul,O'Conor, Karen V. and Collins, Richard, "Revisingthe Statistics of Income Partnership Sampling Plan,"1990 Proceedings of the American StatisticalAssociation, Section on Survey Research Methods;
81
Partnership Returns, 1,992
McMahon, Paul, "Siatistic~ of Income, PartnershipStudies; Sampling Plan Redesign 11," 1991 Proceed-ings.of the American Statistical Association,- Sectionon Survey Research Methods; or McMahon, Paul,
"Statistics of Income Partnership Studies: Evaluationof the Revised Sampling Plan," 1993 Proceedings ofthe American Statistical Association, Section onSurvey Research Methods.
a
82

Partnership
Returns,
1992
I
ZEV
lmt:juuou-moniig
I;gW
5909
AP
-4ag
ria-31,11 -I
Is14
if
it11
21H
.1.11Z
a9aaa
Viot
-91MIkkMM91MR.&RI
-:g-:gtWOVE-
-x
akR414
-115F~
V:
VI%
AS
Sa
01W,xq,xRkk
An
G-;
0N
av;
1:-*;;
MC
M~cc
14-19
--"
g-
CiA
i--M
mm
83
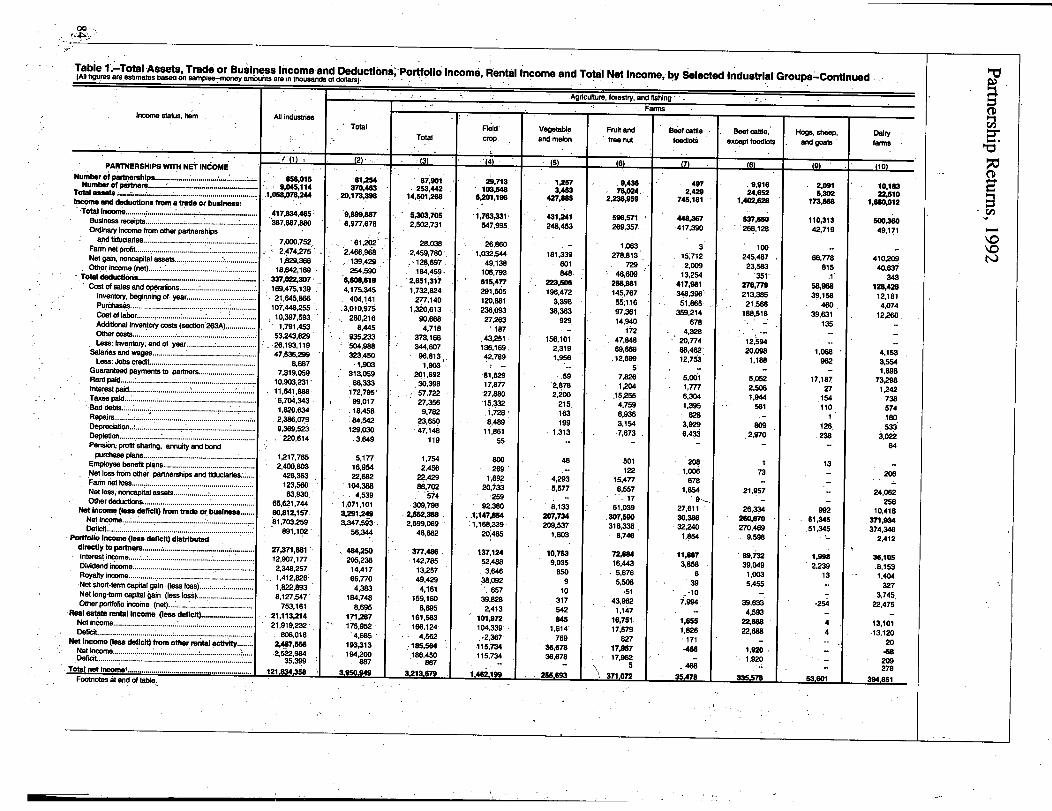
Partnership
Returns,
1992
0CL
2t0E0aCE0E0a*
cCL0Vr,
0'CcIE0
00
EEE
!R
CLIM
MIX
...
5s.
2!
illv
~?I-
v,
otP%rz
w
SO
M*V
12
Ot
Ncy~
Ak..&
,95?
A.Is
14-11!
R
a
i's-
F,~, 2- 9.
1aI
;-ZIIf
9.;
NiR
&RAF
159PnEEO.nfir_ed
9!e
Wig
,ga-
MP
8R
NIN
N
9499
9969.
dN'
Nil
N,
Nc%r
7,cj
N6
Us
-1
ViO
US
"ME
RH
UH
CLc1t
fCd
q
c64.;
I§
9
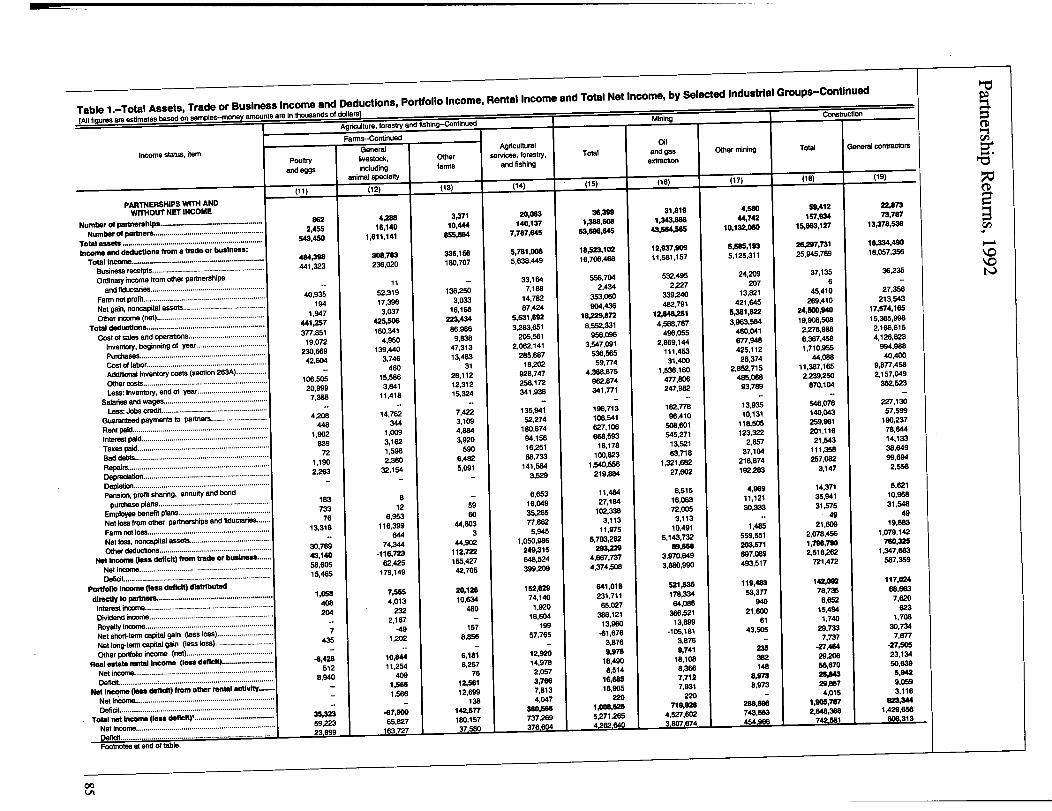
Partnership
Returns,
1992
E0S0
SIPE;k
C
eH
L
RZ
E
Z
mV
Sm
4,
rci
~4;g
g.
zd
6M
-4m
SA
M-41
ES
aR
E
.6a4.Z
Gi dd
i6v
21
R-00
r-:
.1E
PP
C40
mc6
c-~S0
adoid
9vi
N
16
ci
wi
vV
Zak
RR
RR
-R
VCIL
r%q
K
-5,2
;:6041,
%-`,
P.o
w9;
clicli
c!'d
ggd~
ic6N,6
~:64M166
Or:f
3v9!
9-d
'idjg
cici
~tk
m~:
5v
m~
dm
L6c6
6~i
ItV
.3icid
-w
Vv
d4
v9ci
so~
vN
aii
-N
EO-Z
REzEP
.-aDo
.6j!
jIE
WO
oI
I-
ii
!i.
II
Ig
0E
cF§S
ISvi
Ez
wZ
MS
.Z
z
Z-E
z85
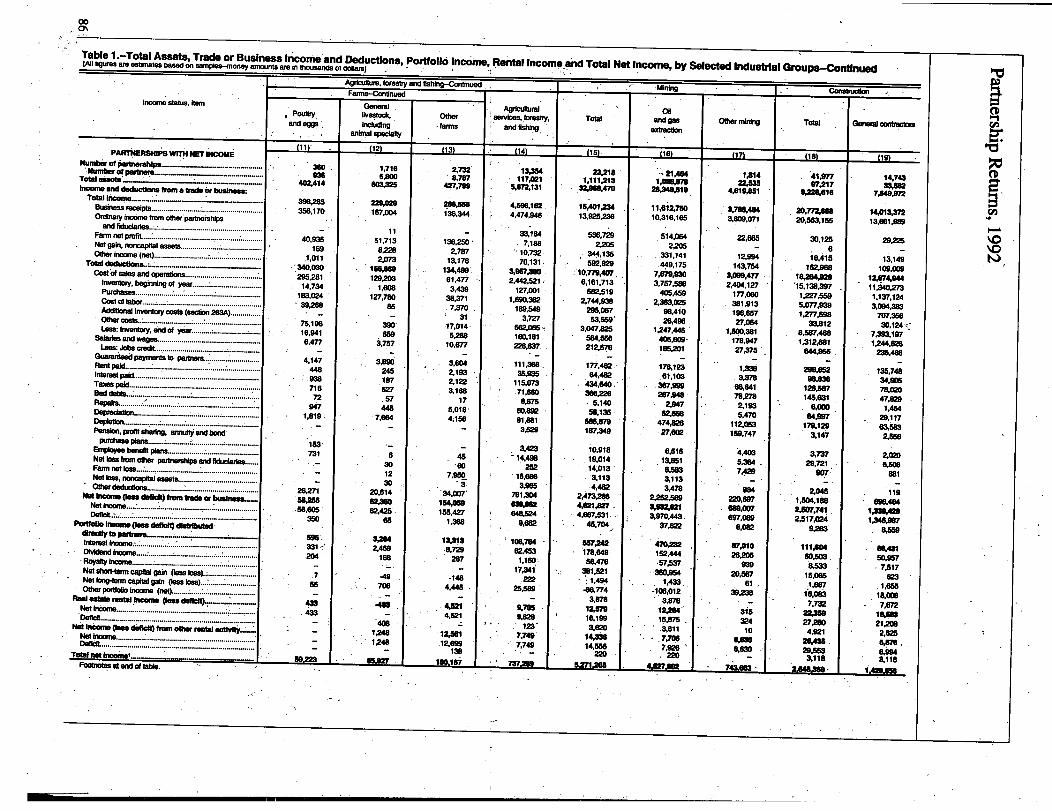
Partnership
Retuim
s,1992
.414If
il
j,I'.
CLI
.,
E-
kam:141zall
5fPZ
-of
~-
ci
voullk
affiffi
PH
IMPA
l,HF.'4'R
RR
Ico
-5
~-1 IVdof
15UP
MR
f .U11H
RR
90cioa
coFe6
-:
-1
.1n
C4
H-
S!0
d
Wv
V
lplP
fAl
WA
MA
.11"ItO
EM
ofN
-5OOF
IRri. c
i~I
]v
-AC;
C6a
0;d
8::W
WF
W~
-71p2g.1~
cd
d4
'"I
;. mg
VP
IVI
a~
1.1
1k
co17.
.~ I
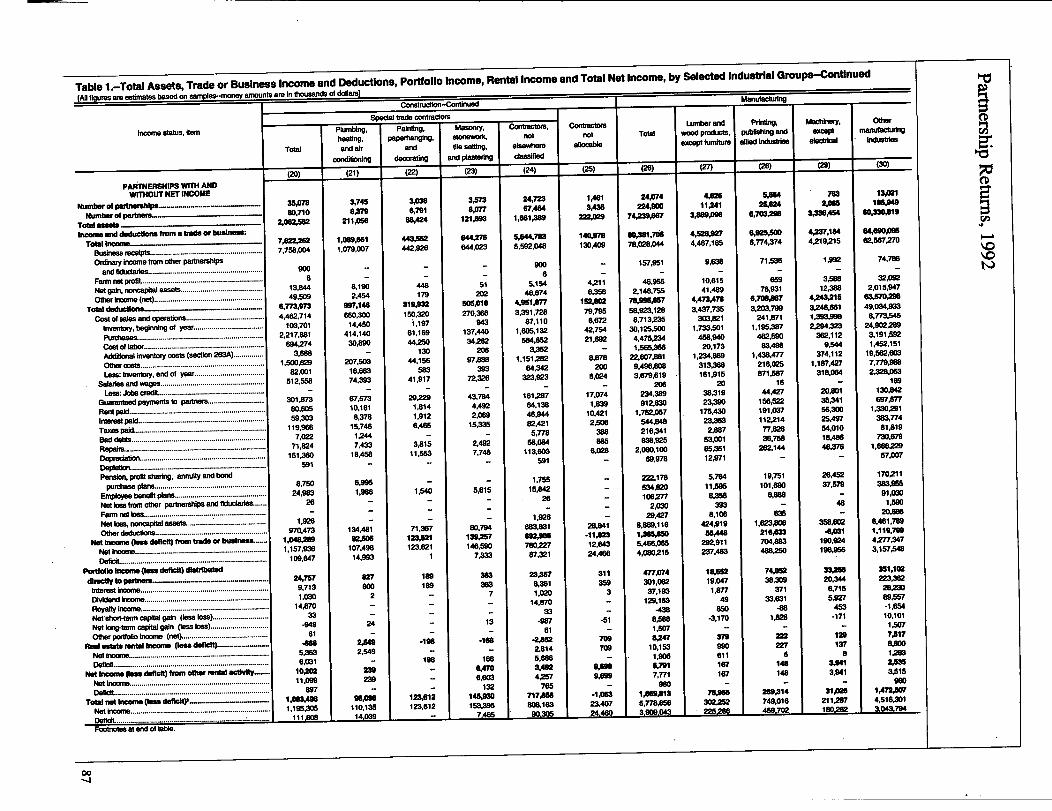
L8LF
F
fill
H'I
titt
C9
9:9,vtI
tt
tV
8tt
II
I
CAO
1
MaH
0815Har-O
txIt
It
tit
I
t~
MW
CO
WIM
HC
MI
'8-V
9.
a
je12
Hm
P1I
gill
4w
w9bilseir
s
I
7AI
EFU
.qsj
ouuu
clZ6
61ls
wm
o-d
dT
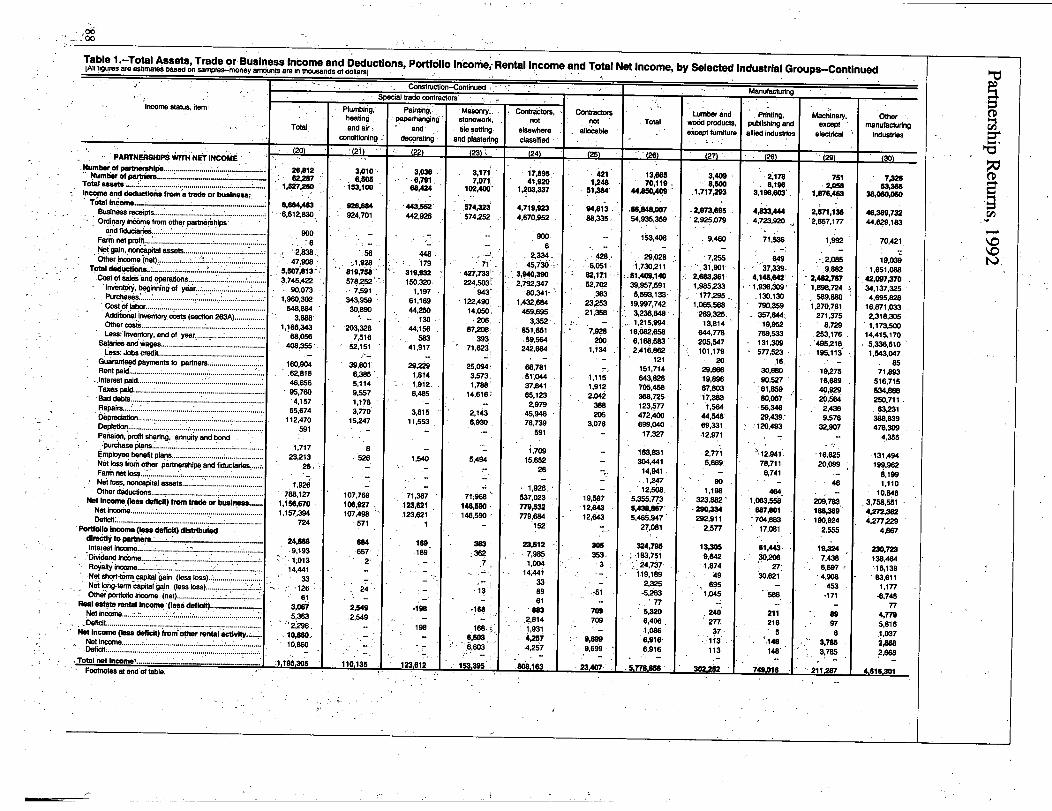
Partnership
Returns,
1992
Ia
gi"M
OU
RV
IGW
kM
004
V~~!!
:1~
v~
Zg
(6,-
C4N
:7
tit
,z-
c6c!
N.
cm
It
imG
.9;9
Ilk
tzrz
C4a
n"i
''
Cm
.91
k9
~~
&d99
!~ePR
:;
C46
kR
10
ia;vi
IqUZ
A1
94
FSI
Pig
o'
FF
ocic'!
ci.a
Sn
H-1
~P
Gdv~
-zz
ea
da
gas
IIq
jR
ag
j'I
8.T
w=
-F@
-W
Ucq
Zq0
IE
:M
.k'
NOa
6Cq
FL'
q9
,ok
cGicq!i
aI!N
ku
I
w
IL
E
Z.2
rDLD
1H
Eco
01
r-"ic
ri'a
w-M
ifE
S191
fi
wz
zaii
ll.,
t[S
ti
~S
zjz
cS
c:Ea:H
51
zz
z
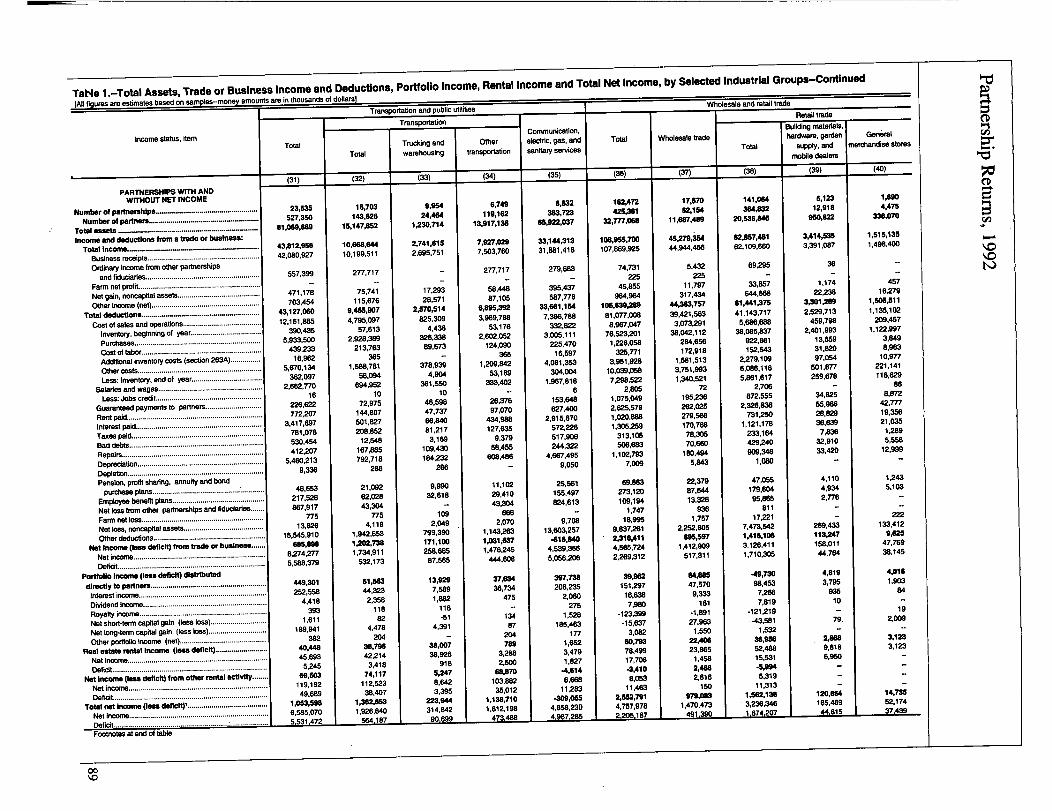
Partnership
Returns,
1992
Is
~vj~
.:~I
a,~
~-I
II
CLv
-q-:q
015:989M
M,
ci;
v;
E
o
.0
2
Rim
qMH
ci
99:S
toi
Ai
~:
:i
iE
,5i
iE
i
M0
..1
..
::
-
~Jfsggj
v.~
0a.
t5
iLi
NE
j.GI
MA
Mz
I
I
iE
mo
z2z
in
EI
g:2
19
X-C
9999aa
4C-1
00
ommu
Rmkzl-~§
k*'X1la
xkk
UU
M""n
01
Iti:t
'ZM
M""M1~
69
ad.
:~99
cm
aH~Mfl
Ci9
StP
90
Iq-
v0-
4q_J,A~~MM'~Hvw"XHFMX
R!SUM!
og~kl~99-
PCa
SiIV-
CIL't
6N
-
MUMMact
pl~0
E:2
gigm
RVF~
ZA
IRR
M-4&
-j6C
4'ji
82
AFG
0a;
P:m
106
Ir-7
CIEit0"
c4
II
m;:
v.
R.
--
RR
I118120""M
WM
Mc,v
g,;.6ma
.igg
iS
4~
~;,
-6LI;
A
q~t-
%17
~:-a-MR
FAk~~`2~:I~4z'VI
cp;vN
Z.
;i0
.2A
89
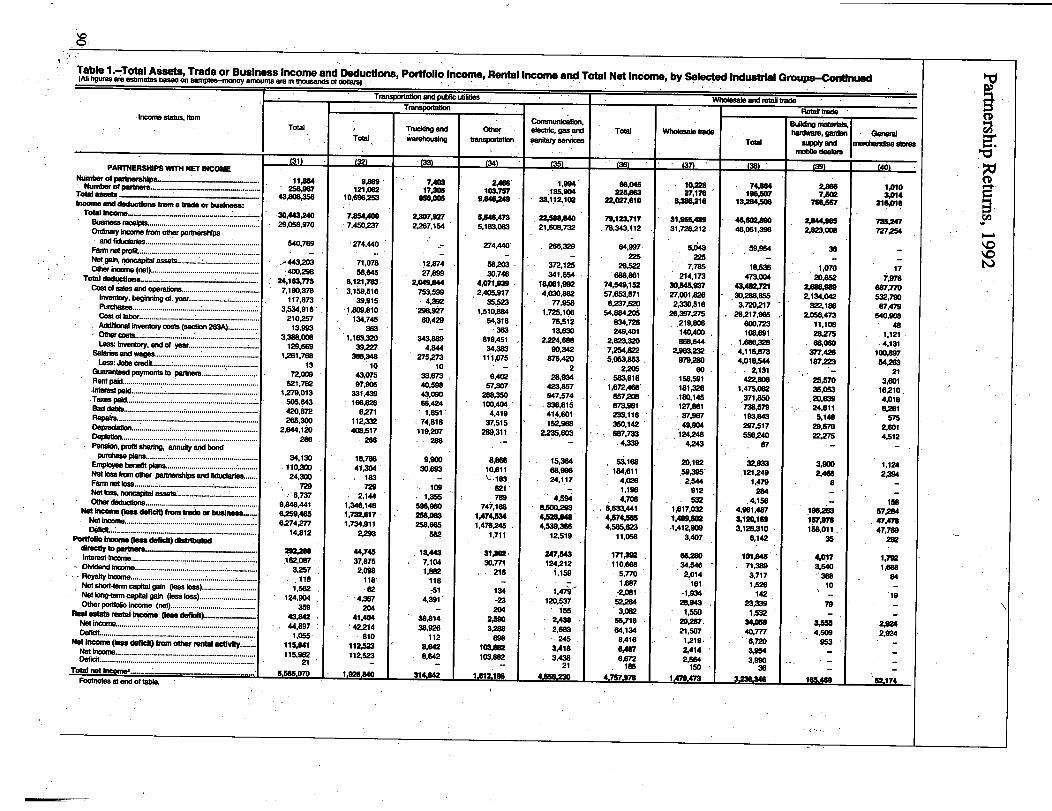
Partnership
Returns,
1992
V1tll
~ 914&
;;cll;i
I
.11119,91
RA
MA
CY
viK
-ifthaggil
8
-91=1915,111FIRIN
va~§Rgm
lmnum
iqlp
igI
Ci
n
-,
kS
ir.-
4ilfV
r,;
:e-
IQ
Uc!t
.5219
Ir
3H
iC6
C4
,] ILq
cc
9
944
~~IZ
NI5~EY
R
v;ej
ZFMW
g4E
gig
i-qa
ag
0co
Mika
PA
RO
M-U
Cq
01
f-EEZU
gillvlo
.vglu
lm
om
4z
R!`g
gjg
xCM
-K
SlA
KK

Partnership
Returns,
1992
10
1
11
19
Al
Iq
III
H2119AIIi9
1,
ja
gla
mIR
&I
6.q9g;--7!k-:A
t4vaig
-R
a-
fliz
HA
C'r
!k
M~Sfflq
19
;:jg~V-Rd-dgdas
*P!91
In
111
15
kwkffiFR
-154
-2A
N'l!'~
HK
M-M
--1
0==
S
i4iig
942%
0W'494,-
Ra
Av
MRa-
W1:
IRS
:fIa
cd
IIIp
r~.Ixoq
tnU
MW
''iUR
RM
,IRA
i&
Ivc"g
vt
48'4
0 -7agg-
g
as
&U.-SM,
I
91
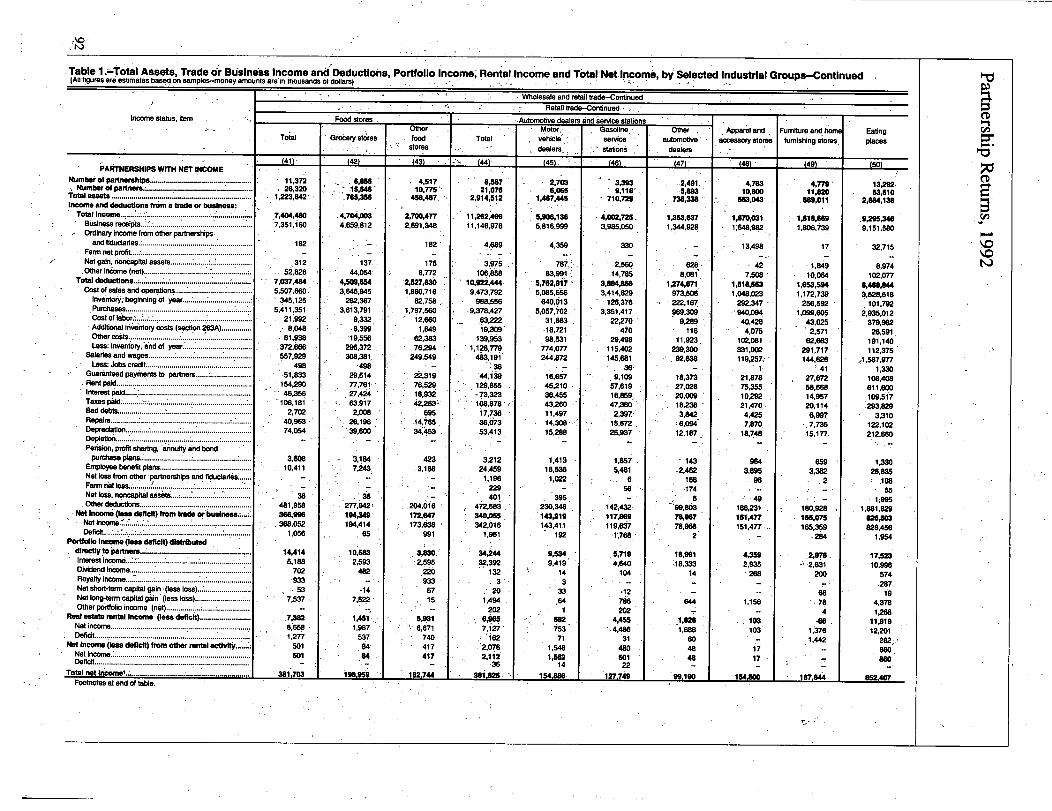
Partnership
Retum
s,1992g
RI
21n
..
~.
.,q
E0US
-am0v
E
-:;ft~
iga
Rt2
dj
:!c
leCd
M~m
cidg
,iN
--
-U
R.
wo.
..
..
..
W.:4:
_N6
vo
sCt
-I
t-,,-;f
'PE
N-
"&,9
:1_-q
; 2,~!A:f9
g~9ci
tz.
vq
I,-
N.1w~:MFMOSRAS
..
..
..
..
..
9;e
OM
A;e
11.:.a
rt
b'It9
::1
ail
29
~E
jj_n
~j
II
H811
Eg
1I
z.
V
99
00,
got
Qi,N
st 6F

Paftnership
Retum
s,1992
g;i'i'dd
v
0%;~q
C"iltA
MM
'sci
-Z16
dK
Z1:
161:
aO
do
4k
-aE
i--2
0cl;
11
V:
V%
~;2
aEe
ed7
d'i
civ
cqI's
Rk
IqN
F!
isR
g
,tpt Nt
r-~ve
opy-mv
Ram
No
-7N
;!Rm
--
..
.cq
!wkp
I't&Rm4zvp--
ci-
~q't
rov
~&
P.
:.!I
Doi-M
OL-
M§19H
i'MilsoU
6rt
S3;;
c;2
4cd
eg
a;
c;
-N
No
99
17
6cj
clkIq
ww
t2N
ocj
1:d
mN
It-
-M
va
mN
m
6a
v
"qR
clLqm16
t2IR
RZc-4:
Fjk 2N
v;.6K
c4
m-ZR
DiN
noa
qvNO 9
-sitOdpz
c6K
cq:2c
a;z
va
dV
;;vm
mi,
zw
si
1
~I
E121
i!
i1
1i
1i
-~~
a~
J~~8
iie
E
-Zr=
ii
E
W.
S
o
ZILEU
EZ
d:CD
zE
ZZ8
ZZ
z9
ccz
93
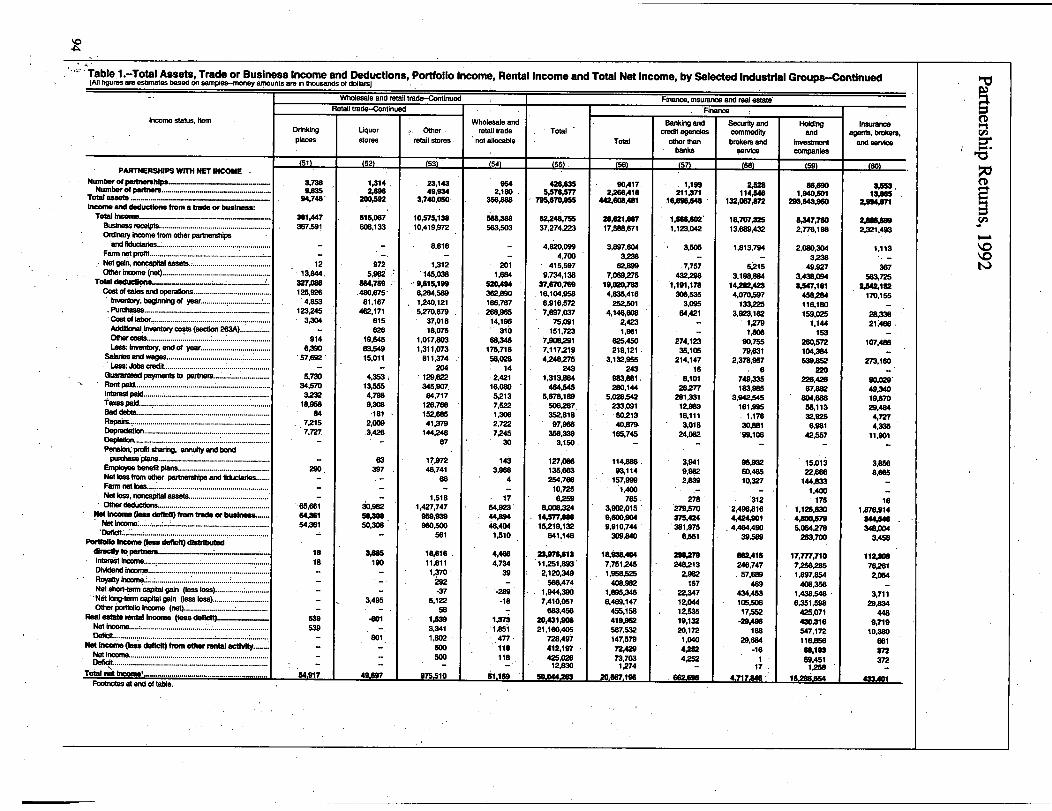
Partnership
Returns,
1992
o0)
C4m
a(
il
1-4
Na
c6Id
F:f,
Q6
16
4c6
ci
05
ILEm
.f.6
dC6
1,Wvi
aHIM
ia
:m
cN-V
g.
ci0
PZ~r
1:cc;
-RJR
ykF
MM
UM
11X
RR
"R
c§6v
'q
Ayf~
11
FlI
1115MMM
II
d7
I9;
NL
lt~
G9
g.
~I
Fvi
P-I
EM
i0
x9
461-:
1~:P:q
z'd
!f'
§9
1i
Na
a;;9
59
91;
Vgn
9i
:.I
_R
16re-,
om
m
Z~
S'
C4i;~
'
&law
wilk
41
1?111&1
.111k
coV
vN
M
max
130
g-fa
mv
r~"
v
MIME!
EA
ccc
Ej
ix(C
z
94
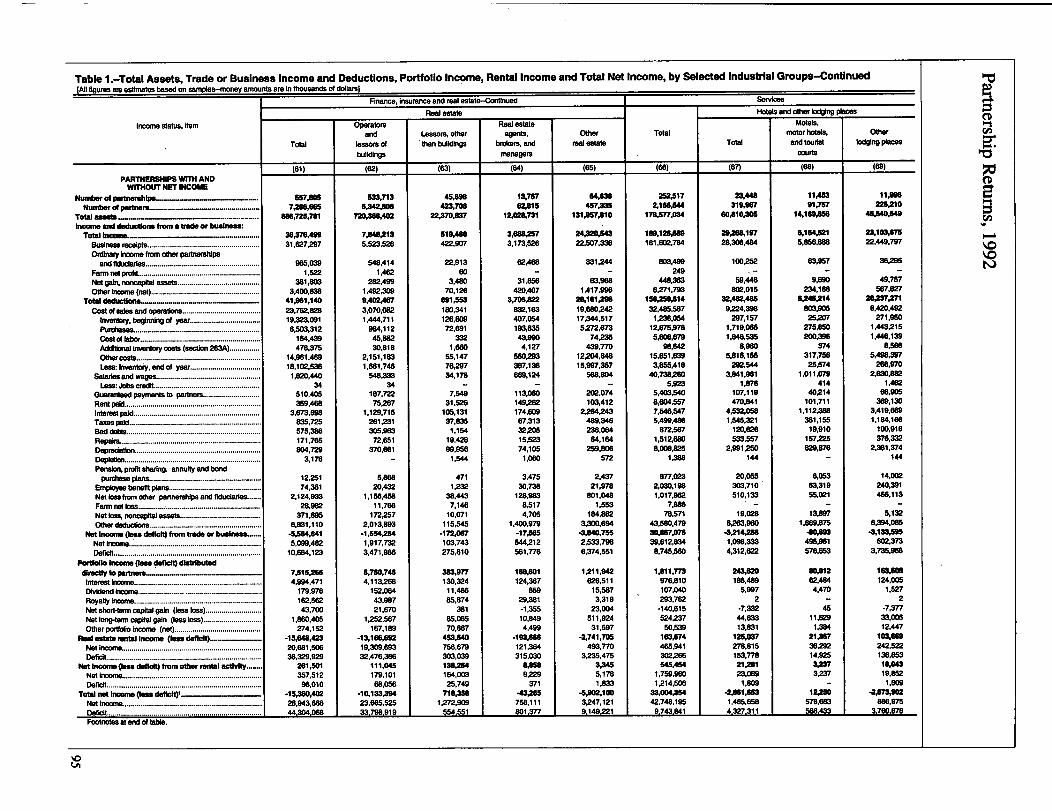
Partnership
Returns,
1992
I
iIm11i
99Eaa
!I
E~U
~~E
V11-04A
a!
Ii?
'~II
RI
A0;-
8$3
-ij
u5qM
,6M
-99R
g-
9-713
Fjcc
--
.0W
A:
ci0;
0
"40114W
MR
1.1z,co
CL
M~
fa
13H
I~I
IV
aiI
Us
I11n
[WR
MU
MM
I139
~n
dq4fa%-
.73~fVI
1km
mm
uU
-W
:"1j4
VF
inva
ss-moz
ME
V.
CLq
L;.f!l
wco
~w
-Cc
CMco
.0N
0'm
In
kk
;5mumn?
96lWMMrR
Emu
IR--9
C199
.6T
5
95
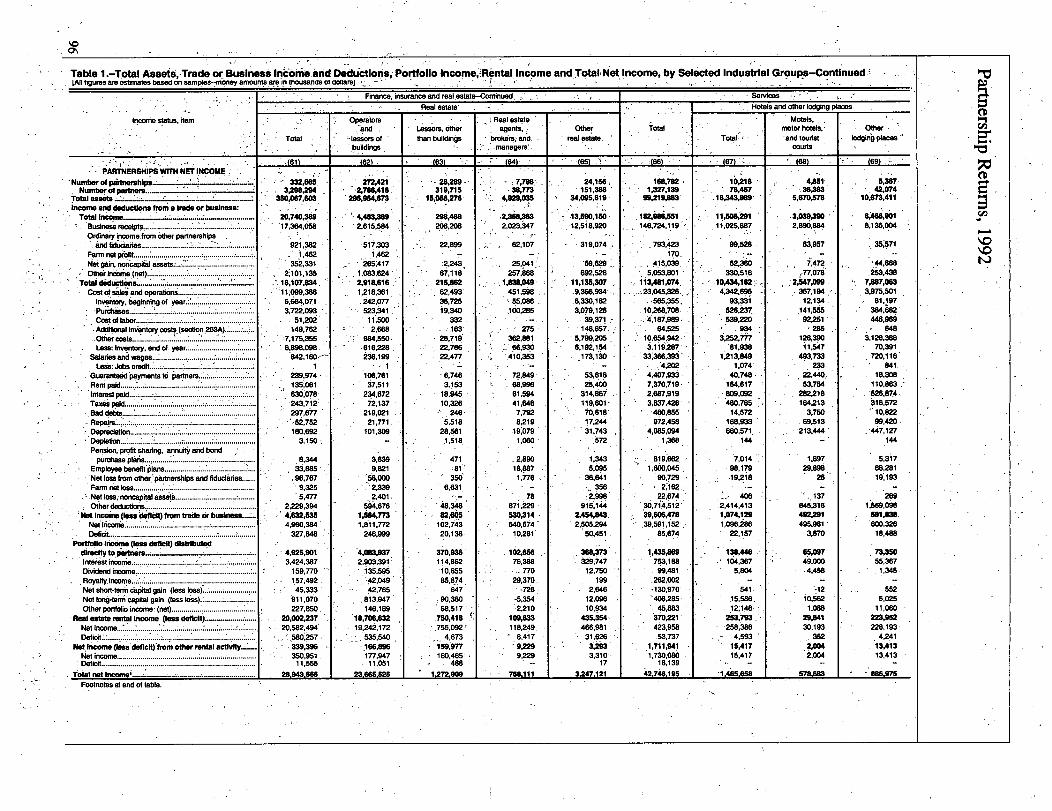
Partnership
Returns,
1992
k-
.0-
cc~
~
E0.0
I
Ii~;99&~i
isqk11,
u-1~RkiaF01
zRVI
I":
--
..
-.
IIq
lzz;6
v~
g1
R::m
91S
Q19,1
8V
1.1
W;
Ia
ci
..
lcr
._~.
-71
...1
1
R9,1~
91A
49
29
2r--:1
-91!RR
Eco
tcq
Ci31
~0
-.
E~
~H
EI
P:i ~6
~v
~,
MIq
--~FI,9
l;,!lHH
lmM
6F~:
I.
..
I.
I.
..
..
.q
-L
..
I'l
"j,64.f.g12
~-'-~-:W~9
J-L-
-.
a."
V_V.
MI.`
Rigum
.uu
qZR
O~
4d
!21
ENEMIM&FRIVI
vC;
9N
0-7
~;i6g
-I-
-_.,,
__
.
otIqN
NV
HMMI
MISR
Ldq
q;~
Ht?
9N
-~wl
H-
~w
-N
cfii
cjcj
-."
I.
i;
a?!v
RIF
Alm
XV
aR;
NV
V.
aR
.11.,
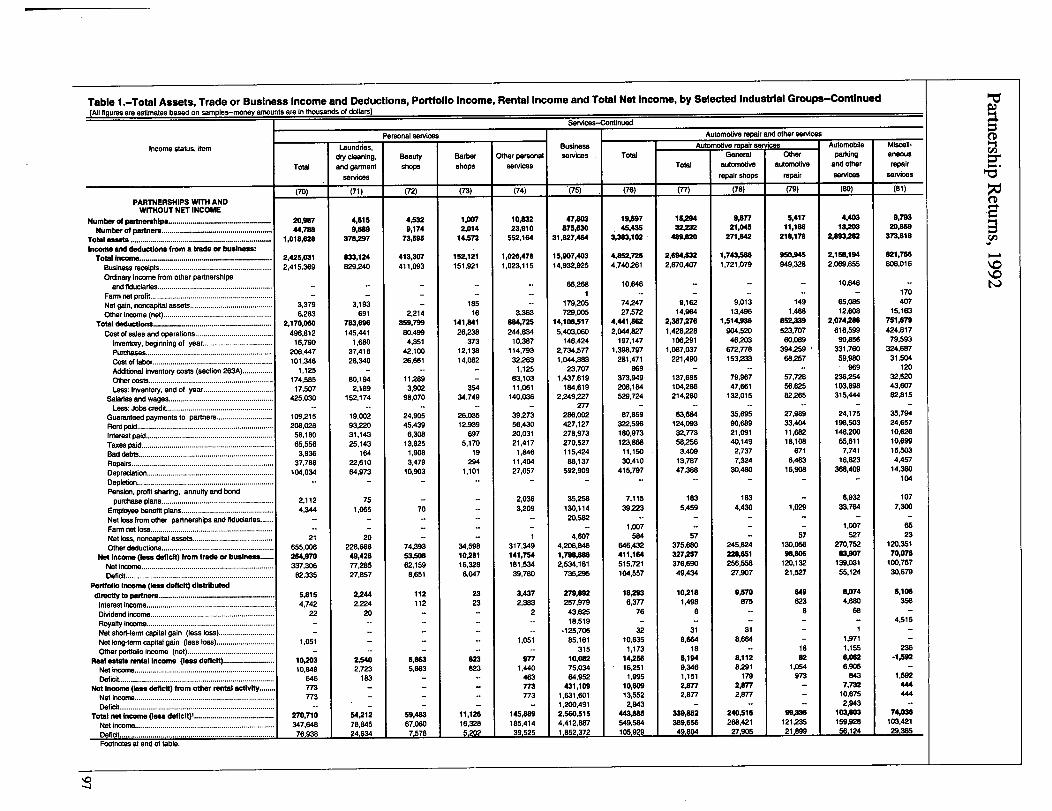
Partnership
Returns,
1992
ws-m
isF
ur-w
Riu
ma
Iq-q
RG91~6.`
919
996-6-V44 -
91~99
A8R
o
Cl
UK
3191HRMIRNWH
'F:RkZH11§
II9M99-
21
Vol
g~'f9
V8
98V
92W21VI
-00
c;~4
ci
cicq
CItN
:!'99
091
dcq6
99
i9
9F
04~
tU:
-N
N
,RES;
Va.:;;
iVag
rz.ug
'q.1
.1~q
ftMt
.-'L
.q
Iqi
MHz
19-
H
cici
c;
0cGq
aR.
;:I
,~
;'~I
19
M
iv
VV
'6
-M
,In
uio
a9
c6t
9-
--
a66,6
i1
.4-
~g
o-
Nq
A4
ci-
Vcj
N't
CLn
clt"t
qcq
--
-V
cq't
R"q
c!v
WW
M0
NV
M!q
IM
01
11
0;c;
c6i
-7s
csc4
aa
cig
ga
r-MMN
all
vo
~..~
sW
AA
10V
Ii3-~z
_Iq-P
%q
ct~~i
WNq
a
is
is
toi
.1,A
BE
j
VE
0L
W'z
EI
2-
ScIr
zz
OS
PIS
IZ
IT
EM
zz
z
97
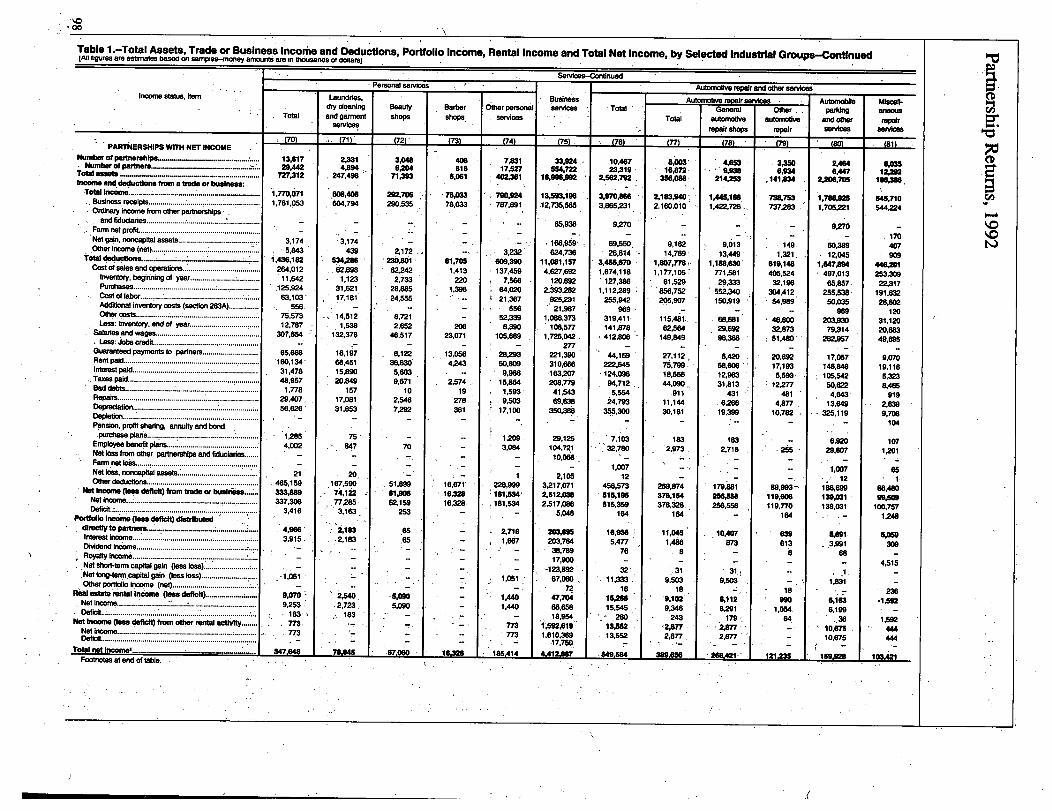
Partnership
Returns,
1992
11
k-
P~
~k
V~
Ikx
a8-
Nag
,
me;-H
iN*SIG
R
Z
C11
EqE
RI-4
3f.
a;w
ei
mC2
crN
v;ci
co":;g
Si16
9?m
g
Aa
R~
K4
Qicd
00
vci
".0
00
cl)
10
1
CJg
N2
NW
0w
a;ci
r~
US
41,
11
M1W
IN
0I~
i1
0T
GR
A
ef6
.i
1V
I.
aV
,
11
11
114
1I'l
I
0G
ro
1In
II
II
II
II
ci
a0;
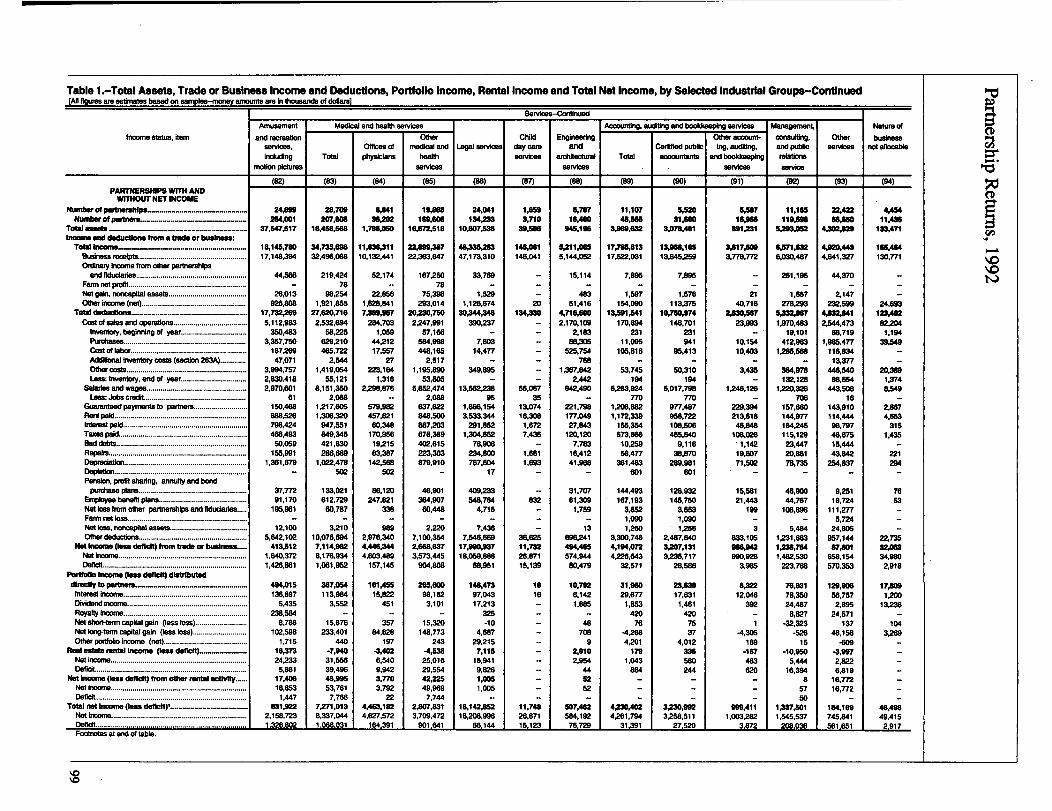
Partnership
Returns,
1992
II
A!M
111RIM11
lk&vq
Ia
1!M
II
I~
kc4!41§41111111
V~:
RU
fi
Acli
'kG
iR
-0N
vo
-139"
1v
aIT
M
a999IE9a9aa
,159"wenem
'Ri%
..
..
da
::'i
Nd
46
C6
23
lie
ME
-;&
v
vIt
WN
w-
FIRlk
FI4R.
9.56-:111U
WH
AF
MP
.,
§Pl
-ful"?
k1&IV
Riv-pill9RII-MU111=0
CdC4
wvj
gigH
aam
a0
Ffguqus~
R§
kF1§xRRRER
ZR
&P
wai
.2
R
RIF
RRedl
~!
':.
..
..
..
..
.I
.k"R
;;ag
igs
dci
RR
Iig
II
IR
vilfff
I.
11,19R.HH11,
11...
~v
II
II
II
I
M422
qu,nali
95IR
~PEI
fig49 -
kqk--5
avt
-:1O
W"R
EC4
d0
0a
IPz
off11§Wum
..
..
..
CIL-
C~at
akum
mig
nig
of:-
IqIt
a9
-714
ai
gas
'rV
F44
ann
xP1
0F~W
99
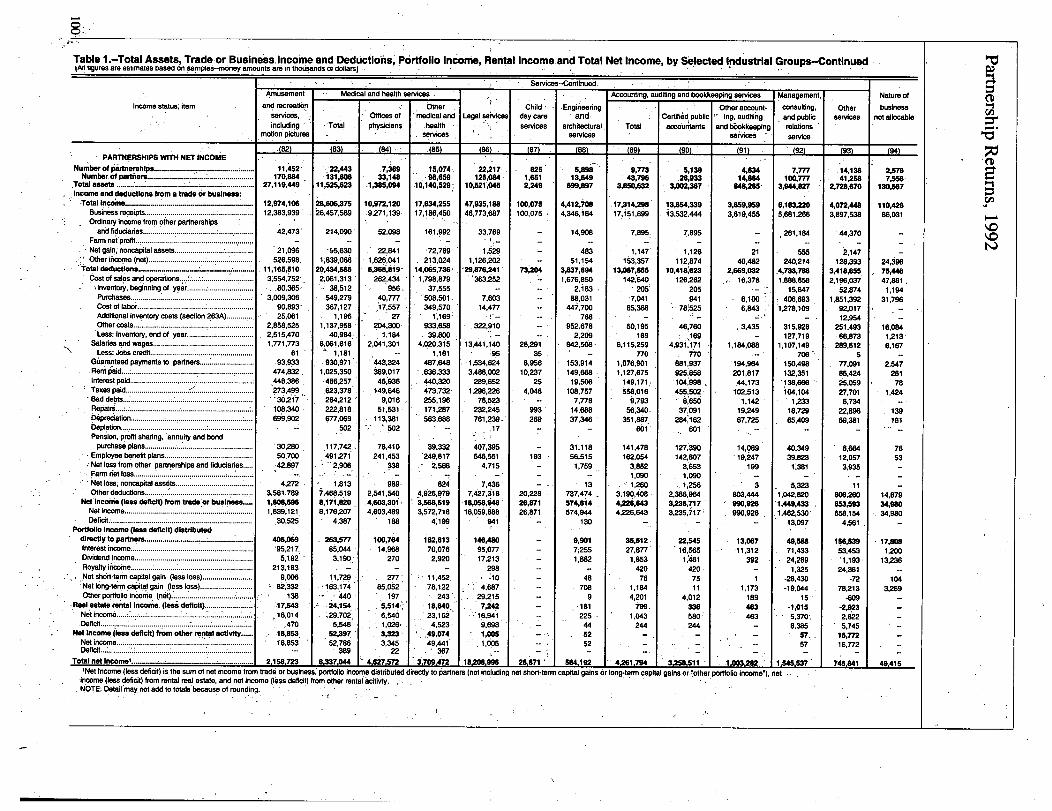
Partnership
Returns,
1992
Ml?
9V6W
g:
%a
2:
cli4~
-.
POV
'i
ov9-1Ldd
99
VVIl
0G
v0
gigm
FM
ub~Ck
Kci
gw
~A
0A
.ClN
0-o
pt
Ct-
--
I-
--
ciw
090
0m
t2LqcilN~
-li
Ali-
3ul
Ct
--
--
--q
F.:0
Nck-c:r
mo
mv
Ciw
wm
vm
.~
0
F1
9?so
Iv
I-rt!
t~9
mr'St
0.
..
...
..
..
4RV
dd
cl;
G1%
0
-s
R
crC'T
88
8;m
mCIL
0.0
00
..
.m
clLpt
-qm
N6
cl;ci
0vz
6
m0
c6l'_6
ORII
w
j
c0
V
'rI
i1z
z
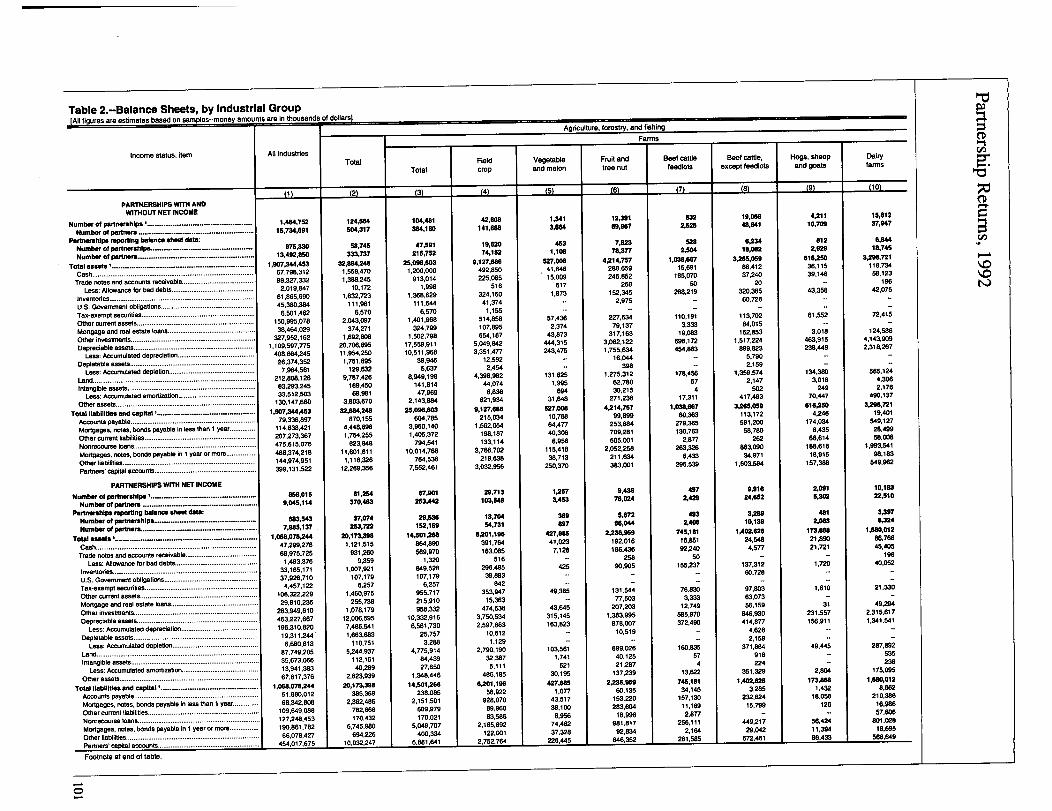
Partnership
Returns,
1992
5.E
>
2
V.IsIF
H2*9
I'VIM
,.6
d.6
g.6
.6'S
iag
eaS
ig
g'
.~
g
a14
Inn
vi6
cim
cj
N
:gdci
:.;
dag
gI
51
A
c;V
.;g
ag
ag`.;
d~.6g
-~nnn
-nn
Rk
zX
vqV-!
NNIV
MM
149U
RM
g`i
gg
g9
'I
99~6"x
".N~t~R:
'"vZ
93
1218cli
clRcli
'R4n
V6
g'd
'iP;,6:'i
g6
d6
gZ.4
RZ
V
;'Z~V
.6.I-
.~t
Gwa
aU
WE
Ftv;2-2.g~
gal
~icj:f'd
!i~;gd
civ
F,vI
N.vg
g
lq:~q
.4n
ckc~
-121Gi -Z
'U~
Itq
--iq
R
'EE
aF
RR
,S
~;z
Ii
E9
IVI
R~i
aZ
~q
av,R
6F
Ri
SR
IRI
N2
~i
cli-:d
&N
dI:d
.6d
:fa16
2.
c6't
H"96
zi
':6
~i
Iq
qI
-tq-k
cli6q
q-t
-qcz
R,1
5q
Ea
II
aR
1H
XM
"-'~
S26
_,d
Zg
~6'~g
.6g
'zCS d
da
g;,d
g!
gg
gag
g.;
~~4
zusz
Za.
ke
cmt
2l
A:H
E3
pa
JEI
g!
0o
't39
m0
5-
~mozm
Ez
z0
.8..8
9E
zzz
0z
itz
1110,

Partnership
Reftim
s,1992
1~H
.pcq
cj:
&
lici
lici-
1;7f,
q
clR
FU
MB4.z
ISO
RU
U~
4W
AR
FA
Ii`
~6'k
z
-91V
Kc;
al
gq
daq
jd2o
-q
ccrsi
49
114
:9d
FA
$V
cc
If
M91
Mns§
wq
qm
If
lln
f§~
IF
AW
HR
IIIp
q;!@
~j
ag-eg-
ge
-qP
tNR
-tR
~:d
iI
9911F
gag
-v
k-i
sil2
g6
9

Partnership
Returns,
1992
Ww1
20%2,10.5
9E
.rk
aE
Icoco1. 1C%l
2
1=;z
19§IlkU1ge
I "!k;z44
S1n
ag
cin
-L
IWOAll
t-mw;,kv
11 EiI-i'Pie
R
9
-19
dS
mgF
-9.5fit
IL
I
EI
R].01.19F24f.
ja
R:RlF
IQW
,!~!g
140
v
II
99-t
Rigq0R:
C%F
Si:1
"P-MROURRUNN
RogVL,N;
aln
RE,ci
go
ci
of
11O
HM
-g
R-2`4"
cl
IA~-VRIIVII
RIWIS
4q
.1111r.
.vim:211=18gg
4e
cl
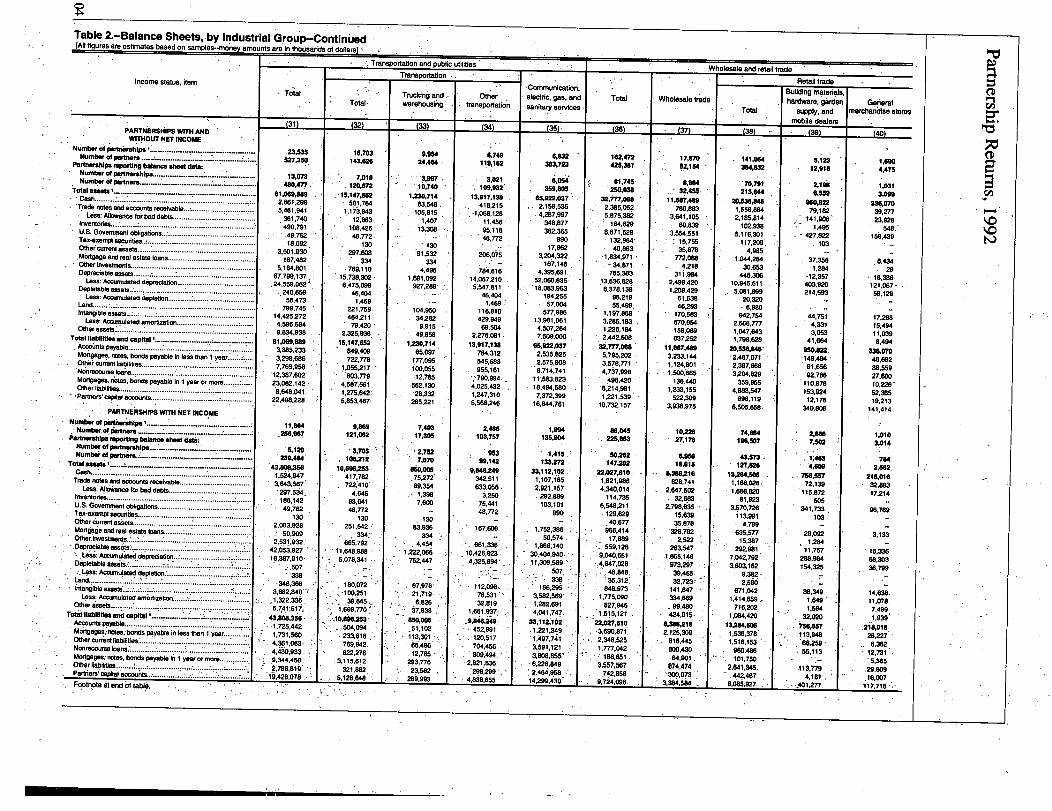
Partnership
Returns,
1992
H
.312
7v
6f
'Ila
g~11A
knk.-R
IS.9
8F
ci-.6
Of='gEll
o
0c.9Eo
cc
C.4
L v.
,z04
1-0 ~_E
E0iEHoS
A9:9
da".6
w6
a.,i
;ZrSV
'8;6'9
-9aID41
IV's
VN
26;
ci.~:6
cli
RaI
K9
9H
IE
59
9F
Rq
UH
119
kU
UiIV
8m
le.-
Y.,&-
I..
-v
".6
6.616
ciwi6
fd
~zd
allI
aII
zall
Girj
B9
E9
RE
19
1Ei
F9
RE~_
II
9.;K
.Sc4
~:cia
c61
.6VI
V
f1vI
IZ-5
§11
8,-
..
zcq
&VR
qR.9
-g
~§
FM
~r
'1i,'
V'2
i2
AR
ii
U;';R
1~
IF2ir
1i
9U
iU
-1E
~zqg-
--
--
--
--
--
agof d
~g:,!;~fd'd
ak"t.
lag
gg
gg
gFv
c%;e-
Ld6
c;'i'i
4
P!3S
85t8
As
§j
HM
v-1
1Af
ck%~
tqq
q.~fLcS
f~zag
a.;g
9rz,
IAr
R2Z1
!M
dd
-i16
1!2
c;m
8'.
HM
11,9121
'.;im
;O
Wt4ci
H~
'.cli
.6.4
~q6
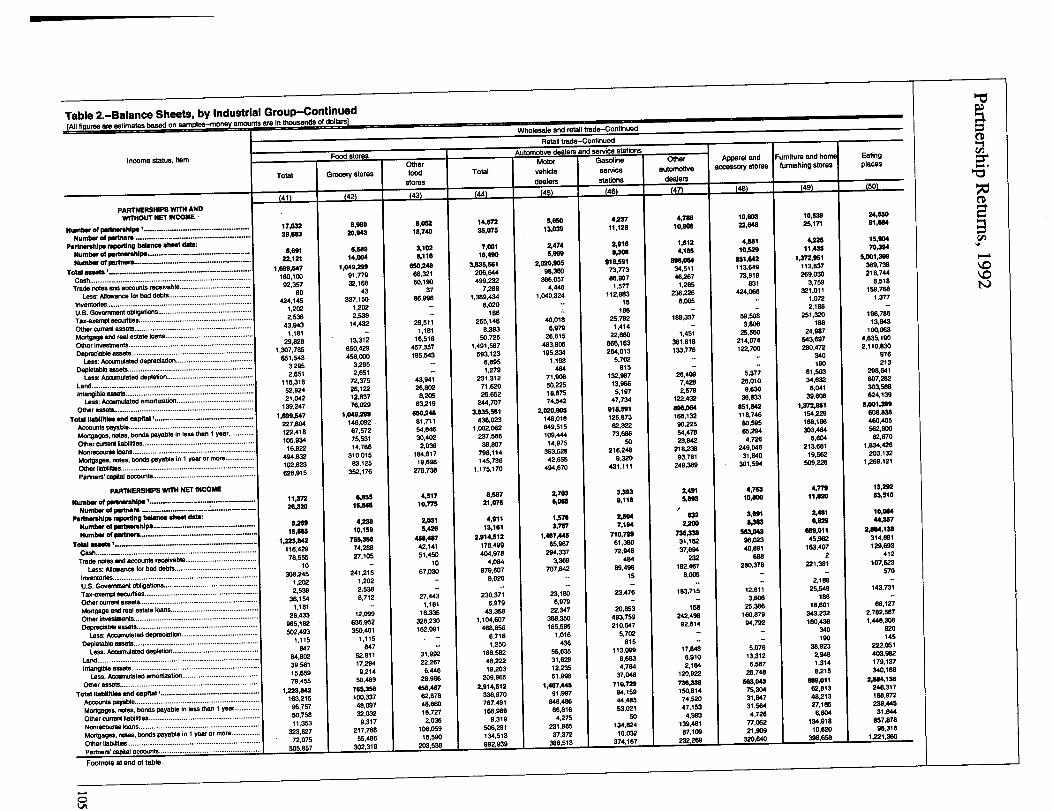
Partnership
Returns,
1992
th,94141412
qI-F
gg
cS
vo
2P
Hpf
Sca
q-t
qR
8i
,.rci
6ci
eiz
ci
k:w8
~!91
1j
a51
§,:&
631~SI,-8
§§§~,t
qct
*=d
d!d
!f.6;;R
.-~
-R
9
:928.S
~2cli
ig
1g
Rag
~,L1%
~t
-S~--
~i
Cli
clcl
CR-q
azCk
6,4
,6Is
'It.1
6.6
Clf0
J.i
iso
ig
Z:
::
:.
:h
:::
;A
x.0
i::g
...
::
jitE
q,,
!I
AiN
!a
;Z~
6:2
58
"6
4Lj
115R
ts-
:lp
Hul
11
11
S9
-28Z
15,6?
~,FIi
-EII
g2
`~I
I~i
EII
A8.
881
SM
zz
Q!
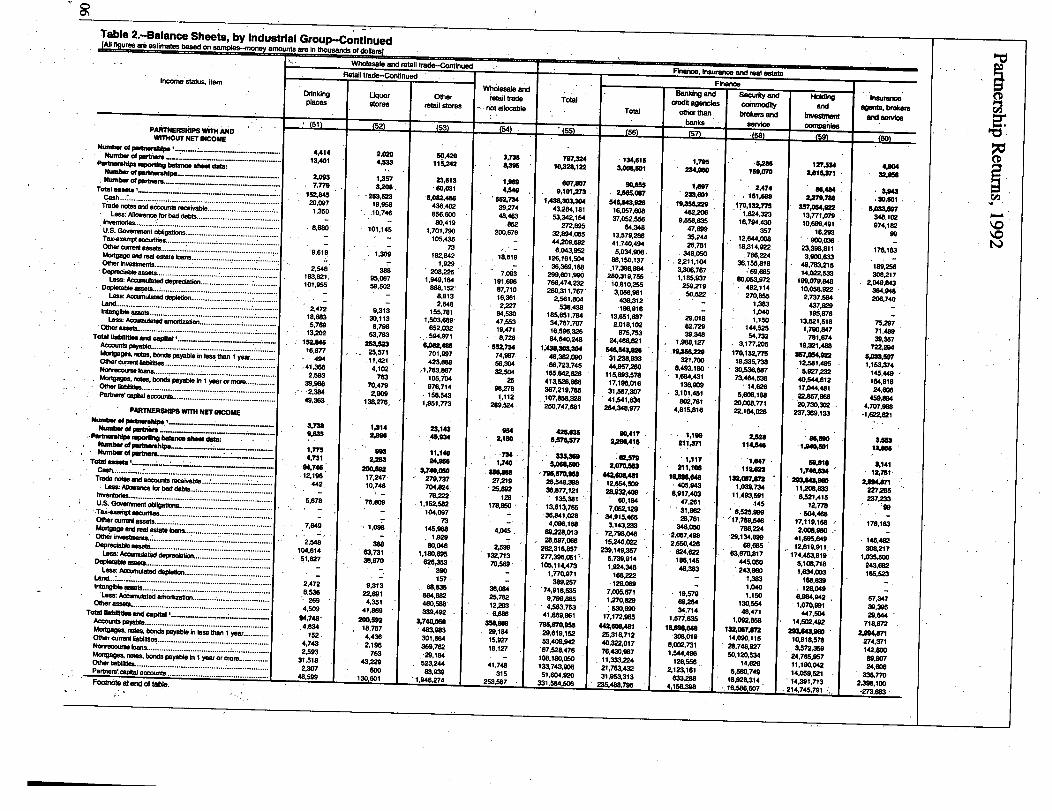
Partnership
Returns,
1992
1
11
fIlit
IU.
a?
ffQ
I-5-91
991
121
1:'i:i
Vi!,R
,'k
MM
UM
,r
00
M1.
HE
RH
IMM
MM
OE
MSf
~,
-i4;'
MM
IMM
119ult
ci.
-R
~9
fie-
kH
RO
WM
IU.,
11401:e
Ci
adg
.!-'m
gal
9a
Qgl.4
313S12-5
aa
clA
MA
8
N
Ila,
YE
Wa
C;
:~
:4
9-.
~.
SMalq
dd
g.:'j
Rag
,''viiIa~
MAMR111UHS
i9..
ci
i:
1j.
~~
;:
::
~!
::
::
;~:
::
W
is
:Li
::
I.I
3J
A111,11L
1111:11hIngINII
zHill

Partnership
Returns,
1992
Im
c6aci
82-5II31
1, r"g,~
112 I-5
MUEFURMWan
:!TI
'qjG
,n
q
6d
cJ0:1
dge~
rdN
cj
la'd
.3
clil~
'W~
.vW
kkgvan
dp
5s
WF
IRm
u;
WX
GR
IUM
NN
OR
Mci
::;
d1:
1
HIN"HolUkk
115~91M
ZH
UU
FE
6a
6.;
c;
§54#4
So:1
--n
RRg
v9
1a
4'
u0CM
1
107
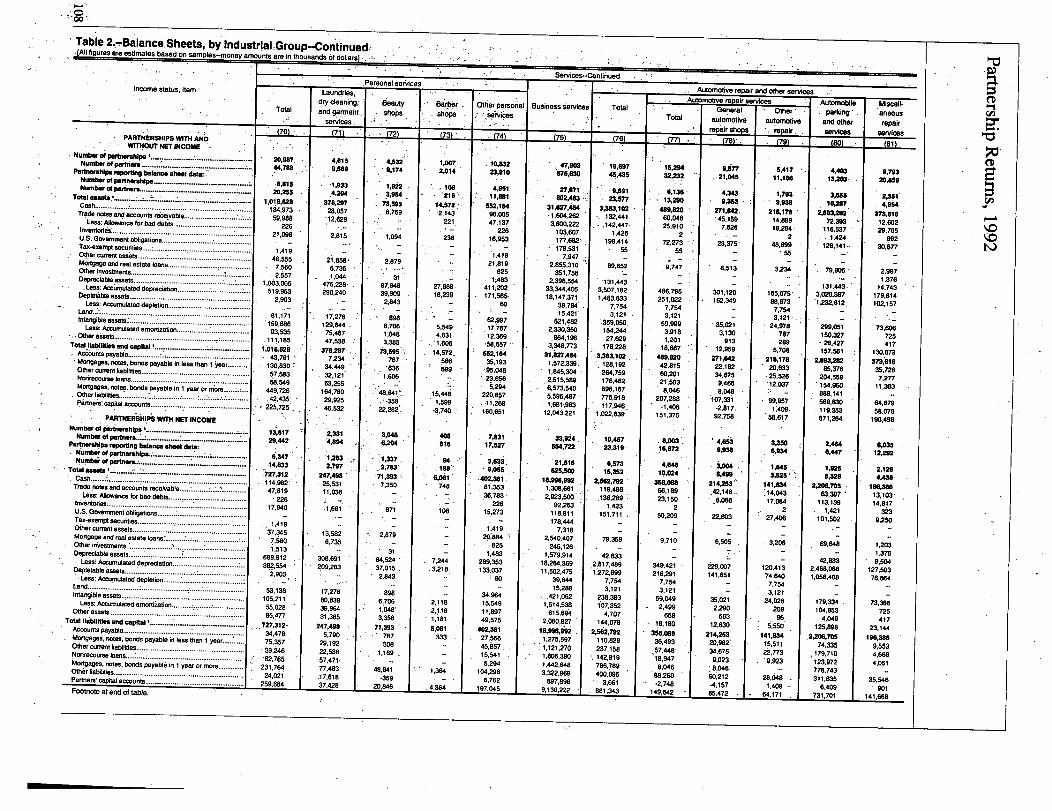
Partnership
Returns,
1992
6
0L
Ru
nR
aYeE
~SIA
UM
tgE
c~o
.4Vq
3R
kk
RZ
35v?
v
ci
Al
uR
I-t7l
A-0",
kI
qci
m-acli
cli.6
'U
R.!e
t2~J
..S
zid
zk~
UM
?a
~-
~.
~c
MC6
Q'.2
4c!
.4-k
IIIMH
UO
ii
I'H
i9
,A
9R
E3
A--
~4
."Oo
9H
.H
.I
21P't
216
cqH
H-
~,6
,~P
a
a2
HIM
,U
M,
4.6
N
C6,6
o;
qG
!-k
R.
..lo
4c4'i
a,
19
D;
c4Sf9
96
1~9
oLD!-oE
20
is
j.Gi
j.5:.2
Ef
i-
cc0i
E*S
:ji-E
iE
ii,.
i3o
j.:
Ei
EE
E25
vI
pZ
Eco
6A
ETA
al
1
,t
&Z
gN
IE
lE
.5v
.f
gfj;
iz
1.)zi
.1E
zz
M4
"g
im
17H
irz
i9
-z
II
.-
Lit
A
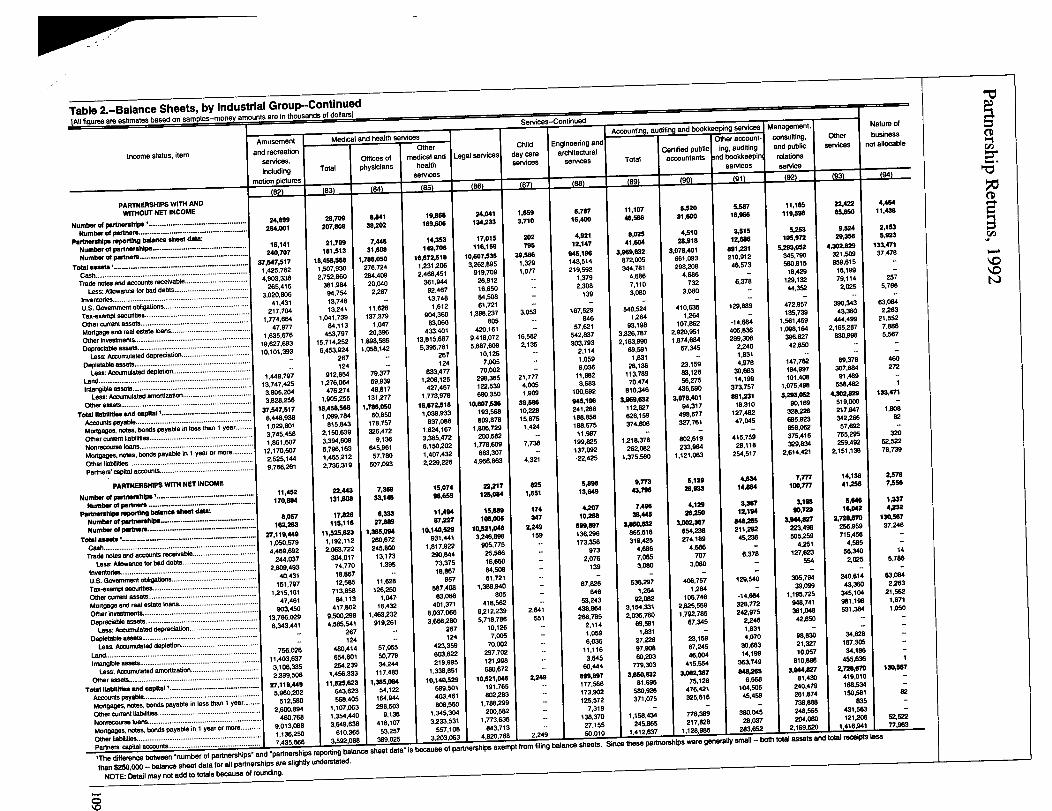
Partnership
Returns,
1992
fm
aERR
u4-n
gg40
44
MR
4S9
g-o
VK
t;1.
ci16
t.
siz
~4-
16'N
cli
S2E
6(Z
nci
cJcl
HU
M%
PH
g-.~
mg
ci6
IRIt
ctIq
n
U
ci
aIki
Ia
RX
FR
Ip
a1
g'-R-k~-t
'8~'kqkR
10ptP%
1P
PkF
999tis
M§
gi~Ra
d"
i?
~~:RP
a...
A-1-miQ;a
a9
A9
clg
c'M
"k
R-
6-
F'R
m&
R§
~;cia;
.I
-c;
6,z
-~LIR -LcL
~tItn
t.A
'tcj
:R'k
gg
gu
gN
EE
-11,5
9I
qd6
gg
6:f
da
cli
6~:,d
6~ig
c6q
2!6;~
cL,6tm
g~,
vI
UG
S-A
.
N.cz
'tq
kcLk
vct
nct
c;
aii
-tc4
E-i5
E1
iffl
1
Z-A
109
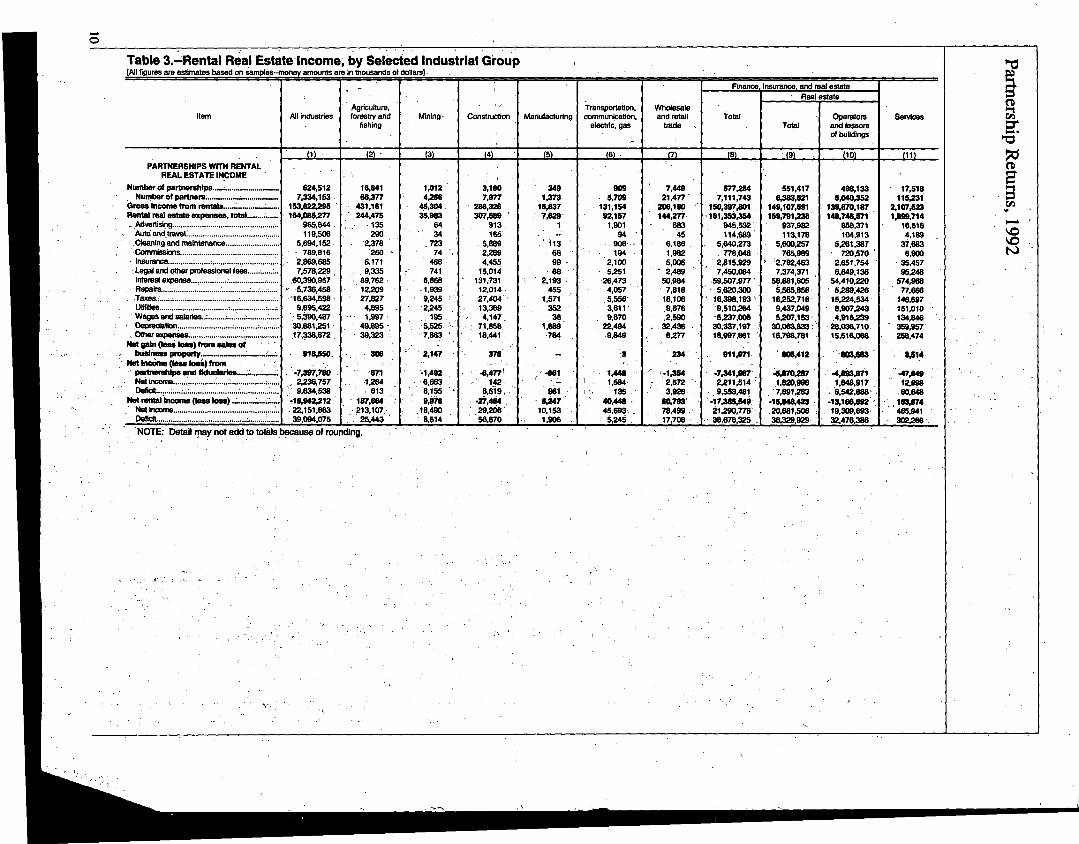
Partnership
Returns,
1992
10
go
9w
idd-f
ff
'dcite
40fa
1O
:'
R!ow
ifm
--
------------
gg
--
HIM
P.:co
0cy
EI
IED:9
1
cil
j0'5
1A
coR
ig!1119
CS~z
o;cm~w
ej7
co06
MA
Co0
CD
coCY
10cq
PO
SU
MIq
HiM
lE
gNg
SCHi
44
Fi
Ai:4
ii
CL6u
Ez
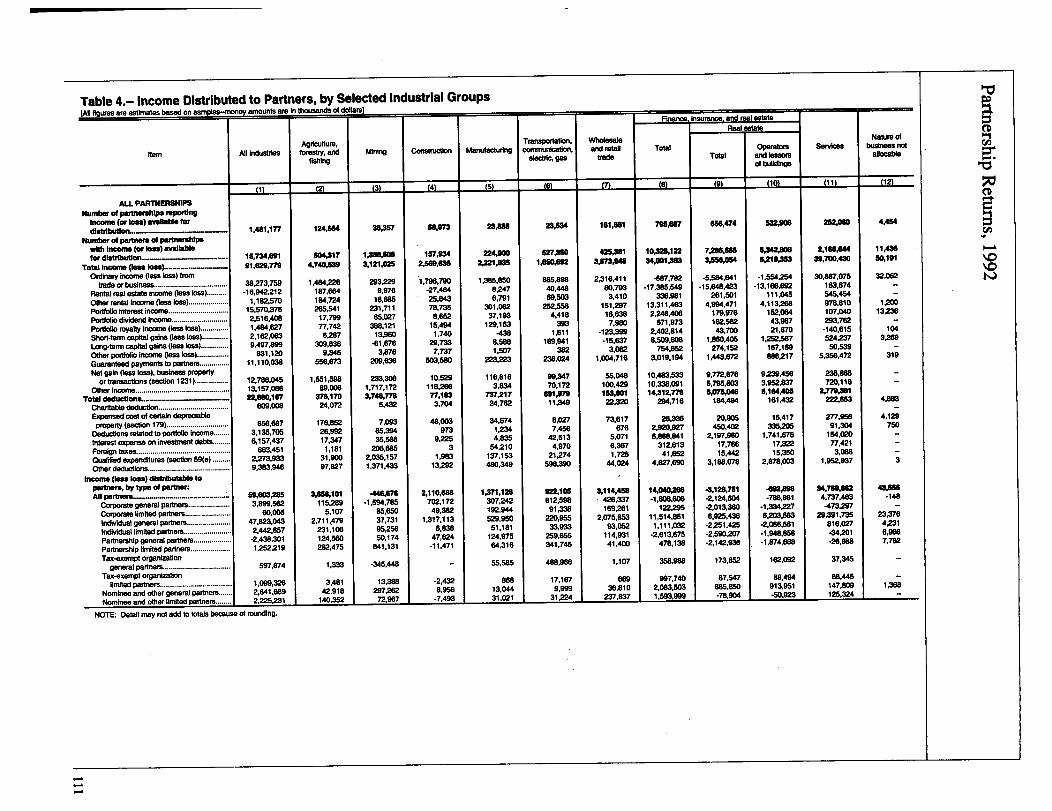
Partnership
Returns,
1992
ii Bilki iFkAIVJR m
m~&Arz-j
kqkp~
V,j
0
9v
13
:um
mill
wN
MCO
17
kRumimm
Ruk
L-
-~Ct
-icy
C~d
epC~
M ROMUqu
-
Eggqkm&'
'i
x4xka~~
:v~
:!:
RRX1
IN
gk
R~
!CZI
Nw
915A
dd
~;
RM
;cjw
o.
-II
YcD
j§
Mo
mI
q9
S
MR
::39
wum
~a04A
RM
I.
3
M
1I
5P
1
ZE
EI
RIH
;R
i
41MRURM
RNFA
RER
RR
mv::
C;K
wS8
j-ell
c'7
B
.72
mm
IC44.9.
oR
1-9
VK9
~9
lR
a18
Sginci
ci
Al
A
II
IT
0U
aedM
,0
IH
Him
'fill
IMLm
I,
aA
,IS
Q
III
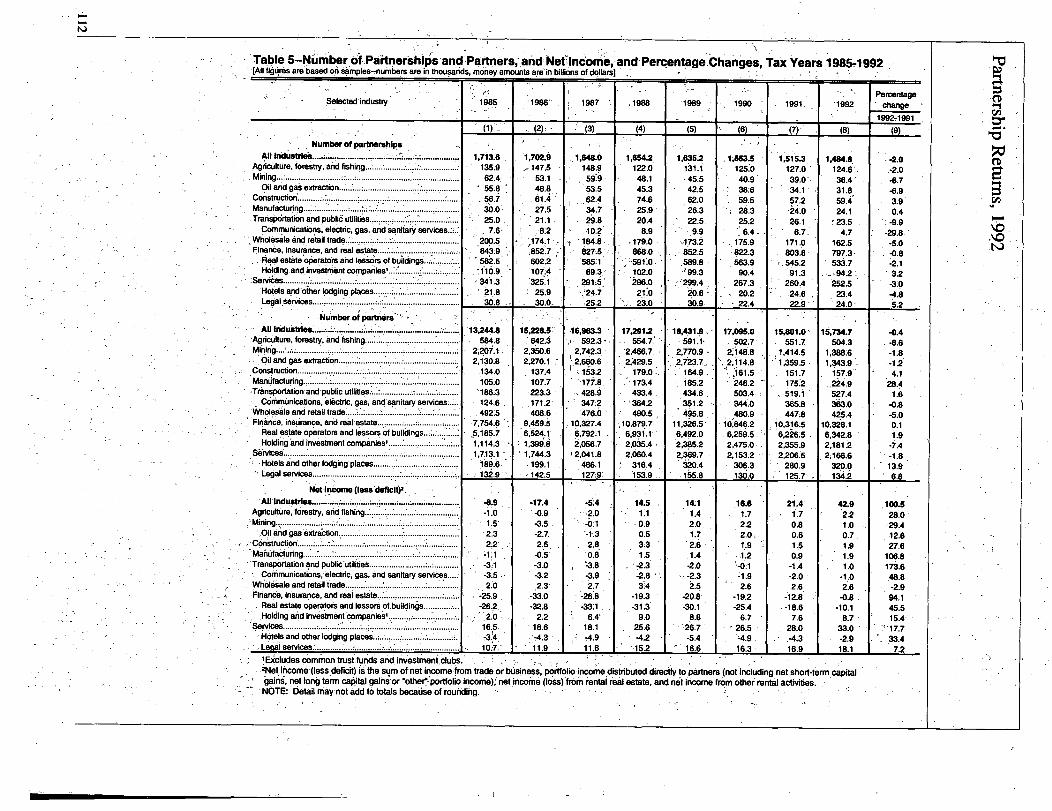
Partnership
Returns,
1-992
412
g_
7S
'C!
r~C~
cl~cl?
Rq
0~1:
C4C
!-cq.c4c~
~p
Tm
Tkq
qc~
mT
Iw
'-t(P
cq'c4(q
CQq
-Cb
VCO
0M
.i
1-:-
99
-7v
9tq
d(6
aqq
taq
qOR
CRaq
a?W
?v
Na
c~L6
(L
cq~..~r-t
w?r4t
c4to
'tq
Lon,I-
tl:cl)
coC~,G~
Id:q
"tcq
N(P
q~
NE
R-k
--
~8
§'~
aclj
oN
a?q~(q
cqr,~
O.c~
c;---
-cm
c?co
c~w;
c;cdci
cj
v3o
cjo
r~q
cocm
cocq
Pq
P~u!
tqr-~
c4(q
cqtq
Lqa?
u~P
rtco
coo
mM
r-cc?
(qul
9(
cr~
V(D
g9
loIt
In1~4
cl,I
cljN
;!~
t,V
Q8
Lnw
Lf)3
MA
cmv
:P
tP
q.
..
..
z:-
co
-o
7c~
NN
Intd
cj
c4
MIq
cc~
qu~
cim
v)o)
qv)
cmv
_,-R24
cocy
No
Rcy
1,'coGo
tncm
-eo
mIQ
219
--:rl
-:"-~.c
ljIt
cj
cm:~..co
cmcj
wP,
Nm
N-m
wN
vr-
wm
mclj
cq-
-77.
mw
o(d
..
..
..
..
..
c~clj
a)M
LnLo
oQ
)Ln
O,c
4Lq
cqcl
'Tcp
PR
.cqq
PP,:(Y!
N(P
Ncq
ulq
Nr:
'd:cq
;w;)112
S11-
a-
wa
c46a
cr
~tq
itq
,tq
clul
a~7
cqrt
Tco
c1l-
Nc~
cy.cjo
IL'~
~2cy
Nqqq
'tpqooqqP-
c4t-:
r-:Iq
q'It
'TN
u~'T~P
cDLo-
05U)
0)in
Q)
CDC-)
C1.1o
toclj
cls'5
..
.-
o6
cdc~
ej
oici7
c?c4
cm.d
cdci
ci
~'mo
vr-
cocq.q
tq:~co
Lq'~r'.cm
..
..
..
..
coM
' tocm
Go(D
cq,oIt
(R":
..
..
..
..
.vo
mco;(a
cocb
Nco
V,(D
(Dco
m.2A
-@~?
--
~y
c~
.P%
cycm,iF
Ir-co
(mM
wv
Sl
fall
,io
c~,\i
c;c6
c~(6
(6~d
A
clj
c%~
de.c
yci
mLn
w1v
ul)cm
cmV
,-cb
gh:
fg1
_;66
4(\i
c~L6
qto
cm"I
Ncl
N(P
U~-::Cq
C!Ul
coc4
0Nw
8$-
w.to
qu
;ci
cTa;
d
VCD
'nr'
W).Lnci
.:.
97
c~-9
TT
c%I
Lo.loR
-:
cqc3i71~
aqrl~
oo
oIn
QLn
mcl)
Gocogl
u-2,
Cy
aco
oo
cow
Low
rlcl
(R-
I.g_~g'Ctg
ge
SjC
D'!
cmcm
inm
cjo
oc,
cb-oC~,;.:.C,_C,-
..,:C4Lq
LQI~~J~CM
Q;
ci
J
Ale
o-
L.LD
oa
J,?(D
cx
9L
o.o
..
ra
r=L
=J.
a)
CME
4mL
c,
si
SL.
'D2
eLo
o,12a
oo
Z'
LaE
Eo
5.jC
vs-
III
Aw
6(D
'SLD
'o
cc_o
Lao
'oc6
v-
I.mcd
w
r
cD
-w
IDE=
(DE
ol
Erh
2a
a&
2ql
2-E
"E2.5
so.,E
32B
'S,'
58a
cc0
0-
oCD
Lcc
LG
LL-A
Ccor-C
~5LD
0.E
L).e,ID
IDc
E'
C8c-E
.2Sc
OT
'DE
ig-
8cm
E-
G2--
S4D
00
ZE
12--,
8.00
0c
4)zCD
SE
00
M~~CO)
3.
So
0ECD
EE
~i
18
4,0E
=.
8
4Z
0Z
Individual Foreign-Earned Income and ForeignTax Credit, 1991
P
by' Lissa Redmiles
or 1991, U.S. taxpayers living abroad excludednearly $9.7 billion of foreign-eamed income andemployer-provided housing expenses from their
U.S. adjusted gross income on approximately 220,000U.S. individual income tax returns. U.S. taxpayers alsoincreased their total statutory adjustment used to computetheir adjusted gross income by about $43.5 million usingthe housing deduction on about 3,000 returns. In addition,U.S. taxpayers claimed $1.8 billion of the foreign taxesthey paid as a credit to reduce their U.S. individual in-come tax on about 873,000 returns.
Foireign-Eamed Income ExclusionFor 1991, U.S. citizens who lived in a foreign country forthe entire tax year and U.S. citizens or resident aliens whomaintained a tax home in a foreign country for I I monthsout of a consecutive 12-month period could exclude up to$70,000 of their foreign-earned income and a certainportion of their 6diploye'r-provided foreign housingexpenses (see Explanation ofSelected Terms) from theiradjusted gross income (see Explanation ofSelectedTerms). The purpose of the foreign-earned incomeexclusion, which was enacted by Congress in 1926, is tomake the tax burden of U.S. citizens abroad more equi-table with the tax burden of U.S. citizens at home.
The excludable portion of employer-provided housingexpenses, the so-called housing exclusion, representedhousing expenses in excess of an allowable housing cost(see Explanation ofSelected Terms), subject to a limita-tion based on employer-provided housing expenses andtotal foreign-earned income [1]. Housing expenses whichexceeded the limitation comprised the housing deduction,one of the statutory adjustments used in computing ad-justed gross income.
To compute the exclusion, the taxpayer first subtractedthe housing exclusion from the foreign-eamed income.The taxpayer then added the housing exclusion to thelesser of this difference or $70,000.
U.S. taxpayers filed Form 2555, Foreign Earned In-come, with their Form 1040, U.S. Individual Income TaxReturn, to claim the exclusion and housing deduction. For1991, of the approximately 114,730,000 individual in-come tax returns filed with the Internal Revenue Service,there were 220,000 with a Form 2555 attached, only 0.2percent of the total [2].
Fomign-Earned IncomeForeign-eamed income includes salaries and wages, pro-
Lissa Redmiles is an economist with the Foreign ReturnsAnalysis Section. This article was prepared under thedirection of Chris Carson, Chief
rata shares of foreign partnership income, certain busi-ness income and other forms of compensation, such ashousing and meals. It does not include pensions, annu-ities, compensation by the U.S. Government, and incomeexcluded by the employer to compensate for meals andlodging provided for the convenience of the employer.For 1991,.U.S. taxpayers reported nearly $14 billion oftotal foreign-eamed income, an increase of 69 percentsince 1987 (in current dollars) [3]. Over the same timeperiod, worldwide income (see the Explanation ofSelected Terms) for U.S. taxpayers increased 25 percent.The increase in foreign-eamed income can be attributedto higher earnings received by U.S. taxpayers livingabroad and to a greater number of U.S. taxpayers report-ing the exclusion. The average foreign-earned incomerose roughly 31 percent, from approximately $48,000 in1987 to about $62,000 for 1991, while the number ofU.S. individual income tax returns with Form 2555increased.29 percent.
Of the approximately 220,000 individual income taxreturns with a Form 2555 for 1991, about 11.5 percentreported Germany as the tax home; 10.4 percent reportedthe United Kingdom; 9.3 percent, Canada; 9.1 percent,
U.S. taxpayers excludedS9.7 billion from "ad-justed gross income"under the foreign-earnedincome provisions andreduced their U.S. incometax by S1.8 billion inforeign tax credits.
Japan; and 5.9 percent,Saudi Arabia. Thecountries with thelargest amounts offoreign-earned incomewere, in descendingorder, the UnitedKingdom (16.4 per-cent), Japan (9.5 per-cent), Canada (8.7percent), Germany (7.3
percent), Saudi Arabia (6.3 percent), and France (4.8percent). Other countries with large amounts of foreign-earned income included Hong Kong, Switzerland, Tai-wan, Singapore, and Indonesia. Taxpayers who lived inthe United Kingdom and Japan received a higher percent-age of their income in the form of noncash items andallowances, reimbursements, or expenses paid by em-ployers than taxpayers living in Canada, Germany, SaudiArabia, or France (Figure A).
Salaries and wages comprised 71 percent of the totalforeign-earned income for 1991, while allowances,reimbursements, or expenses paid by employers ac-counted for approximately 20 percent. Noncash, busi-ness, partnership, and other income comprised theremaining nine percent. The overall average for salariesand wages earned outside the United States by taxpayersclainfing the exclusion was $46,000. The average, how-ever, varied greatly among countries. For example, the 113
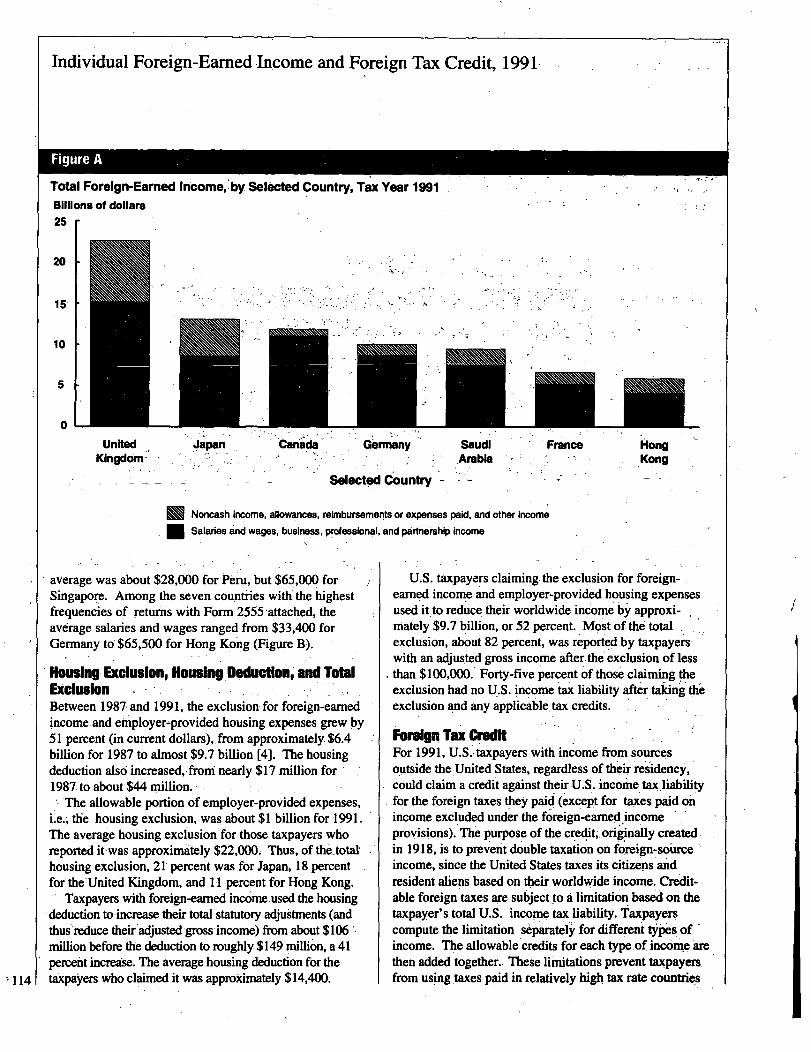
Individual Foreign-Earned Income and Foreign Tax Credit, 199 1
Figure A
Total Foreign-Earned Income, by Selected Country, Tax Year 1991Billions of dollars25 r
20
15
10
5
0
UnitedKingdom-
Japan Canada Germany
Selected Country -
Saudi.Arabia
ANNOB10\00\0
IFrance
SWEENEWOR,
IHongKong
Noncash income, allowances, reimbursements or expenses paid, and other income
Salaries and wages, business, professional, and partnership income
'114
average was about $28,000 for Peru" but $65,000 forSingapore. Among the seven countries with the highestfrequencies of returns with Form 2555 attached, theaverage salaries and wages ranged from $33,400 forGermany to $65,500 for Hong Kong (Figure B).
Housing Exclusion, Housing Deduction,'and TotalExclusionBetween 1987, and 1991, the exclusion for foreign-earnedincome and employer~provided housing expenses grew by51 percent (in current dollars),. from approximately $6.4billion for 1987 to almost $9.7 billion [4]. the housingdeduction also increased, from nearly $17 million for1987 to about $44 million.
1, The allowable portion of employer-provided expenses,Le; th housing exclusion, was about $1 billion for 1991.Th; e
average housing exclusion for those taxpayers whoreported it,was approximately $22,000. Thus, of the-total-housing exclusion, 21 percent was for Japan, 18 percentfor the United Mngdom, and I I percent for Hong Kong.
Taxpayers with foreign-eamed income. used the housing,deduction to -increase their total statutory adjustments (andthus~reduce their-adjusted gross-income) from about $106million before the deduction to roughly $149 million, a 41percent increase. The average housing deduction for thetaxpayers who claimed it was approximately $14,400.
U.S. taxpayers claiming the exclusion for foreign-earned income and employer-provided housing expensesused it to reduce their worldwide inc'ome'by approxi-mately $9.7 billion, or 52 percent. Most of the totalexclusion, about 82 percent, was reported by taxpayerswith an adjusted gross inco
'me after the exclusion of less
than $100,000. Forty-five percent of those claiming theexclusion had no U.S. income tax liability after taking theexclusion and any applicable, tax credits.
Femign Tax CreditFor 1991, U.S.- taxpayers with income fro in sourceso
'utside the.United States, regardless of their residency,
could claim a credit against their U.S. inco 'me, tax,liabilityfor the foreign taxes they paid, ('except for taxes paid onincome excluded under the foreign-earned incomeprovisions). Th
.e purpose of the credit,-.originally created
in 1918, is to prevent double taxation on foreign-sourceincome, since the United States taxes its citizens andresident alie
.ns based on their worldwide income. Cr6dit-
able foreign taxes are subject.,to a limitation based on thetaxpayer's total U.S. income tax liability. Taxpayerscompute the limitation separately for different types. ofincome. The allowable credits for each type of. incomearethen added together. These limitations prevent taxpayersfrom usingtaxes paid in relatively high tax rate countries
I
I
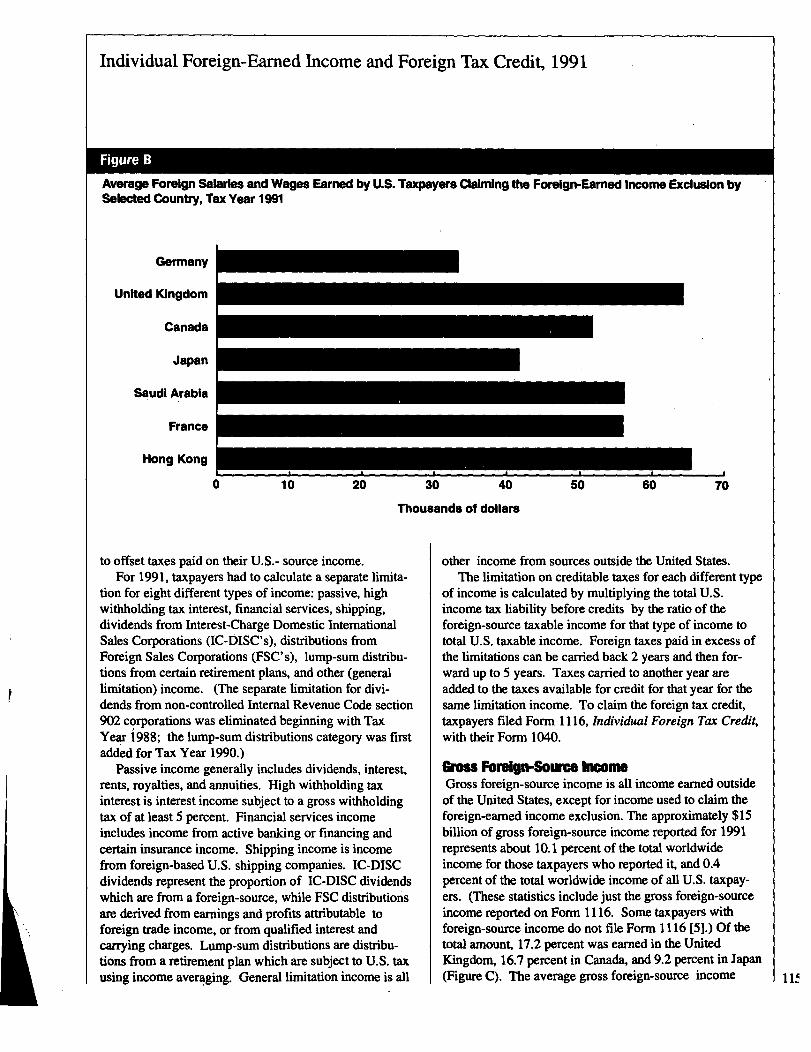
Individual Foreign-Earned Income and Foreign Tax Credit, 1991
Figure B
Average Foreign Salaries and Wages Earned by U.S. Taxpayers Claiming the Foreign-Earned Income Exclusion bySelected Country, Tax Year 1991
Germany
United Kingdom
Canada
Japan
Saudi Arabia
France
Hong Kong
0 10 20 30 40 50 60 70
Thousands of dollars
t
to offset taxes paid on their U.S.- source income.For 199 1, taxpayers had to calculate a separate limita-
tion for eight different types of income: passive, highwithholding tax interest, financial services, shipping,dividends from Interest-Charge Domestic InternationalSales Corporations (IC-DISC's), distributions fromForeign Sales Corporations (FSC's), lump-sum distribu-tions from certain retirement plans, and other (generallimitation) income. (The separate limitation for divi-dends from non-controlled Internal Revenue Code section902 corporations was eliminated beginning with TaxYear i988; the lump-sum distributions category was firstadded for Tax Year 1990.)
Passive income generally includes dividends, interest,rents, royalties, and annuities. High withholding taxinterest is interest income subject to a gross withholdingtax of at least 5 percent. Financial services incomeincludes income from active banking or financing andcertain insurance income. Shipping income is incomefrom foreign-based U.S. shipping companies. IC-DISCdividends represent the proportion of IC-DISC dividendswhich are from a foreign-source, while FSC distributionsare derived from earnings and profits attributable toforeign trade income, or from qualified interest andcarrying charges. Lump-sum distributions are distribu-tions from a retirement plan which are subject to U.S. taxusing income averaging. General limitation income is all
other income from sources outside the United States.The limitation on creditable taxes for each different type
of income is calculated by multiplying the total U.S.income tax liability before credits by the ratio of theforeign-source taxable income for that type of income tototal U.S. taxable income. Foreign taxes paid in excess ofthe limitations can be carried back 2 years and then for-ward up to 5 years. Taxes carried to another year areadded to the taxes available for credit for that year for thesame limitation income. To claim the foreign tax credit,taxpayers filed Form 11 16, Individual Foreign Tax Credit,with their Form 1040.
Giva Fore[WSow= M=mGross foreign-source income is all income earned outside
of the United States, except for income used to claim theforeign-eamed income exclusion. The approximately $15billion of gross foreign-source income reported for 1991represents about 10. 1 percent of the total worldwideincome for those taxpayers who reported it, and 0.4percent of the total worldwide income of all U.S. taxpay-ers. (These statistics include just the gross foreign-sourceincome reported on Form 1116. Some taxpayers withforeign-source income do not file Form It 16 [5].) Of thetotal amount 17.2 percent was earned in the UnitedKingdom, 16.7 percent in Canada, and 9.2 percent in Japan(Figure Q. The average gross foreign-source income llf
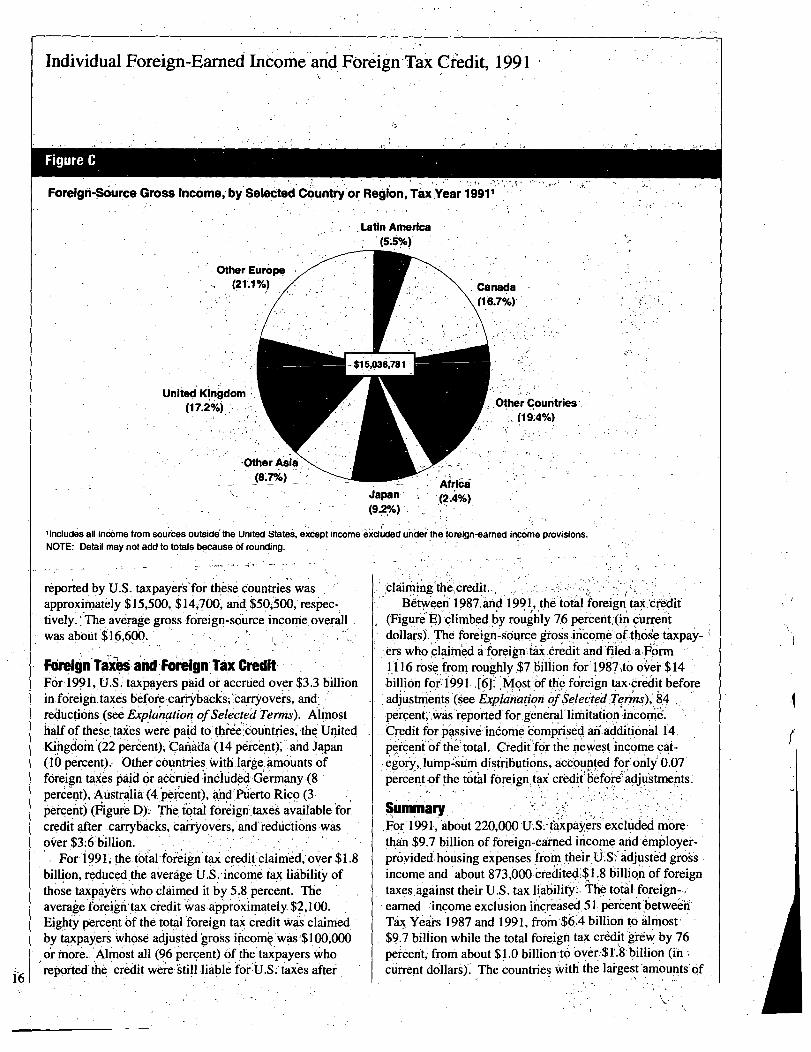
Individual Foreign-Earned. Income and. Foreign Tax Credit, 1991
.Figure C
Forelgh-136urce Gross Incomeli by Selei6teil C6untr'y or Rolon, Tax Year 19911
japan ~(921/6)
Includes all income from sources outside the United States, except income excluded under the foreign-eamed income provisions.
i"6,
NOTE: Detail may not add to totals because of rounding.
reported by U.S. taxpayefsTor these countries wasapproximately $15,500, $K700, and Wj5,00, respec-tively.'The average gross f6reign-source incom
Ie, overall
was abotit'$16,6,00.
Fdmign Takb$ and Foriiilgn,Tax CreditF6r r 199 1 " U.S'. taxpayers paid or accrued over $3.3 billionin foreign taxes befoie.carrybacks';'ca'rr d -yovers, an .reductions (see Explanqtiori ofSelected Terms). ~ Almosthalf of these. taxes wer& paid to tliiiie'.cou
,ntrie
.s, the United
Firigoom (22per6ent)1:ICah4da (l4'p6ice;.nt),' and Japan(10percent)~ Other countries With I fargei,4rnounts oforeign taxes paid or accrLie'd-included' Germany (8,per
.cent),Australia(4pe~cent) Afid'Nerto Rico (I
percent' The i'(Figure Q).~ otal for6igrilaxibg available'forcredit after carrybacks, camyolvers, and'redii&tions wasover $16 billion.
For'0911 the toItal-tore'ig'n tax credit 61airri6d;over $1.8
billion, reduced.the average U.S.-incom6 tax liability ofthose taxpa
.yers who clAimed it by 5.8 percent. The
average,f
.o
,reign-tax c
.redit "was ap' ' im tely $2, 100.prox , a
Eighty percent of the totalIforeign tax credit Was claimed
by taxpayers whose adjusted gross income wdsS100,000o
.r more. Almost all (96
..percent) of the
Itax
.payers who
repor.ted'ther credit werekill 1,iable for'U.S.'. tax*es after ,
c1diming'the,6redit..91Between' 1 987, and 19 , the total foreign tdx.cr6dit
(Figur6'b_6limbedb roughly 760ei~ent,(in current,ydollar
Is). The foreign-sburpe-dross -i&6rh&'of those ta'xpay-
who claimed a foreien:tAx credit and iliie'd,a.V617"Mly $7 billion for' 1987 to 'v r $141116 rose from rough o 6*
b illion foi I.9
191
1[61'.:'Most'of the f6iei~n tax~cre'dit before
adjustments (see Explahation ofSelected,Teims), 8p6rcent-WAs ipported'for,general*limitatio,n,income
,
Credit for ' s :d aii addi-tiona'l 14.passive indorrie ~ompri e.
fcent total. Cied,it`f~.r the newest inc
Iome cdi-7
egory, lump-sum distributions, accIounted for'6nly'0.07
Percent of the totlil ioi-eign,tIAx
acreditiief&~Adiustments.
S.umm*17. .. For 1991, 'about 220,000 U,.S.- taxpayOrs'excitided morethan $9.,7 billion, of f6reign-eaimed income arid -emlloyer-provided -housing expenses fiom their US;'~diuste'd gr'o'ssincome and about 873,000 credited'31.8 billion of foreigntaxes,against their U.S. tax li'ability~ ThJ~ toltatforeig'n-eamed income exclusion i
.ncreitsed,51 peir~ent.betwe6if
Tax Years 1987 and I.991, from-$,6.:4 billion to Almost,
$9.7 billion while the total foreign ta.x credit grew by 76
: . $ npercerit~ from about $1.0 billion t6bvier:, L8- billion (icurrent dollars'). The countries, With the largestamounts: of
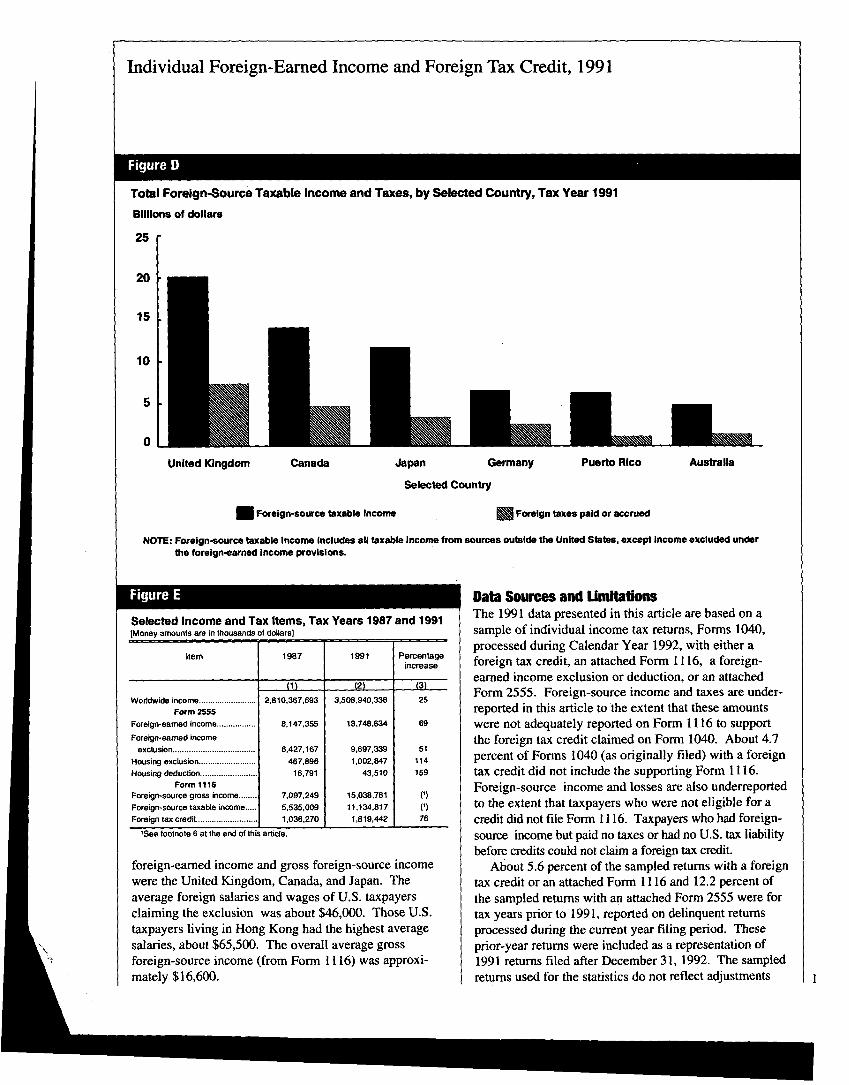
Individual Foreign-Earned Income and Foreign Tax Credit, 1991
Figure D
Total Foreign-Source Taxable Income and Taxes, by Selected Country, Tax Year 1991
Billions of dollars
25
United Kingdom Canada Japan Germany
Selected Country
0Foreign-source taxable income
Puerto RIco
Foreign taxes paid or accrued
'WERROMENAustralia
NOTE: Foreign-source taxable Income Includes all taxable Income from sources outside the United States, except Income excluded under
the foreign-earned Income provisions.
Figure E
Selected Income and Tax Items, Tax Years 1987 and 1991[Money amounts are in thousands of dollars]
Item 1987 1991 Percentageincrease
(1) (2) (3)Worldwide income .......... .............. 2,810,367,693 3,508,940,336 25
Form 2555Foreign-eamed income .......... 8,147,355 13,748,634 69
Foreign-eamed incomeexclusion .................................... 6,427,167 9,697,339 51
Housing exclusion.............. .......... 467,896 1,002,847 114Housing deduction..................... 16,791 43,510 159
Form 1116Foreign-source gross income ........ 7,097,249 15,038,781 (1)Foreign-source taxable income 5.535,009 11,134,817 (1)Foreign tax credit................. 1,036,270 1,819,442 76
'See footnote 6 at the end of this article.
foreign-earried income and gross foreign-source incomewere the United Kingdom, Canada, and Japan. Theaverage foreign salaries and wages of U.S. taxpayersclaiming the exclusion was about $46,000. Those U.S.taxpayers living in Hong Kong had the highest averagesalaries, about $65,500. The overall average grossforeign-source income (from Form 1116) was approxi-mately $16,600.
Data Soumes and UntiltationsThe 1991 data presented in this article are based on asample of individual income tax returns, Forms 1040,processed during Calendar Year 1992, with either aforeign tax credit, an attached Form 1116, a foreign-earned income exclusion or deduction, or an attachedForm 2555. Foreign-source income and taxes are under-reported in this article to the extent that these amountswere not adequately reported on Form 1116 to supportthe foreign tax credit claimed on Form 1040. About 4.7percent of Forms 1040 (as originally filed) with a foreigntax credit did not include the supporting Form 1116.Foreign-source income and losses are also underreportedto the extent that taxpayers who were not eligible for acredit did not file Form 1116. Taxpayers who had foreign-source income but paid no taxes or had no U.S. tax liabilitybefore credits could not claim a foreign tax credit.
About 5.6 percent of the sampled returns with a foreigntax credit or an attached Form 1116 and 12.2 percent ofthe sampled returns with an attached Form 2555 were fortax years prior to 1991, reported on delinquent returnsprocessed during the current year filing period. Theseprior-year returns were included as a representation of1991 returns filed after December 31, 1992. The sampledreturns used for the statistics do not reflect adjustments I
Individual Foreign-Earned Income and Foreign Tax- Credit, 199 1.
made,during.audit examination which determines theacceptability of the reported foreign income and.taxes.
The sample was stratified,based.on the size of totalincome or loss and the size of business plus farm receipts,and the presence-or absence of. Form 2555; Form 1116;foreign tax credit reported on Form 1040; Form 1040,Schedule C, Profit-for Loss).from a Business or Profes-sion; and Form 1040, Schedule F, Farm Income andExienses. For ageneral description of the sampling'.procedures and data limitations of Statistic's of Incometabulations, see Statistics of Income-1991, IndividualIncome Tax Returns and the Appendix to this report.
Explanation of Selectot! TefwnsAdjusted Gross Income. --This is the sum of total incomeor,loss less total statutory adjustments,. -These.adjuistments.include individual retirement-account -deductions, one-halfof self-employment tax, self-employed health insurancededuction, Keogh retirement plan and self-employed SEPdeduction, penalty. on early withdrawal, of savings,.-alimony paid, other adjustments and the foreign housing -deduction.
Allowable Housing Cost. --This amount was 16 percentof the daily salary of a U.S. Government employee. paid, at.the grade GS- 14, step I level, multiplied by, thi, number ofdays of the applicable tax year that the taxpayer lived in.the foreign country.,- For-1991, the GS714 daily rate (annualsalary divided by. 365 days) was $137.94,'si) the daily, rateused to calculat
'e
'allowable housing cost was. $22.07.
Empl4er-Provided'.Foreign Housing Expenses. --This'is,the. amount of housing expenses paid directly. or- indirectly'by the employer. Where. the total amount of foreigncompensation received by the employe6exceided the,costof housing, the 6ntire-h
.ousing cost became the employer-'
provided housing expenses.Foreign Tax Credit Adjustments. -These inc'lude,re
Iduc-
tions for participation in unsanctioned.international boy.-cotts and increases permitt6d by tax treaties between theUnited States and certain foreign countrie&
Foreign Tax Reductions. --These reductions are for taxespaid on' income excluded under the foreign-earned incomeprovisions, taxes specifically attributable t6 unsahc-tionedinternational boycott participation, taxes,-paid on foreign -mineral income when the taxpayer clair.hed.a ded-uctionforpercentaie. depletion for any part o
If the, mineral in-
come, and any penalties,for filing Form 1.116 past the duedate. (In addition to the general penalties applied forfiling late, taxpayers filing Form 1116 past theAue datehad to reduce their total foreign taxesby 10 percent.)
Taxable Foreign-Source Income. --This is foreign-source gross income less deductions. T~e deductionsincluded any"expenses directly related to foreign~source
.income plus A proratpd,.shaie of the taxpayer's it,emized or,,standard deductions. Taxable foreign~source income doesnot include any income excluded under the foreign-earnedincome provisions..
Worldwide Income.--This is the total incIorne or.loss
reported on Forms 1040 before the foreign-earned incomeexclusion has been taken. It includes salaries and wages;taxable interest; dividends; taxable refunds of state andlocal government income tax; alimony received; businessincome or loss; capital gains or losses; taxable distribu-.tions'frorn an individual retirement arrangements; taxablepensions and'annuities; income-or loss from rents, royalties, P"erships, and esiates~iind trusts'; farm. income orloss; unemployment cbmpensation;.'taxable social securitybenefim, and other*incom'd or losses..
Notbs and,116ferences[11 To calculate the limitation oh1he excludable, portion
of housing expenses, taxpayers multiplied, theexcludable portion, by. the ratio.of~employer'-providedexpenses to for6gri-earhed-income. The.allowableportion of housing expenses was the lesser"of thisproduct or the. employer-provided housing expenses.
[2] Data for all taxpayers who filed a Fo= 1040 for1991 cited in.this article are from Statistics of Income7.
.-1991, Individual Income' Tax, Returns.
[3) Data in this article are compared to 1987 because, thisis the last prior year for which comparable statisticsare available-
[41 TheIdata for this article differ slightly. from the data
reporie4in Statistics of Income4991i Individual.Income Tax Returns, primarily because the sampleused for the statistics, presented in this article didnotinclude the small number of returns. filed in 1992 fortax years prior to 1987 (these returns were excludedto fAcilitite 'Processing), and because the foreign taxcredit,frequency and amount reported in the latterpublication include reductions in U.S. taxes for taxespaid,tQ the Virgin Islands.. (The rules and form used,to determine the reduction allowed for Virgin Islandtaxes. differ from those which specify the allowableforeigntax. credit for 91 other countries.)
[5) Some taxpayers with a-foreign tax credit fail'to file aForm 1116 with their return as originally filed.Others file a Form 1116 even though they,are noteligible, f&4 credit to report a foreign tax carryoverfrom a prior year, to provide the, basis for reporting acarryover, the following year, or simply because theyclaimed a credit in another year and wish to'maintain
Individual Foreign-Earned Income and Foreign Tax Credit, 1991
consistency in their reporting of foreign-source in-come and losses.
[61 For 1991, gross foreign-source income and taxableforeign-source income were based on all returns witha Form 1116 attached regardless of whether a foreign
tax credit was actually claimed, while for 1987, theseamounts were based on those returns with both aforeign tax credit claimed on Form 1040 and a Form1116 attached. Thus, the 1991 statistics for foreign-source income are more complete than the 1987statistics.
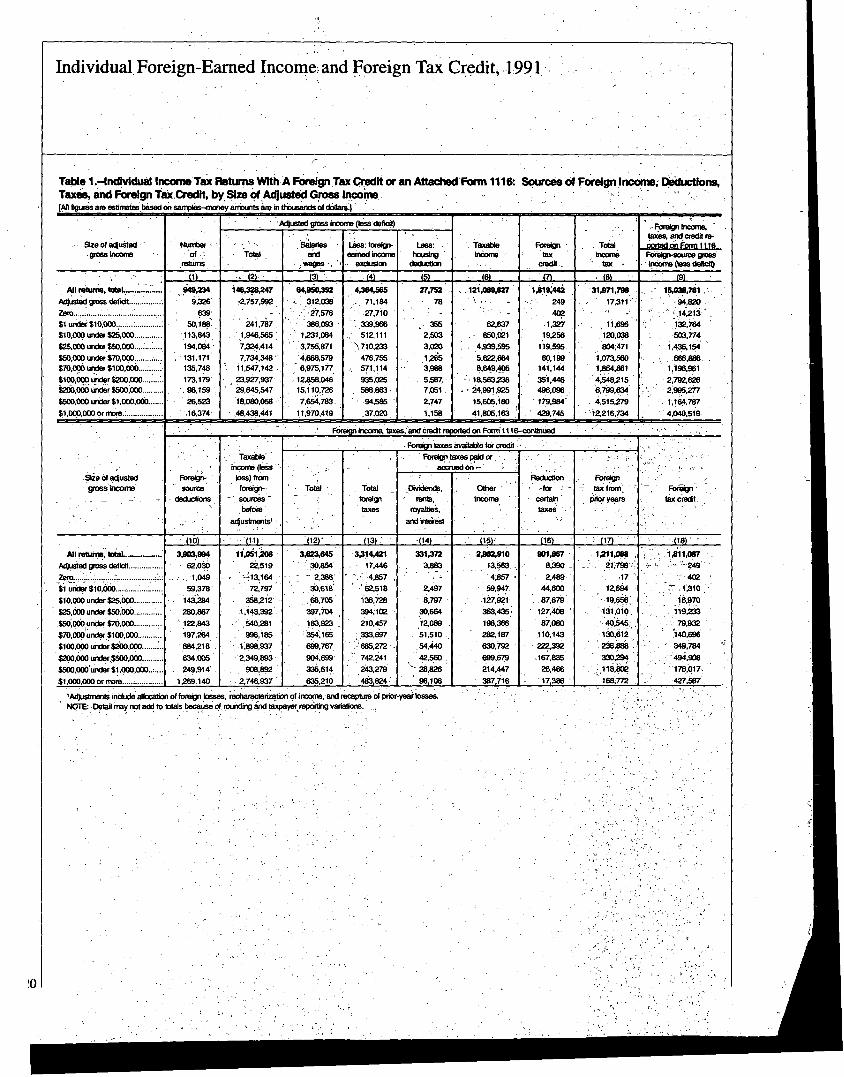
HP
11hi
1114
J8J
-0
CoC
A4-
77".
114
t]N
fig
MA

Individual Foreign-Earned Income and Foreign Tax Credit, 1991
Table 2.-Individual Income Tax Returns With Form 1116: Foreign-Source Income, Deductions, and Taxes, by Country(AN figures are estimates based on samples-money amounts are in thousands of dollars)
Taxable Foreign taxes paid or accrued on-Forelqn- income (less TOW
Selected country Number source Foreign- loss) from foreignOf gross source foreign- taxes Dividends Rents and Interest Other
returns income deductions sources before paid or royalties income(lessloss) adjustments' accrued
(1) (2) (3) - C4) (5) (6) C7) (8) (9)
All geographic areas, tatal. ....... .......... 908,579 15~M,7111 3,903,994 11,134,817 3,314,421 240,069 45~M 45,937 2,11162,9110Canaft....... ...................................... 17%256 2,SD4,T12 1,097,190 1,407,574 464,291 3%M 16,703 19,498 M104Latin Amerlica, total............................ 14,703 827,841 210,896 604,945 1 K414 2,V9 1,117 436 150,583
Argentina .............................. ............ 1,037 37,236 16,763 20,473 5,203 5 103 14 5,081Bahamas.......................... ................. 196 14,471 1,569 12,902 (1) (9) - -
Bermuda ............................... ............ 406 12,618 1,944 10,675 30 3 27Brazil................ ................................. 1,113 81,132 15,287 65.845 22,2" 22 69 10 22,194Cayman Islands.................................. 78 6%2" 8,852 57,441 (2) (2) - (2) (1)
Chile................................................... 605 16,550 3,329 13,221 4,908 73 1 - 4634
Colombia.......................... ................. 1,241 133,758 2,032 131,726 9,621 20 a 9:592Costa Rica.......................................... 205 2,353 577 1,776 253 1 3 249
Guatemala ......................................... 461 3,233 268 2,965 Soo (2)- Soo
Mexico......................... ...................... 9,164 201,174 46,135 15S,039 68,632 1,129 667 380 66,456Panama... ...................................... 696 20,015 4,152 15,863 2,549 1,024 237 17 1,271Peru............. ...................................... 177 5,091 583 4,508 1,967 1 - - 1,967Venezuela.......................................... 1,362 135,741 107,8W 27,933 14,154 (1) (1) 3 14,150Other Latin American countries.......... 2,165 98,175 9,597 88,578 24,003 21 17 3 23,963
Other Western Hemisphere................. 1,052 25,918 9,266 16,652 3,814 15 Is 49 3,731Europe, total .................................. 255,482 5,756,965 I'M1,156 4,47S,610 1,577,oia 120,040 17,207 17,286 11,423,3117
Austria........... .................. ................. 3,093 40.218 8,859 31,359 15.884 621 49 47 15,166Belgium .............................................. 4,604 208,648 39,471 169,178 67223 477 503 196 66,048Denmark........... ................................. 1,075 29,518 8,959 20,559 5,380 178 5,2DIFinland........................ ....................... 278 7.233 3,083 4.150 377 8 369
Francs.............................. ................. 8,725 457,132 131,938 326,194 112.974 7,515 1,023 -132 103,904Germany ............................................ 17,913 821,491 167,922 653,569 254,856 11,020 5.319 4,731 233,787Greece ......................... .................. 192 11,766 630 11,136 3,389 (2) '12 is 3,359
Ireland ........................ ............... 1,945 13,884 3,644 10,240 4,011 927 13 14 3,056Italy..................................................... 5,012 208,952 38,547 170,404 59,965 240 367 597 58,762Luxembourg ....................................... 267 8.726 2,445 6,2BO 1,165 2 30 1,133Netherlands ......................... 37,479 282,6SB 79,378 203,210 59,587 14,708 2,653 77 42,150Norway............................................... 2,591 130,398 21,467 108,931 48,293 803 - 8 47,482Portugal .......................................... 809 5,905 704 5,201 4,460 51 8 1 4,399
Spain.................... -- .................... 16,065 175,993 28,965 147,028 53,480 2,573 510 72 50,325Sweden.............................................. 3,241 43,336 12,481 30,856 6,120 148 (1) 645 5,326
Switzerland......................................... 14,993 449,759 92,678 357,081 104,110 41,231 241 4,747 57,891Turkey ................................................ 340 11,229 3,496 7,733 2,890 - 2,890
United Kingdom.................................. 169,009 2,589,775 577,462 2,012,313 733,332 39,117 6,277 4,989 682,948Other European countries .................. 10,483 260,344 59,028 201,316 40.425 421 231 582 39,190
Africa, total.................................... ... 41,765 355,626 148,240 207,366 69,110 3,440 12 20 65,639Egypt .......................................... 499 18,776 1,831 16,945 8'5W (1) - 8.500
Nigeria- .............................................. 241 44259 15,891 28,367 10,139 1,156 8,983South Africa........................................ 37,645 80.232 12,531 67,701 5,391 2,2DO 12 20 3,158
Other African countries ....................... 3,776 212,359 117,987 94,373 45,081 83 - - 44,998
Asia, total .................................. ........ 59,444 2,579,716 478,291 2,201,425 674,51S I5'W 6,337 3,6114 649,169China.................................................. 1,102 46,839 7,518 39,320 10.786 9 3 10,774HongKong ................... _ .................. 5,920 278.648 50289 228,358 46,946 471 69 4 46,402
India........ ........................................... 615 0205 874 40.331 3,450 2 8 2 3,438Indonesia ............................................ 2,351 230,981 47.739 183,243 94,969 .17 - 6 94.945
Israel ................................ .................. 13,044 88,859 8,459 80,400 24.803 614 405 503 23~182
Japan.................................................. 27,829 1,378,060 206,634 1,171,426 336,327 7,256 5,027 2.751 321,293
Malaysia..................................... 1,267 28,195 3,807 24,389 12,662 64 - 12.598
Philippines .......................................... 1,024 25,895 12,976 12,919 6,759 36 9 4 6,709
Saudi Arabia ...................................... 876 58,333 27,578 30,756 4,791 12 28 4,752
Sjnga~pore ....................................... 4.179 150,925 29,074 121,852 43,456 152 (2) 48 43R56
South Korea....................................... 1,355 50,926 9,703 41,226 14,319 308 99 8 13,904
Taiwan................................................ 2,211 184,605 39,655 144,950 41,774 6,187 710 302 34,577Thailand .............................................. 1,705 64,859 13,385 51,473 26.610 93 7 2 26,508
Other Asian countries ......................... 3,978 51,383 20,601 30,782 6,863 127 4 1 6,731
Oceania, total..................................... 46,981 623,742 $3,144 540,598 157,905 3,636 1,547 2,542 150,199Australia - .................................. 44,084 547,755 67,834 479,922 139,510 3,397 1,099 2.147 132,885NewZealand...................................- 3.694 57,362 5,236 52,127 15,509 212 448 395 14,454
Other Oceania countries .................... 219 18,625 10,075 8,549 2,887 27 M 2,8WPuerto Rico ........................... ...... . ..... 29,806 787,335 IM622 623,713 111,440 11,733 892 98,815Dividends from an IC-DISCand distributions from a FSC 1-1 41,981 124,086 7,199 116,11%) 81906 8,488 13 465
All other countries... ...... ..................... 1 338,387 1 1,362,744 1 416,952 1 935,792 1 91 A% 35,10S 1 2,425 1,537 52,618
I Includes allocation of foreign losses, recharacterization of income, and recapture of prior-year losses.' Less then $5W-3 IC-DISC's are Interest-Charge Domestic International Sales Corporations. IC-DISCs are defined in footnote 5, Table 13, of the historical section of the Bulletin.4 FSC's are Foreign Sales Corporations. FSC's are defined in footnote 6, Table 13, of the historical section of the Bulletin.NOTE: Detail may not add to totals because of rounding and taxpayer reporting variatons.
12
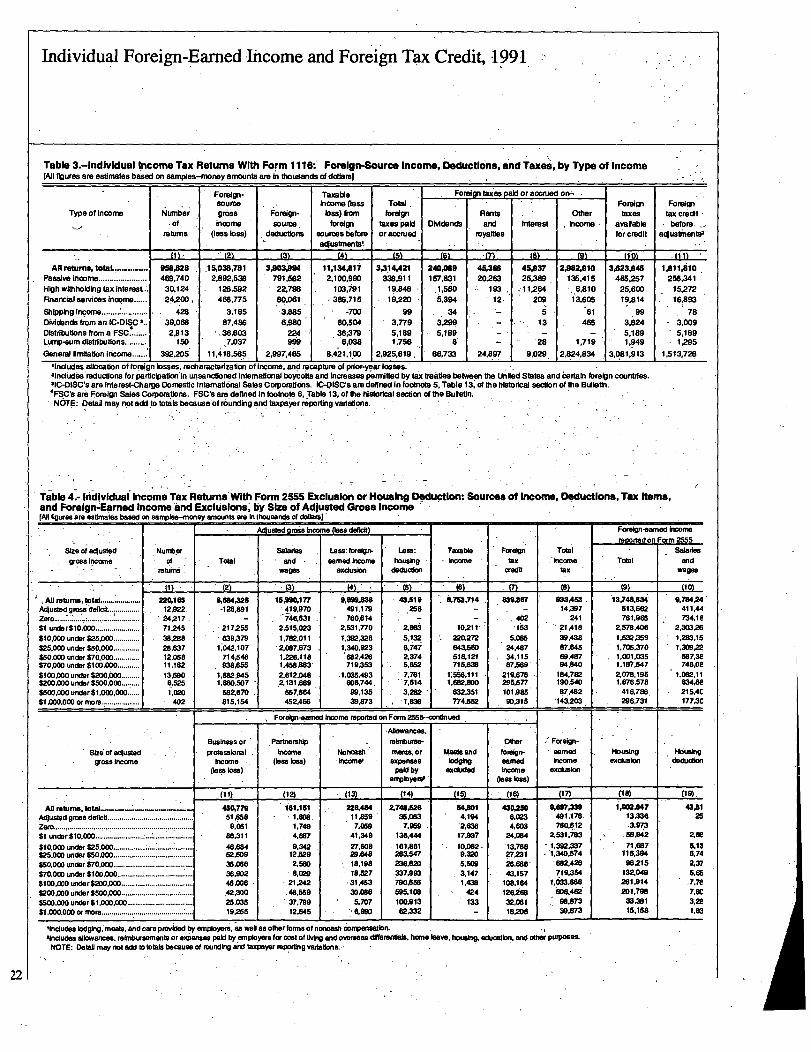
Individual Foreign-Earned -Income and Foreign Tax Credit, .1991
Table 3,1ndividual I'ncome Tax Returns With Form 1116:' Foreign-Source Income, Deductions, and Taxes, by Type of Income
[All figures are estimates based on samples-money amounts am I~ thousands of dollars)
Foreign- Taxable Fo gn taxes paid or accrued on-source income (loss Total Foreign Foreign
Type of Income Number gross Foreign- loss) from foreign Rents Other taxes tax creditOf Income soume. foreign taxes paid Dividends and Interest income available before .. ,
returns Oessloss) deductions sources 69fore or accrued royalties for credit aclustmenteaadiustments!
(I I - (21 131 (41 (51 f6l 1`71 (81 (9) (101 it 11
All returns, total. ............. 9511,828 .1"38,781 3AW94 11,134,817 3,314,121 240,069 45,366 4S,937 2.982,910 3,623,645 1,811,MOPassive income ..................... 469,740 2.892.538 791,582 2,100.990 338,911 157,830 20,263 25,389 135,415 485,257 256,341High withholding tax interesi.. 30,124 126,592 22,798 103.791 19.8m - 1,580 193 1 1.264 ~,~6,810 25,6W 15,272
IncomeFinancial services 24.2.00, 466.775 .80,061 386,715 19.22D 5.394 12, 269 13,605 19.814 16,893.Shipping Income..................... - 428 3.185 3,885 -7W 99 34 5 61 99
'78.
Dividends from an IC-DISC 3.. 39.068 87,486 61980 80,504 3,779 3 RN 13 465 243.8 3.009Distributions from a FSC .
42.913 .36,603 224 36;379 51189 51189 - - 5,189
'5.189
Lump-sum distributions .......... 150 999 '6.038
,
1,756 8 28 1,719 1,949 1,295
General limitation Income 392,205 11,418,565. 2,997,465 8,421.1101) 2.925,619, 66,733 24,8917 9,029, 2.824,834 1 3,R81,913 111,513,7Z8
'includes allocation of foreign losses, recharacterizabon of income, and recapture of or-Pit year losses.21noludes reductions for partialpation'In unsanctioned International boycotts and increases permitted by tax trealies between the United States and certain foreign countries.3IC-DISC's we fnterest-Charge Domestic International Sales Corporations. IC-DISCs are defined In footnote 5, Table 13~ of the historical section of the Bulletin.'FSC!s are Foreign Sales Corporations. FSCs am de~ftned In footnote 6, Table 13, of the historical section of the Bulletin.NoTE: Detall may not add.to totals because of rounding and taxpayer reporting variations.
Table4~
Individual income Tax ReturnsVith Form 2555 Exclusion orHousing Deduction- Sources of income, Deductions, Tax Items,and Foreign-Eamed Income and Exclusions, by Size of Adjusted Gross Income(All %ures are estimates based on sampiw-money amounts are In thousands of dollars]
uslad gross income Osss defk*) Foreign-eamed Incomereoorted on Form 2555
Size of adjusted Number Salaries Less:forelgr~- Less: Taxable Foreign Total Salaries
gross Income of Total and earned Income housing Income tax Total andratu rns wages exclusion deckiction credit tax wages
(2) (3) (4) (5) (7) (a) (10)
All returns total.. 22%165 8.654,328 ISP%177 olsobAss 43,519 0,753,714 83%M 933A53 13,74ILSM 9,794.24
Adjusted gross defictL............... 12,922. -128,891 419,970 491,179 .258 - 14.397 513.662 411.44
Zero ..................................... 24,217 - -i4e,631 760.614 - 402 241 761,965 734,ie
$1 under$10,000 ...................... 171.245 217,255 2,515.023 Z531.770 ZOM 10,211 M 21.418 ZS78,406 2.30326
$10,000 under $25.000 ............. 38,288 639,379 11,782,011 1,392,328 5,132 220,272 5.085 39,438 I.SM,359 1,283.15
$26,000 under $50.000 ............. 28.637 1:042,107 2,087.673 1,340.923 6.747 643,56D 24,487 87,645 1.705.370 1.309.22
$50,OW under $70.000 ............. 12.058 714,546 1,226.1.18 682.426 Z374 518,121 3015 69.487 1,0011.035 667.3e$70,000 under $100.000........... 11,162 93BA55 1,458AS3 719,353 5.652 71SA36 87.569 94.840 1.187,547 746,oe
$100,000under$200,000 13A90 1,882.945 2.612.048 -1,035.493 7.761 1;556,111 219.678 t84,782 2.078,195 1,082.11$200.000 under $500,000 615M 1.880,507 2,131.689 6D6,744 7.614 1.682.SDO 295,577 190,540 1,676,578 834,6e$500,000 under $1,000,000 imo 682,670 557.664 99.135 3.282 632.351 101.985 87,462 416,786. 215,4C
$1,000400 or more................... 402 815,154 452,466 39,873 1AS 774AS2 9OM5 143,203, 296,731 IM3
Foreign-eamed Income reported on Form 2555--conlinued
-Allowances,
Business or PartnershIp reimburse- Other Foreign.
Size of adjusted professional hxXxne Noncash ments.6f Meaft and foreign- earned Housing Housing
gross Income Income (less kxs) Incomes expenses lodging earned Income exclusion dackiction
(lose loss) paid by exeWed Income exclusionemployerst (loss IM)
(11) (12) (13) (14) (15) (16) (17) (18) (19),
Ali ratums, . ....... .......... 450.779 161.151 228AN 2.74BA26 54ACI 430,250 9,697,339 1,002,11147 43A1
Adjusted gross deficit ........................................... 51 ASS 1,8D8 11459 35M3 4.194 6,023 491,178 13.336 25
Zero............................ : ......................................... 9,~Gl 1.749 7.059 7.M9 zow 4,603 M.612 3.9M
$1 under $10,000 ........................ ..... ..... . 86.311 4,897 41.349 136,444- 17,937 - 24.084 Z5311.17ii!13 .56.942 Zee
$10,000 under $25,000 ................ ............. : ......... . 48.684 9.342 27,608 161,861 10.082. 13.758 1,392.337.'
71,687 5.13
SMOOD under $50,000 ........................................ 5Z.W9 12,529 29.648 283,547 0,320 27,231 1,340.574 116.394 6.74
$50,000 under $70.000 ................................... : 35,056 2.55D 18.198 236,620 51509 ~Baw 6SZ425 96.215 Z37
$70,000 under $100.000.............: ........................ 36.902 O.M 18.527 337,993 3,147 43,157 719.354 132.049 516E
$10D,000 under$2DO,000 .................................... 46,006 21.242 .31.453 790AN 1.438 108.164 1,633,1168 261.914 7,7e
$200,000 under $500.000 ............................. 42= 311,086 595.109 424 126268 GX462 201,798 7.OC
$500,000 under $1,000,OOD ................................. 25.035 37.799 5,707 100,913 133 32,061 98,873 33MI 3,2e
$1,000,000 or more................ 19255 12,645 6.9W 62X2 18"0 39,873 15.158 1.82
'includes lodging, meals, and cars provided by employers. as welf as other forms of noncash compensation.&Includes allowances. reimbursements or 9,venses paid by employers for cost of Oft and overseas differentials. home leave. housing, education, and Oth; Purposes.
NOTE: Oetall may not add to lotals because of rounding and taxpayer reporting variations.
22
Self-Employed NonfHers, Post-Audit, Tax Year1988by Laura Rosage
F
or Tax Year 1988, an estimated 1.7 million soleproprietors failed to file an individual income taxreturn. Of these, an estimated 1.5 million returns
were secured through enforcement efforts. Approxi-mately 68 percent owed tax and their average total incomewas $15,000. However, based on a line-by-line examina-tion of a sample of these returns, an estimated 82 percentowed tax and the average total income was nearly$21,000. The most frequent occupation of self-erhployednonfilers was handlers, equipment cleaners and laborers,followed by construction trades. .
Because the self-employed have sources of income notsubject to "information reporting" (and tax withholding),there is a concern that those who fail to file an income taxreturn may escape detection [1]. Even when their returnsare secured, it is difficult to determine how accurate theyare unless they can be audited. For purposes of this ,article, an individual taxpayer (or couple if the tax returnwas ajoint return) was considered self-employed if, afterexamination, it was determined that he or she had grossreceipts from a business or profession reported on aSchedule C, Profit or Loss from Business (Sole Propri-etorship); farm income on a Schedule F, Profit or Lossfrom Farming; or self-employment tax on a Schedule SE,Self-Employment Tax. An estimated 1.5 million, or 43percent, of the 3.5 million nonfilers from whom delin-quent returns for Tax Year 1988 were secured were self-employed.
CharaclulisUcs of Self-Employed Nonfiler RehimsAlthough the Internal Revenue Service (IRS) was able tosecure returns from nonfilers, this does not mean that theincome and deductions reported on these returns wereaccurate. Overall, more than 36 percent of the returnssecured from wage earners, taxpayers all of whose incomewas from wages, were adjusted during IRS audit.However, nearly 87 percent of the returns secured fromself-employed nonfilers were similarly adjusted.
Tolal IncomeWhile average total income before statutory adjustmentsreported on returns secured from wage earners was almost$18,500, the average for a self-employed nonfiler waslittle more than $15,000, with income ranging from anegative $0.9 million to a positive $5.1 million. However,after examination, the average total income for wageearners increased to slightly over $19,000, while the
Laura Rosage is a statistician with the Research Team.This article was prepared under the direction ofWilliamL Lefbom, Research Team Leader, Statistics of Income.
average income of the self-employed nonfiler rose tonearly $21,000. In total, wage earners reported $38.2billion of income on their returns as filed. After examina-tion, the amount rose to $40.0 billion, resulting in adifference of $1.8 billion and a "voluntary reportingpercentage" (VRP) of 95.4.
VRP is a compliance measure, calculated by dividingan income or deduction item as reported by the taxpayeron the return by the corrected amount as determined bythe IRS examiner, then multiplying by 100 [2]. If deduc-tions or credits are overstated, the VRP will exceed 100; ifthey are understated, the VRP will be less than 100. Theself-employed reported only $22 billion of the $30 billiontotal income that examination uncovered, resulting in adifference of $8 billion and a lower VRP of 72.8.
Because the self-employed have income not subject to"information reporting," i.e., statements provided to IRSand the taxpayer on amounts paid out or withheld, theycan more easily understate their income than can wageearners, whose incomes arereported on Forms W-2.Before examination, thelargest percentage of the self-employed (44 percent)reported a total income(which includes sole propri-etorship business and farmprofits) ranging from $1
1001
to $10,000 (Table 1). Al-most 13 percent of the self-
IRS secured income tax
returns from 1.5 million
of the estimated 1.7
million sole proprietors
who failed to file for
1988.
employed nonfilers reported total income of $1,000 orless; this category includes all those whose total incomewas negative. For 21 percent, the income range was$10,001 to $20,000, and slightly more than 16 percentreported income between $20,001 and $50,000. Less than6 percent had income above $50,000.
This distribution changed after audit (Table 1): After"in-depth examinations" for compliance research pur-poses, the percentage of self-employed with total incomeof $1,001 to $10,000 decreased to 33 percent. Only 9percent actually had a total income of $1,000 or less (or atotal loss). For 24 percent, the income range was $10,001to $20,000, while for a little more than 27 percent theincome range was between $20,001 and $50,000. This 27percent represents a 69 percent increase over what wasoriginally reported on the return. Finally, just over 7percent had total income above $50,000.
Although the voluntary reporting percentage (VRP) forthe total income of self-employed individuals was only72.8, it was even lower when only considering nonfarmsole proprietorship (Schedule Q net income or loss. Self-
123
Self-Employed Nonfilers, Post-Audit, Tax Year 19818
1.24
employed nonfilers reported a net total of almost. $10billion in nonfarm sole proprietorship income. . However,'after.examination, the figure
.rose to n.edrly,$1.6 billion, an
increase of $6 billion'and a VRP of 62. 1.It should be noted that unreported gross receipts are
-difficult to' detect, but overstated business expen.ses are
more noticeable uponexamination. Thus-the change innet income on Schedule C is due-both
Ito an understate-
ment of receipts, as well as an overstatement of expenses.This is also true of farm profits reported on Schedule F.Overall, the self-employed reported afarni net loss of $64million. After examination this amount
Irose to a positive
$556 million,-a difference of $62.0 million. Even thoughVRP cannot be calculated when comparing a. negative,amount to'a positive arnoimt, data show: that. the self-.employed are not "voluntaril 'rting" their farmy repoincome (TWe,2).
In total, more than ~5,percent ofthe secured.returnsfrom self-employed nonfiler&had an.in'rease in"totalincome, due to exarninatiofi~ .~:-Siightiy miore than 40'.-cpeic,ent.hadnochan eininc'ome' d' ly,4.,percentg ~. an on.realized a small decrease.
fted Deductions. -While income,,is. generally understated on delin uent.,qreturns.,
,ite
.mized personal deductions are commonly
overstated'.. However; because the self~employpq have'!g
.redter o portunity,to understate their income due to thep
lack.of*information re ort
.n their iteinized deductionsp 0,9~
are g.ene,rally not.as overstated as,t.hose ofwage e.arneris.
in' fact, for the secured returns of self-employed nonfilers,total itemized deductions were understated by. 1.5 percent.The. self-employed claimed $3,590.5 million in, iterriiz&ddeductions,.but were allowed nearly $3,646fi.million after,exa ination, resultin'g in a differenc
Ie of W.1 million and
a total VRP of 98.5.-These totals, however, can be misleading. Deductions
aid to,minimize total taxable, inconie and, 6onseqyently,the,.iotal amount of tax.due. Rowever, a taxpayer may notneed,to claim the total, amount of deductions to which he.,or she is ent,itled.in order to,offset their tax. T.6xpayqrs,may simply claim the standard deduction or~a partial totalfor itemized.deductio.ns sufficient (in combination withdeductions for personal exemptions and tax credits) . to.reduce their tax to'zer'o. More than 79,000 ofthe self-.empjoyed noneifers Were' able to increase their total deduc-tions,enough to offset an increase in total tax liabilityr
.esulting from. audit. 0ply.,2,990, (1,.9 percent), of these
claimed. a.busibess loss before 'audit, -but reported,a profit,,afteraildit, and the total'income of nearly 64
.000(
180.6
per6en,t),increiised after,ex,amination. In addition, therewere nearly 14,000 (17.5 - ercent)P. who increased the
amount of total itemized deductions claimed despite adecrease in total income as a result of examination.
ExemptionsThe, number of personal exemptions a taxpayer is able toclaim directly affects the amount of his or.her tax liab Ility.As in the.case of deductions,.wage earners were more.likely to overstate their exemptions than the self-em-ployed. -In total, wage earners claimed nearly 3.2 millionexemptions,worth $6.2 billion, before examination and2.9 million, worth $5.7 billion, after examination. Theresulting VRP was 109.9, or a net overstatement of 89percent,,Most of this overstatement was due to theclaiming of 37 percent more dependent children living athome tfian''Were allowable.- This'difference accounted for92 p~erc'ent;'or' $46.1 million, of the $501 million inexemption overstatements.,
Although-the self7employed claimed more.exemptionsthan wage earners on.delinqqent returns, their exemptionswere measurably. more accurate.. Self-employed nonfilersclaimedl.3.5-million exemptions, worth $6.9-billion, beforeexamination, but we're allowed 3.4 million exemptions,worth $6.6 billion after examination. The correspondingVRP was 102.8. This overstatement.was due primarily tothe clairning'.of, 7 percent more for. dependent children athome'than-
Ithey~ were-6ntitled'to.. This-§ituatjon' accounts
for 79 percent or $148 million, of the $187.ni,illion,,over-statement.
FillngltafiisOf all the re'tilm items that cou. Id'affect ~a taxpayer~'s totaltax-liability, filing"status (i.e., the marital status 'categoriesrecognized tinder.the tax code) was one of themostaccurately reported.-Ohly, 21'6erc6fit of thetotal self-employ6d~s
'ecu
'redr6turn's had a change in filing status.
Of those changed after audit, most clairried head ofhousehold statu§,whefi they. should have claimed theywere either single or married filing separately. Thus, afterexamination, 33 percent of the self-employed clairnedsingle,filifig status; 54 pprcent,'mai-ried filing jointly; only10 perc
.ent, married filing separately; and les's than 3
perc~ntj head of household. status. ,
Totalincoine TaxSince return items- used to calculate total income tax werechan as aresult o examination, it follows that theged famount6f total'income'tax-also chan
.ged. Before audit,
the self-employed reported almost $5.0 billion in totaltaxes; however, after examination, this number increased37 percent, to more than $6.8 billion. This was partiallydue to the fact that more than 101,000 of the 170,000 self-employed'who.reoorted they had no tax liability before
Self-Employed Nonfilers, Post-Audit, Tax Year 1988
they were examined had a tax balance due afterwards. Intotal, more than 56 percent (816,000) of the returnssecured from self-employed nonfilers reported anincrease in total tax, after examination. (Only 2 percentreported a decrease; there was no change in the reportedtax on the remaining 42 percent.) While tax increased by$100 or less for 4 percent of the self-employed, nearly 22percent reported increases of between $100 and $1,000,and more than 30 percent reported increases of more than$1,000 (Table 3).
Type of RetumThe secured delinquent returns were classified into threetypes: "balance due," if the taxpayer owed taxes beforeany remittances with the returns were credited; "refund,"if prepayments (e.g., taxes withheld or estimated taxpayments) and refundable earned income credits ex-ceeded the tax liabilities, and "even," for returns wherethere were no tax liabilities; or no prepayments of refundsdue, or where prepayments exactly matched tax liabili-ties. These types of returns were compared before andafter examination (Figure A).
Before examination, more than 68 percent (994,000)of the returns secured from self-employed nonfilersshowed a balance due. Another 25 percent were refundreturns and 7 percent were "even." Those self-employedtaxpayers whose returns showed a balance due owedmore than $3.4 billion, while taxpayers filing for refundswere owed almost $0.4 billion. The resulting total net taxbalance due from self-employed nonfiler returns beforeexamination was, therefore, estimated at $3.0 billion.
After examination, however, the numbers tell a differ-ent story. Because of increases in income and decreasesin deductions, more than 82 percent (1,200,000) of thesecured self-employed returns were reclassified as bal-ance due returns. Only 14 percent of the nonfilers weredue refunds, and only 4 percent were "even." The totalbalance due increased more than 50 percent from $3.4billion to more than $5.1 billion, while total refundsclaimed dropped from $0.4 billion to $0.2 billion. Theresult was a total net balance due after examination of$4.9 billion, more than one-and-a-half times the amountreported on the returns as originally filed [3].
Occupationinitially, the taxpayer's occupation was coded only fromwhat was entered on his or her delinquent return. Ap-proximately two-thirds of the self-employed nonfilers didnot provide their occupations on their returns when filed.Of those returns where occupation was available,"retired" was most frequent at 8.3 percent of the totalself-employed population. Although retired status is not
normally an income generating activity, this was thelargest single occupation reported on secured returns. Itshould also be noted that taxpayers with this occupationare not likely to be full-time self-employed. Leadingoccupations after retired persons, were those in construc-tion trades (5.9 percent), mechanics and repairers (2.1percent), management-related occupations (2.0 percent)and occupations in transportation and material-moving (1.6percent) [4].
During the examination phase, tax examiners wererequired to code the occupation of the "primary taxpayee,(i.e., if the return is ajoint return, the spouse with the
After IRS examination, the
tax balance due (net of
refunds) from sole propri-
etors who filed delinquent
returns was S4.9 billion,
1.5 times the amount
originally reported.
larger income), regard-less of the occupationthat may have beenentered on the return.Because the occupa-tions of all the self-employed nonfilerswere identified duringexamination, theresults are slightlydifferent from thosebased on the returns as
filed. The largest occupation group for the self-employednonfilers became handlers, equipment cleaners, and labor-ers (17.5 percent). Construction trades were second (13.5percent), followed by mechanics and repairers (7.8 per-cent); retired persons (7.2 percent); and occupations ininsurance, securities, real estate, and business service sales(5.8 percent) (Figure B).
Many laborers; construction workers; mechanics; andreal estate, insurance, securities, and business servicessalespersons were not only noncompliant in filing theirincome tax returns, but also tended to be inaccurate in whatthey reported. After examination, tax increased for thosein construction trades alone by a net amount of more than$282 million. Tax of handlers, equipment cleaners, andlaborers increased by a net $252 million, while the taxesowed by mechanics and repairers increased by nearly $191million (Figure Q.
Many States or local jurisdictions require a licensebefore a person can practice certain trades. Using listingsof licensed occupations and professions from severalStates, licensing requirements were identified for 30occupations. Based on these lists, 105,000 (7.2 percent) ofthe estimated 1,455,000 nonfilers identified as self-em-ployed, before examination, would have been subject tosome sort of licensing requirement. Before examination,they reported a total balance due of $255 million andclaimed refunds totaling almost $96 million, resulting in anet balance due of $159 million. 125

Self-Employed Nonfilers, Post-Audit, Tax Year 1988
Figure A
Returns of S61f-Employed No.nfilers'b',Y,Tax.Status, Before and After Ex"arninatlo'n,'*Tax'Year 1988;-
11 Perceftdge Before Examination
Pdrcentage After Examination
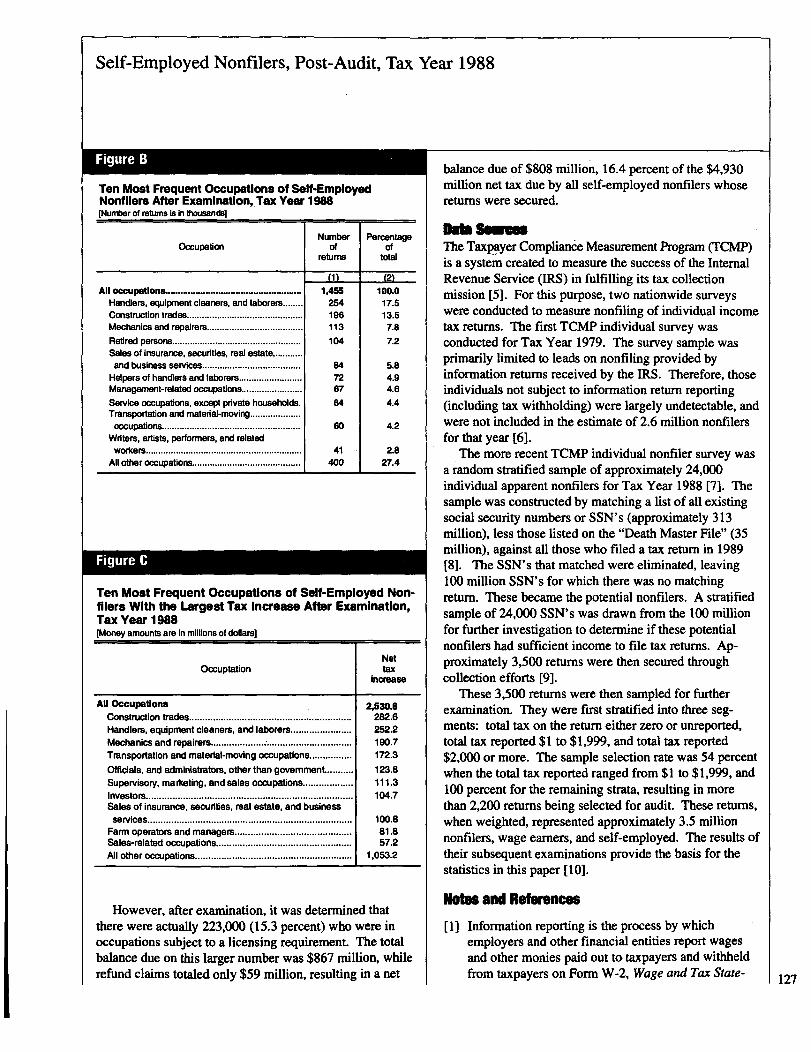
Self-Employed Nonfilers, Post-Audit, Tax Year 1988
Figure B
Ten Most Frequent Occupations of Self-EmployedNonfilers After Examination, Tax Year 19M[Number of returns is in Oxxisands)
OccupationNumber
Ofreturns
PercentageOf
total
Handlers, equipment cleaners, and laborers ........Construction trades..............................................Mechanics and repairers ......................................
Refired persons...................................................Sales of insurance, securities, real estate............and business services .......................................
Helpers of handlers and laborers .........................Managerrient-related occupations ........................
Service occupations, except private households.Transportation and material-moving ....................
occupations.......................................................Writers, artists, performers, and related
workers ..............................................................
All other occupations...........................................
Figure C
til1,455
254196113104
847267
64
60
41400
(2)100.0
17.613.57.87.2
5.84.94.6
4.4
4.2
2.827.4
Ten Most Frequent Occupations of Self-Employed Non-filers With the Largest Tax Increase After Examination,Tax Year 1988[Money amounts are in millions of dollars]
Occuotation
All OccupationsConstruction trades.............................................................
Handlers, equipment cleaners, and laborers.......................Mechanics and repairers.....................................................
Transportation and material-moving occupations................
Officials, and administrators, other than government...........
Supervisory, marketing, and sales occupations ...................
Investors..............................................................................Sales of insurance, securities, real estate, and businessservices .............................................................................
Farm operators and managers............................................Sales-related occupations...................................................All other occupations...........................................................
Nettax
increase
2,530.6282.6252.2190.7172.3
123.8111.3104.7
100.881
*857.21,053.2
However, after examination, it was determined thatthere were actually 223,000 (15.3 percent) who were inoccupations subject to a licensing requirement. The totalbalance due on this larger number was $867 million, whilerefund claims totaled only $59 million, resulting in a net
balance due of $808 million, 16.4 percent of the $4,930million net tax due by all self-employed nonfilers whosereturns were secured.
oft 3111=111111111;-The Taxpa, yer Compliance Measurement Program (TCMP)
is a system created to measure the success of the InternalRevenue Service (IRS) in fulfilling its tax collectionmission [5]. For this purpose, two nationwide surveyswere conducted to measure nonfiling of individual incometax returns. The first TCMP individual survey wasconducted for Tax Year 1979. The survey sample wasprimarily limited to leads on nonfiling provided byinformation returns received by the IRS. Therefore, thoseindividuals not subject to information return reporting(including tax withholding) were largely undetectable, andwere not included in the estimate of 2.6 million nonfilersfor that year [6].
The more recent TCMP individual nonfiler survey wasa random stratified sample of approximately 24,000individual apparent nonfilers for Tax Year 1988 [7]. Thesample was constructed by matching a list ofall existingsocial security numbers or SSN's (approximately 313million), less those listed on the "Death Master File" (35million), against all those who filed a tax return in 1989[8]. The SSN's that matched were eliminated, leaving100 million SSN's for which there was no matchingreturn. These became the potential nonfilers. A stratifiedsample of 24,000 SSN's was drawn from the 100 millionfor further investigation to determine if these potentialnonfilers had sufficient income to file tax returns. Ap-proximately 3,500 returns were then secured throughcollection efforts [9].
These 3,500 returns were then sampled for furtherexamination. They were fast stratified into three seg-ments: total tax on the return either zero or unreported,total tax reported $1 to $1,999, and total tax reported$2,000 or more. The sample selection rate was 54 percentwhen the total tax reported ranged from $1 to $1,999, and100 percent for the remaining strata, resulting in morethan 2,200 returns being selected for audit. These returns,when weighted, represented approximately 3.5 millionnonfilers, wage earners, and self-employed. The results oftheir subsequent exan-driations provide the basis for thestatistics in this paper [101.
Notes and References
[1] Information reporting is the process by whichemployers and other financial entities report wagesand other monies paid out to taxpayers and withheldfrom taxpayers on Form W-2, Wage and Tax State- 127
Self-Employ'ed'Noiffilers'. Post-Audit, Tax Year.1988
128
m~nt; F~rrr),. 10?9'-MISC,'Mikel1aneous1nc6ine; an
-d
the like. Thdse repo'rislr~sent t61th6,payee*f6f his or-her records' ind'for use in tax~ rietu'~rn preparation - aswell. as to thOnternil Revenue Service, for 6ompanLson with'what is'subse4uently ieoorted'b' theytaxpayer'oii.hii-br.t.~er'itic6me'taxretum..*~
.For more detailed information on thi develoipmeint,ofadditional combliance, measures for individualincome tax returns, see -Chin. and Sattler,Ho, ChilfCarol E.,"Oeveloping-MeasuTes of ReppitinjC64liance for Individual. Tai,Returns,~' TheJRS
~:-Research Bulletin,- Research-Division,'IntemalReve-
nue-Servic'e,:U.S. 136partnient of thei-Treasu'ry'j*
1992.
[3] For. more, detail see Table 4 and Table 5.1'
[41~-,10cciipAtion:codes. Vere-baiged.on ffie'Standard,Occup'4,tionalClassificatio'n'Afanual.,,,'1980.'Offido6f~~Federal,'Stati§,ti6al.Poli6y.~n.d~St.;tndardg",U.S..'.
nt of Comrnerce~
[5],.The Servicd7s;pbjectives in, conductirig'the'1988&Onfiler TCMRs
,urvey were to .obtain ififo~mation.'fo~
t.heccn~imung development and
., improvem
.ent of th
.e
0 stem~to idetitify'n mp liant tAxpayers;Ao~estimate the.to6i nitiffiberof nonfilers
I, those wh
.o
were unk1lown to.the IRS,,as well as'.thosd.for'whkh.-~_4he-,§drvi:ce had
.an j
-rives
.tigativ.e,16ad 0eyelope
.d', from
-,information ret4iris; o es ma eti ihe,~ of the taxi.,dwtd by-these nonfilers; to' d6vel6p~ptofile§ of the.,
v,.iriqus fypes,ofnonfiIers,in6.rd6rt6 evaluate
.,".aliehiatiyestr4tegi.es.fo~,d6all'i.~,g"'N~i~th~.delinqueiit.taxpayets;,And to,.measu're the ac urac'v,'ofs6cur'ed'delin4tient returns'..
[61: Grieiberl~ Michael 1.1 Nichols;, 136nnie~L_and,Spar,row,
~ I)., 'Afthur', "Characteristics' of Delihq6eht Re-
ffis,""The IRS Research Bulletin,* ResiirchT:Divi-sion Internal Revenue Sdrvici Department of. thee,
.. Treasury, 4992.
,[7] There was also A.TCMI) study of individ:'al'i " -' ~u ncometax,returns.that were timely filed forTax Year 1.988.For infoiniation on'the re rti ii~g. comp iance of seTo qlf-employed-individuals Who filed their retums,,'6n, time,see"Christian Charl s-W."."Conip liance of Sole' Proprietors Findings From 1988 TCMP Phase"EII, Cycle10".1 -,,The.IRS Research Bulletin, Research Division;1ntdmal.Revdmie Service,,.U.S.Department oftheTieAsury .99
[81 The,D~ath'Master File:is an. incomplete list of de-ceasedl,individiials with social security numbers(SSN's). The DeathMister File and the list of
..~iisting SSN's ~, with'the corresponding, names and4ges,'were 6btained-fr6m the Social Security Admin-ti
fbrbse ih'tak aarrunis ation
[9] For-the cfiar'ac'teristics:of the 3,500 secured returns,see Rosage, LauraR." "Self-Employed'Nonfilers,1998, Statistics of Inconie Bulletin, Summer. 1993,Volume 13, Nurriber 1.
axpayer ompC liari~6M&aguferfi6nt.lftbgra-m-e-x~'aminati6ns are normally,much more,extdn§ive than
-normaloo6iati6nail atidits. In normal operationalaudits, examiners concentrate only.on'thoseissues forwhich there is the greatest likelihood of asubstantial,error, havin'g a bearing 'on tax liability.. . However,-since tCMP 6ximinatioris are designed -to providestatlistics, for use in tax adin. ihistratibn.research, all.potential issuei, i.e., uhreportedincome. overstateddeductions-~afid cte(hts..as Well as any 6ther.,disciep-ancies, -such as in the re orting of occupation'or inp-dustfialactivi 6ode,areall,venfied.:,
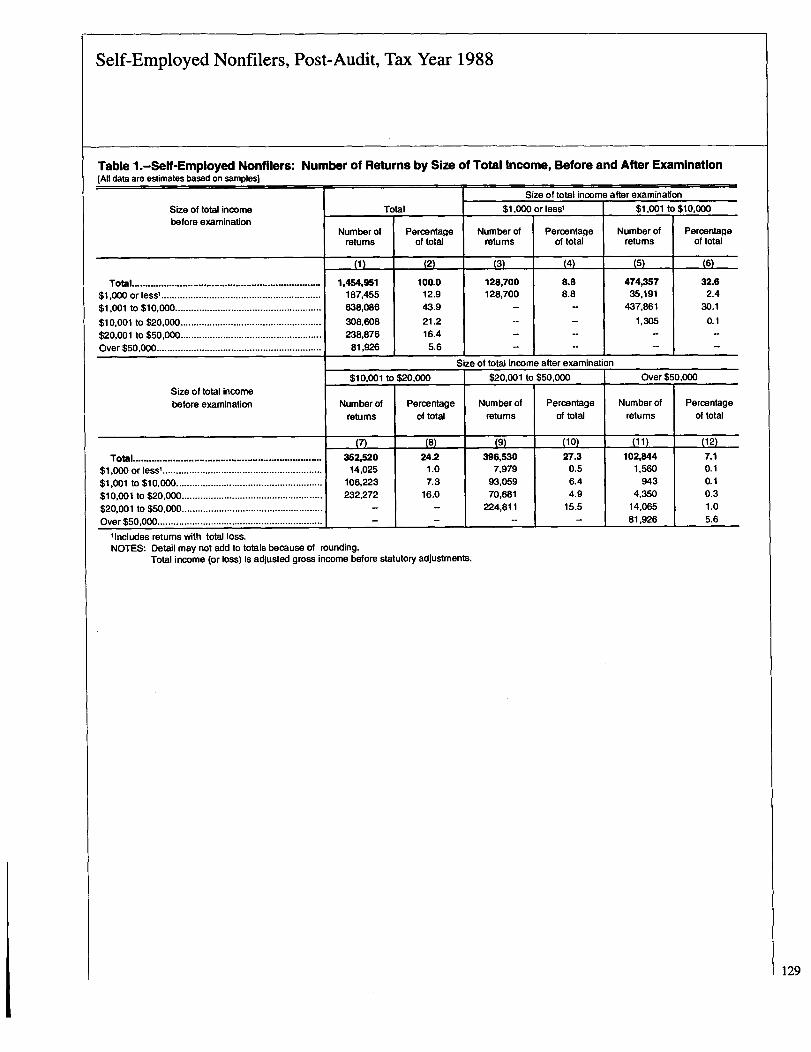
Self-Employed Nonfilers, Post-Audit, Tax Year 1988
Table l.-Self-Employed Nonfilers: Number of Returns by Size of Total Income, Before and After Examination(All data are estimates based on samples)
Size of total income after examinagon
Size of total income Total $1,000 or less' $1,001 to $10,000before examinabon
Number of Percentage Number of Percentage Number of Percentagereturns Of total returns of total returns of total
(1) (2) (3) (4) (5) (6)
Total ....................................................................... 1,454,951 100.0 128,700 8.8 474,357 32.6$1,000 or less' ............................................................ 187,455 12.9 128,700 8.8 35,191 2.4$1,001 to $10,000 ....................................................... 638,086 43.9 - 437,861 30.1
$10,001 to $20,000 ..................................................... 308.608 21.2 1,305 0.1$20,001 to $50,000 ..................................................... 238,876 16.4 - -
Over$50,GDO .............................................................. 81,926 5.6 1Size of total income after examinati on
$10,001 to $20,000 $20,001 to $50,000 Over $50,000Size of total incomebefore examination Number of Percentage Numberof Percentage Number of Percentage
returns of total returns of total returns of total
(7) (8) (9) (10) (11) (12)
Total ....................................................................... 352,520 24.2 396,530 27.3 102,844 7.1$1,000 or less' ............................................................ 14,025 1.0 7,979 0.5 1,560 0.1$1,001 to $10,000....................................................... 106,223 7.3 93,059 6.4 943 0.1$10,001 to $20,000 ..................................................... 232,272 16.0 70,681 4.9 4,350 0.3$20,001 to $50,000 ..................................................... - - 224,811 15.5 14,065 1.0Over $50,000...-................................................ 1 81,926 5.6
'includes returns with total loss.NOTES: Detail may not add to totals because of rounding.
Total income (or loss) is adjusted gross income before statutory adjustments.
129
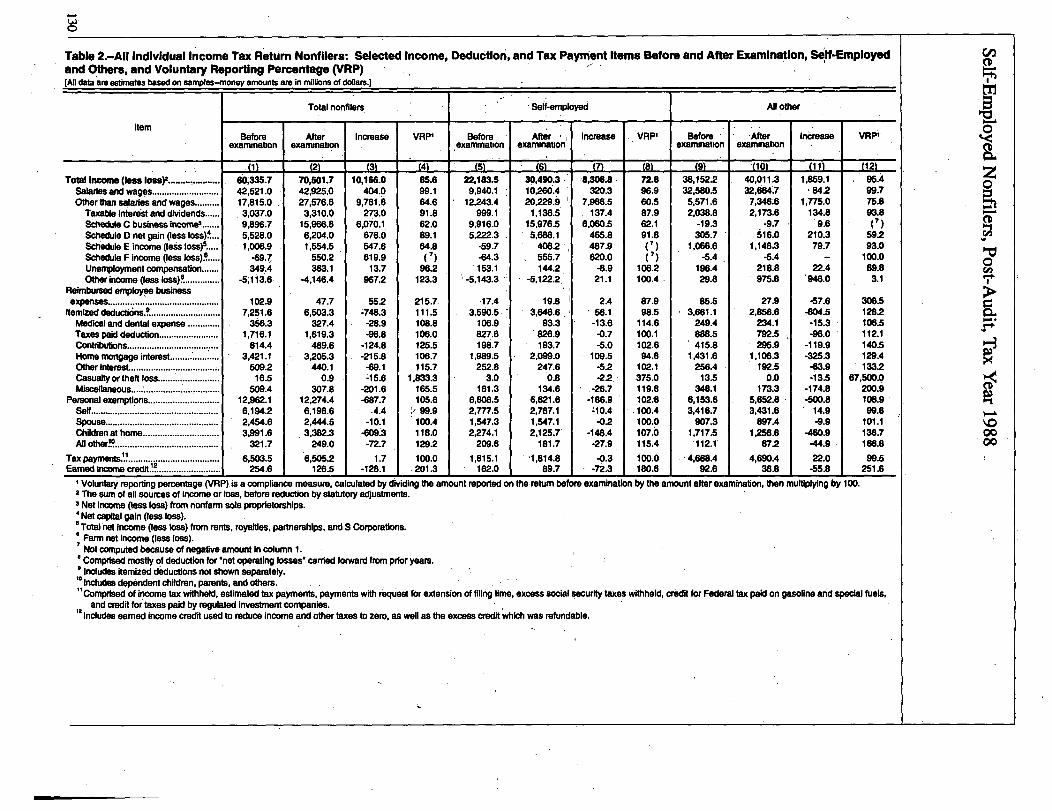
Table 2.-All Individual Income Tax Return Nonfliers: Selected Income, Deduction, and Tax Payment Items Before and After Examination, Salf-Employedand Others, and Voluntary Reporting Percentage (VRP)[All data are estimates based on sarnples-money amounts are in millions of dollars.]
Total nonfilers
Item
Total Income (lose loser.....................Sallades and wages...........................Other than salaries and wages..........
Taxable interdst and dividendsSchedule C business lncome3 .......Schedule D net gain (less loss)~Schedule E income (less loss)~....Schedule F income (less loss)!Unemployment compensation.......Other Income (less loss)~ ..............
Reimbursed employee businessexpenses.............................................Itemized deductiiins.t ............................
Medical and dental expense .............Taxes paid deduction ........................Contributions.....................................Home mortgage interest ....................Other InteresL..................................!.Casualty or theft loss ......... . ..............Miscellaneous.....................................
Personal exemptions.............................sell....................................................
spouse..............................................Children at home...............................All otherl~..........................................
Tax paymsnls~!.....................................Earned ftorne credit~~.........................
VRP1
(4)85.699.164.691.862.089.164.8(7)
96.2123.3
215.7111.5108.8106.0125.5106.7115.7
1,833.3165.5105.699.9
100.4118.0129.2
100.0.201.3 1
Beforeexamination
(5)22,183.5
9,940.112,243.4
999.19,916.05=3
-59.7-64.3
153.11-5,143.3
17A3,590.5
106.9827.6198.7
1,989.5252.8
3.0161.3
61808.52,777.51,547.32,274.1
209.6
1,815.1162.0
- Self-employed
After , ,examination
. (6)30,490.3.10,260.420,M.0
1,136.515,976.55,688.1
4082555.71".2
-5,122.2,
19.83,646.6
93.3826.9193.7
2,099.0247.6
0.8134.6
6,621.62,767.11,547.12.125.7'
181.7
1,814.889.7
Increase
(7)8,306.8.
320.37,986.5
137.46,060.6
465.8467.9620.0
-8.921.1
2.466.1
-13.6-0.7-5.0
109.5-5.2-2.2,
-186.9'10.4
-0.2-148A
-27.9
-0.3-72.3
VRF"
(8)72.896.960.587.962.191.8(7)
(7)
106.2100.4
87.998.5
114.6100.1102.694.8
102.1375.0119.8102.8
1 OD.0107.0115.4
100.0180.6
Before *examination
(9)38,152.232,580.5
5,571.62,038.8
-19.3305.7
1,066.6-5.4
196.429.8
85.53,661.1
249.4686.6415.8
1,431.6256.4
13.5348.1
6,153.63,416.7
907.31,717.51 112.1
.4,868.492.6
All other
-Afterexaminabon
increase VRP`
(10140,011.332,664.7
7,346.62,173.6
-9.7616.0
1,146.3-5.4
218.8975.8
27.92,856.6
234.1792.5295.9
1,106.3192.5
0.0173.3
5,652.83,431.6
897.41,256.8
67.2
4,690.4362
, 01)1,859.1
,84.21.775.0
134.819.6
210.379.7
22.4946.0
-57.6-804.5
-15.3-96.0
-119.9-M.3
-63.9-13.5
-174.8-500.8
14.9-9.9
-460.9-44.9
22.0-55.8
02195.499.7
75.893.8(7)
59293.0
100.089.8
3.1
306.51282106.5112.1140.5129A1332
67,500.0200.9108.999.6
101.1136.7166.8
99.5251.6
Voluntary reporting percentage (VRP) is a compliance measure, calculated by dividing the amount reported on the return before examination by the amount after examination, then multiplying by 1W.The sum of all sources of income or loss, before reduction by statutory adjustments.Not inoomai (less loss) from nonfarm sole proprietorships.
4 Net capital gain (less loss).
: Total not income (loss loss) from rents, royalties, partnerships, and S Corporations.
7 Farm not income (loss loss).Not computed because of negative amount in column 1.Comprised mostly of deduction for 'net operating losses* carried forward from prior years.Includes Itemized deductions not shown separately.Includes dependent children, parents, and others.Comprised of income tax withheld, estimated tax payments, payments with request for extension of filing time, excess social security taxes withheld, credit for Federal tax paid on gasoline and special fuels,
12 and credit for taxes paid by regulated investment companies.Includes earned Income credit used to reduce income and other taxes to zero, as well as the excess credit which was refundable.
Beforeexamination
(1)66,335.7'42,521.017,815.0
3,037.09,896.75,528.01,DD6.9
-69.7349.4
-51-113.6
102.97,251.6
3~6.31,716.1. 614.43,421.1
509.216.5
509.412,962.16,194.22,454.63,991.6
321.7
6,503.5254.6
Afterexamination
(2)70011.742,925.027,576.6
3,310.015,966.86,204.01,554.5
550.2363.1
-4,146.4
47.76,503.3
327.41,619.3
489.63,205.3
440.10.9
307.812,274.46,198.62,444.53,382.3
249.0
6,505.2126.5
Increase
(3)10,166.0
404.09,761.6
273.06,070.1
676.6547.6619.9
13.7967.2
55.2-748.3
-28.9-96.8
-124.8-215.8
-69.14 5.6
-201.6-687.7
-4.4-10.1
-609.3-72.7
1.7-128.1
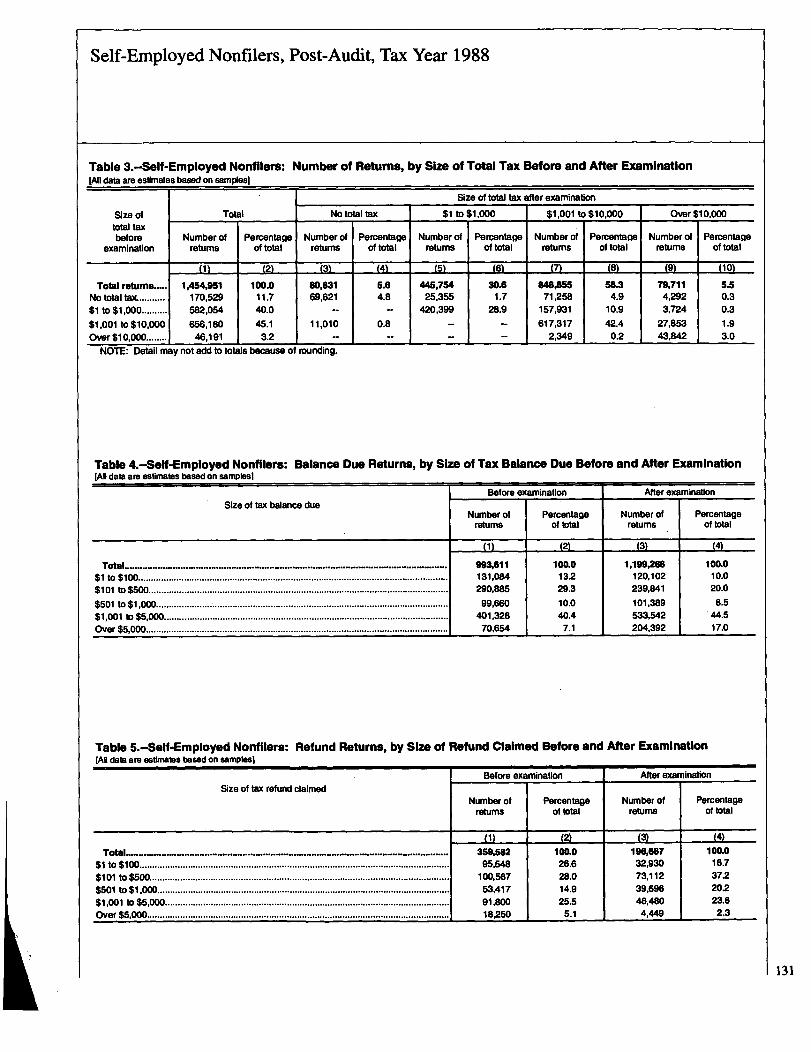
Self-Employed Nonfilers, Post-Audit, Tax Year 1988
Table 3.--Seff-Employed Nonfilers: Number of Returns, by Size of Total Tax Before and After Examination[All data am estimates based on samples)
Size oftotal taxbefore
examination
Total returris.....No total tax..........$1 to $1,000..........
$1,001 to $10,000Over $10,000 ........
Number ofreturns
0)
1,454,951170,529582,054
656.18046,191
Total
PercentageOf total
(2)
100.011.740.0
45.13.2
No total tax
Numberofreturns
M
80,63169,621
11,010
NOTE: Detail may not add to totals because of rounding.
PercentageOf total
AL5.64.8
0.8
Size of total tax after examination
$1 to $1,000
Numberolreturns
M
445,75425,355
420,399
Percentageoftotal
_U6
30.61.7
28.9
$1,001 to $10,000
Numberofreturns
Percentageof total
M
$48,85571,258
157,931617,317
2,349
I&
58.34.9
10.9
42.40.2
Over $
Numberofreturns
19A
79,7114,2923,724
27.85343,842
(10)
5.50.30.31.93.0
Table 4.-Self-Employed Nonfilers: Balance Due Returns, by Size of Tax Balance Due Before and After Examination[All dats are estimates based on samples)
Size of tax balance dueBefore examination
Number ofreturns
Total..................................................................................................................$1 to $100 ..........................................................................................................................
$101 to $500......................................................................................................................
$501 to $1,OOD...................................................................................................................
$1,001 to $6,000................................................................................................................
Over $5,000 .......................................................................................................................
"1
993,611131,084290,885
99,660401,328
70,654
PercentageOf total
"2
100.013229.310.040.4
7.1
After exam
Number ofreturns
L3)
1,199,266120,102239,841
101,389533,542204,392
10,000
PercentageOf total
(4)
100.010.020.0
8.5'44.5
17.0
Table 5.-Self-Employed Nonfilers: Refund Returns, by Size of Refund Claimed Before and After Examination[All data are estimates based on samplesl
Size of tax refund claimedBefore examination
Number ofreturns
Total.................................................... ..........................................................$1 to $100 ..........................................................................................................................
$101 to$500 .....................................................................................................................
$501 to $1,000...................................................................................................................
$1,001 to $5,000 ................................................................................................................Over $5,000 .......................................................................................................................
L11359,582MW
100,56753,41791,80018,250
Percentageof total
D2
100.026.628.014.925.5
5.1
After exam
Number ofreturns
L3)_ _
196,66732,93073,11239,69646,480
4,449
ination
PercentageOf total
ination
Percentageof total
(4)
100.016.737220223.6
2.3
131
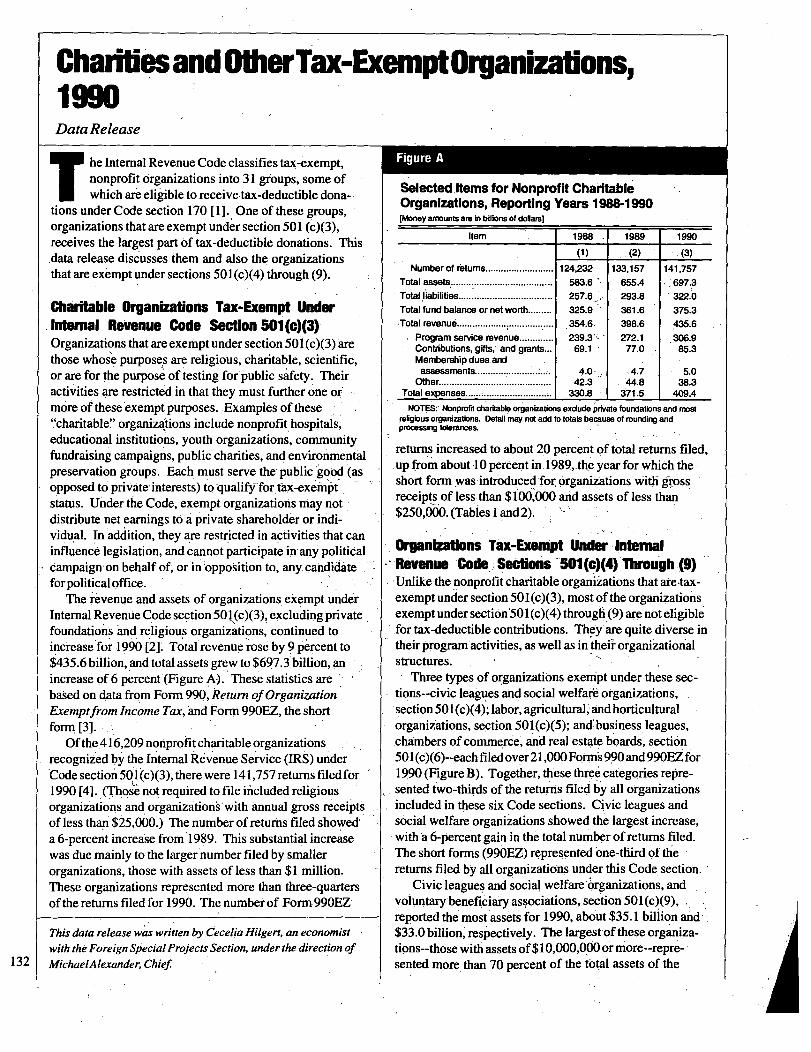
Charities and Otheffax-Exempt.Organir:ations,
132
19MDataRelease
T
he Internal Revenue Code classifies tax-exempt,nonprofit organizations into 31 groups, some ofwhich are eligible to receive tax-deductible dona-
tions under Code section 170 [1]. One of these groups,organizations that are exempt under section 501 (c)(3),receives the largest part of tax-deductible donations. This,data release discusses them and also the organizationsthat are exempt under sections 50 1 (c)(4) through (9).
Charitable Organizations Tax-Exempt UnderInternal Revenue Code Section 501 (c)(3)Organizations that are exempt under section MI (c)(3) arethose whose purposes are religious, charitable, scientific,or are for the purpose of testing for public safety. Theiractivities are restricted in that they must further one or
,
more of these exempt purposes. Examples of these"charitable" organizations include nonprofit.hospitals,
1educational institutions, youth organizations, communityftindraising campaigns, public charities, and environmentalpreservation groups. Each must serve the public'gobd (asopposed to private interests) to qualify'for tax-exemptstatus. Under the Code, exempt organizations may notdistribute net earnings to a private shareholder or indi-vidual. In addition, they are restricted in activities that caninfluence legislation, and cannot participate in any politicalcampaign,on behal
'f of, or in ~opposition to, any candidate
forpolitical office.The revenue and assets of organizations exempt under
Internal Revenue Code section 501~(c)(3), excluding privatefoundations and religious organizations, continued toincrease for 1990 [2]. Total revenue rose by ? percent to$435.6billion, and total assets grew to $697.3 billion,anincrease of 6 percent (Figure A). These statistics arebased on data from Form 990, Return ofOrganizationExemptfrom Income Tax, and Form 990EZ, the shortform. [3].
Of ther416,209nonprofit charitable organizationsrecognized by the Internal Revenue Service (IRS) under'Code section 501 (c)(3); there were 14 1,757 returns filedfor1990 [4]. (Thos'e* not required to file included religiousorganizations and, organizations with annual gross receiptsof less than$~5,000.) The number of returns filed showed,a 6-percent increase from'l989. This substantial increasewas due mainly to the larger number filed by smallerorganizations, those with assets of less than $1 million.These organizations represented more than three-quartersof thereturns filed for 1990. The numberof Form 990EZ
Figure A
Selected.ftems for Nonprofit CharitableOrganizations, Reporting Years 1988-1990[h4oney arrounts are in billions of dollars]
Item 1988 1989 1990
(1) (2) .(3)
Number of riatums .......................... 124,232 133,157 141,757Total assets ....................................... 583.6 655A - 697.3Total)!abilities .................................... 257.6 293.8 322.0Total fund balance or net worth ......... 325.9 361.6 375.3-Total revenue............................ ........ 354.6. 398.6 435.6
Program service revenue............. 239.3', 272.1 .306.9Contributions, gifts, and grants... 69.1 77.0 85.3Membership dues andassessments......... .................... 4.0- A7 5.0
Other .......................................... 42.3 44.8 38.3Total expenses ................................. 1 330.8 371.5 409.4
NOTES: Nonprofit charitable organizations exclude private foundations and mostreligious organizations. Detail may not add to totals because of rounding andprocessing tolerances.
returns increased to about 20 percent of total returns filed,up from about .10 percent in. 1989,,th.e,year for which theshort form was,intr6duced for o
.anizAtions With grossrg
receipts ofless. than $100,000 and assets of less than.$250,000. (Tables I and2).
nizations Tax-Exempt Under Internal,, Revenue Code, .: Sections - 501 (c)(4) Through (9)
Unlike the nonprofit charitable organizations that are~tax-exempt undersection 501(c)(3), most of the organizationsexemptunder secti6n'501 (c)(4) through.(9) are not eligiblefor tax-deductible contributions. The are quite diverse inI Ytheir program activities, as well as in theii organization
.al
structures. I .
Three types of organizations exempt under these see-tions--civic leagues and social welfar,6 organizations,section 50 1 (c)(4); labor, agricultural,'-andhorticulturalorganizations, section 501(c)(5); and'business leagues,chambers ofcommerce, and real estate boards, section501 (c)(6)--each filedover21,000 Forms 9,90and990EZ for19.90 (Figure B). Together, these three categories repre-sented two-thirds of the returns filed by all organizationsincluded in these six Code sections. Civic leagues andsocial welfare organizations showed the largest increase,with'a 6-percent gain in the total number of returns filed.The short forms (990EZ) represented one-third of the -returns filed by all organizations under this Code. section.
Civic leagues and social welfare'prganizations, andvoluntary beneficiary associations, section 501(c)(9),reported the most assets for 1990, about $35.1 billion and:
7his data release was written by Cecelia Hilgert, an economist
with the Foreign Special Projects Section, under the direction ofMin etAtexander, Chief
$33.0 billion,'respectively. The largest of these orgamza-tions--those With assets of$10,000,000ormore--repre-sented more than 70 percent of the total assets of the
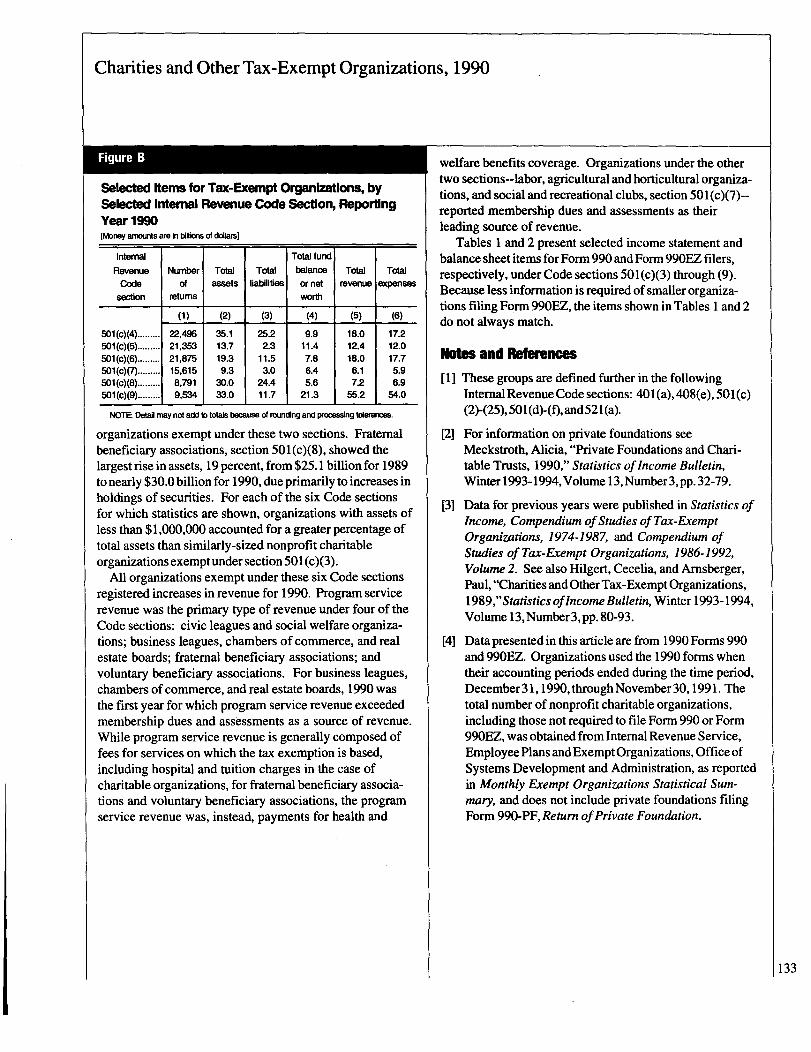
Charities and Other Tax-Exempt Organizations, 1990
Figure B
Selected Rem for Tax-Exempt Organizations, bySelected Internal Revenue Code Section, ReportingYear 19W[k4onsy amounts are in billbr. of dollars]
Internal Total fund
Revenue Number Total Total balance Total TotalCode Of assets liabilities or net revenue expenses
section returns worth
(1) (2) (3) 1 (4) (5) (6)
501(c)(4) 22,496 35.1 25.2 9.9 18.0 17.2501(c)(5) 21,353 13.7 2.3 11.4 12.4 12.0501(c)(6) 21,875 19.3 11.5 7.8 18.0 17.7501 (c)M 15,615 9.3 3.0 6.4 6.1 5.9501(c)(8) 8,791 30.0 24.4 5.6 7.2 6.9501(c)(9) 9,534 33.0 11.7 21.3 55.2 54.0
NOTE Detail rnay not add to totals because of romcing and Wooessing tolerances.
organizations exempt under these two sections. Fraternalbeneficiary associations, section 501(c)(8), showed thelargest rise inassets, 19 percent, from $25.1 billion for 1989to nearly $30.0billion for 1990, due primarily to increases inholdings of securities. For each of the six Code sectionsfor which statistics are shown, organizations with assets ofless than $1,000,000 accounted for a greater percentage oftotal assets than similarly-sized nonprofit charitableorganizations exempt under section501 (c)(3).
All organizations exempt under these six Code sectionsregistered increases in revenue for 1990. Program servicerevenue was the primary type of revenue under four of theCode sections: civic leagues and social welfare organiza-tions; business leagues, chambers of commerce, and realestate boards; fraternal beneficiary associations; andvoluntary beneficiary associations. For business leagues,chambers of commerce, and real estate boards, 1990 wasthe first year for which program service revenue exceededmembership dues and assessments as a source of revenue.While program service revenue is generally composed offees for services on which the tax exemption is based,including hospital and tuition charges in the case ofcharitable organizations, for fraternal beneficiary associa-tions and voluntary beneficiary associations, the programservice revenue was, instead, payments for health and
welfare benefits coverage. Organizations under the othertwo sections--labor, agricultural and horticultural organiza-tions, and social and recreational clubs, section 501 (c)(7)--reported membership dues and assessments as theirleading source of revenue.
Tables I and 2 present selected income statement andbalance sheet items forForm 990 andForm 990EZ filers,respectively, under Code sections 501 (c)(3) through (9).Because less information is required ofsmaller organiza-tions filing Form 990EZ, the items shown in Tables I and 2do not always match.
Notes and Refemnces
[11 These groups are defined further in the followingInternal Revenue Code sections: 401(a), 408(e), 501 (c)(2)-(25),501 (d)-(f), and52 1 (a).
[21 For information on private foundations see
[31
Meckstroth, Alicia, "Private Foundations and Chari-table Trusts, 1990," Statistics of Income Bulletin,Winter 1993-1994, Volume 13,Number 3, pp. 32-79.
Data for previous years were published in Statistics ofIncome, Compendium ofStudies ofTax-ExemptOrganizations, 1974-1987, and Compendium ofStudies of Tax-Exempt Organizations, 1986-199ZVolume 2. See also Hilgert, Cecelia, and Amsberger,Paul, "Charities andOtherTax-Exempt Organizations,1989,"StatisticsofIncome Bulletin, Winter 1993-1994,Volume 13,Number 3, pp. 80-93.
[4] Data presented in this articleare from 1990 Forms 990and 990EZ. Organizations used the 1990 forms whentheir accounting periods ended during the time period,December31, 1990, throughNovember 30,199 1. Thetotal number of nonprofit charitable organizations,including those not required to file Form 990 or Form990EZ, was obtained fromInternal Revenue Service,Employee Plans andExemptOrganizations, Office ofSystems Development and Administration, as reportedin Monthly Exempt Organizations Statistical Sum-mary, and does not include private foundations filingForm 990-PF, Return ofPrivate Foundation.
133
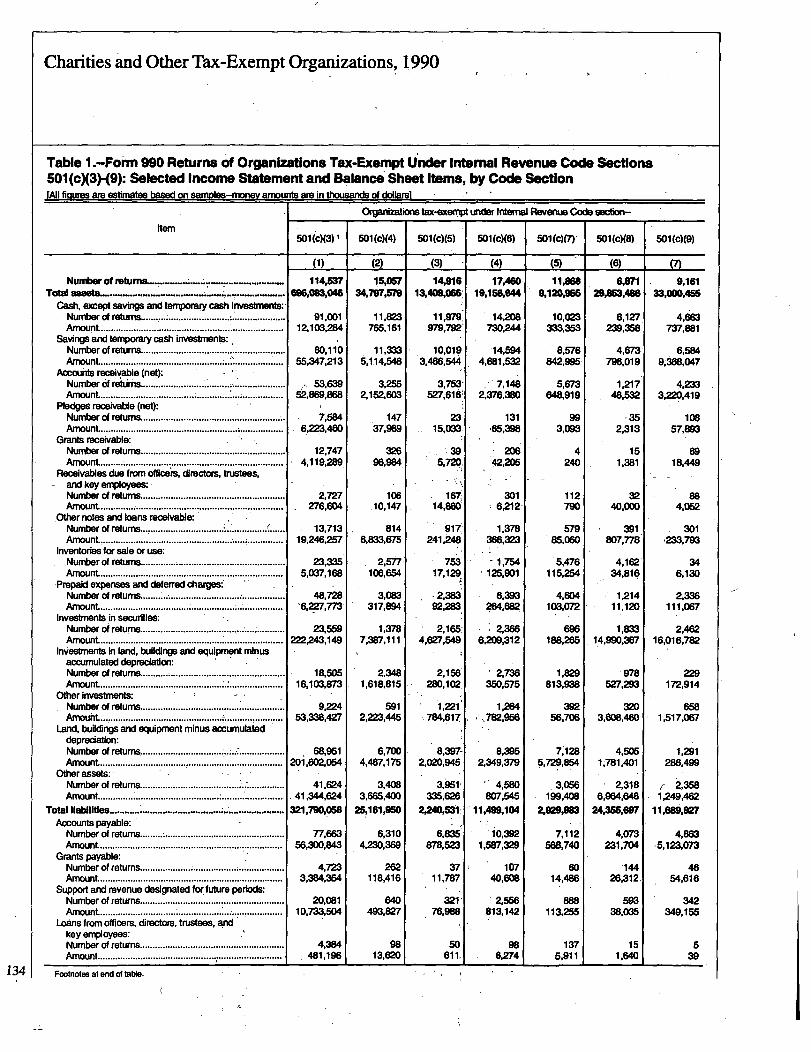
134
Charities and Other Tax-Exempt Organizations, 1990
Table I.-Form 990 Returns of Organizations Tax-Exempt Under Internal Revenue Code Sections501(cX3)-(9): Selected Income Statement and Balance Shoot Items, by Code SectionrAll fioures are estimates based on samples-moriev amounts am in thousands of dollars
501(c)(3)1
(1)
114,637OWN3,046
91,00112,103,284
80,11055,347,213
'.' 53,63952,869,868
7,5846,223,460
12,7474,119,289
2,727276,604
13,71319,246,257
23,3355,037,168
48,728'6,2Z7,773
23,559222,243,149
18,50516,103,873
9,22453,338,427
68,95120i.602,064
41,624. 41,344,624321,790,058
77,66356,300,843
4,7233,384,354
20,08110,733,504
4,384481,196
Organizations twc-exempt under Intemal Revenue Code section-
501(c)(4)
(2)
15,05734,797,M
11,823765,161
11,3335,114,546
3,2552,152,603
14737,969
32696,984
10610,147
8146,833,675
2,577106,654
3,083317,894
1,3787,387,111
2,3481,618,815
5912,223,445
6,7004,467,175
3,4083,665,400
25,161,950
6,3104,230,369
262118,416
640493,827
9813,620
501(c)(5)
(3)
K916113,409,066~
1 1'T19.979,792-
10,0193,466.544
3,753*527,616
2315,033
395,720.
16T14,86d
917.241,~48
75317,129
-2,38392.283
Z165:4,6Z7,549
Z156280,102,
1,221784,617
8,397-2,020,945
3,95t335,626
2,Ml,53t
6,835878,523
3711,787
321,76,988
50611,
501(c)(6)
04
17AM19.156.644
14,208730,244
14,5944,681,5W
7,1482,376,380
131-65,398
M42,205
3016,212-
1,378366,323
-1,754125,901
6,393g64,682
2,3666,2D9,312
2,736350,575
1,264,782,956
8,3952,349,379
4,580807,545
11,499,104
10,3921,597,329
10740,608
2,556813,142
986,274
501(c)(7)
C5)
II'M9,120,955
10,023333,353
8,576842,995
5,673648,919
993,093
4240
112790
57985,060
5,476115,254
4,604103,072
696188,265
1,829813,938
39256,706
7,1285,729,854
199,4082,929,983
7,112568,740
6014,486
888113,255
1375,911
501(c)(8)
(6)
61M2"0,486
6,127239,358
4,673796,019
1,21748,532
2,313
151,381
3240,000
391807,778
4,16234,816
1,21411,120
1,83314,990,367
978527,293
3203,608,460
4,5051,781,401
2,3186,964,648
24,.W,607
4,073231,704
'14426,312
sw38.035
151,640
(7)
Nundxw of returns___......4 ......... .............. .......Total assets.......
Cash, except savings and temporary cash investmentsNumber of returns ........................................................Arn0unt ........................................................................
Savingsand temporary cash investments:~:....................Number of returns ...................................
Amount. ........................................................................Accounts receivable (not):
Number of reitirns ..........................................................Amount..................................... ...............
Pledges receivable (net):Number of returns ........................................................AmounL ...................................................... .................
Grants receivable:Number of returns ......
..................................................Amount ........................................................................Receivables due from officers, directors, trustees,
and key employees: -Number of returns ........................................................Amount ............. ;......................................
Othar notes and bans receivable: .Number of returns................................. ................ .....Amount..................................................... ..............
Inventories for sale or use:Number of returns .........................................................Amount..........................................................
-Prepaid expenses and deferred chargw.Nurriber of returns ......... .............................................Amount..................................................... ..................
Investments in securities:Number of returns......................................... ...........Amount ........................................................................
InvesUrlents in land, buildings and equipment minusaccumulated depreclation:Number of returns .......... .............................................Amount.................
........................................
Other investments:Number of returns.........................................................Amount ................................................ ;........................
Land, buildingsand equipmentminus accumulateddepredation:Number of returns........ ...................................................Amount ........................................................................
Other assets:Number of returns......................................... ..............Amount................................................. ........................
Total liabilities.......................................................................
Accounts payable:Number of returns......... ...............................................Amount. ................................................b.......................
Grants payable:Number of returns.................... ; ................. ;..................AMOML........................................................................
Support and revenue designated for. future periods:Number of returns................................
:*-'*-'*---*-Amount .............................. ...........................................
Loans from officers, directors, trustees, andkey employees:Number of returns.........................................................Amount..........................................................................
Footnotes at end of table.
ROM501(c)(9)
9116133,000,455
4,663737,881
6,5849,368,047
4,2333,220,419
10857,893
6918,449
884,052
301-233,793
346,130
2,336111,067
2,46216,016,782
229172,914
6581,517,067
1,291286,499
2,3581,249,462
11,680,927
4,863-5,123,073
4654,616
342349,155

Charities and Other Tax-Exempt Organizations, 1990
Table 1.-Form 990 Returns of Organizations Tax-Exempt Under Internal Revenue Code Sections501(cX3)-(9): Selected Income Statement and Balance Sheet Items, by Code Section-Continued[All ficuresare estimates based on samples-rnoney amounts are In thousands of dollaw
501 (c)(3)
(1)
39,817132,804,221
34,313118,085,938
113AU374,292,965
114,532434RMA59
96,12684,687,527
87,13139,395,074
23,T718,055,551
36,32037,236,904
68,526306,573,648
25,3814,901,887
93,0406,556,484
21,55413,193,691
17,9901,019,OD9
18,2322,338,773
7,3941,319,763
4,2442,894,799
21,0594,279,676
11,8353,789,677
11,486156,043,998
10,628152,254,321 1
Organizations tax-exempt under Internal Revenue Code section-
501 (c)(4)
(2)
3,59710,920,820
3,0469,384,897
14,9369,635,639
15,05217,WAll
6,9081,T78,941
5,976932,690
983154,260
2,254691,992
5.68811,531,128
9,1182,007,854
13,019854,529
1,354256,803
3.169191,219
3,221340,678
1,404149,459
28163,583
1,06943,585
35913,794
3842,744,041
3622,730,248
501 (c)(5)'
(3)
2,467638,436
3,155634,186
14,67011,168,551
14,91612AW,030
1,682255,938
1,31066,429
22896,595
42592,915
4,0972,650,656
13,4867,329,865
13,001476,758
1,882222,423
3,02635,132
3,060120,767
1,23085,635
35932,073
1,329204,433
4558,028
5033,220,514
5003,212,486
501 (c)(6)
(4)
3,0191.448,343
5,4277,603,410
17,32117,659,W
17,46017,817,926
4,255980,235
2,989306,503
70385,267
1,373588,465
11,6367,570,392
15,8407,259,739
16,129513,217
1,866333,888
2,14521,525
2.171105,110
1,00883,585
38419,236
1,36795,911
44739,331
4293,099.338
4463,060,007
501 (01711
(5)
4,6581,711,262
3,803516,338
11AN6,1190,1167
IIAN5,M,8W
1,97636,140
1,71126,110
4029,294
18736
6,3131,061,909
10,7183,426,733
10,32183,411
78313,838
2,64542,887
2,64272,231
1,16429,344
2305,438
99716,270
2422,308
23938,985
23536,677
501(c)(8)
(6)
2,544299,255
2,18123,758,747
6,8415A97,M
6,8717,159,991
3,64391,043
3,43676,037
49014,112
23894
2,9625,858,421
6,410469,342
5.96071,171
869188,573
1,96323,026
1,97956,177
71133,151
16213,788
67952,594
34413,332
350926,874
3D5913,542
Footnoles at end of tatie.
Itern
Total Ilablittles (continued)Mortgages and other notes payable:Numberof returns.........................................................Amount
OtherNumberof returns.........................................................Amount............. . ..........................................................
Total fund balance or not worth:Number of returns...................................AmounL ............ ...........................................
Total revenue:Number of returns....................... ..................Amount..................... ..... .....................................
Contributions, gifts, and grants:Number of returns .........................................................Amount .........................................................................Contributions received from direct public supportNumber of return&....................................................Amount....................................................................
Contributions received from indirect public supportNumberof returns ....................................................Amount ....................................................................
Government grants.Numberof returns.....................................................Amount.....................................................................
Program service revenue:Number of returns .........................................................Amount ........................................................................
Membership dues and assessments:Number of returns .........................................................Amount .........................................................................
Interest on savings and temporary cash investments.
Numberof returns .........................................................Amount.........................................................................
Dividends and interest from securities:Numberof returns.........................................................Amount.........................................................................
Not rental income (loss):Numberof returns.........................................................
Not income pass loss) ..................................................Gross rents:Numberof returns.....................................................Amount.....................................................................
Rental expensew.Number of returns.....................................................Amount.....................................................................
Other investment income:Numberof returns .........................................................Amount.........................................................................
Total net gain (loss) from sales of assets:Numberof returns .........................................................
Net gain (less loss).......................................................Gain Qoss), sales of securitiew.Number of returns.....................................................Net gain (less loss)...................................................
Gross amount from sales:Number of returns ........................................... .....Amount.................................................................
Cost or other basis and sales expense:Number of returns .................................................Amount.................................................................
501(c)(9)
(7)
6567,609
2,9126,095,435
8'W21,310,528
9,16155,165,697
3853,374,444
3383,067,959
50230,585
9075,900
7,46643,611,858
1,0912,406,846
7,5201,035,121
2,1843,387,322
106763
10810,358
509,595
51088,829
1,435225,988
1,354228,696
1,47738,696,568
1,46938,467,872
135
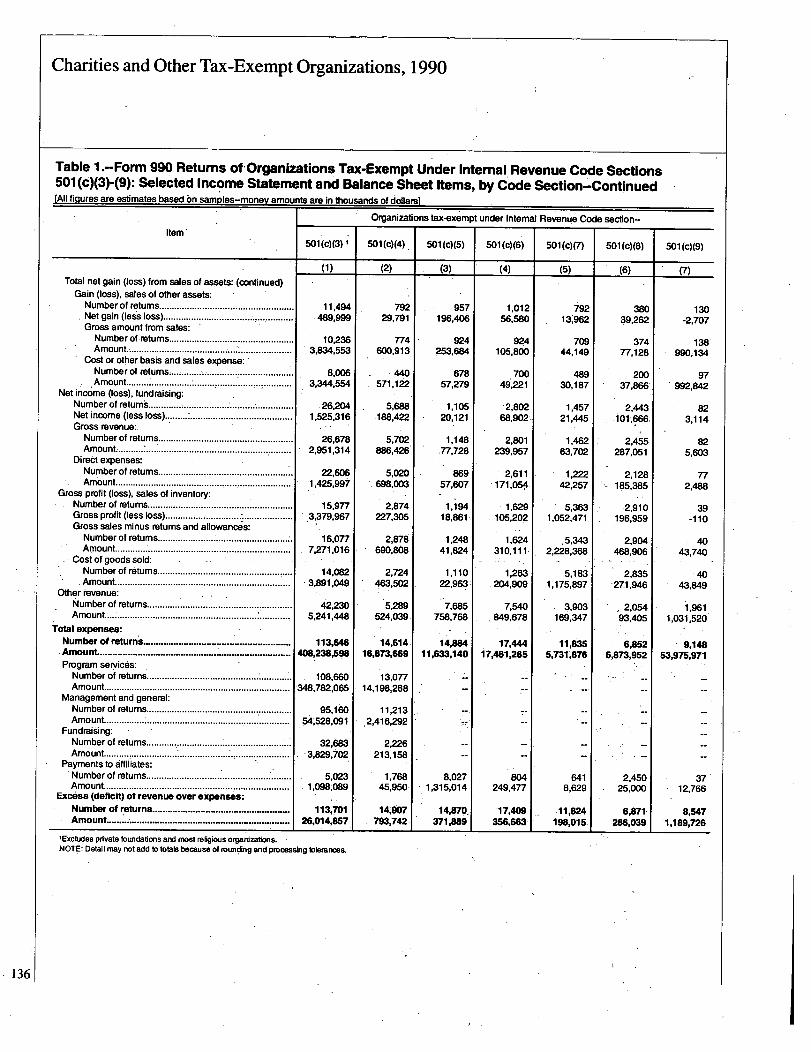
Charities and Other Tax-Exempt Organizations, 1990
Table I.-Form 990.Returns of-Organizations Tax-Exempt Under Internal Revenue Code Sections501 (c)(3)-(9): Selected Income Statement and Balance Sheet Items, by Code Section-Continued[All fi-quires are estimates based on sam~les-money amounts are in thousands of dollarsl
Item501(c)(3)'
Organizations tax-exempt under Internal Revenue Code section-
5011(c)(4).
Total net gain (loss) from sales of assets: (continued)Gain (loss), sales of other assets:Number of returns .....................................................Net gain (less loss) .................................... ..........Gross amount from sales: 'Numberof returns .................................................Amount........................................ . .........................
Cost or other basis and sales expense:Numberof returns .......................................
I............
Amount .......................... ......................................Net income (loss), fundraising:
Number of returns.........................................................Net income (less loss) ...................................................Gross revenue:Numberof returns.....................................................Amount ................................. ...................................
Direct expenses:Number of returns .....................................................
-Amount .................. ..... .......................
... *...........................
Gross profit (loss), sales of inventory:Number of returns .........................................................Gross profit (less loss) ...................................................Gross sales minus returns and allowances:Number of returns ...................................................Amount........................................... : .........................
Cost ofgoods sold:Number of returns.....................................................Amount.....................................................................
Other revenue:Number of returns............................................ ! ............Amount...................... ; ............................... ............
Total expenses:Number of returns ..........................................................Amount ............................................................................Program services:Number of returns............................................ :............Amount.........................................................................
Management and general:Number of returns.........................................................Amount.........................................................................
Fundraising:Number of returns .........................................................Amount................................................... .......................
Payments to affiliates:Number of returns .............................................. ...........Amount.........................................................................
Excess (deficit) ofrevenue over expenses:Number of returns......................................................Amount..........* .............................................. . ..............
(1)
11,494489,999
10,2363,834,553
8,0063,344,554
.26,2041,525,316
26,6782,951,314
22,6061,425,997
15,977
16,0777,271.016
14,082-3,891,049
42,2305,241,448
.113,646408,238,598
1 108,660348,782,065
95,16054.528.091
32,6833,829,702
5,0231 ,098,089
113,70126,014,857
'Excludes private foundations and most religious organizations.NOTE: Detail may not add to totals because of rounding and processing tolerances.
(2)
79229,791
774600,913
440571,122
5,688188,422
5,702886,426
5,020698,003
2,874227,305
2,878690.808
2,724463,502
5,289524,039
14,614116,873,609
13,07714,198,268
11,213.2,416,292
2,226213,158
1,76845,950
14,907793,742
501(c)(5)
(3)
957196,406
924253,684
67857,279
1,10520,121
1,148.77,728
86957,607
1,19418,861
1,24841,824
1,11022,963
7,685758,768
14,8841196M,140
8,0271,315,014
14,870,371,889
501(c)(6)
(4)
1,01256,580
924105.800
7004R,221
68,902.
2,801239,957
-2,611171,054
1,629105,202
1,624310,111-
1,263.204,909
7,540.849,678
17,44417,461,265
804249,477,
17,409356,663
501(c)(7)
(5)
79213,962
70944,149
48930,187
1.45721,445
1,46263,702
1,22242,257
5,3631,052,471,
.5,3432,228,368
5,1831,175,897
3,903169,347
11,8355,731,876
6418,629
.11,824198,015
501(c)(8)
(6)
38039,262
37477,128
20037,866
2,443101,666.
2,455287,051
2.128185,385
2,910196,959
2,904468,906
2,835-27.1,946
2,05493,405
6,8526,873,952
2,45025,000
6,871286,039
501(c)(9)
(7)
130-2,707
138990,134
97992,842
823,114
825,603
772,488
39-110
4043,740
4043,849
1,9611,031,520
9,14853,975,971
3712,766
8,5471,189,726
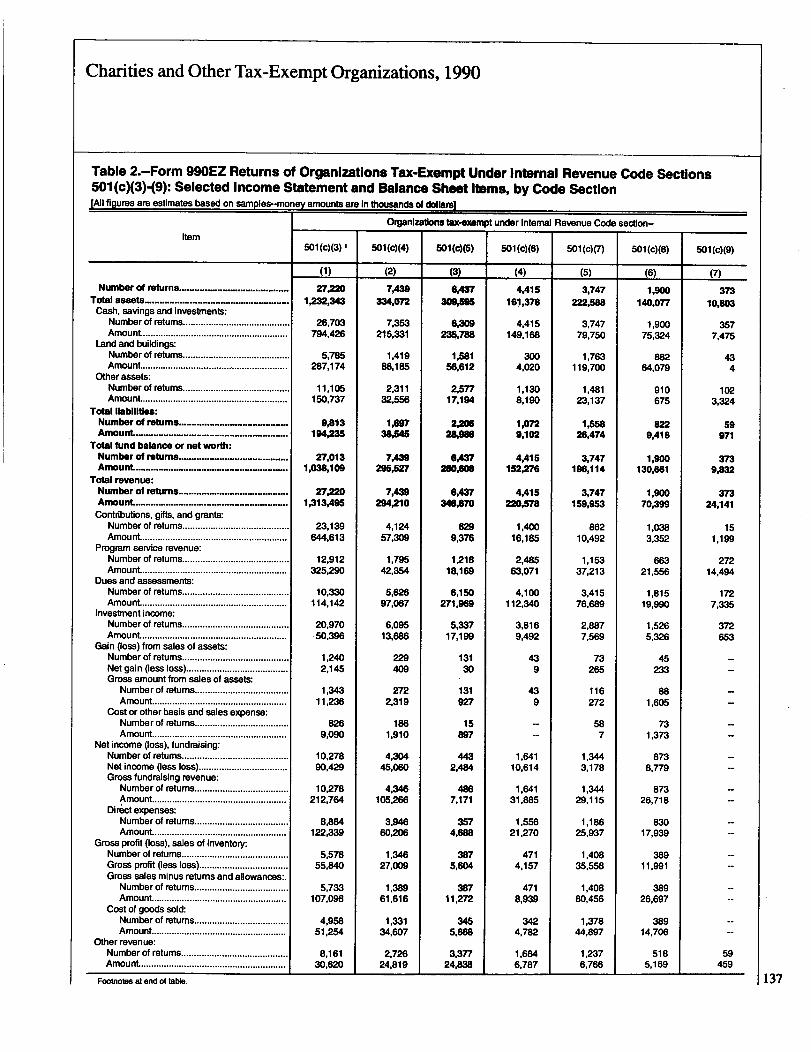
Charities and Other Tax-Exempt Organizations, 1990
Table 2.-Form 990EZ Returns of Organizations Tax-Exempt Under Internal Revenue Code Sections501 (cX3)-(9): Selected I ncome Statement and Balance Shoot Items, by Code Section[All figures are estimates based on samples-money amounts are In thousands of dollars]
501(c)(3)'
(1)
27=01,232,343
26,703794,426
5,785287,174
11,105150,737
9,813194,235
27,0131,038,109
27,2201,313,495
23,1396",613
12,912325,290
10,330114,142
20,970
1,2402,145
1,34311,236
8269,090
10,27890,429
10,278212,764
8,884122,339
5,57855,840
5,733107,098
4,95851,254
8,16130,620
Organizations tax-exempt under Internal Revenue Code section-
501 (c)(4)
(2)
7,439334,072
7.353215,331
1,41986,185
2,31132,556
1,69738.64
7,439295,527
7,439294,210
4,12457,309
1,79542.354
5,62697,067
6.09513,686
229409
2722,319
1861,910
4,30445,060
4,346105,266
3,94660,206
1,34627,009
1,38961,616
1,33134,607
2,72624,819
501 (c)(5)
(3)
SA37309,595
6.309235,788
1,58156,612
2,57717.194
2~=23.M
SAV280,608
6#437346JM
6299,376
1.218118J69
6,150271,969
5,33717,199
13130
131927
15897
4432.484
4867,171
3574,6W
3875,604
38711,272
3456.668
3t37724,8M
501(c)(6)
(4)
4,415161,378
4,415149,168
3004,020
1,1308,190
1,0729,102
4,415152,276
4,415220,578
1,40016,185
2,48563,071
4,100112,340
3,8169,492
439
439
1,64110,614
1,64131,885
1,55621,270
4714,157
4718,939
3424,782
1,6846,787
501(c)(7)
(5)
3,747222,688
3,74779,750
1,763119,700
1,48123,137
1,55826,474
3,747196,114
3,747159,953
86210,492
1,15337,213
3,41576,689
2,8877,569
73265
116272
587
1,3443,178
1,34429,115
1,18625,937
1,40835,558
1,40880,456
1,37844,897
1,2376,766
501(c)(8)
(6)
1,900140,077
1,90075,324
88264,079
910675
8229,416
1,9W130,661
1,90070,399
1,0383,352
66321,556
1,81519,990
1,5265,326
45233
881,605
731,373
8738,779
87326,718
83017,939
38911,991
38926,697
38914,706
5185,169
Footnotes at end of table.
Item
Number of returns........... ............................Total assets... .................. ....... .......................Cash, savings and investments:
Number of returns..........................................Amount.........................................................
Land and buildings:Number of returns..........................................Amount
.........**"** .......Other assets:Number of returns..........................................Amount .........................................................
Total liabilities:Number of returns...........................................Annount. .......................................................
Total fund balance or not worth:Number of returns........................... ..............AmounlL . .............................. ...................... ....
Total revenue:Number of returns................................... .......ArnounL ...................................... .............. ....Contributions, gifts, and grants:
Number of returns ..........................................Amount .........................................................
Program service revenue:Number of returns ..........................................Amount .........................................................
Dues and assessments:Numberof returns ..........................................Amount .........................................................
Investment income:Numberof returns ..........................................Amount .........................................................
Gain (loss) from sales of assets:Number of returns ..........................................Net gain (less loss) ........................................Gross amount from sales of assets:
Number of returns.....................................Amount.....................................................
Costor other basis and sales expense:Number of returns.....................................Amount.....................................................
Net income (loss), fundraising:Number of returns ..........................................Not income (less loss)...................................Gross fundraising revenue:
Number of returns.....................................Amount.....................................................
Dinict expenses:Numberof returns.....................................Amount.....................................................
Gross profit (loss), sales of inventory:Number of returns..........................................Gross profit (less loss) ...................................Gross sales minus returns and allowances%
Numberof returns.....................................Amount.....................................................
Cost of goods sold:Number of returns .....................................Amount.....................................................
Other revenue:Number of returns..........................................Amount .........................................................
501(c)(9)
(7)
37310,803
3577,475
434
1023,324
59971
3739,832
37324,141
151,199
27214,494
1727,335
372653
-
59459
137
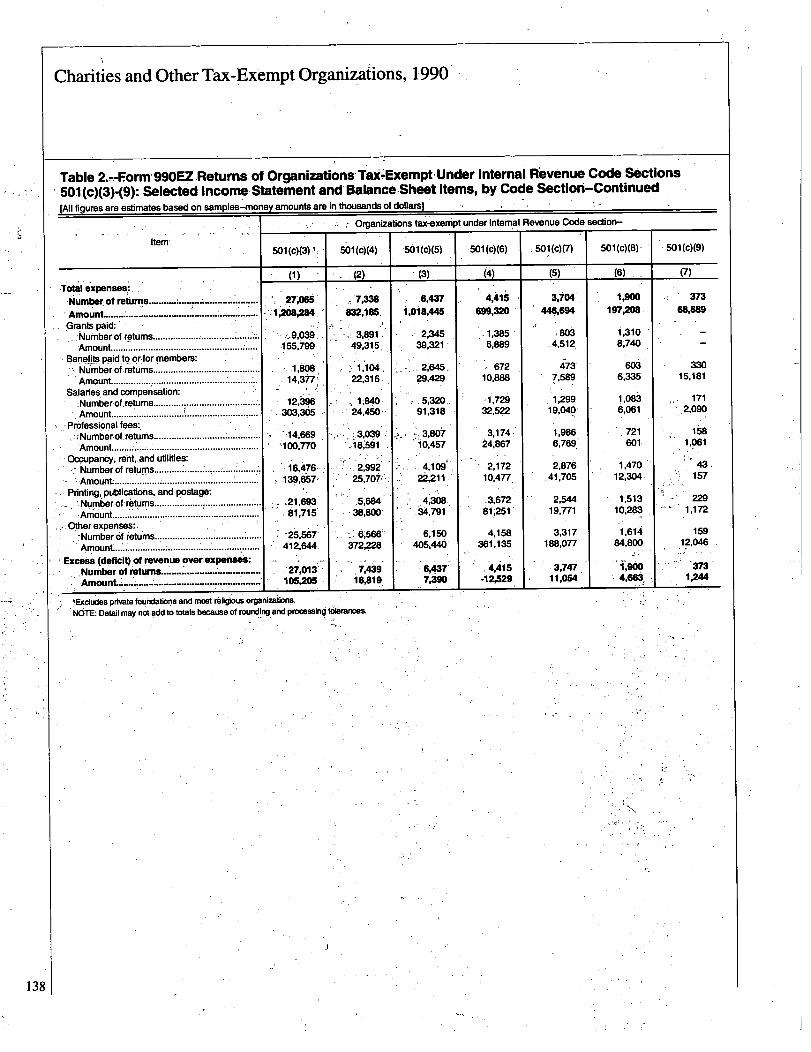
Charities and Other Tax-Exempt Organizations, 1990
138
Table 2.m-Form-990EZ Returns of Organizations- Taii'Exempt,Under Internal Revenue Code Sections
501 (c)(3)-(9): Selected Income Statement and Balance Sheet Items, by Code Section-Continued
[All figures are estimates based on samples-money amounts are in thousands of dollars)
Item
10tal expenses,:. .Number. of returns ........... .............................
Amount .................................................. . ........Prants paid:
Numberof returns ...................... ................Amount............ ! .................. Q .................... :.....
Benefits. paidjo or-for members:Numberof.retums ............... .................. 0.Amount................ : ......................................
Salaries and compensation:;Number of.retums........................................Amount .......
**.................................................
Professional fees:,...............................Numberofretums..........
Amount........ ; ..................................................Ocqupancy, rent, and utilities:
Numberof returns ................................. . .....
Amount;;................. ; .....................................Printing, publications, and postage:
'Numberofr6tums .................................... .......Amount............................................ : .............
0~ther expenses::Number of returns................................... :......Amount ...................... 0 .......................................
Excess (qefIc1Q of revenue over expenses:Number of returns............. ..... .....................Amount..............*...... ..................................
501 (c)(3)
(1)
271,208,M
:,9,039,155,799.
14,377,
12,396303,305
'-14,669100,770
16,47&.139,657,-
.21,693.81,715
*25,567:412,644~
.'27,013105,M
Organizations tax-exempt under Internal Revenue Code section-
501(c)(4)
7,M632,185.
3,89149,315~
1,104,22,316.
1;840,24,450
3 0398,591
2,992~2~,707'
.5,684-38,800
61566372,228
'Excludes private foundations and most religious organizations.NOTE: Detail may not add to totats because of rounding and processing tolerances.
501(c)(5)
(3)
: :6,4371,018,445
2,34539,321,
21645,29,429
5,320,,91,318
3,8&10,457
4,109_2~,21111
4,30834,791
6,150405,440'
.6,4377,390.
501 (c) (6)
(4)
4,415320699
.1,3856,889
1 67210,888
32,522
3,17424,867
2,17210,477.
~3,67261,251'
4,158361,135
.12,529
501(c)(7)
(5)
3,704446,694
803_4,512'
4737,589
1',29919,040
1,9866,769
2,87641,705
2,54419,771
3,317188,077
11,064
501 (c)(8)
(6)
119001 97,208
1,31 0
8,740
6036,335
1.,0836,061
.721601
1,47012,304
1,51310,283
1,61484,800
4,663
501(c)(9)
(7)
37368,689
33015,181
171A090
1581,061
43157
2291,172
159,12.046
1,2,44
Selected Historical and Other Data
Table L-Individual Income Tax Returns: Selected Incomeand Tax Items for Specified Tax Years, 1970-1992Page 140
Table L-Individual Income and Tax Data by State andSize of Adjusted Gross Income, Tax Year 1992Page 142
Table 1-Number of Individual Returns, Income, Tax andAverage Tax by Size of Adjusted Gross Income, TaxYears 1989-1992Page 169
Table 4.-Reconciliation of Adjusted Gross Income (AGI)and Personal Income Used in the National Income andProduct Accounts (NIPA), for Specified Years, 1970-1992Page 171
Table 5.-Personal Income and Total Adjusted Gross In-come Based on Individual Income Tax Returns per Na-tional Income and Product Accounts (NIPA), Tax Years1947-1993Page 172
Table &-Total Adjusted Gross Income Estimated fromNational Income and Product Accounts (NIPA) and Ad-justed Gross Income Reported on Individual Income TaxReturns per SOI, Tax Years 1947-1992Page 173
Table 1-Standard, Itemized and Total Deductions Re-ported on Individual Income Tax Returns, Tax Years1944-1992Page 174
Table 8d-Personal Income per National Income and Prod-uct Accounts (NIPA), and Taxable Income and IndividualIncome Tax per SOI, Tax Years 1947-1993Page 175
Table gi-Number of Individual Income Tax Returns byType of Tax Settlement, Tax Years 1944-1992Page 176
Table ID.-Nonfarm Sole Proprietorship Returns: SelectedIncome Statement Items for Specified Income Years,1970-1992Page 177
Table II.-Partnership Returns: Selected Balance Sheet andIncome Statement Items for Specified Income Years,1970-1992Page 178
Table 12.-Number of Business Income Tax Returns bySize of Business for Specified Income Years, 1970-1992Page 179
Table 13.-Corporation Income Tax Returns: BalanceSheet, Income Statement and Tax Items for SpecifiedIncome Years, 1970-1992Page 180
Table 114.-Corporation Income Tax Returns: SelectedBalance Sheet, Income Statement and Tax Items by Indus-trial Division for Specified Income Years, 1970-1992Page 182
Table 15.-Corporation Profits Before Taxes per NationalIncome and Product Accounts (NIPA) and per SOI, andIncome Subject to Tax per SOI, Income Years 1960-1993Page 184
Table 16.-Estate Tax Returns as a Percentage of AdultDeaths, Selected Years of Death, 1934-1991Page 185
Table 17.-Gross Tax Collections: Amount Collected byQuarter and Fiscal Year, 1987-1994Page 186
Table 1&-Tax Refunds: Amount Refunded by Quarter andFiscal Year, 1987-1994Page 187
Table ligi-Excise Taxes by Specified Fiscal Years, 1970-1993Page 188
Table 20.-Selected Returns and Forms Filed or to be Filedby Type During Specified Calendar Years, 1970-1994Page 189
Table 2li-Taxpayers Receiving Assistance, Paid andUnpaid, Tax Years 1988-1992Page 189
Notes to Selected Historical and Other Data TablesPage 190
Notice: The data on the following pages are the latest andmost accurate available at time of publication. However,they are subject to continuous revision as more informa-tion becomes available. Data labeled as preliminary shouldbe used with caution. 139
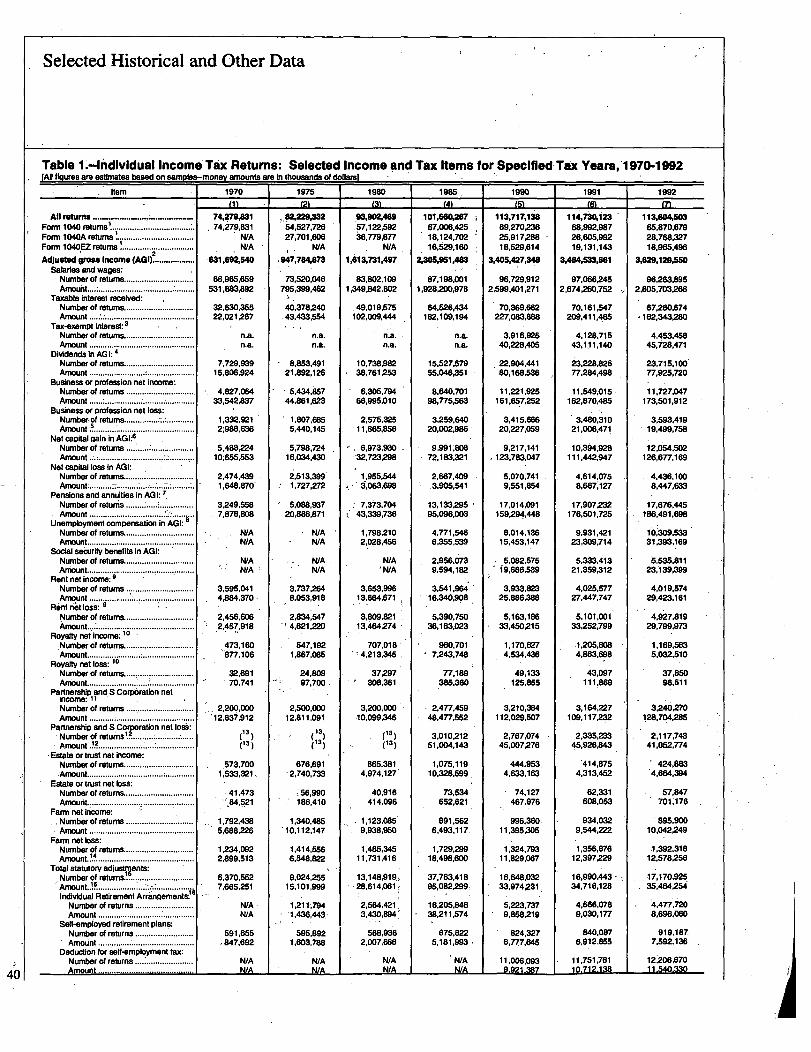
Selected Historical and Other Data
Table I Andividual Income Tax Returns: Selected Income and Tax Items for Specified Tax Years,"197G-1992im fillures; are estimates based on sampies-money amounts are in thousands oT couarsl -
ftern 1970 1976 1980 1985 1990 1991 1992
(1) 12) (3) (4) (5) (6) M
Allreturns ........................................ .... 74,MB31 ~,82,229.332 93,902,469 101,660,W7 113,717,138 11114,7XI23 113,804,50Form 1040 retums~............. ! ..................... 74,279,831 54,527,726 .57,122,592 67.006.425 69,270.238 68,992,987 65,870,679
Form1040A returns ................................... N/A 27,701.606 36,779,877 18.124,702 25,917288 26,605,992 28,768.327
Form 104OEZ returns ................................. N/A NIA NIA 16,529,160 18,529,614 19,131,143 18,965.496.Adjusted gross Income (AGI? ................ 831,69Z540 947,7K873 1,413,731,497 2X5,951,483 3.405,427,348 3,484,533,661 3,629,129,550
Salaries and wages:Number of returns............................... 66,965,659 73,520,046 83,802,109 87,198,001 96,729,912 97,066,245 96,263.895Amount : ....................... :.................... 531.883,892 795,399.462 1,349.842,802 1,928,2DO,978 2,599,401,271 2.674,260.752 2.805,703,266
Taxable interest received:Number of returns. .............................. 32,630,355 46,378,240 .49,019,575 64,526,434 70,369,662 70.161,547 67,280,674Amount :.,.: ........................................ 22.021,267 43,433,5M 102.009.444 182,109,194 227,083,888 209,411,465 .162.343,MO
Tax-exempt Interest: 3
Number of returns .............................. n.a. n.a. n.a. n.a. 3,916,MS 4,128,715 4,453.458Amount ............................................... n.a. n.a. n.a. n.a. 40,228.405 43.1.11,140 45.728,471
DlWiencls in AG 1: 4
Number of return& ............ : ................. 7,729,939 8,853,491 10,738,982 15.527.579 22,904,441 23.228.826 23,715,100.Amount ......................... : ..................... 15,806,924 21,892,126 38,761253 65,048~%l 80,168,536 77,284,498 77,925,720
Business or Profession not income:Number of returns .............................. 4,827,064 5,434,1157 6,305,794 8.640,701 11.221,925 11,549,015 11,727.047Amount i ......................................... 33.542,837 44,861.623 66,995,010 98,775,563 1161,657,252 162,870,485 173,501,912
Business or profession not loss:Number of returns................ i.~............ 1,332,921 1,807,685 2.575.325 3,259.640 3,415.666 3.480,310 3,593,419AmounO..........................I .................. 21988,636 5,440.W 11,865,856 20,002,986 .20,227,059 21,006,471 19,499,758
Net capital aain in AGONumber of returns ............................... 5,488.224 5,798,724 6.973,930 9,991,808 9.217,141 10,394,928 12.054=Amount ; ............................. ......... 10;655,553 16,034,430 32,723,298 72,183,321 123,783,047 111,442,947 126,6T7,169
Net capital loss in AGI:Number of return& .............................. 2,474,439 2.513,399 1.955.544 2,667,409 5.070,741 4,614,075 4,436,100Amount ......................... a .................... 1,648,870 1,727,272 3,063,698 .3.905,541 9,551,854 8,667,127 8,447,633
Pensions and annuities in AG 1: 7Number of returns ................................ 3,249,5W 5,088,937 7.W3,704 13,133,295 17,014,091 17,907,232 17,676,445Amount ................................. :............ ... '7,878,808 20,886,871 43,339,736 95,096.003 159,294,448 176.501.725 186,491,698
Unemployment compensation in AGI: 8 1Number of returns...............; ............... N/A N/A 1,798,210 4,771,546 8,014,136 9,931,421 10,309=Amount ...................................... NtA N/A 2,028,456 6,355.539 15.453,147 23,309,714 31,393,169
Social security benefits In Adl:1
Number of returns............................... N/A NIA - WA 2,956.073 5.082,575 5,333,413 5.535,811Amount................................................ NIA NIA WA 9,594,182 19,686.539 21,359,312 23j3%M
Rent not income: 9Number of returns .............................. 3,595,041 3,737,264 3.653,996 3,541,96~ 3,933,823 4.025.577 4,019,574Amount ................... ........................... 4,884,370. S.OS3,918 13,664,671 16,340,908 25.886,388 27,447,747 29,423.161
Rant n6t loss: 9Number of return& .............................. 2,456.606 2,834,547 3,809,821 5,390.750 5,163,186 5.101,001 4.927,819Amount................................................. 2.467,918 4.621,220 13,464,274 36,163,023 33,450.216 33.252,799 29.799,973.
Royally not income: 10Number of returns .............................. 473.160 647.192 707,018 960,701 1,170,627 .1.205.808 1,169,563Amount........................:....................... 877,106 1,867,086 -.4.213,345 7,243.748 4,SU,436 4,863,698 5,032,510
Royally net loss: 10Number of returns .............................. 32,691 24,809 37,297 77,189 49,133 43,097 37,M0Amount.................................................. 70,741 97,700 308,361 385.360 125,855 111,869 98,511
Partnership and S Corporation netumme:Number of returns .............................. 2,200,000 2,500,000 3,200,000 2,477,459 3,210,384 3,164,227 3,240,270Amount ............................................... A 2.637,912 12,811.091 10,099,346 48,477,552 112.029,507 109,117,232 128,704,9M
Partnership and S Corporation net loss:13 13 13
Number of returns!........... ..........., ., , ( ) 3.010,2V 2,767,074 2,335,233 2,117,743
Arnount.!~ ................... .................
13
(13) (13), 51,004.143 45,007,276 45.926.843 41,052,774
Estate or trust net income:Number of returns............................... 573.700 676,691 865.381 1.075,119 444,963. 414.875 424,883Amount................................................. 1,533,321, -2,740,733 4,974,127 10,328.599 4,633,163 4,313,452 4,664.394
Estate or trust net loss:Number. of returns............................... 41,473 156,990 40.916 73,534 74,127 62,331 ~57,847Amount................................................ ~,84,521 186,410 414,096 652.621 467,976 608,053 701,176
Farm not income:Number of returns .............................. 1,792,438 1,340,485 1,123,085 891,562 996,360. 934,032 895,900Amount ............................................... 5,688,226 -10,112,147 9,938,950 6,493,117, 11,395,305 9,544,222 10,042,249
Farm not loss:Number of returns............................... 1,234.092 1,414,556 1,485.345 1.729,299 1,324,793 1.356,876 1,392.318Amount. !~ ........................................... 2,899,513 6.648,822 11,731,416 18,498,600 11,829,067 12,397.229 12,578,256
Total statutory adjustigents: I -Number of returns............................... 6,370.552 9,024,255 13,148.919 37.763,418 16,648,032 16,990.443 17,170,925
...................ArnounO~ ...................... 7,665,251 16,101,999 2 .614,061,8 96,082299: 33,974,231. 34,716,128 35,464254Individual Retirement Arrimements: . 1
1. . . . .
Number of returns .......................... N/A - 1.211,,794 2,564.421. 16,205,846 5,223,737 4,6W,078 4,477,720Amount ............................... ............ N/A 1,436,443 3,430,894.' 38,211,574 9,858,219 9,030,177 8.696,060
Sag-employed retirement Plans:Number of returns .......................... S91,655 695,892 568,936 675,822 824,327 840.087 919.187Amount ........................................... 847,692 1.603,788 2.007,666 5.181,993 6.777.645 6,912,855 7.592,136
Deduction for self-employment tax:Number of returns N/A N/A NIA N/A 11.006.093 11,751,761 12,20BA70Amount ........................................... I WA I WA N/A I WA 1 9,921,387 1 10,712.138 11.540,330
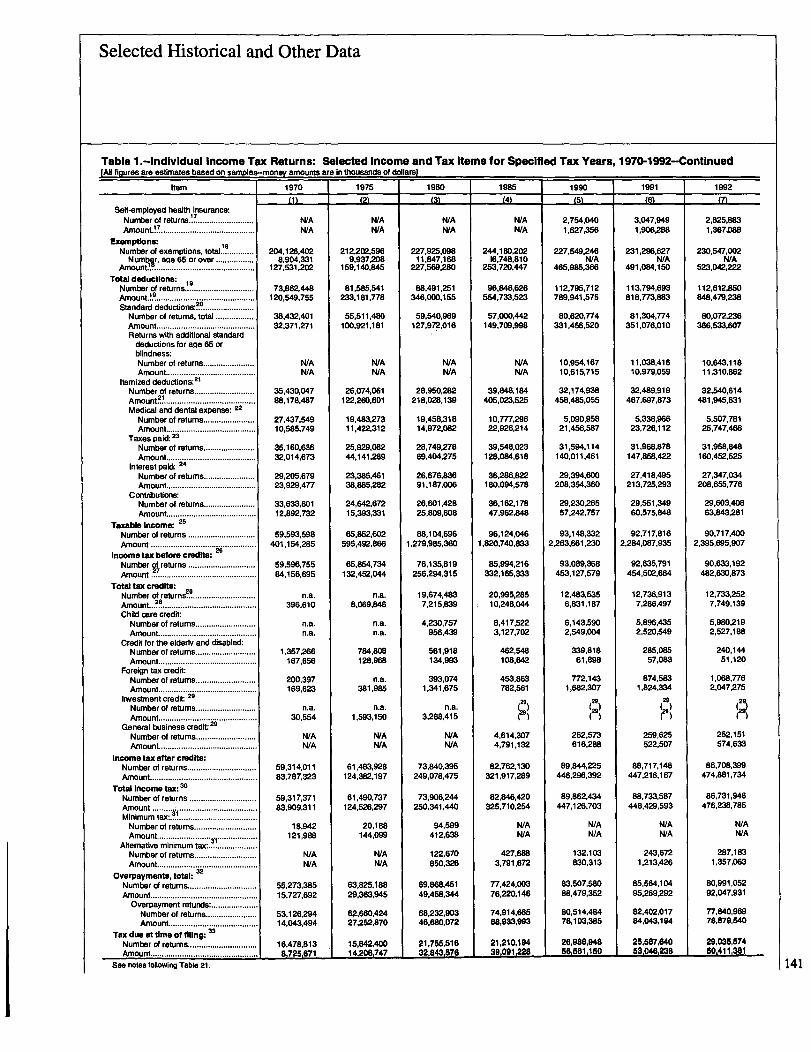
Selected Historical and Other Data
Table l.-Individual Income Tax Returns: Selected Income and Tax Items for Specified Tax Years, 1970-1992--ContinuedJAN Tioures are GSUMateS DaS80 on sampies--money amounts are in mousanas or Goliarsi
Item 1970 1975 1980 19W 1990 1991 1992
(1) (2) (3) (41 (5) (6) M
Self-employed health insurance:Number of returns
~7........................... N/A N/A N/A NIA 2,754,1540 3.047,949 2,825,883
Amount!! .......................................... NtA NtA N/A NtA 1,627,356 1,906,2" 1,367,088
Exemptions:a
Number of exemptions, total.1.............. 204,126.402 212.202,596 227.925,098 244.180,202 227,549,246 231,296,627 230,547,002Num%r, age 65 or over ................. 8.904,331 9,937.208 11,847,168 16,748,810 N/A WA WA
Amount................................................ 127.531,202 159,140,845 227,569,280 253.720.447 465,985,366 491,084,150 523,042,222
Total deductions:
'9Number of returns. ................I .......... 73,86Z448 81,585,541 88.491,251 96,848,626 112,795,712 113.794,693 112.612,850Amount.!~............................................ 120,549,755 233,181,778 346,OOD,155 554,733,523 789,941,575 818,773,883 848,479,238
standard deductions:!~ ......................Number of returns, total ................. 38,432,401 55,511,480 59,540,969 57,000,442 80,620,774 81,304,774 80,072,236
Amount ............................................ 32,371.271 100,921,181 127,972,016 149,709,998 331,456.520 351.076,010 366.533,607Returns with additional standard
deductions for age 65 or
blindness:Number of returns ....................... NtA N/A NIA N/A 10,954,167 11,038,416 10.643,118
Amount ........................................ N/A N/A N/A NIA 10,615,715 10,979,059 11,310,862
Itemized deduction,21Number of returns ........................... 35,430,047 26,074,061 28,950,282 39,848,184 32,174,938 32,489.919 32,540,614
Arnount?!......................................... 88,178.487 122,260,601 218.028,139 405.023.625 458,485,055 467,697,873 481,945.631Medical and dental expense: 22
Number of returns ....................... 27,437.549 19,483.273 19,458,318 10,777,296 5,090.958 5,338.966 5,507,781Amount ........................................ 10,585,749 11,422,312 14,972,0112 22,926,214 21,456,687 23,726,112 25,747,466
Taxes paid: 23
Number of returns ....................... 35,160,636 25.929,082 28,749,278 39,548,023 31,594.114 31,968,878 31.958,848
Amount........................................ 32,014,673 44.141,289 69,404,275 128,084,618 140,011,461 147,858,422 160,452.525
Interest paid:24
Number of returns....................... 29,205,679 23,385,461 26,676,836 36,286,822 29.394,600 27,418,495 27,347,034
Amount........................................ 23,929,477 38,885,282 91,187,006 180,094,578 208,354,360 213,725,293 208,655,776
Contributions:Number of returns....................... 33,633,601 24,642,672 26,601,428 36,162.178 29,230,265 29,551,349 29,603,408
Amount........................................ 12,892.732 15,393,331 25,809,608 47.962,848 57.242,757 60,575,848 63,843,281
TaxableIncome: 25
Number of returns .............................. 59,593,598 65,852,602 88,104,696 96,124,046 93,148,332 92,717,816 90,717,400
Amount ............................................... 401.154,285 595,492,866 1.279,985,360 1,820,740,SW 2,263,661,230 2,284.087,935 2,395,695.907
Income tax before credits:26
Number of returns .............................. 59,596,755 65,854,734 76,135,819 85,994,216 93,089,368 92,635,791 90,633,192Amount 27
84,156,695 132.452,044 256,294.315 332,165,333 453,127.579 454.502,664 482,630,873
Total taxcredits: 2.
Number of returns............................... n.a. n.a. 19,674,483 20,995,285 12,483,535 12,736,913 12,733,252
Arnount..?! .......................................... 396,610 8,069,846 7,215,839 10,248,044 6,831,187 7,286,497 7,749,139
Child care credit:Number of returns ........................... n.a. n.a. 4,230,757 8,417.522 6,143.590 5,896,435 5,980,219
Amount ............................................ n.a. n.a. 956,439 3,127,702 2,549,004 2,520,549 2,527,188
Credit for the elderly and disabled:Number of returns ........................... 1,357.266 784,808 561,918 462,548 339,818 285,085 240,144
Amount...................... ..................... 167,656 128.968 134,993 108,642 61,898 57,083 51,120
Foreign tax credit:Number of returns ........... ............... 200,397 n.a. 393,074 453.8W 772.143 874.583 1.068,776
Amount............................................ 169,623 381,985 1,341,675 782,561 1,682,307 1,824,334 2,047,275
Investment credit 29
Number of returns ........................... n.a. n.a. n.a.29 29
(21)
29
Amount 30 554 1 593,150 3,288,415............................................
General business credit: 29, ,
Number of returns........................... WA N/A N/A 4,614,307 262,573 259,625 252.151
Amount............................................ NIA NtA NtA 4,791,132 616,288 522,507 574,633
Income tax after credits:Number of returns ............................... 59,314,011 61,483,928 73,840.395 82,762,130 89,844,225 88,717,148 86,708,399
Amount ................................................ 83,787,323 124,382,197 249,078,475 321,917,289 446,296,392 447.216,167 474,881,734
Total Income tax: 30Number of returns .............................. 59,317,371 61,490,737 73,906,244 82,846,420 89,862,434 88,733,587 86,731,946
Amount .......... .................................... 83,909,311 124,526,297 250,341,440 325,710,254 447.126,703 448,429,593 476,238,785
Minimum tax:.31......................................Number of returns ............................ 18,942 20,188 94,599 N/A WA WA WA
Amount ........................ 121,988 1"'099 412.638 N/A N/A N/A N/Aif
Alternative minimum tax:......................Number of returns ............................ WA N/A 122,670 427,688 132,103 243,672 287,183
Amount............................................. WA WA 850,325 3,791,672 830.313 1,213.426 1,357,063
Overpayments, total:32
Number of returns............................... 55,273,385 63,825,188 69,868,451 77,424,003 83,507,580 85,564,104 80,991,052
Amount................................................ 15.727,692 29.363,945 49.458,344 76,220,M 88,479,352 95.269,292 92,047,931
Overpayment refunds: .....................
Number of returns ....................... 53,126,294 62,660,424 68,232,903 74.914,665 80,514.484 82,402.017 77.840,969
Amount........................................ 14,043,494 27,252,870 46.680.072 68,933,993 78,103,385 84,043,194 78,879,540
Tax due at time of filing: 33Number of returns............................... 16,478,813
'1 7'R'16
21,210,104 2e,ose,94a 25,567,640 29,035,574
Amount 8,725,671 14:= :32843576 39,091,228 1 56,661,150 1 53,046,230 1 60,411,381
See notes following Table 21. 141
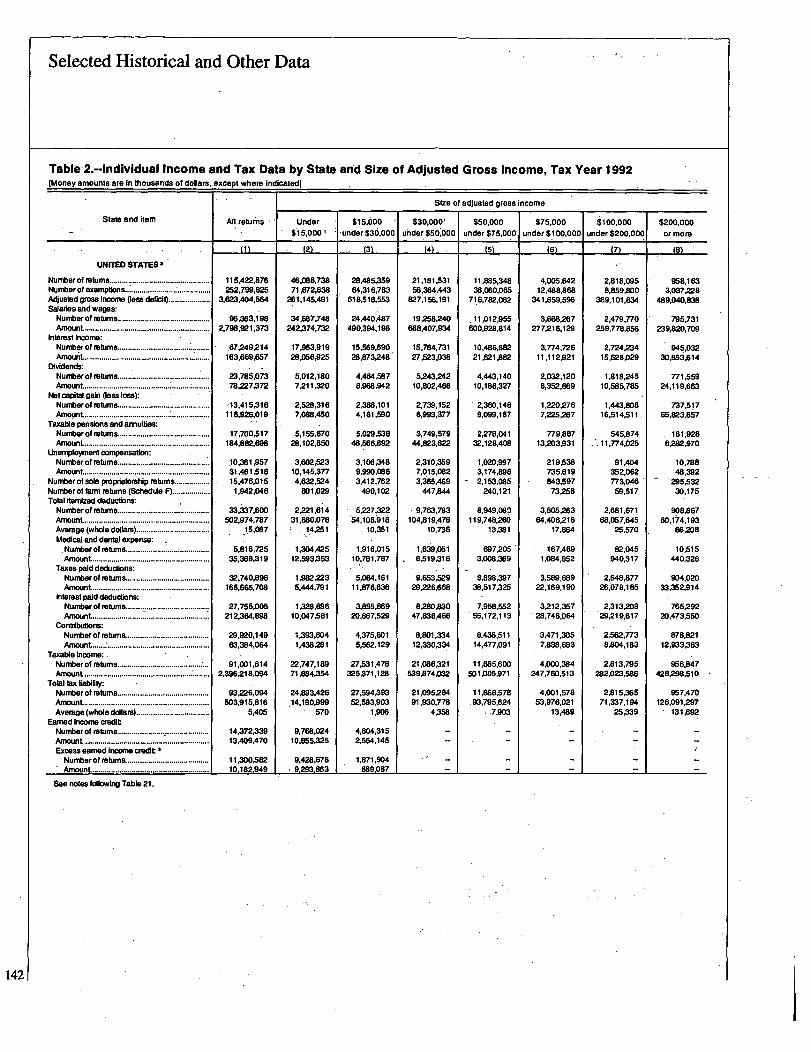
Selected Historical and Other Data
State and Rom
UNr= STATES8
Number of exemptions .........................................Adjusted gross Inoorne Pass deficit)....................Salaries and wages.Numberoffeturns ............................................
Interest Income:Number of returns............................................
Dividends:Number of returns............................................
Not capital gain (less loss):Number of returns............................................Amount......................................... : ..................
Taxable pensions and annuities:
Nurnber of returns............................................
Unemployment compensation:Number of returns.............................................
Number of sole proprietorship returns.................Number of farm returns (Schedule F) ..................Total Itemized deductions:Number of returns............................................
Average (whole dollars)...................................Medical and dental expense: tNumber of returns. .......................................
Taxes paid deductions:Numberofrstums. .......................................
Interest paid deductions:Number of return& .............................
Contributions:Number of retums. .......................................Amount.........................................................
Taxable income:Number of returns........................................Amount ............................................... W.... .......
Total tax liability:
Number of returns............................................AffKKmt. ............................................................Average (whole dollars)...................................
Earned Income credit
Excess earned Income Credit 3
Number of returns. .......................................
See notes following Table 21.
Table-2.--indIvidual Income and Tax Data by State and Size of Adjusted Gross Income, Tax Year 1992[Money amounts are in thousands of dollars, except where Indicated]
All returns
115,422,876 -252,799,825
3,623.404,564
96,363,1882,798.921,373
163,669,657
23,785,07378.227,372
A3,415.318116,926
1019
17,700,517184,882,698
IOX195731,461,51815,476.0151,942,046
33,337,600502,974,787
j5,087
5,816,72535,368,319
32.740,896166,665,708
27,755,005212,364,898
29,920,14963,384,064
91,001,6142,396,218,094
93.226,094503,915,816
5,405
14,372,33913,400,470
11,300,58210.182,949
Under
$15,0001
(2)
46,088,73871,672,638
261,145,491
34.687,748242,374,732
17,963,91928,056R25
5,012,1807.211,320
-2,528,3167,088,450
5,155.67028,102,850
3,602,52310,145,3774,632,524
601,029
241,61431,660,076
1-4,251
1,304,42512,593,353
1,982,2235,444,791
1,328,89610,047,561
1,393,8041.438,281
22,747,18971.884,354
24,893,426114,190,999
570
9,768,02410,855,325
9,428,9789,293.SB3
$15,606 -'
- under $36,000
t3l
28,465,35964.316,783
618,518,553
24,440,487490,394,198
15,569,69028,873.248
4,464,5878,968,942
2,386,1014,181,590
5,029.53848,566,892
3,106.348919W.0863,412,762
490,102
5,227,'322
54,108,91610,351
1,916,01510.781.787
5,064.16111,976,636
3,895,8692D,867,529
4,375,6015,562,129
27,531,47832SA71,128
27,594,39352,593,903
1AW
4,604,3152,554,145
1,871,904889,087
$30,000'
under$56,000
W
21:181,53156364,443
827,156,191
19,258,240688,407,934
15,784,73127,523.038
5.243.24210,802,466
2,739,1526,993,377
3,749,57944.823,622
2.310.3597,015,0823,365,469
447,8*1
9,763,783104,819,478
10,736
11,69,0516,519,316
9,653,52929,226,668
8,280,83047,836,466
8,801,33412,330,334
21,086,321539.874,032
21,09528491,930,778
4"
--
--
Size of adjusted gross Income
$50,000under$75,000
AS-)
11.885,34838,060,065
7116,782,062
11,012,955600,9211,814
10,486,88221,621082
4,443,14010,186.327
2,360,1489,099,167
2,278,04132.128,408
1,020,9973,174,8982,153,085
240,121
8,949,080119,748,260
13,381
6972053,008.369
8,898,39738,517,325
7,958,55255.172,113
8,436,51114,477,091
11,865,600501,005,971
11,868,578193,795,624
:7,903
--
--
$75,000under$100,000
L6)
4,005,64212,488,868
341,659.596
3,6W,267277.216.129
3,T74,72611,112021
2,032,1206,352,869
1,220,2767,225,M7
779,88713,203,931
219538735.619843,59773,258
3,605,28364,406.218
17,864
167,4691,084,852
3,589.68922,169,190
3,212,357'28,748,064
3,471,3057,838,683
4,000,384247,760,513
4,001,S7853,976,021
13,489
--
--
$100,000under$200,000
L7)
2,818,0958.859,800
369,101,834
2,479,770259,778,856
2,724,23415.628P29
1,818,24510,585,785
1,443,80816,514,511.
545,87411,774,025
91.404352,062
- 773,G4659,517
2,661,67168,057,645
25,570
82,045940,317
2,648,87726,078,185
2,313.2D929,219,617
2,562,7738,804,183
2,813,795.282,0235M
2,815,36571,337,194
25.339
--
--
108)
$200,000or more
958,1633,037.228
489,040,838
795,731239,820,709
945,03230.85iA14
771,55924,119,663
737,51765,823.6i7
161,9286,282.970
10,78848,392
295,53230,175
908,86760,04,193
66,208
10,515440,326
904.02033,352,914
765,29220,473,550
$78,82112,933.363
956,847428,298,510
957,470126.091,297
131 A92
--
--
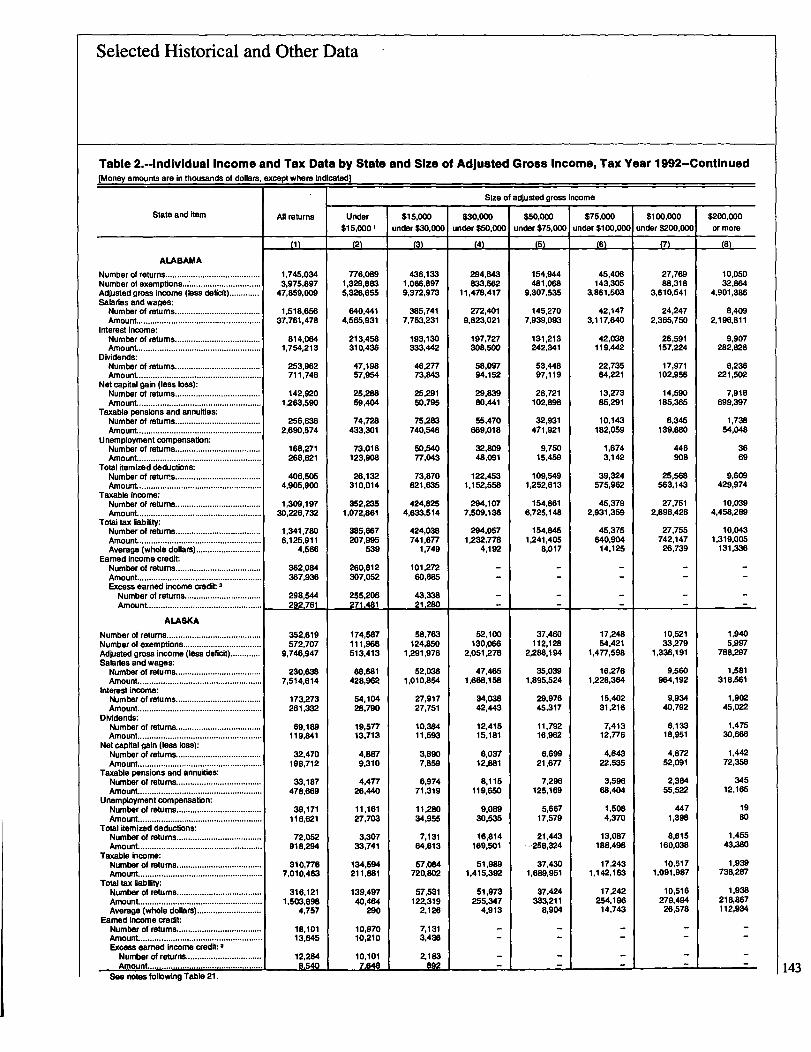
Selected Historical and Other Data
Table 2.--individual Income and Tax Data by State and Size of Adjusted Gross Income, Tax Year 1992-Continued[Money amounts are in thousands of dollars, except whom Indicated)
AJlreturns
U1
1,745,0343,975,897
47,1159,009
1,518,65637,761,478
814,0641,754.213
253,962711.748
142,9201,263,590
256,6382,690,574
168,271268,621
406,5054,906,900
1,309,19730,226,732
1,341,7806,125,911
4.566
362,084367,936
298,544292,761
352,619572,707
9,746,947
230,6387,514,614
173,273261,332
69,189119,841
32,470198,712
33,187478,669
39,171116.621
72,062918,294
310,7767,010,463
316,1211,503,898
4,757
18,10113,645
12,2848.640
Under$15,0001
776,0891,329,8835,326,655
640,4414,565,931
213,458310,436
47,19857,964
25,28859,404
74,728433,301
73,016123,908
26,132310,014
352,2351,072,861
385,667207,995
539
260,812307.062
255,206271,481
174,587111,966513,413
68,681428,962
54.10428,790
19,57713,713
4,8879.310
4,47726,440
11,16127,703
3.30733,741
134,694211,881
1139.49740.464
290
10,97010,210
10.1017.648
$15,000under$30,000
U3
436,1331,066,8979,372,973
385,7417,753,231
193,130333,442
46,27773,843
25,29160,795
75,283740.546
50,64077,043
73,870621,635
424,8254,633,514
424,038741,677
1,749
101,27260,885
43,33821-280
58,763124,850
1,291,976
52,0361,010,854
27,91727,751
10,36411,593
3,8907,859
6,97471,319
11,28034,955
7,13164,813
57,064720,802
57,531122,319
2,126
7,1313.436
2,183892
$30,000
under$50,ODO
L41
294,643833,562
11,478,417
272,4019,823,021
197,727308,600
58,09794,152
29,83980,441
55,470669,018
32,80948,091
122,4631,152.558
294,1077,509.136
294,0571,232,778
4,192
--
--
62,100130,066
2,051,278
47,4651,668,158
34,03842,443
12.41615,181
6,03712,881
8,115119,650
9,08930,536
16,814169,501
51,9891,415,392
51,973255,347
4.913
-
,Size of adjusted gross Income
$50,000under$75,000
t5A
154,944481,068
9,307,535
145,2707,939,093
131,213242,341
53,44897,119
26,721102,898
32,931471,921
9,75015.459
109,5491,252,613
154,8616,725,148
154,8451,241,405
8,017
-
-
37,460112,128
2,288.194
35,0391,895,524
29,97645,317
11,79216,962
6,69921,677
7,296125,169
5,66717,579
21,443258,324
37,4301,689,951
37,424333,211
8,904
-
$75,000
under$100,000
t6_1
45,406143,305
3,861,503
42,1473,117,840
42,038119,442
22,73564,221
13,27386,291
10,143182,059
1,6743,142
39,324575,962
45,3792,931,359
45,375640,904
14.125
-
-
17.24854,421
1,477,598
16,2761,228,364
15,40231,216
7,41312,776
4,64322,535
3,59668,404
11.5084,370
13,087188,496
17,2431,142,163
17,242264,19614,743
-
$100,000under$200,000
M
27,76988,318
3,610,541
24,2472,365,750
26,591157,224
17,971102,956
14,590185'W5
6,345139,680
446908
25,568563,143
27,7612,896,426
27,755742,14726,739
-
-
10,52133,279
1,336,191
9,560964,192
9,93440,792
6,13318,951
4,87252,091
2,38455,522
4471,398
8,815160,038
10,5171,091,987
10,516279,494
26,578
-
State and item
ALABAMA
Numb:r of returns........ ................................Numb
rof exemptions...................................
Adjusted gross income (loss deficit).............Salaries and wages:Number of returns.....................................AmounL ..... ...............................................
Interest income:Number of returns.....................................Amount .....................................................
Dividends:Number of returns.....................................Amount .....................................................
Net capital gain (less loss):Number of returns .....................................Amount......................................................
Taxable pensions and annuities:Number of returns .....................................Amount ......................................................
Unemployment compensation:Number of returns .....................................Amount ......................................................
Total itemized deductions:Number of returns .....................................Amount ......................................................
Taxable income:Number of returns .....................................Amount ......................................................
Totai tax liability:Number of returns .....................................Amount ......................................................Average (whole dollars) ............................
Earned income credit:Number of returns .....................................Amount ......................................................Excess earned income credit: 3
Number of returns .................................Amount..................................................
ALASKA
Number of returns.........................................Number of exemptions ..................................Adjusted gross Income (less deficit) .............Salaries and wages:
Number of returns.....................................Amount......................................................
Interest Income:Number of returns.....................................Amount......................................................
Dividends:Number of returns.....................................Amount......................................................
Not capital gain (less loss):Number of returns.....................................Amount......................................................
Taxable pensions and annuities:Number of returns.....................................Amount......................................................
Unemployment compensation:Number of returns.....................................Amount......................................................
Total itemized deductions:Number of returns.....................................Amount......................................................
Taxable Income:Number of returns .....................................Amount......................................................
Total tax liability:Number of returns .....................................Amount.....................................................Average (whole dollars) ............................
Earned Income credit:Number of returns.....................................Amount......................................................Excess earned Income credit- 3Number of returns.................................Amount .................................................
See notes following Table 21.
$200,000
or more
10,05032,864
4,901,386
8,4092,196,811
9,907282,828
8,236221,502
7,918699,397
1,73854,048
3669
9,609429,974
10,0394,458,289
10,0431,319,005
131,336
-
-
1,9405,997
788.297
1,581318,561
1,90245,022
1,47530,666
1,44272,W8
34512,165
19so
1,45543,380
1,939738,287
1,938218,867112,934
-
143

144
Selected Historical and Other Data
Table 2.-Individual Income and Tax' Data by State And Size of Adjusted Gross Income, Tax Year 1992-Continued[Money amounts are in thousands of dollars, except where indicatecl]
All retu ms
ft)
669,3063863,746
47,304,670
1,367,53335,962,387
881,2232,295.694
333,833-1,134,739
225,5181.488,067
291,31rO3,336,597
113,906293.471
-517,048-7.012,953
1,267,28829,951.359
1,300,5946.106,740
4.695
.249,461.236,700
203.745188,442
989,8762,290.434
24,763,065
834,21918.881,935
466,0121,117,648
157,697475,789
108.520711,316
139,603
102,959223,091
191.6142.482,622
733,07415.236.157
764,0883,091,503
194.602187,324
154,709142,250 -1
Under$15,000
(2)
705,9231.234,7484,011.668
540.4493.896,166
237,844401,577
76,092134,433
48,47385,129
81,895467.024
49,531123,195
'45,584568,072
324,8431,067276
356.448~05,7 18
- 577
173,800193,890
168,878170,946
454,495807,193
2,896.OT7
362,4412,572,315
138,728230,582
34.37542,354
24.20039,692
44,546245,169
43,32792,300
14.855229.371
206,246636,831
235,729134,670
571
153,165
130,585130,872
$15.000 -Linder $30,000
(3)
424.6671.02i.2429,151,855
353,5617,040,323
219,620448.108
72,728175.777
47,22961.399
87,296901.142
33,25487,782
100'.397923,653
405,4474,555,814
406.913733.970
1,804
75,66142,810
34,86717,496
264.240670.034
5,669,594
228,1924,503,261
122,972249,419
36.29863,841
25,81154,761
44,321426,484
35,01376.399
34,737387,707
257,0172,764 R39
257,536456,926
1,774
59,24934,159
24,14411 Gee
$30,000under $50,000
t4l)
291.032817,060
11,337,000
255,0549,035,721
2D4,857416,412-
75,104195.168
47,928116,566
64,089875,871
20~24752.963
158,6091,654,257
289,7397,199,936
289,BT71,209.524
4,173
164.140478,430
6.343,400
148,3365,203,606
110,380205,835
37,99759,775
24.50176,864
29.527359,350
19,02841,544
59,163
163,8944,M,745
163,890686.928
4.191
-
Size of adjusted gross Income
$50,000Linder $75,000
(5)
154,726-481,910
9,31S,349
138,4407,467,170
131,424315,671
56.971162,270
37,155154,183
36.888603.254
6,20321,744
124,7881,643,793
154,4586.446,781
154,498.1,193,594
7,726
-
76,929221.125
4,237,200
64,3213,388,009
59,850141,760
26,51248.714
16.29581,264'
214,475
4,73310,582
'49,948.567,464
70,8693,059557
70.878574,561
8,1D8
$75,000under $100,000
-"6
49,231154,575
4,195,720
43,5653,216,490
45,404165,090
24,40792,901
17,675124,M
11,613227,762
1,7934.894
45,393785,621
49,1603.061,634
49,172665,979
13,544
-
18,55868,035
1,578,267
16,3351,126,711
17,16164,581
9,97228,704
6,7S953,765
3,828-69.929
5941,540
16,313241,970
18,5491,196,515
18,548270,16214,666
-
$100.000under $200,000
L7)
32,820103.939
4.296,806
27.6862,860,628
31.34i222D68
20,303128,023
18,538254,104
7,485176,739
8072,641
31,568785.744
32.7573,294,875
32,788832,04025A76
12,74640,467,
1,688,125
975.244
12,22988,033.
8,69846,063
7,282101,312
2,312.48,856
239649
11,961253,139
12.7361,347,465
12,742351,806
27.610~
-
(8)
State and Item
ARIZONA
Adjusted gross Income (loss deficit)........ . ....Salaries and wages:
Interest income:
Dividends:Number of returns..........................................Amourii.: ....................................... .................
Not capital gain Oass loss): ,
Taxable pensions and annuities:
Unemployment compensation:Number of returns ;...........................Amount ............ ................................................
Total Itemized deductions:Number of returns : ...................................Amount ............ ................... .......................
Taxable income:Number of .......... ..Amount ............................................................
Total tax liability.Number of returns ...............................Amount ............... ............................ :......Average (whole dollars)....................... ...........
'Earned income credit:Number of returns ............................................Amount .............................................................Excess earned Income Cr9cift: 3
ARKANSAS
Number of returns................................................Number of exemptions................................... ;Adjusted gross income (loss deficit)....................Salaries and wages:,N6mber of returns...: .........................................Amount ......................... ~..:...............................
Interest income:
Dividends:Number of returns........................Amount .......................................
Not capital gain Oess loss):
Taxable pensions and annuities:Number of raturni...................................Ambunt. ....................................... ...............
Unemployment compensation:
Total itemized deductions:
Taxable income:
Total tax liability'.Niimber of returns........................... ................Amount : ............... ..............................Average (whole dollars)..........................
Earned Income credt: 1
Excess earned Income credit: I
$200.0130or more
10,90735,272
4,998,371
8,7782.445,888
10,728326,767
8,228246,167
8,520691.840
2,10485.805
71252
10,709661.813
10,8844,335,045
10.8981,265,916
1116.160
-
4,768,15,160
2,350,401
3,9891,112,789
4,692137,438
3,845196,339
3,672303,659
- 700
.2578
4,637251.254
4,7632,095,105
4,76;-,.616,451129,371
-
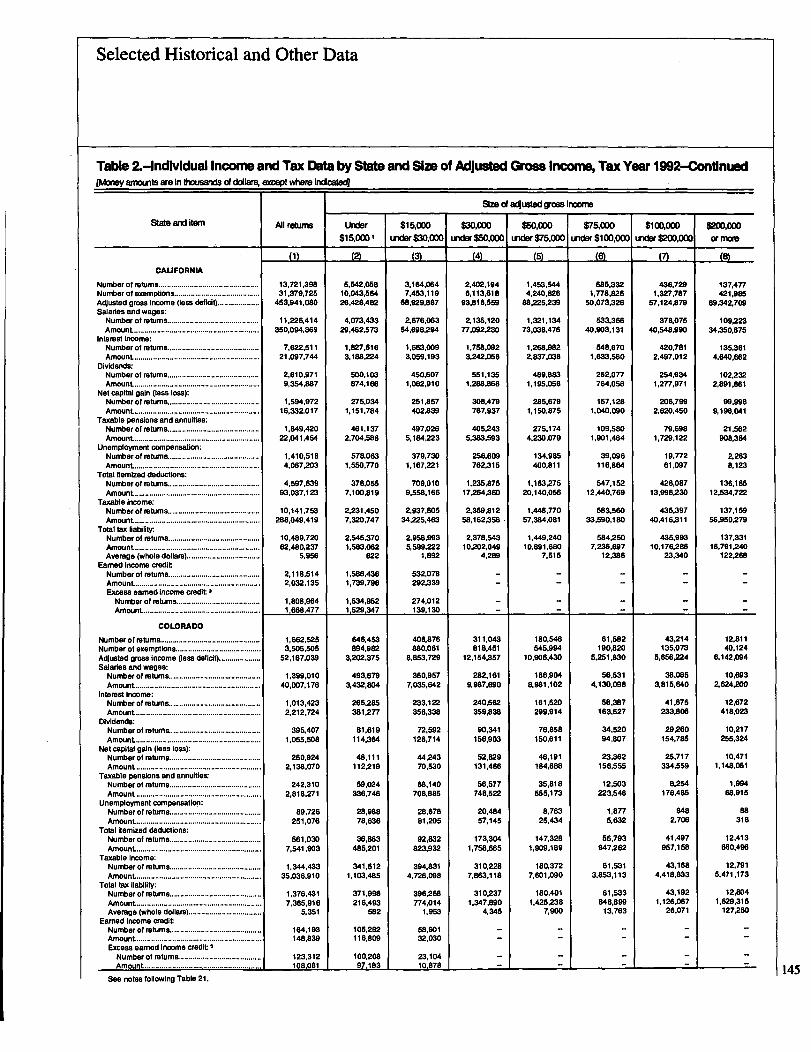
Selected Historical and Other Data
Table 1-individual Income and Tax Data by State arwJ Size of Adjusted Gross Incone, Tax Year 1992-C-ongnued[Morley amounts are In Itiotfsands OF dollars. soWWwre kxfoat94
All returns
Li)
13721,39831:379,725
453,941,080
11,226.414350,094.369
7,622,51121,097,744
2,610,9719,354,887
1.694.97216,33ZO17
1.849,42022,041,464
1.410,5184,067,203
4,597,63993,037.123
10,141.753288,049,419
10,489.72062,480,237
6,956
2.118,5142,032.135
1,808,9641.668,477
A
1,453,6444,240,826
88,225,239
1,321.13473,038,476
1,268,9822.837,038
489.8831.195,066
285.6791,150,875
275.1744,230,079
134,985400.811
1,163,27620,140.056
1,446,77057,384.081
1,449.24010.891.680
7.515
--
--
1,662.5253,505.505
52,167,039
1,399,01040,007,176
1.013,4232,212,724
396,4071,055,508
250,9242,138,070
242,3102,818,271
89,728251,076
561,0307,641,903
1,344,43335,036,910
1,376,4317,365,916
5,351
164,193148.839
123,312108,061
Under$15,000,
t2l
5,542.05810.043,56426.428,482
4,073,43329,462.573
1,827,6163.188,224
500,103874.166
275,0341,151.784
461,1372.704.588
578,0631,5%,770
378.0657,100.819
2.231,4507,320,747
2,545,3701.583.062
622
1,586,4361,739,796
1.534.9521,529,347
646.463894.982
3,202,375
493,6793,432,SD4
265,285381,277
81,619114.364
48.111112,219
59.024336.746
28,98878,636
36.863485.201
341,6121,103,485
371,996216,493
682
105,292116,809
100.20897,183
$15,OWundar$30,000
t3l
3.164,0647,453.119
68,929.887
Z676.06354,698,294
1,663,0093,059,193
450,6071,062,910
251.8574OZ839
497,0265,184,223
379,7301,167,221
709.0109,558,166
2,937,60534,225.463
2,958,9935,599,2P2
1,892
532,078292,339
274,012139,130
406,876880,061
8,863.729
350.9577,035,642
233,122356,338
72,692128,714
44,24370,530
68,140708,885
28,67881.205
92,832823,932
394.8314,726,098
396,268774.014
1,953
58,90132.030
23,104
$30,000undw$50,000
(4)
2.402.1946,113,618
93.816,659
Z 135,12077.092,230
1,758,0923,242,056
551.1351,288,866
308,479767,937
405,2435.383A93
256,609762.315
1,235,87517264,360
2,369.81258,162.358
2,378.54310.202,049
4.289
--
--
311,043818,451
12.154,357
282,1619.087,690
240,662359,838
90,341158,903
62.829131,466
66,577748,522
20,48457,145
173,3041,768,665
310,2287.863,118
310.2371.347,890
4.345
-
Size Of aclusWd gross Inoome
$50.000under$75,000
180,646545,994
10,906,430
166.9D48.981,102
161,520299,914
76,858150,611
46,191184,688
35,818655.173
8,76325,434
147.328I.W9,189
180,3727,601,090
180,4011,425,238
7,900
-
3;75~ODOundar$100,000
(0)
685.3321,778,826
50,073,326
533,36640,903,131
648.6701,633.560
262.077764,058
167,1281,040.090
109.5801,901,464
39,096118,864
547,15212,440,769
583,56033.590,180
584,2607,236.697
12,386
--
--
61,682190,820
5,251,830
56,5314.130,098
58.387163,527
34,52094.807
23,362156,555
12.503223.546
1.87175,632
56,793947,262
61,5313.M,113
61,633$46,89913,763
$100,00D
urKlor$20D,000
(7)
436,7291,327,787
67.124.879
378,07540,648,990
420,7812,497,012
254,9341.277,971
206.799Z620.450
79.6981,729,122
19.77261,097
428,08713.998,230
435,39740,416.311
435,99310,176.286
23,340
-
-
43,214135,073
5.656,224
38,0853.815,640
41,875233,806
29.260154,785
25,717334,559
8.254176,485
848Z706
41,497967,158
43,1684.418,833
43,1921.126.067
26.071
-
M
Adjusted gross Income (less deflciQ....................Salaries and wages:
Interest incor"a:Number of returns ............................................Amount ............................................................
Dividends:Number of returns ...........................................Amount ............................................ . ..............
Not capital gain (less loss):Number of returns............................................Amount ............................................................
Taxable pensions and annuities:Number of returns............................................Amount ............................................................
Unemployment compensation:Number of return&...........................................Amount ......... ........................... .......................
Total itemized deductions:Number of returns............................................Amount ............................................................
Taxable Income:Number of returns............................................Amount ............................................................
Total tax liability.Number of returns............................................Amount............................................................Average (whole dollars)...................................
Earned Income creditNumber of returns.......................... .................Amount ............................................................Excess earned income creclit 3
Number of exemptions.........................................Adjusted gross Income (less deficit)....................Salaries and wages:
Interest Income:Number of returns ...................Amount ...................................
Dividends:Number of returns ..................Amount ...................................
Not capital gain (loss loss):Number of returns...................Amount...................................
Taxable pensions and annuities:Number of returns...................Amount....................................
Unemployment compensation:Number of returns...................Amount....................................
Total Itemized deductions:Number of returns...................AmounL...................................
Taxable Income:Number of retums. ..................Amount...................................
Total tax liability:
Earned Income credit
state MA italm
CALIFORNIA
COLORADO
Excess earned Income credit
See notes following Table 21.
$20D.OOD
or mons
137,477421,985
69,342,709
109,22334,350,675
135,3614,640,662
102.232Z89118611
99.9969,198.041
21.562908.384
Z2638.123
136,18512,534,722
137,15966,950.279
137,33116.791.240
122,268
-
-
12.81140.124
6.142,094
10,693Z624200
12.672418,023
10,217255,324
10.4711.148,061
1,99468,915
as318
12,413660,496
12,7915.471.173
12,8041,629,315
127,250
-
145
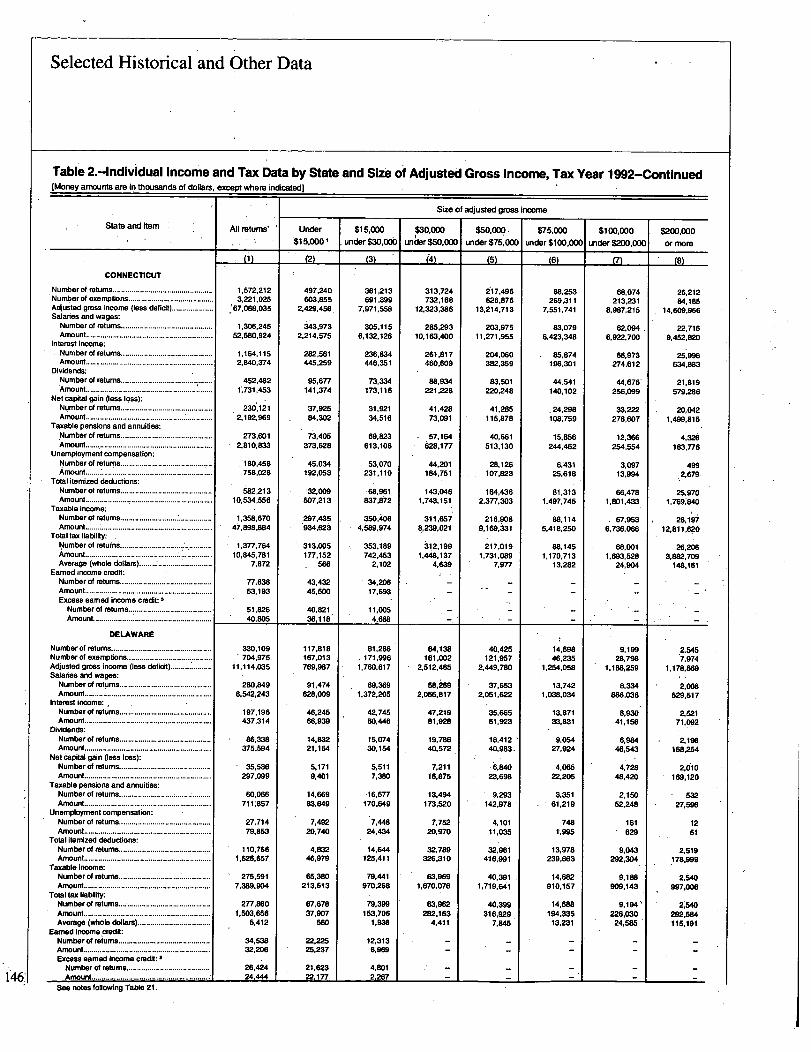
146'
Selected Historical and Other Data
Table 2.-4ndividual Income and Tax Data by State and Size of Adjusted Gross Income, Tax Year 1992-Continued[Money amounts are in thousands of dollars, except where inclicatac!]
State and itern
CONNECTICUT
Adjusted gross Income (less deficit) ....................Salaries and wages:
Interest income:Number of returns............................................
Dividends:Number of returns....................................Amount.............................................................
Net capital gain Pass loss):Number of returns............................................Amount................................................ ............
Taxable pensions and annuities:Number of returns................................... .........Amount.............................................................
Unemployment compensation:Number of returns............................................Amount ..... ................................................
- Total itemized deductions:Number of returns............................................Amount .............................................................
Taxable income:Number of returns.................
........Amount .....................................................Total tax liability:Number of returns..................Amount .................... ........................ .........Average (whole dollars)...................................
Earned income credit:Number of returns............................................Amount .............................................................Excess earned income credit: 3
Number of returns........................................
All returns'
M
5722123:221 025:
.'67,088.035
1.306,24552,580,924
1,164.1152,840.374
452,4821,731,453
230,1212,192,969
273,6012,810,833
180,458758,028
682.21310,534,556
1,358.67047,898,884
1,377,76410,845.781
7,872
77,63863,193
51,82640,805
330.109704.975
1.1,114,035
280,8498.5Q,243
197,196437,314
86,338375,594
35,636297,099
60,066711;857
27,71479,853
110,7661,626,667
275,5917,389,904
277,8601,503,666
6,412
34,63832,206
26,42424,444 f
Under
$15.0001
L21
497,240603,855
2,429.456
343,9732,214.575
282,561445,259
95,677141,374
37.92584.302
73,405373,628
45,034192,053
'32,009507,213
297,435934,623
313.005177.152- 566
43.43245.500
40,82136,118
117,818167,013769,M7
91.474628.0D9
46,24566,939
14.83221,164
5,1719,401
14,66983.649
7.492213.740
4,83246,979
65,380213,613
67,67837,907
560
22,22525,237
21,62322,177
$15,000
under$30,000
L3)
361,213691 .399
7.971.558
305.1156,132,126
236.834446,351
73,334173.116
31,92134,516
69.1123613,106
53,070231.110
68,961837,872
350,4064.~89.974
353,189742,453
2,102
34,20617,693
11,0054,688
81,286171,996
1.760.617
69.3691,372,205
42,74580,446
15,07430,154
5,5117,350
16,577170.649
7,44824,434
14,644125,411
79,441970,268
79,399153,706
1.936
12,3136,969
4,8012-267
$30,000
un6r$50,000
(4)
313,724732.168
12.323,386
285,29310,163.400
261,817460,609
88.934221,228
41,42873,091
57,164628,177
44,201184,751
W,0461,743,151
311,6578,239,021
~12,1991,448,137
4,639
-
64,138161,002
2,512,465
58,i692,056.817
47.21981,928
19,78640,572
7,21116,875
13,494173,520
7,76220,970
32.789326,310
63,9691,670,076
63.9622112,163
4,411
--
--
Size of adjusted gross income
$50,000.
under$75,000
5)
i17,496626,876
13.214,713
203,97511,271,955
204,060382.359
83,501220,248
41,285115,878
40,661513,130
28,126107.823
164,4362,37-7,303
216,9089.169.~31
217,0191.731,089
7,977
-
40,425121,957
2,449,780
37,6532,051.622
35.66561.923
18,41240,983.
.6,84023,698
9.293142,978
4,10111,035
32,961416.991
40,3911,719,641
40,399316.929
7,845
--
--
$75,000
under$100,000
61
88.253269,311
7,551.741
83,0796,423,348
85,874196,301
44,541140,102
.24,298108.759
15,856244,462
6,43125,618
81,3131,497,745
88,1145.418,250
88,1451.170,713
13,282
-
-
14,69846,235
1,254.058
13,7421,038,034
13,87133,831
9,05427,924
4.06522,205
3.351- 61,219
7481,995
13,978239,663
14,682910,157
14,688194,33513,231
--
--
$100,000
under$200,000
(7)
68.074213,231
8,987,215
62,0946,922,700
66,973274,612
44,676-256,099
33,222276,607
U,366254,554
3,09713,994
66.47s1,801,433
67,9536,736,066
68,0011,693.528
24,904
-
-
9.19928.798
1.188,259
8,334866.038
8.93041,156
6,98446.543
4,72848,420
2.15052.248
161629
9,043292,304
9,188909,143
9,194'226,030
24.585
-
DELAWARE
Adjusted gross income (less deficit) ....................Salaries and wages:
Number of returns ............................................
Interest income:Number of returns ............................................Amount.............................................................
Dividends:Number of returns .... ........................................Amount.............................................................
Not capital gain Pass loss):Number of returns............................................Amount.............................................................
Taxable pensions and annuities:Number of returns............................................Amount.............................................................
Unemployment compensation:Number of returns............................................Amount.............................................................
Total itemized deductions:Number of returns............................................Amount .............................................................
Taxable income:Number of returns............................. * .............Amount .............................................................
Total tax liability:Num
,bar of returns ........................................
Amount .............................................................Average (whole dollars)...................................
Earned Income credit:Number of returns ............................................Amount........................
*"'*'*"*'**'*"*"'*""'*"*'*Excess earned income CMfft: 3Number of returns........................................Amount.........................................................
See notes following Table 21.
$200,000
or more
26,21284.1 B5
14,609,966
M,7169,452.820
25,996634,883
21,819579,286
213,0421,499,815
4,326183,776
499Z679
25,9701,769,840
26,19712,811,620
26,2D63,882,709
148,161
-
2,5467,974
1.178,869
2.008629,517
2,62171,092
2,196168,254
2.010169.120
53227,596
1251
Z519178.999
Z540997,006
2,540292,W4115.191
-

Selected Historical and Other Data
Table Z-4ndividual Income and Tax Data by Slate and Size of Adjusted Gkoss Income, Tax Year IW2-CMinued[Moneywwrtsare in Vlousands of ddlafs~ 9xWwtvare irdcatecQ
All ratums
D)
305,450578,374
10,225,762
250.6137,570,546
143,796417,130
51,527339,553
28,061441,002
46,848834,464
16,26168.820
93,4351,673,621
245,7547,018,788
245,0661,559.238
6,363
48,84045,678
38.44935,662
A
23,71550,049
1,434,118
20,5781,128,084
19,75148,118
8.93531.390
4,76715,828
5,543145.061
6843,199
19,582288,439
23,6101.021,330
23,617210,568
8,916
6,238,79113,702,424
187,754.399
4,906,954128,054,712
3,406.33512,946,576
1,400.0287,134,383
903,04010.382,604
1.136.32413,742,308
416,1291,321,884
1,559.59422,138,643
4,779,064128,055,396
4,929.60427.732.223
5.626
847.682612,582
671.924611 7_89 A
Lindef,$15,0001
M
109262174,477490.015
79,581617.071
29,52050,380
8,12713.159
3.47273.861
11,33389,076
8.01331,568
5.65569,966
52,347186,180
53.56032.676
610
30,60835,406
30,25931,708
2,6782454,614,217
14,931.416
1.971,17814"4.405
991.5362,058,923
342,624710,825
199,474506266
328.0091,825,840
177,608514,761
165,3352,178,328
1,280,7064,268,348
1.427,161859245
602
587,528664,624
564.567561.056
$115~0010lLndar$30,000
03
95,518192,567
2,087,819
83,8951,756.979
37.54638,680
8,13215~333
3,3024,637
14,152205,273
5. SW25,007
18,522175.501
93.2531,166,882
91,349175,987
1,927
1823210,272
8,1903,954
1,641.2983.776,183
35,186,167
1,326,63725.944,429
885,0222,231,678
323,027949,033
191,961242,924
345,9853,588,936
124,235417,191
326.8553.501,760
1.587.68418,145,488
1,590,6692,925970
1,839
260,164147,958
107.35750,734
$3Q000under$50,000
(4)
53,302101.952
2.043,991
46,7841,676,646
34.61952,431
10,97225.538
4.8829,074
10,414208.559
1.7097.469
26.861301,803
52.9751.411.973
52,947251.610
4.752
1.030,6452.737.061
40,025,939
868,67330,272,089
738.6652,052221
296,8101,047.546
184,871492,919
239,4303,"6,226
74,399248,873
4312384,605,367
1,024,70326,527,424
1,025.2284.474,137
4,364
Size Of aclusted goss irwrne
$50,000undar$75,000
523.6771,556.530
31.521,319
447,08723,760.250
446,4091,551,551
211,474895.596
136,235681,329
134,4012,426.077
29,344101,316
337.0984.243.983
522,07522,920,365
522.3214,330,912
8,292
$75,000undar$100,000
A
9,63622,296
825,580
8,325626,756
8,84532,846
5,02825,007
3.19817,473
2,37271236
202917
9,060178.979
9.602597,954
9,608137.318
14.292
172.765627,370
14.740,821
145,68010,686.383
159,283807,060
90,941529290
64,926535,357
43,461924,012
6.72724,417
136.3802.197,101~
172,2811 1,238.609
172.4132,480,942
14,390
$100,000under$200,000
0
9,92925,513
1,329243
8,438929,553
9,47157,343
6.82661.315
5,20649.483
2,22078,515
134569
9,695296,624
9,889983,702
91900254,94325,752
132,801408,330
17,638,067
103,55510,383.880
127.0121,269,664
87,222887,948
77,9121,278,890
32293868.381
3.36013294
112,8732.563,222
132,40914,184,347
132,5383,619.923
27.3 12
A
Number of returns ........ .......................................Number of exemptions.........................................Adjusted gross income (loss deficit) ....................Salaries and wages:
Interest income:Number of returns............................................
Dividends:Number of returns............................................
Not capital gain (loss loss):Number of returns............................................
Taxable pensions and annuities:Number of returns............................................
Unemployment compensation:Number of returns............................................Amount ............................................................
Total itemized deductions:
Taxable income:
State and item
DISTRICT OF COLUMBIA
Total tax liability:Number of returns ............................................
Average (whole dollars)...................................Earned income credit:
Excess earned Income credit: INumber of returns........................................
FLORIDANumber of returns ................................................Number of exemptions.........................................Adjusted gross income (loss deficiQ....................Salaries and wages:Number of returns............................................
Interest income:
Dividends:Number of returns............................................
Net capital gain (loss loss):Number of returns............................................Amount............................................................
Taxable pensions and annuities:Number of returns ............................................
Unemployment compensation:Number of returns ............................................Amount............................................................
Total itemized deductions:Number of returns ............................................
Taxable income:
Amount ............................................................Total tax liability:Number of returns ............................................Amount ............................................................Average (whole dollars) ...................................
Earned income credit:Number of returns ............................................
Excess earned income credif: 3Number of returns........................................
See notes following Table 21.
$20D,000ornue
4,08811,520
2.014,995
3,012835,459
4,044137,332
3,507167,811
3.234270,646
81436,743
1991
4,060362,309
4,0781,650,767
4,085496,146121,456
59.360182,733
33,710,670
44.14412,813,275
58,4082,975,478
47,9302,114,145
47,8616,644,919
12,745663.837
4562.032
49,8152,848.882
59,20630,770.815
59.2749.041,794
152.542
147
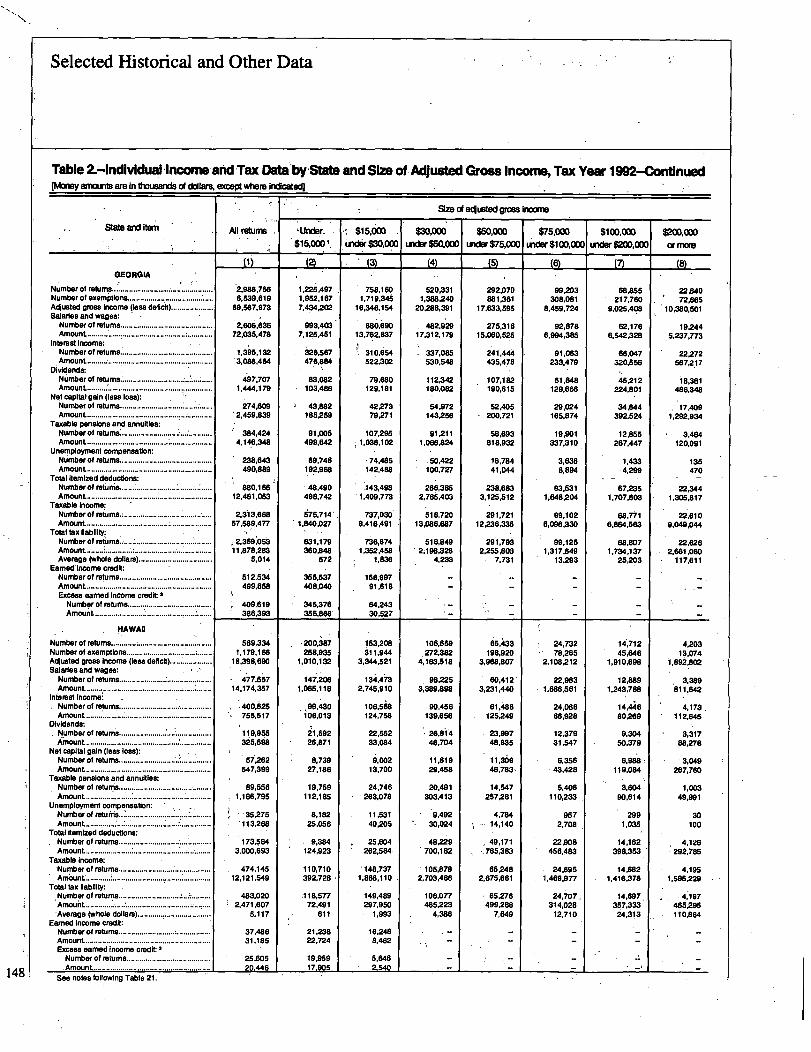
148
Selected Historical and Other Data
Tible 2.Andividualincom and Tax Dita byZteb and Sin ofAdjusted Grm lncwvk Tax Year 1992-ContinuedMoney mounts are in thousands of dollars. e=w where irdcatem
All returns
2 986,7666:639,619
ag,567.973
2,6041.63672.035.478
1,395,1323.086,484
497.7071,444.179
274,609'2,459.839
384,4244,146,348
238,643490,889
880,16612,461,053
2,313,66857.589,477
,2,369,06311.878,283
5.014
512,534499,668
409,619386,393
569,3341,179,166
18,398,69D
477,55714,174,357
400,625755,517
119,955325,698,
V,262547,399
89,5561,186,795
35,275113,268
173.5843.000,693
474,14512,121.649
483,0202,471,607
5,117
37,48631,185
25,60520 4_46
$15,6W I
9
292,070881,361
17,633,596
275,31615.060.526
241,4414
435,478
107.182190,615
52.405200,721
58,693818,932
18,78441,044
238,6833,125,512
291.72112,236,335
291,7832,255,803
7,731
-
1,225,4971,952,1677,434,202
993,4037,125.451
326,567476.884
6,082103,486
43,882185,259
91.005499,642
89,74819.21968
48,490498,742
575.714'1.840427
631,179360,848
572
355,537408,040
345,376355,866
258,9361,010,132
147,2061,065,118
99,430. 1106,013
21,59226,871
8.73927,186
19,759112,185
8,111225,056
9,384124,923
110,710392,728 -
.118,57772,491
611
21,23822,724
19,9591-7905
.$15,000 ,uncler $30,000
758,1601,719.345
16,346,164
680"69013,762.837
310,654522,302
79,680129,181
42.27379.271
107,2951.036,102
74,485142,488
143,4981,409,773
737,0308,416,491
736,6741,362,458
1,836
156,99791,618
64,24330,527
153,208311,944
3,344,521
134,4732,745,910
106.568124,756
22,55233,084
6.00213,700
24,746263,078
11,153140,2D5
25,604262,584
-148,73711868,110
149,489297,950
1,993
16.2488,462
5,6462-540
$30,000UIKkX$50,00D
L4)
620,3311,388.240
2D,288,391
482.92017,312.179
337,085530,548
112,342180,082
$4,972143.256
91,2111,066,824
.50,422100,727
266,3852,765,403
518.72013,086.687
618,8492096,328
4,233
-
106,669.272,382
4,163,618
90,2253,389,898
90,456139,656
26,8 1446,704
11,81929,458
20.491303,413
9,49230,024
48,229700,182
105,8782,703,466
106,077465.223
4,386
Sim d aclusW gross in=ne
$50,000wdsr$75,0W
65,433198,920
3,968,807
60,412'3,231,40
61,486125.249
23,99748,835
11,36946.783,
14,647257,281
4,78414,140
49,171765,383
65,2482,675,661
65,276499,288
7.649
-
$75,000mder$100,000
99,203308.081
8,459.724
92,8786,994,385
91,063233,479
51,848129,666
29,024165.874
19,901337.310
3,6368,894
93,5311,648,204
99,1026,096,330
99,1251.317,849
13,293
-
-
24,73278,265
2,108,212
22,9631.686,561
24,06666.928
12,37931,547
6,35643,428
5,406110,233
9572,708
22,908456,483
24,6951.469,977
24,707.314,028
12,710
-
$100,000uxier$200,000
68,855217.760
9,025,408
62,1766.642.328
66,047320,556
45.212224,801
34,644392,524
12,855267,447
1,4334,299
67,2351,707,603
68,7716.86,1.563
68,8071,734,137
25,203
-
14,71245,646
1,910,698
12,8891,243,788
14,44680,269
9.30450.379
6,988!11 0,084
3,60490,614
2991,035
14,162398A53
14,6821,416,378
14,697.,357,33324,313
-
State anci item
QEORGIA
Adjusted gross Income (loss deficit).............Salaries and wages: 7--Number of returns.... . ......................................Amount ........ ..................................... . o ............
Interest Income:
Dividend&Number of returns..................................Amount..........
Not capital gain (less lossyNumber of .........................Amount....................... .......................
Taxable pensions and annuities:Number of returns..................................Amount........ . . ...........................: ................
Unemployment compensation:Number of returns.................. .......................Amount........................................................
Total Itemized deductions:Number of returns ..................... .........Amount.............. .........................................
Taxable Income:Number of returns.; .....................................Amount ....................................... ................
Total tax Ilabliltr.
Earned Income credit:Number of returns ........................Amount .........................................Excess earned income credit 3
NAWAII
Number of exemptions................................. ......Adjusted gross Income (loss deficit)....................Salaries and wages:
Interest Income:Numberofretums.............................................Amount ............................................................
Dividends:
Net capital gain (low lose):
Taxable pensions and annuities:Number of returns......:---Amount ......................................
Unemployment compensation:
Total Itemized deductions:
Taxable Income:
Total tax liability:Number of return ......................
*Average (whole dollam)............: ......................Earned Income credit:
Excess earned Income credit: 3
See notes following Table 21.
$200,000or fflare
22,64072,665
10,380,501
19,2445,237,773
22,272567,217
18,361486,348
17,4091,292,934
3,464120,091
135470
22,3441,305,817
22,6109,049444
22.6262,661 P60
117,611
-
4,20313,074
1,892,802
3,389811,642
4,173,112,645
3,31788.278
.3,049267,760
1,00349,991
30100
4,126292,785
4,1951,596,229
4,.197
465,295110,864
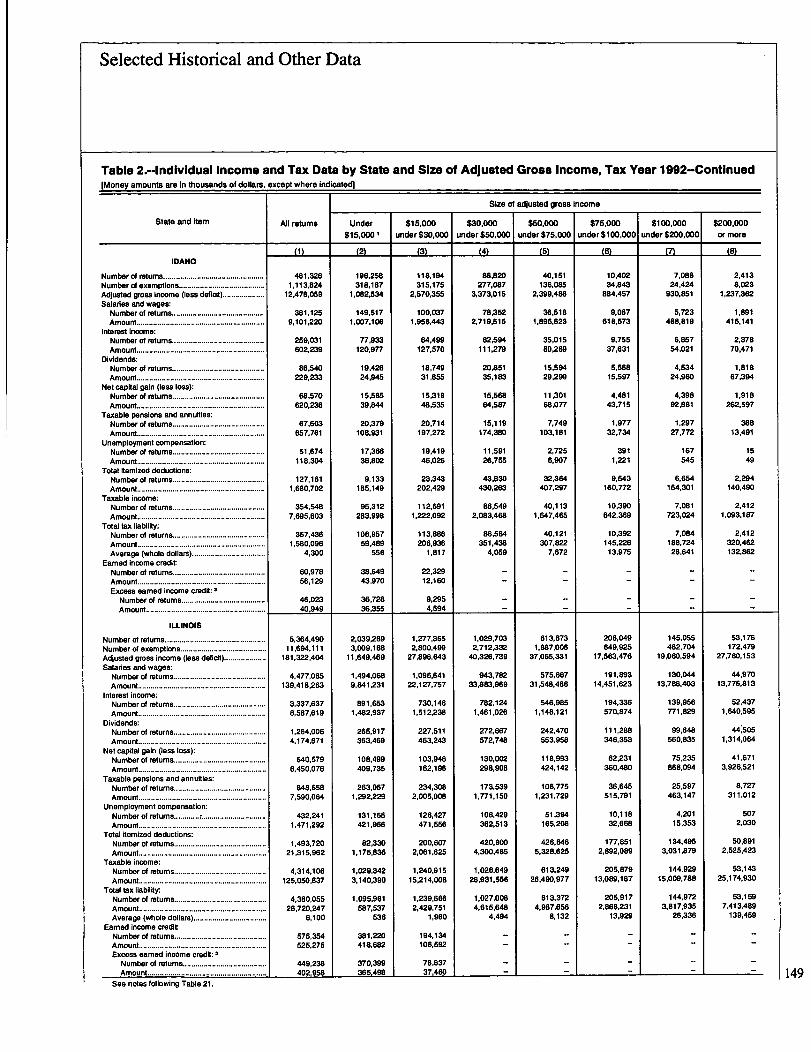
Selected Historical and Other Data
Table 2.-4ndividual Income and Tax Data by State and Size of Adjusted Gross Income, Tax Year 1992-Continued[Money amounts are In thousands of dollars-, except where indicated)
State and Rom
IDAHO
Number of exemptions.........................................Adjusted gross Income (less deficit)....................Salaries and wages:
Interest Income:Number of returns............................................
Amount.............................................................Dividends:
Number of returns............................................
Amount .............................................................Not capital gain (loss loss):
Number of returns............................................
Amount .............................................................Taxable pensions and annuities:
Number of returns.................................. ..........
Amount .............................................................Unemployment compensation:
Number of returns............................................
Amount .............................................................Total Itemized deductions:
Number of returns............................................
Taxable income:Number of returns............................................Amount .............................................................
Total tax liability:Number of returns ............................................Amount .............................................................Average (whole dollars)...................................
Earned income creditNumber of returns ............................................Amount.............................................................Excess earned income credit: 3
ILLINOIS
Adjusted gross income (loss deficit)....................Salaries and wages:
Interest income:Number of returns............................................Amount .............................................................
Dividends:Number of returns............................................Amount .............................................................
Not capital gain (less loss):Number of returns............................................Amount .............................................................
Taxable pensions and annuities:Number of returns ............................................Amount .............................................................
Unemployment compensation:Number of returns ............. ..............................Amount .............................................................
Total Itemized deductions:Number of returns ............................................Amount.............................................................
Taxable Income:Number of returns ............................................Amount.............................................................
Total tax liability:Number of returns ............................................Amount............ .................................................Average (whole dollars)...................................
Earned Income creditNumber of returns............................................Amount.............................................................Excess earned Income credit: 3
All returns
L111
481 3261,113:824
12,478.059
381,1259,101,220
259,031602,239
86.540229.233
68,570620,236
67,603657,761
51,674118,304
127.1611,680.702
354,5487,695,603
367,4381,580,096
4,300
60,97856,129
46,02340.949
5,364,49011,694,111
181,322,404
4,477,065139,418,263
3,337,6378,587,619
1,264,0064,174,671
640,5796,450,076
848,6587.590,064
432,2411,471,292
1,493,72021,315,962
4,314,106125,050.837
4,380,05626,720,247
6,100
675,354526,275
449,236402,958
Size of adjusted gross Income
Under
$15.DD0 I
L21
19::25831 187
1,082,534
149,5171.007.106
77,933120.977
19,42624,945
16,58539,844
20,379108.931
17,36636,802
9,133185,149
95.312283.998
106,95759,489
556
38,64943.970
36,72836,355
$15,000
under$30,000
t3l
118194315:1762,570,355
100,0371,956,443
64.499127,570
18,74931,855
15,31948,635
20.714197,272
19,41946,026
23.343202,429
112,6911.222,092
113.886206,936
1.817
22,32912.160
9,2954,594
2.039,269 1 1.277.3653,009,166 1 2,800,499
11.649.469 1 27,896.643
1.494,068 1 1,096,6419,841,231 1 22,127,757
891,653 1 730,1461,482,937 1,512,238
265,917 227,611363,469 463,243
108,499 103,948162,196409,735
263.067 234,3081.292,229 1 2.005,008
131,166 1 126,427421,966 1 471,556
82,330 200607I'l 2,061:62575,836
34211240:915
':":3'52,4
008314.
1,095,961 1,239,666687,537 2,429,751
636 1,960
381.220 194,134418.682 106.592
370t3::
78'837
3654 37,460
$30,000under$50,000
(41
86'820277,0873.373,015
78,3522,719,615
62,594111,279
20,85135,183
15.56864.587
15.119174.380
11,59126,755
43,830430,263
86,5492.083.468
86,584351.436
4,059
--
--
1,029,7032,712,332
40,326,739
943,78233,883.969
782.1241,461,026
272,667572,748
130,002298,908
173,5391,771,150
108,429362,513
4209004,300:485
1,026.64926,931.556
1,027,0084,615,648
4,494
-
$50,000under $75,000
L51
40,151136,085
2,399,486
36,5181.895,623
35,01580,289
15,59429,299
11,30168,077
7,749103,181
Z7256.907
32,364407.297
40,1131,647,465
40,121307,822
7,672
--
--
613,8731,887,006
37.065,331
575,66731,548,466
646,9851,148,121
242,470563,958
118,993424,142
106,7751,231,729
51,394165,206
426,6465,328,625
613,24926.490,977
613,3724.987,656
8,132
$75,000under $100,000
M
10,40234,843
884,467
9,087618,5
9,75537,631
5,56815,597
4,48143,715
1,97732,734
3911,221
9.543160,772
10.390642.369
10,392145,22613,975
--
--
206,049649,925
17,563,476
191,89314,451,623
194,336570,874
111,288346.353
62,231360.480
36,645515,791
10,11832,668
78512,192017 :
205,87913,089,187
205,9172.868,231
13,929
-
$100,000 1 $200,000
under$200,0001 or more
7,088 1 2,41324,424 1 8,023
930,851 1 1,237,362
5,723 1,891415,141
6,857 2,37854 70,471
4534 81824960 67394
4,398 1,91892,881 1 262,597
1,297 36827 13.491
167 5545 49
6,654 2.294154,301 140,490
7,081 1,092,412723,024 3.187
7,084 2,412188,724 320,46226,641 132,862
--
--
--
--
(7) 1 (a)
145,055 53,176462,704 172,479
19,060,594 1 27,760,153
130,044 1 44,97013,788,403 13,776,813
139,956 62437771,829 1.640:595
99,648 44~505560,835 1,314,064
75,235 4 671868,094 ':
I3,92652
25,597 8,727463 311,012
4,201 50715,353 2,030
134,495 508912.525:423
144.929 1 53,14315,009,788 25,174,930
144,9723,817,935 7,45133.'415899
26,336 139,459
- -
See notes following Table 21.149
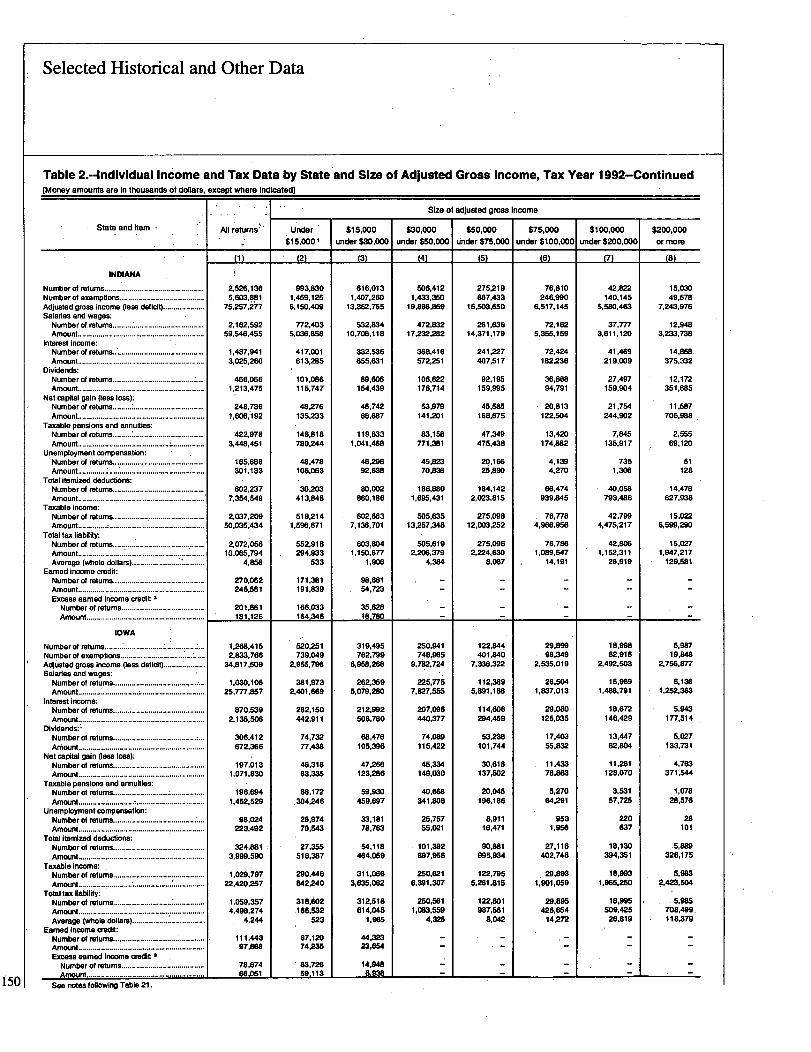
Selected Historical and Other Data
Table 2.--Individual Income and Tax Data by State and Size of Adjusted Gross Income, Tax Year 1992-Continued[Money amounts are in.thousands of dollars, except where indicated]
All returns~'
2,526,1365,603.881
75,257,i~7
2.162,59259.546,455
1,487,9413,025,260
466.D661,213.475
248,7361,606,192
'422,9783,448,451
166,688301,133
602,2377,354,549
2,037,20950,035,434
2.072.05610,065,794
4,8!98
270,062246,561
201,861181,126
1,268.4152,833,766
34,817,509
1.030,10525,777,867
870,5392,135.506
306,412672,366
197,0131,071,630
196,6941,452,629
98,024223,492
324,8813,999,590
1,029,79722,420,257
1,059,3574,496,274
4,244
111,44397,888
78,67466,051
Under
$15,0001
(2)
993,8301.459,1256.150.409
772,4035,036,858
417,001613,285
101,086115,747
48.276135.233
148,818780.244
48.478106,063
30=413,848
519.2141,596.671
652.918294.933
533
171,381191,839
166,033164,346
620,261739,049
2,965,796
381.9732,401,669
282,150442,911
74,73277,438
46.31883.335
66,172.304,246
28.97470.543
27,355518,367
290,"6842,240
318,602.166,532
523
67.12074=
63,726591-13
$15,000
under$30,000
t3)
616,0131,407.260
13,362,765
532,83410,706,118
332,536655,631
89,606164,439
46.74286.687
119,8331,041,468
46,29692,638
80,002860,186
602.6637,136,701
603,8041.150.677
1,906
98,68164,723
35.82816.780
319,496762,799
6.V58.268
262,3595.079,280
212.992608,780
68,476105,396
47.266123,286
59.930459,697
33,18178.763
54,118464,059
311,0663,635,082
312,518614.045
1.985
44.32323,654
14.948-0"
$30,000
under$50,000
L41
506.4121.433,350
19,898,889
472,83217=,282
368,416572,251
106,622176,714
63,979141,201
83.158771,381
45,82370.836
186,8801,695,431
505,63513.257,348
505,6192,206,379
4,3154
-
250,941748,965
9,762,'724
225.7757,827,556
207,096440,377
74,089115,422
45,334149,030
40,668341,808
25,75755,021
101,392897,956
250,6216,391.307
250,5611,083,569
4,325
-
Size of adjusted gross Income
$50,000
under$75,000
01
275,219867,433
16,503,650
261,63614.371,179
241.227407,517
92,195159.995
45,585168,675
47,349475,438
20,16625,890
184,1422,023,815
275,09812,003,252
275,0962,224,630
8,087
-
122,844401,840
7.338.322
112.3895.891,186
114,606294.459
53,238101,744
30.618137,502
20,045196,186
8,91116,471
90,881995.934
122,7955.261,815
122.801987,561
8,042
-
$75,000
under$100,000
C61
76,810246,990
6,517,145
72.1625.355,159
72,424182,236
36.M94,791
20.813122,504
13.420174.882
4,1394,270
66.474939,845
76,T784.966,966
76,7861.089.647
14,191
-
29,89998.349
2,535,019
26.5041,837,013
29,080125,035
17,40355,832
11,43378.M
5,270S4.291
9531,956
27.116402.748
29,8931.901.059
29,895426.654
14.272
-
$100,000
under$200,000
FJ
42,822140,145
5,580,463
37,7773,611.120
41,469219,009
27,497159,904
21.754244,902
7,845135,917
7351,306
40,058793,486
42,7994,475,217
42,8061,152,311
26,919
-
-
18.99862,916
2,492.503
15,9691,488,791
18.672146,429
13,44782,804
11.281128,070
3,53157,725
220637
18.130394.351
18,9931.965.250
18,995509.42526,819
-
IS)
State and Rom -
INDIANA
Number of returns................... .............................Number of exemptions.........................................Adjusted gross income (loss deficit)....................Salaries and wages:
Number of returnsAmount.............................................................
Interest Income:
Dividends:Number of returns.......................................Amount.................................................. ...........
Not capital gain pass loss):Number of returns.......... :...................... ...........Amount.............................................................
Taxable pensions and annuities:Number of returns ..................................Amount............................................ ; ...............
Unemployment compensation: 7 .Number of returns............................................Amount ..............: ..............................................
Total iternized deductions:Number at returns............................................Amount .............................................................
Taxable income:Number of returns............................................
Total tax liability'.
Average (whole dollars) ........................* ..........Earned income credit:
Excess earned Income credit 3
IOWA
Adjusted gross income (loss deficit) ....................Salaries and wages:
Number of returns ....................................Amount ............................. ;...............................
Interest Income:
Dividends:*Number of returns ...........Amount ...........................
Not capital gain Oess loss):
Taxable pensions and annuities:Number of returns ........................... ................
Unemployment compensation:
Total itemized deductions:
Taxable Income:Number of returns ............................................
Total tax liability:
Average (whole dollars)...................................Earned Income credit:
Excess earned Income credit
See notes following Table 21.
$200,000
or more
15.03049,578
7,243,976
12.9483.233.738
14,868375,332
12,172351,885
11-5,87706.988
2,66669,120
51128
14,478627,938
15,0226,599,290
15,0271,947,217
129,581
-
-
5.98719,848
2,756,877
6.1361,262.363
5,943177,514
5,027133,731
4,763371,544
1,07828,576
28101
5,889326,175
5,9M2,423,504
.5,985708,499~118,379
-
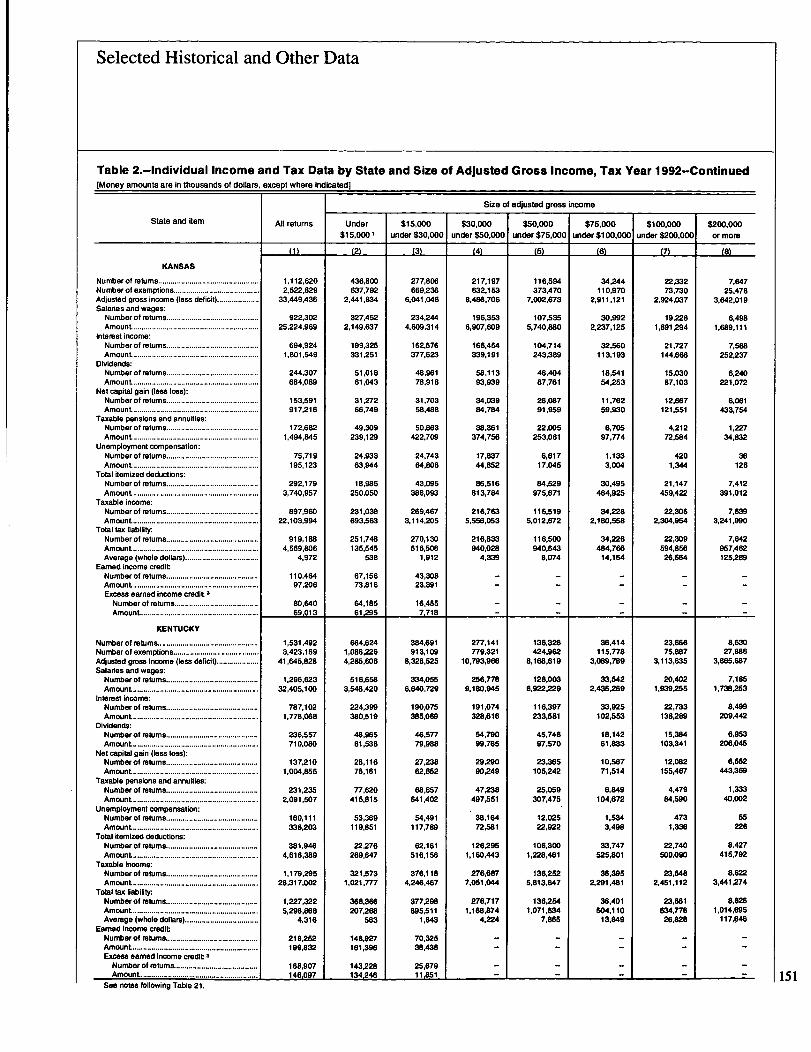
Selected Historical and Other Data
Table 2.-Individual Income and Tax Data by State and Size of Adjusted Gross Income, Tax Year 1992-Continued[Money amounts are in thousands of dollars, except where indicated]
All returns
LI)
'' 12620
2:522 829:33,449,436
92230225,224:969
694,9241,801,549
244,307684.089
153,591917.216
172,6821,494,845
75,719195.123
292,1793,740,957
897,96022,103.994
919,1884.569,806
4,972
110,46497,206
80,64069,013
1,531.4923,423,169
41,645,828
1,296.62332,405,100
787,1021.778,068
236,557710,080
137.2101,004,855
231,2352,091,507
160,111338,203
381,9464,616.389
1.179,29526,317,002
1,227,3225,296,868
4,316
219.252199,832
168,907146,097
Under
$15,0001
"2
436800637792
2,441,834
327.4522,149,637
199.325331.251
61,01861.043
31,27266,749
49.309239,129
24,93363,944
18,985250,050
231,038693,563
251,748135,545
538
67,15673,816
64,185OLM
664.6241,086,2264,285,608
516,6583,548,420
224,399380,519
48.96561,538
28,11676.161
77,620415,815
53,369119,861
22.276269,647
321,6731,021.777
368,366207.268
563
148,927181,396
143.228134,246 1
$15,000underS30,000
J31
277806669236
6,041,046
234,2444,609,314
162,676377,623
48,96178,918
31,70368,488
50,863422,709
24.74364.808
43,095386,093
269,4673,114,206
270,130516,506
1,912
43,30823,391
16,4557,718
384,691913,109
8.328,525
334,0556,640,729
190,075385,069
46,57779,988
27,23862,852
68,657641,402
54,491117,789
62,161516,156
376.1184,246,467
377,298695,511
1,843
70,32638,436
25,67911,851
$30,000under$50,000
"4
217 97632:1153
8,486,706
196,3536,907,609
166.464339,191
68,11393,939
34,03984,784
38.361374,756
17,83744,852
86.516813,784
216,7635,656,053
216,633940,028
4,339
--
--
277.141779.321
10,793.966
256,7789.180,945
191.074328.616
64,79099.765
29.29090,249
47,238497,551
38.16472.581
126,2951,160,443
276,6877,061.044
276,7171.168,874
4.224
-
Size of adjusted gross income
$50,000
under$75,000
"S
116594373:470
7.002,673
107,5355,740,880
104,714243,389
46,40487,761
26.08791,959
22,005253,061
6,61717,045
84,529976,671
116,5195,012,672
116,500940.643
8.074
-
136,326424,962
8.168,619
128,0036,922,229
116,397233,581
46,74697,570
23,365105,242
25,059307,475
12,02522,922
106.3001,228,461
136,2625,813,647
136.2641.071.634
7,885
-
$75,000
under$100,000
L61
34244110:970
2,911,121
30,9922,237,125
32,560113,193
18,54154,Z3
11,76259,930
6,70697,774
1,1333,004
30,495464,925
34,2282.180,668
34,226484,766
14,164
-
-
38,414115.778
3,089,789
33,5422,435,269
33,925102,663
18.14261.833
10.56771,514
6,1349104.672
1,5343,498
33,747525,801
36,3952,291,461
36,401504,110
13,849
-
$100,000
under$200,000
M
2233273730
2.924,037
19,2281.891,294
21,727144,666
15,03087,103
12,667121,551
4,21272,584
4201,344
21,147459,422
22,3062,304,954
22,309594.85e26,664
-
-
23,66675,887
3,113,635
20.4021,939,255
22,733138.289
15.384103,341
12.082155,467
4,479$4,590
4731.336
22.740500,090
23,6482,451,112
23,661634.77626,828
-
16)
Adjusted gross Income (less deficit) ....................Salaries and wages:
Interest income:Number of returns............................................Amount ............................................................
Dividends:Number of returns............................................Amount ............................................................
Net capital gain (loss loss):Number of returns............................................
Taxable pensions and annuities:Number of returns............................................
Unemployment compensation:Number of returns............................................
Total itemized deductions:Number of returns............................................Amount ............................................................
Taxable income:Number of returns............................................Amount ............................................................
Total tax liability:Number of returns............................................Amount ............................................................Average (whole dollars) ...................................
Earned income creditNumber of returns ............................................Amount ............................................................Excess earned income credit 3
Number of exemptions.........................................Adjusted gross Income (less deflciQ ....................Salaries and wages:Number of returns ............................................
Interest Income:
State and Rem
KANSAS
KENTUCKY
Dividends:Number of returns ............................................
Not capital gain (loss loss):Number of returns ............................................Amount ............................................................
Taxable pensions and annuities:
Unemployment compensation:
Total itemized deduclions:Number of returns ............................................
Taxable Income:Number of returns ............................................
Total tax liability.
Earned Income credt
Excess earned income credit -Numberofretums ........................................
See notes following Table 21.
$200,000
or more
764725:478
3,642.019
6,4981,689.111
7,568252,237
6,240221,072
6,061433,754
1,22734.832
36126
7,412391,012
7,6393,241,990
7.642957,462125,289
-
-
8,63027.886
3,865,687
7,1851.738,253
8,499209,442
6,953206,045
6,552443,369
1,33340.002
55226
8.427415,792
8,6223,441.274
8,6251,014,695
117.6416
-
151
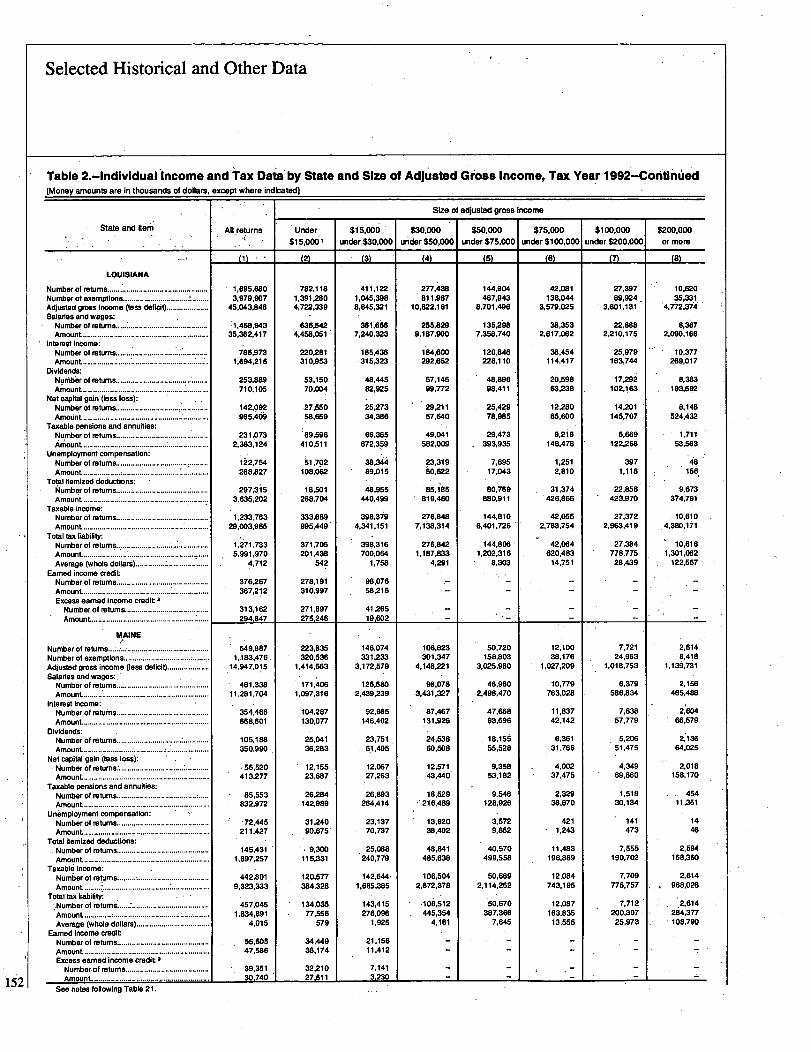
Selected Historical and Other Data
Table 2.-Individ0al-Income and Tax Data'by State and Size of Adjusted Gross Income, Tax Year 1992-Coritirlued
[Money amounts are in thousands of dollars, except where Indicated]
All returns
01111
1695,6803:979,907
45,043.846
:1,458,94335.362,417
785,9731,694.216
253,889710,105
142,092965,409
231,0732,383,124
122,754268,827
297.3J 53,635,202
1,233,76329.003,985
1,271.7335,991,970
4,712
376,267367,212
313,162294,847
549,8871.183,476
14,947,015
461,33811,281,704
354,466668,601
105'188
350.990
56,520.413,277
85,553832,972
211,427
145,4311,897,257
442,8019,323.333
457,0451,834,891
4,015
55,60547,586
39.351 1307-40 1
Under
$15,0001
t2j
782,1181,391.2804,722,339
636.6424,458,051
220,281310.953
53.15070,004
27,55068,659
:69,i96
410,511
51.702108,062
18,501268,704
333,689995,449
371,705201,438
542
278,191310,997
.271,897275 2_46
223,M320.536
1,414.563
171,4061,097,316
104.287130,077
25,04136,283
12,15523.887
26,284142.989
31,24090,675
9,300115,331
120,677384,328
134,03577,656
679
34,44936,174
32,21027,511
$15.000
under $30,000
13I
411,1221,045,3988,845,321
361,6667,240.323
185,436.315,323
48.44582,925
25,27334,386
66,365672,359
89,015
48,955440.499
-398.3794,341.151
398,316700,064
1,768
98.07666,216
41,26519,602
146,074331.233
3,172,679
125,5802,439,239
92,985146,402
23,75151,405
12,06727.263
26,893264,414
23,13770,737
25,088240,779
142,644,1,665,385
143,415276,096
1.925
21,15611.412
7,1413-230
$30,000under $50,000
L41
277,438811,987
10,822,161
255,8299,187,900
184,600292,662
57.14599.772
29,21157,640
49,041582,009
23,31950,622
85,185819,460
276,8487,138.314
276,8421.187,833
4,291
-
106,823301,347
4,148.221
98.0783.431.327
87,467131,926
24,63860,608
12,57143.440
18,529216.489
13.92038.402
48,841485.638
106,5042,672,378
'10i,612445,354
4,181
--
--
Size of adjusted gross Income
$50,000under $75.000
"S
144,904467,943
8,701.496
135,2e87,358.740
120.846228,110
48,89698,411
25,42978,985
29.473393,935
7,69517,043
80,769880,911
144,8106,401,726
144,8061,262,316
8,303
-
50.720158.803
3,025,960
46.9602.498,470
47,66893,696
18,15555,528
9,35853,182
9.546128,926
3,5729,852
40,570499,558
50,6692.114,262
50,670387,366
7,645
-
$75,000
under $100,000
J6A
42,081138,044
3,679.025
38,3532,817,062
38,454114,417
20,59863.238
12,28065,600
9,218148,478
1,2512,810
31,374426,866
42.0552,783,754
42,064620,483
14,751
-
-
12,10038,176
1,027,209
10,779763,028
11.83742,142
6,36131,766
4,00237,475
2,32938.670
4211,243
11,483196,889
12,084743,195
12,087163,835
13,555
-
$100,000under $200,000
M
27,39789,924
3.601,131
22,8882,210,175
25,979163,744
17,292102,163
14.201145,707
5,669122.268
3971.118
22,858423,970
27,3722,963,419
27,384778,775
28,439
-
-
7,72124,963.
1,018,753
6.379586,834
7,63857,779
5,20651,475
4,34969,860
1,51830,134
141473
7.555190,702
7,709775,757
7,712200,30726,973
-
A81
State and Rem
LOUISIANA
Number of returns 1...............................Number of exemptions................................... ......Adjusted gross income (loss deficit)....................Salaries and wages:
Interest Income:
Dividends:Number of returns....................................Amount. .....................................................
Net capital gain (less loss):
Taxable pensions and annuities:Number of returns: .....................................Amount .....................................................
Unemployment compensation:
Total Itemized deductions:Number of returns.................Amount : ......................
Taxable income:
Total tax liability:
Earned income creditNumber of returns............................................
Excess earned income credit 3Number of returns .........................
MAINE
Adjusted gross Income (less deficit) ....................Salaries and wages:
Number of returns............... .............................
Amount. ..........................................
Interest income:
Dividends:
Number of returns............................... ............
Amount ....................... ............... .....................
Not capital gain (less loss):Number of returns:...........................................
Amount ............................................................
Taxable pensions and annuities:
Unemployment compensation:
Total Itemized deductions:Number of returns .............................. .............
Amount ............................................................
Taxable income:
Total tax lability:
Earned Income creditNumber of returns .....................
Amount. .....................................
Excess earned Income credit 3
Numberofretums.................Amount .................................
See notes following Table 21.
$200.000or more
10,62035,331
4.7~2.374:
8,3672,090,166
10,377289,017
8.363193,592
i,148524,432
1,71153.563
46156
9,673374,791
10,610.4,380,171
10,6161.301,062
122,557
-
-
2,6148,418
1,139,7M
2,156465,488
42,604
66,579
2,'1 3664,025
2,018158,170
45411,351
1446
2,594168.360
2,614968,026
Z614284,377108.790
-
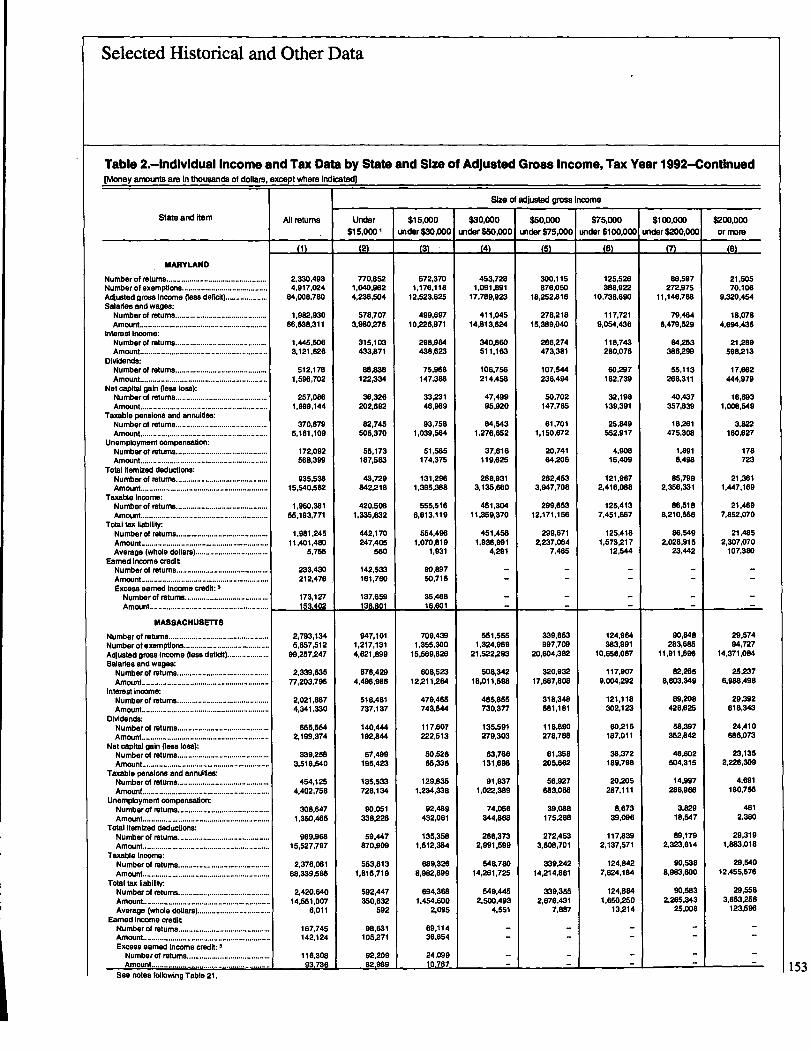
Selected Historical and Other Data
Table 2.-Individual Income and Tax Data by State and Size of Adjusted Gross Income, Tax Year 1992-Continued(Money amounts are In thousands of dollars, except where lndicataQ
Ail returns
LI)
23304934:917:024
84,008,780
1,982.93066.638,311
1,445,5063,121,626
512,1781,596,702
257,0861,999,144
370.6795,181.109
172,092568,399
935,53616.540,562
1,960.38155,193,771
1,981,24511,401,480
5,755
233,430212,476
173,1271534-02
2,793,1345.657,512
99,257,247
2,339.63577,203,795
2,021,8674.341,330
655,5542,199,374
339,2583,518,540
464,1254,402,758
308,6471,350,465
969,96815,527,797
2,376,08168,339,586
2,420,64014,551,007
6,011
167.745142,124
116.30893.736
Under$15,000,
(2)
770 6521,040:9624,236,504
578,7073,980,275
315.103433,871
88,838122,334
36,326202,692
82,745506,370
55,173187,563
43,729542,218
420,5081,335.832
442,170247,405
560
142.533161,760
137,659136,801
947,1011,217,1314,621,899
676,4294,496,986
518.481737,137
140,444192,844
57,499195,423
135,633728,134
90,051338.228
59.447870,909
553.8131.816,719
592,447350,632
592
98,631105,271
02.2D982.969
$15,000under$30,000
(3)
572,3701,176.118
12.523,625
499,69710.226,971
298,98443a,623
75,968147,386
33,23146,989
93,7581,039,664
51,585174,375
131,2961,395,388
556,5166.813,119
554,4961,070,819
1,931
90,89750,715
35.46816.60
709,4391,355,300
15,569,828
608,523112.211,2154
479,465743,544
117,607222,613
50,62665,335
129,8351,234.338
92,489432,061
135,3581,512,384
689,3268,982,899
694.3681,454,600
2,095
69,11436,854
24,09910.767
$30,000under$50,WD
ffl
453,7281,091,891
17,789,923
411,04514,813,624
340.860511,163
106,756214,458
47,49995,920
84,5431.276
,652
37,616119,625
268.9313,135,660
451.30411,359,370
451,4581,936,991
4,291
--
--
551,5551,324,969
21.522,293
508,34218.011,598
465.855730,377
135,591279,303
63,766131.698
91,9371.022,389
74,056344,868
266,3732.991,599
548.78014,261,725
549,4452,500.493
4,551
-
Size of adjusted gross Income
$50,000undar$75,000
L51
300,115876,050
18,252,816
278,21815,389.040
266,274473,381
107.544236,494
50,702147,765
61,7011,160,672
20,74164,206
262,4533,947,708
299,65312,171,156
299,6712,237,064
7,465
-
-
339,853997,709
20,604,382
320,93217.687,808
318,348581,181
118,890278,788
61,358206,662
56,927683,066
39.088175,288
272,4533,808,701
339,24214,214,881
339,3552,676,431
7.887
-
$75.000under$100,OW
0)
125,526388,922
10,73a,690
117,7219,064,436
118,743280,076
60.297162.739
32,198139,391
26.849562,917
4,90816,409
121,9672,416,088
125,4137.451,667
125,4161,573,217
12,544
-
-
124,964383,991
10,656,067
117,9079.004,292
121,118302,123
60,215187,011
36.372189,798
20,205287,111
8,67339,096
117.8392,137,571
124,8427,624.184
124,8841,650,250
13.214
-
$100,000undar$200,000
M
80,597272,975
11,146,768
79,4648.479.529
84,253366,299
55.113268,311
40,437357,839
18,281475,308
1.8916,498
85.7992,356,331
86,5188.210,556
56.5492,028.915
23,442
-
-
90,848283,685
11,911.696
82,2658,803,349
89,208428,625
58.397352,842
46,602504,315
14,997286,968
3,82918,547
89,1792,323,614
90,5388,983.600
90,5832,265,343
25.008
-
Interest Income:
Dividends:
State and Rem
MARYLAND
Number of exemptions.Adjusted gross IncomeSalaries and wages:
Not capital gain (less lose):Number of returns ............................................Amount........................................ . ...................
Taxable pensions and annuities:
Unemployment compensation:Number of returns............................................Amount.............................................................
Total Itemized deductions:Number of returns............................................Amount .............................................................
Taxable Income:Number of retums............................................Amount .............................................................
Total tax Ilability:Number of returns............................................Amount .............................................................Average (whole dollars) ...................................
Earned Income creditNumber of returns............................................Amount.............................................................Excess earned Income credit: 3
Number of returns ........................................
MASSACHUSETTS
Number of returns....................................... . .......Number ofoxamptions.........................................Adjusted gross income Peas defolt) ....................Salaries and wages:
Interest income:Number of returns ............................................Amount .............................................................
Dividends:Number of returns ..... ................................... ..Amount .............................................................
Not capital gain (less lose):Number of returns............................................Amount .... .........................................................
Taxable pensions and annuities:Number of returns............................................
Unemployment compensation:Number of returns............................................
Total itemized deductions:Number of returns............................................
Taxable Income:Number of returns .. . .......... .... .....................
Total tax liability:Number of returns ............................................
Average (whole dollars) ................... . ........ . ..Earned income creditNumber of returns ............................................Amount.............................................................Excess earned Income credit: 3
Number of returns................................... ....Amount ............................................. I ...........
See notes following Table 21.
$2W,000or more
21.50570,106
9,320,454
18,0784,694,435
21,2119598,213
17,662"4,979
16,6931,006,649
3,822160,627
178723
21,3611,447,169
21,4697,852,070
21,4852,307.070
107,380
-
-
29,57494.727
14,371,084
25,2376,988,498
29,392818,343
24,410686,073
23,1352,228.309
4,691160,755
4612,380
29,3191,883,018
29,54012,455,576
29,5583,653,258
123,596
-
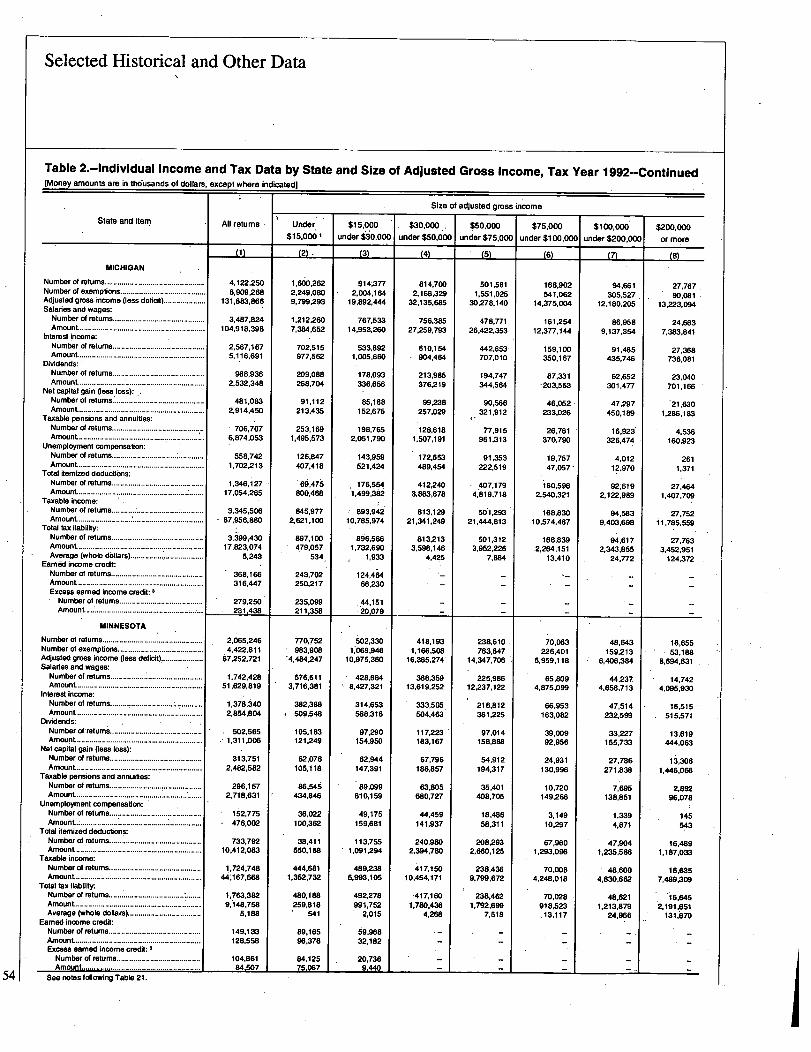
Selected Historical and Other Data
Table 2.-Individui3i Income and Tax Data by State and Size of Adjusted Gross Income, Tax Year 1992--Continued[Money amounts are in thousands of dollars, except where indicated]
All returns
4,122,2508,909,268
131,883,866
3,487.824104,918,398
2,567,1675,116,691
968,9362,532,348
481,0832,914,450
706,7076,874,053
558,7421,702,213
1,346,12717.054,265
3.345,50687.956,880
3,399,43017.823,074
5,243
368,166316,447
279,250231,438
2,065,2464.422,811
67,252,721
1,742,42851.629,819
1.378,3402.854,804
502,5651,311,006
313,7512,482,582
296.1572,718,631
152,775476,002
733,79210.412,083
1,724.74844;167,668
1,763,3829,i48,758
5.188
149,133128,658
104,86184,507
Under$15,0001
1.600.2622,249,0809,799.293
1,212,2607,384,652
702,515977,562
209.088268,704
91,112213,435
253,1691.495,573
126,847407,418- 69,475800.468
845,9772,621,100
897,100479,057
534
243,702250,217
235,099211,358
770,752983,908
'4,484.247
576,6113,716.381
382,388509,548
105.183121.249
62,076105,118
86,545434,846
36,022100.362
38,411550,168
444,6811.362,732
480.188259.818
541
89,16596,376
84.12575,067 1
$15,000under$~0,000
L3)
914;3772,004,164
19,892,444
767,53314,953,260
533,8921,005,660
178,093336.656
85,188152,675
198,7652,051.790
143,959521,424
176,5541,499.382
893.94210.785,974
896,5861,732,690
1,933
124,46466,230
44,151.20,079
502,3301069946
97536010:
428,6848,427,321
314,653568,316
97,290154,950
62,944147,391
89,099810,159
49.175159,681
113,7551,091,294
489,M5.993.105
492,278991,752
2,015
59,96832,182
20,7369-440
$30,000undar$5o,000
L4)
814,7002,168,329
32,135,685
756.38527.259,793
610,154904,464
213,985376,219
99,238257.029
128,6181.507,191
172,553489,454
412,2403,863,678
813,12921,341.249
813,2133,598,146
4,425
418,193166,508
16 385,274'1:
386,35913,619.252
333,605504,463
117,223183,167
67.796186.867
63,805680,727
44,459141,937
240,9802,394,780
07,15010,454,171
417,1601,780,436
4,268
-
Size of adjusted gross income
$50,000under$75,000
(5)
501,5811,551,025
30,278,140
478,77126,422,353
442.653707,010
194,747344,564
90,566321.912
77.915961,313
91,353222,519
407,1794.819,718
561,29321,444,813
501,3123,952,226
7,88,1
-
238.610763,647
14,347,706
225.98612,237.122
216,812361.225
97,014158,888
54,912194,317
35,401408,705
18,48658,311
208,2932,660,125
238,4369.799,672
238,4621,792,699
7,518
-
$75,000under$100.000
L6)
168,902541.062
14,375,004
161,25412,377,144
159,1 DO350,167
87,331-203,563
46,052-233,026
26,781370,790
19,75747,057-
i6O,5962,540,321
168,83010,674,487
168,8392,264,151
13,410
70,063226,401
5,959,118
65,8094,875,099
66,953163,082
39.00992.956
24,931130,996
10,720149,266
3,14910,297
67,9601,293,096
70,0084,248,018
70,028918,623
13.117
-
$100,006under$200,000
(7)
94,661305,527
12,180,205
86,9589,137,354
91,485435.746
62,652301,477
47,297450.189
16,923326,474
4.01212.970
9Z6192,122,989
94,5839,403.698
94,6172,343,855
24,772
-
48,643159.213
6,406,384
44,2374,658,713
47,514232,599
33,227155.733
27,786271,838
7.695138,851
1,3394,871
47,9041,235,586
48,6004,830,662
48,6211.213,879
24,966
-
108)
Slate and item
MICHIGAN
Number of exemptions.........................................Adjusted gross income (loss deficit) ....................Salaries and wages:
Interest income:Number of returns.....................................Amount .....................................................
Dividends:Number of returns.....................................Amount ........ .............................................
Not capital gain Peas loss):Number of returns.....................................Amount......................................................
Taxable pensions and annuities:Number of returns.....................................Amount ....................................................
Unemployment compensation:Number of returns...............................Amount .....................................................
Total Itemized deductions:Number of returns ......................................Amount ...................:* ......................
Taxable income:Number of returns .... .................................Amount ......................................................
Total tax lIabiRW.
Earned income credit:Number of returns...............................Amount ...............................................Excess earned Income credit: 3Numberofretums ...........................Amount ...........................................
MINNESOTA
Adjusted gross income (less deficit) ....................Salaries and wages:
Interest income:Number of returns .................................Amount ...........................................................
Dividends:Number of retums ............................................Amount ...........................................................
Net capital gain pass loss):Number of returns............................................Amount ............................................................
Taxable pensions and annuities:Number of returns.......................................Amount.............................................................
Unemployment compensation:Number of returns :.......................................Amount.~..........................................................
Total Itemized deductions:Number of returns ............................................Amount ....................................... .....................
Taxable income:Number of returns ............................................Amount ............................................................
Total tax liabilit-f.Number of returns .................................... .......Amount ............................................................Average (whole dollars)...................................
Earned income credit:Number of returns............................................Amount. ............................................................Excess earned income credit: 3
See notes following Table 21.
$200,000or more
27.76790,081
13,223,094
24,6637,383,841
27,368736,081
23.040701,166
21,6301,286,183
4.536160,923
2611,371
27,4641,407,709
27,75211,785,559
27,7633,452,951
124,372
16,65553,188
8,694.631
14,7424.095,930
16,515 -515,571
13,619444,063
13,3061,446,066
2,89296.078
145543
16.4891.187,033
16.6357,489,309
i6.6452.191,651
131,670
-
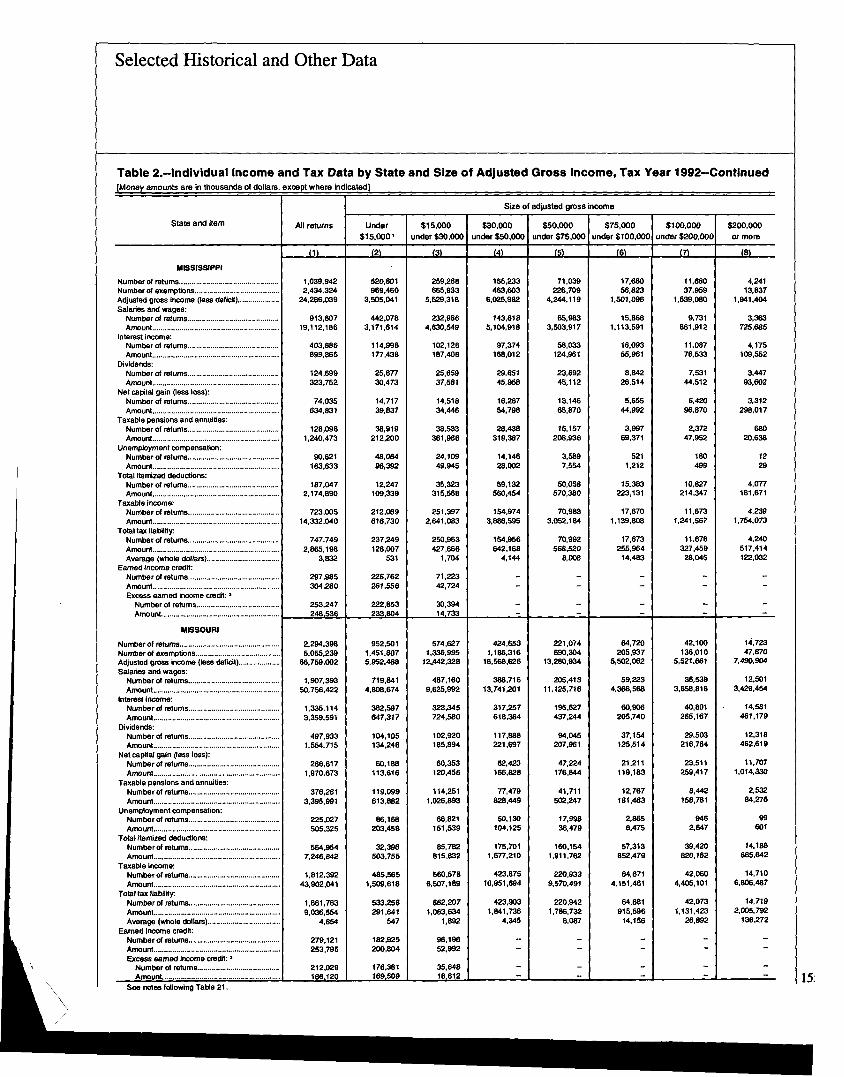
Selected Historical and Other Data
Table 2.--individual Income and Tax Data by State and Size of Adjusted Gross Income, Tax Year 1992--ContinuedLkloney amounts are in thousands of dollars, except where indicated)
All returns
1 039 9422:434:324
24,286,039
913,60719,112,186
403,886899,865
124,699323,752
74,035834,831
128,0961,240.473
90,621183,633
187,0472,174,890
723,00514,332,040
747,7492,865,198
3.832
297,985304,290
253,247248-536
05
71,039226,709
4,244,119
65,9633,503,917
58,033124,961
23,69245,112
13,14665,870
15,157208,936
3,5897,554
50.058570,380
70,9833,052,184
70,992568,520
8.008
-
-
2,294.3985,055.239
66.759,002
1.907,39350,756,422
1.335,1143.359,591
497,9331,5,54,715
286,6171.970,673
376,2813,395.991
225,027505,325
564.9647.246,842
1,812,39243,902,041
1,861,7839,036,554
4,854
279,121253,795
212,029186.120
Under
$15.0001
t2)
620801969:460
3.505,041
"2,0783,171,614
114,998177,438
25,87730,473
14,71739,837
38,919212,200
48,06496,392
12,247109,339
212,069616,730
237,249126,007
531
226,762261,556
222,853 1233,804
952,5011,451.8075.952.488
719,8414,808,674
3112,597647,317
104,105134,246
60.188113,616
119,099613,882
86,168203.458
32,396503,755
4115,5651,509,618
M258291,641
547
182,925200,804
176,381169_509
$15,000
under $30,000
t3A
259268665.933
5.S29,318
232,9864.630,549
102.126187,408
25,65937.581
14,5`1834,446
38,533361,988
24,10949,946
35,323315,668
251.3972,641,083
250,963427,666
1,704
71,22342,724
30,39414,733
574,6271,336,995
12~442,328
487,1609,625,992
323,345724,580
102,920185,894
60,363120,456
114,2511.026,893
66.821151,539
85,782815,832
5W,5786,507,189
562,2071,063,634
1,892
96,19662,992
35,W16,612
$30,000
under $50,000
ffi
155,233463,603
6,025.982
143,6185.104,918
97,374168,012
29.65145,958
16,26754.798
28.436319,387
14,14628,002
59,132560,454
154,9743,886,S95
154,956642,168
4,144
-
-
424,6531,186,316
16,568,626
386,71613,741,201
317.257618,364
117,888221,697
62,423166,828
77,4791128,449
50,130104,125
175,7011,677,210
423.87610,951,694
423,9031,841,736
4,345
-
Size of adjusted gross income
$50,000under $75,000
221,074690,304
13,280,934
206,41311,125,716
195,627437,244
94,045207,961
47,224176,844
41,711502,247
17,99836,479
160.1541,911,762
220.9339,570,491
220,9421,786.732
8.087
-
$75,000
under $100,000
J61
17,68056,823
1,501,096
15,8681,113,591
16,09355,961
8,84226,514
5,66544,992
3,99769,371
5211,212
15,383223,131
17,6701,139,808
17,673255,964
14,483
-
-
64,720205.937
5,502,062
59,2234.366,568
60,906205,740
37,154125.614
21,211119,183
12.767181,463
2,8656,475
57,313852,479
64,6714,151,461
64,681915,596
14,156
$100.000under $200,000
(7)
11.68037.M
1,639,080
9,731861.912
11,08776,533
7.53144,512
6,42096,870
2.37247,952
ISO499
10,827214,347
11,6731,241,567
11,676327,45925,045
-
-
42.100136,010
5,521.681
36,5393,&58,816
40,801265,167
29,5032`16,784
23.511259,417
8,442158,781
9462,647
39.420820,162
42,0604,406,101
42,0731,131,423
26,892
-
t8l
State and item
MISSISSIPPI
Adjusted gross income (less deficit) ....................Salaries and wages:
Interest in me:Number of returns ............................................Amount............... .............................................
Dividends:Number of returns ........................................Amount........... ...... ....... ............... ...................
Not capital gain Pass loss):
Number of returns ............................................Amount......................................... ...................
Taxable pensions and annuities:Number of returns ....................................Amount................................. -..........................
Unemployment compensation:Number of returns ............................................
Amount......................................... ...................Total itemized deductions:
Number of returns ............................................Amount................................................
Taxable income:Number of returns.... ........................................Amount .............................................................
Total tax liability:Number of returns............................................Amount.............................................. ..............Average (whole dollars)....................
Earned income credit:Number of returns............................................
Amount ................................................... .........Excess earned income credit: 3
MISSOURI
Adjusted gross income (less deficit)....................Salaries and wages:
Interest Income:Number of returns............................................Amount..... ........................................................
Dividends:Number of returns............................................Amount.............................................................
Net capital gain Pass loss):Numberof returns............... ............................Amount............. ...............................................
Taxable pensions and annuities:Number of returns ............................................
Unemployment compensation:Number of returns................................-- ...... ..Amount........................ ----...........................
Total itemized deductions:Number of returns ............. ..............................Amount ..............................................
Taxable income:Number of returns ............................................
Amount.............................................. - .. . ........Total tax liability:Number of returns ............................................Amount.............................................................Average (whole dollars) ...................................
Eamed Income credit:Number of returns ..................................
Amount.............................................................Excess earned Income credit: 1
See notes following Table 21.
$2D0,0D0or more
4,24113,837
1,941,404
3,363725,685
4,175109,552
3,44793,602
3,312298,017
68020,638
1229
4.077181,671
4,2391,754,073
4,240517,414122,032
-
-
14,72347,870
7,490,904
12,5013,429,464
14,581461,179
12,318462.619
11,7071,014.330
2,53284,276
99601
14.188665,642
14,7106,806,487
14,7192,005,792
136,272
-

56
Selected Historical and Other Data
Table 2."Individual Income and Tax Data by State and Size of Adjusted Gross Income, Tax Year 1992-Continued[monej amounts are in thousands of dollars, except whom Indicated)
All retums
-Di
373,757830,505
9,167.630
294ASO6,287,154
238,776578,534
90,968220,142
66289447,095
57,749658,162
31,24969,891
97,8631,149,228
282,5955,688,378
294,9091.164.913
..3,950
44,93240,011
33,68627,700
740,7851.649023
20,430,878
614,21315,068.6m
484,8801,181,217
108,841412,989
109,920712,514
98,868829,788
33.52365,058
177,0662,366,928
596,28713,148.436
614,0062,691.268
4,383
74,03166.686
53.99646,257
Under11115.0001
L21
171,777263,626914,826
126,166798.175
at -M6113,007
25,30431,329,
17,64041,058
19.272103,449
11.86824,632
10M2164,320
84,100247,348
95,75452,622
550
29,30431,535
27,65224,925
$15,000under$30,000
L31
92,780234,072
2.012,817
75,5601,433,2W
61,009127,799
21,64338,505
16,01349,397
18,086177,464
10,97426,181
20.622168.863
89,469989,659
90,144170,592
1,892
15,6288,477
5,9342,774
310.488 190,003437.052 457,340
4,113,103
238.099 16OA691,558,394 3.
115.205
155,760 121,428236,494 273,575
3BA37 3721642.970 55,392
25,667 25.43766,794 66,446
29.068 29ASO126.566 237.270
13,433 10,86022.326 17,792
1 1 A61 2SR39166,640 320,544
172,143 184:134513,365
2.117579
189,071 1 184,989101,224 357,716
5 1,934
45,267 2877450.805 15:781
43,230 10176641,170
5087
$30.000under$50,000
(4)
60,938202,033
2.598.732
58,4591,975,004
54.606115.700
21,62640,936
15,080iw,015
12,186148,588
6,519'14,600
32,969305.1520
66,80611655,805
66,783284,250
4,266
--
--
139,923423,266
5,444,656
125,7334,344.611
113,257.237,369
41,43861,888
24,98583,414
2201214,515
6.99710,986
56,662609,641
139686
3,513,903
..139.609598.425
.4,286
Size of adjusted gross Income
$50,000under$75,000
L51
28,98693,846
1.721,642
25,3171,250,151
26,66479,876
13,42434,037
9,47167.658
5,61661,203
1,6123,818
21,944251,960
28,9401,222,141i
28,939234,810
8,114
-
67,176220,606
4,018,377
61,2143,187,954
62,103159,453
29~80366,385
16,92481,403
11,590139,789
1,8733,153
49,433572,228
67,1302,&54,668
67.139536,739
7,994
$75,000under$100,000
M
6,79921,924
577,219
5,531336.024
6,65034,041
4.14916,244
3,39841,633
1,45424,880
193480
5,89190,688
6,791435,799
6,796102,31615,055
--
--
17,72068,847
1,506.061
15,8471,093,037
17,08367,1712
IOA3033,187
6,83249,482
3,37751,057
e247498
15,697242,208
17,7111,123,037
17,715250,849
14,160
$100,000under$200.000
In
4.90310,000
652,185
3.682287,721
4.78248,014
3.52426,094
3,37269,676
90117.503
75256
4,53495.029
4,896522,785
4,899139,49728,475
-
11,40438.596
1,493,910
9,723893,631
11,19080,864
7,89050,331
6,77883,912
2,19139,706
104269
10,707233,463
11.3961.176.248
11,395303,225
26,610
Lei
Earned Income credit:
State and Item
MONTANA
AcQuated gross Income (lose deficit) ................. ...Salaries and wages:
Interest Income:Numher of returns................................Amount................ . ..............................
Dividends:Number of returns................................Amount.......... . ....................................
Net capital gain (loss lose):Number ofAmount .................................................
Taxable pensions and annuities:Number of returns ..............................7Amount. ............................................. . ..
Unemployment cornpensation:Number of returns ................................Amount ...........: .....................................
Totel itemized deductions:Number of returns ................................Amount .................................................
Taxable Income:Number of returns ............................Amount .................................................
Total tex liability:
Excess earned Income credit:
Interest Income:
NEBRASKA
Acqusted gross Income (less deficit) ....................Salaries and wages:
Dividends:Number of returns............................................Amount ......................... ...................................
Not capital gain (loss lose):
Taxable pensions and annuities:Number of returns............................................Amount........ ....................................................
Unemployment compensation: .
Number of returns............................................Amount ...................................................
Total Itemized deductions:Number of retums............................................Amount ............................................................
Taxable Income:Number of returns............................................Amount ............................................................
Tom] tax liabllfty~Number of returns ............ ................................Amount ............................................................Average (whole dollars)...................................
Earned Income credit:Number of returns ............................................Amount ............................................................Excess earned Income credit: 3Numberofretums ........................................Amount. .......................... :.............................
See notes following Table 21.
$200,000or mom
1,5945,104
690.110
1,171206,819
1.57959,198
1,28832,998
1,315109,757
2345,076
a24
1,521-72,847
1,593614,841
1,594180,820113,438
-
-
4,09113.616
2,076,594
3.528875.819
4,069126,291
3,427112,836
3,297291.062
69220,885
934
3,967222204
4,0871,849,636
4,08tl643.090132,850

Selected Historical and Other Data
Table 2.--individual Income and Tax Data by State and Size of Adjusted Gross Income, Tax Year 1992-Continued[Money amounts are in thousands of dollars, except where indicated)
All returns
M
6711,6441,413,435
22,040.874
558,34415.761,766
318,0631.116,690
108,989470,551
76.4341,177,338
104,6791,244,086
61,329173,095
181,2782,536.504
531,12715,389,899
540,2193,456,067
6,398
75,33268.6D0
57,35151,453
532,3551,127.805
17,825,211
453,92514.071.922
367,206722,563
120,290446,567
67,551743,824
aO.228797,324
48,402137.297
174,7632.407,282
444,75812,130,351
455,8172,524,778
5,539
37,91532.947
25,66921.015
U nder$15,0001
U5
65,673193,833
3,943.946
60,2193,219,907
51,772123.144
20,10348,893
13,40367.033
15,450239.706
5,74214,670
45,128585,976
65,4532,814,890
65.475529.622
8,089
--
--
66,275204,028
4,002.258
62,3963.448,662
62,301100,922
23.57559,296
12,65845,095
11,230143,562
5,69717.966
49.8806w,oes
66,1902,789,175
66.210517,769
7,820
-
121
260,478394,808
1,440,922
192,0261,452,722
74,222140.011
21,41238,606
14,14340,037
26,200150,903
21,56761,288
14,672201,225
126.242454,045
135,32283,087
614
46,87652,923
45,44245,893
186,909241,341973,901
141,593929,989
92,699122,682
25.51737,887
12,39635,079
21,825112,108
13,80636,747
1 1, 968145,373
103,876332,501
113,49267,069
591
22,27124.607
20.65418,774
$15,000under $30,000
J3)
182,830388.427
3,937,349
160.7033,201.352
78,673140,290
22.28146,108
14,43222,945
30,485314,722
19,05056,191
34,571340,953
177,2372,113,547
177,131334,730
1,890
28,45615,677
11,9095,560
131,184268,207
2,871,000
113,9822,284,983
83,476127,085
21.99048,779
11,26516.489
22.169199.249
14,SS440,853
25,928257,466
127,2441,585,080
128,547263,463
Z049
15,6448,340
5,0152.242
$30,000under $50,000
L4)
123,714320.413
4,823,523
112.3893,979,505
77,483143,452
24,66452,170
16,03644,913
24.547325,427
13.58436.946
54,591581,432
123,2323,181,256
123,309539,565
4,376
--
--
108,700289,166
4,265,896
100,3853,593,6T7
90,145128,507
26,74061.842
14.16833,561
17,885195,308
12,59836,595
51,525562,653
108.1992,763,656
108,307473.747
4,374
--
--
Size of adjusted gross income
$50,000under $75,000
$75,000under $100,000
6"
19,89359,457
1,693.235
17,8241.296,681
17,70869.535
8,60827,909
6.47357,676
4,84893,659
9952,698
16,363279,783
19,8581,272,046
19,862280,726
14,134
--
--
21,62068,726
1,840,906
20,1401,536,749
21,08952,903
10,64038,126
6,62536,520
3,77260,468
1.0183,492
19,281324,616
21,6051,349,755
21,609293,039
13,561
-
$100,000
under $200,DOO
L7)
13.33239,6SO
1,757,076
10,8281,061,791
12,508115.979
7,59053,802
7,362148,807
3,14676.455
3421,205
11,203262,278
13,3001.402,784
13,305361,86427,198
--
--
13,97044,703
1,818,248
12,3601,307,789
13,81574,586
8,&9666,903
7,51289,939
2,62857,732
3981,541
12,984295,198
13,9491,423,247
13,957359,19725,736
-
Dividends:
State and Rom
NEVADA
Number of exemptions .........................................Adjusted gross Income (loss deficit) ......... ...........Salaries and wages:
Interest Income:Number of returns ............................. ...............
Not capital gain oess loss):Number of returns............................................Amount ...............
Taxable pensionsNumber of returns............................................Amount .............................................................
Unemployment compensation:Number of returns............................................Amount.............................................................
Total itemized deductions:Number of returns............................................Amount.............................................................
Taxable income:Number of returns............................................Amount .............................................................
Total tax liability:Number of returns ............................................Amount.............................................................Average (whole dollars) ...................................
Earned income credit:Number of returns .................... ........................Amount .............................................................Excess earned income credit: 3
NEW HAMPSHIRE
Number of exemptions.........................................Adjusted gross income (less deficit)....................Salaries and wages:
Interest income:Number of returns............................................Amount.............................................................
Dividends:Number of returns ............................................Amount.............................................................
Not capital gain (less loss):Number of returns ............................................Amount .............................................................
Taxable pensions and annuities:Number of returns ............................................Amount .............................................................
Unemployment compensation:Number of returns............................................Amount .............................................................
Total Itemized deductions:Number of returns............................................Amount .............................................................
Taxable income:Number of returns............................................Amount.............................................................
Total tax liability:Number of returns............................................Amount.............................................................Average (whole dollars)...................................
Earned income credit:Number of returns............................................Amount.............................................................Excess earned income credit: 3
Number of return& .......................................
See notes following Table 21.
$2DO,000
or more
5,82416,817
4,444,824
4,3551,539,807
5,687384.279
4.331203,063
4,585795,926
1,00343,214
49197
4,670284,858
5,8054,151,331
5,8151,326.473
228,112
--
--
3,69711.634
2,053,003
3,069970,073
3,681115,878
2,972133,735
2,927487,141
71928,897
21103
3,197IS81890
3,6951,887,037
3,695550,503148,986
-
157
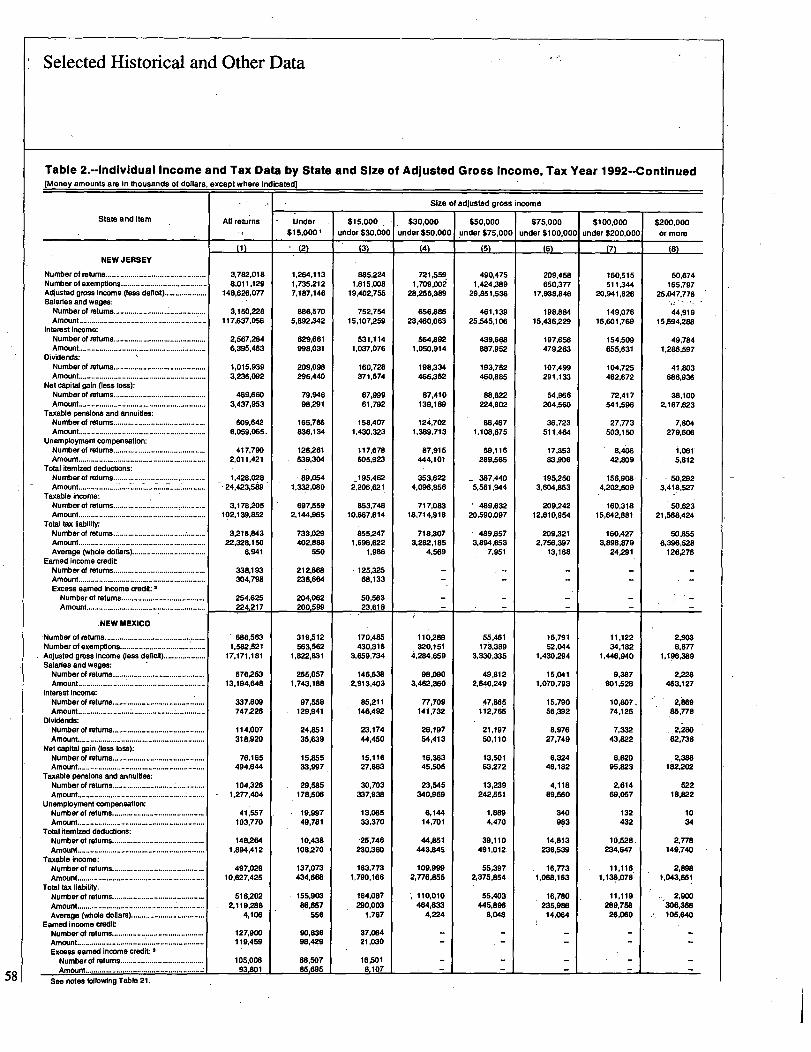
Selected Historical and Other Data
Table 2.--individual Income and Tax Data by State and Size of Adjusted Gross Income, Tax Year 1992--Continued[Money amounts am In thousands of dollars, except where Indicated)
All returns
(1)
3,782,0188,011,129
148,626,077
3,150.228117A37,056
2,567,2846,395,463
1,015.9393.236,092
489,6603,437.953
609,6426,059,065
417,7902,011,421
1.428,02824,423,569
3.178,205102,139,862
3,216,84322,328,150
6,941
338,193304,798
254,625224_217
686.5631.582,621
17,171,181
576.26313,194,648
337,809747,226
114,007318,920
76,165494,644
104,3261,277,404
41,657103.770
148,2641,894,412
497,02910,627,425
516,2022,119,288
4,106
127,900110,459
105,00893,801 1
Under
$15,000,
(2)
1,264.1131,735,2127.187.146
886,5705,892,342
629,661998,031
209,098296.440
79.94698.291
165,766836,134
126.261639,304
89,0541,332,080
697.5592,144,965
733,029402,886
550
212,868236.664
204,062200,599
319.512563,562
1.8n,831
255,0571.743,188
97,558129,941
24,85135,639
15,85533,997
29,686178,506
19.99749,781
10,438108270
137,073434,668
156,90386,657
556
90,83698,429
88.507WAS
$15,000under$30,000
L3)
885,2241,815,008
19,402,756
752,75415,107,259
531,1141,037,076
160.728371,674
67,99961.792
158.4071.430,323
117,678605,923
195,4622,206,621
853,74810,667,614
855,2471.698.622
1,986
125,32668,133
50,56323,618
170,485430,316
3,659,734
146,6382,913,403
85,211146,492
23.17444,450
15,11627,663
30,703337,938
13,06533,370
25,746230,360
163.7731,790,166
164,087290,003
1,767
37,06421,030
16,5018_1 Q7
$30,000
under$50,000
L4)
721,5591.709.00i
28.256,389
656,88623,460,063
664,8921,050,914
198,334466,352
87.410139,189
124,7021,389,713
87,915444.101
353,6224.096,956
717,08318,714,918
71 "073.282,185
4,569
-
-
110,289320,151
4,284,659
98A903,462,360
77,709141.732
26,19754,413
16,36345.506
23,545340,969
6,14414,701
44.851443MS
109,9992.776,855
110,010464.633
4,224
--
--
Size of adjusted gross income
$50,000
lunder$75,000
04
490,4751,424,389
29,851,536
461.13925,545,106
439,668887,952
193,762460,8115
88.822224,902
88,4671,108,675
59.116289,565
387,4405.561.944
489,63220,590,097
489,8573,894.653
7,951
-
-
55,461173,389
3,330,335
49.8122,640,249
47,8651 1 2,765
21,19760,110
13,50163.272
13,239242,551
1.8694,470
39,110491.012
55,3972,375,854
55,403445,896
8,048
-
$75,000under$100,000
M
209,458650.3T7
17,938,846
198,88415,436,229
197,656479,263
107.499291,133
54,966204.560
36,723511,464
17,35383.906
195.2603,604,853
209,24212,810,954
209,3212,756,397
13,168
-
-
16,79152,044
1,430,294
15,0411,070,793
15,79056,392
8,97627,749
6,32446,182
4,11889,560
340983
14.813236,539
16,7731,068,153
16,780235,98614,064
-
$100,000under$200,000
L7)
160.515511,344
20.941.626
149.07616,601,769
154,609655,631
104,725462,672
72,417541.596
27.773503,150
8.40642,809
156,9084,202,609
160,31815,642.881
160.4273,896,879
24,291
-
-
11,12234,182
1,446,940
9,387901,528
10.80774,125
7,33243,822
6,62095,823
2,61469,057
132432
10,528234,647
11.1161,138,078
11.119289,758
26,060
-
AM
Total tax liability:
Earned income credit
State and Item
NEW JERSEY
Adjusted gross Income Pass deficit) ....................Salaries and wages:
interest income:Number of returns...................Amount....................................
Dividends:Number of returns...................Amount....................................
Net capital gain (less loss):Number of returns...................Amount............................. .......
Taxable pensions and annuities:Number of returns ...................Amount....................................
Unemployment compensation:
Total fternized deductions:Number of returns ............................................
Taxable income:
Excess earned income credit: 3
.NEWMEXICO
Number of exemptions.........................................Adjusted gross income (loss deficit) ....................Salaries and wages:Number of returns .................... ........................
Interest income:Number of returns............................................
Dividends:Number of returns............................................Amount............................................ .................
Not capital gain (loss loss):Number of returns............................................Amount............................................ .................
Taxable pensions and annuities:Number of returns.............................. .............Amount............................................ ........
Unemployment compensation:Number of returns...................... ......................Amount.............................................................
Total Itemized deductions:Number of returns............ . ..............................Amount..................................... ............. . ........
Taxable Income:Number of returns............................................Amount.............................................................
Total tax liability:Number of returns........................... .................Amount.............................................................Average (whole dollars)...................................
Earned Income creditNumber of returns............................................Amount .............................................................Excess earned Income credit: 3Number of returns........................................
See notes following Table 21.
$200,000or more
50,674165,797
25,047.778
44,91915,594.288
49,7841.286,597
41.803886,936
38,1002,167,623
7,804279,606
1,0615.812
- 50,2~23,418,527
60,62321,568,424
50.6556,396,628
126,276
-
-
2,9038.877
1.1.96,389
2,228463.127
2,86985,778
2,28062.738
2,386182.202
52218.822
1034
2,778149.740
2.8981,043,651
2.9W306,356106,640
-
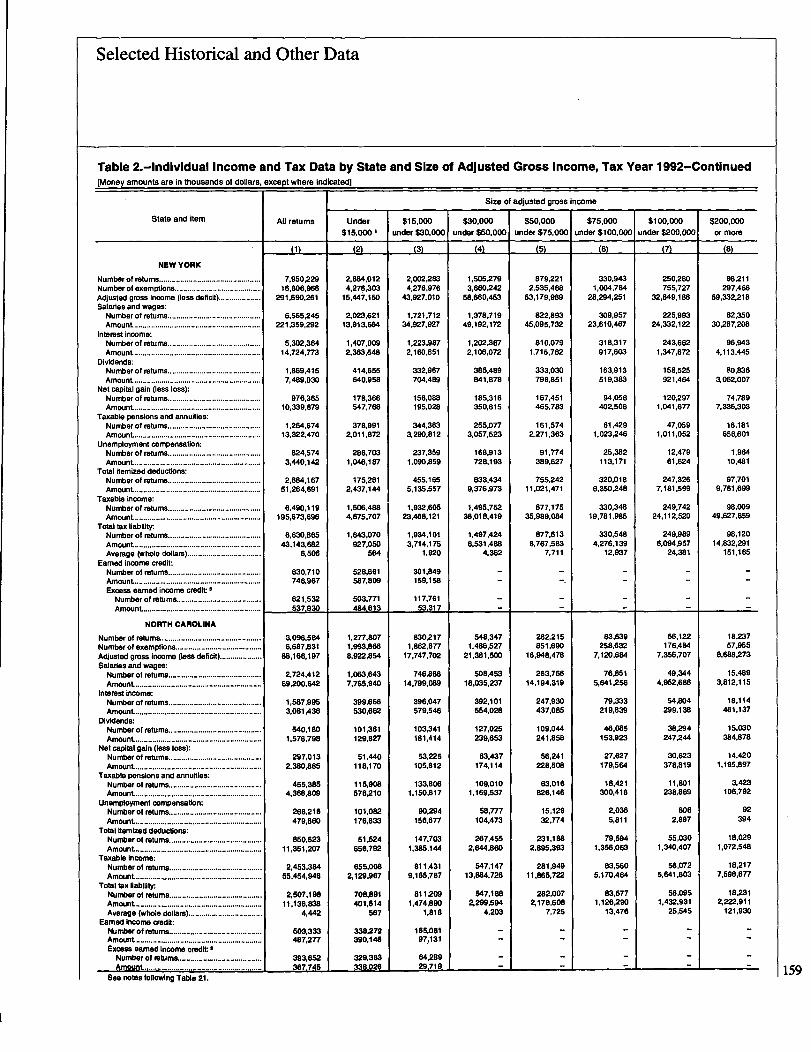
Selected Historical and Other Data
Table 2.-Individual Income and Tax Data by State and Size of Adjusted Gross Income, Tax Year 1992-Continued(Money amounts are in thousands of dollars, except where indicated]
All returns
(1)
7950,22916~806,9641
291,690,261
6,565245221,359,292
5,302,36414,724,773
1,869,4157,489,030
976,36510,339.879
1,264,67413,322.470
824,5743,440,142
2,884,16751,264.691
6.490,119195,673.696
6,630,86543,143,682
6.506
830,710746.967
621,532537,930
3.096,5846.687,831
68.166.197
2,724,41269,200,642
1,587,9953,081.436
640,1801,578,798
297,0132,380,885
455,3854,368,809
268,216479,660
850,52311,351,207
2.453,38455.454,946
2,507,19811,136,838
4,"2
603,333487,277
393,652367,745
Under
$15,0001
12)
2,884,0124,276,303
15,447,150
2,023,62113,913,664
1.407,0092,363.548
414,655640.958
178,366547.766
378,991Z011,872
286,7031,046,187
175=2.437,144
1,506,4884,675,707
1,643,070927,050
564
526,861587,809
503.771484,613
1,277,8071,993.8668,922,854
1,063.6437,765,940
399.666530,662
101,361129,827
51,440118,170
115.908576,210
101,082176,633
51,524656,792
655,0082.129,967
708,891401,614
587
33"72390,146
329,363338.026
$15,000
under$30,000
f3)
2,002,2834,276,976
43,927,010
1,721,71234,927,927
1,223,9872,160,651
332,967704.489
156,088195,028
344,3633,290,812
237,3591,090,859
455,1655,135,557
1,932,60523,468,121
1,934.`1013,714,175
1,920
301,849169,158
117,76163,317
830,2171,862.6T7
17,747,702
746.86614.799.089
396,047579,546
103,341181,414
53,225105,812
133,8061.150,817
90,294156,677
147.7031,3B5,144
811,4319.165,787
811,2091,474,890
1,818
165106197,131
64,28929.719
$30,000
under$50,000
C41
1,505,2793,660942
58.660,463
1,378,71949,192,172
1,202,3672,106,072
385,489841,878
185,316350.815
255.OT73,057,523
168.913728,193
833,4349,376,973
1,495,75238,018,419
1.497,4246.531,488
4,362
--
--
548,3471.486,527
21,381,500
508,45318,035,237
392,101554,028
127,025239.6S3
63,437174,114
109.0101.169,537
58,777104,473
267,4652,644,860
547,14713,884.726
547,188Z299,594
4,203
--
--
Size of adjusted gross income
$50,000
under$75,000
5)
879,2212,535,468
53.179,989
822,89345.095,732
810,0791,715,782
333,030798,851
167,461465,783
161,574Z271.363
91,774389,627
755,24211,021,471
877,17535,989,084
877,6136,767,583
7,711
-
-
282,215851,690
16,948.478
263,76614.194,319
247,930437,085
109,044241,858
S6.241228.508
63.016826,146
15,12932,774
231,1882,895,393
281,94911,865,722
282,007Z178,608
7,725
-
$75,000under$100,000
t6)
330.9431,0D4,784
28,294,251
309,95723,610,467
318,317917,603
163,913519,383
94,058402,506
61,42.91,023,246
25.382113,171
320,0186.350,248
330,34819,781,985
330,5484,276,139
12,937
-
-
83,639258,632
7,120,684
76,8515,641.256
79,333219,839
46,085153.923
27.627179,564
18,421300,418
2,0365,811
79,5941,356,063
83,5605.170,464
83,5771,126,290
13,476
$100,000under$200,000
250,280755,727
32,849,188
225,99324,332,122
243,6621,347.672
158,525921,464
120,2971,041,677
47,0591,011,052
12,47961,624
247,3267,181,599
249,74224.112,520
249,9896,094,957
24,381
-
-
56,122176.484
7,356,707
49,3444.962,686
54,804299,138
38,294247,244
30,623378,819
11,801238.889
8062,897
55,0301,340,407
56,0725,641.603
56,0951,432,931
25,545
-
L81
Earned Income credit:
State and item
NEW YORK
Adjusted gross income (loss deficit)................. ...Salaries and wages:Number of returns ............................................Amount ............................................................
Interest income:Number of returns ......................................... ...Amount ............................................................
Dividends:Number of returns ............................................Amount ............................................................
Not capital gain (less loss):Number of returns............................................Amount ............................................................
Taxable pensions and annuities:Number of returns............................................Amount ............................................................
Unemployment compensation:Numberof returns............................................Amount ........ . ..................................................
Total Itemized deductions:Number of returns............................................Amount ............................................................
Taxable income:Number of returns............................................Amount ............................................................
Total tax liability.
Excess earned Income credit 3Number of returns ............ ............................Amount ........................................................
NORTH CAROLINA
Number of returns........................................... .....Number of exemptions.........................................Adjusted gross income (less deficit)............... .....Salaries and wages:Number of returns............................................Amount ............................................................
Interest income:Number of returns....................................... .....Amount ................................... . .......................
Dividends:Number of returns............................................Amount .... . ......................................................
Not capital gain (less loss):Number of returns............................................Amount ............................................................
Taxable pensions and annuities:Number of returns ........ ....................................Amount ............................................................
Unemployment compensation:Number of returns ............................................Amount. ............................................................
Total Itemized deductions:Number ofAmount ...................................................... ......
Taxable Income:Number of returns............................................
Total tax liability:Number of ratums........ ....................................Amount ............................................................Average (wWe dollars) ...................................
Earned income credit:Number of returns ....................... .....................Amount ............................. ...............................Excess earned Income credit -Number of returns. .......................................Amount.-......
See notes folowing Table 21.
$200,000or more
98,211297.466
59,332,218
82,35030,287.208
96,9434.113,445
80.8363.062,007
74.7897,336,303
16,181656,601
1.96410,481
97,7019,761,699
98,00949,627,859
98,12014,832,291
151,165
-
-
18,23757,955
8,688.273
15,4893,812,116
16,114461,137
15.030384.878
14,4201,195,897
3,423108.792
92394
18,0291,072,548
18,2177,596,677
18,2312,222,911
121,930
-
159

Selected Historical and Other Data
Table 2.-Individual Income and Tax Dati-by State and Size of Adjusted Gross Income, Tax Year 1992-4ContlnuedRVIoney announts are In thousands of dollars, except where Indicated]
All returns.
(1)
283,750639.992
7,225,740
225,6355,006.607
190.955438,842
57,360106,632
44.983204,746
32,539260.575
18.81144,157
51,352614,385
228,2554,631,005
236,803961,973
4,062
26,84823.853
19,17615,883
5,083,08210.576,281
148,229,516
4.323,473115,733.870
3,081,2736.032,679
1,092,1713,086,656
506,9573,209,140
857,5357,861,467
433,9071,248,894
1,398,38816,631.530
4.198.00497,654,661
4.261,98819,741,190
4,632
472,901416.539
350,625300,969
Under$15,0001:
2"
123,481174,736689,841
92.144595,461
65.23789.777
13,97813.681
11.35622,090
9.46042,931
6,02912,051
4.493100.898
70.059207.379
78,36842.897
547
16,61918.352
15.69414,301
1,960,6422,765,683
12,868,321
1 1,509,9159,920,230
861,229.1,190,693
235,105289.366
92,453156,519
296,6241,627.602
126,900373,765
64,458727,787
1.100,7933.562.680
1,161,574646.956
557
303,879325,886
293,462275,357
$15,000 'under$30,000
(3)
72,842182.780
1,575,579
57.7641,081,665
49,327112,295
13,45618,900
11.61834,919
10,49382.901
6,99117,517
9,12378,924
70,680797.774
70,958140.937
1.986
10,2296,501
3,4821_683
1,381.9802,900,827
30.1179.992
1,198,16624,076,765
786,3451,328,493
232,774401,406
99.790156,954
264,1562,491,548
136,141444,573
268,1371.975,358
1,359,02917.139.212
1.361.9632,764,881
2,023
169.02290,652
57,16325,603
$30,000 -wxW$50,000
(4)
53,169165.381
2,066.928
46,17011.533.116
"AS393.702
13,90220.366
iO.26537.464
7,34768.460
4,62511.487
16,180145,836
53.0731,346.170
63,035238.146
4,490
1,025,7782,668.459
40,020,545
953,69234,233,901
775,3361,162,248
275,328478.363
117.216270,485
168.9461,811,896
117,795306,392
486.7304,260.011
1,023,97326,989.016
1,024,1374,645,565
4,536
Size of adQusted grow income
$50,000urKler$75,000
ts)
23,74480.655
11,409,892
20,7741,025.273
21,92660,312
9,33516,304
6,19730,706
3,50438,487
1.0262,730
13,437140,514
23,7341,030,316
23.734203,578
8,577
477,635
28,471,624
449,10824,266,078
421,175773,439
192,807419,459
89,287329,302
83.3991,025284
45.532103.309
355,7244,136.451
477.33720,333.991
477,3773,813,403
7,988
$75,000under$166,000
06
5,48518,634
466,497
4.634280,575
5,26024.656
2,9779,247
2,22216.944
88712,019
92236
3,83751,098
5,482365,045
5.48287,31015.927
120,684386,552
10,264,869
.110,6038,121.476
113,838335,533
68,805248,331
38,808224,372
22.935365,849
5,65214,309
110,2681,761,616
120.5927,591,115
120.6151.679,829
13,927
$1 00,00Dunder$200,00D
3.98513,699
528,377
3.206269,219
3,89329,448
2,63812,909
2.38529,149
64410,320
48137
3,15757.310
3.983437,639
3,984117,55629,507
84,717274,046
11,144,542
74,5447,584,722
82.029433,545
60.191401,157
44,870451,701
16,108318,387
1,6935.765
81,8731,901,217
84,6538,660,436
84,6832,226279
26,290
State and item
NORTH DAKOTANumber of retu ms ................................................Number of exemptions .........................................Adjusted gross Income (less deficit) ..........Salaries and wages:
Interest Income:Numberofretums ............................................
Dividends:Number of retu ins ............................................
Not capital gain (loss loss):Number of returns ............................................
Taxable pensions and annuities:'Number of returms............................................
Unemployment compensation:
Total Itemized deductions:Number of returns ............................................
Taxable Income:Number of returns ............................................Amount ......................................................
Total tax liability:Number of retums .............................................Amount..............................................................Average (whole dollars) ...................................
Earned income credit:Number of returns............................................
Excess earned Income credit
OHIO
Number of exemptions: .................... ; ...................Adjusted gross Income (less deficit) ....................Salaries and wages:Number of returns ............................................
Interest Income:Number of returns ............................................
Dividends:Number of returns ............................................
Not capital gain (loss loss):Number of returns............................................
Taxable pensions and annuities:
Unemployment compensation:Number of returns ............................................Amount ............................................................
Tota I Itemized deductions:
Taxable Income:Number of returns ............................................
Total tax liability:Number of ratums ............................................Amount........................................ ..............:Average (whole dollars) ...................................
Earned income credit:Number of returns............................................Amount .............................................................Excess earned Income credit:'*"N~mber of returns ........................................Amount ............................................
'See notes following Table 21.
$20D,000or more
1,2444.267
488.825
1,043221297
1,22928,452
98415,224
94033,474
2045,456
1,12539.806
1.244446,682
1,244131,54ii05.746
31.646101,663
15279,623
27,4457;530.697
31,321808.728
27,161848,576
24,5331,619,807
5.367220,902,
194781
31,1981.867,090
31,62713,378.210
31,6393,974,278
125,613
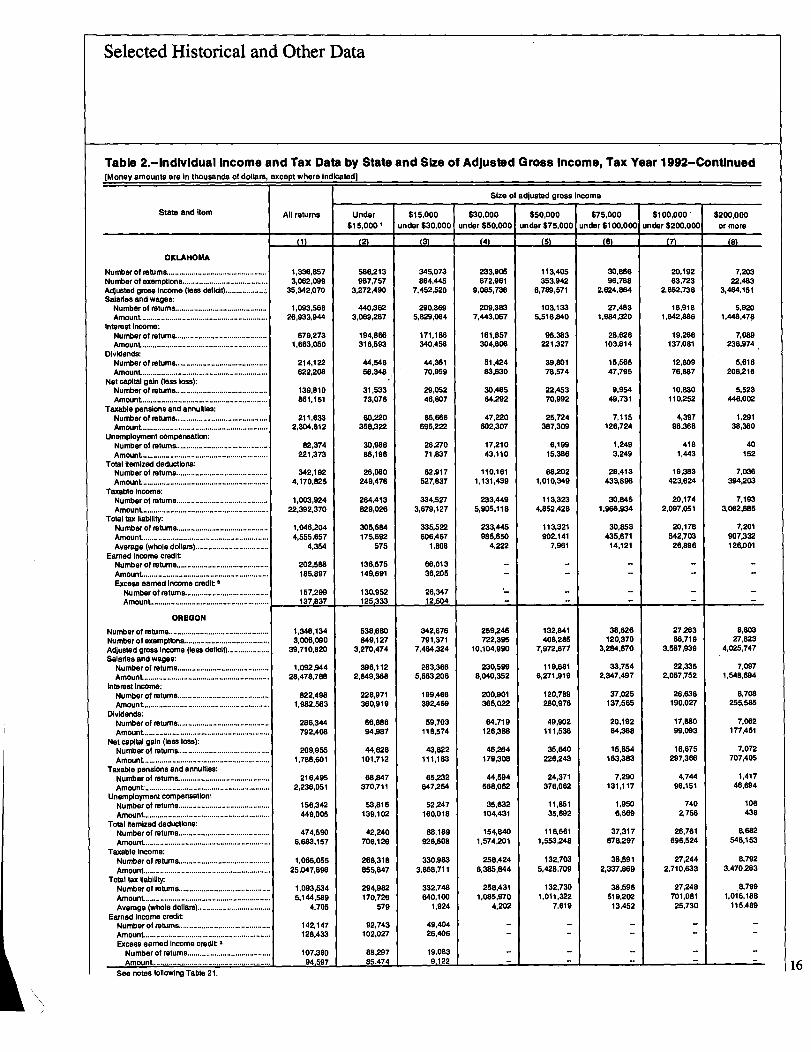
Selected Historical and Other Data
Table 2.-Individual Income and Tax Data by State and SIze of Adjusted Gross Income, Tax Year 1992-Continued(Money amounts are In thousands of dollars, except where Indirated]
All returns
111
1336,8573:082.099
35.342.070
1,093,56826,933,944
679,2731,663.050
214,122622,208
139,810861,151
211,6332,304.612
82,374221,373
342,1924,170,825
1,003,92422.392,370
1.046,2044,555,657
4.354
202,588185,897
157,299137,837
1,348,1343,006,090
39,710,820
1,092,94428,478.788
822,4981.982,563
286,344792,408
209.9551.786.601
216,4962,238.061
156,342449.005
474,5906.6W,157
1,065,05525,047,896
1,093,5345,144,589
4,705
142,147128.433
107,38094.597
Under$1 5,0D0 I
J21
586,213987,757
3,272,490
440,3623,069,287
194,866316.593
44,54656.348
31.53373.076
60,220358,322
30,98888,196
26,080249.476
264,413829,026
305,684175,692
575
136,575149,691
130,952125,333
536,680849,127
3,270,474
396,1122,649,368
228,971360,919
66,88694,987
44,628101,712
68,847370,711
53,816139,102
42,240706,126
268,318855,847
294,982170,726
579
92,743102,027
88,29785_474
$15,000
under$30,000
J31
345,073864.445
7.462,520
290.3695,829,064
1171,186340.456
44,36170,959
29,05246,807
65.666695.222
26,27071,837
62,917527,837
334,5273,679,127
335,522606,467
1,808
66,01336.205
26,347112,504
342,676791,371
7,464,324
283,3665,663.206
199,466392.469
59,703118,574
43,822lil,183
65,232647,254
62,247160,018
88,189926.608
330,9833.858,711
332.748840,100
1,924
49,40426,406
19,0839-122
$30,000under$50,000
"4
233,905672.961
9,085,736
209,3837,443,067
161.857304,806
51,42483,630
30,46564.292
47,220602.307
1721043.110
110,1611.131,439
233,4495'W5'118
233,445985,650
4,222
-
269,245722.395
10,104.990
230,5998,040.352
200,901365,022
64,719126,388
46,264179.308
44,594568,062
35,632104.431
154,8401,574,201
258,4246,385,844
258,4311,085,970
4,202
--
--
Size of adjusted gross Income
$50,000undor$75,000
"S
113,405353.942
6,789,671
103,1336,516,840
96,383221,327
39,80178,574
22,45370,992
25,724387,309
6,19915,386
88,2021,010,349
113,3234,852,428
113,321902,141
7,961
-
132,841408,285
7,972,677
11 9,6816,271,919
120,789280,976
49,902111,536
35,640226,243
24,371376,062
11,85135,692
116,5611,553,248
132,7035,428,709
132,7301,011,322
7,619
-
$75,000undor$100,000
&I
30.86696,788
Z624.SS4
27,4831.984,320
28,626103,814
15,56547,795
9.95449,731
7,115126,724
1,2493,249
28,413433,896
30,8451,966,934
30,853435,671
14,121
-
-
38,626120.370
3,284,670
33,7542,347,497
37,025137,665
20,19284.368
15,854163,383
7,290131,117
119506,669
37,317678,297
38,5912,337,869
38,596519.202
13.452
$100,000
under$200,000
M
20,19263,723
Z652,738
16,9181,642,886
19,266137.0111
'12,80976,687
10,830110,252
4,39796,368
4181.443
19,383423.624
20.1742.097,051
20,178542,70326,896
-
-
27,26386,719
3,587,939
22,3352,057.752
26.638190,027
17,88099.093
16,675297,366
4,74496,151
7402.756
28,761696,524
27,2442.710,633
27.248701.08125,730
-
"S
Number of exemptions...................................... ...Adjusted gross Income (loss deficit).................. 4Salaries and wages:
Interest Income:Number of returns ...........................................Amount ............................................................
Dividends:Number of returns............................................Amount ............................................................
Not capital gain (less loss):Number of returns............................................
Taxable pensions and annuities:Number of returns........................................ ....Amount ............................................................
Unemployment compensation:Number of returns....................... . ..... . .......... .
Amount ............................................................Total Itemized deductions:
Number of returns............................................Amount............................................................
Taxable Income:Number of returns............................................Amount ............................................................
Total tax liability:Number of return& ...........................................Amount ............................................................Average (whole dollars) ...................................
Earned income creditNumber of returns ............................................Amount ............................................................Excess earned income credit 3
Number of exemptions.........................................Adjusted gross Income (less deficit) ....................Salaries and wages:
Interest Income;Number of returns............................................
Dividends:
State and Item
OKLA140MA
OREGON
Net capital gain (loss loss):
Taxable pensions and annu Itles:Number of returns .................................... ........Amount ............................................................
Unemployment compensation:
Total Itemized deductions:Number of returns ............................................Amount ............................................................
Taxable Income:Number of return&...........................................Amount. ............................................................
Total tax liability.Number of returns............................................Amount. ........................................................... .Average (whole dollars) ...................................
Earned Income creditNumber of return& ...........................................Amount ............................................................Excess earned Income credit -
See notes following Table 21.
$200,000or more
7,20322.483
3,4641A511
5,9201,448,478
7,089238.974
5,616208,216
5,523446,002
1,29138,360
40152
7,036394,203
7,1933,062,685
7,201907,332126,001
-
8,80327,823
4,025,747
7,0971,548,694
8,708255,585
7,062177,461
7.072707,405
1,41746,694
106438
8,682548,153
8,7923,470,283
.8,7991.016,188
115,489
-
16
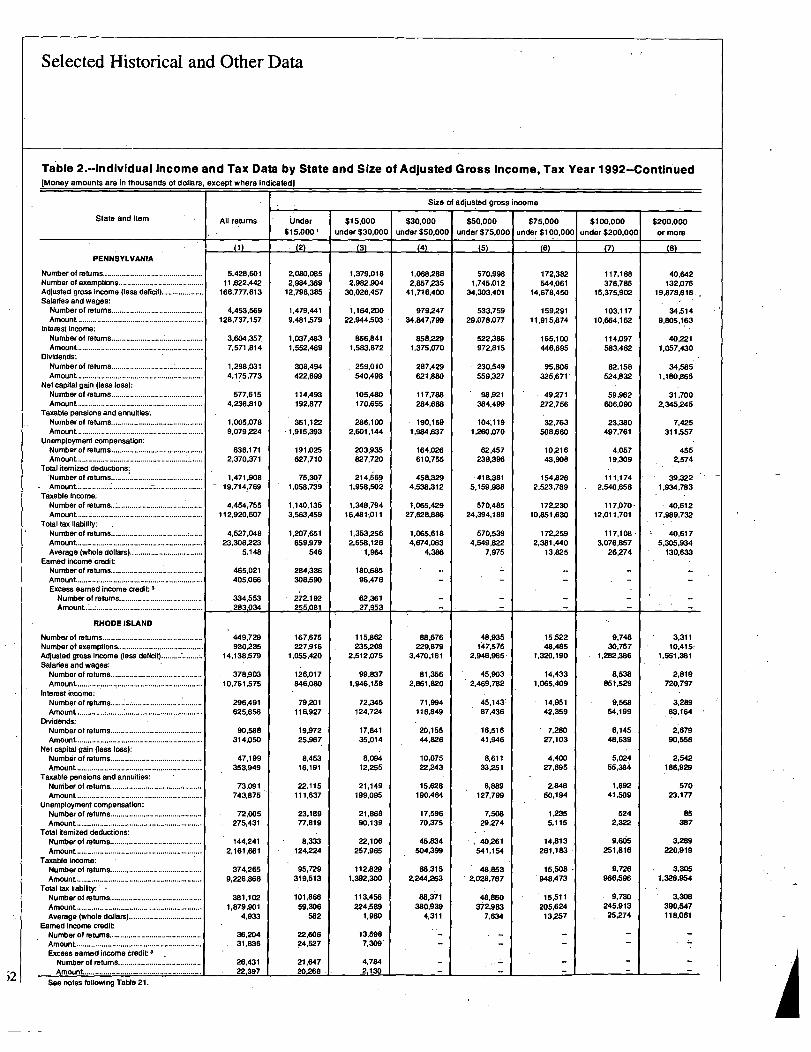
)2
Selected Historical and Other Data
Table 2.-Individual Income and Tax Data by State and Size of Adjusted Gross Income, Tax Year 1992-Continued[Money amounts are in thousands of dollars, except where Indicated)
All returns
Dil
5428,60111 ~622,442
168,777.613
4.453.569128,737.157
3,604,3577,571,814
1,298.0314,175,773
577.6154,236,810
1,005,0789,079,224
636,1712,370.371
1,471,90819,714,769
4,454,755112,920,607
4.527,04823.306,223
5.148
465,021405.066
334.553283,034
449,729930,235
14,138,579
378,90310,761,575
296,491625,658
90,588314,050
47,199353,949
73,091743,875
72,005275,431
144,2412,161,661
W4.2659,226,868
381,1021,879,901
4,933
36,20431,836
26.43122,397
Under$15,0001
(2)
2.080,0852.984,%9
12,798,3136
1.479,4419,481,579
1,037,4831,552,469
308,494422.699
114.493192,BT7
361,122-1,915.393
191 D25627,710
75,3071,058,739
1,140,1353,663,459
1,207,651659,979
546
284,336308,590
272,192255,081
167,675227.916
1.055,420
126,017846,080
79,201116,927
19.97225,967
8.45316.191
22,115111,637
23,18977,819
8.333124,224
95,729319,513
101,86659,306
582
22.60624,527
21,64720,268 1
$15,000under$30,000
L31
1.379,0182.982,904
30,028,457
1,164,20022,944.503
866,8411,583,872
259,010540,498
105,480170,655
286,1002,601.144
203.935827,720
214.9691,958,502
1,348,79416,481;011
1.353,2562,658,126
1.964
180,68596,476
62,36127,953
115,862235,208
2,512,075
99,8371,946,158
72,345124,724
17.84135.014
8,09412,255
21,149199,095
21,86890,139
22,106257,965
112,6291,392,300
113,456224,589
1,980
13,5987,309
4,7842,130 1
$30,000under$50,000
L41
1,068,2882,857,235
41,716,400
979,24734.847,799
858,2291,375,070
287,429621,880
117,788284,688
190,1691,984,637
164,026610,755
456,3294,538.312
1,065.42927,628,886
1.065,6184,674,063
4,386
--
--
88,676229,879
3.470,161
81.3562,861,820
71,994116,849
20,15544,826
10,07522,243
15,628190,464
17,59670,375
45,834504,399
88,3152,244.263
88,371380.939
4,311
-
Size of adjusted gross income
$50,000under$75,000
L5)
570,9981.745,012
34.303.401
533,75929D78.077
522,386972,815
230,549559,327
98,921364,499
104,1191,260,070
62,457238.396
-418,3815,159,988
570,48524,394,189
570,5394,549,822
7,975
-
-
48,935147,575
2,946,965
45.903
45,143'87,436
16,51641,946
8,61133,251
8,aag127,799
7,50829,274
40,261641,154
48,8532,028,767
48,860372,983
7.634
-
$75,000under$100.000
US
172,3112544,061
14,678,450
159,29111,915,874
165.100446,695
95,806325,671
49271272,756
32,763508,660
10,21643,908
154.8262,523,789
172,23010,851,630
172,2592,381,440
13,825
-
-
.15.52248,485
1,320,190
14.4331,065.409
14,95142.359
7,28027,103
4,40027,695
2,114860,194
1.2355,115
14,813261,1113
15.508948,473
15,511205,624
13,257
-
$100.000under$200,000
17A
117.188376,7115
15,375.902
103,11710,664,162
114,097583.462
82,158524.832
59,962606,090
23,380497,761
4,05719,309
111,1742.540.656
117,070-12,011,701
117,108.3.076,857
26.274
-
-
9,74830,757
1,282,386
8.538851,529
9,56854,199
6,14548,639
5,02455,384
1,89241,509
5242,322
9,665251,816
9,726966.596
9,730245,91325,274
-
M
Adjusted gross income (less deficit)....................Salaries and wages:
Interest income:
Dividends:Number of returns ............................... : .............Amount ...........................................................
Not capital gain (loss loss):Number of returns ............................................Amount ............................................................
Taxable pensions and annufties:Number of returns............................................
Unemployment compensation:Number of returns ................................. :..........
Total itemized deductions:
Taxable income:Number of returns..: .........................................
Total tax liability: .
State and Item
PENNSYLVANIA
Average (whole dollars)...................................Earned income credit
Excess earned income credit 3
RHODE ISLAND
Number of exemptions.........................................Adjusted gross income (loss deficit) ...................Salaries and wages:
Interest Income:
Dividends:
Not capital gain (less loss):Number of returns...............................Amount ...............................................
Taxable pensions and annuities:Number of returns ...............................Amount ...............................................
Unemployment compensation:Number of returns ...............................Amount ...............................................
Total itemized deductions:Number of returns ...............................Amount ...............................................
Taxable income:
Total tax liability:
Excess earned income credit
See notes following Table 21.
Average (whole dollars) ...................................Earned Income credit
$200.000or more
40,642132,076
19,878,618- . .
34,5149.805,163
40,2211.057.430
34,5851,180,865
31,7002,345,246
7,425311,557
4552,574
39,3221.934,783
40,61217.989,732
40,6175,305,934
130,633
-
3.31110.415-
1,551,381
2.819720,797
3,28983.164
2,67990.556
2,542186,929
57023.177
86387
3,289220.919
3,3051.328,954
3,308390,547118,061
-
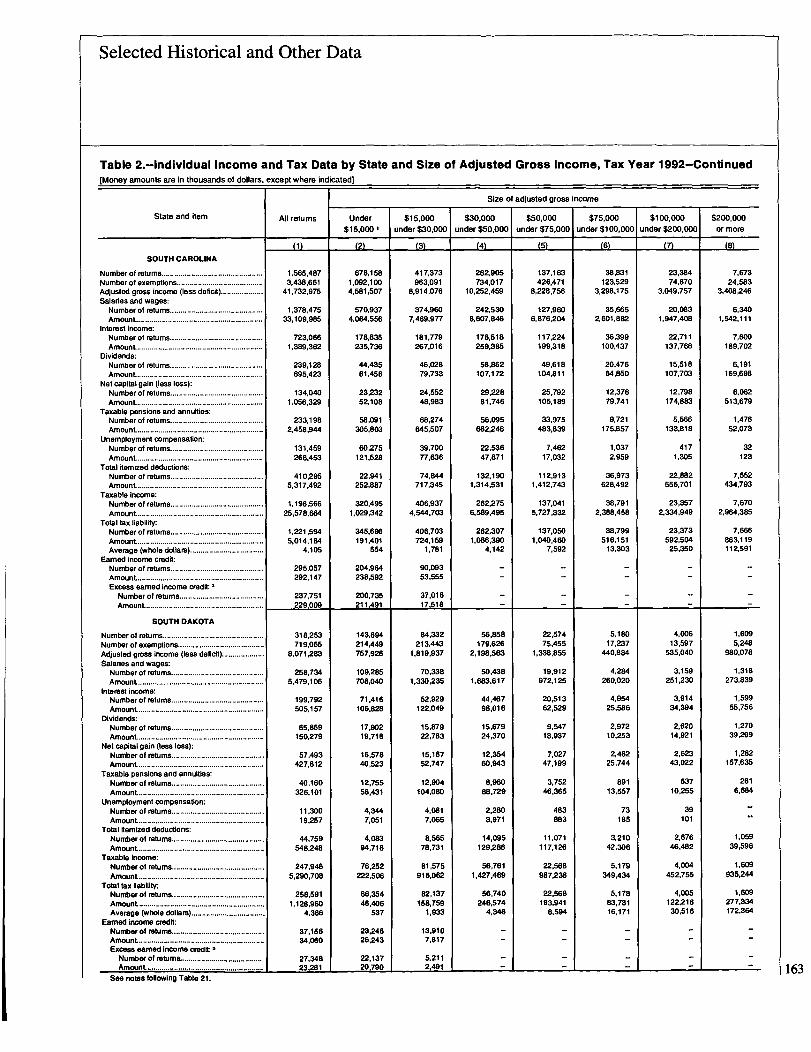
Selected Historical and Other Data
Table 2.-Individual Income and Tax Data by State and Size of Adjusted Gross Income, Tax Year 1992-Continued[Money amounts are in thousands of dollars, except where indicated]
All returns
1"
1,665,4873,438,661
41,732,975
1.378,47533,109,985
723,0661,389,362
239,128695,423
134,0401,056,329
233.1982,458,944
131,459268,453
410.2955.317,492
1.196,56625,578,664
1,221,5945,014,184
4.105
295,057292,147
237,761229,009
318,253719,055
8.071,283
258,7345,479.106
199,792505,157
65,869150,279
57,493427,812
40,160326,101
11,30019,257
44,759548,248
247,9485,290,708
268,5911,128,960
4,366
37.15634.060
27,34823,281
Under$15,0001
C24
678,1581,092.1004,581,507
570,9374,064,556
178,835235.736
44,43561,456
23.23252,108
58,091305,803
60,275121,528
22,941252,887
320,4951.029,342
345,696191,401
654
204.964238,592
200,735211,491
143,694214,449757,926
109,285708.040
71,416106,828
1 7,90219,718
16,57840,523
12,75556.431
4,3447,051
4,08394,718
76,252222.506
86,35446.406
537
23.24626,243
22,13720.790
$15,000under$30,000
"3
417.373963,091
8,914.076
374,9607,469,9T7
181.779267,016
46,02879,733
24,55248,983
68,274645,507
39.70077,636
74,844717.345
406,9374,544.703
406,703724.159
1,781
90,09353,555
37,01617,518
84,332213,443
1,819,937
70,3381.330,235
52,929122,049
15.87922,783
15,16752,747
12,904104.080
4,0817.065
8,56578.731
81.575916,062
82,137158,759
1,933
13.9107,817
5,2112,491
$30,000under$50,000
L41
262,905734,017
10,252,459
242,6308.607,846
178,518259,385
56,862107,172
29.22881,746
56.095662,246
22,53647,871
132.1901,314.531
262,2756,689,495
262,3071,086.390
4,142
--
--
56.858179,626
2,198,563
50,4381,683,617
".46798,016
15,67924,370
12,35460.943
8.96088.729
2.2803,971
14,095129,286
56,7611,427.469
56,740246,574
4,346
--
--
Size of adjusted gross income
$50,000under$75,000
151
137,163426,471
8,228.756
127,9606.876,204
117,224199,318
49.618104,811
25,792105,189
33.975483,639
7,46217,032
112,9131.412.743
137,0415,727,332
137,0501.040,460
7,592
--
--
22,67475,456
1,338,855
19,912972,125
20,51362,529
9,54718,937
7,02747,199
3,75246,365
483883
11,071117,126
22.568987,238
22,668193,941
8,594
--
--
$75,0130under$100,000
L61
38,831123.529
3,298.175
35.6652.601,882
36,399100,437
20,47664.850
12,37679,741
9,721175,857
1.0372.959
36.973628,492
38,7912,388,458
38,799516.151
13,303
--
--
5,18017,237
440,884
4.284260,020
4,95425,586
2.97210,253
2,46225,744
89113,657
73185
3,21042,306
5,179349,434
5117883,73116,171
--
--
$100.0130under$200,000
M
23,38474,870
3,049,757
20,0831,947,408
22,711137,768
15,518107,703
12,798174,883
5.566133,818
4171,305
22,882556,701
23,3572,334,949
23,373592,50425,350
--
--
4,00613,597
535,040
3,159251,230
3,91434,394
2,62014.921
2,62343,022
63710,255
39101
2,67646,482
4.004452,755
4,005122,21630,516
M
State and item
SOUTH CAROLINA
Number of exemptions .........................................Adjusted gross income (less deficit) ....................Salaries and wages:
Interest income:
Dividends'.Number of returns............................................
Not capital gain (loss loss):Number of returns ...................Amount. ...................................
Taxable pensions and annuities:Number of returns ...................Amount. ...................................
Unemployment compensation.,Number of returns ...................Amount ...................................
Total Itemized deductions:Number of returns ...................Amount ...................................
Taxable income:Number of returns ...................Amount ....................... ............
Total tax liability:
Earned income credit:
Excess earned income credit: 3Number of ratums ........................................Amount. ........................................................
SOUTH DAKOTA
Number of returns................................................Number of exemptions .........................................Adjusted gross income (less deficit) ....................Salaries and wages:Number of returns............................................Amount ............................................................
Interest income:Number of returns............................................Amount .................................................. ..........
Dividends:,Number of returns ............................................Amount ............................................................
Not capital gain (less loss):Number of returns ............................................Amount ............................................................
Taxable pensions and annuities:Number of returns ............................................
Amount ............................................................Unemployment compensation:
Number of returns ............................................Amount .................................................. ..........
Total Itemized deductions:Number of returns............................................Amount ............................................................
Taxable income:Number of returns............................................Amount ............................................................
Total tax liability.Number of returns............................................Amount ............................................................Average (whole dollars) ...................................
Earned Income credit:Number of returns............................................Amount ............................................................Excess earned Income credit: $
See notes following Table 21.
$200.000
or more
7,67324,683
3,408,246
6,3401.542,111
7,600189,702
6,191169.698
6,062513,679
1,47652,073
32123
7,552434,793
7,6702,964,385
7,666863,119112,591
--
--
1,6095.248
980,078
1,318273,839
1,59955,756
1.27039,299
1.282157,635
2616.684
1,05939,S98
1,6D9935,244
1,609277,334172,364
-
163
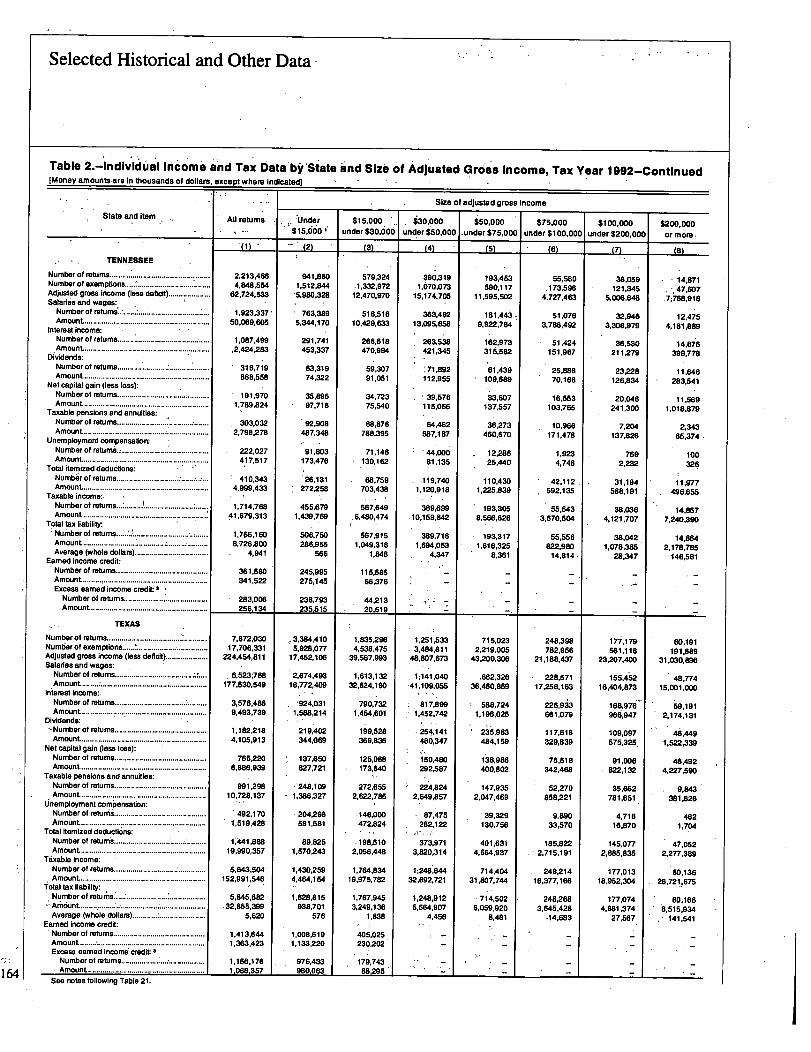
Selected Historical and Other Data -
Table 2.-Individ6al Income and Tax Date bV'Statea"nd Size of Adjusted Gross Income, Tax Y-ear 1992-Continued
[Money amounts are In thousands of dollars, except where Indicated) '
Size of adjusted gross Income
State and Item All returns Under
$15'000 t30'000 iSO-000$75,000 $100,000 $200,000
$15.000.1 under $30,000 underi5O,OOO under$75,000 under$100,000 under$200,000 or more,
(2) (3) (4) (6) (7) (8)TENNESSEE
Number of returns..............**"*'*****
...................... 2,213,466 941,860 579,324 390319 193,453 66,580 38,059 14 871Number of exemptions.. ............ .............. ............. 4,848,554 1,512,844 .1,332.972 1,070:073 590,117 .173,698, 121.345,
- 47 607Adjusted gross Income (loss deficit).................... 62,724,533 5,980,328 12,470.970 15,174,705 11,595,502 4,727,463 5,006,648, ,
7;768 918Salaries and wages: .
Number of retumi..~ .................................. 1,923.337, 763,389 518,516 363,492 181,4Q 51,076 32.948 12 475Amount ................... ..... ............ 50.069,605 5,344,170 10,429,633 13,095,658 9,922,784 3,788.492 3 306 979.
4 181 889Interest Income:, . , .
Number of returns............ ................................ 1.087,499 291,741 266,618 263.53'8 162,973 51,424 36,530 14 67.5.Amount.... ......................... .... ............................ ~2,424.283 453,337 470,994 421,345 315,582 151.967 211,279,
399 778Dividends: ,
Number of returns.......................... .................. 316,719 63,319 59,307 71,892 61,439 25.888 23,228 11 646Amount ............................................................ 868.558 74,322 91,051 112,955 109,689 70,166 126.834,
1 283 541Net capital gain (less loss): ,
Number of returns......................... ................... 191,970 35,896 34,723 - 39,576 33,607 16,553 20.046 11 569Amount ................................. ........................... 1,789,824 97,716 75,540 115,066 137.557 103,765 241.300,
1 018 879Taxable pensions and annuities: . ,
Number of returns ............................................. ..
303,032 92,908 88,876 64,462 36,273 10,966 7,204 2,343Amount. ............................. ............................... 2,798,278 487,348 788,395 687.187 460,670 171.478 137,826 65,374Unemployment compensation:Number of returns .....................
...........222,027 91.803 71,146 44,000 12.286 1,923 769 100Amount. ............................................................. 4 17,517 173,476 130,162 81,135 25,440 4,748 2.232, 328Total Itemized deductions:
Number of returns............................... - 410,343 26,131 68,759 419.740 110,430 42.112 31.194 1 1-977Amount ............................................................ 4,999,433 272.258 703,438 1,120,918 1,225,839 592,135 588,191 496:655Taxable income:Number of returns............ .... ................... 1,714,768 455,679 567,649 389,699 193,305
..55,543 38036 14857Amount....................................................... ...... 41,679,313 1,439.769 :6.480,474 ~10,159.842 8,666,626 3,670,504 4,121:707 7. :240390Total tax liability:
-Number of returns .....................................*
1,766.160 506,750 667,915 389,716 193.317 65,556 38,042 4,864Amount .......................... .............. ................... 8,726.800 286,955 1,049.318 1.694,053 1,616,326 822,980 1,078,385 2.178,795Average (whole dollars).................................. . 4.941 566 1.848 4,347 8,361 14,814. 28,347 146 581Earned income credit: ,
Number of returns ............................................ 361,580 245.995 115,585Amount ............................................................ 341,522 275,145 66,376'Excess earned income credit 3
Number of returns........................................ 283,006 238,793 44,213Amount ........................................................ 256.134 1 235.515 20.619
TEXAS a
Number of returns..................................................
7.672,030 73,384,410 1,835,296 1,251,533 715,023 248.398 17i.179 60,191Number of exemptions ...... .................... .............. 17.706,331 5,928,077 4,538,475 3,484,811 2,219,005 782,966 561,118 191.889Adjusted gross income (loss deficit).................... 224,454,811 17,452,106 39,567.993 48.807,673 43,200.306 21,188,437 23,207,400 31.030,i96Salaries and wages:Number of returns...................................... : n... 6,623,1788 2,674,493 1;613,132 1j141,040 682,326 228,571 155,4k 48,774Amount :........ ..................................... ...... 177,630,549 1 8,T72,409 32,624,190 41,109,055 36,460,869 17,258,163 16,404,873 15,001.000nterest Income:,Number of returns...... ........ .................... 3,576,486 924,031 790,732 ~8117,899 588,724 226,963 168,97i" iiijofAmount ............................................................. 9,493,739 1.588,214 1,464,601 1,452.742 1,196,025 661,079 966,947 2,174.131
Dividends:,,Number of returns ........................................ ..... 1,182,218 219.402 199,528 254;141 235.983 117,618 109,097 48,449Amount ............................................................. 4,105,913 344.069 369,836 480,347 484,159 329,839 575,325 1,
.522.339
Not capital gain (loss loss):Number of returns ............................................ 765,220 125,088 160,480 68,986 msia 91,006 46,492Amount. ................................... ......................... 6,8W,939 627,721 173,640 292,587 400.802 342,468 822.132 4,227,690
rakable pensions and annuities:Number of returns ............................................ 991,298 ~'248,1109 272,655 224.824 147.936 52,270 35.662 9,843Amount ...............: ............................................ 10,728,137 1,386,327 2,622,785 2.649,857 2,047,469 858,221 781,651 381,826
inemployment compensation:Number of returns............................................ 492,170 204,298 146,000 87,475 39,329 91890 4,716 462Amount ...................:........................................ 1,519,428 581.581 472,824 262,122 130,766 33.570 16,870 1,704
otal Itemized deductions:Number of returns.................................. 1',441,888 89,a25 .198,510 373,971 401,631 185,822 145,077 47,052Amount ............................................................ 19,990,357 1,570243 2,056,448 3,820,314 4,664,937 2.715,191 2,885,835 2,277,389
raxable Income: -Number of returns.............................. :............. 5,643,504 1,430,259 1,764.834 1;24i,644 714,404 248,214 177,013 60,136Amount ................................... ......................... 152,991,546 4464,154 19,975,782 32,692,721 31,867,744 16,377,166 18,952,304 28,721,675
fotal tax liability: .Number of retu r6 ....... ............ :.................
.S,M.682 1,628,815 11767945 1,248,912 71 4,sm 248,268 177,074 60,166
Am6unt................ ............... .......................... .32,865,399 938,701 3,249:136 6.564907 6,059,920 3,645,428 4.881,374 8,516.934Average (whole dollars)............ : ...................... 5,620 576 1
.838 4:456 81481 .14,683 27,667 141.541
amed Income credit:Number of returns ............................................ 1.413,644 1,008,619 405,025Amount .................................... ......................... 1,363,423 1,133.220 230,202Excess earned Income credit 3
Number of returns ......................................... 1,156,176 976,433 179,743Amount ........................................................ 1 1,068,357 1 980,063
1 88,295.1
T
E
so notes tonowing Table 21.

Selected Historical and Other Data
Table 2.--individual Income and Tax Data by State and Size of Adjusted Gross Income, Tax Year 1992-Continued[Money amounts are in thousands of dollars, except where Indicated]
All returns
til
729.6281,827,020
21,057,454
624,50616,460,826
428,418701,333
121,0118327,449
83,906571,964
107,4551,228,790
43,022107,108
245.1353,234,257
574,17012,657,384
586,8472,524,189
4,301
79.09472,520
59,58463,015
263.137566,530
7,417,345
220,3325,608,858
177,936367,206
61.874216,687
34,683242,312
36,077326,459
30,38281,753
76,977994,053
214,5944,751.876
221,946946,909
4,266
24,02420,339
16,64612.661
Under
$15,0001
J24
301.014411,379
1,681,816
239.7701,568,536
120.677125,594
25.65331.197
16,69652,123
27,488168,261
13.91133.142
13,185142,501
155,268466.689
165,57085,471
516
48,36555,624
46,09246,392
104,402145.832604.286
78.216510,948
63,01173,229
15,43622,833
8,05917,636
11,34856,053
12,15432,583
5,56862.817
57,851188.495
64,67638,655
598
14,58415,340
13,49611.329
$15,000
under$30,000
L3)
172,184465.807
3,770,568
147,8182,986,699
98,781134,674
23,99638.787
116.28532,621
32,756364,524
14,82038,198
42,341365,943
163,3031.780,242
165.441289,831
1,752
30,73916,897
13,4926,623
68.663147,722
1,489,791
59,5741,156,698
45,10776,769
12,86828.630
7.06319,702
10,64790.505
10,03227,163
13,173117,843
66,899801,844
67,392133,923
1,987
9,4404,999
3,0501.332
$30,000
under$50,000
L4)
145,841518,493
5,693,312
134,7064,829,381
109,047126,930
29,28544.860
19,11750,889
26.036345,307
10,20825.086
90,525935,258
145,1093,294,157
145,308543.337
3,739
--
--
51.022140,629
1.985,349
46.9851,632,595
42.46668,911
13,87034,442
7,28428,596
7.72780,935
6,24516,436
24,723244,197
50.8431,285,967
50,861217,165
4,270
-
Size of adjusted gross Income
$50,000under$75,000
us
74,334288,106
4,451,207
69,6143,747,737
65,265100,160
23,25843.661
15,39764,241
14,308215.087
3,4008,549
64,277857,622
74,2592,889,635
74,289518,146
6,975
-
-
25,61879,433
1,531,951
23,7051,254,700
24,07750,786
10,70832,497
5,66230,182
4,10852,882
1,6074,437
20,417251,673
25.4871,075,141
25,495199,806
7,837
-
$75,000under$100,000
16A
19,23974,404
1,633.474
17,7491,275,012
18,12345,451
8,58223,707
6,43644,929
3,94970,166
4711,421
18,267326,742
19,2281.134.886
19,230243.86812,682
-
-
7.35923,385
624,996
6.660468,970
7.17125.214
4,41120,416
2.70923.155
1,17718,760
226738
7,014116,377
7,350455,184
7,354100,06413,607
-
$100,000
under$200,000
ff)
12,72051,296
1,680,330
11,1781,107,860
12,29163,490
7,25741.686
6.81000,809
2,28847,973
195621
12,353318,606
12,7101,250,618
12,715315,19224,789
-
-
4,92515.601
642,298
4,214394,261
4,86532,270
3,53234,050
2.88848,626
92818.574
389
4,843120,834
4,918488,500
4,920123,73325.149
-
Lei
State and Item
UTAH
Adjusted gross Income (loss deficit)....................Salaries and wages:Number of returns............................................
Interest income:
Dividends:Number of returns............................................Amount. ...................................... ......................
Net capital gain (loss loss):Number of returns............................................
AmounL ............................................................Taxable pensions and annuities:Number of returns ............................................Amount ............................................................
Unemployment compensation:Number of returns............................................Amount ...................................... ......................
Total Itemized deductions:Number of returns............................................
Taxable income:Number of returns............................................
Total tax liability:
Average (whole dollars) ...................................Earned income creditNumber of returns ............................................
Excess earned income credit 3
Number of returns........................................Amount. ........................................................
VERMONT
Number of returns ................................................Number of exemptions.........................................Adjusted gross income (less deficit) ....................
Salaries and wages:Number of returns............................................Amount ............................................................
Interest income:Number of returns............................................
Dividends:Number of returns............................................Amount ............................................................
Net capital gain (less loss):Number of returns............................................Amount ............................................................
Taxable pensions and annuities:
Number of returns ............................................Amount ............................................................
Unemployment compensation:
Number of returns ............................................Amount ............................................................
Total Itemized deductions:Number of returns ............................................Amount ............................................................
Taxable income:Number of returns............................................Amount............................................................
Total tax liability:Number of returns............................................
Average (whole dollars) ...................................Earned Income credit
Excess earned Income credit 3Number of returns ........................................
See notes following Table 21.
$200,000or more
4,29617,536
2,146,747
3,870955,602
4,234106,133
3,057103,492
3,165236,351
63017,472
1790
4,187287,584
4,2931,852,158
4,294528.344123,042
-
-
1,2483,928
538,673
978190,786
1,23940,027
1,05043,819
1.01874,515
2428,751
57
1,23980,312
1,246456,745
1,248133,564107,022
-
165
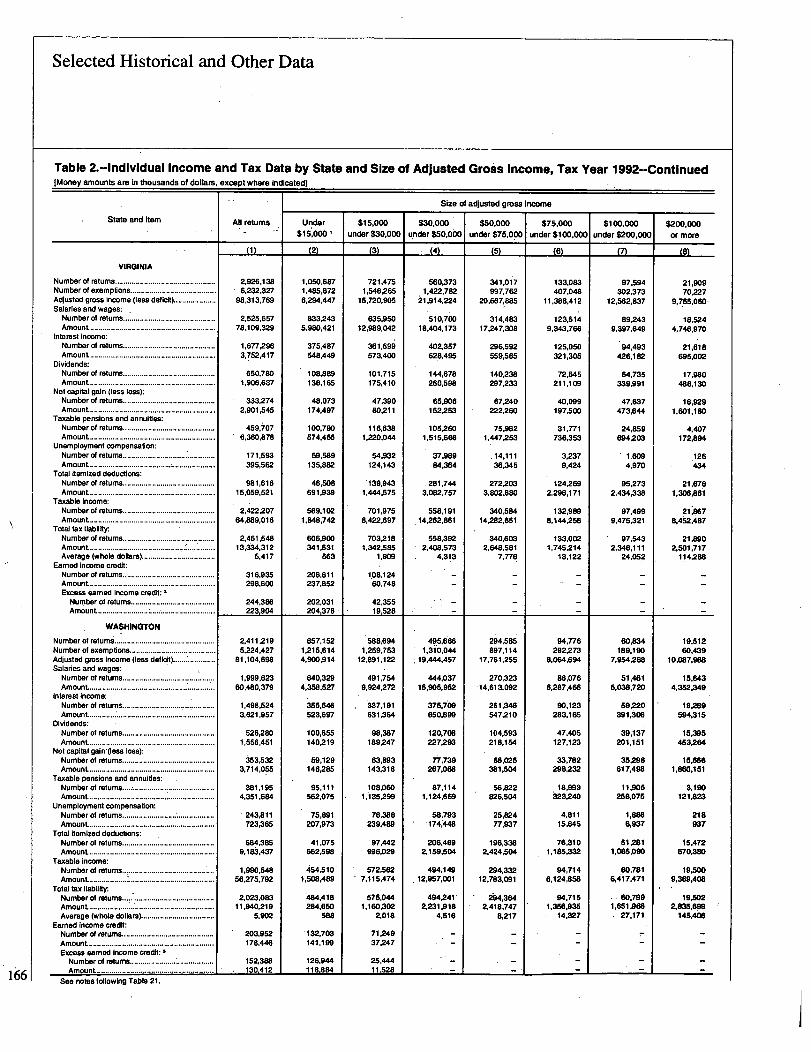
Selected Historical and Other Data
166
Table 2.-Individual Income and Tax Data by State and Size of Adjusted Gross Income, Tax Year 1992--Continued[Money amounts are in thousands of dollars, except where indicated]
Size of adjusted gross income
State and Item All returns Under $15,000 $30,000 $50,000 $75,000 $100,000 $200.000$15.0001 undar$30,000 under$50,000 under$75,000 under$100,000 under$200,000 or more
(1) (2) (3) (4) (5) (6) (7) (8)
VIRGINIA
Number of returns.......... . .................................... 2.926,138 1,050,687 721,4715 560,373 341,017 133,083 97,594 21,909Number of exempfions, ......... ................................ 6,232,327 1,485,872 1.646265 1,422,782 997.762 407,046 302,373 70,227Adjusted gross income (less deficit) .................... 98,313,769 6,294,447 15,720,905 ~1.9114,224 20,667 ass 11,388.412 12,562,837 9,765,060.Salaries and wages: .
Number of returns............................................ 2,525,657 833.243 635,950 510.700 314,483 123,514 89,243 18.524Amount ............................................................ 78,109,329 5.980,421 12,989,042 18,404,173 17,247.308 9,343.766 9,397,649 4,746.970
Interest income:Number of returns...................................... ...... 1,677,296 375,487 361,699 402,357 296.592 125,050 94,493 21.618Amount ............................................................ 3,752.417 548,449 573,400 628,495 559,585 321,305 426,182 695,002
Dividends:Number of returns............................................ 650,780 108,889 101,715 144,678 140,238 72,545 64,735 17,980Amount............................................................ 1.906,637 136,165 175,410 260,598 297,233 211.109 339,991 486,13D
Net capital gain (less loss):Number of returns...................................... ...... 333,274 48.073 47,390 65.906 67.240 40,D99 47,637 16,929Amount............................................... ............. 2,901,545 174.497 80,211 152,253 222,260 197,500 473,644 1,601,180
Taxable pensions and annuities:Number of returns............................................ 459,~07 100,790 116.638 106,260 75,982 31.7-71 24,859 4,407Amount ................................................ ............. 6,360,878 574.465 1,220,044 1,515.666 1,447.263 736,353 694,203 172.894
Unemployment compensation:Number of returns ............................................. 171,593 59,589 54,932 37,989 .14,111 3,237 1,609 126Amount........................................ .................... 395,562 135,882 124.143 84,364 36,345 9.424 4,970 434
Total itemized deductions:Number of returns ............................. ...... 981,616 46.508- -139,943 281,744 272.203 124.269 95,273 21,676Amount............................................................ 15,059,521 691.939 1,444,575 3,082,757 3.802,880 2,296,171 2,434,338 1.306,861
Taxable Income:Number of returns............................................ 2
.422,207 569,102 701,975 558.191 340,584 132.989 97.499 21,867
Amount ............................................................ 64,889,016 1,848.742 8,422,697 114.262.861 14,282,651 8,144,258 9,475.321 8,462,487Total tax liability:Number of returns...................................... ...... 2,461,548 606,900 703,218 558,392 340,603 133,002 97.543 21,890Amount ............................................................. 13,334,312 341,631 1,342,5115 2.408,573 2.648,581 1,745,214 2,346,111 Z501.717Average (whole dollars)................................... 5,417 663 1,909 4,313 7.776 13,122 24.062 114,280
Earned Income credit:Number of returns............................................ 316,935 208,811 108,124 - - - - -Amount ............................................................ 298,600 237,852 60.748Excess earned income credit: 3Number of returns........................................ 244,386 202,031 42,355Amount........................ : ............................... 223.904 204.376 19.528
WASHINGTON
Number of returns ................................................ 2.411,219 857,152 58i,694 49.5,6166 294,585 94,776 W,834 19,512
Number of exemptions......................................... 5,224,427 1,215,614 1,259,763 1,310,044 897,114 292,273 189.190 60,439Adjusted gross Income (loss deficit)..................... 81,104,698 4,900,914 12,891,122 19.444,457 17,761.255 8,064,694 7,954,288 10.087,968Salaries and wages:Number of returns ............................................ 1,999,623 640,329 491,754 444,037 270,323 86,076 51,461 15,643Amount ............................................... ............. 60,480,379 4.358,527 9,924,272 15,905,962 14,613,092 6.287.466 6,038,720 4.352,349
Interest income:Number of returns ............................................ 1,498,524 355,646 337,191 375,i0l) 261,346 90,123 69,220 IqA9Amount ............. .............................................. 3.621.957 623,697 631,364 650.899 547,210 283,165 391,306 594,315
Dividends:Number of returns ............................................ 526,280 100,665 98,387 120,708 104,593 47,405 39,137 15.395Amount ....................................................... ..... 1,566,451 140,219 189,247 227,293 218,154 127,123 201,151 453,264
Not capital gain pass loss):Number of returns ............................................ 353,532 59,129 63,893 77,739 68.025 33,782 35,298 15.666Amount ............................ ................................ 3,714,055 146,285 143,318 267,068 381,504 298,232 617,498 1,860,151
Taxable pensions and annuities:Number of returns ..................... I...................... 381,195 95,111 108,060 87,114 56,822 18,993 11,905 3.190Amount ............................................................ 4,351,684 562,075 1,135,299 1,124,669 826.504 ~23.240 258,075 121,823
Unemployment compensation:Number of returns ............................................. 243,811 76,891 76,388 58,793 25,824 4,811 1,886 218Amount. ............................................................ 723,365 207,973 239,489 174,448 77,937 15,645 6,937 937
Total Itemized deductions:Number of returns ............................................ 684.386 41,075 97,442 206,469 196,336 76,310 51,281 15,472Amount, ............................................................ 9,183,437 662.598 996,029 2,159,504 2,424,504 1,185,332 1,085,090 670,380
Taxable income:Number of returns ...................................... ...... 1,990.548 454.510 572,562 494.149 294,332 94,714 60,781 19,500Amount ............................................................. 56,275,792 1,508,489 7,115,474 12,957,001 12.783,091 6,124,858 6,417,471 9,389,408
Total tax liability.Number of returns ..................................... 2,023,083 484,418 575,044 494,241 i94,364 94.715 80.799 19,502Amount ....................................................... ..... 11,940.219 284,650 1,160,302 2.231.918 2,418,747 1,356.936 1,651.968 Z835.899Average (whole dollars)................................... 5.902 688 2,018 4,616 8,217 14,327 27.171 145,400
Earned Income creclit:Number of returns............................................ 203,962 132,703 71,249 - - - - -
Amount ............................................................ 178,446 141,199 37,247Excess earned Income credit: 3Number of returns......................................... 152,388 126,944 25,444Amount ........................................................ 130,412 118.884 11,628
See notes following Table 21.

Selected Historical and Other Data
Table 2.-Individual Income and Tax Data by State and Size of Adjusted Gross Income, Tax Year 1992-Continued[Money amounts are in thousands of dollars, except where indicated)
All returns
f1l)
692,8941,587,795
18,243,072
576,95213,998,926
390,018790,794
118,545338,522
56,080317,872
128,3551,135,045
78.329231,386
98,0031.142,367
633,76411.536,745
649,9842,262,697
4,114
96,84887,197
74,79365,419
2,284,6544,924.154
69,840,579
1,946,47054,005.531
1.612,3083.118.697
552,7871,425,111
311,9132,287,925
351,7042,972,738
255,926662,478
721.4848,976,084
1,907,94945.622.786
1,938.8349,137.285-
4,713
182.151160,737
132,665111,636
Under$15,0001
L21
301,466609,831
Z104.054
228,0161,503,768
118.792181,418
26,82733.852
11,61818,678
49.728284,778
27,95972,322
4,43445,133
145,883441,776
161,84685,186
626
64,40969.486
62,25359,474
879.1691,180,2425,585,969
672,9494,324,287
478,004627,223
128,676147,035
67,075124,639
118.089575,701
63,600144,792
37,959376,628
615,906J.&%,682
544,379280.814
616
113,828123.455
109,542101,180
$15,000under $30,000
L31
174,327432.330
3,767MI
148,3732,892,595
97,703188,444
24,83446,824
11,27221,157
37,802366,453
26,59687.797
12,361106,730
170,9441,904,514
171,214307,222
1,794
32.43917,711
12,6405,945
555,3081,190.754
12,107,162
478,8919,427,806
376,221661,391
112,039193,637
66,114194,572
103,244892,859
82.235191,311
102,691918,712
542,9746.663,869
545.4201,079,730
1,980
68,32337.281
23.11310,466
$30,000under $50,000
L41
128,774367,334
5,022,637
119,2804.273,418
94,554150,102
28,93856,193
12,15232.678
23.208248,333
18,07264,575
28,545256,227
128,6323,383,648
128.616553.637
4.305
--
--
471,8481,334,612
18,525,334
440,03115,716,739
399,041571,974
130,793215.878
69.421260,916
71,716718,790
75.219158,634
246,2502.332,739
470,92712.002,080
470.8832.WI.909
4.252
--
--
Size of adjusted gross income
$50,000under $75,000
151
62.959197.318
3,763,955
59,2303,222,819
64,806102,646
22,40150,440
9,45837,797
11,992141.016
5.OD314,343
31.295324,117
62,9342.801,774
62,934620,688
8,274
--
--
257,121822,324
15,379.767
243,87913,176,493
241,624415,399
103,915201,586
52,783263,601
38,200427,417
29,98957,003
217,4432,807,721
266,98810,696,810
257.0021,941,275
7, IMSA
$75,000under $100,000
(M
13,96543,867
1,181,444
12,695917,845
13,06843,660
7,43929,175
4,04124,853
3,17047,170
5471,743
10.784142,776
13.961923,047
13,962205.749
14,736
-
-
65,886214,026
5,588,779
61,4504,480,029
63.936183,593
36,830112,793
22,018169,037
10,507147,401
3,8727,844
63.0561,037,130
65,8614,062,101
65,868879,038
13,345
-
$100,000under $200,000
M
8,33826,872
1,096,254
6,915630,761
8.06053,797
5,58048,476
4,22650,518
1,87034,464
142578
7,606143,356
8,334893,119
8,336236,46328,366
-
-
40,656134,339
5,326,806
36,3653,606.719
39,914233,470
28,238173,997
22,942301,271
7.208126,638
110082,619
39.701928,946
40,6294,109,999
40,6381.039,230
25,673
-
State and Rem
WEST VIRGINIA,
Number of exemptions.........................................Adjusted gross income (loss deficit)....................Salaries and wages:
Interest Income:Number of returns............................................Amount.............................................................
Dividends:Number of returns ............................................Amount ............................................................
Not capital gain (less loss):Number of returns ............................................
Taxable pensions and annufties:
Unemployment compensation:Number of returns ............................................
Total itemized deductions:Number of returns............................................
Taxable income:Number of returns............................................Amount ............................................................
Total tax liability:Number of returns............................................Amount ............................................................Average (whole dollars) ...................................
Earned income creditNumber of returns............................................Amount ............................................................Excess earned income credit 3Number of returns........................................Amount........................................................
WISCONSIN
Adjusted gross income (less clefidt)....................Salaries and wages:
Interest income:Number of returns............................................Amount ............................................................
Dividends:Number of returns............................................Amount ...........................................................
Net capital gain (less loss):Number of returns............................................Amount ............................................................
Taxable pensions and annuities:Number of returns............................................Amount ............................................................
Unemployment compensation:Number of returns.............................. . .... ........Amount ............................................................
Total itemized deductions:Number of returns............................................Amount ............................................................
Taxable income:Nurnber of returns............................................Amount ............................................................
Total tax fiabilfty:Number of reftims ............................................
Average (whole dollars) ...................................Earned Income creditNumber of returns ............................................
Excess earned Income credit 3
See notes following Table 21.
$200.000or more
3.07610,243
1,316,886
2,443557,720
3.03570,728
2,52673,562
2.313134,191
58512.840
1029
2.978124,018
3,0761.188,867
3,076353,753116,004
-
-
14.66747,957
7,326,763
12,903.273,458
14.568425,645
12,298380,186
11,560973,889
2,74083.932
103274
14,384776,209
14,6646,533,245
14,6641.915,290
130,612
-
167

-168
Selected Historical and Other Data
Table 2.-Individual Income and Tax Data by State and Size of Adjusted Gross Income, Tax Year 1M--Continued[Money amounts are in thousa ds of dollars, excep-t-where indicated]
Ail returns
211,925480,272
6,197,98~
178,7534,513.935
127362334:371
47,586176,436
30.994313.411
30,473305,618
15,61835,741
38,752433.921
166,9554.259,657
171,933694.814
5,204
23,26020.585
.17,55614,917
1,071,0382.047.307
23,363,782
731,74029.674,138
486,0971.098.337
181,038722,809
97.2031,007,709
74,0731,017.456
14,47653,236
211,4002,194.393
605,87417,130,753
657,6322.948,519
4,484
20.00515.174
15,42911,778
Under$15,000,
(2)
88,130125.859
:431,061
69,404.442,836
38.23351,814
10,76316,187
6,94218,128
8,275".577
S,iF7012,959
2.70827,708
44,705132,362
49,42126,393
534
15,14716,251
14,52613,509
679,647988,572
1.582.741
376,0676,787,560
216,903238,568
62,64093,381
34,65479,199
27,734197,299
6,65023,562
-87,017255,394
223,367868,132
295,373293,496
994
12,11811,381
1 1,52410.126
$15,000undar~$30,000
C3)
49,074121,093
1,068,301
41,763820,855
2845254:210
9,29218,915
6,35716,633
8,64682,171
.5,64413.506
5,93751,443
47,634545,487,
41,173 -1,904
8,1134,334
3,0301,4D8
188,455476,718
3,972.214
168,7044,487,805
io4,194148,380
29,93168,204
12,15942,526
.19,040269,716
4,23815,745
32.081286.496
180,4291,891,992
168,745271.784
.1,611
7,8873.793
3,905352]1 i52
$30,000under$50,000
(4)
41,894125,892
1,645,788
38.120
31,30054.323
11,93523.087
7.10025,184~
7.16681,526
3,0966,634
12,172109,679
41,8171,091-,508
41.819184,770
4.418
96,200266,970
3,712.239
88,3664.184,733
-70.ka
138,807
29.24574,117
12,34853,645
12,366206,935
2,0747,761
28,214317.976
95,5682,457,946
89,08s362,123
4,065
-
Size of adjusted gross income
$50,000under$75,000
L51
23,00475,870
1,373,796
21,3521,138,140
19,95340.926
9,34621,148
5,41126,528
4,44353,281
9352,094
11.605117,493
22,9871,020,297
'22,993193,156
8.401
47,809137,691
2,894,226
44,1963,280,526
40,616117,549
21,66172,078
10,95563,705
7.635150,417
0993,491
22.475307.112
47,6522.149,114
46,192358,085
7,762
-
$75,000under$100,000
AM
5.41617,652
458,450
4,774327,794
5,10819,987
3.01912,490
2.08620,313
1,12816,818
129399
3,42843,036
5,412364,728
5,41382,84715,305
21,00361,465
1,805,692
19,5992,086,422
18,76370,112
11,45847,757
6,68948,883
3.02265,750
3061,307
13,264214,776
26,9721,408,204
20.614252,72112,260
-
$100,000under$200,000
(7)
3,17510.173
419.001
2.491201,502
3,09829,305
2,22621,336
2.05941,442
60414,047
40132
2.0k35,818
3.172355,955
3,17394,90629,910
25,70878,378
3,513,995
23,8644,058,488
23,580120,779
16,53896,589
12,230129,484
3,06176,838
2561,186
19,073398.849
25.6762,922,887
25,465484,69819.034
-
M
State and ftem
WYOMING
Number of returns :........:.:............................Number of exemptions *...................................Adjusted gross income (loss deficit).....................Salaries and wages:
Interest income:Number of returns............................................Amount....................... 7 ................................ ....
Dividends:Number of returns............................................Amount.............................................................
Not capital gain (loss loss):Number of returns ............................................Amount .............................................................
Taxable pensions and annuities:Number of returns ............................................'Amount .............................................................
Unemployment compensation:Number of returns............................................Amount ................. ............................................
-Total itemized deductions:Numberof returns............................................Amount ........................... 7 .................................
Taxable income:Number of returns.............................................Amount .............................................................
Total tax liability:
Average (whole dollars) .............. ....................Earned income credit:
Excess earned income Credit 3
OTHER AREAS 4
Number of returns .............................Number of exemptions........ ..........................
Adjusted gross income (less deficit) ....................Salaries and wages,:_
Interest incorne:.
Dividends:Number of returns..................... . .....................Amount..................... ........................................
Net capital gain (less loss):Number of returns............................................Amount..................... ........................................
Taxable pensions and annuities:Number of returns ............................................Amount ..............................................................
Unemployment compensation:Number of returns ................. ..........................Amount .............................................................
Total itemized deductions:Number of returns............................................Amount ..................... .........................................
Taxable income: 'Number of returns................... ......... :..............Amount ..................... ........................................
Total tax liability:Number of returns............................................Amount............... .............................i ................Average (whole dollars) ...................................
Earned income credit:Number of returns............................................Amount.............................................................Excess earned income Credit 3
See notes following Table 21.
$200,000or more
1,2323,733
601;586
849223,671
1.21883,807
1,00563,271
1,039165,183
21113,198
416
81048,846
1.228749,320
1,230221,569180,137
12,21637,613-.
5;882.675
10.9444,788,604
11,5132i4,141
9,565270,682
8.168590,267
1,21560,501
53183
9,276413,790
5,432,478
12.158925,61276,132
-
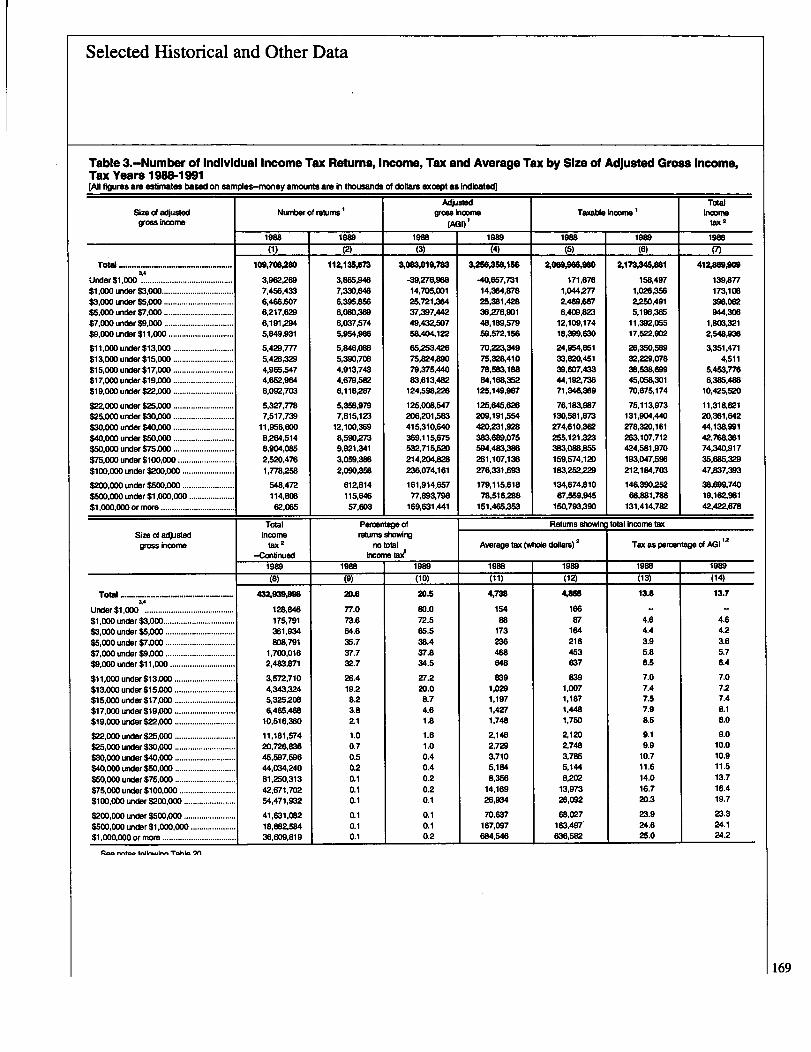
Sfa
!2ti
f2T
§n
at2
?13
5§
fa!21
3§g
§fa
tT!
!!2!R~
a;tja
rg8
83A
.$A
'D4
§§
§8
§§
-§t
§§
§§
cc
cc
SS
S0
§5
SS
ajI
0)
svt
:3C,
~38
'A'A
M OR8
08
8§
§
..
..
..
..
..
..
..
..
..
..
R8t
52it
Tt
A8t
SN
pSO
~4CA
0).01
P.p
S"P
pp
P:q
SAA
,ID
0
-401
3-ID
--
-84
SDSD
SDSp
§~
ot,
(C-A,
C20
all
(waC;
't!4
FA:a
..
.
999
pp
pp
p.1
-14~
ODM
--
-M
h)41
P,0
0)OD
0)-4
0L"
bD~P
,L"
inb
c"
..
..
..
..
..
..
R(A
CAo
SS.S.
.- 82
TSi3
.'
3lm
m§
1gi
g4
1E
jN
igPT
8-3
ii
9PS
4g
80
c,OD
09,as,8
-151
1!,E
to(Sol
!Iy
998
3i
'U"!9
99
99
&r2
E$
inb
b,91
C-4
C4co
8In
bt
TY
WB
R8
16
PD
P9.
-4-4
-4~
49)
SA
P-P
I4
b~I
~Z
n
58-
--
..
..
..
..
.
40-
OC
0040
CA
OD
CD
4b6
iOIN
)~
4In
'(D'-
48
C11
iGCa
-4
-4.4
.-4
ww
t?
88&
;=
88C
DC
OC
O41
~6:
CDCA
caca
S.
:-4
84
~4
CDio
410
0
Sg
~4

Selected Historical and Other Data
Table 3.-Number of Individual Returns, Income, Tax and Average Tax by Size of Adjusted Gross Income,Tax Years 1989~1992-Contlnued[All figures are estimates based on samples-money amounts are in thousands of dollars except as indicated]
Adjusted TotalSize of adjusted Number of returns gross income Taxable income' incomegross income (AGI)' tax 2
1991--
1992---7
1991 1992 1991 1992 1991(119) F16) (17) (18) (19) (20) (21)
Total .............................................. 114,730,123 113,604,503 3,464,524,369 3,629,129,550 Z284,087,935 2,395,695,907 "8,429,593No adjusted gross inoom~ .................. 926,020 951,744 -51.617,151 -51,422,468 - - '186.940$1 under$1,000.................................. 2,849,361 21563,007. 1,683,768 1,545,812 116,682 90,769 17,637$1,000 under $3,000........................... 7,083,525 6,568,092 13,883,582 972,640 916.764 162,746$3,000 under $5,000 .......................... 6,136,013 5,889,687 24,519,899 23,515.915 1,738,88 1,321,361 275,433$5,000 under $7,000 .......................... 6,103,154 5,962,134- 36,691.283 35,835,937 4,069,20 3,614,665 633,850$7,000 under $9,000 .......................... 6,100,223 5,908,675 48,748,999 47,240,900 9,716,366 7,814,798 1;474,313.$9,000 under $11,000 ........................ 5,870,993 5,693,569 58,581,732 56,810,810 15,035,511 12,876,325 2,155,525
$11,000 under $13,000 ...................... 5,572,994 5,582,747 66,796,371 66,943,733 20,520,281 19,106,962 2,804,309$13,000 under $15,000 ...................... 5,363,932 4,967,703 75,239,187 69,4T7,071 29,156,451 24,702,714 3,843,145$15,000 under $17,000 ...................... 5,10
-4,491 4,871,439 81,613,352 77,887,474 36,318,492 32,159,891 4,686,613
$17,000 under $19,000 ...................... -4,477,972 4,506,152 8D,625,320 8D,973,334 39,149,865 36,829,811 5,283,917$19,000 under $22,000.. .................... 6,106,2~4 6,214,933 125,067,606 127.304,158 66,638,998 64,475,972 9,608,292
$22,000 Linder $25,000 ...................... ~5,591,888 5.450,958 131,214,635 128,013,327 74,990,961 70.688,046 11,131,373$25,000 Linder $30,000 ...................... 7,873,619 7,590,154 216,086,077 208,225,889 131,461,525 123,555,002 19,978,743$30.000 under $40,000 ...................... 12,346,753 12,324,990 429,097,816 428,478,262 279,498,354 274,011,013 45,090,210$40,000 under $50,000 ...................... 8,816,813 9,008,646 393,548,840 403,103,550 266,283,650 269,211,742 43,457,571$50,000 under $75,000 ...................... 11,390,205 11,796,348 685,643,232 712,270,449 481,213,M4 495,922,686 87,835,8Q$75,000 under $100.000 .................. i. 3,571,629 3,988,202 305,015,139 340,631,134 221,951,125 247,431,448 47,012,249$100,000 under $200,000..................... 2;597,908* 21810,579 339,097,5B4 368,372,099 258,310,875 2BO.674,802 62,842,884
$200,000 under $500,000 ................ :. 676,038 746,344 196,264,221 218,604,180 165,216,471 186,065,353 46,262,078$500,000 under $1,000,000 ............... 118,350 141,159 79,606,495 95,365,741 69,658,824 84,322,055 2o,49o,663$1,000,000 or more .................. 52,019 67,243, 127,116,380 176,939,720 112,069,567 159,703,788 33,301,257
Total - Percentage of Returns showing total income taxSize of adjusted income returns showing
2'2gross income tax no total Average tax (whole dollars) Tax as percentage of AGl
--Corytinued income tax 2
1992 1991 1992-
1991----- -
1992 1991 1992
---(2-2). ---7-(23) ----F24 ) (257 (26) (27)
................ .......... .................Total 476,238,785 221 23.7 5,034 5,491 13A 13.7.
No adjusted gross income .......... 76,028 99.1 99.2 9,861 10,170 -- -
$1 under $1,000 ................................... 14,421 772 78.3 27 26 3.4 3.2$1,000 under $3,000........................... 147,896 74.5 74.8 90 89 4.7 4.7$3,000 under $5,000 .......................... 214,065 69.0 72.5 145 132 3.6 3.2$5,000 under $7,000 .......................... 552.261 49.5 57.5 205 218 3.3, 3.5$7,000 under $9,000 .......................... 1,166,151 38.6 4o.9 394 334 .4.9 4.2$9,006 under $11,000 ... 1,879,954 40.1 43.6 613 .587 6.1 5.9
$11,000 under $13,000 ...................... 2,666,280 34.6 37.9 769 766 6.4 6.4
$13,000 under $15,000 ...................... 3,303,921 M.5 30.7 1,002 960 7.1 6.9$15,000 under $17,000 ...................... 4,203,490 - 21.3 26.8 1,167 1,180 7.3 7.4$17,000 under $19,000 ...................... 4,877,504 11.5 15.4 1,333 1,280 7.4 7.1$19,000 under $22,000 ............:1 9,065,162 .3.2 6.1 1,626 1,553 7.9 7.6
$22,000 under $25,000 ...................... 10,471,162 2.3 2.0 2,038 1,959 8.7 8.3$25,000 under $30,000 ...................... 18,482,005 1.2 1.8 2,568 2,479 9.4 9.0
$30,000 under $40,000 ...................... 43,730,622 0.8 0.7 3,681 3,573 10.6 10.3
$40,000 under $50,000 ...................... 43,621,782 0.3 0.3 4,943 4,857 11.1 10.9$50,000 under $75.000 ...................... 88,455,492 0.3 0.2 7,732 7,517 12.8 12A$75,000 under $100,000 .................... 51,552,937 0.1 0.1 13,172 12,936 15.4 15.1
$100,000 under $200,000 ............. 67,445,248 0.2 0.1 24,239 24,022 118.6
$200,000 under $500,000 .................. 52,053,401 0.1 0.1 68,530 69,814 23.6 23.8$500,000 under $1,000,000 ................ 24,779,821 0.2 0.1 173,419 175,695 25.8 26.0
$1,000,000 or more ............................ . 47,489,182 0.2 0.1 641,284 1 706,716 1 26.3 26.9
See notes following Table 21.
170
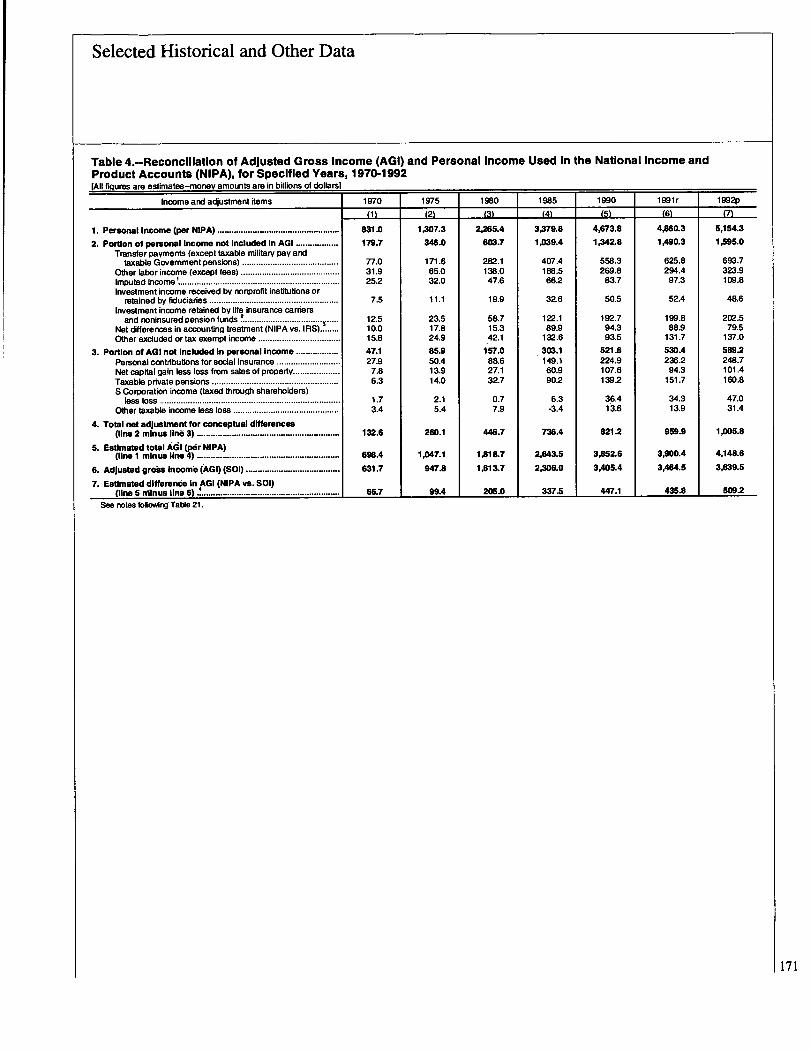
Selected Historical and Other Data
Table 4.-Reconcillation of Adjusted Gross Income (AGI) and Personal Income Used In the National Income andProduct Accounts (NIPA), for Specified Years, 1970-1992[All figures are estimates-moneV amounts are in billions of dollars]
Income ard adjustment items 1970 1975 1980 1985 1990 1991r 19921)
(1) (2) (3) (4) (5) (6) (7)
1. Personal Income (per NIPA) .................................................... 831.0 1,307.3 2,265.4 3,379.8 4,673.8 4A60.3 5,154.3
2. Portion of personal Income not Included In AGI .................. 179.7 346.0 6W.7 1,039.4 1,342.8 1,490.3 11595.0Transfer payments (except taxable military pay arid
taxable Government pensions) ......................................... 77.0 171.6 282.1 407.4 558.3 625.8 693.7Other labor income (except fees) .......................................... 31.9 65.0 138.0 188.5 269.8 294.4 323.9Imputad income ...................................................................... 25.2 32.0 47.6 66.2 83.7 97.3 109.8Investment income received by nonprofit institutions or
retained by fiduciaries ....................................................... 7.5 11.1 19.9 32.6 50.5 52.4 48.6Investment income retained by life insurance carriers
.....and noninsured pension funds 2 ................................. 12.5 23.5 58.7 122.1 192.7 199.8 202.5yNet differences in accounting treatment INIPA vs. IRS)........ 10.0 17.8 15.3 89.9 94.3 88.9 79.5Other excluded or tax exempt income ................................... 15.8 24.9 42.1
"132.6 93.5 131.7 137.0
3. Portion of AGI not Included In personal Income .................. 47.1 85.9 57.01 303.1 S21.6 53DA 589.2Personal contributions for social insurance ........................... 27.9 50.4 88.6 149.1 224.9 236.2 248.7Net capital gain less loss from sales of property.................... 7.8 13.9 27.1 60.9 107.6 94.3 101.4Taxable private pensions ...................................................... 6.3 14.0 32.7 90.2 139.2 151.7 160.8S Corporation income (taxed through shareholders)
less loss ............................................................................. 1.7 2.1 0.7 6.3 36.4 34.3 47.0Other taxable income less loss ............................................. 3.4 5.4 7.9 -3.4 1 3.6 13.9 31.4
4. Total riot adjustment for conceptual differences(line 2 minus line 3) ............................................................. 132.6 260.1 446.7 736.4 821.2 959.9 1,005.8
S. EstimatedtotalAdi(p6eNIPA)(line I minus line 4) ............................................................. 698.4 1,047.1 1,81 &7 2,643.5 3,852.6 3,900.4 4,14&6
6. Adjusted gross Income (AGI) (Sol) ........................................ 631.7 947.8 1,613.7 2,306.0 3,405.4 3,464.6 3,639.5
7. Estimated difference In AGI (NIPA vs. Sol)(line S minus line 6) ~........................................................... 1 66.7 99.4 206.0 337-5 447.1 4W.8 609.2
See notes fallowArgFTable 21.
171
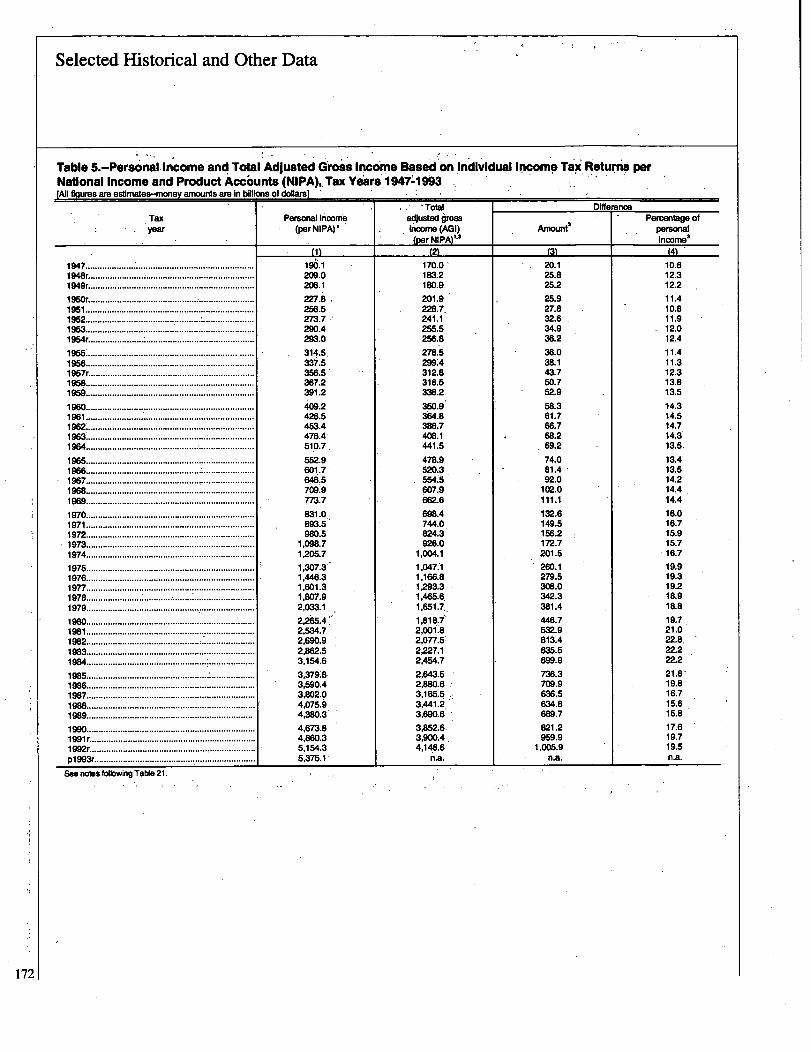
Selected Historical and Other Data
Table S.-Personal Income.and Total Adjusted Gross Income Based on Individual Income Tax Returns per
National Income and Product Accbunts, (NIPA), Tax Years 1947A 993
-.Totw DifferenoeTax POMWM InCORVIS acQusted gmss Percentage ofYew (perNIPA)l income (AGI) Arnoun? personal
(per NIPA)" Incom'(2) (3) (4)
1947......................
196.1 170.0 20.1 10.61948r ...................... ............................................. 209.0 183.2 25.8 12.3194gr .................................................................... 206.1 180.9 25.2 12.2
195or ............................................ ;....................... 227~8 201.9 25.9 11.41951 ................................................ ..................... 256.5 228.7. 27.8 10.8:1952...................................................................... 273.7 241.1 32.6 11.91953...................................................................... 290.4 255.5 34.9 12.01954r ......................* ............................................. 293.0 256.8 36.2 12.4
......................................................................1955 314.5, 278.5 36.0 11.41956...................................................................... 337.5 299.4 38.1 11.31967r .................................................................... 356.5' 312.8 43.7 12.31958...................................................................... 367.2 316.5 50.7 13.81959....................................................................... 391.2 338.2 62.9 13.5
1960...................................................................... 409.2 350.9 58.3 14.31961 ................................................ .................... 426.5 364.8 61 7 14
'6
1962....................................................*** ......... ****"
453.4 386.7 66 7 14.71963....................................................................... 476.4 408.1 68 2 14.31964....................................................................... 510.7, 441.5 69.2 13.5
19615 ..................................................................... 552.9 478.9. 74.0 M4
1966 ...................................................................... 601.7 520.3. 81.4 13.61967 ............. ............................................. 646.5 &5A. 5 - -92.0 14.21968 ...................................................................... 709:9 607.9 102.0 14.41969 ...................................................................... 773.7 662.6 111.1 14.4
1970 ...................................................................... 831.0. 698.4 132.6 16.0
1971 ......................................................................,
893.5 744.0 149.5 16.71972 ...... ............................................................... 980.5 824.3 156.2 15.91973 ........................................... .......................... 1,098.7 M.0 172.7 15.71974 ...................................................................... 1,205.7 1,004.1 201.5 16.7
1975 ...................................................................... 1,307.3 1,047.1 260.1 19.91976 ...................................................................... 1,446.3 1,166.8 279.5 19.31977 ............................................ : ......................... 1.601.3 1,293.3 308.0 19.21978 . .....................
' ..............................................1.807.9 1,465.6 342.3 18.9
1979 ............................................... :~ ..................... 2,033.1,. 1,651.7 381.4 18.8
1980 ...................................................................... 2,2i!lS.4," 1,818'.'7 446.7 19.7,
1981 ...................................................................... 2,534.7 2,001.8 532.9 21.01982 ............................................... ;....................... 2,690.9 2,077.5 613.4 ~22.8,198.3 ...................................................................... 2,862.5 2,227.1 635.5 22.21984 ...................................................................... 3,154.6 2,454.7 699.9 22.2
1985 ....................................................................... 3.379A 2,643.5 736.3 21.8-19N...................................................................... 3,590.4 2,880.6 709.9 19.81987 ...................................................................... 3,802.0 3,165.5 636.5 16.71988...................................................................... 4,075.9 3,"1.2, 634.8 15.61989..................................................................... 4,380.3 3,690.6 689.7 16.8
1990............................................ ......................... 4,673.8 3.852.6 821.2 17.61991 r .......................................... ......................... 4,860.3 3,900.4. 959.9 19.71992r ............................................
I........................ 5,154.3 4.1418.6 1.006.9 19.5
p1993r .................................................................... 5,375.1- na. n.a. n.a.
See notes following Table 21.
1721
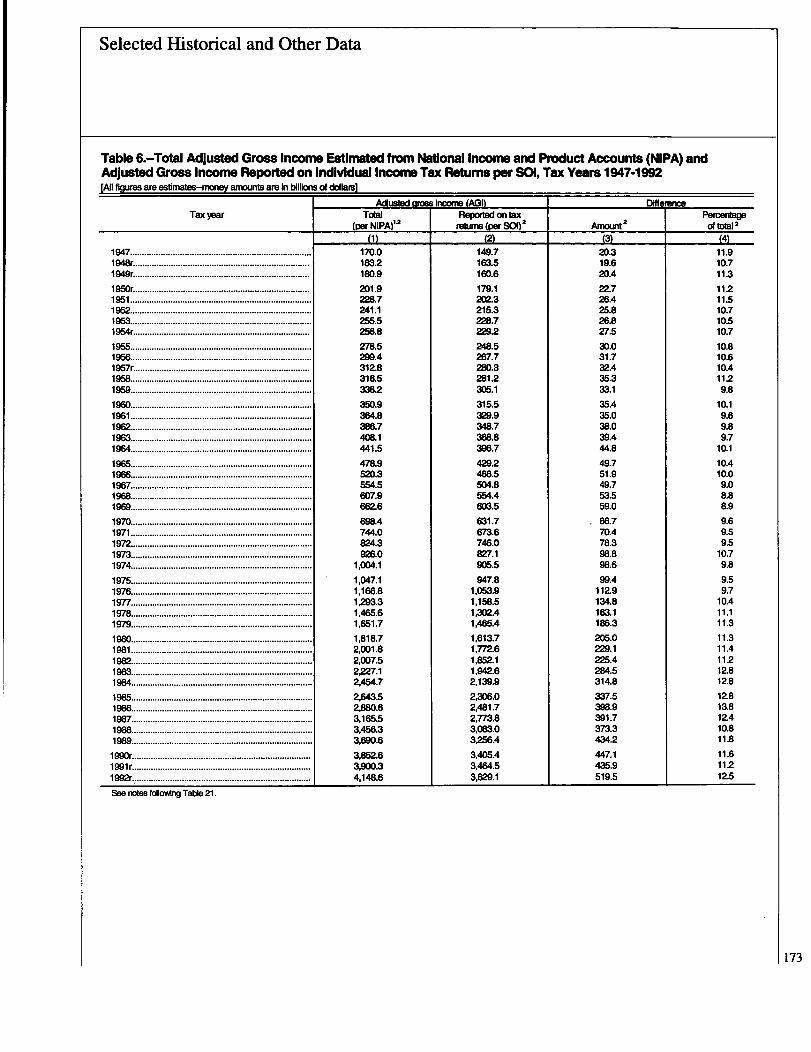
Selected Historical and Other Data
Table 6.-Total Adjusted Gross Income Estimated from National Income and Product Accounts (NIPA) andAdjusted Gross Income Reported on Individual Income Tax Returns per SOI, Tax Years 1947-1992IAJI fioures are estirnates-morm amounts am in billions of dollarsl
AchstWed income (AGI) DifferenceTax year Total Reported on tax PercenbW
(per NIPAV2 MUM (per SC)l) 2 Amount 2 of total 2
(1) (2) (3) (4)1947 .. ......................................................................... 170.0 149.7 2D.3 11.91948r ......................................................................... 183.2 163.5 19.6 10.71949r ......................................................................... 18D.9 160.6 20.4 11.3
1950r ......................................................................... 201.9 179.1 22.7 1121951
........ ***... **'*** .... **'**"*...... ........228.7 202.3 26
*4 11.5
1952......* ....... *'*'**......'**-*****----****-
241.1 215.3 25.8 10.71953
........*** ... "**** * ....255.5 228.7 26.8 10.5
1954r.......................................................................... 256.8 229.2 27.5 10.7
1955 ........................................................................... 278.5 248.5 30.0 10.81956.. ......................................................................... 299.4 267.7 31.7 10.61957r ......................................................................... 312-8 28D.3 32.4 10.41958............................................................................ 316.5 281.2 35.3 1121959............................................................................ 338.2 305.1 33.1 9.8
1960............................................................................ 350.9 315.5 35.4 10.11961 ............................................................................ 364.8 329.9 35.0 9.61962............................................................................ 386.7 348.7 38.0 9.81963............................................................................ 408.1 368.8 39A 9.719CA............................................................................ 441.5 396.7 44.8 10.1
1965............................................................................ 478.9 429.2 49.7 10.41966............................................................................ 52D.3 468.5 51.9 10.01967 ........................................................................... 554.5 504.8 49.7 9.01968............................................................................ 6W.9 554.4 53.5 8.81969............................................................................ 662.6 603.5 59.0 8.9
1970............................................................................ 698.4 631.7 66.7 9.61971 ............................................................................ 744.0 673.6 70.4 9.51972............................................................................ 824.3 746.0 78.3 9.51973............................................................................ 926.0 8Z7.1 98.8 10.71974............................................................................ 1,004.1 905.5 98.6 9.8
1975.................................................................... 1 1,047.1 947.8 99.4 9.51976............................................................................ 1,166.8 1,053.9 112.9 9.71977............................................................................ 1,293.3 1,158.5 134.8 10.41978............................................................................ 1,465.6 1,302.4 163.1 11.11979............................................................................ 1,651.7 1,465A 186.3 11.3
1980............................................................................ 1,818.7 1,613.7 205.0 11.31981 ............................................................................ 2,001.8 1,772.6 229.1 11.41982............................................................................ Z007.5 1,852.1 225.4 1121983............................................................................ 2,227.1 1,942.6 284.5 12.81984............................................................................ Z454.7 2,139.9 314.8 M8
1985 ............................................................................ 2,643.5 2,306.0 337.5 12.81986 ............................................................................ 2,880.6 Z481.7 398.9 13.81987 ............................................................................ 3,165.5 Z773.8 391.7 12.41988 ............................................................................ 3,456.3 3,083.0 373.3 10.81989 ............................................................................ 3,690.6 3,256.4 434.2 11.8
1990r .......................................................................... 3,852.6 3,405.4 447.1 11.61991 r........................................................................... 3,900.3 3,464.5 435.9 1121992r............................................................................ . 4,148.6 3,629.1 519.5 12.5
See noW foUaMV Table 21.
173

Selected Historical and Other Data
Table 7.-Standard, Itemized, and Total Deductions Reported on-individual Income Tax Returns, Tax Years 1944-1992[All figures are estimates based on samples-number of returns are in millions; money amounts are in billions of dollars]
Standard deduction Itemized deductions Total deductionsTax Total number Number Number As a percentageyear of returns Of Arnounf Of Amount' Amount 4 of adjusted gross,
returne returns' income (AG111(2) (3) (4) (5) (6) (7)
1944 ................................... 47.1 38.7 8.0 8.4 4.8 12.8 11.0
1945.:................................. 49.9 41.5 8.1 8.5 5.5 13.6 11.31946................................... 52.8 44.1 8.9 8.8 6.3 15.2 11.31947 ................................... 55.1 44
*7 9.8 10.4 7.8 17.6 11.8
1948................................... 52.1
43.2 11.5 8.8 7.9 19.4 11.91949................................... 51.8 42.1 11.1 9.7 8.8 19.9 12.4
1950................................... 53.1 42.7 12.0 10.3 9.9 21.9 12.21951 ................................... 55.4 43.9 13.3 11.6 11.9 25.2 12.51952................................... 56.5 43.7 13.7 12.8 13.6 27.3 12.71953................................... 57.8 43.4 14.2 14.4 15.6 29.8 13.01954................................... 56.7 41.0 13.3 15.7 17.4 30.7 13.4
1955......................... 58.3 41.4 13,6 16.9 20.0 33.6 13.57
1956 ................................... 59.2 40.7 13.8 18.5 22.6 36.4 13.61957 ................................... 59.8 39.7 13.8 20.2 25.7 39.5 14.11958
**...... ****"'*"* ---*59.1 38.3 13.2 20.8 27.5 40.7 14.5
1959 ................................... 60.3 37.8 13.4 22.5 32.0 45.4 14.9
1960 ................................... 61.0 36.9 13.1 24.1 35.3 48.4 15.31961
....... -*********--61.5 36.2 12.9 25.3 38.4 51.3 15.6
1962...... * ...*
62.7 36.3 13.1 26.5 41.7 54.8 15.71963
.........63.9 35.8 13.1 28.2 46.1 59.2 16.1
1964
......
65.4 38.5 20.2 26.9 46.8 67.0 16.9
1965.. 67.6 39.7 20.6 27.9 50.7 71.4 16.6
1966.**'****70.2 41.6 21.8 28.6 54.6 76.4 16.3
1967.-- 71.7 41.9 22.1 29.8 59.6 81.7 16.21968. 73.7 41.7 22.1 32.0 69.2 91.3 16.51969. 75.8 40.9 21.6 34.9 80.2 101.8 16.9
1970 74.3 38.8 32.4 35.4 88.2 120.6 19.11971. 74.6 43.9 48.1 30.7. 91.9 139.9 20.8
1972.***----*....77.6 50.6 69.8 27.0 96.7 166.4 22.3
1973.*... * * ....... *...
80.7 .52.6 73.6 28.0 107.0 180.6 21.81974................................... 83.3 53.8 76.1 29.6 119.4 195.5 21.6
1976.................................... 82.2 56.1 100.9 26.1 122.3 233.2 24.61976................................... 84.7 58.7 113.8 26.0 133.9 247.6 23.51977................................... 86.6 63.7 137.7 22.9 138.5 276.2 23.81978................................... 89.8 64.0 139.8 25.8 164.4 304.3 23.41979.................................... 92.7 66.2 148.8 26.5 184.2 333.0 22.7
1980.......................... ......... 93.9 65.0 146.0 29.0 218.0 346.0 21.41981 ................................... 95.4 63.8 144.7 31.6 256.4 401.2 22.61982 95.3 61.9 140.2 33.4 284.5 425.2 23.01983
......96.3 61.1 138.5 35.2 309.6 448.7 23.1
1984 : ............................ 99.4 61.2 139.5 38.2 358.9 499.6 23.3
1985 ................................... 101.7 61.8 145.0 39.8 405.0 554.7 24.11986 ................................... 103.3 62.4 151.0 40.7 447.1 611.3 24.61987 ................................... 107.0 7-1.4 215.2 35.6 392.0 607.2 21.91988 ................................... 109.7 .76.5 289.6 31.9 395.2 686.0 22.31989 ................................... 112.1 79.3 309.4 32.0 431.0 740.4 22.7
1990 ................................... 113.7 80.6 331.5 32.2 458.5 789.9 23.21991 ................................... 114.7 81.3 351.1 32.5 497.7 818.8 23.61992r ................................. 113.6 80.1 366.5 32.5 1 481.9 848.5 23.4
See notes following Table 21.
174
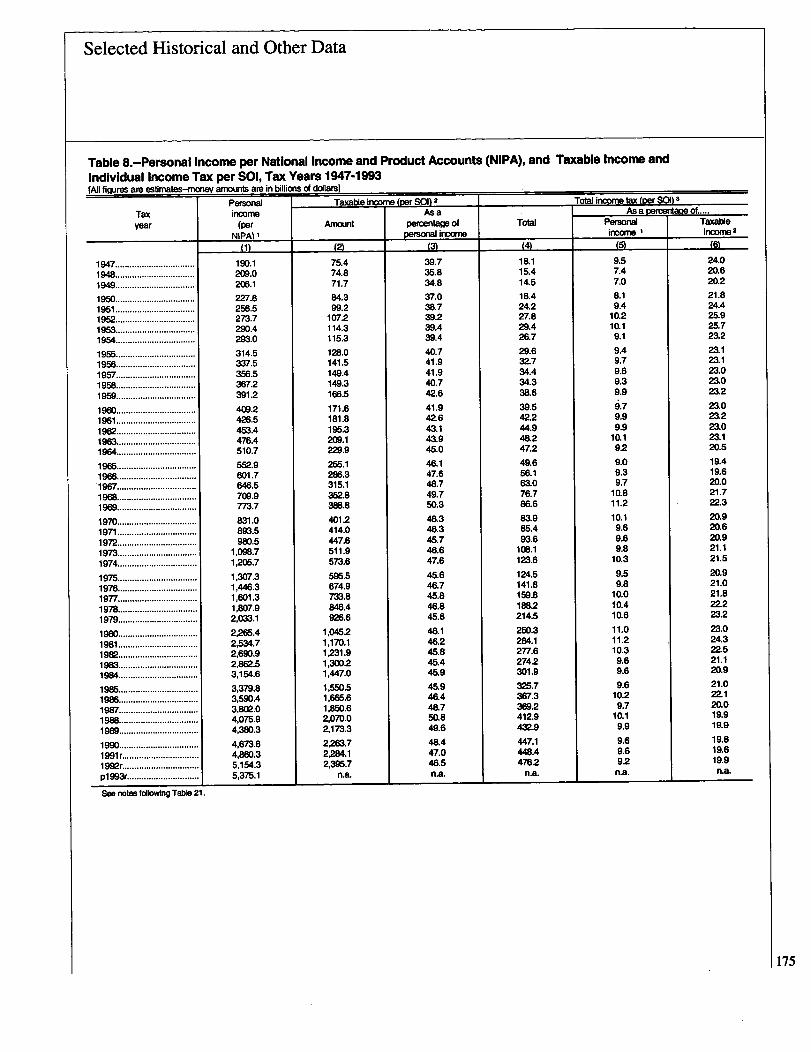
Selected Historical and Other Data
Table 8.-Personal Income per National Income and Product Accounts (NIPA), and Taxable Income andIndividual Income Tax per SOI, Tax Years 1947-1993[AM fiqkjres are estimates-rn arnounts are in billions of dollars]
Personal Taxable i (per Sol) 2 Total i
I
ncorne tax (per S003
Tax inoorne Asa As a De ane of
year (per Aniount ipercentage of Total Personal Tambi
NIPA) personal income income inoorne
(1) (2) (3) (4) (5) (6)
1947 ................................ 19D.1 75.4 39*7 111111 9
'5 24.0
1948 ................................ 209.0 74.8 35.8 15.4 7.4 20.6
1949 ................................. 206.1 71.7 34.8 14.5 7.0 20.2
1950 ................................. 227.8 84.3 37.0 18.4 8.1 21.8
1951 ................................. 256.5 99.2 38.7 24.2 9.4 24.4
1952 ................................ 273.7 107.2 39.2 27.8 10.2 25.9
1953 ................................. 290.4 114.3 39'4 29.4 10.1 25.7
1954 ................................. 293.0 115.3 39.4 26.7 9.1 23.2
1955 ................................. 314.5 12B.0 40.7 29.6 9.4 23.1
1956................................. 337.5 141.5 41.9 32.7 9.7 23.1
1957................................. 356.5 149.4 41.9 34.4 9.6 23.0
1958................................. 367.2 149.3 40.7 34.3 9.3 23.0
1959................................. 391.2 166.5 42.6 38.6 9.9 23.2
1960................................. 409.2 171.6 41.9 39.5 i.7 23.0
1961 ................................. 426.5 181.8 42.6 42.2 9.9 23.2
1962................................. 453.4 195.3 43.1 44.9 9.9 23.0
1963 ................................. 476.4 209.1 43.9 48.2 10.1 23.1
1964 ................................. 510.7 229.9 45.0 47.2 92 20.5
1965 ................................. 552.9 255.1 46.1 49.6 9.0 19.4
1966 ................................. 601.7 286.3 47.6 56.1 9.3 19.6
1967 ................................. 646.5 315.1 48.7 63.0 9.7 20.0
1968 ................................. 709.9 352.8 49.7 76.7 10.8 21.7
1969 ................................. 773.7 388.8 50.3 86.6 11.2 223
1970................................. 831.0 4012 48.3 83.9 10.1 20.9
1971 ................................. 893.5 414.0 46.3 85.4 9.6 20.6
1972................................. 980.5 447.6 45.7 93.6 9.6 20.9
1973................................. 1,098.7 511.9 46.6 108.1 9.8 21.1
1974................................. 1,205.7 573.6 47.6 123.6 10.3 21.5
1975................................. 1,W7.3 595.5 45.6 124.5 9.5 20.9
1976................................. 1,446.3 674.9 46.7 141.8 9.8 21.0
1977 ................................. 1,601.3 733.8 45.8 159.8 10.0 21.8
1978 ................................. 1,807.9 846.4 46.8 188.2 10.4 22.2
1979 ................................. 2,033.1 925.6 45.6 214.5 10.6 23.2
1980 ................................. 2,265.4 1,045.2 46,11 250.3 11.0 23.0
1981 ................................ 2,534.7 1,170.1 46.2 284.1 11.2 24.3.
1982 ................................. 2,690.9 1,231.9 45.8 277.6 10.3 22.5
1983................................. 2,862.5 1,3002 45.4 274.2 9.6 21.1
1984................................. 3,154.6 1,447.0 45.9 301.9 9.6 20.9
1986................................. 3,379.8 1,550.5 45.9 325.7 9.6 21.0
1986................................. 3,590.4 1,665.6 46.4 367.3 10.2 221
`19EW................................. 3,802.0 1,850.6 48,7 369.2 9.7 20.0
1988................................. 4,075.9 2,070.0 50.8 412.9 10.1 19.9
1989................................. 4,380.3 2,173.3 49.6 432.9 9.9 19.9
1990 ... ...................... 4,673.8 2,263.7 48.4 447.1 9.6 19.8....... .
1991r . .............................. 4,860.3 2,284.1 47.0 448.4 9.6 19.6.
1992r................................ 5,154.3 2,395.7 46.5 476.2 92 19.9
p1l 993r.............................. 5,375.1 n.a. n.a. n.a. n.a. n.a.
Sea notes following Table 2 .
175
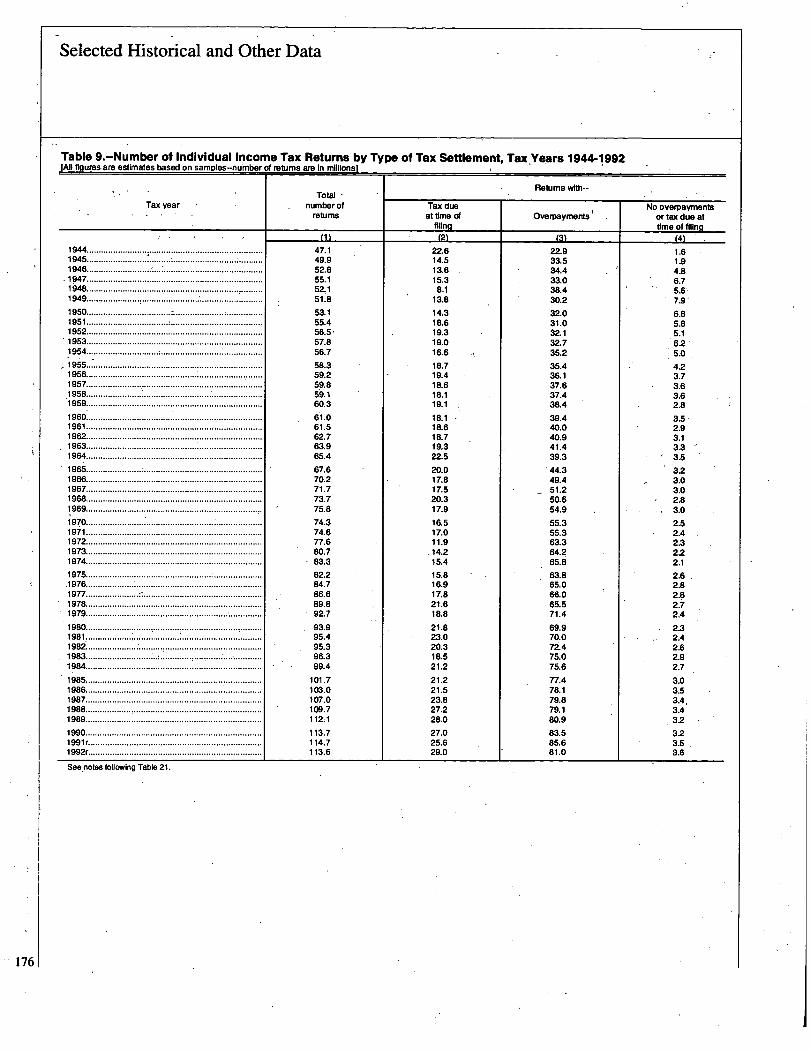
Selected Historical and Other Data
Table 9.-Number of Individual Income Tax Returns by Type of Tax Settlement, Tax.Years 1944-1992[All figures are estimates based on samples-nurnber of returns are in millionsi
Tax vear
1944......................... t ...:................................194 ......................... : ......... i ...........................5 ..........1946........................... :...: .........................................
.1947......................................................
1951 .................................. ......................................1952 .........................................................................1953 .........................................................................
1954..'****-**-**............. : ..........................................
1960 ......................................
1961 .........................................................................
1962 .............................................. :-- -- **"*'*'*1963 .........................................................................
1964 .........................................................................
1965 ....................... ; .................................................1966.........................................................................
1967 .........................................................................
1968 .........................................................................
1970..................................................... :...................
1976.........................................................................1977...................... : ..................................................
1978.........................................................................1979................................................... ......................
1980..*.......................................................................1981 ..........................................................................
1982.........................................................................1983.............................. :.~ I .................. .. ..............
1987.........................................................................1988.........................................................................1989.........................................................................
1990.........................................................................1991 r .......................................................................1992r ...................................... ;................................
Total ..number of
returns
- 1"47 149 952.855.152.151.8
53.155.456.5-57.856.7
58.359.259.859.160.3
61.061.562.763.965.4
67.670.271.773.775.8
74.374.677.680.783.3
82.284.786.689.892.7
93.995.495.396.399.4
101.7103.0107.0109.7112A
113.7114.7.113.6
Tax dueat time of
filinaM
22.614.513.615.38.1
13.8
14
*3
18.619.319.016.6
1117
19.418.6
18*119.1
18.118.618.719.322.5
20.0-17.817.520.317.9
16.517.011.9
.14.215.4
15.816.917.821.618.8
21.823.020.318.521.2
21.221.523.827.228.0
27.025.629.0
Returns with--
Overpayments'
-M
22.933.534.433.038.430.232.031.032.132.735.235.436.137.637
'4
38.439.440.040.941.439.344.349.451.250.654.955.355.363.364.265.863.865.066.065.571.4
69.970.072.475.075.677.478.179.879.160.983.585.681.0
No overpavmentsor tax due attime of filing
(4)
1-61.94.86.75.67.916.85.8
.5.162'5.0423.73.63.62.8
3.52.93.13.33.5323.03.02.83.0
2.52A2.32.22.12.62.82.8272.42.32A2.62.92.73.03.53.4,3.432323.53.6
Seenotas following Table 21.
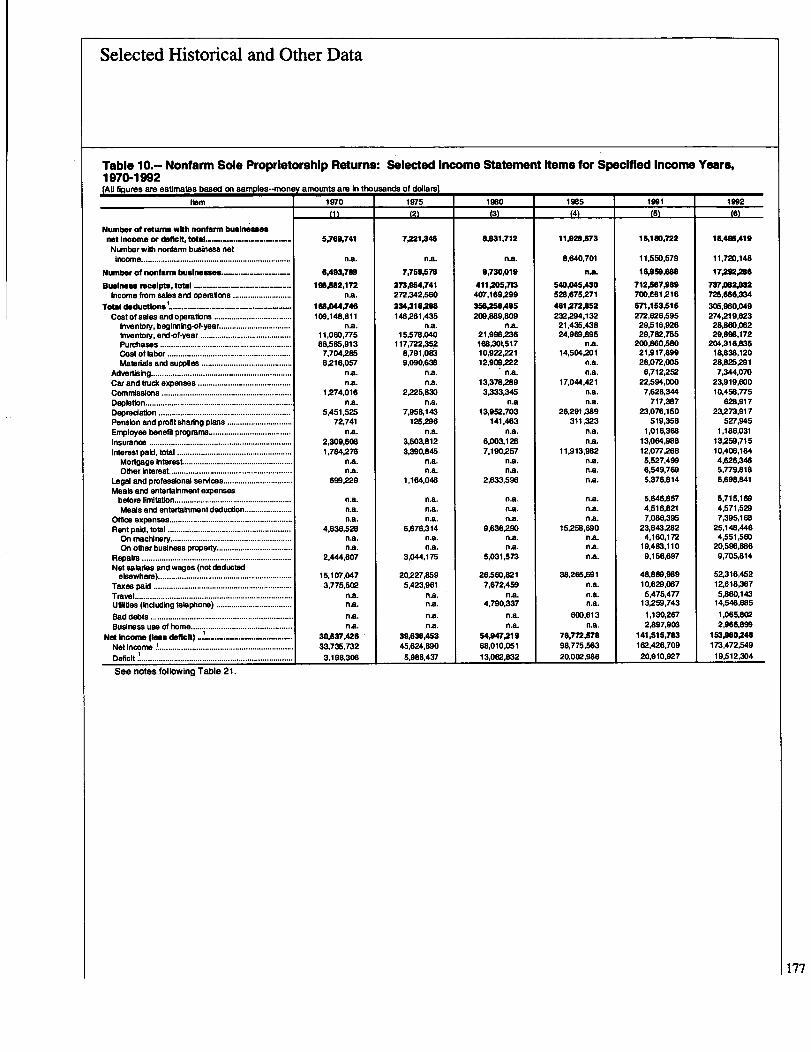
Selected Historical and Other Data
Table 10.-- Nonfarm Sole Proprietorship Returns: Selected Income Statement Items for Specified Income Years,1970-1992tAll tQUr6S are estimates DaS80 On Samples-Mon amounts_are in mo usanos Or aouaral
item 1970 1975 1980 1985 1991 1992
(1) (2) (3) (4) (5) 16)
Number of relturns, with nonfarm businessesnet Income or deficit, total............................ 5,769,741 7,221,346 8,931,712 11.9211.573 1rh180,722 15,495,419Number with nonfarm business notincome..................................................................... na. na. na. 8,640,701 11,550,579 11,720,148
Number of nonfarm businesses....................... 6A93,799 7,759,676 9,730,019 nA. 16eseAse 17,292,2116
Businew receipts, total ................................ 196,582,172 273,954,741 411,205,713 540,045A30 712,587,989 737,082,032Income from sales and operations ........................... n.a. 272,342,560 07,169,299 528,675.271 700,681 ~21 6 725,666,334
Total deductions ~ ....................................... 166,044,746 234,318,288 356,258,495 461,272,852 571.153,515 305,960,049Cost of sales and operations .................................... 109,148,811 146A1,435 209,889,809 232,294,132 272,626,595 274,219,623
inventory, beginning-of-year................................. na. n.a. na. 21,435,438 29.516,926 28,860,062Inventory, end-of-year .......................................... 11,080.775 15,578,040 21,998.236 24,969,895 29,782,755 29,898,172Purchases ............................................................. 88,585.913 117,722,352 168,301,517 na. 200,860,580 204,316,835Cost of labor ......................................................... 7,704.285 8,791,08~ 10,922.221 14,504,201 21,917,899 18,838,120Materials arid supplies .......................................... 6,216,057 9,090,638 12.909,222 n.a. 28.072,WS 28,825291
Advertising................................................................. na. n.a. na. n.a. 6,712,252 7,344,070
Car and truck expenses ........................................... n.a.n.a.
13,378289 17,044,421 22,594,000 23,919,600Commissions ............................................................ 1,274
.016 2,225,830 3=.345 n.a. 7,628,344 10,456,775
Depletion .................................................................... na. n.a. na n.a. 717,387 628.91 7Depreciation ............................................................. 5,451,525 7,958,143 13,952,703 26,291,389 23,076,150 23.273,917Pension and profit sharing plans .............................. 72.741 125296 141,463 311,323 519,358 527,945
Employee benefit programs ...................................... n.a. na. na. n.a. 1,016,368 1,186,031Insurance .................................................................. 2,309,608 3,503,812 6,003,126 na. 13,064,988 13,259,715
Interest paid, total ..................................................... 1,784,276 3,390,845 7.190,257 11,913.982 12.077,268 10,406,164Mortgage Interest.................................................. na. n.a. na. na. 5,527,499 4.626,346Other Interest ......................................................... na. n.a. na. n.a. 6,549,769 5.779.818
Legal and professional services ................................ 699,229 1,164,048 2,633,596 na. 5,376.814 5,698,841
Meals and entertainment expensesbefore limitation...................................................... na. n.a. n.a. na. 5.646,867 S.715,169
Meals and entertainment deduction ...................... na. na. na. na. 4,516,821 4,571,529
Office expenses......................................................... na. n.a. n.a. nA. 7,086,395 7,395,168
Rent paid, total ......................................................... 4,636,528 6.678,314 9,636,290 15,258,690 23,643,282 25,148,448
On machinery........................................................ na. n.a. nA. n.a. 4,160.172 4,551,660
On other business property ................................... na. n.a. n.a. n.a. 19,483,110 20,596,886
Repairs ..................................................................... 2.444,
61Y7 3.044,
175 5,031,573 n.a. 9,158,697 9,705,814
Net salaries and wages (not deductedelsewhere) .............................................................. 15,107,047 20,227,859 26,560,821 38,265,691 48,889,989 52,316,452
Taxes paid ................................................................ 3,775,502 5,423,961 7,672,459 na. 10,629,067 12,618,367
Travel......................................................................... n.a. n.a. na. n.a. 5,475,477 5,860,143Utilities (including telephone) ................................... na. n.a. 4,790,337 n.a. 13,259,743 14,546,685
Bad debts .................................................................. na. n.a. na. 60D,613 1,130,297 1,065.802
Business use of home............................................... na. n.a. n.a. na. 2,897,903 21966,899
Not Income (Was deficit) -1............................ 30,537,426 39,63GA53 S4,947X 9 78,772,578 141,515,783 153,960.246
Not Income 1 .............................................................. 33,735,732 45,624,890 68,010.051 98,775,563 162,426,709 173,472,549
Deficit .. ...................................................................... 3,198,306 5,988,437 13,062,832 20,002,986 20,910,927 19,512,304
See notes following Table 21.
177
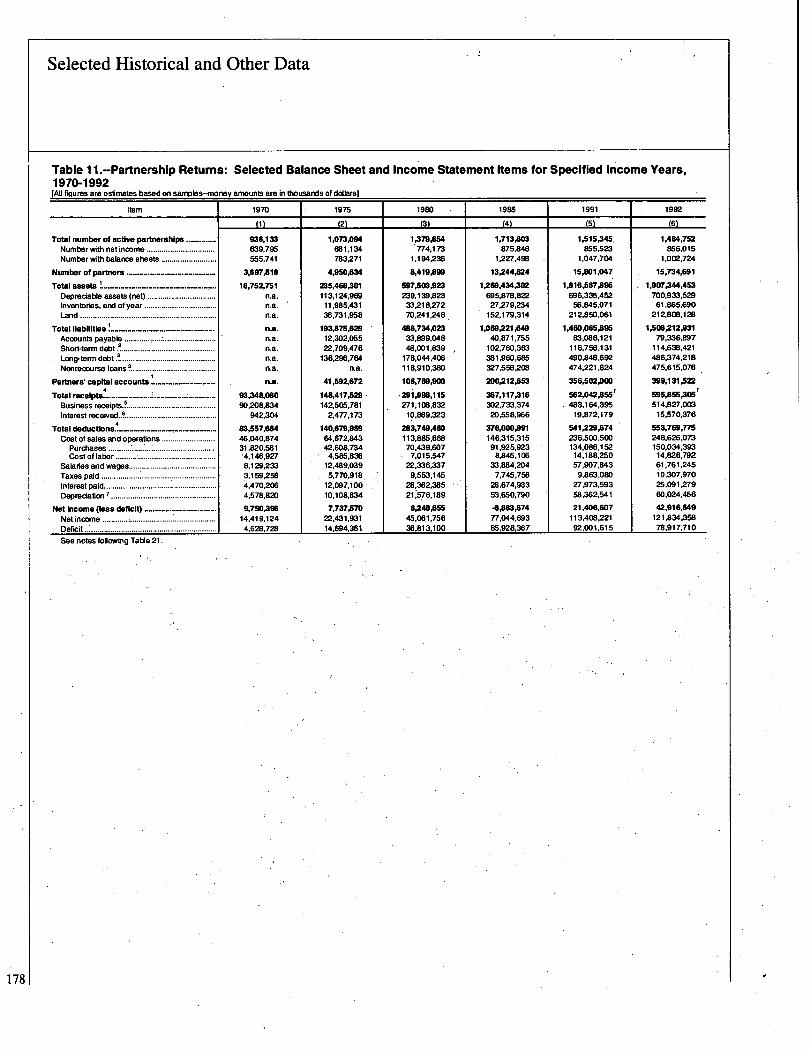
Selected Historical and Other Data
Table I l.-Partnership Returns: Selected Balance Sheet and Income Statement Items for Specified Income Years,1970-1992[AU figures are estimates based on samples-morkey amounts are In thousands of dollars]
Item 1970 1975 1980 1985 1991 1992
(1) (2) (3) (4) (5) (6)
Total number of active partnerships 936,133 1,073dM 1,379AM 1,713,603 1,515,345. 1,484,752Number with not inoDme ................................ 639,795 681,134 774,173 875.846 855,523 856,015Number with balance sheets .......................... 555,741 783,271 1,194.236 1,227,498 1,047,704 1,002,724
Number of partners -------------------------- 3,697,818 4,950,634 8,419,899 13,244,824 15,801,047 15,734,691
Total assets 1 .........; ------------------------ 16,752,751 235,468,301 597,503,923 1.269A34,302 1,816,567,895 1,907,344AS3Depreciable assets (not) ................................ n.a. 113,124,969 239,139,823 695,878,822 696,335,452 700,933,529Inventories, and of year .................................. n.a. 11,985,431 33,218,272 Z7,279,234 56,845,071 61,865,690Land ................................................................ n.a. 36,731,958 70,241,248 152,179,314 212,850,061 212,808.128
Total liabilities! ------------------------------ n.a. 193,875,629 488,734= 1,069,221 1,460,066,895 11,S08,2112,931Accounts payable ............................................ n.a. 12,302,055 33.899,048 40,871,755 63,086,121 79,336,897Short-term debt 2.............................................. n.a. 22,709,476 48,001,839 102,760,363 116.756,131 114,638,421Long-term debt ............................................... n.a. 136,296,764 178.0",406 381,960,685 490,848,692 486,374,218
NonreoDurse loans 1 ................... ................... n.a. n.a. 11 8.910,38D 327,558,208 474,221,624 475,615,076
Partners' capita I accounts ------------------- n.a. 41,592,672 1108,769~M 200,212,653 356,502,000 399,131,522elptS4 7Total rec ------------------------- ;........ 93,348,080 148,417rS29 367,117,316
r562,042,855595,855,305r
Business receipts............................................ 9D,208,834 142,505,781 271,108,832, 302,733,374 483,164,395 514,8Z7,003Interest recelved.~ ........................................... 942,304 2.477,173 10.869,323 20,558,966 19.872,179 15,570,376
4Total deductions ------------------------------ 83,557,684 140,679,959 283,749,460 376,OOD,991 541,229,674 553,769,775
Cost of sales and operations ......................... 46,040,874 64,672,843 113,885,668 146,315,315 236,500,500 248,626,073Purchases ...........* ........ :............................. 31,820,5131 42,608,734 70,439,607 91,925,923 134,086,152 150,034,393Cost of labor ............................................... -4,146,927 4,585,SW 7.015,647 8,845,106 14,188,250 14,826,792
Salaries and wages ......................................... 8,129,233 12,489,039 22.336,337 33,884,2D4 57,907,843 61,761,245Taxes paid .......................... . .......................... 3,159,258 5.770,918
~9.553.M 7,745,756 9,863.08D i0,307,970
Interest paid ..................................................... 4,470,206 12,097,lob ~ 28,362,386 2B,674,933 27,973,593 25,091,279Depreciation 7 ................................................ 4,578,820 10,108,834 21,576,189 53,650,790 68,362,541 60,024,456
Net Income (loss deficit)------------------
9,790,396 7,737,570 8,2 48,655 -8,883,674 21,406,607 42,916,649
Net income ............ ;........................................ 14,419,124 1,931 45,061,756 77,044,693 113,408,221 121,834.358Deficit ..............................................................
7284,628, 14:..4,361 36,813,100 85,928,367 92,001,615 78,917,710
See notes following Table 21.
178
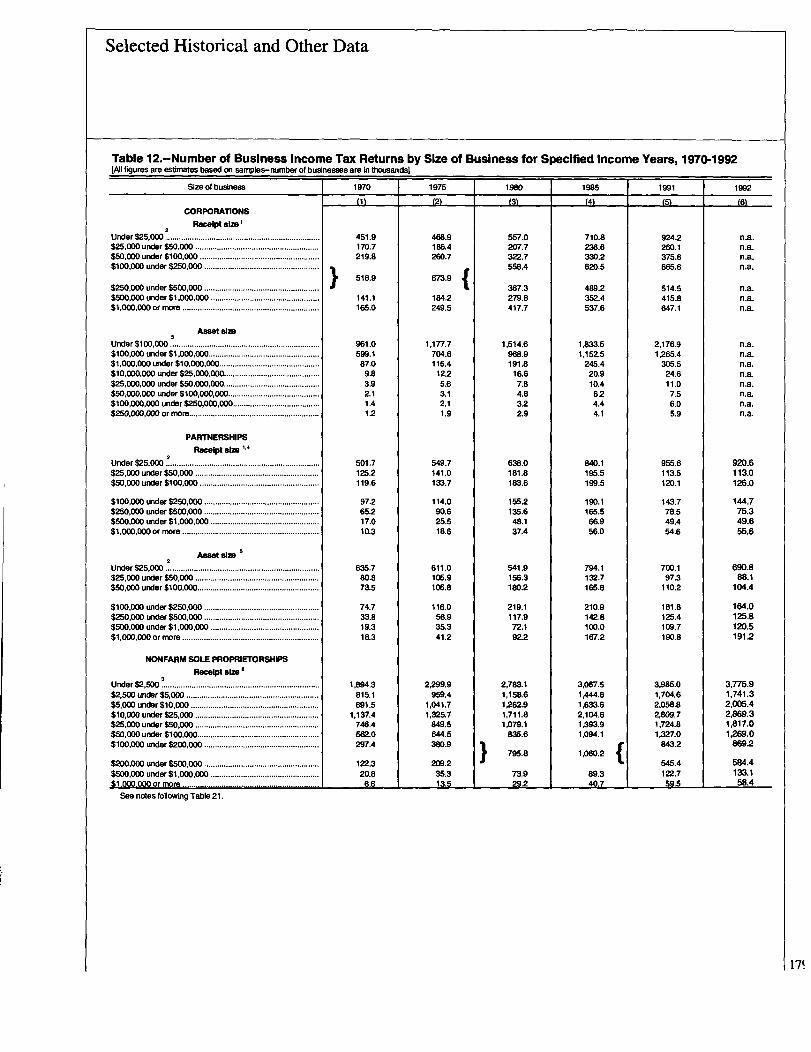
Selected Historical and Other Data
Table 12.-Number of Business Income Tax Returns by Size of Business for Specified Income Years, 1970-1992[All figures are estinates based on samples-number of businesses are in t1vusands]
Sze of business 1970 1975 1980 1985 1991 1992
(1) (2) (3) (4) (5) (6)CORPORATIONS
2Receipt size'
Under$25,000 ....................................................................... 451.9 468.9 557.0 710.8 924.2 n.a.$25 000 under $50,000 ......................................................... 170.7 186.4 207.7 236.6 260.1 n.a.$50: 000 under
$100,ODO ....................................................... 219.8 260.7 322.7 330.2 375.6 n.a.$100,000 under $250,000 .....................................................
516.9 673.9
558A 620,5 665,6 n.a,
$250,000 under$5W,000 ..................................................... 367.3 469.2 514.5 n.a.$500,000 under $1,000,ODO .................................................. 141.1 184.2 279.8 352.4 415.8 n a,$1,000,000 or more ............................................................... 165.0 249.5 417.7 537.6 647.1 n.a.
Asset aim3
Under $100,000 ..................................................................... 961.0 1,177.7 1,514.6 1,833.5 2,176.9 n.a.$100,000 under $1,00D,000 ................................................... 599.1 704.6 968.9 1,152.5 1,265.4 n.a.$1,000,000 under $10,000,000 .............................................. 87.0 116.4 191.8 245.4 305.5 n.a.$10,ODO,OOD under $25,000,000............................................ 9.8 122 16.6 20.9 24.6 na.$25,ODO,000 under $50,ODO,000............................................ 3.9 5.6 7.8 10.4 11.0 n.a.$5D,000,000 under $100,000,000.......................................... 2.1 3A 4.8 62 7.5 n.a.$100,000,000 under $250,000,ODD ........................................ 1 A 2.1 32 4A 6.0 n.a.$250,000,000 or rnore............................................................ 1.2 1.9 2.9 4.1 5.9 n.a.
PARTNERSHIPS
Receipt aim 1.42
Under $25,000
....................................................................... 501.7 549.7 638.0 840.1 955.6 920.6$25,000 under $50,000 ......................................................... 125.2 141.0 181.8 195.5 113.5 113.0$50,0D0 under $100,000 ....................................................... 119.6 133.7 183.6 199.5 12D.1 126.0
$100,000 under $250,000 ..................................................... 97.2 114.0 155.2 190.1 143.7 144.7$250,000 under $5W,000 ..................................................... 65.2 90.6 135.6 165.5 78.5 75.3$500,000 under $1,000,ODO .................................................. 17.0 25.5 48.1 66.9 49.4 49.6$1,000,0W or more ............................................................... 10.3 18.6 37.4 56.0 54.6 55.6
Asset size2
Under$25.000
....................................................................... 635.7 611.0 541.9 794.1 700.1 690.8$25,000 under $50,000 ......................................................... 80.8 105.9 156.3 132.7 97.3 88.1$50,000 under $100,000........................................................ 73.5 106.8 180.2 165.8 110.2 104.4
$100,000 under $250,000 ..................................................... 74.7 116.0 219.1 210.9 181.8 164.0$250,000 underMADO ..................................................... 33.8 56.9 117.9 142.8 125.4 125.8$500,001) under $1,000,ODO .................................................. 19.3 35.3 72.1 100.0 109.7 120.5$i,OOD,ODO or more ............................................................... 1113 41.2 922 167.2 190.8 1912
NONFARM SOLE PROPRIETORSHIPS
Receipt size3
Under $2'500
.... ....................................................................
1,894.3 2,299.9 2,783.1 3,067.5 3,985.0 3,775.9$2,500 wxW $5,000 ............................................................. 815.1 959.4 1,158.6 1,444.6 1,704.6 1,741.3
$5,000 under $10,000 ........................................................... 891.5 1,041.7 1,262.9 1,633.6 2,058.8 2,005.4$10,0DO under $25,000 ......................................................... 1,137.4 1,325.7 1,71 1.8 2,104.6 2,809.7 2,869.3
$25,ODO under $50,00D ......................................................... 746.4 849.5 1.079.1 1,393.9 1,724.8 1,817.0
$50,ODO under $100,000........................................................ 562.0 644.5 835.6 1,094.1 1,327.0 1 ~M.o$100,000 under $200,000 ..................................................... 297.4 38D.9 843.2 8692
795.8 1,060.2$200,OOD under $500,ODO ..................................................... 122.3 209.2 545.4 584.4
$500,000 under $1,000,ODO .................................................. 20.8 35.3 73.9 89.3 122.7 133.1$1.00Q.0Q0 or more ............................................................... 1 6.6 1 13.5 29.2 40.7 59.5 58.4
See notes following Table 21.
IT

Selected Historical and Other Data
Table U.-Corporation Income Tax Returns: Balance Sheet, Income Statement an.d Tax.Items for SpedfiedIncome Years, 1970-1992[AJI f1pres are estimates baud on samples - money amounts am In Vaisands of dDilars)
Itern 1 19710 1975 im 19w, 1991, IN2~F
(3) (4) (5) (6)Number of returns, 1,666,477 2.023,847 2,710,538 31M.219 3,11102,7811 3,SK004Number with not Income -................................... 1,W8.337 1,226,208 1,596,632 1,820,120 1.942,450 2,08Z751Consolidated return&M! ...................................... 19,671 38,307 UAW 79,598 69,120 : 68,637S Corporation retums.!~~! ...................................... 257,475 358,413 545.369 724749 1,698,271 1,784,660DISC rstums.!~~ .................................................. N/A 6,431 8,665 1:383 (1)FSC ................................................... WA WA NIA 2,341 (1)
Total -2,04~706,564 4,MSK273 7,817^403 12,MANAM 119j=,150110M lqjimm~wcash .................................................................... 176,924,573 2D0,426,439 528,914,747 683,204,264 786,735.219 806,229,038Notes and accounts receivable ............................ 614,667,367 1,051,542,806 .1,984,601,790 3,317,635,191 4,191,331,906 4,136,564,537
Less: Allowance for bad debts .......................... 20.03D.327 31,032,998 5D,057,3CY7 61,58D,335 114,576,136 118,901,561Inventod s~............... : ............................................ 190,401,642 317,716,545 534,SDS,547 714,722,928 883,913,179 91 5,049,920Inves=% In Government obligations! .............. 106,222,911 176,955,397 265,542,521 916,560,098 1,068,564,351 1,250,487,147Tax-exempt securities!............................ ............ 9D.402,479 139,176,302 206,517,216 469,245,167 612,453,685Other current assets ............................................. 73,058,482 145,101,716 310,177,160 M,136,396 1,133,425,425 1,313,714,114Loans to stockholders .......................................... 4,774,062 9,355.636 29,873= 56,761,232 1 84,545,262 68,001,676Mortgage and real estate loan& ............................ 327,593,364 648054,483 894,323,469 1,258,672,577 1,529,474,897 1,565
'503,059
Other Investments ...... ;........................................ 401,389,022 626.266,074 1,213,986,210 'Z413,551,474 4,749,=,622 4,954,BD6,660Depreciable assets ............................................... 868,906,018 1,276,564,5DO 2,107,027,914 3,174,193,649 4,549,055,093 4,752.133,709. Less: Accumulated depreciation ....................... 334,646,086 483,798,526 767,841,763 1,232,072,530 1,999,540,977 Z129,372,684'Depletable assets ................................................ 18.517.M 38,511,396 71,901,490 112,339,389 141,758,337 131,947,179
Less: Accumulated depletion............................ 6,774,796 19,569,556 37,203.920 61,141,8ffi 60,367,881Land .................................................................... 46.6M,157 66,819= 92,931,935 141,4411~357 215,498,441 220,985,859Intangible assets (amortizable) ............................ 12,818,168 12,823,183 45,480.694 145,290,625 489,782,490 527,994,244
Less: Accumulated amortization ....................... 5,954,184. 4,491,990 18,393,037 42,605,240 110,369,202 124,Z72,125Other assets ..............I.. ............................................ 69,838,438 121,065,665 187,015,106 582,949,738 1,021,984,633 1,145,347,359
Total 2,M7W6N 4,2K556= j2,M,0".W jq~=,ga" 10M=Mis,Accounts payable t .......................................... ... 148,812,597 263,417,584 542,172,368 891,571,443 1,680,717,102 1,600,238,732Mortgages, notes,.and bonds payable In
less than 1 year ............................................... 170,884,261 27Z123,651 504,80Z2S8 1,001,337,795 1,500,043,192 1,557,858,628Other current liabilities ......................................... 892,218,397 1,577,425,991 Z706,796,360 4,234,983,432 '4,866,974,743. 5,215,150,534Loans from stockholders ...................................... 24,573,814 38,143,938 85,718,510 174,317,253 306,729.880 306,318,324Mortgages, notes, and bonds payable in
1 year or more ................................................. 362,700,303 586,703,526 986,663,932 1,699,272,481 2,697,909,300 2,740,489,823Other liabilities .......................................... ;.......... 283,106,029 451,676,880 846,696,691 1,467,912,913 2,710,749,072 Z857,140,545Capital stock 201,213,719 251,715,862 417,M783 920,182,882 1,740,894,708 1,880,264,707Paid-in or capital 196,642,421 M,534,854 M,039,407 1,420,996,805 3,257,218,951 3,665,208,313Retained earnings, appropriated .......................... 16,657,051 29,955,676 41,461,644 54,074,364 74,926,536 79,384,709Retained earnings, unappropiated........................ 349,225,750 537,631,026 1,027,902,049 1,311,512,589 1,365,865,627 1,344,212,276
Less: Cost of treasury stock ................. 7.......... 11,327,778 20,772,613 74,168,627 403,068,064 1,162,420,270 1,267,962,64410
Total receipts . .................... ........ ............... ........ 1,750,776,503 3,196,627,860 6,361,264,012 8,398,278,426 11 A311,474,76i 1111,7112~40.01)Business receipts!!:!! ....................................... 1,620,886,576 2,961,729,640 5,731,616,337 7,369,538,953 9,965,628,799 10,320,320,572Interest on State and local Government
obligations ....................................................... 3,775,917 6,711,6D6 12,620.876 20,164,514 36,339,860 38,96i,7ogOther Interest ........................................................ 67,794,508 136,587,304 354,243,674 617,622,425 883,325,876 788,610,223Dividends received tmm domesticoorporations.!!-!~ ...............................I................. 5,238,421 8,818,282 i8,654,86o 16,967,379 13,114,6W 13~43,178
Dividends received from foreign oorporatlons.!~ 3.466,515 5,467,726 14,563,353 20,770,361 28,760,176 29,962,210:Rents'! 13.938,502 21,765,130 41,371,141 89,700,937 101',958,702 98,661,382Royattles;V.............................................................. 2,586,387 5,167,141 12,4502W 15,237,421 34,822,123 41 2.57,831
Not short-term capital gain reduced by'not long-term capital loss.................................. 190,439 301,601 Z01 3,510 7,032,06~ 13,742= 14,349,189
Not long-term capital gain reduced bynot short-term capital loss............................ 5,481,580 8,364,523 24,910,957 53,771,685 41,111,234 44,976,386
Not gain, noncapital assets13.14
........... ----*-*-5,315,562 7,757,287 20,117,615 33,537,842 31,476,569 32,351,843
Other receipts ............................................. 22,102,096 35,957,620 128,721,498 . 163,934,848 286,194,531 289,905,738
D
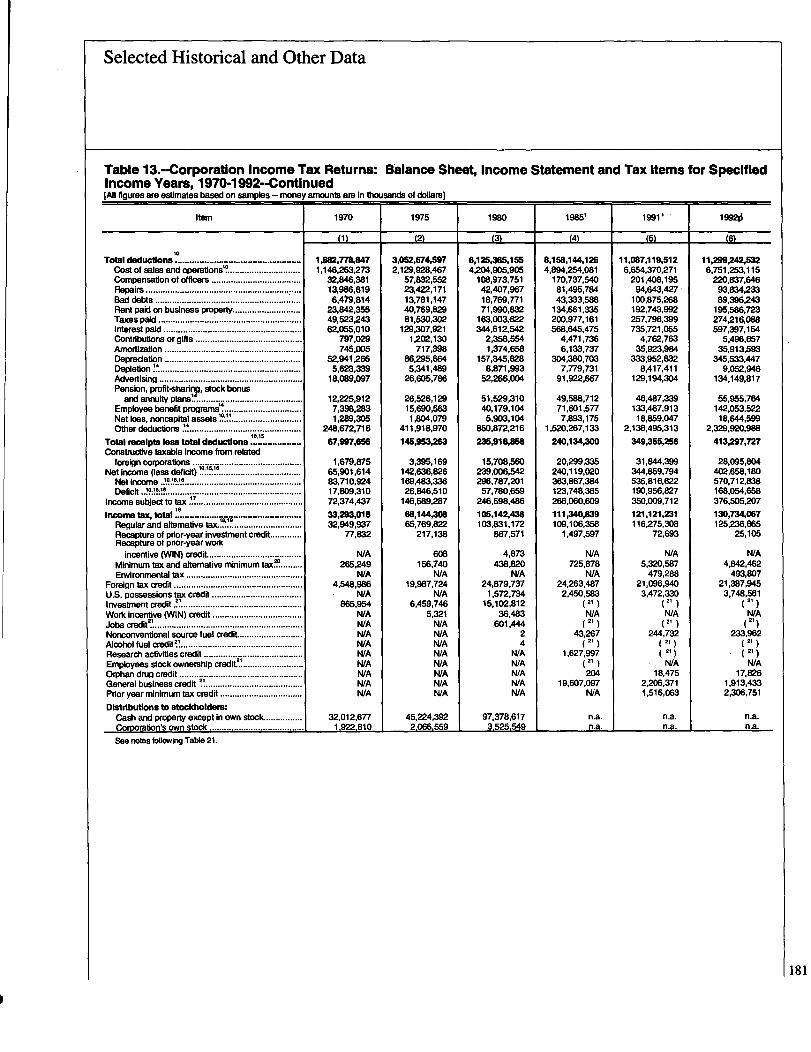
Selected Historical and Other Data
Table 13.-Corporation Income Tax Returns: Ralance Sheet, Income Statement and Tax Items for SpecifiedIncome Years, 1970-1992--Continued[All figures are estimates based on samples -- money amounts are in thousands of dollars)
ftern 1970 1975 1980 1985' 1991, 19926
(1) (2) (3) (4) (5) (6)10
Total deductions . . ........... . .... . ...... .. ......... ........ . 1 =,778,647 3,052,674,597 6,125,365,155 8,156,144,126 11,067,119,512 11,29%=,532Cost of sales and operations'~ ............................. 1.M,263,273 2,129,928,467 42N,905,905 4,894,254,081 6,654,370,271 6,751,253,115Compensation of officers ..................................... 32,846,381 57,832,552 108,973,751 170,737,540 201,408,195 220,837,646Repairs
........................................................... : .... 13,986,819 23,422,171 4Z407,967 81,495,784 94,643,427 93,834=Bad debts ............................................................ 6,479,814 113,781147 18,769,771 43,333,588 100,875,268 89,396,243Rent paid on business property ............................ 23,842,355 40,769,829 71,990.832 134,661,335 192,743,992 195,586,723Taxes paid ........................................................... 49,523,243 81,530,302 163,003,622 200,977,161 257,796.399 274.216,088Interest paid ......................................................... 62,055,010 129,307,921 344,612,542 668,645,475 735,721,055 597,397,154Contributions or gifts ............................................ 797,029 1,202,130 2,358,554 4,471,736 4,762,763 5,496,657Amortization ......................................................... 746,OD5 717,398 1,374,658 6,133,737 35,923,984 35,913,593Depreciation ........................................................ 52,941,266 86,295,664 157,345.828 3D4,380,703 333,952,632 345,533,447Depletion!~.......................................................... 5,623,339 5,341,489 8,871,993 7,779,731 8,417,411 9,052,946Advertising ........................................................... 18,089,097 26,605,786 52,266,004 91,922,667 129,194,304 134,149,817
y, stock bonusPension, profit-shadnand annuity plans!............................................. 12,225,912 26,526,129 51,529,310 49,588,712 46,487,339 55,955,764
14Employee benefit programs ................................ 7,398,283 15,690,563 40,179,104 71,601,577 133,467,913 142,053,522Net loss, noncapital assets T.............................. 1,289,305 1,804,079 5,903,104 7,893,175 16,859,047 18,644,599Other deductions ~! .............................................. 248.672,716 411,918,970 850,87Z216 11,520,267,133 2,138,495,3`13 2,329,920,988
10,15Total receipts lose total deductions ............... . .... 67,9ff,6W 145=263 235,918,858 240,134,300 349,355,256 413,297,MConstructive taxable income from related
foreign corporations. ............................................. 1,679,875 3,395,169 15,708,560 20,299,335 31,844,399 28,095.8040
Net Income (loss dsfIdt)'.:'5." ........................... ....... 65,901,614 142,636,826 239,006,542 240,119,020 344,859,794 402,658,180Not income ..1413.16........................................................ 83,710,924 169,483,336 296,787,201 363,867,384 535,816,622 570,712,838Defic:ft.J?:!1-!~ ....................................................... 17,809,310 26,846,510 57,780,659 123,748,365 190,956,827 168,054,658
Income sublect to tax :~............................................ 72,374,437 146,589,287 246,598,486 266,060,609 350,009,712 376,505,207
Income tM total "*.............
......................... . . ..... 33,293,018 66,144~= 105,142,436 111,340,839 121,121,231 130,734,067Regular and aftemative ta)L ....................................... 32,949,937 65,769,822 103,831,172 109,106,358 116,275,308 125,236,865Recapture of prior-year Investment credit............. 77,832 217,138 867,571 1,497,597 72,693 25,105Recapture of prior-year work
incentive (WIN) credit....................................... WA 608 4,873 NIA N/A WAMinimum tax and alternative minimum tax!! ......... 265,249 156,740 438,820 725,878 5,320,587 4,842,462Environmental tax ................................................ N/A N/A N/A WA 479,288 493,807
Foreign tax credit ..................................................... 4,548,986 19,987,724 24,879,737 24,263,487 21,096,940 21,387,945U.S. possessions tax credit ..................................... N/A N/A 1,572,734 2,450,583 3,472,330 3,748,561Investment credit ..................................................... 865,954 6,459,746 15,102,812 21 ) ( 21 ) ( 21 )
Work Incentive (WIN) credit ..................................... N/A 5,321 36,483 N/A N/A NIAJobs Credit2l
'*'WA N/A 601,444 21 ) ( 21 ) ( 21)
i. source fuel credit ..........................Nonconven N/A N/A 2 43,267 244,732 233,962Alcohol fuel credit!! .................................................. WA NIA 4 21 21 21 )
Research activities credit ......................................... N/A NIA WA 1,627,997 21 21 )
Employees stock ownership credit!........................... N/A N/A N/A 21 ) NA N/AOrphan drug credit ................................................... NIA NIA NIA 204 18,475 17,826General business credit !!........................................ NZA N/A NIA 19,607,097 2,206,371 1,913,433Prior year minimum tax credit .................................. N/A N/A N/A NIA 1,516,063 2,306,751
Distributions to stockholders:Cash and property except in own stock ............... 32,012,677 45,224,392 97,378,617 n.a. n.a. n.a.Corporation's own stock ....................................... 1,922,810 2,066,559 3,525,549 na. n.a. n.a.
See notes following Table 21.
181

Selected Historical and Other Data
Table U.-Corporeition Income Tax Returns: Selected Balance Sheet, Income Statement and Tax Items byIndustrial Division for Specified Income Years, 1970-1992(All flaures are estimates based on samples--money amounts are In thousands of dollars)
Industrial division and itern 1970 1975 1980 1985, 1991, 1992d
(1) (2) (3) (4) (5) (6)AGRICULTURE, FORESTRY AND FISHING
Numberofretums, tolal'.-f-1-11 11-1--l-1-111-1-- 37283 56,280 80,883 103,156 129,886 137,846Number with not Income ..................................... 19,843 33,328 43,827 52,776 69,543 79,412Total assets ............................................................ 11,909,403 21,177,941 40,738.9T7 52,651,197 67,756,553 71,778,019Not worth .................................................................Total rece6ts!
~ 4,012,06814 i
6,844,949 11,460,935 15,406.221 22,769,981 25,109,457t!******'*"*'***"********""*"**,*****,**"'I .27 .707 211,118.514 52,089,915 70,491.486 85.945,700 96.214.615
Business receipts .........................................14 13.591.763 26,624,149 48.850,056 65,419,402 8D,981,26D 90220,004Interest raWiVed.................................................2
.Total deducti n69,742 171.732 476.654 775,383 553,203 514258
o s ................... 14,209,713 27,369,286 51,418,280. 70,559,478 85,331,571 94.666,088Cost of sales and operations ............................... 10,555,539 19,738,447 35,798,332 45,085,526 51,674,644 53,062,015Interest paid ..............
F-* - -1-1 ............. 356.225 797,420 Z 184,441 2,758,952 2,634.724 2.454,021Not income (IVs deficit) ........................................... 65,295 746,908 673.158 -74,270 625,656 1.606,782Not income .-',--'-.............. -****-*----*--2 493,400 1,493.168 2,464,381 2,930,905 3,774,209 4,649,899Deficit
. .................................................................Regular and aftemative tax!. ----
428,105113 115
746,260351 059
1,791,222533 768
3,005,175531 787
3,148,553 3,043,117,, - *--*****-Total income tax after credits ................................
,107,023
,294,584
,422,356
,344,626
498,545473,493
542,849498,280
Distributions to stockholders except in own stock 66,824 244.524 304,733 n.a. n.a. n.a.MINING
.Number of returns, total .................................... 14,465 14,242 25,576- 41,426 39,199 36,664Number with net income ..................................... 7,303 8.297 12,698 18,031 17,893 15,827
Total assets ................. .......................................... 23,972,812 64,505,341 126,947.880 240.815,996 212,962.835 218,793,134Not worth ................................................................Total receipts !
13.381,82117 747 750
32,765,690 54,068.148 104,772,797 106.585,141 106,148,876T- , , , 65,909,994 176,672,390 142,038,595 103,286,287 113,398,176
Business receipts ................................................42
16,699,586 63,670,496 167,397,918 126,710,610 90,512,940 102,965,207.Interest received ..................................................
176,728 522,757 1,301,266 3,584,890 3,289,590 2.687,905Total deductions ... .................. Y--** **---:--11 15.927,348 42.348,765 169,051.624 145,389,514 99,537.632 110,862,900Cost of sales and operations ............................... 9,955,600 30,171,612 116,989,881) 87,972,035 56,314.253 67,512,379Interest paid ............. ........ :.................... 388,032 1,166,182 3,440,080 7,789,995 6,315.413 5,177,953
Net income Oess deficit) ........................................... 1,834,316 23,574,833 7,750,561 -2,543,487 4,001,356 2,704,155Net income~ .........................................................
.2,399,507 24,347,893 10,133,685 6,166,623 7,721,788 6,707,295
Deficit ........................... v.................................... 565,192 773,060 Z383,124 8.710.110 3,720,432 4.003,140Regular and alternative tax..................................... 1,031,550 11,361,037 3,947.569 1,736,952 1,505,027 1,435,651Total income tax after credits ............................... 342.928 1,061,138 1,674,566 557,519 1,041.082 979,234Distributions to stockholders except in own stock 1,177,550 1,015,895 4,757,780 n.a. n.a. n.a.
CONSTRUCTIONNumber of returns, total ..........................................
.138,905' 191 ~219 272,432 318,276 416,987 407,716
. Nuriberwith not income ..................................... 82,078 108,852 150,368 185,613 233,866 224,160Total assets ............................................................ 42,719,792 76,691,947 132,939,026 215,297,771 243,035,939 230,626,129Net worth ................................................................
211.819,604 19,029,077 32,826,174 54,687,270 70,666,636 71,501,020~ __._..... ............ ....................
TotalracePtS
290,610,644 146.955.117 267,205.356 387.232,953 515,12B.533 499.040,111
Business receipt% ,.................: ............................. 88,945,385 143.412,715 260.387,692 374,590,273 502,691,224 488,645,483.Interest received ................................................. 219,698 614,583 2,073,650 3,851.628 3.415,774 2,632,102
total deductions ! .................... 7.............................. 89,070,022 144,717,309 262,116,275 382,823,113 509,247,728 493,488,788cost of sales and operations ................................ 73,434,969 116,845,554 208,064,925 295,803,244 389,883,167 375.795,229 -Interest paid ......... 711,496 1,973,244 4,278,502 6,407,652 6,984,942 5,404.398
Net income (le%s defieft)..., ...................................... 1,538.418 2,236,262 5.Z71,209 4,370,924 6,103,605 5,517,022Not income ..........................................................
2 2,548.013 4,514,864 8,911,143 11,053,145 14,965,305 13,864,874Deficitlr-- ........--..........
. .............................1,009,596 2.278,602 3,639.934 6,682,220 8,861,700 8.347,851
Regular and afternative 776,979 1,32D,196 2,521,507 2,243,786 1,910,621 1,458,665Total income tax after credits................................... 756,637 1,131,960 1,973,659 1,662,563 1,722,422 1,376,476Distributions to stockholders except in own stock 299,204 464,553 793.764 n.a. n.a. n.a.
MANUFACTURINGNumber of returns, total ............ 197,807 217,354 242,550 276,545 300,122 299,728
Nurnber with net income ..................................... 120,811~ 136,839 153,640 159,778 163,599 169,029Total assets ............................................................ 612,912,516 944,581,970 1,709.471,700 2,644,393,424 4.028,360,038 4,115,786,977Net wor1h .....V--- 308,923.293 442,587,674 749,186.774 1,099,645,876 1,481,203,474 1,412.822,933Total receipts ..........................................................
2722,952,890 1,296,359,650 2,404,323,844 Z831,062,496 3,6W,501,307 3,757,094,970
Business receipts ............................................. 700,090,661 1,258,338,650 2.301,056,550 2,656,345,750 3,409,490,090 3,510,138,693Interest recsived!'~..............................................
24,748,499 8,691,092 28,315,784 47,753.626 81,950,229 76.M9.531
Total deductions......................
12----* ...... -'-**- 692,455.462 1.M0,689,496 2,290.593.808 2,733,105,346 3,548,746,793 3,630,439,807Cost of sales and operations ..........: .................... 495,879.549 925,111,030 1,707,143,900 1,797,852,805 2,355,261,594 2.401,042,412Interest PaW ...............V 12,570.242 22,055,903 54.177,356 90,452,072 145.611,955 128,740,454
Not Income Oqs deficit)........................................... 31,846,078 68,406,627 125,667,815 113,758,645 132,269,225 143,383,234Net income .......................................................... 37,925,489 74,466,554 141,547,510 1Q,541,119 181,884.248 184,311,792Deficit 2
............................ Is'---- ......... 6,079,411 6.059,927 15.879,695 28,782,474 - 49,615,023 40,928,558Regular and aftemative tax .. I - ...---*-
16,744.905 32,306,739 59,577,413 55,553,921 51,769,226 51,073,763Total Income tax attar credits ................. 13.242.228 21,024.964 32,726,986 25.382.459 32.104.071 32.729.806Distributions to stockholders except in own stock... 14,616,282 19,973,061 . 371,306,509 n.a. - n.a. n.a.

Selected Historical and Other Data
Table 14.-Corporation Income Tax Returns: Selected Balance Sheet, Income Statement and Tax Items byIndustrial Division for Specified Income Years, 1970-1992-Continued[Ali figures am estimates based on samples--money amounts are in thousands of dollars)
Industrial division and Rom 1970 1975 1980 1985' 1991, 1992p'
(1) (2) (3) (4) (5) (6)
TRANSPORTATION AND PUBLIC UTILITIES......................................Number of returns, total .. 67,398 80,701 111.324 138,337 164.980 178=y
Number with net income ...................................... 38,2134 45.360 62.232 69,938 88,263 97,678Total assets ............................................................. 287,74O,M7 443,236,797 758,364,400 1,246,426,899 1,573,824,265 1,643,969,349Net worth ...... - -*---* - ..... ... --- 12120,022 176,444,407 290,655,693 490,481,127 528,942,779 534,865,704
T................................................Total receipts 135,495.Z71 243,480,637 523,807,396 772,358,188 954,944,592 996,970,422I
Business receipts2.4- 131,463,171 234,689,427 507.372,820 733,943,970 897.131,837 90.929.532Interest received .................................................. MM 1,520,913 5,760,072 12,310,594 17,919,573 16,896,396
Total deductions 2 .............................................. 127,931,131 233,409,166 503,954.2B5 747,836,158 917,837,603 955,808,678....... .Cost of sales and operations ................................ T7,743.359 143.932.463 336,868.172 381,028,354 413,508,684 380.630.827
..........................................Interest paid ............. 7,364.200 13,761,062 27.638,591 44,880,858 59,686,546 56,098,611yNet income (less deficit)............................................ 7,W,718 110,099,571 20,046,155 25,087,629 37,742,965 41,758,449
Netlncome2 .......................................................... 9,471,596 12,088,189 24,917,293 37,880,144 53,590,652 58,205,793DeRCR2
*--*-*1,927,877 1,988,618 4,871.138 12,792,516 15,847,686 16,447,344
..... .............................Regular and afternative tax ..5 4,342,334 5,107,158 10,532,722 14,881,470 15,887,339 16,886,36411Total income tax after credits .............................. 4,036,650 2,836,470 5,322,655 8,432,924 15,793,417 16,626,480Distributions to stockholders except in own stock 5,837.565 8.90D,353 17,329,8D7 n.a. n.a. n.a.
WHOLESALE AND RETAIL TRADEINumber of returns, total .... I ..................................... 518,062 614.632 799,628 917,301 1,043,534 1.052,373Number with net income ...................................... 339.987 399,668 487,300 510,825 536,277 567,705
Total assets ............................................................. 192,181,800 323,496,726 646,901,005 1,009,965,739 1,483,427,907 1,582,087,287Net worth ................................................................. 77,002,132 122,649,734 222,289,687 286,260,274 374,844,301 405,040,316Total
receiptS2........................................................... 522,547,923 969,938,872 1,955,523,778 2,473,865,453 3,380.598,972 3.496,403,360Business receipts 2................................................ 511,316,883 951,463,550 1,919,347,689 2,408,174,933 3,291,367,866 3,408,715,372
2,4Interest received
.................................................. 1,291,906 3,857,318 10,503,989 21,633,480 31,285,080 28,470,330................................................Total deductions . 512,910,193 947,511,780 1,919,454.218 2,440,403,373 3,350,908,857 3,456.211,30411....
Cost of sales and operations ................................ 392,3910% 745,299.2134 1.538.128,634 1,869,766,621 2,527,007.700 2.613,893,783Interest paid ......................................................... 4,309,663 8,587,173 25,645,855 38,217,998 61.081,388 50,515,576
W)2Net income (less de ............................................ 9,671,044 22,489,430 38,3D9,671 33,126,702 29,951,221 41,072,577
2Net inc?me ........................................................... 12,395,411 27,681,721 49,426,5W 51,434,500 64,477,312 72,092.131
Deficit . .................. **'*'**"****"**'*"""*******, Z724,367 5,192.291 11.116,829 18,307,798 34,526,092 31.019,554....... . VRegular and alternative tax .w .................................. 4,476,047 8,103,316 13,515,653 16,130,885 12,789,106 14,234,357
Total income tax after credits ................................. 4,237,181 7,348,619 10,564,358 13,396,555 12,015,216 13,040,696Distributions to stockholders except in own stock 2,068.501 5,029,897 10,343,087 n.a. na. n.a.
FINANCE, INSURANCE AND REAL ESTATEINumberof returns, total ..... ----**-* 406,235 411,846 493,426 518,432 617,557 635,093
,Number with net income ...................................... 248.586 243,409 273,853 285,273 273,097 295,017
Total assets ............................................................. 1,401,153,520 2,321,965,956 4,022,206,073 7,029,452,681 10,780,681,276 11,460,843,090
Net worth ................................................................. 196,480,448 269.T70,527 530,541,317 1,161,968,009 2,513,553,034 2,953,744,655iptS 2 ..............................................Total rem .......... 177,321,173 315.796,981 697,460,846 1.182,034,309 1,924,317,623 1,884,641,45323
Business receipts ................................................. 92,091,887 167,126,715 256,892,475 501,993,840 928,022,390 975,2M.953.................... ...............Interest received ............. 63,694,046 lZ7,040,303 315.146,115 541,268,193 771,288,512 691,000.673
Total deductionS2 .............................................. 161,630,060 297,963,817 652,637,787 1,104,572,202 1,771,169,018 1.707,164.224I........Cost of sales and operations ................................ 48,434.362 84,614,209 129,644,330 237,577.803 556,461,819 563,558,399Interest paid ......................................................... 34,548,509 77,677,659 219,167,6114 363,009,417 r426.757,261 325,057,621
Net income (lossdeficit).2
........................................... 12,214,079 11,663,330 33,122,792 60,670,526 124,545,5D4 148,209,4022
Net income ........................................................... 15.081,939 18,825,003 46,040,390 90,546,934 174,249,613 189,297,648Deficit 2 .............................
-- *' * -2.867,860 7,161,673 12,917,599 29,876.408 49,704,109 41.088,246
.............................ve tR egu Is r~4a e 4,404,449 5,558,647 9,680,755 13,369,981 26,890,049 33,912,280
Total income tax after credits ................................. 4,150,009 4,673,705 7,699,628 10,193,877 24,850,137 30,723,972
Distributions to stockholders except in own stock 7,387,211 8,729,977 24,692,146 n.a. n.a. n.a.
SERVICES INumber of returns, total ..... 281,218 435,672 671,338 939,390 1,061,657 1,100,244
Numberwith net income ...................................... 150,525 249,641 408,716 529,337 551= 6D7,144
Total assets ............................................................. 61,875,140 90,534.067 178,163,737 330,982,941 636,751,574 652,218,395
Net worth ..... 1*11*111111*"****'**'***""***,*"*'*'*"****"**"* 19,529,062 26,855,374 52,865,513 89,852,365 177,668,039 191,743,13411
Total receipts ........... * ....... ---- - 69,572,626 131.377.364 279,883.187 534,587,609 809.724.469 865,933.6749
Business receipts ................................................. 66,459,515 125,747,462 266,088,619 497,980,990 761,589,005 813,423,829
Interest reoelved...'*
........... 435,070 875,506 3,269,412 6,561,301 9,941,775 9,078.042
Total deductions'-
68.3B4.452 IZ7.996,443 271,792.974 528.685,613 800,163,940 847,627.962
Cost of sales and ons ................................ 37.733,747 63,724,869 129.352,692 176,070,808 301,802,690 294.174,925
Interest paid .............. **----- .... 1,802,802 3,279,438 8,033,612 15,027,259 26,544,428 22,887,0119
Net income (less deficit) ............................................ 1,198,703 3,396,744 8,193,903 5,883,782 9,769,891 18,529,0892
Net income ........................................................... 3,384,869 6,025,592 13,246,601 21,124,460 34.963,661 41,428,883
Deficit! 2,186,166 2,628,848 5,052,698 15.240,678 25.193,769 22,899,794
Regular and alternative tax . 5 ....... 1,058,264 1,625,093 3,497.265 4,621,875 5,016,937 5,689,754
Total income tax after crediO ................................. 1,003,130 1,323,637 2,603.370 3,343,830 4,561,377 5,147,707
Distributions to stockholders except In own stock 558,452 1 855,402 1 1,841,945 1 n.a. n.a. n.a.
See notes following Table 21.
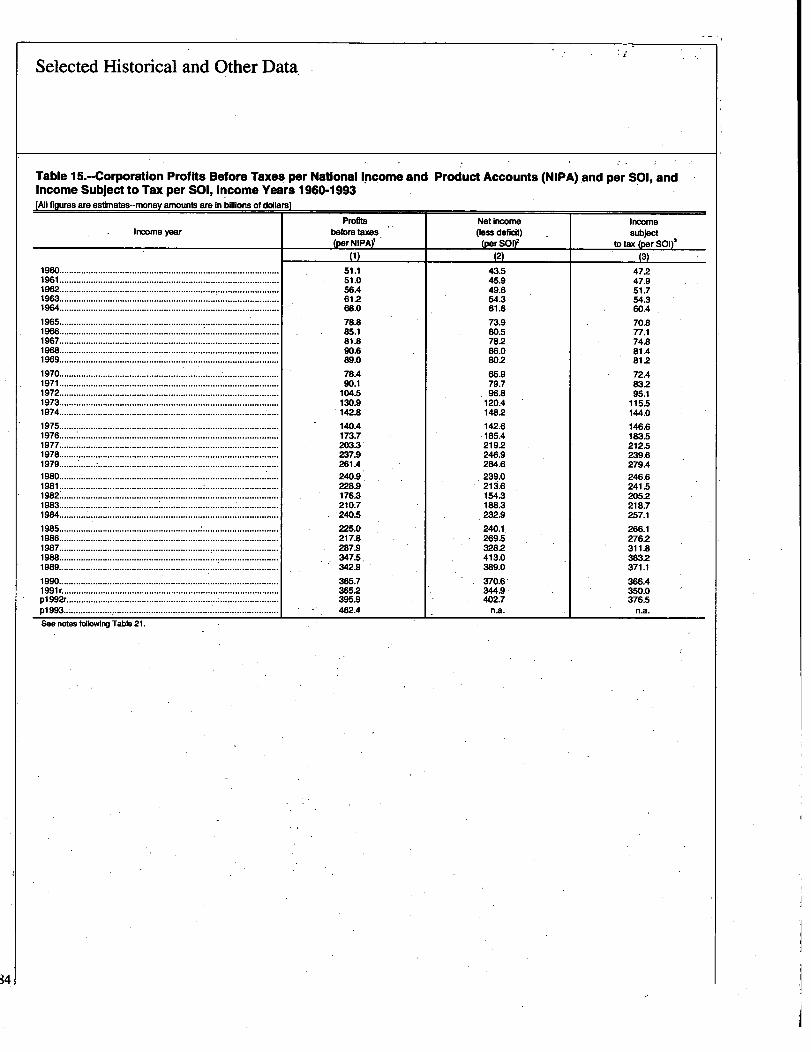
Selected Historical and Other Data-
Table 15.--Corporation Prof Its Before Taxes per National Income and Product Accounts (NIPA) and per Sol, andIncome Subject to Tax per SOI, Income Years 1960-1993[All figures are estimates-money amounts are in billions of dollars]
Income yearProfits
before taxes(per NIPA~
Net income(less deficit)
(perOf
Incomesubject
to tax (per S01)'
(1) (2) (3)1960 ............................................................... :......................... 51.1 43.5 47.21961 .......................................................................................... 51.0 45.9 47.91962 ......................................................................................... 56.4 49.6 51.71963 ......................................................................................... 61.2 54.3 54.31964.......................................................................................... 68.0 61.6 60.4
1965........................................................... 78.8 73.9 70.81966.......................................................................................... 85.1 80.5 77.11967.......................................................................................... 8118 78.2 74.81968......................................................................... . ............... 90.6 86.0 81.41969.......................................................................................... 89.0 80.2 812
1970........ .......................................................... ...................... 78.4 65.9 72.41971 .......................................................................................... '90.1 79.7 8321972.......................................................................................... 104.5 96.8 95.11973 130.9
120.4 115.5
1974
........
142.8 1482 144.01975
..................................................................................140.4 142.6 146.6
1976.......: 173.7 -185.4 183.5
1977***-***--*-**-- ...........203.3' 2192 212.5
1978 .... .................................................................................. 237.9 246.9 239.6.1979 261.4 284.6 279.41980............. ................. . .. ..................... .... . ......................... 240.9 -239..0 246.61981 ........................................................... : .............................. 228.9 213.6 241.6
1982......................................... 7 176.3 154.3 20521983.......................................................................................... 210.7 188.3 218.71984.......................................................................................... 240b 232.9 257.11985.......................................................... : ............................... 225.0 240.1. 266.11986.......................................................................................... 217.8 269.5 27621987.............................................................. ........................... 287.9 3282 311.81988................................................................. ! ........................ 347.5. 413.0 38321989.......................................................................................... 342.9 389.0 371.1
1990.......................................................................................... 365.7 370.6 366.41991 r ........................................................................................ 3652 344.9 350.0p1l 992r ...................:"***'*'*"'* ....* *- -* -*..... ---.... ***"*' 395.9 402.7 376.5p1 993..;...................................................................................... 462A n.a. n.a.See notes following Table 21.
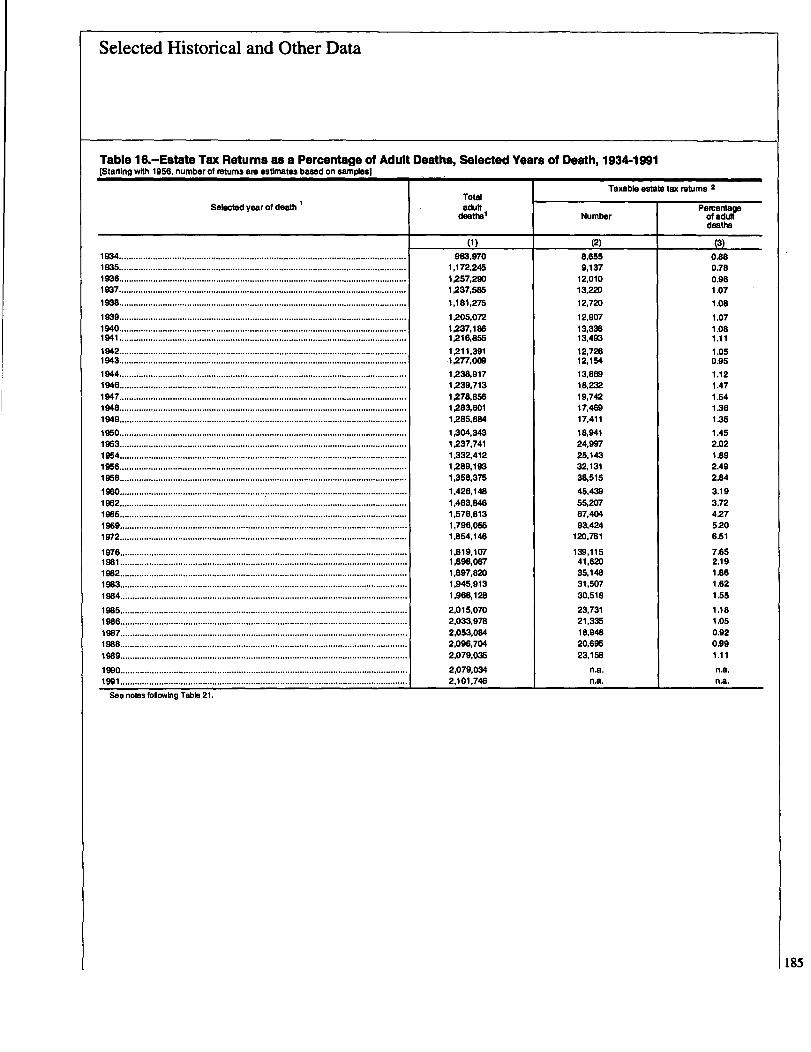
Selected Historical and Other Data
Table 16.-Estate Tax Returns as a Percentage of Adult Deaths, Selected Years of Death, 1934-1991[Sterling wtth 1956, number of returns are estimates based on samples)
Selected year of death 1
1936 .......................................................................................................................1937.......................................................................................................................1938 .......................................................................................................................
1939 .......................................................................................................................
1944 .......................................................................................................................
1947 .......................................................................................................................1948 .......................................................................................................................1949 .......................................................................................................................
1950 .......................................................................................................................1963 .......................................................................................................................1954 .......................................................................................................................1966 .......................................................................................................................1958 .......................................................................................................................
1965 .......................................................................................................................1969.......................................................................................................................
1976.......................................................................................................................1981 .......................................................................................................................
1986.......................................................................................................................
1987.......................................................................................................................
1989.......................................................................................................................
1990.......................................................................................................................
See notes following Table 21.
Totaladult
deaths'
(1)983,970
1,172,2451.257.2901,237,5851,181.2751,205,0721,237,1861,216,8551,211,3911,277.0091,238,9171,239,7131,278,8561,283,6011,285,6841,304,3431,237,7411,332,4121,289,1931,358,3751,426,1481,483,8461,578,8131,796,0551.854,146
1,8 19, 1 W1,898,0671,897,82D1,945,9131,968,1282,015,0702,033,9782,053,0842,096,7042,079,035
2,079,0342,101,746
Taxable estate tax returns 2
NumberPercentage
of adultdeaths
(2)
8,6559,137
12,01013,22012,72D12,90713.33613,49312,72612,15413,86918.23219,74217,46917,41118,94124,99725,14332,13138,51645,43955,2W67,40493,424
120,761
139,11641,62035,14831,50730,51823,73121,33518,94820,69523,158
n.a.n.a.
(3)
0.880.78
0.961.07
1.08
1.07
1.081.11
1.050.95
1.12
1.471.54
1.361.35
1.45
2.021.89
2A92.84
3.19
3.72427
5206.51
7.652.191.86
1.62
1.55
1.18
1.05
0.920.991.11
n.a.n.a.
185
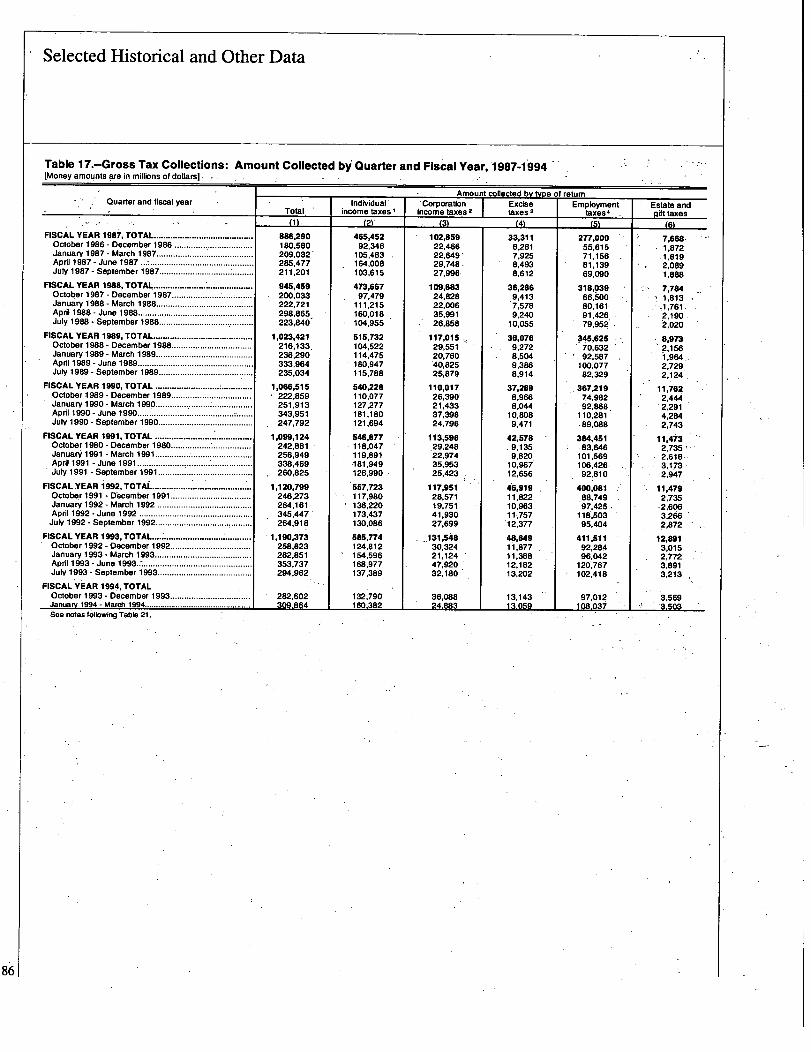
Selected Historical and Other Data
Table 17.-Gross Tax Collections: Amount Collected b~ Quarter and Fiscal Year, 1987-1994[Money amounts are in millions of dollars]
Quarter and fiscal year
FISCAL YEAR 1987, TOTAL..........................................October 1986 - December 1986 .................................January 1987 - March 1987 ................................
:April 1987 - June 1987...:................. *... *"* * ...............July 1987 - September 1987 ........................................
FISCAL YEAR 1988, TOTAL........................******" * ***October 1987 - December 1987 ..................................
January 1988 - March 1988. ........................ * ..............April 1988 - June 1988
................. * ........... * *............July 1988 - September 1988 ........................................
FISCAL YEAR 1989, TOTAL ..........................................October 1988 - December 1988 ..................................January 1989 - March 1989 .........................................April 1989 - June 1989.................................................July 1989 - September 1989...................................
FISCAL YEAR 1990, TOTAL ........................... ;..............October 1989 - December 1989 ..................................January 1990 - March 1990 .........................................April 1990 - June 1990 .................................................July 1990 - September 1990 ........................................
FISCAL YEAR 1991, TOTAL .........................................October 1980 - December 1980................. ................January 1991 - March 1991 ..........................................April 1991 - June 1991 ..................................................July 1991 - September 1991 ............................. ..........
FISCAL YEAR 11 992, TOTAL..........................................October 1991 - December 1991 ..................................January 1992 - March 1992 ........................................April 1992 - June 1992 ................................................July 1992 - September 1992 ...............................
FISCAL YEAR 1993, TOTAL....October 1992 - December 1January 1993 - March 1993.........................................April 1993 - June 1993..................................................July 1993 - September 1993........................................
FISCAL YEAR 1994, TOTALOctober 1993 - December 1993 ..................................January 1994 - March 1994 ................................................
See notes following Table 21.
Total
(1) -
886,290180,580209,032'285,477211,201
945,459200,033222,721298,865,223,840
1,023,421216,133,238.290333,964235,034
1,066,515222,859251,913343,951247,792
1,099,124242,881256.949338,469260,825
1,120,799246,273264,161345,447264,918
1,190,373258,823282.851353.737294,962
282,602309,864
Individualincome taxes
U2Y
465,45292,346
1 D5,483164,0081D3,615
473,66797,479
111,215160,0181 D4.955
515,732104,522114,475180,947115,788
540,228110,077127.277181,180121,694
546,877118.047119,891181,949126,990
557,723117,980136,220173,437130,086
595,774124,812154,596168,977137.389
132,790160,382
Amount collected by type of return' Corporation Excise
income taxes 2 taxes I
(M
102,85922,46622,649-29.748.27,996
109,68324,82822,00635,99126,858
117,01529,55120,76040,82525,879
110,01726,39021,43337,39824,796
113,598
22.97435,95325,423
117,95128,57119,75141,93027,699
131,54830,32421,12447,92032,180
36,08824,883
-"4
33,3118,2817,9258,4938,612
36,286
7,5789,240
10,055
36,0769,2728,5049.3868,914
37,2898,9668,044
10,8089,471
42,578.9,1359,820
10.96712,656
46,91911,82210,96311,75712,377
48,64911,87711,38812,18213,202
13,14313,059
EmploymenttaxeS4
M
277,00055,61571,15681,139.69,090
318,03966,50080,16191,42679,952
345,62570,63292.587
100,07782,329
..367,21974.98292,868.
110,28189,088
384,45183,646
101,569106.426.92,810
400,081
97,425118,50395,404
411,51192,28496,042
120,767102.418
97,012108,037
Estate and-9 itt taxes
-M7,668.1,8721.8192,0891.888
7,7841,813
-.1,761.2,190.~,020
8,9732,1561 9642:7292
,124
11,7622,4442,2914,2842,743
11,4732,735.:.2,6183,1732,947
11,4792,735
-2,6063,2662,872
12,8913,0152,7723,891'3,213
3,569'3.503

Selected Historical and Other Data
Table 18.-Tax Refunds: Amount Refunded by Quarter and Fiscal Year, 1987-1994[Money amounts are in millions of dollars]
Amount refunded bv tvoe f returnOuarter and fiscal year Individual Corporation Excise Employment Estate and
Totai income taxes income taxes 2 taxes 3 taXeS4 gift taxes(1) (2) (3) (4) (5) (6)
FISCAL YEAR 1987, TOTAL.......................................... 96,969 73,583 19,891 1,381 1~w 214October 1986 - December 1986 ................................. 8,668 3,406 4,789 ill 312 50January 1987 - March 1987......................................... 28,422 22,198 5296 479 r393 56April 1987 -June 1987 ................................................ 50,063 42,858 5,948 332 r869 57July 1987 - September 1987........................................ 9,816 5,121 3,858 459 326 52
FISCAL YEAR 1988,TOTAL.......................................... 94AN 74~M 16,477 1,114 2~M 227October 1987 - December 1987.................................. 7,701 3,437 3,727 207 275 55January 1988 - March 1988 ......................................... 27,798 21,744 5,248 198 553 55April 1988 - June 1988................................................. 49,202 43,769 3,848 421 1,114 soJuly 1988 -September 1988 ........................................ 9.T76 5,449 3,654 288 321 67
FISCAL YEAR 1989, TOTAL.......................................... 93,613 73,597 14,921 2A% 2,771 289October 1988 - December 1988.................................. 8,380 3,362 4,461 118 359 soJanuary 1989 - March 1989 ......................................... 32,041 26,759 4,462 182 570 67April 1989 - June 1989.................................. .............. 43,538 38,895 3,849 350 381 63July 1989 - September 1989 ........................................ 9,654 4,581 2,149 1,404 1,461 59
FISCAL YEAR 1990, TOTAL ......................................... 99,656 76,065 18,324 2,261 2AM 329October 1989 - December 1989.................................. 8,487 3,094 4,605 300 409 79January 1990 - March 1990 ......................................... 37,121 31,367 4,922 342 423 67April 1990 - June 1990................................................. 43,308 36,952 4,209 549 1,492 106July 1990 - September 1990 ........................................ 10,740 4,652 4,588 1,070 353 77
FISCAL YEAR 1991, TOTAL . ..................... ............ . ... 104,380 82gn 17,W 1,188 2,471 404October 1990 - December 1990.................................. 8,284 3,367 4,148 344 323 102January 1991 - March 1991 ......................................... 38,020 32,811 4.286 293 538 92April 1991 - June 1991 ................................................. 47,962 41,638 4,748 226 1,249 101July 1991 - September 1991 ........................................ 10,114 5,061 4,258 325 361 109
FISCAL YEAR 1992, TOTAL .......................................... 113,108 $8,624 19,688 1,997 2,398 401October 1991 - December 1991 .................................. 10,072 3,607 5,639 379 346 101January 1992 - March 1992 ........................................ 44,657 38,183 5,750 201 430 93April 1992 - June 1992 ................................................ 47,817 42,231 4,596 476 399 115July 1992 - September 1992 ........................................ 10,562 4,603 3,703 941 1,223 92
FISCALYEAR 1993, TOTAL. . ....................... ............... 93,W 74,Z14 16,035 956 1,969 384October 1992 -December 1992 .................................. 7,891 3,081 4,190 208 324 88January 1993 -March 1993......................................... 37,213 31,503 4.971 239 396 104April 1993 - June 1993................................................. 39,325 35,353 3,195 290 397 90July 1993 - September 1993........................................ 9,151 4,297 3,679 221 852 102
FISCAL YEAR 1994, TOTALOctober 1993 - December 1993 .................................. 7,329 2,322 4,176 394 324 113January 1994 - March 1994......................................... 34,614 27,859 5,800 403 445 107April 1994 - June 1994................................................. 52,548 40,876 1 10.853 333 393 93
See notes following Table 21.
187
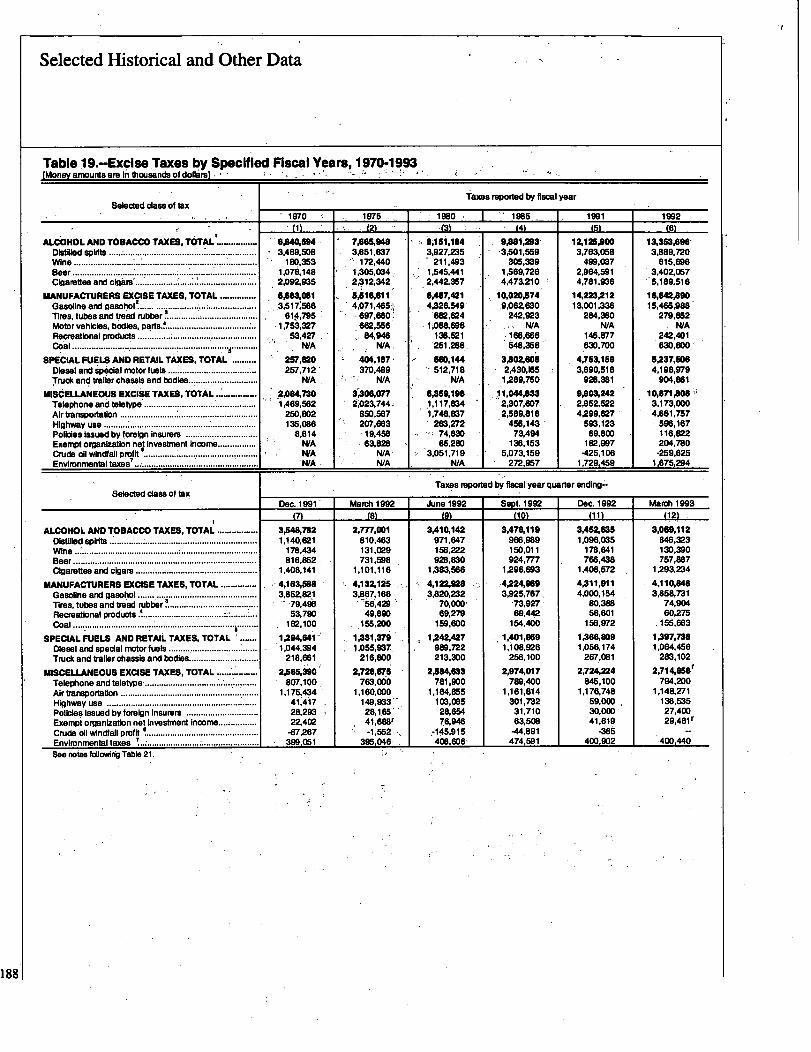
Selected Historical and Other Data
Table.1g.--Excise Taxes Oy Specified Fiscal Years, 1970-1993Dkoney amounts are in thousands of dollars) -
faxes reported by fiscal year
970 1975 1980 1991 1992(1) 2 431 (4) (5) (11)
AL60HOL AND TOBACCO TAXES, TOTALI........ ..... .. GA40,594 ' 7.66%948
'if
6,15i.184 9,881,293 12,125A00 13,3S3,696-Distilled spirits ................................................................ 3,469,508
13.851,837 3,927,235 -3,501,559 3,763.058 3.889,720
Wine ................. 180.353 172,440
:
211.493, 305,339 499,037 615,696Beer ................................ 1.076,148 1,305,034 1.545.441 1,569,726 2,964,591 3,402,057Cigarettes and cla6ni...'
7 -................................................ 2,09Z936
I
2.31Z342 2,44Z357 4,473.210 4,781.936 5,189,516MANUFACTURERS EXCISE TAXES, TOTAL .......... 6'emoel 5,11116,611 6,487,421 10,020,574 K223,212 16,642,890
Gasoline and gasohol! ...... ...................... ;.................... 4.071.465~ 4026,549 .9,06Z63O 13,001,336 15,465.9883
Tires, tubes and tread rubber ............... i ....................... 614.795 697,680,1 682,824 242,923 284,360 279,852Motor vehicles, bodies, parts.~ .................I ................... 1,753,327 .662,556 1 j088,696 N/A N/A WARecreational products .................................................. 53,427 84.946 136,521 -168,666 145,877 242,401coal ........................................................... ........... NIA 4 WA~ 251,288~. 548,356 630,700
*630,800
SPECIAL FUELS AND RETAIL TAXES, TOTAL .......... 257,820 404,187 5W,1" 3,111OZ80i 4,763,IS9 5,237,11106Diesel and special motor fuels ...................
*................. 267,712- 370,489 2,430,165 3.690,518 4,198,979
Truck and trailer chassis and bodies............................. WA NIA NIA 1,289,750 928,381 904,881
MISCELLANEOUS EXCISE TAXES, TOTAL ............. .. 21084,730 3,30411,077 O'SS9,198 11110*lom1 9,903,242 10,871,806Telephone and teletype - I ........: ................................
i.469,562 1,023,744 - 1,117,834
12,307,607 2,952,522 3,173,000
Air transportation .. ................................................... 250,802 850.567 1,748,837 2,1589,818 4,299,627 4,661,757Highway use ................................................................ 135,086 207,663 263,272 456,143- 593,123 596,167Policies issued by foreign Insurers ;....................... 8,614 19,458 -: 74,M 73,494 69,80D 116,822Exempt organization not Investment Income ................ NtA 63,828 65,280
-136,153 182,997 204,780
Crude oil windfall profit ............................................... N/A WA 3,051,719 5,073,159 -425,106 -259,625Environmentel
taxeS7..;................................................. NIA WA NIA 272,957 1,729,450 1,675,294
Taxes reported by fiscal year quarter ending..Selected class of tax
Dec.-1991 March 1992 June1992 Sept 1992 Dec. 1992 March 1993(7) (8) (9) (10) (11) (12)
ALCOHOL AND TOBACCO TAXES, TOTAL ................. 3446,782 2,777,001 3,410,142 3,478,119 3,452,635 3,069,112Distilled spirits ........................... s .................................. 1.140.621 810,463 971,647 966,989 1,096,035 SQ,323Wine
.................................178,434 131,029 156,222 150,011 178,641 130,390816,652 731,598 928,830 924,777 766,438 757,887
Cigarettes and cigars ................................................... 1,408,141 1,101,116 1,383,566 1,296,693 1,408,572 1.293,234
MANUFACTURERS EXCISE TAXES, TOTAL ............... 4,163,568 4,132,12S 4,122,028 4,224,969 4,311,911 4,110,840Gasoline and gasohol ....... .......................................... 3.862,821 3,867,168
-3,820,232 3,925,767, 4,000,154 3.858,731
3Tires, tubes and tread rubber ....................................... 79,498 ~11,42§ " - 70.OOD- 73,927, 80,388 74,904Recreational products ~.................................... : ........... 53,79D 49,890 69,279 69,442 58,601 60,275Coal 100162 155 200 159 600 154,400 156.972 .155,663.................................................................... . , ,
SPECIAL FUELS AND RETAIL TAXES, TOTAL . ....... 1,294,841 1.331,379 1942,427 1 AOI1959 1,366,809 1,397,738Diesel and special motor fuels ..................................... 1,044.394 1,055,937, 989,722 1,108,926 1,056,174 1,064,456Truck and trailer chassis and bodies ............................. 218,661 216,800 213,300 256,100 267,081 283,102
MISCELLANEOUS EXCISE TAXES, TOTAL ..... ......... 2,1565,390 2,726,675 2,584,633 2A74,017 2,724,224 2,7114,1115firTelephone and teletype ................................................ 807,100 763,000 781,900 789,400 845,100 794,200Air transportation .......................................................... 1,175,434
'1,160,000 IJ64,856 1,161,814 1,176,748 1,148,271
Highway use ............................................................... 41417 149,k~ 103.085 301,732 59,OW 136,535Policies Issued by foreign Insurers .............................. 28:293 28,165' 26.654 31,710 30,OOD 27,406Exempt organization net Investment Income ................ 22,402 41,688r 76,946 63,508 41,619 29,48, r
Crude oil windfall profit ! ............................................... -67.267 .1,552 -145,915 -44,891 -365'Environmental taxes ~..; ...................... :........................ 399,061 395,046 406,606- 1 474,591 1 400,902 1 400,440
See notes following Table 21.
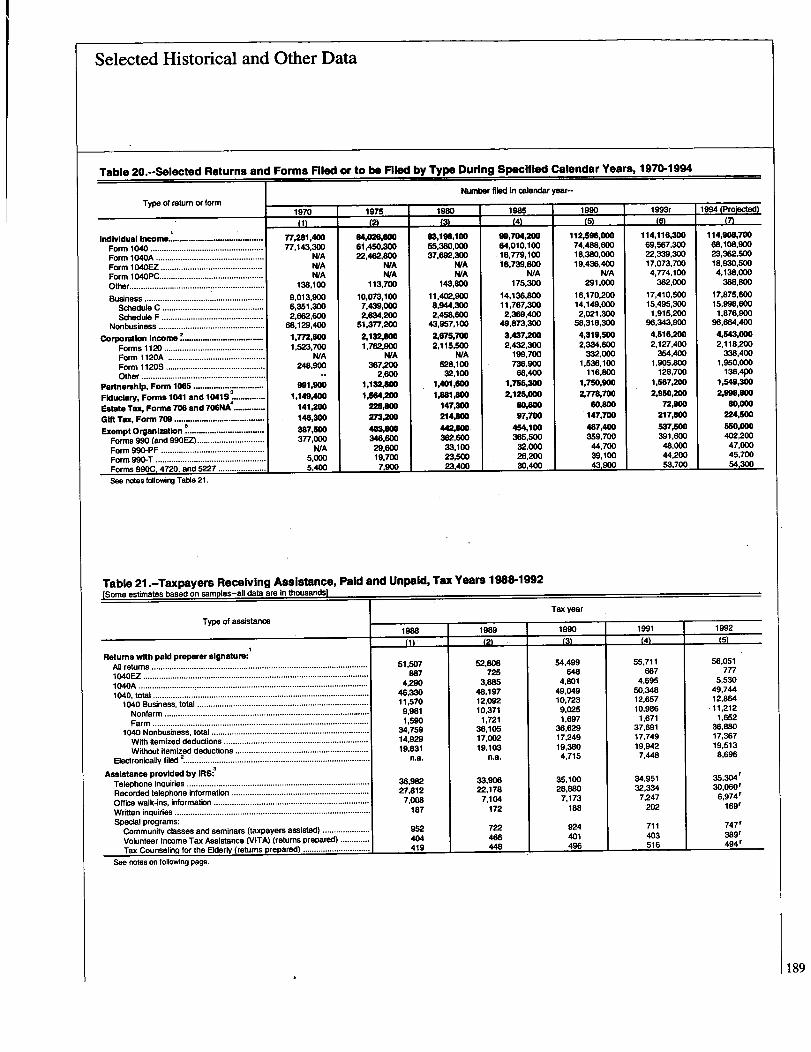
Selected Historical and Other Data
Table 20.--Selected Returns and Forms Filed or to be Flied by Type During Specif led Calendar Years, 1970-1994
Type of return or form1985
E4
IndIvl ual Income ..................................... . 1 77.2.81,4= 1 84.026J= 93,196,100 1 99.704,200 112,596,000 1 114,115AM 114,90a,luur_~_I nAA 7'. 77.143.300 1 61.450.300 1 55.360,000 1 64.010,100 74,488,600 1 69,567.300 68,108.900
Fo m 1040A ...... ..................................... WA 22.462,8W 1 37,692,300 1 1 ird'r' 1-r
1I= ',:Z' '0'WA 1 739 400 17:j73:'700 1j8:j9Z:50DForm D40EZ ..........................................
IVAWA
N/A NIA 4,774 4,138000Form I D40PC ........................................ _... NIA N/A N/AODO 368 SDOr%*-, 1 138.100 113.700 M.800 175,300 291,000 362:100 1
D ~ I n nin am I in.wa.ioo I m4w.gw I 14.136.BW 1 16,170,200 1 17,410,500 1 17,875,600
Schedu.I.a..C.............................................. 6,351,300 7,439,000 944300 11,767.300 14,149,000 15,495,300 15,998,600
- ---- -------------- ------- ----
Schedule F 2,662,600 2,634.200 2i45896OO 2.369,400 2,021.300 1,915,200 1,876,900
Nonbusiness.. 68,129,400 51,3T7,200 43,957.100 49,873,300 58,318.300 96,343,900 98,664.400
Corporation Income .............................. . ... 1,772,600 2,132,800 2,675,700 3,437,M 4,319,500 4,516,200 4,543,000
Fo ms 112D ............................................ 1,523,700 1,762,9W 2,116.500 2.432,3DO 2,334.6DO 2,127,400 2,118,200
Form 1120A ........................................... MIA N/A N/A 199,700 332,000 354,400 338,400
24R.QM 367.2W 528,100 736,900 1,536,100 1,905,800 1,950,000
i~we'r.*..*---.,.,.".".'.'.'.'.,.,.-.-.-.-.-.-......-.-..-....-............... --
__ 2,600 32,100 68,400 116,800 128,700 136,4PO
Partnership, Form 1065 ............................... 991,900 11,4101,11100 11,755~= 1,750,900 1,567,200 1,549,300
Fiduciary, Forms 1041 and 1041S* .............. 1,149,400 1,564,200 1,881 Am 2,12.6,000 2,778,700 2,950,200 2,998,600
Estate Tax, Forms 706 and 706NA!... .......... 141,200 225j= 147,300 $0,800 W1800 72,900 80,000
Glft Tax, Form 709 ....................................... - 146,300 273,200 214,800 97,700 147,700 217,800 224,500
I _ 5387 500 403,800 442,800 454,100 487,400 537,5W wV0,000
1-9MP-rgan_ n .......................... ....... 1 402200Forms 990 (and 990EZ) .............................. 377,000 346.600 362,600
Form 990-PF .............................................. WA 29,600 33,100 32,000 44,700 48.000 47,000
Form 990-T ................................................. 5.000 19.700 23,500 26,200 39,100 44,200 45,700
Forms 990C, 4720, and 5227 ..................... 1 5,400 6 7,900 23,400 30,400 43,900 53,700 54,300
See notes following Table 21.
Table 21.-Taxpayers Receiving Assistance, Paid and Unpaid, Tax Years 1988-1992[Some estimates based on samples-all data are in thousands]
Type of assistance
Returns with paid preparer signature:All returns ................................................................................................1040EZ
* ............1040A......-* ............... :
............................................................................1040, total .. .............................................................................................
1040 Business, total ............................................................................Nonfarm ...........................................................................................Farm ................................................................................................
1040 Nonbusiness, total ......................................................................With itemized deductions ................................................................
Without itemized deductions ...........................................................
Electronically filed 2...................................................................................
Assistance provided by 1W
Telephone inquiries .................................................................................Recorded telephone informaltion .............................................................Office walk-ins, information .....................................................................Written inquiries .......................................................................................Special programs:
Community classes and seminars (taxpayers assisted) .....................Volunteer Income Tax Assistance (VITA) (returns prepared) .............Tax Counseling for the Elderly (returns prepared) ..........
See notes on following page.
198811L
51,507887
4,29046,33011,5709,9811,590
34,75914,92919.831
n.a.
36,98227,8127.008
187
952404419
Number filed in calendar year--
1989
12A
52,808725
3.88548,19712,09210.371
1,72136,10517,00219,103
n.a.
33,90622,178
7,104172
722466448
Tax year
1990
M
54,499648
4,80149,04910,7239,0251,697
36,62917,24919,3804,715
35,10028.880
7,173188
924401496
1991
55,711667
4,69550,34812,65710,9861,671
37,69117,74919,9427,448
34,95132,3347,247
202
711403516
1992
(5)
56.051777
5,53049,74412,864
.11,2121.652
36,88017,36719,5138,696
35,304r
30,060:6,974
16gr
747'38gr
494 r
189
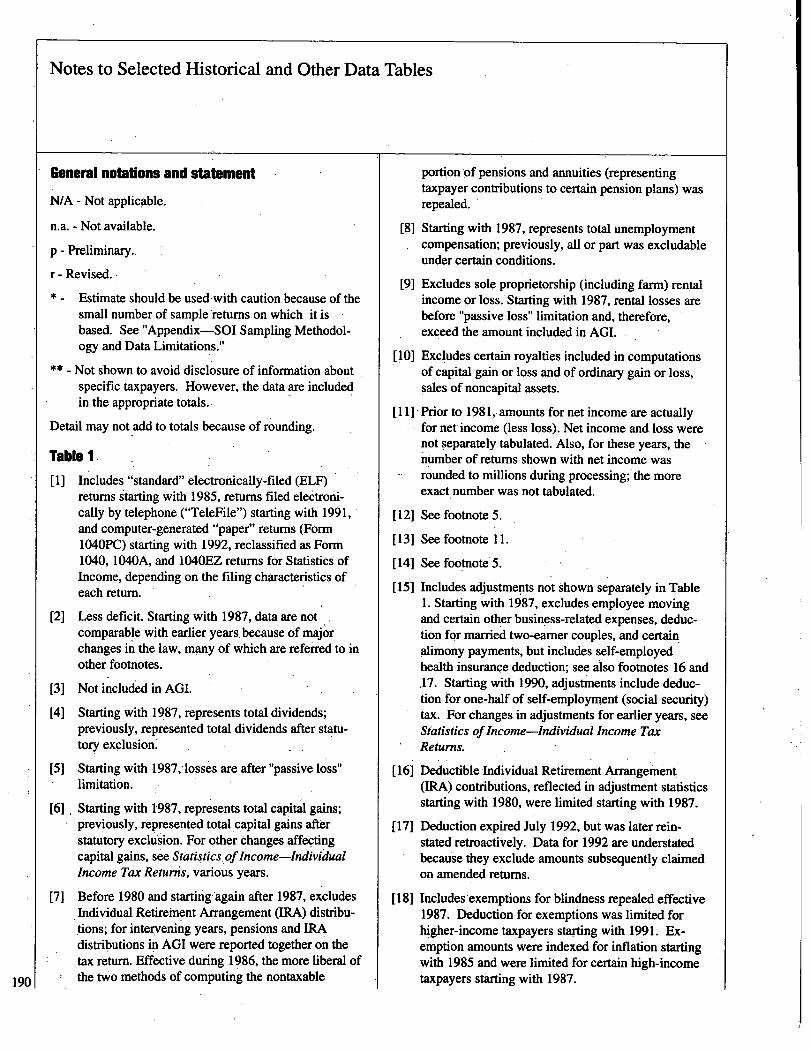
Notes to Selected Historical and Other Data Tables
190
General notations and statement
N/A - Not applicable.
n.a. - Not available.
p - Preliminary.,
r - Revised.
Estimate should be used-with caution because of thesmall number of sample returns on which it is -based. See "Appendix-SOI Sampling Methodol-ogy and Data Limitations.7
Not shown to avoid disclosure of information aboutspecific taxpayers. However, the data are includedin the appropriate totals.
Detail may not add to totals because of rounding.
Table I
[1] Includes "standard" electronically-filed (ELF)returns starting with 1985, returns filed electroni-cally by telephone ("FeleFile") starting with 1991,and computer-generated "paper" returns (Form1040PQ starting with 1992, reclassified as Form1040, 1040A, and 1040EZ returns for Statistics ofIncome, depending on the filing,characteristics ofeach return.
[2] Less deficit. Starting with 1987, data are notcomparable with earlier years, because of majorchanges in the law, many of which are referred to inother footnotes.
[3] Not included in AGI.
[4] Starting with 19.87, represents total dividends;previously, represented total dividends after statu-tory exclusion.'
[5] Starting with 1987,4osses are after "passive loss"limitation.
[6] Starting with 1987, represents total capital gains;previously, represented total,capital gains afterstatutory exclusion. For other changes affectingcapital gains, see Statistics.of Income-IndividualIncome Tax Returns, various years.
[7] Before 1980 and startingagain after 1987, excludesIndividual Retirement Arrangement (IRA) distribu-tions; for intervening years, pensions and ERAdistributions in AGI were reported together on thetax return. Effective during 1986, the more liberal ofthe two methods of computing the nontaxable
portion *of pensions and annuities (representingtaxpayer contributions to certain pension plans) wasrepealed.
[81 Starting with 1987, represents total unemploymentcompensation; previously, all or part was excludableunder certain conditions.
[9] Excludes sole proprietorship (including farm) rentalincome or loss. Starting with 1987, rental losses arebefore "passive loss" limitation and, therefore,
- exceed the amount included in AGI. I
[10] Excludes certain royalties included in computationsof capital gain or loss and of ordinary gain or loss,sales ofnoncapital assets.
[11] Prior to 1981, amounts for net income are actuallyfor net. income (less loss). Net income and loss werenot separately tabulated. Also, for these years, thenumber of returns shown with net income wasrounded to millions during processing; the moreexact number was not tabulated.
[12] See footnote 5.
[13] See footnote 11.
[14] See footnote 5.
[15] Includes adjustments not shown separately in Table1. Starting,with 1987, excludes employee movingand certain other business-related expenses, deduc-tion for married two-earner couples, and certainalimony payments, but includes self-employedhealth insurance deduction; see also footnotes 16 and,17. Starting with 1990, adjustments include deduc-tion for one-half of self-employment (social security)tax. For changes in adjustments for earlier years, seeStatistics of Income-Individual Income TaxReturns.
116] Deductible Individual Retirement Arrangement(IRA) contributions, reflected in adjustment statisticsstarting with 1980, were limited starting with 1987.
[17] Deduction expired July 1992, but was later rein-stated retroactively. Data for 1992 are understatedbecause they exclude amounts subsequently claimedon amended returns.
[18] Includes exemptions for blindness repealed effective1987. Deduction for exemptions was limited forhigher-income taxpayers starting with 1991. Ex-emption amounts were indexed for inflation startingwith 1985 and were limited for certain high-incometaxpayers starting with 1987.

Notes to Selected Historical and Other Data Tables
[19] In general, represents the sum of standard anditemized deductions. For 1980 and 1985 data,includes total itemized deductions before subtractionof "zero bracket amount," plus, for non-itemizeddeduction returns, the zero bracket amount and, for1985 data only, charitable contributions deduction.Starting with 1987, includes revised itemizeddeductions (see also footnotes 21-24), "basic"standard deduction and "additional" standarddeductions for age 65 or over for blindness (forchanges in the standard deduction and its relation tothe zero bracket amount, see Statistics of Income-Individual Income Tax Returns, for appropriateyears). Starting with 1991, total itemized deductionsare after statutory limitation (see footnote 21).
[20] For 1980 and 1985 data, represents "zero bracketamount" used on returns of non-itemizers; see alsofootnote 25. Zero bracket amount for 1985 andstandard deduction, starting with 1986, were indexedfor inflation.
[211 Includes itemized deductions not shown separatelyin Table 1, including revised deductions, startingwith 1987, for "miscellaneous expenses" afterlimitation and for employee moving expenses; seealso footnotes 22-24. In general, total itemizeddeductions were limited for certain high-incometaxpayers starting with 1991. For changes indeductions for earlier years, see Statistics of In-come-Individual Income Tax Returns.
[22] Deductible medical and dental expenses werelimited, starting with 1987, based on a revisedpercentage of AGI. For changes in the deduction for1987 and earlier years, see Statistics of Income-Individual Income Tax Returns.
[23] Starting with 1987, State sales taxes were no longerdeductible.
[24] Starting with 1987, deductions for "personal" interestand mortgage real estate loan interest were limitedand, starting with 1991, personal interest was nolonger deductible.
[25] For 1980 and 1985 data, taxable income includes the"zero bracket amount," repealed effective 1987 andpartially replaced by standard deductions which weresubtracted in computing taxable income. A standarddeduction was similarly used prior to 1980. For thepercentages of AGI used for the standard deductionand the limitation on the deduction, see Statistics ofIncome-Individual Income Tax Returns.
[26] Different tax rate structures applied to Tax Years1970, 1971-1978, 1979-1981, 1982-1986, 1987, and1988-1992. Indexing of tax rate boundaries forinflation was introduced starting with 1985. Thepreferential maximum tax rate on long-term capitalgains under "alternative tax" was revised over theyears. Alternative tax was abolished effective 1987,but a maximum capital gains tax rate slightly lessthan the maximum regular tax rate continued toapply under certain conditions starting with 1991.For additional information on changes affecting taxcomputations, see Statistics ofIncome-IndividualIncome Tax Returns.
[271 For 1970, includes tax surcharge of $2,018,078,000.
[28] Includes credits not shown separately in Table 1,such as the political contributions credit (repealedeffective 1987), earned income credit (liberalizedstarting with 1987 and 1991), and low-incomehousing credit (introduced effective 1987); see alsofootnote 29. For changes in credits allowed forearlier years, see Statistics of Income-IndividualIncome Tax Returns.
[291 Investment credit was included in the more-inclusivegeneral business tax credit starting with 1984. Withexceptions, investment credit was repealed effective1986.
[30] Includes income tax after credits and additional taxfor tax preferences, Le, "minimum tax" or "altema-tive minimum tax" (see footnote 31).
[31] The add-on "minimum tax" on "tax preferences"(chief among which were long-term capital gains)was introduced starting with 1970. (This tax wasformerly described in Statistics of Income as the"additional tax for tax preferences.") The minimumtax computation, using a base related to taxableincome, was revised and the tax rate increasedeffective 1976. The number of preferences subject totax was also revised effective 1976 and 198 1.Starting with 1979, two major preferences formerlysubject to minimum tax (including long-term capitalgains) were subjected, instead, to the new "alterna-tive minimum tax" (AMT) which required taxpayersto pay the larger of the regular income tax or AMT.Computation of AMT was revised effective 1980 (toallow tax to be reduced by certain credits) and,again, effective 1981 (to modify the graduated ratestructure). Minimum tax was abolished effective1983 and many of the tax preferences subject to thistax subjected, instead, to a revised AMT. AMT was
191
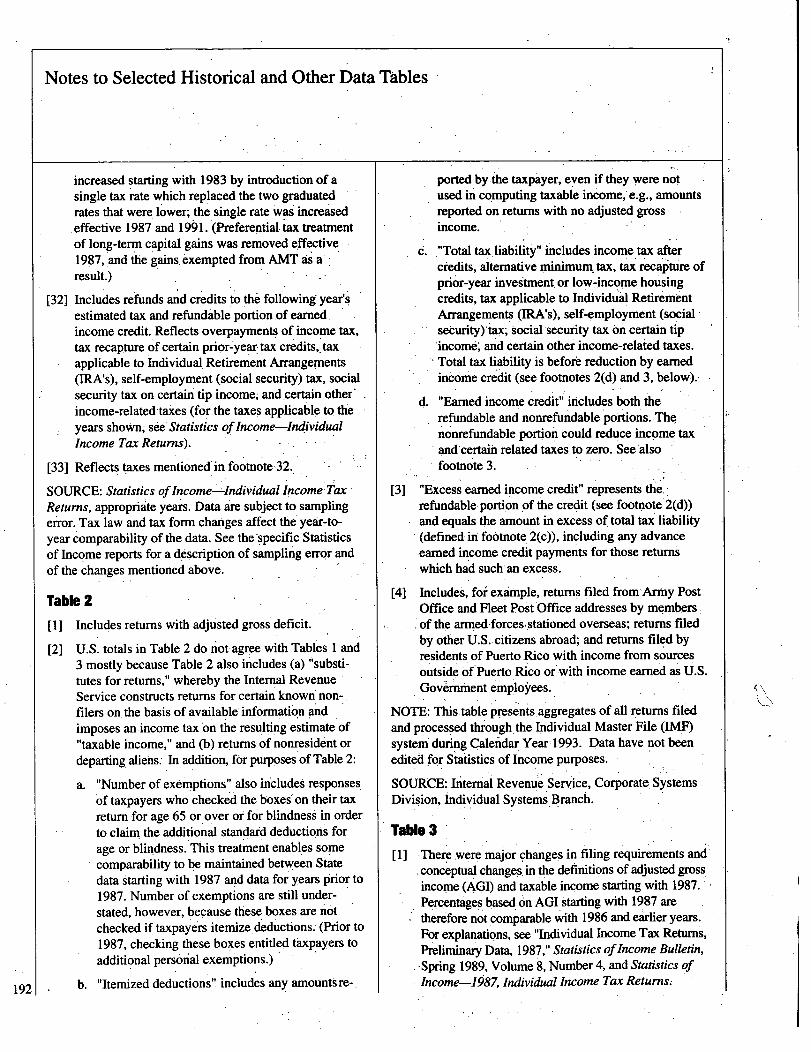
Notes to Selected Historical and Other Data Tables
192
increased starting with 1983 by introduction of asingle tax rate which replaced the two graduatedrates that were. lower; the single rate was increased
. effective 1987 and 190 l.'(Preferential tax treatmentof long-term capital gains was removed effective1987,,and the gains. exempted from AMT as a'.result.)
[321 Includes refunds and credits to the following year'sestimated tax and refundable portion of earned.income credit. Reflects overpayments of income tax,tax recapture of certain prior-year
'tax credits,, tax
applicable to Individual, Retirement Arrangements(IRA's), self-employment (social security) tax, socialsecurity tax on certain tip income; and,certain other'income-related takes (for.the taxes applicable to, theyears shown,- see Statistics of Income-IndividualIncome Tax Returns).
[331 Reflects taxes mentionedin footnote-32.
SOURCE: Statistics of Income-Individual Income TaxReturns, appropriate years. Data are subject to. samplingerror. Tax law and tax formchanges affect the year-to-year comparability of the data. See the'specific Statisticsof Income reports for a description of sampling error andof the changes mentioned above.
Table 2
[11 Includes returns with adjusted gross deficit
[2] U.S. totals in Table 2 do not agree with Tables I and3 mostly because Table 2 also includes (a) "substi-tutes for returns," whereby the Internal RevenueService constructs returns for certain known non-,filers on, the basis of available information andimposes an income taxon the resulting estimate of"taxable income," and (b) returns. of nonresident ordeparting aliens: In addition, for purposes ofTable 2:
a. "Number of exemptions" also includes responsesof taxpayers who checked the boxes~ on their taxreturn for age 65 or over or for blindness in orderto claim the additional standard deductions forage or blindness. This treatment enab
.les some
comparability to be maintained between Statedata starting with 1987 and data for years prior to1987. Number of exemptions are still under-stated, however, because these boxes are notchecked if taxpayers itemize. deductions. (Prior to1987, checking these boxes entitled taxpayers toadditional personal exemptions.)
b. "Itemized deductions". includes any amounts re-.
ported by the taxpayer, even if they were notused in computing taxable income,. e.g., mountsreported on returns with no adjusted grossincome.
6.. "Total tax.liability" includes income tax aftercredits, alternative minimum, tax, tax recapture ofpnor-year investment, or low-income housingcredits, tax applicable to Individual RetirementArrangements (IRA's), self-employment (socialsecurity)'tax-1 social security tax on certain tip'income, and certain other income-relaied taxes.Total tax liability is before reduction by earnedincome credit (see footnotes 2(d) and 3, below).-
d. "Earned income credit" includes both therefundable and nonrefundable portions. The,nonrefundable portion could reduce income taxand'certaih related taxes to zero. See alsofootnote 3.
[31 "Excess earned income credit" represents the.refundable portion.of the credit (see footnote 2(d))and equals the amount in excess of total tax liability(defined in footnote 2(c)), including any advanceearned income credit payments for those returnswhich had such'an excess.
[4] Includes, foi example, returns filed from'Army PostOffice and Fleet Post Office addresses by membersof the armed forces,stationed overseas; returns filedby other U.S. citizens abroad; and returns filed byresidents of PuertoRico with income from sourcesoutside of
IPuerto Rico or'with income earned as U.S.
Gove'rnment employees.
NOTE: This table presents aggregates of all returns filedand processed through. the Individual Master File (MMsystem during Calendar Year 1993. Data have not beenedited for Statistics of income purposes.
SOURCE: Internal Revenue SeryIice, Corporate Systems
Division, Individual Systems Branch.
Table 3
[1] There were major changes in filing requirements andconceptual changes, in the definitions of adjusted grossincome (AGI) and taxable income starting with 1987.Percentages based on AGI starting with 1987 aretherefore not comparable with 1986 and earlier years.For explanations, see '1ndividual Income Tax Returns,Preliminary Data, 1987," Statistics ofIncome Bulletin,-Spring 1989, Volume 8, Number 4, and Statistics ofIncome-1987, Individual Income Tax Returns.
I
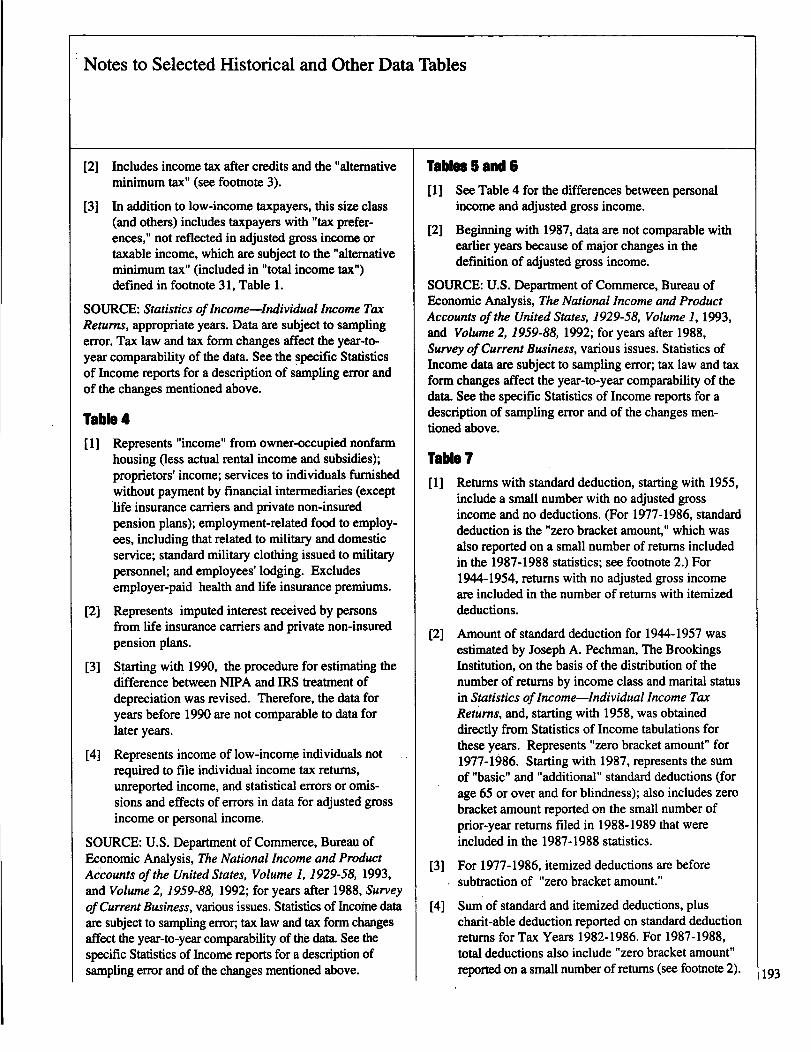
Notes to Selected Historical and Other Data Tables
[2] Includes income tax after credits and the "alternative
[31
n-Animum tax" (see footnote 3).
In addition to low-income taxpayers, this size class(and others) includes taxpayers with "tax prefer-ences," not reflected in adjusted gross income ortaxable income, which are subject to the "alternativeminimum tax" (included in "total income tax")defined in footnote 31, Table 1.
SOURCE: Statistics of Income-Individual Income TaxReturns, appropriate years. Data are subject to samplingerror. Tax law and tax form changes affect the year-to-year comparability of the data. See the specific Statisticsof Income reports for a description of sampling error andof the changes mentioned above.
Table 4[1] Represents "income" from owner-occupied nonfarm
housing (less actual rental income and subsidies);proprietors' income; services to individuals furnishedwithout payment by financial intermediaries (exceptlife insurance carriers and private non-insuredpension plans); employment-related food to employ-ees, including that related to military and domesticservice; standard military clothing issued to militarypersonnel; and employees' lodging. Excludesemployer-paid health and life insurance premiums.
[2] Represents imputed interest received by personsfrom life insurance carriers and private non-insuredpension plans.
[3] Starting with 1990, the procedure for estimating thedifference between NIPA and IRS treatment ofdepreciation was revised. Therefore, the data foryears before 1990 are not comparable to data forlater years.
[4] Represents income of low-income individuals notrequired to file individual income tax returns,unreported income, and statistical errors or omis-sions and effects of errors in data for adjusted grossincome or personal income.
SOURCE: U.S. Department of Commerce, Bureau ofEconomic Analysis, The National Income and ProductAccounts of the United States, Volume 1, 1929-58, 1993,and Volume 2, 1959-88, 1992; for years after 1988, Surveyof Current Business, various issues. Statistics of Income dataare subject to sampling error; tax law and tax form changesaffect the year-to-year comparability of the data. See thespecific Statistics of Income reports for a description ofsampling error and of the changes mentioned above.
Tables 5 and 6[1] See Table 4 for the differences between personal
income and adjusted gross income.
[2] Beginning with 1987, data are not comparable withearlier years because of major changes in thedefinition of adjusted gross income.
SOURCE: U.S. Department of Commerce, Bureau ofEconomic Analysis, The National Income and ProductAccounts of the United States, 1929-58, Volume 1, 1993,and Volume 2, 1959-88, 1992; for years after 1988,Survey ofCurrent Business, various issues. Statistics ofIncome data are subject to sampling error; tax law and taxform changes affect the year-to-year comparability of thedata. See the specific Statistics of Income reports for adescription of sampling error and of the changes men-tioned above.
Table 7
[1] Returns with standard deduction, starting with 1955,include a small number with no adjusted grossincome and no deductions. (For 1977-1986, standarddeduction is the "zero bracket amount," which wasalso reported on a small number of returns includedin the 1987-1988 statistics; see footnote 2.) For1944-1954, returns with no adjusted gross incomeare included in the number of returns with itemizeddeductions.
(2] Amount of standard deduction for 1944-1957 wasestimated by Joseph A. Pechman, The BrookingsInstitution, on the basis of the distribution of thenumber of returns by income class and marital statusin Statistics of Income-Individual Income TaxReturns, and, starting with 1958, was obtaineddirectly from Statistics of Income tabulations forthese years. Represents "zero bracket amount" for1977-1986. Starting with 1987, represents the sumof "basic" and "additional" standard deductions (forage 65 or over and for blindness); also includes zerobracket amount reported on the small number ofprior-year returns filed in 1988-1989 that wereincluded in the 1987-1988 statistics.
[31 For 1977-1986, itemized deductions are before~ subtraction of "zero bracket amount."
[4] Sum of standard and itemized deductions, pluscharit-able deduction reported on standard deductionreturns for Tax Years 1982-1986. For 1987-1988,total deductions also include "zero bracket amount"reported on a small number of returns (see footnote 2). 193
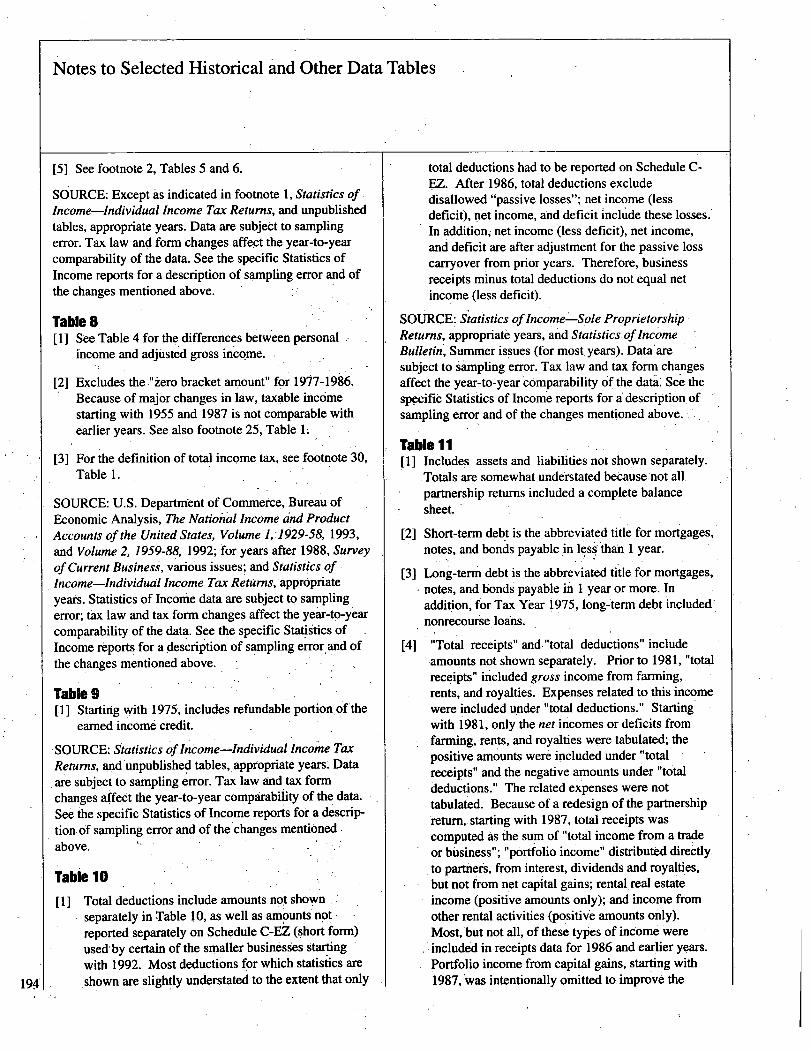
Notes to Selected Historical and Other Data Tables
194'
[5] See footnote 2, Tables 5 and 6.
SOURCE: Except 'as indicated in footnote 1, Statistics ofIncome-Individual Income Tax Returns, and unpublishedtables, appropriate years. Data are subject to samplingerror. Tax law and form changes affe
'ct the year-to-year
comparability of the data. See the specific Statistics ofIncome reports for a description of sampling error and ofthe changes mentioned above.
Table B.I I See Table 4 for the differences between personal
income and adjusted gross income.
[21 Excludes the ."zero bracket amount" for 1977-1986.Because of major changes in law, taxable incomestarting with 1955 and 1987 is not comparable withearlier years. See also footnote 25, Table L
[3] For the definition of total income tax, see footnote 30,Table 1.
SOURCE: U.S. Department of Commerce, Bureau ofEconomic Analysis, The National Income and ProductAccounts of the United States, Volume ],: 1029-58, 1993,and Volume 2, 1959-88, 1992; for years after 1988, Surveyof Current Business, various issues; and Statistics ofIncome-Individual Income Tax Returns, appropriateyears. Statistics of Income data are subject to samplingerror; tax law and tax form changes affect the year-to-yearcomparability of the data. See the specific Statistics ofIncome reports for a description of sampling error.and ofthe changes mentioned above.
Table 9[1] Starting with 1975, includes refundable portion,of the
earned income credit.
-SOURCE: Statistics of Income-Individual Income TaxReturns, and unpublished tables, appropriate years' Dataare subject to sampling error. Tax law And tax formchanges affect the year-to-year comparability of the data.See the specific Statistics of Income reports for a descrip-tion of sampling error and of the changes mentionedabove.
Table 10
[11 Total deductions include amounts not shown . : .separately in Table 10, as well as amounts not .. .reported separately on Schedule C-Ei (short 'form)used-by certain of the smaller busines~es.startingwith 1992
*Most deductions for which statistics are
shown are slightly understated to the extent that only
total deductions had to be reported on Schedule C-EZ. After 1986, total deductions excludedisallowed "passive losses"; net income (lessdeficit), net income, and deficit include these losses.'In additionj net income (less deficit), net income,and deficit are after adjustment for the passive losscarryover from prior years. Therefore, businessreceipts rninus total deductions do not equal netincome (less deficit).
SOURCE: Statistics of Income-Sole Proprietorshl~pReturns, appropriate years, and Statistics of IncomeBulletin, Summer issues (for most. years). Data'aresubject to sampling error. Tax law and tax form changesaffect the year-to-year comparability of the data'. See thespecific Statistics of Income reports for i description. ofsampling error and of the changes mentioned above.
Table I I[1] Includes assetsand liabilities not shown separately.
-Totals are somewhat understated because'not all.partnership returns included a.complete balancesheet. '
.
[2] Short-term debt. is the abbreviated title for mortgages,
[31
notes, and bonds payable in less an I year.
Long-term debt is the abbreviated title for mortgages,notes, and bonds payable in I year or more. Inaddition, for Tax Year 1975, long-term debt included'nonrecourse. loans.
[41 "Total receipts" and "total deductions" includeamounts not shown separately. Prior to 1981, "totalreceipts" included gross income from farming,rents, and royalties. Expenses related to this incomewere included under "total deductions." Startingwith 1981, only the net incomes or deficits fromfarming, rents, and royalties were tabulated; thepositive amounts were included under "total , ,receipts" and the negative amounts under "totaldeductions." The related expenses were nottabulated. Because of a redesign of the partnershipreturn, starting with 1987, total receipts wascomputed As the sum of "total income from a tradeor business"; "portfolio income" distributed directlyto partnen, from interest, dividends and royalties,but not from net capital gains; rentalreal estateincome (positive amounts only); and income fromother rental activities (positive amounts only).Most, but not all, of these types of income wereincluded in receipts data for 1986 and earlier years.Portfolio income from capital gains, starting with1987,was intentionally omitted to improve the
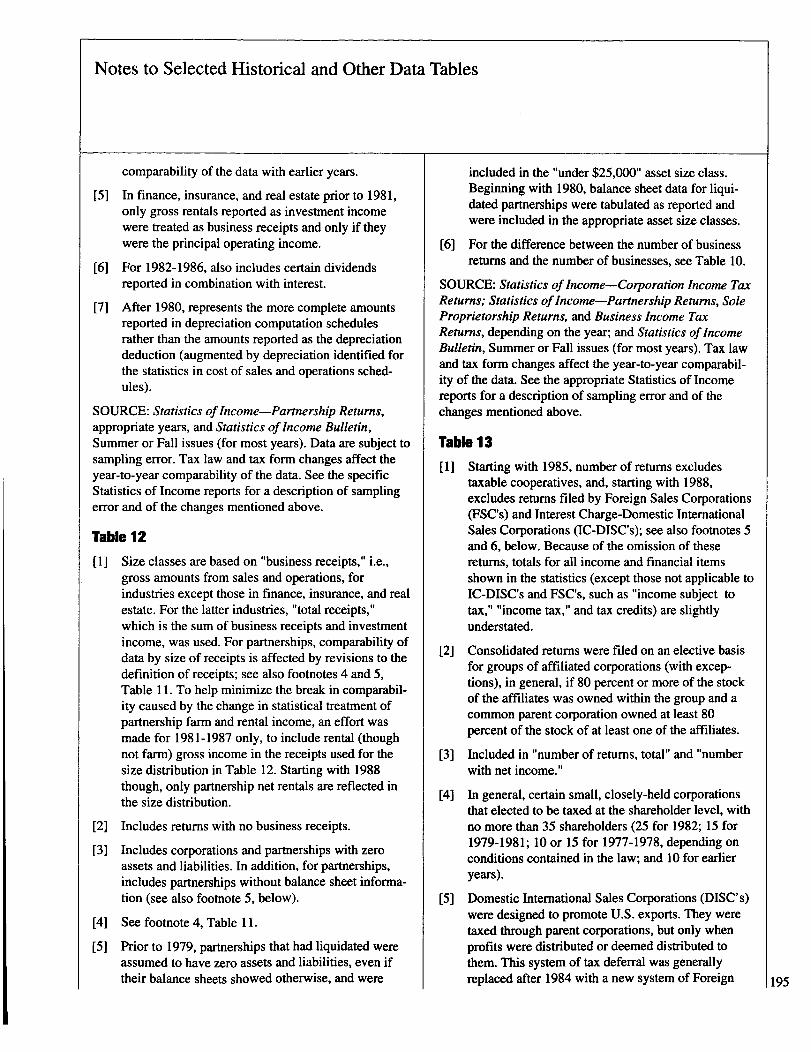
Notes to Selected Historical and Other Data Tables
comparability of the data with earlier years.
[5] In finance, insurance, and real estate prior to 1981,only gross rentals reported as investment incomewere treated as business receipts and only if theywere the principal operating income.
[61 For 1982-1986, also includes certain dividendsreported in combination with interest.
[7] After 1980, represents the more complete amountsreported in depreciation computation schedulesrather than the amounts reported as the depreciationdeduction (augmented by depreciation identified forthe statistics in cost of sales and operations sched-ules).
SOURCE: Statistics of Income-Partnership Returns,appropriate years, and Statistics of Income Bulletin,Summer or Fall issues (for most years). Data are subject tosampling error. Tax law and tax form changes affect theyear-to-year comparability of the data. See the specificStatistics of Income reports for a description of samplingerror and of the changes mentioned above.
Table 12
[1] Size classes are based on "business receipts," i.e.,gross amounts from sales and operations, forindustries except those in finance, insurance, and realestate. For the latter industries, "total receipts,"which is the sum of business receipts and investmentincome, was used. For partnerships, comparability ofdata by size of receipts is affected by revisions to thedefinition of receipts; see also footnotes 4 and 5,Table 11. To help minimize the break in comparabil-ity caused by the change in statistical treatment ofpartnership farm and rental income, an effort wasmade for 1981-1987 only, to include rental (thoughnot farm) gross income in the receipts used for thesize distribution in Table 12. Starting with 1988though, only partnership net rentals are reflected inthe size distribution.
[2] Includes returns with no business receipts.
[3] Includes corporations and partnerships with zeroassets and liabilities. In addition, for partnerships,includes partnerships without balance sheet informa-tion (see also footnote 5, below).
[41 See footnote 4, Table I I -
[5] Prior to 1979, partnerships that had liquidated wereassumed to have zero assets and liabilities, even iftheir balance sheets showed otherwise, and were
included in the "under $25,000" asset size class.Beginning with 1980, balance sheet data for liqui-dated partnerships were tabulated as reported andwere included in the appropriate asset size classes.
[61 For the difference between the number of businessreturns and the number of businesses, see Table 10.
SOURCE: Statistics ofIncome-Corporation Income TaxReturns; Statistics of Income-Partnership Returns, SoleProprietorship Returns, and Business Income TaxReturns, depending on the year; and Statistics of IncomeBulletin, Summer or Fall issues (for most years). Tax lawand tax form changes affect the year-to-year comparabil-ity of the data. See the appropriate Statistics of Incomereports for a description of sampling error and of thechanges mentioned above.
Table 13
[11 Starting with 1985, number of returns excludestaxable cooperatives, and, starting with 1988,excludes returns filed by Foreign Sales Corporations(FSC's) and Interest Charge-Domestic InternationalSales Corporations (IC-DISC's); see also footnotes 5and 6, below. Because of the omission of thesereturns, totals for all income and financial itemsshown in the statistics (except those not applicable toIC-DISC's and FSC's, such as "income subject totax," "income tax," and tax credits) are slightlyunderstated.
[2] Consolidated returns were filed on an elective basis
[31
for groups of affiliated corporations (with excep-tions), in general, if 80 percent or more of the stockof the affiliates was owned within the group and acommon parent corporation owned at least 80percent of the stock of at least one of the affiliates.
Included in "number of returns, total" and "numberwith net income."
[4] In general, certain small, closely-held corporationsthat elected to be taxed at the shareholder level, withno more than 35 shareholders (25 for 1982; 15 for1979-1981; 10 or 15 for 1977-1978, depending onconditions contained in the law; and 10 for earlieryears).
[5] Domestic International Sales Corporations (DISC's)were designed to promote U.S. exports. They weretaxed through parent corporations, but only whenprofits were distributed or deemed distributed tothem. This system of tax deferral was generallyreplaced after 1984 with a new system of Foreign 195
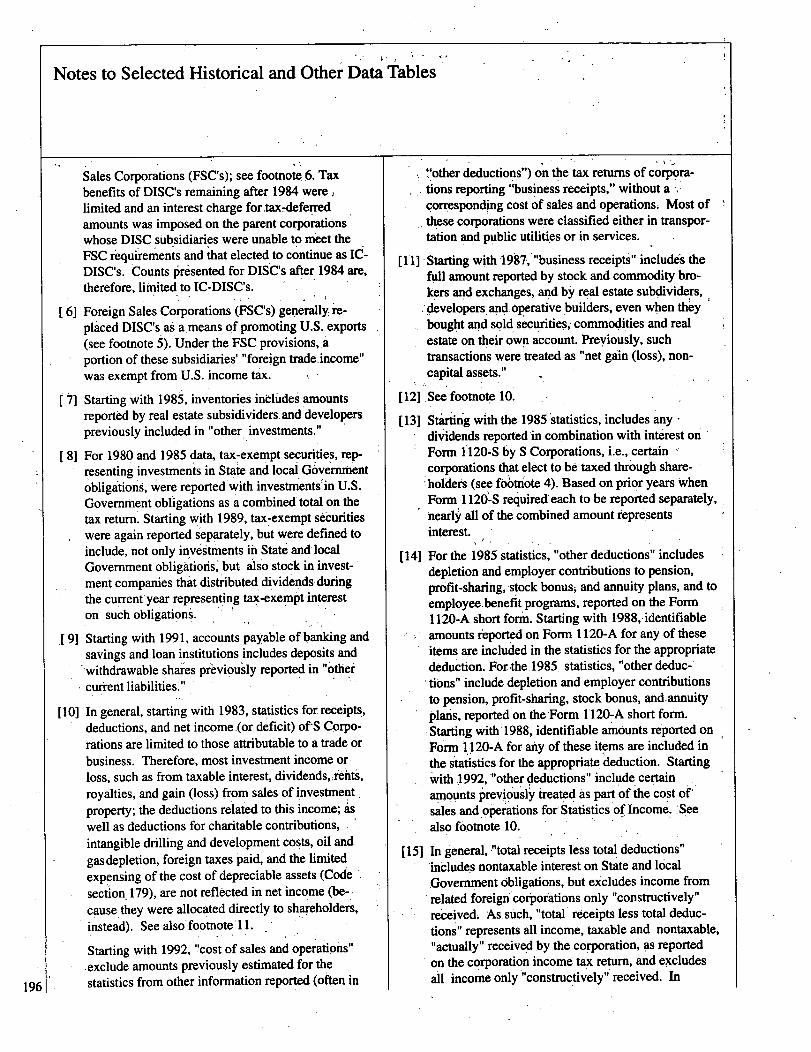
Notes to Selected Historical and Other Data Tables
196
Sales Corporations (FSC's); see footnote 6. Taxbenefits of DISC's remaining after 1984 werelimited and an interest charge fortax-deferredamounts was imposed on the parent corporationswhose DISC subsidiaries were unable to meet theFSC requirements and that elected to continue as IC-DISC's. Counts ~reisented for DISC's after 1984 are,therefore, limited to IC-DISC's.
[ 6] Foreign Sales Corporations (FSC's) generally re-placed DISC's. as a.means of promoting U.S.. exports,(see footnote 5). Under the FSC provisions,aportion of these subsidiaries' "foreign trade.income"was exempt from U.S. income tax.
[ 11 Starting with 19M, inventories includes' arriountsreported by real estate subsidividers, and developerspreviously included in "other, investments."
[ 8] For 1980 and 1985 data, tax-exempt securities, rep-resenting investments in State and local Governmentobligations, were reported -with investmentsin U.S.-Government obligations as a combined total on thetax return. Starting with 1989, tax-exempt securities
191
were again reported sIeparately, but were defined to
include, not only investments in State and localGovernment obligations" but also stock in invest-ment companies that distributed, dividends duringthe cur-rent year representing tax-exempt intereston such obligations.
Starting with 1991, accounts payable of banking andsavings and loan institutions includes deposits and.withdrawable shares previously reported in '.'othercurrent liabilities. "
[10] In general, starting with 1983, statistics for receipts,deductions, and net income.(or deficit) of-S CQrpo-7rations are limited to those attributable to a trade orbusiness. Therefore, most investment income orloss, such as from taxable interest, dividends, rents,royalties, and gain (loss) from sales of investment,property; the deductions related to this income; aswell as deductions for charitable contributions,intangible drilling and development costs, oil and
gasdepletion, foreign taxesIpaid, and the limited
expensing of the cost of depreciable assets (Codesection. 179), are not reflected in net income, (be-cause they were allocated directly to shareholders,instead). See also'footnote 11.
Starting with 1992, "cost of sales and operations"exclude amounts previously estimated for.thestatistics from other information reported (often in
"other deductions") on the tax returns of corpotions reporting "business receipts," without acorresponding cost of sales and operations. Most ofthese corporations were classified either in transpor-tation and public utilities or in services.
[I I] Starting with 1987, "business receipts" includes thefull amount reported by stock and commodity bro-kers and exchanges, and by real estate subdividers,developers, and,operative builders~ even when theybought and sold securities~ commodities and realestate on their own account. Previously, suchtransactions were treated as "net gain (loss), non-capital assets."
12] See footnote 10.
[13] Starting with the 1985statistics, includes any -dividends reported in combination with interest on'Form I 120-S by S Corporations, i.e., certaincorporations that elect to be taxed through share-holders (see footnote 4)-. Based on prior years, whenForm 1126-S required each to be reported separately,nearly all of the combined amount representsinterest.
14] - For the 1985 statistics, "other deductions" includesdepletion and employer contributions to pension,profit-sharing, stock bonusi and annuity plans, and toemployee. benefit programs, reported on the Form1120-A short form. Starting with 1988,. identifiableamounts reported on Form I I20-A for any* of theseitems are included in the statistics for the appropriatededuction. For the 1985 statistics, "other deduc-'tions" include depletion and employer contributionsto pension, profit-sharing, stock bonus, and.annuityplans, reported on the -Form I I20-A short form.Starting with 1988, identifiable amounts reported onForm 1.120-A for any of these items are included inthe statistics for the appropriate, deduction. Startingwith 1992, "other deductions" include certainamounts previously treated As part of the cost of'sales and operations for Statistics of Income. 'Seealso footnote 10.
[151 In general, "total receipts: less total deductions"includes nontaxable interest on State and localGovernment obligations, but excludes income fromrelated foreigrilcorporations only "constructively"received. As.such, "total receipts less total deduc-tions" represents all income, taxable and nontaxable,tiactually" received by the corporation, as reportedon the corporation income tax return, and excludesall income only "constructively" received. In
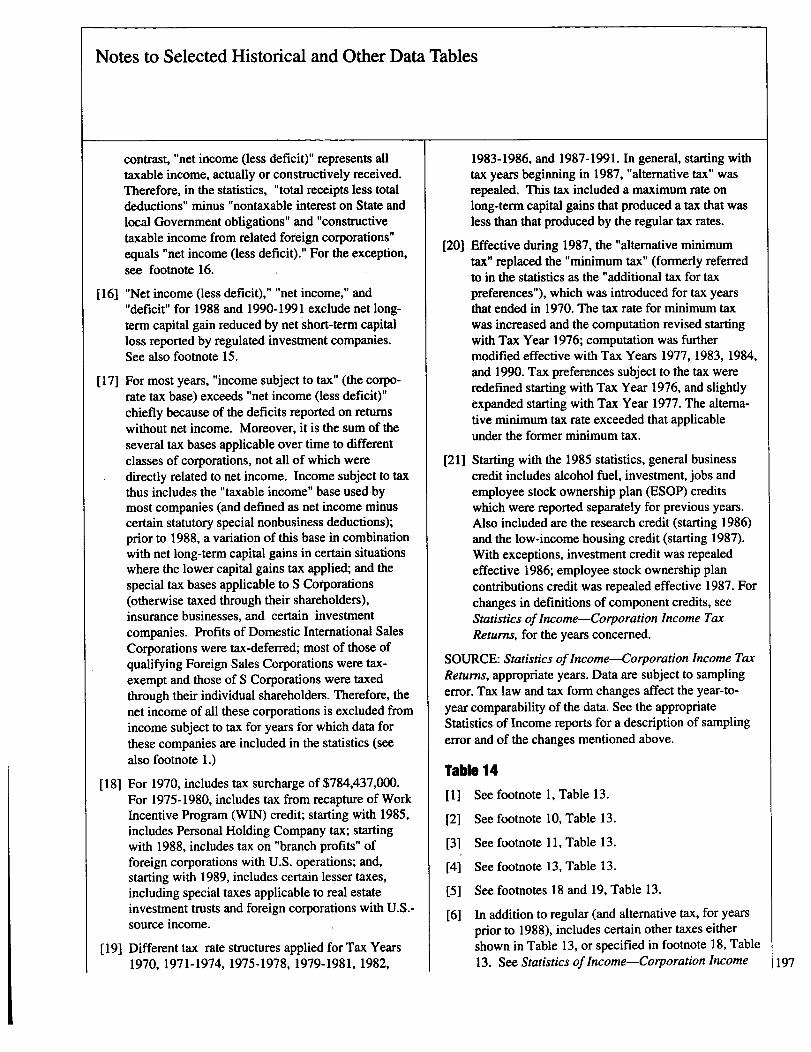
Notes to Selected Historical and Other Data Tables
contrast, "net income (less deficit)" represents alltaxable income, actually or constructively received.Therefore, in the statistics, "total receipts less totaldeductions" minus "nontaxable interest on State andlocal Government obligations" and "constructivetaxable income from related foreign corporations"equals "net income (less deficit)." For the exception,see footnote 16.
[161 "Net income (less deficit)," "net income," and"deficit" for 1988 and 1990-1991 exclude net long-term capital gain reduced by net short-term capitalloss reported by regulated investment companies.See also footnote 15.
[17] For most years, "income subject to tax" (the corpo-rate tax base) exceeds "net income (less deficit)"chiefly because of the deficits reported on returnswithout net income. Moreover, it is the sum of theseveral tax bases applicable over time to differentclasses of corporations, not all of which weredirectly related to net income. Income subject to taxthus includes the "taxable income" base used bymost companies (and defined as net income minuscertain statutory special nonbusiness deductions);prior to 1988, a variation of this base in combinationwith net long-term capital gains in certain situationswhere the lower capital gains tax applied; and thespecial tax bases applicable to S Corporations(otherwise taxed through their shareholders),insurance businesses, and certain investmentcompanies. Profits of Domestic International SalesCorporations were tax-deferred; most of those ofqualifying Foreign Sales Corporations were tax-exempt and those of S Corporations were taxedthrough their individual shareholders. Therefore, thenet income of all these corporations is excluded fromincome subject to tax for years for which data forthese companies are included in the statistics (seealso footnote 1.)
[181 For 1970, includes tax surcharge of $784,437,000.For 1975-1980, includes tax from recapture of WorkIncentive Program (WIN) credit; starting with 1985,includes Personal Holding Company tax; startingwith 1988, includes tax on "branch profits" offoreign corporations with U.S. operations; and,starting with 1989, includes certain lesser taxes,including special taxes applicable to real estateinvestment trusts and foreign corporations with U.S.-source income.
19] Different tax rate structures applied for Tax Years.1970, 1971-1974, 1975-1978, 1979-1981, 1982,
1983-1986, and 1987-1991. In general, starting withtax years beginning in 1987, "alternative tax" wasrepealed. This tax included a maximum rate onlong-term capital gains that produced a tax that wasless than that produced by the regular tax rates.
[20] Effective during 1987, the "alternative minimumtax" replaced the "minimum tax" (formerly referredto in the statistics as the "additional tax for taxpreferences"), which was introduced for tax yearsthat ended in 1970. The tax rate for minimum taxwas increased and the computation revised startingwith Tax Year 1976; computation was furthermodified effective with Tax Years 1977, 1983, 1984,and 1990. Tax preferences subject to the tax wereredefined starting with Tax Year 1976, and slightlyexpanded starting with Tax Year 1977. The altema-tive minimum tax rate exceeded that applicableunder the former minimum tax.
[211 Starting with the 1985 statistics, general businesscredit includes alcohol fuel, investment, jobs andemployee stock ownership plan (ESOP) creditswhich were reported separately for previous years.Also included are the research credit (starting 1986)and the low-income housing credit (starting 1987).With exceptions, investment credit was repealedeffective 1986; employee stock ownership plancontributions credit was repealed effective 1987. Forchanges in definitions of component credits, seeStatistics ofIncome-Corporation Income TaxReturns, for the years concerned.
SOURCE: Statistics of Income-Corporation Income TaxReturns, appropriate years. Data are subject to samplingerror. Tax law and tax form changes affect the year-to-year comparability of the data. See the appropriateStatistics of Income reports for a description of samplingerror and of the changes mentioned above.
Table 14[1] See footnote 1, Table 13.
[21 See footnote 10, Table 13.
[31 See footnote 11, Table 13.
[4] See footnote 13, Table 13.
[5] See footnotes 18 and 19, Table 13.
[61 In addition to regular (and alternative tax, for yearsprior to 1988), includes certain other taxes eithershown in Table 13, or specified in footnote 18, Table13. See Statistics of Income-Corporation Income 197
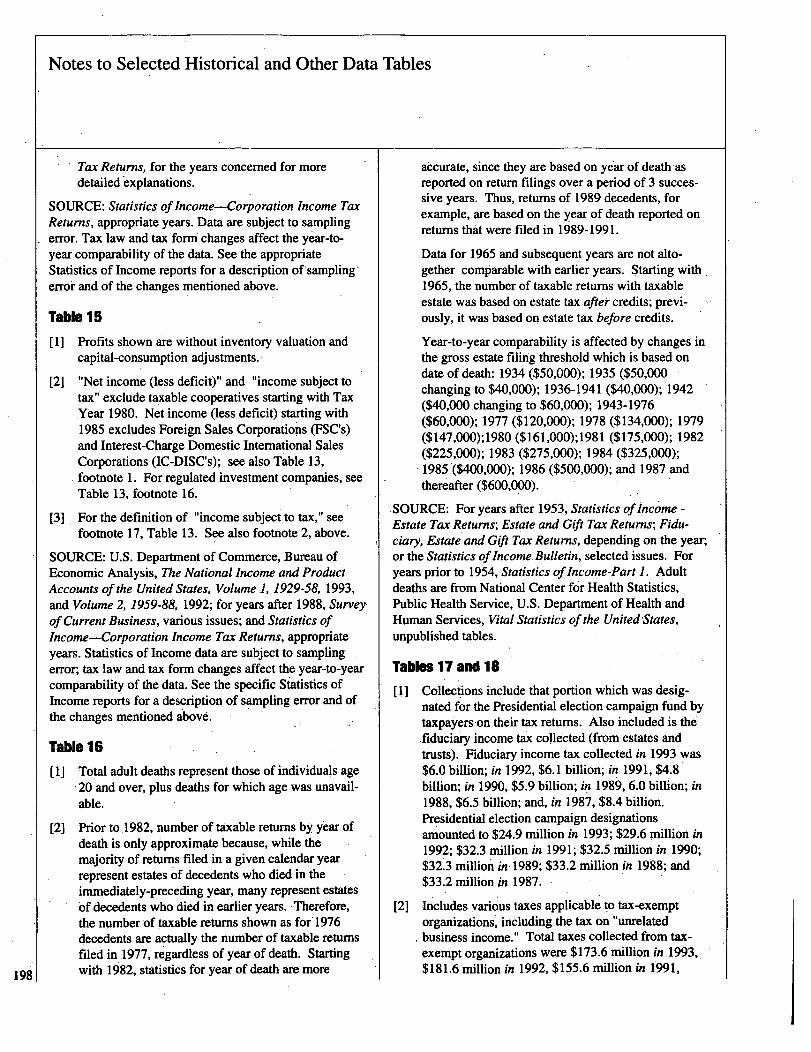
Notes to Selected Historical and Other Data Tables
198
Tax Retums, for the years concerned for moredetailed explanations.
SOURCE: Statistics of Income-Corporation Income TaxRetums, appropriate years. Data are subject to samplingerror. Tax law and tax form changes affect the year-to-year comparability of the data. See the appropriateStatistics of Income reports for a description of'sampling'error and of the changes mentioned above.
Table 15
[1] Profits shown are without inventory valuation andcapital-consumption adjustments.
[2] "Net income (less deficit)" and "income subject totax" exclude taxable cooperatives starting with TaxYear 1980. Net income (less deficit) starting with1085 excludes Foreign Sales Corporatio;'is (FSC's)and Interest-Charge Domestic International SalesCorporations (IC-DISC's); see also Table 13,footnote 1. For regulated investment companies, seeTable 13, footnote 16.
[31 . For the definition of "income subject to tax," seefootnote 17, Table 13. See also footnote 2, above.I
SOURCE: U.S. Department of Commerce, Bureau ofEconomic Analysis, The National Income and ProductAccounts of the United States, Volume 1, 1929-58, 1993,and Volume 2, 1959-88, 1992; for years after 1988, Survey.of Current Business, various issues; and Statistics ofIncome-Corporation Income Tax Retums, appropriateyears. Statistics of Income data are subject to samplingerror; tax law and tax form changes affect the year-to-yearcomparability of the data. See the specific Statistics ofIncome reports for a description of sampling error and ofthe changes mentioned above.
Table 16
[1] Total adult deaths represent those of individuals age-20 and over, plus deaths for which age was unavail-able.
[2] Prior to 1982, number of taxable returns by year ofdeath is only approximate because, while themajority of returns filed in a given calendar yearrepresent estates of decedents who died in theimmediately-preceding year, many represent estatesof decedents who died in earlier years. Therefore,the number of taxable returns shown as for* 1976decedents are actually the number of taxable returnsfiled in .1977, regardless of year of death. Startingwith 1982, statistics for year of death are more
accurate, since they are based on year of death asreported on return filings over a period of 3 succes-siveyears. Thus, returns of 1999 decedents, forexample, are based on the year of death reported onreturns that were filed in 1989-1991.
Data for 1965 and subsequent years are not alto-gether comparable with earlier years. Starting with1965, the number of taxable returns with taxableestate was based on estate tax after credits; previ-ously, it was based on estate tax before credits.
Year-to-year comparability is affected by changes inthe gross estate filing threshold which is based ondate of death: 1934 ($50,000); 1935 ($50,000changing to $40,000); 1936-1941 ($40,000); 1942($40,000changing to $60,000); 1943-1976($60,000); 1977 ($120,000); 1978 ($134,000); 1979($147,000);1980 ($161,000);1981 ($175,000); 1982($225,000); 1983 ($275,000); 1984 ($325,000);1985 ($400,000); 1986 ($500,000); and 1987 andthereafter($600,000). - -
SOURCE: For years after 1953, Statistics of Income -Estate Tax Retums; Estate and Gift Tax Retums; Fidu-ciary, Estate and Gift Tax Returris, depending on the year;or the Statistics of Income. Bulletin, selected issues. Foryears prior to 1954, Statistics of Income-Part 1. Adultdeaths are from National Center for Health Statistics,Public Health Service, U.S. Department of Health andHuman Services, Vital Statistics of the United States,unpublished tables.
Tables 17 and 18[1] Collections include that portion which was desig-
nated for the Presidential election campaign fund bytaxpayers~on their tax returns. Also included is thefiduciary income tax collected (from estates.andtrusts). Fiduciary income tax collected in 1993 was$6.0 billion; in 1992, $6.1.billion; in 1991, $4.8billion; in 1990, $5.9 billion; in 1989, 6.0 billion; in1988, $6.5. billion; and, in 1987, $8.4 billion.Presidential election campaign designationsamounted to $24.9 million in 1993; $29.6 million in1992; $32.3 million in 1991; $32.5 million in 1990;$32.3 million in, 1989; $33.2 million in 1988; and$33.2 million in 1987. -
[21 Includes various taxes applicable to tax-exemptorganizations, including the tax on "unrelatedbusiness income." Total taxes collected from tax-exempt organizations were $173.6 million in 1993,,$181.6 million in 1992, $155.6 million in 1991,
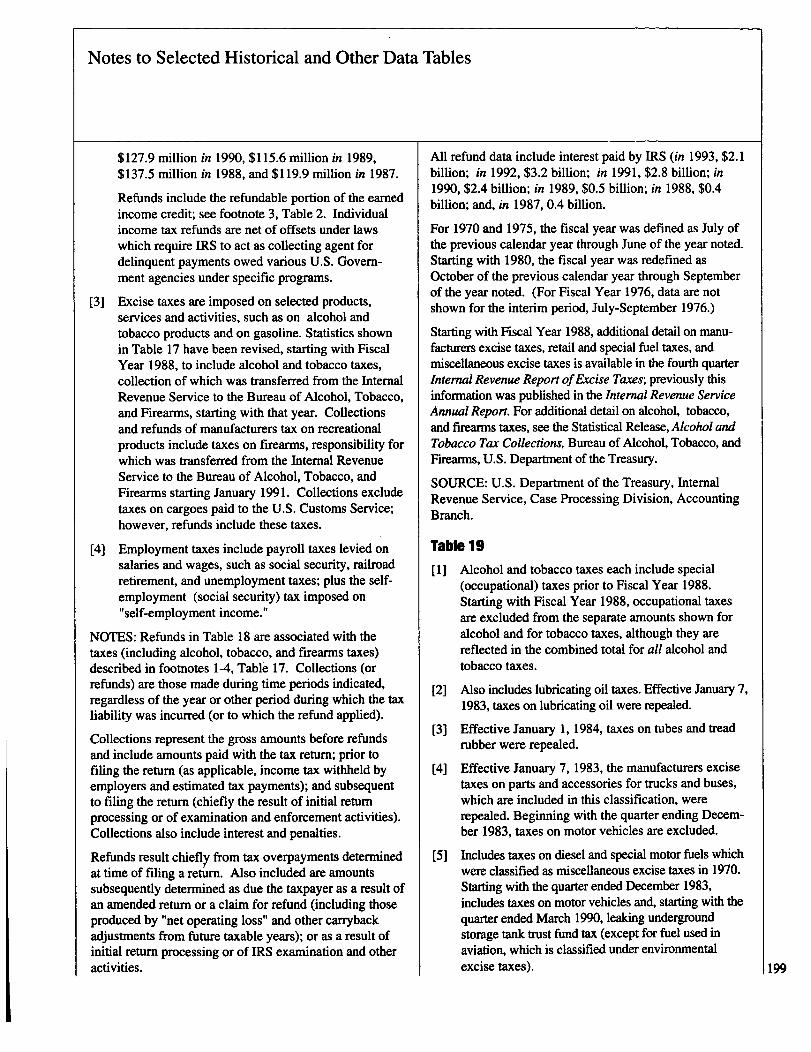
Notes to Selected Historical and Other Data Tables
$127.9 million in 1990, $115.6 million in 1989,$137.5 million in 1988, and $119.9 million in 1987.
Refunds include the refundable portion of the earnedincome credit; see footnote 3, Table 2. Individualincome tax refunds are net of offsets under lawswhich require IRS to act as collecting agent fordelinquent payments owed various U.S. Govern-ment agencies under specific programs.
[3] Excise taxes are imposed on selected products,services and activities, such as on alcohol andtobacco products and on gasoline. Statistics shownin Table 17 have been revised, starting with FiscalYear 1988, to include alcohol and tobacco taxes,collection of which was transferred from the InternalRevenue Service to the Bureau of Alcohol, Tobacco,and Firearms, starting with that year. Collectionsand refunds of manufacturers tax on recreationalproducts include taxes on firearms, responsibility forwhich was transferred from the Internal RevenueService to the Bureau of Alcohol, Tobacco, andFirearms starting January 1991. Collections excludetaxes on cargoes paid to the U.S. Customs Service;however, refunds include these taxes.
[4] Employment taxes include payroll taxes levied onsalaries and wages, such as social security, railroadretirement, and unemployment taxes; plus the self-employment (social security) tax imposed on"self-employment income."
NOTES: Refunds in Table 18 are associated with thetaxes (including alcohol, tobacco, and firearms taxes)described in footnotes 1-4, Table 17. Collections (orrefunds) are those made during time periods indicated,regardless of the year or other period during which the taxliability was incurred (or to which the refund applied).
Collections represent the gross amounts before refundsand include amounts paid with the tax return; prior tofiling the return (as applicable, income tax withheld byemployers and estimated tax payments); and subsequentto filing the return (chiefly the result of initial returnprocessing or of examination and enforcement activities).Collections also include interest and penalties.
Refunds result chiefly from tax overpayments determinedat time of filing a return. Also included are amountssubsequently determined as due the taxpayer as a result ofan amended return or a claim for refund (including thoseproduced by "net operating loss" and other carrybackadjustments from ftiture taxable years); or as a result ofinitial return processing or of IRS examination and otheractivities.
All refund data include interest paid by IRS (in 1993, $2.1billion; in 1992, $3.2 billion; in 1991, $2.8 billion; in1990, $2.4 billion; in 1989, $0.5 billion; in 1988, $0.4billion; and, in 1987, 0.4 billion.
For 1970 and 1975, the fiscal year was defined as July ofthe previous calendar year through June of the year noted.Starting with 1980, the fiscal year was redefined asOctober of the previous calendar year through Septemberof the year noted. (For Fiscal Year 1976, data are notshown for the interim period, July-September 1976.)
Starting with Fiscal Year 1988, additional detail on manu-facturers excise taxes, retail and special fuel taxes, andmiscellaneous excise taxes is available in the fourth quarterInternal Revenue Report ofExcise Taxes; previously thisinformation was published in the Internal Revenue ServiceAnnual Report. For additional detail on alcohol, tobacco,and firearms taxes, see the Statistical Release, Alcohol andTobacco Tax Collections, Bureau of Alcohol, Tobacco, andFirearms, U.S. Department of the Treasury.
SOURCE: U.S. Department of the Treasury, InternalRevenue Service, Case Processing Division, AccountingBranch.
Table 19
Ill Alcohol and tobacco taxes each include special(occupational) taxes prior to Fiscal Year 1988.Starting with Fiscal Year 1988, occupational taxesare excluded from the separate amounts shown foralcohol and for tobacco taxes, although they arereflected in the combined total for all alcohol andtobacco taxes.
[2] Also includes lubricating oil taxes. Effective January 7,1983, taxes on lubricating oil were repealed.
[3] Effective January 1, 1984, taxes on tubes and treadrubber were repealed.
[4] Effective January 7, 1983, the manufacturers excisetaxes on parts and accessories for trucks and buses,which are included in this classification, wererepealed. Beginning with the quarter ending Decem-ber 1983, taxes on motor vehicles are excluded.
[5] Includes taxes on diesel and special motor ftiels whichwere classified as miscellaneous excise taxes in 1970.Starting with the quarter ended December 1983,includes taxes on motor vehicles and, starting with thequarter ended March 1990, leaking undergroundstorage tank trust fund tax (except for fuel used inaviation, which is classified under environmentalexcise taxes). 199
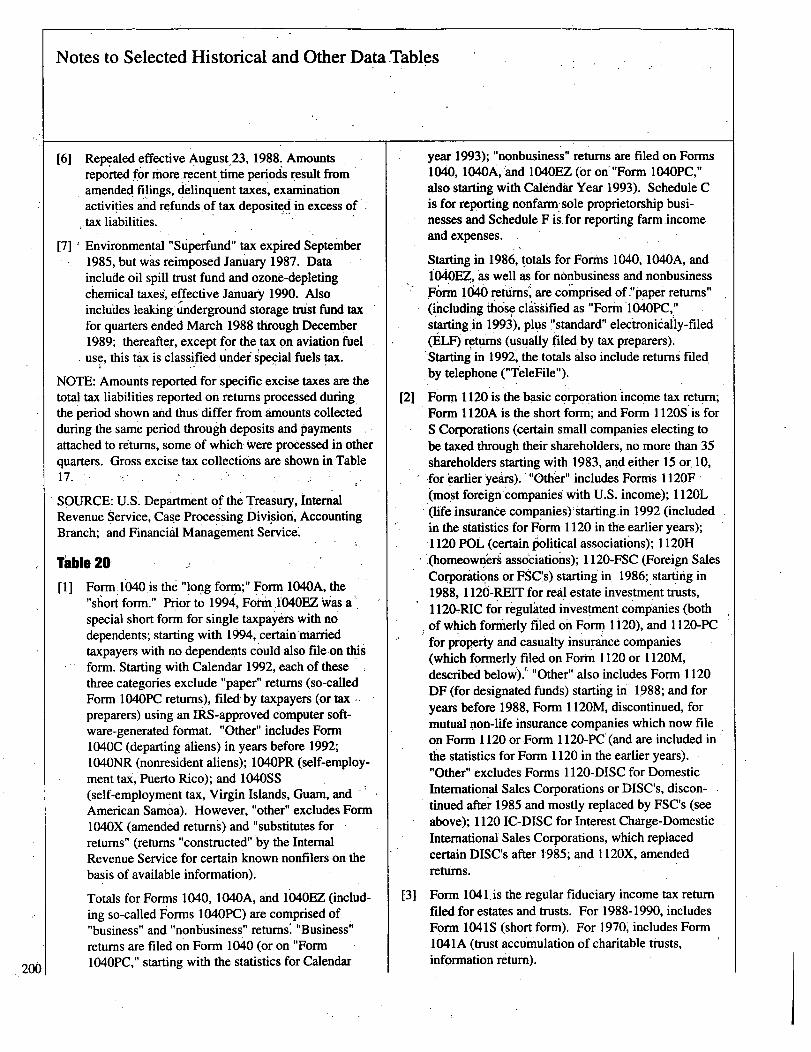
Notes to Selected Historical and Other Data Tables
200
[61 Repealed effective August.23, 1988. Amountsreported for morexecent time periods result fromamended fi
'lings, delinquent taxes, examination
activities and refunds of tax deposited in excess of .:tax liabilities.
[71 ~ Environmental "Superfund" tax expired September1985, but was reimposed January 1987. Datainclude oil spill trust fund and ozone-depletingchemical taxes, effective January 1990. Alsoincludes leaking underground storage trust fund taxfor quarters ended March 1988 through December1989; thereafter, except for the tax on aviation fueluse, this tax is classified under special fuels tax.
NOTE: Amounts reported for specific excise taxes are thetotal tax liabilities reported on returns processed duringthe period shown and thus differ from amounts collectedduring the same period through deposits and Paymentsattached to returns, some of which Were processed in otherquarters. Gross excise tax collections are shown in Table17.
SOURCE: U.S. Department of the Treasury, InternalRevenue Service, Case Processing Divilsion, AccountingBranch; and Financial Management Service.
Tible 20
[I] Form.1040 is the "long form;" Form 1040A, theshort form." Prior to 1994, For'M',1040EZ Was a
special short form for single taxpayers with nodependents; starting with 1994,. certainmarriedtaxpayers with no dependents could also filelon thisform. Starting with Calendar, 1992, each of thesethree categories exclude "paper" returns (so-calledForm 104OPC returns), filed by taxpayers (or taxpreparers) using an IkS-approved computer soft-ware-generated format. "Other" includes Form1040C (departing aliens) in years before 1992;104ONR (nonresident aliens); 1040PR (self-employ-ment tax, Puerto Rico); and 104OSS(self-employment tax, Virgin Islands, Guam, andAmerican Samoa). However, "other" excludes Form104OX (amended returns) and "substitutes forreturns" (returns "constructed" by the InternalRevenue Service for certain known nonfilers on thebasis of available information).
Totals for Forms 1040, 1040A, and 1040EZ (includ-ing so-called Forms 1040PQ are comprised of"business" and "nonliusiness" returns. "Business"returns are filed on Form 1040 (or on "Form104OPC," starting with the statistics for Calendar
year 1993); "nonbusiness" returns are filed on Forms1040,1040A,`and 1040EZ (or on'"Form 104OPC,"also starting with Calendar Year 1993). Schedule Cis for reporting nonfarm, sole proprietorship busi-nesses and Schedule F is. for reporting farm.incomeand expenses.
Starting in 1986, totals for Forms 1040, 1040A, and1040EZ, as well as for n6nbusines§ and nonbusinessform 1040 returns', are comprised of."p~peri returns"(including those classified as "Form'1040PC,"starting in 1993), plus "standard" elecironic'atly-filed(ELF) returns (usually filed by tax preparers).Starting in 1992, the totals also include returns filed.by telephone ("TeleFile").
[21 Form 1120 is the basic corporation income tax return;Form 1120A is the short form; and Form 1120S is forS Corporations (certain small companies electing tobe taxed through their shareholders, no more than 35shareholders starting with 1983, and either 15 or. 10,for 6arlieryears). "'Other" -includes Forms 1 120F(most foreign companies with U.S. income); 1120L(life insurance companies) 'starting in 1992 (includedin the statistics for Form 1 120 in the earlier years);1 120 POIL (certain Political associations); I 120H(homeown'eirs associations); 1120-FSC (Foreign SalesCorporations or FSQs) starting in. 1986; starting in1988, 1120-REIT for real estate investment trusts,1120-RIC for regulated investment companies (bothof which formerly filed on Form 11 20), and I I 20-PCfor properky and casualty insurance companies(which formerly filed on Form 1120 or 1120M,described belom6.- "Other'! also includes Form 1 120DF (for designated funds) starting in 1.988; and foryears before 1988, Form 1120M, discontinued, formutual non-life insurance companies which now fileon Form 1120 or Form I I20-PC'(and are included inthe
Istatistics for Form 1 120 in the earlier years).
"Other" excludes Forms 1120-DISC for DomesticInternational Sales Corporations or DISC's, discon~tinued after 1985 and mostly replaced by FSC's (seeabove); 1120 IC-DISC for Interest Charge-DomesticInternational Sales Corporations, which replacedcertain DISC's after 1985; and 1120X, amendedreturns.
[31 Form 104 1. is the regular fiduciary income tax returnfiled for estates and trusts. For 1988-1990, includesForm 1041S (short form). For 1970, includes Form1041A (trust accumulation of charitable trusts,information return).
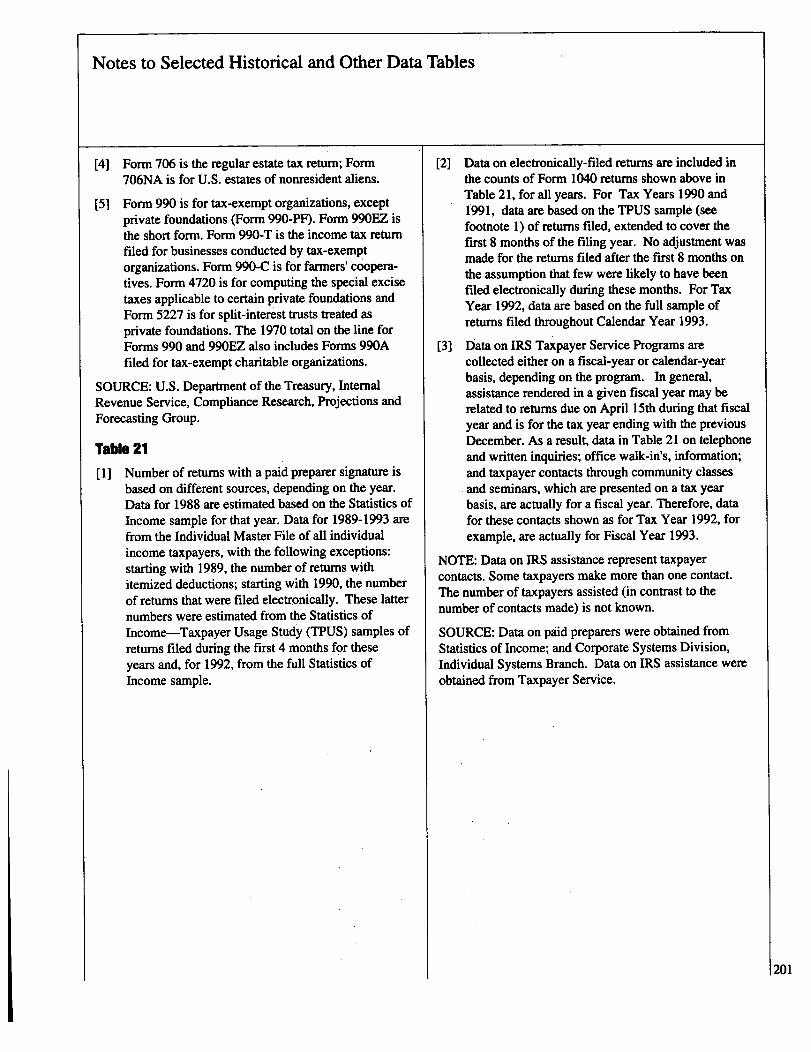
Notes to Selected Historical and Other Data Tables
[4] Form 706 is the regular estate tax return; Form
[51
706NA is for U.S. estates of nonresident aliens.
Form 990 is for tax-exempt organizations, exceptprivate foundations (Form 990-PF). Form 990EZ isthe short form. Form 990-T is the income tax returnfiled for businesses conducted by tax-exempt.organizations. Form 990-C is for farmers' coopera-tives. Form 4720 is for computing the special excisetaxes applicable to certain private foundations andForm 5227 is for split-interest trusts treated asprivate foundations. The 1970 total on the line forForms 990 and 990EZ also includes Forms 990Afiled for tax-exempt charitable organizations.
SOURCE: U.S. Department of the Treasury, InternalRevenue Service, Compliance Research, Projections andForecasting Group.
Table 21
[1] Number of returns with a paid preparer signature isbased on different sources, depending on the year.Data for 1988 are estimated based on the Statistics ofIncome sample for that year. Data for 1989-1993 arefrom the Individual Master File of all individualincome taxpayers, with the following exceptions:starting with 1989, the number of returns withitemized deductions; starting with 1990, the numberof returns that were filed electronically. These latternumbers were estimated from the Statistics ofIncome-Taxpayer Usage Study (TPUS) samples ofreturns filed during the first 4 months for theseyears and, for 1992, from the full Statistics ofIncome sample.
[2] Data on electronically-filed returns are included inthe counts of Form 1040 returns shown above inTable 2 1, for all years. For Tax Years 1990 andt991, data are based on the TPUS sample (seefootnote 1) of returns filed, extended to cover thefirst 8 months of the filing year. No adjustment wasmade for the returns filed after the first 8 months onthe assumption that few were likely to have beenfiled electronically during these months. For TaxYear 1992, data are based on the full sample ofreturns filed throughout Calendar Year 1993.
[3) Data on IRS Taxpayer Service Programs arecollected either on a fiscal-year or calendar-yearbasis, depending on the program. In general,assistance rendered in a given fiscal year may berelated to returns due on April 15th during that fiscalyear and is for the tax year ending with the previousDecember. As a result, data in Table 21 on telephoneand written inquiries; office walk-in's, information;and taxpayer contacts through community classesand seminars, which are presented on a tax yearbasis, are actually for a fiscal year. Therefore, datafor these contacts shown as for Tax Year 1992, forexample, are actually for Fiscal Year 1993.
NOTE: Data on IRS assistance represent taxpayercontacts. Some taxpayers make more than one contact.The number of taxpayers assisted (in contrast to thenumber of contacts made) is not known.
SOURCE: Data on paid preparers were obtained fromStatistics of Income; and Corporate Systems Division,Individual Systems Branch. Data on IRS assistance wereobtained from Taxpayer Service.
201
S01 Sampling Methodology and DataLimitationsAppendix
T
his appendix discusses typical sampling proceduresused in most Statistics of Income (SOI) programs.Aspects covered briefly include sampling criteria,
selection techniques, methods of estimation, and sam-pling variability. Some of the nonsampling error limita-tions of the data are also described, as wel.1 as the tabularconventions employed.
Additional information on sample design and datalimitations for specific SOI studies can be found in theseparate SOI reports (see
'the References at the end of this
appendix). More technical information is available, uponrequest, by writing to the Acting Director, Statistics ofIncome CP:R:S, Internal Revenue Service, P.O. Box2608, Washington, DC 20013-2608.
Sample CdWa and SalecHon of RehmStatistics compiled for the SOI studies are generally basedon stratified probability samples of income tax returns orother forms filed with the Internal Revenue Service (IRS).The statistics do not reflect any changes made by thetaxpayer through an amended return or by the IRS as aresult of an audit. As returns are filed and processed fortax purposes, they are assigned to sampling classes (strata)based on criteria such as: industry, presence or absence ofa tax form or schedule, accounting period, State fromwhich filed, and various income factors or other measuresof economic size (total assets, for example, is used for thecorporation and partnership statistics). The samples areselected from each stratum over the appropriate filingperiods. Thus, sample selection can continue for a givenstudy for several calendar years - 3 for corporationsbecause of the prevalence of fiscal (non-calendar) yearreporting. Because sampling must take place before thepopulation size is known precisely, the rates of sampleselection within each stratum are fixed. This means, inpractice, that both the population and the sample size candiffer from that planned. However, these factors do notcompromise the validity of the estimates.
The probability of a return being designated depends onits sample class or stratum and may range from a fractionof I percent to 100 percent. Considerations in determiningthe selection probability for each stratum include thenumber of returns in the stratum, the diversity of returns in
Information for this appendix was compiled by Bettye Jamerson,Coordination and Publications Staff, under the direction ofRobert Wilson, Technical Advisor. Major contributions weremade by Paul McMahon, Mathematical Statistics Team.
the stratum and interest in the stratum as a separatesubject of study. AD this is subject to constraints based onthe estimated cost or the target size of the total sample forthe program.
For most SOI studies, returns are designated by com-puter from the IRS Master Files based on the taxpayeridentification number (TIN), which is either the socialsecurity number (SSN) or the employer identificationnumber (EIN). A fixed and essentially random number isassociated with each possible TIN. If that random numberfalls into a range of numbers specified for a return'ssample stratum, then it is selected and processed for thestudy. Otherwise, it is counted (for estimation purposes),but not selected. In some cases, the TIN is used directlyby matching specified digits of it against a predeterminedlist for the sample stratum. A match is required for desig-nation.
Under either method of selection, the TIN's designatedfrom one year's sample are for the most part selected forthe next year's, so that a very high proportion of thereturns selected in the current sample are from taxpayerswhose previous years' returns were included in earliersamples. This longitudinal character of the sample designimproves the estimates of change from one year to thenext.
Mfted of EstimathmAs noted above, the probability with which a return isselected for inclusion in a sample depends on the sam-pling rate prescribed for the stratum in which it is classi-fied. Weights are, in general, computed by dividing thecount of returns filed for a given stratum by the count ofsample returns for that same stratum. "Weights" are usedto adjust for the various sampling rates used - the lowerthe rate, the larger the weight. For some studies, it ispossible to improve the estimates by subdividing theoriginal sampling classes into "post-strata," based onadditional criteria or refinements of those used in theoriginal stratification. Weightsare then computed for thesepost-strata using additionalpopulation counts. The data oneach return in a stratum aremultiplied by that weight. Toproduce the tabulated esti-mates, these weighted data aresummed to produce the pub-lished statistical totals.
Sample returns are
designated by
computer from the
IRS Master Files
based on the tax-
payer identification
number.203
S01 Sampling Methodology and Data Limitations
Sampling VariabilityThe particular sample used in a study is only one of alarge number of possible random samples that could havebeen selected using- the same sample design. Estimates
In transcribing and
tabulating data from
tax returns, checks
are imposed to
improve the quality
-of-the-statistics-.
derived from the differentsamples usually vary. Thestandard error of the estimateis a measure of the variationarnong the estimates from all'possible samples and is used tomeasure the precision withwhich an estimate from a
.
particular sample approximatesthe average result of the pos-
sible samples. The sample estimate and an estimate of itsstandard error pefift the construction of 'interval estimateswith prescribed confidence that this interval includes theactual population value.
In SOI revorts the standard error is not directly pre-sented. Instead, the ratio of the standard error to theestimate itself is presented in-dedimal- form. This ratio iscalled-the coefficient of variation (CV). The 'user of SOIdata may multiply,,an estimate by its coefficient of Varia-tion to recreate the standard error and to construct confi-dence intervals.
For example~, if a sample estimate of 150,000 returns isknown. to have a coefficient of variation of0.02, then thefollowing arithmetic procedure would be followed toconstruct a 68 percent confidence interval estimate:
150,000 (sample estimate)x 0.02 (coefficient of vaniation)
= 3 000 (standard error of estimate)15~,QQO (sample estimate)
+ or - 3,0,00" (standard error)
=147;000- 153,000 (68 percent confidence interval).
Based on these data, the interval estimate is.from. 147 to153 thousand, returns. A conclusion that the average,estimate of the number of returns lies within an intervalcomputed in thismay would be correct for approximatelytwo-thirds of all possible similarly selected samples. Toobtain this interval estimate with 95 percent confidence,the standard error should be multiplied by 2 before addingto and subtracting from the sample estimate. (In thisparticular case~, the resulting interval would be,from 144to 156 thousand returns.)
Further details concerning sample design, sample:selection, estimation method, and sampling variability fora particular SOI study may be obtained on request bywriting the Acting Director, Statistics of Income, at theaddress given above.
Nonsamp!ing Error Controls and UmitationsAlthough the previous discussion focuses on samplingmethods and the limitations of the data caused by sarn-pling error, there are other sources of error that may be.significant in evaluating the usefulness of SOI data. Theseinclude taxpayer.reporti ng errors, processing errors andeffects of an early cut-off of sampling. More extensiveinformation on nonsampling error is presented. in SOIreports, when appropriate...
.In. transcribing and, tabulating the information frorn'the.returns or forms selected for the sample, checks areimposed to improve the quality of the resultant estimates.Tax return data may -be disaggregated or, recombined -during statistical "editing" in ord.er-both to improve data,consistency from return to return ap~d to achieve aefini-tions of the data items that are more in keeping with theneeds of major users. In some cases not all of the-data areavailable frorh the tax return as origifially filed. Some-times the missing-data can be obtained through fieldfollow pp. More often, though, they-are obtained throughimputation methods. As examples, other information in.the retlum, or in accompanying schedules may. be sufficientto enable an estimate to be made; prior~year data,for thesame taxpayer may be,used for th6'sz6e purpose; or datafrom another return for. the sam6.year that 'has similarcharacteristics may be substituted. Research to improvemethods of imputing data that are missing from returnscontinues to be an-ongoing process [-11.'
'Quality of the basic data abstracted from the returns issubjected to a number of quality control steps including100-percent key verification.The data are then subjectedto many tests based'on the structure. of the tax law and theimprobability of various data combinations. Recordsfailing these tests are, theii*subjected to further review andany necessary corrections are made. -In addition, Statisticsof Income in the National Office conducts an indepen-dent reprocessing of a small subsample'of statistically-processed returns as a further check [2).
Finally, before publication, all statistics are reviewedfor accuracy and reasonableness in light ofprovisions of
204
S01 Sampling Methodology and Data Limitations
the tax laws, taxpayer reporting variations, as well aslimitations, economic conditions, comparability with otherstatistical series, and statistical techniques used in dataprocessing and estimating.
Tabular ConventionsEstimates of frequencies and money amounts that areconsidered unreliable due to the small sample size onwhich they are based are noted in SOI tables. The pres-ence of the indicator means that the sampling rate is lessthan 100 percent of the population and that there arefewer than 10 sample observations available for estima-tion purposes.
A dash in place of a frequency or amount indicates that
no sample return had that characteristic. In addition, adash in place of a coefficient of variation for which thereis an estimate indicates that all returns contributing to the
estimate were selected at the 100-percent rate.Whenever a weighted frequency in a data cell is less
than 3, the estimate is either combined with other cells ordeleted in order to avoid disclosure of information aboutindividual taxpayers or businesses. These combinations
and deletions are indicated in the tables.
Notes[11 See, for example, Hinkins, Susan M., "Matrix Sam-
pling and the Effects of Using Hot Deck Imputation,"
in 1984 Proceedings of the American Statistical
Association, Section on Survey Research Methods.
Other research efforts are included in Statistical Uses
ofAdministrative Records: Recent Research and
Present Prospects, Volume 1, Internal Revenue
Service, March 1984.
[2] Quality control activities for all SOI studies arepublished from time to time in a series of separatereports. These reports provide detailed informationrelating to quality in all phases of SOI processing.
ReferencesReports that contain additional information about thesamples include:
Statistics of Income-1991, Individual Income Tax Re-turns, (see especially pages 13-17).
Statistics ofIncome-1990, Corporation Income TaxReturns (see especially pages 9-17).
Statistics ofIncome-1 994, Compendium ofFederalEstate Tax and Personal Wealth Studies (see descriptionsfor selected articles).
Statistics of Income-]974-1987, Compendium of StudiesofTax-Exempt Organizations (see descriptions at the end
of each chapter).
Statistics of Income-I986-1992, Compendium ofStudiesof Tax-Exempt Organizations, Volume 2 (see descriptionsfor selected articles).
Statistics of Income-1984-1988, Compendium ofStudiesof International Income and Taxes, Foreign Income andTaxes Reported on U.S. Tax Returns (see descriptions at
the end of each chapter).
Statistics of Income Bulletin (see each issue).
205
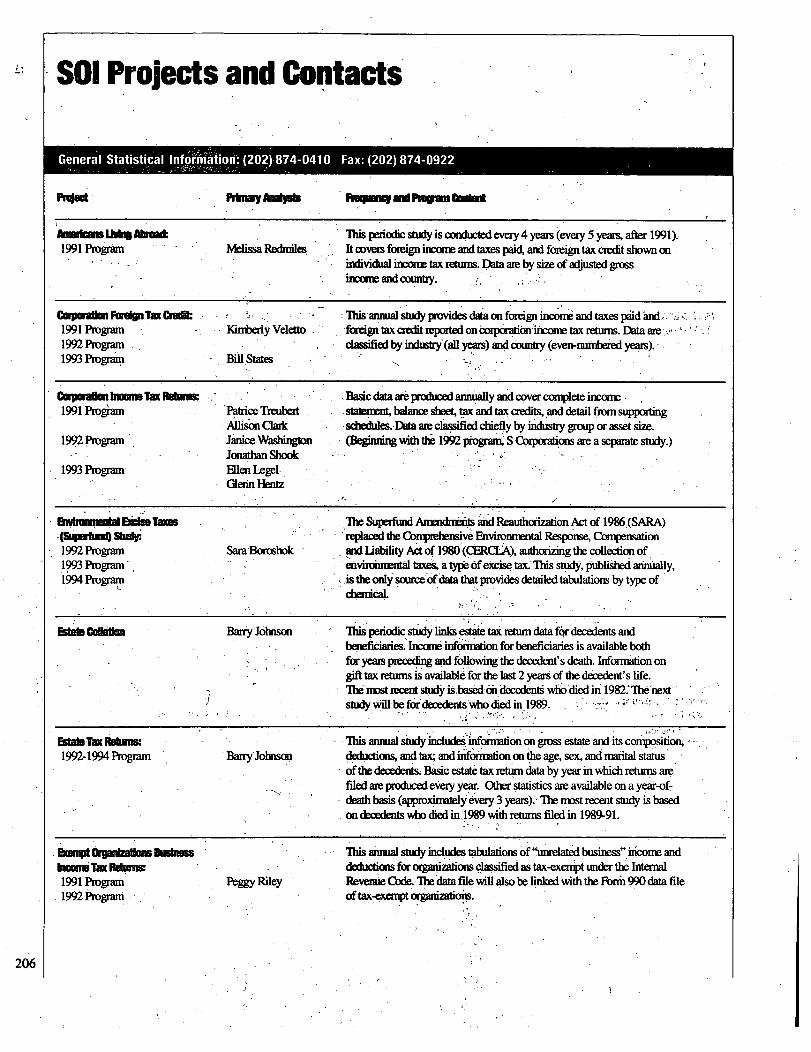
SOI Projects and Contacts
206
General Statistical Info- iii6iioh. (202) 874-041 0 Fax: (202) 874-0922
kMrkMMLhftAWWAk1991 Prograin
MMEYAMIPO
htfissa Redmiles.
Fko*mM wARog GooM
This periodic study is conduicted every4 years (every 5 years, after 1991).It covers foreign incorne and mxes paid, and foreign tax credit shown onindividual, incorne tax reft=. Dataam by sizeof adWted grosshicorne and courritry.
Corpwallm FadgnTax C M1991 Program1992 Program1993 Progmn
capWasm- Tax ndwm11991. Program
1992 Prograrn
1 1993 Program
I EidnTMOS(aver" aw.1992 Prograrn.1993 Ptograin1994 Pfograrri
Fdaft C 0 -1
Fsbft TaxWhirM'1992-1994 RDgrarn
I(irnberly Veletto
Bill.States
Patrice TreubertAllison Cb&Janice WashingtonJonathan ShookEllen Legel.Glenn Hentz
Sara Baroshok
Barry Johnson
Barry-Johnson
B=O bvwhafto BudriffisTax RdMW
1991 Program1992 Program
PeggyRiley
Thism.wal study provides data on foreignuimIrleand taxes paid 'and i.foreign taxaukreported on corporation meow tax retuirns. Dataamclassified by induwry'(all yews) and comtry (even-nuunbered years).
Basic data we produiced anitually and cover complete incorne - ;staterim balarice sheet, tax and tax credits',and detail from supportingschedides. Dataam classified chiefly by industry group or asset size.(ftinning with. the 1992 program S Corporations are a separate study.)
The Superflind Air~s and Reatithorizati,on Act of 1986.(SARA)replaced theConpehensive Erivironamtal Response, CmVensationand liability Act of 1980 (CERCIA), airthorizing the collection ofenviroi~al taxes, a type ofexcise tax:This study, published annually,is the only source ofdata thatpmdes detailed tabulations by typeofchernical.
11iis periodic study links estate tax retuirn data f6r decedents andbeneficiaries.'hicorne irib''rii'vition forbeneficiaries is available bothfor years preceding * fc~flowing the decedene s death. Inforrmtion. ongift tax retuirris is available for the last 2 yews of the decedent's life.7he rimst recent study is based on.decedents whodied in 1982
-stuidy will be fordecedents who died in,1989.
This aruwal.study
ir~llulcllc~~infarrnationon gross estate
Iand its composition; -
.
deductions, and tax; and inforniation on the age, sex, and nwital statusof the decedents. Basic estate tax return data byyear in which returns arefiledareproduced everyyear Offiff statistics are available on a year-of-death basis (approxiinately every 3 years). - The nx)st recent study is basedondecedents who died in 1989 wi
Ith reftinis filed in 1989-91'.
This annual. study incl.udes tabuilationsof"umlatedbusiness",incorne anddeductions for organizations.classified as tax-exeniptmder the firrernalRevenue CO&M The data file will also be linked with theFbirn 9.90 dam fileof tax-exerriptorganizatioT.
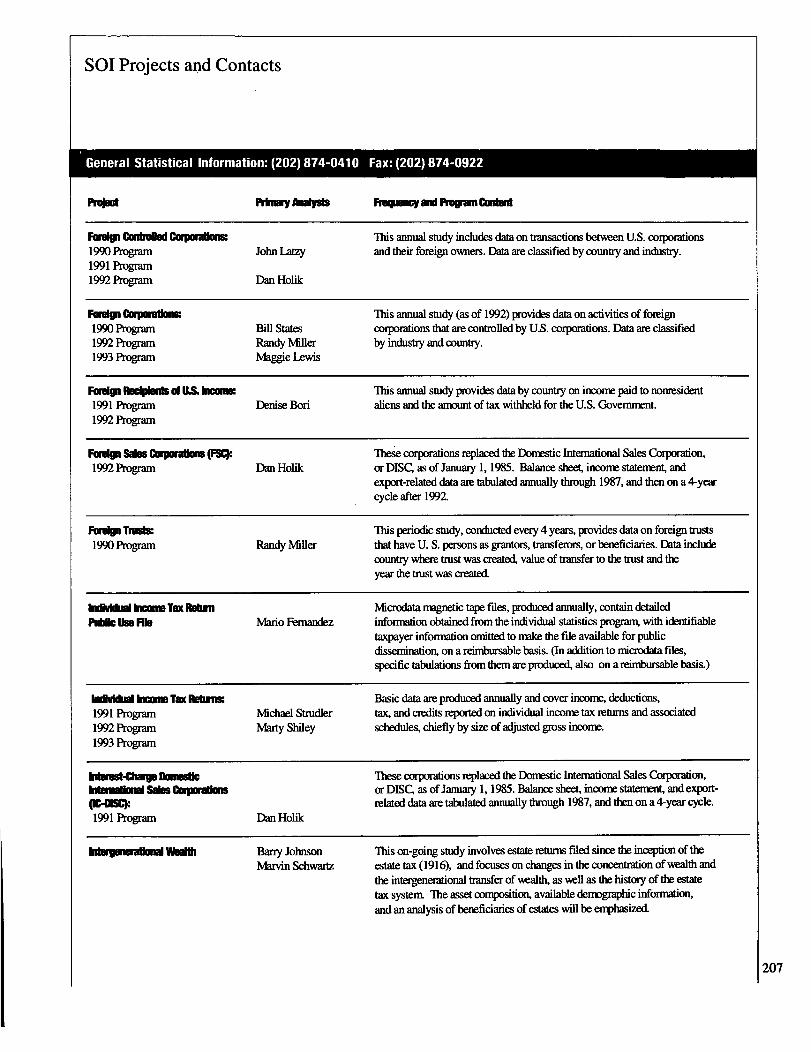
SOI Projects and Contacts
IGeneral Statistical Information: (202) 874-0410 Fax: (202) 874-0922
Pf*d ftnaryAndysts RequmWandRolpa. Codwd
FQrdWCOnbVWrn Fn 'Ho I' This annual study includes data on transactions between US. corporations1990Program John Latzy and their foreign owners. Data are classified by country and industry.1991 Program1992Program Dan Holik
FOrd9O Cwpwadm Tliis annual study (as of 1992) provides data on activities of foreign1990RWM Bill States corporations that are controlled by U.S. corporations. Data are classified1992 Program Randy Miller by industry and country.1993 Program Maggie Lewis
FNd91 MCOOftof" This annual study provides data by country on inconie paid to nonresident1991 Program Denise Bori aliens and the amount of tax withheld for the U.S. Government.1992 Program
Famip Sala C (FSC): These corporations replaced the Domestic International Sales Corporation,1992 Program Dan Holik or DISC, as ofJanuary 1, 1985. Balance sheet, incorne statement, and
export-related data are tabulated annually through 1987, and then on a4-yearcycle after 1992.
Fmigm TMW This periodic study, conducted every 4 years, provides data on foreign trusts1990 Program RandyMiller that have U S. persons as grantors, transferors, orbeneficiaries. Data include
country where trust was created, value of transfer to the trust and theyear the trust was created.
bulmdual, TaxRdum Microdata magnetic tape files, produced annually, contain detailedPdbk we RIO Mario Fernandez information obtained from the individual statistics program with identifiable
taxpayer infommon ornitted to make the file available for publicdissernination, on a reirribursable basis. (In addition to iricrodata files,specific tabulations from them are produced, also on areimbursable basis.)
kulkidual ' 1 TaxRdLwm Basic data are produced annually and cover income, deductions,1991 Program Michael Strudler tax, and credits reported on individual income tax ream and associated1992 Program Marty Shiley schedules, chiefly by size of adjusted gross income.1993 Program
kftud-OWWOMMa These corporations replaced the Domestic International Sales Corporation,. . - sales Mrpmd= or DISC~ as ofJanuary 1, 1985. Balance sheet, income statement, and export-QC41M: related data are tabulated annually through 1987, and then on a4-year cycle.
1991 Program Dan Holik
g Iftalm Barry Johnson This on-going study involves estate returns filed since the inception of theMarvin Schwartz estate tax (1916), and focuses on changes in the concentration ofwealdi and
the intergenerational transfer of wealth, as well as the history of the estatetax systern The asset cornposition, available dernographic information,and an analysis of beneficiaries ofestates will be emphasized.
207

SOI Projects and Contacts
General Statistical Information: (202) 874-041 0 Fax: (202) 874-0922
Pi I toI AnaPpla, RopmMmilRoWn C
1992 Prograin Melissa Radmiles
,,.-1993 Rpgram
INg 11 RawandOmoftDab
~Ill M Multable and Olfw-g
.:1991
N., , 'Alm EddM
1990 Prograrn, - --
This study provides dataon business operations ofUS. persons in boy-cotting countries, as well asthe requests and agreements to participate in, orcooperate with, intemational boycotts not sanctionedby the US. Goverriment
Migrationflow data (based onchanges in individual income tax return,-,.,..~.Saiidy Byberg, --addresses)-andcounty orState in6wne
CIMare availableannually on a
reimbursable basis. The most recetit data are for 1991-92.
Ciecelia FE!gert
The estates are.subject to U.S. estate taxation on U.S. property.
lbs annual study includes ba][ance sheet andmcome statement data fororganizations classified as tax-exempt under subsections 501(c)(3)-(9) ofthe Intemal Revenue CoilL
Ths periodic study, planned fbrevery 4 years, provides data on estatesofRandy Mller., nonresident aliens Who had more than $60,000 of assets in the United States.
Bobhy Clark Ths periodic study, based on availability ofoutside funding, is.designedDodie Riley to classify individual income tax returns by occupation and to develop
a dictionary ofoccupation titles that can be used toenhance the economicdata of many other individual income tax ram studies.
Pabod Nd~d' Basic&ta, produced annually, cover income statement, balance-1992Program TIm. VVheeler sheet, and details ftorn supporting schedules. Data are classifiedchiefly
a 1993 Program, by industry group.
V~"Wiftliftaw.1991 Pingram
TUs annual study includes "'on U.S. partnership payments to fbreignKunberly Veletto partners. Data are classified by country and recipient type.
PA in -,W1,,H 8W.
.1992 Prognuii.
11111110 F 1 11IS~l Program1992 Program
Susan Eastep
Mus penodic studyprtmdes data esumates ofpersonal wealth of topweal'holders dud
Iare gen
.di~6d'ffofni!it&6tai-idm-datailsing the "estate-
in conjunction with both fding-year~eiid,"y:,e-a,r-"of~eslaie data baies.' The most re~ data:(198 9) are based on returns'fil6d -fr6W-'-`1989 to ISM. The 1992 program will bebased onreturns filed frorn 1992-1994.
I
1hs annual study includes babince sheet and income statement datafor private foundations and charitable trusts filing aForm 990-PF.
208

SOI Projects and Contacts
General Statistical Information: (202) 874-041 0 Fax: (202) 874-0922
Ff*dS Corporadorm1992 Rvgram1993 program
Pil my Ambib
Amy Cill
hapoeicy and Piopm. CodedAnnual study data are collected for the income statement, balance sheet, andfrom supporting schedules. Data are classified by industry group orby assetsize.
SalesdCapWilloadw This periodic study provides detailed data on the sales ofcapital assets1985 Program Barbara Longton reported on Schedule D of the individual income tax return, sales of1985-1993 Panel Study Janette Wilson residences, and personal or depreciable business property.
Apanel study provides the saw data on capital asset transactions forasubsample of the remms in the Sales ofCapital Assets basic study, over aperiodof years.
swesd tLL Red ft"" This annual study will provide data on tranders of U.S. real property interesM- ol'lbyftdr Pow when these interests am wquired from foreign persons. Data include the1992 Program Chris Carson amount realized on transfers, U.S. tax withheld, and the country of foreign
persons-
SoloPiopliftol Basic program data, produced annually, cover the business receipts,1991 Program Jeffrey A. Hartzok deductions and net income reported on Schedule C (for nonfarm proprietors),1992 Program by industry group. Similar data filorn Schedule F (for farmers) are available1993 Program on an occasional basis.
Stow DdL.1985 Program1988 Program
Special tabulations of selected individual income, deduction, and tax datab&fio Fernandez by State are produced on a reimbursable basis. (lbe data file for 1988 is the
most recent.)
adie" abscrip"M SWAM Annual data by more detailed uxlustry groups than are used for the regularCaporation Source Book Sandy Byberg corporation statistics areproduced by asset size.
Tex-mnlpt Bond ls~1991 Program1992 Program
TMOMFOrtbw UW.1993 Program
U& P M I I A I ab N Corpordim1993 Program
This annual study provides information on private activity and governmen:talNbrvin Schwartz bond issues by typeof property financed, size of face amotint and State.
Basicdata, Produced annually, provide weeldy frequencies ofLMM Prizzi specific line entries made by taxpayers, the use ofvarious return schedules
and associated forms, and general characteristics of the individual taxpayerpopulation for returns received during the primary filing season (Januarydirough April).
Tlis periodic study, planned for every4 years, provides data on incomeRandy Mller statemeiit~ balance sheet, tax, and "possessions taxcredif'data for
"qualiW'U S. possessions corporations. (Nbst of these corporationsare locatedmi Puerto Rico.)
209

-210
Publications.& Tapes
Statistical Information Services
For questions about the availability of SOI data, other
statistical services, or release dates for new publications,
please contact the Statistical Information Services Office
on (202) 874-0410'or FAX (202) 874-0912. As its name
implies, this office is best able to answer questions about
data. It is not the place to call to obtain tax -forms or infor-
mation about the status of an individual's tax refun'd'o'r'
audit examination. Also, aIl're'q'uesfs froin'the media
should be directed to the IkS,Media Relations Branch,
Communications Division on (202) 622-400V
The following Statistics of.Income reports and tapes can
be purchased from Statistics of Income (unless otherwise
indicated). P~repayment is required, with checks m.ade
payable to the. IRS, Accounting;Section. Please write:
Acting DirectorStatis me: (CP:R:S)''tics of IncoInternal Revenue ServiceP. O.,Boi 2608'.Washington, DC -:20013-2608.
Compendiums
Studies of Tax-Exempt grganizationss. 1974-1987
Publication 141.6 - Price $2,6. 00
This publication presents 22"articles from Statistics of,
income studies on tax-exempt organiz'dti6ns.'Th.e articles
emphasize important issues within the nonprofit sector,
and also include several 6ther articles previously u.npub-
fished in the SOI Bulletid~ as well as'~papers published in
proceedings of th6"Arrieiicari~Stiatist,ical~-Association and
the Independent Sector Research Forum. Topics featured
are.
wnonoi6fit charitable organizations (primarily - -
charitable, educational, and health organizations);
• private foundations and charitable trusts; and• unrelated business income of exempt organizations.
0Studies of Tax-Exempt Organizat! ns,:1986-1992,
Publication 1416 -~- Price $26.00
This is -the second 'volume in a series,of Statistics of
Income (SOI) publications on tax-exempt, nonprofit
organizations. The volume includes data'covering 1986-
1992 and contains 12 previously-published articles fromSOI studies, including articles from the S01 Bulletin, aswell as papers prepared for the Journal ofNonprofitManagement and Leadership, Trusts 'and Estates, theIndependent Sector Research Forum, the National Re-search Council's Committ.ee on National Statistics, andthe American Statistical Association.
Studies of,international Income ,and Taxes, 1984-1988Publication 1267 - Price $2600
This report presents information from 13 Statistics ofIncome studies in the international area (many of thempreviously published in the S01 Bulletin), including:
m foreign activity of.U.S. corporations;m activity of foreign corporations in the United. States-,m foreign controlled U.S. corporations;m statistics. related to individuals, trusts, and estates;
and.m data presented by geographical area or industrial
activity, as well as other classifiers.
Compendium of Federal Estate Tax and PersonalWealth Studies.Publication 1773-$26.00
Part I of this report focuses on data from estatOax r'e-turns, describing decedents, their beneficiaries, and'thecomposition of their estates. It contains a methodologicaldi
Iscussion of the strategy used
,in weigiitingihe sa'm1ple
daia~f6rlthe' estate*studies and also' sitatistics-ofiseie"ci6&com-p6h6tits of decedeuts'-~estates, 1916-1990." `Infdrriti-tion oh6hanitable giving is also included.
Part H presents a series of articles describing the estate-multiplier technique and its applications for personalwealth estimates, estimates of personal 'wealth for selectedyears, 196271989, as well as a discussion of the relation-ship among realized income, wealth, and well-being-
Reimbursable Services
Corporation Source Book, 1991Publication 1053 Price $175
This 478-page document presents detailed income state-
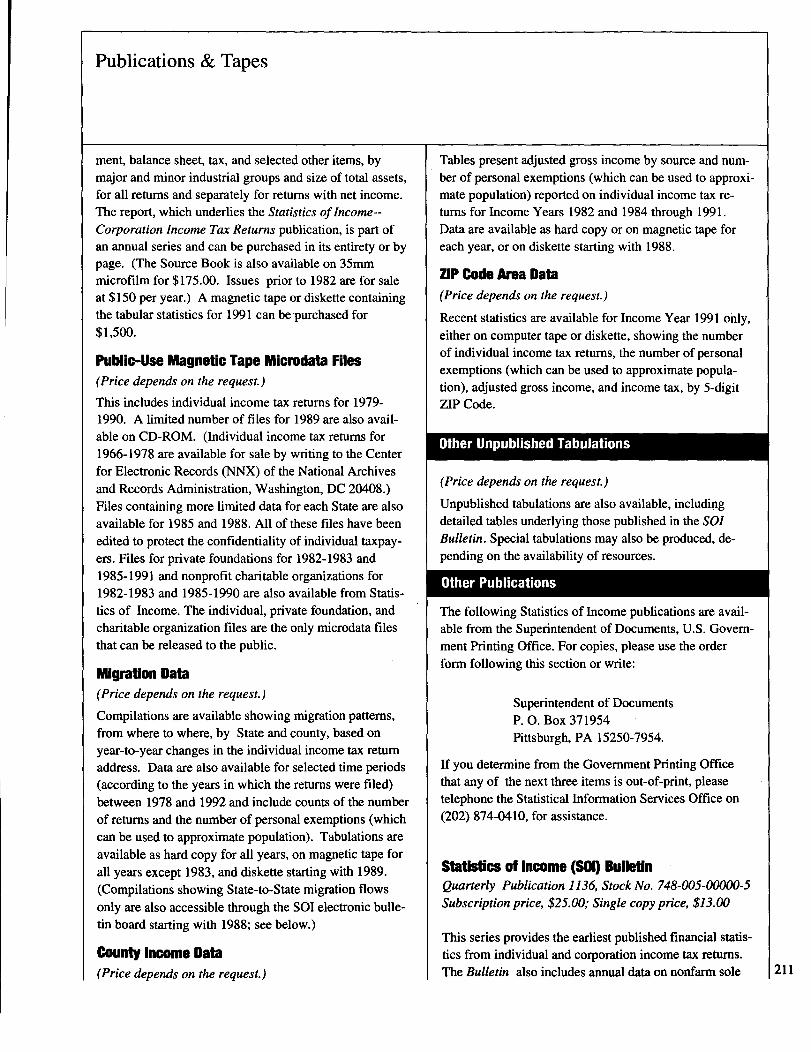
Publications & Tapes
ment, balance sheet, tax, and selected other items, bymajor and minor industrial groups and size of total assets,for all returns and separately for returns with net income.The report, which underlies the Statistics of Income--Corporation Income Tax Returns publication, is part ofan annual series and can be purchased in its entirety or bypage. (The Source Book is also available on 35mmmicrofilm for $175.00. Issues prior to 1982 are for saleat $150 per year.) A magnetic tape or diskette containingthe tabular statistics for 1991 can bepurchased for$1,500.
Public-Use Magnetic Tape Micirodata Files(Price depends on the request)
This includes individual income tax returns for 1979-1990. A limited number of files for 1989 are also avail-able on CD-ROM. (Individual income tax returns for1966-1978 are available for sale by writing to the Centerfor Electronic Records (NNX) of the National Archivesand Records Administration, Washington, DC 20408.)Files containing more limited data for each State are alsoavailable for 1985 and 1988. All of these files have beenedited to protect the confidentiality of individual taxpay-ers. Files for private foundations for 1982-1983 and1985-1991 and nonprofit charitable organizations for1982-1983 and 1985-1990 are also available from Statis-tics of Income. The individual, private foundation, andcharitable organization files are the only microdata filesthat can be released to the public.
Migration Dab(Price depends on the request.)
Compilations are available showing migration patterns,from where to where, by State and county, based onyear-to-year changes in the individual income tax returnaddress. Data are also available for selected time periods(according to the years in which the returns were filed)between 1978 and 1992 and include counts of the numberof returns and the number of personal exemptions (whichcan be used to approximate population). Tabulations areavailable as hard copy for all years, on magnetic tape forall years except 1983, and diskette starting with 1989.(Compilations showing State-to-State migration flowsonly are also accessible through the Sol electronic bulle-tin board starting with 1988; see below.)
County Income Data(Price depends on the request.)
Tables present adjusted gross income by source and num-ber of personal exemptions (which can be used to approxi-mate population) reported on individual income tax re-turns for Income Years 1982 and 1984 through 1991.Data are available as hard copy or on magnetic tape foreach year, or on diskette starting with 1988.
ZIP Code Am Data(Price depends on the request.)
Recent statistics are available for Income Year 1991 only,either on computer tape or diskette, showing the numberof individual income tax returns, the number of personalexemptions (which can be used to approximate popula-tion), adjusted gross income, and income tax, by 5-digitZIP Code.
Other Unpublished Tabulations
(Price depends on the request.)
Unpublished tabulations are also available, includingdetailed tables underlying those published in the SOIBulletin. Special tabulations may also be produced, de-pending on the availability of resources.
Other Publications
The following Statistics of Income publications are avail-able from the Superintendent of Documents, U.S. Govern-ment Printing Office. For copies, please use the orderform following this section or write:
Superintendent of DocumentsP. 0. Box 371954Pittsburgh, PA 15250-7954.
If you determine from the Government Printing Officethat any of the next three items is out-of-print, pleasetelephone the Statistical Information Services Office on(202) 874-0410, for assistance.
Statistics of Income (SM BulletinQuarterly Publication 1136, Stock No. 748-005-00000-5Subscription price, $25.00; Single copy price, $13.00
This series provides the earliest published financial statis-tics from individual and corporation income tax returns.The Bulletin also includes annual data on nonfarm sole 211
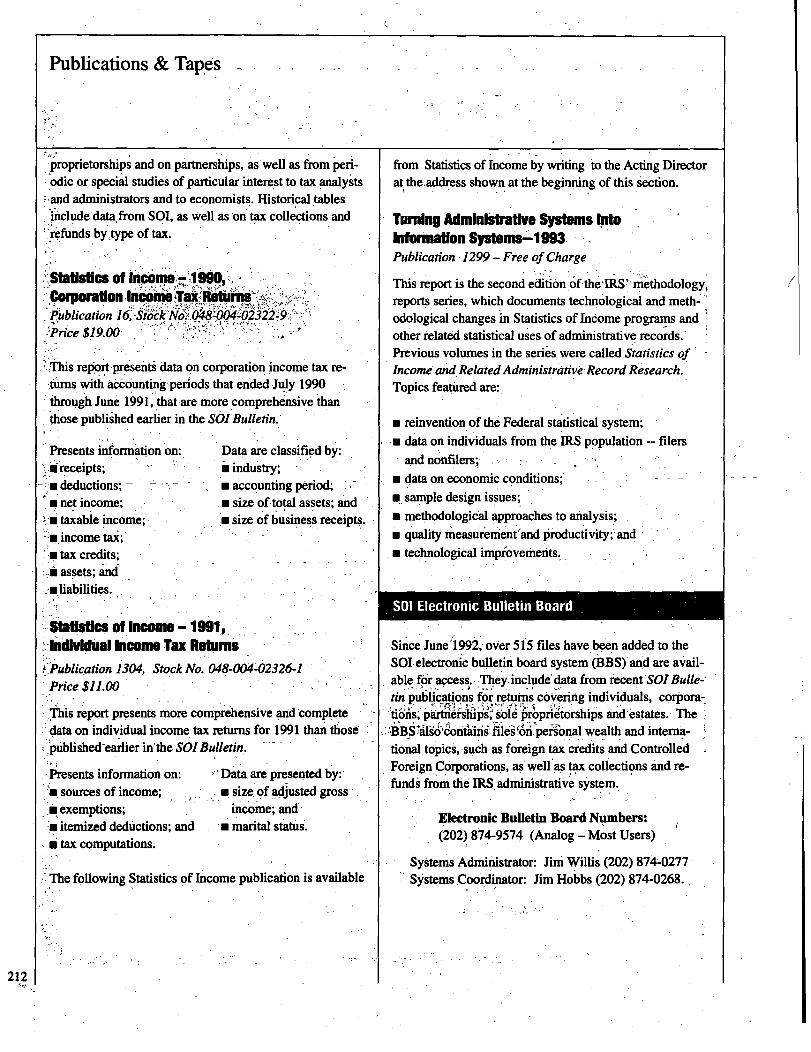
Publications & Tapps -
'proprietorships and on partnerships, as well as from peri-~dic or special studies of particular interest to tax analysts
,-and administrators and to economists. Historicaltablesinclude datalfrom Sol, as well as on tax collections and
-refunds by;type of tax.
'-'stathimcs of Income;!7,,Corporaflonlncome.~. Publication 16,~,46&k`Nd.~.'Price $19.00
:-This report presents data on corporation income tax re--turns with 'accounting -periods. that ended July 1990through June 1991, that are more comprehensive thanthose published earlier in the SOIBulletin.'
Presents information on: . Data are classified-by:.n receipts; m industry;0 deductions; - m accounting period,m
-net income; m size of total assets; and
t~-w taxable income; m size of business receipts.-1m. income tax;
tax credits;..:m assets; and
~m liabilities.
statistics of Income - 1991,,~.'Indlvidual Income Tax Returns,,-,Publication 1304, Stock No. 048-004-02326-1
, Price $11.00
- This report presents more comprehensive and -completedata on individual income tax returns for 1991 than.those
-earlier in'theSOIBulletin.published
Presents information on:~..i.m
,sources of income;
ii exemptions;a itemized deductions; and
,w,tax computations.
:'Data are presented by:size~ of adjusted grossincome; and
m marital status.
The following Statistics of Income publication is available
Q
from Statistics of Income by writing to the Acting Directorat, the,address shown at the beginning of this section.
Taming Administrative Systems IntoInformation Systems, 1993Publication 1299 - Free ofCharge
This report is the second editi6n.6fthe4RS'- methodology,reports series, which documents technological and meth-odological changes in Statistics of Income programs andother related statistical uses of administrative records.Previous volumes in the series were called Statistics ofIncome and.Related Administrative Record Research.Topics featured are:.
n reinvention of the Federal statistical system;
0 data on individuals from the IRS population filers
and nonfilers;,m data on economic conditions;nL sample design issues;m methodological approaches to analysis;m quality measuremient'and Oreductivity;-and -m technological impioverherits.-.,.
SOI Electronic Bulletin Board
since June'1992,- over 5115 files have be
Ien added to the
SOI electronic bulletin board system (BBS) and are avail-able for access,.-They. include'data from recent SOIBulle--tin publications for returns coverin individuals, corp'ora-,. ; - ~1~1 - ~; q --". "" 1_ ~ 0'. ~ 9
F hi-':~ &orshi s and estates. Thetions, p"ers ps, so e propn p,~,BBSjilg6l~oiitiiiiis'filei'6npei-gonaI wealth and interria-tional topics, such as foreign tax credits and ControlledForeign Corporations, as'well as tax collections and re-fund's from the IRS.adriiinistrative system..
Electronic Bulletin Board Numbers:(202) 874-9574 (Analog - Most Users)
Systems Administrator: Jim Willis (202) 874;.0277Systems.Coordinator- Jim Hobbs (202) 874-0268.

Compendiumof FederalEstate Tax andPersonal WealthStudies
In this publication, Statistics of Income (SOI) of the Internal RevenueService has assembled, for the first time, the complete record of its effortsto estimate the wealth of the Nation's living population using Federal estatetax returns. In addition, papers are presented discussing the most recentFederal estate tax studies, as well as new tabulations of historical estate taxdata collected between 1963 and 1990.
The volume contains statistical data and articles on these subjects:
m Personal Wealth Estimates, 1962-1989m The Relationship Between Income and Wealthm Charitable Bequests and Lifetime Giftsm Federal Estate Tax Datam The Estate Multiplier Technique
For further information or to order copies, please contact SOI's Sta-tistical Information Services Office at (202) 874-0410, or write to:
Statistics of Income CP:SInternal Revenue ServiceRO. Box 2608Washington, DC 20013-2608.

U.S. Census Bureau Announces
It's official all right, though not yourusual government catalog-
A 360-page One-Stop Guide to allkinds of statisticslYou'll quickly find enough information about each sourceto help you select what you need. You'll find the where,the when, and especially the what-in detail.
A major reference resource, it covers everything from
mid-'88 through '93--and shows how to get the
latest version.
Want More?
You'll fimd thousands of phone numbers and addresses foreasy access to information and assistance. Why pass uphelp-State or local, public or private?
The catalog describes what you'll find on CD-ROM,paper, floppy disk, or tape:
* 1990 Census of Population and Housing* Current Surveys of Population and Housing
Plus all our other topics too-
• Agriculture * Goverruments• Business * International• Construction * Manufacturing• Foreign Trade * Mineral Industries• Geography * Transportation
------------------------------------------ or Photocopy ---------------------------
0.1. P~.gC.&
*7367Superintendent of Documents Publications Order Form Charge your order
It's easy! 40
El ITS 9 please send me the following-.------copies of
P3
To fax your orders (202) 512-2250
Census Catalog and Guide: 1994, S/N 003-024-08752-9, at $23 each ($28.75 foreign)
The total cost of my order is $ . Prices include regular domestic postage and handling and are subject to change.
(Company or personal name) (Please type or print)
(Additional address/attention line)
(Street address)
(City, State, ZIP Code)
(Daytime phone including area code)
(Purchase Order No.)
Please Choose Method of Payment:
Check payable to the Superintendent of Documents
GPO Deposit Account _71 -DF-1 VISA or Mastercard Account
I I I I I I I I I I I I I
(Credit card expiration date)
(Authorizing Signature)
Mail Th: Superintendent of DocumentsRO. Box 371954, Pittsburgh, PA 15250-7954
Thankyouforyour order!
5/94
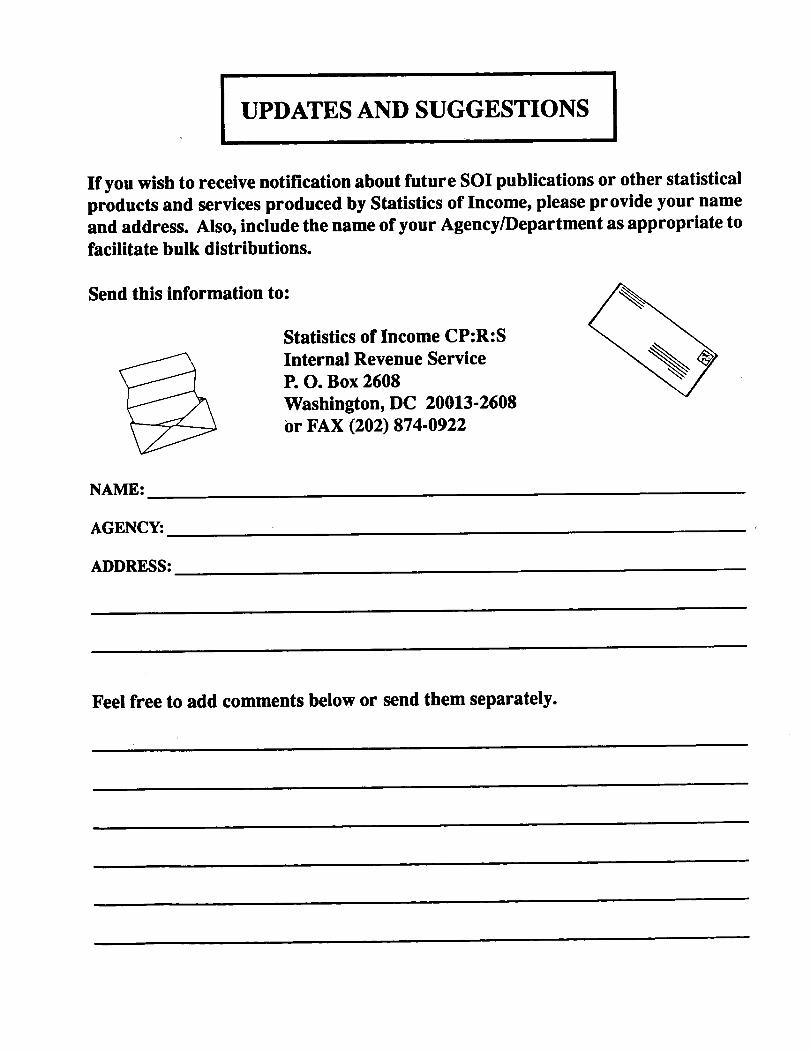
UPDATES AND SUGGESTIONS
Ifyou wish to receive notification about future SOI publications or other statistical
products and services produced by Statistics of Income, please provide your name
and address. Also, include the name of your Agency/Department as appropriate to
facilitate bulk distributions.
Send this information to:
Statistics of Income CP:R:SInternal Revenue ServiceP. 0. Box 2608Washington, DC 20013-2608or FAX (202) 874-0922
NAME:
AGENCY.-.
ADDRESS:
Feel free to add comments below or send them separately.
PLACESTAMPftERE ~
STATISTICS OF INCOME. CP:R:SINTERNALREYENUE SERVICEP.,O. BOX -2608WA.SHINGTON,,DC 10011-2609
. . . . . . . . . . . . ... . . . . . . . . . . . .. . . . .; . . . . . . . . . . . . . ... . . ... . . ... . . . . . . . . . . . . . .
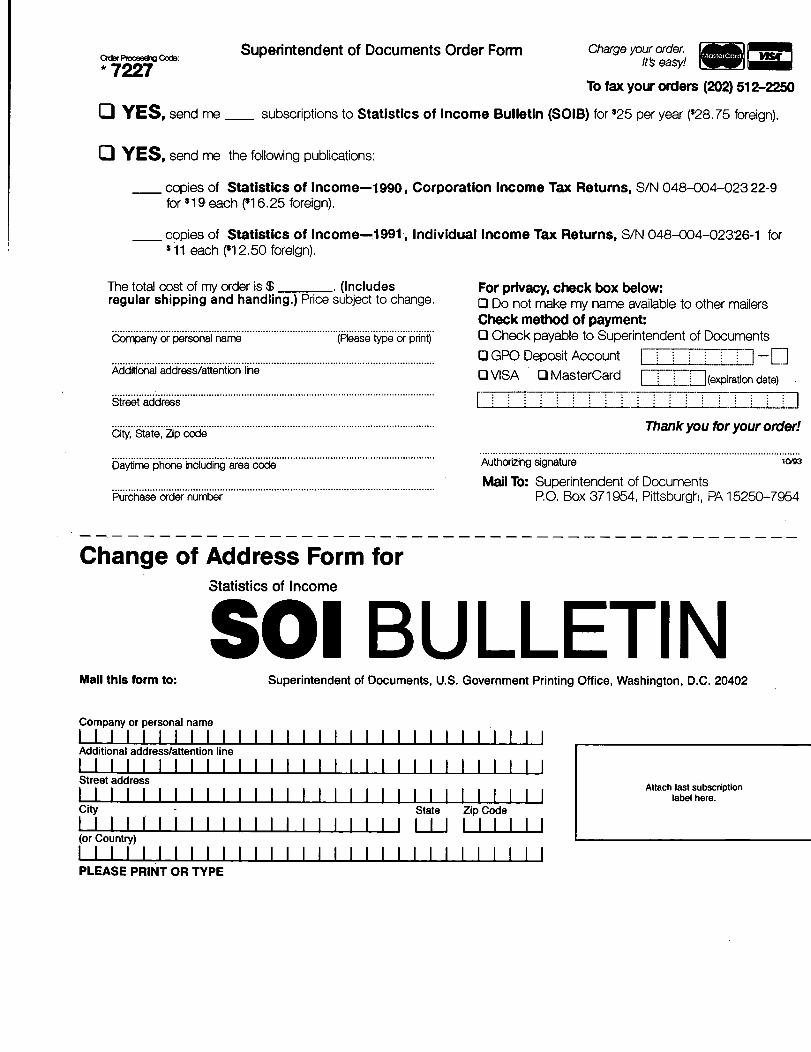
Superintendent of Documents Order Form Charge your order,-1W Itil
* 7227 ~.Oy.r-- -1
To fax your orders (202) 512-2250
L3 YES, send me- subscriptions to Statistics of Income Bulletin (SOIB) for $25 per year ($28.75 foreign).
El YES, send me the following publications:
copies of Statistics of Income-1990, Corporation Income Tax Retums, S/N 048-004-023 22-9for 0 19 each N 6.25 foreign).
copies of Statistics of Income-1991, Individual Income Tax Returns, S/N 048-w4-023,,26-1 for8 11 each ($12.50 foreign).
The totaJ cost of my order is $-. (Includes For privacy, check box below:regular shipping and handling.) Price subject to change. Q Do not make my name available to other mailers
Check method of payment:........................................................................................................................
Additional address/attention line
Street address
6i~**§W6.**f1*P***~6a*q** ... **'** ....- ... -* ... **"**""**"* ..... ---* ..... *"**""*'* ... *"* .....
Daytime phone including area code
Purchase order number
Change of Address Form forStatistics of Income
Li GneCK payable to Superintendent of Documents0 GPO Deposit AccountUVISA Ll MasterCard Ei--1-D. (expiration date)
E=EThankyou foryour order!
Authorizing signature 10/93
Mail To: Superintendent of DocumentsRO. Box 371954, Pittsburgh, PA 15250-7954
01 U LL T1 NMail this form to: Superintendent of Documents, U.S. Government Printing Office, Washington, D.C. 20402
Company or personal name
I I I I I I I I I I I I I I I I I I I I I I I I 1 11 1 1 1Additional address/attention line
I I I I I I I I I I I I I I I I I I I I I I I I I I I I I IStreet address
city State Zip CodeI I I I I' I I I I I I I I I I I I I I I I I I I I I I I I(or Country)I I I I I I I I I I I I I I I I I I I I I I I I I I I I I I
Attach last subscriptionlabel here.
PLEASE PRINT OR TYPE
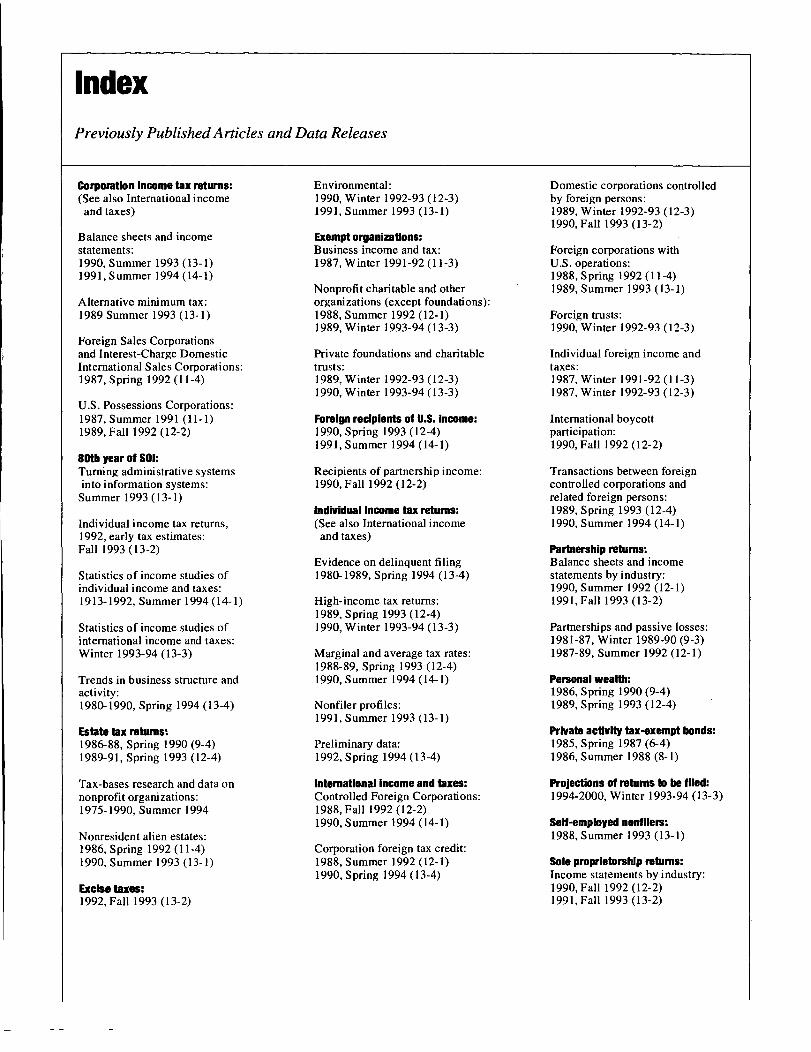
IndexPreviously Published Articles and Data Releases
Corporation Income tax returns:(See also International income
and taxes)
Environmental:1990, Winter 1992-93 (12-3)199 1, S ummer 1993 (13- 1)
Balance sheets and incomestatements:1990, S ummer 1993 (13- 1)199 1, S ummer 1994 (14- 1)
Alternative minimum tax:1989 Summer 1993 (13- 1)
Foreign Sales Corporationsand Interest-Charge DomesticInternational Sales Corporations:1987, Spring 1992 (11-4)
U.S. Possessions Corporations:1987, S ummer 1991 (11 - 1)1989, Fall 1992 (12-2)
80th year of SOI:Turning administrative systemsinto information systems:Summer 1993 (13- 1)
Individual income tax returns,1992, early tax estimates:Fall 1993 (13-2)
Statistics of income studies ofindividual income and taxes:1913-1992, Summer 1994 (14- 1)
Statistics of income studies ofinternational income and taxes:Winter 1993-94 (13-3)
Trends in business structure andactivity:1980-1990, Spring 1994 (13-4)
Estate tax returns:1986-88, Spring 1990 (9-4)1989-91, Spring 1993 (12-4)
Tax-bases research and data onnonprofit organizations:1975-1990, Summer 1994
Nonresident alien estates:1986, Spring 1992 (11-4)1990, S ummer 1993 (13- 1)
Excise taxes:1992, Fall 1993 (13-2)
Exempt organizations:Business income and tax:1987, Winter 1991-92 (11-3)
Nonprofit charitable and otherorganizations (except foundations):1988, Summer 1992 (12-1)1989, Winter 1993-94 (13-3)
Private foundations and charitabletrusts:1989, Winter 1992-93 (12-3)1990, Winter 1993-94 (13-3)
Foreign recipients of U.S. Income:1990, Spring 1993 (12-4)199 1, S ummer 1994 (14- 1)
Recipients of partnership income:1990, Fall 1992 (12-2)
Individual Income tax returns:(See also International incomeand taxes)
Evidence on delinquent filing1980-1989, Spring 1994 (13-4)
High-income tax returns:1989, Spring 1993 (12-4)1990, Winter 1993-94 (13-3)
Marginal and average tax rates:1988-89, Spring 1993 (12-4)1990, Summer 1994 (14- 1)
Nonfiler profiles:199 1, Summer 1993 (13- 1)
Preliminary data:1992, Spring 1994 (13-4)
International Income and taxes:Controlled Foreign Corporations:1988, Fall 1992 (12-2)1990, Summer 1994 (14- 1)
Corporation foreign tax credit:1988, Summer 1992 (12-1)1990, Spring 1994 (13-4)
Domestic corporations controlledby foreign persons:1989, Winter 1992-93 (12-3)1990, Fall 1993 (13-2)
Foreign corporations withU.S. operations:1988, Spring 1992 (11-4)1989, Summer 1993 (13-1)
Foreign trusts:1990, Winter 1992-93 (12-3)
Individual foreign income andtaxes:1987, Winter 1991-92 (11-3)1987, Winter 1992-93 (12-3)
International boycottparticipation:1990, Fall 1992 (12-2)
Transactions between foreigncontrolled corporations andrelated foreign persons:1989, Spring 1993 (12-4)1990, Summer 1994 (14- 1)
Partnership returns-.Balance sheets and incomestatements by industry:1990, Summer 1992 (12- 1)199 1, Fall 1993 (13-2)
Partnerships and passive losses:1981-87, Winter 1989-90 (9-3)1987-89, Summer 1992 (12-1)
Personal wealth:1986, Spring 1990 (9-4)1989, Spring 1993 (12-4)
Private activity tax-exempt bonds,1985, Spring 1987 (6-4)1986, Summer 1988 (8-1)
Projections of returns to be filed:1994-2000, Winter 1993-94 (13-3)
Self-employed nonfilers:1988, S ummer 1993 (13- 1)
Sole proprietorship returns:Income statements by industry:1990, Fall 1992 (12-2)199 1, Fall 1993 (13-2)

Department of the TreasuryInternal Revenue ServicePublication 1136 (Rev. 10-94)Catalog No. 46996F