Embed Size (px)
Citation preview
á1852ñ ATOMIC ABSORPTION SPECTROSCOPY—THEORY ANDPRACTICE
THEORY
The instrumental technique of atomic absorption spectrometry (AAS; see Appendix for a list of acronyms in this chapter) usesthe Beer–Lambert Law (Beer’s Law), which relates the concentration of an analyte in a sample to the sample’s absorption ofelectromagnetic radiation. Beer’s Law states that the optical absorbance of a chromophore in a transparent solvent is linearlyproportional to the chromophore’s concentration and also to the sample cell path length. Beer’s Law is applicable only if thespectral bandwidth of the light is narrow compared to the spectral line widths in the spectrum and is expressed as follows:
A = εbc
A = absorbanceε = molar absorptivity [L/(mol · cm)]b = path length of the sample cell (cm)c = concentration (mol/L)
In addition:
A = log10(P0/P) = log10(1/T) = log10(100/%T) = 2 − log10%T
P0 = intensity of light passing through a sampleP = intensity of light leaving the sampleT = transmittance%T = 100 × T
AAS methods fall into two categories: flame (FAAS) and flameless. Flameless methods include graphite furnace AAS (GFAAS),also known as electrothermal vaporization AAS (ETVAAS), for ultra-trace analyses. Other flameless methods are cold vapor AAS(CVAAS), intended specifically for the analysis of mercury, and hydride generation AAS (HGAAS), intended specifically for theanalysis of arsenic, bismuth, germanium, lead, antimony, selenium, tin, and tellurium.
A basic AAS consists of a radiation source, a sample introduction device, a means to atomize the sample, a monochromatoror a polychromator, a detector, and some means of acquiring data (usually a computer). Most instruments also have some sortof background correction system, which will be discussed later in this chapter.
In the case of FAAS, the flame through which the sample passes is considered to be the sample cell. In the case ofelectrothermal vaporization (ETV), the graphite tube into which the sample is deposited is considered to be the sample cell. Inthe case of CVAAS, a quartz absorption cell is mounted on top of the burner head, and the space above the burner in the opticalpath is considered to be the sample cell. In the case of hydride generation, hydrides are swept into a heated cell.
INSTRUMENTATION
Figure 1. Basic components of an atomic absorption spectrophotometer.
All atomic absorption spectrophotometers share fundamental components (Figure 1). A wide variety of AAS is availablecommercially and is based on one of two designs: a single-beam or a double-beam light path.
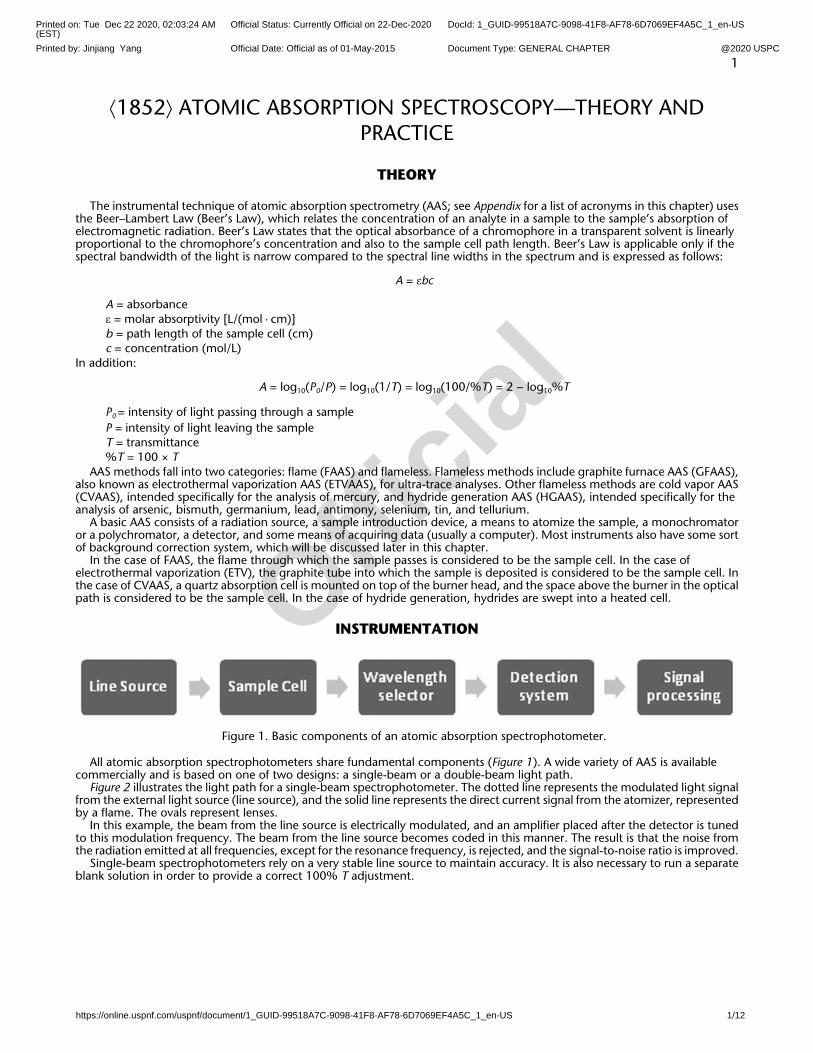
Figure 2 illustrates the light path for a single-beam spectrophotometer. The dotted line represents the modulated light signalfrom the external light source (line source), and the solid line represents the direct current signal from the atomizer, representedby a flame. The ovals represent lenses.
In this example, the beam from the line source is electrically modulated, and an amplifier placed after the detector is tunedto this modulation frequency. The beam from the line source becomes coded in this manner. The result is that the noise fromthe radiation emitted at all frequencies, except for the resonance frequency, is rejected, and the signal-to-noise ratio is improved.
Single-beam spectrophotometers rely on a very stable line source to maintain accuracy. It is also necessary to run a separateblank solution in order to provide a correct 100% T adjustment.
1
Printed on: Tue Dec 22 2020, 02:03:24 AM(EST)
Official Status: Currently Official on 22-Dec-2020 DocId: 1_GUID-99518A7C-9098-41F8-AF78-6D7069EF4A5C_1_en-US
Printed by: Jinjiang Yang Official Date: Official as of 01-May-2015 Document Type: GENERAL CHAPTER @2020 USPC
https://online.uspnf.com/uspnf/document/1_GUID-99518A7C-9098-41F8-AF78-6D7069EF4A5C_1_en-US 1/12
Officia
l
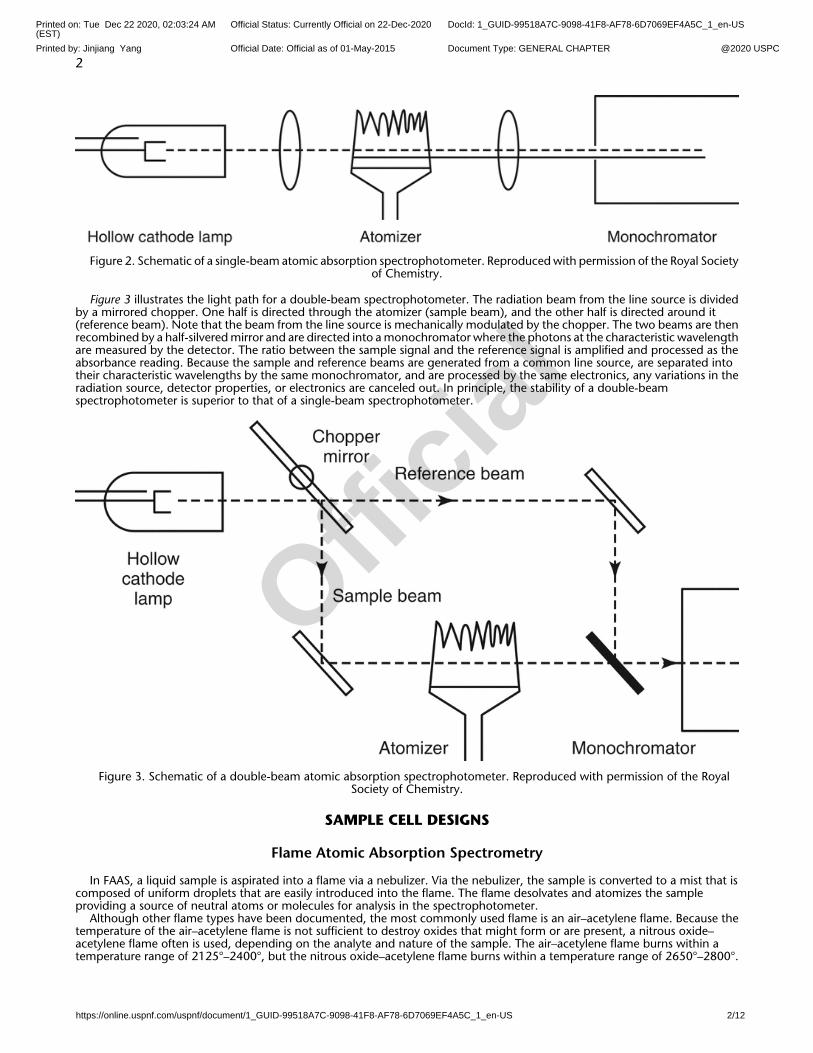
Figure 2. Schematic of a single-beam atomic absorption spectrophotometer. Reproduced with permission of the Royal Societyof Chemistry.
Figure 3 illustrates the light path for a double-beam spectrophotometer. The radiation beam from the line source is dividedby a mirrored chopper. One half is directed through the atomizer (sample beam), and the other half is directed around it(reference beam). Note that the beam from the line source is mechanically modulated by the chopper. The two beams are thenrecombined by a half-silvered mirror and are directed into a monochromator where the photons at the characteristic wavelengthare measured by the detector. The ratio between the sample signal and the reference signal is amplified and processed as theabsorbance reading. Because the sample and reference beams are generated from a common line source, are separated intotheir characteristic wavelengths by the same monochromator, and are processed by the same electronics, any variations in theradiation source, detector properties, or electronics are canceled out. In principle, the stability of a double-beamspectrophotometer is superior to that of a single-beam spectrophotometer.
Figure 3. Schematic of a double-beam atomic absorption spectrophotometer. Reproduced with permission of the RoyalSociety of Chemistry.
SAMPLE CELL DESIGNS
Flame Atomic Absorption Spectrometry
In FAAS, a liquid sample is aspirated into a flame via a nebulizer. Via the nebulizer, the sample is converted to a mist that iscomposed of uniform droplets that are easily introduced into the flame. The flame desolvates and atomizes the sampleproviding a source of neutral atoms or molecules for analysis in the spectrophotometer.
Although other flame types have been documented, the most commonly used flame is an air–acetylene flame. Because thetemperature of the air–acetylene flame is not sufficient to destroy oxides that might form or are present, a nitrous oxide–acetylene flame often is used, depending on the analyte and nature of the sample. The air–acetylene flame burns within atemperature range of 2125°–2400°, but the nitrous oxide–acetylene flame burns within a temperature range of 2650°–2800°.
2
Printed on: Tue Dec 22 2020, 02:03:24 AM(EST)
Official Status: Currently Official on 22-Dec-2020 DocId: 1_GUID-99518A7C-9098-41F8-AF78-6D7069EF4A5C_1_en-US
Printed by: Jinjiang Yang Official Date: Official as of 01-May-2015 Document Type: GENERAL CHAPTER @2020 USPC
https://online.uspnf.com/uspnf/document/1_GUID-99518A7C-9098-41F8-AF78-6D7069EF4A5C_1_en-US 2/12
Officia
l
Flames can be optimized for a particular analysis by either increasing or decreasing the fuel to oxidant ratio. The fuel tooxidant ratio can be adjusted to be either lean or rich—oxidizing or reducing—depending on the analyte of interest. Mostinstrument manufacturers provide guidance regarding the type of flame to use for a specific element, and analysts should referto the manual provided by the instrument manufacturer for optimal flame conditions for a given analyte.
Some AAS can also be used in the flame emission mode. In flame emission, the atoms and molecules achieve an excitedelectronic state following thermal collisions within the flame, and upon their return to a lower or ground electronic state theyemit light at characteristic wavelengths for each analyte. Although instrumentation may be capable of operation in the flameemission mode, this will not be discussed further in this chapter.
Electrothermal Vaporization—Graphite Furnace Atomic Absorption Spectrometry
In ETV or GFAAS, a liquid sample is deposited through a small opening into a graphite tube known as a mini-Massmannfurnace. Inside the furnace, the sample is heated at increasing temperatures until the solvent is evaporated, solid residue is ashedor pyrolyzed, and neutral atoms are atomized in their ground states. The atoms are then excited by absorption of radiation atcharacteristic wavelengths. Samples can be deposited either directly onto the wall of the graphite furnace or onto a smallgraphite platform, known as a L’vov platform, which sits inside of the graphite furnace. With ETV, a series of heating steps isusually employed, including drying, charring or ashing, atomizing, and clean-out. Other intermediate heating steps can beused, depending on the nature of the sample. Throughout the heating process, the graphite furnace is purged with an inertgas, usually nitrogen or argon. At the atomization step, the furnace is quickly heated to a high temperature (usually toincandescence). The purge gas flow is stopped temporarily as a transient absorption signal produced by the atomized analyteis measured. As in FAAS, Beer’s Law can be used to relate the concentration of the analyte and the absorption signal.
Cold Vapor and Hydride Generation Atomic Absorption Spectrometry
Cold vapor and hydride generation techniques are often used for the determination of mercury or for some hydride-formingelements such as tin, arsenic, selenium, antimony, and bismuth.
In the case of mercury, a chemical reduction generates atoms, and a stream of inert gas sweeps the cold vapor into a coldquartz cell in the optical path of the instrument. The technique is very sensitive and has detection limits that range from partsper billion (ppb) to parts per trillion (ppt) depending on the sample and the laboratory environment.
In the case of hydride-forming elements, a reaction with sodium borohydride and hydrochloric acid generates the hydrideof the analyte of interest. The resulting gas is swept into an inert quartz cell that is positioned on top of the burner. The cell canbe externally heated, or it can be heated by an air–acetylene flame. The heat of the flame breaks down the hydride and createsthe elemental form of the analyte. This is known as the direct-transfer mode of hydride generation. Commercial direct-transferhydride generators are available in two configurations, continuous flow and flow injection. As with the cold vapor detection ofmercury, hydride generation also can be very sensitive and has detection limits in the ppb or ppt range.
LINE SOURCES
An external light source (line source) is used to emit spectral lines corresponding to the energy required to elicit the electronictransition from the ground state to an excited state in the sample. The external light sources most commonly used are hollowcathode lamps (HCL) or continuum electrodeless discharge lamps (EDL). Absorption of radiation from the external light sourceis proportional to the population of the analyte species in the ground state, which is proportional to the concentration of theanalyte that is aspirated into the flame, thereby making it possible to use Beer’s Law to determine the concentration of ananalyte in the sample. The absorption is measured by the difference in transmitted signal in the presence and absence of theanalyte.
A suitable line source for AAS must:• Produce lines of sufficiently narrow bandwidths specific to a particular atomic absorption peak• Produce a beam of radiation of sufficient intensity to allow high signal-to-noise absorption measurements• Produce a beam of radiation that is stable for extended periods of time• Be easy to start and have a short warm-up time and an extended shelf life.The gas contained within the HCL tube is ionized when an electrical potential is applied across the electrodes. Gaseous cations
then acquire sufficient kinetic energy to dislodge some of the metal atoms from the anode surface, a process known assputtering. A portion of the resulting cloud of metal ions is excited. Upon relaxation to the ground state, the ions emit photonsat the characteristic wavelengths for that metal. HCLs are available in a variety of configurations and can be specific for a singleelement or multiple elements.
For certain elements, EDLs produce much more intense radiation beams than do HCLs. They are available for the analysis ofantimony, arsenic, bismuth, cadmium, cesium, germanium, lead, mercury, phosphorus, selenium, tellurium, thallium, tin, andzinc. They are similar to HCLs because they rely on the sputtering of a metal by accelerated ions, but they ionize the inert gasby means of an intense radio-frequency field instead of hard-wired electrodes.
The requirement for an individual line source for each metal limits AA to a single-element technique. Some modern systemsallow multi-element analyses by automatic lamp switching or by positioning multiple lamps in an array. High-resolutioncontinuum source AAS combines a high-resolution Echelle monochromator with a Xenon short-arc lamp to obtainmulti-element analytical capabilities (see Reference 1 for additional details).
3
Printed on: Tue Dec 22 2020, 02:03:24 AM(EST)
Official Status: Currently Official on 22-Dec-2020 DocId: 1_GUID-99518A7C-9098-41F8-AF78-6D7069EF4A5C_1_en-US
Printed by: Jinjiang Yang Official Date: Official as of 01-May-2015 Document Type: GENERAL CHAPTER @2020 USPC
https://online.uspnf.com/uspnf/document/1_GUID-99518A7C-9098-41F8-AF78-6D7069EF4A5C_1_en-US 3/12
Officia
l

WAVELENGTH SELECTORS
Because atomic resonance lines are narrow, spectrometers are frequently equipped with monochromator gratings ofmoderate resolution, such as Ebert and Czerny–Turner monochromator systems.
Although the application is not common, high-resolution Echelle polychromators have been used in AAS designed forsimultaneous measurements of multiple elements. Spectrophotometers of this type usually mate a high-resolutionpolychromator with either a Xenon arc continuum source or several individual line sources. They typically are equipped with asolid-state detector system.
DETECTION SYSTEMS
Detection systems convert radiant energy, photons, into a concentration-proportionate electronic signal. This signal isamplified and processed into an absorbance reading or a concentration, as illustrated in Figure 1. Photomultiplier tubes (PMTs)are widely used in AAS to convert photons passed through the monochromator into voltages. Some spectrophotometers aredesigned so that the applied PMT currents are under operator control. As mentioned above, some modern AAS are equippedwith solid-state detection systems. There are two types: a charge-injection device or a charge-coupled device. Advantages anddisadvantages of each design depend on specific applications. In some applications, a solid-state detector can produce a superiorsignal-to-noise ratio, provide a flatter response across the UV/Vis spectrum, and/or have improved background correctioncapabilities when compared to a PMT.
BACKGROUND CORRECTION
Nonspecific absorption can compromise the accuracy of AAS measurements. This is particularly the case for ultra-traceanalyses using GFAAS. The type of background correction used for GFAAS can have a large impact on the success of the analysis.Three types of background correction designs are available for modern AAS: continuum source, Smith–Hieftje or variable giantpulse, and Zeeman effect.
Continuum Source
A continuum source, frequently a deuterium lamp, is configured in the spectrophotometer optics so that radiation from thecontinuum source and the line source is alternately passed through the sample cell by a beam chopper (Figure 4). The widthof the continuum source bandpass is equal to the slit width.
4
Printed on: Tue Dec 22 2020, 02:03:24 AM(EST)
Official Status: Currently Official on 22-Dec-2020 DocId: 1_GUID-99518A7C-9098-41F8-AF78-6D7069EF4A5C_1_en-US
Printed by: Jinjiang Yang Official Date: Official as of 01-May-2015 Document Type: GENERAL CHAPTER @2020 USPC
https://online.uspnf.com/uspnf/document/1_GUID-99518A7C-9098-41F8-AF78-6D7069EF4A5C_1_en-US 4/12
Officia
l
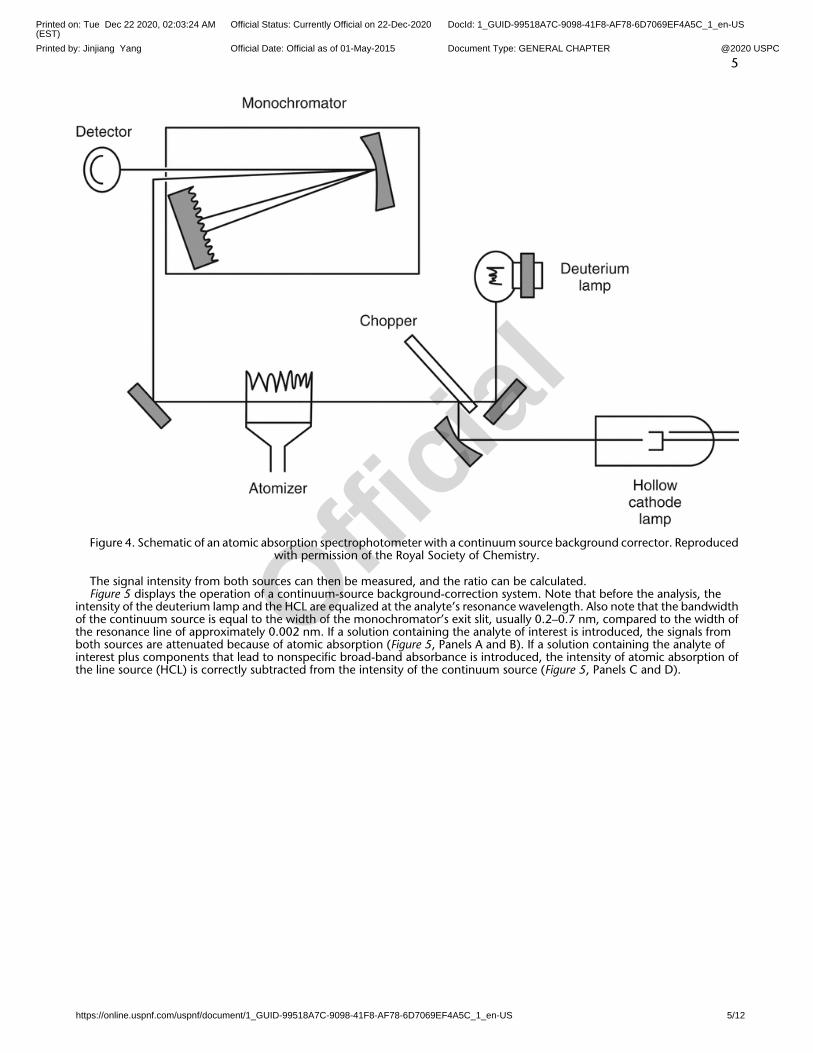
Figure 4. Schematic of an atomic absorption spectrophotometer with a continuum source background corrector. Reproducedwith permission of the Royal Society of Chemistry.
The signal intensity from both sources can then be measured, and the ratio can be calculated.Figure 5 displays the operation of a continuum-source background-correction system. Note that before the analysis, the
intensity of the deuterium lamp and the HCL are equalized at the analyte’s resonance wavelength. Also note that the bandwidthof the continuum source is equal to the width of the monochromator’s exit slit, usually 0.2–0.7 nm, compared to the width ofthe resonance line of approximately 0.002 nm. If a solution containing the analyte of interest is introduced, the signals fromboth sources are attenuated because of atomic absorption (Figure 5, Panels A and B). If a solution containing the analyte ofinterest plus components that lead to nonspecific broad-band absorbance is introduced, the intensity of atomic absorption ofthe line source (HCL) is correctly subtracted from the intensity of the continuum source (Figure 5, Panels C and D).
5
Printed on: Tue Dec 22 2020, 02:03:24 AM(EST)
Official Status: Currently Official on 22-Dec-2020 DocId: 1_GUID-99518A7C-9098-41F8-AF78-6D7069EF4A5C_1_en-US
Printed by: Jinjiang Yang Official Date: Official as of 01-May-2015 Document Type: GENERAL CHAPTER @2020 USPC
https://online.uspnf.com/uspnf/document/1_GUID-99518A7C-9098-41F8-AF78-6D7069EF4A5C_1_en-US 5/12
Officia
l
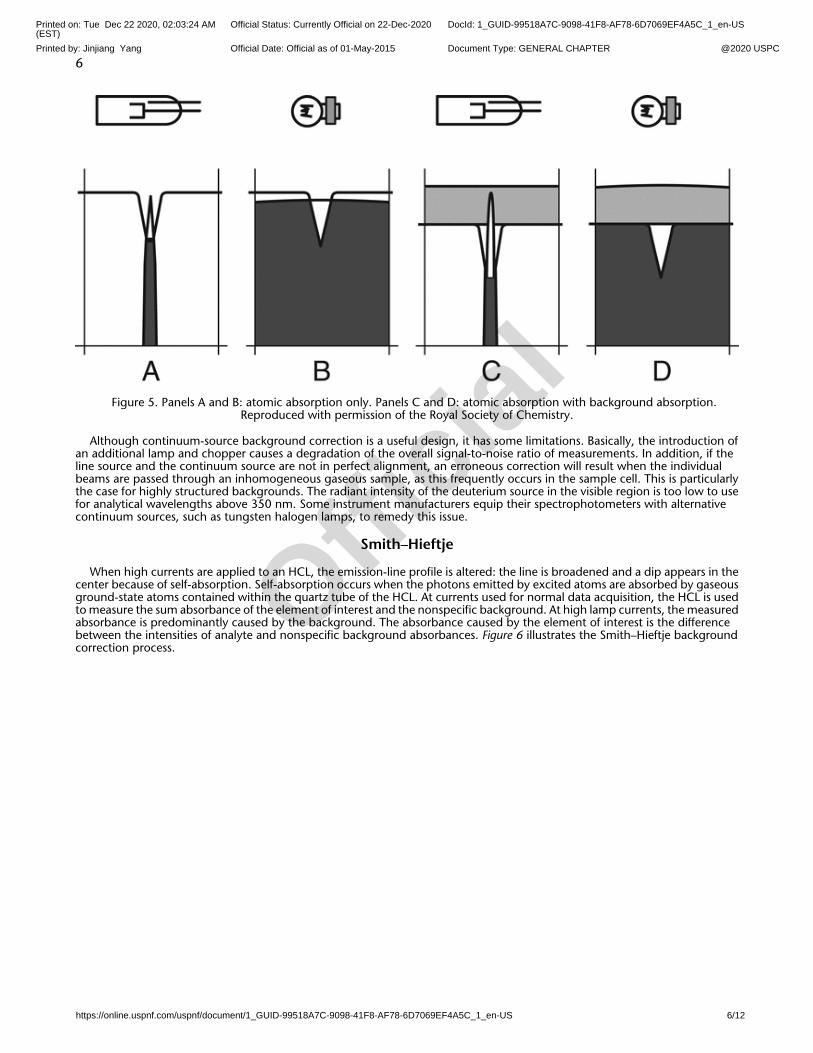
Figure 5. Panels A and B: atomic absorption only. Panels C and D: atomic absorption with background absorption.Reproduced with permission of the Royal Society of Chemistry.
Although continuum-source background correction is a useful design, it has some limitations. Basically, the introduction ofan additional lamp and chopper causes a degradation of the overall signal-to-noise ratio of measurements. In addition, if theline source and the continuum source are not in perfect alignment, an erroneous correction will result when the individualbeams are passed through an inhomogeneous gaseous sample, as this frequently occurs in the sample cell. This is particularlythe case for highly structured backgrounds. The radiant intensity of the deuterium source in the visible region is too low to usefor analytical wavelengths above 350 nm. Some instrument manufacturers equip their spectrophotometers with alternativecontinuum sources, such as tungsten halogen lamps, to remedy this issue.
Smith–Hieftje
When high currents are applied to an HCL, the emission-line profile is altered: the line is broadened and a dip appears in thecenter because of self-absorption. Self-absorption occurs when the photons emitted by excited atoms are absorbed by gaseousground-state atoms contained within the quartz tube of the HCL. At currents used for normal data acquisition, the HCL is usedto measure the sum absorbance of the element of interest and the nonspecific background. At high lamp currents, the measuredabsorbance is predominantly caused by the background. The absorbance caused by the element of interest is the differencebetween the intensities of analyte and nonspecific background absorbances. Figure 6 illustrates the Smith–Hieftje backgroundcorrection process.
6
Printed on: Tue Dec 22 2020, 02:03:24 AM(EST)
Official Status: Currently Official on 22-Dec-2020 DocId: 1_GUID-99518A7C-9098-41F8-AF78-6D7069EF4A5C_1_en-US
Printed by: Jinjiang Yang Official Date: Official as of 01-May-2015 Document Type: GENERAL CHAPTER @2020 USPC
https://online.uspnf.com/uspnf/document/1_GUID-99518A7C-9098-41F8-AF78-6D7069EF4A5C_1_en-US 6/12
Officia
l
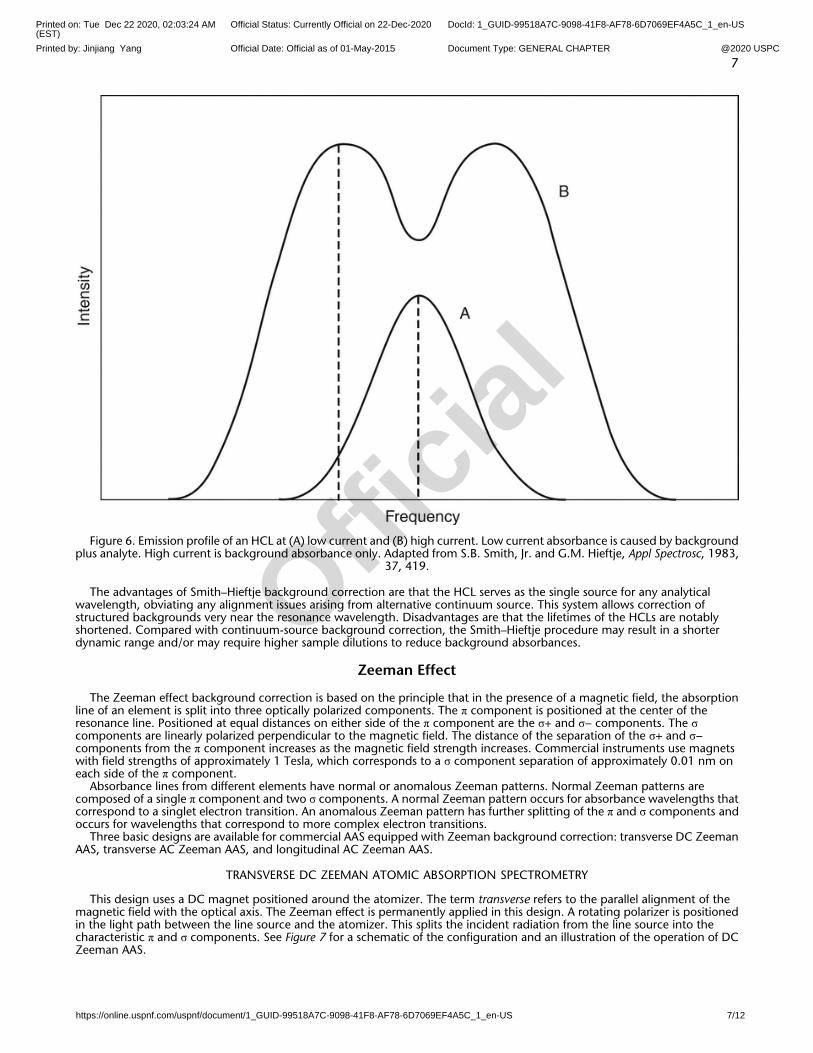
Figure 6. Emission profile of an HCL at (A) low current and (B) high current. Low current absorbance is caused by backgroundplus analyte. High current is background absorbance only. Adapted from S.B. Smith, Jr. and G.M. Hieftje, Appl Spectrosc, 1983,
37, 419.
The advantages of Smith–Hieftje background correction are that the HCL serves as the single source for any analyticalwavelength, obviating any alignment issues arising from alternative continuum source. This system allows correction ofstructured backgrounds very near the resonance wavelength. Disadvantages are that the lifetimes of the HCLs are notablyshortened. Compared with continuum-source background correction, the Smith–Hieftje procedure may result in a shorterdynamic range and/or may require higher sample dilutions to reduce background absorbances.
Zeeman Effect
The Zeeman effect background correction is based on the principle that in the presence of a magnetic field, the absorptionline of an element is split into three optically polarized components. The π component is positioned at the center of theresonance line. Positioned at equal distances on either side of the π component are the σ+ and σ− components. The σcomponents are linearly polarized perpendicular to the magnetic field. The distance of the separation of the σ+ and σ−components from the π component increases as the magnetic field strength increases. Commercial instruments use magnetswith field strengths of approximately 1 Tesla, which corresponds to a σ component separation of approximately 0.01 nm oneach side of the π component.
Absorbance lines from different elements have normal or anomalous Zeeman patterns. Normal Zeeman patterns arecomposed of a single π component and two σ components. A normal Zeeman pattern occurs for absorbance wavelengths thatcorrespond to a singlet electron transition. An anomalous Zeeman pattern has further splitting of the π and σ components andoccurs for wavelengths that correspond to more complex electron transitions.
Three basic designs are available for commercial AAS equipped with Zeeman background correction: transverse DC ZeemanAAS, transverse AC Zeeman AAS, and longitudinal AC Zeeman AAS.
TRANSVERSE DC ZEEMAN ATOMIC ABSORPTION SPECTROMETRY
This design uses a DC magnet positioned around the atomizer. The term transverse refers to the parallel alignment of themagnetic field with the optical axis. The Zeeman effect is permanently applied in this design. A rotating polarizer is positionedin the light path between the line source and the atomizer. This splits the incident radiation from the line source into thecharacteristic π and σ components. See Figure 7 for a schematic of the configuration and an illustration of the operation of DCZeeman AAS.
7
Printed on: Tue Dec 22 2020, 02:03:24 AM(EST)
Official Status: Currently Official on 22-Dec-2020 DocId: 1_GUID-99518A7C-9098-41F8-AF78-6D7069EF4A5C_1_en-US
Printed by: Jinjiang Yang Official Date: Official as of 01-May-2015 Document Type: GENERAL CHAPTER @2020 USPC
https://online.uspnf.com/uspnf/document/1_GUID-99518A7C-9098-41F8-AF78-6D7069EF4A5C_1_en-US 7/12
Officia
l
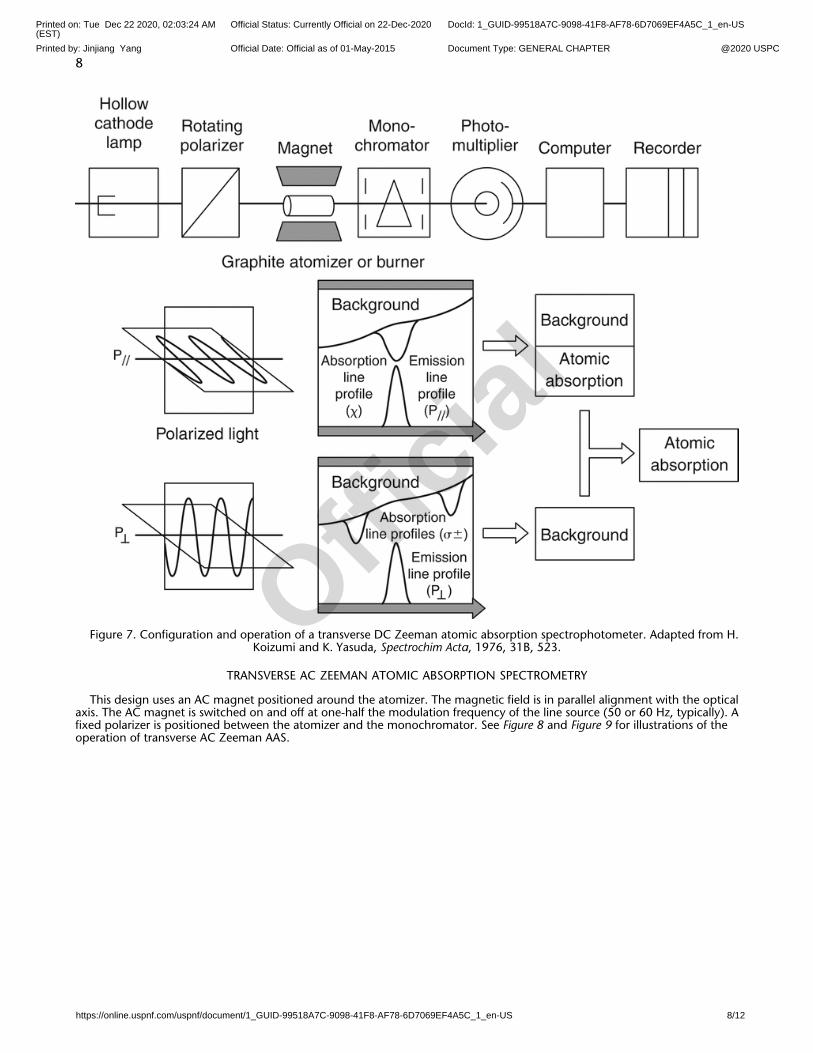
Figure 7. Configuration and operation of a transverse DC Zeeman atomic absorption spectrophotometer. Adapted from H.Koizumi and K. Yasuda, Spectrochim Acta, 1976, 31B, 523.
TRANSVERSE AC ZEEMAN ATOMIC ABSORPTION SPECTROMETRY
This design uses an AC magnet positioned around the atomizer. The magnetic field is in parallel alignment with the opticalaxis. The AC magnet is switched on and off at one-half the modulation frequency of the line source (50 or 60 Hz, typically). Afixed polarizer is positioned between the atomizer and the monochromator. See Figure 8 and Figure 9 for illustrations of theoperation of transverse AC Zeeman AAS.
8
Printed on: Tue Dec 22 2020, 02:03:24 AM(EST)
Official Status: Currently Official on 22-Dec-2020 DocId: 1_GUID-99518A7C-9098-41F8-AF78-6D7069EF4A5C_1_en-US
Printed by: Jinjiang Yang Official Date: Official as of 01-May-2015 Document Type: GENERAL CHAPTER @2020 USPC
https://online.uspnf.com/uspnf/document/1_GUID-99518A7C-9098-41F8-AF78-6D7069EF4A5C_1_en-US 8/12
Officia
l
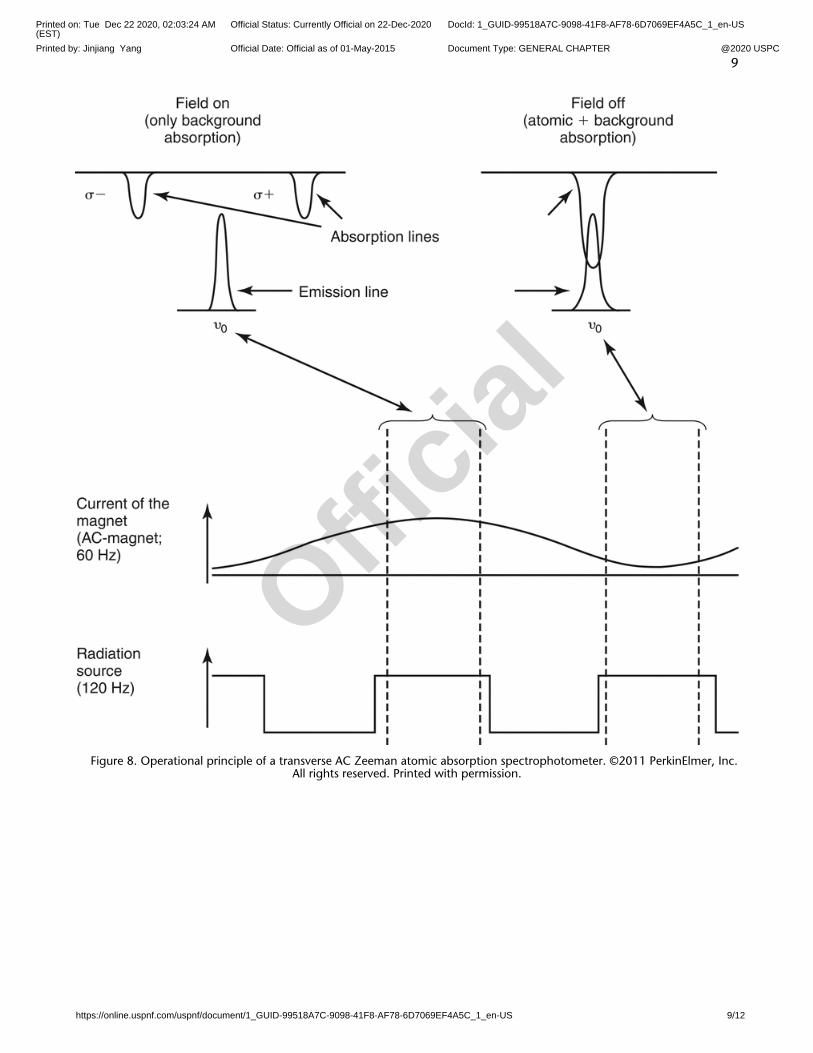
Figure 8. Operational principle of a transverse AC Zeeman atomic absorption spectrophotometer. ©2011 PerkinElmer, Inc.All rights reserved. Printed with permission.
9
Printed on: Tue Dec 22 2020, 02:03:24 AM(EST)
Official Status: Currently Official on 22-Dec-2020 DocId: 1_GUID-99518A7C-9098-41F8-AF78-6D7069EF4A5C_1_en-US
Printed by: Jinjiang Yang Official Date: Official as of 01-May-2015 Document Type: GENERAL CHAPTER @2020 USPC
https://online.uspnf.com/uspnf/document/1_GUID-99518A7C-9098-41F8-AF78-6D7069EF4A5C_1_en-US 9/12
Officia
l
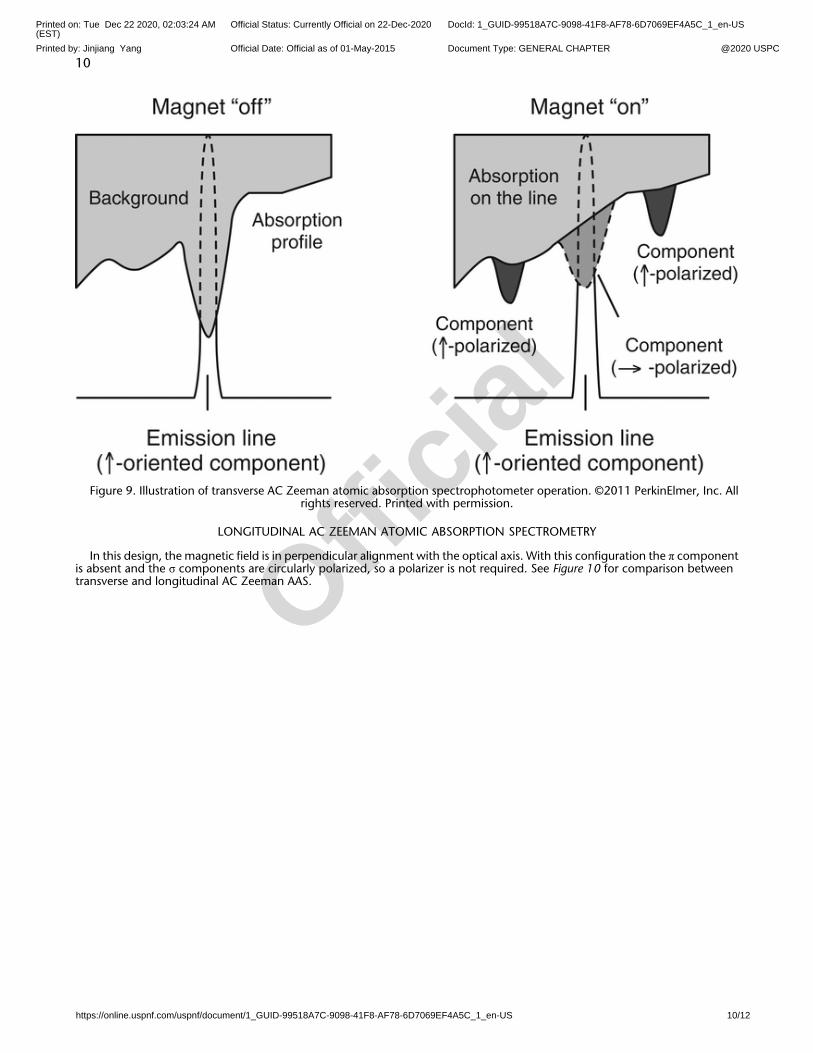
Figure 9. Illustration of transverse AC Zeeman atomic absorption spectrophotometer operation. ©2011 PerkinElmer, Inc. Allrights reserved. Printed with permission.
LONGITUDINAL AC ZEEMAN ATOMIC ABSORPTION SPECTROMETRY
In this design, the magnetic field is in perpendicular alignment with the optical axis. With this configuration the π componentis absent and the σ components are circularly polarized, so a polarizer is not required. See Figure 10 for comparison betweentransverse and longitudinal AC Zeeman AAS.
10
Printed on: Tue Dec 22 2020, 02:03:24 AM(EST)
Official Status: Currently Official on 22-Dec-2020 DocId: 1_GUID-99518A7C-9098-41F8-AF78-6D7069EF4A5C_1_en-US
Printed by: Jinjiang Yang Official Date: Official as of 01-May-2015 Document Type: GENERAL CHAPTER @2020 USPC
https://online.uspnf.com/uspnf/document/1_GUID-99518A7C-9098-41F8-AF78-6D7069EF4A5C_1_en-US 10/12
Officia
l
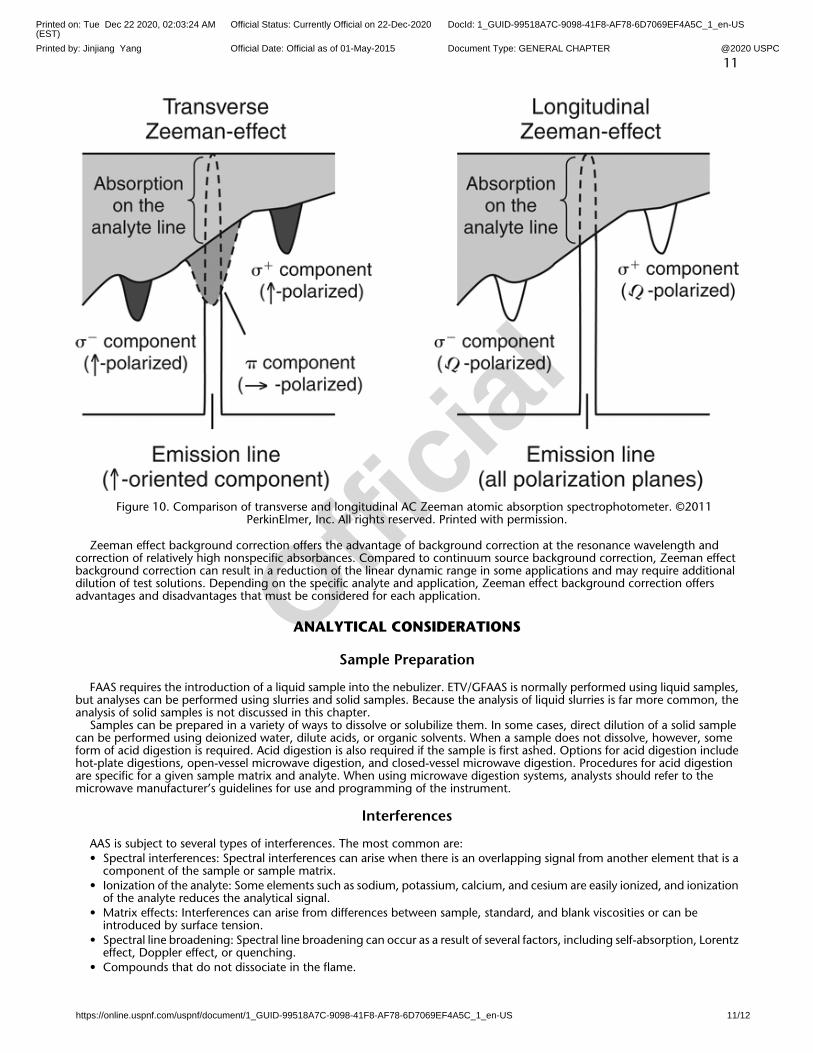
Figure 10. Comparison of transverse and longitudinal AC Zeeman atomic absorption spectrophotometer. ©2011PerkinElmer, Inc. All rights reserved. Printed with permission.
Zeeman effect background correction offers the advantage of background correction at the resonance wavelength andcorrection of relatively high nonspecific absorbances. Compared to continuum source background correction, Zeeman effectbackground correction can result in a reduction of the linear dynamic range in some applications and may require additionaldilution of test solutions. Depending on the specific analyte and application, Zeeman effect background correction offersadvantages and disadvantages that must be considered for each application.
ANALYTICAL CONSIDERATIONS
Sample Preparation
FAAS requires the introduction of a liquid sample into the nebulizer. ETV/GFAAS is normally performed using liquid samples,but analyses can be performed using slurries and solid samples. Because the analysis of liquid slurries is far more common, theanalysis of solid samples is not discussed in this chapter.
Samples can be prepared in a variety of ways to dissolve or solubilize them. In some cases, direct dilution of a solid samplecan be performed using deionized water, dilute acids, or organic solvents. When a sample does not dissolve, however, someform of acid digestion is required. Acid digestion is also required if the sample is first ashed. Options for acid digestion includehot-plate digestions, open-vessel microwave digestion, and closed-vessel microwave digestion. Procedures for acid digestionare specific for a given sample matrix and analyte. When using microwave digestion systems, analysts should refer to themicrowave manufacturer’s guidelines for use and programming of the instrument.
Interferences
AAS is subject to several types of interferences. The most common are:• Spectral interferences: Spectral interferences can arise when there is an overlapping signal from another element that is a
component of the sample or sample matrix.• Ionization of the analyte: Some elements such as sodium, potassium, calcium, and cesium are easily ionized, and ionization
of the analyte reduces the analytical signal.• Matrix effects: Interferences can arise from differences between sample, standard, and blank viscosities or can be
introduced by surface tension.• Spectral line broadening: Spectral line broadening can occur as a result of several factors, including self-absorption, Lorentz
effect, Doppler effect, or quenching.• Compounds that do not dissociate in the flame.
11
Printed on: Tue Dec 22 2020, 02:03:24 AM(EST)
Official Status: Currently Official on 22-Dec-2020 DocId: 1_GUID-99518A7C-9098-41F8-AF78-6D7069EF4A5C_1_en-US
Printed by: Jinjiang Yang Official Date: Official as of 01-May-2015 Document Type: GENERAL CHAPTER @2020 USPC
https://online.uspnf.com/uspnf/document/1_GUID-99518A7C-9098-41F8-AF78-6D7069EF4A5C_1_en-US 11/12
Officia
l
Matrix Modification, Releasing Agents, and Ionization Suppressants
To counteract potential interferences or to enhance their ability to monitor an analyte, analysts sometimes use a matrixmodifier, a releasing agent, or an ionization suppressant.
Matrix modifiers are added to samples, standards, and blanks with GFAAS with the chief goals of changing the nature of thesample or analyte in the sample by:
• Increasing the volatility of the sample matrix so that matrix components are removed during the ashing or pyrolysis step• Reducing the volatility of the analyte, which helps to eliminate loss of the analyte during the ashing or pyrolysis step• Reducing background absorption by eliminating matrix components so that they do not interfere with the analyte signal
during atomization.It may be necessary to use more than one matrix modifier during an analysis. Commonly used matrix modifiers include
magnesium nitrate, nickel nitrate, palladium, and lanthanum. Manufacturers of graphite furnace instrumentation providedetailed information regarding the use of matrix modifiers, and analysts should consult that information when they performan analysis. In some instances, GFAAS analyses require applying the method of standard additions in order to overcome matrixinduced result biases. Many modern GFAAS systems are equipped with autosamplers that automatically spike sample solutionsat multiple levels specified by the analyst, perform the linear regression, and report the final concentration result based uponthe intercept.
Releasing agents and ionization suppressants are used in FAAS to eliminate certain potential interferences. Releasing agentsare added in excess to samples, standards, and blanks to prevent the formation of refractory compounds by combining with apotential interferent. Ionization suppressants are added in excess to samples, standards, and blanks to help control ionizationof the analyte. By adding an ionization suppressant that has an ionization potential lower than that of the analyte, analystscreate an excess of electrons in the flame, and the ionization of the analyte is suppressed. Commonly used releasing agentsinclude lanthanum and strontium. Commonly used ionization suppressants include sodium, potassium, cesium, and lanthanum.Manufacturers of flame atomic absorption (AA) instrumentation provide detailed information regarding the use of releasingagents and ionization suppressants, and analysts should consult that information when performing an analysis.
Because of the separation of the analyte from the matrix in cold-vapor and hydride-generation AA, spectral interferences arenotably reduced when compared to the other AA methods. Nonselective background interferences can occur, however, when asufficient amount of an absorbing species is transported to the cell. Typically this occurs when an excess of anotherhydride-forming species is introduced from the sample matrix or in the case of hydride formation when nonaqueous media areused. Transport interferences take place during transport of a hydride from the sample solution to the sample cell. This eithercauses a delay in hydride formation, known as transport kinetics interference, or loss of the hydride altogether, known astransport efficiency interference. Volatile compounds transported to the cell with the hydride can also interfere nonselectively.These interferences can be remedied either by using the method of standard additions or by further diluting the sample.
APPENDIX
Acronyms
A: absorptionAA: atomic absorptionAAS: atomic absorption spectrometryCVAAS: cold vapor AASEDL: electrodeless discharge lampETV: electrothermal vaporizationFAAS: flame AASGFAAS: graphite furnace AASHCL: hollow cathode lampHGAAS: hydride generation AASPMT: photomultiplier tubeT: transmittance
REFERENCES
1. Welz B., Becker-Ross H., Florek S., Heitmann U., High Resolution Continuum Source AAS, Wiley-VCH, 2005, pp. 53–61.2. Skoog, D.A., Holler, F.J., Nieman, T.A., Principles of Instrumental Analysis, Saunders College Publishing, 5th Ed., 1998, pp.
214–220.3. Ebdon, L., Evans, E.H., Fisher, A., Hill, S.J., An Introduction to Analytical Atomic Spectrometry, John Wiley and Sons, 1998,
pp. 17–23.4. Lajunen, L.H.J. and Peramaki, P., Spectrochemical Analysis by Atomic Absorption and Emission, The Royal Society of
Chemistry, 2nd Ed., 2004, pp. 78–87, 151–152, 156, 161, 164, 168.5. Cullen, M., Atomic Spectroscopy in Elemental Analysis, CRC Press, 2004, pp. 228–237, 251.6. Dedina, J. and Dimiter, L., Hydride Generation Atomic Absorption Spectrometry, Chemical Analysis, Volume 130, John Wiley
and Sons, 1995, pp. 91–93.
12
Printed on: Tue Dec 22 2020, 02:03:24 AM(EST)
Official Status: Currently Official on 22-Dec-2020 DocId: 1_GUID-99518A7C-9098-41F8-AF78-6D7069EF4A5C_1_en-US
Printed by: Jinjiang Yang Official Date: Official as of 01-May-2015 Document Type: GENERAL CHAPTER @2020 USPC
https://online.uspnf.com/uspnf/document/1_GUID-99518A7C-9098-41F8-AF78-6D7069EF4A5C_1_en-US 12/12
Officia
l