Embed Size (px)
Citation preview
DW&M (SYSTEM PAPER) HR & SYSTEMS SPECILISATION
UNIT-1 MANAGING DATA BALAJI INST OF IT & MANAGEMENT
(17E00319) DATA WAREHOUSING AND MINING
(Elective IV)
Objective: The objective of the course is to give an understanding Data Warehousing and Data Mining
concepts.
1. Managing Data: Individual Data Management, Organizational Data Warehousing and Data
Management, Components of Organizational Memory, Evaluation of Database Technology.
2. Database Systems in the Organization: Data Sharing and Data Bases – Sharing Data Between
Functional Units, Sharing Data Between Different Levels of Users, Sharing Data Between Different
Locations.
3. The Data Warehouse Data Base: Context of Data Warehouse Data Base, Data Base Structures –
Organizing Relational Data warehouse – Multi-Dimensional Data Structures – Choosing a Structure.
Meta Data: Human Meta Data, Computer Based Meta Data for people to use, Computer based Meta
Data for the Computer to use.
4. Analyzing the Contexts of the Data warehouse: Active Analysis, User Queries – OLAP
Constructing a Data Warehouse System: Stages of the Project – Developing a Project Plan, Data
warehousing Design Approaches – The Architecture Stage.
5. Getting Data into the Data warehouse – Extraction, Transformation, Cleaning, Loading and
Summarization. Data Mining, creating a Decision Tree, Correlation and Other Statistical Analysis,
Neural Networks, Nearest Neighbor Approaches, Putting the Results to Use.
Text Books:
Data Mining – Concepts and Techniques - Jiawei Han &MichelineKamber, Morgan Kaufmann
Publishers, 2nd Edition, 2006.
Data Mining Introductory and advanced topics –Margaret H Dunham, Pearson education
References:
Decision Support Systems and Data Warehouse Systems, Efram G. Mallach: TMH.
Data Mining Techniques and Tasks, T.H.M.Sivanandam, Thomson.
Data Management, Data Bases and Organizations, Richard T Watson : Wiley.
Modern Data Warehousing, Mining and Visualization Core Concepts, Marakas, Pearson
Data warehousing, Data Mining OLAP, Berson Smith, TMH
DW&M (SYSTEM PAPER) HR & SYSTEMS SPECILISATION
UNIT-1 MANAGING DATA BALAJI INST OF IT & MANAGEMENT
UNIT-1
MANAGING DATA
1. INDIVIDUAL DATA MANAGEMENT (IDM)
IDM includes all aspect of data planning handling, analysis, documentation and storage and takes
place during all stages of a study
The main objective of data management is to create a reliable data containing high quality data and
it includes.
Planning the data needs of the study.
Data collection – data entry – data validation and checking.
Data manipulation – data files back up – data documentation.
The main element of data management is database files. Data files contain text, numerical, images
and other data in machine readable form. Such files should be viewed as part of data base
management systems (DBMS), which allows for a broad range of data functions including data
entry, checking, up detaining documentation and analysis.
1.1 DATA MANAGEMENT SOFTWARE
Many DBMS are available for personal computers options include,
Spread sheet (example-excel SPSS datasheet).
Commercial data bases program (oracle, access).
Specialty data entry program (SPSS data entry builder, EPI data etc.).
As per spread sheet are using in our daily life for different types of data storage.
Commercially available data base programs are expensive tend to be large and slow and often
lack controlled data-entry facilities.
Specialty data entry programs are ideal for data entry and storage. We use EPI data for this
purpose because it is fast reliable allows for controlled data entry and is open-source. Use of
epi data is introduced in the accompanying lab.
1.2 DATA ENTRY AND VALIDATION
Data processing errors are errors that occur often data have been collected.
Examples of data processing errors include.
Transpositions (example - 19 becomes 91 during data entry)
Copying errors (example – 0 zero becomes O during data entry)
Coding errors (example – a racial group gets improperly coded becomes of changes in the coding
scheme)
Routing errors (example – the interviewer asks the wrong question or asks questions in the wrong
order)
Consistency errors (example – such as the reporting of a hysterectomy after the respondent has
identified himself as a male)
Range errors (responses outside of the range of plausible answers such as a reported age of 290)
To prevent such errors you must identify the stage at which they occur and correct the problem.
DW&M (SYSTEM PAPER) HR & SYSTEMS SPECILISATION
UNIT-1 MANAGING DATA BALAJI INST OF IT & MANAGEMENT
Methods to prevent data entry errors include;
Manual checks during data collection
Range and consistency checking during data entry (such as ages greater than 110)
Double entry and validation following data entry
Data analysis screening for outliers during data analysis.
1.3 DATA BACKUP AND STORAGE
Data loss can be due to natural disasters, theft human errors and computer failure, you’ve worked too hard
to collect and enter data, and you must now take care of it.
The most common loss of data among students is due to loss of data somewhere on the computer. The best
way to prevent such loss is to know the physical location of your data (local drive, removable media, network and to
uses logical file names.)
In addition, it is essential back-up all data (example – data files, code books, software settings, computer
programs word processing documents.)
Backup procedures should be thoroughly tested to ensure archived files remain uncorrupted and can be
restored.
1.4 DATA WAREHOUSING AND MINING
DISTINCTION BETWEEN DATABASES AND DATA WAREHOUSES?
Data base in one designed to make transactional system run efficiently. This type of data base is in
OLTP (online transaction processing) database.
In fact, an OLTP database is typically constrained to a single application.
The important fact is that a transactional database doesn’t lend itself to analytics. To effectively
perform analytics, you need a data ware house.
The data ware house is a database of different kind an OLAP (online analyses processing)
database.
A data ware house takes the data from all these databases and creator a layer optimized for and
dedicated to analysis.
A data house designed to handle transactions a data warehouse on the other hand is structured to
make analysis fast and easy.
DW&M (SYSTEM PAPER) HR & SYSTEMS SPECILISATION
UNIT-1 MANAGING DATA BALAJI INST OF IT & MANAGEMENT
2. ORGANISATIONAL DATA WAREHOUSING AND DATA MANAGEMENT
2.1 DATAWARE HOUSING
Large companies have presence in many places each of which may generate a large volume of data
for instance, large retail chains have hundreds or thousands of stores, and where as insurance companies
may have data from thousands of local branches.
Large organizations have a complex internal organization structure, and therefore different data
may be present in different locations or on different operational systems or under different schemes.
Setting up queries on individual sources is both cumbersome and inefficient moreover the sources
of data may store only current data whereas decision makers may need access to part data as well for
instance information about how purchase patterns have changed in the past year could be of great
importance.
Data warehouse provide a solution to these problems. A data warehouse is a repository of information
gathered from multiple sources stored under a unified schema at a single site. Once gathered, the data are stored for
a long time permitting access to historical data. Thus data warehouses provide the user to take decision support
queries easier to write.
2.2 ORGANIZATIONAL DATA WAREHOUSE
Data warehousing overcomes various problems that result from the need to connect large number of
decision support systems to large number of operational systems by providing a hub for subject based
historical, consistent and non volatile information.
By connecting decision sup poet stems and operational systems to a centralized hub the number of
interfaces can be reduced dramatically and information quality can be guaranteed more effectively.
Several studies point out that organization related issues area among the most critical success factor for data
warehouse project.
Most projects (enterprise data warehousing) project fail for political and organizational reasons, rather than
for technical ones.
As a foundation for developing the organization of data warehousing the concept of data ownership has to
be derived from traditional process-oriented ownership concepts.
2.3 DATA OWNERSHIP
Data ownership is primarily a data governance process that details an organizations legal ownership of
enterprise wide data.
A specific organization or the data owner has the ability to create edit modify share and retract access to the
data.
Data ownership also defines the data ownership ability to assign share or surrender all of these privileges to
a third party. This concept is generally implemented in medium to large enterprises with huge repositories
of centralized or distributed data elements.
The data owner claims the possession and copyrights to such data to ensure their control and ability to take
legal action of their ownership is illegitimately breached by an internal or external entity.
DW&M (SYSTEM PAPER) HR & SYSTEMS SPECILISATION
UNIT-1 MANAGING DATA BALAJI INST OF IT & MANAGEMENT
2.4 ORGANISATIONAL DATA MANAGEMENT
Organizational data describe central characteristics of organizations their internal structures and
processes as well their behaviors as corporate actors in different social and economic contexts.
Or
Data organization in broad terms refers to the method of classifying and organizing data sets to
make them more useful.
There are many ways that IT professionals work on the principles of data organist ion many of
these are classified under the more general heading of data management.
For example – re-ordering or analyzing the arrangement of data items in a physical record is part
of data organization.
One other main component of enterprise data organization is the analysis of relatively structured
and unstructured data.
Structured data is comprised of data in tables that can be easily integrated into database and from
there into analytics software or other particular applications.
Unstructured data is data that is raw and unformatted the kind of data that you find in a simple text
document, where names dates and other pieces of information are scattered throughout random
paragraphs.
Experts have developed tech tools and resources to handle relatively unstructured data and
integrate it into a holistic data environment.
Business adopt data organization strategies in order to make better use of the data assets that they
have in a world where data sets represent some of the most valuable assets held by enterprises
across many different industries.
An organization data is recognized as the most vital asset of an enterprise. It is rightly said that
companies who do not understand the importance of data management area less likely to survive in
the modern economy.
Therefore, it is essential of understand the importance of data management in companies.
In any organization data is the main foundation of information knowledge and ultimately the
wisdom for correct decisions and actions.
If the data is relevant complete accurate timely consistent meaningful and usable, then it will
surely help in the growth of the organization.
If not, it can prove to be a useless and even harmful asset.
2.5 HOW DATA MANAGEMENT FUNCTIONS IN AN ORGANISATION
Data management is the function of planning controlling and delivering data and other information
effectively in an organization.
In organization there should be practicing the disciplines in the development execution and
supervision of plans programs policies and practices that project control deliver and enhance the
quality and value of data and information in the organization.
Effective data management helps in minimizing potential errors. And damages coursed by them an
effective data management strategy including data quality and data management tools.
Security of data is very important and proper data is never last and is protected inside the
organization.
DW&M (SYSTEM PAPER) HR & SYSTEMS SPECILISATION
UNIT-1 MANAGING DATA BALAJI INST OF IT & MANAGEMENT
Data security is an essential part of data management companies one that protects members and
companies from various data loss thefts and breaches.
Better data management helps in improving data quality and access.
3. COMPONENTS OF ORGANIZATIONAL MEMORY
Organizational memory sometimes called institutional or corporate memory is the accumulated
body of data, information and knowledge created in the course of an individual organizations
existence.
There are two types of memories,
1. Organizational archives, including its electronic data bases.
2. Individual’s memories.
To make use of organizational memory organizations must have effective retrieval systems for
their archives and good memory recall among the individuals that make up the organization.
Its importance to an organization depends upon how well individuals can apply it. A discipline
known as experiential learning or evidence based practice.
3.1 NATURE
Organizational memory is comprising of
1. Prior data and information.
2. All internally generated documentation related to the organizations activities.
Intellectual property (patents, copy rights, trademarks, brands, process whose ownership is
granted, registered design, trade to the company by law).
Details of events products and individuals.
(Including relationships with people in outside organizations and professional bodies.)
3. Relevant published reference material.
4. Institution – created knowledge of this institution created knowledge is the most important.
The three main facets of organizational memory area data information and knowledge’s.
Data is a fact depicted as a figure or a statistic while data in context – such as in a historical time
frame is information.
By contrast knowledge is interpretative and predictive. Its deductive character allows a person with
knowledge to understand the implications of information and act accordingly.
DW&M (SYSTEM PAPER) HR & SYSTEMS SPECILISATION
UNIT-1 MANAGING DATA BALAJI INST OF IT & MANAGEMENT
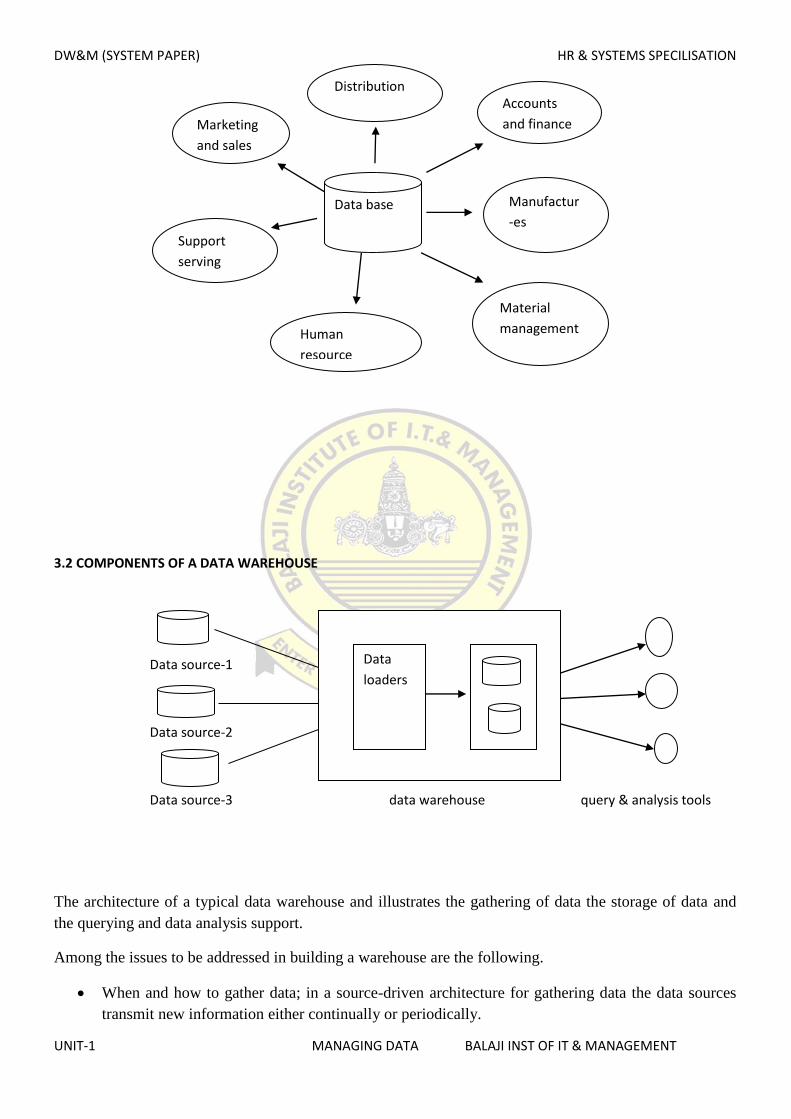
3.2 COMPONENTS OF A DATA WAREHOUSE
Data source-1
Data source-2
dD
Data source-3 data warehouse query & analysis tools
The architecture of a typical data warehouse and illustrates the gathering of data the storage of data and
the querying and data analysis support.
Among the issues to be addressed in building a warehouse are the following.
When and how to gather data; in a source-driven architecture for gathering data the data sources
transmit new information either continually or periodically.
Data
loaders
Data base
Distribution
Marketing
and sales
Manufactur
-es
Accounts
and finance
Support
serving
Human
resource
Material
management
DW&M (SYSTEM PAPER) HR & SYSTEMS SPECILISATION
UNIT-1 MANAGING DATA BALAJI INST OF IT & MANAGEMENT
In destination driven architecture the data warehouses periodically sends requests for new data to the
sources.
3.3 WHAT SCHEMA TO USE
Data source that have been constructed independently are likely to have different schemas.
Part of the task of a warehouse is to perform schema integration and to convert data to the
integrated schema before they are stored.
3.4 DATA TRANSFORMATION AND CLEARISING
The task of correcting and preprocessing data is called data clear sing.
Data source often deliver data with numerous miser inconsistencies which can be corrected. For
example names are often misspelled and addresses may have street / area/city names miss felled or
zip codes entered incorrectly. These can be corrected to a reasonable extent by consulting a
database of street names and zip codes in each city.
The approximate attaching of data required for this task is referred to as fuzzy lookup.
Address list collected from multiple sources may have duplicates that need to be eliminated in
merge – purge operation.
3.5 HOW TO PROPEGATE UPDATES
Updates on relations at the data sources must be propagated to the data ware house.
If the relations at the data warehouse are exactly the same as those at the data source, the
propagation is straight form word.
It they are not the problem of propagating update is basically the view-maintenance problem.
A problem with materials views is that they must be kept up-to-date when the data usages in the
view definition changes.
For instance if the amount value of a loan is updated the materialized view would become
inconsistent with the underlying data.
And must be updated the task of keeping a materialized view up-to-data with the underlying data is
known as view maintenance.
3.6 WAREHOUSE SCHEMAS
A schema in data warehouses is a collection of database objects including table’s views indexes
and synonyms.
There is a variety of ways of arranging schema objects in the schema models designed for data
warehousing. One data warehouse schema model is a star schema and snowflake schema.
Data warehouse typically have schemas that are designed for data analysis using tools such as
OLAP tools thus the data are usually multidimensional data with dimension attributes and measure
attributes.
Tables containing multidimensional data area called fact tables and are visually very large.
To minimize storage requirements dimension attributes are usually short identifiers that area
foreign keys into other tables called dimension tables.
For instance fact table sales would have attributes item-id, store-id, customer-id, and date, and
measure attributes number and price.
DW&M (SYSTEM PAPER) HR & SYSTEMS SPECILISATION
UNIT-1 MANAGING DATA BALAJI INST OF IT & MANAGEMENT
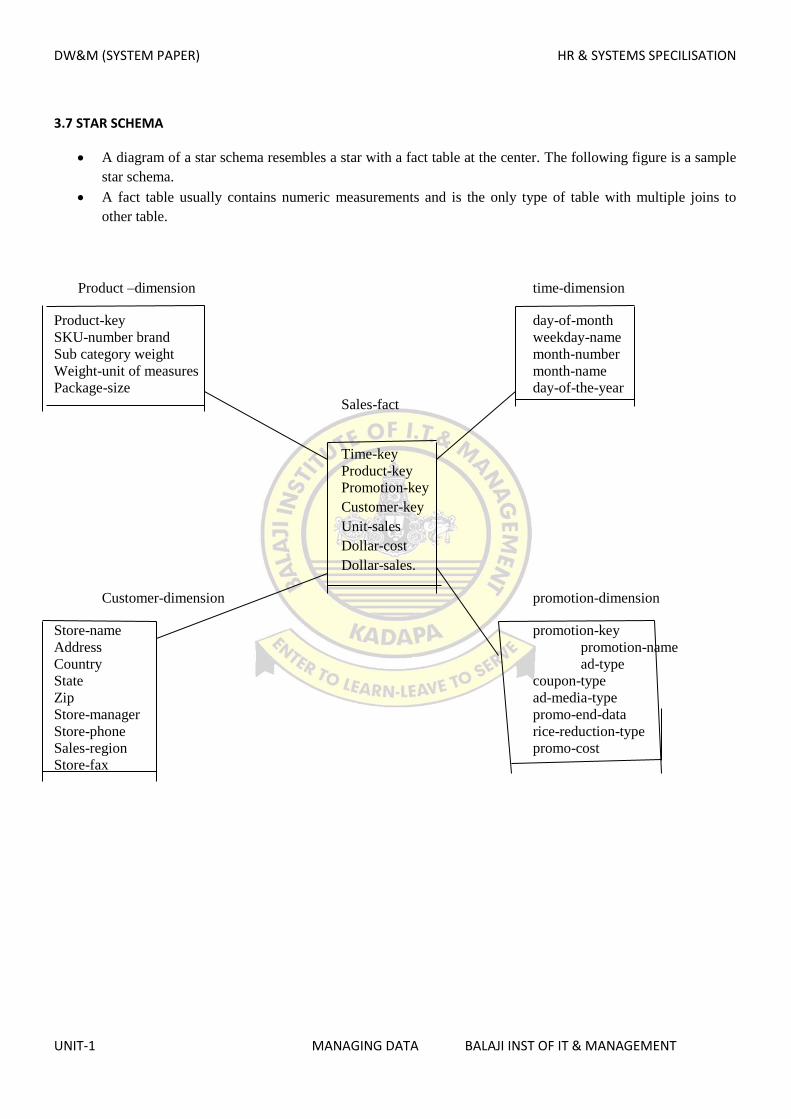
3.7 STAR SCHEMA
A diagram of a star schema resembles a star with a fact table at the center. The following figure is a sample
star schema.
A fact table usually contains numeric measurements and is the only type of table with multiple joins to
other table.
Product –dimension time-dimension
Product-key day-of-month
SKU-number brand weekday-name
Sub category weight month-number
Weight-unit of measures month-name
Package-size day-of-the-year
Sales-fact
Time-key
Product-key
Promotion-key
Customer-key
Unit-sales
Dollar-cost
Dollar-sales.
Customer-dimension promotion-dimension
Store-name promotion-key
Address promotion-name
Country ad-type
State coupon-type
Zip ad-media-type
Store-manager promo-end-data
Store-phone rice-reduction-type
Sales-region promo-cost
Store-fax
DW&M (SYSTEM PAPER) HR & SYSTEMS SPECILISATION
UNIT-1 MANAGING DATA BALAJI INST OF IT & MANAGEMENT
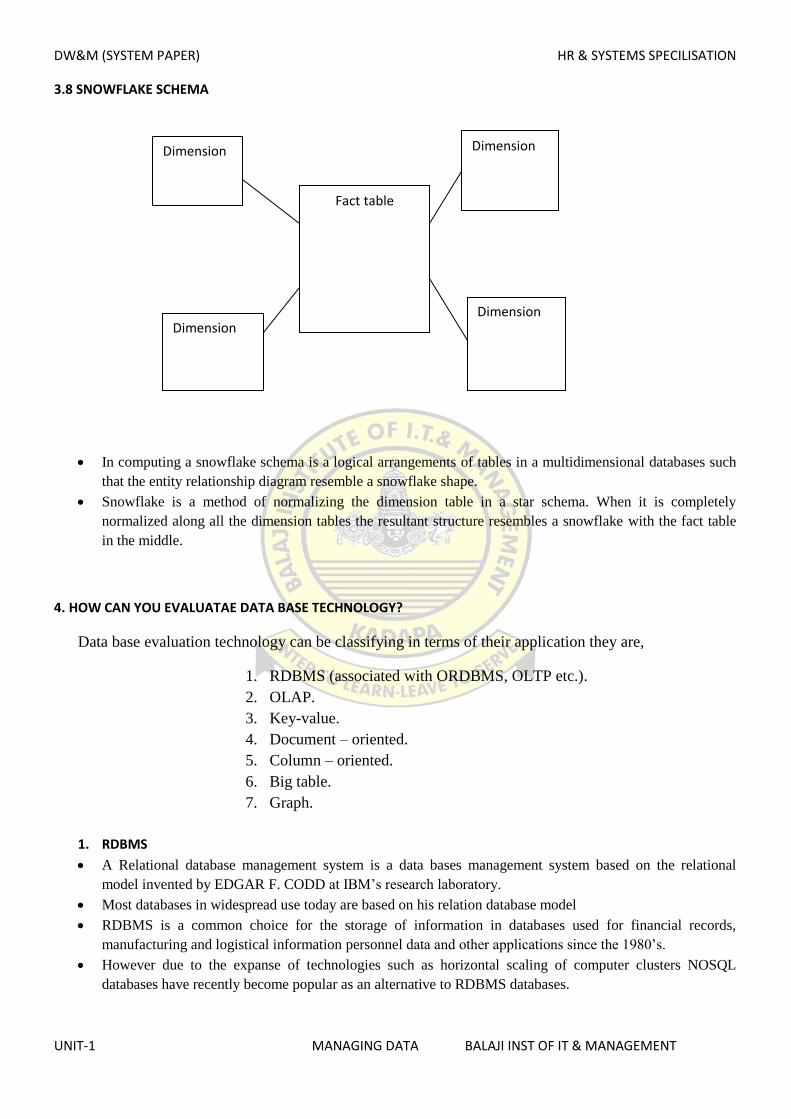
3.8 SNOWFLAKE SCHEMA
In computing a snowflake schema is a logical arrangements of tables in a multidimensional databases such
that the entity relationship diagram resemble a snowflake shape.
Snowflake is a method of normalizing the dimension table in a star schema. When it is completely
normalized along all the dimension tables the resultant structure resembles a snowflake with the fact table
in the middle.
4. HOW CAN YOU EVALUATAE DATA BASE TECHNOLOGY?
Data base evaluation technology can be classifying in terms of their application they are,
1. RDBMS (associated with ORDBMS, OLTP etc.).
2. OLAP.
3. Key-value.
4. Document – oriented.
5. Column – oriented.
6. Big table.
7. Graph.
1. RDBMS
A Relational database management system is a data bases management system based on the relational
model invented by EDGAR F. CODD at IBM’s research laboratory.
Most databases in widespread use today are based on his relation database model
RDBMS is a common choice for the storage of information in databases used for financial records,
manufacturing and logistical information personnel data and other applications since the 1980’s.
However due to the expanse of technologies such as horizontal scaling of computer clusters NOSQL
databases have recently become popular as an alternative to RDBMS databases.
Fact table
Dimension Dimension
Dimension Dimension
DW&M (SYSTEM PAPER) HR & SYSTEMS SPECILISATION
UNIT-1 MANAGING DATA BALAJI INST OF IT & MANAGEMENT
According to research company relational database vendors by revenue were 1979 oracle (48.8%),
IBM (20.2%) MICROSOFT (17.0%), SAP including Sybase (4.6%) and TERADATA (3.7%).
According to DB-ENGINES in June 2018, the most widely used systems were oracle, my SQL
(free software) Microsoft SQL server, postage SQL (free software) IBMDB2, Microsoft access,
and SQ lite (free software).
Present the data to user as relations.
(a presentation in tabular form i.e. as a collection of tables with each table consisting of a set of
rows and columns).
Provide relational operators to manipulate the data in tabular form.
2. OLAP
Online analytical processing or OLAP is in approach to answering multidimensional analytical
queries swiftly in computing.
OLAP is part of the broader category of business intelligence, which also encompasses relational
databases report writing and data mining.
The application of OLAP include business reporting for sales, marketing, management reporting,
budgeting and forecasting financial reporting, with new applications coming up, such as
organization processing (OLTP).
OLAP tools enable users to analyze multidimensional data interactively from multiple
perspectives.
OLAP consists of three basic analytical operations,
A. Consolidation (roll-up).
B. Drill-down.
C. Slicing and dicing.
CONSIDERATION involves the aggregation of data that can be accumulated and computed in
one or more dimensions.
Example – all sales offices are rolled up to the sales department or sales division to anticipate sales
trends, by contrast the drill-down is a technique that allows users to navigate through the details.
Example – users can view the sales by individual products that make up regions sales.
SLICING AND DICING is a feature where by users can take out (slicing) a specific set of data of
OLAP cube and view (dicing) the slices from different viewpoints.
Theses points are sometimes called dimensions
(Such as looking at the same sales by sale person or by data or by customer or by product or by
region etc.)
Database configured for OLAP use a multidimensional data model, allowing for complex
analytical and queries with a rapid execution time.
In OLAP system, it consists of numeric facts called measures that are categorized by dimensions.
The data is created from a star schema or snow flake schema or fact tables in a relational data base.
In OLAP there are
(i) MOLAP – multidimensional OLAP.
(ii) ROLAP – relational OLAP.
(iii) HOLAP – hybrid OLAP.
DW&M (SYSTEM PAPER) HR & SYSTEMS SPECILISATION
UNIT-1 MANAGING DATA BALAJI INST OF IT & MANAGEMENT
Other types,
(iv) WOLAP - Web based OLAP.
(v) DOLAP - desktop OLAP.
(vi) RTOLAP - real-time OLAP.
(vii) GOLAP - Graph OLAP.
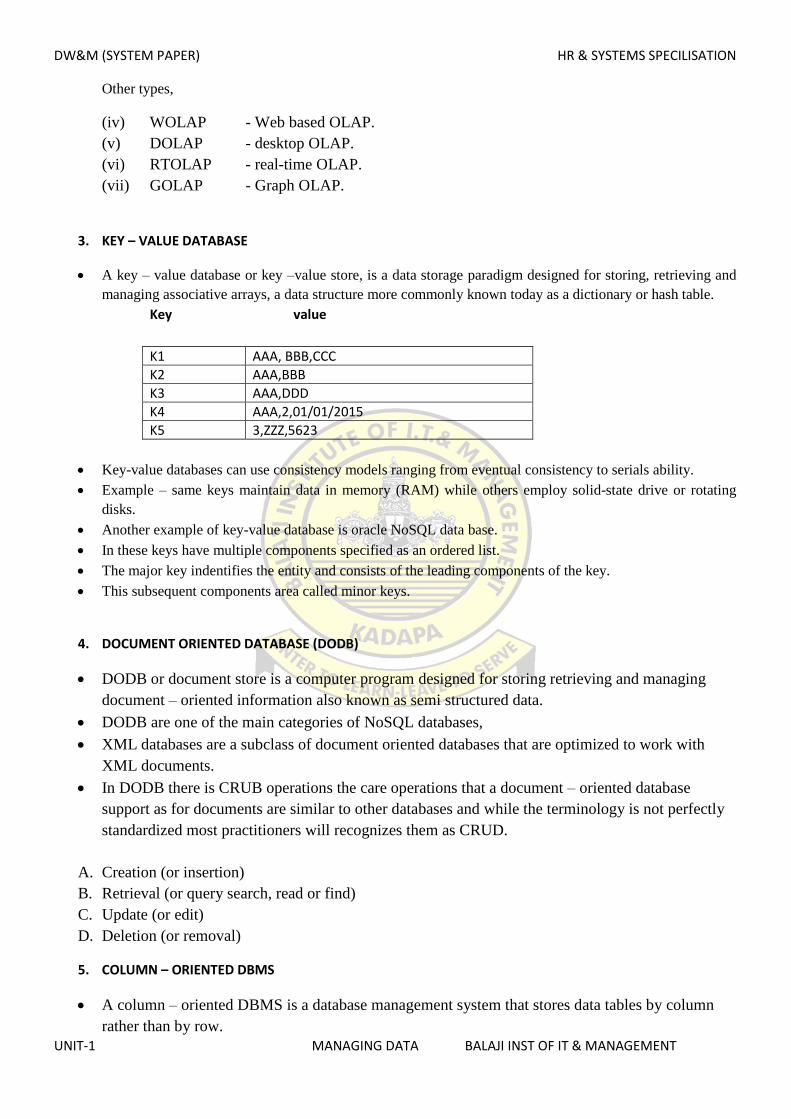
3. KEY – VALUE DATABASE
A key – value database or key –value store, is a data storage paradigm designed for storing, retrieving and
managing associative arrays, a data structure more commonly known today as a dictionary or hash table.
Key value
K1 AAA, BBB,CCC
K2 AAA,BBB
K3 AAA,DDD
K4 AAA,2,01/01/2015
K5 3,ZZZ,5623
Key-value databases can use consistency models ranging from eventual consistency to serials ability.
Example – same keys maintain data in memory (RAM) while others employ solid-state drive or rotating
disks.
Another example of key-value database is oracle NoSQL data base.
In these keys have multiple components specified as an ordered list.
The major key indentifies the entity and consists of the leading components of the key.
This subsequent components area called minor keys.
4. DOCUMENT ORIENTED DATABASE (DODB)
DODB or document store is a computer program designed for storing retrieving and managing
document – oriented information also known as semi structured data.
DODB are one of the main categories of NoSQL databases,
XML databases are a subclass of document oriented databases that are optimized to work with
XML documents.
In DODB there is CRUB operations the care operations that a document – oriented database
support as for documents are similar to other databases and while the terminology is not perfectly
standardized most practitioners will recognizes them as CRUD.
A. Creation (or insertion)
B. Retrieval (or query search, read or find)
C. Update (or edit)
D. Deletion (or removal)
5. COLUMN – ORIENTED DBMS
A column – oriented DBMS is a database management system that stores data tables by column
rather than by row.
DW&M (SYSTEM PAPER) HR & SYSTEMS SPECILISATION
UNIT-1 MANAGING DATA BALAJI INST OF IT & MANAGEMENT
A column – oriented database serializes all of the values of a column together, then the values of
the next column the data would be stores in this fashion.
10:001, 12:002, 11:003, 22:004,
Smith:001, jones:002, Johnson:003, jones:004,
Joe:001, mary:002, cathy,003,bob:004,
40000:001, 5000:002, 44000:003, 55000:004,
6. BIGTABLE
It is a compressed high performance, and proprietary data storage system built on Google file
system SS table and a few other Google technologies.
On may-06-2015 a public version of big table was made available as a service.
Big table also underlies Google cloud data store which is available as a part of the Google cloud
platform
Example – Google maps, Google book search, Google earth blogger cam, YouTube and Gmail
Goggles reason for developing its own database includes scalability and better control of
performance characteristics.
7. GRAPH DATABASE
A Graph database is a database that uses graph structures for semantic queries with nodes edges
and properties to represent and store data.
A key concept of the system is the graph which directly relates data items in the store.

DW&M (SYSTEM PAPER) HR & SYSTEMS SPECILISATION
UNIT-1 MANAGING DATA BALAJI INST OF IT & MANAGEMENT
DB&M (SYSTEMS PAPER) HR & MARKETING SPECILISATION
UNIT 2 DATA BASE SYSTEMS IN ORGANISATION BALAJI INST OF IT & MANAGEMENT
(17E00319) DATA WAREHOUSING AND MINING
(Elective IV)
Objective: The objective of the course is to give an understanding Data Warehousing and Data
Mining concepts.
1. Managing Data: Individual Data Management, Organizational Data Warehousing and Data
Management, Components of Organizational Memory, Evaluation of Database Technology.
2. Database Systems in the Organization: Data Sharing and Data Bases – Sharing Data
Between Functional Units, Sharing Data Between Different Levels of Users, Sharing Data
Between Different Locations.
3. The Data Warehouse Data Base: Context of Data Warehouse Data Base, Data Base
Structures – Organizing Relational Data warehouse – Multi-Dimensional Data Structures –
Choosing a Structure. Meta Data: Human Meta Data, Computer Based Meta Data for people
to use, Computer based Meta Data for the Computer to use.
4. Analyzing the Contexts of the Data warehouse: Active Analysis, User Queries – OLAP
Constructing a Data Warehouse System: Stages of the Project – Developing a Project Plan,
Data warehousing Design Approaches – The Architecture Stage.
5. Getting Data into the Data warehouse – Extraction, Transformation, Cleaning, Loading
and Summarization. Data Mining, creating a Decision Tree, Correlation and Other Statistical
Analysis, Neural Networks, Nearest Neighbor Approaches, Putting the Results to Use.
Text Books:
Data Mining – Concepts and Techniques - Jiawei Han &MichelineKamber, Morgan
Kaufmann Publishers, 2nd Edition, 2006.
Data Mining Introductory and advanced topics –Margaret H Dunham, Pearson
education
References:
Decision Support Systems and Data Warehouse Systems, Efram G. Mallach: TMH.
Data Mining Techniques and Tasks, T.H.M.Sivanandam, Thomson.
Data Management, Data Bases and Organizations, Richard T Watson : Wiley.
Modern Data Warehousing, Mining and Visualization Core Concepts, Marakas,
Pearson
Data warehousing, Data Mining OLAP, Berson Smith, TMH
DB&M (SYSTEMS PAPER) HR & MARKETING SPECILISATION
UNIT 2 DATA BASE SYSTEMS IN ORGANISATION BALAJI INST OF IT & MANAGEMENT
UNIT-2
DATA SYSTEMS IN THE ORGANISATION
1. DATA SHARING
Data base is used to store the data and manipulate the data according to the style of organization
like business ,health care’s, education, government and libraries.
Database technology’s used by individuals like personal computers or by working groups
like department wise.
The most significant different between a file based system and database system is data
sharing.
Data sharing also requires a major change in the way of data are handled and managed
within the organization.
Data sharing are of three types,
1. Data sharing between functional units.
2. Data sharing between management units/levels.
3. Data sharing between geographically dispersed locations.
1.2 DATABASES:
A database is a data structure that stores organized information. Most databases contain
multiple tables, which may each include several different fields. ... These sites use
a database management system (or DBMS), such as Microsoft Access, FileMaker Pro, or
MySQL as the "back end" to the website.
Some DBMS examples include MySQL, PostgreSQL, Microsoft Access, SQL Server,
FileMaker, Oracle, RDBMS, dBASE, Clipper, and FoxPro.
DB&M (SYSTEMS PAPER) HR & MARKETING SPECILISATION
UNIT 2 DATA BASE SYSTEMS IN ORGANISATION BALAJI INST OF IT & MANAGEMENT
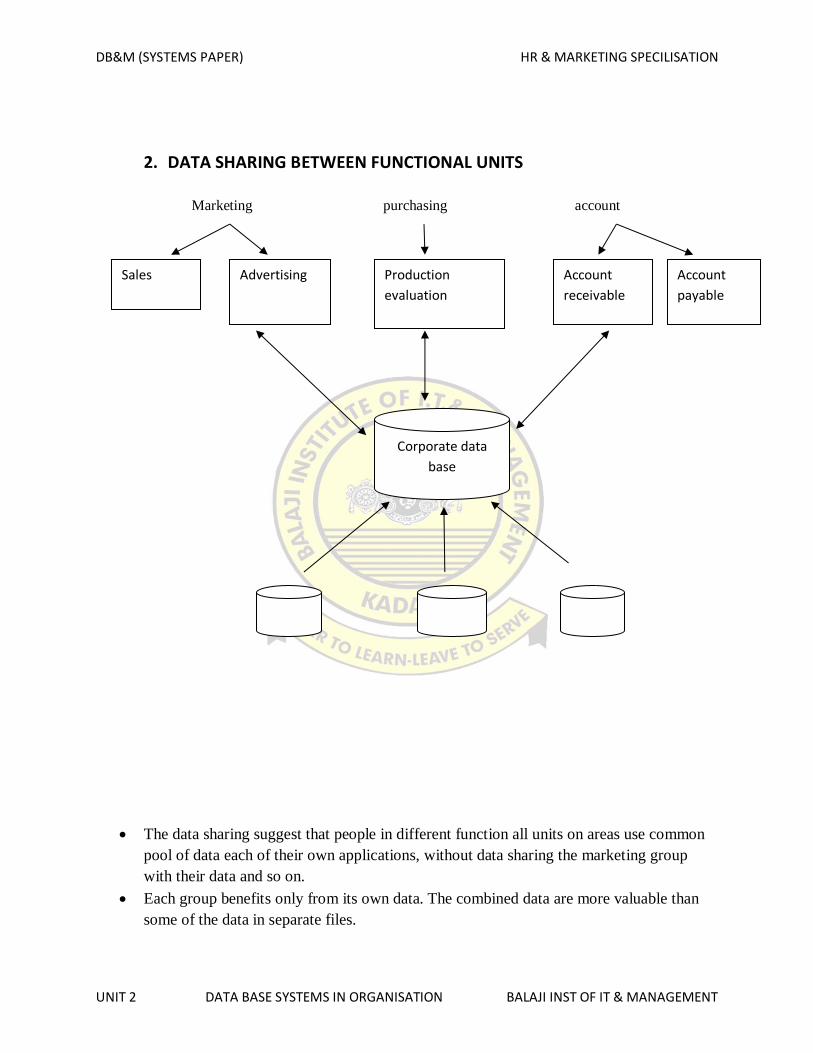
2. DATA SHARING BETWEEN FUNCTIONAL UNITS
Marketing purchasing account
The data sharing suggest that people in different function all units on areas use common
pool of data each of their own applications, without data sharing the marketing group
with their data and so on.
Each group benefits only from its own data. The combined data are more valuable than
some of the data in separate files.
Sales Advertising Production
evaluation
Account
receivable
Account
payable
Corporate data
base
DB&M (SYSTEMS PAPER) HR & MARKETING SPECILISATION
UNIT 2 DATA BASE SYSTEMS IN ORGANISATION BALAJI INST OF IT & MANAGEMENT
Not only does each group continue to have access to its own data but within reasonable
limits of control they have access to other data as well.
The concept of combining data for common use called data integration.
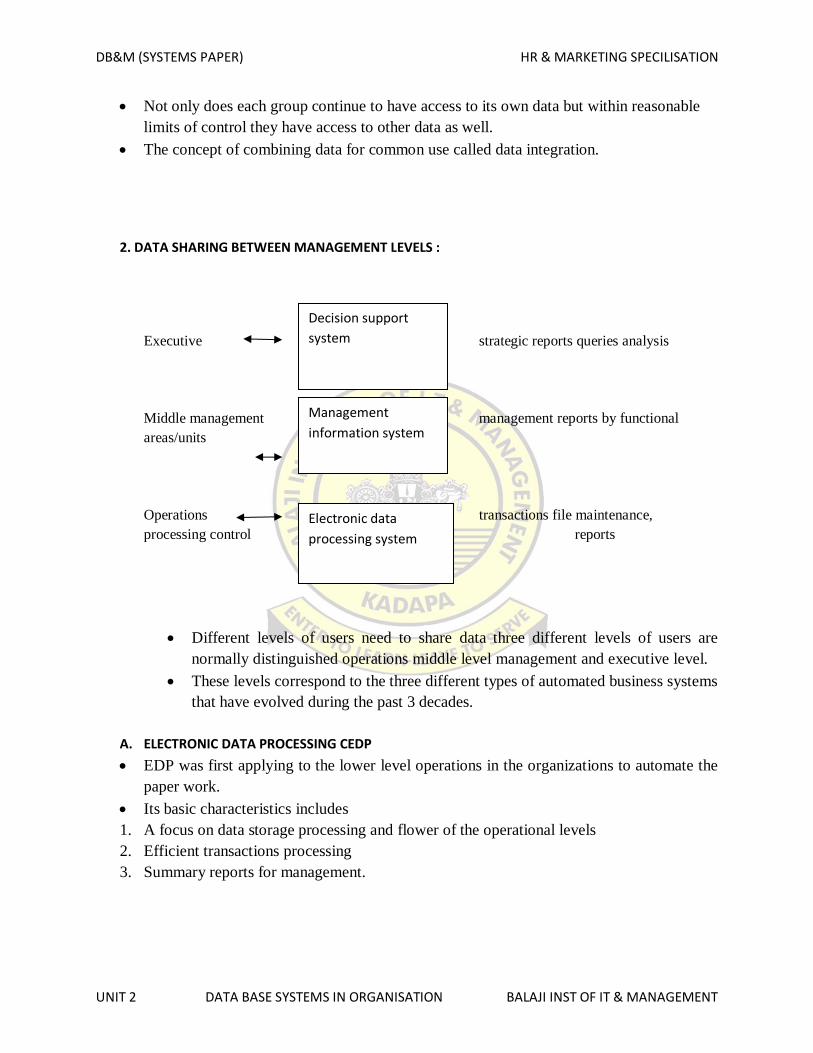
2. DATA SHARING BETWEEN MANAGEMENT LEVELS :
Executive strategic reports queries analysis
Middle management management reports by functional
areas/units
Operations transactions file maintenance,
processing control reports
Different levels of users need to share data three different levels of users are
normally distinguished operations middle level management and executive level.
These levels correspond to the three different types of automated business systems
that have evolved during the past 3 decades.
A. ELECTRONIC DATA PROCESSING CEDP
EDP was first applying to the lower level operations in the organizations to automate the
paper work.
Its basic characteristics includes
1. A focus on data storage processing and flower of the operational levels
2. Efficient transactions processing
3. Summary reports for management.
Decision support
system
Management
information system
Electronic data
processing system
DB&M (SYSTEMS PAPER) HR & MARKETING SPECILISATION
UNIT 2 DATA BASE SYSTEMS IN ORGANISATION BALAJI INST OF IT & MANAGEMENT
B. MANAGEMENT INFORMATION SYSTEM (M/S)
The M/S approach elevated the focus information system activities with additional
emphasis on integration and planning of the IS functions. This includes.
1. The information focus aimed at the middle level managers on management.
2. An integration of EDP jobs by business functions such as production manager’s
management M/S personal M/S etc.
3. Enquiry and report generation usually with a database.
C. DECISION SUPPORTIVEA SYSTEM (DSS)
DSS is focused still higher in the organization with an emphasis on the following
characteristics.
1. Decision focused aimed at top managers and executive decision makers.
2. Emphasis on flexibility adaptability and quick response
3. Support for the personal decision making styles of individual manager.
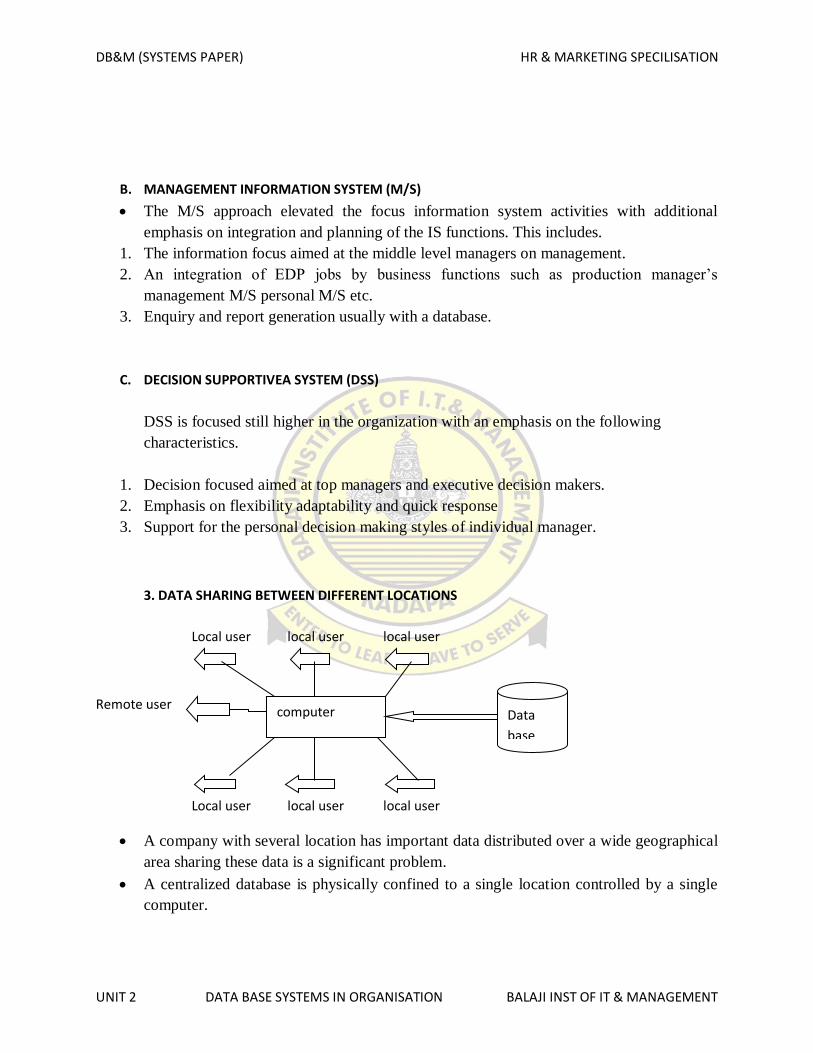
3. DATA SHARING BETWEEN DIFFERENT LOCATIONS
Local user local user local user
Remote user
Local user local user local user
A company with several location has important data distributed over a wide geographical
area sharing these data is a significant problem.
A centralized database is physically confined to a single location controlled by a single
computer.
computer Data
base
DB&M (SYSTEMS PAPER) HR & MARKETING SPECILISATION
UNIT 2 DATA BASE SYSTEMS IN ORGANISATION BALAJI INST OF IT & MANAGEMENT
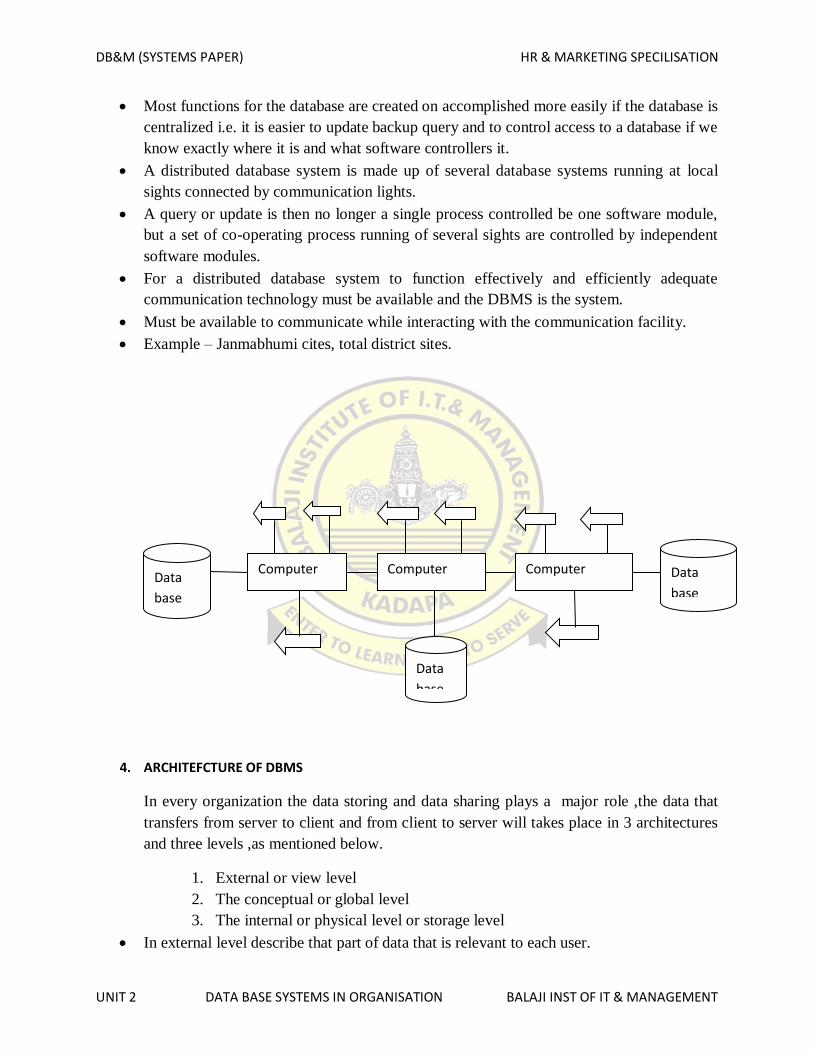
Most functions for the database are created on accomplished more easily if the database is
centralized i.e. it is easier to update backup query and to control access to a database if we
know exactly where it is and what software controllers it.
A distributed database system is made up of several database systems running at local
sights connected by communication lights.
A query or update is then no longer a single process controlled be one software module,
but a set of co-operating process running of several sights are controlled by independent
software modules.
For a distributed database system to function effectively and efficiently adequate
communication technology must be available and the DBMS is the system.
Must be available to communicate while interacting with the communication facility.
Example – Janmabhumi cites, total district sites.
4. ARCHITEFCTURE OF DBMS
In every organization the data storing and data sharing plays a major role ,the data that
transfers from server to client and from client to server will takes place in 3 architectures
and three levels ,as mentioned below.
1. External or view level
2. The conceptual or global level
3. The internal or physical level or storage level
In external level describe that part of data that is relevant to each user.
Data
base
Computer Computer Computer Data
base
Data
base
DB&M (SYSTEMS PAPER) HR & MARKETING SPECILISATION
UNIT 2 DATA BASE SYSTEMS IN ORGANISATION BALAJI INST OF IT & MANAGEMENT
This level describes what is stored in database and relationship among the data.
Internal level it is a physical representation of database this level describes how the data
is stored in database it covers the data structures and file organization.
There are 3 architectures in DBMS.
1. Tier-1
2. Tier-2
3. Tier-3
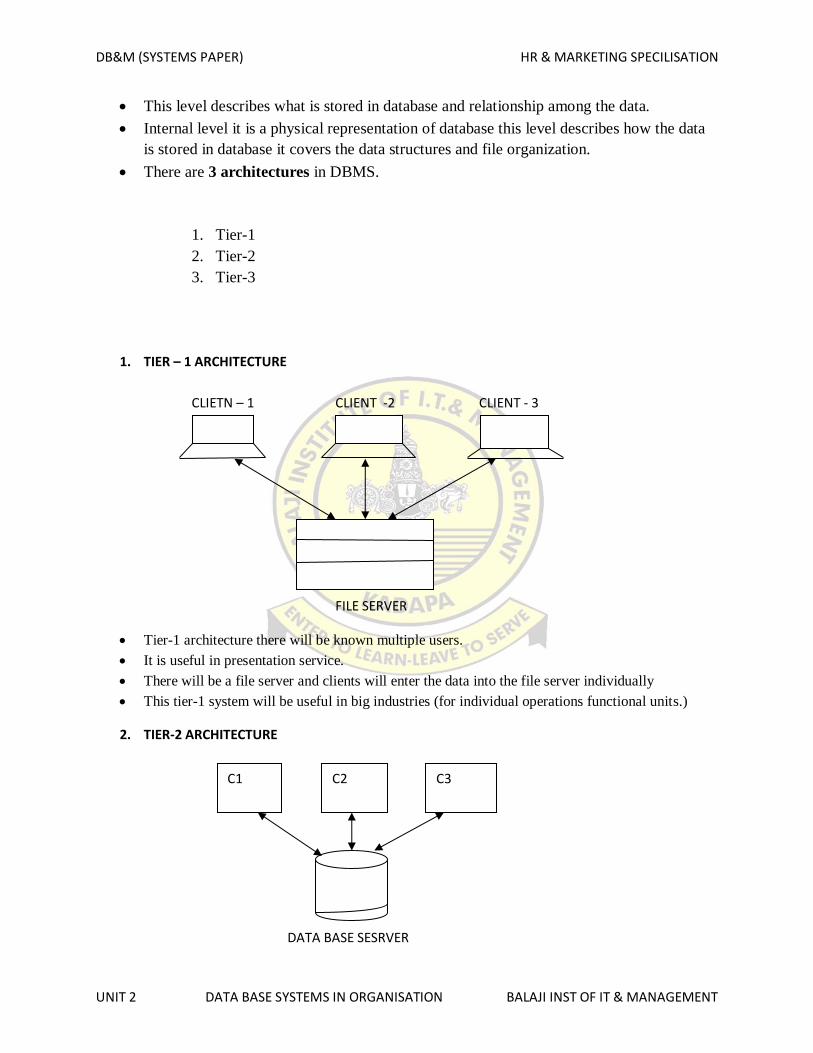
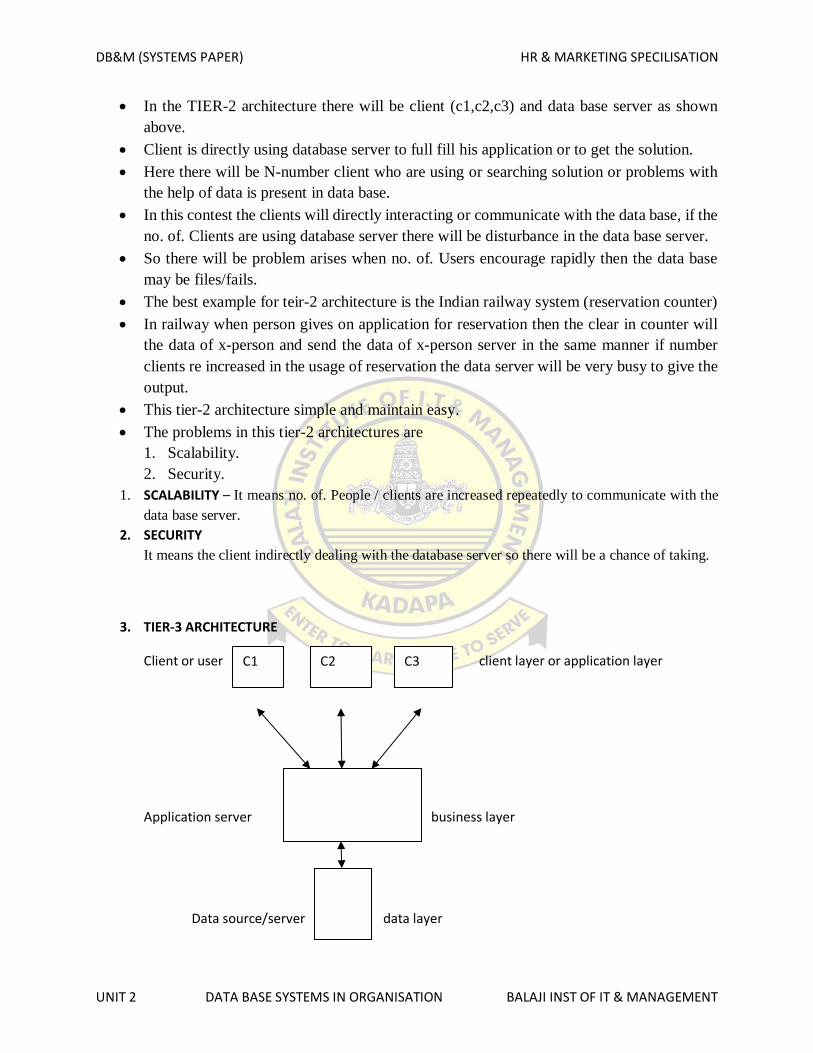
1. TIER – 1 ARCHITECTURE
CLIETN – 1 CLIENT -2 CLIENT - 3
FILE SERVER
Tier-1 architecture there will be known multiple users.
It is useful in presentation service.
There will be a file server and clients will enter the data into the file server individually
This tier-1 system will be useful in big industries (for individual operations functional units.)
2. TIER-2 ARCHITECTURE
DATA BASE SESRVER
C1 C2 C3
DB&M (SYSTEMS PAPER) HR & MARKETING SPECILISATION
UNIT 2 DATA BASE SYSTEMS IN ORGANISATION BALAJI INST OF IT & MANAGEMENT
In the TIER-2 architecture there will be client (c1,c2,c3) and data base server as shown
above.
Client is directly using database server to full fill his application or to get the solution.
Here there will be N-number client who are using or searching solution or problems with
the help of data is present in data base.
In this contest the clients will directly interacting or communicate with the data base, if the
no. of. Clients are using database server there will be disturbance in the data base server.
So there will be problem arises when no. of. Users encourage rapidly then the data base
may be files/fails.
The best example for teir-2 architecture is the Indian railway system (reservation counter)
In railway when person gives on application for reservation then the clear in counter will
the data of x-person and send the data of x-person server in the same manner if number
clients re increased in the usage of reservation the data server will be very busy to give the
output.
This tier-2 architecture simple and maintain easy.
The problems in this tier-2 architectures are
1. Scalability.
2. Security.
1. SCALABILITY – It means no. of. People / clients are increased repeatedly to communicate with the
data base server.
2. SECURITY
It means the client indirectly dealing with the database server so there will be a chance of taking.
3. TIER-3 ARCHITECTURE
Client or user client layer or application layer
Application server business layer
Data source/server data layer
C1 C2 C3
DB&M (SYSTEMS PAPER) HR & MARKETING SPECILISATION
UNIT 2 DATA BASE SYSTEMS IN ORGANISATION BALAJI INST OF IT & MANAGEMENT
In the tier-3 architecture there will be 3 layers
1. Client layer
2. Business layer
3. Data layer or server
This tier-3 architecture use in many large scale industries MNC
In this tier mainly will business layer in which the data will be scrutiny (filtered) and then
it will send data to the data sources or data servers.
This tier-3 system is use full when the no. of. Clients or uses increases in search of solution
or application sending process the performance of the database server will not get disturb.
In this case the scalability can be increased as the no of users using the applications
There will be security for the database server before any client communicating with the
database server.
There will be a little problem in the maintaining the database server.
DW&M HR & SYSTEMS SPELICATION
UNIT-1 THE DATA WAREHOUSE DATA BASE BALAJI INSTI OF IT &MANAGEMENT
(17E00319) DATA WAREHOUSING AND MINING
(Elective IV)
Objective: The objective of the course is to give an understanding Data Warehousing and Data
Mining concepts.
1. Managing Data: Individual Data Management, Organizational Data Warehousing and Data
Management, Components of Organizational Memory, Evaluation of Database Technology.
2. Database Systems in the Organization: Data Sharing and Data Bases – Sharing Data Between
Functional Units, Sharing Data Between Different Levels of Users, Sharing Data Between Different
Locations.
3. The Data Warehouse Data Base: Context of Data Warehouse Data Base, Data Base Structures –
Organizing Relational Data warehouse – Multi-Dimensional Data Structures – Choosing a Structure.
Meta Data: Human Meta Data, Computer Based Meta Data for people to use, Computer based Meta
Data for the Computer to use.
4. Analyzing the Contexts of the Data warehouse: Active Analysis, User Queries – OLAP Constructing
a Data Warehouse System: Stages of the Project – Developing a Project Plan, Data warehousing Design
Approaches – The Architecture Stage.
5. Getting Data into the Data warehouse – Extraction, Transformation, Cleaning, Loading and
Summarization. Data Mining, creating a Decision Tree, Correlation and Other Statistical Analysis,
Neural Networks, Nearest Neighbor Approaches, Putting the Results to Use.
Text Books:
Data Mining – Concepts and Techniques - Jiawei Han &MichelineKamber, Morgan Kaufmann Publishers, 2nd Edition, 2006.
Data Mining Introductory and advanced topics –Margaret H Dunham, Pearson education
References:
Decision Support Systems and Data warehouse Systems, Efram G. Mallach: TMH. Data Mining Techniques and Tasks, T.H.M.Sivanandam, Thomson. Data Management, Data Bases and Organizations, Richard T Watson : Wiley. Modern Data Warehousing, Mining and Visualization Core Concepts, Marakas, Pearson Data warehousing, Data Mining OLAP, Berson Smith, TMH
DW&M HR & SYSTEMS SPELICATION
UNIT-1 THE DATA WAREHOUSE DATA BASE BALAJI INSTI OF IT &MANAGEMENT
UNIT-3
The Data Warehouse Data Base
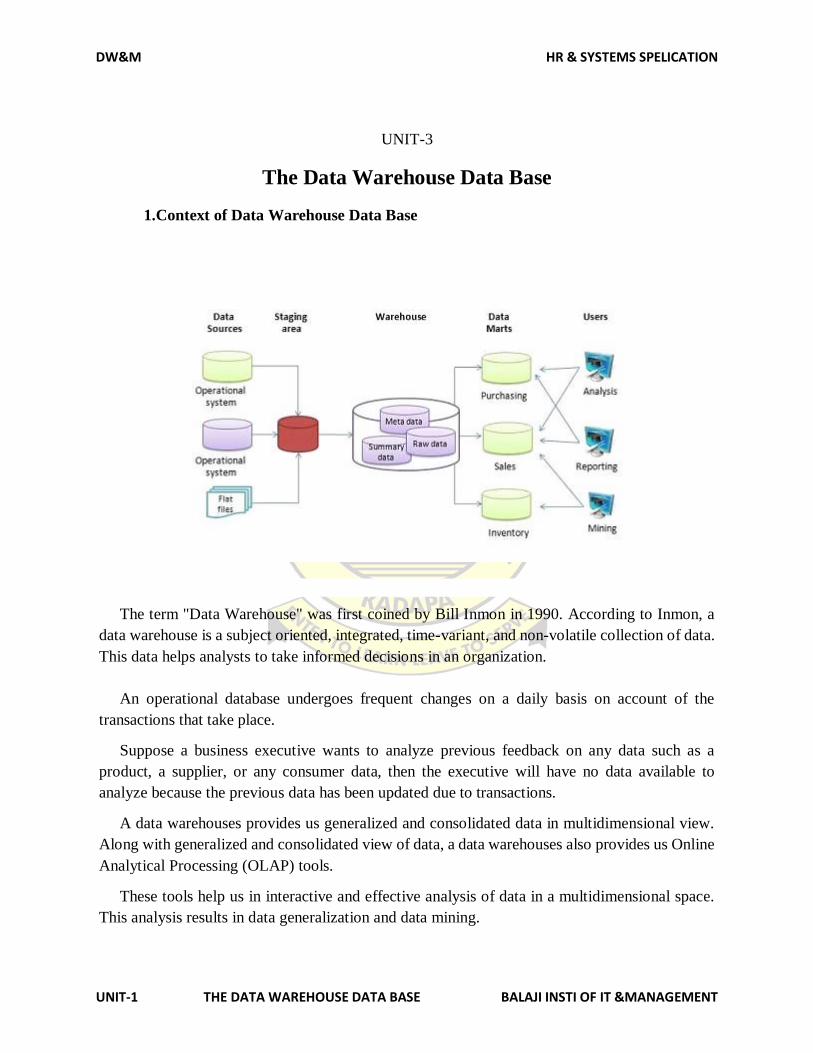
1.Context of Data Warehouse Data Base
The term "Data Warehouse" was first coined by Bill Inmon in 1990. According to Inmon, a
data warehouse is a subject oriented, integrated, time-variant, and non-volatile collection of data.
This data helps analysts to take informed decisions in an organization.
An operational database undergoes frequent changes on a daily basis on account of the
transactions that take place.
Suppose a business executive wants to analyze previous feedback on any data such as a
product, a supplier, or any consumer data, then the executive will have no data available to
analyze because the previous data has been updated due to transactions.
A data warehouses provides us generalized and consolidated data in multidimensional view.
Along with generalized and consolidated view of data, a data warehouses also provides us Online
Analytical Processing (OLAP) tools.
These tools help us in interactive and effective analysis of data in a multidimensional space.
This analysis results in data generalization and data mining.
DW&M HR & SYSTEMS SPELICATION
UNIT-1 THE DATA WAREHOUSE DATA BASE BALAJI INSTI OF IT &MANAGEMENT
A data warehouse (DW or DWH), also known as an enterprise data warehouse (EDW), is
a system used for reporting and data analysis, and is considered a core component of business
intelligence.
DWs are central repositories of integrated data from one or more disparate sources. They
store current and historical data in one single place that are used for creating analytical reports for
workers throughout the enterprise.
The data stored in the warehouse is uploaded from the operational systems (such as
marketing or sales).
The data may pass through an operational data store and may require data cleansing for
additional operations to ensure data quality before it is used in the DW for reporting.
The typical Extract, transform, load (ETL)-based data warehouse [uses staging, data
integration, and access layers to house its key functions.
The staging layer or staging database stores raw data extracted from each of the disparate
source data systems.
The integration layer integrates the disparate data sets by transforming the data from the
staging layer often storing this transformed data in an operational data store (ODS) database.
The integrated data are then moved to yet another database, often called the data warehouse
database, where the data is arranged into hierarchical groups, often called dimensions, and into
facts and aggregate facts.
The combination of facts and dimensions is sometimes called a star schema. The access
layer helps users retrieve data.
The main source of the data is cleansed, transformed, catalogued, and made available for
use by managers and other business professionals for data mining, online analytical
processing, market research and decision support.
However, the means to retrieve and analyze data, to extract, transform, and load data, and
to manage the data dictionary are also considered essential components of a data warehousing
system. Many references to data warehousing use this broader context.
Thus, an expanded definition for data warehousing includes business intelligence tools,
tools to extract, transform, and load data into the repository, and tools to manage and
retrieve metadata.
DW&M HR & SYSTEMS SPELICATION
UNIT-1 THE DATA WAREHOUSE DATA BASE BALAJI INSTI OF IT &MANAGEMENT
Data Warehouse Features
The key features of a data warehouse are discussed below −
Subject Oriented − A data warehouse is subject oriented because it provides information
around a subject rather than the organization's ongoing operations. These subjects can be
product, customers, suppliers, sales, revenue, etc. A data warehouse does not focus on the
ongoing operations; rather it focuses on modeling and analysis of data for decision
making.
Integrated − A data warehouse is constructed by integrating data from heterogeneous
sources such as relational databases, flat files, etc. This integration enhances the effective
analysis of data.
Time Variant − the data collected in a data warehouse is identified with a particular time
period. The data in a data warehouse provides information from the historical point of
view.
Non-volatile − Non-volatile means the previous data is not erased when new data is added
to it. A data warehouse is kept separate from the operational database and therefore
frequent changes in operational database are not reflected in the data warehouse.
1.2 DATA BASE
A database is a collection of information that is organized so that it can be easily accessed,
managed and updated.
Data is organized into rows, columns and tables, and it is indexed to make it easier to find
relevant information. Data gets updated, expanded and deleted as new information is added.
Databases process workloads to create and update themselves, querying the data they contain and
running applications against it.
Computer databases typically contain aggregations of data records or files, such as sales
transactions, product catalogs and inventories, and customer profiles.
Typically, a database manager provides users with the ability to control read/write access,
specify report generation and analyze usage. Some databases offer ACID (atomicity, consistency,
isolation and durability) compliance to guarantee that data is consistent and that transactions are
complete.
DW&M HR & SYSTEMS SPELICATION
UNIT-1 THE DATA WAREHOUSE DATA BASE BALAJI INSTI OF IT &MANAGEMENT
Databases are prevalent in large mainframe systems, but are also present in smaller
distributed workstations and midrange systems, such as IBM's AS/400 and personal computers.
Evolution of databases
Databases have evolved since their inception in the 1960s, beginning with hierarchical and
network databases, through the 1980s with object-oriented databases, and today with SQL and
NoSQL databases and cloud databases.
In one view, databases can be classified according to content type: bibliographic, full text,
numeric and images. In computing, databases are sometimes classified according to their
organizational approach.
There are many different kinds of databases, ranging from the most prevalent approach,
the relational database, to a distributed database, cloud database or NoSQL database.
Relational database
A relational database, invented by E.F. Codd at IBM in 1970, is a tabular database in which
data is defined so that it can be reorganized and accessed in a number of different ways.
Relational databases are made up of a set of tables with data that fits into a predefined
category. Each table has at least one data category in a column, and each row has a certain data
instance for the categories which are defined in the columns.
The Structured Query Language (SQL) is the standard user and application program
interface for a relational database. Relational databases are easy to extend, and a new data category
can be added after the original database creation without requiring that you modify all the existing
applications.
Distributed database
A distributed database is a database in which portions of the database are stored in multiple
physical locations, and in which processing is dispersed or replicated among different points in a
network.
Distributed databases can be homogeneous or heterogeneous. All the physical locations in
a homogeneous distributed database system have the same underlying hardware and run the same
operating systems and database applications.
The hardware, operating systems or database applications in a heterogeneous distributed
database may be different at each of the locations.
DW&M HR & SYSTEMS SPELICATION
UNIT-1 THE DATA WAREHOUSE DATA BASE BALAJI INSTI OF IT &MANAGEMENT
Cloud database
A cloud database is a database that has been optimized or built for a virtualized
environment, either in a hybrid cloud, public cloud or private cloud.
Cloud databases provide benefits such as the ability to pay for storage capacity and
bandwidth on a per-use basis, and they provide scalability on demand, along with high availability.
A cloud database also gives enterprises the opportunity to support business applications in
a software-as-a-service deployment.
NoSQL database
NoSQL databases are useful for large sets of distributed data.
NoSQL databases are effective for big data performance issues that relational databases
aren't built to solve. They are most effective when an organization must analyze large chunks
of unstructured data or data that's stored across multiple virtual servers in the cloud.
Object-oriented database
Items created using object-oriented programming languages are often stored in relational
databases, but object-oriented databases are well-suited for those items.
An object-oriented database is organized around objects rather than actions, and data rather
than logic. For example, a multimedia record in a relational database can be a definable data object,
as opposed to an alphanumeric value.
Graph database
A graph-oriented database, or graph database, is a type of NoSQL database that uses graph
theory to store, map and query relationships.
Graph databases are basically collections of nodes and edges, where each node represents
an entity, and each edge represents a connection between nodes.
Graph databases are growing in popularity for analyzing interconnections. For example,
companies might use a graph database to mine data about customers from social media.
DW&M HR & SYSTEMS SPELICATION
UNIT-1 THE DATA WAREHOUSE DATA BASE BALAJI INSTI OF IT &MANAGEMENT
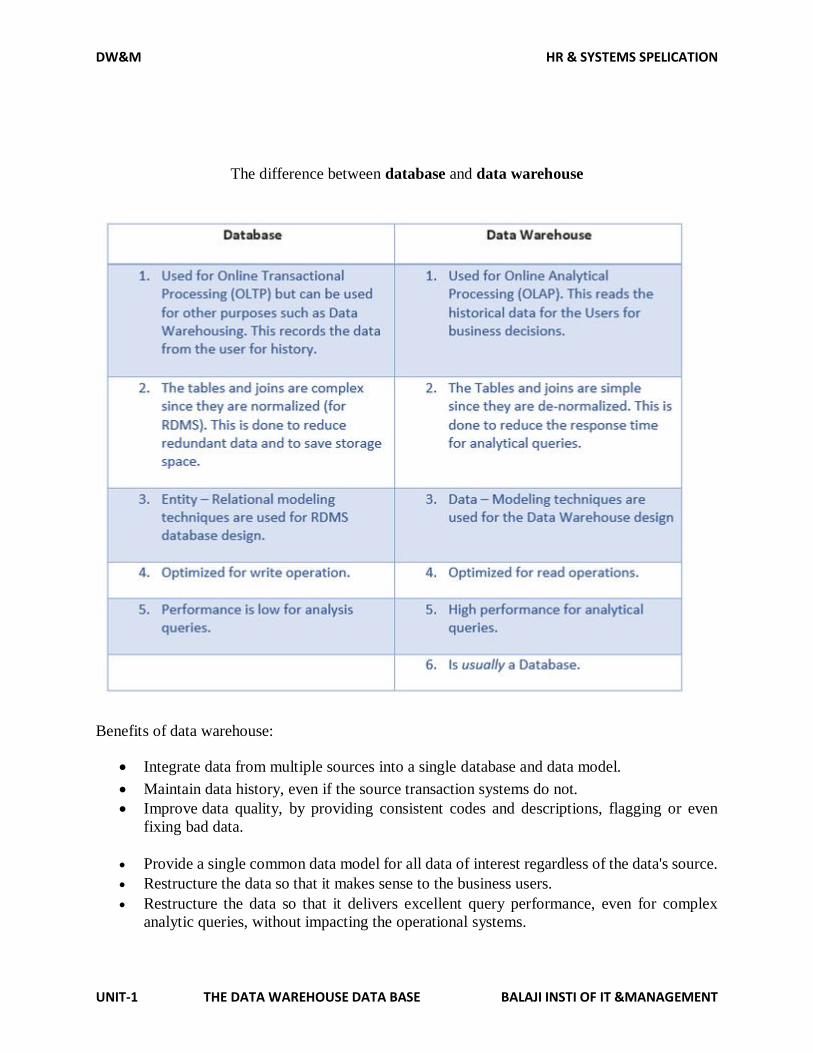
The difference between database and data warehouse
Benefits of data warehouse:
Integrate data from multiple sources into a single database and data model.
Maintain data history, even if the source transaction systems do not.
Improve data quality, by providing consistent codes and descriptions, flagging or even
fixing bad data.
Provide a single common data model for all data of interest regardless of the data's source.
Restructure the data so that it makes sense to the business users.
Restructure the data so that it delivers excellent query performance, even for complex
analytic queries, without impacting the operational systems.
DW&M HR & SYSTEMS SPELICATION
UNIT-1 THE DATA WAREHOUSE DATA BASE BALAJI INSTI OF IT &MANAGEMENT
Add value to operational business applications, notably customer relationship
management (CRM) systems.
Make decision–support queries easier to write.
2.DATA BASE STRUCTURES
A database is an organized collection of data. Instead of having all the data in a list with a
random order, a database provides a structure to organize the data.
One of the most common data structures is a database table. A database table consists
of rows and columns. A database table is also called a two-dimensional array.
An array is like a list of values, and each value is identified by a specific index. A two-
dimensional array uses two indices, which correspond to the rows and columns of a table.
In database terminology, each row is called a record. A record is also called an object or
an entity. In other words, a database table is a collection of records.
The records in a table are the objects you are interested in, such as the books in a library
catalog or the customers in a sales database.
A field corresponds to a column in the table and represents a single value for each record.
A field is also called an attribute. In other words, a record is a collection of related attributes that
make up a single database entry.
The example shows a simple database table of customers. Each customer has a unique
identifier (Customer ID), a name, and a telephone number. These are the fields. The first row is
called the header row and indicates the name of each field. Following the header row, each record
is a unique customer.
A data structure is a specialized format for organizing and storing data. Any data structure
is designed to organize data to suit a specific purpose so that it can be used according to needs,
stored normally on RAM”
Database tables and indexes may be stored on disk in one of a number of forms, including
ordered/unordered flat files, ISAM, heap files, hash buckets, or B+ trees.
Each form has its own particular advantages and disadvantages. The most commonly used
forms are B+ trees and ISAM. Such forms or structures are one aspect of the overall schema used
by a database engine to store information.
Structured files
Heap files
Heap files are lists of unordered records of variable size. Although sharing a similar name,
heap files are widely different from in-memory heaps. In-memory heaps are ordered, as opposed
to heap files.
DW&M HR & SYSTEMS SPELICATION
UNIT-1 THE DATA WAREHOUSE DATA BASE BALAJI INSTI OF IT &MANAGEMENT
Simplest and most basic method
Insert efficient, with new records added at the end of the file, providing chronological
order retrieval inefficient as searching has to be linear.
Deletion is accomplished by marking selected records as "deleted"
Requires periodic reorganization if file is very volatile (changed frequently)
Advantages
Efficient for bulk loading data
Efficient for relatively small relations as indexing overheads are avoided
Efficient when retrievals involve large proportion of stored records
Disadvantages
Not efficient for selective retrieval using key values, especially if large
Sorting may be time-consuming.
Not suitable for volatile tables.
Hash buckets
Hash functions calculate the address of the page in which the record is to be stored based on
one or more fields in the record
Hashing functions chosen to ensure that addresses are spread evenly across the address
space
‘occupancy’ is generally 40% to 60% of the total file size
Unique address not guaranteed so collision detection and collision resolution mechanisms
are required
Open addressing
Chained/unchained overflow
Pros and cons
Efficient for exact matches on key field.
Not suitable for range retrieval, which requires sequential storage.
Calculates where the record is stored based on fields in the record.
Hash functions ensure even spread of data.
Collisions are possible, so collision detection and restoration is required.
B+ trees
These are the most commonly used in practice.
Time taken to access any record is the same because the same number of nodes is searched
Index is a full index so data file does not have to be ordered.
Pros and cons.
Versatile data structure – sequential as well as random access.
Access is fast.
Supports exact, range, part key and pattern matches efficiently.
Volatile files are handled efficiently because index is dynamic – expands and contracts as
table grows and shrinks.
DW&M HR & SYSTEMS SPELICATION
UNIT-1 THE DATA WAREHOUSE DATA BASE BALAJI INSTI OF IT &MANAGEMENT
Less well suited to relatively stable files – in this case, ISAM is more efficient.
Data Structure is about storing data or handling data into RAM or Temporary Memory. Where
Database is concept or tool which store & handle data at permanent memory location (Hard Drive)
Data structure is not permanent storage. It is alive till the program is alive. But we can use the
different data structure to add data into database.
3.Organizing Relational Data warehouse
First of all, everyone needs to clarify the difference between an OLAP Server and a Database
Management System (DBMS), as well as their roles in data warehouse architecture.
Oracle Server, Microsoft SQL Server and IBM DB2 are all relational database management
systems.
The main role of a relational database server is to manage access to data stored in bi-
dimensional tables comprised of rows and columns (relational tables¾the table defines a relation
between things in each row/record).
The DBMS also provides management of computer resources, shared access, security,
programming interfaces, and many administrative functions.
An OLAP server is a specialized database engine capable of handling the ethereal
multidimensional data cubes.
The idea of a cube is a mere abstraction; actually, OLAP products store their data in
multidimensional array structures (array data types that are referenced by multiple indexes).
"Cubes" are constructed in such a way that each combination of dimensional data attributes
with the relevant numeric additive data is either precalculated or easy to compute very quickly.
OLAP engines are very good at, and specially designed for, doing analytical processing, i.e.,
calculating aggregations/summarizations, constraining queries through different paths (slice and
dice), etc.
There are currently several different implementations of OLAP technologies in the market.
The major categories are:
1) Desktop OLAP Tools (DOLAP)
Processing on PC or on mid-tier servers, not on data servers. Multidimensional arrays
stored on PCs or mid-tier servers.
DW&M HR & SYSTEMS SPELICATION
UNIT-1 THE DATA WAREHOUSE DATA BASE BALAJI INSTI OF IT &MANAGEMENT
Allows users to have current information that is portable and can be analyzed on their
desktops. These tools provide users with the ability to have a personal copy of their
multidimensional database or provide access to a central data repository from the desktop.
Representative Products/Vendors: Business Objects, Brio, Power Play/Cognos and Web
Focus/Information Builders
2) Relational OLAP Tools (ROLAP)
ROLAP tools support a three tier architecture consisting of a client, a mid-tier server, and
a target database (data warehouse).
The function of the client is to support a GUI interface for the initiation of queries and the
display of query results. The mid-tier server is a dedicated server that performs multidimensional
OLAP calculations and accesses data on a relational database through SQL.
Representative Products/Vendors: Micro Strategy, Eureka Suite/Sterling (now CA),
MetaCube/Informix, Info Beacon/CA (formerly Platinum). .
3) Multidimensional OLAP Tools (MOLAP)
MOLAP tools implement database engines that store data on multidimensional arrays.
They are recommended for relatively small data marts (typically less than 50 GB), where
performance is critically important, or where complex analytical processing must be supported.
Representative Products/Vendors: Essbase/Hyperion, Oracle Express, OLAP@Work/Business
Objects, SAS Multidimensional Database Server.
4) Hybrid OLAP Tools (HOLAP)
The Hybrid OLAP tools combine the best of both worlds, relational access for low
granularity and high volume data, and a multidimensional database engine for OLAP processing.
Representative Products/Vendors: Microsoft SQL Server OLAP Services (Plato), IBM
DB2 OLAP Server, Holos 7/Seagate.
Below are descriptions of all the components of sustainable enterprise data warehouse architecture:
1. Source Systems
often referred to as "legacy" systems. All existing corporate data assets currently in use that
is relevant for the data warehouse purpose.
These source systems include formal and informal data sources, internal and external
systems, and structured and unstructured data.
DW&M HR & SYSTEMS SPELICATION
UNIT-1 THE DATA WAREHOUSE DATA BASE BALAJI INSTI OF IT &MANAGEMENT
2. Data Conversion and Migration Services
These are the processes, programs and tools used to extract the source data from the legacy
environment, cleanse it, transform it, and load it into the data warehouse.
3. The Data Warehouse
Integrates and stores the enterprise data. It is designed to optimize query and analysis
performance, end-user understandability and scalability.
The data marts are subsets of the data warehouse focused on a specific subject area. The
data warehouse can be used to feed multidimensional databases (OLAP servers) for more
specialized analytical applications.
The central corporate data warehouse is the cornerstone of the data warehousing
environment, but this function also includes other special purpose data stores like the ODS
(Operational Data Store), Multidimensional databases (MDDB), and specialized downstream data
marts.
4. Data Access and Analysis Services
Those are the front-end tools and applications that provide intuitive access, powerful query
and analysis capabilities to end-users across the organization
5. Metadata
"It is data about the data". The Metadata Repository is a foundation of the data warehouse.
It is essential to integrate all components of the data warehouse.
Metadata stores definitions of the source data, data models for target databases,
transformation rules that convert source data into target data, and semantic definitions for the end-
user tools/applications.
The Central Data Warehouse should be implemented in a relational database
(RDBMS). It stores consolidated, detailed, corporate-wide data.
It is based on a "star-schema" design, and it is constituted by multiple data
marts integrated through conformed facts and dimensions.
Multidimensional databases (MDDBs) are ideally suited for very specialized
multidimensional calculations, involving aggregations, matrix calculations, cross-dimensional
calculations, read/write analysis, statistical analysis, what-if-analysis, etc.
MDDBs provide faster response and additional capabilities for more sophisticated OLAP
processing than RDBMSs, but they have severe size limitations, and are difficult to integrate with
the other components of the data warehouse architecture.
DW&M HR & SYSTEMS SPELICATION
UNIT-1 THE DATA WAREHOUSE DATA BASE BALAJI INSTI OF IT &MANAGEMENT
What to Look for in a Relational Database for your Data Warehouse.
Scalability to support very large databases (terabytes) and large numbers of concurrent end-
users performing complex analysis.
Adequate performance for ad hoc queries to any data in the database.
High-speed query processing using symmetric multiprocessors (SMP), massively parallel
processors (MPP), and/or clustered multiprocessors (NUMA).
Integration with local and central metadata repositories.
Integration with data extraction and transformation tools.
Integration with multidimensional databases (OLAP servers).
Integration with business intelligence tools.
Supported by large number of third-party tools.
Support of open systems standards, e.g., SQL, ODBC, OLE DB.
Support for star join and multidimensional extensions to SQL to support OLAP
calculations, variances, moving averages, etc.
Support for physical partitioning of data.
Aggregate awareness.
Portability, security, data integrity, backup/restore.
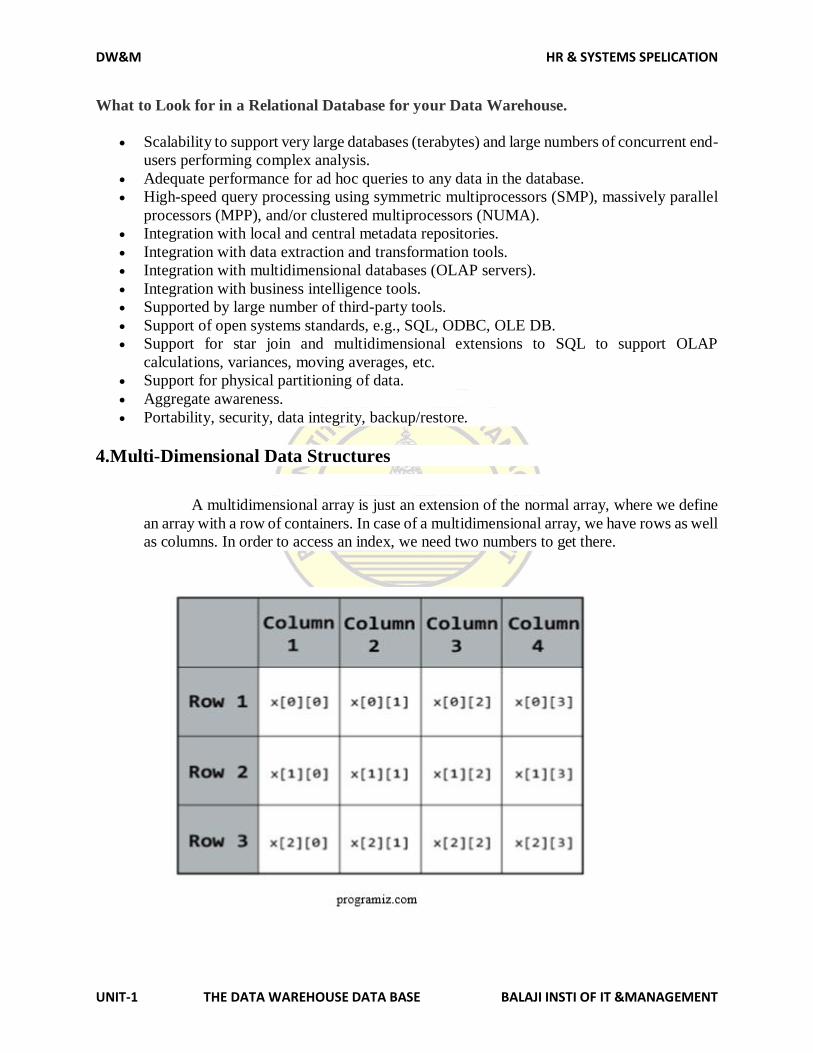
4.Multi-Dimensional Data Structures
A multidimensional array is just an extension of the normal array, where we define
an array with a row of containers. In case of a multidimensional array, we have rows as well
as columns. In order to access an index, we need two numbers to get there.
DW&M HR & SYSTEMS SPELICATION
UNIT-1 THE DATA WAREHOUSE DATA BASE BALAJI INSTI OF IT &MANAGEMENT
In the picture above, we defined an array Name [3][4] with 3 rows and 4 columns
and in total of Row * Column (3*4) indexes. Multidimensional arrays are sometimes
referred to as tables or matrix because of their structure.
Multidimensional data structures
Two main categories of data: 1) Point Data.
2) Spatial Data.
Point data: Database objects are k-tuples in a k-dimensional space. Geometrically, tuple
elements correspond to coordinates in space.
The domains of elements can be arbitrary. Applications: multi-attribute retrieval
from relational databases (access methods based on several attributes), document
databases, feature vectors of multimedia objects.
Spatial data:
Database objects have some kind of shape and size, such as lines, rectangles, and
polygons on the 2D Euclidean plane, or lines, rectangular boxes, and polyhedrons in 3D
space. Points are a special case of spatial data types.
Applications: CAD drawings, VLSI design, geography, image processing.
Arranging a multidimensional point space
Fixed number (k) of dimensions, each with its own domain of values.
Variable-dimensional objects (such as documents with keywords) may be mapped
to a fixed-length representation (e.g. signature, bitmap, etc.)
Typical approach for arranging points: Repeated partitioning of the point set into
a hierarchy as follows,
space-driven: Partition the current space into two/four/… equal-sized halves, and
split the point set accordingly
data-driven: Partition the point set into two or more subsets in a balanced way.
Multidimensional query types
„ Exact-match queries: All coordinates (attributes) are fixed in the query.
Logarithmic complexity should be achieved.
„ Partial-match queries: Only t out of total k coordinates are specified in the query.
The rest may have arbitrary values. Lower bound for worst-case complexity: Ω(n1-t/k).
„ Range queries: For each dimension, a range of values is specified. Exact match:
range = [c, c], partial-match: (-∞, ∞) for some coordinate.
„ Best-match queries: Find the nearest neighbor of point/area, specified by the
query conditions (exact or range).
Finding k nearest neighbors: Generalization of the above.
Ranking query: k nearest neighbors in the order of proximity.
DW&M HR & SYSTEMS SPELICATION
UNIT-1 THE DATA WAREHOUSE DATA BASE BALAJI INSTI OF IT &MANAGEMENT
5.Choosing a data structure
This is a list of data structures. For a wider list of terms, see list of terms relating to
algorithms and data structures. For a comparison of running time of subset of this list
see comparison of data structures.
1) Data types
In this data type structures there are three sub groups.
a) primitive type.
b) composite type.
c) abstract type.
2) Linear data structures
a) Arrays.
b) Lists
3) Trees.
a) Binary trees
b) Heaps.
c) Tries.
1)data types
Primitive types
Boolean, true or false.
Character
Floating-point numbers, limited precision rational number values
Fixed-point numbers
Integer, integral or fixed-precision values.
Reference (also called a pointer or handle), a small value referring to another object's address
in memory, possibly a much larger one.
Enumerated type, a small set of uniquely named values.
Composite types or non-primitive type
Language support for array types may include certain built-in array data types, some
syntactic constructions (array type constructors) that the programmer may use to define such types
and declare array variables, and special notation for indexing array elements.
The different types of composite types are as follows:
Array
Record (also called tuple or structure)
String, a sequence of characters.
Union
Tagged union (also called variant, variant record, discriminated union, or disjoint union).
DW&M HR & SYSTEMS SPELICATION
UNIT-1 THE DATA WAREHOUSE DATA BASE BALAJI INSTI OF IT &MANAGEMENT
Abstract data types
Container
List
Tuple
Associative array
Multimap
Heap
Set
Multiset (bag)
Stack
Queue
Double-ended queue
Priority queue
Tree
Graph
2) Linear data structures:
A data structure is said to be linear if its elements form a sequence.
a) Arrays
b) Lists
a) Arrays
Bit array.
Bit field.
Bit board.
Bitmap.
Circular buffer.
Control table.
b) Lists
Doubly linked list
Array list
Linked list
Self-organizing list
Skip list
Unrolled linked list.
DW&M HR & SYSTEMS SPELICATION
UNIT-1 THE DATA WAREHOUSE DATA BASE BALAJI INSTI OF IT &MANAGEMENT
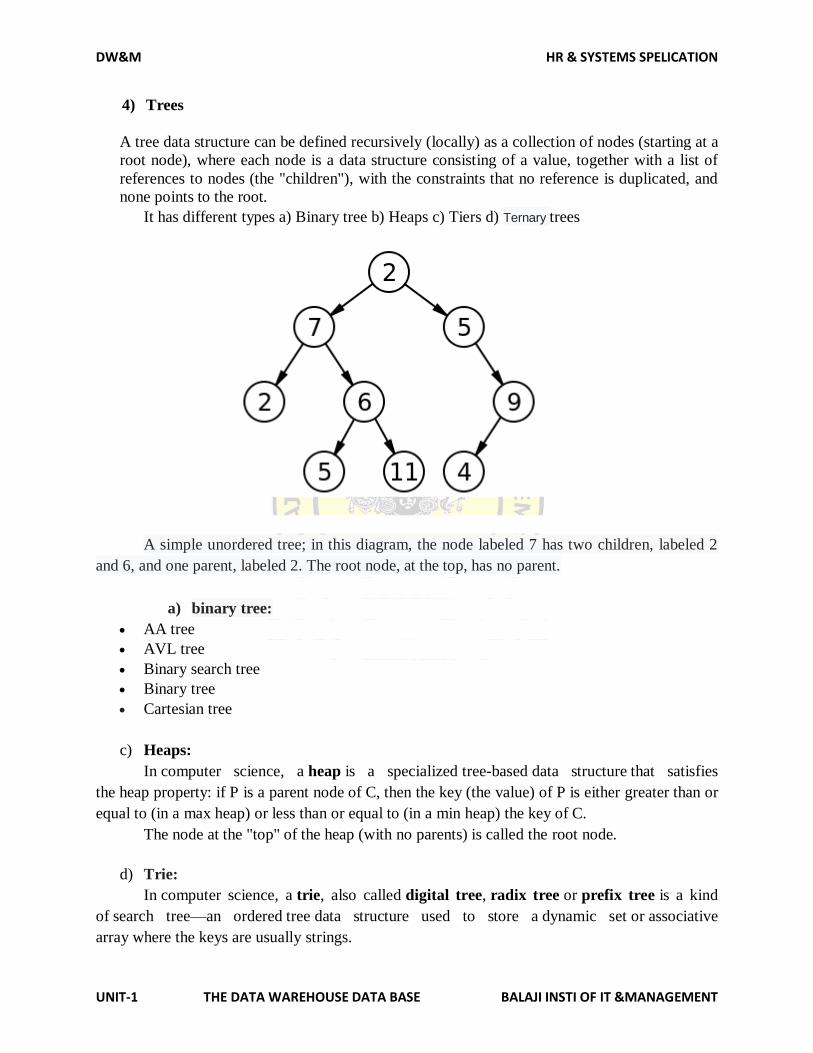
4) Trees
A tree data structure can be defined recursively (locally) as a collection of nodes (starting at a
root node), where each node is a data structure consisting of a value, together with a list of
references to nodes (the "children"), with the constraints that no reference is duplicated, and
none points to the root.
It has different types a) Binary tree b) Heaps c) Tiers d) Ternary trees
A simple unordered tree; in this diagram, the node labeled 7 has two children, labeled 2
and 6, and one parent, labeled 2. The root node, at the top, has no parent.
a) binary tree:
AA tree
AVL tree
Binary search tree
Binary tree
Cartesian tree
c) Heaps:
In computer science, a heap is a specialized tree-based data structure that satisfies
the heap property: if P is a parent node of C, then the key (the value) of P is either greater than or
equal to (in a max heap) or less than or equal to (in a min heap) the key of C.
The node at the "top" of the heap (with no parents) is called the root node.
d) Trie:
In computer science, a trie, also called digital tree, radix tree or prefix tree is a kind
of search tree—an ordered tree data structure used to store a dynamic set or associative
array where the keys are usually strings.
DW&M HR & SYSTEMS SPELICATION
UNIT-1 THE DATA WAREHOUSE DATA BASE BALAJI INSTI OF IT &MANAGEMENT
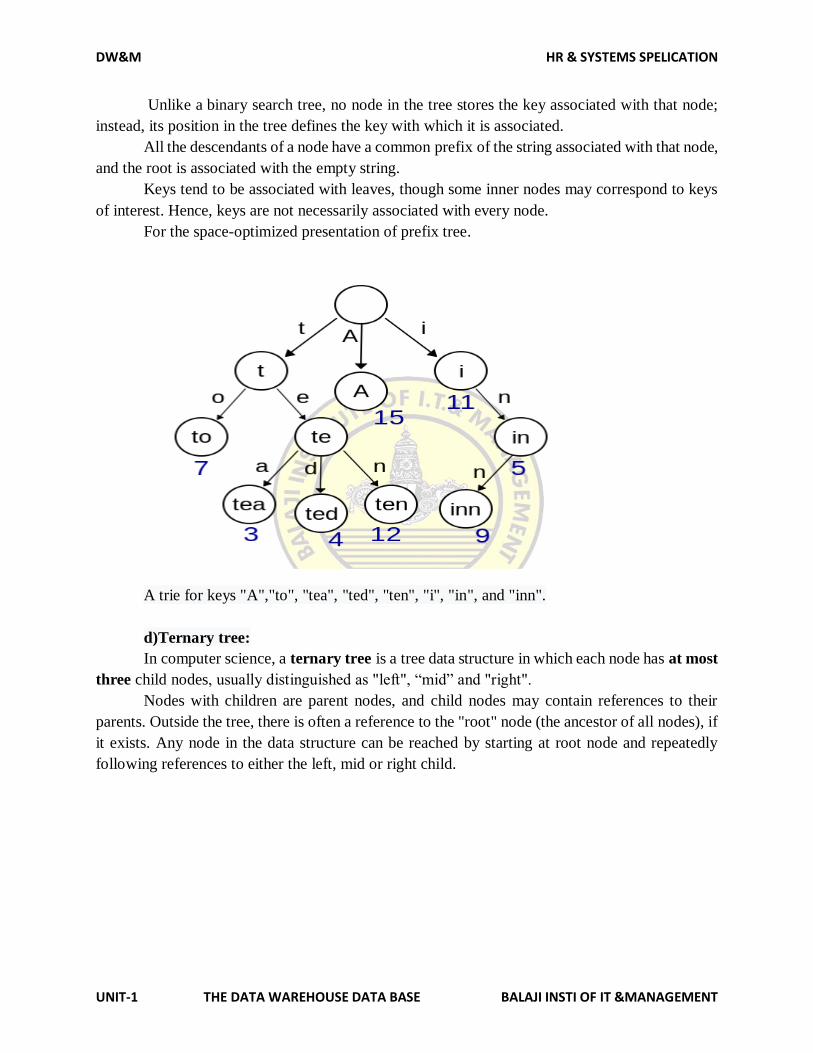
Unlike a binary search tree, no node in the tree stores the key associated with that node;
instead, its position in the tree defines the key with which it is associated.
All the descendants of a node have a common prefix of the string associated with that node,
and the root is associated with the empty string.
Keys tend to be associated with leaves, though some inner nodes may correspond to keys
of interest. Hence, keys are not necessarily associated with every node.
For the space-optimized presentation of prefix tree.
A trie for keys "A","to", "tea", "ted", "ten", "i", "in", and "inn".
d)Ternary tree:
In computer science, a ternary tree is a tree data structure in which each node has at most
three child nodes, usually distinguished as "left", “mid” and "right".
Nodes with children are parent nodes, and child nodes may contain references to their
parents. Outside the tree, there is often a reference to the "root" node (the ancestor of all nodes), if
it exists. Any node in the data structure can be reached by starting at root node and repeatedly
following references to either the left, mid or right child.

DW&M HR & SYSTEMS SPELICATION
UNIT-1 THE DATA WAREHOUSE DATA BASE BALAJI INSTI OF IT &MANAGEMENT
A simple ternary tree of size 10 and height 2.
6.META DATA: HUMAN METADATA
Metadata is data that describes other data. Meta is a prefix that in most information
technology usages means "an underlying definition or description."
Metadata summarizes basic information about data, which can make finding and working
with particular instances of data easier.
For example, author, date created and date modified and file size are examples of very
basic document metadata.
Having the ability to filter through that metadata makes it much easier for someone to
locate a specific document.
In addition to document files, metadata is used for images, videos, spreadsheets and web
pages. The use of metadata on web pages can be very important.
Metadata for web pages contain descriptions of the page’s contents, as well as keywords
linked to the content. These are usually expressed in the form of metatags.
The metadata containing the web page’s description and summary is often displayed in
search results by search engines, making its accuracy and details very important since it can
determine whether a user decides to visit the site or not.
Metatags are often evaluated by search engines to help decide a web page’s relevance, and
were used as the key factor in determining position in a search until the late 1990s.
The increase in search engine optimization (SEO) towards the end of the 1990s led to many
websites “keyword stuffing” their metadata to trick search engines, making their websites seem
more relevant than others.
DW&M HR & SYSTEMS SPELICATION
UNIT-1 THE DATA WAREHOUSE DATA BASE BALAJI INSTI OF IT &MANAGEMENT
Since then search engines have reduced their reliance on metatags, though they are still
factored in when indexing pages.
Many search engines also try to halt web pages’ ability to thwart their system by regularly
changing their criteria for rankings, with Google being notorious for frequently changing their
highly-undisclosed ranking algorithms.
Metadata can be created manually, or by automated information processing. Manual
creation tends to be more accurate, allowing the user to input any information they feel is relevant
or needed to help describe the file.
Automated metadata creation can be much more elementary, usually only displaying
information such as file size, file extension, when the file was created and who created the file.
Metadata can be broadly categorized into three categories −
Business Metadata − It has the data ownership information, business definition, and
changing policies.
Technical Metadata − It includes database system names, table and column names and
sizes, data types and allowed values. Technical metadata also includes structural
information such as primary and foreign key attributes and indices.
Operational Metadata − It includes currency of data and data lineage. Currency of data
means whether the data is active, archived, or purged. Lineage of data means the history
of data migrated and transformation applied on it.
Metadata has a very important role in a data warehouse. The role of metadata in a
warehouse is different from the warehouse data, yet it plays an important role. The various roles
of metadata are explained below.
Metadata acts as a directory.
This directory helps the decision support system to locate the contents of the data
warehouse.
DW&M HR & SYSTEMS SPELICATION
UNIT-1 THE DATA WAREHOUSE DATA BASE BALAJI INSTI OF IT &MANAGEMENT
Metadata helps in decision support system for mapping of data when data is transformed
from operational environment to data warehouse environment.
Metadata helps in summarization between current detailed data and highly summarized
data.
Metadata also helps in summarization between lightly detailed data and highly
summarized data.
Metadata is used for query tools.
Metadata is used in extraction and cleansing tools.
Metadata is used in reporting tools.
Metadata is used in transformation tools.
Metadata plays an important role in loading functions.
7.USE OF COMPUTER BASED META DATA TO PEOPLE: Metadata may be written into a digital photo file that will identify who owns it, copyright
and contact information, what brand or model of camera created the file, along with exposure
information (shutter speed, f-stop, etc.) and descriptive information, such as keywords about the
photo, making the file or image searchable on a computer and/or the Internet.
Some metadata is created by the camera and some is input by the photographer and/or
software after downloading to a computer.
Most digital cameras write metadata about model number, shutter speed, etc., and some
enable you to edit it; this functionality has been available on most Nikon DSLRs since the Nikon
D3, on most new Canon cameras since the Canon EOS 7D, and on most Pentax DSLRs since the
Pentax K-3. Metadata can be used to make organizing in post-production easier with the use of
key-wording.
Filters can be used to analyze a specific set of photographs and create selections on criteria
like rating or capture time.
Photographic Metadata Standards are governed by organizations that develop the following
standards. They include, but are not limited to:
IPTC Information Interchange Model IIM (International Press Telecommunications
Council),
IPTC Core Schema for XMP
XMP – Extensible Metadata Platform (an ISO standard)
Exif – Exchangeable image file format, maintained by CIPA (Camera & Imaging Products
Association) and published by JEITA (Japan Electronics and Information Technology
Industries Association)
DW&M HR & SYSTEMS SPELICATION
UNIT-1 THE DATA WAREHOUSE DATA BASE BALAJI INSTI OF IT &MANAGEMENT
Dublin Core (Dublin Core Metadata Initiative – DCMI)
PLUS (Picture Licensing Universal System).
VRA Core (Visual Resource Association).
Telecommunications: Information on the times, origins and destinations of phone calls,
electronic messages, instant messages and other modes of telecommunication, as opposed
to message content, is another form of metadata. Bulk collection of this call detail record
metadata by intelligence agencies has proven controversial after disclosures by Edward
Snowden of the fact that certain Intelligence agencies such as the NSA had been (and
perhaps still are) keeping online metadata on millions of internet user for up to a year,
regardless of whether or not they [ever] were persons of interest to the agency.
Video: Metadata is particularly useful in video, where information about its contents (such
as transcripts of conversations and text descriptions of its scenes) is not directly
understandable by a computer, but where efficient search of the content is desirable. This
is particularly useful in video applications such as Automatic Number Plate Recognition
and Vehicle Recognition Identification software, wherein license plate data is saved and
used to create reports and alerts. There are two sources in which video metadata is derived:
(1) operational gathered metadata, that is information about the content produced, such as
the type of equipment, software, date, and location; (2) human-authored metadata, to
improve search engine visibility, discoverability, audience engagement, and providing
advertising opportunities to video publishers. In today's society most professional video
editing software has access to metadata. Avid's MetaSync and Adobe's Bridge are two
prime examples of this.
8.COMPUTER BASED METADATA FOR THE COMPUTER TO USE
An important role in modern computer systems is played by a special kind of
information resources known as metadata.
Numerous publications are available on metadata. Most of them deal with the standards
of metadata used in various areas, while publications discussing the properties and functions of
this kind of information resources are rather rare.
Probably, for this reason, there is no sustained treatment of the term metadata in the
literature.
DW&M HR & SYSTEMS SPELICATION
UNIT-1 THE DATA WAREHOUSE DATA BASE BALAJI INSTI OF IT &MANAGEMENT
Rather frequently, metadata-concerning publications involve obvious errors or no
necessary comments are made in discussions of special kinds of metadata.
As a result, their properties and functions are incorrectly extended to the general case.
The definition of this term is discussed, and examples of metadata used in various areas
of information technologies are given.
The general (domain-independent) properties and functions of metadata are examined.
Facilities for metadata representation, available generalized classifications of metadata, and
activities related to metadata standardization are discussed.
INTRODUCTION
The storage, processing, and exchange of data in computer systems and user data access are impossible to implement without explicitly represented descriptions of the data properties.
Such descriptions are required for software tools intended for data storage, processing, and exchange and for users who need to estimate the relevance of data in particular situations, interpret and analyze the content of data, and formulate data queries.
Such descriptions are known as metadata and are a special form of information resources. The creation of meta- data frequently requires much effort and considerable costs. However, metadata considerably raise the value of data and ensure more opportunities for their use.
It is rather difficult to trace back who was the first to coin the term metadata in information technologies and when this happened.
Metadata were used long before the emergence of computer systems and the introduction of this term into the scientific and engineering.
we are interested in metadata used in computer systems. In this area, metadata have been employed since an early stage of development.
When the first programming languages and technologies were created, the term metadata did not exist.
How- ever, the source code of a program had to contain descriptions of all types of the data it handled.
Using such descriptions, a compiler ensures the memory allocation required for data and verifies the validity of the operations executed over them.
If a program operates with data from external memory, the properties of the files storing these data have to be described in the source code and, for some operating systems, in the job control language as well. Undoubtedly, these descriptions are examples of metadata.
The creation of database technologies and information retrieval systems also required the use of meta- data.
When a particular database is designed, a conceptual schema of the subject domain has to be developed and represented with the use of a conceptual modeling language.
This schema is then used to create a description of the database structure, integrity constraints, user rights, etc. For this purpose, the designer uses the data description language of the database management system (DBMS) chosen for implementing the database system.
The indicated description is represented as a schema of the database to be created, which, like the conceptual schema of the subject domain, is an example of metadata.
In earlier document retrieval systems, each document was represented by its search
DW&M HR & SYSTEMS SPELICATION
UNIT-1 THE DATA WAREHOUSE DATA BASE BALAJI INSTI OF IT &MANAGEMENT
image, which identified this document, characterized its content by a set of descriptors, and replaced this document in processing user queries. Search images of documents are examples
of metadata.
Metadata of publications in digital library catalogues are their bibliographic descriptions and abstracts, the classes of the corresponding subject classifiers, and other characteristics.
In the 1960–1970s, widely used were report generators with the input programming language PRG (Report Program Generator) originally developed and implemented by IBM.
This language makes it possible to describe the format of a generated report.
Undoubtedly, such descriptions are metadata.
The invention of hypertext technologies and the World Wide Web has led to hypertext markup
of the original text in hypertext publishing systems and web pages. The collection of text markup tags
is metadata of such resources.
With the creation of knowledge-based systems and Semantic Web technologies, the
semantics of data and the ontology of a subject domain can be explicitly represented and used for data
search and logical inference.
In recent years, the RDF language, the ontology description languages RDFS, OWL, and
OWL2, and the pro- files of the OWL2 language have been extensively used to describe data semantics
and subject domain ontologies. Such descriptions are also examples of metadata.
In scientific information systems, metadata describe the properties of data associated
with the specific features of a research subject domain.
At the same time, descriptions of the characteristics of the instruments used to obtain
these data, the places and times of their recording, computer model experiments, etc., are also
frequently required.
Metadata are necessary in modern digital libraries. They describe the overall content of a
library, the components of its collections of information resources, individual resources in the
collections, their classifiers and relationships, the organizations owning the library information
resources, profiles of authors and library users, and other information objects and services of such
systems.
The necessity of metadata has led to the creation of a toolkit for managing information resources of this specific kind.
For the first time, much attention to the management of metadata was given in the 1970s in the context of information systems operating structured data.
The concept of a data dictionary/directory sys- tem was proposed, and several such
systems were created.
Later, the concept of integrated data dictionary systems, i.e., database management
systems performing traditional DBMS functions and functions of a data dictionary/directory
system was implemented. An international standard of data dictionary systems was also
developed.
DW&M HR & SYSTEMS SPELICATION
UNIT-1 THE DATA WAREHOUSE DATA BASE BALAJI INSTI OF IT &MANAGEMENT
The idea of integrating a data dictionary/directory system with a DBMS was later
supported, though in a limited form, in the standard of the SQL language.
Specifically, the database schema is represented (at the “logical” level) in the form of a set
of system tables that can be operated with the help of usual language facilities.
As a result, databases managed by DBMSs based on the SQL standards have become
self-described; i.e., they contain user data together with metadata describing them (database
schema).
Due to the development of information technologies and their applications, the
functions of metadata and their variety have expanded considerably.
Facilities for metadata representation and management have been created and
developed for information systems and computer systems of other kinds.
The content of metadata, their functions, and representation tools depend on the
information technologies used, on the functional capabilities and the subject domain of the
systems using them, on the nature of the resources described, on the context and character of
their use, and on many other factors.
Over the last two decades, much attention has been focused on metadata motivated
primarily by the development of Semantic Web technologies, digital libraries, and other new
information technologies.
Additionally, important tasks to be addressed have become those of ensuring metadata
exchange between various systems and providing the interoperability and reuse of information
resources and the integration of data from various sources.
All these tasks have caused vigorous activities aimed at metadata standardization
implemented by international and national standards bodies, industrial consortia, and scientific
and other communities.
As a result, numerous standards of metadata descriptions of “horizontal” and “vertical”
sphere have been created.
The XML standards, the Dublin Core, the descriptive subset of the SQL language, a
large number of metadata schemas for various applications, standards of conceptual and
ontological modeling languages, numerous standards of scientific meta- data, and many
others are actively used in practice.
Although the term metadata has been much more frequently used in recent years,
unfortunately, there is no unified understanding of this term.
A widespread abstract formula stating that metadata is data about data fails to uncover the
variety of its properties and functions.
In recent years, metadata has been addressed in a huge number of publications. However,
little attention was given to a systematic discussion of the general properties and functions of
metadata.
The most frequently dis- cussed issues concern the creation of metadata systems for
particular area of scientific research, business, electronic governments, digital libraries, various

DW&M HR & SYSTEMS SPELICATION
UNIT-1 THE DATA WAREHOUSE DATA BASE BALAJI INSTI OF IT &MANAGEMENT
digital object repositories, and information systems.
Moreover, in many studies related to digital libraries or applications based on the
Semantic Web standards, a rather limited view of metadata functions dominates, according to
which they are only a facility for describing the con- tent of information resources, although
this is one of many possible metadata functions.
PREPARED BY
T. HIMMAT.
DW&M HR& SYSTEMS SPELISATION
UNIT-4 Analyzing The Context Of Data Warehouse Balaji Insti of IT & Management
(17E00319) DATA WAREHOUSING AND MINING
(Elective IV)
Objective: The objective of the course is to give an understanding Data Warehousing and Data
Mining concepts.
1. Managing Data: Individual Data Management, Organizational Data Warehousing and Data
Management, Components of Organizational Memory, Evaluation of Database Technology.
2. Database Systems in the Organization: Data Sharing and Data Bases – Sharing Data Between
Functional Units, Sharing Data Between Different Levels of Users, Sharing Data Between Different
Locations.
3. The Data Warehouse Data Base: Context of Data Warehouse Data Base, Data Base Structures –
Organizing Relational Data warehouse – Multi-Dimensional Data Structures – Choosing a Structure.
Meta Data: Human Meta Data, Computer Based Meta Data for people to use, Computer based Meta
Data for the Computer to use.
4. Analyzing the Contexts of the Data warehouse: Active Analysis, User Queries – OLAP Constructing
a Data Warehouse System: Stages of the Project – Developing a Project Plan, Data warehousing Design
Approaches – The Architecture Stage.
5. Getting Data into the Data warehouse – Extraction, Transformation, Cleaning, Loading and
Summarization. Data Mining, creating a Decision Tree, Correlation and Other Statistical Analysis,
Neural Networks, Nearest Neighbor Approaches, Putting the Results to Use.
Text Books:
Data Mining – Concepts and Techniques - Jiawei Han &MichelineKamber, Morgan Kaufmann Publishers, 2nd Edition, 2006.
Data Mining Introductory and advanced topics –Margaret H Dunham, Pearson education
References:
Decision Support Systems and Data warehouse Systems, Efram G. Mallach: TMH. Data Mining Techniques and Tasks, T.H.M.Sivanandam, Thomson. Data Management, Data Bases and Organizations, Richard T Watson : Wiley. Modern Data Warehousing, Mining and Visualization Core Concepts, Marakas, Pearson Data warehousing, Data Mining OLAP, Berson Smith, TMH
DW&M HR& SYSTEMS SPELISATION
UNIT-4 Analyzing The Context Of Data Warehouse Balaji Insti of IT & Management
UNIT-4
ANALYSING THE CONTEXT OF DATA WAREHOUSE
1.ACTIVE ANALYSIS
Active Analysis (formerly Data Dynamics Analysis) is a complete OLAP, data
visualization and Business Intelligence component for Silverlight, Windows Forms and ASP.NET
that allows you to rapidly embed interactive, ad hoc Business Intelligence features for both
Windows and Web applications.
Active Analysis comes with the ability to connect to virtually any data source and support
for three development platforms, rolling out your own ad hoc Business Intelligence application is
now easier than ever.
Active Analysis features include: charts, pivot tables and data visualization, rich drag-
and-drop user experience, Excel exports allow end users to share analysis results offline and much
more.
Active Analysis - Features and Benefits
Support for Silverlight, Windows Forms and ASP.NET development in one component.
Charts, pivot tables and data visualization in one programmable control.
Rich drag-and-drop user experience encourages self-discovery of data.
Excel exports allow end users to share analysis results offline.
Flexible data binding allows you to treat relational data as multi-dimensional.
Native support for SQL Server Analysis Services (SSAS) and custom intelligent MDX
queries...
Active Analysis - Out-of-the-box functionality saves time. Thanks to the out-of-the-box features and the built-in user interface in Active Analysis,
you can develop and deploy a full-blown Business Intelligence solution with interactive OLAP
and data visualization features without writing a single line of code.
Active Analysis - Combines charts and pivot tables into one powerful data visualization
component
Unlike some OLAP and analysis products that are either primarily pivot tables or primarily
charts, Active Analysis goes beyond these limitations.
We grasp data at its fundamental level and deliver a single component that offers a wide
array of data visualization capabilities. With the click of a button, you can turn a cross-tab pivot
table into a trellis display of feature-rich charts and turn it back with another click.
DW&M HR& SYSTEMS SPELISATION
UNIT-4 Analyzing The Context Of Data Warehouse Balaji Insti of IT & Management
Active Analysis - Microsoft Excel export allows users to share analysis results offline Allow your users to take the analysis they perform within your application and put it into
a format that they can use. Excel exports allow them to perform additional analysis and what-if
scenarios, and to share the results with people who do not have access to the data.
Active Analysis - Built-in toolbar gives end users access to data visualization features
In addition to the drag-and-drop user interface, most of the Active Analysis functionality
is accessible using the built-in toolbar. This allows developers to get up and running with a full
data analysis solution in no time at all.
You can hide the toolbar using the design-time Properties grid or at run time with a single
line of code.
Active Analysis - Powerful built-in data filters for fast analysis Filtering data is an essential element of any data analysis experience. Active Analysis is
built to ensure that every conceivable way to filter data is available by default with no configuration
necessary.
Simply place the control on a Windows Form, a Silverlight form or an ASP.NET Web
form, add data, and your users are immediately able to begin drilling into their data and filtering
results to show only the data that are most important to their analysis goals.
Active Analysis - Paging and slideshow features help analyze data changes over time
Active Analysis provides paging to help in visually analyzing data changes over time by
displaying each time interval as its own page. Users can either manually switch between pages or
use the slideshow feature to turn the pages automatically.
Active Analysis - Numerous ways to rank and sort data
With the built-in context menus in Active Analysis, users can sort their data in many
different ways. They can sort and rank members in ascending or descending order, by caption, key
or any field they select. When the user applies sorting to a field, a sort indicator displays on the
field to remind them that a custom sort operation is set.
Active Analysis - Easy printing of data analysis results Users can share their results by using the Active Analysis print preview and print features.
All of the presentation data are sent to the printer as well to help describe the resulting view,
including the various legends, the title, and the description text.
Active Analysis – Layouts Save data layout configurations to XML and you can load them later to refresh the view with the latest data. When you save layouts, an optional flag allows you to save them with data. This lets you send layouts to business users who do not have access to the data source.
DW&M HR& SYSTEMS SPELISATION
UNIT-4 Analyzing The Context Of Data Warehouse Balaji Insti of IT & Management
2.USER QUIRES
Data warehouses usually store a tremendous amount of data, which is advantageous and
yet challenging at the same time, since the particular querying/updating/modeling characteristics
make query processing rather difficult due to the high number of degrees of freedom.
Typical data warehouse queries are usually generated by on-line analytical
processing (OLAP) or data mining software components.
They show an extremely complex structure and usually address a large number of rows
of the underlying database.
For example, consider the following query: ‘Compute the monthly variation in the
behavior of seasonal sales for all European countries but restrict the calculations to stores
with > 1 million turnover in the same period of the last year and incorporate only 10% of all
products with more than 8% market...
Distributed query optimization refers to the process of producing a plan for the processing
of a query to a distributed database system. The plan is called a query execution plan.
In a distributed database system, schema and queries refer to logical units of data. In a
relational distributed relation database system, for instance, logical units of data are relations.
These units may be fragmented at the underlying physical level. The fragments, which
can be redundant and replicated, are allocated to different database servers in the distributed
system.
A query execution plan consists of operators and their allocation to servers. Standard
physical operators, usually implementing the data model's algebra, are used to process data and
to consolidate intermediary and final results. Communication operators realize the transfer,
sending and receiving, of data from one server to another.
3.OLAP CONSTRUCTING A DATA WAAREHOUSE SYSTEMS
Data Warehousing - OLAP.
Online Analytical Processing Server (OLAP) is based on the
multidimensional data model. It allows managers, and analysts to get an insight of the information
through fast, consistent, and interactive access to information.
OLAP tools enable users to analyze different dimensions of multidimensional data. For
example, it provides time series and trend analysis views. OLAP often is used in data mining. The
DW&M HR& SYSTEMS SPELISATION
UNIT-4 Analyzing The Context Of Data Warehouse Balaji Insti of IT & Management
chief component of OLAP is the OLAP server, which sits between a client and a database
management systems (DBMS).
Types of OLAP Servers
We have four types of OLAP servers −
Relational OLAP (ROLAP)
Multidimensional OLAP (MOLAP)
Hybrid OLAP (HOLAP)
Specialized SQL Servers
Relational OLAP
ROLAP servers are placed between relational back-end server and client front-end tools.
To store and manage warehouse data, ROLAP uses relational or extended-relational DBMS.
ROLAP includes the following −
Implementation of aggregation navigation logic.
Optimization for each DBMS back end.
Additional tools and services.
Multidimensional OLAP
MOLAP uses array-based multidimensional storage engines for multidimensional views
of data. With multidimensional data stores, the storage utilization may be low if the data set is
sparse.
Therefore, many MOLAP server use two levels of data storage representation to handle
dense and sparse data sets.
Hybrid OLAP
Hybrid OLAP is a combination of both ROLAP and MOLAP. It offers higher scalability
of ROLAP and faster computation of MOLAP.
HOLAP servers allows to store the large data volumes of detailed information. The
aggregations are stored separately in MOLAP store.
Specialized SQL Servers

DW&M HR& SYSTEMS SPELISATION
UNIT-4 Analyzing The Context Of Data Warehouse Balaji Insti of IT & Management
Specialized SQL servers provide advanced query language and query processing support
for SQL queries over star and snowflake schemas in a read-only environment.
OLAP Operations:
Since OLAP servers are based on multidimensional view of data, we will discuss OLAP
operations in multidimensional data.
Here is the list of OLAP operations −
Roll-up
Drill-down
Slice and dice
Pivot (rotate)
Roll-up:
Roll-up performs aggregation on a data cube in any of the following ways −
By climbing up a concept hierarchy for a dimension
By dimension reduction
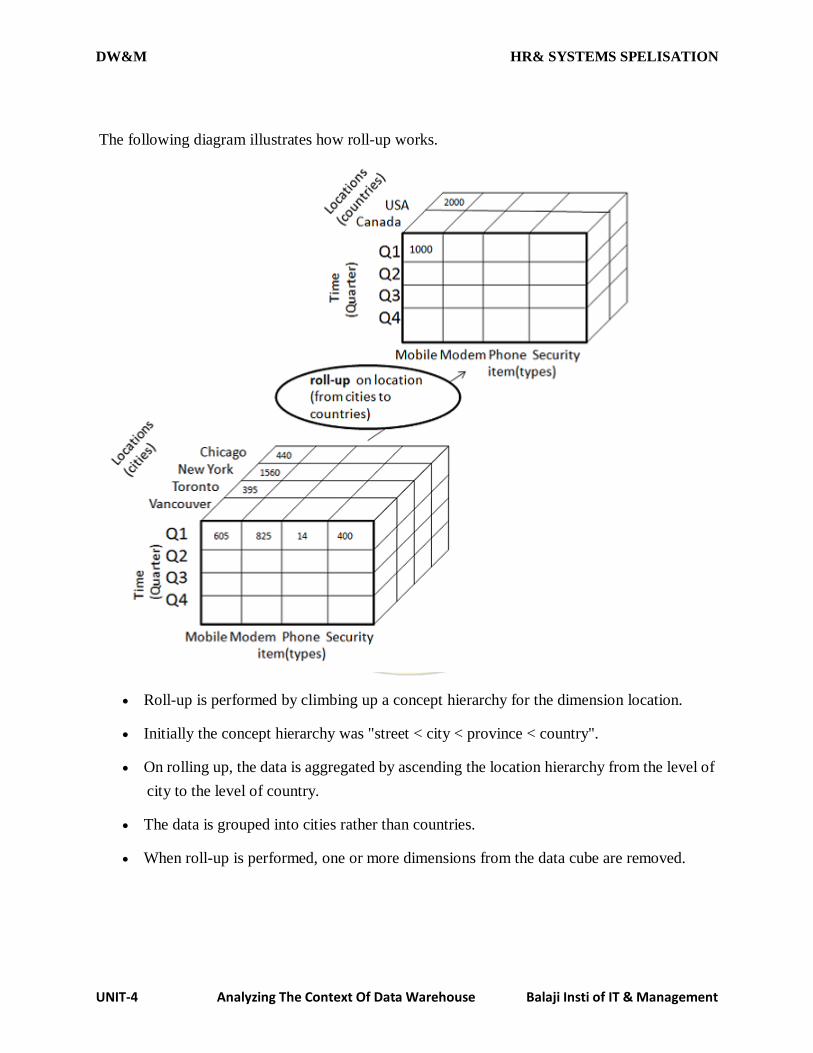
DW&M HR& SYSTEMS SPELISATION
UNIT-4 Analyzing The Context Of Data Warehouse Balaji Insti of IT & Management
The following diagram illustrates how roll-up works.
Roll-up is performed by climbing up a concept hierarchy for the dimension location.
Initially the concept hierarchy was "street < city < province < country".
On rolling up, the data is aggregated by ascending the location hierarchy from the level of
city to the level of country.
The data is grouped into cities rather than countries.
When roll-up is performed, one or more dimensions from the data cube are removed.
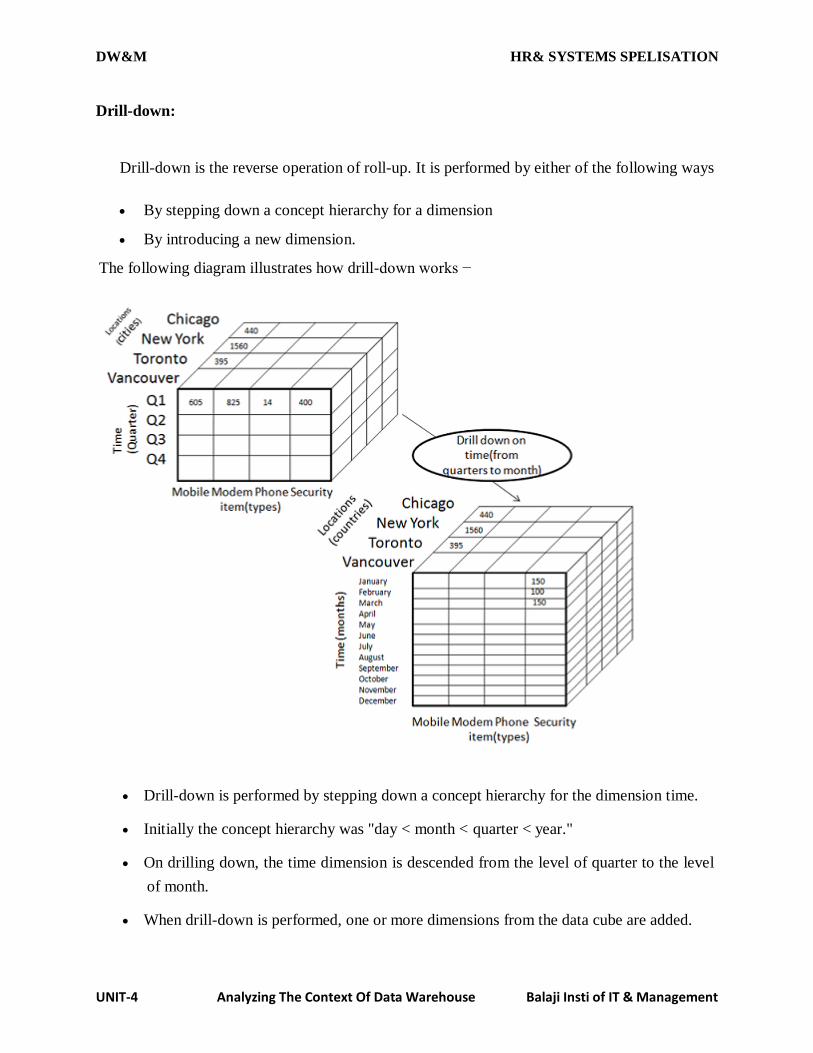
DW&M HR& SYSTEMS SPELISATION
UNIT-4 Analyzing The Context Of Data Warehouse Balaji Insti of IT & Management
Drill-down:
Drill-down is the reverse operation of roll-up. It is performed by either of the following ways
By stepping down a concept hierarchy for a dimension
By introducing a new dimension.
The following diagram illustrates how drill-down works −
Drill-down is performed by stepping down a concept hierarchy for the dimension time.
Initially the concept hierarchy was "day < month < quarter < year."
On drilling down, the time dimension is descended from the level of quarter to the level
of month.
When drill-down is performed, one or more dimensions from the data cube are added.
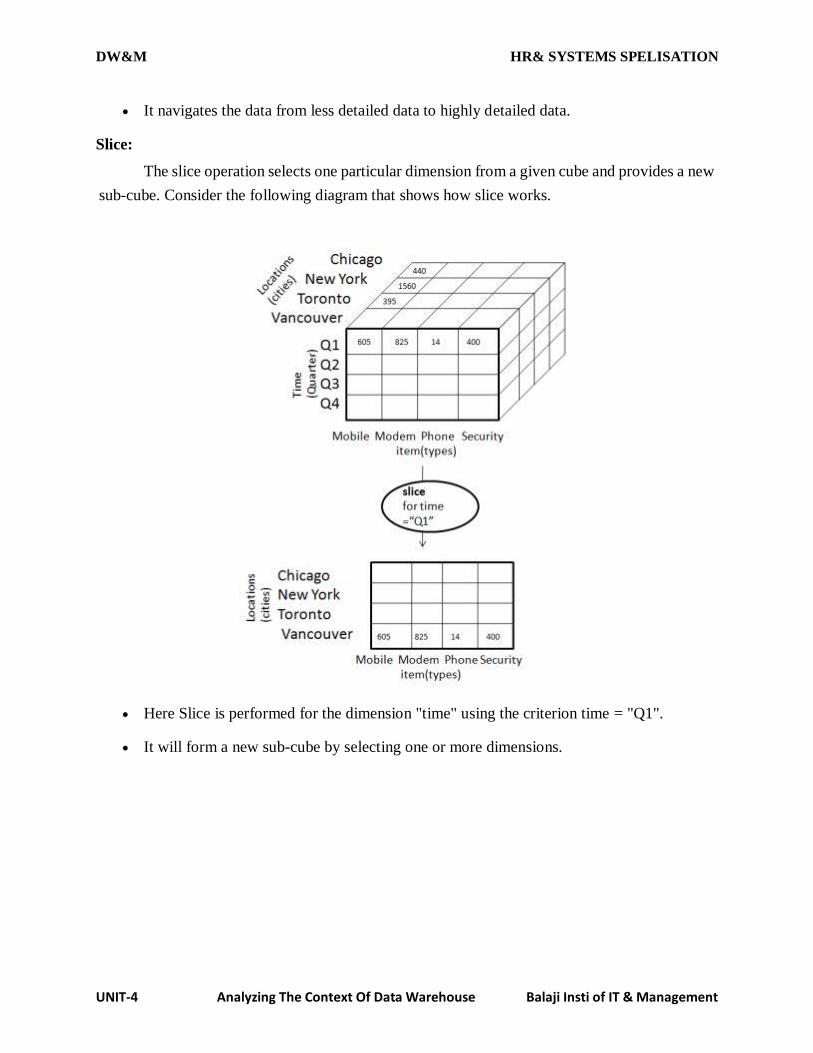
DW&M HR& SYSTEMS SPELISATION
UNIT-4 Analyzing The Context Of Data Warehouse Balaji Insti of IT & Management
It navigates the data from less detailed data to highly detailed data.
Slice:
The slice operation selects one particular dimension from a given cube and provides a new
sub-cube. Consider the following diagram that shows how slice works.
Here Slice is performed for the dimension "time" using the criterion time = "Q1".
It will form a new sub-cube by selecting one or more dimensions.
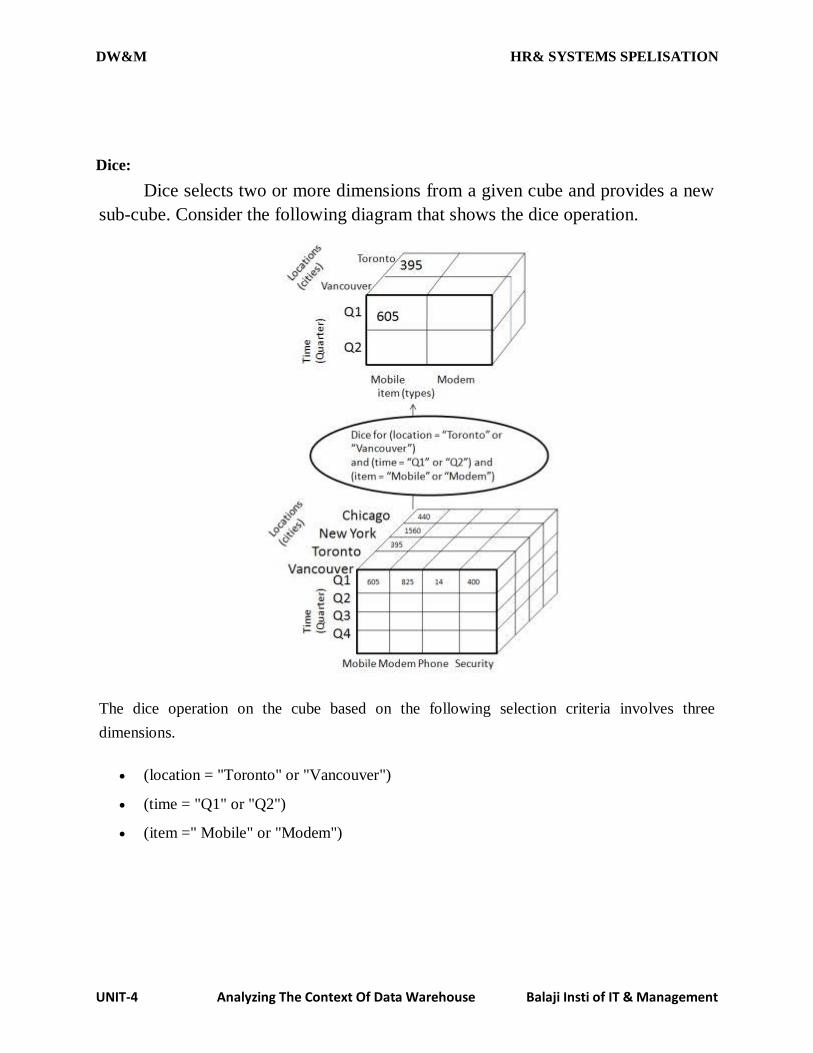
DW&M HR& SYSTEMS SPELISATION
UNIT-4 Analyzing The Context Of Data Warehouse Balaji Insti of IT & Management
Dice:
Dice selects two or more dimensions from a given cube and provides a new
sub-cube. Consider the following diagram that shows the dice operation.
The dice operation on the cube based on the following selection criteria involves three
dimensions.
(location = "Toronto" or "Vancouver")
(time = "Q1" or "Q2")
(item =" Mobile" or "Modem")
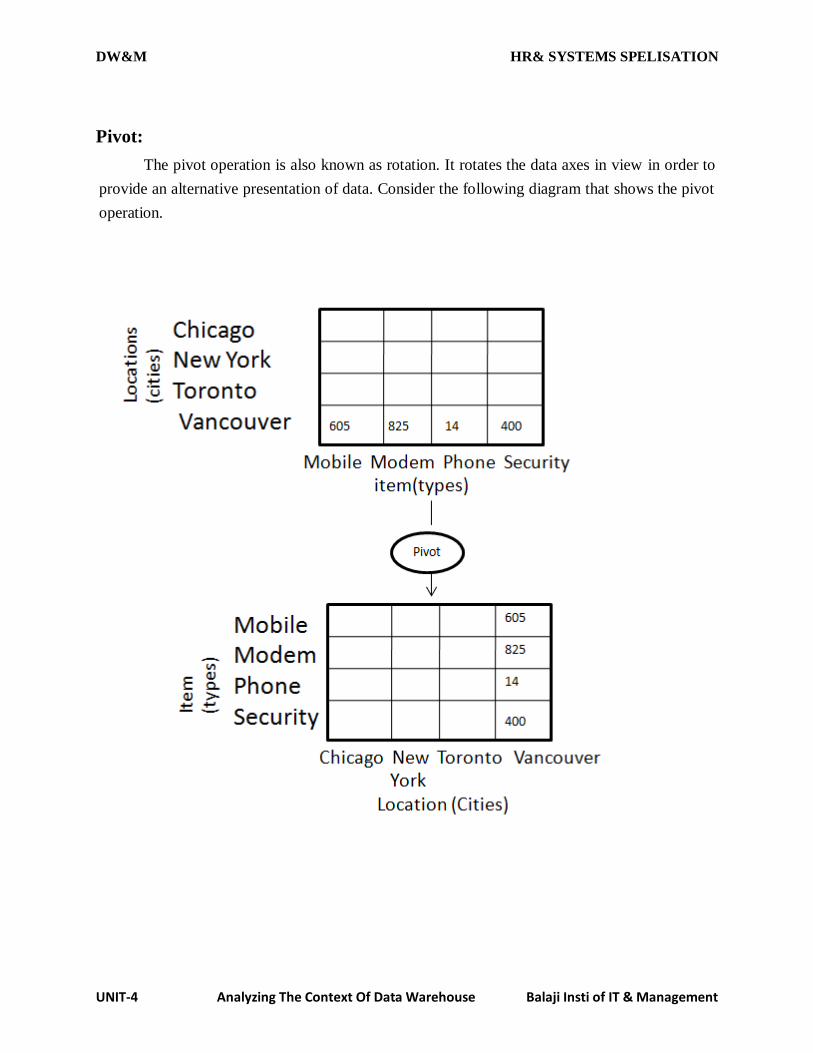
DW&M HR& SYSTEMS SPELISATION
UNIT-4 Analyzing The Context Of Data Warehouse Balaji Insti of IT & Management
Pivot:
The pivot operation is also known as rotation. It rotates the data axes in view in order to
provide an alternative presentation of data. Consider the following diagram that shows the pivot
operation.
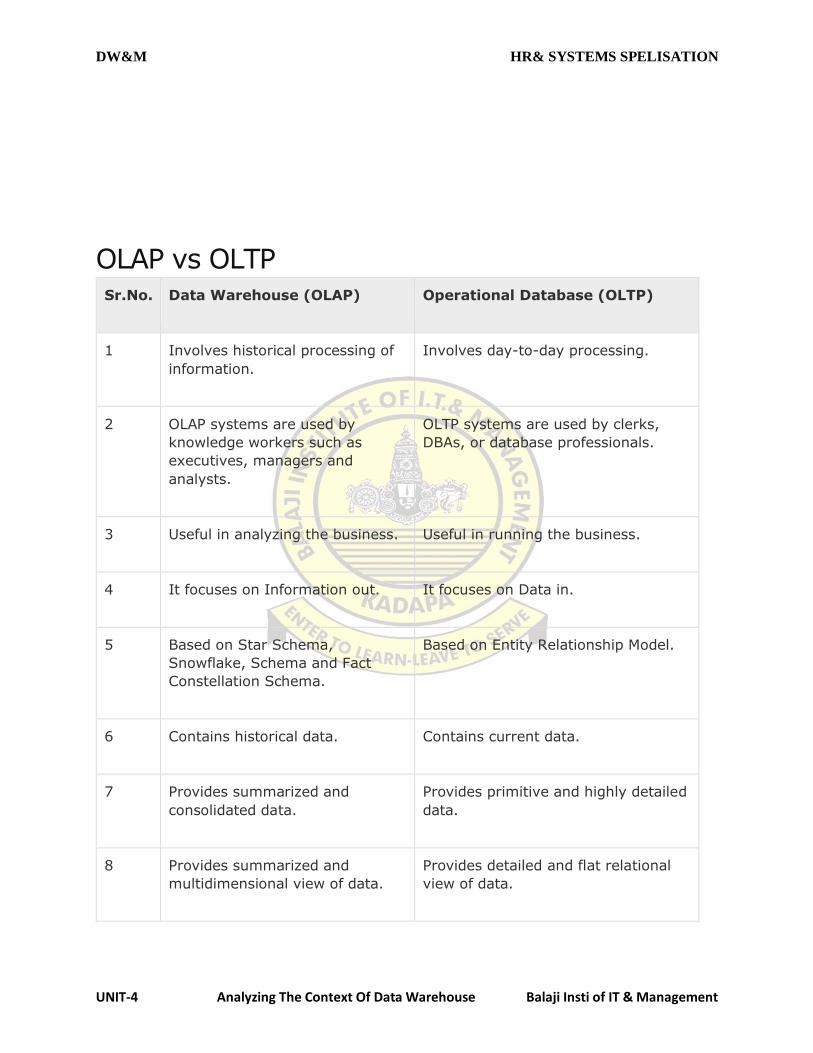
DW&M HR& SYSTEMS SPELISATION
UNIT-4 Analyzing The Context Of Data Warehouse Balaji Insti of IT & Management
OLAP vs OLTP Sr.No. Data Warehouse (OLAP) Operational Database (OLTP)
1 Involves historical processing of
information.
Involves day-to-day processing.
2 OLAP systems are used by
knowledge workers such as
executives, managers and
analysts.
OLTP systems are used by clerks,
DBAs, or database professionals.
3 Useful in analyzing the business. Useful in running the business.
4 It focuses on Information out. It focuses on Data in.
5 Based on Star Schema,
Snowflake, Schema and Fact
Constellation Schema.
Based on Entity Relationship Model.
6 Contains historical data. Contains current data.
7 Provides summarized and
consolidated data.
Provides primitive and highly detailed
data.
8 Provides summarized and
multidimensional view of data.
Provides detailed and flat relational
view of data.
DW&M HR& SYSTEMS SPELISATION
UNIT-4 Analyzing The Context Of Data Warehouse Balaji Insti of IT & Management
9 Number or users is in hundreds. Number of users is in thousands.
10 Number of records accessed is in
millions.
Number of records accessed is in
tens.
11 Database size is from 100 GB to
1 TB
Database size is from 100 MB to 1
GB.
12 Highly flexible. Provides high performance.
4.STAGES OF THE PROJECT & DEVELOPING A PROJECT PLAN
Data warehousing is not about the tools. Rather, it is about creating a strategy to plan,
design, and construct a data store capable of answering business questions. Good strategy is a
process that is never really finished.
A defined data warehouse development process provides a foundation for reliability and
reduction of risk. This process is defined through methodology. Reliability is pivotal in reducing
the costs of maintenance and support.
The data warehouse development enjoys high visibility; many firms have concentrated on
reducing these costs. Standardization and reuse of the development artifacts and the deliverables
of the process can reduce the time and cost of the data warehouses creation.
In today’s business world, data warehouses are increasingly being used to help companies
make strategic business decisions. To understand how a warehouse can benefit you and what is
required to manage a warehouse, you must first understand how a data warehouse is constructed
and established.
The designing and construction of data warehouse can be summarized as follows:
1) Project initiation.
2) Requirements analysis.
3) Design (architecture, databases and applications).
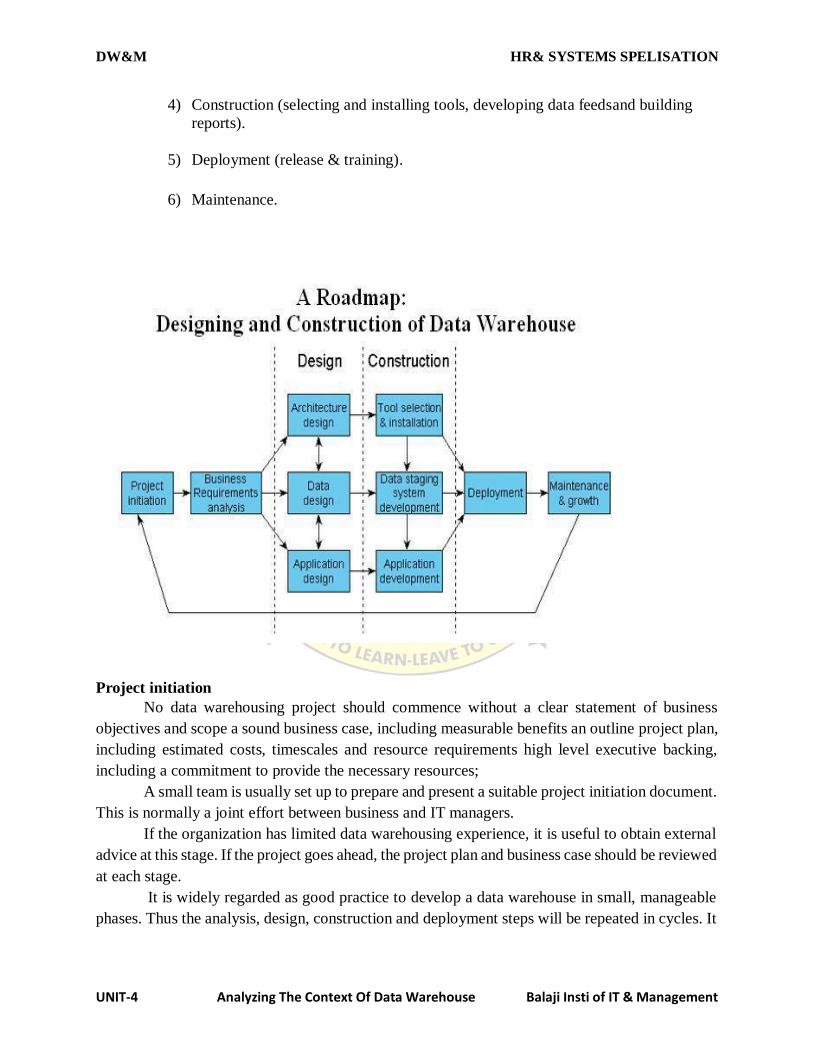
DW&M HR& SYSTEMS SPELISATION
UNIT-4 Analyzing The Context Of Data Warehouse Balaji Insti of IT & Management
4) Construction (selecting and installing tools, developing data feedsand building
reports).
5) Deployment (release & training).
6) Maintenance.
Project initiation
No data warehousing project should commence without a clear statement of business
objectives and scope a sound business case, including measurable benefits an outline project plan,
including estimated costs, timescales and resource requirements high level executive backing,
including a commitment to provide the necessary resources;
A small team is usually set up to prepare and present a suitable project initiation document.
This is normally a joint effort between business and IT managers.
If the organization has limited data warehousing experience, it is useful to obtain external
advice at this stage. If the project goes ahead, the project plan and business case should be reviewed
at each stage.
It is widely regarded as good practice to develop a data warehouse in small, manageable
phases. Thus the analysis, design, construction and deployment steps will be repeated in cycles. It
DW&M HR& SYSTEMS SPELISATION
UNIT-4 Analyzing The Context Of Data Warehouse Balaji Insti of IT & Management
is generally a good tactic to provide something that is not already available during the first phase,
as this will help to stimulate real interest.
This could be new data or enhanced functionality. It is also better to start with something
relatively easy, which the warehousing team can deliver whilst still learning the ropes.
Recruitment Analysis
Establishing a broad view of the business requirements should always be the first step. The
understanding gained will guide everything that follows, and the details can be filled in for each
phase in turn.
Collecting requirements typically involves 4 principal activities: Interviewing a number of
potential users to find out what they do, the information they need and how they analyze it in order
to make decisions.
It is often helpful to analyze some of the reports they currently use.
Interviewing information systems specialists to find out what data are available in potential
source systems, and how they are organized.
Analyzing the requirements to establish those that are feasible given available data.
Running facilitated workshops that bring representative users and IT staff together to build
consensus about what is needed, what is feasible and where to start.
Design
The goal of the design process is to define the warehouse components that will need to be
built. The architecture, data and application designs are all inter-related, and are normally produced
in parallel.
Data design
This step determines the structure of the primary data stores used in the warehouse
environment, based on the outcome of the requirements analysis.
It is best to produce a broad outline quickly, and then break the detailed design into phases,
each of which usually progresses from logical to physical.
The logical design determines what data are stored in the main data warehouse and any
associated functional data marts. There are a number of data modeling techniques that can be used
to help.
Once the logical design is established, the next step is to define the physical characteristics
of individual data stores (including aggregates) and any associated indexes required to optimize
performance.
The data design is critical to further progress, in that it defines the target for the data feeds
and provides the source data for all reporting and analysis applications.
DW&M HR& SYSTEMS SPELISATION
UNIT-4 Analyzing The Context Of Data Warehouse Balaji Insti of IT & Management
Construction
Warehouse components are usually developed iteratively and in parallel. That said, the
most efficient sequence to begin construction is probably as follows:
Tool selection & installation-
Selecting tools is best carried out as part of a pilot exercise, using a sample of real data.
This allows the development team to assess how well competing tools handle problems specific to
their organization and to test system performance before committing to purchase.
The most important choices are the:
--ETL tool.
--Database(s) for the warehouse (usually relational) and marts (often multi-dimensional).
--Reporting and analysis tools.
Clearly these need to be compatible, and it is worth checking reference sites to make sure
they work well together.
It pays to define standards and configure the development, testing and production
environments as soon as tools are installed, rather than waiting until development is well
underway.
Most vendors are willing to provide assistance with these steps, and this is normally well
worth the investment.
--Create a provisional set of aggregates.
--Automate all regular procedures.
--Document the whole process.
Substantial time should be allowed to resolve any issues that arise, establish appropriate
data cleansing procedures (preferably within the source systems environment) and to validate all
data before they are released for live use.
Deployment
As well as training, planning for deployment needs to cover: Installing and configuring
desktop PCs - any hardware upgrades or amendments to the Standard build need to be organized
well in advance;
Implementing appropriate security measures - to control access to applications and data;
Setting up a support organization to deal with questions about the tools, the applications
and the data.
DW&M HR& SYSTEMS SPELISATION
UNIT-4 Analyzing The Context Of Data Warehouse Balaji Insti of IT & Management
However thoroughly the data were checked and documented prior to publication, users are
likely to spot anomalies requiring investigation and to need assistance interpreting the results they
obtain from the warehouse and reconciling these with existing reports.
Providing more advanced tool training later, when users are ready, and assisting potential
power users to develop their first few reports.
Do not start deployment until the data are ready (available and validated) and the tools and
update procedures have been tested; Use a small, representative group to try out the finished system
before rolling out, including users with a range of abilities and attitudes;
Do not grant system access to users until they have been trained.
Maintenance
A data warehouse is not like an OLTP system, development is never finished, but follows
an iterative cycle (analyze & build & deploy). Also, once live, a warehousing environment requires
substantial effort to keep running. Thus the development team should not anticipate handing over
and moving on to other projects, but to spend half of their time on support and maintenance. The
most important activities are:
--Monitoring the realization of expected benefits;
--Providing ongoing support to users;
--Training new staff;
--Assisting with the identification and cleansing of dirty data;
-- Maintaining both feeds & meta-data as source systems change over time;
--Tuning the warehouse for maximum performance (this includes managing indexes and
aggregates according to actual usage); Purging dormant data;
--Recording successes and using these to continuously market the warehouse.
Conclusion
Data Warehousing is not a new phenomenon. All large organizations already have data
warehouses, but they are just not managing them.
Over the next few years, the growth of data warehousing is going to be enormous with
new products and technologies coming out frequently.
In order to get the most out of this period, it is going to be important that data warehouse
planners and developers have a clear idea of what they are looking for and then choose strategies
and methods that will provide them with performance today and flexibility for tomorrow.
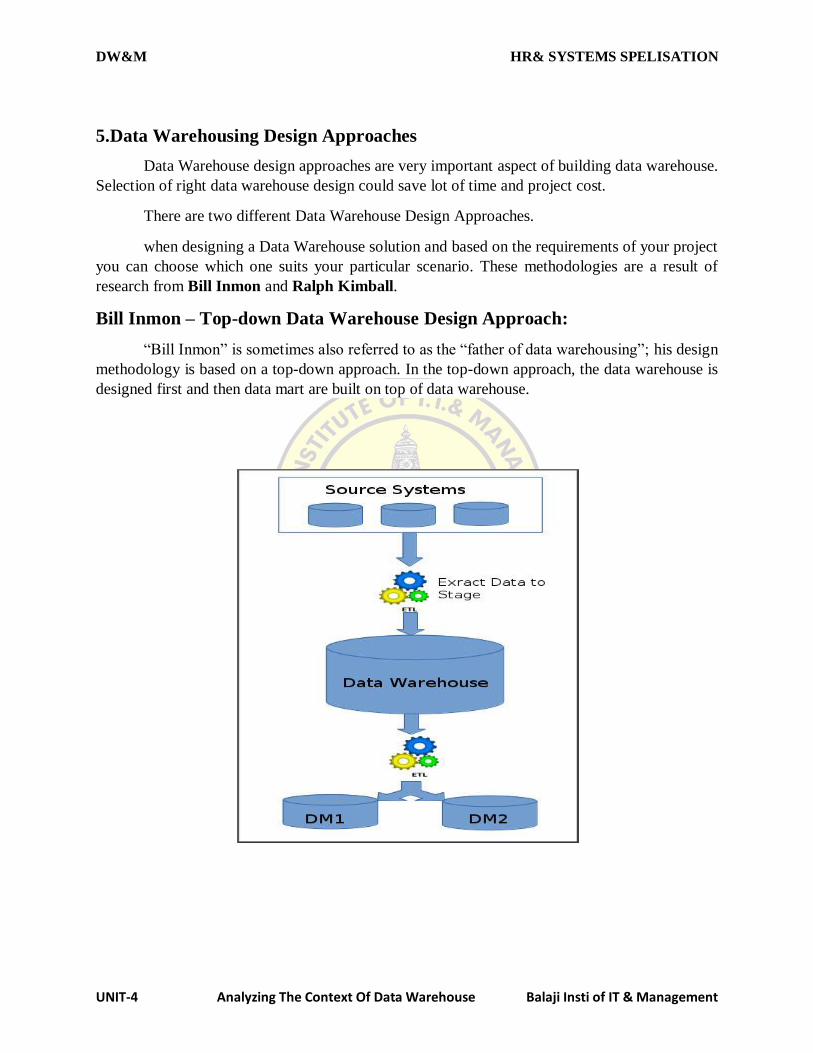
DW&M HR& SYSTEMS SPELISATION
UNIT-4 Analyzing The Context Of Data Warehouse Balaji Insti of IT & Management
5.Data Warehousing Design Approaches
Data Warehouse design approaches are very important aspect of building data warehouse.
Selection of right data warehouse design could save lot of time and project cost.
There are two different Data Warehouse Design Approaches.
when designing a Data Warehouse solution and based on the requirements of your project
you can choose which one suits your particular scenario. These methodologies are a result of
research from Bill Inmon and Ralph Kimball.
Bill Inmon – Top-down Data Warehouse Design Approach:
“Bill Inmon” is sometimes also referred to as the “father of data warehousing”; his design
methodology is based on a top-down approach. In the top-down approach, the data warehouse is
designed first and then data mart are built on top of data warehouse.
DW&M HR& SYSTEMS SPELISATION
UNIT-4 Analyzing The Context Of Data Warehouse Balaji Insti of IT & Management
Data is extracted from the various source systems. The extracts are loaded and validated in
the stage area.
Validation is required to make sure the extracted data is accurate and correct. You can
use the ETL tools or approach to extract and push to the data warehouse.
Data is extracted from the data warehouse in regular basis in stage area. At this step,
you will apply various aggregation, summarization techniques on extracted data and
loaded back to the data warehouse.
Once the aggregation and summarization is completed, various data marts extract that
data and apply the some more transformation to make the data structure as defined by
the data marts.
Advantages of top-down design are:
Provides consistent dimensional views of data across data marts, as all data marts are
loaded from the data warehouse.
This approach is robust against business changes. Creating a new data mart from the data
warehouse is very easy.
Disadvantages of top-down design are:
This methodology is inflexible to changing departmental needs during implementation
phase.
It represents a very large project and the cost of implementing the project is significant.
Ralph Kimball – Bottom-up Data Warehouse Design Approach
Ralph Kimball is a renowned author on the subject of data warehousing. His data
warehouse design approach is called dimensional modelling or the Kimball methodology. This
methodology follows the bottom-up approach.
As per this method, data marts are first created to provide the reporting and analytics
capability for specific business process, later with these data marts enterprise data warehouse is
created.
Basically, Kimball model reverses the Inmon model i.e. Data marts are directly loaded with
the data from the source systems and then ETL process is used to load in to Data Warehouse. The
above image depicts how the top-down approach works.
The data flow in the bottom up approach starts from extraction of data from various source
system into the stage area where it is processed and loaded into the data marts that are handling
specific business process.
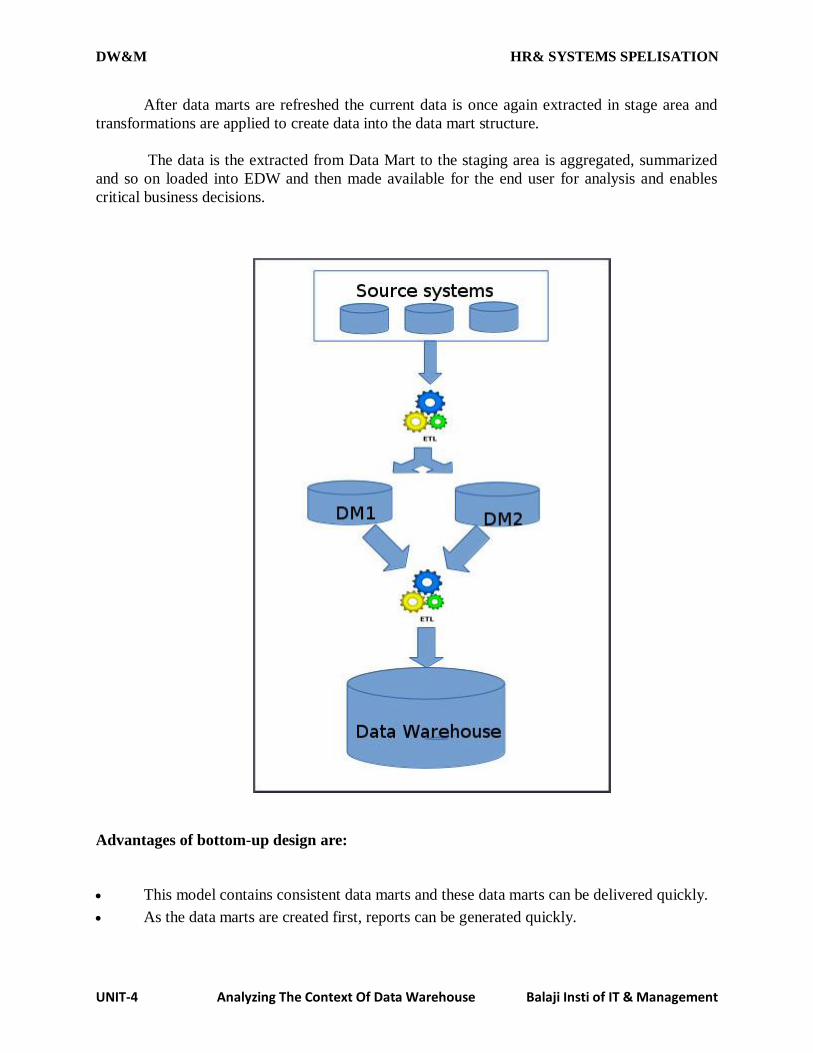
DW&M HR& SYSTEMS SPELISATION
UNIT-4 Analyzing The Context Of Data Warehouse Balaji Insti of IT & Management
After data marts are refreshed the current data is once again extracted in stage area and
transformations are applied to create data into the data mart structure.
The data is the extracted from Data Mart to the staging area is aggregated, summarized
and so on loaded into EDW and then made available for the end user for analysis and enables
critical business decisions.
Advantages of bottom-up design are:
This model contains consistent data marts and these data marts can be delivered quickly.
As the data marts are created first, reports can be generated quickly.
DW&M HR& SYSTEMS SPELISATION
UNIT-4 Analyzing The Context Of Data Warehouse Balaji Insti of IT & Management
The data warehouse can be extended easily to accommodate new business units. It is just
creating new data marts and then integrating with other data marts.
Disadvantages of bottom-up design are:
The positions of the data warehouse and the data marts are reversed in the bottom-up
approach design.
6.The architecture stage:
Data architecture is composed of models, policies, rules or standards that govern which
data is collected, and how it is stored, arranged, integrated, and put to use in data systems and in
organizations.
Data is usually one of several architecture domains that form the pillars of an enterprise
architecture or solution architecture.
A data architecture should set data standards for all its data systems as a vision or a model
of the eventual interactions between those data systems.
Data integration, for example, should be dependent upon data architecture standards since
data integration requires data interactions between two or more data systems.
A data architecture, in part, describes the data structures used by a business and its
computer applications software.
Data architectures address data in storage and data in motion; descriptions of data stores,
data groups and data items; and mappings of those data artifacts to data qualities, applications,
locations etc.
the Data Architecture breaks a subject down to the atomic level and then builds it back up
to the desired form. The data architect breaks the subject down by going through 3 traditional
architectural processes:
Conceptual - represents all business entities.
Logical - represents the logic of how entities are related.
Physical - the realization of the data mechanisms for a specific type of functionality.
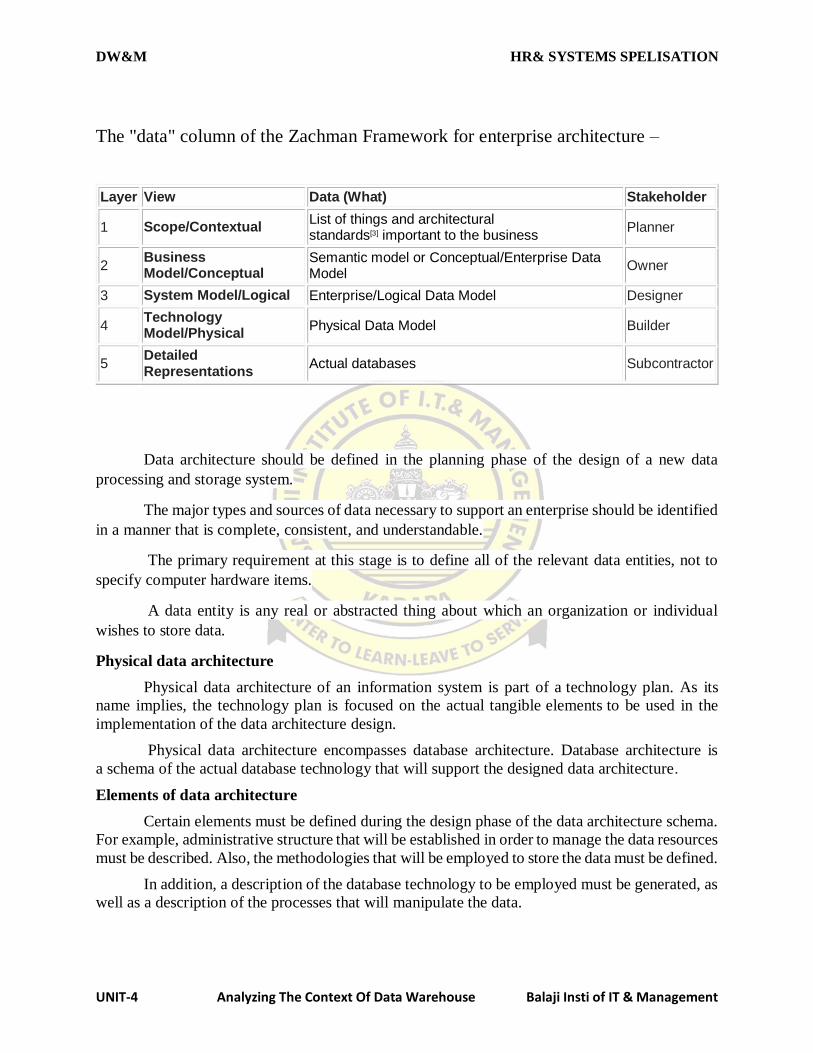
DW&M HR& SYSTEMS SPELISATION
UNIT-4 Analyzing The Context Of Data Warehouse Balaji Insti of IT & Management
The "data" column of the Zachman Framework for enterprise architecture –
Layer View Data (What) Stakeholder
1 Scope/Contextual List of things and architectural standards[3] important to the business
Planner
2 Business Model/Conceptual
Semantic model or Conceptual/Enterprise Data Model
Owner
3 System Model/Logical Enterprise/Logical Data Model Designer
4 Technology Model/Physical
Physical Data Model Builder
5 Detailed Representations
Actual databases Subcontractor
Data architecture should be defined in the planning phase of the design of a new data
processing and storage system.
The major types and sources of data necessary to support an enterprise should be identified
in a manner that is complete, consistent, and understandable.
The primary requirement at this stage is to define all of the relevant data entities, not to
specify computer hardware items.
A data entity is any real or abstracted thing about which an organization or individual
wishes to store data.
Physical data architecture
Physical data architecture of an information system is part of a technology plan. As its
name implies, the technology plan is focused on the actual tangible elements to be used in the
implementation of the data architecture design.
Physical data architecture encompasses database architecture. Database architecture is
a schema of the actual database technology that will support the designed data architecture.
Elements of data architecture
Certain elements must be defined during the design phase of the data architecture schema.
For example, administrative structure that will be established in order to manage the data resources
must be described. Also, the methodologies that will be employed to store the data must be defined.
In addition, a description of the database technology to be employed must be generated, as
well as a description of the processes that will manipulate the data.
DW&M HR& SYSTEMS SPELISATION
UNIT-4 Analyzing The Context Of Data Warehouse Balaji Insti of IT & Management
It is also important to design interfaces to the data by other systems, as well as a design
for the infrastructure that will support common data operations (i.e. emergency procedures, data
imports, data backups, external transfers of data).
Constraints and influences
Various constraints and influences will have an effect on data architecture design. These
include enterprise requirements, technology drivers, economics, business policies and data
processing needs.
Enterprise requirements
The conversion of raw data such as transaction records and image files into more
useful information forms through such features as data warehouses is also a common
organizational requirement, since this enables managerial decision making and other
organizational processes.
One of the architecture techniques is the split between managing transaction data and
(master) reference data. Another one is splitting data capture systems from data retrieval systems
(as done in a data warehouse).
Technology drivers
These are usually suggested by the completed data architecture and database architecture
designs. In addition, some technology drivers will derive from existing organizational integration
frameworks and standards, organizational economics, and existing site resources (e.g. previously
purchased software licensing).
Business policies
Business policies that also drive data architecture design include internal organizational
policies, rules of regulatory bodies, professional standards, and applicable governmental laws that
can vary by applicable agency.
These policies and rules will help describe the manner in which enterprise wishes to
process their data.
Data processing needs
These include accurate and reproducible transactions performed in high volumes, data
warehousing for the support of management information systems (and potential data mining),
repetitive periodic reporting, ad hoc reporting, and support of various organizational initiatives as
required (i.e. annual budgets, new product development).
Prepared By
T. Himmat
DW&M HR&SYSTEMS SPELICATION
UNIT-5 GETTING DATA INTO DATA WARE HOUSE BALAJI INSTI OF IT & MANAGEMENT
(17E00319) DATA WAREHOUSING AND MINING
(Elective IV)
Objective: The objective of the course is to give an understanding Data Warehousing and Data
Mining concepts.
1. Managing Data: Individual Data Management, Organizational Data Warehousing and Data
Management, Components of Organizational Memory, Evaluation of Database Technology.
2. Database Systems in the Organization: Data Sharing and Data Bases – Sharing Data Between
Functional Units, Sharing Data Between Different Levels of Users, Sharing Data Between Different
Locations.
3. The Data Warehouse Data Base: Context of Data Warehouse Data Base, Data Base Structures –
Organizing Relational Data warehouse – Multi-Dimensional Data Structures – Choosing a Structure.
Meta Data: Human Meta Data, Computer Based Meta Data for people to use, Computer based Meta
Data for the Computer to use.
4. Analyzing the Contexts of the Data warehouse: Active Analysis, User Queries – OLAP Constructing
a Data Warehouse System: Stages of the Project – Developing a Project Plan, Data warehousing Design
Approaches – The Architecture Stage.
5. Getting Data into the Data warehouse – Extraction, Transformation, Cleaning, Loading and
Summarization. Data Mining, creating a Decision Tree, Correlation and Other Statistical Analysis,
Neural Networks, Nearest Neighbor Approaches, Putting the Results to Use.
Text Books:
Data Mining – Concepts and Techniques - Jiawei Han &MichelineKamber, Morgan Kaufmann Publishers, 2nd Edition, 2006.
Data Mining Introductory and advanced topics –Margaret H Dunham, Pearson education
References:
Decision Support Systems and Data warehouse Systems, Efram G. Mallach: TMH. Data Mining Techniques and Tasks, T.H.M.Sivanandam, Thomson. Data Management, Data Bases and Organizations, Richard T Watson : Wiley. Modern Data Warehousing, Mining and Visualization Core Concepts, Marakas, Pearson Data warehousing, Data Mining OLAP, Berson Smith, TMH
DW&M HR&SYSTEMS SPELICATION
UNIT-5 GETTING DATA INTO DATA WARE HOUSE BALAJI INSTI OF IT & MANAGEMENT
UNIT-5
GETTING DATA INTO THE DATA WAREHOUSE
1.EXTRACTION
Extraction in Data Warehouses
Extraction, which is the process of taking data from an operational system and moving it to your
warehouse or staging system.
Overview of Extraction in Data Warehouses.
Introduction to Extraction Methods in Data Warehouses.
Data Warehousing Extraction Examples.
Overview of Extraction in Data Warehouses
Extraction is the operation of extracting data from a source system for further use in a data
warehouse environment. This is the first step of the ETL process.
After the extraction, this data can be transformed and loaded into the data warehouse.
The source systems for a data warehouse are typically transaction processing applications.
For example, one of the source systems for a sales analysis data warehouse might be an order entry
system that records all of the current order activities.
Designing and creating the extraction process is often one of the most time-consuming
tasks in the ETL process and, indeed, in the entire data warehousing process.
The source systems might be very complex and poorly documented, and thus determining
which data needs to be extracted can be difficult.
The data has to be extracted normally not only once, but several times in a periodic manner
to supply all changed data to the warehouse and keep it up-to-date. Moreover, the source system
typically cannot be modified, nor can its performance or availability be adjusted, to accommodate
the needs of the data warehouse extraction process.
These are important considerations for extraction and ETL in general. This chapter,
however, focuses on the technical considerations of having different kinds of sources and
extraction methods.
It assumes that the data warehouse team has already identified the data that will be
extracted, and discusses common techniques used for extracting data from source databases.
DW&M HR&SYSTEMS SPELICATION
UNIT-5 GETTING DATA INTO DATA WARE HOUSE BALAJI INSTI OF IT & MANAGEMENT
Designing this process means making decisions about the following two main aspects:
Which extraction method do I choose?
This influences the source system, the transportation process, and the time needed for
refreshing the warehouse.
How do I provide the extracted data for further processing?
This influences the transportation method, and the need for cleaning and transforming the
data.
Introduction to Extraction Methods in Data Warehouses
The extraction method you should choose is highly dependent on the source system and
also from the business needs in the target data warehouse environment.
Very often, there's no possibility to add additional logic to the source systems to enhance
an incremental extraction of data due to the performance or the increased workload of these
systems. Sometimes even the customer is not allowed to add anything to an out-of-the-box
application system.
The estimated amount of the data to be extracted and the stage in the ETL process (initial
load or maintenance of data) may also impact the decision of how to extract, from a logical and a
physical perspective. Basically, you have to decide how to extract data logically and physically.
Logical Extraction Methods
There are two kinds of logical extraction:
Full Extraction
Incremental Extraction
Full Extraction
The data is extracted completely from the source system. Since this extraction reflects all
the data currently available on the source system, there's no need to keep track of changes to the
data source since the last successful extraction.
The source data will be provided as-is and no additional logical information (for example,
timestamps) is necessary on the source site. An example for a full extraction may be an export file
of a distinct table or a remote SQL statement scanning the complete source table.
Incremental Extraction
DW&M HR&SYSTEMS SPELICATION
UNIT-5 GETTING DATA INTO DATA WARE HOUSE BALAJI INSTI OF IT & MANAGEMENT
At a specific point in time, only the data that has changed since a well-defined event back
in history will be extracted.
This event may be the last time of extraction or a more complex business event like the last
booking day of a fiscal period. To identify this delta, change there must be a possibility to identify
all the changed information since this specific time event.
This information can be either provided by the source data itself like an application column,
reflecting the last-changed timestamp or a change table where an appropriate additional
mechanism keeps track of the changes besides the originating transactions. In most cases, using
the latter method means adding extraction logic to the source system.
Many data warehouses do not use any change-capture techniques as part of the extraction
process. Instead, entire tables from the source systems are extracted to the data warehouse or
staging area, and these tables are compared with a previous extract from the source system to
identify the changed data.
This approach may not have significant impact on the source systems, but it clearly can
place a considerable burden on the data warehouse processes, particularly if the data volumes are
large.
Physical Extraction Methods
Depending on the chosen logical extraction method and the capabilities and restrictions on
the source side, the extracted data can be physically extracted by two mechanisms. The data can
either be extracted online from the source system or from an offline structure. Such an offline
structure might already exist or it might be generated by an extraction routine.
There are the following methods of physical extraction:
Online Extraction
Offline Extraction
Online Extraction
The data is extracted directly from the source system itself. The extraction process can
connect directly to the source system to access the source tables themselves or to an intermediate
system that stores the data in a preconfigured manner (for example, snapshot logs or change
tables). Note that the intermediate system is not necessarily physically different from the source
system.
With online extractions, you need to consider whether the distributed transactions are using
original source objects or prepared source objects.
DW&M HR&SYSTEMS SPELICATION
UNIT-5 GETTING DATA INTO DATA WARE HOUSE BALAJI INSTI OF IT & MANAGEMENT
Offline Extraction
The data is not extracted directly from the source system but is staged explicitly outside
the original source system.
The data already has an existing structure (for example, redo logs, archive logs or
transportable table spaces) or was created by an extraction routine.
You should consider the following structures:
Flat files (flat files are the files that are filled with ordinary data i.e., details of persons or
student details.)
Data in a defined, generic format. Additional information about the source object is
necessary for further processing.
Dump files
Oracle-specific format. Information about the containing objects is included.
Redo and archive logs
Information is in a special, additional dump file.
Transportable table spaces
A powerful way to extract and move large volumes of data between Oracle databases. A
more detailed example of using this feature to extract and transport data.
Oracle Corporation recommends that you use transportable table spaces whenever
possible, because they can provide considerable advantages in performance and
manageability over other extraction techniques.
Change Data Capture
An important consideration for extraction is incremental extraction, also called Change
Data Capture. If a data warehouse extracts data from an operational system on a nightly basis, then
the data warehouse requires only the data that has changed since the last extraction (that is, the
data that has been modified in the past 24 hours).
Timestamps
Partitioning
Triggers
These techniques are based upon the characteristics of the source systems, or may require
modifications to the source systems.
DW&M HR&SYSTEMS SPELICATION
UNIT-5 GETTING DATA INTO DATA WARE HOUSE BALAJI INSTI OF IT & MANAGEMENT
Timestamps
The tables in some operational systems have timestamp columns. The timestamp specifies
the time and date that a given row was last modified.
If the tables in an operational system have columns containing timestamps, then the latest
data can easily be identified using the timestamp columns. For example, the following query might
be useful for extracting today's data from an orders table:
SELECT * FROM orders WHERE TRUNC(CAST(order_date AS date),'dd') = TO_
DATE(SYSDATE,'dd-mon-yyyy');
If the timestamp information is not available in an operational source system, you will not
always be able to modify the system to include timestamps.
Such modification would require, first, modifying the operational system's tables to
include a new timestamp column and then creating a trigger to update the timestamp column
following every operation that modifies a given row.
Partitioning
Some source systems might use Oracle range partitioning, such that the source tables are
partitioned along a date key, which allows for easy identification of new data.
For example, if you are extracting from an orders table, and the orders table is partitioned
by week, then it is easy to identify the current week's data.
Triggers
Triggers can be created in operational systems to keep track of recently updated records.
They can then be used in conjunction with timestamp columns to identify the exact time and date
when a given row was last modified.
You do this by creating a trigger on each source table that requires change data capture.
Following each DML statement that is executed on the source table, this trigger updates the
timestamp column with the current time.
Thus, the timestamp column provides the exact time and date when a given row was last
modified.
Data Warehousing Extraction Examples
You can extract data in two ways:
DW&M HR&SYSTEMS SPELICATION
UNIT-5 GETTING DATA INTO DATA WARE HOUSE BALAJI INSTI OF IT & MANAGEMENT
Extraction Using Data Files
Extraction Via Distributed Operations
Extraction Using Data Files
Most database systems provide mechanisms for exporting or unloading data from the
internal database format into flat files.
Extracts from mainframe systems often use COBOL programs, but many databases, as well
as third-party software vendors, provide export or unload utilities.
Data extraction does not necessarily mean that entire database structures are unloaded in
flat files. In many cases, it may be appropriate to unload entire database tables or objects.
In other cases, it may be more appropriate to unload only a subset of a given table such as
the changes on the source system since the last extraction or the results of joining multiple tables
together.
Different extraction techniques vary in their capabilities to support these two scenarios.
When the source system is an Oracle database, several alternatives are available for
extracting data into files:
Extracting into Flat Files Using SQL*Plus
Extracting into Flat Files Using OCI or Pro*C Programs
Exporting into Oracle Export Files Using Oracle's Export Utility
Extracting into Flat Files Using SQL*Plus
The most basic technique for extracting data is to execute a SQL query in SQL*Plus and
direct the output of the query to a file.
For example, to extract a flat file, country_city.log, with the pipe sign as delimiter between
column values, containing a list of the cities in the US in the tables countries and customers, the
following SQL script could be run:
SET echo off SET pagesize 0
SPOOL country_city.log
SELECT distinct t1.country_name ||'|'|| t2.cust_city
FROM countries t1, customers t2
WHERE t1.country_id = t2.country_id
AND t1.country_name= 'United States of America';
SPOOL off
The exact format of the output file can be specified using SQL*Plus system variables.
DW&M HR&SYSTEMS SPELICATION
UNIT-5 GETTING DATA INTO DATA WARE HOUSE BALAJI INSTI OF IT & MANAGEMENT
This extraction technique offers the advantage of being able to extract the output of any
SQL statement. The example previously extracts the results of a join.
This extraction technique can be parallelized by initiating multiple, concurrent SQL*Plus
sessions, each session running a separate query representing a different portion of the data to be
extracted. For example, suppose that you wish to extract data from an orders table, and that
the orders table has been range partitioned by month, with
partitions orders_jan1998, orders_feb1998, and so on.
To extract a single year of data from the orders table, you could initiate 12 concurrent
SQL*Plus sessions, each extracting a single partition. The SQL script for one such session could
be:
SPOOL order_jan.dat
SELECT * FROM orders PARTITION (orders_jan1998);
SPOOL OFF
Exporting into Oracle Export Files Using Oracle's Export Utility
Oracle's Export utility allows tables (including data) to be exported into Oracle export files.
Unlike the SQL*Plus and OCI approaches, which describe the extraction of the results of a SQL
statement, Export provides a mechanism for extracting database objects.
Thus, Export differs from the previous approaches in several important ways:
The export files contain metadata as well as data. An export file contains not only the raw
data of a table, but also information on how to re-create the table, potentially including any
indexes, constraints, grants, and other attributes associated with that table.
A single export file may contain a subset of a single object, many database objects, or even
an entire schema.
Export cannot be directly used to export the results of a complex SQL query. Export can
be used only to extract subsets of distinct database objects.
The output of the Export utility must be processed using the Oracle Import utility.
Oracle provides a direct-path export, which is quite efficient for extracting data. However, in
Oracle8i, there is no direct-path import, which should be considered when evaluating the overall
performance of an export-based extraction strategy.
Extraction Via Distributed Operations
Using distributed-query technology, one Oracle database can directly query tables located
in various different source systems, such as another Oracle database or a legacy system connected
with the Oracle gateway technology.
DW&M HR&SYSTEMS SPELICATION
UNIT-5 GETTING DATA INTO DATA WARE HOUSE BALAJI INSTI OF IT & MANAGEMENT
Specifically, a data warehouse or staging database can directly access tables and data
located in a connected source system. Gateways are another form of distributed-query technology.
Gateways allow an Oracle database (such as a data warehouse) to access database tables stored in
remote, non-Oracle databases.
This is the simplest method for moving data between two Oracle databases because it
combines the extraction and transformation into a single step, and requires minimal programming.
However, this is not always feasible.
Continuing our example, suppose that you wanted to extract a list of employee names with
department names from a source database and store this data into the data warehouse.
Using an Oracle Net connection and distributed-query technology, this can be achieved
using a single SQL statement:
CREATE TABLE country_city
AS
SELECT distinct t1.country_name, t2.cust_city
FROM countries@source_db t1, customers@source_db t2
WHERE t1.country_id = t2.country_id
AND t1.country_name='United States of America';
This statement creates a local table in a data mart, country_city, and populates it with data
from the countries and customer’s tables on the source system.
This technique is ideal for moving small volumes of data. However, the data is transported
from the source system to the data warehouse through a single Oracle Net connection.
Thus, the scalability of this technique is limited. For larger data volumes, file-based data
extraction and transportation techniques are often more scalable and thus more appropriate.
2.Data Transformation:
Data transformation is the process of converting data from one format (e.g. a database file,
XML document, or Excel sheet) to another. Because data often resides in different locations and
formats across the enterprise, data transformation is necessary to ensure data from one application
or database is intelligible to other applications and databases, a critical feature for applications
integration.
DW&M HR&SYSTEMS SPELICATION
UNIT-5 GETTING DATA INTO DATA WARE HOUSE BALAJI INSTI OF IT & MANAGEMENT
In a typical scenario where information needs to be shared, data is extracted from the source
application or data warehouse, transformed into another format, and then loaded into the target
location.
Extraction, transformation, and loading (together known as ETL) are the central processes
of data integration. Depending on the nature of the integration scenario, data may need to be
merged, aggregated, enriched, summarized, or filtered.
The first step of data transformation is data mapping. Data mapping determines the
relationship between the data elements of two applications and establishes instructions for how the
data from the source application is transformed before it is loaded into the target application.
In other words, data mapping produces the critical metadata that is needed before the actual
data conversion takes place.
For instance, in field mapping, the information in one application might be rendered in
lowercase letters while another application stores information in uppercase letters.
This means the data from the source application needs to be converted to uppercase letters
before being loaded into the corresponding fields in the target application.
The structure of stored data may also vary between applications, requiring semantic
mapping prior to the transformation process. For instance, two applications might store the same
customer credit card information using slightly different structures:
Transformers: Data Integration Tools and Technologies
System administrators can choose from a variety of data integration products that automate
the ETL process with visual mapping tools and drag-and-drop technologies. ETL capabilities can
be found as standalone data integration software, as built-in tools in database servers, or as
components.
DW&M HR&SYSTEMS SPELICATION
UNIT-5 GETTING DATA INTO DATA WARE HOUSE BALAJI INSTI OF IT & MANAGEMENT
Standalone integration software and ETL tools found in database servers are particularly
useful solutions for migrating data from enterprise applications to data warehouses and other IT
projects geared towards data management.
Informatics’ Power Center, for instance, is an example data integration solution that is
capable of accessing data in a variety of formats, including flat files and web applications, while
Talend’s Integration Suite offers similar data integration capabilities based on open source
technologies. SQL Server Integration Services (SISS) is an ETL tool included in Microsoft SQL
Server that extracts operational data from different sources for transformation and loading into a
database.
For enterprises interested in integrating processes and data, middleware tools such as
an Enterprise Service Bus (ESB) provide a way to share data between applications.
But data no longer belongs to a single department, but rather to the entire enterprise. This
means that data from one application should be usable in other applications and requires the
loosening of data from business processes, and transformation into the right format. Without data
transformation, data will fail to reach its potential in delivering tangible benefits to the enterprise.
Types of Transformation flows
Multistage Data Transformation in Data Warehouses.
Pipelined Data Transformation in Data Warehouses.
Staging Area in Data Warehouses.
Multistage Data Transformation in Data Warehouses
The data transformation logic for most data warehouses consists of multiple steps. For example,
in transforming new records to be inserted into a sales table, there may be separate logical
transformation steps to validate each dimension key.
Multistage Data Transformation
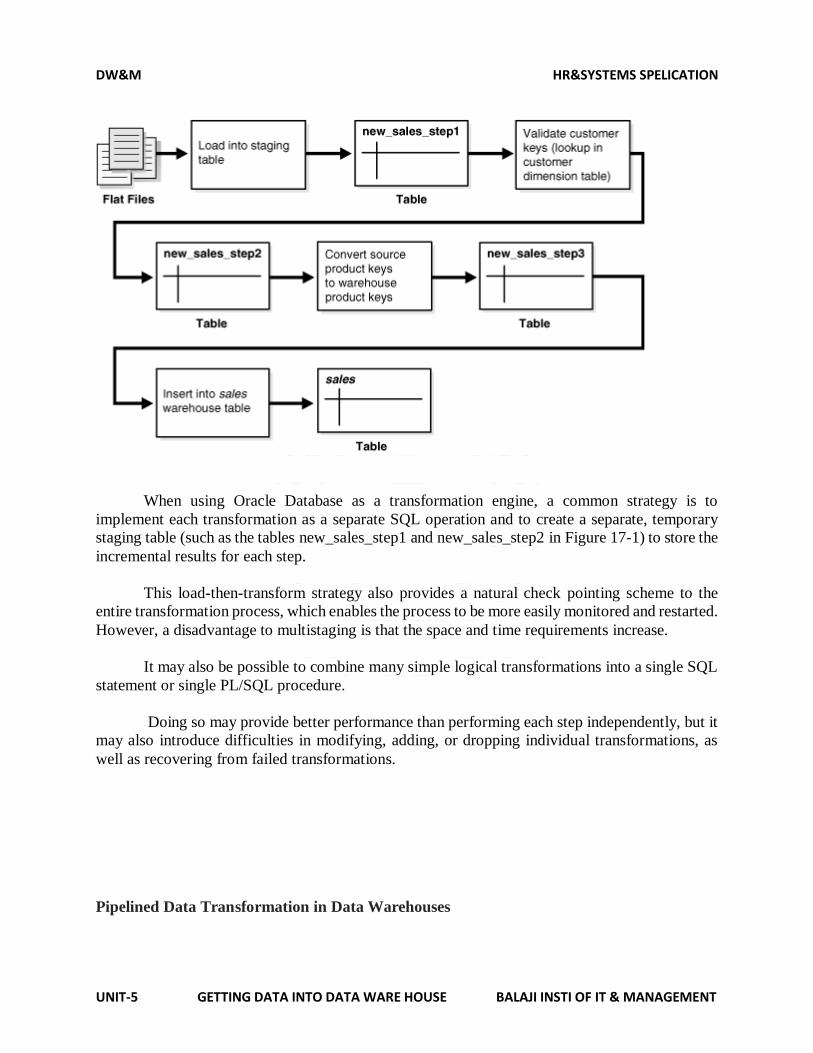
DW&M HR&SYSTEMS SPELICATION
UNIT-5 GETTING DATA INTO DATA WARE HOUSE BALAJI INSTI OF IT & MANAGEMENT
When using Oracle Database as a transformation engine, a common strategy is to
implement each transformation as a separate SQL operation and to create a separate, temporary
staging table (such as the tables new_sales_step1 and new_sales_step2 in Figure 17-1) to store the
incremental results for each step.
This load-then-transform strategy also provides a natural check pointing scheme to the
entire transformation process, which enables the process to be more easily monitored and restarted.
However, a disadvantage to multistaging is that the space and time requirements increase.
It may also be possible to combine many simple logical transformations into a single SQL
statement or single PL/SQL procedure.
Doing so may provide better performance than performing each step independently, but it
may also introduce difficulties in modifying, adding, or dropping individual transformations, as
well as recovering from failed transformations.
Pipelined Data Transformation in Data Warehouses
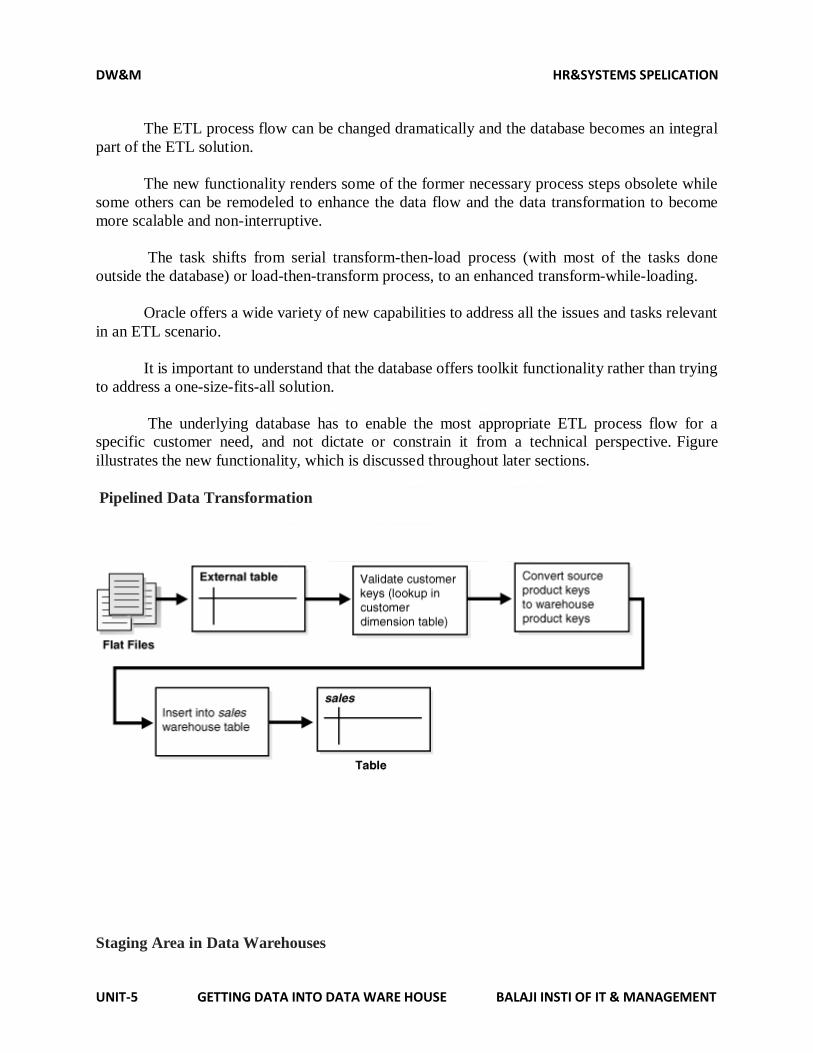
DW&M HR&SYSTEMS SPELICATION
UNIT-5 GETTING DATA INTO DATA WARE HOUSE BALAJI INSTI OF IT & MANAGEMENT
The ETL process flow can be changed dramatically and the database becomes an integral
part of the ETL solution.
The new functionality renders some of the former necessary process steps obsolete while
some others can be remodeled to enhance the data flow and the data transformation to become
more scalable and non-interruptive.
The task shifts from serial transform-then-load process (with most of the tasks done
outside the database) or load-then-transform process, to an enhanced transform-while-loading.
Oracle offers a wide variety of new capabilities to address all the issues and tasks relevant
in an ETL scenario.
It is important to understand that the database offers toolkit functionality rather than trying
to address a one-size-fits-all solution.
The underlying database has to enable the most appropriate ETL process flow for a
specific customer need, and not dictate or constrain it from a technical perspective. Figure
illustrates the new functionality, which is discussed throughout later sections.
Pipelined Data Transformation
Staging Area in Data Warehouses
DW&M HR&SYSTEMS SPELICATION
UNIT-5 GETTING DATA INTO DATA WARE HOUSE BALAJI INSTI OF IT & MANAGEMENT
The overall speed of your load is determined by how quickly the raw data can be read from
the staging area and written to the target table in the database.
It is highly recommended that you stage your raw data across as many physical disks as
possible to ensure the reading of the raw data is not a bottleneck during the load.
An excellent place to stage the data is in an Oracle Database File System (DBFS). DBFS
creates a mountable file system which can be used to access files stored in the database as Secure
Files LOBs. DBFS is similar to NFS in that it provides a shared network file system that looks like
a local file system.
Oracle recommends that you create the DBFS in a separate database from the data
warehouse, and that the file system be mounted using the DIRECT_IO option to avoid contention
on the system page cache while moving the raw data files in and out of the file system.
3.Cleaning:
Data cleansing or data cleaning is the process of detecting and correcting (or removing)
corrupt or inaccurate records from a record set, table, or database and refers to identifying
incomplete, incorrect, inaccurate or irrelevant parts of the data and then replacing, modifying, or
deleting the dirty or coarse data.
Data cleansing may be performed interactively with data wrangling tools, or as batch
processing through scripting.
Data wrangling, sometimes referred to as data munging, is the process of transforming
and mapping data from one "raw" data form into another format with the intent of making it more
appropriate and valuable for a variety of downstream purposes such as analytics.
After cleansing, a data set should be consistent with other similar data sets in the system.
The inconsistencies detected or removed may have been originally caused by user entry errors, by
corruption in transmission or storage, or by different data dictionary definitions of similar entities
in different stores.
Data cleaning differs from data validation in that validation almost invariably means data
is rejected from the system at entry and is performed at the time of entry, rather than on batches of
data.
The actual process of data cleansing may involve removing typographical errors
(misprint) or validating and correcting values against a known list of entities. The validation may
be strict (such as rejecting any address that does not have a valid postal code) or fuzzy (such as
correcting records that partially match existing, known records). Some data cleansing solutions
will clean data by cross checking with a validated data set.
Data quality:
DW&M HR&SYSTEMS SPELICATION
UNIT-5 GETTING DATA INTO DATA WARE HOUSE BALAJI INSTI OF IT & MANAGEMENT
High-quality data needs to pass a set of quality criteria. Those include:
Validity:
The degree to which the measures conform to defined business rules or constraints (see
also Validity (statistics)).
When modern database technology is used to design data-capture systems, validity is fairly
easy to ensure: invalid data arises mainly in legacy contexts (where constraints were not
implemented in software) or where inappropriate data-capture technology was used (e.g.,
spreadsheets, where it is very hard to limit what a user chooses to enter into a cell, if cell
validation is not used).
Data constraints fall into the following categories:
Data-Type Constraints – e.g., values in a particular column must be of a particular
datatype, e.g., Boolean, numeric (integer or real), date, etc.
Range Constraints: typically, numbers or dates should fall within a certain range. That is,
they have minimum and/or maximum permissible values.
Mandatory Constraints: Certain columns cannot be empty.
Unique Constraints: A field, or a combination of fields, must be unique across a dataset.
For example, no two persons can have the same social security number.
Set-Membership constraints: The values for a column come from a set of discrete values
or codes. For example, a person's gender may be Female, Male or Unknown (not recorded).
Foreign-key constraints: This is the more general case of set membership. The set of values
in a column is defined in a column of another table that contains unique values. For
example, in a US taxpayer database, the "state" column is required to belong to one of the
US's defined states or territories: the set of permissible states/territories is recorded in a
separate States table. The term foreign key is borrowed from relational database
terminology.
Regular expression patterns: Occasionally, text fields will have to be validated this way.
For example, phone numbers may be required to have the pattern (999) 999-9999.
Cross-field validation: Certain conditions that utilize multiple fields must hold. For
example, in laboratory medicine, the sum of the components of the differential white blood
cell count must be equal to 100 (since they are all percentages). In a hospital database, a
patient's date of discharge from hospital cannot be earlier than the date of admission.
Accuracy:
DW&M HR&SYSTEMS SPELICATION
UNIT-5 GETTING DATA INTO DATA WARE HOUSE BALAJI INSTI OF IT & MANAGEMENT
Accuracy is very hard to achieve through data-cleansing in the general case, because it
requires accessing an external source of data that contains the true value: such "gold standard"
data is often unavailable.
Accuracy has been achieved in some cleansing contexts, notably customer contact data, by
using external databases that match up zip codes to geographical locations (city and state), and
also help verify that street addresses within these zip codes actually exist.
Uniformity:
The degree to which a set data measures are specified using the same units of measure in all
systems ( see also Unit of measure). In datasets pooled from different locales, weight may be
recorded either in pounds or kilos, and must be converted to a single measure using an
arithmetic transformation.
Good quality source data has to do with “Data Quality Culture” and must be initiated at the
top of the organization.
It is not just a matter of implementing strong validation checks on input screens, because
almost no matter how strong these checks are, they can often still be circumvented by the users.
There is a nine-step guide for organizations that wish to improve data quality.
Declare a high level commitment to a data quality culture.
Drive process reengineering at the executive level.
Spend money to improve the data entry environment.
Spend money to improve application integration.
Spend money to change how processes work.
Promote end-to-end team awareness.
Promote interdepartmental cooperation.
Publicly celebrate data quality excellence.
Continuously measure and improve data quality.
Problems in cleaning:
Error correction and loss of information.
Maintenance of cleansed data.
Data cleansing in virtually integrated environments.
4.LOADING
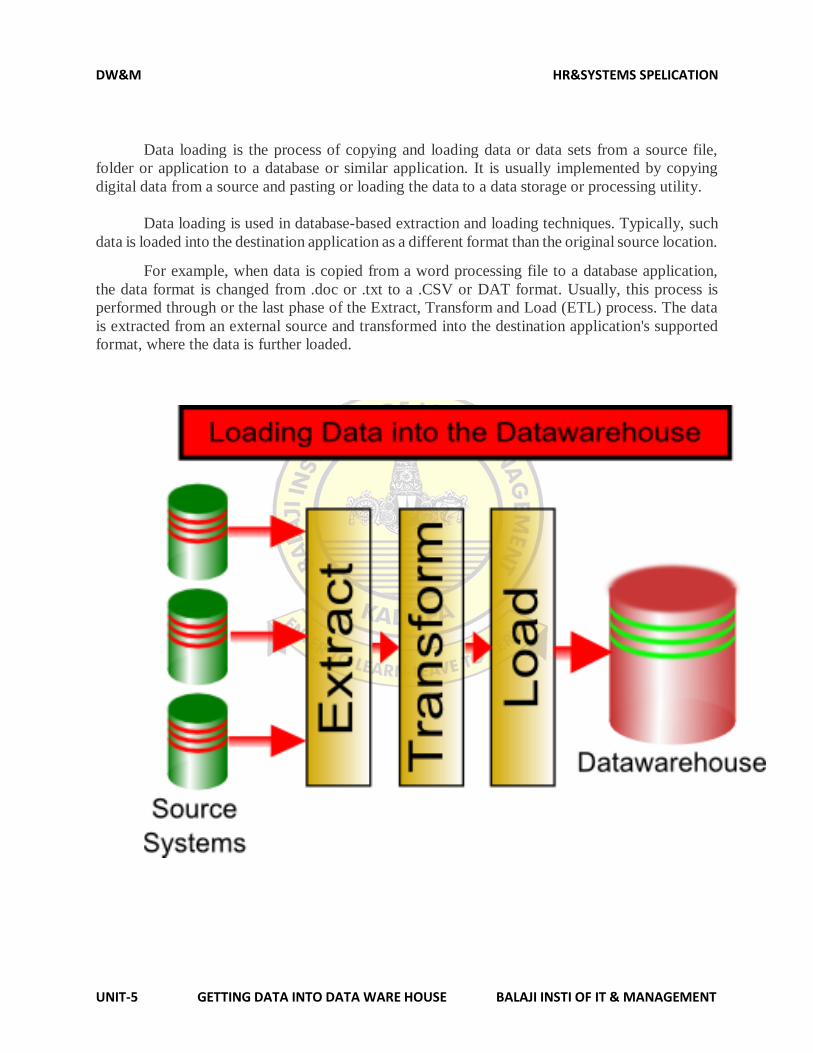
DW&M HR&SYSTEMS SPELICATION
UNIT-5 GETTING DATA INTO DATA WARE HOUSE BALAJI INSTI OF IT & MANAGEMENT
Data loading is the process of copying and loading data or data sets from a source file,
folder or application to a database or similar application. It is usually implemented by copying
digital data from a source and pasting or loading the data to a data storage or processing utility.
Data loading is used in database-based extraction and loading techniques. Typically, such
data is loaded into the destination application as a different format than the original source location.
For example, when data is copied from a word processing file to a database application,
the data format is changed from .doc or .txt to a .CSV or DAT format. Usually, this process is
performed through or the last phase of the Extract, Transform and Load (ETL) process. The data
is extracted from an external source and transformed into the destination application's supported
format, where the data is further loaded.
DW&M HR&SYSTEMS SPELICATION
UNIT-5 GETTING DATA INTO DATA WARE HOUSE BALAJI INSTI OF IT & MANAGEMENT
5.SUMMARIZATION
Data Summarization summarizes evaluation data included both primitive and derived data,
in order to create a derived evaluation data that is general in nature.
Since the data in the data warehouse is of very high volume, there needs to be a mechanism
in order to get only the relevant and meaningful information in a less messy format.
Data summarization provides the capacity to give data consumers generalize view of
disparate bulks of data.
Data summarization in very large multi-dimensional datasets as in the case of data
warehouses is a very challenging work.
This typically requires very intensive investigation to be done by IT experts, database
administrators and programmers so that overall trends and important exceptions can be identified
and dealt with technically.
A computer, or several computer working together, can perform very exhaustive searches
using highly sophisticated and complex algorithms to do the data summarization.
Data summarization is quite a common thing but may require a very powerful and time
consuming approach in order to analyze ultra large datasets.
For instance, when somebody want to do an investigation of census data so that he can
understand the relationship between the salary and educational level in the United States, this can
involve querying high volume databases and intensive data aggregation.
This can be presented in a compact summary with a plotting of the average salary level
against educational level. But some other data consumers may have more requirements such the
inclusion of standard deviation information along with the averages.
Yet some other data consumers may require breaking down the average salaries by age
group or excluding outlying salaries.
In addition, there may be those who will require the salary and education level relationship
in the men and women, or by race or geography. Effective data summarization involves identifying
overall trends and substantial exceptions to them.
Data summarization can also be done with a simple spreadsheet application such as
Microsoft Excel. For example, random sample can be collected such as three persons given three
containers with different kinds of beverages, say, Coke, Pepsi, and Dr. Pepper. The beverage each
person prefers is marked X.
With manual presentation of data, the result could be presented as P, P, C, P, P, P, P, P, P,
C, P, P, D, and so. But that would be too confusing. With the use of computer programs, this could
be easily summarized. And since most programs have visual interface, one can even get a graphical
view like a chart or a bar graph, line graph and other graphical presentation formats.
DW&M HR&SYSTEMS SPELICATION
UNIT-5 GETTING DATA INTO DATA WARE HOUSE BALAJI INSTI OF IT & MANAGEMENT
There are many tools available in the market to make data summarization a lot easier by
making it in visual environment.
These tools may help a data consumer produce a data summary of the data one at a time
and they can also allow the end user to explore the dataset manually.
While the end user only clicks and drags, the computer is performing the exhaustive search
at the back while informing the end user about where further investigation is warranted.
Data summarization makes it easy for business makers to spot trends and patterns in the
industry where the business operates as well as trends and patterns in the internal operations of the
business organization. This way, the decision makers can get accurate pictures of the strong and
weak points in the operation.
When they get the details of these areas, the decision makers can make moves on how to
optimize the strong points and how to innovate and improve products in order to overcome the
problems associated with the weak points. Companies will definitely gain competitive advantage
over other companies.
6.DATA MINING
Data mining is the process of discovering patterns in large data sets involving methods at
the intersection of machine learning, statistics, and database systems.
Data mining is an interdisciplinary subfield of computer science with an overall goal to
extract information (with intelligent methods) from a data set and transform the information into
a comprehensible structure for further use.
Data mining is the analysis step of the "knowledge discovery in databases" process, or
KDD.
Aside from the raw analysis step, it also involves database and data
management aspects, data pre-processing, model and inference considerations ,interestingness
metrics, complexity considerations, post-processing of discovered structures, visualization,
and online updating.
The actual data mining task is the semi-automatic or automatic analysis of large quantities of data
to extract previously unknown, interesting patterns such as groups of data records (cluster
analysis), unusual records (anomaly detection), and dependencies (association rule
mining, sequential pattern mining). This usually involves using database techniques such as spatial
indices.
Spatial indices are used by spatial databases (databases which store information related to
objects in space) to optimize spatial queries.
DW&M HR&SYSTEMS SPELICATION
UNIT-5 GETTING DATA INTO DATA WARE HOUSE BALAJI INSTI OF IT & MANAGEMENT
The knowledge discovery in databases (KDD) process is commonly defined with the stages:
1. Selection
2. Pre-processing
3. Transformation
4. Data mining
5. Interpretation/evaluation.[5]
It exists, however, in many variations on this theme, such as the Cross Industry Standard Process
for Data Mining (CRISP-DM) which defines six phases:
1. Business understanding
2. Data understanding
3. Data preparation
4. Modeling
5. Evaluation
6. Deployment
Data mining involves six common classes of tasks:[5]
Anomaly detection (outlier/change/deviation detection) – The identification of unusual data
records, that might be interesting or data errors that require further investigation.
Association rule learning (dependency modelling) – Searches for relationships between
variables. For example, a supermarket might gather data on customer purchasing habits. Using
association rule learning, the supermarket can determine which products are frequently bought
together and use this information for marketing purposes. This is sometimes referred to as
market basket analysis.
Clustering – is the task of discovering groups and structures in the data that are in some way
or another "similar", without using known structures in the data.
Classification – is the task of generalizing known structure to apply to new data. For example,
an e-mail program might attempt to classify an e-mail as "legitimate" or as "spam".
Regression – attempts to find a function which models the data with the least error that is, for
estimating the relationships among data or datasets.
Summarization – providing a more compact representation of the data set, including
visualization and report generation.
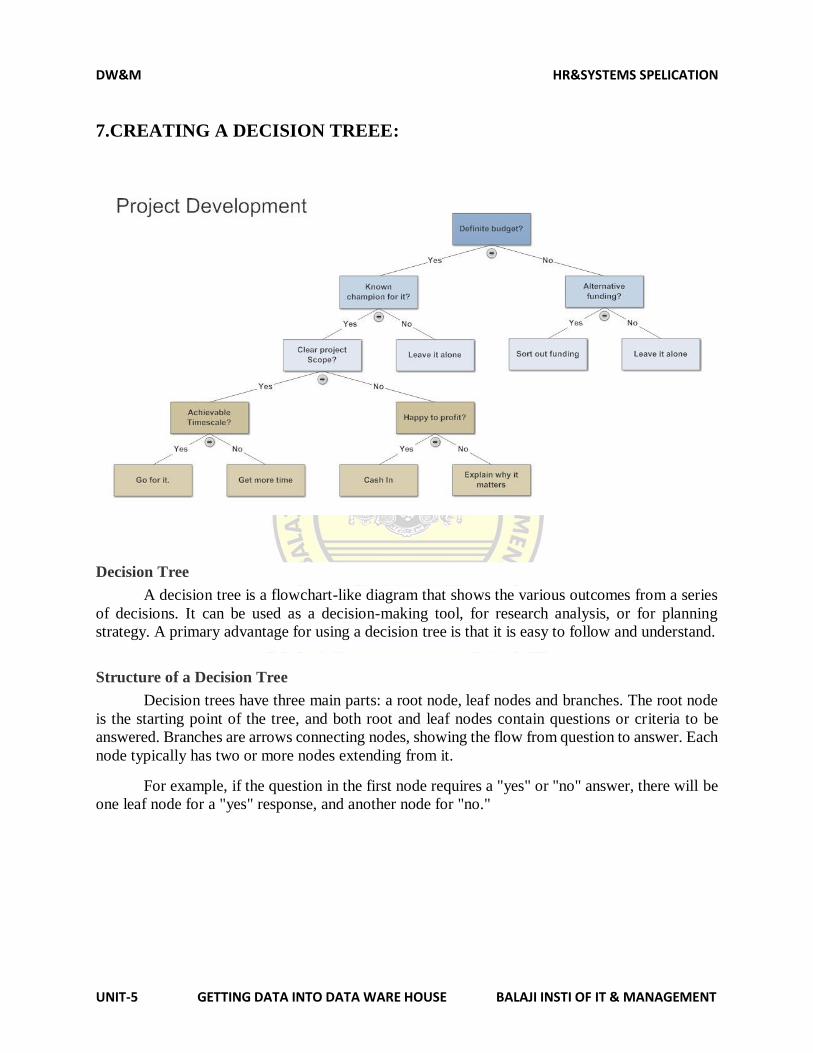
DW&M HR&SYSTEMS SPELICATION
UNIT-5 GETTING DATA INTO DATA WARE HOUSE BALAJI INSTI OF IT & MANAGEMENT
7.CREATING A DECISION TREEE:
Decision Tree
A decision tree is a flowchart-like diagram that shows the various outcomes from a series
of decisions. It can be used as a decision-making tool, for research analysis, or for planning
strategy. A primary advantage for using a decision tree is that it is easy to follow and understand.
Structure of a Decision Tree
Decision trees have three main parts: a root node, leaf nodes and branches. The root node
is the starting point of the tree, and both root and leaf nodes contain questions or criteria to be
answered. Branches are arrows connecting nodes, showing the flow from question to answer. Each
node typically has two or more nodes extending from it.
For example, if the question in the first node requires a "yes" or "no" answer, there will be
one leaf node for a "yes" response, and another node for "no."
DW&M HR&SYSTEMS SPELICATION
UNIT-5 GETTING DATA INTO DATA WARE HOUSE BALAJI INSTI OF IT & MANAGEMENT
How to Make a Decision Tree
Smart Draw's automated formatting makes it easy to create a decision tree, and hundreds
of other diagrams, in minutes.
You'll want to start with a decision tree template then add decisions and unknowns by
clicking simple commands in the Smart Panel. Smart Draw builds your diagram for you,
connecting decisions and nodes automatically.
Decision Tree Uses
A decision tree can be used in either a predictive manner or a descriptive manner. In either
instance they are constructed the same way and are always used to visualize all possible outcomes
and decision points that occur chronologically.
Decision trees are most commonly used in the financial world for areas such as loan
approval, portfolio management, and spending.
A decision tree can also be helpful when examining the viability of a new product or
defining a new market for an existing product.
Seven Tips for Creating a Decision Tree
Here are some best practice tips for creating a decision tree diagram:
Start the tree. Draw a rectangle near the left edge of the page to represent the first node. In
this rectangle, write the first question, main idea, or criterion that will lead to a decision.
Add branches. For every possible alternative draw a separate line that begins at the node and
moves away toward the right of the page. Using a loan approval process as an example, the
first node may have been "Income", and the associated branches might be <$50K, $51K -
$100K, >$101K.
Add leaves. The bulk of the decision tree will be leaf nodes. At the end of each branch add a
leaf node. Fill each of these leaf nodes with another question or criterion.
Add more branches. Repeat the process of adding a branch for each possible alternative
leading from a leaf. Label each branch just as before.
Complete the decision tree. Continue adding leaves and branches until every question or
criterion has been resolved and an outcome has been reached.
Terminate a branch. Continue adding leaves and branches until every question or criterion
has been resolved and an outcome has been reached.
Verify accuracy. Consult with all stakeholders to verify accuracy.
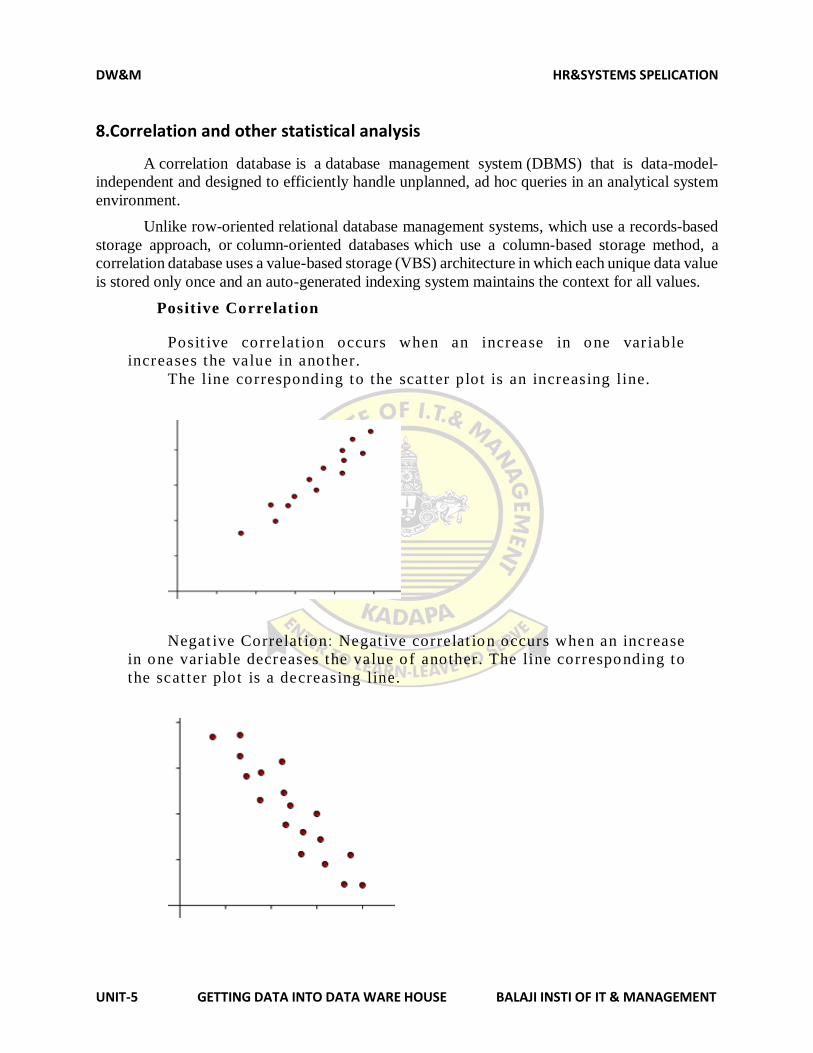
DW&M HR&SYSTEMS SPELICATION
UNIT-5 GETTING DATA INTO DATA WARE HOUSE BALAJI INSTI OF IT & MANAGEMENT
8.Correlation and other statistical analysis
A correlation database is a database management system (DBMS) that is data-model-
independent and designed to efficiently handle unplanned, ad hoc queries in an analytical system
environment.
Unlike row-oriented relational database management systems, which use a records-based
storage approach, or column-oriented databases which use a column-based storage method, a
correlation database uses a value-based storage (VBS) architecture in which each unique data value
is stored only once and an auto-generated indexing system maintains the context for all values.
Positive Correlation
Posit ive correlat ion occurs when an increase in one var iable
increases the value in another.
The line corresponding to the scat ter plot is an increasing line.
Negat ive Correlat ion: Negat ive correlat ion occurs when an increase
in one var iable decreases the value o f another. The line corresponding to
the scat ter plot is a decreasing line.
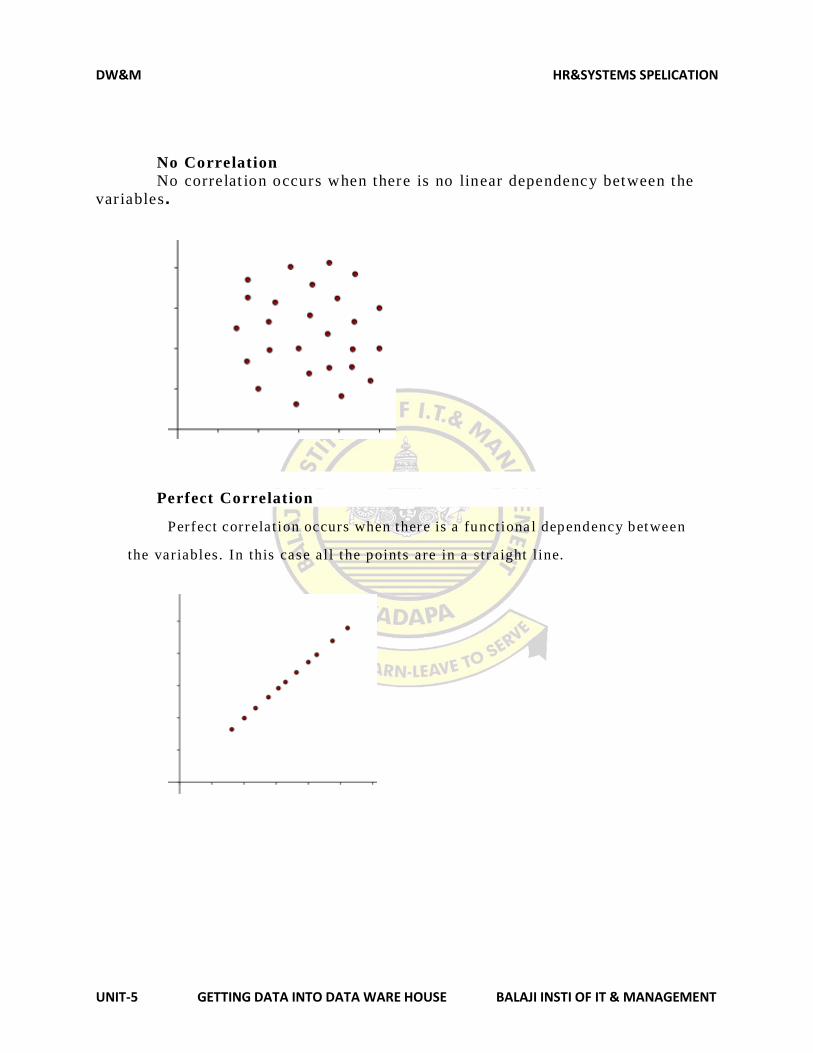
DW&M HR&SYSTEMS SPELICATION
UNIT-5 GETTING DATA INTO DATA WARE HOUSE BALAJI INSTI OF IT & MANAGEMENT
No Correlation
No correlat ion occurs when there is no linear dependency between the
var iables.
Perfect Correlation
Perfect corr elation occurs when there is a functiona l dependency between
the var iables. In this case all the points are in a straight l ine.
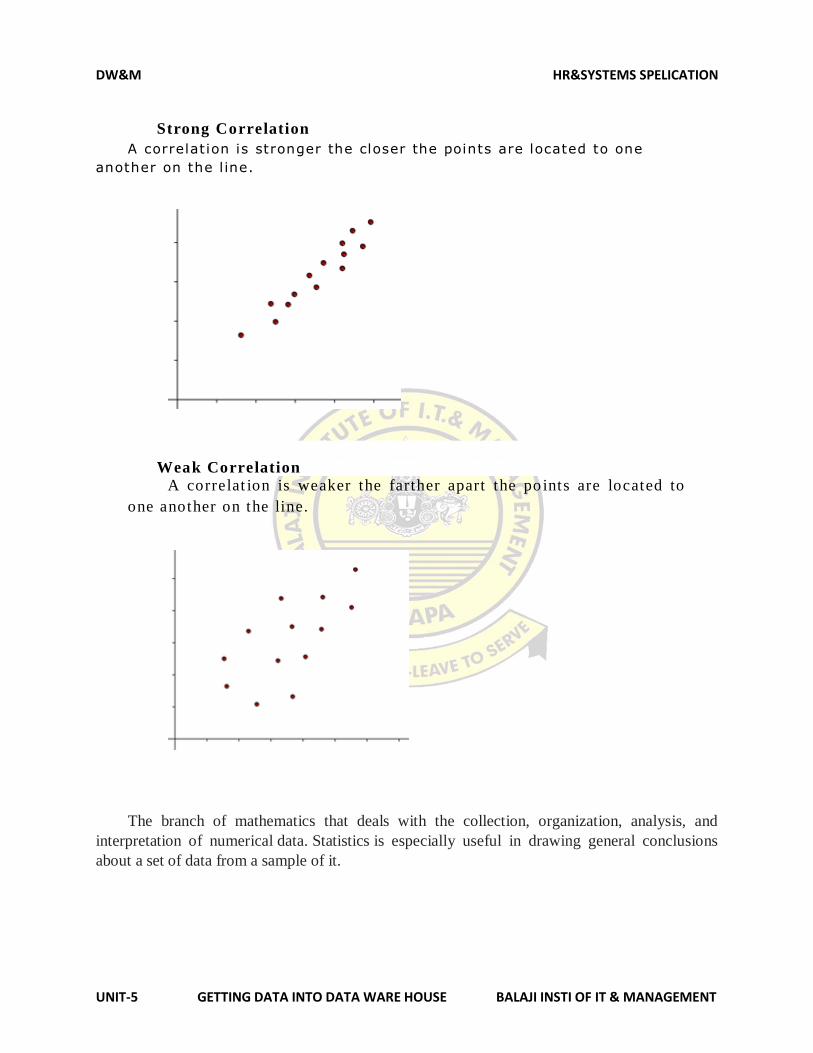
DW&M HR&SYSTEMS SPELICATION
UNIT-5 GETTING DATA INTO DATA WARE HOUSE BALAJI INSTI OF IT & MANAGEMENT
Strong Correlation
A correlation is stronger the closer the points are located to one
another on the l ine.
Weak Correlation
A correlat ion is weaker the farther apart the po ints are located to
one another on the line.
The branch of mathematics that deals with the collection, organization, analysis, and
interpretation of numerical data. Statistics is especially useful in drawing general conclusions
about a set of data from a sample of it.
DW&M HR&SYSTEMS SPELICATION
UNIT-5 GETTING DATA INTO DATA WARE HOUSE BALAJI INSTI OF IT & MANAGEMENT
9.Neural networks
A neural network is a series of algorithms that endeavors to recognize underlying
relationships in a set of data through a process that mimics the way the human brain operates.
Neural networks can adapt to changing input so the network generates the best possible
result without needing to redesign the output criteria.
The conception of neural networks is swiftly gaining popularity in the area of trading
system development.
Neural networks, in the world of finance, assist in the development of such process as time-
series forecasting, algorithmic trading, securities classification, credit risk modeling and
constructing proprietary indicators and price derivatives.
A neural network works similarly to the human brain’s neural network. A “neuron” in a
neural network is a mathematical function that collects and classifies information according to a
specific architecture.
The network bears a strong resemblance to statistical methods such as curve fitting and
regression analysis.
A neural network contains layers of interconnected nodes. Each node is a perceptron and is
similar to a multiple linear regression.
The perceptron feeds the signal produced by a multiple linear regression into an activation
function that may be nonlinear.
In a multi-layered perceptron (MLP), perceptrons are arranged in interconnected layers. The
input layer collects input patterns.
The output layer has classifications or output signals to which input patterns may map.
For instance, the patterns may comprise a list of quantities for technical indicators about a
security; potential outputs could be “buy,” “hold” or “sell.” Hidden layers fine-tune the input
weightings until the neural network’s margin of error is minimal.
It is hypothesized that hidden layers extrapolate salient features in the input data that have
predictive power regarding the outputs.
This describes feature extraction, which accomplishes a utility similar to statistical techniques
such as principal component analysis.
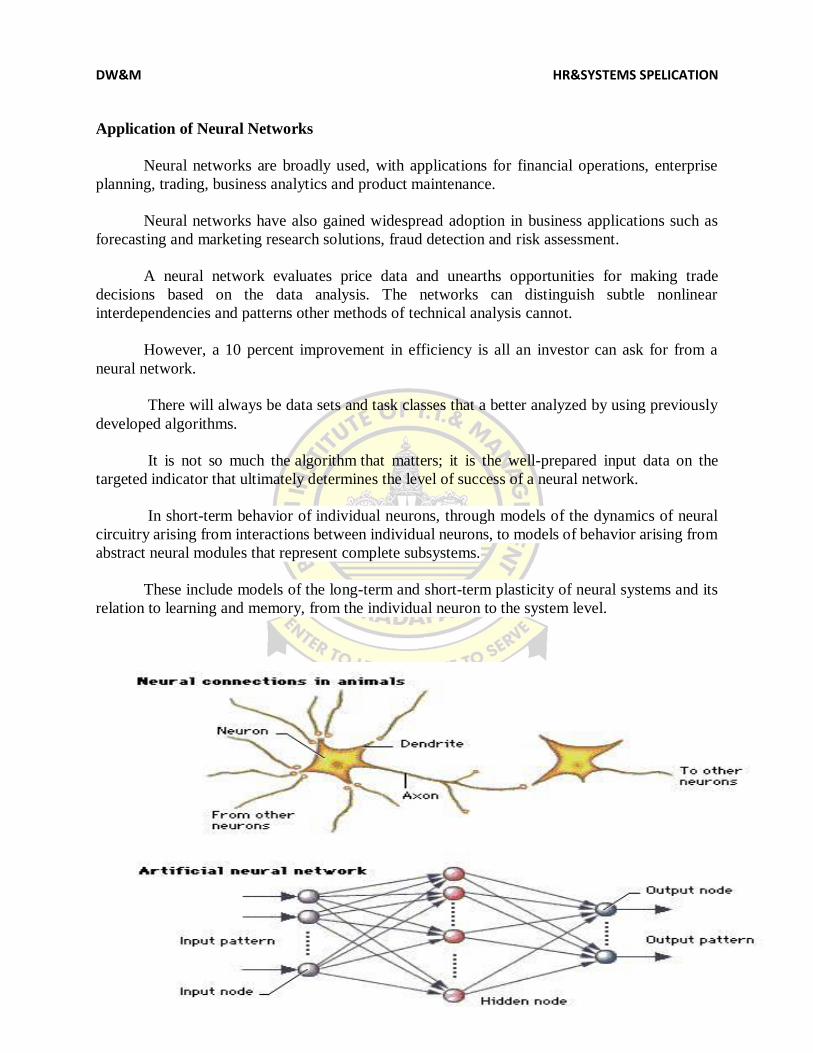
DW&M HR&SYSTEMS SPELICATION
UNIT-5 GETTING DATA INTO DATA WARE HOUSE BALAJI INSTI OF IT & MANAGEMENT
Application of Neural Networks
Neural networks are broadly used, with applications for financial operations, enterprise
planning, trading, business analytics and product maintenance.
Neural networks have also gained widespread adoption in business applications such as
forecasting and marketing research solutions, fraud detection and risk assessment.
A neural network evaluates price data and unearths opportunities for making trade
decisions based on the data analysis. The networks can distinguish subtle nonlinear
interdependencies and patterns other methods of technical analysis cannot.
However, a 10 percent improvement in efficiency is all an investor can ask for from a
neural network.
There will always be data sets and task classes that a better analyzed by using previously
developed algorithms.
It is not so much the algorithm that matters; it is the well-prepared input data on the
targeted indicator that ultimately determines the level of success of a neural network.
In short-term behavior of individual neurons, through models of the dynamics of neural
circuitry arising from interactions between individual neurons, to models of behavior arising from
abstract neural modules that represent complete subsystems.
These include models of the long-term and short-term plasticity of neural systems and its
relation to learning and memory, from the individual neuron to the system level.
DW&M HR&SYSTEMS SPELICATION
UNIT-5 GETTING DATA INTO DATA WARE HOUSE BALAJI INSTI OF IT & MANAGEMENT
Neural Network Topologies:
These are of two types
1) FEEDFORWARD NEURAL NETWORK.
2) RECURRENT NETWORK.
Feedforward neural network:
The feedforward neural network was the first and arguably simplest type of artificial
neural network devised.
In this network, the information moves in only one direction, forward, from the input
nodes, through the hidden nodes (if any) and to the output nodes.
There are no cycles or loops in the network. The data processing can extend over
multiple (layers of) units, but no feedback connections are present, that is, connections
extending from outputs of units to inputs of units in the same layer or previous layers.
Recurrent network:
Recurrent neural networks that do contain feedback connections. Contrary to
feedforward networks, recurrent neural networks (RNs) are models with bi-directional data
flow.
While a feedforward network propagates data linearly from input to output, RNs also
propagate data from later processing stages to earlier stages.
Training Of Artificial Neural Networks:
A neural network has to be configured such that the application of a set of inputs
produces (either 'direct' or via a relaxation process) the desired set of outputs.
Various methods to set the strengths of the connections exist. One way is to set the
weights explicitly, using a priori knowledge.
Another way is to 'train' the neural network by feeding it teaching patterns and letting
it change its weights according to some learning rule. We can categorize the learning
situations as follows:
a) SUPERVISED LEARNING.
b) UNSUPERVISED LEARNING.
c) REINFORCEMENT LEARNING.
a) Supervised learning
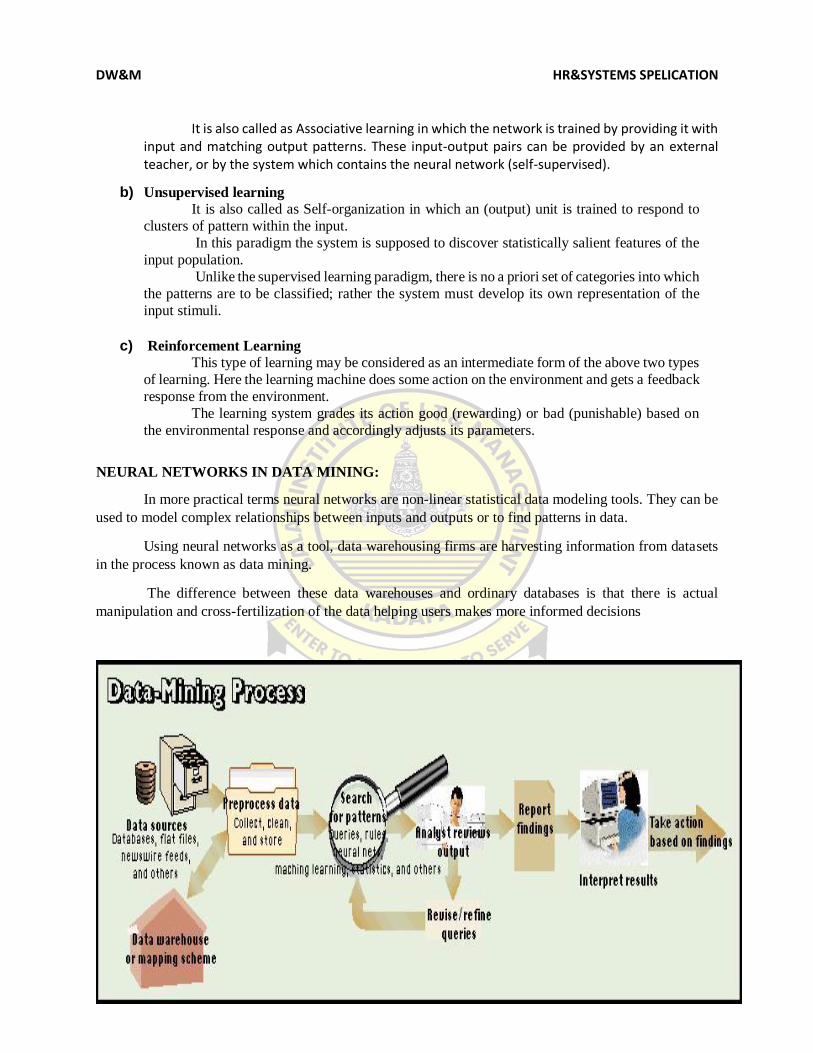
DW&M HR&SYSTEMS SPELICATION
UNIT-5 GETTING DATA INTO DATA WARE HOUSE BALAJI INSTI OF IT & MANAGEMENT
It is also called as Associative learning in which the network is trained by providing it with input and matching output patterns. These input-output pairs can be provided by an external teacher, or by the system which contains the neural network (self-supervised).
b) Unsupervised learning It is also called as Self-organization in which an (output) unit is trained to respond to
clusters of pattern within the input.
In this paradigm the system is supposed to discover statistically salient features of the
input population.
Unlike the supervised learning paradigm, there is no a priori set of categories into which
the patterns are to be classified; rather the system must develop its own representation of the
input stimuli.
c) Reinforcement Learning This type of learning may be considered as an intermediate form of the above two types
of learning. Here the learning machine does some action on the environment and gets a feedback
response from the environment.
The learning system grades its action good (rewarding) or bad (punishable) based on
the environmental response and accordingly adjusts its parameters.
NEURAL NETWORKS IN DATA MINING:
In more practical terms neural networks are non-linear statistical data modeling tools. They can be
used to model complex relationships between inputs and outputs or to find patterns in data.
Using neural networks as a tool, data warehousing firms are harvesting information from datasets
in the process known as data mining.
The difference between these data warehouses and ordinary databases is that there is actual
manipulation and cross-fertilization of the data helping users makes more informed decisions
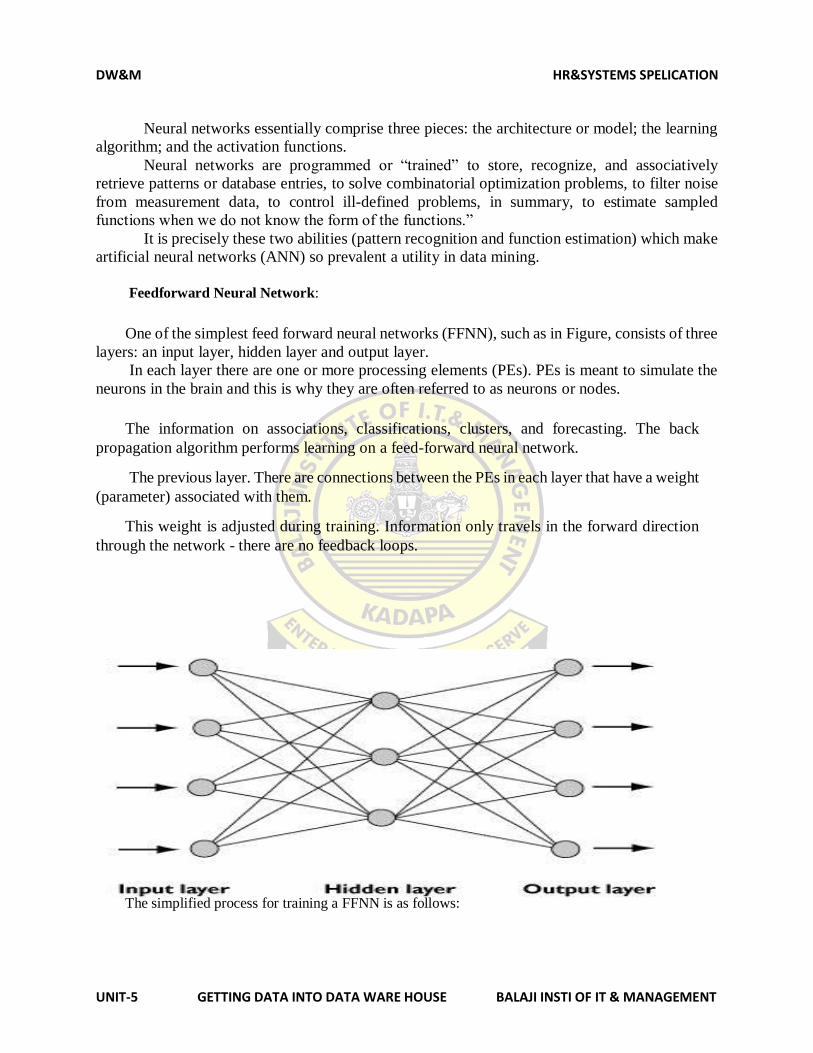
DW&M HR&SYSTEMS SPELICATION
UNIT-5 GETTING DATA INTO DATA WARE HOUSE BALAJI INSTI OF IT & MANAGEMENT
Neural networks essentially comprise three pieces: the architecture or model; the learning
algorithm; and the activation functions.
Neural networks are programmed or “trained” to store, recognize, and associatively
retrieve patterns or database entries, to solve combinatorial optimization problems, to filter noise
from measurement data, to control ill-defined problems, in summary, to estimate sampled
functions when we do not know the form of the functions.”
It is precisely these two abilities (pattern recognition and function estimation) which make
artificial neural networks (ANN) so prevalent a utility in data mining.
Feedforward Neural Network:
One of the simplest feed forward neural networks (FFNN), such as in Figure, consists of three
layers: an input layer, hidden layer and output layer.
In each layer there are one or more processing elements (PEs). PEs is meant to simulate the
neurons in the brain and this is why they are often referred to as neurons or nodes.
The information on associations, classifications, clusters, and forecasting. The back
propagation algorithm performs learning on a feed-forward neural network.
The previous layer. There are connections between the PEs in each layer that have a weight
(parameter) associated with them.
This weight is adjusted during training. Information only travels in the forward direction
through the network - there are no feedback loops.
The simplified process for training a FFNN is as follows:
DW&M HR&SYSTEMS SPELICATION
UNIT-5 GETTING DATA INTO DATA WARE HOUSE BALAJI INSTI OF IT & MANAGEMENT
1. Input data is presented to the network and propagated through the network until it reaches the output layer. This forward process produces a predicted output.
2. The predicted output is subtracted from the actual output and an error value for the networks is
calculated. 3. The neural network then uses supervised learning, which in most cases is back propagation, to
train the network. Back propagation is a learning algorithm for adjusting the weights. It starts with the weights between the output layer PE’s and the last hidden layer PE’s and works backwards
through the network.
4. Once back propagation has finished, the forward process starts again, and this cycle is continued
until the error between predicted and actual outputs is minimized.
10.Nearest Neighbor Approaches:
Nearest neighbor search (NNS), as a form of proximity search, is the optimization
problem of finding the point in a given set that is closest (or most similar) to a given point.
Closeness is typically expressed in terms of a dissimilarity function: the less similar the
objects, the larger the function values.
Formally, the nearest-neighbor (NN) search problem is defined as follows: given a set S of
points in a space M and a query point q ∈ M, find the closest point in S to q.
The nearest neighbor search problem arises in numerous fields of application, including:
Pattern recognition – in particular for optical character recognition.
Computer vision.
Computational geometry – Closest pair of points problem.
Databases – content-based image retrieval.
Coding theory – maximum likelihood decoding.
Data compression – MPEG-2 standard.
Robotic sensing.
Recommendation systems, e.g. Collaborative filtering.
Internet marketing – contextual advertising and behavioral targeting.
DNA sequencing.
Spell checking – suggesting correct spelling.
Plagiarism detection.
Contact searching algorithms in FEA.
Similarity scores for predicting career paths of professional athletes.
Cluster analysis – assignment of a set of observations into subsets (called clusters) so that
observations in the same cluster are similar in some sense, usually based on Euclidean
distance.
Chemical similarity.
Sampling-based motion planning.
Intermodal freight transport.
DW&M HR&SYSTEMS SPELICATION
UNIT-5 GETTING DATA INTO DATA WARE HOUSE BALAJI INSTI OF IT & MANAGEMENT
Different extract methods:
Linear search
The simplest solution to the NNS problem is to compute the distance from the query point
to every other point in the database, keeping track of the "best so far".
This algorithm, sometimes referred to as the naive approach, has a running time of O(dN)
where N is the cardinality of S and d is the dimensionality of M.
There are no search data structures to maintain, so linear search has no space complexity
beyond the storage of the database.
Naive search can, on average, outperform space partitioning approaches on higher
dimensional spaces.
Approximation methods[edit]
An approximate nearest neighbor search algorithm is allowed to return points, whose
distance from the query is at most.
The appeal of this approach is that, in many cases, an approximate nearest neighbor is
almost as good as the exact one.
In particular, if the distance measure accurately captures the notion of user quality, then
small differences in the distance should not matter.
Locality sensitive hashing[edit]
Locality sensitive hashing (LSH) is a technique for grouping points in space into 'buckets'
based on some distance metric operating on the points.
Points that are close to each other under the chosen metric are mapped to the same bucket
with high probability.[17]
Nearest neighbor search in spaces with small intrinsic dimension[edit]
The cover tree has a theoretical bound that is based on the dataset's doubling constant. The
bound on search time is O(c12 log n) where c is the expansion constant of the dataset.
Projected radial search[edit]
In the special case where the data is a dense 3D map of geometric points, the projection
geometry of the sensing technique can be used to dramatically simplify the search problem.
This approach requires that the 3D data is organized by a projection to a two dimensional
grid and assumes that the data is spatially smooth across neighboring grid cells with the exception
of object boundaries.
These assumptions are valid when dealing with 3D sensor data in applications such as
surveying, robotics and stereo vision but may not hold for unorganized data in general.
DW&M HR&SYSTEMS SPELICATION
UNIT-5 GETTING DATA INTO DATA WARE HOUSE BALAJI INSTI OF IT & MANAGEMENT
In practice this technique has an average search time of O(1) or O(K) for the k-nearest
neighbor problem when applied to real world stereo vision data.
Variants
There are numerous variants of the NNS problem and the two most well-known are the k-
nearest neighbor search and the ε-approximate nearest neighbor search.
k-nearest neighbors
k-nearest neighbor search identifies the top k nearest neighbors to the query. This technique
is commonly used in predictive analytics to estimate or classify a point based on the consensus of
its neighbors.
k-nearest neighbor graphs are graphs in which every point is connected to its k nearest
neighbors.
Approximate nearest neighbor
In some applications it may be acceptable to retrieve a "good guess" of the nearest
neighbor. In those cases, we can use an algorithm which doesn't guarantee to return the actual
nearest neighbor in every case, in return for improved speed or memory savings.
Often such an algorithm will find the nearest neighbor in a majority of cases, but this
depends strongly on the dataset being queried.
Algorithms that support the approximate nearest neighbor search include locality-sensitive
hashing, best bin first and balanced box-decomposition tree based search.[21]
Nearest neighbor distance ratio
Nearest neighbor distance ratio do not apply the threshold on the direct distance from the
original point to the challenger neighbor but on a ratio of it depending on the distance to the
previous neighbor.
It is used in CBIR to retrieve pictures through a "query by example" using the similarity
between local features. More generally it is involved in several matching problems.
Fixed-radius near neighbors.
Fixed-radius near neighbors is the problem where one wants to efficiently find all points
given in Euclidean space within a given fixed distance from a specified point.
The data structure should work on a distance which is fixed however the query point is
arbitrary.
11.PUTTING THE RESULTS TO USE:
The neural networks are used in the following categories -
There are numerous examples of commercial applications for neural networks. These include,
1.High Accuracy: Neural networks are able to approximate complex non-linear mappings.
2.Noise Tolerance: Neural networks are very flexible with respect to incomplete, missing
DW&M HR&SYSTEMS SPELICATION
UNIT-5 GETTING DATA INTO DATA WARE HOUSE BALAJI INSTI OF IT & MANAGEMENT
and noisy data.
3.Independence from prior assumptions: Neural networks do not make a priori assumptions
about the distribution of the data, or the form of interactions between factors.
4.Ease of maintenance: Neural networks can be updated with fresh data, making them
useful for dynamic environments.
5.Neural networks can be implemented in parallel hardware.
6.When an element of the neural network fails, it can continue without any problem by
their parallel nature.
7.Assign "blame" for the local error to neurons at the previous level, giving greater
responsibility to neurons connected by stronger weights.
8.Repeat the steps above on the neurons at the previous level, using each
one's "blame" as its error.
Fraud detection, telecommunications, medicine, marketing, bankruptcy prediction, insurance, the
list goes on. The following are examples of where neural networks have been used.
Accounting
Identifying tax fraud.
Enhancing auditing by finding irregularities.
Finance
Signature and bank note verification.
Risk Management.
Foreign exchange rate forecasting.
Bankruptcy prediction.
Customer credit scoring.
Credit card approval and fraud detection.
Forecasting economic turning points.
Bond rating and trading.
Loan approvals.
Economic and financial forecasting.
Marketing
Classification of consumer spending pattern.
New product analysis.
Identification of customer characteristics.
Sale forecasts.
Human resources

DW&M HR&SYSTEMS SPELICATION
UNIT-5 GETTING DATA INTO DATA WARE HOUSE BALAJI INSTI OF IT & MANAGEMENT
Predicting employee’s performance and behavior.
Determining personnel resource requirements.


