Embed Size (px)
Citation preview
1 - 3 - 1
1.3 International Trade
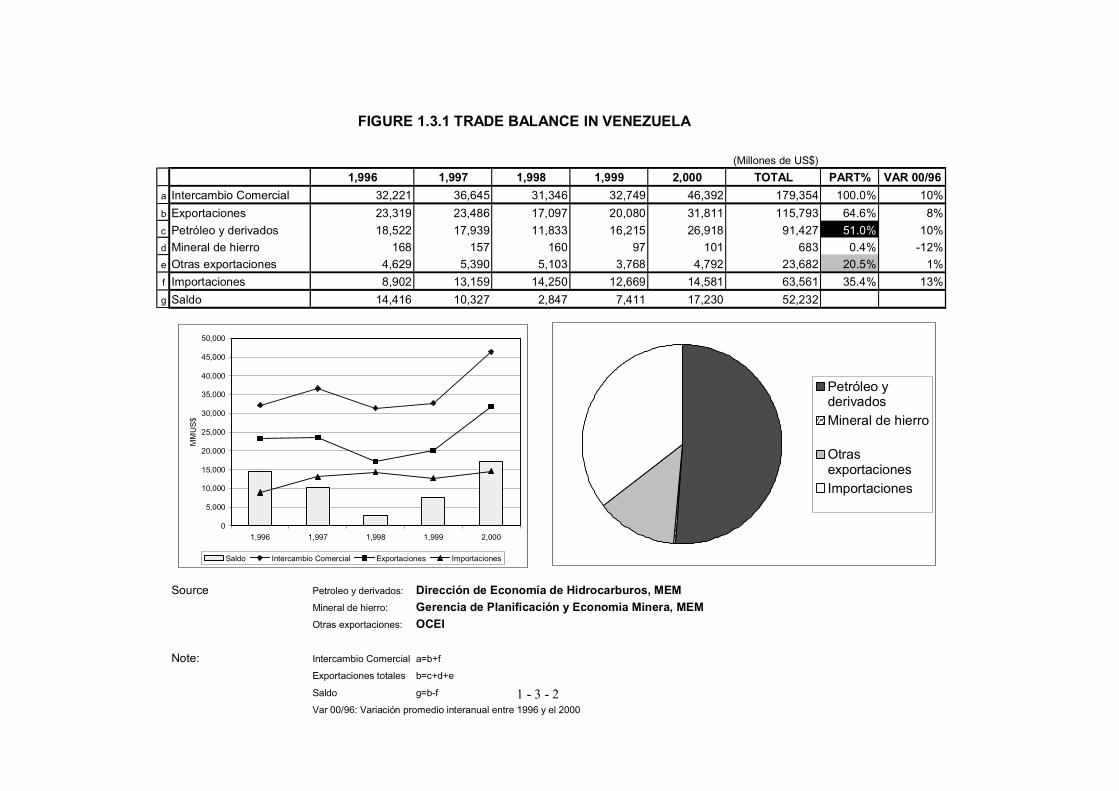
The country’s exports are still dominated by crude and petroleum products, which
account for 75-85% of the total value of exports during the past decade, subject to
variation of crude oil price. Imports were previously dominated by raw materials
(nearly 50%) and the share of machinery and equipment (including transportation
machinery) is recently on the rise. Exports of industrial products still represent a
relatively small share. As the economy globalizes rapidly, the manufacturing sector is
expected to establish international competitiveness in terms of quality and other aspects.
In addition, the country is expected to establish its own market strategy in
preparation for the establishment of FTAA (Free Trade Area of Americas) in 2005,
including export promotion policies and programs. The country’s export and import
trends for the past five years are summarized in Figure 1.3.1. made from materials of
the MPC.
1.3.1 Export
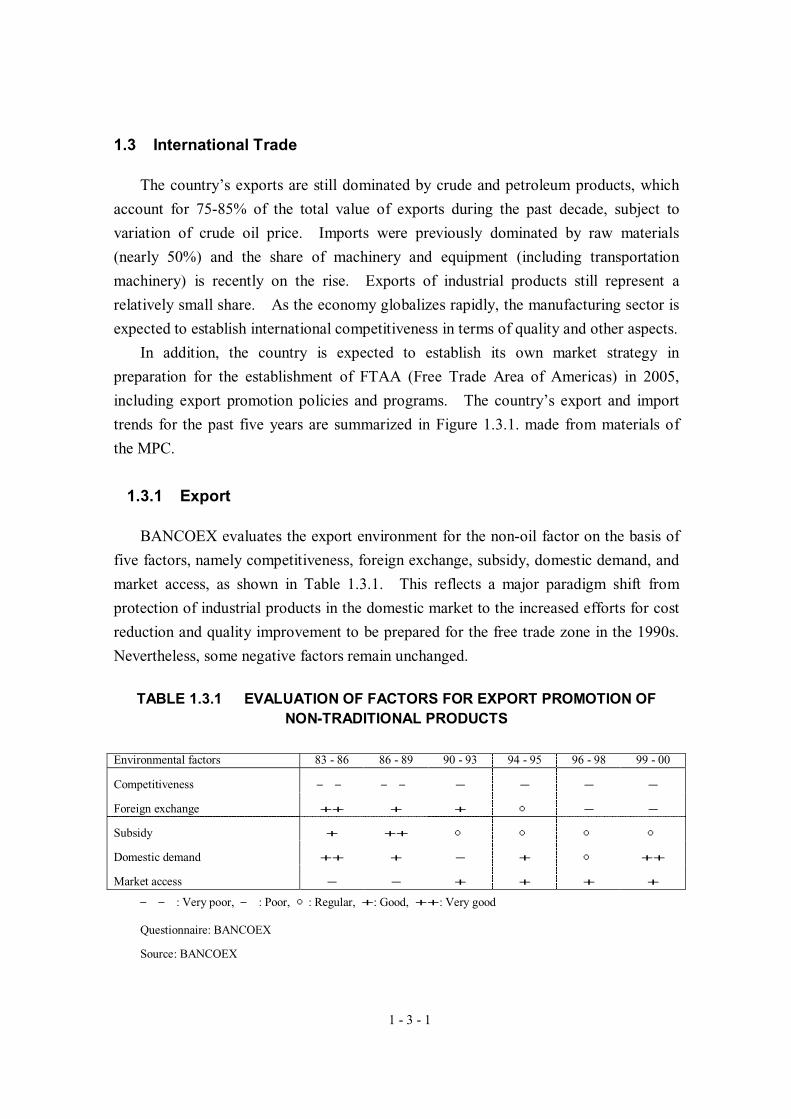
BANCOEX evaluates the export environment for the non-oil factor on the basis of
five factors, namely competitiveness, foreign exchange, subsidy, domestic demand, and
market access, as shown in Table 1.3.1. This reflects a major paradigm shift from
protection of industrial products in the domestic market to the increased efforts for cost
reduction and quality improvement to be prepared for the free trade zone in the 1990s.
Nevertheless, some negative factors remain unchanged.
TABLE 1.3.1 EVALUATION OF FACTORS FOR EXPORT PROMOTION OF NON-TRADITIONAL PRODUCTS
Environmental factors 83 - 86 86 - 89 90 - 93 94 - 95 96 - 98 99 - 00
Competitiveness ― ― ― ― - - - -
Foreign exchange ++ + + ○ - -
Subsidy + ++ ○ ○ ○ ○
Domestic demand ++ + - + ○ ++
Market access - - + + + +
― ― : Very poor, ― : Poor, ○: Regular, +: Good, ++: Very good
Questionnaire: BANCOEX
Source: BANCOEX
1 - 3 - 2
FIGURE 1.3.1 TRADE BALANCE IN VENEZUELA
(Millones de US$)
1,996 1,997 1,998 1,999 2,000 TOTAL PART% VAR 00/96
a Intercambio Comercial 32,221 36,645 31,346 32,749 46,392 179,354 100.0% 10%
b Exportaciones 23,319 23,486 17,097 20,080 31,811 115,793 64.6% 8%
c Petróleo y derivados 18,522 17,939 11,833 16,215 26,918 91,427 51.0% 10%d Mineral de hierro 168 157 160 97 101 683 0.4% -12%e Otras exportaciones 4,629 5,390 5,103 3,768 4,792 23,682 20.5% 1%
f Importaciones 8,902 13,159 14,250 12,669 14,581 63,561 35.4% 13%
g Saldo 14,416 10,327 2,847 7,411 17,230 52,232
Source Petroleo y derivados: Dirección de Economía de Hidrocarburos, MEMMineral de hierro: Gerencia de Planificación y Economia Minera, MEMOtras exportaciones: OCEI
Note: Intercambio Comercial a=b+f
Exportaciones totales b=c+d+e
Saldo g=b-f
Var 00/96: Variación promedio interanual entre 1996 y el 2000
0
5,000
10,000
15,000
20,000
25,000
30,000
35,000
40,000
45,000
50,000
1,996 1,997 1,998 1,999 2,000
MM
US
$
Saldo Intercambio Comercial Exportaciones Importaciones
Petróleo yderivadosMineral de hierro
Otrasexportaciones Importaciones
1 - 3 - 3
The following table compares the yearly changes in the value of non-traditional
exports, its growth rate, GDP and foreign exchange rate between 1996 and 2000.
TABLE 1.3.2 EXPORT TRENDS OF NON-TRADITIONAL GOODS, AND CHANGES IN GDP GROWTH RATE AND FOREIGN EXCHANGE RATE
1996 1997 1998 1999 2000
Export (Net MMUSD) 23,319 23,486 17,097 20,080 31,811
Growth rate (%) - 0.7 27.2 17.4 58.4
GDP growth rate (%) 0.2 6.4 0.2 -6.1 3,583.2
Foreign exchange rate (Bs/US$) 476.5 504.3 564.3 648.3 699.8
Source: MPC
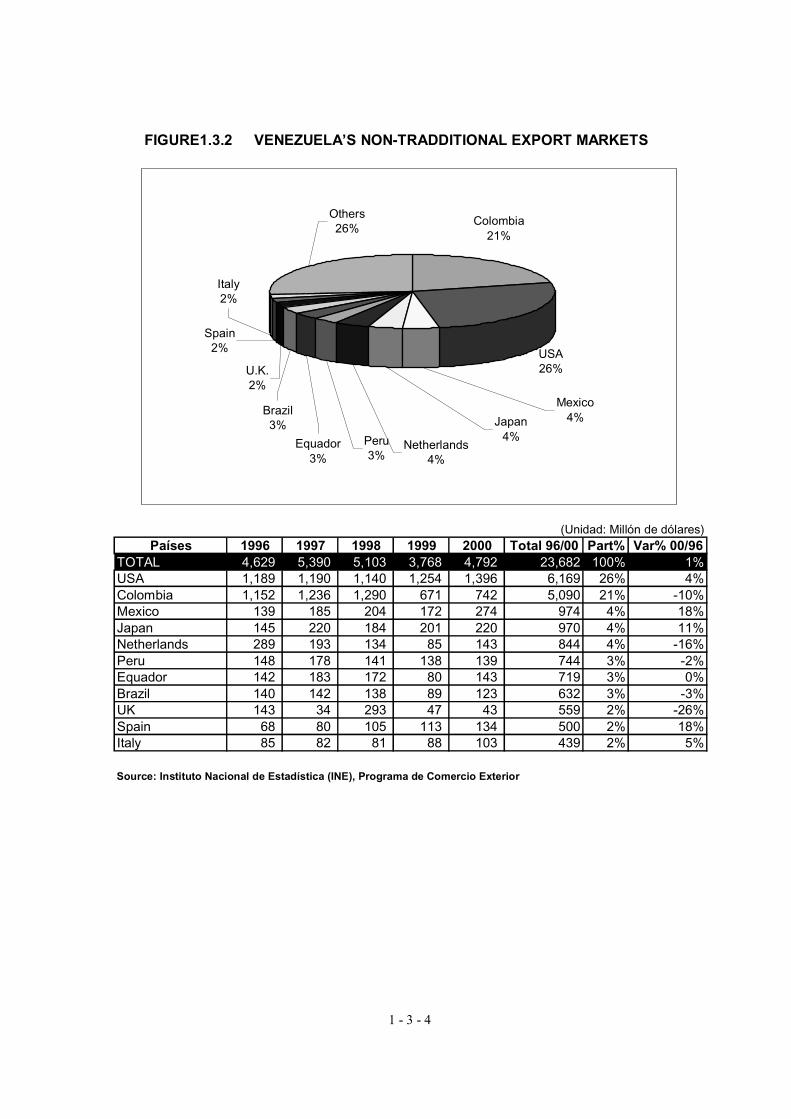
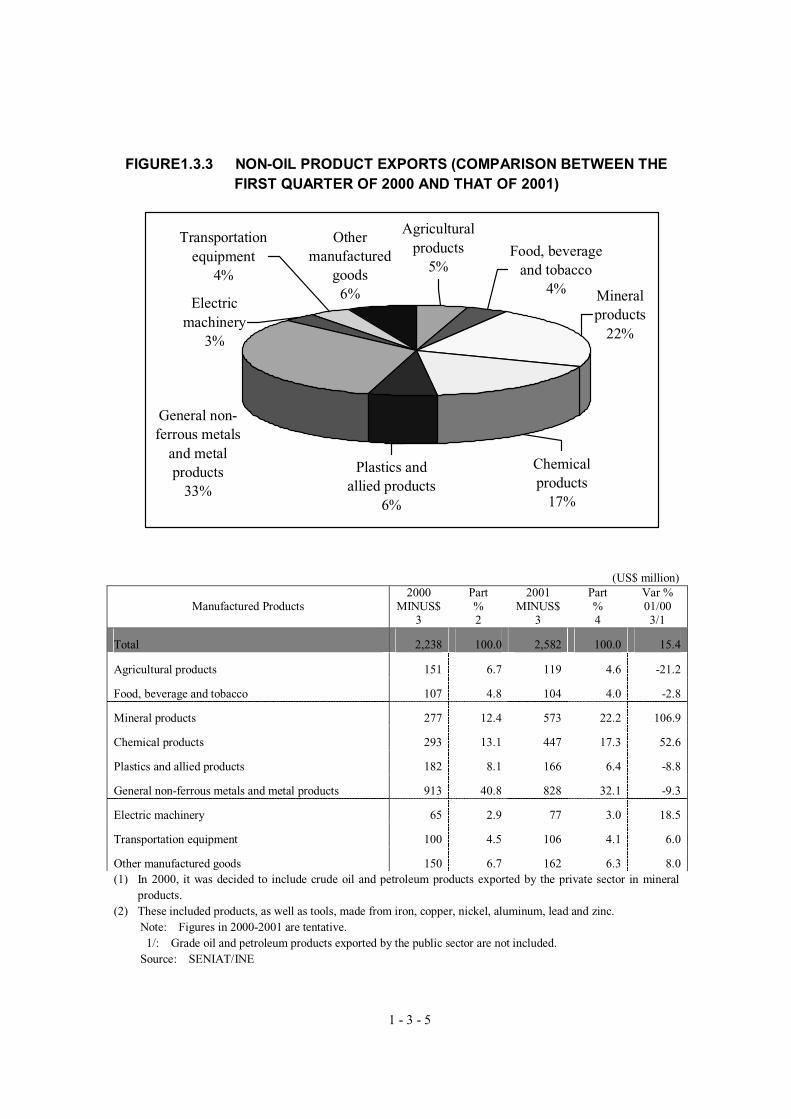
Major export items among non-traditional products (non-oil sector) are non-ferrous
metals and metal products, followed by chemical products, transportation equipment,
plastics, food, farm and dairy products, and machinery and equipment. Figure1.3.2
tabulates export values in the first quarter in 2001, their growth rates over a year ago,
and percentage composition, on the basis of SENIAT’s latest data. Exports of
manufactured goods grew by 15.4% over the previous year, and general non-ferrous
metals and metal products account for 32% of the total, followed by mineral products
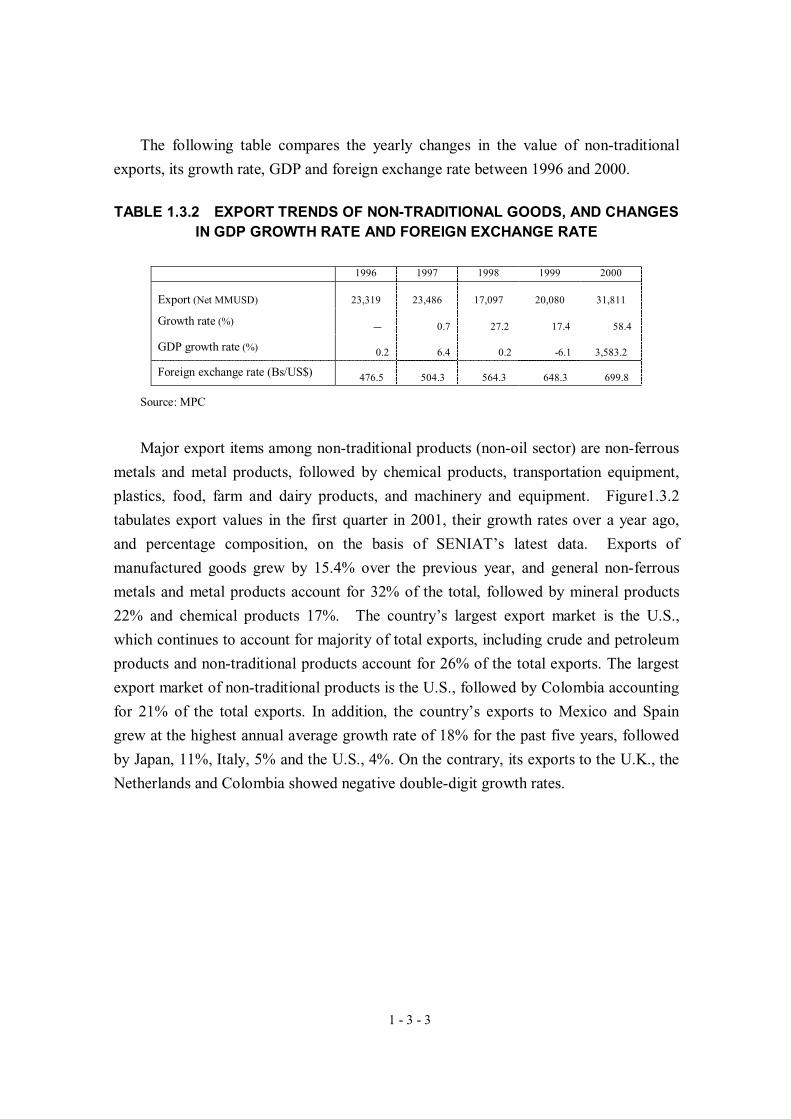
22% and chemical products 17%. The country’s largest export market is the U.S.,
which continues to account for majority of total exports, including crude and petroleum
products and non-traditional products account for 26% of the total exports. The largest
export market of non-traditional products is the U.S., followed by Colombia accounting
for 21% of the total exports. In addition, the country’s exports to Mexico and Spain
grew at the highest annual average growth rate of 18% for the past five years, followed
by Japan, 11%, Italy, 5% and the U.S., 4%. On the contrary, its exports to the U.K., the
Netherlands and Colombia showed negative double-digit growth rates.
1 - 3 - 4
FIGURE1.3.2 VENEZUELA’S NON-TRADDITIONAL EXPORT MARKETS
(Unidad: Millón de dólares)Países 1996 1997 1998 1999 2000 Total 96/00 Part% Var% 00/96
TOTAL 4,629 5,390 5,103 3,768 4,792 23,682 100% 1%USA 1,189 1,190 1,140 1,254 1,396 6,169 26% 4%Colombia 1,152 1,236 1,290 671 742 5,090 21% -10%Mexico 139 185 204 172 274 974 4% 18%Japan 145 220 184 201 220 970 4% 11%Netherlands 289 193 134 85 143 844 4% -16%Peru 148 178 141 138 139 744 3% -2%Equador 142 183 172 80 143 719 3% 0%Brazil 140 142 138 89 123 632 3% -3%UK 143 34 293 47 43 559 2% -26%Spain 68 80 105 113 134 500 2% 18%Italy 85 82 81 88 103 439 2% 5%
Source: Instituto Nacional de Estadística (INE), Programa de Comercio Exterior
USA26%
Brazil3%
Equador3%
Peru3%
Netherlands4%
Japan4%
Mexico4%
Colombia21%
Others26%
U.K.2%
Spain2%
Italy2%
1 - 3 - 5
FIGURE1.3.3 NON-OIL PRODUCT EXPORTS (COMPARISON BETWEEN THE FIRST QUARTER OF 2000 AND THAT OF 2001)
Othermanufactured
goods6%
Chemicalproducts
17%
General non-ferrous metals
and metalproducts
33%
Plastics andallied products
6%
Mineralproducts
22%
Food, beverageand tobacco
4%
Agriculturalproducts
5%
Transportationequipment
4%
Electricmachinery
3%
(US$ million)
Manufactured Products 2000
MINUS$3
Part % 2
2001 MINUS$
3
Part % 4
Var % 01/00 3/1
Total 2,238 100.0 2,582 100.0 15.4
Agricultural products 151 6.7 119 4.6 -21.2
Food, beverage and tobacco 107 4.8 104 4.0 -2.8
Mineral products 277 12.4 573 22.2 106.9
Chemical products 293 13.1 447 17.3 52.6
Plastics and allied products 182 8.1 166 6.4 -8.8
General non-ferrous metals and metal products 913 40.8 828 32.1 -9.3
Electric machinery 65 2.9 77 3.0 18.5
Transportation equipment 100 4.5 106 4.1 6.0
Other manufactured goods 150 6.7 162 6.3 8.0(1) In 2000, it was decided to include crude oil and petroleum products exported by the private sector in mineral
products. (2) These included products, as well as tools, made from iron, copper, nickel, aluminum, lead and zinc. Note: Figures in 2000-2001 are tentative. 1/: Grade oil and petroleum products exported by the public sector are not included. Source: SENIAT/INE
1 - 3 - 6
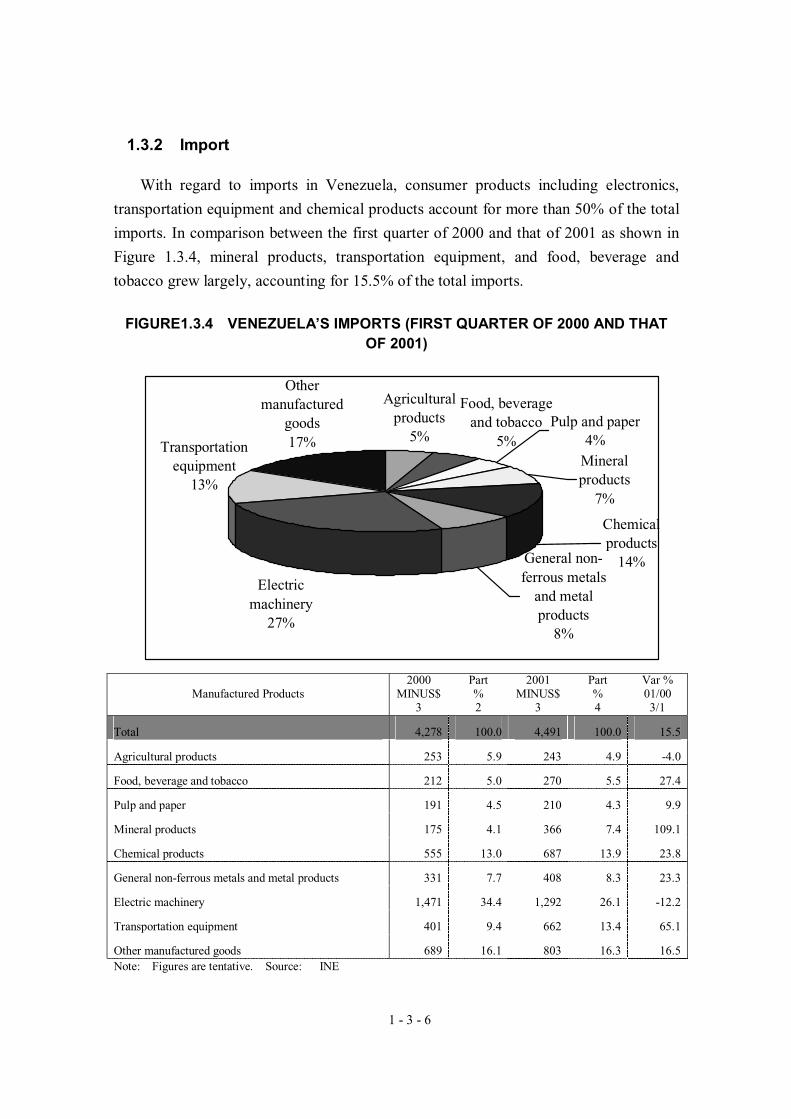
1.3.2 Import
With regard to imports in Venezuela, consumer products including electronics,
transportation equipment and chemical products account for more than 50% of the total
imports. In comparison between the first quarter of 2000 and that of 2001 as shown in
Figure 1.3.4, mineral products, transportation equipment, and food, beverage and
tobacco grew largely, accounting for 15.5% of the total imports.
FIGURE1.3.4 VENEZUELA’S IMPORTS (FIRST QUARTER OF 2000 AND THAT OF 2001)
Electricmachinery
27%
General non-ferrous metals
and metalproducts
8%
Chemicalproducts
14%
Transportationequipment
13%
Othermanufactured
goods17%
Food, beverageand tobacco
5%
Agriculturalproducts
5%Pulp and paper
4%Mineralproducts
7%
Manufactured Products 2000
MINUS$3
Part % 2
2001 MINUS$
3
Part % 4
Var % 01/00 3/1
Total 4,278 100.0 4,491 100.0 15.5
Agricultural products 253 5.9 243 4.9 -4.0
Food, beverage and tobacco 212 5.0 270 5.5 27.4
Pulp and paper 191 4.5 210 4.3 9.9
Mineral products 175 4.1 366 7.4 109.1
Chemical products 555 13.0 687 13.9 23.8
General non-ferrous metals and metal products 331 7.7 408 8.3 23.3
Electric machinery 1,471 34.4 1,292 26.1 -12.2
Transportation equipment 401 9.4 662 13.4 65.1
Other manufactured goods 689 16.1 803 16.3 16.5Note: Figures are tentative. Source: INE
1 - 3 - 7
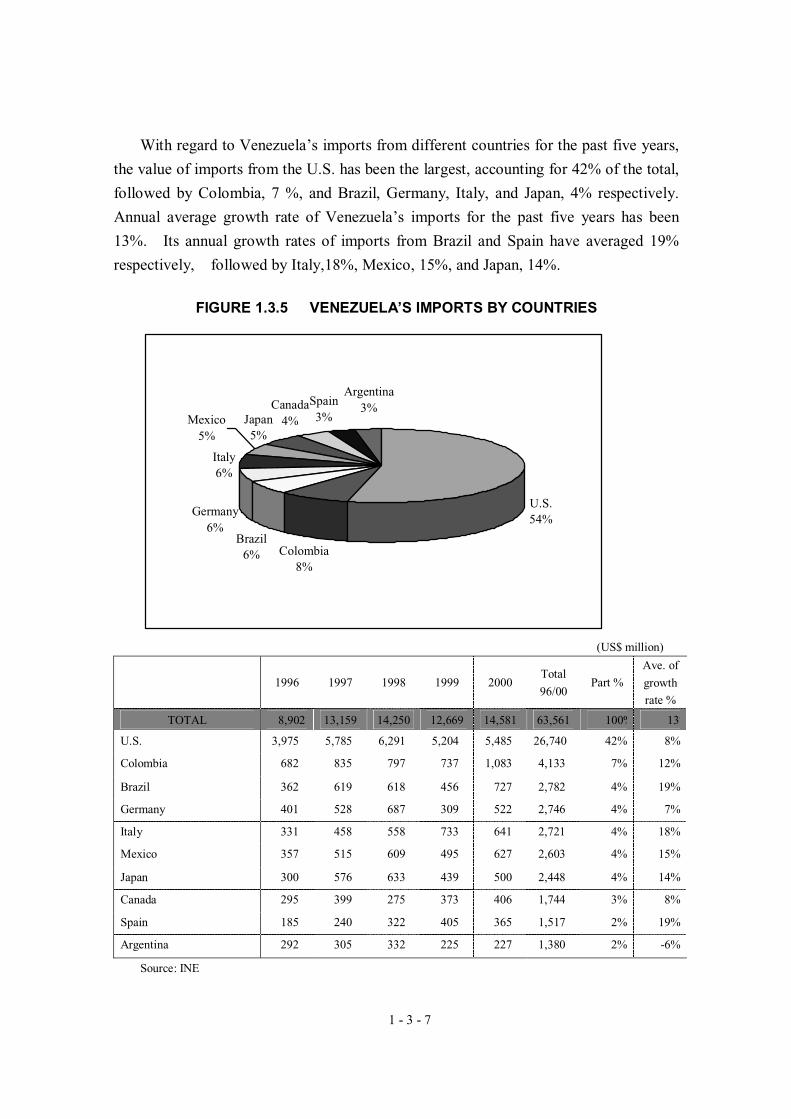
With regard to Venezuela’s imports from different countries for the past five years,
the value of imports from the U.S. has been the largest, accounting for 42% of the total,
followed by Colombia, 7 %, and Brazil, Germany, Italy, and Japan, 4% respectively.
Annual average growth rate of Venezuela’s imports for the past five years has been
13%. Its annual growth rates of imports from Brazil and Spain have averaged 19%
respectively, followed by Italy,18%, Mexico, 15%, and Japan, 14%.
FIGURE 1.3.5 VENEZUELA’S IMPORTS BY COUNTRIES
U.S.54%
Germany6%
Canada4%
Spain3%
Argentina3%
Japan5%
Italy6%
Mexico5%
Brazil6% Colombia
8%
(US$ million)
1996 1997 1998 1999 2000 Total
96/00 Part %
Ave. of
growth
rate %
TOTAL 8,902 13,159 14,250 12,669 14,581 63,561 100% 13%
U.S. 3,975 5,785 6,291 5,204 5,485 26,740 42% 8%
Colombia 682 835 797 737 1,083 4,133 7% 12%
Brazil 362 619 618 456 727 2,782 4% 19%
Germany 401 528 687 309 522 2,746 4% 7%
Italy 331 458 558 733 641 2,721 4% 18%
Mexico 357 515 609 495 627 2,603 4% 15%
Japan 300 576 633 439 500 2,448 4% 14%
Canada 295 399 275 373 406 1,744 3% 8%
Spain 185 240 322 405 365 1,517 2% 19%
Argentina 292 305 332 225 227 1,380 2% -6%
Source: INE
1 - 3 - 8
1.3.3 Trade Agreements
In the Americas, the move to form a free trade zone, after a stationary period in the
1980s, was accelerated since the early 1990s. Today, various regional economic zones
exist, including NAFTA in North America, MERCOSUR in South America, and CAN,
CACM and CARICOM in between. Venezuela participates in CAN, forms Group-3
(G-3) with Mexico and Colombia, and has entered a free trade agreement (FTA) with
Chile.
In 2000, the country’s exports of non-oil products grew by 27%, compared with the
previous year due to recoveries of two major markets other than the U.S., namely
Colombia (CAN) and Brazil (MERCOSUR). Imports also surged 15% due to some
signs of economic recovery, including increased production of family-size cars due to
the revived market. In the meantime, South America is moving ahead of FTAA
toward a continental free trade zone, as the summit meeting of South American nations
held in early September 2000 (Brasilia Summit) resolved the integration of
MERCOSUR and CAN, targeted in 2002. In particular, Venezuela and Brazil
expressed a clear intent to expand their mutual trade and promote close cooperation in
the areas of energy and infrastructure development, as evidenced by President Chavez
of Venezuela who actively approached President Caldozo of Brazil to discuss these
matters. Since then, Venezuela has been exploring closer ties with its southern
neighbor, which is positioned as a destination of its decentralization and rural
development plan.
Furthermore, FTAA has also moved one step further to reality. The difference
between the U.S. as the leader of NAFTA and Brazil as the leader of MERCOSUR in
relation to the “comprehensive agreement based on a fast track method” was resolved in
the declaration of ministries at the FTT’s Sixth Meeting of Trade Ministers of the
Americas, which was held in Buenos Aires, Argentina, on April 7, 2001. The fast
track method was confirmed and a proposal to complete the negotiation by January
2005 and effectuate the agreement by December 2005 was made. The proposal was
endorsed at the American Summit held in Quebec, on April 21-22, 2001. It was
agreed to start the FTAA tariff negotiation by May 15, 2002. More importantly, the
April 7 declaration gives consideration to regional disparity that must face FTAA and
sets forth the following actions:
1 - 3 - 9
a. To create opportunity for full participation of small economies in the FTAA
process;
b. To recognize the need for special provision to address the needs for countries with
different development levels and varying economy sizes, including the special needs
of small economies, together with the need for technical assistance; and
c. To continue negotiation for special treatment requested by small economies.
In this conjunction, an important strategy for Venezuela is to align development and
export promotion strategies for SMEs with the future moves in the region by selecting
small economies in Central America and the Caribbean as the target markets for SME
exports. More precisely, it has to be confirmed that Venezuela will be able to expand
its exports to these markets by taking advantage of geographic proximity and a close
relationship with AEC, including preferential treatment of these countries in crude oil
supply under the San Jose Agreement.
In the future, research and study should be carried out to coordinate indirect
participation of SMEs and identify opportunities for their direct participation in the
economic operation agreements joined by Venezuela.
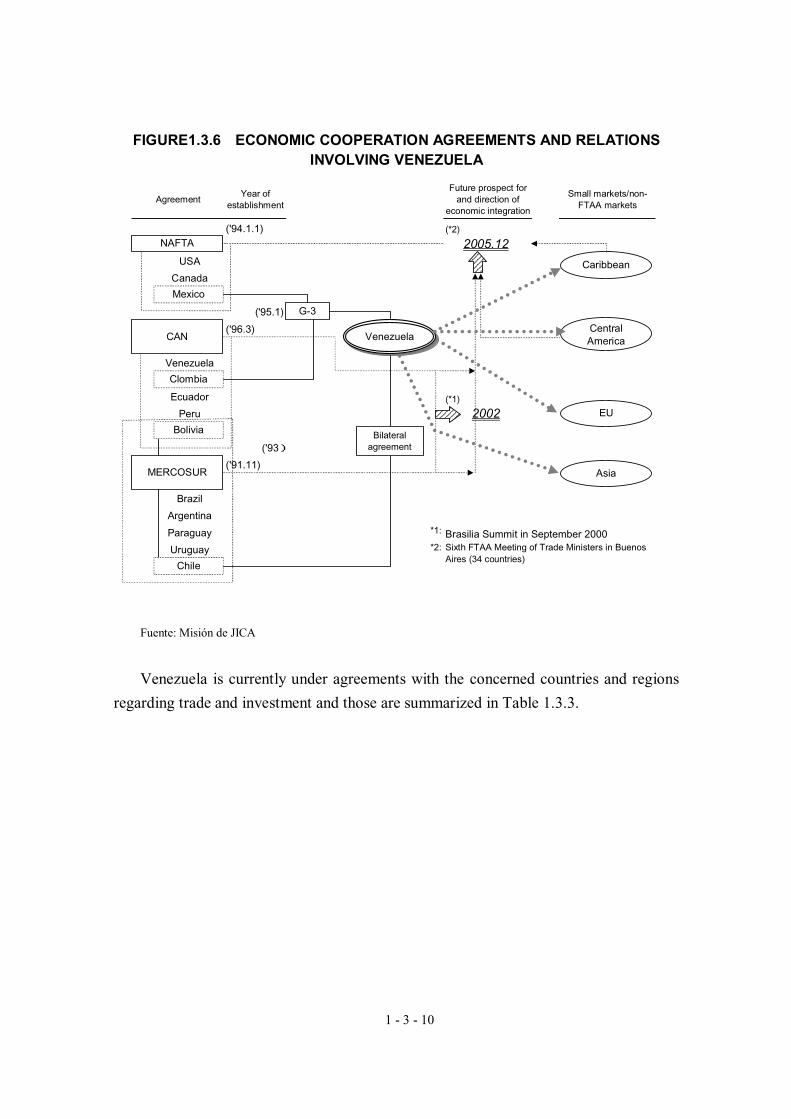
Economic cooperation agreements within the Americas, which involve Venezuela,
are summarized as follows.
1 - 3 - 10
FIGURE1.3.6 ECONOMIC COOPERATION AGREEMENTS AND RELATIONS INVOLVING VENEZUELA
Fuente: Misión de JICA
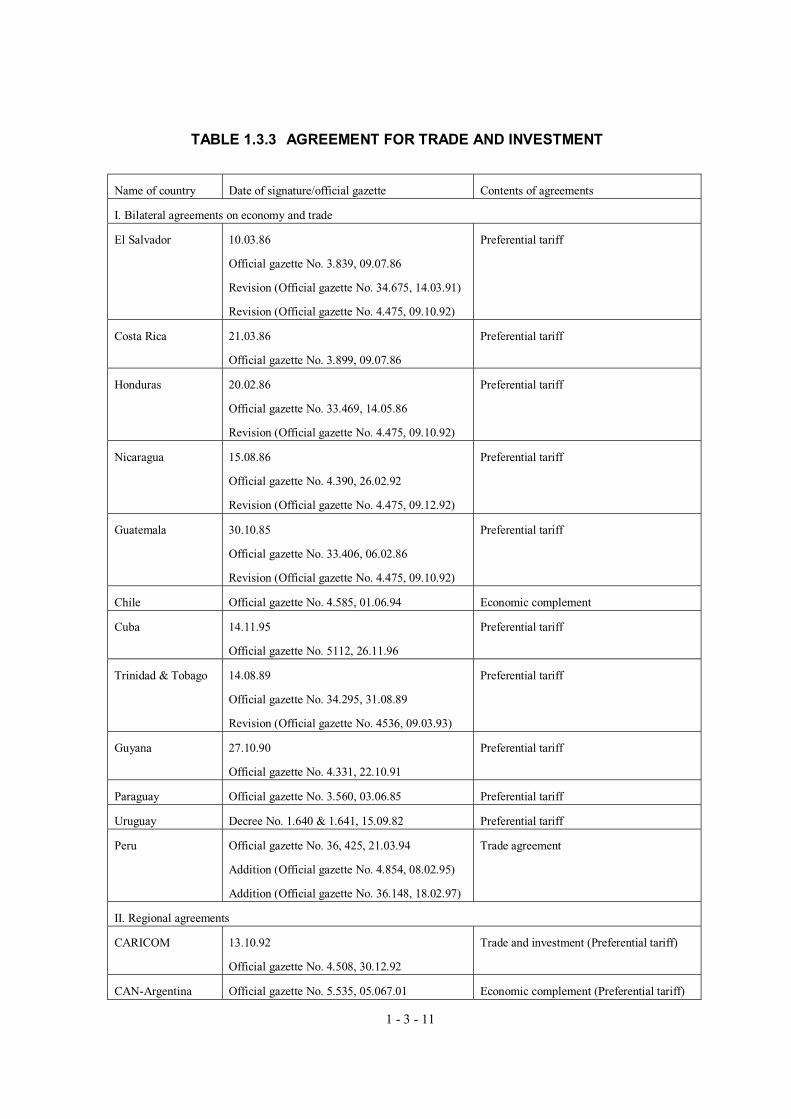
Venezuela is currently under agreements with the concerned countries and regions
regarding trade and investment and those are summarized in Table 1.3.3.
AgreementYear of
establishment
Future prospect forand direction of
economic integration
Small markets/non-FTAA markets
('94.1.1) (*2)
USA
Canada
('95.1)
('96.3)
Venezuela
Ecuador (*1)
Peru
('93)
('91.11)
Brazil
Argentina
Paraguay *1: Brasilia Summit in September 2000
Uruguay *2: Sixth FTAA Meeting of Trade Ministers in BuenosAires (34 countries)
NAFTA
Mexico
CAN
Clombia
Bolivia
MERCOSUR
Chile
G-3
Venezuela
Bilateralagreement
2005.12
Caribbean
CentralAmerica
EU2002
Asia
1 - 3 - 11
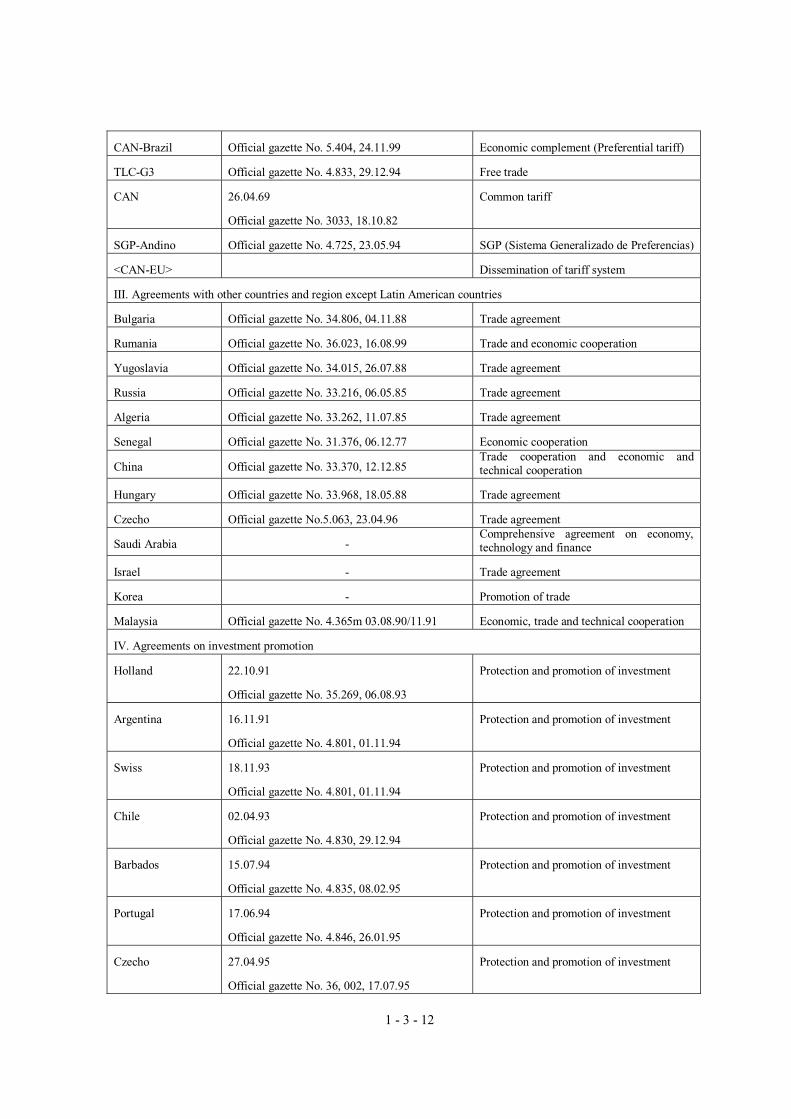
TABLE 1.3.3 AGREEMENT FOR TRADE AND INVESTMENT
Name of country Date of signature/official gazette Contents of agreements
I. Bilateral agreements on economy and trade
El Salvador 10.03.86
Official gazette No. 3.839, 09.07.86
Revision (Official gazette No. 34.675, 14.03.91)
Revision (Official gazette No. 4.475, 09.10.92)
Preferential tariff
Costa Rica 21.03.86
Official gazette No. 3.899, 09.07.86
Preferential tariff
Honduras 20.02.86
Official gazette No. 33.469, 14.05.86
Revision (Official gazette No. 4.475, 09.10.92)
Preferential tariff
Nicaragua 15.08.86
Official gazette No. 4.390, 26.02.92
Revision (Official gazette No. 4.475, 09.12.92)
Preferential tariff
Guatemala 30.10.85
Official gazette No. 33.406, 06.02.86
Revision (Official gazette No. 4.475, 09.10.92)
Preferential tariff
Chile Official gazette No. 4.585, 01.06.94 Economic complement
Cuba 14.11.95
Official gazette No. 5112, 26.11.96
Preferential tariff
Trinidad & Tobago 14.08.89
Official gazette No. 34.295, 31.08.89
Revision (Official gazette No. 4536, 09.03.93)
Preferential tariff
Guyana 27.10.90
Official gazette No. 4.331, 22.10.91
Preferential tariff
Paraguay Official gazette No. 3.560, 03.06.85 Preferential tariff
Uruguay Decree No. 1.640 & 1.641, 15.09.82 Preferential tariff
Peru Official gazette No. 36, 425, 21.03.94
Addition (Official gazette No. 4.854, 08.02.95)
Addition (Official gazette No. 36.148, 18.02.97)
Trade agreement
II. Regional agreements
CARICOM 13.10.92
Official gazette No. 4.508, 30.12.92
Trade and investment (Preferential tariff)
CAN-Argentina Official gazette No. 5.535, 05.067.01 Economic complement (Preferential tariff)
1 - 3 - 12
CAN-Brazil Official gazette No. 5.404, 24.11.99 Economic complement (Preferential tariff)
TLC-G3 Official gazette No. 4.833, 29.12.94 Free trade
CAN 26.04.69
Official gazette No. 3033, 18.10.82
Common tariff
SGP-Andino Official gazette No. 4.725, 23.05.94 SGP (Sistema Generalizado de Preferencias)
<CAN-EU> Dissemination of tariff system
III. Agreements with other countries and region except Latin American countries
Bulgaria Official gazette No. 34.806, 04.11.88 Trade agreement
Rumania Official gazette No. 36.023, 16.08.99 Trade and economic cooperation
Yugoslavia Official gazette No. 34.015, 26.07.88 Trade agreement
Russia Official gazette No. 33.216, 06.05.85 Trade agreement
Algeria Official gazette No. 33.262, 11.07.85 Trade agreement
Senegal Official gazette No. 31.376, 06.12.77 Economic cooperation
China Official gazette No. 33.370, 12.12.85 Trade cooperation and economic and technical cooperation
Hungary Official gazette No. 33.968, 18.05.88 Trade agreement
Czecho Official gazette No.5.063, 23.04.96 Trade agreement
Saudi Arabia - Comprehensive agreement on economy, technology and finance
Israel - Trade agreement
Korea - Promotion of trade
Malaysia Official gazette No. 4.365m 03.08.90/11.91 Economic, trade and technical cooperation
IV. Agreements on investment promotion
Holland 22.10.91
Official gazette No. 35.269, 06.08.93
Protection and promotion of investment
Argentina 16.11.91
Official gazette No. 4.801, 01.11.94
Protection and promotion of investment
Swiss 18.11.93
Official gazette No. 4.801, 01.11.94
Protection and promotion of investment
Chile 02.04.93
Official gazette No. 4.830, 29.12.94
Protection and promotion of investment
Barbados 15.07.94
Official gazette No. 4.835, 08.02.95
Protection and promotion of investment
Portugal 17.06.94
Official gazette No. 4.846, 26.01.95
Protection and promotion of investment
Czecho 27.04.95
Official gazette No. 36, 002, 17.07.95
Protection and promotion of investment
1 - 3 - 13
British 15.03.95
Official gazette No. 36, 010, 30.07.96
Protection and promotion of investment
Denmark 28.11.94
Official gazette No. 5.080, 23.07.96
Protection and promotion of investment
Lithuania 24.04.95
Official gazette No. 5.080, 2307.96
Protection and promotion of investment
Peru 12.01.96
Official gazette No. 36.266, 11.08.97
Protection and promotion of investment
Spain 02.11.95
Official gazette No. 36.304, 29.09.97
Protection and promotion of investment
Paraguay 05.09.96
Official gazette No. 35.281, 01.09.97
Protection and promotion of investment
Sweden 25.11.96
Official gazette No. 5.192, 18.12.97
Protection and promotion of investment
Canada 01.07.96
Official gazette No. 5.207, 20.01.98
Protection and promotion of investment
Germany 14.05.96
Official gazette No. 36.383, 28.01.98
Protection and promotion of investment
Costa Rica 17.03.97
Official gazette No. 36.383, 28.01.98
Protection and promotion of investment
Source: CEPAL, “APEC and NAFTA,” Yuhikaku, 1995
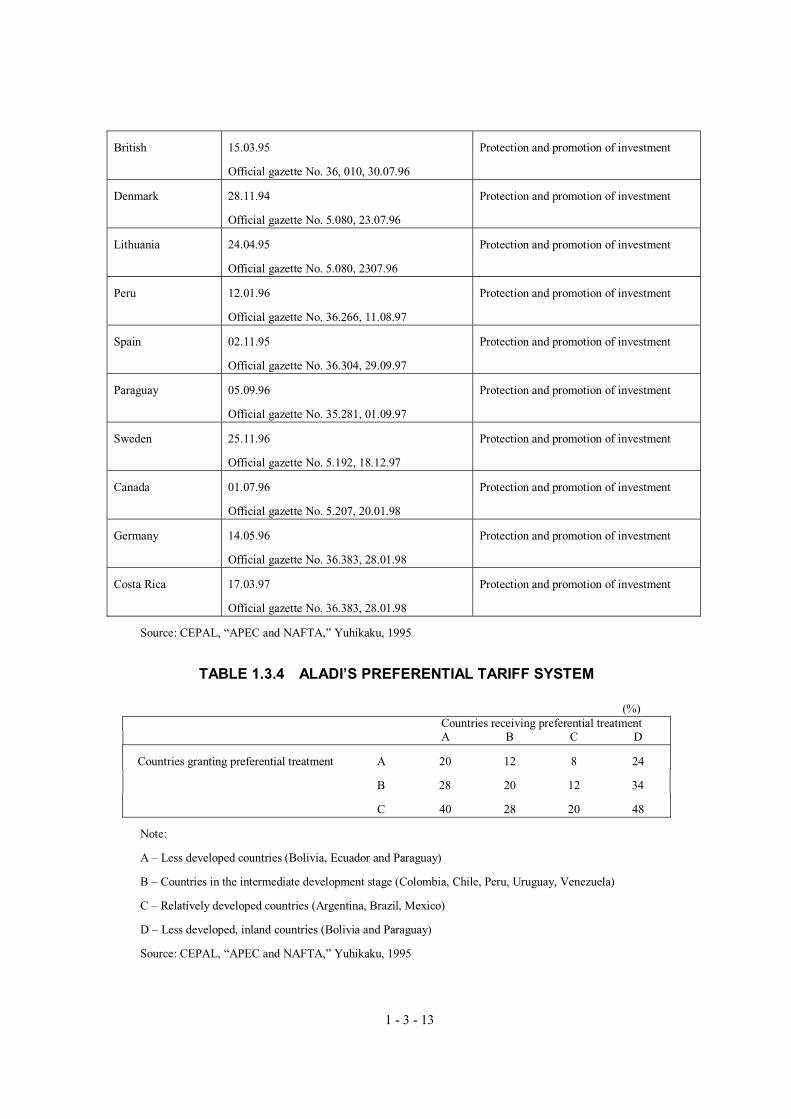
TABLE 1.3.4 ALADI’S PREFERENTIAL TARIFF SYSTEM
(%) Countries receiving preferential treatment
A B C D
Countries granting preferential treatment A 20 12 8 24
B 28 20 12 34
C 40 28 20 48
Note:
A – Less developed countries (Bolivia, Ecuador and Paraguay)
B – Countries in the intermediate development stage (Colombia, Chile, Peru, Uruguay, Venezuela)
C – Relatively developed countries (Argentina, Brazil, Mexico)
D – Less developed, inland countries (Bolivia and Paraguay)
Source: CEPAL, “APEC and NAFTA,” Yuhikaku, 1995
1 - 3 - 14
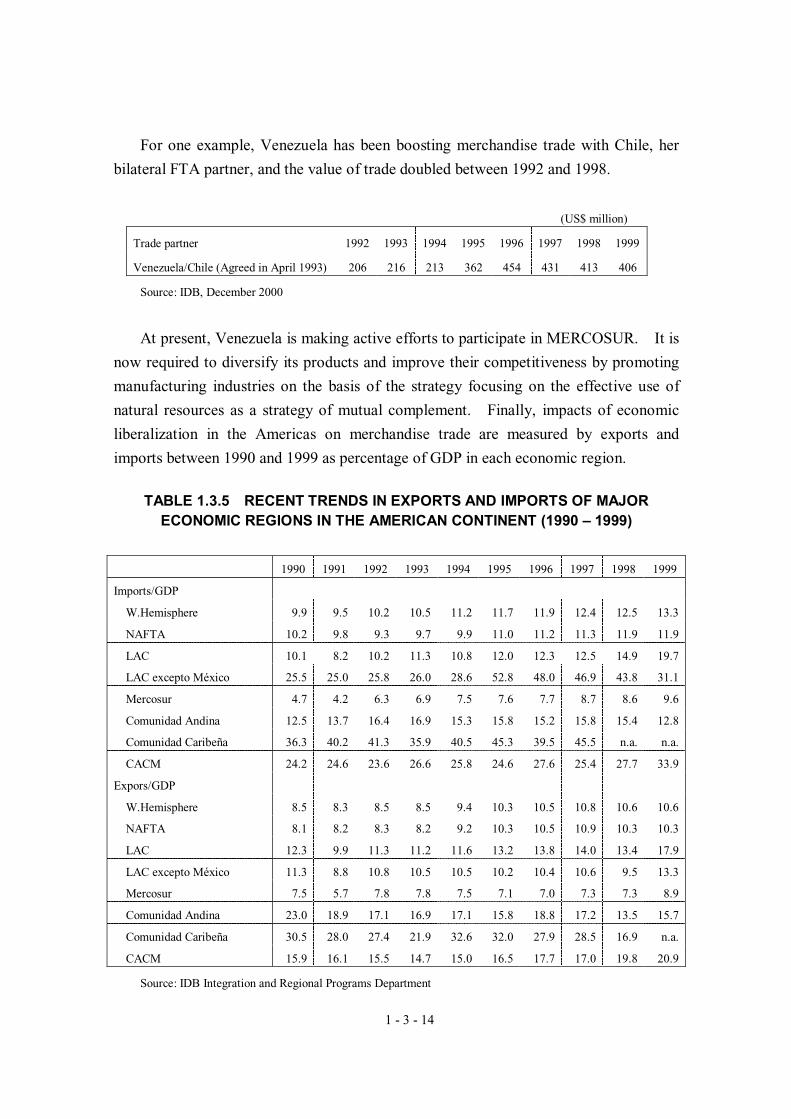
For one example, Venezuela has been boosting merchandise trade with Chile, her
bilateral FTA partner, and the value of trade doubled between 1992 and 1998.
(US$ million)
Trade partner 1992 1993 1994 1995 1996 1997 1998 1999
Venezuela/Chile (Agreed in April 1993) 206 216 213 362 454 431 413 406
Source: IDB, December 2000
At present, Venezuela is making active efforts to participate in MERCOSUR. It is
now required to diversify its products and improve their competitiveness by promoting
manufacturing industries on the basis of the strategy focusing on the effective use of
natural resources as a strategy of mutual complement. Finally, impacts of economic
liberalization in the Americas on merchandise trade are measured by exports and
imports between 1990 and 1999 as percentage of GDP in each economic region.
TABLE 1.3.5 RECENT TRENDS IN EXPORTS AND IMPORTS OF MAJOR ECONOMIC REGIONS IN THE AMERICAN CONTINENT (1990 – 1999)
1990 1991 1992 1993 1994 1995 1996 1997 1998 1999
Imports/GDP
W.Hemisphere 9.9 9.5 10.2 10.5 11.2 11.7 11.9 12.4 12.5 13.3
NAFTA 10.2 9.8 9.3 9.7 9.9 11.0 11.2 11.3 11.9 11.9
LAC 10.1 8.2 10.2 11.3 10.8 12.0 12.3 12.5 14.9 19.7
LAC excepto México 25.5 25.0 25.8 26.0 28.6 52.8 48.0 46.9 43.8 31.1
Mercosur 4.7 4.2 6.3 6.9 7.5 7.6 7.7 8.7 8.6 9.6
Comunidad Andina 12.5 13.7 16.4 16.9 15.3 15.8 15.2 15.8 15.4 12.8
Comunidad Caribeña 36.3 40.2 41.3 35.9 40.5 45.3 39.5 45.5 n.a. n.a.
CACM 24.2 24.6 23.6 26.6 25.8 24.6 27.6 25.4 27.7 33.9
Expors/GDP
W.Hemisphere 8.5 8.3 8.5 8.5 9.4 10.3 10.5 10.8 10.6 10.6
NAFTA 8.1 8.2 8.3 8.2 9.2 10.3 10.5 10.9 10.3 10.3
LAC 12.3 9.9 11.3 11.2 11.6 13.2 13.8 14.0 13.4 17.9
LAC excepto México 11.3 8.8 10.8 10.5 10.5 10.2 10.4 10.6 9.5 13.3
Mercosur 7.5 5.7 7.8 7.8 7.5 7.1 7.0 7.3 7.3 8.9
Comunidad Andina 23.0 18.9 17.1 16.9 17.1 15.8 18.8 17.2 13.5 15.7
Comunidad Caribeña 30.5 28.0 27.4 21.9 32.6 32.0 27.9 28.5 16.9 n.a.
CACM 15.9 16.1 15.5 14.7 15.0 16.5 17.7 17.0 19.8 20.9
Source: IDB Integration and Regional Programs Department
1 - 3 - 15
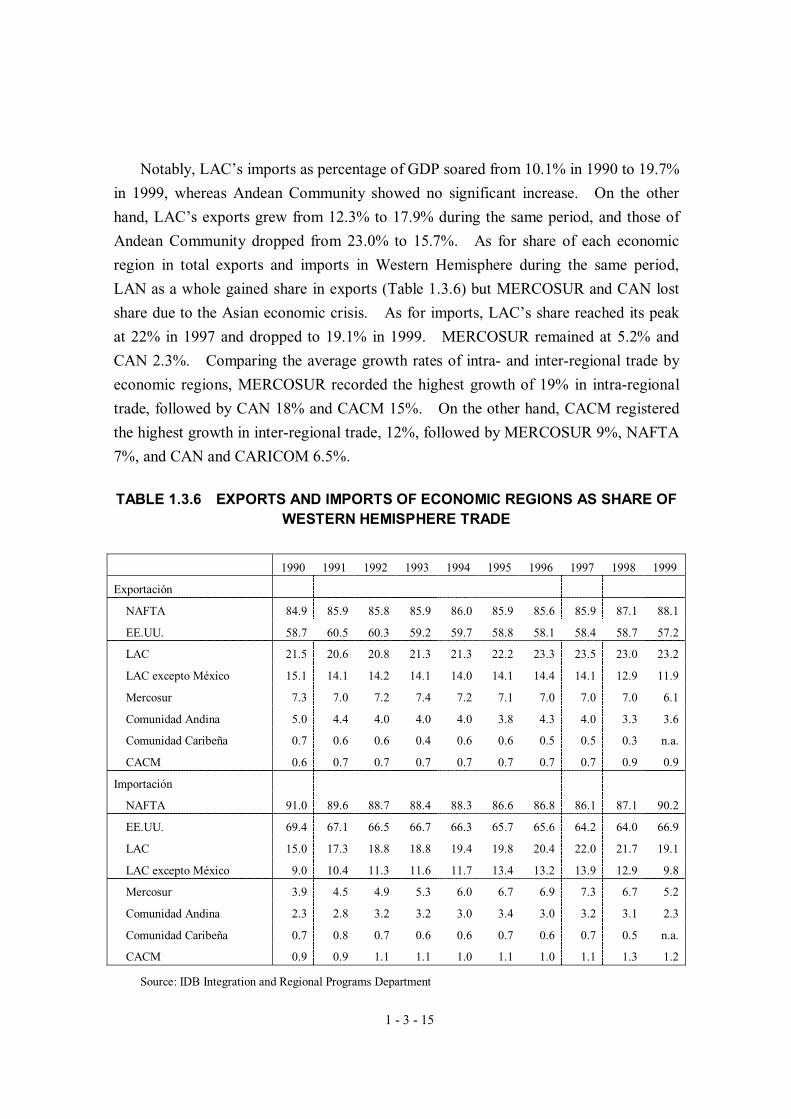
Notably, LAC’s imports as percentage of GDP soared from 10.1% in 1990 to 19.7%
in 1999, whereas Andean Community showed no significant increase. On the other
hand, LAC’s exports grew from 12.3% to 17.9% during the same period, and those of
Andean Community dropped from 23.0% to 15.7%. As for share of each economic
region in total exports and imports in Western Hemisphere during the same period,
LAN as a whole gained share in exports (Table 1.3.6) but MERCOSUR and CAN lost
share due to the Asian economic crisis. As for imports, LAC’s share reached its peak
at 22% in 1997 and dropped to 19.1% in 1999. MERCOSUR remained at 5.2% and
CAN 2.3%. Comparing the average growth rates of intra- and inter-regional trade by
economic regions, MERCOSUR recorded the highest growth of 19% in intra-regional
trade, followed by CAN 18% and CACM 15%. On the other hand, CACM registered
the highest growth in inter-regional trade, 12%, followed by MERCOSUR 9%, NAFTA
7%, and CAN and CARICOM 6.5%.
TABLE 1.3.6 EXPORTS AND IMPORTS OF ECONOMIC REGIONS AS SHARE OF WESTERN HEMISPHERE TRADE
1990 1991 1992 1993 1994 1995 1996 1997 1998 1999
Exportación
NAFTA 84.9 85.9 85.8 85.9 86.0 85.9 85.6 85.9 87.1 88.1
EE.UU. 58.7 60.5 60.3 59.2 59.7 58.8 58.1 58.4 58.7 57.2
LAC 21.5 20.6 20.8 21.3 21.3 22.2 23.3 23.5 23.0 23.2
LAC excepto México 15.1 14.1 14.2 14.1 14.0 14.1 14.4 14.1 12.9 11.9
Mercosur 7.3 7.0 7.2 7.4 7.2 7.1 7.0 7.0 7.0 6.1
Comunidad Andina 5.0 4.4 4.0 4.0 4.0 3.8 4.3 4.0 3.3 3.6
Comunidad Caribeña 0.7 0.6 0.6 0.4 0.6 0.6 0.5 0.5 0.3 n.a.
CACM 0.6 0.7 0.7 0.7 0.7 0.7 0.7 0.7 0.9 0.9
Importación
NAFTA 91.0 89.6 88.7 88.4 88.3 86.6 86.8 86.1 87.1 90.2
EE.UU. 69.4 67.1 66.5 66.7 66.3 65.7 65.6 64.2 64.0 66.9
LAC 15.0 17.3 18.8 18.8 19.4 19.8 20.4 22.0 21.7 19.1
LAC excepto México 9.0 10.4 11.3 11.6 11.7 13.4 13.2 13.9 12.9 9.8
Mercosur 3.9 4.5 4.9 5.3 6.0 6.7 6.9 7.3 6.7 5.2
Comunidad Andina 2.3 2.8 3.2 3.2 3.0 3.4 3.0 3.2 3.1 2.3
Comunidad Caribeña 0.7 0.8 0.7 0.6 0.6 0.7 0.6 0.7 0.5 n.a.
CACM 0.9 0.9 1.1 1.1 1.0 1.1 1.0 1.1 1.3 1.2
Source: IDB Integration and Regional Programs Department
1 - 3 - 16
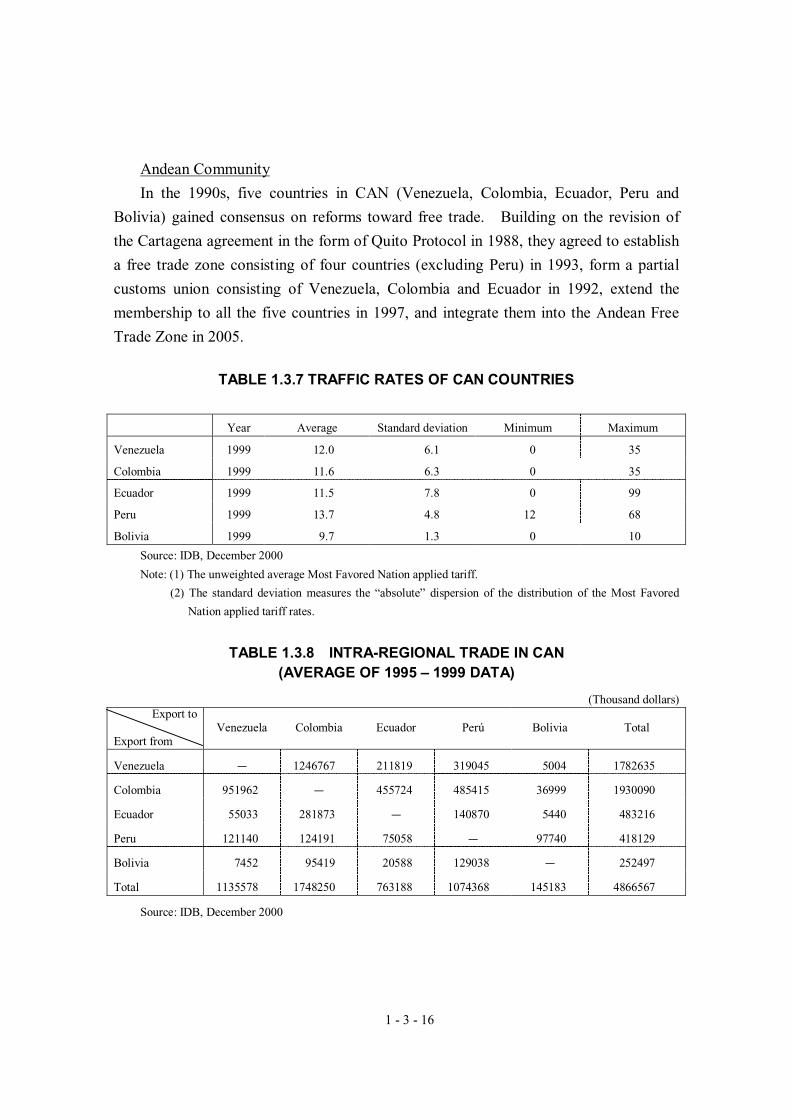
Andean Community
In the 1990s, five countries in CAN (Venezuela, Colombia, Ecuador, Peru and
Bolivia) gained consensus on reforms toward free trade. Building on the revision of
the Cartagena agreement in the form of Quito Protocol in 1988, they agreed to establish
a free trade zone consisting of four countries (excluding Peru) in 1993, form a partial
customs union consisting of Venezuela, Colombia and Ecuador in 1992, extend the
membership to all the five countries in 1997, and integrate them into the Andean Free
Trade Zone in 2005.
TABLE 1.3.7 TRAFFIC RATES OF CAN COUNTRIES
Year Average Standard deviation Minimum Maximum
Venezuela 1999 12.0 6.1 0 35
Colombia 1999 11.6 6.3 0 35
Ecuador 1999 11.5 7.8 0 99
Peru 1999 13.7 4.8 12 68
Bolivia 1999 9.7 1.3 0 10
Source: IDB, December 2000
Note: (1) The unweighted average Most Favored Nation applied tariff.
(2) The standard deviation measures the “absolute” dispersion of the distribution of the Most Favored
Nation applied tariff rates.
TABLE 1.3.8 INTRA-REGIONAL TRADE IN CAN (AVERAGE OF 1995 – 1999 DATA)
(Thousand dollars) Export to
Export from Venezuela Colombia Ecuador Perú Bolivia Total
Venezuela - 1246767 211819 319045 5004 1782635
Colombia 951962 - 455724 485415 36999 1930090
Ecuador 55033 281873 - 140870 5440 483216
Peru 121140 124191 75058 - 97740 418129
Bolivia 7452 95419 20588 129038 - 252497
Total 1135578 1748250 763188 1074368 145183 4866567
Source: IDB, December 2000
1 - 3 - 17
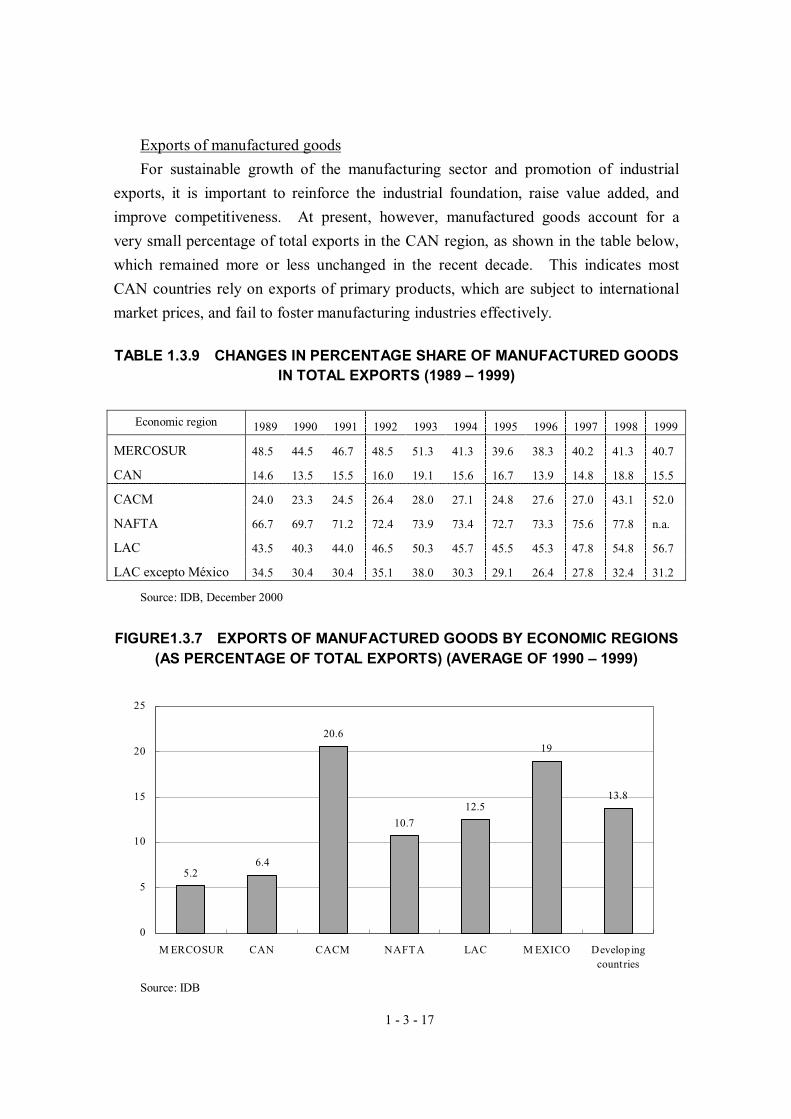
Exports of manufactured goods
For sustainable growth of the manufacturing sector and promotion of industrial
exports, it is important to reinforce the industrial foundation, raise value added, and
improve competitiveness. At present, however, manufactured goods account for a
very small percentage of total exports in the CAN region, as shown in the table below,
which remained more or less unchanged in the recent decade. This indicates most
CAN countries rely on exports of primary products, which are subject to international
market prices, and fail to foster manufacturing industries effectively.
TABLE 1.3.9 CHANGES IN PERCENTAGE SHARE OF MANUFACTURED GOODS IN TOTAL EXPORTS (1989 – 1999)
Economic region 1989 1990 1991 1992 1993 1994 1995 1996 1997 1998 1999
MERCOSUR 48.5 44.5 46.7 48.5 51.3 41.3 39.6 38.3 40.2 41.3 40.7
CAN 14.6 13.5 15.5 16.0 19.1 15.6 16.7 13.9 14.8 18.8 15.5
CACM 24.0 23.3 24.5 26.4 28.0 27.1 24.8 27.6 27.0 43.1 52.0
NAFTA 66.7 69.7 71.2 72.4 73.9 73.4 72.7 73.3 75.6 77.8 n.a.
LAC 43.5 40.3 44.0 46.5 50.3 45.7 45.5 45.3 47.8 54.8 56.7
LAC excepto México 34.5 30.4 30.4 35.1 38.0 30.3 29.1 26.4 27.8 32.4 31.2
Source: IDB, December 2000
FIGURE1.3.7 EXPORTS OF MANUFACTURED GOODS BY ECONOMIC REGIONS (AS PERCENTAGE OF TOTAL EXPORTS) (AVERAGE OF 1990 – 1999)
Source: IDB
5.26.4
20.6
10.7
12.5
19
13.8
0
5
10
15
20
25
M ERCOSUR CAN CACM NAFTA LAC M EXICO Develop ingcountries
1 - 3 - 18
Comparing CAN, CACM and Mexico, exports of manufactured goods from CACM
and Mexico grew rapidly, while those from CAN showed moderate growth. Clearly,
CACM enjoys benefits from preferential tariff treatment by the U.S., and Mexico
benefits from NAFTA. In fact, CAN countries (Bolivia, Colombia, Ecuador and Peru)
and the Caribbean countries receive preferential treatment from the U.S. under the
ATPA program, but they do not obviously take advantage of the privilege.
1 - 3 - 19
1.3.4 Trade policy
The country’s trade policy under the current President Chavez administration has
the following objectives.
(1) Political and economic framework for successful growth of Venezuela in the
world economy
1) Strategy
To reinforce the effective vehicles related to promotion of non-traditional trade,
specially to leverage the existing skills in the field of energy sources and the means to
use them.
a. To start trade negotiations with different countries and economic blocs in pursuit of
more favorable commercial opportunities, which should be expanded to countries and
areas with which Venezuela has not have close relations so as to unleash economic
dynamism.
b. To evaluate advantages of trade agreements signed and entered by Venezuela in
order to complete and pursue the national objective of production promotion.
c. To support the establishment of new international alliance strategy and
diversification of commerce, followed by verification their effects. The strategy
should address the important of the Asia/Pacific area and emphasize alliances with
India, Malaysia and China in the context of WTO.
d. To enable the domestic market to expand into the Andean and Caribbean markets in
the context of open and supplemental relations. It is important to check the market
environment in the Caribbean and Andean regions.
e. To determine strategy to establish the relations with MERCOSUR, particularly
Brazil, in order to study the objective to create a free trade zone. Note that
negotiation with Brazil on expansion of commercial relations should include the
issues related to energy, which is of mutual interest for both countries.
f. To define special concerns of Venezuela and incorporate them into agenda for
multilateral and western hemisphere negotiations. In particular, it is desirable to
incorporate them into the framework for negotiations at FTAA and WTO.
g. To upgrade skills of bureaucrats who are engaged in the above negotiation process,
and to define the country’s arguments and propositions on important negotiation
scenarios. It is important for both the government and private sectors to develop a
proposal in the context of international economic relations when they implement the
above strategies.
1 - 3 - 20
(2) Protection of commercial interest of Venezuela in domestic and international
markets
1) Strategy
a. To check common tariff rates of CAN. At present, four tariff rates (5%, 10%,
15% and 20%) are established according to product grade, as designated under Decree
989 dated December 20, 1995.
b. To allocate agricultural items in order to allow consideration of Venezuela’s
proposals at WTO. Auxiliary tariff standards for products are established in List L36
under gazette No.36.831 dated November 17, 1999, as a result of the agriculture
negotiation at the Uruguay round.
c. To correct corruptive practice in customs clearance procedures, while improving
organizational accountability.
(3) Promotion of export diversification and development
1) Strategy
a. To raise value added in the domestic production process and reinforce
competitiveness of goods and services for export diversification and development.
As international trade rapidly changes and develops, the markets are liberalized and
globalizing. Also, international trade practices??? are changing and competition is
intensifying.
b. To reinforce financial support for export; to provide financial support for
non-traditional product exports via commercial banks; to provide policy risk
mitigation and contingency measures for exporters (insurance, etc.); to implement
export promotion, advice and information service; to provide credit line for exporters;
to provide financial assistance investment in exports and infusion of working capital
by BANCOEX for export service; to provide credit line for purchasers (importers) in
the country; to support the issuance of letter of credit; and BANCOEX’s insurance
service for exporters via La Mundial, C.a. Venezolana de Seguros De Credito.
c. To provide resources and means to promote exports of non-traditional products in
expert markets. MPC will establish Fond Ficuciario de Promocion for export
promotion purposes, and actual export promotion activities will be carried out by
Contrato de Fideicomiso.
d. To apply free trade zone standards and special tariffs to industrial development
projects that involve the development of hubs for export promotion. MPC is
expected to work jointly with the Ministry of Finance, SENIAT and related ministries
1 - 3 - 21
to devise policies and programs to provide export assistance measures and adjust tariff
standards. As for the free trade zone, export incentives and measures to attract
foreign investment should be developed. As part of policy of the Ministry of
Production and Trade (MPC), the following actions appears to be mandated:
• Review and amendment of the legal system
• Establishment of conditions to approve the free trade zone
• Evaluation of the WTO agreement related to subsidy and compensation
• Evaluation on payment of direct tax
(4) Others
a. To modernize the customs office under concerted efforts of related ministries and
agencies; and to ensure, promote and assist reforms of customs management,
including human resource development, and automation of service including service
providers and forwarders. Venezuela has committed to development and
improvement of the following business facilities related to customs service within the
framework of FTAA:
• Temporary import and transit approval
• Streamlining of procedures for shipment of low-cost products
• Implementation of the EDI system and configuration of general data
• Establishment of operation codes for customs officers
b. To promote upgrading of statistical information systems related to trade and
investment operated by various ministries. It is important to perform timely analysis
of statistical data on foreign trade, thereby to allow effective linkage to policymaking
processes.
1 - 3 - 22
1.3.5 Infrastructure related to foreign trade
In a questionnaire survey of companies by BANCOEX in CAN, responses of
Venezuelan companies related to the future expectation for CAN and its market are
summarized as follows:
• 94% feels that CAN brings benefits to each country and expand business
opportunities.
• 88% expects business expansion within CAN in the next three years and 71%
expansion of the domestic market.
• The percentage of “high expectation” for increased exports form CAN to other
countries is 40% on the CAN average, compared to 17% of Venezuelan
companies. 50% of Venezuelan companies have “moderate expectation” and
17% “do not have any expectation.”
Nevertheless, most respondents share recognition on the economic effects of CAN
on the region and each country, including market expansion to third party countries and
growth of exports and sales.
Therefore, further study and analyses on this subject are to be contemplated.
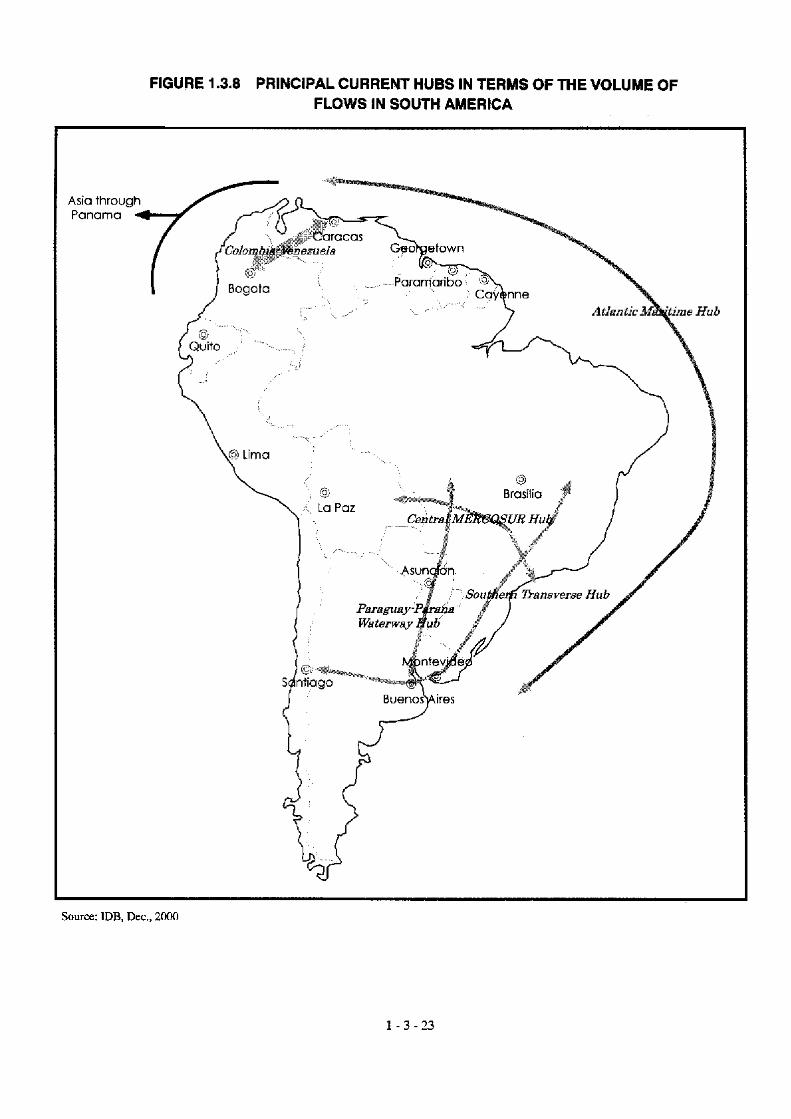
(1) Current state of transportation hubs for physical distribution in South America
Figure1.3.8 shows international physical distribution routes that are widely
recognized and designated by IDB for infrastructure development. Among them, two
physical distribution routes are important for Venezuela and its trade, namely the
Venezuela-Colombia route and the Atlantic route. In addition, infrastructure
development plans are proposed or implemented in the countries within CAN and
MERCORSUR, and sub-regional infrastructure projects are planned to establish or
upgrade physical distribution routes between neighboring countries.
1 - 3 - 25
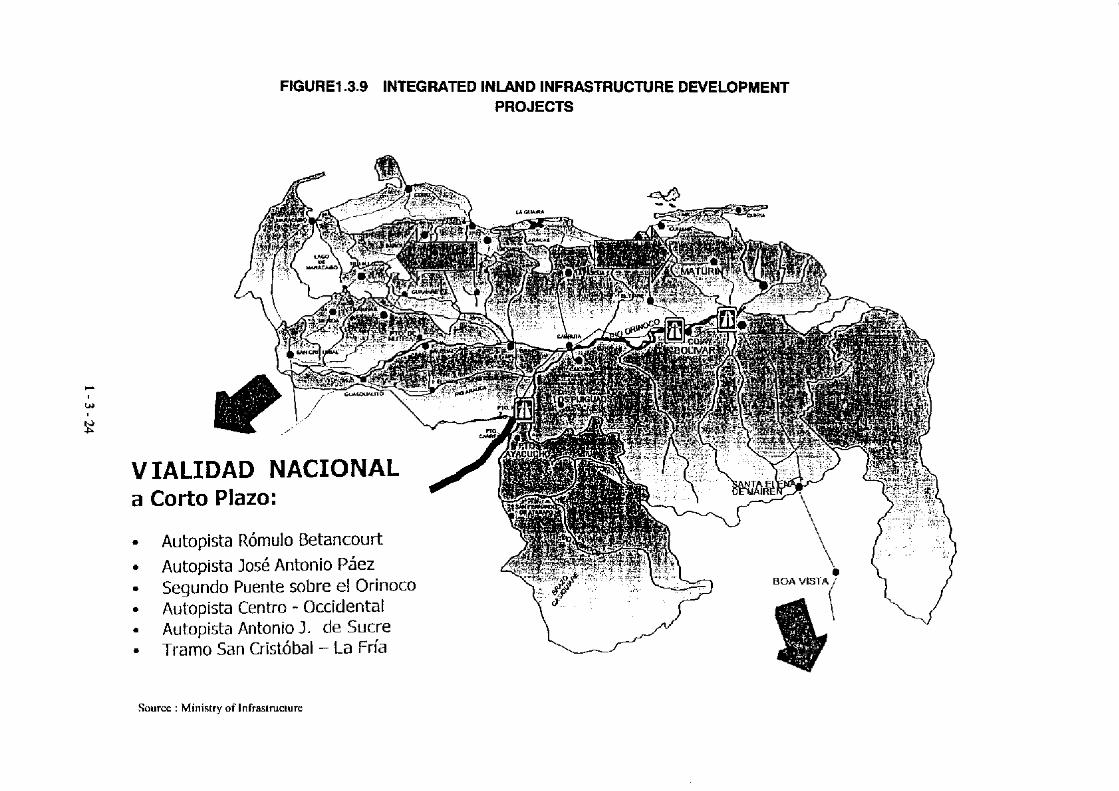
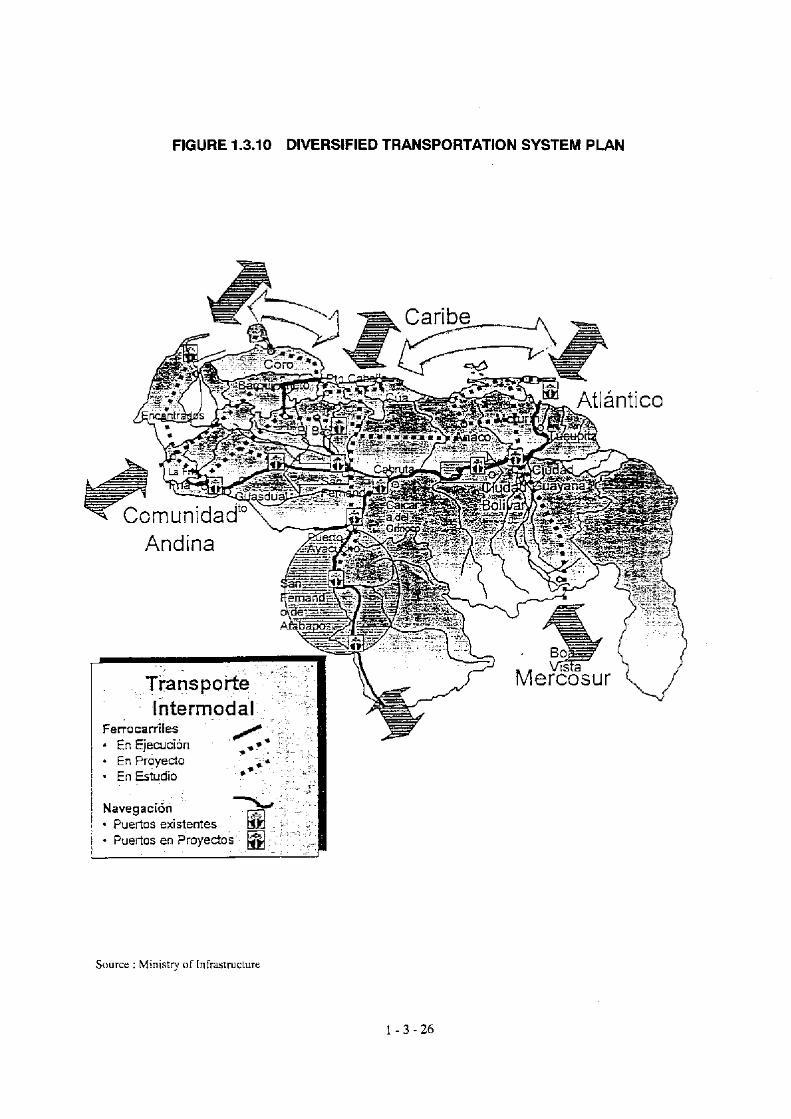
(2) Infrastructure development plan for physical distribution in trade in Venezuela
The country’s infrastructure for physical distribution service consists of land (roads
and rails), river and marine transport. According to the infrastructure development
plan of the Ministry of Infrastructure, 6 road integration projects are planned. In the
south-east area, a route from Santa Elena de Uairen to Boa Vista, northern Brazil, is
planned and expected to help link the country with the MERCOSUR region. The
project is also linked to a infrastructure development plan in Brazil, “Avanca Brasil.”
In the south-west area, a project connecting San Cristobal and Colombia is being
planned.
Furthermore, the “Regional Decentralized Development Plan” in the country
envisages the upgrading of river and marine transportation systems and the construction
and expansion of rail transport networks, for the purpose of promoting functional
linkages among regions and enhance physical distribution services connecting adjacent
economic regions. The focal point of the plan is placed on the linkage between two
major rivers (Orinoco and Apure) in order to allow transportation of inland resources
and manufactured goods (future) to the eastern seaboard, while the upgrading of
transportation routes from major cities along the rivers to ports in the northern part, in
consideration of access to the Caribbean area, as well as expansion of feeder
transportation routes along the coast.
1 - 3 - 27
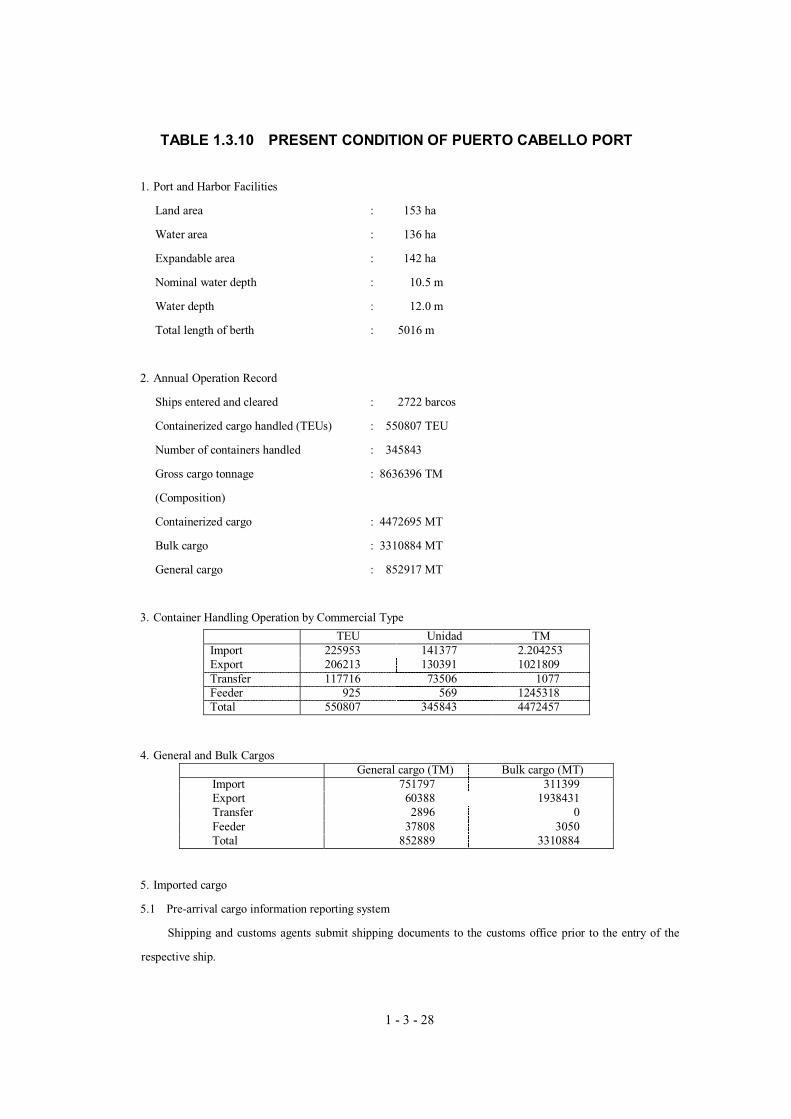
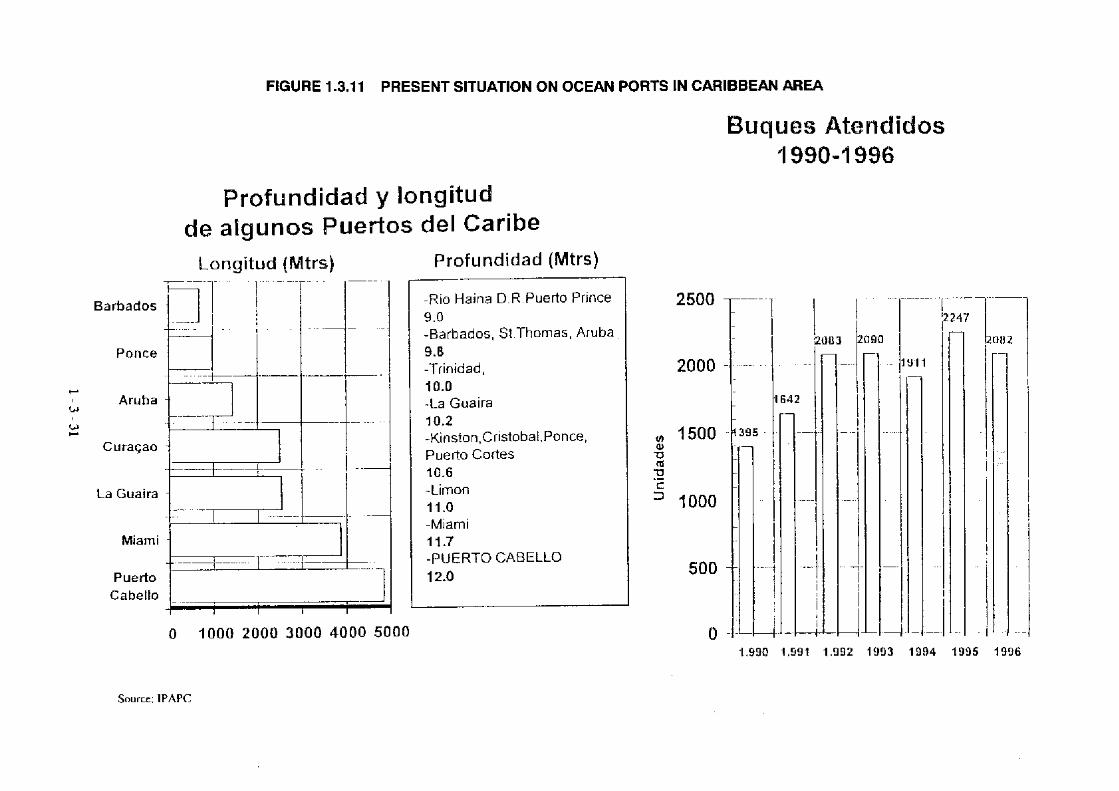
Finally, Puerto Cabello, a major port located in the north-western part of the
country and serving as a center for physical distribution from nearby industrial areas
and Colombia to the Caribbean area, is evaluated in terms of functions and handling
capacities. The port is rated by many users (private companies) as “functionally
efficient” and it has been handling more and more cargos. It is expected to become a
hub port in the north side of South America and enhance feeder transport service to and
from coastal areas and the Caribbean countries. Furthermore, it will handle more
cargos to and from Asia under the linkage with a new container terminal in Panama.
Now, it is imperative to promote modernization projects for the port and its facilities,
which will serve as infrastructure for foreign trade activities as discussed in 1.3.4 (4)a
and b.
1 - 3 - 28
TABLE 1.3.10 PRESENT CONDITION OF PUERTO CABELLO PORT
1. Port and Harbor Facilities
Land area : 153 ha
Water area : 136 ha
Expandable area : 142 ha
Nominal water depth : 10.5 m
Water depth : 12.0 m
Total length of berth : 5016 m
2. Annual Operation Record
Ships entered and cleared : 2722 barcos
Containerized cargo handled (TEUs) : 550807 TEU
Number of containers handled : 345843
Gross cargo tonnage : 8636396 TM
(Composition)
Containerized cargo : 4472695 MT
Bulk cargo : 3310884 MT
General cargo : 852917 MT
3. Container Handling Operation by Commercial Type
TEU Unidad TM Import 225953 141377 2.204253 Export 206213 130391 1021809 Transfer 117716 73506 1077 Feeder 925 569 1245318 Total 550807 345843 4472457
4. General and Bulk Cargos General cargo (TM) Bulk cargo (MT) Import 751797 311399 Export 60388 1938431 Transfer 2896 0 Feeder 37808 3050 Total 852889 3310884
5. Imported cargo
5.1 Pre-arrival cargo information reporting system
Shipping and customs agents submit shipping documents to the customs office prior to the entry of the
respective ship.
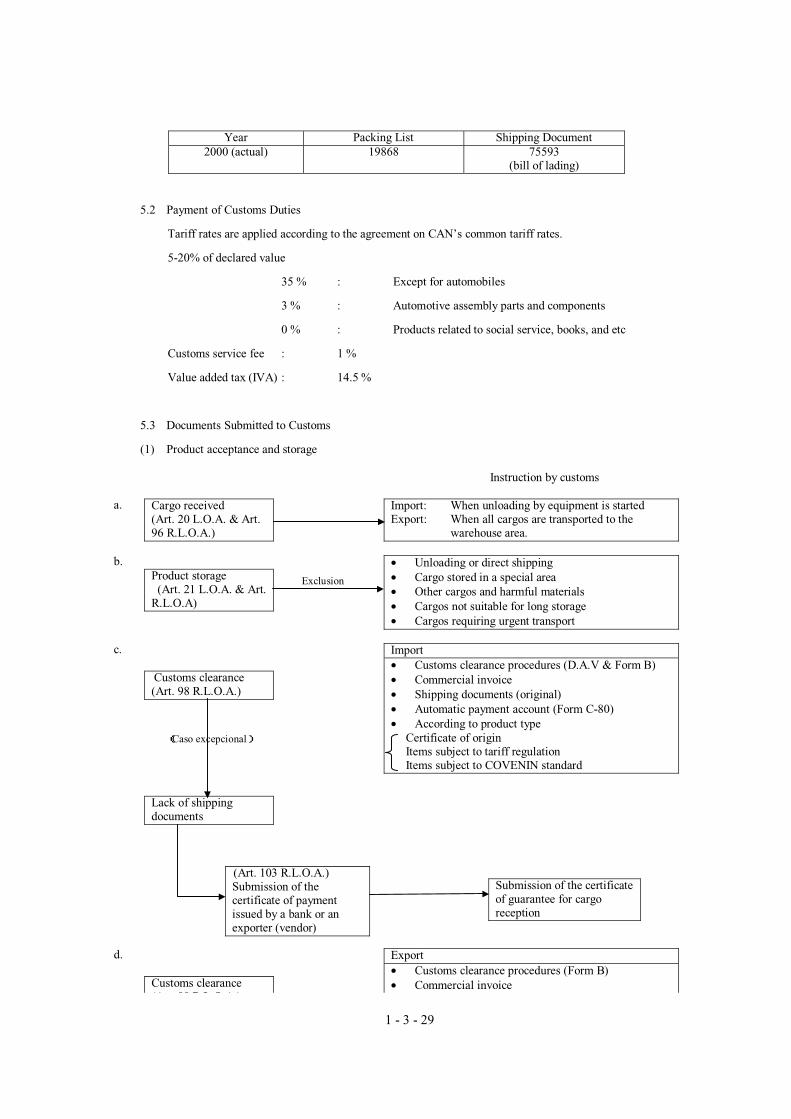
1 - 3 - 29
Year Packing List Shipping Document 2000 (actual) 19868 75593
(bill of lading)
5.2 Payment of Customs Duties
Tariff rates are applied according to the agreement on CAN’s common tariff rates.
5-20% of declared value
35 % : Except for automobiles
3 % : Automotive assembly parts and components
0 % : Products related to social service, books, and etc
Customs service fee : 1 %
Value added tax (IVA) : 14.5 %
5.3 Documents Submitted to Customs
(1) Product acceptance and storage
Instruction by customs a. Cargo received
(Art. 20 L.O.A. & Art. 96 R.L.O.A.)
Import: When unloading by equipment is started Export: When all cargos are transported to the
warehouse area. b.
Product storage (Art. 21 L.O.A. & Art. R.L.O.A)
• Unloading or direct shipping • Cargo stored in a special area • Other cargos and harmful materials • Cargos not suitable for long storage • Cargos requiring urgent transport
c.
Customs clearance (Art. 98 R.L.O.A.)
Import • Customs clearance procedures (D.A.V & Form B) • Commercial invoice • Shipping documents (original) • Automatic payment account (Form C-80) • According to product type
Certificate of origin Items subject to tariff regulation Items subject to COVENIN standard
Lack of shipping documents
(Art. 103 R.L.O.A.) Submission of the certificate of payment issued by a bank or an exporter (vendor)
Submission of the certificate of guarantee for cargo reception
d.
Customs clearance (A 98 R L O A )
Export• Customs clearance procedures (Form B) • Commercial invoice
Exclusion
(Caso excepcional)
1 - 3 - 30
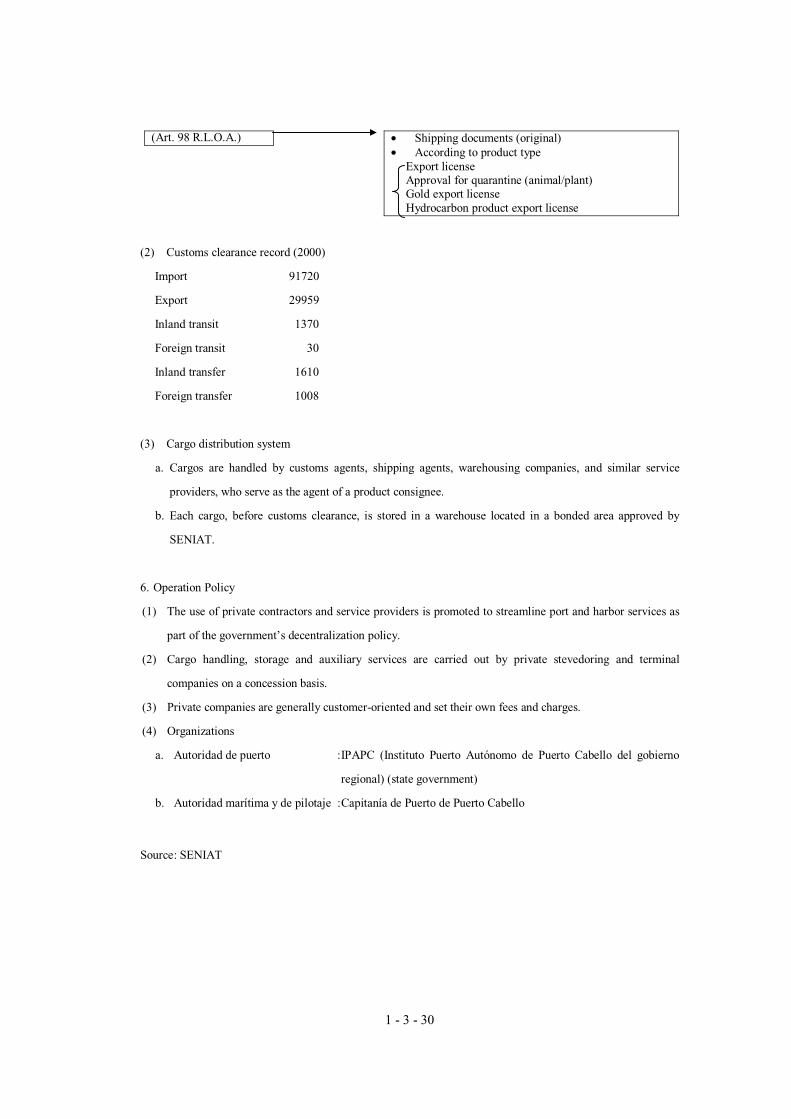
(Art. 98 R.L.O.A.) • Shipping documents (original) • According to product type
Export license Approval for quarantine (animal/plant) Gold export license Hydrocarbon product export license
(2) Customs clearance record (2000)
Import 91720
Export 29959
Inland transit 1370
Foreign transit 30
Inland transfer 1610
Foreign transfer 1008
(3) Cargo distribution system
a. Cargos are handled by customs agents, shipping agents, warehousing companies, and similar service
providers, who serve as the agent of a product consignee.
b. Each cargo, before customs clearance, is stored in a warehouse located in a bonded area approved by
SENIAT.
6. Operation Policy
(1) The use of private contractors and service providers is promoted to streamline port and harbor services as
part of the government’s decentralization policy.
(2) Cargo handling, storage and auxiliary services are carried out by private stevedoring and terminal
companies on a concession basis.
(3) Private companies are generally customer-oriented and set their own fees and charges.
(4) Organizations
a. Autoridad de puerto : IPAPC (Instituto Puerto Autónomo de Puerto Cabello del gobierno
regional) (state government)
b. Autoridad marítima y de pilotaje : Capitanía de Puerto de Puerto Cabello
Source: SENIAT
1 - 4 - 1
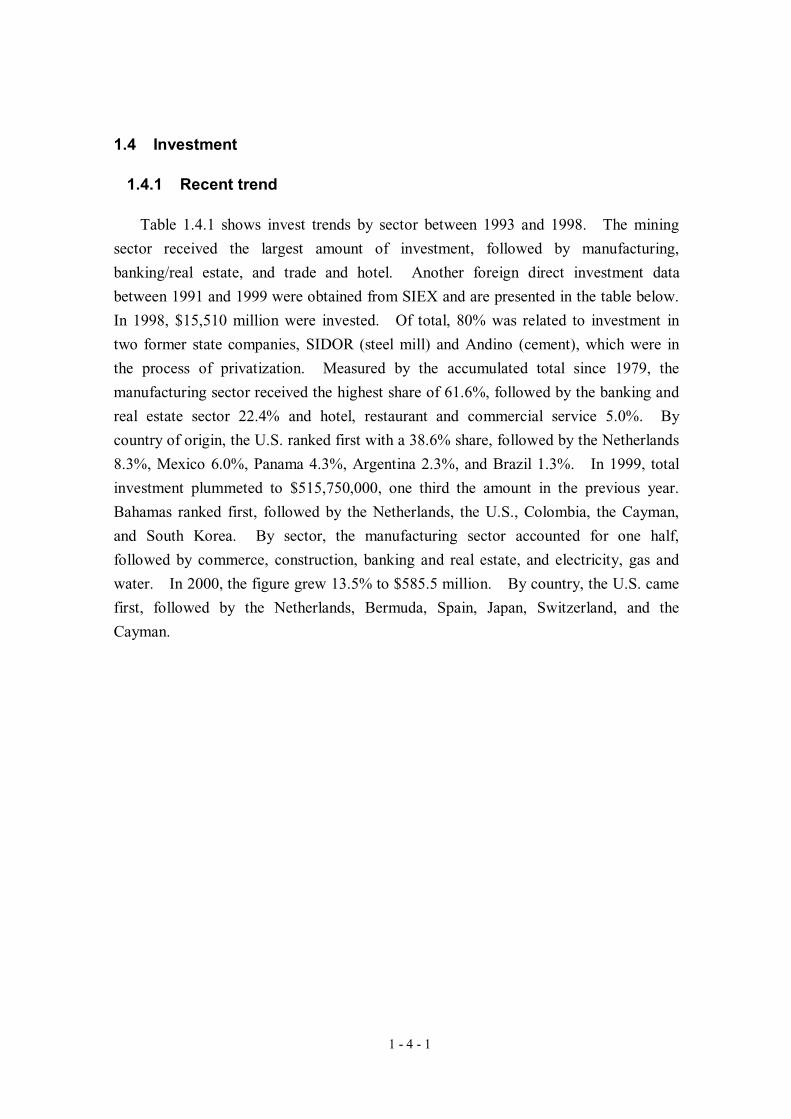
1.4 Investment
1.4.1 Recent trend
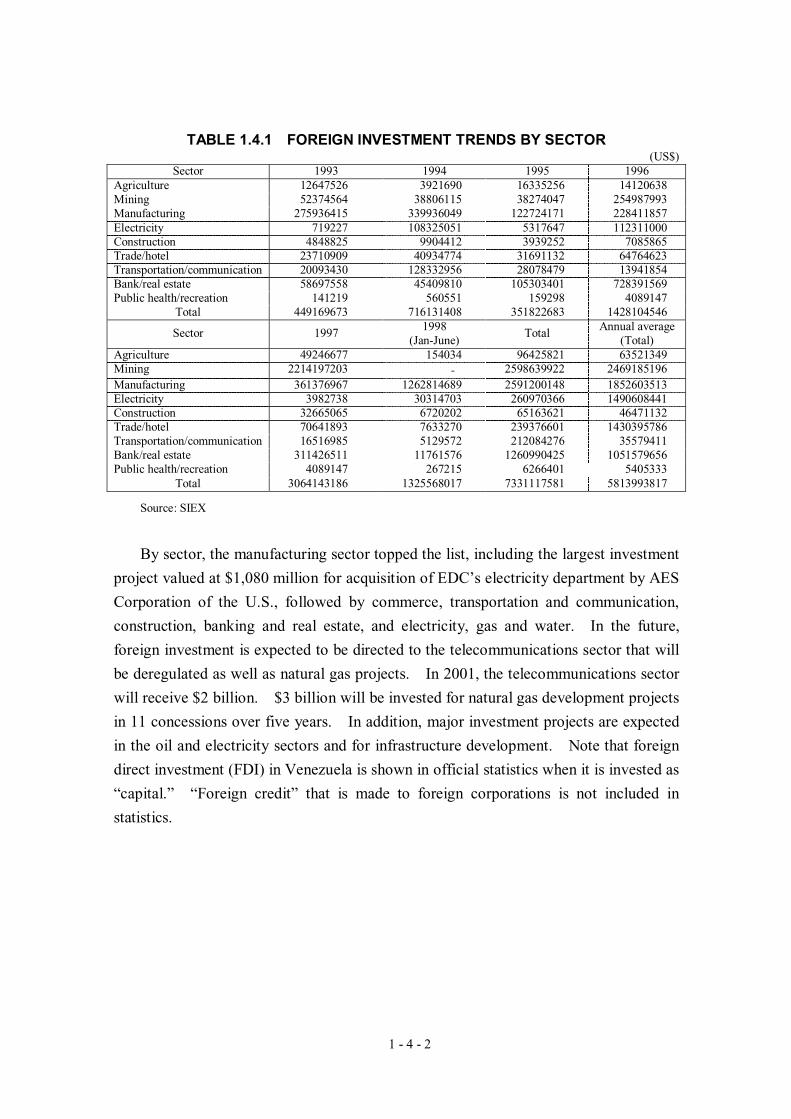
Table 1.4.1 shows invest trends by sector between 1993 and 1998. The mining
sector received the largest amount of investment, followed by manufacturing,
banking/real estate, and trade and hotel. Another foreign direct investment data
between 1991 and 1999 were obtained from SIEX and are presented in the table below.
In 1998, $15,510 million were invested. Of total, 80% was related to investment in
two former state companies, SIDOR (steel mill) and Andino (cement), which were in
the process of privatization. Measured by the accumulated total since 1979, the
manufacturing sector received the highest share of 61.6%, followed by the banking and
real estate sector 22.4% and hotel, restaurant and commercial service 5.0%. By
country of origin, the U.S. ranked first with a 38.6% share, followed by the Netherlands
8.3%, Mexico 6.0%, Panama 4.3%, Argentina 2.3%, and Brazil 1.3%. In 1999, total
investment plummeted to $515,750,000, one third the amount in the previous year.
Bahamas ranked first, followed by the Netherlands, the U.S., Colombia, the Cayman,
and South Korea. By sector, the manufacturing sector accounted for one half,
followed by commerce, construction, banking and real estate, and electricity, gas and
water. In 2000, the figure grew 13.5% to $585.5 million. By country, the U.S. came
first, followed by the Netherlands, Bermuda, Spain, Japan, Switzerland, and the
Cayman.
1 - 4 - 2
TABLE 1.4.1 FOREIGN INVESTMENT TRENDS BY SECTOR (US$)
Sector 1993 1994 1995 1996 Agriculture 12647526 3921690 16335256 14120638 Mining 52374564 38806115 38274047 254987993 Manufacturing 275936415 339936049 122724171 228411857 Electricity 719227 108325051 5317647 112311000 Construction 4848825 9904412 3939252 7085865 Trade/hotel 23710909 40934774 31691132 64764623 Transportation/communication 20093430 128332956 28078479 13941854 Bank/real estate 58697558 45409810 105303401 728391569 Public health/recreation 141219 560551 159298 4089147
Total 449169673 716131408 351822683 1428104546
Sector 1997 1998(Jan-June)
Total Annual average(Total)
Agriculture 49246677 154034 96425821 63521349 Mining 2214197203 ‐ 2598639922 2469185196 Manufacturing 361376967 1262814689 2591200148 1852603513 Electricity 3982738 30314703 260970366 1490608441 Construction 32665065 6720202 65163621 46471132 Trade/hotel 70641893 7633270 239376601 1430395786 Transportation/communication 16516985 5129572 212084276 35579411 Bank/real estate 311426511 11761576 1260990425 1051579656 Public health/recreation 4089147 267215 6266401 5405333
Total 3064143186 1325568017 7331117581 5813993817
Source: SIEX
By sector, the manufacturing sector topped the list, including the largest investment
project valued at $1,080 million for acquisition of EDC’s electricity department by AES
Corporation of the U.S., followed by commerce, transportation and communication,
construction, banking and real estate, and electricity, gas and water. In the future,
foreign investment is expected to be directed to the telecommunications sector that will
be deregulated as well as natural gas projects. In 2001, the telecommunications sector
will receive $2 billion. $3 billion will be invested for natural gas development projects
in 11 concessions over five years. In addition, major investment projects are expected
in the oil and electricity sectors and for infrastructure development. Note that foreign
direct investment (FDI) in Venezuela is shown in official statistics when it is invested as
“capital.” “Foreign credit” that is made to foreign corporations is not included in
statistics.
1 - 4 - 3
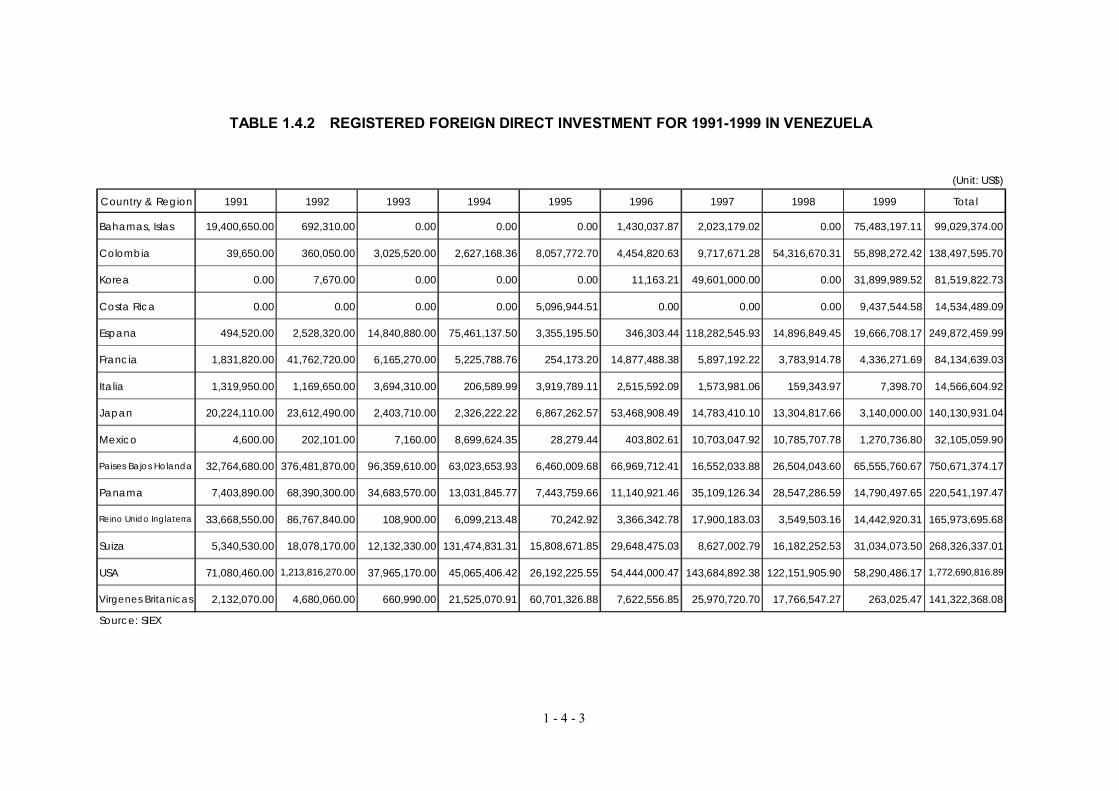
TABLE 1.4.2 REGISTERED FOREIGN DIRECT INVESTMENT FOR 1991-1999 IN VENEZUELA
(Unit: US$)
Country & Region 1991 1992 1993 1994 1995 1996 1997 1998 1999 Total
Bahamas, Islas 19,400,650.00 692,310.00 0.00 0.00 0.00 1,430,037.87 2,023,179.02 0.00 75,483,197.11 99,029,374.00
Colombia 39,650.00 360,050.00 3,025,520.00 2,627,168.36 8,057,772.70 4,454,820.63 9,717,671.28 54,316,670.31 55,898,272.42 138,497,595.70
Korea 0.00 7,670.00 0.00 0.00 0.00 11,163.21 49,601,000.00 0.00 31,899,989.52 81,519,822.73
Costa Rica 0.00 0.00 0.00 0.00 5,096,944.51 0.00 0.00 0.00 9,437,544.58 14,534,489.09
Espana 494,520.00 2,528,320.00 14,840,880.00 75,461,137.50 3,355,195.50 346,303.44 118,282,545.93 14,896,849.45 19,666,708.17 249,872,459.99
Francia 1,831,820.00 41,762,720.00 6,165,270.00 5,225,788.76 254,173.20 14,877,488.38 5,897,192.22 3,783,914.78 4,336,271.69 84,134,639.03
Italia 1,319,950.00 1,169,650.00 3,694,310.00 206,589.99 3,919,789.11 2,515,592.09 1,573,981.06 159,343.97 7,398.70 14,566,604.92
Japan 20,224,110.00 23,612,490.00 2,403,710.00 2,326,222.22 6,867,262.57 53,468,908.49 14,783,410.10 13,304,817.66 3,140,000.00 140,130,931.04
Mexico 4,600.00 202,101.00 7,160.00 8,699,624.35 28,279.44 403,802.61 10,703,047.92 10,785,707.78 1,270,736.80 32,105,059.90
Paises Bajos Holanda 32,764,680.00 376,481,870.00 96,359,610.00 63,023,653.93 6,460,009.68 66,969,712.41 16,552,033.88 26,504,043.60 65,555,760.67 750,671,374.17
Panama 7,403,890.00 68,390,300.00 34,683,570.00 13,031,845.77 7,443,759.66 11,140,921.46 35,109,126.34 28,547,286.59 14,790,497.65 220,541,197.47
Reino Unido Inglaterra 33,668,550.00 86,767,840.00 108,900.00 6,099,213.48 70,242.92 3,366,342.78 17,900,183.03 3,549,503.16 14,442,920.31 165,973,695.68
Suiza 5,340,530.00 18,078,170.00 12,132,330.00 131,474,831.31 15,808,671.85 29,648,475.03 8,627,002.79 16,182,252.53 31,034,073.50 268,326,337.01
USA 71,080,460.00 1,213,816,270.00 37,965,170.00 45,065,406.42 26,192,225.55 54,444,000.47 143,684,892.38 122,151,905.90 58,290,486.17 1,772,690,816.89
Virgenes Britanicas 2,132,070.00 4,680,060.00 660,990.00 21,525,070.91 60,701,326.88 7,622,556.85 25,970,720.70 17,766,547.27 263,025.47 141,322,368.08
Source: SIEX
1 - 4 - 4
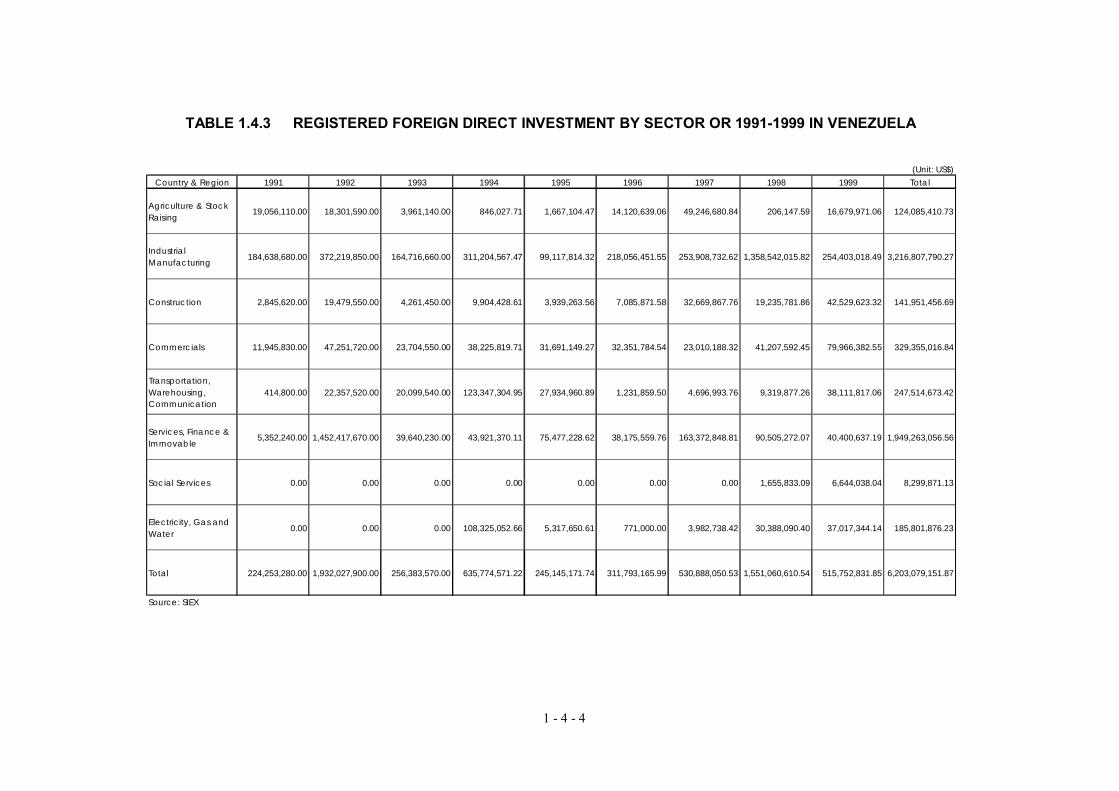
TABLE 1.4.3 REGISTERED FOREIGN DIRECT INVESTMENT BY SECTOR OR 1991-1999 IN VENEZUELA
(Unit: US$)Country & Region 1991 1992 1993 1994 1995 1996 1997 1998 1999 Total
Agriculture & StockRaising
19,056,110.00 18,301,590.00 3,961,140.00 846,027.71 1,667,104.47 14,120,639.06 49,246,680.84 206,147.59 16,679,971.06 124,085,410.73
IndustrialManufacturing 184,638,680.00 372,219,850.00 164,716,660.00 311,204,567.47 99,117,814.32 218,056,451.55 253,908,732.62 1,358,542,015.82 254,403,018.49 3,216,807,790.27
Construction 2,845,620.00 19,479,550.00 4,261,450.00 9,904,428.61 3,939,263.56 7,085,871.58 32,669,867.76 19,235,781.86 42,529,623.32 141,951,456.69
Commercials 11,945,830.00 47,251,720.00 23,704,550.00 38,225,819.71 31,691,149.27 32,351,784.54 23,010,188.32 41,207,592.45 79,966,382.55 329,355,016.84
Transportation,Warehousing,Communication
414,800.00 22,357,520.00 20,099,540.00 123,347,304.95 27,934,960.89 1,231,859.50 4,696,993.76 9,319,877.26 38,111,817.06 247,514,673.42
Services, Finance &Immovable
5,352,240.00 1,452,417,670.00 39,640,230.00 43,921,370.11 75,477,228.62 38,175,559.76 163,372,848.81 90,505,272.07 40,400,637.19 1,949,263,056.56
Social Services 0.00 0.00 0.00 0.00 0.00 0.00 0.00 1,655,833.09 6,644,038.04 8,299,871.13
Electricity, Gas andWater 0.00 0.00 0.00 108,325,052.66 5,317,650.61 771,000.00 3,982,738.42 30,388,090.40 37,017,344.14 185,801,876.23
Total 224,253,280.00 1,932,027,900.00 256,383,570.00 635,774,571.22 245,145,171.74 311,793,165.99 530,888,050.53 1,551,060,610.54 515,752,831.85 6,203,079,151.87
Source: SIEX
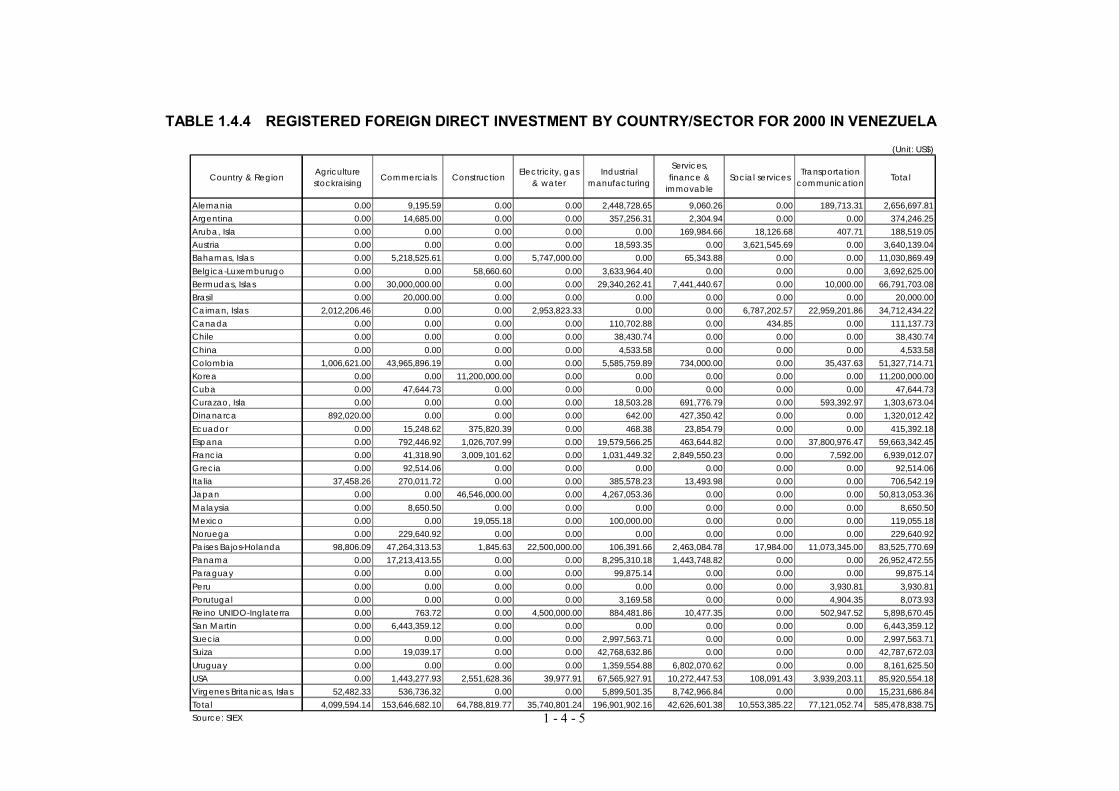
1 - 4 - 5
TABLE 1.4.4 REGISTERED FOREIGN DIRECT INVESTMENT BY COUNTRY/SECTOR FOR 2000 IN VENEZUELA
(Unit: US$)
Country & Region Agriculturestockraising Commercials Construction Electricity, gas
& waterIndustrial
manufacturing
Services,finance &
immovableSocial services Transportation
communication Total
Alemania 0.00 9,195.59 0.00 0.00 2,448,728.65 9,060.26 0.00 189,713.31 2,656,697.81Argentina 0.00 14,685.00 0.00 0.00 357,256.31 2,304.94 0.00 0.00 374,246.25Aruba, Isla 0.00 0.00 0.00 0.00 0.00 169,984.66 18,126.68 407.71 188,519.05Austria 0.00 0.00 0.00 0.00 18,593.35 0.00 3,621,545.69 0.00 3,640,139.04Bahamas, Islas 0.00 5,218,525.61 0.00 5,747,000.00 0.00 65,343.88 0.00 0.00 11,030,869.49Belgica-Luxemburugo 0.00 0.00 58,660.60 0.00 3,633,964.40 0.00 0.00 0.00 3,692,625.00Bermudas, Islas 0.00 30,000,000.00 0.00 0.00 29,340,262.41 7,441,440.67 0.00 10,000.00 66,791,703.08Brasil 0.00 20,000.00 0.00 0.00 0.00 0.00 0.00 0.00 20,000.00Caiman, Islas 2,012,206.46 0.00 0.00 2,953,823.33 0.00 0.00 6,787,202.57 22,959,201.86 34,712,434.22Canada 0.00 0.00 0.00 0.00 110,702.88 0.00 434.85 0.00 111,137.73Chile 0.00 0.00 0.00 0.00 38,430.74 0.00 0.00 0.00 38,430.74China 0.00 0.00 0.00 0.00 4,533.58 0.00 0.00 0.00 4,533.58Colombia 1,006,621.00 43,965,896.19 0.00 0.00 5,585,759.89 734,000.00 0.00 35,437.63 51,327,714.71Korea 0.00 0.00 11,200,000.00 0.00 0.00 0.00 0.00 0.00 11,200,000.00Cuba 0.00 47,644.73 0.00 0.00 0.00 0.00 0.00 0.00 47,644.73Curazao, Isla 0.00 0.00 0.00 0.00 18,503.28 691,776.79 0.00 593,392.97 1,303,673.04Dinanarca 892,020.00 0.00 0.00 0.00 642.00 427,350.42 0.00 0.00 1,320,012.42Ecuador 0.00 15,248.62 375,820.39 0.00 468.38 23,854.79 0.00 0.00 415,392.18Espana 0.00 792,446.92 1,026,707.99 0.00 19,579,566.25 463,644.82 0.00 37,800,976.47 59,663,342.45Francia 0.00 41,318.90 3,009,101.62 0.00 1,031,449.32 2,849,550.23 0.00 7,592.00 6,939,012.07Grecia 0.00 92,514.06 0.00 0.00 0.00 0.00 0.00 0.00 92,514.06Italia 37,458.26 270,011.72 0.00 0.00 385,578.23 13,493.98 0.00 0.00 706,542.19Japan 0.00 0.00 46,546,000.00 0.00 4,267,053.36 0.00 0.00 0.00 50,813,053.36Malaysia 0.00 8,650.50 0.00 0.00 0.00 0.00 0.00 0.00 8,650.50Mexico 0.00 0.00 19,055.18 0.00 100,000.00 0.00 0.00 0.00 119,055.18Noruega 0.00 229,640.92 0.00 0.00 0.00 0.00 0.00 0.00 229,640.92Paises Bajos-Holanda 98,806.09 47,264,313.53 1,845.63 22,500,000.00 106,391.66 2,463,084.78 17,984.00 11,073,345.00 83,525,770.69Panama 0.00 17,213,413.55 0.00 0.00 8,295,310.18 1,443,748.82 0.00 0.00 26,952,472.55Paraguay 0.00 0.00 0.00 0.00 99,875.14 0.00 0.00 0.00 99,875.14Peru 0.00 0.00 0.00 0.00 0.00 0.00 0.00 3,930.81 3,930.81Porutugal 0.00 0.00 0.00 0.00 3,169.58 0.00 0.00 4,904.35 8,073.93Reino UNIDO-Inglaterra 0.00 763.72 0.00 4,500,000.00 884,481.86 10,477.35 0.00 502,947.52 5,898,670.45San Martin 0.00 6,443,359.12 0.00 0.00 0.00 0.00 0.00 0.00 6,443,359.12Suecia 0.00 0.00 0.00 0.00 2,997,563.71 0.00 0.00 0.00 2,997,563.71Suiza 0.00 19,039.17 0.00 0.00 42,768,632.86 0.00 0.00 0.00 42,787,672.03Uruguay 0.00 0.00 0.00 0.00 1,359,554.88 6,802,070.62 0.00 0.00 8,161,625.50USA 0.00 1,443,277.93 2,551,628.36 39,977.91 67,565,927.91 10,272,447.53 108,091.43 3,939,203.11 85,920,554.18Virgenes Britanicas, Islas 52,482.33 536,736.32 0.00 0.00 5,899,501.35 8,742,966.84 0.00 0.00 15,231,686.84Total 4,099,594.14 153,646,682.10 64,788,819.77 35,740,801.24 196,901,902.16 42,626,601.38 10,553,385.22 77,121,052.74 585,478,838.75Source: SIEX
1 - 4 - 6
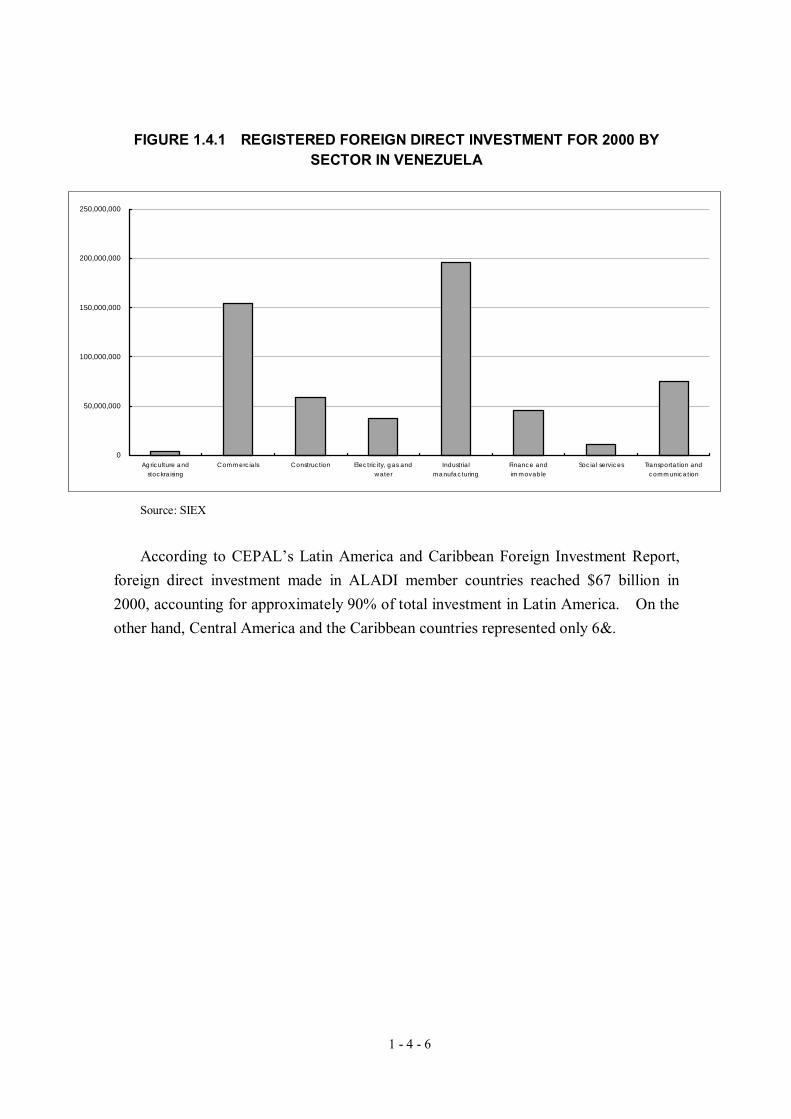
FIGURE 1.4.1 REGISTERED FOREIGN DIRECT INVESTMENT FOR 2000 BY SECTOR IN VENEZUELA
Source: SIEX
According to CEPAL’s Latin America and Caribbean Foreign Investment Report,
foreign direct investment made in ALADI member countries reached $67 billion in
2000, accounting for approximately 90% of total investment in Latin America. On the
other hand, Central America and the Caribbean countries represented only 6&.
0
50,000,000
100,000,000
150,000,000
200,000,000
250,000,000
Agriculture andstockraising
Commercials Construction Electricity, gas andwater
Industrialmanufacturing
Finance andimmovable
Social services Transportation andcommunication
1 - 4 - 7
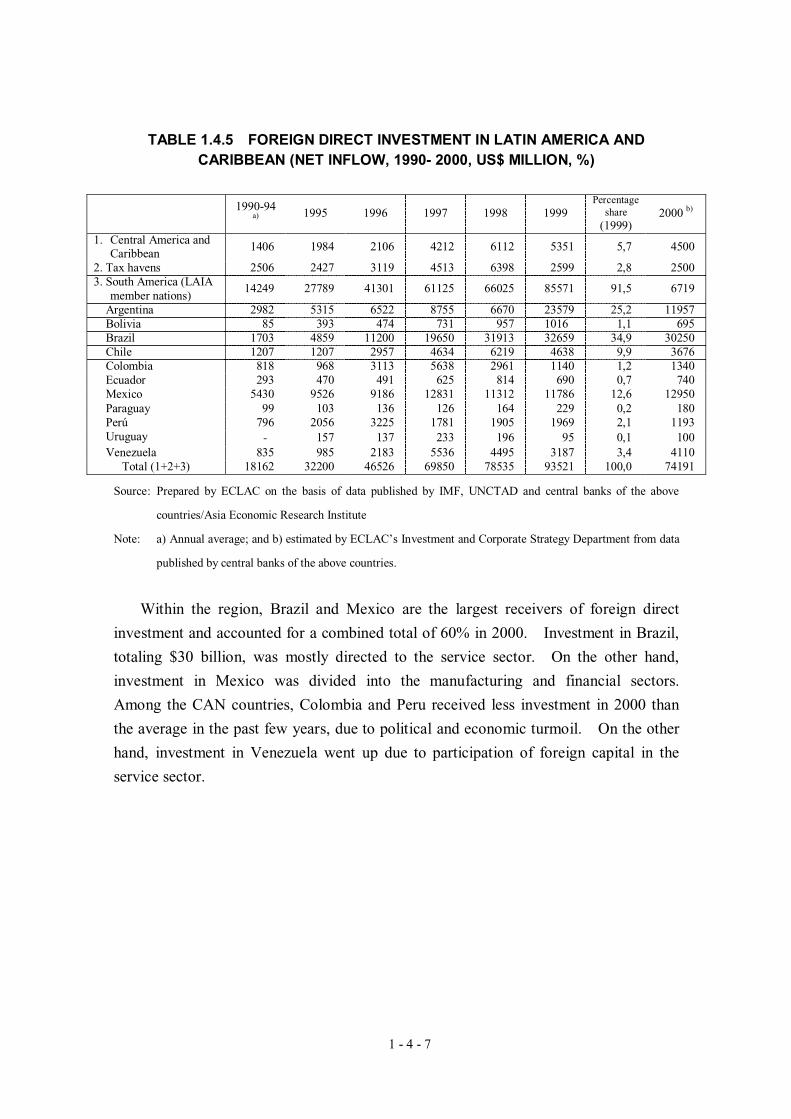
TABLE 1.4.5 FOREIGN DIRECT INVESTMENT IN LATIN AMERICA AND CARIBBEAN (NET INFLOW, 1990- 2000, US$ MILLION, %)
1990-94 a) 1995 1996 1997 1998 1999
Percentage share
(1999)2000 b)
1. Central America and Caribbean
1406 1984 2106 4212 6112 5351 5,7 4500
2. Tax havens 2506 2427 3119 4513 6398 2599 2,8 25003. South America (LAIA
member nations) 14249 27789 41301 61125 66025 85571 91,5 6719
Argentina 2982 5315 6522 8755 6670 23579 25,2 11957 Bolivia 85 393 474 731 957 1016 1,1 695 Brazil 1703 4859 11200 19650 31913 32659 34,9 30250 Chile 1207 1207 2957 4634 6219 4638 9,9 3676 Colombia 818 968 3113 5638 2961 1140 1,2 1340 Ecuador 293 470 491 625 814 690 0,7 740 Mexico 5430 9526 9186 12831 11312 11786 12,6 12950 Paraguay 99 103 136 126 164 229 0,2 180 Perú 796 2056 3225 1781 1905 1969 2,1 1193 Uruguay ‐ 157 137 233 196 95 0,1 100 Venezuela 835 985 2183 5536 4495 3187 3,4 4110
Total (1+2+3) 18162 32200 46526 69850 78535 93521 100,0 74191
Source: Prepared by ECLAC on the basis of data published by IMF, UNCTAD and central banks of the above
countries/Asia Economic Research Institute
Note: a) Annual average; and b) estimated by ECLAC’s Investment and Corporate Strategy Department from data
published by central banks of the above countries.
Within the region, Brazil and Mexico are the largest receivers of foreign direct
investment and accounted for a combined total of 60% in 2000. Investment in Brazil,
totaling $30 billion, was mostly directed to the service sector. On the other hand,
investment in Mexico was divided into the manufacturing and financial sectors.
Among the CAN countries, Colombia and Peru received less investment in 2000 than
the average in the past few years, due to political and economic turmoil. On the other
hand, investment in Venezuela went up due to participation of foreign capital in the
service sector.
1 - 4 - 8
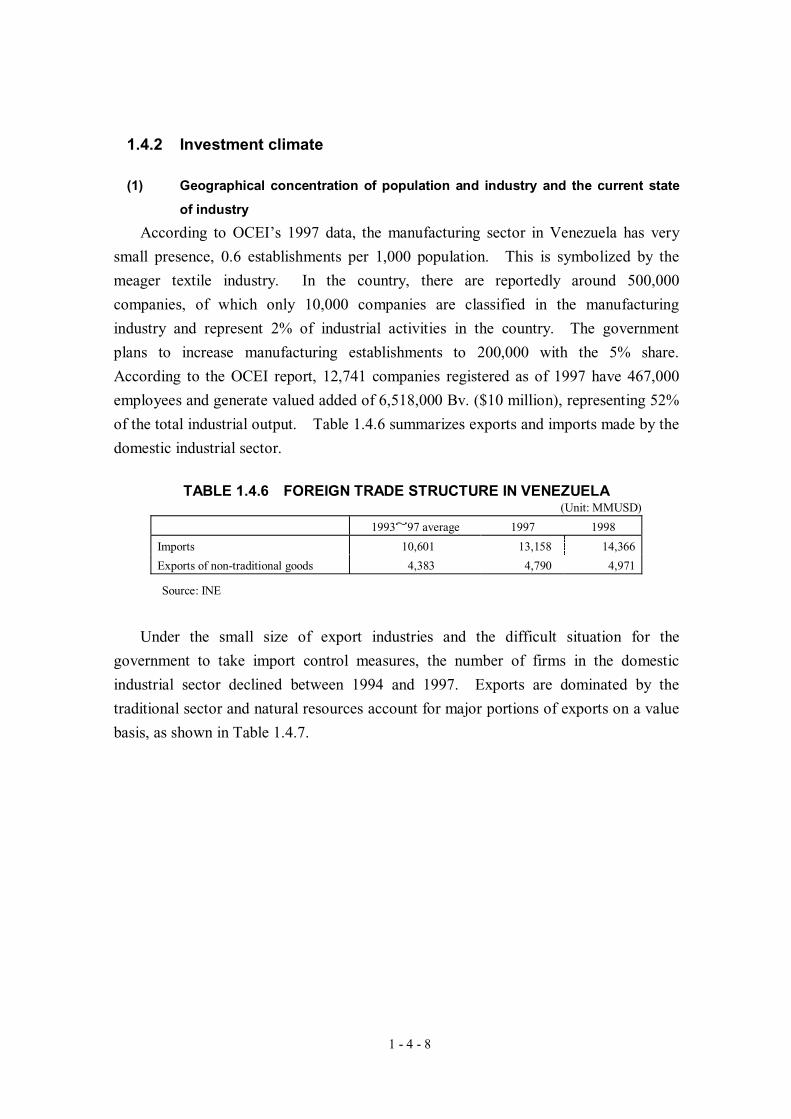
1.4.2 Investment climate
(1) Geographical concentration of population and industry and the current state
of industry
According to OCEI’s 1997 data, the manufacturing sector in Venezuela has very
small presence, 0.6 establishments per 1,000 population. This is symbolized by the
meager textile industry. In the country, there are reportedly around 500,000
companies, of which only 10,000 companies are classified in the manufacturing
industry and represent 2% of industrial activities in the country. The government
plans to increase manufacturing establishments to 200,000 with the 5% share.
According to the OCEI report, 12,741 companies registered as of 1997 have 467,000
employees and generate valued added of 6,518,000 Bv. ($10 million), representing 52%
of the total industrial output. Table 1.4.6 summarizes exports and imports made by the
domestic industrial sector.
TABLE 1.4.6 FOREIGN TRADE STRUCTURE IN VENEZUELA (Unit: MMUSD)
1993~97 average 1997 1998
Imports 10,601 13,158 14,366
Exports of non-traditional goods 4,383 4,790 4,971
Source: INE
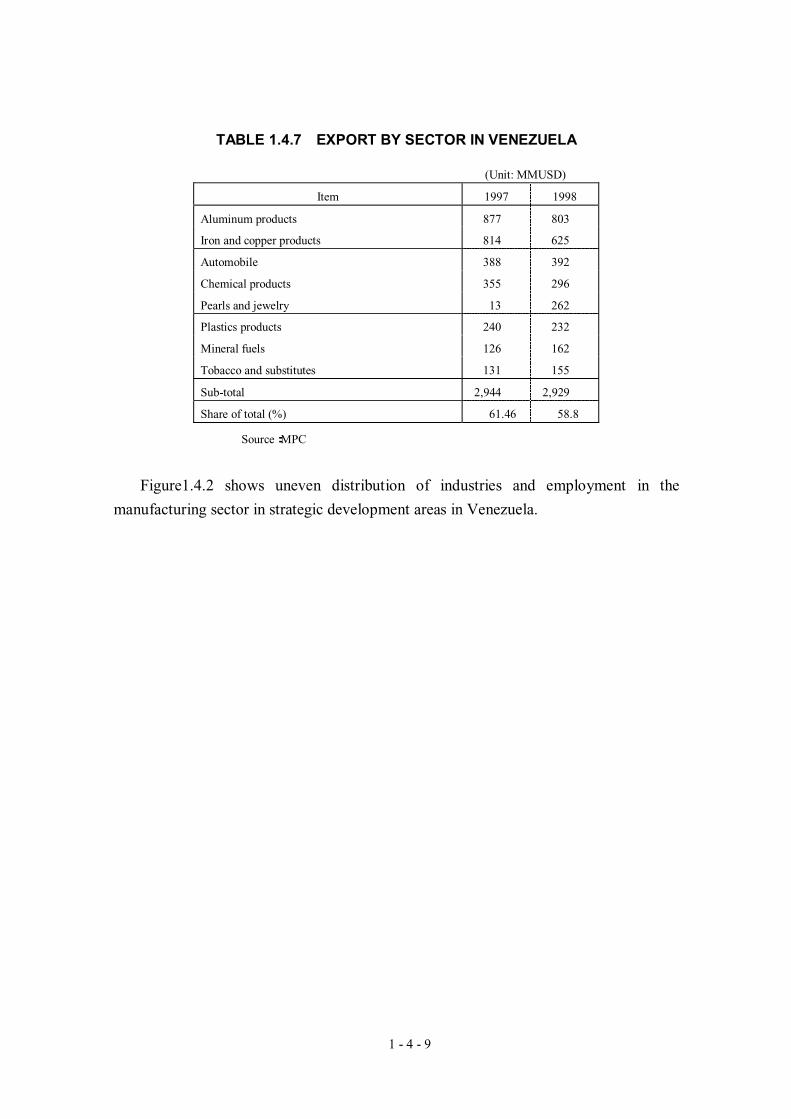
Under the small size of export industries and the difficult situation for the
government to take import control measures, the number of firms in the domestic
industrial sector declined between 1994 and 1997. Exports are dominated by the
traditional sector and natural resources account for major portions of exports on a value
basis, as shown in Table 1.4.7.
1 - 4 - 9
TABLE 1.4.7 EXPORT BY SECTOR IN VENEZUELA
(Unit: MMUSD)
Item 1997 1998
Aluminum products 877 803
Iron and copper products 814 625
Automobile 388 392
Chemical products 355 296
Pearls and jewelry 13 262
Plastics products 240 232
Mineral fuels 126 162
Tobacco and substitutes 131 155
Sub-total 2,944 2,929
Share of total (%) 61.46 58.8
Source:MPC
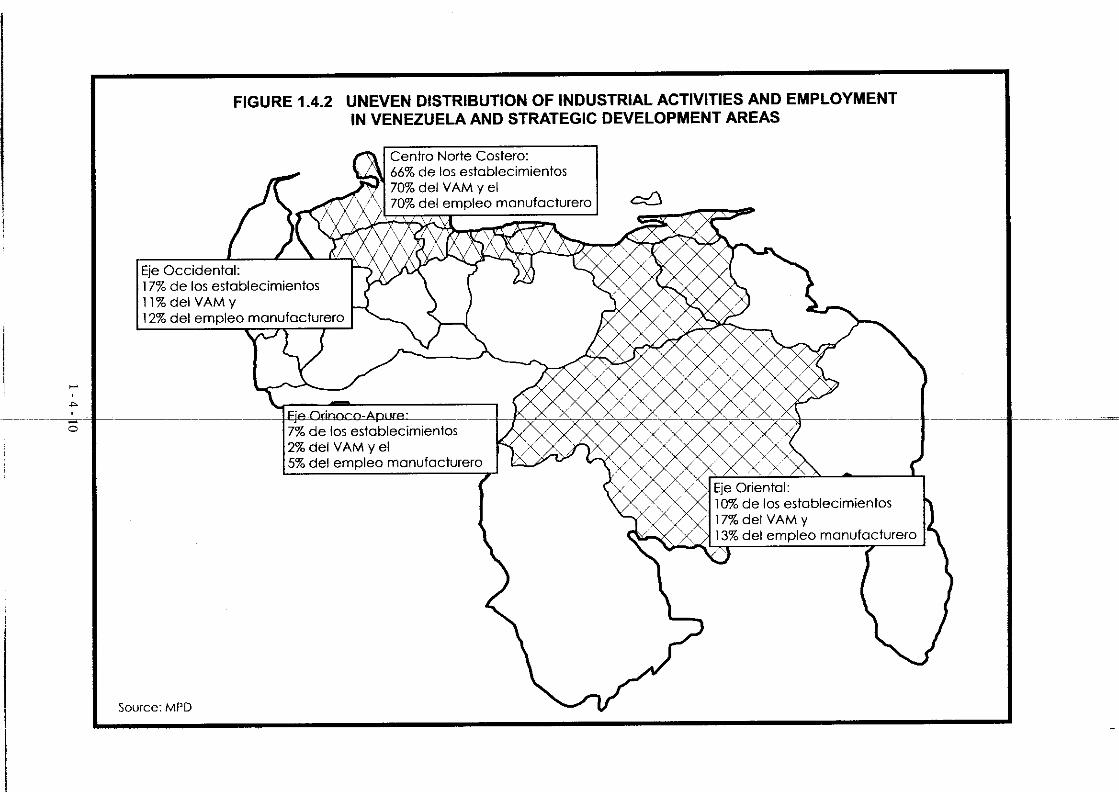
Figure1.4.2 shows uneven distribution of industries and employment in the
manufacturing sector in strategic development areas in Venezuela.
1 - 4 - 11
The country is divided into four regions, showing the number of companies per
population, the value added ratio of the manufacturing industry, and share of
employment in the manufacturing industry. Between 1994 and 1997, the textile
industry declined 22% in the Orinoco-Apure area and 9% in the Centro Norte-Costero
are, suggesting the outflow of industries from the development areas. The number of
manufacturing establishments and employment in key sectors are summarized as
follows.
1) Traditional sector (54% in the number of establishments and 42% in the number of
employees)
・Food, beverage, tobacco
・Textile, apparel, leather
・Woodworking (including furniture)
2) Intermediate sector (7% in the number of establishments and 16% in the number of
employees)
・Chemical products, oil derivatives, coal, plastics
3) Machinery sector (24% in the number of establishments and 27% in the number of
employees)
・Base metal, metallic products, machinery and equipment
4) Other sectors (15% in the number of establishments and 15% in the number of
employees)
・Pulp and paper, printing, publishing
・Non-ferrous metal
・Other manufacturing
(2) Decentralized regional development plan
In December 1999, the Ministry of Planning and Development announced its
“regional decentralization policy” (“hub strategy”), entitled “Base para la Elaboración
del Plan Nacional de Desarrollo Regional 1999-2004, Descentralización
Desconcentrada: Hacia un Desarrollo Sostenible para Venezuela” (Basis of
Implementation of National Plan Related to Regional Development in 1999 – 2004:
Anti-concentration and Decentralization for Sustainable Development of Venezuela).
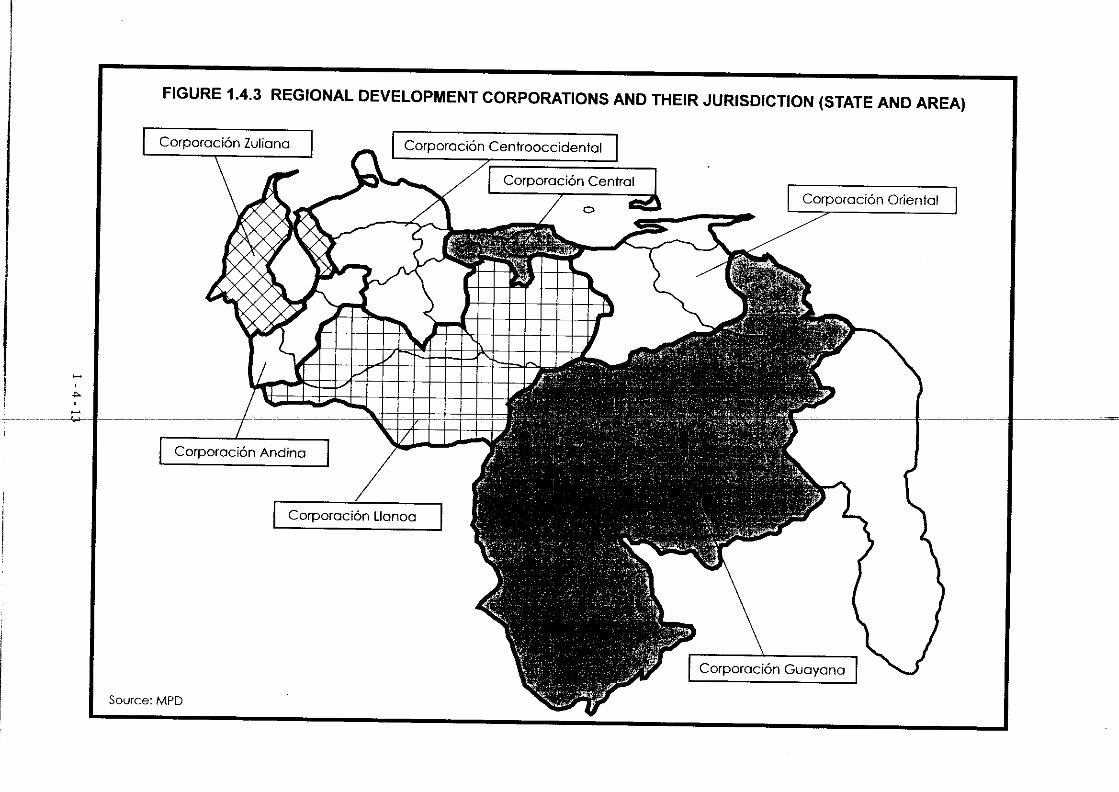
Essentially, the development plan divides the country into three regions, “West Hub
1 - 4 - 12
(Eje Occidental),” “East Hub (Eje Oriental)” and “Orinoco-Apure Hub (Eje
Orinoco-Apure),” which will be developed by seven development corporations.
General profiles of each hub region (states) and development are summarized below.
The existing development corporations will be responsible for implementation of the
development plan.
1 - 4 - 14
1) Eje Occidental (West Hub)
States: Zulia、Táchira、Merida、Trujillo
Infrastructure: Construction of a deep port in the Bay of Venezuela
Supplementa:
- For the Carribean and Colombian markets
- To the Atlantic via Orinoco-apure
- Eje Abejales-La Pedrera: Development of phosphor mines and cotton plantation
- Eje Guasdualito-El Amparo: Development based on river transport
Resources:
Hydrocarbon, hydropower generation, coal, phosphor ore, agriculture and cattle
raising, agricultural products, forestry, tourism
2) EjeOriental (East Hub)
States: Nueva Esparta、Sucre、Anzoategui、Monagas、Bolivar、Isla de Margarita
Industries:
Orinoco oil belt, petroleum refining, petrochemical, base industries in Guyana
district (aluminum and steel), and urban complex (Guyana city/Bolivar city)
Resources:
Petroleum, gas, aluminum, iron, phosphor ore, cattle raising, fishery, wood, uranium,
gold, diamond
Problems:
- Rapid growth of poverty due to reliance on oil-based industrial production
- Need for the irrigation system to promote soil improvement
- Protection of aboriginal people as part of environmental protection
3) Eje Orinoco (Orinoco-Apure Hub)
States:
Tàchira, Barinas, Apure, Protuguesa, Cojedes, Guàrico, Anzoategui, Amazonas,
Managas, Bolivar, Delta Amacuro
- Land area of 300,000 km2, representing 30% of national land and 12% of
population
- San Cristobal in west and Cd.Guayana in east
Resources: Agriculture, cattle raising, forestry, heavy oil, water, fishtry
- Heavy oil: 200,000MM BBLS
- Natural forest: 25 MM ha (83% of total), and opportunity for pulp production by
reforestation of 1 million ha
1 - 4 - 15
- Water resources (90% of total), and hydropower generation potential 95% (Caroni,
Caura, Orinoco)
- Soil suitable for cattle rasing, 50% of total
- Fishery resources: 40,000 – 100,000 tons/year
- Mineral resources: Coal 50 MM T/Y; phosphor 1,000MM T/Y; bauxcite 200 MM
tons (reserves); iron ore 200 MM tons
Positioning and development strategy:
Prompt buildup of development strategy as the region that significantly affects
regional decentralization and industrial diversification
a. Supporting inter-regional economy and physical distribution using two major
rivers of Orinoco and Apure, and water transport
b. Promotion of agricultural and industrial production contributing to the
improvement of standards of living of local people
c. Promotion of integration of different industries using a geographical space in the
area
- Supply of phosphorous fertilizer produced in the Tàchira area using river
transport
- Promoted development of middle-sized cities:Guasdualito, El Amparo, El Nulo,
La Victoria, Mantecal, Elorza, Bruzual, Puerto Nutrias, San Fernando, Pueroto
Paèz, Caicara, Cabruta, Mapire, Barramca, Tucupita
- Orientation to local people and need for development of surrounding areas
- A support mechanism for farming activities in intermediate areas
- Need for industrial cooperation reated to forest development
- Eco-toursism and aventure tour using river transport
d. Priority
- Agiriculture and cattle raising: Uribante-Aragua, Caparo-Urbante, Mòdulos de
Apure, Guanare-Masparro, Biruaca-Achaguas, Sur del Guarico, Vegas Adel
Orinoco, La Paragua-El Crsto y Delta
- Forestry: Use of recyclable resources - Sur de Monagas, Anzoategu; mid-term
plan
- Cinaruco-Capanaparu
- Mining and manufacturing: Phosphor ore, coal, metal and machinery (San
Cristobal), bauxcite, iron and steel, basic industry, metal and machinery (Cd.
Guayana), agriculture and industry (national), and pulp and paper (Sur de
Anzoategui)
1 - 4 - 16
e. Infrastructure: Inter-regional river transport (Orinoco-Apure)
- Multimodal transportation system: First improvement of transportation – coal,
iron ore, bauxcite (40MM tons/year)
- River transport contributes to social and economic integration
1 - 4 - 17
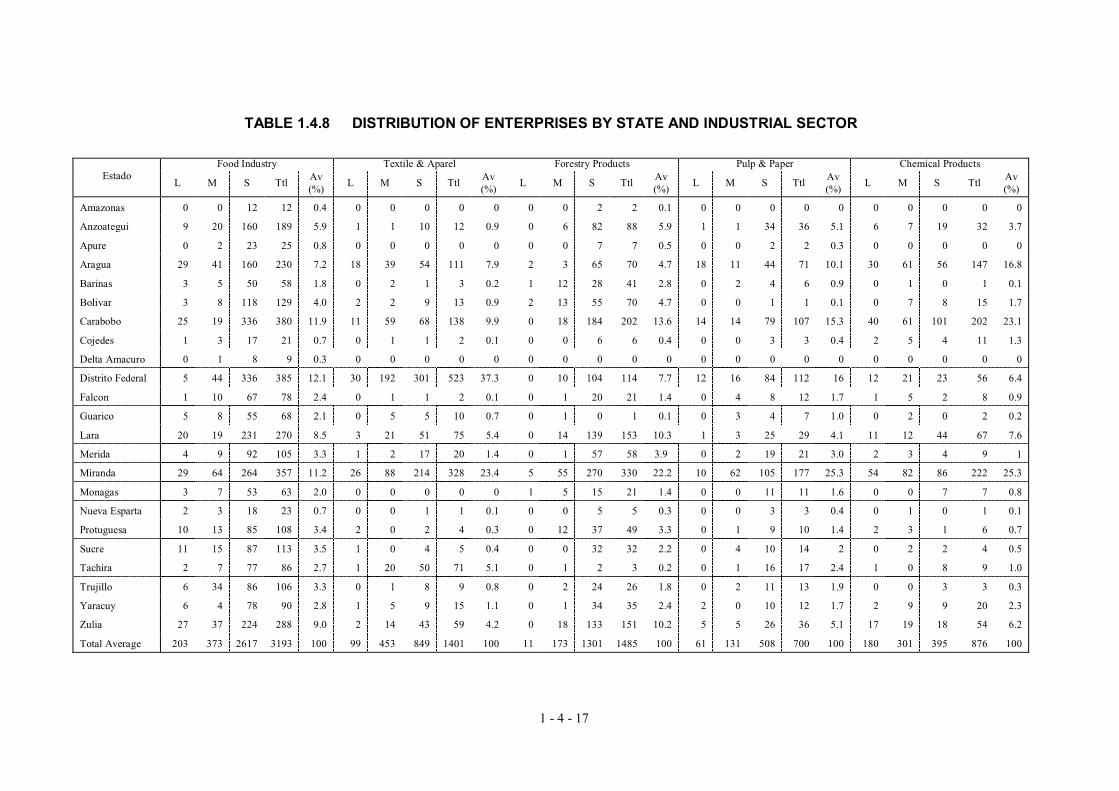
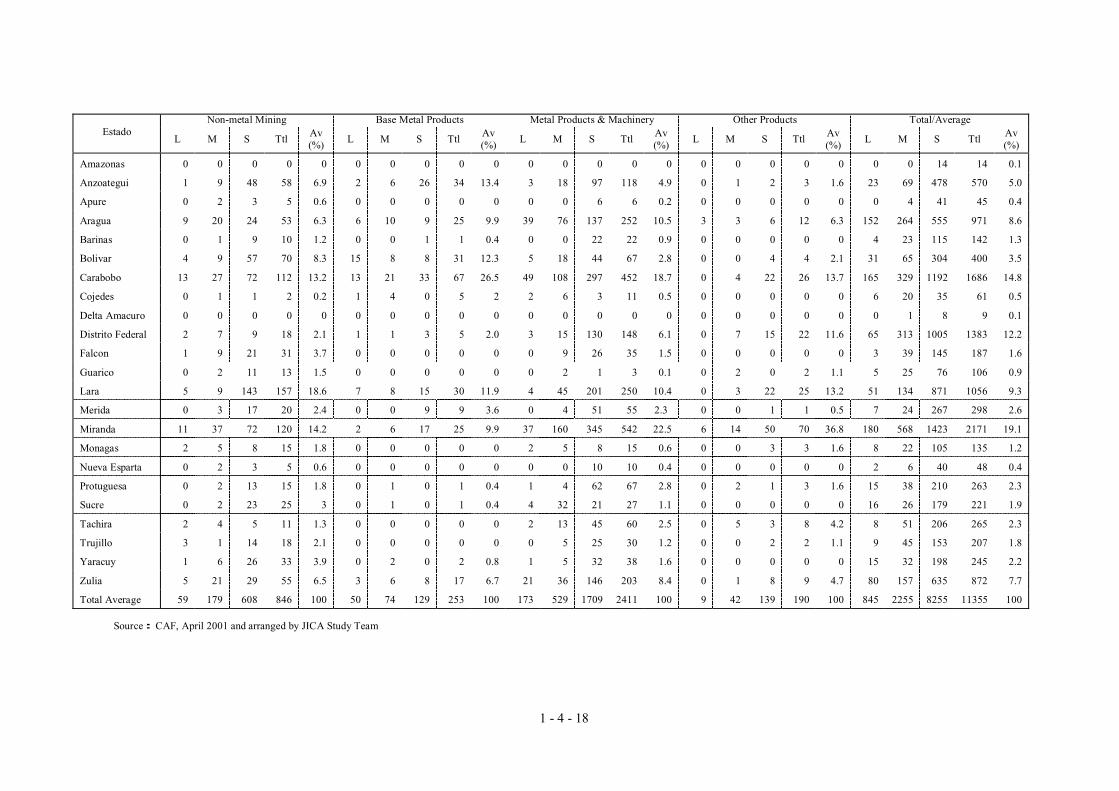
TABLE 1.4.8 DISTRIBUTION OF ENTERPRISES BY STATE AND INDUSTRIAL SECTOR
Food Industry Textile & Aparel Forestry Products Pulp & Paper Chemical Products Estado
L M S Ttl Av (%)
L M S Ttl Av (%)
L M S Ttl Av (%)
L M S Ttl Av (%)
L M S Ttl Av (%)
Amazonas 0 0 12 12 0.4 0 0 0 0 0 0 0 2 2 0.1 0 0 0 0 0 0 0 0 0 0
Anzoategui 9 20 160 189 5.9 1 1 10 12 0.9 0 6 82 88 5.9 1 1 34 36 5.1 6 7 19 32 3.7
Apure 0 2 23 25 0.8 0 0 0 0 0 0 0 7 7 0.5 0 0 2 2 0.3 0 0 0 0 0
Aragua 29 41 160 230 7.2 18 39 54 111 7.9 2 3 65 70 4.7 18 11 44 71 10.1 30 61 56 147 16.8
Barinas 3 5 50 58 1.8 0 2 1 3 0.2 1 12 28 41 2.8 0 2 4 6 0.9 0 1 0 1 0.1
Bolivar 3 8 118 129 4.0 2 2 9 13 0.9 2 13 55 70 4.7 0 0 1 1 0.1 0 7 8 15 1.7
Carabobo 25 19 336 380 11.9 11 59 68 138 9.9 0 18 184 202 13.6 14 14 79 107 15.3 40 61 101 202 23.1
Cojedes 1 3 17 21 0.7 0 1 1 2 0.1 0 0 6 6 0.4 0 0 3 3 0.4 2 5 4 11 1.3
Delta Amacuro 0 1 8 9 0.3 0 0 0 0 0 0 0 0 0 0 0 0 0 0 0 0 0 0 0 0
Distrito Federal 5 44 336 385 12.1 30 192 301 523 37.3 0 10 104 114 7.7 12 16 84 112 16 12 21 23 56 6.4
Falcon 1 10 67 78 2.4 0 1 1 2 0.1 0 1 20 21 1.4 0 4 8 12 1.7 1 5 2 8 0.9
Guarico 5 8 55 68 2.1 0 5 5 10 0.7 0 1 0 1 0.1 0 3 4 7 1.0 0 2 0 2 0.2
Lara 20 19 231 270 8.5 3 21 51 75 5.4 0 14 139 153 10.3 1 3 25 29 4.1 11 12 44 67 7.6
Merida 4 9 92 105 3.3 1 2 17 20 1.4 0 1 57 58 3.9 0 2 19 21 3.0 2 3 4 9 1
Miranda 29 64 264 357 11.2 26 88 214 328 23.4 5 55 270 330 22.2 10 62 105 177 25.3 54 82 86 222 25.3
Monagas 3 7 53 63 2.0 0 0 0 0 0 1 5 15 21 1.4 0 0 11 11 1.6 0 0 7 7 0.8
Nueva Esparta 2 3 18 23 0.7 0 0 1 1 0.1 0 0 5 5 0.3 0 0 3 3 0.4 0 1 0 1 0.1
Protuguesa 10 13 85 108 3.4 2 0 2 4 0.3 0 12 37 49 3.3 0 1 9 10 1.4 2 3 1 6 0.7
Sucre 11 15 87 113 3.5 1 0 4 5 0.4 0 0 32 32 2.2 0 4 10 14 2 0 2 2 4 0.5
Tachira 2 7 77 86 2.7 1 20 50 71 5.1 0 1 2 3 0.2 0 1 16 17 2.4 1 0 8 9 1.0
Trujillo 6 34 86 106 3.3 0 1 8 9 0.8 0 2 24 26 1.8 0 2 11 13 1.9 0 0 3 3 0.3
Yaracuy 6 4 78 90 2.8 1 5 9 15 1.1 0 1 34 35 2.4 2 0 10 12 1.7 2 9 9 20 2.3
Zulia 27 37 224 288 9.0 2 14 43 59 4.2 0 18 133 151 10.2 5 5 26 36 5.1 17 19 18 54 6.2
Total Average 203 373 2617 3193 100 99 453 849 1401 100 11 173 1301 1485 100 61 131 508 700 100 180 301 395 876 100
1 - 4 - 18
Non-metal Mining Base Metal Products Metal Products & Machinery Other Products Total/Average Estado
L M S Ttl Av (%)
L M S Ttl Av (%)
L M S Ttl Av (%)
L M S Ttl Av (%)
L M S Ttl Av (%)
Amazonas 0 0 0 0 0 0 0 0 0 0 0 0 0 0 0 0 0 0 0 0 0 0 14 14 0.1
Anzoategui 1 9 48 58 6.9 2 6 26 34 13.4 3 18 97 118 4.9 0 1 2 3 1.6 23 69 478 570 5.0
Apure 0 2 3 5 0.6 0 0 0 0 0 0 0 6 6 0.2 0 0 0 0 0 0 4 41 45 0.4
Aragua 9 20 24 53 6.3 6 10 9 25 9.9 39 76 137 252 10.5 3 3 6 12 6.3 152 264 555 971 8.6
Barinas 0 1 9 10 1.2 0 0 1 1 0.4 0 0 22 22 0.9 0 0 0 0 0 4 23 115 142 1.3
Bolivar 4 9 57 70 8.3 15 8 8 31 12.3 5 18 44 67 2.8 0 0 4 4 2.1 31 65 304 400 3.5
Carabobo 13 27 72 112 13.2 13 21 33 67 26.5 49 108 297 452 18.7 0 4 22 26 13.7 165 329 1192 1686 14.8
Cojedes 0 1 1 2 0.2 1 4 0 5 2 2 6 3 11 0.5 0 0 0 0 0 6 20 35 61 0.5
Delta Amacuro 0 0 0 0 0 0 0 0 0 0 0 0 0 0 0 0 0 0 0 0 0 1 8 9 0.1
Distrito Federal 2 7 9 18 2.1 1 1 3 5 2.0 3 15 130 148 6.1 0 7 15 22 11.6 65 313 1005 1383 12.2
Falcon 1 9 21 31 3.7 0 0 0 0 0 0 9 26 35 1.5 0 0 0 0 0 3 39 145 187 1.6
Guarico 0 2 11 13 1.5 0 0 0 0 0 0 2 1 3 0.1 0 2 0 2 1.1 5 25 76 106 0.9
Lara 5 9 143 157 18.6 7 8 15 30 11.9 4 45 201 250 10.4 0 3 22 25 13.2 51 134 871 1056 9.3
Merida 0 3 17 20 2.4 0 0 9 9 3.6 0 4 51 55 2.3 0 0 1 1 0.5 7 24 267 298 2.6
Miranda 11 37 72 120 14.2 2 6 17 25 9.9 37 160 345 542 22.5 6 14 50 70 36.8 180 568 1423 2171 19.1
Monagas 2 5 8 15 1.8 0 0 0 0 0 2 5 8 15 0.6 0 0 3 3 1.6 8 22 105 135 1.2
Nueva Esparta 0 2 3 5 0.6 0 0 0 0 0 0 0 10 10 0.4 0 0 0 0 0 2 6 40 48 0.4
Protuguesa 0 2 13 15 1.8 0 1 0 1 0.4 1 4 62 67 2.8 0 2 1 3 1.6 15 38 210 263 2.3
Sucre 0 2 23 25 3 0 1 0 1 0.4 4 32 21 27 1.1 0 0 0 0 0 16 26 179 221 1.9
Tachira 2 4 5 11 1.3 0 0 0 0 0 2 13 45 60 2.5 0 5 3 8 4.2 8 51 206 265 2.3
Trujillo 3 1 14 18 2.1 0 0 0 0 0 0 5 25 30 1.2 0 0 2 2 1.1 9 45 153 207 1.8
Yaracuy 1 6 26 33 3.9 0 2 0 2 0.8 1 5 32 38 1.6 0 0 0 0 0 15 32 198 245 2.2
Zulia 5 21 29 55 6.5 3 6 8 17 6.7 21 36 146 203 8.4 0 1 8 9 4.7 80 157 635 872 7.7
Total Average 59 179 608 846 100 50 74 129 253 100 173 529 1709 2411 100 9 42 139 190 100 845 2255 8255 11355 100
Source: CAF, April 2001 and arranged by JICA Study Team
1 - 4 - 19
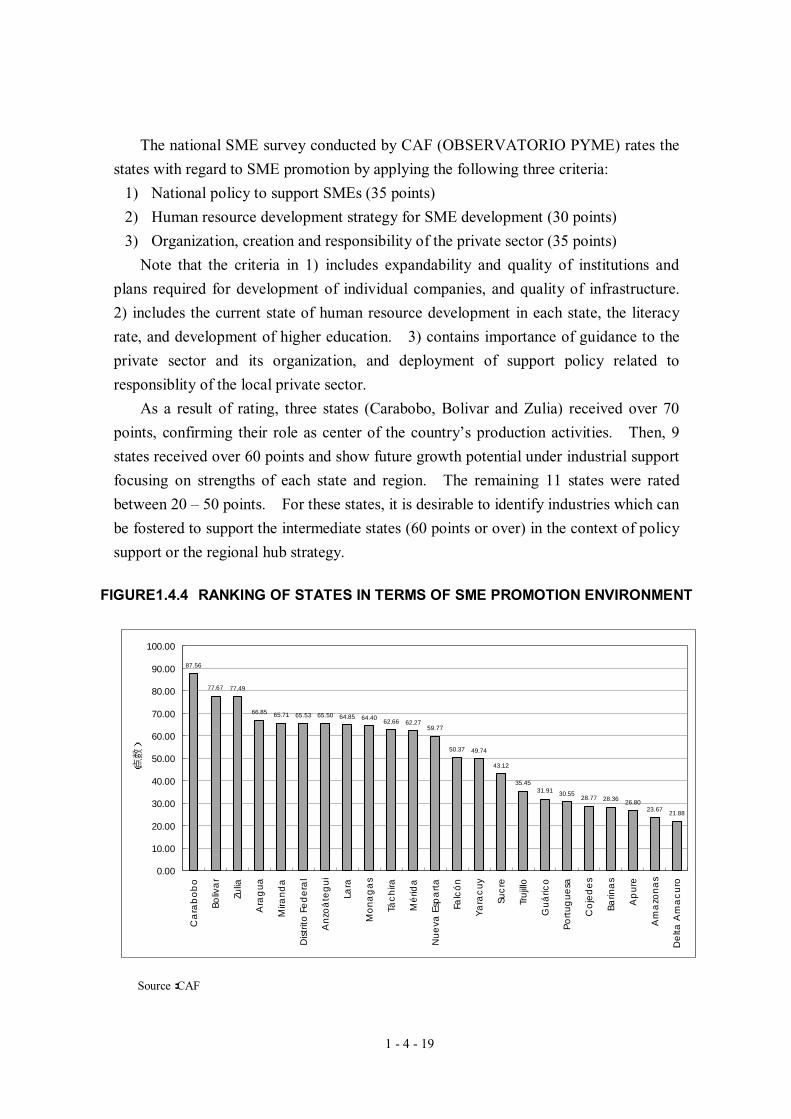
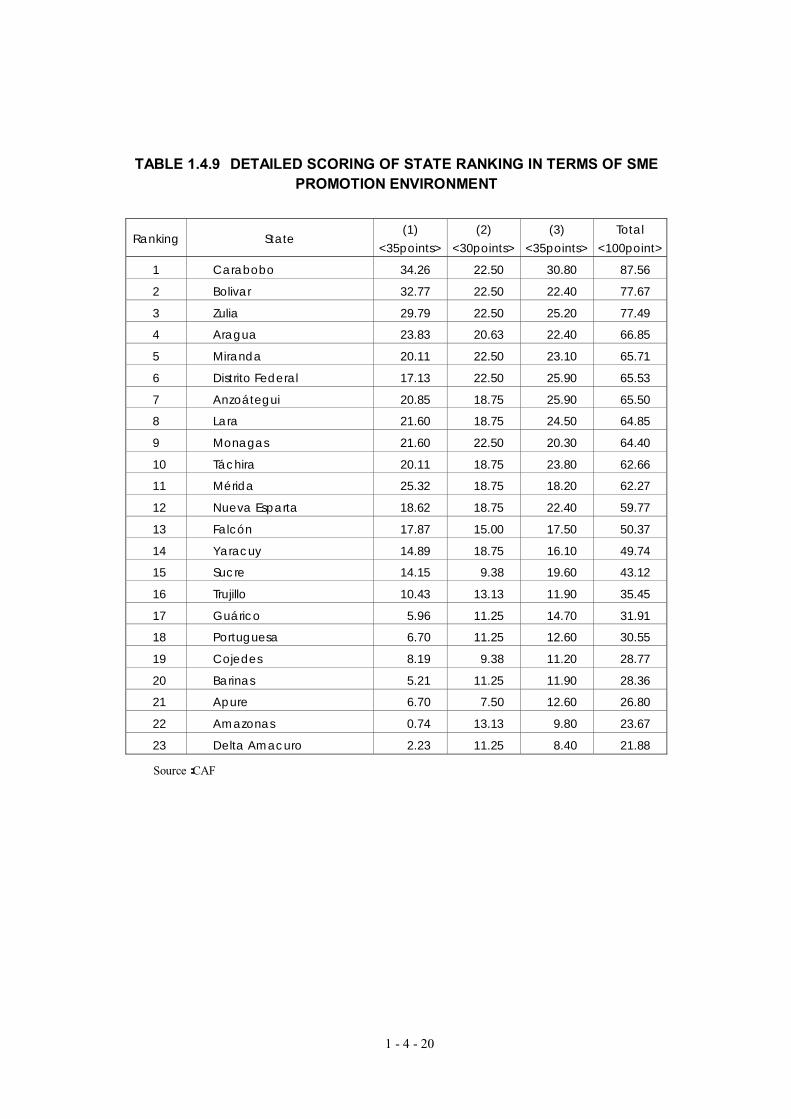
The national SME survey conducted by CAF (OBSERVATORIO PYME) rates the
states with regard to SME promotion by applying the following three criteria:
1) National policy to support SMEs (35 points)
2) Human resource development strategy for SME development (30 points)
3) Organization, creation and responsibility of the private sector (35 points)
Note that the criteria in 1) includes expandability and quality of institutions and
plans required for development of individual companies, and quality of infrastructure.
2) includes the current state of human resource development in each state, the literacy
rate, and development of higher education. 3) contains importance of guidance to the
private sector and its organization, and deployment of support policy related to
responsiblity of the local private sector.
As a result of rating, three states (Carabobo, Bolivar and Zulia) received over 70
points, confirming their role as center of the country’s production activities. Then, 9
states received over 60 points and show future growth potential under industrial support
focusing on strengths of each state and region. The remaining 11 states were rated
between 20 – 50 points. For these states, it is desirable to identify industries which can
be fostered to support the intermediate states (60 points or over) in the context of policy
support or the regional hub strategy.
FIGURE1.4.4 RANKING OF STATES IN TERMS OF SME PROMOTION ENVIRONMENT
Source:CAF
87.56
77.67 77.49
66.85 65.71 65.53 65.50 64.85 64.40 62.66 62.2759.77
50.37 49.74
43.12
35.4531.91 30.55 28.77 28.36 26.80
23.67 21.88
0.00
10.00
20.00
30.00
40.00
50.00
60.00
70.00
80.00
90.00
100.00
Car
abob
o
Boliv
ar
Zulia
Ara
gua
Mira
nda
Dist
rito
Fede
ral
Anz
oáte
gui
Lara
Mon
agas
Tách
ira
Mér
ida
Nue
va E
spar
ta
Falc
ón
Yara
cuy
Sucr
e
Truj
illo
Guá
rico
Portu
gues
a
Coj
edes
Barin
as
Apu
re
Am
azon
as
Del
ta A
mac
uro
(点数)
1 - 4 - 20
TABLE 1.4.9 DETAILED SCORING OF STATE RANKING IN TERMS OF SME PROMOTION ENVIRONMENT
Ranking State (1)
<35points>(2)
<30points>(3)
<35points> Total
<100point>
1 Carabobo 34.26 22.50 30.80 87.56
2 Bolivar 32.77 22.50 22.40 77.67
3 Zulia 29.79 22.50 25.20 77.49
4 Aragua 23.83 20.63 22.40 66.85
5 Miranda 20.11 22.50 23.10 65.71
6 Distrito Federal 17.13 22.50 25.90 65.53
7 Anzoátegui 20.85 18.75 25.90 65.50
8 Lara 21.60 18.75 24.50 64.85
9 Monagas 21.60 22.50 20.30 64.40
10 Táchira 20.11 18.75 23.80 62.66
11 Mérida 25.32 18.75 18.20 62.27
12 Nueva Esparta 18.62 18.75 22.40 59.77
13 Falcón 17.87 15.00 17.50 50.37
14 Yaracuy 14.89 18.75 16.10 49.74
15 Sucre 14.15 9.38 19.60 43.12
16 Trujillo 10.43 13.13 11.90 35.45
17 Guárico 5.96 11.25 14.70 31.91
18 Portuguesa 6.70 11.25 12.60 30.55
19 Cojedes 8.19 9.38 11.20 28.77
20 Barinas 5.21 11.25 11.90 28.36
21 Apure 6.70 7.50 12.60 26.80
22 Amazonas 0.74 13.13 9.80 23.67
23 Delta Amacuro 2.23 11.25 8.40 21.88
Source:CAF
1 - 4 - 21
1.4.3 Investment promotion policies and programs
(1) Leagal framework
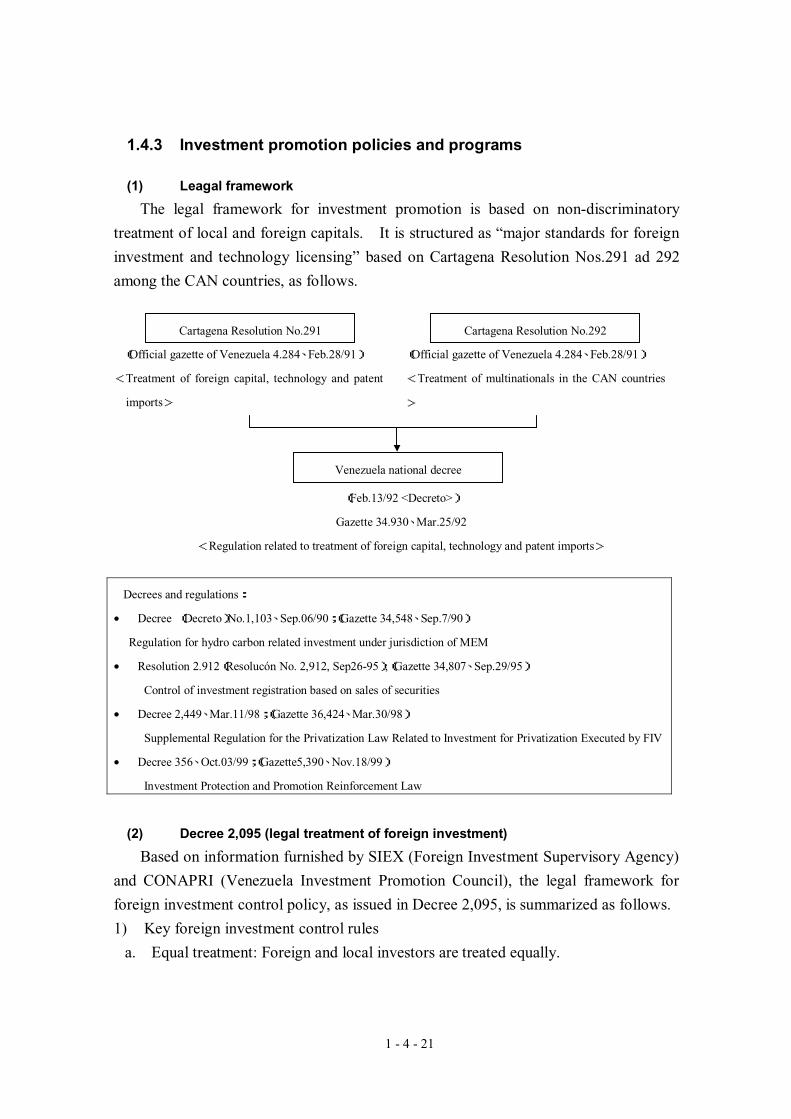
The legal framework for investment promotion is based on non-discriminatory
treatment of local and foreign capitals. It is structured as “major standards for foreign
investment and technology licensing” based on Cartagena Resolution Nos.291 ad 292
among the CAN countries, as follows.
(Official gazette of Venezuela 4.284、Feb.28/91)
<Treatment of foreign capital, technology and patent
imports>
(Official gazette of Venezuela 4.284、Feb.28/91)
<Treatment of multinationals in the CAN countries
>
(Feb.13/92 <Decreto>)
Gazette 34.930、Mar.25/92
<Regulation related to treatment of foreign capital, technology and patent imports>
Decrees and regulations:
• Decree (Decreto)No.1,103、Sep.06/90;(Gazette 34,548、Sep.7/90)
Regulation for hydro carbon related investment under jurisdiction of MEM
• Resolution 2.912(Resolucón No. 2,912, Sep26-95);(Gazette 34,807、Sep.29/95)
Control of investment registration based on sales of securities
• Decree 2,449、Mar.11/98;(Gazette 36,424、Mar.30/98)
Supplemental Regulation for the Privatization Law Related to Investment for Privatization Executed by FIV
• Decree 356、Oct.03/99;(Gazette5,390、Nov.18/99)
Investment Protection and Promotion Reinforcement Law
(2) Decree 2,095 (legal treatment of foreign investment)
Based on information furnished by SIEX (Foreign Investment Supervisory Agency)
and CONAPRI (Venezuela Investment Promotion Council), the legal framework for
foreign investment control policy, as issued in Decree 2,095, is summarized as follows.
1) Key foreign investment control rules
a. Equal treatment: Foreign and local investors are treated equally.
Cartagena Resolution No.291 Cartagena Resolution No.292
Venezuela national decree
1 - 4 - 22
b. General principle: Foreign investment accompanied by commercial activities is
permitted for most economic sectors, except for special services regulated by law,
such as newspaper, television and radio stations in Spanish language.
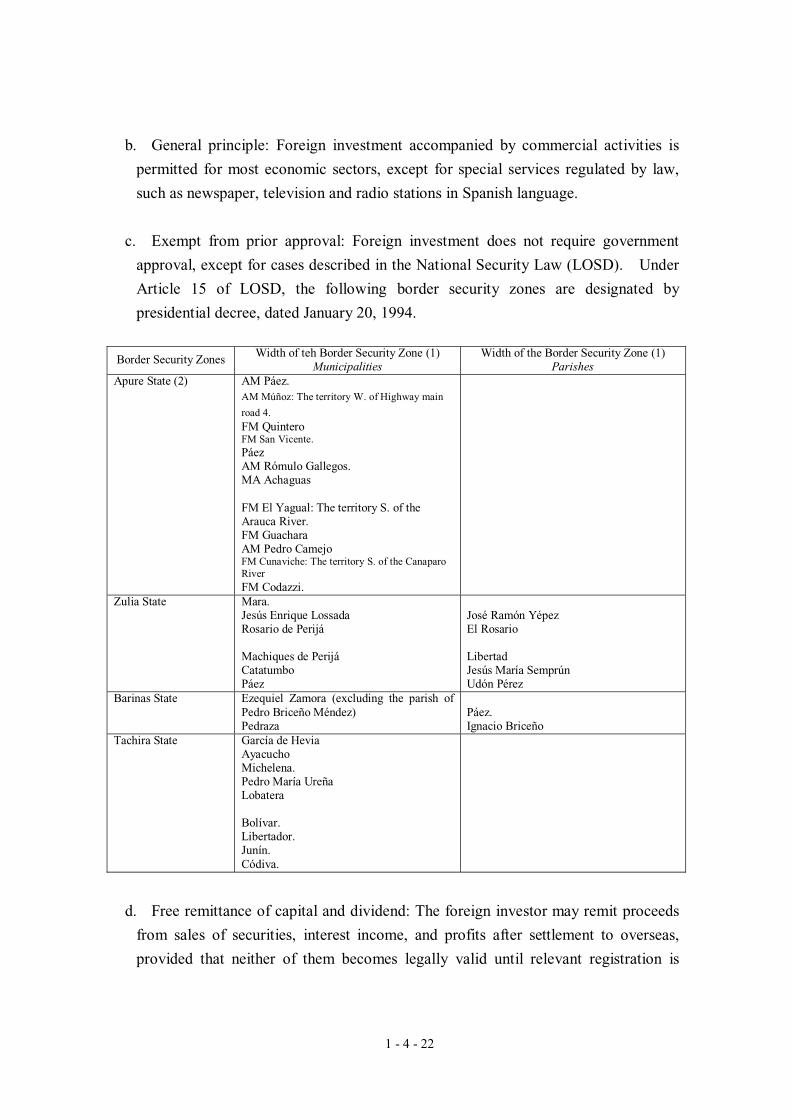
c. Exempt from prior approval: Foreign investment does not require government
approval, except for cases described in the National Security Law (LOSD). Under
Article 15 of LOSD, the following border security zones are designated by
presidential decree, dated January 20, 1994.
Border Security Zones Width of teh Border Security Zone (1) Municipalities
Width of the Border Security Zone (1) Parishes
Apure State (2) AM Páez. AM Múñoz: The territory W. of Highway main
road 4. FM Quintero FM San Vicente. Páez AM Rómulo Gallegos. MA Achaguas
FM El Yagual: The territory S. of the Arauca River. FM Guachara AM Pedro Camejo FM Cunaviche: The territory S. of the Canaparo River FM Codazzi.
Zulia State Mara. Jesús Enrique Lossada Rosario de Perijá
Machiques de Perijá Catatumbo Páez
José Ramón Yépez El Rosario
Libertad Jesús María Semprún Udón Pérez
Barinas State Ezequiel Zamora (excluding the parish of Pedro Briceño Méndez) Pedraza
Páez. Ignacio Briceño
Tachira State García de Hevia Ayacucho Michelena. Pedro María Ureña Lobatera
Bolívar. Libertador. Junín. Códiva.
d. Free remittance of capital and dividend: The foreign investor may remit proceeds
from sales of securities, interest income, and profits after settlement to overseas,
provided that neither of them becomes legally valid until relevant registration is
1 - 4 - 23
approved by SIEX according to the regulations pursuant to Cartagena Resolution
291 and 292.
e. Credit negotiation: The foreign investor is basically free to negotiate credit service
in or outside the country.
f. Benefits under the Andes Liberalization Program: Any foreign company may, by
participating in the Andes Liberalization Program, make exports within the
subregion under the same terms and conditions applied to local companies.
g. Classification of investment: Investment is classified by decree into three types:
foreign direct investment, domestic investment, and subregional investment.
- Foreign direct investment: Investment made by a foreign individual or entity in a
freely exchangeable currency, clear assets, the domestic currency as the fund
transferable to overseas, or reinvestment made pursuant to Decree 2,095. Other
types of investment include debt/equity conversion and technology investment
(trademark, etc.)
- Domestic investment: Investment by an individual, an entity and a state that is
deemed to be a Venezuelan national by law; investment made by a foreign
individual, which has obtained the “Domestic Investor Certificate” from SIEX by
meeting specific requirements; and investment made by subregional investors in
the CAN countries.
- Subregional investment: Investment by a person (national) of any of the CAN
countries, namely Bolivia, Colombia, Ecuador, Peru and Venezuela.
- Indirect investment: Investment made by obtaining shares from the Stock
Exchange pursuant to the provisions of Item 27, Article 1, Decree 2,095.
h. National Regulatory Agencies: Item 11, Cartagena 291 requires each member
country to establish an organization or a government agency responsible for
application of foreign investment rules. Under Decree 2,095, this authority is
granted to SIEX under the Ministry of Finance. However, for some sectors, other
organizations control the foreign investment rules.
- Banking and insurance sector: Regulatory agencies for banking and insurance
services
- Hydrocarbon, petrochemical, coal and other industries: Ministry of Energy and
Mining
1 - 4 - 24
- Public credit operation: Public Finance Management, Ministry of Finance (Article
2 of Public Credit Law)
i. Registration of foreign investment: Every foreign direct investment must be
registered with SIEX within 60 days after its commercial registration. The
following documents must be submitted with the application for registration:
- A certificate of foreign currency registration or a certificate of assets as payment of
shared capital
- A copy of the certificate of the articles of incorporation of the foreign company or
a public notification
- The articles of incorporation must be translated to Spanish, with certification by
the Venezuelan consulate in a given country
- The power of attorney to a local agent of the investing company
- The application for corporate classification
Registration for foreign direct investment must be renewed annually by the foreign
investor. For this purpose, the foreign investor must submit the following documents
within 120 days after the end of each fiscal year.
- Application for registration renewal (revision)
- A copy of the certificate to show corporate classification
- A financial report for the latest fiscal year, audited by an independent accountant
- The minutes of shareholders’ meeting that adopts a resolution to change the capital,
if any
- The minutes of shareholders’ meeting that declares a dividend, together with
collection of withdrawal tax
j. The real value of foreign investment: Registration rules state as follows:
- Contribution related to foreign currency: A freely exchangeable foreign currency
- Physical assets or scientific contribution
- Reinvestment of profits
k. Assessment of the real value of investment according to execution
- Payment in foreign currency
- Payment in kind
- Acquisition of shares by a domestic investor, a joint venture or a mixed company
- Purchase of shares at the stock exchange
1 - 4 - 25
- Reinvestment: To be registered in the value converted by applying the foreign
exchange rate effective at the time of investment.
- Payment of unpaid capital
- Capitalization of the creditor’s right
l. Areas in which domestic investors retain the exclusive right: The following areas
are designed under Article 6 of Decree 2,095.
- Television and radio stations, and newspapers in Spanish language
- Professional services which practice is regulated by law: Lawyer, corporate
manager, accountant, economist, engineer, physician, veterinarian, dentist,
journalist, and psychologist
m. Special cases
Article 1 of Decree 2,095 states that foreign investment in the fields related to
hydrocarbon, iron ore, banking and insurance service is regulated by the decree and
the applicable laws that are listed below:
- Decree on National Title and Ownership of Commerce and Industry in the Field of
Hydrocarbon (Article 5 of Organic Law)
- Decree on National Title to Iron Ore Mining (December 16, 1974)
- General Decree on Banks and Other Financial Institutions (foreign investment in
this sector was opened on November 2, 1993)
- Decree on Insurance and Reinsurance ((foreign investment in this sector was
opened on September 23, 1994)
- Decree on Development and Protection of National Maritime Trade (Articles 7 and
9 of Organic Law)
- Regulation for Registration of Private Aircraft (Articles 4 and 5 of Organic Law)
n. Corporate classification
- Certification of corporate registration: Issued by SIEX as the act of management
- Considerations in issuing the certification
* Percentage share of local and foreign capitals
* Reflection of capital: Technology, commerce, administration, and financial
management
- Appointment of the foreign investor to management position of the company
- Investment by the joint venture
- Reconfirmation of classification: Reconfirmation by SIEX
o. Settlement of dispute: Venezuela participates in the following international
agreements on dispute and settlement:
- Panama Convention on Commercial Arbitration
1 - 4 - 26
- The New York Convention on Recognition of Enforcement of Arbitration Awards
- The dispute settlement mechanisms of the Group of Three (G-3)
- The agreement on membership of the International Center for Settlement of
Investment Dispute (ICSID).
p. Subsidies, joint ventures and branches: Item 8, Article 2 of Decree 2,095 defines
the subsidy and the joint venture as follows:
- A foreign company controlled in all aspects by other company which capital
(share) or management (voting right) is mandated by its parent company
- A company separately controlled in terms of capital and management for any
purpose, regardless of the parent company
- When a company holds 50% or more of capital (share) of other company, the
former is a parent company and the latter is a subsidy.
- The foreign company is authorized to establish a branch office in Venezuela
according to the commercial code.
q. Technology licensing, license and franchise agreement: Article 1 of Decree 2,095
states that contractual provisions concerning the trademark, patent, license and
royalty must comply with Cartagena Resolutions Nos. 291 and 292. General
Resolution No.344 concerning “industrial property rights” states that a license
agreement on the patent or trademark, or an investment agency or SAPI (Industrial
Property Right Autonomous Service Organization) becomes effective when it is
registered with an organization responsible for registration of intellectual property
rights (patent, trademark, and other assets accrued from commerce and industry).
- Technology licensing agreement: Technology is protected by patent, utility model,
trademark and trade secret.
- Scientific contribution by foreign direct investment: Decree 2,095 takes into
account the form of scientific contribution by foreign direct investment. It
defines technological contribution as provision, sales, leasing or transfer of trade
mark, patent, utility model, document, instruction, production process, method, or
technical assistance, control method by personnel, and other similar services.
- The technology licensing agreement must be registered as investment within 60
days after its conclusion. Also, it is encouraged to submit the agreement to SAPI
in advance.
- The decree requires the method for technology licensing to cover the following:
* Authorization of use of the trademark related to distribution of products,
including the trademark owned by a foreign person, or transfer of use
1 - 4 - 27
* Authorization of use of patent, industrial design or utility model, or transfer of
use
* Provision or instruction on technical knowledge by any method, and human
resource development training
* Basic or detailed engineering standards related to production
* Technical support in business areas
* Advice on corporate management and administration
- Provisions to be included in the technology licensing agreement
* Identification of contracting parties
* Content of technological contribution and non-biding provision, identification of
trademark and patent, the purpose of the contract
* Conditions for technology licensing, guarantee for application, and treatment of
progress proposed and developed by contracting parties during the contract
period
* Contract value for each element contained in technology licensing
* The term of the agreement
* Currency and country for payment
* Provisions defining the effect of technology licensing
* Obligation of technology provider to provide education for local people to
maximize efficiency
- Confidentiality: Technical information and know-how disclosed during the term of
the technology licensing agreement shall be kept in secret for the period equal to
the term, with no extension being allowed. Nevertheless, Cartagena Resolution
No.344 concerning protection of information requires that protection continue so
long as conditions for trade secrete remains valid. The user shall not disclose
confidential information unless otherwise agreed with the approving party.
- Payment: Payment does not require prior approval, subject to the terms and
conditions of the agreement. This principle is contained in Cartagena Resolution
No.291, provided that no party is obliged to pay royalty to the owner of patent or
trademark that is unused or expired. All taxes shall be paid prior to performance
of obligation under the technology licensing agreement. Each payment shall be
reported to SIEX within 60 days after actual payment, together with a certificate or
receipt for tax payment. The licensor may capitalize an amount unpaid for
technical service, subject to the consent of corporate shareholders and the permit
of SIEX.
1 - 4 - 28
Payment of royalty for intellectual property rights may be made for a period longer
than that specified in Resolution No.344.
Payment agreed under the technology licensing agreement is withheld until
registration with SIEX.
- Control: SIEX may check if the agreement complies with requirements for
registration. For this purpose, the contracting party is required to report, within
60 days after the end of each fiscal year, services performed under the agreement,
including the report as to whether a process, patent or trademark is used
economically and adequately according to the requirements, together with a
training program. In the case of non-compliance, SIEX may withhold or revoke
registration of the agreement.
- License: Resolution No.344 specifically sets forth the provisions for patent license
(Chapter I, Sec. VII), with the intent to transfer trademark license (Chapter V. Sec.
VII).
- Registration of the licensing agreement: SIEX is responsible for registration of the
licensing agreement. SAPI registration is intended to transfer the valid license
under the presence of a third party. SIEX registration can be made after transfer.
- Restriction imposed on the licensor under Cartagena Resolution No.291: To
promote free competition, the licensor is prohibited from:
* Fixing the price of the product made under the license
* Regulating the production volume of a licensed item
* Preventing the use of competing technology
In addition, the licensee is required to transfer any improvement made on the
licensed technology to the licensor.
- Authorization: SIEX may approve the licensing agreement containing export
regulation, provided that it does not affect inter-Andean exports.
- Franchise: In Venezuela, there is no specific legal provision concerning franchise,
nor legal definition of conditions. General rules for franchise found in the
country are summarized as follows:
* The company markets its product via an independent agent.
* The owner of a specific technology may grant to a third party the license to
manufacture a product or provide service in a form strictly determined by the
leading company.
* The grantor shall be the owner of a patent based on invention that is transferred
to a third party for the purpose of manufacturing a product.
1 - 4 - 29
- Typical structure of the franchise agreement: Generally contained contractual
elements are specified in Article 44 of Decree No.2095 and Articles 12, 13 and 14
of Cartagena Resolution No.291.
* Statutory provisions: The franchise agreement shall contain the following
provisions.
* Obligation of the franchiser to provide training for local people
* Prohibition of price fixing for the product made using the proprietary technology
* Restriction on product exports in intra-subregional trade
* Contractual value for each element contained in technology licensing
* The term of the agreement
* General provisions: The following provisions shall be included.
* Territory: Generally limited to a specific country or a group of countries
(complying with Article 10 of the Pro-Competition Law)
* Type of business: Specifying the franchisee’s activities. The franchisee shall
limit its commercial activities to the type of business contained in the franchise
agreement.
* Purchase: Generally, the franchise agreement covers a specific product, raw
material, input from a designated raw material, or purchase of the franchiser.
* Training of personnel and commercial technology: Including the training
contract and the transfer of commercial knowledge related to business.
* Right to review the business: Including corporate books (manuals) and the
method required for the franchisee to execute the business.
* License to use the trademark: Generally, franchise includes the license to use the
trade name (name) or trademark owned by the franchiser, but not the transfer of
the ownership thereto.
* Technological know-how: A certain form of franchise includes commercial or
technological know-how required to make a product
* Price: The price is divided into two elements, franchiser’s royalty and profit
distribution.
* Form of payment: The fixed amount or percentage share on net or gross sales
* Generally acceptable restriction on the franchise and licensing agreements: the
Law of Promotion and Protection of Free Competition prohibits the following
acts:
- Marketing area and permissible competition restricted by licensor
- Fixing of price or market conditions
- Unfair refusal by the licenser to meet product demand or service provisions
1 - 4 - 30
- Advertisement or act that restricts or misleads free competition
(3) Decree 356 (Protection and Promotion of Investment; October 3, 1999)
Chapter 1: General
Paragraph 1:
To provide for domestic and foreign investment and investors for the purpose of
achieving promotion of investment for national development, diversification and
harmonious supplementation.
Paragraph 2:
The decree applies to ongoing, effective investment, future investment and investors,
unless having any conflict with the existing law.
Paragraph 3:
(1) Capital: All activities to obtain production income under the license agreement
pursuant to the domestic law or by an enterprise of various forms
(2) Foreign investment: Investment effectively controlled or owned by a foreign
enterprise or person
(3) Investment considered as foreign investment is defined under the resolution
adopted by the CAN countries and the regulation in the country.
(4) Foreign investor: The owner of foreign investment or a person who effectively
controls it
(5) Venezuelan capital: Capital effectively controlled or owned by a Venezuelan
company or person
(6) Venezuelan investor: A Venezuelan company or person who owns or effectively
control the Venezuelan capital
Paragraph 4:
Foreign direct investment, subregional investment, neutral capital investment, and
intra-Andes corporate investment in Venezuela may continue under an appropriate
resolution by the CAN countries and legal standards.
Paragraph 5:
Validity and application of treaties, agreements and arrangements related to
protection and promotion of investment, as signed by Venezuela, become effective
by enacting this decree.
Chapter II: Treatment of Investment in Venezuela
Paragraph 6:
The foreign investor has the right equal to that granted to the domestic investor.
1 - 4 - 31
Paragraph 7:
Foreign investment and foreign investors are subject to the same obligations that are
imposed on domestic investment and investors.
Paragraph 8:
No discriminatory treatment of foreign investment and foreign investors is made
with regard to the source of capital.
Paragraph 9:
Foreign investment and foreign investors are eligible for favorable treatment under
Paragraphs 7 and 8 of this decree.
Paragraph 10:
Venezuelan investment and investors receive the same treatment as foreign
investment and investors receive in the similar environment.
Paragraph 11:
Foreign investment or investors are not mandated to make confiscation or settlement
by law, unless otherwise specified in constitutional provisions.
Paragraph 12:
Foreign investment and investors are required to pay taxes related to payment made
in connection with investment and comply with domestic standards.
Paragraph 13:
The central and local governments do not prevent commercial or industrial activities
within the competing range of service.
Paragraph 14:
To permit temporary income for people who provide service related to investment in
accordance with policy for entry and immigration of foreigners to the country, and
subject to the labor law.
Chapter III: Promotion and Policy Related to Incentive for Investment in Venezuela
Paragraph 15:
The state, for the purpose of promoting investment, establishes favorable conditions
for investment and investors:
(1) To establish incentives for investment in order to achieve the policy objective;
(2) To provide incentives responsive to Venezuelan investment and investors;
(3) To condition each incentive to the purchase of share by the investing person or
company; and
(4) To establish incentives favorable to Venezuelan capital in foreign countries, in
harmony with the treaties and agreements signed by the country.
1 - 4 - 32
Paragraph 16:
Formation of human resource investment, production development, and participation
of the Venezuelan economy in the world economy???
(1) Formation of human resources, and implementation of scientific and
technological research and study
(2) Improvement of competitiveness in production activities
(3) Improvement of value added from export activities, including advanced
knowledge
(4) Promotion of corporate networks and complexes, and formation of the value
added production chain
(5) Development and reinforcement of SMEs
(6) General export promotion
(7) Infrastructure development, particularly support for competitiveness and foreign
trade
(8) Deployment of promotional activities for environmental protection and
preservation
Paragraph 17:
The state may fulfill the promise of legal stability for the purpose of stabilizing the
current economic conditions and assuring safety of investment.
(1) Stability of the taxation system effective during performance of the investment
agreement
(2) Stability of the export promotion program
(3) Stability of incentive accepted by the investor pursuant to Paragraph 15
Paragraph 18:
Agreement on legal stability
(1) The agreement is enacted prior to investment, with validity of less than 10 years
(2) To be signed by the investor according to the requirements in this decree and
under the collateral and investment program.
(3) Legal solution for failure of the investor to perform the agreement
(4) Legal arbitration on dispute arising between investors
Paragraph 19:
According to the administrative power and function. MPC and MF coordinate
policy and action in efforts to ensure legal stability and security for investment.
Paragraph 20:
1 - 4 - 33
To coordinate administrative activities, together with the administrative power and
function, in implementation of investment promotion and within the scope of
national policy.
Chapter IV: Settlement of Dispute
Paragraph 21:
Any dispute between the investor in a country with which no investment agreement
is made and Venezuela shall be settled through diplomacy. If not agreed within 12
months, the dispute shall be referred to arbitration.
Paragraph 22:
If an effective investment agreement exists, the dispute shall be settled according to
the applicable provisions of the agreement and through the international arbitration
procedures.
Paragraph 23:
Any dispute that should be settled according to the provisions of this decree shall be
settled at an international tribunal or court.
Chapter V: Temporary and Final measures
Paragraph 24:
Provisions in this decree does not prevent or exclude the following measures from
being taken:
(1) Measures required to protect human life or health, animals or plants, or to
preserve natural resources
(2) Measures related to financial service in order to achieve the following
objectives:
a. Protection of investors or depositors
b. Maintenance of responsibility and safety of financial institutions
c. Guarantee of just and fair action and stability of the financial system in
Venezuela
Paragraph 25:
Provisions of this decree shall be enforced on the basis of interpretation written and
established in the inherent law of the high court.
Paragraph 26:
Related regulations shall be promulgated within 60 days after notification of this
decree.
This decree is attached in the original language.
1 - 4 - 34
1.4.4 Investment in Industrial Parks and Future Projects
Development of industrial parks in the country was started two decades ago under
the leadership of CORPOINDUSTIRIA. Major industrial parks currently in service
are shown in Figure1.4.5. Also, Tables 1.4.10 and 1.4.11 show data on “industrial
estates and development organizations” and “trends in incorporation, employment,
gross production and value added by state” that are based on the results of CAF’s recent
SME survey.
During the second field survey, the study team visited and analyzed four industrial
parks, namely Carupano (Sucre), El Tigre (Anzoategui), Tinaguillo (Cojedes), and El
Tocuyo (Lara). Then the third field survey covered industrial estates and districts in
Parque Tecnológico(Mérida), Zona Libre Cultural、Cientifica y Tecnológica(Mérida),
San Fernando-Biruaca ( Apure ) , San Antonio(Tàchira), Ureña(Tàchira), San
Cristobal(Tàchira), Coro(Falcón)and Punto Fijo(Zona Franca Industrial, Comercial y
de Servicios de Paraguná-Falcón). The study team discussed members of the local
chamber of commerce and industry, as well as executive officers of local governments
(including governors and mayors), and visited production facilities of major enterprises
in each area. The results of analysis are summarized in the following table. Major
issues commonly seen among the four industrial parks are the lack of facility
maintenance due to a poor management organization, the lack of support for
entrepreneurs who show interest in new projects, and the absence of coordination
between central government and local organizations. To overcome the situation, the
government should redefine the role of industrial parks and a strategic direction for
future development.
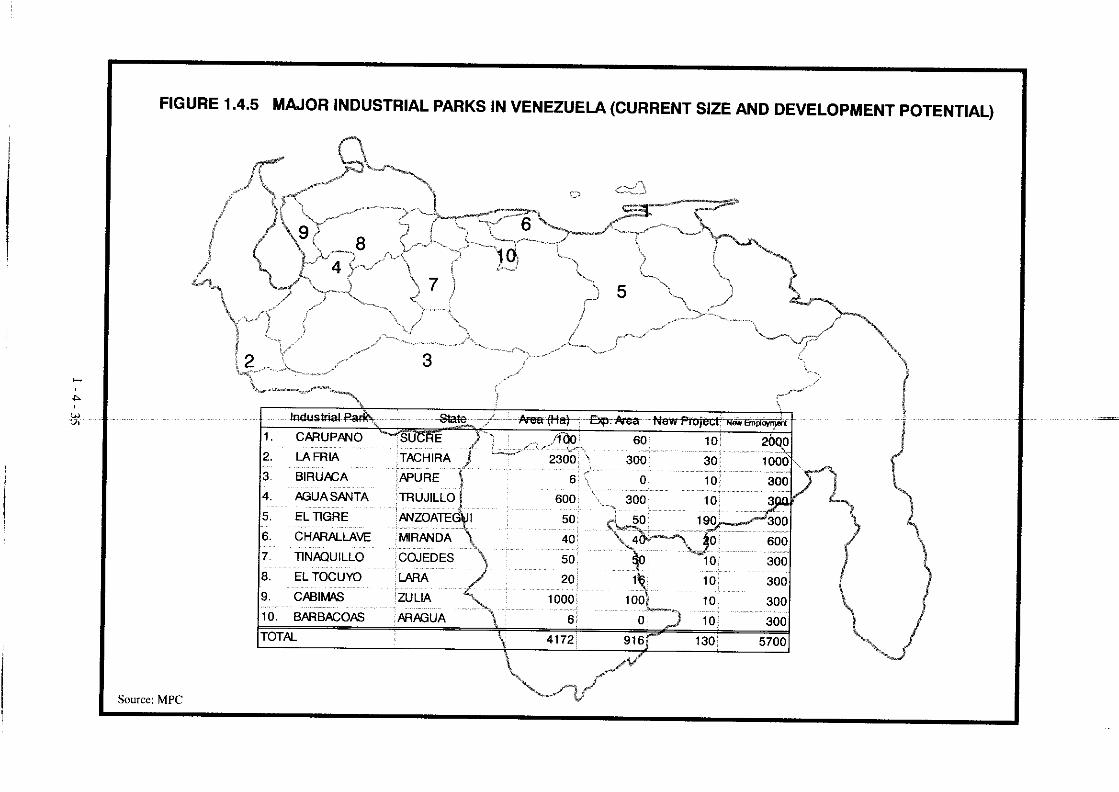
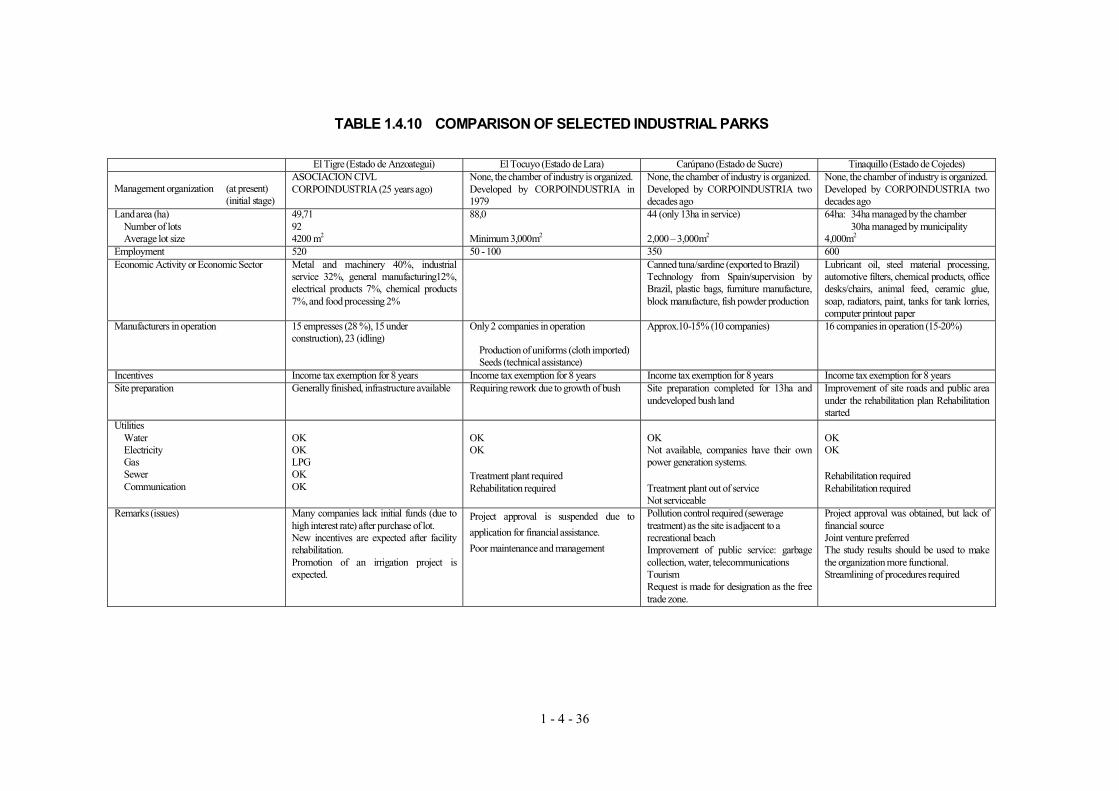
1 - 4 - 36
TABLE 1.4.10 COMPARISON OF SELECTED INDUSTRIAL PARKS
El Tigre (Estado de Anzoategui) El Tocuyo (Estado de Lara) Carúpano (Estado de Sucre) Tinaquillo (Estado de Cojedes)
Management organization (at present) (initial stage)
ASOCIACION CIVL CORPOINDUSTRIA (25 years ago)
None, the chamber of industry is organized. Developed by CORPOINDUSTRIA in 1979
None, the chamber of industry is organized.Developed by CORPOINDUSTRIA two decades ago
None, the chamber of industry is organized. Developed by CORPOINDUSTRIA two decades ago
Land area (ha) Number of lots Average lot size
49,71 92 4200 m2
88,0
Minimum 3,000m2
44 (only 13ha in service)
2,000 – 3,000m2
64ha: 34ha managed by the chamber 30ha managed by municipality 4,000m2
Employment 520 50 - 100 350 600 Economic Activity or Economic Sector Metal and machinery 40%, industrial
service 32%, general manufacturing12%, electrical products 7%, chemical products 7%, and food processing 2%
Canned tuna/sardine (exported to Brazil) Technology from Spain/supervision by Brazil, plastic bags, furniture manufacture, block manufacture, fish powder production
Lubricant oil, steel material processing, automotive filters, chemical products, office desks/chairs, animal feed, ceramic glue, soap, radiators, paint, tanks for tank lorries, computer printout paper
Manufacturers in operation 15 empresses (28 %), 15 under construction), 23 (idling)
Only 2 companies in operation
Production of uniforms (cloth imported) Seeds (technical assistance)
Approx.10-15% (10 companies) 16 companies in operation (15-20%)
Incentives Income tax exemption for 8 years Income tax exemption for 8 years Income tax exemption for 8 years Income tax exemption for 8 years Site preparation Generally finished, infrastructure available Requiring rework due to growth of bush Site preparation completed for 13ha and
undeveloped bush land Improvement of site roads and public area under the rehabilitation plan Rehabilitation started
Utilities Water Electricity Gas Sewer Communication
OK OK LPG OK OK
OK OK
Treatment plant required Rehabilitation required
OK Not available, companies have their own power generation systems.
Treatment plant out of service Not serviceable
OK OK
Rehabilitation required Rehabilitation required
Remarks (issues) Many companies lack initial funds (due to high interest rate) after purchase of lot. New incentives are expected after facility rehabilitation. Promotion of an irrigation project is expected.
Project approval is suspended due to
application for financial assistance.
Poor maintenance and management
Pollution control required (sewerage treatment) as the site is adjacent to a recreational beach Improvement of public service: garbage collection, water, telecommunications Tourism Request is made for designation as the free trade zone.
Project approval was obtained, but lack of financial source Joint venture preferred The study results should be used to make the organization more functional. Streamlining of procedures required
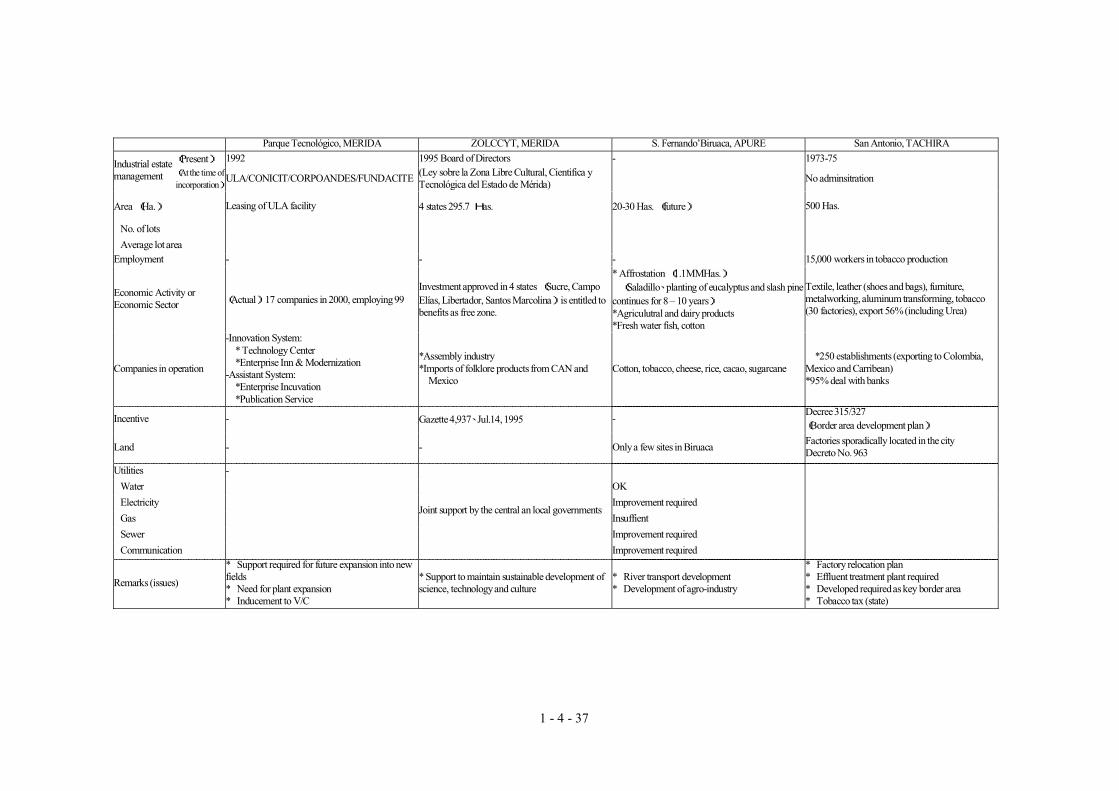
1 - 4 - 37
Parque Tecnológico, MERIDA ZOLCCYT, MERIDA S. Fernando’Biruaca, APURE San Antonio, TACHIRA
(Present) 1992 1995 Board of Directors - 1973-75 Industrial estate management (At the time of
incorporation)ULA/CONICIT/CORPOANDES/FUNDACITE
(Ley sobre la Zona Libre Cultural, Cientifica y Tecnológica del Estado de Mérida)
No adminsitration
Area (Ha.) Leasing of ULA facility 4 states 295.7 Has. 20-30 Has. (future) 500 Has.
No. of lots
Average lot area Employment - - - 15,000 workers in tobacco production
Economic Activity or Economic Sector (Actual) 17 companies in 2000, employing 99
Investment approved in 4 states (Sucre, Campo Elías, Libertador, Santos Marcolina) is entitled to benefits as free zone.
* Affrostation (1.1MMHas.)(Saladillo、planting of eucalyptus and slash pine
continues for 8 – 10 years)*Agriculutral and dairy products *Fresh water fish, cotton
Textile, leather (shoes and bags), furniture, metalworking, aluminum transforming, tobacco (30 factories), export 56% (including Urea)
Companies in operation
-Innovation System: * Technology Center *Enterprise Inn & Modernization
-Assistant System: *Enterprise Incuvation *Publication Service
*Assembly industry *Imports of folklore products from CAN and
Mexico Cotton, tobacco, cheese, rice, cacao, sugarcane
*250 establishments (exporting to Colombia, Mexico and Carribean) *95% deal with banks
Incentive - Gazette 4,937、Jul.14, 1995 -Decree 315/327 (Border area development plan)
Land - - Only a few sites in Biruaca Factories sporadically located in the city Decreto No. 963
Utilities -
Water OK
Electricity Improvement required
Gas Insuffient
Sewer Improvement required
Communication
Joint support by the central an local governments
Improvement required
Remarks (issues)
* Support required for future expansion into new fields * Need for plant expansion * Inducement to V/C
* Support to maintain sustainable development of science, technology and culture
* River transport development * Development of agro-industry
* Factory relocation plan * Effluent treatment plant required * Developed required as key border area * Tobacco tax (state)
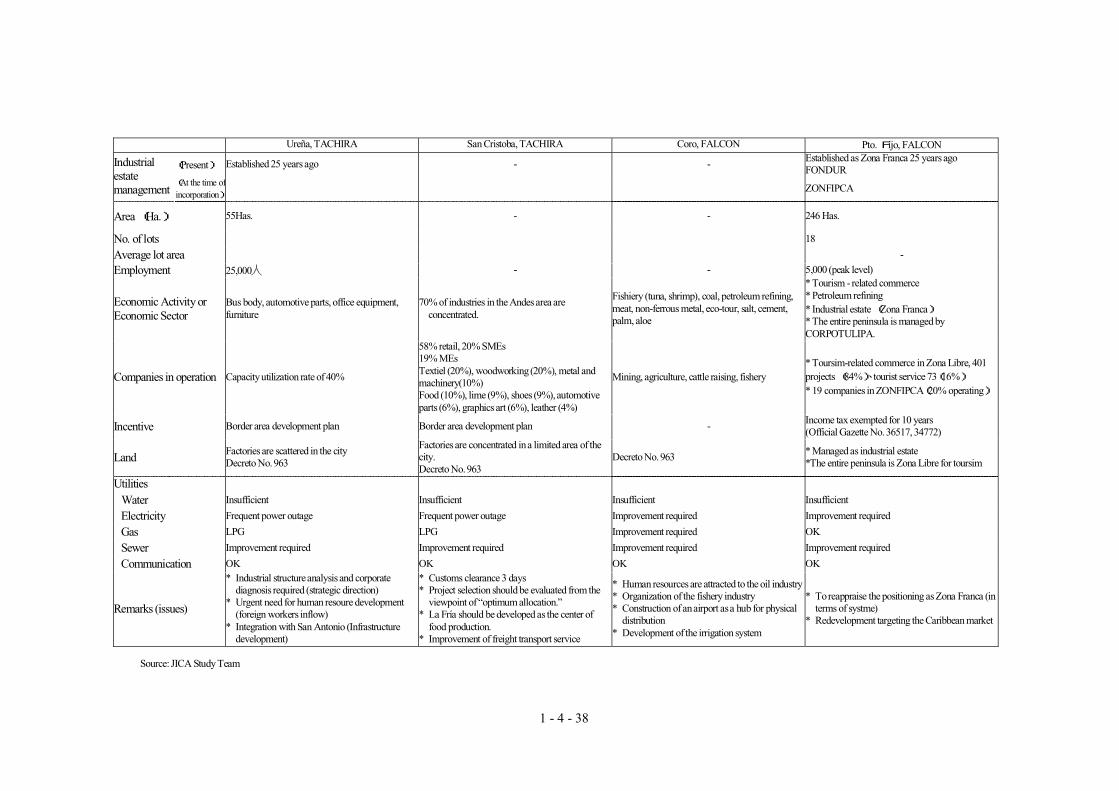
1 - 4 - 38
Ureña, TACHIRA San Cristoba, TACHIRA Coro, FALCON Pto. Fijo, FALCON
(Present) Established 25 years ago - - Established as Zona Franca 25 years ago FONDUR
Industrial estate management
(At the time ofincorporation)
ZONFIPCA
Area (Ha.) 55Has. - - 246 Has.
No. of lots 18
Average lot area -
Employment 25,000人 - - 5,000 (peak level)
Economic Activity or Economic Sector
Bus body, automotive parts, office equipment, furniture
70% of industries in the Andes area are concentrated.
Fishiery (tuna, shrimp), coal, petroleum refining, meat, non-ferrous metal, eco-tour, salt, cement, palm, aloe
* Tourism - related commerce * Petroleum refining * Industrial estate (Zona Franca)* The entire peninsula is managed by CORPOTULIPA.
Companies in operation Capacity utilization rate of 40%
58% retail, 20% SMEs 19% MEs Textiel (20%), woodworking (20%), metal and machinery(10%) Food (10%), lime (9%), shoes (9%), automotive parts (6%), graphics art (6%), leather (4%)
Mining, agriculture, cattle raising, fishery * Toursim-related commerce in Zona Libre, 401 projects (84%)、tourist service 73(16%)
* 19 companies in ZONFIPCA(20% operating)
Incentive Border area development plan Border area development plan - Income tax exempted for 10 years (Official Gazette No. 36517, 34772)
Land Factories are scattered in the city Decreto No. 963
Factories are concentrated in a limited area of the city. Decreto No. 963
Decreto No. 963 * Managed as industrial estate *The entire peninsula is Zona Libre for toursim
Utilities
Water Insufficient Insufficient Insufficient Insufficient
Electricity Frequent power outage Frequent power outage Improvement required Improvement required
Gas LPG LPG Improvement required OK
Sewer Improvement required Improvement required Improvement required Improvement required
Communication OK OK OK OK
Remarks (issues)
* Industrial structure analysis and corporate diagnosis required (strategic direction)
* Urgent need for human resoure development (foreign workers inflow)
* Integration with San Antonio (Infrastructure development)
* Customs clearance 3 days * Project selection should be evaluated from the
viewpoint of “optimum allocation.” * La Fría should be developed as the center of
food production. * Improvement of freight transport service
* Human resources are attracted to the oil industry* Organization of the fishery industry * Construction of an airport as a hub for physical
distribution * Development of the irrigation system
* To reappraise the positioning as Zona Franca (in terms of systme)
* Redevelopment targeting the Caribbean market
Source: JICA Study Team
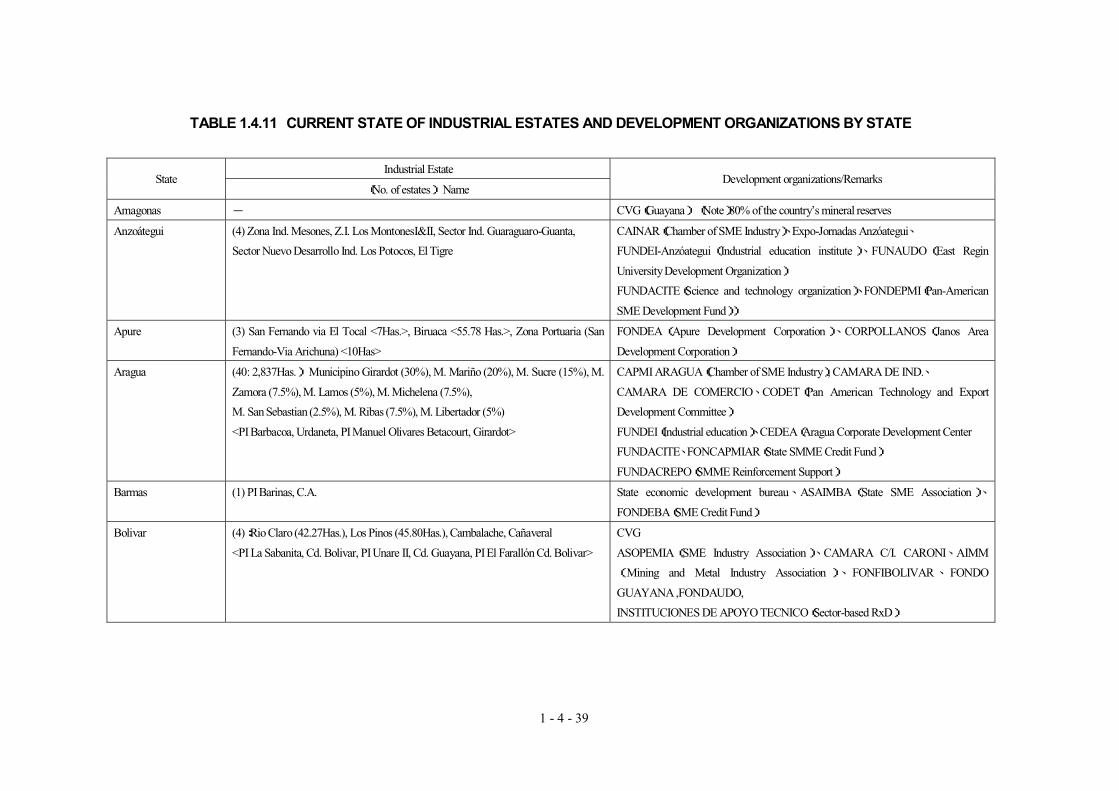
1 - 4 - 39
TABLE 1.4.11 CURRENT STATE OF INDUSTRIAL ESTATES AND DEVELOPMENT ORGANIZATIONS BY STATE
Industrial Estate State
(No. of estates) Name Development organizations/Remarks
Amagonas - CVG(Guayana) (Note)80% of the country’s mineral reserves
Anzoátegui (4) Zona Ind. Mesones, Z.I. Los MontonesI&II, Sector Ind. Guaraguaro-Guanta,
Sector Nuevo Desarrollo Ind. Los Potocos, El Tigre
CAINAR(Chamber of SME Industry)、Expo-Jornadas Anzóategui、
FUNDEI-Anzóategui ( Industrial education institute)、FUNAUDO(East Regin
University Development Organization)
FUNDACITE(Science and technology organization)、FONDEPMI(Pan-American
SME Development Fund))
Apure (3) San Fernando via El Tocal <7Has.>, Biruaca <55.78 Has.>, Zona Portuaria (San
Fernando-Via Arichuna) <10Has>
FONDEA( Apure Development Corporation) 、CORPOLLANOS( Janos Area
Development Corporation)
Aragua (40: 2,837Has.) Municipino Girardot (30%), M. Mariño (20%), M. Sucre (15%), M.
Zamora (7.5%), M. Lamos (5%), M. Michelena (7.5%),
M. San Sebastian (2.5%), M. Ribas (7.5%), M. Libertador (5%)
<PI Barbacoa, Urdaneta, PI Manuel Olivares Betacourt, Girardot>
CAPMI ARAGUA(Chamber of SME Industry), CAMARA DE IND.、
CAMARA DE COMERCIO、CODET(Pan American Technology and Export
Development Committee)
FUNDEI(Industrial education)、CEDEA(Aragua Corporate Development Center
FUNDACITE、FONCAPMIAR(State SMME Credit Fund)
FUNDACREPO(SMME Reinforcement Support)
Barmas (1) PI Barinas, C.A. State economic development bureau、 ASAIMBA(State SME Association)、
FONDEBA(SME Credit Fund)
Bolivar (4):Rio Claro (42.27Has.), Los Pinos (45.80Has.), Cambalache, Cañaveral
<PI La Sabanita, Cd. Bolivar, PI Unare II, Cd. Guayana, PI El Farallón Cd. Bolivar>
CVG
ASOPEMIA(SME Industry Association)、CAMARA C/I. CARONI、AIMM
( Mining and Metal Industry Association ) 、 FONFIBOLIVAR 、 FONDO
GUAYANA ,FONDAUDO,
INSTITUCIONES DE APOYO TECNICO(Sector-based RxD)
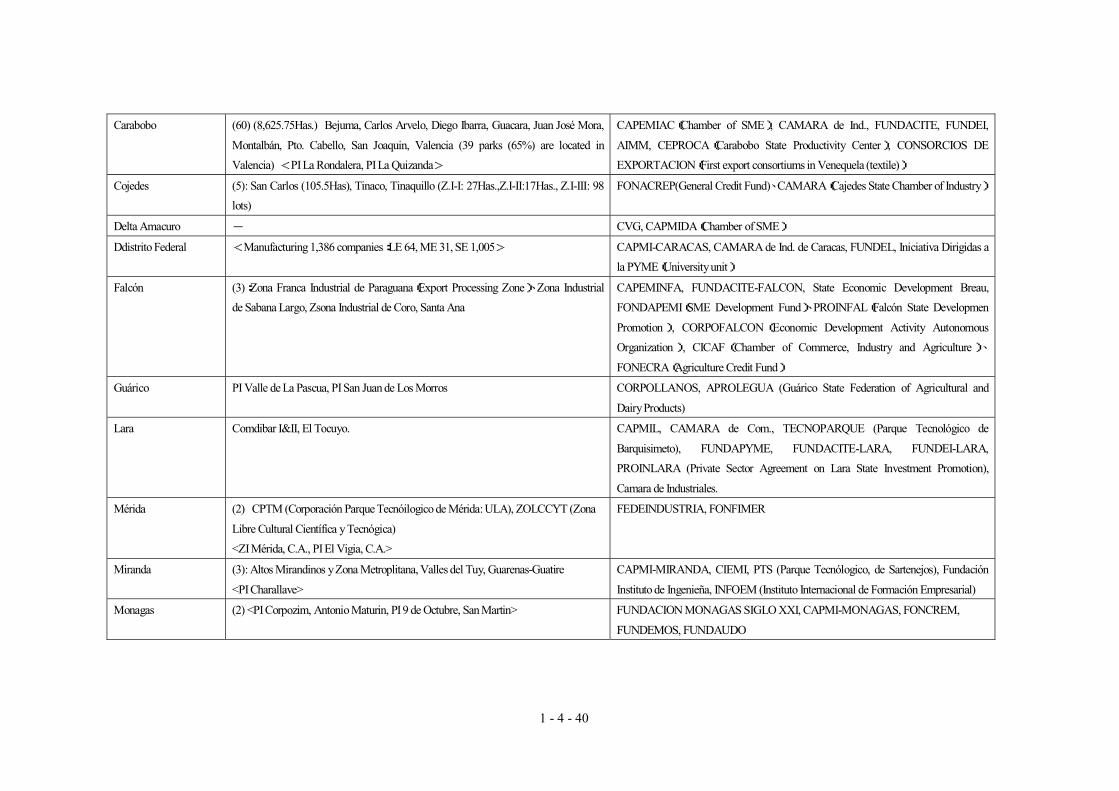
1 - 4 - 40
Carabobo (60) (8,625.75Has.) Bejuma, Carlos Arvelo, Diego Ibarra, Guacara, Juan José Mora,
Montalbán, Pto. Cabello, San Joaquin, Valencia (39 parks (65%) are located in
Valencia) <PI La Rondalera, PI La Quizanda>
CAPEMIAC(Chamber of SME), CAMARA de Ind., FUNDACITE, FUNDEI,
AIMM, CEPROCA(Carabobo State Productivity Center), CONSORCIOS DE
EXPORTACION(First export consortiums in Venequela (textile))
Cojedes (5): San Carlos (105.5Has), Tinaco, Tinaquillo (Z.I-I: 27Has.,Z.I-II:17Has., Z.I-III: 98
lots)
FONACREP(General Credit Fund)、CAMARA(Cajedes State Chamber of Industry)
Delta Amacuro - CVG, CAPMIDA(Chamber of SME)
Ddistrito Federal <Manufacturing 1,386 companies:LE 64, ME 31, SE 1,005> CAPMI-CARACAS, CAMARA de Ind. de Caracas, FUNDEL, Iniciativa Dirigidas a
la PYME(University unit)
Falcón (3):Zona Franca Industrial de Paraguana(Export Processing Zone)、Zona Industrial
de Sabana Largo, Zsona Industrial de Coro, Santa Ana
CAPEMINFA, FUNDACITE-FALCON, State Economic Development Breau,
FONDAPEMI(SME Development Fund)、PROINFAL(Falcón State Developmen
Promotion) , CORPOFALCON(Economic Development Activity Autonomous
Organization) , CICAF(Chamber of Commerce, Industry and Agriculture)、
FONECRA(Agriculture Credit Fund)
Guárico PI Valle de La Pascua, PI San Juan de Los Morros CORPOLLANOS, APROLEGUA (Guárico State Federation of Agricultural and
Dairy Products)
Lara Comdibar I&II, El Tocuyo. CAPMIL, CAMARA de Com., TECNOPARQUE (Parque Tecnológico de
Barquisimeto), FUNDAPYME, FUNDACITE-LARA, FUNDEI-LARA,
PROINLARA (Private Sector Agreement on Lara State Investment Promotion),
Camara de Industriales.
Mérida (2) CPTM (Corporación Parque Tecnóilogico de Mérida: ULA), ZOLCCYT (Zona
Libre Cultural Científica y Tecnógica)
<ZI Mérida, C.A., PI El Vigia, C.A.>
FEDEINDUSTRIA, FONFIMER
Miranda (3): Altos Mirandinos y Zona Metroplitana, Valles del Tuy, Guarenas-Guatire
<PI Charallave>
CAPMI-MIRANDA, CIEMI, PTS (Parque Tecnólogico, de Sartenejos), Fundación
Instituto de Ingenieña, INFOEM (Instituto Internacional de Formación Empresarial)
Monagas (2) <PI Corpozim, Antonio Maturin, PI 9 de Octubre, San Martin> FUNDACION MONAGAS SIGLO XXI, CAPMI-MONAGAS, FONCREM,
FUNDEMOS, FUNDAUDO
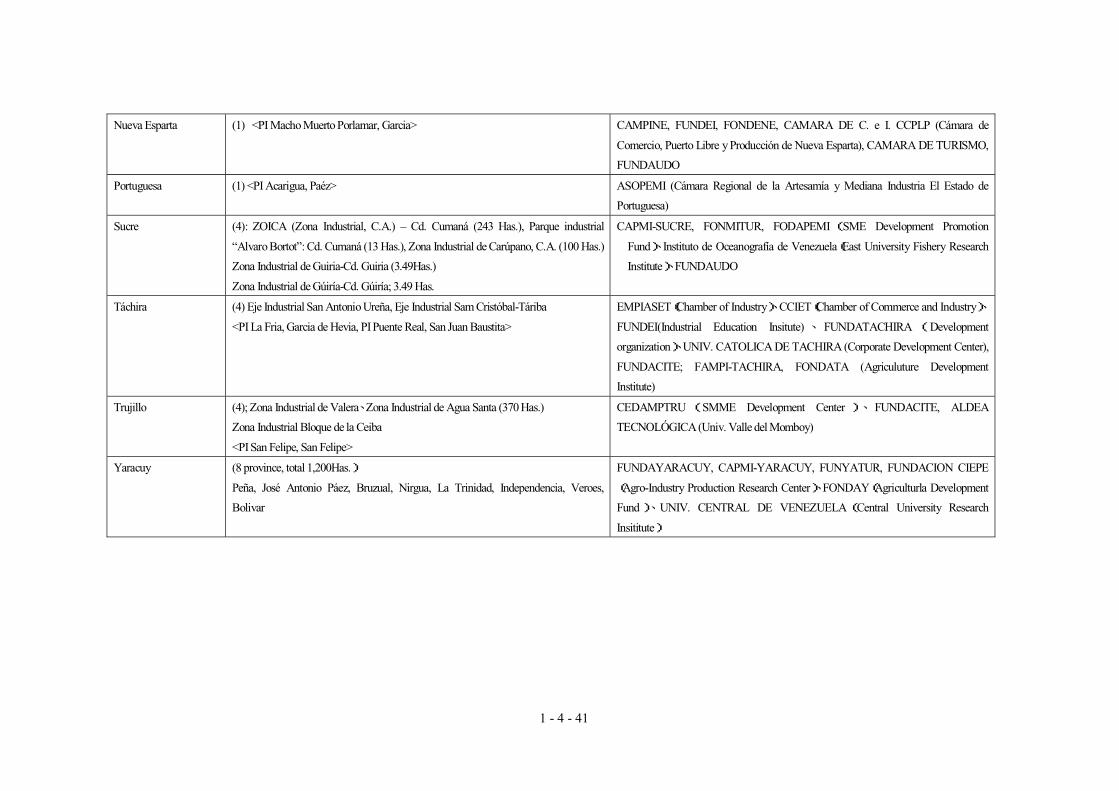
1 - 4 - 41
Nueva Esparta (1) <PI Macho Muerto Porlamar, Garcia> CAMPINE, FUNDEI, FONDENE, CAMARA DE C. e I. CCPLP (Cámara de
Comercio, Puerto Libre y Producción de Nueva Esparta), CAMARA DE TURISMO,
FUNDAUDO
Portuguesa (1) <PI Acarigua, Paéz> ASOPEMI (Cámara Regional de la Artesamía y Mediana Industria El Estado de
Portuguesa)
Sucre (4): ZOICA (Zona Industrial, C.A.) – Cd. Cumaná (243 Has.), Parque industrial
“Alvaro Bortot”: Cd. Cumaná (13 Has.), Zona Industrial de Carúpano, C.A. (100 Has.)
Zona Industrial de Guiria-Cd. Guiria (3.49Has.)
Zona Industrial de Gúiría-Cd. Gúiría; 3.49 Has.
CAPMI-SUCRE, FONMITUR, FODAPEMI ( SME Development Promotion
Fund)、Instituto de Oceanografía de Venezuela(East University Fishery Research
Institute)、FUNDAUDO
Táchira (4) Eje Industrial San Antonio Ureña, Eje Industrial Sam Cristóbal-Táriba
<PI La Fria, Garcia de Hevia, PI Puente Real, San Juan Baustita>
EMPIASET(Chamber of Industry)、CCIET(Chamber of Commerce and Industry)、
FUNDEI(Industrial Education Insitute) 、 FUNDATACHIRA ( Development
organization)、UNIV. CATOLICA DE TACHIRA (Corporate Development Center),
FUNDACITE; FAMPI-TACHIRA, FONDATA (Agriculuture Development
Institute)
Trujillo (4); Zona Industrial de Valera、Zona Industrial de Agua Santa (370 Has.)
Zona Industrial Bloque de la Ceiba
<PI San Felipe, San Felipe>
CEDAMPTRU ( SMME Development Center ) 、 FUNDACITE, ALDEA
TECNOLÓGICA (Univ. Valle del Momboy)
Yaracuy (8 province, total 1,200Has.)
Peña, José Antonio Páez, Bruzual, Nirgua, La Trinidad, Independencia, Veroes,
Bolivar
FUNDAYARACUY, CAPMI-YARACUY, FUNYATUR, FUNDACION CIEPE
(Agro-Industry Production Research Center)、FONDAY(Agriculturla Development
Fund ) 、 UNIV. CENTRAL DE VENEZUELA( Central University Research
Insititute)
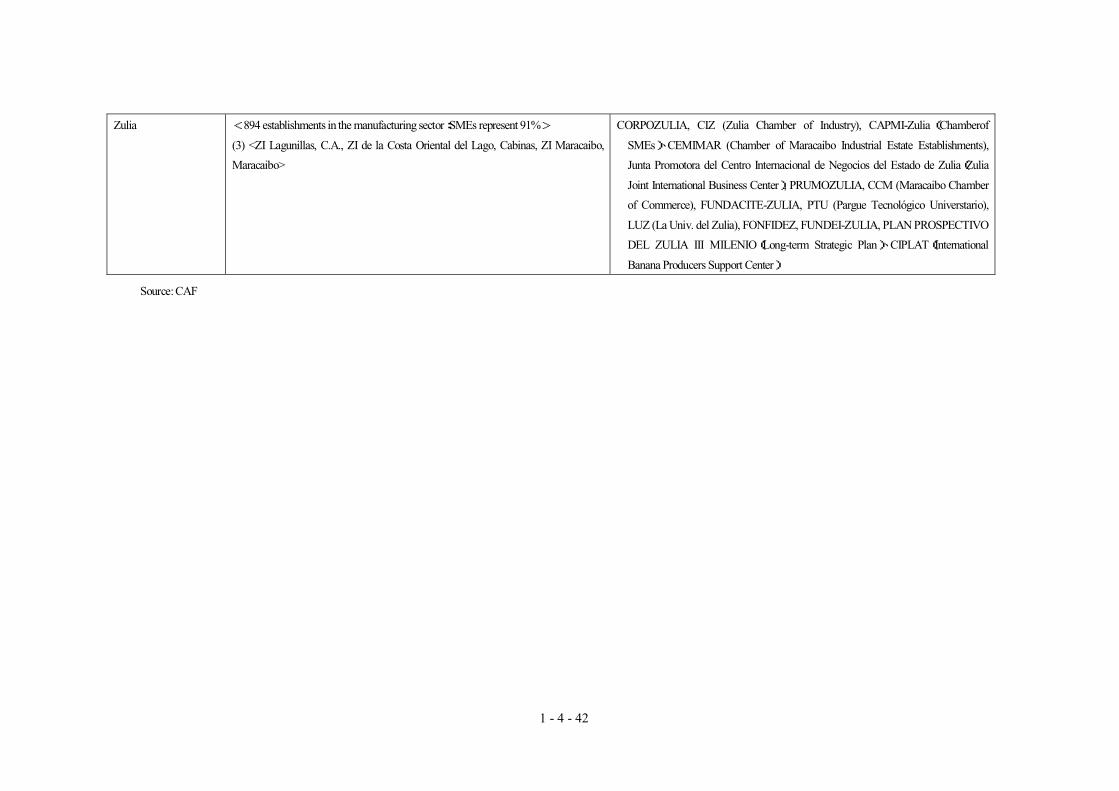
1 - 4 - 42
Zulia <894 establishments in the manufacturing sector:SMEs represent 91%>
(3) <ZI Lagunillas, C.A., ZI de la Costa Oriental del Lago, Cabinas, ZI Maracaibo,
Maracaibo>
CORPOZULIA, CIZ (Zulia Chamber of Industry), CAPMI-Zulia(Chamberof
SMEs)、CEMIMAR (Chamber of Maracaibo Industrial Estate Establishments),
Junta Promotora del Centro Internacional de Negocios del Estado de Zulia(Zulia
Joint International Business Center), PRUMOZULIA, CCM (Maracaibo Chamber
of Commerce), FUNDACITE-ZULIA, PTU (Pargue Tecnológico Universtario),
LUZ (La Univ. del Zulia), FONFIDEZ, FUNDEI-ZULIA, PLAN PROSPECTIVO
DEL ZULIA III MILENIO(Long-term Strategic Plan)、CIPLAT(International
Banana Producers Support Center)
Source: CAF
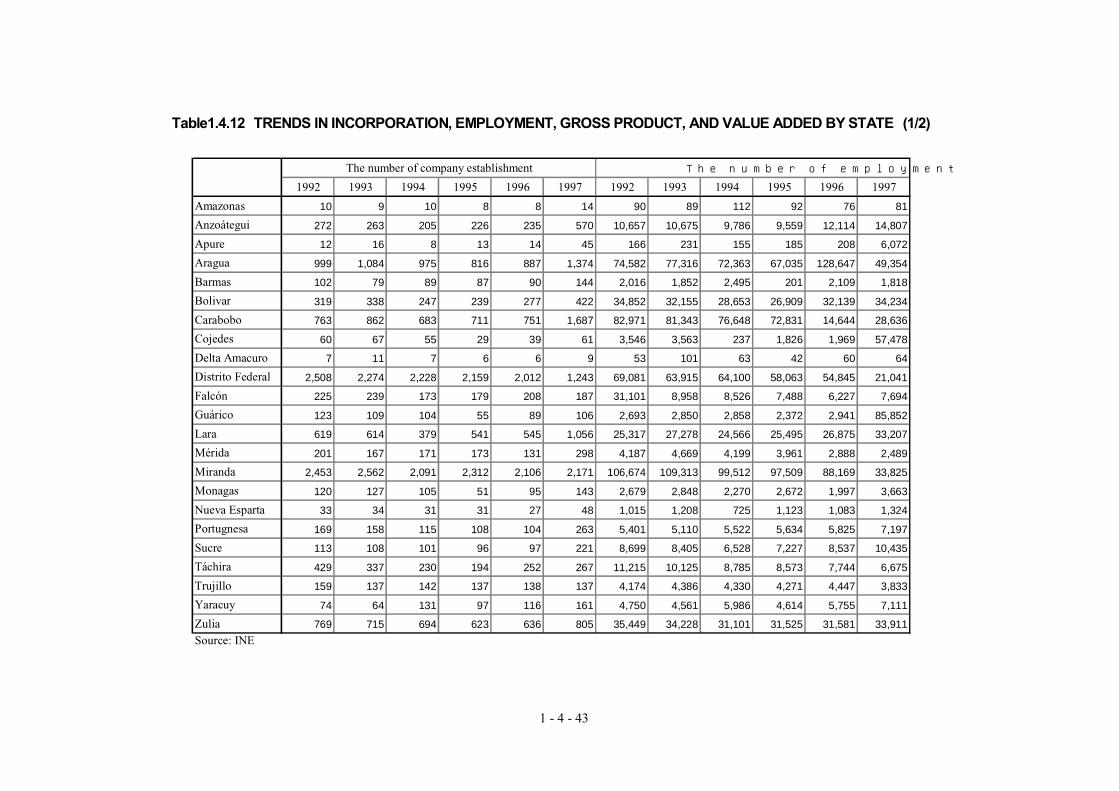
1 - 4 - 43
Table1.4.12 TRENDS IN INCORPORATION, EMPLOYMENT, GROSS PRODUCT, AND VALUE ADDED BY STATE (1/2)
The number of company establishment The number of employment
1992 1993 1994 1995 1996 1997 1992 1993 1994 1995 1996 1997
Amazonas 10 9 10 8 8 14 90 89 112 92 76 81
Anzoátegui 272 263 205 226 235 570 10,657 10,675 9,786 9,559 12,114 14,807
Apure 12 16 8 13 14 45 166 231 155 185 208 6,072
Aragua 999 1,084 975 816 887 1,374 74,582 77,316 72,363 67,035 128,647 49,354
Barmas 102 79 89 87 90 144 2,016 1,852 2,495 201 2,109 1,818
Bolivar 319 338 247 239 277 422 34,852 32,155 28,653 26,909 32,139 34,234
Carabobo 763 862 683 711 751 1,687 82,971 81,343 76,648 72,831 14,644 28,636
Cojedes 60 67 55 29 39 61 3,546 3,563 237 1,826 1,969 57,478
Delta Amacuro 7 11 7 6 6 9 53 101 63 42 60 64
Distrito Federal 2,508 2,274 2,228 2,159 2,012 1,243 69,081 63,915 64,100 58,063 54,845 21,041
Falcón 225 239 173 179 208 187 31,101 8,958 8,526 7,488 6,227 7,694
Guárico 123 109 104 55 89 106 2,693 2,850 2,858 2,372 2,941 85,852
Lara 619 614 379 541 545 1,056 25,317 27,278 24,566 25,495 26,875 33,207
Mérida 201 167 171 173 131 298 4,187 4,669 4,199 3,961 2,888 2,489
Miranda 2,453 2,562 2,091 2,312 2,106 2,171 106,674 109,313 99,512 97,509 88,169 33,825
Monagas 120 127 105 51 95 143 2,679 2,848 2,270 2,672 1,997 3,663
Nueva Esparta 33 34 31 31 27 48 1,015 1,208 725 1,123 1,083 1,324
Portugnesa 169 158 115 108 104 263 5,401 5,110 5,522 5,634 5,825 7,197
Sucre 113 108 101 96 97 221 8,699 8,405 6,528 7,227 8,537 10,435
Táchira 429 337 230 194 252 267 11,215 10,125 8,785 8,573 7,744 6,675
Trujillo 159 137 142 137 138 137 4,174 4,386 4,330 4,271 4,447 3,833
Yaracuy 74 64 131 97 116 161 4,750 4,561 5,986 4,614 5,755 7,111
Zulia 769 715 694 623 636 805 35,449 34,228 31,101 31,525 31,581 33,911Source: INE
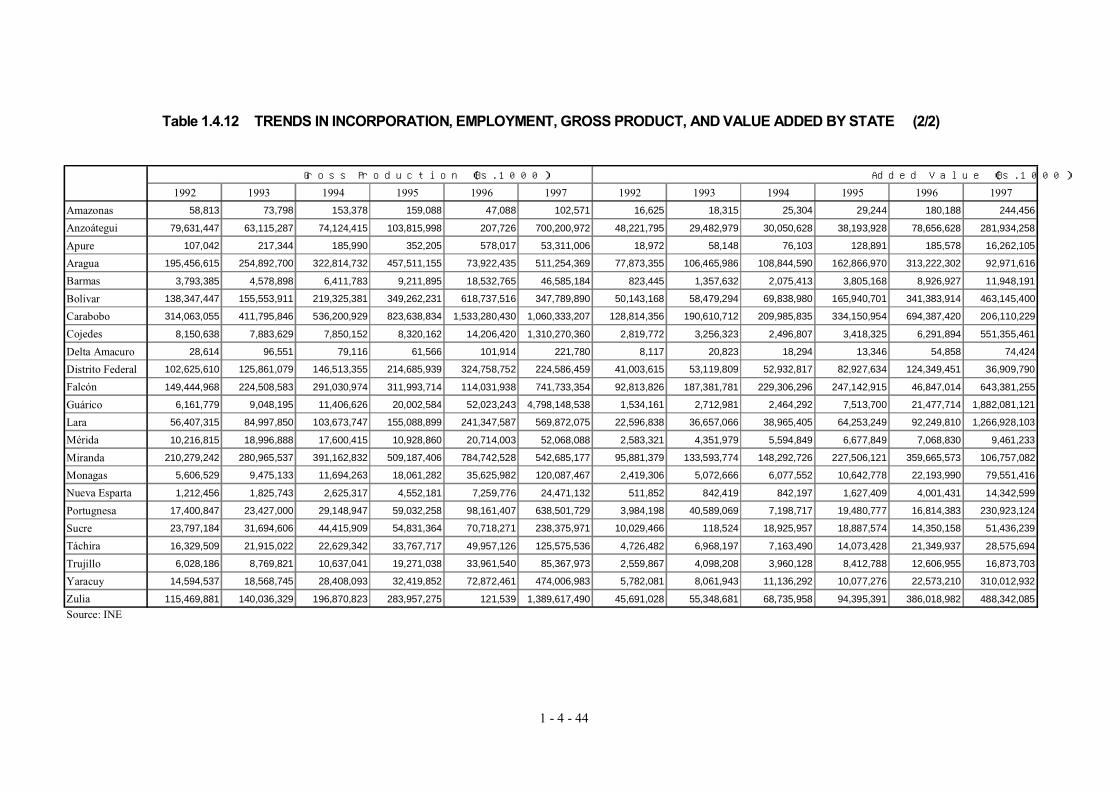
1 - 4 - 44
Table 1.4.12 TRENDS IN INCORPORATION, EMPLOYMENT, GROSS PRODUCT, AND VALUE ADDED BY STATE (2/2)
Gross Production (Bs.1000) Added Value (Bs.1000)
1992 1993 1994 1995 1996 1997 1992 1993 1994 1995 1996 1997
Amazonas 58,813 73,798 153,378 159,088 47,088 102,571 16,625 18,315 25,304 29,244 180,188 244,456
Anzoátegui 79,631,447 63,115,287 74,124,415 103,815,998 207,726 700,200,972 48,221,795 29,482,979 30,050,628 38,193,928 78,656,628 281,934,258
Apure 107,042 217,344 185,990 352,205 578,017 53,311,006 18,972 58,148 76,103 128,891 185,578 16,262,105
Aragua 195,456,615 254,892,700 322,814,732 457,511,155 73,922,435 511,254,369 77,873,355 106,465,986 108,844,590 162,866,970 313,222,302 92,971,616
Barmas 3,793,385 4,578,898 6,411,783 9,211,895 18,532,765 46,585,184 823,445 1,357,632 2,075,413 3,805,168 8,926,927 11,948,191
Bolivar 138,347,447 155,553,911 219,325,381 349,262,231 618,737,516 347,789,890 50,143,168 58,479,294 69,838,980 165,940,701 341,383,914 463,145,400
Carabobo 314,063,055 411,795,846 536,200,929 823,638,834 1,533,280,430 1,060,333,207 128,814,356 190,610,712 209,985,835 334,150,954 694,387,420 206,110,229
Cojedes 8,150,638 7,883,629 7,850,152 8,320,162 14,206,420 1,310,270,360 2,819,772 3,256,323 2,496,807 3,418,325 6,291,894 551,355,461
Delta Amacuro 28,614 96,551 79,116 61,566 101,914 221,780 8,117 20,823 18,294 13,346 54,858 74,424
Distrito Federal 102,625,610 125,861,079 146,513,355 214,685,939 324,758,752 224,586,459 41,003,615 53,119,809 52,932,817 82,927,634 124,349,451 36,909,790
Falcón 149,444,968 224,508,583 291,030,974 311,993,714 114,031,938 741,733,354 92,813,826 187,381,781 229,306,296 247,142,915 46,847,014 643,381,255
Guárico 6,161,779 9,048,195 11,406,626 20,002,584 52,023,243 4,798,148,538 1,534,161 2,712,981 2,464,292 7,513,700 21,477,714 1,882,081,121
Lara 56,407,315 84,997,850 103,673,747 155,088,899 241,347,587 569,872,075 22,596,838 36,657,066 38,965,405 64,253,249 92,249,810 1,266,928,103
Mérida 10,216,815 18,996,888 17,600,415 10,928,860 20,714,003 52,068,088 2,583,321 4,351,979 5,594,849 6,677,849 7,068,830 9,461,233
Miranda 210,279,242 280,965,537 391,162,832 509,187,406 784,742,528 542,685,177 95,881,379 133,593,774 148,292,726 227,506,121 359,665,573 106,757,082
Monagas 5,606,529 9,475,133 11,694,263 18,061,282 35,625,982 120,087,467 2,419,306 5,072,666 6,077,552 10,642,778 22,193,990 79,551,416
Nueva Esparta 1,212,456 1,825,743 2,625,317 4,552,181 7,259,776 24,471,132 511,852 842,419 842,197 1,627,409 4,001,431 14,342,599
Portugnesa 17,400,847 23,427,000 29,148,947 59,032,258 98,161,407 638,501,729 3,984,198 40,589,069 7,198,717 19,480,777 16,814,383 230,923,124
Sucre 23,797,184 31,694,606 44,415,909 54,831,364 70,718,271 238,375,971 10,029,466 118,524 18,925,957 18,887,574 14,350,158 51,436,239
Táchira 16,329,509 21,915,022 22,629,342 33,767,717 49,957,126 125,575,536 4,726,482 6,968,197 7,163,490 14,073,428 21,349,937 28,575,694
Trujillo 6,028,186 8,769,821 10,637,041 19,271,038 33,961,540 85,367,973 2,559,867 4,098,208 3,960,128 8,412,788 12,606,955 16,873,703
Yaracuy 14,594,537 18,568,745 28,408,093 32,419,852 72,872,461 474,006,983 5,782,081 8,061,943 11,136,292 10,077,276 22,573,210 310,012,932
Zulia 115,469,881 140,036,329 196,870,823 283,957,275 121,539 1,389,617,490 45,691,028 55,348,681 68,735,958 94,395,391 386,018,982 488,342,085Source: INE
1 - 5 - 1
1.5 Finance
1.5.1 Financial System and Reform
The "general law of a bank and other financial institutions" known as a bank law
was published in 1993, and was enforced in January, 1994. The purpose of this law is
to strengthen the domestic financial system and the domestic financial institution and to
build the firm base of this sector in order to increase competitiveness. The important
points of this law were to liberalize strongly regulated and protected conventional
domestic bank sector, and to open the door to foreign investment. Each business lines
of a commercial bank, a housing loan specialized bank, and a leasing company was
limited for every bank before this, thus the universal bank without operating restrictions
was accepted by this law. Thereby, the major banks which were commercial banks
took over other specialized banks, and turned into universal banks which can perform
all business by inheriting business from the specialized banks. On the other hand, a
certain specialized bank turned into a universal bank by merging with other specialized
banks. The financial institutions which were 124 in 1996 are decreasing in number to 79.
The breakdown is as follows.
Universal banks 16
Commercial banks 25
Investment banks 10
Real estate mortgage banks 4
Renter Financiers 4
Saving and Loan organizations 10
The major universal banks occupied about 60% of the whole financial market, and
the other 70 financial institutions divides remaining market. A small bank has high
operating cost and it’s borrowing rate is also high as a result. In order to make raise
the efficiency of these banks to be developed, the Venezuelan government is promoting
the inter-bank merger considered to be the best method. The main banks are as follows.
- Banco Provincial
- Banco de Venezuela (Grupo Stantander)
- Banco Mercantil
- Unibanco
- Banesco
- Banco Venezolano de Crédito
1 - 5 - 2
Private banks make short-term loan for mainly working capital and other needs, on
the other hand, finance institutions such as FONCREI lend for fixed assets and
mortgage banks and saving and loan institutions are geared to longer-term lending,
mostly for home purchases and construction. However, since the leasing company
went bankrupt at the same time, there is only a small number of leasing company
operating.
The draft amendment of "the general law of a bank and other financial institutions"
was proposed in October, 2000. The main contents are; 1) higher minimum capital
requirements of all the financial institutions and 2) strengthening authority of the
Superintendency of Banks (SUDEBAN) which has controlled over all financial
intuitions. Although increasing equity capital leads to improve constitution of a bank,
it might have influence on the loan to SMEs (if a bank has to improve capitalization
rate1, the loan to the SMEs with a higher risk will become disadvantage). The main
missions of the SUDEBAN are inspection, supervision, intervention, supervision and
sanctions of a bank and other financial institutions. And by this law, S&L Institution
and credit guarantee society, etc. will be under the management of the SUDEBAN.
Although interest rate became very high during the financial crisis in 1994, the
interest rate has also fallen from 1998 as shown in table below, when the inflation rate
became low. However, the interest rate still remains in the high level for SMEs
making a new investment.
1 The gross assets which is weighted with bad loans are used for a denominator to calculate the capitalization rate.
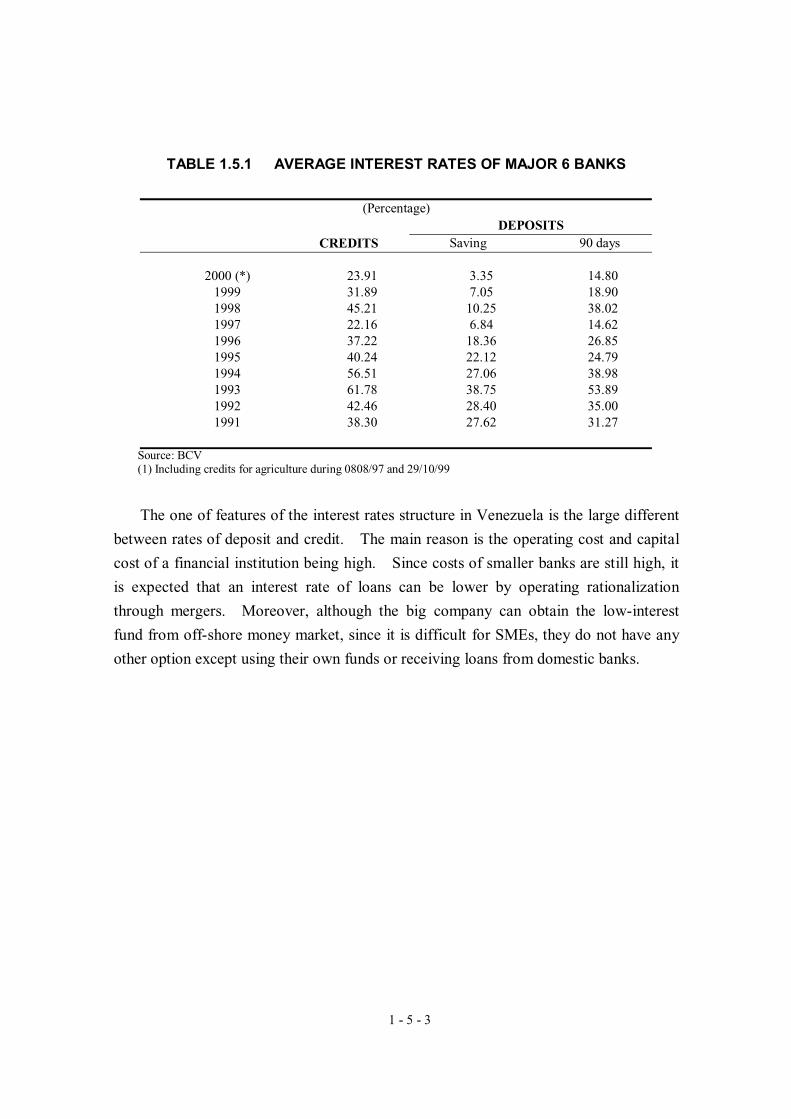
1 - 5 - 3
TABLE 1.5.1 AVERAGE INTEREST RATES OF MAJOR 6 BANKS
(Percentage) DEPOSITS
CREDITS Saving 90 days
2000 (*) 23.91 3.35 14.80 1999 31.89 7.05 18.90 1998 45.21 10.25 38.02 1997 22.16 6.84 14.62 1996 37.22 18.36 26.85 1995 40.24 22.12 24.79 1994 56.51 27.06 38.98 1993 61.78 38.75 53.89 1992 42.46 28.40 35.00 1991 38.30 27.62 31.27
Source: BCV (1) Including credits for agriculture during 0808/97 and 29/10/99
The one of features of the interest rates structure in Venezuela is the large different
between rates of deposit and credit. The main reason is the operating cost and capital
cost of a financial institution being high. Since costs of smaller banks are still high, it
is expected that an interest rate of loans can be lower by operating rationalization
through mergers. Moreover, although the big company can obtain the low-interest
fund from off-shore money market, since it is difficult for SMEs, they do not have any
other option except using their own funds or receiving loans from domestic banks.
1 - 5 - 4
1.5.2 SMEs financing
The major problems in the finance for SMEs are; a)high lending rate, b)insufficient
securities or collaterals, c)complexity and long procedure. Regarding a), the interest is
falling as already mentioned, however, the rate for small manufacturer is set up highly
in many cases. Moreover, in the case of the private bank, it is usual to require the
security worth 2 to 3 times of amount of loan. Regarding c), preparation of the
documents submitted to a financial institution is complicated for SMEs, financial
institution side does not give sufficient explanation of a document but usually only pass
it to a customer. These caused more difficulty for SMEs. It has been said that a
borrower feels longer since the examination begins from the time of documents being
ready completely. In addition, since a private bank is only able to provide a short-term
loan (maximum lending periods are three years from a commercial bank and five years
from a universal bank), it is difficult to fulfill the demand for fund to purchase a
machine or/and an equipment. Moreover, it can not lend out to the informal company
which has not paid the tax or social security.
(1) Private bank loans
Conventionally the private bank had not been positive regarding loans for SMEs
with small lot and time consuming. Right after the financial crisis in 1994, efficiency
and safety were especially important for a bank in order to recover the sound
management, therefore the risky loan was reduced. On the other hand, the government
request private bank to reduce the interest rate on loans and to extend credit lines for
SMEs.
The interest rate on loans for SMEs in a certain bank was 28% (this is a base rate
and a preferential rate can be applied by conditions) and there is still a major difference
from the interest rate of around 21% for large companies loans as of June, 2001. This
difference in the interest is caused by relatively large risk of the loan for SMEs and
larger operational cost for the small amount of loans.
Another problem is that the total amount of a loan to SMEs is limited. The
proportion of the loan was 40 to 50% of bank gross assets at the beginning of 1990, now
the portfolio of a loan has been shrunk to 20% or less. The bank was investing much
capital in National Debt Bond where profits can be expected certainly. For example,
the rate to the loan in the bank property of Banco Industrial de Venezuela (BIV) which
1 - 5 - 5
is a national bank is about 15%, and the almost half (47%, the end of December, 1999)
serves as the investment to a security etc. The breakdown of the loan is; construction
38%, service 21%, manufactures 17%, and travel 14% (at the end of December, 1999),
and by the company scale 5.6% for small enterprises, 7.3% for middle-sized enterprises,
and 87% for large enterprises (the end of June, 1999). The rate of capitalization which
shows the soundness of a bank is 15.58% (1999 ends of the year), and since it has far
exceeded 8%, which the SUDEBAN requires, it is surmised that there is room to lend
SMEs. The rate of capitalization of the private bank of Venezuela is 12% to 14% in
average.
There is an opinion that a loan does not increase in the present situation of economy
though interest rate becomes low. Since interest rate, such as a national bond which is
a safe investment place, has fallen, it is becoming difficult for a bank to gain the profits
as before. Moreover, as the strength of a bank is gaining and with advancement of
loan management technique, there is also a trend to increase the total amount of loan
and to enclose a well operating companies.
(2) The Public Finance System
The law of Regulation for Public Finance System in Venezuela was published in
1999. The purposes of a public financial system are; a. re-activation of domestic
production sectors, b. coordination of the financial policy which is closely related with
production sectors, c. optimization of the public investment through the organizations
which constitute a public finance system, and d. management and supervision of public
financial institutions. The Finance Technical Council was formed by this law, and
issues related with a public financial institutions are discussed and decided by this
council. The member of this council is each vice-minister of the Ministry of Finance
(MF), Ministry of Pacification and Development (MPD), and Ministry of Production
and Commerce (MPC).
Public financial institutions such as FONCREI and BIV are guided by this council.
The Public Financial Coordination performs planning, systematization, instruction, and
management until a project carries out in response to the determination of the council.
Moreover, this organization monitors the implementation stage of the project, also has
the role in feeding back the result of a policy to the council. The following items are
listed as main contents currently discussed by this council.
1) Loan approve situation in Antonio José de Sucre Project
1 - 5 - 6
2) Regional Fund (planning)
3) Programa de Apoyo y Sosteimiento a la Pyme Manufacurera en operración
(planning)
Regarding a., it acts as a part of industrial park rehabilitation plan at the beginning.
Although it was one of conditions for entrepreneur to move into the industrial park,
since not all the industrial parks were fully operational, this condition was eased.
Loans for 11 projects were approved among 117 projects which MPC had selected last
year. Only one project among 11 has actually received loan disbursement.
1) FONCREI
FONDREI provides medium- and long-term credit to industry with preferential
rates, through the private banking system. FONCREI became only organization which
can provide a long-term loan to an industrial sector after CORPOINDUSTRIA closed in
1999. The financial programs of FONCREI can cover following purposes for credits.
- Start business
- Modernization of factory
- Purchasing machineries (non pollution discharge)
- Reopening operation
- Working capital for reusing an installation which has not been used
- Lease fee or purchasing lease items
In addition to the above-mentioned programs, FONCREI began to re-loan program
for rescheduling the loan which the company borrowed from the private bank and had a
difficulty to pay back. This program has funded US$ 60 million by CAF (Coperación
Andina de Fomento), however, it has not been very successful at the moment.
The interest rate of FONCREI loans varies from 75% to 90% of TAPP2. In fact,
FONCREI lends loan to the company lower than above rates. Since the interest of
TAPP at the present is 21%, when the interest rate of FONCREI loan program is
assumed to be 80% of TAPP, it becomes 16.8% for customers. Among these, 40% of
interest will be paid as the commission of a handling bank (intermediary). The term of
a program will be from 3 to 15 years with grace period of six months to five years. The
2 Average Nominal Interest Rate in major banks
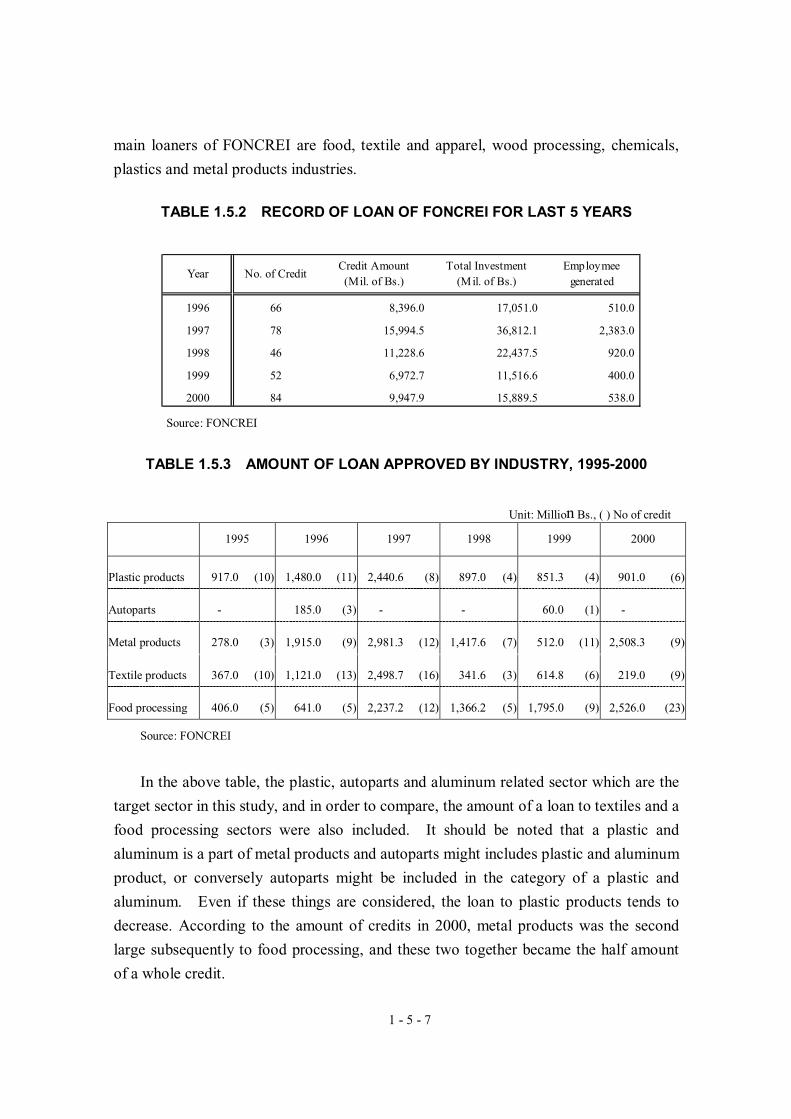
1 - 5 - 7
main loaners of FONCREI are food, textile and apparel, wood processing, chemicals,
plastics and metal products industries.
TABLE 1.5.2 RECORD OF LOAN OF FONCREI FOR LAST 5 YEARS
Source: FONCREI
TABLE 1.5.3 AMOUNT OF LOAN APPROVED BY INDUSTRY, 1995-2000
Unit: Million Bs., ( ) No of credit
1995 1996 1997 1998 1999 2000
Plastic products 917.0 (10) 1,480.0 (11) 2,440.6 (8) 897.0 (4) 851.3 (4) 901.0 (6)
Autoparts - 185.0 (3) - - 60.0 (1) -
Metal products 278.0 (3) 1,915.0 (9) 2,981.3 (12) 1,417.6 (7) 512.0 (11) 2,508.3 (9)
Textile products 367.0 (10) 1,121.0 (13) 2,498.7 (16) 341.6 (3) 614.8 (6) 219.0 (9)
Food processing 406.0 (5) 641.0 (5) 2,237.2 (12) 1,366.2 (5) 1,795.0 (9) 2,526.0 (23)
Source: FONCREI
In the above table, the plastic, autoparts and aluminum related sector which are the
target sector in this study, and in order to compare, the amount of a loan to textiles and a
food processing sectors were also included. It should be noted that a plastic and
aluminum is a part of metal products and autoparts might includes plastic and aluminum
product, or conversely autoparts might be included in the category of a plastic and
aluminum. Even if these things are considered, the loan to plastic products tends to
decrease. According to the amount of credits in 2000, metal products was the second
large subsequently to food processing, and these two together became the half amount
of a whole credit.
Year No. of CreditCredit Amount(Mil. of Bs.)
Total Investment(Mil. of Bs.)
Employmeegenerated
1996 66 8,396.0 17,051.0 510.0
1997 78 15,994.5 36,812.1 2,383.0
1998 46 11,228.6 22,437.5 920.0
1999 52 6,972.7 11,516.6 400.0
2000 84 9,947.9 15,889.5 538.0
1 - 5 - 8
A software development company is not the subject to receive a loan of FONCREI
since it is not considered as a manufacturing industry. However, FONCREI can lend
funds for software development requirement of a manufacturing industry. At the
present, FONCREI is considering a special program to lend to a software development
company.
According to number and amount of loans in 2000 by the area, a metropolitan area
(Caracas federal division and Miranda) combined with the central part (Aragua,
Carabobo, Cojedes) occupies 74% in the amount and 68% in the number of cases.
The loan evaluation term in FONCREI generally takes about 50 days more after
evaluation by a private bank for three months. The reason for long period of
evaluation is a time taken in preparation of documents and setting collaterals for loans.
Another reason is that a private bank is not accustomed to deal with long-term loans.
In order to shorten this evaluation process, FONCREI gives training of the long-term
loan evaluation for person in charge in a private bank. Moreover, FONCREI is also
taking into consideration excluding evaluation at FONCREI to the project which the
private bank already examined. Although it is said that the potential demand for
FONCREI loans is 10 times more than the actual amount of lending, since the amount
of capital is limited, much demand cannot be met.
2) SOGAMPI
SOGAMPI is the only public credit guarantee organization in Venezuela as of
March, 2001. SOGAMPI guarantees 80% of PYMI loans, without which loans from
commercial banks would not be applied. The maximum amount of loan guarantee is
300 million Bolivar, and an average amount of actual guarantee extended is 200 million
Bolivar. SOGAMPI gives special consideration to PYMI’s for their financing, and its
definition of eligibility is summarized as follows.
a. Manufacturing or related enterprise
b. 200 or less employees
c. Annual sales of 188 million Bolivar or less
d. Nominal capital of 250 million Bolivar
The SOGAMPI guarantee scheme is intended to cover the short-term credits for
working capital, an association, materials purchase, credit line, machines and
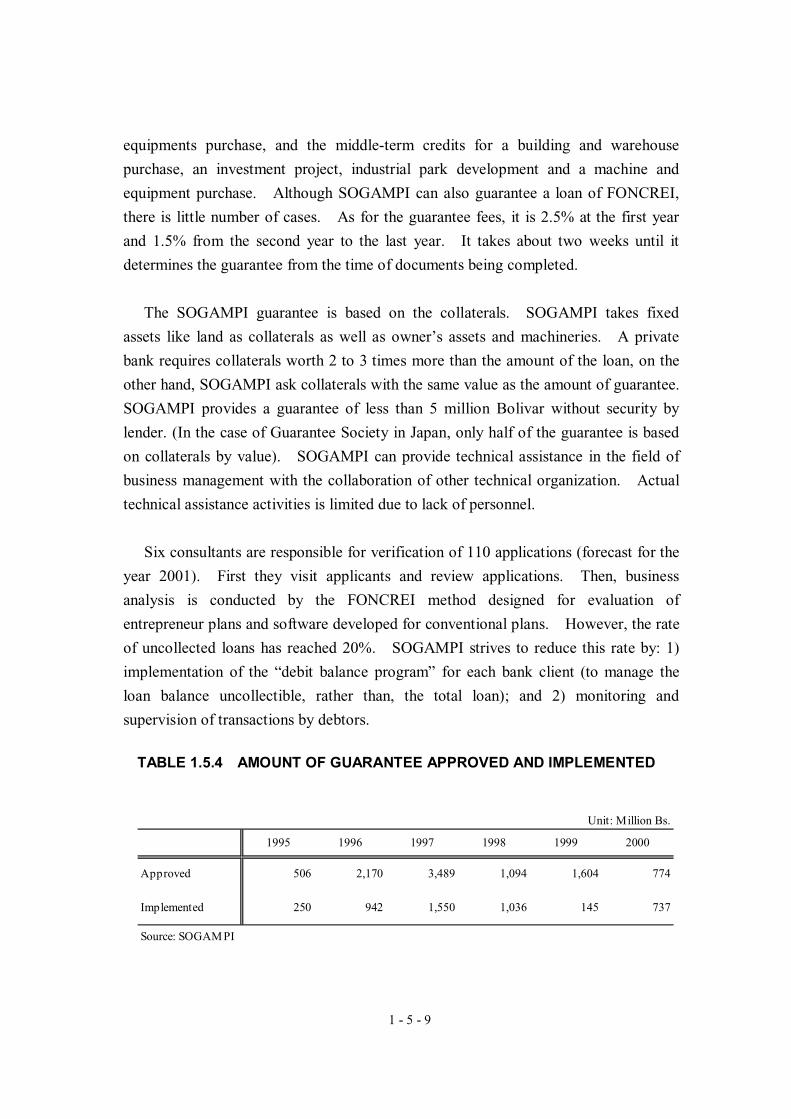
1 - 5 - 9
equipments purchase, and the middle-term credits for a building and warehouse
purchase, an investment project, industrial park development and a machine and
equipment purchase. Although SOGAMPI can also guarantee a loan of FONCREI,
there is little number of cases. As for the guarantee fees, it is 2.5% at the first year
and 1.5% from the second year to the last year. It takes about two weeks until it
determines the guarantee from the time of documents being completed.
The SOGAMPI guarantee is based on the collaterals. SOGAMPI takes fixed
assets like land as collaterals as well as owner’s assets and machineries. A private
bank requires collaterals worth 2 to 3 times more than the amount of the loan, on the
other hand, SOGAMPI ask collaterals with the same value as the amount of guarantee.
SOGAMPI provides a guarantee of less than 5 million Bolivar without security by
lender. (In the case of Guarantee Society in Japan, only half of the guarantee is based
on collaterals by value). SOGAMPI can provide technical assistance in the field of
business management with the collaboration of other technical organization. Actual
technical assistance activities is limited due to lack of personnel.
Six consultants are responsible for verification of 110 applications (forecast for the
year 2001). First they visit applicants and review applications. Then, business
analysis is conducted by the FONCREI method designed for evaluation of
entrepreneur plans and software developed for conventional plans. However, the rate
of uncollected loans has reached 20%. SOGAMPI strives to reduce this rate by: 1)
implementation of the “debit balance program” for each bank client (to manage the
loan balance uncollectible, rather than, the total loan); and 2) monitoring and
supervision of transactions by debtors.
TABLE 1.5.4 AMOUNT OF GUARANTEE APPROVED AND IMPLEMENTED
Unit: Million Bs.
1995 1996 1997 1998 1999 2000
Approved 506 2,170 3,489 1,094 1,604 774
Implemented 250 942 1,550 1,036 145 737
Source: SOGAMPI
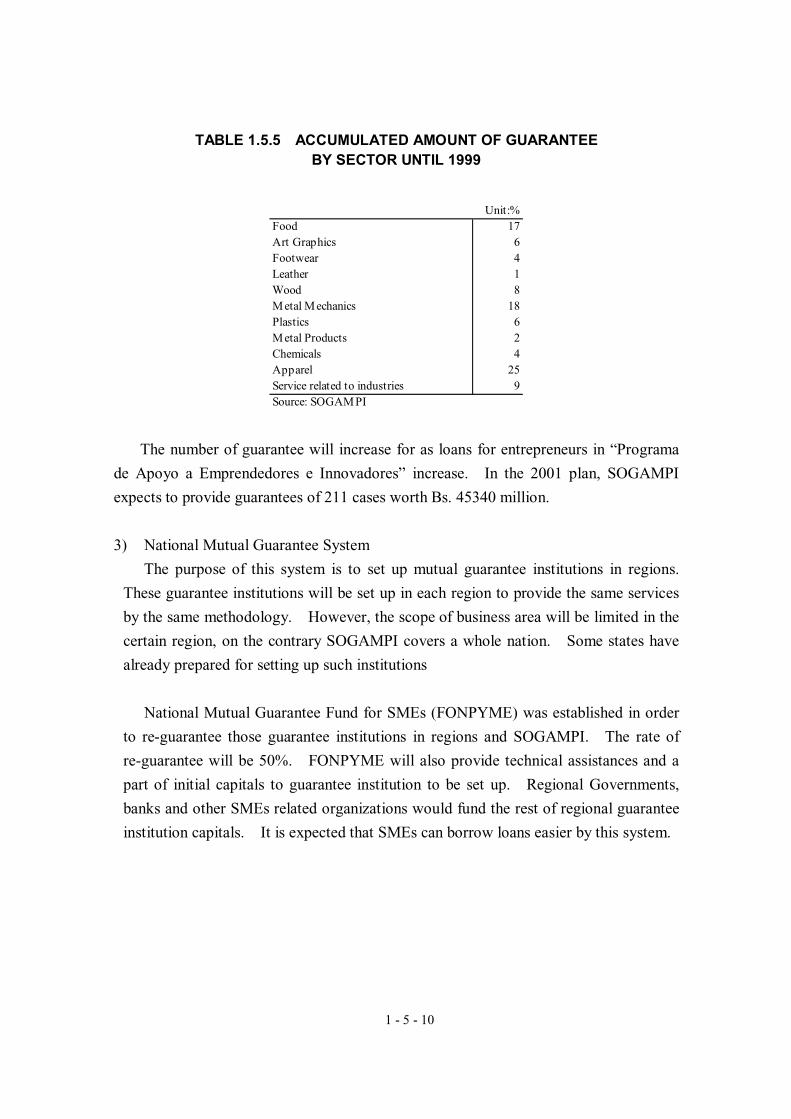
1 - 5 - 10
TABLE 1.5.5 ACCUMULATED AMOUNT OF GUARANTEE BY SECTOR UNTIL 1999
The number of guarantee will increase for as loans for entrepreneurs in “Programa
de Apoyo a Emprendedores e Innovadores” increase. In the 2001 plan, SOGAMPI
expects to provide guarantees of 211 cases worth Bs. 45340 million.
3) National Mutual Guarantee System
The purpose of this system is to set up mutual guarantee institutions in regions.
These guarantee institutions will be set up in each region to provide the same services
by the same methodology. However, the scope of business area will be limited in the
certain region, on the contrary SOGAMPI covers a whole nation. Some states have
already prepared for setting up such institutions
National Mutual Guarantee Fund for SMEs (FONPYME) was established in order
to re-guarantee those guarantee institutions in regions and SOGAMPI. The rate of
re-guarantee will be 50%. FONPYME will also provide technical assistances and a
part of initial capitals to guarantee institution to be set up. Regional Governments,
banks and other SMEs related organizations would fund the rest of regional guarantee
institution capitals. It is expected that SMEs can borrow loans easier by this system.
Unit:%Food 17Art Graphics 6Footwear 4Leather 1Wood 8Metal Mechanics 18Plastics 6Metal Products 2Chemicals 4Apparel 25Service related to industries 9Source: SOGAMPI
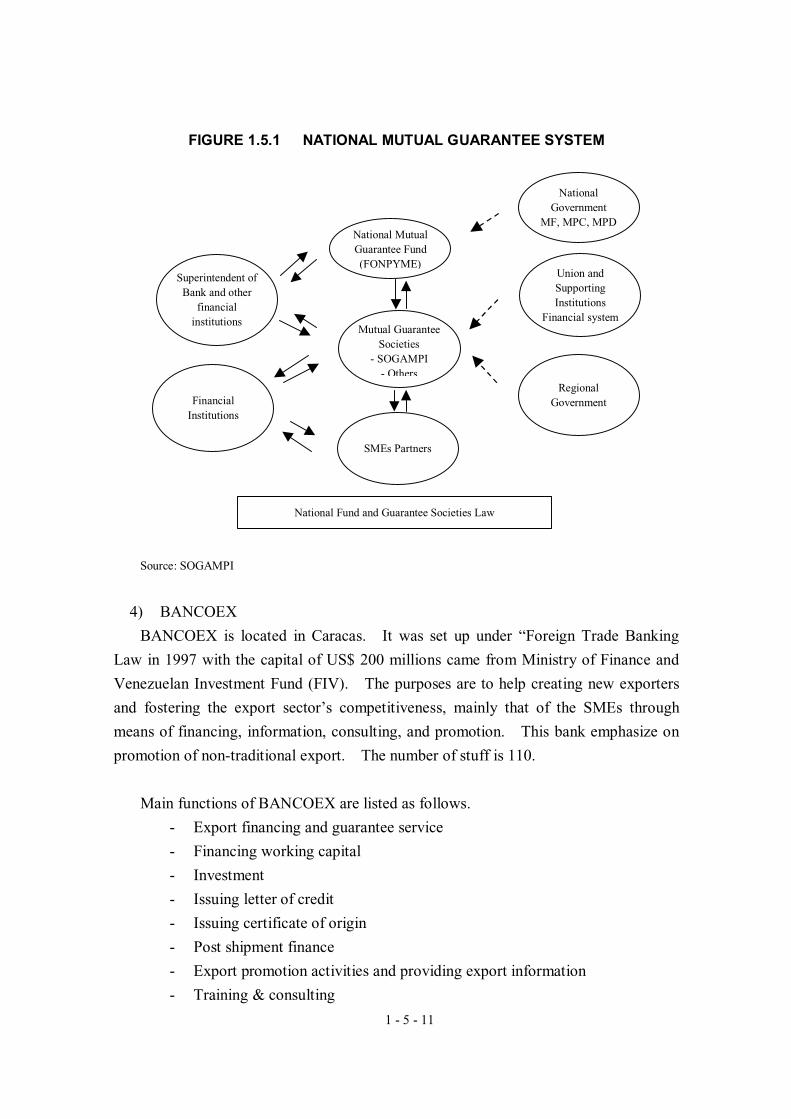
1 - 5 - 11
FIGURE 1.5.1 NATIONAL MUTUAL GUARANTEE SYSTEM
Source: SOGAMPI
4) BANCOEX
BANCOEX is located in Caracas. It was set up under “Foreign Trade Banking
Law in 1997 with the capital of US$ 200 millions came from Ministry of Finance and
Venezuelan Investment Fund (FIV). The purposes are to help creating new exporters
and fostering the export sector’s competitiveness, mainly that of the SMEs through
means of financing, information, consulting, and promotion. This bank emphasize on
promotion of non-traditional export. The number of stuff is 110.
Main functions of BANCOEX are listed as follows.
- Export financing and guarantee service
- Financing working capital
- Investment
- Issuing letter of credit
- Issuing certificate of origin
- Post shipment finance
- Export promotion activities and providing export information
- Training & consulting
NationalGovernment
MF, MPC, MPD
Union andSupportingInstitutions
Financial system
RegionalGovernment
SMEs Partners
Mutual GuaranteeSocieties
- SOGAMPI- Others
National MutualGuarantee Fund(FONPYME)
Superintendent ofBank and other
financialinstitutions
FinancialInstitutions
National Fund and Guarantee Societies Law
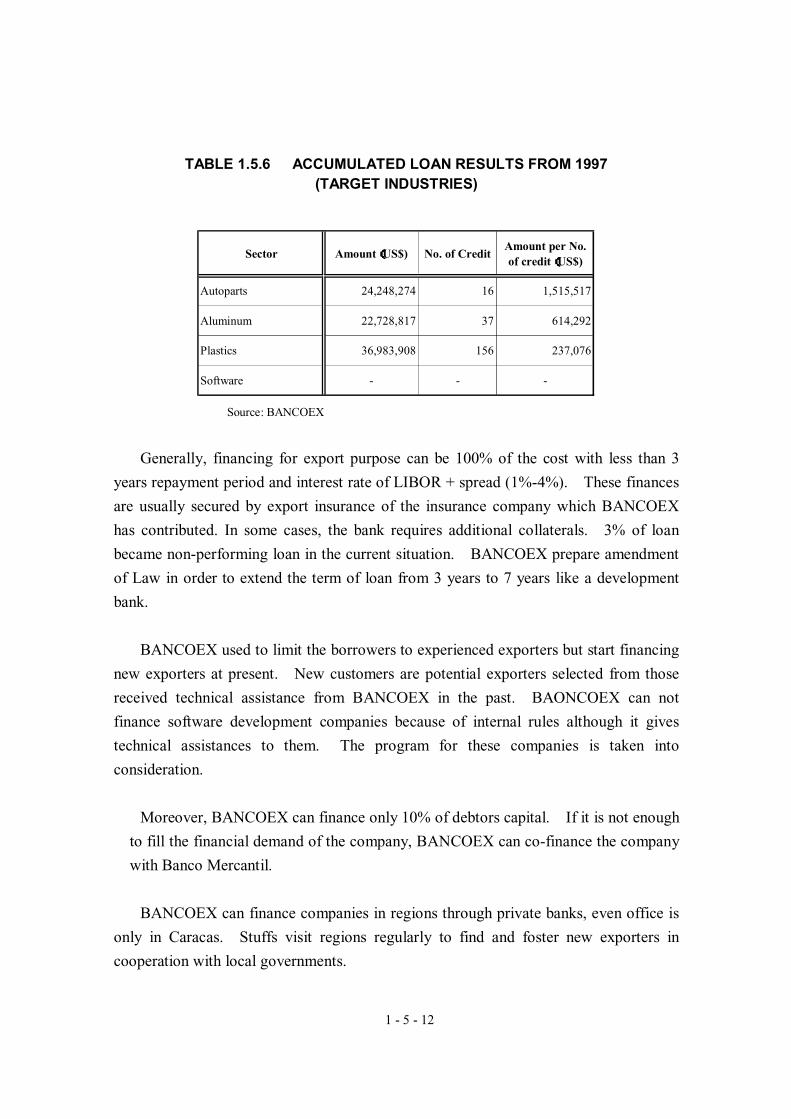
1 - 5 - 12
TABLE 1.5.6 ACCUMULATED LOAN RESULTS FROM 1997 (TARGET INDUSTRIES)
Source: BANCOEX
Generally, financing for export purpose can be 100% of the cost with less than 3
years repayment period and interest rate of LIBOR + spread (1%-4%). These finances
are usually secured by export insurance of the insurance company which BANCOEX
has contributed. In some cases, the bank requires additional collaterals. 3% of loan
became non-performing loan in the current situation. BANCOEX prepare amendment
of Law in order to extend the term of loan from 3 years to 7 years like a development
bank.
BANCOEX used to limit the borrowers to experienced exporters but start financing
new exporters at present. New customers are potential exporters selected from those
received technical assistance from BANCOEX in the past. BAONCOEX can not
finance software development companies because of internal rules although it gives
technical assistances to them. The program for these companies is taken into
consideration.
Moreover, BANCOEX can finance only 10% of debtors capital. If it is not enough
to fill the financial demand of the company, BANCOEX can co-finance the company
with Banco Mercantil.
BANCOEX can finance companies in regions through private banks, even office is
only in Caracas. Stuffs visit regions regularly to find and foster new exporters in
cooperation with local governments.
Sector Amount((((US$) No. of CreditAmount per No.of credit((((US$)
Autoparts 24,248,274 16 1,515,517
Aluminum 22,728,817 37 614,292
Plastics 36,983,908 156 237,076
Software - - -
1 - 5 - 13
5) BANFOANDES
BANFOANDES has it’s headquarter in San Cristóbal, Tachira and serves mainly
south eastern area. It is a national bank with purposes of regional development. It
finances small and medium sized manufacturers with favorable conditions compared
with private banks.
The condition of credit as of July 2001 is described below.
Credit form: promissory note, loan, credit line
Securities: guarantor and collaterals (Land or/and machineries 1.75 to 2
times as value as loan amount)
Interest: 21% to 23% annual
Term: Maximum 5 years ( 1 year grace period )
Purpose: Working capital, purchasing facilities, new business, factoring, etc.
Maximum amount: Bs. 500 millions
BANFOANDES provided Bs. 6.8 billion to industry accounted 17% of total loan as
of May, 2001. Recently it tries to improve the service, then amount of finance
increase as a result. Evaluation of credit takes only 2 weeks after the documents
completed according to BANFOANDES. Originally this bank mainly operated in
Tachira state and extended branches in other states and widen its service area.
6) BANDES
BANDES is an organization under the supervision of the Ministry of Planning and
Development. Its mission is to expand, diversify and decentralize social and
industrial infrastructures to ensure the country’s comprehensive development. It is
therefore primarily responsible for formulation of the national development strategy
and manage economic and social aspects of development.
Major functions are summarized as follows.
• Loan and support for regional development
• Loans to infrastructure projects under the joint leadership of the public and
private sectors
• Loans for innovation, technology transfer and development projects
• Promotion of private investment in new ventures, projects and businesses
• Loans for expansion, diversification, and modernization of technical support,
production staff and social infrastructure, and reinforcement of
competitiveness
1 - 5 - 14
• Functioning as a trust
• Promotion of startup companies funded by venture capital
• Issuance of bonds
• Operation and management of a fund for independent contractors
• Support for SMEs and MEs
• Land, collateral, guarantee
• Consultation for public organizations
In particular, Investor Support Department coordinates policies and strategies to
advance PYMEs. At the same time, it is studying the possibility to devote its
resources to PYMEs by establishing an organization primarily responsible for
promotion of the enterprise group.
BANDES, while providing long-term loans, provides various services to help
improve financial accessibility. It also intends to establish a specific support
mechanism such as an automatic lending program, a special tariff and development tax
according to the field of development, geographic location, job creation, venture
capital, loan guarantee structure.
1 - 5 - 15
1.5.3 Capital Market
(1) Caracas Stock Exchange
The Capital market in Venezuela can be traced back to 1805 when some trading
house were founded. A formal trading place was established in 1840 and stocks of
companies was traded. The first modern market started in 1947, auctioned off 22 seats
and traded the securities of 54 companies as well as part of the national debt. In 1975,
the Capital Market Law was issued and establish Caracas Stock Exchange (Bolsa de
Valores de Caracas). At the same time the National Securities commission (Comisión
Nacional de Valores, CNV) became responsible for the regulation and management of
capital markets.
The trading volume was expanded in 1989 following the liberalization of the
economy. It led the exchange acquire an Automated Exchange Transaction System
(SATB) from Vancouver, Canada. In addition, the exchange introduced Remote
Connection System (SISTECOR) and Electronic Compensation and Liquidation System
(SECOMLI) in 1994. These modernizations made remote trading possible from each
trading house office.
As of June, 2001, the Caracas Stock Exchange was made up of 63 members and
managed by the Board of Directors. The members of the Board of Directors are
representatives from trading houses, listed companies, CNV as well as management
department of the Exchange. Trading takes place form Monday through Friday except
holidays from 9:45 AM to 2:00 PM.
Main listed members;
- BBO
- ACTIVALORES
- ECONINVEST
- VALORES VENCRED
- SANTANDER
- PROVINCIAL VALORES
- MERINVEST
Market current situation
Monthly trade volume is shown in below table.
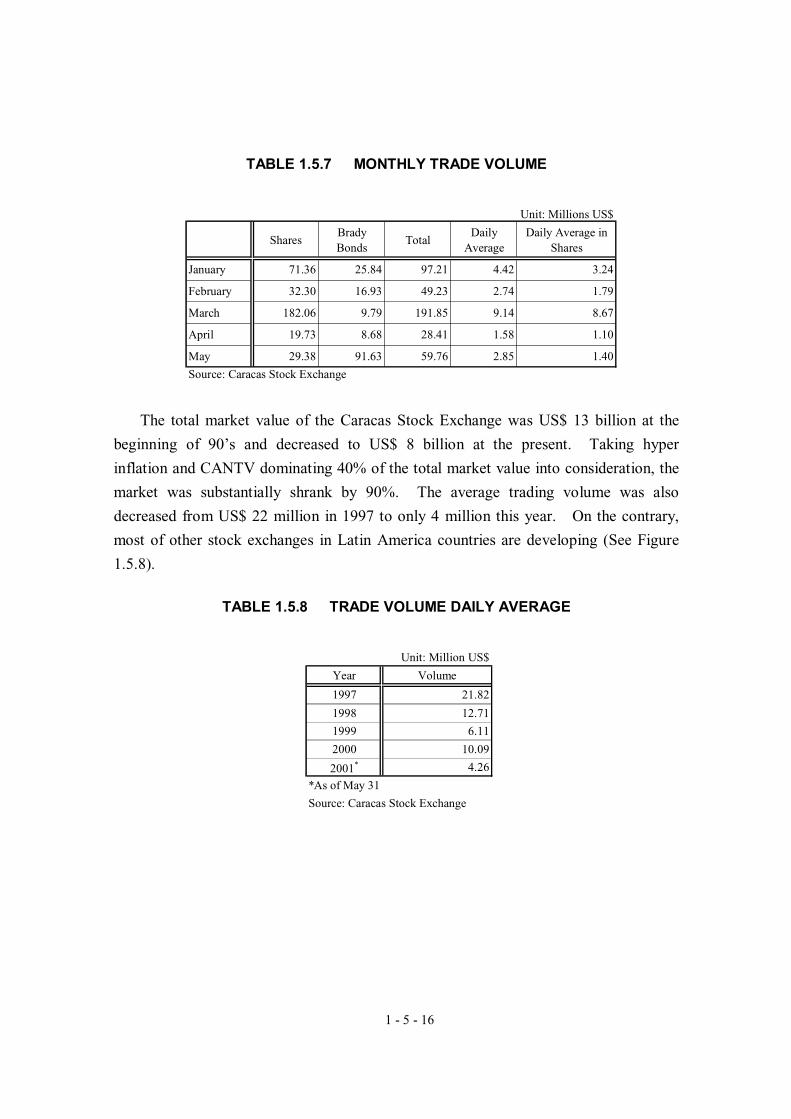
1 - 5 - 16
TABLE 1.5.7 MONTHLY TRADE VOLUME
The total market value of the Caracas Stock Exchange was US$ 13 billion at the
beginning of 90’s and decreased to US$ 8 billion at the present. Taking hyper
inflation and CANTV dominating 40% of the total market value into consideration, the
market was substantially shrank by 90%. The average trading volume was also
decreased from US$ 22 million in 1997 to only 4 million this year. On the contrary,
most of other stock exchanges in Latin America countries are developing (See Figure
1.5.8).
TABLE 1.5.8 TRADE VOLUME DAILY AVERAGE
Unit: Millions US$
SharesBradyBonds
TotalDaily
AverageDaily Average in
Shares
January 71.36 25.84 97.21 4.42 3.24
February 32.30 16.93 49.23 2.74 1.79
March 182.06 9.79 191.85 9.14 8.67
April 19.73 8.68 28.41 1.58 1.10
May 29.38 91.63 59.76 2.85 1.40
Source: Caracas Stock Exchange
Unit: Million US$
Year Volume
1997 21.82
1998 12.71
1999 6.11
2000 10.09
2001* 4.26
*As of May 31
Source: Caracas Stock Exchange
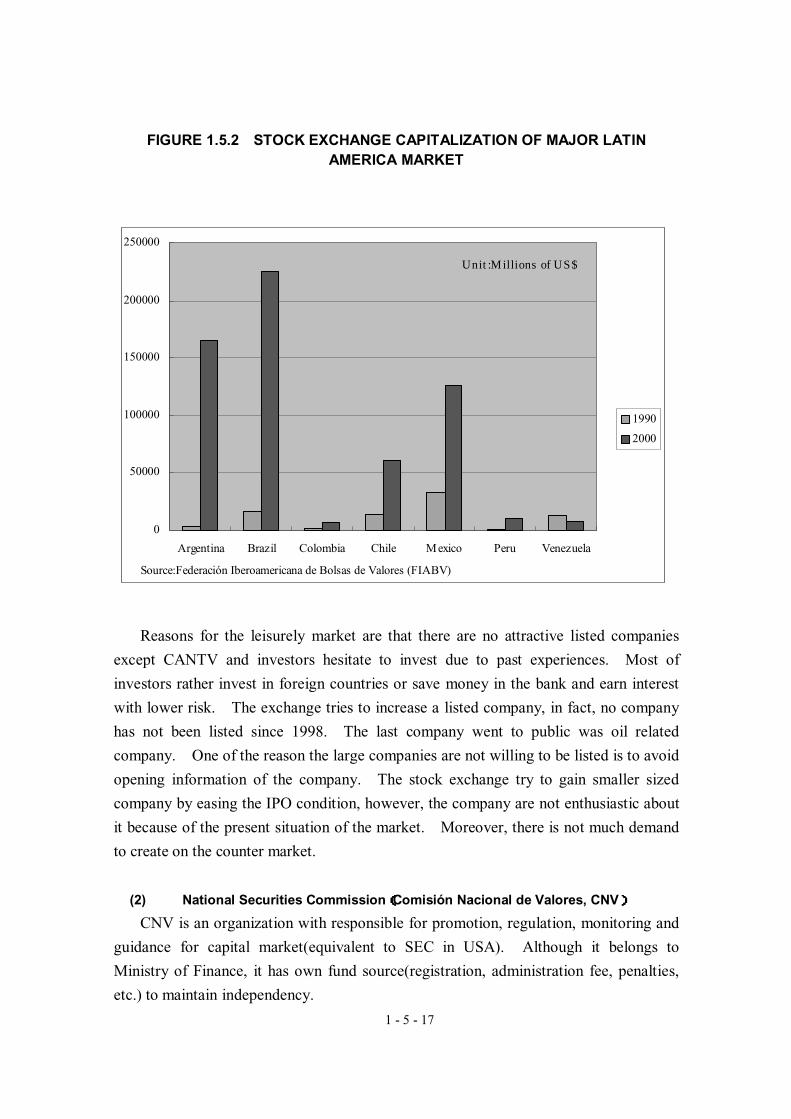
1 - 5 - 17
FIGURE 1.5.2 STOCK EXCHANGE CAPITALIZATION OF MAJOR LATIN AMERICA MARKET
Reasons for the leisurely market are that there are no attractive listed companies
except CANTV and investors hesitate to invest due to past experiences. Most of
investors rather invest in foreign countries or save money in the bank and earn interest
with lower risk. The exchange tries to increase a listed company, in fact, no company
has not been listed since 1998. The last company went to public was oil related
company. One of the reason the large companies are not willing to be listed is to avoid
opening information of the company. The stock exchange try to gain smaller sized
company by easing the IPO condition, however, the company are not enthusiastic about
it because of the present situation of the market. Moreover, there is not much demand
to create on the counter market.
(2) National Securities Commission((((Comisión Nacional de Valores, CNV))))
CNV is an organization with responsible for promotion, regulation, monitoring and
guidance for capital market(equivalent to SEC in USA). Although it belongs to
Ministry of Finance, it has own fund source(registration, administration fee, penalties,
etc.) to maintain independency.
1990 2000Argentina 3268 165802Brazil 16364 225530Colombia 1416 6965Chile 13636 60411Mexico 32725 125679Peru 812 10511Venezuela 13018 8128
1991
*
0
50000
100000
150000
200000
250000
Argentina Brazil Colombia Chile Mexico Peru Venezuela
1990
2000
Unit:Millions of US$
Source:Federación Iberoamericana de Bolsas de Valores (FIABV)
1 - 5 - 18
There are plans to activate the market as follows. However, SMEs participation in
the Capital Market has not been taken into consideration.
��EPIC is a collective investment entity of venture capital , where foreign and local
individuals will be able to invest in a pull of 18 oil projects that total US$ 500
million.
��Real State: There is a local company listed in the stock market already called
“Fondo de Valores Inmobiliario”. This company is made up of local and many
foreign investors who are planning to invest luxury offices in Latin America.
��Public Bonds: Investors will now have the possibility to purchase government
bonds through “REPOs, Deuda Pública Nacional (National Public Debt)” at a
fixed rate directly to the government.
��Second market for Mortgage bonds
��Reactivate second CP market
Consejo Estratégico para el Fortalecimiento del Mercado de Capital: Strategic
Council for the Fortification of the Stock Market are responsible for activate capital
market. For example, lowering the standards of issuing public bonds and company
bonds has been discussed in this council. The present objective was reducing the
purchase – sale – payment process of stock and bonds to three days (T+3) in July.
1 - 6 - 1
1.6 Tax System
The taxation system in Venezuela is fundamentally defined by the law, the authority to formulate a tax is exceptionally granted to the President on the constitution. Since Venezuela has adopted the federal system, a tax can be formulated and imposed in a country level, a state level, and each local governing level (municipality). Among these, the national tax is the most important.
1.6.1 National Tax
National tax is regulated by Organic Code Taxation. National taxation is mainly formed by;
- Income tax - Business asset tax - Value added tax (IVA)
In addition, there are import tax, registration taxation on production and/or
purchasing of alcohol, tobacco, match and salt as well as production of hydro carbonated energy.
(1) Income tax
Income tax is imposed according to the provision of Income Tax Law. This tax is imposed to net income earned through economic activities in Venezuela and assets located in Venezuela of domestic and foreign companies. Tariff of income tax is based on the size of net income expressed in tax units(UT)1.
Tariff for a company - Net income is less than 2,000UT:15% - 2,000UT to 3,000UT:22% - More than 3,000UT: 34%
The SMEs which begin new business in the unpopulated area which the government
decides are permitted 50% of income tax credit for ten years.
1 UT is set by Bs. 1000 in 1994 as standard value and fluctuated by inflation. 1UT is Bs.13200 as of 14 of July,
2001
1 - 6 - 2
(2) Business Asset Tax This tax is imposed on tangible and intangible assets used in production of company
profits. The tax was made in 1993 and applied to all the individuals and companies which are subjects to the income tax by carrying out business in Venezuela. The tax is levied at the rate of 1% on the total tangible and intangible assets. However, the amount of tax is reduced by the income tax payable in the same fiscal year. Moreover, companies in the pre-operating period and additional 2 years in the operating period are exempt from the business asset tax. The amount of the tax is determined based on a report from the company. The tax is imposed on book-values of only operational equipments and machineries with consideration of inflation and depreciation.
SMEs complained that this tax has to be paid even in the year when there is no profit and the tax is levied on the values of equipments and machineries regardless of the rate of operation.
(3) Value Added Tax
Value Added Tax (VAT) is paid by all individuals, public or private sector organization, the import trader of goods and service, a manufacturer, and a merchant. The tax is determined when goods and service sell. However, a tax is not imposed at the following cases.
- Temporary imports - Import under free port regime - Operations in the import in bond warehouse
The rate of VAT is determined by every year at least 8% and a maximum of 16.5%. The rate of 14.5% applied for all at this moment.
(4) Import tax
Before 1989 a protection policy had been adapted, the tariff was set between 130-150%. The customs duty was reformed at 5% of materials, 10% for half-processed goods, 15% for pre-finished goods and 20% for finished goods, as of 1989. This is a common uniform tariff. For example, in the case of iron, roll of iron is specified as half-processed goods and pre-finished goods is specified as goods becomes finished goods if one process is added (example : parts of KD). According to the free trade agreement, such as the Andeans Community (Venezuela, Colombia, Ecuador, Bolivia and Peru) and G3 (Venezuela, Colombia, Mexico), the customs duty about the items specified has become 0 or low. Venezuela is going to make the bilateral agreement with other Central America countries.
1 - 6 - 3
1.6.2 Regional tax
(1) State tax At preset State tax is still insignificant and the taxation burden is limited. It is
because the federal state of Venezuela basically depends on budget allotment of a country, and it is to be distributed to a state 20% of national budget by the decentralization law. State taxes are documentary stamp tax, fees for using a road, a bridge, a harbor, and an airport, and others. However, the rate of State tax may become large if decentralization will progress in the future.
(2) Municipality Tax
The constitution of Venezuela allowed the municipalities to form and collect taxes. The common taxes by municipalities (cities, towns and villages) are as follows.
a. Production in the municipality b. Fees of services provided by the municipality c. License tax applied for industry and commerce d. Automobile tax e. City immovable tax f. Others
Among these, License tax and City immovable tax are important. In order to perform industry and commerce, according to regulation of a municipality, registration and permission are needed respectively. The tax is determined by production activity which yield profits within the municipality. A tax is imposed on taxpayer's total income or total sales with the tax rate the each municipality decide. The tax is to be paid in every three-month.
The tax is imposed on only the real estate in the city of each municipalities, therefore the other land is not an object. Moreover, a tax is imposed only on the land and not on a machine nor an equipment. Tax rates are decided in each municipality, and the amount is calculated by the value of land multiplied by the tax rate. This tax is also paid in 4 times a year every three months.
It is a problem that a municipality tax can be imposed by discretion of a municipality therefore there is difference among municipalities, thus the tax base are not standardized.
1 - 6 - 4
1.6.3 Special tax treatment
(1) Tax reduction measures Income tax can be rebated within the limit of 20 % of the amount of the new
investments into agriculture, agro-industry, manufacturer, fishing, fish culture and sight-seeing, etc. Moreover, VAT is exempted in case of the purchase of the capital goods in oil and gas industry, agriculture and fishing. On the municipality level, a term of duty free, rebate, exemption and others can be determined as special measures according to the law of the municipality In case of Lara state, there is municipality tax exemption as an incentives for a company investing which moves to an industrial area. In case of Japan, the government sets the special tax treatment for SMEs such as the preferential corporation tax rate for small and medium sized company and cooperatives, the support taxation measures for investments in facilities and research and development for modernization and rationalization, however, there are no special measures on the taxation system for SMEs in Venezuela.
(2) DRAW BACK
DRAW BACK is a rebate system of a part or all of an import duty concerning the product to export, started in 1991, revised in 1996. SENIAT (National Integral Tax Administration Service) has determined the rate of refund for each industry. An exporter has to apply for DRAW BACK to SENIAT or directly to a CUSTOM office after export within 30 days. Refund is paid by a central bank with CERT (Tax Refund Certificates). It is to be refunded within 30 working day by law.
An actual refund of import tax will take more than one year, since there is much complains, the following improvements are made.
a. Increase of stuffs in the field b. It makes CERT be cashable in a private bank. c. The conditions for applying DRAW BACK were cut off, thus the check items
was reduced. d. Automation was advanced since almost all work had been done manually.
A target is to refund for the piled up application by 2001, and will shift to the new system from the next year. As of February, 2001, Bs. 8,800,000 was refunded to 319 companies (8,077 applications) in the total.
The VAT can be refunded when a manufacture an export his product like Draw Back system. It is to be paid by law within 60 working days.


