Embed Size (px)
Citation preview

Clinical and biochemical effects of omega-3 fatty acid
supplementation on patients with homozygous Sickle cell disease
A thesis Submitted for the Degree of Doctor of Philosophy
By
Ahmed Abd Almalik Daak
London Metropolitan University
-. . ••••• • •• ••• • •• • •• . ..-LONDON :_.
metropolitan: -••• university _ -
The Institute of Brain Chemistry and Human Nutrition (IBCHN)
.... IBCHN ~ ~ .- .. .. . . . , ..
•• L • ,. -.... , .. - "
November 2011

Dedication
In memory of my father, whose message I continue
I

Author's declaration
I certify that the thesis titled: Clinical and biochemical effects of omega-3 fatty acid
supplementation on patients with homozygous Sickle cell disease, submitted for the
decree of : Doctor of Philosophy, has not been previously submitted for another degree
in this or any other educational institution. Moreover, I confirm that the clinical
research, laboratory analysis, data analysis and interpretation of the data are entirely
my own work, except where otherwise acknowledged in the main text of the thesis.
Name: Ahmed Abd Almalik Daak
Signed ... ,
Date .. I..!. .. ' .. e?'.: .. 2 .c?. -'.J: .................... .
II

Table of contents
Acknowledgement ................................................................................... IV
Abstract. ....................................................................... ............................... VII
Publication ..................... ........................................................................ x
Index ...................................................................................................... XI
Abbreviations . ......................................................................................... XVII
List of figures .......................................................................................... XXIII
List of tables ......................................................................................... . XXVII
III

Acknowledgement
I am heartily thankful to my supervisor Professor Kebreab Ghebremeskel whose
rigorous scientific approach and free reasoning helped profoundly in developing this
research programme. His meticulousness, perfectionism, devotion to science and good
grace turned the last three year hard but enjoyable time, through which I gained
knowledge, experience and skills that, will have immense impact on my entire life.
Looking back I will never do this in any other way.
I would like to express my sincere gratitude to my supervisor Professor Michael
Crawford, Imperial College, London, for immense support and guidance through out
this research programme. His breath of knowledge, constructive comments and holistic
thinking refined this work considerably.
This research programme will not have been possible without the invaluable help,
encouragement and direction of my supervisor Professor Mustafa Idris Elbashir,
University of Khartoum, Sudan. His instinct rational optimism always made what
appeared to me impossible possible. I am deeply indebted to him.
Particular thanks go to Dr Bakihta Attallah who established the Sickle Cell Referral
Clinic in Khartoum and devoted her professional life caring for the patients with the
disease. I would like to express my sincere gratitude to her for allowing me to conduct
the research in her clinic. I am also grateful to all the members of the Sickle Cell
Referral Clinic, particularly Am Abdelrahim for his relentless support and
encouragement.
I am very grateful to Professor Clara Lowy for reading the final draft of the thesis and
for her thoughtful and professional suggestions and comments.
Conducting a clinical trial in Sudan is truly a challenge. However, the stupendous
levels of awareness, keenness and patience of the patients and their families made the
programme successful. Their smiley faces despite the excruciating pain from the
disease taught me the true meaning of patience and hope. I convey my gratitude and
sincere wishes for disease-free life to all of them. It feels me with pleasure when I hear
them say, JlT7uir lives have been transformed radically since they started to receive n-3 fatty
add treatment".
IV

Clinical follow-up was critical for the success of this research endeavour. I would like
to thank wholeheartedly my junior (Dr Mohammed Abdelrahman, Dr Una Mustafa,
Dr Una Abdellah, Dr Fatma Abd-elgayoum, Dr Hajer Mustafa and Hadeil Morsi) and
senior (Dr Zahir Hassan, Dr Haj Hammad Elzain) colleagues who participated in the
clinical follow-up of the patients throughout the study with enthusiasm and
commitment. Special thanks go to Dr Zahir; his personal rapport that he built with the
patients ensured good compliance and adherence to treatment.
I would like to thank all my colleagues and friends in IBCHN who worked with me as
a unified team in an exemplary and friendly manner. Their encouragement eased
apprehensions associated with the occasional setbacks of laboratory work. Thanks are
due to Dr Katia Mariniello for sharing with me her laboratory expertise and usage of
many software programmes and Dr Julia Geppert for providing me with the essential
training of fatty acid analysiS, and most importantly for her pleasant demeanour and
distinct social sense. I am grateful to Dr Allan Amador Bueno for his excellent
laboratory management and valuable help, Dr Kot Nyuar for his kind guidance and
help in my very early days in London and to Dr Yiqun Wang and Dr Yoeju Min for
sharing their experience.
I am very grateful to Kitchener Fund, Arab British Chamber of Commerce (ABCC) and
African Educational Fund (AEF) for their financial support. Without their support this
work would not have been achievable. I also wish to acknowledge with thanks the
Mother and Child and Letten Foundations for the underlying support they gave to the
IBCHN which made possible the analysis of fatty acids and the derivation of the
science behind this thesis. In addition I am grateful to Peter Clough of Efamol for his
encouragement and the provision of fatty acids supplements which was essential to
conduct this research.
Several people have fuelled my enthusiasm for research and gave me genuine
guidance and support, especially Dr Ghazi Atabany, Dr Gelal El-digar, Mr Haj Majid
Souar and Mr Salam Elsied Adlan. I wish to extend very special thanks to all of them.
I am indebted to my mother, sisters and brothers, mother and father -in-low for their
moral support and guidance during my study. Special thanks go to my sister Ensaf and
v

her wonderful family; the love and support I received from them during my stay in
London is remarkable.
I wish to thank all members of Nansen village family, tenants, managers and trustees
for the good time and nice neighbourhood they provided for me and my family, being
in Nansen for two years as a tenant representative on Board of Trustees I can say this is
the best supportive and interesting place for PhD students in London.
Finally, I would like to thank my wonderful wife Sara and my lovely son Abdelmalik,
who had to endure my early morning start and long hours at work. Thank you Sara;
for making horne the best place for me ever.
VI

Abstract
Sickle Cell Disease (SeD) is a group of autosomal recessive genetic blood disorders due
to a mutation in the sixth codon of the p goblin gene. The resultant haemoglobin S
(HbS) polymerises under low oxygen tension causes rigid, sickled red blood cells. The
main clinical manifestations are vaso-occlusisve painful crisis and haemolytic anaemia
which lead to degenerative tissue pathology that affect major organs including the
brain, eye, lung, spleen, liver, kidney, heart and bone. The pattern of the complications
and survival vary considerably between patients. These clinical variations suggest, the
outcome of the disease is determined by the interaction of environmental and genetic
factors.
According to the classical paradigm, the pathophysiology of vaso-occlusion is
primarily due to mechanical blockage of small blood vessels by the deformed sickled
red cells. However, the frequency of vaso-occlusive crisis does not correlate with the
number of irreversible sickled cells. In contrast, the occurrence of vaso-occlusion
events and clinical severity correlate strongly with the degree of leucocyte-erythrocyte
endothelial adhesion and inflammatory state. Adhesion, aggregation, elasticity of
blood cells and inflammatory response are strongly modulated by cell membrane n-3
and n-6 fatty acids. There is evidence that steady state patients with SCD have
abnormal erythrocytes, platelets and mononuclear cell fatty acid composition. The
abnormality is characterised by increased levels of arachidonic (AA), adrenic and
osbond acids, and reduced levels of docosahexanoic (DHA) and eicosapentnoic (EPA)
acids and n-3/n-6 fatty acid ratio. Hence, it is possible that amelioration of the
membrane fatty acid abnormality may have beneficial clinical effects on SCD patients.
This research programme investigated whether:
.:. The beneficial effects of Hydroxyurea (HU), the commonly used treatment for the
disease involves modulation of blood cell membrane fatty acid abnomlalities observed in
sickle cell disease. HU-treated (n=19) and untreated (n=l7) Homozygous patients
and healthy control subjects (n=20) were enrolled from SCD Referral Clinic,
Khartoum, Sudan. Blood samples obtained from the three groups were
analysed for membrane fatty acids. The data showed that HU-treated patients
and healthy controls had comparable levels of docosahexaenoic (DHA) and
VII

total n-3 fatty acids in ethanolamine and (EPG) and choline (CPG)
phosphoglycerides. In contrast, the untreated group had significantly lower
DHA and total n-3 compared with the controls. In addition, HU treatment
selectively mobilised arachidonic acid (AA) from the inner cell membrane
amino-phosphoglycerides, EPG and serine (SPG) phosphoglycerides. Hence, it
appears that the clinical benefits of HU are partially mediated through
modulation of blood cell membrane fatty acid composition
.:. Supplementation with n-3 FA reduces the frequency of vasa-occlusive crisis through
correction of the membrane fatty acid perturbation. One hundred forty patients
recruited from Sickle Cell Referral Clinical in Khartoum, Sudan, were
randomised to receive high-DHA n-3 fatty acid (n=70) or placebo (n=70)
capsules for one year. Treatment with n-3 fatty acids resulted in three fold
increase in red cell membrane DHA and EPA, with a concomitant decrease in n-
6 fatty acids particularly AA. Supplementation with the highly unsaturated and
labile DHA and EPA did not induced additional oxidative stress as it was
evident by the significant increase in plasma vitamin E concentration and a
reduction in activity of red cell Se-glutathione peroxidise.
Treatment with the high DHA n-3 fatty acids for one year reduced the
frequency of vaso-occlusive and haemolytic crises, number of blood
transfusion, and hospitalisation and absence from school due to SCD associated
illnesses. None of the patients in the n-3 fatty acid group but two in the placebo
group developed stroke.
The patients treated with high-DHA n-3 fatty acids had reduced total white
blood cell, integrin and lactate dehydrogenase. These findings suggest that the
beneficial action of n-3 fatty acids is mediated through reduction of
inflammation and adhesion.
This research programme which was based on an appreciable number of homozygous
sickle cell patients clearly demonstrated that HU modulates cell membrane fatty acid
abnormality, and supplementation with high-DHA n-3 fatty acids have the potential to
be effective and affordable treatment option for patients with SCD. In order to test the
VIII

generalisability of the effect of n-3 on patients with SeD, a multi-centre study which
involve patients from different dietary and genetic backgrounds is warranted.
IX

Pu b lications
Journal articles
Daak AA, Ghebremeskel K, Elbashir MI, Bakhita A, Hassan Z Crawford MA (2011).
Hydroxyurea therapy mobilises arachidonic Acid from inner cell membrane
aminophospholipids in patients with homozygous sickle cell disease. 1 Lipids; 2011
718014
Conference abstract
Daak AA, Ghebremeskel K, Elbashir MI, Attalla B, and Crawford MA
The effect of n-3 fatty acids on prevention of vaso-occlusive crisis in homozygous
sickle cell desease. 9th Congress of International Society for Study of fatty acids and
lipids, Maastricht, Netherlands, 2010
x

Index
Index
Introduction ......................................................................... 1
1.1
1.1.1
Sickle cell disease ...................................................................................................... 2
1.1.2
1.1.3
1.1.4
1.1.5
1.1.6
1.1.7
Inherited haemoglobin disorders .................................................................. 2
Genetic modifiers of SCD ............................................................................... 4
Environmental modifier of the SCD ............................................................. 5
Epidemiology of HbS gene ............................................................................. 7
History of SCD ................................................................................................ 10
Clinical manifestation of SCD ...................................................................... 12
Pathophysiology of vaso-occlustion ............................................................ 22
Management of SCD ...................................................................................... 26 1.1.8
1.2 Cell membrane and SCD ....................................................................................... 35
1.2.1
1.2.2
1.2.3
1.2.4
1.2.5
Cell membrane composition ......................................................................... 36
Membrane structure and organisation ........................................................ 36
Membrane lipids ............................................................................................. 41
Membrane phospholipids asymmetry ........................................................ 49
Fatty acid ........................................................................................................... 51
1.3 Overview and Aims ................................................................................................ 70
1.3.1
1.3.2
Hypothesis ........................................................................................................ 71
Specific Aims ................................................................................................... 71
2 Methods ...................................................................................................... 73
XI

Index
2.1 Patients recruitment and determination of haemoglobin phenotype .......... 74
2.2 Blood collection and processing ........................................................................... 74
2.2.1 Determination of haemoglobine concentration and the pertinent blood parameters ........................................................................................................................ 74
2.2.2 Preparation of plasma, serum and red blood cells .................................... 74
2.2.3 Preparation of mononuclear cells, granulocytes, platelets ...................... 75
2.3 Fatty acid analysis ................................................................................................... 76
2.3.1 Lipid extraction ................................................................................................ 76
2.3.2 Partitioning-Separation of lipid and non-lipid components .................. 76
2.3.3 Collection of lipids ......................................................................................... 77
2.3.4 Thin-layer chromatography (TLC) ............................................................... 77
2.3.5 Preparation of fatty acids methyl esters ...................................................... 78
2.3.6 Analysis of fatty acids methyl esters by Gas-Liquid Chromatography (GC) 79
2.4 Analysis of plasma lipids ...................................................................................... 82
2.5 Determination of plasma retinol and a-tocopheroL ....................................... 82
2.5.1 Extraction .......................................................................................................... 82
2.5.2 Separation and identification ....................................................................... 82
2.5.3 Quantification .................................................................................................. 83
2.6 Determination of anti-oxidants enzymes activities .......................................... 84
2.6.1 Preparation of red cell haemolysates ........................................................... 84
2.6.2 Determination of CujZn-Superoxide Dismutase (CujZn-SOD) activity
84
2.6.3 Determination of Se-Glutathione Peroxidase (Se-GPx) activity ............ 88
2.7 Determination of plasma concentrations of lactate dehydrogenase enzyme
(LDH)91
2.7.1 Preparation of LDH assay reagents and working standards .................. 91
2.8 Determination of plasma concentration of haptoglobin (Hp) ............•........... 94
2.8.1 Preparation of Hp assay reagents and working standards ..•................. 94
XII

Index
2.9 Determination of plasma levels of pro- and anti- inflammatory cytokines 96
2.9.1 Tumor necrosis factor-a (TNF-a) .................................................................. 96
2.9.2 Interlukin-l0 (IL-I0) ...................................................................................... 98
2.9.3 Preparation of IL-I0 assay reagents and working standards .................. 99
2.10 Determination of adhesive molecules on blood cell membranes ............... 101
2.10.1 Determination of monocytes and granulocytes CD11b and CD62L expression ....................................................................................................................... 101
2.10.2 Preparation of reagents for the integrin aM (CD11 b) and L-selectin (CD62L) assay ................................................................................................................ 101
2.11 Statistical analysis ................................................................................................. 105
3 The effect of hydroxyhurea on red blood cell membrane fatty acid composition ............................................................................................ 106
3.1 Introduction ........................................................................................................... 107
3.2 Subjects and methods .......................................................................................... 109
3.2.1 Subjects ........................................................................................................... 109
3.2.2 Blood collection and separation of blood component ........................... 110
3.2.3 Analysis of plasma lipids ............................................................................ 110
3.2.4 Analysis of red blood cell fatty acids ........................................................ 110
3.2.5 Statistical analysis ......................................................................................... 110
3.3 Results ..................................................................................................................... 111
3.3.1 Plasma lipids .................................................................................................. 111
3.3.2 Red blood cell fatty acids ............................................................................ 111
3.4 Discussion .............................................................................................................. 117
4 An investigation into the impact of omega-3 LC PUF A on oxidative status in Sickle cell patients ...................................................... 121
4.1 Introduction ........................................................................................................... 122
4.2 Methodology .......................................................................................................... 126
4.2.1 Design and intervention .............................................................................. 126
XIIl

Index
4.2.2 Blood sampling .............................................................................................. 126
4.2.3 Complete blood count (CBC) ...................................................................... 126
4.2.4 Analysis of red blood cell fatty acids ........................................................ 127
4.2.5 Measurement of plasma a-tocopherol (v it E) and retinol concentration 127
4.2.6 Glutathione peroxidase (Se-GPx) and CujZn-Super oxide dismutase (CujZn-SOD) enzymes' activity assay ....................................................................... 127
4.2.7 Statistical analysis ......................................................................................... 127
4.3 Results ............................................................ , ........................................................ 128
4.3.1 Red blood cell membrane PE and PC fatty acid composition .............. 128
4.3.2 PE fatty acid composition ............................................................................ 128
4.3.3 PC fatty acid composition ............................................................................ 128
4.3.4 Comparison of the GPx and SOD activities in RBCs of the placebo and active groups .................................................................................................................. 129
4.3.5 Relation of enzyme activity to oxidative stress ....................................... 129
4.4 Discussion .............................................................................................................. 135
5 Long chain omega-3 fatty acids and clinical outcomes in patients with homozygous Sickle cell disease- Randomised, placebo-controlled, double blinded clinical trial ................................... 139
5.1 Introduction: .......................................................................................................... 140
5.2 Methods .................................................................................................................. 142
5.2.1 Design and intervention .............................................................................. 142
5.2.2 Patients ............................................................................................................ 142
5.2.3 Randomisation and blinding ...................................................................... 144
5.2.4 Data collection ................................................. Error! Bookmark not defined.
5.2.5 Outcome assessment ..................................................................................... 146
5.2.6 Blood sampling and complete blood count (CBq ................................. 147
5.2.7 Statistical analysis ......................................................................................... 147
5.3 Results ..................................................................................................................... 148 XIV

Index
5.3.1 Harms .............................................................................................................. 149
5.4 Discussion: ............................................................................................................. 154
6 Long chain omega-3 fatty acids and markers of haemolysis in patients with homozygous Sickle cell disease ........................................ 158
6.1 Introduction ........................................................................................................... 159
6.2 Patients, Material and Methods ......................................................................... 160
6.2.1 Subjects ........................................................................................................... 160
6.2.2 Blood sample collection and processing ................................................... 160
6.2.3 Complete blood count (CBC) ...................................................................... 160
6.2.4 Analysis of red blood cell fatty acids ........................................................ 160
6.2.5 (Hp)
6.2.6
6.2.7
Measurement of plasma lactate dehydrogenase (LDH) and haptoglobin 161
Measurement of plasma a-tocopherol concentration ............................. 161
Statistical analysis ......................................................................................... 161
6.3 Results ..................................................................................................................... 162
6.3.1 Serum lactate dehydrogenase and haptoglobin ...................................... 162
6.3.2 EP A DHA and AA levels of Red blood cell membrane ......................... 162
6.3.3 Haematological parameters ......................................................................... 162
6.4 Discussion .............................................................................................................. 165
7 Markers of adhesion and inflammation, and membrane fatty acid composition in patients with homozygous Sickle cell disease ... 168
7.1 Introduction ........................................................................................................... 169
7.2 Methods .................................................................................................................. 171
7.2.1 Subjects ........................................................................................................... 171
7.2.2 Samples collection and preparation plasma, rd blood cell, monocytes, granulocytes ................................................................................................................... 171
7.2.3 Analysis of red blood cell fatty acids ........................................................ 171
7.2.4 Complete blood count (CBC) ...................................................................... 172
xv

Index
7.2.5 Measurements of plasma tumour necrosis factor-a (TNF-a) and interleukin-10 (IL-10) .................................................................................................... 172
7.2.6 Assessing j32-integrin CDllb/C18 (CD-llb) and L-selectin (CD62L) expression in granulocytes and mononuclear cells ................................................ 172
7.2.7 Statistics .......................................................................................................... 172
7.3 Results ..................................................................................................................... 173
7.3.1 Fatty acid composition of red blood cell ethanolamine phosphoglyceride (EPG) and choline phosphoglyceride (CPG) ......................... 173
7.3.2 Total white blood cellcount (TWBC) and platelets (PLTs) count ........ 173
7.3.3 Tumour necrosis factor-a (TNF-a) and Interleukin-10 (IL-I0) ............. 173
7.3.4 Relationships between plasma TNF-a levels and percent of RBC EPG& CPG fatty acids at baseline .......................................................................................... 173
7.3.5 Relationships between plasma IL-10 levels and percent of RBC PE& PC fatty acids at baseline ................................................................................................... 173
7.3.6 Expression of j32-integrin CDllb/C18 (CD-llb) in monocytes ............ 174
7.3.7 Expression of j32-integrin CDllb/C18 (CD-llb) and L-selectin (CD62L) in granulocytes .............................................................................................................. 174
7.3.8 Adhesive molecules and fatty acids correlations at baseline ............... 174
7.4 Discussion .............................................................................................................. 180
8 Overview conclusion and future research ......................................... 184
8.1 Overview ................................................................................................................. 185
8.2 Conclusion .............................................................................................................. 189
8.3 Future studies ........................................................................................................ 189
9 Bibliograpy ............................................................................................... 192
10 Appendices ............................................................................................... 244
XVI

AA
ACS
AI
ALA
AMDR
ANOVA
APLT
BHT
B-CAM/Lu
BSA
CBC
CDP- diacylglycerol
CD62L
CD62P
CD47
CDllb/CD18
cGMP
CHD
CONSORT
cPLA2
Cu/Zn-SOD
Ab breviations
Arachidonic acid
Acute chest syndrome
Adequate intake
a-Linolenic acid (C18:2n-3)
Abbreviations
Acceptable macronutrient distribution range
One-way analysis of variance
Aminophospholipid translocase
Butylated hydroxy toluene
Lutheran blood-group antigen
Bovine serum albumin
Complete Blood Count
Cytidine diphospho- diacylglycerol
L-selectin
P-selectin
Integrine associated protein
aM~2 integrine
Cyclic guanosine monophosphate
Coronary heart disease
Consolidated Standards of Reporting Trials
Cytosolic phospholipase A2
Cu/ Zn-Superoxide Dismutase
XVII

CVD
cyclooxygenase-l
cyclooxygenase-2
CPG
CYP
DNA
DAG
DHA
DHGLA
DPA
EDTA
ECs
EFA
EFAD
eNOS
EPA
EPG
FA
FAME
Fe-CAT
FlD
FSC
GalCer
GC
Cardiovascular disease
COX-l
COX-2
Choline phosphoglycride
Cytochrome P450
Deoxyribonucleac acid
Diacylglycerol
Docosahexaenoic acid (c22:6n-3)
Dihomo-y-linolenic acid
Docosapentaenoic acid (22:5n-3)
Ethylendiaminetetraacetic acid
Endothelial cells
Essential fatty acid
Essential fatty acid deficiency
Endothelial nitric oxide synthase
Eicosapentaenoic acid (C20:5n-3)
Ethanolamine phodphoglyceride
Fatty acid
Fatty acids methyl esters
Catalse
Flame-ionisation detector
Forward Scatter
Galactosy lceramide
Gas-Liquid Chromatography
XVIII
Abbreviations

Glycosphingolipids
G1cCer
GR
GPCR
Hb
HDL
HbA
HbC
HbE
HbF
HbS
HbSC
HbS po
HbS (3+
HbSS
HPLC
Hp
HRP
Ht
HU
H202
ICAM-l
IL-6
IL-tO
GSLs
Glucosy lceramide
Glutathione reductase
G protein-coupled receptor
Haemoglobin
High-density lipoprotein
Haemoglobin A
Haemoglobin C
Haemoglobin E
Haemoglobin F
Haemoglobin S
Sickle cell-haemoglobin C
Sickle Cell-po thalassaemia
Sickle cell-p+ thalassaemia
Homozygous sickle cell disease
Abbreviations
High performance liquid chromatograph
Haptoglobin
Horseradish peroxidase enzyme
Haematocit
Hydroxyurea
Hydrogen peroxide
Intercellular adhesion molecule-l
Interleukin-6
Interlukin-l0
XIX

IL-l~
IPG
IUPAC
ISSFAL
IQR
LA
LCPUFA
LDL
LDH
LOX
LT
MCH
MCHC
MCV
MetHb
MUFA
NADPH
NO
NFKB
n-3
n-6
n-9
Abbreviations
Interleukin-l ~
Inositol phosphoglycerides
International Union of Pure and Applied Chemistry
International Society for the Study of Fatty Acids and Lipids
Inter-quartile range
Linoleic acid (c18:2n-6)
Long chain polyunsaturated fatty acid
Low density lipoprotein
Lactate dehydrogenase enzyme
Lipooxygenase
Leukotriene
Mean corpuscular haemoglobin
Mean corpuscular haemoglobine
concentration
Mean corpuscular volume
Methaemoglobin
Monounsaturated fatty cid
Nicotinamide adenine dinucleotide
phosphate
Nitric oxide
Nuclear favtor kappa B
Omega-3 fatty acid
Omega-6 fatty acid
Omega-9 fatty acid
xx

OA
OFN
os
0'2
PA
PBS
PG
PGI2
PL
PLSCR
PLTs
PMN
PUFA
Prdx
PPARSa
RBC
SCD
ROS
SPG
Rv
Se-GPx
SD
SFA
Abbreviations
Oleic acid
Oxygen-free Nitrogen
Oxidative stress
Superoxide
Phosphatidic acid
Phosphate buffer saline
Prostaglandin
Prostacyclin
Phospholipas enzyme
Phospholipids scramblase
Platelets count
Polymorphonuclear Cell
Polyunsaturated fatty acids
Peroxiredoxin
Peroxisome proliferator-activated receptor alpha
Red Blood Cell
Sickle Cell Disease
Reactive oxygen species
Serine phosphoglycerides
Resolvins
Se-Glutathione Peroxidase
Standard deviation
Saturated fatty acid
XXI

SMS
SPM
ssc
TGF-13
TLC
TMB
TNF-a
TSP
TWBC
TX
TXA2
VCAM-l
VLA-4/a4131 integrin
SM synthase
Sphingomyelin
Side scatter
Transforming growth factor- p
Thin-layer chromatography
3' ,3,5,5' -tetramethylbenzidine
Tumor necrosis factor-a
Thrombospondin
Total white blood cell count
Thromboxane
ThromboxaneA2
Vascular cell adhesion molecule-l
Very-Iate-activation-antigen-4
XXII
Abbreviations

List of figures
List of figures
Figure 1-lGeographical distribution and schematic representation of the sickle gene .....................................................................................................................................................• 6
Figure 1-2Global distributions of HbS and malaria ......................................................... 10
Figure 1-3 of complications of sickle cell anaemia from birth through adult life ...... 14
Figure 1-4 Pathophysiology of acute chest syndrome, adopted from (Rees et al. 2010) . .................................................................................................................................................... 17
Figure 1-5 Pathophysiology of intravascular haemolysis in sickle cell disease .......... 21
Figure 1-6 Sickle cell vasoocclusion .................................................................................... 24
Figure 1-7 Fluid-mosaic model ............................................................................................. 37
Figure 1-8 Organisation of lipid rafts and caveolae membranes ................................... 40
Figure 1-9 Cholesterol structure ........................................................................................... 42
Figure 1-10 structure of sphingosine and ceramide .......................................................... 43
Figure 1-11 the structure of glycosphingolipids ................................................................ 44
Figure 1-12 the structure of sphingomyelin and ceramide .............................................. 45
Figure 1-13 Phosphoglyceride structure ............................................................................. 46
Figure 1-14 De novo synthesis of phosphatidic acid ........................................................ 47
Figure 1-15 Summary of Pathways to Phosphatidy1choline and Phosphatidyethanolamine synthesis .................................................................................. 49
Figure 1-16 Enzymes involved in lipid translocation within biological membranes 51
Figure 1-17 Saturated fatty acid (stearic acid) .................................................................... 52
Figure 1-18 Trans and cis configurations of a monounsaturated fatty acid ................. 53
Figure 1-19 Strucure of polyunsaturated fatty acids a-n-3, b- n-6, c- n-9 fatty acid .... 54
Figure 1-20 Pathway of metabolism and synthesis of n-3, n-6, and n-9 LCPUFAs ..... 57
XXIII

List of figures
Figure 1-21 The positions of hydrolytic activities of and Mechanism of action of phospholipases (A, B, C, D),(Adopted from (Kohler et al. 2006) ) ................................. 64
Figure 1-22 Biosynthesis of eicosanoids ............................................................................. 67
Figure 1-23 pathways of lekotriens, resolvines, protectines and maresin Adopted from (Hutchinson et al. 2011) ................................................................................................ 68
Figure 2-1 Blood cell separation ........................................................................................... 76
Figure 2-2 Block diagram of a gas chromatograph ............................................................ 81
Figure 2-3 Standard curve of retinol .................................................................................... 83
Figure 2-4 Standard curve of a-tocopherol. .................. ~ ..................................................... 84
Figure 2-5 Scheme of the Superoxide Dismutase Assay .................................................. 85
Figure 2-6 Standard curve of CufZn-SOD activity ............................................................ 87
Figure 2-7 Scheme Glutathione Peroxidase of the Assay ................................................ 88
Figure 2-8 Standard curve of the activity of bovine red blood cell Se-GPx ................. 90
Figure 2-9 Lactate dehydrogenase working standards ..................................................... 92
Figure 2-10 Standard curve of LDH ..................................................................................... 93
Figure 2-11 Standard curve of Hp ........................................................................................ 95
Figure 2-12 TNF- a four-parametric logistic standard curve fit ...................................... 98
Figure 2-13 IL-I0 four-parametric logistic curve fit ....................................................... 100
Figure 2-14 Ml Background fluorescence, M2 FITC green fluorescent, FSC-Log forward scatter, SSC-Log side scatter ................................................................................ 103
Figure 2-15 Determination of mononuclear cells (a) and granulocytes (b) CDllb and CD62L expression ................................................................................................................. 104
Figure 3-1 Mechanism of fetal hemoglobin induction by hydroxyurea ..................... 109
Figure 4-1 Neutralization of ROS in red blood cells by superoxide dismutase (SOD) and glutathion peroxidase (GPx), ...................................................................................... 123
Figure 4-2 Effect of n-3 fatty acids supplementation on GPx activity in red blood cells of patients with HbSS ................................................................................................. 133
Figure 4-3 Effect of n-3 fatty acids supplementation on SOD activity in red blood cells of patients with HbSS ................................................................................................. 133
XXIV

List of figures
Figure 4-4 Effect of n-3 fatty acids supplementation on plasma a-tocopherol levels in patients with HbSS ............................................................................................................... 134
Figure 4-5 Effect of n-3 supplementation on phosphatidylethanolamine dimethyl acetals (DMAs) ...................................................................................................................... 134
Figure 5-1 Map of Sudan ..................................................................................................... 143
Figure 5-2 Flow chart of the patients considered for the trial and randomisation ... 145
Figure 5-3 Comparison of the cumulative clinical vaso-occlusive crisis of active and placebo groups ....................................................................................................................... 151
Figure 5-4 Red blood cell EPA and DHA percentages of ethanolamine phosphoglyceride before and after the intervention ..................................................... 152
Figure 5-5 Red blood cell LA and AA percentages of ethanolamine phosphoglyceride before and after the intervention ....................................................................................... 152
Figure 5-6 Red blood cells EPA and DHA percentages of outer cell membrane choline phosphoglyceraide before and after the intervention ..................................... 153
Figure 5-7 Red blood cells LA and AA percentages of outer cell membrane choline phosphoglyceride before and after the intervention ..................................................... 153
Figure 6-1 a) Lactate dehydrogenase (LDH) b)Haptoglobin levels before and after one year of supplementation with n-3 fatty acids .................................................................. 162
Figure 7-1 Plasma TNF-a concentrations (a) and IL-IO concentrations (b) of patients with n-3 fatty acids before and after one year of supplementation with n-3 fatty acid . .................................................................................................................................................. 176
Figure 7-2 Correlation of EP A, AA and LA to cytokines ............................................... 176
7-3 Effect of n-3 and placebo supplementation on monocytes integrin CD11b/C18 (CD-lIb) .................................................................................................................................. 177
7-4 Effect of n-3 and placebo supplementation on granulocytes CD11b/CD18 (CO-lIb) ........................................................................................................................................... 177
Figure 7-5 Effect of n-3 fatty acid supplementation on monocytes and granulocyctes CD11 ~2-integrin CDllb/C18 (CD-11b) and granulocytes Selectin (C062L) ............ 178
Figure 7-6 Relationship between C011-Monocytes level and eicosapentaenoic acid (a) linoleic acid (b) percent in red blood cell PC of patients with HbSS .................... 178
Figure 7-7 Relationship between C011-Granulocytes level and n-6-meta,ln-3-met in red blood cell PE (a) and PC (b) of patients with HbSS ................................................ 179
xxv

List of figures
Figure 7-8 Relationship between CD62L-Granulocytes level and Linoleic acid in red blood cell PC of patients with HbSS ................................................................................. 179
XXVI

List of Tables
List of Tables
Table 1-1 Important discoveries of the pathological and clinical features of SCD in chronological order ................................................................................................................. 12
Table 3-1 Characteristics of the hydroxyurea treated and untreated HbSS patients and healthy (HbAA) subjects .......................................................................................... 110
Table 3-2 Plasma lipid concentrations of steady state HU treated HbSS sickle cell patients and HbAA healthy controls ................................................................................. 112
Table 3-3 Fatty acid composition of red blood cell choline phosphoglycerides of hydroxyurea untreated (n=l7) and treated (n=19) HbSS patients and HbAA controls (n=20) ....................................................................................................................................... 113
Table 3-4 Fatty acid composition of red blood cell sphingomyelin of hydroxyurea untreated (n=l7) and treated (n=19) HbSS patients and HbAA healthy controls (n=20) ....................................................................................................................................... 114
Table 3-5 Fatty acid composition of red blood cell ethanolamine phosphoglycerides of hydoxyurea untreated (n=l7) and treated (n=19) HbSS sickle cell patients and HbAA healthy controls ( n=20) ........................................................................................... 115
Table 3-6 Fatty acid composition of red blood cell serine phosphogIycerides of hydoxyurea untreated (n=l7) and treated (n=19) HbSS sickle cell patients and HbAA healthy controls (n=20) ......................................................................................................... 116
Table 4-1 Patients' basic characteristics ............................................................................ 130
Table 4-2 Fatty acids composition of red blood cell membrane phosphatidylethanolamine of the active and placebo group before and after supplementation ................................................................................................................... 131
Table 4-3 Fatty acids composition of red blood cell membrane phosphatidy1choline of the active and placebo group before and after supplementation ........................... 132
Table 5-1 Demographic and clinical Characteristics of the Patients at Base Line .... 143
Table 5-2 Complete blood count at base line and one year after intervention ......... 150
Table 5-3 Annual rates of vaso-occlusive crisis and clinical vasa-occlusive crisis ... 150
Table 5-4 Sickle cell-associated Complications in active and placebo group after intervention ............................................................................................................................ 151
XXVII

List of Tables
Table 6-1 Paired haematological and biochemical data measures of steady-state HbSS patients studied before and after supplementation with n-3 fatty acids ........ 164
Table 7-1 Effect of supplementation with n-3 FA on Fatty acids composition of red blood cell membrane phosphatidylethanolamine (PE), phosphatidylecholine (PC), total white blood cells (TWBC) and platelets (PL Ts) ..................................................... 175
XXVIII

Chapter One
Introduction
1
Chapter One - Introduction

Chapter One - Introduction
1.1 Sickle cell disease
1.1.1 Inherited haemoglobin disorders
Sickle Cell Disease (SCD) is a group of autosomal recessive genetic blood disorder due
to a mutation in the sixth codon of the p goblin gene. The resultant haemoglobin S
(Hbs) which polymerises under low oxygen tension causes rigid, sickled red blood
cells(Serjeant 2001; Knight-Perry et al. 2009; Rees et al. 2010). The principal phenotypes
are homozygous sickle cell disease (HbSS), sickle cell-haemoglobin C (HbSC), sickle
cell-po thalassaemia (HbS PO), sickle cell-p+ thalassaemia (HbS W), HbSO Arab and HbSD
Punjab and HbS Lepore Boston SCD(Serjeant 2001; Nagel et al. 2003). The main clinical
manifestations are vaso-occlusisve painful crisis and haemolytic anaemia which lead
to degenerative tissue pathology that affect major organs including the brain, eye, lung,
spleen, liver, kidney, heart, bone. (Ballas et al. 2010). The pattern of the complications
and survival vary considerably between patients. These clinical variations suggest, the
outcome of the disease is determined by the interaction of environmental and genetic
factors(Driss et al. 2009).
Haemoglobin (Hb) is a heterotetramer protein that contains two polypeptide subunits
related to a-globin gene subfamily and two polypeptide subunits related to p-globin
gene subfamily. Globin polypeptides bind heme, which in tum allows the
haemoglobin in red blood cells (RBC) to bind oxygen reversibly and transport it from
the lungs to respiring tissues. The structure of human haemoglobin changes during
embryonic, foetal and adult life. Adult and foetal haemoglobin have a chains
combined with P (Hb A, a2p2), 6 (HbA2, a2 62) or y chains (Hb F, a2 y 2). After birth,
Hb F is replaced by Hbs A (97%) and A2 (2-3.5%) over the first year of life (Weatherall
and Clegg 2001; Steinberg 2009a)
HbS is caused by a single amino acid substitution of Glutamic Acid replaced by Valine
at the sixth position of the p-globin chain. This is due to a single nucleotide
2

Chapter One - Introduction
substitution, GAG -> GTG in codon 6 of the p-globin gene on chromosome 11 (Driss
et al. 2009). The inheritance of SCD obeys the principle of Mendelian genetics (Serjeant
2001), the genetic outcome of offspring depends on whether the are parent
homozygous or heterozygous for HbS. In the homozygous form of the disease (HbSS),
patients inherit the gene for HbS from both parents, who are either carriers
(heterozygous) or have SCD. The term sickle cell anaemia refers specifically to
homozygosity for the ps allele (Rees et al. 2010).
Heterozygous Sickle cell disease results from the inheritance of HbS with a wide
variety of mutations in p-globin. In haemoglobin C (HbC) the same codon 6 in p
globin that accountable for HbS mutation is changed from GAG to AAG, resulting in
insertion of lysine in place of glutamic acid. In population of Africa ethnic origin, sickle
cell anaemia typically account for 70% of cases of sickle cell disease, with most of the
remainder having HbSC disease (HbSC) owing to the co-inheritance of ps and pc alleles(Nagel et al. 2003).
The second major type of heterozygous sickle cell disease occurs when ps is inherited
with p-thalassaemia allele, causing HbSj p-thalassaemia; this is a variable disorder
dependent on the type of the p-thalassaemia mutation. Thalassemias are a group of
inherited autosomal recessive hematolgical disorders that cause haemolytic anaemia
because of the decreased or abscent synthesis of globin chain(Muncie and Campbell
2009). Thalassaemias are classified into a-, p-, 5P- and ycSp- depending on the affected
polypeptide chains (sergeant 1994). Deletion of the entire p gene or part of cS gene
causes cSp-thalassias(Henthom et al. 1990). Deletion involving p, 5, y genes gives rise to
the rare condition ycSp-thalassaemia. B-thalassemia includes Thalassemia Major,
thalassemia Intermedia and Thalassemia Minor. Subjects with thalassemia major are
homozygotes or compound heterozygotes for po or p+ genes, subjects with thalassemia
intermedia are mostly homozygotes or compound heterozgotes and subjects with
thalassemia minor are mostly heterozygotes(Galanello and Origa 2010). Sickle cell p
thalassemia (HbSpo or HbSp+) results from co-inheritance of HbS with the p
thalassemia major (HbSPO, HbA=O%) or p-thalassemia minor(HbSW, HbA=20-40%)
(Mukherjee et al. 2010). Disease severity decreases in the sequence HbSS .., HbSpo
>HbSC, with HbSW severity depending on remaining HbS percent(Dijs 2004).
3
Chapter One -Introduction
Among the less frequently occurring forms of the disease are combination of HbS with
other point mutations, i.e. HbDPunjab, HbOArab, Hblepore and possibily HbE. In
HbDPunjab, glutamine replaces glutamic acids at position p 121, and in HbOArab, Lysine
substitutes glutamic acid in the same location p 121 (Serjeant 2001). Hblepore is the
hybrid hemoglobin (Hb) composed of two alpha-globin chains and two deltabeta
hybrid chains.(McKeown et al. 2009) These variants of abnormal haemoglobin tend to
co-precipitate with HbS and result in clinically significant SCD
1.1.2 Genetic modifiers of seD SCD is prototypical Mendelian single gene disorder, and yet, despite the apparent
genetic simplicity, it has long been appreciated that patients with SCD display
remarkable diversity in the clinical severity of disease(Chui and Dover 2001; Fertrin
and Costa 2010). For example, in Cooperative Study of Sickle Cell Disease in the
USA(Platt et al. 1991),39% of 3578 patients with SCD had no episodes of pain but 1 %
had more than six per year. The complications in SCD are likely to be modulated by
interactions among many genes and the environment.(Sebastiani et al. 2005; Steinberg
2005). The first study on genetic differences accounting for clinical variability in SCD
reported the discovery of a site in linkage disequilibrium with the pS gene by use of
restriction endonucleases(Kan and Dozy 1978). Subsequent studies characterized the
presence of at least five different haplotypes of the p-like-globin gene cluster,
suggesting distinct geographic origins of the same pS gene (Senegal, Benin, Bantu,
Arab-Indian and Cameroon) and documented that haplotypes differed in foetal Hb
(HbF) levels(Nagel and Labie 1989; Nagel and Steinberg 2001) (Figure 1-1). HbF (a2p2)
has the ability to inhibit the polymerization of deoxygenated HbS, making its levels an
important modulator of the disease(Goldberg et al. 1977; Charache 1990). Senegal and
Arab-Indian haplotypes are strongly associated with higher HbF levels and hence
exhibit milder clinical course(Powars et al. 1990; el-Hazmi et al. 1992). In addition, the
HbF concentration in SCD which varies from 1 % to 30% is inherited as a quantitative
genetic trait(Rees et al. 2010). Three major loci have been identified, which account for
up to 50% of this variation in SCD. Specifically, the Xmnl polymorhism in the
promoter region of the Gy globin gene(Gilman and Huisman 1985), the HMIP locus in
chromosom 6q23.3(Thein et al. 2007) and BCUIA on chrornsom 2(Menzel et al. 2007).
4

Chapter One -Introduction
Other primary modifier of SCD is coinheritance of a-thalassemia(de Ceulaer et a1.
1983; Mukherjee et a1. 1997). a-thalassaemia is present in about 30% of SCD
patient(Steinberg and Embury 1986; Flint et a1. 1998), it reduces the RBC mean
corpuscular haemoglobin content (MCHC), deoxygenated HbS polymerization, denser
dehydrated cells, irreversibly sickled cells and ultimately less haemolysis and
sickling(Embury et a1. 1982; Noguchi et a1. 1985; Vasavda et a1. 2007).
Neither HbF level nor a-globin genotype can fully explain the clinical and laboratory
diversity of the sickle cell disease(Steinberg 2009b). Presently, most reported studies
have examined only polymorphic genes that could potentially affect the pathogenesis
of the disease and modulate the phenotype and more comprehensive genome-wide
association studies (GWAS) are just beginning(Steinberg 2005). To date, a unifying
theme that is emerging from the candidate gene studies is that polymorphism in genes
of TGF-P/BMP pathway, a superfamily of genes modulating wound healing and
angiogenesis, appear to be associated with several disease subphenotype(Bertolino et
a1. 2005; Steinberg 2008).
1.1.3 Environmental modifiers of the SeD
The inter-individul variation of SCD outcome not only refer to a pure genetic
paradigm, but also refer to geographic, social, dietetic, traditional and socio
economical matter(Driss et a1. 2009). Studies have shown a direct role of protein
intake(Archer et aI. 2008), water intake(Fowler et a1. 2010), and temperature(Smith et a1.
2009) in disease severity.
Northern Sudan, with its short rainy season, has hot daytime temperatures year round.
In Khartoum, the capital, temperatures can reach 48°C. This extreme temperature may
contribute to the severity of the disease due to increased risk of dehydration. However,
our own observation in Sickle Cell Referral Clinic and Khartoum hospitals, a noticeable
surge of hospitalization due to SCD crises occurs during the short cold season Ganuary
and February). The possible explanation is the increased incidence of viral infection
andlor the high speed of cold dry air of winter.
5

Chapter One - Introduction
It.
B I I I I I 60 ,>0 40 30 20 10 0
.:b
c G-., k y ~I~ C. ~s
5'~ [[}-{I] 3'
~
i i • J i tJ Jit ;t Hin.: )(cr .... 1 Hm::l Pvv Hinc mf Hgi Ava rtpa Bam HI
II III II " ,(0,1 II
Figure I-IGeographicaJ distribution and schematic representation of the sickle gene (A) Map identifies the three distinct areas in Africa and one in the Arab-India region where the sickle gene is present (dotted lines) . Numbers of individuals with sickle-cell disease (red lines) in Senegal, Benin, and Bantu are higher near the coast, and falls concentrically inland. (B) The pglobin gene cluster haplotype is determined by DNA polymorphic sites (boxes) that are identified by endonuclease enzymes. With this information, haplotypes are constructed as shown. Adopted from(Stuart and Nagel 2004).
6

Chapter One - Introduction
1.1.4 Epidemiology of HbS gene
1.1.4.1 Origin of the sickle cell gene
Lehmann and Huntsman, based on anthropological evidence as well as the
geographical distribution of the gene within Africa hypothesised that a single gene
mutation occurring in Neolithic times in the fertile Arabian Peninsula is the origin of
the disease. However the studies in the DNA polymorphism (region-specific
haplotypes) provided support for the hypothesis that the mutation causing HbS has
occurred, and have been locally amplified, on at least two, and possibly several,
separate occasions(Flint et a1. 1998; Serjeant 2001). The factors that caused this
amplification despite the high mortality that must have resulted in reduction of HbS
gene are not fully understood(Stuart and Nagel 2004). However, substantial evidence
indicates that malaria caused this amplification(Allison 1954; Aidoo et a1. 2002; Rees et
a1. 2010). This hypothesis supported by the close geographic correlation between the
frequency of HbS gene in populations and historical incidence of malaria (Flint et al.
1998)(figure 1-2) and the evidence for partial resistance of carriers to all forms of
plasmodium falcuparum malaria(Williams et a1. 2005b; May et al. 2007). It has been
postulated the HbS resistance to malaria resulted in "balanced polymorphism", that is,
a balance of deleterious and advantageous effects of a gene which allow it to remain at
a relatively constant level in a population(Allison 1954; Serjeant 2001; Stuart and Nagel
2004).
The protective mechanism of HbS against malaria is yet to be elucidated. To some
extend it relates to the peculiar physical or biochemical prosperi ties of HbAS red blood
cells(Williarns et a1. 2005a). There is evidence that invasion, growth, and development
of plasmodium falciparum parasite are all reduced in sickle red blood cells under
physiological conditions in vetro(Friedman 1978; Pas vol et al. 1978), a process that may
result in their premature destruction by the spleen(Shear et a1. 1993). Moreover,
mounting evidence suggests involvement of both innate and immune-mediated
mechanisrns(Marsh et a1. 1989; Bayoumi et al. 1990; Abu-Zeid et a1. 1992; Wellems et al.
2009).
From the primary areas of mutation the Benin haplotype spread to North Africa, Sicily,
northern Greece, Albania, southern Turkey, and southwest Saudi Arabia(Serjeant
7

Chapter One -Introduction
2001). The Bantu haplotype accounts for most of the disease in Kenya(Ojwang et a1.
1987). The vagaries of war and slave trade have been responsible for the dissemination
of HbS gene in North and South America, the Caribbean and the UK, where the
predominant haplotype is Benin(Zago et a1. 1992). The Arab-Indian haplotype
probably originated in the Indus valley Harappa culture, and by gene flow it was
distributed to Saudi Arabia, Bahrain, Kuwait and Oman. This haplotype is also linked
to SCD gene in population from eastern oasis of Saudi Arabia and Adivasis tribe of
India(Stuart and Nagel 2004). In Sudan, the most abundant haplotypes are the
Cameroon, Benin, Bantu and Senegal haplotypes, respectively (Mohammed et a1. 2006).
1.1.4.2 Distribution of seD
At least 5.2% of the world population (and over 7% of pregnant women) carry a
significant haemoglobin variant. HbS account for 40% of carriers but causes over 80%
of disorders because of the localised very high carrier prevalence(Modell and Darlison
2008); recent estimate suggests more than 230000 affected children are born in Africa
every year (0.74% of the birth in Sub-Saharan Africa), which is about 80% of the global
total. By comparison the estimated affected births in North America are 2600 and 1300
in Europe(Modell and Darlison 2008) (Figurel-2).
In the Sudan, the distribution of sickle cell disease was thought to follow the historical
route of the Pilgrims. Three foci of the disease have been described: Western Sudan,
where a prevalence rate of up to 30.4% was reported among Misseria of Darfur(Vella
1964). A survey in Kordofan reported a prevalence rate of 18 % in Misseria Humur
tribe and showed that one in every 123 children born to this tribe is in danger of having
the disease(R Launder 1970). The other focus is in southern Sudan, where a sickling
rate of 18% among the southern Nilotes Madi and Mandari tribes of the Equatorial
region with zero prevalence among the northern Nilotes, the Dinka, Nuer and Shilok
was reported(Foy et al. 1954). The third focus in the Blue Nile area showed a
prevalence ranging from 0-5% among the indigenous population, and up to 16% was
found among the immigrant tribes from Western Sudan and West Africa in this
area(Ahmed and Baker 1986). Now the disease is common in the capital (Khartoum),
centre, north and east of Sudan due to the movement and intermarriage of the tribes,
but the prevalence is not well reported.
8

Chapter One - Introduction
A verage survival is clearly strongly influenced by environmental, social and economic
factors. Although almost no formal studies of survival are available in literature from
African countries(Serjeant 2005), there is undoubtedly a high mortality, major
determinant of which are malaria, malnutrition and infection(Serjeant 2001). It has
been estimated that life expectancy among African people with sickle-cell disease is
less than 20 years(Tshilolo et al. 2008). In the Cooperative Study USA, the peak
incidence for death was 1-3 years(Leikin et al. 1989), and it was estimated that 85% of
HbSS patients survive beyond the age of 20 years, compared to 50% 30 years ago(Scott
1970). Recent autopsy study in USA showed that the most frequent causes of death are
infection (33-48%) and stroke (9.8%)(Manci et al. 2003).
9

A
",.
B
HbS allele frequency (\0)
i'2I 0-3 0 3-"
• &-9 • 9- 1~ . 12-1 5
• >15
Eastern Medi terranean
'egoo06491
Figure 1-2Global distributions of HbS and malaria
Chapter One - Introduction
ASian region 2603i
Westem PaCific region 13
'I;, ~("
(A) this map shows the distribution of the HbS allele. The figures indicate estimates for the combined yearly total number of individuals affected by HbSS, HbSC, and HbS/P-thalassaemia by WHO region. (B) This map shows the global distribution of malaria (red) before intervention
to control malaria (adapted from(Rees et al. 2010)
1.1.5 History of seD Centuries before Dr Herrick first reported sickle cell disease; the people of West Africa
knew the disease syndrome and gave it specific tribal names(Konotey-Ahulu 1968).
The African medical literature reported this condition in the 1870's where it was known
locally as ogbanjes (,children who come and go') because of the very high infant
10

Chapter One - Introduction
mortality in this condition. They also knew that the disease was hereditary, with the
typical presentation of cold-season rheumatism, pallor of nails, tongue, palms of hands
and soles of feet, yellow coloration of the eyes and a generally low state of
health(Konotey-Ahulu 1974). Herrick in 1910 was the first to describe sickle red cells in
the blood of dental student from Grenada who complained of pain, dizziness and
general tiredness(Herrick 2001). Using the new technique of protein electrophoresis,
Pauling et al(1949) described the molecular basis of the SeD disease, the study that
opened a new era of medical research(Gormley 2007).(Tabll-l).
11

Chapter One - Introduction
Table I-I Important discoveries of the pathological and clinical features of SCD in chronological order
1890
1948
1948
1951
1978
19805
1984
1984
1995
1998
2008
Discovery Importance
Sickled erythrocytes in Grenadian dental First description of a disease student linked to abnormal erythrocytes
Pauling et al delineated the abnormal Identified pathophysiology to electrophoretic mobility of sickle have molecular basis haemoglobin
Watson(1948) noted no symptoms in infants
with SCD
Perutz et al(1951) describe characteristics of polymerisation of deoxygenated HbS
Kan and Dozy describe the first haplotype polymorphism associated with HbS gene
John et al (1984)showed the value of the penicillin in young children with SCD
Beneficial effects of high foetal concentrations of
haemoglobin
Primary molecular identified
mechanism
Provided insight about the genetic modifier of the disease
Reduced mortality, role of neonatal screening
Platt et al(1984) demonstrate that Identified potential treatment hydroxyurea increases HbF production in SCD
Jounson et al(1984) reported bone marrow Identified potential cure transplant in child with sickle cell anaemia and Leukaemia
Charache et al (1995) demonstrate that hydrxyurea decreases painful crises in SCD
Only-disease identified
modifying drug
Adams et al (1998) demonstrate reduced Primary stroke prevention with stroke incidence in children with abnormal fall in stroke occurance transcranial dopplers who were given blood transfusion
Sedgewick et al(2008) published the first Identified the role of functional genome-wide association study in SCD motifs in HbF levels
1.1.6 Clinical manifestation of SCD
1.1.6.1 Sickle cell pain
Pain is the protean manifestation of SeD, in which episodic microvessel occlusion at on
or many sites induces tissue damage accompanied by pain (nociceptive pain) and
12

Chapter One -Introduction
inflamrnation(Stuart and Nagel 2004; Ballas 2005). It may be acute or chronic, somatic
or visceral, unilateral or bilateral, localised or diffuse, moderate or severe(Ballas 1998).
Typically, acute painful episodes (vaso-occlusive crisis) affect long bones and joints,
with the low back being the most frequently reported site of pain(Ballas and
Delengowski 1993). Other region of the body, including the scalp, face, jaw, abdomen,
and pelvis, may be involved(Charache et al. 1995; Charache et al. 1996). Objective signs
of a painful crisis such as fever, leukocytosis, joint effusions and tenderness occur in
about 50% of patients at initial presentation(BaIlas et al. 1988). Painful crisis affect
virtually all patients with SCD, often beginning in late infancy and recurring
throughout life (Almeida and Roberts 2005) (Figure 1-3). The frequency of painful
crisis varies across the patients as third of the patients are asymptomatic, with small
cohort (5%) accounting for a third of admission(Stuart and Nagel 2004). Platt et al
calculated from hospital-based data a vaso-occlusive crises average rate of 0.8 episode
per patients per year in HbSS patients(Platt et al. 1991). Brozovic et al(1987) reported
that 90% of hospital admissions of patients with sickle cell disease are for the treatment
of acute pain. Studies have shown that painful crises are more frequent in patients
with high haemoglobin levels and high reticlucyte count(Baum et al. 1987; Platt et al.
1991). Adults who experience painful crises more often than three times per year tend
to have a shorter life expectancy than those with low pain rates(Platt et al. 1991).
Chronic pain that persists for 3 or more months, may result from ongoing damage to
bone and other tissues(Koshy et al. 1989; Ballas 2005; Dunlop and Bennett 2006) ; and
inadequate treatment to recurrent episodes of acute pain may lead to chronic
neuropathic pain that is maintained centrally by abnormal somatosensory processes
and central sensitization(Ballas 2005; Niscola et al. 2009).
13

Chapter One - Introduction
: I I . .
Palliative
Figure 1-3 of complications of sickle cdl anaemia from birth through adult life. ACS, acute chest syndrome; A Y , avascul ar necrosis; CY A, cerebrovascular accident
1.1.6.2 Bone involvement in SeD
The major bone complications in SCD include vaso-oclusive crisis and
osteomyelitis(Neonato et al. 2000; Almeida and Roberts 2005). While vaso-occlusion
can occur in any organ, it is particularly common in the bone marrow, resulting in
bone marrow infarc tion typically in medullary cav ity or epiphyses(Lonergan et al.
2001; Kim and Miller 2002). The reasons for the vulnerability of the bone marrow to
microvascular occlusion is not clear, but may be partly due to red marrow expansion
(hepercellularity) leading to impaired blood flow and regional hypoxia(Smith 1996).
Epiphyseal infa rction has a predilection for the head of the femur (avascular necrosis),
followed by the humeru s, knee and small joints of the hand and feet.(Jean-Baptiste and
De Ceulaer 2000; Lonergan et al. 2001) . About 50% of patients with HbSS will develop
epiphyseal osteonecrosis by the age of 35 years(Ware et al. 1991; Styles and Vichinsky
1996).
In infants and young child ren, infarction occurs in the diaphysis of small tubular bone
in hands and feet causing dactylitis or "hand-foot" syndrome(Babhulkar et al. 1995).
Hand-foo t syndrome is common between the age 6 months and 2 years but is rare after
14

Chapter One - Introduction
the age of 6 years because of the regression of red marrow in these areas with
increasing age(Ejindu et al. 2007). Children often present clinically with tender and
swollen hands and feet, diminished movement and fever(Stevens et al. 1981).
The effects of sickle cell anaemia on growth are thought to result from bone infarction.
Epiphyseal shortening arises from vascular compromise, which causes damage to the
growth plate, slowing or halting cartilage growth and leading to shortened bone(Siffert
1966). In addition, endplate depressions of vertebral bodies contribute in growth
disturbance associated with SCD(Marlow et al. 1998).
Osteomyelitis and septic arthritis are serious complications of SCD and important
causes of hospitalisation. The relative rate of occurrence of osteomyelitis has been
estimated up to 18%, and 7% for septic arthritis (Neonato et al. 2000; Bahebeck et al.
2004). The most common cause of osteonyelitis in SCD is Salmonella especially the
non-typical serotypes (salmonella typhimurium, salmonella enteriditis, salmonella
choleraesuis and salmonella paratyphi B)(Piehl et al. 1993; Burnett et al. 1998).
Staphylococcus aureus, the second most common causal organism, is seen in
approximately 10% of cases(Ejindu et al. 2007). Gram negative organisms also
implicated, and tuberculosis osteomyelitis and arthritis have been reported in
SCD(Kooy et al. 1996; Burnett et al. 1998). Infection is commonly haematogenous in
origin(Anand and Glatt 1994). The increased susceptibility of seD patients to infection
has been attributed to hyposplenism secondary to infarction in childhood, impaired of
phagocytosis and complement dysfunction(Almeida and Roberts 2005). Moreover,
infarction and necrosis of medulary bone create a good milieu for bacterial growth and
spread(Ejindu et al. 2007).
1.1.6.3 Aplastic crises
Human parvovirus (HPV) B19, a common childhood infection, frequently causes
transient red cell aplasia (Aplastic crises) in children with sickle cell disease
(SCD)(Goldstein et al. 1987; Serjeant et al. 2001). Although most individuals
spontaneously recover in a few days, the anaemia can be so sever that it causes cardiac
decompensation and death(Serjeant et al. 1993; Goldstein et al. 1995).Serjeant et al
(2001)reported that 70% of SCD patients seroconvert by age 20, and 67% of the infected
group suffered aplastic crises.
15

Chapter One - Introduction
1.1.6.4 Acute chest syndrome
Pulmonary complications represent 20 to 30% of mortality due to sickle cell and can be
divided into acute and chronic events(Maitre et al. 2011). Acute chest syndrome (ACS)
is a common form of acute lung injury in SCD, and second most common cause of
hospital admission(Platt et al. 1994). It is defined by the development of a new alveolar
pulmonary infiltrate involving at least one lung segment(Gladwin and Vichinsky
2008). The radiographic abnormality is usually accompanied by chest pain, fever,
tachypnea, wheezing, or cough(Vichinsky et al. 2000). Risk factors include HbSS
genotype, low HbF, high steady-state leucocyte and Hb concentration(Castro et al.
1994). Severity varies, but 13% of patients require mechanical ventilation 3%
die(Vichinsky et al. 2000). Repeated episodes of ACS predispose to chronic pulmonary
disease, including pulmonary hypertension (pulmonary artery systolic pressure> 35
mmHg)(Vichinsky et al. 2000; Stuart and Setty 2001a; Gladwin et al. 2004).
Acute chest syndrome is caused by a combination of pulmonary infection, fat
embolism and vaso-occlusion of the pulmonary vasculature by sickled cell(Vichinsky
et al. 2000) (Figure 1-4). The most common cause of the acute chest syndrome in
children and adults is pulmonary infection by a community-acquired pathogen such as
Streptococcus pneumoniae, Mycoplasma pneumonia and respiratory syncytial
virus(Vichinsky et al. 2000). The pulmonary symptoms are commonly preceded by
bone pain, significant reduction in Hb concentration, platelet count, increased plasma
levels of free fatty acids and secretory phospholipase A2(Schuster 1994; Styles et al.
1996; Ballas et al. 2006).
16

Vaso-occiLlSlon Incr{'aSolod Hb5 poi;.'m{'nsauon
Erythrocyte rigidity
( 04~] integrin) -.. ~ Increased endothelia l
VCA M·] expr.,."on and adh<>slOn
No/- l InCFlMsed €,fythrocyte adneslon
In lung-pulmonary Infarction
NO /-~
=,.. c :'F;t ; mboliSm
\~: ::-":"'~'"c.. M lCr(wa~ulatur f' occlusion
and bone marrow infarctIOn
~- -, .,::: :~ = .. - .' .. : .:- .~ .~=-: .. ~ c
~ :> .. ::...,C :, Inflamm.ll 10n ~(reror)'
phosphollp.s<> A
"'X
Chapter One - Introduction
Hypovent ilat lon
and atelectasis secondary to rib /"" and vertebral Infarct ion
Acutt chest syndrome
,®~ Pulmonary Infect ion '
Figure 1-4 Pathoph)'siology of acute chest syndrome, adopted from (Rees et al. 2010).
1.1.6.5 Cardiac complications
Sickle cell patients are known to have multiple clinically significant cardiac
abnormalities, primarily during adulthood(Lindsay et al. 1974; Lester et al. 1990; Ballas
et al. 2010). Morphologic and physiologic changes include dilated chambers, septal
hypertrophy, abnormal contractility and echocardiogram abnormalities(Covitz et al.
1995; Liem et al. 2009). These changes are thought to be due to high cardiac output, the
adaptive response to reduced oxygen carrying capacity in SCD(Varat et al. 1972;
Lindsay et al. 1974; Hankins et al. 2010).
1.1.6.6 Neurological complications of SCD
The developing brain is particularly vulnerable to hypoxaemia and ischaemia, to
which children with SCD are frequently exposed(Hogan et al. 2006a). Neurological and
cranial complications occur in at least 25 % of patients with SCD(Hebbel 2005). These
17

Chapter One - Introduction
complications include transient ischemic attacks, overt and silent cerebral infarction,
cerebral haemorrhage, infections, moya-moya pattern, posterior reversible
encephalopathy syndrome, dural venous sinus thrombosis, thickness of the diploic
space, cerebral atrophy and Seizures (Uu et al. 1994; Henderson et al. 2003; Yildirim et
al. 2005; Alkan et al. 2009). Cerebral infarction has been reported to be the most
common cause of stroke in the first two decades of life and from fourth decade
onward, whereas hemorrhagic stroke occurs more commonly in the third
decade(Ohene-Frempong et al. 1998). In SCD clinical stroke with focal signs lasting
more than 24 hours is 250 times more common than general paediatric
population(Earley et al. 1998). SCD Patients with Low haemoglobin, high white cell
count and history of previous transient ischemic event, hypertension and history of
chest crisis seem to be at higher risk to devolve overt ischemic stroke. Moreover, recent
studies suggest familial predisposition and epistatic polymorphisms as additional risk
factors for stroke in SCD (Driscoll et a1. 2003; Kirkham 2007). Besides the structural
brain abnormalities, children with SCD with or without a history of overt stroke tend
to have lower cognitive function(Watkins et al. 1998; Noll et al. 2001; Hogan et al.
2006a), which commonly affect attention and executive function(DeBaun et a1. 1998;
Hogan et a1. 2006b).
Neuropathology of ischemic complications in SCD is due to narrowing and occlusion
of blood vessel which results from endothelial hyperplasia, fibroblastic reaction,
hyalinization and fragmentation of the internal elastic lamina, thrombi in large and
small vessels, increases adhesion of blood cells and fat embolisation after bone marrow
infarction (Powars et a1. 1978; Rothman et al. 1986; Switzer et a1. 2006). Approximately
75% of ischemic strokes are typically due to large-artery involvement. The most
common subtype of overt cerebral infarction is the border-zone stroke, which occurs
between the anterior cerebral artery and middle cerebral artery territories(Moran et al.
1998; Alkan et a1. 2009). Recurrent stroke is generally haemorrhagic due to rupture of
fragile, dilated collateral vessels from prior ischemic infarction(Ohene-Frempong et al.
1998).
18

Chapter One - Introduction
1.1.6.7 Ocular and cochlear complications of SCD
Ocular manifestations are important long-term complications of SCD(Elagouz et al.;
Nagpal et al. 1977). The pathological process of SCD can affect virtually every vascular
bed in the eye, in its advanced stages, has the potential to cause blindness (To and
Nadel 1991; Babalola and Wambebe 2005). Classification of ophthalmic manifestations
in the retina can be based on the presence or absence of vascular proliferation in the
eye fundus(Fadugbagbe et al.). Proliferative sickle retinopathy (PSR) is the most
important causative factor of vitreous haemorrhage or retinal detachment, the severest
complications of sickle cell eye disease(Nagpal et al. 1977; Moriarty et al. 1988; Kent et
al. 1994). Moriarty et al (1988) have reported that incidence of visual loss in eyes with
proliferative disease was 31/1000 eye-years compared with 1.4/1000 eye-years in
subjects with non proliferative disease. Non-proliferative ocular manifestations of SCD
include conjunctival vascular occlusions, iris atrophy, retinal pigmentary changes,
retinal haemorrhages and other abnormalities of the choroid, macula, optic disc and
retinal vasculature(Fadugbagbe et al.).
The prevalence of hearing impairment reported range from 0 to 66%. Different patterns
and degrees of hearing loss are reported, ranging from profound bilateral losses with
partial recovery over time, to mild to moderate unilateral losses- predominately in
the high frequencies(Wilimas et al. 1988; Onakoya et al. 2002; Burch-Sims and Matlock
2005). The extensive vascular anatomy and the high metabolic activity requirement of
the cochlear render it very vulnerable to vaso-occlusive ischaemic damage(Brown et al.
1983; Russell and Cowley 1983).
1.1.6.8 Kidney involvement in SCD
The renal features of SCD include hematuria, proteinuria, tubular disturbances, acute
kidney injury and chronic kidney disease(Scheinman 2009). At early stages, the renal
complications manifest as impaired urinary concentration ability, defects in urinary
acidification and potassium excretion, increased phosphate reabsorption, increased
creatinine secretion, glomerular hyperfilteration and proteinurea(Allon 1990; Gurkan
et al. 2010). A urinary concentration defect is the most common tubular abnormality
and it can present as enuresis(Devereux and Knowles 1985; Scheinman 2009). 4-21 % of
19

Chapter One - Introduction
adult HbSS patents suffer renal failure, and contributes to early mortality from the
disease(Guasch et al. 2006).
Sickle cell disease (SCD) affects the kidney by acute mechanisms, as a form of the sickle
crisis, and insidiously with renal medullary I papillary necrosis, with resulting tubular
defects(Okpala 2006). The urinary concentration defects and haematurea are probably
a consequence of RBC sickling in renal medulla combined with vascular obstruction
and RBC extravasation; as it is weIl known that, the hypoxic, acidotic, and
hyperosmolar environment of the inner medulla are strong promoters of RBC sickling,
which in turn results in impairment of renal medullary blood flow, ischemia,
microinfarct, and papillary necrosis(Statius van Eps LW 1997; Pham et al. 2000).
Moreover, the repetitive episodes of localized ischemia and reperfusion contribute to
renal damage by inciting a low-grade chronic inflammatory tissue-injuring state(Platt
2000). The mechanisms underlie protein urea and glomerulopathy include both
hyperfilteration and glomerular hypertrophy(de Jong and Statius van Eps 1985; Allon
1990). In addition, sickled cell can cause direct damage to the glomerular endothelium.
Studies have also shown that, endogenous perturbation of the prostaglandin system is
implicated in early development of glomerulopathy in SCD(Buckalew and Someren
1974; de Jong and Statius van Eps 1985; de Santis Feltran et al. 2002).
1.1.6.9 Acute exacerbations of anaemia
Sickle cell disorders are associated with variable degrees of anaemia depending on
genotype; with the most sever disease in haemoglobin level seen in HbSS. After the
first 5 years of life, the Hb concentration remains constant in the steady state over time.
However, clinically significant lowering of Hb concentration below steady state values
does occur episodicalIy(Ballas et al. 2010). These episodes may result from variety of
causes include hyperhaeamolysis, splenic sequestration and aplastic crisis(Manci et al.
2003; Ballas et al. 2010). Hyperhaemolyis is diagnosed when the exacerbation of anemia
occurs in the absence of splenic and hepatic sequestration. Isolated hyperheamolysis in
the absence of painful crisis is reffered to as haemolytic crisis(Ballas and Marcolina
2006). Intravascular haemolysis (1/3 of SCD haemolysis) and extravascular haemolysis
are driven by HbS polymerisation and HbS instability respectively(Bensinger and
Gillette 1974; Hebbel 2010). Recent evidence suggests that chronic intravascular
20

Chapter One - Introduction
hemolysis is associated with a state of progressive vasculopathy, characterized by
reduced nitric oxide (NO) bioavailability, pro-oxidant and pro-inflammatory stress,
coagulopathy, pulomnary hypertension, stroke, leg ulcers and priapism (Reiter et al.
2002; Gladwin et aJ. 2004; Gladwin and Kato 2005; Kato et al. 2007; Morris et al. 2008).
Figure 1-5.
Nitric Oxide Synthase
----------)0 Marker A ( , '-'
. A V l L-Citrulline ) g Argmase
[ Omnhine ) /\
Xanthine. Oxidase • NADPH
Oxidase
Figure 1-5 Pathophysiology of intravascular haemolysis in sickle cell disease adopted from(Kato et al. 2007).
1.1.6.10 Splenic complications
Leg ulceration
The relative hypoxic, acidic environments in the spleen coupled with slow circulation
provide a uniquely hostile milieu for sickle RBC(Harrod et al. 2007). Enhanced sickling
and repetitive infarctions lead to functional asplenia and ultimately splenic fibrosis and
atrophy (Pearson et aJ. 1969; Pearson et aJ. 1985; Adekile et al. 2002). This functional
asplenia in turn results in increased susceptibility to sepsis, particularly from
encapsulated bacteria(Ballas et aJ. 2010). Abnormal splenic function in HbSS is
common by six months of age, and affect more that 20% by one year and over 40% by
two years(Serjeant 2001). The onset of functional asplenia is reflected by the 21

Chapter One - Introduction
appearance of irreversibly sickle cell, anisocytosis, howell-Jolly bodies and
sidrocytes(Ebert et al. 2010). Acute intra splenic vaso-occlusion can occur, resulting in
life-threatening splenic sequestration(Kinney et al. 1990; Machado et al. 2009). In HbSS
patients, the life time prevalence of acute splenic sequestration has been reported to be
between 7% and 30%(Emond et al. 1985; Kinney et al. 1990). The initial event occurs in
toddler age group, but episodes as early as 9 weeks were reported(Pappo and
Buchanan 1989; Rezende et al. 2009). Acute splenic sequestration is characterised by a
tender, rapidly enlarging massive spleen due to the trapping of sickle RBC and blood
constituents(Ballas et al. 2010). The haemoglobin decreases by at least 2g/ dl with
concomitant 20-30% increase in reticulocytes from baseline, and often moderate to
severe thrompocytopenia(Singhal et al. 1995; Lonergan et al. 2001), leading rapidly to
severe anaemia.
1.1.6.11 Hepatic involvement in SCD
Hepatic dysfunction is a commonly recognized complication of sickle cell disease
(SCD) due to multiple factors such as intrahepatic sinusoidal sickling and congestion,
bilirubin gallstones, intrahepatic cholestasis, transfusion-related viral infections or
excess iron deposition (haemosiderosis)(Kakarala and Lindberg 2004; Gurkan et al.
2005). Hepatomegaly occurs in 40-80% of patients(Serjeant 2001) (Serjeant 2001), and
liver infarction has been observed in 34% of autopsies (Bauer et al. 1980).Traditional
liver function test may be abnormal but gneraly reflects non-hepatic pathology(Brody
et al. 1975; Ebert et al. 2010). In addition to the chronic hepatic complications of SCD,
there may be episodes of acute hepatic crisis and acute hepatic sequestration (AHS)
(Hatton et al. 1985; Berry et a1. 2007). It has been reported that 10% of hospital
admission for painful crisis are due to acute hepatic crisisGohnson et al. 1985). Patients
with the uncommon AHS present with tender, progressive hepatomegaly, accentuated
anaemia below baseline, reticlucytosis and hyperbilirubinemia and moderate
transaminitis(Hemandez et al. 1989; Norris 2004). Because liver is not distensible as is
the spleen, AHS is not usually life threatening(Sheehy 1977; Ballas et al. 2010).
1.1.7 Pathophysiology of vaso-occlustion
The two major pathophysiological processes underpinning the complications
associated with SCD are vaso-occlusion with reperfusion injury and haemolytic
22

Chapter One - Introduction
anaemia(Frenette 2002; Rees et al. 2010). Acute vaso-occlustion was thought to be
caused by entrapment of RBC containing the rope-like fibre of deoxygenated HbS. HbS
polymerises when deoxygenated, since valine which substituted glutamic acid in
position six can interact hydrophobicaly with the complementary sites on adjacent
globin chains(Stuart and Nagel 2004; Hebbel et al. 2009). The polymerisation of HbS is
a nucleation-initiated reaction with a delay time, during which no polymer is
detectable. At the end of the delay time, the critical nucleus is formed and exponential
polymer formation follows(Eaton and Hofrichter 1990; Ferrone 2004). Although HbS
polymerisation and red cell sickling are central to pathophysiology of the disease,
emerging evidence indicates primary events in vaso-occlusion may involve a complex
interplay of complex factors(Embury 2004; Kaul et al. 2009). Firestly, Studies on
polymerisation kinetics have shown that, the range of the transit times of RBC in the
microcirculation is short relative to the range of delay times of HbS, and consequently,
most of HbS under physiological conditions fails to polymerise unless the delay times
being lengthened by other factors such as inflammation and adhesion biology of sickle
vascular pathobiology(Mozzarelli et al. 1987; Turhan et al. 2002; Hebbel et al. 2009).
Secondly, no correlation was found between painful events and sickling. In addition,
in most circumstances vaso-occlusion is triggered by polymerisation-independent
antecedent events, with sickling occurring as secondary event(Billett et al. 1986; Ballas
et al. 1988; Nagel 1993; Barker and Wandersee 1999). These observations led to
conclusion that sickling is not necessary and sufficient or the primary initiator of vaso
occlusion(Embury 2004). The current consensus is that, the primary events crucial to
vaso-occlusion include adhesion of RBC to endothelium of postcapillary venule, and
leukocyte-endothelium adhesion with formation of heterocellular aggregates(Kaul et
al. 1989; Turhan et al. 2002; Kaul et al. 2009), Figure 1.6.
23

Adheren! neutroph il ---
Figure 1-6 Sickle cell vasoocclusion adopted from(Frenettc and Atvveh 2007)
1.1.7.1 Red cell adhesion and vaso-occlusion
Chapter One - Introduction
Sickle red ceIIs are abnormaIIy adherent to endothelium(Hoover et al. 1979; Hebbel
2008). The RBC adhesion correlates inversely with the venular capilIaries, and the
prime sit of adhesion was shown to be the postcapilIary venules(Kaul et al. 1989; Kaul
and Fabry 2004; Zennadi et al. 2007). Studies have revealed that RBC adhesion act as a
trigger that slows down the flow to fulfil the delay time requirement for
sickling(Hebbel et al. 1980; Kaul and Fabry 2004), the finding which may explain the
established positive correlation between sikcle cell adhesivity to endothelium and
clinical severity of SCD. Major determinants of RBC-endothelial interactions are the
RBC and endothelial cell membranes, both of which display a great variety of adhesion
molecules (Hebbel 2008; Hebbel et al. 2009). In addition, interactions have been
observed between sickle cell and immobilised extracellular matrix components(Stuart
and Nagel 2(04). The adhesion molecules commonly expressed in sick red cells include
very-Iate-activation-antigen-4 (VLA-4/a4p1 integrin), (Joneckis et al. 1993; Brittain and
Parise 2008), CD36(Gupta et al. 1999; Telen 2007), serine phosphoglycerides
(SPG),(Manodori et al. 2000; Setty et al. 2002), integrine associated protein
(CD47),(Brittain et al. 2001; Brittain et al. 2004), the protein that carries the Lutheran
blood-group antigen (B-CAM/Lu),(EI Nemer et al. 2008) and integrin receptor LW
(ICAM-4),(Kaul et al. 2006; Zennadi et al. 2007).
24

Chapter One - Introduction
Studies have shown different mechanisms of interaction between RBC adhesive
molecule and vascular endothelium. For some mechanisms RBC adhesive molecules
interact directly with endothelial molecules without participation of an intervening
adhesogen, such as the interaction of a4pl integrin with vascular cell adhesion
molecule-l (VCAM-l) on cytokine andj or hypoxia stimulated endothelial
cells(Swerlick et a1. 1993), and interactions between reticulocyte CD36 and endothelial
cell vitronectin receptors via thrombospondin(Gupta et a1. 1999; Kaul et al. 2000). On
the contrary, other mechanisms involve participation of an intervening, bridging
molecule such as thrombospondin (TSP) released by platelet (Sugihara et a1. 1992a;
Brittain et a1. 1993), von Willebrand factor released by endothelial cells(Gupta et a1.
1999; Kaul et a1. 2000) and fibronectin(Kumar et a1. 1996; Brittain et al. 2008).
1.1.7.2 White cell adhesion and vaso-occlusion
It has been known that polymorphonuclear leukocytosis correlates with severity of
SCD progression(Miller et a1. 2000), stroke and early death(Platt et a1. 1994; Ohene
Frempong et a1. 1998; Okpala 2004). This central role of white blood cell in SCD
pathophysiology and vaso-occlusion is attributed to its increased propensity to adhere
to endothelium and red blood cells (Frenette 2002; Frenette 2004; Canalli et a1. 2008).
Leukocytes adhesion to vascular endothelium is mediated by the interaction of
leukocyte adhesion molecules L-selectin (CD62L), aM~2 integrine (CDllbjCD18) and
LFA-l (CDllAjCD18) with endoendothelial adhesion molecules, including
intercellular adhesion molecule-l (ICAM-l), vascular adhesion molecule-l (VCAM-l),
E-selectin and P-selectin(Okpala 2002; Turhan et al. 2002; Johnson and Telen 2008). Due
to fact that leukocytes are far larger, stiffer, and stickier than red cells, it has been
suggested that they play a pivotal role in slowing microvasulare blood flow and,
ultimately, initiation and propagation of vaso-occlusion(Chiang and Frenette 2005;
Hebbel et a1. 2009).
1.1.7.3 Role of platelet in vaso-occlusion and hypercoagulability in SeD
Hypercoagulable or prothrombotic state is thought to be one of major factor that
contribute to vasa-occlusion in SCD(Stuart and Setty 200lb; Ataga and Orringer 2003).
Factors underlie the hypercoagulabl state in SCD include increased thrombin
generation (Francis 1989; Tomer et a1. 2001a), decreased natural anticoagulant
25

Chapter One - Introduction
proteins (Wright et al. 1997; Westerman et al. 1999), increased tissue factor
procoagulant activity(Key et al. 1998; Mohan et al. 2005) and increased platelet count
and activity(Wun et al. 1997; Tomer et a1. 2001a; Blann et a1. 2003). Steady state platelet
activation manifests by elevated levels of activation markers such as surface and
plasma P-selectin (CD62P) and CD40L (Wun et al. 1997; Inwald et a1. 2000; Tomer et a1.
2001a). In addition, thrombospondin, platelet factor 4 and p-thromboglobulin are
elevated in steady state(Tomer et a1. 2001a; Lee et a1. 2006). Studies showed that
platelet activation accelerates further during vaso-occlusive crisis(Wun et a1. 1997;
Stuart and Setty 2001b). Several pieces of data provide evidence for the relationship
between serine phosphoglycerides externalisation in RBC, decreased bio-availability of
NO due to chronic haemolysis and platelet activation in SCD(Setty et a1. 2000; Setty et
a1. 2001; Villagra et a1. 2007).
1.1.8 Management of SeD
1.1.8.1 General measures
The care of patients with SCD has undergone important advances in recent years. The
institution of newborn screening programme in many countries, paved the way for
early identifications of the disease and application of the comprehensive care
programme (Steinberg 1999; Hankins and Aygun 2009). Early in life, when the risk of
infection is highest, simple and cost-effective measures such as counselling the parents
about the prophylactic therapy, the detection of enlarging spleen, the dangers of fever
and increasing pallor and periodic visits to the physician can positively influence the
clinical outcome and may be life-saving(Vichinsky et a1. 1988; Rahimy et a1. 2003;
Frempong and Pearson 2007).
1.1.8.2 Prophylactic therapy
The mortality rate due to streptococcus pneumoniae pneumonia, sepsis and
meningistis was historically very high prior to the age of 6 years in children with
SCD(Ramakrishnan et a1. 2010). This high mortality rate has been lowered
tremendously by three manoeuvres. Firstly, immediate initiation of prophylactic
penicillin after diagnostic screening and continued until 5 years old (Gaston et a1. 1986),
26

Chapter One - Introduction
and secondly, introduction of immunisation programme with heptavalent
pneumococcal-conjucated vaccine at 2,4,6 and 12 months of age(Aliyu et al. 2006). The
third is immunisation with 23-valent pneumococcal polysaccharide vaccine at 2 and 5
years of age(AAP 2000). In addition, 1 mg of folate daily provided as a supplement to
meet the increased metabolic requirement for folate in SCS is frequently
administered(Wang 1999).
1.1.8.3 Supportive therapy
The supportive management of pain includes hydration, pain relief, blood transfusion
and psychosocial support(Aliyu et al. 2006; Verduzco and Nathan 2009; Edwards and
Edwards 2010; Tanabe et al. 2010).
1.1.8.3.1 Pharmacologic management of pain
Nonopioids, opioids and co-analgesics are the three major classes of compounds
commonly used for pharmacologic management of pain in SCD(Stinson and Naser
2003; Ballas 2005; Dunlop and Bennett 2006). Unlike opioids, nonopioids have a
"ceiling effect", a dose above which no additive analgesic effects is attainable(Beaver
1988). Co-analgesics are heterogeneous compounds that potentiate the analgesic effect
of opioids, ameliorate their side effects and have their own mild analgesic effect(Ballas
2005). They include antihistamines, antidepressant, benzodiazpines and anti
convulsant.
Acute painful episodes of mild or moderate severity are usually treated at home using
a combination of nonpharmacologic and nonopioids analgesics(Field et a1. 2009). Sever
acute sickle painful episodes are usually treated in hospitals using parenteral
analgesics(Benjamin et a!. 2000).
Management of chronic sickle pain entails multidisciplinary approach. Chronic pain
due to avascular necrosis and leg ulceration necessitate input of wound care centre,
orthopaedics, physical therapy, rehabilitation and rheumatology(Ballas 2005; Dowsett
2005; Marti-Carvajal et a1. 2009). Neuropathic pain management in SCD involves
anticonvulsant, specially Gabapentin that is general used in this complication(Ballas
2005; Wilkie et a1. 2010).
27

Chapter One - Introduction
1.1.8.3.2 Blood transfusions
Blood transfusions are administered in SCD to increase oxygen carrying capacity,
replace rigid, sickle-shaped red blood cells with normal, deformable cells, and restore
blood flow(Vichinsky et a1. 1995; Adams et a1. 1998). Transfusions may be indicated for
a variety of reasons in patients with SCD, including acute or episodic symptoms or
long-term management(Inati 2009). Simple transfusions are usually indicated for
symptomatic anaemia, acute neurologic event, acute chest syndrome, acute splenic or
hepatic sequestration and acute multi organ failure(Vichinsky 2001a; Lottenberg and
Hassell 2005); Whereas chronic simple transfusion is generally indicated for prevention
of recurrent stroke, recurrent acute chest syndrome and pulmonary
hypertension(Adams et a1. 1998; Vichinsky 2001a; Lottenberg and Hassell 2005).
Exchange transfusions are recommended for severe acute chest syndrome, acute
multi organ failure and acute neurologic event(Inati 2009). Despite the beneficial effects
of blood transfusions in SCD, it is limited by myriad complications which include auto
and aBo-immunisation, anaphylaxis, acute lung injury, delayed haemolytic
transfusion reaction (Norol et a1. 1994; Vichinsky 2001b; Wanko and Telen 2005;
Raphael et al. 2008; de Montalembert et a1. 2011), enhanced blood viscosity and risk of
central nervous system infarction(Ohene-Frempong et al. 1998), infections and iron
overIoad(Vichinsky 2001b; Vichinsky et a1. 2011). Although iron chelation has been
shown to reduce iron stores(Olivieri et a1. 1995; Inati et a1. 2011), and reverse congestive
cardiomyopathy resulting from iron overIoad(Rahko et al. 1986), improvements do
occur only in 50% of patients due to poor compliance and high cost(Delea et a1. 2007;
Payne et a1. 2007; Vichinsky et a1. 2008).
1.1.8.4 Curative treatment and strategies
1.1.8.4.1 Haemopoietic cell transplantation
A matched allogeneic Haemopoietic cell transplantation (HSCT) is the only curative
treatment for SCDGohnson et a1. 1984; Pinto and Roberts 2008). Most groups reported
event-free survival rates of around 80-90%(Bernaudin et a1. 2007; Panepinto et a1.
2007). However, the HSCT is restricted by the availability of matched related donors
and the potential serious complications(Fitzhugh et a1. 2008; Pinto and Roberts 2008).
Other emerging alternative options are unrelated donor marrow HSCT(La Nasa et a1.
28

Chapter One - Introduction
2005) or cord blood transplantation from an unrelated or related donor, sometimes in
conjunction with preimplantation genetic diagnosis(Qureshi et al. 2005; Kuliev et al.
2011).
1.1.8.4.2 Gene Therapy
The strategy for gene therapy for SCD relies on production of an anti-polymerization
globin in a cell producing a full complement of globin chains(Perumbeti and Malik
2010). Lentiviral-mediated gene transfer can correct haematological defects and organ
damage in mice with SCD(Pawliuk et al. 2001; Levasseur et al. 2003). Nevertheless, to
date no randomised controlled trials of gene therapy have been reported, hence no
objective conclusions about gene therapy are established(Olowoyeye and Okwundu
2010).
1.1.S.S Sickle cell Disease-modifying drugs
1.1.8.5.1 HbF-inducing drugs
The potential therapeutic effect of HbF modulation has been derived from the
observations that infants with SCD have few symptoms until their HbF levels
fall (Watson 1948), and patients with Hereditary Persistence of Foetal Haemoglobin
have a milder clinical course(Perrine et al. 1978). Moreover, studies have shown that
HbF levels predict the frequency of vaso-occlusive crises, acute chest syndrome,
osteonecrosis and death(Castro et al. 1994; Platt et al. 1994). Different drugs have the
ability to increase HbF production, using different mechanisms(Bank 2006; Fathal1ah
and Atweh 2006). However, only hydroxyurea (HU) is commonly used for treatment
of adult and children with SCD(Hankins and Aygun 2009).
1.1.S.S.1.1 Hydroxyurea
Hydroxyurea (HU) is the commonly used, effective therapy for adults, children and
infants with severe sickle cell disease (Hoppe et al. 2000; Stuart and Nagel 2004; Segal
et al. 2008; Strouse et al. 2008a). HU clinical effects, mechanism of action and side
effects are discussed in the relevant section, chapter 3, section 3.1.
1.1.S.S.1.2 De-methylating agents
29
Chapter One - Introduction
decitabine and its analogue 5-azacytidine are cytidine surrogate(Hankins and Aygun
2009). They incorporate in the DNA and form covalent bonds with DNA
methyltransferase, leading to depletion of this enzyme and ultimately DNA
hypomethylation(Creusot et al. 1982). The induction of HbF is attributed to trigger
effect on y-globin gene promoter due to drug-induced hypomethylation(Charache et al.
1983; DeSimone et al. 1983). The initial reports about efficacy of 5-azacytidine in SCD
were very encouraging. However concern about its carcinogenic effects halted further
investigation(Carr et al. 1984). There have been no clinical studies of decitabine in
children with SCD(Trompeter and Roberts 2009). In adults with SCD small studies of
intravenous or subcutaneous decitabine show that it increases HbF and total Hb, as
well as reducing red cell adhesion and endothelial damage with no apparent
tumorigenic risks(Koshy et al. 2000; DeSimone et al. 2002; Saunthararajah et al. 2003).
The long-term clinical effects, long-term side effects, effects in children and non-toxic
oral formulations have not yet been investigate(Hankins and Aygun 2009; Trompeter
and Roberts 2009).
1.1.8.5.1.3 Butyrate derivatives
Short chain fatty acid butyrate inhibits histone deacetylase and promotes elevated
levels of core histone acetylation, affecting chromatine structure and transcription rate
of y-globin genes and HbF level(McCaffrey et al. 1997; Davie 2003). Studies of
intermittent, but not continuous, intravenous infusion of arginine butyrate or pulsed
dosing with oral phenylbutyrate show sustained induction of HbF in most adult
patients with SCD(Atweh et al. 1999; Hines et al. 2008). Moreover, it has been reported
that butyrate has beneficial effect in treatment of intractable leg ulcer(Sher and Olivieri
1994). The disadvantages of butyrate centre on its short half-life, requiring continuous
IV dosage through a central line or very high oral dose (40 tablets per day) and the
unpalatable nature of the treatment(Collins et al. 1995).
1.1.8.5.1.4 Erythropoietin
In vitro and in vivo experiments have demonstrated recombinant human
erythropoietin's ability to raise the concentration of HbF(AI-Khatti et al. 1987;
Stamatoyannopoulos et al. 1987). Moreover, SCD patients have some degree of
erythropoietin deficiency(Saraf et al. 2011). The studies investigated potential effects of
30

Chapter One - Introduction
erythropoietin on HbF levels in patients with SCD in combination with HU showed
mixed results(Goldberg et al. 1990; el-Hazmi et al. 1995). However, emerging data
suggest potential role to erythropoietin in improving patient tolerance to hydroxyurea
dose escalation and prevention of HU-induced erythroid toxicity(Little et al. 2006;
Hankins and Aygun 2009).
1.1.8.5.2 Vasodilators
1.1.8.5.2.1 Inhaled nitric oxide
Nitric oxide (NO) is the critical effector of endothelial-dependent vasodilatation and
exerts pleiotropic effects on vascular and circulating blood cells, including the
inhibition of platelet aggregation, down-regulation of cellular adhesion molecules, and
modulation of ischemia-reperfusion injury, all pathways adversely affected
duringVOC(Ignarro et al. 1987; De Caterina et al. 1995; Villagra et al. 2007; Akinsheye
and Klings 2010). Preclinical studies in transgenic mouse models have consistently
demonstrated effects on inhibition of Gardos channels; reduction in red cell density;
improved perfusion; and reductions in lung injury, microvascular vaso-occlusion, and
mortality(Martinez-Ruiz et al. 2001; de Franceschi et al. 2003; Dasgupta et al. 2006).
Early single-centre and multi-centre clinical trials suggested decreased pain severity
and reduced opioid analgesic use, with trends toward reductions in length of
hospitalization(Weiner et al. 2003; Head et al. 2010). However, a recent well designed
multi-centre, double-blind, placebo controlled, randomized clinical trial in SCD
patients found no difference in painful crisis between Inhaled nitric oxide versus
inhaled nitrogen placebo(Gladwin et al. 2011).
1.1.8.5.2.2 Arginine
L-arginine is deficient in adults with steady state Hb SS disease, and decreases to even
lower levels during a vaso-occlusive episodes(Enwonwu et al. 1990; Lopez et al. 2003).
In children with SCD, arginine decreases during vaso-occlusive crisis. L-arginine is the
precursor to NO(Morris et al. 2000a; Morris et al. 2000b). Oral arginine supplement has
been showed to increase NO levels during vaso-occlusive crisis and reduce pulmonary
hypertention(Morris et al. 2000a; Morris et al. 2003; Morris 2006). Based on these
promising results clinical trial has been conducted but no significant change was found
in any laboratory outcome including arginine level(Hankins and Aygun 2009).
31

Chapter One - Introduction
1.1.8.5.2.3 Sildenafil
Sildenafil is an oral phophodiesterase-5 inhibitor. In tissues that express
phosphodiesterase-5, such as the lungs and corpora cavernosa, sildenafil amplifies NO
signaling by inhibiting hydrolysis of cGMP, the mediator of NO signal
transduction(Atz and Wessel 1999; Corbin and Francis 1999). Machado et al have
reported improvements in pulmonary hypertension and exercise capacity in patients
with SCD after treatment with sildenafil(Machado et al. 2005) . In addition, studies
have shown encouraging therapeutic effects on priapism(Bialecki and Bridges 2002;
Burnett et al. 2006). However, the observations that long term treatment with sildenafil
is associated with frequency of vaso-occlusive crises may limit its use as treatment for
SCD(Lane and Deveras 2011).
1.1.8.5.2.4 Statins
Independent of their cholesterol-lowering, emerging data indicate that many of statins
clinical effects are largely conferred through modulation of NO, via inhibition of
Ras/Rho proteins and direct upregulation of endothelial nitric oxide
synthase(Hernandez-Perera et al. 1998; Laufs et al. 1998; Kano et al. 1999; Laufs 2003).
Subsequent studies have shown that statins down-regulate inflammation, adhesion
and thrombosis(Diomede et al. 2001). Data from transgenic mouse models indicate that
statins attenuate endothelial activation in SCD(Solovey et al. 2004). Preliminary data
from pilot studies in SCD patients showed increase in NO levels and improvement in
measures of NO-dependent vascular dysfunction and inflammatory markers after
treatment with simvastatin(Hoppe et al. 2011). These findings suggest a potential
therapeutic role for SCD has to be yet verified.
1.1.8.5.3 Antioxidant Therapy Oral L-glutamine has been shown to significantly increase NAD redox potential and
NADH concentration in sickle RBCs, thereby reducing oxidative damage(Niihara et al.
1998). Moreover, supplementation with L-glutamine resulted in improvement of sickle
RBC adhesion(Niihara et al. 2005). Other possible anti-oxidant strategy is repletion of
over consumed tocopherol (vitamin E)(Browne et al. 1998).
32

Chapter One -Introduction
1.1.8.5.4 Drugs for prevention of red cell dehydration
HbS concentration directly depends upon cellular hydration status(Hankins and
Aygun 2009). Therefore, dehydrated RBCs have higher intracellular HbS concentration
and enhance propensity of RBC to sickle(Eaton and Hofrichter 1987). Inhibition of
sickle cell dehydration has been demonstrated to reduce dense cell formation and
improve anaemia in patients with SCD(Ataga et al. 2008b). Major pathways in cell
membrane involve in red cell dehydration include calcium-activated potassium efflux
channel (Gardos channel)(Canessa 1991), KCI co-transporter(Lauf and Adragna 2000)
and the Na+ pumpOoiner et al. 1986). Abnormal cation transport is implicated in
formation of dehydrated dense sickle cell and irreversible sickle cells(Bookchin and
Lew 2002; Lew and Bookchin 2005). Hence, inhibition of any of these pathways can
potentially prevent RBC dehydration and prevent polymerization of HbS(De
Franceschi et al. 1994; Brugnara 1995; Brugnara 2003).
1.1.8.5.4.1 Senicapoc (lCA-17043)
Senicapoc (ICA-17043) is an ion-channel blocker that selectively blocks potassium
efflux through the Gardos channel in human RBCs(McNaughton-Smith et al. 2008).
Placebo controlled Clinical trails investigated the efficacy and safety of senicapoc
consistently reported increased haematocrit, haemoglobin, and decreased numbers of
both dense erythrocytes and reticulocyte in active group(Ataga et al. 2008b; Ataga et al.
2011). However, no significant improvement in the rate of sickle cell painful crises was
observed in patients treated with senicapoc compared to those on placebo(Ataga et al.
2011).
1.1.8.5.4.2 Magnesium Pidolate
Magnesium (Mg++) is an important regulator of cellular cation transporters such as the
KCl co-transporter, Ca++ and K+ channels(De Franceschi et al. 1996). Increased
intracellular Mg++ inhibits K+ efflux from the sickle erythrocyte and consequently
prevents RBC dehydration(Brugnara and Tosteson 1987). Patients with sickle cell
anaemia have decreased magnesium levels in plasma and erythrocytesand increased
urinary excretion of magnesium(Olukoga et al. 1990; Olukoga et al. 1993).
Experimental studies in transgenic sickle mice have shown that magnesium
supplementation can significantly reduce KCl co-transport activity, decrease MCHC,
33

Chapter One -Introduction
red cell density, and reticulocyte count, when compared to mice receiving a low
magnesium diet(De Franceschi et a1. 1996). Administration of magnesium
supplementation to adult patients with SCD has been associated with minimal toxicity
and possibly a reduced frequency of vaso-occlusion(De Franceschi et a1. 1997; De
Franceschi et a1. 2000). A Phase II clinical trial is underway to investigate the role of
magnesium pidolate in SCD (http://clinicaltrials.gov/NCT00040456).
1.1.8.5.5 Anticoagulants and Antiplatelet Agents
Multiple studies of anticoagulants and antiplatelet agents have been conducted in SCD
patients with varying results(Ataga and Key 2007). Mautsi et al(2002) have found that
unfractionated heparin decreases sickle cell adhesion to endothelium under static
conditions. In a randomized double-blind trial of low molecular weight heparin,
tinzaparin, showed a significant reduction in the overall duration of painful crisis,
number of days with the most severe pain scores, and duration of hospitalization(Qari
et a1. 2007).
1.1.8.5.6 Anti-inflammatory and antiadhesion treatment
1.1.8.5.6.1 Sulfasalazine
The inflammatory state of sickle cell disease and the presence of a chronic
vasculopathy with increased blood cell-endothelium interaction argue for application
of anti-inflammatory therapeutic approaches(Hebbel et a1. 2004). Nuclear factor-kappa
B (NFkB) is a transcription factor that activates expression of endothelial adhesion
molecules(Ataga 2009). In transgenic mice, inhibition of NFkB significantly reduced
leukocyte adhesion and improved microvascular blood flow(Kaul et a1. 2004). Solovey
et al(2001) have reported similar results from few numbers of patients with SeD.
1.1.8.5.6.2 Steroids
Steroids have been reported to reduce the duration of severe pain episodes, as well as
the severity of acute chest syndrome in children and adolescents, although there
appears to be a substantial risk for rebound painful events(Griffin et a1. 1994; Bernini et
34

Chapter One -Introduction
al. 1998; Strouse et al. 2008b). In addition, treatment with corticosteroids may also be
associated with an increased risk of hemorrhagic stroke in children with SCD(Strouse
et al. 2006).
1.1.8.5.6.3 Integrin and selectin inhibition
Phase 1 trials of eptifibatide a2~3 Integrin antagonist have shown decreases in platelet
activation and inflammatory markers with increase in vasodilation parameters in
patients with sickle cell anemia(Lee et al. 2007). Blocking of integrin binding on the
ICAM-4 receptor by synthetic peptides may also have some promise in sickle cell
adhesion therapy(Kaul et al. 2006). In addition, experimental data showed improved
microcirculatory blood flow and survival after intervention with pan-selectin
inhibitors(Chang et al. 2010).
1.2 Cell membrane and SCD It has been increasingly recognised that cell membrane defects in sickle cell has a
significant influences on pathophysiology and clinical severity of the disease(Hebbel
1991). The major membrane abnormalities observed in SCD are compromised
membrane transport defects(Gibson and Ellory 2002), dysfunctional lipid
bilayer(Kuypers 2007; Barber et al. 2009), perturbation of fatty acids composition of
membrane phospholipids(Connor et al. 1997; Ren et al. 2006) and enhanced lipid
peroxidation due to iron deposition in cell membrane(Repka and Hebbel 1991;
Sugihara et al. 1992b; Browne et al. 1998).
Dysfunctional lipid bilayer in sickle cell membrane is characterised by externalisation
of serine phosphoglycerides (SPG)(Middelkoop et al. 1988; Kuypers et al. 1996). The
SPG externalisation in SeD is found to be due to abnormal activities of
aminophospholipid translocase (APLT) and phospholipids scramblase (PLSCR), the
enzymes responsible for maintenance of phospholipids asymmetry across cell
membrane(de Jong et al. 2001; Kuypers and de Jong 2004; Barber et al. 2009). It has
been proposed that external SPG contributes to thrombogenesis(Atichartakarn et al.
2002), enhanced adhesion with other blood cells and endothelium(Schwartz et al.
1985b; Manodori et al. 2000; Setty et al. 2002), shortened RBC lifespan in SCD (Bratosin
35

Chapter One - Introduction
et al. 2001; Lang et al. 2005), providing a cellular substrate for secretory phospholipase
A2(Fourcade et a1. 1995; Neidlinger et a1. 2006), and ultimately, vaso-occlusion and
chronic haemolysis(Boas et a1. 1998).
Besides red blood cell, membrane phospholipids fatty acids perturbation has also been
observed on platelets and mononuclear cell fatty acid composition(Ren et a1. 2005b).
The abnormality is characterised by high omega-6, low omega-3 and an imbalance
between the two fatty acid families (Connor et a1. 1997; Manodori et a1. 2000; Ren et a1.
2005b; Ren et a1. 2006). The n-3 and n-6 LCPUF A are vital structural and functional
components of cell and sub-cellular component; Studies have shown that the balance
between these two fatty acids families influences blood cell adhesion, aggregation,
blood coagulation, cell deformability and inflammatory response (Mills et al. 1993;
Nishiyama et a1. 2000; Saito and Kubo 2003; Mukherjee et a1. 2004). Hence, It has been
postulated that an imbalance in membrane n-6/n-3 LCPUFA is the antecedent of the
loss of membrane asymmetry, blood cell adhesion and aggregation and vaso-occlusion
in SCD(Ren et a1. 2005a).
1.2.1 Cell membrane composition
All cells are delimited by membranes, which confer them spatial identity and define
the boundary between intracellular and extracellular space. These membranes are
composed of lipids, proteins and carbohydrates(Simons and Sampaio 2011). However,
the proportions of these components vary wildly between cells types, as well as
between the same cells of different animal species. Generally speaking, lipids and
proteins are at the ratio of 30% and 70% respectively (Cooper and Hausman 2007).
Human red blood cell contains approximately 52% (w /w) proteins, 40% lipids, and 8%
carbohydrates(Steck 1974). The corresponding proportions in liver are 54%, 36% and
8% and those in myelin membranes are 20%, 75% and 5%, respectively(Guidotti 1972).
1.2.2 Membrane structure and organisation
The basic structure of all cell membranes is the lipid bilayer, the oldest still valid
molecular model of cellular structures(Gorter and Grendel 1925). Mammalian cell
membranes lipids are glycerophospholipids, sphingolipids and cholesterol(Simons and
Sampaio 2011). The fluid mosaic membrane model proved to be a very useful
hypothesis in explaining many phenomena taking place in biolOgical membranes,
36

Chapter One - Introduction
specially the distribution of molecular components in the membrane(Vereb et al. 2003).
Membranes had been considered by the Singer-Nicolson fluid mosaic model as II a two
dimensional oriented solution of integral proteins freely diffuse in the viscous
phospholipid bilayer"(Singer and Nicolson 1972; Jacobson et al. 1995). The
phospholipids bilayer is composed of two layers of phosphoglycerides that have their
hydrophobic fatty acyl groups pointed toward each other and the polar hydrophilic
phospholipid head groups oriented outwards to the extracellular and cytoplasmic
surface(Yeagle 1989), figure 1-7. The four major phospholipids species present in the
membrane choline phosphoglycride (CPG, PC),ethanolamine phodphoglyceride (EPG,
PE), Serine phosphoglyceride (SPG, PS), and sphingomyelin (SPM) are distributed
asymmetrically across the bilayer leaflet resulting in an enrichment of choline
phospholipid (CPG and SPM) in the outer leaflet and of amino-phospholipid (EPG and
SPG) in the cytoplasmic leaflet(Schwartz et al. 1985a).
Outside cell
Inside cell
peripheral protein
carbohydrate (sugar) chain
/
~ ~ .. - ~ .....
filaments of - --the cytoskeleton
Figure 1-7 Fluid-mosaic model Adopted from facstaff.bloomu.eduj gdavisjCeU
37
plasma membrane

Chapter One -Introduction
1.2.2.1 Rafts and caveolae Experimental evidence accumulated over the last three decades indicated that the
lateral motion of membrane components was not free after all as predicted by the fluid
mosaic model, but constrained by various mechanisms such as direct and indirect
interactions with cytoskeleton elements(Marguet et a1. 2006). In additions, a
heterogeneous membrane regions (microdomains) do exist(Lingwood and Simons
2010). Thus, the straightforward application of the S-N model as a frame of events is
impossible without introducing a new model that incorporate the microdomains
concept and non-random distribution of a significant number of cell-surface
molecules(Vereb et a1. 2003; Lingwood et a1. 2009). Microdomains are sub
compartments that have specific lipid and protein composition(Kurzchalia and Parton
1999; Mukherjee and Maxfield 2000). Two important microdomains have been
identified; lipid rafts and subset of rafts known as caveolae(Maxfield 2002), Figure 1-8.
Lipid rafts were firstly isolated as membrane structures insoluble in non-ionic
detergents(Brown and London 2000b). Membrane rafts are defined as dynamic
nanoscale sterol, sphingolipid-enriched, ordered assemblies of specific
proteins(Lingwood and Simons 2010; Simons and Gerl 2010). Among the proteins that
occur in rafts are phosphoglyceride-anchored proteins and proteins involved in cell
signalling(Lingwood and Simons 2010; Stuermer 2010). Studies have shown that, these
highly dynamic raft domains are essential in signalling processes and also form sorting
platforms for targeted protein traffic(Patel et a1. 2008; Patra 2008). Lipid rafts are also
involved in protein endocytosis that occurs via caveolae or flotillin-dependent
pathway(Lajoie and Nabi 2007; Lajoie and Nabi 2010). Non-constitutive protein
components of rafts fluctuate dramatically in cancer with impacts on cell proliferation,
signalling, protein trafficking, adhesion and apoptosis(Staubach and Hanisch 2011).
Caveolae, specialized forms of lipid rafts, are small tube-like invaginations of the
plasma membrane with diameter of approximately 60-80nm, and characterized by
specific scaffolding proteins, the caveolins(Le Lay and Kurzchalia 2005; Chidlow and
Sessa 2010; Bastiani and Parton 2011). The lipid composition of caveolae (cholesterol,
sphingomyelin, glycosphingolipids and saturated fatty acids) is similar to that of "lipid
rafts (Stan 2005). Caveolae occur at different densities in different cell types, being most
prominent in vascular endothelial cells (ECs), adipocytes, fibroblasts, and epithelial 38

Chapter One - Introduction
cells(Chidlow and Sessa 2010). Mounting evidence indicates that caveolae function as
cell signalling platforms and regulate the kinetics of vesicle transport, making them
both versatile and highly integrated into cellular physiology(Quest et a1. 2004; Pike
2005). In terms of EC function, caveolae are important regulators of vascular tone
through modulation of endothelial nitric oxide synthase (eNOS) activity(Sowa et a1.
2001; Bematchez et a1. 2005). Caveolin-1 has also been shown to regulate important
inflammatory signalling mediators including cyclooxygenase-2 (COX-2)(Engelman et
a1. 1998; Chen et a1. 2010). In-vitro and animal studies show that rafts and caveolae are
potentially modifiable by diet particularly n-3 fatty acids, and potentially influencing a
wide range of biological processes, including immune function, neuronal Signaling,
cancer cell growth and insulin resistance in metabolic disorders(Garattini 2007;
Siddiqui et a1. 2007; Yaqoob and Shaikh 2010).
39

a
- -_a: :':"--: .. .. ~ ~
Figure 1-8 Organisation of lipid rafts and ca,'eolae membranes (Simons and Ikonen 1997)
Chapter One -Introduction
raft
a. Rafts contain specific proteins attached to the exoplasmic leaflet of the bilayer (i.e.
Clycosylphosphatidylinositol (CPI) anchored, the Src-family kinase Yes, the influenza virus
protein haemagglutinin (HA))
b. Rafts lipid organization: sphingomyelin and glycosphingolipids (red) enriched in the
exoplasmic leaflet and glycerolipids (for example phosphatidylserine and
phosphatidylethanolamine; green) in the cytoplasmic leaflet. Cholesterol (grey) is present in
both leaflets and fills the space under the head groups of sphingolipids or extends the fatty acyl
chain in the apposing leaflet.
c. Caveolae are formed by self-associating caveolin molecules making a hairpin loop in the
membrane.
40

Chapter One - Introduction
1.2.3 Membrane lipids
At the time the fluid mosaic model was formulated, evidence was become available
that membrane's lipids are not as considered before biologically inert compounds,
simply form a barrier between the inner and external environment of cells(Spector and
Yorek 1985). It becomes increasingly evident that membrane lipids, independently and
in concert with proteins, play a crucial role in the regulation of cell
functions(Williamson et al. 2003; Lee 2005), including cellular metabolism(Di Paolo and
De Camilli 2006; Worgall 2008), signal transduction(Wymann and Schneiter 2008),
regulation of gene expression(Sampath and Ntambi 2004; Sampath and Ntambi 2005)
and major determinant of cell membrane fluidity and permeability(van Meer et al.
2008).
The major structural lipids in mammals membranes are the glycerophospholipids,
sphingolipids and sterols, specifically cholesterol, are the main component of animal
cell membrane lipids(van Meer et al. 2008; Mannock et al. 2010). In human red blood
cells the content of total lipids is approximately 5.0 x 10⁻¹⁰ mg per red cell. In which
phospholipids are about 60%, neutral lipids (chiefly free cholesterol) 30% and the rest
is glycolipids(Yawata 2003).
1.2.3.1 Membrane cholesterol
Cholesterol is a major and essential lipid component of the plasma membranes of the
cells of higher animals, and is also found in lower concentrations in certain
intracellular membranes in vesicular communication with the plasma
membrane(Liscum and Munn 1999; Mannock et al. 2010). It typically accounts for 20-
25% of the lipid molecules in plasma membrane (Ikonen 2008), but it can increase up
to 50% in red blood ceUs(Rog et al. 2009). Structurally, cholesterol is a steroid built from
four linked hydrocarbon rings attached to hydrocarbon tail at one end, and hydrophilic
hydroxyl group to the other end, Figure 1-9. Cholesterol affects cellular processes by
interacting both with other membrane lipids as well as with specific proteins. Because
of the rigid sterol backbone, cholesterol is preferentially positioned in close proximity
to saturated hydrocarbon chains of neighbouring lipids, hence resulting in increased
lateral ordering of membrane lipids, and consequently affects the biophysical
properties of the membrane, by decreasing fluidity and reducing the permeability of
41

Chapter One - Introduction
polar molecules(Simons and Vaz 2004; Ikonen 2008). Moreover, sterol-induced
alterations in membrane biophysical properties and direct interaction with proteins
could affect the cell membrane protein functions and cell signalling(Lee 2004;
Olkkonen et al. 2006; Raychaudhuri and Prinz 2010). Interestingly, There is evidence
patients with SCD do have high concentration of cholesterol in RBC membrane,
However the underpinning cause (s) and implications of this is not well
elucidated(Muskiet and Muskiet 1984; Sasaki et al. 1986)
HO
H ~
Figure 1-9 Cholesterol structure Adopted from http://www.ganfyd.org
1.2.3.2 Spingolipid
H
SphingoJipids are vital cell components, mainly residing in the extemallayer of the
plasma membrane. The lipid moiety of sphingolipids is named ceramide. Ceramide is
constituted by a long chain amino alcohol, 2-amino-1,3-dihydroxy-octadec-4-ene,
sphingosine, connected to a fatty acid by an amide linkage(Karlsson 1970; Merrill
2002), Figure 1-10. The major sphingolipids in mammalian cells are sphingomyelins
(SMs) and the glycosphingolipids (GSLs)(Feizi 1985; Sonnino et al. 2006).
42

OH OH
I H I H.C-C-CH
~ I H~N-t- CH
II HC I
tCH·L. 'I .:.'1.
splungm 11 e Qi~
OH OH
I I H.C-~-CH .: I NH CH
II o=c He
I R (r ~~
l'e r am Ide CH,
Figure 1-10 structure of sphingosine and ceramide Adopted from www.rpi.edujdept/bcbp/molbiochem
1.2.3.3 Glycosphingolipid
Chapter One - Introduction
Glycosphingolipids (GSLs) contain mono-, di - or oligosaccharides based on
glucosy1cerarnide (GlcCer) and sometimes galactosy1cerarnide (GaICer)(van Meer and
Lisman 2002). The major GSLs in animal cell membranes are cerbrosides and
gangliosides(Hakomori 2003). Cerbrosides also called monoglycosylceramides (Figure
1-11 b), have ceramide linked with amide bond to glucose (glucocerbroside) or glactose
(glactocerbrosides). Cerbrosides are particulary occur in neuronal tissues(Tan and
Chen 2003), and they appear to be involved in the regulation of specific aspects of
neuronal proliferation, differentiation, survival and apoptosis(Buccoliero and
Futerman 2003). In gangliosided (Figure 1-11a), the carbohydrate moiety is
oligosaccharide which carries residues of sialic acid or neuraminic acid, the trivial
names used for the derivatives of 5-amino-3,5-dideoxy-D-glycero-D-galacto-non-2-
ulopyranosonic acid (Cantu et a1. 2011). Besides its structural importance,
glycosphingolipids are involved in the regulation of signalling through the growth
factor and adhesion receptors(Odintsova et a1. 2006; Sonnino and Prinetti 2010).
43

Figure 1-11 the structure of glycosphingolipids
Chapter One - Introduction
b
~nl.!> ldc ".11 1 \ i=-a1&·l~C I'rad }:!ntl.('!
a) One of gangliosides b) Cerebroside. Adopted from http:www.cyberlipid.orgjglycolip
1.2.3.4 Sphingomyelin
Sphingomyelins (SMs) constitute the most common sphingolipids in mammalian
membranes(Talbott et al. 2000). These molecules result from the addition of a polar
head group, phosphorylcholine or phophorylethanolamine to ceramides, Figure 1-12.
The acyle group is generally saturated (16:0, 18:0, 22:0, 24:0) or monosaturated (18:1,
20:1, 22:1, 24:1) fatty acids(KarIsson et al. 1998; Byrdwell and Perry 2007).
Sphingomyelin (SPM, ceramide-1- phosphorylcholine) is the most abundant
sphingomyelins that present mainly in the outer cell membrane(Ramstedt and Slotte
2002; Daleke 2008). Tissues in which SPM is the predominant phospholipid include the
sheath of nerve cell axons, myelin (25 %), erythrocytes (18 %) and lenses (10 to 15%) of
the phospholipids content (Calhoun and Shipley 1979; Borchman et al. 1994). SPM
synthesis occurs in the lumen of the Golgi as well as on the cell membrane(Huitema et
al. 2004). The synthesis process which is catalysed by SM synthase (SMS), involves the
transfer of phosphocholine from phosphatidylcholine onto cerami de, yielding
diacylglycerol in the process (Villani et al. 2008; Gault et al. 2010). Because SMS activity
directly regulates the level of cerami de and diacylglycerol, it has also been proposed to
play an essential role in regulating cellular functions(Gault et al. 2010).
Sphingomyelin high packing density and affinity for sterols help provide a rigid
barrier to the extracellular environment and playa role in the formation of lipid rafts,
signal transduction and membrane trafficking(Holthuis et al. 2001; Ohanian and
Ohanian 2001; Tafesse et al. 2007).
44

~ ~.
• -1 . I r _ '_r _ r _ ~ _;;:_ "
.- I - - - I -r 0 OH
I I H 1 C - C - CH
r ,. p h, . t. .. 11 f. :
I I p h i g I ne NH I
0=
iall} .a I d I
SphUlgom ye llll
Figure 1-12 the structure of sphingom)'clin and ccramidc Adopted from www.rpi .edu/dept/bcbp/molbiochem
1.2.3.5 Phospho glyceride
1.2.3.5.1 Structure and function
Chapter One - Introduction
Phosphoglycerides are the most abundant cell membrane lipids in virtually all
mammalian membranes. Phosphoglycerides consist of a glycerol core binding to a
phosphate group (hydrophilic head) and two fatty acids (hydrophobic tail), Figure 1-
13. According to structure of the head group, Phosphoglycerides are classified into
choline (CPG), ethanolamine (EPG), serine (SPG), and inositol phosphoglycerides
(IPG), phosphatidic acid (PA), phosphatidyglycerol (PG) and cardiolipin, Figure 1-13.
Choline phosphoglyceride accounts for >50% of the phospholipids in most eukaryotic
membranes(van Meer et al. 2008). While the hydrocarbon chain at the sn2 position is
always ester-linked to the glycerol moiety, that in the snl position can be linked via an
ester, ether or a vinylether bon. The length of the alkyl chain typically varies from 14 to
24 carbons and the number of double bonds from 0 to 6. The alkyl chain in the sn1
position is typically saturated or monounsaturated, while that in the sn2 position is
often polyunsaturated(Hermansson et al. 2011). Because of the large number of
different alkyl chain combinations, each phospholipid class in tum consists of
numerous molecular species, i.e. molecules that have the same head group but differ in
respect of the acyl chains(Han and Gross 2005; Taguchi and Ishikawa 2010).
45

Chapter One - Introduction
Besides serving as key structural components of membranes, phosphoglyceride many
have other functions particularly in signalling transduction(Femandis and Wenk 2007;
Meyer zu Heringdorf and Jakobs 2007; Guan and Wenk 2008; van Meer et al. 2008).
RI,,- / 0 C CH ~
o O- C- rl 0 R2'--., / - I' _ H 2
C C NH -
o 0 - ( - 0 CH3 Rh / I: H / . " c ' - 2 +
H C P / c" / N" I :,c" /-\-::--0/ " c/ 3
0 , r · o b H - COO-
Phosphatidylserine
Phosphatidyl ethanolamine
o
Figure 1-13 Phosphoglyceride structure (Adopted from www.Biochem.uthscsa.edu)
1.2.3.5.2 Phospho glyceride synthesis
~ 0 / ',\0 "c \ ., CH3 o b H2 CH 3
Phosphatidyl choline
Phosphatidyl inositol
0" 0 R ,, / 4 C
II °
Phosphatidic acid (PA) is a key building block of all the mammalian phospholipids. PA
is mainly synthesised by acylation of glycerol-3phosphate by the action of glycerol-3-
phosphate acyl transferase. The product l-acyl-glycerol-3-phosphat (lyso Phosphatidic
46

Chapter One - Introduction
acid) is subsequently acylated by another acyltransferase enzyme, Figure 1-14. The
donor of the fatty acyl chains of phosphatidic acid is acyl-CoA(Das et al. 1992; Vance
and Vance 2004) . A small amount of PA is also formed from dihydroxyacetone
phosphate (DHAP). The pathway involves acylation of DHAP to I-acyl DHAP which
in tum reduced and acylated to produce lyso Phosphatidic acid (Dircks and SuI 1997;
Chakraborty et al. 1999). Notably, beside de novo biosynthesis, PA can also be
generated via phosphorylation of diacylglycerol (DAG) by a diacylglycerol kinase(Cai
et al. 2009; Topham and Epand 2009) .
CH 2 0H I
HO-C-H 0 I (I CH2-0-P-0-
I 0-
L -Glycerol 3-phosphate R'--eOO-
l~;~::H o synthetase
R'-C" AMP 'S-CoA + PP i
acyl transferase
CoA-SH
R2 --eOO-
jJli.COA-SH
acyl -eoA o synthetase
R 2-C" AMP 'S-CoA + PP
acyl transferase
CoA-SH o II ,
o CH2 -o-C-R II I
R2-C-0 -cr-H ?!
CH2 -o-P-0-I
Phosphatidic acid 0-
Figure 1-14 De no\'o synthesis of phosphatidic acid (Adopted from www.med.ufl.eduj ... jPL %20&%20cholesteroI %20biosynthesis)
The biosynthesiS of CPG, EPG, and SPG requires a source of diacylglycerol (DAG) that
is generated through the hydrolysis of phosphatidic acid(Shindou and Shimizu 2009). 47

Chapter One - Introduction
The enzyme catalyzing this reaction is phosphatidic acid phosphatase. This
phosphatase can be regulated by reversible translocation from a less active form in the
cytosol to a more active form in endoplasmic reticulum (ER) membranes(Hermansson
et al. 2011). A second fate of phosphatidic acid is its conversion to cytidine diphospho
diacylglycerol (CDP-diacylglycerol) which is used for the synthesis of
phosphatidylinositol (IPG), phosphatidylglycerol (PG), and diphosphatidylglycerol
(cardiolipin)(Heacock and Agranoff 1997). Mammalian CDP-diacylglycerol synthase,
which converts phosphatidic acid into COP-diacylglycerol, is present in both
mitochondrial and microsomal fractions, although 90%-95% of the activity resides in
microsomes(Vance and Vance 2004).
All mammalian cells and tissues synthesize CPG via the cytidine 5' -phosphate (CDP)
choline (Kennedy) pathway, but hepatocytes can produce this phospholipid also by
sequential methylation of phosphatidylethanolamine. Synthesis of CPG via the CDP
choline pathway involves three steps. First, choline is phosphorylated by choline
kinase to phosphocholine(Wu and Vance 2010). Second, CTP:phosphocholine
cytidylyltransferase catalyzes the condensation of phosphocholine and CTP thus
producing CDP-choline(Choy et al. 1980; Sugimoto et al. 2008). Finally,
phosphocholine is transferred from CDP-choline to diacylglycerol by CDP
choline:diacylglycerol cholinephosphotransferase thus forming CPG(McMaster and
Bell 1997).
Mammalian cells synthesize EPG via CDP-ethanolamine pathway and decarboxylation
of SPG(Arthur and Page 1991). The synthesis of EPG via CDP-ethanolamine (Kennedy)
pathway is analogous to that of CPG(Hermansson et al. 2011). The main route of the
synthesis of SPG is by base-exchange from CPG or EPG by one of the SPG synthases.
Phosphatidylserine synthase 1 replaces the head group of CPG with L-serine and
phosphatidylserine synthase 2 catalyses the analogous reaction with EPG(Vance 2008).
IPG is synthesised by the condensation of myo-inositol and CDP-DAG by CDP
diacylglycerol: inositol-3-phosphatidyl transferase(Antonsson 1997). A similar reaction
between glycerol-3-phosphate and CDP-diacylglycerol produces PG(Ohtsuka et a1.
1993), which contributes in formation of cardiolipin by condensation with CDP
diacylglycerol(Houtkooper and Vaz 2008), Figure 1-15.
48

Chapter One - Introduction
After their synthesis de novo many phospholipid species undergo acyl chain
remodelling (Lands' Cycle), a process which involves phospholipase A and acyl
transferase or transacylase(MacDonald and Sprecher 1991; Lands 2000).
Phosphoglyceride remodelling is thought to be responsible for establishing and
maintaining the specific molecular species composition of the various
Phosphoglyceride classes(Shindou et al. 2009) .
Ethanolamine ~
Mammals Choline~
"- "-COP- COP-choline ethanolamine
iacylglycerol
CMP CMP
311C1oMet ailORcy
~PhosphatidJI-ethanoluUne choline
PhospMtidyl
Edulnolaniine + serine CMP
Serine
CDP-cliacylglycerol
Bacteria and yeast
Figure 1-15 Summary of Pathways to Phosphatidylcholine and Phosphatidyethanolamine synthesis (www.wlu.ca/ ... / 02-05 _Biosynthesis_oCMembrane_Li pids)
1.2.4 Membrane phospholipids asymmetry
The plasma membrane is characterized by a strict lipid asymmetry in which CPG and
sphingomyelin (SPM) are mainly localized in the extracellular leaflet, whereas EPG
and SPG are exclusively present in the cytoplasmic(inner) leaflet(Contreras et al. 2010). 49

Chapter One - Introduction
Other minor phospholipids, such as phosphatidic acid (PA) and IPG, are also enriched
on the cytofacial (inner) side of the membrane(Daleke 2003). The distribution of
glycosylsphingolipids favors the external leaflet of the plasma membrane(Kolter et al.
2002). In red blood cell membrane, approximately 80% of SPM and ePG are located in
the outer cell membrane. In contrary, 80% of EPG and 100% of SPG occur in the inner
leaflet of the cell membrane(Bretscher 1972; Schwartz et al. 1985a).
The asymmetric distribution of phospholipids in the plasma membrane may be the
result of the selective trafficking of phospholipids from endoplasmic reticulum (ER)
and Golgi apparatus, or regulation of lipid transporting proteins(Daleke 2003).
Establishment and maintenance of lipid asymmetry involves several different
membrane proteins. These lipid translocators include ATP-dependent flippases
(catalyze lipid transfer towards the inward) and floppases (catalyze lipid transfer
outward monolayer) and energy-independent bi-directional transporters
scramblases(Pomorski and Menon 2006; Devaux et al. 2008), Figure 1-16. The
scramblase flips aminophospholipids in particular PS from the plasma membrane
inner to outer monolayer upon increased level of calcium in the cytosol (Williamson et
al. 1992). Although asymmetry is the rule for normal cells, loss of asymmetry,
especially the appearance of SPG at the cell surface is associated with many
physiologic phenomena(Zwaal and Schroit 1997), such as thrombosis(Zwaal 1978;
Heemskerk et al. 2002), cells phagocytosis and apoptosis(Martin et al. 1995; Fadok et al.
2001). Moreover, tumorigenic cells also express relatively large amounts of outer-leaflet
SPG(Utsugi et al. 1991). The loss of red cell membrane asymmetry and externalisation
of SPG has been observed in many diseases associated with co-agulopathy including
sickle cell disease(Manodori et al. 2000), stroke and diabetes(Wilson et al. 1993).
50
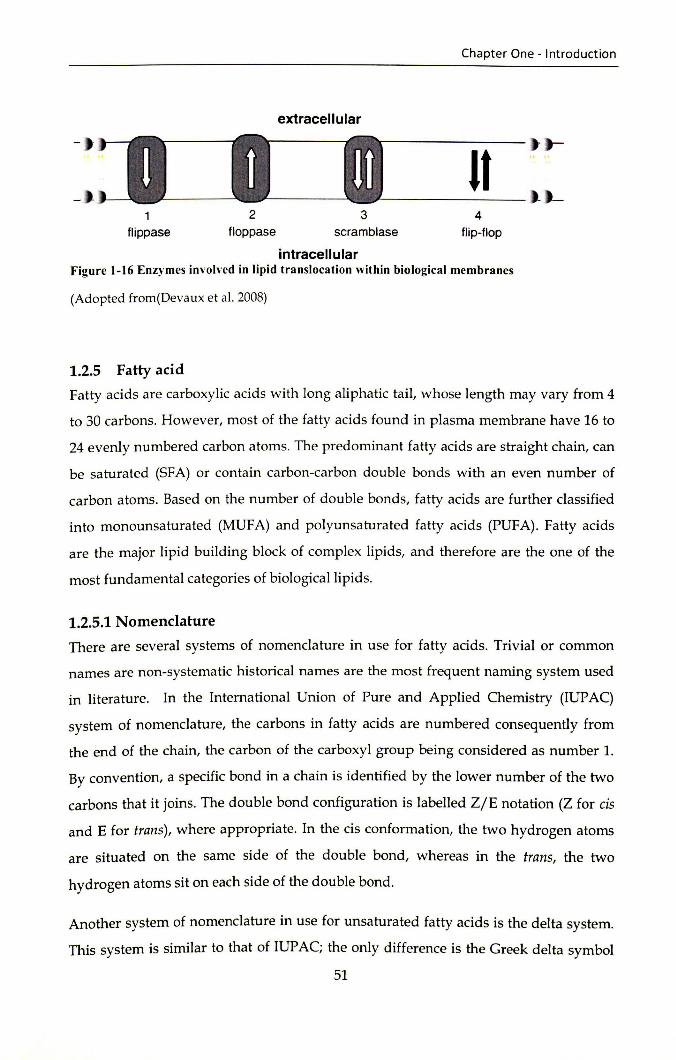
extracellular
2 3 f1ippase floppase scramblase
intracellular
Chapter One - Introduction
It 4
flip-flop
Figure 1-16 Enzymes involved in lipid translocation within biological membranes
(Adopted from (Devaux et al. 2008)
1.2.5 Fatty acid
Fatty acids are carboxylic acids with long aliphatic tail, whose length may vary from 4
to 30 carbons. However, most of the fatty acids found in plasma membrane have 16 to
24 evenly numbered carbon atoms. The predominant fatty acids are straight chain, can
be saturated (SFA) or contain carbon-carbon double bonds with an even number of
carbon atoms. Based on the number of double bonds, fatty acids are further classified
into monounsaturated (MUFA) and polyunsaturated fatty acids (PUFA). Fatty acids
are the major lipid building block of complex lipids, and therefore are the one of the
most fundamental categories of biological lipids.
1.2.5.1 Nomenclature
There are several systems of nomenclature in use for fatty acids. Trivial or common
names are non-systematic historical names are the most frequent naming system used
in literature. In the International Union of Pure and Applied Chemistry (IUPAC)
system of nomenclature, the carbons in fatty acids are numbered consequently from
the end of the chain, the carbon of the carboxyl group being considered as number 1.
By convention, a specific bond in a chain is identified by the lower number of the two
carbons that it joins. The double bond configuration is labelled Z/E notation (Z for cis
and E for trans), where appropriate. In the cis conformation, the two hydrogen atoms
are situated on the same side of the double bond, whereas in the trans, the two
hydrogen atoms sit on each side of the double bond.
Another system of nomenclature in use for unsaturated fatty acids is the delta system.
This system is similar to that of IUP AC; the only difference is the Greek delta symbol
51

Chapter One - Introduction
(~) is used to indicate the position of double bond counting from the carboxylic carbon.
Whereas, the Greek symbol omega ((i)), or letter n denote the position of the first
double bond from the methyl end. The delta symbol is preceded by a cis- or trans
prefix indicating the configuration of the double bond.
1.2.5.2 Saturated fatty acids
Saturated fatty acis contain only single carbon-carbon bonds (no double bonds), Figure
1-17. Most of the SFAs occurring in nature have unbranched and even number of
carbon atoms. They have general formula R-COOH, in which R group is a straight
chain hydrocarbon of the form CH3(CH2)X. SFA are the least reactive chemically and
therefore, they are more stable. The melting point of SFA increases with chain length.
Decanoic and longer chain fatty acids are solid at room temperature.
The saturated fatty acids are further classified into three subgroups, short, medium and
long. Short chain fatty acids contain less than eight carbons. Butyric (4:0), and caproic
(6:0) are the most important member of this group and they occur mainly in milk fat.
The second subgroup, medium chain fatty acids are fatty acids with carbon atom from
8-14. Capric (10:0), lauric (12:0) and myristic (14:0) are members of this group. The long
chain fatty acids are fatty acids with 16 carbons or more. Plamitic (16:0) and stearic
(18:0) are the most important fatty acid of the group. Plmitic acid is the most widely
occurring SFA. Saturated fatty acids longer than stearic, arachidic (20:0), behenic (22:0)
and lingceric (24:0) are minor dietary components(Ratnayake 2008).
Figure 1-17 Saturated fatty acid (stearic acid). (Adopted from www.anslab.iastate.edu)
52

Chapter One - Introduction
1.2.5.3 Monounsaturated fatty acids
The monounsaturated fatty acids contain a single carbon-carbon double bond. The
presence of a single double bond in the structure allows two possible conformations;
the cis and the trans, Figure 1-18. The cis configuration results in a non-straight
structure, which confers more fluidity to membranes as compared to the trans
conformation. Trans fatty acids are in fact straight chains with properties similar to
saturated fatty acids, and they increase membrane rigidity. The fatty acids present in
animal cell membranes have cis configurations(Shantha and Napolitano 1992). The
double bond is most likely located at /).9 position. Oleic acid (cis-9-octadecenoic) is the
commonest cis-MUFA and it is also the most widely distributed of all natural lipids,
Figure 1-18.
trans-Oleic acid
cis-Oleic acid
Figure 1-18 Trans and cis configurations of a monounsaturated fatty acid (Adopted from www.anslab.iastate.edu)
53

Chapter One - Introduction
1.2.5.4 Polyunsaturated fatty acids (PUF A)
Polyunsaturated fatty acids have two or more double bonds. The double bonds can be
uninterrupted (allenic), conjugated one-methylene-interrupted or poly methylene
interrupted. Most animal cells have one-methylene-interrupted double bonds. The
presence of several double bonds lowers their melting point compared to saturated
fatty acids of the same length, and produces extremely flexible molecules. Therefore,
high "liquidity" of cell membranes is usually associated with the presence of increased
number of unsaturated fatty acids. The natural PUFA with methylene interrupted
double bonds and with all cis configuration can be divided into 12 different families
ranging from double bonds located from the n-1 position to n-12 position counted from
the terminal carbon of the fatty acid chain(Gunstone 1999). The most important
families, in term of extent of occurrence and human health and nutrition are n-3, n-6
and n-9 families, Figure 1-19. All of which are metabolized using the same group of
enzymes. Besides their vital role as integral part of the cell membranes, PUF As serve as
the major constituents of plasma lipoprotein particles phospholipids, triglycerides, and
cholesterol esters(Le et a1. 2009).
H2 H2 H H H2 H2 H2 H2 0 H3C,C/C,C/C,C~C,C/~C/C,C/C,C/C,C/C,~
H2 H2 H H2 H H2 H2 H2 OH
Figure 1-19 Strucure of polyunsaturated fatty acids a-0-3, b- 0-6, c- n-9 fatty acid (Adopted from www.anslabjastate.edu)
54

Chapter One - Introduction
1.2.5.5 Essential fatty acids (EF A)
An 'essential' nutrient is one that is needed for normal development and function of
mammalian cells throughout the life cycle(Cunnane 2003). The term EFA was first
coined by Burr and Burr in 1929 when these F As were used to reverse the symptoms
developed in young rodents fed with a fat-free diet. The fat-free diets resulted in
dermatitis, kidney lesion, infertility, premature death and impaired growth. These
symptoms were reversed by the introduction of linoleic (LA) and a-linolenic (ALA)
acids in the diets(Burr and Burr 1973). However, ALA was not as effective as LA in
curing the condition. In human, the importance of LA was not realised until 1958 when
Arild Hansen and colleagues demonstrated for the first time that LA- deficient milk is
associated with skin symptoms and growth retardation(Hansen et al. 1958). In contrast
to LA, ALA essentiality was not established in human until Holman et al reported that
ALA deficiency causes neurological and visual impairment and these lesions are
treatable by supplementation with ALA (Holman et a1. 1982). ALA deficiency
symptoms ere also observed other mammals. In monkeys, ALA deficiency reported to
cause scaly dermatitis, alopecia and visual impairment. In rats, visual impairments,
learning difficulties, lower reproduction, impaired lactation and increased prenatal
mortality were also reported. However, there are no dose-response studies in animals
or humans investigated the ability of ALA, EPA, or DHA to reverse n-3 FA deficiency.
In humans, the essentiality of dietary intake of polyunsaturated fatty acids (PUFAs) is
increasingly recognised as it proved that the body is unable to synthesize LA and ALA
and the de novo synthesis rat of EPA and DHA don not meet the metabolic needs of
the body(Gomez Candela et a1. 2011). It is know accepted that the clinical
manifestations of LA and ALA are due to the deficiency of their respective longer chain
metabolites, such as Dihomo-y-linolenic (DHGLA), arachidonic acid (AA),
eicosapentanoic (EPA) and docosahexaenoic (DHA) acids. Hence, AA, EPA, and DHA
are considered conditional EFAs because their production may be inadequate in
certain conditions and necessitate exogenous supplementation(Le et a1. 2009)
1.2.5.6 Endogenous synthesis of LCPUF As
Among these three families of PUFAs, only OA, a parent n- 9 FA, can be synthesized
by mammals from simple carbon precursors. Both the parent n-3 and n-6 F As must be
55

Chapter One - Introduction
acquired from the diet, as mammals cannot insert double bonds at position-3 and
position-6 to produce ALA and LA respectively, because the lack of ~12 and ~15
desaturases(Pudelkewicz et a1. 1968). ALA and LA can be further desaturated and
elongated to varying degrees depending on the animal species, li6 and liS desaturases
and elongases enzymes activity and tissue 10cation(Innis 1991; Wang et a1. 2005; Zheng
et a1. 2005), Figure 1-20. The changes in expression levels of the desaturase and the
elongase genes are thought to involve transcription factors such as peroxisome
proliferator-activated receptor alpha (PPARa)(Keller et a1. 1993). There is evidence to
suggest that the activity of desaturase genes is related to the prevailing concentrations
of PUFAs, and these genes are upregulated in response to low dietary PUFAs and
suppressed at high PUFA/LCPUFA levels(Igarashi et a1. 2007; Tu et a1. 2010).
The pathway leading to the biosynthesis of DHA from docosapentaenoic acid (DP A,
22:5n-3) has only recently been deciphered in mammals. Until 1991, it was postulated
that a li4 desaturase catalyzes the conversion of DPA to DHA in the microsome.
However, radiolabeling studies and lack of evidence of li4 presence in mammalian
cells paved the way for a new model for DHA synthesis (Sprecher pathway)(Voss et a1.
1991; Sprecher et a1. 1995). DPA is elongated to C24:5n-3, which is then desaturated by
a li6 desaturase to generate C24:6n-3 in the microsome. C24:6n-3 is then thought to be
transported to the peroxisomes, wherein it undergoes p-oxidation (retroconversion) to
generate DHA. The Sprecher pathway has been accepted as a working modeC though
the exact enzymes or specific mechanism involved in retroconversion are not fully
delineated(Pereira et a1. 2003; Benatti et a1. 2004).
56

Omega-3 a-linolenic acid
AlA (18:3<03)
Omega-6 linoleic acid LA (18:2(06)
~ ......- 66 deHtufil5e
octadecatetraenoic add
-.~ ..... ..-y-linolenic acid GLA (18:3(06)
~6 desatufilse
(18:4<03)
~......- elonpse -. ~ ...... ..-- elonpse
eicosatetraenoic add dihomo-y-linolenic acid (20:40)3) DGLA (20:3(1)6)
+......- ,:\5 desaturase ______ ~ ~ AS desaturase
eicosapentaenoic add arachidonic acid EPA (20:5013) AA (20:4(1)6)
~......- elonpse ------ + docosapentaenoic add
DPA (22:Sw3)
+......- elonpse
(24:Sw3)
+ ......- A6 desatura5e
docosatetraenok add (22:4w6)
------+ (24:4w6)
-.~ (24:6w3) (24:5{J}6)
+......- ~~dation ------ + docosahexaenok add docosapentaenolc add
DHA (22:6(,03) (22:5(06)
Chapter One - Introduction
Omega-9 oleic acid
OA (18:1(09)
. + octadecadienoic add
(18:20)9)
. + eicosadienoic add
(20:2(1)9)
-+ elcosatrienoic Kid
MA (20:3(09)
Figure 1-20 Pathway of metabolism and synthesis of n-3, n-6, and n-9 LCPUFAs Adopted from(Le et al. 2009).
1.2.5.7 Clinical and Biochemical markers of essential fatty acid deficiency
Essential fatty acid deficiency (EFAD) typically occurs when less than 1-2% of total
calories are provided from EFAs(Holman 1960). In humans, biochemical changes
consistent with EF AD can occur in as little as a few days in infants. However, Clinical
symptoms of EFAD may take 4-6 weeks to appear in older patients. Oinica! signs of
EFAD include growth retardation, hair loss, infertility, coagulopathies, dry and scaly
skin(Alfin-Slater and Aftergood 1968). The biochemical indicator of EFAD is increased
oliec acid (OA) conversion to mead (MA, 20:3n-9) and di-homo mead (22:3n-9)
acids(Siguel et al. 1987). This metabolic switch is seen as a compensatory mechanism to
57

Chapter One - Introduction
maintain the number of double bonds in FAs incorporated in cell membranes(Le et a1.
2009). Desaturase enzymes display differential activity in the following order of
preference: n-3>n-6>n-9. As a result, conversion of OA to MA (n-9), only occurs when
there are low dietary levels of both ALA and LA. Hence, a mead and arachidonic acid
ratio of less than 0.2 is equated with linoleic acid sufficiency(Mascioli et a1. 1996).
Likewise, an insufficient intake of DHA, if n-6 fatty acids are not limiting, leads to
decrease in DHA, and concomitant increase in n-6 docosapentaenoic acid (22:5n-6)
synthesised from n-6 docosatetraenoic acid (22:4n-6). Therefore, the ratios of 22:5n-
6/22:4n-6 and DHA/22:5n-6 are regarded as reliable DHA markers of status.
1.2.5.8 Dietary requirements of LPUF A
Because LA is abundant in the human diet, the amount of AA available almost always
exceeds the level needed to maintain the metabolic needs. n-6 fatty acids abundantly
present in liquid vegetable oils, including soybean, corn, safflower oil and cotton seed
oils. It was only upon the introduction of parenteral nutrition that LA and AA became
more common. In rodents, AA alone has been shown to be as effective as LA in
preventing symptoms of essential fatty acids deficiency (EFAD)(Thomasson 1962;
Hansen et a1. 1986). These studies demonstrate that AA can replace LA as the sole
source of dietary omega-6 F As(Le et a1. 2009).
Unlike n-6 fatty acids, n-3 fatty acids do not occur in large amounts in plants food and
western human diet. Moreover, ALA conversion process to EPA and DHA in humans
is not efficient as only 5-10% are converted to EPA, and a mere 2-5% to
DHA(Arterburn et a1. 2006). N-3 fatty acids are abundantly present in fish and
shellfish. In fact, fish-oil supplements typically contain 30-50% of n-3 FAs(Russo 2009).
The current adequate intake (AI) for ALA issued by the Institute of Medicine of the
National Academies, USA (2005) is 1.6g/day for men 19-47 years and 1.1 g/day for
women 19-47 years. The acceptable macronutrient distribution range (AMDR) for ALA
is 0.6-1.2% of energy. The lower boundary of the range meets the AI for ALA.
Approximately 10% of the AMDR for ALA can be consumed as EPA and/ or DHA. The
dietary guidelines (2005) also note that consumption of approximately two servings of
fish per week (approximately 224 g total) may reduce the risk of mortality from
58

Chapter One - Introduction
coronary heart disease. However, since the physiological potency of EPA and DHA is
greater than ALA and there has been a substantive increase in the evidence base about
the health benefits of omega-3 fatty acids(Mozaffarian and Rimm 2006), the
recommendations of International Society for the Study of Fatty Acids and Lipids
(lSSFAL) for minimum DHA and EPA intake is 500 mg/ day (ISSFAL 2004).
The traditional diet of northern Sudanese population is characterised by high
carbohydrate and low fat intake, particularly n-3 fatty acids due to paucity of marine
food and absence of dietary supplementation culture. Nyuar et al (2010) have recently
reported that the breast milk of Sudanese mothers contains the lowest level of DHA
compared to 106 studies conducted in several countries all over the world(Brenna et a1.
2007).
Another important and more controversial aspect in LCPUFA dietary intake is the
relationship between the n-6 and n-3 intake. There is a controversial point of view
regarding the n-6/n-3 fatty acids ration role in health and disease(Crawford 2000;
Griffin 2008; Simopoulos 2009). Nevertheless, it can be stated that an adequate intake
of both FAs, n-3 and n-6 fatty acids, is essential for good health, though it is not clear
whether the ratio between them is of crucial importance(Willett 2007).
1.2.5.9 Biomedical importance of n-6 and n-3 LCPUF As
1.2.5.9.1 Biomedical importance of n-6 arachidonic acid
The n-6 fatty acid AA is present in all biological membranes and represents up to 15%
of the total fatty acids in phospholipids. Studies have shown that, low AA in maternal
and cord blood is associated with low birth weight reduced head
circumference(Crawford et a1. 1989; Leaf et a1. 1992), intrauterine growth
retardation(Vilbergsson et a1. 1994) and impaired growth in preterm infants(Carlson et
a1. 1993). Biochemical, AA is a precursor of very active metabolites particularly
prostaglandins, thromboxanes, leukotrienes and lipoxins. The eicosanoids from AA
are biologically active in very small quantities and, if they are formed in large amounts,
they contribute to the inflammatory state, allergic reactions, particularly in susceptible
people, and formation of thrombus. Thus high n-6/n-3 ration may shift the
59

Chapter One - Introduction
physiological state to one that is prothrombotic and proaggregatory, with increases in
blood viscosity, vasospasm, and vasoconstriction(Ferrucci et al. 2006; Simopoulos
2009).
1.2.5.9.2 Biomedical importance of EPA and DHA n-3 fatty acids
EPA and DHA fatty acids have effects on diverse physiological processes impacting
normal health and chronic diseases(Benatti et al. 2004), such as the regulation of genes
function and metabolism(Sampath and Ntambi 2005), cardiovascular and immune
function(Cottin et al. 2011), neuronal and visual development and functions(Haag
2003).
The adult brain contains approximately 50%-60% of its dry weight as lipid and
approximately 35% of these lipids are LCPUFAs particulate DHA. In (1976) Crawford
et al compared thirty different mammalian species and found that, despite a wide
variation in the fatty acid composition of the livers, that of brain tissue was remarkably
constant, with DHA making up 25% of grey matter phospholipid fatty acids. In the
photoreceptor outer segments, DHA constitutes 60% of total fatty acidsGeffrey et al.
2001). The functional importance of DHA in eye may be related to the interaction of the
photoactive protein rhodopsin with DHA containing phospholipids. Moreover,
Phospholipid bilayers rich in DHA have a high fluidity and enhanced rates of fusion
and permeability which are characteristics vital to the normal functioning of
photoreceptor cells(Gordon and Bazan 1990; Giusto et al. 2000).Martinez and colleague
(2000) provided a compelling evidence about the fundamental role of DHA in brain by
showing that supplementing patients with Zellweger syndrome (Generalized
peroxisomal disorders) with DHA improves myelination, vision, liver function, muscle
tone, and social contact.
Evidence from animal studies suggests that DHA deficiency can decrease brain DHA
levels, increase the n-6/ n-3 ratio in nerve membranes and result in poor
functioning(Auestad and Innis 2000). In addition, studies have shown enhanced visual
development and cognitive performance due to increased intakes of docosahexaenoic
acid (DHA)(Moriguchi et al. 2000; Neuringer 2000; Helland et al. 2003). However,
conclusive evidence in human subjects is lacking(Transler et al.; Ruxton et al. 2005).
60

Chapter One -Introduction
The cardioprotective effects of OHA and EPA fatty acids supplementation have been
extensively studied since firstly highlighted by Oyerberg and Bang(Oyerberg and Bang
1979). It is now widely accepted that OHA and EPA supplementation decreases the
risk of cardiovascular diseases (CVD)(von Schacky and Harris 2007), such as fatal
Coronary heart disease (CHO)(Hu and Willett 2002) and stroke(He et al. 2004). These
cardioprotective effects of OHA and EPA have been attributed to their anti
inflammatory EPA-derived eicosanoids(Calder 2008a), anti-arrhythmic and anti
aggregatory effects, as well as their beneficial effects on vascular and endothelial
functions. In addition, both EPA and OHA are precursors of a novel class of lipid
mediators, known as E-series resolvins (Rv) from EPA and O-series Rv and
neuroprotectin 01 from OHA, which are involved in the resolution of
inflammation(Serhan and Chiang 2008), figure 1-24. Anti-thrombotic properties of fish
oils were initially attributed to EPA due to its competition with AA in the
cyclooxygenase (COX) and lipooxygenase (LOX) pathways(Nomura et al. 2003).
However, animal human studies suggest that OHA is a more potent anti-aggregatory
agent than EPA at high doses(Adan et al. 1999; Woodman et al. 2003; Cottin et al. 2011).
Consistent with the anti-inflammatory effects of OHA and EPA, several clinical studies
have shown that n-3 fatty acid supplementation had beneficial effects in atopic
disease(Calder 2003), and conditions characterised by chronic inflammatory state such
as arthritis(Calder and Zurier 2001; Sales et al. 2008), psoriasis(Mayser et al. 2002;
Zulfakar et a1. 2007) and inflammatory bowel disease(Calder 2008a). Interestingly, and
may be of more importance in regard to sickle cell disease, there is a preliminary
evidence that genetic disorder cystic fibrosis which associated with chronic
inflammatory state is responsive to n-3 fatty acids supplementation(Keen et al. 2010).
Although the role of individual fatty acids in human cancer risk has hitherto been
poorly investigated, epidemiological and experimental data linked a high dietary
intake of n-6 PUFA, especially in association with a low intake of n-3 PUFA, to
increased risk for cancer of the breast, colon, and possibly prostate. n-6 PUFA enhance
tumorigenesis and metastasis in experimental animals by several mechanisms, whereas
n-3 PUFA can inhibit the growth of initiated cancer cells (Benatti et al. 2004; Gleissman
et al. 2010).
61

Chapter One - Introduction
1.2.5.10 Eicosanoid
Eicosanoids are 20-carbon derivatives of essential fatty acids group of biologically
active compounds that play major roles in human physiology in both health and
disease. Eicosanoids include prostanoids (prostaglandins, thromboxanes, prostacyclin),
leukotrienes and lipoxins(Cook 200S; Miller 2006; Wang and Dubois 2010). The first
step in synthesis of eicosanoids from its fatty acids precursors (AA, EPA, DHGLA) is
cleavage of these fatty acids from sn-2 position of cell membrane phospholipids the by
the action of phosphoslipases under effect of specific stimuli(Russo 2009). The
Eicosanoids exert their biological effects in an autocrine or paracrine manner
(autocoids) by binding to their cognate cell surface receptors which belong to the G
protein-coupled receptor (GPCR) family, or bind nuclear receptors such as peroxisome
proliferator-activated receptors (PPARs)(Wang et al. 2004; Wang and Dubois 2010). The
eicosanoides contribute significantly to the regulation of inflammation(Dobrian et al.
2011), renal function(Imig 2006; Harris 2008), vascular function(Feletou et al. 2011),
insulin secretion (Luo and Wang 2011) and reproduction(Olson and Ammann 2007;
Roldan and Shi 2007).
1.2.5.10.1 Phospolipases
Phospholipases (PL) are a group of enzymes that catabolise membrane
phosphoglycerides. They are classified into phospholipase A1 (PLA1), A2 (PLA2), B
(PLB), C (PLC) and D (PLD), according to the bond they cleave(Exton 1994; Murakami
and Kudo 2002; Fukami et al. 2010), figure 1-21. Pospholipase Al and A2 catalyse the
hydrolysis of the sn-2 position of membrane glycerophospholipids to liberate free fatty
acids and lysophospholipids. Whereas, phospholipases B hydrolyze both acyl groups,
resulting in only minimal accumulation of lysophospholipid product. Hence, these
enzymes often also have lysophospholipase activity, removing the remaining acyl
moiety on lysophospholipids(Ghannoum 2000). Phospholipase C enzymes are
phosphodiesterases that cleave the glycerophosphate bond(Kohler et al. 2006). Thirteen
PLC isozymes have been identified, of these the phosphoinositide-specific isoform has
been recognised to have a key rol in cell signalling. It hydrolyzes phosphatidylinositol
4,S-bisphosphate into two second messengers, inositol l,4,S-trisphosphate and
diacylglycerol (DAG). l,4,S-trisphosphate triggers the release of calcium from
intracellular stores, and DAG mediates the activation of protein kinase (Fukarni et al.
62

Chapter One - Introduction
2010). Phospholipase 0 enzymes remove the base group of phospholipids and generate
the membrane lipid phosphatidic acid (P A). Phosphatidic acid is a negatively charged
phospholipid which is thought to facilitate membrane vesicle fusion and fission. In
addition, PA can be converted to other signalling lipids, specifically lyso-PA, by
phospholipase A2, or diacylglycerol (DAG), by lipid phosphatases(Peng and Frohman
2011).
To date, more than 30 enzymes that possess PLA2 or related activity have been
identified in mammals, based on their structures, catalytic mechanisms and
localizations, these enzymes have been subdivided into secretory PLA2 (sPLA2) family,
cytosolic PLA2 (cPLA2) family, Ca2+-independent PLAz (iPLAz), The platelet-activating
factor (PAF) acetylhydrolase (PAF-AH) family and lysosomal PLA2S and adipose
specific PLA2 (AdPLA) family(Murakami et al. 2011).
63

Chapter One - Introduction
O~PLB
PLA1 ~ J V-PLA2
~~g: -. ~) 0 0
~/'V0-~-/~ g Phospholipid (e.g. PAPC)
o
R~} o II
/o-p-
OH
x I \. g ) '----~y
LysophosphOlipid
H} o OH + R 1 -COOH
II /O-p-
X I g Phosphoglycerate + FFA
cox
LOX
Prostaglandins Thromboxanes
Leukotrienes
L.C-~~ Oxylipins
FFA
o II
/O-p-X I g
Phospholipid
Figure 1-21 The positions of hydrolytic activities of and Mechanism of action of phospholipases (A, B, C, D),(Adopted from (Kohler et al. 2006) )
The secretory PLA2 (sPLA2) are stored in cytosolic granules or synthesised on
stimulation, secreted extracellularly, and have no selectivity for specific fatty
acidGaross et a1. 2002). The levels of sPLA2 in serum or exudative fluids are well
correlated with the severity of inflammatory conditions such as rheumatoid arthritis,
Crohn's disease and sepsis, as well as cardiovascular diseases such as brain and
64

Chapter One - Introduction
myocardial infarction(Menschikowski et al. 2006). In SCD serum sPLA2 level is
elevated threefold in steady state SCD patients compared to healthy controles(Styles et
al. 2000). Moreover, sPLA2 level is strong predictor of acute chest syndrome(Ballas et
al. 2006).
The cytosolic (cPLA2) isoforms (IVA. IVB, IVC) are primarily located in the cytosol.
Group IVA (cPLA2a), the most extensively studied isoform in the cPLA2 family, is
widely expressed in mammalian cells and mediates the production of functionally
diverse lipid products in response to extracellular stimuli(Ghosh et al. 2006). This
enzyme has PLA2 and lysophospholipase activities and is the only PLA2 that shows
specificity for phospholipid substrates containing AA(Murakami et al. 2011). Hence, its
activation is important for regulating various physiological and pathological processes
involve the eicosanoids. In contrast to sPLA2S those require mM-Ievels of Ca2+ and
iPLA2s and PAF-AHs that do not require Ca2+, cPLA2a is activated by pM-levels of
Ca2+ concentration(Kita et al. 2006).
1.2.5.10.2 Eicosanoid biochemistry
Non-esterified AA, DHGLA and EPA released from the sn-2 position of the membrane
phospholipids by the action of phospholipases are substrates for modification by three
major pathways, including cyc100xygenase (COX), lipoxygenase (LOX), and
cytochrome P450 (CYP), into biologically active eicosanoids(Jump 2002; Arnold et al.
2011), Figure 1-22.
There are two isoforms of COX, COX-l and COX-2. COX-l is constitutively expressed
in most cells, whereas COX-2 is inducible by inflammatory or stimulatory events in
tissues and responds to specific inducers(Vane et al. 1998; Cheng and Harris 2004). The
major COX-derived eicosanoids are prostaglandins (PGs) and thromboxane (TX). The
metabolism of AA by COX-lor COX-2 generates the 2-series prostaglandins which
include PGD2, PGE2, PGI2, PGF2a and thromboxane A2 (TXA2)(Luo and Wang 2011).
The action of these PGs and TXA2 is mediated through the binding of these products
into their membrane-bound receptors, including DP, EPs (EPI to EP4), IP, FP, and TP
receptors(Robertson 1998; Hao and Breyer 2007b). Although derived from the same
parent molecule, PGI2 (prostacydin) is a potent vasodilator and an inhibitor of platelet
aggregation, whereas TXA2 is a potent vasoconstrictor and a pro-aggregatory
65

Chapter One - Introduction
substance(Kawabe et al. 2010). Therefore, the balance between PGI2 and TXA2 in the
circulation is important for cardiovascular homeostasis.
Lipoxygenases (LOX) catalyse the reactions that convert AA to 4-series leukotrienes
(LTA4, LTB4, LTC4, LID4, and LTE4), hydroperoxyeicosatetraenoic acids (HPETEs),
hydroxyeicosatetraenoic acids (HETEs), and hydroxyoctadecadienoic acids
(HODEs)(Dobrian et al. 2011). The human LOX enzymes include 5-LOX (which
produces (LTs), 12-LOX and and 15-LOX(Kuhn et al. 2002; Mochizuki and Kwon 2008).
Of circulating cells, LTs are mainly synthesized by eosinophils, neutrophils, monocytes
or macrophages, and mast cells(Camara et al. 2009). A substantial body of evidence
indicates that 5-LOX products exert pro inflammatory effects by increasing the
production of proinflamrnatory cytokines; also, 5- LOX products act as chemotaxins to
recruit inflammatory cells in the blood vessels(Poeckel and Funk 2010). Hence, 5-LOX
products are considered to be detrimental factors in pathological conditions, including
cardiovascular and renal diseases(Hao and Breyer 2007a; Mochizuki and Kwon 2008).
In steady state SCD, consistent with high levels of sPLA2 and high cell membrane AA,
LTB4 was found significantly high compared to healthy controls(Setty and Stuart
2002). In addition, studies have shown that LTB4 stimulates sickle erythrocyte
adhesion, the effect which can be attenuated by anti-ILB4 treatment(Haynes and
Obiako 2002; Knight-Perry et al. 2009).
AA is also a precursor of CYP-derived eicosanoids (HETEs)(Luo and Wang 2011), and
have been shown to exert potent biological effects on regulation of cardiovascular and
renal function. Notably, 20-HETE is a vasoconstrictor in the renal and cerebral
rnicrocirculation(Imig and Hammock 2009; Yousif et al. 2009).
66

Chapter One - Introduction
Phospholipase A2
~_"c>"':.- .,~ ~ - - - O~: · ·· · · · · :
Cell membrane
...... ....... . ......... :
OffG~' . _ ••
.:-:!; .... .... :. ."
COX ....... LOX
.~ ....
"' ·PGl series • PG2 series • TXA2
·TXA1
• L T4 series
Figure 1-22 Biosynthesis of eicosanoids.
... .. ....
. ... ;, • TXA3 ·PG3 series ·LT5 series
L T, leukotriene; PC, prostaglandin; TX, thromboxane; COX, cycooxygenase; LOX,
Ii pooxygenase.
AA, DHGLA EPA compete at all steps of prostanoid biosynthesis resulting in specific
alterations in metabolite production and action(Wada et al. 2007). When catalysed by
cyclooxygenases, DHGLA and EPA produce 1- and 3-series prostanoids
(prostaglandins, prostacyclins and thromboxanes), respectively. Moreover, EPA is
converted to 5-series leukotriense by the action of the 5-lipoxygenases. In contrast to
AA LTB4, LTB5 from EPA a metabolite at least 30 times less potent than LTB4(Wu et al.
1996). However, recent studies reveal that the anti-inflammatory effects of EPA and
DHA are not only due to an exchange of the classical AA derived pro-inflammatory
eicosanoids for their less potent n-3 counterparts. EPA and DHA are the precursors of
novel lipid mediators resolvins, protectins and mares in, which have highly potent anti
inflammatory and pro-resolution properties and may play an essential role in the
protection against various inflammatory diseases(Serhan 2009; Levy 2010; Serhan et al.
2011). In addition, EPA and DHA also interfere with cytochrome P450 (CYP) pathway.
The same CYP isoforms that metabolize AA accept EPA and DHA as efficient
67

Chapter One - Introduction
alternative substrates(Konkel and Schunck 2011). These interactions may have
important physiological implications and provide novel insight into the mechanisms of
the vascular and cardioprotective effects of DHA and EPA (Arnold et al. 2011), Figure
1-23.
Prostaglandins - AA EPA OHA .'F. ®.
14S-HDHA
Epoxidationl COI1'o'BI'&ion
"'MiMl',i;.j,,!zi¥~itk Maresin R1
LTA. 15S-HETE 15R-HETE
Leukotrienes ' 5-0H-LIA. 15S·ffi ' SR-rn
Hydrolysis Hydrolysis
Upoxins
'-"""in A.
¢~ OM
Upoxin B. OH
~ HO OH
Aspirin triggered Jipoxins
1S-epi-lipoxin A.
(Diverse cell types)
18-HEPE 17R-HpOHA 17S-HpDHA
EpolCiclation
Proteclin 01
5S-'8-HpEPE 7S{8I-o-17S-HDHA 4S{~-17S-HDHA 7S{81-e-17S-HDHA_ 4S{S\4 -17S-HDHA
Epoxidationl reduction
Epoxidation
Aspirin triggered E resolvins
Resolvins El and E2
t: PMNs
Aspirin triggered o resolvins
AT-resolvins D,~
::: Platelets
Epoxidation
o resclvins Resolvins D,~
~ Monocy\es .. Endothelial cells
,® Macrophages • Epithelial cells
~ Dendritic cells - Smooth rruscfe cells
Figure 1-23 pathways of lekotriens, resolvines, protectines and maresin Adopted from (Hutchinson et al. 2011)
1.2.5.11 DHA and EPA supplementation, and membrane responsiveness
Despite the rapid turnover of membrane lipids, changes in the fatty acid composition
of the diet can have varying effects on the fatty acid composition of membrane lipids. 68

Chapter One - Introduction
Studies have shown that variation in dietary composition of saturated and
monosaturated fatty acids cause a very little change in percent saturation of membrane
lipids(Hulbert et al. 2005). In contrast, membrane lipids are very responsive to
variation to dietary composition of LCPUFA. The greatest sensitivity to changes in
dietary fatty acids was for n-3 PUFA and n-6/n-3 fatty acids ratio. Membrane fatty acid
composition varies from a 6% change in cerebral myelin up to a 75% change in cerebral
synaptosomes in response to a 100% change in dietary n-3 PUFA(Srinivasarao et al.
1997). Cao et al(2006) have reported 300% increase in red blood DHA and EPA
composition in subjects supplemented with 1296 mg EPA and 864 mg DHA. Similarly,
10 fold increase in EPA concentration of mononuclear cell membrane phospholipids
have been observed four weeks after supplementation(Hocker et al. 1990). Studies
using multiple doses of fish oil show that the incorporation of these fatty acids in
immune cells occurs in a manner that is highly correlated with the amount of the fatty
acid consumed(Healy et al. 2000; Rees et al. 2006). Typically the increase in content of
n-3 PUFAs occurs at the expense of n-6 PUFAs, especially arachidonic acid. There is
evidence, changing the cell membrane EPA and DHA composition modulate the
eicosanoids and resolvine production, expression of adhesive molecules and the
overall inflammatory state(Calder 2008b).
69

Chapter One - Introduction
1.3 Overview and Aims For a long time, it was thought; vaso-occlusive crisis in SeD is caused by a mechanical
blockage of small blood vessels by rigidly distorted (sickled) red blood cells. However,
there is no relationship between number of irreversible sickle cells and vaso-occlusive
events. Moreover, steady state SeD patients have high levels of inflamatory markers
and enhanced expression of adhesive molecules in red cells, neutrophils and
lymphocytes. These observations led to a new paradigm that excessive tendency of red
cells (sickled and non-sickled) to adhere to vascular endothelium and activation of
platelets and leukocytes are the primary causative factors of vasoocclusion. Adhesion,
aggregation, elasticity of blood cells and inflammatory response are strongly
modulated by long chain polyunsaturated fatty. There is evidence that SeD patients in
steady state have abnormal erythrocytes, platelets and mononuclear cell fatty acids
composition. The abnormality is characterised by high omega-6 arachidonic (AA),
adrenic and osbond acids, and low omega-3 docosahexanoic acid (DHA) and
eicosapentnoic acid (EPA). Hence, it is conceivable that cell membrane fatty acid
composition may have a role in pathophysiology of vaso-occlusion. In this study we
have investigated whether the current treatment of seD (hydroxurea) or
supplementation with DHA and EPA ameliorate the perturbation in fatty acids
composition of blood cell membrane, and the effect of n-3 fatty acid supplementation
on clinical severity of the disease and overall life quality of the patients.
70

Chapter One - Introduction
1.3.1 Hypothesis
1- N-3 fatty acid Supplementation of patients with homozygous Sickle Cell Disease
(HbSS) will not have effect on:
Cell membrane fatty acid composition, clinical course of the disease, haematological
manifestations, blood cell adhesion, Markers of haemolysis, inflammation and
oxidative stress
2-Hydroxyurea, the chemotherapic agent used for the treatment of sickle cell disease,
does not alter fatty acid composition of red blood cell membrane
1.3.2 Specific Aims
1-In n-3 Fatty acid (DHA & EPA) supplemented and un-supplemented HbSS
patients:
.:. The red blood cell membrane fatty acid composition at Zero-time and one year
after supplementation, frequency and severity of vaso-occlusive crisis, number
of hospital admission and types and number of new complications will be
collected through two-arm, randomised, placebo-controlled, double blinded
clinical trial.
.:. Full blood count (reticulocytes, leukocytes, platelets, total haemoglobin (Hb),
foetal Haemoglobin (Hb F), mean corpuscular haemoglobin concentration
(MCHC), mean corpuscular haemoglobin (MCH), mean corpuscular volume
(MCV» and concentration of other pertinent blood parameters ( Lactate
dehydrogenase, haptoglobin) will be determined .
• :. Expression of TNF-a and IL-I0 cytokines and leukocytes adhesion molecules
(aMp integrin, L-selectin) will be assessed .
• :. Plasma anti-oxidant vitamins concentration and anti-oxidant enzymes
activities (CujZn Superoxide dismutase, Se-glutathione peroxidase) will be
assayed
71

Chapter One - Introduction
2-ln hydroxyurea treated and untreated HbSS patients and healthy controls fatty
acid composition of red blood will be assessed
72

Chapter Two - Methods
Chapter Two
Methods
73

Chapter Two - Methods
2.1 Patients recruitment and determination of haemoglobin phenotype
Steady-state HbSS patients aged 2-24 years who were in regular follow-up at SCD
referral clinic, Abnaoaf Pediatrics Hospital, Khartoum, Sudan were enrolled for the
studies. Steady state was defined by absence of evidence of fever, infection or crisis for
at least four weeks before the study. The phenotypic characteristic was confirmed by
cellulose acetate electrophoresis at pH 8.5 using membranes from Lablnkoop Benelux,
Germany (Cat. No 11200-57-145-N). The studies design and patients' characteristics
will be discussed on the appropriate section.
2.2 Blood collection and processing Whole blood, 10 ml, was taken from patients with homozygeous sickle cell and healthy
controls in a tube containing the anticoagulant, ethylendiaminetetraacetic acid (EDT A)
(K2 EDITA (spray-dried), BD Company). In sub-group of patients 3 ml of blood was
taken in a tube containg gold hemogard (Vacutainer tube serum separator, BD) for
serum preparation.
2.2.1 Determination of haemoglobine concentration and the pertinent blood parameters
Haemoglobine concentration (Hb), haematocit (Ht), Mean corpuscular volume (MCV),
mean corpuscular haemoglobine (MCH), mean corpuscular haemoglobine
concentration (MCHC), total white blood cell count (TWBC), platelets count (PLTs)
total red blood cell count were obtained by using automated haematology analyzer
Sysmex KX-21N (Sysmex Corporation, Kobe, Japan).
2.2.2 Preparation of plasma, serum and red blood cells
The whole blood collected in EDT A-containing tube was fractionated into RBC and
plasma by cold centrifugation at 3000 rpm (g) for 15 min. The top plasma layer was
carefully siphoned off and transferred into another tube. The lower red cell layer was
washed three times with physiological saline (0.85% NaCl) and centrifuged at 3000
rpm (g) to remove traces of plasma and buffy coat. The resulting plasma and RBC
pellet were stored at -80°C until analysis. 74

Chapter Two - Methods
The whole blood collected in serum separator tube was fractionated into RBC and
plasma by cold centrifugation at 3000 rpm (g) for 15 min. the tope layer (serum) was
separated from the other blood component gold hemogard gel. The serum was used
immediately to re-suspend mononuclear cell, granulocyte and platelet of the respective
partici pan t.
2.2.3 Preparation of mononuclear cells, granulocytes, platelets
In subgroup of the recruited subjects, the plasma, red blood cell, monocytes,
granulocytes and platelet were separated through a sequence of centrifugation steps
using histopaque-l077 (density 1.077 g/m) and histopaque-1119( density 1.119 g/m)
(Sigma-Aldrich, UK) . Firstly, 3 ml of histopaque-1119 was added to a 50 ml tube
followed by 3ml of histopaque-l077 to form two distinct phases. Consequently, 5ml of
the collected whole blood was layered carefully over the histopaque and centrifuged at
700 xg for 50 minutes at 22°C (room temperature), Figure 2-1. Separation of plasma,
mononuclear cells/platelets, granulocytes and red blood cells was obtained. The top
layer (plasma) was transferred to cryotubes and stored at -80°C. The mononuclear
celli platelet fraction was transferred to a new tube and re-suspended in 10 ml IX PBS
(Sigma-Aldrich, UK) and centrifuged at 250 x g for 10 min at 22°C. The supernatant
(platelet) was transferred to a new 15ml tube, whereas the remaining pellet was re
suspended with 10 ml 1X PBS and washed twice by centrifugation at 250 x g for 10
minutes. Mononuclear cells, granulocytes and platelets were washed twice with 10 m1
1X PBS at 2000 x g for 5 min, resuspended in 450 Jll serum (described on section 2.2.2)
and 50Jll Dimethyl sulfoxide (DMSO), and stored at -80 °C until the analysis. The red
blood cell was processed as described on section 2.2.2.
75

Blood
Cantrifuga ,.., _ 700 X g 1IIIIIIiI1t''''''''''-iI ..... ''''''I ~.J(
30 MlnID8
HISTOPAQU~1077 tISTOPAQUE--1119
Figure 2-1 Blood cell separation
2.3 Fatty acid analysis
2.3.1 Lipid extraction
Chapter Two - Methods
PI8Ima A- Mononuclear cell1/P .. telet.
BGranul~
cErythrogylw
Total lipids were extracted by the method of Folch et al(1957) by homogenising of
processed RBC as described in section (2.2.2) in 2:1 v /v chloroform/methanol
containing 0.01 % (w / v) butylated hydroxy toluene (BHT), under nitrogen. The ratio of
the samples to extracting solvent mixture was 1:90 in all analysis. The extraction
procedure used is as following. 0.5 ml of RBC carefully transferred to a 100 ml
extraction tube containing 15 ml methanol and shake gently to prevent clumping.
Subsequently, 30 ml of chloroform + BHT was added to RBC- methanol mixture,
vortexed thoroughly and flushed with oxygen-free nitrogen for one minute and
capped instantly. Each sample extracted for 24 hours at 4°C. The chemical and reagent
used and their sources are detailed in appendix 2.
2.3.2 Partitioning-Separation of lipid and non-lipid components
The tube containing the extracted samples were taken from the refrigerator and kept at
room temperature in dim light for 30 minutes to equilibrate, then filtered into 100 ml
separating funnel (Whatman International Ltd. England). The extraction tube and filter
paper were washed twice with total of 15 ml chloroform/methanol 2:1 v /v + BHT.
Afterwards, the filter paper was removed, and 25%v/v of 0.85% NaCl was added to
the separating funnel to ensure complete partitioning, flushed thoroughly by bubbling
76

Chapter Two - Methods
nitrogen gas through the liquid. Finally, the funnels were closed tightly and stored
overnight at 4 0c.
2.3.3 Collection of lipids
The separating funnels were taken out the refrigerator and kept at room temperature in
dim light for 30 minutes. Subsequently, the lower organic layer obtained after
partitioning was drained into 250 ml round bottomed flasks and the solvent removed
under reduced pressure in a water bath at 37°C, using a rotary evaporator (vacuum
pump V-700, Buchi, Switzerland). To remove any trace of water, the lipid residue was
re-dissolved twice in 2 ml of methanol and dried. After complete drying, the whole
lipid extract were removed from the round bottomed flasks to a 10 ml vial by washing
them three times with chloroform I methanol 2:1 v Iv + 0.01 % BHT. The samples were
reduced to one ml under a stream of OFN at 370C and stored at -20°C until applied to
thin-layer chromatography (TLC) as described in the next section.
2.3.4 Thin-layer chromatography (TLC)
• Principle- Thin-layer chromatography (TLC) is an indispensable tool for lipid
analysis and separation of complex lipid classes. Separation occurs in stationary
phase is due to polarity differences of the analytes(Fuchs et a1. 2011). The
stationary phase is normally a thin layer of finely ground silica gel adhered to
glass, aluminium or plastic plate. The resolving efficiency of a stationary phase
is dependent on particle size of the silica gel powder, pore diameter and
thickness of silica layer on the plate. In normal phase TLC, the stationary phase
(normally silica gel) is polar and the mobile phase is quite apolar. The mobile
phase mixture is composed of two or more solvent with different polarities and
elutropic values, which is the ability of the solvent to displace lipid component
from a stationary phase. Solvent, such as chloroform, methanol and water,
which have high polarity and elutropic value, are suitable for resolving
phospholipids.
• TLC plates preparation- 20X20 em thin-layer chromatography (TLC) plates
pre-coated with 0.25 nun thick silica gel were used for the analysis (Merck Kga,
Germany). The silica was scored from top to bottom 0.5 em in from each side,
and from left to right about 3 em from the top. Then, the plates were activated
77

Chapter Two - Methods
at 100 °C before use in order to dry off any moisture from the plate. After one
hour, the plates were removed from the oven and kept in a desiccator to cool.
• Equilibration of developing chamber- The solvent mixture
chloroform/methanol/methylamine (65:30:15, v /v Iv) containing 0.01% was
used as mobile phase. 200 ml of the freshly prepared solvent was placed in a
glass tank (10x21x21) lined with filter paper and closed instantly, to help the
solvent saturate the atmosphere within the tank. The tanks were kept close for
30 minutes before use.
• Application of samples on TLC plates- The activated plates were gently placed
on a surface lined with filter paper, in a room with a dimmed light. A line was
lightly drawn with a soft pencil 2 cm from the bottom edge of the plate, just
above the tope surface of the mobile phase. The samples were completely dried
under a stream of oxygen-free nitrogen (OFN) and the total lipid extract re
dissolved in 1 ml of chloroform/ methanol 2:1 v / v + 0.01 % BHT. The total
lipids extract was applied as a narrow band along the bottom pencil line using a
capillary tube. A maximum of three samples were applied on each plate.
• Development and visualization of TLC plates- The plates were put quickly
into the equilibrated tank and developed for 90 minutes. Next, the plates were
removed from the tank, dried and sprayed with 0.1% solution of 2,7-
dichlorofluorescein in methanol, and dried again under stream of cold air in a
darkened fume cupboard. Subsequently, the different phospholipids bands
were visualised under UV light (533 nm) and the boundaries of the bands were
carefully demarcated with pencil. The phospholipids classes were identified by
comparison with authentic standards, (figure 2-2). CPG, EPG, SM and SPG
phospholipids bands were scraped onto filter paper using a blunt spatula and
transferred to their respective nethylation tube.
2.3.5 Preparation of fatty acids methyl esters
Transmethylation- Freshly made methylating reagent (15% acetyle chloride in dry
methanol), 4 ml, was added to each nethylation tube, flushed with N2, tightly capped
and incubated at 70 °C for three hours. Each tube was hourly checked for leakage of
78

Chapter Two - Methods
methylation reagent and vortexed. In case of leakage, methylation reagent was added
to maintain the original volume.
• Extraction of fatty acids methyl esters (FAMEs) - After oven incubation, the
tubes were cooled down at room temperature in dimmed light cupboard. To
each tube, 4 ml of 5% NaCl plus 2 ml of petroleum ether were added and mixed
vigorously. Emulsions resulted from vortexing were cleared by adding few
drops of methanol. The upper petroleum ether layer containing the FAMEs
was transferred into a new tube and its acidity was neutralised by addition of
2% potassium bicarbonate. Afterwards, 2 ml of petroleum ether were added to
the original tubes, the tubes were shaken and the upper petroleum ether was
transferred to the same tube containing 2% potassium bicarbonate. The tubes
were vortexed and the upper layer was transferred to a new tube containing
100 mg of dried granular sodium sulphate, to remove any moisture possibly
comes from the aqueous solution of potassium bicarbonate. Finally, the
moisture-free FAMEs solution was transferred into 3 ml vial and dried down at
37°C under OFN and re-dissolved in Iml heptane (containing 0.01 % BHT). The
samples were flushed under nitrogen and store at -20°C until analysed by gas
chromatography.
2.3.6 Analysis of fatty acids methyl esters by Gas-Liquid Chromatography
(GC) Principal- Like all chromatographic techniques, gas chromatograph separate mixture
of volatile derivatives of analytes by taking advantage of their deferential distribution
between the stationary and mobile phases. The distinctive feature of GC is the use of an
inert gas as a mobile phase, and a layer of immobilised liquid film coated on an inert
solid support of a long tube (column) as stationary phase(Willett 1987). All gas
chromatograph must have gas supply with controlled flow rate, a column contained
with a thermos tatted oven, sample injection system and sensitive detector to determine
and record the concentration of separated constituent at the end of the column, Figure
2-2.
The commonly used GC columns are packed and capillary column. The capillary
columns are high purity fused silica tubes, usually 25 to 60 meters I length and 0.1 to
79

Chapter Two - Methods
0.5 millimetres in internal diameters. Unlike packed column, capillary columns do not
contain a packing but have their stationary phase supported on their inner walls in one
of two ways. The simplest version is Wall Coated Open (WCOT), in which the liquid
stationary phase is a thin film over the smooth, inner surface of the capillary. The other
type called Support Coated Open Tubular columns (SCOT) has the liquid stationary
phase deposited onto a thin layer of small support particles on the inner wall of the
column. The absence of packing in the centre of the bore of capillary columns makes
them much more permeable to gas flow than packed column, and hence can be longer
without using extremes of gas pressure, and better resolution of the separated mixture
components(Baugh 1993). The efficiency of separation of analytes in GC is mainly
dependant on the column length, column's internal diameter and film thickness, oven
temperature and the carrier gas flow.
The mobile phase (the carrier gas) is inert and highly diffusive or low resistant to mass
transfer. The most frequently gas used in UK is nitrogen, followed by helium,
hydrogen and carbon dioxide. The choice of the gas depends on safety, cost and most
importantly compatibility with the detector. While the nitrogen provide the highest
chromatographic efficacy in accordance to Van Deemter Plot, the optimum velocity of
hydrogen is four times greater than the nitrogen, the characteristic that renders it more
preferable over the nitrogen and helium, especially after the wide availability of cheap
and low capacity hydrogen generator which minimised the hazard associated to
hydrogen use. Besides its use as a carrier gas, hydrogen is used in GC as a fuel gas for
flame-ionisation detectors (FIDs).
The main detection systems used in GC are flame-ionization detectors (FIDs), thermal
conductivity detector (TCD) and electron capture detector (ECD). The FID detectors are
very stable and highly sensitive to most organic compounds including fatty acids
methyl esters (FAMEs). The FID detector consists of a flame ionisation tip and a
collector plate. The column effluent is mixed with hydrogen and passed through a jet
into a chamber through which air is passed, and hydrogen is ignited to produce
continuous flame. As compound from the column enter the flam, they undergo
combustion and a very few proportion (0.001 %) of the carbon atoms will be ionized.
80

Chapter Two - Methods
An electrode collects these ions and the resulting electrical current is amplified to
provide the chromatographic signal(Bartle 1993).
Flow controller
Carrier gas
Injector port
Column oven
Figure 2-2 Block diagram of a gas chromatograph
Recorder
• Analysis of fatty acids methyl esters- FAMEs were separated by a capillary gas
chromatograph (HRGC MEGA 2 series, Fisons Instruments, Italy), fitted with a BPX-70
capillary column (60 m x 0.32 mm ID, 0.251-1 film, SGE Europe Ltd (UK). Hydrogen was
used as a carrier gas at 2 ml/min, and the injector, oven and detector temperatures
were 250, 230 and 280°C, respectively. Specifications regarding gas chromatography
instrumentation are listed in Appendix 1.
Quality certified fatty acid methyl ester standard mixture (Supelco® 37 Component
FAME Mix. U47885-U, Sigma-Aldrich, Dorset, UK), and GC-MS authenticated fatty
acid methyl esters prepared from lipid extract of vegetable seed oils which contain
alpha-linolenic, gamma-linolenic and stearidonic acids, and from bovine brain L-A
phosphatidylethanolamine Type 1 (Sigma-Aldrich, Dorset, UK) were used to identify
the fatty acids. Peak areas were computed with EZChrom chromatography data
system (Scientific Software, Inc, San Ramon, CA). The area of each peak was expressed
as percentage of total identified peaks (Appendices 3&8&9).
81

Chapter Two - Methods
2.4 Analysis of plasma lipids Plasma total cholesterol, high-density lipoprotein cholesterol (HDL-cholesterol) and
triglyceride concentrations were analysed by the use of Ace Alera Clinical Chemistry
System (AHa Wassermann Diagnostic Technologies B.V. Pompmolenlaan 24, 3447 GK
Woerden, The Netherlands). Low-density lipoprotein cholesterol (LDL-cholesterol)
was computed with the equation:
(LDL-Cholesterol = Total Cholesterol- (HDL-Cholesterol + Triglyceridef5)J. Equation 2-1
2.5 Determination of plasma retinol and a-tocopherol
2.5.1 Extraction
Plasma sample (prepared as described in section 2.2.2) , 500 Ill, was deproteinised with
500 III of ethanol (HPLC-grad, Sigma-Aldrich Co. UK), the resulted mixture was
extracted with 1 ml hexane (HPLC-grad, Sigma-Aldrich Co. UK). Both solvents
(ethanol and hexane) contained 0.01 % of the antioxidant butylated hydroxy toluene
(BH1). The extract was vortexed thoroughly for 5 minutes and centrifuged at 2000 rpm.
The upper organic layer containing the vitamins was transferred to another new glass
tube, and the remaining precipitate was extracted twice with 1ml hexane described
above. The collected organic extract (3ml of hexane) was evaporated to dryness under
nitrogen and subsequently dissolved in 100 III of 98% HPLC-grade methanol. All the
extraction steps were conducted in a dimmed light.
2.5.2 Separation and identification
The retinol, a-tocopherol and p-carotene in the plasma extract were separated and
identified with use of an Agilent 1100 series high performance liquid chromatograph
(HPLC), connected to autosampler and diod-array detector (Agilent Technologies
Deutchland GmbH, Waldbronn, Germany). A reverse phase C18 column (511, 250x 4.6
mm, Thermo Scientific) was used (Apprenix 1). 98% HPLC-grade methanol and 2%
HPLC-grade water were used for the mobile phase at a flow rate of 1ml/ min, and the
column temperature was maintained at 20°C. Retinol and a-tocopherol were detected
at their respective maximum absorption wavelength 325 nm and 292 nm. Based on
authentic standards, the retention times were 4.5 for the retinol and 8.4 for a-
tocopherol.
82

Chapter Two - Methods
2.5.3 Quantification
Standard stock solutions of retinol (650 ug/ dl) and a-tocopherol (30 mg/ dl) were
prepared by dissolving the obtained standards from Sigma-Aldrich Co Ltd, UK in
HPLC-grade methanol. The concentrations of stock solutions of the retinol and a
tocopherol were confirmed by measuring the absorbance at wave length 325 and292.8
respectively (Equation 2-2, 2-3), using Lamda 35 UV /Vis spectrophotometer
(PerkinElmer Ltd., UK). Working standards with concentration ranges of 219.3-1 .7
Ilg/ ml for retinol and 10.2-0.08 for a-tocoherol were prepared from the stock solution.
Linear regression lines of concentrations (Figure 2-3, Figure 2-4) were obtained by
plotting the concentrations versus HPLC peak areas. The concentrations of the
vitamins in the sample were calculated from their respective standand regression line
equations, (Figure 2-4, Figure 2-5) The coefficient variations of the reproducibility of
the assay were 1.5% for retinol and 3.95 for a-tocoherol. The computer software,
Agilent ChemStation (Agilent Technologies Deutschland GmbH, Waldbom, Germany)
was employed to compute peak areas and the concentrations of the vitamins.
Retnol Jlg/ ml = (Absorbance/1780)*10 Equation 2-2
a-tocoherol mg/ml = (Absorbance/75.8)*10 Equation 2-3
600
500
400
~ 300 « E
200
100
0 0 50 100 150 200 250
ug/dl
Figure 2-3 Standard curve of retinol Equation of the regression line- retinol Jlg/ml= (Peak area Mau) - 3.44)/2.23
Correlation coefficient(r) =0.99, coefficient of determination (r2) = 0.98.
83

Chapter Two - Methods
1200
1000
800
::» ci600 E
400
200
0 0 2 4 "W/dl 8 10 12
Figure 2-4 Standard curve of a-tocopherol
Equation of the regression line- a-tocoherol mg/ml= (Peak area (mAU)-+2.5)/109.6
Correlation coefficient(r) =0.99, , coefficient of determination (r2) = 0.98.
2.6 Determination of anti-oxidants enzymes activities
2.6.1 Preparation of red cell haemolysates
SOp I red cell as prepared in 2.2.2, was added to 200pl ice-cold deionised distilled water
(4/1, v/v), thoroughly vortexed and centrifuged at 10,000xg for 15 minutes at 4°C.
The supernatant (haemolysate) was collected and stored at -80°C until needed.
Haemolysates were used to analys the activities of superoxide dismutase, glutathione
peroxidase and catalase enzymes.
2.6.2 Determination of CujZn-Superoxide Dismutase (CujZn-SOD) activity
Principle- The activity of CU / Zn-SOD in erythrocytes was assayed based on the
method of Woolliams et al (1983) using a kit (catalog No. 706002) from Cayman
(Cayman Chemical Company, 1180 East Ellsworth Road, Ann Arbor, Michigan 48108,
USA). The kit utilizes a water soluble tetrazolium salt (WST-1) for detection of
superoxide radicals generated by xanthine oxidase and hypoxanthine. The oxidised
tetrazolium salt forms a highly water soluble formazan dye (WST-1 formazan) that
84

Chapter Two - Methods
absorbs light at the wavelength of 440-460. The formation of WST-1 formazan is
inhibited by CU / Zn-SOD, \vhich competitively converts the generated superoxide
radicals to hydrogen peroxide (H20 2 ) and oxgen (02). One unit of SOD is defined as
the amount of enzyme needed to exhibit 50% dismutation of superoxide radical
(Figure. 2-5).
X3 l'l'tnine 0,
/ 20:?
,I xanltlln@ oxidase
./ uric add
HzOz 202
SOD 0 2 + H20 2
iflttibition reaction
Figure 2-5 Scheme of the Superoxide Dismutase Assay
WST -, fotmalan
2.6.2.1 Preparation of CujZn-SOD reagents and working standards
Assay buffer- The final assay buffer (50 mM Tris-HCl, PH 8.0, containing 0.1 rnM
diethylenetriaminpentaacetic acid (DTPA) and 0.1 mM hypoxanthine) was prepared
by diluting 3 ml assay buffer concentrate (lOX) (Cayman Chemical Company, UK) with
27ml HPLC-grade water.
Sample buffer- sample buffer (50 rnM Tris-HCl, PH 8.0) was prepared by diluting 2ml
sample buffer concentrate (lOX) (Cayman Chemical Company, UK) with 18ml HPLC
grade water.
Radical detector- Radical detector (tetrazolium sat) was prepared by diluting 50 111 of
the supplied solution (Cayman Chemical Company, US) with 19.5 ml of diluted assay
85

Chapter Two - Methods
buffer. The final solution was kept well protected from light and used within two
hours after preparation.
Xanthine oxidase- Xanthine oxidase reagent was prepared by diluting 50 ~l of
supplied enzyme (Cayman Chemical Company, US) with 1.95 ml of diluted sample
buffer. The enzyme solution was kept on ice and used within one hour after
preparation.
Working standards- Cui Zn-SOD working standards (Std A- Std G) were Prepared as
described in the kit obtained from Cayman (Cat NO. 706006), Cayman Chemical
Company, US). 20 ~l of supplied Cu/Zn SOD standard was diluted with 1.98 sample
buffer (diluted) to obtain the SOD stock solution. The working standards (STD A, B, C,
0, G), their concentration ranges from 0-0.25 Ulml, were prepared by serial dilution of
stock standard with sample buffer.
Sample preparation- An aliquot (5 ~l) of red blood lysate which was prepared as
described in 2.5.1, was diluted with 495 ~l sample buffer in order to obtain final
Cu/Zn-SOD activity within the dynamic range of the kit (0.025-0.25 Vlml). The
diluted red blood cell lysate was assayed for Cui Zn SOD activity.
Standard curve of Superoxide dismutase- The change of absorbance due to inhibition
of formation of formazan dye by the Cui Zn SOD working standards in a reaction
mixture containing 10 ~l of standard (STD A- STD G), 200 ~l of the diluted radical
detector was determined. The reaction was initiated by 20 ~l of diluted xanthine
oxidase. After 20 minutes of incubation at room temperature, the absorbance (Abs) was
read at 450 nm by plate reader (Fluor Star Omega, BMG Labtech).
The average absorbance from triplicates of each standard was calculated. The
linearized rate (LR) was obtained by dividing standard A's absorbance by itself and all
other standard (SID B- SID G), equation 2-4.
LR for Std B= Abs Std AI Abs Std B (Equation-2-4).
The linearized Cui Zn-SOD standard rate was plotted (Fig 2-6) as a function of final
CujZn-SOD activity (Vlml) in accordance to value determined in table 2-1. The
86

Chapter Two - Methods
equation obtained from linear regression of the standard cure was employed to
calculate the samples final Cu/Zn-SOD activity.
Linearized rate versuse CulZn-SOD activity
3.000
2 .500
Q) -~ 2.000
"C Q) N
0':::: C'CI Q) 1.000 C ..J
0.500
0 .000 --------- ..
o 0.05 0.1 0.15
SOD Activity( Ulml) L ___ _
Figure 2-6 Standard curve of CujZn-SOD activity.
•
0.2 0.25
Equation of the regression line: Cui Zn-SOD activity (U / ml) = (Linearized rate- 0.9678) /7.6065
Correlation coefficient(r) =0.994, , coefficient of determination (r2) = 0.99.
Cu/Zn activity of red cell haemolysate- The activity of red Cui Zn-SOD was
determined from a reaction mixture containing 10 III of the diluted red cell
haemolysate, 200 III diluted radical detector and 20 III of diluted xanthine oxidase.
After shaking and incubation at room temperature for 20 minutes, final absorption at
450 nm was read using plate reader (Fluor Star Omega, BMG Labtech). Samples and
standards were assessed on the same plate under the same conditions.
The average absorbance from triplicates of each sample was calculated. The linearized
rate (LR) for each sample was obtained by dividing standard A's averaged absorbance
by the samples' averaged absorbance. The red cell Cui Zn-sod activity was calculated
using the equation obtained from linear regression of the standard curve (Equation 2-3)
in accordance to the equations (2-5, 2-6).
Cui Zn-SOD (U/ml) = [ sample LR-y-intercept
slope
SOD (U/ml)
Cui Zn-SOD U / g =
0.23 ml j x X sample dilution Equation 2-5
0.01 ml
Equation 2-6
Haemoglobin (g/ ml)

Chapter Two - Methods
2.6.3 Determination of Se-Glutathione Peroxidase (Se-GPx) activity
• Principle- The activity of Se-GPx was measured indirectly by coupled reaction
with glutathione reductase (GR) based on a modified method of Paglia and
Valentine (Paglia and Valentine 1967; Pleban et a1. 1982) using the kit (catalog
No. 706002) obtained from Cayman (Cayman Chemical Company , 1180 East
Ellsworth Road, Ann Arbor, Michigan 48108, USA). As illustrated in the Fig 2-
7, the oxidized glutathione, glutathione disulfide (GSSG), produced upon
reduction of hydroperoxide by Se-GPx, is recycled to its reduced state (GSH) by
glutathione reductase (GR), in the presence of hydrogen donor coenzyme pnicotinamide adenine dinucleotide phosphate (NADPH). The oxidation of
NADPH to NADP+ is accompanied by a decrease in absorbance at 340 nm
(A340). Under conditions in which the GPx activity is rate limiting, the rate of
decrease in the A340 is directly proportional to the GPx activity in the sample.
GPx
R-O-OH + 2GSH R-O-H +GSSG +H20
GR GSSG +NADPH+H 2GSH +NADP+
Figure 2-7 Scheme Glutathione Peroxidase of the Assay
2.6.3.1 Preparation of reagents and working standards-
Se-GPx assay buffer- The assay buffer was prepared by diluting 2ml of assay buffer
concentrate (Cayman Chemical Company, US) with 18ml of HPLC-grade water to
obtain the final assay buffer (50 mM Tris-HCl, pH 7.6, containing 5 mM EDTA).
Se-GPx sample buffer- The assay buffer was prepared by diluting 2ml of sample
buffer concentrate (Cayman Chemical Company, US) with 18ml of HPLC-grade water
to obtain the final sample buffer (50 mM Tris-HO, pH 7.6, containing 5 mM EDT A and
I mg/ml bovine serum abumin).
Se-GPx co-substrate mixture- The supplied co-substrate mixture (Cayman Chemical
Company, US) comprised of lyophilized powder NADPH, glutathione and glutathione 88

Chapter Two - Methods
reductase. The co-substrate mixture was reconstituted by adding 2ml HPLC-grade
water to one vial of the powder.
Se-GPx Cumene Hydroperoxidase- The reagent was ready to use as supplied by
(Cayman Chemical Company, US), Cumene hydroperoxide was the source of peroxide
(oxidant agent) in the reaction.
Bovine red blood cell Se-glutathione peroxidise (control) - The stock solution was
prepared by diluting 10 III of the supplied enzyme (Cayman Chemical Company, US)
with 490 III of diluted sample buffer.
Sample preparation- An aliquot (20 Ill) of red blood cell haemolysate, that was
prepared as explained in 2.5.1, was diluted in 60 III of diluted sample buffer. The final
dilution factor (X35) was prepared to obtain suitable target absorbance decrease
between 0.02 and 0.135/min, the absorbance suitable to guarantee reproducible results
according to the supplier instructions (Cayman Chemical Company,US).
Standard curve of Se-GPx- in order to assess the integrity of the provided reagents
(Cayman Chemical Company, US), the activity of Bovine red blood cell Se-glutathione
peroxidise (control) was measured in the reaction mixture containing 100 III of assay
buffer, 50 III of co-substrate mixture and 20 III of diluted Se-GPx (control). The
absorbance was read once every minute for 8 minutes at 340 nm (Fig 2.10). The diluted
enzyme caused a decrease of 0.04 absorbance unit/minute as calculated from equation
(2-7).
89

Chapter Two - Methods
Act-ivity of bovine red blood cell Se-GPx
-;:-C
~
i
0 .600
0 .500
00400
0 .300
0 .200
0.100
0 .000 -0 .0 2 .0 4 .0
Time (rninut:es)
6.0 B .O
----- -----
Figure 2-8 Standard curve of the activity of bovine red blood cell Se-GPx Equation of the regression line: Absorbance (340 nm) = 0.039xTime (minutes) + 0.49)
Equation 2-7 Correlation coefficient(r) = -0.9974, , coefficient of determination (r2) = 0.995.
Determination of Se-GPx activity-The oxidation of NADPH to NADP and
concomitant reduction of the absorbance at 340 (L\A340) was assessed in a duplicate of
a reaction mixture containing 20 ~l of the diluted haemolysate, 100 ~l of the diluted
assay buffer, 50 ~l of the co-substrate mixture and 20 ~l of cumene hydroperoxide.
After few seconds of careful shaking, the absorbance was immediately read at
wavelength 40 nm once every minutes for 8 minutes by using plate reader (Fluor Star
Omega, BMG Labtech ) and soft ware (Fluor Star Omega Analysis, BMG Labtech) for
data analysis.
The average absorbance of sample duplicates at each minute was calculated. The rate
of reduction of the absorbance at 340 (L\A340) was calculated using the equation 2-8.
The rate of M340/min for the non-enzymatic well (background) was calculated and
subtracted from that of the sample wells. The reaction rate (GPx activity) at 340 run was
determined using the NADPH extinction coefficient of 0.0373 ~M-l (equation 2-9). One
unite is defined as the amount of the enzyme that will cause the oxidation of 1.0 nmol
of NADPH to NADP per minute at 25 °C.
90

Chapter Two - Methods
A340/ (Time2)- A340/(Time1)
M340/min = Equation 2-8
Time2 (min)- Time 1 (min)
,!)'A34o/ min 0.19ml GPx x Equation 2-9
0.0373IlM-1 0.02
2.7 Determination of plasma concentrations of lactate dehydrogenase enzyme (LDH)
Principle -Plasma levels of LDH was measured by using ELISA kit (Catalog No.
E91864Hu) obtained from Uscn Life Science Inc, USA. In this assay the LDH present in
the samples reacts with monoclonal antibody specific to LDH which have been
adsorbed to the surface of the microtiter plate. Next, a biotin-conjugated polyclonal
antibody preparation specific for LDH (detection A) is bound to LDH-antibody.
Afterwards, avidin conjugated to Horseradish Peroxidase (detection B) is added to the
LDH-anti-body complex. Following washing step, the enzyme bound to the
immunosorbnt is assayed by the addition of a chromogenic substrate, 3',3,5,5'
tetramethylbenzidine (TMB). The enzyme-substrate reaction is terminated by the
addition of a sulphuric acid solution and the colour change is measured
spectrophotometrically at a wavelength of 450 nm. The concentration of LDH in the
samples is determined by comparing the absorption of the samples to the standard
curve.
2.7.1 Preparation of LDH assay reagents and working standards
Anti-human LDH ELISA micro plate- Was used as supplied.
Assay diluent A and Assay Diluent B - Was prepared by diluting the supplied diluent
concentrates (1:2) with deionised water.
91

Chapter Two - Methods
Detection reagent A and Detection Reagent B- Was prepared by diluting the detection
reagents concentrates A and B (1 :100) with assay diluent A and B respectively.
Wash solution- Diluted wash solution (xl) was prepared from the supplied wash
solution concentrate (x30) by adding deionized water.
TMB substrate- Was used as supplied.
Working standards- The stock standard solution (50 ng/ ml) was prepared by
reconstituting the dry standard with 1 ml of the supplied standard diluent. The stock
standard was kept for 10 minutes at room temperature and mixed gently before use.
The working standards 25 ng/ml (Std 25 ng/ml) was prepared by additing 500 III of
reconstituted standard to 500 III standard diluent solution. The standards 12.5- 0 ng/ ml
(Std 12.5- Std 0 ng/ml) were prepared by serial dilution using 500 III of the higher
standard concentration, Figure 2-9.
500iJL 500iJL 500iJL 500iJL 500iJL 500iJL
Stock I •. • -
Standard l:~l ' .. ~ ....... '~. J't-'
Tube 1 2 3 4 5 6 7 8
ng/ml 50 25 12.5 6.25 3.12 1.56 0.78 o
Figure 2-9 Lactate dehydrogenase working standards
Preparation of the sample- An aliquot (0.5 ml) of plasma, that was prepared as
explained in (2.2.2), was gradually equilibrated to room temperature and diluted (1:10)
with distilled water.
Measurement of absorbance of LDH standards and samples- 100 III of the standards,
blank and samples were added in duplicate to the appropriate wells and incubated for
two hours in 37°C. After aspiration of all contents of each well, 100JlL of Detection
92

Chapter Two - Methods
reagent A was added to each well and incubated for one hour in 37°C. The plates were
tightly sealed by adhesive plate cover during incubation period. Afterwards, the well's
content was aspirated and washed three times with wash solution. Subsequently, 100
III of detection reagent B was added to each "veIl and incubated for 30 minutes at 370C
followed by five cycles of wash. Then, 90pL of substrate solution was added to each
well and incubated for 20 minutes in dark at 37oC. The reaction was stopped by
adding 50 pL of stop solution. The plate reader (Fluor Star Omega, BMG Labtech) was
used to read the test absorbance at 450 nm.
Standard curve of LDH- The standard curve for LDH was generated by plotting the
average absorbance of each standard versus the corresponding LDH concentration
(figure 2- 9& figure 2-10). TI1e curve was created using the GraphPad prism software
(GraphPad Prism 5) .
Calculation of the samples' LDH concentrations- The concentration of samples Hp
was interpolated using the soft ware package GraphPad Prism (version 5), Figure 2-10.
1.5
_ 1.0 o Lr'} ~ -o o 0.5
o.o~~----------~------~---------------o 50
Figure 2-10 Standard curve of LDH Regression line- y=163.7 x + 0.02
100 150 200 250
nglml
93

Chapter Two - Methods
2.8 Determination of plasma concentration of haptoglobin (Hp) Priciple- plasma levels of haptoglobin (Hp) was measured by high sensetive double
anti-body sandwich ELISA using a kit (Catalog No. E-80HPT) obtained from
Immunology Consultant Laboratory, Inc, USA. In this assay the haptoglobin present in
the samples reacts with the anti-Hp anti-bodies which have been adsorbed to the
surface of polystyrene microtitre wells. Afterwards, the Hp-anti-body complex is
bound to anti-haptoglopin conjugated with horseradish peroxidase enzyme (HRP).
Following washing step, the enzyme bound to the immunosorbant is assayed by the
addition of a chromogenic substrate, 3',3,5,5' -tetramethylbenzidine. The quantity of
bound enzyme varies directly with the concentration of Hp in the sample tested. The
absorbance at 450 was used to measure the concentration of Hp in the test samples. The
quantities of Hp in the samples were interpolated from standard curve.
2.8.1 Preparation of Hp assay reagents and working standards
Anti-human haptoglobin ELISA micro plate- Was used as supplied.
Diluent solution -Was prepared by diluting the diluent concentrate (1:5) with
deionised water.
Wash solution- Was prepared by diluting wash solution concentrate (1:20) with
deionised water.
Diluted enzyme-antibody conjugate- Was prepared by diluting the supplied enzyme
antibody conjugated with horseradish peroxidase (1:100) with diluent solution.
Chromagen-substrate solution- Was used as supplied.
Stop solution- Was used as supplied.
Working standards- The stock standard solution was prepared by adding 1 ml of
deionised water to the supplied human haptoglobin calibrator and mixed gently until
completely dissolved. The working standards 200 ng/ ml (Std 200 ng/ ml) was
prepared by additing 2 III of reconstituted human haptoglobin calibrator to 488 III
diluent solution. The standards 100- 0 ng/ml (Std 100- Std 0 ng/ml) were prepared by
serial dilution using 250 III of the higher standard concentration.
94

Chapter Two - Methods
Preparation of the sample- An aliquot (0.5 ml) of plasma, that was prepared as
explained in (2.2.2), was gradually equilibrated to room temperature and diluted
1:50000 with Diluent solution. The diluted samples were mixed thoroughly at each
stage.
Measurement of absorbance of Hp standards and samples- The absorbance (Abs) at
450 nm of each standard concentration (Std 0- Std 200 ng/ ml) and sample, was
measured by incubating 100 III in duplicate of sample and standard in the pre-coated
well for fifteen minutes at room temperature. The plate was kept covered during the
incubation. After aspiration of all contents of each well, they were washed manually
three times with wash solution. Afterwards, 100 III of diluted enzyme-antibody
conjugate was added to each well and incubated covered in the dark at room
temperature for another fifteen minutes. The plate was washed three times before 100
III of chromagen-substrate solution was added to each well and incubated for precisely
five minutes at room temperature. Subsequently, 100 III of stop solution was added to
each well. The plate reader (Fluor Star Omega, BMG Labtech ) was used to read the test
absorbance. The absorbence of samples and standards were calculated by subtracting
the average background value from the test value.
Standard curve of Hp- The standard curve for Hp was generated by plotting the
average absorbance of each standards versus the corresponding Hp concentration,
using a four-parametric logistic curve fit, (Figure 2-11). The curve was created using
the GraphPad prism software (GraphPad Prism 5).
4
3
~ ~2 o o
1
o~-----r-----''-----~----~-----' 1.0 1 .5
Log(nr/ml)
2.0 2 .5 0.0 0 .5
Figure 2-11 Standard curve of Hp Equation of the regression line- y=-0.42+0.96x+0.27x2
95

Chapter Two - Methods
Calculation of the samples' Hp concentrations- The concentrations of samples' Hp
were interpolated using the four-parametric logistic curve fit equation; Figure (2-11).
The soft ware package GraphPad Prism (version 5) was used for calculation of the
samples' concentrations.
2.9 Determination of plasma levels of pro- and antiinflammatory cytokines
2.9.1 Tumor necrosis factor-a (TNF-a)
Principle- The plasma levels of TNF-a was determined by enzyme-linked
immunosorbent assay (ELISA) using a kit (catalog No. EH3TNFA) obtained from
Pierce Biotechnology (Pierce Biotechnology, Rockford, USA). The method is based on
microtiter strips coated with monoclonal antibody specific for human TNF- a. The
TNF- a present in the samples (or standards) forms a complex with the anti- TNF-a
antibody, and is subsequently labelled by a biotin conjugated monoclonal antibody
specific to TNF-a. The unbound biotinylated anti-TNF-a is removed by multible
washing. Streptavidin- horseradish peroxidise (Streptavidin-HRP) is then added to
bind the remained bound biotinylated antibody. A substrate solution reactive with
HRP is added, and results in the formation of a coloured product, in proportion to the
amount of TNF- a present in the sample (or standards). The reaction is terminated by
addition of acid and absorbance can be measured at 450 nm.
2.9.1.1 Preparation of TNF-a assay reagents and working standards
Anti-human TNF-a pre-coated 96-well strip plate- the Anti-human TNF-a pre-coated
96-well strip plate was used as supplied.
Wash buffer- wash buffer wash prepared by diluting 50 ml of the supplied
concentrated (30X) solution (Pierce Biotechnology, USA) with 1450 ml of ultra pure
water.
Sample diluent- The sample diluent (0.1% sodium azid) was used as supplied
(Pierce Biotechnology, USA).
96

Chapter Two - Methods
Biotinylated antibody- The biotinylated antibody was used as supplied (Pierce
Biotechnology, USA).
Streptavidin-HRP- The Streptavidin-HRP was used as supplied (Pierce Biotechnology,
USA).
HRP substrate solution (TMB) - The HRP substrate solution (3,3' ,5,5'
tetramethylbenzidine (TMB), hydrogene peroxide (H202), and proprietary catalyzing
and stabilizing agents) was used as provided (Pierce Biotechnology, USA).
Stop solution- The stop solution (0.16M sulphuric acid) was used as supplied (Pierce
Biotechnology, USA).
Working standard- The stock standard solution was prepared by reconstituting the
supplied vial of lyophilized recombinant human TNF- a by adding 1 ml of water. The
working standards (Std 1000 pg/ml- Std 0 pg/ml) were prepared by pipetting 200 ~l of
sample diluent into each tube. The standard (Std 1000 pg/ml) was prepared by adding
200 ~l of the reconstituted standard, serial dilution was made using 200 ~l to prepare
the rest of the standard concentrations (Std 500250, 125, 62.5,31.2,15.6,0 pg/ml).
Preparation of the sample- An aliquot (0.5 ml) of plasma, that was prepared as
explained in (2.), was gradually equilibrated to room temperature, and gently mixed
before assay performance.
Measurement of absorbance of TNF- a standards and samples- The absorbance (Abs)
at 450 nm and 550 nm of each standard concentration (Std 1000 pg/ ml- Std 0 pg/ ml)
and sample, was measured by incubating 50 ~l in duplicate of sample and standard in
the pre-coated well for one hour at room temperature. After washing three times with
the diluted wash buffer, 100 ~l of biotinylated antibody was added to each wells and
incubated for another one hour. The plate was washed three times as above before 100
~l of Streptavidin-HRP was added to each well and incubated for 30 minutes at room
temperature. Subsequently, 100 ~l of TMB substrate solution was added to each well
and the reaction was allowed to develop at room temperature in the dark for 30
minutes. The reaction was stopped by adding 100 ~l of stop solution to each well. A
plate reader (Fluor Star Omega, BMG Labtech) was used to read the absorbance (Abs).
97

Chapter Two - Methods
The 550 nm values were subtracted from at 450 values to correct for optical
imperfections of the microplate. Samples and standards were assessed on the same
plate under the same conditions.
Standard curve of TNF- a - The standard curve for TNF- a was generated by plotting
the average absorbance (450 nm- 550 nm) obtained from each standard concentration
versus the corresponding TNF- a concentration using a four-parametric logistic curve
fit (Figue. 2-12). The curve was created using the GraphPad prism software (GraphPad
Prism 5).
Calculation of the samples' TNF- a concentrations - The concentration of samples
TNF- a was interpolated using the four-parametric logistic curve fit (figure 2-14). The
soft ware package GraphPad Prism (version 5) was used for calculation of the samples'
TNF- a concentrations.
-o lr") lr")
•
1.5
o lr") 1.0 ~ -QJ
<;.J = !'U ,J:I 0.5 .... o
CI)
,J:I
< O.O~-------------r-------------r-------------
o 1 2
Log(pglnd)
Figure 2-12 TNF- a four-parametric logistic standard curve fit Equation of they curve, Y=0.07+ 1433/ (1 + 10"'((6.3-x)*0.9))
2.9.2 Interlukin-l0 (IL-IO)
3
Principle-The plasma levels of IL-lO was determined by enzyme-linked
immunosorbent assay (ELISA) using a kit (catalog No.EHIL02) obtained from Pierce
98

Chapter Two - Methods
Biotechnology (Pierce Biotechnology, Rockford, USA). The assay principle is as
described on section 2.8.1.
2.9.3 Preparation of IL-tO assay reagents and working standards
Anti-human IL-10 pre-coated 96-well strip plate- the Anti-human TNF-a pre-coated
96-well strip plate was used as supplied (Pierce Biotechnology, USA).
Wash buffer- wash buffer wash prepared by diluting 50 mI of the supplied
concentrated (30X) wash solution (Pierce Biotechnology, USA) with 1450 ml of ultra
pure water.
Standard diluent- Was used as supplied.
Biotinylated antibody- The biotinylated antibody was used as supplied.
Streptavidin-HRP dilution buffer- Was used as supplied.
Streptavidin-HRP solution- Was prepared by adding 30 JlI of streptavidin-HRP
concentrate to 12 ml of streptavidin-HRP dilution buffer.
HRP substrate solution (TMB)- Was used as supplied.
Stop solution- Was used as supplied.
Working standard- The stock standard solution was prepared by reconstituting the
supplied vial of lyophilized recombinant human IL-10 by adding 1 ml of ultrapure
water. The working standards (Std 600 pg/mI- Std 0 pg/ml) were prepared by
pipetting 240 of standard diluent into pre-labelled standard tube. The standard (Std
1000 pg/mI) was prepared by adding 160 Jll of the reconstituted standard, serial
dilution was made using 160 III to prepare the rest of the standard concentrations (Std
240,96,38.4,15.36,0 pg/mI).
Preparation of the sample- An aliquot (0.5 ml) of plasma, that was prepared as
explained in (2.2.2), was gradually equilibrated to room temperature, and gently mixed
before assay performance
Measurement of absorbance of IL-10- standards and samples- 50 III of the standards
or test samples were added in duplicate to each well. In addition, 50 III of standard
99

Chapter Two - Methods
diluents were added to two wells that do not contain samples or standard. The plate
was tightly sealed by adhesive plate cover and incubated at the room temperature for
two hours with 50 III of biotinylated antibody. After aspiration of all contents, each
well was washed manually three times with wash buffer. Subsequently, 100 III of
Streptavidin-HRP solution was added to each well and incubated in room temperature
for thirty minutes. After washing three times with the diluted wash buffer, 100 III of
TMB substrate solution was added to each well and the reaction was allowed to
develop at room temperature in the dark for 30 minutes, and stopped by adding 100 III
of stop solution to each well. The by plate reader (Fluor Star Omega, BMG Labtech)
was used to read the absorbance (Abs) at 450 nm and 550 run of standards and samples
concentrations. The 550 nm values were subtracted from at 450 values to correct for
optical imperfections in the microplate.
Standard curve of IL-IO- The standard curve for IL-10- a was generated by plotting
the average absorbance (450 nm- 550 nm) obtained from each standard concentration
versus the corresponding IL-I0 concentration using a four-parametric logistic curve fit
(Figure. 2-13) . The curve was created using the GraphPad prism software (GraphPad
Prism 5).
2_5
2.0 -C) &on &on 1.5 • C) &on ~ 1.0 -Cl 0
0.5
0.0 0 1
Log( pg/rnl)
Figure 2-13 IL-I0 four-parametric logistic curve fit Equation of the curve, Y= 0.012+ 10.9/ (1 +10" ((3.34-x)*1 .02))
100
2 3

Chapter Two - Methods
Calculation of the samples' IL-tO concentrations- The concentration of samples IL-10
was interpolated using the four-parametric logistic curve fit fig (2-13). The soft ware
package GraphPad Prism (version 5) was used for calculation of the samples' IL-I0
concentrations.
2.10 Determination of adhesive molecules on blood cell
membranes
2.10.1 Determination of monocytes and granulocytes CDll band CD62L
expression
Principle- Flow cytometry is a method allowing unique recognition of cellular patterns
in fluid suspention (Hulett eta I 1969, Alvarez et al 2009). One of the fundamentals of
flow cytometry is the ability to order samples into a stream of single particles by
employing the hydrodynamic focusing mechanism. The fluid flows past a detector
point, where the stream is illuminated by a focused laser beam. The cells are usually
labelled using fluorescent probes which bind to specific cell associated molecules.
Subsequently, the probes fluoresce and the emitted light is detected and converted into
electronic signals proportional to the amount of light collected.
An important feature of flowcytometry data analysiS is gating- the ability to selectively
visualize the cells of interest while eliminating results from unwanted particles. Cells
can be gated according to their physical characteristics, the different physical
properties of granulocytes, monocytes and lymphocytes allow them to be
distinguished from each other and from cellular contaminants in the forward (FSC)
and side scatter (SSC) plot (figure 2-14)
2.10.2 Preparation of reagents for the integrin aM (CD11b) and L-selectin
(CD62L) assay
Antibodies-The mouse anti-human COllb FITC conjugated, anti-human C062L FITC
conjugated, and the anti-lgG was used as supplied (Appenix 2)
Phosphate buffer saline (PBS 10X)- 100 ml of the concentrated PBS XIO (Sigrna
Aldrich Co. UK, 01408) was diluted with 900 ml HPLC-grade water.
101

Chapter Two - Methods
Bovine serum albumin (BSA)- The bovine serum albumin 2mgj ml was prepared by
desolving 200mg (Sigma-Aldrich Co. UK, A7906) of the supplied powder in 100 ml of
HPLC-grade water.
Preparation of mononuclear cells and granulocytes samples- Mononuclear cells
and granulocytes, prepared as described in 2.2.3, were quickly defrosted at 37°C. 200
p.l of each defrosted sample was washed in 10 ml of phosphate buffer saline (PBS IX)
by centrifugation at 400xg for 5 minutes. Supernatant was discarded, and the pellet
was suspended in 1 ml PBS 1X/BSA 2mgjml (Sigma-Aldrich Co. UK, A7906). 50 pI of
cell suspension was incubated on a shaker with 10 pI (used as supplied) of anti-hum an
CDllb fluorescein isothiocyanate (FITC) conjugated antibody, anti-human -CD62L
FITC, or mouse anti-IgG, at 4°C for one hour in the dark (Appenidx 2). Cells were also
incubated with no antibody at the same conditions, and used as negative control. After
incubation, cells were washed three times in 1.5 ml PBS IX, by centrifugation at 150xg
for 5 minutes. Cells pellet was resuspended in 200 pI PBS IX, and used for flow
cytometry analysis
Calibration of flowcytometer forward and side scatter- In order to standardise the
positioning of monocytes, micro beads conjugated to anti-Human-Cd14 antibody were
used for monocytes purification (Miltenyi Biotec GmbH, Germany). 107 total
mononuclear cells counted by microscope visualization using a counting chamber were
suspended in 80 pI of incubation buffer (0.5 % BSA, 2mM EDTA in PBIX pH 7.2), and
incubated with CD14 micro beads for 30 minutes at 4 0c, on a shaker in the dark.
Subsequently, cells were washed three times in incubation buffer by centrifugation at
300xg for 10 minutes. Cells were resuspended in 500 pI of incubation buffer. Cells
bound to CD14 micro beads were sequestered by the used of a column placed in a
magnetic field separator (Miltenyi Biotec GmbH, Germany). Cells were eluted by
washing the column with 1 ml of incubation buffer. Cells were precipitated at 300xg,
diluted in PBSIX /BSA 2mgjml, and labelled with anti-human-CDllb FITC
conjugated as described in section (2.7.1, iii) The fluorescent signal from the purified
monocytes was compared to the same non purified sample (Figure 2-14).
102
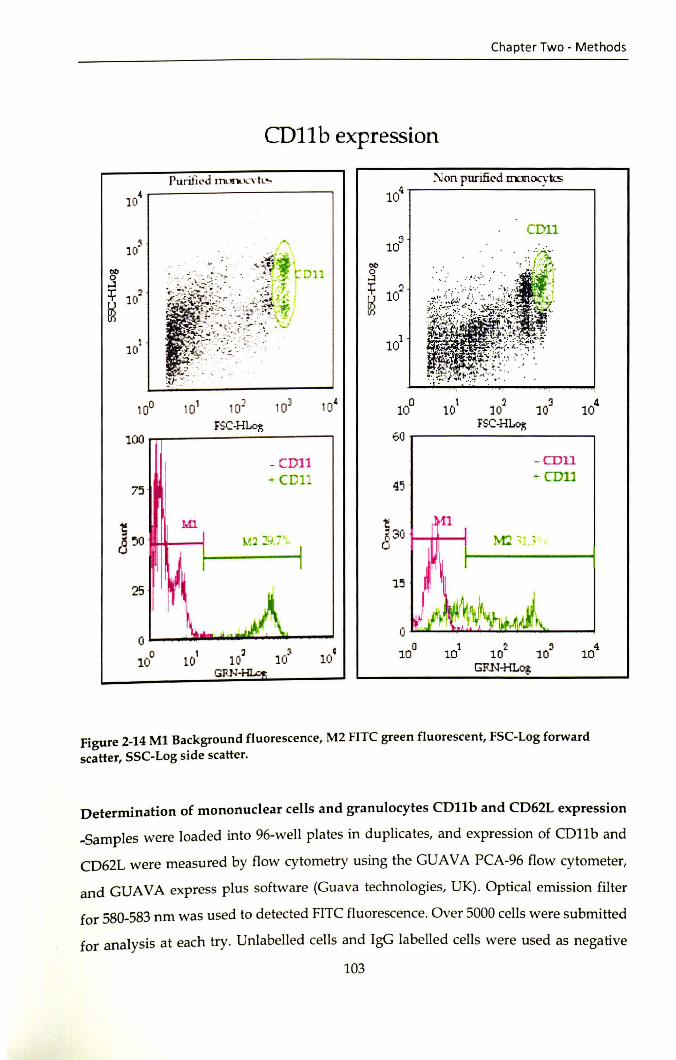
Chapter Two - Methods
CD1I b expression
CDll lOS
10° 101 101 103 10' 10
0 10
1 102 10~ 104
FSC-HLo~ FSC-HLo~
100 60
- cm1 - COil
"CDll 45 -- COlJ
75
]'0 Ml ~
~30 ~ ~
25 1~
0 ~
0
10° 101 1 0~ 10') 10c 10° 10
1 10? 10' 104
GRN- GRN-HLog
Figure 2-14 M1 Background fluorescence, M2 FITC green fluorescent, FSC-Log forward scatter, SSC-Log side scatter.
Determination of mononuclear cells and granulocytes CDll band CD62L expression
-Samples were loaded into 96-well plates in duplicates, and expression of CDllb and
CD62L were measured by flow cytometry using the GUAVA PCA-96 flow cytometer,
and GUAVA express plus software (Guava technologies, UK). Optical emission filter
for 580-583 nm was used to detected FITC fluorescence. Over 5000 cells were submitted
for analysis at each try. Unlabelled cells and IgG labelled cells were used as negative
103

Chapter Two - Methods
control for non-specific flow cytometry background. Mononuclear and granulocytes
cells were gated carefully based on forward and side scatter, (Figure 2-15)
a
11' ~ ~ q .
b
10 •
1(0 ,
0 10"
1 10
10
4(0
30
C 520 t..
lC'
0
. j
-~~~ ,i-'>
Granulocytes
( 1'111
CD 11 . ( ['\ 11
~ -' :,: ~
1(1'
1(1"
, iLt
, . C 1 0~ 1 0~ 10'
55C-H1...og
4(' r-----------,
1111
(0 IQ--..... -=.;;;;.;.----' o
10 10' 1(' 10' GF:loHi Lq:
• 10
Figure 2-15 Determination of mononuclear cells (a) and granulocytes (b) CDllb and CD62L expression
104

Chapter Two - Methods
2.11 Statistical analysis The data-demographic, fatty acids, anti-oxidant vitamins, anti-oxidant enzymes,
cytokines, adhesive molecules, plasma lactate dehydrogenase, plasma haptoglobine ,
haematological parameters were expressed as meant Standard deviation (SD). The
annual sickle cell associated crisis rates were expressed as median and percentile or
inter-quartile range (IQR). Normality test was applied to all data set. Depending on the
normality of the Gaussian distribution, parametric or non-parametric statistical tests
will be used to investigate if there is a significant difference between test and control
groups. Significance was assumed at a "p" value of less than 0.05. The statistical
software, SPSS for Windows, Version 18 (SPSS Ltd., Woking, Surrey, UK) and
GraphPad Prism 5 was used to analyse the data. The detailed statistical methods
employed were discussed where appropriate.
105

Chapter Three - Hydroxyurea and cell membrane fatty acid
Chapter Three
The effect of hydroxyhurea on red blood cell membrane fatty acid composition
106

Chapter Three - Hydroxyurea and cell membrane fatty acid
3.1 Introduction Hydroxyurea (HU) is effective therapy for adults, children and infants with severe
sickle cell disease (Hoppe et a1. 2000; Stuart and Nagel 2004; Segal et a1. 2008; Strouse et
a1. 2008a). In randomised controlled clinical trails, HU decreased the frequency of
painful episodes, acute chest syndrome, blood transfusion and hospital admission in
severely affected adult, children and infants with SCD(Charache et a1. 1995; Brawley et
a1. 2008; Strouse et a1. 2008a; Wang et a1. 2011). In addition HU might have other
benefits including increasing life expectancy(Voskaridou et a1. 2010), protection against
cardiovascular disease(Zimmerman et a1. 2007), proteinurea(Fitzhugh et a1. 2005), and
reduction of hypoxaemia(Singh et a1. 2008). However, Despite the extensive evidence
of efficacy, HU remains vastly underutilised drug due to continuous concerns about
short and long term side effects(Hankins and Aygun 2009), which include
myelosuppression(Lanzkron et a1. 2008), malignancy(Zumberg et a1. 2005), irreversible
male subfertility and teratogenicity(Berthaut et a1. 2008; Ballas et a1. 2009). Other factor
that complicat HU usage that it undergoes renal clearance, dose adjustment and close
monitoring of myelotoxicity must be implemented in individual with renal
impairment(Yan et a1. 2005). In addition, large number of patents with SCD do not
respond to treatment with HU(Stuart and Nagel 2004).
Hydroxyurea (HU) is a chemotherapeutic agent that inhibits ribonucleotide reductase
and interferes with S-phase of the cell cycle(Trompeter and Roberts 2009). The
myelosuppressive and cytotoxic effects of HU induce RBC regeneration and the
recruitment of earlier progenitor programmed to produce higher levels of HbF(Dover
et a1. 1986; Fathallah and Atweh 2006). There is evidence; one of the mechanism by
which HU increases HbF levels is mediated through a NO-dependant activation of
soluble quanylyl cyclase in erythroid cells, Figure 3-1(Cokic et a1. 2003; Lou et a1. 2009).
It was thought that it mediates its action solely through induction of foetal
haemoglobin (HbF) and subsequent inhibition of polymerisation of deoxyhaemoglobin
S (Steinberg et a1. 1997). Nevertheless, clinical improvements do occur prior to a
significant rise in levels of HbF (Charache et a1. 1996). This suggests; HU may modulate
the pathophysiology of the disease by other additional factors. Indeed, there is 107
Chapter Three - Hydroxyurea and cell membrane fatty acid
evidence HU mediates its beneficial effects on SCD through lowering leukocytes,
reticlocyte and platelets count (Ballas et al. 1999), reducing myeloperoxidase,
diminishing endothelial adhesion molecule and red cell adhesion(Johnson and Telen
2008), reducing PS externalisation(Covas et a1. 2004), increasing NO
production(Nahavandi et al. 2002), and improving level of red cell dehydration and
deformability(Ballas et a1. 1989; Athanassiou et al. 2006).
Adhesion, aggregation and deformability of blood cells are strongly modulated by
membrane fatty acids(Schwartz et al. 1985c; Nishiyama et a1. 2000; Mukherjee et a1.
2004). Steady-state sickle cell patients untreated with HU have abnormal RBC, platelets
and mononuclear cell fatty acids, which is characterised by increase in arachidonic acid
(AA, 20:4n-6), and decrease in linoleic acid (LA, 18:2n-6), eicosapentaenoic acid (EPA,
20:5n-3) and docosahexaenoic acid (DHA, 22:6n-3)(Connor et a1. 1997; Manodori et a1.
2000; Ren et a1. 2005a) (a). These findings have led to the postulation; "an imbalance of
blood cell membrane n-3 and n-6 fatty acids may be the antecedent of loss of
membrane asymmetry, blood cell adhesion, aggregation and vaso-occlusion in
SCD"(Ren et a1. 2005b). The aim of this study was to elucidate whether HU-treatment
modulates RBC membrane fatty acids of steady state homozygous sickle cell patients
(HbSS).
108

Direct activation?
Chapter Three - Hydroxyurea and cell membrane fatty acid
o
H2NANH I
OH
Hydroxyurea
1 Metabolism to NO
NO
1 Binds and activates sGC
1 tcGMP
I Interaction with .. transcription factors
Induction of fetal hemoglobin synthesis
1 Reduction of clinical complications
of sickle-cell disease
Figure 3-1 Mechanism of fetal hemoglobin induction by hydroxyurea Adopted from (King 2003)
3.2 Subjects and methods
3.2.1 Subjects
Steady state HbSS sickle cell patients treated (age 7-26; n=19) and untreated (age 7-22;
n=l7) with HU, and healthy (HbAA) controls aged (age 6-21; n=20) matched for
ethnicity and economic background were enrolled from Abnaof Paediatric Hospital,
Khartoum, Sudan, Table 3-1. The phenotypic characteristic was confirmed by cellulose
acetate electrophoresis. The treated patients were on HU for three months or longer.
The exclusion criteria were: sickle cell crisis, acute illness in the pervious one-month,
presence of other chronic diseases, blood transfusion in the previous four-months or
109

Chapter Three - Hydroxyurea and cell membrane fatty acid
pregnancy. The Research Board of the Faculty of Medicine, University of Khartoum,
Sudan, approved the study. Self- or investigator-read and explained written consent
was obtained from the participants or their guardians. In addition, approval was
obtained from National Research Ethics Service, Southampton & South West
Hampshire Research Ethics Committee (A) UK (REC reference: 05/Q1702/48).
Table 3-1 Characteristics of the hydroxyurea treated and untreated HbSS patients and healthy (HbAA) subjects
Hydroxyurea Hydroxyurea Healthy Control
trea ted HbSS untreated HbSS (HbAAl Number of subjects 19 17 20
Gender (Male/Female) 8/11 7/10 9/11
Age ± SO (year) 14.5 ± 4.3 14.5 ± 6.1 9.7 ± 6.7
Weight ± SD (kg) 36 ± 7.1 31.5 ± 11.8 36.1 ± 14.6
Height ± SO (cm) 146.9 ± 15.3 127.8 ± 25.5 146.3 ± 15.0
3.2.2 Blood collection and separation of blood component
After an overnight fast, 5 ml of whole blood was taken from the patients and controls
in EDT A tubes. The separation of blood component is decribed in chapter 2, section
2.2.2.
3.2.3 Analysis of plasma lipids
The analysis of plasma total cholesterol, high-density lipoprotein cholesterol (HOL-
cholesterol) and triglyceride concentrations is decribed in chapter 2, section 2-4.
3.2.4 Analysis of red blood cell fatty acids
The procedure of lipid extraction and fatty acid analysis of red cell and plasma is
described in chapter 2, section 2-3.
3.2.5 Statistical analysis The data are expressed as mean ± SO. Unpaired t-test was used to explore differences
in concentrations of total, HOL and LOL cholesterol, and triglycerides between the HU
treated patients and healthy controls. RBC fatty acids between the HU treated and
untreated patients and healthy controls were compared with one- way ANOVA and
the post hoc test for unequal variance, Tamhane's 2. Statistical significance was
110

Chapter Three - Hydroxyurea and cell membrane fatty acid
assumed at a "p" value of less than 0.05. The statistical software, SPSS for Windows,
Version 17 (SPSS Ltd., Woking, Surrey, UK) was used to analyse the data.
3.3 Results
3.3.1 Plasma lipids
Mean concentrations of total, HDL and LDL cholesterol, and triglyceride of the HU
treated sickle cell patients and healthy controls are presented in Table 3-2. The
patients, compared with their healthy counterparts, had lower total HDL (p<O.OOI) and
LDL (p<O.OI) cholesterol.
3.3.2 Red blood cell fatty acids
Percent fatty acid composition of RBC choline phospho glycerides (CPG) and
sphingomyelin (SPM), the major phospholipids of the outer membrane leaflet, and
ethanolamine (EPG) and serine (SPG) phospho glycerides, the dominant phospholipids
of the inner membrane leaflet, are shown in Table 3-3, 3-4, 3-5 and 3-6, respectively.
3.3.2.1 Red cell ePG
The healthy controls had lower levels of palmitic acid (CI6:0), oleic acid (CI8:1n-9),
total monoenes and adrenic acid (C22:4n-6) (p<O.OOI), and higher stearic (CI8:0) and
linoleic (CI8:2n-6) acids and total n-6 (p<O.OOI) fatty acids compared with the
hydroxyurea treated and untreated patients. In addition, they had higher
docosahexaenoic acid (22:6n-3), n-3 metabolites (p<O.D1) and total n-3 fatty acids
(p<O.05) than the HU untreated patients. Stearic and gamma linolenic (18:3n-6, GLA)
acids (p<O.OOI) and total saturated fatty acids (p<O.OI) were reduced in the HU
untreated compared with the treated patients.
3.3.2.2 Red cell SPM Palmitic, stearic, total saturates and arachidonc were elevated (p<O.Ol), and oleic,
nervonic (p<O.OI) and total monoenes (p<O.OOl) reduced in the healthy controls than in
the HU untreated patients. The HU treated compared with the untreated patients had
increased palmitic, stearic and arachidonic (p<O.05), and decreased lignoceric (C24:0)
and total monoenes (p<.OOl) and nervonic (p<O.Ol)
111

Chapter Three - Hydroxyurea and cell membrane fatty acid
3.3.2.3 Red cell EPG
The healthy control group compared with the HU treated and untreated patients had
reduced stearic, total saturates, adrenic and dihomo gamma linolenic (20:3n-6,
DHGLA) (p<O.OOl) and increased linoleic and eicosapentaenoic (20:5n-3) acids
(p<O.OOl). The HU treated patients had lower arachidonic, adrenic, osbond (22:5n-6)
(p<0.05) and n-6 metabolites and total n-6 (p<O.OOl) than their untreated counterparts.
3.3.2.4 Red cell SPG
Both the HU treated and untreated patients had lower linoleic (p<O.OO1) and higher
DHGLA, adrenic, osbond and total n-6 (p<O.Ol) compared with the healthy control
subjects. The HU treated patients had lower GLA, eicosdienoic (20:2n-6), arachidonc,
osbond, n-6 metabolites and total n-6 (p<O.Ol) than their untreated counterparts.
Table 3-2 Plasma lipid concentrations of steady state HU treated HbSS sickle cell patients and HbAA healthy controls.
Plasma lipids HbAA (n=20) LDL-cholesterol (mmol/U 2.4 ± 0.5 HDL-cholesterol (mmoljL) 1.1 ± 0.3 Total-cholesterol (mmoljL) 3.71 ± 0.56 Triacylglycerol (mmoljL) 1.01 + 0.4
HbSS patients versus HbAA controls: ** P<0.01, ***P<O.OO1.
112
HbSS (n=17) 1.7 ± 0.7** 0.8 ± 0.2*** 2.7 ± 0.8*** 1.24 ± 0.03

Chapter Three - Hydroxyurea and cell membrane fatty acid
Table 3-3 Fatty acid composition of red blood cell choline phosphoglycerides of hydroxyurea untreated (n=17) and treated (n=19) HbSS patients and HbAA controls (n=20).
HbSS HbSS HbAA Fatty acids
(Un-treated) (Treated) (Healthy Control)
16:0 (Palmitic acid) 36.7 ± 1.6 36.3 ± l.7xxx 31.8 ± 2.5+++ 18:0 (Stearic acid) 8.9 ± 0.7*- 10.3± 1.2xxx 13.2± 1.0+++ 20:0 (Arachidic acid) 0.1 ± 0.03*** 0.2 ± O.lx 0.1 ± 0.1 22:0 (Behenic acid) tr tr tr 24:0 (Lignoceric acid) 0.04 ± 0.01 0.05±0.01 .04±0.01 Y.Saturates 46.0 ± 1.3** 47.2±0.8xx 45.2 ± 1.9
16:1n-7 (Palmitoleic acid) 0.3 ± 0.1 0.3 ± 0.1 0.3 ± 0.1 18:1n-7 (Vaccenic acid) 1.6 ± 0.2 1.7± 0.3x 1.4 ± 0.2+ 18:1n-9 (Oleic acid) 18.3 ± 1.1 17.7 ± 1.sxxx 14.2 ± 1.S+++ 24:1n-9 (Nervonic acid) tr tr tr YMonoenes 20.2 ± 1.1 19.7± 1.6xxx lS.9 ± 1.6+++
18:2n-6 (Linoleic acid) 16.3 ± 1.4 lS.4 ± 2.6xxx 20.7 ± 2.1 +++ 18:3n-6 (y -linolenic acid) 0.1 ± 0.02*** 0.1 ± 0.03 0.1 ± O.OS 20:2n-6 (Eicosdienoic acid) 0.5 ± 0.1 0.4 ± 0.2 0.5 ± 0.1 20:3n-6 (Dihomo-y-linolenic) 1.9 ± 0.4 1.7 ± 0.2xx 2.1 ± 0.1 20:4n-6 (Arachidonic acid) 9.6 ± 0.7 9.5 ± 1.1 9.4 ± 1.S 22:4n-6 (Adrenic acid) 0.9 ± 0.2 0.9± 0.2xxx 0.7 ± 0.1+++ 22:5n-6 (Osbond acid) 0.5 ± 0.1 O.S ± O.1x 0.6 ± 0.2+ Ymetabolites 13.6 ± 0.7 13.1 ± 1.3 13.4 ± 1.7 Yn-6 29.9 ± 1.6 28.4± 1.9xxx 34.1 ± 2.7
18:3n-3 (a-Linolenic acid) tr tr tr 20:5n-3 (Timnodonic acid) 0.1 ± 0.02 0.1 ± 0.05 0.11 ± 0.03 22:5n-3 (Clupandonic acid) 0.3 ± 0.06 0.3 ± 0.07 0.3 ± O.OS 22:6n-3 (Cervonic acid) 0.7 ± 0.2 0.8 ± 0.4 1.0 ± 0.2 ++ Ymetabolites 1.1 ± 0.2 1.2 ± 0.4 1.3 ± 0.3++ Yn-3 1.2 ± 0.2 1.2 ± 0.4 1.4 ± 0.3+
N6LN3 26.58 + S.03 24.91 ± 6.78 25.65 ± 5.09
tr- trace HU untreated versus treated HbSS patients, *p<O.OS, **p<O.Ol, ***p<O.OOl
HU untreated HbSS patients versus HbAA healthy controls, +p<O.OS, ++p<O.Ol,
+++p<O.OOl HU treated HbSS Patients versus HbAA healthy controls, x p<0.05, xxp<O.Ol, xxxp<O.OOl
113

Chapter Three - Hydroxyurea and cell membrane fatty acid
Table 3-4 Fatty acid composition of red blood cell sphingomyelin of hydroxyurea untreated (n=17) and treated (n=19) HbSS patients and HbAA healthy controls (n=20).
Fatty acids HbSS HbSS HbAA (Un-treated) (Treated) (Healthy Control)
16:0 21.1 ± 4.3* 25.3 ± 3.5 26.1 ± 2.2++ 18:0 8.7 ± 2.2* 11.9 ± 3.5 11.3 ± 2.0++
20:0 2.0 ± 0.2 1.00 ± 0.2x x x 1.44 ± 0.2+++
22:0 8.1 ± 1.5* 6.6 ± 1.3 7.6 ± 1.1
24:0 25.3 ± 4.8*** 18.5 ± 2.9xx 21.6 ± 2.6+
ISaturates 63.9 ± 3.8 63.8 ± 3.1xxx 68.2 ± 1.4++
16:1n-7 tr tr tr
18:1n-7 0.3 ± 0.1*** 0.7± O.lxx 0.5 ± 0.1+++
18:1n-9 3.8 ± 1.9 3.4 ± 0.6xxx 2.0 ± 0.3++
24:1n-9 17.8 ± 3.6** 14.2 ± 1.7 13.9 ± 1.7++
IMonoenes 21.9 ± 2.8*** 18.3 ± 2.0x 16.5 ± 1.8+++
18:2n-6 2.1 ± 1.1 2.3 ± 0.6 2.0 ± 0.3
18:3n-6 tr tr tr
20:2n-6 0.4 ± 0.3** 0.1 ± O.04xx 0.09 ± 0.04++
20:3n-6 0.3± 0.1** 0.5± O.lxx 0.3 ± 0.1
20:4n-6 3.7 ± 1.3* 4.9 ± 1 5.1 ± 1.3++
22:4n-6 1.8 ± 1.0 2.0 ± 0.8x 1.3 ± 0.4
22:5n-6 1.4 ± 0.6 1.3 ± 0.6 1.1 ± 0.3
Imetabolites 7.5 ± 2.9 8.4 ± 1.9 7.9 ± 2.1
In-6 9.6 ± 3.5 10.8 ± 1.7 9.9± 2.2
18:3n-3 tr tr tr
20:5n-3 0.11 ± 0.02*** 0.07 ± 0.02 0.06 ± 0.02+++
22:5n-3 0.4± 0.2 0.45 ± 0.2 0.4 ± 0.1
22:6n-3 1.4 ± 0.7 1.8 ± 0.8 1.7 ± 0.6
Imetabolites 1.9 ± 0.8 2.4 ± 0.9 2.1 ± 0.7
In-3 1.9 ± 0.8 2.4 ± 0.9 2.1 ± 0.7
N6/N3 5.3± 1.6 5.3 ± 1.7 4.9 ± 1.1
tr- trace HU untreated versus treated HbSS patients: *p<0.05, **p<O.Ol, ***p<O.OOl HU untreated HbSS patients versus HbAA healthy controls: +p<O.05, ++p<O.Ol,
+++p<O.OOl HU treated HbSS patients versus HbAA healthy controls: xp<0.05, xxp<O.Ol, xxxp<O.OOl
114

Chapter Three - Hydroxyurea and cell membrane fatty acid
Table 3-5 Fatty acid composition of red blood cell ethanolamine phosphoglycerides of hydoxyurea untreated (n=17) and treated (n=19) HbSS sickle cell patients and HbAA healthy controls ( n=20).
HbSS HbSS HbAA Fatty acids
(Un-treated) (Treated) (Healthy Control)
16:0 12.8 ± 1.3 12.8 ± 1.3 12.8 ± 1.2
18:0 7.9 ± 0.9 8.7± 1.4xxx 6.0 ± 0.7+++
20:0 0.1 ± 0.02 0.08 ± 0.03 0.06 ± 0.03
22:0 0.03 ± 0.01*** 0.07 ± 0.02 0.08 ± 0.04+++
24:0 0.06 ± 0.03* 0.08 ± 0.02xxx 0.06 ± 0.02
ISaturates 21.02 ± 1.0 21.9 ± 1.5xxx 19.1 ± 1.1+++
16:1n-7 0.1 ± 0.03*** 0.1 ± 0.02 0.1 ± 0.04+++
18:1n-7 0.9 ± 0.2 1.2 ± 0.8 0.9 ± 0.1
18:1n-9 13.1 ± 1.2 12.1± 1.1 12.9 ± 0.7
24:1n-9 tr tr tr
IMonoenes 14.0 ± 1.3 13.2 ± 1.1 13.9 ± 1.0
18:2n-6 4.9 ± 0.7 4.9 ± 0.9x xx 6.7 ± 0.9+++
18:3n-6 0.2 ± 0.05*** 0.04 ± 0.01 0.04 ± 0.01+++
20:2n-6 0.6 ± 0.2 0.5 ± 0.1 0.5 ± 0.1
20:3n-6 1.4 ± 0.3 1.3 ± 0.2xxx 1.0 ± 0.1+++
20:4n-6 24.0 ± 1.1* 22.9 ± 1.2xx 24.8 ± 1.5
22:4n-6 10.8 ± 0.1* 9.89 ± 1.0xxx 8.6 ± 0.7+++
22:Sn-6 2.6 ± 0.4* 2.2 ± 0.5 1.9 ± 0.3+++
Imetabolites 39.4 ± 1.3*** 36.8 ± 2.2 36.8 ± 1.7+++
In-6 44.3 ± 1.5*** 41.4 ± 2.5x 43.9 ± 1.8
18:3n-3 0.08 ± 0.04 0.08 ± 0.02 0.1 ± 0.03
20:Sn-3 0.11 ± 0.03* 0.15 ± O.OSxxx 0.23 ± 0.06+++
22:Sn-3 1.7 ± 0.3 1.6 ± 0.3 1.7 ± 0.2
22:6n-3 2.7 ± 0.4 2.9 ± 0.88 3.2 ± 0.6+
Imeta boli tes 4.5 ± 0.5 4.6 ± 1.1 5.1 ± 0.7+
In-3 4.6 ± 0.5 4.7 ± 1.1 5.2 ± 0.7+
N6/N3 9.8 ± 1.4 9.3 ± 2.34 ± 1.3+
tr- trace HU untreated versus treated HbSS patients: *p<O.OS, **p<O.Ol, ***p<O.OOl HU untreated HbSS patients versus HbAA healthy controls: +p<O.OS,++p<O.Ol,
+++p<O.OOl HU treated versus HbAA healthy controls: xp<O.OS, xxp<O.Ol, xxxp<O.OOl
115

Chapter Three - Hydroxyurea and cell membrane fatty acid
Table 3-6 Fatty acid composition of red blood cell serine phosphoglycerides of hydoxyurea untreated (n=l7) and treated (n=19) HbSS sickle cell patients and HbAA healthy controls (n=20).
Fatty acids HbSS HbSS HbAA
(Un-treated) (Treated) (Healthy Control)
16:0 4.4 ± 0.9 5.5 ± 1.6 5.2 ± 1.2
lS:0 41.9 ± 1.3 42.9 ± 1.9 41.6 ± 1.1
20:0 0.3 ± 0.1 0.3 ± 0.06xx 0.2 ± 0.07++
22:0 0.1 ± 0.04*** 0.2 ± 0.1 0.2 ± 0.07
24:0 tr tr tr
LSaturates 46.9 ± 0.9*** 49.2± O.Sxxx 47.5 ± 1.0
16:1n-7 tr tr tr
lS:ln-7 0.4 ± 0.9*** O.S ± 0.2 0.7 ± 0.1+++
lS:ln-9 4.9 ± 1.03* 6.0 ± 1.23 5.1±1.0
24:1n-9 0.03 ± 0.01*** 0.4 ± 0.31 0.3 ± 0.23+++
LMonoenes 5.4 ± 1.1** 7.1 ± 1.5xx 5.4 ± 1.2
lS:2n-6 3.20 ± 0.6 3.3 ± 0.6 xxx 6.1 ± 1.6+++
lS:3n-6 0.2 ± 0.06*** 0.06 ± 0.03xxx 0.02 ± 0.02+++
20:2n-6 0.5 ± 0.1*** 0.2 ± 0.04 0.3 ± 0.09+++
20:3n-6 3.2 ± 0.8 2.9 ± 0.8xxx 2.1 ± 0.3+++
20:4n-6 24.9 ± 2.3** 22.13 ± 2.2xxx 25.7± 1.9
22:4n-6 6.7 ± 1.1 6.1 ± 1.0xxx 3.9 ± 0.8+++
22:5n-6 3.4 ± 0.7** 2.7 ± 0.58xx 2.1 ± 0.5+++
Lmetabolites 3S.S ± 1.4*** 34.1 ± 1.9 33.9 ± 2.4+++
Ln-6 42.0± 1.2*** 37.0 ± 2.0xxx 40.1 ± 2.7++
lS:3n-3 tr tr tr
20:5n-3 0.07 ± 0.01 O.OS ± 0.09 0.11 ± 0.04++
22:5n-3 1.4 ± 0.3 1.2 ± 0.3 1.1 ± 0.2++
22:6n-3 3.0 ± 0.6 2.8 ± 0.8 2.7 ± 0.8
Lmetabolites 4.4 ± 0.7 4.1 ± 1.0 3.9 ± 1.1
Ln-3 4.4 ± 0.7 4.1 ± 1.03 3.9 ± 0.1
N6/N3 9.7 ± 1.9 9.7 ±2.6 11.0± 2.9
tr- trace HU untreated versus treated HbSS patients: *p<0.05, **p<O.Ol, ***p<O.OOl HU untreated HbSS patients versus HbAA healthy controls: +p<O.OS, ++p<O.Ol,
+++p<O.OOl HU treated HbSS Patients versus HbAA healthy controls: xp<O.OS, xxp<O.Ol,
xxxp<O.OOl
116

Chapter Three - Hydroxyurea and cell membrane fatty acid
3.4 Discussion The reduced concentrations of total, HOL and LOL cholesterol in the HU treated sickle
cell patients is consistent with the low level total, HOL and LOL (Saha and Samuel
1982; Stone et al. 1990; VanderJagt et al. 2002; Marzouki and Khoja 2003; Rahimi et al.
2006) and total cholesterol (Shores et al. 2003) reported in HU untreated, steady state,
sickle cell patients. The patients and healthy control subjects in the current study were
broadly matched for age, gender, ethnicity and socio-economic background.
Consequently, the observed reduction in cholesterol levels in the HU treated patients
was unlikely to have been a reflection of genetic or environment factors. It has been
postulated, hypocholesterolemia in sickle cell patients is due to haemodilution, down
regulation of cholesterol synthesis, and decreased transfer of cholesterol from
membrane to circulating High density lipoprotein (HOL) because of reduced activity of
lecithin-cholesterol acyltransferase(Glew et al. 2003; Shores et al. 2003). In the current
study, the HU patients and healthy controls had a comparable level of triacylglycerols.
Hence, the hypocholesterelomia in the patients could not be explained by
haemodilution. Likewise, down-regulation of biosynthesis of cholesterol may not be a
factor as there is evidence that RBC of sickle cell patients have higher content of
cholesterol (Muskiet and Muskiet 1984; Sasaki et al. 1986). SCO patients have lower
level of apolipoprotein A-I (Sasaki et al. 1986; Morris 2008; Yuditskaya et al. 2009), and
deoxygenated HbS red cells has been shown to have increased uptake of cholesterol
analogue (Kavecansky et al. 1995). Hence, it is plausible; the hypocholosterelomia
observed in the patients was a reflection of increased uptake by RBC membranes and
reduced transfer to circulating HOL.
The current comparative study of Sudanese homozygous sickle cell patients and
healthy controls revealed both HU treated and untreated patients had abnormal red
cell fatty acid pattern, which was more pronounced in the latter group. The remarkable
anomalies in the HU untreated patients compared with the healthy controls were:
decreased linoleic, stearic, and increased palmitic and oleic acids in CPG, decreased
palmitic and stearic and increased nervonic and lignoceric acids in SPM, decreased
linoleic acid, EPA and OHA and increased stearic, adrenic and osbond acids in EPG
and decreased linoleic and oleic and increased adrenic and osbond acids. These
117

Chapter Three - Hydroxyurea and cell membrane fatty acid
findings are broadly consistent with the previous findings in serum
phospholipids(Enomoto et al. 1998), red cell total phospholipids(VanderJagt et al. 2003)
, red cell phospholipid classes(Connor et al. 1997; Ren et al. 2005a) and total lipids of
mononuclear cells and platelets(Ren et al. 2005b). These findings in steady state
homozygous sickle cell patients of different ethnic, cultural and socio-economic
backgrounds demonstrate, the disease induces blood cell membrane fatty acid
perturbation. This could be due to: (a) metabolic dysfunction - impaired synthesis,
uptake and/ or enhanced turnover; (b) peroxidation caused by iron overload. Both the
HU untreated patients and healthy controls had very low n-3 fatty acids compared
with the British and Nigerian subjects previously investigated by our group(Ren et al.
2005a). This difference is most likely a reflection of the n-3 fatty acid status of the
populations studied since we have observed North Sudanese maternal milk(Nyuar KB
2010) and blood (unpublished) have very low content of these nutrients.
Hydroxyurea had a profound effect on fatty acid composition of membrane
phospholipids, particularly sphingomyeilin, and ethanolamine and serine
phosphoglycerides. The striking effect on the former phospholipid was a reduction of
18.1, 26.7 and 20.6% of behenic (C20:0), lignoceric (C22:0) and nervonic (C24:1n-9)
acids, respectively. The HU-induced changes in sphingomyelin composition is
significant since lipid rafts, the highly ordered membrane microdomains, which are
thought to playa pivotal role in membrane trafficking, signal transduction and gene
and protein expression, are rich in sphingomyelin(Brown and London 2000a; Niemela
et al. 2007). Moreover, saturated and mono-unsaturated fatty acids are structural
components and major functional determinants of sphingomyelin.
In addition, hydroxurea reduced arachidonc acid (AA, C20:4n-6) significantly in both
ethanolamine (-4.7%) and serine (-11.1%) phosphoglycerides, phospholipids found
predominately in the inner leaflet of membrane lipid bi-Iayer. Such reductions were
not apparent in choline phospho glycerides and sphingomyelin, which are principally
found in the outer leaflet of membrane lipid bi-Iayer. Hydroxyurea generates nitric
oxide in vivo (Glover et al. 1999; Nahavandi et al. 2002; King 2004) and in vitro(Pacelli
118

Chapter Three - Hydroxyurea and cell membrane fatty acid
et al. 1996; Kim-Shapiro et al. 1998), and the functionally coupled cPLA2a and
cyclooxygenase 2 (COX2)(Fitzpatrick and Soberman 2001) are activated by nitric
oxide(Kim et al. 2005; Xu et al. 2008).
Prostaglandin E2 (PGE2), which is a metabolite of AA and a vasodilator, has been
shown to induce the synthesis of foetal haemoglobin in peripheral blood derived from
erythroid colonies from normal and sickle cell adults(Datta 1985). In rats, the HU
induced synthesis of foetal haemoglobin is obviated by aspirin, the potent inhibitor of
COX (Datta et al. 1991) . Hence, it is tenable to suggest, in the HU treated patients, AA
is selectively released by the activation of the arachidonic acid-selective cytosolic
phosopholipase A2a (cPLA2a) and subsequently metabolised by COX2 to generate
PGE2.
Consistent with our previous findings in HU-untreated HbSS patients(Ren et al.
2005b), the HU-untreated patients in this study had significantly lower levels of DHA
and total n-3 fatty acids in CPG and EPG; and EPA in EPG, SPG and SPM compared
with healthy controls. In contrast, in the HU-treated patients, the reduction in n-3 fatty
acids was restricted only to EPA in EPG. It appears the n-3 fatty acid abnormality often
observed in HU-unreated patients was partially ameliorated by hydroxyurea
treatment. This modulation of membrane fatty acid composition would be expected to
help enhance trans-membrane ion flux, cell hydration, rheology and
deformability(Poschl et al. 1996; Ho et al. 1999; Djemli-Shipkolye et al. 2003), factors
which are known to improve in hydroxyurea treated sickle cell patients (Ballas et al.
1989; Adragna et al. 1994; Athanassiou et al. 2006).
This investigation demonstrates, hydoxyurea modulates red blood cell membrane fatty
acid abnormalities including the n-3/n-6 imbalance reported previously in steady state
homozygous sickle cell patients. These modulations in synergy with the hydroxyurea
generated vasodilators nitric oxide and PGE2 may be play a critical role in clinical
improvements which occur prior to the increased synthesis of HbF in treated patients.
119

Chapter Three - Hydroxyurea and cell membrane fatty acid
The current study did not investigate the effect of hydroxyurea on metabolism of
eicosanoids derived from arachidonic acid, oxidative stress and fatty acid composition
of other blood cells, such as platelets and leukocytes. These limitations are potential
lines of inquiry which may need to be explored in future studies.
120

Chapter Four- Omega-3 PUFA and oxidative status
Chapter Four
An investigation into the impact of omega-3 LC PUF A on oxidative status in Sickle cell
patients
121

Chapter Four- Omega-3 PUFA and oxidative status
4.1 Introduction Red blood cells (RBCs) experience continuous oxidative insults by being exposed to
endogenous and exogenous reactive oxygen species (ROS)(Nagababu et al.
2003).Despite the fact that RBC lacks the mitochondrion which is the major source of
ROS in other tissues(Turrens 2003), the RBC iron-containing haemoglobin (Hb)
produces substantial amount of ROS through auto-oxidation, the process in which oxy
haemoglobin Hb (oxyHbS) undergoes spontaneous heterolytic dissociation into metHb
and superoxide (0'2) (Reeder and Wilson 2005), equation 4-1.
(equation.4-1)
In addition, The Hb iron, can act as a potent catalyst in reactions that generates highly
reactive radicals (hydroxyl radical) in biological systems. Hydroxide radicals are
generated from hydrogen peroxide (H202) through superoxide-driven, iron- catalysed
Haber-Weiss reaction (equation. 4-4) , which makes use of Fenton chemistry(equation.
4-2&4-3) (Kehrer 2000).
Fe3+ + 0"2- ____ .~ Fe2+ + 0 2 (equation 4-2)
----.~ Fe3+ + OH- + OH . (equation 4-3)
(Fenton reaction)
The net reaction (Haber-Weiss):
(equation 4-4)
Under normal conditions, this iron-mediated oxidative reaction is prevented by the
hydrophobic globin pocket that tightly binds haem and consequently limiting
(compartmentalisation) the access of the iron to the labile membrane unsaturated fatty
acids (Marengo-Rowe 2006).However, it has been estimated 1-2% of normal RBCs 122

Chapter Four- Omega-3 PUFA and oxidative status
oxyhaemoglobin undergoes autoxidation, (Johnson et a1. 2010).In order to cope with
continuous production of H202 and superoxide, RBCs are equipped with enzymetic
and no-enzyme tic anti-oxidant systems (Wood and Granger 2007). The major non
enzymatic anti-oxidant include those scavenge free radicals as Vitamin E, C,
caretenoids and glutathion(Chan et a1. 1999; Manfredini et a1. 2008). These antioxidant
nutrients occupy distinct cellular compartments and among them, there are active
recyclings. ROS in the aqueous phase are scavenged by the water-soluble vitamin C,
while vitamin E, A and p-carotene, predominantly scavenge ROS that pervade the non
aqueous lipid membrane environment, and consequently prevent the peroxidation of
PUFA by breaking the radical chain reaction (Sies and Stahl 1995; Fang et a1. 2002). The
most important enzymatic antioxidants are superoxide dismutase (Cu-Zn-SOD), which
catalyses dismutation of the 0 L- into H202. The H202 generated from Cui Zn-SOD
reaction is then deactivated by glutathione peroxidase (Se-GPx, Figure 4-1), catalase
(Fe-CAT) and peroxiredoxin-2 (Prdx2)(Andersen et a1. 1997; Low et a1. 2007; Johnson et
a1. 2010). While Fe-CAT is completely specific for H202, Se-GPx is able to reduce
organic peroxides and lipid hydroperoxide(Johnson et a1. 2002). Therefore it has been
suggested Se-GPx might have particular importance in SCD(Cho et a1. 2010).
NADPH+W GSSG
SOD
2GSH
GS-conjugale + W J/f
~ GST
substrate
Figure 4-1 Neutralization of ROS in red blood cells by superoxide dismutase (SOD) and gIutathion peroxidase (GPx), Adopted from(Yan et a1. 2008)
123

Chapter Four- Omega-3 PUFA and oxidative status
GR=glutathione reductase, GSH= glutathione, GSSG=glutathione disulfide.
Compared to normal Haemoglobin A (HbA) ,haemoglobin S (HbS) auto-oxidises 1.7-
fold faster in solution (Hebbel et a1. 1988) resulting in continuous production of
superoxide anion. In addition, the conversion of metHbS to oxyHbS is impaired due to
insufficiency of nicotinamide adenine dinucleotide (NADH) the co-enzyme of metHb
reductase in sickle red blood cells (Zerez et a1. 1990). Such imbalance results in higher
metHb levels and subsequent denaturation of Hb (haemachrome) and release of heme.
Furthermore, the instability of HbS and its ability to interact with membrane lipids of
intact sickle red blood cells(Sugihara et a1. 1992b; Marva and Hebbel 1994), leads to
iron decompartrnentalisation and deposition in form of hemichrome, free
heme(Kuross et a1. 1988) and free iron associated with component of RBC
membrane(Kuross and Hebbel 1988). As a result, the membrane iron provides a
biologic "Fenton reagent" for the generation of hydroxyl radicals at the membrane and
consequent oxidation of membrane lipids(Misra and Fridovich 1972; Repka and
HebbeI1991).
Among the factors thought to participate in systemic high OS associated with SCD is
the increased intravascular haemolysis and excessive levels of cell-free haemoglobin
with its catalytic action on oxidative reaction (Jeney et a1. 2002; Nur et a1. 2011). In
addition, chronic pro-inflammatory state is a characteristic of SCD patients even in
steady state(Akohoue et a1. 2007), and ROS production is a main feature of and plays
an important role in inflammation(Guzik et a1. 2003). Hence, it has been suggested that
chronic inflammatory state may contribute in OS related to SCD. A possible source of
ROS stemming from SCD-related inflammation is high polymorphonuclear Cells
(PMNs) count in SCD(Wun 2001; Frenette 2002). It has also been demonstrated that
hypoxia-reoxygenation cycles in SeD associated with increased OS in SCD(Kaul and
Hebbel 2000). Due to fact that SCD patients have high number PMNs and NADPH
oxidase-mediated respiratory burst is chronically activated in (PMNs) of SCD patients
(Dahlgren and Karlsson 1999; Wun 2001), more severe reperfusion injury-induced
oxidative stress tend to occur in SCD(Nur et a1. 2011).
On the other hand, it has been found that the anti-oxidant capacity in RBCs of SCD
patients is highly impaired (Schacter et a1. 1988; Wood and Granger 2007; Ren et a1.
124

Chapter Four- Omega-3 PUFA and oxidative status
2008; Cho et al. 2010).Thus, the chronic high oxadative stress state (OS) associated with
SCD(Aslan and Freeman 2007; Hebbel 2010) is an outcome of imbalance between
enhanced generation of reactive oxygen species (ROS) and disrupted antioxidant
system.
Different studies have shown that, red blood cell membrane of patients with SeD has
abnormal cell membrane fatty acids composition characterized by low levels of n-3
long chain polyunsaturated fatty acids (n-3 FA) (Connor et al. 1997; Ren et al.
2005b).The underlying cause(s) of these abnormal levels of membrane fatty acids is not
fully understood. However, one of the possible explanations of reduced levels of the n-
3 fatty is their higher vulnerability to oxidation, especially docosahexanoic acid (DHA)
which possesses a high un-saturation index (Richard D 2008).
It is well known that, alterations in cell membrane fatty acid composition has a
tremendous effect on blood cell adhesion, aggregation, elasticity and inflammatory
response (Chiu et al. 1981; Mills et al. 1993; Nishiyama et al. 2000; Mukherjee et al.
2004), the same factors underlie complications associated with SCD (Hebbel et al. 1980;
Kaul et al. 1996; Rosse et al. 2000; Frenette 2002; Okpala 2006; Frenette and Atweh
2007).Hence, It is conceivable, correction of membrane fatty acids abnormality by
supplementation with n-3 FA may have a beneficial clinical effect. However, the effect
of supplementation with relatively highly oxidize-able polyunsaturated n-3 FA poses a
theoretical concern owing to possibility of aggravation of high oxidative stress
associated with SeD. Nevertheless, the in vivo effect of n-3 FA on lipid peroxidation
and oxidative stress are debatable(Nenseter and Drevon 1996). Indeed, In vitro and in
vivo studies have shown that supplementation with n-3 fatty in condition with high
oxidative stress dose lessen markers of peroxidation(Yang et al. 1993; Supari et al. 1995;
Bas et al. 2007; Richard D 2008), corroborating the possible anti-oxidant activity of n-3
in biological milieu (Bechoua et al. 1999; Yavin 2006). This study was conducted to
investigate whether supplementation with LCPUF A n-3 fatty acids exacerbate the
oxidatives stress in SeD patients, and the possible the effect of n-3 fatty acids
supplementation on anti-oxidant enzyme activity.
125

Chapter Four- Omega-3 PUFA and oxidative status
4.2 Methodology
4.2.1 Design and intervention This study was conducted in the context of single centre, two-arm, randomised,
placebo-controlled, double blinded clinical trial investigating the effects of omega-3
fatty acid supplementation on Sudanese children with homozygous SeD. Forty (n=40)
subjects fromed the active group aged 2-13 years (supplemented with capsules
composed of 60% DHA and 18% EPA omega-3 fatty acids) and thirty-three (n=33)
subjects fromed the placebo group aged 2-14 years (supplemented with high oleic acid
sunflower seed oil) were investigated at base line, six-month and one-year after
intervention. potential participant (HbSS patients) were excluded if they have history
of sickle cell crisis, acute illness in the previous one-month, presence of other chronic
diseases, blood transfusion in the previous four-months or hydroxyurea treatment.
According to age ranges 2-4, 5-10 and 11-16 years participants were given daily dose of
250,500 and 750 mg respectively of either the placebo or active supplements. To inhibit
peroxidation 1.5 mg of alpha-tocopherol (vitamin E) per capsule was added to
treatment and placebo capsules.
The trial was approved by the Ethics Committee of the, Faculty of Medicine,
University of Khartoum, Sudan and the Research Ethics Committee of Southampton &
South West Hampshire, UK (REC reference number-05/Q1702/48). All participants or
their guardians provided informed written consent.
4.2.2 Blood sampling After an overnight fast, 5 m1 of whole blood was taken in EDT A tubes from all
participants (n=73) at zero-time, samples of 36 and 28 participants from active and
placebo groupS respectively were collected at six-month and one year of intervention.
Blood samples of nine patients (n=9), five from placebo (n=5) and four (n=4) from
active groupS were not collected at six-month and/or one-year due to drop-out, or
inability to collect the blood sample at the pre-scheduled time points. The separation of
blood component is decribed in chapter 2, section 2.2.2.
4.2.3 Complete blood count (CBC) The complet blood count was measured as described in chapter 2, section 2.2.1.
126

Chapter Four- Omega-3 PUFA and oxidative status
4.2.4 Analysis of red blood cell fatty acids
The procedure of lipid extraction and fatty acid analysis of red blood cell is described
in chapter 2, section 2-3.
4.2.5 Measurement of plasma a-tocopherol (v it E) and retinol concentration
The procedure of plasma vitamins extraction and analysis of is described in chapter 2,
section 2-5.
4.2.6 Glutathione peroxidase (Se-GPx) and Cu/Zn-Super oxide dismutase (Cu/Zn-SOD) enzymes' activity assay
The measurement of Se-GPx and Cui Zn-SOD is described in chapter 2, section 2-6.
4.2.7 Statistical analysis
The data are expressed as mean ± SD. Paired t-test was used to explore differences
within the placebo or active group, fatty acids, un-paired t-test was used to test
differences between the two groups. The Statistical significance was assumed at a "p"
value of less than 0.05. The statistical software, SPSS for Windows, Version 17 (SPSS
Ltd., Woking, Surrey, UK) was used to analyse the data.
127

Chapter Four- Omega-3 PUFA and oxidative status
4.3 Results Table 4-1 gives the base-line characteristics of the 73 study participants. No significant
differences were found between the active and placebo groups in demographic
characteristic and haematological profile at base-line.
4.3.1 Red blood cell membrane PE and PC fatly acid composition
The effect of supplementation on fatty acids composition of PE and PC phospholipids
is shown in Table 4-2 and 4-3. No differences in fatty acids profile of placebo and
active groups were found at base line in PE and PC phospholipids.
4.3.2 PE fatly acid composition
In the active group, n-3 FA increased eicosapentanoic«C20:5n-3, EPA) by 67.7 %
(P<O.001), Docosahexanoic «C22:6n-3, DHA) by 71.9 %( P<O.001), and total n-3 fatty
acids by 59.6% (P<O.001), after six months of supplementation. These increases in n-3
fatty acids were associated with decrease in n-6 fatty acid, specifically linoleic (LA,
C18:2n-6, P<O.05), arachidonic (AA, C20:4n-6, P<O.Ol), total n-6 (P<O.OOl) and total
monoenoic (P<O.001). Continuation of n-3 fatty acids supplementation for one year
caused no significant changes in fatty acid profile compared to six-month apart from
slight but significant further reduction on AA (P<O.05).
The fatty acids composition of the placebo group broadly remained unchanged after
supplementation, with the exception n-3 docosapentaenoic(DP A, C22:Sn-3) that
showed significant reduction (P<O.01) after six month of supplementation
4.3.3 PC fatly acid composition
Similar to PE, in the active group EPA increased by 69.6 % (p<O.001), DHA by 73.6 %(
P<O.OO1), and total n-3 by 64.4% (P<O.OOl), after six months of supplementation.
Concomitantly, total saturate (P<O.001), total monoenoic (P<O.OS), archidonic acid
(P<.Ol) and adrenic acid (P<O.01) were reduced after supplementation. In contrast to
PE, linoleic acid (LA, C18:2n-6) increased significantly and total n-6 showed no
difference after intervention. Continuation of supplementation to one year resulted in
additional significant increase in LA (P<O.05) and decrease in AA, adrenic acid
(p<O.OOl) and n-3 DPA (P<O.001).
128

Chapter Four- Omega-3 PUFA and oxidative status
In contrast to active group, the total saturate, total n-3 and DHA were significantly
decreased (P<O.Ol) in placebo group after six months of supplementation. Further
reductions in n-6 and DHA occurred after one year of supplementation.
4.3.4 Comparison of the GPx and SOD activities in RBCs of the placebo and
active groups
GPx and SOD activities in placebo and active groups were normally distributed at base
line and six-month of supplementation. The two groups showed no differences in
enzymes activities at base line. The GPx activity of placebo group remained unchanged
after six-month of supplementation. After intervention, the GPx activity of the active
group was reduced by 31.55% (P<O.OOl) and 24.5% (P<O.Ol) compared to base-line and
placebo group respectively, Figure 4-1.
The SOD activates were significantly reduced after intervention both in placebo
(p<O.05) and active group (P<O.Ol), Figure 4-2.
4.3.5 Relation of enzyme activity to oxidative stress
In order to assess the association of changes in enzyme activates with the redox status
we analysed the effects of supplementation on levels of plasma vitamin E, A and RBe
total plasmalogen contents of membrane phospholipids.
The Vitamin E levels of placebo and active group were comparable at base-line.
Supplementation with omega-3 fatty acids resulted in slight insignificant increase in
Vitamin E levels at six-month (P>O.05), and significant increase at one-year of
supplementation compared to baseline (P<O.OOl) and placebo (P<O.05), Figure. 4-3.
Vitamin A level of placebo and active group were comparable at base-line (O.64±O.2
versus O.69±O.2), no significant difference (p>O.05) was observed in concentrations of
vit A of placebo (O.6±0.1) and active group (O.63±O.2) after 6 months of
supplementation. Continuation in supplement for one year showed no difference
within or between the groups, vit A concentration of both placebo and active group
was O.62±0.2.
Total plasmalogens (alkenylacyl subclass) content determined as the sum of fatty
aldehyde acetals (16:0DMA, 18:0DMA and 18:1 DMA), which are produced after 129

Chapter Four- Omega-3 PUFA and oxidative status
derivatization of sn-l fatty acids contained in plasmalogens. n-3 FA supplementation
caused no significant lose in PE and PC plasmalogens Dimethyl acetals neither at six
month nor one year of supplementation, Table 4-3& Figure 4-4.
Table 4-1 Patients' basic characteristics
Measure Active Placebo
Cn=4Q) Cn=33) Demographic characteristics
Female 18 17 Male 22 19 Age (mean in years(± SD)) 6.4±3.02 6.8±3.S
Haematological profile Hbg/dL 6.7±1.3 7.0±1.3 Hct (%) 21.7±4.07 22.8±3.9 MCV (fL) 79.4±6.3 78.6±7.6 MCH (pg) 24.5±2.4 24.0±3.7 MCHC(g/dl) 30.8±0.9S 30.8±1.8 TWBC(xl03/pL) lS.8±4.2 14.8±S.4 PLTs (xl03/pL) 531.3±168.6 534±118.2 RBC(xl06/pL) lS.B±4.2 14.B±S.4
Hb, haemoglobin; Hct, haematocrit; MCV, mean Corpuscular Volume; MCH, mean corpuscular haemoglobin; MCHC, mean Corpuscular haemoglobin concentration; TWBC, total white blood Cell; PLTs, platelets count; RBC, red blood cell count.
130

Chapter Four- Omega-3 PUFA and oxidative status
Table 4-2 Fatly acids composition of red blood cell membrane phosphatidylethanolamine of the active and placebo group before and after supplementation
Active group acids group Placebo group
Major fatly acids Baseline Six-month One-year Baseline Six-month One-year (%)
C16:0 12.0± 1.4 12.4±1.6 13.S±1.6++ 12.6± 1.2 12.2± 1.2 13.4±1.2++
C18:0 B.O± 0.8* 8.3±1.19 7.7±0.9++ 7.5± 1.2 7.1± 1.1 7.0±0.8
Total saturate 20.2± 1.1 20.82±1.3 21.3±1.1 20.2± 1.2 19.4± 1.6 20.5±1.3
C18:l 14.1±1.4*** 13.3±1.3 13.6±1.5 14.0± 1.2 13.7± 1.7 13.3±1.3
Total monoenoic 14.4± 1.4*** 13.5±1.3 13.9±1.6 14.3± 1.3 14.0± 1.7 13.5±1.3
C18:2n-6 S.0±0.8* 4.6±0.8 4.7±0.B S.3± 0.7 S.3± 0.7 S.5±0.9
C20:4n-6 24.3± 1.1** 22.8±1.8 22.S±1.3+ 24.5± 1.3 24.7± 1.4 2S.0±1.3
C22:4n-6 10.9± 8.1*** 6.B±1.7 7.4±2.2 lO.4± 1.2 10.0± 1.6 1O.2±1.3
Total n-6 44.8± 1.3*** 38.0±3.6 37.6±3.9 44.6± 1.6 44.0±3.7 44.7±2.4
C20:Sn-3 0.1±0.04*** 0.3±0.2 0.3±0.2 O.1±O.OS O.ll± 0.06 O.HO.OS
C22:Sn-3 1.7± 0.3*** 1.4±0.3 1.4±0.2 1.B± 0.4** 1.5± 0.3 1.S±0.3
C22:6n-3 2.6± 0.7*** 9.2±2.8 B.0±3.2 2.B± 0.6 3.1± 1.3 3.l±1.2
Total n-3 4.S± 0.8*** 1l.0±3.l 9.B±3.S 4.7± O.B 4.59± 1.02 4.7±1.3
Minor fatty acids are included for calculation but not tabulated. Baseline versuS Six-month within the supplement group: *p<O.OS, **p<O.Ol, ***p<O.OOl
One-year versus Six-month within the group: +p<O.OS, ++p<O.Ol
131

Chapter Four- Omega-3 PUFA and oxidative status
Table 4-3 Fatty acids composition of red blood cell membrane phosphatidylcholine of the active and placebo group before and after supplementation
Omega-3 fatty acids group Placebo group
Major Baseline Six-month One-Year Baseline Six-month One-year
fatty acids
C16:0 36.49± 1.85*" 34.58±1.97 36.5±2.3 ...... 36.59± 2.11 ** 34.87±1.98 37.1±2.4*"
C18:0 9.02± 0.90** 9. 57±1.04 8.9±1.2* 9.39± 1.25 9.41±1.51 8.7±1.4**
Total 46.14± 1.41-* 44.88±1.32 45.5±1.5* 46.63± 1.50** 44.9±1.47 4S.9±1.5*
saturate CI8:I 21.07±1.67* 20.21±1.63 20.2±2.0 19.8S±1.78 I9.55±1.70 I8.3±2.3
Total 21.58± 1.74* 20.66±1.70 20.5±2.1 20.33± 1.87 19.99±1.72 18.6±2.4**
monoenoic C18:2n-6 15.65±2.01 ** 17.24±2.11 18.5±2.2* 16.75±1.93** 18.82±2.43 20.4±2.6-
C20:4n-6 9.81± 0.94** 8.81±1.31 7.8±1.4*** 9.41± 0.91 9.82±1.39 8.6±1.1
C22:4n-6 1.08± 0.21** 0.69±0.19 0.6±O.2*** 0.96± 0.20 0.95±O.26 0.8±0.4
Total n-6 29.44± 1.65 29.41±2.46 29.0±2.7 30.26± 2.26*** 32.55±2.49 32.2±2.2**
C20:5n-3 0.085±O.039*** 0.28±0.18 O.2±D.l 0.078±O.04 0.085±0.02 0.08±O.03
C22:5n-3 0.29±0.08 0.24±O.07 0.2±O.07*** 0.29± 0.07** 0.23±O.07 0.2±0.07
C22:6n-3 0.74± 0.27*** 2.83±1.07 2.3±1.0 0.69±0.20** 0.88±O.32 0.7±0.3**
Total n-3 1.21± 0.33*** 3.40±1.27 2.7±1.2 1.16± 0.24 1.24±O.36 1.0±0.4**
Dimethyl 0.61±O.12 O.64±O.l1 0.7±O.2 0.69±O.14 0.65±O.08 0.6±O.2
acetals Dimethyl acetals correspond to the sum of 16:0+ 18:0+ 18:1 DMA. Minor fatty acids are
included for calculation but not tabulated. Baseline versuS Six-month within the supplement group: *p<0.05, **p<0.01, ***p<0.001 One-year versus Six-month within the group: +p<0.05, ++p<0.01
132

70 -
60
50 ~
.:. 40 -~ .......
30 ::J -
20 -
10 -
0
:.' I
Placebo
Chapter Four- Omega -3 PUFA and oxidative status
1
Active
• GPX ::ero-tlme
GPX six-months
Figure 4-2 Effect of n-3 fatty acids supplementation on GPx activity in red blood cells of patients with HbSS
["" ?<0.D:- l :><' ,. r . ... - l
1 SOD six-months 1 • SOD zero-time
Placebo Active
Figure 4-3 Effect of n-3 fatty acids supplementation on SOD activity in red blood cells of
patients with HbSS
133

Chapter Four- Omega-3 PUFA and oxidative status
.. ····.PLuE'bo
20
.... 15 ::::-0 E ~ ....
10
5
uro-timE' Six-month .~-------.------------~--~-- ---_ .. _--_. __ .----
Figure 4-4 Effect of n-3 fatty acids supplementation on plasma a-tocopherol levels in patients
with HbSS. All values are in means ± SO, ap< 0.05 one-year vs. baseline Within the group. bP<O.OOl one-
year beteen the groups.
20
.·.·ePlacebo
17.5 - ••• Active
~ 15 Q •................... .1. ........ .
I 12.5 -.
10 ------- -- --------- ----------- ---~-~----- -----------------
lero-time Six-month One-year
Figure 4-5 Effect of n-3 supplementation on phosphatidylethanolamine dimethyl acetals
(DMAs). . .., .. All values are in means ± SO. no slgmflcan dlfference wlthm or between the groups before and
after Intervention.
134

Chapter Four- Omega-3 PUFA and oxidative status
4.4 Discussion Although basically defined as a genetic disease, it is now becoming more evident that
the pathogenesis in SCD is an out come of the concerted actions of genetic, cellular,
humoral and environmental factors (Thomas et al. 1997). In this study we investigated
the effects of nutritional intervention with n-3 fatty acids in RBC membrane fatty acids
composition and the parameters of redox state in steady state HbSS patients. The
demographic, haematological and fatty acids profile of placebo and active group were
well matched at base-line, hence the observed effects of supplementation on anti
oxidant enzyme activities and markers of OS are unlikely to be due to dietary, genetic
and/ or sample variation.
Our study focused on the incorporation of the n-3 fatty acids DHA and EPA into RBC
PE and Pc, which are the main phospholipids regarding polyunsaturated fatty acids
esterification(Delton-Vandenbroucke et al. 2001). The base line contents of DHA, EPA
and total n-3 fatty acid are consistent with values observed on Sudanese children with
or without SCO(Daak et al. 2011). After six months of supplementation the n-3 fatty
acids concentration in active group increased to levels comparable to that of healthy
individuals from high omega-3 intake communities(Ren et al. 2005a), the placebo
group showed no significant difference compared to the base line. These results
indicate reasonable compliance to supplementation, and provide evidence that the
reported low levels of cell membrane n-3 fatty acids in SCD is responsive to dietary
modulation(Connor et al. 1997; Ren et al. 2005b).
Plasmalogens (alkenylacyl) might be of particular importance in this study, as they are
preferentially esterified with DHA(Lessig and Fuchs 2009). Moreover, Plasmalogen
(endogenous anti-oxidant) are supposed to be protective against deleterious actions of
ROS(Khaselev and Murphy 1999; Leray et al. 2002). It protects cells by functioning as
scavengers to the free radical due to high susceptibility of vinyl ether linkage of
plasmalogen to oxidative attack in comparison to unsaturated fatty acyl residues of
phospholipids(Skaff et al. 2008).It have also been shown to have a role in inhibiting
iron-induced peroxidation of PUFA(Sindelar et al. 1999) The pathophysilogical and
clinical importances of plamalogen lie on the fact that, conditions with high oxidative
stress status tend to have reduced level of plasmalogen (Brites et al. 2004; Gorgas et al.
135

Chapter Four- Omega-3 PUFA and oxidative status
2006). Hence, in this study we considered DMA levels as indicator of OS. In contrast
to previous studies investigated effect of n-3 supplementation in DMA levels in cell
lines(Delton-Vandenbroucke et a1. 2001) and rats neuronal tissue(Destaillats et a1.
2010), our data showed no significant effect on DMA after six-month and one-year of
supplementation. This finding could indicate that n-3 FA supplementation caused no
additional oxidative stress to these patients.
Vitamin E is considered as pathophysiologicaly important determinant of ant-oxidative
protection(Kassab-Chekir et a1. 2003; Gizi et a1. 2011). SCD patients are known to have
decreased levels of plasma vitamin E which is attributed hyper-consumption through
excessively generated ROS(Marwah et a1. 2001; Walter et a1. 2006). In this study long
term supplementation with n-3 caused significant increase in vitamin E levels.
Although the placebo supplement contains the same amount of vitamin E no
significant changes were detected, the fact which accentuates unequivocal effect of n-3
in vitamin E concentration. The observed increase in vitamin E after n-3
supplementation is consistent with previous study conducted in children and infants
with or without SCD(Muskiet et a1. 1991; Skouroliakou et a1. 2010).
The static level of plasmalogen and significant increase in vitamin E do not support
adverse effect of n-3 supplementation on overall oxidative stress in SCD. These
findings are in accordance with previous studies that showed anti-oxidant effect of n-3
on healthy subjects(Guillot et a1. 2009), patients with type 2 diabetes(Mori et a1. 2003)
and systemic lupus erythmatosus(Richard D 2008).However, a contradictory data
related to n-3 FA and lipid peroxidation have been reported (Meydani et a1. 1991a;
Allard et a1. 1997). These discrepancies could be a reflection of variation in population
studied, composition of supplement used, dosage and/or the duration of the study.
Indeed, there is evidence that low n-3 intake exerts an anti-oxidant effect, whereas the
higher might rather promote peroxidation(Guillot et a1. 2009). The positive effect of
supplementation with n-3 on anti-oxidant capacity observed in this study could be
attributed to relatively low dosage (250-750 mg/d) of n-3 FA with high DHA/EPA
ratio.
Different mechanisms have been suggested to explain the anti-oxidant effect of n- fatty
acids. The enhanced free radical scavenging capacity of DHA has been regarded as one
136

Chapter Four- Omega-3 PUFA and oxidative status
of the major mechanisms(Yavin 2006). Other potential mechanisms for the decrease in
OS may relate to assembly on n-3 fatty acids in membrane lipids making the double
bond less vulnerable to ROS attacks(Applegate and Glomset 1986). In addition, there is
evidence n-3 FA modulates anti-oxidant enzymes activity(Takahashi et al. 2002; Iraz et
al. 2005) and inhibits pro-oxidant enzymes NAD(P) H oxidase and phospholipase A2
(Mori et al. 2003; Richard D 2008).
Anti-oxidant enzymes provide the first line of cellular defence against toxic free
radicals(Gizi et al. 2011).5tudies have shown, the red blood cell anti-oxidant enzymes
activities are responsive to variations in environmental factors, including diet, and
degree of oxidative stress (Andersen et al. 1997; Iraz et al. 2005; Ji et al. 2006). Data
about the effect of omega-3 fatty acids on superoxide dismutase (SOD) activity are
contradictory (Song and Miyazawa 2001; Sarsilmaz et al. 2003; Erdogan et al. 2004). In
accordance with studies conducted in rats(Iraz et al. 2005) and patients with ulcerative
colitis(Barbosa et al. 2003), n-3 fatty acids supplementation in this study caused no
significant difference in activity compared to placebo group. The observed significant
decrease of SOD activity in both placebo and active group is intriguing. However,
vitamin E which was added in a very small amount to supplement capsules may be
implicated in the SOD reduction after intervention. There is evidence that vitamin E
supplementation induces significant reduction in SOD activity in conditions associated
with high oxidative stress status (Wang et al. 2010; Abd Hamid et al. 2011).
In contrast to other clinical trials in patients with hyperlipidemia and psoriasis(Olivieri
et al. 1988; Corrocher et al. 1989; Mabile et al. 2001), Glutathione peroxidase-1 (GPx-1)
activity decreased significantly after intervention. The previous studies were
conducted in relatively small sample size for short period of time and used very high
dose, the factors which may explain the discrepancies in the results. Similarly, Delton
Vanderbroucke etal(200l) reported decreased GPx activity in cell lines incubated in
low but not high concentration of DHA. Hence, taking into account the enhanced
vitamin E levels and preserved DMA concentration after n-3 supplementation, the
observed reduction in GPx-1 could be interpreted as a reflection of decreased oxidative
stress levels. Nevertheless, the possibility that other anti-oxidant and oxidative stress
137

Chapter Four- Omega-3 PUFA and oxidative status
markers not assessed in the present study were enhanced can not be excluded; further
analysis and investigations may be of interest.
In conclusion, our results show that low supplementation dose n-3 FA of high
DHA/EPA ratio modulated positively the RBC membrane fatty acids abnormality
with no sign of additional oxidative stress. In addition, long term supplementation
provided more anti-oxidant protection capacity as indicated by the significant increase
in plasma vitamin E levels. This study supports the suggestions that supplementing
SCD patients with n-3 fatty acids might have beneficial clinical effect.
138

Chapter Five-LC PUFA and clinical outcomes
Chaper Five
Long chain omega-3 fatty acids and clinical outcomes in patients with homozygous Sickle cell disease- Randomised, placebo-controlled, double blinded clinical trial
139

Chapter Five-LC PUFA and clinical outcomes
5.1 Introduction: Sickle Cell Disease (SCD) is a group of autosomal recessive genetic blood disorders
characterised by single point mutation in the sixth codon of the p globin gene. The
resultant abnormal haemoglobin S (HbS), under low oxygen tension, polymerises and
causes rigid and sickle-shaped red blood cells.(Rees et a1. 2010) Homozygous sickle cell
disease (HbSS), also known as sickle cell anaemia, is the major and severest
forrn.(Serjeant 2001) In sub-Sahara Africa, the prevalence of sickle cell trait (AS) ranges
between 5 and 40%(Weatherall et a1. 2006) and more than 230,000 (0.74% of total birth)
babies are born with sickle anaemia every year.(Weatherall et al. 2006),(Modell and
Darlison 2008) Vaso-occlusive crisis is the main clinical manifestation and cause of
hospitalisation, organ damage and death.(Platt et a1. 1994; Perronne et a1. 2002; Ballas et
al. 2010) Stroke is the most serious complication and the major cause of physical
disability and cognitive impairment.(Hogan et al. 2006a; Kirkham 2007) Over 10% of
patients with sickle cell anaemia develop overt stroke and about 22% show evidence of
silent cerebral infarction.(Ohene-Frempong et al. 1998; Alkan et al. 2009) In Africa, life
expectancy of patients with SCD is less than 20 years(Tshilolo et al. 2008) and those
under 5 years of age are at a highest risk of death. (Makani et a1. 2011)
It was thought that vaso-occlusive crisis is caused by a mechanical obstruction of small
blood vessels by rigidly distorted (sickled) red blood cells.(Raphael 2005) There is no
relationship between number of irreversible sickle cells and vaso-occlusive
crisis.(Zipursky et al. 1993; Barker and Wandersee 1999) However, blood cells of sickle
cell patients have a tendency to adhere to vascular endothelium and there is a
correlation between blood cell-vessel wall adhesive interactions and vaso-occlusive
crisis. (Hebbel et al. 1980; Zennadi et a1. 2008; Kaul et a1. 2009) These findings have
lead to the current postulation that an enhanced tendency of red cells (sickled and non
sickled) to adhere to vascular endothelium and activation of platelets and leukocytes
are the primary causative factors of vaso-ocdusion.(Kaul et a1. 1996; Okpala 2006;
Frenette and Atweh 2007) The aforementioned factors are strongly modulated by cell
membrane polyunsaturated fatty acids (PUFA).(Harbige et a1. 1990; Meydani et al.
140

Chapter Five-LC PUFA and clinical outcomes
1991b; Hagve et al. 1993; Mills et al. 1993; Nishiyama et al. 2000; Mukherjee et al. 2004)
Steady state sickle cell patients have abnormal red cell, platelet and mononuclear cell
PUF A composition characterised by increased arachidonic (A A, 20:4n-6), adrenic
(22:4u>-6) and os bond (22:Sn-6), and decreased linoleic (LA, 18:2n-6), eicosapentaenoic
(EPA, 20:Sn-3) and docosahexaenoic (DHA, 22:6n-3) acid.(Connor et al. 1997; Ren et al.
2005b) The above studies(Harbige et al. 1990; Meydani et al. 1991b; Hagve et al. 1993;
Mills et al. 1993; Nishiyama et al. 2000; Mukherjee et al. 2004), taken together, suggest
that abnormality of blood cell membrane PUF A may contribute to the disregulation of
blood cell-vessel wall interaction and vaso-occlusive crisis in patients with SCD. It has
been reported that supplementation with fish oil containing n-3 fatty acids reduce the
frequency of pain episodes requiring hospital presentation (2001b) and the number of
sickle cell crisis.(Okpala et al. 2011) The latter did not use placebo controls, and both
studies were not sufficiently powered to assess unbiased outcomes. Therefore, the aim
of this double-blind placebo-controlled trial was to investigate the therapeutic potential
of n-3 fatty acids supplementation in patients with homozygous sickle cell disease.
141

Chapter Five-LC PUFA and clinical outcomes
5.2 Methods
5.2.1 Design and intervention
The study was single centre, two-arm, randomised, placebo-controlled, double blinded
clinical trial. The primary objective was to investigate the potential effect of omega-3
fatty acid on prevention of vaso-occlusive crisis in patients with homozygous sickle cell
disease. After stratification by age and gender, the subjects were randomly assigned
into treatment (n=70) or control (n=70) group. Both groups were on their respective
treatment for one year.
5.2.2 Patients Patients with homozygous sickle cell disease, aged 2 to 24 years, in regular follow up at
the outpatient SCD Referral Clinic, Ibn-Aoaf Paediatrics and Khartoum Teaching
Hospitals, Khartoum (Sudan) were enrolled between January 2009 and May 2010
(Figure 5-1), Table 5-1. The patients were in a "Steady State" defined as the absence of
evidence of fever, infection or crisis for longer than four weeks before the start of the
study. Phenotypic characteristic was confirmed with the use of cellulose acetate
electrophoresis at pH 8.5. All of the patients were on regular folate supplement and
those under five years on standard oral prophylactic penicillin. The exclusion criteria
were: presence of other chronic diseases, blood transfusion in the previous four
months, hydroxyurea treatment, a previous history of overt stroke or pregnancy,
Appendix 6.
The trial was approved by the Ethics Committee of the, Faculty of Medicine, University
of Khartoum, Sudan and the Research Ethics Committee of Southampton & South West
Hampshire, UK (REC reference number-05/Q1702/48). All participants or their
guardians provided informed written consent, Appendix 5. The trial was conducted
according to the conventional methodological standards and reported according to the
standards of the CONSORT statement.
142

Chapter Five-LC PUFA and clinical outcomes
SUDAN eGYPT Abu Simbel Tropic of CaACft'
• ,- - -wadiHalt&~ abian TJbpa Z. Dc!sa1
SAUDI ARABIA ---. UBYA
Desert =~go
0- 300 Ian o ·180 m iles
CHAO
--0.
CENTRAL AFRICAN REPUBLIC
~- -
Waue
I -- ... CONGO (ZA'iRE)
Figure 5-1 Map of Sudan Adopted from www.lonelyplanet.com/maps
. Mila kal
--
D J1BOun .",.l
ETHIOPIA
r-..... "'-'
KENYA- -,/ ,,'
Table 5-1 Demographic and clinical Characteristics of the Patients at Base Line.
Measure Omega-3 Placebo
Female 41 38
Male 29 32
Age (mean in years(± SD)) 8.1 ± 4.6 7.8 ± 5.48
Mean weight (Kg) 21.3 ± 10.5 21 .8 ± 9.65
Mean height (em) 117.5 ± 21.7 120.0 ± 22.6
No. of crisis-induced hospitalisation/year
No admission 9.8 % 10.6%
1-2 43.7% 48.7%
3-5 24.1 % 24.1 %
5> 22.4 % 16.7%
143

Chapter Five-LC PUFA and clinical outcomes
5.2.3 Randomisation and blinding
Randomisation was conducted using a sequence of computer-generated random
numbers at the Faculty of Life Sciences, London Metropolitan University (UK). The
person who performed randomisation had no knowledge about demographic, clinical
or laboratory characteristics of the patients, and staff of the SCD Referral Clinic,
investigators and participants was blinded until the biochemical and clinical outcome
data were analysed and the database unlocked.
144

... C CII E "0 ... c w
c o 'D III
~ ~
Chapter Five-LC PUFA and clinical outcomes
Assessed for eligibility (n= 225\
1
Randomized (n=1401
Excluded (n= 82)
• Not meeting inclusion criteria (n=45)
• Declined to participate (n=O ) • Loss of contacts (n=39 )
1 Allocated to receive omega-3 fatty acids Allocated to placebo (n=70)
(n=70) • Received allocated intervention
(n= 67).
• Not supplemented due to loss of contacts and conversion to hydroxyurea (n= 3)
,~
Lost to follow-up (n=9)
• Moved out of the study area (2)
• Stopped treatment (1)
• Loss of contacts (6)
•
1 Intention to treat analysis (n=67)
• Received allocated intervention (n=61)
• Not supplemented due to loss of contacts and conversion to hydroxyurea (n= 9 )
1 Lost to follow-up (n= 6)
• Moved out of the study area (1) • Stopped treatment (2) • Loss of contacts (3)
1 Intention to treat analysed (n=61)
Figure 5-2 Flow chart of the patients considered for the trial and randomisation
145

Chapter Five-LC PUFA and clinical outcomes
5.2.4 Procedure
Subsequent to randomisation, the patients were given, daily, for one year, one (2-4 year
old), two (5-10), three (11-16) or four (~ 17) omega 3 or placebo capsules. The omega 3
capsule contains 277.8 mg DHA and 39.0 mg EPA and the placebo high oleic acid (41 %)
oil blend. The antioxidant vitamin E, 1 -5mgJ capsule, was added to both types of
capsules to prevent peroxidation
The base line data were collected by completing a pre-structured questionnaire,
Appendix 6. The data collected were the name, enrolment identity number, sex,
residence, ethnic group, weight, height, number of hospital admission due to sickle cell
disease during last year, history of blood transfusion and sickle cell complications.
Whole blood (about 10 ml) was collected from both groups at recruitment and one year
for measurement of Complete Blood Count (CBC) and fatty acids profile. The
extraction of red blood cell lipid and analysis of red blood cell phospholipids fatty acid
composition is described in chapter 2, section 2-3.
The patients were provided with monthly self-assessment health records to be filled in
daily basis, Appendix-7. The record assessed pain frequency, compliance to
supplementation and hospitalisation. In a monthly follow-up appointment, patients'
health records were reviewed by a medical doctor, and the patients underwent
comprehensive clinical assessment; findings were documented in structured form.
After one year of follow up, 1203 health records were collected. A telephone number to
contact the medical doctor in charge was given to all patients to provide advice and
help in case of experiencing sickle cell crisis or severe complications.
5.2.5 Outcome assessment
Vaso-occlusive crisis was defined as a painful event characterised by musculoskeletal
and/ or visceral pain not otherwise explained, usually associated with mild pyrexia
and the passage of dark or red urine (Serjeant 1985). The primary end point was
annualised rates of clinical vaso-occlusive crisis, which is defined as painful that leads
to hospitalization. Secondary end points were incidence of severe anaemia
(haemoglobin concentration < 5.0 mg/ dl), rate of blood transfusion, school attendance,
Hb levels and mean cell volume (MCV).
146

Chapter Five-lC PUFA and clinical outcomes
The design did not include active surveillance of harm; the participants' observations
about the supplementation effects were systemically recorded.
5.2.6 Blood sampling and complete blood count (CBC)
Blood sample collection and complete blood count procedure are described in
chapter2, section 2.2.1.
5.2.7 Statistical analysis
The data are presented as meant standard deviation (sd), median and percentile or
median and inter-quartile range (IQR). The treatment effects were compared on the
basis of annualised vaso-occ1usive crisis rate computed by dividing the total number of
crisis experienced by the number of follow up months and multiplication by 12 (A
patient who experienced 3 crisis and followed up for 11 months will have a crisis rate
of 3 ·3/year). Statistical differences of continuous variables of the two groups were
examined with Mann-Whitney-Wilcoxon or t-test depending on the homogeneity of
variance (data distribution). Categorical data differences were explored with Fisher's
exact test for expected frequency of less than five or chi-squared test for five or more.
All patients who started the treatment regardless of the duration of supplementation or
follow-up period were analysed. Statistical analysis was performed with the use of the
software, SPSS for Windows, version 17 (SPSS Ltd., Woking, Surrey, UK).
147
Chapter Five-LC PUFA and clinical outcomes
5.3 Results Two hundred twenty-five homozygous sickle cell patients were screened for eligibility.
Of these, one hundred forty were randomised on the basis of fulfilling the inclusion
criteria, and one hundred twenty-eight received omega 3 or placebo, followed up and
analysed (Figure 5- 2). Seventeen patients, eleven omega 3 and six placebo groups, had
a follow up period of less than six months and the median follow period was 10
months.
There were no significant differences with regard to gender, age, ethnic background,
disease severity, haemoglobin phenotype (HbSS), haematological profile (Table 5-1 &
Table5-2) and red blood fatty acid composition before the start of supplementation
(Figures 5-4, 5-5, 5-6 and 5- 7).
After one year of supplementation, n-3 fatty acids EPA and DHA were significantly
higher in the red blood cells of the active group compared to the placebo group both in
ethanolamine phosphoglyceride (Figure 5-4) and choline phosphoglyceride(Fig 5-6).
On the other hand, the omega-6 linoleic acid (LA) and arachidonic acid (AA) were
significantly lower in the red blood cells of the active group in comparison to placebo
group in EPG and ePG (Figure 5-5 and 5- 7).
In intention to treat analysis, the clinical vaso-occlusive crisis (primary outcome) was
significantly lower in omega-3 supplemented group, with median rates 0.00 per year
on omega-3 fatty acids group compared to 1 in the placebo group (P< 0.0001) (Table 5-
3) and (Figure 5-3). In the omega 3 group, the odds ratio of having clinical vaso
occlusive crisis at least once during the study period was reduced to 0 '21 (95%CI: 0 D9-
0.47, p<O DOl). The median annual rates of vaso-occlusive crisis regardless of
hospitalisation were also significantly lower in omega-3 supplemented groups (2.7 Vs
4.6; P < 0.01) (Table 5-3). the number of inpatient days due to sickle cell disease crisis
and its associated complications were significantly lower in omega-fatty acid
supplemented group (median=O.OO, IQR=l) compared to placebo group (median=O.OO,
IQR=6, P< 0.05).
There were no significant differences in risk of stroke, sequestration crisis and vascular
necrosis between two groups. However, the incidence of severe anaemia and the
148

Chapter Five-LC PUFA and clinical outcomes
percentage of patients who required blood transfusions were significantly lower in n-3
fatty acids supplemented group compared to placebo group, (Table 5-4).
In analysis of effect of supplementation on the school attendance only n=95
Participants were included (n=46 on placebo and n=49 on active supplements) as the
rest n=45 were not of school age at the time of the study. The median of absence from
school due sickle cell complications was significantly lower on omega-3 fatty acids
supplemented group (P<0.02), (table 5-4). The odds ratio of inability to attend school at
least once during the study period due to the disease was significantly reduced in
omega-3 fatty acids group to 0.40 (95%CI: 0.18-0.92; P< 0.03).
Haemoglobin level (Hb), mean corpuscular volumes (MCV), mean corpuscular
haemoglobin (MCH) and mean corpuscular haemoglobin concentration (MCHC) were
significantly higher in both groups after supplementation. Whereas the total white
blood cell counts (TWC) were significantly lower in omega 3 fatty acids supplemented
group but not on placebo group. Platelet (PLTs) counts remained unchanged on both
groups, (Table 5-2).
5.3.1 Harms No allergies, or adverse effects attributed to supplementation were recorded. There
were no symptoms of easy bruising or episodes of spontaneous haemorrhage. Very
few patients on placebo or active treatment complained of dyspepsia. Some patients
from the active group reported increased appetite especially during the first two
month of usage.
149

Chapter Five-LC PUFA and clinical outcomes
Table 5-2 Complete blood count at base line and one year after intervention
Omega-3 fatty acids group Placebo group
Baseline One year Baseline One year
Hbgjl 67.10± 8.52 76.30± 8.50*** 67.45± 8.32 77.00± 10.15***
Hct (%) 21.12± 3.29 21.04±2.32 22.26± 3.02 21.67± 3.61
MCV (fl) 80.10± 5.55 82.70± 6.14*** 79.34± 6.55 80.62± 7.23*
MCH (pg/L) 24.85±2.11 30.36±2.55*** 24.73±2.38 29.37±3.08***
MCHC 30.85± 0.84 36.62± 1.43*** 31.22± 1.11 36.69± 1.30***
TWBC(x103/pL) 15.63± 3.97 14.40± 3.34* 14.53± 5.28 14.00± 5.13
PLTs (xl03/pL) 516.78± 148.78 487.43± 114.72 496.8± 146.55 450.65± 165.05
Table 5-3 Annual rates of vaso-occlusive crisis and clinical vaso-occlusive crisis
Omega-3 Placebo
Measure (n=67) (n=61)
Vaso-occlusive crisis ..
Minimal Value 0.0 0.0 25th percentile 0.9 3 Median Value 2.7 4.6
75th percentile 4.8 6.4
Maximal value 12 12
Clinical Vasa-occlusive crisis ....
Minimal value 0.0 0.0 25th percentile 0.0 0.0 Median Value 0.0 1.0 75th percentile 0.9 2.4 Maximum Value 4.0 6.00
*p<O.01, **P<O.OOOl Va so-occlusive crisis -painful event regardless of hospitalisation as reported by the patients. Clinical vaso-occlusive crisis- Vaso-occlusive crisis which leads to hospitalization.
150

Chapter Five-LC PUFA and clinical outcomes
MO
-~ 70 • --OJ .. ..... ~ 60 ~
• • .....
t: 50 OJ • :;- --r-Actiw L:J OJ 40 :;-... ..... ttl
!J 30
E !J 20 U
JO
0
• •
• • . .. ... -~ -6"-. ,,~ ....
..... --~- .. -~- .. "
2 :l 4 , 6 i ~ 9 10 11 12
Months of Treatment
Figure 5-3 Comparison of the cumulative clinical vaso-occlusive crisis of active and placebo
groups
Table 5-4 Sickle cell-associated Complications in active and placebo group after intervention
Measure Omega-3 Placebo Pvalue
Severe anaemia (%) (%) (2/67)3 ·2 10/61)16 0.03
Sequestration crisis (%) (1/67)1·5 (2/61)3 ·3 0·5
A-vascular necrosis (%) (1/67)1-5 (2/61)3 -3 0-5
Stroke (%) (0/67)0 () 2/61)3 -3 0.5
Blood transfusion (%) (3/67)4 ·5 (10/61)1 0.03 Absence from School per year-days (Median o () (7-6) 4 -3 (21-1) 0.02
(IQR»
151

Chapter Five-LC PUFA and clinical outcomes
10 - .' .. ' 9 -
8 -
7 -
6
?Ie 5 - NS • Active
4 - o Placebo 3 -
2 -
1 -
0
EPA DHA EPA DHA
Zero-time One- year _____________ J
Figure 5-4 Red blood ceIl EPA and DHA percentages of ethanolamine phosphoglyceride before and after the intervention.
30 -
'?I!. 15 .Active
[] Placebo
o LA AA LA AA
Zero-time One- year
L ------------------ ---- -- ---- ---------________ ---1
Figure 5-5 Red blood cell LA and AA percentages of ethanolamine phosphoglyceride before and after the intervention.
152

Chapter Five-LC PUFA and clinical outcomes
5 -
4
3
~ 0 2
1
NS 0 ...........
EP.-\
NS
- IJ. DH.-\
Zero· tune
11-" a·
EP.-\ DH.-\
• Acti,-e
o Placebo
Figure 5-6 Red blood cells EPA and DHA percentages of outer cell membrane choline phosphoglyceraide before and after the intervention_
25 -
20 - NS
o
Zero· tune 0 ne- n'cu-
Figure 5-7 Red blood cells LA and AA percentages of outer cell membrane choline phosphoglyceride before and after the intervention
153
• . -\ctiye
[] Placebo

Chapter Five-LC PUFA and clinical outcomes
5.4 Discussion: This randomised clinical trial signifies that omega-3 fatty acid supplementation on
homozygous sickle cell disease reduces the median annual rate of vaso-occlusive crisis
by 41.3 % and a 100% reduction in median annual rate of clinical vaso-oocc1usive crisis,
81.7% reduction on haemolytic crisis and 72.7% reduction on annul rate of blood
transfusion. These results show that DHA and EPA improve the clinical course of
sickle cell patients and decrease the severity of the disease. These beneficial effects of
DHA and EPA reflected on the quality of life of the patients as measured by the
significant reduction of days out of school due to the disease and the risk of inability to
attend school at least once due to disease.
The outcomes of supplementation on pain frequency are in accordance with the results
reported by Tomer et al (2001b) in adult patients. The previous study based on a very
small sample size (n=10, 5 patients in each arm) and only patients of severe course
were included. These two limitation factors were well controlled in this study.
Moreover, the participants were both children and young adults, overcoming one of
the major pitfalls of clinical trial in sickle cell disease (Debaun and Field 2007).
The effect of supplementation on stroke, sequestration crisis and vascular necrosis
showed no significant differences. This is intelligible, taking in account that the trial
was not powered to detect the effect on these complications. However, the results
revealed general positive trends that deserve more investigation. Especially in regard
to stroke as some other emerging evidence indicates fish consumption (omega-3 rich
diet) may have a good preventive effect (He et a1. 2004; Larsson et a1. 2011).
The observed decrease rate of haemolytic rate and blood transfusion in active group
are in accordance with previous studies in rabbits(van den Berg et a1. 1991) and healthy
people (Mabile et a1. 2001). These studies demonstrated reduced levels of haemolysis
after omega-3 supplementation. Moreover, in seD patients (in print) we observed a
significant reduction in markers of haemolysis after omega-3 fatty acids
supplementation. These findings do emphasis the predicted anti-haemolytic role of
omega-3 fatty acids.
154

Chapter Five-LC PUFA and clinical outcomes
Intriguingly, the Hb concentration and MCH levels were increased to equivalent levels
in placebo and active group. These results indicate that factors other than omega-3
fatty acids might have influenced the increase in Hb levels. A singular factor that may
have played a role is vitamin E, which was added in a very small concentration to
protect supplemented fatty acids from peroxidation. There is evidence, that
supplementing SCD patients with vitamin E increases haemoglobin concentration,
percent foetal haemoglobin, forearm blood flow and resistance of the cell to lysis
(Gbenebitse et al. 2005; Jaja et al. 2005). Hence, we postulate that a combination of
omega-3 with higher doses of vitamin E may provide extra beneficial effect to patients
withSCD.
The omega-3 fatty acids supplement used in this study were composed of high DHA
(54.9%) and low EPA (7.7%). This was particularly designed to ameliorate the observed
reduction of DHA and EPA concentration on blood cell membrane in SCD. Among the
omega-3 fatty acids, DHA reduction was more pronounced (Connor et al. 1997; Ren et
al. 2005b). The second reason for using relatively lower EPA percentage is to anticipate
the possibility of haemorrhage due to EPA anti-aggregatory effect (Park Y 2002;
Nomura et al. 2003). Further more, the unsaturation index of DHA is higher than EPA,
providing greater influence on cell membrane deformability and fluidity (Hashimoto
et al. 1999).
The base line red blood cell omega-3 fatty acids concentration of sickler Sudanese
patients were lower than we had previously observed in patients from Nigerian and
British populations (Ren et al. 2005a; Ren et al. 2006). This difference is most likely a
reflection of the n-3 fatty acid status of the population studied since we have found
North Sudanese maternal milk (Nyuar KB 2010) and blood of healthy Sudanese
children(Daak et al. 2011) have very low content of these nutrients. These low levels of
base line omega-3 fatty allowed massive change in fatty acids profile due to omega-3
supplementation. The EPA & DHA concentrations of red blood cell from active group
increased by three fold accompanied with significant reduction on arachidonic acid.
Whereas the EPA and DHA percentages of placebo group remained unchanged with
slight increase in omega-6 linoleic and archidonic acids, which may be due to placebo
supplement. These notable modulations in fatty acid profile may have played a part in
155

Chapter Five-LC PUFA and clinical outcomes
ensuring the explicitness of effects observed owing to omega-3 fatty acid
supplementation. On the other hand, a very valid question should be raised, whether
the same evident response is reproducible in high omega-3 intake communities? And
whether high habitual intake of omega-3 fatty acids has any role in modifying the
clinical course of the disease? Indeed, these two questions warrant proper
investigation.
Taking in account the myriad biochemical effects of omega-3 fatty acids, many
mechanisms may be involved in amelioration of vaso-occlusive crisis and lessening the
rate of haemolytic crisis. However, according to pathophysiology of SCD some
mechanisms may be of grater relevance than others. Firstly, DHA and EPA proved to
be effective in treatment of some chronic inflammatory disorders and cardiovascular
diseases (Cleland and James 2000; Calder 2002; Ruxton et al. 2005). These effects
attributed to decrease in n-6/n-3 ratio which in favour of production of more anti
coagulant and anti-inflammatory n-3 -series prostaglandins (Fischer et a1. 1988; Knapp
1990; Mantzioris et al. 2000; Bagga et al. 2003). Moreover, it has been shown that
omega-3 fatty acids supplementation do reduce the expression of adhesive molecules
on blood and endothelial cells (Mayer et a1. 2002; Tian H 2009). Second, the significant
increase in MCV in active group can not be explained merely by the increase of Hb and
MCH, as the same amount of increase in Hb occurred in the placebo group without
causing equal increase in MCV. It is possible that the increase in MCV is a reflection of
improved cell membrane prosperi ties and hydration state. Indeed, there is evidence,
DHA reduces oxidative damage in SCD and improves red cell deformability and
hydration state (Relton et a1. 1993; Maccoll et a1. 1996; Bechoua et al. 1999; Valentine
and Valentine 2004; Yavin 2006; Brand et a1. 2008; Ren et a1. 2008).
The current data obtained from this RCT did not provide an answer about the long
term effects of supplementation, specially the potential role of DHA and EPA in
prevention of neurological and cognitive complications in children with SCD.
Moreover, in this study we excluded children less than two years, and knowing the
fact that organ damage starts when SCD children as young as 9 months, investigating
of effect of supplementations in these group of patients is of great importance.
156

Chapter Five-LC PUFA and clinical outcomes
The advantages of this study include the randomised double blind design and the
duration of supplement. Among the disadvantages, only homozygous SeD patients
were enrolled excluding other phenotypes and no objective measures were used to
assess the severity of vaso-occlusive besides the hospitalization.
In conclusion, our data suggest that DHA and EPA could be safe and effective therapy
for prevention of vaso-occlusive crisis and decrease the rate of haemolysis in
homozygous sickle cell disease.
157

Chapter Six- LCPUFA and markers of haemolysis
Chapter Six
Long chain omega-3 fatty acids and markers of haemolysis in patients with homozygous
Sickle cell disease
158

Chapter Six- LCPUFA and markers of haemolysis
6.1 Introduction Chronic haemolytic anaemia is one of the major clinical manifestations of homozygous
sickle cell disease (SCD), both during steady state and acute exacerbation events of the
disease (Ballas and Marcolina 2006). Several studies suggest haemolysis is a primary
determinant of cardiopulmonary complications(Gladwin and Kato 2005),
glomerulopathy(Maier-Redelsperger et al. 2010), priapism(Nolan et al. 2005), leg ulcer
and death(Kato et al. 2006).
Haemolysis in sickle cell disease is often precipitated by inflammation and increased
endothelial-leukocyte-erythrocyte adhesive interaction (Rees et al. 2010), high oxidative
stress(Wood and Granger 2007) and changes in red blood cell deformability(Ballas and
Mohandas 2004). Inflammation, cell adhesion, red cell deformability and oxidative
stress are known to be strongly modulated by cell membrane fatty acids (FA) (Mills et
a1. 1993; Nishiyama et a1. 2000; Saito and Kubo 2003; Mukherjee et al. 2004). Hence, it is
conceivable that fatty acids composition of red cell membrane might influence the
degree of haemolysis in SCD. In accordance to this assumption, previous studies have
shown that red blood cell membrane of patients with SCD have abnormal fatty acid
composition. The abnormality is typically characterized by high n-6 and low n-3 long
chain polyunsaturated fatty acids (Connor et a1. 1997; Ren et a1. 2005b; Daak et a1.
2011). In addition, Ren et al (2005a) reported that Hb concentration in SCD patients
correlates positively with omega-3 fatty acid in red blood cell membrane. Interestingly,
there is evidence supplementation with omega-3 fatty acid reduces haemolysis in
rabbits and healthy human(van den Berg et a1. 1991; Mabile et a1. 2001). Hence, it is
plaUSible that correction of the imbalanced cell membrane fatty acid abnormality by
supplementation with n-3 eicosapentanoic (EPA) and docosapentanoic (DHA) fatty
acids could ameliorate anaemia and reduce haemolysis in patients with SCD.
In this study we have investigated the potential effect of n-3 fatty acid supplementation
on haemolysis in children with homozygous sickle cell disease.
159

Chapter Six- LCPUFA and markers of haemolysis
6.2 Patients, Material and Methods
6.2.1 Subjects Steady state HbSS sickle cell patients age 3-12 (n=21), twelve male (n=12) and nine
female (n=9) were enrolled from Abnaof Paediatric Hospital, Khartoum, Sudan. Steady
state was defined by absence of evidence of fever, infection or crisis for at least four
weeks before the study. The phenotypic characteristic was confirmed by cellulose
acetate electrophoresis. All of the patients were on regular folate supplement, those
younger than five years were receiving daily prophylactic dose of phenoxypenicillin
before and during the study. The exclusion criteria were: sickle cell crisis, acute illness
in the pervious one-month, presence of other chronic diseases, blood transfusion in the
previous four-months or hydroxyurea treatment. According to age group 2-4 years, 5-
10 years and >11 years, the enrolled subjects were supplemented daily with 250 mg,
500 mg, 750 mg of high docosahexanoic n-3 fatty acid respectively. The subjects were
on continuous supplementation for one year. To prevent lipids peroxidation 1.5
mg/ capsule of a-tocopherol (vit E) was added to each capsule. The Research Board of
the Faculty of Medicine, University of Khartoum, Sudan, and The Research Ethics
Committee of Southampton & South West Hampshire, UK (REC reference number-
05/ Q1702/ 48) approved the study. The guardians of all participants provided
informed written consent.
6.2.2 Blood sample collection and processing
After an overnight fast, 5 rnl of whole blood were taken in EDT A tubes from patients at
zero-time and one-year of supplementation. The separation of blood component is
decribed in chapter 2, section 2.2.2.
6.2.3 Complete blood count (CBC)
The complet blood count was measured as described in chapter 2, section 2.2.1.
6.2.4 Analysis of red blood cell fatty acids
The procedure of lipid extraction and fatty acid analysis of red blood cell is described
in chapter 2, section 2-3.
160

Chapter Six- LCPUFA and markers of haemolysis
6.2.5 Measurement of plasma lactate dehydrogenase (LDH) and haptoglobin
(Hp)
The procedures of plasma LDH and Hp are described in chapter 2, section 2-7 and 2-8
respectively.
6.2.6 Measurement of plasma a-tocopherol concentration
The procedure of plasma a-tocopherol extraction and analysis of is described in
chapter 2, section 2-5.
6.2.7 Statistical analysis
The data are expressed as mean ± SD. Paired t-test was used to explore differences in
concentrations of LDH, fatty acids, vitamin E and blood parameter before and after
supplementation. Pearson correlation was used to investigate the association between
fatty acids. The Statistical significance was assumed at a lip" value of less than 0.05. The
statistical software, SPSS for Windows, Version 17 (SPSS Ltd., Woking, Surrey, UK)
was used to analyse the data.
161

Chapter Six- LCPUFA and markers of haemolysis
6.3 Results
6.3.1 Serum lactate dehydrogenase and haptoglobin
Mean plasma LDH (fig.6-1a) was significantly lower after one year of supplementation
with n-3 fatty acids (P= 0.005). The difference between female and male was not
significant either before (907.35± 321.31 lUll vs. 7S1.27± 219.43; P=0.2) or after (588.73±
128.9 lUll vs. 651.20± 257.70; P= 0.005) supplementation.
Plasma haptoglobin levels showed no difference before and after supplementation
(P=0.3) (Fig.6-1b).
a b 1400 - P<0.005 -- 0.20 - P>0.05
1200 ~
~ c
1000 c 0.15 r 5
~ ~ 1 800 § < -Q 600 ~ 0.10 .... 400
200 0.05 Zero-time On..-year Zero-time One-year
Figure 6-1 a) Lactate dehydrogenase (LDH) b)Haptoglobin levels before and after one year of supplementation with n-3 fatty acids.
6.3.2 EPA DHA and AA levels of Red blood cell membrane
N-3 fatty acids EPA and DHA were significantly higher after one year of
supplementation with n-3 fatty acids (P< 0.0001), Table. 1. In contrast, n-6 fatty acids
arachidonic acid (AA) was significantly lower after supplementation (P< 0.0001), Table
6-1.
After supplementation, n-6/n-3 ratio was significantly decreased (10.4±2.3 vs 4.0±2.1, P=
0.001), AA and total n-6 fatty acids were inversely correlated with DHA and total n-3
fatty acids (R=0.53; P= 0.02 & R=0.85; P=O.OOOl respectively)
6.3.3 Haematological parameters
Haemoglobin (Hb, P< 0.01), mean corpuscular volume (MCV, P<0.004), mean
corpuscular haemoglobin (MCH, P<O.OOOl,) and mean corpuscular haemoglobin
concentrations (MCHC, P<O.OOOl) were significantly higher after one year of 162

Chapter Six- LCPUFA and markers of haemolysis
supplementation. The total white blood cell and platelets were significantly lower after
one year of supplementation (P=O.05, P=O.04). Red blood cell count (RBC) and
haematocrit (Hct) showed no difference before and after supplementation, Table 6-1.
163

Chapter Six- LCPUFA and markers of haemolysis
Table 6-1 Paired haematological and biochemical data measures of steady-state HbSS patients studied before and after supplementation with n-3 fatty acids.
Measure HbAA HbSS HbSS
Reference values Zero-time One-Year
(range)
Blood count
Hbg/L 66.73 ± 13.2 76.00 ± 9.40 102.0- 152.0
Hct (%) 20.81 ± 4.13 20.84 ± 2.47 36.0-46.0
MCV (fL) 79.92 ± 5.61 82.85 ± 5.5 78.0- 94.0
MCH (pg/L) 24.73 ± 2.17 30.25 ± 2.57 23.0- 31.0
MCHC 30.9 ± 0.74 36.5 ± 1.76 32.0 -36.0
RBC count (x106/pL) 2.54 ± 0.50 2.51 ± 0.31 4.0 -5.2
PLTs (x103/pL) 574.2 ± 239. 469.8 ± 146.9 150.0 -450.0
TWB (xl03/pL) 17.62 ± 9.38 13.99 ± 2.69 5.0-17.0
PE fatty acids
composition
EPA (%) 0.11 ± 0.04 0.34 ± 0.19 0.5-1.6
DHA (%) 2.57 ± 0.73 8.89 ± 2.85 6.0-11.0
AA(%) 24.47 ± 1.03 22.09 ± 1.66 19.0- 26.0
Vitamin E Jlmol/l 10.20 ± 3.62 14.54 ± 2.62 8.4-26.1
* PE- Ethanolamine phosphoglyceride
164
Pvalue
0.01
0.40
0.004
0.0001
0.0001
0.3
0.04
0.05
0.0001
0.0001
0.0001
0.001

Chapter Six- LCPUFA and markers of haemolysis
6.4 Discussion Chronic haemolysis is a principal feature of HbSS (Ballas and Marcolina 2006). In this
study we found that supplementation with omega-3 fatty acids caused a remarkable
effect on haematological parameters and significant reduction in haemolysis rate, as
indicated by the decrease of plasma lactate dehydrogenase levels. The observed
responses due supplementation are unlikely to be a reflection of variation in the
clinical state, as all participants were on steady state at recruitment, and none of them
showed sign of infection or malaria. Moreover, the after-supplementation blood
samples were collected exactly at the same time of zero-time sampling. Hence,
excluding the potential effect of seasonal temperature (Smith et a1. 2009), and hydration
state(Fowler et al. 2010).
In contrast to previous studies(Muskiet et al. 1991; Tomer et a1. 2001b), the
supplementation with omega-3 resulted in increased haemoglobin by 13.9%, MCH by
22.5%, and MCHC by 18.1%. Conversely, the total white blood cell (TWBC) and
platelets (PLTs) count were reduced by 20.5% and 18.2% respectively. These
differences in haematological outcomes from previous studies may be due to
composition of the supplement used in this study (high DHA), or the relatively long
duration of supplementation period.
The improvements in MCV can be merely a reflection of increased red cell
haemoglobin content (MCH) and/or enhanced hydration as a result of omega-3
induced membrane modifications (Ballas 2000; Djemli-Shipkolye et a1. 2(03).
Considering the concomitant increase in MCHC as determinate of red cell density, the
detected increase in MCV is more likely an outcome of increased MCH. The increase in
MCHC with concomitant decrease in overall haemolysis is intriguing. However it may
support the line of argument proposing that, no relation exist between the percentages
of dense cell and disease severity(Billett et a1. 1986).
The observed decrease in PLTs and TWBC owing to omega-3 fatty acids
supplementation is constituent with findings obtained from conditions other than SCD
(Hamazaki et al. 1984; Mukaro et al. 2008; Park and Harris 2009). It is tenable; these
165

Chapter Six- LCPUFA and markers of haemolysis
reductions in blood cell count is a manifestation of an improved inflammatory state
(Ataga and Orringer 2003; Semple and Freedman 2010) or diminished haemopoietic
activity of the bone marrow(Tancabelic et a1. 1999). Interestingly, red blood cell count
remained unchained after supplementation despite decrease in haemolysis. This
finding together with reduced PLTs and TWBC suggests reduced bone marrow
activity. There is evidence, omega-3 fatty acids supplementation reduces proliferation
of myeloid progenitors and bone marrow expansion and promote differentiation
(Varney et a1. 2009).
In accordance to previous studies, the haptoglobin level in zero-time was very low
signifying predominant haemolysis effect in steady state SCD patients (Singhal et a1.
1993; Bourantas et a1. 1998). Startlingly, haptoglobin levels remained unchanged after
supplementation despite remarkable decrease in haemolysis. These paradoxical result
can be explained by considering the dual function of Haptoglobin, an acute phase
protein (Kato 2009) as well as primary Hb scavenger in the circulation level (Ascenzi et
al. 2005). Therefore, the plasma concentration is an outcome of the balance between
degree of consumption determined by haemolysis rate and production that increases in
inflammatory state. The significant decrease in TWBC implies a decreased
inflammatory state due omega-3 supplementation. Moreover, Wigmore et al(1997)
observed in cultured human hepatocytes treated with omega-3 fatty acids that the
production of haptoglobin is decreased. Hence, it is possible the expected increase in
haptoglobin was disguised by coincident decrease in production due to overall
decrease in inflammatory state or the direct omega-3 fatty acid suppressive effect.
High steady state Lactate dehydrogenase(Kato et a1. 2006; Gurkan et a1. 2010),
platelets(Sarris et a1. 2008), increased white cell count and low Hb(Miller et a1. 2000) are
widely considered adverse risk factor for survival and sever clinical course. In this
study, omega-3 fatty acids affected positively the four parameters; suggesting a
beneficial effect on long term clinical course. Moreover, Tomer et al(2001b) in a pilot
study has reported fish oil (rich in omega-3) reduces markers of thrombosis. It would
be of interest to investigate the short and long-term clinical effect of omega-3 fatty
acids supplementation in SCD.
166

Chapter Six- LCPUFA and markers of haemolysis
The measurement of omega-3 fatty acids after one year of supplementation showed
threefold increase in EPA and DHA and parallel reduction in AA and nomega-
6/omega-3 ratio. These findings are broadly similar to previous studies(Muskiet et a1.
1991; Tomer et a1. 2001b).The question is; How these profound alteration in red cell
membrane fatty acid composition could contribute in reduction of haemolysis rate?
Firstly, enrichment cell membrane with long chain omega-3 fatty acids increases the
total unsaturation index(Hashimoto et a1. 1999), enhance red cell deformability(Terano
et a1. 1983; Mills et a1. 1993) and resistibility of red blood cell to haemolysis(Mabile et a1.
2001). Second, oxidative damage of the cell membrane is one of the major mechanism
of red cell fragmentation and haemolysis(Hebbel 2011), and it is known DHA not EPA
to have an anti-oxidant activity (Relton et a1. 1993; Bechoua et a1. 1999; Yavin 2006;
Brand et a1. 2008). Moreover, Ren et a1. (2008) reported, DHA levels in red blood cell
phospholipids of SCD patients correlates positively with anti-oxidant enzyme activity.
Thus, it is plausible the detected reduction in haemolysis is a reflection of reduced
oxidative damage due to high DHA contents after supplementation. In agreement with
this assumption, Vitamin E concentration increased significantly after
supplementation, the thing which may indicate improvement in oxidative stress
status(Gbenebitse et a1. 2005) and it may explain partially the increased levels of Hb
and decreased rate oh haemolysis(Jaja et a1. 2005; Chaves et a1. 2008). Finally, increased
cell adhesion is provocative factor to voso-occlusion and haemolysis in SCD, and
omega-3 fatty acid supplementation proved to reduce adhesive molecules expression
in non-SCD subjects (Mayer et a1. 2002; Thies et a1. 2003) and. Therefore, it is
conceivable the observed reduction in haemolyse rate could be influenced by decrease
in blood cell adhesiveness.
In conclusion our study demonstrates, supplementing HbSS patients with omega-3
fatty acids do reduce markers of haemolysis and improve haematological parameters.
In order to investigate the clinical implications of these laboratory findings, well
designed clinical trials are needed.
167

Chapter Seven- Membrane fatty acid, adhesion and inflamation
Chapter Seven
Markers of adhesion and inflammation, and membrane fatty acid composition in
patients with homozygous Sickle cell disease
168

Chapter Seven- Membrane fatty acid, adhesion and inflamation
7.1 Introduction The classical paradigm of Sickle cell (SCD) pathophysiology has always considered
haemoglobin S (HbS) polymerisation and red cell sickling as the primary causative
factors of the acute and chronic complications associated with disease(Platt 2000).
However, emerging evidence indicates initial events in vaso-occlusion may involve
complex array of factors, both-polymerization dependent and polymerization
independent(Hebbel 1991; Embury 2004; Kaul et a!. 2009). The presence of
haemolysis(Kato et a1. 2007), intense oxidative stress(Wood and Granger 2007) and
chronic inflammatory state are among the abnormalities contribute to pathophysiology
of the SCD(Hebbel et a1. 2004).In vivo studies have shown that, inflammation and
increased leucocyte-erythrocyte-endothelial interaction are the major potential
initiating mechanisms in vaso-occlusion(Frenette 2002; Kaul and Fabry 2004; Rees et aI.
2010).
Consistent with the concept that SCD is a state of chronic inflammation, sickle cell
subjects even in II steady stat" exhibit chronically elevated levels of pro-inflammatory
cytokines (TNF-a, IL-6, IL-1p)(Pathare et aI. 2004; Lanaro et aI. 2009), acute phase
proteins (Krishnan et aI. 2010), prostaglandin E2(Graido-Gonzalez et aI. 1998). In
addition, studies showed SCD patients to have activated coagulation system,
endothelium(Solovey et aI. 2004; Ataga et aI. 2008a) and leukocytosis with activated
adhesive circulating blood ceIls(Platt 2000; Kato et a1. 2009), including
monocytes(BeIcher et a1. 2000; Chaar et aI. 2010), neutrophi1(Canalli et a1. 2008),
reticulocytes(Brittain and Parise 2008) and platelets(VilIagra et aI. 2007). A growing
body of evidence suggests that adhesive molecules involved in granulocytes and
monocytes increased adhesiveness are the cytokines-induced L-and P-selectin (CD-
62L), p2-integrin CDllb/C18 (CD-llb) and LFA-l (CDlla/CD18)(Okpala 2004; Assis
et al. 2005; Canalli et a1. 2008). Moreover, Turhan et aI. demonstrated that recruitment
of leukocytes was reduced in sickle mice lacking P- and L-selectin, resulting in
protection from vaso-occlusion and increased survival(Turhan et aI. 2002).
Interestingly, experimental and pilot studies tested the potential anti-inflammatory
(sulfasalazine, statins) (Solovey et a1. 2001; Laufs et a1. 2002; Kaul et aI. 2004; Solovey et
169

Chapter Seven- Membrane fatty acid, adhesion and inflamation
al. 2004) and anti-adhessive molecules immunoglobulin therapies (Turhan et al. 2004;
Chang et al. 2008) in SCD have shown reduction in vaso-occlusion by decreasing
blood and endothelial cells adhesion.
The mechanisms that implicate persistence of inflammation and increased blood
adhesion are not well understood. However, some unique aspects of the disease seems
to be likely proximate stimulus to inflammation(Hebbel et al. 2004). A number of
studies suggest that reperfusion injury (ischemia/reperfusion pathology) is one of the
fundamental factors inciting inflammation in SCD(Solovey et al. 1997; Kaul and Hebbel
2000; Hebbel et al. 2009). Metabolic changes accompanying ischemia allow an excessive
burst of oxidative stress during reoxygenation and activation of potent inflammatory
factors such NFKB(Carden and Granger 2000). Subsequently, this results in production
of inflammatory cytokines, increased activation of leukocytes and vascular
endothelium(Osarogiagbon et al. 2000). In addition, monocytes in SCD seem to have a
significant role in inflammatory state associated with SCD(Wun et al. 2002). This role is
mainly attributed to increased monocytes expression of IL-1p/TNF-a(Belcher et al.
2000) and monocyte-mediated vasculopathic lesions in SCD(Hebbel et al. 2004). Other
pathophysiological aspects of SCD that are thought to contribute to increased
adhesiveness of blood cells and hypercoagulable state are the myriad abnormalities of
blood cells membrane(Schwartz et al. 1985c; Hebbe11991; Setty et al. 2002). The major
cell membrane abnormalities reported in SCD are disruption of normal membrane
asymmetry and exposure of the reactive serine phosphoglyceride (SPG)(Tait and
Gibson 1994; Wood et al. 1996), abnormalities of phospholipids molecular
species(Connor et al. 1997), and fatty acids composition of erythrocytes(Ren et al.
2005a), platelets and mononuclear cells(Ren et al. 2005b). The fatty acids composition
abnormality characterised by presence of high n-6 and low n-3 long-chain
polyunsaturated fatty acids (LCPUFA)(Ren et al. 2005b).
The n-3 and n-6 LCPUFA are vital structural and functional components of cell and
sub-cellular component. They are precursors of eicosanoids which act as key regulators
of inflammation.(Tilley et al. 2001).In contrast to n-6 arachidonic acid- derived
eicosanoids, n-3 eicosapentanoic acid-derived ecosanoids are anti-inflammatory and
anti-aggregatory. It is well documented that increased concentration of n-3 fatty acid in
170

Chapter Seven- Membrane fatty acid, adhesion and inflamation
cell membranes shift the balance to production of more anti-inflammatory mediators
(Calder 2002). Moreover, new studies identified a novel series of mediators (resolvines,
protectins, maresins) formed from EPA and DHA with potent anti-inflammatory
actions in neutrophils and macrophages(Calder 2009; Serhan et a1. 2011). In
monocyctes, there is evidence that n-3 fatty acid inhibits production of TNF-a and IL-
1~ and reduces adhesion with endothelium (Caughey et a1. 1996; Mayer et a1.
2003).Hence, it is plausible the observed perturbation in fatty acids composition of
blood cells membrane of SCD patents might have a significant role in chronic
inflammatory and increased blood cells adhesiveness associated with the disease.
In this study we have investigated whether a) cell membrane fatty acid composition
influence the inflammatory state and blood cell adhesion b) supplementation with
DHA and EPA n-3 F As ameliorate the inflammatory state and reduces the blood cell
adhesion
7.2 Methods
7.2.1 Subjects Steady state HbSS sickle cell patients (not experienced any painful crisis or other acute
medical condition for at least 1 month) age 2-11 (n=27), sixteen male (n=16) and eleven
female (n=l1) were enrolled from Abnaof Paediatric Hospital, Khartoum, Sudan. The
patients characteristics is described in chapter 5, section 5.22.
7.2.2 Samples collection and preparation plasma, rd blood cell, monocytes,
granulocytes After an overnight fast, 10 ml of whole blood was taken into EDT A tubes and 3 ml in
serum preparation tube from the patients at zero-time and one-year of
supplementation.
Plasma, red blood cells, monocytes, granulocytes and platelets were separated as
described in chapter 2, section 2.2.2 and 2.2.3.
7.2.3 Analysis of red blood cell fatty acids
The procedure of lipid extraction and fatty acid analysis of red blood cell is described
in chapter 2, section 2-3.
171

Chapter Seven- Membrane fatty acid, adhesion and inflamation
7.2.4 Complete blood count (CBC)
The complet blood count was measured as described in chapter 2, section 2.2.1.
7.2.5 Measurements of plasma tumour necrosis factor-a (TNF-a) and
interleukin-lO (IL-lO)
The procedure of plasma TNF-o and IL-10 determination is described in chapter 2,
section 2.9.1 and 2.92 respectively.
7.2.6 Assessing p2-integrin CDllb/Cl8 (CD-llb) and L-selectin (CD62L)
expression in granulocytes and mononuclear cells
The procedure of measurement of CDllbjC18 (CD-llb) and L-selectin (CD62L)
expression in granulocytes and mononuclear cells is illustrated in chapter 2, section 2-
10.
7.2.7 Statistics
The data are expressed as mean ± SD. Non parametric test Related-Samples Wilcoxon
Signed Ranks used was used to explore differences in concentrations of TNF-o, IL-10
and adhesive molecules before and after supplementation. Independent sample Mann
Whitney U test was used to test the effect of supplementation on adhesive molecules.
Paired t-test was used to test differences in fatty acids. Pearson correlation was used to
investigate the association between fatty acids and other parameters of interest. The
Statistical significance was assumed at a lip" value of less than 0.05. The statistical
software, SPSS for Windows, Version 17 (SPSS Ltd., Woking, Surrey, UK) was used to
analyse the data.
172

Chapter Seven- Membrane fatty acid, adhesion and inflamation
7.3 Results
7.3.1 Fatty acid composition of red blood cell ethanolamine
phosphoglyceride (EPG) and choline phosphoglyceride (CPG).
The fatty acids composition of red blood cells PE and PC at baseline and after one year
of supplementations were included in Table 7-1.
7.3.2 Total white blood cell count (TWBC) and platelets (PLTs) count
The supplementation with n-3 fatty acids caused significant reduction on TWBC
(P<0.05), whereas PLTs showed no significant difference, Table 7-1.
7.3.3 Tumour necrosis factor-a (TNF-a) and Interleukin-IO (IL-IO)
The patients gender and age have no significant effect on TNF-a and IL-10
concentrations either before or after supplementation (P>O.5). No significant
differences were detected on plasma TNF-a (18.6±12.8 vs 17.8±9.1) (P=0.47, Figure.7-1,
a) and IL-10 (1l.0±4.3 vs 1l.3±5.8) (P=, 0.7, Figur.7-1, b) after one year of
supplementation with n-3 fatty acids.
7.3.4 Relationships between plasma TNF-a levels and percent of RBC EPG& CPG fatty acids at baseline
TNF-a level positively correlated with red blood cell membrane PE- AA (R=0.6,
P=0.OO5) (Figure 7-2, a). No significant correlations were found between PE-LA, PC-LA
and PC-AA and plasma TNF-a.
No significant correlations (P>O.5) were found between TNF-a and EPG and CPG n-3
fatty acids EPA (R=O.2& 0.3) and DHA (R= 0.01&0.3) respectively.
7.3.5 Relationships between plasma IL-IO levels and percent of RBC PE& PC fatty acids at baseline
IL-10 level positively correlated with red blood cell membrane PE-LA (R=0.7, P=0.004)
(Figure 7-2, b). No significant correlations were found between PE-AA (R=-0.3, P=0.3),
PC-AA (R=-O.l, P= 0.7) and PC- LA (R=O.l, P=0.6) and plasma IL-10.
No significant correlation were fount between PE -EPA (R=O.4, P=O.07)(Figure 7-2, c) ,
PE- DHA (R=0.2, P=.4), PC-EPA (R=-O.l, P=O.7), PC-DHA (R=0.2, P=O.5) and IL-10.
173

Chapter Seven- Membrane fatty acid, adhesion and inflamation
7.3.6 Expression of p2-integrin CDllb/CI8 (CD-lIb) in monocytes
Adhesive molecules p2-integrin CDllb/C18 (CD-llb) and L-selectin (CD62L) analysis
were made on radomely selected ten samples (n=10) from placebo and samples from
active group at base-line. After one year of intervention six samples were collected
from from active group (n=6) and eight samples from placebo (n=8). The drop out at
one year (n=6) is due to inability of the patients to present at the pre-scheduled time for
sample collection and processing. The level of adhesive molecules of placebo and
active group were comparable at baseline (p>0.05), Figure 7-3 and 7-4.
After one year of Supplementation with n-3 fatty, CDllb expression in monocyte was
significantly lower compared to placebo and baseline (P<0.05), Figure 7-3 and 7-5
respectively.
7.3.7 Expression of p2-integrin CDllb/CI8 (CD-lIb) and L-selectin (CD62L)
in granulocytes
Supplementation with n-3 fatty acid or placebo caused no significant effect on CDllb
and CD62L expression (P>O.5), Figure 7-4 and 7-5.
7.3.8 Adhesive molecules and fatty acids correlations at baseline
At base -line, negative correlations were established between monocytes CDllb and
PC-EPA (R=-O.6, P=O.04), PC-LA(R=-0.6, P=0.02), Figure 7-6, a and figure 7-6, b
respectively. The PE n6-metabolites/n3-metabolites ratio (n-6-met/n-3-met) negatively
correlated with granulocytes CDllb (R=-0.7, P=0.04), Figure 7-7, a. Negative but not
significant correlation was found between PC n-6-met/n-3-met and granulocytes
CDllb (R=-O.6, P=0.06), Fig 7-7, b. A strong negative correlation was found between
granulocytes CD62L and PE-LA(R=0.8, P=0.02), Figure 7-8.
174

Chapter Seven- Membrane fatty acid, adhesion and inflamation
Table 7-1 Effect of supplementation with n-3 FA on Fatty acids composition of red blood cell membrane phosphatidylethanolamine (PE), phosphatidylecholine (PC), total white blood cells (TWBC) and platelets (PLTs).
n=20
Measure Baseline One-year
Fatty acids- PE
C18:2n-6 4.9±0.7 4.5±0.6
C20:4n-6 24.3±1.1 22.2±1.6***
C22:4n-6 10.7±1.2 7.2±2.3***
Total n-6 44.5±1.2 36.9±3.7***
C20:5n-3 0.1±0.04 0.3±0.2***
C22:5n-3 1.7±0.3 1.4±0.2***
C22:6n-3 2.5±0.7 8.8±2.8***
Total n-3 4.4±0.9 10.6±3.2***
Dimethyl acetals 13.3±1.1 13.5±1.4
Fatty acids- PC
C18:2n-6 15.7±2.3 18.1±2.18***
C20:4n-6 9.9± 1.0 7.9±1.2***
C22:4n-6 1.1± 0.2 0.6±0.2***
Total n-6 29.5± 1.9 28.8±2.7***
C20:5n-3 0.1±0.O4 0.24±0.1***
C22:5n-3 0.3± 0.06 0.2±O.1***
C22:6n-3 0.7± 0.2 2.6±O.9****
Total n-3 1.2± 0.3 3.1±1.1***
Dimethyl acetaIs 0.6±0.2 0.7±O.2
TWBC 15.3±3.5 14.1±2.8*
PLTs 524.3±141.4 487.6±141.4
175

Chapter Seven- Membrane fatty acid, adhesion and inflamation
a --P=O.5-- b 30 -P=O.7--
60
20 ~ 40 ~ .: :.. 0 -, ;:; ..
Z 20 ~ 10 r- -0 0
Zero-time One-vear Zero-time One-year
Figure 7-1 Plasma TNF-a concentrations (a) and IL-I0 concentrations (b) of patients with n-3 fatty acids before and after one year of supplementation with n-3 fatty acid.
a
28
" -g 26 u C o :E 24 .= u 1"11
~ 22 w Q.
r"= 0.36 p= 0.005 •
~ ••• • • •
20.l-----r----r-------, o 20 40 60
c
" o. -g -5 0.15 c: 1"11
10.10
:g 80.os iii W
TNF-a
r2= 0.16 • •
P=0.07 • .... ~
~ . • •• • •
Q. o.oo·.J---,.---r-----r----, o 5 10 15 20
Interleukin-10
b
7
:E 6 u 1"11
tJ Gl
~ 5 c:: :::i W4 Q.
r2 = 0.49
P = 0.007 •
3+------r----~----~~--~ o 5 10
IL-10 15 20
Figure 7-2 Correlation of EPA, AA and LA to cytokines
(a) Relationship between the plasma concentration
TNF-a and Percent AA in red blood cell PE of HbSS
patients
(b) Relationship between the plasma concentration IL-
10 and Percent LA in red blood cell PE of HbSS patients .
(c) Relationship between the plasma concentration IL-I0
and Percent EPA in red blood cell PE of HbSS patients
176

Chapter Seven- Membrane fatty acid, adhesion and inflamation
30.000
25 .000
NS
1 20.000
% 15.000 -
P< 0.0-1
1 • Act ive
Placebo
10.000 -
5.000 -
0.000
Time Zero One Year
7-3 Effect of n-3 and placebo supplementation on monocytes integrin CDlIbjC18 (CD-lIb)
50
45 N
I 40
r S NS
35
% 30
25 Zerotime
20 • One year
15
10
5
0 pacebo Act ive
7-4 Effect of n-3 and placebo supplementation on granulocytes CDII b/CDI8 (CD-lIb)
177

Chapter Seven- Membrane fatty acid, adhesion and inflamation
50
45 P=O.071
40
35 ~ I P~DJ 1 30 -
-:Ie 0 25
20 -
15
10 -
5
o --CDll-Mon0C}1t."S CDll-Granuloq.1t."S CD62L-Granulocytt."S
Figure 7-5 Effect of n-3 fatty acid supplementation on monocytes and granulocyctes CDll p2-integrin CDllb/C18 (CD-Ub) and granulocytes Selectin (CD62L)
~ i 0.1
I • 10.
~
• •
•
b O.
o .! 1 0.1
~ u Q. O.
•
• • o.mJl-----.----T----r---, O.oo-tr-----.r-----...----...----.
o 10 20 30 CD11b-Monocytes (%)
40 o 10 20 30 CD11b-Monocytes (%)
Figure 7-6 Relationship between CDU-Monocytes level and eicosapentaenoic acid (a) linoleic acid (h) percent in red blood cell PC of patients with HbSS.
178
40

a
-• ~ 1 ... ~
1 '! 5 W Do
o
Chapter Seven- Membrane fatty acid, adhesion and inflamation
•
20 40 60
CD11b-Granulocytes (%)
b
25
a; 20 ~ E 15 a; ~ 10 '! U Do 5
r2=O.36 P=O.06
o+-------,-------,-------~ o 20 40 60
CD11b-Granulocytes (%)
Figure 7-7 Relationship between COll-Granulocytes level and n-6-metafn-3-met in red blood cell PE (a) and PC (b) of patients with HbSS.
r2=O.64 p= 0.03 • -~ 0 -"a .-U
C'G Co) 5 .-c:u -0 c ::J
I 4 U.I • D.
3 0 10 20 30
CD62L-Granulocytes (%)
Figure 7-8 Relationship between CD62L-Granulocytes level and Linoleic acid in red blood cell PC of patients with HbSS.
179

Chapter Seven- Membrane fatty acid, adhesion and inflamation
7.4 Discussion The relationship between fatty acid composition of blood cells and inflammatory status
is well documented(Calder 2008b). Although the fatty acids anomalies observed in red
blood cells reflect similar abnormalities in white blood cells and plasma of SCD
patients (Ren et a1. 2005b; Ren et a1. 2006), few studies if not any have examined the
effect of fatty acids status on biomarkers of inflammation and blood cells adhesive
molecules in sickle cell disease. The findings in this study suggest strong association
between fatty acids composition of sickle red blood cells and inflammatory state, and
support partially the hypothesis that n-3 fatty acids have anti-inflammatory
prosperities.(Farzaneh-Far et a1. 2009; Cottin et a1. 2011).
The positive association between base-line PE-AA and TNF-a is of particular
importance. TNF-a is generally considered pro-inflammatory cytokines, and AA is
precursor of strong pro-inflammatory eicosanoid , particularly PC E2 the most
abundant eicosanoid in human body(Tilley et a1. 2001; Serhan and Levy 2003). Hence,
it is conceivable (Tanaka et a1. 1996)that high concentration of AA in blood cell
membrane may aggravate the inflammatory response (Karck et a1. 1988). Indeed, there
is evidence, reduction of AA in blood cells is associated with concomitant reduction of
PG E2 and TNF-a both in healthy subject and patients with rheumaroid arthritis (James
et a1. 2000; Sundrarjun et a1. 2004; Ferrucci et a1. 2006; Rees et a1. 2006; Farzaneh-Far et
a1. 2009). From these clinical studies it has been suggested that the modulatory effect of
blood cell fatty acids composition on inflammatory response is a role of PCE2Games et
a1. 20(0). However, in vitro studies investigated the effect of PC E2 upon production of
TNF-a have shown inhibitory rather than the predicted stimulatory effect (Dooper et
a1. 2002; Miles et a1. 2003; Serhan and Levy 2003). This inhibitory effect in experimental
studies have been attributed to differences between the in vivo environment and the ex
vivo conditions, as the overall impact of eicosanoid in inflammatory response depend
on several factors including the level of immune cell activation, presence of other
mediators and the physiological state(Tilley et a1. 2001; Pischon et a1. 2003).
In contrast to AA, the n-6 parent fatty acids Linoleic acid (LA) is positively correlated
with anti-inflammatory cytokines IL-10(de Waal Malefyt et a1. 1991; Sabat et a1. 2010),
and negatively correlated with adhesive molecules CD11b-Monocytes and CD62L-
180

Chapter Seven- Membrane fatty acid, adhesion and inflamation
granulocytes. These correlations signify that LA acid might have an anti-inflammatory
role. Recently, Poudel-Tandukar et al(2009) reported similar inverse association
between LA and inflammatory marker C-reactive protein. Moreover, clinical trials and
comprehensive reviews of epidemiologic investigations on n-6 and cardiovascular
diseases (CVD) concluded that higher intake of LA is not associated with elevated
levels of inflammatory markers and tend to decrease cardiovascular disease (CVD)
rlsk(Djousse et a1. 2001; Willett 2007; Harris et a1. 2009). In addition, PE and PC n-6/n-3
ration in this study were negatively correlated with CDllb-granulocytes.These
observations do challenge the predominant conception that all n-6 fatty acids are
fundamentally pro-inflammatory by necessity (Hennig et a1. 2006; Calder 2009).
In SCD disease, the role of LA in pathophysiology of the disease is intriguing. Previous
studies investigated the fatty acids composition of sickle red blood cells have
demonstrated constantly lower LA, whereas the n-6 fatty acids metabolites are
significantly higher compared to controls(Ren et a1. 2005a; Ren et a1. 2006). This may
indicate FA metabolic dysfunction- impaired synthesis, uptake or enhanced turnover
of LA to long chain n-6 metabolites. In this study LA strongly negatively correlated
with AA and supplementation with n-3 fatty acids decreased AA and increased LA.
Hence, it is tenable to postulate that increased LA conversion to AA may contribute to
pro-inflammatory state associated with SCD by generating higher concentration of AA,
and in tum higher levels of pro-inflammatory eicosanoids.
In contrast to Ferrucci et al(2006) that reported positive correlation between EPA and
IL-l0 and negative correlation between n-3 and TNF-a on healthy individual, our
results showed no association between DHA, total n-3 and IL-l0 or TNF-a. Moreover,
supplementation with n-3 fatty acids caused no effect on TNF- a and IL-l0. The effect
of supplementation on plasma TNF-a is in accordance with that reported from
interventional studies conducted on patients with diabetes mellitus (Molvig et a1. 1991;
Morl et a1. 2003), rheumatoid artheritis(Adam et a1. 2003; Sundrarjun et a1. 2004) and
crohn disease(Trebble et a1. 2004). Similar to TNF-a, no previous studies reported
significant effects of n-3 supplementation on systemic IL-10(Sijben and Calder 2007).On
the other hand, some studies that measured the effect of supplementation on
cytokines production by monocytes (Caughey et a1. 1996; Mayer et a1. 2003) or local
181

Chapter Seven- Membrane fatty acid, adhesion and inflamation
rather than systemic levels of cytokines showed significant effects(Matsuyama et a1.
2005). This discrepancy between the systemic and cell or tissue-specific levels of
cytokines may indicate that systemic plasma cytokines is not sensitive enough to reflect
the possible variability in sensitivity of different tissues to the immunomodulatory
effects of n-3 (Sijben and Calder 2007). Therefore, further investigation considering the
effect of supplementation on cytokines production from blood cells of patients with
SCD might be of interest.
Interaction of leukocytes with endothelial cells involves expression of adhesive
molecules(Tan et a1. 1999). L-selectin (CD62L) facilitate rolling and temporary arrest of
circulating leukocytes on endothelium surface(Strausbaugh et a1. 1999), whereas P2-
integrin (CDllb) is involved in subsequent stable adhesion(Nathan 2002). Therefore,
therapeutic approaches to reduce expression of CD62L and CDllB have been
important strategies to prevent vaso-occlusion in sickle cell disease(Canalli et a1. 2008).
In this study, EPA negatively correlated with CDllb-monocytes at baseline, and
supplementation with n-3 reduced significantly total number of leukocytes and
expersion of CDllb- monocytes, indicating improvements in the chronic inflammatory
states. These results are consistent with previous in vitro (De Caterina and Libby 1996;
Mayer et a1. 2002) and in vivo(Mayer et a1. 2003) studies that showed supplementation
with n-3 fatty acids reduce inflammatory markers and expression of adhesive
molecules. The mechanism (s) by which n-3 fatty acids regulates the expression of
adhesive molecules remains elusive. However, studies showed that modifying cell
membrane lipids composition by n-3 supplementations alters lipid microdomains, such
as lipid rafts and caveolae, involved in the compartmentalisation, modulation and
integration of cell signalling components(Stillwell et a1. 2005; Massaro et a1. 2008).
Moreover, there is evidence the EPA-derived resolving E1 induces L-selectin shedding
together with reduction in CD18 surface expression on human polymorphonulear cells
and monocytes(Dona et a1. 2008). In SCD multiple mechanisms are thought to be
involved in pathophysiology of blood cell adhesion and chronic inflammatory stat.
Therefore the n-3 FA multi-level actions with broad adhesion preventing ability render
it a promising therapy for SCD that may be able to meet the criteria of the "vascular
lubricants" proposed by Hebbel et al(2oo4) as a preferable therapeutic approach over
specific anti-adhesive agents.
182

Chapter Seven- Membrane fatty acid, adhesion and inflamation
In conclusion, the current study demonstrates that fatty acids status of patients with
sickle cell disease has a significant effect on the inflammatory state, and
supplementation with omega-3 fatty acids does modulate adhesive molecules on blood
cells. Therefore, further studies investigating the effect of omega-3 fatty acids
supplementation on clinical outcomes, PG2, acute phase proteins and tissue-specific
cytokines might be of interest
183

Chapter 8 -Conclusion
Chapter Eight
Overview conclusion and future research
184

Chapter 8 -Conclusion
8.1 Overview Sickle cell disease (SCD) is a debilitating monogenic blood disorder, which is
characterised by recurrent episodes of vaso-occlusive crisis and chronic haemolytic
anaemia. It causes short and long term complications that affect all organs and systems
of the body. The pattern of the complications and long-term survival vary considerably
among patients but the reason for the variations is yet to be elucidated. However, it is
now thought that the pathophysiology of the disease is an out come of the concerted
actions of genetic, cellular, humoral and environmental factors. Indeed, there is
evidence that leucocyte-erythrocyte-endothelial interaction and inflammation are the
primary predisposing factors of vaso-occlusion.
Ahesion, aggregation, elasticity of blood cells and inflammatory response are strongly
modulated by cell membrane omega-3 and omega-6 fatty acids. Indeed, there is
evidence steady state patients with seD have abnormal erythrocytes, platelets and
mononuclear cell fatty acid composition. The abnormality is characterised by high
omega-6 arachidonic (AA), adrenic and osbond acids, low omega-3 docosahexanoic
(DHA) and eicosapentnoic (EPA) acids and n-6/n-3 imbalance. Besides their vital role
as integral part of the cell membranes AA and EPA are precursors of eicosanoids, a
group of very active metabolites particularly prostaglandins, thromboxanes,
leukotrienes and lipoxins. The eicosanoids from AA are biologically active in very
small quantities and, if they are formed in large amounts, they contribute to the
inflammatory state and formation of thrombus. In contrast, EPA-derived eicosanoids
are relatively anti-inflammatory and anti-aggregatory. In addition EPA and DHA are
precursors of a novel class of lipid mediators, resolvins (Rv), and maresin and
neuroprotectin 01 from DHA, with strong anti-inflammatory effects.
This research programme investigated whether (a) HU, the commonly used treatment
for the disease, ameliorate red cell membrane fatty acid abnormalities observed in
previous studies; (b) Supplementation with n-3 FA reduce the frequency of painful
crisis through correction of the membrane fatty acid perturbation and reduction of
inflammation and blood cell adhesion.
185

Chapter 8 -Conclusion
Study l(Chapter 3) investigated the effect of hydroxyuea on red blood cell membrane
fatty acids composition of gender and aged matched HU-treated and untreated
homozygous sickle cell patients and healthy controls. The HU treated compared with
the untreated patients had lower arachidonic (AA) acid level in EPG and SPG. The
treated patients and healthy controls had comparable levels of docosahexaenoic (DHA)
and total n-3 fatty acids in EPG and CPG. In contrast, the untreated group had
significantly lower DHA and total n-3 compared with the controls in EPG. HU is
known to activate cytosolic phospholipase A2 and cyclooxygenase 2, and from this
study it appears to induce mobilisation of AA from the inner cell membrane PE and PS.
Hence, it is possible the clinical benefits of HU can be partially mediated through
correction of membrane fatty acids composition.
Study 2(Chapter 4) - Sickle patients are under continuous oxidative stress (OS) and
LCPUFA n-3 fatty acids are susceptible to peroxidation because of their high
unsaturation index. This study assessed whether supplementation with n-3 FAs
exacerbates oxidative stress by comparing n-3 FA supplemented and unsupplmented
homozygous sickle cell patients. The base line contents of DHA, EPA and total n-3
fatty acid were consistent with values observed on Sudanese children with SCD. After
six months of supplementation the n-3 fatty acids concentration in active group
increased to levels comparable to that of healthy individuals from high omega-3 intake
communities, with concomitant decrease in n-6 fatty acids particularly AA acid.
Continuation of n-3 fatty acids supplementation for one year caused no significant
changes in fatty acid profile compared to six-month apart from further reduction on
AA. These results provide evidence that the reported low levels of cell n-3 and high n-6
membrane fatty acids in SCD is responsive to dietary modulation. After one year of
supplementation, vit E level was significantly increased in active group whereas the
total plasmalogens content remained unchanged. In accordance with previous studies,
n-3 fatty acids supplementation in this study caused no significant difference in
activity of Cui Zn-Superoxide dismutase (SOD) compared to placebo group. The
observed significant decrease of SOD activity in both placebo and active group
compared to base-line activities is intriguing. However, vit E which was added in a
very small amount to supplement capsules may be implicated in the SOD reduction
after intervention. In contrast to the reported results of clinical trials in patients with
186

Chapter 8 -Conclusion
other chronic inflammatory state, Glutathione peroxidase-l (GPx-l) activity decreased
significantly after intervention in our study. Hence, taking into account the enhanced
vitamin E levels and preserved plamalogen (DMA) concentration after n-3
supplementation, the observed reduction in GPx-l could be interpreted as a reflection
of decreased oxidative stress levels. Therefore, we concluded that our findings do not
support the anticipated adverse effect of n-3 supplementation on overall oxidative
stress in SCD, and long term supplementation provides more anti-oxidant protection
capacity.
Study 3 (Chapter five)- In order to examine the potential therapeutic effects of omega-
3 fatty acids in sickle cell disease, we have conducted single centre, two-ann,
randomised, placebo-controlled, double blinded clinical trial. One hundred forty (n=70
in each arm) Sudanese SCD patients participated in the study. The primary end point
was annualised rates of clinical vaso-occlusive crisis, which is defined as painful crisis
that leads to hospitalization. Secondary end points were haemolytic crisis, rate of blood
transfusion, school attendance, Hb levels and mean cell volume (MCV). Intention to
treat was the analysis strategy and encompassed all randomised patients regardless of
the duration of follow-up. The monthly self-assessment health records and the 0, 6 and
12 months red blood cell membrane fatty acids composition showed high compliance
and tolerability to supplementation. The primary end point was successfully met and
the number of inpatient days due to sickle cell disease crisis and its associated
complications were significantly lower in omega-fatty acid supplemented group.
Moreover, the beneficial effects of DHA and EPA were reflected on the quality of life of
the patients as measured by the significant reduction of days out of school due to the
disease. In contrast to the placebo group, no patient in active group developed stroke,
the finding which suggest a potential preventive effect of n-3 FA. The observed
decrease rate of haemolytic crisis and blood transfusion is consistent with the reported
anti-haemolytic role of omega-3 fatty acids. Enigmatically, the Hb concentration and
MCH levels were increased to comparable levels in placebo and active group. These
results indicate that factors other than n-3 fatty acids might have influenced the
increase in Hb levels. A singular factor that may have played a role is vitamin E, which
was added in a very small concentration to protect supplemented fatty acids from
peroxidation. Interestingly, the high increase in MCV of the active can not be
187

Chapter 8 -Conclusion
explained merely by the increase of Hb and MCH, as the same amount of increase in
Hb occurred in the placebo group without causing equal increase in MCV. It is possible
that the increase in MCV is a reflection of improved cell membrane prosperties and
hydration state. In conclusion, this study provides strong evidence that DHA and EPA
could be safe and effective therapy for prevention of vaso-occlusive crisis and decrease
the rate of haemolysis in homozygous sickle cell disease.
Study 4 (Chapter six) - Study 3 showed that n-3 fatty supplementation reduced the
haemolytic crises and blood transfusion rate. In this study we investigated the effect of
n-3 FA supplementation on biochemical markers of haemolysis lactate dehydrogenase
(LDH) and haemoglobin concentration in sub-group of patients at steady state.
Intervention with n-3 fatty acids caused significant reduction in LDH, which signifies
improvement in haemolysis rate. In contrast to previous studies reported by other
groups, the supplementation with omega-3 resulted in Significant increase in
haemoglobin, MCV, MCH and MCHC. Conversely, the total white blood cell (TWBC)
and platelets (PLTs) count were reduced by 20.5% and 18.2% respectively, indicating
lessened inflammatory state and/or diminished haemopoietic activity of the bone
marrow. These differences in haematological outcomes from previous studies may be
due to composition of the supplement used in this study (high DHA), or the relatively
long duration of supplementation period. High steady state Lactate dehydrogenase,
platelets, increased white cell count and low Hb are widely considered adverse risk
factor for survival and sever clinical course. In this study, omega-3 fatty acids affected
positively the four parameters; the findings which agree with the observed beneficial
clinical effects off n-3 fatty acid supplementation in SCD.
Study 5 (Chapter seven) - In this study, we investigated the effect of DHA and EPA
supplementation on fatty inflammatory state and blood cells adhesion. The patients
contributed in this study were sub-group of the placebo and the active group of the
clinical trial (study 3) discussed above. Supplementation with n-3 FAs showed no effect
on IL-I0 or TNF-a. However, other studies investigated the effect of n-3
supplementation showed significant reduction in tissue or local TNF-a rather than in
systemic levels. Hence, we have postulated that discrepancy between the systemic and
local or tissue-specific levels of cytokines may indicate that systemic plasma cytokines
188

Chapter 8 -Conclusion
are not sensitive enough to reflect the possible variability in sensitivity of different
tissues to the immunomodulatory effects of n-3 FA. As an indication of improvement
in inflammatory state, DHA and EPA supplementation caused a significant reduction
in total number of leukocytes and expression of CDllb- monocytes. These results are
consistent with previous studies that showed supplementation with n-3 fatty acids do
ameliorate inflammatory markers and expression of adhesive molecules. In conclusion,
our data provide a limited evidence that supplementation with DHA and EPA does
modulate adhesive molecules on blood cells and mitigate the inflammatory state.
8.2 Conclusion This study which was based on a significant number of homozygous sickle cell patients
clearly demonstrated that supplementation with DHA and EPA reduces significantly
the frequency of vaso-occlusive crisis, and it suggested that the effect may be mediated
by reductions of blood cell adhesion, haemolysis and inflammation. In addition, it
revealed that DHA and EPA, which are highly labile and prone to peroxidation, do not
exacerbate oxidative stress.
8.3 Future studies As it is evident from the above conclusions, DHA and EPA have the potential to be
effective and affordable treatment option for patients with SCD. However, before such
recommendation could be made, further studies would need to be undertaken to
establish universality and possible mechanisms.
~ Multi-centre clinical trial
This study provided strong evidence that DHA and EPA supplementation reduces
vaso-occlusive crisis in patients with SCD. However, because of the influence of
environmental and genetic variation on the clinical course of the disease, a multi-centre
study involving patients from different genetic and environmental backgrounds must
be conducted to test the generalisability of the current findings.
~ N-3 fatty acids and neurological and cognitive complications.
189

Chapter 8 -Conclusion
The current study has suggested that supplementation with DHA and EPA reduces the
risk of SeD-induced stroke. A well-powered, long-term, study is needed to delineate
the efficacy of EPA and DHA supplementation in reduction of silent and overt stroke,
brain vascular pathology and cognitive impairment. To obtain objective data, MRI,
TeD and standardised cognitive assessment test should be employed.
~ N-3 fatty acids and prevention of organ damage in infants.
Sickle-cell anaemia is associated with substantial morbidity from acute complications
and organ dysfunction beginning in the first year of life. The current investigation did
not included patients less than two years of age. Hence, it is important to assess
whether supplementation with DHA and EPA prevents or delays the onset of organ
damage.
~ Effect of n-3 fatty acids on organ-specific complications
The pattern of organ-speCific complication varies among sickle cell patients. These
variations suggest interplay between environment and genetic factors. As
consumption of fish, which is the main source of n-3 fatty acids, differs between
regions (coastal versus inland), the effect of n-3 fatty acids on variations on organ
specific complications (avascular necrosis, kidney function, retinopathy and
cardiopulmonary complication) is warranted.
~ Synergistic effect of hydroxyurea and n-3 fatty acids
Hydroxurea (HU) is the commonly used drug for SeD. About 30% of patients are not
responsive. Moreover, as HU is a cytotoxic drug, its long term adverse effects are of
concern. It would be instructive to unravel whether a combination therapy of n-3 fatty
acids and HU enhances responsiveness; and reduces the therapuetatic dosage.
~ Mechanisms of efficacy of n-3 fatty acid supplementation
Our findings in this study provide limited evidence that DHA and EPA may have anti
inflammatory and anti-adhesive effects in seD. Thus, studying the effect on additional
markers of inflammation, endothelium function and co-agulation state will shed light
on mechanisms through which n-3 FAs mediate its effects in SeD.
190

Chapter 8 -Conclusion
~ Hydroxyurea treatment and arachidonic acid metabolism
Data from the current study show that arachidonic acid (AA) is selectively mobilised
from the inner cell membrane amino-phosphoglycerides, ethanolamine and serine, in
patients treated with HU. There is evidence which suggests that PGE2, metabolite of
AA, plays a role in HbF production. A study that which explores the potential role of
eicosanoids generated from the AA would help to understand the mechanism of action
of HU treatment in SeD and the role of lipid mediators in the pathophysiology of the
disease.
~ Metabolism of n-3 and n-6 fatty acids
The current Sudanese study consistent with our earlier investigations in British and
Nigerian patients demonstrate that sickle cell disease is associated with abnormal
levels of red cell n-3 and n-6 polyunsaturated fatty acids (PUFA). Levels of n-3 and n-6
PUFA are determined by Single nucleotide polymorphism of the lipid desaturase
(FADS1 and FADS2) genes, which along with the beta globin gene are located in
chromosome 11. A study should be undertaken to elucidate the genetic variations in
FADS1 and FADS2, and the activity of the expressed enzymes in steady state patients.
191

Bibliography
Bibliograpy AAP (2000). American Academy of Pediatrics. Committee on Infectious Diseases.
Policy statement: recommendations for the prevention of pneumococcal infections, including the use of pneumococcal conjugate vaccine (Prevnar), pneumococcal polysaccharide vaccine, and antibiotic prophylaxis. Pediatrics; 106(2 Pt 1): 362-6.
Abd Hamid NA, A MH, J RR, Ibrahim IA, Baruah ps, Mazlan M, Mohd Yusof YA Wan Ngah WZ (2011). Effect of vitamin E (Tri E(R)) on antioxidant enzymes and DNA damage in rats following eight weeks exercise. Nutr 1; 10(1): 37.
Abu-Zeid YA, Abdulhadi NH, Theander TG, Hviid L, Saeed BO, Jepsen S, Jensen JB Bayoumi RA (1992). Seasonal changes in cell, mediated immune responses to soluble Plasmodium falciparum antigens in children with haemoglobin AA and haemoglobin AS. Trans R Soc Trop Med Hyg; 86(1): 20-2.
Adam 0, Beringer C, Kless T, Lemmen C, Adam A, Wiseman M, Adam P, Klimmek R Forth W (2003). Anti-inflammatory effects of a low arachidonic acid diet and fish oil in patients with rheumatoid arthritis. Rheumatol Int; 23(1): 27-36.
Adams RJ, McKie Vc, Hsu L, Files B, Vichinsky E, Pegelow C, Abboud M, Gallagher D, Kutlar A, Nichols FT, Bonds DR Brambilla 0 (1998). Prevention of a first stroke by transfusions in children with sickle cell anemia and abnormal results on transcranial Doppler ultrasonography. N Engl1 Med; 339(1): 5-11.
Adan Y, Shibata K, Sato M, Ikeda I Imaizumi K (1999). Effects of docosahexaenoic and eicosapentaenoic acid on lipid metabolism, eicosanoid production, platelet aggregation and atherosclerosis in hypercholesterolemic rats. Biosci Biotechnol Biochem; 63(1): 111-9.
Adekile AD, Owunwanne A, Al-Za'abi K, Haider MZ, Tuli M AI-Mohannadi S (2002). Temporal sequence of splenic dysfunction in sickle cell disease. Am 1 Hematol; 69(1): 23-7.
Adragna NC, Fonseca P Lauf PK (1994). Hydroxyurea affects cell morphology, cation transport, and red blood cell adhesion in cultured vascular endothelial cells. Blood; 83(2): 553-60.
Ahmed HA Baker EA (1986). Sickling in the Sudan. Result of surveys in Blue Nile Province. East Aft Med D 63(6): 395-9.
Aidoo M, Terlouw DJ, Kolczak MS, McElroy PD, ter Kuile FO, Kariuki S, Nahlen BL, Lal AA Udhayakumar V (2002). Protective effects of the sickle cell gene against malaria morbidity and mortality. Lancet; 359(9314): 1311-2.
Akinsheye I Klings ES (2010). Sickle cell anemia and vascular dysfunction: the nitric oxide connection. 1 Cell Physiol; 224(3): 620-5.
Akohoue SA, Shankar S, Milne GL, Morrow J, Chen KY, Ajayi WU Buchowski MS (2007). Energy expenditure, inflammation, and oxidative stress in steady-state adolescents with sickle cell anemia. Pediatr Res; 61(2): 233-8.
AI-Khatti A, Veith RW, Papayannopoulou T, Fritsch EF, Goldwasser E Stamatoyannopoulos G (1987). Stimulation of fetal hemoglobin synthesis by erythropoietin in baboons. N Engl1Med; 317(7): 415-20.
Alfin-Slater RB Aftergood L (1968). Essential fatty acids reinvestigated. Physiol Rev; 48(4): 758-84.
Aliyu ZY, Tumblin AR Kato GJ (2006). Current therapy of sickle cell disease. Haematologica; 91(1): 7-10.
192

Bibliography
Alkan 0, Kizilkilic E, Kizilkilic 0, Yildirim T, Karaca S, Yeral M, Kasar M Ozdogu H (2009). Cranial involvement in sickle cell disease. Eur T Radial; 76(2): 151-6.
Allard JP, Kurian R, Aghdassi E, Muggli R Royall 0 (1997). Lipid peroxidation during n-3 fatty acid and vitamin E supplementation in humans. Lipids; 32(5): 535-41.
Allison AC (1954). Protection afforded by sickle-cell trait against subtertian malareal infection. Br Med 1; 1(4857): 290-4.
Allon M (1990). Renal abnormalities in sickle cell disease. Arch Intern Med; 150(3): 501-4.
Almeida A Roberts I (2005). Bone involvement in sickle cell disease. Br 1 Haematol; 129(4): 482-90.
Anand AJ Glatt AE (1994). Salmonella osteomyelitis and arthritis in sickle cell disease. Semin Arthritis Rheum; 24(3): 211-21.
Andersen HR, Nielsen JB, Nielsen F Grandjean P (1997). Antioxidative enzyme activities in human erythrocytes. Clin Chem; 43(4): 562-8.
Antonsson B (1997). Phosphatidylinositol synthase from mammalian tissues. Biochim Biophys Acta; 1348(1-2): 179-86.
Applegate KR Glomset JA (1986). Computer-based modeling of the conformation and packing properties of docosahexaenoic acid. 1 Lipid Res; 27(6): 658-80.
Archer DR, Stiles JK, Newman GW, Quarshie A, Hsu LL, Sayavongsa P, Perry J, Jackson EM Hibbert JM (2008). C-reactive protein and interleukin-6 are decreased in transgenic sickle cell mice fed a high protein diet. 1 Nutr; 138(6): 1148-52.
Arnold C, Konkel A, Fischer R Schunck WH (2011). Cytochrome P450-dependent metabolism of omega-6 and omega-3 long-chain polyunsaturated fatty acids. Pharmacol Rep; 62(3): 536-47.
Arterburn LM, Hall EB Oken H (2006). Distribution, interconversion, and dose response of n-3 fatty acids in humans. Am 1 Clin Nutr; 83(6 Suppl): 14675-1476S.
Arthur G Page L (1991). Synthesis of phosphatidylethanolamine and ethanolamine plasmalogen by the COP-ethanolamine and decarboxylase pathways in rat heart, kidney and liver. Biochem 1; 273(Pt 1) 121-5.
Ascenzi P, Bocedi A, Visca P, Altruda F, Tolosano E, Beringhelli T Fasano M (2005). Hemoglobin and heme scavenging. IUBMB Life; 57(11): 749-59.
AsIan M Freeman BA (2007). Redox-dependent impairment of vascular function in sickle cell disease. Free Radic Bioi Med; 43(11): 1469-83.
Assis A, Conran N, Canalli AA, Lorand-Metze I, Saad ST Costa FF (2005). Effect of cytokines and chemokines on sickle neutrophil adhesion to fibronectin. Acta Haematol; 113(2): 130-6.
Ataga KI (2009). Novel therapies in sickle cell disease. Hematology Am Soc Hematol Educ Program; 54-61.
Ataga KI Key NS (2007). Hypercoagulability in sickle cell disease: new approaches to an old problem. Hematology Am Soc Hematol Educ Program; 91-6.
Ataga KI, Moore CG, Hillery CA, Jones S, Whinna HC, Strayhorn 0, Sohier C, Hinderliter A, Parise LV Orringer EP (2008a). Coagulation activation and inflammation in sickle cell disease-associated pulmonary hypertension. Haematologica; 93(1): 20-6.
Ataga KI Orringer EP (2003). Hypercoagulability in sickle cell disease: a curious paradox. Am 1 Med; 115(9): 721-8.
193

Bibliography
Ataga KI, Reid M, Ballas SK, Yasin Z, Bigelow C, James LS, Smith WR, Galacteros F, Kutlar A, Hull JH Stocker JW (2011). Improvements in haemolysis and indicators of erythrocyte survival do not correlate with acute vaso-occlusive crises in patients with sickle cell disease: a phase III randomized, placebocontrolled, double-blind study of the Gardos channel blocker senicapoc (ICA-17043). Br [Haematol; 153(1): 92-104.
Ataga KI, Smith WR, De Castro LM, Swerdlow p, Saunthararajah Y, Castro 0, Vichinsky E, Kutlar A, Orringer EP, Rigdon GC Stocker JW (2008b). Efficacy and safety of the Gardos channel blocker, senicapoc (ICA-17043), in patients with sickle cell anemia. Blood; 111(8): 3991-7.
Athanassiou G, Moutzouri A, Kourakli A Zoumbos N (2006). Effect of hydroxyurea on the deformability of the red blood cell membrane in patients with sickle cell anemia. Clinical Hemorheology and Microcirculation; 35(1-2): 291-5.
Atichartakam V, Angchaisuksiri P, Aryurachai K, Onpun S, Chuncharunee S, Thakkinstian A Atamasirikul K (2002). Relationship between hypercoagulable state and erythrocyte phosphatidylserine exposure in splenectomized haemoglobin E/beta-thalassaemic patients. Br [Haematol; 118(3): 893-8.
Atweh GF, Sutton M, Nassif I, Boosalis V, Dover GJ, Wallenstein S, Wright E, McMahon L, Stamatoyannopoulos G, Faller DV Perrine SP (1999). Sustained induction of fetal hemoglobin by pulse butyrate therapy in sickle cell disease. Blood; 93(6): 1790-7.
Atz AM Wessel DL (1999). Sildenafil ameliorates effects of inhaled nitric oxide withdrawal. Anesthesiology; 91(1): 307-10.
Auestad N Innis SM (2000). Dietary n-3 fatty acid restriction during gestation in rats: neuronal cell body and growth-cone fatty acids. Am [ Clin Nutr; 71(1 Suppl):
312S-4S. Babalola OE Wambebe CO (2005). Ocular morbidity from sickle cell disease in a
Nigerian cohort. Niger Postgrad Med [; 12(4): 241-4. Babhulkar SS, Pande K Babhulkar S (1995). The hand-foot syndrome in sickle-cell
haemoglobinopathy. [Bone [oint Surg Br; 77(2): 310-2. Bagga D, Wang L, Farias-Eisner R, Glaspy JA Reddy ST (2003). Differential effects of
prostaglandin derived from omega-6 and omega-3 polyunsaturated fatty acids on COX-2 expression and IL-6 secretion. Proc Natl Acad Sci USA; 100(4): 1751-
6. Bahebeck J, Atangana R, Techa A, Monny-Lobe M, Sasso M Hoffmeyer P (2004).
Relative rates and features of musculoskeletal complications in adult sicklers. Acta Orthop Belg; 70(2): 107-11.
Ballas S (1998). Sickle cell pain. Progress in pain research and management. Seattle ~3.
Ballas SK (2000). Hydration of sickle erythrocytes using a herbal extract (Pfaffia paniculata) in vitro. Br [Haematol; 111(1): 359-62.
Ballas SK (2005). Pain management of sickle cell disease. Hematol Oncol Clin North Am; 19(5): 785-802, v.
Ballas SK Delengowski A (1993). Pain measurement in hospitalized adults with sickle cell painful episodes. Ann Clin Lab Sci; 23(5): 358-61.
Ballas SK, Dover GJ Charache S (1989). Effect of hydroxyurea on the rheological properties of sickle erythrocytes in vivo. American TournaI of Hematology; 32(2): 104-11.
194

Bibliography
Ballas SK, Files B, Luchtman-Jones L, Benjamin L, Swerdlow P, Hilliard L, Coates T, Abboud M, Wojtowicz-Praga S, Kuypers FA Michael Grindel J (2006). Secretory phospholipase A2 levels in patients with sickle cell disease and acute chest syndrome. Hemoglobin; 30(2): 165-70.
Ballas SK, Lamer J, Smith ED, Surrey S, Schwartz E Rappaport EF (1988). Rheologic predictors of the severity of the painful sickle cell crisis. Blood; 72(4): 1216-23.
Ballas SK, Lieff S, Benjamin LJ, Dampier CD, Heeney MM, Hoppe C, Johnson CS, Rogers ZR, Smith-Whitley K, Wang WC Telen MJ (2010). Definitions of the phenotypic manifestations of sickle cell disease. Am 1 Hematol; 85(1): 6-13.
Ballas SK Marcolina MJ (2006). Hyperhemolysis during the evolution of uncomplicated acute painful episodes in patients with sickle cell anemia. Trans6~sion; 46(1): 105-10.
Ballas SK, Marcolina MJ, Dover GJ Barton FB (1999). Erythropoietic activity in patients with sickle cell anaemia before and after treatment with hydroxyurea. &.l Haematol; 105(2): 491-6.
Ballas SK, McCarthy WF, Guo N, DeCastro L, Bellevue R, Barton BA Waclawiw MA (2009). Exposure to hydroxyurea and pregnancy outcomes in patients with sickle cell anemia. 1 Nat! Med Assoc; 101(10): 1046-51.
Ballas SK Mohandas N (2004). Sickle red cell microrheology and sickle blood rheology. Microcirculation; 11(2): 209-25.
Bank A (2006). Regulation of human fetal hemoglobin: new players, new complexities. Blood; 107(2): 435-43.
Barber LA, Palascak MB, Joiner CH Franco RS (2009). Aminophospholipid translocase and phospholipid scramblase activities in sickle erythrocyte subpopulations. Br THaematol; 146(4): 447-55.
Barbosa DS, Cecchini R, El Kadri MZ, Rodriguez MA, Burini RC Dichi I (2003). Decreased oxidative stress in patients with ulcerative colitis supplemented with fish oil omega-3 fatty acids. Nutrition; 19(10): 837-42.
Barker JE Wandersee NJ (1999). Thrombosis in heritable hemolytic disorders. Curr Opin Hematol; 6(2): 71-5.
Bartle D, K (1993). Introduction to the theory of chromatographic separation with reference to gas chromatography. (1n) Gas Chromatography: A practical Approach, Oxford University Press Inc, New York.
Bas 0, Songur A, Sahin 0, Mollaoglu H, Ozen OA, Yaman M, Eser 0, Fidan H Yagmurca M (2007). The protective effect of fish n-3 fatty acids on cerebral ischemia in rat hippocampus. Neurochem lilt; 50(3): 548-54.
Bastiani M Parton RG (2011). Caveolae at a glance. T Cell Sci; 123(Pt 22): 3831-6. Bauer TW, Moore GW Hutchins GM (1980). The liver in sickle cell disease. A
clinicopathologic study of 70 patients. Am T Med; 69(6): 833-7. Baugh J, P (1993). Gas Chromatography A practical Approach. Thepractical Approach
Series, Oxford University Press Inc, New York. Baum KF, Dunn DT, Maude GH Serjeant GR (1987). The painful crisis of homozygous
sickle cell disease. A study of the risk factors. Arch Intern Med; 147(7): 1231-4. Bayoumi RA, Abu-Zeid Y A, Abdulhadi NH, Saeed BO, Theander TG, Hviid L, Ghalib
HW, Nugud AH, Jepsen S Jensen JB (1990). Cell-mediated immune responses to Plasmodium falciparum purified soluble antigens in sickle-cell trait subjects. Immunol Lett; 25(1-3): 243-9.
195

Bibliography
Beaver WT (1988). Impact of non-narcotic oral analgesics on pain management. Am , Med; 84(5A): 3-15.
Bechoua S, Dubois M, Dominguez Z, Goncalves A, Nemoz G, Lagarde M Prigent AF (1999). Protective effect of docosahexaenoic acid against hydrogen peroxideinduced oxidative stress in human lymphocytes. Biochem Pharmacal; 57(9): 1021-30.
Belcher JD, Marker PH, Weber JP, Hebbel RP Vercellotti GM (2000). Activated monocytes in sickle cell disease: potential role in the activation of vascular endothelium and vaso-occlusion. Blood; 96(7): 2451-9.
Benatti P, Peluso G, Nicolai R Calvani M (2004). Polyunsaturated fatty acids: biochemical, nutritional and epigenetic properties. 'Am ColI Nutr; 23(4): 281-302.
Benjamin LJ, Swinson GI Nagel RL (2000). Sickle cell anemia day hospital: an approach for the management of uncomplicated painful crises. Blood; 95(4): 1130-6.
Bensinger TA Gillette PN (1974). Hemolysis in sickle cell disease. Arch Illtem Med; 133(4): 624-31.
Bernatchez PN, Bauer PM, Yu J, Prendergast JS, He P Sessa WC (2005). Dissecting the molecular control of endothelial NO synthase by caveolin-1 using cellpermeable peptides. Pmc Natl Acad Sci USA; 102(3): 761-6.
Bernaudin F, Socie G, Kuentz M, Chevret 5, Duval M, Bertrand Y, Vannier JP, Yakouben K, Thuret I, Bordigoni P, Fischer A, Lutz P, Stephan JL, Dhedin N, Plouvier E, Margueritte G, Bories D, Verlhac 5, Esperou H, Coic L, Vernant JP Gluckman E (2007). Long-term results of related myeloablative stem-cell transplantation to cure sickle cell disease. Blood; 110(7): 2749-56.
Bernini JC, Rogers ZR, Sandler ES, Reisch JS, Quinn CT Buchanan GR (1998). Beneficial effect of intravenous dexamethasone in children with mild to moderately severe acute chest syndrome complicating sickle cell disease. Blood; 92(9): 3082-
9. Berry PA, Cross TJ, Thein SL, Portmann BC, Wend on JA, Karani JB, Heneghan MA
Bomford A (2007). Hepatic dysfunction in sickle cell disease: a new system of classification based on global assessment. Clill Gastroellterol Hepatol; 5(12): 1469-76; quiz 1369.
Berthaut I, Guignedoux G, Kirsch-Noir F, de Larouziere V, Ravel C, Bachir D, Galacteros F, Ancel PY, Kunstmann JM, Levy L, Jouannet P, Girot R Mandelbaum J (2008). Influence of sickle cell disease and treatment with hydroxyurea on sperm parameters and fertility of human males. Haematolo~ica; 93(7): 988-93.
Bertolino P, Deckers M, Lebrin F ten Dijke P (2005). Transforming growth factor-beta signal transduction in angiogenesis and vascular disorders. Chest; 128(6 Suppl): 5855-5905.
Bialecki ES Bridges KR (2002). Sildenafil relieves priapism in patients with sickle cell disease. Am 'Med; 113(3): 252.
Billett HH, Kim K, Fabry ME Nagel RL (1986). The percentage of dense red cells does not predict incidence of sickle cell painful crisis. Blood; 68(1): 301-3.
Blann AD, Marwah 5, Serjeant G, Bareford D Wright J (2003). Platelet activation and endothelial cell dysfunction in sickle cell disease is unrelated to reduced antioxidant capacity. Blood Coa~ul Fibrinolysis; 14(3): 255-9.
196

Bibliography
Boas FE, Forman L Beutler E (1998). Phosphatidylserine exposure and red cell viability in red cell aging and in hemolytic anemia. Proc Natl Acad Sci USA; 95(6): 3077-81.
Bookchin RM Lew VL (2002). Sickle red cell dehydration: mechanisms and interventions. Curr Opin Hematol; 9(2): 107-10.
Borchman 0, Byrdwell WC Yappert MC (1994). Regional and age-dependent differences in the phospholipid composition of human lens membranes. Invest Ophtltalmol Vis Sci; 35(11): 3938-42.
Bourantas KL, Dalekos GN, Makis A, Chaidos A, Tsiara S Mavridis A (1998). Acute phase proteins and interleukins in steady state sickle cell disease. ~ Haematol; 61(1): 49-54.
Brand A, Schonfeld E, Isharel I Yavin E (2008). Docosahexaenoic acid-dependent iron accumulation in oligodendroglia cells protects from hydrogen peroxideinduced damage. 1 Neurochem; 105(4): 1325-35.
Bratosin 0, Estaquier J, Petit F, Arnoult 0, Quatannens B, Tissier JP, Slomianny C, Sartiaux C, Alonso C, Huart JJ, Montreuil J Ameisen JC (2001). Programmed cell death in mature erythrocytes: a model for investigating death effector pathways operating in the absence of mitochondria. Cell Death Ditfer; 8(12): 1143-56.
Brawley OW, Cornelius LJ, Edwards LR, Gamble VN, Green BL, Inturrisi CE, James AH, Laraque 0, Mendez MH, Montoya q, Pollock BH, Robinson L, Scholnik AP Schori M (2008). NIH consensus development statement on hydroxyurea treatment for sickle cell disease. NIH Consens State Sci Statements; 25(1): 1-30.
Brenna JT, Varamini B, Jensen RG, Diersen-Schade DA, Boettcher JA Arterburn LM (2007). Docosahexaenoic and arachidonic acid concentrations in human breast milk worldwide. Am , Ciin Nutr; 85(6): 1457-64.
Bretscher MS (1972). Phosphatidyl-ethanolamine: differential labelling in intact cells and cell ghosts of human erythrocytes by a membrane-impermeable reagent. 1 Mol Bioi; 71(3): 523-8.
Brites P, Waterham HR Wanders RJ (2004). Functions and biosynthesis of plasmalogens in health and disease. Biocllim Biophys Acta; 1636(2-3): 219-31.
Brittain HA, Eckman JR, Swerlick RA, Howard RJ Wick TM (1993). Thrombospondin from activated platelets promotes sickle erythrocyte adherence to human microvascular endothelium under physiologic flow: a potential role for platelet activation in sickle cell vaso-occlusion. Blood; 81(8): 2137-43.
Brittain JE, Han J, Ataga KI, Orringer EP Parise LV (2004). Mechanism of CD47-induced alpha4betal integrin activation and adhesion in sickle reticulocytes. 1 Bioi Chem; 279(41): 42393-402.
Brittain JE, Knoll CM, Ataga KI, Orringer EP Parise LV (2008). Fibronectin bridges monocytes and reticulocytes via integrin alpha4beta1. Br 1 Haematol; 141(6): 872-81.
Brittain JE, Mlinar KJ, Anderson CS, Orringer EP Parise LV (2001). Integrin-associated protein is an adhesion receptor on sickle red blood cells for immobilized thrombospondin. Blood; 97(7): 2159-64.
Brittain JE Parise LV (2008). The alpha4betal integrin in sickle cell disease. Transfus Clin Bioi; 15(1-2): 19-22.
Brody JI, Ryan WN Haidar MA (1975). Serum alkaline phosphatase isoenzymes in sickle cell anemia. lama; 232(7): 738-41.
197

Bibliography
Brown DA London E (2000a). Structure and function of sphingolipid- and cholesterolrich membrane rafts. Journal of Biological Chemistry; 275(23): 17221-4.
Brown DA London E (2000b). Structure and function of sphingolipid- and cholesterolrich membrane rafts. [BioI Chem; 275(23): 17221-4.
Brown Me, Nuttall AL, Masta RI Lawrence M (1983). Cochlear inner hair cells: effects of transient asphyxia on intracellular potentials. Hear Res; 9(2): 131-44.
Browne P, Shalev 0 Hebbel RP (1998). The molecular pathobiology of cell membrane iron: the sickle red cell as a model. Free Radic BioI Med; 24(6): 1040-8.
Brozovic M, Davies SC Brownell AI (1987). Acute admissions of patients with sickle cell disease who live in Britain. Br Med [ (Oil1 Res Ed); 294(6581): 1206-8.
Brugnara C (1995). Erythrocyte dehydration in pathophysiology and treatment of sickle cell disease. Curr Opil1 HematoI; 2(2): 132-8.
Brugnara C (2003). Sickle cell disease: from membrane pathophysiology to novel therapies for prevention of erythrocyte dehydration. 1 Pediatr Hematol 0l1col; 25(12): 927-33.
Brugnara C Tosteson DC (1987). Inhibition of K transport by divalent cations in sickle erythrocytes. Blood; 70(6): 1810-5.
Buccoliero R Futerman AH (2003). The roles of ceramide and complex sphingolipids in neuronal cell function. Phannacol Res; 47(5): 409-19.
Buckalew VM, Jr. Someren A (1974). Renal manifestations of sickle cell disease. Arch I11tem Med; 133(4): 660-9.
Burch-Sims GP Matlock VR (2005). Hearing loss and auditory function in sickle cell disease. [ Commul1 Disord; 38(4): 321-9.
Burnett AL, Bivalacqua TJ, Champion HC Musicki B (2006). Long-term oral phosphodiesterase 5 inhibitor therapy alleviates recurrent priapism. Urolo~JD 67(5): 1043-8.
Burnett MW, Bass JW Cook BA (1998). Etiology of osteomyelitis complicating sickle cell disease. Pediatrics; 101(2): 296-7.
Burr GO Burr MM (1973). Nutrition classics from The Journal of Biological Chemistry 82:345-67, 1929. A new deficiency disease produced by the rigid exclusion of fat from the diet. Nutr Rev; 31(8): 248-9.
Byrdwell WC Perry RH (2007). Liquid chromatography with dual parallel mass spectrometry and 31P nuclear magnetic resonance spectroscopy for analysis of sphingomyelin and dihydrosphingomyelin. II. Bovine milk sphingolipids. 1 Chromatogr A; 1146(2): 164-85.
Cai J, Abramovici H, Gee SH Topham MK (2009). Diacylglycerol kinases as sources of phosphatidic acid. Biochim Biophys Acta; 1791(9): 942-8.
Calder PC (2002). Dietary modification of inflammation with lipids. Proc Nutr Soc; 61(3): 345-58.
Calder PC (2003). N-3 polyunsaturated fatty acids and inflammation: from molecular biology to the clinic. Lipids; 38(4): 343-52.
Calder PC (2008a). Polyunsaturated fatty acids, inflammatory processes and inflammatory bowel diseases. Mol Nutr Food Res; 52(8): 885-97.
Calder PC (2008b). The relationship between the fatty acid composition of immune cells and their function. Prostaglal1dil1s Leukot Essel1t Fatty Acids; 79(3-5): 101-8.
Calder PC (2009). Polyunsaturated fatty acids and inflammatory processes: new twists in an old tale. Biochimie.
198

Bibliography
Calder PC Zurier RB (2001). Polyunsaturated fatty acids and rheumatoid arthritis. Curr Opin Clil1 Nutr Metab Care; 4(2): 115-21.
Calhoun WI Shipley GG (1979). Fatty acid composition and thermal behavior of natural sphingomyelins. Biochim Biophys Acta; 555(3): 436-41.
Camara NO, Martins JO, Landgraf RG Jancar S (2009). Emerging roles for eicosanoids in renal diseases. Curr Opin Nephrol Hypertens; 18(1): 21-7.
Canalli AA, Franco-Penteado CF, Saad ST, Conran N Costa FF (2008). Increased adhesive properties of neutrophils in sickle cell disease may be reversed by pharmacological nitric oxide donation. Haematologica; 93(4): 605-9.
Canessa M (1991). Red cell volume-related ion transport systems in hemoglobinopathies. Hematol Oncol Clin North Am; 5(3): 495-516.
Cantu L, Del Favero E, Sonnino S Prinetti A (2011). Gangliosides and the multiscale modulation of membrane structure. Chem Phys Lipids.
Cao J, Schwichtenberg KA, Hanson NQ Tsai MY (2006). Incorporation and clearance of omega-3 fatty acids in erythrocyte membranes and plasma phospholipids. Clin Chem; 52(12): 2265-72.
Carden OL Granger ON (2000). Pathophysiology of ischaemia-reperfusion injury. I Pathol; 190(3): 255-66.
Carlson SE, Werkman SH, Peeples JM, Cooke RJ Tolley EA (1993). Arachidonic acid status correlates with first year growth in preterm infants. Proc Natl Acad Sci U SA; 90(3): 1073-7.
Carr BI, Reilly JG, Smith SS, Winberg C Riggs A (1984). The tumorigenicity of 5-azacytidine in the male Fischer rat. Carcinogenesis; 5(12): 1583-90.
Castro 0, Brambilla OJ, Thorington B, Reindorf CA, Scott RB, Gillette P, Vera JC Levy PS (1994). The acute chest syndrome in sickle cell disease: incidence and risk factors. The Cooperative Study of Sickle Cell Disease. Blood; 84(2): 643-9.
Caughey GE, Mantzioris E, Gibson RA, Cleland LG James MJ (1996). The effect on human tumor necrosis factor alpha and interleukin 1 beta production of diets enriched in n-3 fatty acids from vegetable oil or fish oil. Am l Clin Nutr; 63(1): 116-22.
Chaar V, Picot J, Renaud 0, Bartolucci P, Nzouakou R, Bachir 0, Galacteros F, Colin Y, Le Van Kim C EI Nemer W (2010). Aggregation of mononuclear and red blood cells through an {alpha}4{beta}1-Lu/basal cell adhesion molecule interaction in sickle cell disease. Haematologica; 95(11): 1841-8.
Chakraborty TR, Vancura A, Balija VS Haldar D (1999). Phosphatidic acid synthesis in mitochondria. Topography of formation and transmembrane migration. l Bioi Che111; 274(42): 29786-90.
Chan AC, Chow CK Chiu D (1999). Interaction of antioxidants and their implication in genetic anemia. Proc Soc Exp Bioi Med; 222(3): 274-82.
Chang J, Patton JT, Sarkar A, Ernst B, Magnani JL Frenette PS (2010). GMI-I070, a novel pan-selectin antagonist, reverses acute vascular occlusions in sickle cell mice. Blood; 116(10): 1779-86.
Chang J, Shi PA, Chiang EY Frenette PS (2008). Intravenous immunoglobulins reverse acute vasa-occlusive crises in sickle cell mice through rapid inhibition of neutrophil adhesion. Blood; 111(2): 915-23.
Charache S (1990). Fetal hemoglobin, sickling, and sickle cell disease. Adv Pediatr; 371-31.
199

Bibliography
Charache S, Barton FB, Moore RD, Terrin ML, Steinberg MH, Dover GJ, Ballas SK, McMahon RP, Castro 0 Orringer EP (1996). Hydroxyurea and sickle cell anemia. Clinical utility of a myelosuppressive "switching" agent. The Multicenter Study of Hydroxyurea in Sickle Cell Anemia. Medicine (Baltimore); 75(6): 300-26.
Charache S, Dover G, Smith K, Talbot Cc, Jr., Moyer M Boyer S (1983). Treatment of sickle cell anemia with 5-azacytidine results in increased fetal hemoglobin production and is associated with nonrandom hypomethylation of DNA around the gamma-delta-beta-globin gene complex. Proc Natl Acad Sci USA; 80(15): 4842-6.
Charache S, Terrin ML, Moore RD, Dover GJ, Barton FB, Eckert SV, McMahon RP Bonds DR (1995). Effect of hydroxyurea on the frequency of painful crises in sickle cell anemia. Investigators of the Multicenter Study of Hydroxyurea in Sickle Cell Anemia. N En~ITMed; 332(20): 1317-22.
Chaves MA, Leonart MS do Nascimento AJ (2008). Oxidative process in erythrocytes of individuals with hemoglobin S. Hematology; 13(3): 187-92.
Chen SF, Liou JY, Huang TY, Lin YS, Yeh AL, Tam K, Tsai TH, Wu KK Shyue SK (2010). Caveolin-1 facilitates cyclooxygenase-2 protein degradation. T Cell Biochem; 109(2): 356-62.
Cheng HF Harris RC (2004). Cyclooxygenases, the kidney, and hypertension. Hypertension; 43(3): 525-30.
Chiang EY Frenette PS (2005). Sickle cell vaso-occlusion. Hematol Oncol Clin North Am; 19(5): 771-84, v.
Chidlow JH, Jr. Sessa WC (2010). Caveolae, caveolins, and cavins: complex control of cellular signalling and inflammation. Cardiovasc Res; 86(2): 219-25.
Chiu 0, Lubin B, Roelofsen B van Oeenen LL (1981). Sickled erythrocytes accelerate clotting in vitro: an effect of abnormal membrane lipid asymmetry. Blood; 58(2): 398-401.
Cho CS, Kato GJ, Yang SH, Bae SW, Lee JS, Gladwin MT Rhee SG (2010). Hydroxyureainduced expression of glutathione peroxidase 1 in red blood cells of individuals with sickle cell anemia. Antioxid Redox Si~nal; 13(1): 1-11.
Choy PC, Paddon HB Vance OE (1980). An increase in cytoplasmic CTP accelerates the reaction catalyzed by CTP:phosphocholine cytidylyltransferase in poliovirusinfected HeLa cells. T BioI Chem; 255(3): 1070-3.
Chui OH Dover GJ (2001). Sickle cell disease: no longer a single gene disorder. Curr Opin Pediatr; 13(1): 22-7.
Cleland LG James MJ (2000). Fish oil and rheumatoid arthritis: antiinflammatory and collateral health benefits. T Rheumatol; 27(10): 2305-7.
Cokic VP, Smith RO, Beleslin-Cokic BB, Njoroge JM, Miller JL, Gladwin MT Schechter AN (2003). Hydroxyurea induces fetal hemoglobin by the nitric oxidedependent activation of soluble guanylyl cyclase. T Clin Invest; 111(2): 231-9.
Collins AF, Pearson HA, Giardina P, McDonagh KT, Brusilow SW Dover GJ (1995). Oral sodium phenylbutyrate therapy in homozygous beta thalassemia: a clinical trial. Blood; 85(1): 43-9.
Connor WE, Lin OS, Thomas G, Ey F, DeLoughery T Zhu N (1997). Abnormal phospholipid molecular species of erythrocytes in sickle cell anemia. The TournaI of Lipid Research; 38(12): 2516-28.
200

Bibliography
Contreras FX, Sanchez-Magraner L, Alonso A Goni FM (2010). Transbilayer (flip-flop) lipid motion and lipid scrambling in membranes. FEBS Lett; 584(9): 1779-86.
Cook JA (2005). Eicosanoids. Crit Care Med; 33(12 Suppl): 5488-91. Cooper GM Hausman RE (2007). The Cell A Molecular Approch. Corbin JD Francis SH (1999). Cyclic GMP phosphodiesterase-5: target of sildenafil. 1
Biol Oum; 274(20): 13729-32. Corrocher R, Ferrari S, de Gironcoli M, Bassi A, Olivieri 0, Guarini P, Stanzial A, Barba
AL Gregolini L (1989). Effect of fish oil supplementation on erythrocyte lipid pattern, malondialdehyde production and glutathione-peroxidase activity in psoriasis. Clin Chim Acta; 179(2): 121-31.
Cottin Sc, Sanders TA Hall WL (2011). The differential effects of EPA and DHA on cardiovascular risk factors. Proc Nutr Soc; 1-17.
Covas Dr, de Lucena Angulo I, Vianna Bonini Palma P Zago MA (2004). Effects of hydroxyurea on the membrane of erythrocytes and platelets in sickle cell anemia. Haematolozica; 89(3): 273-80.
Covitz W, Espeland M, Gallagher D, Hellenbrand W, Leff S Talner N (1995). The heart in sickle cell anemia. The Cooperative Study of Sickle Cell Disease (CSSCD). Chest; 108(5): 1214-9.
Crawford MA (2000). Commentary on the workshop statement. Essentiality of and recommended dietary intakes for Omega-6 and Omega-3 fatty acids. Prostaziandins Leukot Essent Fatty Acids; 63(3): 131-4.
Crawford MA, Casperd NM Sinclair AJ (1976). The long chain metabolites of linoleic avid linolenic acids in liver and brain in herbivores and carnivores. Comp Biochem Physiol B; 54(3): 395-401.
Crawford MA, Doyle W, Drury P, Lennon A, Costeloe K Leighfield M (1989). n-6 and n-3 fatty acids during early human development. 1 Intern Med SuppI; 731159-69.
Creusot F, Acs G Christman JK (1982). Inhibition of DNA methyltransferase and induction of Friend erythroleukemia cell differentiation by 5-azacytidine and 5-aza-2'-deoxycytidine. 1 BioI Own; 257(4): 2041-8.
Cunnane SC (2003). Problems with essential fatty acids: time for a new paradigm? Prog Lipid Res; 42(6): 544-68.
Daak AA, Ghebremeskel K, Elbashir MI, Bakhita A, Hassan Z Crawford MA (2011). Hydroxyurea therapy mobilises arachidonic Acid from inner cell membrane aminophospholipids in patients with homozygous sickle cell disease. 1 Lipids; 2011 718014.
Dahlgren C Karlsson A (1999). Respiratory burst in human neutrophils. 1 Immunol Methods; 232(1-2): 3-14.
Daleke DL (2003). Regulation of transbilayer plasma membrane phospholipid asymmetry. 1 Lipid Res; 44(2): 233-42.
Daleke DL (2008). Regulation of phospholipid asymmetry in the erythrocyte membrane. Curr Opin Hematol; 15(3): 191-5.
Das AK, Horle 5 Hajra AK (1992). Biosynthesis of glycerolipid precursors in rat liver peroxisomes and their transport and conversion to phosphatidate in the endoplasmic reticulum. 1 BioI Chem; 267(14): 9724-30.
Dasgupta T, Hebbel RP Kaul DK (2006). Protective effect of arginine on oxidative stress in transgenic sickle mouse models. Free Radic BioI Med; 41(12}: 1771-80.
Datta MC (1985). Prostaglandin E2 mediated effects on the synthesis of fetal and adult hemoglobin in blood erythroid bursts. Prostaglandins; 29(4}: 561-77.
201

Bibliography
Datta MC, Dowla HA, Srivastava KK, Boswell VD Washington I (1991). Aspirin blocks 5-azacytidine- and hydroxyurea-induced changes in hemoglobin proportions in adult rats. European Tournai ofPharmacolozy 193(2): 173-7.
Davie JR (2003). Inhibition of histone deacetylase activity by butyrate. T Nutr; 133(7 Suppl): 24855-24935.
De Caterina R Libby P (1996). Control of endothelial leukocyte adhesion molecules by fatty acids. Lipids; 31 SuppIS57-63.
De Caterina R, Libby P, Peng HB, Thannickal VJ, Rajavashisth TB, Gimbrone MA, Jr., Shin WS Liao JK (1995). Nitric oxide decreases cytokine-induced endothelial activation. Nitric oxide selectively reduces endothelial expression of adhesion molecules and proinflammatory cytokines. T Clin Invest; 96(1): 60-8.
de Ceulaer K, Higgs DR, Weatherall DJ, Hayes RJ, Serjeant BE Serjeant GR (1983). alpha-Thalassemia reduces the hemolytic rate in homozygous sickle-cell disease. N Engl TMed; 309(3): 189-90.
De Franceschi L, Bachir D, Galacteros F, Tchernia G, Cynober T, Alper 5, Platt 0, Beuzard Y Brugnara C (1997). Oral magnesium supplements reduce erythrocyte dehydration in patients with sickle cell disease. T Clin Invest; 100(7): 1847-52.
De Franceschi L, Bachir D, Galacteros F, Tchernia G, Cynober T, Neuberg 0, Beuzard Y Brugnara C (2000). Oral magnesium pidolate: effects of long-term administration in patients with sickle cell disease. Br T Haematol; 108(2): 284-9.
de Franceschi L, Baron A, Scarpa A, Adrie C, Janin A, Barbi 5, Kister J, Rouyer-Fessard p, Corrocher R, Leboulch P Beuzard Y (2003). Inhaled nitric oxide protects transgenic SAD mice from sickle cell disease-specific lung injury induced by hypoxia/reoxygenation. Blood; 102(3): 1087-96.
De Franceschi L, Beuzard Y, Jouault H Brugnara C (1996). Modulation of erythrocyte potassium chloride cotransport, potassium content, and density by dietary magnesium intake in transgenic SAD mouse. Blood; 88(7): 2738-44.
De Franceschi L, Saadane N, Trudel M, Alper SL, Brugnara C Beuzard Y (1994). Treatment with oral clotrimazole blocks Ca(2+)-activated K+ transport and reverses erythrocyte dehydration in transgenic SAD mice. A model for therapy of sickle cell disease. T Clin Invest; 93(4): 1670-6.
de Jong K, Larkin SK, Styles LA, Bookchin RM Kuypers FA (2001). Characterization of the phosphatidylserine-exposing subpopulation of sickle cells. Blood; 98(3): 860-7.
de Jong PE Statius van Eps LW (1985). Sickle cell nephropathy: new insights into its pathophysiology. Kidney Int; 27(5): 711-7.
de Montalembert M, Dumont MD, Heilbronner C, Brousse V, Charrara 0, Pellegrino B, Piguet C, Soussan V Noizat-Pirenne F (2011). Delayed hemolytic transfusion reaction in children with sickle cell disease. Haematologica; 96(6): 801-7.
de Santis Feltran L, de Abreu Carvalhaes JT Sesso R (2002). Renal complications of sickle cell disease: managing for optimal outcomes. Paediatr Drugs; 4(1): 29-36.
de Waal Malefyt R, Abrams J, Bennett B, Figdor CG de Vries JE (1991). Interleukin 10(IL-10) inhibits cytokine synthesis by human monocytes: an autoregulatory role of IL-10 produced by monocytes. 1 Exp Med; 174(5): 1209-20.
Debaun MR Field JJ (2007). Limitations of clinical trials in sickle cell disease: a case study of the Multi-center Study of Hydroxyurea (MSH) trial and the Stroke Prevention (STOP) trial. Hematolo~ Am Soc Hematol Educ Program; 482-8.
202

Bibliography
DeBaun MR, Schatz J, Siegel MJ, Koby M, Craft S, Resar L, Chu JY, Launius G, DadashZadeh M, Lee RB Noetzel M (1998). Cognitive screening examinations for silent cerebral infarcts in sickle cell disease. Neurology; 50(6): 1678-82.
Delea TE, Edelsberg J, Sofrygin 0, Thomas SK, Baladi JF, Phatak PO Coates TD (2007). Consequences and costs of noncompliance with iron chelation therapy in patients with transfusion-dependent thalassemia: a literature review. Transfusion; 47(10): 1919-29.
Delton-Vandenbroucke I, Vericel E, Januel C, Carreras M, Lecomte M Lagarde M (2001). Dual regulation of glutathione peroxidase by docosahexaenoic acid in endothelial cells depending on concentration and vascular bed origin. Free Radic BioI Med; 30(8): 895-904.
DeSimone J, Heller P, Schimenti JC Duncan CH (1983). Fetal hemoglobin production in adult baboons by 5-azacytidine or by phenylhydrazine-induced hemolysis is associated with hypomethylation of globin gene DNA. Proll Clin BioI Res; 134 489-500.
DeSimone J, Koshy M, Dorn L, Lavelle 0, Bressler L, Molokie R Talischy N (2002). Maintenance of elevated fetal hemoglobin levels by decitabine during dose interval treatment of sickle cell anemia. Blood; 99(11): 3905-8.
Destaillats F, Joffre C, Acar N, Joffre F, Bezelgues JB, Pasquis B, Cruz-Hernandez C, Rezzi 5, Montoliu I, Dionisi F Bretillon L (2010). Differential effect of maternal diet supplementation with alpha-Linolenic adcid or n-3 long-chain polyunsaturated fatty acids on glial cell phosphatidylethanolamine and phosphatidylserine fatty acid profile in neonate rat brains. Nutr Metab (Lond); 7 2.
Devaux PF, Herrmann A, Ohlwein N Kozlov MM (2008). How lipid flippases can modulate membrane structure. Biochim Biophys Acta; 1778(7-8): 1591-600.
Devereux S Knowles SM (1985). Rhabdomyolysis and acute renal failure in sickle cell anaemia. Br Med , (Clin Res Ed); 290(6483): 1707.
Di Paolo G De Camilli P (2006). Phosphoinositides in cell regulation and membrane dynamics. Nature; 443(7112): 651-7.
Dijs FPL (2004). Sickle cell disease and alpha thalassemia in Curacao: Contribution to Epidemiology, Pathophysiology and Supportive Care. Thesis.
Diomede L, Albani 0, Sottocorno M, Donati MB, Bianchi M, Fruscella P Salmona M (2001). In vivo anti-inflammatory effect of statins is mediated by nonsterol mevalonate products. Arterioscler Thromb Vasc BioI; 21(8): 1327-32.
Dircks LK SuI HS (1997). Mammalian mitochondrial glycerol-3-phosphate acyltransferase. Biochim Biophys Acta; 1348(1-2): 17-26.
Djemli-Shipkolye A, Raccah D, Pieroni G, Vague P, Coste TC Gerbi A (2003). Differential effect of omega3 PUFA supplementations on Na,K-ATPase and Mg-A TPase activities: possible role of the membrane omega6/omega3 ratio. 'ournal of Membrane Biology 191(1): 37-47.
Djousse L, Pankow IS, Eckfeldt JH, Folsom AR, Hopkins PN, Province MA, Hong Y Ellison RC (2001). Relation between dietary linolenic acid and coronary artery disease in the National Heart, Lung, and Blood Institute Family Heart Study. Am 'Clin Nutr; 74(5): 612-9.
Dobrian AD, Lieb DC, Cole BK, Taylor-Fishwick OA, Chakrabarti SK Nadler JL (2011). Functional and pathological roles of the 12- and 15-lipoxygenases. ProfI Lipid Res; 50(1): 115-31.
203

Bibliography
Dona M, Fredman G, Schwab JM, Chiang N, Arita M, Goodarzi A, Cheng G, von Andrian UH Serhan CN (2008). Resolvin E1, an EPA-derived mediator in whole blood, selectively counterregulates leukocytes and platelets. Blood; 112(3): 848-55.
Dooper MM, Wassink L, M'Rabet L Graus YM (2002). The modulatory effects of prostaglandin-E on cytokine production by human peripheral blood mononuclear cells are independent of the prostaglandin subtype. InznzunoloSJ/; 107(1): 152-9.
Dover GJ, Humphries RK, Moore JG, Ley TJ, Young NS, Charache S Nienhuis AW (1986). Hydroxyurea induction of hemoglobin F production in sickle cell disease: relationship between cytotoxicity and F cell production. Blood; 67(3): 735-8.
Dowsett C (2005). Managing leg ulceration in patients with sickle cell disorder. Nurs Times; 101(16): 48-9,51.
Driscoll Me, Hurlet A, Styles L, McKie V, Files B, Olivieri N, Pegelow C, Berman B, Drachtman R, Patel K Brambilla D (2003). Stroke risk in siblings with sickle cell anemia. Blood; 101(6): 2401-4.
Driss A, Asare KO, Hibbert JM, Gee BE, Adamkiewicz TV Stiles JK (2009). Sickle Cell Disease in the Post Genomic Era: A Monogenic Disease with a Polygenic Phenotype. Genomics Insights; 2009(2): 23-48.
Dunlop RJ Bennett KC (2006). Pain management for sickle cell disease. Cochrane Database Syst Rev; (2): CD003350.
Dyerberg J Bang HO (1979). Lipid metabolism, atherogenesis, and haemostasis in Eskimos: the role of the prostaglandin-3 family. Haemostasis; 8(3-5): 227-33.
Earley CJ, Kittner SJ, Feeser BR, Gardner J, Epstein A, Wozniak MA, Wityk R, Stem BJ, Price TR, Macko RF, Johnson e, Sloan MA Buchholz D (1998). Stroke in children and sickle-cell disease: Baltimore-Washington Cooperative Young Stroke Study. Neurology; 51(1): 169-76.
Eaton WA Hofrichter J (1987). Hemoglobin S gelation and sickle cell disease. Blood; 70(5): 1245-66.
Eaton WA Hofrichter J (1990). Sickle cell hemoglobin polymerization. Adv Protein Chem; 40 63-279.
Ebert EC, Nagar M Hagspiel KD (2010). Gastrointestinal and hepatic complications of sickle cell disease. Clin Gastroenterol Hepatol; 8(6): 483-9; quiz e70.
Edwards L Y Edwards CL (2010). Psychosocial treatments in pain management of sickle cell disease. I Natl Med Assoc; 102(11): 1084-94.
Ejindu Ve, Hine AL, Mashayekhi M, Shorvon PJ Misra RR (2007). Musculoskeletal manifestations of sickle cell disease. Radiographics; 27(4): 1005-21.
el-Hazmi MA, al-Momen A, Kandaswamy S, Huraib S, Harakati M, aI-Mohareb F Warsy AS (1995). On the use of hydroxyurea/erythropoietin combination therapy for sickle cell disease. Acta Haematol; 94(3): 128-34.
el-Hazmi MA, Bahakim HM Warsy AS (1992). DNA polymorphism in the beta-globin gene cluster in Saudi Arabs: relation to severity of sickle cell anaemia. Acta Haematol; 88(2-3): 61-6.
El Nemer W, Gauthier E, Wautier MP, Rahuel e, Gane P, Galacteros F, Wautier JL, Cartron JP, Colin Y Le Van Kim C (2008). Role of Lu/BCAM in abnormal adhesion of sickle red blood cells to vascular endothelium. Transfus Clin BioI; 15(1-2): 29-33.
204

Bibliography
Elagouz M, Jyothi S, Gupta B Sivaprasad 5 Sickle cell disease and the eye: old and new concepts. Suro Ophthalmol; 55(4): 359-77.
Embury SH (2004). The not-so-simple process of sickle cell vasoocclusion. Microcirculation; 11(2): 101-13.
Embury SH, Dozy AM, Miller J, Davis JR, Jr., Kleman KM, Preisler H, Vichinsky E, Lande WN, Lubin BH, Kan YW Mentzer WC (1982). Concurrent sickle-cell anemia and alpha-thalassemia: effect on severity of anemia. N En~l 1 Med; 306(5): 270-4.
Emond AM, Collis R, Darvill D, Higgs DR, Maude GH Serjeant GR (1985). Acute splenic sequestration in homozygous sickle cell disease: natural history and management. T Pediatr; 107(2): 201-6.
Engelman JA, Chu C, Lin A, Jo H, Ikezu T, Okamoto T, Kohtz OS Lisanti MP (1998). Caveolin-mediated regulation of signaling along the p42/44 MAP kinase cascade in vivo. A role for the caveolin-scaffolding domain. FEBS Lett; 428(3): 205-11.
Enomoto TM, Isichei C, VanderJagt DJ, Fry DE Glew RH (1998). Decreased polyunsaturated fatty acids in sickle cell anaemia. TournaI of Tropical Pediatrics 44(1): 28-34.
Enwonwu CO, Xu XX Turner E (1990). Nitrogen metabolism in sickle cell anemia: free amino acids in plasma and urine. Am T Med Sci; 300(6): 366-71.
Erdogan H, Fadillioglu E, Ozgocmen S, Sogut 5, Ozyurt B, Akyol 0 Ardicoglu 0 (2004). Effect of fish oil supplementation on plasma oxidant/ antioxidant status in rats. Prosta~landins Leukot Essent Fatty Acids; 71(3): 149-52.
Exton JH (1994). Phosphatidy1choline breakdown and signal transduction. Biochim Biophys Acta; 1212(1): 26-42.
Fadok VA, de Cathelineau A, Daleke DL, Henson PM Bratton DL (2001). Loss of phospholipid asymmetry and surface exposure of phosphatidylserine is required for phagocytosis of apoptotic cells by macrophages and fibroblasts. 1 BioI Clum; 276(2): 1071-7.
Fadugbagbe AO, Gurgel RQ, Mendonca CQ, Cipolotti R, dos Santos AM Cuevas LE Ocular manifestations of sickle cell disease. Ann Trop Paediatr; 30(1): 19-26.
Fang YZ, Yang 5 Wu G (2002). Free radicals, antioxidants, and nutrition. Nutrition; 18(10): 872-9.
Farzaneh-Far R, Harris WS, Garg S, Na B Whooley MA (2009). Inverse association of erythrocyte n-3 fatty acid levels with inflammatory biomarkers in patients with stable coronary artery disease: The Heart and Soul Study. Atherosclerosis; 205(2): 538-43.
Fathallah H Atweh GF (2006). DNA hypomethylation therapy for hemoglobin disorders: molecular mechanisms and clinical applications. Blood Rev; 20(4): 227-34.
Feizi T (1985). Demonstration by monoclonal antibodies that carbohydrate structures of glycoproteins and glycolipids are onco-developmental antigens. Nature; 314(6006): 53-7.
Feletou M, Huang Y Vanhoutte PM (2011). Vasoconstrictor prostanoids. Pflu~ers Arch; 459(6): 941-50.
Femandis AZ Wenk MR (2007). Membrane lipids as signaling molecules. Curr Opin Lipidol; 18(2): 121-8.
205

Bibliography
Ferrone FA (2004). Polymerization and sickle cell disease: a molecular view. Microcirculation; 11(2): 115-28.
Ferrucci L, Cherubini A, Bandinelli S, Bartali B, Corsi A, Lauretani F, Martin A, Andres-Lacueva e, Senin U Guralnik JM (2006). Relationship of plasma polyunsaturated fatty acids to circulating inflammatory markers. T Clin Endocrinol Metab; 91(2): 439-46.
Fertrin KY Costa FF (2010). Genomic polymorphisms in sickle cell disease: implications for clinical diversity and treatment. Expert Rev Hematol; 3(4): 443-58.
Field H, Knight-Perry JE Debaun MR (2009). Acute pain in children and adults with sickle cell disease: management in the absence of evidence-based guidelines. Curr Opin Hematol; 16(3): 173-8.
Fischer S, von Schacky C Schweer H (1988). Prostaglandins E3 and F3 alpha are excreted in human urine after ingestion of n - 3 polyunsaturated fatty acids. Biochim Biophys Acta; 963(3): 501-8.
Fitzhugh CD, Perl S Hsieh MM (2008). Late effects of myeloablative bone marrow transplantation (BMT) in sickle cell disease (SCD). Blood; 111(3): 1742-3; author reply 1744.
Fitzhugh CD, Wigfall DR Ware RE (2005). Enalapril and hydroxyurea therapy for children with sickle nephropathy. Pediatr Blood Cancer; 45(7): 982-5.
Fitzpatrick FA Soberman R (2001). Regulated formation of eicosanoids. 'ournal of Clinical Investigation; 107(11): 1347-51.
Flint J, Harding RM, Boyce AJ Clegg JB (1998). The population genetics of the haemoglobinopathies. Bail/ieres Clin Haematol; 11(1): 1-51.
Fo1ch J, Lees M Sloane Stanley GH (1957). A simple method for the isolation and purification of total lipides from animal tissues. The 'ournal of Biological Chemistry; 226(1): 497-509.
Fourcade 0, Simon MF, Viode e, Rugani N, Leballe F, Ragab A, Fournie B, Sarda L Chap H (1995). Secretory phospholipase A2 generates the novel lipid mediator lysophosphatidic acid in membrane microvesicles shed from activated cells. Cell; 80(6): 919-27.
Fowler KT, Williams R, Mitchell CO, Levy Me, Pope LF, Smeltzer MP Wang we (2010). Dietary water and sodium intake of children and adolescents with sickle cell anemia. 'Pediatr Hematol Oncol; 32(5): 350-3.
Foy H, Kondi A, Timms GL, Brass W Bushra F (1954). The variability of sickle-cell rates in the tribes of Kenya and the Southern Sudan. Br Med 1; 1(4857): 294-7.
Francis RB, Jr. (1989). Elevated fibrin D-dimer fragment in sickle cell anemia: evidence for activation of coagulation during the steady state as well as in painful crisis. Haemostasis; 19(2): 105-11.
Frempong T Pearson HA (2007). Newborn screening coupled with comprehensive follow-up reduced early mortality of sickle cell disease in Connecticut. Conn Med; 71(1): 9-12.
Frenette PS (2002). Sickle cell va so-occlusion: multistep and multicellular paradigm. Curr Opin Hematol; 9(2): 101-6.
Frenette PS (2004). Sickle cell vasoocclusion: heterotypic, multicellular aggregations driven by leukocyte adhesion. Microcirculation; 11(2): 167-77.
Frenette PS Atweh GF (2007). Sickle cell disease: old discoveries, new concepts, and future promise. 'Clin Invest; 117(4): 850-8.
206

Bibliography
Friedman MJ (1978). Erythrocytic mechanism of sickle cell resistance to malaria. Proc Nat! Acad Sci USA; 75(4): 1994-7.
Fuchs B, Suss R, Teuber K, Eibisch M Schiller J (2011). Lipid analysis by thin-layer chromatography--a review of the current state. T Chromatogr A; 1218(19): 2754-74.
Fukami K, Inanobe 5, Kanemaru K Nakamura Y (2010). Phospholipase C is a key enzyme regulating intracellular calcium and modulating the phosphoinositide balance. Prog Lipid Res; 49(4): 429-37.
Galanello R Origa R (2010). Beta-thalassemia. Orphanet T Rare Dis; 5 11. Garattini 5 (2007). Long-chain n-3 fatty acids in lipid rafts: implications for anti
inflammatory effects. T Cardiovasc Med (Hagerstown); 8 Suppl1 530-3. Gaston MH, Verter JI, Woods G, Pegelow e, Kelleher J, Presbury G, Zarkowsky H,
Vichinsky E, Iyer R, Lobel JS et al. (1986). Prophylaxis with oral penicillin in children with sickle cell anemia. A randomized trial. N Engl 1 Med; 314(25): 1593-9.
Gault CR, Obeid LM Hannun Y A (2010). An overview of sphingolipid metabolism: from synthesis to breakdown. Adv Exp Med BioI; 6881-23.
Gbenebitse S, Jaja SI Kehinde MO (2005). Effect of changes in plasma vitamin E level of vascular responses and lipid peroxidation in sickle cell anaemia subjects. Niger Postgrad Med l; 12(2): 81-4.
Ghannoum MA (2000). Potential role of phospholipases in virulence and fungal pathogenesis. Clin Microbial Rev; 13(1): 122-43, table of contents.
Ghosh M, Tucker DE, Burchett SA Leslie CC (2006). Properties of the Group IV phospholipase A2 family. Prog Lipid Res; 45(6): 487-510.
Gibson JS Ellory JC (2002). Membrane transport in sickle cell disease. Blood Cells Mol Dis; 28(3): 303-14.
Gilman JG Huisman TH (1985). DNA sequence variation associated with elevated fetal G gamma globin production. Blood; 66(4): 783-7.
Giusto NM, Pasquare SJ, Salvador GA, Castagnet PI, Roque ME Ilincheta de Boschero MG (2000). Lipid metabolism in vertebrate retinal rod outer segments. Prog Lipid Res; 39(4): 315-91.
Gizi A, Papassotiriou I, Apostolakou F, Lazaropoulou C, Papastamataki M, Kanavaki I, Kalotychou V, Goussetis E, Kattamis A, Rombos I Kanavakis E (2011). Assessment of oxidative stress in patients with sickle cell disease: The glutathione system and the oxidant-antioxidant status. Blood Cells Mol Dis; 46(3): 220-5.
Gladwin MT Kato GJ (2005). Cardiopulmonary complications of sickle cell disease: role of nitric oxide and hemolytic anemia. Hematoloin! Am Soc Hematol Educ Program; 51-7.
Gladwin MT, Kato GJ, Weiner 0, Onyekwere ~C, Dampier C, Hsu L, Hagar RW, Howard T, Nuss R, Okam MM, Tremonti CK, Berman B, Villella A, Krishnamurti L, Lanzkron S, Castro 0, Gordeuk VR, Coles W A, PetersLawrence M, Nichols J, Hall MK, Hildesheim M, Blackwelder WC, Baldassarre J Casella JF (2011). Nitric oxide for inhalation in the acute treatment of sickle cell pain crisis: a randomized controlled trial. lama; 305(9): 893-902.
Gladwin MT, Sachdev V, Jison ML, Shizukuda Y, Plehn JF, Minter K, Brown B, Coles WA, Nichols JS, Ernst I, Hunter LA, Blackwelder We, Schechter AN, Rodgers
207

Bibliography
GP, Castro 0 Ognibene FP (2004). Pulmonary hypertension as a risk factor for death in patients with sickle cell disease. N Engl 1 Med; 350(9): 886-95.
Gladwin MT Vichinsky E (2008). Pulmonary complications of sickle cell disease. N Engl 1 Med; 359(21): 2254-65.
Gleissman H, Johnsen JI Kogner P (2010). Omega-3 fatty acids in cancer, the protectors of good and the killers of evil? Exp Cell Res; 316(8): 1365-73.
Glew RH, Casados J, Huang YS, Chuang LT VanderJagt OJ (2003). Correlation of the fatty acid composition and fluid property of the cholesteryl esters in the serum of Nigerian children with sickle cell disease and healthy controls. Prostaglandins Leukot Essent Fatty Acids; 68(1): 61-8.
Glover RE, Ivy ED, Orringer EP, Maeda H Mason RP (1999). Detection of nitrosyl hemoglobin in venous blood in the treatment of sickle cell anemia with hydroxyurea. Molecular Phannacology; 55(6): 1006-10.
Goldberg MA, Brugnara C, Dover GJ, Schapira L, Charache S Bunn HF (1990). Treatment of sickle cell anemia with hydroxyurea and erythropoietin. N Engl 1 Med; 323(6): 366-72.
Goldberg MA, Husson MA Bunn HF (1977). Participation of hemoglobins A and F in polymerization of sickle hemoglobin. 1 BioI Chern; 252(10): 3414-2l.
Goldstein AR, Anderson MJ Serjeant GR (1987). Parvovirus associated aplastic crisis in homozygous sickle cell disease. Arch Dis Child; 62(6): 585-8.
Goldstein LJ, Strenger R, King TC, Le SC Rogers BB (1995). Retrospective diagnosis of sickle cell-hemoglobin C disease and parvovirus infection by molecular DNA analysis of postmortem tissue. Hum Pathol; 26(12): 1375-8.
Gomez Candela C, Bermejo Lopez LM Loria Kohen V (2011). Importance of a balanced omega 6/omega 3 ratio for the maintenance of health: nutritional recommendations. Nutr Hosp; 26(2): 323-9.
Gordon WC Bazan NG (1990). Docosahexaenoic acid utilization during rod photoreceptor cell renewal. 1 Neurosci; 10(7): 2190-202.
Gorgas K, Teigler A, Komljenovic 0 Just WW (2006). The ether lipid-deficient mouse: tracking down plasmalogen functions. Biochim Biophys Acta; 1763(12): 1511-26.
Gormley M (2007). The first 'molecular disease': a story of Linus Pauling, the intellectual patron. Endeavour; 31(2): 71-7.
Gorter E Grendel F (1925). On Bimolecular Layers of Lipoids on the Chromocytes of the Blood. 1 Exp Med; 41(4): 439-43.
Graido-Gonzalez E, Doherty JC, Bergreen EW, Organ G, Telfer M McMillen MA (1998). Plasma endothelin-1, cytokine, and prostaglandin E2levels in sickle cell disease and acute va so-occlusive sickle crisis. Blood; 92(7): 2551-5.
Griffin BA (2008). How relevant is the ratio of dietary n-6 to n-3 polyunsaturated fatty acids to cardiovascular disease risk? Evidence from the opnup study. Curr Opin Lipidol; 19(1): 57-62.
Griffin rc, Mcintire 0 Buchanan GR (1994). High-dose intravenous methylprednisolone therapy for pain in children and adolescents with sickle cell disease. N EngllMed; 330(11): 733-7.
Guan X Wenk MR (2008). Biochemistry of inositol lipids. Front Biosci; 133239-51. Guasch A, Navarrete J, Nass K Zayas CF (2006). Glomerular involvement in adults
with sickle cell hemoglobinopathies: Prevalence and clinical correlates of progressive renal failure. lAm Soc Nephrol; 17(8): 2228-35.
208

Bibliography
Guidotti G (1972). The composition of biological membranes. Arch Intern Med; 129(2): 194-201.
Guillot N, Caillet E, Laville M, Calzada C, Lagarde M Vericel E (2009). Increasing intakes of the long-chain omega-3 docosahexaenoic acid: effects on platelet functions and redox status in healthy men. Faseb l; 23(9): 2909-16.
Gunstone F (1999). Fatty acid structure. In F. D. Gunstone, J. L. Harwood and F. B. Pdley (eds). TIle lipid hand book, Second Edition, Champan and Hall, London, UK; 1-19.
Gupta K, Gupta P, Solovey A Hebbel RP (1999). Mechanism of interaction of thrombospondin with human endothelium and inhibition of sickle erythrocyte adhesion to human endothelial cells by heparin. Biochim Biophys Acta; 1453(1):
63-73. Gurkan E, Ergun Y, Zorludernir S, Baslarnisli F Kocak R (2005). Liver involvement in
sickle cell disease. Turk l Gastroenteroi; 16(4): 194-8. Gurkan S, Scarponi KJ, Hotchkiss H, Savage B Drachtman R (2010). Lactate
dehydrogenase as a predictor of kidney involvement in patients with sickle cell anemia. Pediatr Nephrol; 25(10): 2123-7.
Guzik TJ, Korbut R Adamek-Guzik T (2003). Nitric oxide and superoxide in inflammation and immune regulation. l Physiol Pharmacol; 54(4): 469-87.
Haag M (2003). Essential fatty acids and the brain. Can l Psychiatry; 48(3): 195-203. Hagve TA, Lie 0 Gronn M (1993). The effect of dietary N-3 fatty acids on osmotic
fragility and membrane fluidity of human erythrocytes. Scand l Clin Lab Invest ~21575-84.
Hakomori S (2003). Structure, organization, and function of glycosphingolipids in membrane. Curr Opin Hematol; 10(1): 16-24.
Hamazaki T, Nakazawa R, Tateno S, Shishido H, Isoda K, Hattori Y, Yoshida T, Fujita T, Yano S Kumagai A (1984). Effects of fish oil rich in eicosapentaenoic acid on serum lipid in hyperlipidemic hemodialysis patients. Kidney Int; 26(1): 81-4.
Han X Gross RW (2005). Shotgun lipidornics: multidimensional MS analysis of cellular lipidomes. Expert Rev Proteomics; 2(2): 253-64.
Hankins J Aygun B (2009). Pharmacotherapy in sickle cell disease--state of the art and future prospects. Br 1 Haematol; 145(3): 296-308.
Hankins JS, McCarville MB, Hillenbrand CM, Loeffler RB, Ware RE, Song R, Smeltzer MP Joshi V (2010). Ventricular diastolic dysfunction in sickle cell anemia is common but not associated with myocardial iron deposition. Pediatr Blood Cancer; 55(3): 495-500.
Hansen AE, Haggard ME, Boelsche AN, Adam DJ Wiese HF (1958). Essential fatty acids in infant nutrition. III. Clinical manifestations of linoleic acid deficiency. 1 Nutr; 66(4): 565-76.
Hansen HS, Jensen B von Wettstein-Knowles P (1986). Apparent in vivo retroconversion of dietary arachidonic to linoleic acid in essential fatty aciddeficient rats. Biochim Biophys Acta; 878(2): 284-7.
Hao CM Breyer MD (2007a). Physiologic and pathophysiologic roles of lipid mediators in the kidney. Kidney Int; 71(11): 1105-15.
Hao CM Breyer MD (2007b). Roles of lipid mediators in kidney injury. Semin Ngphrol; 27(3): 338-51.
Harbige LS, Ghebremeskel K, Williams G Summers P (1990). N-3 and N-6 phosphoglyceride fatty acids in relation to in vitro erythrocyte haemolysis
209

Bibliography
induced by hydrogen peroxide in captive common marmosets (Callithrix jacchus). Comp Biochem Physiol B; 97(1): 167-70.
Harris RC (2008). An update on cyclooxygenase-2 expression and metabolites in the kidney. Curr Opin Nephrol Hypertens; 17(1): 64-9.
Harris WS, Mozaffarian D, Rimm E, Kris-Etherton P, Rudel LL, Appel LJ, Engler MM, Engler MB Sacks F (2009). Omega-6 fatty acids and risk for cardiovascular disease: a science advisory from the American Heart Association Nutrition Subcommittee of the Council on Nutrition, Physical Activity, and Metabolism; Council on Cardiovascular Nursing; and Council on Epidemiology and Prevention. Circulation; 119(6): 902-7.
Harrod VL, Howard T A, Zimmerman SA, Dertinger SD Ware RE (2007). Quantitative analysis of Howell-Jolly bodies in children with sickle cell disease. Exp Hematol; 35(2): 179-83.
Hashimoto M, Hossain S, Yamasaki H, Yazawa K Masumura S (1999). Effects of eicosapentaenoic acid and docosahexaenoic acid on plasma membrane fluidity of aortic endothelial cells. Lipids; 34(12): 1297-304.
Hatton CS, Bunch C Weatherall DJ (1985). Hepatic sequestration in sickle cell anaemia. Br Med [(Clin Res Ed); 290(6470): 744-5.
Haynes J, Jr. Obiako B (2002). Activated polymorphonuclear cells increase sickle red blood cell retention in lung: role of phospholipids. Am [ Physiol Heart Circ Physiol; 282(1): H122-30.
He K, Song Y, Daviglus ML, Liu K, Van Horn L, Dyer AR, Goldbourt U Greenland P (2004). Fish consumption and incidence of stroke: a meta-analysis of cohort studies. Stroke; 35(7): 1538-42.
Heacock AM Agranoff BW (1997). CDP-diacylglycerol synthase from mammalian tissues. Biochim BiophYs Acta; 1348(1-2): 166-72.
Head CA, Swerdlow P, McDade WA, Joshi RM, Ikuta T, Cooper ML Eckman JR (2010). Beneficial effects of nitric oxide breathing in adult patients with sickle cell crisis. Am [Hematol; 85(10): 800-2.
Healy DA, Wallace FA, Miles EA, Calder PC Newsholm P (2000). Effect of low-tomoderate amounts of dietary fish oil on neutrophil lipid composition and function. Lipids; 35(7): 763-8.
Hebbel P (2005). Pathobiology of sickle cell disease. In: Hotfman R, editor. Hematology basic principles and practice. Philadelphia, Elsevier Churchill-Livinsstone; 591-645.
Hebbel RP (1991). Beyond hemoglobin polymerization: the red blood cell membrane and sickle disease pathophysiology. Blood; 77(2): 214-37.
Hebbel RP (2008). Adhesion of sickle red cells to endothelium: myths and future directions. Transfus Clin BioI; 15(1-2): 14-8.
Hebbel RP (2010). Reconstructing sickle cell disease: a data-based analysis of the "hyperhemolysis paradigm" for pulmonary hypertension from the perspective of evidence-based medicine. Am [Hematol; 86(2): 123-54.
Hebbel RP (2011). Reconstructing sickle cell disease: a data-based analysis of the "hyperhemolysis paradigm" for pulmonary hypertension from the perspective of evidence-based medicine. Am [Hematol; 86(2): 123-54.
Hebbel RP, Boogaerts MA, Eaton JW Steinberg MH (1980). Erythrocyte adherence to endothelium in sickle-cell anemia. A possible determinant of disease severity. N EnSl [Med; 302(18): 992-5.
210

Bibliography
Hebbel RP, Morgan WT, Eaton JW Hedlund BE (1988). Accelerated autoxidation and heme loss due to instability of sickle hemoglobin. Proc Natl Acad Sci USA; 85(1): 237-41.
Hebbel RP, Osarogiagbon R Kaul D (2004). The endothelial biology of sickle cell disease: inflammation and a chronic vasculopathy. Microcirculation; 11(2): 129-51.
Hebbel RP, Vercellotti G Nath KA (2009). A systems biology consideration of the vasculopathy of sickle cell anemia: the need for multi-modality chemoprophylaxsis. Cardiovasc Hematol Disord Drug Targets; 9(4): 271-92.
Heemskerk JW, Bevers EM Lindhout T (2002). Platelet activation and blood coagulation. Thromb Haemost; 88(2): 186-93.
Helland IB, Smith L, Saarem K, Saugstad OD Drevon CA (2003). Maternal supplementation with very-long-chain n-3 fatty acids during pregnancy and lactation augments children's IQ at 4 years of age. Pediatrics; 111(1): e39-44.
Henderson IN, Noetzel MJ, McKinstry RC, White DA, Armstrong M DeBaun MR (2003). Reversible posterior leukoencephalopathy syndrome and silent cerebral infarcts are associated with severe acute chest syndrome in children with sickle cell disease. Blood; 101(2): 415-9.
Hennig B, Lei W, Arzuaga X, Ghosh DD, Saraswathi V Toborek M (2006). Linoleic acid induces proinflammatory events in vascular endothelial cells via activation of PI3K/ Akt and ERKI/2 signaling. T Nutr Biochem; 17(11): 766-72.
Henthorn ps, Smithies 0 Mager DL (1990). Molecular analysis of deletions in the human beta-globin gene cluster: deletion junctions and locations of breakpoints. Genomics; 6(2): 226-37.
Hermansson M, Hokynar K Somerharju P (2011). Mechanisms of glycerophospholipid homeostasis in mammalian cells. Prog Lipid Res; 50(3): 240-57.
Hernandez-Perera 0, Perez-Sal a D, Navarro-Antolin J, Sanchez-Pascuala R, Hernandez G, Diaz C Lamas S (1998). Effects of the 3-hydroxy-3-methylglutaryl-CoA reductase inhibitors, atorvastatin and simvastatin, on the expression of endothelin-l and endothelial nitric oxide synthase in vascular endothelial cells. T Clin Invest; 101(12): 2711-9.
Hernandez P, Dorticos E, Espinosa E, Gonzalez X Svarch E (1989). Clinical features of hepatic sequestration in sickle cell anaemia. Haematologia (Budap); 22(3): 169-74.
Herrick JB (2001). Peculiar elongated and sickle-shaped red blood corpuscles in a case of severe anemia. 1910. Yale T BioI Med; 74(3): 179-84.
Hines p, Dover GJ Resar LM (2008). Pulsed-dosing with oral sodium phenylbutyrate increases hemoglobin F in a patient with sickle cell anemia. Pediatr Blood Cancer; 50(2): 357-9.
Ho M, Maple C, Bancroft A, McLaren M Belch JJ (1999). The beneficial effects of omega-3 and omega-6 essential fatty acid supplementation on red blood cell rheology. Prostaglandins, Leukotrienes and Essential Fatty Acids 61(1): 13-7.
Hocker M, Schmidt WE, Wilms HM, Lehnhoff F, Nustede R, Schafmayer A Folsch UR (1990). Measurement of tissue cholecystokinin (CCK) concentrations by bioassay and specific radioimmunoassay: characterization of the bioactivity of CCK-58 before and after tryptic cleavage. Eur 1 Clin Invest; 20 Suppll 545-50.
Hogan AM, Pit-ten Cate 1M, Vargha-Khadem F, Prengler M Kirkham FJ (2006a). PhYSiological correlates of intellectual function in children with sickle cell disease: hypoxaemia, hyperaemia and brain infarction. Dev Sci; 9(4): 379-87.
211
Bibliography
Hogan AM, Vargha-Khadem F, Saunders DE, Kirkham FJ Baldeweg T (2006b). Impact of frontal white matter lesions on performance monitoring: ERP evidence for cortical disconnection. Brain; 129(Pt 8): 2177-88.
Holman RT (1960). The ratio of trienoic: tetraenoic acids in tissue lipids as a measure of essential fatty acid requirement. I Nutr; 70 405-10.
Holman RT, Johnson SB Hatch TF (1982). A case of human linolenic acid deficiency involving neurological abnormalities. Am T Clin Nutr; 35(3): 617-23.
Holthuis JC, Pomorski T, Raggers RJ, Sprong H Van Meer G (2001). The organizing potential of sphingolipids in intracellular membrane transport. PhysioI Rev; 81(4): 1689-723.
Hoover R, Rubin R, Wise G Warren R (1979). Adhesion of normal and sickle erythrocytes to endothelial monolayer cultures. Blood; 54(4): 872-6.
Hoppe C, Kuypers F, Larkin 5, Hagar W, Vichinsky E Styles L (2011). A pilot study of the short-term use of simvastatin in sickle cell disease: effects on markers of vascular dysfunction. Br T Haematol; 153(5): 655-63.
Hoppe C, Vichinsky E, Quirolo K, van Warmerdam J, Allen K Styles L (2000). Use of hydroxyurea in children ages 2 to 5 years with sickle cell disease. TournaI of Pediatric Hematology/Oncology; 22(4): 330-4.
Houtkooper RH Vaz FM (2008). Cardiolipin, the heart of mitochondrial metabolism. Cell Mol Life Sci; 65(16): 2493-506.
Hu FB Willett WC (2002). Optimal diets for prevention of coronary heart disease. lama; 288(20): 2569-78.
Huitema K, van den Dikkenberg J, Brouwers JF Holthuis JC (2004). Identification of a family of animal sphingomyelin synthases. Embo T; 23(1): 33-44.
Hulbert AJ, Turner N, Storlien LH Else PL (2005). Dietary fats and membrane function: implications for metabolism and disease. Bioi Rev Camb Philos Soc; 80(1): 155-69.
Hutchinson JL, Rajagopal SP, Sales KJ Jabbour HN (2011). Molecular regulators of resolution of inflammation: potential therapeutic targets in the reproductive system. Reproduction; 142(1): 15-28.
Igarashi M, DeMar Je, Jr., Ma K, Chang L, Bell JM Rapoport 51 (2007). Upregulated liver conversion of alpha-linolenic acid to docosahexaenoic acid in rats on a 15 week n-3 PUFA-deficient diet. T Lipid Res; 48(1): 152-64.
Ignarro LJ, Buga GM, Wood KS, Byrns RE Chaudhuri G (1987). Endothelium-derived relaxing factor produced and released from artery and vein is nitric oxide. Proc Natl Acad Sci USA; 84(24): 9265-9.
Ikonen E (2008). Cellular cholesterol trafficking and compartmentalization. Nat Rev Mol Cell BioI; 9(2): 125-38.
Imig JD (2006). Eicosanoids and renal vascular function in diseases. Clin Sci (Lond); 111(1): 21-34.
Imig JD Hammock BD (2009). Soluble epoxide hydrolase as a therapeutic target for cardiovascular diseases. Nat Rev Drug Discov; 8(10): 794-805.
Inati A (2009). Recent advances in improving the management of sickle cell disease. Blood Rev; 23 Supp11 59-13.
Inati A, Khoriaty E Musallam KM (2011). Iron in sickle-cell disease: what have we learned over the years? Pediatr Blood Cancer; 56(2): 182-90.
Innis 5M (1991). Essential fatty acids in growth and development. Prog Lipid Res; 30(1): 39-103.
212

Bibliography
Inwald DP, Kirkham FJ, Peters MJ, Lane R, Wade A, Evans JP Klein NJ (2000). Platelet and leucocyte activation in childhood sickle cell disease: association with nocturnal hypoxaemia. Br 1 Haematol; 111(2): 474-81.
Iraz M, Erdogan H, Ozyurt B, Ozugurlu F, Ozgocmen S FadiIlioglu E (2005). Brief communication: omega-3 essential fatty acid supplementation and erythrocyte oxidant! antioxidant status in rats. Ann Clin Lab Sci; 35(2): 169-73.
ISSFAL ISftSoFAaL (2004). Recommendations for intake of polyunsaturated fatty acids inhealthyadults.
Jacobson K, Sheets ED Simson R (1995). Revisiting the fluid mosaic model of membranes. Science; 268(5216): 1441-2.
Jaja SI, Aigbe PE, Gbenebitse S Temiye EO (2005). Changes in erythrocytes following supplementation with alpha-tocopherol in children suffering from sickle cell anaemia. Niger Postgrad Med 1; 12(2): 110-4.
James MJ, Gibson RA Cleland LG (2000). Dietary polyunsaturated fatty acids and inflammatory mediator production. Am T Clin Nutr; 71(1 Suppl): 3435-8S.
Jaross W, Eckey R Menschikowski M (2002). Biological effects of secretory phospholipase A(2) group IIA on lipoproteins and in atherogenesis. Eur T Clin Invest; 32(6): 383-93.
Jean-Baptiste G De Ceulaer K (2000). Osteoarticular disorders of haematological origin. Baillieres Best Pract Res Clin Rheu111atol; 14(2): 307-23.
Jeffrey BG, Weisinger HS, Neuringer M Mitchell DC (2001). The role of docosahexaenoic acid in retinal function. Lipids; 36(9): 859-71.
Jeney V, Balla J, Yachie A, Varga Z, Vercellotti GM, Eaton JW Balla G (2002). Prooxidant and cytotoxic effects of circulating heme. Blood; 100(3): 879-87.
Ji LL, Gomez-Cabrera MC Vina J (2006). Exercise and hormesis: activation of cellular antioxidant signaling pathway. Ann NY Acad Sci; 1067425-35.
John AB, Ramlal A, Jackson H, Maude GH, Sharma AW Serjeant GR (1984). Prevention of pneumococcal infection in children with homozygous sickle cell disease. Br Med 1 (Clin Res Ed); 288(6430): 1567-70.
Johnson C Telen MJ (2008). Adhesion molecules and hydroxyurea in the pathophysiology of sickle cell disease. Haematologica; 93(4): 481-5.
Johnson CS, Ornata M, Tong MJ, Simmons JF, Jr., Weiner J Tatter D (1985). Liver involvement in sickle cell disease. Medicine (Baltimore); 64(5): 349-56.
Johnson FL, Look AT, Gockerman J, Ruggiero MR, Dalla-Pozza L Billings FT, 3rd (1984). Bone-marrow transplantation in a patient with sickle-cell anemia. N Engi T Med; 311(12): 780-3.
Johnson RM, Goyette G, Jr., Ravindranath Y Ho YS (2002). Oxidation of glutathione peroxidase-deficient red cells by organic peroxides. Blood; 100(4): 1515-6.
Johnson RM, Ho YS, Yu DY, Kuypers FA, Ravindranath Y Goyette GW (2010). The effects of disruption of genes for peroxiredoxin-2, glutathione peroxidase-1, and catalase on erythrocyte oxidative metabolism. Free Radic BioI Med; 48(4): 519-25.
Joiner CH, Platt OS Lux SEt (1986). Cation depletion by the sodium pump in red cells with pathologic cation leaks. Sickle cells and xerocytes. 1 Clin Invest; 78(6): 1487-96.
Joneckis CC Ackley RL, Orringer EP, Wayner EA Parise LV (1993). Integrin alpha 4 beta 1 and glycoprotein IV (CD36) are expressed on circulating reticulocytes in sickle cell anemia. Blood; 82(12): 3548-55.
213

Bibliography
Jump DB (2002). The biochemistry of n-3 polyunsaturated fatty acids. T BioI Clum; 277(11): 8755-8.
Kakarala S Lindberg M (2004). Safety of liver biopsy in acute sickle hepatic crisis. Conn Med; 68(5): 277-9.
Kan YW Dozy AM (1978). Polymorphism of DNA sequence adjacent to human betaglobin structural gene: relationship to sickle mutation. Proc Natl Acad Sci USA; 75(11): 5631-5.
Kano H, Hayashi T, Sumi D, Esaki T, Asai Y, Thakur NK, Jayachandran M Iguchi A (1999). A HMG-CoA reductase inhibitor improved regression of atherosclerosis in the rabbit aorta without affecting serum lipid levels: possible relevance of up-regulation of endothelial NO synthase mRNA. Biochem Biophys Res Communi 259(2): 414-9.
Karck U, Peters T Decker K (1988). The release of tumor necrosis factor from endotoxin-stimulated rat Kupffer cells is regulated by prostaglandin E2 and dexamethasone. [Hepatol; 7(3): 352-61.
Karlsson AA, Michelsen P Odham G (1998). Molecular species of sphingomyelin: determination by high-performance liquid chromatography/mass spectrometry with electrospray and high-performance liquid chromatography/tandem mass spectrometry with atmospheric pressure chemical ionization. T Mass Spectrom; 33(12): 1192-8.
Karlsson KA (1970). On the chemistry and occurrence of sphingolipid long-chain bases. (hem Pllys Lipids; 5(1): 6-43.
Kassab-Chekir A, Laradi S, Ferchichi 5, Haj Khelil A, Feki M, Amri F, Selmi H, Bejaoui M Miled A (2003). Oxidant, antioxidant status and metabolic data in patients with beta-thalassemia. Clin Chim Acta; 338(1-2): 79-86.
Kato GJ (2009). Haptoglobin halts hemoglobin's havoc. T Clin Invest; 119(8): 2140-2. Kato GJ, Gladwin MT Steinberg MH (2007). Deconstructing sickle cell disease:
reappraisal of the role of hemolysis in the development of clinical subphenotypes. Blood Rev; 21(1): 37-47.
Kato GJ, Hebbel RP, Steinberg MH Gladwin MT (2009). Vasculopathy in sickle cell disease: Biology, pathophysiology, genetics, translational medicine, and new research directions. Am l Hematoli 84(9): 618-25.
Kato GJ, McGowan V, Machado RF, Little JA, Taylor Jt, Morris CR, Nichols JS, Wang X, Poljakovic M, Morris SM, Jr. Gladwin MT (2006). Lactate dehydrogenase as a biomarker of hemolysis-associated nitric oxide resistance, priapism, leg ulceration, pulmonary hypertension, and death in patients with sickle cell disease. Blood; 107(6): 2279-85.
Kaul DK Fabry ME (2004). In vivo studies of sickle red blood cells. Microcirculation; 11(2): 153-65.
Kaul DK, Fabry ME Nagel RL (1989). Microvascular sites and characteristics of sickle cell adhesion to vascular endothelium in shear flow conditions: pathophysiological implications. Proc Natl Acad Sci USA; 86(9): 3356-60.
Kaul DK, Fabry ME Nagel RL (1996). The pathophysiology of vascular obstruction in the sickle syndromes. Blood Rev; 10(1): 29-44.
Kaul DK, Finnegan E Barabino GA (2009). Sickle red cell-endothelium interactions. Microcirculation; 16(1): 97-111.
Kaul DK Hebbel RP (2000). Hypoxia/reoxygenation causes inflammatory response in transgenic sickle mice but not in normal mice. I Clin Invest; 106(3): 411-20.
214

Bibliography
Kaul OK, Liu XD, GlOong S, Belcher JD, Vercellotti GM Hebbel RP (2004). Antiinflammatory therapy ameliorates leukocyte adhesion and microvascular flow abnormalities in transgenic sickle mice. Am 1 Physiol Heart Ore Physiol; 287(1): H293-301.
Kaul OK, Liu XD, Zhang X, Mankelow T, Parsons S, Spring F, An X, Mohandas N, Anstee 0 Chasis JA (2006). Peptides based on alpha V-binding domains of erythrocyte ICAM-4 inhibit sickle red cell-endothelial interactions and vasoocclusion in the microcirculation. Am T Physiol Cell Physiol; 291(5): C922-30.
Kaul OK, Tsai HM, Liu XD, Nakada MT, Nagel RL Coller BS (2000). Monoclonal antibodies to alpha Vbeta3 (7E3 and LM609) inhibit sickle red blood cellendothelium interactions induced by platelet-activating factor. Blood: 95(2): 368-74.
Kavecansky J, Schroeder F Joiner CH (1995). Deoxygenation-induced alterations in sickle cell membrane cholesterol exchange. American TournaI of Physiology-Heart and Circulatory Physiology; 269(5 Pt 1): C1105-11.
Kawabe J, Ushikubi F Hasebe N (2010). Prostacyclin in vascular diseases. - Recent insights and future perspectives. Ore 1; 74(5): 836-43.
Keen C, Olin AC, Eriksson S, Ekman A, Lindblad A, Basu S, Beermann C Strandvik B (2010). Supplementation with fatty acids influences the airway nitric oxide and inflammatory markers in patients with cystic fibrosis. 1 Pediatr Gastroenterol Nutr; 50(5): 537-44.
Kehrer JP (2000). The Haber-Weiss reaction and mechanisms of toxicity. Toxicology; 149(1): 43-50.
Keller H, Dreyer C, Medin J, Mahfoudi A, Ozato K Wahli W (1993). Fatty acids and retinoids control lipid metabolism through activation of peroxisome proliferator-activated receptor-retinoid X receptor heterodimers. Proc Natl Acad Sci USA; 90(6): 2160-4.
Kent D, Arya R, Aclimandos WA, Bellingham AJ Bird AC (1994). Screening for ophthalmic manifestations of sickle cell disease in the United Kingdom. Eye (Lond); 8 ( Pt 6) 618-22.
Key NS, Slungaard A, Dandelet L, Nelson SC, Moertel C, Styles LA, Kuypers FA Bach RR (1998). Whole blood tissue factor procoagulant activity is elevated in patients with sickle cell disease. Blood; 91(11): 4216-23.
Khaselev N Murphy RC (1999). Susceptibility of plasmenyl glycerophosphoethanolamine lipids containing arachidonate to oxidative degradation. Free Radic BioI Med; 26(3-4): 275-84.
Kim-Shapiro DB, King SB, Bonifant CL, Kolibash CP Ballas SK (1998). Time resolved absorption study of the reaction of hydroxyurea with sickle cell hemoglobin. Biochimica Biophysica Acta; 1380(1): 64-74.
Kim SF, Huri DA Snyder SH (2005). Inducible nitric oxide synthase binds, Snitrosylates, and activates cyclooxygenase-2. Science; 310(5756): 1966-70.
Kim SK Miller JH (2002). Natural history and distribution of bone and bone marrow infarction in sickle hemoglobinopathies. 1 Nucl Med; 43(7): 896-900.
King SB (2003). A role for nitric oxide in hydroxyurea-mediated fetal hemoglobin induction. 1 Clin Invest; 111(2): 171-2.
King SB (2004). Mechanisms and novel directions in the biological applications of nitric oxide donors. Free Radical Biology and Medicine; 37(6): 735-6.
215

Bibliography
Kinney TR, Ware RE, Schultz WH Filston HC (1990). Long-term management of splenic sequestration in children with sickle cell disease. 1 Pediatr; 117(2 Pt 1): 194-9.
Kirkham FJ (2007). Therapy insight: stroke risk and its management in patients with sickle cell disease. Nat Clin Pract Neurol; 3(5): 264-78.
Kita Y, Ohto T, Uozumi N Shimizu T (2006). Biochemical properties and pathophysiological roles of cytosolic phospholipase A2s. Biochim Biophys Acta; 1761(11): 1317-22.
Knapp HR (1990). Prostaglandins in human semen during fish oil ingestion: evidence for in vivo cyclooxygenase inhibition and appearance of novel trienoic compounds. Prostaslandins; 39(4): 407-23.
Knight-Perry J, DeBaun MR, Strunk RC Field JJ (2009). Leukotriene pathway in sickle cell disease: a potential target for directed therapy. Expert Rev Hematol; 2(1): 57-68.
Kohler GA, Brenot A, Haas-Stapleton E, Agabian N, Deva R Nigam S (2006). Phospholipase A2 and phospholipase B activities in fungi. Biochim Biophys Acta; 1761(11): 1391-9.
Kolter T, Proia RL Sandhoff K (2002). Combinatorial ganglioside biosynthesis. 1 BioI Chem; 277(29): 25859-62.
Konkel A Schunck WH (2011). Role of cytochrome P450 enzymes in the bioactivation of polyunsaturated fatty acids. Biochim Biophys Acta; 1814(1): 210-22.
Konotey-Ahulu (1968). Hereditary qualitative and quantitative erythrocyte defect in Ghana: an historical and geographical survey. Ghana Med.l; 46118-9.
Konotey-Ahulu FI (1974). The sickle cell diseases. Clinical manifestations including the "sickle crisis". Arch Intern Med; 133(4): 611-9.
Kooy A, de Heide LJ, ten Tije AJ, Mulder AH, Tanghe HL, Kluytmans JA Michiels JJ (1996). Vertebral bone destruction in sickle cell disease: infection, infarction or both. Netll TMed; 48(6): 227-31.
Koshy M, Dom L, Bressler L, Molokie R, Lavelle 0, Talischy N, Hoffman R, van Overveld W DeSimone J (2000). 2-deoxy 5-azacytidine and fetal hemoglobin induction in sickle cell anemia. Blood; 96(7): 2379-84.
Koshy M, Entsuah R, Koranda A, Kraus AP, Johnson R, Bellvue R, Floumoy-Gill Z Levy P (1989). Leg ulcers in patients with sickle cell disease. Blood; 74(4): 1403-8.
Krishnan S, Setty Y, Betal SG, Vijender V, Rao K, Dampier C Stuart M (2010). Increased levels of the inflammatory biomarker C-reactive protein at baseline are associated with childhood sickle cell vasocclusive crises. Br T Haematol; 148(5): 797-804.
Kuhn H, Walther M Kuban RJ (2002). Mammalian arachidonate 15-lipoxygenases structure, function, and biolOgical implications. Prostaglandins Other Lipid Mediat; 68-69 263-90.
Kuliev A, Pakhalchuk T, Verlinsky 0 Rechitsky S (2011). Preimplantation Genetic Diagnosis for Hemoglobinopathies. Hemoglobin.
Kumar A, Eckmam JR, Swerlick RA Wick TM (1996). Phorbol ester stimulation increases sickle erythrocyte adherence to endothelium: a novel pathway involving alpha 4 beta 1 integrin receptors on sickle reticulocytes and fibronectin. Blood; 88(11): 4348-58.
216

Bi bl iogra phy
Kuross SA Hebbel RP (1988). Nonheme iron in sickle erythrocyte membranes: association with phospholipids and potential role in lipid peroxidation. Blood; 72(4): 1278-85.
Kuross SA, Rank BH Hebbel RP (1988). Excess heme in sickle erythrocyte inside-out membranes: possible role in thiol oxidation. Blood; 71(4): 876-82.
Kurzchalia TV Parton RG (1999). Membrane microdomains and caveolae. Curr Opin Cell Bioi; 11(4): 424-31.
Kuypers FA (2007). Membrane lipid alterations in hemoglobinopathies. Hematology Am Soc He111ato/ Educ Prozram; 68-73.
Kuypers FA de Jong K (2004). The role of phosphatidylserine in recognition and removal of erythrocytes. Cell Mol Bioi (Noisy-Ie-zrand); 50(2): 147-58.
Kuypers FA, Lewis RA, Hua M, Schott MA, Discher D, Ernst JD Lubin BH (1996). Detection of altered membrane phospholipid asymmetry in subpopulations of human red blood cells using fluorescently labeled annexin V. Blood; 87(3): 1179-87.
La Nasa G, Argiolu F, Giardini C, Pession A, Fagioli F, Caocci G, Vacca A, De Stefano p, Piras E, Ledda A, Piroddi A, Littera R, Nesci S Locatelli F (2005). Vnrelated bone marrow transplantation for beta-thalassemia patients: The experience of the Italian Bone Marrow Transplant Group. Ann N Y Acad Sci; 1054 186-95.
Lajoie P Nabi IR (2007). Regulation of raft-dependent endocytosis. T Cell Mol Med; 11(4): 644-53.
Lajoie P Nabi IR (2010). Lipid rafts, caveolae, and their endocytosis. Int Rev Cell Mol Bioi; 282 135-63.
Lanaro C, Franco-Penteado CF, Albuqueque OM, Saad ST, Conran N Costa FF (2009). Altered levels of cytokines and inflammatory mediators in plasma and leukocytes of sickle cell anemia patients and effects of hydroxyurea therapy. 1 Leukoc Bioi; 85(2): 235-42.
Lands WE (2000). Stories about acyl chains. Biochim Biophys Acta; 1483(1): 1-14. Lane A Deveras R (2011). Potential Risks of Chronic Sildenafil Vse for Priapism in
Sickle Cell Disease. 1 Sex Med. Lang KS, Lang PA, Bauer C, Duranton C, Wieder T, Huber SM Lang F (2005).
Mechanisms of suicidal erythrocyte death. Cell Physiol Biochem; 15(5): 195-202. Lanzkron S, Strouse JJ, Wilson R, Beach MC, Haywood C, Park H, Witkop C, Bass EB
Segal JB (2008). Systematic review: Hydroxyurea for the treatment of adults with sickle cell disease. Ann Intern Med; 148(12): 939-55.
Larsson Sc, Virtamo J Wolk A (2011). Fish consumption and risk of stroke in Swedish women. Am T Clin Nutr; 93(3): 487-93.
Lauf PK Adragna NC (2000). K-Cl cotransport: properties and molecular mechanism. Cell Physiol Biochem; 10(5-6): 341-54.
Laufs V (2003). Beyond lipid-lowering: effects of statins on endothelial nitric oxide. Eur T Clin Pharmacol; 58(11): 719-31.
Laufs V, Gertz K, Dirnagl V, Bohm M, Nickenig G Endres M (2002). Rosuvastatin, a new HMG-CoA reductase inhibitor, upregulates endothelial nitric oxide synthase and protects from ischemic stroke in mice. Brain Res; 942(1-2): 23-30.
Laufs V, La Fata V, Plutzky J Liao JK (1998). Vpregulation of endothelial nitric oxide synthase by HMG CoA reductase inhibitors. Circulation; 97(12): 1129-35.
217

Bibliography
Le HD, Meisel JA, de Meijer VE, Gura KM Puder M (2009). The essentiality of arachidonic acid and docosahexaenoic acid. Prostaglandins Leukot Essent Fatty Acids; 81(2-3): 165-70.
Le Lay S Kurzchalia TV (2005). Getting rid of caveolins: phenotypes of caveolindeficient animals. Biochim Biophys Acta; 1746(3): 322-33.
Leaf AA, Leighfield MJ, Costeloe KL Crawford MA (1992). Long chain polyunsaturated fatty acids and fetal growth. Early Hum Dev; 30(3): 183-91.
Lee AG (2004). How lipids affect the activities of integral membrane proteins. Biochim Biophys Acta; 1666(1-2): 62-87.
Lee AG (2005). How lipids and proteins interact in a membrane: a molecular approach. Mol Biosyst; 1(3): 203-12.
Lee SP, Ataga KI, Orringer EP, Phillips DR Parise LV (2006). Biologically active CD40 ligand is elevated in sickle cell anemia: potential role for platelet-mediated inflammation. Arterioscler Thromb Vasc BioI; 26(7): 1626-31.
Lee SP, Ataga KI, Zayed M, Manganello JM, Orringer EP, Phillips DR Parise LV (2007). Phase I study of eptifibatide in patients with sickle cell anaemia. Br T Haematol; 139(4): 612-20.
Leikin SL, Gallagher 0, Kinney TR, Sloane 0, Klug P Rida W (1989). Mortality in children and adolescents with sickle cell disease. Cooperative Study of Sickle Cell Disease. Pediatrics; 84(3): 500-8.
Leray C, Cazenave JP Gachet C (2002). Platelet phospholipids are differentially protected against oxidative degradation by plasmalogens. Lipids; 37(3): 285-90.
Lessig J Fuchs B (2009). Plasmalogens in biological systems: their role in oxidative processes in biological membranes, their contribution to pathological processes and aging and plasmalogen analysis. Curr Med Chem; 16(16): 2021-41.
Lester LA, Sodt pc, Hutcheon N Arcilla RA (1990). Cardiac abnormalities in children with sickle cell anemia. Chest; 98(5): 1169-74.
Levasseur ON, Ryan TM, Pawlik KM Townes TM (2003). Correction of a mouse model of sickle cell disease: lentiviral/ antisickling beta-globin gene transduction of unmobilized, purified hematopoietic stem cells. Blood; 102(13): 4312-9.
Levy BO (2010). Resolvins and protectins: natural pharmacophores for resolution biology. Prostaglandins Leukot Essent Fatty Acids; 82(4-6): 327-32.
Lew VL Bookchin RM (2005). Ion transport pathology in the mechanism of sickle cell dehydration. Physiol Rev; 85(1): 179-200.
Liem RI, Young LT Thompson AA (2009). Prolonged QTc interval in children and young adults with sickle cell disease at steady state. Pediatr Blood Cancer; 52(7): 842-6.
Lindsay J, Jr., Meshel }C Patterson RH (1974). The cardiovascular manifestations of sickle cell disease. Arch Intern Med; 133(4): 643-51.
Lingwood 0, Kaiser HJ, Levental I Simons K (2009). Lipid rafts as functional heterogeneity in cell membranes. Biochem Soc Trans; 37(Pt 5): 955-60.
Lingwood 0 Simons K (2010). Lipid rafts as a membrane-organizing principle. Science; 327(5961): 46-50.
Liscum L Munn NJ (1999). Intracellular cholesterol transport. Biochim Biophys Acta; 1438(1): 19-37.
Little JA, McGowan VR, Kato G}, Partovi KS, Feld H, Maric I, Martyr 5, Taylor JGt, Machado RF, Heller T, Castro 0 Gladwin MT (2006). Combination erythropoietin-hydroxyurea therapy in sickle cell disease: experience from the
218

Bibliography
National Institutes of Health and a literature review. Haematologiea; 91(8): 1076-83.
Liu JE, Gzesh OJ Ballas SK (1994). The spectrum of epilepsy in sickle cell anemia. I Neural Sci; 123(1-2): 6-10.
Lonergan GJ, Cline DB Abbondanzo SL (2001). Sickle cell anemia. Radiographies; 21(4): 971-94.
Lopez BL, Kreshak AA, Morris CR, Davis-Moon L, Ballas SK Ma XL (2003). L-arginine levels are diminished in adult acute vaso-occlusive sickle cell crisis in the emergency department. Br 1 Haematol; 120(3): 532-4.
Lottenberg R Hassell KL (2005). An evidence-based approach to the treatment of adults with sickle cell disease. Hematology Am Soe Hematol Edue Program; 58-65.
Lou TF, Singh M, Mackie A, Li W Pace BS (2009). Hydroxyurea generates nitric oxide in human erythroid cells: mechanisms for gamma-globin gene activation. fu Bioi Med (Maywood); 234(11): 1374-82.
Low FM, Hampton MB, Peskin A V Winterbourn CC (2007). Peroxiredoxin 2 functions as a noncatalytic scavenger of low-level hydrogen peroxide in the erythrocyte. Blood; 109(6): 2611-7.
Luo P Wang MH (2011). Eicosanoids, beta-cell function, and diabetes. Prostaglandins Other Lipid Mediat; 95(1-4): 1-10.
Mabile L, Piolot A, Boulet L, Fortin LJ, Doyle N, Rodriguez C, Davignon J, Blache D Lussier-Cacan S (2001). Moderate intake of n-3 fatty acids is associated with stable erythrocyte resistance to oxidative stress in hypertriglyceridemic subjects. Am 1 Clin Nutr; 74(4): 449-56.
Maccoll AJ, James KA Booth CL (1996). Erythrocyte morphology and filterability in rats fed on diets containing different fats and oils. Br 1 Nutr; 76(1): 133-40.
MacDonald JI Sprecher H (1991). Phospholipid fatty acid remodeling in mammalian cells. Bioehim Biophys Aeta; 1084(2): 105-21.
Machado NO, Grant CS, Alkindi 5, Daar S, AI-Kindy N, Al Lamki Z Ganguly SS (2009). Splenectomy for haematological disorders: a single center study in 150 patients from Oman. Int I Surg; 7(5): 476-81.
Machado RF, Martyr 5, Kato GJ, Barst RJ, Anthi A, Robinson MR, Hunter L, Coles W, Nichols J, Hunter C, Sachdev V, Castro 0 Gladwin MT (2005). Sildenafil therapy in patients with sickle cell disease and pulmonary hypertension. l1L1 Haematol; 130(3): 445-53.
Maier-Redelsperger M, Levy P, Lionnet F, Stankovic K, Haymann JP, Lefevre G, Avellino V, Perol JP, Girot R Elion J (2010). Strong association between a new marker of hemolysis and glomerulopathy in sickle cell anemia. Blood Cells Mol Dis; 45(4): 289-92.
Maitre B, Mekontso-Dessap A, Habibi A, Bachir D, Parent F, Godeau B Galacteros F (2011). [Pulmonary complications in adult sickle cell disease). Rev Mal Respir; 28(2): 129-37.
Makani J, Cox SE, Soka D, Komba AN, Oruo J, Mwamtemi H, Magesa P, Rwezaula 5, Meda E, Mgaya J, Lowe B, Muturi D, Roberts DJ, Williams TN, PaUangyo K, Kitundu J, Fegan G, Kirkham FJ, Marsh K Newton CR (2011). Mortality in sickle cell anemia in Africa: a prospective cohort study in Tanzania. PLoS One; 6(2): e14699.
219

Bibliography
Manci EA, Culberson DE, Yang YM, Gardner TM, Powell R, Haynes J, Jr., Shah AK Mankad VN (2003). Causes of death in sickle cell disease: an autopsy study. Br T Haenzatol; 123(2): 359-65.
Manfredini V, Lazzaretti LL, Griebeler IH, Santin AP, Brandao VD, Wagner S, Castro SM, Peralba Mdo C Benfato MS (2008). Blood antioxidant parameters in sickle cell anemia patients in steady state. 1 Nat! Med Assoc; 100(8): 897-902.
Mannock DA, Lewis RN, McMullen TP McElhaney RN (2010). The effect of variations in phospholipid and sterol structure on the nature of lipid-sterol interactions in lipid bilayer model membranes. Che71l Phys Lipids; 163(6): 403-48.
Manodori AB, Barabino GA, Lubin BH Kuypers FA (2000). Adherence of phosphatidylserine-exposing erythrocytes to endothelial matrix thrombospondin. Blood; 95(4): 1293-300.
Mantzioris E, Cleland LG, Gibson RA, Neumann MA, Demasi M James MJ (2000). Biochemical effects of a diet containing foods enriched with n-3 fatty acids. Am T Clin Nutr; 72(1): 42-8.
Marengo-Rowe AJ (2006). Structure-function relations of human hemoglobinS. Proc (Bayl Univ Med Cent); 19(3): 239-45.
Marguet D, Lenne PF, Rigneault H He HT (2006). Dynamics in the plasma membrane: how to combine fluidity and order. Embo 1; 25(15): 3446-57.
Marlow 1], Brunson CY, Jackson S Schabel SI (1998). "Tower vertebra": a new observation in sickle cell disease. Skeletal Radial; 27(4): 195-8.
Marsh K, Gtoo L, Hayes RJ, Carson DC Greenwood BM (1989). Antibodies to blood stage antigens of Plasmodium falciparum in rural Gambians and their relation to protection against infection. Trans R Soc Trop Med Hy~; 83(3): 293-303.
Marti-Carvajal AJ, Sola 1 Agreda-Perez LH (2009). Treatment for avascular necrosis of bone in people with sickle cell disease. Cochrane Database Syst Rev; (3): CD004344.
Martin SJ, Reutelingsperger CP, McGahon AJ, Rader JA, van Schie RC, La Face DM Green DR (1995). Early redistribution of plasma membrane phosphatidylserine is a general feature of apoptosis regardless of the initiating stimulus: inhibition by overexpression of Bcl-2 and Abl. 1 Exp Med; 182(5): 1545-56.
Martinez-Ruiz R, Montero-Huerta P, Hromi J Head CA (2001). Inhaled nitric oxide improves survival rates during hypoxia in a sickle cell (SAD) mouse model. Anesthesiolo~y; 94(6): 1113-8.
Martinez M, Vazquez E, Garcia-Silva MT, Manzanares J, Bertran JM, Castello F Mougan 1 (2000). Therapeutic effects of docosahexaenoic acid ethyl ester in patients with generalized peroxisomal disorders. Am T Clin Nutr; 71(1 Suppl): 376S-85S.
Marva E Hebbel RP (1994). Denaturing interaction between sickle hemoglobin and phosphatidylserine liposomes. Blood; 83(1): 242-9.
Marwah SS, Wheelwright D, Blann AD, Rea C, Beresford R, Phillips JD, Wright J Bareford D (2001). Vitamin E correlates inversely with non-transferrin-bound iron in sickle cell disease. Br THaematol; 114(4): 917-9.
Marzouki ZM Khoja SM (2003). Plasma and red blood cells membrane lipid concentration of sickle cell disease patients. Saudi Medical lou mal 24(4): 376-9.
Mascioli EA, Lopes SM, Champagne C Driscoll DF (1996). Essential fatty acid deficiency and horne total parenteral nutrition patients. Nutrition; 12(4): 245-9.
220

Bibliography
Massaro M, Scoditti E, Carluccio MA De Caterina R (2008). Basic mechanisms behind the effects of n-3 fatty acids on cardiovascular disease. Prostaslandins Leukot Essent Fatty Acids; 79(3-5): 109-15.
Matsui NM, Varki A Embury SH (2002). Heparin inhibits the flow adhesion of sickle red blood cells to P-selectin. Blood; 100(10): 3790-6.
Matsuyama W, Mitsuyama H, Watanabe M, Oonakahara K, Higashimoto I, Osame M Arimura K (2005). Effects of omega-3 polyunsaturated fatty acids on inflammatory markers in COPD. Chest; 128(6): 3817-27.
Maxfield FR (2002). Plasma membrane microdomains. Curr Opin Cell BioI; 14(4): 483-7. May J, Evans JA, Timmann C, Ehmen C, Busch W, Thye T, Agbenyega T Horstmann
RD (2007). Hemoglobin variants and disease manifestations in severe faIciparum malaria. lama; 297(20): 2220-6.
Mayer K, Merfels M, Muhly-Reinholz M, Gokorsch 5, Rosseau 5, Lohmeyer J, Schwarzer N, Krull M, Suttorp N, Grimminger F Seeger W (2002). Omega-3 fatty acids suppress monocyte adhesion to human endothelial cells: role of endothelial PAF generation. Am l Physiol Heart Orc Physiol; 283(2): H811-8.
Mayer K, Meyer 5, Reinholz-Muhly M, Maus U, Merfels M, Lohmeyer J, Grimminger F Seeger W (2003). Short-time infusion of fish oil-based lipid emulsions, approved for parenteral nutrition, reduces monocyte proinflammatory cytokine generation and adhesive interaction with endothelium in humans. l lmmunol; 171(9): 4837-43.
Mayser p, Grimm H Grimminger F (2002). n-3 fatty acids in psoriasis. Br l Nutr; 87 Suppl 1 577-82.
McCaffrey PG, Newsome DA, Fibach E, Yoshida M Su MS (1997). Induction of gammaglobin by histone deacetylase inhibitors. Blood; 90(5): 2075-83.
McKeown SM, Carmichael H, Markowitz RB, Kutlar A, Holley L Kutlar F (2009). Rare occurrence of Hb Lepore-Baltimore in African Americans: molecular characteristics and variations of Hb Lepores. Ann Hematol; 88(6): 545-8.
McMaster CR Bell RM (1997). CDP-choline:1,2-diacylglycerol cholinephosphotransferase. Biochim Biophys Acta; 1348(1-2): 100-10.
McNaughton-Smith GA, Burns JF, Stocker JW, Rigdon GC, Creech C, Arrington 5, Shelton T de Franceschi L (2008). Novel inhibitors of the Gardos channel for the treatment of sickle cell disease. lMed Chem; 51(4): 976-82.
Medicine 10 (2005). Dietary Reference Intakes for Energy, Carbohydrate, Fat, Fatty Acids, Cholesterol, Protein, and AminoAcids(Macronutrients). National Academy Press, Washington, DC.
Menschikowski M, Hagelgans A Siegert G (2006). Secretory phospholipase A2 of group IIA: is it an offensive or a defensive player during atherosclerosis and other inflammatory diseases? Prostaslandins Other Lipid Mediat; 79(1-2): 1-33.
Menzel 5, Gamer C, Gut I, Matsuda F, Yamaguchi M, Heath 5, Foglio M, Zelenika D, Boland A, Rooks H, Best 5, Spector TO, Farrall M, Lathrop M Thein SL (2007). A QTL influencing F cell production maps to a gene encoding a zinc-finger protein on chromosome 2p15. Nat Genet; 39(10): 1197-9.
Merrill AH, Jr. (2002). De novo sphingolipid biosynthesis: a necessary, but dangerous, pathway. l Bioi Chem; 277(29): 25843-6.
Meydani M, Natiello F, Goldin B, Free N, Woods M, Schaefer E, Blumberg JB Gorbach SL (1991a). Effect of long-term fish oil supplementation on vitamin E status and lipid peroxidation in women. I Nutr; 121(4): 484-91.
221

Bibliography
Meydani SN, Endres 5, Woods MM, Goldin BR, 500 C, Morrill-Labrode A, Dinarello CA Gorbach SL (1991b). Oral (n-3) fatty acid supplementation suppresses cytokine production and lymphocyte proliferation: comparison between young and older women. 1 Nutr; 121(4): 547-55.
Meyer zu Heringdorf 0 Jakobs KH (2007). Lysophospholipid receptors: signalling, pharmacology and regulation by lysophospholipid metabolism. Biochim Biophys Acta; 1768(4): 923-40.
Middelkoop E, Lubin BH, Bevers EM, Op den Kamp JA, Comfurius P, Chiu DT, Zwaal RF, van Deenen LL Roelofsen B (1988). Studies on sickled erythrocytes provide evidence that the asymmetric distribution of phosphatidylserine in the red cell membrane is maintained by both ATP-dependent translocation and interaction with membrane skeletal proteins. Biochim Biophys Acta; 937(2): 281-8.
Miles EA, Aston L Calder PC (2003). In vitro effects of eicosanoids derived from different 20-carbon fatty acids on T helper type 1 and T helper type 2 cytokine production in human whole-blood cultures. Clin Exp Aller~; 33(5): 624-32.
Miller SB (2006). Prostaglandins in health and disease: an overview. Semin Arthritis Rheum; 36(1): 37-49.
Miller ST, Sleeper LA, Pegelow CH, Enos LE, Wang WC, Weiner SJ, Wethers DL, Smith J Kinney TR (2000). Prediction of adverse outcomes in children with sickle cell disease. N Engl 1 Med; 342(2): 83-9.
Mills DE, Galey WR Dixon H (1993). Effects of dietary fatty-acid supplementation on fatty-acid composition and deformability of young and old erythrocytes. Biochim Biophys Acta; 1149(2): 313-8.
Misra HP Fridovich I (1972). The generation of superoxide radical during the autoxidation of hemoglobin. 1 BioI Chern; 247(21): 6960-2.
Mochizuki N Kwon YG (2008). 15-lipoxygenase-1 in the vasculature: expanding roles in angiogenesis. Circ Res; 102(2): 143-5.
Modell B Darlison M (2008). Global epidemiology of haemoglobin disorders and derived service indicators. Bull World Health Organ; 86(6): 480-7.
Mohammed AO, Attalla B, Bashir FM, Ahmed FE, El Hassan AM, Ibnauf G, Jiang W, Cavalli-Sforza LL, Karrar ZA Ibrahim ME (2006). Relationship of the sickle cell gene to the ethnic and geographic groups populating the Sudan. Community Genet; 9(2): 113-20.
Mohan JS, Lip GY, Wright J, Bareford 0 Blann AD (2005). Plasma levels of tissue factor and soluble E-selectin in sickle cell disease: relationship to genotype and to inflammation. Blood Coagul Fibrinolysis; 16(3): 209-14.
Molvig J, Pociot F, Worsaae H, Wogensen LD, Baek L, Christensen P, MandrupPoulsen T, Andersen K, Madsen P, Dyerberg J et a1. (1991). Dietary supplementation with omega-3-polyunsaturated fatty acids decreases mononuclear cell proliferation and interleukin-1 beta content but not monokine secretion in healthy and insulin-dependent diabetic individuals. Scand 1 Immunoli 34(4): 399-410.
Moran CJ, Siegel MJ DeBaun MR (1998). Sickle cell disease: imaging of cerebrovascular complications. Radiology; 206(2): 311-21.
Mori TA, Woodman RJ, Burke V, Puddey IB, Croft KD Beilin LJ (2003). Effect of eicosapentaenoic acid and docosahexaenoic acid on oxidative stress and inflammatory markers in treated-hypertensive type 2 diabetic subjects. Free Radic BioI Med; 35(7): 772-81.
222

Bibliography
Moriarty BJ, Acheson RW, Condon PI Serjeant GR (1988). Patterns of visual loss in untreated sickle cell retinopathy. Eye (Lond); 2 ( Pt 3) 330-5.
Moriguchi T, Greiner RS Salem N, Jr. (2000). Behavioral deficits associated with dietary induction of decreased brain docosahexaenoic acid concentration. T Neurochem; 75(6): 2563-73.
Morris CR (2006). New strategies for the treatment of pulmonary hypertension in sickle cell disease: the rationale for arginine therapy. Treat Respir Med; 5(1): 31-45.
Morris CR (2008). Mechanisms of vasculopathy in sickle cell disease and thalassemia. HEMA TOLOGY American Society of Hematology Education Pro~ram; 177-85.
Morris CR, Gladwin MT Kato GJ (2008). Nitric oxide and arginine dysregulation: a novel pathway to pulmonary hypertension in hemolytic disorders. Curr Mol Med; 8(7): 620-32.
Morris CR, Kuypers FA, Larkin S, Sweeters N, Simon J, Vichinsky EP Styles LA (2000a). Arginine therapy: a novel strategy to induce nitric oxide production in sickle cell disease. Br T Haematol; 111(2): 498-500.
Morris CR, Kuypers FA, Larkin S, Vichinsky EP Styles LA (2000b). Patterns of arginine and nitric oxide in patients with sickle cell disease with vaso-occlusive crisis and acute chest syndrome. T Pediatr Hematol Oncol; 22(6): 515-20.
Morris CR, Morris SM, Jr., Hagar W, Van Warmerdam J, Claster S, Kepka-Lenhart D, Machado L, Kuypers FA Vi chin sky EP (2003). Arginine therapy: a new treatment for pulmonary hypertension in sickle cell disease? Am T Respir Crit Care Med; 168(1): 63-9.
Mozaffarian 0 Rimrn EB (2006). Fish intake, contaminants, and human health: evaluating the risks and the benefits. lama; 296(15): 1885-99.
Mozzarelli A, Hofrichter J Eaton WA (1987). Delay time of hemoglobin S polymerization prevents most cells from sickling in vivo. Science; 237(4814): 500-6.
Mukaro VR, Costabile M, Murphy KJ, Hii CS, Howe PR Ferrante A (2008). Leukocyte numbers and function in subjects eating n-3 enriched foods: selective depression of natural killer cell levels. Arthritis Res Ther; 10(3): R57.
Mukherjee MB, Colah RB, Ghosh K, Mohanty 0 Krishnamoorthy R (1997). Milder clinical course of sickle cell disease in patients with alpha thalassemia in the Indian subcontinent. Blood; 89(2): 732.
Mukherjee MB, Nadkarni AH, Gorakshakar AC, Ghosh K, Mohanty D Colah RB (2010). Clinical, hematologic and molecular variability of sickle cell-beta thalassemia in western India. Indian T Hum Genet; 16(3): 154-8.
Mukherjee PK, Marcheselli VL, Serhan CN Bazan NG (2004). Neuroprotectin D1: a docosahexaenoic acid-derived docosatriene protects human retinal pigment epithelial cells from oxidative stress. Proceedings of the National Academy of Science ofthe United States of An eric a; 101(22): 8491-6.
Mukherjee S Maxfield FR (2000). Role of membrane organization and membrane domains in endocytic lipid trafficking. Traffic; 1(3): 203-11.
Muncie HL, Jr. Campbell J (2009). Alpha and beta thalassemia. Am Fam Physician; 80(4): 339-44.
Murakami M Kudo I (2002). Phospholipase A2. T Biochem; 131(3): 285-92. Murakami M, Taketomi Y, Miki Y, Sato H, Hirabayashi T Yamamoto K (2011). Recent
progress in phospholipase A research: from cells to animals to humans. Prog Lipid Res; 50(2): 152-92.
223

Bibliography
Muskiet FA, Muskiet FD, Meiborg G Schermer JG (1991). Supplementation of patients with homozygous sickle cell disease with zinc, alpha-tocopherol, vitamin C, soybean oil, and fish oil. Am [ Clin Nutr; 54(4): 736-44.
Muskiet FD Muskiet FA (1984). Lipids, fatty acids and trace elements in plasma and erythrocytes of pediatric patients with homozygous sickle cell disease. Clinica Chimica Acta; 142(1): 1-10.
Nagababu E, Chrest FJ Rifkind JM (2003). Hydrogen-peroxide-induced heme degradation in red blood cells: the protective roles of catalase and glutathione peroxidase. Biochim Biophys Acta; 1620(1-3): 211-7.
Nagel RL (1993). Sickle cell anemia is a multi gene disease: sickle painful crises, a case in point. Am [Hematol; 42(1): 96-101.
Nagel RL, Fabry ME Steinberg MH (2003). The paradox of hemoglobin SC disease. Blood Rev; 17(3): 167-78.
Nagel RL Labie 0 (1989). DNA haplotypes and the beta s globin gene. Prog Clin BioI Res; 316B 371-93.
Nagel RL Steinberg MH (2001). Role of epistatic (modifier) genes in the modulation of the phenotypic diversity of sickle cell anemia. Pediatr Pathol Mol Med; 20(2): 123-36.
Nagpal KC, Goldberg MF Rabb MF (1977). Ocular manifestations of sickle hemoglobinopathies. SUr!.' Ophthalmol; 21(5): 391-411.
Nahavandi M, Tavakkoli F, Wyche MQ, Perlin E, Winter WP Castro 0 (2002). Nitric oxide and cyclic GMP levels in sickle cell patients receiving hydroxyurea. British Tournai of Hematology; 119(3): 855-7.
Nathan C (2002). Points of control in inflammation. Nature; 420(6917): 846-52. Neidlinger NA, Larkin SK, Bhagat A, Victorino GP Kuypers FA (2006). Hydrolysis of
phosphatidylserine-exposing red blood cells by secretory phospholipase A2 generates lysophosphatidic acid and results in vascular dysfunction. 1 BioI Chem; 281(2): 775-81.
Nenseter MS Drevon CA (1996). Dietary poly unsaturates and peroxidation of low density lipoprotein. Curr Opin Lipidoi; 7(1): 8-13.
Neonato MG, Guilloud-Bataille M, Beauvais P, Begue P, Belloy M, Benkerrou M, Ducrocq R, Maier-Redelsperger M, de Montalembert M, Quinet B, Elion J, Feingold J Girot R (2000). Acute clinical events in 299 homozygous sickle cell patients living in France. French Study Group on Sickle Cell Disease. Eur 1 Haematol; 65(3): 155-64.
Neuringer M (2000). Infant vision and retinal function in studies of dietary long-chain polyunsaturated fatty acids: methods, results, and implications. Am 1 Clin Nutr; 71(1 Suppl): 2565-67S.
Niemela PS, Ollila S, Hyvonen MT, Karttunen M Vattulainen I (2007). Assessing the nature of lipid raft membranes. PLoS Computational Biology; 3(2): e34.
Niihara Y, Matsui NM, Shen YM, Akiyama DA, Johnson CS, Sunga MA, Magpayo J, Embury SH, Kalra VK, Cho SH Tanaka KR (2005). L-glutamine therapy reduces endothelial adhesion of sickle red blood cells to human umbilical vein endothelial cells. BMC Blood Disord; 5 4.
Niihara y, Zerez CR, Akiyama DS Tanaka KR (1998). Oral L-glutamine therapy for sickle cell anemia: I. Subjective clinical improvement and favorable change in red cell NAD redox potential. Am [HematoI; 58(2): 117-21.
224
Bibliography
Niscola P, Sorrentino F, Scaramucci L, de Fabritiis P Cianciulli P (2009). Pain syndromes in sickle cell disease: an update. Pain Med; 10(3): 470-80.
Nishiyama A, Cavaglieri CR, Curi R Calder PC (2000). Arachidonic acid-containing phosphatidylcholine inhibits lymphocyte proliferation and decreases interleukin-2 and interferon-gamma production from concanavalin Astimulated rat lymphocytes. Biochemica et Biophysica Acta; 1487(1): 50-60.
Noguchi CT, Dover GJ, Rodgers GP, Serjeant GR, Antonarakis SE, Anagnou NP, Higgs DR, Weatherall DJ Schechter AN (1985). Alpha thalassemia changes erythrocyte heterogeneity in sickle cell disease. T Clin Invest; 75(5): 1632-7.
Nolan VG, Wyszynski DF, Farrer LA Steinberg MH (2005). Hemolysis-associated priapism in sickle cell disease. Blood; 106(9): 3264-7.
Noll RB, Stith L, Gartstein MA, Ris MD, Grueneich R, Vannatta K Kalinyak K (2001). Neuropsychological functioning of youths with sickle cell disease: comparison with non-chronically ill peers. T Pediatr Psychol; 26(2): 69-78.
Nomura S, Kanazawa S Fukuhara S (2003). Effects of eicosapentaenoic acid on platelet activation markers and cell adhesion molecules in hyperlipidemic patients with Type 2 diabetes mellitus. T Diabetes Complications; 17(3): 153-9.
Norol F, Nadjahi J, Bachir D, Desaint C, Guillou Bataille M, Beaujean F, Bierling P, Bonin P, Galacteros F Duedari N (1994). [Transfusion and alloimmunization in sickle cell anemia patients]. Transfus Clin Bioi; 1(1): 27-34.
Norris WE (2004). Acute hepatic sequestration in sickle cell disease. T Nat! Med Assoc; 96(9): 1235-9.
Nur E, Biemond BJ, Otten HM, Brandjes DP Schnog JJ (2011). Oxidative stress in sickle cell disease; pathophysiology and potential implications for disease management. Am T Hematol; 86(6): 484-489.
Nyuar KB MY, Ghebremeskel K, Khalil AK, Elbashir MI, Cawford MA. (2010). Milk of northern Sudanese mothers whose traditional diet is high in carbohydrate contains low docosahexaenoic acid. Acta Paediatrica; (12): 1824-7.
Odintsova E, Butters TD, Monti E, Sprong H, van Meer G Berditchevski F (2006). Gangliosides play an important role in the organization of CD82-enriched microdomains. Biochem ~ 400(2): 315-25.
Ohanian J Ohanian V (2001). Sphingolipids in mammalian cell signalling. Cell Mol Life ~ 58(14): 2053-68.
Ohene-Frempong K, Weiner SJ, Sleeper LA, Miller ST, Embury S, Moohr JW, Wethers DL, Pegelow CH Gill FM (1998). Cerebrovascular accidents in sickle cell disease: rates and risk factors. Blood; 91(1): 288-94.
Ohtsuka T, Nishijima M Akamatsu Y (1993). A somatic cell mutant defective in phosphatidylglycerophosphate synthase, with impaired phosphatidylglycerol and cardiolipin biosynthesis. T Bioi Chem; 268(30): 22908-13.
Ojwang PJ, Ogada T, Beris P, Hattori Y, Lanclos KD, Kutlar A, Kutlar F Huisman TH (1987). Haplotypes and alpha globin gene analyses in sickle cell anaemia patients from Kenya. Br 1 Haematol; 65(2): 211-5.
Okpala I (2002). Relationship between the clinical manifestations of sickle cell disease and the expression of adhesion molecules on white blood cells. Eur 1 Haematol; 69135-144.
Okpala I (2004). The intriguing contribution of white blood cells to sickle cell disease - a red cell disorder. Blood Rev; 18(1): 65-73.
225

Bibliogra phy
Okpala I (2006). Leukocyte adhesion and the pathophysiology of sickle cell disease. Curr Opin Hematol; 13(1): 40-4.
Okpala I, Ibegbulam 0, Dum A, Ocheni 5, Emodi I, Ikefuna A, Vmar G, Asinobi I, Madu A, Okoye A, Nwagha T, Oguonu V, Vamai I, Agwu 0, Nonyelu C, Anike V, Agu K, Anigbo C, Chukwura A, Vgwu 0 Herrada 5 (2011). Pilot study of omega-3 fatty acid supplements in sickle cell disease. Apmis; 119(7): 442-8.
Olivieri NF, Brittenham GM, Matsui D, Berkovitch M, Blendis LM, Cameron RG, McClelland RA, Liu PP, Templeton DM Koren G (1995). Iron-chelation therapy with oral deferipronein patients with thalassemia major. N En~l 1 Med; 332(14): 918-22.
Olivieri 0, Negri M, De Gironcoli M, Bassi A, Guarini p, Stanzial AM, Grigolini L, Ferrari 5 Corrocher R (1988). Effects of dietary fish oil on malondialdehyde production and glutathione peroxidase activity in hyperlipidaemic patients. Scand 1 Clin Lab Invest; 48(7}: 659-65.
Olkkonen VM, Johansson M, Suchanek M, Yan D, Hynynen R, Ehnholm C, Jauhiainen M, Thiele C Lehto M (2006). The OSBP-related proteins (ORPs): global sterol sensors for co-ordination of cellular lipid metabolism, membrane trafficking and signalling processes? Biochem Soc Trans; 34(Pt 3): 389-91.
Olowoyeye A Okwundu CI (2010). Gene therapy for sickle cell disease. Cochrane Database Syst Rev; (8): CD007652.
Olson DM Ammann C (2007). Role of the prostaglandins in labour and prostaglandin receptor inhibitors in the prevention of preterm labour. Front Biosci; 12 1329-43.
Olukoga AO, Adewoye HO, Erasmus RT Adedoyin MA (1990). Erythrocyte and plasma magnesium in sickle-cell anaemia. East Aft Med ,; 67(5): 348-54.
Olukoga AO, Adewoye HO, Erasmus RT Adedoyin MA (1993). Vrinary magnesium excretion in steady-state sickle cell anaemia. Acta Haematol; 90(3): 136-8.
Onakoya PA, Nwaorgu OG Shokunbi WA (2002). Sensorineural hearing loss in adults with sickle cell anaemia. Afr 1 Med Med Sci; 31(1): 21-4.
Osarogiagbon VR, Choong S, Belcher JD, Vercellotti GM, Paller MS Hebbel RP (2000). Reperfusion injury pathophysiology in sickle transgenic mice. Blood; 96(1): 314-20.
Pacelli R, Taira J, Cook JA, Wink DA Krishna MC (1996). Hydroxyurea reacts with heme proteins to generate nitric oxide. Lancet; 347(9005): 900.
Paglia DE Valentine WN (1967). Studies on the quantitative and qualitative characterization of erythrocyte glutathione peroxidase. 1 Lab Clin Med; 70(1): 158-69.
Panepinto JA, Walters Me, Carreras J, Marsh J, Bredeson CN, Gale RP, Hale GA, Horan J, Hows JM, Klein JP, Pasquini R, Roberts I, Sullivan K, Eapen M Ferster A (2007). Matched-related donor transplantation for sickle cell disease: report from the Center for International Blood and Transplant Research. Br T Haematol; 137(5): 479-85.
Pappo A Buchanan GR (1989). Acute splenic sequestration in a 2-month-old infant with sickle cell anemia. Pediatrics; 84(3): 578-9.
Park Y Harris WS (2009). Dose-dependent effects of n-3 polyunsaturated fatty acids on platelet activation in mildly hypertriglyceridemic subjects. 1 Med Food; 12(4): 809-13.
226

Bibliography
Park Y HW (2002). EPA, but not DHA, decreases mean platelet volume in normal subjects. Lipids. ; 37(10): 941-6.
Pasvol G, Weatherall DJ Wilson RJ (1978). Cellular mechanism for the protective effect of haemoglobin S against P. falciparum malaria. Nature; 274(5672): 701-3.
Patel HH, Murray F Insel PA (2008). G-protein-coupled receptor-signaling components in membrane raft and caveolae microdomains. Handb Exp Pharmacol; (186): 167-84.
Pathare A, Al Kindi S, Alnaqdy AA, Daar S, Knox-Macaulay H Dennison D (2004). Cytokine profile of sickle cell disease in Oman. Am 1 Hematol; 77(4): 323-8.
Patra SK (2008). Dissecting lipid raft facilitated cell signaling pathways in cancer. Biochi11l Biophys Acta; 1785(2): 182-206.
Pauling L, Itano HA et al. (1949). Sickle cell anemia, a molecular disease. Science; 109(2835): 443.
Pawliuk R, Westerman KA, Fabry ME, Payen E, Tighe R, Bouhassira EE, Acharya SA, Ellis J, London 1M, Eaves CJ, Humphries RK, Beuzard Y, Nagel RL Leboulch P (2001). Correction of sickle cell disease in transgenic mouse models by gene therapy. Science; 294(5550): 2368-71.
Payne KA, Desrosiers MP, Caro JJ, Baladi JF, Lordan N, Proskorovsky I, Ishak K Rofail D (2007). Clinical and economic burden of infused iron chelation therapy in the United States. Transfusion; 47(10): 1820-9.
Pearson HA, Gallagher D, Chilcote R, Sullivan E, Wilimas J, Espeland M Ritchey AK (1985). Developmental pattern of splenic dysfunction in sickle cell disorders. Pediatrics; 76(3): 392-7.
Pearson HA, Spencer RP Cornelius EA (1969). Functional asplenia in sickle-cell anemia. N En~ll Med; 281(17): 923-6.
Peng X Frohman MA (2011). Mammalian phospholipase D physiological and pathological roles. Acta Physiol (OxD.
Pereira SL, Leonard AE Mukerji P (2003). Recent advances in the study of fatty acid desaturases from animals and lower eukaryotes. Prosta~landins Leukot Essent Fatty Acids; 68(2): 97-106.
Perrine RP, Pembrey ME, John P, Perrine S Shoup F (1978). Natural history of sickle cell anemia in Saudi Arabs. A study of 270 subjects. Ann Intern Med; 88(1): 1-6.
Perronne V, Roberts-Harewood M, Bachir D, Roudot-Thoraval F, Delord JM, Thuret I, Schaeffer A, Davies SC, Galacteros F Godeau B (2002). Patterns of mortality in sickle cell disease in adults in France and England. Hematoll; 3(1): 56-60.
Perumbeti A Malik P (2010). Genetic correction of sickle cell anemia and betathalassemia: progress and new perspective. ScientificWorldlournal; 10 644-54.
Perutz RR, Liquori AM Eirich F (1951). X-ray and solubility studies of the haemoglobin of sickle-cell anaemia patients. Nature; 167(4258): 929-31.
Pham PT, Pham PC, Wilkinson AH Lew SQ (2000). Renal abnormalities in sickle cell disease. Kidney Int; 57(1): 1-8.
Piehl FC, Davis RJ Prugh SI (1993). Osteomyelitis in sickle cell disease. I Pediatr Orthop; 13(2): 225-7.
Pike LJ (2005). Growth factor receptors, lipid rafts and caveolae: an evolving story. Biochim Biophys Acta; 1746(3): 260-73.
Pinto FO Roberts I (2008). Cord blood stem cell transplantation for haemoglobinopathies. Br I Haematol; 141(3): 309-24.
227

Bibliography
Pischon T, Hankinson SE, Hotamisligil CS, Rifai N, Willett WC Rirnrn EB (2003). Habitual dietary intake of n-3 and n-6 fatty acids in relation to inflammatory markers among US men and women. Circulation; 108(2): 155-60.
Platt OS (2000). Sickle cell anemia as an inflammatory disease. 1 Clin Invest; 106(3): 337-8.
Platt OS, Brambilla DJ, Rosse WF, Milner PF, Castro 0, Steinberg MH Klug PP (1994). Mortality in sickle cell disease. Life expectancy and risk factors for early death. N Engll Med; 330(23): 1639-44.
Platt OS, Orkin SH, Dover C, Beardsley CP, Miller B Nathan DC (1984). Hydroxyurea enhances fetal hemoglobin production in sickle cell anemia. 1 Clin Invest; 74(2): 652-6.
Platt OS, Thorington BD, Brambilla DJ, Milner PF, Rosse WF, Vichinsky E Kinney TR (1991). Pain in sickle cell disease. Rates and risk factors. N Engl 1 Med; 325(1): 11-6.
Pleban PA, Munyani A Beachum J (1982). Determination of selenium concentration and glutathione peroxidase activity in plasma and erythrocytes. Clin Chem; 28(2): 311-6.
poeckel D Funk CD (2010). The 5-lipoxygenase/leukotriene pathway in preclinical models of cardiovascular disease. Cardiovasc Res; 86(2): 243-53.
pomorski T Menon AK (2006). Lipid flippases and their biological functions. Cell Mol Life Sci; 63(24): 2908-21.
Poschl JM, Leray C, Croscolas R, Ruef P Linderkamp 0 (1996). Dietary docosahexaenoic acid improves red blood cell deformability in rats. Thrombosis Research 81(2): 283-8.
poudel-Tandukar K, Nanri A, Matsushita Y, Sasaki S, Ohta M, Sa to M Mizoue T (2009). Dietary intakes of alpha-linolenic and linoleic acids are inversely associated with serum C-reactive protein levels among Japanese men. Nutr Res; 29(6): 363-70.
powars D, Wilson B, Imbus C, Pegelow CAllen J (1978). The natural history of stroke in sickle cell disease. Am lMed; 65(3): 461-71.
powars DR, Chan L Schroeder WA (1990). Beta S-gene-cluster haplotypes in sickle cell anemia: clinical implications. Am 1 Pediatr Hematol Oncol; 12(3): 367-74.
Pudelkewicz C, Seufert J Holman RT (1968). Requirements of the female rat for linoleic and linolenic acids. 1 Nutr; 94(2): 138-46.
Qari MH, Aljaouni SK, Alardawi MS, Fatani H, Alsayes FM, Zografos P, Alsaigh M, Alalfi A, Alamin M, Cadi A Mousa SA (2007). Reduction of painful vasoocclusive crisis of sickle cell anaemia by tinzaparin in a double-blind randomized trial. Thromb Haemost; 98(2): 392-6.
Quest AF, Ley ton L Parraga M (2004). Caveolins, caveolae, and lipid rafts in cellular transport, signalin~ and disease. Biochem Cell Bioi; 82(1): 129-44.
Qureshi N, Foote D, Walters MC, Singer ST, Quirolo K Vichinsky EP (2005). Outcomes of preimplantation genetic diagnosis therapy in treatment of beta-thalassemia: A retrospective analysis. Ann N Y Acad Sci; 1054 500-3.
R Launder ISSiS-WK (1970). Sickling in South-West Kordo. SM[; 8 207-14. Rahimi Z, Merat A, Haghshenass M, Madani H, Rezaei M Nagel RL (2006). Plasma
lipids in Iranians with sickle cell disease: hypocholesterolemia in sickle cell anemia and increase of HDL-cholesterol in sickle cell trait. Clinica Chimica Acta; 365(1-2): 217-20.
228

Bibliography
Rahimy Me, Gangbo A, Ahouignan G, Adjou R, Deguenon e, Goussanou S Alihonou E (2003). Effect of a comprehensive clinical care program on disease course in severely ill children with sickle cell anemia in a sub-Saharan African setting. Blood; 102(3): 834-8.
Rahko PS, Salemi R Uretsky BF (1986). Successful reversal by chelation therapy of congestive cardiomyopathy due to iron overload. 'Am Coil Cardiol; 8(2): 436-40.
Ramakrishnan M, Moisi Je, Klugman KP, Iglesias JM, Grant LR, Mpoudi-Etame M Levine OS (2010). Increased risk of invasive bacterial infections in African people with sickle-cell disease: a systematic review and meta-analysis. Lancet Infect Dis; 10(5): 329-37.
Ramstedt B Slotte JP (2002). Membrane properties of sphingomyelins. FEBS Lett; 531(1): 33-7.
Raphael JL, Shetty PB, Liu H, Mahoney DH Mueller BU (2008). A critical assessment of transcranial doppler screening rates in a large pediatric sickle cell center: opportunities to improve healthcare quality. Pediatr Blood Cancer; 51(5): 647-51.
Raphael RI (2005). Pathophysiology and treatment of sickle cell disease. Clin Adv Hematol Oncol; 3(6): 492-505.
Ratnayake W (2008). Fats and fatty acid terminology, methods of analysis and fat digestion and metabolism. 'oint FAO/WHO Expert Consultation on fats fatty acids in human nutrition; WHO.
Raychaudhuri S Prinz WA (2010). The diverse functions of oxysterol-binding proteins. Annu Rev Cell Dev Bioi; 26157-77.
Reeder BJ Wilson MT (2005). Hemoglobin and myoglobin associated oxidative stress: from molecular mechanisms to disease States. Curr Med Chem; 12(23): 2741-51.
Rees D, Miles EA, Banerjee T, Wells SJ, Roynette CE, Wahle KW Calder PC (2006). Dose-related effects of eicosapentaenoic acid on innate immune function in healthy humans: a comparison of young and older men. Am , Clin Nutr; 83(2): 331-42.
Rees DC, Williams TN Gladwin MT (2010). Sickle-cell disease. Lancet; 376(9757): 2018-31.
Reiter CD, Wang X, Tanus-Santos JE, Hogg N, Cannon RO, 3rd, Schechter AN Gladwin MT (2002). Cell-free hemoglobin limits nitric oxide bioavailability in sickle-cell disease. Nat Med; 8(12): 1383-9.
Relton JK, Strijbos PJ, Cooper AL Rothwell NJ (1993). Dietary N-3 fatty acids inhibit ischaemic and excitotoxic brain damage in the rat. Brain Res Bull; 32(3): 223-6.
Ren H, Ghebremeskel K, Okpala I, Lee A, Ibegbulam 0 Crawford M (2008). Patients with sickle cell disease have reduced blood antioxidant protection. Int , Vitam Nutr Res; 78(3): 139-47.
Ren H, Ghebremeskel K, Okpala I, Ugochukwu CC, Crawford M Ibegbulam 0 (2006). Abnormality of erythrocyte membrane n-3 long chain polyunsaturated fatty acids in sickle cell haemoglobin C (HbSC) disease is not as remarkable as in sickle cell anaemia (HbSS). Prostaglandins Leukot Essent Fatty Acids; 74(1): 1-6.
Ren H, Obike I, Okpala I, Ghebremeskel K, Ugochukwu C Crawford M (2oo5a). Steady-state haemoglobin level in sickle cell anaemia increases with an increase in erythrocyte membrane n-3 fatty acids. Prostaglandins Leukot Essent Fatty Acids; 72(6): 415-21.
229

Bibliography
Ren H, Okpala I, Ghebremeskel K, Ugochukwu Cc, Ibegbulam 0 Crawford M (2005b). Blood mononuclear cells and platelets have abnormal fatty acid composition in homozygous sickle cell disease. Annals of Hematology; 84(9): 578-83.
Repka T Hebbel RP (1991). Hydroxyl radical formation by sickle erythrocyte membranes: role of pathologic iron deposits and cytoplasmic reducing agents. Blood; 78(10): 2753-8.
Rezende PV, Viana MB, Murao M, Chaves AC Ribeiro AC (2009). Acute splenic sequestration in a cohort of children with sickle cell anemia. T Pediatr (Rio V; 85(2): 163-9.
Richard 0 KK, Barbe U, Bausero P, Visioli F. (2008). Polyunsaturated fatty acids as antioxidants. Pharmacol Res.; 57(6): 451-5.
Robertson RP (1998). Dominance of cyclooxygenase-2 in the regulation of pancreatic islet prostaglandin synthesis. Diabetes; 47(9): 1379-83.
Rog T, Pasenkiewicz-Gierula M, Vattulainen I Karttunen M (2009). Ordering effects of cholesterol and its analogues. Biochim Biophys Acta; 1788(1): 97-121.
Roldan ER Shi QX (2007). Sperm phospholipases and acrosomal exocytosis. Front Biosci; 1289-104.
Rosse WF, Narla M, Petz LD Steinberg MH (2000). New Views of Sickle Cell Disease Pathophysiology and Treatment. Hematology Am Soc Hematol Educ Program; 2-17.
Rothman SM, Fulling KH Nelson JS (1986). Sickle cell anemia and central nervous system infarction: a neuropathological study. Ann Neurol; 20(6): 684-90.
RusselllJ Cowley EM (1983). The influence of transient asphyxia on receptor potentials in inner hair cells of the guinea pig cochlea. Hear Res; 11(3): 373-84.
Russo GL (2009). Dietary n-6 and n-3 polyunsaturated fatty acids: from biochemistry to clinical implications in cardiovascular prevention. Biochem Pharmacol; 77(6): 937-46.
Ruxton CH, Calder Pc, Reed SC Simpson MJ (2005). The impact of long-chain n-3 polyunsaturated fatty acids on human health. Nutr Res Rev; 18(1): 113-29.
Sabat R, Grutz G, Warszawska K, Kirsch S, Witte E, Wolk K Geginat J (2010). Biology of interleukin-10. Cytokine Growth Factor Rev; 21(5): 331-44.
Saha N Samuel AP (1982). Sickle cell gene and liver functions in a Sudanese population. Acta Haematologica; 68(1): 65-7.
Saito M Kubo K (2003). Relationship between tissue lipid peroxidation and peroxidizability index after alpha-linolenic, eicosapentaenoic, or docosahexaenoic acid intake in rats. Br T Nutr; 89(1): 19-28.
Sales C, Oliviero F Spinella P (2008). [Fish oil supplementation in rheumatoid arthritis]. Reumatismo; 60(3): 174-9.
Sampath H Ntambi JM (2004). Polyunsaturated fatty acid regulation of gene expression. Nutr Rev; 62(9): 333-9.
Sampath H Ntambi JM (2005). Polyunsaturated fatty acid regulation of genes of lipid metabolism. Annu Rev Nutr; 25 317-40.
Saraf S, Farooqui M, Infusino G, Oza B, Sidhwani S, Gowhari M, Vara S, Gao W, Krauz L, Lavelle 0, DeSimone J, Molokie R Saunthararajah Y (2011). Standard clinical practice underestimates the role and significance of erythropoietin deficiency in sickle cell disease. Br T Haematol; 153(3): 386-92.
230

Bibliography
Sarris I, Litos M, Bewley 5, Okpala I, Seed P Oteng-Ntim E (2008). Platelet count as a predictor of the severity of sickle cell disease during pregnancy. T Obstet Gynaecol; 28(7): 688-91.
Sarsilmaz M, Songur A, Ozyurt H, Kus I, Ozen OA, Ozyurt B, Sogut 5 Akyol 0 (2003). Potential role of dietary omega-3 essential fatty acids on some oxidant/ antioxidant parameters in rats' corpus striatum. Prostaglandins Leukot Essent Fatty Acids; 69(4): 253-9.
Sasaki J, Waterman MR Cottam GL (1986). Decreased apolipoprotein A-I and B content in plasma of individuals with sickle cell anemia. Clinical Chemistry; 32(1 Pt 1): 226-7.
Saunthararajah Y, Hillery CA, Lavelle D, Molokie R, Dorn L, Bressler L, Gavazova 5, Chen YH, Hoffman R DeSimone J (2003). Effects of 5-aza-2'-deoxycytidine on fetal hemoglobin levels, red cell adhesion, and hematopoietic differentiation in patients with sickle cell disease. Blood; 102(12): 3865-70.
Schacter L, Warth JA, Gordon EM, Prasad A Klein BL (1988). Altered amount and activity of superoxide dismutase in sickle cell anemia. Faseb 1; 2(3): 237-43.
Scheinman JI (2009). Sickle cell disease and the kidney. Nat Clin Pract Nephrol; 5(2): 78-88.
Schuster DP (1994). ARDS: clinical lessons from the oleic acid model of acute lung injury. Am T Respir Crit Care Med; 149(1): 245-60.
Schwartz RS, Chiu DT Lubin B (1985a). Plasma membrane phospholipid organization in human erythrocytes. Curr Top Hematol; 5 63-112.
Schwartz RS, Tanaka Y, Fidler IJ, Chiu DT, Lubin B Schroit AJ (1985b). Increased adherence of sickled and phosphatidylserine-enriched human erythrocytes to cultured human peripheral blood monocytes. T Clin Invest; 75(6): 1965-72.
Schwartz RS, Tanaka Y, Fidler IJ, Chiu DT, Lubin B Schroit AJ (1985c). Increased adherence of sickled and phosphatidylserine-enriched human erythrocytes to cultured human peripheral blood monocytes. TournaI of Clinical Investigation 75(6): 1965-72.
Scott RB (1970). Health care priority and sickle cell anemia. Tama; 214(4): 731-4. Sebastiani P, Ramoni MF, Nolan V, Baldwin CT Steinberg MH (2005). Genetic
dissection and prognostic modeling of overt stroke in sickle cell anemia. Nat Genet; 37(4): 435-40.
Sedgewick AE, Timofeev N, Sebastiani P, So JC, Ma ES, Chan LC, Fucharoen G, Fucharoen 5, Barbosa CG, Vardarajan BN, Farrer LA, Baldwin cr, Steinberg MH Chui DH (2008). BCL11A is a major HbF quantitative trait locus in three different populations with beta-hemoglobinopathies. Blood Cells Mol Dis; 41(3): 255-8.
Segal JB, Strouse H, Beach MC, Haywood C, Witkop C, Park H, Wilson RF, Bass EB Lanzkron 5 (2008). Hydroxyurea for the treatment of sickle cell disease. Evidence report/technology assessment; (165): 1-95.
Semple JW Freedman J (2010). Platelets and innate immunity. Cell Mol Life Sci; 67(4): 499-511.
Serhan CN (2009). Systems approach to inflammation resolution: identification of novel anti-inflammatory and pro-resolving mediators. 1 Thromb Haemost; 7 Suppl 1 44-8.
Serhan CN Chiang N (2008). Endogenous pro-resolving and anti-inflammatory lipid mediators: a new pharmacologic genus. Br 1 Pharmacol; 153 Suppll 5200-15.
231

Bibliography
Serhan CN, Krishnamoorthy S, Recchiuti A Chiang N (2011). Novel anti-inflammatory-pro-resolving mediators and their receptors. Curr Top Med Chem; 11(6): 629-47.
Serhan CN Levy B (2003). Success of prostaglandin E2 in structure-function is a challenge for structure-based therapeutics. Proc Natl Acad Sci USA; 100(15): 8609-11.
Serjeant BE, Hambleton IR, Kerr S, Kilty CG Serjeant GR (2001). Haematological response to parvovirus B19 infection in homozygous sickle-cell disease. Lancet; 358(9295): 1779-80.
Serjeant GR (1985). Sickle Cell Disease. New York: Oxford University Press. Serjeant GR (2005). Mortality from sickle cell disease in Africa. Bmj; 330(7489): 432-3. Serjeant GR, Serjeant BE, Thomas PW, Anderson MJ, Patou G Pattison JR (1993).
Human parvovirus infection in homozygous sickle cell disease. Lancet; 341(8855): 1237-40.
Serjeant GR, Serjeant, B.E. (2001). Sickle Cell Disease. Oxford, UK, Oxford University Press; third edition.
Setty BN, Kulkarni S, Rao AK Stuart MJ (2000). Fetal hemoglobin in sickle cell disease: relationship to erythrocyte phosphatidylserine exposure and coagulation activation. Blood; 96(3): 1119-24.
Setty BN, Kulkarni S Stuart MJ (2002). Role of erythrocyte phosphatidylserine in sickle red cell-endothelial adhesion. Blood; 99(5): 1564-71.
Setty BN, Rao AK Stuart MJ (2001). Thrombophilia in sickle cell disease: the red cell connection. Blood; 98(12): 3228-33.
Setty BN Stuart MJ (2002). Eicosanoids in sickle cell disease: potential relevance of neutrophil leukotriene B4 to disease pathophysiology. l Lab Clin Med; 139(2): 80-9.
Shantha NC Napolitano GE (1992). Gas chromatography of fatty acids. l Chromatogr; 624(1-2): 37-51.
Shear HL, Roth EF, Jr., Fabry ME, Costantini FD, Pachnis A, Hood A Nagel RL (1993). Transgenic mice expressing human sickle hemoglobin are partially resistant to rodent malaria. Blood; 81(1): 222-6.
Sheehy TW (1977). Sickle cell hepatopathy. South Med l; 70(5): 533-8. Sher GD Olivieri NF (1994). Rapid healing of chronic leg ulcers during arginine
butyrate therapy in patients with sickle cell disease and thalassemia. Blood; 84(7): 2378-80.
Shindou H, Hishikawa D, Harayama T, Yuki K Shimizu T (2009). Recent progress on acyl CoA: lysophospholipid acyltransferase research. l Lipid Res; 50 Suppl 546-51.
Shindou H Shimizu T (2009). Acyl-CoA:lysophospholipid acyltransferases. l BioI Chern; 284(1): 1-5.
Shores J, Peterson J, VanderJagt D Glew RH (2003). Reduced cholesterol levels in African-American adults with sickle cell disease. Nastional Medical Association; 95(9): 813-7.
Siddiqui RA, Harvey KA, Zaloga GP Stillwell W (2007). Modulation of lipid rafts by Omega-3 fatty acids in inflammation and cancer: implications for use of lipids during nutrition support. Nutr Clin Pract; 22(1): 74-88.
Sies H Stahl W (1995). Vitamins E and C, beta-carotene, and other carotenoids as antioxidants. Am l Clin Nutr; 62(6 Suppl): 13155-1321S.
232

Bibliography
Siffert RS (1966). The growth plate and its affections. [Bone [oint Surg Am; 48(3): 546-63.
Siguel EN, Chee KM, Gong JX Schaefer EJ (1987). Criteria for essential fatty acid deficiency in plasma as assessed by capillary column gas-liquid chromatography. Clin Chem; 33(10): 1869-73.
Sijben JW Calder PC (2007). Differential immunomodulation with long-chain n-3 PUFA in health and chronic disease. Proc Nutr Soc; 66(2): 237-59.
Simons K Gerl MJ (2010). Revitalizing membrane rafts: new tools and inSights. Nat Rev Mol Cell BioI; 11(10): 688-99.
Simons K Ikonen E (1997). Functional rafts in cell membranes. Nature; 387(6633): 569-72.
Simons K Sampaio JL (2011). Membrane organization and lipid rafts. Cold Spring Harb Perspect BioI; 3(10).
Simons K Vaz WL (2004). Model systems, lipid rafts, and cell membranes. Annu Rev Biophys Bio111o1 Struct; 33 269-95.
Simopoulos AP (2009). Omega-6/omega-3 essential fatty acids: biological effects. World Rev Nutr Diet; 99 1-16.
Sindelar PJ, Guan Z, Dallner G Ernster L (1999). The protective role of plasmalogens in iron-induced lipid peroxidation. Free Radic BioI Med; 26(3-4): 318-24.
Singer SJ Nicolson GL (1972). The fluid mosaic model of the structure of cell membranes. Science; 175(23): 720-31.
Singh SA, Koumbourlis AC Aygun B (2008). Resolution of chronic hypoxemia in pediatric sickle cell patients after treatment with hydroxyurea. Pediatr Blood Cancer; 50(6): 1258-60.
Singhal A, Doherty JF, Raynes JG, McAdam KP, Thomas PW, Serjeant BE Serjeant GR (1993). Is there an acute-phase response in steady-state sickle cell disease? Lancet; 341(8846): 651-3.
Singhal A, Thomas P, Kearney T, Venugopal S Serjeant G (1995). Acceleration in linear growth after splenectomy for hypersplenism in homozygous sickle cell disease. Arch Dis Child; 72(3): 227-9.
Skaff 0, Pattison DI Davies MJ (2008). The vinyl ether linkages of plasmalogens are favored targets for myeloperoxidase-derived oxidants: a kinetic study. Biochemistry; 47(31): 8237-45.
Skouroliakou M, Konstantinou D, Koutri K, Kakavelaki C, Stathopoulou M, Antoniadi M, Xemelidis N, Kona V Markantonis S (2010). A double-blind, randomized clinical trial of the effect of omega-3 fatty acids on the oxidative stress of preterm neonates fed through parenteral nutrition. Eur [ Clin Nutr; 64(9): 940-7.
Smith JA (1996). Bone disorders in sickle cell disease. He111atol Oncol Clin North Am; 10(6): 1345-56.
Smith WR, Bauserman RL, Ballas SK, McCarthy WF, Steinberg MH, Swerdlow PS, Waclawiw MA Barton BA (2009). Climatic and geographic temporal patterns of pain in the Multicenter Study of Hydroxyurea. Pain; 146(1-2): 91-8.
Solovey A, Kollander R, Shet A, Milbauer LC, Choong S, Panoskaltsis-Mortari A, Blazar BR, KeIrn RJ, Jr. Hebbel RP (2004). Endothelial cell expression of tissue factor in sickle mice is augmented by hypoxia/ reoxygenation and inhibited by lovastatin. Blood; 104(3): 840-6.
Solovey A, Lin Y, Browne P, Choong S, Wayner E Hebbel RP (1997). Circulating activated endothelial cells in sickle cell anemia. N EnSI T Med; 337(22): 1584-90.
233

Bibliography
Solovey AA, Solovey AN, Harkness J Hebbel RP (2001). Modulation of endothelial cell activation in sickle cell disease: a pilot study. Blood; 97(7): 1937-41.
Song JH Miyazawa T (2001). Enhanced level of n-3 fatty acid in membrane phospholipids induces lipid peroxidation in rats fed dietary docosahexaenoic acid oil. Atherosclerosis; 155(1): 9-18.
Sonnino S Prinetti A (2010). Gangliosides as regulators of cell membrane organization and functions. Adv Exp Med BioI; 688 165-84.
Sonnino S, Prinetti A, Mauri L, Chigorno V Tettamanti G (2006). Dynamic and structural properties of sphingolipids as driving forces for the formation of membrane domains. Chem Rev; 106(6): 2111-25.
Sowa G, Pypaert M Sessa WC (2001). Distinction between signaling mechanisms in lipid rafts vs. caveolae. Proc Nat! Acad Sci USA; 98(24): 14072-7.
Spector AA Yorek MA (1985). Membrane lipid composition and cellular function. 1 Lipid Res; 26(9): 1015-35.
Sprecher H, Luthria DL, Mohammed BS Baykousheva SP (1995). Reevaluation of the pathways for the biosynthesis of polyunsaturated fatty acids. 1 Lipid Res; 36(12): 2471-7.
Srinivasarao P, Narayanareddy K, Vajreswari A, Rupalatha M, Prakash PS Rao P (1997). Influence of dietary fat on the activities of subcellular membrane-bound enzymes from different regions of rat brain. Neurochemlnt; 31(6): 789-94.
Stamatoyannopoulos G, Veith R, AI-Khatti A, Fritsch EF, Goldwasser E Papayannopoulou T (1987). On the induction of fetal hemoglobin in the adult; stress erythropoiesis, cell cycle-specific drugs, and recombinant erythropoietin. Prog Clin BioI Res; 251 443-53.
Stan RV (2005). Structure of caveolae. Biochim Biophys Acta; 1746(3): 334-48. Statius van Eps LW DJP (1997). Sickle cell disease. in Diseases of the Kidney (6th ed),
edited by Schrier RW, Gottschalk C, Boston, Little Brown; 2201-2219. Staubach S Hanisch FG (2011). Lipid rafts: signaling and sorting platforms of cells and
their roles in cancer. Expert Rev Proteomics; 8(2): 263-77. Steck TL (1974). The organization of proteins in the human red blood cell membrane. A
review. 1 Cell BioI; 62(1): 1-19. Steinberg (2009a). Disorders of hemoglobin. New York, Cambridge University Press. Steinberg MH (1999). Management of sickle cell disease. N EnSI 1 Med; 340(13): 1021-
30. Steinberg MH (2005). Predicting clinical severity in sickle cell anaemia. Br 1 Haematol;
129(4): 465-81. Steinberg MH (2008). SNPing away at sickle cell pathophysiology. Blood; 111(12): 5420-
1. Steinberg MH (2009b). Genetic etiologies for phenotypic diversity in sickle cell anemia.
ScientificWorldlournal; 946-67. Steinberg MH Embury SH (1986). Alpha-thalassemia in blacks: genetic and clinical
aspects and interactions with the sickle hemoglobin gene. Blood; 68(5): 985-90. Steinberg MH, Lu ZH, Barton FB, Terrin ML, Charache S Dover GJ (1997). Fetal
hemoglobin in sickle cell anemia: determinants of response to hydroxyurea. Multicenter Study of Hydroxyurea. Blood; 89(3): 1078-88.
Stevens MC, Pad wick M Serjeant GR (1981). Observations on the natural history of dactylitis in homozygous sickle cell disease. Clin Pediatr (Phila); 20(5): 311-7.
234

Bibliography
Stillwell W, Shaikh SR, Zerouga M, Siddiqui R Wassall SR (2005). Docosahexaenoic acid affects cell signaling by altering lipid rafts. Reprod Nutr Dev; 45(5): 559-79.
Stinson J Naser B (2003). Pain management in children with sickle cell disease. Paediatr Drugs; 5(4): 229-41.
Stone WL, Payne PH Adebonojo FO (1990). Plasma-vitamin E and low plasma lipoprotein levels in sickle cell anemia patients. Tournai of the Association for Academic Minority Physicians; 1(2): 12-6.
Strausbaugh HJ, Green PG, Lo E, Tangemann K, Reichling DB, Rosen SD Levine JD (1999). Painful stimulation suppresses joint inflammation by inducing shedding of L-selectin from neutrophils. Nat Med; 5(9): 1057-61.
Strouse H, Hulbert ML, DeBaun MR, Jordan LC Casella JF (2006). Primary hemorrhagic stroke in children with sickle cell disease is associated with recent transfusion and use of corticosteroids. Pediatrics; 118(5): 1916-24.
Strouse H, Lanzkron S, Beach Me, Haywood C, Park H, Witkop e, Wilson RF, Bass EB Segal JB (2008a). Hydroxyurea for sickle cell disease: a systematic review for efficacy and toxicity in children. Pediatrics; 122(6): 1332-42.
Strouse H, Takemoto CM, Keefer JR, Kato GJ Casella JF (2008b). Corticosteroids and increased risk of readmission after acute chest syndrome in children with sickle cell disease. Pediatr Blood Cancer; 50(5): 1006-12.
Stuart MJ Nagel RL (2004). Sickle-cell disease. Lancet; 364(9442): 1343-60. Stuart MJ Setty BN (2001a). Acute chest syndrome of sickle cell disease: new light on an
old problem. Curr Opin Hematol; 8(2): 111-22. Stuart MJ Setty BN (200lb). Hemostatic alterations in sickle cell disease: relationships
to disease pathophysiology. Pediatr Pat/wi Mol Med; 20(1): 27-46. Stuermer CA (2010). The reggie/flotillin connection to growth. Trends Cell Bioi; 20(1):
6-13. Styles LA, Aarsman AJ, Vichinsky EP Kuypers FA (2000). Secretory phospholipase
A(2) predicts impending acute chest syndrome in sickle cell disease. Blood; 96(9): 3276-8.
Styles LA, Schalkwijk CG, Aarsman AJ, Vichinsky EP, Lubin BH Kuypers FA (1996). Phospholipase A2 levels in acute chest syndrome of sickle cell disease. Blood; 87(6): 2573-8.
Styles LA Vichinsky EP (1996). Core decompression in avascular necrosis of the hip in sickle-cell disease. Am T Hematol; 52(2): 103-7.
Sugihara K, Sugihara T, Mohandas N Hebbel RP (1992a). Thrombospondin mediates adherence of CD36+ sickle reticulocytes to endothelial cells. Blood; 80(10): 2634-42.
Sugihara T, Repka T Hebbel RP (1992b). Detection, characterization, and bioavailability of membrane-associated iron in the intact sickle red cell. T Clin Invest; 90(6): 2327-32.
Sugimoto H, Banchio C Vance DE (2008). Transcriptional regulation of phosphatidylcholine biosynthesiS. Prog Lipid Res; 47(3): 204-20.
Sundrarjun T, Komindr S, Archararit N, Dahlan W, Puchaiwatananon 0, Angthararak S, Udomsuppayakul U Chuncharunee S (2004). Effects of n-3 fatty acids on serum interleukin-6, tumour necrosis factor-alpha and soluble tumour necrosis factor receptor p55 in active rheumatoid arthritis. TInt Med Res; 32(5): 443-54.
235

Bibliography
Supari F, Ungerer T, Harrison DG Williams JK (1995). Fish oil treatment decreases superoxide anions in the myocardium and coronary arteries of atherosclerotic monkeys. Circulation; 91(4): 1123-8.
Swerlick RA, Eckman JR, Kumar A, Jeitler M Wick TM (1993). Alpha 4 beta 1-integrin expression on sickle reticulocytes: vascular cell adhesion molecule-I-dependent binding to endothelium. Blood; 82(6): 1891-9.
Switzer JA, Hess DC, Nichols FT Adams RJ (2006). Pathophysiology and treatment of stroke in sickle-cell disease: present and future. Lancet Neurol; 5(6): 501-12.
Tafesse FG, Huitema K, Hermansson M, van der Poel S, van den Dikkenberg J, Uphoff A, Somerharju P Holthuis JC (2007). Both sphingomyelin synthases SMSI and SMS2 are required for sphingomyelin homeostasis and growth in human HeLa cells. l BioI Chem; 282(24): 17537-47.
Taguchi R Ishikawa M (2010). Precise and global identification of phospholipid molecular species by an Orbitrap mass spectrometer and automated search engine Lipid Search. l Chromatogr A; 1217(25): 4229-39.
Tait JF Gibson D (1994). Measurement of membrane phospholipid asymmetry in normal and sickle-cell erythrocytes by means of annexin V binding. l Lab Clin Med; 123(5): 741-8.
Takahashi M, Tsuboyama-Kasaoka N, Nakatani T, Ishii M, Tsutsumi S, Aburatani H Ezaki 0 (2002). Fish oil feeding alters liver gene expressions to defend against PPARalpha activation and ROS production. Am l Physiol Gastrointest Liver Physiol; 282(2): G338-48.
Talbott CM, Vorobyov I, Borchman D, Taylor KG, DuPre DB Yap pert Me (2000). Conformational studies of sphingolipids by NMR spectroscopy. II. Sphingomyelin. Biochim Biophys Acta; 1467(2): 326-37.
Tan P, Luscinskas FW Homer-Vanniasinkam S (1999). Cellular and molecular mechanisms of inflammation and thrombosis. Eur l Vasc Endovasc Surg; 17(5): 373-89.
Tan RX Chen JH (2003). The cerebrosides. Nat Prod Rep; 20(5): 509-34. Tanabe P, Porter J, Creary M, Kirkwood E, Miller S, Ahmed-Williams E Hassell K
(2010). A qualitative analysis of best self-management practices: sickle cell disease. l Natl Med Assoc; 102(11): 1033-41.
Tanaka M, Ishibashi H, Hirata Y, Miki K, Kudo J Niho Y (1996). Tumor necrosis factor production by rat Kupffer cells-regulation by lipopolysaccharide, macrophage activating factor and prostaglandin E2. l Clin Lab Immunol; 48(1): 17-31.
Tancabelic J, Sheth S, Paik M Piomelli S (1999). Serum transferrin receptor as a marker of erythropoiesis suppression in patients on chronic transfusion. Am l Hematol; 60(2): 121-5.
Telen MJ (2007). Role of adhesion molecules and vascular endothelium in the pathogenesis of sickle cell disease. Hematology Am Soc Hematol Educ Program; 84-90.
Terano T, Hirai A, Hamazaki T, Kobayashi S, Fujita T, Tamura Y Kumagai A (1983). Effect of oral administration of highly purified eicosapentaenoic acid on platelet function, blood viscosity and red cell deformability in healthy human subjects. Atherosclerosis; 46(3): 321-31.
Thein SL, Menzel S, Peng X, Best S, Jiang J, Close J, Silver N, Gerovasilli A, Ping e, Yamaguchi M, Wahlberg K, Ulug P, Spector TD, Garner e, Matsuda F, FarraH M Lathrop M (2007). Intergenic variants of HBS1L-MYB are responsible for a
236

Bibliography
major quantitative trait locus on chromosome 6q23 influencing fetal hemoglobin levels in adults. Proc Natl Acad Sci USA; 104(27): 11346-51.
Thies F, Garry JM, Yaqoob P, Rerkasem K, Williams J, Shearman CP, Gallagher PJ, Calder PC Grimble RF (2003). Association of n-3 polyunsaturated fatty acids with stability of atherosclerotic plaques: a randomised controlled trial. Lancet; 361(9356): 477-85.
Thomas PW, Higgs OR Serjeant GR (1997). Benign clinical course in homozygous sickle cell disease: a search for predictors. T Clin Epidemiol; 50(2): 121-6.
Thomasson HJ (1962). Essential fatty acids. Nature; 194 973. Tian H L Y, Sherwood AM, Hongqian 0, Hong S. (2009). Resolvins E1 and 01 in
Choroid-Retinal Endothelial Cells and Leukocytes: Biosynthesis and Mechanisms of Anti-inflammatory Actions
Invest Ophthalmol Vis Sci. ; 50(8): 3613-20. Tilley SL, Coffman TM Koller BH (2001). Mixed messages: modulation of inflammation
and immune responses by prostaglandins and thromboxanes. T Clin Invest; 108(1): 15-23.
To KW Nadel AJ (1991). Ophthalmologic complications in hemoglobinopathies. Hematol Oncol Clin North Am; 5(3): 535-48.
Tomer A, Harker LA, Kasey SEckman JR (2001a). Thrombogenesis in sickle cell disease. T Lab Clin Med; 137(6): 398-407.
Tomer A, Kasey S, Connor WE, Clark S, Harker LA Eckman JR (2001b). Reduction of pain episodes and prothrombotic activity in sickle cell disease by dietary n-3 fatty acids. Thromb Haemost; 85(6): 966-74.
Topham MK Epand RM (2009). Mammalian diacylglycerol kinases: molecular interactions and biological functions of selected isoforms. Biochim Biophys Acta; 1790(6): 416-24.
Transler C, Eilander A, Mitchell S van de Meer N The impact of polyunsaturated fatty acids in reducing child attention deficit and hyperactivity disorders. T Atten Disord; 14(3): 232-46.
Trebble TM, Arden NK, Wootton SA, Calder PC, Mullee MA, Fine DR Stroud MA (2004). Fish oil and antioxidants alter the composition and function of circulating mononuclear cells in Crohn disease. Am T Clin Nutr; 80(5): 1137-44.
Trompeter S Roberts I (2009). Haemoglobin F modulation in childhood sickle cell disease. Br T Haematol; 144(3): 308-16.
Tshilolo L, Kafando E, Sawadogo M, Cotton F, Vertongen F, Ferster A Gulbis B (2008). Neonatal screening and clinical care programmes for sickle cell disorders in sub-Saharan Africa: lessons from pilot studies. Public Health; 122(9): 933-4l.
Tu WC, Cook-Johnson RJ, James MJ, MuhIhausler BS Gibson RA (2010). Omega-3 long chain fatty acid synthesis is regulated more by substrate levels than gene expression. Prostaglandins Leukot Essent Fatty Acids; 83(2): 61-8.
Turhan A, Jenab P, Bruhns P, Ravetch JV, Coller BS Frenette PS (2004). Intravenous immune globulin prevents venular va so-occlusion in sickle cell mice by inhibiting leukocyte adhesion and the interactions between sickle erythrocytes and adherent leukocytes. Blood; 103(6): 2397-400.
Turhan A, Weiss LA, Mohandas N, Coller BS Frenette PS (2002). Primary role for adherent leukocytes in sickle cell vascular occlusion: a new paradigm. Proc Natl Acad Sci USA; 99(5): 3047-51.
237

Bibliography
Turrens JF (2003). Mitochondrial formation of reactive oxygen species. [Physiol; 552(Pt 2): 335-44.
Utsugi T, Schroit AJ, Connor J, Bucana CD Fidler IJ (1991). Elevated expression of phosphatidylserine in the outer membrane leaflet of human tumor cells and recognition by activated human blood monocytes. Cancer Res; 51(11): 3062-6.
Valentine RC Valentine DL (2004). Omega-3 fatty acids in cellular membranes: a unified concept. Prog Lipid Res; 43(5): 383-402.
van den Berg JJ, de Fouw NJ, Kuypers FA, Roelofsen B, Houtsmuller UM Op den Kamp JA (1991). Increased n-3 polyunsaturated fatty acid content of red blood cells from fish oil-fed rabbits increases in vitro lipid peroxidation, but decreases hemolysis. Free Radic BioI Med; 11(4): 393-9.
van Meer G Lisman Q (2002). Sphingolipid transport: rafts and translocators. [ BioI Chern; 277(29): 25855-8.
van Meer G, Voelker DR Feigenson GW (2008). Membrane lipids: where they are and how they behave. Nat Rev Mol Cell BioI; 9(2): 112-24.
Vance JE (2008). Phosphatidylserine and phosphatidylethanolamine in mammalian cells: two metabolically related aminophospholipids. T Lipid Res; 49(7): 1377-87.
Vance JE Vance DE (2004). Phospholipid biosynthesis in mammalian cells. Biochem Cell BioI; 82(1): 113-28.
VanderJagt DJ, Shores J, Okorodudu A, Okolo SN Glew RH (2002). Hypocholesterolemia in Nigerian children with sickle cell disease. [ournal of Tropical Pediatrics; 48(3): 156-61.
VanderJagt DJ, Trujillo MR, Bode-Thomas F, Huang YS, Chuang LT Glew RH (2003). Phase angle correlates with n-3 fatty acids and cholesterol in red cells of Nigerian children with sickle cell disease. Lipids in Health and Disease; 2 2.
Vane JR, Bakhle YS Botting RM (1998). Cyclooxygenases 1 and 2. Annu Rev Pharmacal Toxicol; 38 97-120.
Varat MA, Adolph RJ Fowler NO (1972). Cardiovascular effects of anemia. Am Heart l; 83(3): 415-26.
Varney ME, Hardman WE Sollars VE (2009). Omega 3 fatty acids reduce myeloid progenitor cell frequency in the bone marrow of mice and promote progenitor cell differentiation. Lipids Health Dis; 8 9.
Vasavda N, Menzel S, Kondaveeti S, Maytham E, Awogbade M, Bannister 5, Cunningham J, Eichholz A, Daniel Y, Okpala I, Fulford T Thein SL (2007). The linear effects of alpha-thalassaemia, the UGT1A1 and HMOX1 polymorphisms on cholelithiasis in sickle cell disease. Br [Haematol; 138(2): 263-70.
Vella F (1964). Sickling in the Western Sudan. SMl; 3 16-20. Verduzco LA Nathan DG (2009). Sickle cell disease and stroke. Blood; 114(25): 5117-25. Vereb G, Szollosi J, Matko J, Nagy P, Farkas T, Vigh L, Matyus L, Waldmann TA
Damjanovich 5 (2003). Dynamic, yet structured: The cell membrane three decades after the Singer-Nicolson model. Proc Natl Acad Sci USA; 100(14): 8053-8.
Vichinsky E (2001a). Consensus document for transfusion-related iron overload. Semin Hematol; 38(1 Suppll): 2-4.
Vichinsky E, Bemaudin F, Forni GL, Gardner R, Hassell K, Heeney MM, Inusa B, Kutlar A, Lane P, Mathias L, Porter J, Tebbi C, Wilson F, Griffel L, Deng W, Giannone V Coates T (2011). Long-term safety and efficacy of deferasirox
238

Bibliography
(Exjade) for up to 5 years in transfusional iron-overloaded patients with sickle cell disease. Br T Haematol; 154(3): 387-97.
Vichinsky E, Hurst D, Earles A, Kleman K Lubin B (1988). Newborn screening for sickle cell disease: effect on mortality. Pediatrics; 81(6): 749-55.
Vichinsky E, Pakbaz Z, Onyekwere 0, Porter J, Swerdlow P, Coates T, Lane P, Files B, Mueller BU, Coic L, Forni GL, Fischer R, Marks P, Rofail D, Abetz L Baladi JF (2008). Patient-reported outcomes of deferasirox (Exjade, ICL670) versus deferoxamine in sickle cell disease patients with transfusional hemosiderosis. Substudy of a randomized open-label phase II trial. Acta Haematol; 119(3): 133-41.
Vichinsky EP (200lb). Current issues with blood transfusions in sickle cell disease. Semin Hematol; 38(1 Suppl1): 14-22.
Vichinsky EP, Haberkern CM, Neumayr L, Earles AN, Black D, Koshy M, Pegelow C, Abboud M, Ohene-Frempong K Iyer RV (1995). A comparison of conservative and aggressive transfusion regimens in the perioperative management of sickle cell disease. The Preoperative Transfusion in Sickle Cell Disease Study Group. N En~l T Med; 333(4): 206-13.
Vichinsky EP, Neumayr LD, Earles AN, Williams R, Lennette ET, Dean D, Nickerson B, Orringer E, McKie V, Bellevue R, Daeschner C Manei EA (2000). Causes and outcomes of the acute chest syndrome in sickle cell disease. National Acute Chest Syndrome Study Group. N En~l T Med; 342(25): 1855-65.
Vilbergsson G, Wennergren M, Samsioe G, Percy P, Percy A, Mansson JE Svennerholm L (1994). Essential fatty acid status is altered in pregnancies complicated by intrauterine growth retardation. World Rev Nutr Diet; 76 105-9.
Villagra J, Shiva S, Hunter LA, Machado RF, Gladwin MT Kato GJ (2007). Platelet activation in patients with sickle disease, hemolysis-associated pulmonary hypertension, and nitric oxide scavenging by cell-free hemoglobin. Blood; 110(6): 2166-72.
Villani M, Subathra M, 1m YB, Choi Y, Signorelli P, Del Poeta M Luberto C (2008). Sphingomyelin synthases regulate production of diacylglycerol at the Golgi. Biochem l; 414(1): 31-41.
von Schacky C Harris WS (2007). Cardiovascular benefits of omega-3 fatty acids. Cardiovasc Res; 73(2): 310-5.
Voskaridou E, Christoulas D, Bilalis A, Plata E, Varvagiannis K, Stamatopoulos G, Sinopoulou K, Balassopoulou A, Loukopoulos D Terpos E (2010). The effect of prolonged administration of hydroxyurea on morbidity and mortality in adult patients with sickle cell syndromes: results of a 17-year, single-center trial (LaSHS). Blood; 115(12): 2354-63.
Voss A, Reinhart M, Sankarappa S Sprecher H (1991). The metabolism of 7,10,13,16,19-docosapentaenoic acid to 4,7,10,13,16,19-docosahexaenoic acid in rat liver is independent of a 4-desaturase. l BioI Chem; 266(30): 19995-20000.
Wada M, DeLong CJ, Hong YH, Rieke CJ, Song I, Sidhu RS, Yuan C, Warnock M, Schmaier AH, Yokoyama C, Smyth EM, Wilson SJ, FitzGerald GA, Garavito RM, Sui de X, Regan JW Smith WL (2007). Enzymes and receptors of prostaglandin pathways with arachidonic acid-derived versus eicosapentaenoic acid-derived substrates and products. l BioI Chem; 282(31): 22254-66.
Walter PB, Fung EB, Killilea DW, Jiang Q, Hudes M, Madden J, Porter J, Evans P, Vichinsky E Harmatz P (2006). Oxidative stress and inflammation in iron-
239

Bibliography
overloaded patients with beta-thalassaemia or sickle cell disease. Br 'Haematol; 135(2): 254-63.
Wang D Dubois RN (2010). Eicosanoids and cancer. Nat Rev Cancer; 10(3): 181-93. Wang D, Wang H, Shi Q, Katkuri 5, Walhi W, Desvergne B, Das SK, Dey SK DuBois
RN (2004). Prostaglandin E(2) promotes colorectal adenoma growth via trans activation of the nuclear peroxisome proliferator-activated receptor delta. Cancer Cell; 6(3): 285-95.
Wang Q Sun Y, Ma A, Li Y, Han X Liang H (2010). Effects of vitamin E on plasma lipid status and oxidative stress in Chinese women with metabolic syndrome. Int , Vitam Nutr Res; 80(3): 178-87.
Wang WC (1999). Role of nutritional supplement in sickle cell disease. 'Pediatr Hematol Oncol; 21(3): 176-8.
Wang We, Ware RE, Miller ST, Iyer RV, Casella JF, Minniti CP, Rana 5, Thornburg CO, Rogers ZR, Kalpatthi RV, Barredo JC, Brown Re, Sarnaik SA, Howard TH, Wynn LW, Kutlar A, Armstrong FO, Files BA, Goldsmith JC, Waclawiw MA, Huang X Thompson BW (2011). Hydroxycarbamide in very young children with sickle-cell anaemia: a multicentre, randomised, controlled trial (BABY HUG). Lancet; 377(9778): 1663-72.
Wang Y, Botolin D, Christian B, Busik J, XU J Jump DB (2005). Tissue-specific, nutritional, and developmental regulation of rat fatty acid elongases. 'Lipid Res; 46(4): 706-15.
Wanko SO Telen MJ (2005). Transfusion management in sickle cell disease. Hematol Oncol Clin North Am; 19(5): 803-26, v-vi.
Ware HE, Brooks AP, Toye R Berney 51 (1991). Sickle cell disease and silent avascular necrosis of the hip. 'Bone [oint Surg Br; 73(6): 947-9.
Watkins KE, Hewes OK, Connelly A, Kendall BE, Kingsley DP, Evans JE, Gadian DC, Vargha-Khadem F Kirkham FJ (1998). Cognitive deficits associated with frontallobe infarction in children with sickle cell disease. Dev Med Child Neurol; 40(8): 536-43.
Watson J (1948). The significance of the paucity of sickle cells in newborn Negro infants. Am 'Med Sci; 215(4): 419-23.
Weatherall DJ, Akinyanju 0, Fucharoen 5 et al (2006). Inherited disorders of hemoglobin. In: Disease control priorities in developing countries, In: Jamison DT, Bobadilla J-S, Mosley W H, Measham A R, eds. New York: Oxford University Press and the World Bank; 663-80.
Weatherall DJ Clegg JB (2001). Inherited haemoglobin disorders: an increasing global health problem. Bull World Health Organ; 79(8): 704-12.
Weiner OL, Hibberd PL, Betit P, Cooper AB, Botelho CA Brugnara C (2003). Preliminary assessment of inhaled nitric oxide for acute vaso-occlusive crisis in pediatric patients with sickle cell disease. lama; 289(9): 1136-42.
Well ems TE, Hayton K Fairhurst RM (2009). The impact of malaria parasitism: from corpuscles to communities. , Clin Invest; 119(9): 2496-505.
Westerman MP, Green D, Gilman-Sachs A, Beaman K, Freels 5, Boggio L, Allen 5, Zuckerman L, Schlegel R Williamson P (1999). Antiphospholipid antibodies, proteins C and 5, and coagulation changes in sickle cell disease. [Lab Clin Med; 134(4): 352-62.
240

Bibliography
Wigmore SJ, Fearon KC Ross JA (1997). Modulation of human hepatocyte acute phase protein production in vitro by n-3 and n-6 polyunsaturated fatty acids. Ann SUl'g; 225(1): 103-11.
Wilimas JA, McHaney V A, Pres bury G, Dahl J Wang W (1988). Auditory function in sickle cell anemia. Am l Pediatl' Hematol Oncol; 10(3): 214-6.
Wilkie DJ, Molokie R, Boyd-Seal D, Suarez ML, Kim YO, Zong S, Wittert H, Zhao Z, Saunthararajah Y Wang ZJ (2010). Patient-reported outcomes: descriptors of nociceptive and neuropathic pain and barriers to effective pain management in adult outpatients with sickle cell disease. l Natl Med Assoc; 102(1): 18-27.
Willett JE (1987). Gas Chromatography. Analytical chemistry by open learning,ACOL, London.
Willett WC (2007). The role of dietary n-6 fatty acids in the prevention of cardiovascular disease. l Cal'diovasc Med (Hagerstown); 8 Suppl1 542-5.
Williams TN, Mwangi TIV, Roberts DJ, Alexander ND, Weatherall DJ, Wambua S, Kortok M, Snow RW Marsh K (2005a). An immune basis for malaria protection by the sickle cell trait. PLoS Med; 2(5): e128.
Williams TN, Mwangi TIV, Wambua S, Alexander ND, Kortok M, Snow RW Marsh K (2005b). Sickle cell trait and the risk of Plasmodium falciparum malaria and other childhood diseases. l Infect Dis; 192(1): 178-86.
Williamson 1M, Alvis SJ, East JM Lee AG (2003). The potassium channel KcsA and its interaction with the lipid bilayer. Cell Mol Life Sci; 60(8): 1581-90.
Williamson P, Kulick A, Zachowski A, Schlegel RA Devaux PF (1992). Ca2+ induces trans bilayer redistribution of all major phospholipids in human erythrocytes. Biochemistry; 31(27): 6355-60.
Wilson MJ, Richter-Lowney K Daleke DL (1993). Hyperglycemia induces a loss of phospholipid asymmetry in human erythrocytes. Biochemistry; 32(42): 11302-10.
Wood BL, Gibson DF Tait JF (1996). Increased erythrocyte phosphatidylserine exposure in sickle cell disease: flow-cytometric measurement and clinical associations. Blood; 88(5): 1873-80.
Wood KC Granger DN (2007). Sickle cell disease: role of reactive oxygen and nitrogen metabolites. Clin Exp Phannacol Physiol; 34(9): 926-32.
Woodman RJ, Mori TA, Burke V, Puddey IB, Barden A, Watts GF Beilin LJ (2003). Effects of purified eicosapentaenoic acid and docosahexaenoic acid on platelet, fibrinolytic and vascular function in hypertensive type 2 diabetic patients. Atherosclerosis; 166(1): 85-93.
Woolliams JA, Wiener G, Anderson PH McMurray CH (1983). Variation in the activities of glutathione peroxidase and superoxide dismutase and in the concentration of copper in the blood in various breed crosses of sheep. Res Vet ~ 34(3): 253-6.
Worgall 1'5 (2008). Regulation of lipid metabolism by sphingolipids. Subcell Biochem; 49 371-85.
Wright JG, Malia R, Cooper P, Thomas P, Preston FE Serjeant GR (1997). Protein C and protein S in homozygous sickle cell disease: does hepatic dysfunction contribute to low levels? Br lHaematol; 98(3): 627-31.
Wu G Vance DE (2010). Choline kinase and its function. Biochem Cell Bioi; 88(4): 559-64. Wu S, Moomaw CR, Tomer KB, Falck JR Zeldin DC (1996). Molecular cloning and
expression of CYP2]2, a human cytochrome P450 arachidonic acid epoxygenase highly expressed in heart. l Bioi Chem; 271(7): 3460-8.
241

Bibliography
Wun T (2001). The Role of Inflammation and Leukocytes in the Pathogenesis of Sickle Cell Disease; Haemoglobinopathy. Hematology; 5(5): 403-412.
Wun T, Cordoba M, Rangaswami A, Cheung A W Paglieroni T (2002). Activated monocytes and platelet-monocyte aggregates in patients with sickle cell disease. Clill Lab Haematol; 24(2): 81-8.
Wun T, Paglieroni T, Tablin F, Welborn J, Nelson K Cheung A (1997). Platelet activation and platelet-erythrocyte aggregates in patients with sickle cell anemia. 'Lab Clill Med; 129(5): 507-16.
Wymann MP Schneiter R (2008). Lipid signalling in disease. Nat Rev Mol Cell BioI; 9(2): 162-76.
Xu L, Han C, Lim K Wu T (2008). Activation of cytosolic phospholipase A2alpha through nitric oxide-induced S-nitrosylation. Involvement of inducible nitricoxide synthase and cyclooxygenase-2. 'ournal of Biological Chemistry 283(6): 3077-87.
Yan F, Yang WK, Li XY, Lin TI, Lun YN, Lin F, Lv SW, Yan GL, Liu JQ, Shen JC, Mu Y Luo GM (2008). A trifunctional enzyme with glutathione S-transferase, glutathione peroxidase and superoxide dismutase activity. Biochim Biophys Acta; 1780(6): 869-72.
Yan JH, Ataga K, Kaul S, Olson JS, Grasela OM, Gothelf S, Kutlar A Orringer E (2005). The influence of renal function on hydroxyurea pharmacokinetics in adults with sickle cell disease. 'Clin Phamlacol; 45(4): 434-45.
Yang Be, Saldeen TG, Bryant JL, Nichols WW Mehta JL (1993). Long-term dietary fish oil supplementation protects against ischemia-reperfusion-induced myocardial dysfunction in isolated rat hearts. Am Heart T; 126(6): 1287-92.
Yaqoob P Shaikh SR (2010). The nutritional and clinical significance of lipid rafts. Curr Opin Clin Nutr Metab Care; 13(2): 156-66.
Yavin E (2006). Versatile roles of docosahexaenoic acid in the prenatal brain: from proand anti-oxidant features to regulation of gene expression. Prostaglandins Leukot Essent Fatty Acids; 75(3): 203-11.
Yawata Y (2003). Cell Membrane The Red Blood Cell as a Model. Wiley-VCR Gmbh&Co.KGaA.
Yeagle PL (1989). Lipid regulation of cell membrane structure and function. Faseb 1; 3(7): 1833-42.
Yildirim T, Agildere AM, Oguzkurt L, Barutcu 0, Kizilkilic 0, Kocak R Alp Niron E (2005). MRI evaluation of cranial bone marrow signal intensity and thickness in chronic anemia. Eur 'Radiol; 53(1): 125-30.
Yousif MH, Benter IF Roman RJ (2009). Cytochrome P450 metabolites of arachidonic acid playa role in the enhanced cardiac dysfunction in diabetic rats following ischaemic reperfusion injury. Auton Autacoid Phamlacol; 29(1-2): 33-41.
Yuditskaya 5, Tumblin A, Hoehn GT, Wang G, Drake SK, Xu X, Ying S, Chi AH, Remaley AT, Shen RF, Munson PJ, Suffredini AF Kato GJ (2009). Proteomic identification of altered apolipoprotein patterns in pulmonary hypertension and vasculopathy of sickle cell disease. Blood; 113(5): 1122-8.
Zago MA, Figueiredo MS Ogo SH (1992). Bantu beta s cluster haplotype predominates among Brazilian blacks. Am 'Phys Anthropol; 88(3): 295-8.
Zennadi R, De Castro L, Eyler e, Xu K, Ko M Telen MJ (2008). Role and regulation of sickle red cell interactions with other cells: ICAM-4 and other adhesion receptors. Transfus Clin BioI; 15(1-2): 23-8.
242

Bibliography
Zennadi R, Moeller BJ, Whalen EJ, Batchvarova M, Xu K, Shan S, Delahunty M, Dewhirst MW Telen MJ (2007). Epinephrine-induced activation of LWmediated sickle cell adhesion and vaso-occlusion in vivo. Blood; 110(7): 2708-17.
Zerez CR, Lachant NA Tanaka KR (1990). Impaired erythrocyte methemoglobin reduction in sickle cell disease: dependence of methemoglobin reduction on reduced nicotinamide adenine dinucleotide content. Blood; 76(5): 1008-14.
Zheng X, Tocher DR, Dickson CA, Bell JG Teale AJ (2005). Highly unsaturated fatty acid synthesis in vertebrates: new insights with the cloning and characterization of a delta6 desaturase of Atlantic salmon. Lipids; 40(1): 13-24.
Zimmerman SA, Schultz WH, Burgett S, Mortier NA Ware RE (2007). Hydroxyurea therapy lowers transcranial Doppler flow velocities in children with sickle cell anemia. Blood; 110(3): 1043-7.
Zipursky A, Chachula OM Brown EJ (1993). The reversibly sickled cell. Am 1 Pediatr Hematol Ol1eol; 15(2): 219-25.
Zulfakar MH, Edwards M Heard CM (2007). Is there a role for topically delivered eicosapentaenoic acid in the treatment of psoriasis? Eur 1 Dermatol; 17(4): 284-91.
Zumberg MS, Reddy S, Boyette RL, Schwartz RJ, Konrad TR Lottenberg R (2005). Hydroxyurea therapy for sickle cell disease in community-based practices: a survey of Florida and North Carolina hematologists/ oncologists. Am 1 Hematol; 79(2): 107-13.
Zwaal RF (1978). Membrane and lipid involvement in blood coagulation. Bioehim Biophys Acta; 515(2): 163-205.
Zwaal RF Schroit AJ (1997). Pathophysiologic implications of membrane phospholipid asymmetry in blood cells. Blood; 89(4): 1121-32.
243

Appendices
Appendices
244

Appendices
Appendix 1- List of instruments
Gas-Liquid chromatography:-
Product: 1800 Series gas chromatography model 8533 (HRGC MEGA 2 Series) with
dual flame ionisation detector, split/ splitless, amplifiers with A 2005 autosampler.
Supplier: Fisons Instruments (UK organic sales, Crewe Road, Wythenshaw,
Manchester, M23 9BE)
Column: BPX-70 column
Supplier: SGE Europe Ltd (UK)
Length: 60 metre
Physi properties: Highly Polar
Material 70% Cyanopropyl Polysilphenylene-siloxane
Type: BPX70
Film Thickness: 0.25 pm
Operating temperature 150°C to 250°C
Conditioning temperature 250 OC for 5 minutes
Hydrogen generator:-
Product:
Supplier: In house Gas
This hydrogen generator produces up to 400 cc/min of pure dry hydrogen gas using
deionised water and electricity.
245

Appendices
UV /VIS spectrometer:-
Product: Lambda 35
Supplier: Perkin Elmer Inc.
96-well microplate reader:-
Product: Fluor Star Omega
Supplier: BMG Labtech
Flow Cytometry system:-
Product: Guava PCA-96 System
Supplier: Guava technologies
High Performance Liquid Chromatograph:-
Model Agilent 1100 series high performance liguid chromatograph
system with a quaternary pump connected to an autosampler, fraction collector and
diode-array detector.
Diode Array Detector:-
Model Agillent 1100 Series diode array detector
Light source Deuterium and tungsten lamps
Wavelength range 190-950 nm
Diode Width <lnm
246
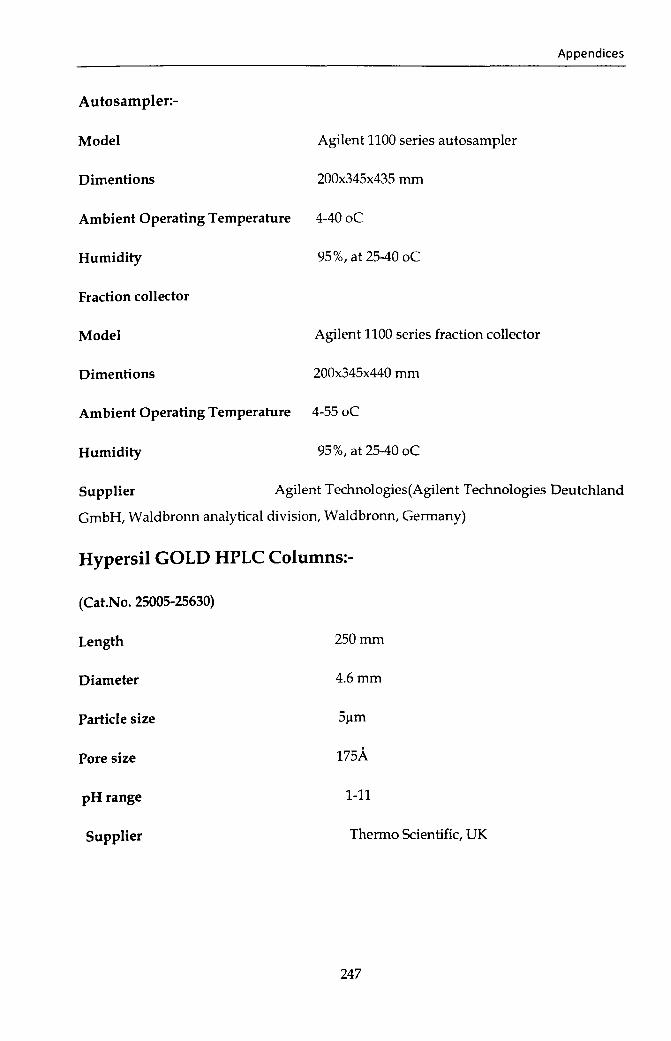
Appendices
Autosampler:-
Model Agilent 1100 series autosampler
Dimentions 200x345x435 mm
Ambient Operating Temperature 4-40oC
Humidity 95%, at 25-40 oC
Fraction collector
Model Agilent 1100 series fraction collector
Dimentions 200x345x440 mm
Ambient Operating Temperature 4-55 oC
Humidity 95%, at 25-40 oC
Supplier Agilent Technologies(Agilent Technologies Deutchland
GmbH, Waldbronn analytical division, Waldbronn, Germany)
Hypersil GOLD HPLC Columns:-
(Cat.No.25005-25630)
Length 250mm
Diameter 4.6mm
Particle size 51lm
Pore size 175A
pH range 1-11
Supplier Thermo Scientific, UK
247

Appendices
Appendix 2 List of reagents and kits
Name Company Code
Acetic Acid Fisher Scientific UK A/0400/PB08
Acetone Fluka 00568
Acetyl chloride Acros organic 151270010
ACOXI Applied Biosystems Hs01074240_m1
Boric acid Sigma-Aldrich Co. UK B6768
Bovine serum albumin Sigma-Aldrich Co. UK A7906
Butylated hydroxy toluene Sigma-AldrichCo. UK B-1378
Chloroform, HPLC grade Fisher Scientific UK Ltd C/4966/17
CPG standard Sigma-Aldrich Co. UK P5394
2, 7-Dichlorofluorescein Sigma-Aldrich Co. UK 410217
Diethylpyrocarbonate BDH 441703D
Dried methanol Fisher Scientific UK Ltd M/4050/15
EPG standard Sigma-Aldrich Co. UK P7693
Ethanol Hayman Ltd. 64-17-5
FAME Mix Sigma-Aldrich Co. UK 18919-IAMP
GUAVA via count flex reagent Guava technologies 4700-0060
Heptane Fisher Scientific UK Ltd H/0l06/17
Hexane Sigma-Aldrich Co. UK H/0406/17
248

Histopaque-l077
Histopaque-
Hydrochloric Acid 37%
IPG standard
Isopropanol
Methylamine, extra pure, 40 wt%
Petroleum ether
PBS
Potassium bicarbonte
Sodium chloride
Sigma-Aldrich Co. UK
Sigma-Aldrich Co. UK
Sigma-Aldrich Co. UK
Sigma-Aldrich Co. UK
Fisher Scientific UK Ltd
Acros organic
Fisher Chemical
Sigma-Aldrich Co. UK
Fisher Scientific
5igma-AldrichCo. UK
Sodium sulphate anhydrous, Fisher Scientific
granular
Vacutainer Serum Separator Becton, Dickinson
Company (BD)
Vacutainer K2E Becton, Dickinson
Company (BD)
249
Appendices
1077-1
1119
7647-01-0
P6636
P/7490/08
126230010
P/1800/17
P /5120/53
57653
5/6600/53
and 367954
and 367525

Appendices
Analysis kit:
Kit Company Catalog No.
Se-GPX Cayman 703102
CujZn-SOO Cayman 706002
LOH Life science Inc E91864Hu
Immunology Consultant E-80HPT Hp
Laboratory
TNF-a Pierce Biotechnology EH3TNFA
IL-10 Pierce Biotechnology EHIL02
Anti-bodies:
Name Company Code
Mouse Anti-human CDllb FITC conjugate Beckman Coulter IM0530
Mouse Anti-human CD62L FITC conjugate Beckman Coulter IM1231U
250

Thin-Layer Chromatography Plates:
Product
Cat No
Size
Layer thickness
Pore volume
Supplier
TLC silica gel
1.5721.0001
20x20 em
210-270llm
0.74-0.84 m/ g
Merck KGaA, Germany
251
Appendices

Appendices
Appendix 3
Fatty acids standard mix: 100 mg ampule contains the following
with weight percentages indicated
Trivial Name Abbreviation
Butyric acid Methyl Ester 4:0
Caproic acid Methyl Ester 6:0
Caprylic acid Methyl Ester 8:0
Undecanoic acid Methyl Ester 10:0
Lauric acid Methyl Ester 12:0
Tridecanoic acid Methyl Ester 13:0
Myristic Acid Methyl Ester 14:0
Myristoleic acid Methyl Ester 14:1
Pentadecanoic acid Methyl Ester 15:0
Cis-10-Pentadecenoic acid Methyl 15:1
Palmitic acid Methyl Ester 16:0
Palmitoleic acid Methyl Ester 16:1
Heptadecanoic acid Methyl Ester 17:0
Cis-10-Heptadecenoic acid Methyl 17:1
Stearic acid Methyl Ester 18:0
Oleic acid Methyl Ester 18:1
Elaidic acid Methyl Ester 18:1
Linoleic acid Methyl Ester 18:2
Linolelaidic acid 18:2
a- linolenic acid Methyl Ester 18:3
V-linolenic acid Methyl Ester 18:3
Arachidic acid Methyl Ester 20:0
Cis-ll-eicosenoic acid Methyl 20:1
Cis-ll,l4-eicosadienoic acid 20:2
252
Weight (%)
4
4
4
2
4
2
4
2
2
2
6
2
2
4
4
4
2
2
2
2
2
4
2
2

Cis-11,14,17-eicosatrienoic acid 20:3
Arachidonic acid Methyl Ester 20:4
Cis-5,8,11,14,17-eicosapentaenoic 20:5
Heneicosanoic acid Methyl Ester 21:0
Behenic acid Methyl Ester 22:0
Erucic acid Methyl Ester 22:1
Cis-13,16-docosadienoic acid 22:2
Cis-4,7,10,13,16,19- 22:6
Tricosanoic acid Methyl Ester 23:0
Lignoceric acid Methyl Ester 24:0
Nervonic acid Methyl Ester 24:1
Appendix 4
V itamin Standards:
Retinol, purity >99.0% (HPLC Fluka
a-Tocopherol, purity >97.0% (HPLC) Fluka
253
2
2
2
2
4
2
2
2
2
4
2
Appendices
95144
95240

Appendices
Appendix 5
Information Letter and Consent
Information
• You are invited to participate in a study on Sickle Cell Disease (SCD) to be conducted by staff from the Faculty of Medicine, University of Khartoum in collaboration with researchers from London Metropolitan University, London, United Kingdom
• Read carefully the information provided below before deciding whether or not to participate in the study. If the infonnation provided is not clear or you have any other question related to the study, please feel free to ask.
• Title of study - Omega-3 Fatty Acid Therapy for Prevention of Vaso-Occlusive Crisis in Patients with Homozygous Sickle Cell Disease (SCD).
Investigators - Dr Ahmed Daak and Professor Mustafa EI Bashir, Department of
Medical Biochemistry, Faculty of Medicine, University of Khartoum, Sudan.
What is the purpose of the study? Previous studies conducted in other countries (America and Venezuela) indicate omega 3 fatty acids have beneficial effects for patients with sickle cell disease. These findings are very important since omega 3 fatty acids, which are obtained from fish and fish products, are cheap and easily accessible
to poor patients. Unlike the drugs which are currently used for sickle cell patients, omega 3 fatty acids do not have serious side effects. The studies conducted in the past were based on a small number of patients and the supplementation period was short.
Hence, we are unsure whether omega 3 fatty acids (a) will be beneficial for Sudanese patients who are ethnically different from those previously studied; (b) Have adverse
effects when given for a longer period of time. The purpose of this study is to find out if omega-3 fatty acid supplementation reduces the frequency of painful crises in
Sudanese sickle cell patients.
What do have to do if I volunteer to participate? You are invited to participate in the study described above. if you volunteers to take part in the study, you will be asked to:
254

Appendices
(a) take omega 3 fatty acid capsules for one year (capsules shown); (b) Keep written
record about your medial condition; (c) Provide a teaspoon of blood (5 ml) before you
start to take the capsules and subsequently after 6 and 12 months; (d) Attend the
monthly clinic appointment for clinical and biochemical assessments of your condition.
Do omega 3 fatty acids have side effects? Omega-3 fatty acids are nutrients extracted
from fish and do not have side effects. However, there very few people who develop
allergic reaction if they eat fish. If you are one of those individuals, you must inform
the investigators before deciding to volunteer.
What will happen if I decide to withdraw from the study? You are free to withdraw
from the study at anytime without giving any reason. Withdrawal from the study will
not affect the treatment you receive from the doctors in the clinic.
Consent
Title of study - Omega-3 Fatty Acid Therapy for Prevention of Vaso-Occlusive Crisis
in Patients with Homozygous Sickle Cell Disease (SCD).
Investigators - Dr Ahmed Daak and Professor Mustafa El Bashir, Department of
Medical Biochemistry, Faculty of Medicine, University of Khartoum, Sudan.
Declaration of consent - I confirm I have read and understood the information
provided regarding the study and I had the opportunity to ask questions. Also, I know
that I can withdraw from the study without giving a reason for my decision.
I agree to take part in the study.
Name (Patient/Guardian) Signature Date
Investigators Dr Ahmed Daak Professor Mustaf El bashir
255

Appendices
Signature
Date
Telephone Number 091231515331
If you have questions or require advice please phone Dr Ahmed Daak
256

Appendix 6
Enrollment Form:
Khartoum University
Faculty of Medicine
Homozygous Sickle cell Diseases Assessment form
From No ....................................... .
Date of enrollment: ...................................... .
Demographic Data:
• Name: ............................................................. . Age:
• Sex: Male D Female D
• Place of birth: ........................... ..
• Original home: ......................................... . Tribe: .....
• Father name: ........................................................... Mother name:
• Consanguinity: Yes D NoD
• Permanent address:
Appendices
Geographic area ............................. , .................................................. .
Prominent sign ................................................................................... .
Tel No ............................................ .. - E. mail
Person in Kin: ............................................................. .
Address .............................................................................................. .
Homozygous SCD past history:
• Age when the disease firstly diagnosed:- ...................................... ..
• Diagnostic tests:
257

- Sickling test Paraffin wax: Yes 0 No 0
- Sickling test sodium metabisulphate: YesO NoD
- Haemoglobin electrophoresis: Yes 0 No 0
• Symptoms of first presentation: ......................... .
• Past history of hospital admission (last year): Yes 0
• If "Yes", Number of hospital admission (per year):
1- 20 3-5 0 >5 D (Specify):
• Causes of hospital admission:
- Pallor 0 - Hand food swelling and pain
- Jaundice 0 - Long bones pain
- Fever 0 - Abdominal pain
- Chest pain 0 - Back pain
- Limb weakness 0 - Visual impairment
- Leg ulcer 0 - Limbing
- Priapsim 0
0
No 0
o
o
o o
o
o o
Appendices
Others: .......................................................... .
• Past history of blood transfusion: Yes 0 No 0
• If "Yes" number of blood transfusion: c=J
• Duration from last blood transfusion (in months):
<3 months 0 3- 6 0 7 -120 > 12 0
• Drug history:
Phenoxy penicillin: Yes 0 No 0 258

- Folic acid:
- NAID:
YesD
YesD
- If "Yes" How many per month:
- Others (specify):
e Vaccinations:
NoD
NoD
eNo D - Started D - Completed D
Family and Social history:
Father
Age
Tribe
Occupation
Residence
Education
Income/month
History of disease
Siblings:
No. Age Sex State of health No. Age
1 7
2 8
3 9
4 10
5 11
6 12
Is the family living in its own house: Yes D No D
259
Appendices
Mother
Sex State
of
health

Appendices
Residential area class:
First D - Second D - Third D -SlumpsD
Schooling:
- School attendance: GoodD Moderate D Poor D
D - School Performance: GoodD Moderate Poor D
Is poor performance due to Sickle cell disease: Yes D NoD
Clinical examination:
Wt.- ................ kg Ht.- ................ cm
General condition: Good D Satisfactory D PoorD
C.V.S:- Pulse ...................... .jmin BP ...................... .jmmHg
Heart:
...................................................................................................................
Chest:
..................................................................................................................
Abdomen: - Liver:
.......................................................................................................
Spleen: ...................................................................................................... .
Others: ...................................................................................................... .
CNS: - Limb weakness: Yes D NoD
If "Yes" specify: ....................................................... ..
Sensory loss: YesD NoD
If "Yes" specify: .......................................................... ..
260

Appendices
Hand & foot syndrome: YesD NoD
Sickle cell disease complications:
Priapism: Yes D No D
Osteomylitis: Yes D No D
Leg ulcer: YesD No D
Enuresis: YesD No D
Other signs: ................................. .
Investigations:
I-Haematological analysis:
Total Hb ............... mg/ dl PCV ................. % MCV ................ .fm
MCH ............................ . TWBC ............... ..
Platelets ........................... ..
% of sickle cells ...................... .
diff.: Nitrophils ............................. . Lymphocytes ............................ ..
D. dimmer concentration ................................. Prothrombin fragment.. ............ ..
Bilirubin ........................................ ..
Urine:- pH ...................... R.B.Cs ..................... Pus cells ............... ..
Casts .............. ..
Urine specific
gravity ...................................................................................... ..
Radiology:-
Chest: ....................... ..
Others: ............................................................................. .
261

Appendices
Abdominal ultrasound:-
262

-&I t:1
I i
' i ~ i ~
tJ .. ...
I ~ ! ~
] ] J !!I
~ ; i ~


Appendices
265


