Embed Size (px)
Citation preview
भारत GOVERNME
े ीके द्रीय जCENTRAL WATE
भारतभारत मम जलाशयोजलाशयो मम गादगाद अअCOMPENDIUM ON SILTING COMPENDIUM ON SILTING
जलिवभाजन एवं जलाशय
WATERSHED & RESERVOIR SEDर् ं
201 पयार्वरण प्रबंध ENVIRONMENT MANAGE
जल आयोजन एवं पWATER PLANNING AN
2020
सरकार ENT OF INDIA
ो
FOR OFFICIAL USE
जल आयोगER COMMISSION
अवसादनअवसादन कीकी संग्रहसंग्रह पुि तकापुि तका OF RESERVOIRS IN INDIA OF RESERVOIRS IN INDIA
य अवसादन िनदेशालयDIMENTATION DIRECTORATE
ं5धन संगठन EMANT ORGANISATION पिरयोजना कंधND PROJECTS WING
015015
i
COMPENDIUM ON SILTING OF RESERVOIRS IN INDIA
NEW DELHI APRIL 2015
,

iv
OFFICERS AND STAFF ASSOCIATED WITH THE PREPARATION OF COMPENDIUM
Shri. R.K. Pachauri, Chief Engineer Environmental Management Organisation, CWC
Shri R.K.Gupta,Chief Engineer Environmental Management Organisation, CWC
Shri. W.M. Tembhurney, Chief Engineer Environmental Management Organisation, CWC
Shri. Jitendra Panwar, Director Watershed & Reservoir Sedimentation Directorate, CWC
Shri. Yogesh Paithankar, Director Director, Remote Sensing Directorate, CWC
Shri Alok Paul Kalsi, Deputy Director Remote Sensing Directorate, CWC
Shri. Prashant Kumar Gupta, Deputy Director Deputy Director, Remote Sensing Directorate, CWC
Shri. Arkaprabha Majumder, Assistant Director Watershed & Reservoir Sedimentation Directorate, CWC
Shri Vinod Kumar Gupta, Assistant Director - II Watershed & Reservoir Sedimentation Directorate, CWC
Shri. Ashish Awasthi, Assistant Director Remote Sensing Directorate, CWC
v
Disclaimer
The data contained in this publication is as received from the State Governments / Authorities concerned. No warranty as to the accuracy, usefulness, or completeness is expressed or implied. The sole purpose of the compendium is to provide basic information about siltation data of dam to any interested party. It is in no way intended for the purpose other than mentioned above. The information given in compendium is not binding on any party and does not confer rights or restrictions to any party. CWC would be ever willing to rectify erroneous information if any, brought to its notice.
CONTENTS
PAGE No.
1.0 INTRODUCTION 1
2.0 NATIONAL SYSTEM OF SURVEILLANCE ON SILTING OF LARGE RESERVOIRS 2
3.0 SEDIMENTATION PLANNING 3
3.1 LIFE OF RESERVOIR 3 3.2 DISTRIBUTION OF SEDIMENT 3 3.3 SEDIMENTATION PLANNING PRACTICES 4
4.0 TECHNIQUES OF MEASUREMENT OF SEDIMENTATION 6
4.1 STREAM FLOW ANALYSIS 6 4.2 CAPACITY SURVEY 6 4.2.1 CONVENTIONAL METHOD 6 4.2.2 MODERN TECHNIQUES 7
4.2.2.1 HITECH SYSTEM 7 4.2.2.2 REMOTE SENSING 7
5.0 STATUS OF SEDIMENTATION SURVEYS OF RESERVOIRS 9
6.0 FINDINGS FROM THE CAPACITY SURVEYS 10
6.1 OBSERVED RATE OF SEDIMENTATION 10 6.3 ESTIMATION OF LOSS OF STORAGE IN RESERVOIRS 10
6.3 TREND IN SEDIMENTATION OF RESERVOIRS 11 6.4 TRAP EFFICIENCY OF RESERVOIRS 13
6.5 REGION-WISE SEDIMENTATION RATES 14 6.6 DISTRIBUTION OF SEDIMENTS IN RESERVOIRS 16 6.7 DENSITY OF DEPOSITED SEDIMENTS IN RESERVOIRS 19 6.8 ANALYSIS OF DEPOSITED SEDIMENTS 20
7.0 CONCLUSIONS 20
APPENDIX – I (Details of sedimentation data of 243 reservoirs in India) 22
APPENDIX – II (Rate of silting in various reservoirs in India- an abstract of 146
Appendix – I) vi
APPENDIX – III (List of large reservoirs which have served more than 50 years of 156
their useful life)
APPENDIX – IV (List of large reservoirs which have lost more than 25% of their 158
gross storage)
APPENDIX – V Vertical distribution of sediment deposit 161
APPENDIX – VI Grain size distribution of deposited sediment 163
APPENDIX – VII Region- wise list of reservoirs 173
APPENDIX – VIII- Sediment Volume Distribution Curves 179
ABBREVIATIONS 193
REFERENCES 194
vii
Page No
ANDHRA PRADESH1 Cumbum Tank 22
2 Srisailam 22
BIHAR3 Badua 23
CHHATTISGARH4 Dudhwa 23
5 Minimata 24
6 Ravishankar sagar 24
GOA7 Slaulim 25
GUJARAT8 Ajwa 25
9 Bhadar(P) 26
10 Bhadar(S) 26
11 Bhimdad 27
12 Bramani 27
13 Chopadvav 28
14 Damanganga 28
15 Dantiwada 29
16 Demi‐I 29
17 Deo 30
18 Dharoi 30
19 Dhatarwadi 31
20 Fulzar‐I 31
21 Ghee 32
22 Ghelo‐I 32
23 Godhatad 33
24 Goma 33
25 Gondali 34
26 Hadaf 34
27 Hathmati 35
28 Hiran‐I 35
29 Hiran‐II 36
30 Kadana 36
31 Kaila 37
32 Kankavati 37
33 Karjan 38
34 Khodiyar 38
35 Limbdi‐Bhogavo 39
36 Machhannala 39
37 Machhu‐I 40
38 Machhu‐II 40
LIST OF RESERVOIRS
viii
39 Madhuvanti 41
40 Mazam 41
41 Meshwo 42
42 Moj 42
43 Mukteshwar 43
44 Nara 43
45 Panam 44
46 PataDungri 44
47 Puna 45
48 Rajki 45
49 Rami 46
50 Ranghola 46
51 Rudramata 47
52 Sanandro 47
53 Sani 48
54 Sarthi 48
55 Sasoi 49
56 Shetrunji 49
57 Sipu 50
58 Sukhi 50
59 Suvi 51
60 Und‐I 51
61 Ukai 52
62 Vartu 52
63 Venu‐II 53
64 Ver‐II 53
65 WadhawanBhogavo 54
66 WadhawanBhogavo‐II 54
67 Watrak 55
HIMACHAL PRADESH68 Baira 55
69 Bhakra 56
70 Chamera‐I 58
71 Chamera‐II 58
72 Pong 59
JHARKHAND73 Getalsud 60
74 Konar 60
75 Maithon 61
76 Mayurakshi 61
77 Panchet 62
78 Tenughat 62
79 Tilaiya 63
Karnataka80 Almatti 63
81 Bhasavasagara 64
82 Bhadra 64
ix
83 Ghataprabha 65
84 Harangi 65
85 Hemvathy 66
86 Kabini 66
87 Krishnaraja Sagar 67
88 Linganamakki 67
89 Malaprabha 68
90 Tungabhadra 68
KERALA91 Anayirankal 69
92 Chulliar 69
93 Idamalayar 70
94 Idukki 70
95 Kakki 71
96 Kallarkutty 71
97 Kundala 72
98 Kuttiyadi 72
99 Madupetty 73
100 Malampuzha 73
101 Mangalam 74
102 Meenkara 74
103 Neyyar 75
104 Peechi 75
105 Ponmudi 76
106 Poomala 76
107 Porinngalkuthu 77
108 Pothundi 77
MADHYA PRADESH109 Gandhi Sagar 78
MAHARASHTRA110 Asolamendha 78
111 Bendsura 79
112 Bhatghar 79
113 Bhima 80
114 Chankapur 80
115 Dimbhe 81
116 Ekurk 81
117 Gangapur 82
118 Girna 82
119 Ghod 83
120 Jayakwadi 83
121 Karanjvan 84
122 Khadakwasla 84
123 Khaspur 85
124 Khelna 85
125 Koyna 86
126 Kolgaon 86
x
127 Majalgaon 87
128 Manar 87
129 Mangi 88
130 Manikdoh 88
131 Mhaswad 89
132 Mukti 89
133 Mula 90
134 Nalganga 90
135 Nazare 91
136 Panshet 91
137 Powai 92
138 Radhnagri 92
139 Ramsagar 93
140 Tulshi 93
141 Upperwardha 94
142 Varasgaon 94
143 Vir 95
144 Visapur 95
145 Waghad 96
146 Warna 96
147 Yeldari 97
MEGHALAYA148 Umium 97
ODISHA149 Balimela 98
150 Hirakud 98
151 Rengali 99
152 Upper Kolab 99
RAJASTHAN153 Ranapratap Sagar 100
TAMIL NADU154 Adavinainar 100
155 Aliyar 101
156 Amaravathy 101
157 Anaikuttam 102
158 Anaimaduvu 102
159 Barur Tank 103
160 Bhavani Sagar 103
161 Berijam 104
162 Chittar‐I 104
163 Chittar‐II 105
164 Emerald Avalanche 105
165 Gadana 106
166 Glenmorgan(New Forebay) 106
167 Glenmorgan (Kariappa) 107
168 Gomukhinathi 107
xi
169 Gunderipallam 108
170 Kadamba Tank 108
171 Kamraj Sakar 109
172 Kaveripakkam 109
173 Kodaganar 110
174 Krishnagiri 110
175 Kudhiraiyar 111
176 Kundah 111
177 Madhuranthagam 112
178 Manimuktha Nadhi 112
179 Manimuthar 113
180 Manjalar 113
181 Maravakandy 114
182 Marudhanathi 114
183 Mettur 115
184 Mukurthy 115
185 Nagavathy 116
186 Palar Poranthalar 116
187 Pambar 117
188 Parambikulam 117
189 Parappalar 118
190 Parson Valley 118
191 Pechiparai 119
192 Pegumbahalla 119
193 Perumal Tank 120
194 Perumpallam 120
195 Perunchani 121
196 Pilavukkal Periyar 121
197 Pillur 122
198 Ponnaniyar 122
199 Porthimund 123
200 Pykara 123
201 Sathanur 124
202 Sathiyarar 124
203 Thirumurthy 125
204 Thunakadavu 125
205 Thoppiyar 126
206 Uppar Dam 126
207 Upper Bhawani 127
208 Vaigai 127
209 Vaniyar 128
210 Varadamanathi 128
211 Varattupallam 129
212 Veeranam 129
213 Vembakottai 130
214 Vidur 130
215 Wallajah 131
216 Willingdon 131
xii
TELENGANA217 Dindi 132
218 Himayatsagar 132
219 Kaddam 133
220 Lakhamvaram Lake 133
221 Manjira 134
222 Nagarjuna sagar 134
223 Nizamsagar 135
224 Palair 135
225 Pocharam 136
226 Priyadarshini Jurala 136
227 Ramappa lake 137
228 Shanigram tank 137
229 Sriramsagar 138
230 Wyra 138
UTTAR PRADESH231 Dhukwan 139
232 Matatila 139
233 Pili 140
234 Rihand 140
UTTARAKHAND235 Baigul 141
236 Dhora 141
237 Ichari 142
238 Nanak Sagar 142
239 Sarda Sagar 143
240 Ramganga (Kalagarh) 143
241 Tehri Dam 144
WEST BENGAL242 Durgapur 144
243 Kangsabati 145
xiii
WS&RSDirectorate,EMO,CentralWaterCommission 1
COMPENDIUM OF SILTING OF RESERVOIRS IN INDIA
1. INTRODUCTION
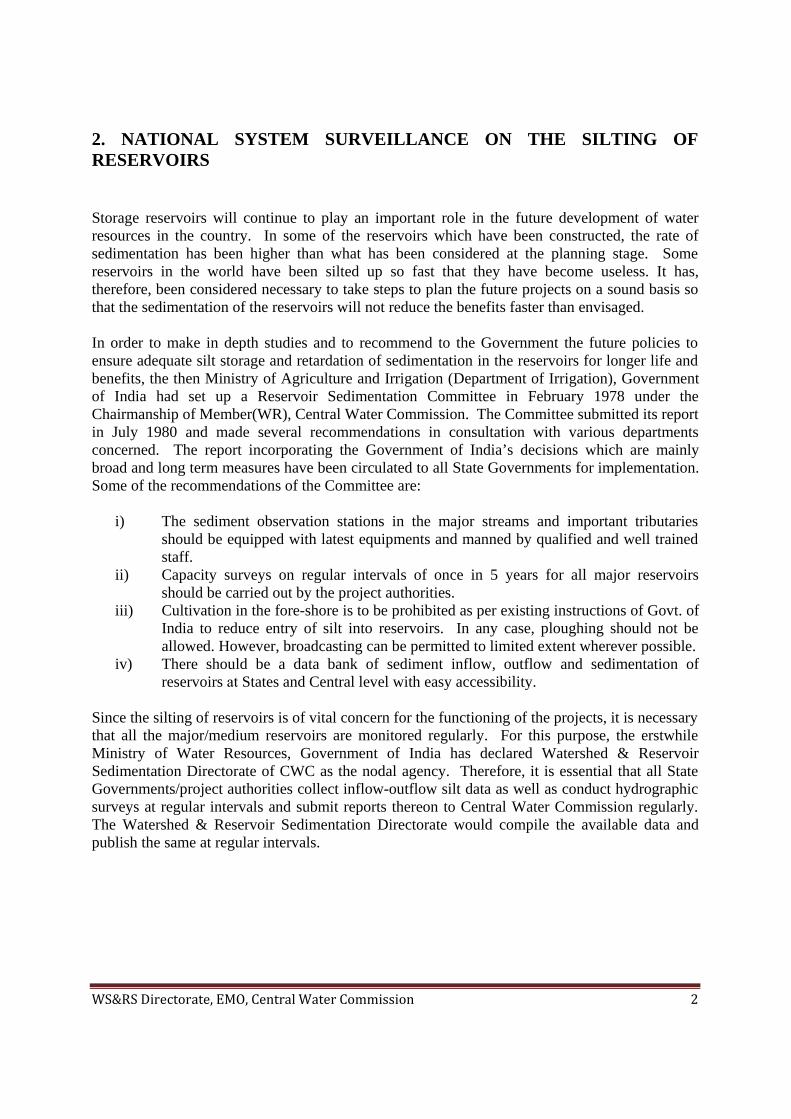
All our developmental plans have given high priority to water resources projects involving construction of dams and creation of reservoirs for flood control, irrigation, hydropower etc. During the past, many major and medium river valley projects comprising large reservoirs have been constructed.
As the above storages are subject to silting, sedimentation of reservoirs is a matter of vital concern to all water resources development projects. Silting not only occurs in the dead storage but also encroaches into the live storage capacity which impairs the intended benefits for the reservoirs. Water storage capacity of reservoirs is reduced by the accumulating sediments. The long term efficiency of reservoirs also gets reduced considerably. Therefore, the problem of sedimentation needs careful consideration.
Soil erosion, its transportation and subsequent deposition in reservoirs is a universal phenomenon. Uncontrolled deforestation, forest-fires, over grazing, improper methods of tillage, unwise agriculture practices and other activities are mainly responsible for accelerated soil erosion. All eroded material does not get into a stream. Some particles travel for a short distance and get deposited before reaching a stream for want of sufficient velocity of water. Some may travel into the river system and get lodged in the vegetation on the banks. Some others may be carried downstream only to be deposited in the plains and finally only a portion of eroded particles enters the reservoir. Thus at a given control point on a river all the sediment produced by the upstream watershed does not get delivered. In a cascade system of reservoirs, upstream reservoirs intercept a part of the transported material and sediment inflow into the downstream reservoir reduces.
The channel and flow characteristics change considerably with the obstruction to the flow of water in a natural stream, when a dam is constructed. The depth of flow increases along a reservoir limb and the velocity decreases progressively. This results in reduction of transporting capacity of flow. The sediment brought by the stream into the reservoir starts settling down and gets deposited on the bed of the reservoir at all levels. The coarser particles settle first. The finer particles are carried in suspension and may finally settle down on the reservoir floor while some of these are passed over the spillway or through the outlets to the downstream of a dam. If the concentration is high, density current occur along the floor of the reservoir. At higher reservoir levels finer particle initially get deposited in the live storage space but successively move into the dead storage space depending on inflows due to successive floods, the drawdown of the reservoir and operation of outlets. Thus the deposit of sediment can affect the storage volume available at all levels. Loss of storage space is estimated at the planning stage and provisions are so made that the benefits of the reservoir are not adversely affected.
WS&RSDirectorate,EMO,CentralWaterCommission 2
2. NATIONAL SYSTEM SURVEILLANCE ON THE SILTING OF RESERVOIRS
Storage reservoirs will continue to play an important role in the future development of water resources in the country. In some of the reservoirs which have been constructed, the rate of sedimentation has been higher than what has been considered at the planning stage. Some reservoirs in the world have been silted up so fast that they have become useless. It has, therefore, been considered necessary to take steps to plan the future projects on a sound basis so that the sedimentation of the reservoirs will not reduce the benefits faster than envisaged.
In order to make in depth studies and to recommend to the Government the future policies to ensure adequate silt storage and retardation of sedimentation in the reservoirs for longer life and benefits, the then Ministry of Agriculture and Irrigation (Department of Irrigation), Government of India had set up a Reservoir Sedimentation Committee in February 1978 under the Chairmanship of Member(WR), Central Water Commission. The Committee submitted its report in July 1980 and made several recommendations in consultation with various departments concerned. The report incorporating the Government of India’s decisions which are mainly broad and long term measures have been circulated to all State Governments for implementation. Some of the recommendations of the Committee are:
i) The sediment observation stations in the major streams and important tributaries should be equipped with latest equipments and manned by qualified and well trained staff.
ii) Capacity surveys on regular intervals of once in 5 years for all major reservoirs should be carried out by the project authorities.
iii) Cultivation in the fore-shore is to be prohibited as per existing instructions of Govt. of India to reduce entry of silt into reservoirs. In any case, ploughing should not be allowed. However, broadcasting can be permitted to limited extent wherever possible.
iv) There should be a data bank of sediment inflow, outflow and sedimentation of reservoirs at States and Central level with easy accessibility.
Since the silting of reservoirs is of vital concern for the functioning of the projects, it is necessary that all the major/medium reservoirs are monitored regularly. For this purpose, the erstwhile Ministry of Water Resources, Government of India has declared Watershed & Reservoir Sedimentation Directorate of CWC as the nodal agency. Therefore, it is essential that all State Governments/project authorities collect inflow-outflow silt data as well as conduct hydrographic surveys at regular intervals and submit reports thereon to Central Water Commission regularly. The Watershed & Reservoir Sedimentation Directorate would compile the available data and publish the same at regular intervals.
WS&RSDirectorate,EMO,CentralWaterCommission 3
3.0 SEDIMENTATION PLANNING
3.1 LIFE OF RESERVOIR
The problem of sedimentation of reservoirs and its effect on the useful life of reservoir is complex. The phenomenon of sedimentation and the concept of life of a reservoir and its estimation have been studied in depth over many years.
Strictly speaking reservoirs do not have a defined ‘life’ which denotes two functional states ‘ON’ and OFF. They belong to one of those systems which show gradual degradation of performance without any sudden non-functional stage. Sedimentation and consequent reduction of capacity is a gradual process, which can be classified in following phases:
Phase-1: The reservoir shows no adverse effect and is able to deliver full planned benefits. Phase-II: The reservoir delivers progressively smaller benefits, but its continued operation
for the reduced benefits is economically beneficial. Phase-III: The sedimentation causes difficulties in operation such as jamming the passage
of flow in channels or flow in canals or through turbines. Phase-IV: The phase-III difficulties become so serious that the operation becomes
impossible. Phase-IV A: The benefits reduce to such an extent that it is not longer beneficial to operate
the reservoir.
In the existing concept, the end of the Phase-I is depicted as the ‘Full service Time’ and the end of Phase-II is called the ‘Feasible Service Time’. The beginning of phase-IV will depict the end of physical life. Similarly beginning of phase-IV (A) will depict the end of economic life. However, there are no instances of Phase-IV or IV (A) having been reached amongst the modern projects. Planning of sedimentation includes prefixing the required period of full service period and feasible service period including the sediment levels and capacities to meet these targets.
3.2 DISTRIBUTION OF SEDIMENT
Initially, the above mentioned life related concepts were vague, as the life of reservoir had been estimated differently from project to project with different assumptions. This is due to the fact that clear knowledge and data regarding the inflow of sediment into the reservoir, its distribution and the consolidation and density aspects of sediment etc. were not available in earlier periods. For instance, it was frequently assumed that all the sediment would first be deposited in the dead storage zone and would then only encroach on the live storage zone. Under this assumption the period taken for the hypothetical total sedimentation of the dead storage was considered as the life. Such an assumption has been made in most of the projects planned up to the mid sixties.
WS&RSDirectorate,EMO,CentralWaterCommission 4
Thus, it can be taken as the normal practice of the earlier period. This assumption was proved wrong by sediment surveys of several reservoirs in the country, conducted since late fifties.
In earlier periods, the life of certain reservoirs like Krishnarajsagar and Hirakud has been worked out by the deltaic theory enunciated by Col. Ellis of Madras PWD which assumed silting up of reservoirs in three stages i.e., i) Forming the silt up to sill of sluices ii) Intermediate stage is the formation of channel by river flow iii) Slow deposit of silt thereafter. For computing the quantity of silt deposited, it had been assumed that the silt deposit in area is proportional to the water standing or flowing over the area.
In case of Bhakra Reservoir, silt load was estimated by suspended silt measurement and its distribution was done assuming that all the coarse silt would be deposited in head reach of reservoir, forming delta below the full reservoir level encroaching on the live storage and that the delta would gradually progress towards the dam.
3.3 SEDIMENTATION PLANNING PRACTICES
Dr. A.N. Khosla, the then chairman, Central Water Commission, had reviewed the work of reservoir sedimentation in fifties based on data available for 200 reservoirs all over the world including U.S.A., China and Africa and developed enveloping curves for annual sedimentation rate for major and minor catchments above and below 1000 sq. miles (2600 sq. kms) respectively. He concluded that the sediment rate for major catchments varies from 0.357 to 0.476 mm./year (3.57 to 4.76 Ha.m./100sq.km./yr.) and for minor catchments from 0.38 to 1.28 mm./year (3.80 to 12.80Ha.m./100sq.km./yr.). Up to 1965, these recommendations were adopted in the design of reservoirs and the sediment was assumed to get deposited at the lowest level and “life” was taken as the period required for complete sedimentation of the dead storage.
The assumption that sediment would settle within the dead storage was not supported by the experience in India or other countries. The experience of USA that sedimentation takes place throughout the reservoir and the development of methods for sediment distribution were published around early fifties. It was also realized that the sediment inflow rates need to be checked up through reservoir resurveys. Hence re-surveys in a number of projects were taken up through research schemes of CBIP. The results, indicating a considerable difference from the initial assumption, started becoming available by 1965.
After 1965, CWC started insisting that the sediment inflow rates be based on the basis of reservoir survey data. It also brought out the need for distributing the sediment throughout the reservoir. Although the earlier practices also continued, at least the more important major projects had to adopt this new approach. However, no guidance was given until then about which stage of sedimentation should be used for the working table studies.
Around 1974, CWC decided that the 50 year sedimentation position of the reservoir should be used in the simulation or working table studies for the project. Also by this time, the observed suspended sediment data from the key hydrologic network of CWC had become available in
WS&RSDirectorate,EMO,CentralWaterCommission 5
considerable volume. CWC therefore, started insisting on the use of this measured sediment transport data also to firm up the assumption of the inflow rates of sediment, in addition to the reservoir resurvey information.
In 1980, the report of the working group on the guidelines for the preparation of detailed project report of major and medium irrigation projects was published. In this report, CWC had incorporated the above mentioned practices to make this mandatory on the state government. Also in this report the detailing of the sediment studies was linked with the expected seriousness of the sediment problem. For very serious cases, redistribution and re-estimation of trap efficiency in 10 year block was indicated.
In 1987, CWC got this practice incorporated in the BIS Code 12182 (1987) “Guidelines for determination of Effects of Sedimentation in Planning and Performance of Reservoirs” to make this the national practice. In these guidelines the general philosophy and concept of multiple life related terms was also spelt out. Also these guidelines indicate that the full service time for hydroelectric projects can be reduced to 25 years against 50 years for irrigation projects. These BIS guidelines also include notes on the need for periodic resurveys and given guidance to determine their frequency.
The present practice as incorporated in BIS: 12182(1987) has following main features:
1. The sedimentation rate is to be decided on the basis of observations of river sediment flow and reservoir surveys
2. Methodologies for trap efficiency and sediment distribution have been specified. 3. The live storage is to be so planned that the benefits do not reduce for a period of 50 years
(full service time) for irrigation or 25 years for hydropower on account of sedimentation. 4. The feasible service time for irrigation projects shall not be less than 100 years after start
of operation. For hydropower projects the feasible service time should not be less than 70 years.
5. For simulation, if sedimentation is not serious, the simulation studies for conditions expected at the end of the full service period may be made. If the problem is serious, studies are to be done by more realistic method. It should be sufficient to consider sediment trapped in every 10 years block, and to use the expected sedimental elevation area capacity curve at the end of each 10 year block for simulation of that block.
WS&RSDirectorate,EMO,CentralWaterCommission 6
4.0 TECHNIQUES OF MEASUREMENT OF SEDIMENTATION
There are broadly two methods for measurement of sedimentation in reservoirs.
i) Stream flow analysis and
ii) Capacity survey
4.1 STREAM FLOW ANALYSIS
Stream flow analysis is a continuous observation process consisting of measurement of inflows and outflows with sediment sampling. Apart from the measurements, accuracy of analysis is also vital for the proper estimation of unit-mass of the deposited material from the point of view of volumetric conversion.
In this method, the sediment inflow into the reservoir including estimated bed load and the outflow there from is measured at all significant points of entry and exit. The difference gives the quantity of deposit during the period of analysis. The point of measurement should be sufficiently close to the reservoir periphery and particular care must be taken to complete outflow sampling before it meets the credible channel downstream.
The analysis consists of two main parts (1) measurement of water inflows and outflows and (2) simultaneous measurement of sediment concentration.
This method gives quantity of deposit in gravimetric terms and conversion into volumetric units calls for the estimation of the average unit mass off the deposited sediment material. A direct method of doing this is by collecting systematic samples of the deposit in an undisturbed state from all over the reservoir bed and finding out a correlation between the average dry unit mass and the fractional composition of different grains such as clay, silt and sand.
4.2 CAPACITY SURVEY
4.2.1. CONVENTIONAL METHOD
The conventional method of conducting sedimentation surveys in the reservoirs involves the use of conventional equipments e.g. theodolite, plane table, sextant, range finders, sounding rods, echo-sounder and slow moving boat etc. The depths of the reservoirs are recorded with the help of echo. With the help of data collected from the site by the above surveys the volume of silt deposited in the reservoir is calculated between the two successive surveys. The normal frequency of the surveys is supposed to be around five years interval. However, in practice it is found that the interval between two successive surveys has been varying from, 1 to 15 years or even more in some cases. This could be either due to lack of resources like equipment, man and material etc. with the project authorities or due to some other reason.
WS&RSDirectorate,EMO,CentralWaterCommission 7
The surveys conducted conventional methods are time consuming and sometimes, they take up to three years to complete just one survey of a major reservoir (like Hirakud). Even the accuracy of the survey cannot be ascertained in realistic terms.
4.2.2. MODERN TECHNIQUES
4.2.2.1 HITECH SYSTEM
The system consists of the following components:
i) Positioning System : This includes GPS Unit in differential mode ii) Depth Measuring Units : This consists of Echo-sounder and Transducers iii) Computer System: This includes Plotter, Printer, Disc Drive, Monitor etc.
The survey is carried out in a rapid and efficient manner. A boat equipped with the bathymetric equipment, the GPS system mounted on board and a lap-top computer is used for bathymetric survey while its reference station is positioned in a known geographical benchmark. The survey software enables fixing of grid lines and interfacing of bathymeter and DGPS and taking X,Yand Z values at required interval/grid. Boat navigation is also controlled by the software so that boat tracks the grid line accurately. The surveys can also be carried out at random mode. The data collected is then processed and analysed using specially developed software to obtain the results in various forms e.g. point plots contour and three dimensional maps of reservoirs bed, area capacity elevation tables and cross-sections of reservoir.
DGPS hydrographic surveying allows faster data acquisition with better accuracy than any previous hydrographic survey technique. The line of sight from the base station to the boat is not necessary. The base station is set up only once per day, instead of the usual once per cross section. A DGPS survey can be completed between control points (even on opposite side of a mountain) without having to traverse or even to see the other point. Other advantages are the ability to achieve accuracy and the ability to efficiently collect large amount of data. The data collecting system with GPS is compact and can be accommodated in smaller boats.
Central Water Commission has carried out capacity survey of thirty six (36) important reservoirs in the country through consultants available in the field using this technique.
4.2.2.2. REMOTE SENSING
Remote Sensing is the art and science of collecting information about earth’s feature without being in physical contact with it. Various features on earth’s surface reflect or emit electromagnetic energy depending upon their characteristics. The reflected radiation depends upon physical properties of the terrain and emitted radiation depends upon temperature and emissivity. The radiations are recorded by the sensor on board satellite and are then transmitted back to the earth. Difference between features depends on the fact that response from different features like vegetation, soil, water is different and discernable. Data received at ground stations
WS&RSDirectorate,EMO,CentralWaterCommission 8
is digitally or visually interpreted to generate thematic maps. The data from satellites such as Landsat, SPOT and IRS are more useful for mapping and monitoring the surface water bodies and other land resources based on which better water management strategies can be planned.
Reservoir sedimentation surveys are essentially based on mapping of water-spread area at the time of satellite overpass. Multi-date satellite data is needed which covers the operating level of reservoirs at close interval. Water spread area is the water level contour at that level. Using different contours, capacity between them is calculated. With the sedimentation, the water spread area of the reservoir reduces at different levels. The water spread area and the elevation information is used to calculate the volume of water stored between different levels. These capacity values are then compared with the previously calculated capacity values to find out the change in capacity between different levels.
Remote Sensing based reservoir capacity estimation has certain limitations. The capacity estimation works between MDDL and FRL only as these are the levels between which reservoirs operates. Thus changes can be estimated only in the live capacity of reservoir. For capacity estimation below MDDL corresponding to dead storage conventional hydrographic survey techniques are to be used. Availability of cloud free data throughout reservoir operations also poses limitations in the analysis. This can be overcome by combining data from different water years to get full operative range. This technique gives accurate estimates for fan shaped reservoir where there is a considerable change in water spread area with change in water level.
In the third meeting of National Natural Resources Management Systems- Standing Committee Water Resources held in June, 2000, appreciating the gravity of sedimentation problems and urgent need to tackle them, Government of India constituted a Working Group for National Action Plan for Reservoir Sedimentation Assessment using Satellite Remote Sensing under the Chairmanship of Member (WP&P), Central Water Commission, with its members drawn from various water resources organizations and from Department of Space. The recommendations of the Working Group have emerged as a result of discussions held during its three meetings and deliberations in the brainstorming sessions.
Working Group recommended for laying emphasis and high importance to carrying out reservoir sedimentation surveys in the country. While using remote sensing technique for the sedimentation survey, composite method coupling both the hydrographic technique (below MDDL) and SRS technique needs to be adopted since the latter does not cover the area of reservoir below MDDL. The periodicity of the composite reservoir sedimentation survey can be set as 10 years. It has to be complemented by mid-term survey by Satellite Remote Sensing technique every 5 years. In case of high silting reservoirs, the frequency of mid-term survey can be kept as 3 years.
It is also recommended that the reservoir sedimentation survey of the reservoirs, where no study could be undertaken so far, should be taken up by satellite remote sensing technique on top priority.
WS&RSDirectorate,EMO,CentralWaterCommission 9
5.0 STATUS OF SEDIMENTATION SURVEYS OF RESERVOIRS
The sedimentation surveys of reservoirs in India although dates back to as early as 1870 but the systematic surveys started only in 1958 when the Central Board of Irrigation and Power undertook a coordinated scheme of reservoir sedimentation and entrusted this task to several research stations in the country viz. Karnataka Engineering Research Station, Directorate of Irrigation Research, Bhopal, Maharashtra Engineering Research Institute Nashik, U.P. Irrigation Research Institute Roorkee, Andhra Pradesh Engineering Research Laboratories Hyderabad etc. Under this scheme 28 major reservoirs have been surveyed.
Appreciating the gravity of the problem and need for taking remedial measures the State Governments have also carried out capacity surveys of reservoirs. From the VIII five year plan, Central Water Commission has started carrying out capacity survey of some reservoirs and up to the end of XI Five Year Plan, survey of thirty six (36) reservoirs in the country have been completed.
The details of such surveys in respect of 243 reservoirs of the country have been compiled and analysed by Watershed and Reservoir Sedimentation Directorate of Central Water Commission details of which are given at Appendix I. An abstract showing the average rate of sedimentation, percentage loss of storage and other useful information is given at Appendix II.
The list of reservoirs which have served more than 50 years of their useful life and those which have lost more than 25 percent of their gross storage is given at Appendix-III and Appendix-IV respectively. Vertical distributions of sediment deposit for 21 reservoirs have been given at Appendix V. Grain-size distribution analysis of the deposited sediments for 32 reservoirs have been given at Appendix VI . Region-wise list of reservoirs have been given at Appendix VII. Curves for sediment volume distribution have also been prepared for 28 reservoirs and given at Appendix VIII.
WS&RSDirectorate,EMO,CentralWaterCommission 10
6.0 FINDINGS FROM THE CAPACITY SURVEYS
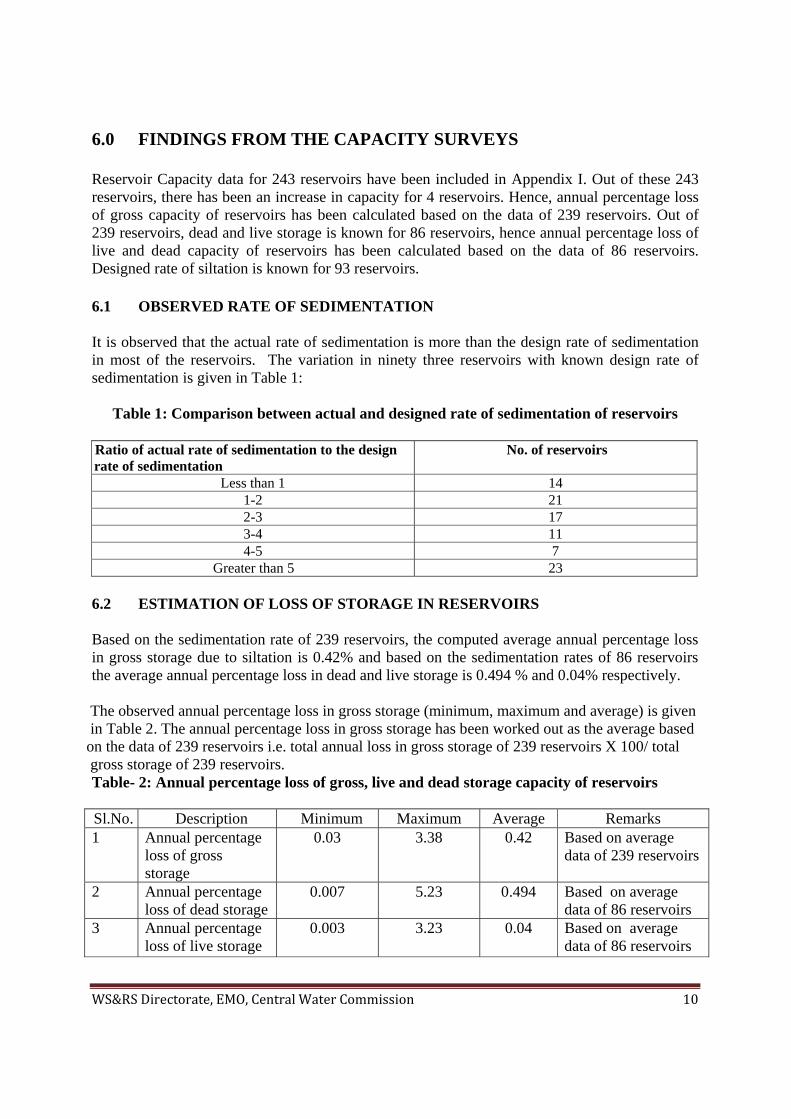
Reservoir Capacity data for 243 reservoirs have been included in Appendix I. Out of these 243 reservoirs, there has been an increase in capacity for 4 reservoirs. Hence, annual percentage loss of gross capacity of reservoirs has been calculated based on the data of 239 reservoirs. Out of 239 reservoirs, dead and live storage is known for 86 reservoirs, hence annual percentage loss of live and dead capacity of reservoirs has been calculated based on the data of 86 reservoirs. Designed rate of siltation is known for 93 reservoirs.
6.1 OBSERVED RATE OF SEDIMENTATION
It is observed that the actual rate of sedimentation is more than the design rate of sedimentation in most of the reservoirs. The variation in ninety three reservoirs with known design rate of sedimentation is given in Table 1:
Table 1: Comparison between actual and designed rate of sedimentation of reservoirs
Ratio of actual rate of sedimentation to the design rate of sedimentation
No. of reservoirs
Less than 1 14 1-2 21 2-3 17 3-4 11 4-5 7
Greater than 5 23
6.2 ESTIMATION OF LOSS OF STORAGE IN RESERVOIRS
Based on the sedimentation rate of 239 reservoirs, the computed average annual percentage loss in gross storage due to siltation is 0.42% and based on the sedimentation rates of 86 reservoirs the average annual percentage loss in dead and live storage is 0.494 % and 0.04% respectively.
The observed annual percentage loss in gross storage (minimum, maximum and average) is given in Table 2. The annual percentage loss in gross storage has been worked out as the average based on the data of 239 reservoirs i.e. total annual loss in gross storage of 239 reservoirs X 100/ total gross storage of 239 reservoirs.
Table- 2: Annual percentage loss of gross, live and dead storage capacity of reservoirs
Sl.No. Description Minimum Maximum Average Remarks 1 Annual percentage
loss of gross storage
0.03 3.38 0.42 Based on average data of 239 reservoirs
2 Annual percentage loss of dead storage
0.007 5.23 0.494 Based on average data of 86 reservoirs
3 Annual percentage loss of live storage
0.003 3.23 0.04 Based on average data of 86 reservoirs
WS&RSDirectorate,EMO,CentralWaterCommission 11
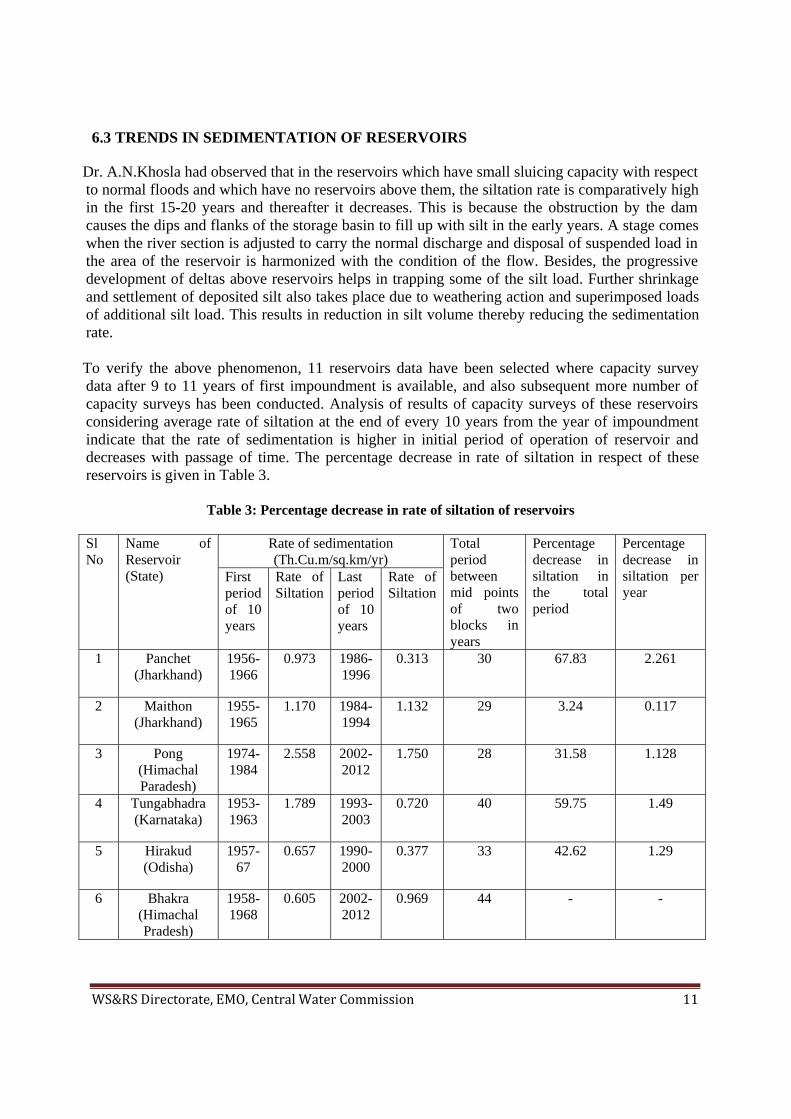
6.3 TRENDS IN SEDIMENTATION OF RESERVOIRS
Dr. A.N.Khosla had observed that in the reservoirs which have small sluicing capacity with respect to normal floods and which have no reservoirs above them, the siltation rate is comparatively high in the first 15-20 years and thereafter it decreases. This is because the obstruction by the dam causes the dips and flanks of the storage basin to fill up with silt in the early years. A stage comes when the river section is adjusted to carry the normal discharge and disposal of suspended load in the area of the reservoir is harmonized with the condition of the flow. Besides, the progressive development of deltas above reservoirs helps in trapping some of the silt load. Further shrinkage and settlement of deposited silt also takes place due to weathering action and superimposed loads of additional silt load. This results in reduction in silt volume thereby reducing the sedimentation rate.
To verify the above phenomenon, 11 reservoirs data have been selected where capacity survey data after 9 to 11 years of first impoundment is available, and also subsequent more number of capacity surveys has been conducted. Analysis of results of capacity surveys of these reservoirs considering average rate of siltation at the end of every 10 years from the year of impoundment indicate that the rate of sedimentation is higher in initial period of operation of reservoir and decreases with passage of time. The percentage decrease in rate of siltation in respect of these reservoirs is given in Table 3.
Table 3: Percentage decrease in rate of siltation of reservoirs
SlNo
Name of Reservoir (State)
Rate of sedimentation (Th.Cu.m/sq.km/yr)
Total period between mid points of two blocks in years
Percentage decrease in siltation in the total period
Percentage decrease in siltation per year
First period of 10 years
Rate of Siltation
Last period of 10 years
Rate of Siltation
1 Panchet (Jharkhand)
1956-1966
0.973 1986-1996
0.313 30 67.83 2.261
2 Maithon (Jharkhand)
1955-1965
1.170 1984-1994
1.132 29 3.24 0.117
3 Pong (Himachal Paradesh)
1974-1984
2.558 2002-2012
1.750 28 31.58 1.128
4 Tungabhadra (Karnataka)
1953-1963
1.789 1993-2003
0.720 40 59.75 1.49
5 Hirakud (Odisha)
1957-67
0.657 1990-2000
0.377 33 42.62 1.29
6 Bhakra (Himachal Pradesh)
1958-1968
0.605 2002-2012
0.969 44 - -
WS&RSDirectorate,EMO,CentralWaterCommission 12
7 Lower Bhavani
(Tamil Nadu)
1953-1963
0.306 1973-1983
0.246 20 19.60 0.980
8 Vaigai (Tamil Nadu)
1958-1968
0.409 2002-2012
0.1989 44 51.36 1.167
9 Matatila (Uttar
Pradesh)
1956-1966
0.849 1989-1999
0.223 33 73.73 2.23
10 Dukwan (Uttar
Pradesh)
1907-1917
0.042 1970-80
0.012 63 71.43 1.138
11 Damanganga (Gujarat)
1983-1993
0.549 1998-2008
0.058 15 89.43 5.96
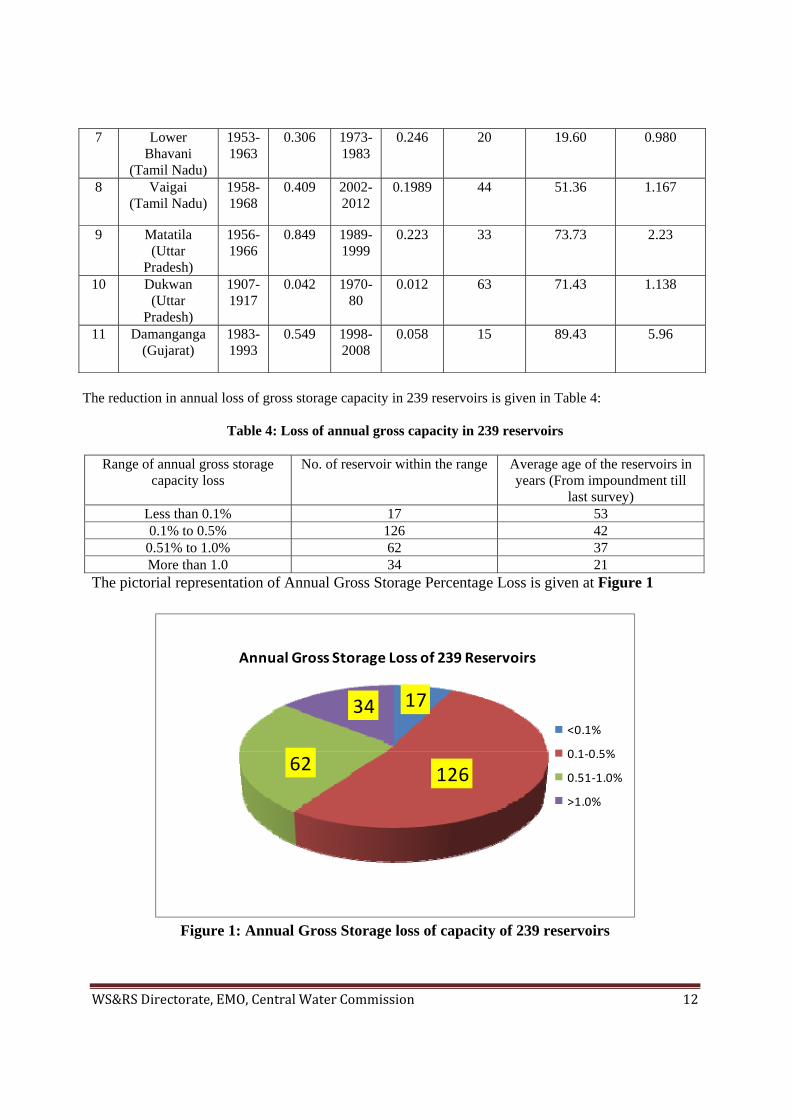
The reduction in annual loss of gross storage capacity in 239 reservoirs is given in Table 4:
Table 4: Loss of annual gross capacity in 239 reservoirs
Range of annual gross storage capacity loss
No. of reservoir within the range Average age of the reservoirs in years (From impoundment till
last survey) Less than 0.1% 17 53 0.1% to 0.5% 126 42
0.51% to 1.0% 62 37 More than 1.0 34 21
The pictorial representation of Annual Gross Storage Percentage Loss is given at Figure 1
17
12662
34<0.1%
0.1‐0.5%
0.51‐1.0%
>1.0%
Annual Gross Storage Loss of 239 Reservoirs
Figure 1: Annual Gross Storage loss of capacity of 239 reservoirs
WS&RSDirectorate,EMO,CentralWaterCommission 13
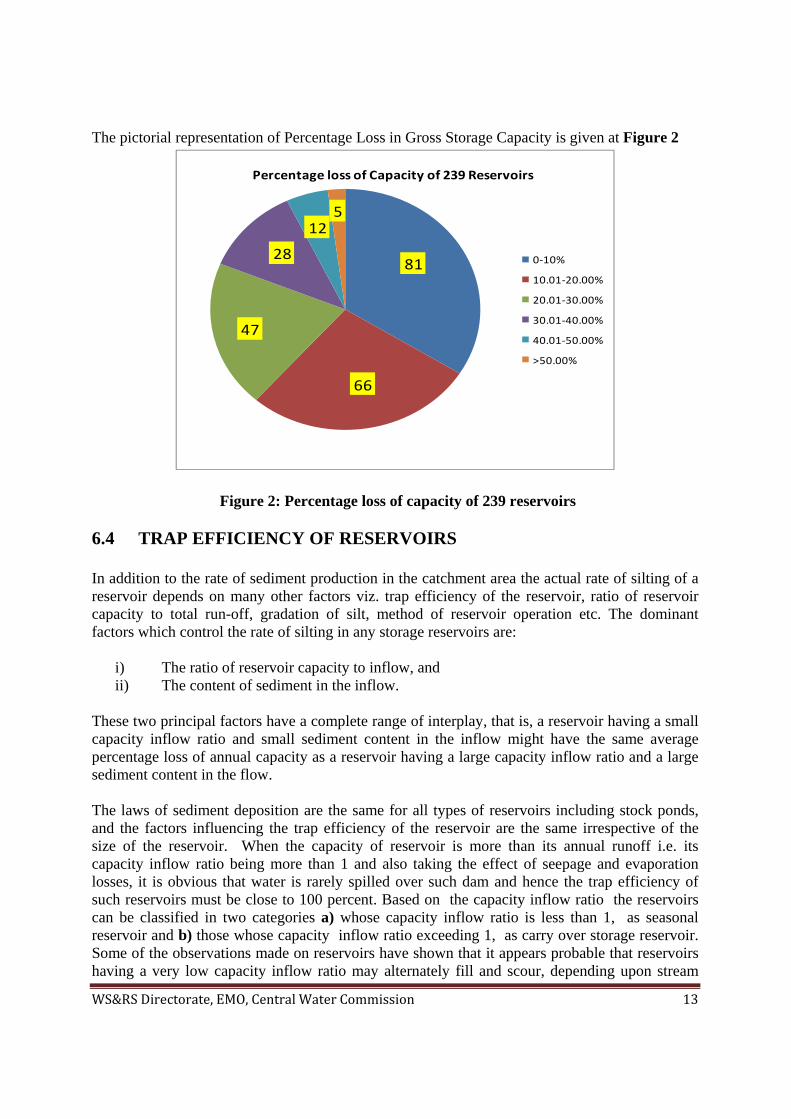
The pictorial representation of Percentage Loss in Gross Storage Capacity is given at Figure 2
81
66
47
28
125
0‐10%
10.01‐20.00%
20.01‐30.00%
30.01‐40.00%
40.01‐50.00%
>50.00%
Percentage loss of Capacity of 239 Reservoirs
Figure 2: Percentage loss of capacity of 239 reservoirs
6.4 TRAP EFFICIENCY OF RESERVOIRS In addition to the rate of sediment production in the catchment area the actual rate of silting of a reservoir depends on many other factors viz. trap efficiency of the reservoir, ratio of reservoir capacity to total run-off, gradation of silt, method of reservoir operation etc. The dominant factors which control the rate of silting in any storage reservoirs are:
i) The ratio of reservoir capacity to inflow, and ii) The content of sediment in the inflow.
These two principal factors have a complete range of interplay, that is, a reservoir having a small capacity inflow ratio and small sediment content in the inflow might have the same average percentage loss of annual capacity as a reservoir having a large capacity inflow ratio and a large sediment content in the flow.
The laws of sediment deposition are the same for all types of reservoirs including stock ponds, and the factors influencing the trap efficiency of the reservoir are the same irrespective of the size of the reservoir. When the capacity of reservoir is more than its annual runoff i.e. its capacity inflow ratio being more than 1 and also taking the effect of seepage and evaporation losses, it is obvious that water is rarely spilled over such dam and hence the trap efficiency of such reservoirs must be close to 100 percent. Based on the capacity inflow ratio the reservoirs can be classified in two categories a) whose capacity inflow ratio is less than 1, as seasonal reservoir and b) those whose capacity inflow ratio exceeding 1, as carry over storage reservoir. Some of the observations made on reservoirs have shown that it appears probable that reservoirs having a very low capacity inflow ratio may alternately fill and scour, depending upon stream
WS&RSDirectorate,EMO,CentralWaterCommission 14
flow conditions and may have a trap efficiency of zero or less during periods of scour. Even in carry over storage reservoirs, if the operation is so adjusted as to allow a major portion of the inflow through the outlets, the trap efficiency may be brought to 60 per cent with the capacity inflow ratio of 1.7 while the trap efficiency would be in the order of 90% under normal operating conditions.
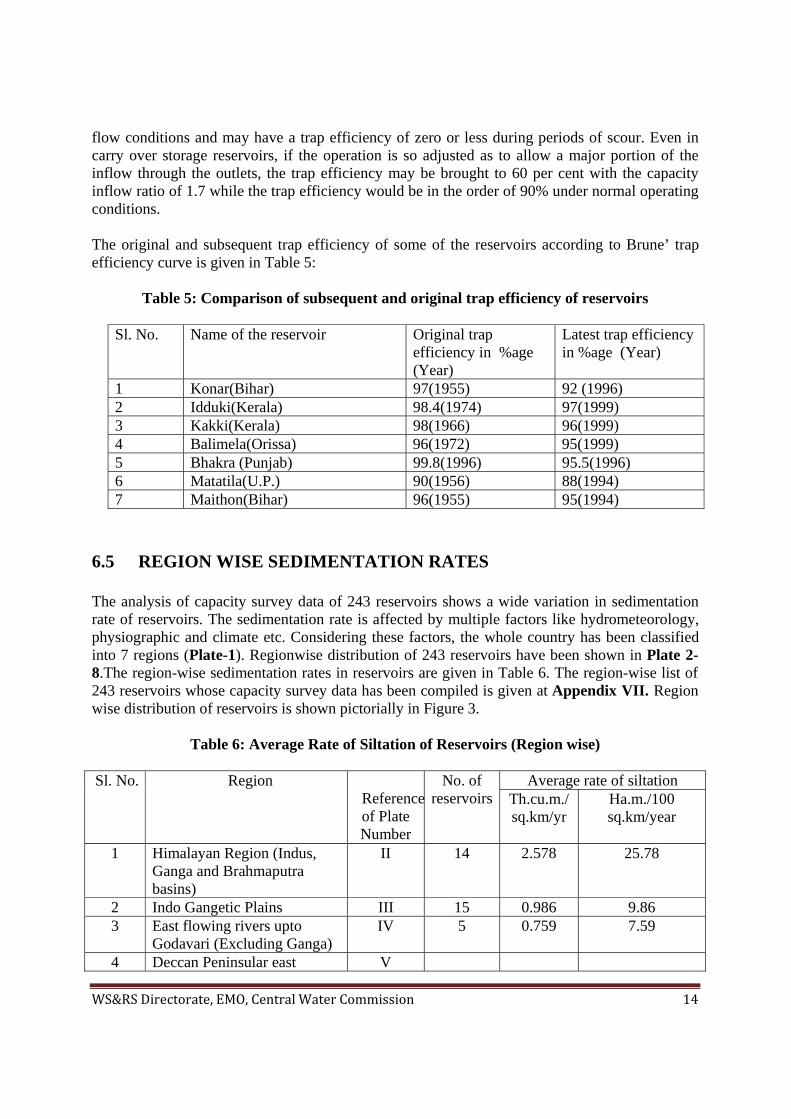
The original and subsequent trap efficiency of some of the reservoirs according to Brune’ trap efficiency curve is given in Table 5:
Table 5: Comparison of subsequent and original trap efficiency of reservoirs
Sl. No. Name of the reservoir Original trap efficiency in %age (Year)
Latest trap efficiency in %age (Year)
1 Konar(Bihar) 97(1955) 92 (1996) 2 Idduki(Kerala) 98.4(1974) 97(1999) 3 Kakki(Kerala) 98(1966) 96(1999) 4 Balimela(Orissa) 96(1972) 95(1999) 5 Bhakra (Punjab) 99.8(1996) 95.5(1996) 6 Matatila(U.P.) 90(1956) 88(1994) 7 Maithon(Bihar) 96(1955) 95(1994)
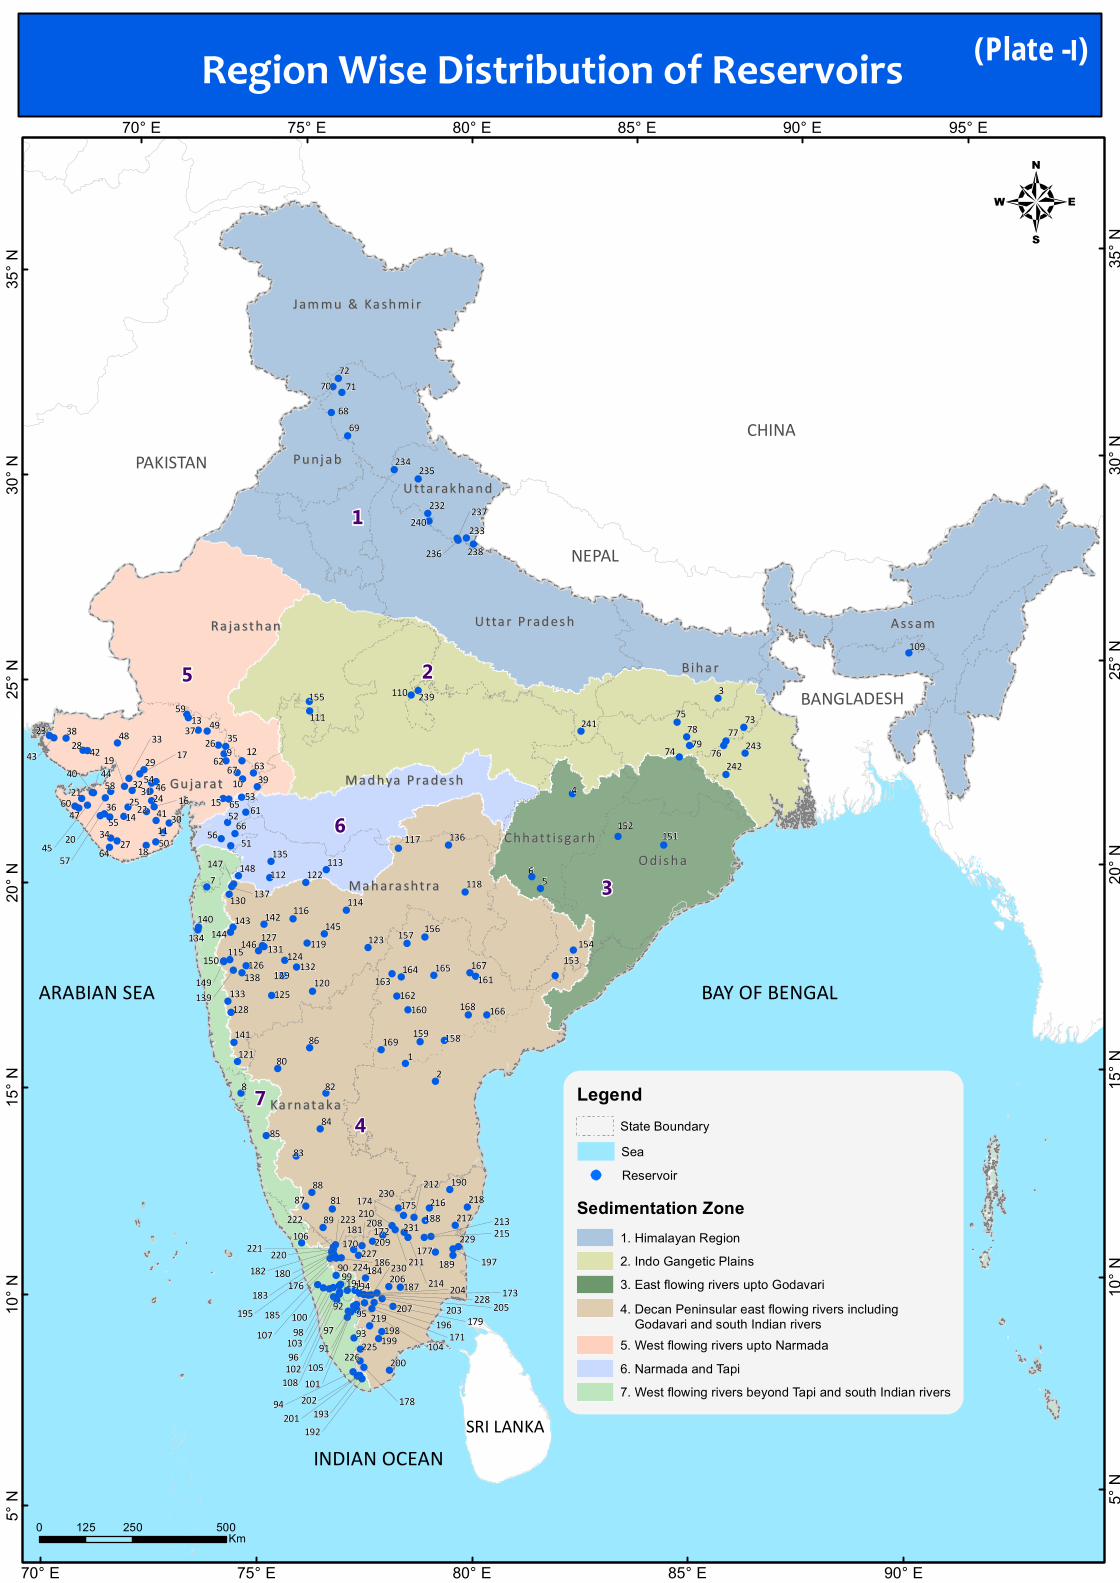
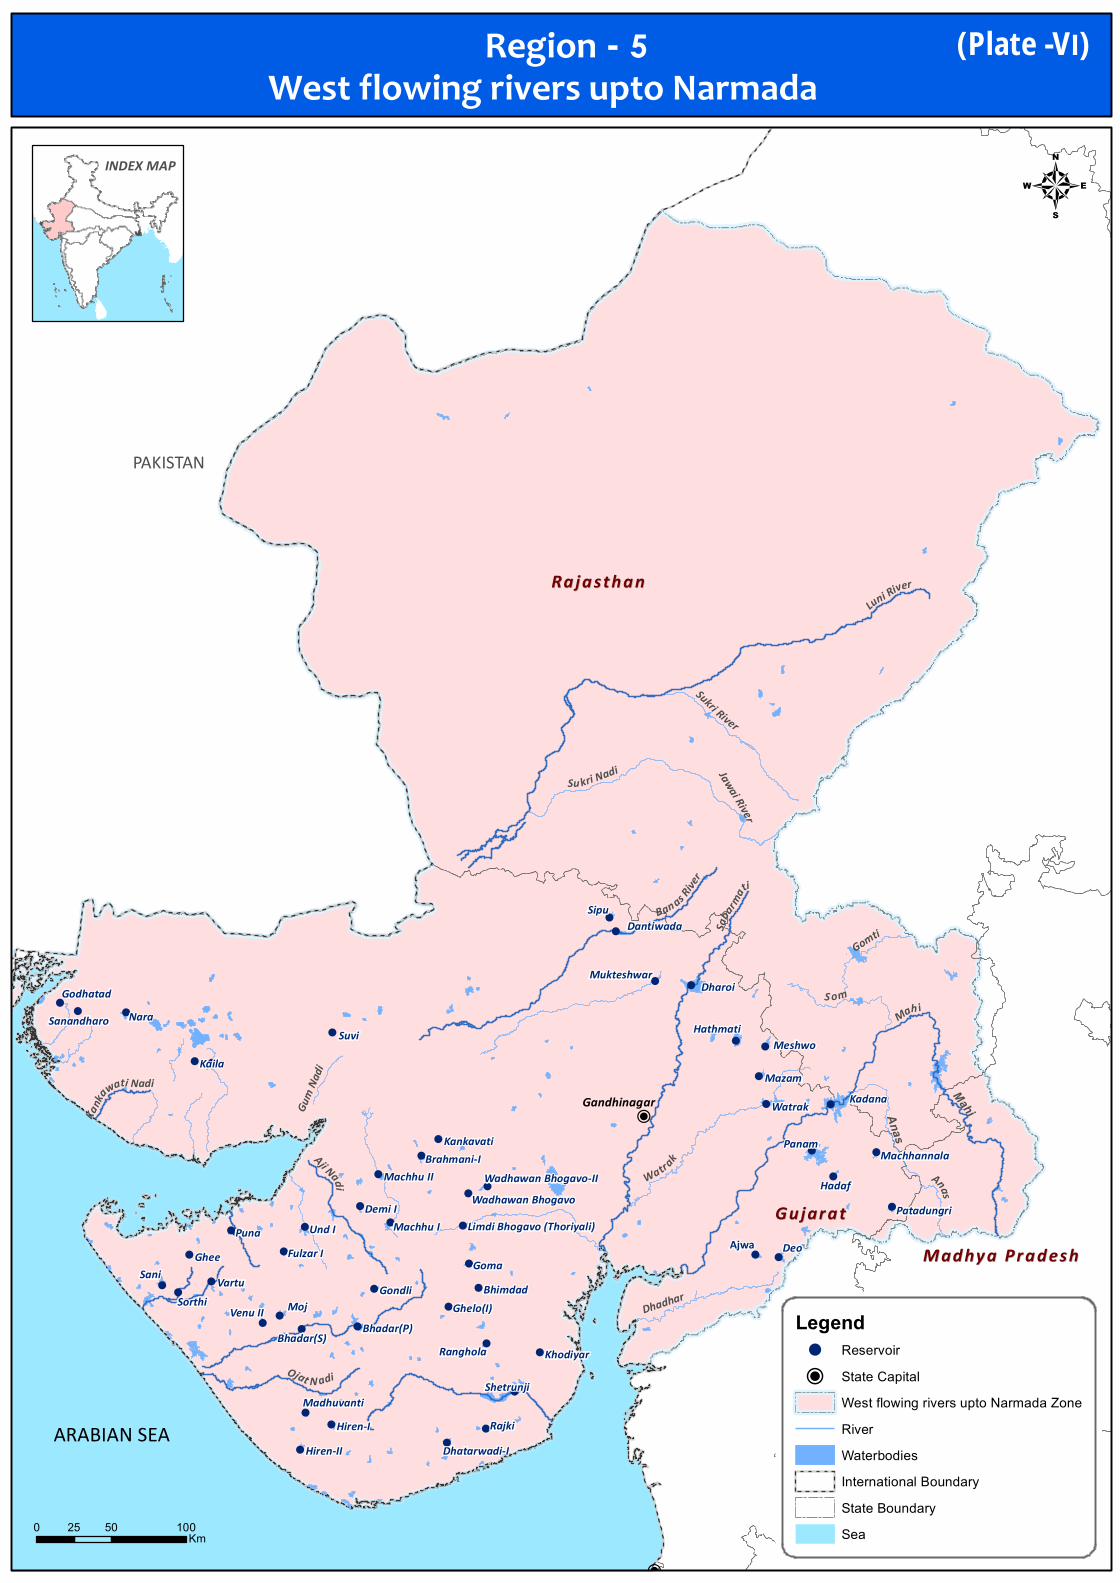
6.5 REGION WISE SEDIMENTATION RATES
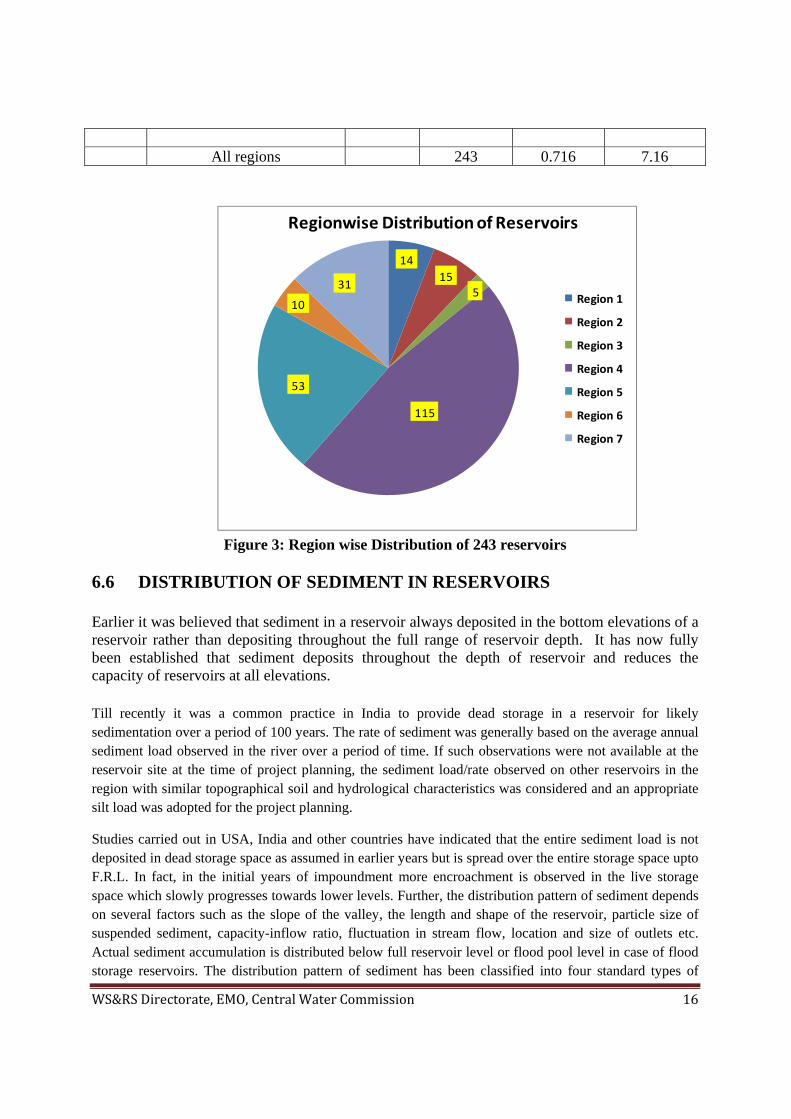
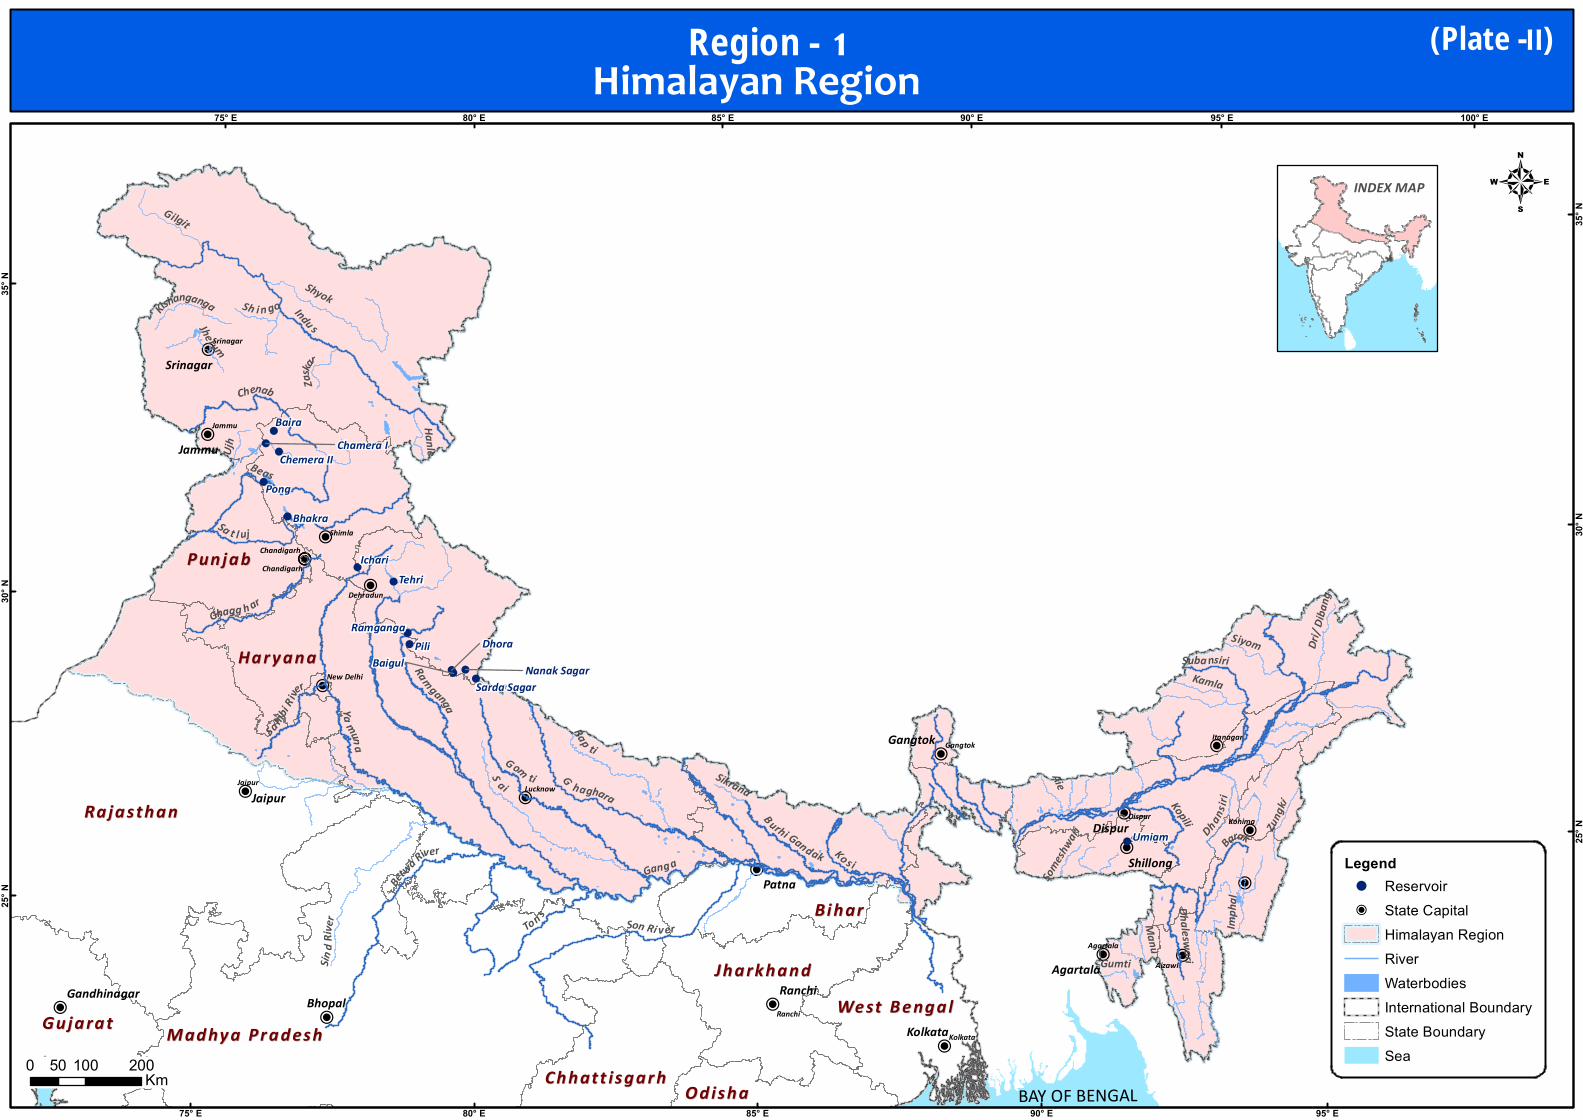
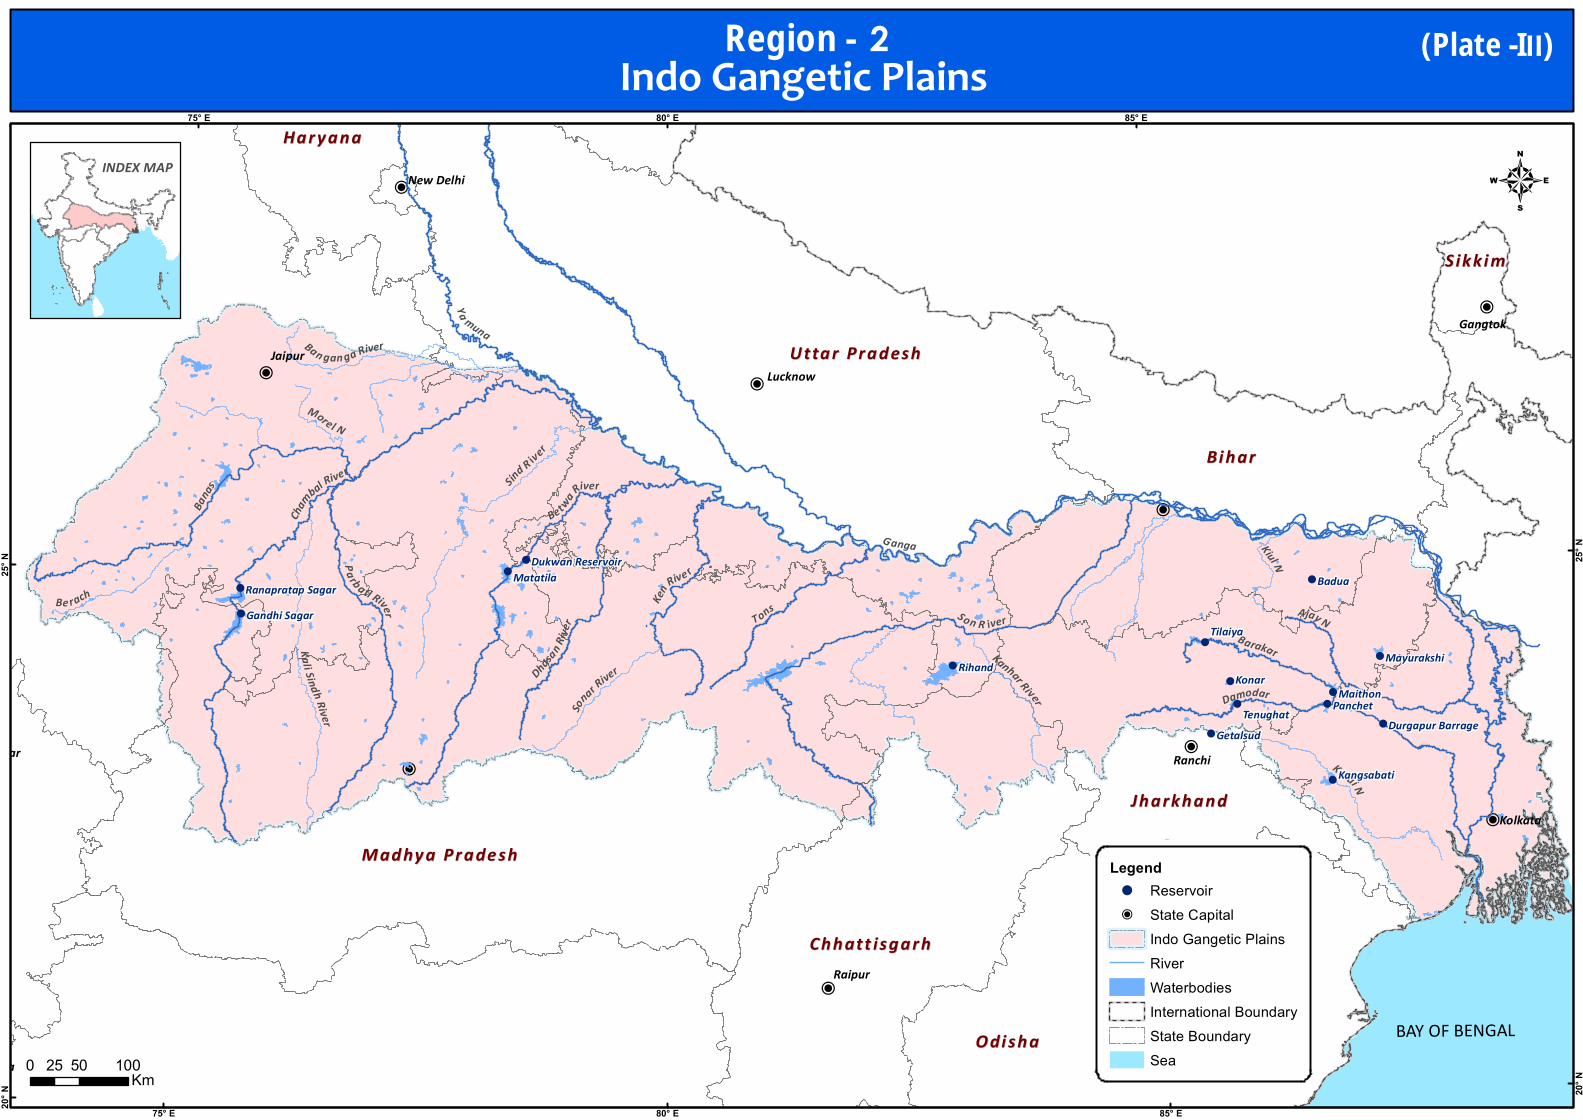
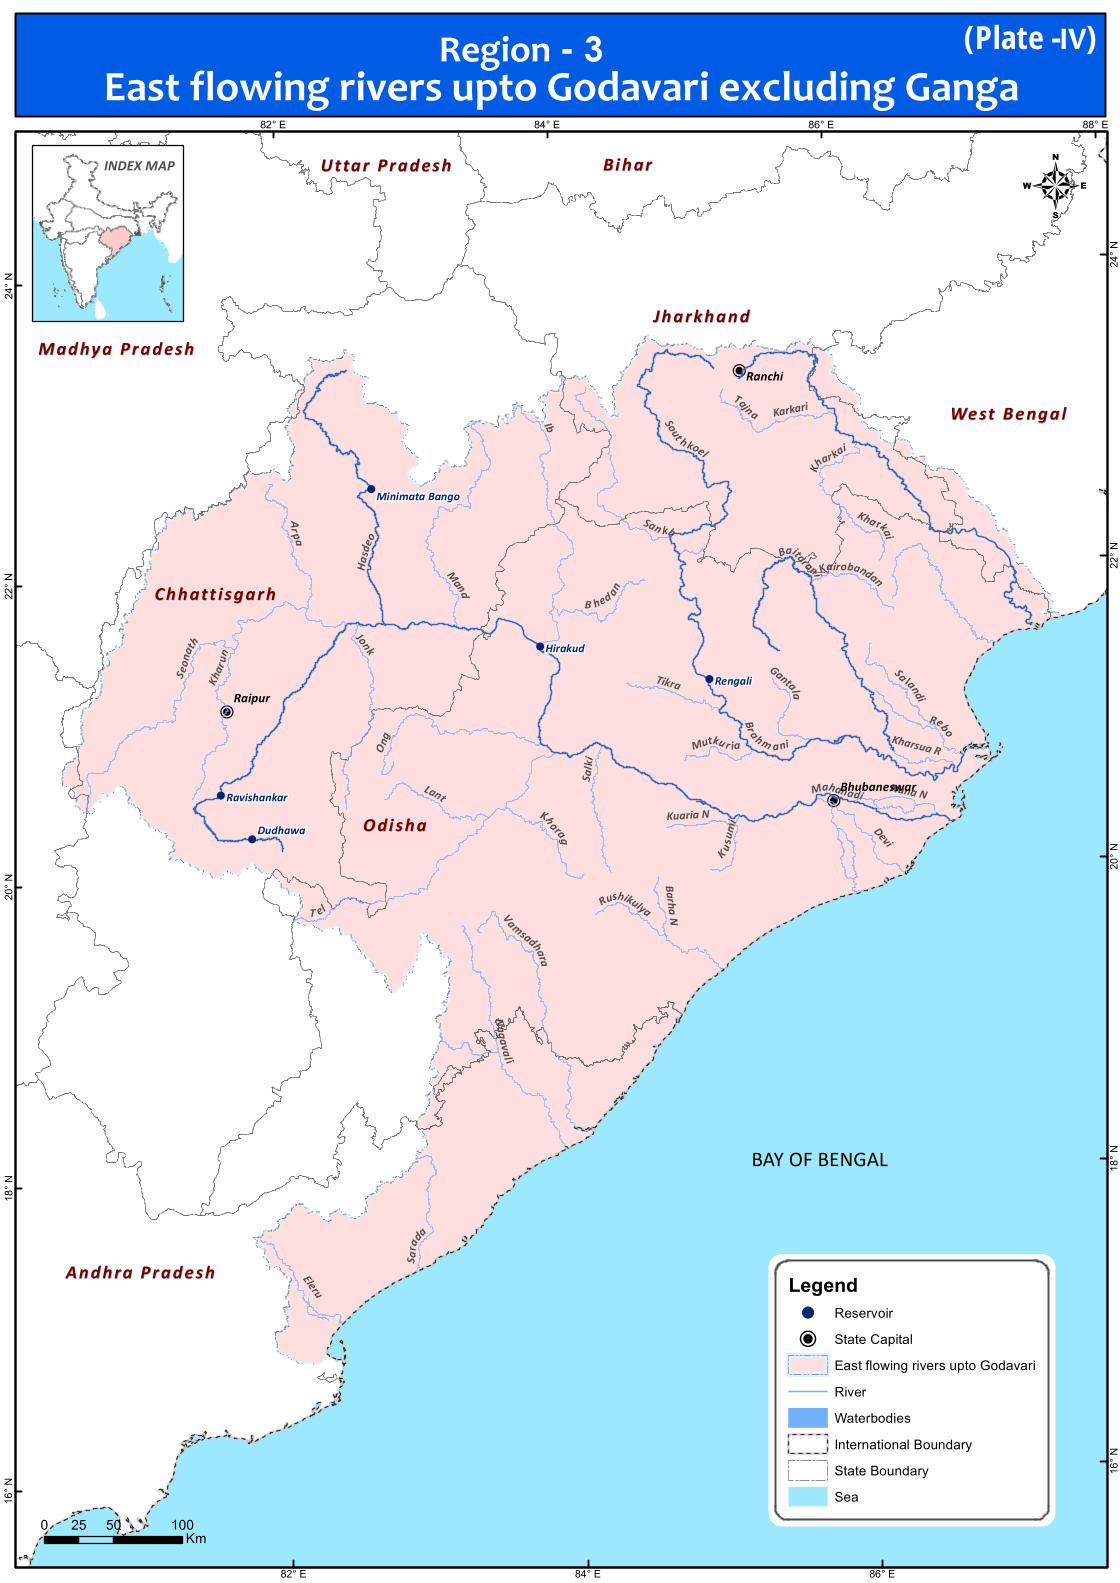
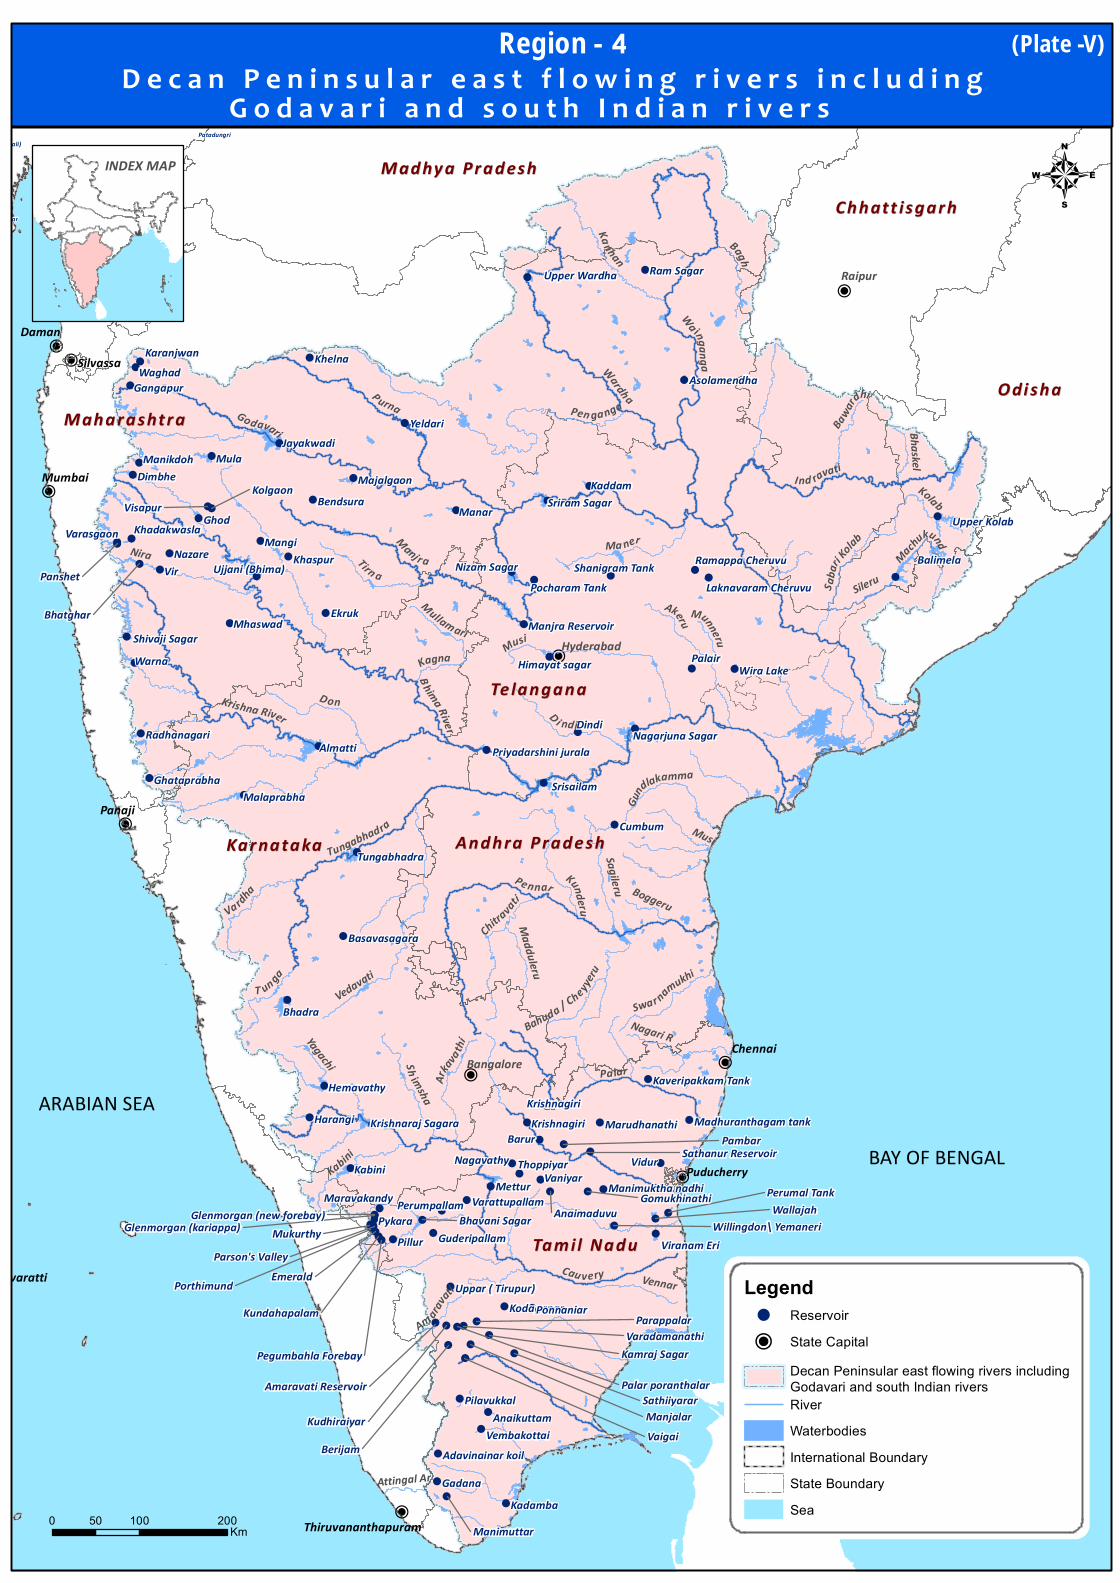
The analysis of capacity survey data of 243 reservoirs shows a wide variation in sedimentation rate of reservoirs. The sedimentation rate is affected by multiple factors like hydrometeorology, physiographic and climate etc. Considering these factors, the whole country has been classified into 7 regions (Plate-1). Regionwise distribution of 243 reservoirs have been shown in Plate 2-8.The region-wise sedimentation rates in reservoirs are given in Table 6. The region-wise list of 243 reservoirs whose capacity survey data has been compiled is given at Appendix VII. Region wise distribution of reservoirs is shown pictorially in Figure 3.
Table 6: Average Rate of Siltation of Reservoirs (Region wise)
Sl. No. Region Reference of Plate Number
No. of reservoirs
Average rate of siltation Th.cu.m./ sq.km/yr
Ha.m./100 sq.km/year
1 Himalayan Region (Indus, Ganga and Brahmaputra basins)
II 14 2.578 25.78
2 Indo Gangetic Plains III 15 0.986 9.86 3 East flowing rivers upto
Godavari (Excluding Ganga) IV 5 0.759 7.59
4 Deccan Peninsular east V
WS&RSDirectorate,EMO,CentralWaterCommission 15
flowing rivers including Godavari and south Indian rivers
a) Excluding reservoirs in the western ghat
b) Reservoirs in the western ghat of east flowing rivers
110
5
1.108
15.523
11.08
155.23
5 West flowing rivers upto Narmada
VI 53 1.117 11.17
6. Narmada and Tapi Basins VII 10 1.742 17.42 7. West flowing rivers beyond
Tapi and south Indian rivers VIII 31 3.322 33.22
All regions 243
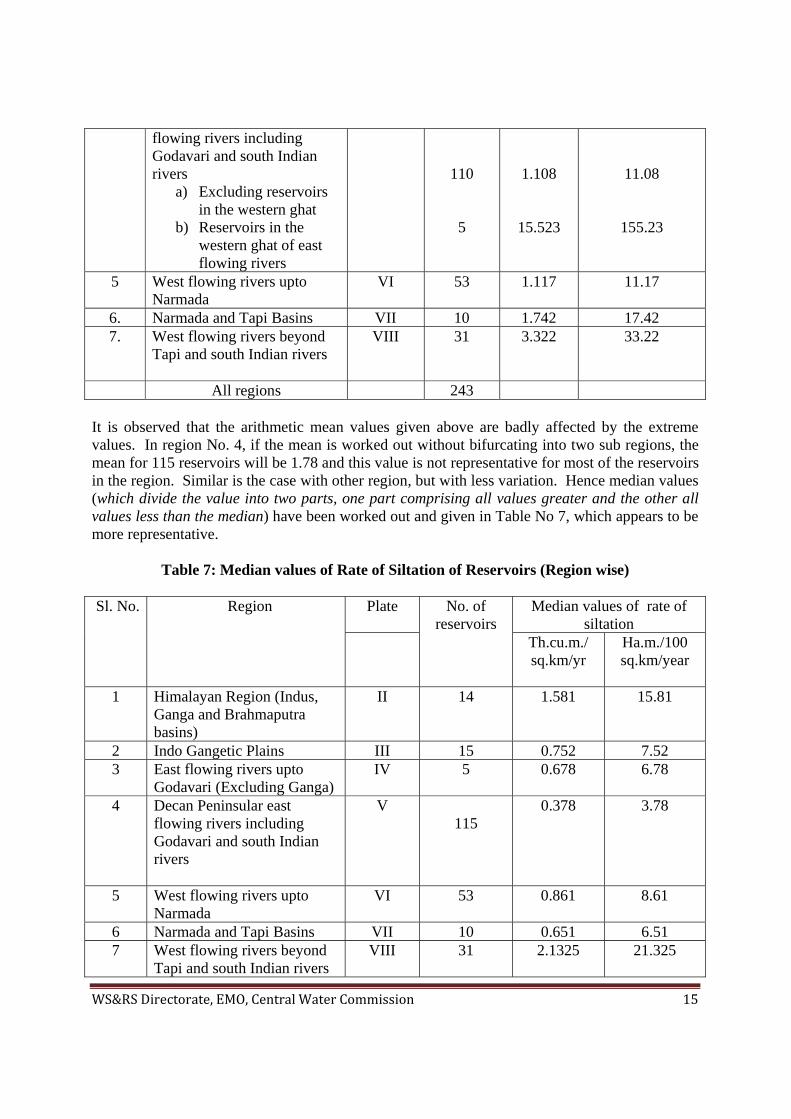
It is observed that the arithmetic mean values given above are badly affected by the extreme values. In region No. 4, if the mean is worked out without bifurcating into two sub regions, the mean for 115 reservoirs will be 1.78 and this value is not representative for most of the reservoirs in the region. Similar is the case with other region, but with less variation. Hence median values (which divide the value into two parts, one part comprising all values greater and the other all values less than the median) have been worked out and given in Table No 7, which appears to be more representative.
Table 7: Median values of Rate of Siltation of Reservoirs (Region wise)
Sl. No. Region Plate No. of reservoirs
Median values of rate of siltation
Th.cu.m./ sq.km/yr
Ha.m./100 sq.km/year
1 Himalayan Region (Indus, Ganga and Brahmaputra basins)
II 14 1.581 15.81
2 Indo Gangetic Plains III 15 0.752 7.52 3 East flowing rivers upto
Godavari (Excluding Ganga) IV 5 0.678 6.78
4 Decan Peninsular east flowing rivers including Godavari and south Indian rivers
V 115
0.378 3.78
5 West flowing rivers upto Narmada
VI 53 0.861 8.61
6 Narmada and Tapi Basins VII 10 0.651 6.51 7 West flowing rivers beyond
Tapi and south Indian rivers VIII 31 2.1325 21.325
WS&RSDirectorate,EMO,CentralWaterCommission 16
All regions 243 0.716 7.16
14
155
115
53
10
31Region 1
Region 2
Region 3
Region 4
Region 5
Region 6
Region 7
Regionwise Distribution of Reservoirs
Figure 3: Region wise Distribution of 243 reservoirs
6.6 DISTRIBUTION OF SEDIMENT IN RESERVOIRS Earlier it was believed that sediment in a reservoir always deposited in the bottom elevations of a reservoir rather than depositing throughout the full range of reservoir depth. It has now fully been established that sediment deposits throughout the depth of reservoir and reduces the capacity of reservoirs at all elevations. Till recently it was a common practice in India to provide dead storage in a reservoir for likely sedimentation over a period of 100 years. The rate of sediment was generally based on the average annual sediment load observed in the river over a period of time. If such observations were not available at the reservoir site at the time of project planning, the sediment load/rate observed on other reservoirs in the region with similar topographical soil and hydrological characteristics was considered and an appropriate silt load was adopted for the project planning.
Studies carried out in USA, India and other countries have indicated that the entire sediment load is not deposited in dead storage space as assumed in earlier years but is spread over the entire storage space upto F.R.L. In fact, in the initial years of impoundment more encroachment is observed in the live storage space which slowly progresses towards lower levels. Further, the distribution pattern of sediment depends on several factors such as the slope of the valley, the length and shape of the reservoir, particle size of suspended sediment, capacity-inflow ratio, fluctuation in stream flow, location and size of outlets etc. Actual sediment accumulation is distributed below full reservoir level or flood pool level in case of flood storage reservoirs. The distribution pattern of sediment has been classified into four standard types of
WS&RSDirectorate,EMO,CentralWaterCommission 17
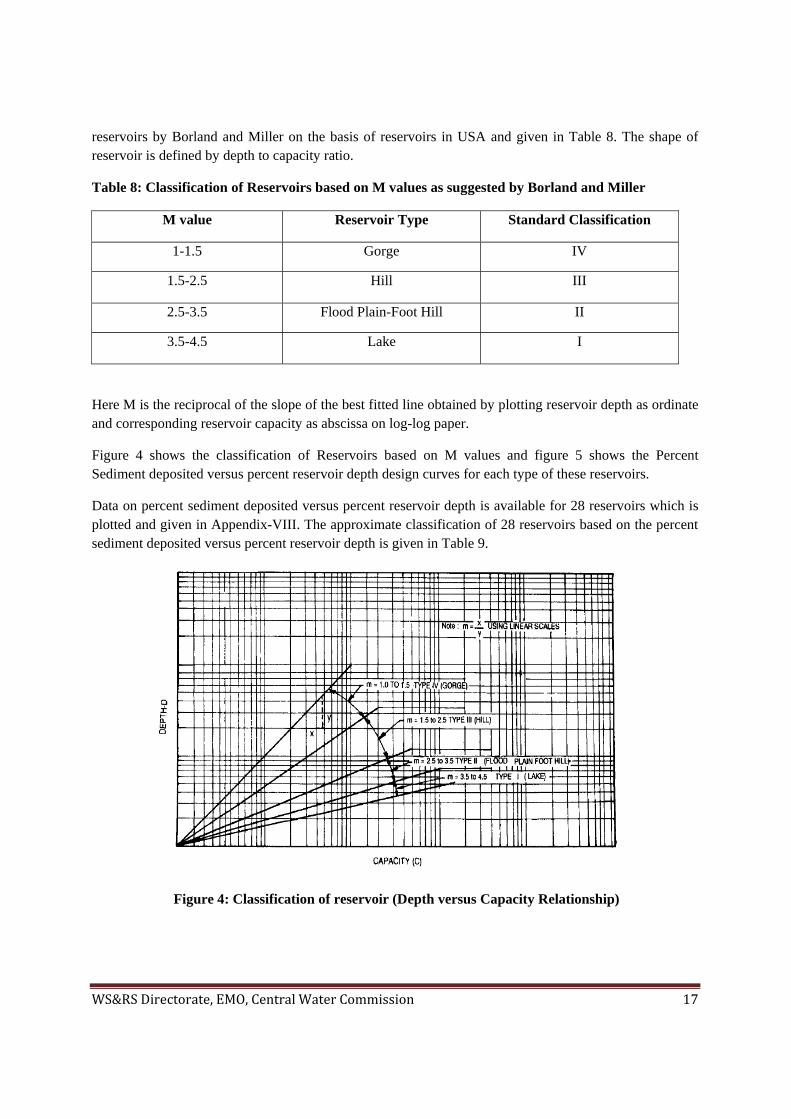
reservoirs by Borland and Miller on the basis of reservoirs in USA and given in Table 8. The shape of reservoir is defined by depth to capacity ratio.
Table 8: Classification of Reservoirs based on M values as suggested by Borland and Miller
M value Reservoir Type Standard Classification
1-1.5 Gorge IV
1.5-2.5 Hill III
2.5-3.5 Flood Plain-Foot Hill II
3.5-4.5 Lake I
Here M is the reciprocal of the slope of the best fitted line obtained by plotting reservoir depth as ordinate and corresponding reservoir capacity as abscissa on log-log paper.
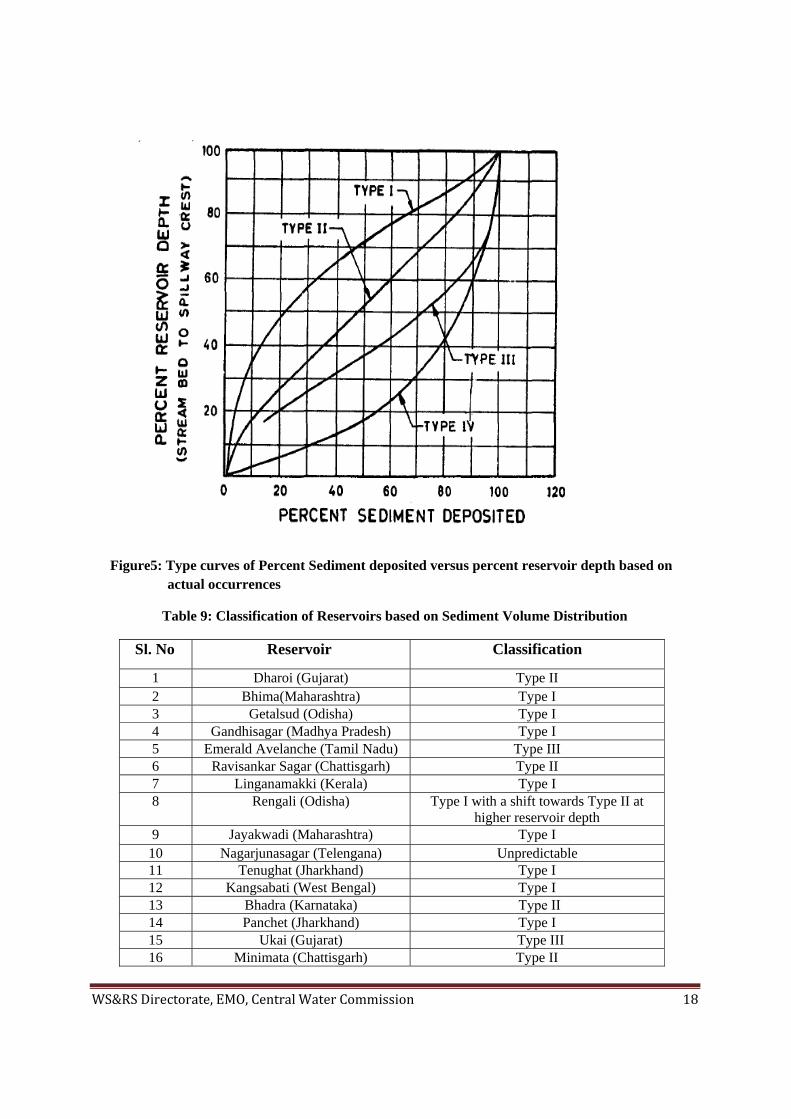
Figure 4 shows the classification of Reservoirs based on M values and figure 5 shows the Percent Sediment deposited versus percent reservoir depth design curves for each type of these reservoirs.
Data on percent sediment deposited versus percent reservoir depth is available for 28 reservoirs which is plotted and given in Appendix-VIII. The approximate classification of 28 reservoirs based on the percent sediment deposited versus percent reservoir depth is given in Table 9.
Figure 4: Classification of reservoir (Depth versus Capacity Relationship)
WS&RSDirectorate,EMO,CentralWaterCommission 18
Figure5: Type curves of Percent Sediment deposited versus percent reservoir depth based on actual occurrences
Table 9: Classification of Reservoirs based on Sediment Volume Distribution
Sl. No Reservoir Classification
1 Dharoi (Gujarat) Type II 2 Bhima(Maharashtra) Type I 3 Getalsud (Odisha) Type I 4 Gandhisagar (Madhya Pradesh) Type I 5 Emerald Avelanche (Tamil Nadu) Type III 6 Ravisankar Sagar (Chattisgarh) Type II 7 Linganamakki (Kerala) Type I 8 Rengali (Odisha) Type I with a shift towards Type II at
higher reservoir depth 9 Jayakwadi (Maharashtra) Type I 10 Nagarjunasagar (Telengana) Unpredictable 11 Tenughat (Jharkhand) Type I 12 Kangsabati (West Bengal) Type I 13 Bhadra (Karnataka) Type II 14 Panchet (Jharkhand) Type I 15 Ukai (Gujarat) Type III 16 Minimata (Chattisgarh) Type II
WS&RSDirectorate,EMO,CentralWaterCommission 19
17 Watrak (Maharashtra) Unpredictable 18 Ghataprabha(Karnataka) Type II 19 Ranapratap Sagar (Rajasthan). Unpredictable 20 Salaulim (Goa) Unpredictable 21 Mayurakshi (West Bengal) Type I 22 Bhavanisagar (Tamil Nadu) Type I 23 Badua (Bihar) Type I with a shift towards Type II at
higher reservoir depth 24 Upper Kolab (Odisha) Type I 25 Upper Wardha (Maharashtra) Unpredictable 26 Idamayalar (Kerala) Unpredictable 27 Idukki (Kerala) Type I 28 Warna (Maharashtra) Type III
6.7 DENSITY OF DEPOSITED SEDIMENTS IN RESERVOIRS
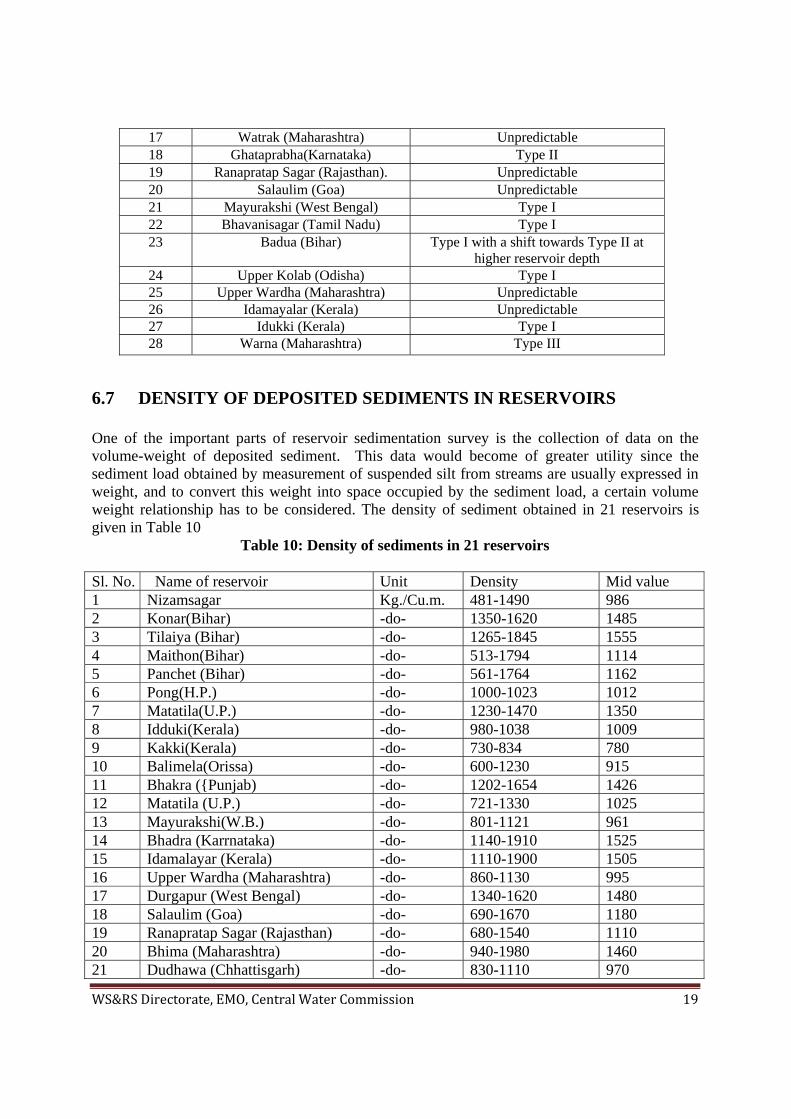
One of the important parts of reservoir sedimentation survey is the collection of data on the volume-weight of deposited sediment. This data would become of greater utility since the sediment load obtained by measurement of suspended silt from streams are usually expressed in weight, and to convert this weight into space occupied by the sediment load, a certain volume weight relationship has to be considered. The density of sediment obtained in 21 reservoirs is given in Table 10
Table 10: Density of sediments in 21 reservoirs
Sl. No. Name of reservoir Unit Density Mid value 1 Nizamsagar Kg./Cu.m. 481-1490 986 2 Konar(Bihar) -do- 1350-1620 1485 3 Tilaiya (Bihar) -do- 1265-1845 1555 4 Maithon(Bihar) -do- 513-1794 1114 5 Panchet (Bihar) -do- 561-1764 1162 6 Pong(H.P.) -do- 1000-1023 1012 7 Matatila(U.P.) -do- 1230-1470 1350 8 Idduki(Kerala) -do- 980-1038 1009 9 Kakki(Kerala) -do- 730-834 780 10 Balimela(Orissa) -do- 600-1230 915 11 Bhakra ({Punjab) -do- 1202-1654 1426 12 Matatila (U.P.) -do- 721-1330 1025 13 Mayurakshi(W.B.) -do- 801-1121 961 14 Bhadra (Karrnataka) -do- 1140-1910 1525 15 Idamalayar (Kerala) -do- 1110-1900 1505 16 Upper Wardha (Maharashtra) -do- 860-1130 995 17 Durgapur (West Bengal) -do- 1340-1620 1480 18 Salaulim (Goa) -do- 690-1670 1180 19 Ranapratap Sagar (Rajasthan) -do- 680-1540 1110 20 Bhima (Maharashtra) -do- 940-1980 1460 21 Dudhawa (Chhattisgarh) -do- 830-1110 970
WS&RSDirectorate,EMO,CentralWaterCommission 20
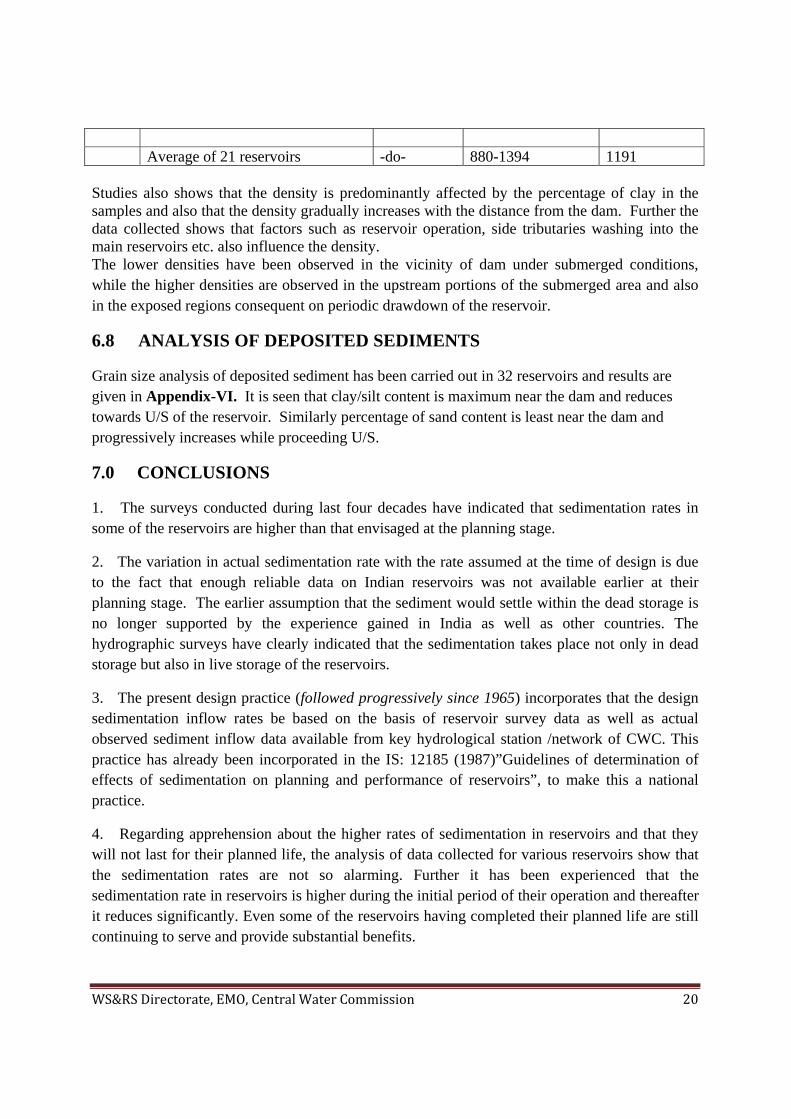
Average of 21 reservoirs -do- 880-1394 1191
Studies also shows that the density is predominantly affected by the percentage of clay in the samples and also that the density gradually increases with the distance from the dam. Further the data collected shows that factors such as reservoir operation, side tributaries washing into the main reservoirs etc. also influence the density. The lower densities have been observed in the vicinity of dam under submerged conditions, while the higher densities are observed in the upstream portions of the submerged area and also in the exposed regions consequent on periodic drawdown of the reservoir.
6.8 ANALYSIS OF DEPOSITED SEDIMENTS
Grain size analysis of deposited sediment has been carried out in 32 reservoirs and results are given in Appendix-VI. It is seen that clay/silt content is maximum near the dam and reduces towards U/S of the reservoir. Similarly percentage of sand content is least near the dam and progressively increases while proceeding U/S.
7.0 CONCLUSIONS
1. The surveys conducted during last four decades have indicated that sedimentation rates in some of the reservoirs are higher than that envisaged at the planning stage.
2. The variation in actual sedimentation rate with the rate assumed at the time of design is due to the fact that enough reliable data on Indian reservoirs was not available earlier at their planning stage. The earlier assumption that the sediment would settle within the dead storage is no longer supported by the experience gained in India as well as other countries. The hydrographic surveys have clearly indicated that the sedimentation takes place not only in dead storage but also in live storage of the reservoirs.
3. The present design practice (followed progressively since 1965) incorporates that the design sedimentation inflow rates be based on the basis of reservoir survey data as well as actual observed sediment inflow data available from key hydrological station /network of CWC. This practice has already been incorporated in the IS: 12185 (1987)”Guidelines of determination of effects of sedimentation on planning and performance of reservoirs”, to make this a national practice.
4. Regarding apprehension about the higher rates of sedimentation in reservoirs and that they will not last for their planned life, the analysis of data collected for various reservoirs show that the sedimentation rates are not so alarming. Further it has been experienced that the sedimentation rate in reservoirs is higher during the initial period of their operation and thereafter it reduces significantly. Even some of the reservoirs having completed their planned life are still continuing to serve and provide substantial benefits.
WS&RSDirectorate,EMO,CentralWaterCommission 21
5. DGPS enabled bathymetric survey techniques in conducting capacity surveys of reservoirs saves time and obtain more reliable results.
6. Since sedimentation study of reservoirs using remote sensing technique is fast and economical but considering its limitation that sedimentation taking place below MDDL cannot be measured, it would be appropriate to conduct hydrographic surveys at longer intervals and remote sensing based sedimentation surveys are carried out at shorter intervals to make both surveys complementary to each other.
7. It is observed that the rate of sedimentation is maximum in the reservoirs lying in West flowing rivers beyond Tapi and South Indian rivers i.e. the region No. 7. Median value of sedimentation observed in this region is 2.1325 mm/year (21.325 Ha.m./100sq.km./year).Second highest rate of sedimentation is observed in the Himalayan rivers (1.581 mm/year i.e.15.81 Ha.m./100sq./km year). In the plains of Indus and Ganga, only 0.752 mm/year (7.52 Ha.m./100sq.km /year) is observed. The rate of 0.678 mm/year (6.78 Ha.m/100sq.km/year) observed in the east flowing rivers up to Godavari. Rate of sedimentation in the reservoirs constructed in the west flowing rivers upto Narmada is 0.861 mm/year (8.61 Ha.m./100sq.km /year) and in the reservoirs lying in Narmada and Tapi basins is 0.651 mm/year (6.51 Ha.m./100sq.km /year).The least sedimentation rate of 0.378 mm/year (3.78 Ha.m./100sq.km /year) is observed in the Deccan Peninsular region.
8. It is observed that the average annual percentage loss of capacity is 0.42 in gross storages.
9. The average dry density of deposited sediment works out to 1191 kg/cu.m.
10. Density of deposited sediment is predominantly affected by the percentage of clay in the samples and also that the density gradually increases with the distances from the dam. The lower densities have been observed in the vicinity of dam under submerged conditions, while the higher densities are observed in the upstream portions of the submerged area and also in the exposed regions consequent on periodic drawdown of the reservoir.
11. The clay/silt content is maximum near the dam and reduces towards u/s of the reservoir. Similarly percentage of sand content is least near the dam and progressively increases while proceeding u/s.
!
!
!
!
!!
!
!
!
!
!
!
!
!
!
!!
!
!
!
!!
!
!
!!
!
!
!
!
!
!!
!
!
!
!
!!
!!
!
!
!
!
!
!
!
!
!
!
!
!
!
!
!
!
!!!
!
!
!
!!
!
!
!
!
!
!
!
!
!
!
!!
!
!
!
!
!
!
!
!
!
!
!
!
!
!
!
!
!
!
!
!! !
!
!
!
!
!
!
!
!
!
!
! !
!
!
!
!
!
!!!!
!
!
!!
!
!
!
!
!
!
!
!
!
!
!
!
!
!
!
!
!
!!
!
!
!
!
!
!
! !!
!
!
!!
!!
!
!
!
!
!
!
!
!
!
!
!
!
!
!
!
!
!
!!
!
!
!
!
!
!
!
!
!
!
!! !
!
!!
!
!
!!! !
!
!!
!!
!!
!!!
!!!
!
!
! !
!!
!
!! !
!
!
!
!
!!!!
!
!
!
!
!
!
!
!
!
!
!
!
!
1
4
25
3
6
78
7
21
6 5
4
3
967
89
8887
86
6665
64
6362
6160
59
58
5756
55
54
99
98 9795
94
93
8584
83
82
81
80
53
51
7977
76
75
74
73
50
4948
47
46
45
43 42
41
39
38 37 3533
32
30
2928
27
25
23
18
1514
13
12
727170
6968
231
230
230
229
228
227
241
240
169
225
224
223222
219
218217
216
215
214
209
207
206
202
200199198
150149
148147
146145144
143 142
141
140
139138
137
238
237
235
197
136135
134
106
192
133168
132
190
131129
128
189
188
167
184
125
123
177
175
122
121
120
119
118
166
165164163
162161
160159
172
117
154
158
116157
114
153
156
152 151113
112
243
239111
242
234
109
96
92
91
90
52
78
4440
36
34
31
26
2422
21
20
19 17
16
11
10
108226
221 220
213
212
211
210208
205204
203
201
236
196107195
194
193
105104103
102101
100
191
130
127
187186
185
126
183182
181
180
179
178
124
176
174
173
171
170
115
110155
233232
Ra ja sth anRa ja sth an
Gu ja ratGu ja rat
Ma h ara shtraMa h ara shtraO dis h aO dis h a
Ka rn atakaKa rn ataka
Ma d hya Pra de shMa d hya Pra de sh
Bih a rBih a r
U tta r Prad es hU tta r Prad es h
Jam mu & Ka sh mi rJam mu & Ka sh mi r
Ass amAss am
Chh att i sgar hChh att i sgar h
Pu nj a bPu nj a bU tta rak ha n dU tta rak ha n d
95° E
90° E
90° E
85° E
85° E
80° E
80° E
75° E
75° E
70° E
70° E
35° N 35
° N
30° N 30
° N
25° N 25
° N
20° N 20
° N
15° N 15
° N
10° N 10
° N
5° N 5°
N
0 250 500125Km
4
BAY OF BENGALARABIAN SEA
INDIAN OCEANSRI LANKA
PAKISTANCHINA
BANGLADESH
Legend
Sedimentation Zone
State Boundary
ReservoirSea
1. Himalayan Region2. Indo Gangetic Plains
6. Narmada and Tapi7. West flowing rivers beyond Tapi and south Indian rivers
4. Decan Peninsular east flowing rivers including Godavari and south Indian rivers
3. East flowing rivers upto Godavari
5. West flowing rivers upto Narmada
NEPAL
Region Wise Distribution of Reservoirs (Plate -I)
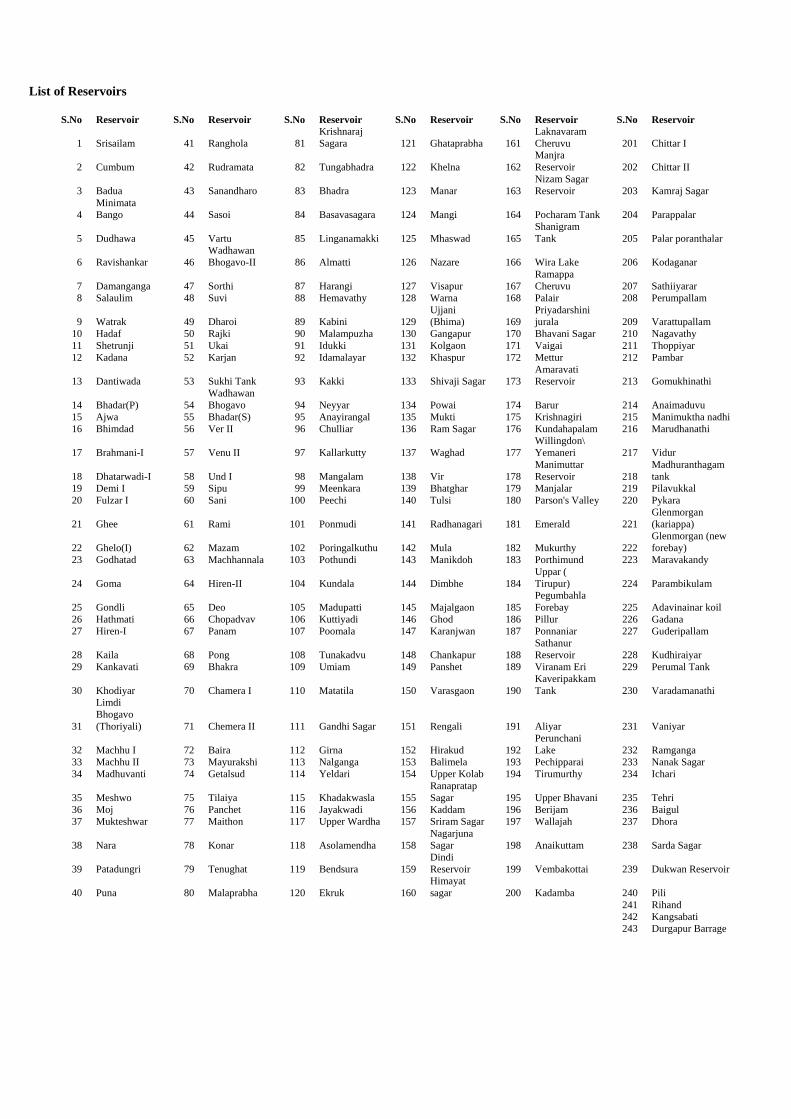
List of Reservoirs
S.No Reservoir S.No Reservoir S.No Reservoir S.No Reservoir S.No Reservoir S.No Reservoir
1 Srisailam 41 Ranghola 81 Krishnaraj Sagara 121 Ghataprabha 161
Laknavaram Cheruvu 201 Chittar I
2 Cumbum 42 Rudramata 82 Tungabhadra 122 Khelna 162 Manjra Reservoir 202 Chittar II
3 Badua 43 Sanandharo 83 Bhadra 123 Manar 163 Nizam Sagar Reservoir 203 Kamraj Sagar
4 Minimata Bango 44 Sasoi 84 Basavasagara 124 Mangi 164 Pocharam Tank 204 Parappalar
5 Dudhawa 45 Vartu 85 Linganamakki 125 Mhaswad 165 Shanigram Tank 205 Palar poranthalar
6 Ravishankar 46 Wadhawan Bhogavo-II 86 Almatti 126 Nazare 166 Wira Lake 206 Kodaganar
7 Damanganga 47 Sorthi 87 Harangi 127 Visapur 167 Ramappa Cheruvu 207 Sathiiyarar
8 Salaulim 48 Suvi 88 Hemavathy 128 Warna 168 Palair 208 Perumpallam
9 Watrak 49 Dharoi 89 Kabini 129 Ujjani (Bhima) 169
Priyadarshini jurala 209 Varattupallam
10 Hadaf 50 Rajki 90 Malampuzha 130 Gangapur 170 Bhavani Sagar 210 Nagavathy 11 Shetrunji 51 Ukai 91 Idukki 131 Kolgaon 171 Vaigai 211 Thoppiyar 12 Kadana 52 Karjan 92 Idamalayar 132 Khaspur 172 Mettur 212 Pambar
13 Dantiwada 53 Sukhi Tank 93 Kakki 133 Shivaji Sagar 173 Amaravati Reservoir 213 Gomukhinathi
14 Bhadar(P) 54 Wadhawan Bhogavo 94 Neyyar 134 Powai 174 Barur 214 Anaimaduvu
15 Ajwa 55 Bhadar(S) 95 Anayirangal 135 Mukti 175 Krishnagiri 215 Manimuktha nadhi 16 Bhimdad 56 Ver II 96 Chulliar 136 Ram Sagar 176 Kundahapalam 216 Marudhanathi
17 Brahmani-I 57 Venu II 97 Kallarkutty 137 Waghad 177 Willingdon\ Yemaneri 217 Vidur
18 Dhatarwadi-I 58 Und I 98 Mangalam 138 Vir 178 Manimuttar Reservoir 218
Madhuranthagam tank
19 Demi I 59 Sipu 99 Meenkara 139 Bhatghar 179 Manjalar 219 Pilavukkal 20 Fulzar I 60 Sani 100 Peechi 140 Tulsi 180 Parson's Valley 220 Pykara
21 Ghee 61 Rami 101 Ponmudi 141 Radhanagari 181 Emerald 221 Glenmorgan (kariappa)
22 Ghelo(I) 62 Mazam 102 Poringalkuthu 142 Mula 182 Mukurthy 222 Glenmorgan (new forebay)
23 Godhatad 63 Machhannala 103 Pothundi 143 Manikdoh 183 Porthimund 223 Maravakandy
24 Goma 64 Hiren-II 104 Kundala 144 Dimbhe 184 Uppar ( Tirupur) 224 Parambikulam
25 Gondli 65 Deo 105 Madupatti 145 Majalgaon 185 Pegumbahla Forebay 225 Adavinainar koil
26 Hathmati 66 Chopadvav 106 Kuttiyadi 146 Ghod 186 Pillur 226 Gadana 27 Hiren-I 67 Panam 107 Poomala 147 Karanjwan 187 Ponnaniar 227 Guderipallam
28 Kaila 68 Pong 108 Tunakadvu 148 Chankapur 188 Sathanur Reservoir 228 Kudhiraiyar
29 Kankavati 69 Bhakra 109 Umiam 149 Panshet 189 Viranam Eri 229 Perumal Tank
30 Khodiyar 70 Chamera I 110 Matatila 150 Varasgaon 190 Kaveripakkam Tank 230 Varadamanathi
31
Limdi Bhogavo (Thoriyali) 71 Chemera II 111 Gandhi Sagar 151 Rengali 191 Aliyar 231 Vaniyar
32 Machhu I 72 Baira 112 Girna 152 Hirakud 192 Perunchani Lake 232 Ramganga
33 Machhu II 73 Mayurakshi 113 Nalganga 153 Balimela 193 Pechipparai 233 Nanak Sagar 34 Madhuvanti 74 Getalsud 114 Yeldari 154 Upper Kolab 194 Tirumurthy 234 Ichari
35 Meshwo 75 Tilaiya 115 Khadakwasla 155 Ranapratap Sagar 195 Upper Bhavani 235 Tehri
36 Moj 76 Panchet 116 Jayakwadi 156 Kaddam 196 Berijam 236 Baigul 37 Mukteshwar 77 Maithon 117 Upper Wardha 157 Sriram Sagar 197 Wallajah 237 Dhora
38 Nara 78 Konar 118 Asolamendha 158 Nagarjuna Sagar 198 Anaikuttam 238 Sarda Sagar
39 Patadungri 79 Tenughat 119 Bendsura 159 Dindi Reservoir 199 Vembakottai 239 Dukwan Reservoir
40 Puna 80 Malaprabha 120 Ekruk 160 Himayat sagar 200 Kadamba 240 Pili
241 Rihand 242 Kangsabati 243 Durgapur Barrage
#
# #
##
#
#
#
#
#
#
#
#
##
#
#
#
##
###
!
!
!
!
!!
!
!
!
!
!!!
!
Rajki
Shetrunji
Dhatarwadi-I
Jammu
Dispur Kohima
Jaipur
Shimla
Ranchi
Aizawl
Lucknow
Gangtok
Kolkata
Itanagar
Shillong
Dehradun
Srinagar
Agartala
New Delhi
ChandigarhChandigarh
S ai
Ya muna
G om ti
Sa t l uj
Indu s
Beas
Rap ti
Son Ri v erTon s
Sind R
iver
Shyok
Barak
Chenab
Gilgit
Gang a
Betwa River
Kopili
Aie
Ramganga
G haghara
Kamla
Imph
al
S iyom
Dhansir
i
Ghagg h ar
Kos i
Suba nsiri
Jhel um
Burhi Gandak
Sahibi R iver
Ujh
Hanle
Dhaleswari
Manu
Sh i n goKishangangaZas
kar
Sikrana
Gumti
Zungki
Dri/ D
ibang
Somesh
wari
Pili Dhora
Tehri
Umiam
Sarda Sagar
Pong
Baira
Baigul
Ichari
Bhakra
Ramganga
Chamera IChemera II
Nanak Sagar
Patna
Jammu
DispurJaipur
Bhopal Ranchi
Gangtok
Kolkata
Shillong
Srinagar
AgartalaGandhinagar
RajasthanRajasthan
Bi harBi har
Madhy a Pr adeshMadhy a Pr adeshGujaratGujarat
JharkhandJharkhand
PunjabPunjab
West BengalWest Bengal
Har y anaHar y ana
Chhatt isgar hChhatt isgar h OdishaOdisha
100° E
95° E
95° E
90° E
90° E
85° E
85° E
80° E
80° E
75° E
75° E
35° N
35° N
30° N
30° N
25° N
25° N
0 100 20050 Km
4
BAY OF BENGAL
Legend
WaterbodiesRiver
International BoundaryState BoundarySea
Reservoir!
State CapitalP
Himalayan Region
INDEX MAP
(Plate -II) Region - 1 Himalayan Region
#
#
#
#
#
#
#
#
#
#
!
!
!
!
!
!
!!
!
!
!
!
!
!
!
RajasthanRajasthan
Odi shaOdi sha
Madhy a Pr adeshMadhy a Pr adesh
Bi harBi har
Uttar Pr adeshUttar Pr adesh
Chhatt isgar hChhatt isgar h
JharkhandJharkhand
Har y anaHar y ana
Sikk i mSikk i m
Daman
Jaipur
Raipur
Ranchi
Lucknow
Gangtok
Kolkata
Silvassa
New Delhi
Gandhinagar
Ya muna
Banas
G anga
Son R iverT ons
Chambal River
Damodar
Sind R iv er
Ajay N
Pa rbati River
Kasai N
Betwa River
Ken Rive r
Be rach
Kali Sindh River
Dhasan R
iver
Barakar
Sonar River
Kiul N
Kanhar River
Ban gan ga River
Morel N
Konar
Badua
Tilaiya
Tenughat
Matatila
Kangsabati
MayurakshiRihandMaithonPanchet
Getalsud
Gandhi Sagar
Durgapur Barrage
Dukwan ReservoirRanapratap Sagar
85° E
85° E
80° E
80° E
75° E
75° E
25° N 25
° N20
° N
20° N
0 50 10025 Km
4
BAY OF BENGAL
Legend
WaterbodiesRiver
International BoundaryState BoundarySea
Reservoir!
State CapitalP
Indo Gangetic Plains
INDEX MAP
(Plate -III) Region - 2 Indo Gangetic Plains
#
#
#
!
!
!
!
!
Ib
T el
Mahanadi
Jonk
Seonat
h
Ong
Mand
Hasde
o
San kh
Br ahm ani
Nagaval i
Ar pa
Salki
Lant
Kharun
Rebo
Tikra
Sout h koel
Devi
Vamsadhara
Sarad
a
Baitarani
Sa landi
Kharag
Eleru
Rushikulya
B hed an
Tajna Karkari
Khar kai
Nuna NKuaria N
Barha N
Mutku r ia
K usum
i
Kairobandan
Kharsua R
Gantala
Kha rkai
Dudhawa
Rengali
Ravishankar
Minimata Bango
Raipur
Ranchi
Bhubaneswar
Odi shaOdi sha
Chhatt isgar hChhatt isgar h
JharkhandJharkhand
Andhra Pr adeshAndhra Pr adesh
Madhy a Pr adeshMadhy a Pr adesh
Bi harBi har
West BengalWest Bengal
Uttar Pr adeshUttar Pr adesh
Hirakud
88° E
86° E
86° E
84° E
84° E
82° E
82° E
24° N
24° N
22° N
22° N
20° N
20° N
18° N
18° N
16° N
16° N
0 50 10025Km
4
BAY OF BENGAL
Legend
WaterbodiesRiver
International BoundaryState BoundarySea
Reservoir!
State CapitalP
INDEX MAP
East flowing rivers upto Godavari
(Plate -IV) Region - 3 East flowing rivers upto Godavari excluding Ganga
#
#
#
##
#
#
#
##
!!
!
!
!
!
!
!
!
!
!
!
!
!
!
!
!
!
!
!
!
!! !
!
!
!
!
!
!
!
!
!
!
!!
!
!
!
!
!
!!!!
!
!
! !
!
!
!
!
!
!
!
!
!
!
!
!
!
!
!
!
!
!
!
!
!
!
!!
!
!!
! !
!
!
!!
!
!
!
!
!!
!
!
!!
!!
!
!! !
!
!
!
!
!!!!
!
!
!
!
!
!
!
!
Anas
Hadaf
Puducherry
Te langanaTe langana
Andhra Pr adeshAndhra Pr adesh
Chhatt isgar hChhatt isgar hMadhy a Pr adeshMadhy a Pr adeshDeo
Panam
Bhimdad
Khodiyar
Shetrunji
Patadungri
Machhannala
Wadhawan BhogavoWadhawan Bhogavo-II
Limdi Bhogavo (Thoriyali)
Vir
Ghod
Mula
Vidur
Warna
Mangi
Manar
Ekruk
Barur
Gadana
Pykara
Dimbhe
Waghad
Kabini
Palair
Pillur
Nazare
Khelna
Cumbum
Bhadra
Mettur
Vaigai
Kaddam
Vaniyar
Kadamba
Panshet
Harangi
Almatti
Berijam
Khaspur
Kolgaon
Mhaswad
Yeldari
Manikdoh
Wallajah
Gangapur
Bendsura
Balimela
Thoppiyar
Kodaganar
Karanjwan
Majalgaon
Hemavathy
Ram Sagar
Wira Lake
Jayakwadi
Srisailam
Pilavukkal
Anaimaduvu
Parappalar
Anaikuttam
Malaprabha
Krishnagiri
Maravakandy Perumpallam
Sathiiyarar
Vembakottai
Radhanagari
Viranam Eri
Krishnagiri
Ghataprabha
Asolamendha
Tungabhadra
Upper Kolab
Perumal Tank
Guderipallam
Marudhanathi
Basavasagara
Upper Wardha
Sriram Sagar
Shivaji Sagar
Pocharam Tank
Himayat sagar
Ramappa Cheruvu
Dindi
Adavinainar koil
Uppar ( Tirupur)
Manjra Reservoir
Kaveripakkam Tank
Krishnaraj SagaraSathanur Reservoir
Laknavaram Cheruvu
Madhuranthagam tank
Priyadarshini jurala
Pambar
Visapur
Emerald
Bhatghar
Mukurthy
Manjalar
Nagavathy
Varasgaon
PonnaniarPorthimund
Kudhiraiyar
Khadakwasla
Gomukhinathi
Kamraj Sagar
KundahapalamVaradamanathi
VarattupallamBhavani Sagar
Ujjani (Bhima) Shanigram Tank
Parson's Valley
Nagarjuna Sagar
Manimuktha nadhi
Palar poranthalarPegumbahla Forebay
Amaravati Reservoir
Manimuttar
Willingdon\ YemaneriGlenmorgan (kariappa)
Nizam Sagar
Glenmorgan (new forebay)
Daman
Mumbai
Panaji
Chennai
Silvassa
Kavaratti
Thiruvananthapuram
Gujar atGujar at
Mahar ashtr aMahar ashtr aOdi shaOdi sha
Kar natakaKar nataka
Tamil NaduTamil Nadu
Godavari
Cau very
Pennar
Bhima River
Nira
Musi
Don
Wardha
Manj r a
Palar
Pen ga nga
D i ndiKrishna River
Ind ravati
Tirn aMa ner
Wa ingangaP urna
Kanhan
Kabini
Tungabhadra
Kolab
Akeru
Bagh
Sh imsha
Kunderu
T un ga
Sagileru
Sileru
Chitravati
Vennar
Va rdha
Munneru
Am aravati
Arkava
thi
Sabar
i Kolab
Vedavati
Kagna
Baward
hi
Swar namukhi
Mullam ari
Bhaskel
Yagachi
Boggeru
Madduleru
Nagari R
Gundlakamma
Machukund
Bahuda / Cheyyeru
Attingal Ar
Musi
0 100 20050Km
4
BAY OF BENGAL
Legend
WaterbodiesRiver
International BoundaryState BoundarySea
Reservoir!
State CapitalP
Decan Peninsular east flowing rivers includingGodavari and south Indian rivers
ARABIAN SEA
Hyderabad
Bangalore
Raipur
INDEX MAP
Region - 4 (Plate -V)D e c a n P e n i n s u l a r e a s t f l o w i n g r i v e r s i n c l u d i n g G o d a v a r i a n d s o u t h I n d i a n r i v e r s
#
#
!
!
!
!
!
!
!
!
!
!
!
!!
!
!
!
!
!
!
!
!
!
!!
!
!
!
!
!
!
!
!
!
!
!
!
!
!
!
!
!
!
!
!!
!
!
!
!
!
!
!
!
Sanandharo Hathmati
Ajwa
MahiAnas
Hadaf
Deo
Moj
Sani
Sipu
Suvi
Puna
Nara
GomaGhee
Mazam
Und I
Rajki
Vartu
Kaila
Panam
Dharoi
Sorthi
Meshwo
Gondli
Demi I
KadanaWatrak
Venu II
Hiren-I
Bhimdad
Hiren-II
Ranghola
Machhu I
Khodiyar
Godhatad
Ghelo(I)
Fulzar I
Bhadar(S)
Machhu II
Kankavati
Bhadar(P)
Dantiwada
Shetrunji
Patadungri
Mukteshwar
Madhuvanti
Brahmani-I Machhannala
Dhatarwadi-I
Wadhawan BhogavoWadhawan Bhogavo-II
Limdi Bhogavo (Thoriyali)
Mah i
Luni River
Sabarm
ati
Watr ak
Ban as River
S om
Anas
Aji Nadi
Gomti
Su kri Nadi Jawai River
Ojat N adi
Sukri River
Dhadhar
Kankawati Nadi
Gum N
adi
Gandhinagar
RajasthanRajasthan
Gujar atGujar atMadhy a Pr adeshMadhy a Pr adesh
Mahar ashtr aMahar ashtr a
0 50 10025Km
4
ARABIAN SEA
PAKISTAN
Legend
WaterbodiesRiver
International BoundaryState BoundarySea
Reservoir!
INDEX MAP
P State CapitalWest flowing rivers upto Narmada Zone
West flowing rivers upto Narmada Region - 5 (Plate -VI)
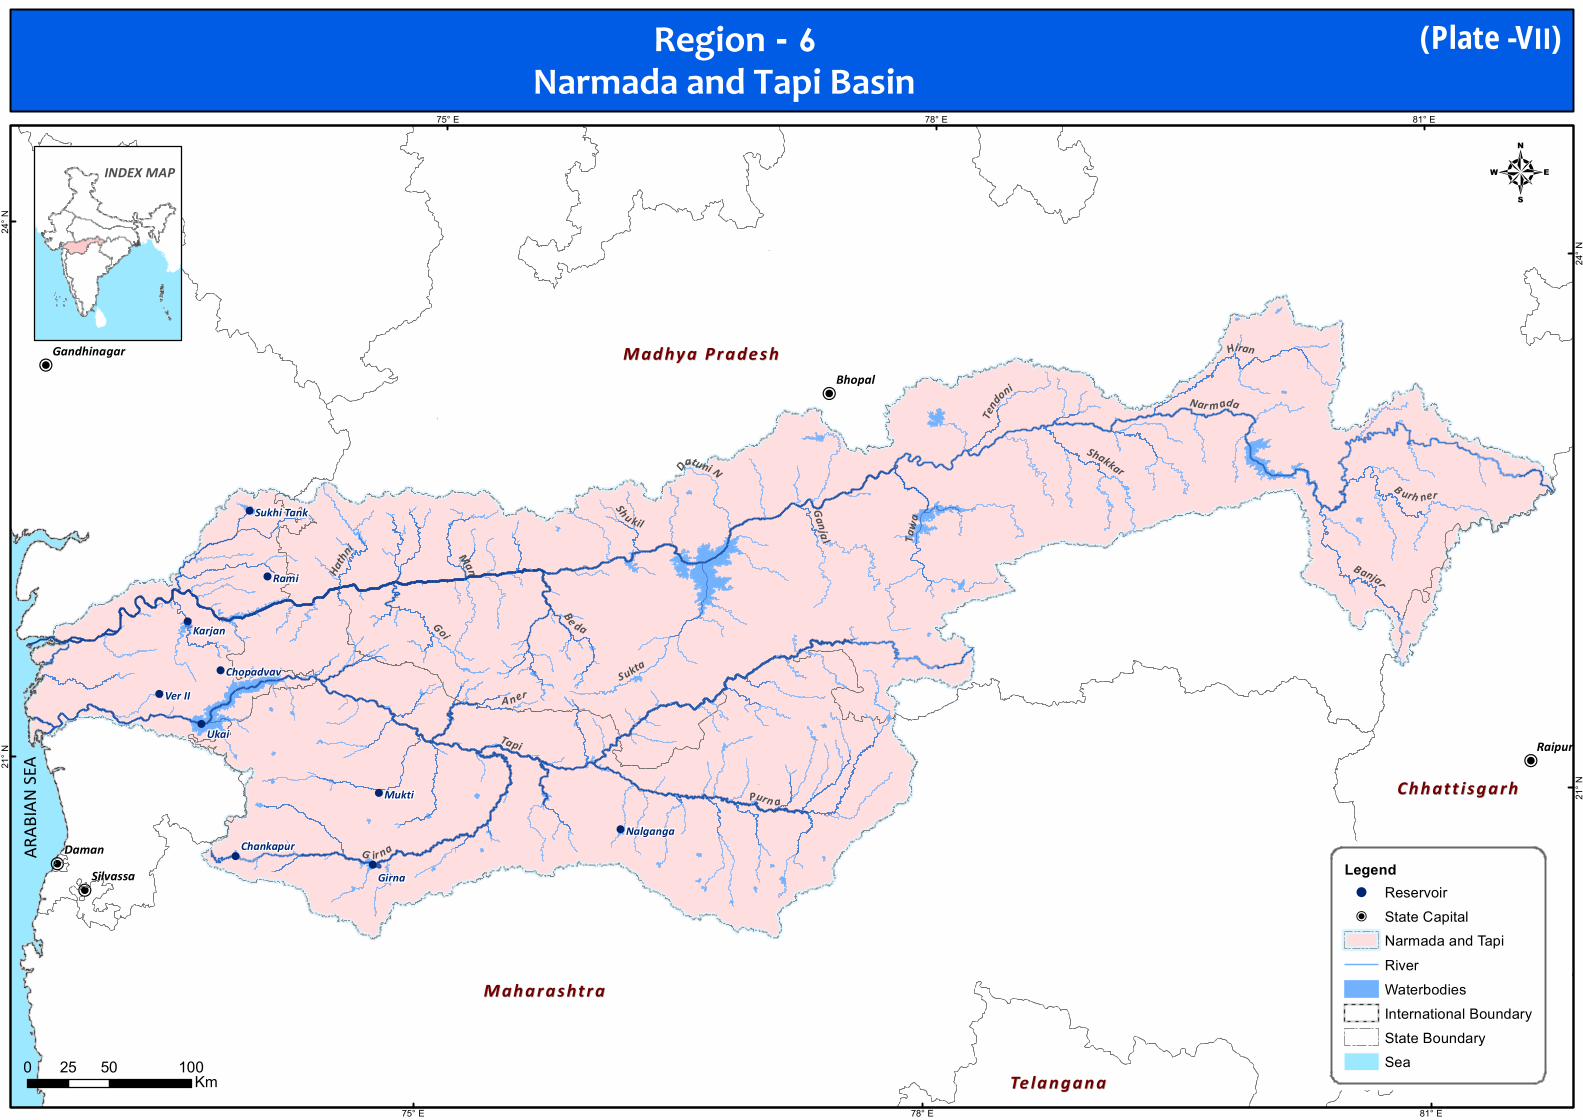
#
#
#
#
#
!
!
!
!
!
!
!
!
!
!
Te langanaTe langana
Mahar ashtr aMahar ashtr a
Madhy a Pr adeshMadhy a Pr adesh
Chhatt isgarhChhatt isgarh
Tapi
Nar m ada
G ir na
Purn a
Goi
Hiran
Tawa
A ner
Be da
S ukta
Banjar
B urh ner
Shakkar
ManHathni
Ganja l
Tendoni
Datuni N
Shu kil
Rami
Ukai
Mukti
Girna
Ver II
Karjan
NalgangaChankapur
Chopadvav
Sukhi Tank
Daman
Raipur
Bhopal
Silvassa
Gandhinagar
81° E
81° E
78° E
78° E
75° E
75° E
24° N
24° N
21° N
21° N
0 50 10025 Km
4
ARAB
IAN SE
A
Legend
WaterbodiesRiver
International BoundaryState BoundarySea
Reservoir!
State CapitalP
Narmada and Tapi
INDEX MAP
Region - 6 (Plate -VII)Narmada and Tapi Basin
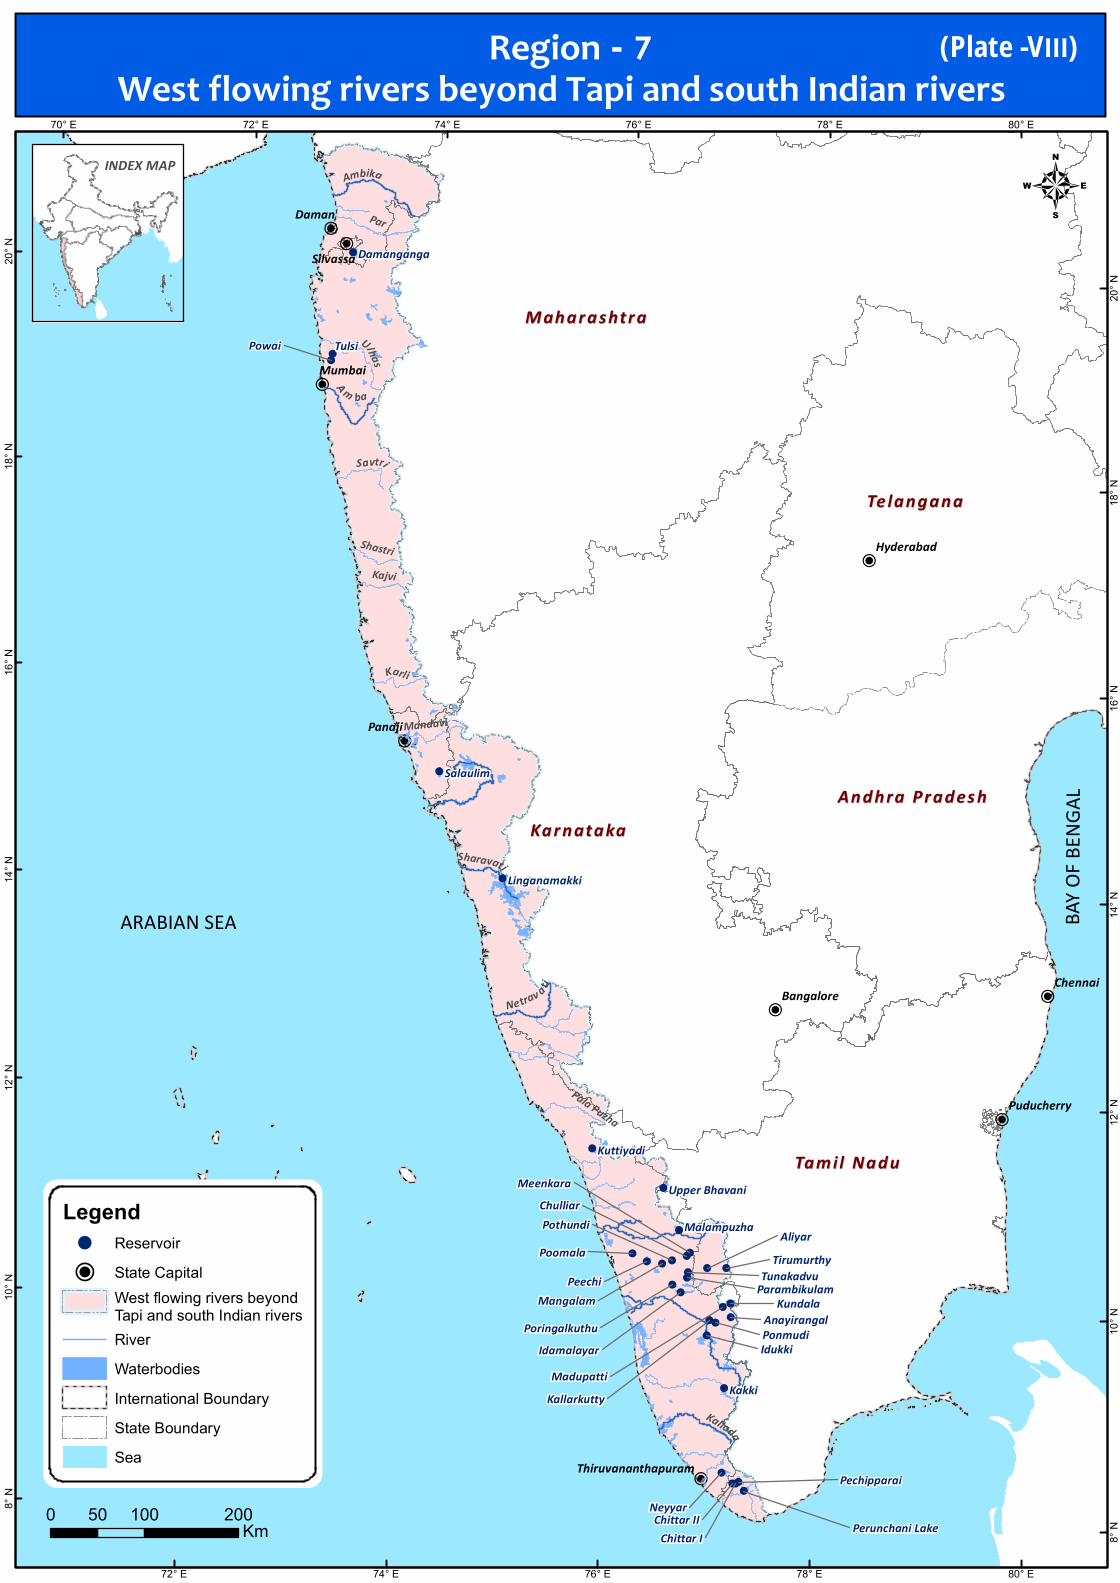
#
#
##
#
#
#
##
#!
!
!
!
!
!
!
!
!
!
!
!!
!
!
!
!
!
!!
!
!
!
!
!
!
!
!
!!
!!
Te langanaTe langana
TulsiPowai
Kakki
Peechi
Neyyar
Aliyar
Idukki
Poomala
Kundala
Salaulim
Meenkara
Chittar I
Kuttiyadi
Damanganga
Malampuzha
Linganamakki
Upper Bhavani
Ponmudi
Pothundi
Mangalam
Chulliar
Tunakadvu
Madupatti
Chittar II
Tirumurthy
Idamalayar
Pechipparai
Kallarkutty
AnayirangalParambikulam
Poringalkuthu
Perunchani Lake
Mahar ashtr aMahar ashtr a
Kar natakaKar natakaAndhra Pr ades hAndhra Pr ades h
Tamil NaduTamil Nadu
Par
Ulhas
Karli
Sharavati
Kallada
Kajvi
A m ba
Savtri
Ambika
Shastri
Netrav a ti
Mandavi
Pala Puzha
Daman
Mumbai
Panaji
Chennai
Silvassa
Kavaratti
Bangalore
Hyderabad
Puducherry
Thiruvananthapuram
80° E
80° E
78° E
78° E
76° E
76° E
74° E
74° E
72° E
72° E70° E
20° N
20° N
18° N
18° N
16° N
16° N
14° N
14° N
12° N
12° N
10° N
10° N
8° N
8° N0 100 20050
Km
4
BAY O
F BEN
GAL
ARABIAN SEA
Legend
WaterbodiesRiver
International BoundaryState BoundarySea
Reservoir!
State CapitalP
INDEX MAP
West flowing rivers beyond Tapi and south Indian rivers
West flowing rivers beyond Tapi and south Indian rivers Region - 7 (Plate -VIII)
Appendix‐I
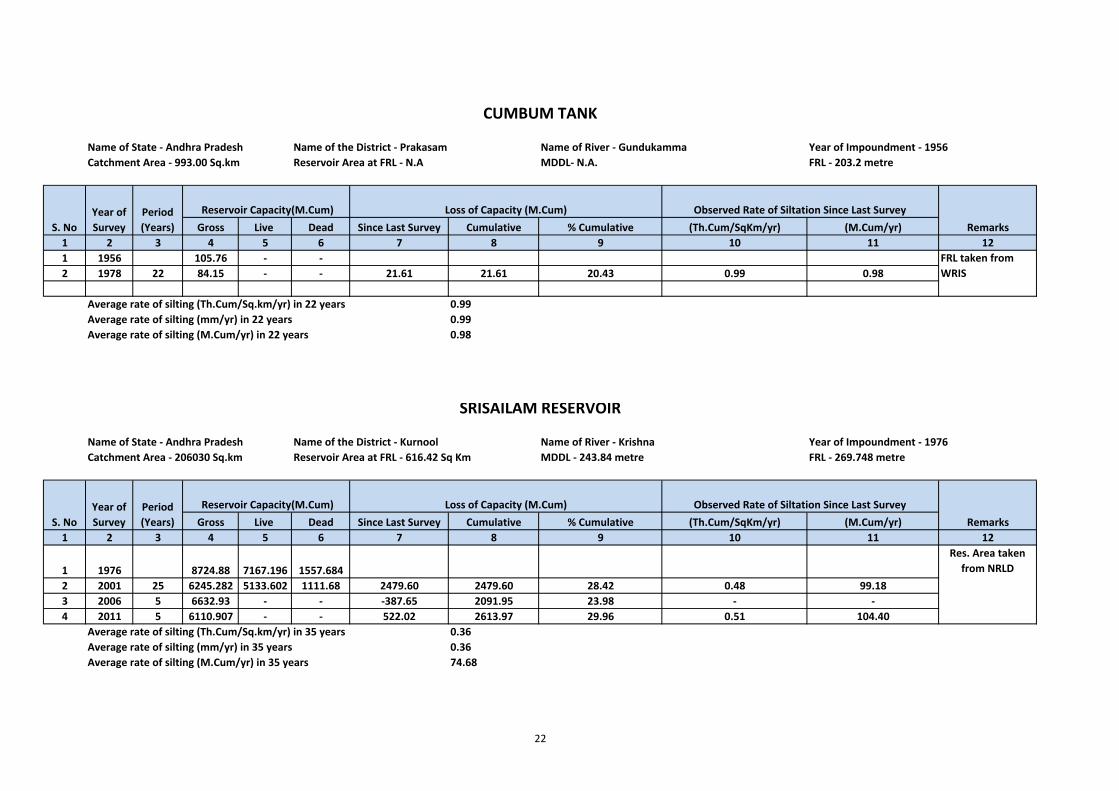
Name of State ‐ Andhra Pradesh Name of the District ‐ Prakasam Name of River ‐ Gundukamma Year of Impoundment ‐ 1956Catchment Area ‐ 993.00 Sq.km Reservoir Area at FRL ‐ N.A MDDL‐ N.A. FRL ‐ 203.2 metre
Gross Live Dead Since Last Survey Cumulative % Cumulative (Th.Cum/SqKm/yr) (M.Cum/yr)1 2 3 4 5 6 7 8 9 10 11 121 1956 105.76 ‐ ‐ FRL taken from2 1978 22 84.15 ‐ ‐ 21.61 21.61 20.43 0.99 0.98 WRIS
Average rate of silting (Th.Cum/Sq.km/yr) in 22 years 0.99Average rate of silting (mm/yr) in 22 years 0.99Average rate of silting (M.Cum/yr) in 22 years 0.98
Name of State ‐ Andhra Pradesh Name of the District ‐ Kurnool Name of River ‐ Krishna Year of Impoundment ‐ 1976Catchment Area ‐ 206030 Sq.km Reservoir Area at FRL ‐ 616.42 Sq Km MDDL ‐ 243.84 metre FRL ‐ 269.748 metre
Gross Live Dead Since Last Survey Cumulative % Cumulative (Th.Cum/SqKm/yr) (M.Cum/yr)1 2 3 4 5 6 7 8 9 10 11 12
1 1976 8724.88 7167.196 1557.684Res. Area takenfrom NRLD
2 2001 25 6245.282 5133.602 1111.68 2479.60 2479.60 28.42 0.48 99.183 2006 5 6632.93 ‐ ‐ ‐387.65 2091.95 23.98 ‐ ‐4 2011 5 6110.907 ‐ ‐ 522.02 2613.97 29.96 0.51 104.40
Average rate of silting (Th.Cum/Sq.km/yr) in 35 years 0.36Average rate of silting (mm/yr) in 35 years 0.36Average rate of silting (M.Cum/yr) in 35 years 74.68
S. NoReservoir Capacity(M.Cum)Year of
SurveyPeriod(Years)
Remarks
Remarks
Year ofSurvey
Period(Years)
Reservoir Capacity(M.Cum) Observed Rate of Siltation Since Last SurveyLoss of Capacity (M.Cum)S. No
Observed Rate of Siltation Since Last Survey
SRISAILAM RESERVOIR
Loss of Capacity (M.Cum)
CUMBUM TANK
22
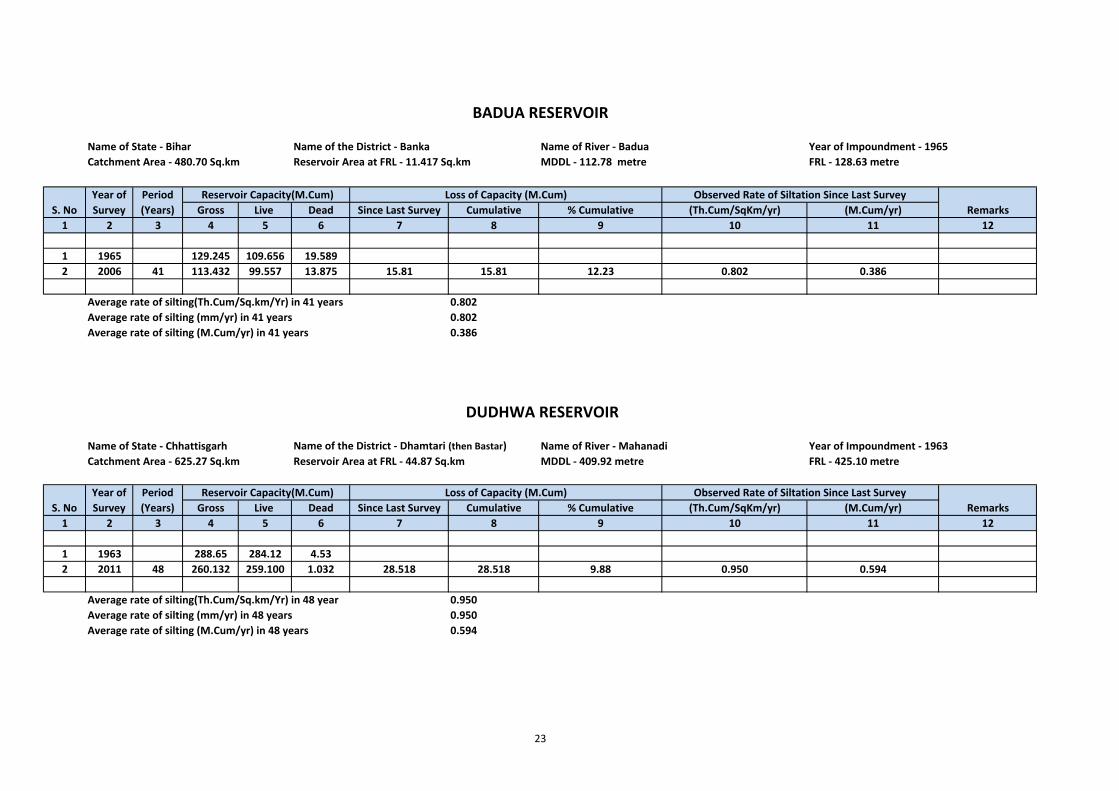
Name of State ‐ Bihar Name of the District ‐ Banka Name of River ‐ Badua Year of Impoundment ‐ 1965Catchment Area ‐ 480.70 Sq.km Reservoir Area at FRL ‐ 11.417 Sq.km MDDL ‐ 112.78 metre FRL ‐ 128.63 metre
Gross Live Dead Since Last Survey Cumulative % Cumulative (Th.Cum/SqKm/yr) (M.Cum/yr)1 2 3 4 5 6 7 8 9 10 11 12
1 1965 129.245 109.656 19.5892 2006 41 113.432 99.557 13.875 15.81 15.81 12.23 0.802 0.386
Average rate of silting(Th.Cum/Sq.km/Yr) in 41 years 0.802Average rate of silting (mm/yr) in 41 years 0.802Average rate of silting (M.Cum/yr) in 41 years 0.386
Name of State ‐ Chhattisgarh Name of the District ‐ Dhamtari (then Bastar) Name of River ‐ Mahanadi Year of Impoundment ‐ 1963Catchment Area ‐ 625.27 Sq.km Reservoir Area at FRL ‐ 44.87 Sq.km MDDL ‐ 409.92 metre FRL ‐ 425.10 metre
Gross Live Dead Since Last Survey Cumulative % Cumulative (Th.Cum/SqKm/yr) (M.Cum/yr)1 2 3 4 5 6 7 8 9 10 11 12
1 1963 288.65 284.12 4.532 2011 48 260.132 259.100 1.032 28.518 28.518 9.88 0.950 0.594
Average rate of silting(Th.Cum/Sq.km/Yr) in 48 year 0.950Average rate of silting (mm/yr) in 48 years 0.950Average rate of silting (M.Cum/yr) in 48 years 0.594
Year of Survey
Period (Years)
Reservoir Capacity(M.Cum) Loss of Capacity (M.Cum) Observed Rate of Siltation Since Last SurveyRemarks
Year of Survey
Period (Years)
Reservoir Capacity(M.Cum) Loss of Capacity (M.Cum) Observed Rate of Siltation Since Last SurveyRemarks
BADUA RESERVOIR
S. No
DUDHWA RESERVOIR
S. No
23
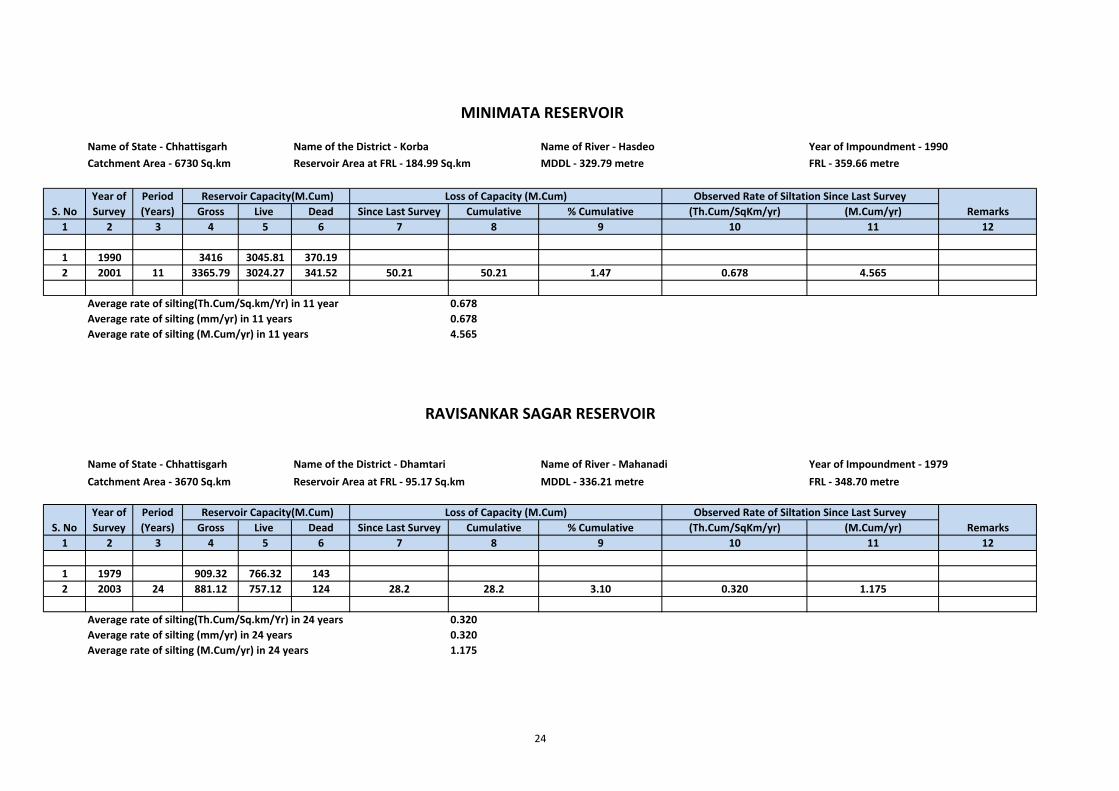
Name of State ‐ Chhattisgarh Name of the District ‐ Korba Name of River ‐ Hasdeo Year of Impoundment ‐ 1990Catchment Area ‐ 6730 Sq.km Reservoir Area at FRL ‐ 184.99 Sq.km MDDL ‐ 329.79 metre FRL ‐ 359.66 metre
Gross Live Dead Since Last Survey Cumulative % Cumulative (Th.Cum/SqKm/yr) (M.Cum/yr)1 2 3 4 5 6 7 8 9 10 11 12
1 1990 3416 3045.81 370.192 2001 11 3365.79 3024.27 341.52 50.21 50.21 1.47 0.678 4.565
Average rate of silting(Th.Cum/Sq.km/Yr) in 11 year 0.678Average rate of silting (mm/yr) in 11 years 0.678Average rate of silting (M.Cum/yr) in 11 years 4.565
Name of State ‐ Chhattisgarh Name of the District ‐ Dhamtari Name of River ‐ Mahanadi Year of Impoundment ‐ 1979Catchment Area ‐ 3670 Sq.km Reservoir Area at FRL ‐ 95.17 Sq.km MDDL ‐ 336.21 metre FRL ‐ 348.70 metre
Gross Live Dead Since Last Survey Cumulative % Cumulative (Th.Cum/SqKm/yr) (M.Cum/yr)1 2 3 4 5 6 7 8 9 10 11 12
1 1979 909.32 766.32 1432 2003 24 881.12 757.12 124 28.2 28.2 3.10 0.320 1.175
Average rate of silting(Th.Cum/Sq.km/Yr) in 24 years 0.320Average rate of silting (mm/yr) in 24 years 0.320Average rate of silting (M.Cum/yr) in 24 years 1.175
Period (Years)
Reservoir Capacity(M.Cum)Year of Survey
Reservoir Capacity(M.Cum)Remarks
Period (Years)
Remarks
RAVISANKAR SAGAR RESERVOIR
S. NoLoss of Capacity (M.Cum) Observed Rate of Siltation Since Last Survey
MINIMATA RESERVOIR
S. NoYear of Survey
Loss of Capacity (M.Cum) Observed Rate of Siltation Since Last Survey
24
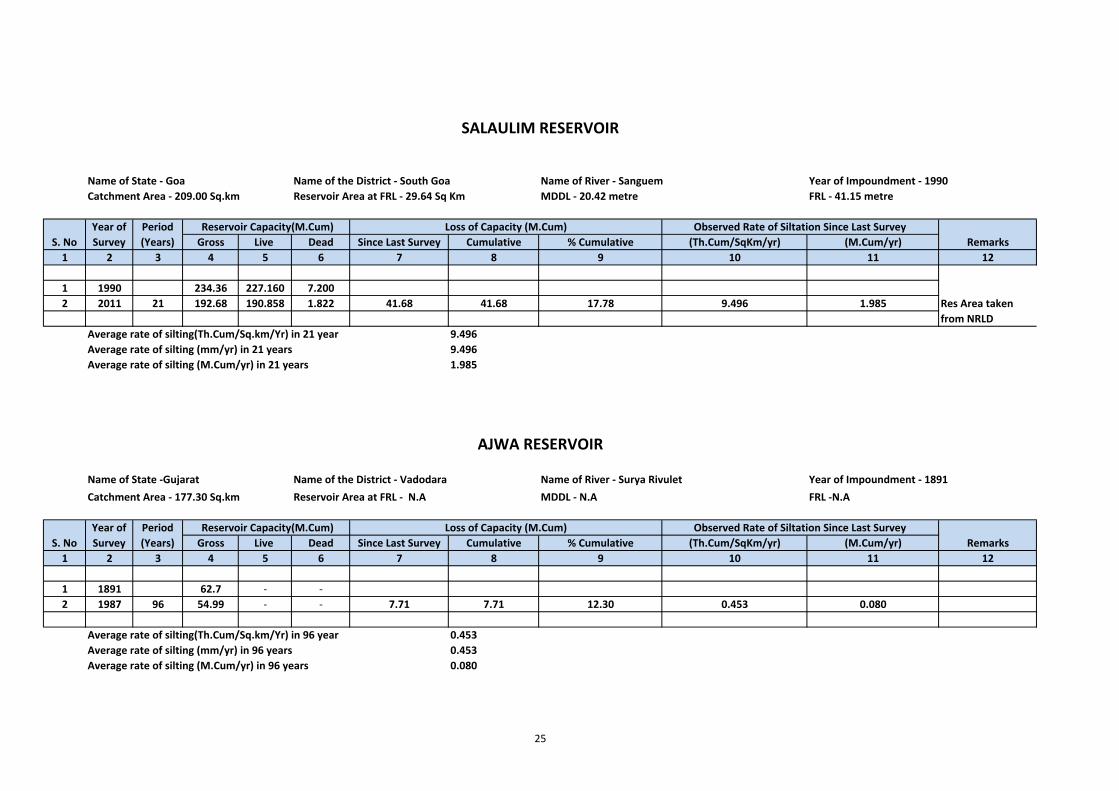
Name of State ‐ Goa Name of the District ‐ South Goa Name of River ‐ Sanguem Year of Impoundment ‐ 1990Catchment Area ‐ 209.00 Sq.km Reservoir Area at FRL ‐ 29.64 Sq Km MDDL ‐ 20.42 metre FRL ‐ 41.15 metre
Gross Live Dead Since Last Survey Cumulative % Cumulative (Th.Cum/SqKm/yr) (M.Cum/yr)1 2 3 4 5 6 7 8 9 10 11 12
1 1990 234.36 227.160 7.2002 2011 21 192.68 190.858 1.822 41.68 41.68 17.78 9.496 1.985
Average rate of silting(Th.Cum/Sq.km/Yr) in 21 year 9.496Average rate of silting (mm/yr) in 21 years 9.496Average rate of silting (M.Cum/yr) in 21 years 1.985
Name of State ‐Gujarat Name of the District ‐ Vadodara Name of River ‐ Surya Rivulet Year of Impoundment ‐ 1891Catchment Area ‐ 177.30 Sq.km Reservoir Area at FRL ‐ N.A MDDL ‐ N.A FRL ‐N.A
Gross Live Dead Since Last Survey Cumulative % Cumulative (Th.Cum/SqKm/yr) (M.Cum/yr)1 2 3 4 5 6 7 8 9 10 11 12
1 1891 62.7 ‐ ‐2 1987 96 54.99 ‐ ‐ 7.71 7.71 12.30 0.453 0.080
Average rate of silting(Th.Cum/Sq.km/Yr) in 96 year 0.453Average rate of silting (mm/yr) in 96 years 0.453Average rate of silting (M.Cum/yr) in 96 years 0.080
Res Area taken from NRLD
S. NoYear of Survey
Period (Years)
Period (Years)
Remarks
SALAULIM RESERVOIR
Reservoir Capacity(M.Cum) Loss of Capacity (M.Cum)
Loss of Capacity (M.Cum) Reservoir Capacity(M.Cum) Observed Rate of Siltation Since Last Survey
Observed Rate of Siltation Since Last Survey
AJWA RESERVOIR
S. NoYear of Survey Remarks
25
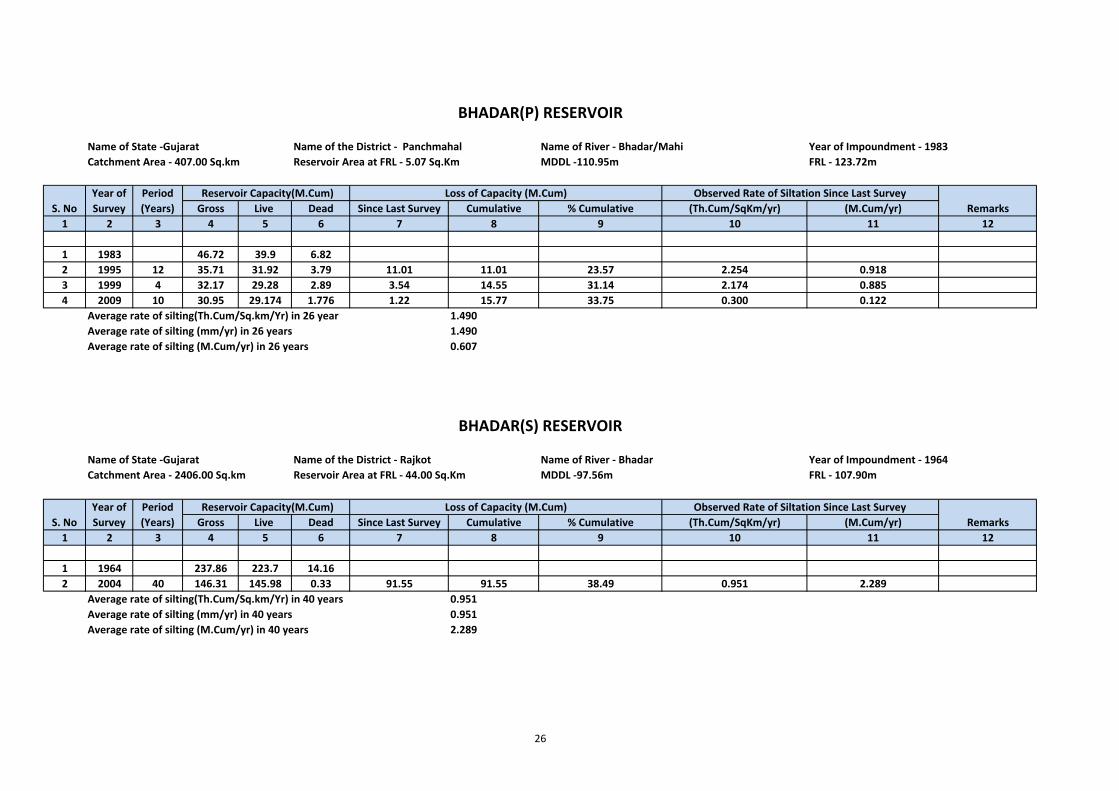
Name of State ‐Gujarat Name of the District ‐ Panchmahal Name of River ‐ Bhadar/Mahi Year of Impoundment ‐ 1983Catchment Area ‐ 407.00 Sq.km Reservoir Area at FRL ‐ 5.07 Sq.Km MDDL ‐110.95m FRL ‐ 123.72m
Gross Live Dead Since Last Survey Cumulative % Cumulative (Th.Cum/SqKm/yr) (M.Cum/yr)1 2 3 4 5 6 7 8 9 10 11 12
1 1983 46.72 39.9 6.822 1995 12 35.71 31.92 3.79 11.01 11.01 23.57 2.254 0.9183 1999 4 32.17 29.28 2.89 3.54 14.55 31.14 2.174 0.8854 2009 10 30.95 29.174 1.776 1.22 15.77 33.75 0.300 0.122
Average rate of silting(Th.Cum/Sq.km/Yr) in 26 year 1.490Average rate of silting (mm/yr) in 26 years 1.490Average rate of silting (M.Cum/yr) in 26 years 0.607
Name of State ‐Gujarat Name of the District ‐ Rajkot Name of River ‐ Bhadar Year of Impoundment ‐ 1964Catchment Area ‐ 2406.00 Sq.km Reservoir Area at FRL ‐ 44.00 Sq.Km MDDL ‐97.56m FRL ‐ 107.90m
Gross Live Dead Since Last Survey Cumulative % Cumulative (Th.Cum/SqKm/yr) (M.Cum/yr)1 2 3 4 5 6 7 8 9 10 11 12
1 1964 237.86 223.7 14.162 2004 40 146.31 145.98 0.33 91.55 91.55 38.49 0.951 2.289
Average rate of silting(Th.Cum/Sq.km/Yr) in 40 years 0.951Average rate of silting (mm/yr) in 40 years 0.951Average rate of silting (M.Cum/yr) in 40 years 2.289
Loss of Capacity (M.Cum)Year of Survey
Period (Years) Remarks
BHADAR(P) RESERVOIR
S. No
Loss of Capacity (M.Cum)
Reservoir Capacity(M.Cum) Observed Rate of Siltation Since Last Survey
Year of Survey
Observed Rate of Siltation Since Last SurveyRemarks
Period (Years)S. No
Reservoir Capacity(M.Cum)
BHADAR(S) RESERVOIR
26
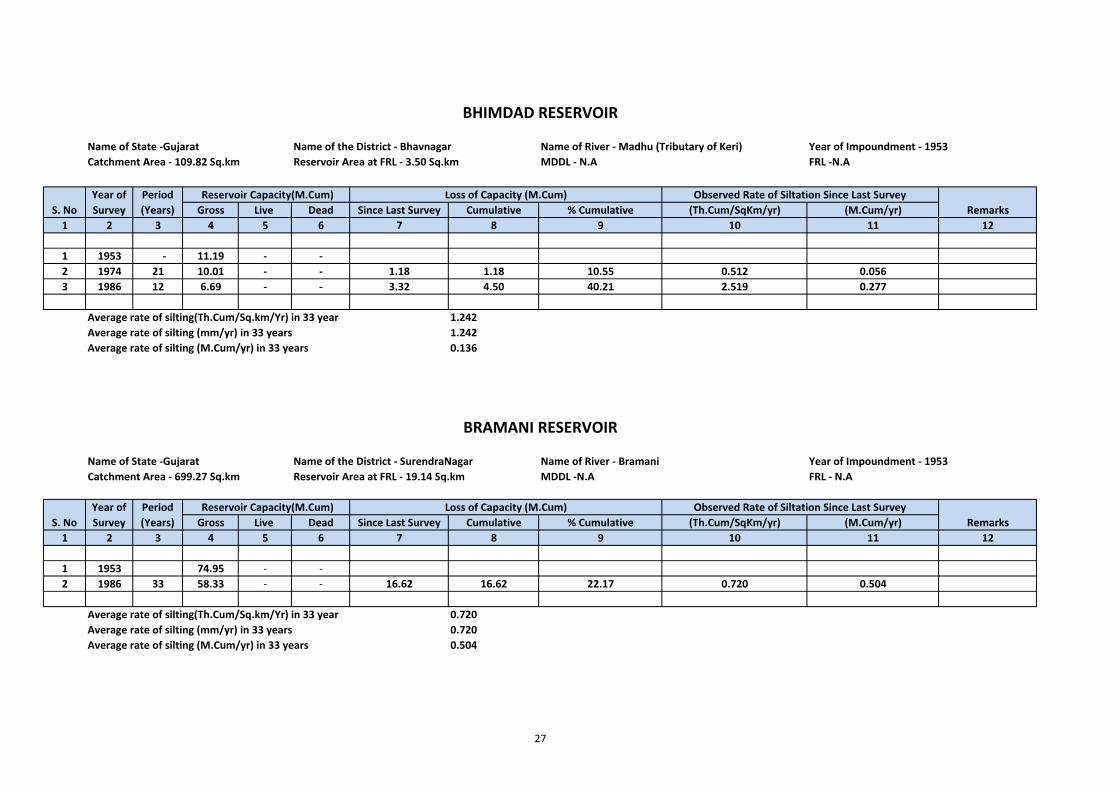
Name of State ‐Gujarat Name of the District ‐ Bhavnagar Name of River ‐ Madhu (Tributary of Keri) Year of Impoundment ‐ 1953Catchment Area ‐ 109.82 Sq.km Reservoir Area at FRL ‐ 3.50 Sq.km MDDL ‐ N.A FRL ‐N.A
Gross Live Dead Since Last Survey Cumulative % Cumulative (Th.Cum/SqKm/yr) (M.Cum/yr)1 2 3 4 5 6 7 8 9 10 11 12
1 1953 ‐ 11.19 ‐ ‐2 1974 21 10.01 ‐ ‐ 1.18 1.18 10.55 0.512 0.0563 1986 12 6.69 ‐ ‐ 3.32 4.50 40.21 2.519 0.277
Average rate of silting(Th.Cum/Sq.km/Yr) in 33 year 1.242Average rate of silting (mm/yr) in 33 years 1.242Average rate of silting (M.Cum/yr) in 33 years 0.136
Name of State ‐Gujarat Name of the District ‐ SurendraNagar Name of River ‐ Bramani Year of Impoundment ‐ 1953Catchment Area ‐ 699.27 Sq.km Reservoir Area at FRL ‐ 19.14 Sq.km MDDL ‐N.A FRL ‐ N.A
Gross Live Dead Since Last Survey Cumulative % Cumulative (Th.Cum/SqKm/yr) (M.Cum/yr)1 2 3 4 5 6 7 8 9 10 11 12
1 1953 74.95 ‐ ‐2 1986 33 58.33 ‐ ‐ 16.62 16.62 22.17 0.720 0.504
Average rate of silting(Th.Cum/Sq.km/Yr) in 33 year 0.720Average rate of silting (mm/yr) in 33 years 0.720Average rate of silting (M.Cum/yr) in 33 years 0.504
Period (Years)S. No
Period (Years)
BRAMANI RESERVOIR
Year of Survey
Observed Rate of Siltation Since Last Survey
S. NoYear of Survey
Loss of Capacity (M.Cum) Observed Rate of Siltation Since Last Survey
BHIMDAD RESERVOIR
Remarks
Reservoir Capacity(M.Cum)
Reservoir Capacity(M.Cum)
Loss of Capacity (M.Cum)Remarks
27
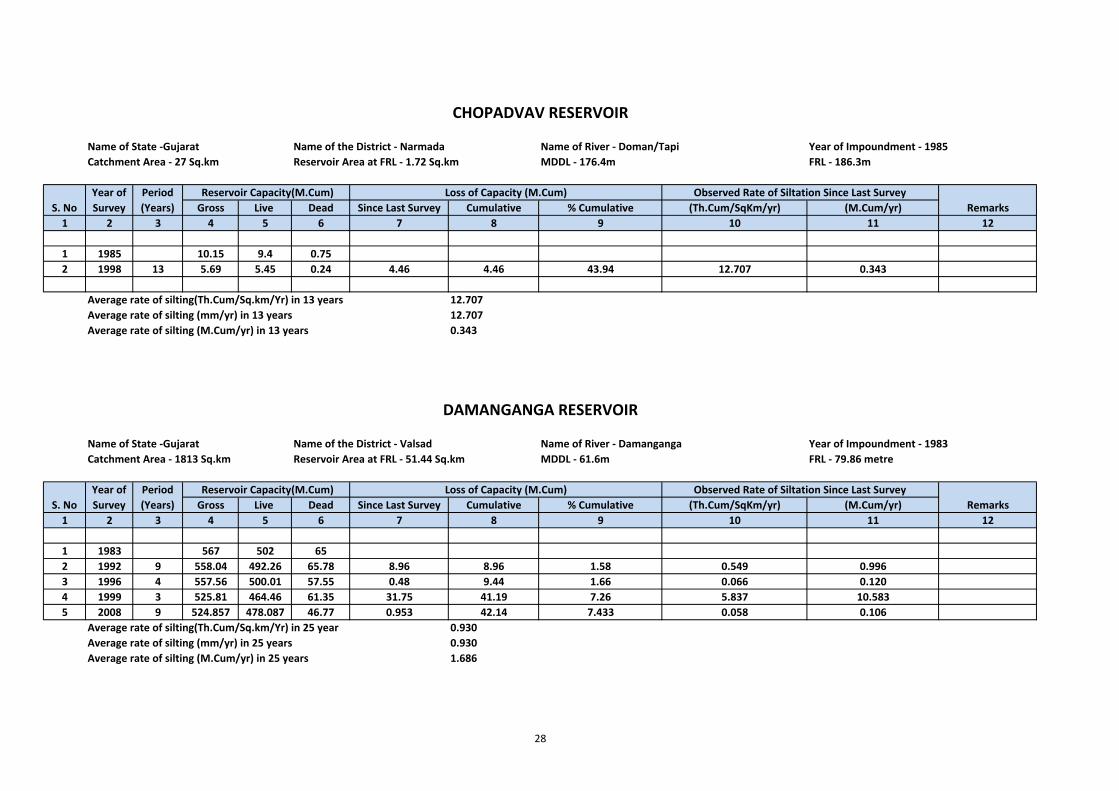
Name of State ‐Gujarat Name of the District ‐ Narmada Name of River ‐ Doman/Tapi Year of Impoundment ‐ 1985Catchment Area ‐ 27 Sq.km Reservoir Area at FRL ‐ 1.72 Sq.km MDDL ‐ 176.4m FRL ‐ 186.3m
Gross Live Dead Since Last Survey Cumulative % Cumulative (Th.Cum/SqKm/yr) (M.Cum/yr)1 2 3 4 5 6 7 8 9 10 11 12
1 1985 10.15 9.4 0.752 1998 13 5.69 5.45 0.24 4.46 4.46 43.94 12.707 0.343
Average rate of silting(Th.Cum/Sq.km/Yr) in 13 years 12.707Average rate of silting (mm/yr) in 13 years 12.707Average rate of silting (M.Cum/yr) in 13 years 0.343
Name of State ‐Gujarat Name of the District ‐ Valsad Name of River ‐ Damanganga Year of Impoundment ‐ 1983Catchment Area ‐ 1813 Sq.km Reservoir Area at FRL ‐ 51.44 Sq.km MDDL ‐ 61.6m FRL ‐ 79.86 metre
Gross Live Dead Since Last Survey Cumulative % Cumulative (Th.Cum/SqKm/yr) (M.Cum/yr)1 2 3 4 5 6 7 8 9 10 11 12
1 1983 567 502 652 1992 9 558.04 492.26 65.78 8.96 8.96 1.58 0.549 0.9963 1996 4 557.56 500.01 57.55 0.48 9.44 1.66 0.066 0.1204 1999 3 525.81 464.46 61.35 31.75 41.19 7.26 5.837 10.5835 2008 9 524.857 478.087 46.77 0.953 42.14 7.433 0.058 0.106
Average rate of silting(Th.Cum/Sq.km/Yr) in 25 year 0.930Average rate of silting (mm/yr) in 25 years 0.930Average rate of silting (M.Cum/yr) in 25 years 1.686
Period (Years)
Year of Survey
Reservoir Capacity(M.Cum) Observed Rate of Siltation Since Last Survey
DAMANGANGA RESERVOIR
CHOPADVAV RESERVOIR
S. NoPeriod (Years)
Reservoir Capacity(M.Cum) Loss of Capacity (M.Cum)Remarks
S. No
Observed Rate of Siltation Since Last SurveyYear of Survey
Loss of Capacity (M.Cum)Remarks
28
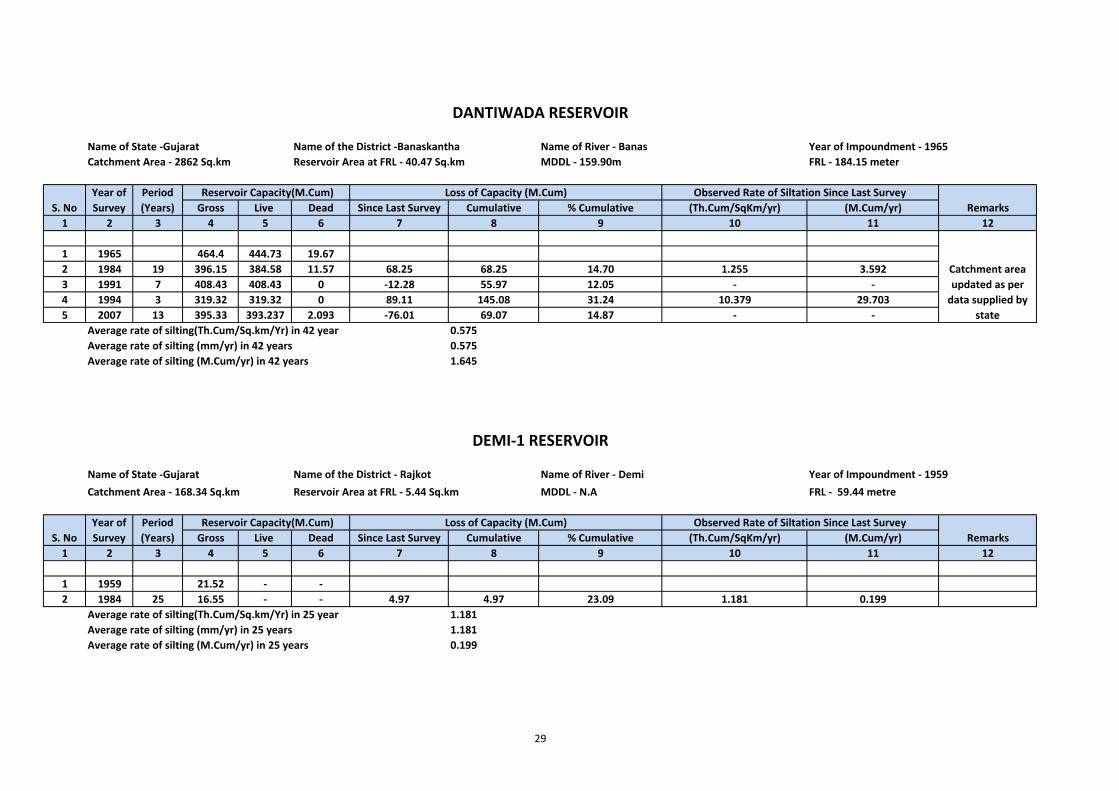
Name of State ‐Gujarat Name of the District ‐Banaskantha Name of River ‐ Banas Year of Impoundment ‐ 1965Catchment Area ‐ 2862 Sq.km Reservoir Area at FRL ‐ 40.47 Sq.km MDDL ‐ 159.90m FRL ‐ 184.15 meter
Gross Live Dead Since Last Survey Cumulative % Cumulative (Th.Cum/SqKm/yr) (M.Cum/yr)1 2 3 4 5 6 7 8 9 10 11 12
1 1965 464.4 444.73 19.672 1984 19 396.15 384.58 11.57 68.25 68.25 14.70 1.255 3.5923 1991 7 408.43 408.43 0 ‐12.28 55.97 12.05 ‐ ‐4 1994 3 319.32 319.32 0 89.11 145.08 31.24 10.379 29.7035 2007 13 395.33 393.237 2.093 ‐76.01 69.07 14.87 ‐ ‐
Average rate of silting(Th.Cum/Sq.km/Yr) in 42 year 0.575Average rate of silting (mm/yr) in 42 years 0.575Average rate of silting (M.Cum/yr) in 42 years 1.645
Name of State ‐Gujarat Name of the District ‐ Rajkot Name of River ‐ Demi Year of Impoundment ‐ 1959Catchment Area ‐ 168.34 Sq.km Reservoir Area at FRL ‐ 5.44 Sq.km MDDL ‐ N.A FRL ‐ 59.44 metre
Gross Live Dead Since Last Survey Cumulative % Cumulative (Th.Cum/SqKm/yr) (M.Cum/yr)1 2 3 4 5 6 7 8 9 10 11 12
1 1959 21.52 ‐ ‐2 1984 25 16.55 ‐ ‐ 4.97 4.97 23.09 1.181 0.199
Average rate of silting(Th.Cum/Sq.km/Yr) in 25 year 1.181Average rate of silting (mm/yr) in 25 years 1.181Average rate of silting (M.Cum/yr) in 25 years 0.199
Catchment area updated as per data supplied by
state
S. NoPeriod (Years)
Year of Survey Remarks
DEMI‐1 RESERVOIR
Observed Rate of Siltation Since Last SurveyLoss of Capacity (M.Cum)Period (Years)
Loss of Capacity (M.Cum)Remarks
S. No Reservoir Capacity(M.Cum)
Reservoir Capacity(M.Cum) Observed Rate of Siltation Since Last SurveyYear of Survey
DANTIWADA RESERVOIR
29
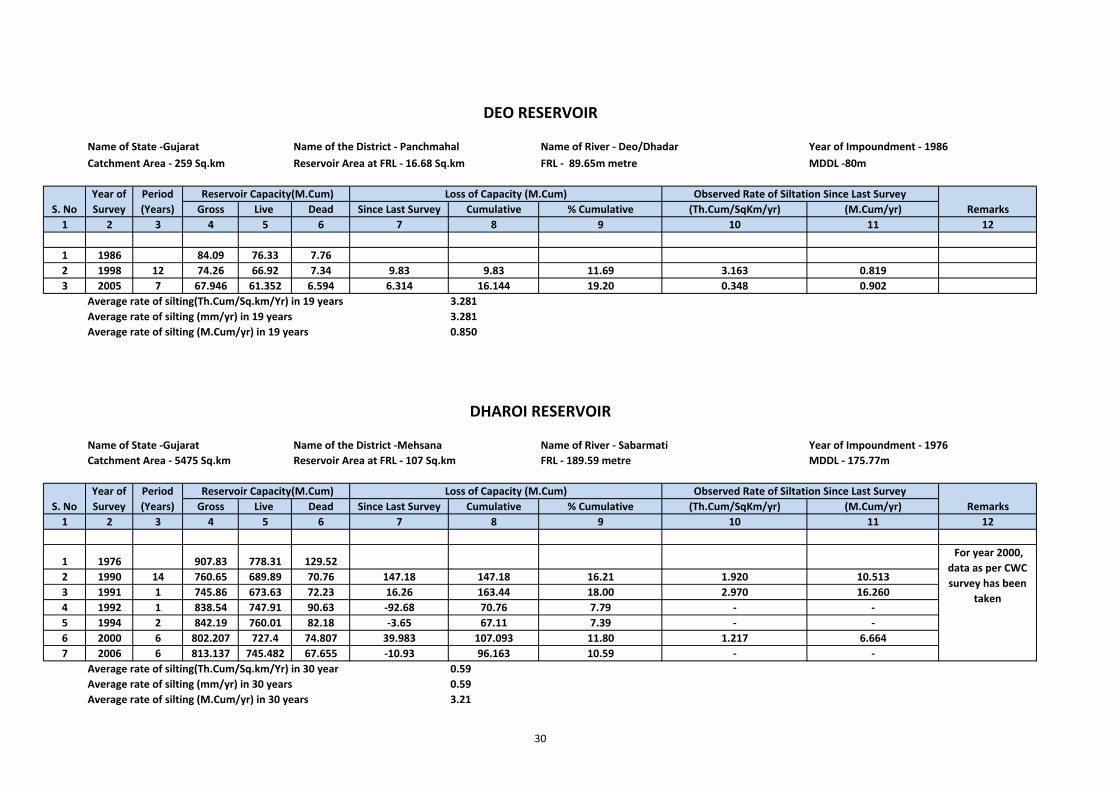
Name of State ‐Gujarat Name of the District ‐ Panchmahal Name of River ‐ Deo/Dhadar Year of Impoundment ‐ 1986Catchment Area ‐ 259 Sq.km Reservoir Area at FRL ‐ 16.68 Sq.km FRL ‐ 89.65m metre MDDL ‐80m
Gross Live Dead Since Last Survey Cumulative % Cumulative (Th.Cum/SqKm/yr) (M.Cum/yr)1 2 3 4 5 6 7 8 9 10 11 12
1 1986 84.09 76.33 7.762 1998 12 74.26 66.92 7.34 9.83 9.83 11.69 3.163 0.8193 2005 7 67.946 61.352 6.594 6.314 16.144 19.20 0.348 0.902
Average rate of silting(Th.Cum/Sq.km/Yr) in 19 years 3.281Average rate of silting (mm/yr) in 19 years 3.281Average rate of silting (M.Cum/yr) in 19 years 0.850
Name of State ‐Gujarat Name of the District ‐Mehsana Name of River ‐ Sabarmati Year of Impoundment ‐ 1976Catchment Area ‐ 5475 Sq.km Reservoir Area at FRL ‐ 107 Sq.km FRL ‐ 189.59 metre MDDL ‐ 175.77m
Gross Live Dead Since Last Survey Cumulative % Cumulative (Th.Cum/SqKm/yr) (M.Cum/yr)1 2 3 4 5 6 7 8 9 10 11 12
1 1976 907.83 778.31 129.522 1990 14 760.65 689.89 70.76 147.18 147.18 16.21 1.920 10.5133 1991 1 745.86 673.63 72.23 16.26 163.44 18.00 2.970 16.2604 1992 1 838.54 747.91 90.63 ‐92.68 70.76 7.79 ‐ ‐5 1994 2 842.19 760.01 82.18 ‐3.65 67.11 7.39 ‐ ‐6 2000 6 802.207 727.4 74.807 39.983 107.093 11.80 1.217 6.6647 2006 6 813.137 745.482 67.655 ‐10.93 96.163 10.59 ‐ ‐
Average rate of silting(Th.Cum/Sq.km/Yr) in 30 year 0.59Average rate of silting (mm/yr) in 30 years 0.59Average rate of silting (M.Cum/yr) in 30 years 3.21
Reservoir Capacity(M.Cum)
DHAROI RESERVOIR
Observed Rate of Siltation Since Last Survey
For year 2000, data as per CWC survey has been
taken
RemarksPeriod (Years)
Loss of Capacity (M.Cum)
Year of Survey
Reservoir Capacity(M.Cum)
Loss of Capacity (M.Cum)S. No
Observed Rate of Siltation Since Last SurveyRemarks
DEO RESERVOIR
S. NoYear of Survey
Period (Years)
30
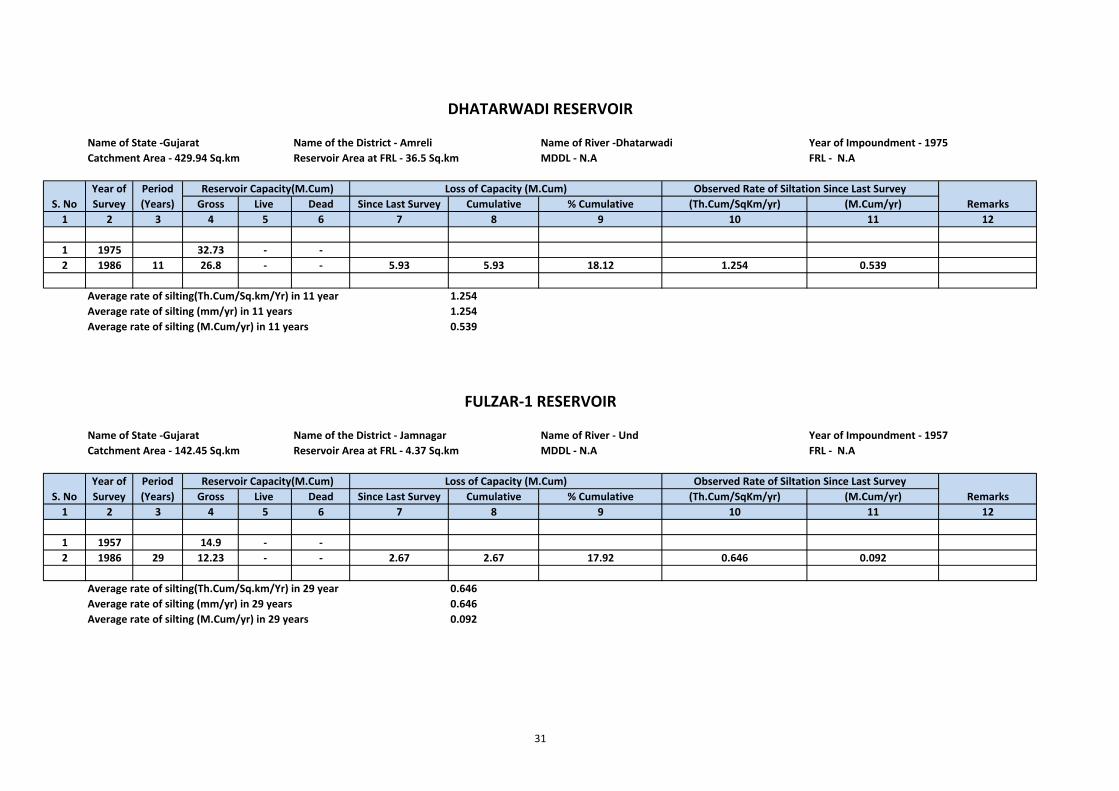
Name of State ‐Gujarat Name of the District ‐ Amreli Name of River ‐Dhatarwadi Year of Impoundment ‐ 1975Catchment Area ‐ 429.94 Sq.km Reservoir Area at FRL ‐ 36.5 Sq.km MDDL ‐ N.A FRL ‐ N.A
Gross Live Dead Since Last Survey Cumulative % Cumulative (Th.Cum/SqKm/yr) (M.Cum/yr)1 2 3 4 5 6 7 8 9 10 11 12
1 1975 32.73 ‐ ‐2 1986 11 26.8 ‐ ‐ 5.93 5.93 18.12 1.254 0.539
Average rate of silting(Th.Cum/Sq.km/Yr) in 11 year 1.254Average rate of silting (mm/yr) in 11 years 1.254Average rate of silting (M.Cum/yr) in 11 years 0.539
Name of State ‐Gujarat Name of the District ‐ Jamnagar Name of River ‐ Und Year of Impoundment ‐ 1957Catchment Area ‐ 142.45 Sq.km Reservoir Area at FRL ‐ 4.37 Sq.km MDDL ‐ N.A FRL ‐ N.A
Gross Live Dead Since Last Survey Cumulative % Cumulative (Th.Cum/SqKm/yr) (M.Cum/yr)1 2 3 4 5 6 7 8 9 10 11 12
1 1957 14.9 ‐ ‐2 1986 29 12.23 ‐ ‐ 2.67 2.67 17.92 0.646 0.092
Average rate of silting(Th.Cum/Sq.km/Yr) in 29 year 0.646Average rate of silting (mm/yr) in 29 years 0.646Average rate of silting (M.Cum/yr) in 29 years 0.092
Reservoir Capacity(M.Cum)
Observed Rate of Siltation Since Last Survey
Loss of Capacity (M.Cum)
FULZAR‐1 RESERVOIR
Period (Years)
Year of Survey
Period (Years)
Remarks
Observed Rate of Siltation Since Last SurveyYear of Survey
Reservoir Capacity(M.Cum)
Remarks
DHATARWADI RESERVOIR
Loss of Capacity (M.Cum)
S. No
S. No
31
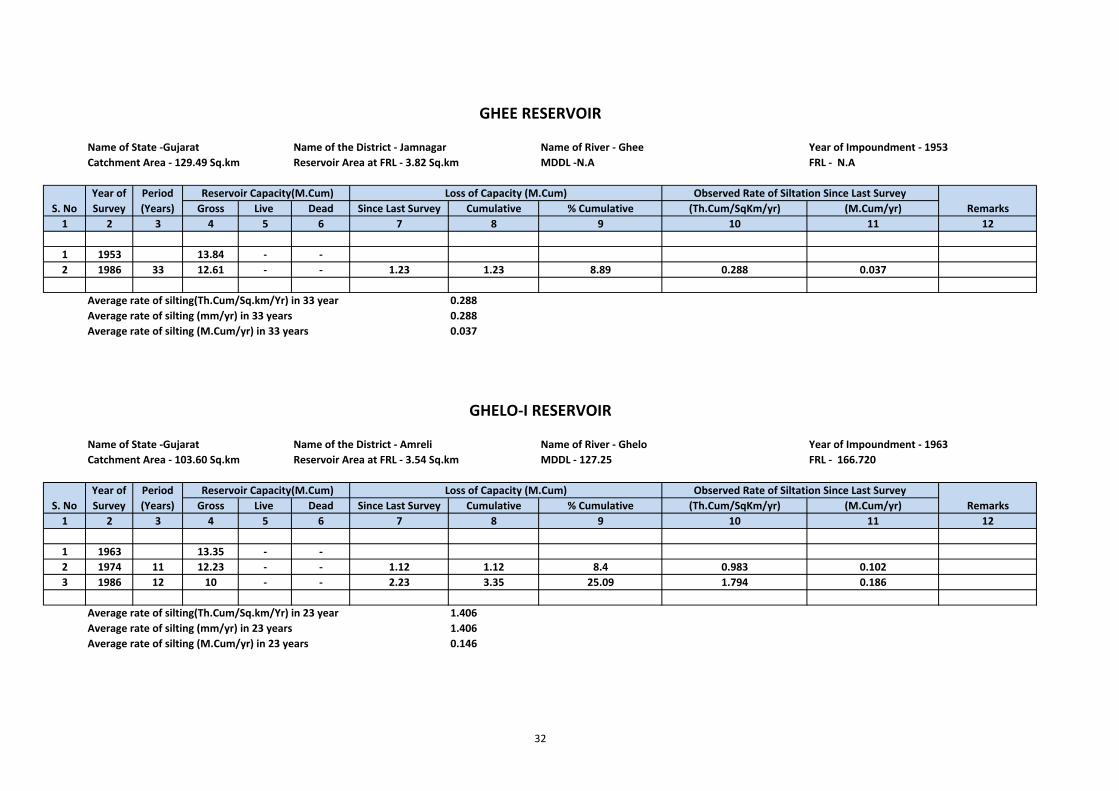
Name of State ‐Gujarat Name of the District ‐ Jamnagar Name of River ‐ Ghee Year of Impoundment ‐ 1953Catchment Area ‐ 129.49 Sq.km Reservoir Area at FRL ‐ 3.82 Sq.km MDDL ‐N.A FRL ‐ N.A
Gross Live Dead Since Last Survey Cumulative % Cumulative (Th.Cum/SqKm/yr) (M.Cum/yr)1 2 3 4 5 6 7 8 9 10 11 12
1 1953 13.84 ‐ ‐2 1986 33 12.61 ‐ ‐ 1.23 1.23 8.89 0.288 0.037
Average rate of silting(Th.Cum/Sq.km/Yr) in 33 year 0.288Average rate of silting (mm/yr) in 33 years 0.288Average rate of silting (M.Cum/yr) in 33 years 0.037
Name of State ‐Gujarat Name of the District ‐ Amreli Name of River ‐ Ghelo Year of Impoundment ‐ 1963Catchment Area ‐ 103.60 Sq.km Reservoir Area at FRL ‐ 3.54 Sq.km MDDL ‐ 127.25 FRL ‐ 166.720
Gross Live Dead Since Last Survey Cumulative % Cumulative (Th.Cum/SqKm/yr) (M.Cum/yr)1 2 3 4 5 6 7 8 9 10 11 12
1 1963 13.35 ‐ ‐2 1974 11 12.23 ‐ ‐ 1.12 1.12 8.4 0.983 0.1023 1986 12 10 ‐ ‐ 2.23 3.35 25.09 1.794 0.186
Average rate of silting(Th.Cum/Sq.km/Yr) in 23 year 1.406Average rate of silting (mm/yr) in 23 years 1.406Average rate of silting (M.Cum/yr) in 23 years 0.146
GHELO‐I RESERVOIR
Reservoir Capacity(M.Cum)
Observed Rate of Siltation Since Last Survey
RemarksLoss of Capacity (M.Cum)
GHEE RESERVOIR
Observed Rate of Siltation Since Last SurveyS. No
S. No
Year of Survey
Reservoir Capacity(M.Cum)
Period (Years)
Year of Survey
Period (Years) Remarks
Loss of Capacity (M.Cum)
32
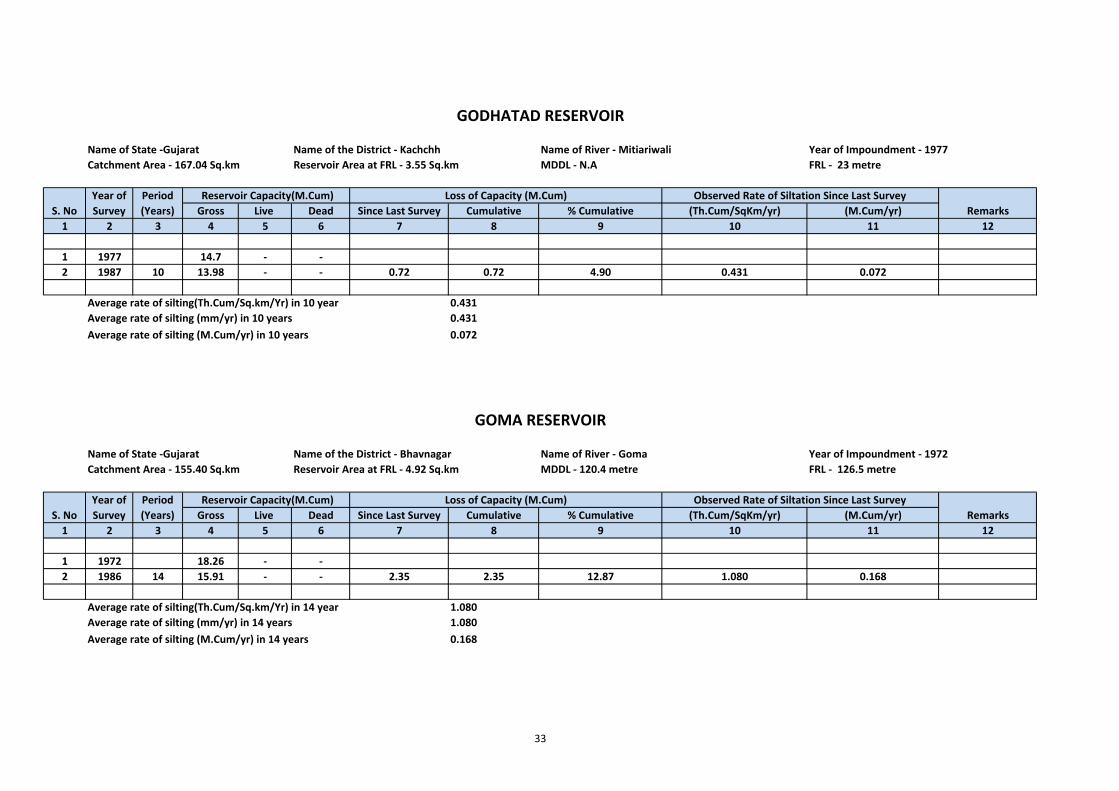
Name of State ‐Gujarat Name of the District ‐ Kachchh Name of River ‐ Mitiariwali Year of Impoundment ‐ 1977Catchment Area ‐ 167.04 Sq.km Reservoir Area at FRL ‐ 3.55 Sq.km MDDL ‐ N.A FRL ‐ 23 metre
Gross Live Dead Since Last Survey Cumulative % Cumulative (Th.Cum/SqKm/yr) (M.Cum/yr)1 2 3 4 5 6 7 8 9 10 11 12
1 1977 14.7 ‐ ‐2 1987 10 13.98 ‐ ‐ 0.72 0.72 4.90 0.431 0.072
Average rate of silting(Th.Cum/Sq.km/Yr) in 10 year 0.431Average rate of silting (mm/yr) in 10 years 0.431Average rate of silting (M.Cum/yr) in 10 years 0.072
Name of State ‐Gujarat Name of the District ‐ Bhavnagar Name of River ‐ Goma Year of Impoundment ‐ 1972Catchment Area ‐ 155.40 Sq.km Reservoir Area at FRL ‐ 4.92 Sq.km MDDL ‐ 120.4 metre FRL ‐ 126.5 metre
Gross Live Dead Since Last Survey Cumulative % Cumulative (Th.Cum/SqKm/yr) (M.Cum/yr)1 2 3 4 5 6 7 8 9 10 11 12
1 1972 18.26 ‐ ‐2 1986 14 15.91 ‐ ‐ 2.35 2.35 12.87 1.080 0.168
Average rate of silting(Th.Cum/Sq.km/Yr) in 14 year 1.080Average rate of silting (mm/yr) in 14 years 1.080Average rate of silting (M.Cum/yr) in 14 years 0.168
Year of Survey Remarks
Loss of Capacity (M.Cum)
GODHATAD RESERVOIR
Period (Years)
Reservoir Capacity(M.Cum)
Period (Years)
Reservoir Capacity(M.Cum)
S. No
Observed Rate of Siltation Since Last Survey
Year of Survey
GOMA RESERVOIR
S. No
RemarksObserved Rate of Siltation Since Last Survey
Loss of Capacity (M.Cum)
33
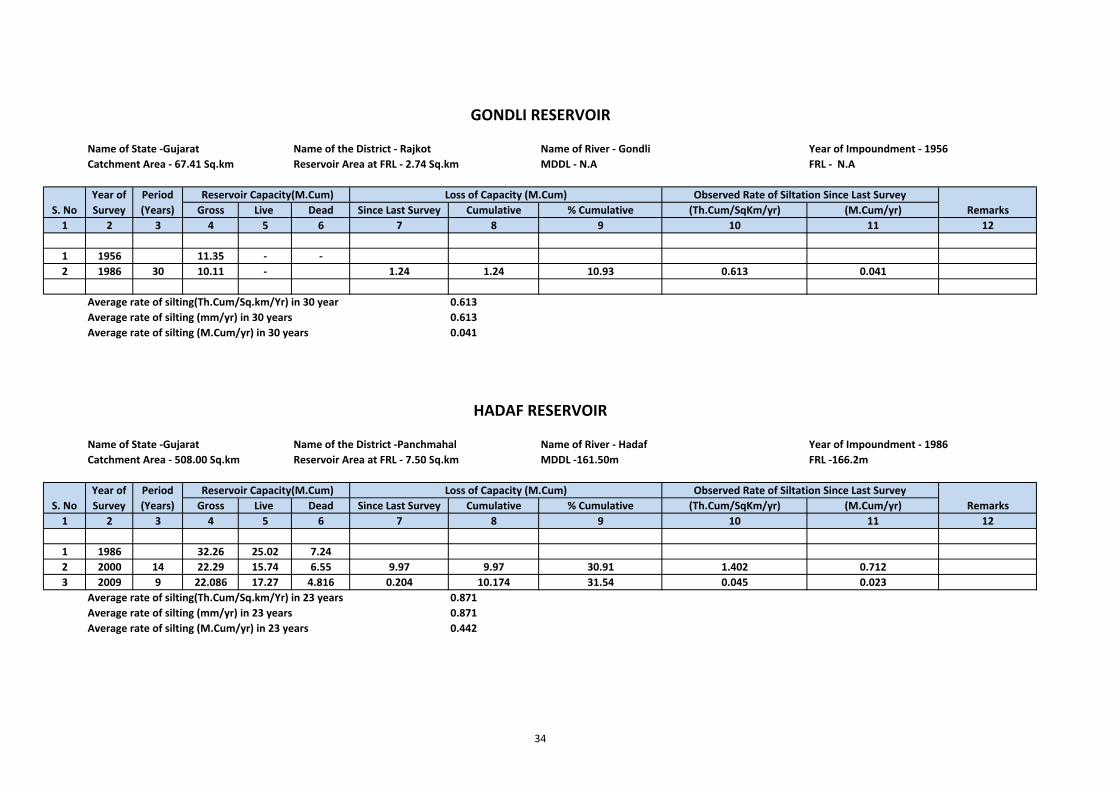
Name of State ‐Gujarat Name of the District ‐ Rajkot Name of River ‐ Gondli Year of Impoundment ‐ 1956Catchment Area ‐ 67.41 Sq.km Reservoir Area at FRL ‐ 2.74 Sq.km MDDL ‐ N.A FRL ‐ N.A
Gross Live Dead Since Last Survey Cumulative % Cumulative (Th.Cum/SqKm/yr) (M.Cum/yr)1 2 3 4 5 6 7 8 9 10 11 12
1 1956 11.35 ‐ ‐2 1986 30 10.11 ‐ 1.24 1.24 10.93 0.613 0.041
Average rate of silting(Th.Cum/Sq.km/Yr) in 30 year 0.613Average rate of silting (mm/yr) in 30 years 0.613Average rate of silting (M.Cum/yr) in 30 years 0.041
Name of State ‐Gujarat Name of the District ‐Panchmahal Name of River ‐ Hadaf Year of Impoundment ‐ 1986Catchment Area ‐ 508.00 Sq.km Reservoir Area at FRL ‐ 7.50 Sq.km MDDL ‐161.50m FRL ‐166.2m
Gross Live Dead Since Last Survey Cumulative % Cumulative (Th.Cum/SqKm/yr) (M.Cum/yr)1 2 3 4 5 6 7 8 9 10 11 12
1 1986 32.26 25.02 7.242 2000 14 22.29 15.74 6.55 9.97 9.97 30.91 1.402 0.7123 2009 9 22.086 17.27 4.816 0.204 10.174 31.54 0.045 0.023
Average rate of silting(Th.Cum/Sq.km/Yr) in 23 years 0.871Average rate of silting (mm/yr) in 23 years 0.871Average rate of silting (M.Cum/yr) in 23 years 0.442
Period (Years)
RemarksYear of Survey
Loss of Capacity (M.Cum) Observed Rate of Siltation Since Last Survey
S. No Reservoir Capacity(M.Cum)
HADAF RESERVOIR
Year of Survey
S. No
Observed Rate of Siltation Since Last Survey
GONDLI RESERVOIR
Loss of Capacity (M.Cum)Remarks
Reservoir Capacity(M.Cum)Period (Years)
34
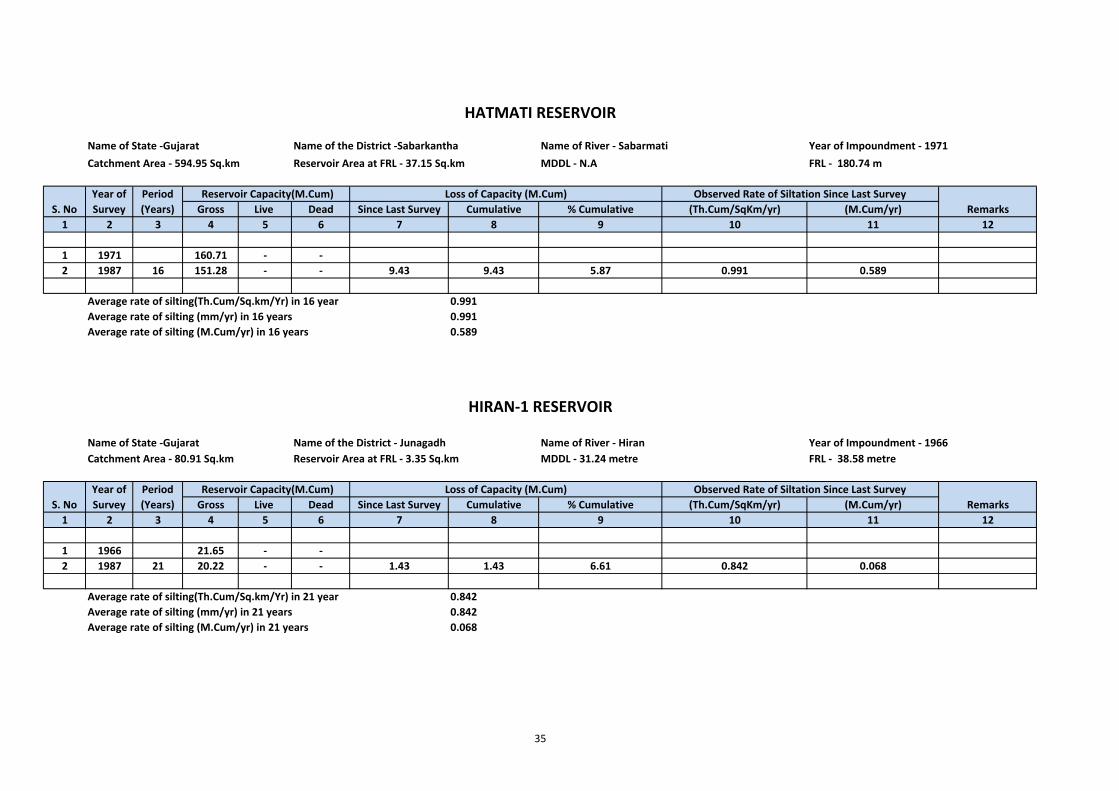
Name of State ‐Gujarat Name of the District ‐Sabarkantha Name of River ‐ Sabarmati Year of Impoundment ‐ 1971Catchment Area ‐ 594.95 Sq.km Reservoir Area at FRL ‐ 37.15 Sq.km MDDL ‐ N.A FRL ‐ 180.74 m
Gross Live Dead Since Last Survey Cumulative % Cumulative (Th.Cum/SqKm/yr) (M.Cum/yr)1 2 3 4 5 6 7 8 9 10 11 12
1 1971 160.71 ‐ ‐2 1987 16 151.28 ‐ ‐ 9.43 9.43 5.87 0.991 0.589
Average rate of silting(Th.Cum/Sq.km/Yr) in 16 year 0.991Average rate of silting (mm/yr) in 16 years 0.991Average rate of silting (M.Cum/yr) in 16 years 0.589
Name of State ‐Gujarat Name of the District ‐ Junagadh Name of River ‐ Hiran Year of Impoundment ‐ 1966Catchment Area ‐ 80.91 Sq.km Reservoir Area at FRL ‐ 3.35 Sq.km MDDL ‐ 31.24 metre FRL ‐ 38.58 metre
Gross Live Dead Since Last Survey Cumulative % Cumulative (Th.Cum/SqKm/yr) (M.Cum/yr)1 2 3 4 5 6 7 8 9 10 11 12
1 1966 21.65 ‐ ‐2 1987 21 20.22 ‐ ‐ 1.43 1.43 6.61 0.842 0.068
Average rate of silting(Th.Cum/Sq.km/Yr) in 21 year 0.842Average rate of silting (mm/yr) in 21 years 0.842Average rate of silting (M.Cum/yr) in 21 years 0.068
HATMATI RESERVOIR
S. No
RemarksLoss of Capacity (M.Cum)
Year of Survey
HIRAN‐1 RESERVOIR
Reservoir Capacity(M.Cum)
Period (Years)
Observed Rate of Siltation Since Last Survey Reservoir Capacity(M.Cum)Year of Survey
Observed Rate of Siltation Since Last SurveyRemarks
S. No
Loss of Capacity (M.Cum)Period (Years)
35
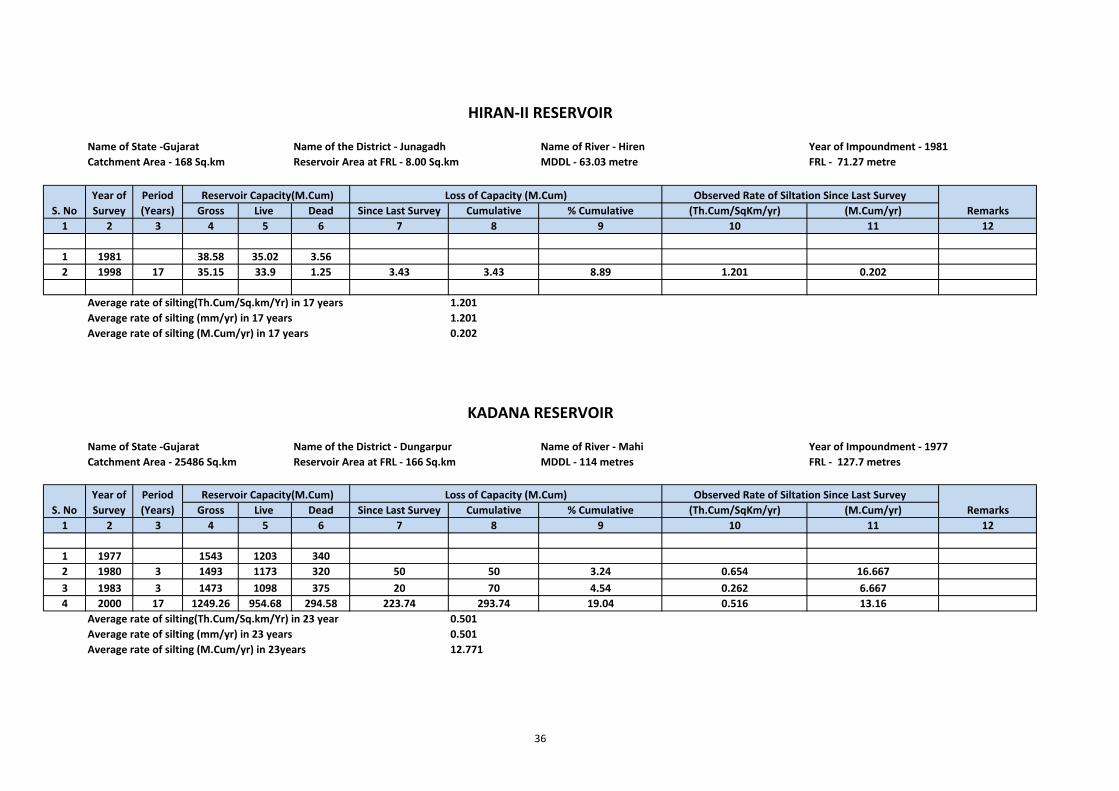
Name of State ‐Gujarat Name of the District ‐ Junagadh Name of River ‐ Hiren Year of Impoundment ‐ 1981Catchment Area ‐ 168 Sq.km Reservoir Area at FRL ‐ 8.00 Sq.km MDDL ‐ 63.03 metre FRL ‐ 71.27 metre
Gross Live Dead Since Last Survey Cumulative % Cumulative (Th.Cum/SqKm/yr) (M.Cum/yr)1 2 3 4 5 6 7 8 9 10 11 12
1 1981 38.58 35.02 3.562 1998 17 35.15 33.9 1.25 3.43 3.43 8.89 1.201 0.202
Average rate of silting(Th.Cum/Sq.km/Yr) in 17 years 1.201Average rate of silting (mm/yr) in 17 years 1.201Average rate of silting (M.Cum/yr) in 17 years 0.202
Name of State ‐Gujarat Name of the District ‐ Dungarpur Name of River ‐ Mahi Year of Impoundment ‐ 1977Catchment Area ‐ 25486 Sq.km Reservoir Area at FRL ‐ 166 Sq.km MDDL ‐ 114 metres FRL ‐ 127.7 metres
Gross Live Dead Since Last Survey Cumulative % Cumulative (Th.Cum/SqKm/yr) (M.Cum/yr)1 2 3 4 5 6 7 8 9 10 11 12
1 1977 1543 1203 3402 1980 3 1493 1173 320 50 50 3.24 0.654 16.6673 1983 3 1473 1098 375 20 70 4.54 0.262 6.6674 2000 17 1249.26 954.68 294.58 223.74 293.74 19.04 0.516 13.16
Average rate of silting(Th.Cum/Sq.km/Yr) in 23 year 0.501Average rate of silting (mm/yr) in 23 years 0.501Average rate of silting (M.Cum/yr) in 23years 12.771
Reservoir Capacity(M.Cum)Remarks
Year of Survey
Year of Survey
Period (Years)
Reservoir Capacity(M.Cum) Observed Rate of Siltation Since Last SurveyRemarks
KADANA RESERVOIR
Observed Rate of Siltation Since Last SurveyLoss of Capacity (M.Cum)
Loss of Capacity (M.Cum)
S. No
HIRAN‐II RESERVOIR
S. No
Period (Years)
36
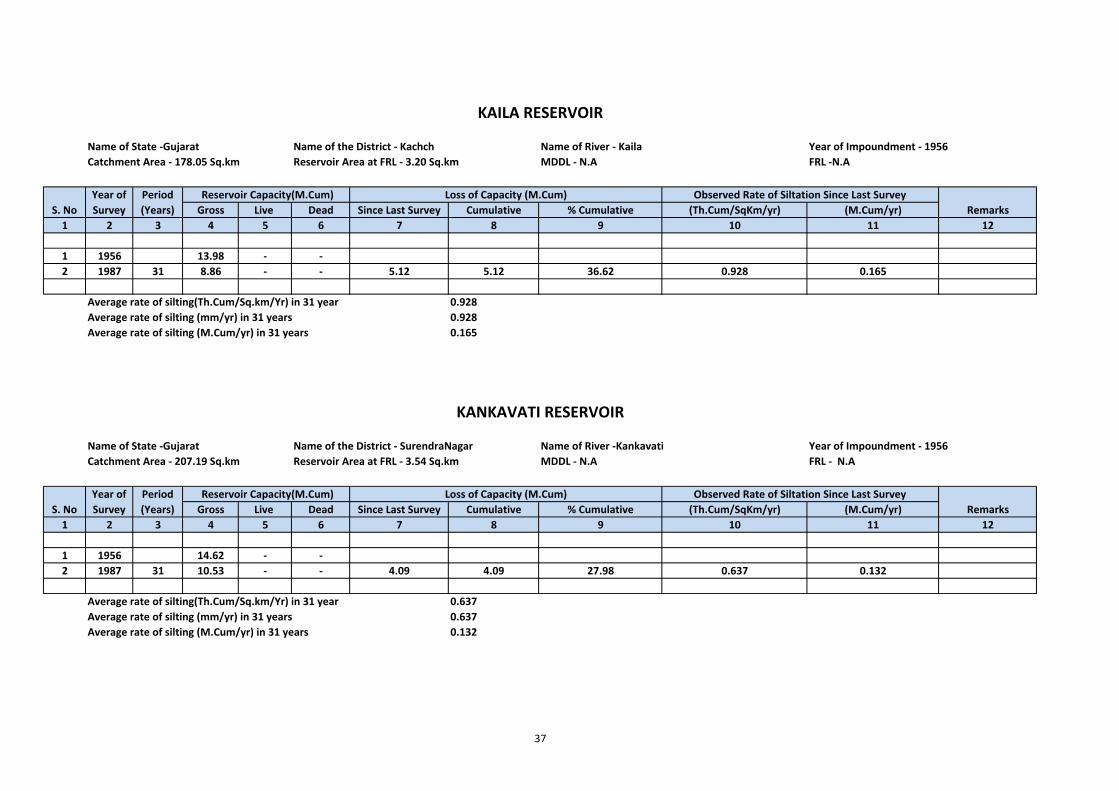
Name of State ‐Gujarat Name of the District ‐ Kachch Name of River ‐ Kaila Year of Impoundment ‐ 1956Catchment Area ‐ 178.05 Sq.km Reservoir Area at FRL ‐ 3.20 Sq.km MDDL ‐ N.A FRL ‐N.A
Gross Live Dead Since Last Survey Cumulative % Cumulative (Th.Cum/SqKm/yr) (M.Cum/yr)1 2 3 4 5 6 7 8 9 10 11 12
1 1956 13.98 ‐ ‐2 1987 31 8.86 ‐ ‐ 5.12 5.12 36.62 0.928 0.165
Average rate of silting(Th.Cum/Sq.km/Yr) in 31 year 0.928Average rate of silting (mm/yr) in 31 years 0.928Average rate of silting (M.Cum/yr) in 31 years 0.165
Name of State ‐Gujarat Name of the District ‐ SurendraNagar Name of River ‐Kankavati Year of Impoundment ‐ 1956Catchment Area ‐ 207.19 Sq.km Reservoir Area at FRL ‐ 3.54 Sq.km MDDL ‐ N.A FRL ‐ N.A
Gross Live Dead Since Last Survey Cumulative % Cumulative (Th.Cum/SqKm/yr) (M.Cum/yr)1 2 3 4 5 6 7 8 9 10 11 12
1 1956 14.62 ‐ ‐2 1987 31 10.53 ‐ ‐ 4.09 4.09 27.98 0.637 0.132
Average rate of silting(Th.Cum/Sq.km/Yr) in 31 year 0.637Average rate of silting (mm/yr) in 31 years 0.637Average rate of silting (M.Cum/yr) in 31 years 0.132
Period (Years)
Loss of Capacity (M.Cum)S. No
Period (Years)
Reservoir Capacity(M.Cum)Remarks
Remarks
KANKAVATI RESERVOIR
Observed Rate of Siltation Since Last SurveyLoss of Capacity (M.Cum)
Reservoir Capacity(M.Cum)
Year of Survey
KAILA RESERVOIR
Observed Rate of Siltation Since Last Survey
S. No
Year of Survey
37
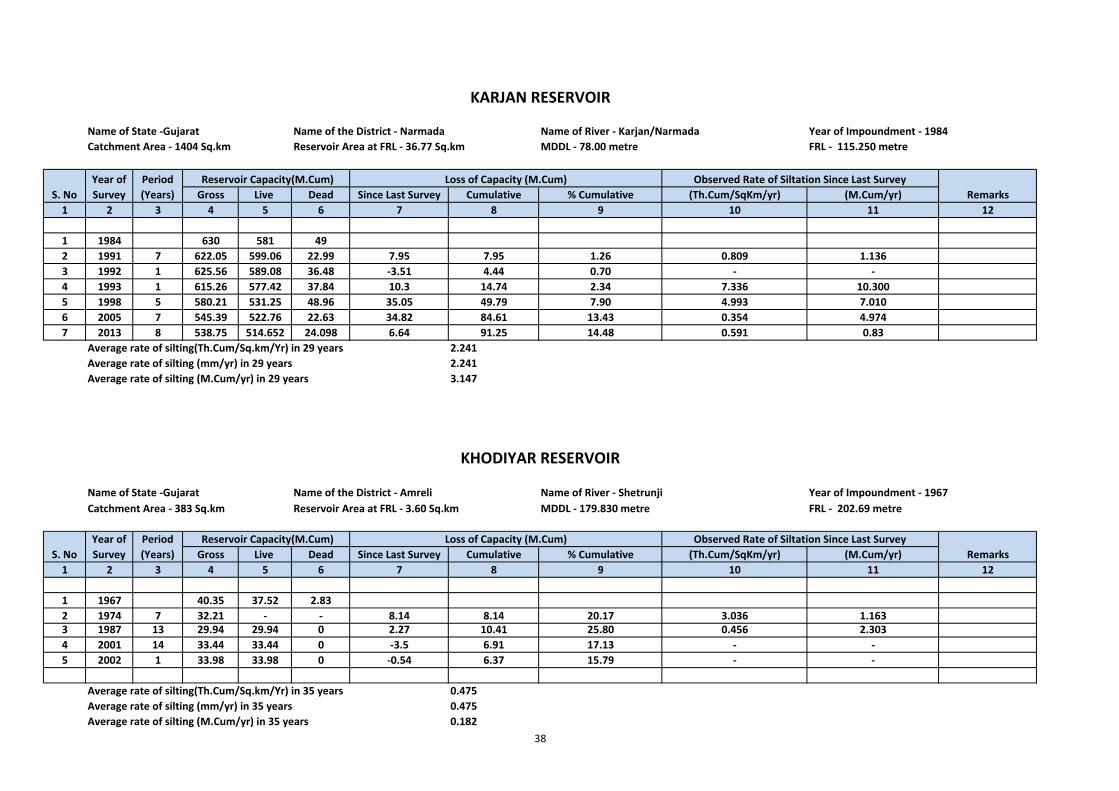
Name of State ‐Gujarat Name of the District ‐ Narmada Name of River ‐ Karjan/Narmada Year of Impoundment ‐ 1984Catchment Area ‐ 1404 Sq.km Reservoir Area at FRL ‐ 36.77 Sq.km MDDL ‐ 78.00 metre FRL ‐ 115.250 metre
Gross Live Dead Since Last Survey Cumulative % Cumulative (Th.Cum/SqKm/yr) (M.Cum/yr)1 2 3 4 5 6 7 8 9 10 11 12
1 1984 630 581 492 1991 7 622.05 599.06 22.99 7.95 7.95 1.26 0.809 1.1363 1992 1 625.56 589.08 36.48 ‐3.51 4.44 0.70 ‐ ‐4 1993 1 615.26 577.42 37.84 10.3 14.74 2.34 7.336 10.3005 1998 5 580.21 531.25 48.96 35.05 49.79 7.90 4.993 7.0106 2005 7 545.39 522.76 22.63 34.82 84.61 13.43 0.354 4.9747 2013 8 538.75 514.652 24.098 6.64 91.25 14.48 0.591 0.83
Average rate of silting(Th.Cum/Sq.km/Yr) in 29 years 2.241Average rate of silting (mm/yr) in 29 years 2.241Average rate of silting (M.Cum/yr) in 29 years 3.147
Name of State ‐Gujarat Name of the District ‐ Amreli Name of River ‐ Shetrunji Year of Impoundment ‐ 1967Catchment Area ‐ 383 Sq.km Reservoir Area at FRL ‐ 3.60 Sq.km MDDL ‐ 179.830 metre FRL ‐ 202.69 metre
Gross Live Dead Since Last Survey Cumulative % Cumulative (Th.Cum/SqKm/yr) (M.Cum/yr)1 2 3 4 5 6 7 8 9 10 11 12
1 1967 40.35 37.52 2.832 1974 7 32.21 ‐ ‐ 8.14 8.14 20.17 3.036 1.1633 1987 13 29.94 29.94 0 2.27 10.41 25.80 0.456 2.3034 2001 14 33.44 33.44 0 ‐3.5 6.91 17.13 ‐ ‐5 2002 1 33.98 33.98 0 ‐0.54 6.37 15.79 ‐ ‐
Average rate of silting(Th.Cum/Sq.km/Yr) in 35 years 0.475Average rate of silting (mm/yr) in 35 years 0.475Average rate of silting (M.Cum/yr) in 35 years 0.182
KHODIYAR RESERVOIR
S. NoPeriod (Years)
KARJAN RESERVOIR
Reservoir Capacity(M.Cum)
Loss of Capacity (M.Cum)
Loss of Capacity (M.Cum)Year of Survey Remarks
Reservoir Capacity(M.Cum) Observed Rate of Siltation Since Last Survey
Period (Years)
Year of Survey
S. No
Remarks
Observed Rate of Siltation Since Last Survey
38
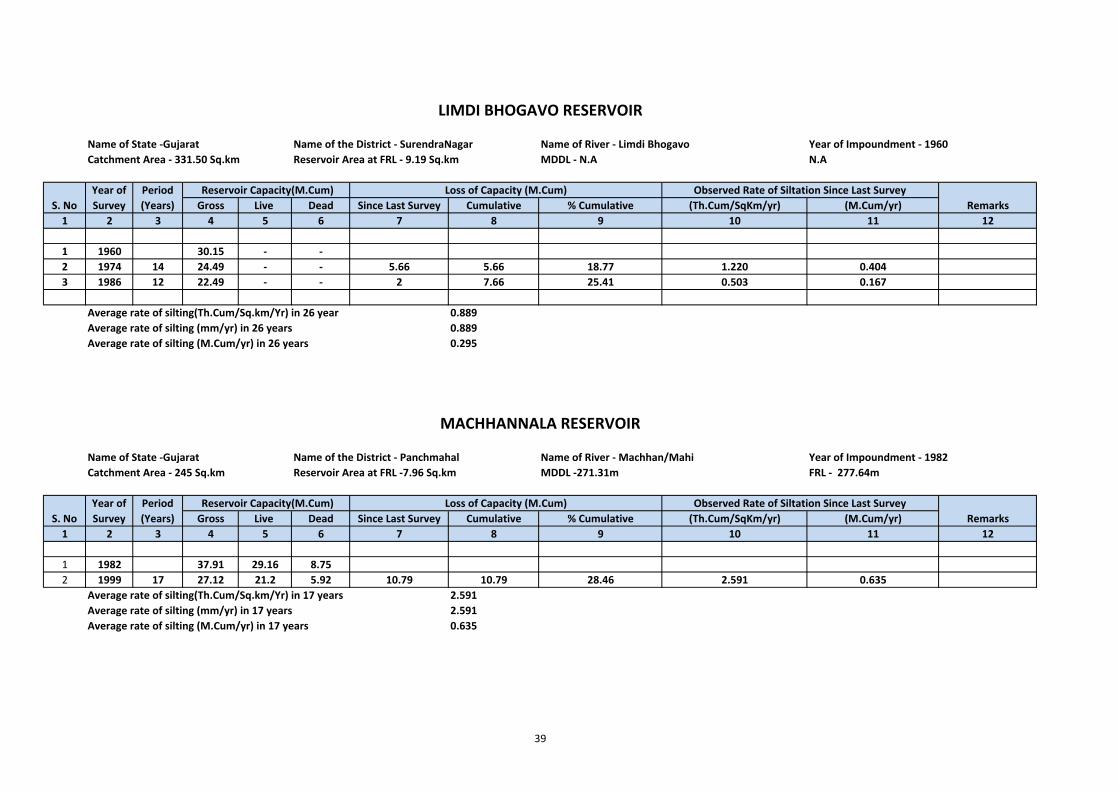
Name of State ‐Gujarat Name of the District ‐ SurendraNagar Name of River ‐ Limdi Bhogavo Year of Impoundment ‐ 1960Catchment Area ‐ 331.50 Sq.km Reservoir Area at FRL ‐ 9.19 Sq.km MDDL ‐ N.A N.A
Gross Live Dead Since Last Survey Cumulative % Cumulative (Th.Cum/SqKm/yr) (M.Cum/yr)1 2 3 4 5 6 7 8 9 10 11 12
1 1960 30.15 ‐ ‐2 1974 14 24.49 ‐ ‐ 5.66 5.66 18.77 1.220 0.4043 1986 12 22.49 ‐ ‐ 2 7.66 25.41 0.503 0.167
Average rate of silting(Th.Cum/Sq.km/Yr) in 26 year 0.889Average rate of silting (mm/yr) in 26 years 0.889Average rate of silting (M.Cum/yr) in 26 years 0.295
Name of State ‐Gujarat Name of the District ‐ Panchmahal Name of River ‐ Machhan/Mahi Year of Impoundment ‐ 1982Catchment Area ‐ 245 Sq.km Reservoir Area at FRL ‐7.96 Sq.km MDDL ‐271.31m FRL ‐ 277.64m
Gross Live Dead Since Last Survey Cumulative % Cumulative (Th.Cum/SqKm/yr) (M.Cum/yr)1 2 3 4 5 6 7 8 9 10 11 12
1 1982 37.91 29.16 8.752 1999 17 27.12 21.2 5.92 10.79 10.79 28.46 2.591 0.635
Average rate of silting(Th.Cum/Sq.km/Yr) in 17 years 2.591Average rate of silting (mm/yr) in 17 years 2.591Average rate of silting (M.Cum/yr) in 17 years 0.635
Loss of Capacity (M.Cum)
LIMDI BHOGAVO RESERVOIR
Observed Rate of Siltation Since Last SurveyPeriod (Years)
Reservoir Capacity(M.Cum)
MACHHANNALA RESERVOIR
S. No
Year of Survey
Year of Survey
RemarksS. No
Reservoir Capacity(M.Cum) Observed Rate of Siltation Since Last SurveyPeriod (Years)
Loss of Capacity (M.Cum)Remarks
39
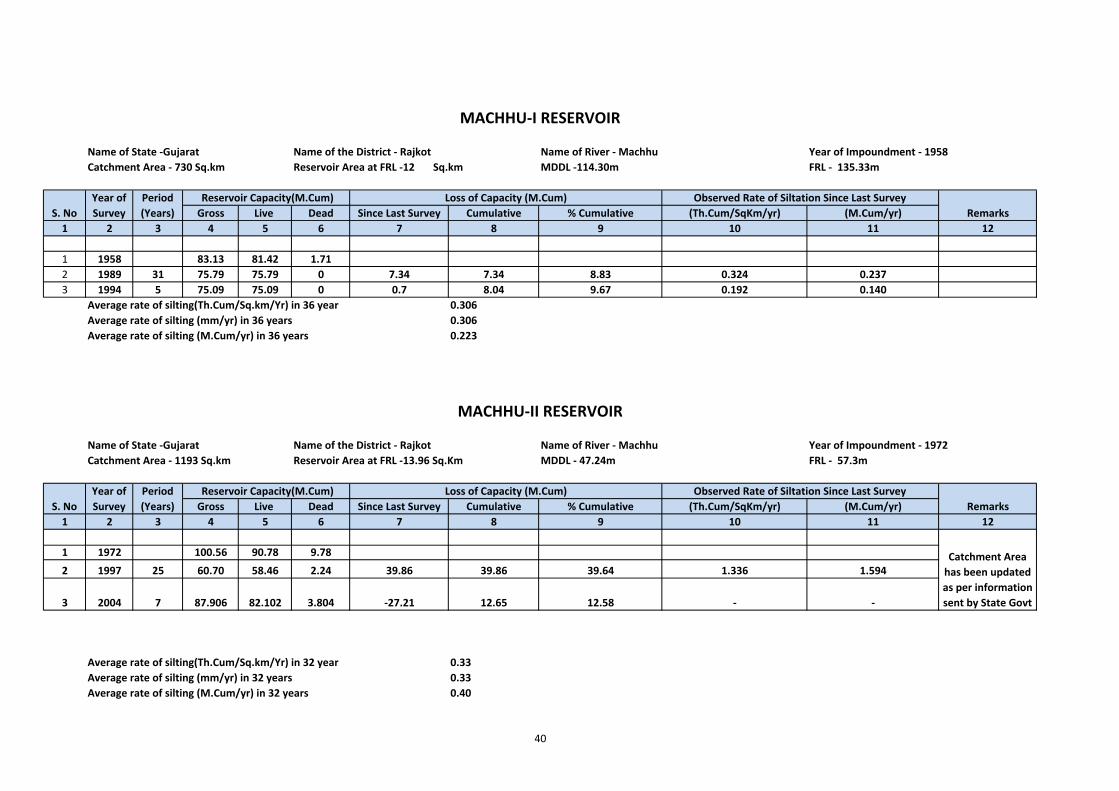
Name of State ‐Gujarat Name of the District ‐ Rajkot Name of River ‐ Machhu Year of Impoundment ‐ 1958Catchment Area ‐ 730 Sq.km Reservoir Area at FRL ‐12 Sq.km MDDL ‐114.30m FRL ‐ 135.33m
Gross Live Dead Since Last Survey Cumulative % Cumulative (Th.Cum/SqKm/yr) (M.Cum/yr)1 2 3 4 5 6 7 8 9 10 11 12
1 1958 83.13 81.42 1.712 1989 31 75.79 75.79 0 7.34 7.34 8.83 0.324 0.2373 1994 5 75.09 75.09 0 0.7 8.04 9.67 0.192 0.140
Average rate of silting(Th.Cum/Sq.km/Yr) in 36 year 0.306Average rate of silting (mm/yr) in 36 years 0.306Average rate of silting (M.Cum/yr) in 36 years 0.223
Name of State ‐Gujarat Name of the District ‐ Rajkot Name of River ‐ Machhu Year of Impoundment ‐ 1972Catchment Area ‐ 1193 Sq.km Reservoir Area at FRL ‐13.96 Sq.Km MDDL ‐ 47.24m FRL ‐ 57.3m
Gross Live Dead Since Last Survey Cumulative % Cumulative (Th.Cum/SqKm/yr) (M.Cum/yr)1 2 3 4 5 6 7 8 9 10 11 12
1 1972 100.56 90.78 9.78
2 1997 25 60.70 58.46 2.24 39.86 39.86 39.64 1.336 1.594
3 2004 7 87.906 82.102 3.804 ‐27.21 12.65 12.58 ‐ ‐
Average rate of silting(Th.Cum/Sq.km/Yr) in 32 year 0.33Average rate of silting (mm/yr) in 32 years 0.33Average rate of silting (M.Cum/yr) in 32 years 0.40
Period (Years)
Observed Rate of Siltation Since Last Survey
Reservoir Capacity(M.Cum)
Reservoir Capacity(M.Cum)Year of Survey
Year of Survey
Period (Years)
Loss of Capacity (M.Cum)
RemarksS. No
Observed Rate of Siltation Since Last SurveyRemarks
Catchment Area has been updated as per information sent by State Govt
MACHHU‐I RESERVOIR
Loss of Capacity (M.Cum)
S. No
MACHHU‐II RESERVOIR
40
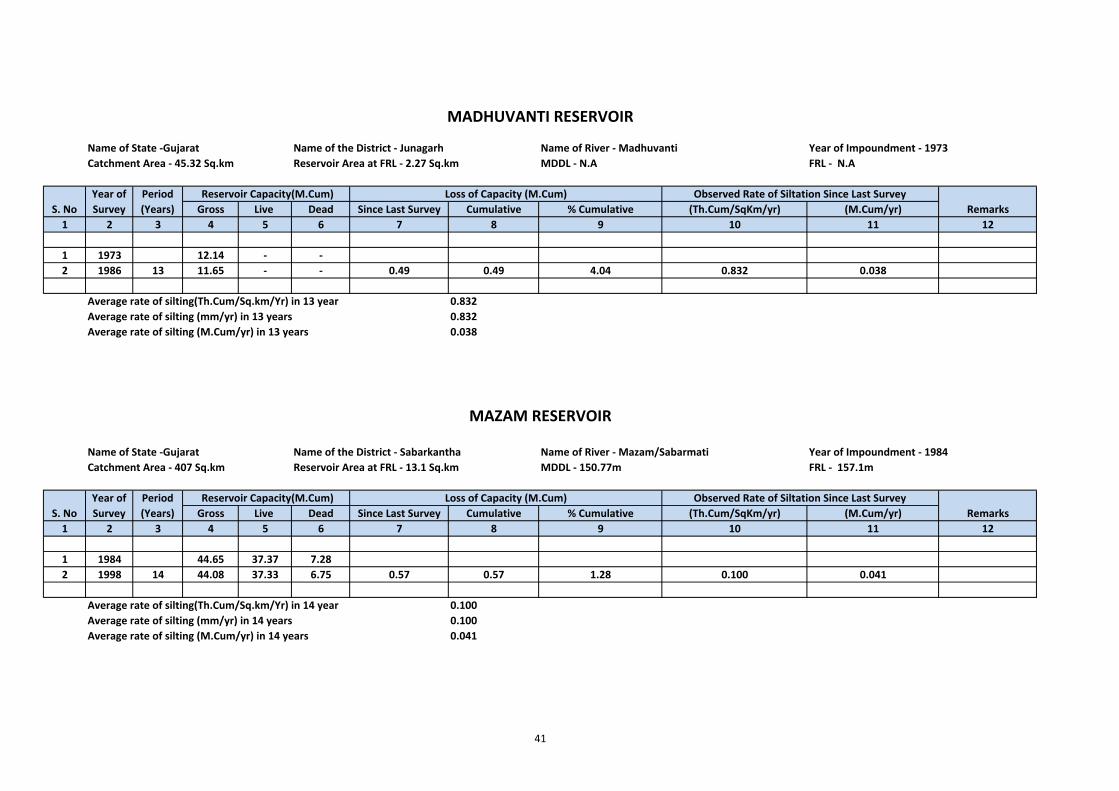
Name of State ‐Gujarat Name of the District ‐ Junagarh Name of River ‐ Madhuvanti Year of Impoundment ‐ 1973Catchment Area ‐ 45.32 Sq.km Reservoir Area at FRL ‐ 2.27 Sq.km MDDL ‐ N.A FRL ‐ N.A
Gross Live Dead Since Last Survey Cumulative % Cumulative (Th.Cum/SqKm/yr) (M.Cum/yr)1 2 3 4 5 6 7 8 9 10 11 12
1 1973 12.14 ‐ ‐2 1986 13 11.65 ‐ ‐ 0.49 0.49 4.04 0.832 0.038
Average rate of silting(Th.Cum/Sq.km/Yr) in 13 year 0.832Average rate of silting (mm/yr) in 13 years 0.832Average rate of silting (M.Cum/yr) in 13 years 0.038
Name of State ‐Gujarat Name of the District ‐ Sabarkantha Name of River ‐ Mazam/Sabarmati Year of Impoundment ‐ 1984Catchment Area ‐ 407 Sq.km Reservoir Area at FRL ‐ 13.1 Sq.km MDDL ‐ 150.77m FRL ‐ 157.1m
Gross Live Dead Since Last Survey Cumulative % Cumulative (Th.Cum/SqKm/yr) (M.Cum/yr)1 2 3 4 5 6 7 8 9 10 11 12
1 1984 44.65 37.37 7.282 1998 14 44.08 37.33 6.75 0.57 0.57 1.28 0.100 0.041
Average rate of silting(Th.Cum/Sq.km/Yr) in 14 year 0.100Average rate of silting (mm/yr) in 14 years 0.100Average rate of silting (M.Cum/yr) in 14 years 0.041
Remarks Reservoir Capacity(M.Cum) Observed Rate of Siltation Since Last SurveyYear of
Survey Period (Years)
Loss of Capacity (M.Cum)
MADHUVANTI RESERVOIR
MAZAM RESERVOIR
S. NoYear of Survey
Period (Years)
Reservoir Capacity(M.Cum) Loss of Capacity (M.Cum) Observed Rate of Siltation Since Last Survey
S. No
Remarks
41
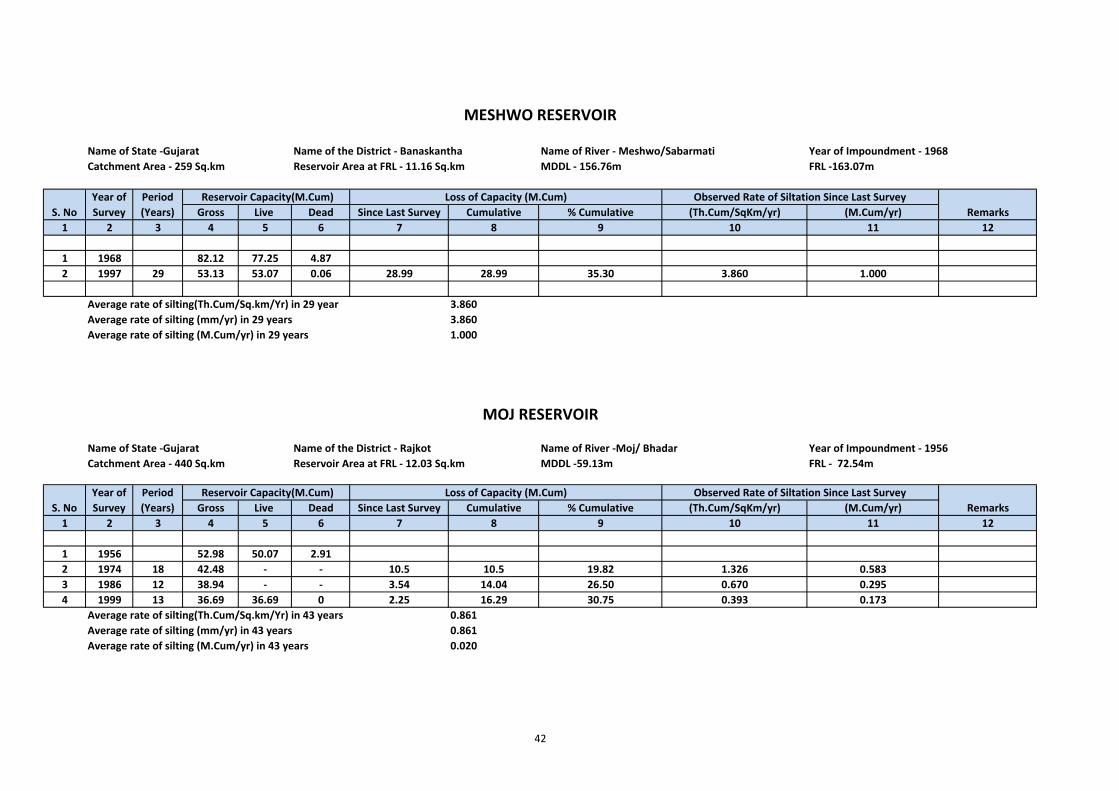
Name of State ‐Gujarat Name of the District ‐ Banaskantha Name of River ‐ Meshwo/Sabarmati Year of Impoundment ‐ 1968Catchment Area ‐ 259 Sq.km Reservoir Area at FRL ‐ 11.16 Sq.km MDDL ‐ 156.76m FRL ‐163.07m
Gross Live Dead Since Last Survey Cumulative % Cumulative (Th.Cum/SqKm/yr) (M.Cum/yr)1 2 3 4 5 6 7 8 9 10 11 12
1 1968 82.12 77.25 4.872 1997 29 53.13 53.07 0.06 28.99 28.99 35.30 3.860 1.000
Average rate of silting(Th.Cum/Sq.km/Yr) in 29 year 3.860Average rate of silting (mm/yr) in 29 years 3.860Average rate of silting (M.Cum/yr) in 29 years 1.000
Name of State ‐Gujarat Name of the District ‐ Rajkot Name of River ‐Moj/ Bhadar Year of Impoundment ‐ 1956Catchment Area ‐ 440 Sq.km Reservoir Area at FRL ‐ 12.03 Sq.km MDDL ‐59.13m FRL ‐ 72.54m
Gross Live Dead Since Last Survey Cumulative % Cumulative (Th.Cum/SqKm/yr) (M.Cum/yr)1 2 3 4 5 6 7 8 9 10 11 12
1 1956 52.98 50.07 2.912 1974 18 42.48 ‐ ‐ 10.5 10.5 19.82 1.326 0.5833 1986 12 38.94 ‐ ‐ 3.54 14.04 26.50 0.670 0.2954 1999 13 36.69 36.69 0 2.25 16.29 30.75 0.393 0.173
Average rate of silting(Th.Cum/Sq.km/Yr) in 43 years 0.861Average rate of silting (mm/yr) in 43 years 0.861Average rate of silting (M.Cum/yr) in 43 years 0.020
MESHWO RESERVOIR
Loss of Capacity (M.Cum)Year of Survey
Observed Rate of Siltation Since Last Survey
Loss of Capacity (M.Cum)Remarks
MOJ RESERVOIR
S. No Reservoir Capacity(M.Cum)
Period (Years)S. No
Period (Years) Remarks
Reservoir Capacity(M.Cum)Year of Survey
Observed Rate of Siltation Since Last Survey
42
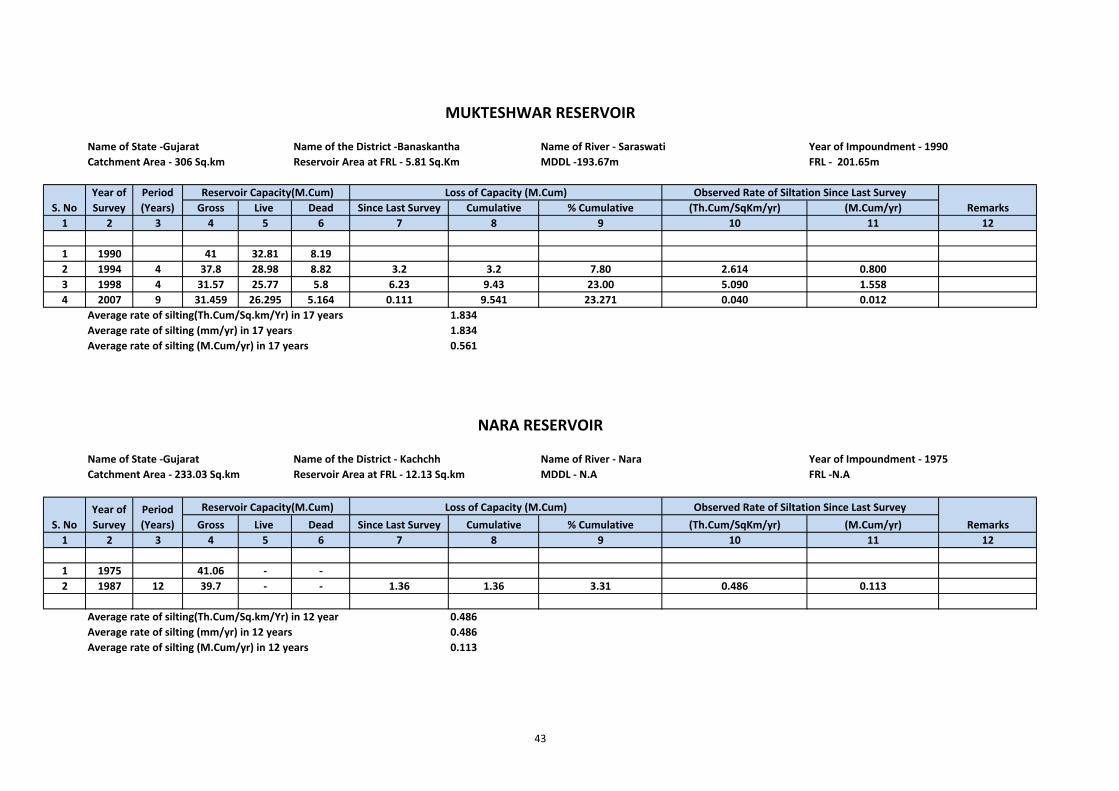
Name of State ‐Gujarat Name of the District ‐Banaskantha Name of River ‐ Saraswati Year of Impoundment ‐ 1990Catchment Area ‐ 306 Sq.km Reservoir Area at FRL ‐ 5.81 Sq.Km MDDL ‐193.67m FRL ‐ 201.65m
Gross Live Dead Since Last Survey Cumulative % Cumulative (Th.Cum/SqKm/yr) (M.Cum/yr)1 2 3 4 5 6 7 8 9 10 11 12
1 1990 41 32.81 8.192 1994 4 37.8 28.98 8.82 3.2 3.2 7.80 2.614 0.8003 1998 4 31.57 25.77 5.8 6.23 9.43 23.00 5.090 1.5584 2007 9 31.459 26.295 5.164 0.111 9.541 23.271 0.040 0.012
Average rate of silting(Th.Cum/Sq.km/Yr) in 17 years 1.834Average rate of silting (mm/yr) in 17 years 1.834Average rate of silting (M.Cum/yr) in 17 years 0.561
Name of State ‐Gujarat Name of the District ‐ Kachchh Name of River ‐ Nara Year of Impoundment ‐ 1975Catchment Area ‐ 233.03 Sq.km Reservoir Area at FRL ‐ 12.13 Sq.km MDDL ‐ N.A FRL ‐N.A
Gross Live Dead Since Last Survey Cumulative % Cumulative (Th.Cum/SqKm/yr) (M.Cum/yr)1 2 3 4 5 6 7 8 9 10 11 12
1 1975 41.06 ‐ ‐2 1987 12 39.7 ‐ ‐ 1.36 1.36 3.31 0.486 0.113
Average rate of silting(Th.Cum/Sq.km/Yr) in 12 year 0.486Average rate of silting (mm/yr) in 12 years 0.486Average rate of silting (M.Cum/yr) in 12 years 0.113
S. No
Reservoir Capacity(M.Cum)S. No Remarks
NARA RESERVOIR
Period (Years) Remarks
Observed Rate of Siltation Since Last Survey
Year of Survey
Observed Rate of Siltation Since Last Survey
Year of Survey
Period (Years)
Loss of Capacity (M.Cum)
Loss of Capacity (M.Cum) Reservoir Capacity(M.Cum)
MUKTESHWAR RESERVOIR
43
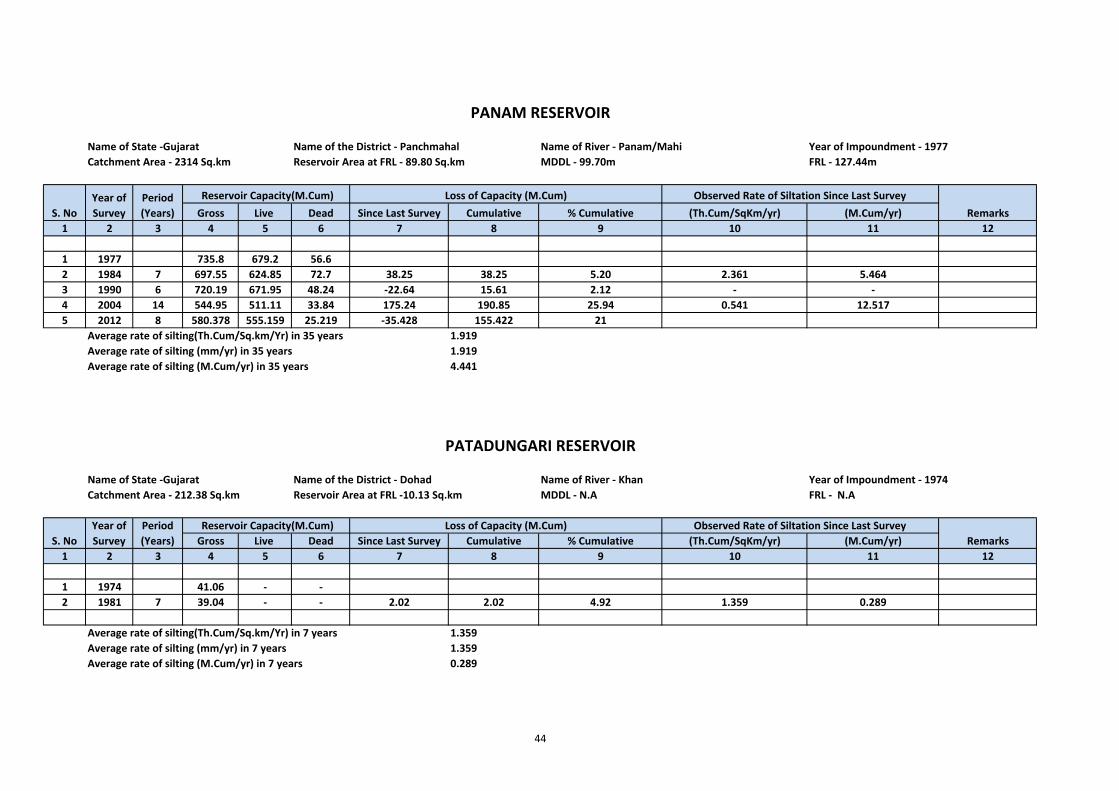
Name of State ‐Gujarat Name of the District ‐ Panchmahal Name of River ‐ Panam/Mahi Year of Impoundment ‐ 1977Catchment Area ‐ 2314 Sq.km Reservoir Area at FRL ‐ 89.80 Sq.km MDDL ‐ 99.70m FRL ‐ 127.44m
Gross Live Dead Since Last Survey Cumulative % Cumulative (Th.Cum/SqKm/yr) (M.Cum/yr)1 2 3 4 5 6 7 8 9 10 11 12
1 1977 735.8 679.2 56.62 1984 7 697.55 624.85 72.7 38.25 38.25 5.20 2.361 5.4643 1990 6 720.19 671.95 48.24 ‐22.64 15.61 2.12 ‐ ‐4 2004 14 544.95 511.11 33.84 175.24 190.85 25.94 0.541 12.5175 2012 8 580.378 555.159 25.219 ‐35.428 155.422 21
Average rate of silting(Th.Cum/Sq.km/Yr) in 35 years 1.919Average rate of silting (mm/yr) in 35 years 1.919Average rate of silting (M.Cum/yr) in 35 years 4.441
Name of State ‐Gujarat Name of the District ‐ Dohad Name of River ‐ Khan Year of Impoundment ‐ 1974Catchment Area ‐ 212.38 Sq.km Reservoir Area at FRL ‐10.13 Sq.km MDDL ‐ N.A FRL ‐ N.A
Gross Live Dead Since Last Survey Cumulative % Cumulative (Th.Cum/SqKm/yr) (M.Cum/yr)1 2 3 4 5 6 7 8 9 10 11 12
1 1974 41.06 ‐ ‐2 1981 7 39.04 ‐ ‐ 2.02 2.02 4.92 1.359 0.289
Average rate of silting(Th.Cum/Sq.km/Yr) in 7 years 1.359Average rate of silting (mm/yr) in 7 years 1.359Average rate of silting (M.Cum/yr) in 7 years 0.289
Observed Rate of Siltation Since Last SurveyYear of Survey
Period (Years)
S. NoPeriod (Years)
S. No
Year of Survey Remarks
Loss of Capacity (M.Cum) Reservoir Capacity(M.Cum) Observed Rate of Siltation Since Last Survey
Loss of Capacity (M.Cum)Remarks
PATADUNGARI RESERVOIR
PANAM RESERVOIR
Reservoir Capacity(M.Cum)
44
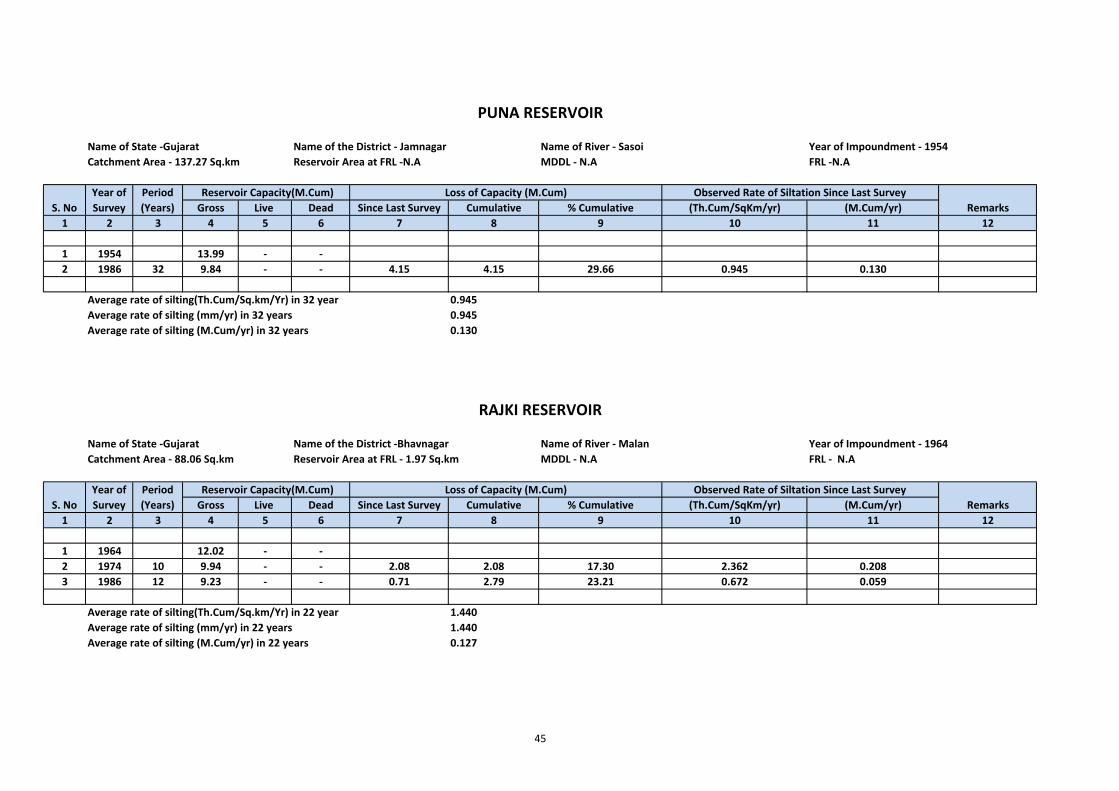
Name of State ‐Gujarat Name of the District ‐ Jamnagar Name of River ‐ Sasoi Year of Impoundment ‐ 1954Catchment Area ‐ 137.27 Sq.km Reservoir Area at FRL ‐N.A MDDL ‐ N.A FRL ‐N.A
Gross Live Dead Since Last Survey Cumulative % Cumulative (Th.Cum/SqKm/yr) (M.Cum/yr)1 2 3 4 5 6 7 8 9 10 11 12
1 1954 13.99 ‐ ‐2 1986 32 9.84 ‐ ‐ 4.15 4.15 29.66 0.945 0.130
Average rate of silting(Th.Cum/Sq.km/Yr) in 32 year 0.945Average rate of silting (mm/yr) in 32 years 0.945Average rate of silting (M.Cum/yr) in 32 years 0.130
Name of State ‐Gujarat Name of the District ‐Bhavnagar Name of River ‐ Malan Year of Impoundment ‐ 1964Catchment Area ‐ 88.06 Sq.km Reservoir Area at FRL ‐ 1.97 Sq.km MDDL ‐ N.A FRL ‐ N.A
Gross Live Dead Since Last Survey Cumulative % Cumulative (Th.Cum/SqKm/yr) (M.Cum/yr)1 2 3 4 5 6 7 8 9 10 11 12
1 1964 12.02 ‐ ‐2 1974 10 9.94 ‐ ‐ 2.08 2.08 17.30 2.362 0.2083 1986 12 9.23 ‐ ‐ 0.71 2.79 23.21 0.672 0.059
Average rate of silting(Th.Cum/Sq.km/Yr) in 22 year 1.440Average rate of silting (mm/yr) in 22 years 1.440Average rate of silting (M.Cum/yr) in 22 years 0.127
Reservoir Capacity(M.Cum)
S. No Reservoir Capacity(M.Cum)
Year of Survey
Observed Rate of Siltation Since Last Survey
PUNA RESERVOIR
Period (Years)
Year of Survey
Period (Years)
RAJKI RESERVOIR
Observed Rate of Siltation Since Last SurveyLoss of Capacity (M.Cum)S. No
RemarksLoss of Capacity (M.Cum)
Remarks
45
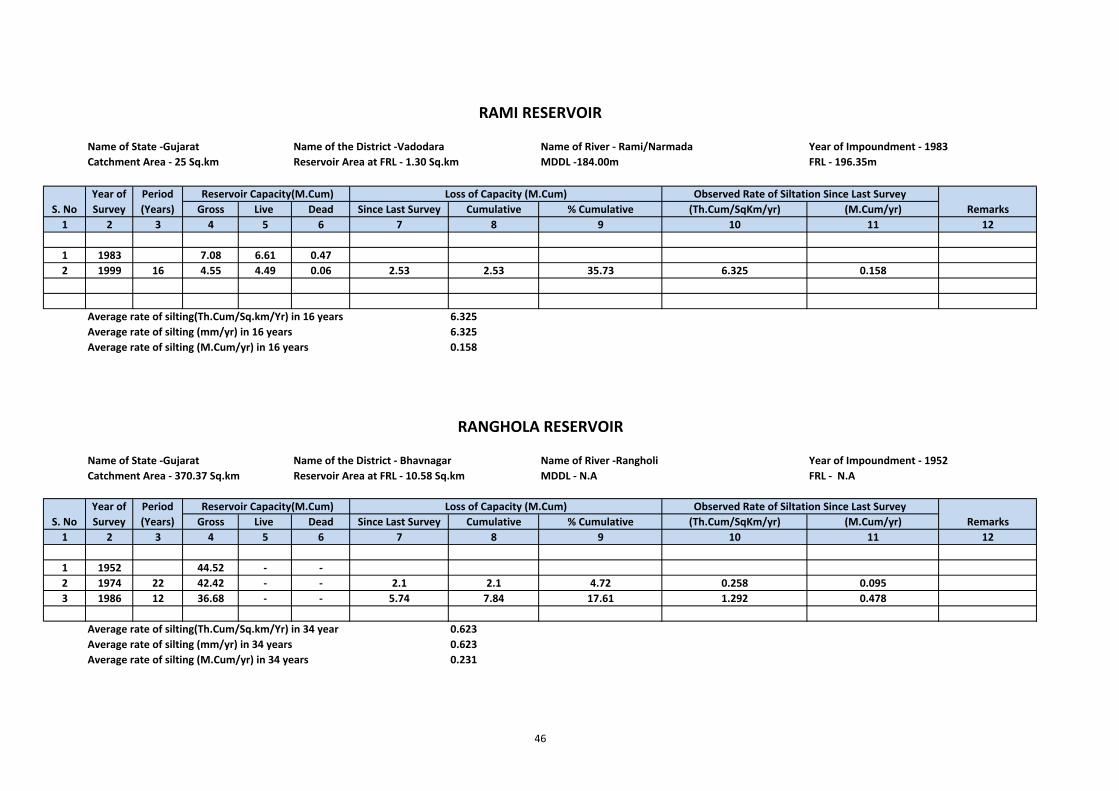
Name of State ‐Gujarat Name of the District ‐Vadodara Name of River ‐ Rami/Narmada Year of Impoundment ‐ 1983Catchment Area ‐ 25 Sq.km Reservoir Area at FRL ‐ 1.30 Sq.km MDDL ‐184.00m FRL ‐ 196.35m
Gross Live Dead Since Last Survey Cumulative % Cumulative (Th.Cum/SqKm/yr) (M.Cum/yr)1 2 3 4 5 6 7 8 9 10 11 12
1 1983 7.08 6.61 0.472 1999 16 4.55 4.49 0.06 2.53 2.53 35.73 6.325 0.158
Average rate of silting(Th.Cum/Sq.km/Yr) in 16 years 6.325Average rate of silting (mm/yr) in 16 years 6.325Average rate of silting (M.Cum/yr) in 16 years 0.158
Name of State ‐Gujarat Name of the District ‐ Bhavnagar Name of River ‐Rangholi Year of Impoundment ‐ 1952Catchment Area ‐ 370.37 Sq.km Reservoir Area at FRL ‐ 10.58 Sq.km MDDL ‐ N.A FRL ‐ N.A
Gross Live Dead Since Last Survey Cumulative % Cumulative (Th.Cum/SqKm/yr) (M.Cum/yr)1 2 3 4 5 6 7 8 9 10 11 12
1 1952 44.52 ‐ ‐2 1974 22 42.42 ‐ ‐ 2.1 2.1 4.72 0.258 0.0953 1986 12 36.68 ‐ ‐ 5.74 7.84 17.61 1.292 0.478
Average rate of silting(Th.Cum/Sq.km/Yr) in 34 year 0.623Average rate of silting (mm/yr) in 34 years 0.623Average rate of silting (M.Cum/yr) in 34 years 0.231
Year of Survey
Loss of Capacity (M.Cum)
RAMI RESERVOIR
Reservoir Capacity(M.Cum) Observed Rate of Siltation Since Last Survey
Loss of Capacity (M.Cum)Year of Survey
RANGHOLA RESERVOIR
S. No RemarksPeriod (Years)
Period (Years) Remarks
Reservoir Capacity(M.Cum) Observed Rate of Siltation Since Last Survey
S. No
46
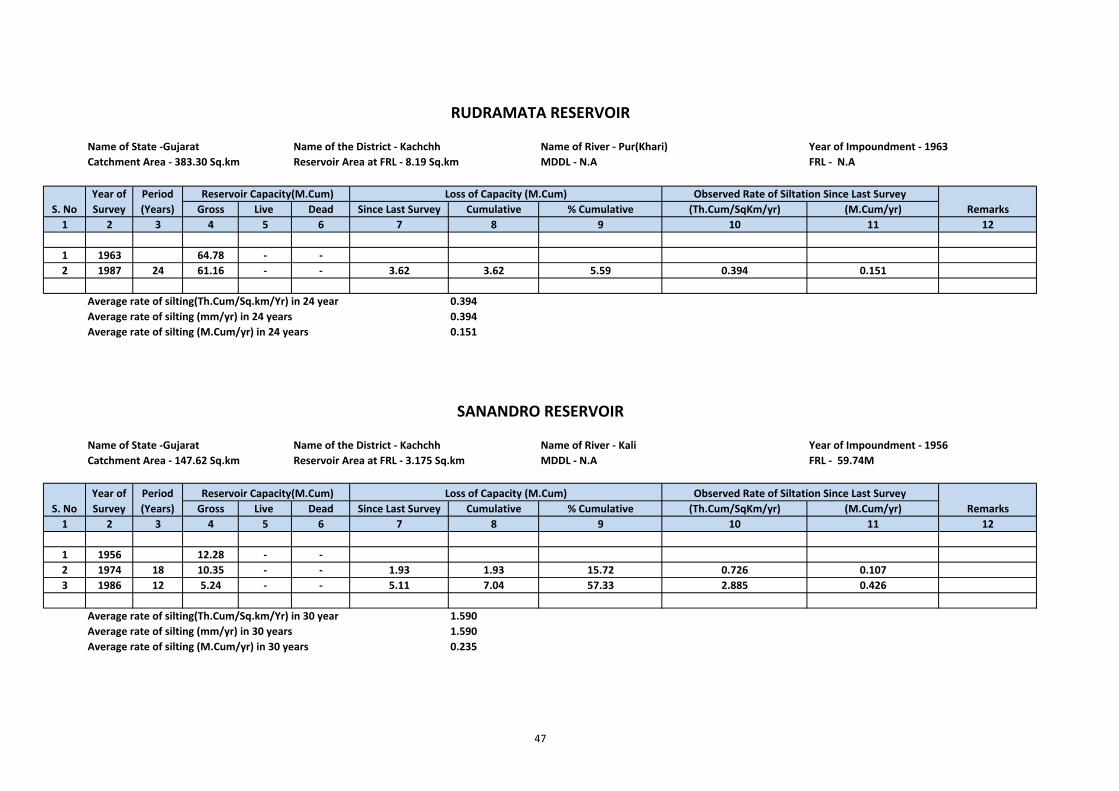
Name of State ‐Gujarat Name of the District ‐ Kachchh Name of River ‐ Pur(Khari) Year of Impoundment ‐ 1963Catchment Area ‐ 383.30 Sq.km Reservoir Area at FRL ‐ 8.19 Sq.km MDDL ‐ N.A FRL ‐ N.A
Gross Live Dead Since Last Survey Cumulative % Cumulative (Th.Cum/SqKm/yr) (M.Cum/yr)1 2 3 4 5 6 7 8 9 10 11 12
1 1963 64.78 ‐ ‐2 1987 24 61.16 ‐ ‐ 3.62 3.62 5.59 0.394 0.151
Average rate of silting(Th.Cum/Sq.km/Yr) in 24 year 0.394Average rate of silting (mm/yr) in 24 years 0.394Average rate of silting (M.Cum/yr) in 24 years 0.151
Name of State ‐Gujarat Name of the District ‐ Kachchh Name of River ‐ Kali Year of Impoundment ‐ 1956Catchment Area ‐ 147.62 Sq.km Reservoir Area at FRL ‐ 3.175 Sq.km MDDL ‐ N.A FRL ‐ 59.74M
Gross Live Dead Since Last Survey Cumulative % Cumulative (Th.Cum/SqKm/yr) (M.Cum/yr)1 2 3 4 5 6 7 8 9 10 11 12
1 1956 12.28 ‐ ‐2 1974 18 10.35 ‐ ‐ 1.93 1.93 15.72 0.726 0.1073 1986 12 5.24 ‐ ‐ 5.11 7.04 57.33 2.885 0.426
Average rate of silting(Th.Cum/Sq.km/Yr) in 30 year 1.590Average rate of silting (mm/yr) in 30 years 1.590Average rate of silting (M.Cum/yr) in 30 years 0.235
Observed Rate of Siltation Since Last SurveyS. No
Reservoir Capacity(M.Cum)Year of Survey Remarks
S. No
RUDRAMATA RESERVOIR
Year of Survey
Period (Years)
SANANDRO RESERVOIR
Remarks
Period (Years)
Loss of Capacity (M.Cum)
Observed Rate of Siltation Since Last Survey Reservoir Capacity(M.Cum) Loss of Capacity (M.Cum)
47
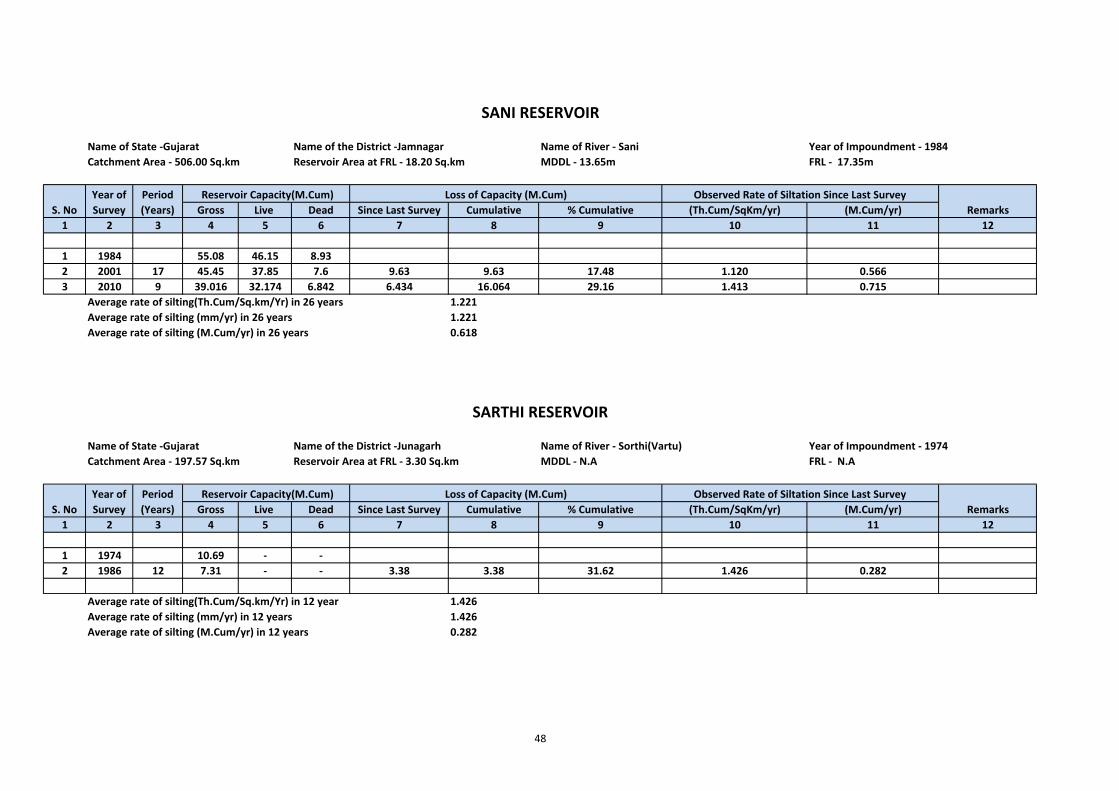
Name of State ‐Gujarat Name of the District ‐Jamnagar Name of River ‐ Sani Year of Impoundment ‐ 1984Catchment Area ‐ 506.00 Sq.km Reservoir Area at FRL ‐ 18.20 Sq.km MDDL ‐ 13.65m FRL ‐ 17.35m
Gross Live Dead Since Last Survey Cumulative % Cumulative (Th.Cum/SqKm/yr) (M.Cum/yr)1 2 3 4 5 6 7 8 9 10 11 12
1 1984 55.08 46.15 8.932 2001 17 45.45 37.85 7.6 9.63 9.63 17.48 1.120 0.5663 2010 9 39.016 32.174 6.842 6.434 16.064 29.16 1.413 0.715
Average rate of silting(Th.Cum/Sq.km/Yr) in 26 years 1.221Average rate of silting (mm/yr) in 26 years 1.221Average rate of silting (M.Cum/yr) in 26 years 0.618
Name of State ‐Gujarat Name of the District ‐Junagarh Name of River ‐ Sorthi(Vartu) Year of Impoundment ‐ 1974Catchment Area ‐ 197.57 Sq.km Reservoir Area at FRL ‐ 3.30 Sq.km MDDL ‐ N.A FRL ‐ N.A
Gross Live Dead Since Last Survey Cumulative % Cumulative (Th.Cum/SqKm/yr) (M.Cum/yr)1 2 3 4 5 6 7 8 9 10 11 12
1 1974 10.69 ‐ ‐2 1986 12 7.31 ‐ ‐ 3.38 3.38 31.62 1.426 0.282
Average rate of silting(Th.Cum/Sq.km/Yr) in 12 year 1.426Average rate of silting (mm/yr) in 12 years 1.426Average rate of silting (M.Cum/yr) in 12 years 0.282
S. NoPeriod (Years)
Reservoir Capacity(M.Cum)
Year of Survey
Period (Years)S. No Remarks
Loss of Capacity (M.Cum) Reservoir Capacity(M.Cum) Observed Rate of Siltation Since Last Survey
RemarksLoss of Capacity (M.Cum) Observed Rate of Siltation Since Last Survey
SANI RESERVOIR
Year of Survey
SARTHI RESERVOIR
48
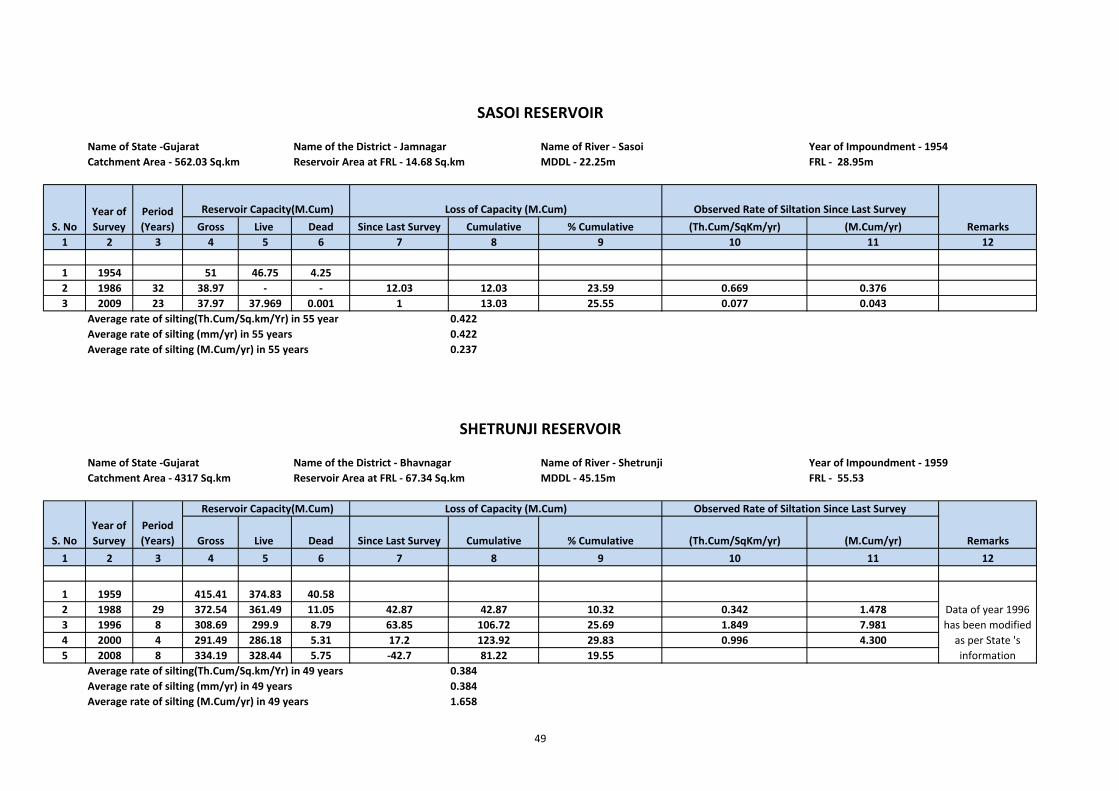
Name of State ‐Gujarat Name of the District ‐ Jamnagar Name of River ‐ Sasoi Year of Impoundment ‐ 1954Catchment Area ‐ 562.03 Sq.km Reservoir Area at FRL ‐ 14.68 Sq.km MDDL ‐ 22.25m FRL ‐ 28.95m
Gross Live Dead Since Last Survey Cumulative % Cumulative (Th.Cum/SqKm/yr) (M.Cum/yr)1 2 3 4 5 6 7 8 9 10 11 12
1 1954 51 46.75 4.252 1986 32 38.97 ‐ ‐ 12.03 12.03 23.59 0.669 0.3763 2009 23 37.97 37.969 0.001 1 13.03 25.55 0.077 0.043
Average rate of silting(Th.Cum/Sq.km/Yr) in 55 year 0.422Average rate of silting (mm/yr) in 55 years 0.422Average rate of silting (M.Cum/yr) in 55 years 0.237
Name of State ‐Gujarat Name of the District ‐ Bhavnagar Name of River ‐ Shetrunji Year of Impoundment ‐ 1959Catchment Area ‐ 4317 Sq.km Reservoir Area at FRL ‐ 67.34 Sq.km MDDL ‐ 45.15m FRL ‐ 55.53
Gross Live Dead Since Last Survey Cumulative % Cumulative (Th.Cum/SqKm/yr) (M.Cum/yr)1 2 3 4 5 6 7 8 9 10 11 12
1 1959 415.41 374.83 40.582 1988 29 372.54 361.49 11.05 42.87 42.87 10.32 0.342 1.4783 1996 8 308.69 299.9 8.79 63.85 106.72 25.69 1.849 7.9814 2000 4 291.49 286.18 5.31 17.2 123.92 29.83 0.996 4.3005 2008 8 334.19 328.44 5.75 ‐42.7 81.22 19.55
Average rate of silting(Th.Cum/Sq.km/Yr) in 49 years 0.384Average rate of silting (mm/yr) in 49 years 0.384Average rate of silting (M.Cum/yr) in 49 years 1.658
Year of Survey
Remarks Reservoir Capacity(M.Cum)Year of
Survey Period (Years)S. No
S. No
SASOI RESERVOIR
Data of year 1996 has been modified as per State 's information
Observed Rate of Siltation Since Last Survey
Period (Years)
Loss of Capacity (M.Cum)
Remarks
SHETRUNJI RESERVOIR
Reservoir Capacity(M.Cum) Observed Rate of Siltation Since Last Survey
Loss of Capacity (M.Cum)
49
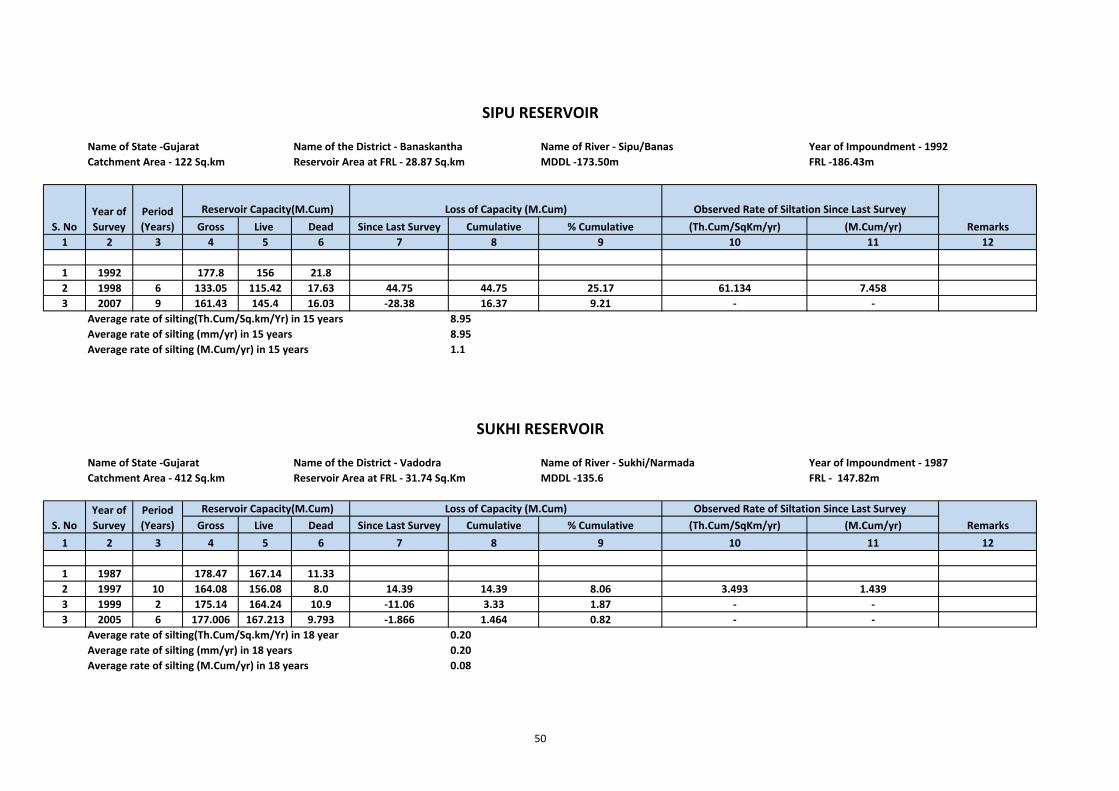
Name of State ‐Gujarat Name of the District ‐ Banaskantha Name of River ‐ Sipu/Banas Year of Impoundment ‐ 1992Catchment Area ‐ 122 Sq.km Reservoir Area at FRL ‐ 28.87 Sq.km MDDL ‐173.50m FRL ‐186.43m
Gross Live Dead Since Last Survey Cumulative % Cumulative (Th.Cum/SqKm/yr) (M.Cum/yr)1 2 3 4 5 6 7 8 9 10 11 12
1 1992 177.8 156 21.82 1998 6 133.05 115.42 17.63 44.75 44.75 25.17 61.134 7.4583 2007 9 161.43 145.4 16.03 ‐28.38 16.37 9.21 ‐ ‐
Average rate of silting(Th.Cum/Sq.km/Yr) in 15 years 8.95Average rate of silting (mm/yr) in 15 years 8.95Average rate of silting (M.Cum/yr) in 15 years 1.1
Name of State ‐Gujarat Name of the District ‐ Vadodra Name of River ‐ Sukhi/Narmada Year of Impoundment ‐ 1987Catchment Area ‐ 412 Sq.km Reservoir Area at FRL ‐ 31.74 Sq.Km MDDL ‐135.6 FRL ‐ 147.82m
Gross Live Dead Since Last Survey Cumulative % Cumulative (Th.Cum/SqKm/yr) (M.Cum/yr)1 2 3 4 5 6 7 8 9 10 11 12
1 1987 178.47 167.14 11.332 1997 10 164.08 156.08 8.0 14.39 14.39 8.06 3.493 1.4393 1999 2 175.14 164.24 10.9 ‐11.06 3.33 1.87 ‐ ‐3 2005 6 177.006 167.213 9.793 ‐1.866 1.464 0.82 ‐ ‐
Average rate of silting(Th.Cum/Sq.km/Yr) in 18 year 0.20Average rate of silting (mm/yr) in 18 years 0.20Average rate of silting (M.Cum/yr) in 18 years 0.08
Remarks Reservoir Capacity(M.Cum) Loss of Capacity (M.Cum)
Observed Rate of Siltation Since Last SurveyLoss of Capacity (M.Cum)
SIPU RESERVOIR
S. NoYear of Survey
Period (Years)
Observed Rate of Siltation Since Last Survey
Reservoir Capacity(M.Cum)Year of Survey Remarks
Period (Years)
SUKHI RESERVOIR
S. No
50
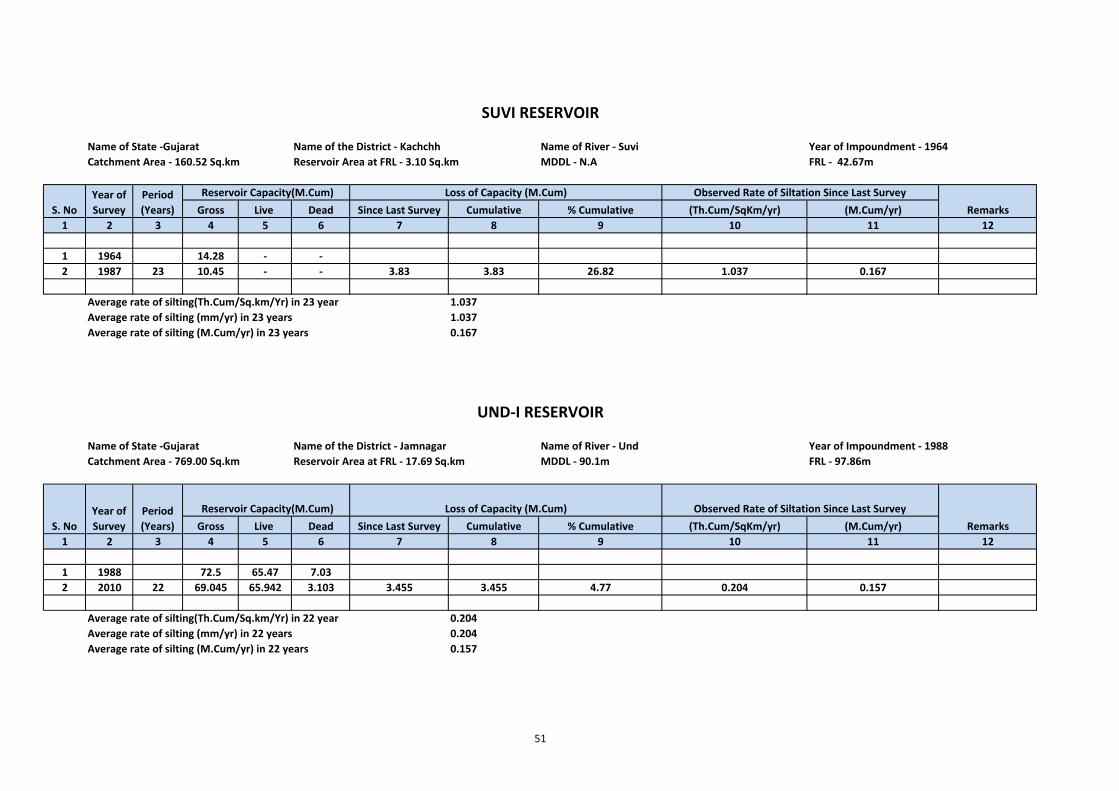
Name of State ‐Gujarat Name of the District ‐ Kachchh Name of River ‐ Suvi Year of Impoundment ‐ 1964Catchment Area ‐ 160.52 Sq.km Reservoir Area at FRL ‐ 3.10 Sq.km MDDL ‐ N.A FRL ‐ 42.67m
Gross Live Dead Since Last Survey Cumulative % Cumulative (Th.Cum/SqKm/yr) (M.Cum/yr)1 2 3 4 5 6 7 8 9 10 11 12
1 1964 14.28 ‐ ‐2 1987 23 10.45 ‐ ‐ 3.83 3.83 26.82 1.037 0.167
Average rate of silting(Th.Cum/Sq.km/Yr) in 23 year 1.037Average rate of silting (mm/yr) in 23 years 1.037Average rate of silting (M.Cum/yr) in 23 years 0.167
Name of State ‐Gujarat Name of the District ‐ Jamnagar Name of River ‐ Und Year of Impoundment ‐ 1988Catchment Area ‐ 769.00 Sq.km Reservoir Area at FRL ‐ 17.69 Sq.km MDDL ‐ 90.1m FRL ‐ 97.86m
Gross Live Dead Since Last Survey Cumulative % Cumulative (Th.Cum/SqKm/yr) (M.Cum/yr)1 2 3 4 5 6 7 8 9 10 11 12
1 1988 72.5 65.47 7.032 2010 22 69.045 65.942 3.103 3.455 3.455 4.77 0.204 0.157
Average rate of silting(Th.Cum/Sq.km/Yr) in 22 year 0.204Average rate of silting (mm/yr) in 22 years 0.204Average rate of silting (M.Cum/yr) in 22 years 0.157
SUVI RESERVOIR
UND‐I RESERVOIR
Reservoir Capacity(M.Cum) Observed Rate of Siltation Since Last Survey
RemarksLoss of Capacity (M.Cum)
Loss of Capacity (M.Cum)Year of Survey
Period (Years) Remarks
Period (Years)
Observed Rate of Siltation Since Last SurveyS. No
Year of Survey
Reservoir Capacity(M.Cum)
S. No
51
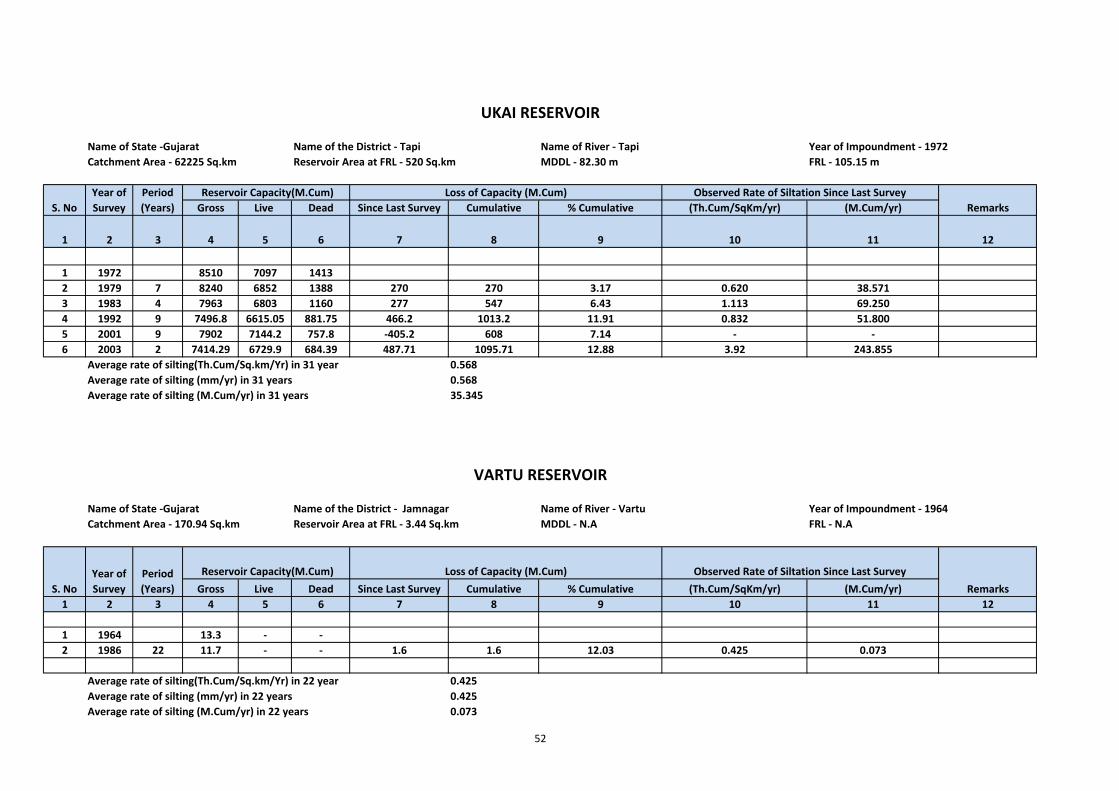
Name of State ‐Gujarat Name of the District ‐ Tapi Name of River ‐ Tapi Year of Impoundment ‐ 1972Catchment Area ‐ 62225 Sq.km Reservoir Area at FRL ‐ 520 Sq.km MDDL ‐ 82.30 m FRL ‐ 105.15 m
Gross Live Dead Since Last Survey Cumulative % Cumulative (Th.Cum/SqKm/yr) (M.Cum/yr)
1 2 3 4 5 6 7 8 9 10 11 12
1 1972 8510 7097 14132 1979 7 8240 6852 1388 270 270 3.17 0.620 38.5713 1983 4 7963 6803 1160 277 547 6.43 1.113 69.2504 1992 9 7496.8 6615.05 881.75 466.2 1013.2 11.91 0.832 51.8005 2001 9 7902 7144.2 757.8 ‐405.2 608 7.14 ‐ ‐6 2003 2 7414.29 6729.9 684.39 487.71 1095.71 12.88 3.92 243.855
Average rate of silting(Th.Cum/Sq.km/Yr) in 31 year 0.568Average rate of silting (mm/yr) in 31 years 0.568Average rate of silting (M.Cum/yr) in 31 years 35.345
Name of State ‐Gujarat Name of the District ‐ Jamnagar Name of River ‐ Vartu Year of Impoundment ‐ 1964Catchment Area ‐ 170.94 Sq.km Reservoir Area at FRL ‐ 3.44 Sq.km MDDL ‐ N.A FRL ‐ N.A
Gross Live Dead Since Last Survey Cumulative % Cumulative (Th.Cum/SqKm/yr) (M.Cum/yr)1 2 3 4 5 6 7 8 9 10 11 12
1 1964 13.3 ‐ ‐2 1986 22 11.7 ‐ ‐ 1.6 1.6 12.03 0.425 0.073
Average rate of silting(Th.Cum/Sq.km/Yr) in 22 year 0.425Average rate of silting (mm/yr) in 22 years 0.425Average rate of silting (M.Cum/yr) in 22 years 0.073
Period (Years)
Year of Survey
Loss of Capacity (M.Cum)
RemarksPeriod (Years)
RemarksS. No
UKAI RESERVOIR
Reservoir Capacity(M.Cum)
VARTU RESERVOIR
Reservoir Capacity(M.Cum)
Observed Rate of Siltation Since Last Survey
Loss of Capacity (M.Cum)S. No
Year of Survey
Observed Rate of Siltation Since Last Survey
52
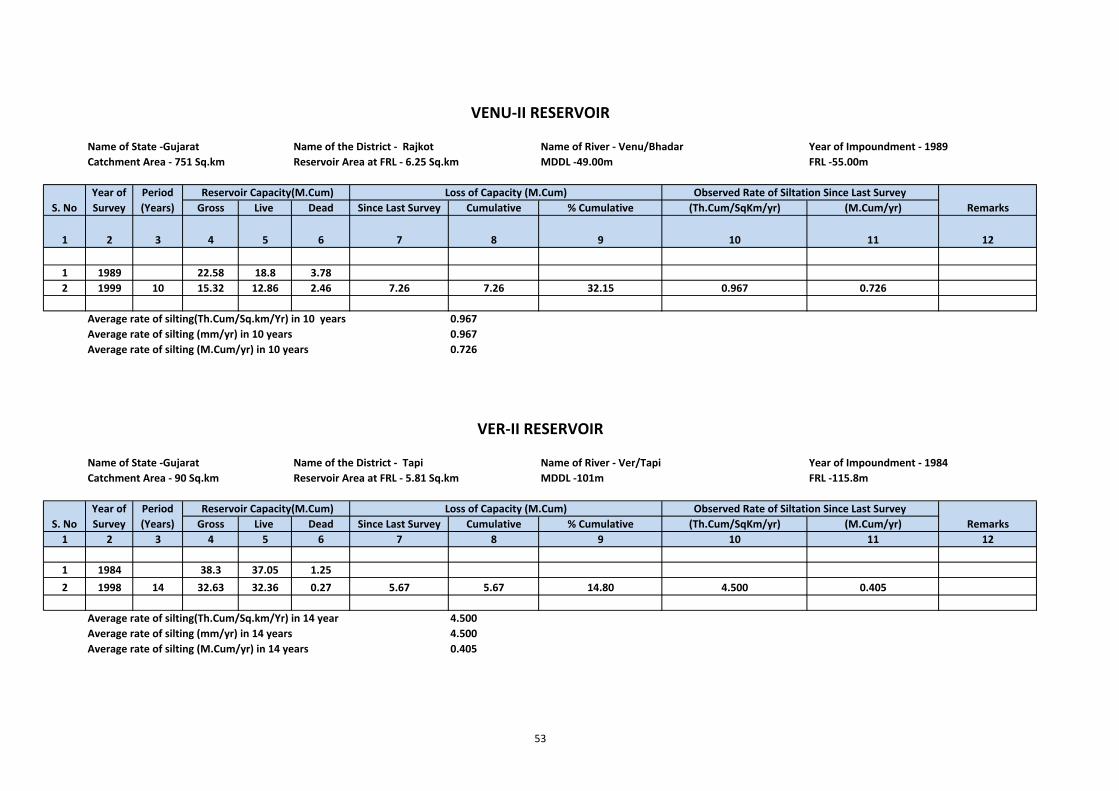
Name of State ‐Gujarat Name of the District ‐ Rajkot Name of River ‐ Venu/Bhadar Year of Impoundment ‐ 1989Catchment Area ‐ 751 Sq.km Reservoir Area at FRL ‐ 6.25 Sq.km MDDL ‐49.00m FRL ‐55.00m
Gross Live Dead Since Last Survey Cumulative % Cumulative (Th.Cum/SqKm/yr) (M.Cum/yr)
1 2 3 4 5 6 7 8 9 10 11 12
1 1989 22.58 18.8 3.782 1999 10 15.32 12.86 2.46 7.26 7.26 32.15 0.967 0.726
Average rate of silting(Th.Cum/Sq.km/Yr) in 10 years 0.967Average rate of silting (mm/yr) in 10 years 0.967Average rate of silting (M.Cum/yr) in 10 years 0.726
Name of State ‐Gujarat Name of the District ‐ Tapi Name of River ‐ Ver/Tapi Year of Impoundment ‐ 1984Catchment Area ‐ 90 Sq.km Reservoir Area at FRL ‐ 5.81 Sq.km MDDL ‐101m FRL ‐115.8m
Gross Live Dead Since Last Survey Cumulative % Cumulative (Th.Cum/SqKm/yr) (M.Cum/yr)1 2 3 4 5 6 7 8 9 10 11 12
1 1984 38.3 37.05 1.252 1998 14 32.63 32.36 0.27 5.67 5.67 14.80 4.500 0.405
Average rate of silting(Th.Cum/Sq.km/Yr) in 14 year 4.500Average rate of silting (mm/yr) in 14 years 4.500Average rate of silting (M.Cum/yr) in 14 years 0.405
Loss of Capacity (M.Cum)
Year of Survey
Period (Years)
Reservoir Capacity(M.Cum) Loss of Capacity (M.Cum)
Reservoir Capacity(M.Cum)
Observed Rate of Siltation Since Last Survey
VENU‐II RESERVOIR
S. No Remarks
Observed Rate of Siltation Since Last SurveyRemarks
VER‐II RESERVOIR
S. NoYear of Survey
Period (Years)
53
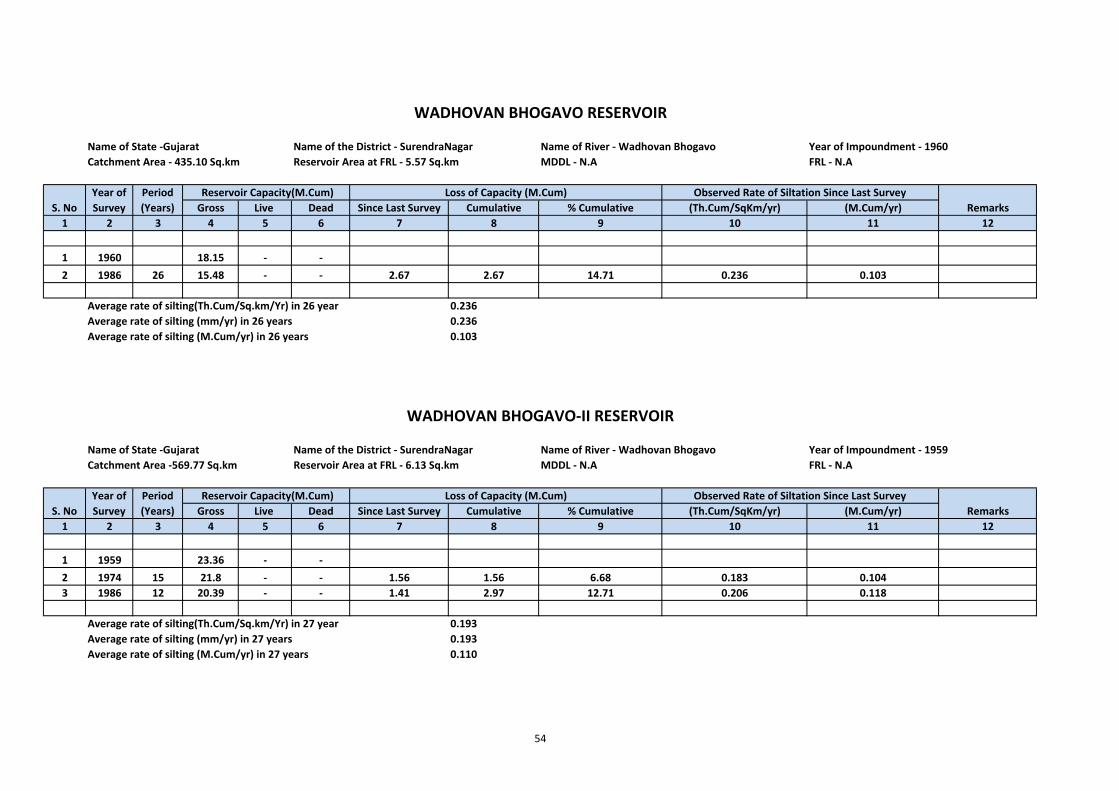
Name of State ‐Gujarat Name of the District ‐ SurendraNagar Name of River ‐ Wadhovan Bhogavo Year of Impoundment ‐ 1960Catchment Area ‐ 435.10 Sq.km Reservoir Area at FRL ‐ 5.57 Sq.km MDDL ‐ N.A FRL ‐ N.A
Gross Live Dead Since Last Survey Cumulative % Cumulative (Th.Cum/SqKm/yr) (M.Cum/yr)1 2 3 4 5 6 7 8 9 10 11 12
1 1960 18.15 ‐ ‐2 1986 26 15.48 ‐ ‐ 2.67 2.67 14.71 0.236 0.103
Average rate of silting(Th.Cum/Sq.km/Yr) in 26 year 0.236Average rate of silting (mm/yr) in 26 years 0.236Average rate of silting (M.Cum/yr) in 26 years 0.103
Name of State ‐Gujarat Name of the District ‐ SurendraNagar Name of River ‐ Wadhovan Bhogavo Year of Impoundment ‐ 1959Catchment Area ‐569.77 Sq.km Reservoir Area at FRL ‐ 6.13 Sq.km MDDL ‐ N.A FRL ‐ N.A
Gross Live Dead Since Last Survey Cumulative % Cumulative (Th.Cum/SqKm/yr) (M.Cum/yr)1 2 3 4 5 6 7 8 9 10 11 12
1 1959 23.36 ‐ ‐2 1974 15 21.8 ‐ ‐ 1.56 1.56 6.68 0.183 0.1043 1986 12 20.39 ‐ ‐ 1.41 2.97 12.71 0.206 0.118
Average rate of silting(Th.Cum/Sq.km/Yr) in 27 year 0.193Average rate of silting (mm/yr) in 27 years 0.193Average rate of silting (M.Cum/yr) in 27 years 0.110
S. No
WADHOVAN BHOGAVO RESERVOIR
Period (Years)
Year of Survey
Observed Rate of Siltation Since Last Survey
WADHOVAN BHOGAVO‐II RESERVOIR
Loss of Capacity (M.Cum)Year of Survey Remarks
Remarks Reservoir Capacity(M.Cum)
S. No
Observed Rate of Siltation Since Last Survey
Loss of Capacity (M.Cum)
Period (Years)
Reservoir Capacity(M.Cum)
54
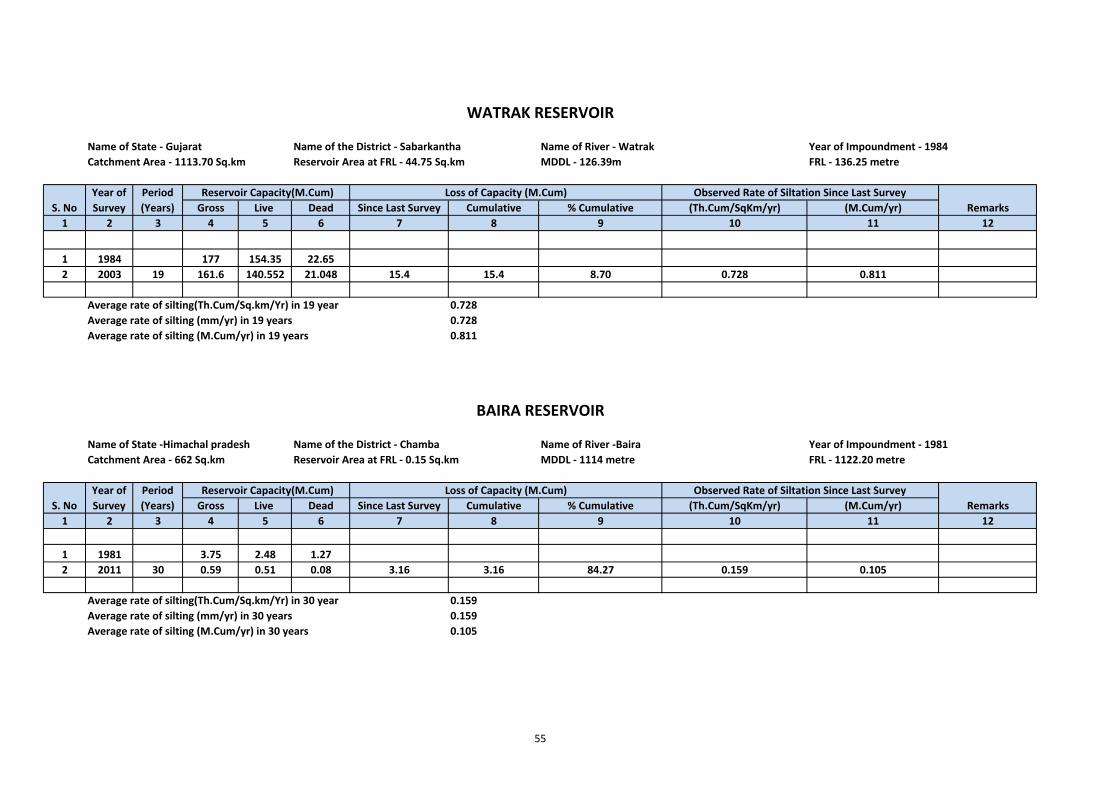
Name of State ‐ Gujarat Name of the District ‐ Sabarkantha Name of River ‐ Watrak Year of Impoundment ‐ 1984Catchment Area ‐ 1113.70 Sq.km Reservoir Area at FRL ‐ 44.75 Sq.km MDDL ‐ 126.39m FRL ‐ 136.25 metre
Gross Live Dead Since Last Survey Cumulative % Cumulative (Th.Cum/SqKm/yr) (M.Cum/yr)1 2 3 4 5 6 7 8 9 10 11 12
1 1984 177 154.35 22.652 2003 19 161.6 140.552 21.048 15.4 15.4 8.70 0.728 0.811
Average rate of silting(Th.Cum/Sq.km/Yr) in 19 year 0.728Average rate of silting (mm/yr) in 19 years 0.728Average rate of silting (M.Cum/yr) in 19 years 0.811
Name of State ‐Himachal pradesh Name of the District ‐ Chamba Name of River ‐Baira Year of Impoundment ‐ 1981Catchment Area ‐ 662 Sq.km Reservoir Area at FRL ‐ 0.15 Sq.km MDDL ‐ 1114 metre FRL ‐ 1122.20 metre
Gross Live Dead Since Last Survey Cumulative % Cumulative (Th.Cum/SqKm/yr) (M.Cum/yr)1 2 3 4 5 6 7 8 9 10 11 12
1 1981 3.75 2.48 1.272 2011 30 0.59 0.51 0.08 3.16 3.16 84.27 0.159 0.105
Average rate of silting(Th.Cum/Sq.km/Yr) in 30 year 0.159Average rate of silting (mm/yr) in 30 years 0.159Average rate of silting (M.Cum/yr) in 30 years 0.105
Reservoir Capacity(M.Cum) Observed Rate of Siltation Since Last SurveyS. No Remarks
Loss of Capacity (M.Cum)S. No
Year of Survey
Loss of Capacity (M.Cum)Year of Survey
Period (Years)
Period (Years)
BAIRA RESERVOIR
Observed Rate of Siltation Since Last Survey
WATRAK RESERVOIR
Remarks Reservoir Capacity(M.Cum)
55
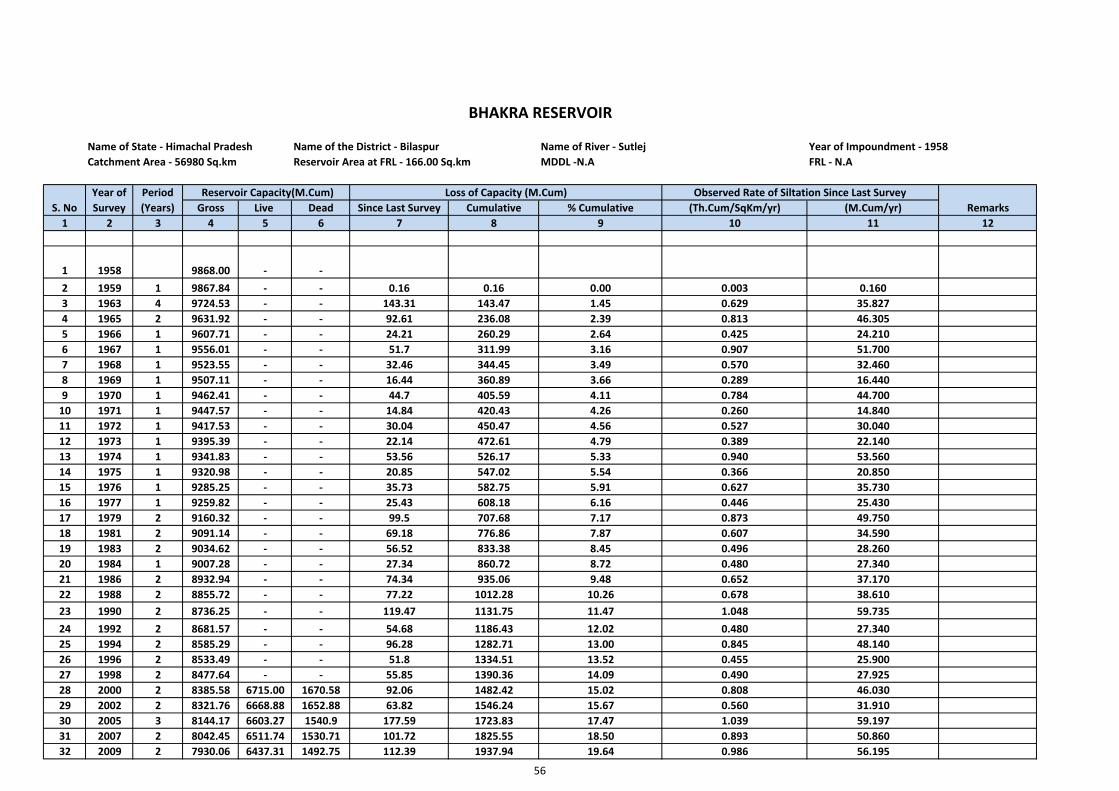
Name of State ‐ Himachal Pradesh Name of the District ‐ Bilaspur Name of River ‐ Sutlej Year of Impoundment ‐ 1958Catchment Area ‐ 56980 Sq.km Reservoir Area at FRL ‐ 166.00 Sq.km MDDL ‐N.A FRL ‐ N.A
Gross Live Dead Since Last Survey Cumulative % Cumulative (Th.Cum/SqKm/yr) (M.Cum/yr)1 2 3 4 5 6 7 8 9 10 11 12
1 1958 9868.00 ‐ ‐2 1959 1 9867.84 ‐ ‐ 0.16 0.16 0.00 0.003 0.1603 1963 4 9724.53 ‐ ‐ 143.31 143.47 1.45 0.629 35.8274 1965 2 9631.92 ‐ ‐ 92.61 236.08 2.39 0.813 46.3055 1966 1 9607.71 ‐ ‐ 24.21 260.29 2.64 0.425 24.2106 1967 1 9556.01 ‐ ‐ 51.7 311.99 3.16 0.907 51.7007 1968 1 9523.55 ‐ ‐ 32.46 344.45 3.49 0.570 32.4608 1969 1 9507.11 ‐ ‐ 16.44 360.89 3.66 0.289 16.4409 1970 1 9462.41 ‐ ‐ 44.7 405.59 4.11 0.784 44.70010 1971 1 9447.57 ‐ ‐ 14.84 420.43 4.26 0.260 14.84011 1972 1 9417.53 ‐ ‐ 30.04 450.47 4.56 0.527 30.04012 1973 1 9395.39 ‐ ‐ 22.14 472.61 4.79 0.389 22.14013 1974 1 9341.83 ‐ ‐ 53.56 526.17 5.33 0.940 53.56014 1975 1 9320.98 ‐ ‐ 20.85 547.02 5.54 0.366 20.85015 1976 1 9285.25 ‐ ‐ 35.73 582.75 5.91 0.627 35.73016 1977 1 9259.82 ‐ ‐ 25.43 608.18 6.16 0.446 25.43017 1979 2 9160.32 ‐ ‐ 99.5 707.68 7.17 0.873 49.75018 1981 2 9091.14 ‐ ‐ 69.18 776.86 7.87 0.607 34.59019 1983 2 9034.62 ‐ ‐ 56.52 833.38 8.45 0.496 28.26020 1984 1 9007.28 ‐ ‐ 27.34 860.72 8.72 0.480 27.34021 1986 2 8932.94 ‐ ‐ 74.34 935.06 9.48 0.652 37.17022 1988 2 8855.72 ‐ ‐ 77.22 1012.28 10.26 0.678 38.61023 1990 2 8736.25 ‐ ‐ 119.47 1131.75 11.47 1.048 59.73524 1992 2 8681.57 ‐ ‐ 54.68 1186.43 12.02 0.480 27.34025 1994 2 8585.29 ‐ ‐ 96.28 1282.71 13.00 0.845 48.14026 1996 2 8533.49 ‐ ‐ 51.8 1334.51 13.52 0.455 25.90027 1998 2 8477.64 ‐ ‐ 55.85 1390.36 14.09 0.490 27.92528 2000 2 8385.58 6715.00 1670.58 92.06 1482.42 15.02 0.808 46.03029 2002 2 8321.76 6668.88 1652.88 63.82 1546.24 15.67 0.560 31.91030 2005 3 8144.17 6603.27 1540.9 177.59 1723.83 17.47 1.039 59.19731 2007 2 8042.45 6511.74 1530.71 101.72 1825.55 18.50 0.893 50.86032 2009 2 7930.06 6437.31 1492.75 112.39 1937.94 19.64 0.986 56.195
Period (Years)
Reservoir Capacity(M.Cum) Loss of Capacity (M.Cum)Remarks
Observed Rate of Siltation Since Last SurveyYear of Survey S. No
BHAKRA RESERVOIR
56
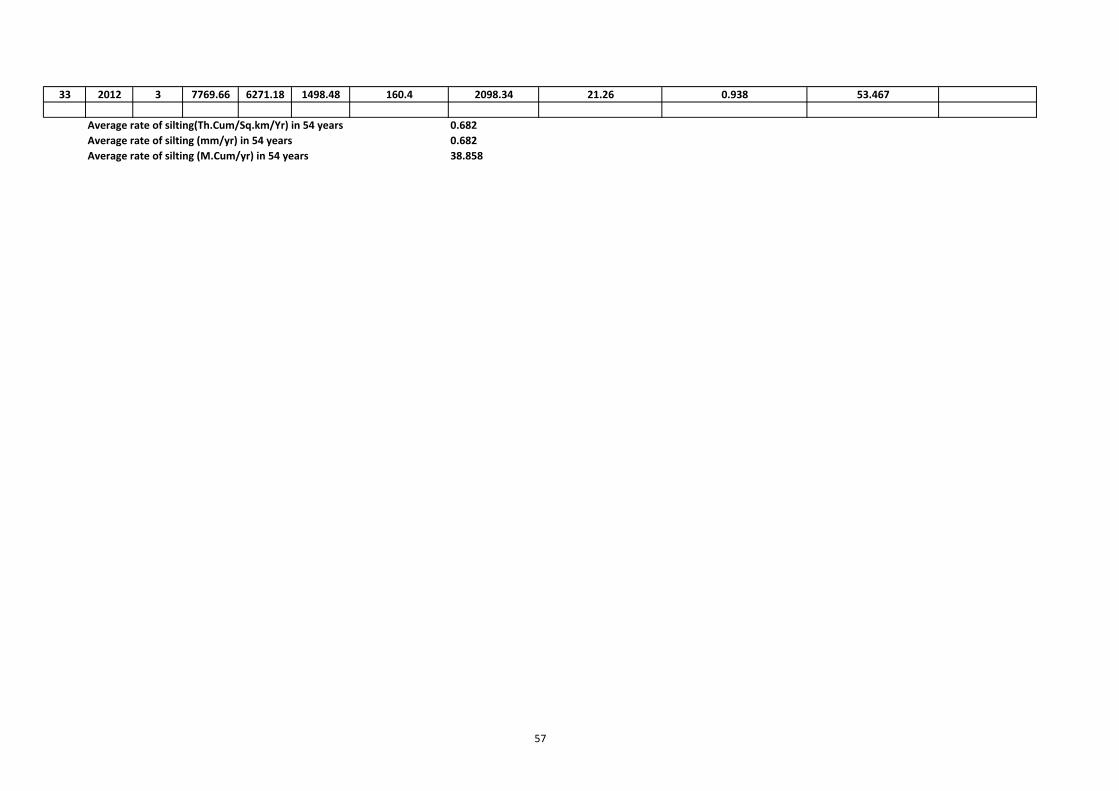
33 2012 3 7769.66 6271.18 1498.48 160.4 2098.34 21.26 0.938 53.467
Average rate of silting(Th.Cum/Sq.km/Yr) in 54 years 0.682Average rate of silting (mm/yr) in 54 years 0.682Average rate of silting (M.Cum/yr) in 54 years 38.858
57
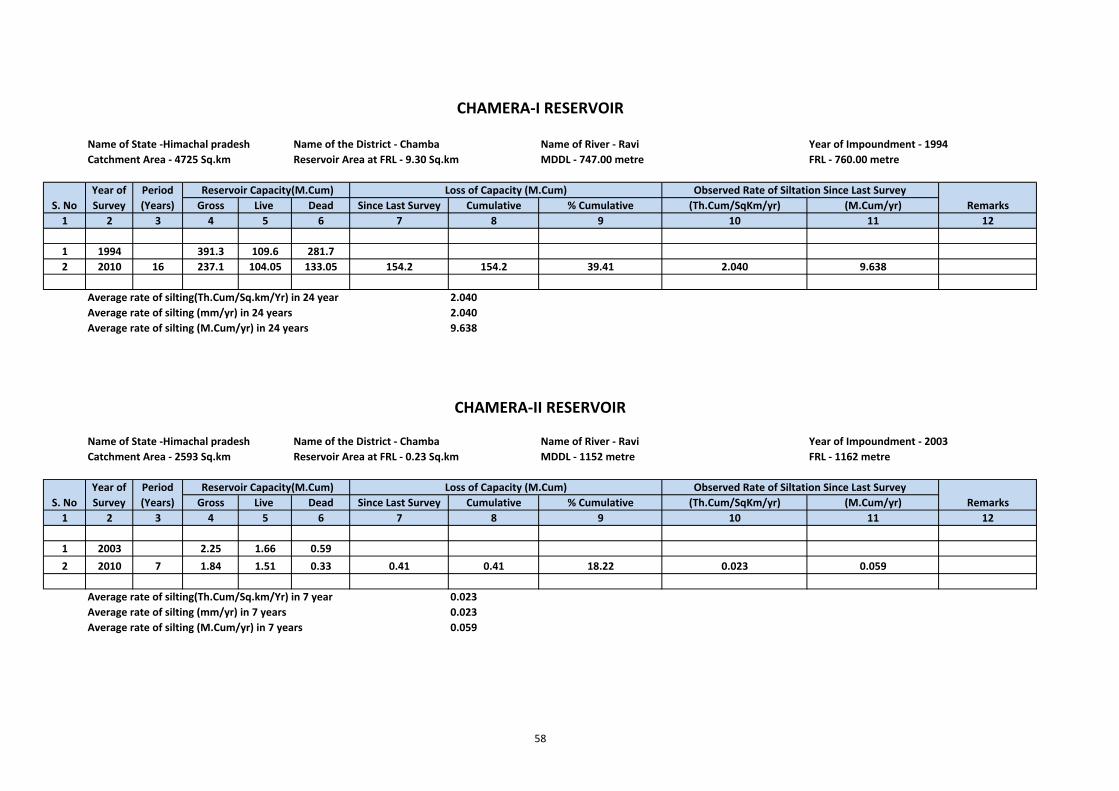
Name of State ‐Himachal pradesh Name of the District ‐ Chamba Name of River ‐ Ravi Year of Impoundment ‐ 1994Catchment Area ‐ 4725 Sq.km Reservoir Area at FRL ‐ 9.30 Sq.km MDDL ‐ 747.00 metre FRL ‐ 760.00 metre
Gross Live Dead Since Last Survey Cumulative % Cumulative (Th.Cum/SqKm/yr) (M.Cum/yr)1 2 3 4 5 6 7 8 9 10 11 12
1 1994 391.3 109.6 281.72 2010 16 237.1 104.05 133.05 154.2 154.2 39.41 2.040 9.638
Average rate of silting(Th.Cum/Sq.km/Yr) in 24 year 2.040Average rate of silting (mm/yr) in 24 years 2.040Average rate of silting (M.Cum/yr) in 24 years 9.638
Name of State ‐Himachal pradesh Name of the District ‐ Chamba Name of River ‐ Ravi Year of Impoundment ‐ 2003Catchment Area ‐ 2593 Sq.km Reservoir Area at FRL ‐ 0.23 Sq.km MDDL ‐ 1152 metre FRL ‐ 1162 metre
Gross Live Dead Since Last Survey Cumulative % Cumulative (Th.Cum/SqKm/yr) (M.Cum/yr)1 2 3 4 5 6 7 8 9 10 11 12
1 2003 2.25 1.66 0.592 2010 7 1.84 1.51 0.33 0.41 0.41 18.22 0.023 0.059
Average rate of silting(Th.Cum/Sq.km/Yr) in 7 year 0.023Average rate of silting (mm/yr) in 7 years 0.023Average rate of silting (M.Cum/yr) in 7 years 0.059
CHAMERA‐II RESERVOIR
Loss of Capacity (M.Cum)
CHAMERA‐I RESERVOIR
Reservoir Capacity(M.Cum)
Reservoir Capacity(M.Cum)
RemarksYear of Survey
Period (Years)
S. NoYear of Survey
Period (Years)
Loss of Capacity (M.Cum) Observed Rate of Siltation Since Last SurveyRemarks
S. NoObserved Rate of Siltation Since Last Survey
58
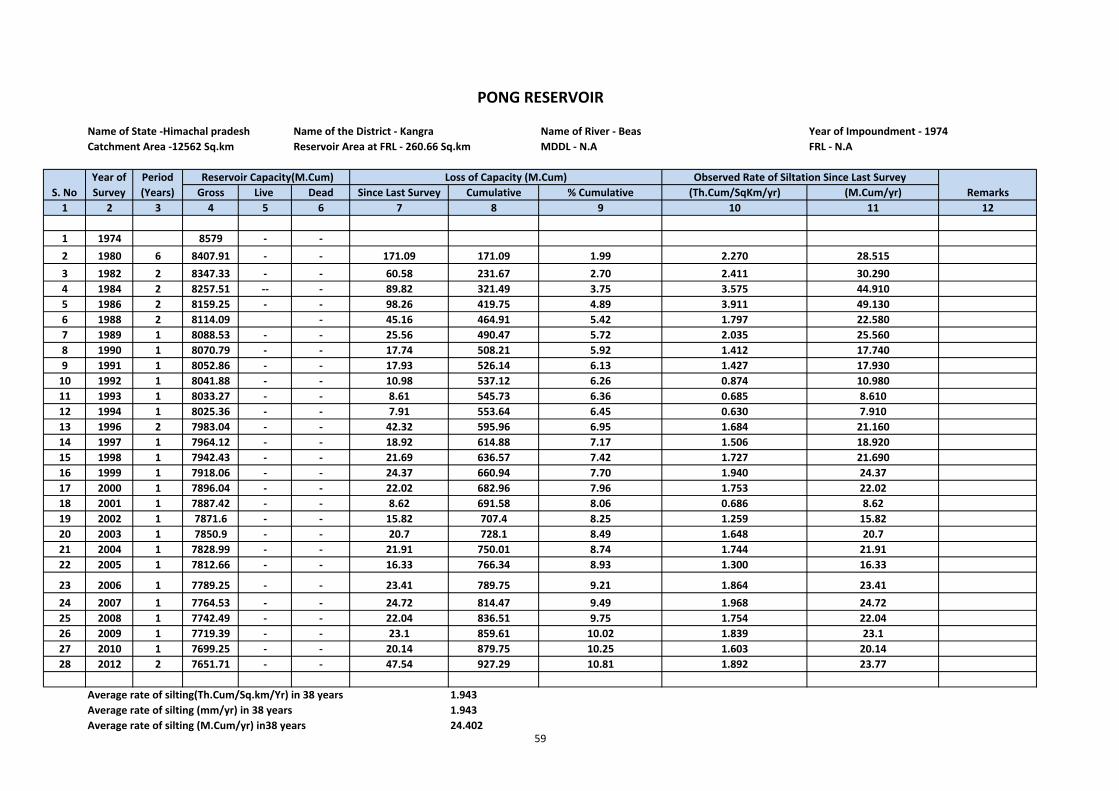
Name of State ‐Himachal pradesh Name of the District ‐ Kangra Name of River ‐ Beas Year of Impoundment ‐ 1974Catchment Area ‐12562 Sq.km Reservoir Area at FRL ‐ 260.66 Sq.km MDDL ‐ N.A FRL ‐ N.A
Gross Live Dead Since Last Survey Cumulative % Cumulative (Th.Cum/SqKm/yr) (M.Cum/yr)1 2 3 4 5 6 7 8 9 10 11 12
1 1974 8579 ‐ ‐2 1980 6 8407.91 ‐ ‐ 171.09 171.09 1.99 2.270 28.5153 1982 2 8347.33 ‐ ‐ 60.58 231.67 2.70 2.411 30.2904 1984 2 8257.51 ‐‐ ‐ 89.82 321.49 3.75 3.575 44.9105 1986 2 8159.25 ‐ ‐ 98.26 419.75 4.89 3.911 49.1306 1988 2 8114.09 ‐ 45.16 464.91 5.42 1.797 22.5807 1989 1 8088.53 ‐ ‐ 25.56 490.47 5.72 2.035 25.5608 1990 1 8070.79 ‐ ‐ 17.74 508.21 5.92 1.412 17.7409 1991 1 8052.86 ‐ ‐ 17.93 526.14 6.13 1.427 17.93010 1992 1 8041.88 ‐ ‐ 10.98 537.12 6.26 0.874 10.98011 1993 1 8033.27 ‐ ‐ 8.61 545.73 6.36 0.685 8.61012 1994 1 8025.36 ‐ ‐ 7.91 553.64 6.45 0.630 7.91013 1996 2 7983.04 ‐ ‐ 42.32 595.96 6.95 1.684 21.16014 1997 1 7964.12 ‐ ‐ 18.92 614.88 7.17 1.506 18.92015 1998 1 7942.43 ‐ ‐ 21.69 636.57 7.42 1.727 21.69016 1999 1 7918.06 ‐ ‐ 24.37 660.94 7.70 1.940 24.3717 2000 1 7896.04 ‐ ‐ 22.02 682.96 7.96 1.753 22.0218 2001 1 7887.42 ‐ ‐ 8.62 691.58 8.06 0.686 8.6219 2002 1 7871.6 ‐ ‐ 15.82 707.4 8.25 1.259 15.8220 2003 1 7850.9 ‐ ‐ 20.7 728.1 8.49 1.648 20.721 2004 1 7828.99 ‐ ‐ 21.91 750.01 8.74 1.744 21.9122 2005 1 7812.66 ‐ ‐ 16.33 766.34 8.93 1.300 16.33
23 2006 1 7789.25 ‐ ‐ 23.41 789.75 9.21 1.864 23.4124 2007 1 7764.53 ‐ ‐ 24.72 814.47 9.49 1.968 24.7225 2008 1 7742.49 ‐ ‐ 22.04 836.51 9.75 1.754 22.0426 2009 1 7719.39 ‐ ‐ 23.1 859.61 10.02 1.839 23.127 2010 1 7699.25 ‐ ‐ 20.14 879.75 10.25 1.603 20.1428 2012 2 7651.71 ‐ ‐ 47.54 927.29 10.81 1.892 23.77
Average rate of silting(Th.Cum/Sq.km/Yr) in 38 years 1.943Average rate of silting (mm/yr) in 38 years 1.943Average rate of silting (M.Cum/yr) in38 years 24.402
Remarks Reservoir Capacity(M.Cum) Observed Rate of Siltation Since Last Survey
S. NoYear of Survey
Period (Years)
PONG RESERVOIR
Loss of Capacity (M.Cum)
59
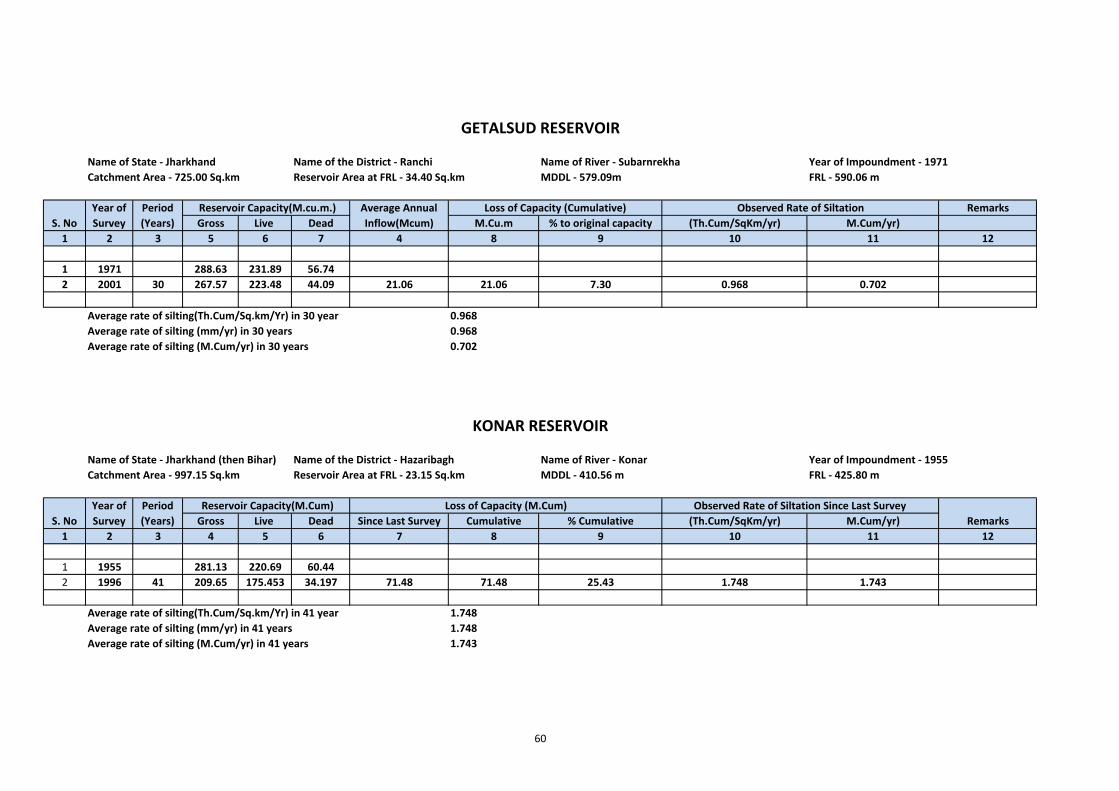
Name of State ‐ Jharkhand Name of the District ‐ Ranchi Name of River ‐ Subarnrekha Year of Impoundment ‐ 1971Catchment Area ‐ 725.00 Sq.km Reservoir Area at FRL ‐ 34.40 Sq.km MDDL ‐ 579.09m FRL ‐ 590.06 m
RemarksGross Live Dead M.Cu.m % to original capacity (Th.Cum/SqKm/yr) M.Cum/yr)
1 2 3 5 6 7 4 8 9 10 11 12
1 1971 288.63 231.89 56.742 2001 30 267.57 223.48 44.09 21.06 21.06 7.30 0.968 0.702
Average rate of silting(Th.Cum/Sq.km/Yr) in 30 year 0.968Average rate of silting (mm/yr) in 30 years 0.968Average rate of silting (M.Cum/yr) in 30 years 0.702
Name of State ‐ Jharkhand (then Bihar) Name of the District ‐ Hazaribagh Name of River ‐ Konar Year of Impoundment ‐ 1955Catchment Area ‐ 997.15 Sq.km Reservoir Area at FRL ‐ 23.15 Sq.km MDDL ‐ 410.56 m FRL ‐ 425.80 m
Gross Live Dead Since Last Survey Cumulative % Cumulative (Th.Cum/SqKm/yr) M.Cum/yr)1 2 3 4 5 6 7 8 9 10 11 12
1 1955 281.13 220.69 60.442 1996 41 209.65 175.453 34.197 71.48 71.48 25.43 1.748 1.743
Average rate of silting(Th.Cum/Sq.km/Yr) in 41 year 1.748Average rate of silting (mm/yr) in 41 years 1.748Average rate of silting (M.Cum/yr) in 41 years 1.743
Period (Years)
Observed Rate of Siltation Since Last Survey
Loss of Capacity (Cumulative) Reservoir Capacity(M.cu.m.) Average Annual Inflow(Mcum)
Observed Rate of Siltation
Loss of Capacity (M.Cum)S. No
S. No
Year of Survey
GETALSUD RESERVOIR
Remarks Reservoir Capacity(M.Cum)
Year of Survey
Period (Years)
KONAR RESERVOIR
60
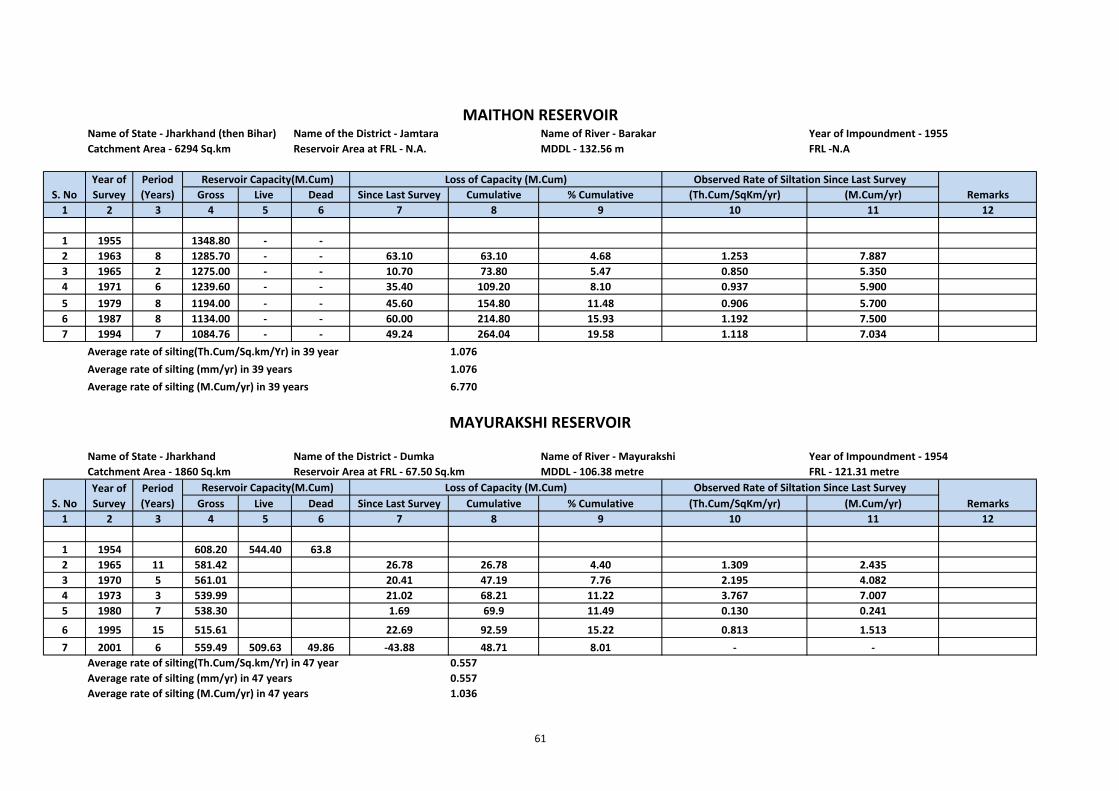
Name of State ‐ Jharkhand (then Bihar) Name of the District ‐ Jamtara Name of River ‐ Barakar Year of Impoundment ‐ 1955Catchment Area ‐ 6294 Sq.km Reservoir Area at FRL ‐ N.A. MDDL ‐ 132.56 m FRL ‐N.A
Gross Live Dead Since Last Survey Cumulative % Cumulative (Th.Cum/SqKm/yr) (M.Cum/yr)1 2 3 4 5 6 7 8 9 10 11 12
1 1955 1348.80 ‐ ‐2 1963 8 1285.70 ‐ ‐ 63.10 63.10 4.68 1.253 7.8873 1965 2 1275.00 ‐ ‐ 10.70 73.80 5.47 0.850 5.3504 1971 6 1239.60 ‐ ‐ 35.40 109.20 8.10 0.937 5.9005 1979 8 1194.00 ‐ ‐ 45.60 154.80 11.48 0.906 5.7006 1987 8 1134.00 ‐ ‐ 60.00 214.80 15.93 1.192 7.5007 1994 7 1084.76 ‐ ‐ 49.24 264.04 19.58 1.118 7.034
Average rate of silting(Th.Cum/Sq.km/Yr) in 39 year 1.076Average rate of silting (mm/yr) in 39 years 1.076Average rate of silting (M.Cum/yr) in 39 years 6.770
Name of State ‐ Jharkhand Name of the District ‐ Dumka Name of River ‐ Mayurakshi Year of Impoundment ‐ 1954Catchment Area ‐ 1860 Sq.km Reservoir Area at FRL ‐ 67.50 Sq.km MDDL ‐ 106.38 metre FRL ‐ 121.31 metre
Gross Live Dead Since Last Survey Cumulative % Cumulative (Th.Cum/SqKm/yr) (M.Cum/yr)1 2 3 4 5 6 7 8 9 10 11 12
1 1954 608.20 544.40 63.82 1965 11 581.42 26.78 26.78 4.40 1.309 2.4353 1970 5 561.01 20.41 47.19 7.76 2.195 4.0824 1973 3 539.99 21.02 68.21 11.22 3.767 7.0075 1980 7 538.30 1.69 69.9 11.49 0.130 0.241
6 1995 15 515.61 22.69 92.59 15.22 0.813 1.5137 2001 6 559.49 509.63 49.86 ‐43.88 48.71 8.01 ‐ ‐
Average rate of silting(Th.Cum/Sq.km/Yr) in 47 year 0.557Average rate of silting (mm/yr) in 47 years 0.557Average rate of silting (M.Cum/yr) in 47 years 1.036
Year of Survey
Period (Years)
Reservoir Capacity(M.Cum)
Period (Years)
Reservoir Capacity(M.Cum)
MAITHON RESERVOIR
Loss of Capacity (M.Cum)Year of Survey
S. No Remarks
RemarksObserved Rate of Siltation Since Last Survey
MAYURAKSHI RESERVOIR
Loss of Capacity (M.Cum)
S. No
Observed Rate of Siltation Since Last Survey
61
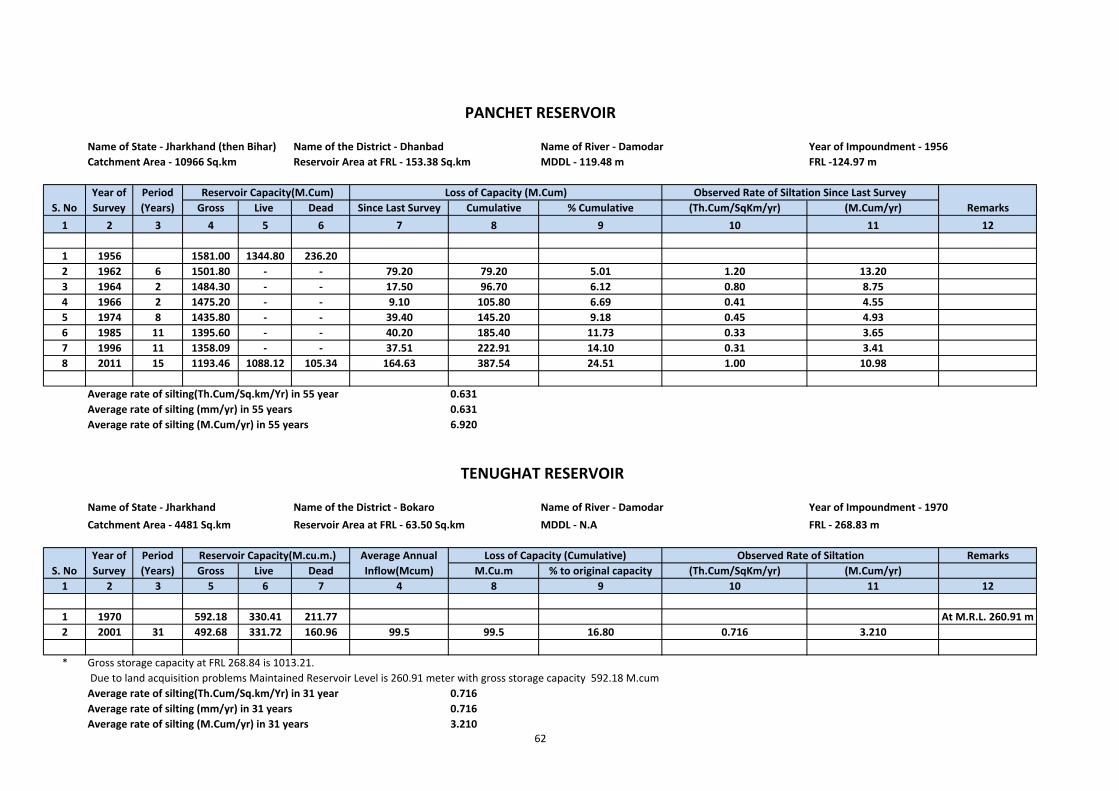
Name of State ‐ Jharkhand (then Bihar) Name of the District ‐ Dhanbad Name of River ‐ Damodar Year of Impoundment ‐ 1956Catchment Area ‐ 10966 Sq.km Reservoir Area at FRL ‐ 153.38 Sq.km MDDL ‐ 119.48 m FRL ‐124.97 m
Gross Live Dead Since Last Survey Cumulative % Cumulative (Th.Cum/SqKm/yr) (M.Cum/yr)1 2 3 4 5 6 7 8 9 10 11 12
1 1956 1581.00 1344.80 236.202 1962 6 1501.80 ‐ ‐ 79.20 79.20 5.01 1.20 13.203 1964 2 1484.30 ‐ ‐ 17.50 96.70 6.12 0.80 8.754 1966 2 1475.20 ‐ ‐ 9.10 105.80 6.69 0.41 4.555 1974 8 1435.80 ‐ ‐ 39.40 145.20 9.18 0.45 4.936 1985 11 1395.60 ‐ ‐ 40.20 185.40 11.73 0.33 3.657 1996 11 1358.09 ‐ ‐ 37.51 222.91 14.10 0.31 3.418 2011 15 1193.46 1088.12 105.34 164.63 387.54 24.51 1.00 10.98
Average rate of silting(Th.Cum/Sq.km/Yr) in 55 year 0.631Average rate of silting (mm/yr) in 55 years 0.631Average rate of silting (M.Cum/yr) in 55 years 6.920
Name of State ‐ Jharkhand Name of the District ‐ Bokaro Name of River ‐ Damodar Year of Impoundment ‐ 1970Catchment Area ‐ 4481 Sq.km Reservoir Area at FRL ‐ 63.50 Sq.km MDDL ‐ N.A FRL ‐ 268.83 m
RemarksGross Live Dead M.Cu.m % to original capacity (Th.Cum/SqKm/yr) (M.Cum/yr)
1 2 3 5 6 7 4 8 9 10 11 12
1 1970 592.18 330.41 211.77 At M.R.L. 260.91 m2 2001 31 492.68 331.72 160.96 99.5 99.5 16.80 0.716 3.210
* Gross storage capacity at FRL 268.84 is 1013.21. Due to land acquisition problems Maintained Reservoir Level is 260.91 meter with gross storage capacity 592.18 M.cumAverage rate of silting(Th.Cum/Sq.km/Yr) in 31 year 0.716Average rate of silting (mm/yr) in 31 years 0.716Average rate of silting (M.Cum/yr) in 31 years 3.210
Year of Survey
Period (Years)
Observed Rate of Siltation Since Last Survey
Average Annual Inflow(Mcum)
S. NoLoss of Capacity (M.Cum)Period
(Years) Reservoir Capacity(M.Cum)
Loss of Capacity (Cumulative) Reservoir Capacity(M.cu.m.)
TENUGHAT RESERVOIR
PANCHET RESERVOIR
Year of Survey
S. No
Remarks
Observed Rate of Siltation
62
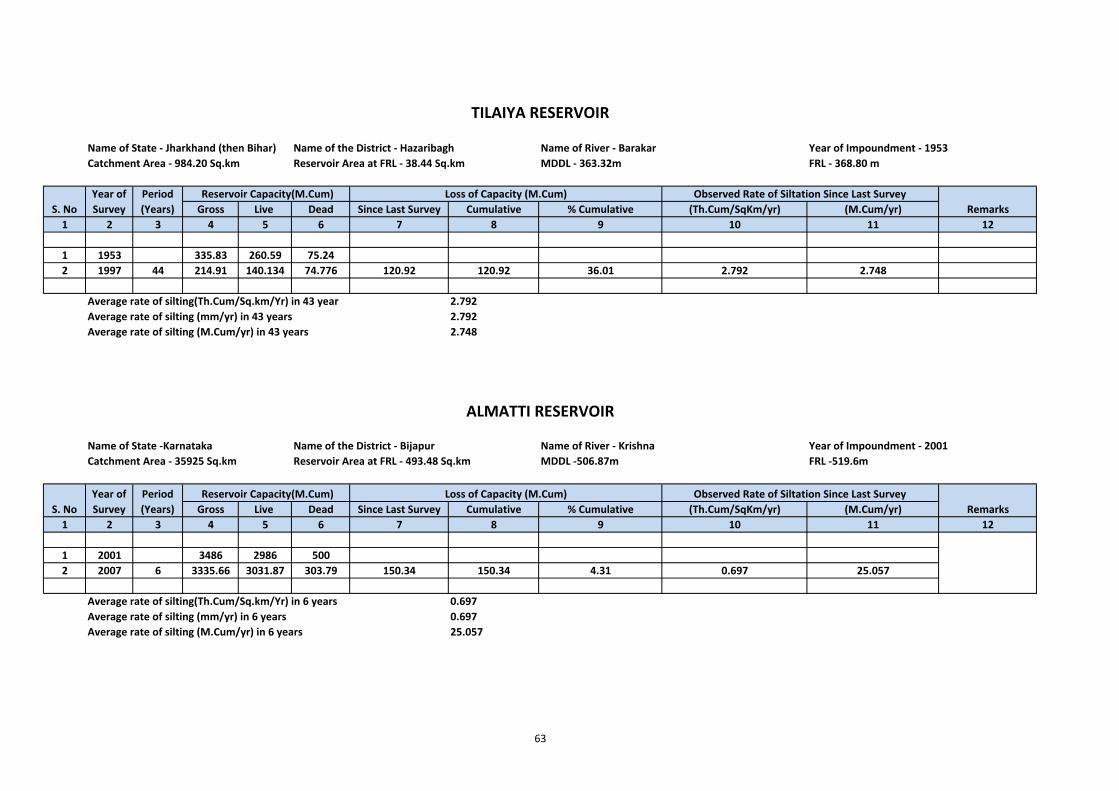
Name of State ‐ Jharkhand (then Bihar) Name of the District ‐ Hazaribagh Name of River ‐ Barakar Year of Impoundment ‐ 1953Catchment Area ‐ 984.20 Sq.km Reservoir Area at FRL ‐ 38.44 Sq.km MDDL ‐ 363.32m FRL ‐ 368.80 m
Gross Live Dead Since Last Survey Cumulative % Cumulative (Th.Cum/SqKm/yr) (M.Cum/yr)1 2 3 4 5 6 7 8 9 10 11 12
1 1953 335.83 260.59 75.242 1997 44 214.91 140.134 74.776 120.92 120.92 36.01 2.792 2.748
Average rate of silting(Th.Cum/Sq.km/Yr) in 43 year 2.792Average rate of silting (mm/yr) in 43 years 2.792Average rate of silting (M.Cum/yr) in 43 years 2.748
Name of State ‐Karnataka Name of the District ‐ Bijapur Name of River ‐ Krishna Year of Impoundment ‐ 2001Catchment Area ‐ 35925 Sq.km Reservoir Area at FRL ‐ 493.48 Sq.km MDDL ‐506.87m FRL ‐519.6m
Gross Live Dead Since Last Survey Cumulative % Cumulative (Th.Cum/SqKm/yr) (M.Cum/yr)1 2 3 4 5 6 7 8 9 10 11 12
1 2001 3486 2986 5002 2007 6 3335.66 3031.87 303.79 150.34 150.34 4.31 0.697 25.057
Average rate of silting(Th.Cum/Sq.km/Yr) in 6 years 0.697Average rate of silting (mm/yr) in 6 years 0.697Average rate of silting (M.Cum/yr) in 6 years 25.057
Observed Rate of Siltation Since Last SurveyLoss of Capacity (M.Cum)
Year of Survey
Reservoir Capacity(M.Cum)
Remarks
RemarksPeriod (Years)
Period (Years)
Reservoir Capacity(M.Cum)
S. No
Observed Rate of Siltation Since Last SurveyS. No
Loss of Capacity (M.Cum)
Year of Survey
TILAIYA RESERVOIR
ALMATTI RESERVOIR
63
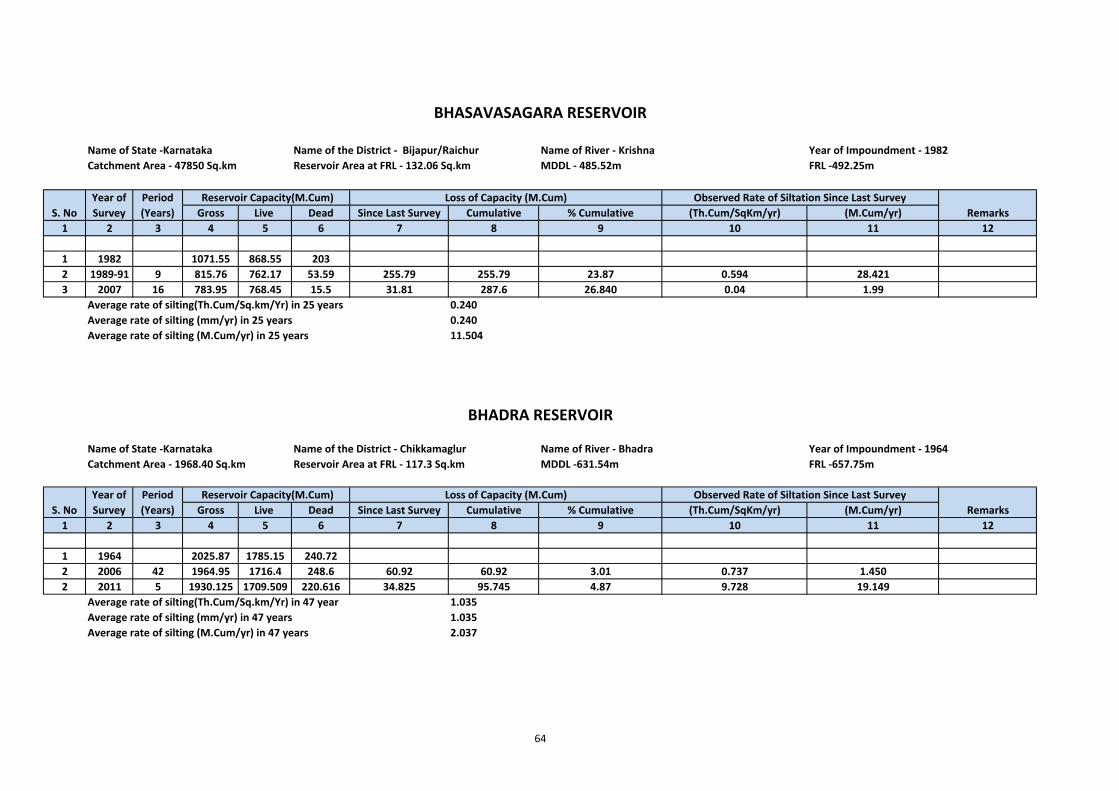
Name of State ‐Karnataka Name of the District ‐ Bijapur/Raichur Name of River ‐ Krishna Year of Impoundment ‐ 1982Catchment Area ‐ 47850 Sq.km Reservoir Area at FRL ‐ 132.06 Sq.km MDDL ‐ 485.52m FRL ‐492.25m
Gross Live Dead Since Last Survey Cumulative % Cumulative (Th.Cum/SqKm/yr) (M.Cum/yr)1 2 3 4 5 6 7 8 9 10 11 12
1 1982 1071.55 868.55 2032 1989‐91 9 815.76 762.17 53.59 255.79 255.79 23.87 0.594 28.4213 2007 16 783.95 768.45 15.5 31.81 287.6 26.840 0.04 1.99
Average rate of silting(Th.Cum/Sq.km/Yr) in 25 years 0.240Average rate of silting (mm/yr) in 25 years 0.240Average rate of silting (M.Cum/yr) in 25 years 11.504
Name of State ‐Karnataka Name of the District ‐ Chikkamaglur Name of River ‐ Bhadra Year of Impoundment ‐ 1964Catchment Area ‐ 1968.40 Sq.km Reservoir Area at FRL ‐ 117.3 Sq.km MDDL ‐631.54m FRL ‐657.75m
Gross Live Dead Since Last Survey Cumulative % Cumulative (Th.Cum/SqKm/yr) (M.Cum/yr)1 2 3 4 5 6 7 8 9 10 11 12
1 1964 2025.87 1785.15 240.722 2006 42 1964.95 1716.4 248.6 60.92 60.92 3.01 0.737 1.4502 2011 5 1930.125 1709.509 220.616 34.825 95.745 4.87 9.728 19.149
Average rate of silting(Th.Cum/Sq.km/Yr) in 47 year 1.035Average rate of silting (mm/yr) in 47 years 1.035Average rate of silting (M.Cum/yr) in 47 years 2.037
BHASAVASAGARA RESERVOIR
Remarks Reservoir Capacity(M.Cum) Observed Rate of Siltation Since Last Survey
Period (Years)
Reservoir Capacity(M.Cum) Loss of Capacity (M.Cum) Observed Rate of Siltation Since Last Survey
Loss of Capacity (M.Cum)
Year of Survey S. No
Year of Survey S. No
Period (Years)
Remarks
BHADRA RESERVOIR
64
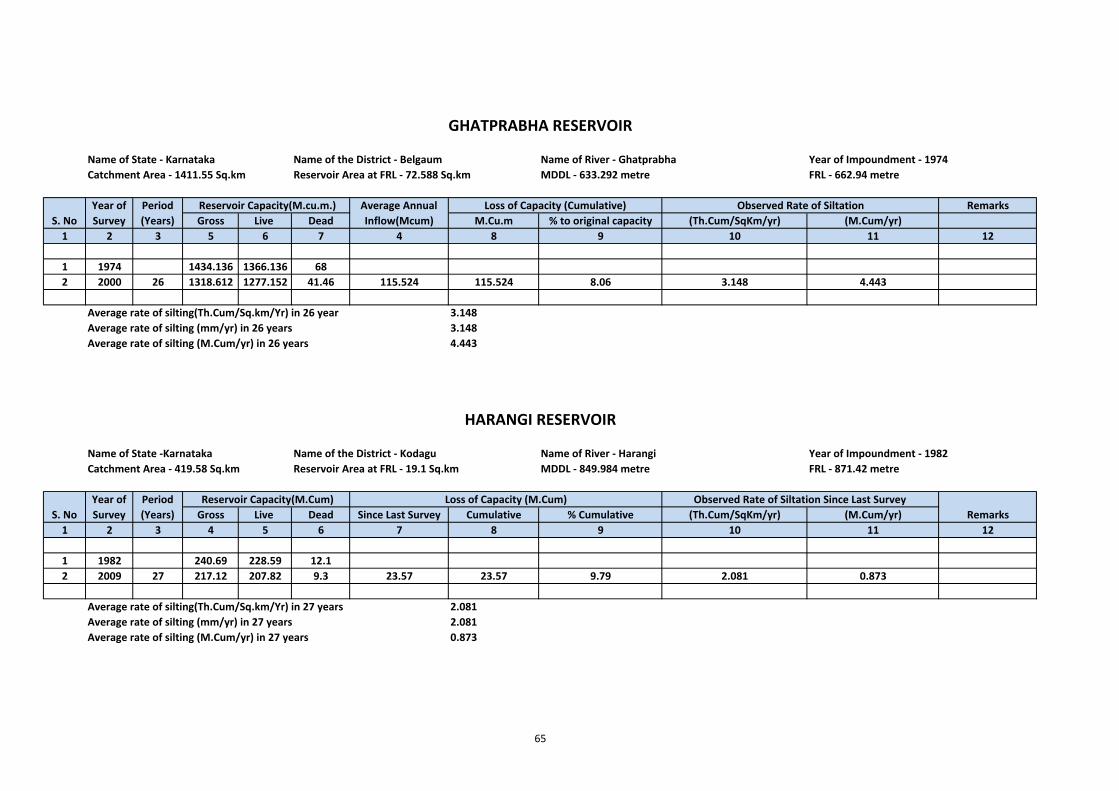
Name of State ‐ Karnataka Name of the District ‐ Belgaum Name of River ‐ Ghatprabha Year of Impoundment ‐ 1974Catchment Area ‐ 1411.55 Sq.km Reservoir Area at FRL ‐ 72.588 Sq.km MDDL ‐ 633.292 metre FRL ‐ 662.94 metre
RemarksGross Live Dead M.Cu.m % to original capacity (Th.Cum/SqKm/yr) (M.Cum/yr)
1 2 3 5 6 7 4 8 9 10 11 12
1 1974 1434.136 1366.136 682 2000 26 1318.612 1277.152 41.46 115.524 115.524 8.06 3.148 4.443
Average rate of silting(Th.Cum/Sq.km/Yr) in 26 year 3.148Average rate of silting (mm/yr) in 26 years 3.148Average rate of silting (M.Cum/yr) in 26 years 4.443
Name of State ‐Karnataka Name of the District ‐ Kodagu Name of River ‐ Harangi Year of Impoundment ‐ 1982Catchment Area ‐ 419.58 Sq.km Reservoir Area at FRL ‐ 19.1 Sq.km MDDL ‐ 849.984 metre FRL ‐ 871.42 metre
Gross Live Dead Since Last Survey Cumulative % Cumulative (Th.Cum/SqKm/yr) (M.Cum/yr)1 2 3 4 5 6 7 8 9 10 11 12
1 1982 240.69 228.59 12.12 2009 27 217.12 207.82 9.3 23.57 23.57 9.79 2.081 0.873
Average rate of silting(Th.Cum/Sq.km/Yr) in 27 years 2.081Average rate of silting (mm/yr) in 27 years 2.081Average rate of silting (M.Cum/yr) in 27 years 0.873
Loss of Capacity (Cumulative)S. No
Year of Survey
Observed Rate of Siltation
Remarks
HARANGI RESERVOIR
Period (Years)
Reservoir Capacity(M.cu.m.)
Year of Survey
Reservoir Capacity(M.Cum) Loss of Capacity (M.Cum) Observed Rate of Siltation Since Last SurveyS. No
Period (Years)
GHATPRABHA RESERVOIR
Average Annual Inflow(Mcum)
65
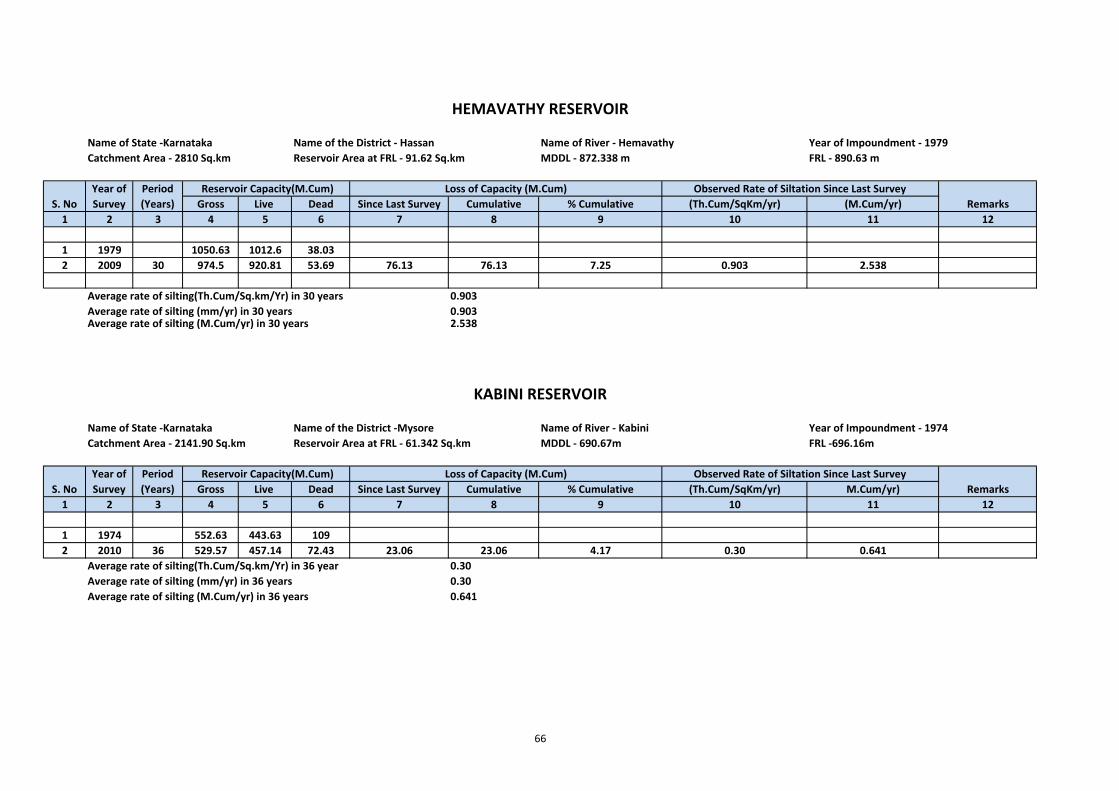
Name of State ‐Karnataka Name of the District ‐ Hassan Name of River ‐ Hemavathy Year of Impoundment ‐ 1979Catchment Area ‐ 2810 Sq.km Reservoir Area at FRL ‐ 91.62 Sq.km MDDL ‐ 872.338 m FRL ‐ 890.63 m
Gross Live Dead Since Last Survey Cumulative % Cumulative (Th.Cum/SqKm/yr) (M.Cum/yr)1 2 3 4 5 6 7 8 9 10 11 12
1 1979 1050.63 1012.6 38.032 2009 30 974.5 920.81 53.69 76.13 76.13 7.25 0.903 2.538
Average rate of silting(Th.Cum/Sq.km/Yr) in 30 years 0.903Average rate of silting (mm/yr) in 30 years 0.903Average rate of silting (M.Cum/yr) in 30 years 2.538
Name of State ‐Karnataka Name of the District ‐Mysore Name of River ‐ Kabini Year of Impoundment ‐ 1974Catchment Area ‐ 2141.90 Sq.km Reservoir Area at FRL ‐ 61.342 Sq.km MDDL ‐ 690.67m FRL ‐696.16m
Gross Live Dead Since Last Survey Cumulative % Cumulative (Th.Cum/SqKm/yr) M.Cum/yr)1 2 3 4 5 6 7 8 9 10 11 12
1 1974 552.63 443.63 1092 2010 36 529.57 457.14 72.43 23.06 23.06 4.17 0.30 0.641
Average rate of silting(Th.Cum/Sq.km/Yr) in 36 year 0.30Average rate of silting (mm/yr) in 36 years 0.30Average rate of silting (M.Cum/yr) in 36 years 0.641
Remarks
Loss of Capacity (M.Cum)
Year of Survey
Period (Years)
Observed Rate of Siltation Since Last SurveyYear of Survey
Period (Years)
Reservoir Capacity(M.Cum)
S. No
Loss of Capacity (M.Cum)
HEMAVATHY RESERVOIR
Reservoir Capacity(M.Cum)
S. NoObserved Rate of Siltation Since Last Survey
Remarks
KABINI RESERVOIR
66
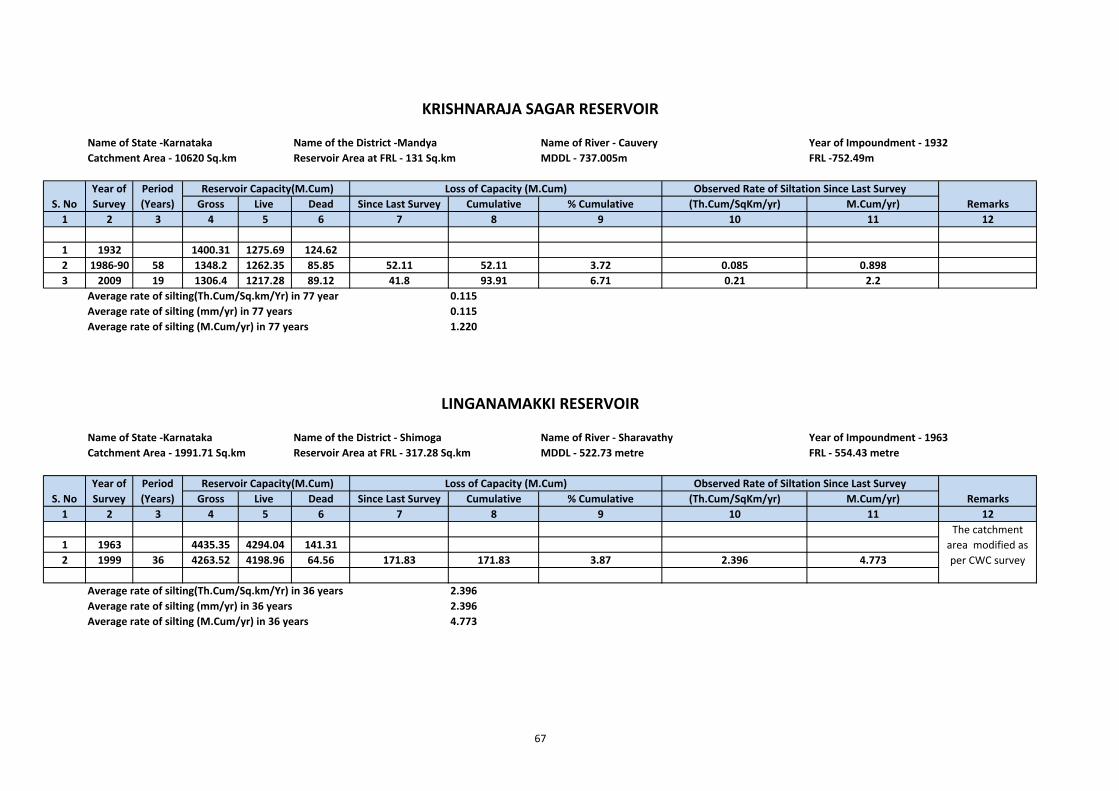
Name of State ‐Karnataka Name of the District ‐Mandya Name of River ‐ Cauvery Year of Impoundment ‐ 1932Catchment Area ‐ 10620 Sq.km Reservoir Area at FRL ‐ 131 Sq.km MDDL ‐ 737.005m FRL ‐752.49m
Gross Live Dead Since Last Survey Cumulative % Cumulative (Th.Cum/SqKm/yr) M.Cum/yr)1 2 3 4 5 6 7 8 9 10 11 12
1 1932 1400.31 1275.69 124.622 1986‐90 58 1348.2 1262.35 85.85 52.11 52.11 3.72 0.085 0.8983 2009 19 1306.4 1217.28 89.12 41.8 93.91 6.71 0.21 2.2
Average rate of silting(Th.Cum/Sq.km/Yr) in 77 year 0.115Average rate of silting (mm/yr) in 77 years 0.115Average rate of silting (M.Cum/yr) in 77 years 1.220
Name of State ‐Karnataka Name of the District ‐ Shimoga Name of River ‐ Sharavathy Year of Impoundment ‐ 1963Catchment Area ‐ 1991.71 Sq.km Reservoir Area at FRL ‐ 317.28 Sq.km MDDL ‐ 522.73 metre FRL ‐ 554.43 metre
Gross Live Dead Since Last Survey Cumulative % Cumulative (Th.Cum/SqKm/yr) M.Cum/yr)1 2 3 4 5 6 7 8 9 10 11 12
1 1963 4435.35 4294.04 141.312 1999 36 4263.52 4198.96 64.56 171.83 171.83 3.87 2.396 4.773
Average rate of silting(Th.Cum/Sq.km/Yr) in 36 years 2.396Average rate of silting (mm/yr) in 36 years 2.396Average rate of silting (M.Cum/yr) in 36 years 4.773
Observed Rate of Siltation Since Last Survey
KRISHNARAJA SAGAR RESERVOIR
Reservoir Capacity(M.Cum) Observed Rate of Siltation Since Last SurveyS. No
The catchment area modified as per CWC survey
LINGANAMAKKI RESERVOIR
Reservoir Capacity(M.Cum)Period (Years)
Year of Survey
S. NoYear of Survey Remarks
Loss of Capacity (M.Cum)Period (Years) Remarks
Loss of Capacity (M.Cum)
67
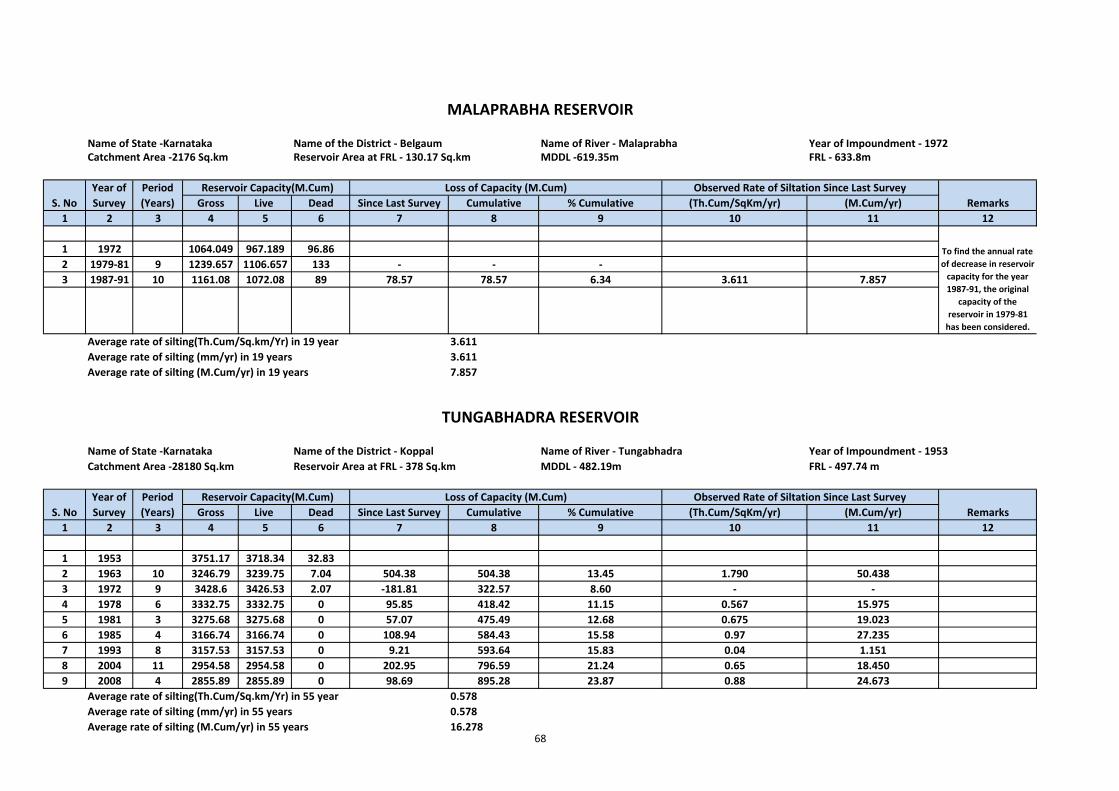
Name of State ‐Karnataka Name of the District ‐ Belgaum Name of River ‐ Malaprabha Year of Impoundment ‐ 1972Catchment Area ‐2176 Sq.km Reservoir Area at FRL ‐ 130.17 Sq.km MDDL ‐619.35m FRL ‐ 633.8m
Gross Live Dead Since Last Survey Cumulative % Cumulative (Th.Cum/SqKm/yr) (M.Cum/yr)1 2 3 4 5 6 7 8 9 10 11 12
1 1972 1064.049 967.189 96.862 1979‐81 9 1239.657 1106.657 133 ‐ ‐ ‐3 1987‐91 10 1161.08 1072.08 89 78.57 78.57 6.34 3.611 7.857
Average rate of silting(Th.Cum/Sq.km/Yr) in 19 year 3.611Average rate of silting (mm/yr) in 19 years 3.611Average rate of silting (M.Cum/yr) in 19 years 7.857
Name of State ‐Karnataka Name of the District ‐ Koppal Name of River ‐ Tungabhadra Year of Impoundment ‐ 1953Catchment Area ‐28180 Sq.km Reservoir Area at FRL ‐ 378 Sq.km MDDL ‐ 482.19m FRL ‐ 497.74 m
Gross Live Dead Since Last Survey Cumulative % Cumulative (Th.Cum/SqKm/yr) (M.Cum/yr)1 2 3 4 5 6 7 8 9 10 11 12
1 1953 3751.17 3718.34 32.832 1963 10 3246.79 3239.75 7.04 504.38 504.38 13.45 1.790 50.4383 1972 9 3428.6 3426.53 2.07 ‐181.81 322.57 8.60 ‐ ‐4 1978 6 3332.75 3332.75 0 95.85 418.42 11.15 0.567 15.9755 1981 3 3275.68 3275.68 0 57.07 475.49 12.68 0.675 19.0236 1985 4 3166.74 3166.74 0 108.94 584.43 15.58 0.97 27.2357 1993 8 3157.53 3157.53 0 9.21 593.64 15.83 0.04 1.1518 2004 11 2954.58 2954.58 0 202.95 796.59 21.24 0.65 18.4509 2008 4 2855.89 2855.89 0 98.69 895.28 23.87 0.88 24.673
Average rate of silting(Th.Cum/Sq.km/Yr) in 55 year 0.578Average rate of silting (mm/yr) in 55 years 0.578Average rate of silting (M.Cum/yr) in 55 years 16.278
Year of Survey
Period (Years) Remarks
Observed Rate of Siltation Since Last Survey
Year of Survey
MALAPRABHA RESERVOIR
S. No
Period (Years)
Loss of Capacity (M.Cum)
Loss of Capacity (M.Cum)
S. NoObserved Rate of Siltation Since Last Survey
Reservoir Capacity(M.Cum)
Remarks
TUNGABHADRA RESERVOIR
To find the annual rate of decrease in reservoir capacity for the year 1987‐91, the original
capacity of the reservoir in 1979‐81 has been considered.
Reservoir Capacity(M.Cum)
68
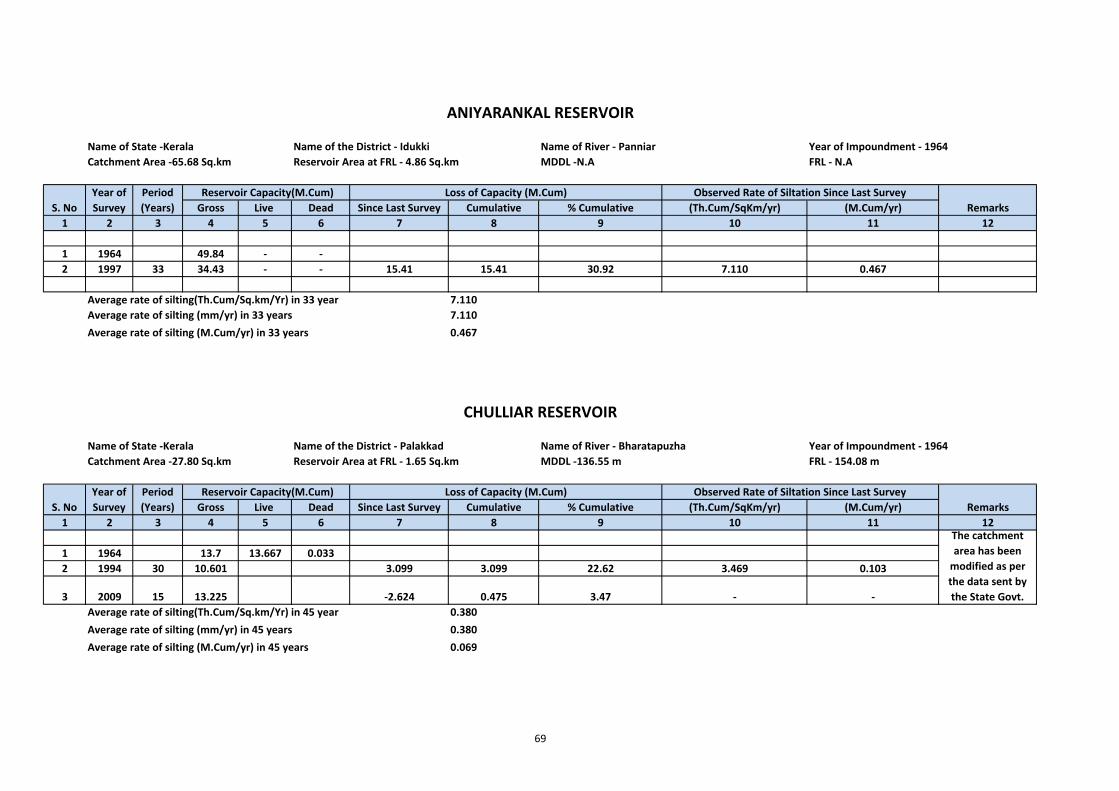
Name of State ‐Kerala Name of the District ‐ Idukki Name of River ‐ Panniar Year of Impoundment ‐ 1964Catchment Area ‐65.68 Sq.km Reservoir Area at FRL ‐ 4.86 Sq.km MDDL ‐N.A FRL ‐ N.A
Gross Live Dead Since Last Survey Cumulative % Cumulative (Th.Cum/SqKm/yr) (M.Cum/yr)1 2 3 4 5 6 7 8 9 10 11 12
1 1964 49.84 ‐ ‐2 1997 33 34.43 ‐ ‐ 15.41 15.41 30.92 7.110 0.467
Average rate of silting(Th.Cum/Sq.km/Yr) in 33 year 7.110Average rate of silting (mm/yr) in 33 years 7.110Average rate of silting (M.Cum/yr) in 33 years 0.467
Name of State ‐Kerala Name of the District ‐ Palakkad Name of River ‐ Bharatapuzha Year of Impoundment ‐ 1964Catchment Area ‐27.80 Sq.km Reservoir Area at FRL ‐ 1.65 Sq.km MDDL ‐136.55 m FRL ‐ 154.08 m
Gross Live Dead Since Last Survey Cumulative % Cumulative (Th.Cum/SqKm/yr) (M.Cum/yr)1 2 3 4 5 6 7 8 9 10 11 12
1 1964 13.7 13.667 0.0332 1994 30 10.601 3.099 3.099 22.62 3.469 0.103
3 2009 15 13.225 ‐2.624 0.475 3.47 ‐ ‐Average rate of silting(Th.Cum/Sq.km/Yr) in 45 year 0.380Average rate of silting (mm/yr) in 45 years 0.380Average rate of silting (M.Cum/yr) in 45 years 0.069
CHULLIAR RESERVOIR
S. NoYear of Survey
Period (Years)
Loss of Capacity (M.Cum)
The catchment area has been modified as per the data sent by the State Govt.
S. NoYear of Survey
ANIYARANKAL RESERVOIR
Reservoir Capacity(M.Cum) Observed Rate of Siltation Since Last Survey
Observed Rate of Siltation Since Last Survey
Period (Years) Remarks
Remarks Reservoir Capacity(M.Cum)
Loss of Capacity (M.Cum)
69
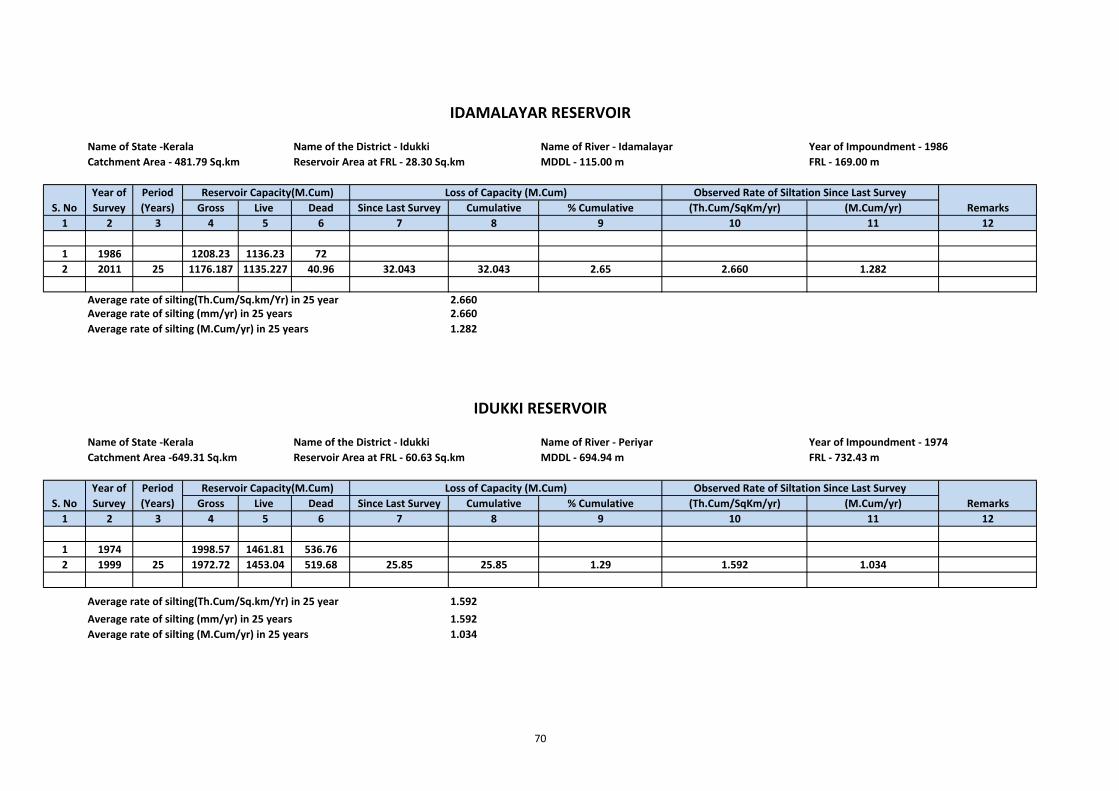
Name of State ‐Kerala Name of the District ‐ Idukki Name of River ‐ Idamalayar Year of Impoundment ‐ 1986Catchment Area ‐ 481.79 Sq.km Reservoir Area at FRL ‐ 28.30 Sq.km MDDL ‐ 115.00 m FRL ‐ 169.00 m
Gross Live Dead Since Last Survey Cumulative % Cumulative (Th.Cum/SqKm/yr) (M.Cum/yr)1 2 3 4 5 6 7 8 9 10 11 12
1 1986 1208.23 1136.23 722 2011 25 1176.187 1135.227 40.96 32.043 32.043 2.65 2.660 1.282
Average rate of silting(Th.Cum/Sq.km/Yr) in 25 year 2.660Average rate of silting (mm/yr) in 25 years 2.660Average rate of silting (M.Cum/yr) in 25 years 1.282
Name of State ‐Kerala Name of the District ‐ Idukki Name of River ‐ Periyar Year of Impoundment ‐ 1974Catchment Area ‐649.31 Sq.km Reservoir Area at FRL ‐ 60.63 Sq.km MDDL ‐ 694.94 m FRL ‐ 732.43 m
Gross Live Dead Since Last Survey Cumulative % Cumulative (Th.Cum/SqKm/yr) (M.Cum/yr)1 2 3 4 5 6 7 8 9 10 11 12
1 1974 1998.57 1461.81 536.762 1999 25 1972.72 1453.04 519.68 25.85 25.85 1.29 1.592 1.034
Average rate of silting(Th.Cum/Sq.km/Yr) in 25 year 1.592Average rate of silting (mm/yr) in 25 years 1.592Average rate of silting (M.Cum/yr) in 25 years 1.034
IDUKKI RESERVOIR
Year of Survey
Loss of Capacity (M.Cum)
S. NoYear of Survey Remarks
Period (Years)
Reservoir Capacity(M.Cum) Observed Rate of Siltation Since Last SurveyS. No
IDAMALAYAR RESERVOIR
Period (Years)
Reservoir Capacity(M.Cum)
Remarks
Observed Rate of Siltation Since Last SurveyLoss of Capacity (M.Cum)
70
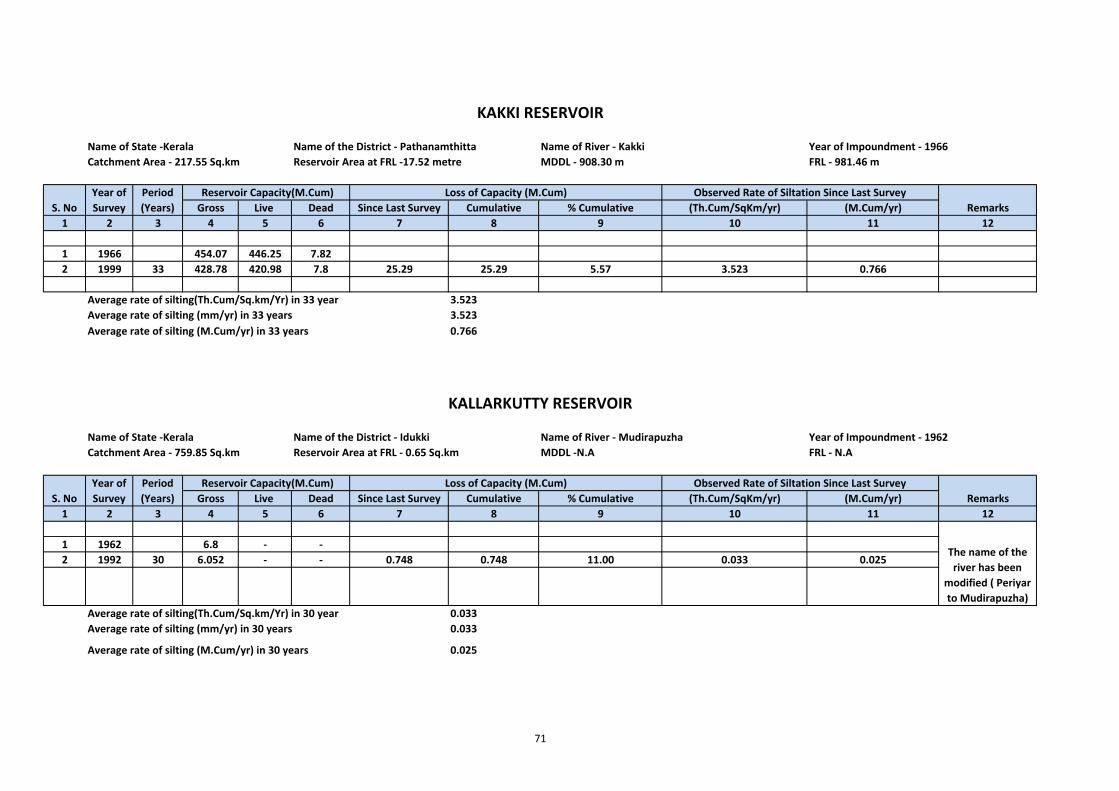
Name of State ‐Kerala Name of the District ‐ Pathanamthitta Name of River ‐ Kakki Year of Impoundment ‐ 1966Catchment Area ‐ 217.55 Sq.km Reservoir Area at FRL ‐17.52 metre MDDL ‐ 908.30 m FRL ‐ 981.46 m
Gross Live Dead Since Last Survey Cumulative % Cumulative (Th.Cum/SqKm/yr) (M.Cum/yr)1 2 3 4 5 6 7 8 9 10 11 12
1 1966 454.07 446.25 7.822 1999 33 428.78 420.98 7.8 25.29 25.29 5.57 3.523 0.766
Average rate of silting(Th.Cum/Sq.km/Yr) in 33 year 3.523Average rate of silting (mm/yr) in 33 years 3.523Average rate of silting (M.Cum/yr) in 33 years 0.766
Name of State ‐Kerala Name of the District ‐ Idukki Name of River ‐ Mudirapuzha Year of Impoundment ‐ 1962Catchment Area ‐ 759.85 Sq.km Reservoir Area at FRL ‐ 0.65 Sq.km MDDL ‐N.A FRL ‐ N.A
Gross Live Dead Since Last Survey Cumulative % Cumulative (Th.Cum/SqKm/yr) (M.Cum/yr)1 2 3 4 5 6 7 8 9 10 11 12
1 1962 6.8 ‐ ‐2 1992 30 6.052 ‐ ‐ 0.748 0.748 11.00 0.033 0.025
Average rate of silting(Th.Cum/Sq.km/Yr) in 30 year 0.033Average rate of silting (mm/yr) in 30 years 0.033
Average rate of silting (M.Cum/yr) in 30 years 0.025
Year of Survey Remarks
Period (Years)
The name of the river has been
modified ( Periyar to Mudirapuzha)
Year of Survey
S. No
KALLARKUTTY RESERVOIR
Period (Years)
KAKKI RESERVOIR
S. No
Loss of Capacity (M.Cum)
Observed Rate of Siltation Since Last Survey
Reservoir Capacity(M.Cum) Observed Rate of Siltation Since Last Survey
Remarks Reservoir Capacity(M.Cum) Loss of Capacity (M.Cum)
71
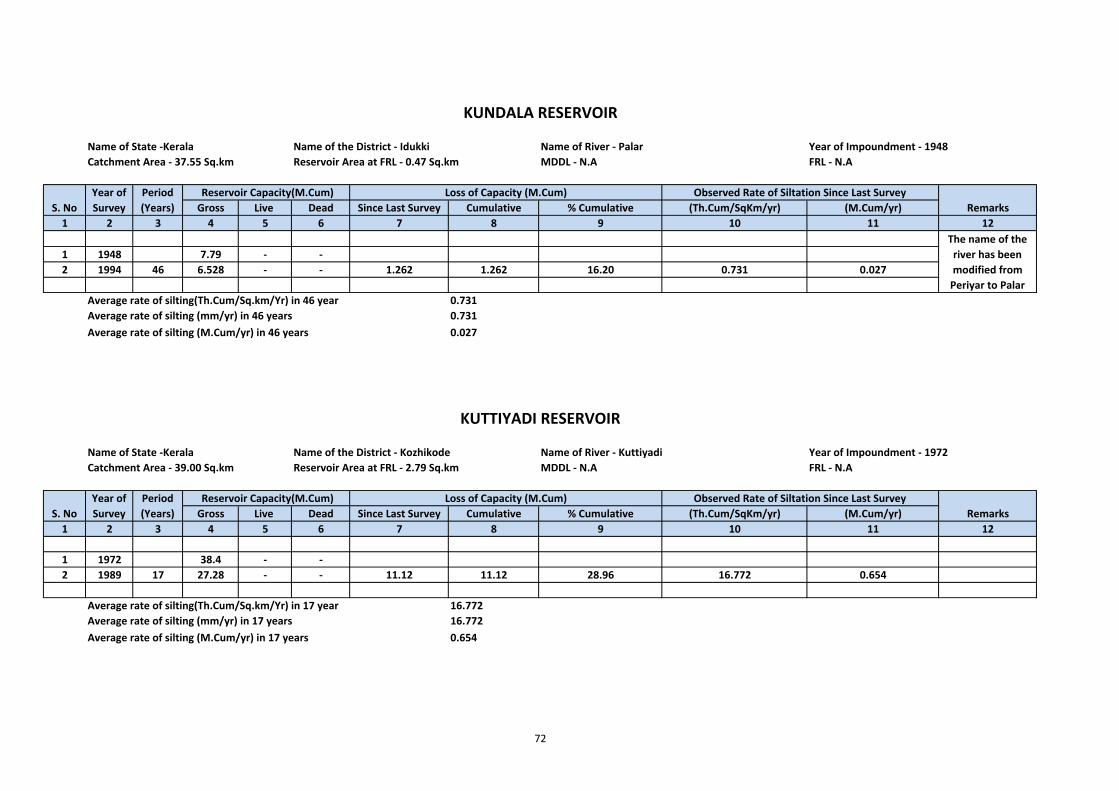
Name of State ‐Kerala Name of the District ‐ Idukki Name of River ‐ Palar Year of Impoundment ‐ 1948Catchment Area ‐ 37.55 Sq.km Reservoir Area at FRL ‐ 0.47 Sq.km MDDL ‐ N.A FRL ‐ N.A
Gross Live Dead Since Last Survey Cumulative % Cumulative (Th.Cum/SqKm/yr) (M.Cum/yr)1 2 3 4 5 6 7 8 9 10 11 12
1 1948 7.79 ‐ ‐2 1994 46 6.528 ‐ ‐ 1.262 1.262 16.20 0.731 0.027
Average rate of silting(Th.Cum/Sq.km/Yr) in 46 year 0.731Average rate of silting (mm/yr) in 46 years 0.731Average rate of silting (M.Cum/yr) in 46 years 0.027
Name of State ‐Kerala Name of the District ‐ Kozhikode Name of River ‐ Kuttiyadi Year of Impoundment ‐ 1972Catchment Area ‐ 39.00 Sq.km Reservoir Area at FRL ‐ 2.79 Sq.km MDDL ‐ N.A FRL ‐ N.A
Gross Live Dead Since Last Survey Cumulative % Cumulative (Th.Cum/SqKm/yr) (M.Cum/yr)1 2 3 4 5 6 7 8 9 10 11 12
1 1972 38.4 ‐ ‐2 1989 17 27.28 ‐ ‐ 11.12 11.12 28.96 16.772 0.654
Average rate of silting(Th.Cum/Sq.km/Yr) in 17 year 16.772Average rate of silting (mm/yr) in 17 years 16.772Average rate of silting (M.Cum/yr) in 17 years 0.654
KUTTIYADI RESERVOIR
Year of Survey
The name of the river has been modified from Periyar to Palar
Remarks
Period (Years)
S. No
Observed Rate of Siltation Since Last Survey
Year of Survey
Reservoir Capacity(M.Cum)S. No
KUNDALA RESERVOIR
Loss of Capacity (M.Cum)Remarks
Period (Years)
Reservoir Capacity(M.Cum) Observed Rate of Siltation Since Last SurveyLoss of Capacity (M.Cum)
72
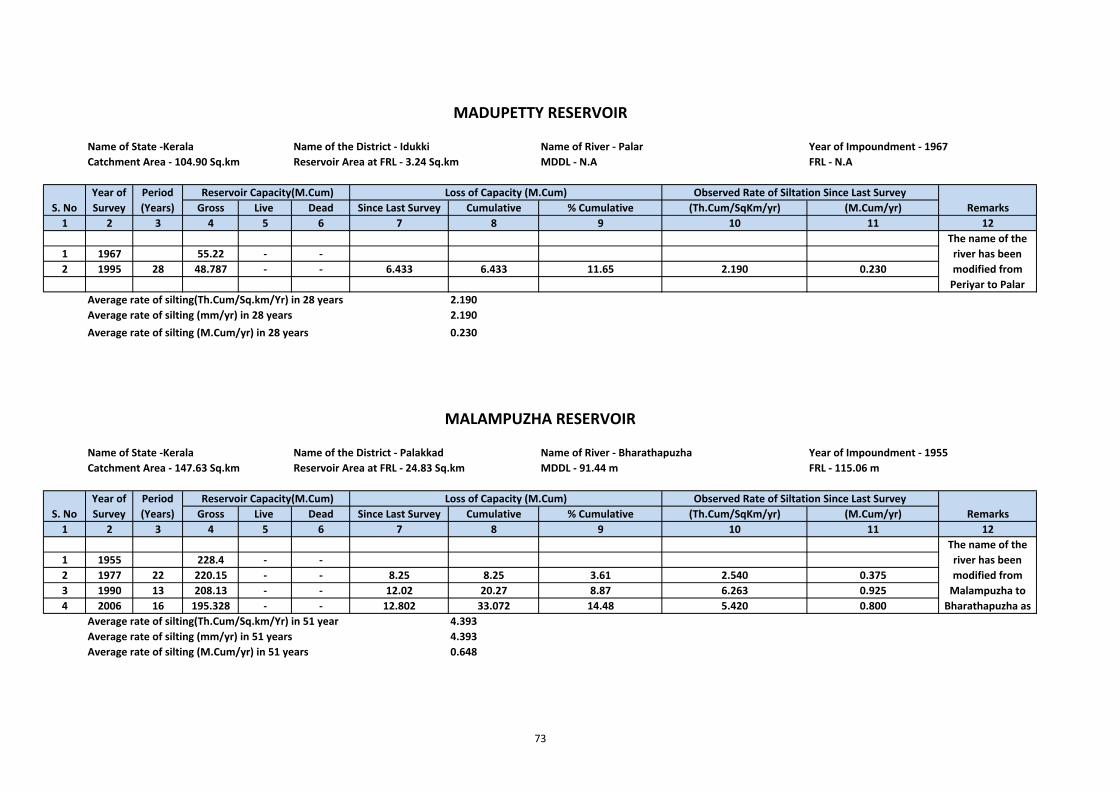
Name of State ‐Kerala Name of the District ‐ Idukki Name of River ‐ Palar Year of Impoundment ‐ 1967Catchment Area ‐ 104.90 Sq.km Reservoir Area at FRL ‐ 3.24 Sq.km MDDL ‐ N.A FRL ‐ N.A
Gross Live Dead Since Last Survey Cumulative % Cumulative (Th.Cum/SqKm/yr) (M.Cum/yr)1 2 3 4 5 6 7 8 9 10 11 12
1 1967 55.22 ‐ ‐2 1995 28 48.787 ‐ ‐ 6.433 6.433 11.65 2.190 0.230
Average rate of silting(Th.Cum/Sq.km/Yr) in 28 years 2.190Average rate of silting (mm/yr) in 28 years 2.190Average rate of silting (M.Cum/yr) in 28 years 0.230
Name of State ‐Kerala Name of the District ‐ Palakkad Name of River ‐ Bharathapuzha Year of Impoundment ‐ 1955Catchment Area ‐ 147.63 Sq.km Reservoir Area at FRL ‐ 24.83 Sq.km MDDL ‐ 91.44 m FRL ‐ 115.06 m
Gross Live Dead Since Last Survey Cumulative % Cumulative (Th.Cum/SqKm/yr) (M.Cum/yr)1 2 3 4 5 6 7 8 9 10 11 12
1 1955 228.4 ‐ ‐2 1977 22 220.15 ‐ ‐ 8.25 8.25 3.61 2.540 0.3753 1990 13 208.13 ‐ ‐ 12.02 20.27 8.87 6.263 0.9254 2006 16 195.328 ‐ ‐ 12.802 33.072 14.48 5.420 0.800
Average rate of silting(Th.Cum/Sq.km/Yr) in 51 year 4.393Average rate of silting (mm/yr) in 51 years 4.393Average rate of silting (M.Cum/yr) in 51 years 0.648
Observed Rate of Siltation Since Last Survey
S. NoYear of Survey
MALAMPUZHA RESERVOIR
Reservoir Capacity(M.Cum)Period (Years)
MADUPETTY RESERVOIR
Loss of Capacity (M.Cum)
Loss of Capacity (M.Cum)RemarksS. No
The name of the river has been modified from Periyar to Palar
Period (Years)
Reservoir Capacity(M.Cum)Year of Survey
The name of the river has been modified from Malampuzha to Bharathapuzha as
Observed Rate of Siltation Since Last SurveyRemarks
73
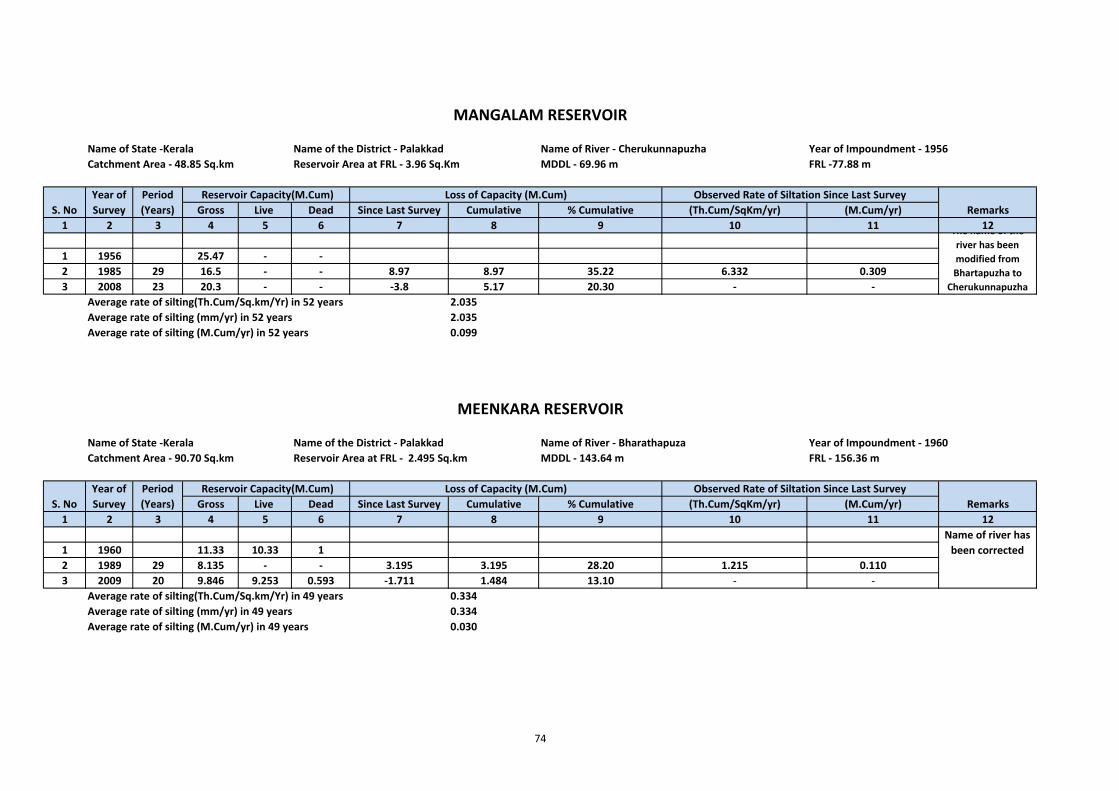
Name of State ‐Kerala Name of the District ‐ Palakkad Name of River ‐ Cherukunnapuzha Year of Impoundment ‐ 1956Catchment Area ‐ 48.85 Sq.km Reservoir Area at FRL ‐ 3.96 Sq.Km MDDL ‐ 69.96 m FRL ‐77.88 m
Gross Live Dead Since Last Survey Cumulative % Cumulative (Th.Cum/SqKm/yr) (M.Cum/yr)1 2 3 4 5 6 7 8 9 10 11 12
1 1956 25.47 ‐ ‐2 1985 29 16.5 ‐ ‐ 8.97 8.97 35.22 6.332 0.3093 2008 23 20.3 ‐ ‐ ‐3.8 5.17 20.30 ‐ ‐
Average rate of silting(Th.Cum/Sq.km/Yr) in 52 years 2.035Average rate of silting (mm/yr) in 52 years 2.035Average rate of silting (M.Cum/yr) in 52 years 0.099
Name of State ‐Kerala Name of the District ‐ Palakkad Name of River ‐ Bharathapuza Year of Impoundment ‐ 1960Catchment Area ‐ 90.70 Sq.km Reservoir Area at FRL ‐ 2.495 Sq.km MDDL ‐ 143.64 m FRL ‐ 156.36 m
Gross Live Dead Since Last Survey Cumulative % Cumulative (Th.Cum/SqKm/yr) (M.Cum/yr)1 2 3 4 5 6 7 8 9 10 11 12
1 1960 11.33 10.33 12 1989 29 8.135 ‐ ‐ 3.195 3.195 28.20 1.215 0.1103 2009 20 9.846 9.253 0.593 ‐1.711 1.484 13.10 ‐ ‐
Average rate of silting(Th.Cum/Sq.km/Yr) in 49 years 0.334Average rate of silting (mm/yr) in 49 years 0.334Average rate of silting (M.Cum/yr) in 49 years 0.030
The name of the river has been modified from Bhartapuzha to
Cherukunnapuzha
Observed Rate of Siltation Since Last Survey
Year of Survey
Loss of Capacity (M.Cum)
Loss of Capacity (M.Cum)
Reservoir Capacity(M.Cum)S. No
Period (Years)
MEENKARA RESERVOIR
Year of Survey
S. No
Remarks
Reservoir Capacity(M.Cum) Observed Rate of Siltation Since Last SurveyRemarks
Period (Years)
MANGALAM RESERVOIR
Name of river has been corrected
74
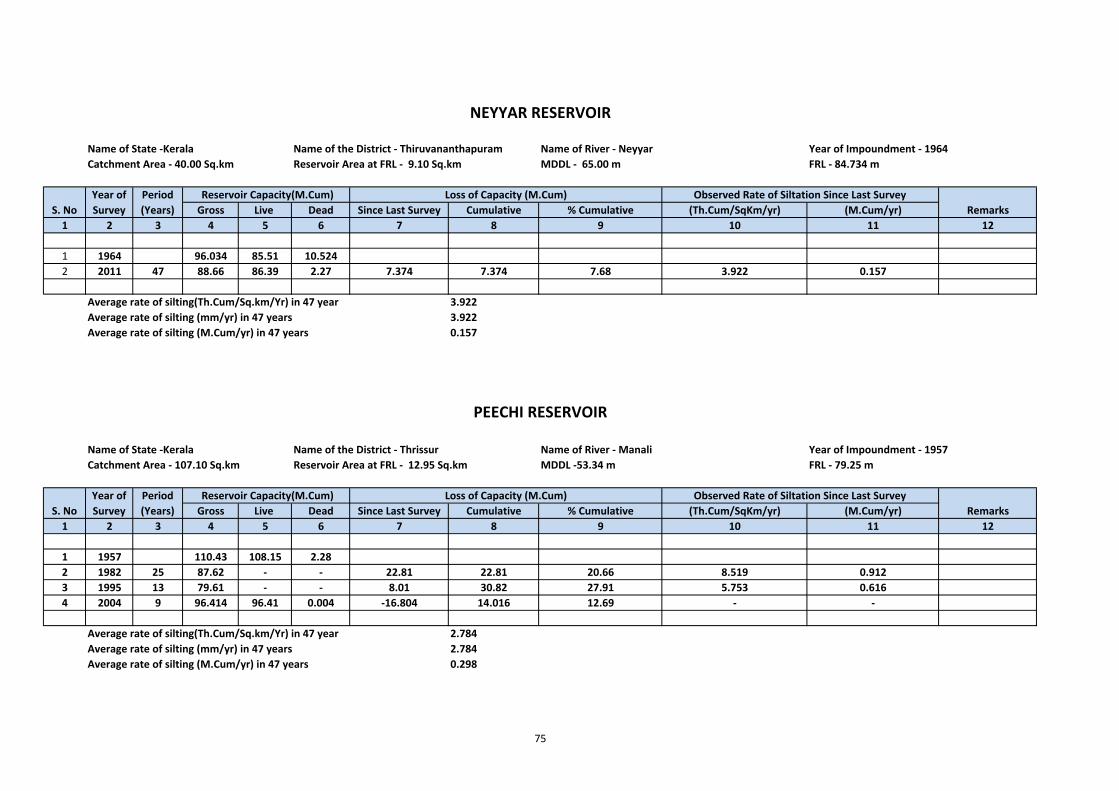
Name of State ‐Kerala Name of the District ‐ Thiruvananthapuram Name of River ‐ Neyyar Year of Impoundment ‐ 1964Catchment Area ‐ 40.00 Sq.km Reservoir Area at FRL ‐ 9.10 Sq.km MDDL ‐ 65.00 m FRL ‐ 84.734 m
Gross Live Dead Since Last Survey Cumulative % Cumulative (Th.Cum/SqKm/yr) (M.Cum/yr)1 2 3 4 5 6 7 8 9 10 11 12
1 1964 96.034 85.51 10.5242 2011 47 88.66 86.39 2.27 7.374 7.374 7.68 3.922 0.157
Average rate of silting(Th.Cum/Sq.km/Yr) in 47 year 3.922Average rate of silting (mm/yr) in 47 years 3.922Average rate of silting (M.Cum/yr) in 47 years 0.157
Name of State ‐Kerala Name of the District ‐ Thrissur Name of River ‐ Manali Year of Impoundment ‐ 1957Catchment Area ‐ 107.10 Sq.km Reservoir Area at FRL ‐ 12.95 Sq.km MDDL ‐53.34 m FRL ‐ 79.25 m
Gross Live Dead Since Last Survey Cumulative % Cumulative (Th.Cum/SqKm/yr) (M.Cum/yr)1 2 3 4 5 6 7 8 9 10 11 12
1 1957 110.43 108.15 2.282 1982 25 87.62 ‐ ‐ 22.81 22.81 20.66 8.519 0.9123 1995 13 79.61 ‐ ‐ 8.01 30.82 27.91 5.753 0.6164 2004 9 96.414 96.41 0.004 ‐16.804 14.016 12.69 ‐ ‐
Average rate of silting(Th.Cum/Sq.km/Yr) in 47 year 2.784Average rate of silting (mm/yr) in 47 years 2.784Average rate of silting (M.Cum/yr) in 47 years 0.298
Year of Survey
Reservoir Capacity(M.Cum)
Observed Rate of Siltation Since Last Survey
Loss of Capacity (M.Cum)Remarks
Year of Survey S. No
Loss of Capacity (M.Cum)
Period (Years)
NEYYAR RESERVOIR
Remarks Reservoir Capacity(M.Cum)
Observed Rate of Siltation Since Last SurveyS. No
Period (Years)
PEECHI RESERVOIR
75
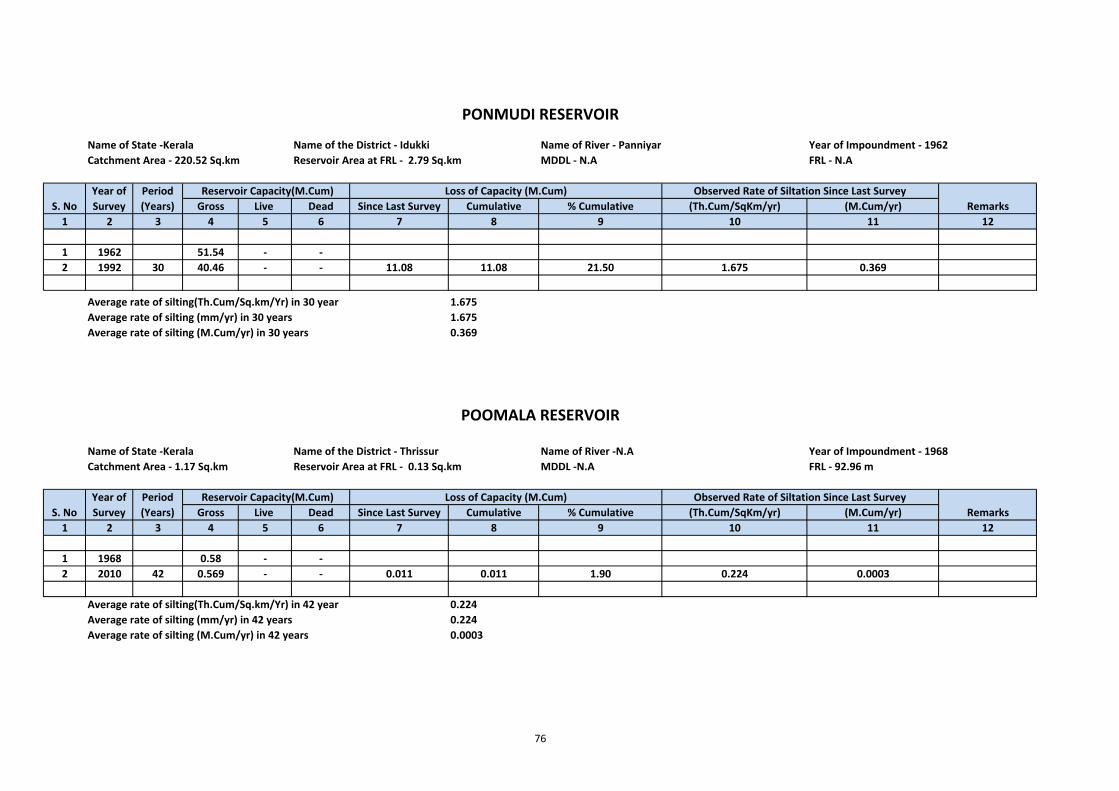
Name of State ‐Kerala Name of the District ‐ Idukki Name of River ‐ Panniyar Year of Impoundment ‐ 1962Catchment Area ‐ 220.52 Sq.km Reservoir Area at FRL ‐ 2.79 Sq.km MDDL ‐ N.A FRL ‐ N.A
Gross Live Dead Since Last Survey Cumulative % Cumulative (Th.Cum/SqKm/yr) (M.Cum/yr)1 2 3 4 5 6 7 8 9 10 11 12
1 1962 51.54 ‐ ‐2 1992 30 40.46 ‐ ‐ 11.08 11.08 21.50 1.675 0.369
Average rate of silting(Th.Cum/Sq.km/Yr) in 30 year 1.675Average rate of silting (mm/yr) in 30 years 1.675Average rate of silting (M.Cum/yr) in 30 years 0.369
Name of State ‐Kerala Name of the District ‐ Thrissur Name of River ‐N.A Year of Impoundment ‐ 1968Catchment Area ‐ 1.17 Sq.km Reservoir Area at FRL ‐ 0.13 Sq.km MDDL ‐N.A FRL ‐ 92.96 m
Gross Live Dead Since Last Survey Cumulative % Cumulative (Th.Cum/SqKm/yr) (M.Cum/yr)1 2 3 4 5 6 7 8 9 10 11 12
1 1968 0.58 ‐ ‐2 2010 42 0.569 ‐ ‐ 0.011 0.011 1.90 0.224 0.0003
Average rate of silting(Th.Cum/Sq.km/Yr) in 42 year 0.224Average rate of silting (mm/yr) in 42 years 0.224Average rate of silting (M.Cum/yr) in 42 years 0.0003
Loss of Capacity (M.Cum)
Observed Rate of Siltation Since Last Survey Reservoir Capacity(M.Cum)
POOMALA RESERVOIR
S. No
PONMUDI RESERVOIR
S. NoLoss of Capacity (M.Cum)
RemarksYear of Survey
Period (Years)
Observed Rate of Siltation Since Last SurveyRemarks
Year of Survey
Period (Years)
Reservoir Capacity(M.Cum)
76
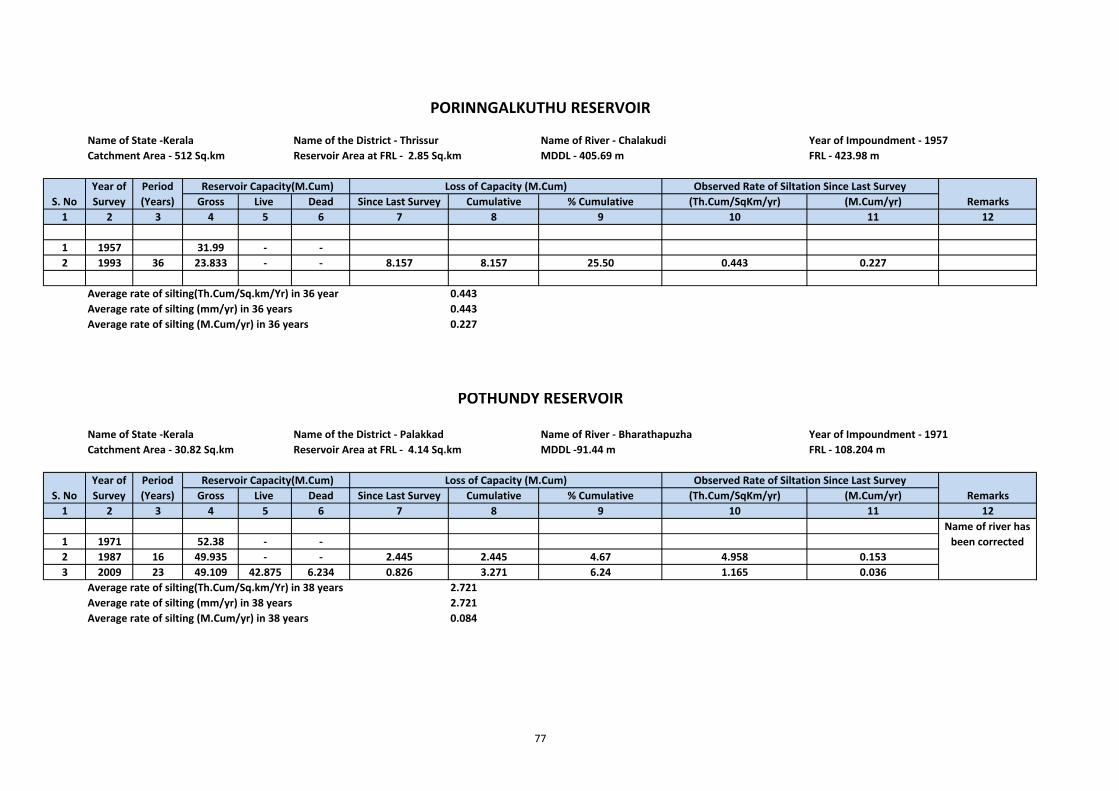
Name of State ‐Kerala Name of the District ‐ Thrissur Name of River ‐ Chalakudi Year of Impoundment ‐ 1957Catchment Area ‐ 512 Sq.km Reservoir Area at FRL ‐ 2.85 Sq.km MDDL ‐ 405.69 m FRL ‐ 423.98 m
Gross Live Dead Since Last Survey Cumulative % Cumulative (Th.Cum/SqKm/yr) (M.Cum/yr)1 2 3 4 5 6 7 8 9 10 11 12
1 1957 31.99 ‐ ‐2 1993 36 23.833 ‐ ‐ 8.157 8.157 25.50 0.443 0.227
Average rate of silting(Th.Cum/Sq.km/Yr) in 36 year 0.443Average rate of silting (mm/yr) in 36 years 0.443Average rate of silting (M.Cum/yr) in 36 years 0.227
Name of State ‐Kerala Name of the District ‐ Palakkad Name of River ‐ Bharathapuzha Year of Impoundment ‐ 1971Catchment Area ‐ 30.82 Sq.km Reservoir Area at FRL ‐ 4.14 Sq.km MDDL ‐91.44 m FRL ‐ 108.204 m
Gross Live Dead Since Last Survey Cumulative % Cumulative (Th.Cum/SqKm/yr) (M.Cum/yr)1 2 3 4 5 6 7 8 9 10 11 12
1 1971 52.38 ‐ ‐2 1987 16 49.935 ‐ ‐ 2.445 2.445 4.67 4.958 0.1533 2009 23 49.109 42.875 6.234 0.826 3.271 6.24 1.165 0.036
Average rate of silting(Th.Cum/Sq.km/Yr) in 38 years 2.721Average rate of silting (mm/yr) in 38 years 2.721Average rate of silting (M.Cum/yr) in 38 years 0.084
S. No Remarks
Year of Survey
Period (Years)
PORINNGALKUTHU RESERVOIR
Year of Survey
S. NoLoss of Capacity (M.Cum)
POTHUNDY RESERVOIR
Remarks
Name of river has been corrected
Loss of Capacity (M.Cum) Reservoir Capacity(M.Cum) Observed Rate of Siltation Since Last Survey
Reservoir Capacity(M.Cum) Observed Rate of Siltation Since Last Survey
Period (Years)
77
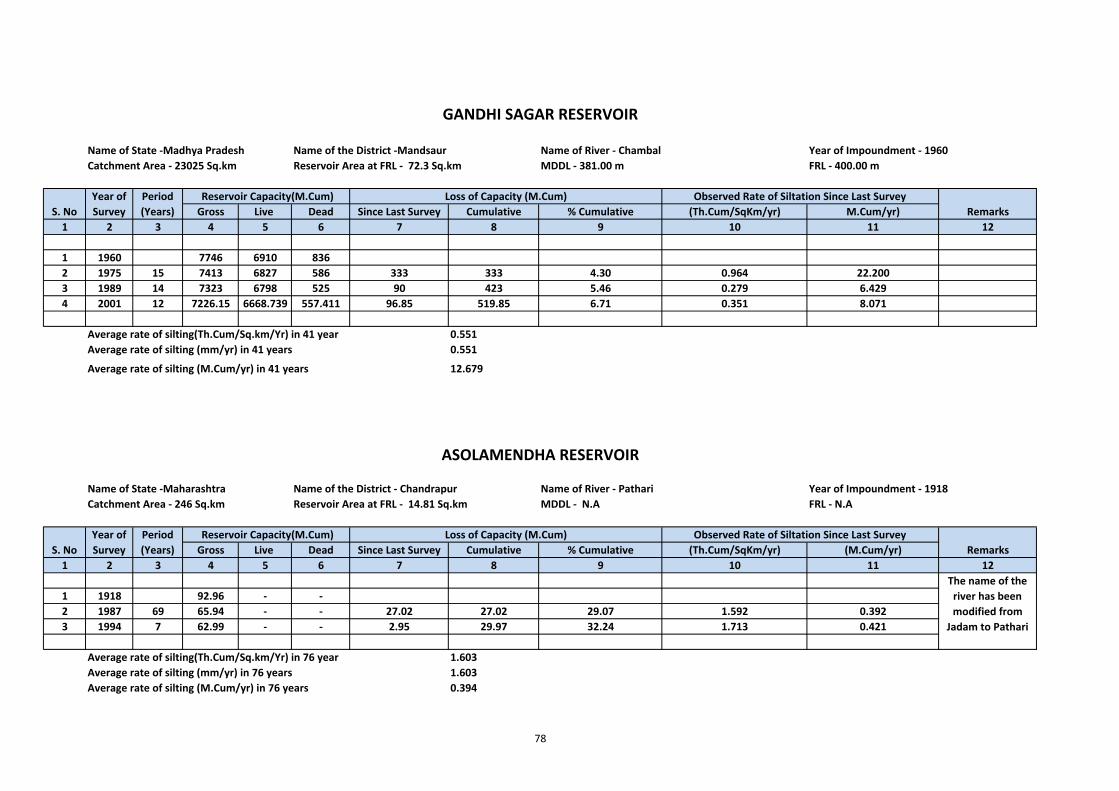
Name of State ‐Madhya Pradesh Name of the District ‐Mandsaur Name of River ‐ Chambal Year of Impoundment ‐ 1960Catchment Area ‐ 23025 Sq.km Reservoir Area at FRL ‐ 72.3 Sq.km MDDL ‐ 381.00 m FRL ‐ 400.00 m
Gross Live Dead Since Last Survey Cumulative % Cumulative (Th.Cum/SqKm/yr) M.Cum/yr)1 2 3 4 5 6 7 8 9 10 11 12
1 1960 7746 6910 8362 1975 15 7413 6827 586 333 333 4.30 0.964 22.2003 1989 14 7323 6798 525 90 423 5.46 0.279 6.4294 2001 12 7226.15 6668.739 557.411 96.85 519.85 6.71 0.351 8.071
Average rate of silting(Th.Cum/Sq.km/Yr) in 41 year 0.551Average rate of silting (mm/yr) in 41 years 0.551
Average rate of silting (M.Cum/yr) in 41 years 12.679
Name of State ‐Maharashtra Name of the District ‐ Chandrapur Name of River ‐ Pathari Year of Impoundment ‐ 1918Catchment Area ‐ 246 Sq.km Reservoir Area at FRL ‐ 14.81 Sq.km MDDL ‐ N.A FRL ‐ N.A
Gross Live Dead Since Last Survey Cumulative % Cumulative (Th.Cum/SqKm/yr) (M.Cum/yr)1 2 3 4 5 6 7 8 9 10 11 12
1 1918 92.96 ‐ ‐2 1987 69 65.94 ‐ ‐ 27.02 27.02 29.07 1.592 0.3923 1994 7 62.99 ‐ ‐ 2.95 29.97 32.24 1.713 0.421
Average rate of silting(Th.Cum/Sq.km/Yr) in 76 year 1.603Average rate of silting (mm/yr) in 76 years 1.603Average rate of silting (M.Cum/yr) in 76 years 0.394
Loss of Capacity (M.Cum)
GANDHI SAGAR RESERVOIR
Reservoir Capacity(M.Cum)
ASOLAMENDHA RESERVOIR
RemarksPeriod (Years)
Reservoir Capacity(M.Cum) Observed Rate of Siltation Since Last Survey
Loss of Capacity (M.Cum)S. No
The name of the river has been modified from
Jadam to Pathari
S. NoYear of Survey
RemarksObserved Rate of Siltation Since Last SurveyYear of
Survey Period (Years)
78
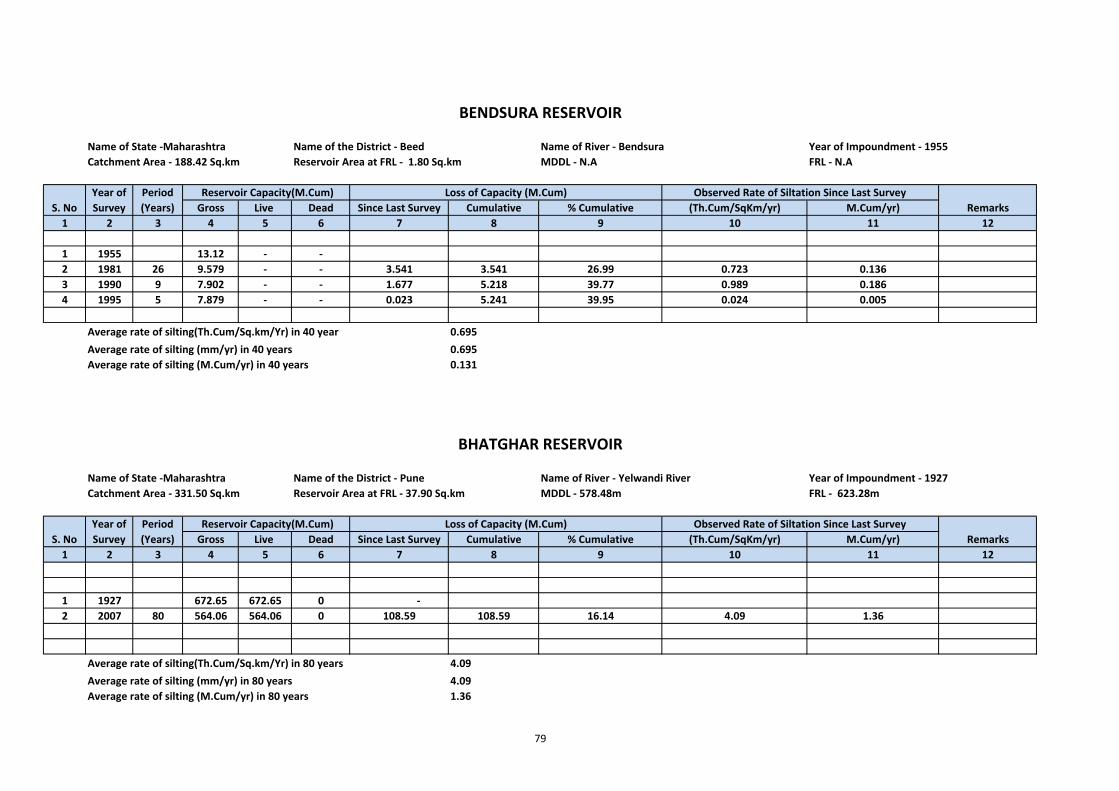
Name of State ‐Maharashtra Name of the District ‐ Beed Name of River ‐ Bendsura Year of Impoundment ‐ 1955Catchment Area ‐ 188.42 Sq.km Reservoir Area at FRL ‐ 1.80 Sq.km MDDL ‐ N.A FRL ‐ N.A
Gross Live Dead Since Last Survey Cumulative % Cumulative (Th.Cum/SqKm/yr) M.Cum/yr)1 2 3 4 5 6 7 8 9 10 11 12
1 1955 13.12 ‐ ‐2 1981 26 9.579 ‐ ‐ 3.541 3.541 26.99 0.723 0.1363 1990 9 7.902 ‐ ‐ 1.677 5.218 39.77 0.989 0.1864 1995 5 7.879 ‐ ‐ 0.023 5.241 39.95 0.024 0.005
Average rate of silting(Th.Cum/Sq.km/Yr) in 40 year 0.695Average rate of silting (mm/yr) in 40 years 0.695Average rate of silting (M.Cum/yr) in 40 years 0.131
Name of State ‐Maharashtra Name of the District ‐ Pune Name of River ‐ Yelwandi River Year of Impoundment ‐ 1927Catchment Area ‐ 331.50 Sq.km Reservoir Area at FRL ‐ 37.90 Sq.km MDDL ‐ 578.48m FRL ‐ 623.28m
Gross Live Dead Since Last Survey Cumulative % Cumulative (Th.Cum/SqKm/yr) M.Cum/yr)1 2 3 4 5 6 7 8 9 10 11 12
1 1927 672.65 672.65 0 ‐2 2007 80 564.06 564.06 0 108.59 108.59 16.14 4.09 1.36
Average rate of silting(Th.Cum/Sq.km/Yr) in 80 years 4.09Average rate of silting (mm/yr) in 80 years 4.09Average rate of silting (M.Cum/yr) in 80 years 1.36
Period (Years)
Reservoir Capacity(M.Cum)Year of Survey
BHATGHAR RESERVOIR
Observed Rate of Siltation Since Last SurveyLoss of Capacity (M.Cum)Remarks
Loss of Capacity (M.Cum) Observed Rate of Siltation Since Last SurveyRemarks
S. No
BENDSURA RESERVOIR
S. NoPeriod (Years)
Reservoir Capacity(M.Cum)Year of Survey
79
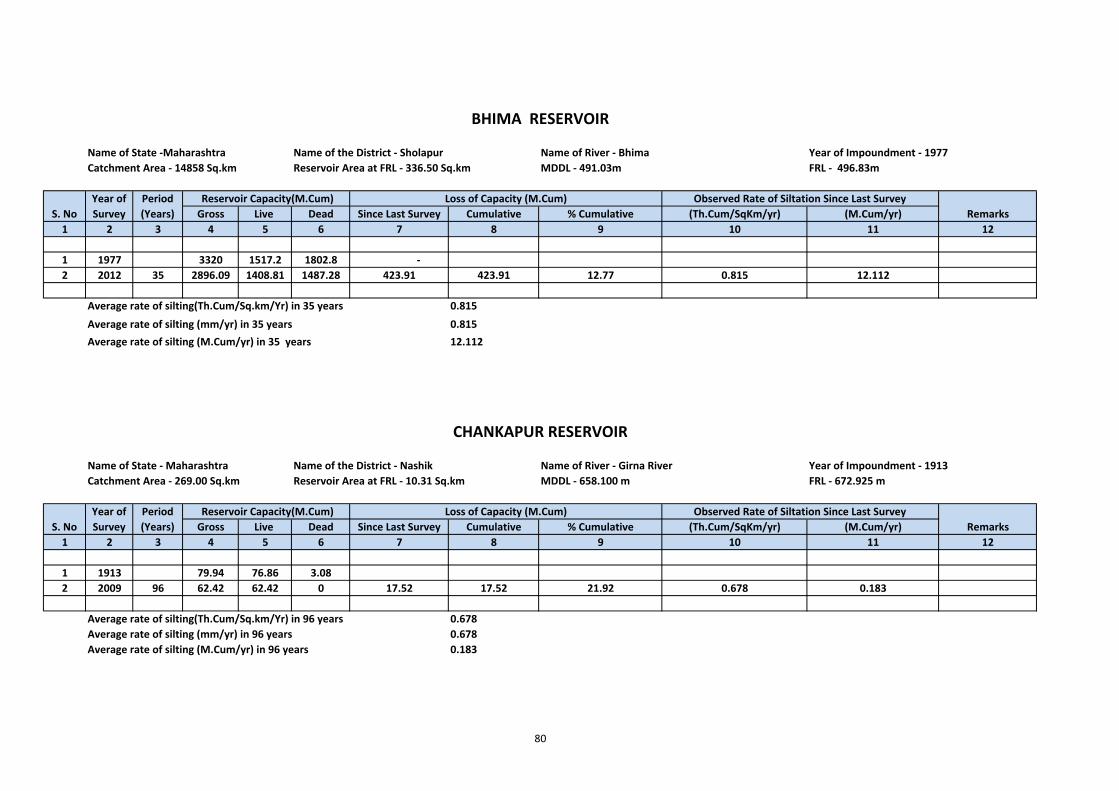
Name of State ‐Maharashtra Name of the District ‐ Sholapur Name of River ‐ Bhima Year of Impoundment ‐ 1977Catchment Area ‐ 14858 Sq.km Reservoir Area at FRL ‐ 336.50 Sq.km MDDL ‐ 491.03m FRL ‐ 496.83m
Gross Live Dead Since Last Survey Cumulative % Cumulative (Th.Cum/SqKm/yr) (M.Cum/yr)1 2 3 4 5 6 7 8 9 10 11 12
1 1977 3320 1517.2 1802.8 ‐2 2012 35 2896.09 1408.81 1487.28 423.91 423.91 12.77 0.815 12.112
Average rate of silting(Th.Cum/Sq.km/Yr) in 35 years 0.815
Average rate of silting (mm/yr) in 35 years 0.815Average rate of silting (M.Cum/yr) in 35 years 12.112
Name of State ‐ Maharashtra Name of the District ‐ Nashik Name of River ‐ Girna River Year of Impoundment ‐ 1913Catchment Area ‐ 269.00 Sq.km Reservoir Area at FRL ‐ 10.31 Sq.km MDDL ‐ 658.100 m FRL ‐ 672.925 m
Gross Live Dead Since Last Survey Cumulative % Cumulative (Th.Cum/SqKm/yr) (M.Cum/yr)1 2 3 4 5 6 7 8 9 10 11 12
1 1913 79.94 76.86 3.082 2009 96 62.42 62.42 0 17.52 17.52 21.92 0.678 0.183
Average rate of silting(Th.Cum/Sq.km/Yr) in 96 years 0.678Average rate of silting (mm/yr) in 96 years 0.678Average rate of silting (M.Cum/yr) in 96 years 0.183
Reservoir Capacity(M.Cum)
Period (Years)S. No
S. NoYear of Survey
Observed Rate of Siltation Since Last Survey
Loss of Capacity (M.Cum)
Year of Survey Remarks
Loss of Capacity (M.Cum)
Remarks
Reservoir Capacity(M.Cum)
BHIMA RESERVOIR
Observed Rate of Siltation Since Last SurveyPeriod (Years)
CHANKAPUR RESERVOIR
80
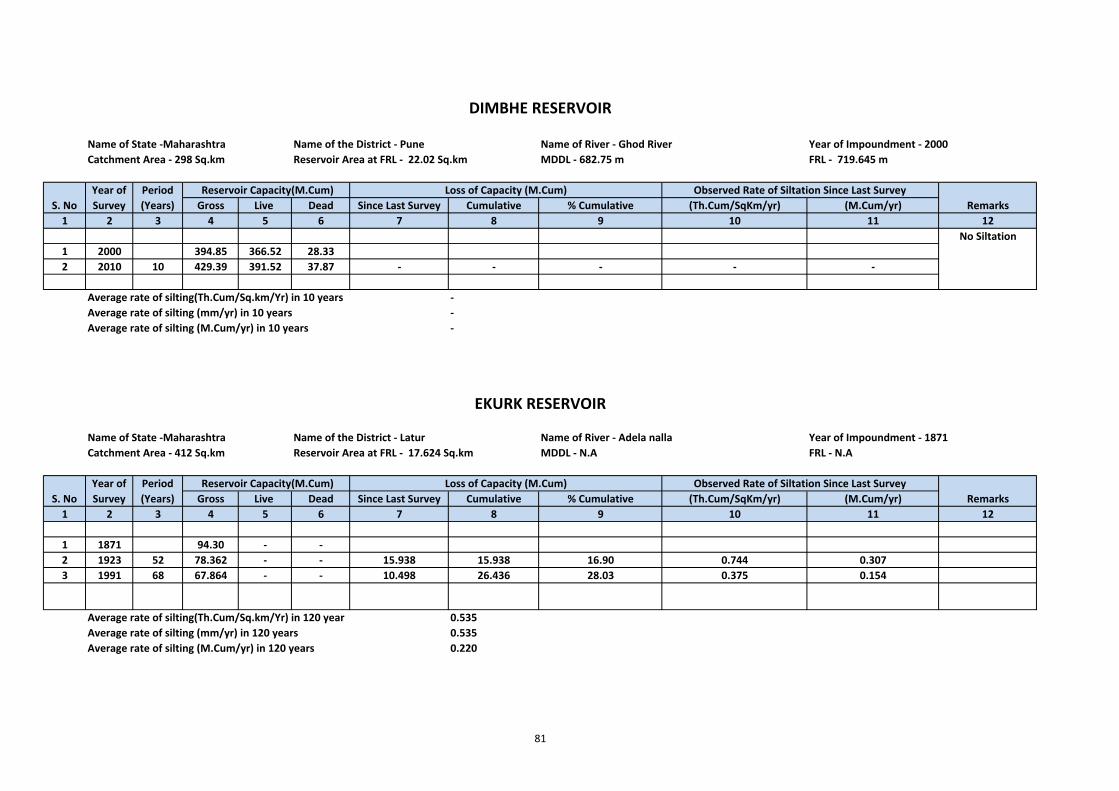
Name of State ‐Maharashtra Name of the District ‐ Pune Name of River ‐ Ghod River Year of Impoundment ‐ 2000Catchment Area ‐ 298 Sq.km Reservoir Area at FRL ‐ 22.02 Sq.km MDDL ‐ 682.75 m FRL ‐ 719.645 m
Gross Live Dead Since Last Survey Cumulative % Cumulative (Th.Cum/SqKm/yr) (M.Cum/yr)1 2 3 4 5 6 7 8 9 10 11 12
1 2000 394.85 366.52 28.332 2010 10 429.39 391.52 37.87 ‐ ‐ ‐ ‐ ‐
Average rate of silting(Th.Cum/Sq.km/Yr) in 10 years ‐Average rate of silting (mm/yr) in 10 years ‐Average rate of silting (M.Cum/yr) in 10 years ‐
Name of State ‐Maharashtra Name of the District ‐ Latur Name of River ‐ Adela nalla Year of Impoundment ‐ 1871Catchment Area ‐ 412 Sq.km Reservoir Area at FRL ‐ 17.624 Sq.km MDDL ‐ N.A FRL ‐ N.A
Gross Live Dead Since Last Survey Cumulative % Cumulative (Th.Cum/SqKm/yr) (M.Cum/yr)1 2 3 4 5 6 7 8 9 10 11 12
1 1871 94.30 ‐ ‐2 1923 52 78.362 ‐ ‐ 15.938 15.938 16.90 0.744 0.3073 1991 68 67.864 ‐ ‐ 10.498 26.436 28.03 0.375 0.154
Average rate of silting(Th.Cum/Sq.km/Yr) in 120 year 0.535Average rate of silting (mm/yr) in 120 years 0.535Average rate of silting (M.Cum/yr) in 120 years 0.220
Observed Rate of Siltation Since Last SurveyS. No
No Siltation
Remarks
DIMBHE RESERVOIR
Year of Survey
Period (Years)
EKURK RESERVOIR
Loss of Capacity (M.Cum)
S. NoYear of Survey
Reservoir Capacity(M.Cum)
RemarksPeriod (Years)
Reservoir Capacity(M.Cum) Loss of Capacity (M.Cum) Observed Rate of Siltation Since Last Survey
81
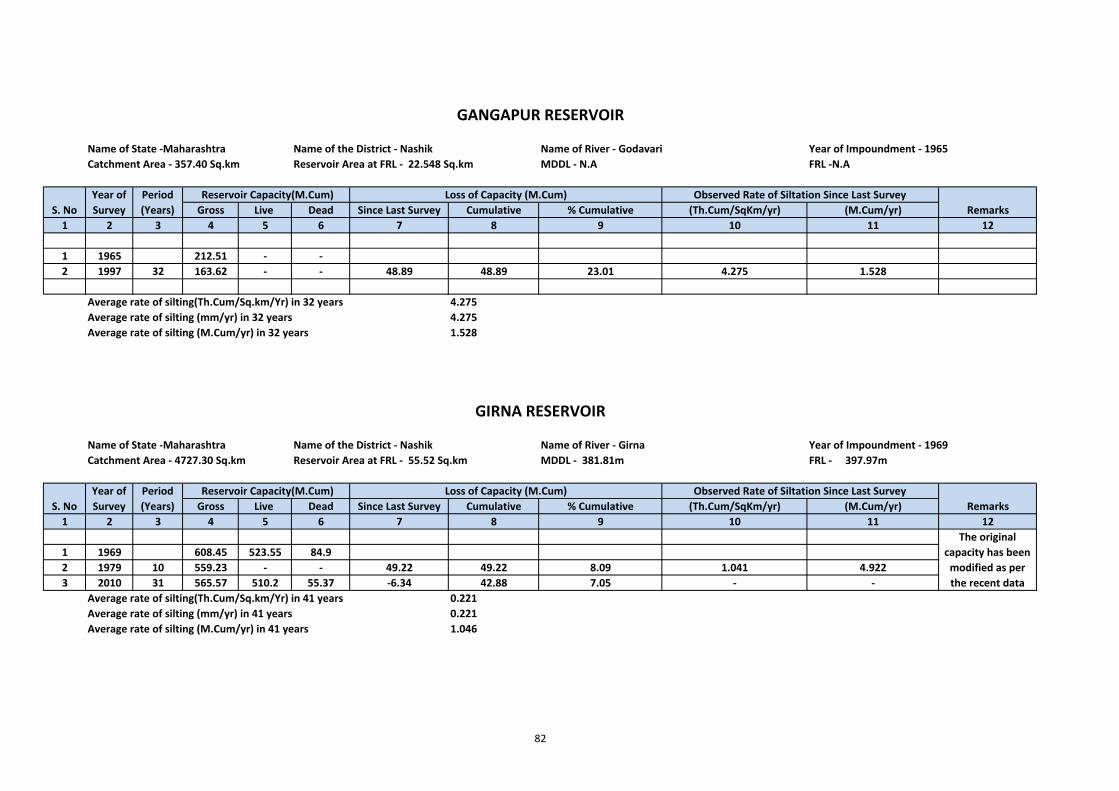
Name of State ‐Maharashtra Name of the District ‐ Nashik Name of River ‐ Godavari Year of Impoundment ‐ 1965Catchment Area ‐ 357.40 Sq.km Reservoir Area at FRL ‐ 22.548 Sq.km MDDL ‐ N.A FRL ‐N.A
Gross Live Dead Since Last Survey Cumulative % Cumulative (Th.Cum/SqKm/yr) (M.Cum/yr)1 2 3 4 5 6 7 8 9 10 11 12
1 1965 212.51 ‐ ‐2 1997 32 163.62 ‐ ‐ 48.89 48.89 23.01 4.275 1.528
Average rate of silting(Th.Cum/Sq.km/Yr) in 32 years 4.275Average rate of silting (mm/yr) in 32 years 4.275Average rate of silting (M.Cum/yr) in 32 years 1.528
Name of State ‐Maharashtra Name of the District ‐ Nashik Name of River ‐ Girna Year of Impoundment ‐ 1969Catchment Area ‐ 4727.30 Sq.km Reservoir Area at FRL ‐ 55.52 Sq.km MDDL ‐ 381.81m FRL ‐ 397.97m
Gross Live Dead Since Last Survey Cumulative % Cumulative (Th.Cum/SqKm/yr) (M.Cum/yr)1 2 3 4 5 6 7 8 9 10 11 12
1 1969 608.45 523.55 84.92 1979 10 559.23 ‐ ‐ 49.22 49.22 8.09 1.041 4.9223 2010 31 565.57 510.2 55.37 ‐6.34 42.88 7.05 ‐ ‐
Average rate of silting(Th.Cum/Sq.km/Yr) in 41 years 0.221Average rate of silting (mm/yr) in 41 years 0.221Average rate of silting (M.Cum/yr) in 41 years 1.046
Reservoir Capacity(M.Cum)S. No
Year of Survey
Observed Rate of Siltation Since Last SurveyPeriod (Years)
Observed Rate of Siltation Since Last Survey
Year of Survey S. No
Loss of Capacity (M.Cum)Remarks
GANGAPUR RESERVOIR
Remarks
GIRNA RESERVOIR
Period (Years)
Reservoir Capacity(M.Cum)
The original capacity has been modified as per the recent data
Loss of Capacity (M.Cum)
82
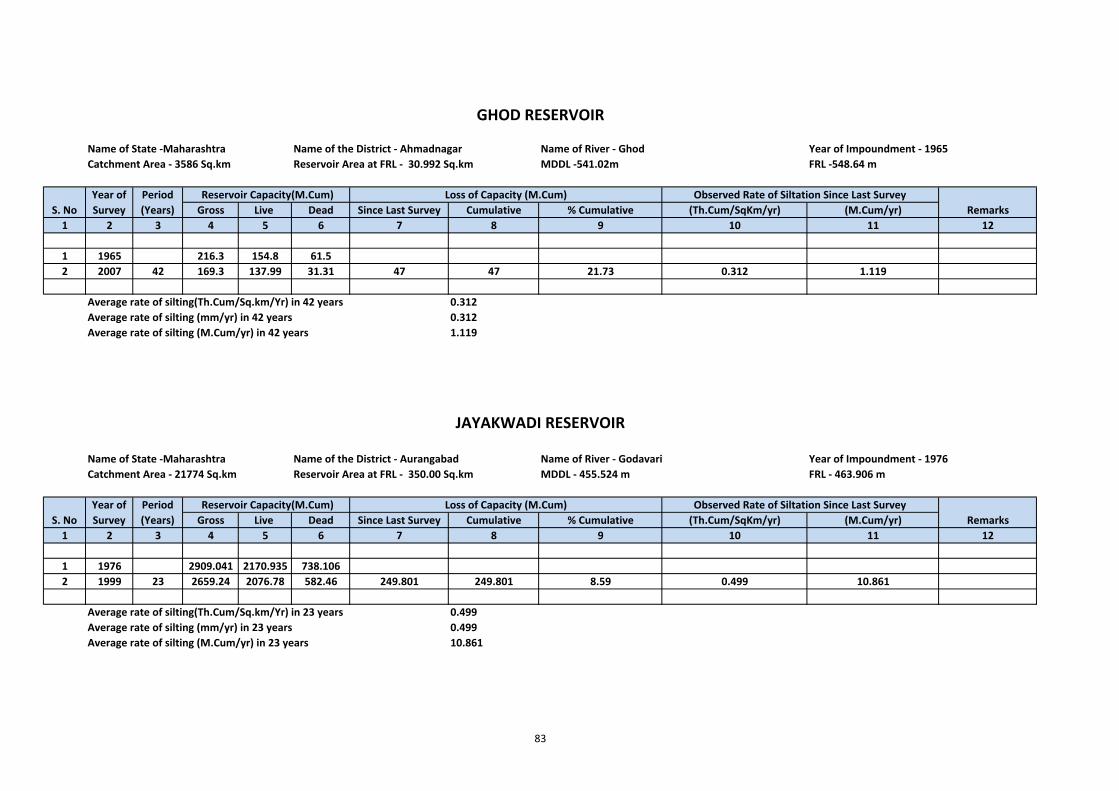
Name of State ‐Maharashtra Name of the District ‐ Ahmadnagar Name of River ‐ Ghod Year of Impoundment ‐ 1965Catchment Area ‐ 3586 Sq.km Reservoir Area at FRL ‐ 30.992 Sq.km MDDL ‐541.02m FRL ‐548.64 m
Gross Live Dead Since Last Survey Cumulative % Cumulative (Th.Cum/SqKm/yr) (M.Cum/yr)1 2 3 4 5 6 7 8 9 10 11 12
1 1965 216.3 154.8 61.52 2007 42 169.3 137.99 31.31 47 47 21.73 0.312 1.119
Average rate of silting(Th.Cum/Sq.km/Yr) in 42 years 0.312Average rate of silting (mm/yr) in 42 years 0.312Average rate of silting (M.Cum/yr) in 42 years 1.119
Name of State ‐Maharashtra Name of the District ‐ Aurangabad Name of River ‐ Godavari Year of Impoundment ‐ 1976Catchment Area ‐ 21774 Sq.km Reservoir Area at FRL ‐ 350.00 Sq.km MDDL ‐ 455.524 m FRL ‐ 463.906 m
Gross Live Dead Since Last Survey Cumulative % Cumulative (Th.Cum/SqKm/yr) (M.Cum/yr)1 2 3 4 5 6 7 8 9 10 11 12
1 1976 2909.041 2170.935 738.1062 1999 23 2659.24 2076.78 582.46 249.801 249.801 8.59 0.499 10.861
Average rate of silting(Th.Cum/Sq.km/Yr) in 23 years 0.499Average rate of silting (mm/yr) in 23 years 0.499Average rate of silting (M.Cum/yr) in 23 years 10.861
Remarks
Remarks
JAYAKWADI RESERVOIR
GHOD RESERVOIR
S. NoYear of Survey
Reservoir Capacity(M.Cum)
Period (Years)
Reservoir Capacity(M.Cum)
Loss of Capacity (M.Cum) Observed Rate of Siltation Since Last Survey
Loss of Capacity (M.Cum)
Period (Years)
Observed Rate of Siltation Since Last Survey
S. NoYear of Survey
83
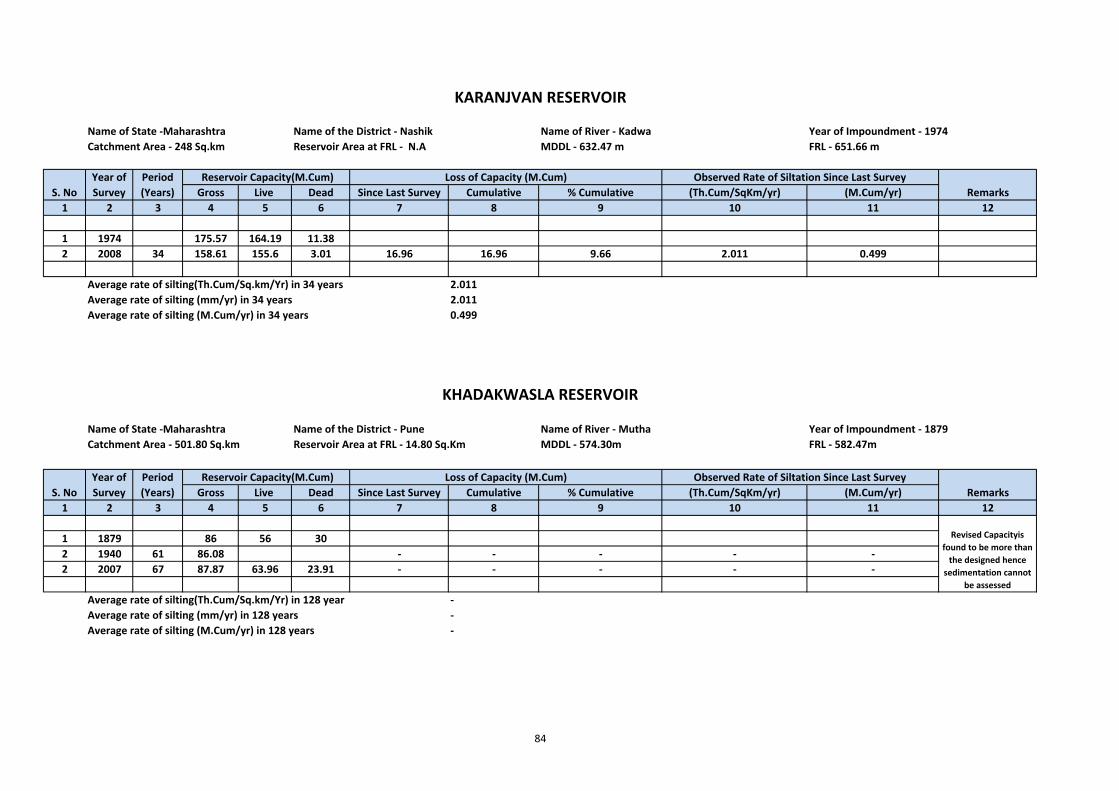
Name of State ‐Maharashtra Name of the District ‐ Nashik Name of River ‐ Kadwa Year of Impoundment ‐ 1974Catchment Area ‐ 248 Sq.km Reservoir Area at FRL ‐ N.A MDDL ‐ 632.47 m FRL ‐ 651.66 m
Gross Live Dead Since Last Survey Cumulative % Cumulative (Th.Cum/SqKm/yr) (M.Cum/yr)1 2 3 4 5 6 7 8 9 10 11 12
1 1974 175.57 164.19 11.382 2008 34 158.61 155.6 3.01 16.96 16.96 9.66 2.011 0.499
Average rate of silting(Th.Cum/Sq.km/Yr) in 34 years 2.011Average rate of silting (mm/yr) in 34 years 2.011Average rate of silting (M.Cum/yr) in 34 years 0.499
Name of State ‐Maharashtra Name of the District ‐ Pune Name of River ‐ Mutha Year of Impoundment ‐ 1879Catchment Area ‐ 501.80 Sq.km Reservoir Area at FRL ‐ 14.80 Sq.Km MDDL ‐ 574.30m FRL ‐ 582.47m
Gross Live Dead Since Last Survey Cumulative % Cumulative (Th.Cum/SqKm/yr) (M.Cum/yr)1 2 3 4 5 6 7 8 9 10 11 12
1 1879 86 56 302 1940 61 86.08 ‐ ‐ ‐ ‐ ‐2 2007 67 87.87 63.96 23.91 ‐ ‐ ‐ ‐ ‐
Average rate of silting(Th.Cum/Sq.km/Yr) in 128 year ‐Average rate of silting (mm/yr) in 128 years ‐Average rate of silting (M.Cum/yr) in 128 years ‐
Observed Rate of Siltation Since Last Survey Reservoir Capacity(M.Cum) Loss of Capacity (M.Cum)Year of Survey
Reservoir Capacity(M.Cum)
Period (Years)
Observed Rate of Siltation Since Last SurveyLoss of Capacity (M.Cum)
Remarks
KARANJVAN RESERVOIR
S. No
KHADAKWASLA RESERVOIR
S. NoYear of Survey
Period (Years) Remarks
Revised Capacityis found to be more than the designed hence
sedimentation cannot be assessed
84
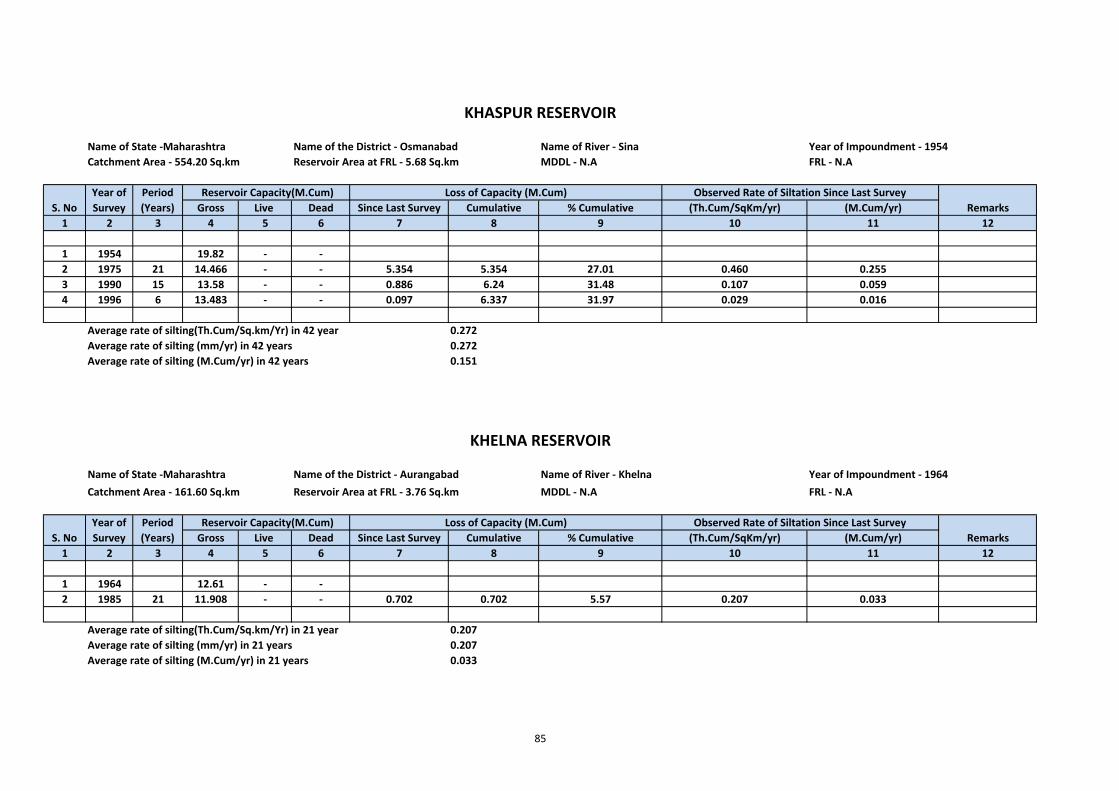
Name of State ‐Maharashtra Name of the District ‐ Osmanabad Name of River ‐ Sina Year of Impoundment ‐ 1954Catchment Area ‐ 554.20 Sq.km Reservoir Area at FRL ‐ 5.68 Sq.km MDDL ‐ N.A FRL ‐ N.A
Gross Live Dead Since Last Survey Cumulative % Cumulative (Th.Cum/SqKm/yr) (M.Cum/yr)1 2 3 4 5 6 7 8 9 10 11 12
1 1954 19.82 ‐ ‐2 1975 21 14.466 ‐ ‐ 5.354 5.354 27.01 0.460 0.2553 1990 15 13.58 ‐ ‐ 0.886 6.24 31.48 0.107 0.0594 1996 6 13.483 ‐ ‐ 0.097 6.337 31.97 0.029 0.016
Average rate of silting(Th.Cum/Sq.km/Yr) in 42 year 0.272Average rate of silting (mm/yr) in 42 years 0.272Average rate of silting (M.Cum/yr) in 42 years 0.151
Name of State ‐Maharashtra Name of the District ‐ Aurangabad Name of River ‐ Khelna Year of Impoundment ‐ 1964Catchment Area ‐ 161.60 Sq.km Reservoir Area at FRL ‐ 3.76 Sq.km MDDL ‐ N.A FRL ‐ N.A
Gross Live Dead Since Last Survey Cumulative % Cumulative (Th.Cum/SqKm/yr) (M.Cum/yr)1 2 3 4 5 6 7 8 9 10 11 12
1 1964 12.61 ‐ ‐2 1985 21 11.908 ‐ ‐ 0.702 0.702 5.57 0.207 0.033
Average rate of silting(Th.Cum/Sq.km/Yr) in 21 year 0.207Average rate of silting (mm/yr) in 21 years 0.207Average rate of silting (M.Cum/yr) in 21 years 0.033
Loss of Capacity (M.Cum)Period (Years)S. No
Year of Survey
Reservoir Capacity(M.Cum)
S. No
KHASPUR RESERVOIR
Year of Survey Remarks
Loss of Capacity (M.Cum)Period (Years)
Reservoir Capacity(M.Cum) Observed Rate of Siltation Since Last Survey
RemarksObserved Rate of Siltation Since Last Survey
KHELNA RESERVOIR
85
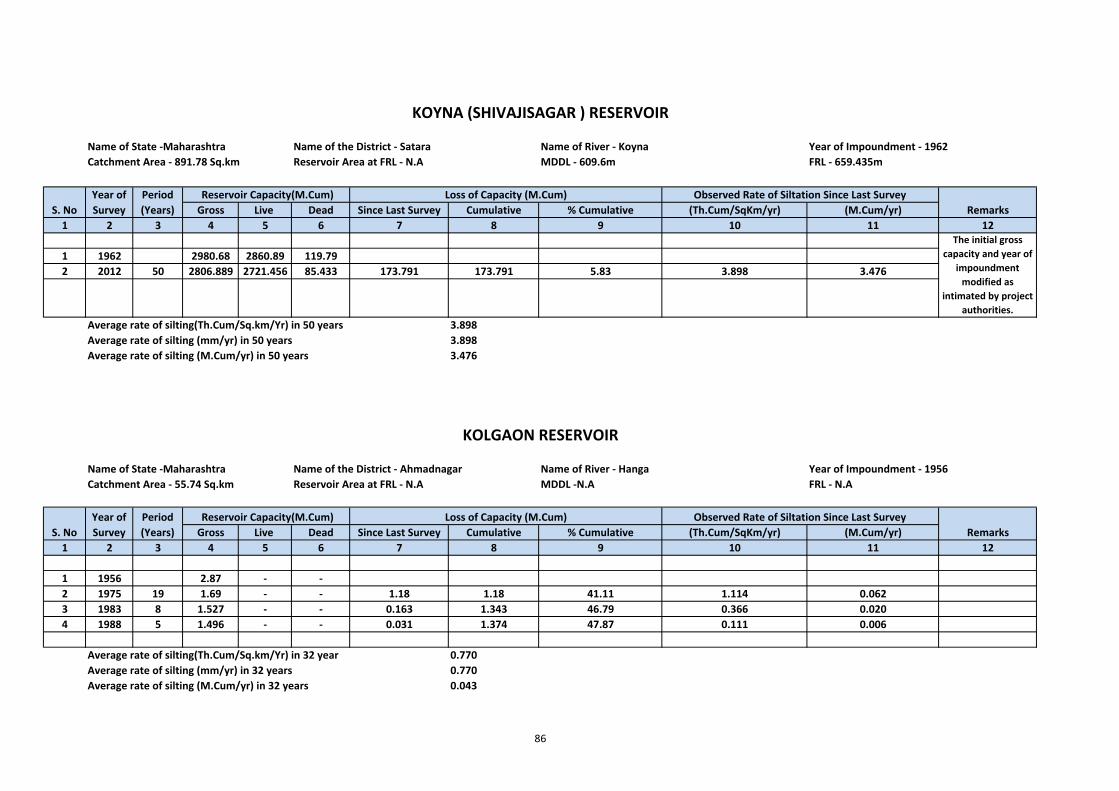
Name of State ‐Maharashtra Name of the District ‐ Satara Name of River ‐ Koyna Year of Impoundment ‐ 1962Catchment Area ‐ 891.78 Sq.km Reservoir Area at FRL ‐ N.A MDDL ‐ 609.6m FRL ‐ 659.435m
Gross Live Dead Since Last Survey Cumulative % Cumulative (Th.Cum/SqKm/yr) (M.Cum/yr)1 2 3 4 5 6 7 8 9 10 11 12
1 1962 2980.68 2860.89 119.792 2012 50 2806.889 2721.456 85.433 173.791 173.791 5.83 3.898 3.476
Average rate of silting(Th.Cum/Sq.km/Yr) in 50 years 3.898Average rate of silting (mm/yr) in 50 years 3.898Average rate of silting (M.Cum/yr) in 50 years 3.476
Name of State ‐Maharashtra Name of the District ‐ Ahmadnagar Name of River ‐ Hanga Year of Impoundment ‐ 1956Catchment Area ‐ 55.74 Sq.km Reservoir Area at FRL ‐ N.A MDDL ‐N.A FRL ‐ N.A
Gross Live Dead Since Last Survey Cumulative % Cumulative (Th.Cum/SqKm/yr) (M.Cum/yr)1 2 3 4 5 6 7 8 9 10 11 12
1 1956 2.87 ‐ ‐2 1975 19 1.69 ‐ ‐ 1.18 1.18 41.11 1.114 0.0623 1983 8 1.527 ‐ ‐ 0.163 1.343 46.79 0.366 0.0204 1988 5 1.496 ‐ ‐ 0.031 1.374 47.87 0.111 0.006
Average rate of silting(Th.Cum/Sq.km/Yr) in 32 year 0.770Average rate of silting (mm/yr) in 32 years 0.770Average rate of silting (M.Cum/yr) in 32 years 0.043
Remarks
KOLGAON RESERVOIR
Reservoir Capacity(M.Cum)
Year of Survey
S. No
KOYNA (SHIVAJISAGAR ) RESERVOIR
RemarksObserved Rate of Siltation Since Last Survey
The initial gross capacity and year of
impoundment modified as
intimated by project authorities.
Period (Years)
Loss of Capacity (M.Cum) Observed Rate of Siltation Since Last Survey
Period (Years)
Reservoir Capacity(M.Cum) Loss of Capacity (M.Cum)
Year of Survey
S. No
86
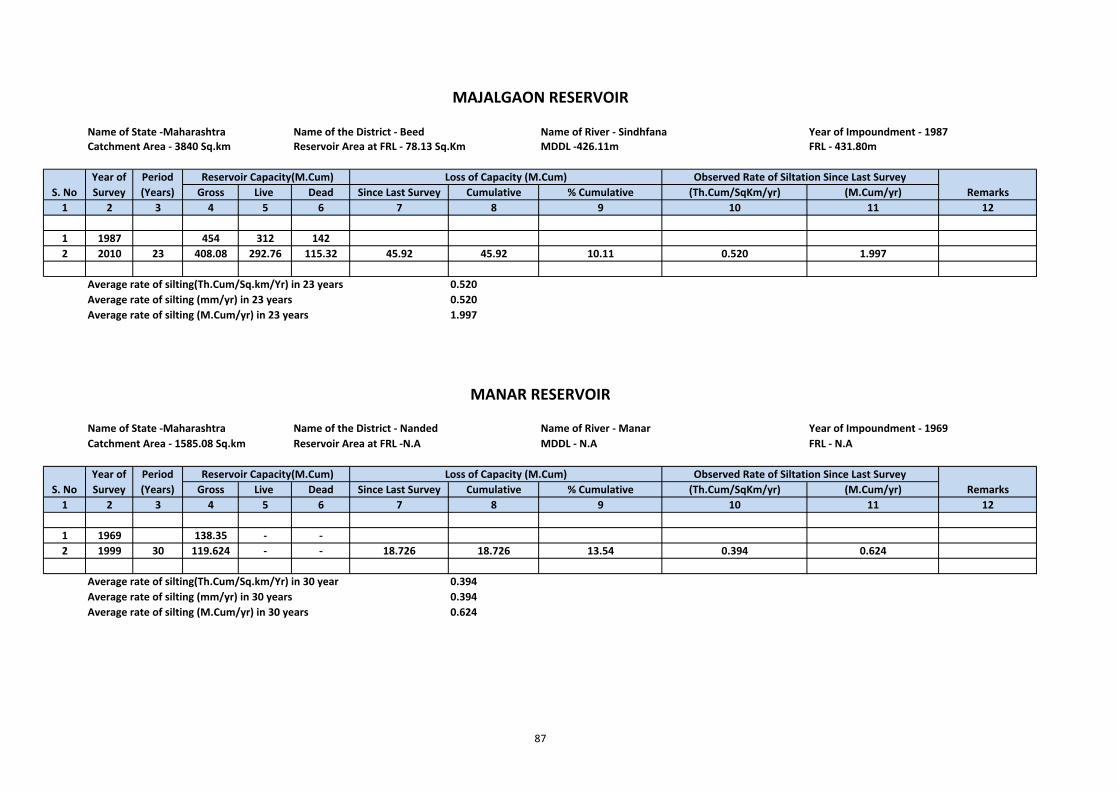
Name of State ‐Maharashtra Name of the District ‐ Beed Name of River ‐ Sindhfana Year of Impoundment ‐ 1987Catchment Area ‐ 3840 Sq.km Reservoir Area at FRL ‐ 78.13 Sq.Km MDDL ‐426.11m FRL ‐ 431.80m
Gross Live Dead Since Last Survey Cumulative % Cumulative (Th.Cum/SqKm/yr) (M.Cum/yr)1 2 3 4 5 6 7 8 9 10 11 12
1 1987 454 312 1422 2010 23 408.08 292.76 115.32 45.92 45.92 10.11 0.520 1.997
Average rate of silting(Th.Cum/Sq.km/Yr) in 23 years 0.520Average rate of silting (mm/yr) in 23 years 0.520Average rate of silting (M.Cum/yr) in 23 years 1.997
Name of State ‐Maharashtra Name of the District ‐ Nanded Name of River ‐ Manar Year of Impoundment ‐ 1969Catchment Area ‐ 1585.08 Sq.km Reservoir Area at FRL ‐N.A MDDL ‐ N.A FRL ‐ N.A
Gross Live Dead Since Last Survey Cumulative % Cumulative (Th.Cum/SqKm/yr) (M.Cum/yr)1 2 3 4 5 6 7 8 9 10 11 12
1 1969 138.35 ‐ ‐2 1999 30 119.624 ‐ ‐ 18.726 18.726 13.54 0.394 0.624
Average rate of silting(Th.Cum/Sq.km/Yr) in 30 year 0.394Average rate of silting (mm/yr) in 30 years 0.394Average rate of silting (M.Cum/yr) in 30 years 0.624
Remarks
Period (Years)
Reservoir Capacity(M.Cum) Loss of Capacity (M.Cum) Observed Rate of Siltation Since Last Survey
MAJALGAON RESERVOIR
S. No
MANAR RESERVOIR
Loss of Capacity (M.Cum)
Year of Survey
Reservoir Capacity(M.Cum)
Remarks
Period (Years)
Year of Survey S. No
Observed Rate of Siltation Since Last Survey
87
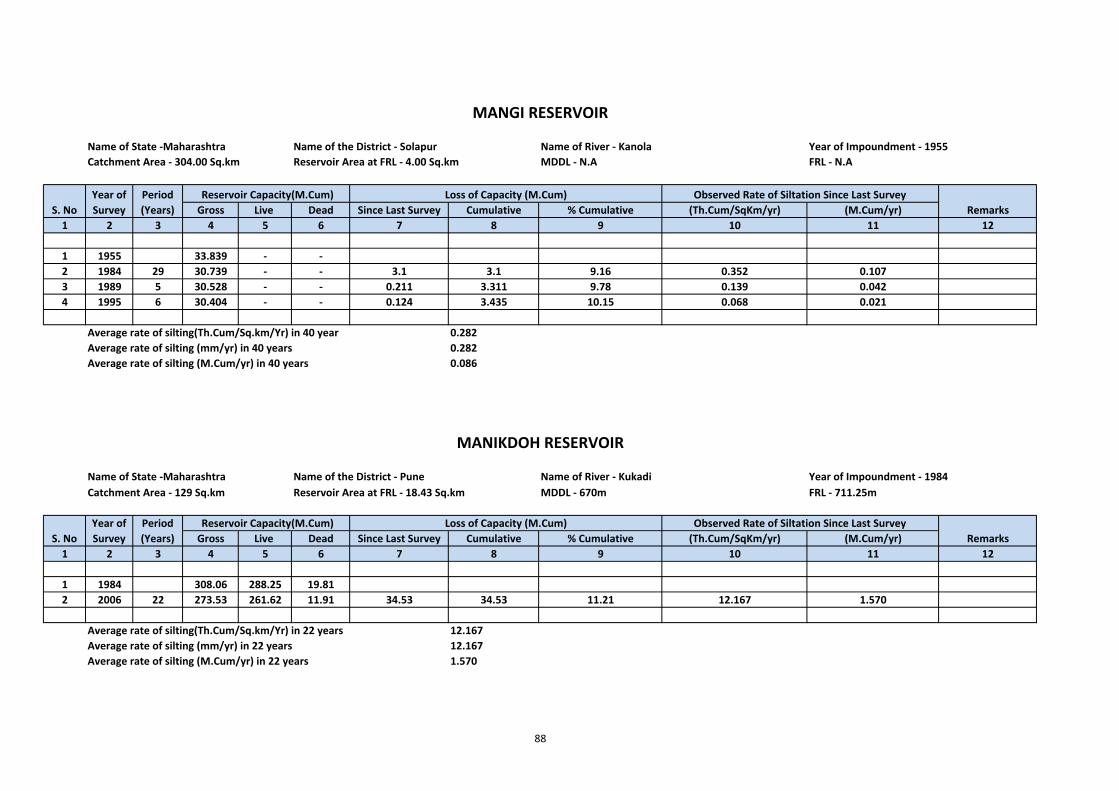
Name of State ‐Maharashtra Name of the District ‐ Solapur Name of River ‐ Kanola Year of Impoundment ‐ 1955Catchment Area ‐ 304.00 Sq.km Reservoir Area at FRL ‐ 4.00 Sq.km MDDL ‐ N.A FRL ‐ N.A
Gross Live Dead Since Last Survey Cumulative % Cumulative (Th.Cum/SqKm/yr) (M.Cum/yr)1 2 3 4 5 6 7 8 9 10 11 12
1 1955 33.839 ‐ ‐2 1984 29 30.739 ‐ ‐ 3.1 3.1 9.16 0.352 0.1073 1989 5 30.528 ‐ ‐ 0.211 3.311 9.78 0.139 0.0424 1995 6 30.404 ‐ ‐ 0.124 3.435 10.15 0.068 0.021
Average rate of silting(Th.Cum/Sq.km/Yr) in 40 year 0.282Average rate of silting (mm/yr) in 40 years 0.282Average rate of silting (M.Cum/yr) in 40 years 0.086
Name of State ‐Maharashtra Name of the District ‐ Pune Name of River ‐ Kukadi Year of Impoundment ‐ 1984Catchment Area ‐ 129 Sq.km Reservoir Area at FRL ‐ 18.43 Sq.km MDDL ‐ 670m FRL ‐ 711.25m
Gross Live Dead Since Last Survey Cumulative % Cumulative (Th.Cum/SqKm/yr) (M.Cum/yr)1 2 3 4 5 6 7 8 9 10 11 12
1 1984 308.06 288.25 19.812 2006 22 273.53 261.62 11.91 34.53 34.53 11.21 12.167 1.570
Average rate of silting(Th.Cum/Sq.km/Yr) in 22 years 12.167Average rate of silting (mm/yr) in 22 years 12.167Average rate of silting (M.Cum/yr) in 22 years 1.570
MANGI RESERVOIR
S. No
MANIKDOH RESERVOIR
Loss of Capacity (M.Cum)Remarks
Loss of Capacity (M.Cum)Year of Survey Remarks
Reservoir Capacity(M.Cum)
Observed Rate of Siltation Since Last SurveyPeriod (Years)
Reservoir Capacity(M.Cum)S. No
Year of Survey
Observed Rate of Siltation Since Last SurveyPeriod (Years)
88
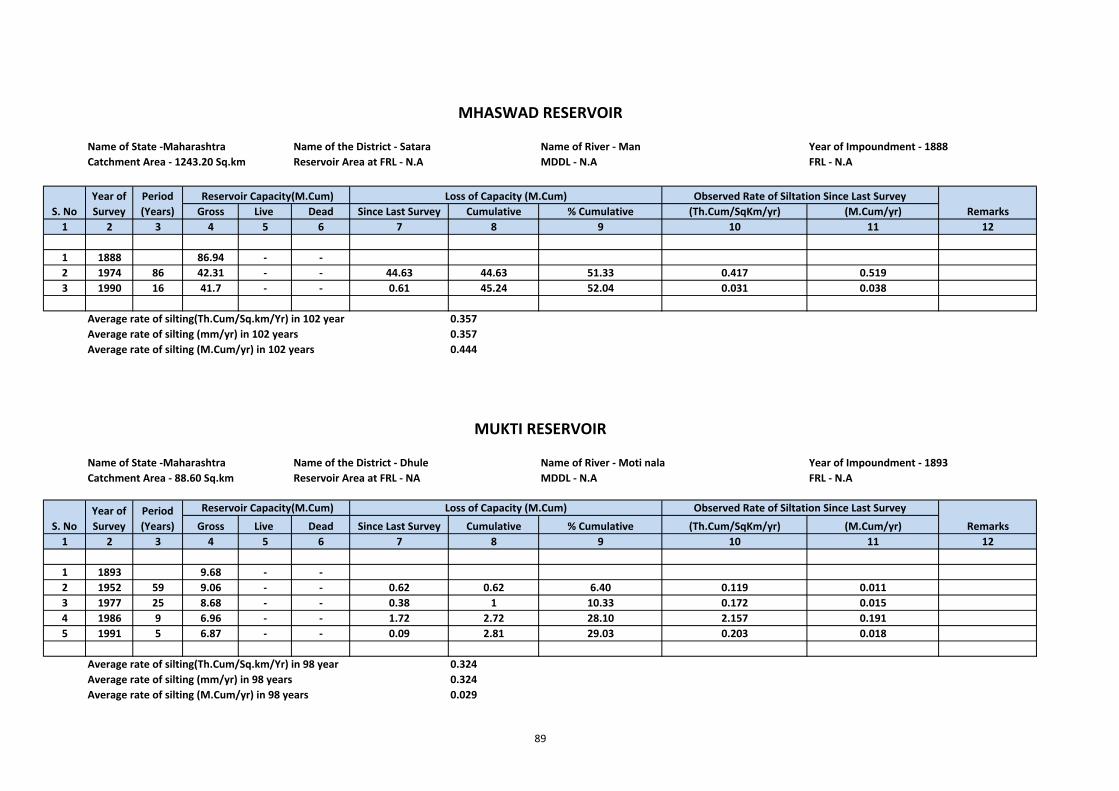
Name of State ‐Maharashtra Name of the District ‐ Satara Name of River ‐ Man Year of Impoundment ‐ 1888Catchment Area ‐ 1243.20 Sq.km Reservoir Area at FRL ‐ N.A MDDL ‐ N.A FRL ‐ N.A
Gross Live Dead Since Last Survey Cumulative % Cumulative (Th.Cum/SqKm/yr) (M.Cum/yr)1 2 3 4 5 6 7 8 9 10 11 12
1 1888 86.94 ‐ ‐2 1974 86 42.31 ‐ ‐ 44.63 44.63 51.33 0.417 0.5193 1990 16 41.7 ‐ ‐ 0.61 45.24 52.04 0.031 0.038
Average rate of silting(Th.Cum/Sq.km/Yr) in 102 year 0.357Average rate of silting (mm/yr) in 102 years 0.357Average rate of silting (M.Cum/yr) in 102 years 0.444
Name of State ‐Maharashtra Name of the District ‐ Dhule Name of River ‐ Moti nala Year of Impoundment ‐ 1893Catchment Area ‐ 88.60 Sq.km Reservoir Area at FRL ‐ NA MDDL ‐ N.A FRL ‐ N.A
Gross Live Dead Since Last Survey Cumulative % Cumulative (Th.Cum/SqKm/yr) (M.Cum/yr)1 2 3 4 5 6 7 8 9 10 11 12
1 1893 9.68 ‐ ‐2 1952 59 9.06 ‐ ‐ 0.62 0.62 6.40 0.119 0.0113 1977 25 8.68 ‐ ‐ 0.38 1 10.33 0.172 0.0154 1986 9 6.96 ‐ ‐ 1.72 2.72 28.10 2.157 0.1915 1991 5 6.87 ‐ ‐ 0.09 2.81 29.03 0.203 0.018
Average rate of silting(Th.Cum/Sq.km/Yr) in 98 year 0.324Average rate of silting (mm/yr) in 98 years 0.324Average rate of silting (M.Cum/yr) in 98 years 0.029
Observed Rate of Siltation Since Last SurveyS. No
Year of Survey
Period (Years)
Period (Years)
Remarks
RemarksS. No
MHASWAD RESERVOIR
Year of Survey
Loss of Capacity (M.Cum) Observed Rate of Siltation Since Last Survey
Reservoir Capacity(M.Cum) Loss of Capacity (M.Cum)
Reservoir Capacity(M.Cum)
MUKTI RESERVOIR
89
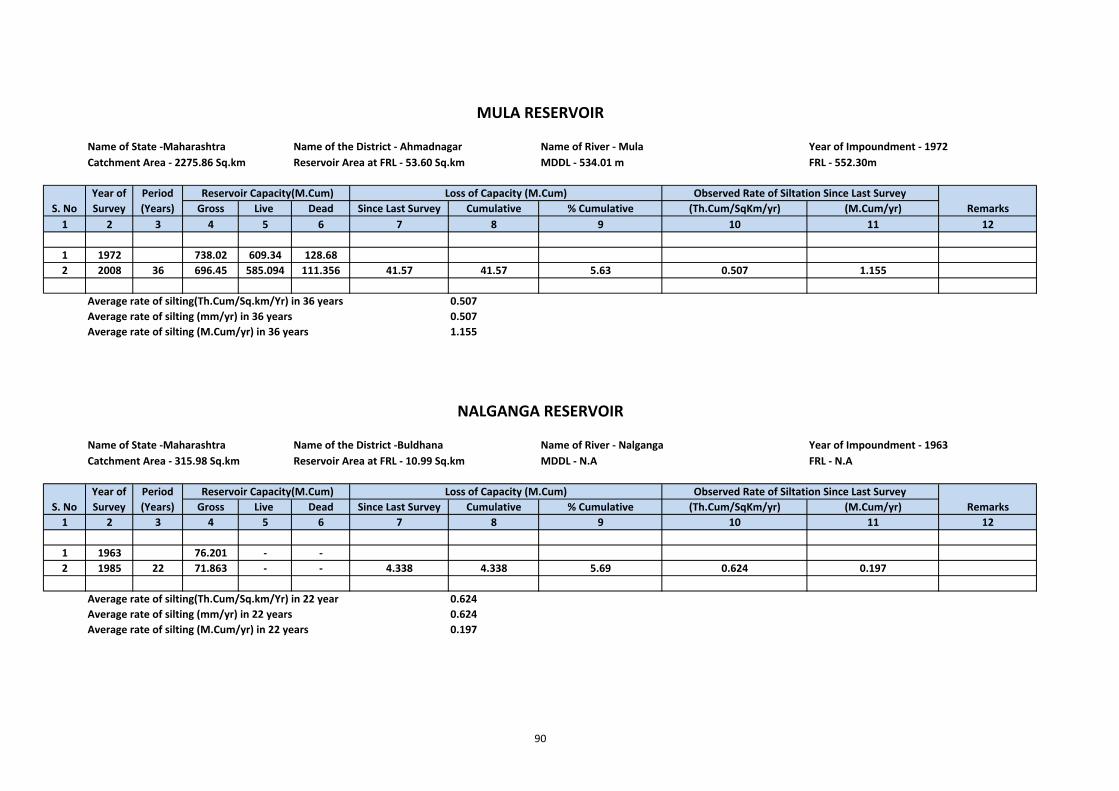
Name of State ‐Maharashtra Name of the District ‐ Ahmadnagar Name of River ‐ Mula Year of Impoundment ‐ 1972Catchment Area ‐ 2275.86 Sq.km Reservoir Area at FRL ‐ 53.60 Sq.km MDDL ‐ 534.01 m FRL ‐ 552.30m
Gross Live Dead Since Last Survey Cumulative % Cumulative (Th.Cum/SqKm/yr) (M.Cum/yr)1 2 3 4 5 6 7 8 9 10 11 12
1 1972 738.02 609.34 128.682 2008 36 696.45 585.094 111.356 41.57 41.57 5.63 0.507 1.155
Average rate of silting(Th.Cum/Sq.km/Yr) in 36 years 0.507Average rate of silting (mm/yr) in 36 years 0.507Average rate of silting (M.Cum/yr) in 36 years 1.155
Name of State ‐Maharashtra Name of the District ‐Buldhana Name of River ‐ Nalganga Year of Impoundment ‐ 1963Catchment Area ‐ 315.98 Sq.km Reservoir Area at FRL ‐ 10.99 Sq.km MDDL ‐ N.A FRL ‐ N.A
Gross Live Dead Since Last Survey Cumulative % Cumulative (Th.Cum/SqKm/yr) (M.Cum/yr)1 2 3 4 5 6 7 8 9 10 11 12
1 1963 76.201 ‐ ‐2 1985 22 71.863 ‐ ‐ 4.338 4.338 5.69 0.624 0.197
Average rate of silting(Th.Cum/Sq.km/Yr) in 22 year 0.624Average rate of silting (mm/yr) in 22 years 0.624Average rate of silting (M.Cum/yr) in 22 years 0.197
MULA RESERVOIR
S. No
Year of Survey
Period (Years)
NALGANGA RESERVOIR
Loss of Capacity (M.Cum)Remarks
Observed Rate of Siltation Since Last Survey
S. No
Year of Survey
Reservoir Capacity(M.Cum)Period (Years)
Reservoir Capacity(M.Cum) Loss of Capacity (M.Cum) Observed Rate of Siltation Since Last SurveyRemarks
90
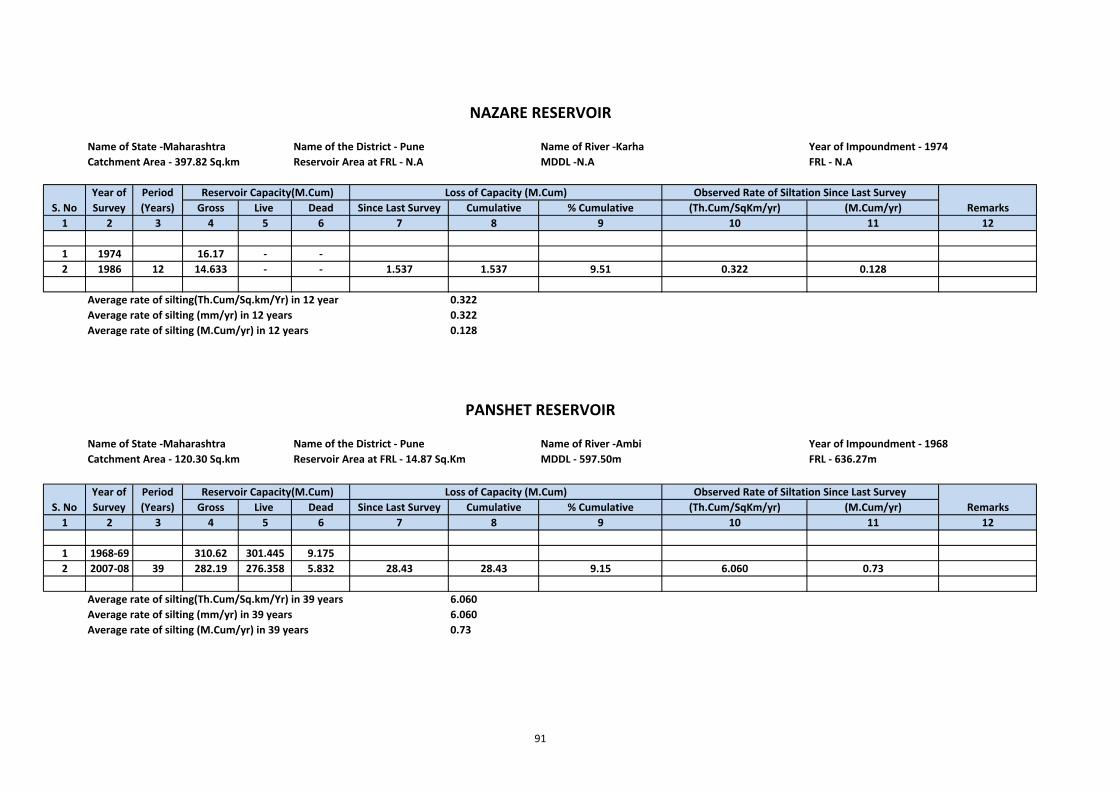
Name of State ‐Maharashtra Name of the District ‐ Pune Name of River ‐Karha Year of Impoundment ‐ 1974Catchment Area ‐ 397.82 Sq.km Reservoir Area at FRL ‐ N.A MDDL ‐N.A FRL ‐ N.A
Gross Live Dead Since Last Survey Cumulative % Cumulative (Th.Cum/SqKm/yr) (M.Cum/yr)1 2 3 4 5 6 7 8 9 10 11 12
1 1974 16.17 ‐ ‐2 1986 12 14.633 ‐ ‐ 1.537 1.537 9.51 0.322 0.128
Average rate of silting(Th.Cum/Sq.km/Yr) in 12 year 0.322Average rate of silting (mm/yr) in 12 years 0.322Average rate of silting (M.Cum/yr) in 12 years 0.128
Name of State ‐Maharashtra Name of the District ‐ Pune Name of River ‐Ambi Year of Impoundment ‐ 1968Catchment Area ‐ 120.30 Sq.km Reservoir Area at FRL ‐ 14.87 Sq.Km MDDL ‐ 597.50m FRL ‐ 636.27m
Gross Live Dead Since Last Survey Cumulative % Cumulative (Th.Cum/SqKm/yr) (M.Cum/yr)1 2 3 4 5 6 7 8 9 10 11 12
1 1968‐69 310.62 301.445 9.1752 2007‐08 39 282.19 276.358 5.832 28.43 28.43 9.15 6.060 0.73
Average rate of silting(Th.Cum/Sq.km/Yr) in 39 years 6.060Average rate of silting (mm/yr) in 39 years 6.060Average rate of silting (M.Cum/yr) in 39 years 0.73
Reservoir Capacity(M.Cum)
S. NoPeriod (Years)
Observed Rate of Siltation Since Last Survey
NAZARE RESERVOIR
PANSHET RESERVOIR
Year of Survey
RemarksS. NoYear of Survey
Loss of Capacity (M.Cum) Reservoir Capacity(M.Cum)
Period (Years)
Loss of Capacity (M.Cum)
Remarks
Observed Rate of Siltation Since Last Survey
91
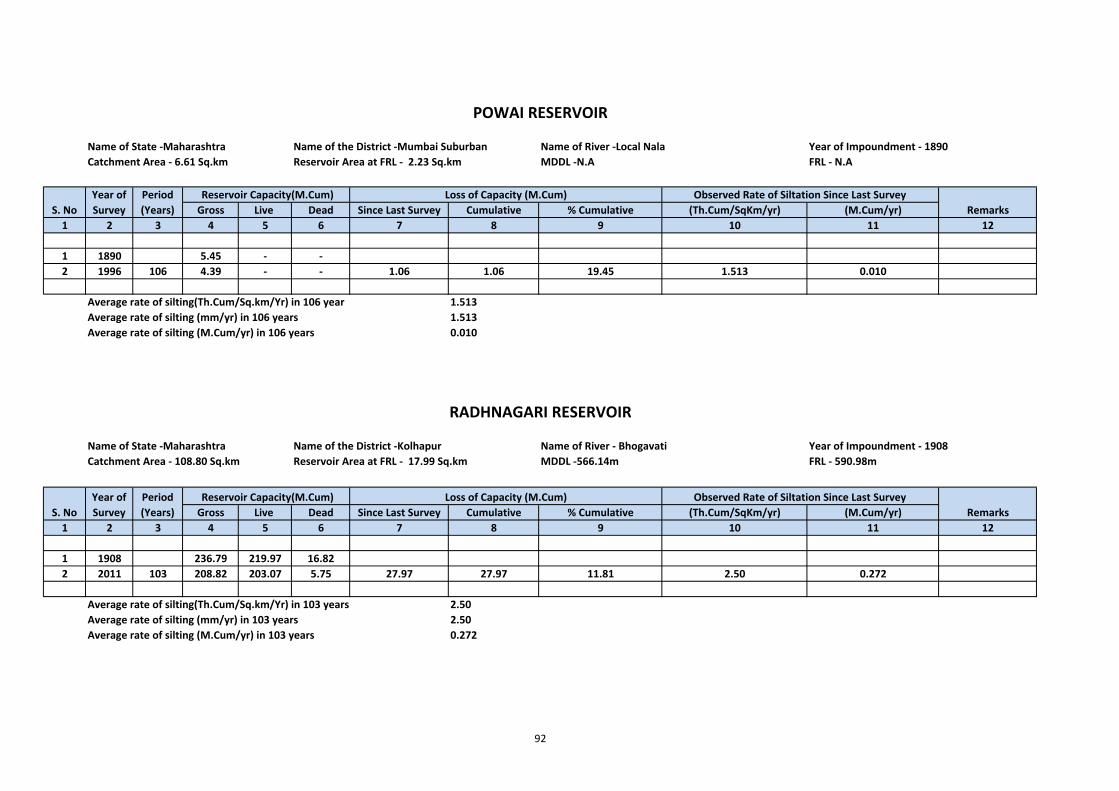
Name of State ‐Maharashtra Name of the District ‐Mumbai Suburban Name of River ‐Local Nala Year of Impoundment ‐ 1890Catchment Area ‐ 6.61 Sq.km Reservoir Area at FRL ‐ 2.23 Sq.km MDDL ‐N.A FRL ‐ N.A
Gross Live Dead Since Last Survey Cumulative % Cumulative (Th.Cum/SqKm/yr) (M.Cum/yr)1 2 3 4 5 6 7 8 9 10 11 12
1 1890 5.45 ‐ ‐2 1996 106 4.39 ‐ ‐ 1.06 1.06 19.45 1.513 0.010
Average rate of silting(Th.Cum/Sq.km/Yr) in 106 year 1.513Average rate of silting (mm/yr) in 106 years 1.513Average rate of silting (M.Cum/yr) in 106 years 0.010
Name of State ‐Maharashtra Name of the District ‐Kolhapur Name of River ‐ Bhogavati Year of Impoundment ‐ 1908Catchment Area ‐ 108.80 Sq.km Reservoir Area at FRL ‐ 17.99 Sq.km MDDL ‐566.14m FRL ‐ 590.98m
Gross Live Dead Since Last Survey Cumulative % Cumulative (Th.Cum/SqKm/yr) (M.Cum/yr)1 2 3 4 5 6 7 8 9 10 11 12
1 1908 236.79 219.97 16.822 2011 103 208.82 203.07 5.75 27.97 27.97 11.81 2.50 0.272
Average rate of silting(Th.Cum/Sq.km/Yr) in 103 years 2.50Average rate of silting (mm/yr) in 103 years 2.50Average rate of silting (M.Cum/yr) in 103 years 0.272
S. NoYear of Survey
Loss of Capacity (M.Cum) Observed Rate of Siltation Since Last Survey
Period (Years)
Reservoir Capacity(M.Cum) Loss of Capacity (M.Cum)
Reservoir Capacity(M.Cum)
POWAI RESERVOIR
Remarks
RADHNAGARI RESERVOIR
S. No
RemarksPeriod (Years)
Year of Survey
Observed Rate of Siltation Since Last Survey
92
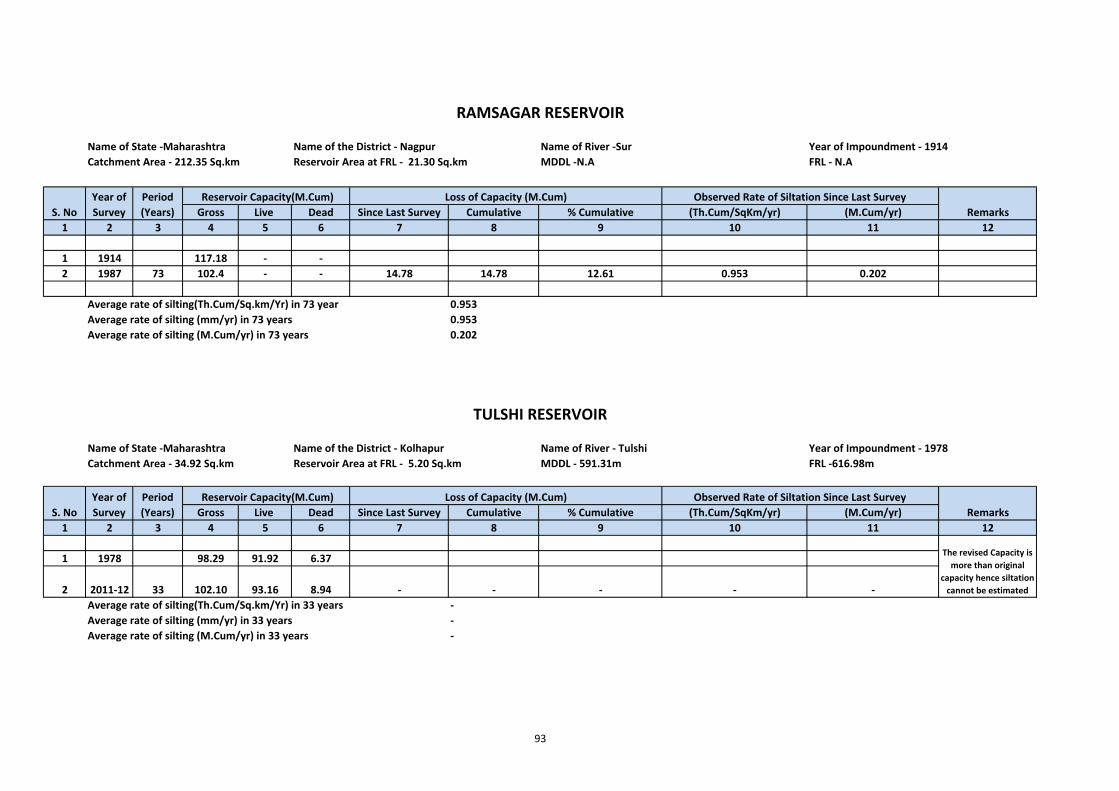
Name of State ‐Maharashtra Name of the District ‐ Nagpur Name of River ‐Sur Year of Impoundment ‐ 1914Catchment Area ‐ 212.35 Sq.km Reservoir Area at FRL ‐ 21.30 Sq.km MDDL ‐N.A FRL ‐ N.A
Gross Live Dead Since Last Survey Cumulative % Cumulative (Th.Cum/SqKm/yr) (M.Cum/yr)1 2 3 4 5 6 7 8 9 10 11 12
1 1914 117.18 ‐ ‐2 1987 73 102.4 ‐ ‐ 14.78 14.78 12.61 0.953 0.202
Average rate of silting(Th.Cum/Sq.km/Yr) in 73 year 0.953Average rate of silting (mm/yr) in 73 years 0.953Average rate of silting (M.Cum/yr) in 73 years 0.202
Name of State ‐Maharashtra Name of the District ‐ Kolhapur Name of River ‐ Tulshi Year of Impoundment ‐ 1978Catchment Area ‐ 34.92 Sq.km Reservoir Area at FRL ‐ 5.20 Sq.km MDDL ‐ 591.31m FRL ‐616.98m
Gross Live Dead Since Last Survey Cumulative % Cumulative (Th.Cum/SqKm/yr) (M.Cum/yr)1 2 3 4 5 6 7 8 9 10 11 12
1 1978 98.29 91.92 6.37
2 2011‐12 33 102.10 93.16 8.94 ‐ ‐ ‐ ‐ ‐Average rate of silting(Th.Cum/Sq.km/Yr) in 33 years ‐Average rate of silting (mm/yr) in 33 years ‐Average rate of silting (M.Cum/yr) in 33 years ‐
Remarks
The revised Capacity is more than original
capacity hence siltation cannot be estimated
S. No
RemarksYear of Survey
Loss of Capacity (M.Cum)Period (Years)
TULSHI RESERVOIR
RAMSAGAR RESERVOIR
Loss of Capacity (M.Cum) Observed Rate of Siltation Since Last SurveyYear of Survey
S. No
Reservoir Capacity(M.Cum)
Reservoir Capacity(M.Cum) Observed Rate of Siltation Since Last Survey
Period (Years)
93
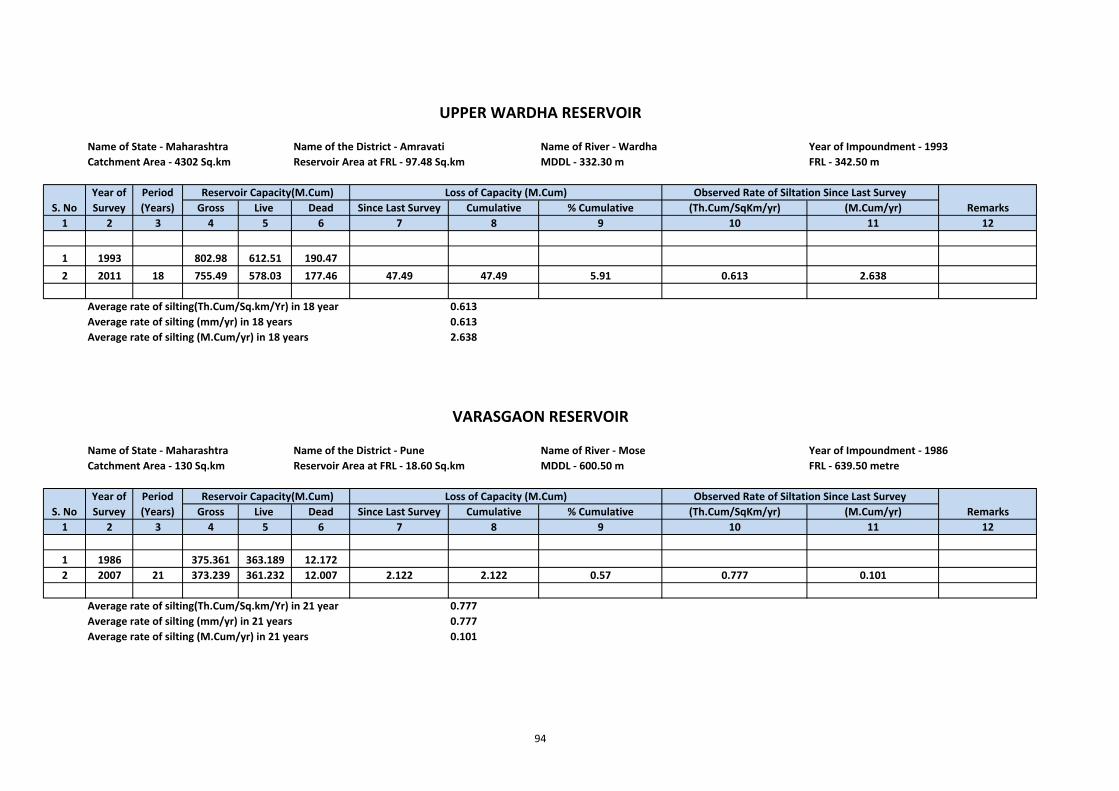
Name of State ‐ Maharashtra Name of the District ‐ Amravati Name of River ‐ Wardha Year of Impoundment ‐ 1993Catchment Area ‐ 4302 Sq.km Reservoir Area at FRL ‐ 97.48 Sq.km MDDL ‐ 332.30 m FRL ‐ 342.50 m
Gross Live Dead Since Last Survey Cumulative % Cumulative (Th.Cum/SqKm/yr) (M.Cum/yr)1 2 3 4 5 6 7 8 9 10 11 12
1 1993 802.98 612.51 190.472 2011 18 755.49 578.03 177.46 47.49 47.49 5.91 0.613 2.638
Average rate of silting(Th.Cum/Sq.km/Yr) in 18 year 0.613Average rate of silting (mm/yr) in 18 years 0.613Average rate of silting (M.Cum/yr) in 18 years 2.638
Name of State ‐ Maharashtra Name of the District ‐ Pune Name of River ‐ Mose Year of Impoundment ‐ 1986Catchment Area ‐ 130 Sq.km Reservoir Area at FRL ‐ 18.60 Sq.km MDDL ‐ 600.50 m FRL ‐ 639.50 metre
Gross Live Dead Since Last Survey Cumulative % Cumulative (Th.Cum/SqKm/yr) (M.Cum/yr)1 2 3 4 5 6 7 8 9 10 11 12
1 1986 375.361 363.189 12.1722 2007 21 373.239 361.232 12.007 2.122 2.122 0.57 0.777 0.101
Average rate of silting(Th.Cum/Sq.km/Yr) in 21 year 0.777Average rate of silting (mm/yr) in 21 years 0.777Average rate of silting (M.Cum/yr) in 21 years 0.101
Period (Years) Remarks
Year of Survey
Reservoir Capacity(M.Cum)S. No
Observed Rate of Siltation Since Last Survey
VARASGAON RESERVOIR
Year of Survey
Observed Rate of Siltation Since Last SurveyPeriod (Years)
Loss of Capacity (M.Cum)
Loss of Capacity (M.Cum)
UPPER WARDHA RESERVOIR
S. No Reservoir Capacity(M.Cum)
Remarks
94
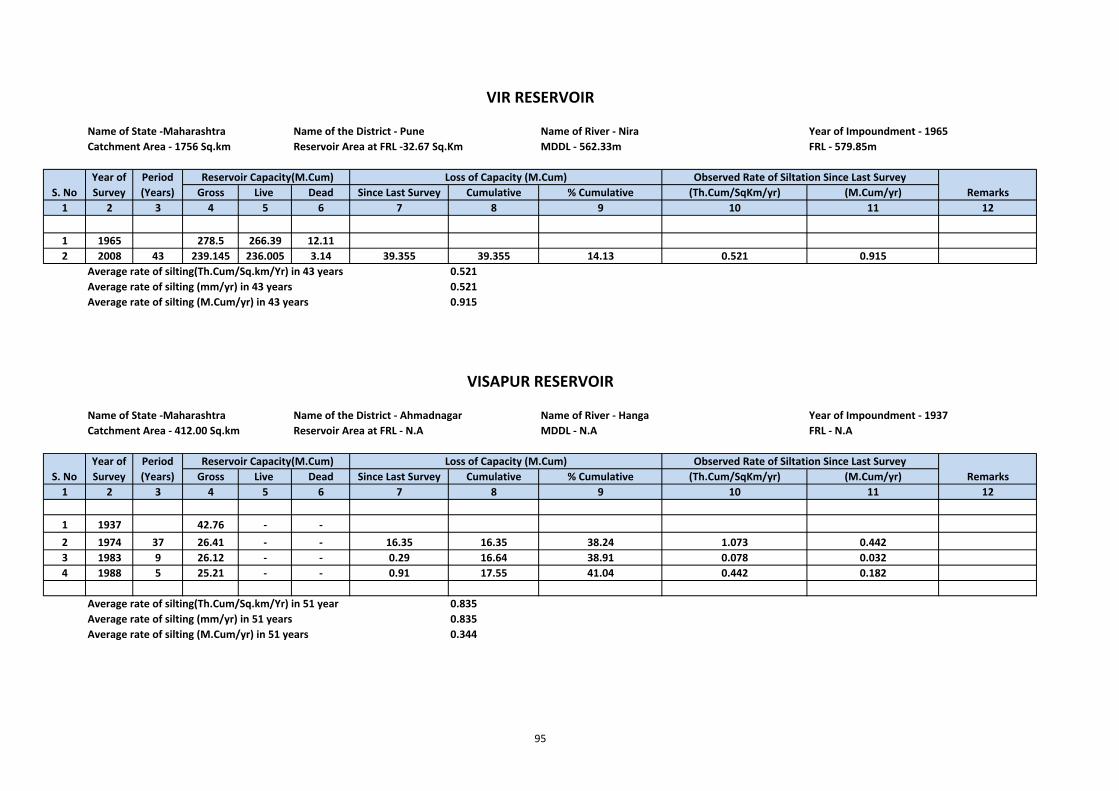
Name of State ‐Maharashtra Name of the District ‐ Pune Name of River ‐ Nira Year of Impoundment ‐ 1965Catchment Area ‐ 1756 Sq.km Reservoir Area at FRL ‐32.67 Sq.Km MDDL ‐ 562.33m FRL ‐ 579.85m
Gross Live Dead Since Last Survey Cumulative % Cumulative (Th.Cum/SqKm/yr) (M.Cum/yr)1 2 3 4 5 6 7 8 9 10 11 12
1 1965 278.5 266.39 12.112 2008 43 239.145 236.005 3.14 39.355 39.355 14.13 0.521 0.915
Average rate of silting(Th.Cum/Sq.km/Yr) in 43 years 0.521Average rate of silting (mm/yr) in 43 years 0.521Average rate of silting (M.Cum/yr) in 43 years 0.915
Name of State ‐Maharashtra Name of the District ‐ Ahmadnagar Name of River ‐ Hanga Year of Impoundment ‐ 1937Catchment Area ‐ 412.00 Sq.km Reservoir Area at FRL ‐ N.A MDDL ‐ N.A FRL ‐ N.A
Gross Live Dead Since Last Survey Cumulative % Cumulative (Th.Cum/SqKm/yr) (M.Cum/yr)1 2 3 4 5 6 7 8 9 10 11 12
1 1937 42.76 ‐ ‐2 1974 37 26.41 ‐ ‐ 16.35 16.35 38.24 1.073 0.4423 1983 9 26.12 ‐ ‐ 0.29 16.64 38.91 0.078 0.0324 1988 5 25.21 ‐ ‐ 0.91 17.55 41.04 0.442 0.182
Average rate of silting(Th.Cum/Sq.km/Yr) in 51 year 0.835Average rate of silting (mm/yr) in 51 years 0.835Average rate of silting (M.Cum/yr) in 51 years 0.344
Observed Rate of Siltation Since Last Survey
RemarksLoss of Capacity (M.Cum)
Reservoir Capacity(M.Cum) Loss of Capacity (M.Cum)S. No Remarks
S. No
Period (Years)
Period (Years)
Reservoir Capacity(M.Cum)Year of Survey
Observed Rate of Siltation Since Last Survey
VIR RESERVOIR
Year of Survey
VISAPUR RESERVOIR
95
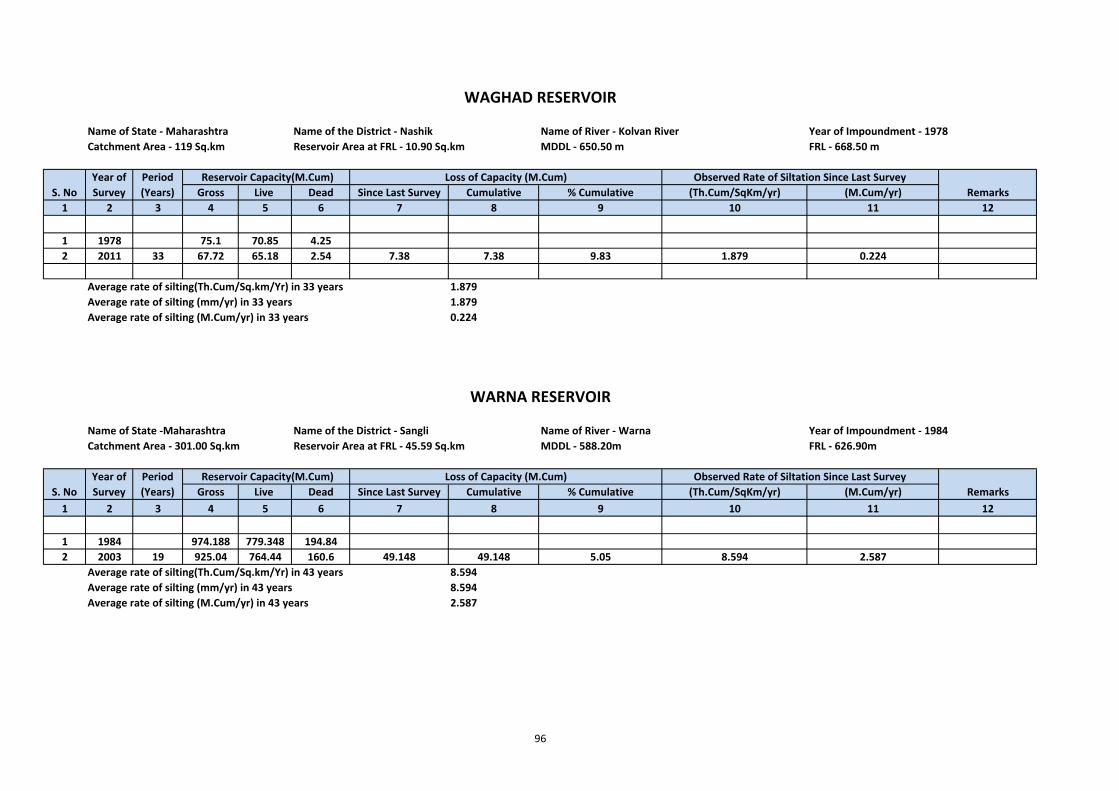
Name of State ‐ Maharashtra Name of the District ‐ Nashik Name of River ‐ Kolvan River Year of Impoundment ‐ 1978Catchment Area ‐ 119 Sq.km Reservoir Area at FRL ‐ 10.90 Sq.km MDDL ‐ 650.50 m FRL ‐ 668.50 m
Gross Live Dead Since Last Survey Cumulative % Cumulative (Th.Cum/SqKm/yr) (M.Cum/yr)1 2 3 4 5 6 7 8 9 10 11 12
1 1978 75.1 70.85 4.252 2011 33 67.72 65.18 2.54 7.38 7.38 9.83 1.879 0.224
Average rate of silting(Th.Cum/Sq.km/Yr) in 33 years 1.879Average rate of silting (mm/yr) in 33 years 1.879Average rate of silting (M.Cum/yr) in 33 years 0.224
Name of State ‐Maharashtra Name of the District ‐ Sangli Name of River ‐ Warna Year of Impoundment ‐ 1984Catchment Area ‐ 301.00 Sq.km Reservoir Area at FRL ‐ 45.59 Sq.km MDDL ‐ 588.20m FRL ‐ 626.90m
Gross Live Dead Since Last Survey Cumulative % Cumulative (Th.Cum/SqKm/yr) (M.Cum/yr)1 2 3 4 5 6 7 8 9 10 11 12
1 1984 974.188 779.348 194.842 2003 19 925.04 764.44 160.6 49.148 49.148 5.05 8.594 2.587
Average rate of silting(Th.Cum/Sq.km/Yr) in 43 years 8.594Average rate of silting (mm/yr) in 43 years 8.594Average rate of silting (M.Cum/yr) in 43 years 2.587
Period (Years)
Reservoir Capacity(M.Cum)Year of Survey
Observed Rate of Siltation Since Last SurveyRemarks
Loss of Capacity (M.Cum)
S. NoYear of Survey
S. No
Observed Rate of Siltation Since Last SurveyLoss of Capacity (M.Cum)
WAGHAD RESERVOIR
Reservoir Capacity(M.Cum)Period (Years) Remarks
WARNA RESERVOIR
96
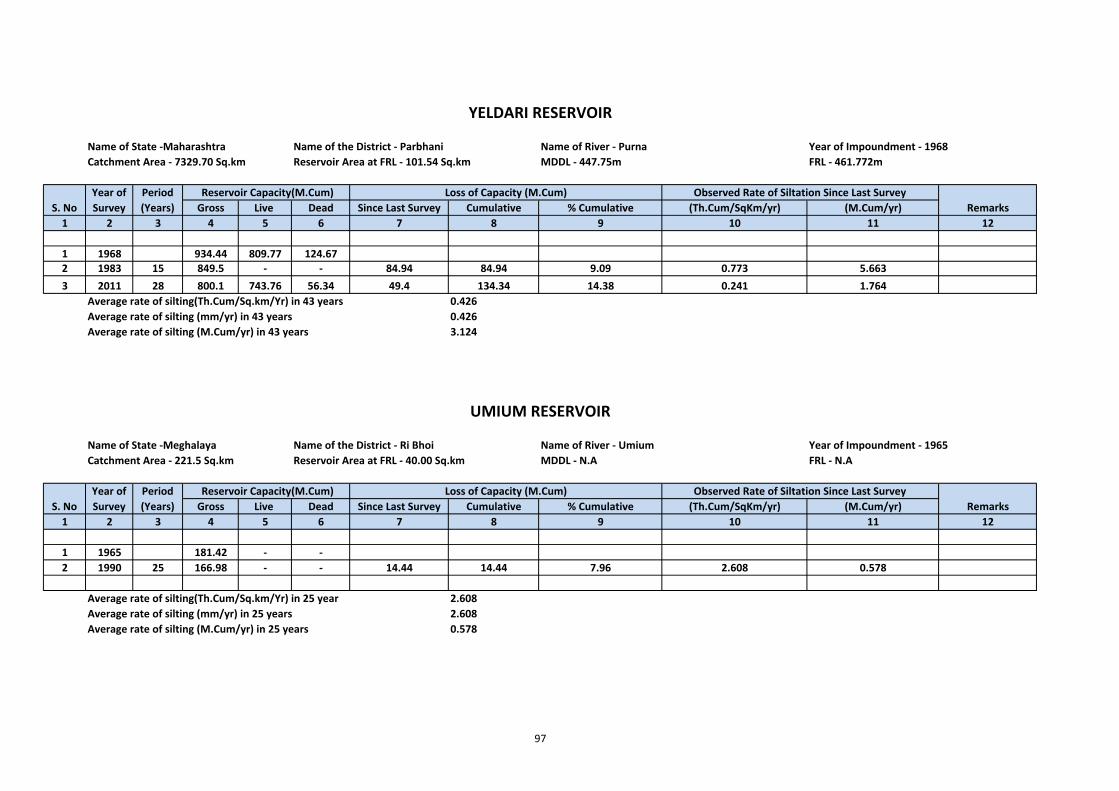
Name of State ‐Maharashtra Name of the District ‐ Parbhani Name of River ‐ Purna Year of Impoundment ‐ 1968Catchment Area ‐ 7329.70 Sq.km Reservoir Area at FRL ‐ 101.54 Sq.km MDDL ‐ 447.75m FRL ‐ 461.772m
Gross Live Dead Since Last Survey Cumulative % Cumulative (Th.Cum/SqKm/yr) (M.Cum/yr)1 2 3 4 5 6 7 8 9 10 11 12
1 1968 934.44 809.77 124.672 1983 15 849.5 ‐ ‐ 84.94 84.94 9.09 0.773 5.6633 2011 28 800.1 743.76 56.34 49.4 134.34 14.38 0.241 1.764
Average rate of silting(Th.Cum/Sq.km/Yr) in 43 years 0.426Average rate of silting (mm/yr) in 43 years 0.426Average rate of silting (M.Cum/yr) in 43 years 3.124
Name of State ‐Meghalaya Name of the District ‐ Ri Bhoi Name of River ‐ Umium Year of Impoundment ‐ 1965Catchment Area ‐ 221.5 Sq.km Reservoir Area at FRL ‐ 40.00 Sq.km MDDL ‐ N.A FRL ‐ N.A
Gross Live Dead Since Last Survey Cumulative % Cumulative (Th.Cum/SqKm/yr) (M.Cum/yr)1 2 3 4 5 6 7 8 9 10 11 12
1 1965 181.42 ‐ ‐2 1990 25 166.98 ‐ ‐ 14.44 14.44 7.96 2.608 0.578
Average rate of silting(Th.Cum/Sq.km/Yr) in 25 year 2.608Average rate of silting (mm/yr) in 25 years 2.608Average rate of silting (M.Cum/yr) in 25 years 0.578
Year of Survey
UMIUM RESERVOIR
Period (Years)
Period (Years)
Reservoir Capacity(M.Cum)
RemarksLoss of Capacity (M.Cum)
Year of Survey S. No
Reservoir Capacity(M.Cum)
Loss of Capacity (M.Cum) Observed Rate of Siltation Since Last SurveyRemarks
YELDARI RESERVOIR
S. NoObserved Rate of Siltation Since Last Survey
97
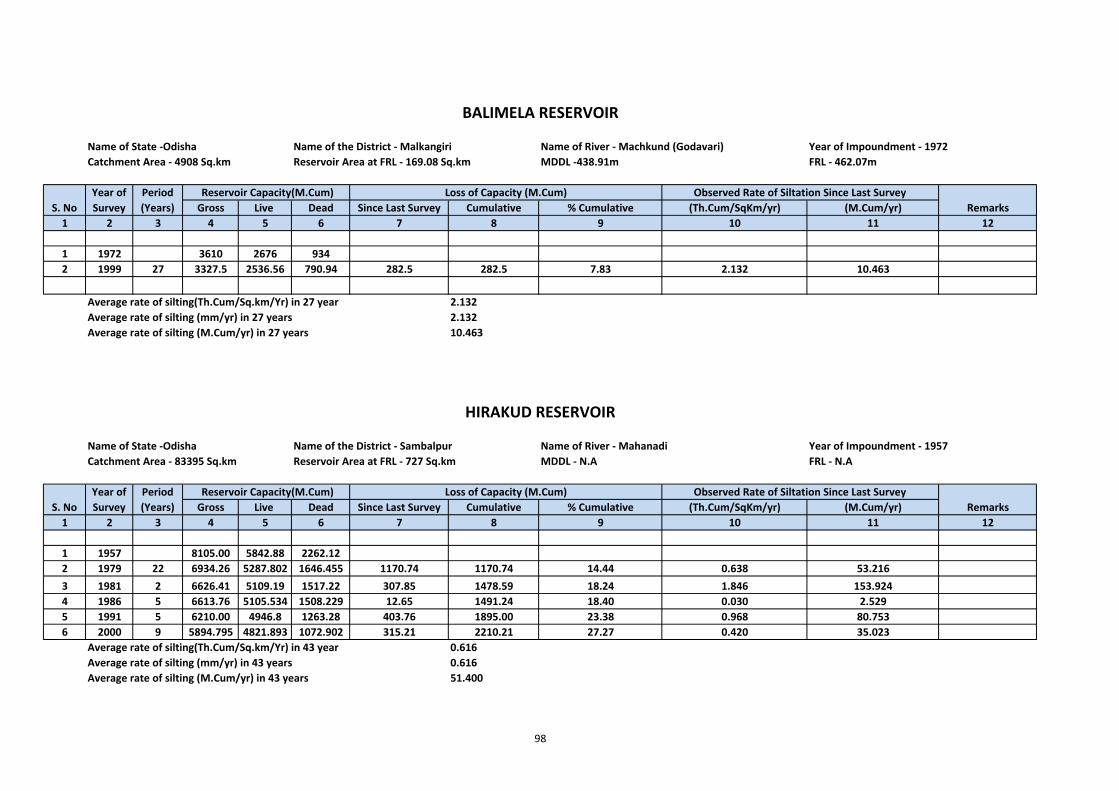
Name of State ‐Odisha Name of the District ‐ Malkangiri Name of River ‐ Machkund (Godavari) Year of Impoundment ‐ 1972Catchment Area ‐ 4908 Sq.km Reservoir Area at FRL ‐ 169.08 Sq.km MDDL ‐438.91m FRL ‐ 462.07m
Gross Live Dead Since Last Survey Cumulative % Cumulative (Th.Cum/SqKm/yr) (M.Cum/yr)1 2 3 4 5 6 7 8 9 10 11 12
1 1972 3610 2676 9342 1999 27 3327.5 2536.56 790.94 282.5 282.5 7.83 2.132 10.463
Average rate of silting(Th.Cum/Sq.km/Yr) in 27 year 2.132Average rate of silting (mm/yr) in 27 years 2.132Average rate of silting (M.Cum/yr) in 27 years 10.463
Name of State ‐Odisha Name of the District ‐ Sambalpur Name of River ‐ Mahanadi Year of Impoundment ‐ 1957Catchment Area ‐ 83395 Sq.km Reservoir Area at FRL ‐ 727 Sq.km MDDL ‐ N.A FRL ‐ N.A
Gross Live Dead Since Last Survey Cumulative % Cumulative (Th.Cum/SqKm/yr) (M.Cum/yr)1 2 3 4 5 6 7 8 9 10 11 12
1 1957 8105.00 5842.88 2262.122 1979 22 6934.26 5287.802 1646.455 1170.74 1170.74 14.44 0.638 53.2163 1981 2 6626.41 5109.19 1517.22 307.85 1478.59 18.24 1.846 153.9244 1986 5 6613.76 5105.534 1508.229 12.65 1491.24 18.40 0.030 2.5295 1991 5 6210.00 4946.8 1263.28 403.76 1895.00 23.38 0.968 80.7536 2000 9 5894.795 4821.893 1072.902 315.21 2210.21 27.27 0.420 35.023
Average rate of silting(Th.Cum/Sq.km/Yr) in 43 year 0.616Average rate of silting (mm/yr) in 43 years 0.616Average rate of silting (M.Cum/yr) in 43 years 51.400
Period (Years)
Observed Rate of Siltation Since Last SurveyRemarks
Observed Rate of Siltation Since Last Survey Reservoir Capacity(M.Cum) Loss of Capacity (M.Cum)Remarks
BALIMELA RESERVOIR
S. NoYear of Survey
Period (Years)
Reservoir Capacity(M.Cum) Loss of Capacity (M.Cum)
HIRAKUD RESERVOIR
Year of Survey S. No
98
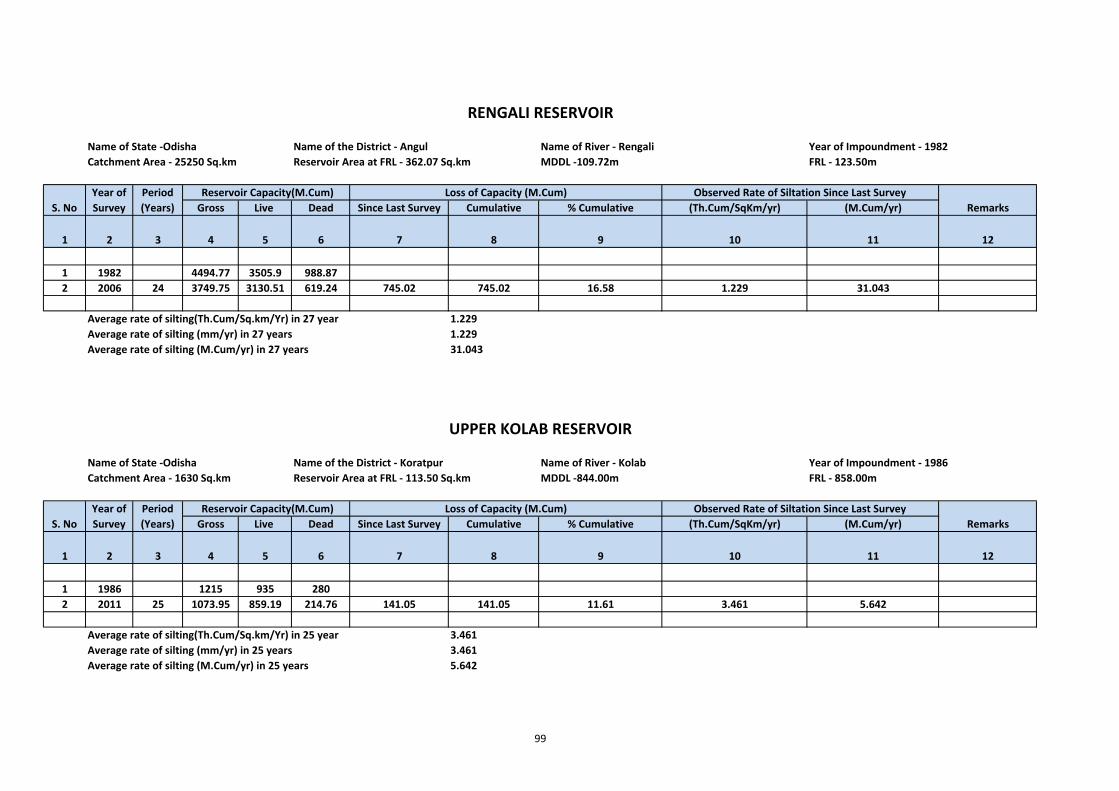
Name of State ‐Odisha Name of the District ‐ Angul Name of River ‐ Rengali Year of Impoundment ‐ 1982Catchment Area ‐ 25250 Sq.km Reservoir Area at FRL ‐ 362.07 Sq.km MDDL ‐109.72m FRL ‐ 123.50m
Gross Live Dead Since Last Survey Cumulative % Cumulative (Th.Cum/SqKm/yr) (M.Cum/yr)
1 2 3 4 5 6 7 8 9 10 11 12
1 1982 4494.77 3505.9 988.872 2006 24 3749.75 3130.51 619.24 745.02 745.02 16.58 1.229 31.043
Average rate of silting(Th.Cum/Sq.km/Yr) in 27 year 1.229Average rate of silting (mm/yr) in 27 years 1.229Average rate of silting (M.Cum/yr) in 27 years 31.043
Name of State ‐Odisha Name of the District ‐ Koratpur Name of River ‐ Kolab Year of Impoundment ‐ 1986Catchment Area ‐ 1630 Sq.km Reservoir Area at FRL ‐ 113.50 Sq.km MDDL ‐844.00m FRL ‐ 858.00m
Gross Live Dead Since Last Survey Cumulative % Cumulative (Th.Cum/SqKm/yr) (M.Cum/yr)
1 2 3 4 5 6 7 8 9 10 11 12
1 1986 1215 935 2802 2011 25 1073.95 859.19 214.76 141.05 141.05 11.61 3.461 5.642
Average rate of silting(Th.Cum/Sq.km/Yr) in 25 year 3.461Average rate of silting (mm/yr) in 25 years 3.461Average rate of silting (M.Cum/yr) in 25 years 5.642
Observed Rate of Siltation Since Last Survey
Year of Survey
Period (Years)S. No
Period (Years)
Reservoir Capacity(M.Cum)Year of Survey
Loss of Capacity (M.Cum)
Remarks Reservoir Capacity(M.Cum) Observed Rate of Siltation Since Last SurveyLoss of Capacity (M.Cum)
UPPER KOLAB RESERVOIR
RENGALI RESERVOIR
RemarksS. No
99
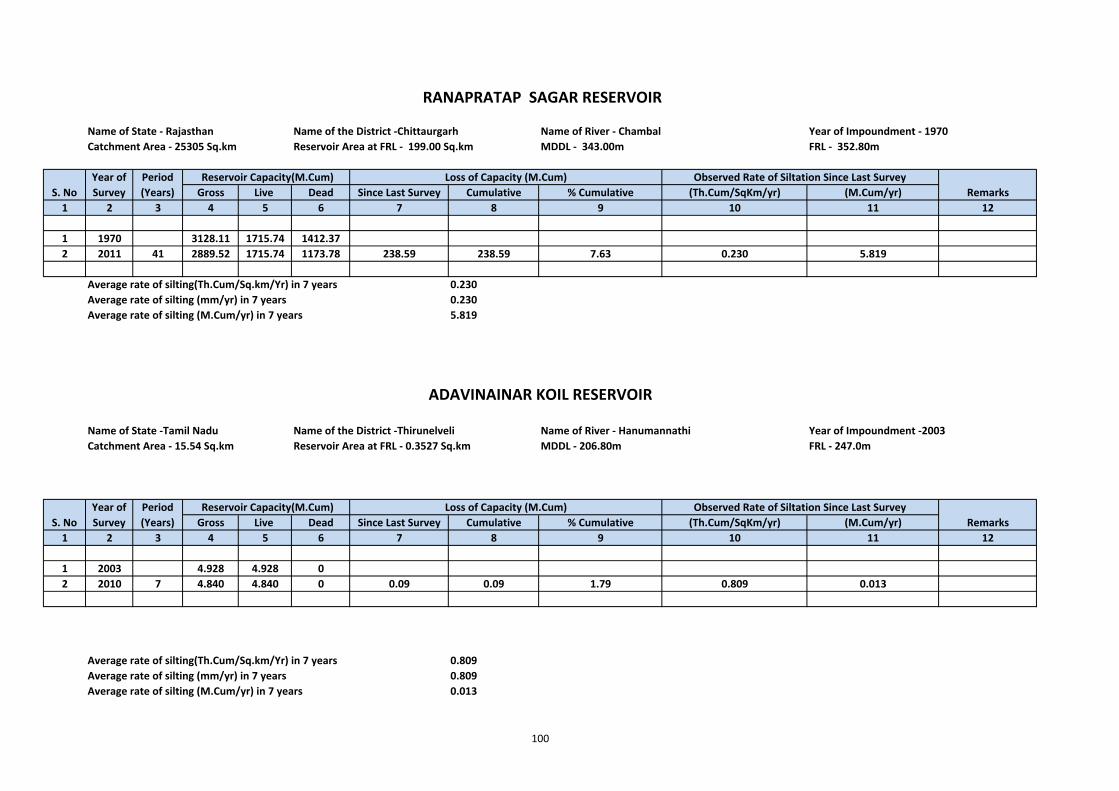
Name of State ‐ Rajasthan Name of the District ‐Chittaurgarh Name of River ‐ Chambal Year of Impoundment ‐ 1970Catchment Area ‐ 25305 Sq.km Reservoir Area at FRL ‐ 199.00 Sq.km MDDL ‐ 343.00m FRL ‐ 352.80m
Gross Live Dead Since Last Survey Cumulative % Cumulative (Th.Cum/SqKm/yr) (M.Cum/yr)1 2 3 4 5 6 7 8 9 10 11 12
1 1970 3128.11 1715.74 1412.372 2011 41 2889.52 1715.74 1173.78 238.59 238.59 7.63 0.230 5.819
Average rate of silting(Th.Cum/Sq.km/Yr) in 7 years 0.230Average rate of silting (mm/yr) in 7 years 0.230Average rate of silting (M.Cum/yr) in 7 years 5.819
Name of State ‐Tamil Nadu Name of the District ‐Thirunelveli Name of River ‐ Hanumannathi Year of Impoundment ‐2003Catchment Area ‐ 15.54 Sq.km Reservoir Area at FRL ‐ 0.3527 Sq.km MDDL ‐ 206.80m FRL ‐ 247.0m
Gross Live Dead Since Last Survey Cumulative % Cumulative (Th.Cum/SqKm/yr) (M.Cum/yr)1 2 3 4 5 6 7 8 9 10 11 12
1 2003 4.928 4.928 02 2010 7 4.840 4.840 0 0.09 0.09 1.79 0.809 0.013
Average rate of silting(Th.Cum/Sq.km/Yr) in 7 years 0.809Average rate of silting (mm/yr) in 7 years 0.809Average rate of silting (M.Cum/yr) in 7 years 0.013
S. NoObserved Rate of Siltation Since Last SurveyPeriod
(Years)Year of Survey Remarks
Loss of Capacity (M.Cum) Reservoir Capacity(M.Cum)
ADAVINAINAR KOIL RESERVOIR
RemarksS. NoYear of Survey
Period (Years)
Reservoir Capacity(M.Cum) Loss of Capacity (M.Cum) Observed Rate of Siltation Since Last Survey
RANAPRATAP SAGAR RESERVOIR
100
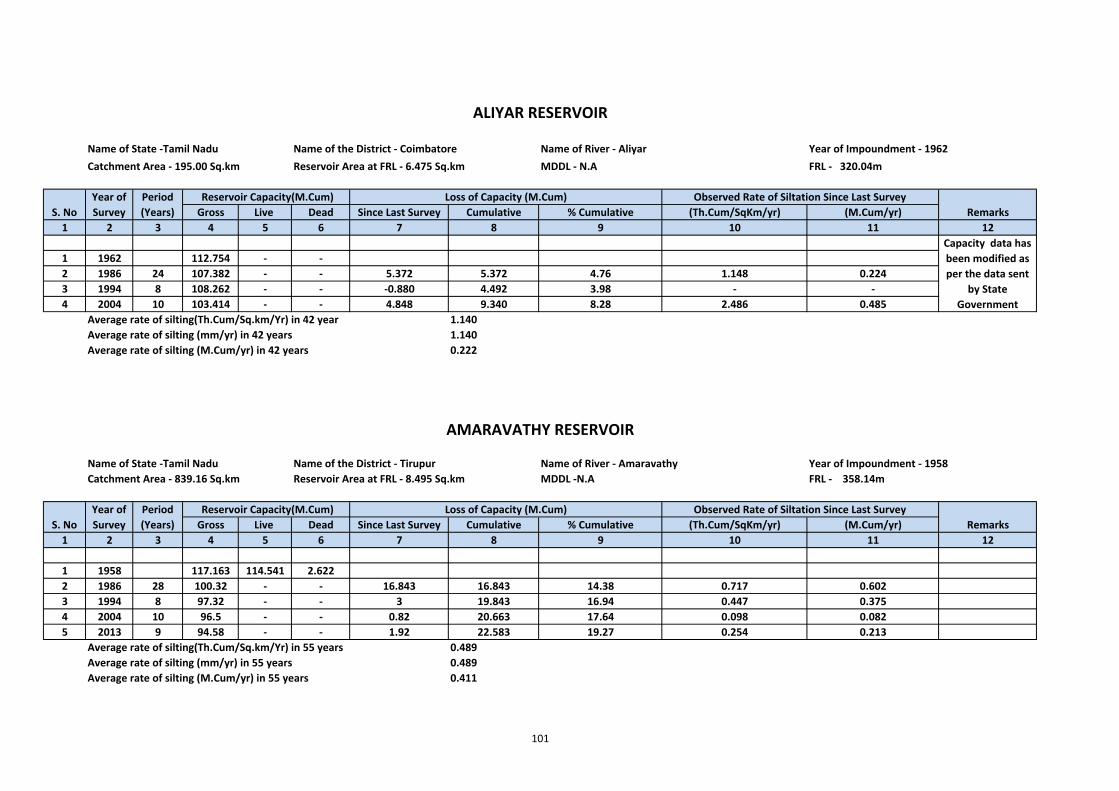
Name of State ‐Tamil Nadu Name of the District ‐ Coimbatore Name of River ‐ Aliyar Year of Impoundment ‐ 1962Catchment Area ‐ 195.00 Sq.km Reservoir Area at FRL ‐ 6.475 Sq.km MDDL ‐ N.A FRL ‐ 320.04m
Gross Live Dead Since Last Survey Cumulative % Cumulative (Th.Cum/SqKm/yr) (M.Cum/yr)1 2 3 4 5 6 7 8 9 10 11 12
1 1962 112.754 ‐ ‐2 1986 24 107.382 ‐ ‐ 5.372 5.372 4.76 1.148 0.2243 1994 8 108.262 ‐ ‐ ‐0.880 4.492 3.98 ‐ ‐4 2004 10 103.414 ‐ ‐ 4.848 9.340 8.28 2.486 0.485
Average rate of silting(Th.Cum/Sq.km/Yr) in 42 year 1.140Average rate of silting (mm/yr) in 42 years 1.140Average rate of silting (M.Cum/yr) in 42 years 0.222
Name of State ‐Tamil Nadu Name of the District ‐ Tirupur Name of River ‐ Amaravathy Year of Impoundment ‐ 1958Catchment Area ‐ 839.16 Sq.km Reservoir Area at FRL ‐ 8.495 Sq.km MDDL ‐N.A FRL ‐ 358.14m
Gross Live Dead Since Last Survey Cumulative % Cumulative (Th.Cum/SqKm/yr) (M.Cum/yr)1 2 3 4 5 6 7 8 9 10 11 12
1 1958 117.163 114.541 2.6222 1986 28 100.32 ‐ ‐ 16.843 16.843 14.38 0.717 0.6023 1994 8 97.32 ‐ ‐ 3 19.843 16.94 0.447 0.3754 2004 10 96.5 ‐ ‐ 0.82 20.663 17.64 0.098 0.0825 2013 9 94.58 ‐ ‐ 1.92 22.583 19.27 0.254 0.213
Average rate of silting(Th.Cum/Sq.km/Yr) in 55 years 0.489Average rate of silting (mm/yr) in 55 years 0.489Average rate of silting (M.Cum/yr) in 55 years 0.411
Loss of Capacity (M.Cum)
Capacity data has been modified as per the data sent
by State Government
Remarks
Reservoir Capacity(M.Cum)
Observed Rate of Siltation Since Last Survey
Remarks
ALIYAR RESERVOIR
Period (Years)
Loss of Capacity (M.Cum)
Period (Years)
Observed Rate of Siltation Since Last Survey
Year of Survey
S. NoYear of Survey
S. No
AMARAVATHY RESERVOIR
Reservoir Capacity(M.Cum)
101
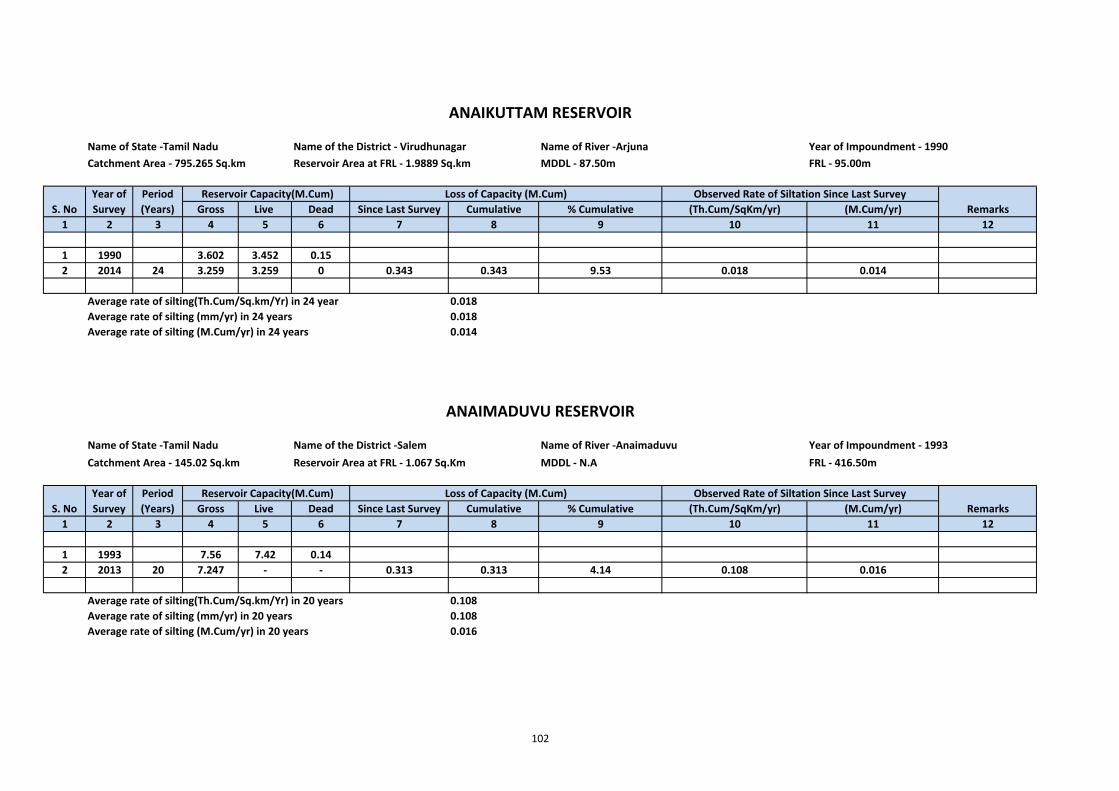
Name of State ‐Tamil Nadu Name of the District ‐ Virudhunagar Name of River ‐Arjuna Year of Impoundment ‐ 1990Catchment Area ‐ 795.265 Sq.km Reservoir Area at FRL ‐ 1.9889 Sq.km MDDL ‐ 87.50m FRL ‐ 95.00m
Gross Live Dead Since Last Survey Cumulative % Cumulative (Th.Cum/SqKm/yr) (M.Cum/yr)1 2 3 4 5 6 7 8 9 10 11 12
1 1990 3.602 3.452 0.152 2014 24 3.259 3.259 0 0.343 0.343 9.53 0.018 0.014
Average rate of silting(Th.Cum/Sq.km/Yr) in 24 year 0.018Average rate of silting (mm/yr) in 24 years 0.018Average rate of silting (M.Cum/yr) in 24 years 0.014
Name of State ‐Tamil Nadu Name of the District ‐Salem Name of River ‐Anaimaduvu Year of Impoundment ‐ 1993Catchment Area ‐ 145.02 Sq.km Reservoir Area at FRL ‐ 1.067 Sq.Km MDDL ‐ N.A FRL ‐ 416.50m
Gross Live Dead Since Last Survey Cumulative % Cumulative (Th.Cum/SqKm/yr) (M.Cum/yr)1 2 3 4 5 6 7 8 9 10 11 12
1 1993 7.56 7.42 0.142 2013 20 7.247 ‐ ‐ 0.313 0.313 4.14 0.108 0.016
Average rate of silting(Th.Cum/Sq.km/Yr) in 20 years 0.108Average rate of silting (mm/yr) in 20 years 0.108Average rate of silting (M.Cum/yr) in 20 years 0.016
Remarks
ANAIKUTTAM RESERVOIR
Loss of Capacity (M.Cum) Observed Rate of Siltation Since Last SurveyRemarks
Observed Rate of Siltation Since Last Survey Reservoir Capacity(M.Cum)
Reservoir Capacity(M.Cum)
Loss of Capacity (M.Cum)S. No
Year of Survey
Period (Years)
S. NoYear of Survey
Period (Years)
ANAIMADUVU RESERVOIR
102
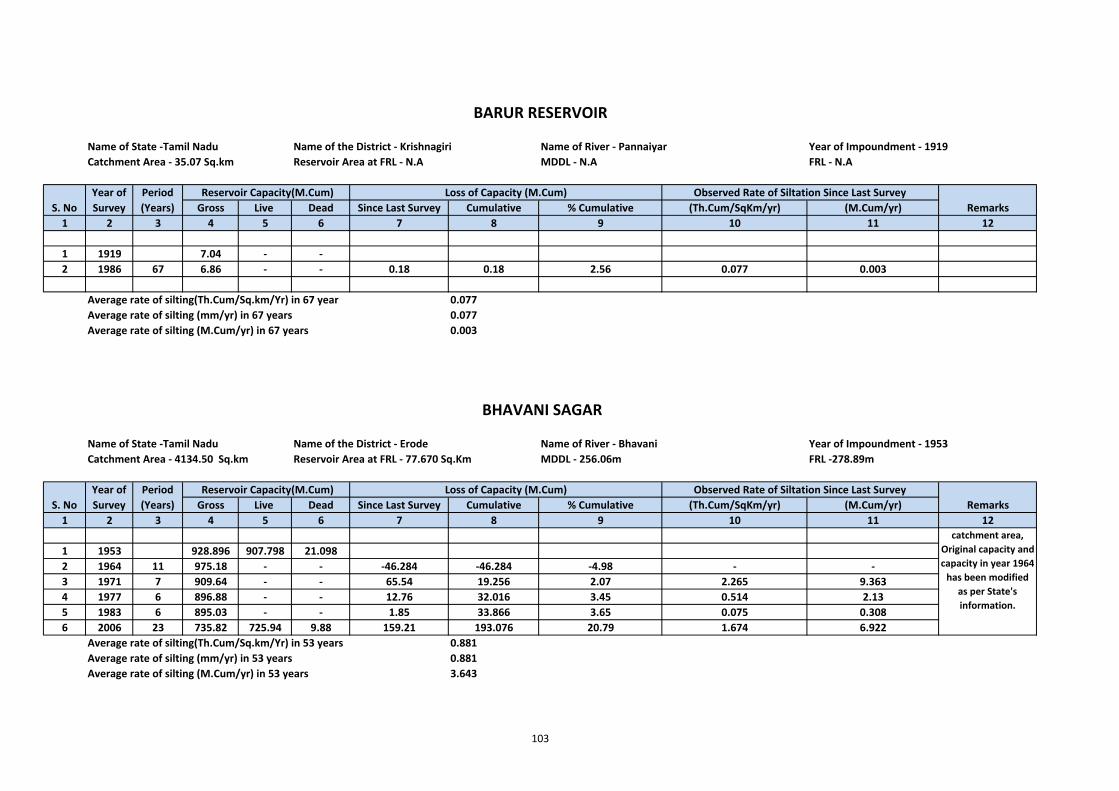
Name of State ‐Tamil Nadu Name of the District ‐ Krishnagiri Name of River ‐ Pannaiyar Year of Impoundment ‐ 1919Catchment Area ‐ 35.07 Sq.km Reservoir Area at FRL ‐ N.A MDDL ‐ N.A FRL ‐ N.A
Gross Live Dead Since Last Survey Cumulative % Cumulative (Th.Cum/SqKm/yr) (M.Cum/yr)1 2 3 4 5 6 7 8 9 10 11 12
1 1919 7.04 ‐ ‐2 1986 67 6.86 ‐ ‐ 0.18 0.18 2.56 0.077 0.003
Average rate of silting(Th.Cum/Sq.km/Yr) in 67 year 0.077Average rate of silting (mm/yr) in 67 years 0.077Average rate of silting (M.Cum/yr) in 67 years 0.003
Name of State ‐Tamil Nadu Name of the District ‐ Erode Name of River ‐ Bhavani Year of Impoundment ‐ 1953Catchment Area ‐ 4134.50 Sq.km Reservoir Area at FRL ‐ 77.670 Sq.Km MDDL ‐ 256.06m FRL ‐278.89m
Gross Live Dead Since Last Survey Cumulative % Cumulative (Th.Cum/SqKm/yr) (M.Cum/yr)1 2 3 4 5 6 7 8 9 10 11 12
1 1953 928.896 907.798 21.0982 1964 11 975.18 ‐ ‐ ‐46.284 ‐46.284 ‐4.98 ‐ ‐3 1971 7 909.64 ‐ ‐ 65.54 19.256 2.07 2.265 9.3634 1977 6 896.88 ‐ ‐ 12.76 32.016 3.45 0.514 2.135 1983 6 895.03 ‐ ‐ 1.85 33.866 3.65 0.075 0.3086 2006 23 735.82 725.94 9.88 159.21 193.076 20.79 1.674 6.922
Average rate of silting(Th.Cum/Sq.km/Yr) in 53 years 0.881Average rate of silting (mm/yr) in 53 years 0.881Average rate of silting (M.Cum/yr) in 53 years 3.643
catchment area, Original capacity and capacity in year 1964 has been modified
as per State's information.
Loss of Capacity (M.Cum)
BARUR RESERVOIR
Reservoir Capacity(M.Cum) Loss of Capacity (M.Cum)
S. NoYear of Survey
Observed Rate of Siltation Since Last SurveyRemarks
Observed Rate of Siltation Since Last SurveyRemarks
Year of Survey
Period (Years)
BHAVANI SAGAR
Period (Years)
Reservoir Capacity(M.Cum)
S. No
103
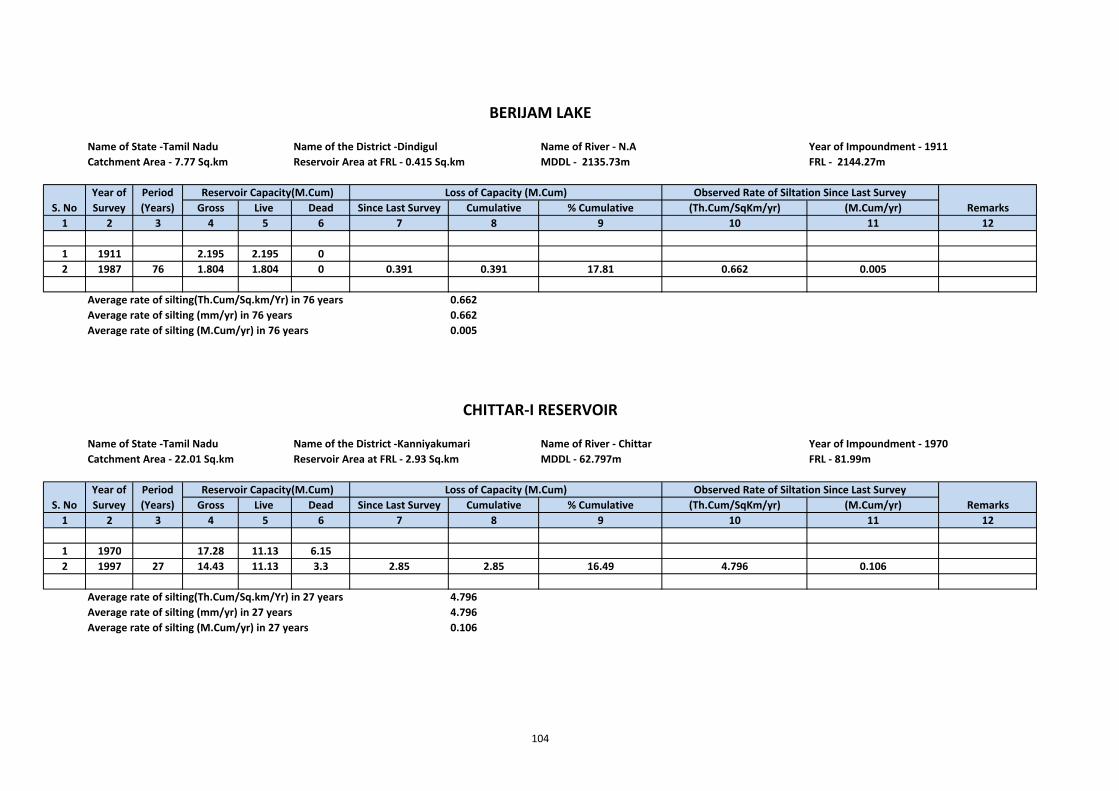
Name of State ‐Tamil Nadu Name of the District ‐Dindigul Name of River ‐ N.A Year of Impoundment ‐ 1911Catchment Area ‐ 7.77 Sq.km Reservoir Area at FRL ‐ 0.415 Sq.km MDDL ‐ 2135.73m FRL ‐ 2144.27m
Gross Live Dead Since Last Survey Cumulative % Cumulative (Th.Cum/SqKm/yr) (M.Cum/yr)1 2 3 4 5 6 7 8 9 10 11 12
1 1911 2.195 2.195 02 1987 76 1.804 1.804 0 0.391 0.391 17.81 0.662 0.005
Average rate of silting(Th.Cum/Sq.km/Yr) in 76 years 0.662Average rate of silting (mm/yr) in 76 years 0.662Average rate of silting (M.Cum/yr) in 76 years 0.005
Name of State ‐Tamil Nadu Name of the District ‐Kanniyakumari Name of River ‐ Chittar Year of Impoundment ‐ 1970Catchment Area ‐ 22.01 Sq.km Reservoir Area at FRL ‐ 2.93 Sq.km MDDL ‐ 62.797m FRL ‐ 81.99m
Gross Live Dead Since Last Survey Cumulative % Cumulative (Th.Cum/SqKm/yr) (M.Cum/yr)1 2 3 4 5 6 7 8 9 10 11 12
1 1970 17.28 11.13 6.152 1997 27 14.43 11.13 3.3 2.85 2.85 16.49 4.796 0.106
Average rate of silting(Th.Cum/Sq.km/Yr) in 27 years 4.796Average rate of silting (mm/yr) in 27 years 4.796Average rate of silting (M.Cum/yr) in 27 years 0.106
Loss of Capacity (M.Cum)
Loss of Capacity (M.Cum) Observed Rate of Siltation Since Last SurveyPeriod (Years)
Reservoir Capacity(M.Cum)S. No Remarks
S. No
Year of Survey
BERIJAM LAKE
Remarks
CHITTAR‐I RESERVOIR
Year of Survey
Reservoir Capacity(M.Cum) Observed Rate of Siltation Since Last SurveyPeriod (Years)
104
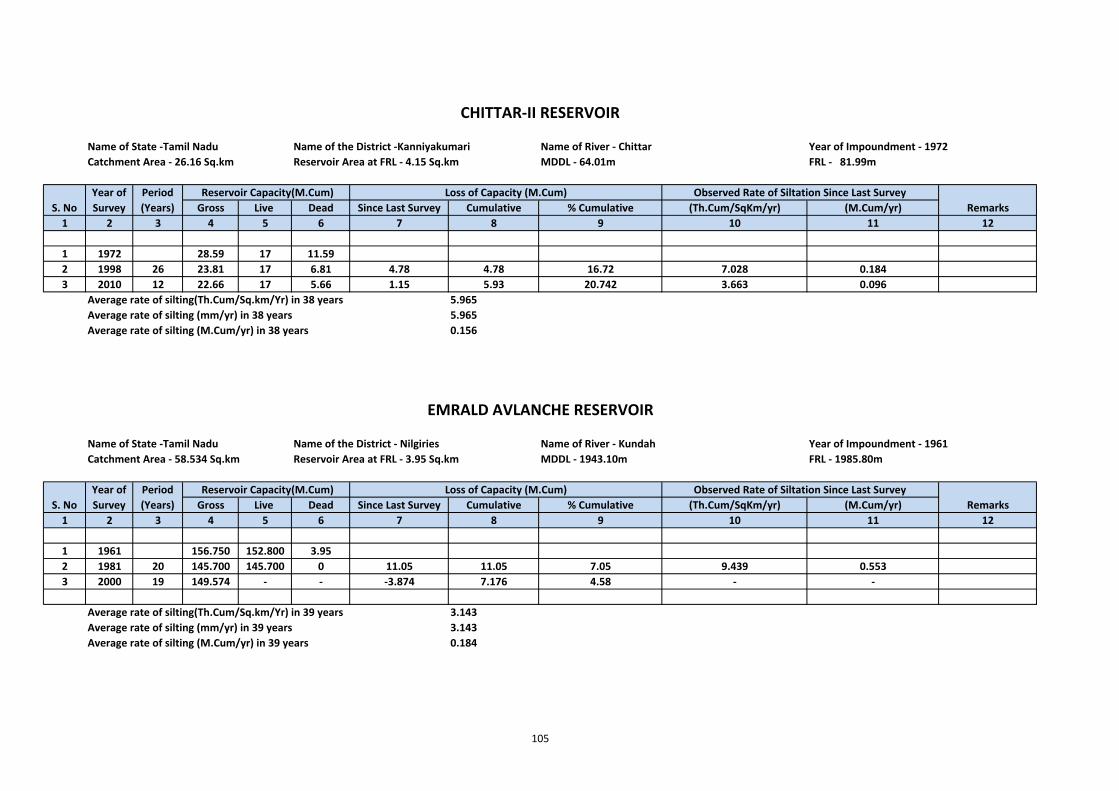
Name of State ‐Tamil Nadu Name of the District ‐Kanniyakumari Name of River ‐ Chittar Year of Impoundment ‐ 1972Catchment Area ‐ 26.16 Sq.km Reservoir Area at FRL ‐ 4.15 Sq.km MDDL ‐ 64.01m FRL ‐ 81.99m
Gross Live Dead Since Last Survey Cumulative % Cumulative (Th.Cum/SqKm/yr) (M.Cum/yr)1 2 3 4 5 6 7 8 9 10 11 12
1 1972 28.59 17 11.592 1998 26 23.81 17 6.81 4.78 4.78 16.72 7.028 0.1843 2010 12 22.66 17 5.66 1.15 5.93 20.742 3.663 0.096
Average rate of silting(Th.Cum/Sq.km/Yr) in 38 years 5.965Average rate of silting (mm/yr) in 38 years 5.965Average rate of silting (M.Cum/yr) in 38 years 0.156
Name of State ‐Tamil Nadu Name of the District ‐ Nilgiries Name of River ‐ Kundah Year of Impoundment ‐ 1961Catchment Area ‐ 58.534 Sq.km Reservoir Area at FRL ‐ 3.95 Sq.km MDDL ‐ 1943.10m FRL ‐ 1985.80m
Gross Live Dead Since Last Survey Cumulative % Cumulative (Th.Cum/SqKm/yr) (M.Cum/yr)1 2 3 4 5 6 7 8 9 10 11 12
1 1961 156.750 152.800 3.952 1981 20 145.700 145.700 0 11.05 11.05 7.05 9.439 0.5533 2000 19 149.574 ‐ ‐ ‐3.874 7.176 4.58 ‐ ‐
Average rate of silting(Th.Cum/Sq.km/Yr) in 39 years 3.143Average rate of silting (mm/yr) in 39 years 3.143Average rate of silting (M.Cum/yr) in 39 years 0.184
EMRALD AVLANCHE RESERVOIR
Reservoir Capacity(M.Cum) Loss of Capacity (M.Cum)
Period (Years)
S. NoYear of Survey
CHITTAR‐II RESERVOIR
Period (Years)
Remarks
Remarks
Reservoir Capacity(M.Cum) Loss of Capacity (M.Cum) Observed Rate of Siltation Since Last SurveyYear of Survey
Observed Rate of Siltation Since Last Survey
S. No
105
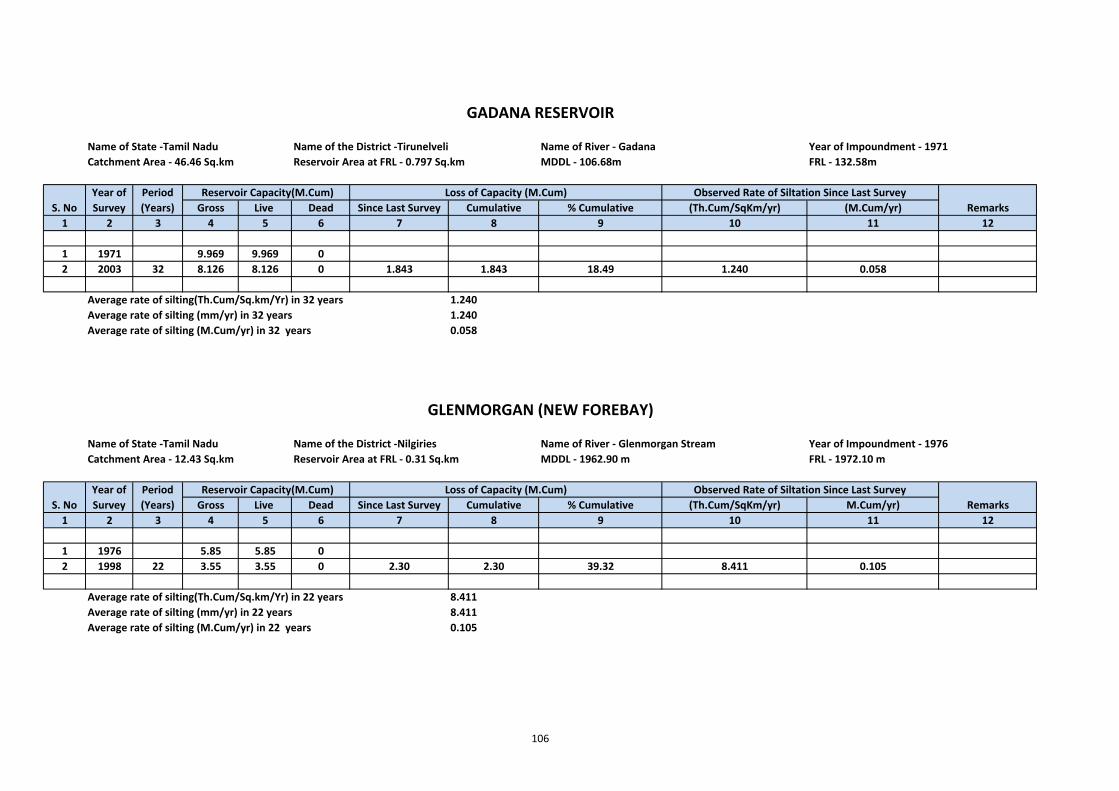
Name of State ‐Tamil Nadu Name of the District ‐Tirunelveli Name of River ‐ Gadana Year of Impoundment ‐ 1971Catchment Area ‐ 46.46 Sq.km Reservoir Area at FRL ‐ 0.797 Sq.km MDDL ‐ 106.68m FRL ‐ 132.58m
Gross Live Dead Since Last Survey Cumulative % Cumulative (Th.Cum/SqKm/yr) (M.Cum/yr)1 2 3 4 5 6 7 8 9 10 11 12
1 1971 9.969 9.969 02 2003 32 8.126 8.126 0 1.843 1.843 18.49 1.240 0.058
Average rate of silting(Th.Cum/Sq.km/Yr) in 32 years 1.240Average rate of silting (mm/yr) in 32 years 1.240Average rate of silting (M.Cum/yr) in 32 years 0.058
Name of State ‐Tamil Nadu Name of the District ‐Nilgiries Name of River ‐ Glenmorgan Stream Year of Impoundment ‐ 1976Catchment Area ‐ 12.43 Sq.km Reservoir Area at FRL ‐ 0.31 Sq.km MDDL ‐ 1962.90 m FRL ‐ 1972.10 m
Gross Live Dead Since Last Survey Cumulative % Cumulative (Th.Cum/SqKm/yr) M.Cum/yr)1 2 3 4 5 6 7 8 9 10 11 12
1 1976 5.85 5.85 02 1998 22 3.55 3.55 0 2.30 2.30 39.32 8.411 0.105
Average rate of silting(Th.Cum/Sq.km/Yr) in 22 years 8.411Average rate of silting (mm/yr) in 22 years 8.411Average rate of silting (M.Cum/yr) in 22 years 0.105
Remarks Reservoir Capacity(M.Cum) Loss of Capacity (M.Cum) Observed Rate of Siltation Since Last Survey
Year of Survey
Period (Years)
Period (Years)
S. NoYear of Survey
GADANA RESERVOIR
GLENMORGAN (NEW FOREBAY)
S. NoObserved Rate of Siltation Since Last Survey
RemarksLoss of Capacity (M.Cum) Reservoir Capacity(M.Cum)
106

Name of State ‐Tamil Nadu Name of the District ‐Nilgiries Name of River ‐ Glenmorgan Stream Year of Impoundment ‐ 1930Catchment Area ‐ 2.59 Sq.km Reservoir Area at FRL ‐ N.A MDDL ‐N.A FRL ‐ 2018.69 m
Gross Live Dead Since Last Survey Cumulative % Cumulative (Th.Cum/SqKm/yr) M.Cum/yr)1 2 3 4 5 6 7 8 9 10 11 12
1 1930 0.74 0.74 02 2013 83 0.70 0.70 0 0.04 0.04 5.41 0.186 0.0005
Average rate of silting(Th.Cum/Sq.km/Yr) in 83 years 0.186Average rate of silting (mm/yr) in 83 years 0.186Average rate of silting (M.Cum/yr) in 83 years 0.0005
Name of State ‐Tamil Nadu Name of the District ‐Villupuram Name of River‐ Gomuki(Vellar) Year of Impoundment ‐ 1965Catchment Area ‐292.67 Sq.km Reservoir Area at FRL ‐ 3.60 Sq.Km MDDL ‐ N.A FRL ‐ 183.18m
Gross Live Dead Since Last Survey Cumulative % Cumulative (Th.Cum/SqKm/yr) (M.Cum/yr)1 2 3 4 5 6 7 8 9 10 11 12
1 1965 15.86 15.86 02 2002 37 12.947 ‐ ‐ 2.913 2.913 18.37 0.269 0.079
Average rate of silting(Th.Cum/Sq.km/Yr) in 37 years 0.269Average rate of silting (mm/yr) in 37 years 0.269Average rate of silting (M.Cum/yr) in 37 years 0.079
GOMUKHINATHI
S. No
Loss of Capacity (M.Cum)
Period (Years)
Reservoir Capacity(M.Cum)
GLENMORGAN (KARIAPPA)
Observed Rate of Siltation Since Last SurveyRemarks
Loss of Capacity (M.Cum) Observed Rate of Siltation Since Last Survey
Year of Survey
Remarks
Reservoir Capacity(M.Cum)Period (Years)
Year of Survey
S. No
107
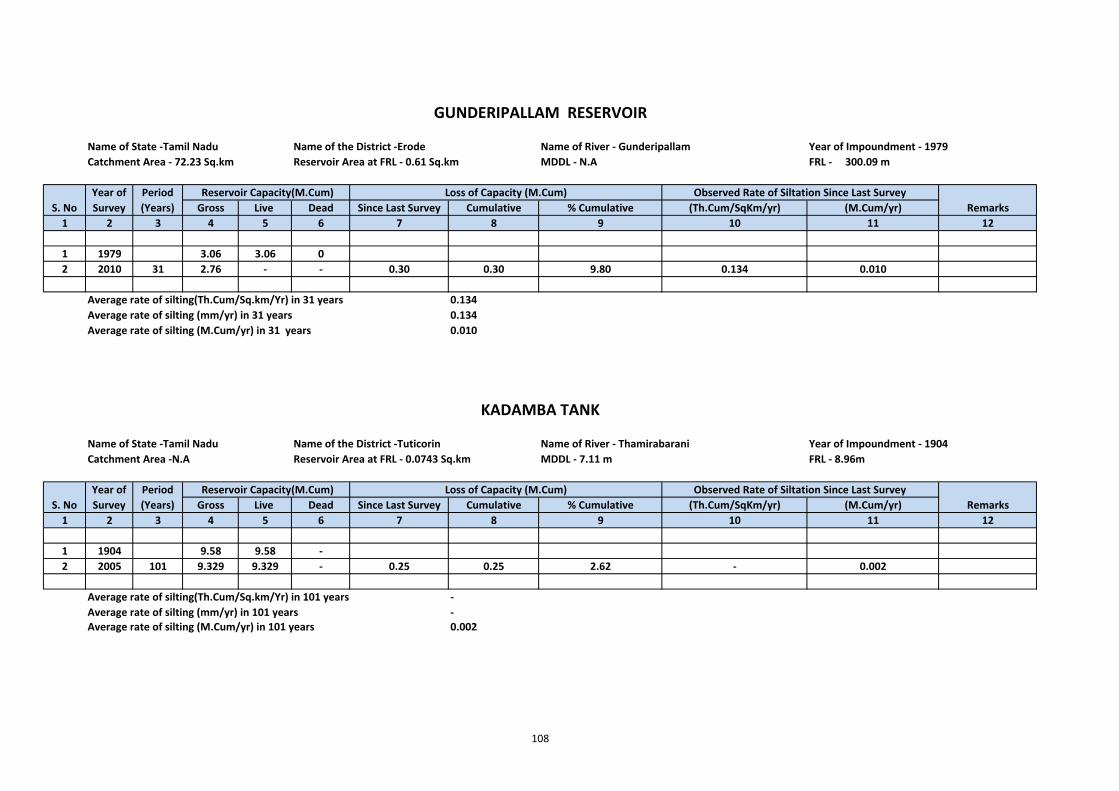
Name of State ‐Tamil Nadu Name of the District ‐Erode Name of River ‐ Gunderipallam Year of Impoundment ‐ 1979Catchment Area ‐ 72.23 Sq.km Reservoir Area at FRL ‐ 0.61 Sq.km MDDL ‐ N.A FRL ‐ 300.09 m
Gross Live Dead Since Last Survey Cumulative % Cumulative (Th.Cum/SqKm/yr) (M.Cum/yr)1 2 3 4 5 6 7 8 9 10 11 12
1 1979 3.06 3.06 02 2010 31 2.76 ‐ ‐ 0.30 0.30 9.80 0.134 0.010
Average rate of silting(Th.Cum/Sq.km/Yr) in 31 years 0.134Average rate of silting (mm/yr) in 31 years 0.134Average rate of silting (M.Cum/yr) in 31 years 0.010
Name of State ‐Tamil Nadu Name of the District ‐Tuticorin Name of River ‐ Thamirabarani Year of Impoundment ‐ 1904Catchment Area ‐N.A Reservoir Area at FRL ‐ 0.0743 Sq.km MDDL ‐ 7.11 m FRL ‐ 8.96m
Gross Live Dead Since Last Survey Cumulative % Cumulative (Th.Cum/SqKm/yr) (M.Cum/yr)1 2 3 4 5 6 7 8 9 10 11 12
1 1904 9.58 9.58 ‐2 2005 101 9.329 9.329 ‐ 0.25 0.25 2.62 ‐ 0.002
Average rate of silting(Th.Cum/Sq.km/Yr) in 101 years ‐Average rate of silting (mm/yr) in 101 years ‐Average rate of silting (M.Cum/yr) in 101 years 0.002
S. NoObserved Rate of Siltation Since Last SurveyYear of
Survey
Remarks
Period (Years)
Reservoir Capacity(M.Cum) Loss of Capacity (M.Cum)Remarks
Reservoir Capacity(M.Cum) Loss of Capacity (M.Cum)
KADAMBA TANK
Observed Rate of Siltation Since Last SurveyS. No
Year of Survey
Period (Years)
GUNDERIPALLAM RESERVOIR
108
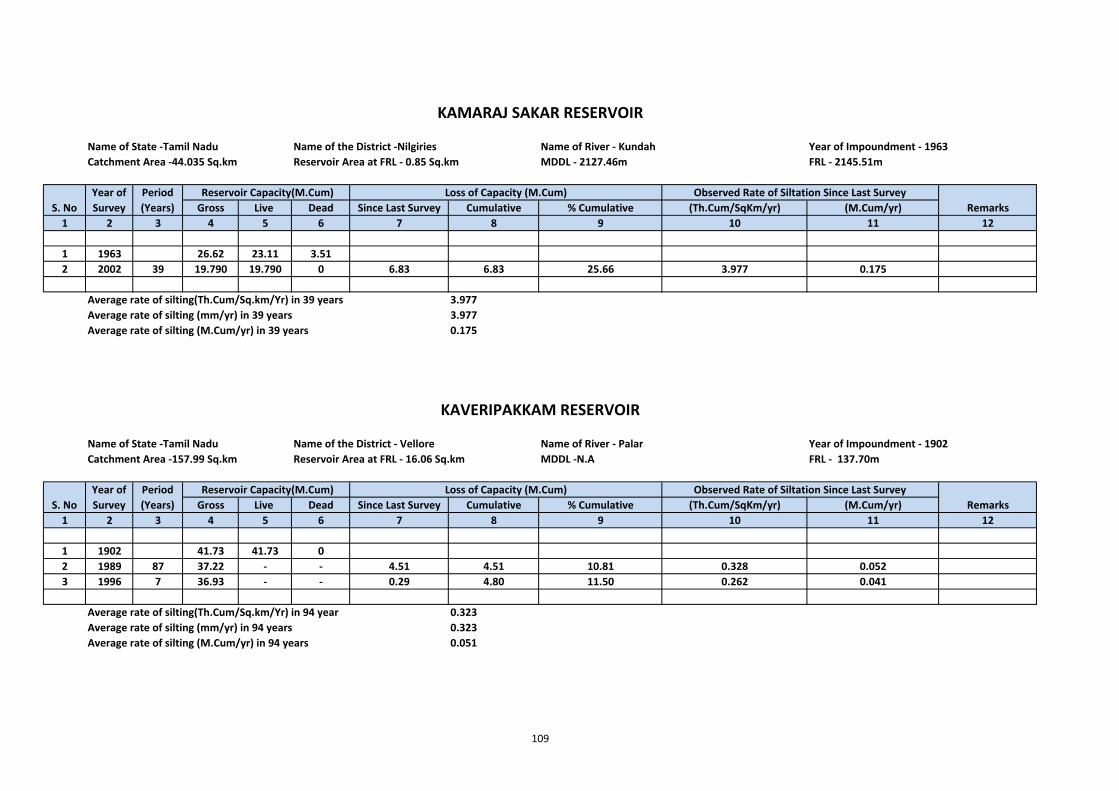
Name of State ‐Tamil Nadu Name of the District ‐Nilgiries Name of River ‐ Kundah Year of Impoundment ‐ 1963Catchment Area ‐44.035 Sq.km Reservoir Area at FRL ‐ 0.85 Sq.km MDDL ‐ 2127.46m FRL ‐ 2145.51m
Gross Live Dead Since Last Survey Cumulative % Cumulative (Th.Cum/SqKm/yr) (M.Cum/yr)1 2 3 4 5 6 7 8 9 10 11 12
1 1963 26.62 23.11 3.512 2002 39 19.790 19.790 0 6.83 6.83 25.66 3.977 0.175
Average rate of silting(Th.Cum/Sq.km/Yr) in 39 years 3.977Average rate of silting (mm/yr) in 39 years 3.977Average rate of silting (M.Cum/yr) in 39 years 0.175
Name of State ‐Tamil Nadu Name of the District ‐ Vellore Name of River ‐ Palar Year of Impoundment ‐ 1902Catchment Area ‐157.99 Sq.km Reservoir Area at FRL ‐ 16.06 Sq.km MDDL ‐N.A FRL ‐ 137.70m
Gross Live Dead Since Last Survey Cumulative % Cumulative (Th.Cum/SqKm/yr) (M.Cum/yr)1 2 3 4 5 6 7 8 9 10 11 12
1 1902 41.73 41.73 02 1989 87 37.22 ‐ ‐ 4.51 4.51 10.81 0.328 0.0523 1996 7 36.93 ‐ ‐ 0.29 4.80 11.50 0.262 0.041
Average rate of silting(Th.Cum/Sq.km/Yr) in 94 year 0.323Average rate of silting (mm/yr) in 94 years 0.323Average rate of silting (M.Cum/yr) in 94 years 0.051
S. NoYear of Survey
Period (Years)
Observed Rate of Siltation Since Last Survey
Year of Survey
Reservoir Capacity(M.Cum) Observed Rate of Siltation Since Last SurveyLoss of Capacity (M.Cum)
Remarks
KAMARAJ SAKAR RESERVOIR
Reservoir Capacity(M.Cum) Loss of Capacity (M.Cum)
KAVERIPAKKAM RESERVOIR
S. No RemarksPeriod (Years)
109
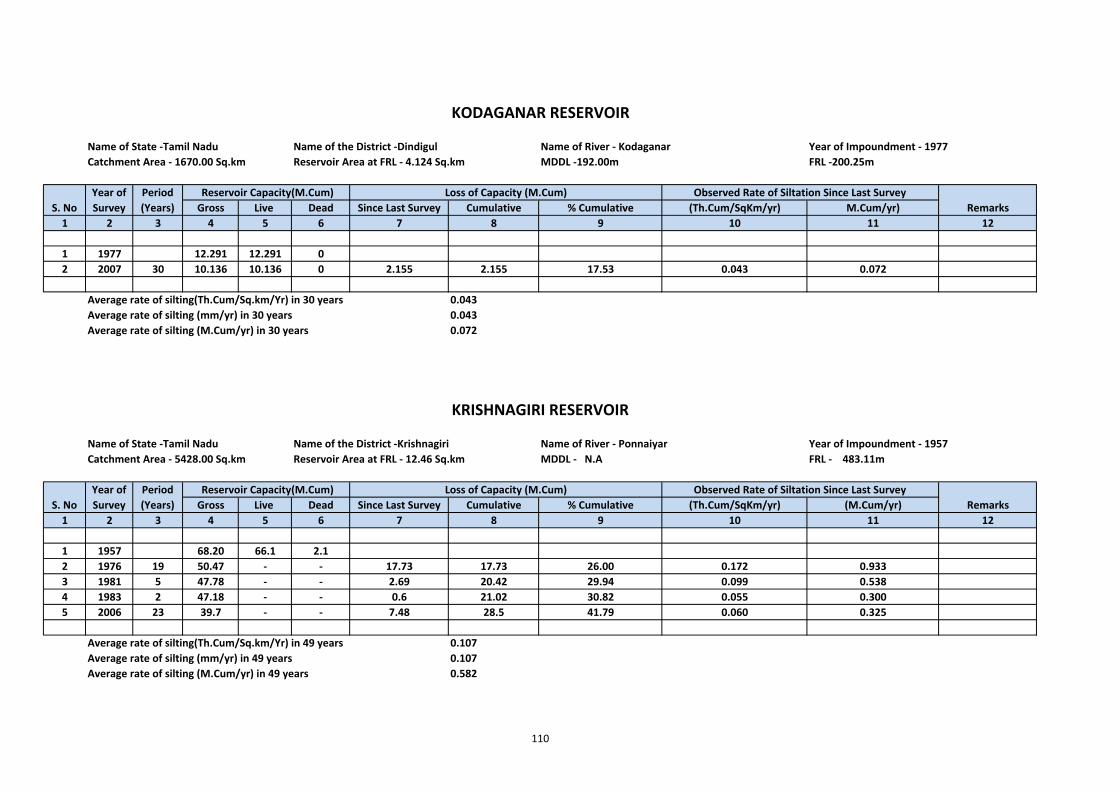
Name of State ‐Tamil Nadu Name of the District ‐Dindigul Name of River ‐ Kodaganar Year of Impoundment ‐ 1977Catchment Area ‐ 1670.00 Sq.km Reservoir Area at FRL ‐ 4.124 Sq.km MDDL ‐192.00m FRL ‐200.25m
Gross Live Dead Since Last Survey Cumulative % Cumulative (Th.Cum/SqKm/yr) M.Cum/yr)1 2 3 4 5 6 7 8 9 10 11 12
1 1977 12.291 12.291 02 2007 30 10.136 10.136 0 2.155 2.155 17.53 0.043 0.072
Average rate of silting(Th.Cum/Sq.km/Yr) in 30 years 0.043Average rate of silting (mm/yr) in 30 years 0.043Average rate of silting (M.Cum/yr) in 30 years 0.072
Name of State ‐Tamil Nadu Name of the District ‐Krishnagiri Name of River ‐ Ponnaiyar Year of Impoundment ‐ 1957Catchment Area ‐ 5428.00 Sq.km Reservoir Area at FRL ‐ 12.46 Sq.km MDDL ‐ N.A FRL ‐ 483.11m
Gross Live Dead Since Last Survey Cumulative % Cumulative (Th.Cum/SqKm/yr) (M.Cum/yr)1 2 3 4 5 6 7 8 9 10 11 12
1 1957 68.20 66.1 2.12 1976 19 50.47 ‐ ‐ 17.73 17.73 26.00 0.172 0.9333 1981 5 47.78 ‐ ‐ 2.69 20.42 29.94 0.099 0.5384 1983 2 47.18 ‐ ‐ 0.6 21.02 30.82 0.055 0.3005 2006 23 39.7 ‐ ‐ 7.48 28.5 41.79 0.060 0.325
Average rate of silting(Th.Cum/Sq.km/Yr) in 49 years 0.107Average rate of silting (mm/yr) in 49 years 0.107Average rate of silting (M.Cum/yr) in 49 years 0.582
Period (Years)S. No
Reservoir Capacity(M.Cum)
KODAGANAR RESERVOIR
Observed Rate of Siltation Since Last SurveyRemarks
Loss of Capacity (M.Cum)
RemarksYear of Survey
KRISHNAGIRI RESERVOIR
Reservoir Capacity(M.Cum)S. No
Year of Survey
Period (Years)
Observed Rate of Siltation Since Last SurveyLoss of Capacity (M.Cum)
110
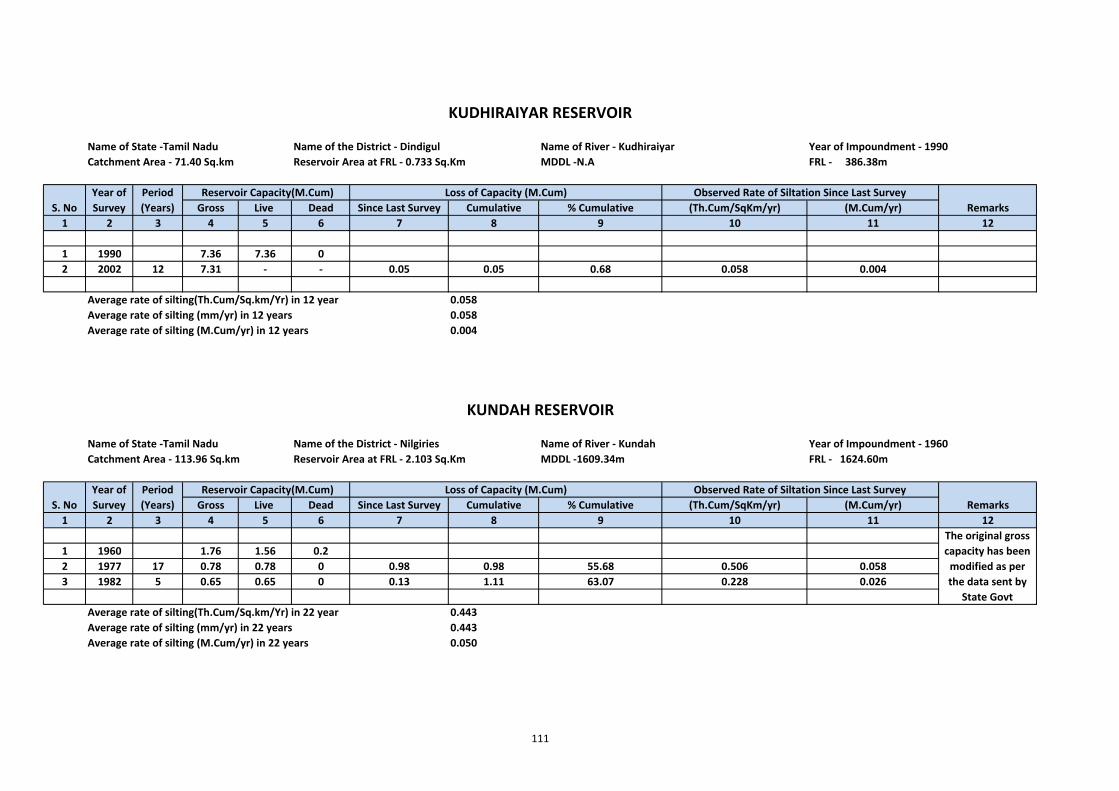
Name of State ‐Tamil Nadu Name of the District ‐ Dindigul Name of River ‐ Kudhiraiyar Year of Impoundment ‐ 1990Catchment Area ‐ 71.40 Sq.km Reservoir Area at FRL ‐ 0.733 Sq.Km MDDL ‐N.A FRL ‐ 386.38m
Gross Live Dead Since Last Survey Cumulative % Cumulative (Th.Cum/SqKm/yr) (M.Cum/yr)1 2 3 4 5 6 7 8 9 10 11 12
1 1990 7.36 7.36 02 2002 12 7.31 ‐ ‐ 0.05 0.05 0.68 0.058 0.004
Average rate of silting(Th.Cum/Sq.km/Yr) in 12 year 0.058Average rate of silting (mm/yr) in 12 years 0.058Average rate of silting (M.Cum/yr) in 12 years 0.004
Name of State ‐Tamil Nadu Name of the District ‐ Nilgiries Name of River ‐ Kundah Year of Impoundment ‐ 1960Catchment Area ‐ 113.96 Sq.km Reservoir Area at FRL ‐ 2.103 Sq.Km MDDL ‐1609.34m FRL ‐ 1624.60m
Gross Live Dead Since Last Survey Cumulative % Cumulative (Th.Cum/SqKm/yr) (M.Cum/yr)1 2 3 4 5 6 7 8 9 10 11 12
1 1960 1.76 1.56 0.22 1977 17 0.78 0.78 0 0.98 0.98 55.68 0.506 0.0583 1982 5 0.65 0.65 0 0.13 1.11 63.07 0.228 0.026
Average rate of silting(Th.Cum/Sq.km/Yr) in 22 year 0.443Average rate of silting (mm/yr) in 22 years 0.443Average rate of silting (M.Cum/yr) in 22 years 0.050
S. NoYear of Survey
Period (Years)
Observed Rate of Siltation Since Last Survey Reservoir Capacity(M.Cum) Loss of Capacity (M.Cum)Remarks
Loss of Capacity (M.Cum) Reservoir Capacity(M.Cum)
KUNDAH RESERVOIR
S. NoYear of Survey
The original gross capacity has been modified as per the data sent by
State Govt
RemarksObserved Rate of Siltation Since Last Survey
KUDHIRAIYAR RESERVOIR
Period (Years)
111
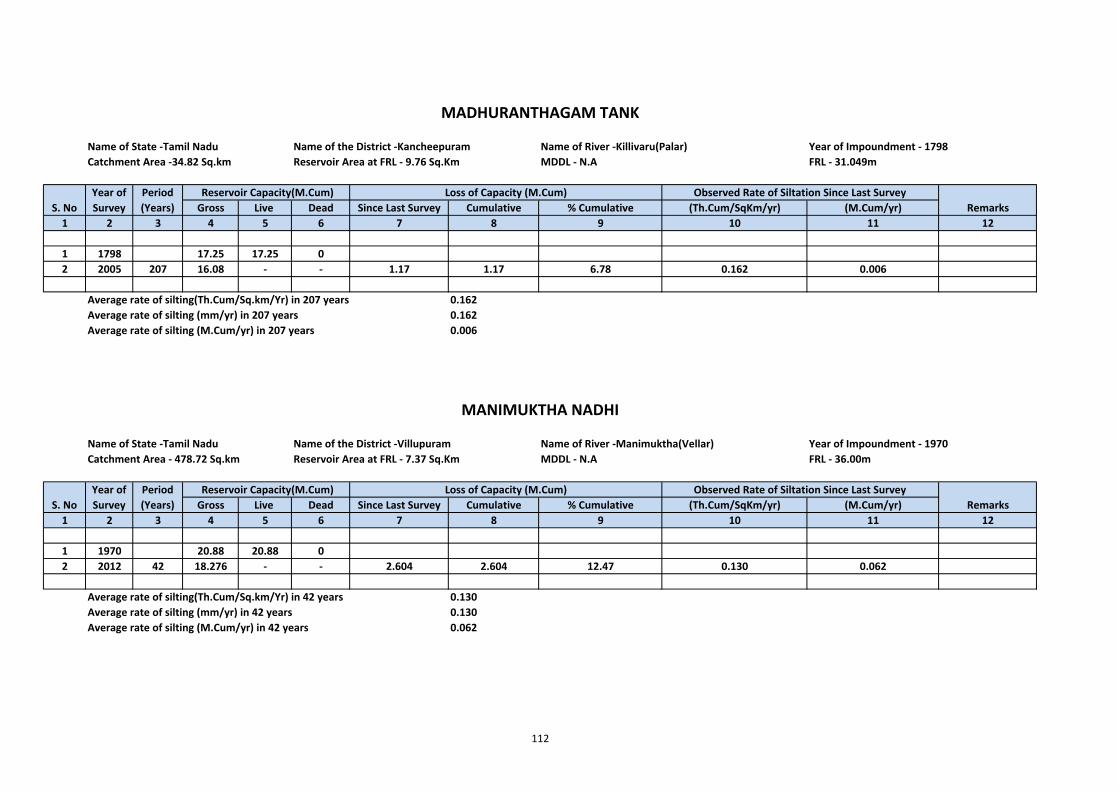
Name of State ‐Tamil Nadu Name of the District ‐Kancheepuram Name of River ‐Killivaru(Palar) Year of Impoundment ‐ 1798Catchment Area ‐34.82 Sq.km Reservoir Area at FRL ‐ 9.76 Sq.Km MDDL ‐ N.A FRL ‐ 31.049m
Gross Live Dead Since Last Survey Cumulative % Cumulative (Th.Cum/SqKm/yr) (M.Cum/yr)1 2 3 4 5 6 7 8 9 10 11 12
1 1798 17.25 17.25 02 2005 207 16.08 ‐ ‐ 1.17 1.17 6.78 0.162 0.006
Average rate of silting(Th.Cum/Sq.km/Yr) in 207 years 0.162Average rate of silting (mm/yr) in 207 years 0.162Average rate of silting (M.Cum/yr) in 207 years 0.006
Name of State ‐Tamil Nadu Name of the District ‐Villupuram Name of River ‐Manimuktha(Vellar) Year of Impoundment ‐ 1970Catchment Area ‐ 478.72 Sq.km Reservoir Area at FRL ‐ 7.37 Sq.Km MDDL ‐ N.A FRL ‐ 36.00m
Gross Live Dead Since Last Survey Cumulative % Cumulative (Th.Cum/SqKm/yr) (M.Cum/yr)1 2 3 4 5 6 7 8 9 10 11 12
1 1970 20.88 20.88 02 2012 42 18.276 ‐ ‐ 2.604 2.604 12.47 0.130 0.062
Average rate of silting(Th.Cum/Sq.km/Yr) in 42 years 0.130Average rate of silting (mm/yr) in 42 years 0.130Average rate of silting (M.Cum/yr) in 42 years 0.062
Year of Survey
Period (Years)
Reservoir Capacity(M.Cum) Loss of Capacity (M.Cum)
MADHURANTHAGAM TANK
S. NoYear of Survey
Observed Rate of Siltation Since Last SurveyRemarks
Observed Rate of Siltation Since Last SurveyPeriod (Years)
Loss of Capacity (M.Cum)Remarks
Reservoir Capacity(M.Cum)
MANIMUKTHA NADHI
S. No
112
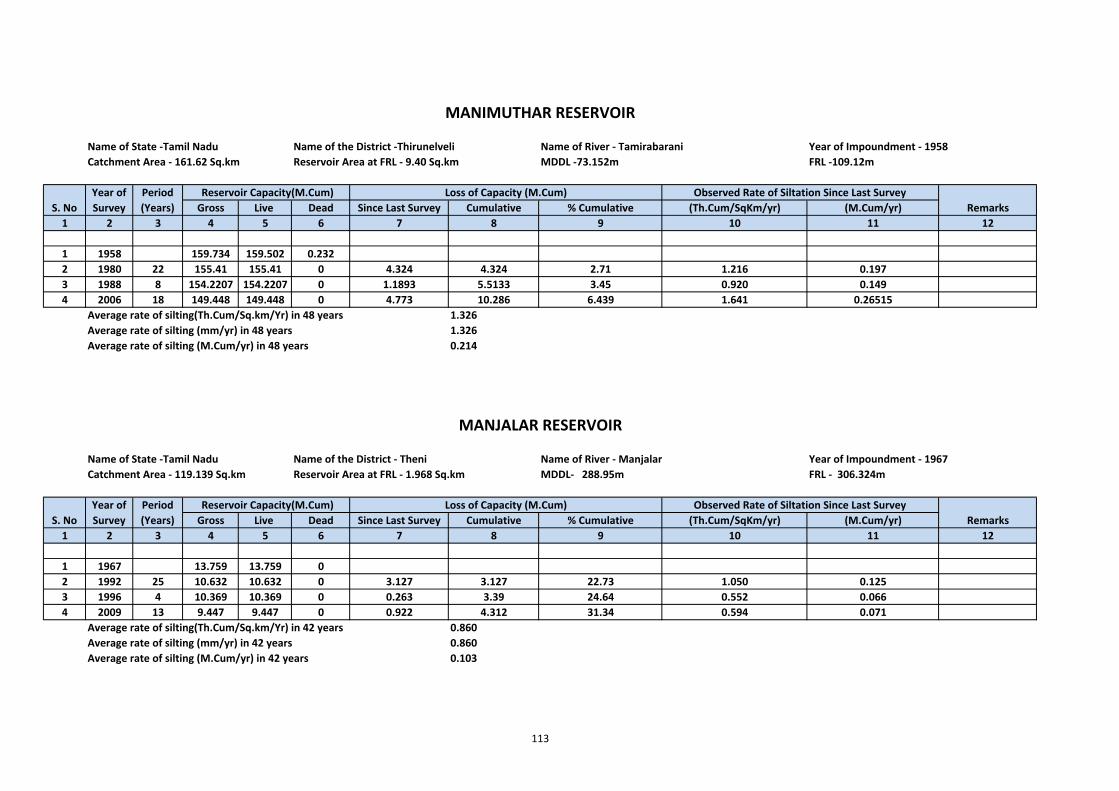
Name of State ‐Tamil Nadu Name of the District ‐Thirunelveli Name of River ‐ Tamirabarani Year of Impoundment ‐ 1958Catchment Area ‐ 161.62 Sq.km Reservoir Area at FRL ‐ 9.40 Sq.km MDDL ‐73.152m FRL ‐109.12m
Gross Live Dead Since Last Survey Cumulative % Cumulative (Th.Cum/SqKm/yr) (M.Cum/yr)1 2 3 4 5 6 7 8 9 10 11 12
1 1958 159.734 159.502 0.2322 1980 22 155.41 155.41 0 4.324 4.324 2.71 1.216 0.1973 1988 8 154.2207 154.2207 0 1.1893 5.5133 3.45 0.920 0.1494 2006 18 149.448 149.448 0 4.773 10.286 6.439 1.641 0.26515
Average rate of silting(Th.Cum/Sq.km/Yr) in 48 years 1.326Average rate of silting (mm/yr) in 48 years 1.326Average rate of silting (M.Cum/yr) in 48 years 0.214
Name of State ‐Tamil Nadu Name of the District ‐ Theni Name of River ‐ Manjalar Year of Impoundment ‐ 1967Catchment Area ‐ 119.139 Sq.km Reservoir Area at FRL ‐ 1.968 Sq.km MDDL‐ 288.95m FRL ‐ 306.324m
Gross Live Dead Since Last Survey Cumulative % Cumulative (Th.Cum/SqKm/yr) (M.Cum/yr)1 2 3 4 5 6 7 8 9 10 11 12
1 1967 13.759 13.759 02 1992 25 10.632 10.632 0 3.127 3.127 22.73 1.050 0.1253 1996 4 10.369 10.369 0 0.263 3.39 24.64 0.552 0.0664 2009 13 9.447 9.447 0 0.922 4.312 31.34 0.594 0.071
Average rate of silting(Th.Cum/Sq.km/Yr) in 42 years 0.860Average rate of silting (mm/yr) in 42 years 0.860Average rate of silting (M.Cum/yr) in 42 years 0.103
MANIMUTHAR RESERVOIR
S. No Reservoir Capacity(M.Cum)
Period (Years)
Period (Years)
Reservoir Capacity(M.Cum)Year of Survey
Loss of Capacity (M.Cum)
MANJALAR RESERVOIR
Observed Rate of Siltation Since Last Survey
Year of Survey
S. No
Remarks
Remarks
Loss of Capacity (M.Cum) Observed Rate of Siltation Since Last Survey
113
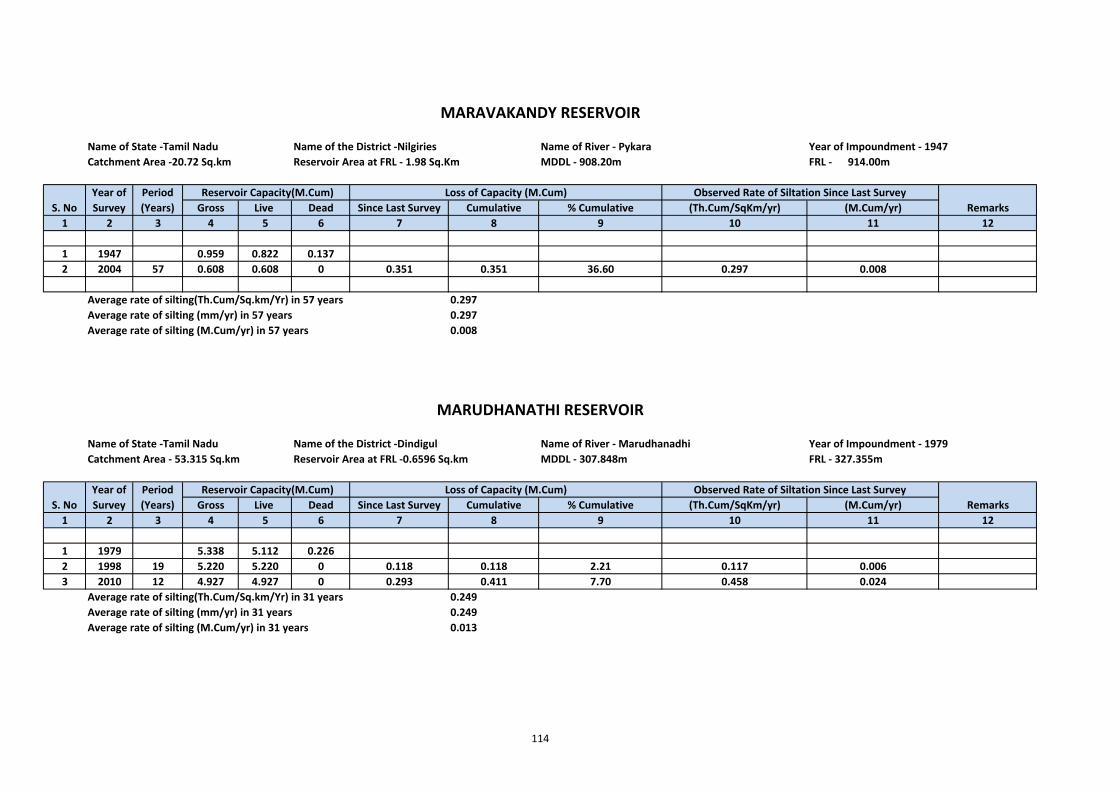
Name of State ‐Tamil Nadu Name of the District ‐Nilgiries Name of River ‐ Pykara Year of Impoundment ‐ 1947Catchment Area ‐20.72 Sq.km Reservoir Area at FRL ‐ 1.98 Sq.Km MDDL ‐ 908.20m FRL ‐ 914.00m
Gross Live Dead Since Last Survey Cumulative % Cumulative (Th.Cum/SqKm/yr) (M.Cum/yr)1 2 3 4 5 6 7 8 9 10 11 12
1 1947 0.959 0.822 0.1372 2004 57 0.608 0.608 0 0.351 0.351 36.60 0.297 0.008
Average rate of silting(Th.Cum/Sq.km/Yr) in 57 years 0.297Average rate of silting (mm/yr) in 57 years 0.297Average rate of silting (M.Cum/yr) in 57 years 0.008
Name of State ‐Tamil Nadu Name of the District ‐Dindigul Name of River ‐ Marudhanadhi Year of Impoundment ‐ 1979Catchment Area ‐ 53.315 Sq.km Reservoir Area at FRL ‐0.6596 Sq.km MDDL ‐ 307.848m FRL ‐ 327.355m
Gross Live Dead Since Last Survey Cumulative % Cumulative (Th.Cum/SqKm/yr) (M.Cum/yr)1 2 3 4 5 6 7 8 9 10 11 12
1 1979 5.338 5.112 0.2262 1998 19 5.220 5.220 0 0.118 0.118 2.21 0.117 0.0063 2010 12 4.927 4.927 0 0.293 0.411 7.70 0.458 0.024
Average rate of silting(Th.Cum/Sq.km/Yr) in 31 years 0.249Average rate of silting (mm/yr) in 31 years 0.249Average rate of silting (M.Cum/yr) in 31 years 0.013
Reservoir Capacity(M.Cum) Loss of Capacity (M.Cum)
MARAVAKANDY RESERVOIR
Year of Survey
Period (Years)
Reservoir Capacity(M.Cum) Loss of Capacity (M.Cum) Observed Rate of Siltation Since Last Survey
Remarks
Remarks
MARUDHANATHI RESERVOIR
S. NoYear of Survey
S. NoObserved Rate of Siltation Since Last SurveyPeriod
(Years)
114
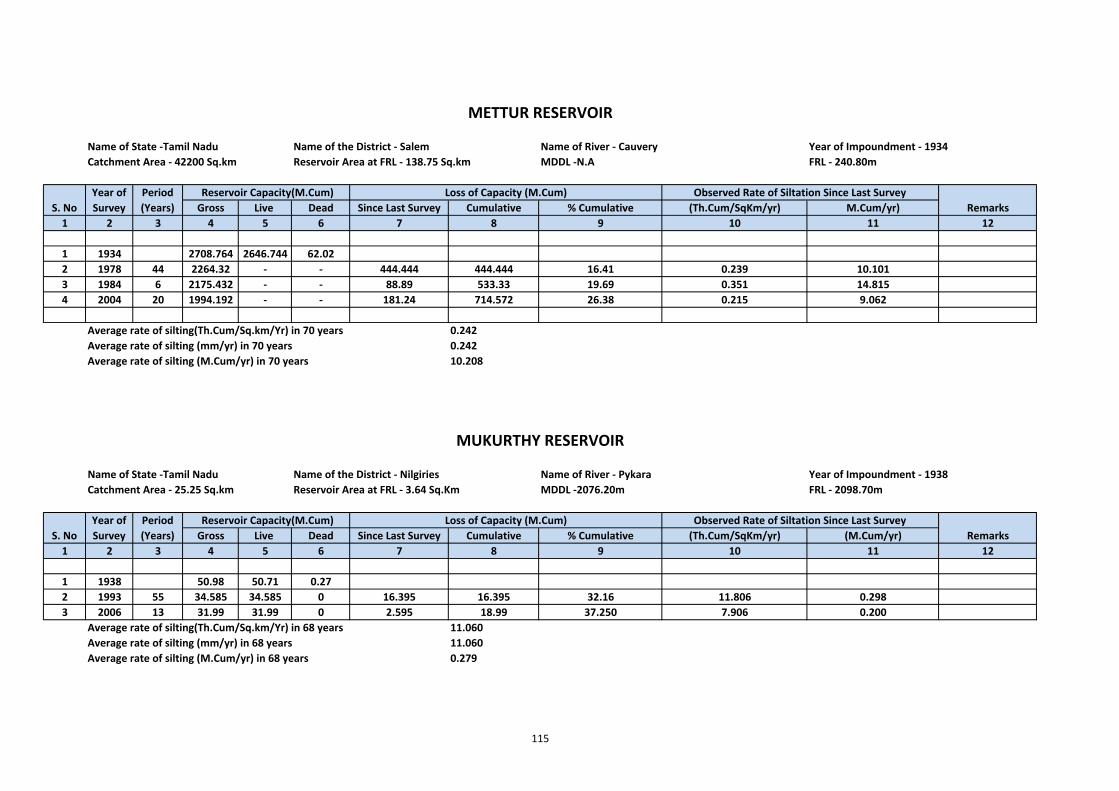
Name of State ‐Tamil Nadu Name of the District ‐ Salem Name of River ‐ Cauvery Year of Impoundment ‐ 1934Catchment Area ‐ 42200 Sq.km Reservoir Area at FRL ‐ 138.75 Sq.km MDDL ‐N.A FRL ‐ 240.80m
Gross Live Dead Since Last Survey Cumulative % Cumulative (Th.Cum/SqKm/yr) M.Cum/yr)1 2 3 4 5 6 7 8 9 10 11 12
1 1934 2708.764 2646.744 62.022 1978 44 2264.32 ‐ ‐ 444.444 444.444 16.41 0.239 10.1013 1984 6 2175.432 ‐ ‐ 88.89 533.33 19.69 0.351 14.8154 2004 20 1994.192 ‐ ‐ 181.24 714.572 26.38 0.215 9.062
Average rate of silting(Th.Cum/Sq.km/Yr) in 70 years 0.242Average rate of silting (mm/yr) in 70 years 0.242Average rate of silting (M.Cum/yr) in 70 years 10.208
Name of State ‐Tamil Nadu Name of the District ‐ Nilgiries Name of River ‐ Pykara Year of Impoundment ‐ 1938Catchment Area ‐ 25.25 Sq.km Reservoir Area at FRL ‐ 3.64 Sq.Km MDDL ‐2076.20m FRL ‐ 2098.70m
Gross Live Dead Since Last Survey Cumulative % Cumulative (Th.Cum/SqKm/yr) (M.Cum/yr)1 2 3 4 5 6 7 8 9 10 11 12
1 1938 50.98 50.71 0.272 1993 55 34.585 34.585 0 16.395 16.395 32.16 11.806 0.2983 2006 13 31.99 31.99 0 2.595 18.99 37.250 7.906 0.200
Average rate of silting(Th.Cum/Sq.km/Yr) in 68 years 11.060Average rate of silting (mm/yr) in 68 years 11.060Average rate of silting (M.Cum/yr) in 68 years 0.279
METTUR RESERVOIR
Year of Survey
Reservoir Capacity(M.Cum) Loss of Capacity (M.Cum)Period (Years)
Period (Years)
Reservoir Capacity(M.Cum)
MUKURTHY RESERVOIR
S. NoObserved Rate of Siltation Since Last Survey
Remarks
Loss of Capacity (M.Cum) Observed Rate of Siltation Since Last SurveyYear of Survey S. No Remarks
115
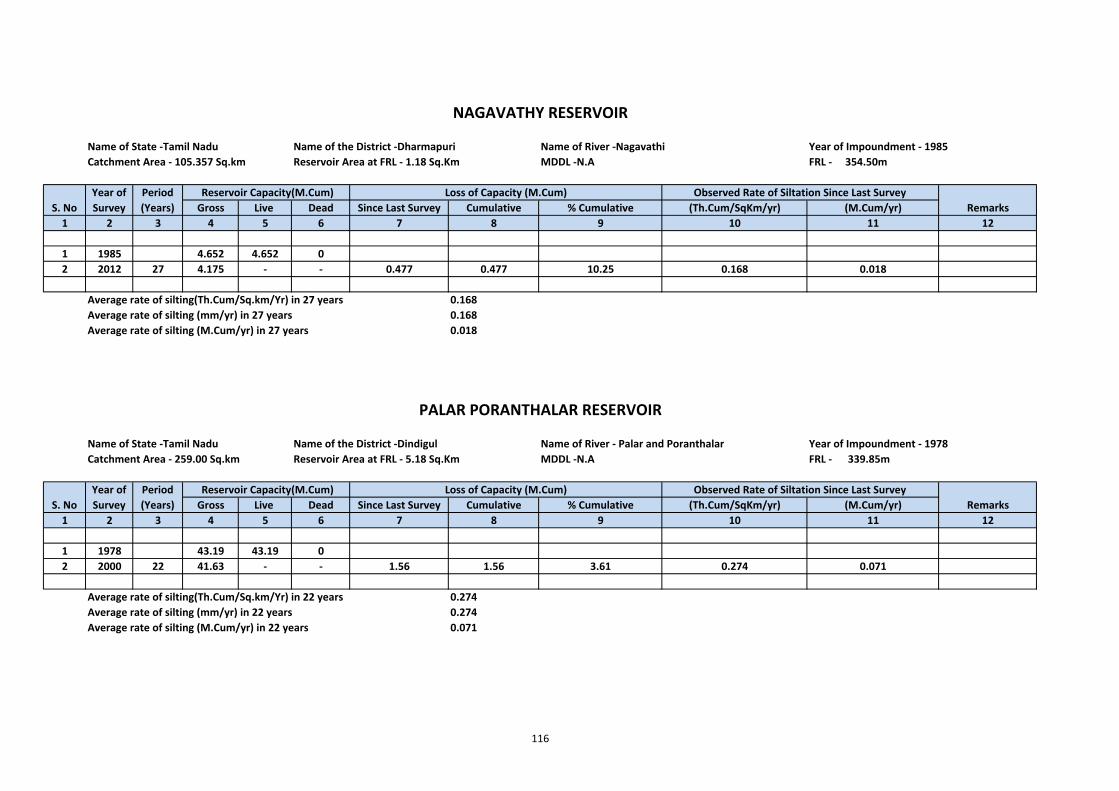
Name of State ‐Tamil Nadu Name of the District ‐Dharmapuri Name of River ‐Nagavathi Year of Impoundment ‐ 1985Catchment Area ‐ 105.357 Sq.km Reservoir Area at FRL ‐ 1.18 Sq.Km MDDL ‐N.A FRL ‐ 354.50m
Gross Live Dead Since Last Survey Cumulative % Cumulative (Th.Cum/SqKm/yr) (M.Cum/yr)1 2 3 4 5 6 7 8 9 10 11 12
1 1985 4.652 4.652 02 2012 27 4.175 ‐ ‐ 0.477 0.477 10.25 0.168 0.018
Average rate of silting(Th.Cum/Sq.km/Yr) in 27 years 0.168Average rate of silting (mm/yr) in 27 years 0.168Average rate of silting (M.Cum/yr) in 27 years 0.018
Name of State ‐Tamil Nadu Name of the District ‐Dindigul Name of River ‐ Palar and Poranthalar Year of Impoundment ‐ 1978Catchment Area ‐ 259.00 Sq.km Reservoir Area at FRL ‐ 5.18 Sq.Km MDDL ‐N.A FRL ‐ 339.85m
Gross Live Dead Since Last Survey Cumulative % Cumulative (Th.Cum/SqKm/yr) (M.Cum/yr)1 2 3 4 5 6 7 8 9 10 11 12
1 1978 43.19 43.19 02 2000 22 41.63 ‐ ‐ 1.56 1.56 3.61 0.274 0.071
Average rate of silting(Th.Cum/Sq.km/Yr) in 22 years 0.274Average rate of silting (mm/yr) in 22 years 0.274Average rate of silting (M.Cum/yr) in 22 years 0.071
S. No Remarks
PALAR PORANTHALAR RESERVOIR
Period (Years)
Reservoir Capacity(M.Cum)
Loss of Capacity (M.Cum)
Observed Rate of Siltation Since Last SurveyLoss of Capacity (M.Cum)
Observed Rate of Siltation Since Last SurveyS. No
Year of Survey
Period (Years)
Reservoir Capacity(M.Cum)
Year of Survey
NAGAVATHY RESERVOIR
Remarks
116

Name of State ‐Tamil Nadu Name of the District ‐Krishnagiri Name of River ‐Pambar Year of Impoundment ‐ 1983Catchment Area ‐ 1736 Sq.km Reservoir Area at FRL ‐ 1.78 Sq.Km MDDL ‐ N.A FRL ‐ 321.00m
Gross Live Dead Since Last Survey Cumulative % Cumulative (Th.Cum/SqKm/yr) (M.Cum/yr)1 2 3 4 5 6 7 8 9 10 11 12
1 1983 7.93 7.02 0.912 2013 30 7.54 ‐ ‐ 0.39 0.39 4.92 0.007 0.013
Average rate of silting(Th.Cum/Sq.km/Yr) in 30 years 0.007Average rate of silting (mm/yr) in 30 years 0.007Average rate of silting (M.Cum/yr) in 30 years 0.013
Name of State ‐Tamil Nadu Name of the District ‐Coimbatore Name of River ‐ Parambikulam Year of Impoundment ‐ 1967Catchment Area ‐ 230.50 Sq.km Reservoir Area at FRL ‐ 20.72 Sq.Km MDDL ‐ N.A FRL ‐ 556.26m
Gross Live Dead Since Last Survey Cumulative % Cumulative (Th.Cum/SqKm/yr) (M.Cum/yr)1 2 3 4 5 6 7 8 9 10 11 12
1 1967 504.66 379.71 124.952 2013 46 442.298 ‐ ‐ 62.362 62.362 12.36 5.882 1.356
Average rate of silting(Th.Cum/Sq.km/Yr) in 46 years 5.882Average rate of silting (mm/yr) in 46 years 5.882Average rate of silting (M.Cum/yr) in 46 years 1.356
PARAMBIKULAM RESERVOIR
Remarks Reservoir Capacity(M.Cum)
PAMBAR RESERVOIR
Loss of Capacity (M.Cum) Observed Rate of Siltation Since Last SurveyPeriod (Years)
Year of Survey
Year of Survey
Loss of Capacity (M.Cum) Observed Rate of Siltation Since Last Survey Reservoir Capacity(M.Cum)
S. No
S. NoPeriod (Years) Remarks
117
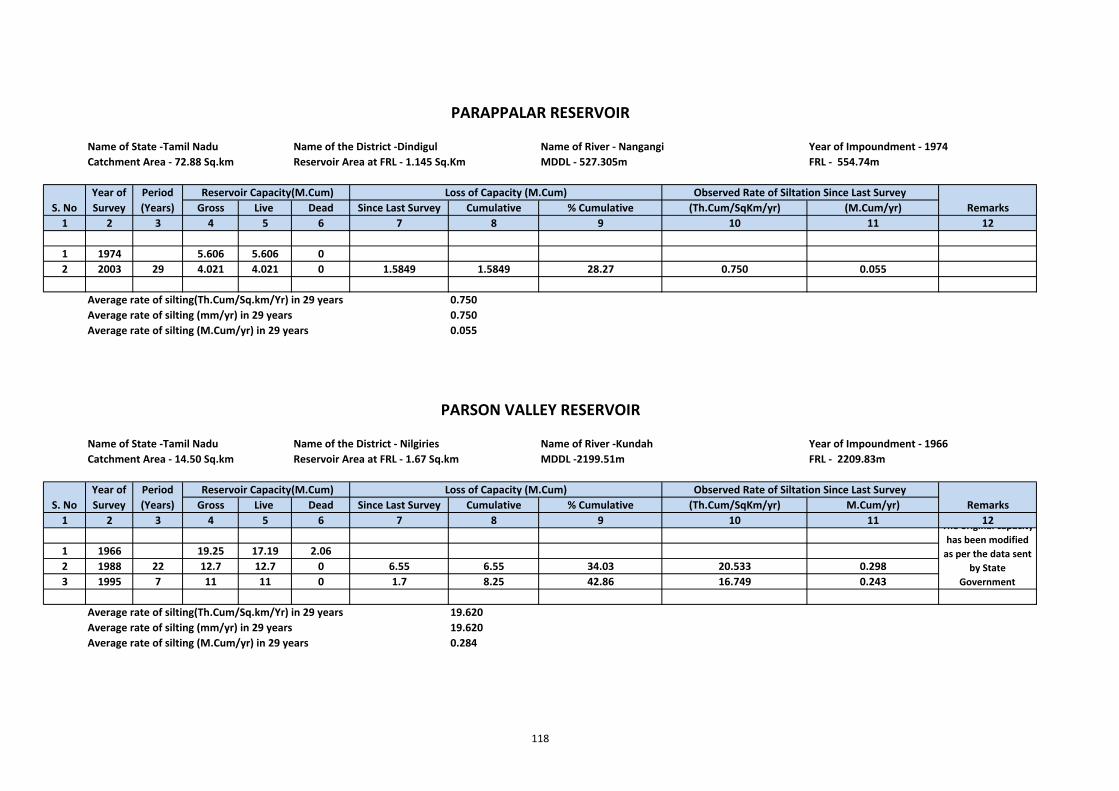
Name of State ‐Tamil Nadu Name of the District ‐Dindigul Name of River ‐ Nangangi Year of Impoundment ‐ 1974Catchment Area ‐ 72.88 Sq.km Reservoir Area at FRL ‐ 1.145 Sq.Km MDDL ‐ 527.305m FRL ‐ 554.74m
Gross Live Dead Since Last Survey Cumulative % Cumulative (Th.Cum/SqKm/yr) (M.Cum/yr)1 2 3 4 5 6 7 8 9 10 11 12
1 1974 5.606 5.606 02 2003 29 4.021 4.021 0 1.5849 1.5849 28.27 0.750 0.055
Average rate of silting(Th.Cum/Sq.km/Yr) in 29 years 0.750Average rate of silting (mm/yr) in 29 years 0.750Average rate of silting (M.Cum/yr) in 29 years 0.055
Name of State ‐Tamil Nadu Name of the District ‐ Nilgiries Name of River ‐Kundah Year of Impoundment ‐ 1966Catchment Area ‐ 14.50 Sq.km Reservoir Area at FRL ‐ 1.67 Sq.km MDDL ‐2199.51m FRL ‐ 2209.83m
Gross Live Dead Since Last Survey Cumulative % Cumulative (Th.Cum/SqKm/yr) M.Cum/yr)1 2 3 4 5 6 7 8 9 10 11 12
1 1966 19.25 17.19 2.062 1988 22 12.7 12.7 0 6.55 6.55 34.03 20.533 0.2983 1995 7 11 11 0 1.7 8.25 42.86 16.749 0.243
Average rate of silting(Th.Cum/Sq.km/Yr) in 29 years 19.620Average rate of silting (mm/yr) in 29 years 19.620Average rate of silting (M.Cum/yr) in 29 years 0.284
Reservoir Capacity(M.Cum)
PARAPPALAR RESERVOIR
Reservoir Capacity(M.Cum)
Remarks
Loss of Capacity (M.Cum)
S. NoYear of Survey
The original capacity has been modified as per the data sent
by State Government
Observed Rate of Siltation Since Last Survey
PARSON VALLEY RESERVOIR
Period (Years)
Loss of Capacity (M.Cum) Observed Rate of Siltation Since Last Survey
S. NoYear of Survey
Period (Years) Remarks
118
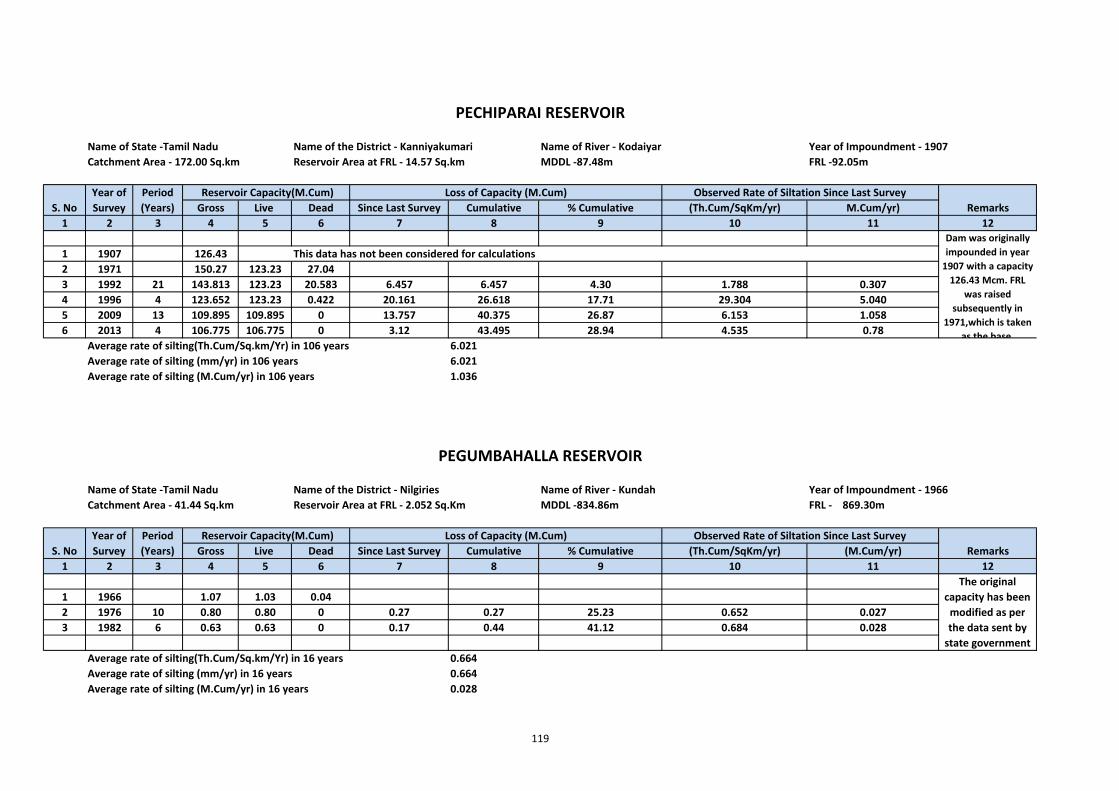
Name of State ‐Tamil Nadu Name of the District ‐ Kanniyakumari Name of River ‐ Kodaiyar Year of Impoundment ‐ 1907Catchment Area ‐ 172.00 Sq.km Reservoir Area at FRL ‐ 14.57 Sq.km MDDL ‐87.48m FRL ‐92.05m
Gross Live Dead Since Last Survey Cumulative % Cumulative (Th.Cum/SqKm/yr) M.Cum/yr)1 2 3 4 5 6 7 8 9 10 11 12
1 1907 126.43 This data has not been considered for calculations2 1971 150.27 123.23 27.043 1992 21 143.813 123.23 20.583 6.457 6.457 4.30 1.788 0.3074 1996 4 123.652 123.23 0.422 20.161 26.618 17.71 29.304 5.0405 2009 13 109.895 109.895 0 13.757 40.375 26.87 6.153 1.0586 2013 4 106.775 106.775 0 3.12 43.495 28.94 4.535 0.78
Average rate of silting(Th.Cum/Sq.km/Yr) in 106 years 6.021Average rate of silting (mm/yr) in 106 years 6.021Average rate of silting (M.Cum/yr) in 106 years 1.036
Name of State ‐Tamil Nadu Name of the District ‐ Nilgiries Name of River ‐ Kundah Year of Impoundment ‐ 1966Catchment Area ‐ 41.44 Sq.km Reservoir Area at FRL ‐ 2.052 Sq.Km MDDL ‐834.86m FRL ‐ 869.30m
Gross Live Dead Since Last Survey Cumulative % Cumulative (Th.Cum/SqKm/yr) (M.Cum/yr)1 2 3 4 5 6 7 8 9 10 11 12
1 1966 1.07 1.03 0.042 1976 10 0.80 0.80 0 0.27 0.27 25.23 0.652 0.0273 1982 6 0.63 0.63 0 0.17 0.44 41.12 0.684 0.028
Average rate of silting(Th.Cum/Sq.km/Yr) in 16 years 0.664Average rate of silting (mm/yr) in 16 years 0.664Average rate of silting (M.Cum/yr) in 16 years 0.028
The original capacity has been modified as per the data sent by state government
Loss of Capacity (M.Cum)Period (Years)
Observed Rate of Siltation Since Last Survey
Remarks
Dam was originally impounded in year 1907 with a capacity 126.43 Mcm. FRL
was raised subsequently in
1971,which is taken as the base
Year of Survey
PEGUMBAHALLA RESERVOIR
PECHIPARAI RESERVOIR
S. No
Reservoir Capacity(M.Cum)Remarks
Year of Survey S. No
Period (Years)
Loss of Capacity (M.Cum) Observed Rate of Siltation Since Last Survey Reservoir Capacity(M.Cum)
119
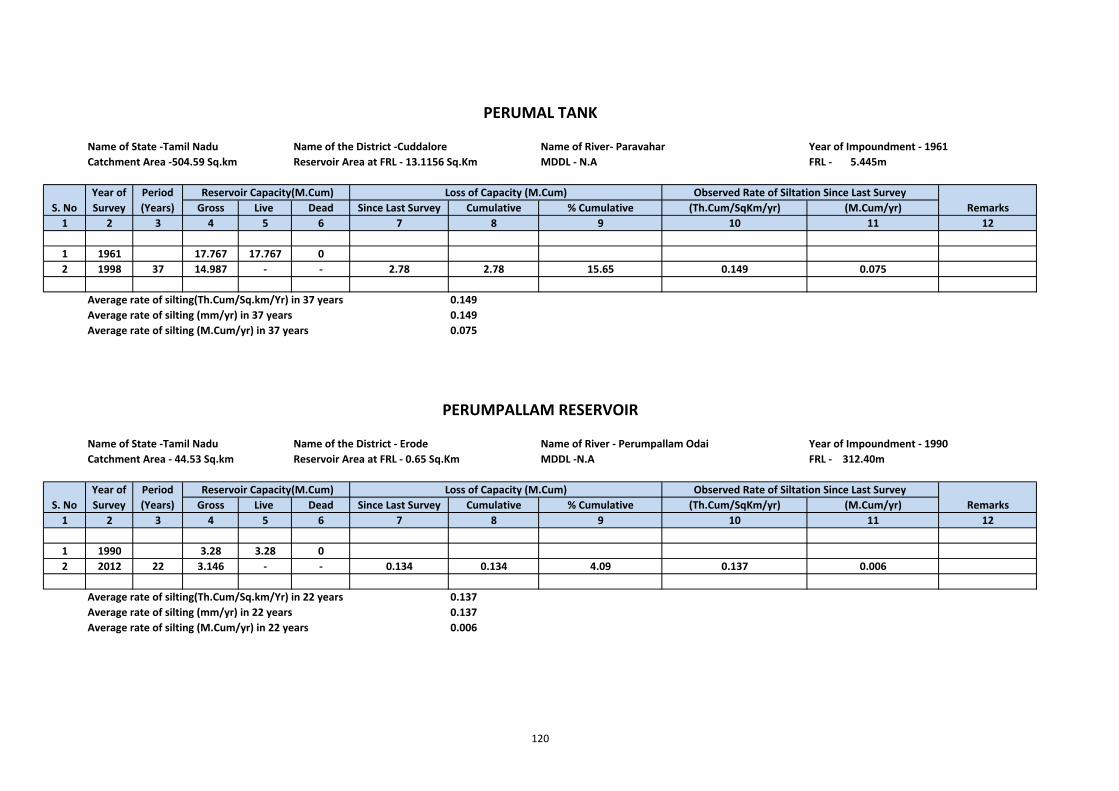
Name of State ‐Tamil Nadu Name of the District ‐Cuddalore Name of River‐ Paravahar Year of Impoundment ‐ 1961Catchment Area ‐504.59 Sq.km Reservoir Area at FRL ‐ 13.1156 Sq.Km MDDL ‐ N.A FRL ‐ 5.445m
Gross Live Dead Since Last Survey Cumulative % Cumulative (Th.Cum/SqKm/yr) (M.Cum/yr)1 2 3 4 5 6 7 8 9 10 11 12
1 1961 17.767 17.767 02 1998 37 14.987 ‐ ‐ 2.78 2.78 15.65 0.149 0.075
Average rate of silting(Th.Cum/Sq.km/Yr) in 37 years 0.149Average rate of silting (mm/yr) in 37 years 0.149Average rate of silting (M.Cum/yr) in 37 years 0.075
Name of State ‐Tamil Nadu Name of the District ‐ Erode Name of River ‐ Perumpallam Odai Year of Impoundment ‐ 1990Catchment Area ‐ 44.53 Sq.km Reservoir Area at FRL ‐ 0.65 Sq.Km MDDL ‐N.A FRL ‐ 312.40m
Gross Live Dead Since Last Survey Cumulative % Cumulative (Th.Cum/SqKm/yr) (M.Cum/yr)1 2 3 4 5 6 7 8 9 10 11 12
1 1990 3.28 3.28 02 2012 22 3.146 ‐ ‐ 0.134 0.134 4.09 0.137 0.006
Average rate of silting(Th.Cum/Sq.km/Yr) in 22 years 0.137Average rate of silting (mm/yr) in 22 years 0.137Average rate of silting (M.Cum/yr) in 22 years 0.006
Year of Survey S. No
PERUMAL TANK
PERUMPALLAM RESERVOIR
Period (Years)
Reservoir Capacity(M.Cum)S. No
Year of Survey
Observed Rate of Siltation Since Last Survey
Observed Rate of Siltation Since Last Survey
Period (Years)
RemarksLoss of Capacity (M.Cum)
Reservoir Capacity(M.Cum) Loss of Capacity (M.Cum)Remarks
120
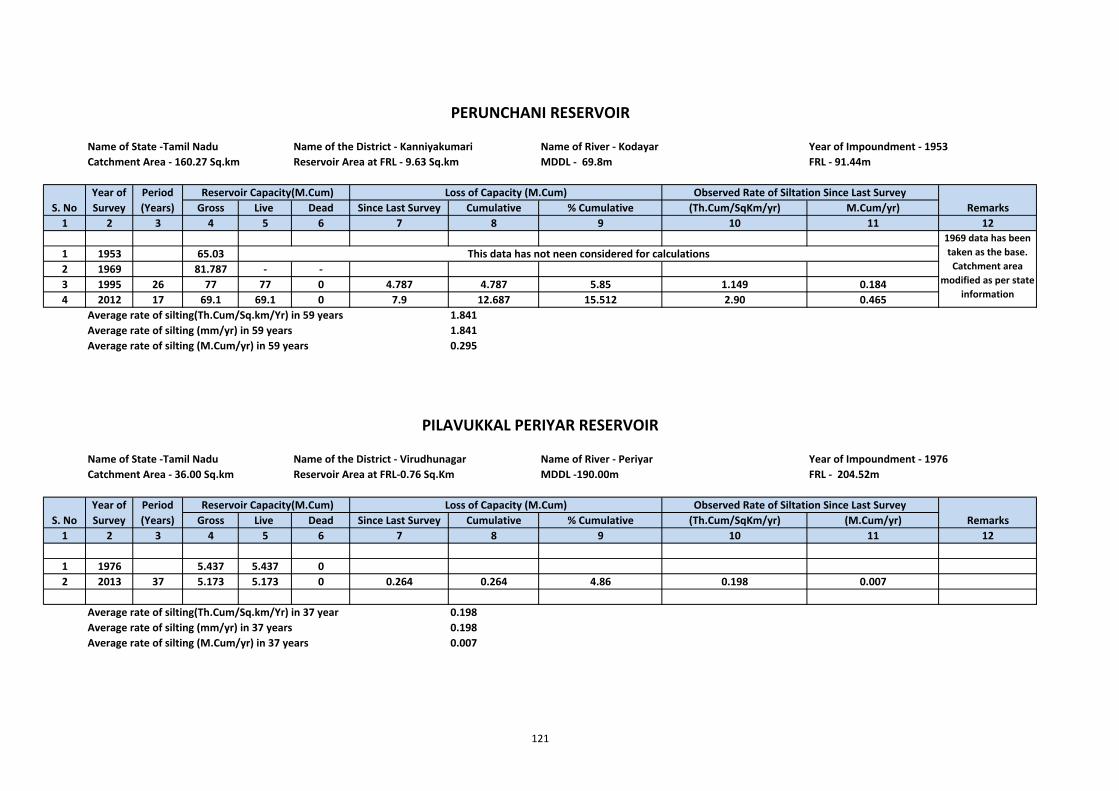
Name of State ‐Tamil Nadu Name of the District ‐ Kanniyakumari Name of River ‐ Kodayar Year of Impoundment ‐ 1953Catchment Area ‐ 160.27 Sq.km Reservoir Area at FRL ‐ 9.63 Sq.km MDDL ‐ 69.8m FRL ‐ 91.44m
Gross Live Dead Since Last Survey Cumulative % Cumulative (Th.Cum/SqKm/yr) M.Cum/yr)1 2 3 4 5 6 7 8 9 10 11 12
1 1953 65.032 1969 81.787 ‐ ‐3 1995 26 77 77 0 4.787 4.787 5.85 1.149 0.1844 2012 17 69.1 69.1 0 7.9 12.687 15.512 2.90 0.465
Average rate of silting(Th.Cum/Sq.km/Yr) in 59 years 1.841Average rate of silting (mm/yr) in 59 years 1.841Average rate of silting (M.Cum/yr) in 59 years 0.295
Name of State ‐Tamil Nadu Name of the District ‐ Virudhunagar Name of River ‐ Periyar Year of Impoundment ‐ 1976Catchment Area ‐ 36.00 Sq.km Reservoir Area at FRL‐0.76 Sq.Km MDDL ‐190.00m FRL ‐ 204.52m
Gross Live Dead Since Last Survey Cumulative % Cumulative (Th.Cum/SqKm/yr) (M.Cum/yr)1 2 3 4 5 6 7 8 9 10 11 12
1 1976 5.437 5.437 02 2013 37 5.173 5.173 0 0.264 0.264 4.86 0.198 0.007
Average rate of silting(Th.Cum/Sq.km/Yr) in 37 year 0.198Average rate of silting (mm/yr) in 37 years 0.198Average rate of silting (M.Cum/yr) in 37 years 0.007
PERUNCHANI RESERVOIR
Observed Rate of Siltation Since Last SurveyS. No
Period (Years)
Reservoir Capacity(M.Cum)Year of Survey
Remarks
Remarks
PILAVUKKAL PERIYAR RESERVOIR
S. NoYear of Survey
This data has not neen considered for calculations1969 data has been taken as the base. Catchment area
modified as per state information
Loss of Capacity (M.Cum)
Period (Years)
Reservoir Capacity(M.Cum) Loss of Capacity (M.Cum) Observed Rate of Siltation Since Last Survey
121
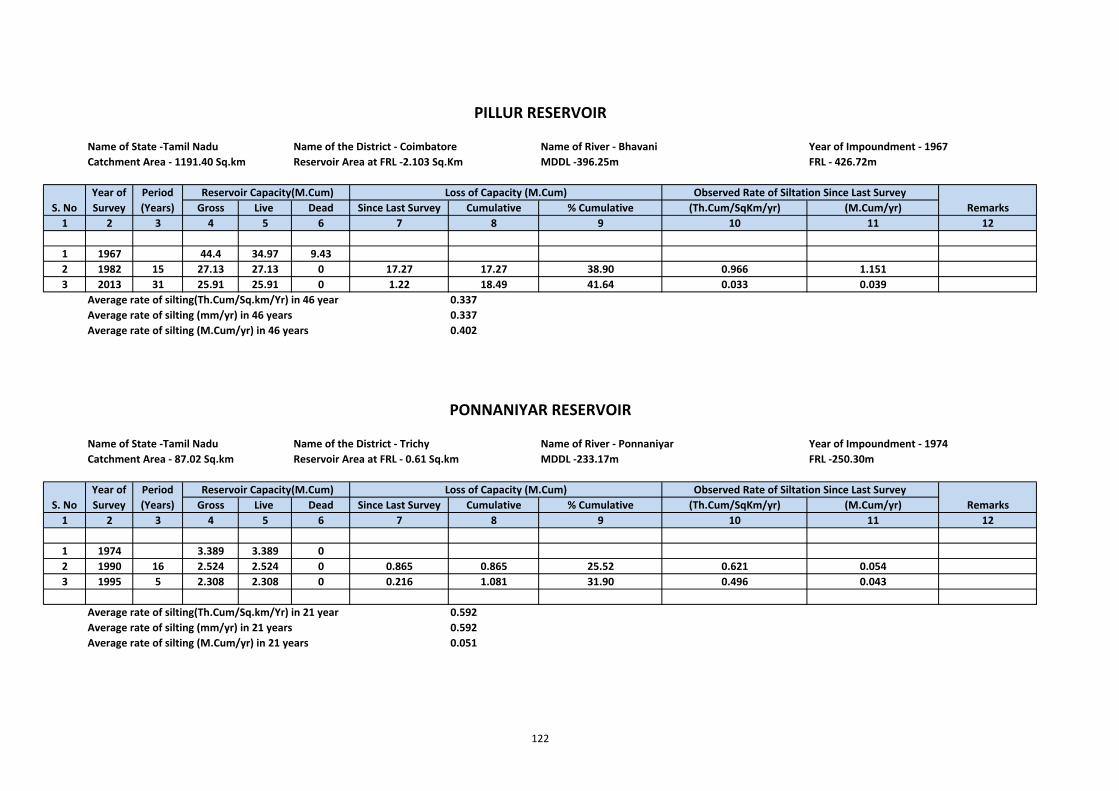
Name of State ‐Tamil Nadu Name of the District ‐ Coimbatore Name of River ‐ Bhavani Year of Impoundment ‐ 1967Catchment Area ‐ 1191.40 Sq.km Reservoir Area at FRL ‐2.103 Sq.Km MDDL ‐396.25m FRL ‐ 426.72m
Gross Live Dead Since Last Survey Cumulative % Cumulative (Th.Cum/SqKm/yr) (M.Cum/yr)1 2 3 4 5 6 7 8 9 10 11 12
1 1967 44.4 34.97 9.432 1982 15 27.13 27.13 0 17.27 17.27 38.90 0.966 1.1513 2013 31 25.91 25.91 0 1.22 18.49 41.64 0.033 0.039
Average rate of silting(Th.Cum/Sq.km/Yr) in 46 year 0.337Average rate of silting (mm/yr) in 46 years 0.337Average rate of silting (M.Cum/yr) in 46 years 0.402
Name of State ‐Tamil Nadu Name of the District ‐ Trichy Name of River ‐ Ponnaniyar Year of Impoundment ‐ 1974Catchment Area ‐ 87.02 Sq.km Reservoir Area at FRL ‐ 0.61 Sq.km MDDL ‐233.17m FRL ‐250.30m
Gross Live Dead Since Last Survey Cumulative % Cumulative (Th.Cum/SqKm/yr) (M.Cum/yr)1 2 3 4 5 6 7 8 9 10 11 12
1 1974 3.389 3.389 02 1990 16 2.524 2.524 0 0.865 0.865 25.52 0.621 0.0543 1995 5 2.308 2.308 0 0.216 1.081 31.90 0.496 0.043
Average rate of silting(Th.Cum/Sq.km/Yr) in 21 year 0.592Average rate of silting (mm/yr) in 21 years 0.592Average rate of silting (M.Cum/yr) in 21 years 0.051
Period (Years)
Reservoir Capacity(M.Cum)
Year of Survey
S. NoObserved Rate of Siltation Since Last Survey
RemarksLoss of Capacity (M.Cum)
PONNANIYAR RESERVOIR
Year of Survey
S. No
PILLUR RESERVOIR
Loss of Capacity (M.Cum)Period (Years)
Observed Rate of Siltation Since Last SurveyRemarks
Reservoir Capacity(M.Cum)
122
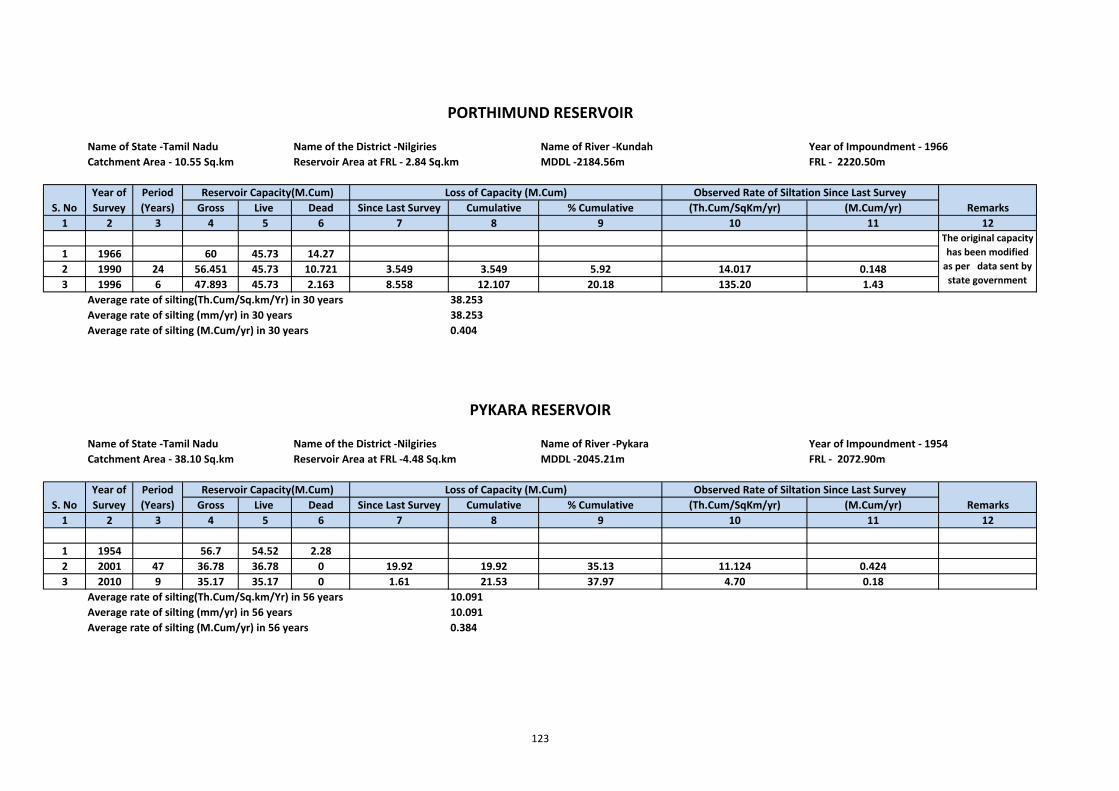
Name of State ‐Tamil Nadu Name of the District ‐Nilgiries Name of River ‐Kundah Year of Impoundment ‐ 1966Catchment Area ‐ 10.55 Sq.km Reservoir Area at FRL ‐ 2.84 Sq.km MDDL ‐2184.56m FRL ‐ 2220.50m
Gross Live Dead Since Last Survey Cumulative % Cumulative (Th.Cum/SqKm/yr) (M.Cum/yr)1 2 3 4 5 6 7 8 9 10 11 12
1 1966 60 45.73 14.272 1990 24 56.451 45.73 10.721 3.549 3.549 5.92 14.017 0.1483 1996 6 47.893 45.73 2.163 8.558 12.107 20.18 135.20 1.43
Average rate of silting(Th.Cum/Sq.km/Yr) in 30 years 38.253Average rate of silting (mm/yr) in 30 years 38.253Average rate of silting (M.Cum/yr) in 30 years 0.404
Name of State ‐Tamil Nadu Name of the District ‐Nilgiries Name of River ‐Pykara Year of Impoundment ‐ 1954Catchment Area ‐ 38.10 Sq.km Reservoir Area at FRL ‐4.48 Sq.km MDDL ‐2045.21m FRL ‐ 2072.90m
Gross Live Dead Since Last Survey Cumulative % Cumulative (Th.Cum/SqKm/yr) (M.Cum/yr)1 2 3 4 5 6 7 8 9 10 11 12
1 1954 56.7 54.52 2.282 2001 47 36.78 36.78 0 19.92 19.92 35.13 11.124 0.4243 2010 9 35.17 35.17 0 1.61 21.53 37.97 4.70 0.18
Average rate of silting(Th.Cum/Sq.km/Yr) in 56 years 10.091Average rate of silting (mm/yr) in 56 years 10.091Average rate of silting (M.Cum/yr) in 56 years 0.384
Loss of Capacity (M.Cum)
PYKARA RESERVOIR
S. No RemarksYear of Survey
Period (Years) Remarks
PORTHIMUND RESERVOIR
Year of Survey
Observed Rate of Siltation Since Last SurveyS. No
Reservoir Capacity(M.Cum) Loss of Capacity (M.Cum)Period (Years)
The original capacity has been modified as per data sent by state government
Reservoir Capacity(M.Cum)
Observed Rate of Siltation Since Last Survey
123
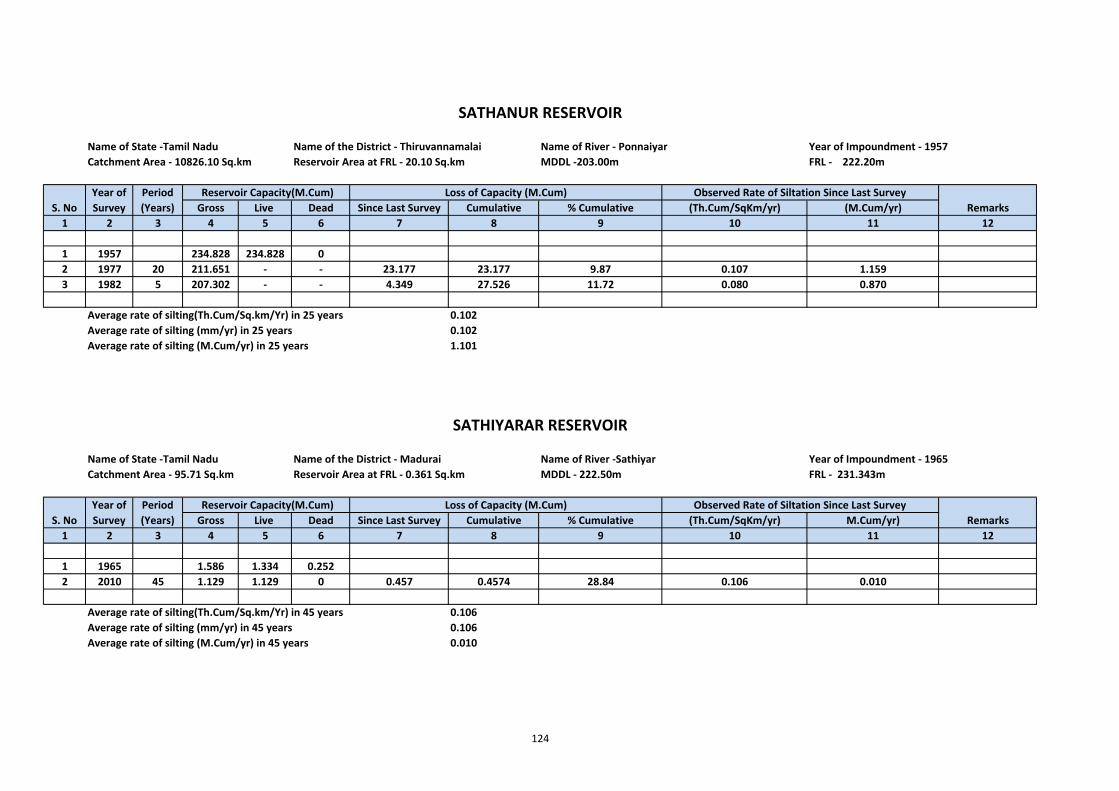
Name of State ‐Tamil Nadu Name of the District ‐ Thiruvannamalai Name of River ‐ Ponnaiyar Year of Impoundment ‐ 1957Catchment Area ‐ 10826.10 Sq.km Reservoir Area at FRL ‐ 20.10 Sq.km MDDL ‐203.00m FRL ‐ 222.20m
Gross Live Dead Since Last Survey Cumulative % Cumulative (Th.Cum/SqKm/yr) (M.Cum/yr)1 2 3 4 5 6 7 8 9 10 11 12
1 1957 234.828 234.828 02 1977 20 211.651 ‐ ‐ 23.177 23.177 9.87 0.107 1.1593 1982 5 207.302 ‐ ‐ 4.349 27.526 11.72 0.080 0.870
Average rate of silting(Th.Cum/Sq.km/Yr) in 25 years 0.102Average rate of silting (mm/yr) in 25 years 0.102Average rate of silting (M.Cum/yr) in 25 years 1.101
Name of State ‐Tamil Nadu Name of the District ‐ Madurai Name of River ‐Sathiyar Year of Impoundment ‐ 1965Catchment Area ‐ 95.71 Sq.km Reservoir Area at FRL ‐ 0.361 Sq.km MDDL ‐ 222.50m FRL ‐ 231.343m
Gross Live Dead Since Last Survey Cumulative % Cumulative (Th.Cum/SqKm/yr) M.Cum/yr)1 2 3 4 5 6 7 8 9 10 11 12
1 1965 1.586 1.334 0.2522 2010 45 1.129 1.129 0 0.457 0.4574 28.84 0.106 0.010
Average rate of silting(Th.Cum/Sq.km/Yr) in 45 years 0.106Average rate of silting (mm/yr) in 45 years 0.106Average rate of silting (M.Cum/yr) in 45 years 0.010
Loss of Capacity (M.Cum)Year of Survey
Period (Years)
Remarks
Remarks
S. NoYear of Survey
SATHIYARAR RESERVOIR
S. NoObserved Rate of Siltation Since Last Survey
Period (Years)
Reservoir Capacity(M.Cum)
Reservoir Capacity(M.Cum)
SATHANUR RESERVOIR
Loss of Capacity (M.Cum) Observed Rate of Siltation Since Last Survey
124
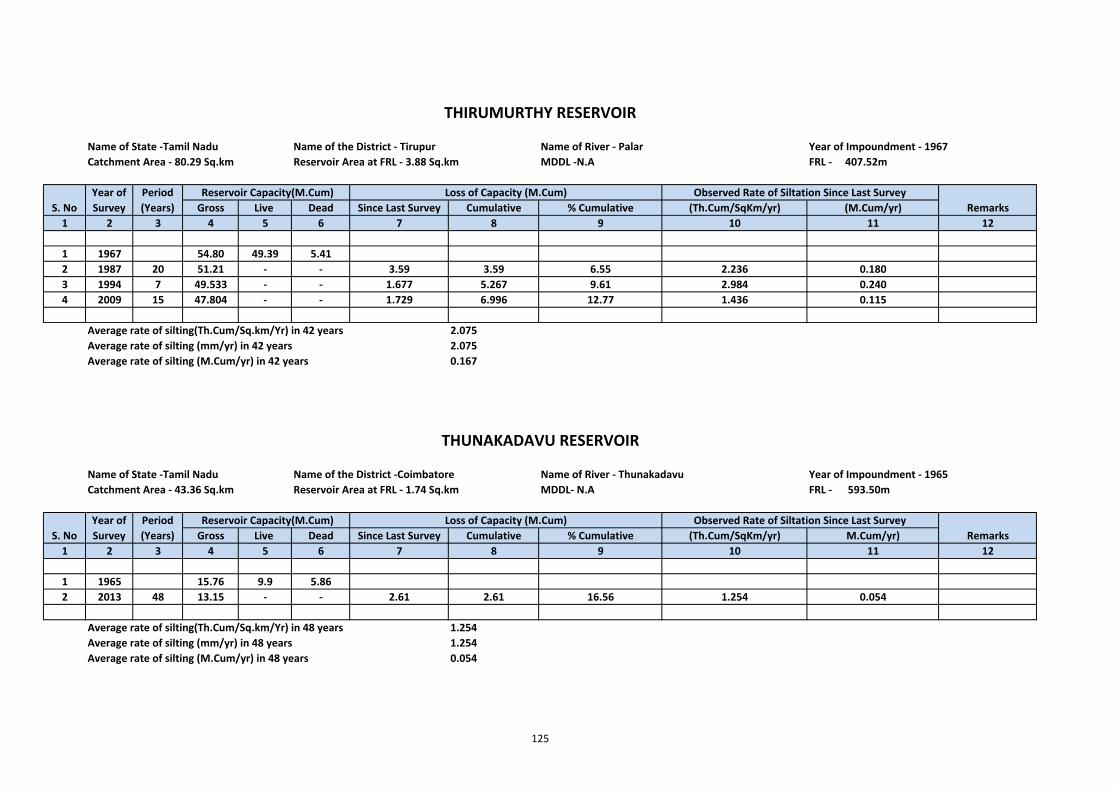
Name of State ‐Tamil Nadu Name of the District ‐ Tirupur Name of River ‐ Palar Year of Impoundment ‐ 1967Catchment Area ‐ 80.29 Sq.km Reservoir Area at FRL ‐ 3.88 Sq.km MDDL ‐N.A FRL ‐ 407.52m
Gross Live Dead Since Last Survey Cumulative % Cumulative (Th.Cum/SqKm/yr) (M.Cum/yr)1 2 3 4 5 6 7 8 9 10 11 12
1 1967 54.80 49.39 5.412 1987 20 51.21 ‐ ‐ 3.59 3.59 6.55 2.236 0.1803 1994 7 49.533 ‐ ‐ 1.677 5.267 9.61 2.984 0.2404 2009 15 47.804 ‐ ‐ 1.729 6.996 12.77 1.436 0.115
Average rate of silting(Th.Cum/Sq.km/Yr) in 42 years 2.075Average rate of silting (mm/yr) in 42 years 2.075Average rate of silting (M.Cum/yr) in 42 years 0.167
Name of State ‐Tamil Nadu Name of the District ‐Coimbatore Name of River ‐ Thunakadavu Year of Impoundment ‐ 1965Catchment Area ‐ 43.36 Sq.km Reservoir Area at FRL ‐ 1.74 Sq.km MDDL‐ N.A FRL ‐ 593.50m
Gross Live Dead Since Last Survey Cumulative % Cumulative (Th.Cum/SqKm/yr) M.Cum/yr)1 2 3 4 5 6 7 8 9 10 11 12
1 1965 15.76 9.9 5.862 2013 48 13.15 ‐ ‐ 2.61 2.61 16.56 1.254 0.054
Average rate of silting(Th.Cum/Sq.km/Yr) in 48 years 1.254Average rate of silting (mm/yr) in 48 years 1.254Average rate of silting (M.Cum/yr) in 48 years 0.054
S. NoLoss of Capacity (M.Cum)
THIRUMURTHY RESERVOIR
Observed Rate of Siltation Since Last Survey
Year of Survey
Period (Years)
Reservoir Capacity(M.Cum) Loss of Capacity (M.Cum)
Year of Survey
Observed Rate of Siltation Since Last Survey
Reservoir Capacity(M.Cum)Remarks
Period (Years)
THUNAKADAVU RESERVOIR
S. No Remarks
125
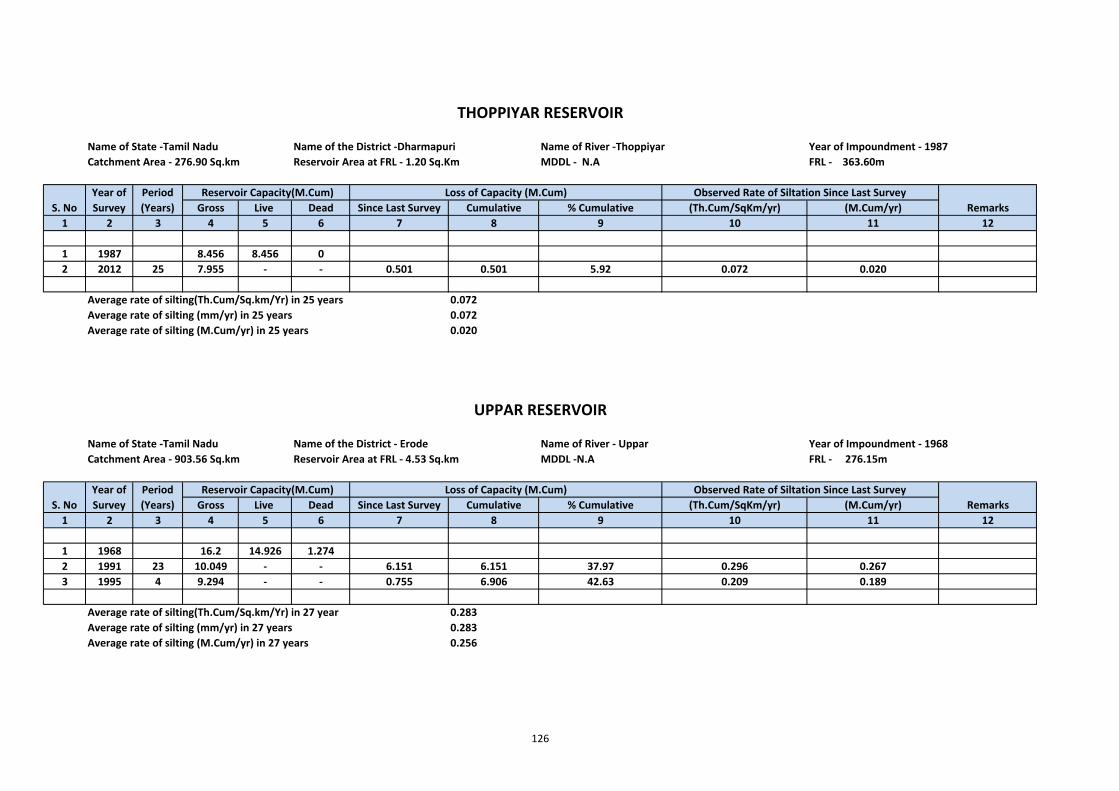
Name of State ‐Tamil Nadu Name of the District ‐Dharmapuri Name of River ‐Thoppiyar Year of Impoundment ‐ 1987Catchment Area ‐ 276.90 Sq.km Reservoir Area at FRL ‐ 1.20 Sq.Km MDDL ‐ N.A FRL ‐ 363.60m
Gross Live Dead Since Last Survey Cumulative % Cumulative (Th.Cum/SqKm/yr) (M.Cum/yr)1 2 3 4 5 6 7 8 9 10 11 12
1 1987 8.456 8.456 02 2012 25 7.955 ‐ ‐ 0.501 0.501 5.92 0.072 0.020
Average rate of silting(Th.Cum/Sq.km/Yr) in 25 years 0.072Average rate of silting (mm/yr) in 25 years 0.072Average rate of silting (M.Cum/yr) in 25 years 0.020
Name of State ‐Tamil Nadu Name of the District ‐ Erode Name of River ‐ Uppar Year of Impoundment ‐ 1968Catchment Area ‐ 903.56 Sq.km Reservoir Area at FRL ‐ 4.53 Sq.km MDDL ‐N.A FRL ‐ 276.15m
Gross Live Dead Since Last Survey Cumulative % Cumulative (Th.Cum/SqKm/yr) (M.Cum/yr)1 2 3 4 5 6 7 8 9 10 11 12
1 1968 16.2 14.926 1.2742 1991 23 10.049 ‐ ‐ 6.151 6.151 37.97 0.296 0.2673 1995 4 9.294 ‐ ‐ 0.755 6.906 42.63 0.209 0.189
Average rate of silting(Th.Cum/Sq.km/Yr) in 27 year 0.283Average rate of silting (mm/yr) in 27 years 0.283Average rate of silting (M.Cum/yr) in 27 years 0.256
THOPPIYAR RESERVOIR
Loss of Capacity (M.Cum)
UPPAR RESERVOIR
Observed Rate of Siltation Since Last Survey
S. NoPeriod (Years)
S. No
Year of Survey
Reservoir Capacity(M.Cum)Remarks
Year of Survey
Loss of Capacity (M.Cum)Period (Years)
Observed Rate of Siltation Since Last Survey
Reservoir Capacity(M.Cum)Remarks
126
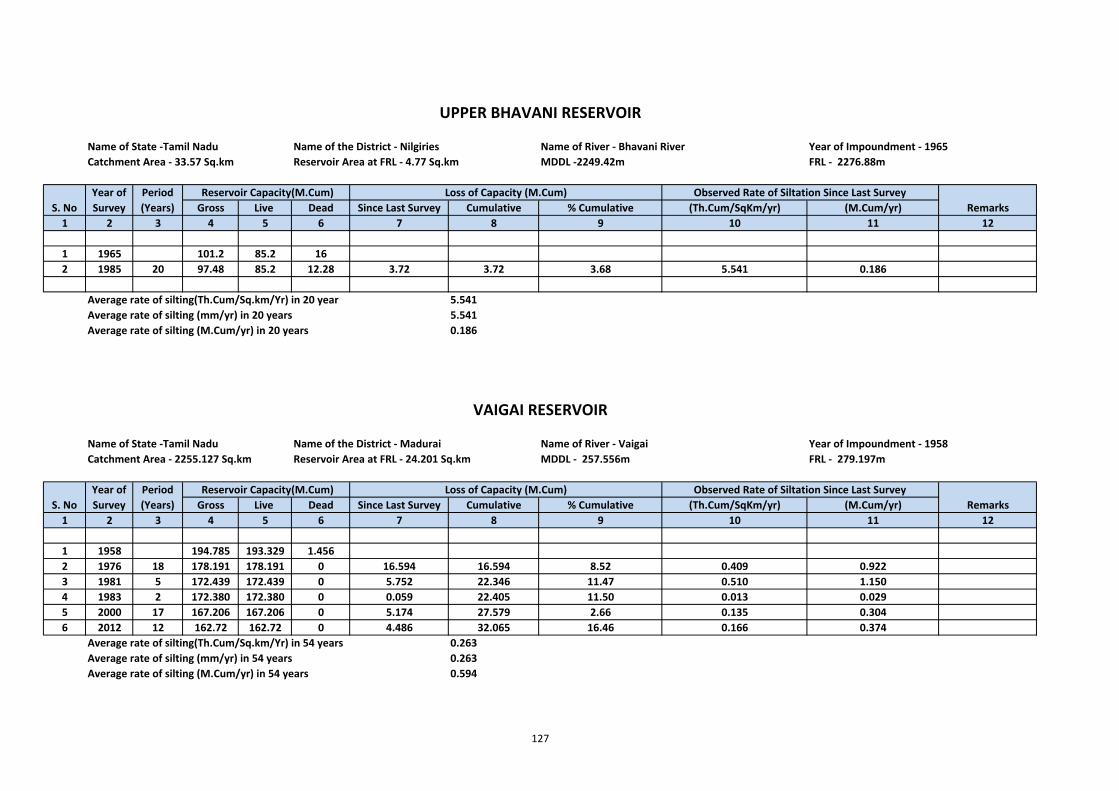
Name of State ‐Tamil Nadu Name of the District ‐ Nilgiries Name of River ‐ Bhavani River Year of Impoundment ‐ 1965Catchment Area ‐ 33.57 Sq.km Reservoir Area at FRL ‐ 4.77 Sq.km MDDL ‐2249.42m FRL ‐ 2276.88m
Gross Live Dead Since Last Survey Cumulative % Cumulative (Th.Cum/SqKm/yr) (M.Cum/yr)1 2 3 4 5 6 7 8 9 10 11 12
1 1965 101.2 85.2 162 1985 20 97.48 85.2 12.28 3.72 3.72 3.68 5.541 0.186
Average rate of silting(Th.Cum/Sq.km/Yr) in 20 year 5.541Average rate of silting (mm/yr) in 20 years 5.541Average rate of silting (M.Cum/yr) in 20 years 0.186
Name of State ‐Tamil Nadu Name of the District ‐ Madurai Name of River ‐ Vaigai Year of Impoundment ‐ 1958Catchment Area ‐ 2255.127 Sq.km Reservoir Area at FRL ‐ 24.201 Sq.km MDDL ‐ 257.556m FRL ‐ 279.197m
Gross Live Dead Since Last Survey Cumulative % Cumulative (Th.Cum/SqKm/yr) (M.Cum/yr)1 2 3 4 5 6 7 8 9 10 11 12
1 1958 194.785 193.329 1.4562 1976 18 178.191 178.191 0 16.594 16.594 8.52 0.409 0.9223 1981 5 172.439 172.439 0 5.752 22.346 11.47 0.510 1.1504 1983 2 172.380 172.380 0 0.059 22.405 11.50 0.013 0.0295 2000 17 167.206 167.206 0 5.174 27.579 2.66 0.135 0.3046 2012 12 162.72 162.72 0 4.486 32.065 16.46 0.166 0.374
Average rate of silting(Th.Cum/Sq.km/Yr) in 54 years 0.263Average rate of silting (mm/yr) in 54 years 0.263Average rate of silting (M.Cum/yr) in 54 years 0.594
Reservoir Capacity(M.Cum)Year of Survey
Period (Years)
Loss of Capacity (M.Cum) Observed Rate of Siltation Since Last SurveyRemarksS. No
VAIGAI RESERVOIR
Period (Years)
Reservoir Capacity(M.Cum) Loss of Capacity (M.Cum) Observed Rate of Siltation Since Last Survey
UPPER BHAVANI RESERVOIR
RemarksS. NoYear of Survey
127
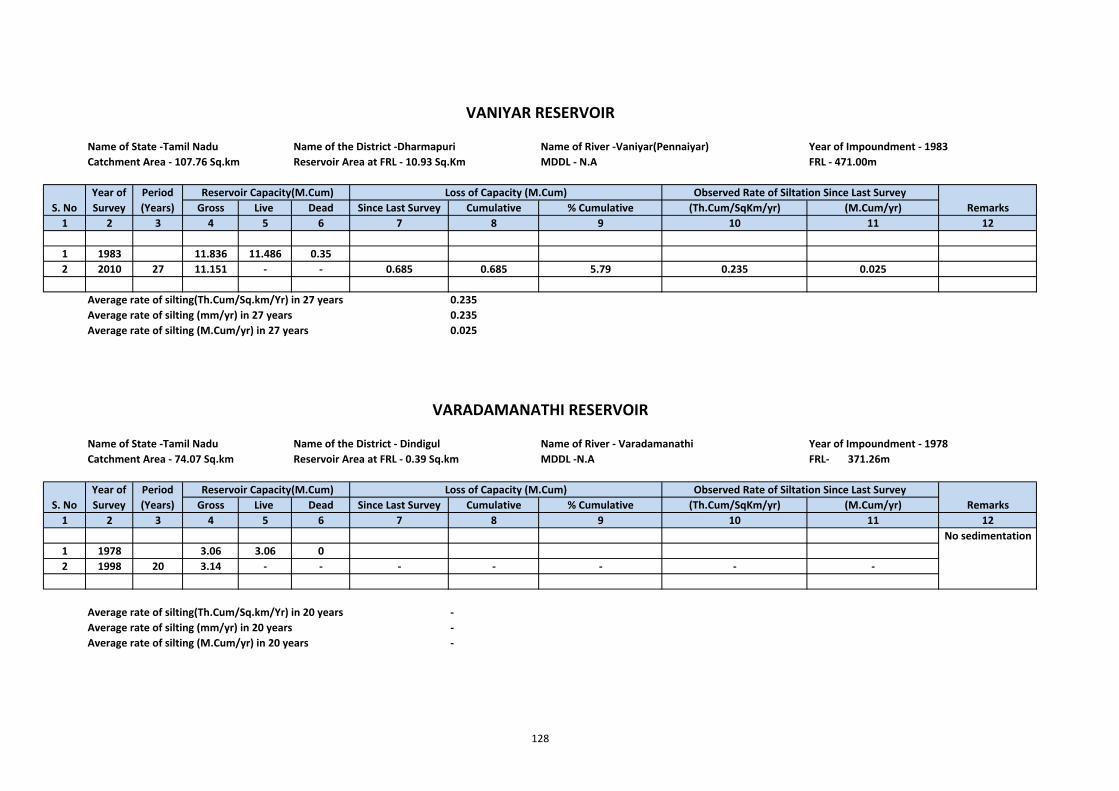
Name of State ‐Tamil Nadu Name of the District ‐Dharmapuri Name of River ‐Vaniyar(Pennaiyar) Year of Impoundment ‐ 1983Catchment Area ‐ 107.76 Sq.km Reservoir Area at FRL ‐ 10.93 Sq.Km MDDL ‐ N.A FRL ‐ 471.00m
Gross Live Dead Since Last Survey Cumulative % Cumulative (Th.Cum/SqKm/yr) (M.Cum/yr)1 2 3 4 5 6 7 8 9 10 11 12
1 1983 11.836 11.486 0.352 2010 27 11.151 ‐ ‐ 0.685 0.685 5.79 0.235 0.025
Average rate of silting(Th.Cum/Sq.km/Yr) in 27 years 0.235Average rate of silting (mm/yr) in 27 years 0.235Average rate of silting (M.Cum/yr) in 27 years 0.025
Name of State ‐Tamil Nadu Name of the District ‐ Dindigul Name of River ‐ Varadamanathi Year of Impoundment ‐ 1978Catchment Area ‐ 74.07 Sq.km Reservoir Area at FRL ‐ 0.39 Sq.km MDDL ‐N.A FRL‐ 371.26m
Gross Live Dead Since Last Survey Cumulative % Cumulative (Th.Cum/SqKm/yr) (M.Cum/yr)1 2 3 4 5 6 7 8 9 10 11 12
1 1978 3.06 3.06 02 1998 20 3.14 ‐ ‐ ‐ ‐ ‐ ‐ ‐
Average rate of silting(Th.Cum/Sq.km/Yr) in 20 years ‐Average rate of silting (mm/yr) in 20 years ‐Average rate of silting (M.Cum/yr) in 20 years ‐
No sedimentation
Loss of Capacity (M.Cum)
VANIYAR RESERVOIR
Year of Survey
Period (Years)
Reservoir Capacity(M.Cum)
VARADAMANATHI RESERVOIR
S. No RemarksObserved Rate of Siltation Since Last Survey
Period (Years)
Observed Rate of Siltation Since Last SurveyS. No
Reservoir Capacity(M.Cum)Remarks
Year of Survey
Loss of Capacity (M.Cum)
128
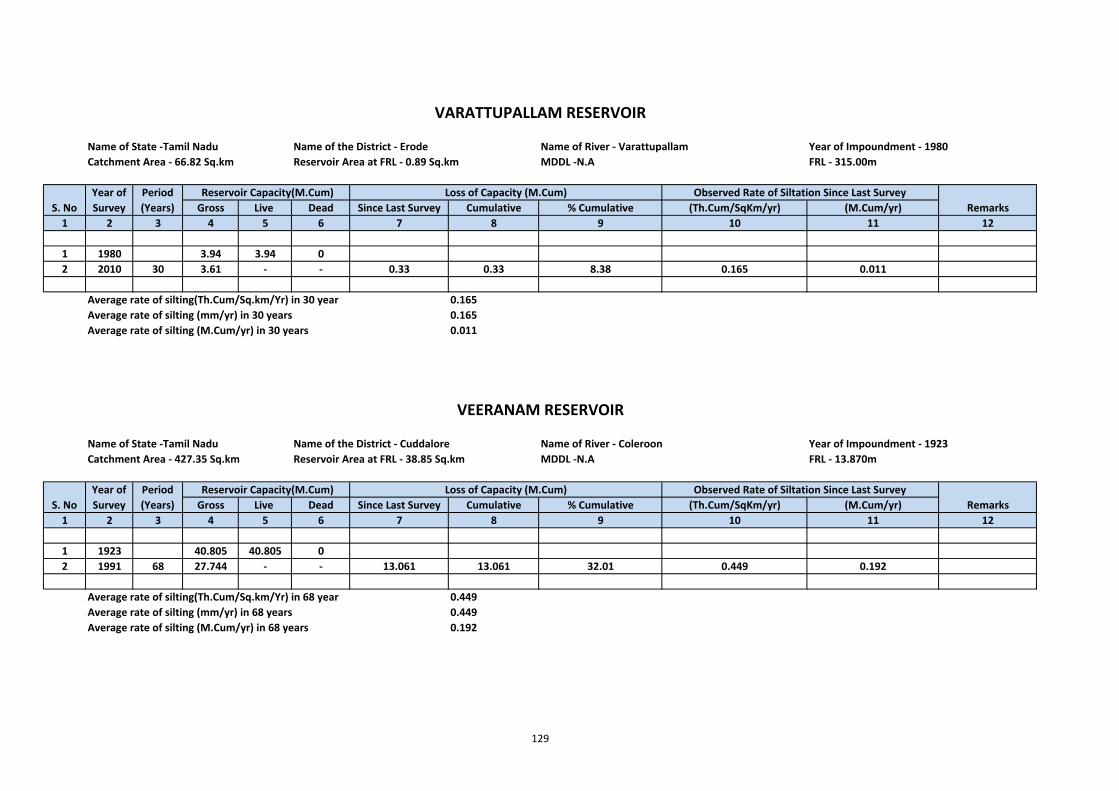
Name of State ‐Tamil Nadu Name of the District ‐ Erode Name of River ‐ Varattupallam Year of Impoundment ‐ 1980Catchment Area ‐ 66.82 Sq.km Reservoir Area at FRL ‐ 0.89 Sq.km MDDL ‐N.A FRL ‐ 315.00m
Gross Live Dead Since Last Survey Cumulative % Cumulative (Th.Cum/SqKm/yr) (M.Cum/yr)1 2 3 4 5 6 7 8 9 10 11 12
1 1980 3.94 3.94 02 2010 30 3.61 ‐ ‐ 0.33 0.33 8.38 0.165 0.011
Average rate of silting(Th.Cum/Sq.km/Yr) in 30 year 0.165Average rate of silting (mm/yr) in 30 years 0.165Average rate of silting (M.Cum/yr) in 30 years 0.011
Name of State ‐Tamil Nadu Name of the District ‐ Cuddalore Name of River ‐ Coleroon Year of Impoundment ‐ 1923Catchment Area ‐ 427.35 Sq.km Reservoir Area at FRL ‐ 38.85 Sq.km MDDL ‐N.A FRL ‐ 13.870m
Gross Live Dead Since Last Survey Cumulative % Cumulative (Th.Cum/SqKm/yr) (M.Cum/yr)1 2 3 4 5 6 7 8 9 10 11 12
1 1923 40.805 40.805 02 1991 68 27.744 ‐ ‐ 13.061 13.061 32.01 0.449 0.192
Average rate of silting(Th.Cum/Sq.km/Yr) in 68 year 0.449Average rate of silting (mm/yr) in 68 years 0.449Average rate of silting (M.Cum/yr) in 68 years 0.192
VEERANAM RESERVOIR
Observed Rate of Siltation Since Last SurveyRemarks
VARATTUPALLAM RESERVOIR
Loss of Capacity (M.Cum)Period (Years) Remarks
Year of Survey
Reservoir Capacity(M.Cum)
Reservoir Capacity(M.Cum) Loss of Capacity (M.Cum)S. No
Period (Years)
Year of Survey
Observed Rate of Siltation Since Last SurveyS. No
129
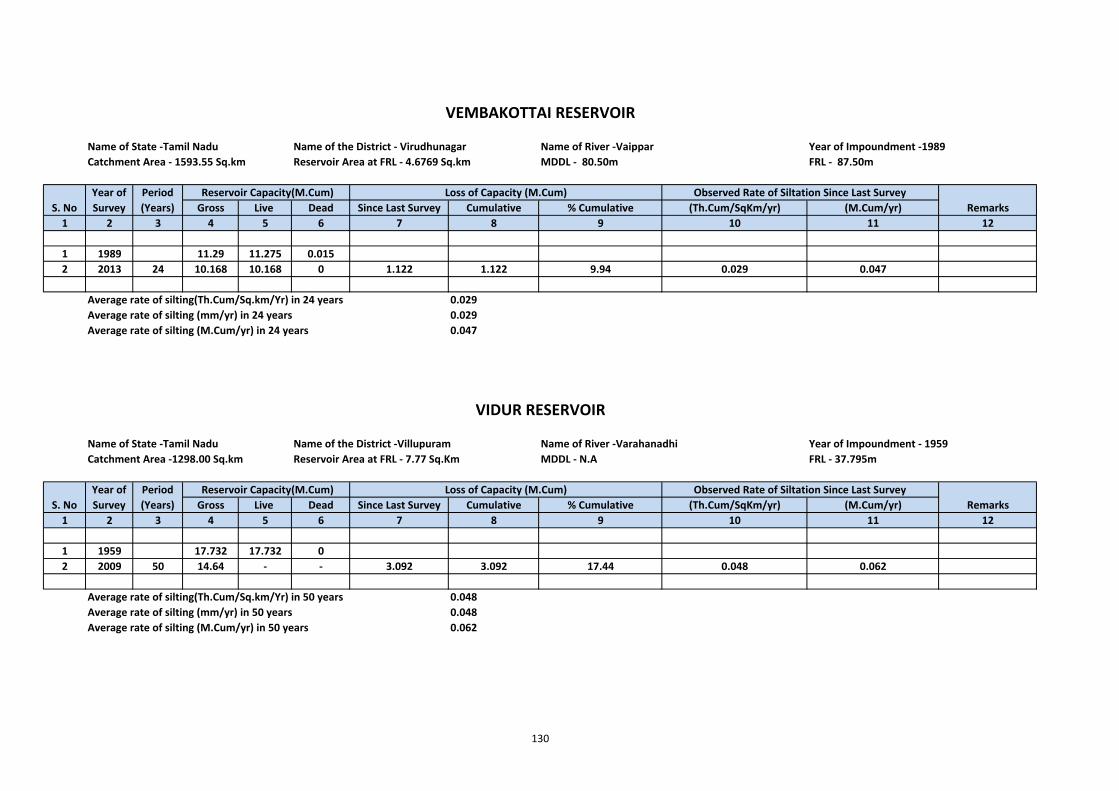
Name of State ‐Tamil Nadu Name of the District ‐ Virudhunagar Name of River ‐Vaippar Year of Impoundment ‐1989Catchment Area ‐ 1593.55 Sq.km Reservoir Area at FRL ‐ 4.6769 Sq.km MDDL ‐ 80.50m FRL ‐ 87.50m
Gross Live Dead Since Last Survey Cumulative % Cumulative (Th.Cum/SqKm/yr) (M.Cum/yr)1 2 3 4 5 6 7 8 9 10 11 12
1 1989 11.29 11.275 0.0152 2013 24 10.168 10.168 0 1.122 1.122 9.94 0.029 0.047
Average rate of silting(Th.Cum/Sq.km/Yr) in 24 years 0.029Average rate of silting (mm/yr) in 24 years 0.029Average rate of silting (M.Cum/yr) in 24 years 0.047
Name of State ‐Tamil Nadu Name of the District ‐Villupuram Name of River ‐Varahanadhi Year of Impoundment ‐ 1959Catchment Area ‐1298.00 Sq.km Reservoir Area at FRL ‐ 7.77 Sq.Km MDDL ‐ N.A FRL ‐ 37.795m
Gross Live Dead Since Last Survey Cumulative % Cumulative (Th.Cum/SqKm/yr) (M.Cum/yr)1 2 3 4 5 6 7 8 9 10 11 12
1 1959 17.732 17.732 02 2009 50 14.64 ‐ ‐ 3.092 3.092 17.44 0.048 0.062
Average rate of silting(Th.Cum/Sq.km/Yr) in 50 years 0.048Average rate of silting (mm/yr) in 50 years 0.048Average rate of silting (M.Cum/yr) in 50 years 0.062
Reservoir Capacity(M.Cum)
Loss of Capacity (M.Cum)
Loss of Capacity (M.Cum)
Year of Survey
Period (Years)
S. NoYear of Survey
Observed Rate of Siltation Since Last Survey
Observed Rate of Siltation Since Last SurveyS. No
Reservoir Capacity(M.Cum)Remarks
VIDUR RESERVOIR
Period (Years) Remarks
VEMBAKOTTAI RESERVOIR
130
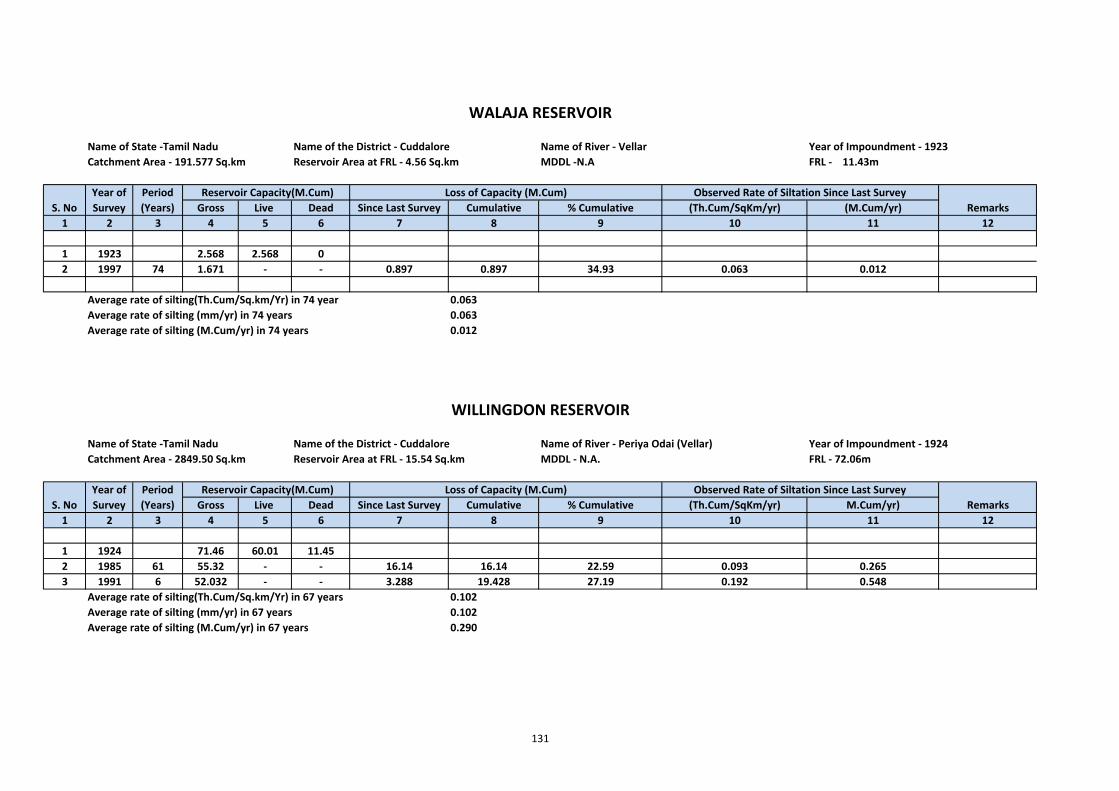
Name of State ‐Tamil Nadu Name of the District ‐ Cuddalore Name of River ‐ Vellar Year of Impoundment ‐ 1923Catchment Area ‐ 191.577 Sq.km Reservoir Area at FRL ‐ 4.56 Sq.km MDDL ‐N.A FRL ‐ 11.43m
Gross Live Dead Since Last Survey Cumulative % Cumulative (Th.Cum/SqKm/yr) (M.Cum/yr)1 2 3 4 5 6 7 8 9 10 11 12
1 1923 2.568 2.568 02 1997 74 1.671 ‐ ‐ 0.897 0.897 34.93 0.063 0.012
Average rate of silting(Th.Cum/Sq.km/Yr) in 74 year 0.063Average rate of silting (mm/yr) in 74 years 0.063Average rate of silting (M.Cum/yr) in 74 years 0.012
Name of State ‐Tamil Nadu Name of the District ‐ Cuddalore Name of River ‐ Periya Odai (Vellar) Year of Impoundment ‐ 1924Catchment Area ‐ 2849.50 Sq.km Reservoir Area at FRL ‐ 15.54 Sq.km MDDL ‐ N.A. FRL ‐ 72.06m
Gross Live Dead Since Last Survey Cumulative % Cumulative (Th.Cum/SqKm/yr) M.Cum/yr)1 2 3 4 5 6 7 8 9 10 11 12
1 1924 71.46 60.01 11.452 1985 61 55.32 ‐ ‐ 16.14 16.14 22.59 0.093 0.2653 1991 6 52.032 ‐ ‐ 3.288 19.428 27.19 0.192 0.548
Average rate of silting(Th.Cum/Sq.km/Yr) in 67 years 0.102Average rate of silting (mm/yr) in 67 years 0.102Average rate of silting (M.Cum/yr) in 67 years 0.290
S. No Remarks Reservoir Capacity(M.Cum)
S. No
WALAJA RESERVOIR
Remarks
WILLINGDON RESERVOIR
Year of Survey
Reservoir Capacity(M.Cum) Loss of Capacity (M.Cum) Observed Rate of Siltation Since Last Survey
Observed Rate of Siltation Since Last SurveyLoss of Capacity (M.Cum)Year of Survey
Period (Years)
Period (Years)
131
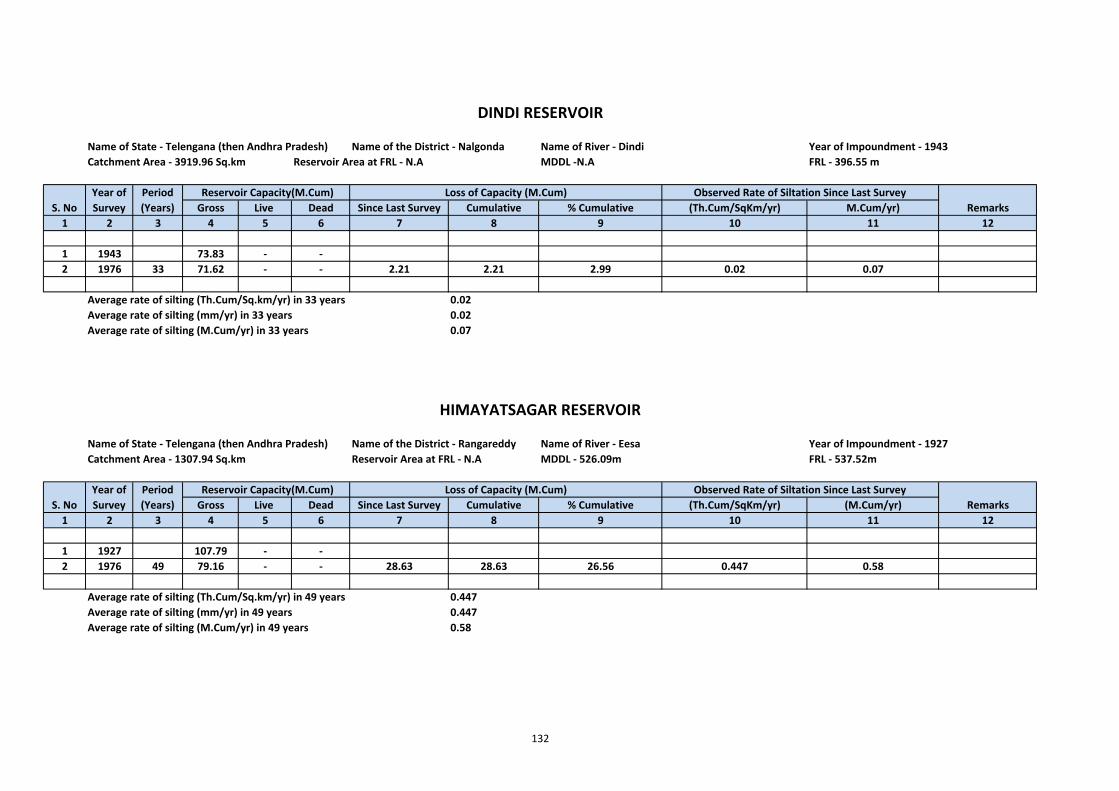
Name of State ‐ Telengana (then Andhra Pradesh) Name of the District ‐ Nalgonda Name of River ‐ Dindi Year of Impoundment ‐ 1943Catchment Area ‐ 3919.96 Sq.km Reservoir Area at FRL ‐ N.A MDDL ‐N.A FRL ‐ 396.55 m
Gross Live Dead Since Last Survey Cumulative % Cumulative (Th.Cum/SqKm/yr) M.Cum/yr)1 2 3 4 5 6 7 8 9 10 11 12
1 1943 73.83 ‐ ‐2 1976 33 71.62 ‐ ‐ 2.21 2.21 2.99 0.02 0.07
Average rate of silting (Th.Cum/Sq.km/yr) in 33 years 0.02Average rate of silting (mm/yr) in 33 years 0.02Average rate of silting (M.Cum/yr) in 33 years 0.07
Name of State ‐ Telengana (then Andhra Pradesh) Name of the District ‐ Rangareddy Name of River ‐ Eesa Year of Impoundment ‐ 1927Catchment Area ‐ 1307.94 Sq.km Reservoir Area at FRL ‐ N.A MDDL ‐ 526.09m FRL ‐ 537.52m
Gross Live Dead Since Last Survey Cumulative % Cumulative (Th.Cum/SqKm/yr) (M.Cum/yr)1 2 3 4 5 6 7 8 9 10 11 12
1 1927 107.79 ‐ ‐2 1976 49 79.16 ‐ ‐ 28.63 28.63 26.56 0.447 0.58
Average rate of silting (Th.Cum/Sq.km/yr) in 49 years 0.447Average rate of silting (mm/yr) in 49 years 0.447Average rate of silting (M.Cum/yr) in 49 years 0.58
DINDI RESERVOIR
Year of Survey
S. NoYear of Survey
HIMAYATSAGAR RESERVOIR
Reservoir Capacity(M.Cum) Observed Rate of Siltation Since Last SurveyPeriod (Years) RemarksS. No
Loss of Capacity (M.Cum)
RemarksLoss of Capacity (M.Cum)Period
(Years) Reservoir Capacity(M.Cum) Observed Rate of Siltation Since Last Survey
132
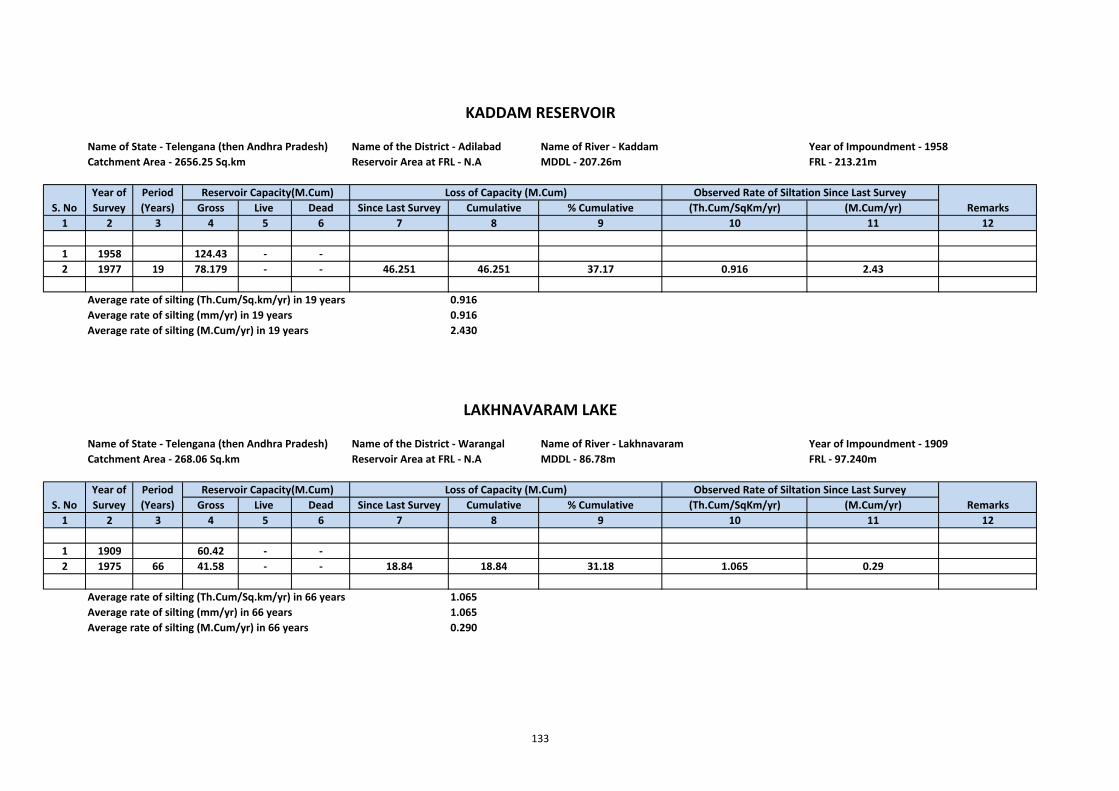
Name of State ‐ Telengana (then Andhra Pradesh) Name of the District ‐ Adilabad Name of River ‐ Kaddam Year of Impoundment ‐ 1958Catchment Area ‐ 2656.25 Sq.km Reservoir Area at FRL ‐ N.A MDDL ‐ 207.26m FRL ‐ 213.21m
Gross Live Dead Since Last Survey Cumulative % Cumulative (Th.Cum/SqKm/yr) (M.Cum/yr)1 2 3 4 5 6 7 8 9 10 11 12
1 1958 124.43 ‐ ‐2 1977 19 78.179 ‐ ‐ 46.251 46.251 37.17 0.916 2.43
Average rate of silting (Th.Cum/Sq.km/yr) in 19 years 0.916Average rate of silting (mm/yr) in 19 years 0.916Average rate of silting (M.Cum/yr) in 19 years 2.430
Name of State ‐ Telengana (then Andhra Pradesh) Name of the District ‐ Warangal Name of River ‐ Lakhnavaram Year of Impoundment ‐ 1909Catchment Area ‐ 268.06 Sq.km Reservoir Area at FRL ‐ N.A MDDL ‐ 86.78m FRL ‐ 97.240m
Gross Live Dead Since Last Survey Cumulative % Cumulative (Th.Cum/SqKm/yr) (M.Cum/yr)1 2 3 4 5 6 7 8 9 10 11 12
1 1909 60.42 ‐ ‐2 1975 66 41.58 ‐ ‐ 18.84 18.84 31.18 1.065 0.29
Average rate of silting (Th.Cum/Sq.km/yr) in 66 years 1.065Average rate of silting (mm/yr) in 66 years 1.065Average rate of silting (M.Cum/yr) in 66 years 0.290
S. No
Period (Years)
Observed Rate of Siltation Since Last Survey
Loss of Capacity (M.Cum)
Reservoir Capacity(M.Cum)Year of Survey Remarks
Period (Years)
S. NoYear of Survey
KADDAM RESERVOIR
Loss of Capacity (M.Cum)
LAKHNAVARAM LAKE
Remarks Reservoir Capacity(M.Cum) Observed Rate of Siltation Since Last Survey
133

Name of State ‐ Telengana (then Andhra Pradesh) Name of the District ‐ Medak Name of River ‐ Manjira Year of Impoundment ‐ 1966Catchment Area ‐ 16770.25 Sq.km Reservoir Area at FRL ‐ N.A MDDL ‐N.A FRL ‐N.A
Gross Live Dead Since Last Survey Cumulative % Cumulative (Th.Cum/SqKm/yr) (M.Cum/yr)1 2 3 4 5 6 7 8 9 10 11 12
1 1966 50.94 ‐ ‐2 1977 11 32.20 ‐ ‐ 18.74 18.74 36.79 0.102 1.70
Average rate of silting (Th.Cum/Sq.km/yr) in 11 years 0.102Average rate of silting (mm/yr) in 11 years 0.102Average rate of silting (M.Cum/yr) in 11 years 1.700
Name of State ‐ Telengana Name of the District ‐ Nalgonda Name of River ‐ Krishna Year of Impoundment ‐ 1967Catchment Area ‐ 215185 Sq.km Reservoir Area at FRL ‐ 295.19 Sq.km MDDL ‐ 149.00m FRL ‐ 179.83m
Gross Live Dead Since Last Survey Cumulative % Cumulative (Th.Cum/SqKm/yr) (M.Cum/yr)1 2 3 4 5 6 7 8 9 10 11 12
1 1967 11553 6840 47132 2001 34 9309.56 6158.19 3151.37 2243.44 2243.44 19.42 0.307 65.9843 2009 8 8836.045 6042.490 2793.555 473.51 2716.96 23.52 0.275 59.19
Average rate of silting (Th.Cum/Sqkm/yr) in 42 years 0.301Average rate of silting (mm/yr) in 42 years 0.301Average rate of silting (M.Cum/yr) in 42 years 64.689
Period (Years)
Reservoir Capacity(M.Cum)
S. NoLoss of Capacity (M.Cum)
NAGARJUNA SAGAR
RemarksYear of Survey S. No
Reservoir Capacity(M.Cum)Year of Survey
Period (Years)
Loss of Capacity (M.Cum)
Observed Rate of Siltation Since Last Survey
Observed Rate of Siltation Since Last Survey
Remarks
MANJIRA RESERVOIR
134
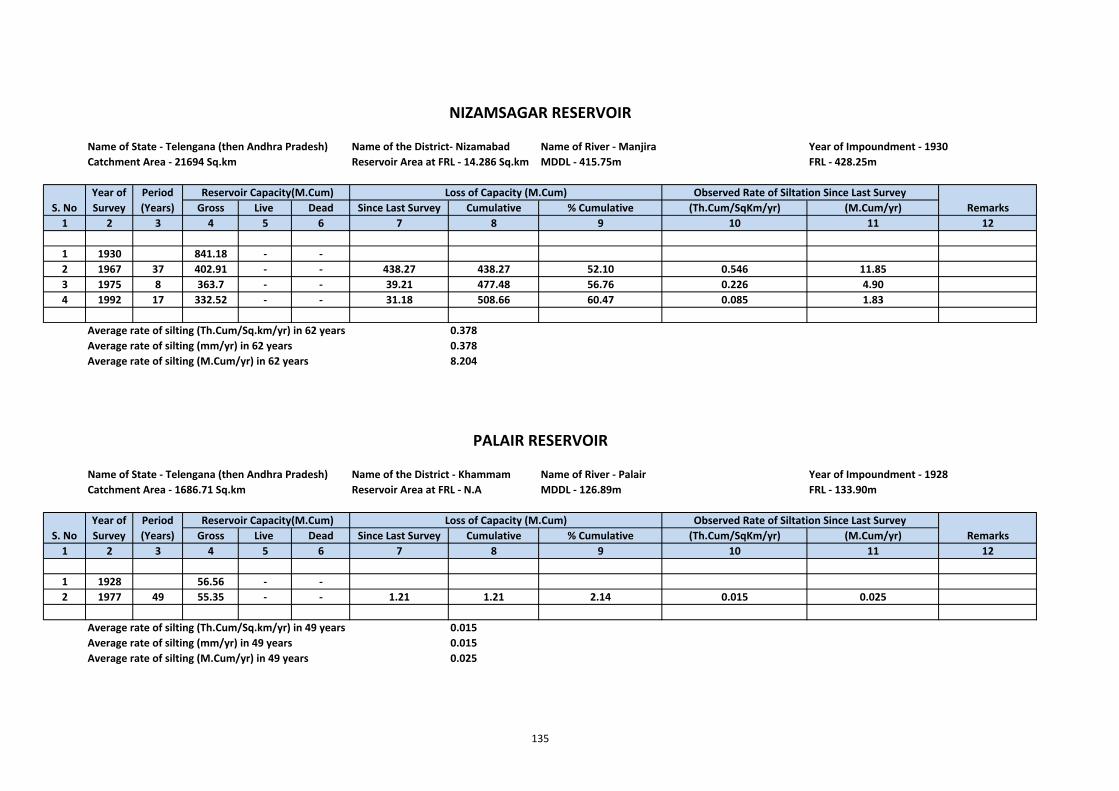
Name of State ‐ Telengana (then Andhra Pradesh) Name of the District‐ Nizamabad Name of River ‐ Manjira Year of Impoundment ‐ 1930Catchment Area ‐ 21694 Sq.km Reservoir Area at FRL ‐ 14.286 Sq.km MDDL ‐ 415.75m FRL ‐ 428.25m
Gross Live Dead Since Last Survey Cumulative % Cumulative (Th.Cum/SqKm/yr) (M.Cum/yr)1 2 3 4 5 6 7 8 9 10 11 12
1 1930 841.18 ‐ ‐2 1967 37 402.91 ‐ ‐ 438.27 438.27 52.10 0.546 11.853 1975 8 363.7 ‐ ‐ 39.21 477.48 56.76 0.226 4.904 1992 17 332.52 ‐ ‐ 31.18 508.66 60.47 0.085 1.83
Average rate of silting (Th.Cum/Sq.km/yr) in 62 years 0.378Average rate of silting (mm/yr) in 62 years 0.378Average rate of silting (M.Cum/yr) in 62 years 8.204
Name of State ‐ Telengana (then Andhra Pradesh) Name of the District ‐ Khammam Name of River ‐ Palair Year of Impoundment ‐ 1928Catchment Area ‐ 1686.71 Sq.km Reservoir Area at FRL ‐ N.A MDDL ‐ 126.89m FRL ‐ 133.90m
Gross Live Dead Since Last Survey Cumulative % Cumulative (Th.Cum/SqKm/yr) (M.Cum/yr)1 2 3 4 5 6 7 8 9 10 11 12
1 1928 56.56 ‐ ‐2 1977 49 55.35 ‐ ‐ 1.21 1.21 2.14 0.015 0.025
Average rate of silting (Th.Cum/Sq.km/yr) in 49 years 0.015Average rate of silting (mm/yr) in 49 years 0.015Average rate of silting (M.Cum/yr) in 49 years 0.025
S. No
S. No
Remarks
Period (Years) Remarks
Year of Survey
Reservoir Capacity(M.Cum)
Loss of Capacity (M.Cum) Reservoir Capacity(M.Cum)
Observed Rate of Siltation Since Last SurveyLoss of Capacity (M.Cum)
Year of Survey
Period (Years)
Observed Rate of Siltation Since Last Survey
NIZAMSAGAR RESERVOIR
PALAIR RESERVOIR
135
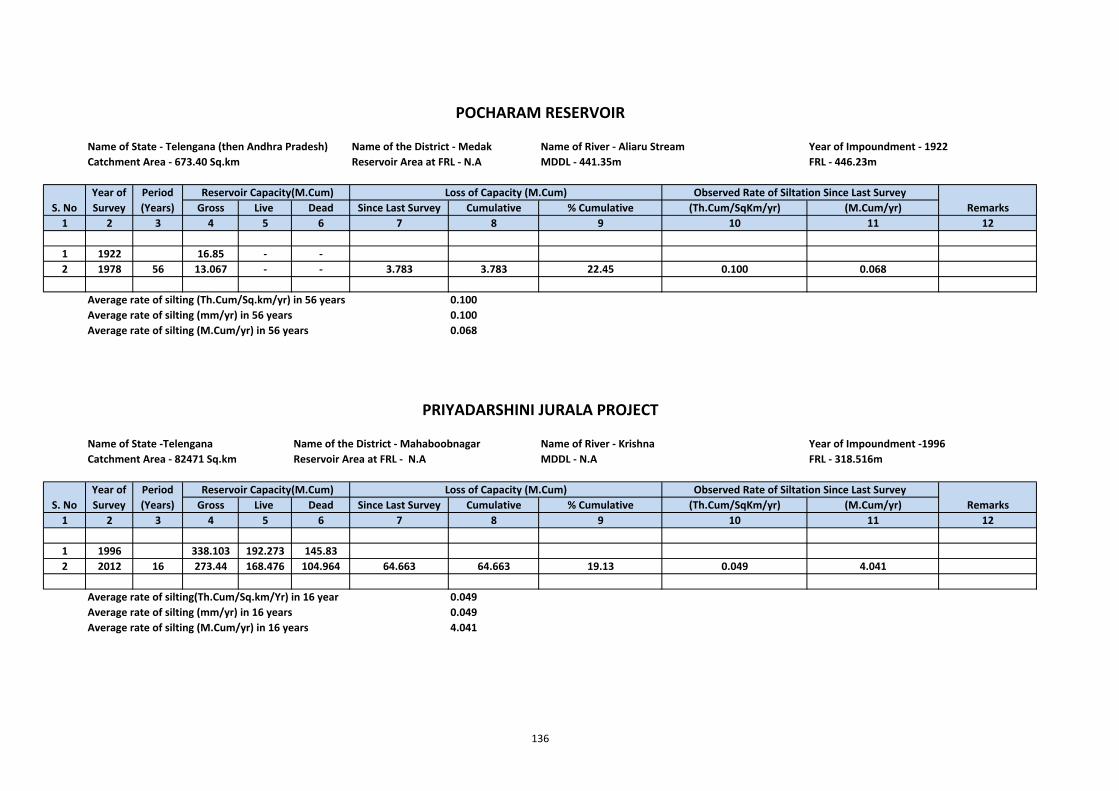
Name of State ‐ Telengana (then Andhra Pradesh) Name of the District ‐ Medak Name of River ‐ Aliaru Stream Year of Impoundment ‐ 1922Catchment Area ‐ 673.40 Sq.km Reservoir Area at FRL ‐ N.A MDDL ‐ 441.35m FRL ‐ 446.23m
Gross Live Dead Since Last Survey Cumulative % Cumulative (Th.Cum/SqKm/yr) (M.Cum/yr)1 2 3 4 5 6 7 8 9 10 11 12
1 1922 16.85 ‐ ‐2 1978 56 13.067 ‐ ‐ 3.783 3.783 22.45 0.100 0.068
Average rate of silting (Th.Cum/Sq.km/yr) in 56 years 0.100Average rate of silting (mm/yr) in 56 years 0.100Average rate of silting (M.Cum/yr) in 56 years 0.068
Name of State ‐Telengana Name of the District ‐ Mahaboobnagar Name of River ‐ Krishna Year of Impoundment ‐1996 Catchment Area ‐ 82471 Sq.km Reservoir Area at FRL ‐ N.A MDDL ‐ N.A FRL ‐ 318.516m
Gross Live Dead Since Last Survey Cumulative % Cumulative (Th.Cum/SqKm/yr) (M.Cum/yr)1 2 3 4 5 6 7 8 9 10 11 12
1 1996 338.103 192.273 145.832 2012 16 273.44 168.476 104.964 64.663 64.663 19.13 0.049 4.041
Average rate of silting(Th.Cum/Sq.km/Yr) in 16 year 0.049Average rate of silting (mm/yr) in 16 years 0.049Average rate of silting (M.Cum/yr) in 16 years 4.041
Period (Years)
Period (Years)
Loss of Capacity (M.Cum) Observed Rate of Siltation Since Last Survey Reservoir Capacity(M.Cum)
Observed Rate of Siltation Since Last Survey Reservoir Capacity(M.Cum)S. No Remarks
Year of Survey
Loss of Capacity (M.Cum)
POCHARAM RESERVOIR
PRIYADARSHINI JURALA PROJECT
RemarksS. No
Year of Survey
136
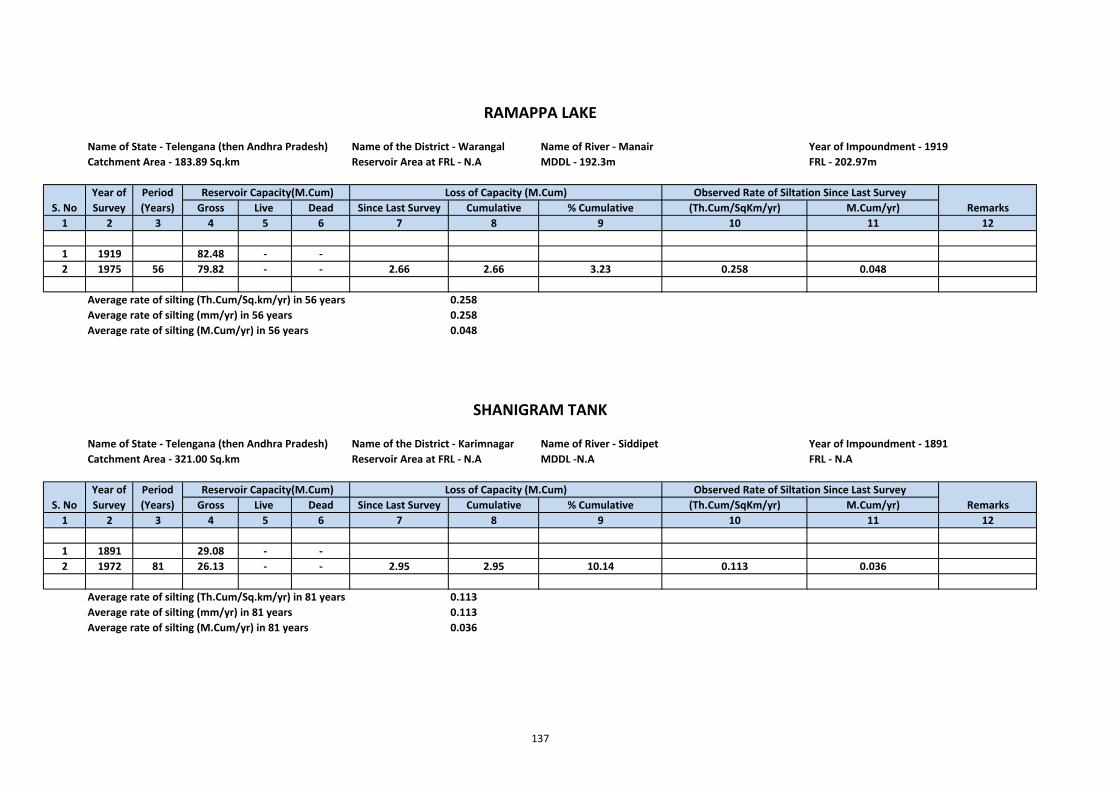
Name of State ‐ Telengana (then Andhra Pradesh) Name of the District ‐ Warangal Name of River ‐ Manair Year of Impoundment ‐ 1919Catchment Area ‐ 183.89 Sq.km Reservoir Area at FRL ‐ N.A MDDL ‐ 192.3m FRL ‐ 202.97m
Gross Live Dead Since Last Survey Cumulative % Cumulative (Th.Cum/SqKm/yr) M.Cum/yr)1 2 3 4 5 6 7 8 9 10 11 12
1 1919 82.48 ‐ ‐2 1975 56 79.82 ‐ ‐ 2.66 2.66 3.23 0.258 0.048
Average rate of silting (Th.Cum/Sq.km/yr) in 56 years 0.258Average rate of silting (mm/yr) in 56 years 0.258Average rate of silting (M.Cum/yr) in 56 years 0.048
Name of State ‐ Telengana (then Andhra Pradesh) Name of the District ‐ Karimnagar Name of River ‐ Siddipet Year of Impoundment ‐ 1891Catchment Area ‐ 321.00 Sq.km Reservoir Area at FRL ‐ N.A MDDL ‐N.A FRL ‐ N.A
Gross Live Dead Since Last Survey Cumulative % Cumulative (Th.Cum/SqKm/yr) M.Cum/yr)1 2 3 4 5 6 7 8 9 10 11 12
1 1891 29.08 ‐ ‐2 1972 81 26.13 ‐ ‐ 2.95 2.95 10.14 0.113 0.036
Average rate of silting (Th.Cum/Sq.km/yr) in 81 years 0.113Average rate of silting (mm/yr) in 81 years 0.113Average rate of silting (M.Cum/yr) in 81 years 0.036
Reservoir Capacity(M.Cum)Remarks
RAMAPPA LAKE
Period (Years)S. No
RemarksYear of Survey
Period (Years)
Loss of Capacity (M.Cum) Reservoir Capacity(M.Cum) Observed Rate of Siltation Since Last Survey
SHANIGRAM TANK
Observed Rate of Siltation Since Last SurveyYear of Survey
Loss of Capacity (M.Cum)
S. No
137
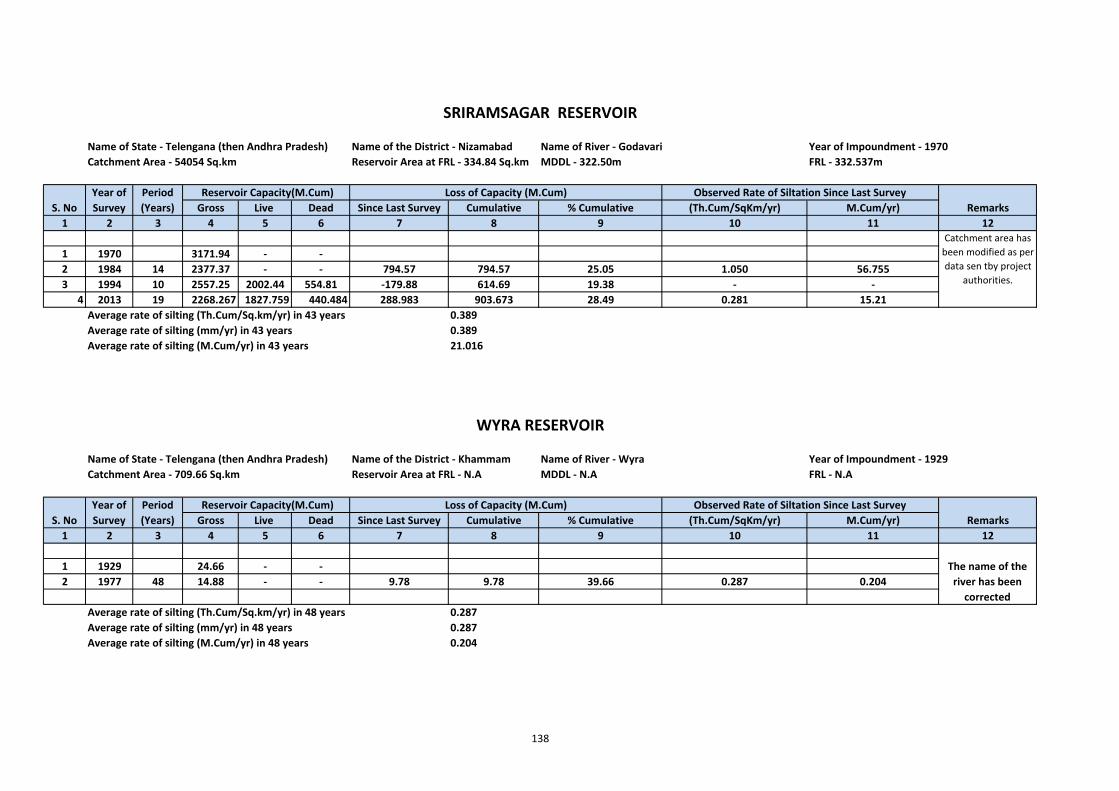
Name of State ‐ Telengana (then Andhra Pradesh) Name of the District ‐ Nizamabad Name of River ‐ Godavari Year of Impoundment ‐ 1970Catchment Area ‐ 54054 Sq.km Reservoir Area at FRL ‐ 334.84 Sq.km MDDL ‐ 322.50m FRL ‐ 332.537m
Gross Live Dead Since Last Survey Cumulative % Cumulative (Th.Cum/SqKm/yr) M.Cum/yr)1 2 3 4 5 6 7 8 9 10 11 12
1 1970 3171.94 ‐ ‐2 1984 14 2377.37 ‐ ‐ 794.57 794.57 25.05 1.050 56.7553 1994 10 2557.25 2002.44 554.81 ‐179.88 614.69 19.38 ‐ ‐
4 2013 19 2268.267 1827.759 440.484 288.983 903.673 28.49 0.281 15.21Average rate of silting (Th.Cum/Sq.km/yr) in 43 years 0.389Average rate of silting (mm/yr) in 43 years 0.389Average rate of silting (M.Cum/yr) in 43 years 21.016
Name of State ‐ Telengana (then Andhra Pradesh) Name of the District ‐ Khammam Name of River ‐ Wyra Year of Impoundment ‐ 1929Catchment Area ‐ 709.66 Sq.km Reservoir Area at FRL ‐ N.A MDDL ‐ N.A FRL ‐ N.A
Gross Live Dead Since Last Survey Cumulative % Cumulative (Th.Cum/SqKm/yr) M.Cum/yr)1 2 3 4 5 6 7 8 9 10 11 12
1 1929 24.66 ‐ ‐2 1977 48 14.88 ‐ ‐ 9.78 9.78 39.66 0.287 0.204
Average rate of silting (Th.Cum/Sq.km/yr) in 48 years 0.287Average rate of silting (mm/yr) in 48 years 0.287Average rate of silting (M.Cum/yr) in 48 years 0.204
Observed Rate of Siltation Since Last Survey
S. NoPeriod (Years)
Remarks
Loss of Capacity (M.Cum)
S. NoYear of Survey
Reservoir Capacity(M.Cum) Observed Rate of Siltation Since Last Survey
The name of the river has been corrected
Remarks
Period (Years)
Year of Survey
Catchment area has been modified as per data sen tby project
authorities.
WYRA RESERVOIR
SRIRAMSAGAR RESERVOIR
Reservoir Capacity(M.Cum) Loss of Capacity (M.Cum)
138
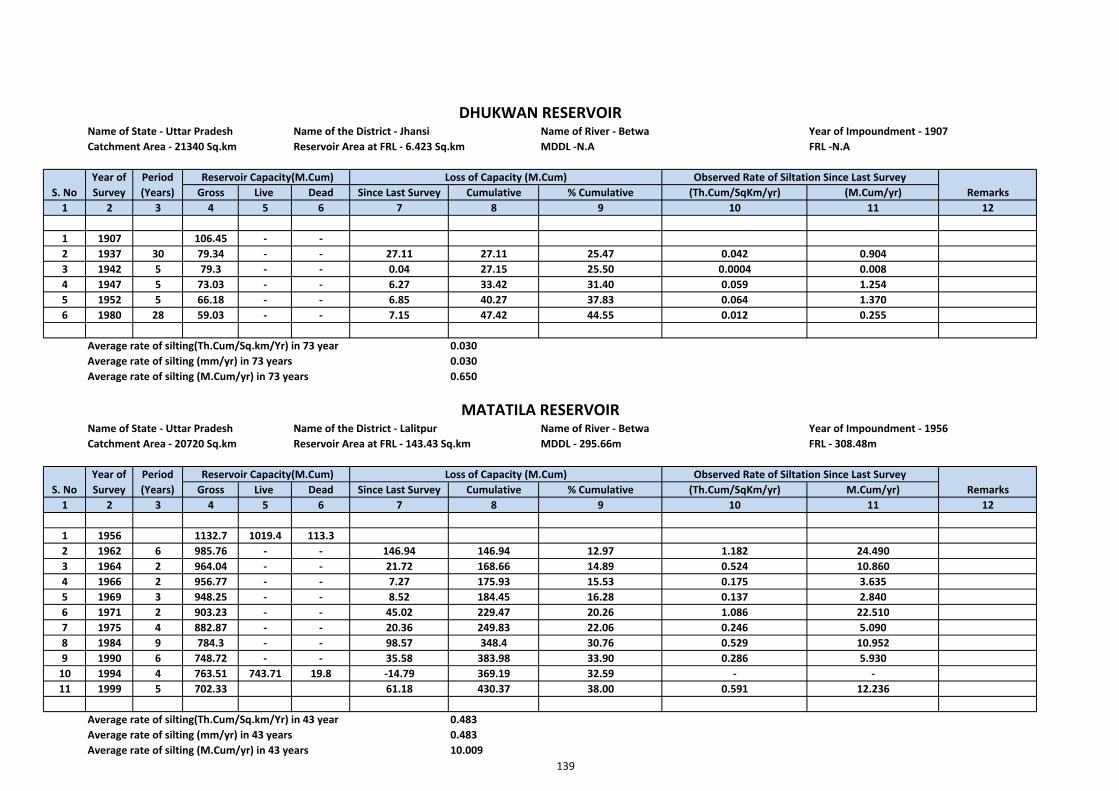
Name of State ‐ Uttar Pradesh Name of the District ‐ Jhansi Name of River ‐ Betwa Year of Impoundment ‐ 1907Catchment Area ‐ 21340 Sq.km Reservoir Area at FRL ‐ 6.423 Sq.km MDDL ‐N.A FRL ‐N.A
Gross Live Dead Since Last Survey Cumulative % Cumulative (Th.Cum/SqKm/yr) (M.Cum/yr)1 2 3 4 5 6 7 8 9 10 11 12
1 1907 106.45 ‐ ‐2 1937 30 79.34 ‐ ‐ 27.11 27.11 25.47 0.042 0.9043 1942 5 79.3 ‐ ‐ 0.04 27.15 25.50 0.0004 0.0084 1947 5 73.03 ‐ ‐ 6.27 33.42 31.40 0.059 1.2545 1952 5 66.18 ‐ ‐ 6.85 40.27 37.83 0.064 1.3706 1980 28 59.03 ‐ ‐ 7.15 47.42 44.55 0.012 0.255
Average rate of silting(Th.Cum/Sq.km/Yr) in 73 year 0.030Average rate of silting (mm/yr) in 73 years 0.030Average rate of silting (M.Cum/yr) in 73 years 0.650
Name of State ‐ Uttar Pradesh Name of the District ‐ Lalitpur Name of River ‐ Betwa Year of Impoundment ‐ 1956Catchment Area ‐ 20720 Sq.km Reservoir Area at FRL ‐ 143.43 Sq.km MDDL ‐ 295.66m FRL ‐ 308.48m
Gross Live Dead Since Last Survey Cumulative % Cumulative (Th.Cum/SqKm/yr) M.Cum/yr)1 2 3 4 5 6 7 8 9 10 11 12
1 1956 1132.7 1019.4 113.32 1962 6 985.76 ‐ ‐ 146.94 146.94 12.97 1.182 24.4903 1964 2 964.04 ‐ ‐ 21.72 168.66 14.89 0.524 10.8604 1966 2 956.77 ‐ ‐ 7.27 175.93 15.53 0.175 3.6355 1969 3 948.25 ‐ ‐ 8.52 184.45 16.28 0.137 2.8406 1971 2 903.23 ‐ ‐ 45.02 229.47 20.26 1.086 22.5107 1975 4 882.87 ‐ ‐ 20.36 249.83 22.06 0.246 5.0908 1984 9 784.3 ‐ ‐ 98.57 348.4 30.76 0.529 10.9529 1990 6 748.72 ‐ ‐ 35.58 383.98 33.90 0.286 5.93010 1994 4 763.51 743.71 19.8 ‐14.79 369.19 32.59 ‐ ‐11 1999 5 702.33 61.18 430.37 38.00 0.591 12.236
Average rate of silting(Th.Cum/Sq.km/Yr) in 43 year 0.483Average rate of silting (mm/yr) in 43 years 0.483Average rate of silting (M.Cum/yr) in 43 years 10.009
Observed Rate of Siltation Since Last SurveyLoss of Capacity (M.Cum)Year of Survey S. No
Year of Survey
DHUKWAN RESERVOIR
Remarks
Period (Years)
Reservoir Capacity(M.Cum)S. No
Loss of Capacity (M.Cum)Remarks
Period (Years)
Observed Rate of Siltation Since Last Survey
MATATILA RESERVOIR
Reservoir Capacity(M.Cum)
139
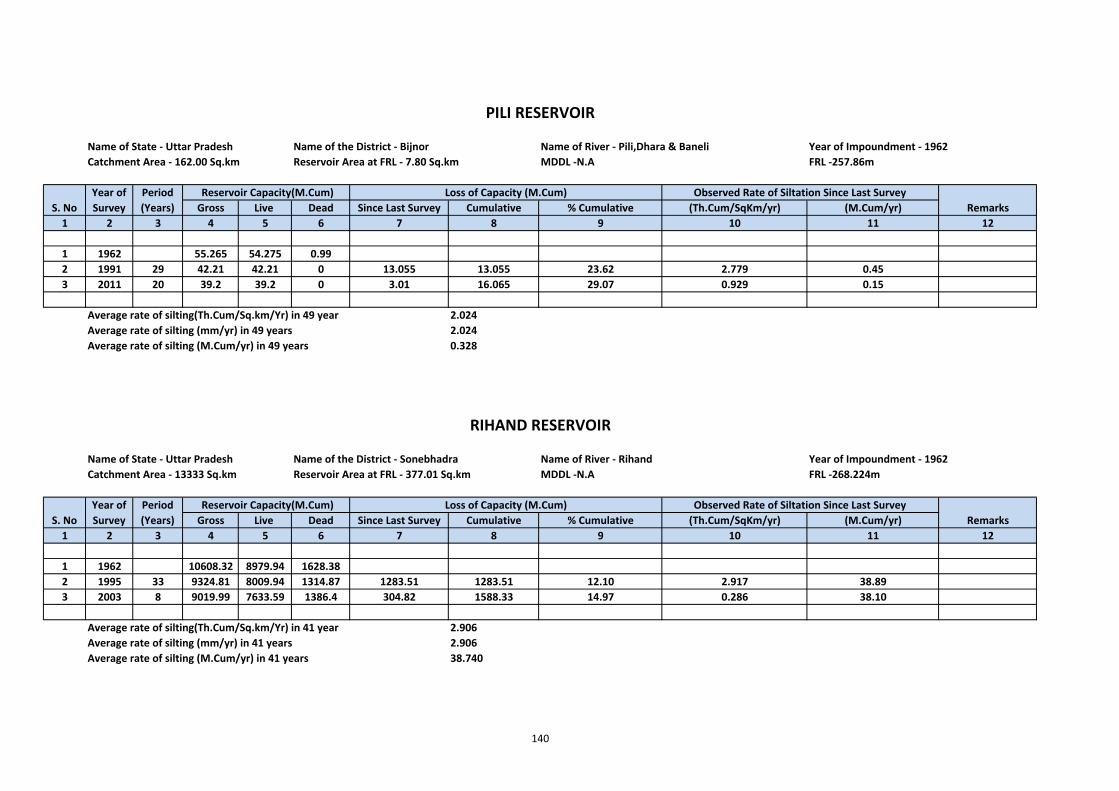
Name of State ‐ Uttar Pradesh Name of the District ‐ Bijnor Name of River ‐ Pili,Dhara & Baneli Year of Impoundment ‐ 1962Catchment Area ‐ 162.00 Sq.km Reservoir Area at FRL ‐ 7.80 Sq.km MDDL ‐N.A FRL ‐257.86m
Gross Live Dead Since Last Survey Cumulative % Cumulative (Th.Cum/SqKm/yr) (M.Cum/yr)1 2 3 4 5 6 7 8 9 10 11 12
1 1962 55.265 54.275 0.992 1991 29 42.21 42.21 0 13.055 13.055 23.62 2.779 0.453 2011 20 39.2 39.2 0 3.01 16.065 29.07 0.929 0.15
Average rate of silting(Th.Cum/Sq.km/Yr) in 49 year 2.024Average rate of silting (mm/yr) in 49 years 2.024Average rate of silting (M.Cum/yr) in 49 years 0.328
Name of State ‐ Uttar Pradesh Name of the District ‐ Sonebhadra Name of River ‐ Rihand Year of Impoundment ‐ 1962Catchment Area ‐ 13333 Sq.km Reservoir Area at FRL ‐ 377.01 Sq.km MDDL ‐N.A FRL ‐268.224m
Gross Live Dead Since Last Survey Cumulative % Cumulative (Th.Cum/SqKm/yr) (M.Cum/yr)1 2 3 4 5 6 7 8 9 10 11 12
1 1962 10608.32 8979.94 1628.382 1995 33 9324.81 8009.94 1314.87 1283.51 1283.51 12.10 2.917 38.893 2003 8 9019.99 7633.59 1386.4 304.82 1588.33 14.97 0.286 38.10
Average rate of silting(Th.Cum/Sq.km/Yr) in 41 year 2.906Average rate of silting (mm/yr) in 41 years 2.906Average rate of silting (M.Cum/yr) in 41 years 38.740
Year of Survey
RIHAND RESERVOIR
Year of Survey
Period (Years)
Reservoir Capacity(M.Cum)
Period (Years)
PILI RESERVOIR
S. No
S. No
Loss of Capacity (M.Cum)
Loss of Capacity (M.Cum)
Remarks
Remarks Reservoir Capacity(M.Cum) Observed Rate of Siltation Since Last Survey
Observed Rate of Siltation Since Last Survey
140
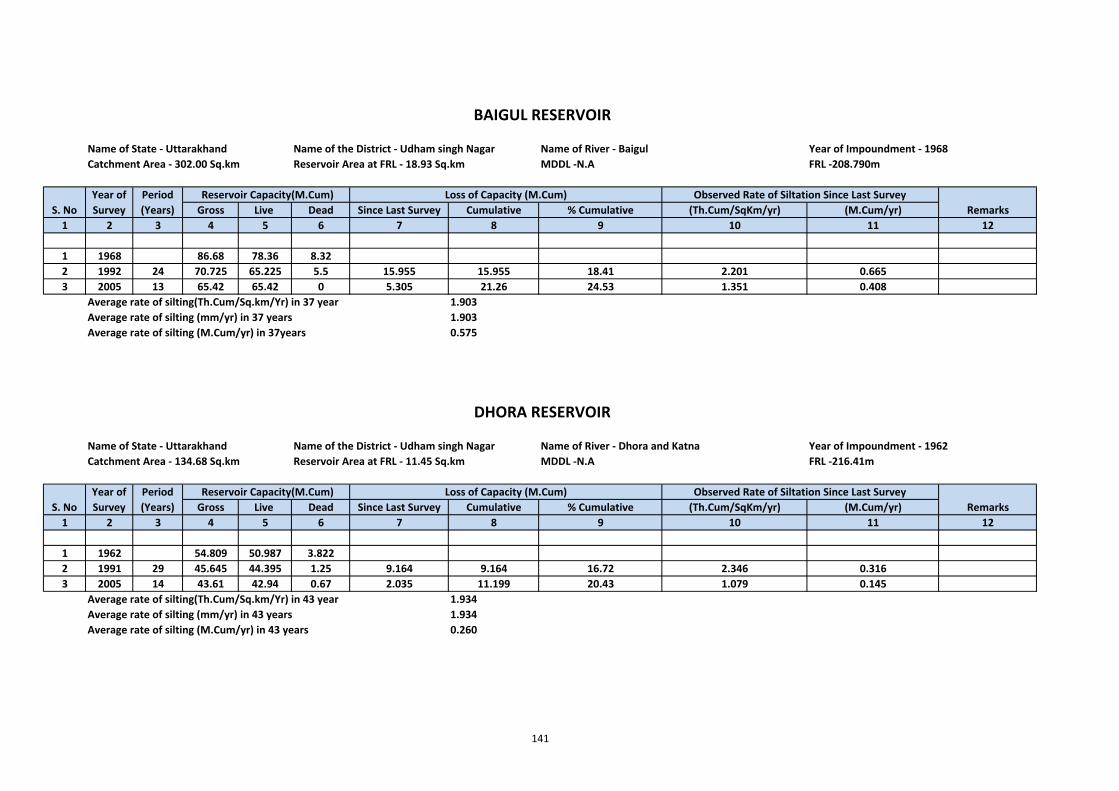
Name of State ‐ Uttarakhand Name of the District ‐ Udham singh Nagar Name of River ‐ Baigul Year of Impoundment ‐ 1968Catchment Area ‐ 302.00 Sq.km Reservoir Area at FRL ‐ 18.93 Sq.km MDDL ‐N.A FRL ‐208.790m
Gross Live Dead Since Last Survey Cumulative % Cumulative (Th.Cum/SqKm/yr) (M.Cum/yr)1 2 3 4 5 6 7 8 9 10 11 12
1 1968 86.68 78.36 8.322 1992 24 70.725 65.225 5.5 15.955 15.955 18.41 2.201 0.6653 2005 13 65.42 65.42 0 5.305 21.26 24.53 1.351 0.408
Average rate of silting(Th.Cum/Sq.km/Yr) in 37 year 1.903Average rate of silting (mm/yr) in 37 years 1.903Average rate of silting (M.Cum/yr) in 37years 0.575
Name of State ‐ Uttarakhand Name of the District ‐ Udham singh Nagar Name of River ‐ Dhora and Katna Year of Impoundment ‐ 1962Catchment Area ‐ 134.68 Sq.km Reservoir Area at FRL ‐ 11.45 Sq.km MDDL ‐N.A FRL ‐216.41m
Gross Live Dead Since Last Survey Cumulative % Cumulative (Th.Cum/SqKm/yr) (M.Cum/yr)1 2 3 4 5 6 7 8 9 10 11 12
1 1962 54.809 50.987 3.8222 1991 29 45.645 44.395 1.25 9.164 9.164 16.72 2.346 0.3163 2005 14 43.61 42.94 0.67 2.035 11.199 20.43 1.079 0.145
Average rate of silting(Th.Cum/Sq.km/Yr) in 43 year 1.934Average rate of silting (mm/yr) in 43 years 1.934Average rate of silting (M.Cum/yr) in 43 years 0.260
BAIGUL RESERVOIR
S. NoYear of Survey
Remarks
DHORA RESERVOIR
Observed Rate of Siltation Since Last Survey
Loss of Capacity (M.Cum) Observed Rate of Siltation Since Last SurveyPeriod (Years)
Reservoir Capacity(M.Cum)Remarks
Year of Survey
Reservoir Capacity(M.Cum)S. No
Period (Years)
Loss of Capacity (M.Cum)
141
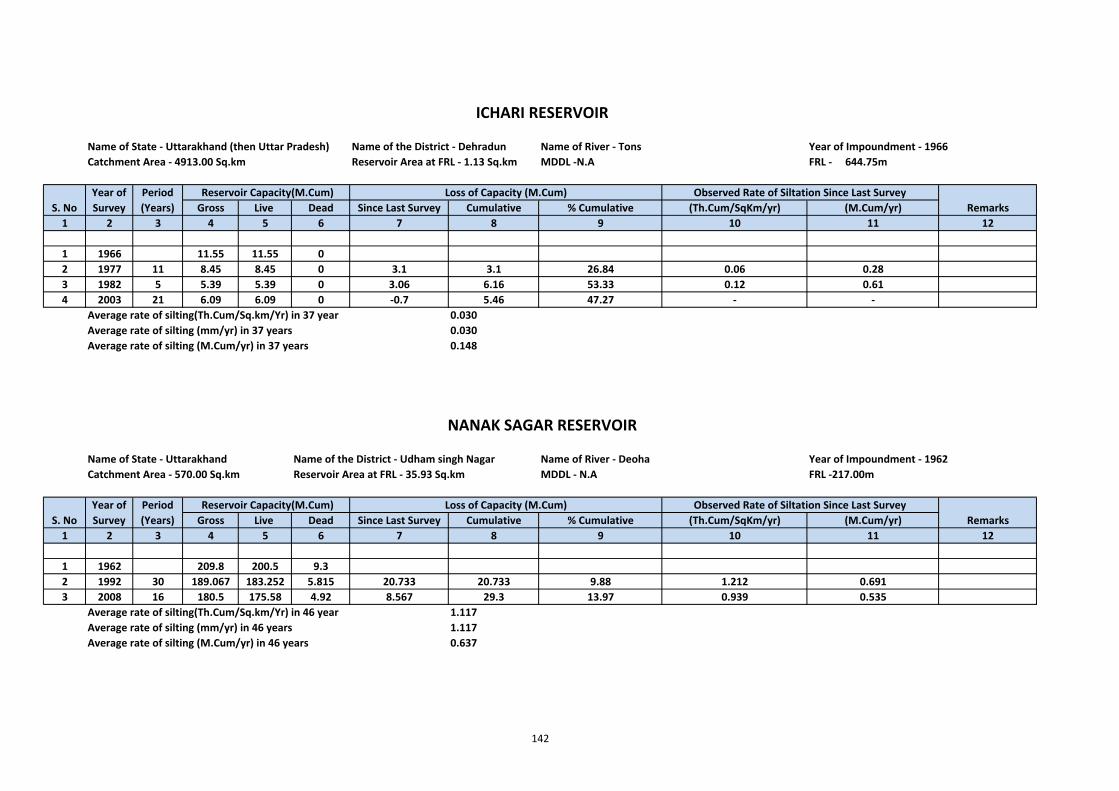
Name of State ‐ Uttarakhand (then Uttar Pradesh) Name of the District ‐ Dehradun Name of River ‐ Tons Year of Impoundment ‐ 1966Catchment Area ‐ 4913.00 Sq.km Reservoir Area at FRL ‐ 1.13 Sq.km MDDL ‐N.A FRL ‐ 644.75m
Gross Live Dead Since Last Survey Cumulative % Cumulative (Th.Cum/SqKm/yr) (M.Cum/yr)1 2 3 4 5 6 7 8 9 10 11 12
1 1966 11.55 11.55 02 1977 11 8.45 8.45 0 3.1 3.1 26.84 0.06 0.283 1982 5 5.39 5.39 0 3.06 6.16 53.33 0.12 0.614 2003 21 6.09 6.09 0 ‐0.7 5.46 47.27 ‐ ‐
Average rate of silting(Th.Cum/Sq.km/Yr) in 37 year 0.030Average rate of silting (mm/yr) in 37 years 0.030Average rate of silting (M.Cum/yr) in 37 years 0.148
Name of State ‐ Uttarakhand Name of the District ‐ Udham singh Nagar Name of River ‐ Deoha Year of Impoundment ‐ 1962Catchment Area ‐ 570.00 Sq.km Reservoir Area at FRL ‐ 35.93 Sq.km MDDL ‐ N.A FRL ‐217.00m
Gross Live Dead Since Last Survey Cumulative % Cumulative (Th.Cum/SqKm/yr) (M.Cum/yr)1 2 3 4 5 6 7 8 9 10 11 12
1 1962 209.8 200.5 9.32 1992 30 189.067 183.252 5.815 20.733 20.733 9.88 1.212 0.6913 2008 16 180.5 175.58 4.92 8.567 29.3 13.97 0.939 0.535
Average rate of silting(Th.Cum/Sq.km/Yr) in 46 year 1.117Average rate of silting (mm/yr) in 46 years 1.117Average rate of silting (M.Cum/yr) in 46 years 0.637
Loss of Capacity (M.Cum) Observed Rate of Siltation Since Last SurveyRemarks
Period (Years)
RemarksLoss of Capacity (M.Cum) Observed Rate of Siltation Since Last Survey Reservoir Capacity(M.Cum)
ICHARI RESERVOIR
NANAK SAGAR RESERVOIR
S. No
S. NoYear of Survey
Period (Years)
Reservoir Capacity(M.Cum)Year of Survey
142
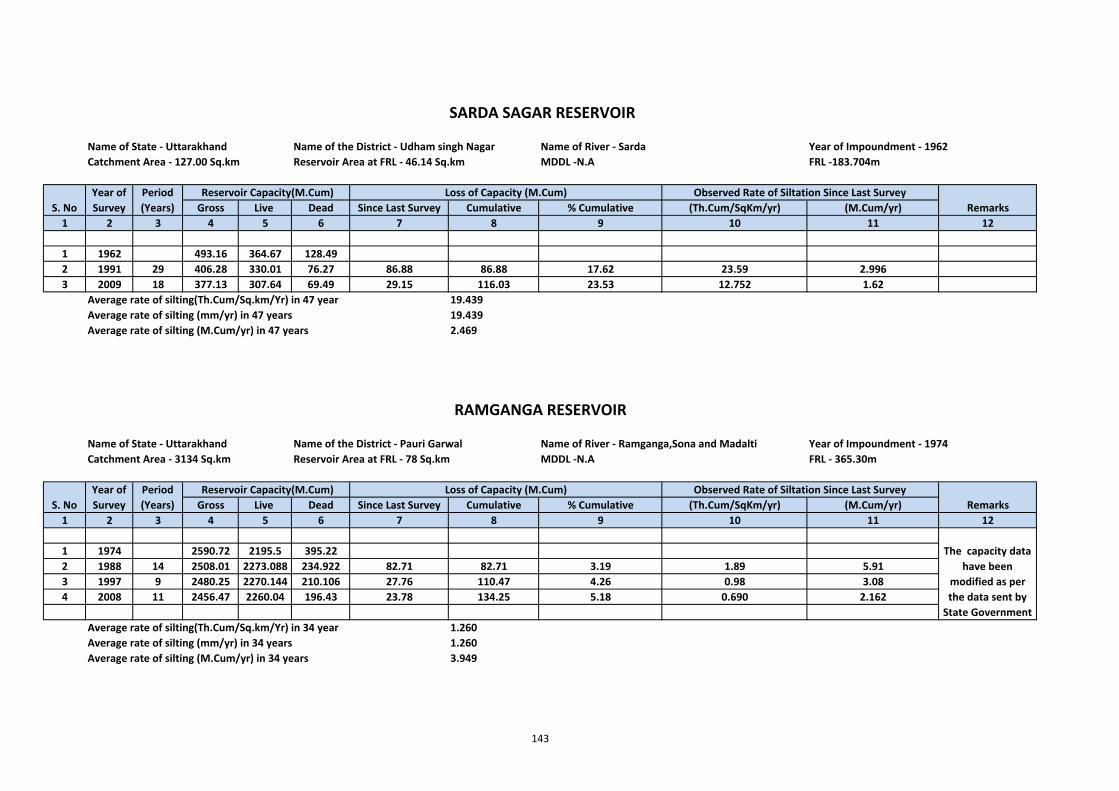
Name of State ‐ Uttarakhand Name of the District ‐ Udham singh Nagar Name of River ‐ Sarda Year of Impoundment ‐ 1962Catchment Area ‐ 127.00 Sq.km Reservoir Area at FRL ‐ 46.14 Sq.km MDDL ‐N.A FRL ‐183.704m
Gross Live Dead Since Last Survey Cumulative % Cumulative (Th.Cum/SqKm/yr) (M.Cum/yr)1 2 3 4 5 6 7 8 9 10 11 12
1 1962 493.16 364.67 128.492 1991 29 406.28 330.01 76.27 86.88 86.88 17.62 23.59 2.9963 2009 18 377.13 307.64 69.49 29.15 116.03 23.53 12.752 1.62
Average rate of silting(Th.Cum/Sq.km/Yr) in 47 year 19.439Average rate of silting (mm/yr) in 47 years 19.439Average rate of silting (M.Cum/yr) in 47 years 2.469
Name of State ‐ Uttarakhand Name of the District ‐ Pauri Garwal Name of River ‐ Ramganga,Sona and Madalti Year of Impoundment ‐ 1974Catchment Area ‐ 3134 Sq.km Reservoir Area at FRL ‐ 78 Sq.km MDDL ‐N.A FRL ‐ 365.30m
Gross Live Dead Since Last Survey Cumulative % Cumulative (Th.Cum/SqKm/yr) (M.Cum/yr)1 2 3 4 5 6 7 8 9 10 11 12
1 1974 2590.72 2195.5 395.222 1988 14 2508.01 2273.088 234.922 82.71 82.71 3.19 1.89 5.913 1997 9 2480.25 2270.144 210.106 27.76 110.47 4.26 0.98 3.084 2008 11 2456.47 2260.04 196.43 23.78 134.25 5.18 0.690 2.162
Average rate of silting(Th.Cum/Sq.km/Yr) in 34 year 1.260Average rate of silting (mm/yr) in 34 years 1.260Average rate of silting (M.Cum/yr) in 34 years 3.949
Loss of Capacity (M.Cum) Observed Rate of Siltation Since Last SurveyRemarks
Reservoir Capacity(M.Cum)
Observed Rate of Siltation Since Last SurveyS. No
S. NoYear of Survey
Period (Years)
SARDA SAGAR RESERVOIR
Period (Years)
Reservoir Capacity(M.Cum) Loss of Capacity (M.Cum)
The capacity data have been
modified as per the data sent by State Government
RemarksYear of Survey
RAMGANGA RESERVOIR
143
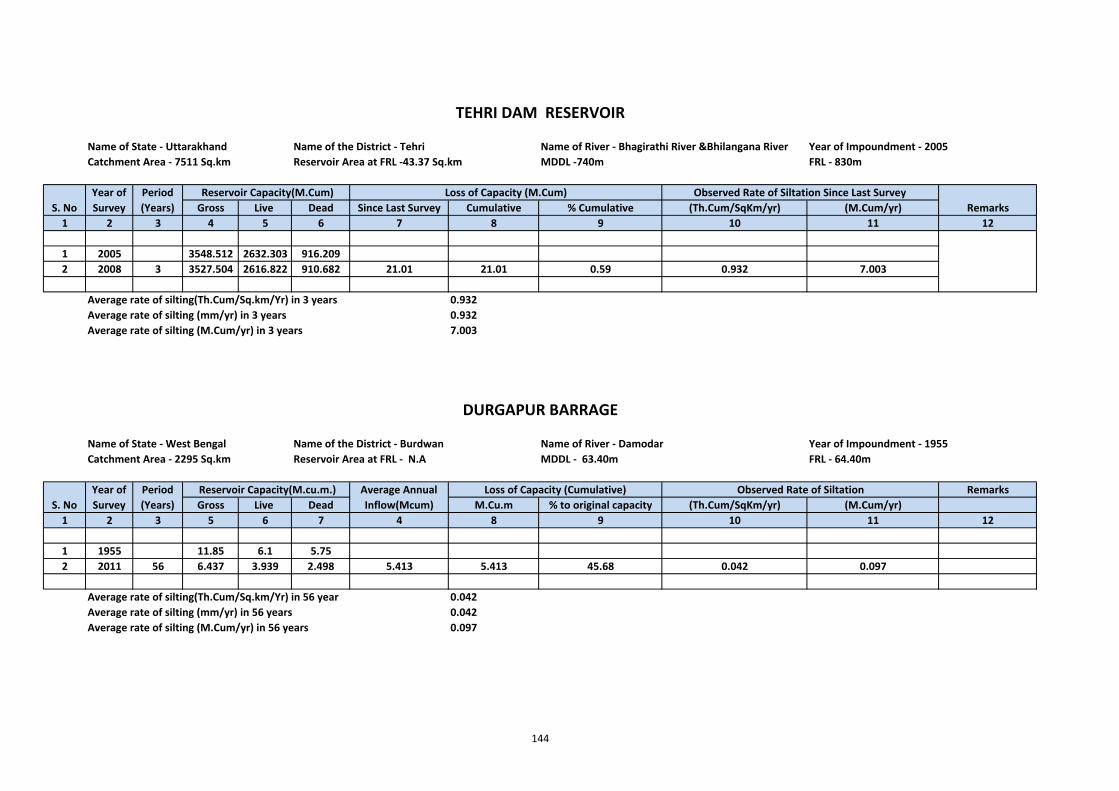
Name of State ‐ Uttarakhand Name of the District ‐ Tehri Name of River ‐ Bhagirathi River &Bhilangana River Year of Impoundment ‐ 2005Catchment Area ‐ 7511 Sq.km Reservoir Area at FRL ‐43.37 Sq.km MDDL ‐740m FRL ‐ 830m
Gross Live Dead Since Last Survey Cumulative % Cumulative (Th.Cum/SqKm/yr) (M.Cum/yr)1 2 3 4 5 6 7 8 9 10 11 12
1 2005 3548.512 2632.303 916.2092 2008 3 3527.504 2616.822 910.682 21.01 21.01 0.59 0.932 7.003
Average rate of silting(Th.Cum/Sq.km/Yr) in 3 years 0.932Average rate of silting (mm/yr) in 3 years 0.932Average rate of silting (M.Cum/yr) in 3 years 7.003
Name of State ‐ West Bengal Name of the District ‐ Burdwan Name of River ‐ Damodar Year of Impoundment ‐ 1955Catchment Area ‐ 2295 Sq.km Reservoir Area at FRL ‐ N.A MDDL ‐ 63.40m FRL ‐ 64.40m
RemarksGross Live Dead M.Cu.m % to original capacity (Th.Cum/SqKm/yr) (M.Cum/yr)
1 2 3 5 6 7 4 8 9 10 11 12
1 1955 11.85 6.1 5.752 2011 56 6.437 3.939 2.498 5.413 5.413 45.68 0.042 0.097
Average rate of silting(Th.Cum/Sq.km/Yr) in 56 year 0.042Average rate of silting (mm/yr) in 56 years 0.042Average rate of silting (M.Cum/yr) in 56 years 0.097
TEHRI DAM RESERVOIR
S. NoLoss of Capacity (M.Cum)
Reservoir Capacity(M.cu.m.) Average Annual Inflow(Mcum)
Loss of Capacity (Cumulative) Observed Rate of Siltation
DURGAPUR BARRAGE
S. NoYear of Survey
Period (Years)
Year of Survey
Period (Years) Remarks
Observed Rate of Siltation Since Last Survey Reservoir Capacity(M.Cum)
144
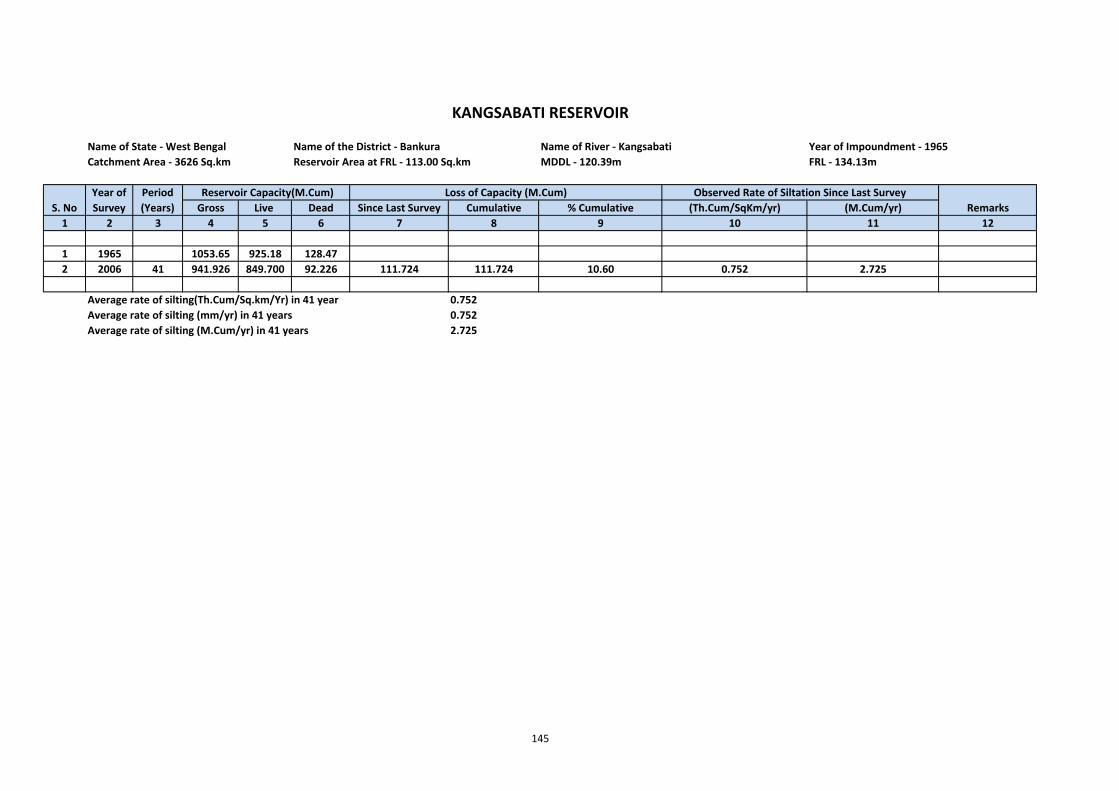
Name of State ‐ West Bengal Name of the District ‐ Bankura Name of River ‐ Kangsabati Year of Impoundment ‐ 1965Catchment Area ‐ 3626 Sq.km Reservoir Area at FRL ‐ 113.00 Sq.km MDDL ‐ 120.39m FRL ‐ 134.13m
Gross Live Dead Since Last Survey Cumulative % Cumulative (Th.Cum/SqKm/yr) (M.Cum/yr)1 2 3 4 5 6 7 8 9 10 11 12
1 1965 1053.65 925.18 128.472 2006 41 941.926 849.700 92.226 111.724 111.724 10.60 0.752 2.725
Average rate of silting(Th.Cum/Sq.km/Yr) in 41 year 0.752Average rate of silting (mm/yr) in 41 years 0.752Average rate of silting (M.Cum/yr) in 41 years 2.725
Period (Years)
Reservoir Capacity(M.Cum)Year of Survey S. No
Loss of Capacity (M.Cum)
KANGSABATI RESERVOIR
RemarksObserved Rate of Siltation Since Last Survey
145
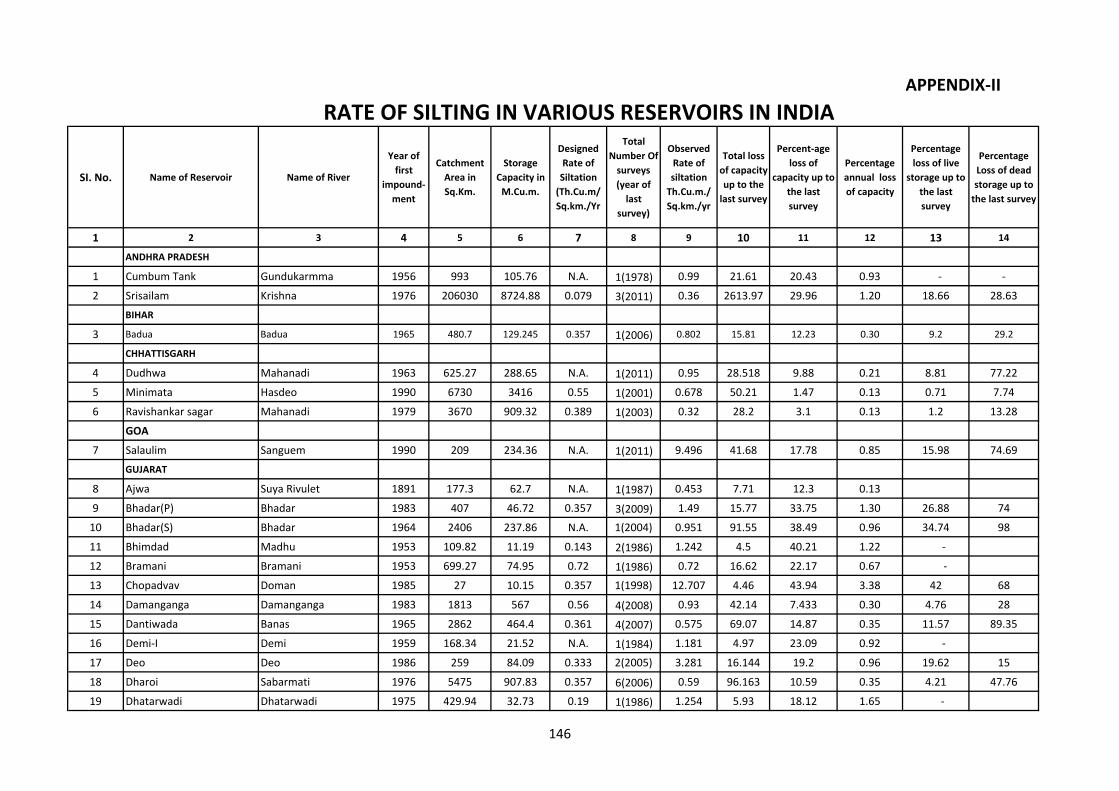
APPENDIX‐IIRATE OF SILTING IN VARIOUS RESERVOIRS IN INDIA
SI. No. Name of Reservoir Name of River
Year of first
impound‐ ment
Catchment Area in Sq.Km.
Storage Capacity in M.Cu.m.
Designed Rate of Siltation (Th.Cu.m/ Sq.km./Yr
Total Number Of surveys (year of last
survey)
Observed Rate of siltation Th.Cu.m./ Sq.km./yr
Total loss of capacity up to the last survey
Percent‐age loss of
capacity up to the last survey
Percentage annual loss of capacity
Percentage loss of live
storage up to the last survey
Percentage Loss of dead storage up to the last survey
1 2 3 4 5 6 7 8 9 10 11 12 13 14
ANDHRA PRADESH
1 Cumbum Tank Gundukarmma 1956 993 105.76 N.A. 1(1978) 0.99 21.61 20.43 0.93 ‐ ‐
2 Srisailam Krishna 1976 206030 8724.88 0.079 3(2011) 0.36 2613.97 29.96 1.20 18.66 28.63
BIHAR
3 Badua Badua 1965 480.7 129.245 0.357 1(2006) 0.802 15.81 12.23 0.30 9.2 29.2
CHHATTISGARH
4 Dudhwa Mahanadi 1963 625.27 288.65 N.A. 1(2011) 0.95 28.518 9.88 0.21 8.81 77.22
5 Minimata Hasdeo 1990 6730 3416 0.55 1(2001) 0.678 50.21 1.47 0.13 0.71 7.74
6 Ravishankar sagar Mahanadi 1979 3670 909.32 0.389 1(2003) 0.32 28.2 3.1 0.13 1.2 13.28
GOA
7 Salaulim Sanguem 1990 209 234.36 N.A. 1(2011) 9.496 41.68 17.78 0.85 15.98 74.69
GUJARAT
8 Ajwa Suya Rivulet 1891 177.3 62.7 N.A. 1(1987) 0.453 7.71 12.3 0.13
9 Bhadar(P) Bhadar 1983 407 46.72 0.357 3(2009) 1.49 15.77 33.75 1.30 26.88 74
10 Bhadar(S) Bhadar 1964 2406 237.86 N.A. 1(2004) 0.951 91.55 38.49 0.96 34.74 98
11 Bhimdad Madhu 1953 109.82 11.19 0.143 2(1986) 1.242 4.5 40.21 1.22 ‐
12 Bramani Bramani 1953 699.27 74.95 0.72 1(1986) 0.72 16.62 22.17 0.67 ‐
13 Chopadvav Doman 1985 27 10.15 0.357 1(1998) 12.707 4.46 43.94 3.38 42 68
14 Damanganga Damanganga 1983 1813 567 0.56 4(2008) 0.93 42.14 7.433 0.30 4.76 28
15 Dantiwada Banas 1965 2862 464.4 0.361 4(2007) 0.575 69.07 14.87 0.35 11.57 89.35
16 Demi‐I Demi 1959 168.34 21.52 N.A. 1(1984) 1.181 4.97 23.09 0.92 ‐
17 Deo Deo 1986 259 84.09 0.333 2(2005) 3.281 16.144 19.2 0.96 19.62 15
18 Dharoi Sabarmati 1976 5475 907.83 0.357 6(2006) 0.59 96.163 10.59 0.35 4.21 47.76
19 Dhatarwadi Dhatarwadi 1975 429.94 32.73 0.19 1(1986) 1.254 5.93 18.12 1.65 ‐
146
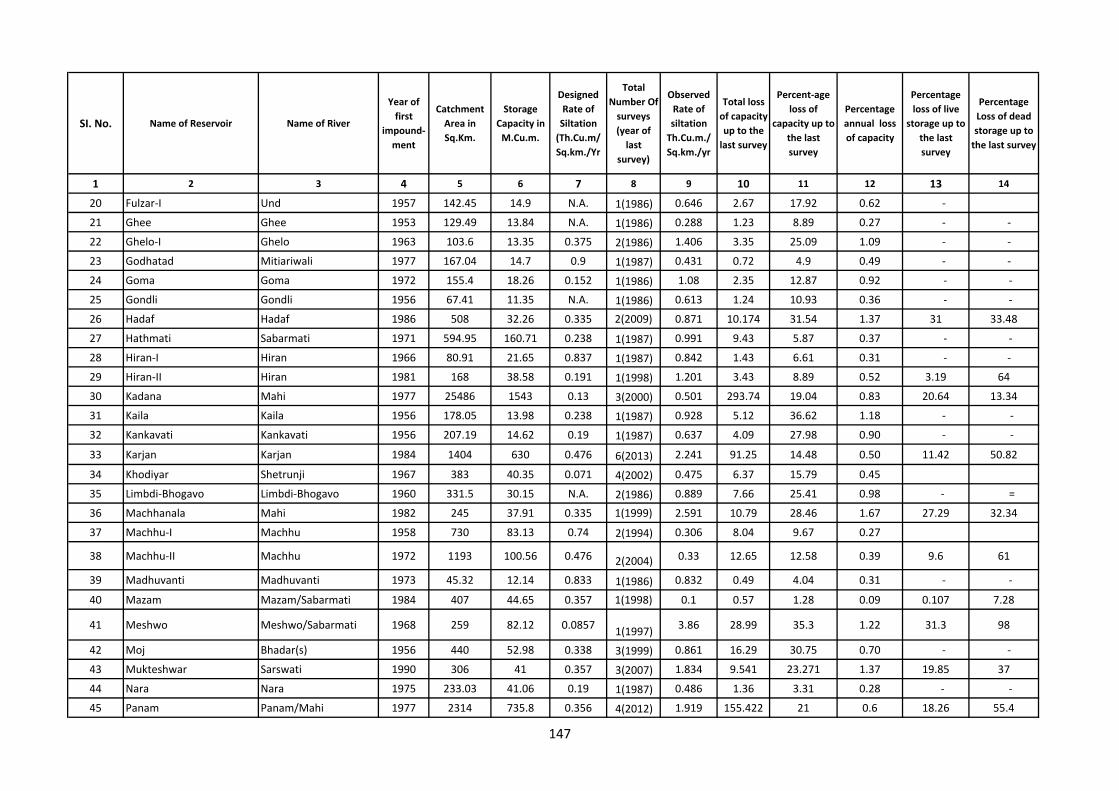
SI. No. Name of Reservoir Name of River
Year of first
impound‐ ment
Catchment Area in Sq.Km.
Storage Capacity in M.Cu.m.
Designed Rate of Siltation (Th.Cu.m/ Sq.km./Yr
Total Number Of surveys (year of last
survey)
Observed Rate of siltation Th.Cu.m./ Sq.km./yr
Total loss of capacity up to the last survey
Percent‐age loss of
capacity up to the last survey
Percentage annual loss of capacity
Percentage loss of live
storage up to the last survey
Percentage Loss of dead storage up to the last survey
1 2 3 4 5 6 7 8 9 10 11 12 13 14
20 Fulzar‐I Und 1957 142.45 14.9 N.A. 1(1986) 0.646 2.67 17.92 0.62 ‐
21 Ghee Ghee 1953 129.49 13.84 N.A. 1(1986) 0.288 1.23 8.89 0.27 ‐ ‐
22 Ghelo‐I Ghelo 1963 103.6 13.35 0.375 2(1986) 1.406 3.35 25.09 1.09 ‐ ‐
23 Godhatad Mitiariwali 1977 167.04 14.7 0.9 1(1987) 0.431 0.72 4.9 0.49 ‐ ‐
24 Goma Goma 1972 155.4 18.26 0.152 1(1986) 1.08 2.35 12.87 0.92 ‐ ‐
25 Gondli Gondli 1956 67.41 11.35 N.A. 1(1986) 0.613 1.24 10.93 0.36 ‐ ‐
26 Hadaf Hadaf 1986 508 32.26 0.335 2(2009) 0.871 10.174 31.54 1.37 31 33.48
27 Hathmati Sabarmati 1971 594.95 160.71 0.238 1(1987) 0.991 9.43 5.87 0.37 ‐ ‐
28 Hiran‐I Hiran 1966 80.91 21.65 0.837 1(1987) 0.842 1.43 6.61 0.31 ‐ ‐
29 Hiran‐II Hiran 1981 168 38.58 0.191 1(1998) 1.201 3.43 8.89 0.52 3.19 64
30 Kadana Mahi 1977 25486 1543 0.13 3(2000) 0.501 293.74 19.04 0.83 20.64 13.34
31 Kaila Kaila 1956 178.05 13.98 0.238 1(1987) 0.928 5.12 36.62 1.18 ‐ ‐
32 Kankavati Kankavati 1956 207.19 14.62 0.19 1(1987) 0.637 4.09 27.98 0.90 ‐ ‐
33 Karjan Karjan 1984 1404 630 0.476 6(2013) 2.241 91.25 14.48 0.50 11.42 50.82
34 Khodiyar Shetrunji 1967 383 40.35 0.071 4(2002) 0.475 6.37 15.79 0.45
35 Limbdi‐Bhogavo Limbdi‐Bhogavo 1960 331.5 30.15 N.A. 2(1986) 0.889 7.66 25.41 0.98 ‐ =
36 Machhanala Mahi 1982 245 37.91 0.335 1(1999) 2.591 10.79 28.46 1.67 27.29 32.34
37 Machhu‐I Machhu 1958 730 83.13 0.74 2(1994) 0.306 8.04 9.67 0.27
38 Machhu‐II Machhu 1972 1193 100.56 0.476 2(2004) 0.33 12.65 12.58 0.39 9.6 61
39 Madhuvanti Madhuvanti 1973 45.32 12.14 0.833 1(1986) 0.832 0.49 4.04 0.31 ‐ ‐
40 Mazam Mazam/Sabarmati 1984 407 44.65 0.357 1(1998) 0.1 0.57 1.28 0.09 0.107 7.28
41 Meshwo Meshwo/Sabarmati 1968 259 82.12 0.0857 1(1997) 3.86 28.99 35.3 1.22 31.3 98
42 Moj Bhadar(s) 1956 440 52.98 0.338 3(1999) 0.861 16.29 30.75 0.70 ‐ ‐
43 Mukteshwar Sarswati 1990 306 41 0.357 3(2007) 1.834 9.541 23.271 1.37 19.85 37
44 Nara Nara 1975 233.03 41.06 0.19 1(1987) 0.486 1.36 3.31 0.28 ‐ ‐
45 Panam Panam/Mahi 1977 2314 735.8 0.356 4(2012) 1.919 155.422 21 0.6 18.26 55.4
147
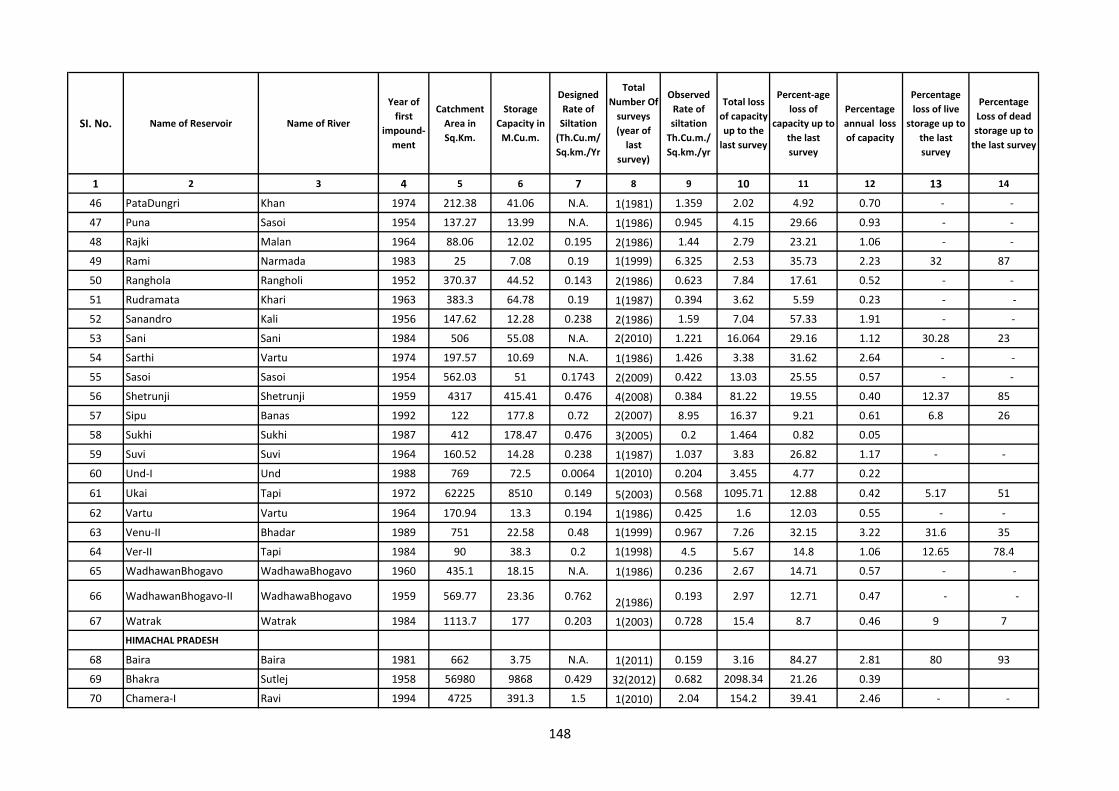
SI. No. Name of Reservoir Name of River
Year of first
impound‐ ment
Catchment Area in Sq.Km.
Storage Capacity in M.Cu.m.
Designed Rate of Siltation (Th.Cu.m/ Sq.km./Yr
Total Number Of surveys (year of last
survey)
Observed Rate of siltation Th.Cu.m./ Sq.km./yr
Total loss of capacity up to the last survey
Percent‐age loss of
capacity up to the last survey
Percentage annual loss of capacity
Percentage loss of live
storage up to the last survey
Percentage Loss of dead storage up to the last survey
1 2 3 4 5 6 7 8 9 10 11 12 13 14
46 PataDungri Khan 1974 212.38 41.06 N.A. 1(1981) 1.359 2.02 4.92 0.70 ‐ ‐
47 Puna Sasoi 1954 137.27 13.99 N.A. 1(1986) 0.945 4.15 29.66 0.93 ‐ ‐
48 Rajki Malan 1964 88.06 12.02 0.195 2(1986) 1.44 2.79 23.21 1.06 ‐ ‐
49 Rami Narmada 1983 25 7.08 0.19 1(1999) 6.325 2.53 35.73 2.23 32 87
50 Ranghola Rangholi 1952 370.37 44.52 0.143 2(1986) 0.623 7.84 17.61 0.52 ‐ ‐
51 Rudramata Khari 1963 383.3 64.78 0.19 1(1987) 0.394 3.62 5.59 0.23 ‐ ‐
52 Sanandro Kali 1956 147.62 12.28 0.238 2(1986) 1.59 7.04 57.33 1.91 ‐ ‐
53 Sani Sani 1984 506 55.08 N.A. 2(2010) 1.221 16.064 29.16 1.12 30.28 23
54 Sarthi Vartu 1974 197.57 10.69 N.A. 1(1986) 1.426 3.38 31.62 2.64 ‐ ‐
55 Sasoi Sasoi 1954 562.03 51 0.1743 2(2009) 0.422 13.03 25.55 0.57 ‐ ‐
56 Shetrunji Shetrunji 1959 4317 415.41 0.476 4(2008) 0.384 81.22 19.55 0.40 12.37 85
57 Sipu Banas 1992 122 177.8 0.72 2(2007) 8.95 16.37 9.21 0.61 6.8 26
58 Sukhi Sukhi 1987 412 178.47 0.476 3(2005) 0.2 1.464 0.82 0.05
59 Suvi Suvi 1964 160.52 14.28 0.238 1(1987) 1.037 3.83 26.82 1.17 ‐ ‐
60 Und‐I Und 1988 769 72.5 0.0064 1(2010) 0.204 3.455 4.77 0.22
61 Ukai Tapi 1972 62225 8510 0.149 5(2003) 0.568 1095.71 12.88 0.42 5.17 51
62 Vartu Vartu 1964 170.94 13.3 0.194 1(1986) 0.425 1.6 12.03 0.55 ‐ ‐
63 Venu‐II Bhadar 1989 751 22.58 0.48 1(1999) 0.967 7.26 32.15 3.22 31.6 35
64 Ver‐II Tapi 1984 90 38.3 0.2 1(1998) 4.5 5.67 14.8 1.06 12.65 78.4
65 WadhawanBhogavo WadhawaBhogavo 1960 435.1 18.15 N.A. 1(1986) 0.236 2.67 14.71 0.57 ‐ ‐
66 WadhawanBhogavo‐II WadhawaBhogavo 1959 569.77 23.36 0.762 2(1986) 0.193 2.97 12.71 0.47 ‐ ‐
67 Watrak Watrak 1984 1113.7 177 0.203 1(2003) 0.728 15.4 8.7 0.46 9 7
HIMACHAL PRADESH
68 Baira Baira 1981 662 3.75 N.A. 1(2011) 0.159 3.16 84.27 2.81 80 93
69 Bhakra Sutlej 1958 56980 9868 0.429 32(2012) 0.682 2098.34 21.26 0.39
70 Chamera‐I Ravi 1994 4725 391.3 1.5 1(2010) 2.04 154.2 39.41 2.46 ‐ ‐
148
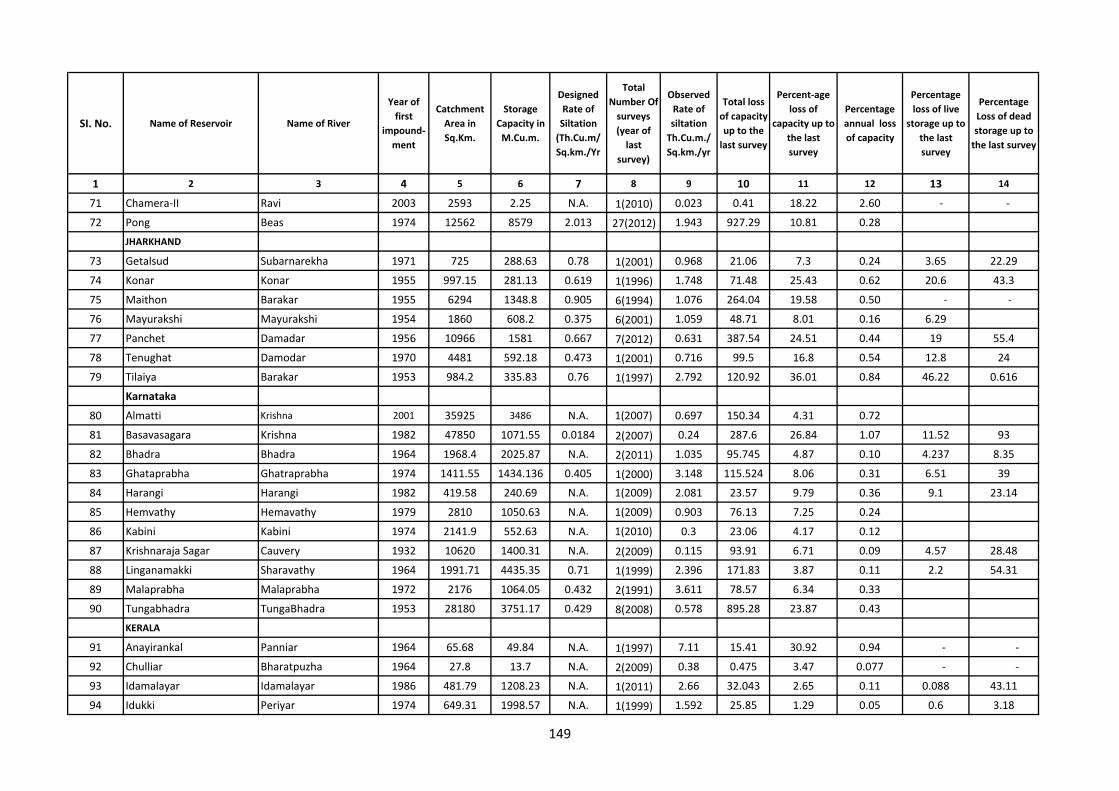
SI. No. Name of Reservoir Name of River
Year of first
impound‐ ment
Catchment Area in Sq.Km.
Storage Capacity in M.Cu.m.
Designed Rate of Siltation (Th.Cu.m/ Sq.km./Yr
Total Number Of surveys (year of last
survey)
Observed Rate of siltation Th.Cu.m./ Sq.km./yr
Total loss of capacity up to the last survey
Percent‐age loss of
capacity up to the last survey
Percentage annual loss of capacity
Percentage loss of live
storage up to the last survey
Percentage Loss of dead storage up to the last survey
1 2 3 4 5 6 7 8 9 10 11 12 13 14
71 Chamera‐II Ravi 2003 2593 2.25 N.A. 1(2010) 0.023 0.41 18.22 2.60 ‐ ‐
72 Pong Beas 1974 12562 8579 2.013 27(2012) 1.943 927.29 10.81 0.28
JHARKHAND
73 Getalsud Subarnarekha 1971 725 288.63 0.78 1(2001) 0.968 21.06 7.3 0.24 3.65 22.29
74 Konar Konar 1955 997.15 281.13 0.619 1(1996) 1.748 71.48 25.43 0.62 20.6 43.3
75 Maithon Barakar 1955 6294 1348.8 0.905 6(1994) 1.076 264.04 19.58 0.50 ‐ ‐
76 Mayurakshi Mayurakshi 1954 1860 608.2 0.375 6(2001) 1.059 48.71 8.01 0.16 6.29
77 Panchet Damadar 1956 10966 1581 0.667 7(2012) 0.631 387.54 24.51 0.44 19 55.4
78 Tenughat Damodar 1970 4481 592.18 0.473 1(2001) 0.716 99.5 16.8 0.54 12.8 24
79 Tilaiya Barakar 1953 984.2 335.83 0.76 1(1997) 2.792 120.92 36.01 0.84 46.22 0.616
Karnataka
80 Almatti Krishna 2001 35925 3486 N.A. 1(2007) 0.697 150.34 4.31 0.72
81 Basavasagara Krishna 1982 47850 1071.55 0.0184 2(2007) 0.24 287.6 26.84 1.07 11.52 93
82 Bhadra Bhadra 1964 1968.4 2025.87 N.A. 2(2011) 1.035 95.745 4.87 0.10 4.237 8.35
83 Ghataprabha Ghatraprabha 1974 1411.55 1434.136 0.405 1(2000) 3.148 115.524 8.06 0.31 6.51 39
84 Harangi Harangi 1982 419.58 240.69 N.A. 1(2009) 2.081 23.57 9.79 0.36 9.1 23.14
85 Hemvathy Hemavathy 1979 2810 1050.63 N.A. 1(2009) 0.903 76.13 7.25 0.24
86 Kabini Kabini 1974 2141.9 552.63 N.A. 1(2010) 0.3 23.06 4.17 0.12
87 Krishnaraja Sagar Cauvery 1932 10620 1400.31 N.A. 2(2009) 0.115 93.91 6.71 0.09 4.57 28.48
88 Linganamakki Sharavathy 1964 1991.71 4435.35 0.71 1(1999) 2.396 171.83 3.87 0.11 2.2 54.31
89 Malaprabha Malaprabha 1972 2176 1064.05 0.432 2(1991) 3.611 78.57 6.34 0.33
90 Tungabhadra TungaBhadra 1953 28180 3751.17 0.429 8(2008) 0.578 895.28 23.87 0.43
KERALA
91 Anayirankal Panniar 1964 65.68 49.84 N.A. 1(1997) 7.11 15.41 30.92 0.94 ‐ ‐
92 Chulliar Bharatpuzha 1964 27.8 13.7 N.A. 2(2009) 0.38 0.475 3.47 0.077 ‐ ‐
93 Idamalayar Idamalayar 1986 481.79 1208.23 N.A. 1(2011) 2.66 32.043 2.65 0.11 0.088 43.11
94 Idukki Periyar 1974 649.31 1998.57 N.A. 1(1999) 1.592 25.85 1.29 0.05 0.6 3.18
149
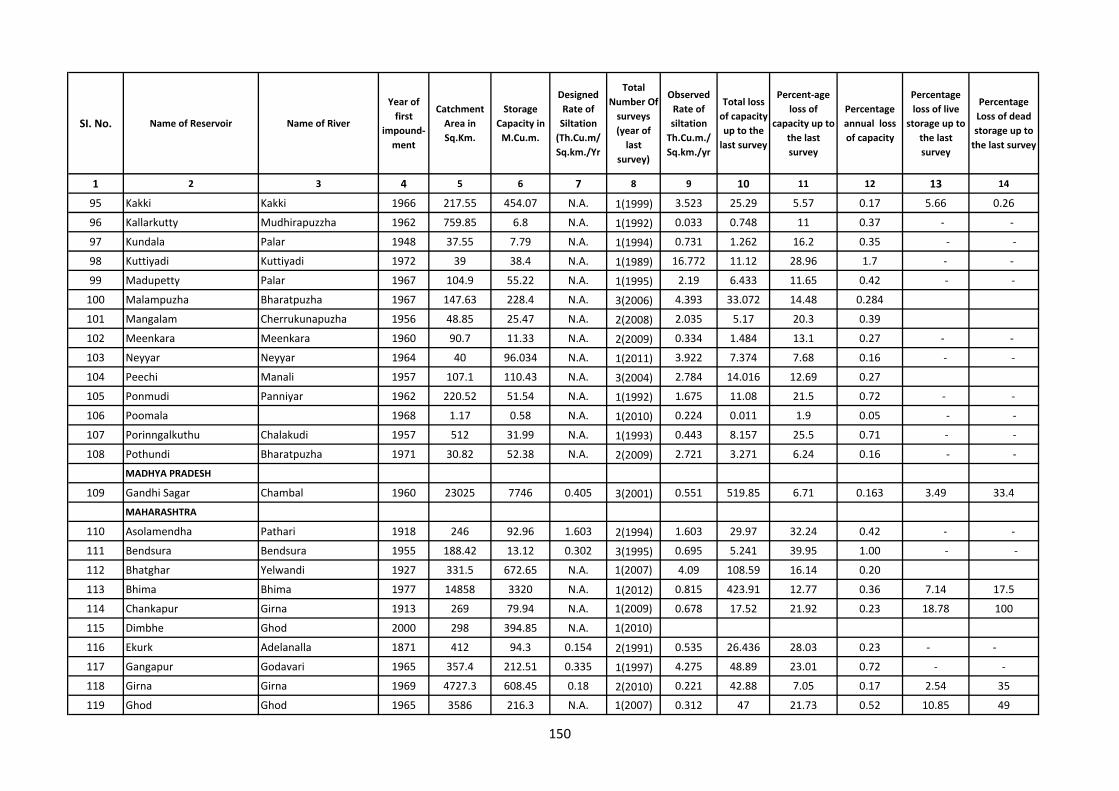
SI. No. Name of Reservoir Name of River
Year of first
impound‐ ment
Catchment Area in Sq.Km.
Storage Capacity in M.Cu.m.
Designed Rate of Siltation (Th.Cu.m/ Sq.km./Yr
Total Number Of surveys (year of last
survey)
Observed Rate of siltation Th.Cu.m./ Sq.km./yr
Total loss of capacity up to the last survey
Percent‐age loss of
capacity up to the last survey
Percentage annual loss of capacity
Percentage loss of live
storage up to the last survey
Percentage Loss of dead storage up to the last survey
1 2 3 4 5 6 7 8 9 10 11 12 13 14
95 Kakki Kakki 1966 217.55 454.07 N.A. 1(1999) 3.523 25.29 5.57 0.17 5.66 0.26
96 Kallarkutty Mudhirapuzzha 1962 759.85 6.8 N.A. 1(1992) 0.033 0.748 11 0.37 ‐ ‐
97 Kundala Palar 1948 37.55 7.79 N.A. 1(1994) 0.731 1.262 16.2 0.35 ‐ ‐
98 Kuttiyadi Kuttiyadi 1972 39 38.4 N.A. 1(1989) 16.772 11.12 28.96 1.7 ‐ ‐
99 Madupetty Palar 1967 104.9 55.22 N.A. 1(1995) 2.19 6.433 11.65 0.42 ‐ ‐
100 Malampuzha Bharatpuzha 1967 147.63 228.4 N.A. 3(2006) 4.393 33.072 14.48 0.284
101 Mangalam Cherrukunapuzha 1956 48.85 25.47 N.A. 2(2008) 2.035 5.17 20.3 0.39
102 Meenkara Meenkara 1960 90.7 11.33 N.A. 2(2009) 0.334 1.484 13.1 0.27 ‐ ‐
103 Neyyar Neyyar 1964 40 96.034 N.A. 1(2011) 3.922 7.374 7.68 0.16 ‐ ‐
104 Peechi Manali 1957 107.1 110.43 N.A. 3(2004) 2.784 14.016 12.69 0.27
105 Ponmudi Panniyar 1962 220.52 51.54 N.A. 1(1992) 1.675 11.08 21.5 0.72 ‐ ‐
106 Poomala 1968 1.17 0.58 N.A. 1(2010) 0.224 0.011 1.9 0.05 ‐ ‐
107 Porinngalkuthu Chalakudi 1957 512 31.99 N.A. 1(1993) 0.443 8.157 25.5 0.71 ‐ ‐
108 Pothundi Bharatpuzha 1971 30.82 52.38 N.A. 2(2009) 2.721 3.271 6.24 0.16 ‐ ‐
MADHYA PRADESH
109 Gandhi Sagar Chambal 1960 23025 7746 0.405 3(2001) 0.551 519.85 6.71 0.163 3.49 33.4
MAHARASHTRA
110 Asolamendha Pathari 1918 246 92.96 1.603 2(1994) 1.603 29.97 32.24 0.42 ‐ ‐
111 Bendsura Bendsura 1955 188.42 13.12 0.302 3(1995) 0.695 5.241 39.95 1.00 ‐ ‐
112 Bhatghar Yelwandi 1927 331.5 672.65 N.A. 1(2007) 4.09 108.59 16.14 0.20
113 Bhima Bhima 1977 14858 3320 N.A. 1(2012) 0.815 423.91 12.77 0.36 7.14 17.5
114 Chankapur Girna 1913 269 79.94 N.A. 1(2009) 0.678 17.52 21.92 0.23 18.78 100
115 Dimbhe Ghod 2000 298 394.85 N.A. 1(2010)
116 Ekurk Adelanalla 1871 412 94.3 0.154 2(1991) 0.535 26.436 28.03 0.23 ‐ ‐
117 Gangapur Godavari 1965 357.4 212.51 0.335 1(1997) 4.275 48.89 23.01 0.72 ‐ ‐
118 Girna Girna 1969 4727.3 608.45 0.18 2(2010) 0.221 42.88 7.05 0.17 2.54 35
119 Ghod Ghod 1965 3586 216.3 N.A. 1(2007) 0.312 47 21.73 0.52 10.85 49
150
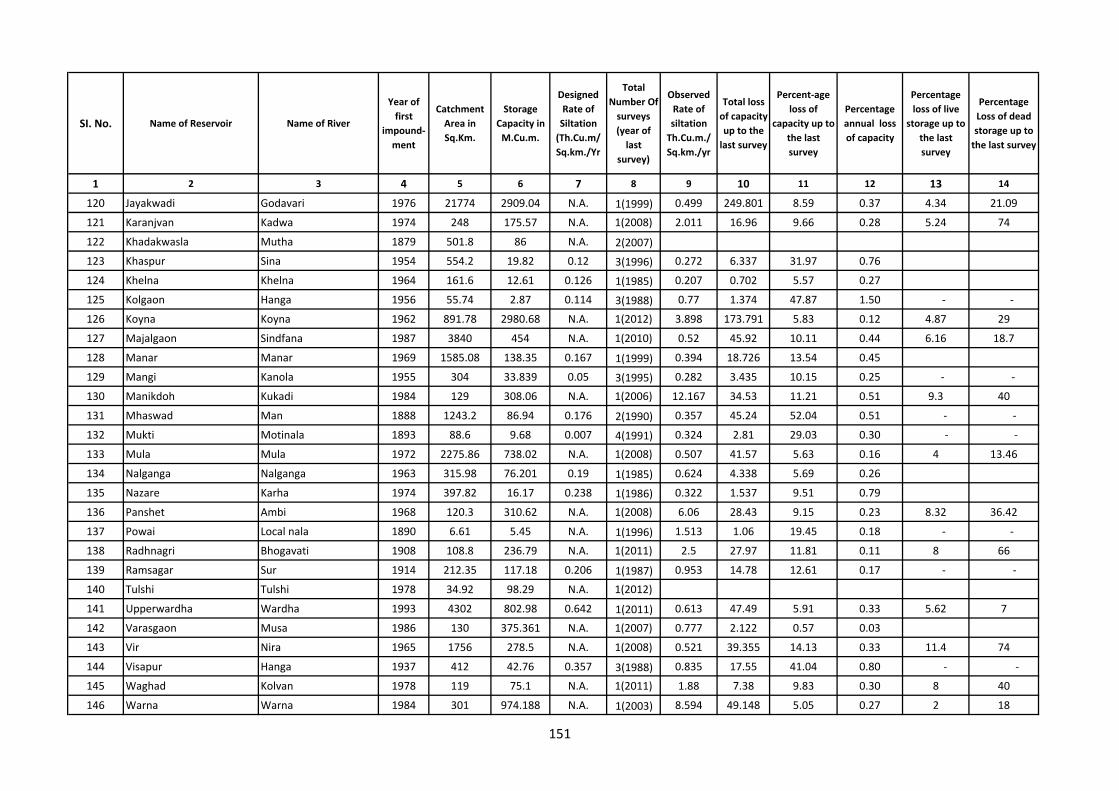
SI. No. Name of Reservoir Name of River
Year of first
impound‐ ment
Catchment Area in Sq.Km.
Storage Capacity in M.Cu.m.
Designed Rate of Siltation (Th.Cu.m/ Sq.km./Yr
Total Number Of surveys (year of last
survey)
Observed Rate of siltation Th.Cu.m./ Sq.km./yr
Total loss of capacity up to the last survey
Percent‐age loss of
capacity up to the last survey
Percentage annual loss of capacity
Percentage loss of live
storage up to the last survey
Percentage Loss of dead storage up to the last survey
1 2 3 4 5 6 7 8 9 10 11 12 13 14
120 Jayakwadi Godavari 1976 21774 2909.04 N.A. 1(1999) 0.499 249.801 8.59 0.37 4.34 21.09
121 Karanjvan Kadwa 1974 248 175.57 N.A. 1(2008) 2.011 16.96 9.66 0.28 5.24 74
122 Khadakwasla Mutha 1879 501.8 86 N.A. 2(2007)123 Khaspur Sina 1954 554.2 19.82 0.12 3(1996) 0.272 6.337 31.97 0.76
124 Khelna Khelna 1964 161.6 12.61 0.126 1(1985) 0.207 0.702 5.57 0.27
125 Kolgaon Hanga 1956 55.74 2.87 0.114 3(1988) 0.77 1.374 47.87 1.50 ‐ ‐
126 Koyna Koyna 1962 891.78 2980.68 N.A. 1(2012) 3.898 173.791 5.83 0.12 4.87 29
127 Majalgaon Sindfana 1987 3840 454 N.A. 1(2010) 0.52 45.92 10.11 0.44 6.16 18.7
128 Manar Manar 1969 1585.08 138.35 0.167 1(1999) 0.394 18.726 13.54 0.45
129 Mangi Kanola 1955 304 33.839 0.05 3(1995) 0.282 3.435 10.15 0.25 ‐ ‐
130 Manikdoh Kukadi 1984 129 308.06 N.A. 1(2006) 12.167 34.53 11.21 0.51 9.3 40
131 Mhaswad Man 1888 1243.2 86.94 0.176 2(1990) 0.357 45.24 52.04 0.51 ‐ ‐
132 Mukti Motinala 1893 88.6 9.68 0.007 4(1991) 0.324 2.81 29.03 0.30 ‐ ‐
133 Mula Mula 1972 2275.86 738.02 N.A. 1(2008) 0.507 41.57 5.63 0.16 4 13.46
134 Nalganga Nalganga 1963 315.98 76.201 0.19 1(1985) 0.624 4.338 5.69 0.26
135 Nazare Karha 1974 397.82 16.17 0.238 1(1986) 0.322 1.537 9.51 0.79
136 Panshet Ambi 1968 120.3 310.62 N.A. 1(2008) 6.06 28.43 9.15 0.23 8.32 36.42
137 Powai Local nala 1890 6.61 5.45 N.A. 1(1996) 1.513 1.06 19.45 0.18 ‐ ‐
138 Radhnagri Bhogavati 1908 108.8 236.79 N.A. 1(2011) 2.5 27.97 11.81 0.11 8 66
139 Ramsagar Sur 1914 212.35 117.18 0.206 1(1987) 0.953 14.78 12.61 0.17 ‐ ‐
140 Tulshi Tulshi 1978 34.92 98.29 N.A. 1(2012)
141 Upperwardha Wardha 1993 4302 802.98 0.642 1(2011) 0.613 47.49 5.91 0.33 5.62 7
142 Varasgaon Musa 1986 130 375.361 N.A. 1(2007) 0.777 2.122 0.57 0.03
143 Vir Nira 1965 1756 278.5 N.A. 1(2008) 0.521 39.355 14.13 0.33 11.4 74
144 Visapur Hanga 1937 412 42.76 0.357 3(1988) 0.835 17.55 41.04 0.80 ‐ ‐
145 Waghad Kolvan 1978 119 75.1 N.A. 1(2011) 1.88 7.38 9.83 0.30 8 40
146 Warna Warna 1984 301 974.188 N.A. 1(2003) 8.594 49.148 5.05 0.27 2 18
151
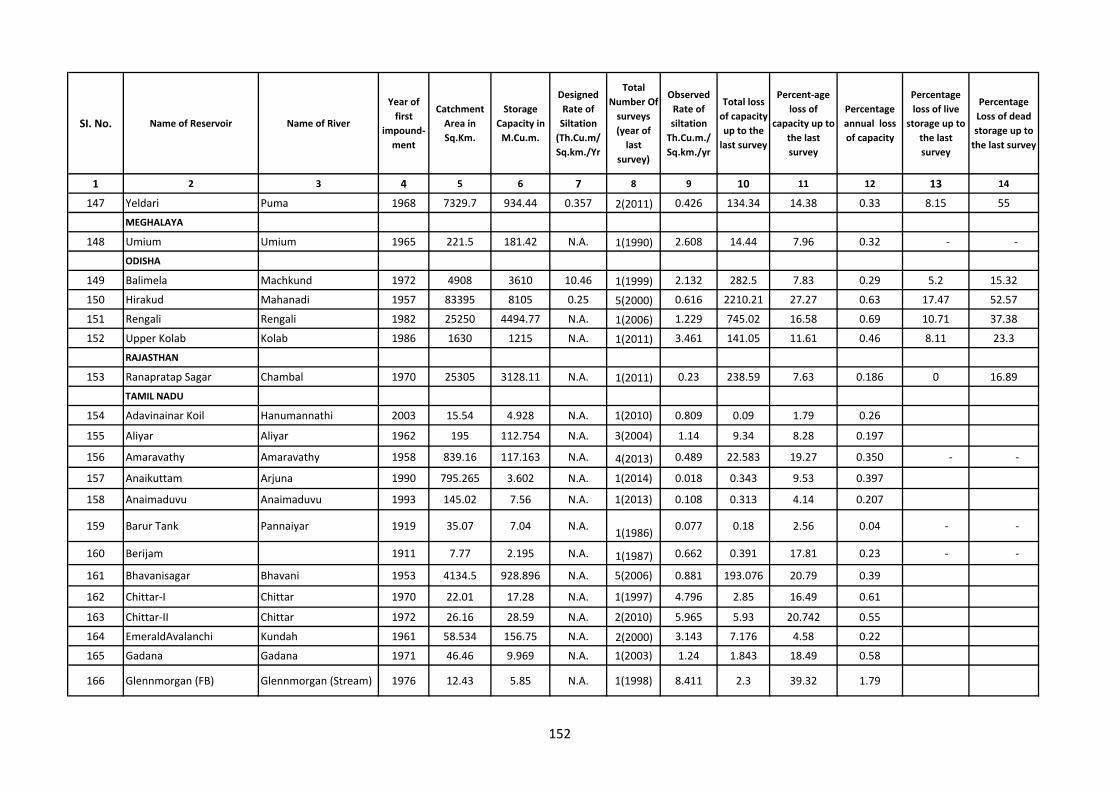
SI. No. Name of Reservoir Name of River
Year of first
impound‐ ment
Catchment Area in Sq.Km.
Storage Capacity in M.Cu.m.
Designed Rate of Siltation (Th.Cu.m/ Sq.km./Yr
Total Number Of surveys (year of last
survey)
Observed Rate of siltation Th.Cu.m./ Sq.km./yr
Total loss of capacity up to the last survey
Percent‐age loss of
capacity up to the last survey
Percentage annual loss of capacity
Percentage loss of live
storage up to the last survey
Percentage Loss of dead storage up to the last survey
1 2 3 4 5 6 7 8 9 10 11 12 13 14
147 Yeldari Puma 1968 7329.7 934.44 0.357 2(2011) 0.426 134.34 14.38 0.33 8.15 55
MEGHALAYA
148 Umium Umium 1965 221.5 181.42 N.A. 1(1990) 2.608 14.44 7.96 0.32 ‐ ‐
ODISHA
149 Balimela Machkund 1972 4908 3610 10.46 1(1999) 2.132 282.5 7.83 0.29 5.2 15.32
150 Hirakud Mahanadi 1957 83395 8105 0.25 5(2000) 0.616 2210.21 27.27 0.63 17.47 52.57
151 Rengali Rengali 1982 25250 4494.77 N.A. 1(2006) 1.229 745.02 16.58 0.69 10.71 37.38
152 Upper Kolab Kolab 1986 1630 1215 N.A. 1(2011) 3.461 141.05 11.61 0.46 8.11 23.3
RAJASTHAN
153 Ranapratap Sagar Chambal 1970 25305 3128.11 N.A. 1(2011) 0.23 238.59 7.63 0.186 0 16.89
TAMIL NADU
154 Adavinainar Koil Hanumannathi 2003 15.54 4.928 N.A. 1(2010) 0.809 0.09 1.79 0.26
155 Aliyar Aliyar 1962 195 112.754 N.A. 3(2004) 1.14 9.34 8.28 0.197
156 Amaravathy Amaravathy 1958 839.16 117.163 N.A. 4(2013) 0.489 22.583 19.27 0.350 ‐ ‐
157 Anaikuttam Arjuna 1990 795.265 3.602 N.A. 1(2014) 0.018 0.343 9.53 0.397
158 Anaimaduvu Anaimaduvu 1993 145.02 7.56 N.A. 1(2013) 0.108 0.313 4.14 0.207
159 Barur Tank Pannaiyar 1919 35.07 7.04 N.A. 1(1986) 0.077 0.18 2.56 0.04 ‐ ‐
160 Berijam 1911 7.77 2.195 N.A. 1(1987) 0.662 0.391 17.81 0.23 ‐ ‐
161 Bhavanisagar Bhavani 1953 4134.5 928.896 N.A. 5(2006) 0.881 193.076 20.79 0.39
162 Chittar‐I Chittar 1970 22.01 17.28 N.A. 1(1997) 4.796 2.85 16.49 0.61
163 Chittar‐II Chittar 1972 26.16 28.59 N.A. 2(2010) 5.965 5.93 20.742 0.55
164 EmeraldAvalanchi Kundah 1961 58.534 156.75 N.A. 2(2000) 3.143 7.176 4.58 0.22
165 Gadana Gadana 1971 46.46 9.969 N.A. 1(2003) 1.24 1.843 18.49 0.58
166 Glennmorgan (FB) Glennmorgan (Stream) 1976 12.43 5.85 N.A. 1(1998) 8.411 2.3 39.32 1.79
152
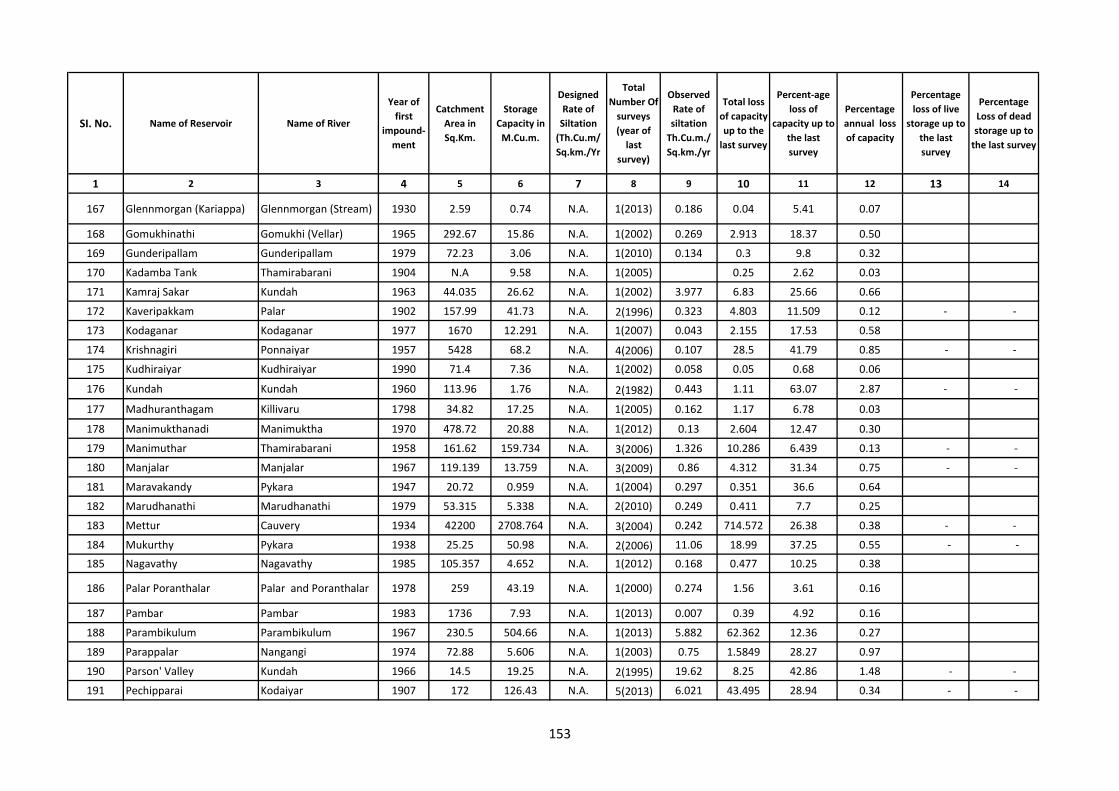
SI. No. Name of Reservoir Name of River
Year of first
impound‐ ment
Catchment Area in Sq.Km.
Storage Capacity in M.Cu.m.
Designed Rate of Siltation (Th.Cu.m/ Sq.km./Yr
Total Number Of surveys (year of last
survey)
Observed Rate of siltation Th.Cu.m./ Sq.km./yr
Total loss of capacity up to the last survey
Percent‐age loss of
capacity up to the last survey
Percentage annual loss of capacity
Percentage loss of live
storage up to the last survey
Percentage Loss of dead storage up to the last survey
1 2 3 4 5 6 7 8 9 10 11 12 13 14
167 Glennmorgan (Kariappa) Glennmorgan (Stream) 1930 2.59 0.74 N.A. 1(2013) 0.186 0.04 5.41 0.07
168 Gomukhinathi Gomukhi (Vellar) 1965 292.67 15.86 N.A. 1(2002) 0.269 2.913 18.37 0.50
169 Gunderipallam Gunderipallam 1979 72.23 3.06 N.A. 1(2010) 0.134 0.3 9.8 0.32
170 Kadamba Tank Thamirabarani 1904 N.A 9.58 N.A. 1(2005) 0.25 2.62 0.03
171 Kamraj Sakar Kundah 1963 44.035 26.62 N.A. 1(2002) 3.977 6.83 25.66 0.66
172 Kaveripakkam Palar 1902 157.99 41.73 N.A. 2(1996) 0.323 4.803 11.509 0.12 ‐ ‐
173 Kodaganar Kodaganar 1977 1670 12.291 N.A. 1(2007) 0.043 2.155 17.53 0.58
174 Krishnagiri Ponnaiyar 1957 5428 68.2 N.A. 4(2006) 0.107 28.5 41.79 0.85 ‐ ‐
175 Kudhiraiyar Kudhiraiyar 1990 71.4 7.36 N.A. 1(2002) 0.058 0.05 0.68 0.06
176 Kundah Kundah 1960 113.96 1.76 N.A. 2(1982) 0.443 1.11 63.07 2.87 ‐ ‐
177 Madhuranthagam Killivaru 1798 34.82 17.25 N.A. 1(2005) 0.162 1.17 6.78 0.03
178 Manimukthanadi Manimuktha 1970 478.72 20.88 N.A. 1(2012) 0.13 2.604 12.47 0.30
179 Manimuthar Thamirabarani 1958 161.62 159.734 N.A. 3(2006) 1.326 10.286 6.439 0.13 ‐ ‐
180 Manjalar Manjalar 1967 119.139 13.759 N.A. 3(2009) 0.86 4.312 31.34 0.75 ‐ ‐
181 Maravakandy Pykara 1947 20.72 0.959 N.A. 1(2004) 0.297 0.351 36.6 0.64
182 Marudhanathi Marudhanathi 1979 53.315 5.338 N.A. 2(2010) 0.249 0.411 7.7 0.25
183 Mettur Cauvery 1934 42200 2708.764 N.A. 3(2004) 0.242 714.572 26.38 0.38 ‐ ‐
184 Mukurthy Pykara 1938 25.25 50.98 N.A. 2(2006) 11.06 18.99 37.25 0.55 ‐ ‐
185 Nagavathy Nagavathy 1985 105.357 4.652 N.A. 1(2012) 0.168 0.477 10.25 0.38
186 Palar Poranthalar Palar and Poranthalar 1978 259 43.19 N.A. 1(2000) 0.274 1.56 3.61 0.16
187 Pambar Pambar 1983 1736 7.93 N.A. 1(2013) 0.007 0.39 4.92 0.16
188 Parambikulum Parambikulum 1967 230.5 504.66 N.A. 1(2013) 5.882 62.362 12.36 0.27
189 Parappalar Nangangi 1974 72.88 5.606 N.A. 1(2003) 0.75 1.5849 28.27 0.97
190 Parson' Valley Kundah 1966 14.5 19.25 N.A. 2(1995) 19.62 8.25 42.86 1.48 ‐ ‐
191 Pechipparai Kodaiyar 1907 172 126.43 N.A. 5(2013) 6.021 43.495 28.94 0.34 ‐ ‐
153
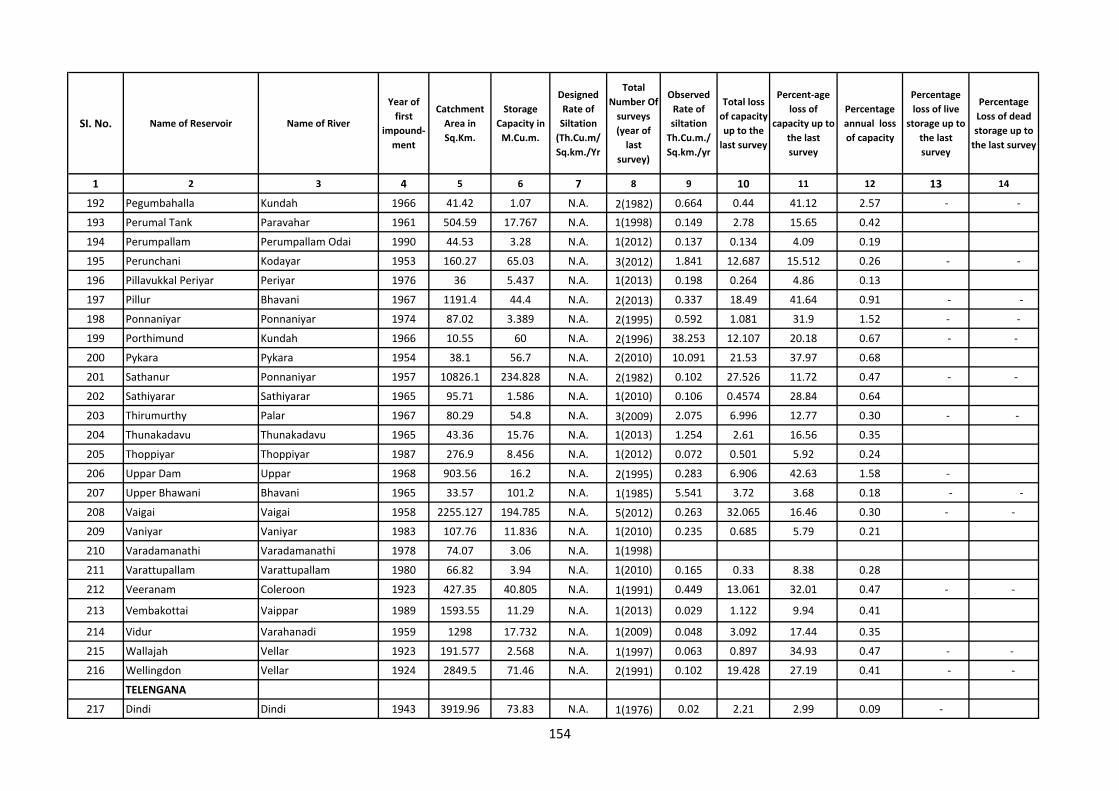
SI. No. Name of Reservoir Name of River
Year of first
impound‐ ment
Catchment Area in Sq.Km.
Storage Capacity in M.Cu.m.
Designed Rate of Siltation (Th.Cu.m/ Sq.km./Yr
Total Number Of surveys (year of last
survey)
Observed Rate of siltation Th.Cu.m./ Sq.km./yr
Total loss of capacity up to the last survey
Percent‐age loss of
capacity up to the last survey
Percentage annual loss of capacity
Percentage loss of live
storage up to the last survey
Percentage Loss of dead storage up to the last survey
1 2 3 4 5 6 7 8 9 10 11 12 13 14
192 Pegumbahalla Kundah 1966 41.42 1.07 N.A. 2(1982) 0.664 0.44 41.12 2.57 ‐ ‐
193 Perumal Tank Paravahar 1961 504.59 17.767 N.A. 1(1998) 0.149 2.78 15.65 0.42
194 Perumpallam Perumpallam Odai 1990 44.53 3.28 N.A. 1(2012) 0.137 0.134 4.09 0.19
195 Perunchani Kodayar 1953 160.27 65.03 N.A. 3(2012) 1.841 12.687 15.512 0.26 ‐ ‐
196 Pillavukkal Periyar Periyar 1976 36 5.437 N.A. 1(2013) 0.198 0.264 4.86 0.13
197 Pillur Bhavani 1967 1191.4 44.4 N.A. 2(2013) 0.337 18.49 41.64 0.91 ‐ ‐
198 Ponnaniyar Ponnaniyar 1974 87.02 3.389 N.A. 2(1995) 0.592 1.081 31.9 1.52 ‐ ‐
199 Porthimund Kundah 1966 10.55 60 N.A. 2(1996) 38.253 12.107 20.18 0.67 ‐ ‐
200 Pykara Pykara 1954 38.1 56.7 N.A. 2(2010) 10.091 21.53 37.97 0.68
201 Sathanur Ponnaniyar 1957 10826.1 234.828 N.A. 2(1982) 0.102 27.526 11.72 0.47 ‐ ‐
202 Sathiyarar Sathiyarar 1965 95.71 1.586 N.A. 1(2010) 0.106 0.4574 28.84 0.64
203 Thirumurthy Palar 1967 80.29 54.8 N.A. 3(2009) 2.075 6.996 12.77 0.30 ‐ ‐
204 Thunakadavu Thunakadavu 1965 43.36 15.76 N.A. 1(2013) 1.254 2.61 16.56 0.35
205 Thoppiyar Thoppiyar 1987 276.9 8.456 N.A. 1(2012) 0.072 0.501 5.92 0.24
206 Uppar Dam Uppar 1968 903.56 16.2 N.A. 2(1995) 0.283 6.906 42.63 1.58 ‐
207 Upper Bhawani Bhavani 1965 33.57 101.2 N.A. 1(1985) 5.541 3.72 3.68 0.18 ‐ ‐
208 Vaigai Vaigai 1958 2255.127 194.785 N.A. 5(2012) 0.263 32.065 16.46 0.30 ‐ ‐
209 Vaniyar Vaniyar 1983 107.76 11.836 N.A. 1(2010) 0.235 0.685 5.79 0.21
210 Varadamanathi Varadamanathi 1978 74.07 3.06 N.A. 1(1998)
211 Varattupallam Varattupallam 1980 66.82 3.94 N.A. 1(2010) 0.165 0.33 8.38 0.28
212 Veeranam Coleroon 1923 427.35 40.805 N.A. 1(1991) 0.449 13.061 32.01 0.47 ‐ ‐
213 Vembakottai Vaippar 1989 1593.55 11.29 N.A. 1(2013) 0.029 1.122 9.94 0.41
214 Vidur Varahanadi 1959 1298 17.732 N.A. 1(2009) 0.048 3.092 17.44 0.35
215 Wallajah Vellar 1923 191.577 2.568 N.A. 1(1997) 0.063 0.897 34.93 0.47 ‐ ‐
216 Wellingdon Vellar 1924 2849.5 71.46 N.A. 2(1991) 0.102 19.428 27.19 0.41 ‐ ‐
TELENGANA
217 Dindi Dindi 1943 3919.96 73.83 N.A. 1(1976) 0.02 2.21 2.99 0.09 ‐
154
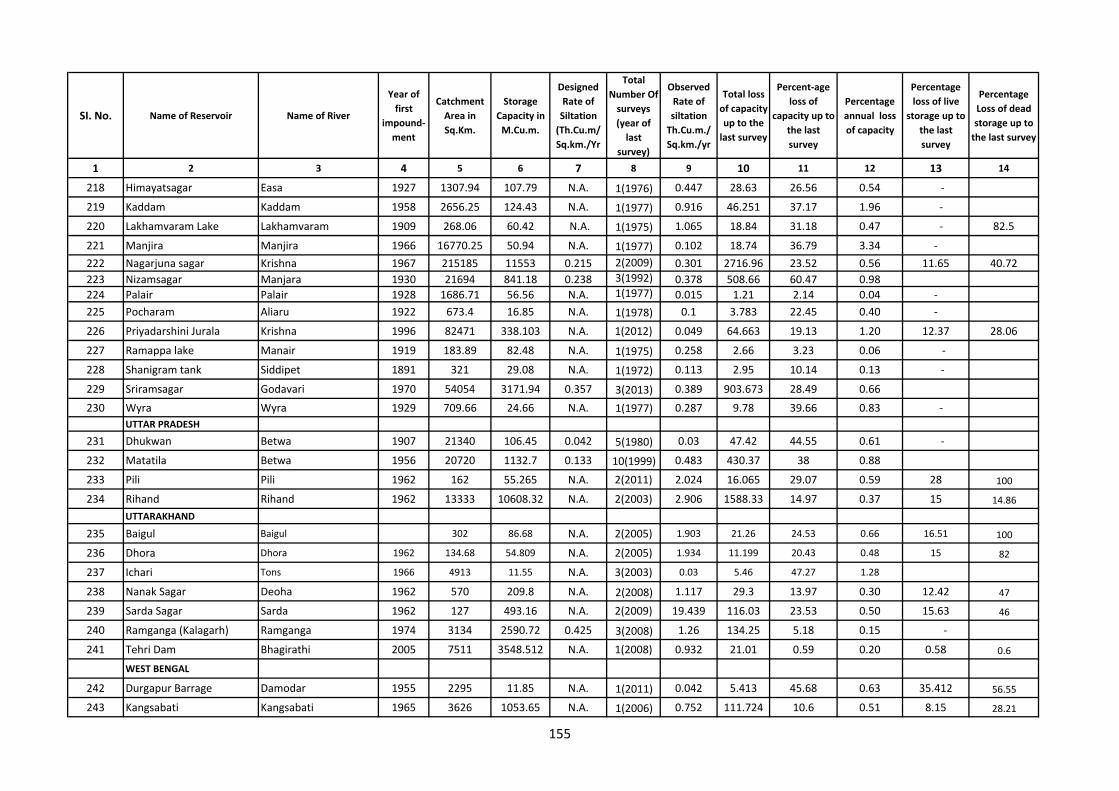
SI. No. Name of Reservoir Name of River
Year of first
impound‐ ment
Catchment Area in Sq.Km.
Storage Capacity in M.Cu.m.
Designed Rate of Siltation (Th.Cu.m/ Sq.km./Yr
Total Number Of surveys (year of last
survey)
Observed Rate of siltation Th.Cu.m./ Sq.km./yr
Total loss of capacity up to the last survey
Percent‐age loss of
capacity up to the last survey
Percentage annual loss of capacity
Percentage loss of live
storage up to the last survey
Percentage Loss of dead storage up to the last survey
1 2 3 4 5 6 7 8 9 10 11 12 13 14
218 Himayatsagar Easa 1927 1307.94 107.79 N.A. 1(1976) 0.447 28.63 26.56 0.54 ‐
219 Kaddam Kaddam 1958 2656.25 124.43 N.A. 1(1977) 0.916 46.251 37.17 1.96 ‐
220 Lakhamvaram Lake Lakhamvaram 1909 268.06 60.42 N.A. 1(1975) 1.065 18.84 31.18 0.47 ‐ 82.5
221 Manjira Manjira 1966 16770.25 50.94 N.A. 1(1977) 0.102 18.74 36.79 3.34 ‐222 Nagarjuna sagar Krishna 1967 215185 11553 0.215 2(2009) 0.301 2716.96 23.52 0.56 11.65 40.72223 Nizamsagar Manjara 1930 21694 841.18 0.238 3(1992) 0.378 508.66 60.47 0.98224 Palair Palair 1928 1686.71 56.56 N.A. 1(1977) 0.015 1.21 2.14 0.04 ‐225 Pocharam Aliaru 1922 673.4 16.85 N.A. 1(1978) 0.1 3.783 22.45 0.40 ‐
226 Priyadarshini Jurala Krishna 1996 82471 338.103 N.A. 1(2012) 0.049 64.663 19.13 1.20 12.37 28.06
227 Ramappa lake Manair 1919 183.89 82.48 N.A. 1(1975) 0.258 2.66 3.23 0.06 ‐
228 Shanigram tank Siddipet 1891 321 29.08 N.A. 1(1972) 0.113 2.95 10.14 0.13 ‐
229 Sriramsagar Godavari 1970 54054 3171.94 0.357 3(2013) 0.389 903.673 28.49 0.66
230 Wyra Wyra 1929 709.66 24.66 N.A. 1(1977) 0.287 9.78 39.66 0.83 ‐UTTAR PRADESH
231 Dhukwan Betwa 1907 21340 106.45 0.042 5(1980) 0.03 47.42 44.55 0.61 ‐
232 Matatila Betwa 1956 20720 1132.7 0.133 10(1999) 0.483 430.37 38 0.88
233 Pili Pili 1962 162 55.265 N.A. 2(2011) 2.024 16.065 29.07 0.59 28 100
234 Rihand Rihand 1962 13333 10608.32 N.A. 2(2003) 2.906 1588.33 14.97 0.37 15 14.86UTTARAKHAND
235 Baigul Baigul 302 86.68 N.A. 2(2005) 1.903 21.26 24.53 0.66 16.51 100
236 Dhora Dhora 1962 134.68 54.809 N.A. 2(2005) 1.934 11.199 20.43 0.48 15 82
237 Ichari Tons 1966 4913 11.55 N.A. 3(2003) 0.03 5.46 47.27 1.28
238 Nanak Sagar Deoha 1962 570 209.8 N.A. 2(2008) 1.117 29.3 13.97 0.30 12.42 47
239 Sarda Sagar Sarda 1962 127 493.16 N.A. 2(2009) 19.439 116.03 23.53 0.50 15.63 46
240 Ramganga (Kalagarh) Ramganga 1974 3134 2590.72 0.425 3(2008) 1.26 134.25 5.18 0.15 ‐
241 Tehri Dam Bhagirathi 2005 7511 3548.512 N.A. 1(2008) 0.932 21.01 0.59 0.20 0.58 0.6
WEST BENGAL
242 Durgapur Barrage Damodar 1955 2295 11.85 N.A. 1(2011) 0.042 5.413 45.68 0.63 35.412 56.55
243 Kangsabati Kangsabati 1965 3626 1053.65 N.A. 1(2006) 0.752 111.724 10.6 0.51 8.15 28.21
155
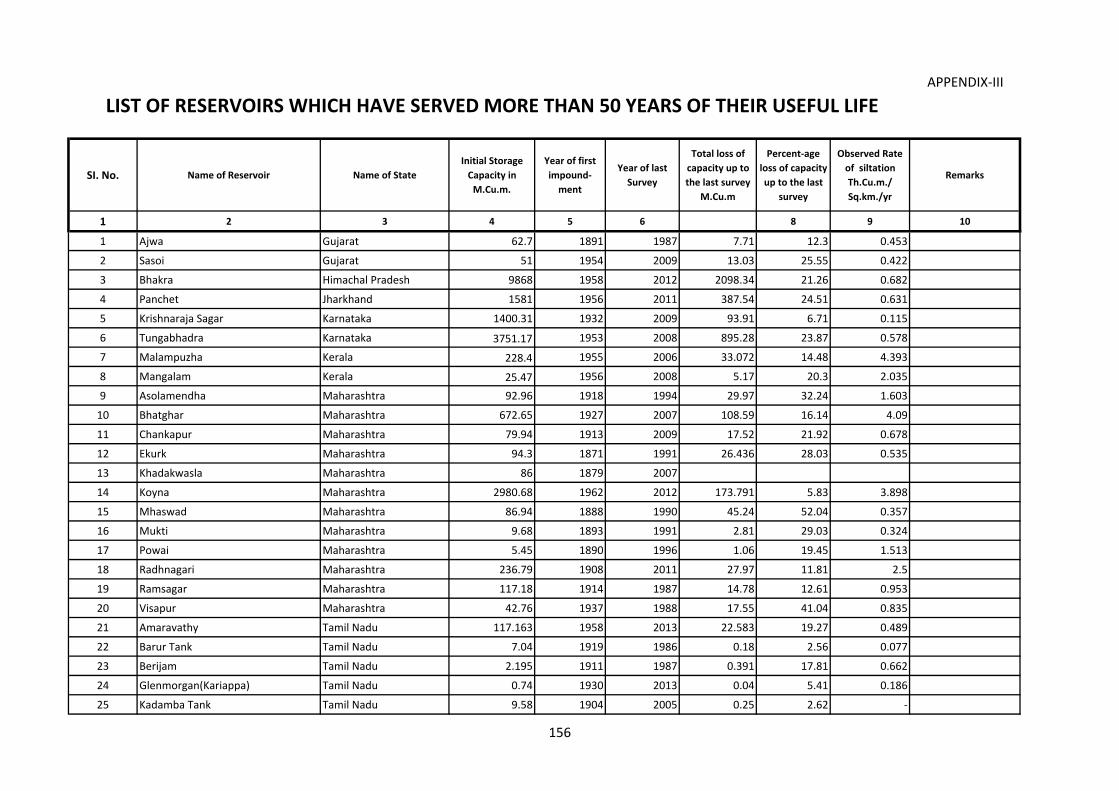
APPENDIX‐III
LIST OF RESERVOIRS WHICH HAVE SERVED MORE THAN 50 YEARS OF THEIR USEFUL LIFE
SI. No. Name of Reservoir Name of StateInitial Storage Capacity in M.Cu.m.
Year of first impound‐ ment
Year of last Survey
Total loss of capacity up to the last survey
M.Cu.m
Percent‐age loss of capacity up to the last
survey
Observed Rate of siltation Th.Cu.m./ Sq.km./yr
Remarks
1 2 3 4 5 6 8 9 10
1 Ajwa Gujarat 62.7 1891 1987 7.71 12.3 0.453
2 Sasoi Gujarat 51 1954 2009 13.03 25.55 0.422
3 Bhakra Himachal Pradesh 9868 1958 2012 2098.34 21.26 0.682
4 Panchet Jharkhand 1581 1956 2011 387.54 24.51 0.631
5 Krishnaraja Sagar Karnataka 1400.31 1932 2009 93.91 6.71 0.115
6 Tungabhadra Karnataka 3751.17 1953 2008 895.28 23.87 0.578
7 Malampuzha Kerala 228.4 1955 2006 33.072 14.48 4.393
8 Mangalam Kerala 25.47 1956 2008 5.17 20.3 2.035
9 Asolamendha Maharashtra 92.96 1918 1994 29.97 32.24 1.603
10 Bhatghar Maharashtra 672.65 1927 2007 108.59 16.14 4.09
11 Chankapur Maharashtra 79.94 1913 2009 17.52 21.92 0.678
12 Ekurk Maharashtra 94.3 1871 1991 26.436 28.03 0.535
13 Khadakwasla Maharashtra 86 1879 2007
14 Koyna Maharashtra 2980.68 1962 2012 173.791 5.83 3.898
15 Mhaswad Maharashtra 86.94 1888 1990 45.24 52.04 0.357
16 Mukti Maharashtra 9.68 1893 1991 2.81 29.03 0.324
17 Powai Maharashtra 5.45 1890 1996 1.06 19.45 1.513
18 Radhnagari Maharashtra 236.79 1908 2011 27.97 11.81 2.5
19 Ramsagar Maharashtra 117.18 1914 1987 14.78 12.61 0.953
20 Visapur Maharashtra 42.76 1937 1988 17.55 41.04 0.835
21 Amaravathy Tamil Nadu 117.163 1958 2013 22.583 19.27 0.489
22 Barur Tank Tamil Nadu 7.04 1919 1986 0.18 2.56 0.077
23 Berijam Tamil Nadu 2.195 1911 1987 0.391 17.81 0.662
24 Glenmorgan(Kariappa) Tamil Nadu 0.74 1930 2013 0.04 5.41 0.186
25 Kadamba Tank Tamil Nadu 9.58 1904 2005 0.25 2.62 ‐
156
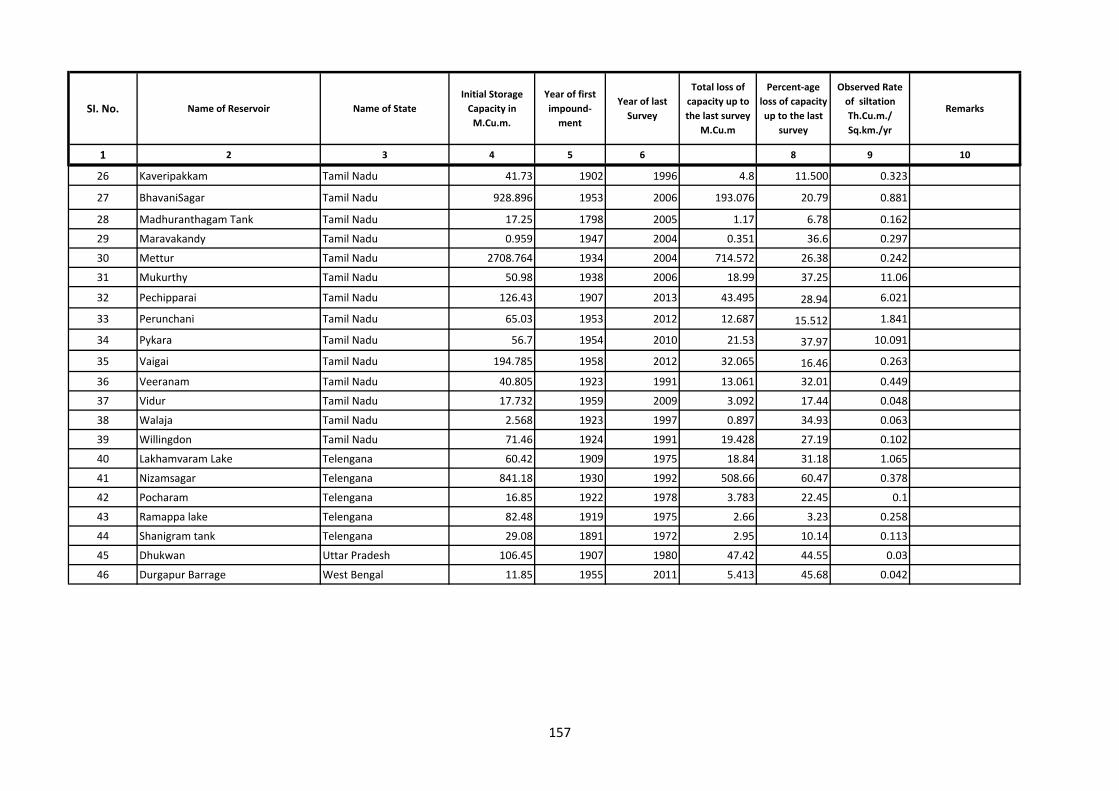
SI. No. Name of Reservoir Name of StateInitial Storage Capacity in M.Cu.m.
Year of first impound‐ ment
Year of last Survey
Total loss of capacity up to the last survey
M.Cu.m
Percent‐age loss of capacity up to the last
survey
Observed Rate of siltation Th.Cu.m./ Sq.km./yr
Remarks
1 2 3 4 5 6 8 9 10
26 Kaveripakkam Tamil Nadu 41.73 1902 1996 4.8 11.500 0.323
27 BhavaniSagar Tamil Nadu 928.896 1953 2006 193.076 20.79 0.881
28 Madhuranthagam Tank Tamil Nadu 17.25 1798 2005 1.17 6.78 0.162
29 Maravakandy Tamil Nadu 0.959 1947 2004 0.351 36.6 0.297
30 Mettur Tamil Nadu 2708.764 1934 2004 714.572 26.38 0.242
31 Mukurthy Tamil Nadu 50.98 1938 2006 18.99 37.25 11.06
32 Pechipparai Tamil Nadu 126.43 1907 2013 43.495 28.94 6.021
33 Perunchani Tamil Nadu 65.03 1953 2012 12.687 15.512 1.841
34 Pykara Tamil Nadu 56.7 1954 2010 21.53 37.97 10.091
35 Vaigai Tamil Nadu 194.785 1958 2012 32.065 16.46 0.263
36 Veeranam Tamil Nadu 40.805 1923 1991 13.061 32.01 0.449
37 Vidur Tamil Nadu 17.732 1959 2009 3.092 17.44 0.048
38 Walaja Tamil Nadu 2.568 1923 1997 0.897 34.93 0.063
39 Willingdon Tamil Nadu 71.46 1924 1991 19.428 27.19 0.102
40 Lakhamvaram Lake Telengana 60.42 1909 1975 18.84 31.18 1.065
41 Nizamsagar Telengana 841.18 1930 1992 508.66 60.47 0.378
42 Pocharam Telengana 16.85 1922 1978 3.783 22.45 0.1
43 Ramappa lake Telengana 82.48 1919 1975 2.66 3.23 0.258
44 Shanigram tank Telengana 29.08 1891 1972 2.95 10.14 0.113
45 Dhukwan Uttar Pradesh 106.45 1907 1980 47.42 44.55 0.03
46 Durgapur Barrage West Bengal 11.85 1955 2011 5.413 45.68 0.042
157
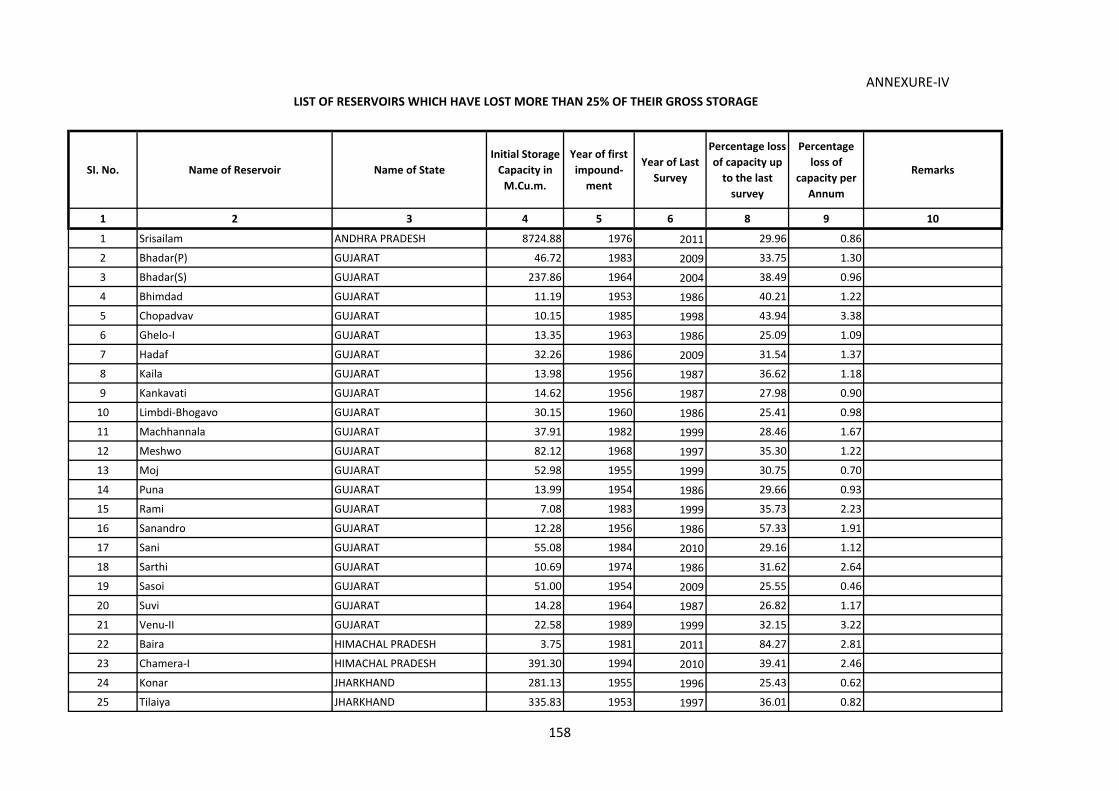
ANNEXURE‐IVLIST OF RESERVOIRS WHICH HAVE LOST MORE THAN 25% OF THEIR GROSS STORAGE
SI. No. Name of Reservoir Name of StateInitial Storage Capacity in M.Cu.m.
Year of first impound‐ ment
Year of Last Survey
Percentage loss of capacity up to the last survey
Percentage loss of
capacity per Annum
Remarks
1 2 3 4 5 6 8 9 10
1 Srisailam ANDHRA PRADESH 8724.88 1976 2011 29.96 0.86
2 Bhadar(P) GUJARAT 46.72 1983 2009 33.75 1.30
3 Bhadar(S) GUJARAT 237.86 1964 2004 38.49 0.96
4 Bhimdad GUJARAT 11.19 1953 1986 40.21 1.22
5 Chopadvav GUJARAT 10.15 1985 1998 43.94 3.38
6 Ghelo‐I GUJARAT 13.35 1963 1986 25.09 1.09
7 Hadaf GUJARAT 32.26 1986 2009 31.54 1.37
8 Kaila GUJARAT 13.98 1956 1987 36.62 1.18
9 Kankavati GUJARAT 14.62 1956 1987 27.98 0.90
10 Limbdi‐Bhogavo GUJARAT 30.15 1960 1986 25.41 0.98
11 Machhannala GUJARAT 37.91 1982 1999 28.46 1.67
12 Meshwo GUJARAT 82.12 1968 1997 35.30 1.22
13 Moj GUJARAT 52.98 1955 1999 30.75 0.70
14 Puna GUJARAT 13.99 1954 1986 29.66 0.93
15 Rami GUJARAT 7.08 1983 1999 35.73 2.23
16 Sanandro GUJARAT 12.28 1956 1986 57.33 1.91
17 Sani GUJARAT 55.08 1984 2010 29.16 1.12
18 Sarthi GUJARAT 10.69 1974 1986 31.62 2.64
19 Sasoi GUJARAT 51.00 1954 2009 25.55 0.46
20 Suvi GUJARAT 14.28 1964 1987 26.82 1.17
21 Venu‐II GUJARAT 22.58 1989 1999 32.15 3.22
22 Baira HIMACHAL PRADESH 3.75 1981 2011 84.27 2.81
23 Chamera‐I HIMACHAL PRADESH 391.30 1994 2010 39.41 2.46
24 Konar JHARKHAND 281.13 1955 1996 25.43 0.62
25 Tilaiya JHARKHAND 335.83 1953 1997 36.01 0.82
158
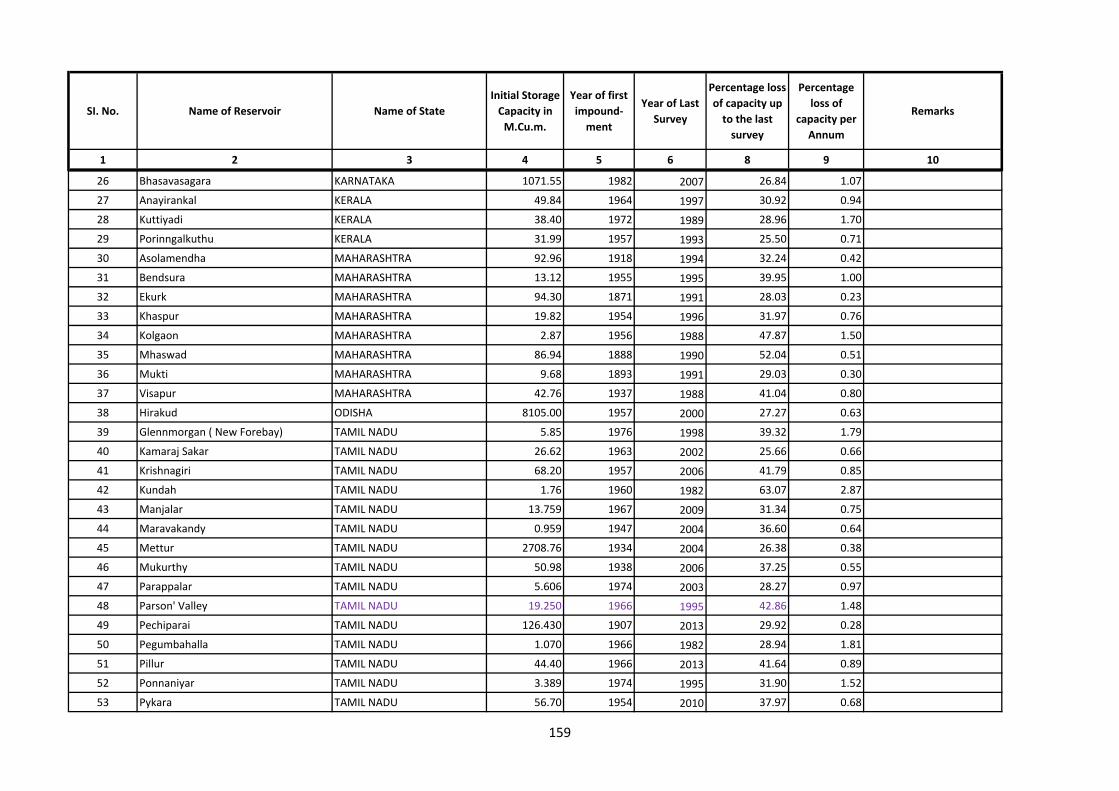
SI. No. Name of Reservoir Name of StateInitial Storage Capacity in M.Cu.m.
Year of first impound‐ ment
Year of Last Survey
Percentage loss of capacity up to the last survey
Percentage loss of
capacity per Annum
Remarks
1 2 3 4 5 6 8 9 10
26 Bhasavasagara KARNATAKA 1071.55 1982 2007 26.84 1.07
27 Anayirankal KERALA 49.84 1964 1997 30.92 0.94
28 Kuttiyadi KERALA 38.40 1972 1989 28.96 1.70
29 Porinngalkuthu KERALA 31.99 1957 1993 25.50 0.71
30 Asolamendha MAHARASHTRA 92.96 1918 1994 32.24 0.42
31 Bendsura MAHARASHTRA 13.12 1955 1995 39.95 1.00
32 Ekurk MAHARASHTRA 94.30 1871 1991 28.03 0.23
33 Khaspur MAHARASHTRA 19.82 1954 1996 31.97 0.76
34 Kolgaon MAHARASHTRA 2.87 1956 1988 47.87 1.50
35 Mhaswad MAHARASHTRA 86.94 1888 1990 52.04 0.51
36 Mukti MAHARASHTRA 9.68 1893 1991 29.03 0.30
37 Visapur MAHARASHTRA 42.76 1937 1988 41.04 0.80
38 Hirakud ODISHA 8105.00 1957 2000 27.27 0.63
39 Glennmorgan ( New Forebay) TAMIL NADU 5.85 1976 1998 39.32 1.79
40 Kamaraj Sakar TAMIL NADU 26.62 1963 2002 25.66 0.66
41 Krishnagiri TAMIL NADU 68.20 1957 2006 41.79 0.85
42 Kundah TAMIL NADU 1.76 1960 1982 63.07 2.87
43 Manjalar TAMIL NADU 13.759 1967 2009 31.34 0.75
44 Maravakandy TAMIL NADU 0.959 1947 2004 36.60 0.64
45 Mettur TAMIL NADU 2708.76 1934 2004 26.38 0.38
46 Mukurthy TAMIL NADU 50.98 1938 2006 37.25 0.55
47 Parappalar TAMIL NADU 5.606 1974 2003 28.27 0.97
48 Parson' Valley TAMIL NADU 19.250 1966 1995 42.86 1.48
49 Pechiparai TAMIL NADU 126.430 1907 2013 29.92 0.28
50 Pegumbahalla TAMIL NADU 1.070 1966 1982 28.94 1.81
51 Pillur TAMIL NADU 44.40 1966 2013 41.64 0.89
52 Ponnaniyar TAMIL NADU 3.389 1974 1995 31.90 1.52
53 Pykara TAMIL NADU 56.70 1954 2010 37.97 0.68
159
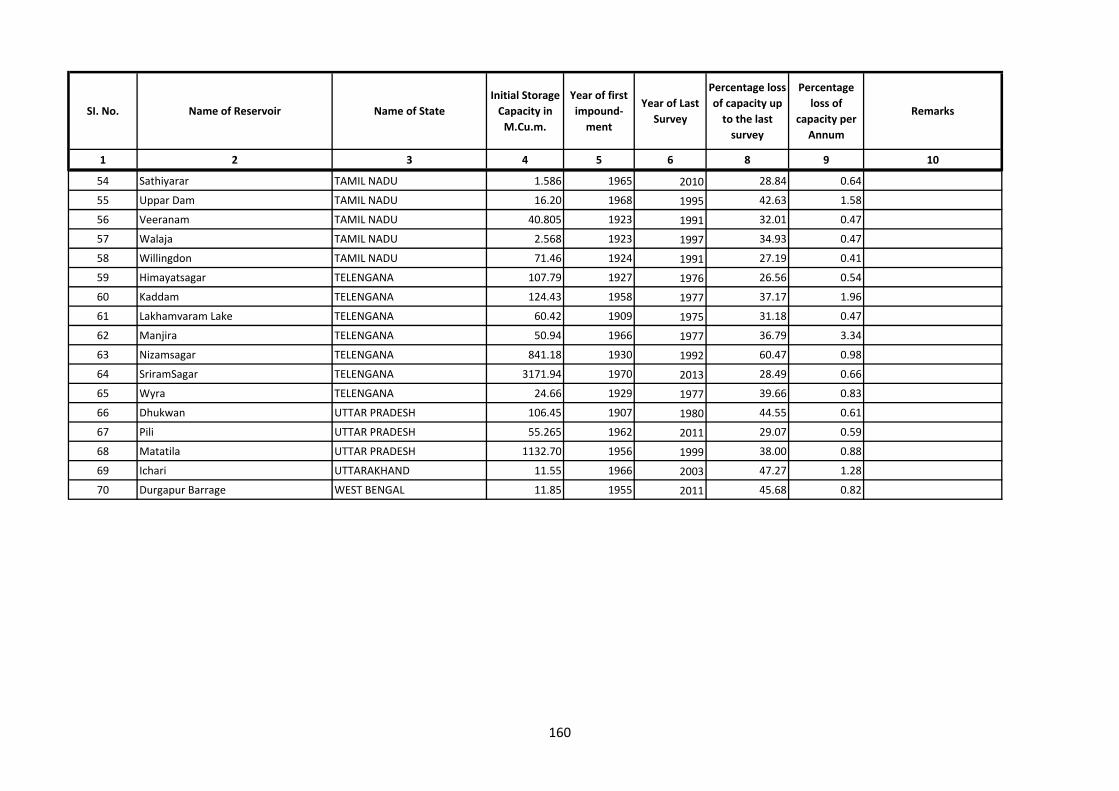
SI. No. Name of Reservoir Name of StateInitial Storage Capacity in M.Cu.m.
Year of first impound‐ ment
Year of Last Survey
Percentage loss of capacity up to the last survey
Percentage loss of
capacity per Annum
Remarks
1 2 3 4 5 6 8 9 10
54 Sathiyarar TAMIL NADU 1.586 1965 2010 28.84 0.64
55 Uppar Dam TAMIL NADU 16.20 1968 1995 42.63 1.58
56 Veeranam TAMIL NADU 40.805 1923 1991 32.01 0.47
57 Walaja TAMIL NADU 2.568 1923 1997 34.93 0.47
58 Willingdon TAMIL NADU 71.46 1924 1991 27.19 0.41
59 Himayatsagar TELENGANA 107.79 1927 1976 26.56 0.54
60 Kaddam TELENGANA 124.43 1958 1977 37.17 1.96
61 Lakhamvaram Lake TELENGANA 60.42 1909 1975 31.18 0.47
62 Manjira TELENGANA 50.94 1966 1977 36.79 3.34
63 Nizamsagar TELENGANA 841.18 1930 1992 60.47 0.98
64 SriramSagar TELENGANA 3171.94 1970 2013 28.49 0.66
65 Wyra TELENGANA 24.66 1929 1977 39.66 0.83
66 Dhukwan UTTAR PRADESH 106.45 1907 1980 44.55 0.61
67 Pili UTTAR PRADESH 55.265 1962 2011 29.07 0.59
68 Matatila UTTAR PRADESH 1132.70 1956 1999 38.00 0.88
69 Ichari UTTARAKHAND 11.55 1966 2003 47.27 1.28
70 Durgapur Barrage WEST BENGAL 11.85 1955 2011 45.68 0.82
160
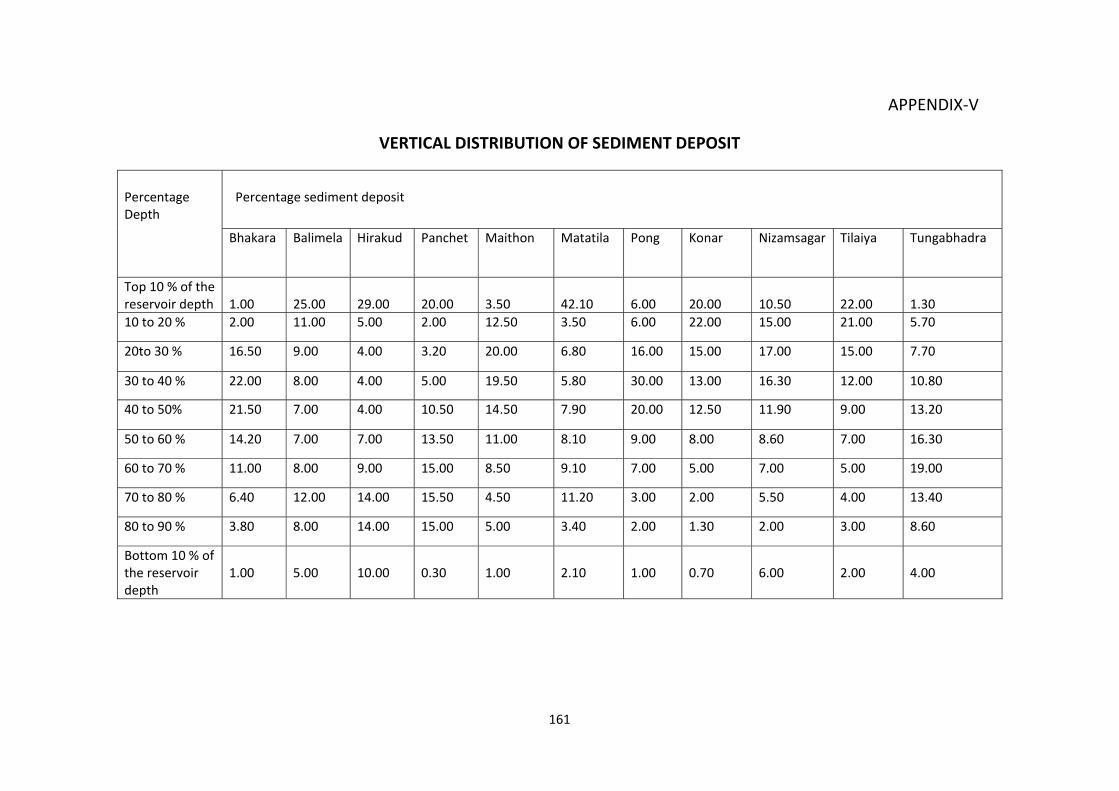
161
APPENDIX‐V
VERTICAL DISTRIBUTION OF SEDIMENT DEPOSIT
Percentage Depth
Percentage sediment deposit
Bhakara Balimela Hirakud Panchet Maithon Matatila Pong Konar Nizamsagar Tilaiya Tungabhadra
Top 10 % of the reservoir depth
1.00
25.00
29.00
20.00
3.50
42.10
6.00
20.00
10.50
22.00
1.30
10 to 20 % 2.00 11.00 5.00 2.00 12.50 3.50 6.00 22.00 15.00 21.00 5.70
20to 30 % 16.50 9.00 4.00 3.20 20.00 6.80 16.00 15.00 17.00 15.00 7.70
30 to 40 % 22.00 8.00 4.00 5.00 19.50 5.80 30.00 13.00 16.30 12.00 10.80
40 to 50% 21.50 7.00 4.00 10.50 14.50 7.90 20.00 12.50 11.90 9.00 13.20
50 to 60 % 14.20 7.00 7.00 13.50 11.00 8.10 9.00 8.00 8.60 7.00 16.30
60 to 70 % 11.00 8.00 9.00 15.00 8.50 9.10 7.00 5.00 7.00 5.00 19.00
70 to 80 % 6.40 12.00 14.00 15.50 4.50 11.20 3.00 2.00 5.50 4.00 13.40
80 to 90 % 3.80 8.00 14.00 15.00 5.00 3.40 2.00 1.30 2.00 3.00 8.60
Bottom 10 % of the reservoir depth
1.00
5.00
10.00
0.30
1.00
2.10
1.00
0.70
6.00
2.00
4.00
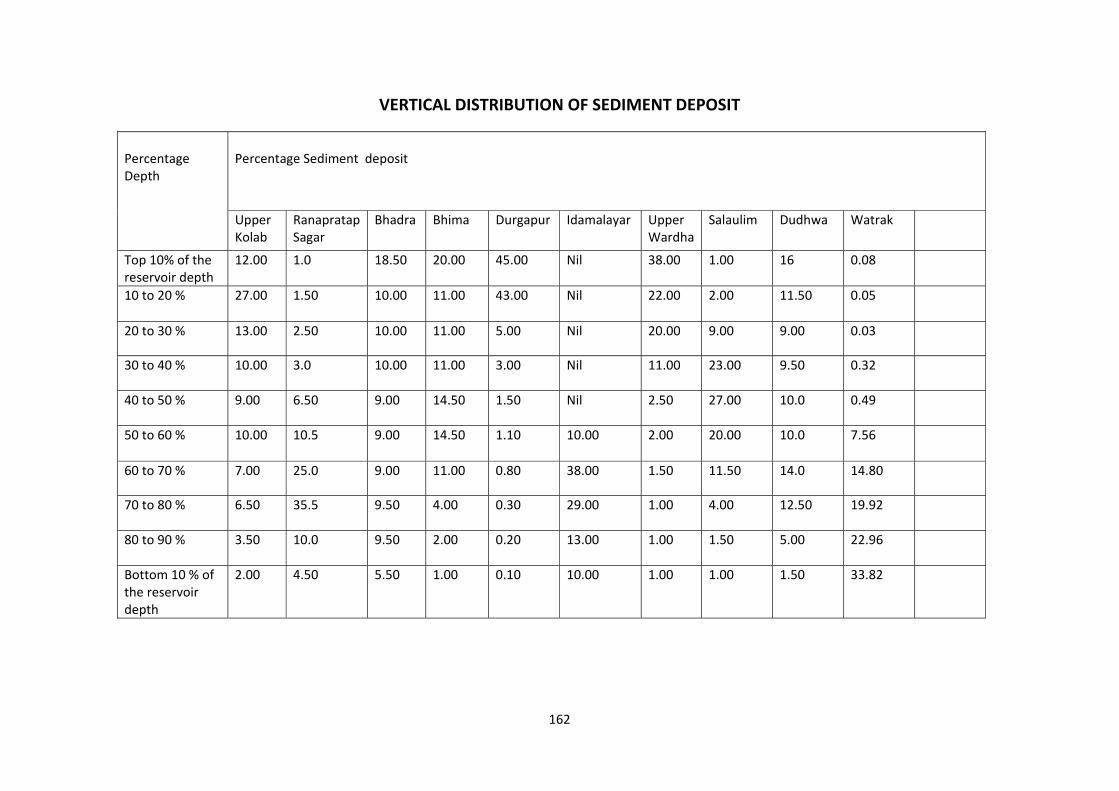
162
VERTICAL DISTRIBUTION OF SEDIMENT DEPOSIT
Percentage Depth
Percentage Sediment deposit
Upper Kolab
RanapratapSagar
Bhadra Bhima Durgapur Idamalayar Upper Wardha
Salaulim Dudhwa Watrak
Top 10% of the reservoir depth
12.00 1.0 18.50 20.00 45.00 Nil 38.00 1.00 16 0.08
10 to 20 % 27.00 1.50 10.00 11.00 43.00 Nil 22.00 2.00 11.50 0.05
20 to 30 % 13.00 2.50 10.00 11.00 5.00 Nil 20.00 9.00 9.00 0.03
30 to 40 % 10.00 3.0 10.00 11.00 3.00 Nil 11.00 23.00 9.50 0.32
40 to 50 % 9.00 6.50 9.00 14.50 1.50 Nil 2.50 27.00 10.0 0.49
50 to 60 % 10.00 10.5 9.00 14.50 1.10 10.00 2.00 20.00 10.0 7.56
60 to 70 % 7.00 25.0 9.00 11.00 0.80 38.00 1.50 11.50 14.0 14.80
70 to 80 % 6.50 35.5 9.50 4.00 0.30 29.00 1.00 4.00 12.50 19.92
80 to 90 % 3.50 10.0 9.50 2.00 0.20 13.00 1.00 1.50 5.00 22.96
Bottom 10 % of the reservoir depth
2.00 4.50 5.50 1.00 0.10 10.00 1.00 1.00 1.50 33.82
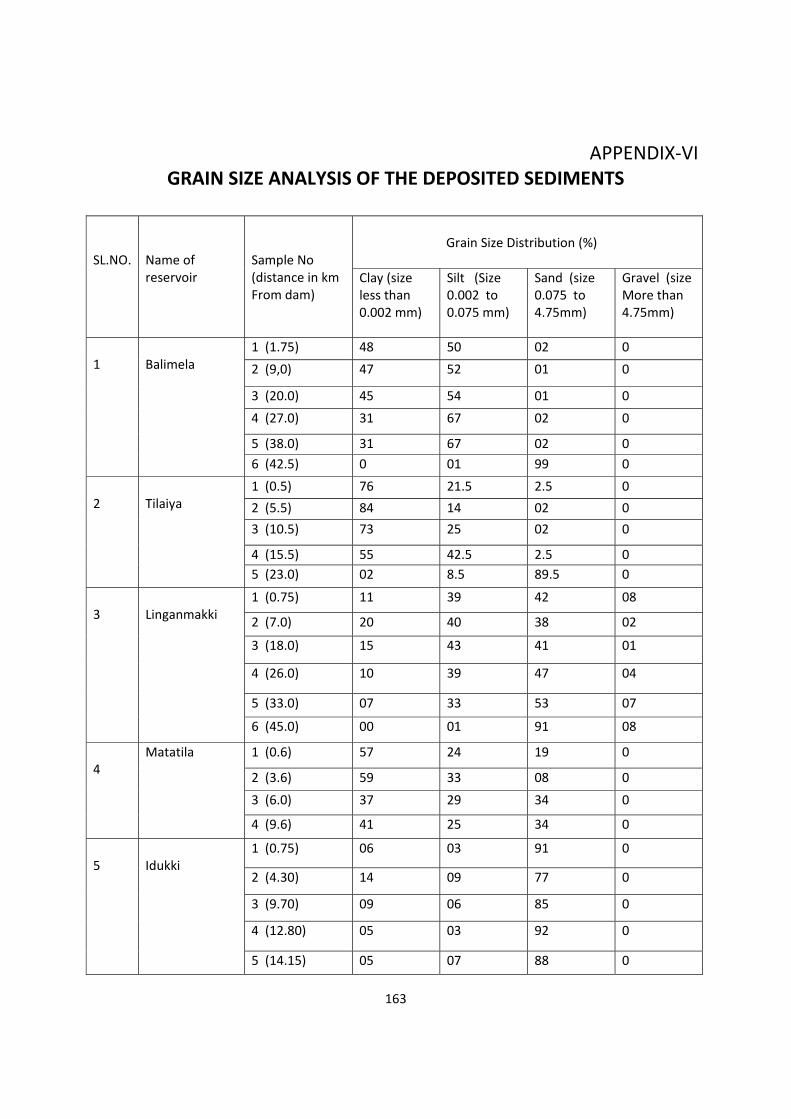
163
APPENDIX‐VI GRAIN SIZE ANALYSIS OF THE DEPOSITED SEDIMENTS
SL.NO.
Name of reservoir
Sample No (distance in km From dam)
Grain Size Distribution (%)
Clay (size less than 0.002 mm)
Silt (Size 0.002 to 0.075 mm)
Sand (size 0.075 to 4.75mm)
Gravel (size More than 4.75mm)
1
Balimela
1 (1.75) 48 50 02 0
2 (9,0) 47 52 01 0
3 (20.0) 45 54 01 0
4 (27.0) 31 67 02 0
5 (38.0) 31 67 02 0
6 (42.5) 0 01 99 0
2
Tilaiya
1 (0.5) 76 21.5 2.5 0
2 (5.5) 84 14 02 0
3 (10.5) 73 25 02 0
4 (15.5) 55 42.5 2.5 0
5 (23.0) 02 8.5 89.5 0
3
Linganmakki
1 (0.75) 11 39 42 08
2 (7.0) 20 40 38 02
3 (18.0) 15 43 41 01
4 (26.0) 10 39 47 04
5 (33.0) 07 33 53 07
6 (45.0) 00 01 91 08
4
Matatila 1 (0.6) 57 24 19 0
2 (3.6) 59 33 08 0
3 (6.0) 37 29 34 0
4 (9.6) 41 25 34 0
5
Idukki
1 (0.75) 06 03 91 0
2 (4.30) 14 09 77 0
3 (9.70) 09 06 85 0
4 (12.80) 05 03 92 0
5 (14.15) 05 07 88 0
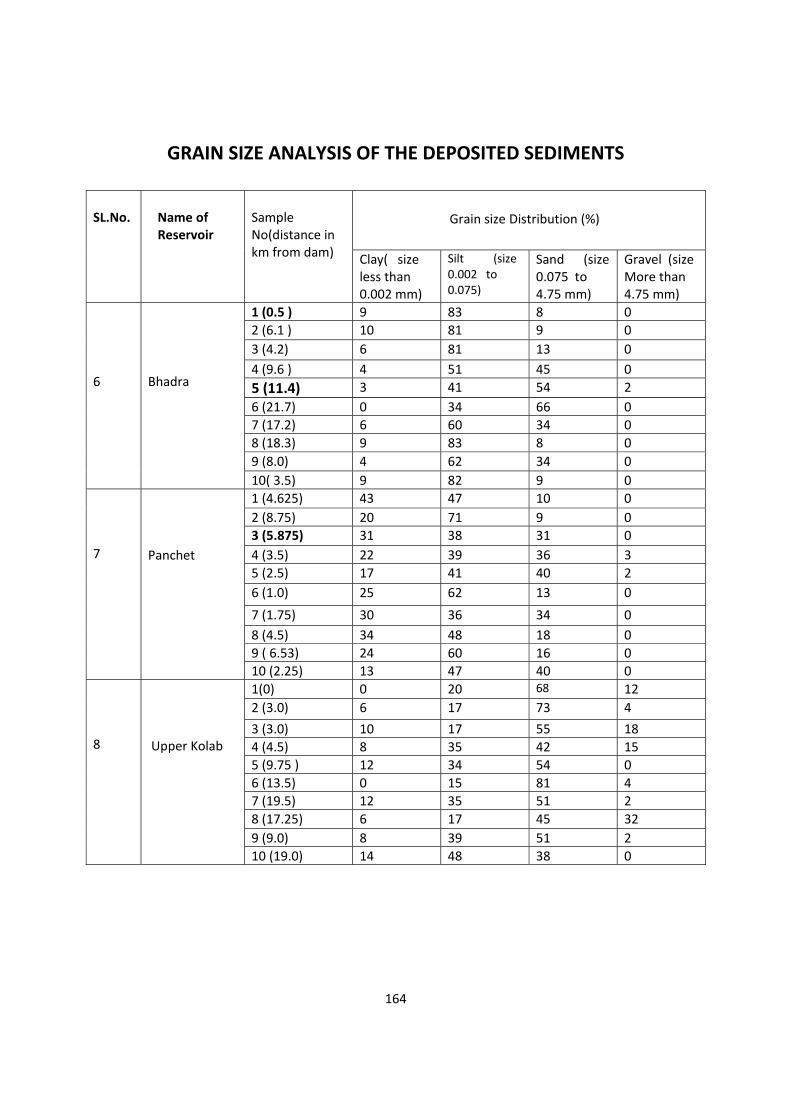
164
GRAIN SIZE ANALYSIS OF THE DEPOSITED SEDIMENTS
SL.No.
Name of Reservoir
Sample No(distance in km from dam)
Grain size Distribution (%)
Clay( size less than 0.002 mm)
Silt (size0.002 to 0.075)
Sand (size 0.075 to 4.75 mm)
Gravel (size More than 4.75 mm)
6
Bhadra
1 (0.5 ) 9 83 8 0
2 (6.1 ) 10 81 9 0
3 (4.2) 6 81 13 0
4 (9.6 ) 4 51 45 0
5 (11.4) 3 41 54 2
6 (21.7) 0 34 66 0
7 (17.2) 6 60 34 0
8 (18.3) 9 83 8 0
9 (8.0) 4 62 34 0
10( 3.5) 9 82 9 0
7
Panchet
1 (4.625) 43 47 10 0
2 (8.75) 20 71 9 0
3 (5.875) 31 38 31 0
4 (3.5) 22 39 36 3
5 (2.5) 17 41 40 2
6 (1.0) 25 62 13 0
7 (1.75) 30 36 34 0
8 (4.5) 34 48 18 0
9 ( 6.53) 24 60 16 0
10 (2.25) 13 47 40 0
8
Upper Kolab
1(0) 0 20 68 12
2 (3.0) 6 17 73 4
3 (3.0) 10 17 55 18
4 (4.5) 8 35 42 15
5 (9.75 ) 12 34 54 0
6 (13.5) 0 15 81 4
7 (19.5) 12 35 51 2
8 (17.25) 6 17 45 32
9 (9.0) 8 39 51 2
10 (19.0) 14 48 38 0
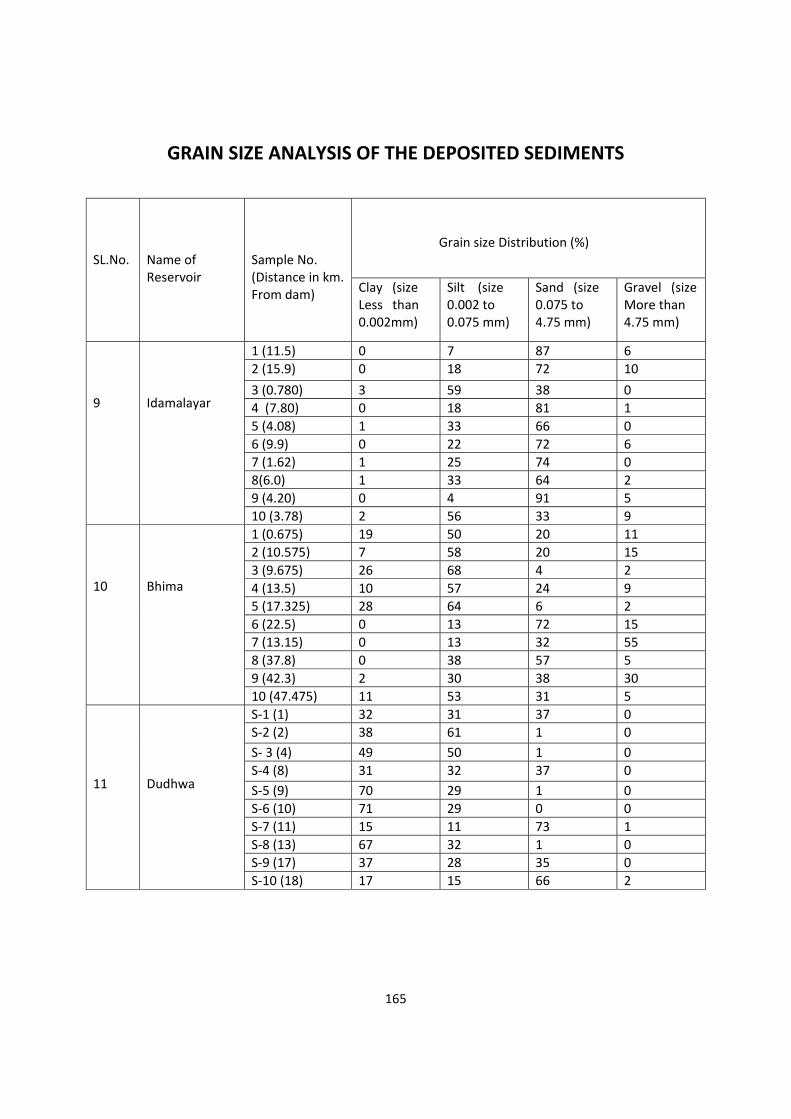
165
GRAIN SIZE ANALYSIS OF THE DEPOSITED SEDIMENTS
SL.No.
Name of Reservoir
Sample No. (Distance in km.From dam)
Grain size Distribution (%)
Clay (size Less than 0.002mm)
Silt (size 0.002 to 0.075 mm)
Sand (size 0.075 to 4.75 mm)
Gravel (sizeMore than 4.75 mm)
9
Idamalayar
1 (11.5) 0 7 87 6
2 (15.9) 0 18 72 10
3 (0.780) 3 59 38 0
4 (7.80) 0 18 81 1
5 (4.08) 1 33 66 0
6 (9.9) 0 22 72 6
7 (1.62) 1 25 74 0
8(6.0) 1 33 64 2
9 (4.20) 0 4 91 5
10 (3.78) 2 56 33 9
10
Bhima
1 (0.675) 19 50 20 11
2 (10.575) 7 58 20 15
3 (9.675) 26 68 4 2
4 (13.5) 10 57 24 9
5 (17.325) 28 64 6 2
6 (22.5) 0 13 72 15
7 (13.15) 0 13 32 55
8 (37.8) 0 38 57 5
9 (42.3) 2 30 38 30
10 (47.475) 11 53 31 5
11
Dudhwa
S‐1 (1) 32 31 37 0
S‐2 (2) 38 61 1 0
S‐ 3 (4) 49 50 1 0
S‐4 (8) 31 32 37 0
S‐5 (9) 70 29 1 0
S‐6 (10) 71 29 0 0
S‐7 (11) 15 11 73 1
S‐8 (13) 67 32 1 0
S‐9 (17) 37 28 35 0
S‐10 (18) 17 15 66 2
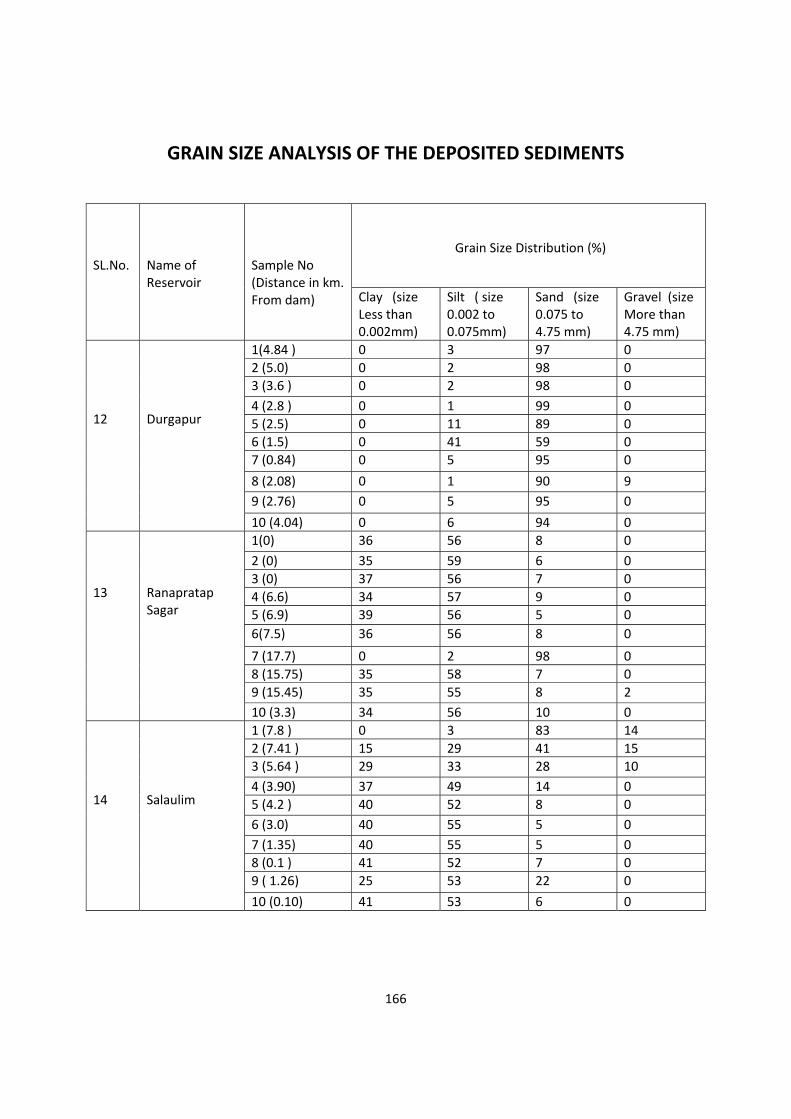
166
GRAIN SIZE ANALYSIS OF THE DEPOSITED SEDIMENTS
SL.No.
Name of Reservoir
Sample No (Distance in km.From dam)
Grain Size Distribution (%)
Clay (size Less than 0.002mm)
Silt ( size 0.002 to 0.075mm)
Sand (size 0.075 to 4.75 mm)
Gravel (size More than 4.75 mm)
12
Durgapur
1(4.84 ) 0 3 97 0
2 (5.0) 0 2 98 0
3 (3.6 ) 0 2 98 0
4 (2.8 ) 0 1 99 0
5 (2.5) 0 11 89 0
6 (1.5) 0 41 59 0
7 (0.84) 0 5 95 0
8 (2.08) 0 1 90 9
9 (2.76) 0 5 95 0
10 (4.04) 0 6 94 0
13
Ranapratap Sagar
1(0) 36 56 8 0
2 (0) 35 59 6 0
3 (0) 37 56 7 0
4 (6.6) 34 57 9 0
5 (6.9) 39 56 5 0
6(7.5) 36 56 8 0
7 (17.7) 0 2 98 0
8 (15.75) 35 58 7 0
9 (15.45) 35 55 8 2
10 (3.3) 34 56 10 0
14
Salaulim
1 (7.8 ) 0 3 83 14
2 (7.41 ) 15 29 41 15
3 (5.64 ) 29 33 28 10
4 (3.90) 37 49 14 0
5 (4.2 ) 40 52 8 0
6 (3.0) 40 55 5 0
7 (1.35) 40 55 5 0
8 (0.1 ) 41 52 7 0
9 ( 1.26) 25 53 22 0
10 (0.10) 41 53 6 0
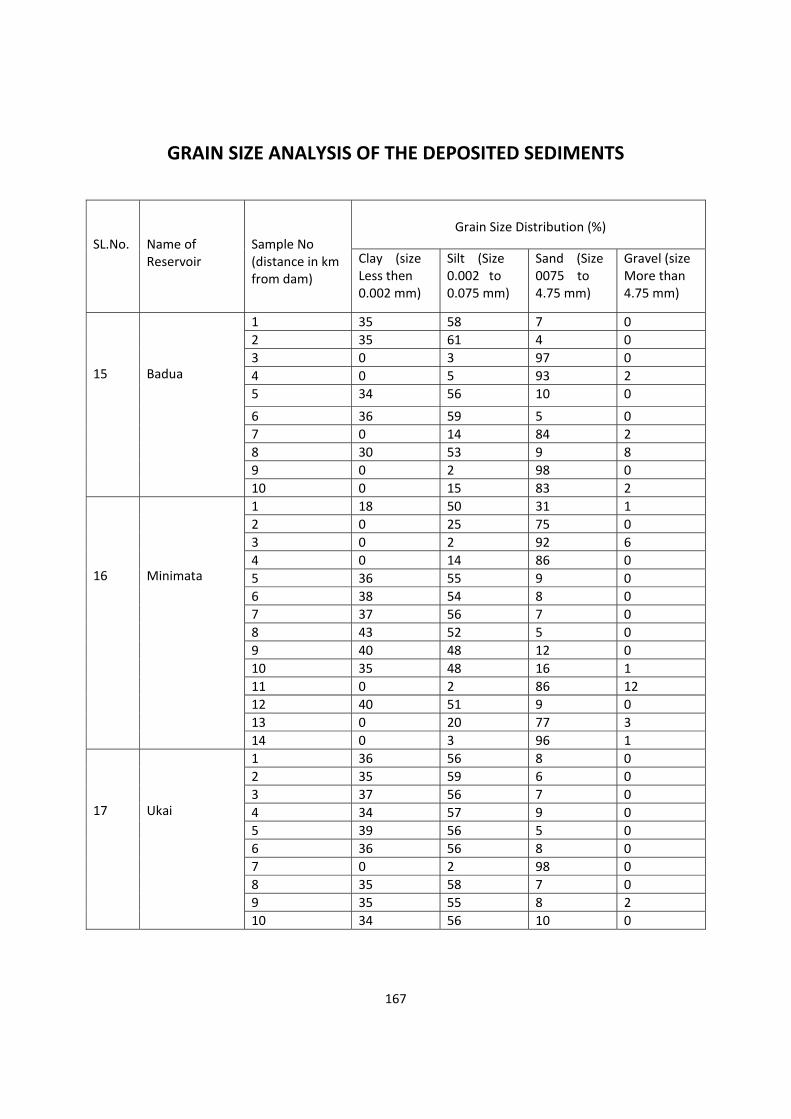
167
GRAIN SIZE ANALYSIS OF THE DEPOSITED SEDIMENTS
SL.No.
Name of Reservoir
Sample No (distance in km from dam)
Grain Size Distribution (%)
Clay (size Less then 0.002 mm)
Silt (Size 0.002 to 0.075 mm)
Sand (Size 0075 to 4.75 mm)
Gravel (size More than 4.75 mm)
15
Badua
1 35 58 7 0
2 35 61 4 0
3 0 3 97 0
4 0 5 93 2
5 34 56 10 0
6 36 59 5 0
7 0 14 84 2
8 30 53 9 8
9 0 2 98 0
10 0 15 83 2
16
Minimata
1 18 50 31 1
2 0 25 75 0
3 0 2 92 6
4 0 14 86 0
5 36 55 9 0
6 38 54 8 0
7 37 56 7 0
8 43 52 5 0
9 40 48 12 0
10 35 48 16 1
11 0 2 86 12
12 40 51 9 0
13 0 20 77 3
14 0 3 96 1
17
Ukai
1 36 56 8 0
2 35 59 6 0
3 37 56 7 0
4 34 57 9 0
5 39 56 5 0
6 36 56 8 0
7 0 2 98 0
8 35 58 7 0
9 35 55 8 2
10 34 56 10 0
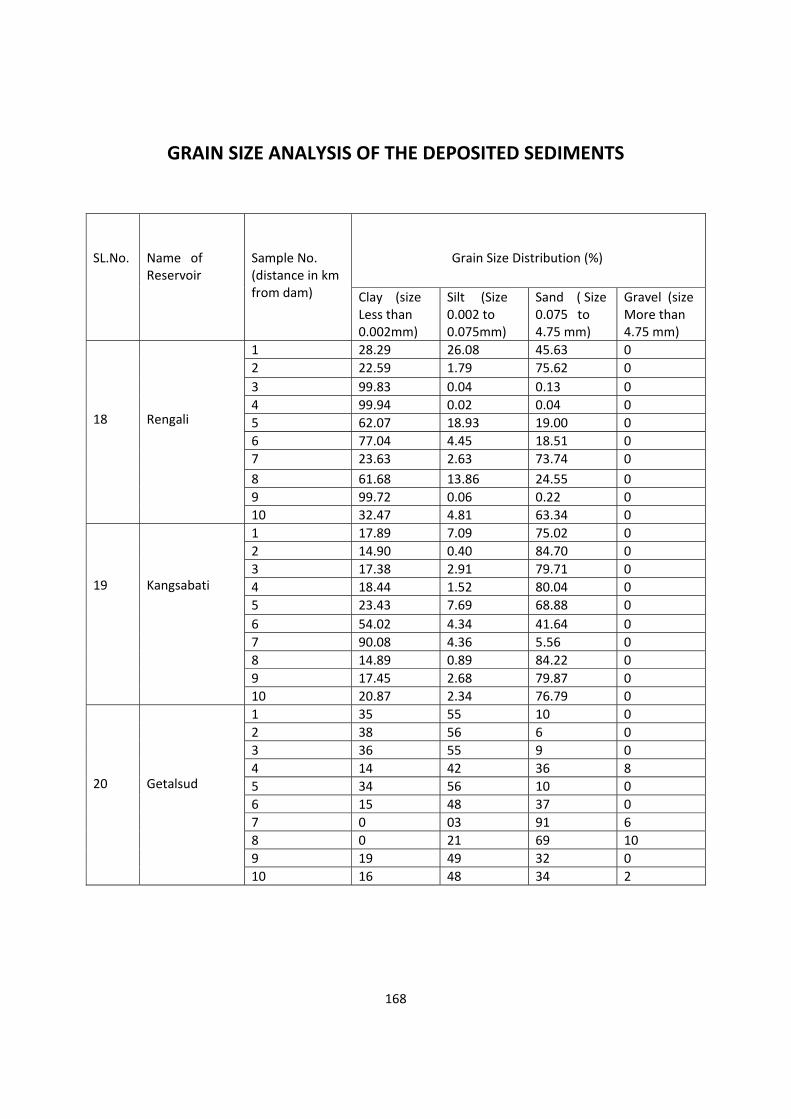
168
GRAIN SIZE ANALYSIS OF THE DEPOSITED SEDIMENTS
SL.No.
Name of Reservoir
Sample No. (distance in km from dam)
Grain Size Distribution (%)
Clay (size Less than 0.002mm)
Silt (Size 0.002 to 0.075mm)
Sand ( Size 0.075 to 4.75 mm)
Gravel (size More than 4.75 mm)
18
Rengali
1 28.29 26.08 45.63 0
2 22.59 1.79 75.62 0
3 99.83 0.04 0.13 0
4 99.94 0.02 0.04 0
5 62.07 18.93 19.00 0
6 77.04 4.45 18.51 0
7 23.63 2.63 73.74 0
8 61.68 13.86 24.55 0
9 99.72 0.06 0.22 0
10 32.47 4.81 63.34 0
19
Kangsabati
1 17.89 7.09 75.02 0
2 14.90 0.40 84.70 0
3 17.38 2.91 79.71 0
4 18.44 1.52 80.04 0
5 23.43 7.69 68.88 0
6 54.02 4.34 41.64 0
7 90.08 4.36 5.56 0
8 14.89 0.89 84.22 0
9 17.45 2.68 79.87 0
10 20.87 2.34 76.79 0
20
Getalsud
1 35 55 10 0
2 38 56 6 0
3 36 55 9 0
4 14 42 36 8
5 34 56 10 0
6 15 48 37 0
7 0 03 91 6
8 0 21 69 10
9 19 49 32 0
10 16 48 34 2
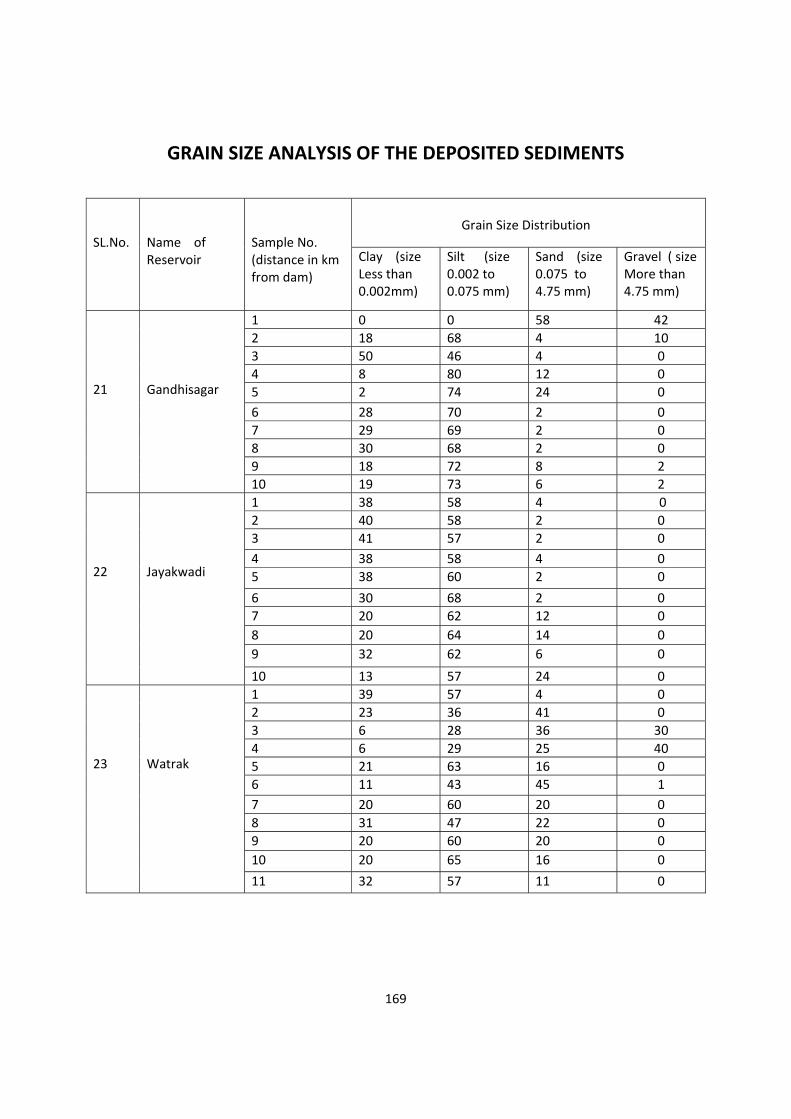
169
GRAIN SIZE ANALYSIS OF THE DEPOSITED SEDIMENTS
SL.No.
Name of Reservoir
Sample No. (distance in km from dam)
Grain Size Distribution
Clay (size Less than 0.002mm)
Silt (size 0.002 to 0.075 mm)
Sand (size 0.075 to 4.75 mm)
Gravel ( sizeMore than 4.75 mm)
21
Gandhisagar
1 0 0 58 42
2 18 68 4 10
3 50 46 4 0
4 8 80 12 0
5 2 74 24 0
6 28 70 2 0
7 29 69 2 0
8 30 68 2 0
9 18 72 8 2
10 19 73 6 2
22
Jayakwadi
1 38 58 4 0
2 40 58 2 0
3 41 57 2 0
4 38 58 4 0
5 38 60 2 0
6 30 68 2 0
7 20 62 12 0
8 20 64 14 0
9 32 62 6 0
10 13 57 24 0
23
Watrak
1 39 57 4 0
2 23 36 41 0
3 6 28 36 30
4 6 29 25 40
5 21 63 16 0
6 11 43 45 1
7 20 60 20 0
8 31 47 22 0
9 20 60 20 0
10 20 65 16 0
11 32 57 11 0
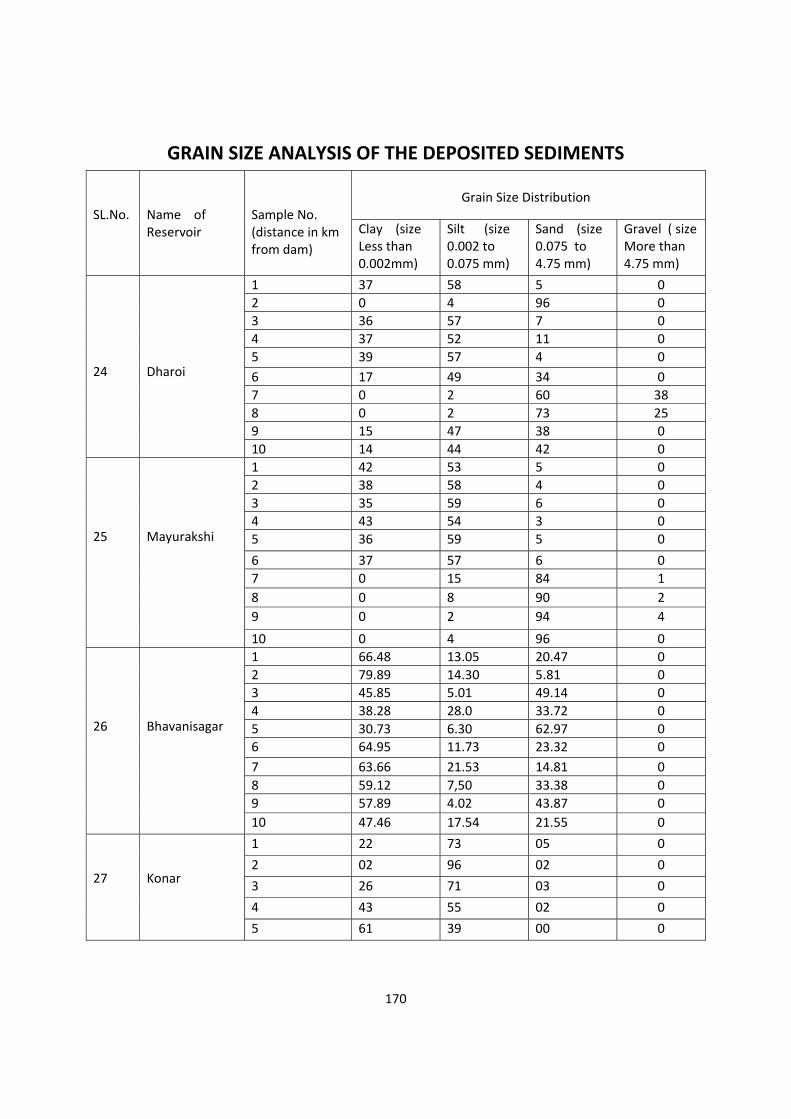
170
GRAIN SIZE ANALYSIS OF THE DEPOSITED SEDIMENTS
SL.No.
Name of Reservoir
Sample No. (distance in km from dam)
Grain Size Distribution
Clay (size Less than 0.002mm)
Silt (size 0.002 to 0.075 mm)
Sand (size 0.075 to 4.75 mm)
Gravel ( sizeMore than 4.75 mm)
24
Dharoi
1 37 58 5 0
2 0 4 96 0
3 36 57 7 0
4 37 52 11 0
5 39 57 4 0
6 17 49 34 0
7 0 2 60 38
8 0 2 73 25
9 15 47 38 0
10 14 44 42 0
25
Mayurakshi
1 42 53 5 0
2 38 58 4 0
3 35 59 6 0
4 43 54 3 0
5 36 59 5 0
6 37 57 6 0
7 0 15 84 1
8 0 8 90 2
9 0 2 94 4
10 0 4 96 0
26
Bhavanisagar
1 66.48 13.05 20.47 0
2 79.89 14.30 5.81 0
3 45.85 5.01 49.14 0
4 38.28 28.0 33.72 0
5 30.73 6.30 62.97 0
6 64.95 11.73 23.32 0
7 63.66 21.53 14.81 0
8 59.12 7,50 33.38 0
9 57.89 4.02 43.87 0
10 47.46 17.54 21.55 0
27
Konar
1 22 73 05 0
2 02 96 02 0
3 26 71 03 0
4 43 55 02 0
5 61 39 00 0
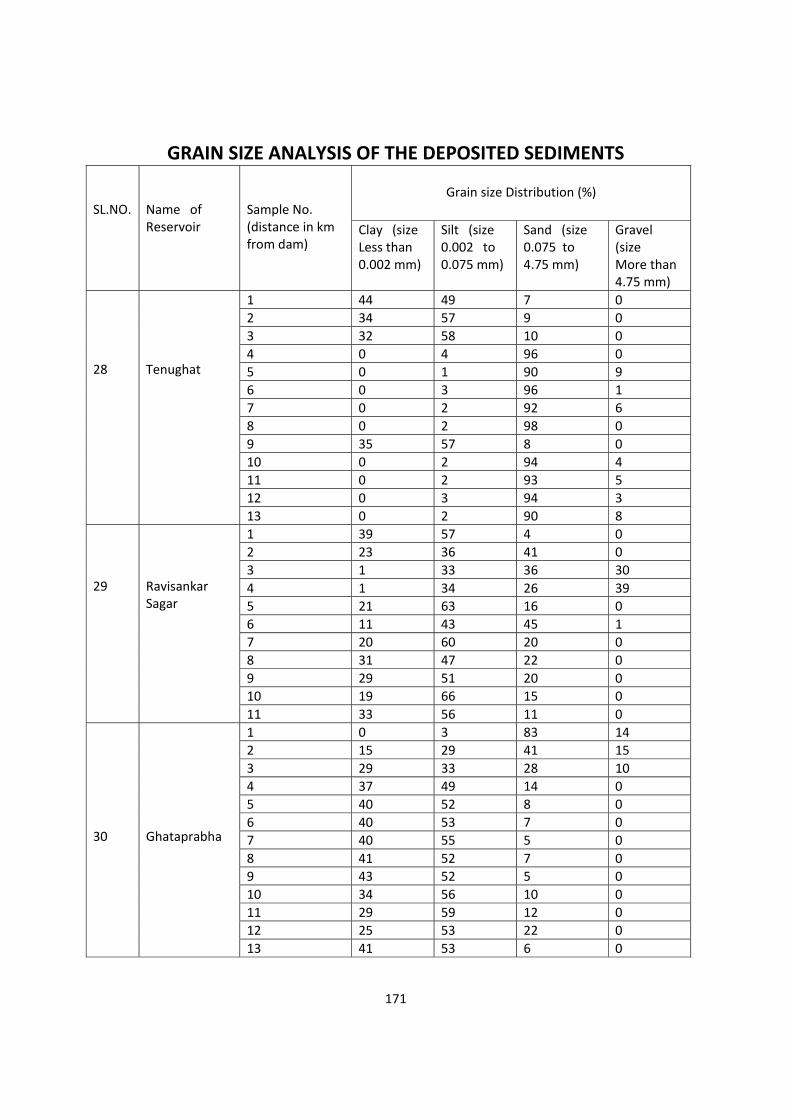
171
GRAIN SIZE ANALYSIS OF THE DEPOSITED SEDIMENTS SL.NO.
Name of Reservoir
Sample No. (distance in km from dam)
Grain size Distribution (%)
Clay (size Less than 0.002 mm)
Silt (size 0.002 to 0.075 mm)
Sand (size 0.075 to 4.75 mm)
Gravel (size More than 4.75 mm)
28
Tenughat
1 44 49 7 0
2 34 57 9 0
3 32 58 10 0
4 0 4 96 0
5 0 1 90 9
6 0 3 96 1
7 0 2 92 6
8 0 2 98 0
9 35 57 8 0
10 0 2 94 4
11 0 2 93 5
12 0 3 94 3
13 0 2 90 8
29
Ravisankar Sagar
1 39 57 4 0
2 23 36 41 0
3 1 33 36 30
4 1 34 26 39
5 21 63 16 0
6 11 43 45 1
7 20 60 20 0
8 31 47 22 0
9 29 51 20 0
10 19 66 15 0
11 33 56 11 0
30
Ghataprabha
1 0 3 83 14
2 15 29 41 15
3 29 33 28 10
4 37 49 14 0
5 40 52 8 0
6 40 53 7 0
7 40 55 5 0
8 41 52 7 0
9 43 52 5 0
10 34 56 10 0
11 29 59 12 0
12 25 53 22 0
13 41 53 6 0
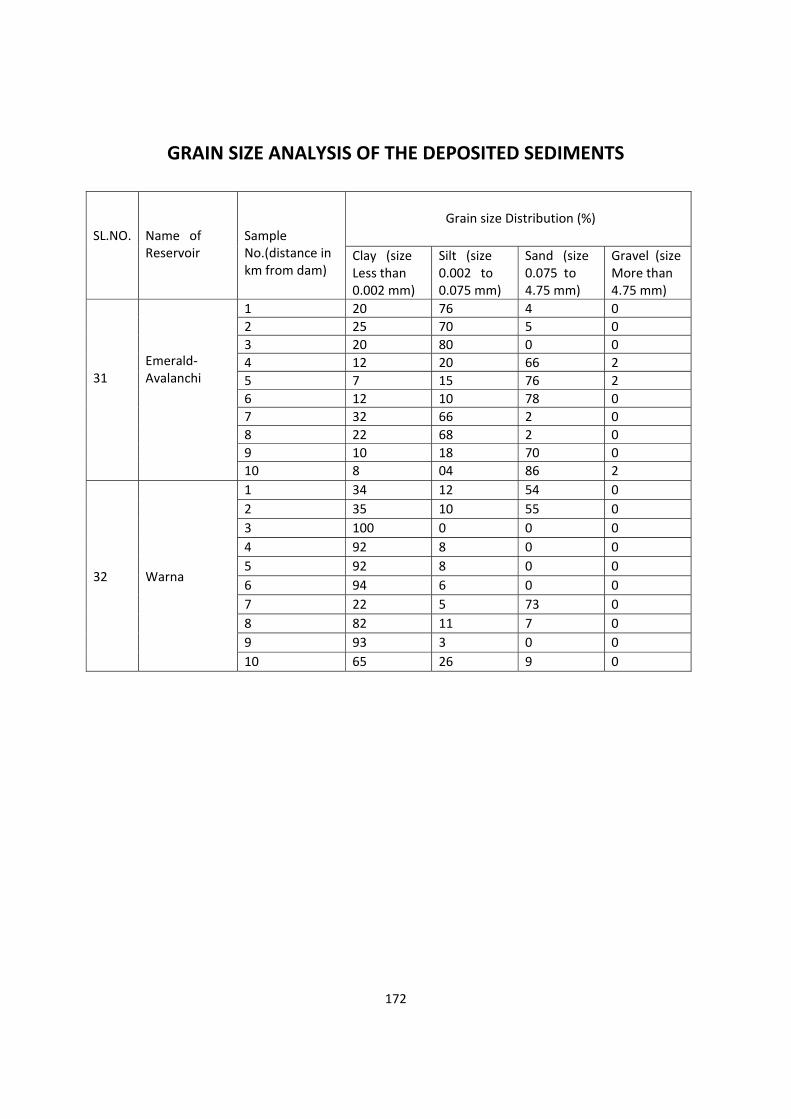
172
GRAIN SIZE ANALYSIS OF THE DEPOSITED SEDIMENTS
SL.NO.
Name of Reservoir
Sample No.(distance in km from dam)
Grain size Distribution (%)
Clay (size Less than 0.002 mm)
Silt (size 0.002 to 0.075 mm)
Sand (size 0.075 to 4.75 mm)
Gravel (size More than 4.75 mm)
31
Emerald‐Avalanchi
1 20 76 4 0
2 25 70 5 0
3 20 80 0 0
4 12 20 66 2
5 7 15 76 2
6 12 10 78 0
7 32 66 2 0
8 22 68 2 0
9 10 18 70 0
10 8 04 86 2
32
Warna
1 34 12 54 0
2 35 10 55 0
3 100 0 0 0
4 92 8 0 0
5 92 8 0 0
6 94 6 0 0
7 22 5 73 0
8 82 11 7 0
9 93 3 0 0
10 65 26 9 0
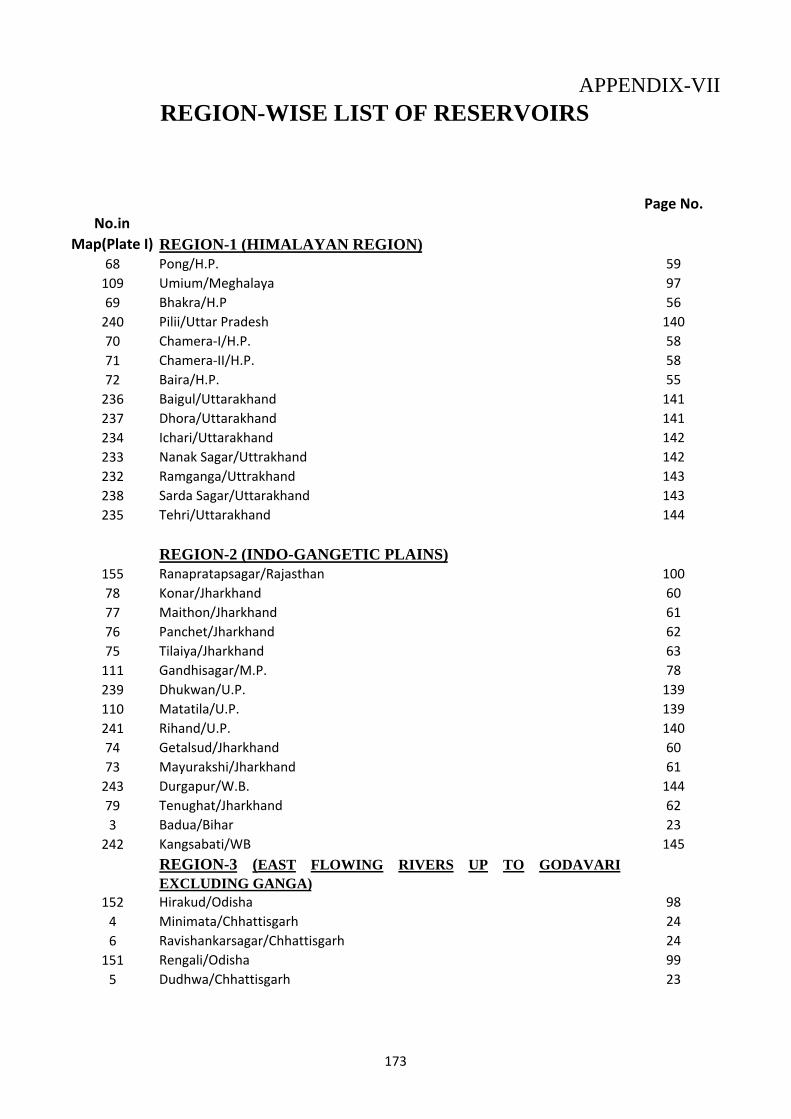
APPENDIX-VIIREGION-WISE LIST OF RESERVOIRS
Page No.
REGION-1 (HIMALAYAN REGION)68 Pong/H.P. 59
109 Umium/Meghalaya 97
69 Bhakra/H.P 56
240 Pilii/Uttar Pradesh 140
70 Chamera‐I/H.P. 58
71 Chamera‐II/H.P. 58
72 Baira/H.P. 55
236 Baigul/Uttarakhand 141
237 Dhora/Uttarakhand 141
234 Ichari/Uttarakhand 142
233 Nanak Sagar/Uttrakhand 142
232 Ramganga/Uttrakhand 143
238 Sarda Sagar/Uttarakhand 143
235 Tehri/Uttarakhand 144
REGION-2 (INDO-GANGETIC PLAINS)155 Ranapratapsagar/Rajasthan 100
78 Konar/Jharkhand 60
77 Maithon/Jharkhand 61
76 Panchet/Jharkhand 62
75 Tilaiya/Jharkhand 63
111 Gandhisagar/M.P. 78
239 Dhukwan/U.P. 139
110 Matatila/U.P. 139
241 Rihand/U.P. 140
74 Getalsud/Jharkhand 60
73 Mayurakshi/Jharkhand 61
243 Durgapur/W.B. 144
79 Tenughat/Jharkhand 62
3 Badua/Bihar 23
242 Kangsabati/WB 145
REGION-3 (EAST FLOWING RIVERS UP TO GODAVARIEXCLUDING GANGA)
152 Hirakud/Odisha 98
4 Minimata/Chhattisgarh 24
6 Ravishankarsagar/Chhattisgarh 24
151 Rengali/Odisha 99
5 Dudhwa/Chhattisgarh 23
No.in
Map(Plate I)
173
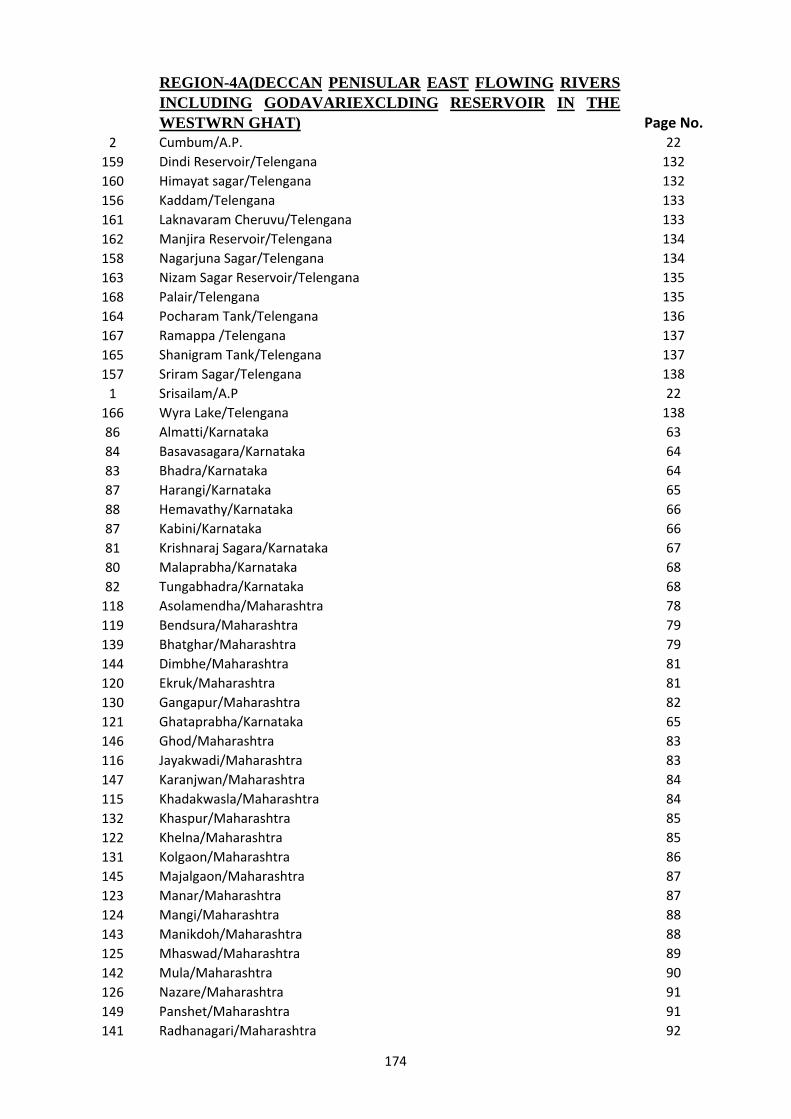
REGION-4A(DECCAN PENISULAR EAST FLOWING RIVERSINCLUDING GODAVARIEXCLDING RESERVOIR IN THEWESTWRN GHAT) Page No.
2 Cumbum/A.P. 22
159 Dindi Reservoir/Telengana 132
160 Himayat sagar/Telengana 132
156 Kaddam/Telengana 133
161 Laknavaram Cheruvu/Telengana 133
162 Manjira Reservoir/Telengana 134
158 Nagarjuna Sagar/Telengana 134
163 Nizam Sagar Reservoir/Telengana 135
168 Palair/Telengana 135
164 Pocharam Tank/Telengana 136
167 Ramappa /Telengana 137
165 Shanigram Tank/Telengana 137
157 Sriram Sagar/Telengana 138
1 Srisailam/A.P 22
166 Wyra Lake/Telengana 138
86 Almatti/Karnataka 63
84 Basavasagara/Karnataka 64
83 Bhadra/Karnataka 64
87 Harangi/Karnataka 65
88 Hemavathy/Karnataka 66
87 Kabini/Karnataka 66
81 Krishnaraj Sagara/Karnataka 67
80 Malaprabha/Karnataka 68
82 Tungabhadra/Karnataka 68
118 Asolamendha/Maharashtra 78
119 Bendsura/Maharashtra 79
139 Bhatghar/Maharashtra 79
144 Dimbhe/Maharashtra 81
120 Ekruk/Maharashtra 81
130 Gangapur/Maharashtra 82
121 Ghataprabha/Karnataka 65
146 Ghod/Maharashtra 83
116 Jayakwadi/Maharashtra 83
147 Karanjwan/Maharashtra 84
115 Khadakwasla/Maharashtra 84
132 Khaspur/Maharashtra 85
122 Khelna/Maharashtra 85
131 Kolgaon/Maharashtra 86
145 Majalgaon/Maharashtra 87
123 Manar/Maharashtra 87
124 Mangi/Maharashtra 88
143 Manikdoh/Maharashtra 88
125 Mhaswad/Maharashtra 89
142 Mula/Maharashtra 90
126 Nazare/Maharashtra 91
149 Panshet/Maharashtra 91
141 Radhanagari/Maharashtra 92
174
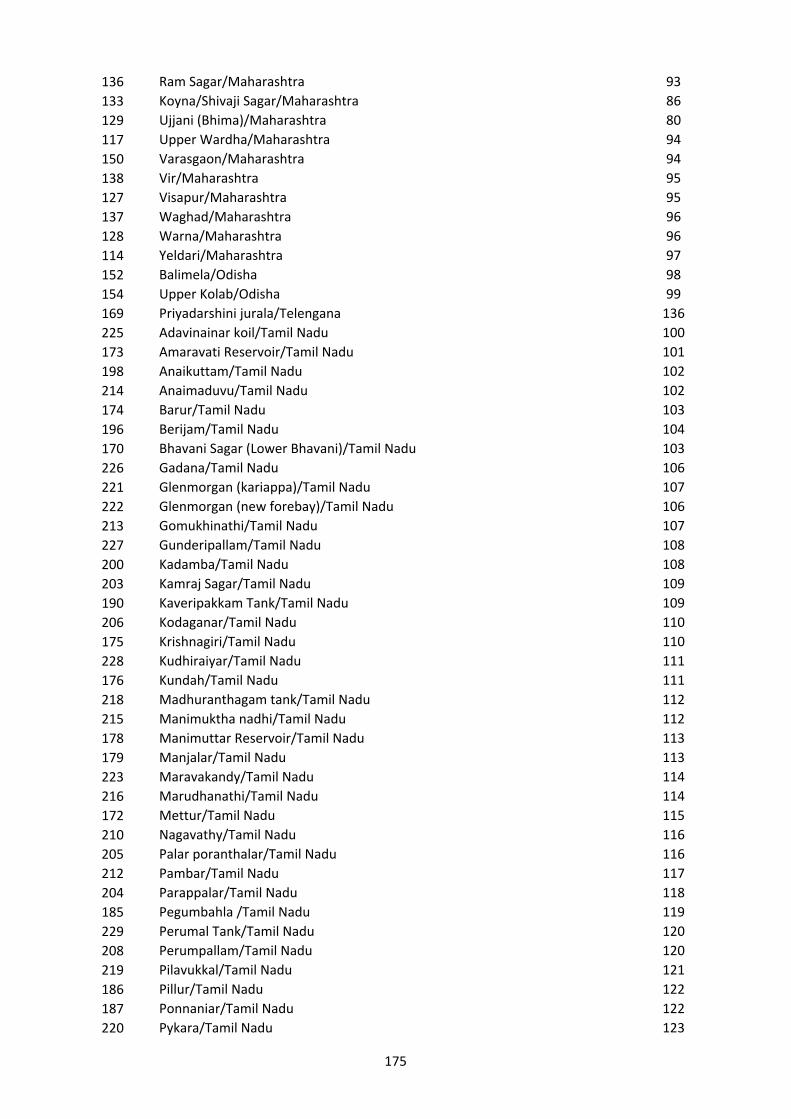
136 Ram Sagar/Maharashtra 93
133 Koyna/Shivaji Sagar/Maharashtra 86
129 Ujjani (Bhima)/Maharashtra 80
117 Upper Wardha/Maharashtra 94
150 Varasgaon/Maharashtra 94
138 Vir/Maharashtra 95
127 Visapur/Maharashtra 95
137 Waghad/Maharashtra 96
128 Warna/Maharashtra 96
114 Yeldari/Maharashtra 97
152 Balimela/Odisha 98
154 Upper Kolab/Odisha 99
169 Priyadarshini jurala/Telengana 136
225 Adavinainar koil/Tamil Nadu 100
173 Amaravati Reservoir/Tamil Nadu 101
198 Anaikuttam/Tamil Nadu 102
214 Anaimaduvu/Tamil Nadu 102
174 Barur/Tamil Nadu 103
196 Berijam/Tamil Nadu 104
170 Bhavani Sagar (Lower Bhavani)/Tamil Nadu 103
226 Gadana/Tamil Nadu 106
221 Glenmorgan (kariappa)/Tamil Nadu 107
222 Glenmorgan (new forebay)/Tamil Nadu 106
213 Gomukhinathi/Tamil Nadu 107
227 Gunderipallam/Tamil Nadu 108
200 Kadamba/Tamil Nadu 108
203 Kamraj Sagar/Tamil Nadu 109
190 Kaveripakkam Tank/Tamil Nadu 109
206 Kodaganar/Tamil Nadu 110
175 Krishnagiri/Tamil Nadu 110
228 Kudhiraiyar/Tamil Nadu 111
176 Kundah/Tamil Nadu 111
218 Madhuranthagam tank/Tamil Nadu 112
215 Manimuktha nadhi/Tamil Nadu 112
178 Manimuttar Reservoir/Tamil Nadu 113
179 Manjalar/Tamil Nadu 113
223 Maravakandy/Tamil Nadu 114
216 Marudhanathi/Tamil Nadu 114
172 Mettur/Tamil Nadu 115
210 Nagavathy/Tamil Nadu 116
205 Palar poranthalar/Tamil Nadu 116
212 Pambar/Tamil Nadu 117
204 Parappalar/Tamil Nadu 118
185 Pegumbahla /Tamil Nadu 119
229 Perumal Tank/Tamil Nadu 120
208 Perumpallam/Tamil Nadu 120
219 Pilavukkal/Tamil Nadu 121
186 Pillur/Tamil Nadu 122
187 Ponnaniar/Tamil Nadu 122
220 Pykara/Tamil Nadu 123
175
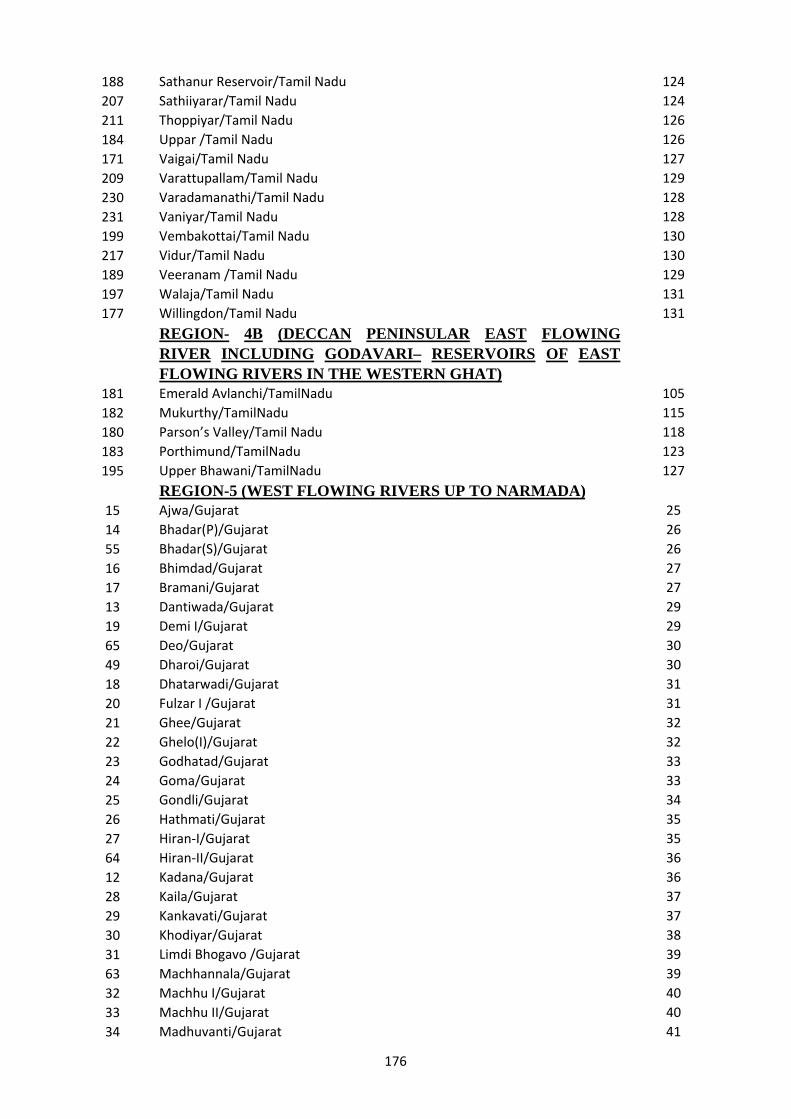
188 Sathanur Reservoir/Tamil Nadu 124
207 Sathiiyarar/Tamil Nadu 124
211 Thoppiyar/Tamil Nadu 126
184 Uppar /Tamil Nadu 126
171 Vaigai/Tamil Nadu 127
209 Varattupallam/Tamil Nadu 129
230 Varadamanathi/Tamil Nadu 128
231 Vaniyar/Tamil Nadu 128
199 Vembakottai/Tamil Nadu 130
217 Vidur/Tamil Nadu 130
189 Veeranam /Tamil Nadu 129
197 Walaja/Tamil Nadu 131
177 Willingdon/Tamil Nadu 131
REGION- 4B (DECCAN PENINSULAR EAST FLOWINGRIVER INCLUDING GODAVARI– RESERVOIRS OF EASTFLOWING RIVERS IN THE WESTERN GHAT)
181 Emerald Avlanchi/TamilNadu 105
182 Mukurthy/TamilNadu 115
180 Parson’s Valley/Tamil Nadu 118
183 Porthimund/TamilNadu 123
195 Upper Bhawani/TamilNadu 127
REGION-5 (WEST FLOWING RIVERS UP TO NARMADA)15 Ajwa/Gujarat 25
14 Bhadar(P)/Gujarat 26
55 Bhadar(S)/Gujarat 26
16 Bhimdad/Gujarat 27
17 Bramani/Gujarat 27
13 Dantiwada/Gujarat 29
19 Demi I/Gujarat 29
65 Deo/Gujarat 30
49 Dharoi/Gujarat 30
18 Dhatarwadi/Gujarat 31
20 Fulzar I /Gujarat 31
21 Ghee/Gujarat 32
22 Ghelo(I)/Gujarat 32
23 Godhatad/Gujarat 33
24 Goma/Gujarat 33
25 Gondli/Gujarat 34
26 Hathmati/Gujarat 35
27 Hiran‐I/Gujarat 35
64 Hiran‐II/Gujarat 36
12 Kadana/Gujarat 36
28 Kaila/Gujarat 37
29 Kankavati/Gujarat 37
30 Khodiyar/Gujarat 38
31 Limdi Bhogavo /Gujarat 39
63 Machhannala/Gujarat 39
32 Machhu I/Gujarat 40
33 Machhu II/Gujarat 40
34 Madhuvanti/Gujarat 41
176
62 Mazam/Gujarat 41
35 Meshwo/Gujarat 42
36 Moj/Gujarat 42
37 Mukteshwar/Gujarat 43
38 Nara/Gujarat 43
67 Panam/Gujarat 44
10 Hadaf/Gujarat 34
39 Patadungri/Gujarat 44
40 Puna/Gujarat 45
50 Rajki/Gujarat 45
41 Ranghola/Gujarat 46
42 Rudramata/Gujarat 47
43 Sanandro/Gujarat 47
60 Sani/Gujarat 48
44 Sasoi/Gujarat 49
11 Shetrunji/Gujarat 49
59 Sipu/Gujarat 50
47 Sarthi/Gujarat 48
48 Suvi/Gujarat 51
58 Und I/Gujarat 51
45 Vartu/Gujarat 52
57 Venu II/Gujarat 53
54 Wadhawan Bhogavo/Gujarat 54
46 Wadhawan Bhogavo‐II/Gujarat 54
9 Watrak/Gujarat 55
REGION-6 (NARMADA & TAPI BASIN)66 Chopadvav/Gujarat 28
52 Karjan/Gujarat 38
61 Rami/Gujrat 46
53 Sukhi /Gujarat 50
51 Ukai/Gujarat 52
56 Ver‐II/Gujrat 53
112 Girna/Maharashtra 82
148 Chankapur/Maharashtra 80
135 Mukti/Maharashtra 89
113 Nalganga/Maharashtra 90
REGION-7 (WEST FLOWING RIVERS BEYOND TAPI ANDSOUTH INDIAN RIVERS)
7 Damanganga/Gujarat 28
8 Salaulim/Goa 25
85 Linganamakki/Karnataka 67
95 Anayirangal/Kerala 69
96 Chulliar/Kerala 69
92 Idamalayar/Kerala 70
91 Idukki/Kerala 70
93 Kakki/Kerala 71
97 Kallarkutty/Kerala 71
104 Kundala/Kerala 72
106 Kuttiyadi/Kerala 72
105 Madupatti/Kerala 73
177
90 Malampuzha/Kerala 73
98 Mangalam/Kerala 74
99 Meenkara/Kerala 74
94 Neyyar/Kerala 75
100 Peechi/Kerala 75
101 Ponmudi/Kerala 76
107 Poomala/Kerala 76
102 Poringalkuthu/Kerala 77
103 Pothundi/Kerala 77
108 Tunakadvu/Tamil Nadu 125
134 Powai/Maharashtra 92
140 Tulsi/Maharashtra 93
191 Aliyar/Tamil Nadu 101
201 Chittar I/Tamil Nadu 104
202 Chittar II/Tamil Nadu 105
224 Parambikulam/Tamil Nadu 117
193 Pechipparai/Tamil Nadu 119
192 Perunchani /Tamil Nadu 121
194 Tirumurthy/Tamil Nadu 125
178
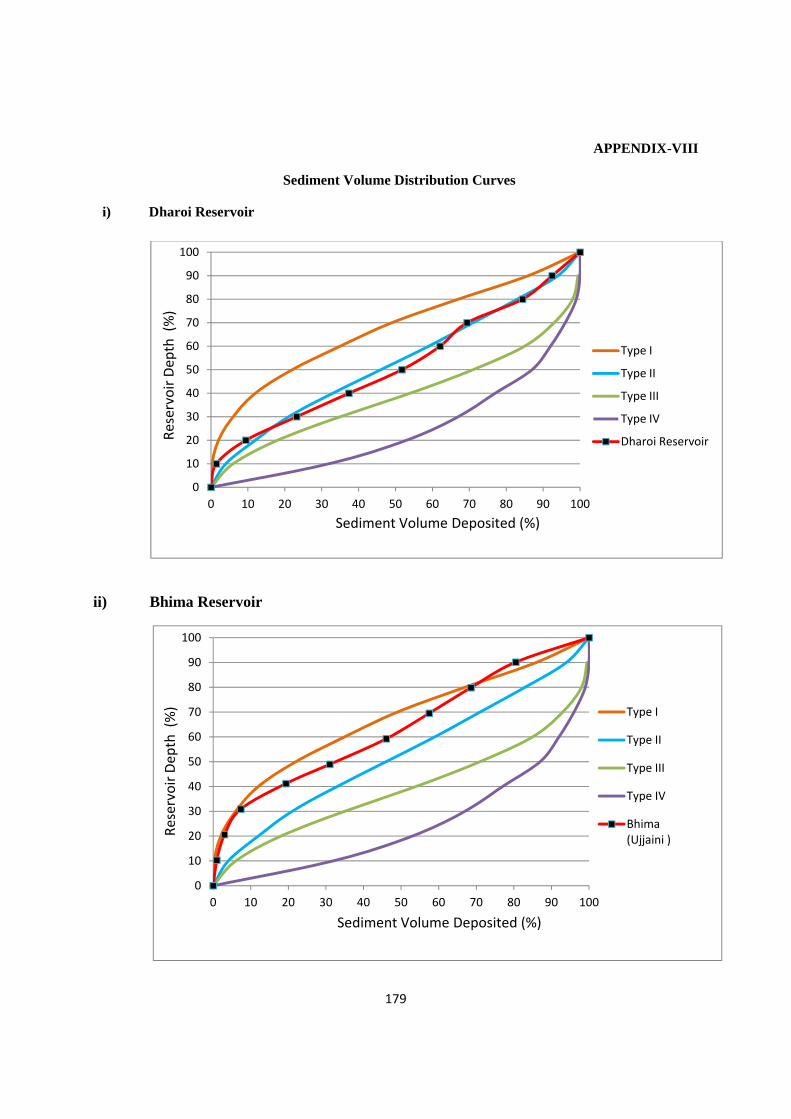
179
APPENDIX-VIII
Sediment Volume Distribution Curves
i) Dharoi Reservoir
ii) Bhima Reservoir
0
10
20
30
40
50
60
70
80
90
100
0 10 20 30 40 50 60 70 80 90 100
Type I
Type II
Type III
Type IV
Dharoi Reservoir
Sediment Volume Deposited (%)
Reservoir Dep
th (%)
0
10
20
30
40
50
60
70
80
90
100
0 10 20 30 40 50 60 70 80 90 100
Type I
Type II
Type III
Type IV
Bhima (Ujjaini )
Sediment Volume Deposited (%)
Reservoir Dep
th (%)
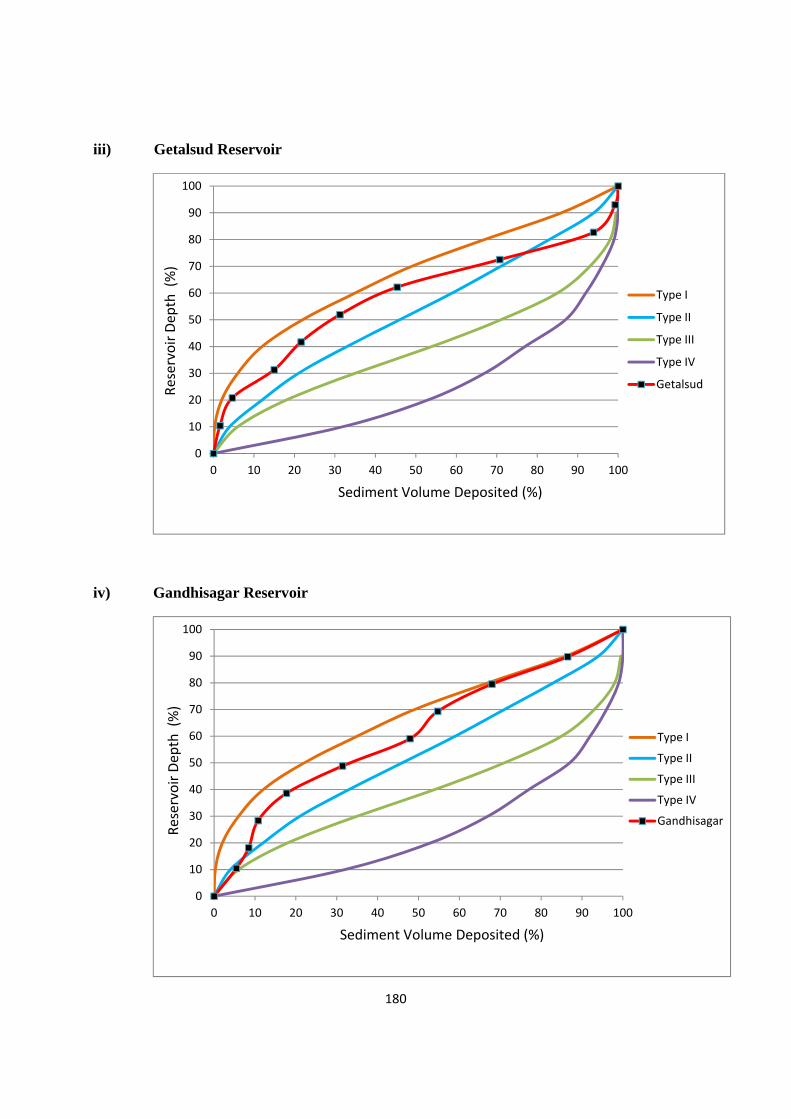
180
iii) Getalsud Reservoir
iv) Gandhisagar Reservoir
0
10
20
30
40
50
60
70
80
90
100
0 10 20 30 40 50 60 70 80 90 100
Type I
Type II
Type III
Type IV
Getalsud
Sediment Volume Deposited (%)
ReservoirDep
th(%
)
0
10
20
30
40
50
60
70
80
90
100
0 10 20 30 40 50 60 70 80 90 100
Type I
Type II
Type III
Type IV
Gandhisagar
Sediment Volume Deposited (%)
ReservoirDep
th(%
)
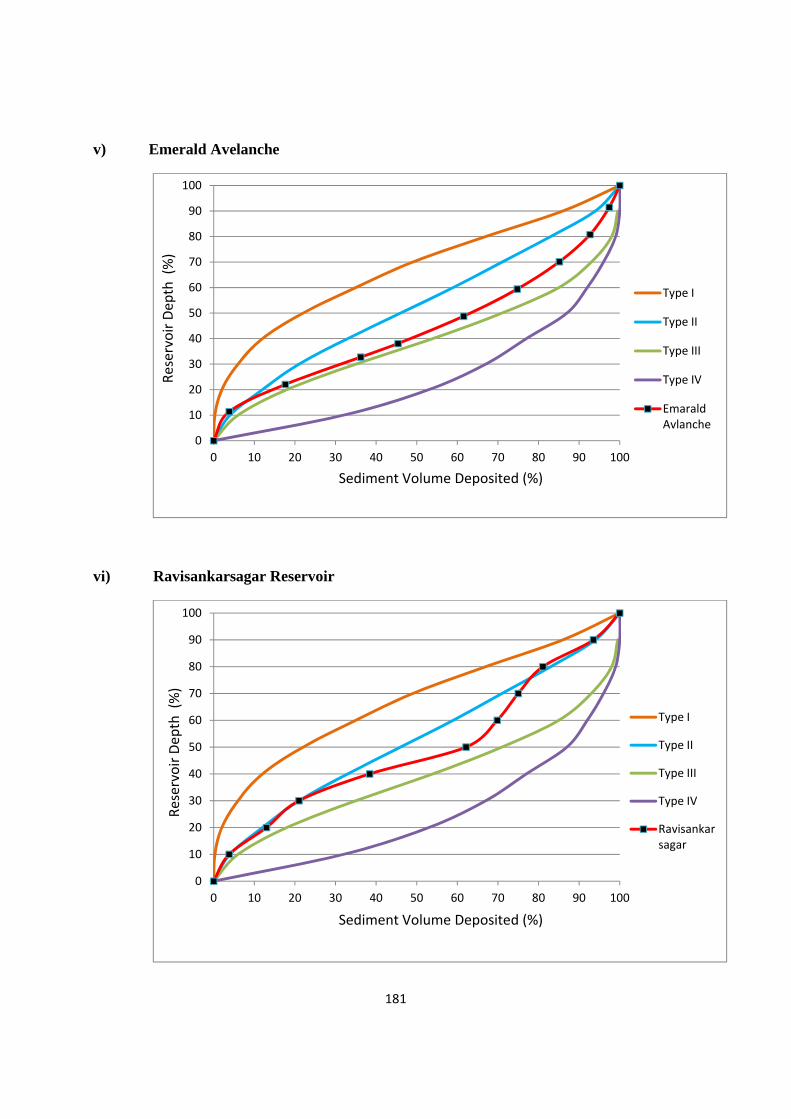
181
v) Emerald Avelanche
vi) Ravisankarsagar Reservoir
0
10
20
30
40
50
60
70
80
90
100
0 10 20 30 40 50 60 70 80 90 100
Type I
Type II
Type III
Type IV
Emarald Avlanche
Sediment Volume Deposited (%)
Reservoir Dep
th (%)
0
10
20
30
40
50
60
70
80
90
100
0 10 20 30 40 50 60 70 80 90 100
Type I
Type II
Type III
Type IV
Ravisankar sagar
Sediment Volume Deposited (%)
Reservoir Dep
th (%)
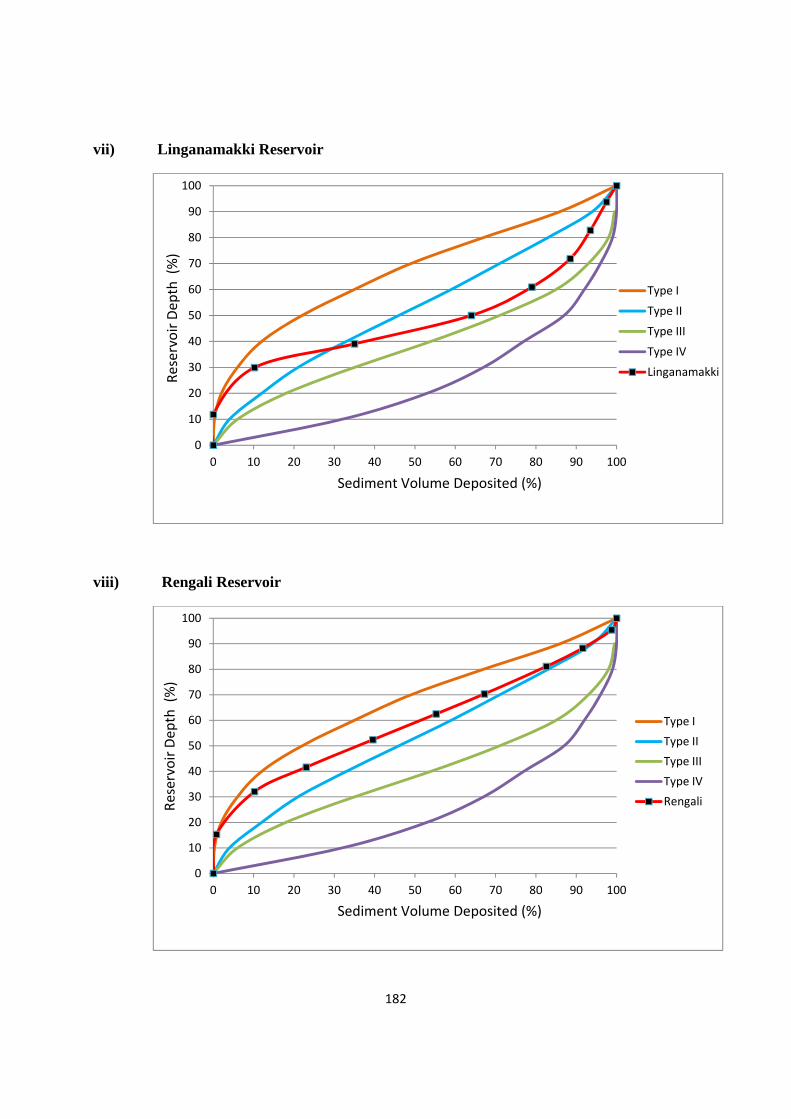
182
vii) Linganamakki Reservoir
viii) Rengali Reservoir
0
10
20
30
40
50
60
70
80
90
100
0 10 20 30 40 50 60 70 80 90 100
Type I
Type II
Type III
Type IV
Linganamakki
Sediment Volume Deposited (%)
Reservoir Dep
th (%)
0
10
20
30
40
50
60
70
80
90
100
0 10 20 30 40 50 60 70 80 90 100
Type I
Type II
Type III
Type IV
Rengali
Sediment Volume Deposited (%)
Reservoir Dep
th (%)
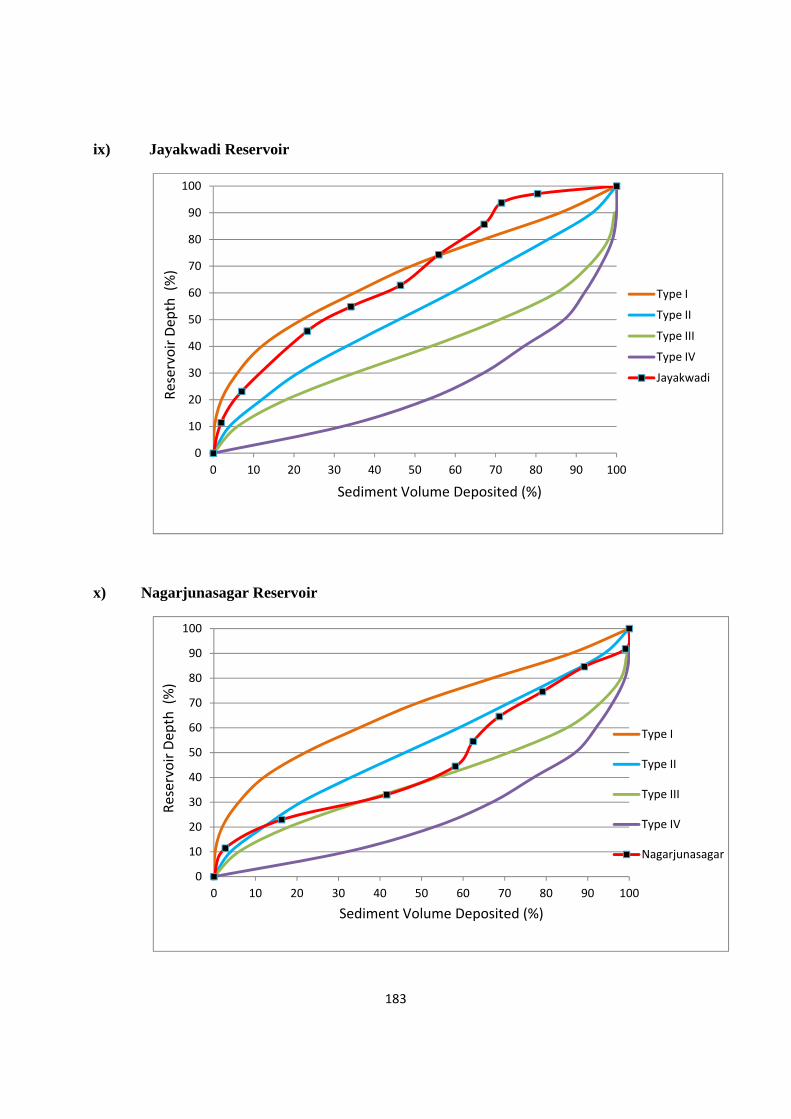
183
ix) Jayakwadi Reservoir
x) Nagarjunasagar Reservoir
0
10
20
30
40
50
60
70
80
90
100
0 10 20 30 40 50 60 70 80 90 100
Type I
Type II
Type III
Type IV
Jayakwadi
Sediment Volume Deposited (%)
Reservoir Dep
th (%)
0
10
20
30
40
50
60
70
80
90
100
0 10 20 30 40 50 60 70 80 90 100
Type I
Type II
Type III
Type IV
Nagarjunasagar
Sediment Volume Deposited (%)
Reservoir Dep
th (%)
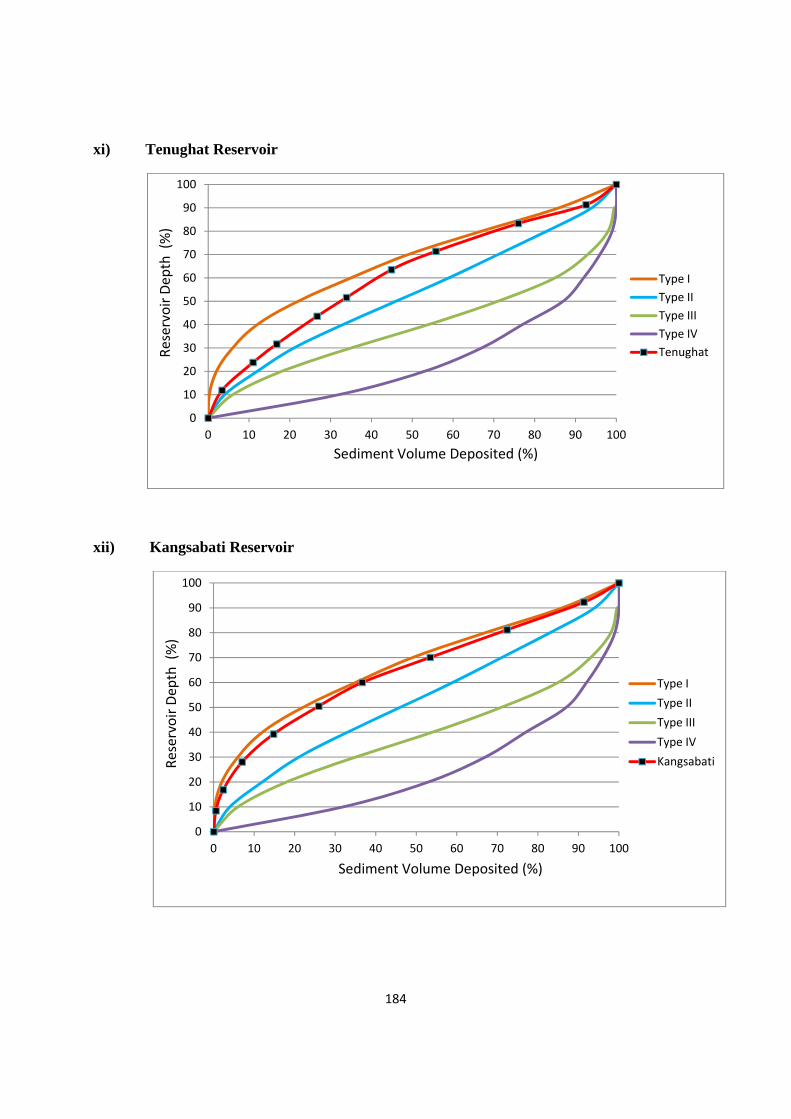
184
xi) Tenughat Reservoir
xii) Kangsabati Reservoir
0
10
20
30
40
50
60
70
80
90
100
0 10 20 30 40 50 60 70 80 90 100
Type I
Type II
Type III
Type IV
Tenughat
Sediment Volume Deposited (%)
Reservoir Dep
th (%)
0
10
20
30
40
50
60
70
80
90
100
0 10 20 30 40 50 60 70 80 90 100
Type I
Type II
Type III
Type IV
Kangsabati
Sediment Volume Deposited (%)
Reservoir Dep
th (%)
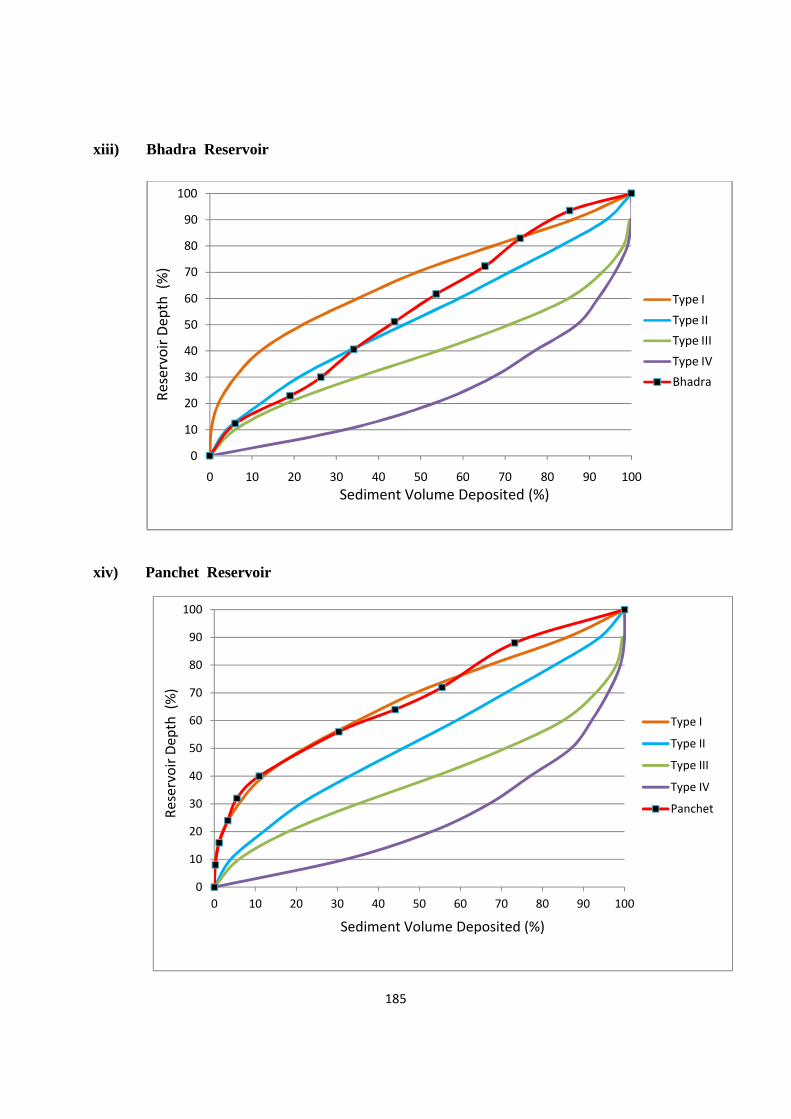
185
xiii) Bhadra Reservoir
xiv) Panchet Reservoir
0
10
20
30
40
50
60
70
80
90
100
0 10 20 30 40 50 60 70 80 90 100
Type I
Type II
Type III
Type IV
Panchet
Sediment Volume Deposited (%)
ReservoirDep
th(%
)
0
10
20
30
40
50
60
70
80
90
100
0 10 20 30 40 50 60 70 80 90 100
Type IType IIType IIIType IVBhadra
Sediment Volume Deposited (%)
Rese
rvoi
r Dep
th (
%)
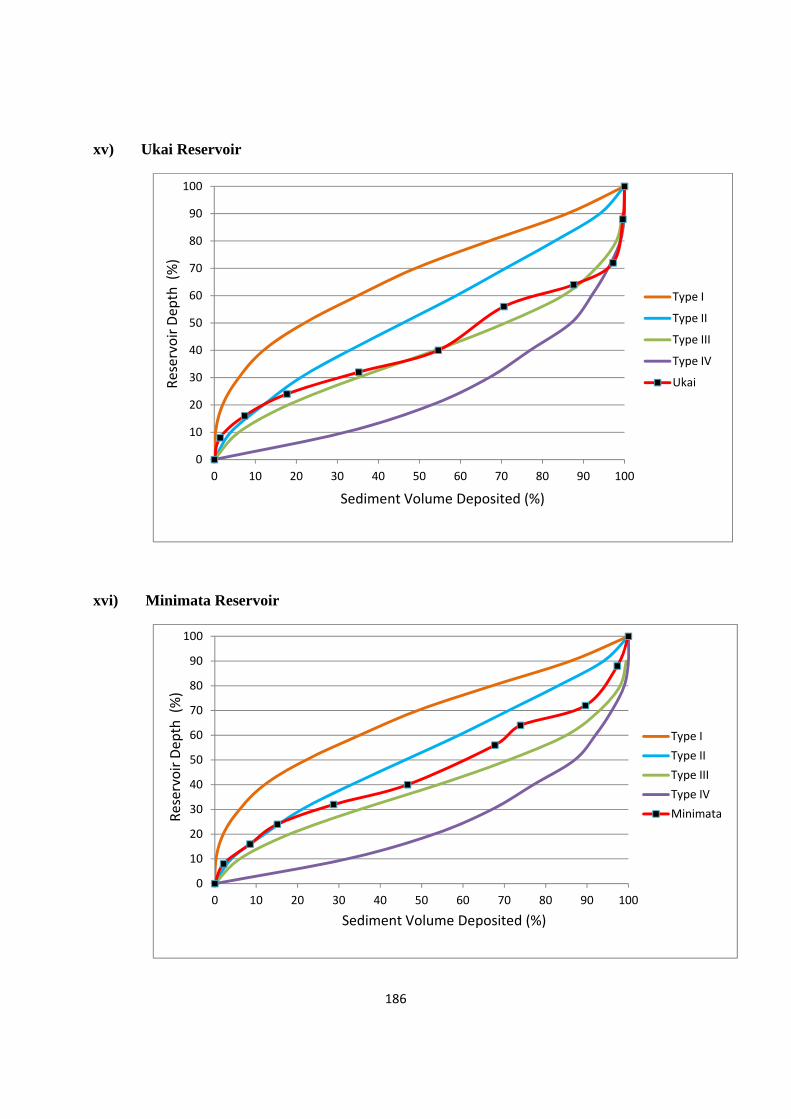
186
xv) Ukai Reservoir
xvi) Minimata Reservoir
0
10
20
30
40
50
60
70
80
90
100
0 10 20 30 40 50 60 70 80 90 100
Type I
Type II
Type III
Type IV
Ukai
Sediment Volume Deposited (%)
Reservoir Dep
th (%)
0
10
20
30
40
50
60
70
80
90
100
0 10 20 30 40 50 60 70 80 90 100
Type I
Type II
Type III
Type IV
Minimata
Sediment Volume Deposited (%)
Reservoir Dep
th (%)
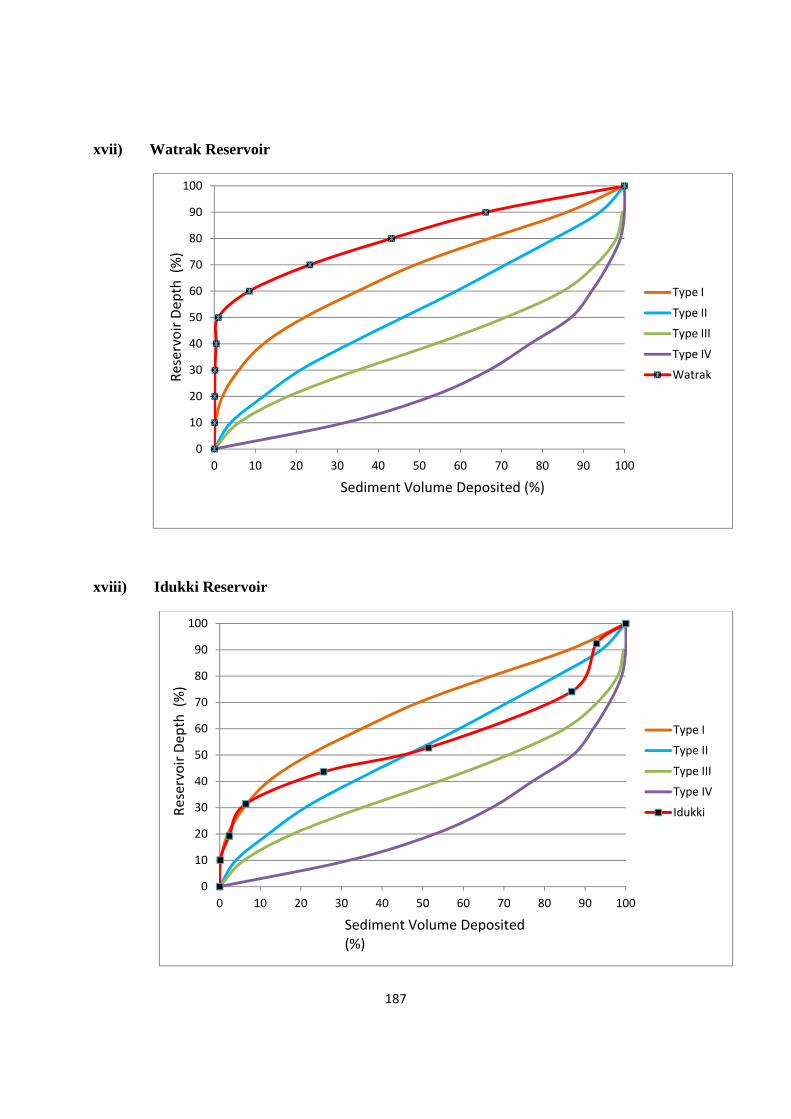
187
xvii) Watrak Reservoir
xviii) Idukki Reservoir
0
10
20
30
40
50
60
70
80
90
100
0 10 20 30 40 50 60 70 80 90 100
Type I
Type II
Type III
Type IV
Watrak
Sediment Volume Deposited (%)
Reservoir Depth (%)
0
10
20
30
40
50
60
70
80
90
100
0 10 20 30 40 50 60 70 80 90 100
Type I
Type II
Type III
Type IV
Idukki
Sediment Volume Deposited (%)
Reservoir Dep
th (%)
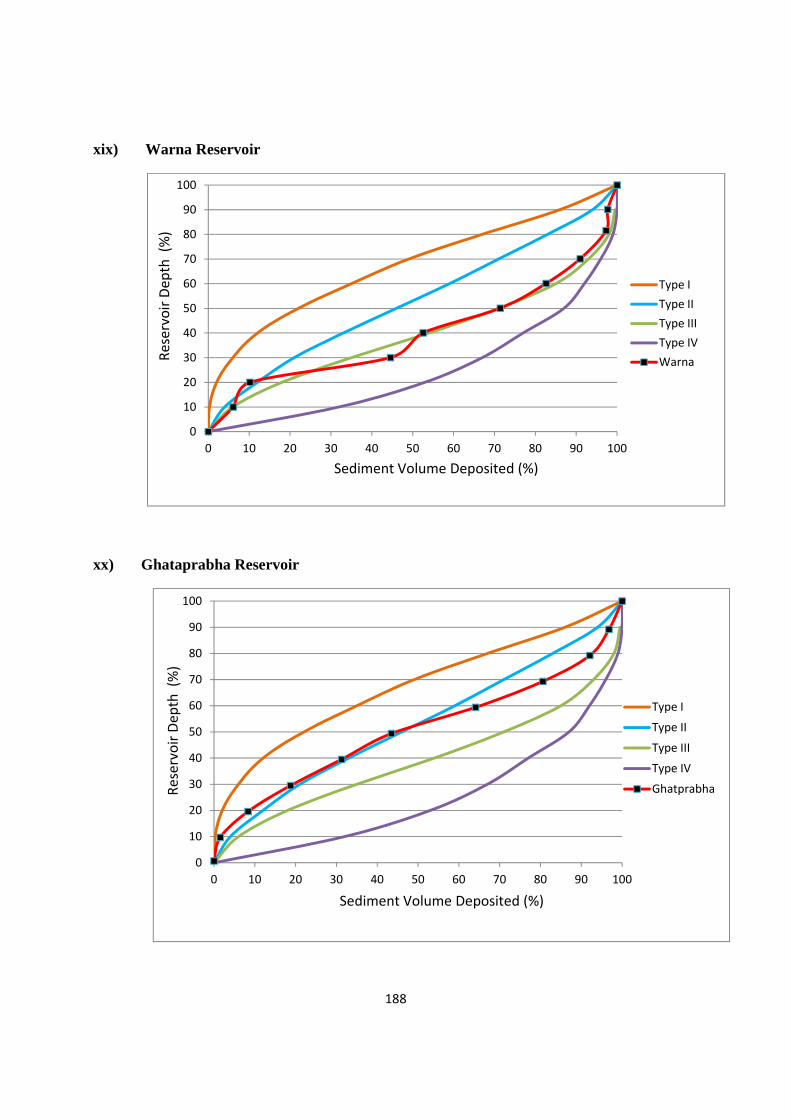
188
xix) Warna Reservoir
xx) Ghataprabha Reservoir
0
10
20
30
40
50
60
70
80
90
100
0 10 20 30 40 50 60 70 80 90 100
Type I
Type II
Type III
Type IV
Warna
Sediment Volume Deposited (%)
Reservoir Dep
th (%)
0
10
20
30
40
50
60
70
80
90
100
0 10 20 30 40 50 60 70 80 90 100
Type I
Type II
Type III
Type IV
Ghatprabha
Sediment Volume Deposited (%)
Reservoir Dep
th (%)
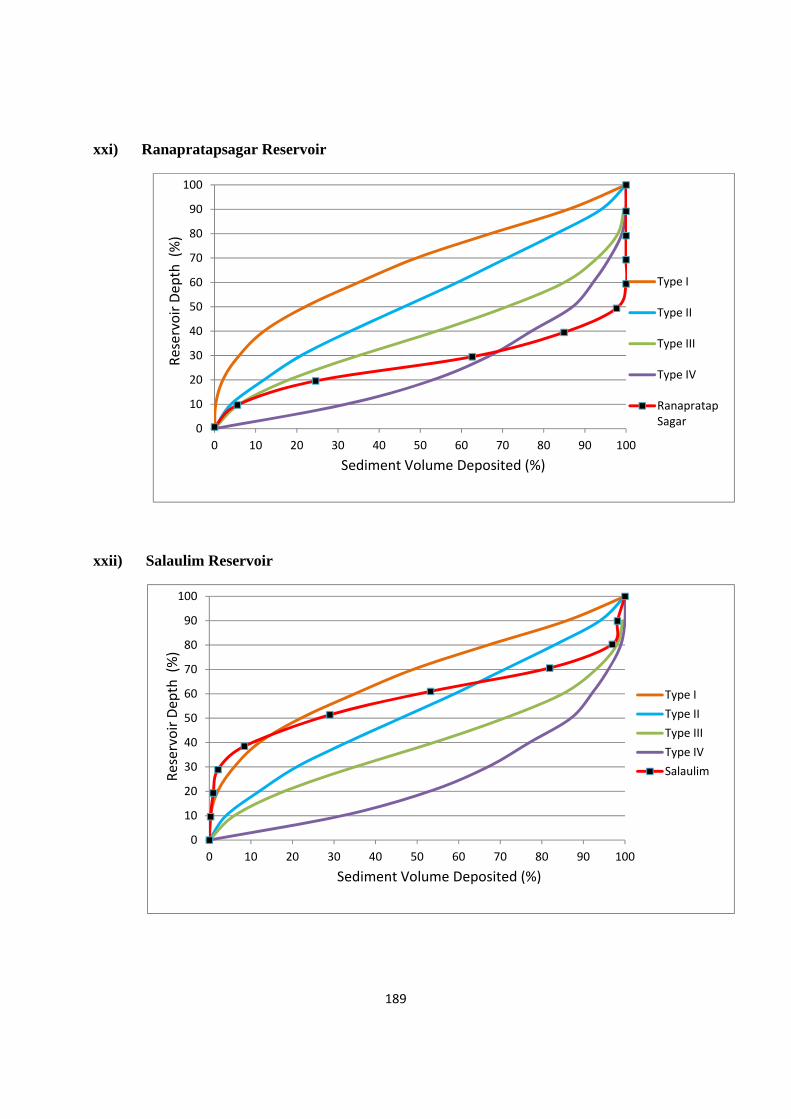
189
xxi) Ranapratapsagar Reservoir
xxii) Salaulim Reservoir
0
10
20
30
40
50
60
70
80
90
100
0 10 20 30 40 50 60 70 80 90 100
Type I
Type II
Type III
Type IV
Ranapratap Sagar
Sediment Volume Deposited (%)
Reservoir Dep
th (%)
0
10
20
30
40
50
60
70
80
90
100
0 10 20 30 40 50 60 70 80 90 100
Type I
Type II
Type III
Type IV
Salaulim
Sediment Volume Deposited (%)
Reservoir Dep
th (%)
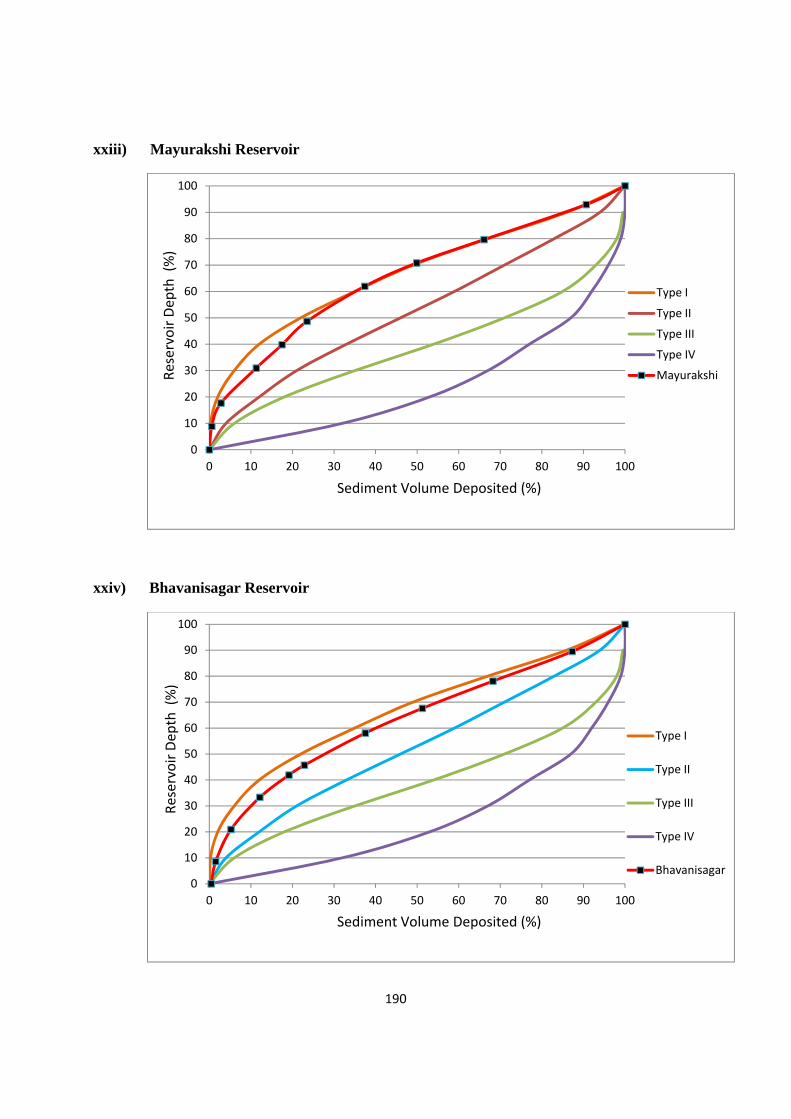
190
xxiii) Mayurakshi Reservoir
xxiv) Bhavanisagar Reservoir
0
10
20
30
40
50
60
70
80
90
100
0 10 20 30 40 50 60 70 80 90 100
Type I
Type II
Type III
Type IV
Mayurakshi
Sediment Volume Deposited (%)
Reservoir Dep
th (%)
0
10
20
30
40
50
60
70
80
90
100
0 10 20 30 40 50 60 70 80 90 100
Type I
Type II
Type III
Type IV
Bhavanisagar
Sediment Volume Deposited (%)
Reservoir Dep
th (%)
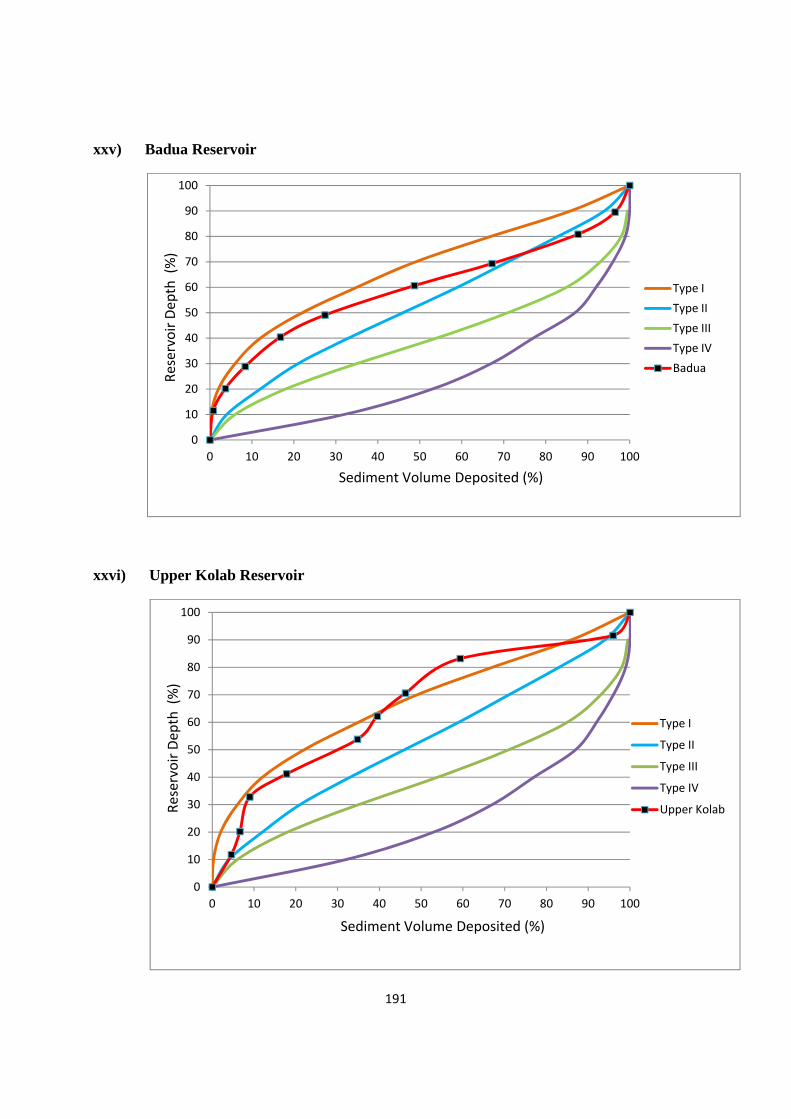
191
xxv) Badua Reservoir
xxvi) Upper Kolab Reservoir
0
10
20
30
40
50
60
70
80
90
100
0 10 20 30 40 50 60 70 80 90 100
Type I
Type II
Type III
Type IV
Badua
Sediment Volume Deposited (%)
Reservoir Dep
th (%)
0
10
20
30
40
50
60
70
80
90
100
0 10 20 30 40 50 60 70 80 90 100
Type I
Type II
Type III
Type IV
Upper Kolab
Sediment Volume Deposited (%)
Reservoir Dep
th (%)
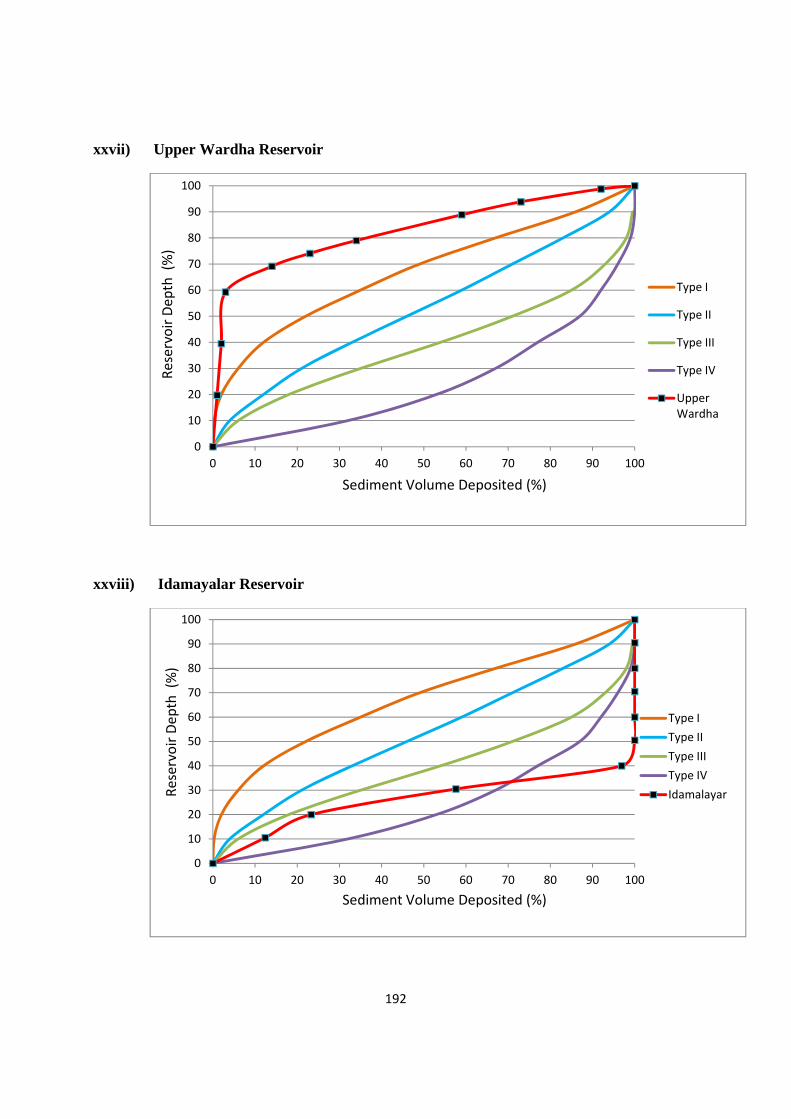
192
xxvii) Upper Wardha Reservoir
xxviii) Idamayalar Reservoir
0
10
20
30
40
50
60
70
80
90
100
0 10 20 30 40 50 60 70 80 90 100
Type I
Type II
Type III
Type IV
Upper Wardha
Sediment Volume Deposited (%)
Reservoir Dep
th (%)
0
10
20
30
40
50
60
70
80
90
100
0 10 20 30 40 50 60 70 80 90 100
Type I
Type II
Type III
Type IV
Idamalayar
Sediment Volume Deposited (%)
Reservoir Depth (%)
193
ABBREVIATIONS
Cu.km. Cubic kilometre
Th.Cu.m. Thousand cubic metre
M.Cu.m. Million Cubic metre
Ha.m. Hectare metre
Sq.km. Square kilometre
mm Millimetre
Cm Centimetre
m Metre
Yr. Year
N.A. Not Available
C.A. Catchment Area
F.R.L. Full Reservoir Level
GPS
MDDL
FRL
WRIS
NRLD
SRS
NA
Global Positioning System
Maximum Drawdown Level
Full Reservoir Level
Water Resource Information System
National Register of Large Dams
Satellite Remote Sensing
Not Available
194
REFERENCES
i) Compendium on Silting of Reservoirs in India (Jan 2001) – Central Water Commission, New Delhi, (publication no. 113/2001),
ii) Impact of siltation on the useful life of large reservoirs (Jan. 1997) – Indian National Committeee on Hydrology Secretariat (publication no. INCOH/SAR-11/97), National Institute of Hydrology, Roorkee.
iii) Capacity of Storage Reservoirs (Revised Edition-1995) – Central Board of Irrigation and Power, New Delhi (publication no. 89)
iv) Report of Reservoir Sedimentation Committee (July-1985) constituted by the Ministry of Agriculture and Irrigation (Department of Irrigation) on 4th February 1978.
v) I.S 12182 (1987) – Guidelines for Determination of Effects of Sedimentation in Planning and Performance of Reservoirs.
vi) I.S.5477 (Part I):1999- Fixing the Capacities of Reservoirs- Methods, Part-1 General Requirements.
vii) I.S.5477 (Part II):1994- Fixing the Capacities of Reservoirs- Methods, Part-2 Dead Storage.
viii) I.S.5477 (Part III):2002- Fixing the Capacities of Reservoirs- Methods, Part-3 Live Storage.
ix) Life of Reservoir – Technical Report No. 19 (Sept. 1980), Central Board of Irrigation and Power, New Delhi.
x) Capacity Survey report of various reservoirs
xi) Final Report – Capacity Survey of Tenughat Reservoir (Volume-1), Environment Management Organisation, Central Water Commission,New Delhi.
xii) Sedimentation Assessment of Pechipparai Reservoir, Tamil Nadu through Satellite Remote Sensing (March 2014)- Remote Sensing Directorate, Central Water Commission, Government of India, New Delhi.
* * *


