Embed Size (px)
Citation preview
Using network segments in the
spatial representation of travel
time isochrones
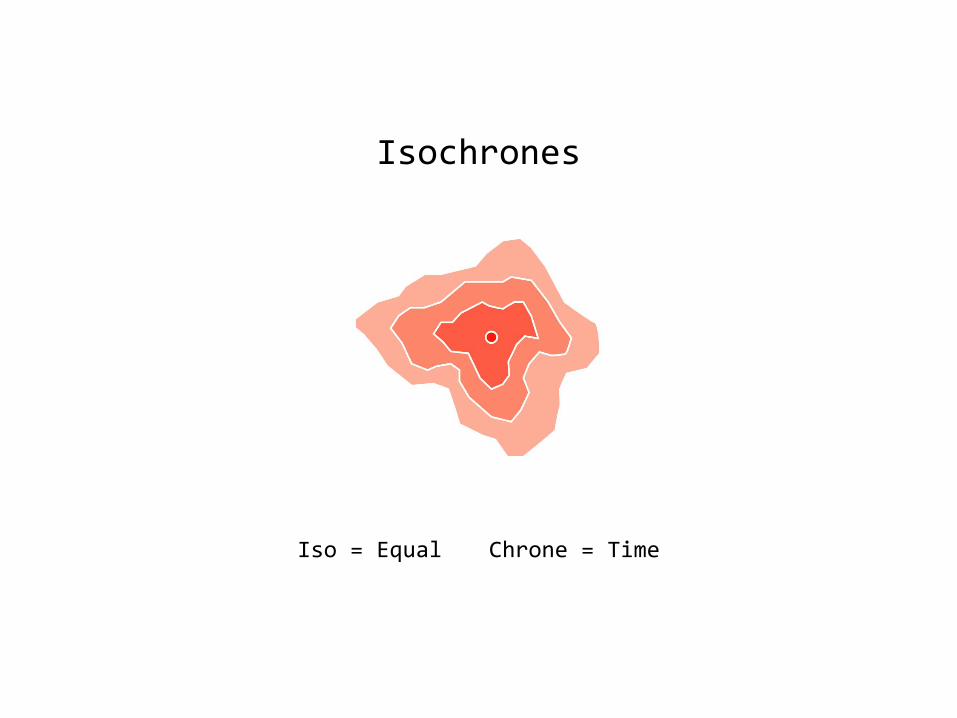
Isochrones
Iso = Equal Chrone = Time

https://upload.wikimedia.org/wikipedia/commons/8/86/Isochronic_Passage_Chart_Francis_Galton_1881.jpg
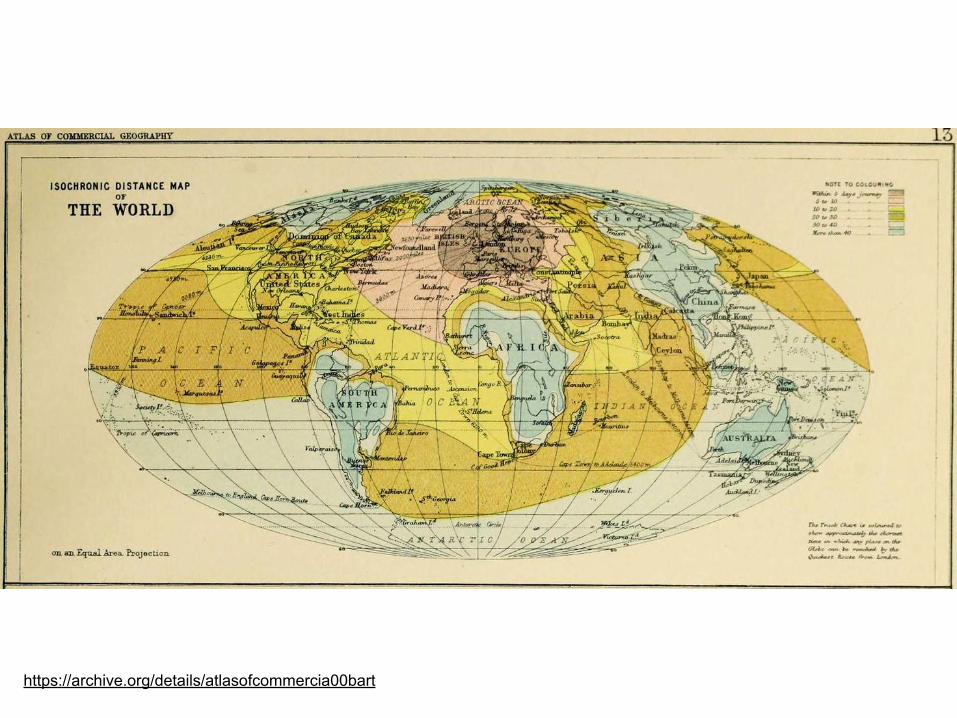
https://archive.org/details/atlasofcommercia00bart
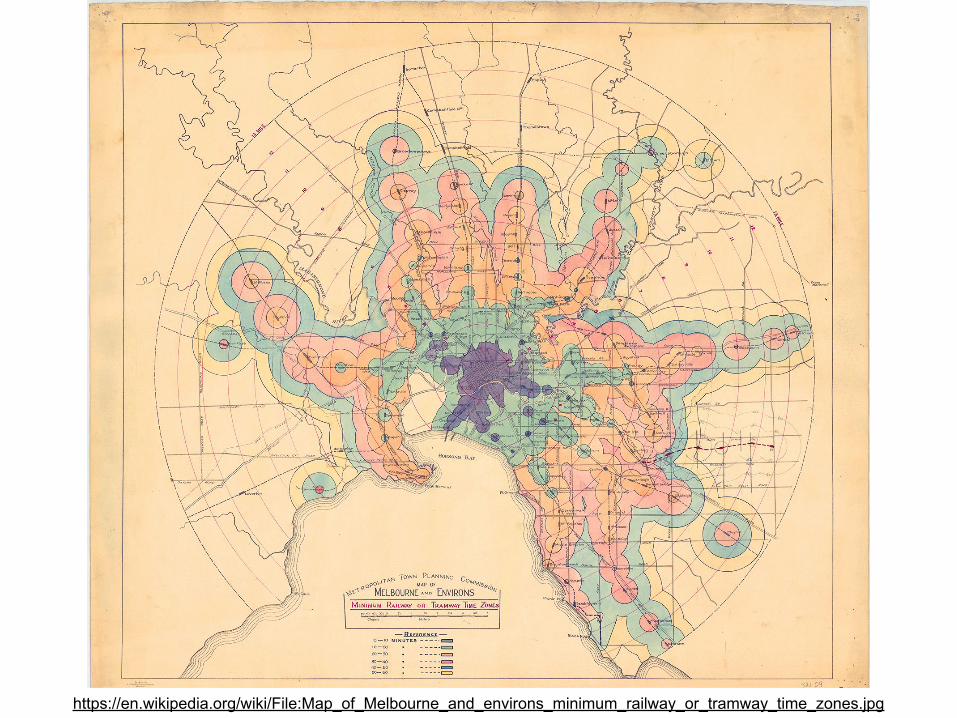
https://en.wikipedia.org/wiki/File:Map_of_Melbourne_and_environs_minimum_railway_or_tramway_time_zones.jpg

https://en.wikipedia.org/wiki/File:Map_of_Melbourne_and_environs_minimum_railway_or_tramway_time_zones.jpg

Existing Tools:
ArcGIS Network Analysis
PostGIS + pgRouting
OpenTripPlanner
Dozens of Web Applications
etc.
General Steps
1 - Create a Network Graph
2 - Compute travel time from a point to network vertices
3 - Generate shapes or surface for specific travel times
4 - Visualize output
Output:
Isolines, polygons, vector grids, or rasters that represent the AREA that is accessible from a point (or points)

A structural alternative:
General Steps
1 - Create a network graph
2 - Compute travel times from a point to network vertices
3 - Generate shapes at specific travel times
3 - Join travel times to edges
4 - Classify / visualize output
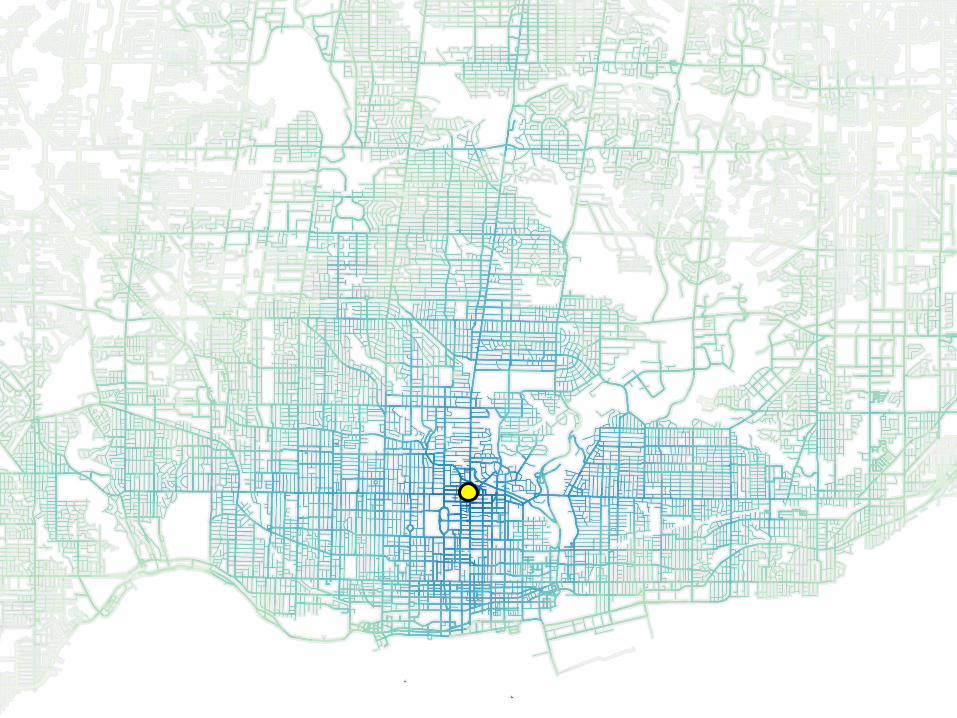
Using network segments in the spatial representation of travel time isochrones.

Output Data Structure:


Questions
1 - How can this technique be applied?
2 - How can it lead to new insights about our data?
3 - When is it preferable over conventional isochrones?
or

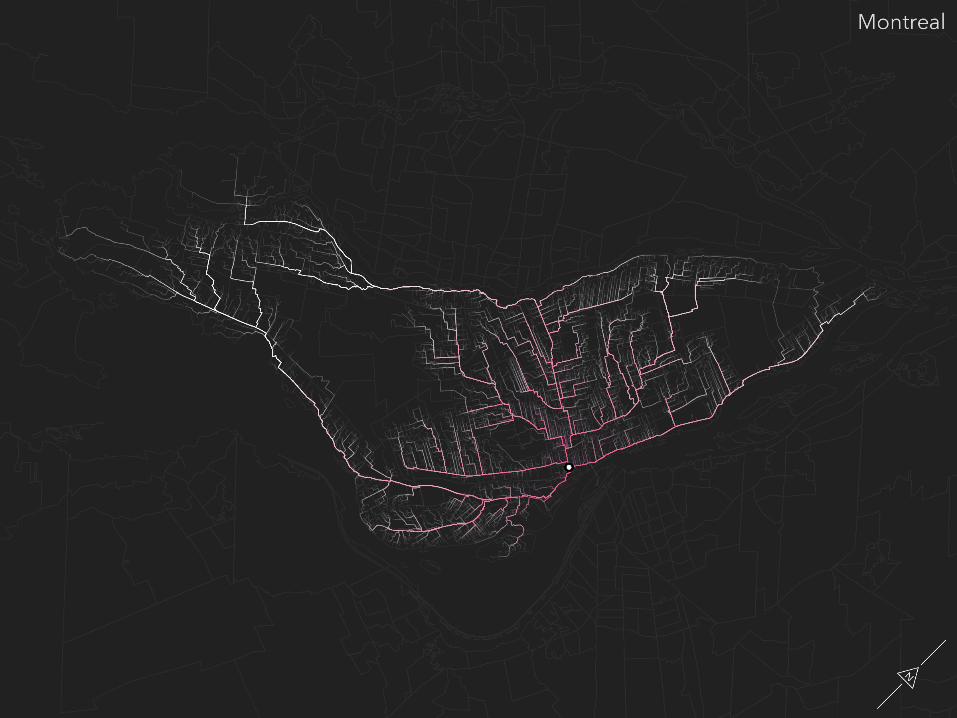
1 - Mapping Differences in Travel Times:
By Travel Mode
By Time of Day
For Different Transit Agencies

1 - Differences in Travel Times

1 - Differences in Travel Times

v 2 - Combining with Areal Data
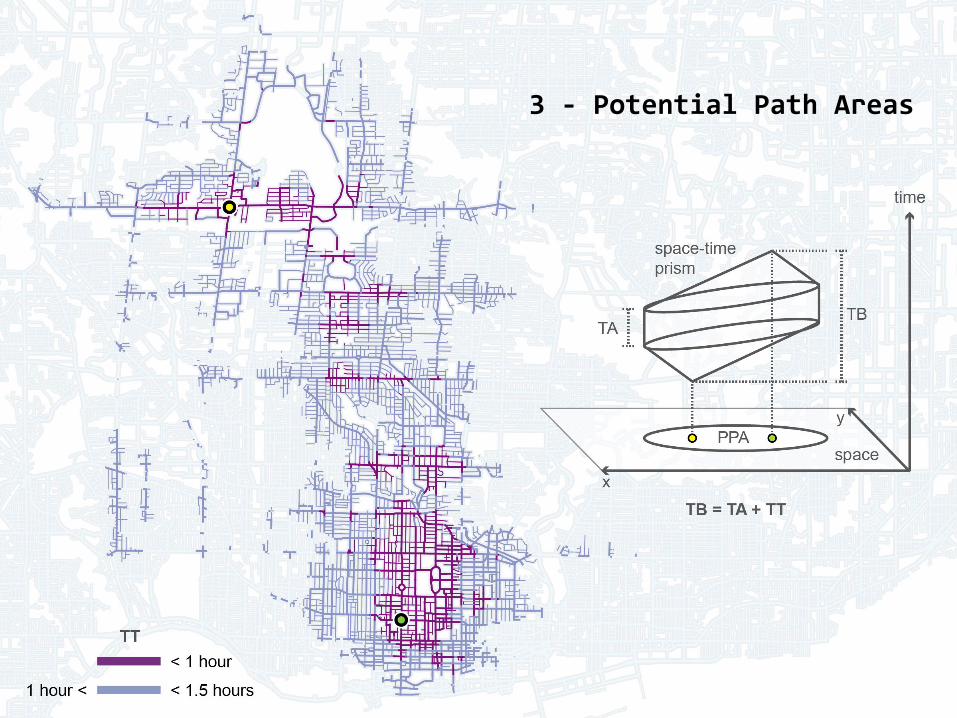
3 - Potential Path Areas

4 - Transit Maps:

4 - Transit Maps:

4 - Transit Maps:

5 - Travel Surveys:

5 - Travel Surveys:

5 - Travel Surveys:


Some code & maps are on my github page at jamaps.github.io
Thank You!
![Functionally important segments in proteins dissected ... · patterns [13] or symbolic representation of structural frag-ments [14-16] to relate protein fragments to function. In](https://img.dokumen.tips/doc/110x75/5e6a6cd26429da078c646804/functionally-important-segments-in-proteins-dissected-patterns-13-or-symbolic.jpg)