Embed Size (px)
Citation preview

NYC D3.js – January 25, 2016
Tiny Data Visualizations in the Newsroom

Hi! I’m Matt.
My twitter handle is @ilikescience
I work for a company called Planetary.
Our website is planetary.io.

2016: data is a big part of reporting.
Source: http://xkcd.com/904/

Source: http://www.nytimes.com/interactive/2015/05/28/upshot/you-draw-it-how-family-income-affects-childrens-college-chances.html

Source: http://fivethirtyeight.com/features/science-isnt-broken

Source: http://www.buzzfeed.com/heidiblake/the-tennis-racket

Source: http://www.wsj.com/articles/as-growth-slows-china-highlights-transition-from-manufacturing-to-service-1453221751

Current practice: Data is an illustration of the story.
New practice: Data is the story.

A sparkline is a small intense, simple, word-sized graphic with typographic resolution.
Sparklines mean that graphics are no longer cartoonish special occasions with captions and boxes, but rather sparkline graphics can be everywhere a word or number can be: embedded in a sentence, table, headline, map, spreadsheet, graphic. Data graphics should have the resolution of typography.
Edward Tufte, Beautiful Evidence, 46-63


thanks 😁

thanks 😕

Vanguard Index 500 IndexFidelity MagellanAmer A Invest Co of AmAmer A WA Mutual InvPIMCO Instl Tot ReturnAmer A Grow Fd of AmerFidelity ContrafundFidelity Growth & IncAmer A Inc Fund of AmerVanguard Instl Index
$64,36862,51050,32947,35540,50037,64131,16128,29625,31424,155
ASSETS (M) FUND- 2.0%- 2.1- 1.2- 1.5- 2.3- 2.9- 1.0- 1.8- 0.5- 2.0
4 WKS12.211.3 9.49.92.4
14.110.78.29.9
12.3
++++++++++
%2003
11.712.93.90.89.4
11.06.58.75.5
11.6
---++---+-
%3 YRS
0.80.24.03.07.67.43.00.15.40.7
---++---+-
%5 YRS
RETURN

Vanguard Index 500 IndexFidelity MagellanAmer A Invest Co of AmAmer A WA Mutual InvPIMCO Instl Tot ReturnAmer A Grow Fd of AmerFidelity ContrafundFidelity Growth & IncAmer A Inc Fund of AmerVanguard Instl Index
$64,36862,51050,32947,35540,50037,64131,16128,29625,31424,155
0.80.24.03.07.67.43.00.15.40.7
---++---+-
%

Source: Proprietary analytics platform developed by Planetary

What tools can we use?

<style> .sparkline { fill: none; stroke: #000; stroke-width: 0.5px; } .sparkcircle { fill: #f00; stroke: none; } </style> ... <script src="//d3js.org/d3.v3.min.js"></script> <script> var width = 100; var height = 25; var x = d3.scale.linear().range([0, width - 2]); var y = d3.scale.linear().range([height - 4, 0]); var parseDate = d3.time.format("%b %d, %Y").parse; var line = d3.svg.line() .interpolate("basis") .x(function(d) { return x(d.date); }) .y(function(d) { return y(d.close); });
function sparkline(elemId, data) { data.forEach(function(d) { d.date = parseDate(d.Date); d.close = +d.Close; }); x.domain(d3.extent(data, function(d) { return d.date; })); y.domain(d3.extent(data, function(d) { return d.close; }));
var svg = d3.select(elemId) .append('svg') .attr('width', width) .attr('height', height) .append('g') .attr('transform', 'translate(0, 2)'); svg.append('path') .datum(data) .attr('class', 'sparkline') .attr('d', line); svg.append('circle') .attr('class', 'sparkcircle') .attr('cx', x(data[0].date)) .attr('cy', y(data[0].close)) .attr('r', 1.5); }
d3.csv('/csv/goog.csv', function(error, data) { sparkline('#spark_goog', data); }); ... </script> Source: http://www.tnoda.com/blog/2013-12-19
D3.js

❀"❀"★"✧"◆"❖"✪"✲"✧"★59+35+34+78+79+37+45+34+35+37
59+35+34+78= !+#+$+%=
59+35+34+78+23+14+87+65 !"#"$"%"&"'"(")
34+78+79+37+75+90+38 !+#+$+%+&+'+(
→
→
→
→
FF Chartwell
Source: https://www.fontfont.com/how-to-use-ff-chartwell

How should we design sparklines?

Source: http://www.buzzfeed.com/heidiblake/the-tennis-racket

Wall St. Slides After Chinese Stocks Plunge
… The selling on Monday started after China released a weak manufacturing report, and continued after the United States did the same. Chinese stocks lost nearly 7 percent of their value, although they appeared to stabilize Tuesday morning. The Standard & Poor’s 500-stock index, the main benchmark for the United States stock market, posted a decline of 1.5 percent, while European stocks also fell.
Source: http://www.nytimes.com/2016/01/05/business/international/stocks-asia-markets-china.html

Wall St. Slides After Chinese Stocks Plunge
… The selling on Monday started after China released a weak manufacturing report, and continued after the United States did the same. Chinese stocks lost nearly 7 percent of their value, although they appeared to stabilize Tuesday morning. The Standard & Poor’s 500-stock index, the main benchmark for the United States stock market, posted a decline of 1.5 percent, while European stocks also fell.
3493 3362
202 198
Source: http://www.nytimes.com/2016/01/05/business/international/stocks-asia-markets-china.html
3180 3140
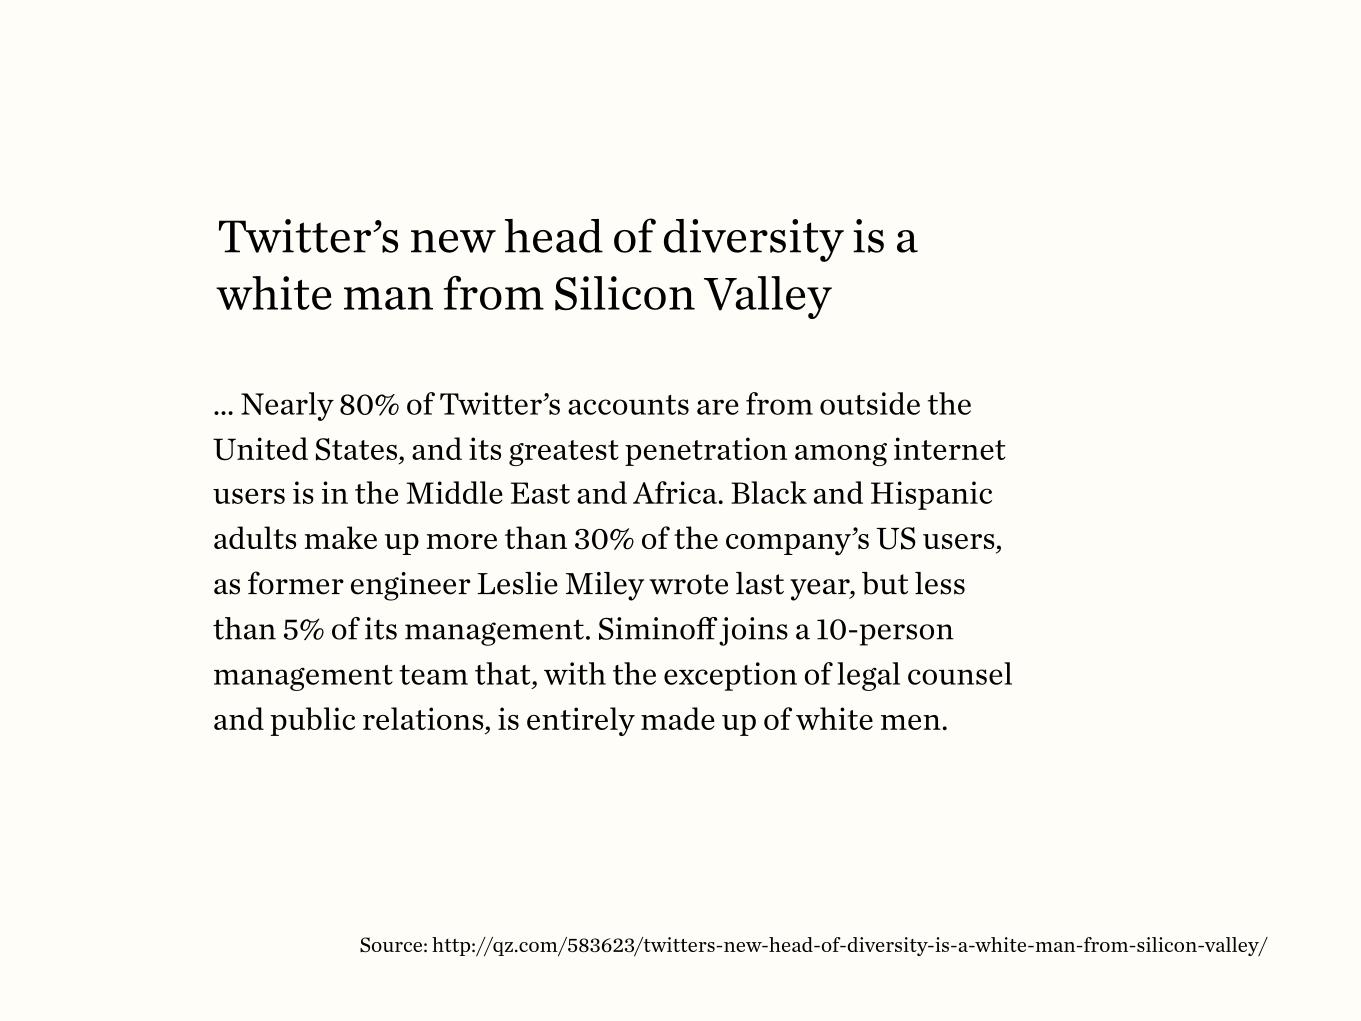
… Nearly 80% of Twitter’s accounts are from outside the United States, and its greatest penetration among internet users is in the Middle East and Africa. Black and Hispanic adults make up more than 30% of the company’s US users, as former engineer Leslie Miley wrote last year, but less than 5% of its management. Siminoff joins a 10-person management team that, with the exception of legal counsel and public relations, is entirely made up of white men.
Twitter’s new head of diversity is a white man from Silicon Valley
Source: http://qz.com/583623/twitters-new-head-of-diversity-is-a-white-man-from-silicon-valley/
N AmericaM.E. & Africa
UsersMgmt

Thanks!
Planetary is hiring: a frontend developer, a lead designer, and
a part-time data scientist. If you’re interested, please contact
us at [email protected].