Embed Size (px)
Citation preview

Bottleneck Bottleneck OperationOperation
Bottleneck operation: An operationin a sequence of operations whosecapacity is lower than that of theother operations


Capacity planningCapacity is the maximum output rate of a production
or service facility.
Capacity also includes EquipmentSpaceEmployee skills
05/03/23 3

The basic questions in capacity The basic questions in capacity planningplanning

Capacity planning is the process of establishing the output rate that may be needed at a facility.
05/03/23 5

Reasons of capacity Reasons of capacity planningplanning

Impacts ability to meet future demandsAffects operating costsMajor determinant of initial costsInvolves long-term commitmentAffects competitivenessAffects ease of management
Importance of Capacity Decisions
05/03/23 7

Measuring Capacity Examples
Type of Business Input Measures of Capacity
Output Measures of Capacity
Car manufacturer Labor hours Cars per shift
Hospital Available beds Patients per month
Pizza parlor Labor hours Pizzas per day
Retail store Floor space in square feet Revenue per foot
05/03/23 8

Capacity terminologyCapacity terminology Design capacity Design capacity ( Max. Capacity )
is the maximum theoretical output of a is the maximum theoretical output of a systemsystem Normally expressed as a rateNormally expressed as a rate Under ideal conditionsUnder ideal conditions
Effective capacity Effective capacity ( Best Operating Level ) is the capacity a firm expects to achieve is the capacity a firm expects to achieve given current operating constraintsgiven current operating constraints Often lower than design capacityOften lower than design capacity Under ideal conditionsUnder ideal conditions Actual output Actual output ( Capacity Used )
is rate of output actually is rate of output actually achievedachieved
Cannot exceed effective capacity.Cannot exceed effective capacity.

Utilization is the percent of design capacity achievedEfficiency is the percent of effective capacity achieved
Utilization = Actual Output/Design CapacityUtilization = Actual Output/Design Capacity
Efficiency = Actual Output/Effective CapacityEfficiency = Actual Output/Effective Capacity
Utilization and EfficiencyUtilization and Efficiency
Both measures expressed as percentagesBoth measures expressed as percentages

Calculating Capacity Utilization
Measures how much of the available capacity is actually being used:
Measures effectiveness Use either effective or design capacity in denominator
100%capacity
rateoutput actualnUtilizatio
05/03/23 11

Efficiency/UtilizationEfficiency/Utilization
Actual output 36 units/day Efficiency = = = 90%
Effective capacity 40 units/ day Actual output 36 units/day
Utilization = = = 72% Design capacity 50 units/day
Design capacity = 50 trucks/day
Effective capacity = 40 trucks/day
Actual output = 36 units/day
Ex.Ex.

Facilities (size, location, layout, heating, lighting, ventilations)
Product and service factors (similarity of products)
Process factors (productivity, quality)Human factors (training, skills, experience, motivations,
absentation, turnover)Policy factors (overtime system, no. of shifts)Operational factors (scheduling problems,
purchasing requirements, inventory shortages)Supply chain factors (warehousing, transportation,
distribution)External factors (product standards, government agencies,
pollution standard)
Determinants of Effective Determinants of Effective CapacityCapacity

P r o d u c tA n n u a l
D e m a n d
S t a n d a r dp r o c e s s i n g t i m e
p e r u n i t ( h r . )P r o c e s s i n g t i m e
n e e d e d ( h r . )
# 1
# 2
# 3
4 0 0
3 0 0
7 0 0
5 . 0
8 . 0
2 . 0
2 , 0 0 0
2 , 4 0 0
1 , 4 0 0 5 , 8 0 0
Calculating Processing Calculating Processing RequirementsRequirements
A dept. works 8-hour shift, 250 days/year
annual capacity is 250*8 = 2000 hours, number of machines required = 5,800 hours/2,000 hours = 2.90 machinesthen we need three machines to handle the required volume

ForecastDemand
ComputeNeededCapacity
ComputeRated
Capacity
EvaluateCapacity
Plans
ImplementBest Plan
QualitativeFactors
(e.g., Skills)
Select BestCapacity
Plan
DevelopAlternative
Plans
QuantitativeFactors
(e.g., Cost)
Capacity Planning Process

Modify capacityModify capacity Use capacityUse capacity
Planning Over a Time HorizonPlanning Over a Time Horizon
IntermediatIntermediate-range e-range planningplanning
Subcontract Add personnelAdd equipment Build or use inventory Add shifts
Short-range Short-range planningplanning
Schedule jobsSchedule personnel Allocate machinery*
Long-range Long-range planningplanning
Add facilitiesAdd long lead time equipment*
* Limited options exist* Limited options exist
05/03/23 16

Economies of ScaleEconomies of scale
If the output rate is less than the optimal level, increasing output rate results in decreasing average unit costs
Diseconomies of scaleIf the output rate is more than the optimal
level, increasing the output rate results in increasing average unit costs

Minimumcost
Aver
age
cost
per
uni
t
0 Rate of output
Production units have an optimal rate of output for minimal cost.
Minimum average cost per unit

5-19
Minimum cost & optimal operating rate are functions of size of production unit.
Aver
age
cost
per
uni
t
0
Smallplant Medium
plant Largeplant
Output rate

05/03/23 20

Cost Volume Analysis: Breakeven AnalysisTechnique for evaluating process & equipment alternativesObjective: Find the point at which total cost equals total revenueAssumptions•Revenue & costs are related linearly to volume•All information is known with certainty•No time value of money
22
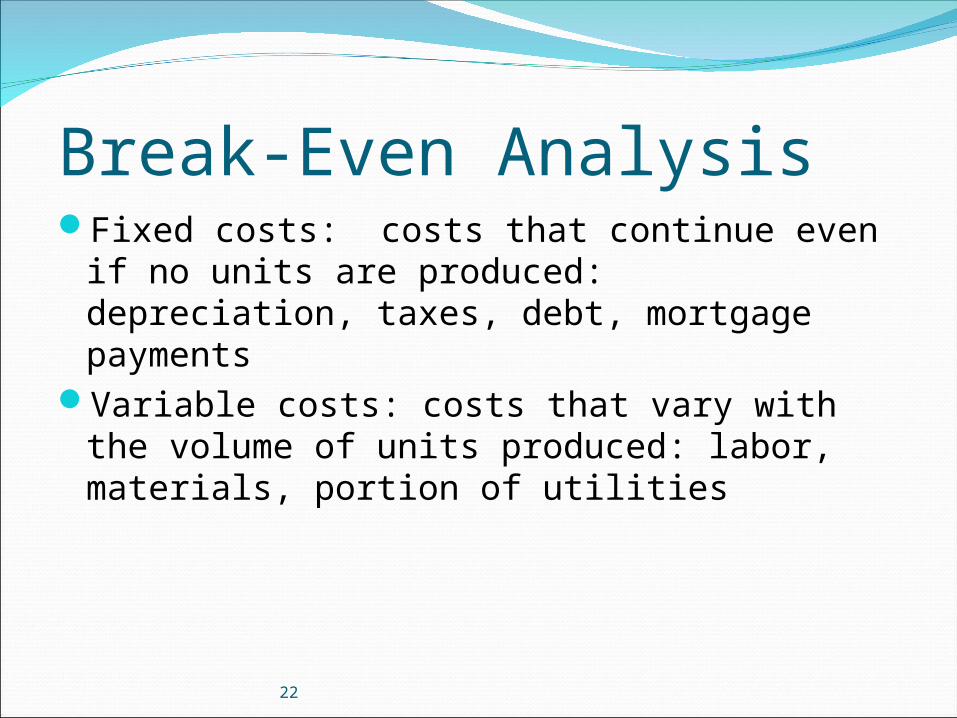
Break-Even AnalysisFixed costs: costs that continue even if no
units are produced: depreciation, taxes, debt, mortgage payments
Variable costs: costs that vary with the volume of units produced: labor, materials, portion of utilities

Breakeven Chart
Fixed cost
Variable cost
Total cost line
Total revenue lineProfitBreakeven point
Total cost = Total revenue
Volume (units/period)
Cost
in D
olla
rs
Loss

5-24
1.One product is involved2.Everything produced can be sold3.Variable cost per unit is the same
regardless of volume4.Fixed costs do not change with volume5.Revenue per unit constant with volume6.Revenue per unit exceeds variable cost per
unit
Assumptions of Cost-Volume Analysis
5-25
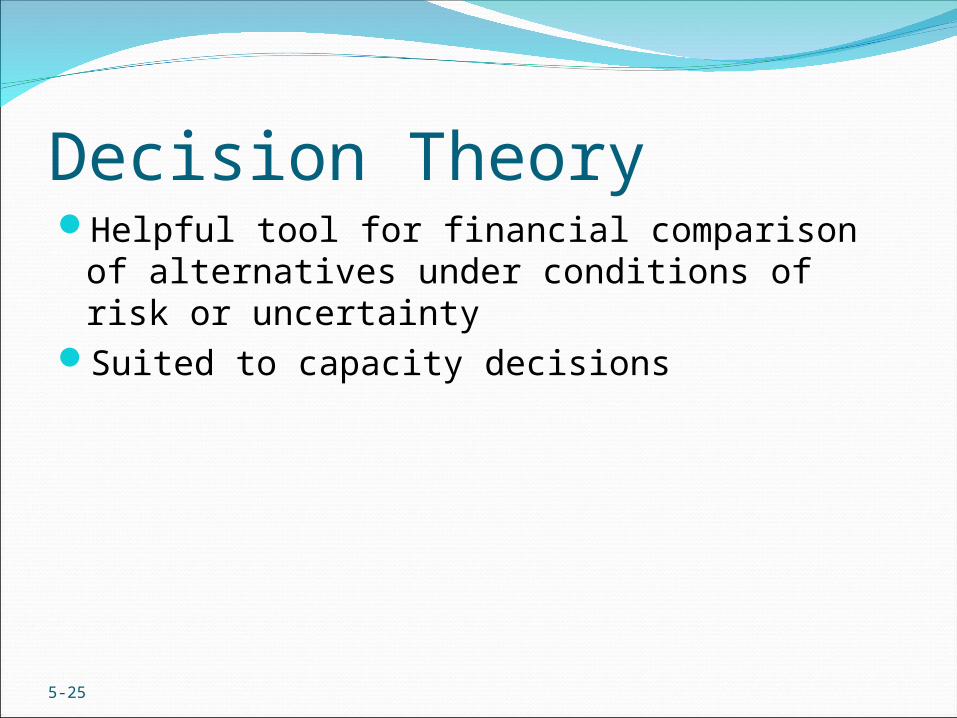
Decision TheoryHelpful tool for financial comparison of
alternatives under conditions of risk or uncertainty
Suited to capacity decisions

Small Box Office
Medium Box Office
Large Box Office
Small Box Office
Medium Box Office
Large Box Office
Sign with Movie Co.
Sign with TV Network
200,000
1,000,000
300,000
900,000
900,000
900,000
.3
.6
.1
.3
.6
.1
ER900,000
ER690,000
ER900,000

5-27
Financial AnalysisCash Flow - the difference between cash
received from sales and other sources, and cash outflow for labor, material, overhead, and taxes.
Present Value - the sum, in current value, of all future cash flows of an investment proposal.

Net Present ValueF = future valueP = present valuei = interest rateN = number of years
NiFP
)1(

5-29
Waiting-Line AnalysisUseful for designing or modifying service
systemsWaiting-lines occur across a wide variety of
service systemsWaiting-lines are caused by bottlenecks in
the processHelps managers plan capacity level that will
be cost-effective by balancing the cost of having customers wait in line with the cost of additional capacity

PROCESS PLANNINGDesign Machine
Tool
Scheduling and Production Control
Process
Planning

What methods were used?Machining methodsPressworkingWelding/fabricationCastingPowder materialsLayered depositionOthers

Welding/fabrication:Additive techniques
Initial Stock
WeldAdd-on
WeldAdd-on
Final Product

Machining Methods:Subtractive techniques
Initial Stock
Slotting
Drilling
Final Product

Casting:Form Methods

ENGINEERING DESIGN MODELING
10" +0.01-0.01
1'-4" +0.01-0.01
4" +0.01-0.01
7" +0.05-0.05
5" +0.01-0.01
3" +0.01-0.01
2" +0.01-0.01 0.001 A B
A
B
S.F. 64 u inch
U*
- *
CSG MODEL
Fa c e
Lo o p
Ed g e
V e rt e x
B-REP MODEL

INTERACTION OF PLANNING FUNCTIONS
GEOMETRIC REASONING
PROCESS SELECTION
CUTTER SELECTION
MACHINE TOOL SELECTION
SETUP PLANNING
FIXTURE PLANNING
CUTTER PATH GENERATION
• global & local geometry
• process capability• process cost
• available tools• tool dimension and geometry• geometric constraints
• machine availability, cost• machine capability
• feature relationship• approach directions• process constraints• fixture constraints
• fixture element function• locating, supporting, and clamping surfaces• stability
• feature merging and split• path optimization• obstacle and interference avoidance