Embed Size (px)
Citation preview

© OECD/IEA 2017
Outlook for fossil fuels
Webinar
Tim Gould Tae-Yoon Kim
Christophe McGlade Johannes Trüby

© OECD/IEA 2017
Tipping the energy world off its axis
Four large-scale upheavals in global energy set the scene for the new Outlook:
The United States is turning into the undisputed global leader for oil & gas
Solar PV is on track to be the cheapest source of new electricity in many countries
China’s new drive to “make the skies blue again” is recasting its role in energy
The future is electrifying, spurred by cooling, electric vehicles & digitalisation
These changes brighten the prospects for affordable, sustainable energy &
require a reappraisal of approaches to energy security
There are many possible pathways ahead & many potential pitfalls if
governments or industry misread the signs of change
© OECD/IEA 2017
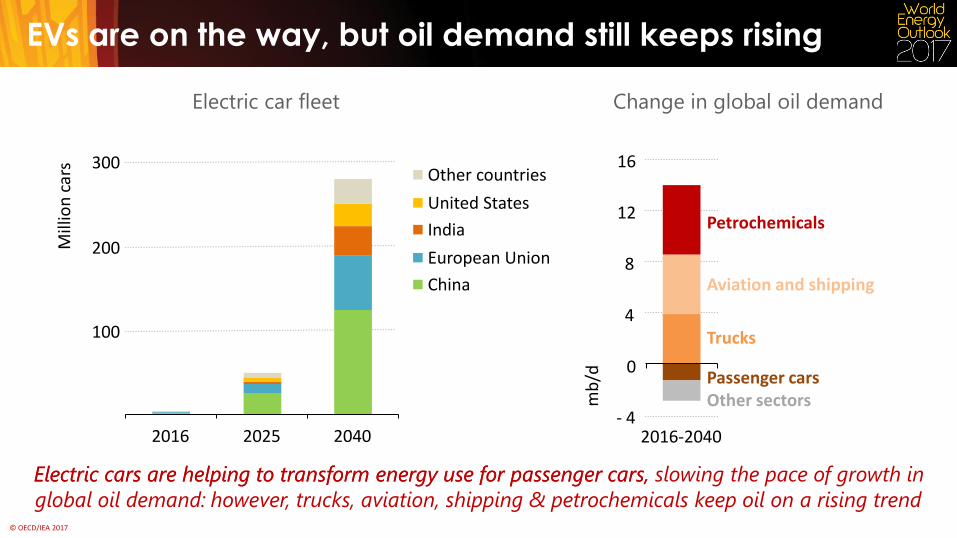
Electric cars are helping to transform energy use for passenger cars, slowing the pace of growth in
global oil demand: however, trucks, aviation, shipping & petrochemicals keep oil on a rising trend
Electric cars are helping to transform energy use for passenger cars, slowing the pace of growth in
global oil demand: however, trucks, aviation, shipping & petrochemicals keep oil on a rising trend
however, trucks, aviation, shipping & petrochemicals keep oil on a rising trend
EVs are on the way, but oil demand still keeps rising
Electric car fleet
100
200
300
2016 2025 2040
Mill
ion
car
s
Other countries
United States
India
European Union
China
Passenger cars Other sectors
Change in global oil demand
4
8
12
16
Petrochemicals
Aviation and shipping
Trucks
mb
/d
- 4 2016-2040
0

© OECD/IEA 2017
25
30
35
US becomes undisputed leader of oil & gas production
Oil and gas production in the United States
The US is already switching to become a net exporter of gas & becomes a net exporter of oil
in the 2020s, helped also by the demand-side impact of fuel efficiency & fuel switching
5
10
15
20
1980 1990 2000 2010 2020 2030 2040
mboe/d Shale oil
Shale gas
Other unconventionals
Conventional oil & gas

© OECD/IEA 2017
Traditional patterns of oil trade undergoing a major upheaval
Gross crude oil export
North America becomes the second-largest gross crude oil exporter by 2040,
while Asia Pacific’s need for crude oil imports intensifies
mb/d
2
4
6
2016 2040
Middle East
North America
South America
Africa
Russia
20
22
Gross crude oil import
6
12
18
24
30
2016 2040
Asia Pacific
Europe
North America

© OECD/IEA 2017
Cost reductions: structural or cyclical?
Changes in capital costs per barrel for developing conventional oil projects
Costs have fallen by 40% since 2014; unit costs accounted for nearly 60% of the reduction.
Costs rebound in the future as prices rise and companies develop more complex fields
20%
40%
60%
80%
100%
2014 2016
Index (2014 = 100%)
2025
Technology Downsizing and simplification Asset high grading Unit costs
New Policies Scenario

© OECD/IEA 2017
706 bcm in 2016
Global gas trade
Asia’s growing gas import requirements are largely met by LNG,
with exports from the US accelerating a shift towards a more flexible, liquid global market
LNG ushers in a new global gas order
39% shipped by LNG
1 230 bcm in 2040
59% shipped by LNG

© OECD/IEA 2017
706 bcm in 2016
Global gas trade
Asia’s growing gas import requirements are largely met by LNG,
with exports from the US accelerating a shift towards a more flexible, liquid global market
LNG ushers in a new global gas order
Gas exporters
39% shipped by LNG
1 230 bcm in 2040
59% shipped by LNG
Australia Russia & Caspian
Middle East
Other
Africa
US & Canada
Australia Russia & Caspian
Middle East Other
Africa US & Canada

© OECD/IEA 2017
706 bcm in 2016
Global gas trade
Asia’s growing gas import requirements are largely met by LNG,
with exports from the US accelerating a shift towards a more flexible, liquid global market
LNG ushers in a new global gas order
Gas exporters Gas importers
39% shipped by LNG
1 230 bcm in 2040
59% shipped by LNG
Australia Russia & Caspian
Middle East
Other
Africa
US & Canada
Australia Russia & Caspian
Middle East Other
Africa US & Canada
Asia 37%
Europe 52%
Other
Asia 60%
Europe 35%
Other Other Asia
China
Japan & Korea
Japan & Korea
China
Other Asia
Europe
Europe

© OECD/IEA 2017
The opportunities for gas are formidable but…
Buyers are less willing to enter long-term commitments, making financing of
new LNG projects more difficult
There is a need for new business models to underpin investment
Expansion of transmission and distribution infrastructure is essential to
enable growth in gas demand in developing countries
To roll out costly infrastructure policy-makers in developing countries need
to be convinced that gas is a clean, affordable and reliable energy source
New gas importers in Asia are price sensitive with good renewable energy
potentials and cheap coal within easy reach
Rigorous cost control is essential to ensure gas remains competitive

© OECD/IEA 2017
Coal trade: an Asian seesaw
Change in net coal imports in selected regions, 2016-2040
While LNG trade expands & diversifies, the range of international buyers for coal is
narrowing & the falling cost of solar could squeeze coal trade even more
-150
-100
-50
0
50
100
150
200
China European
Union
Korea Japan India Other Asia
Mtc
e
© OECD/IEA 2017
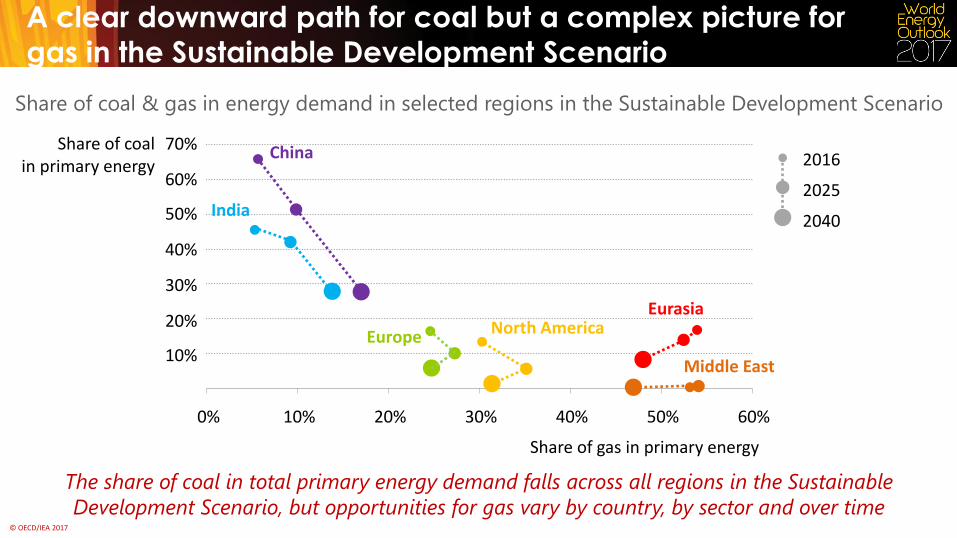
A clear downward path for coal but a complex picture for
gas in the Sustainable Development Scenario
Share of coal & gas in energy demand in selected regions in the Sustainable Development Scenario
The share of coal in total primary energy demand falls across all regions in the Sustainable
Development Scenario, but opportunities for gas vary by country, by sector and over time
10%
20%
30%
40%
50%
60%
70%
0% 10% 20% 30% 40% 50% 60%
Share of gas in primary energy
Share of coal in primary energy
India
Europe North America
Eurasia
Middle East
China 2016
2025
2040

© OECD/IEA 2017
The lifecycle emissions of gas are lower than coal
Greenhouse-gas emission intensity of natural gas compared with coal
The global average emission intensity of gas is low enough for gas to result in fewer GHG
emissions than coal regardless of the timeframe considered
2%
4%
6%
8%
0 20 40 60 80 100 120
CH4 conversion to CO2
Coal better than gas
Gas better than coal for electricity only
Gas better than coal
GWP100 from IPCC (2014)
GWP20 from IPCC (2014)
Met
han
e le
akag
e ra
te
Average global gas emission intensity

© OECD/IEA 2017
iea.org/weo


