Embed Size (px)
Citation preview
Using Value-by-Alpha Maps to Visualize CTPP/ACS Bus Commute Estimate Reliability
Nichole StewartESRI Mid-Atlantic User Conference 2014
Transportation Mapping & Analysis Session

Today’s Discussion
• CTPP and ACS Data Overview• Estimate Reliability, Sampling Error and MOE,
and Coefficient of Variation• CTPP Flow Data and Bus Commute by Census
Tract• Creating Value-by-Alpha Maps Using ArcMap
CTPP Data• Census Transportation Planning Products Data Tabulations
(CTPP) • American Association of State Highway and Transportation
Officials (AASHTO)-sponsored and funded by state DOTs and MPOs
• “Designed to help transportation analysts and planners understand where people are commuting to and from, and how they get there.”

CTPP Data• Data Organization
– Part 1: Residence Tabulations– Part 2: Workplace Tabulations– Part 3: Commuting Flow to Work
• Commute data with more detailed crosstabs of critical transportation data than standard ACS– Means of transportation– Number of occupants per vehicle– Travel time to work and time leaving home– Demographic information: income, age, presence of children, minority
status
ResidenceOrigin
Workplace Destination
ACS Data and 5 Year Estimates• American Community Survey
– Previous CTPP data tabulations based on decennial Census long form but that survey replaced by American Community Survey (ACS)
– Sample of HH, 1 in 40 HH surveyed monthly over 12 months, accumulated and pooled/reported for 1, 3, and 5 year periods (not point in time)
• 5 year estimates – Late 2013 first CTPP data based on 5-year ACS data – Available from state to neighborhood (census tracts, block groups and
blocks, <20k population)– 1 in 8 households surveyed over 5 year period (as compared to about
1 in 6 that received the census long form in the 2000 census).– Trade-off: low reliability for small areas
Why does this matter? Data users want to know the statistical reliability and usability of estimates

Estimate Reliability and Sampling Error
• Sampling error/standard error(SE): The uncertainty or variability associated with an estimate that is based on data gathered from a sample of the population rather than the full population
• 90% confidence level for all published ACS estimates
• Margin of Error (MOE): Measure of the precision of an estimate (+/-) at a given level of confidence
Read: A data user can be 90 percent certain that the sample estimate and the population value differ by no more than the value of the MOE
MOE =SE*1.645

Coefficient of Variation (CV)
• The relative amount of sampling error associated with a sample estimate
• Ratio of the standard error of the estimate to the estimate: CV = SE / Estimate * 100%
MOE =SE*1.645
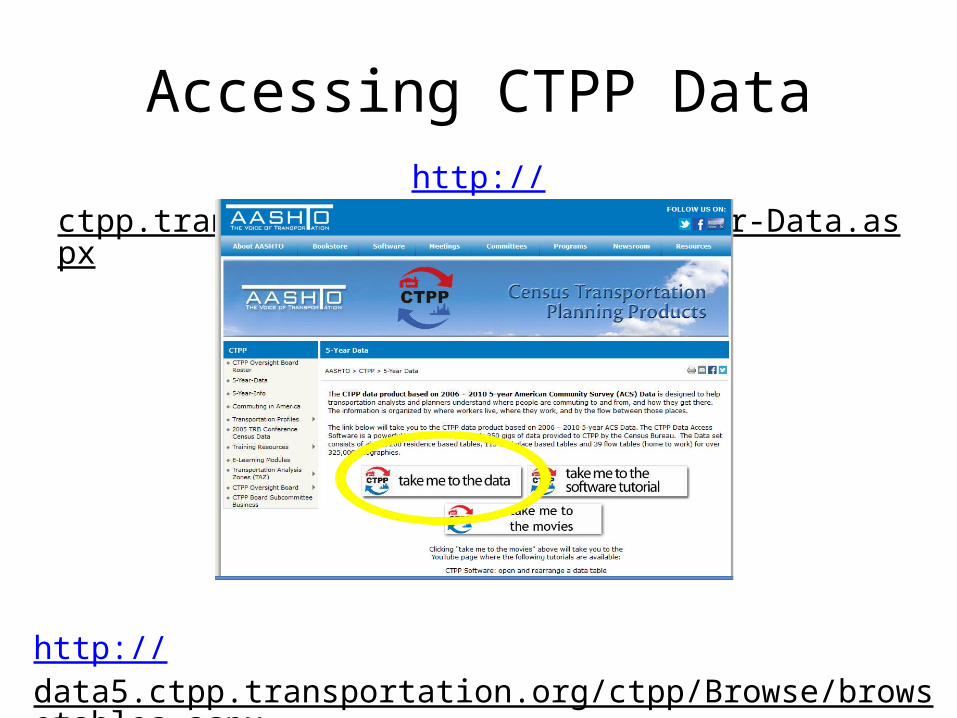
Accessing CTPP Datahttp://ctpp.transportation.org/Pages/5-Year-Data.aspx
http://data5.ctpp.transportation.org/ctpp/Browse/browsetables.aspx


Bus Commuters (Flow Data)
• Percent of Baltimore City Residents Commuting throughout the Region by Bus
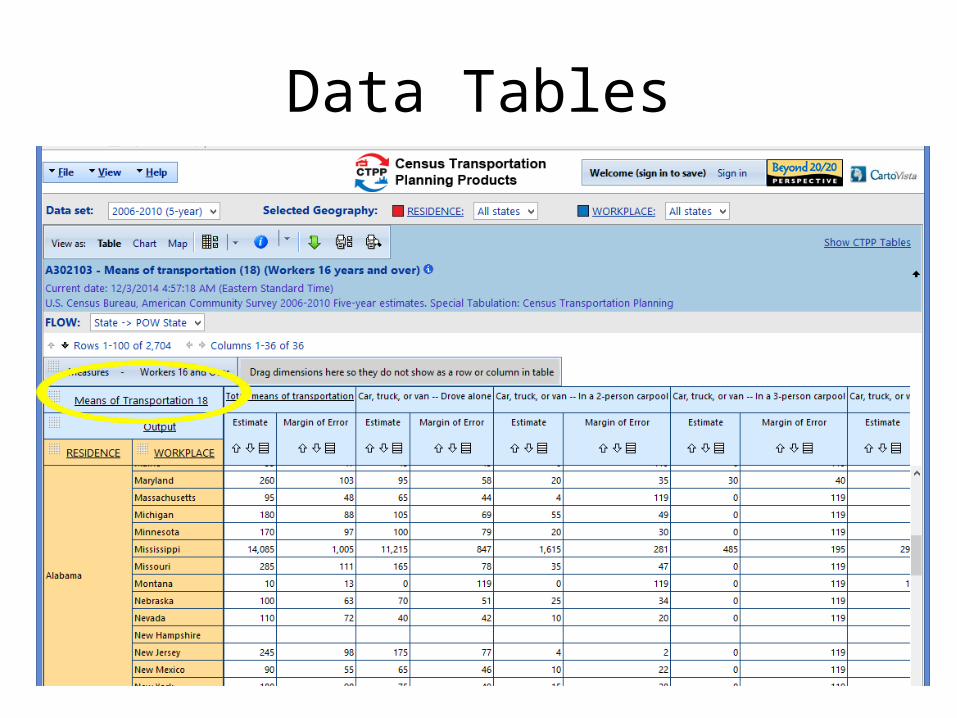
Data Tables

Refining Selections

Choosing Geography
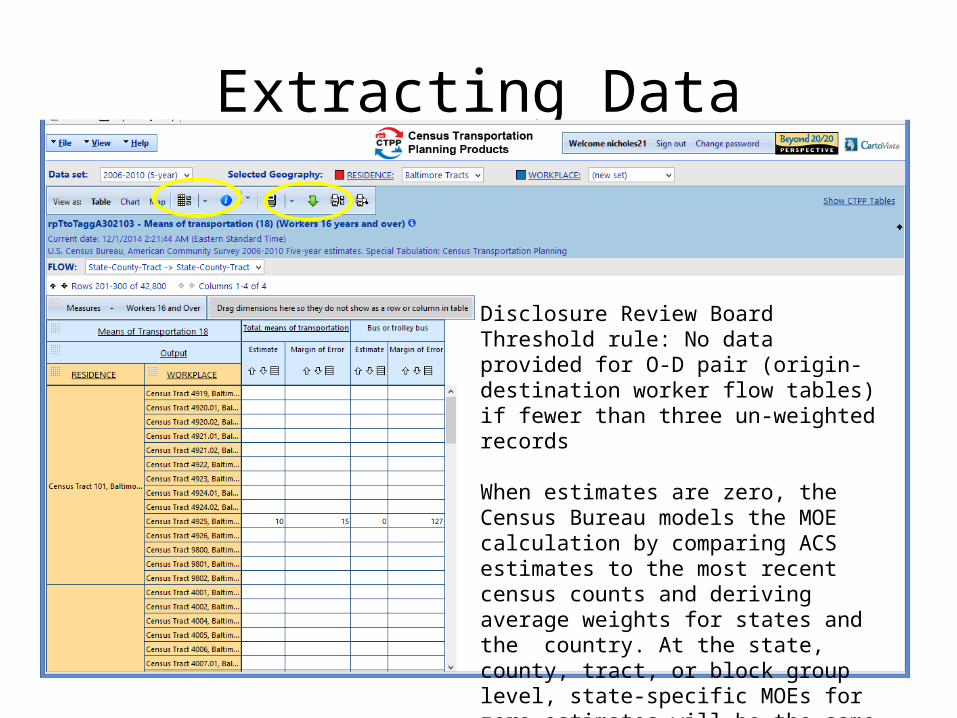
Extracting Data
Disclosure Review Board Threshold rule: No data provided for O-D pair (origin-destination worker flow tables) if fewer than three un-weighted records
When estimates are zero, the Census Bureau models the MOE calculation by comparing ACS estimates to the most recent census counts and deriving average weights for states and the country. At the state, county, tract, or block group level, state-specific MOEs for zero estimates will be the same regardless of the base of the table

Challenges with Data Extraction Tool for this Analysis
• It can calculate percentages/rates…..• BUT we have to aggregate the workplace census tracts
for all of Baltimore City first• It can aggregate data using Totals…….• BUT it aggregates MOE for Zero estimates and this
misinterprets the data• It can also suppress empty or zero values……• BUT not across more than one variable (total and
number using bus)• SO you must download raw values and manipulate!

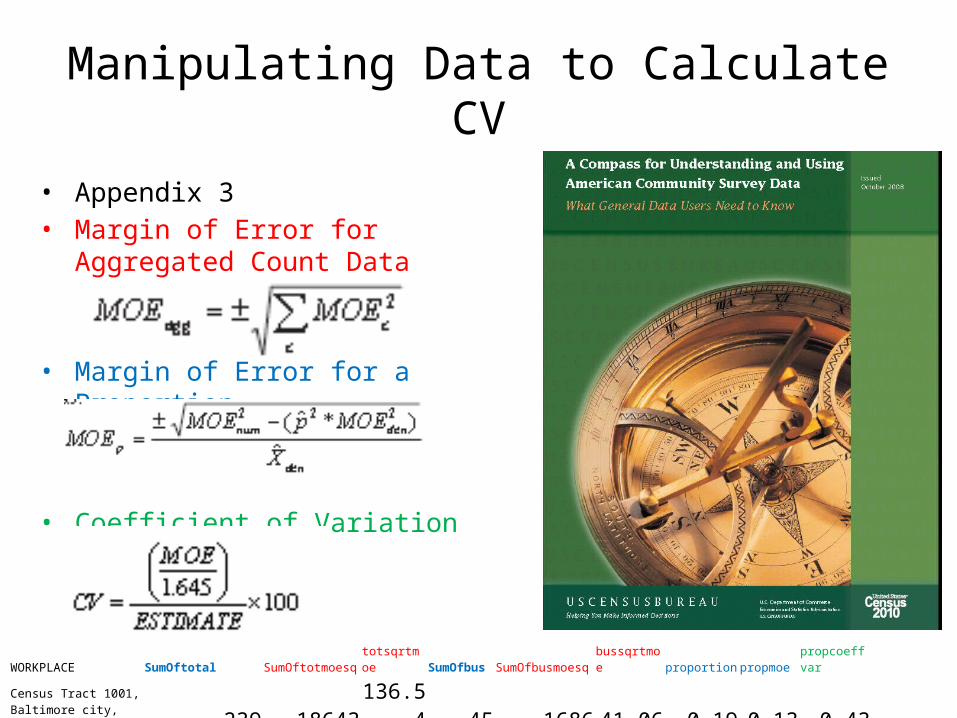
Manipulating Data to Calculate CV• Appendix 3• Margin of Error for Aggregated Count
Data
• Margin of Error for a Proportion
• Coefficient of Variation
WORKPLACE SumOftotal SumOftotmoesq totsqrtmoe SumOfbus SumOfbusmoesq bussqrtmoe proportion propmoe propcoeffvar
Census Tract 1001, Baltimore city, Maryland 239 18643 136.54 45 1686 41.06 0.19 0.13 0.43

Value-by-Alpha Maps
• Bivariate choropleth maps are used to visualize two measures at the same time.
• Value-by-alpha maps are a type of bivariate choropleth map
• The intensity of color will represent the reported estimate of bus commuters and the transparency of the layer will represent a measure of the reliability of the estimate, the CV.

VBA in ArcMap
• Map a layer of the estimate of interest (percent Baltimore City commuters traveling by bus) and adjust choropleth classifications and color scheme.
• Make copies of the estimate layer based on the number of reliability classifications in the analysis.
• Use definition query to select tracts that fall within the specified reliability range and adjust the transparency of the reliability layers so that more reliable estimates are more visible.
Adapted from: https://andrewpwheeler.wordpress.com/2012/08/24/making-value-by-alpha-maps-with-arcmap/


VBA in ArcMap
• Map a layer of the estimate of interest (percent Baltimore City commuters traveling by bus) and adjust choropleth classifications and color scheme.
• Make copies of the estimate layer based on the number of reliability classifications.
• Use definition query to select tracts that fall within the specified reliability range and adjust the transparency of the reliability layers so that more reliable estimates are more visible.
Adapted from: https://andrewpwheeler.wordpress.com/2012/08/24/making-value-by-alpha-maps-with-arcmap/
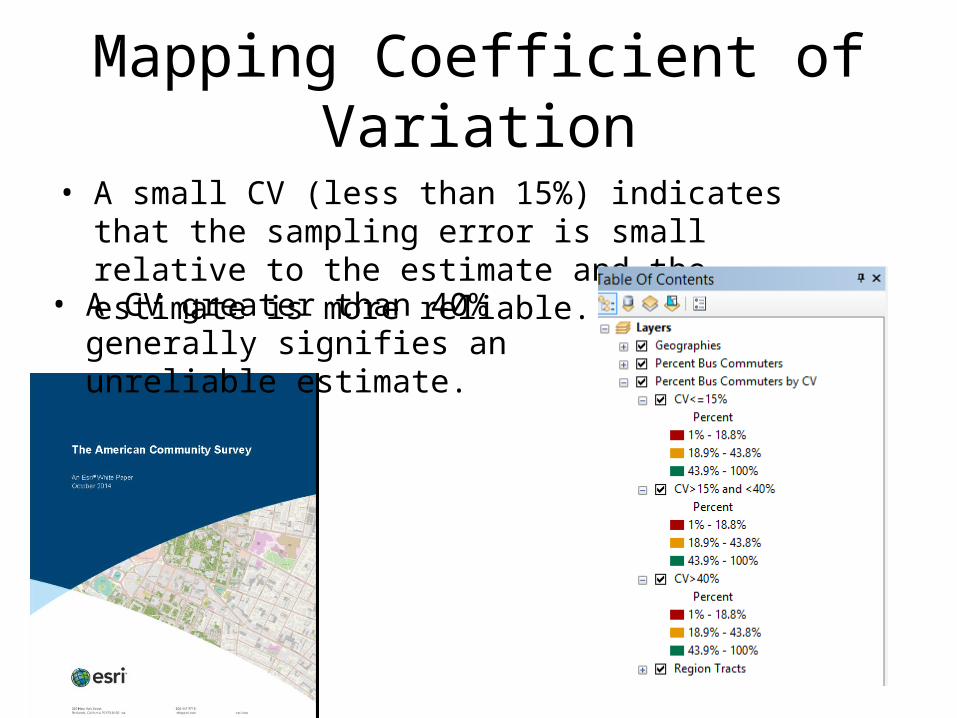
Mapping Coefficient of Variation
• A small CV (less than 15%) indicates that the sampling error is small relative to the estimate and the estimate is more reliable.
• A CV greater than 40% generally signifies an unreliable estimate.

VBA in ArcMap
• Map a layer of the estimate of interest (percent Baltimore City commuters traveling by bus) and adjust choropleth classifications and color scheme.
• Make copies of the estimate layer based on the number of reliability classifications in the analysis.
• Use definition query to select tracts that fall within the specified reliability range and adjust the transparency of the reliability layers so that more reliable estimates are more visible.
Adapted from: https://andrewpwheeler.wordpress.com/2012/08/24/making-value-by-alpha-maps-with-arcmap/


Making the Legend
• Convert legend to graphics and then ungroup to arrange symbology
• Final legend is a bivariate scheme showing the estimate of bus commuter percentage going top to bottom, and the CV transparency dimension running from left to right
Adapted from: https://andrewpwheeler.wordpress.com/2012/08/24/making-value-by-alpha-maps-with-arcmap/

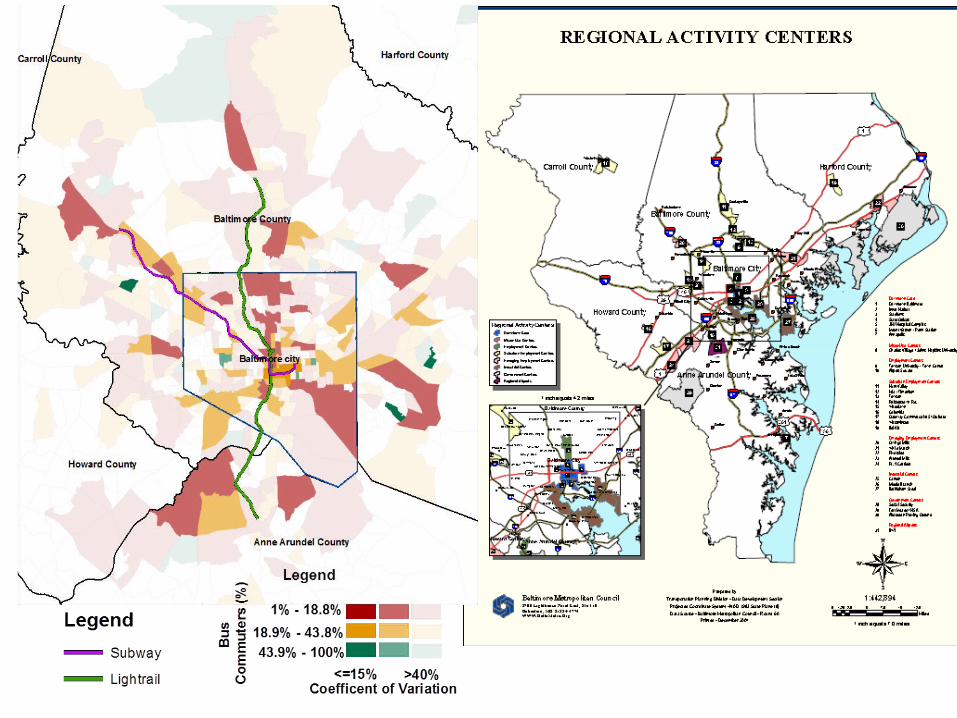
Legend
>40%Coefficent of Variation
<=15%
Bu
s C
om
mu
ters
(%
)
43.9% - 100%
18.9% - 43.8%
1% - 18.8%

CV<=15% CV>15% and <=40% CV>40%


Why Do We Care?
• The Maryland Transit Administration (MTA) recently announced its Baltimore Bus Network Improvement Project (BNIP). The initiative is designed to improve Baltimore City’s local bus system and ultimately connect residents to the region and employment opportunities.
• Value-by-alpha maps can be used to determine the usability of estimates of Baltimore City residents who commute to work locally and throughout the region using the bus as their mode of transportation.

NICHOLE M. STEWART
/wherejobsare
Data Analyst and Researcher Public Policy Doctoral Student (UMBC)
/wherejobsare
Contact