Embed Size (px)
Citation preview

ADVANCED WATER TREATMENT & DESALINATION GREENFIELD + WATER = BLUEFIELD
Source: Joshua Doubeck
FOCUS REPORT
US Municipal Wastewater & Reuse: Market Trends, Opportuni2es, & Forecasts, 2015-‐2025 Table of Contents June 2015
Purple/ Flickr / cropped & resized/ / Source: John Loo / CC BY-SA 2.0

ADVANCED WATER TREATMENT & DESALINATION
US Municipal Wastewater & Reuse: Market Trends, Opportunities, & Forecasts, 2015-2025 FOCUS REPORT
About This Focus Report
2
US Municipal Wastewater & Reuse: Market Trends, Opportunities, & Forecasts, 2015-2025 is an in-depth analysis of the rapidly changing U.S. municipal water landscape for wastewater reuse solutions and business strategies. This 141-page Focus Report has been developed to support companies addressing the US market with detailed data, market trend analysis, and growth forecasts. Bluefield forecasts market outlook for reuse to 2025. Bluefield’s in-depth forecasts build on the more than 8.3 million m3/d of municipal wastewater flows currently reused in the US. Wastewater reuse for municipal utilities will increase 61% by 2025, requiring US$11.0 of capital expenditures. Key forecast outputs include state-by-state capacity additions, technology utilization, capital investment, and reclaimed water applications. A detailed research methodology and approach is provided in the report with forecast data and analysis. Uncovering greenfield opportunities in a scaling US project pipeline. From California to Florida, municipal utilities and industrial off-takers are responding to a more regulated and volatile water market environment. Bluefield’s bottom-up data analysis of more than 3,000 existing wastewater treatment plants, over 700 operating wastewater reuse systems, and 247 reuse projects in various stages of planning signal an increasingly positive climate benefitting water solutions providers. The lion’s share of the activity, or 94%, is expected to take place in nine states, headlined by Florida and California. Identifying drivers of change. Bluefield highlights the evolving water landscape by state and water district that are shaping business models and market growth going forward. Deep-dive analysis of regulatory policies and investment across 9 primary states and 32 water districts are included in 41 profiles to support companies as they navigate a nascent and highly fragmented landscape. Bluefield’s analysis also indicates a change in the market’s overall profile. Potable reuse – treating wastewater to drinking water quality – currently makes up 15% of the total capacity, but is expected to increase to 19% of total water reuse by 2025.
California)Municipal)Wastewater)Treatment)&)Reuse:)Market'Drivers,'Trends,'and'Outlook'
ADVANCED WATER TREATMENT & DESALINATION
DATA INSIGHT
21
SoCal Represents Market Epicenter
California’s 2.3 million m3/d project pipeline is dominated by Los Angeles County, where urban water
use, population growth, and drought combine for the greatest demand.
San Diego .378
Riverside .227
San Bernardino .174
Stanislaus .075
Santa Clara .113
Fresno .037 San Francisco
.022
Orange .022
Sacramento .018
Monterrey 15.1
Yolo .011
Contra Costa .0113
Marin <.01
Merced <.01
Napa <.01
Ventura <.01
Los Angeles 1.222
Geographically, more than 94% of California’s project
pipeline is located in seven counties
• Seven counties, led by Los Angeles, have more than
37,000 m3/d in planned capacity additions. Another 11
counties make up the remainder of currently planned
reuse systems.
• Reinforcing the trend toward urban reuse, the large
majority of activity is in the more populated coastal
counties and greater metropolitan areas of Los Angeles,
San Francisco, and San Diego.
• Eight projects greater than 45,000 m3/d are planned for
Los Angeles County, headlined by the Joint Water
Pollution Control plant and the Hyperion MBR project
which are system upgrades.
Analysis
Circle size represents planned
capacity additions, million m3/d
Planned Reuse Projects in California by County
Source: Bluefield Research
California)Municipal)W
astewater)Treatment)&)Reus
e:)Market'Drivers,'Trends,'
and'Outlook'
ADVANCED WATER TREATMENT & DESALINATION
DATA INSIGHT
21
SoCal Represents Market Epicenter
California’s 2.3 million m3/d project pipeline is dominated by Los Angeles County, where urban water
use, population growth, and drought combine for the greatest demand.
San Diego
.378
Riverside
.227
San Bernardino
.174
Stanislaus
.075
Santa Clara
.113
Fresno
.037 San Francisco
.022
Orange
.022
Sacramento
.018
Monterrey
15.1
Yolo .011
Contra Costa
.0113
Marin <.01 Merced
<.01
Napa <.01
Ventura
<.01
Los Angeles
1.222
Geographically, more than 94% of California’s project
pipeline is located in seven counties
• Seven counties, led by Los Angeles, have more than
37,000 m3/d in planned capacity additions. Another 11
counties make up the remainder of currently planned
reuse systems.
• Reinforcing the trend toward urban reuse, the large
majority of activity is in the more populated coastal
counties and greater metropolitan areas of Los Angeles,
San Francisco, and San Diego.
• Eight projects greater than 45,000 m3/d are planned for
Los Angeles County, headlined by the Joint Water
Pollution Control plant and the Hyperion MBR project
which are system upgrades.
Analysis
Circle size represents planned
capacity additions, million m3/d
Planned Reuse Projects in California by County
Source: Bluefield Research
California)Municipal)Wastewater)Treatment)&)Reuse:)Market'Drivers,'Trends,'and'Outlook'
ADVANCED WATER TREATMENT & DESALINATION
DATA INSIGHT
14
Shifts Along the Technology Adoption Curve
Relative Technology Adoption and Applications of Reclaimed Water
Urban applications to drive demand for more advanced water treatment technologies.
• Increasing pressure on the state’s water supplies has initiated moves towards potable reuse– direct and indirect– driving market potential for more advanced treatment technologies (e.g. MF, RO, UV) capable of ensuring higher water quality.
• Reverse osmosis is currently the go-to technology for indirect potable reuse as project planners look to successful RO reuse systems like the groundwater recharge facility in Orange County.
• There are 17 planned reuse projects with a combined capacity of 1.2 million m3/d that have indicated they will use RO treatment technology.
• A further 11 projects with a combined capacity of 317,000 m3/d will use membrane bioreactor (MBR) treatment technology.
• With greater adoption of RO and MBR there will be adoption of complementary technologies like microfiltration (MF) and ultraviolet disinfection (UV).
• Another 39 projects have yet to reach the technology selection phase and are listed as to be determined.
Analysis
The trend toward more urban and industrial applications underpins a movement toward advanced membrane technologies.
Direct Potable Reuse
Indirect Potable Reuse / Groundwater Recharge
Industrial
Public Landscaping
Agriculture
Conventional Treatment
Reverse Osmosis
Membrane Bioreactor
Time
-
10
20
30
40
50
To B
e Det
erm
ined
Micr
ofiltr
ation
Rever
se O
smos
is
Distrib
ution
Sys
tem
Ultrav
iolet
Mem
bran
e Bior
ecac
tor
Stora
ge
Nu
mb
er o
f P
roje
cts
Planned Project Technology Selection, 85 Projects
Projects use multiple technologies, thereby resulting in the double counting
of projects
Source: Bluefield Research
Report'Title:'Sub$tle(
ADVANCED WATER TREATMENT & DESALINATION
MARKET INSIGHT
13
Texas State Water Plan Projected Wastewater Reuse
The current state water plan calls for a 55% (1.4 million m3/d) growth in wastewater reuse capacity between 2020 and 2070.
• While these forecasts portend a major build out in wastewater reuse infrastructure, they are likely overly optimistic as Texas has not yet met the 2010 predictions for wastewater reuse laid out in their 2007 and 2012 State Water Plans. • In order to meet the forecasted 2020 reuse levels, Texas will have to expand reuse capacity 56%, up from its current rate of 1.05 million m3/d. Since the 2007, when an extensive wastewater reuse plan was first included in the State Water Plan, Texas has been steadily revising down its forecasted wastewater reuse. • Bluefield research expects that this revision does not reflect a slowing down of the reuse market but rather reflects a more realistic understanding of the timeline to commission reuse projects.
• The downward revision also reflects Texas’s failure to reach past reuse targets, which were overly optimistic given the existing regulatory, planning, and financing environments. • In order for water projects to qualify for state funding, they must be included in the state water plan, leading local water authorities to map out specific reuse projects.
Analysis
0
1
2
3
4
5
6
2010 2020 2030 2040 2050 2060 2070
m3 /
d (
mill
ion
)
2007 State Water Plan
2012 State Water Plan
2017 State Water Plan (preliminary)
Shifting Expectations for Reuse in the State Water Plan
The preliminary estimate from the 2016 regional water plans calls for water reuse supplies to reach 3.9 million m3/d by
2070, an ambitious goal considering the current wastewater reuse rate of 1.05 million m3/d.
Current Reuse Levels (est)
Source: Texas Water Development Board (TWDB), Bluefield Research
Bluefield Takeaways
• What is the size and forecast of the US municipal reuse market by state, application, and CAPEX?
• Where do greenfield opportunities exist in the for wastewater reuse?
• Which projects in the pipeline are most likely to be realized? • Which states or municipalities offer the most favorable
environment for pursuing reuse strategies? • How are state and federal policies altering forecast outlook? • What is the demand for treated municipal wastewater from
industrial sectors such as power, private industry, and mining re-shaping the ownership landscape?
Key Questions Addressed in Report

ADVANCED WATER TREATMENT & DESALINATION
US Municipal Wastewater & Reuse: Market Trends, Opportunities, & Forecasts, 2015-2025 FOCUS REPORT
Table of Contents
3
Section 1 – Executive Summary 7 Summary 8 Summary, Continued 9 The US Municipal Wastewater Landscape, 2015-2025 10 Wastewater Reuse in the US in a Global Context 11 Current State of Reuse in the US 12 Wastewater Reuse Applications in the US 13 US Treated Wastewater Utilization 14 US Market Attractiveness - Evaluating the Opportunity 15 Historical Growth Trend
Section 2 – US Regulatory Landscape 17 Summary – Policy Landscape 18 State Policy Landscape: Drivers & Inhibitors 19 Water Rights Impact Reuse Habits, Opportunities 20 State Revolving Funds Underpin Project Financing 21 State Water Plans Set Stage for Long Term Water Management 22 California, Texas, at Forefront of Direct Potable Reuse Deployment 23 The Profile of Potable Reuse at Cusp of Change 24 Water Scarcity Prompts Demand Side Restrictions 25 Drought Prompts Allocation of Emergency Funds for Reuse Projects
Section 3 – Market Drivers and Trends 27 Summary 28 State and Regional Market Trends Driving Reuse 29 Population Growth Drives Increasing Demand for Reuse 30 Water Stressed Hotspots Drive Adoption 31 Reuse Cost Challenges Legacy, Desalination Supplies 32 Models for Reuse Treatment Systems 33 Water Risks Drive Industry to Alternative Solutions 34 Power Sector Drought Proofs Water Supply 35 Fracking Firms Seek Municipal Wastewater for Operations
Section 4 – Technology & Cost Trends 37 Summary 38 Advanced Water Treatment Technology Adoption 39 Wastewater Reuse Plants CAPEX Costs
Section 5 – US Municipal Wastewater Market Forecasts 41 Summary 42 Forecast Methodology 43 Municipal Wastewater & Reuse Capacity Forecasts, 2015-2025 44 Forecasted Capacity Addition by Application, 2015-2025
Section 5 (continues) 45. State-by-State Capacity Forecasts, 2015-2025 46. Municipal Wastewater & Reuse CAPEX Forecasts, 2015-2025 47. Treatment CAPEX Forecasts by Application, 2015-2025
Section 6 – Competitive Landscape 49 Summary 50 Company Value Chain Positioning 51 Miami-Dade Highlights Stiff Competition for Reuse Project 52 RO Suppliers Position for Potable Reuse
Section 7 – California Market Analysis 54 Summary 55 Intensifying Drought Conditions Across California 56 Regulatory Environment Evolves in Face of Deteriorating Conditions 57 Population Growth Heightens the Long-Term Challenge 58 California’s Demand-side Challenge 59 Reclaimed Water Utilization by Sector 60 Wastewater Reuse Growth Hinges on Urban Water Suppliers 61 Wastewater Treatment Plant Capacity and Unused Effluent Flows by County 62 Ocean Outfalls Reflect Untapped Reuse Potential 63 SoCal Represents Market Epicenter
Section 8 – Florida Market Analysis 65 Summary 66 Florida Experience Demonstrates Policy Impacts on Build-Out 67 State Policy Initiatives Fundamental to Sector Growth 68 Ocean Outfall Legislation Planned Investment Underway 69 Miami–Dade OOL Compliance Planned Capital Investment Breakdown 70 Wastewater Flows and Reuse by County 71 Florida’s Wastewater Reuse Off-takers by Segment
Section 9 – Texas Market Analysis 73 Summary 74 Drought cycles and Impacts on Wastewater Reuse 75 Water Demand by Sector 76 Water Demand and Wastewater Reuse by Sector 77 Urban Areas Provide Opportunity for Wastewater Reuse 78 State Policy Initiatives Provide Support for Reuse Expansion 79 Market Conditions Unique to Texas 80 Texas at Forefront of Direct Potable Reuse 81 State Water Plan Planned Investment 82 Water Regions Dialing Back Reuse Plans, Reflecting Market Realities 83 Reuse Projects Apply for SRF, SWIFT Funding

ADVANCED WATER TREATMENT & DESALINATION
US Municipal Wastewater & Reuse: Market Trends, Opportunities, & Forecasts, 2015-2025 FOCUS REPORT
Table of Contents, continued
Georgia
Oklahoma
New Mexico
Nevada
Texas • Region A: Amarillo • Region B: Wichita Falls, Vernon, Burkburnett • Region C: Dallas-Fort Worth • Region D: Texarkana, Greenville, Marshall • Region E: El Paso • Region F: Midland, Odessa, San Angelo • Region G: Abilene, Waco, Cedar Park... • Region H: Houston, Galveston • Region I: Brownsboro, Elkhart • Region J: Del Rio, Kerrville • Region K: Austin • Region L: San Antonio, Victoria, Seguin • Region M: Laredo • Region N: Corpus Christi, Portland • Region O: Lamesa, Lubbock. Levelland • Region P: El Campo, Yoakum
Arizona • Phoenix AMA • Pinal AMA • Tucson AMA
California • East Bay MUD • Sacramento Regional County
Sanitation District • San Francisco • Los Angeles County Sanitation
District • Los Angeles • Orange County Sanitation District • Inland Empire Utilities District • San Diego
Colorado
Florida • Northwest Florida WMD • St Johns River WMD • South Florida WMD • Southwest Florida WMD • Suwannee River WMD
Section 10 – 41 State and Water District Profiles (pages 85-125)
Section 11 – Planned Projects (pages 125-135) APPENDIX; Project Data, Industrial Off-takers Forecasts Data (xls)
American Water � Abengoa � AECOM � Allen Plummer and Associates � AKM Consulting Engineers � American Water � Arcadis � BiWater � Black and Veatch � Bowen Engineering � Brasfield and Gorrie � Brown and Caldwell � Carollo � CDM Smith � Ceinsa USA � CH2M Hill � Chevron � China Gezhouba Group (CGGC) � Cintra � CW Roen � Dow � Dragados USA � Dudek � Eagle Contracting LP � Edgemoor/Clark � Electra Therm � Evoqua � GAI Consultants � Garney Holding Co. � GE � GHD Inc � Harvest Power � Haskell � Hatch Mott MacDonald � Hazen and Sawyer � HDR � Hydranautics � IDE Technologies � JR Filanc � Kennedy Jenks � Kiewit � Klienfelder � Koch Membrane Systes � Layne � M3 Capital Partners � McCarthy Construction � Meridiam Infrastructure � Michael Baker International � Mittauer & Associates Inc. � MWH � ONEFCO � Odebrecht � Overaa � Ovivo � Pall � Parsons � PCL Construction � WSP � Pepper Construction � PERC � Poseidon Water � Reiss Engineering � RMC Water and Environment � RTD Construction � Severn Trent Services � SJ Amoroso � Skanska � Slayden Construction � South Dade Soil & Water Conservation District � Suez Environment � Synagro Inc � Tetra Tech � Toray � Trojan UV � Trussell Technologies � Ulliman Schute � United Water � Veolia � The Walsh Group � West Yost � Woodard and Curran � Wharton Smith � W.M. Lyles � WPC Industrial Contractors Inc � Xylem
KEY COMPANIES MENTIONED
!!!!!!US!Municipal!Wastewater!&!Reuse:"Market'Trends,'Opportuni2es,'&'Forecasts,'2015:2025'
ADVANCED WATER TREATMENT & DESALINATION
FOCUS REPORT
14
US Market Attractiveness Drivers
Policy Drivers
Available Funding
Historical Experience
Water Scarcity
Market Attractiveness
California High
Florida High
Texas High
Arizona Medium
Colorado Medium
Georgia Medium
Oklahoma Medium
Nevada Low
New Mexico
Low
Market Inhibitor Limited Impact Improving Conditions Market Driver
Acute water stress shapes near-term development.
• California’s extreme drought conditions have sparked a wave of infrastructure investment and planned reuse projects.
• Texas has undergone a significant shift after recent rainfall, moving it from a near-term to long-term market opportunity, strengthened by a transparent water plan focused on statewide water risks.
• More than US$1.98 billion of funding for reuse has been made available in California and Texas to address drought.
Policy measures impact long-term outlook.
• Florida has made wastewater reuse development a state-wide priority since 1989 to mitigate aquifer saltwater intrusion and environmental contamination. Regulators continue to pass reuse initiatives, including the 2013 mandate that the Florida Department of Environmental Protection produce a feasibility study to expand reuse.
• Arizona’s water management strategy focused on banking water limits its overall opportunity for other applications.
• Nevada policies are dictated by Colorado River entitlements and capturing credits by returning water back to surface water sources.
Distinct regulatory environments, infrastructure investment, and water environments segment the markets of opportunity.
Source: Bluefield Research
Analysis
!!!!!!US!Municipal!Wastewater!&!Reuse:"Market'Trends,'Opportuni2es,'&'Forecasts,'2015:2025'
ADVANCED WATER TREATMENT & DESALINATION
FOCUS REPORT
Nine Leading States
Potable vs.
Non-Potable
Reclaimed Water
Applications
Potable Reuse
Regulations
Water Stressed
US States*
US Global Footprint
2015
Mar
ket
Lan
dsc
ape
2015
– 2
025
Mar
ket
U
S O
utl
oo
k
Potable vs.
Non-Potable
Capacity Additions
Capital Expenditures
The US Municipal Wastewater Landscape, 2015-2025 The US$9.6 billion outlook for US municipal reuse is built on a series of critical factors already in place in 2015, including more than 247 projects in the development pipeline.
Treatment Systems
46% Pipe
Networks 48%
Other 6%
US9.6 Billion
Florida 55%
California 27%
Texas 6%
Other States 12%
8.9 Million m3/d
Non-Potable 73%
Potable 27%
8.9 Million m3/d
Rest of World 62%
US 38%
9 States 93%
41 States 7%
Irrigation 66%
Industry 16%
Potable 15%
No Regulations 39 States
Limited Stress 70.4%
IPR Regulations 11 States
Moderate to Exceptional Drought
29.6%
Indirect Potable Reuse 99%
Note: Water Stress was measure in May 2015 Source: NOAA, Bluefield Research
9
!!!!!!US!Municipal!Wastewater!&!Reuse:"Market'Trends,'Opportuni2es,'&'Forecasts,'2015:2025'
ADVANCED WATER TREATMENT & DESALINATION
FOCUS REPORT
45
State-by-State Capacity Forecasts, 2015-2025
0
200
400
600
800
1,000
1,200
1,400
2015
2016
2017
2018
2019
2020
2021
2022
2023
2024
2025
M3 /
d (
tho
usa
nd
s)
Rest of the US
New Mexico
Oklahoma
Georgia
Arizona
Nevada
Colorado
Texas
California
Florida
• Bolstered by Miami- Dade wastewater infrastructure
projects through 2025 Florida will add 4.9 million m3/d of capacity. Florida Power and Light’s (FPL) Turkey Point Nuclear Power Plant offtake from the Miami-Dade South District wastewater plant will account for 340,700 m3/d of capacity by 2021.
• California will represents 27% of total additions that will increase if drought conditions persist, but the real impact of San Diego Pure Water plant will be after the forecast period when the remaining 219,600 m3/d is expected by 2035.
• California’s ramp up in 2025 is driven by several large scale projects set to come online including the 216,000 m3/d Hyperion MBR project.
• The near-term Texas forecast has been pushed back to account for the 2015 rains, but political and industrial momentum will enable momentum more than 560,000 m3/d of additions through 2025.
• Outside of the leading states, the remainder will add 1.0 million m3/d, led by Colorado’s 400,000 m3/d.
Analysis
Florida and California represent 82%, or 7.3 million m3/d, of total forecasted capacity additions through 2025, building on their significant share of current capacity to date.
Forecasted Wastewater Reuse Capacity Additions by State
Source: Bluefield Research
4
ADVANCED WATER TREATMENT & DESALINATION
US Municipal Wastewater & Reuse: Market Trends, Opportunities, & Forecasts, 2015-2025 FOCUS REPORT
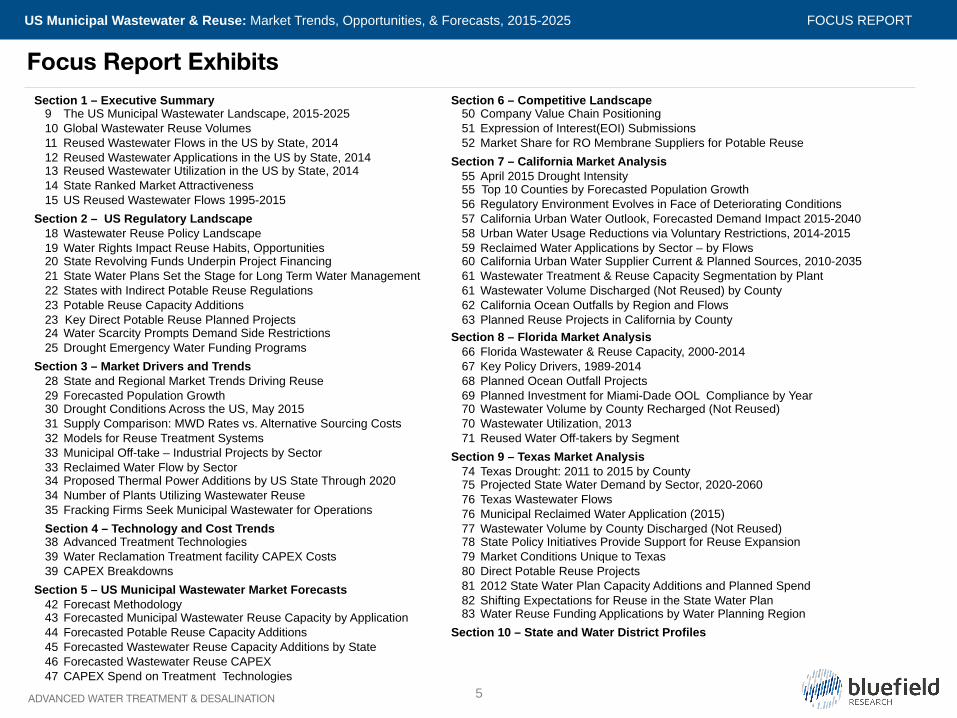
5
Focus Report Exhibits Section 1 – Executive Summary
9 The US Municipal Wastewater Landscape, 2015-2025 10 Global Wastewater Reuse Volumes 11 Reused Wastewater Flows in the US by State, 2014 12 Reused Wastewater Applications in the US by State, 2014 13 Reused Wastewater Utilization in the US by State, 2014 14 State Ranked Market Attractiveness 15 US Reused Wastewater Flows 1995-2015
Section 2 – US Regulatory Landscape 18 Wastewater Reuse Policy Landscape 19 Water Rights Impact Reuse Habits, Opportunities 20 State Revolving Funds Underpin Project Financing 21 State Water Plans Set the Stage for Long Term Water Management 22 States with Indirect Potable Reuse Regulations 23 Potable Reuse Capacity Additions 23 Key Direct Potable Reuse Planned Projects 24 Water Scarcity Prompts Demand Side Restrictions 25 Drought Emergency Water Funding Programs
Section 3 – Market Drivers and Trends 28 State and Regional Market Trends Driving Reuse 29 Forecasted Population Growth 30 Drought Conditions Across the US, May 2015 31 Supply Comparison: MWD Rates vs. Alternative Sourcing Costs 32 Models for Reuse Treatment Systems 33 Municipal Off-take – Industrial Projects by Sector 33 Reclaimed Water Flow by Sector 34 Proposed Thermal Power Additions by US State Through 2020 34 Number of Plants Utilizing Wastewater Reuse 35 Fracking Firms Seek Municipal Wastewater for Operations
Section 4 – Technology and Cost Trends 38 Advanced Treatment Technologies 39 Water Reclamation Treatment facility CAPEX Costs 39 CAPEX Breakdowns
Section 5 – US Municipal Wastewater Market Forecasts 42 Forecast Methodology 43 Forecasted Municipal Wastewater Reuse Capacity by Application 44 Forecasted Potable Reuse Capacity Additions 45 Forecasted Wastewater Reuse Capacity Additions by State 46 Forecasted Wastewater Reuse CAPEX 47 CAPEX Spend on Treatment Technologies
Section 6 – Competitive Landscape 50 Company Value Chain Positioning 51 Expression of Interest(EOI) Submissions 52 Market Share for RO Membrane Suppliers for Potable Reuse
Section 7 – California Market Analysis 55 April 2015 Drought Intensity 55 Top 10 Counties by Forecasted Population Growth 56 Regulatory Environment Evolves in Face of Deteriorating Conditions 57 California Urban Water Outlook, Forecasted Demand Impact 2015-2040 58 Urban Water Usage Reductions via Voluntary Restrictions, 2014-2015 59 Reclaimed Water Applications by Sector – by Flows 60 California Urban Water Supplier Current & Planned Sources, 2010-2035 61 Wastewater Treatment & Reuse Capacity Segmentation by Plant 61 Wastewater Volume Discharged (Not Reused) by County 62 California Ocean Outfalls by Region and Flows 63 Planned Reuse Projects in California by County
Section 8 – Florida Market Analysis 66 Florida Wastewater & Reuse Capacity, 2000-2014 67 Key Policy Drivers, 1989-2014 68 Planned Ocean Outfall Projects 69 Planned Investment for Miami-Dade OOL Compliance by Year 70 Wastewater Volume by County Recharged (Not Reused) 70 Wastewater Utilization, 2013 71 Reused Water Off-takers by Segment
Section 9 – Texas Market Analysis 74 Texas Drought: 2011 to 2015 by County 75 Projected State Water Demand by Sector, 2020-2060 76 Texas Wastewater Flows 76 Municipal Reclaimed Water Application (2015) 77 Wastewater Volume by County Discharged (Not Reused) 78 State Policy Initiatives Provide Support for Reuse Expansion 79 Market Conditions Unique to Texas 80 Direct Potable Reuse Projects 81 2012 State Water Plan Capacity Additions and Planned Spend 82 Shifting Expectations for Reuse in the State Water Plan 83 Water Reuse Funding Applications by Water Planning Region
Section 10 – State and Water District Profiles

ADVANCED WATER TREATMENT & DESALINATION
US Municipal Wastewater & Reuse: Market Trends, Opportunities, & Forecasts, 2015-2025 FOCUS REPORT
Appendix: US Municipal Wastewater & Reuse
Purchasers receive the report’s complete US Municipal Wastewater & Reuse Appendix, which includes:
Planned Reuse Systems
US Market Forecast Data
• Project Name • Current Project Status • Project Location • Project Timing & Status • Planned Capacity (m3/d) • Planned Investment US$, million
Wastewater Treatment Systems by State
• US Capacity Forecasts, 2015-2025 • State-by-State Capacity Forecasts, 2015-2025 • CAPEX Forecasts, 2015-2025 • Technology Forecasts, 2015-2025
• Wastewater Flows • Reuse Capacity by Water District • More than 100 Industrial Off-takers and
Flows
6
Industrial Reclaimed Water Users
• Company • Locations • Reclaimed Water Supplier • Industrial Sector • Flow (m3/d)
ADVANCED WATER TREATMENT & DESALINATION
US Municipal Wastewater & Reuse: Market Trends, Opportunities, & Forecasts, 2015-2025 FOCUS REPORT
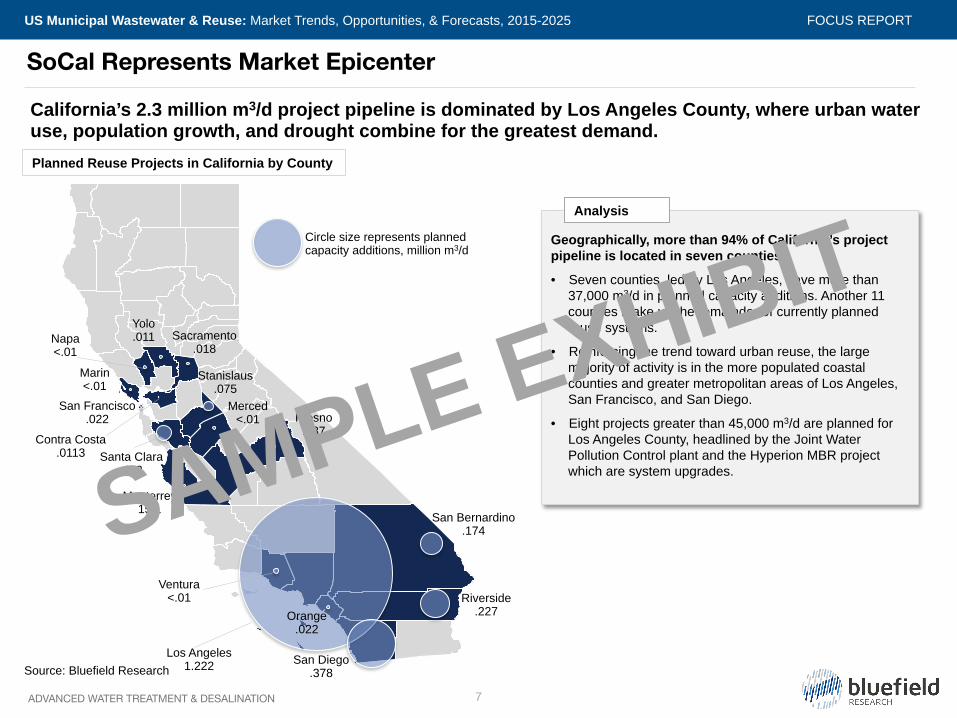
SoCal Represents Market Epicenter
California’s 2.3 million m3/d project pipeline is dominated by Los Angeles County, where urban water use, population growth, and drought combine for the greatest demand.
San Diego .378
Riverside .227
San Bernardino .174
Stanislaus .075
Santa Clara .113
Fresno .037
San Francisco .022
Orange .022
Sacramento .018
Monterrey 15.1
Yolo .011
Contra Costa .0113
Marin <.01
Merced <.01
Napa <.01
Ventura <.01
Los Angeles 1.222
Geographically, more than 94% of California’s project pipeline is located in seven counties
• Seven counties, led by Los Angeles, have more than 37,000 m3/d in planned capacity additions. Another 11 counties make up the remainder of currently planned reuse systems.
• Reinforcing the trend toward urban reuse, the large majority of activity is in the more populated coastal counties and greater metropolitan areas of Los Angeles, San Francisco, and San Diego.
• Eight projects greater than 45,000 m3/d are planned for Los Angeles County, headlined by the Joint Water Pollution Control plant and the Hyperion MBR project which are system upgrades.
Analysis
Circle size represents planned capacity additions, million m3/d
Planned Reuse Projects in California by County
Source: Bluefield Research
SAMPLE EXHIBIT
7

ADVANCED WATER TREATMENT & DESALINATION
US Municipal Wastewater & Reuse: Market Trends, Opportunities, & Forecasts, 2015-2025 FOCUS REPORT
Florida Wastewater Treatment and Reuse Additions
0
2
4
6
8
10
12
M3 /
d (
mill
ion
)
Wastewater Treatment Capacity
Reuse Capacity
Retrofits and add-ons to existing wastewater treatment plants represent the lion’s share of capacity additions.
• Installed reuse capacity has increased 3% year-over-year, compared to 1% average annual increase in wastewater treatment capacity.
• There are approximately 2,000 domestic wastewater facilities in the state of Florida permitted by the Department of Environmental Protection, with a combined capacity of over 9.5 million cubic meters per day (m3/d).
• Only 18% of permitted treatment facilities have a capacity of over 1,892 m3/d but account for 96% of total permitted domestic wastewater treatment in the state.
• Estimated capacity additions in 2014 brings the total to 6.6 million m3/d of reuse capacity.
Analysis
Since 2000, installed reuse capacity in Florida has grown 52%, reaching 6.6 million m3/d in 2014, outpacing installed wastewater treatment capacity, which grew only 17% over the same period.
Florida Wastewater & Reuse Capacity, 2000-2014
Source: Florida Dept. Of Environmental Protection, Bluefield Research
SAMPLE EXHIBIT
8

ADVANCED WATER TREATMENT & DESALINATION
US Municipal Wastewater & Reuse: Market Trends, Opportunities, & Forecasts, 2015-2025 FOCUS REPORT
Order Form
SINGLE SITE LICENSE!US$2200 ! !!
PAYMENT METHOD! CREDIT CARD! INVOICE / PURCHASE ORDER!
CREDIT CARD NUMBER ___________________________________________________________________!
NAME AS APPEARS ON CREDIT CARD __________________________________________________________!
CVV CODE ____________________________________!EXPIRATION DATE ___________________________!
BILLING ADDRESS!
COMPANY ____________________________________!
FIRST NAME _____________________________!
STREET ADDRESS ______________________________________________________________________________!
LAST NAME ________________________________________!
COUNTRY ___________________________________!
SIGNATURE __________________________________________!TOTAL CHARGE (US$) _________________!
CITY ___________________________________! POSTAL CODE ____________________________________!
EMAIL ________________________________________! PHONE ______________________________________!
SELECT REPORT LICENSE!
SIGNATURE _____________________________________! DATE _____________________________________!
ENTERPRISE LICENSE!US$3100 ! !!
US Municipal Wastewater & Reuse: Market Trends, Opportunities & Forecasts, 2015-2025 Publication Date: July 2015
This Focus Report highlights the following:
• A 2015–2025 forecast of municipal wastewater reuse in the US by key state, capital investment, and technology adoption totaling $11.0B of CAPEX
• Bottom-up assessment of the 247 projects in the pipeline by state and status
• In-depth analysis of state and federal regulatory environments influencing the deployment of wastewater reuse
• More than 40 profiles and analysis of 9 key states and 32 water districts.
• Industrial users of reclaimed water and trends for greater adoption
Complete the order form to the right and fax or email a scanned copy to Bluefield Research at +1 617 249 2082, or [email protected].
REPORT PRICE
US$3500
9

ADVANCED WATER TREATMENT & DESALINATION
US Municipal Wastewater & Reuse: Market Trends, Opportunities, & Forecasts, 2015-2025 FOCUS REPORT
ADVANCED WATER TREATMENT & DESALINATION INSIGHT SERVICE
CLIENT FOCUS: This Insight Service is designed for companies involved in the supply, purchase or integration of water and wastewater treatment technologies, including:
• Municipal and water utilities tracking new players and technologies • Business development and strategy executives at manufacturers and
integrators of water and wastewater treatment systems, components • EPC and water project developers seeking new supply relationships or
strategic or vertical partnerships • Large industrial water users searching for optimal supply solutions • Investors targeting new business models in water treatment and re-use
RESEARCH COVERAGE: a 12-month cycle of data- and analytics-driven research provided in multiple formats to support client strategies, covering:
• Desalination market trends including new projects, emerging brackish water applications, and cost drivers
• Growth of water and wastewater treatment markets by segment (membrane, chemical, thermal, etc), by vertical market, and by region
• Water re-use strategies and market acceptance by sector • In-depth insight into industrial treatment markets including mining, oil &
gas, fracking, power, agriculture, and manufacturing • Technology trends in materials, processes, and energy efficiency • Supplier rankings and market share by segment and region • Supply chain shifts and tracking of new entrants
METRICS: primary research and analysis is supported by proprietary market, project and company databases updated continuously:
• WT, WWT and desalination project databases (technology, supplier) • EPC and equipment supplier databases • Industrial segment project databases (mining, O&G, power, etc) • Rigorous market forecasts detailing models, assumptions, and detailed
scenarios
Insight Service Description
WATER SOLUTIONS COVERED:
Business Models
Cost Drivers
M&A Activity
Regulatory Activity
Market Share
MARKET SEGMENTS COVERED:
Industrial Water Municipal Water • Power Gen • Oil & Gas • Mining • Chemicals • Food & Beverage Water Reuse
Water Treatment
Wastewater Treatment Desalination
Agriculture
SELECT LIST OF COMPANIES COVERED:
10

ADVANCED WATER TREATMENT & DESALINATION
US Municipal Wastewater & Reuse: Market Trends, Opportunities, & Forecasts, 2015-2025 FOCUS REPORT
© 2015 BLUEFIELD RESEARCH, LLC.
Global companies across the value chain are developing strategies to capitalize on greenfield opportunities in water -- new build, new business models, and private investment. Bluefield Research supports a growing roster of companies across key technology segments and industry verticals addressing risks and opportunities in the new water landscape. Companies are turning to Bluefield for in-depth, actionable intelligence into the water sector and the sector's impacts on key industries. The insights draw on primary research from the water, energy, power, mining, agriculture, financial sectors and their respective supply chains. Bluefield works with key decision-makers at utilities, project development companies, independent water and power providers, EPC companies, technology suppliers, manufacturers, and investment firms, giving them tools to define and execute strategies.
Contact Bluefield Research
NORTH AMERICA 34 Farnsworth St // Floor 3 Boston, MA 02210 T +1 617 910 2540 EUROPE C/de Santa Eulàlia 5-9 // 3a
08012 Barcelona Spain T +34 673 408 963 [email protected] www.bluefieldresearch.com
WWW.BLUEFIELDRESEARCH.COM GREENFIELD + WATER = BLUEFIELD
About Bluefield Research