Embed Size (px)
Citation preview

Sector
1 / 13 8 March 2016
© Tricumen Limited 2016. All rights reserved.
-
Capital Markets: Regions FY15 This publication is supplementary to our quarterly Results Review; it shows banks' capital markets quarterly revenue and semi-annual pre-tax profit and productivity dynamics relative to their peers in major regions. The full dataset includes operating revenue, expenses and pre-tax profit at the Level 3 product detail in 7 regions, as well as normalised client segment revenue allocations, RWA and Equity.
All data is reconciled against the published financial statements. Further detail is available on request.
EMEA
% change share of peer group operating revenue & pre-tax profit (US$, FY15/FY14)
Issu
an
ce
& A
dvis
ory
FIC
C
Eq
uit
ies
Source: Tricumen. Notes: (1) Tricumen product definitions throughout. (2) Revenue is post-writedowns, excludes DVA/FVA/equivalent, one-offs, dedicated proprietary trading and principal revenue. (3) Outliers are excluded.
0.4
%
0.5
%
0.7
%
0.0
%
-0.9
%
-2.1
%
1.3
%
-0.1
%
0.8
%
-0.1
%
-1.2
%
-0.4
%
1.1
%
0.5
% 1.2
%
6.0
%
-0.6
%
-6.1
%
-4.0
%
-3.3
%
1.2
%
1.0
%
-0.6
%
2.4
%
0.0
%
2.3
%
-0.08
-0.06
-0.04
-0.02
0
0.02
0.04
0.06
0.08
BAML BARC BNPP Citi CS DBK GS HSBC JPM MS RBS SG UBS
mkt share gain
mkt share loss
RevenuePre-Tax Profit
1.1
%
0.4
%
0.3
%
0.3
%
-0.3
%
-0.2
%
-1.2
%
1.6
%
-0.1
%
0.4
%
-1.5
%
-2.1
%
1.2
%
-0.3
%
4.5
%
0.3
%
-3.8
%
-3.6
%
-19.4
%
-5.0
% -1.8
%
5.8
%
3.1
% 6.8
%
-9.7
%
23.0
%
-0.25
-0.2
-0.15
-0.1
-0.05
0
0.05
0.1
0.15
0.2
0.25
0.3
BAML BARC BNPP Citi CS DBK GS HSBC JPM MS RBS SG UBS
mkt share gain
mkt share loss
RevenuePre-Tax Profit
0.9
%
-1.0
%
-0.1
%
0.2
%
-1.6
%
-0.7
%
0.9
%
0.6
%
1.7
%
1.0
%
0.0
%
-1.4
%
-0.3
%
8.5
%
-1.8
%
-3.4
%
4.4
%
-15.7
%
-7.2
%
-0.2
%
-1.5
%
6.6
% 8.1
%
0.0
%
11.8
%
-9.6
%
-0.2
-0.15
-0.1
-0.05
0
0.05
0.1
0.15
BAML BARC BNPP Citi CS DBK GS HSBC JPM MS RBS SG UBS
mkt share gain
mkt share loss
RevenuePre-Tax Profit

Sector
2 / 13 8 March 2016
© Tricumen Limited 2016. All rights reserved.
EMEA (cont.)
Operating revenue dynamics (US$, Level 1 products, FY15/FY14)
Source: Tricumen. Notes: (1) Tricumen product definitions apply throughout. (2) Arrows show % change in revenue vs peers. Up-/down-arrows: top-/bottom-quartile. (3) Revenue is post-writedowns, excludes DVA/FVA/equivalent, one-offs and outliers.
BAML BARC BNPP Citi CS DBK GS HSBC JPM MS RBS SG UBS Top 25% Bottom 25%
Capital Markets 2% -11%
Issuance & Advisory -13% -25%
DCM Bonds N/M -10% -36%
DCM Loans -2% -28%
Securitisation N/M N/M -46% -78%
ECM N/M -14% -21%
M&A /Advisory N/M N/M 8% -18%
Sales & Trading 10% -10%
FX 16% -7%
Rates N/M 3% -12%
Credit N/M 14% -22%
Commodities N/M 9% -18%
EQ Cash N/M 37% 5%
EQ Derv & Converts N/M 21% -10%
Prime Services N/M 6% -9%
Prop & Princ Inv N/M N/M N/M N/M N/M N/M -14% -35%

Sector
3 / 13 8 March 2016
© Tricumen Limited 2016. All rights reserved.
EMEA (cont.)
Operating cost / income (US$, Level 1 products, FY14 vs FY15)
Capital Markets Banking
FICC Equities
Source: Tricumen. Notes: (1) TRIC product definitions, standard deviation, product Level 1; (2) Operating expenses exclude one-off non-operational items, insurance-related benefits & claims, and credit expense/recovery/NPL provisions. Capital expenditure is included as accrued. Litigation expense is allocated to front-line units. (3) positive values indicate outperformance; missing fields indicate that data is not meaningful, or available; (4) outliers are excluded. (5) RBS does not compete in Equities markets.
-3.0
-2.0
-1.0
0.0
1.0
2.0 BAML
BARC
BNPP
Citi
CS
DBK
GSHSBC
JPM
MS
RBS
SG
UBS
FY15 FY14 Peer Gp Avg
-3.0
-2.0
-1.0
0.0
1.0
2.0 BAML
BARC
BNPP
Citi
CS
DBK
GSHSBC
JPM
MS
RBS
SG
UBS
FY15 FY14 Peer Gp Avg
-3.0
-2.0
-1.0
0.0
1.0
2.0 BAML
BARC
BNPP
Citi
CS
DBK
GSHSBC
JPM
MS
RBS
SG
UBS
FY15 FY14 Peer Gp Avg
-2.0
-1.0
0.0
1.0
2.0
3.0 BAML
BARC
BNPP
Citi
CS
DBK
GS
HSBC
JPM
MS
SG
UBS
FY15 FY14 Peer Gp Avg

Sector
4 / 13 8 March 2016
© Tricumen Limited 2016. All rights reserved.
EMEA (cont.)
Operating revenue / Front Office headcount (FTE, US$, Level 1 products, FY15)
Capital Markets Banking
FICC Equities
Source: Tricumen. Notes: (1) TRIC product definitions, standard deviation, product Level 1; (2) positive values indicate outperformance; missing fields indicate that data is not meaningful, or available; (3) outliers are excluded. (4) RBS does not compete in Equities markets.
-2.0
-1.0
0.0
1.0
2.0
3.0 BAML
BARC
BNPP
Citi
CS
DBK
GSHSBC
JPM
MS
RBS
SG
UBS
FY15 Peer Gp Avg
-2.0
-1.0
0.0
1.0
2.0
3.0 BAML
BARC
BNPP
Citi
CS
DBK
GSHSBC
JPM
MS
RBS
SG
UBS
FY15 Peer Gp Avg
-2.0
-1.0
0.0
1.0
2.0 BAML
BARC
BNPP
Citi
CS
DBK
GSHSBC
JPM
MS
RBS
SG
UBS
FY15 Peer Gp Avg
-2.0
-1.0
0.0
1.0
2.0 BAML
BARC
BNPP
Citi
CS
DBK
GS
HSBC
JPM
MS
SG
UBS
FY15 Peer Gp Avg

Sector
5 / 13 8 March 2016
© Tricumen Limited 2016. All rights reserved.
Americas
% change share of peer group operating revenue & pre-tax profit (US$, FY15/FY14)
Issu
an
ce
& A
dvis
ory
FIC
C
Eq
uit
ies
Source: Tricumen. Notes: (1) Tricumen product definitions throughout. (2) Revenue is post-writedowns, excludes DVA/FVA/equivalent, one-offs, dedicated proprietary trading and principal revenue. (3) Outliers are excluded.
-0.7
%
-0.4
%
-0.1
%
0.7
%
-1.1
%
-1.2
%
2.2
%
0.0
%
1.6
%
0.7
%
-1.1
%
0.3
%
-1.0
%
-0.9
%
3.6
%
0.2
%
0.7
%
-4.6
%
-14.3
%
-3.7
%
0.3
% 2.5
%
22.5
%
-4.6
%
0.3
%
-1.9
%
-0.2
-0.15
-0.1
-0.05
0
0.05
0.1
0.15
0.2
0.25
BAML BARC BNPP Citi CS DBK GS HSBC JPM MS RBS SG UBS
mkt share gain
mkt share loss
RevenuePre-Tax Profit
0.3
%
0.2
%
-0.1
%
0.8
%
-1.9
% -0.2
%
-1.6
%
0.1
%
0.1
% 1.2
%
-0.2
%
1.0
%
0.2
%
-2.4
%
4.3
%
0.1
%
-1.0
%
-7.5
%
-7.1
%
-4.7
%
0.2
%
4.6
%
3.5
%
-0.5
%
-3.1
%
13.5
%
-0.1
-0.05
0
0.05
0.1
0.15
BAML BARC BNPP Citi CS DBK GS HSBC JPM MS RBS SG UBS
mkt share gain
mkt share loss
RevenuePre-Tax Profit
-0.1
%
-1.4
%
-0.2
%
0.8
%
-0.9
%
-1.9
%
0.9
%
0.5
%
1.0
%
1.7
%
0.0
%
-0.4
%
-0.1
%
1.5
%
-3.1
% -1.7
%
2.9
%
-5.7
%
-6.4
%
-0.4
%
-0.6
%
0.3
%
13.6
%
0.0
%
2.2
%
-2.6
%
-0.1
-0.05
0
0.05
0.1
0.15
BAML BARC BNPP Citi CS DBK GS HSBC JPM MS RBS SG UBS
mkt share gain
mkt share loss
RevenuePre-Tax Profit
Sector
6 / 13 8 March 2016
© Tricumen Limited 2016. All rights reserved.
Americas (cont.)
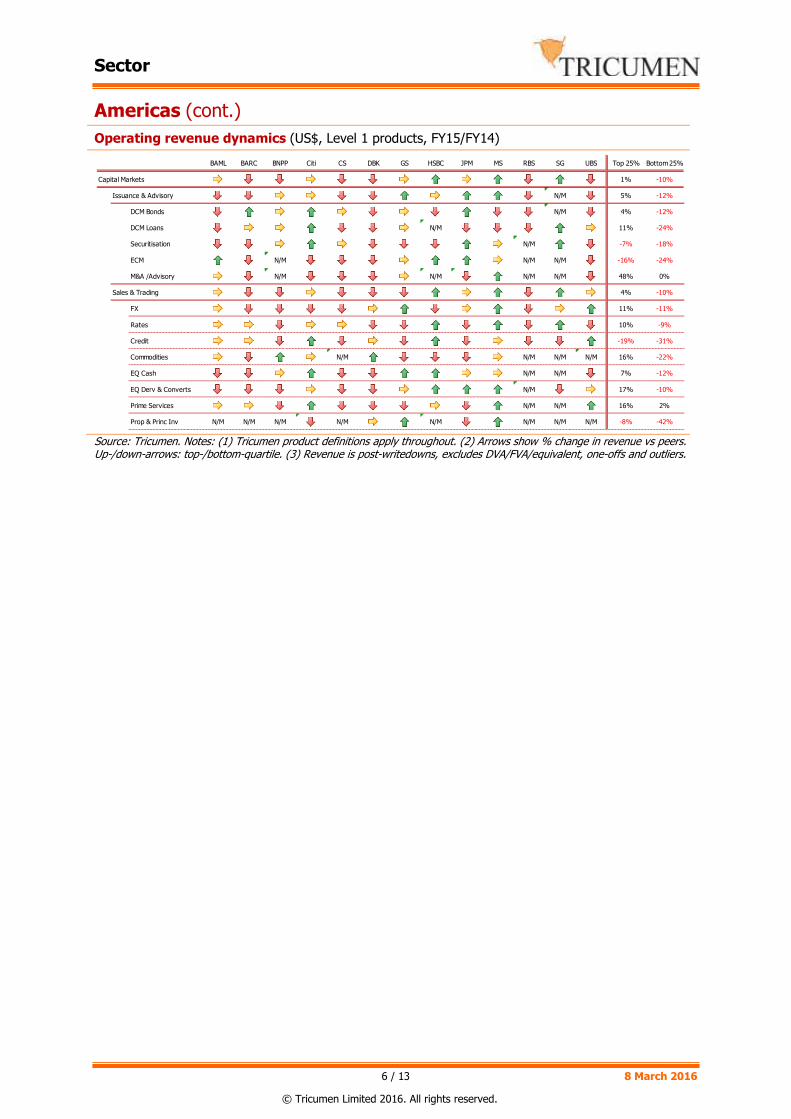
Operating revenue dynamics (US$, Level 1 products, FY15/FY14)
Source: Tricumen. Notes: (1) Tricumen product definitions apply throughout. (2) Arrows show % change in revenue vs peers. Up-/down-arrows: top-/bottom-quartile. (3) Revenue is post-writedowns, excludes DVA/FVA/equivalent, one-offs and outliers.
BAML BARC BNPP Citi CS DBK GS HSBC JPM MS RBS SG UBS Top 25% Bottom 25%
Capital Markets 1% -10%
Issuance & Advisory N/M 5% -12%
DCM Bonds N/M 4% -12%
DCM Loans N/M 11% -24%
Securitisation N/M -7% -18%
ECM N/M N/M N/M -16% -24%
M&A /Advisory N/M N/M N/M N/M 48% 0%
Sales & Trading 4% -10%
FX 11% -11%
Rates 10% -9%
Credit -19% -31%
Commodities N/M N/M N/M N/M 16% -22%
EQ Cash N/M N/M 7% -12%
EQ Derv & Converts N/M 17% -10%
Prime Services N/M N/M 16% 2%
Prop & Princ Inv N/M N/M N/M N/M N/M N/M N/M N/M -8% -42%

Sector
7 / 13 8 March 2016
© Tricumen Limited 2016. All rights reserved.
Americas (cont.)
Operating cost / income (US$, Level 1 products, FY14 vs FY15)
Capital Markets Banking
FICC Equities
Source: Tricumen. Notes: (1) TRIC product definitions, standard deviation, product Level 1; (2) Operating expenses exclude one-off non-operational items, insurance-related benefits & claims, and credit expense/recovery/NPL provisions. Capital expenditure is included as accrued. Litigation expense is allocated to front-line units. (3) positive values indicate outperformance; missing fields indicate that data is not meaningful, or available; (4) outliers are excluded. (5) RBS does not compete in Equities markets.
-3.0
-2.0
-1.0
0.0
1.0
2.0 BAML
BARC
BNPP
Citi
CS
DBK
GSHSBC
JPM
MS
RBS
SG
UBS
FY15 FY14 Peer Gp Avg
-4.0
-3.0
-2.0
-1.0
0.0
1.0 BAML
BARC
BNPP
Citi
CS
DBK
GSHSBC
JPM
MS
RBS
SG
UBS
FY15 FY14 Peer Gp Avg
-4.0
-3.0
-2.0
-1.0
0.0
1.0
2.0 BAML
BARC
BNPP
Citi
CS
DBK
GSHSBC
JPM
MS
RBS
SG
UBS
FY15 FY14 Peer Gp Avg
-2.0
-1.0
0.0
1.0
2.0
3.0 BAML
BARC
BNPP
Citi
CS
DBK
GS
HSBC
JPM
MS
SG
UBS
FY15 FY14 Peer Gp Avg

Sector
8 / 13 8 March 2016
© Tricumen Limited 2016. All rights reserved.
Americas (cont.)
Operating revenue / Front Office headcount (FTE, US$, Level 1 products, FY15)
Capital Markets Banking
FICC Equities
Source: Tricumen. Notes: (1) TRIC product definitions, standard deviation, product Level 1; (2) positive values indicate outperformance; missing fields indicate that data is not meaningful, or available; (3) outliers are excluded. (4) RBS does not compete in Equities markets.
-2.0
-1.0
0.0
1.0
2.0
3.0 BAML
BARC
BNPP
Citi
CS
DBK
GSHSBC
JPM
MS
RBS
SG
UBS
FY15 Peer Gp Avg
-2.0
-1.0
0.0
1.0
2.0
3.0 BAML
BARC
BNPP
Citi
CS
DBK
GSHSBC
JPM
MS
RBS
SG
UBS
FY15 Peer Gp Avg
-2.0
-1.0
0.0
1.0
2.0 BAML
BARC
BNPP
Citi
CS
DBK
GSHSBC
JPM
MS
RBS
SG
UBS
FY15 Peer Gp Avg
-1.0
0.0
1.0
2.0
3.0 BAML
BARC
BNPP
Citi
CS
DBK
GS
HSBC
JPM
MS
SG
UBS
FY15 Peer Gp Avg
Sector
9 / 13 8 March 2016
© Tricumen Limited 2016. All rights reserved.
Asia Pacific
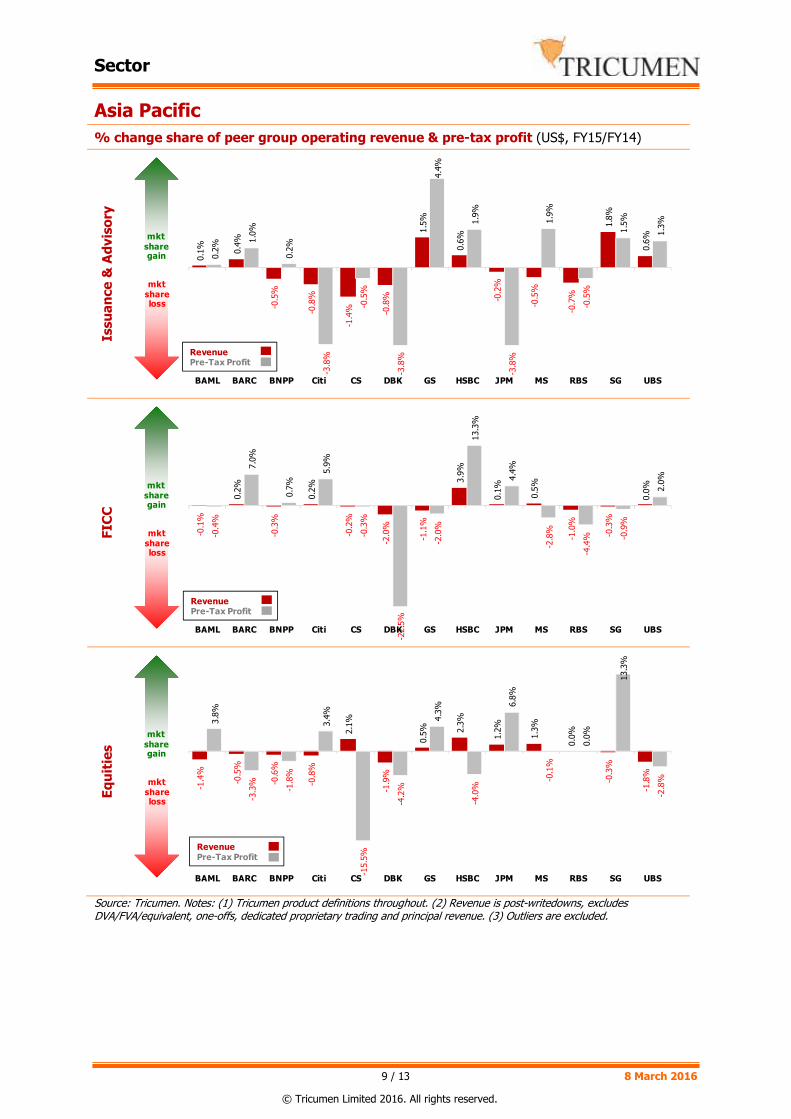
% change share of peer group operating revenue & pre-tax profit (US$, FY15/FY14)
Issu
an
ce
& A
dvis
ory
FIC
C
Eq
uit
ies
Source: Tricumen. Notes: (1) Tricumen product definitions throughout. (2) Revenue is post-writedowns, excludes DVA/FVA/equivalent, one-offs, dedicated proprietary trading and principal revenue. (3) Outliers are excluded.
0.1
%
0.4
%
-0.5
%
-0.8
%
-1.4
% -0.8
%
1.5
%
0.6
%
-0.2
%
-0.5
%
-0.7
%
1.8
%
0.6
%
0.2
%
1.0
%
0.2
%
-3.8
%
-0.5
%
-3.8
%
4.4
%
1.9
%
-3.8
%
1.9
%
-0.5
%
1.5
%
1.3
%
-0.05
-0.04
-0.03
-0.02
-0.01
0
0.01
0.02
0.03
0.04
0.05
BAML BARC BNPP Citi CS DBK GS HSBC JPM MS RBS SG UBS
mkt share gain
mkt share loss
RevenuePre-Tax Profit
-0.1
%
0.2
%
-0.3
%
0.2
%
-0.2
%
-2.0
%
-1.1
%
3.9
%
0.1
%
0.5
%
-1.0
%
-0.3
%
0.0
%
-0.4
%
7.0
%
0.7
%
5.9
%
-0.3
%
-22.5
%
-2.0
%
13.3
%
4.4
%
-2.8
%
-4.4
% -0.9
%
2.0
%
-0.25
-0.2
-0.15
-0.1
-0.05
0
0.05
0.1
0.15
0.2
BAML BARC BNPP Citi CS DBK GS HSBC JPM MS RBS SG UBS
mkt share gain
mkt share loss
RevenuePre-Tax Profit
-1.4
%
-0.5
%
-0.6
%
-0.8
%
2.1
%
-1.9
%
0.5
% 2.3
%
1.2
%
1.3
%
0.0
%
-0.3
%
-1.8
%
3.8
%
-3.3
%
-1.8
%
3.4
%
-15.5
%
-4.2
%
4.3
%
-4.0
%
6.8
%
-0.1
%
0.0
%
13.3
%
-2.8
%
-0.2
-0.15
-0.1
-0.05
0
0.05
0.1
0.15
BAML BARC BNPP Citi CS DBK GS HSBC JPM MS RBS SG UBS
mkt share gain
mkt share loss
RevenuePre-Tax Profit

Sector
10 / 13 8 March 2016
© Tricumen Limited 2016. All rights reserved.
Asia Pacific (cont.)
Operating revenue dynamics (US$, Level 1 products, FY15/FY14)
Source: Tricumen. Notes: (1) Tricumen product definitions apply throughout. (2) Arrows show % change in revenue vs peers. Up-/down-arrows: top-/bottom-quartile. (3) Revenue is post-writedowns, excludes DVA/FVA/equivalent, one-offs and outliers.
BAML BARC BNPP Citi CS DBK GS HSBC JPM MS RBS SG UBS Top 25% Bottom 25%
Capital Markets 3% -8%
Issuance & Advisory N/M -4% -20%
DCM Bonds N/M -17% -39%
DCM Loans N/M 6% -57%
Securitisation N/M N/M N/M -20% -72%
ECM N/M N/M N/M -7% -38%
M&A /Advisory N/M N/M 54% -13%
Sales & Trading 6% -9%
FX 9% -5%
Rates 6% -15%
Credit -8% -29%
Commodities N/M N/M N/M N/M -12% -46%
EQ Cash N/M 41% -9%
EQ Derv & Converts N/M 10% -13%
Prime Services N/M 18% -13%
Prop & Princ Inv N/M N/M N/M N/M N/M N/M N/M N/M N/M N/M -15% -39%

Sector
11 / 13 8 March 2016
© Tricumen Limited 2016. All rights reserved.
Asia Pacific (cont.)
Operating cost / income (US$, Level 1 products, FY14 vs FY15)
Capital Markets Banking
FICC Equities
Source: Tricumen. Notes: (1) TRIC product definitions, standard deviation, product Level 1; (2) Operating expenses exclude one-off non-operational items, insurance-related benefits & claims, and credit expense/recovery/NPL provisions. Capital expenditure is included as accrued. Litigation expense is allocated to front-line units. (3) positive values indicate outperformance; missing fields indicate that data is not meaningful, or available; (4) outliers are excluded. (5) RBS does not compete in Equities markets.
-2.0
-1.0
0.0
1.0
2.0
3.0 BAML
BARC
BNPP
Citi
CS
DBK
GSHSBC
JPM
MS
RBS
SG
UBS
FY15 FY14 Peer Gp Avg
-3.0
-2.0
-1.0
0.0
1.0
2.0 BAML
BARC
BNPP
Citi
CS
DBK
GSHSBC
JPM
MS
RBS
SG
UBS
FY15 FY14 Peer Gp Avg
-3.0
-2.0
-1.0
0.0
1.0
2.0 BAML
BARC
BNPP
Citi
CS
DBK
GSHSBC
JPM
MS
RBS
SG
UBS
FY15 FY14 Peer Gp Avg
-2.0
-1.0
0.0
1.0
2.0
3.0 BAML
BARC
BNPP
Citi
CS
DBK
GS
HSBC
JPM
MS
SG
UBS
FY15 FY14 Peer Gp Avg

Sector
12 / 13 8 March 2016
© Tricumen Limited 2016. All rights reserved.
Asia Pacific (cont.)
Operating revenue / Front Office headcount (FTE, US$, Level 1 products, FY15)
Capital Markets Banking
FICC Equities
Source: Tricumen. Notes: (1) TRIC product definitions, standard deviation, product Level 1; (2) positive values indicate outperformance; missing fields indicate that data is not meaningful, or available; (3) outliers are excluded. (4) RBS does not compete in Equities markets.
-2.0
-1.0
0.0
1.0
2.0
3.0 BAML
BARC
BNPP
Citi
CS
DBK
GSHSBC
JPM
MS
RBS
SG
UBS
FY15 Peer Gp Avg
-2.0
-1.0
0.0
1.0
2.0 BAML
BARC
BNPP
Citi
CS
DBK
GSHSBC
JPM
MS
RBS
SG
UBS
FY15 Peer Gp Avg
-2.0
-1.0
0.0
1.0
2.0 BAML
BARC
BNPP
Citi
CS
DBK
GSHSBC
JPM
MS
RBS
SG
UBS
FY15 Peer Gp Avg
-2.0
-1.0
0.0
1.0
2.0 BAML
BARC
BNPP
Citi
CS
DBK
GS
HSBC
JPM
MS
SG
UBS
FY15 Peer Gp Avg
Sector
13 / 13 8 March 2016
© Tricumen Limited 2016. All rights reserved.
About Tricumen Tricumen was founded in 2008. It quickly became a strong provider of diversified market intelligence across the capital markets and has since expanded into transaction and corporate banking coverage. Tricumen’s data has been used by many of the world’s leading investment banks as well as strategy consulting firms, investment managers and ‘blue chip’ corporations.
Situated near Cambridge in the UK, Tricumen is almost exclusively staffed with senior individuals with an extensive track record of either working for or analysing banks; and boasts what we believe is the largest capital markets-focused research network of its peer group.
Notes & Caveats No part of this document may be reproduced or transmitted in any form by any means without written permission of Tricumen Limited. Such consent is often given, provided that the information released is sourced to Tricumen and that it does not prejudice Tricumen Limited’s business or compromise the company’s ability to analyse the financial markets. Full acknowledgement of Tricumen Limited must be given.
Tricumen Limited has used all reasonable care in writing, editing and presenting the information found in this report. All reasonable effort has been made to ensure the information supplied is accurate and not misleading. For the purposes of cross- market comparison, all numerical data is normalised in accordance to Tricumen Limited’s proprietary product classification. Fully-researched dataset may contain margin of error of 10%; for modelled datasets, this margin may be wider.
The information and commentary provided in this report has been compiled for informational purposes only. We recommend that independent advice and enquiries should be sought before acting upon it. Readers should not rely on this information for legal, accounting, investment, or similar purposes. No part of this report constitutes investment advice, any form of recommendation, or a solicitation to buy or sell any instrument or to engage in any trading or investment activity or strategy. Tricumen Limited does not provide investment advice or personal recommendation nor will it be deemed to have done so.
Tricumen Limited makes no representation, guarantee or warranty as to the suitability, accuracy or completeness of the report or the information therein. Tricumen Limited assumes no responsibility for information contained in this report and disclaims all liability arising from negligence or otherwise in respect of such information.
Tricumen Limited is not liable for any damages arising in contract, tort or otherwise from the use of or inability to use this report or any material contained in it, or from any action or decision taken as a result of using the report.
© Tricumen Limited 2016. All rights reserved